UNITED STATES
SECURITIES AND EXCHANGE COMMISSION
Washington, D.C. 20549
FORM N-CSR
CERTIFIED SHAREHOLDER REPORT OF REGISTERED
MANAGEMENT INVESTMENT COMPANIES
Investment Company Act file number 811-03015
Ohio National Fund, Inc.
(Exact name of registrant as specified in charter)
| One Financial Way, Cincinnati, Ohio | 45242 | |
| (Address of principal executive offices) | (Zip code) |
CT Corporation 300 E. Lombard St. Suite 1400 Baltimore, MD 21202
(Name and address of agent for service)
Registrant’s telephone number, including area code: 513-794-6971
Date of fiscal year end: December 31
Date of reporting period: December 31, 2011
Form N-CSR is to be used by management investment companies to file reports with the Commission not later than 10 days after the transmission to stockholders of any report that is required to be transmitted to stockholders under Rule 30e-1 under the Investment Company Act of 1940 (17 CFR 270.30e-1). The Commission may use the information provided on Form N-CSR in its regulatory, disclosure review, inspection, and policymaking roles.
A registrant is required to disclose the information specified by Form N-CSR, and the Commission will make this information public. A registrant is not required to respond to the collection of information contained in Form N-CSR unless the Form displays a currently valid Office of Management and Budget (“OMB”) control number. Please direct comments concerning the accuracy of the information collection burden estimate and any suggestions for reducing the burden to Secretary, Securities and Exchange Commission, 450 Fifth Street, NW, Washington, DC 20549-0609. The OMB has reviewed this collection of information under the clearance requirements of 44 U.S.C. § 3507.
| Item 1. | Reports To Stockholders. |
WEALTH BUILDING OPPORTUNITY
Ohio National Fund, Inc.
Annual Report
December 31, 2011
Ohio National Fund, Inc.
OHIO NATIONAL FUND, INC.
| 1 | ||||
| 2 | ||||
The following pages contain Performance, Management’s Comments, Change in Value of $10,000 Investment, Portfolio Composition, Top Holdings, and Schedule of Investments for each of the Fund’s Portfolios: | ||||
| 3 | ||||
| 7 | ||||
| 9 | ||||
| 14 | ||||
| 19 | ||||
| 24 | ||||
| 29 | ||||
| 32 | ||||
| 36 | ||||
| 40 | ||||
| 45 | ||||
| 50 | ||||
| 57 | ||||
| 61 | ||||
| 70 | ||||
| 75 | ||||
| 79 | ||||
| 82 | ||||
| 85 | ||||
| 88 | ||||
| 93 | ||||
| 97 | ||||
| 101 | ||||
| 104 | ||||
| 107 | ||||
| 110 | ||||
| 113 | ||||
| 119 | ||||
| 131 | ||||
| 152 | ||||
| 153 | ||||
| 161 | ||||
Message |  |
Dear Investor:
The year 2011 was a tale of two halves and a tale of volatility. For the first half of the year, the markets were relatively calm and performance was good. The S&P 500® Index was up 6.0 percent, the MSCI EAFE (Europe, Australasia and Far East) Index was up 5.3 percent, and the VIX Index averaged 18.04, several points below its ten-year average. However, as mid-year approached, storm clouds began brewing on the horizon as troubles in Europe grew and the U.S. debt ceiling debate took center stage. A potential default in Greece caused serious concern about the fate of the European Union, and the large European banks that had lent money to Greece through the purchase of Greek sovereign debt. These concerns sparked fears of a European recession spreading to the United States and further weakening other overextended European nations such as Italy, Portugal, Ireland and Spain.
These events caused significant changes in the second half of the year, starting with falling interest rates in the U.S., as Treasuries became the flight-to-quality asset of choice. From its high, the yield on ten-year Treasuries fell 200 basis points, from 3.7 percent to 1.7 percent. This significant decline in yields made U.S. Treasuries the clear total return winner in 2011, as price moves inversely to yield.
Equity performance in the second half of the year was also challenging and very volatile. The S&P 500® Index was down 3.7 percent. The MSCI EAFE Index, because of its significant exposure to Europe, fared even worse and finished down 16.2 percent. Volatility showed the most dramatic change with the VIX Index averaging 30.3 during the last six months of the year, reaching a high of 48.0 on August 8. However, by year-end, volatility had returned close to its decade-long average, finishing December at 23.4.
Through November, volatility remained high as equity returns fluctuated widely. Returns at the end of October
were up almost 11 percent, then November ended with slightly negative returns. What was amazing to watch through all of this was the day-to-day movement of the markets. For example, of the twenty-one trading days in November, over 50 percent of the days had moves of 1 percent or more, one-third of the days had moves of 2 percent or more, and two days saw moves of over 3 percent.
By the end of the year, the S&P 500® Index was largely unchanged with a beginning value of 1257.6, an ending value of 1257.6 and an annual return of 2.1 percent coming entirely from dividends. 2011 truly was a roller-coaster year that gave us a wild ride that ended where we started.
Active managers often struggle in highly volatile markets, and the portfolio managers of the Ohio National Fund were no exception. During the first half of the year, nine of the twenty-one actively managed Portfolios (excluding the Money Market, S&P 500® Index and Nasdaq-100® Index Portfolios) outperformed their respective benchmarks and were in the top half of their respective peer groups. Five others underperformed their benchmarks, but ranked in the top half of their peer groups, leaving only 7 of 21 underperforming both.
In the second half of the year, the story reversed – eleven Portfolios underperformed both their respective benchmarks and their peer groups, 6 outperformed their respective peer groups but underperformed the benchmarks, and only 4 outperformed both. There was an improvement in December as volatility declined; twelve Portfolios outperformed their respective benchmarks or peer groups for the month. Several Portfolios that performed very well during the year were the Millennium Portfolio, sub-advised by Neuberger Berman, the Small Cap Growth Portfolio, sub-advised by Janus, and the Strategic Value Portfolio, sub-advised by Federated Investors.
| 1 |
As we look forward into 2012, we are left with many of the same issues from 2011: a highly contentious political environment leading into an election year; stubbornly high but gradually improving unemployment; potential slowing growth in China; and the European debt crisis, which I see as the largest problem of the year. Unfortunately, this is an economic problem created by politicians, and it must be solved by politicians. One of the characteristics of a political solution is that it does not happen until the absolute last moment and is usually inadequate to address the long-term problem. A good example is the U.S. deficit reduction debate of last summer.
The center of the European debt crisis is Greece. Even though Greece is deeply in debt and potentially on the verge of default, it is in the driver’s seat. There’s an old expression in the real estate development business that says, “If you want to be in debt to your bank, owe them a little money. If you want your bank to be in debt to you, owe them a lot of money.” There is no doubt that Greece owes a lot of money to its banks. The European Central Bank, as well as most European commercial banks, cannot afford a Greek default. On the other hand, Greece has a history of default. The first Greek default occurred in the fourth century B.C., and it has defaulted five times in the modern era (1826, 1843, 1860, 1894, and 1932). The Greeks
probably prefer default to the austerity measures that come with a bailout.
For these reasons, a solution will take time to craft. This is actually good news. John Maynard Keynes said, “For as long as a bank is in a position to wait quietly for better times… there is no cause for panic.” While it may not be quiet, waiting will give banks the time they need to de-lever their balance sheets in as orderly a fashion as possible.
On the positive side, U.S. equity valuations are at very low levels and the value in higher quality companies is starting to be recognized. This bodes well for U.S. equity returns going forward and I am hopeful 2012 will be a better year than 2011.
Thank you for entrusting your assets to the Ohio National Fund. We look forward to serving your investment needs.
Sincerely

Christopher A. Carlson
President
Directors and Officers of Ohio National Fund, Inc.
John J. Palmer, Director |
| James E. Bushman, Director |
| George M. Vredeveld, Director |
| John I. Von Lehman, Director |
| Christopher A. Carlson, President |
| Thomas A. Barefield, Vice President |
| Dennis R. Taney, Chief Compliance Officer |
| R. Todd Brockman, Treasurer |
Catherine E. Gehr, Assistant Treasurer |
Kimberly A. Plante, Secretary |
Katherine L. Carter, Assistant Secretary |
The Statement of Additional Information of Ohio National Fund, Inc. (the “Fund”) includes additional information about the Fund’s Board of Directors (the “Board”) and is available, without charge, upon request, by calling 877-781-6392 (toll-free).
A description of the policies and procedures that the Fund uses in voting proxies relating to Fund securities, as well as information regarding how the Fund voted proxies during the most recent twelve-month period ended June 30, is available without charge, upon request, by calling 877-781-6392 (toll-free) and on the Securities and Exchange Commission (the “Commission”) website at http://www.sec.gov.
The Fund has filed its Schedules of Investments as of March 31 and September 30 with the Commission, as required, on Form N-Q. Form N-Q is required to be filed with the Commission for the first and third quarters of each fiscal year within sixty days after the end of each period and is available on the Commission website upon acceptance of each submission. The Fund’s Forms N-Q may be reviewed and copied at the Commission’s Public Reference Room in Washington, DC. Information about the Public Reference Room is available by calling 1-800-SEC-0330 (toll-free).
This report and the financial statements contained herein are submitted for the general information of the shareholders of the Fund. This report is not authorized for distribution to prospective investors in the Fund unless preceded or accompanied by an effective prospectus of Ohio National Fund, Inc. For a prospectus containing more complete information, including charges and expenses, please contact Ohio National Investments, Inc., One Financial Way, Cincinnati, OH 45242, telephone 513-794-6100.
| 2 |
| Ohio National Fund, Inc. | Equity Portfolio |
Objective/Strategy
The Equity Portfolio seeks long-term growth of capital by investing at least 80% of its assets in equity securities.
Performance as of December 31, 2011
Average Annual Total Returns: | ||||
One year | -3.38% | |||
Five years | -9.21% | |||
Ten years | -0.82% |
Past performance does not guarantee future results. The performance data quoted represents past performance and current returns may be lower or higher. Total return figures include change in share price and reinvestment of dividends and capital gains. The investment return and principal value will fluctuate so that an investor’s shares, when redeemed, may be worth more or less than the original cost. To obtain performance information up to the most recent month end, call toll-free 1-877-781-6392.
The Portfolio is not open to direct retail investment. Beneficial interest in shares is obtained solely by purchase of variable life insurance policies and variable annuity contracts. Actual performance results for variable annuity and variable universal life contracts will be lower due to contract charges. Consult your contract for applicable charges.
Comments
For the year ended December 31, 2011, the Equity Portfolio returned -3.38% versus 2.11% for the current benchmark, the S&P 500 Index.
Relative Portfolio underperformance was driven by both sector allocation effects and security selection. At the sector level, the Portfolio’s relative underperformance was driven by a relative overweight position in the Financials sector, which underperformed the benchmark, and relative underweight positions in Utilities and Consumer Staples, which outperformed the benchmark. However, a relative overweight position in Health Care contributed to the Portfolio’s performance as the sector outperformed the benchmark, and relative underweight exposure to the Materials and Industrials sectors contributed positively to performance, as both underperformed the benchmark. At the security level, Hewlett-Packard Co., Bank of America Corp., and Citigroup, Inc. were the top three detractors from performance while UnitedHealth Group, Inc., Aetna, Inc., and International Business Machines Corp. were the top contributors to performance during 2011.(1)
U.S. equities began the year on a strong foot, bolstered by corporate earnings and overcoming the effects of a natural disaster in Japan and foreign political turmoil. However, about halfway into the year, concerns over a brewing European liquidity crisis coupled with a downgrade of the U.S. debt rating shook investor confidence and sent the markets sharply lower in a volatile and troubling third quarter. Stocks rebounded, however, once the S&P 500 Index reached a level just under 1100, providing a strong fourth quarter to close out the year. All in all, the S&P 500 Index finished nearly flat for the year, with a positive return provided solely by dividends, amid uncertainty surrounding the sovereign debt crisis, record corporate earnings, and largely consensus-beating economic indicators.
Stocks opened 2011 with the strongest first quarter in more than a decade, as almost every major index posted gains between 5% and 10%. Investors continued to find reasons for bullishness despite political unrest in North Africa and the Middle East, as economic data indicated gathering strength in the recovery and a turnaround in the jobs market. In mid-March, the tsunami in Japan sent the S&P 500 Index into a 3.6% dive as investors were uncertain of the disaster’s impact on the world’s third largest economy. U.S. equities
quickly recovered from this plunge until the market took a hit in April, after Standard & Poor’s ratcheted down the U.S. credit outlook to “negative” due to large budget deficits and a politically polarized budget process. However, a strong earnings season carried stocks past this dip to post almost 3% in gains on the month. Investors saw a volatile decline throughout May and June with rising commodity prices and emerging evidence of a slowdown in manufacturing growth in China and Europe served to deepen concerns that a global slowdown may gain momentum. Headlines in June focused on weak employment reports, falling second-quarter gross domestic product estimates, the conclusion of QE2 (quantitative easing phase II), and the ongoing debate over the U.S. debt ceiling. Markets also became more short-term oriented and reactionary in the face of broad uncertainty surrounding the growing European sovereign debt problems.
The market started to struggle fairly early in the third quarter and it proceeded to post a loss in each month, resulting in the largest quarterly loss since the financial crisis in 2008. The market was rocked by events on both sides of the Atlantic including a U.S. debt ceiling show-down and escalating European sovereign debt problems. Congress squabbled right up to the deadline date, but finally managed to reach a deal with the Administration, although not a long-term solution to the country’s structural deficits. Standard & Poor’s reacted several days later by lowering its U.S. government sovereign debt rating from AAA to AA+ with a negative outlook. Increased uncertainty and a darkening economic outlook for Europe, which threatens to spill over into China and possibly the U.S., sent market volatility to historically high levels. In its September 21 Federal Open Market Committee (“FOMC”) statement, the Federal Reserve described the downside risks to the U.S. economy as “significant,” producing fresh anxiety for investors and causing the market to sell off over 6% in 2 days. In that same meeting, the FOMC introduced the widely expected “Operation Twist,” which is a $400 billion sterilized asset purchase program aimed at lowering long-term rates and improving the mortgage market.
Equities rebounded in the fourth quarter as markets continued to exhibit what is colloquially known as “risk on/risk off” behavior, reacting to European debt crisis developments, economic indicators, and corporate earnings. European Union (“EU”) summit meetings yielded concrete steps towards containing and possibly remedying Europe’s mounting debt issues, ultimately leading EU leaders to introduce the European Financial Stabilization Mechanism, a proposed temporary €500 billion bailout fund expected to launch in early 2012. Additionally, leadership changes swept through some of Europe’s most debt burdened countries, which were received as generally positive developments by the market. The Federal Reserve, in a coordinated effort with the European Central Bank, Swiss National Bank, and the Banks of England, Japan and Canada, lowered the U.S. dollar liquidity swap rate 50 basis points in an effort to “provide liquidity support” and “ease strain in financial markets.” Many economic indicators were at better-than-feared levels and corporate earnings were again strong. Payroll numbers were revised higher for the fifth consecutive month, consumer spending expanded, retail sales were up each month during the fourth quarter, and gross domestic product grew at an annualized rate of 1.8%. Three hundred twenty eight companies in the S&P 500 Index beat their respective estimates, while expectations were revised lower heading into 2012, but still on pace to finish at record levels.
The S&P 500 Index ended the year at 1,257.60, just four basis points under its 2010 closing price, and provided investors with a total return including dividends of 2.1%. The Dow Jones Industrial Aver-
| 3 | (continued) |
| Ohio National Fund, Inc. | Equity Portfolio (Continued) |
age fared the best, up 8.4% on the year, while the tech-heavy Nasdaq Composite Index slipped 0.8%. In terms of size, large-cap companies prevailed in 2011, besting the losses generated by small- and mid-cap companies. Specifically, the Russell 1000 Index climbed 1.5% compared to the Russell Midcap Index and Russell 2000 Index, which fell 1.5% and 4.2%, respectively. On the whole, growth-oriented stocks outperformed value names, as the Russell 1000 Growth Index returned +2.6% to the Russell 1000 Value Index’s +0.4%. At a sector level, Utilities, Consumer Staples, and Health Care were primarily responsible for driving the S&P 500 Index’s gains, each up over 12.0%, though they were weighed down by Financials and Materials stocks that were off 17.0% and 9.7%, respectively.
Hewlett-Packard Co. was the top detractor in the Portfolio in 2011 due to a slew of disappointing announcements and news headlines. The company began the year with an investigation into the sudden departure of former CEO Mark Hurd, and newly-appointed CEO Leo Apotheker made headlines by shaking up management in an effort to implement his new strategy for the tech giant. Hewlett-Packard Co. also came under fire on reports that Apotheker was too actively involved in selecting new board members. The stock suffered after management lowered its quarterly and annual revenue and earnings guidance several times, most recently due to concerns over the macro outlook and its exit from the tablet market. Hewlett-Packard Co. also announced the spin-off or sale of its PC business and said the services business will likely turn around in four to six quarters. A month later, Hewlett-Packard Co.’s Board dismissed CEO Leo Apotheker after just 11 months at the helm of the company and appointed former eBay CEO Meg Whitman to take his place, the company’s third CEO in six years. Additionally, the company paid a stunning $10 billion to acquire British corporate search provider Autonomy, which we believe is a gross misallocation of capital. While shares appear inexpensive at only six times fiscal 2012 consensus earnings, improvement in the services business appears to be at least four to six quarters out and the very rich Autonomy deal will depress share repurchase activity. We, therefore, chose to exit the position halfway through the third quarter in favor of more secularly advantaged names which are trading at attractive valuations.(1)
Bank of America Corp. shares were weighed down all year by legal battles with investors over issues related to mortgage securities, in addition to the factors affecting other financials, including regulatory uncertainty, fears of an economic slowdown, and a lackluster housing market. The stock contributed negatively to performance through August before we swapped it for PNC Financial Services Group, Inc., a stock that subsequently became a top contributor for the year. After a review of our investment case, we determined that much of the apparent discount in Bank of America Corp.’s valuation on tangible book value disappeared when adjusted for the capital needed to meet Basel III requirements and settle a variety of lawsuits related to its Countrywide mortgage business. In contrast, we believed that PNC Financial Services Group, Inc. was very attractive on a tangible book basis and also had the potential to do better in more environments than Bank of America Corp. PNC Financial Services Group, Inc. ranks among the best of the large regional banks when considering its returns on equity, underwriting strength, dilution risk, market share, and capital adequacy. Despite this, PNC Financial Services Group, Inc. trades at among the lowest multiple of earnings and tangible book value, adjusted for Basel III and potential settlements, among its peers, belying the bank’s impressive business fundamentals.(1)
Citigroup, Inc. was another Financials position that detracted from performance as macroeconomic uncertainty roiled banks. The stock took a major hit in August along with its financial sector peers when ratings agency Standard & Poor’s downgraded U.S. debt, spurring a substantial sell-off in equities. Investors have also grown increasingly worried that a renewed global economic slowdown, especially in Europe where Citigroup, Inc. has exposure, might hurt banks by curbing loan demand and reducing the overall appetite for risk, among other factors. Nevertheless, we believe Citigroup, Inc. is on firm footing, having posted seven straight profitable quarters while strengthening its balance sheet significantly and implementing a more stringent risk management process. In addition, we consider shares to be attractively valued, as they trade at a sharp discount to tangible book value and normalized returns on equity.(1)
International Business Machines Corp. upheld its reputation as a best-in-class technology company this year, as the stock ascended throughout the year, resilient against macro concerns and far outpacing the S&P 500 Index and its tech peer group. The stock appreciated as the company consistently beat consensus estimates for quarterly earnings, while maintaining a steady income stream to investors. Management repurchased nearly 100 million shares and boosted the quarterly dividend by 15% mid year to provide a 1.7% dividend yield to shareholders. An additional $12 billion remains in buyback authorizations which could retire approximately another 6% of current shares outstanding. Though the stock has performed very well the past several years, we continue to see strong upside in the position as the company repeatedly outperforms expectations and returns capital to shareholders while trading at around ten times forward earnings estimates.(1)
Stocks of managed-care organizations Aetna, Inc. and UnitedHealth Group, Inc. were top contributors this past year as investors’ anxiety over the possibility of punitive health care reforms faded early in the year and as the companies posted strong quarterly earnings results. Uncertainty surrounding the outcome of health care reforms has restrained managed-care stocks for some time, but the group has managed through the first round of reform implementation without devolving into a utility model, as some investors had feared. The pricing environment continues to be favorable for the industry, evident in consensus-beating quarterly results from Aetna, Inc. and UnitedHealth Group, Inc. Both companies also boosted their dividends significantly and announced new share-buyback authorizations. These actions indicate intent to continue returning capital to shareholders, which we see as a positive for the stocks heading into 2012.(1)
The tremendous volatility that shaped the market in 2011 had many sources, but none were more persistent or bedeviling than the European fiscal woes. While Europe is far from resolved, we continue to believe that the critical element is not a comprehensive solution that fixes all problems, but time. As long as the European Union, the European Central Bank, the International Monetary Fund, and other central banks buy European banks time to de-leverage and hedge exposures, the odds of a disastrous event diminish.
2011 rewarded “risk-off” portfolios as investors sought income through bonds of all forms and “bond-like” equities. We foresee a significant behavioral shift towards “risk-on” returns in 2012. Stocks rebounded in the fourth quarter of 2011 and we expect investor confidence to continue into 2012 as U.S. gross domestic product growth persists, the unemployment rate declines, and as corporations begin to utilize their cash-rich balance sheets to generate growth through
| 4 | (continued) |
| Ohio National Fund, Inc. | Equity Portfolio (Continued) |
both capital expenditures and acquisitions. We also believe investors will be rewarded as the global economic picture becomes clearer and macro drags on the market subside. U.S. equities are well-positioned to capture the upside presented by current conditions as valuations remain historically low and are currently discounting little to no growth, in our opinion.
| (1) | The Portfolio’s composition is subject to change. Holdings and weightings are as of December 31, 2011. |
Change in Value of $10,000 Investment
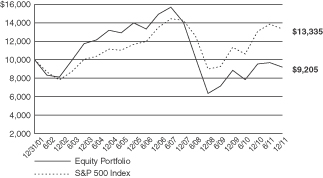
Hypothetical illustration based on past performance. Future performance will vary. The Portfolio’s returns reflect reinvested dividends. The Portfolio’s holdings may differ significantly from the securities in the index. The index is unmanaged and therefore does not reflect the cost of portfolio management and accounting.
The S&P 500 Index is a capitalization-weighted index designed to measure performance of the broad domestic economy through changes in the aggregate market value of 500 stocks representing all major industries. The index presented herein includes the effects of reinvested dividends.
Portfolio Composition as of December 31, 2011 (1)
| % of Net Assets | ||||
Common Stocks (3) | 96.6 | |||
Preferred Stocks (3) | 1.2 | |||
Repurchase Agreements and | 2.2 | |||
|
| |||
| 100.0 | ||||
|
|
Top 10 Portfolio Holdings as of December 31, 2011 (1) (2)
| % of Net Assets | ||||
1. Apple, Inc. | 3.9 | |||
2. General Electric Co. | 3.0 | |||
3. Pfizer, Inc. | 2.7 | |||
4. MetLife, Inc. | 2.6 | |||
5. BlackRock, Inc. | 2.6 | |||
6. eBay, Inc. | 2.6 | |||
7. Philip Morris International, Inc. | 2.6 | |||
8. Microsoft Corp. | 2.5 | |||
9. ConocoPhillips | 2.5 | |||
10. PNC Financial Services Group, Inc. | 2.4 |
| (1) | Composition of Portfolio subject to change. |
| (2) | Short-term investments have been excluded from the list of Top 10 Portfolio Holdings. |
| (3) | Sectors (combined): |
| % of Net Assets | ||||
Information Technology | 22.6 | |||
Financials | 19.8 | |||
Health Care | 16.4 | |||
Consumer Discretionary | 13.4 | |||
Industrials | 9.7 | |||
Consumer Staples | 9.3 | |||
Energy | 6.6 | |||
|
| |||
| 97.8 | ||||
|
|
| 5 |
| Ohio National Fund, Inc. | Equity Portfolio |
Schedule of Investments | December 31, 2011 |
| Common Stocks – 96.6% | Shares | Value | ||||||||
CONSUMER DISCRETIONARY – 12.2% | ||||||||||
Ford Motor Co. (Automobiles) | (a) | 319,500 | $ | 3,437,820 | ||||||
Yum! Brands, Inc. (Hotels, Restaurants & Leisure) | 48,600 | 2,867,886 | ||||||||
Amazon.com, Inc. (Internet & Catalog Retail) | (a) | 20,200 | 3,496,620 | |||||||
Groupon, Inc. (Internet & Catalog Retail) | (a) | 102,800 | 2,120,764 | |||||||
Time Warner, Inc. (Media) | 121,500 | 4,391,010 | ||||||||
Target Corp. (Multiline Retail) | 58,000 | 2,970,760 | ||||||||
Lowe’s Cos., Inc. (Specialty Retail) | 145,600 | 3,695,328 | ||||||||
|
| |||||||||
| 22,980,188 | ||||||||||
|
| |||||||||
CONSUMER STAPLES – 9.3% | ||||||||||
PepsiCo, Inc. (Beverages) | 66,000 | 4,379,100 | ||||||||
CVS Caremark Corp. (Food & Staples Retailing) | 104,000 | 4,241,120 | ||||||||
Procter & Gamble Co. / The (Household Products) | 61,800 | 4,122,678 | ||||||||
Philip Morris International, Inc. (Tobacco) | 61,400 | 4,818,672 | ||||||||
|
| |||||||||
| 17,561,570 | ||||||||||
|
| |||||||||
ENERGY – 6.6% | ||||||||||
BP PLC – ADR (Oil, Gas & Consumable Fuels) | 92,300 | 3,944,902 | ||||||||
Chevron Corp. (Oil, Gas & Consumable Fuels) | 35,100 | 3,734,640 | ||||||||
ConocoPhillips (Oil, Gas & Consumable Fuels) | 64,100 | 4,670,967 | ||||||||
|
| |||||||||
| 12,350,509 | ||||||||||
|
| |||||||||
FINANCIALS – 19.8% | ||||||||||
BlackRock, Inc. (Capital Markets) | 27,200 | 4,848,128 | ||||||||
Fifth Third Bancorp (Commercial Banks) | 137,500 | 1,749,000 | ||||||||
PNC Financial Services Group, Inc. (Commercial Banks) | 79,600 | 4,590,532 | ||||||||
Wells Fargo & Co. (Commercial Banks) | 159,400 | 4,393,064 | ||||||||
Citigroup, Inc. (Diversified Financial Svs.) | 141,820 | 3,731,284 | ||||||||
JPMorgan Chase & Co. (Diversified Financial Svs.) | 128,100 | 4,259,325 | ||||||||
Aflac, Inc. (Insurance) | 101,205 | 4,378,128 | ||||||||
MetLife, Inc. (Insurance) | 156,800 | 4,889,024 | ||||||||
Annaly Capital Management, Inc. (Real Estate Investment Trusts) | 269,900 | 4,307,604 | ||||||||
|
| |||||||||
| 37,146,089 | ||||||||||
|
| |||||||||
HEALTH CARE – 16.4% | ||||||||||
Celgene Corp. (Biotechnology) | (a) | 50,800 | 3,434,080 | |||||||
Medtronic, Inc. (Health Care Equip. & Supplies) | 94,100 | 3,599,325 | ||||||||
Aetna, Inc. (Health Care Providers & Svs.) | 79,109 | 3,337,609 | ||||||||
UnitedHealth Group, Inc. (Health Care Providers & Svs.) | 64,900 | 3,289,132 | ||||||||
Abbott Laboratories (Pharmaceuticals) | 71,100 | 3,997,953 | ||||||||
Johnson & Johnson (Pharmaceuticals) | 59,300 | 3,888,894 | ||||||||
Pfizer, Inc. (Pharmaceuticals) | 238,000 | 5,150,320 | ||||||||
Teva Pharmaceutical Industries Ltd. – ADR (Pharmaceuticals) | 99,600 | 4,019,856 | ||||||||
|
| |||||||||
| 30,717,169 | ||||||||||
|
| |||||||||
| Common Stocks (Continued) | Shares | Value | ||||||||
INDUSTRIALS – 9.7% | ||||||||||
United Technologies Corp. (Aerospace & Defense) | 39,500 | $ | 2,887,055 | |||||||
United Continental Holdings, Inc. (Airlines) | (a) | 187,400 | 3,536,238 | |||||||
General Electric Co. (Industrial Conglomerates) | 316,500 | 5,668,515 | ||||||||
Parker Hannifin Corp. (Machinery) | 36,000 | 2,745,000 | ||||||||
Norfolk Southern Corp. (Road & Rail) | 47,200 | 3,438,992 | ||||||||
|
| |||||||||
| 18,275,800 | ||||||||||
|
| |||||||||
INFORMATION TECHNOLOGY – 22.6% | ||||||||||
Cisco Systems, Inc. (Communications Equip.) | 227,700 | 4,116,816 | ||||||||
QUALCOMM, Inc. (Communications Equip.) | 65,000 | 3,555,500 | ||||||||
Apple, Inc. (Computers & Peripherals) | (a) | 18,050 | 7,310,250 | |||||||
EMC Corp. (Computers & Peripherals) | (a) | 172,600 | 3,717,804 | |||||||
eBay, Inc. (Internet Software & Svs.) | (a) | 158,900 | 4,819,437 | |||||||
Google, Inc. Class A (Internet Software & Svs.) | (a) | 6,475 | 4,182,202 | |||||||
International Business Machines Corp. (IT Svs.) | 18,050 | 3,319,034 | ||||||||
Intel Corp. (Semiconductors & Equip.) | 118,050 | 2,862,713 | ||||||||
Texas Instruments, Inc. (Semiconductors & Equip.) | 135,500 | 3,944,405 | ||||||||
Microsoft Corp. (Software) | 181,000 | 4,698,760 | ||||||||
|
| |||||||||
| 42,526,921 | ||||||||||
|
| |||||||||
Total Common Stocks (Cost $166,236,540) | $ | 181,558,246 | ||||||||
|
| |||||||||
| Preferred Stocks – 1.2% | Shares | Value | ||||||||
CONSUMER DISCRETIONARY – 1.2% | ||||||||||
General Motors Co. – Series B (Automobiles) | (b) | 64,000 | $ | 2,192,000 | ||||||
|
| |||||||||
Total Preferred Stocks (Cost $2,774,111) | $ | 2,192,000 | ||||||||
|
| |||||||||
| Repurchase Agreements – 1.8% | Face Amount | Amortized Cost | ||||||||
| U.S. Bank 0.010%, 01/03/2012, Agreement Date: 12/30/11, Repurchase price $3,379,943 Collateralized by: Fannie Mae 15 yr Pool #CI-729590 (FNCI) 4.500%, Due 07/01/2018 with a value of $3,447,693 | $ | 3,379,939 | $ | 3,379,939 | ||||||
|
| |||||||||
Total Repurchase Agreements (Cost $3,379,939) | $ | 3,379,939 | ||||||||
|
| |||||||||
Total Investments – 99.6% (Cost $172,390,590) | (c) | $ | 187,130,185 | |||||||
Other Assets in Excess of Liabilities – 0.4% | 726,573 | |||||||||
|
| |||||||||
Net Assets – 100.0% | $ | 187,856,758 | ||||||||
|
| |||||||||
Percentages are stated as a percent of net assets.
Abbreviations:
ADR: American Depositary Receipts
Footnotes:
| (a) | Non-income producing security. |
| (b) | This preferred stock is convertible at a 20% conversion premium until 12/01/2013. There is a mandatory conversion at 12/01/2013, at which time the conversion proceeds will be determined by the General Motors, Inc. common share price on that date. |
| (c) | Represents cost for financial reporting purposes, which may differ from cost basis for federal income tax purposes. See also Note 7 of the Notes to Financial Statements. |
The accompanying notes are an integral part of these financial statements.
| 6 |
| Ohio National Fund, Inc. | Money Market Portfolio |
Portfolio Composition as of December 31, 2011 (1)
| % of Net Assets | ||||
Commercial Paper (2) | 65.4 | |||
Asset-Backed Securities (2) | 0.8 | |||
Repurchase Agreements and | 33.8 | |||
|
| |||
| 100.0 | ||||
|
|
Top 10 Portfolio Holdings as of December 31, 2011 (1)
| % of Net Assets | ||||
1. U.S. Bank Repurchase Agreement | 4.9 | |||
2. Prudential Funding LLC | 4.9 | |||
3. American Express Credit Corp. | 4.5 | |||
4. Chevron Corp. | 4.5 | |||
5. Exxon Mobil Corp. | 4.5 | |||
6. Wal-Mart Stores, Inc. | 4.5 | |||
7. Abbott Laboratories | 4.5 | |||
8. General Electric Capital Corp. | 4.5 | |||
9. HSBC Finance Corp. | 4.5 | |||
10. Nestle Capital Corp. | 3.5 | |||
| (1) | Composition of Portfolio subject to change. |
| (2) | Sectors (combined): |
| % of Net Assets | ||||
Financials | 26.3 | |||
Consumer Staples | 18.2 | |||
Health Care | 12.6 | |||
Energy | 9.1 | |||
|
| |||
| 66.2 | ||||
|
|
| 7 |
| Ohio National Fund, Inc. | Money Market Portfolio |
Schedule of Investments | December 31, 2011 |
| Commercial Paper – 65.4% | Rate | Maturity | Face Amount | Amortized Cost | ||||||||||||
CONSUMER STAPLES – 18.2% | ||||||||||||||||
Coca-Cola Co. / The (Beverages) | (a) | 0.120% | 01/10/2012 | $ | 6,000,000 | $ | 5,999,820 | |||||||||
Coca-Cola Co. / The (Beverages) | (a) | 0.130% | 01/10/2012 | 4,000,000 | 3,999,870 | |||||||||||
Coca-Cola Co. / The (Beverages) | (a) | 0.080% | 02/24/2012 | 3,000,000 | 2,999,640 | |||||||||||
Wal-Mart Stores, Inc. (Food & Staples Retailing) | (a) | 0.020% | 01/23/2012 | 13,000,000 | 12,999,841 | |||||||||||
Nestle Capital Corp. (Food Products) | (a) | 0.030% | 01/17/2012 | 10,000,000 | 9,999,867 | |||||||||||
Nestle Capital Corp. (Food Products) | (a) | 0.070% | 03/05/2012 | 3,000,000 | 2,999,627 | |||||||||||
Procter & Gamble International Funding SCA (Household Products) | (a) | 0.060% | 01/09/2012 | 8,000,000 | 7,999,893 | |||||||||||
Procter & Gamble Co. / The (Household Products) | (a) | 0.060% | 03/20/2012 | 3,000,000 | 2,999,605 | |||||||||||
Procter & Gamble Co. / The (Household Products) | (a) | 0.100% | 01/19/2012 | 2,000,000 | 1,999,900 | |||||||||||
|
| |||||||||||||||
| 51,998,063 | ||||||||||||||||
|
| |||||||||||||||
ENERGY – 9.1% | ||||||||||||||||
Chevron Corp. (Oil, Gas & Consumable Fuels) | 0.020% | 01/06/2012 | 13,000,000 | 12,999,964 | ||||||||||||
Exxon Mobil Corp. (Oil, Gas & Consumable Fuels) | 0.030% | 01/11/2012 | 13,000,000 | 12,999,892 | ||||||||||||
|
| |||||||||||||||
| 25,999,856 | ||||||||||||||||
|
| |||||||||||||||
FINANCIALS – 25.5% | ||||||||||||||||
American Express Credit Corp. (Consumer Finance) | 0.020% | 01/04/2012 | 13,000,000 | 12,999,978 | ||||||||||||
Toyota Motor Credit Corp. (Consumer Finance) | 0.060% | 01/09/2012 | 10,000,000 | 9,999,867 | ||||||||||||
American Honda Finance Corp. (Consumer Finance) | 0.250% | 03/06/2012 | 10,000,000 | 9,995,486 | ||||||||||||
HSBC Finance Corp. (Diversified Financial Services) | 0.180% | 01/27/2012 | 13,000,000 | 12,998,310 | ||||||||||||
General Electric Capital Corp. (Diversified Financial Services) | 0.070% | 02/06/2012 | 13,000,000 | 12,999,090 | ||||||||||||
Prudential Funding LLC (Insurance) | 0.040% | 01/03/2012 | 14,000,000 | 13,999,969 | ||||||||||||
|
| |||||||||||||||
| 72,992,700 | ||||||||||||||||
|
| |||||||||||||||
HEALTH CARE – 12.6% | ||||||||||||||||
Abbott Laboratories (Pharmaceuticals) | (a) | 0.040% | 01/17/2012 | 13,000,000 | 12,999,769 | |||||||||||
Pfizer, Inc. (Pharmaceuticals) | (a) | 0.020% | 01/26/2012 | 10,000,000 | 9,999,861 | |||||||||||
Johnson & Johnson (Pharmaceuticals) | (a) | 0.060% | 03/21/2012 | 10,000,000 | 9,998,667 | |||||||||||
Johnson & Johnson (Pharmaceuticals) | (a) | 0.060% | 02/17/2012 | 3,000,000 | 2,999,765 | |||||||||||
|
| |||||||||||||||
| 35,998,062 | ||||||||||||||||
|
| |||||||||||||||
Total Commercial Paper (Cost $186,988,681) | $ | 186,988,681 | ||||||||||||||
|
| |||||||||||||||
| Asset-Backed Securities – 0.8% | Rate | Maturity | Face Amount | Amortized Cost | ||||||||||||
FINANCIALS – 0.8% | ||||||||||||||||
CNH Equipment Trust 2011-A, Class A1 (Consumer Finance) | (a) | 0.336% | 05/15/2012 | $ | 215,892 | $ | 215,892 | |||||||||
Honda Auto Receivables Owner Trust 2011-3, Class A1 (Consumer Finance) | 0.398% | 10/22/2012 | 754,135 | 754,134 | ||||||||||||
Nissan Auto Receivables Owners Trust 2011-A, Class A1 (Consumer Finance) | 0.261% | 04/16/2012 | 8,371 | 8,371 | ||||||||||||
Nissan Auto Lease Trust 2011-B, Class A1 (Consumer Finance) | 0.350% | 10/15/2012 | 651,199 | 651,199 | ||||||||||||
Volkswagen Auto Lease Trust 2011-A, Class A1 (Consumer Finance) | 0.461% | 11/20/2012 | 738,744 | 738,744 | ||||||||||||
|
| |||||||||||||||
Total Asset-Backed Securities (Cost $2,386,340) | $ | 2,368,340 | ||||||||||||||
|
| |||||||||||||||
| Repurchase Agreements – 4.9% | Rate | Maturity | Face Amount | Amortized Cost | ||||||||||||
U.S. Bank, Agreement date: 12/30/11, Repurchase price $14,000,016, | 0.010% | 01/03/2012 | $ | 14,000,000 | $ | 14,000,000 | ||||||||||
Collateralized by: Fannie Mae 15 yr. Pool #CI-254919 (FNCI) 4.000%, | ||||||||||||||||
Due 09/01/2018 with value of $14,280,226 | ||||||||||||||||
|
| |||||||||||||||
Total Repurchase Agreements (Cost $14,000,000) | $ | 14,000,000 | ||||||||||||||
|
| |||||||||||||||
Total Investments – 71.1% (Cost $203,357,021) | (b) | $ | 203,357,021 | |||||||||||||
Other Assets in Excess of Liabilities – 28.9% | 82,831,076 | |||||||||||||||
|
| |||||||||||||||
Net Assets – 100.0% | $ | 286,188,097 | ||||||||||||||
|
| |||||||||||||||
Percentages are stated as a percent of net assets.
Footnotes:
| (a) | Security exempt from registration under Section 4 (2) of the Securities Act of 1933. These securities may be resold in transactions exempt from registration, normally to qualified buyers under Rule 144A. At December 31, 2011, the value of these securities totaled $88,212,017, or 30.8% of the Portfolio’s net assets. These securities were deemed liquid pursuant to procedures approved by the Board of Directors. |
| (b) | Represents cost for federal income tax and financial reporting purposes. See also Note 2 regarding the use of amortized cost for valuation of instruments in this Portfolio. |
The accompanying notes are an integral part of these financial statements.
| 8 |
| Ohio National Fund, Inc. | Bond Portfolio |
Objective/Strategy
The Bond Portfolio seeks to obtain a high level of income and opportunity for capital appreciation consistent with the preservation of capital by investing primarily in intermediate-term and long-term fixed income securities.
Performance as of December 31, 2011
Average Annual Total Returns: | ||||
One year | 6.36% | |||
Five years | 4.96% | |||
Ten years | 5.44% |
Past performance does not guarantee future results. The performance data quoted represents past performance and current returns may be lower or higher. Total return figures include change in share price and reinvestment of dividends and capital gains. The investment return and principal value will fluctuate so that an investor’s shares, when redeemed, may be worth more or less than the original cost. To obtain performance information up to the most recent month end, call toll-free 1-877-781-6392.
The Portfolio is not open to direct retail investment. Beneficial interest in shares is obtained solely by purchase of variable life insurance policies and variable annuity contracts. Actual performance results for variable annuity and variable universal life contracts will be lower due to contract charges. Consult your contract for applicable charges.
Comments
For the year ended December 31, 2011, the Bond Portfolio returned 6.36% versus 7.51% for the current benchmark, the BofA Merrill Lynch U.S. Corporate Master Index (the ”Merrill Lynch Index” or the “Index”).
Both the Merrill Lynch Index and the Portfolio had reasonably good absolute positive total returns because U.S. Treasury rates declined significantly in 2011. For the year, the 10-year U.S. Treasury yield declined 142 basis points. U.S. Treasury yields declined because the United States, despite its economic and political problems, became a “safe haven” for investors given all the economic and banking problems in Europe, particularly in Southern Europe. While U.S. Treasury yields declined in 2011, credit spreads widened for the year. The credit spread for the Merrill Lynch Index widened 92 basis points during 2011, a result of a soft economy in the U.S., fears of a double-dip recession, and a demand on the part of investors for more yield due to the low absolute level of interest rates existing in the economy during the year. The decline in U.S. Treasury yields more than offset the credit spread widening that occurred during 2011, resulting in positive price performance for bonds for the year. Of the 7.51% return of the Merrill Lynch Index in 2011, 2.19% of the return was from price appreciation of bonds in the Index.
The Portfolio under-performed the Merrill Lynch Index primarily because the duration of the Portfolio was shorter than the duration of the Index during a year in which interest rates declined. During 2011, the Portfolio’s duration was approximately 2.0 years shorter than the duration of the Merrill Lynch Index. The Portfolio’s duration was positioned shorter than the Index’s duration in anticipation of an increase in Treasury yields. The expectation was for interest rates to rise as the U.S. economy improved. This did not occur because economic growth remained sub-par and demand for U.S. Treasury securities was strong because of the problems in Europe.(1)
Several industry weightings had an impact on relative performance during 2011. The Portfolio’s under-weighting in the banking sector benefited performance because this sector under-performed. The over-weighting in the insurance and brokerage sectors hurt
performance because these two sectors under-performed. The over-weighting in electric utilities benefited performance because this sector out-performed. The under-weighting in Telecommunication Services hurt performance because this sector out-performed. The Portfolio was positively impacted by its holdings of U.S. Treasuries because Treasury yields declined and credit spreads widened for the year. The overall credit quality of the Portfolio had little impact on relative performance because both the Portfolio and the Index had an average quality of A3 (Moody’s rating).(1)
Because the U.S. economy continued to grow, albeit at a slow rate, the credit quality of most of the holdings in the Portfolio was maintained. That being said, several bonds performed poorly, and most of these were either in the Financials sector or were domiciled in Europe. The five poorest performing bonds were Deutsche Bank Capital Funding Trust VII, Telecom Italia Capital SA, Computer Sciences Corp., Jefferies Group, Inc., and Bank of America Corp. The five best performing bonds were Verizon Communications, Inc., Shell International Finance BV, Texas Utilities Energy Future Competitive Holdings Co., Avista Corp., and Appalachian Power Co.(1)
We expect that the growth rate of the U.S. economy will improve over the course of the coming year, and ordinarily this would imply that the Federal Reserve would begin to remove its monetary stimulus, thus suggesting higher interest rates in 2012. However, due to the economic problems in Europe, we do not expect U.S. interest rates to rise meaningfully this year because U.S. Treasury securities will remain a “safe haven” investment for international investors. Duration on the Portfolio will be lengthened but not to the duration of the Merrill Lynch Index because absolute interest rates are very low and, despite our expectation for continued low interest rates, rates could rise. Because we expect credit spreads to tighten modestly in 2012 as the economy grows, we anticipate that purchases for the Portfolio will be skewed toward BBB names, which are slightly lower in quality than the average for the Merrill Lynch Index.
| (1) | The Portfolio’s composition is subject to change. Holdings and weightings are as of December 31, 2011. |
Change in Value of $10,000 Investment
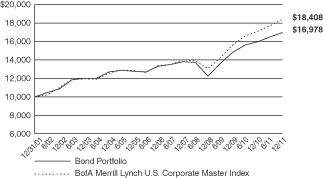
Hypothetical illustration based on past performance. Future performance will vary. The Portfolio’s returns reflect reinvested dividends. The Portfolio’s holdings may differ significantly from the securities in the index. The index is unmanaged and therefore does not reflect the cost of portfolio management and accounting.
The BofA Merrill Lynch U.S. Corporate Master Index tracks the performance of all U.S. dollar-denominated, investment grade corporate public debt issued in the U.S. domestic bond market. Qualifying bonds must have at least one year remaining term to maturity, a fixed coupon schedule, and a minimum amount outstanding of $250 million.
| 9 | (continued) |
| Ohio National Fund, Inc. | Bond Portfolio (Continued) |
Portfolio Composition as of December 31, 2011 (1)
| % of Net Assets | ||||
Corporate Bonds (3) | 90.3 | |||
U.S. Treasury Obligations | 2.8 | |||
Commercial Paper | 4.3 | |||
Repurchase Agreements and | 2.6 | |||
|
| |||
| 100.0 | ||||
|
|
Top 10 Portfolio Holdings as of December 31, 2011 (1) (2)
| % of Net Assets | ||||
1. United States Treasury Note | 2.1 | |||
2. Union Electric Co. | 1.1 | |||
3. UnitedHealth Group, Inc. | 1.1 | |||
4. Kraft Foods, Inc. | 1.1 | |||
5. Fifth Third Bancorp | 1.1 | |||
6. Commonwealth Edison Co. | 1.1 | |||
7. Virginia Electric and Power Co. | 1.1 | |||
8. CSX Corp. | 1.1 | |||
9. Kansas City Power & Light Co. | 1.1 | |||
10. Weatherford International Ltd. | 1.0 | |||
| (1) | Composition of Portfolio subject to change. |
| (2) | Short-term investments have been excluded from the list of Top 10 Portfolio Holdings. |
| (3) | Sectors: |
| % of Net Assets | ||||
Financials | 27.3 | |||
Utilities | 15.2 | |||
Industrials | 9.0 | |||
Energy | 8.6 | |||
Consumer Discretionary | 7.3 | |||
Consumer Staples | 7.1 | |||
Health Care | 6.7 | |||
Telecommunication Services | 3.9 | |||
Materials | 3.3 | |||
Information Technology | 1.9 | |||
|
| |||
| 90.3 | ||||
|
|
| 10 |
| Ohio National Fund, Inc. | Bond Portfolio |
Schedule of Investments | December 31, 2011 |
| Corporate Bonds – 90.3% | Rate | Maturity | Face Amount | Value | ||||||||||||
CONSUMER DISCRETIONARY – 7.3% |
| |||||||||||||||
Newell Rubbermaid, Inc. (Household Durables) | 6.250% | 04/15/2018 | $ | 500,000 | $ | 569,096 | ||||||||||
Comcast Corp. (Media) | 5.875% | 02/15/2018 | 750,000 | 868,333 | ||||||||||||
Discovery Communications LLC (Media) | 4.375% | 06/15/2021 | 1,000,000 | 1,057,639 | ||||||||||||
News America, Inc. (Media) | 4.500% | 02/15/2021 | 1,250,000 | 1,313,087 | ||||||||||||
Time Warner Cable, Inc. (Media) | 5.850% | 05/01/2017 | 1,000,000 | 1,140,148 | ||||||||||||
Time Warner, Inc. (Media) | 3.150% | 07/15/2015 | 1,250,000 | 1,301,236 | ||||||||||||
Viacom, Inc. (Media) | 4.375% | 09/15/2014 | 1,000,000 | 1,071,934 | ||||||||||||
Kohl’s Corp. (Multiline Retail) | 4.000% | 11/01/2021 | 1,250,000 | 1,283,220 | ||||||||||||
Macy’s Retail Holdings, Inc. (Multiline Retail) | 5.900% | 12/01/2016 | 1,000,000 | 1,118,674 | ||||||||||||
Home Depot, Inc. / The (Specialty Retail) | 5.250% | 12/16/2013 | 1,000,000 | 1,086,415 | ||||||||||||
Lowe’s Cos., Inc. (Specialty Retail) | 3.800% | 11/15/2021 | 1,000,000 | 1,052,035 | ||||||||||||
|
| |||||||||||||||
| 11,861,817 | ||||||||||||||||
|
| |||||||||||||||
CONSUMER STAPLES – 7.1% |
| |||||||||||||||
Anheuser-Busch Cos. LLC (Beverages) | 5.500% | 01/15/2018 | 750,000 | 866,231 | ||||||||||||
CVS Caremark Corp. (Food & Staples Retailing) | 5.750% | 06/01/2017 | 1,000,000 | 1,168,222 | ||||||||||||
Wal-Mart Stores, Inc. (Food & Staples Retailing) | 1.500% | 10/25/2015 | 1,250,000 | 1,270,799 | ||||||||||||
Bunge NA Finance LP (Food Products) | 5.900% | 04/01/2017 | 1,500,000 | 1,639,911 | ||||||||||||
Kraft Foods, Inc. (Food Products) | 6.125% | 02/01/2018 | 1,500,000 | 1,760,517 | ||||||||||||
Mead Johnson Nutrition Co. (Food Products) | 3.500% | 11/01/2014 | 800,000 | 835,998 | ||||||||||||
Sara Lee Corp. (Food Products) | 2.750% | 09/15/2015 | 1,250,000 | 1,260,371 | ||||||||||||
Tyson Foods, Inc. (Food Products) | (b) | 6.850% | 04/01/2016 | 1,000,000 | 1,102,500 | |||||||||||
Procter & Gamble Co. / The (Household Products) | 4.700% | 02/15/2019 | 250,000 | 295,492 | ||||||||||||
Philip Morris International, Inc. (Tobacco) | 4.125% | 05/17/2021 | 1,250,000 | 1,375,024 | ||||||||||||
|
| |||||||||||||||
| 11,575,065 | ||||||||||||||||
|
| |||||||||||||||
ENERGY – 8.6% |
| |||||||||||||||
Weatherford International Ltd. (Energy Equip. & Svs.) | 6.000% | 03/15/2018 | 1,500,000 | 1,671,133 | ||||||||||||
Anadarko Petroleum Corp. (Oil, Gas & Consumable Fuels) | 5.950% | 09/15/2016 | 1,000,000 | 1,134,726 | ||||||||||||
Atlantic Richfield Co. (Oil, Gas & Consumable Fuels) | 8.550% | 03/01/2012 | 200,000 | 201,837 | ||||||||||||
Buckeye Partners LP (Oil, Gas & Consumable Fuels) | 4.875% | 02/01/2021 | 1,000,000 | 1,054,484 | ||||||||||||
Cenovus Energy, Inc. (Oil, Gas & Consumable Fuels) | 5.700% | 10/15/2019 | 1,000,000 | 1,174,846 | ||||||||||||
Energy Transfer Partners LP (Oil, Gas & Consumable Fuels) | 5.650% | 08/01/2012 | 1,000,000 | 1,021,816 | ||||||||||||
EOG Resources, Inc. (Oil, Gas & Consumable Fuels) | 2.950% | 06/01/2015 | 1,250,000 | 1,307,317 | ||||||||||||
Kinder Morgan Energy Partners LP (Oil, Gas & Consumable Fuels) | 4.150% | 03/01/2022 | 1,000,000 | 1,019,235 | ||||||||||||
Magellan Midstream Partners LP (Oil, Gas & Consumable Fuels) | 4.250% | 02/01/2021 | 1,000,000 | 1,050,076 | ||||||||||||
Occidental Petroleum Corp. (Oil, Gas & Consumable Fuels) | 3.125% | 02/15/2022 | 1,000,000 | 1,028,019 | ||||||||||||
ONEOK Partners LP (Oil, Gas & Consumable Fuels) | 3.250% | 02/01/2016 | 1,000,000 | 1,030,323 | ||||||||||||
Shell International Finance BV (Oil, Gas & Consumable Fuels) | 4.375% | 03/25/2020 | 1,250,000 | 1,461,899 | ||||||||||||
Valero Energy Corp. (Oil, Gas & Consumable Fuels) | 6.875% | 04/15/2012 | 750,000 | 762,245 | ||||||||||||
|
| |||||||||||||||
| 13,917,956 | ||||||||||||||||
|
| |||||||||||||||
FINANCIALS – 27.3% |
| |||||||||||||||
BlackRock, Inc. (Capital Markets) | 2.250% | 12/10/2012 | 500,000 | 506,874 | ||||||||||||
Credit Suisse (Capital Markets) | 3.500% | 03/23/2015 | 1,250,000 | 1,238,200 | ||||||||||||
Franklin Resources, Inc. (Capital Markets) | 3.125% | 05/20/2015 | 1,000,000 | 1,038,449 | ||||||||||||
Goldman Sachs Group, Inc. / The (Capital Markets) | 6.150% | 04/01/2018 | 1,250,000 | 1,291,775 | ||||||||||||
Janus Capital Group, Inc. (Capital Markets) | (b) | 6.700% | 06/15/2017 | 1,500,000 | 1,593,594 | |||||||||||
Jefferies Group, Inc. (Capital Markets) | 5.875% | 06/08/2014 | 1,500,000 | 1,496,250 | ||||||||||||
Morgan Stanley (Capital Markets) | 4.750% | 04/01/2014 | 1,250,000 | 1,232,005 | ||||||||||||
Northern Trust Corp. (Capital Markets) | 3.450% | 11/04/2020 | 1,000,000 | 1,031,681 | ||||||||||||
State Street Corp. (Capital Markets) | 4.375% | 03/07/2021 | 1,250,000 | 1,373,444 | ||||||||||||
TD Ameritrade Holding Corp. (Capital Markets) | 4.150% | 12/01/2014 | 1,000,000 | 1,057,615 | ||||||||||||
BB&T Corp. (Commercial Banks) | 5.200% | 12/23/2015 | 1,000,000 | 1,071,560 | ||||||||||||
Comerica Bank (Commercial Banks) | 5.750% | 11/21/2016 | 1,500,000 | 1,645,704 | ||||||||||||
Deutsche Bank Capital Funding Trust VII (Commercial Banks) | (a)(c) | 5.628% | Perpetual | 1,500,000 | 1,087,500 | |||||||||||
Fifth Third Bancorp (Commercial Banks) | 4.500% | 06/01/2018 | 1,750,000 | 1,756,898 | ||||||||||||
KeyCorp (Commercial Banks) | 5.100% | 03/24/2021 | 500,000 | 520,184 | ||||||||||||
PNC Funding Corp. (Commercial Banks) | 5.250% | 11/15/2015 | 1,500,000 | 1,632,901 | ||||||||||||
SunTrust Bank (Commercial Banks) | 5.000% | 09/01/2015 | 229,000 | 238,586 | ||||||||||||
Wells Fargo & Co. (Commercial Banks) | 4.600% | 04/01/2021 | 1,250,000 | 1,373,457 | ||||||||||||
American Express Co. (Consumer Finance) | 7.000% | 03/19/2018 | 1,250,000 | 1,512,475 | ||||||||||||
Capital One Bank U.S.A. NA (Consumer Finance) | 5.125% | 02/15/2014 | 750,000 | 794,604 | ||||||||||||
Discover Financial Services (Consumer Finance) | 6.450% | 06/12/2017 | 750,000 | 784,394 | ||||||||||||
Bank of America Corp. (Diversified Financial Svs.) | 5.650% | 05/01/2018 | 1,000,000 | 953,995 | ||||||||||||
Citigroup, Inc. (Diversified Financial Svs.) | 6.125% | 05/15/2018 | 1,250,000 | 1,332,201 | ||||||||||||
General Electric Capital Corp. (Diversified Financial Svs.) | 5.625% | 05/01/2018 | 1,000,000 | 1,121,509 | ||||||||||||
JPMorgan Chase & Co. (Diversified Financial Svs.) | 5.150% | 10/01/2015 | 1,500,000 | 1,593,426 | ||||||||||||
National Rural Utilities Cooperative Finance Corp. (Diversified Financial Svs.) | 1.900% | 11/01/2015 | 1,000,000 | 1,006,886 | ||||||||||||
| 11 | (continued) |
| Ohio National Fund, Inc. | Bond Portfolio (Continued) |
Schedule of Investments | December 31, 2011 |
| Corporate Bonds – (Continued) | Rate | Maturity | Face Amount | Value | ||||||||||||
FINANCIALS – (continued) |
| |||||||||||||||
Assurant, Inc. (Insurance) | 5.625% | 02/15/2014 | $ | 1,500,000 | $ | 1,569,429 | ||||||||||
Axis Capital Holdings Ltd. (Insurance) | 5.750% | 12/01/2014 | 1,000,000 | 1,052,132 | ||||||||||||
Berkshire Hathaway, Inc. (Insurance) | 3.200% | 02/11/2015 | 1,250,000 | 1,326,185 | ||||||||||||
Hartford Financial Services Group, Inc. (Insurance) | 5.375% | 03/15/2017 | 1,500,000 | 1,510,815 | ||||||||||||
Liberty Mutual Group, Inc. (Insurance) | (a) | 5.750% | 03/15/2014 | 1,000,000 | 1,043,334 | |||||||||||
Loews Corp. (Insurance) | 5.250% | 03/15/2016 | 750,000 | 826,538 | ||||||||||||
Metropolitan Life Global Funding I (Insurance) | (a) | 2.875% | 09/17/2012 | 1,000,000 | 1,013,249 | |||||||||||
Prudential Financial, Inc. (Insurance) | 6.100% | 06/15/2017 | 1,500,000 | 1,648,695 | ||||||||||||
StanCorp Financial Group, Inc. (Insurance) | 6.875% | 10/01/2012 | 500,000 | 516,242 | ||||||||||||
Equity One, Inc. (Real Estate Investment Trusts) | 6.250% | 01/15/2017 | 1,250,000 | 1,309,499 | ||||||||||||
HCP, Inc. (Real Estate Investment Trusts) | 5.375% | 02/01/2021 | 1,000,000 | 1,050,269 | ||||||||||||
Mack-Cali Realty LP (Real Estate Investment Trusts) | 4.600% | 06/15/2013 | 1,000,000 | 1,022,108 | ||||||||||||
|
| |||||||||||||||
| 44,174,662 | ||||||||||||||||
|
| |||||||||||||||
HEALTH CARE – 6.7% |
| |||||||||||||||
Amgen, Inc. (Biotechnology) | 4.100% | 06/15/2021 | 1,000,000 | 1,027,770 | ||||||||||||
Celgene Corp. (Biotechnology) | 2.450% | 10/15/2015 | 1,250,000 | 1,267,487 | ||||||||||||
Baxter International, Inc. (Health Care Equip. & Supplies) | 1.800% | 03/15/2013 | 250,000 | 253,044 | ||||||||||||
Becton Dickinson and Co. (Health Care Equip. & Supplies) | 5.000% | 05/15/2019 | 500,000 | 578,195 | ||||||||||||
Covidien International Finance SA (Health Care Equip. & Supplies) | 2.800% | 06/15/2015 | 1,250,000 | 1,298,698 | ||||||||||||
St. Jude Medical, Inc. (Health Care Equip. & Supplies) | 2.200% | 09/15/2013 | 1,000,000 | 1,018,570 | ||||||||||||
AmerisourceBergen Corp. (Health Care Providers & Svs.) | 4.875% | 11/15/2019 | 500,000 | 561,572 | ||||||||||||
UnitedHealth Group, Inc. (Health Care Providers & Svs.) | 6.000% | 02/15/2018 | 1,500,000 | 1,785,776 | ||||||||||||
Thermo Fisher Scientific, Inc. (Life Sciences Tools & Svs.) | 3.250% | 11/20/2014 | 300,000 | 317,894 | ||||||||||||
Abbott Laboratories (Pharmaceuticals) | 2.700% | 05/27/2015 | 1,000,000 | 1,049,646 | ||||||||||||
Merck & Co., Inc. (Pharmaceuticals) | 5.000% | 06/30/2019 | 1,000,000 | 1,181,150 | ||||||||||||
Teva Pharmaceutical Finance II BV / Teva Pharmaceutical Finance III LLC (Pharmaceuticals) | 3.000% | 06/15/2015 | 500,000 | 521,107 | ||||||||||||
|
| |||||||||||||||
| 10,860,909 | ||||||||||||||||
|
| |||||||||||||||
INDUSTRIALS – 9.0% |
| |||||||||||||||
BAE Systems Holdings, Inc. (Aerospace & Defense) | (a) | 6.375% | 06/01/2019 | 750,000 | 840,332 | |||||||||||
Lockheed Martin Corp. (Aerospace & Defense) | 3.350% | 09/15/2021 | 1,000,000 | 996,844 | ||||||||||||
Raytheon Co. (Aerospace & Defense) | 4.400% | 02/15/2020 | 1,250,000 | 1,375,358 | ||||||||||||
Owens Corning (Building Products) | 6.500% | 12/01/2016 | 1,000,000 | 1,092,534 | ||||||||||||
Republic Services, Inc. (Commercial Svs. & Supplies) | 3.800% | 05/15/2018 | 1,000,000 | 1,037,306 | ||||||||||||
Waste Management, Inc. (Commercial Svs. & Supplies) | 6.100% | 03/15/2018 | 500,000 | 591,754 | ||||||||||||
Emerson Electric Co. (Electrical Equip.) | 4.250% | 11/15/2020 | 1,250,000 | 1,391,574 | ||||||||||||
Caterpillar, Inc. (Machinery) | 5.700% | 08/15/2016 | 1,000,000 | 1,174,672 | ||||||||||||
Deere & Co. (Machinery) | 4.375% | 10/16/2019 | 1,250,000 | 1,402,766 | ||||||||||||
Illinois Tool Works, Inc. (Machinery) | (a) | 3.375% | 09/15/2021 | 500,000 | 523,799 | |||||||||||
CSX Corp. (Road & Rail) | 5.600% | 05/01/2017 | 1,500,000 | 1,717,311 | ||||||||||||
Ryder System, Inc. (Road & Rail) | 3.600% | 03/01/2016 | 1,000,000 | 1,032,641 | ||||||||||||
Union Pacific Corp. (Road & Rail) | 4.000% | 02/01/2021 | 1,250,000 | 1,343,701 | ||||||||||||
|
| |||||||||||||||
| 14,520,592 | ||||||||||||||||
|
| |||||||||||||||
INFORMATION TECHNOLOGY – 1.9% |
| |||||||||||||||
Cisco Systems, Inc. (Communications Equip.) | 2.900% | 11/17/2014 | 300,000 | 317,597 | ||||||||||||
Computer Sciences Corp. (IT Svs.) | 6.500% | 03/15/2018 | 1,500,000 | 1,470,375 | ||||||||||||
International Business Machines Corp. (IT Svs.) | 2.100% | 05/06/2013 | 1,250,000 | 1,276,213 | ||||||||||||
|
| |||||||||||||||
| 3,064,185 | ||||||||||||||||
|
| |||||||||||||||
MATERIALS – 3.3% |
| |||||||||||||||
FMC Corp. (Chemicals) | 3.950% | 02/01/2022 | 1,000,000 | 1,018,028 | ||||||||||||
Monsanto Co. (Chemicals) | 7.375% | 08/15/2012 | 1,000,000 | 1,039,092 | ||||||||||||
Praxair, Inc. (Chemicals) | 2.125% | 06/14/2013 | 1,250,000 | 1,275,444 | ||||||||||||
Rio Tinto Finance U.S.A. Ltd. (Metals & Mining) | 1.875% | 11/02/2015 | 1,000,000 | 1,009,307 | ||||||||||||
Teck Resources Ltd. (Metals & Mining) | 7.000% | 09/15/2012 | 1,000,000 | 1,038,225 | ||||||||||||
|
| |||||||||||||||
| 5,380,096 | ||||||||||||||||
|
| |||||||||||||||
TELECOMMUNICATION SERVICES – 3.9% |
| |||||||||||||||
AT&T, Inc. (Diversified Telecom. Svs.) | 3.875% | 08/15/2021 | 1,000,000 | 1,059,879 | ||||||||||||
Embarq Corp. (Diversified Telecom. Svs.) | 6.738% | 06/01/2013 | 1,000,000 | 1,040,908 | ||||||||||||
Telecom Italia Capital SA (Diversified Telecom. Svs.) | 5.250% | 10/01/2015 | 750,000 | 688,566 | ||||||||||||
Verizon Communications, Inc. (Diversified Telecom. Svs.) | 4.600% | 04/01/2021 | 1,250,000 | 1,413,778 | ||||||||||||
America Movil SAB de CV (Wireless Telecom. Svs.) | 5.750% | 01/15/2015 | 1,000,000 | 1,111,992 | ||||||||||||
Rogers Communications, Inc. (Wireless Telecom. Svs.) | 5.500% | 03/15/2014 | 1,000,000 | 1,078,499 | ||||||||||||
|
| |||||||||||||||
| 6,393,622 | ||||||||||||||||
|
| |||||||||||||||
| 12 | (continued) |
| Ohio National Fund, Inc. | Bond Portfolio (Continued) |
Schedule of Investments | December 31, 2011 |
| Corporate Bonds – (Continued) | Rate | Maturity | Face Amount | Value | ||||||||||||
UTILITIES – 15.2% |
| |||||||||||||||
Appalachian Power Co. (Electric Utilities) | 4.600% | 03/30/2021 | $ | 1,000,000 | $ | 1,098,740 | ||||||||||
Commonwealth Edison Co. (Electric Utilities) | 5.950% | 08/15/2016 | 1,500,000 | 1,751,714 | ||||||||||||
Consumers Energy Co. (Electric Utilities) | 6.000% | 02/15/2014 | 1,000,000 | 1,092,457 | ||||||||||||
Duke Energy Corp. (Electric Utilities) | 3.350% | 04/01/2015 | 1,250,000 | 1,318,694 | ||||||||||||
Florida Power Corp. (Electric Utilities) | 4.550% | 04/01/2020 | 500,000 | 568,001 | ||||||||||||
Kansas City Power & Light Co. (Electric Utilities) | 5.850% | 06/15/2017 | 1,500,000 | 1,716,336 | ||||||||||||
Metropolitan Edison Co. (Electric Utilities) | 4.875% | 04/01/2014 | 750,000 | 797,237 | ||||||||||||
Pepco Holdings, Inc. (Electric Utilities) | 2.700% | 10/01/2015 | 750,000 | 760,332 | ||||||||||||
Tenaska Georgia Partners LP (Electric Utilities) | 9.500% | 02/01/2030 | 479,993 | 578,914 | ||||||||||||
Union Electric Co. (Electric Utilities) | 6.400% | 06/15/2017 | 1,500,000 | 1,795,067 | ||||||||||||
Virginia Electric and Power Co. (Electric Utilities) | 5.400% | 01/15/2016 | 1,500,000 | 1,730,318 | ||||||||||||
AGL Capital Corp. (Gas Utilities) | 5.250% | 08/15/2019 | 1,000,000 | 1,119,731 | ||||||||||||
CenterPoint Energy Resources Corp. (Gas Utilities) | 5.950% | 01/15/2014 | 500,000 | 542,893 | ||||||||||||
Southwest Gas Corp. (Gas Utilities) | 7.625% | 05/15/2012 | 1,000,000 | 1,022,703 | ||||||||||||
Spectra Energy Capital LLC (Gas Utilities) | 5.500% | 03/01/2014 | 750,000 | 801,261 | ||||||||||||
Energy Future Competitive Holdings Co. (Ind. Power Prod. & Energy Traders) | 7.480% | 01/01/2017 | 472,246 | 419,641 | ||||||||||||
PSEG Power LLC (Ind. Power Prod. & Energy Traders) | 5.000% | 04/01/2014 | 750,000 | 803,557 | ||||||||||||
TransAlta Corp. (Ind. Power Prod. & Energy Traders) | 6.750% | 07/15/2012 | 1,000,000 | 1,027,228 | ||||||||||||
Alliant Energy Corp. (Multi-Utilities) | 4.000% | 10/15/2014 | 1,000,000 | 1,048,625 | ||||||||||||
Avista Corp. (Multi-Utilities) | 5.950% | 06/01/2018 | 1,000,000 | 1,203,222 | ||||||||||||
LG&E and KU Energy LLC (Multi-Utilities) | (a) | 4.375% | 10/01/2021 | 1,000,000 | 1,022,008 | |||||||||||
NextEra Energy Capital Holdings, Inc. (Multi-Utilities) | 2.600% | 09/01/2015 | 1,250,000 | 1,262,495 | ||||||||||||
Xcel Energy, Inc. (Multi-Utilities) | 4.700% | 05/15/2020 | 1,000,000 | 1,128,997 | ||||||||||||
|
| |||||||||||||||
| 24,610,171 | ||||||||||||||||
|
| |||||||||||||||
Total Corporate Bonds (Cost $136,422,462) | $ | 146,359,075 | ||||||||||||||
|
| |||||||||||||||
| U.S. Treasury Obligations – 2.8% | Rate | Maturity | Face Amount | Value | ||||||||||||
United States Treasury Note | 2.375% | 09/30/2014 | $ | 1,000,000 | $ | 1,055,235 | ||||||||||
United States Treasury Note | 3.375% | 11/15/2019 | 3,000,000 | 3,420,234 | ||||||||||||
|
| |||||||||||||||
Total U.S. Treasury Obligations (Cost $4,195,400) | $ | 4,475,469 | ||||||||||||||
|
| |||||||||||||||
| Commercial Paper – 4.3% | Rate | Maturity | Face Amount | Amortized Cost | ||||||||||||
HSBC Finance Corp. | 0.030% | 01/03/2012 | $ | 7,000,000 | $ | 6,999,988 | ||||||||||
|
| |||||||||||||||
Total Commercial Paper (Cost $6,999,988) | $ | 6,999,988 | ||||||||||||||
|
| |||||||||||||||
| Repurchase Agreements – 1.8% | Rate | Maturity | Face Amount | Amortized Cost | ||||||||||||
| U.S. Bank, Agreement date: 12/30/2011, Repurchase price: $2,857,003, Collateralized by: Fannie Mae 15 yr. Pool #CI-254919 (FNCI) 4.000%, Due 09/01/2018 with value of $2,914,154 | 0.010% | 01/03/2012 | $ | 2,857,000 | $ | 2,857,000 | ||||||||||
|
| |||||||||||||||
Total Repurchase Agreements (Cost $2,857,000) | $ | 2,857,000 | ||||||||||||||
|
| |||||||||||||||
Total Investments – 99.2% (Cost $150,474,850) | (d) | $ | 160,691,532 | |||||||||||||
Other Assets in Excess of Liabilities – 0.8% | 1,343,445 | |||||||||||||||
|
| |||||||||||||||
Net Assets – 100.0% | $ | 162,034,977 | ||||||||||||||
|
| |||||||||||||||
Percentages are stated as a percent of net assets.
Footnotes:
| (a) | Security exempt from registration under Regulation D of the Securities Act of 1933. These securities may be resold in transactions exempt from registration, normally to qualified buyers under Rule 144A. At December 31, 2011, the value of these securities totaled $5,530,222, or 3.4% of the Portfolio’s net assets. These securities were deemed liquid pursuant to procedures approved by the Board of Directors. |
| (b) | These securities are credit sensitive bonds. The coupon rates are variable rates subject to adjustment based on changes in national credit rating agency ratings. Interest rates stated are those in effect at December 31, 2011. |
| (c) | Fixed-to-floating rate, callable, perpetual life trust preferred security. Interest rates stated are those in effect at December 31, 2011. |
| (d) | Represents cost for financial reporting purposes, which may differ from cost basis for federal income tax purposes. See also Note 7 of the Notes to Financial Statements. |
The accompanying notes are an integral part of these financial statements.
| 13 |
| Ohio National Fund, Inc. | Omni Portfolio |
Objective/Strategy
The Omni Portfolio seeks a high level of long-term total return consistent with preservation of capital by investing in stocks, bonds, and money market instruments.
Performance as of December 31, 2011
Average Annual Total Returns: | ||||
One year | -4.12% | |||
Five years | 1.17% | |||
Ten years | 3.22% |
Past performance does not guarantee future results. The performance data quoted represents past performance and current returns may be lower or higher. Total return figures include change in share price and reinvestment of dividends and capital gains. The investment return and principal value will fluctuate so that an investor’s shares, when redeemed, may be worth more or less than the original cost. To obtain performance information up to the most recent month end, call toll-free 1-877-781-6392.
The Portfolio is not open to direct retail investment. Beneficial interest in shares is obtained solely by purchase of variable life insurance policies and variable annuity contracts. Actual performance results for variable annuity and variable universal life contracts will be lower due to contract charges. Consult your contract for applicable charges.
Comments
For the year ended December 31, 2011, the Omni Portfolio returned -4.12% versus 3.92% for the current benchmark, which is composed of 70% S&P 500 Index and 30% BofA Merrill Lynch U.S. Corporate Master Index (the “Merrill Lynch Index”).
The under-performance of the Portfolio versus the blended benchmark is the result of several factors, most important of which is the under-performance of the equity portion of the Portfolio compared to the S&P 500 Index. Other factors that contributed to the under-performance include under-performance of the bond portion of the Portfolio versus the Merrill Lynch Index, and holding approximately 4% of the Portfolio in cash equivalents during a period in which both equities and bonds had positive total returns. The asset allocation decision to under-weight bonds versus the blended Index also had a negative impact on relative performance because bonds returned more than equities during 2011, particularly in the second half of the year.(1)
The equity portion of the Portfolio returned a negative 6.67% versus a positive 2.11% for the S&P 500 Index. The over-weighting in the Financials sector was a major reason for the relative under-performance. Continued worries about the debt crisis in Europe, the lack of clarity on resolution of the mortgage meltdown in the U.S., and lower than expected interest rates combined to negatively impact the Financials sector. Of the five top detractors from performance, three were from the Financials sector: Bank of America Corp., Morgan Stanley, and Citigroup, Inc. The other two top detractors were Royal Caribbean Cruises Ltd., which was hurt by high oil prices and weak demand in Europe, and Warner Chilcott PLC. The top contributors to performance were SunPower Corp., Apple, Inc., International Business Machines Corp., Pharmasset, Inc., and UnitedHealth Group, Inc.(1)
During 2011, the main sector weight changes in the equity portion of the Portfolio included adding to Industrials, which went from 10.4% to 19.3% (versus the benchmark’s 10.7%) while lowering the exposure to Financials, but still maintaining an overweight, which went from 23.7% to 16.9% (versus the benchmark’s 13.4%). This reflects our belief in an economic recovery and our expectations for
the Financials sector. This was also the basis for increasing Information Technology by 4.7% to 26.0% (versus the benchmark weighting of 19.0%) and Energy by 3.5% to 12.8% (close to the benchmark weighting), at the expense of Materials (reduced by 6.0%) and Health Care (reduced by 3.1%).(1)
For 2011, the bond portion of the Portfolio had a total return of 6.45% versus 7.51% for the Merrill Lynch Index. Both the bond portion of the Portfolio and the Merrill Lynch Index had reasonably good absolute positive total returns because U.S. Treasury yields declined significantly in 2011. For the year, the 10-year U.S. Treasury yield declined 142 basis points. U.S. Treasury yields declined because the United States, despite its economic and political problems, became a “safe haven” for investors given the economic and banking problems in Europe, most particularly in Southern Europe. While U.S. Treasury yields declined in 2011, credit spreads widened (the Merrill Lynch Index widened 92 basis points) due to softness in the U.S. economy. Because the decline in U.S. Treasury yields exceeded the widening in credit spreads, bonds enjoyed positive price performance for the year.(1)
The bond portion of the Portfolio under-performed the Merrill Lynch Index primarily because its duration was shorter than the duration of the Merrill Lynch Index during a year in which interest rates declined. During 2011, the duration of the Portfolio’s bond holdings was approximately two to two and a half years shorter than that of the Merrill Lynch Index. The bond portion of the Portfolio was under-weighted in the banking sector and over-weighted in the electric utility sector; both of these weightings had a minor positive impact on performance because the banking sector under-performed and the electric utility sector out-performed.(1)
Because the U.S. economy continued to grow, albeit at a slow rate, the credit quality of most of the bonds in the Portfolio was maintained. That being said, several bonds performed poorly, and most of these were either in the Financials sector or were domiciled in Europe. The five poorest performing bonds were Deutsche Bank Capital Funding Trust VII, Telecom Italia Capital SA, Computer Sciences Corp., Bank of America Corp., and Jefferies Group, Inc. The five best performing bonds were Procter & Gamble Company, United States Treasury Notes, Anadarko Petroleum Corp., Bunge NA Finance LP, and Pennsylvania Electric Co.(1)
Early in 2011, many of the basic requirements that favor the growth management style for equities were in place: the widespread belief that this was the year of recovery following a three year recession, a lean corporate sector awash with cash, robust earnings, and the end of the Financials sector’s uncertainties. A year later, in hindsight, we see little evidence for such optimism, but the factors are still in place for a better 2012. We will remain committed to our investment style and process and expect that, with the positive factors at work, 2012 will finally offer those higher expected returns.
| (1) | The Portfolio’s composition is subject to change. Holdings and weightings are as of December 31, 2011. |
| 14 | (continued) |
| Ohio National Fund, Inc. | Omni Portfolio (Continued) |
Change in Value of $10,000 Investment
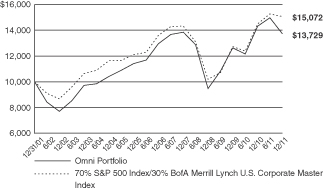
Hypothetical illustration based on past performance. Future performance will vary. The Portfolio’s returns reflect reinvested dividends. The Portfolio’s holdings may differ significantly from the securities in the index. The index is unmanaged and therefore does not reflect the cost of portfolio management and accounting.
The BofA Merrill Lynch U.S. Corporate Master Index tracks the performance of all U.S. dollar-denominated, investment grade corporate public debt issued in the U.S. domestic bond market. Qualifying bonds must have at least one year remaining term to maturity, a fixed coupon schedule, and a minimum amount outstanding of $250 million.
The S&P 500 Index is a capitalization-weighted index designed to measure performance of the broad domestic market through changes in the aggregate market value of 500 stocks representing all major industries. The index presented herein includes the effects of reinvested dividends.
Portfolio Composition as of December 31, 2011 (1)
| % of Net Assets | ||||
Common Stocks (3) | 70.3 | |||
Corporate Bonds (3) | 23.6 | |||
U.S. Treasury Obligations | 1.0 | |||
Money Market Funds and | 5.1 | |||
|
| |||
| 100.0 | ||||
|
|
Top 10 Portfolio Holdings as of December 31, 2011 (1) (2)
| % of Net Assets | ||||
1. Apple, Inc. | 3.6 | |||
2. JPMorgan Chase & co. | 1.8 | |||
3. Citigroup, Inc. | 1.6 | |||
4. Wells Fargo & Co. | 1.6 | |||
5. Bank of New York Mellon Corp./The | 1.5 | |||
6. UnitedHealth Group, Inc. | 1.5 | |||
7. Google, Inc. Class A | 1.5 | |||
8. Maxim Integrated Products, Inc. | 1.5 | |||
9. Lowe’s Cos., Inc. | 1.5 | |||
10. United Parcel Service, Inc. Class B | 1.5 |
| (1) | Composition of Portfolio subject to change. |
| (2) | Short-term investments have been excluded from the list of Top 10 Portfolio Holdings. |
| (3) | Sectors (combined): |
| % of Net Assets | ||||
Information Technology | 18.7 | |||
Financials | 18.6 | |||
Industrials | 15.3 | |||
Energy | 11.7 | |||
Consumer Discretionary | 9.8 | |||
Health Care | 7.7 | |||
Utilities | 4.6 | |||
Consumer Staples | 4.5 | |||
Telecommunication Services | 1.5 | |||
Materials | 1.5 | |||
|
| |||
| 93.9 | ||||
|
|
| 15 |
| Ohio National Fund, Inc. | Omni Portfolio |
Schedule of Investments | December 31, 2011 |
| Common Stocks – 70.3% | Shares | Value | ||||||||||||
CONSUMER DISCRETIONARY - 8.1% |
| |||||||||||||
Johnson Controls, Inc. (Auto Components) | 16,100 | $ | 503,286 | |||||||||||
Las Vegas Sands Corp. (Hotels, Restaurants & Leisure) | (a) | 10,800 | 461,484 | |||||||||||
Yum! Brands, Inc. (Hotels, Restaurants & Leisure) | 7,300 | 430,773 | ||||||||||||
Amazon.com, Inc. (Internet & Catalog Retail) | (a) | 2,000 | 346,200 | |||||||||||
Lowe’s Cos., Inc. (Specialty Retail) | 20,300 | 515,214 | ||||||||||||
Tiffany & Co. (Specialty Retail) | 5,000 | 331,300 | ||||||||||||
Hanesbrands, Inc. (Textiles, Apparel & Luxury Goods) | (a) | 10,500 | 229,530 | |||||||||||
|
| |||||||||||||
| 2,817,787 | ||||||||||||||
|
| |||||||||||||
CONSUMER STAPLES – 2.2% |
| |||||||||||||
Anheuser-Busch InBev NV – ADR (Beverages) | 7,900 | 481,821 | ||||||||||||
Tyson Foods, Inc. Class A (Food Products) | 14,000 | 288,960 | ||||||||||||
|
| |||||||||||||
| 770,781 | ||||||||||||||
|
| |||||||||||||
ENERGY – 9.0% |
| |||||||||||||
Baker Hughes, Inc. (Energy Equip. & Svs.) | 9,700 | 471,808 | ||||||||||||
Dresser-Rand Group, Inc. (Energy Equip. & Svs.) | (a) | 8,700 | 434,217 | |||||||||||
Schlumberger Ltd. (Energy Equip. & Svs.) | 7,000 | 478,170 | ||||||||||||
Apache Corp. (Oil, Gas & Consumable Fuels) | 5,100 | 461,958 | ||||||||||||
Devon Energy Corp. (Oil, Gas & Consumable Fuels) | 7,900 | 489,800 | ||||||||||||
Forest Oil Corp. (Oil, Gas & Consumable Fuels) | (a) | 23,000 | 311,650 | |||||||||||
Hess Corp. (Oil, Gas & Consumable Fuels) | 8,300 | 471,440 | ||||||||||||
|
| |||||||||||||
| 3,119,043 | ||||||||||||||
|
| |||||||||||||
FINANCIALS – 11.9% |
| |||||||||||||
Bank of New York Mellon Corp. / The (Capital Markets) | 26,500 | 527,615 | ||||||||||||
Wells Fargo & Co. (Commercial Banks) | 19,500 | 537,420 | ||||||||||||
Citigroup, Inc. (Diversified Financial Svs.) | 20,700 | 544,617 | ||||||||||||
JPMorgan Chase & Co. (Diversified Financial Svs.) | 18,600 | 618,450 | ||||||||||||
Hartford Financial Services Group, Inc. (Insurance) | 28,500 | 463,125 | ||||||||||||
Lincoln National Corp. (Insurance) | 23,500 | 456,370 | ||||||||||||
MetLife, Inc. (Insurance) | 15,600 | 486,408 | ||||||||||||
Prudential Financial, Inc. (Insurance) | 9,600 | 481,152 | ||||||||||||
|
| |||||||||||||
| 4,115,157 | ||||||||||||||
|
| |||||||||||||
HEALTH CARE – 5.7% |
| |||||||||||||
Amarin Corp PLC – ADR (Biotechnology) | (a) | 19,700 | 147,553 | |||||||||||
Amgen, Inc. (Biotechnology) | 7,800 | 500,838 | ||||||||||||
UnitedHealth Group, Inc. (Health Care Providers & Svs.) | 10,300 | 522,004 | ||||||||||||
WellPoint, Inc. (Health Care Providers & Svs.) | 7,300 | 483,625 | ||||||||||||
Warner Chilcott PLC Class A (Pharmaceuticals) | (a) | 22,300 | 337,399 | |||||||||||
|
| |||||||||||||
| 1,991,419 | ||||||||||||||
|
| |||||||||||||
INDUSTRIALS – 13.6% |
| |||||||||||||
Honeywell International, Inc. (Aerospace & Defense) | 9,300 | 505,455 | ||||||||||||
United Technologies Corp. (Aerospace & Defense) | 5,200 | 380,068 | ||||||||||||
FedEx Corp. (Air Freight & Logistics) | 6,000 | 501,060 | ||||||||||||
United Parcel Service, Inc. Class B (Air Freight & Logistics) | 7,000 | 512,330 | ||||||||||||
United Continental Holdings, Inc. (Airlines) | (a) | 26,600 | 501,942 | |||||||||||
Rockwell Automation, Inc. (Electrical Equip.) | 6,700 | 491,579 | ||||||||||||
Caterpillar, Inc. (Machinery) | 4,500 | 407,700 | ||||||||||||
Pentair, Inc. (Machinery) | 13,300 | 442,757 | ||||||||||||
Snap-On, Inc. (Machinery) | 4,900 | 248,038 | ||||||||||||
Stanley Black & Decker, Inc. (Machinery) | 5,000 | 338,000 | ||||||||||||
Xylem, Inc. (Machinery) | 14,600 | 375,074 | ||||||||||||
|
| |||||||||||||
| 4,704,003 | ||||||||||||||
|
| |||||||||||||
INFORMATION TECHNOLOGY – 18.3% |
| |||||||||||||
Cisco Systems, Inc. (Communications Equip.) | 25,300 | 457,424 | ||||||||||||
QUALCOMM, Inc. (Communications Equip.) | 9,000 | 492,300 | ||||||||||||
Apple, Inc. (Computers & Peripherals) | (a) | 3,050 | 1,235,250 | |||||||||||
EMC Corp. (Computers & Peripherals) | (a) | 21,300 | 458,802 | |||||||||||
Google, Inc. Class A (Internet Software & Svs.) | (a) | 800 | 516,720 | |||||||||||
International Business Machines Corp. (IT Svs.) | 2,500 | 459,700 | ||||||||||||
Altera Corp. (Semiconductors & Equip.) | 10,400 | 385,840 | ||||||||||||
Maxim Integrated Products, Inc. (Semiconductors & Equip.) | 19,800 | 515,592 | ||||||||||||
Texas Instruments, Inc. (Semiconductors & Equip.) | 16,400 | 477,404 | ||||||||||||
Citrix Systems, Inc. (Software) | (a) | 8,000 | 485,760 | |||||||||||
Electronic Arts, Inc. (Software) | (a) | 22,400 | 461,440 | |||||||||||
Oracle Corp. (Software) | 15,500 | 397,575 | ||||||||||||
|
| |||||||||||||
| 6,343,807 | ||||||||||||||
|
| |||||||||||||
MATERIALS – 1.5% |
| |||||||||||||
Monsanto Co. (Chemicals) | 7,200 | 504,504 | ||||||||||||
|
| |||||||||||||
Total Common Stocks (Cost $25,469,313) | $ | 24,366,501 | ||||||||||||
|
| |||||||||||||
| 16 | (continued) |
| Ohio National Fund, Inc. | Omni Portfolio (Continued) |
Schedule of Investments | December 31, 2011 |
| Corporate Bonds – 23.6% | Rate | Maturity | Face Amount | Value | ||||||||||||
CONSUMER DISCRETIONARY – 1.7% |
| |||||||||||||||
Daimler Finance North America LLC (Automobiles) | 6.500% | 11/15/2013 | $ | 100,000 | $ | 108,968 | ||||||||||
Comcast Corp. (Media) | 5.875% | 02/15/2018 | 150,000 | 173,667 | ||||||||||||
Walt Disney Co. / The (Media) | 6.200% | 06/20/2014 | 100,000 | 113,328 | ||||||||||||
Kohl’s Corp. (Multiline Retail) | 4.000% | 11/01/2021 | 75,000 | 76,993 | ||||||||||||
Macy’s Retail Holdings, Inc. (Multiline Retail) | 5.900% | 12/01/2016 | 100,000 | 111,867 | ||||||||||||
|
| |||||||||||||||
| 584,823 | ||||||||||||||||
|
| |||||||||||||||
CONSUMER STAPLES – 2.3% |
| |||||||||||||||
Anheuser-Busch Cos. LLC (Beverages) | 5.500% | 01/15/2018 | 150,000 | 173,246 | ||||||||||||
CVS Caremark Corp. (Food & Staples Retailing) | 5.750% | 06/01/2017 | 150,000 | 175,233 | ||||||||||||
Bunge NA Finance LP (Food Products) | 5.900% | 04/01/2017 | 150,000 | 163,991 | ||||||||||||
Kraft Foods, Inc. (Food Products) | 6.500% | 08/11/2017 | 150,000 | 178,649 | ||||||||||||
Procter & Gamble Co. / The (Household Products) | 4.700% | 02/15/2019 | 100,000 | 118,197 | ||||||||||||
|
| |||||||||||||||
| 809,316 | ||||||||||||||||
|
| |||||||||||||||
ENERGY – 2.7% |
| |||||||||||||||
Weatherford International Ltd. (Energy Equip. & Svs.) | 6.000% | 03/15/2018 | 150,000 | 167,113 | ||||||||||||
Anadarko Petroleum Corp. (Oil, Gas & Consumable Fuels) | 5.950% | 09/15/2016 | 100,000 | 113,473 | ||||||||||||
Boardwalk Pipelines LP (Oil, Gas & Consumable Fuels) | 5.500% | 02/01/2017 | 100,000 | 109,160 | ||||||||||||
Enterprise Products Operating LLC (Oil, Gas & Consumable Fuels) | 5.000% | 03/01/2015 | 150,000 | 163,496 | ||||||||||||
Kinder Morgan Energy Partners LP (Oil, Gas & Consumable Fuels) | 4.150% | 03/01/2022 | 75,000 | 76,443 | ||||||||||||
Magellan Midstream Partners LP (Oil, Gas & Consumable Fuels) | 6.400% | 07/15/2018 | 150,000 | 179,765 | ||||||||||||
Valero Energy Corp. (Oil, Gas & Consumable Fuels) | 4.750% | 06/15/2013 | 100,000 | 104,714 | ||||||||||||
|
| |||||||||||||||
| 914,164 | ||||||||||||||||
|
| |||||||||||||||
FINANCIALS – 6.7% |
| |||||||||||||||
Goldman Sachs Group, Inc. / The (Capital Markets) | 5.150% | 01/15/2014 | 100,000 | 101,952 | ||||||||||||
Jefferies Group, Inc. (Capital Markets) | 5.875% | 06/08/2014 | 150,000 | 149,625 | ||||||||||||
Mellon Funding Corp. (Capital Markets) | 5.500% | 11/15/2018 | 100,000 | 110,989 | ||||||||||||
Morgan Stanley (Capital Markets) | 4.750% | 04/01/2014 | 100,000 | 98,560 | ||||||||||||
BB&T Corp. (Commercial Banks) | 5.200% | 12/23/2015 | 100,000 | 107,156 | ||||||||||||
Deutsche Bank Capital Funding Trust VII (Commercial Banks) | (b)(c) | 5.628% | Perpetual | 100,000 | 72,500 | |||||||||||
KeyBank NA (Commercial Banks) | 5.700% | 11/01/2017 | 150,000 | 161,203 | ||||||||||||
PNC Funding Corp. (Commercial Banks) | 5.250% | 11/15/2015 | 150,000 | 163,290 | ||||||||||||
Capital One Bank U.S.A. NA (Consumer Finance) | 5.125% | 02/15/2014 | 100,000 | 105,947 | ||||||||||||
Discover Financial Services (Consumer Finance) | 6.450% | 06/12/2017 | 150,000 | 156,879 | ||||||||||||
Bank of America Corp. (Diversified Financial Svs.) | 5.750% | 08/15/2016 | 150,000 | 139,447 | ||||||||||||
Citigroup, Inc. (Diversified Financial Svs.) | 5.850% | 08/02/2016 | 150,000 | 157,762 | ||||||||||||
General Electric Capital Corp. (Diversified Financial Svs.) | 5.000% | 01/08/2016 | 100,000 | 109,513 | ||||||||||||
JPMorgan Chase & Co. (Diversified Financial Svs.) | 5.150% | 10/01/2015 | 100,000 | 106,228 | ||||||||||||
Assurant, Inc. (Insurance) | 5.625% | 02/15/2014 | 100,000 | 104,629 | ||||||||||||
Liberty Mutual Group, Inc. (Insurance) | (b) | 5.750% | 03/15/2014 | 100,000 | 104,333 | |||||||||||
MetLife, Inc. (Insurance) | 5.375% | 12/15/2012 | 100,000 | 104,094 | ||||||||||||
Duke Realty LP (Real Estate Investment Trusts) | 4.625% | 05/15/2013 | 100,000 | 102,293 | ||||||||||||
HCP, Inc. (Real Estate Investment Trusts) | 6.000% | 01/30/2017 | 150,000 | 162,478 | ||||||||||||
|
| |||||||||||||||
| 2,318,878 | ||||||||||||||||
|
| |||||||||||||||
HEALTH CARE – 2.0% |
| |||||||||||||||
UnitedHealth Group, Inc. (Health Care Providers & Svs.) | 6.000% | 02/15/2018 | 150,000 | 178,578 | ||||||||||||
WellPoint, Inc. (Health Care Providers & Svs.) | 5.875% | 06/15/2017 | 150,000 | 173,044 | ||||||||||||
Abbott Laboratories (Pharmaceuticals) | 5.600% | 11/30/2017 | 150,000 | 179,353 | ||||||||||||
Hospira, Inc. (Pharmaceuticals) | 6.050% | 03/30/2017 | 150,000 | 165,788 | ||||||||||||
|
| |||||||||||||||
| 696,763 | ||||||||||||||||
|
| |||||||||||||||
INDUSTRIALS – 1.7% |
| |||||||||||||||
Owens Corning (Building Products) | 6.500% | 12/01/2016 | 150,000 | 163,880 | ||||||||||||
Waste Management, Inc. (Commercial Svs. & Supplies) | 6.100% | 03/15/2018 | 75,000 | 88,763 | ||||||||||||
CSX Corp. (Road & Rail) | 5.600% | 05/01/2017 | 150,000 | 171,731 | ||||||||||||
ERAC U.S.A. Finance LLC (Road & Rail) | (b) | 6.375% | 10/15/2017 | 150,000 | 173,546 | |||||||||||
|
| |||||||||||||||
| 597,920 | ||||||||||||||||
|
| |||||||||||||||
INFORMATION TECHNOLOGY – 0.4% |
| |||||||||||||||
Computer Sciences Corp. (IT Svs.) | 6.500% | 03/15/2018 | 150,000 | 147,038 | ||||||||||||
|
| |||||||||||||||
TELECOMMUNICATION SERVICES – 1.5% |
| |||||||||||||||
Embarq Corp. (Diversified Telecom. Svs.) | 6.738% | 06/01/2013 | 150,000 | 156,136 | ||||||||||||
Telecom Italia Capital SA (Diversified Telecom. Svs.) | 5.250% | 10/01/2015 | 100,000 | 91,809 | ||||||||||||
America Movil SAB de CV (Wireless Telecom. Svs.) | 5.750% | 01/15/2015 | 100,000 | 111,199 | ||||||||||||
Rogers Communications, Inc. (Wireless Telecom. Svs.) | 5.500% | 03/15/2014 | 150,000 | 161,775 | ||||||||||||
|
| |||||||||||||||
| 520,919 | ||||||||||||||||
|
| |||||||||||||||
| 17 | (continued) |
| Ohio National Fund, Inc. | Omni Portfolio (Continued) |
Schedule of Investments | December 31, 2011 |
| Corporate Bonds – (Continued) | Rate | Maturity | Face Amount | Value | ||||||||||||
UTILITIES – 4.6% |
| |||||||||||||||
Commonwealth Edison Co. (Electric Utilities) | 5.950% | 08/15/2016 | $ | 150,000 | $ | 175,171 | ||||||||||
Consumers Energy Co. (Electric Utilities) | 6.000% | 02/15/2014 | 100,000 | 109,246 | ||||||||||||
Kansas City Power & Light Co. (Electric Utilities) | 5.850% | 06/15/2017 | 150,000 | 171,634 | ||||||||||||
Nevada Power Co. (Electric Utilities) | 5.950% | 03/15/2016 | 150,000 | 173,977 | ||||||||||||
Pennsylvania Electric Co. (Electric Utilities) | 6.050% | 09/01/2017 | 150,000 | 171,850 | ||||||||||||
Union Electric Co. (Electric Utilities) | 6.400% | 06/15/2017 | 150,000 | 179,507 | ||||||||||||
Virginia Electric and Power Co. (Electric Utilities) | 4.750% | 03/01/2013 | 100,000 | 104,276 | ||||||||||||
Spectra Energy Capital LLC (Gas Utilities) | 5.500% | 03/01/2014 | 100,000 | 106,835 | ||||||||||||
PSEG Power LLC (Ind. Power Prod. & Energy Traders) | 5.000% | 04/01/2014 | 100,000 | 107,141 | ||||||||||||
Southern Power Co. (Ind. Power Prod. & Energy Traders) | 4.875% | 07/15/2015 | 100,000 | 109,527 | ||||||||||||
American Water Capital Corp. (Water Utilities) | 6.085% | 10/15/2017 | 150,000 | 174,703 | ||||||||||||
|
| |||||||||||||||
| 1,583,867 | ||||||||||||||||
|
| |||||||||||||||
Total Corporate Bonds (Cost $7,455,157) | $ | 8,173,688 | ||||||||||||||
|
| |||||||||||||||
| U.S. Treasury Obligations – 1.0% | Rate | Maturity | Face Amount | Value | ||||||||||||
United States Treasury Note | 3.375% | 11/15/2019 | $ | 300,000 | $ | 342,023 | ||||||||||
|
| |||||||||||||||
Total U.S. Treasury Obligations (Cost $313,282) | $ | 342,023 | ||||||||||||||
|
| |||||||||||||||
| Money Market Funds – 5.0% | Shares | Value | ||||||||||||||
Federated Prime Cash Obligations Fund | 108,000 | $ | 108,000 | |||||||||||||
Fidelity Institutional Money Market Funds | 1,641,000 | 1,641,000 | ||||||||||||||
|
| |||||||||||||||
Total Money Market Funds (Cost $1,749,000) | $ | 1,749,000 | ||||||||||||||
|
| |||||||||||||||
Total Investments – 99.9% (Cost $34,986,752) | (d) | $ | 34,631,212 | |||||||||||||
Other Assets in Excess of Liabilities – 0.1% | 21,771 | |||||||||||||||
|
| |||||||||||||||
Net Assets – 100.0% | $ | 34,652,983 | ||||||||||||||
|
| |||||||||||||||
Percentages are stated as a percent of net assets.
Abbreviations:
ADR: American Depositary Receipts
Footnotes:
| (a) | Non-income producing security. |
| (b) | Security exempt from registration under Regulation D of the Securities Act of 1933. These securities may be resold in transactions exempt from registration, normally to qualified buyers under Rule 144A. At December 31, 2011, the value of these securities totaled $350,379, or 1.0% of the Portfolio’s net assets. These securities were deemed liquid pursuant to procedures approved by the Board of Directors. |
| (c) | Fixed-to-floating rate, callable, perpetual life trust preferred security. Interest rates stated are those in effect at December 31, 2011. |
| (d) | Represents cost for financial reporting purposes, which may differ from cost basis for federal income tax purposes. See also Note 7 of the Notes to Financial Statements. |
The accompanying notes are an integral part of these financial statements.
| 18 |
| Ohio National Fund, Inc. | International Portfolio |
Objective/Strategy
The International Portfolio seeks total return on assets by investing at least 80% of its assets in securities of foreign companies.
Performance as of December 31, 2011
Average Annual Total Returns: | ||||
One year | -15.41% | |||
Five years | -4.23% | |||
Ten years | 2.25% |
Past performance does not guarantee future results. The performance data quoted represents past performance and current returns may be lower or higher. Total return figures include change in share price and reinvestment of dividends and capital gains. The investment return and principal value will fluctuate so that an investor’s shares, when redeemed, may be worth more or less than the original cost. To obtain performance information up to the most recent month end, call toll-free 1-877-781-6392.
The Portfolio is not open to direct retail investment. Beneficial interest in shares is obtained solely by purchase of variable life insurance policies and variable annuity contracts. Actual performance results for variable annuity and variable universal life contracts will be lower due to contract charges. Consult your contract for applicable charges.
Comments
For the year ended December 31, 2011, the International Portfolio returned -15.41% versus -13.71% for the current benchmark, the MSCI All Country World ex-USA Index (Net-USD).
The stock market was a tale of two halves during the year. From January 1, 2011 through July 26, 2011, the MSCI All Country World ex-USA Index returned 4.7% followed by a sharp decline beginning July 26th thru December 31st of 17.6%. Markets began 2011 on a positive note following the U.S. QE2 program, but were derailed by headline events, including the Japanese earthquake, tsunami, and nuclear disaster, unrest in the Middle East and North Africa, concerns over a hard landing in China, and the United States and the EuroZone’s fiscal and economic uncertainties that reached a crescendo in August. What started out as Congressional deadlock in the U.S., concluded with the August Standard & Poor’s downgrade of the U.S. credit rating. It was an unprecedented event that put a renewed spotlight on global sovereign debt levels. Concerns rose as the EuroZone debt crisis intensified.
Despite the debt crisis in the EuroZone, the German economy stood apart with a strong jobs market, growing domestic demand, and a growing export market. Germany ended the year with strong employment numbers as the unemployment rate fell to 6.8%, the lowest level since reunification. Furthermore, Germany, which recorded strong 3.7% growth in 2010 while vulnerable to the debt concerns amongst its neighbors, is estimated to achieve solid 3.0% growth in 2011. The world’s third largest economy was held up by strong industrial production solidifying its long-term prospects. However, after a positive first half, MSCI’s Germany Index declined 18.1% for the year.
Global stock market valuations became increasingly attractive as the crisis escalated amongst EuroZone members and remained well below long-term levels, providing long-term investors with opportunities. Fears of either a U.S. or a global recession did not materialize. Global growth was solidly positive, nearing 3% (2011 full year), and corporate earnings rose in the range of 15-20% across the forty countries that we monitor. When inter-bank funding fears developed, the world’s five central banks acted aggressively and, once
again, demonstrated that they are willing to initiate coordinated responses. The world watched Greece, then Italy, achieve smooth political transitions. These transitions deflected concerns of high debt contagion to other global markets. Meanwhile, the European Central Bank navigated a smooth transition to new leadership in November.
As the year progressed, the events in EuroZone raised the level of economic uncertainty and growth visibility. While Japan began the process of rebuilding swiftly, established leaderships fell in North Africa leading to higher oil prices. Interest rate hikes earlier in the year in response to inflationary pressures (as energy prices and food prices peaked) have since been replaced by more growth-oriented concerns. Since the U.S. debt downgrade, we’ve had a strong record of interest rate cuts (23 cuts total in the past five months), which is supportive of global growth.
The latest news out of Europe suggests a roadmap to the EuroZone resolution is being set and, more importantly, policymakers are no longer in denial and are working methodically to a more complete solution. Talk of a hard landing in China’s slowing economy raised doubts early in the year as to whether global growth would continue as exports to China slowed. However, driven by domestic demand, the Purchasing Managers Index and Gross Domestic Product indications at the end of 2011 suggest that China is headed towards a soft landing as its economy expanded at 9.2% (estimated) despite weakening exports. Despite the EuroZone crisis, the U.S. economy also showed steady annualized growth of 1.75% (estimated). The regions of the U.S., Europe, Asia, and Latin America have each seen positive economic surprises beginning in late August. Meanwhile, global company fundamentals have remained strong.
Classical businesses like manufacturing firms are holding up well and, in some cases, exceeding their all-time peak production levels. Financials, though, are struggling with funding issues, especially in Europe. A key positive for capital market investors is that corporate balance sheets globally are strong and continue to improve since the financial crisis of 2008 and corporate leverage is at all-time lows. As an example, forecasts for Asia, excluding Japan, show net cash levels set to hit a historical high by 2012. This record level of corporate cash as a percentage of equity market capitalization is well above the levels seen in both 2000 and 2007 when stock prices peaked. This may be a source to enhance shareholder returns once risk aversion declines. This will also aid investment and help sustain positive growth momentum.
For the year ended December 31, 2011, the MSCI Developed Markets Index (-12.1%) outperformed the MSCI All Country World ex-USA Index (-13.7%) and the MSCI Emerging Markets Index (-18.4%). There was a strong divergence amongst country returns. Select developed countries experienced positive performance in 2011 including MSCI Ireland (+13.7%) and MSCI New Zealand (+5.5%). MSCI Indonesia (+6.0%) topped the emerging country returns.
Country allocation remained the primary driver of performance as it has consistently been over the past three years. The Portfolio maintained exposure to select healthy, high sovereign quality, developed markets. We maintained our overweight in Germany as strength in German companies led unemployment to a new post reunification low and unemployment level of 6.8%. Norway, the Portfolio’s second largest overweight allocation contributed to Portfolio performance as companies benefited most from the industrial cycle recovery. Many of the headwinds described previously did not impact Norway as it maintained strong country balances and a positive current
| 19 | (continued) |
| Ohio National Fund, Inc. | International Portfolio (Continued) |
account surplus. Examples of top quality companies that positively impacted performance include: Norway’s Seadrill Ltd. up 9.7%, Statoil ASA up 14.3%, and Gjensidige Forsikring ASA up 24.9%.(1)
For the second year in a row, many developed European countries dealt with necessary austerity measures. While developing Asia and Latin America experienced stronger-than-expected economic growth. These robust economies highlight the tug-o-war between developed debt-ridden countries versus cash-rich fiscally sound developing countries. Although the recovery moderated in the second half, booming China and Brazil remained supportive of both global growth and Asian and Latin American regional growth. Our holdings in South Korea and Indonesia positively impacted relative performance as these economies grew robustly driven by demand for autos and electronics. Samsung Electronics, up 9.9% for the year, was a top performer in the Asian region. Auto companies, such as South Korea’s Kia Motors Corp., up 29.9%, & Hyundai Motor Co., up 20.9%, along with Indonesia’s Astra International Tbk PT, up 38.3%, all contributed positively to performance.(1)
The Fund’s relative underperformance for the year was driven primarily by two country allocations: Germany and the United Kingdom. German companies contributed the most to our performance in the first half of the year and were top contributors in 2010, but negatively impacted relative performance in the second half. As the market became increasingly concerned about a global slowdown, investors punished cyclically-oriented industries and companies. German shares negatively impacted performance as concerns escalated about the Eurozone debt crisis, despite Germany’s relatively strong economy and fiscal position. Companies like Daimler AG, down 32.2% for the year, and Siemens AG, down 19.8%, which are clear market leaders in their respective industries, were indicative of high quality companies that detracted from relative performance. The Portfolio’s weakest country allocation on a relative basis, though, was the United Kingdom, which detracted from performance as it was underweight relative to the benchmark. Concerns over the health of United Kingdom banks such as HSBC Holdings PLC, down 21.8% for the year, and Barclays, down 31.6%, were justified. However, global companies with exposure to emerging markets such as Diageo PLC, up 21.6%, and GlaxoSmithKline, up 24.2%, turned in a strong performance as global exporters rallied.(1)
We are consistently applying our long-term methodology that seeks to identify countries and stocks with growth and stability in earnings and cash flows. Our country ranking process seeks to identify strong economies trading at reasonable valuation levels with favorable macroeconomic outlooks. We continue to find country and stock holdings attractive for the long-term.
The latest research shows that country effects have become even more influential in a well-diversified international portfolio. Relative country trades have increased. We believe the greater importance of country divergences is likely to persist given the increasing fundamental divergences between countries (even within the EuroZone) and increased macro instability related to sovereign indebtedness and low trend growth. If we do get a recession, which is not our expectation, country return dispersion would likely peak.
The Portfolio maintained its overweight in high quality emerging markets, many of which are healthier in terms of economic conditions relative to their developed counterparts. Developing economies as a group are creditor nations, whereas the advanced economies as a group are debtor nations. Our overweight is spread among several top-quality emerging countries: South Korea (13.5%), Indonesia (7.9%), and Mexico (11.9%). These markets continue to
benefit not only from stronger growth dynamics, driven by both export and domestic demand, but they have superior fiscal and debt positions. We expect this to continue. At the end of the year, our emerging markets weight stood at 36.6%. Excluding South Korea, which some key benchmark providers consider a developed market, our emerging market weight is 23.0%.(1)
The Portfolio maintained exposure to select healthy, high quality developed markets. Our highest conviction, overweight investments include Germany and Norway while our under-weights are within European debt-laden, peripheral economies. The Portfolio is maintaining its overweight in Germany based on the foundation that long-term fundamentals, as opposed to panic, will return as the key driver of stock returns and that German shares will benefit from continued low European Central Bank rates and a weaker Euro. The Portfolio is over-weighted in Norway as the country has strong public finances and is benefiting most from the industrial cycle recovery. The Portfolio reduced its weight in Denmark and re-allocated to the United Kingdom.(1)
The Portfolio continues to invest in Japan, primarily by selectively owning companies oriented towards a more globalized chain of production and demand. While tragic, the earthquake, tsunami, and nuclear disaster struck at a time that Japan, and the rest of the global economy, was at a positive point in the business cycle, i.e., the beginning phases of an expansionary phase. We feel the trajectory in the mid/longer term is for positive economic growth, both from cyclical and structural spending. (1)
We continue to monitor our investment universe for signs of countries and companies with poor credit quality (or unmanageable debt levels), preferring to focus on countries and companies with strategic expansion opportunities. As developed economies continue to adjust to new debt levels and investors continue to fear a reoccurrence of 2008, markets will continue to be volatile. However, as long-term investors, we feel that fundamentals are supportive of global growth. We expect the winners to maintain higher profitability and gain market share, while the weaker players, who continue to struggle to gain footing, will under-perform. Global stock market valuations became increasingly attractive as the crisis escalated amongst EuroZone members, and they remained well below long-term levels providing long-term investors with numerous investment opportunities.
| (1) | The Portfolio’s composition is subject to change. Holdings and weightings are as of December 31, 2011. |
| 20 | (continued) |
| Ohio National Fund, Inc. | International Portfolio (Continued) |
Change in Value of $10,000 Investment
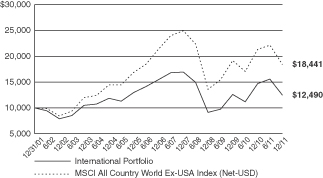
Hypothetical illustration based on past performance. Future performance will vary. The Portfolio’s returns reflect reinvested dividends. The Portfolio’s holdings may differ significantly from the securities in the index. The index is unmanaged and therefore does not reflect the cost of portfolio management and accounting.
The MSCI All Country World Ex-USA Index (Net-USD) is a free float-adjusted market capitalization weighted index that is designed to measure the equity market performance of the developed and emerging markets. The MSCI All Country World Index consists of 24 developed and 21 emerging market country indices.
Portfolio Composition as of December 31, 2011 (1)
| % of Net Assets | ||||
Common Stocks (3) | 91.6 | |||
U.S. Treasury Obligations | 0.7 | |||
Money Market Funds and | 7.7 | |||
|
| |||
| 100.0 | ||||
|
|
Top 10 Portfolio Holdings as of December 31, 2011 (1) (2)
| % of Net Assets | ||||
1. Samsung Electronics Co. Ltd. | 3.4 | |||
2. Statoil ASA | 3.3 | |||
3. Siemens AG | 3.1 | |||
4. America Movil SAB de CV - ADR | 2.6 | |||
5. Yara International ASA | 2.5 | |||
6. BASF SE | 2.2 | |||
7. Hyundai Motors Co. | 2.1 | |||
8. Allianz SE | 1.9 | |||
9. Kia Motors Corp. | 1.8 | |||
10. Muenchener Rueckversicherungs AG | 1.8 | |||
| (1) | Composition of Portfolio subject to change. |
| (2) | Short-term investments have been excluded from the list of Top 10 Portfolio Holdings. |
| (3) | Top 10 Country Weightings: |
| % of Net Assets | ||||
Germany | 19.9 | |||
South Korea | 13.5 | |||
Norway | 12.0 | |||
Mexico | 11.9 | |||
United Kingdom | 11.1 | |||
Japan | 8.8 | |||
Indonesia | 7.9 | |||
Brazil | 3.2 | |||
Bermuda | 1.4 | |||
Luxembourg | 1.2 |
| 21 |
| Ohio National Fund, Inc. | International Portfolio |
Schedule of Investments | December 31, 2011 |
| Common Stocks – 91.6% | Shares | Value | ||||||||
Germany – 19.9% | ||||||||||
Allianz SE | (b) | 34,200 | $ | 3,266,241 | ||||||
Aurubis AG | (b) | 8,200 | 436,382 | |||||||
BASF SE | (b) | 53,400 | 3,717,623 | |||||||
Bayer AG | (b) | 13,600 | 868,542 | |||||||
Bayerische Motoren Werke AG | (b) | 21,900 | 1,463,974 | |||||||
Continental AG | (a)(b) | 16,200 | 1,005,995 | |||||||
Daimler AG | (b) | 67,700 | 2,965,837 | |||||||
Deutsche Lufthansa AG | (b) | 40,600 | 482,919 | |||||||
Deutsche Telekom AG | (b) | 61,200 | 702,018 | |||||||
Deutsche Wohnen AG | (b) | 126,250 | 1,676,611 | |||||||
Fresenius SE & Co. KGaA | (b) | 17,200 | 1,590,516 | |||||||
Hannover Rueckversicherung AG | (b) | 27,600 | 1,367,598 | |||||||
Leoni AG | (b) | 35,800 | 1,190,699 | |||||||
MAN SE | (b) | 19,200 | 1,705,422 | |||||||
MTU Aero Engines Holding AG | (b) | 22,500 | 1,436,673 | |||||||
Muenchener Rueckversicherungs AG | (b) | 25,010 | 3,064,793 | |||||||
SAP AG | (b) | 10,300 | 544,784 | |||||||
Siemens AG | (b) | 55,734 | 5,332,396 | |||||||
Suedzucker AG | (b) | 47,300 | 1,506,776 | |||||||
|
| |||||||||
| 34,325,799 | ||||||||||
|
| |||||||||
South Korea – 13.5% | ||||||||||
CJ CheilJedang Corp. | (a)(b) | 2,800 | 704,188 | |||||||
Daewoo Shipbuilding & Marine Engineering Co. Ltd. | (a)(b) | 41,900 | 885,981 | |||||||
Dongkuk Steel Mill Co. Ltd. | (a)(b) | 24,500 | 436,931 | |||||||
Hanwha Chem Corp. | (a)(b) | 35,500 | 758,781 | |||||||
Hyundai Heavy Industries Co. Ltd. | (a)(b) | 2,880 | 643,938 | |||||||
Hyundai Motor Co. | (a)(b) | 19,200 | 3,556,369 | |||||||
Kia Motors Corp. | (a)(b) | 54,500 | 3,162,511 | |||||||
LG Chem Ltd. | (a)(b) | 3,010 | 830,025 | |||||||
Mando Corp. | (a)(b) | 6,100 | 1,092,839 | |||||||
POSCO – ADR | 8,900 | 730,690 | ||||||||
Samsung Electronics Co. Ltd. | (b) | 6,400 | 5,886,959 | |||||||
Samsung Engineering Co. Ltd. | (b) | 7,000 | 1,225,733 | |||||||
Samsung Heavy Industries Co. Ltd. | (b) | 34,700 | 842,972 | |||||||
Samsung SDI Co. Ltd. | (b) | 9,800 | 1,137,506 | |||||||
SK Innovation Co. Ltd. | (a)(b) | 6,200 | 765,506 | |||||||
Woongjin Coway Co. Ltd. | (a)(b) | 23,173 | 737,906 | |||||||
|
| |||||||||
| 23,398,835 | ||||||||||
|
| |||||||||
Norway – 12.0% | ||||||||||
DNB ASA | (b) | 200,444 | 1,953,681 | |||||||
Fred Olsen Energy ASA | (b) | 74,200 | 2,487,475 | |||||||
Gjensidige Forsikring ASA | (b) | 100,000 | 1,157,497 | |||||||
Statoil ASA | (b) | 225,000 | 5,762,311 | |||||||
Statoil Fuel & Retail ASA | (a)(b) | 141,603 | 1,053,347 | |||||||
Telenor ASA | (b) | 173,700 | 2,842,384 | |||||||
TGS Nopec Geophysical Co. ASA | (b) | 54,900 | 1,212,527 | |||||||
Yara International ASA | (b) | 107,600 | 4,295,354 | |||||||
|
| |||||||||
| 20,764,576 | ||||||||||
|
| |||||||||
Mexico – 11.9% | ||||||||||
Alfa SAB de CV | 172,500 | 1,880,049 | ||||||||
America Movil SAB de CV – ADR | 198,000 | 4,474,800 | ||||||||
Fomento Economico Mexicano SAB de CV – ADR | 42,800 | 2,983,588 | ||||||||
Grupo Aeroportuario del Sureste SAB de CV – ADR | 13,200 | 738,408 | ||||||||
Grupo Financiero Banorte SAB de CV | 597,000 | 1,807,509 | ||||||||
Grupo Mexico SAB de CV | 857,609 | 2,254,844 | ||||||||
Grupo Modelo SAB de CV | 76,883 | 484,833 | ||||||||
Grupo Televisa SAB – ADR | 91,700 | 1,931,202 | ||||||||
Industrias Penoles SAB de CV | 38,400 | 1,692,306 | ||||||||
Mexichem SAB de CV | 128,000 | 400,840 | ||||||||
Wal–Mart de Mexico SAB de CV | 715,400 | 1,963,483 | ||||||||
|
| |||||||||
| 20,611,862 | ||||||||||
|
| |||||||||
| Common Stocks – (Continued) | Shares | Value | ||||||||
United Kingdom – 11.1% | ||||||||||
AstraZeneca PLC – ADR | 44,100 | $ | 2,041,389 | |||||||
BHP Billiton PLC | (b) | 54,000 | 1,578,726 | |||||||
British Sky Broadcasting Group PLC | (b) | 162,840 | 1,852,678 | |||||||
BT Group PLC – ADR | 24,000 | 711,360 | ||||||||
Burberry Group PLC | (b) | 45,000 | 827,442 | |||||||
Diageo PLC – ADR | 11,500 | 1,005,330 | ||||||||
HSBC Holdings PLC | (b) | 387,000 | 2,954,375 | |||||||
Kingfisher PLC | (b) | 358,000 | 1,391,187 | |||||||
Rio Tinto PLC – ADR | 58,600 | 2,866,712 | ||||||||
Royal Dutch Shell PLC – ADR | 37,000 | 2,812,370 | ||||||||
Royal Dutch Shell PLC – ADR | 278 | 20,319 | ||||||||
WM Morrison Supermarkets PLC | (b) | 228,000 | 1,153,221 | |||||||
|
| |||||||||
| 19,215,109 | ||||||||||
|
| |||||||||
Japan – 8.8% | ||||||||||
Asahi Kasei Corp. | (b) | 355,000 | 2,139,408 | |||||||
Astellas Pharma, Inc. | (b) | 13,000 | 527,895 | |||||||
Daiichi Sankyo Co. Ltd. | (b) | 125,600 | 2,487,524 | |||||||
Kaneka Corp. | (b) | 251,000 | 1,331,954 | |||||||
Kao Corp. | (b) | 20,000 | 545,720 | |||||||
Mitsubishi Chemical Holdings Corp. | (b) | 101,500 | 556,264 | |||||||
Mitsubishi Electric Corp. | (b) | 74,000 | 709,204 | |||||||
Mitsui Chemicals, Inc. | (b) | 181,000 | 549,574 | |||||||
Nippon Steel Corp. | (b) | 620,000 | 1,542,299 | |||||||
Sumitomo Electric Industries Ltd. | (b) | 234,000 | 2,533,444 | |||||||
Takeda Pharmaceutical Co. Ltd. | (b) | 17,700 | 777,481 | |||||||
Toshiba Corp. | (b) | 119,451 | 487,484 | |||||||
Ube Industries Ltd. | (b) | 340,000 | 929,321 | |||||||
|
| |||||||||
| 15,117,572 | ||||||||||
|
| |||||||||
Indonesia – 7.9% | ||||||||||
Alam Sutera Realty Tbk PT | (b) | 16,230,000 | 821,737 | |||||||
Astra International Tbk PT | (b) | 340,000 | 2,770,691 | |||||||
Bank Central Asia Tbk PT | (b) | 880,000 | 775,044 | |||||||
Bank Mandiri Tbk PT | (b) | 1,110,000 | 824,941 | |||||||
Bank Negara Indonesia Persero Tbk PT | (b) | 903,500 | 377,928 | |||||||
Bank Rakyat Indonesia Persero Tbk PT | (b) | 2,535,000 | 1,884,323 | |||||||
Charoen Pokphand Indonesia Tbk PT | (b) | 1,800,000 | 425,908 | |||||||
Indofood Sukses Makmur Tbk PT | (b) | 2,270,000 | 1,150,377 | |||||||
International Nickel Indonesia Tbk PT | (b) | 2,320,000 | 817,046 | |||||||
Perusahaan Gas Negara PT | (b) | 1,350,000 | 472,206 | |||||||
Tambang Batubara Bukit Asam Tbk PT | (b) | 350,000 | 668,440 | |||||||
Unilever Indonesia Tbk PT | (b) | 515,000 | 1,066,866 | |||||||
United Tractors Tbk PT | (b) | 532,540 | 1,545,203 | |||||||
|
| |||||||||
| 13,600,710 | ||||||||||
|
| |||||||||
Brazil – 3.2% | ||||||||||
BRF – Brasil Foods SA – ADR | 21,000 | 410,550 | ||||||||
Cia de Bebidas das Americas – ADR | 19,000 | 685,710 | ||||||||
Cia Energetica de Minas Gerais – ADR | 32,000 | 569,280 | ||||||||
Cia Siderurgica Nacional SA – ADR | 45,000 | 368,100 | ||||||||
Embraer SA – ADR | 15,000 | 378,300 | ||||||||
Itau Unibanco Holding SA – ADR | 42,000 | 779,520 | ||||||||
Petroleo Brasileiro SA – ADR | 39,000 | 916,110 | ||||||||
Redecard SA | 30,000 | 469,481 | ||||||||
Vale SA – ADR | 50,000 | 1,030,000 | ||||||||
|
| |||||||||
| 5,607,051 | ||||||||||
|
| |||||||||
Bermuda – 1.4% | ||||||||||
Seadrill Ltd. | (b) | 70,100 | 2,337,768 | |||||||
|
| |||||||||
Luxembourg – 1.2% | ||||||||||
Subsea 7 SA | (a)(b) | 116,630 | 2,153,005 | |||||||
|
| |||||||||
Cyprus – 0.4% | ||||||||||
Songa Offshore SE | (a)(b) | 247,000 | 752,098 | |||||||
|
| |||||||||
Jersey – 0.3% | ||||||||||
Shire PLC | (b) | 15,000 | 521,311 | |||||||
|
| |||||||||
Total Common Stocks (Cost $143,490,456) | $ | 158,405,696 | ||||||||
|
| |||||||||
| 22 | (continued) |
| Ohio National Fund, Inc. | International Portfolio (Continued) |
Schedule of Investments | December 31, 2011 |
| U.S. Treasury Obligations – 0.7% | Face Amount | Value | ||||||||
U.S. Treasury Bill | (c) | $ | 100,000 | $ | 99,996 | |||||
U.S. Treasury Bill | (c) | 900,000 | 899,970 | |||||||
U.S. Treasury Bill | (c) | 150,000 | 149,997 | |||||||
|
| |||||||||
Total U.S. Treasury Obligations (Cost $1,149,963) | $ | 1,149,963 | ||||||||
|
| |||||||||
| Money Market Funds – 1.3% | Shares | Value | ||||||||
State Street Institutional Liquid Reserves Fund Institutional Class 2 | 2,190,621 | $ | 2,190,621 | |||||||
|
| |||||||||
Total Money Market Funds (Cost $2,190,621) | $ | 2,190,621 | ||||||||
|
| |||||||||
Total Investments – 93.6% (Cost $146,831,040) | (d) | $ | 161,746,280 | |||||||
Other Assets in Excess of Liabilities – 6.4% | 11,063,703 | |||||||||
|
| |||||||||
Net Assets – 100.0% | $ | 172,809,983 | ||||||||
|
| |||||||||
Percentages are stated as a percent of net assets.
Abbreviations:
ADR: American Depositary Receipts
Footnotes:
| (a) | Non-Income producing security. |
| (b) | Security traded on a foreign exchange has been valued at an estimate of fair value that is different than the local market close price. These fair value estimates are determined by an independent fair valuation service that has been approved by the Board. These securities represent $121,998,613, or 70.6% of the Portfolio’s net assets. |
Other Portfolio securities are not subjected to fair valuation procedures because they are traded on domestic or foreign exchanges that have close times that are consistent with the U.S. market close, normally 4:00 pm Eastern Time.
| (c) | Security is pledged as collateral for the Portfolio’s futures contracts outstanding at December 31, 2011. See also Note 6 of the Notes to Financial Statements. |
| (d) | Represents cost for financial reporting purposes, which may differ from cost basis for federal income tax purposes. See also Note 7 of the Notes to Financial Statements. |
Sector Classifications: (Percent of net assets)
Materials | 16.9% | |||
Consumer Discretionary | 14.5% | |||
Financials | 13.1% | |||
Industrials | 11.8% | |||
Energy | 11.5% | |||
Consumer Staples | 8.1% | |||
Health Care | 5.1% | |||
Telecommunication Services | 5.1% | |||
Information Technology | 4.9% | |||
Utilities | 0.6% | |||
|
| |||
| 91.6% | ||||
|
|
The accompanying notes are an integral part of these financial statements.
| 23 |
| Ohio National Fund, Inc. | Capital Appreciation Portfolio |
Objective/Strategy
The Capital Appreciation Portfolio seeks long-term capital growth by investing primarily in common stocks of established companies with either current or emerging earnings growth not fully appreciated or recognized by the market.
Performance as of December 31, 2011
Average Annual Total Returns: | ||||
One year | -1.65% | |||
Five years | 0.80% | |||
Ten years | 4.18% |
Past performance does not guarantee future results. The performance data quoted represents past performance and current returns may be lower or higher. Total return figures include change in share price and reinvestment of dividends and capital gains. The investment return and principal value will fluctuate so that an investor’s shares, when redeemed, may be worth more or less than the original cost. To obtain performance information up to the most recent month end, call toll-free 1-877-781-6392.
The Portfolio is not open to direct retail investment. Beneficial interest in shares is obtained solely by purchase of variable life insurance policies and variable annuity contracts. Actual performance results for variable annuity and variable universal life contracts will be lower due to contract charges. Consult your contract for applicable charges.
Comments
For the year ended December 31, 2011, the Capital Appreciation Portfolio returned -1.65% versus 2.11% for the current benchmark, the S&P 500 Index.
The portfolio management team believes its proprietary, fundamental research is critical to successful stock selection. It utilizes an intensive “value with a catalyst” bottom-up approach to research and an opportunistic approach to security selection based on valuations and earnings prospects. The strategy is unconstrained relative to market capitalization and style. While the strategy is not managed to a particular benchmark, the investment team seeks to outperform the S&P 500 Index over the long term with market-like risk. Rigorous risk-reward analysis drives the buy-sell decisions. The team remained true to its philosophy during the year.
2011 ended on an up note and pushed most market indices into positive territory. The Russell 3000 Index posted a 1.0% gain, trailing the S&P 500 Index which returned 2.1%. During the year, larger cap growth companies did the best, with the Russell Top 200 gaining 4.6%, while smaller cap and value names lagged. Within the broader market, sector disparity was wide, with the defensive Utilities, Consumer Staples, and Health Care sectors doing the best, and Financials and Materials faring the worst. The Portfolio trailed the broader market for the full year, as perceived safety in the form of defensive, mega cap stocks were rewarded by investors rather than the company fundamentals that meet our investment criteria.(1)
The Portfolio’s Energy and Health Care names had the largest negative impact on relative performance, though some Financials names were among the largest detractors. Included in the Financials detractors were capital market companies The Goldman Sachs Group, Inc. and The Charles Schwab Corp. The Goldman Sachs Group, Inc.’s share price has been under pressure due to the uncertainty relating to the interpretation of the Volker Rule and its impact on The Goldman Sachs Group, Inc. and all capital markets players’ revenues. The issue boils down to what constitutes proprietary trading. Stand alone proprietary trading has been shut down, but how the regulators interpret the rules as to determine what is
facilitating customer trades and what is considered proprietary trading (even if it touches a customer) is the devil in the details. We continue to view The Goldman Sachs Group, Inc. as best in class and believe its strong capital base and leading global positions in investment banking, capital markets, trading, private equity, and asset management provide attractive exposure to long-term global economic expansion. The Goldman Sachs Group, Inc. trades at less than 80% of tangible book value and under nine times low expectation earnings, which we think offers a compelling risk/reward amid a lackluster financial market landscape.(1)
Shares of The Charles Schwab Corp., along with its industry competitors, fell on weak DART (daily average revenue trade) transaction metrics and detracted from the Portfolio’s performance. The market is focused on the drop in retail trading volumes; that, however, is more perception than reality since less than 20% of the company’s revenue comes from trading. On the positive side, The Charles Schwab Corp. posted net new assets of $9.4 billion in May, at a 6.9% month-over-month annualized rate and has captured over $500 billion in net new assets over the last 6 years, more than most competitors combined. While the current low interest rate environment remains challenging (as low interest rates reduce yields on margin loans and cash balances), we think current valuations are assigning almost no value to the option of an eventual rate increase, which would result in higher net interest revenues and asset management fees that would drive future earnings.(1)
Metlife, Inc. also suffered outsized losses. The insurer declined as the falling equity market weighed on insurance companies that have equity-based guarantees. Additionally, the prospect that long-term interest rates will remain low hurt insurers since it could make it difficult for them to pay the higher rates they sometimes guarantee in contracts. We continue to like its attractive valuation as well as its fundamental strengths, such as its growing international presence and capital redeployment goals.(1)
Casino operator Pinnacle Entertainment, Inc. detracted from Portfolio performance this year after being a large contributor in 2010. Shares declined with the entire gaming sector on fears of slowing consumer spending. We believe the sell off was overdone as regional gaming data continues to support rising revenues. On top of that, we believe that margins will continue to improve given a higher mix of top tiered customers and management focus on driving spending efficiency. Additionally, Pinnacle Entertainment, Inc.’s Baton Rouge facility is on track to open next year despite some weather related delays, and progress is being made on adding video lottery terminals to River Downs Racetrack in Cincinnati, Ohio. In our estimation, the stock is trading at less than half of its intrinsic value and at a free cash flow yield of close to 20% before growth capital expenditures. As such, we continue to see substantial value in the equity over the coming two to three years.(1)
We initiated a new position in Arch Coal, Inc. toward the end of the year, which slightly lagged the other Energy company returns, but in our view offers a tremendous risk/reward opportunity in the coal sector with a reserve life of over 30 years. Our outlook for the global demand for coal remains bullish, while supply, which is above normal levels, is trending downward, creating a favorable pricing environment. Unfortunately, in the near term, the increased production from the non-conventional shale plays in the U.S. caused a near term supply overhang of natural gas which has displaced coal in electricity generation. This overhang should self-correct as the flush production from these new gas wells declines and tails off to a much lower, but steady, rate. Also within the Energy sector, not owning Exxon Mobil weighed on relative results as its large weighting in
| 24 | (continued) |
| Ohio National Fund, Inc. | Capital Appreciation Portfolio (Continued) |
the S&P 500 Index coupled with strong gains during the year gave a boost to index performance. The Portfolio’s Information Technology, Industrials, and Materials holdings contributed to absolute and relative gains.(1)
RSC Holdings, Inc. led Portfolio results as shares climbed steadily during the quarter and received a tremendous bump in December when the company agreed to be bought out by United Rentals at a premium of more than 60%, supporting our thesis that RSC Holdings, Inc. was an undervalued, strategically positioned player within the equipment rental industry.(1)
Cabot Oil & Gas Corp. had a large positive impact on performance, as shares have climbed more than 100% in 2011. Cabot Oil & Gas Corp. is a North American exploration and production company whose reserves are focused in both conventional and unconventional resource plays. The spotlight is on its two unconventional shale plays with large land positions and upside to current solid reserves in prolific basins. Natural gas production in the Marcellus Shale of Pennsylvania, where the company has a 160,000 acre land position and owns its own gathering system, is the first. The second is the oil play in the Eagle Ford Shale of West Texas, where the company has a 60,000 acre net leasehold with potential reserves of 150-300 million barrels of oil equivalent. The company announced continued drilling success in the Marcellus, Marmaton, and Eagle Ford Shale plays, new takeaway capacity expansion in Marcellus, and the Rocky Mountain sale closed in early October as anticipated. We like Cabot Oil & Gas Corp.’s production growth profile and low unit costs but, given the incredible appreciation in the stock, the risk/reward ratio has narrowed and we have taken profits in the name.(1)
MasterCard, Inc., the No. 2 payment system in the U.S., after Visa, has enjoyed stronger-than-anticipated volume and transaction growth. We expect continued growth in its gross dollar volume (the total value of its cardholders’ transactions) as consumers continue their ongoing shift from paper money to electronic credit/debit transactions. New international markets also offer significant growth potential, in our view.(1)
Shares of Pfizer, Inc. rose toward the end of the year despite the launching of an authorized generic version of the cholesterol drug Lipitor by Watson Pharmaceuticals. Pfizer, Inc. has undertaken a motivated plan to hold onto at least 40% of prescriptions by bargaining with pharmacy benefits managers and insurers to continue dispensing Lipitor. The possible restructuring potential breakup of the company into “innovative core” and non-pharmaceutical divisions, along with nearer-term pipeline opportunities make Pfizer, Inc. an attractive investment, in our opinion.(1)
Moody’s Corp. has enjoyed stronger-than-expected revenues associated with robust bond market issuance, which benefited Moody’s Investors Service, and accelerated completion of software projects for customers of Moody’s Analytics. Also for 2011, Moody Corp.’s increased standard pricing on transactions by 7.5%. The company increased its quarterly dividend by 22% in April as well. At the current valuation, we think Moody’s Corp. remains inexpensive. We think corporate debt issuance should continue to benefit from favorable yields, a still-significant refinancing wall, and potential increase in debt-financed corporate marketing, advertising, and capital expenditures. Moreover, securitization volumes remain substantially below peak levels, and regulatory risks have receded. As the risk/reward narrowed during the second quarter, we trimmed the position in Moody’s Corp. by approximately 50%.(1)
Despite slower economic growth, corporate profits overall remain strong and should support equity market advances. Our company contacts are seeing some slowing of gross margins, especially in European-exposed parts of their businesses, but overall balance sheets and inventories remain in good shape and stock valuations are attractive. Signs of slowing in U.S. consumer electronics end markets are also emerging; however, sentiment is improving. With several key variants of the global economy in flux, we believe bottom-up stock selection based on rigorous fundamental research will be the key to outperforming market indexes. We are confident that the value in the Portfolio will be realized as the market spends less time worrying about European risks and more time focusing on the underlying positive fundamentals present in the companies we own. We continue to look for new ideas that have compelling risk/rewards with catalysts that should effectively realize our stocks’ full market value over the next 12-24 months.
| (1) | The Portfolio’s composition is subject to change. Holdings and weightings are as of December 31, 2011. |
Change in Value of $10,000 Investment
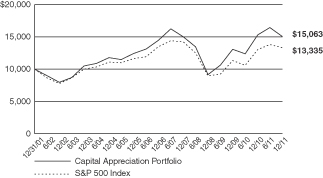
Hypothetical illustration based on past performance. Future performance will vary. The Portfolio’s returns reflect reinvested dividends. The Portfolio’s holdings may differ significantly from the securities in the index. The index is unmanaged and therefore does not reflect the cost of portfolio management and accounting.
The S&P 500 Index is a capitalization-weighted index designed to measure performance of the broad domestic economy through changes in the aggregate market value of 500 stocks representing all major industries. The index presented herein includes the effects of reinvested dividends.
| 25 | (continued) |
| Ohio National Fund, Inc. | Capital Appreciation Portfolio (Continued) |
Portfolio Composition as of December 31, 2011 (1)
| % of Net Assets | ||||
Common Stocks (3) | 97.5 | |||
Money Market Funds | 2.5 | |||
|
| |||
| 100.0 | ||||
|
|
Top 10 Portfolio Holdings as of December 31, 2011 (1) (2)
| % of Net Assets | ||||
1. Comcast Corp. Class A | 2.7 | |||
2. News Corp. Class A | 2.2 | |||
3. Schlumberger Ltd. | 2.1 | |||
4. International Game Technology | 2.0 | |||
5. Pfizer, Inc. | 2.0 | |||
6. Kraft Foods, Inc. Class A | 2.0 | |||
7. Xilinx, Inc. | 1.9 | |||
8. Google, Inc. Class A | 1.9 | |||
9. Cameron International Corp. | 1.9 | |||
10. Monsanto Co. | 1.8 | |||
| (1) | Composition of Portfolio subject to change. |
| (2) | Short-term investments have been excluded from the list of Top 10 Portfolio Holdings. |
| (3) | Sectors: |
| % of Net Assets | ||||
Consumer Discretionary | 21.2 | |||
Financials | 14.5 | |||
Information Technology | 14.1 | |||
Energy | 12.0 | |||
Health Care | 10.4 | |||
Industrials | 9.0 | |||
Consumer Staples | 8.1 | |||
Materials | 3.8 | |||
Utilities | 3.1 | |||
Telecommunication Services | 1.3 | |||
|
| |||
| 97.5 | ||||
|
|
| 26 |
| Ohio National Fund, Inc. | Capital Appreciation Portfolio |
Schedule of Investments | December 31, 2011 |
| Common Stocks – 97.5% | Shares | Value | ||||||||
CONSUMER DISCRETIONARY - 21.2% | ||||||||||
Lear Corp. (Auto Components) | 43,889 | $ | 1,746,782 | |||||||
Toyota Motor Corp. – ADR (Automobiles) | 20,953 | 1,385,622 | ||||||||
Accor SA (Hotels, Restaurants & Leisure) | (b) | 42,968 | 1,082,855 | |||||||
International Game Technology (Hotels, Restaurants & Leisure) | 134,382 | 2,311,370 | ||||||||
Pinnacle Entertainment, Inc. (Hotels, Restaurants & Leisure) | (a) | 201,763 | 2,049,912 | |||||||
Wendy’s Co. / The (Hotels, Restaurants & Leisure) | 226,541 | 1,214,260 | ||||||||
Ryland Group, Inc. / The (Household Durables) | 94,864 | 1,495,057 | ||||||||
Expedia, Inc. (Internet & Catalog Retail) | 24,975 | 724,760 | ||||||||
TripAdvisor, Inc. (Internet & Catalog Retail) | (a) | 24,975 | 629,607 | |||||||
Comcast Corp. Class A (Media) | 129,076 | 3,041,031 | ||||||||
Liberty Global, Inc. (Media) | (a) | 29,959 | 1,183,980 | |||||||
News Corp. Class A (Media) | 141,127 | 2,517,706 | ||||||||
Thomson Reuters Corp. (Media) | 42,984 | 1,146,383 | ||||||||
Viacom, Inc. Class B (Media) | 36,349 | 1,650,608 | ||||||||
GameStop Corp. Class A (Specialty Retail) | (a) | 85,709 | 2,068,158 | |||||||
|
| |||||||||
| 24,248,091 | ||||||||||
|
| |||||||||
CONSUMER STAPLES – 8.1% | ||||||||||
CVS Caremark Corp. (Food & Staples Retailing) | 48,293 | 1,969,389 | ||||||||
Wal-Mart Stores, Inc. (Food & Staples Retailing) | 33,709 | 2,014,450 | ||||||||
Bunge Ltd. (Food Products) | 27,168 | 1,554,010 | ||||||||
Kraft Foods, Inc. Class A (Food Products) | 60,852 | 2,273,431 | ||||||||
Tyson Foods, Inc. Class A (Food Products) | 70,868 | 1,462,716 | ||||||||
|
| |||||||||
| 9,273,996 | ||||||||||
|
| |||||||||
ENERGY – 12.0% | ||||||||||
Cameron International Corp. (Energy Equip. & Svs.) | (a) | 43,367 | 2,133,223 | |||||||
National Oilwell Varco, Inc. (Energy Equip. & Svs.) | 24,289 | 1,651,409 | ||||||||
Schlumberger Ltd. (Energy Equip. & Svs.) | 35,205 | 2,404,854 | ||||||||
Arch Coal, Inc. (Oil, Gas & Consumable Fuels) | 61,012 | 885,284 | ||||||||
Cobalt International Energy, Inc. (Oil, Gas & Consumable Fuels) | (a) | 64,356 | 998,805 | |||||||
Consol Energy, Inc. (Oil, Gas & Consumable Fuels) | 49,242 | 1,807,181 | ||||||||
Kosmos Energy Ltd. (Oil, Gas & Consumable Fuels) | (a) | 39,267 | 481,413 | |||||||
Occidental Petroleum Corp. (Oil, Gas & Consumable Fuels) | 12,599 | 1,180,526 | ||||||||
Southwestern Energy Co. (Oil, Gas & Consumable Fuels) | (a) | 31,417 | 1,003,459 | |||||||
Suncor Energy, Inc. (Oil, Gas & Consumable Fuels) | 41,569 | 1,198,434 | ||||||||
|
| |||||||||
| 13,744,588 | ||||||||||
|
| |||||||||
FINANCIALS – 14.5% | ||||||||||
Charles Schwab Corp. / The (Capital Markets) | 127,757 | 1,438,544 | ||||||||
Evercore Partners, Inc. Class A (Capital Markets) | 46,084 | 1,226,756 | ||||||||
Goldman Sachs Group, Inc. / The (Capital Markets) | 16,479 | 1,490,196 | ||||||||
Lazard Ltd. Class A (Capital Markets) | 37,707 | 984,530 | ||||||||
Morgan Stanley (Capital Markets) | 83,334 | 1,260,843 | ||||||||
Wells Fargo & Co. (Commercial Banks) | 56,046 | 1,544,628 | ||||||||
Citigroup, Inc. (Diversified Financial Svs.) | 41,125 | 1,081,999 | ||||||||
JPMorgan Chase & Co. (Diversified Financial Svs.) | 44,658 | 1,484,878 | ||||||||
Moody’s Corp. (Diversified Financial Svs.) | 37,174 | 1,252,020 | ||||||||
Axis Capital Holdings Ltd. (Insurance) | 41,105 | 1,313,716 | ||||||||
MetLife, Inc. (Insurance) | 52,124 | 1,625,226 | ||||||||
Symetra Financial Corp. (Insurance) | 109,596 | 994,036 | ||||||||
Travelers Cos., Inc. / The (Insurance) | 16,280 | 963,288 | ||||||||
|
| |||||||||
| 16,660,660 | ||||||||||
|
| |||||||||
HEALTH CARE – 10.4% | ||||||||||
Amarin Corp PLC – ADR (Biotechnology) | (a) | 93,421 | 699,723 | |||||||
Celgene Corp. (Biotechnology) | (a) | 30,223 | 2,043,075 | |||||||
Vertex Pharmaceuticals, Inc. (Biotechnology) | (a) | 35,446 | 1,177,162 | |||||||
Hologic, Inc. (Health Care Equip. & Supplies) | (a) | 108,166 | 1,893,987 | |||||||
Quest Diagnostics, Inc. (Health Care Providers & Svs.) | 26,033 | 1,511,476 | ||||||||
| Common Stocks (Continued) | Shares | Value | ||||||
HEALTH CARE (continued) | ||||||||
Thermo Fisher Scientific, Inc. (Life Sciences Tools & Svs.) | (a) | 24,546 | $ 1,103,834 | |||||
Impax Laboratories, Inc. (Pharmaceuticals) | (a) | 60,099 | 1,212,197 | |||||
Pfizer, Inc. (Pharmaceuticals) | 105,074 | 2,273,801 | ||||||
| ||||||||
| 11,915,255 | ||||||||
| ||||||||
INDUSTRIALS – 9.0% | ||||||||
Boeing Co. / The (Aerospace & Defense) | 28,568 | 2,095,463 | ||||||
Exelis, Inc. (Aerospace & Defense) | 114,850 | 1,039,392 | ||||||
Teledyne Technologies, Inc. (Aerospace & Defense) | (a) | 16,428 | 901,076 | |||||
Delta Air Lines, Inc. (Airlines) | (a) | 127,687 | 1,032,988 | |||||
Dover Corp. (Machinery) | 21,719 | 1,260,788 | ||||||
Xylem, Inc. (Machinery) | 54,086 | 1,389,469 | ||||||
Manpower, Inc. (Professional Svs.) | 34,402 | 1,229,871 | ||||||
CSX Corp. (Road & Rail) | 65,561 | 1,380,715 | ||||||
| ||||||||
| 10,329,762 | ||||||||
| ||||||||
INFORMATION TECHNOLOGY – 14.1% | ||||||||
Juniper Networks, Inc. (Communications Equip.) | (a) | 57,113 | 1,165,676 | |||||
Dell, Inc. (Computers & Peripherals) | (a) | 75,616 | 1,106,262 | |||||
EMC Corp. (Computers & Peripherals) | (a) | 48,837 | 1,051,949 | |||||
Flextronics International Ltd. (Electronic Equip., Instr. & Comp.) | (a) | 115,603 | 654,313 | |||||
Google, Inc. Class A (Internet Software & Svs.) | (a) | 3,377 | 2,181,204 | |||||
Mastercard, Inc. Class A (IT Svs.) | 4,432 | 1,652,338 | ||||||
Xilinx, Inc. (Semiconductors & Equip.) | 68,666 | 2,201,432 | ||||||
Activision Blizzard, Inc. (Software) | 133,285 | 1,642,071 | ||||||
Microsoft Corp. (Software) | 71,954 | 1,867,926 | ||||||
Oracle Corp. (Software) | 48,914 | 1,254,644 | ||||||
Symantec Corp. (Software) | (a) | 87,150 | 1,363,897 | |||||
| ||||||||
| 16,141,712 | ||||||||
| ||||||||
MATERIALS – 3.8% | ||||||||
Monsanto Co. (Chemicals) | 30,006 | 2,102,520 | ||||||
PPG Industries, Inc. (Chemicals) | 14,069 | 1,174,621 | ||||||
Goldcorp, Inc. (Metals & Mining) | 24,020 | 1,062,885 | ||||||
| ||||||||
| 4,340,026 | ||||||||
| ||||||||
TELECOMMUNICATION SERVICES – 1.3% | ||||||||
Vivendi SA (Diversified Telecom. Svs.) | (b) | 70,092 | 1,530,072 | |||||
| ||||||||
UTILITIES – 3.1% | ||||||||
Exelon Corp. (Electric Utilities) | 41,228 | 1,788,058 | ||||||
Calpine Corp. (Ind. Power Prod. & Energy Traders) | (a) | 111,054 | 1,813,512 | |||||
| ||||||||
| 3,601,570 | ||||||||
| ||||||||
Total Common Stocks (Cost $109,635,502) | $111,785,732 | |||||||
| ||||||||
| Money Market Funds – 2.5% | Shares | Value | ||||||
Fidelity Institutional Money Market Funds | 2,920,000 | $ 2,920,000 | ||||||
| ||||||||
Total Money Market Funds (Cost $2,920,000) | $ 2,920,000 | |||||||
| ||||||||
Total Investments – 100.0% (Cost $112,555,502) | (c) | $114,705,732 | ||||||
Liabilities in Excess of Other Assets – (0.0)% | (35,254) | |||||||
| ||||||||
Net Assets – 100.0% | $114,670,478 | |||||||
| ||||||||
| 27 | (continued) |
| Ohio National Fund, Inc. | Capital Appreciation Portfolio (Continued) |
Schedule of Investments | December 31, 2011 |
Percentages are stated as a percent of net assets.
Abbreviations:
ADR: American Depositary Receipts
Footnotes:
| (a) | Non-income producing security. |
| (b) | Security traded on a foreign exchange has been valued at an estimate of fair value that is different than the local market close price. These fair value estimates are determined by an independent fair valuation service that has been approved by the Board. These securities represent $2,612,927, or 2.3% of the Portfolio’s net assets. Other Portfolio securities are not subjected to fair valuation procedures because they are traded on domestic or foreign exchanges that have close times that are consistent with the U.S. market close, normally 4:00 pm Eastern Time. |
| (c) | Represents cost for financial reporting purposes, which may differ from cost basis for federal income tax purposes. See also Note 7 of the Notes to Financial Statements. |
The accompanying notes are an integral part of these financial statements.
| 28 |
| Ohio National Fund, Inc. | Millennium Portfolio |
Objective/Strategy
The Millennium Portfolio seeks capital growth by investing primarily in common stocks of small sized companies.
Performance as of December 31, 2011
Average Annual Total Returns: | ||||
One year | -0.88% | |||
Five years | 1.52% | |||
Ten years | 1.75% |
Past performance does not guarantee future results. The performance data quoted represents past performance and current returns may be lower or higher. Total return figures include change in share price and reinvestment of dividends and capital gains. The investment return and principal value will fluctuate so that an investor’s shares, when redeemed, may be worth more or less than the original cost. To obtain performance information up to the most recent month end, call toll-free 1-877-781-6392.
The Portfolio is not open to direct retail investment. Beneficial interest in shares is obtained solely by purchase of variable life insurance policies and variable annuity contracts. Actual performance results for variable annuity and variable universal life contracts will be lower due to contract charges. Consult your contract for applicable charges.
Comments
For the year ended December 31, 2011, the Millennium Portfolio returned -0.88% versus -2.91% for the current benchmark, the Russell 2000 Growth Index.
The fourth quarter brought to close a year in which macro and political headlines overshadowed fundamentals. Characterized by “risk-on/risk-off” volatility and highly correlated market moves that failed to differentiate between companies, 2011, much like 2010, was plagued by Europe’s unresolved debt crisis, political gridlock and acrimony in Washington, and concerns over China’s management of its growth. As a result, caution reigned as investors sought safety and their investable dollars poured into lower risk cash and bond investments.
Despite the broader negative sentiment and legitimate risks to both a domestic and global recovery, there were encouraging signs. While the pace of the U.S. economic recovery remained muted, it continued to march in the right direction. Unemployment and housing remained weak, but also showed small signs of life in the fourth quarter. While the volatility posed certain problems, it also afforded opportunities as valuations for quality small cap stocks moved from fair to attractive during the course of the year. Overall, and relative to other options, the U.S. equity market was attractive with corporate balance sheets continuing to gain strength, strong earnings, lean inventories, low leverage, and margins that, for the most part, held steady. The Federal Reserve maintained the low rate environment and inflation, with the exception of a few shorter-term supply price shocks, remained muted. While the pace of mergers and acquisitions didn’t necessarily match expectations, it was still a positive environment for small and mid-sized companies as large companies, flush with cash and seeking inorganic growth, selectively pursued strategic deals.
Growth stocks outperformed value stocks over the course of the year. Within the small cap growth universe, lower quality, higher beta stocks staged a mini-recovery in the fourth quarter. For the year, however, the more volatile segments, as represented by higher beta, lower market cap and lower stock prices, significantly underperformed, underscoring a reduced investor appetite for risk. This
type of environment, typically conducive to active management and our higher quality style of investing, was the major reason the Portfolio out-performed its benchmark.
As we look back on the year, we find that many of our best performers shared common traits: they tended to be businesses primarily focused on markets outside of Europe, under-leveraged with great cash flow, and well-run with seasoned management. Health Care, Industrials, and Consumer Staples were the leading positive contributors to the Portfolio’s relative performance, while Information Technology was the leading detractor. Stock selection in Health Care, Industrials, Energy, Consumer Staples, and Consumer Discretionary was additive, while selection in Information Technology, Financials, and Materials detracted. Our underweight allocation of Health Care and overweight of Energy stocks proved to be slight detractors from relative performance for the year, while our overweight of Consumer Staples stocks and underweights of Materials and Financials stocks were additive.(1)
Based on our expectations for 2012, we remain overweight in Consumer Discretionary, Energy, and Information Technology and underweight in Health Care and Materials. Our key growth investment themes in the Portfolio are focused on longer-term trends that we believe are relevant regardless of the current economic climate: mobile, cloud & network computing, health care companies that save the system money, high growth retailers, aerospace, health/beauty products and services, and software-as-a-solution products. Our thematic views are based on data that continues to improve broadly, the outlook and levels of optimism expressed by many of the companies we meet with, and the positive growth trends, and catalysts that we have identified across various markets.(1)
There are still many threats to both global and domestic financial stability. 2012 will likely be about business confidence and whether we can move beyond the current fragile state and begin to log meaningful gains in hiring and capital expenditures, which in turn can lend support to the consumer. We believe there is pent-up demand that, in many cases, has been on hold in developed markets since 2008. If the leaders in Washington and overseas, especially Europe, can turn uncertainties into resolutions, then companies may have the confidence to put their cash to work and we can see the potential for momentum in our economy.
As we look forward into 2012, we remain cautiously optimistic and are increasingly more confident in our economy’s continued and measured recovery. We expect modest growth in the U.S. economy to continue, with the risk of recession already priced into the market, and an economic downtown unlikely. We believe that stocks can do well, even if the pace of economic growth remains slow. We are likely to continue to experience volatility, but also opportunities for active managers, in particular, those focused on higher quality companies with innovative, new product cycles, exceptional top-line growth, attractive valuations, and the management teams, operating models, and balance sheet strength needed to continue to succeed in a competitive global economy. Quality has historically shined when investors have been discriminating and mindful of risk. Given the current challenges and sentiment in the market, we remain confident that now is the time to embrace higher quality.
| (1) | The Portfolio’s composition is subject to change. Holdings and weightings are as of December 31, 2011. |
| 29 | (continued) |
| Ohio National Fund, Inc. | Millennium Portfolio (Continued) |
Change in Value of $10,000 Investment
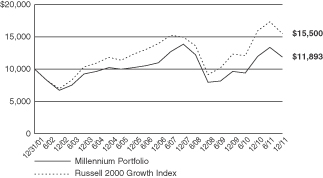
Hypothetical illustration based on past performance. Future performance will vary. The Portfolio’s returns reflect reinvested dividends. The Portfolio’s holdings may differ significantly from the securities in the index. The index is unmanaged and therefore does not reflect the cost of portfolio management and accounting.
The Russell 2000 Growth Index is a market-weighted total return index that measures the performance of companies within the Russell 2000 Index having higher price to book ratios and higher forecasted growth values. The Russell 2000 Index includes the 2000 firms from the Russell 3000 Index with the smallest market capitalizations. The Russell 3000 Index represents 98% of the investable U.S. equity markets. The index presented herein includes the effects of reinvested dividends.
Portfolio Composition as of December 31, 2011 (1)
| % of Net Assets | ||||
Common Stocks (3) | 99.1 | |||
Other Net Assets | 0.9 | |||
|
| |||
| 100.0 | ||||
|
|
Top 10 Portfolio Holdings as of December 31, 2011 (1) (2)
| % of Net Assets | ||||
1. Ultimate Software Group, Inc. | 2.6 | |||
2. HEICO Corp. | 2.5 | |||
3. Zoll Medical Corp. | 2.3 | |||
4. Taleo Corp. Class A | 1.9 | |||
5. Actuant Corp. Class A | 1.9 | |||
6. Cubist Pharmaceuticals, Inc. | 1.9 | |||
7. Air Methods Corp. | 1.9 | |||
8. Pricesmart, Inc. | 1.8 | |||
9. Triumph Group, Inc. | 1.8 | |||
10. Old Dominion Freight Line, Inc. | 1.6 |
| (1) | Composition of Portfolio subject to change. |
| (2) | Short-term investments have been excluded from the list of Top 10 Portfolio Holdings. |
| (3) | Sectors: |
| % of Net Assets | ||||
Information Technology | 23.3 | |||
Health Care | 17.8 | |||
Industrials | 16.9 | |||
Consumer Discretionary | 15.8 | |||
Energy | 9.9 | |||
Financials | 7.0 | |||
Consumer Staples | 4.4 | |||
Materials | 4.0 | |||
|
| |||
| 99.1 | ||||
|
|
| 30 |
| Ohio National Fund, Inc. | Millennium Portfolio |
Schedule of Investments | December 31, 2011 |
| Common Stocks – 99.1% | Shares | Value | ||||||||
CONSUMER DISCRETIONARY – 15.8% | ||||||||||
Steiner Leisure Ltd. (Diversified Consumer Svs.) | (a) | 10,400 | $ | 472,056 | ||||||
Bally Technologies, Inc. (Hotels, Restaurants & Leisure) | (a) | 12,000 | 474,720 | |||||||
Buffalo Wild Wings, Inc. (Hotels, Restaurants & Leisure) | (a) | 6,200 | 418,562 | |||||||
Marriott Vacations Worldwide Corp. (Hotels, Restaurants & Leisure) | (a) | 22,200 | 380,952 | |||||||
Orient-Express Hotels Ltd. Class A (Hotels, Restaurants & Leisure) | (a) | 54,300 | 405,621 | |||||||
Peet’s Coffee & Tea, Inc. (Hotels, Restaurants & Leisure) | (a) | 6,800 | 426,224 | |||||||
DSW, Inc. Class A (Specialty Retail) | 5,800 | 256,418 | ||||||||
Genesco, Inc. (Specialty Retail) | (a) | 6,100 | 376,614 | |||||||
Hibbett Sports, Inc. (Specialty Retail) | (a) | 11,900 | 537,642 | |||||||
Sally Beauty Holdings, Inc. (Specialty Retail) | (a) | 17,600 | 371,888 | |||||||
Tractor Supply Co. (Specialty Retail) | 7,100 | 498,065 | ||||||||
Ulta Salon Cosmetics & Fragrance, Inc. (Specialty Retail) | (a) | 9,100 | 590,772 | |||||||
Vitamin Shoppe, Inc. (Specialty Retail) | (a) | 13,700 | 546,356 | |||||||
|
| |||||||||
| 5,755,890 | ||||||||||
|
| |||||||||
CONSUMER STAPLES – 4.4% | ||||||||||
Pricesmart, Inc. (Food & Staples Retailing) | 9,300 | 647,187 | ||||||||
Elizabeth Arden, Inc. (Personal Products) | (a) | 15,300 | 566,712 | |||||||
Nu Skin Enterprises, Inc. (Personal Products) | 8,200 | 398,274 | ||||||||
|
| |||||||||
| 1,612,173 | ||||||||||
|
| |||||||||
ENERGY – 9.9% | ||||||||||
Dril-Quip, Inc. (Energy Equip. & Svs.) | (a) | 5,900 | 388,338 | |||||||
Hornbeck Offshore Services, Inc. (Energy Equip. & Svs.) | (a) | 11,100 | 344,322 | |||||||
Lufkin Industries, Inc. (Energy Equip. & Svs.) | 4,600 | 309,626 | ||||||||
Carrizo Oil & Gas, Inc. (Oil, Gas & Consumable Fuels) | (a) | 19,300 | 508,555 | |||||||
Northern Oil and Gas, Inc. (Oil, Gas & Consumable Fuels) | (a) | 17,900 | 429,242 | |||||||
Oasis Petroleum, Inc. (Oil, Gas & Consumable Fuels) | (a) | 18,800 | 546,892 | |||||||
Rex Energy Corp. (Oil, Gas & Consumable Fuels) | (a) | 22,300 | 329,148 | |||||||
Rosetta Resources, Inc. (Oil, Gas & Consumable Fuels) | (a) | 8,800 | 382,800 | |||||||
World Fuel Services Corp. (Oil, Gas & Consumable Fuels) | 9,100 | 382,018 | ||||||||
|
| |||||||||
| 3,620,941 | ||||||||||
|
| |||||||||
FINANCIALS – 7.0% | ||||||||||
Lazard Ltd. Class A (Capital Markets) | 19,700 | 514,367 | ||||||||
Stifel Financial Corp. (Capital Markets) | (a) | 11,100 | 355,755 | |||||||
Texas Capital Bancshares, Inc. (Commercial Banks) | (a) | 16,300 | 498,943 | |||||||
Umpqua Holdings Corp. (Commercial Banks) | 28,600 | 354,354 | ||||||||
First Cash Financial Services, Inc. (Consumer Finance) | (a) | 12,100 | 424,589 | |||||||
Jones Lang LaSalle, Inc. (Real Estate Mgmt. & Development) | 6,300 | 385,938 | ||||||||
|
| |||||||||
| 2,533,946 | ||||||||||
|
| |||||||||
HEALTH CARE – 17.8% | ||||||||||
Cubist Pharmaceuticals, Inc. (Biotechnology) | (a) | 17,200 | 681,464 | |||||||
Onyx Pharmaceuticals, Inc. (Biotechnology) | (a) | 8,200 | 360,390 | |||||||
Align Technology, Inc. (Health Care Equip. & Supplies) | (a) | 13,400 | 317,915 | |||||||
Zoll Medical Corp. (Health Care Equip. & Supplies) | (a) | 13,100 | 827,658 | |||||||
Air Methods Corp. (Health Care Providers & Svs.) | (a) | 8,000 | 675,600 | |||||||
Centene Corp. (Health Care Providers & Svs.) | (a) | 12,700 | 502,793 | |||||||
HMS Holdings Corp. (Health Care Providers & Svs.) | (a) | 16,100 | 514,878 | |||||||
| Common Stocks (Continued) | Shares | Value | ||||||||
HEALTH CARE (continued) | ||||||||||
U.S. Physical Therapy, Inc. (Health Care Providers & Svs.) | 22,400 | $ | 440,832 | |||||||
WellCare Health Plans, Inc. (Health Care Providers & Svs.) | (a) | 7,200 | 378,000 | |||||||
SXC Health Solutions Corp. (Health Care Technology) | (a) | 10,500 | 593,040 | |||||||
Akorn, Inc. (Pharmaceuticals) | (a) | 42,100 | 468,152 | |||||||
Questcor Pharmaceuticals, Inc. (Pharmaceuticals) | (a) | 7,900 | 328,482 | |||||||
Salix Pharmaceuticals Ltd. (Pharmaceuticals) | (a) | 8,700 | 416,295 | |||||||
|
| |||||||||
| 6,505,499 | ||||||||||
|
| |||||||||
INDUSTRIALS – 16.9% | ||||||||||
HEICO Corp. (Aerospace & Defense) | 15,306 | 895,095 | ||||||||
Triumph Group, Inc. (Aerospace & Defense) | 11,000 | 642,950 | ||||||||
HUB Group, Inc. Class A (Air Freight & Logistics) | (a) | 13,400 | 434,562 | |||||||
Fortune Brands Home & Security, Inc. (Building Products) | (a) | 22,900 | 389,987 | |||||||
Clean Harbors, Inc. (Commercial Svs. & Supplies) | (a) | 7,600 | 484,348 | |||||||
Regal-Beloit Corp. (Electrical Equip.) | 7,000 | 356,790 | ||||||||
Actuant Corp. Class A (Machinery) | 30,400 | 689,776 | ||||||||
CLARCOR, Inc. (Machinery) | 5,500 | 274,945 | ||||||||
CoStar Group, Inc. (Professional Svs.) | (a) | 7,100 | 473,783 | |||||||
Huron Consulting Group, Inc. (Professional Svs.) | (a) | 11,900 | 461,006 | |||||||
Old Dominion Freight Line, Inc. (Road & Rail) | (a) | 14,800 | 599,844 | |||||||
MSC Industrial Direct Co., Inc. Class A (Trading Companies & Distributors) | 6,500 | 465,075 | ||||||||
|
| |||||||||
| 6,168,161 | ||||||||||
|
| |||||||||
INFORMATION TECHNOLOGY – 23.3% | ||||||||||
DealerTrack Holdings, Inc. (Internet Software & Svs.) | (a) | 16,350 | 445,701 | |||||||
Keynote Systems, Inc. (Internet Software & Svs.) | 9,700 | 199,238 | ||||||||
LivePerson, Inc. (Internet Software & Svs.) | (a) | 33,600 | 421,680 | |||||||
Rackspace Hosting, Inc. (Internet Software & Svs.) | (a) | 11,500 | 494,615 | |||||||
Cardtronics, Inc. (IT Svs.) | (a) | 16,200 | 438,372 | |||||||
Echo Global Logistics, Inc. (IT Svs.) | (a) | 27,800 | 448,970 | |||||||
Heartland Payment Systems, Inc. (IT Svs.) | 17,000 | 414,120 | ||||||||
ServiceSource International, Inc. (IT Svs.) | (a) | 23,700 | 371,853 | |||||||
Cavium, Inc. (Semiconductors & Equip.) | (a) | 18,200 | 517,426 | |||||||
Ceva, Inc. (Semiconductors & Equip.) | (a) | 12,000 | 363,120 | |||||||
Mellanox Technologies Ltd. (Semiconductors & Equip.) | (a) | 13,600 | 441,864 | |||||||
Semtech Corp. (Semiconductors & Equip.) | (a) | 14,200 | 352,444 | |||||||
Volterra Semiconductor Corp. (Semiconductors & Equip.) | (a) | 18,400 | 471,224 | |||||||
Ariba, Inc. (Software) | (a) | 8,100 | 227,448 | |||||||
CommVault Systems, Inc. (Software) | (a) | 8,000 | 341,760 | |||||||
Concur Technologies, Inc. (Software) | (a) | 9,900 | 502,821 | |||||||
Imperva, Inc. (Software) | (a) | 10,860 | 378,036 | |||||||
Qlik Technologies, Inc. (Software) | (a) | 1,500 | 36,300 | |||||||
Taleo Corp. Class A (Software) | (a) | 18,300 | 708,027 | |||||||
Ultimate Software Group, Inc. (Software) | (a) | 14,400 | 937,728 | |||||||
|
| |||||||||
| 8,512,747 | ||||||||||
|
| |||||||||
MATERIALS – 4.0% | ||||||||||
Balchem Corp. (Chemicals) | 9,100 | 368,914 | ||||||||
Silgan Holdings, Inc. (Containers & Packaging) | 13,700 | 529,368 | ||||||||
Carpenter Technology Corp. (Metals & Mining) | 10,800 | 555,984 | ||||||||
|
| |||||||||
| 1,454,266 | ||||||||||
|
| |||||||||
Total Common Stocks (Cost $33,568,736) | $ | 36,163,623 | ||||||||
|
| |||||||||
Total Investments – 99.1% (Cost $33,568,736) | (b) | $ | 36,163,623 | |||||||
Other Assets in Excess of Liabilities – 0.9% | 311,605 | |||||||||
|
| |||||||||
Net Assets – 100.0% | $ | 36,475,228 | ||||||||
|
| |||||||||
Percentages are stated as a percent of net assets.
Footnotes:
| (a) | Non-income producing security. |
| (b) | Represents cost for financial reporting purposes, which may differ from cost basis for federal income tax purposes. See also Note 7 of the Notes to Financial Statements. |
The accompanying notes are an integral part of these financial statements.
| 31 |
| Ohio National Fund, Inc. | International Small-Mid Company Portfolio |
Objective/Strategy
The International Small-Mid Company Portfolio seeks long-term growth of capital by investing at least 80% of its assets in equity securities of foreign small and mid-cap companies.
Performance as of December 31, 2011
Average Annual Total Returns: | ||||
One year | -17.51% | |||
Five years | -3.77% | |||
Ten years | 7.84% |
Past performance does not guarantee future results. The performance data quoted represents past performance and current returns may be lower or higher. Total return figures include change in share price and reinvestment of dividends and capital gains. The investment return and principal value will fluctuate so that an investor’s shares, when redeemed, may be worth more or less than the original cost. To obtain performance information up to the most recent month end, call toll-free 1-877-781-6392.
The Portfolio is not open to direct retail investment. Beneficial interest in shares is obtained solely by purchase of variable life insurance policies and variable annuity contracts. Actual performance results for variable annuity and variable universal life contracts will be lower due to contract charges. Consult your contract for applicable charges.
Comments
For the year ended December 31, 2011, the International Small-Mid Company Portfolio returned -17.51% versus -14.18% for the current benchmark, the S&P Developed Small Cap Ex-U.S. Growth Index.
The year was very volatile with several global external shocks affecting market sentiment more than fundamental investing which resulted in many major equity markets posting negative returns. Company earnings results were better than expected over the year. However, investor sentiment rose and fell in response to wide ranging developments from, not only within Europe, but also from unforeseen events in the U.S., Asia, and the Middle East. In Europe, the European Union sovereign debt crisis continued to weigh on equity markets. The contagion spread beyond Greece, Portugal, and Ireland and began to raise solvency concerns in Italy and Spain. As a result, the European Central Bank (ECB) and European finance ministers continued to work on a solution to stem the funding crisis in Europe, but there has yet to be an agreed upon plan, which is sizable, concrete, and adequately funded. Consequently, this continued uncertainty weighed on European equity markets and, to a greater extent, on the European banking sector. The crisis has caused several government leaders to resign their posts, specifically in Italy and Greece. Subsequent Spanish elections also mandated a change in Spain’s future leadership.
In the U.S., despite periodic pockets of economic strength, unemployment remained stubbornly high and rating agencies raised concerns over the level of outstanding U.S. government debt and the inability of the government to show fiscal prudence. As a result, Standard & Poor’s downgraded the U.S. long-term credit rating from AAA to AA+ with a negative outlook. Within Asia, China continued with their bias toward monetary tightening for most of the year and Japan slowly recovered from March’s devastating earthquake, tsunami, and subsequent nuclear crisis. The Middle East gave rise to social unrest leading to additional government upheavals in Egypt, Tunisia, Yemen, and Libya.
Several European summits with no resulting bailout announcements led the markets lower toward the end of the year. The European Central Bank (ECB) lowered rates by 25 basis points (bps), as did the Norwegian (50 bps), Swedish (50 bps), and Australian (25bps) central banks. Japan’s 4th Quarter Tankan survey was broadly negative with the outlook for manufacturing and non-manufacturing sectors slipping as well. The People’s Bank of China cut the reserve-requirement ratio for all banks by 50 basis points. This was the first cut since 2008. Many of the central bank moves were in response to deteriorating economic conditions
stemming from the European crisis. The U.S. dollar was once again bought as the safe haven from the world’s problems. The U.S. 3rd quarter gross domestic product growth was reduced to 2% from 2.5%, reigniting concerns about U.S. growth.
On a regional basis, the S&P Europe Small Cap Growth Index fell 15.6% while the S&P Asia Pacific ex-Japan Small Cap Growth Index lost 16.5%. Japanese small caps had the best relative performance as measured by the S&P Japan Small Cap Growth Index, losing 4.4% during the year, in terms of U.S. dollars.
The Portfolio’s relative underperformance largely stemmed from a number of factors. One of these factors was the Portfolio was under-weighted in Japan, while Japan was the best performing small cap market, as noted earlier. We started increasing our Japan weighting following the earthquake in March. We were hoping to invest in good companies whose stock prices fell with the market, but were poised to recover due to their own strong fundamentals and with no direct exposure to the earthquake or ensuing tsunami. This proved to be the correct course of action until early August. Another reason for the relative under-performance was the Portfolio’s overweighting in Germany which had performed very well until the beginning of August. Germany was the best performing European market through the first-half of the year, but fear of the growing debt crisis soon gave way to investors and speculators selling anything that did well. Clearly, this past year’s performance was a tale of two halves where the first half of the year performed as we expected in a healthy global economic growth with positions in small companies benefiting from the rise in industrial and consumer spending. This positive outlook and trend quickly reversed course.
August 2011 was the beginning of a downward channeling market, led by the S&P downgrade of the United States long-term credit rating to AA+ with a negative outlook. Our exposure to cyclical stocks, including Industrials, the Consumer sectors, and Financials, detracted from the Portfolio’s performance. Being overweight in Consumer Discretionary and Industrials, which were also our two largest sector weightings, weighed very negatively on the Portfolio’s returns. More specifically, retailing and consumer durable stocks on all continents fell sharply for fear that consumers would shut their collective wallets against the uncertain economic back drop. Within Industrials, the largest invested sector for the Portfolio, capital goods investments fell heavily, as concern of a double-dip recession gathered steam. The underlying theme here is that many of the capital good names are investments in industrial countries like Germany and Switzerland.
In terms of currency exposure affecting the Portfolio’s returns in 2011, we had two positions that worked against us. Firstly, we were overweighted in the Euro, which declined 3.2% against the U.S. dollar. Secondly, the Portfolio was underweighted in Japanese Yen, which appreciated 5.2% against the dollar. As a reminder, a strong U.S. dollar works against positive portfolio returns.
The most significant changes to the Portfolio’s holdings over the year were a decrease of investments in Information Technology and Health Care and a slight increase in our exposure to Consumer Discretionary and Materials. These changes were in line with our view of a stronger economy which began to deteriorate towards the end of the year.(1)
Top performing relative markets in the Portfolio included the United Kingdom, Indonesia, and Sweden. Weaker relative contributions were experienced with investments in Germany, Japan, and Switzerland. Key drivers of the Portfolio’s positive performance came from the strong relative investment returns in Information Technology and Materials. Individual stocks that contributed to the Portfolio’s performance (all total returns in U.S. dollars) included: Rightmove PLC, a UK internet real estate listing company gained 60.9% during the reporting period. Rightmove PLC successfully increased the number of real estate listing agents to its website services thereby increasing revenues. Kia Motors Corp., the South Korean automobile manufacturer rose 44.1% on the back of a strong
| 32 | (continued) |
| Ohio National Fund, Inc. | International Small-Mid Company Portfolio (Continued) |
model year, continued strong sales, and an increase in market share. Autonomy, a UK software company gained 72.5% as it was acquired by Hewlett-Packard at a 59% takeover premium to the last traded price.(1)
Weaker relative performance was delivered by investments in Financials, Industrials, and Consumer Discretionary. Individual stocks that held back relative performance included: Commerzbank, a German regional bank offering retail and commercial banking services, which fell 64.3%. The bank was subject to many rumors of an imminent government takeover which never materialized. Clariant, a Swiss specialty chemical company fell 55.2% as the company cited softer sales and reduced sales and profit guidance for the year. Dah Sing Financial Holdings, a Hong Kong bank, was down 58.3% as lending business slowed.(1)
The markets continue to be dominated by fear rather than by fundamentals as investors remain risk aversive. We continue to be positive for the long term. The U.S. dollar strength is of concern. The Euro has weakened and continues to face headwinds stemming from the European debt crisis. We believe that despite the recent underperformance of emerging markets, the future growth opportunities lie in those regions. We have seen China begin to lower banks’ reserve-requirement ratio and Brazil reducing interest rates twice with more cuts planned. After an extended tightening cycle, China heads towards a pro-growth bias. We expect that monetary and fiscal policies will continue to move towards more accommodative stances as inflation remains manageable and consumption needs stimulus. International small-mid cap companies are very attractively priced with good growth prospects.
| (1) | The Portfolio’s composition is subject to change. Holdings and weightings are as of December 31, 2011. |
Top 10 Portfolio Holdings as of December 31, 2011 (1) (2)
| % of Net Assets | ||||
1. Aggreko PLC | 2.2 | |||
2. SNC-Lavalin Group, Inc. | 2.1 | |||
3. AMEC PLC | 2.0 | |||
4. Assa Abloy AB | 1.9 | |||
5. Adidas AG | 1.9 | |||
6. Herbalife Ltd. | 1.9 | |||
7. Signet Jewelers Ltd. | 1.9 | |||
8. Andritz AG | 1.8 | |||
9. Weir Group PLC / The | 1.8 | |||
10. John Wood Group PLC | 1.8 |
Portfolio Composition as of December 31, 2011 (1)
| % of Net Assets | ||||
Common Stocks (3) | 92.2 | |||
Preferred Stocks (3) | 0.9 | |||
Exchange Traded Funds | 2.1 | |||
Money Market Funds and | 4.8 | |||
|
| |||
| 100.0 | ||||
|
|
Change in Value of $10,000 Investment
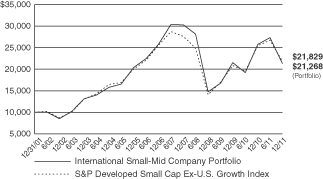
Hypothetical illustration based on past performance. Future performance will vary. The Portfolios returns reflect reinvested dividends. The Portfolios holdings may differ significantly from the securities in the index. The index is unmanaged and therefore does not reflect the cost of portfolio management and accounting.
The S&P Developed Small Cap Ex-U.S. Growth Index is a subset of the S&P Global Broad Market Index (BMI), a broad index including all publicly listed equities with float-adjusted market values of US$ 100 million or more and annual dollar value traded of at least US$ 50 million in all included countries. The Developed Small Cap component of the BMI includes the equities in the bottom 15% of the market capitalization within each “developed” local market. Ex-U.S. denotes the use of all developed markets excluding the United States. The “Growth” subset includes those companies in each local market that exhibit the characteristics of growth. The index presented includes the effects of reinvested dividends.
| (1) | Composition of Portfolio subject to change. |
| (2) | Short-term investments have been excluded from the list of Top 10 Portfolio Holdings. |
| (3) | Top 10 Country Weightings (combined): |
| % of Net Assets | ||||
United Kingdom | 22.0 | |||
Japan | 10.8 | |||
Canada | 8.5 | |||
France | 7.6 | |||
Germany | 6.3 | |||
Singapore | 4.1 | |||
Italy | 4.1 | |||
Netherlands | 3.7 | |||
Bermuda | 3.5 | |||
Sweden | 3.2 |
| 33 |
| Ohio National Fund, Inc. | International Small-Mid Company Portfolio |
Schedule of Investments | December 31, 2011 |
| Common Stocks – 92.2% | Shares | Value | ||||||||
United Kingdom – 22.0% | ||||||||||
Aggreko PLC | (b) | 40,403 | $ | 1,264,245 | ||||||
AMEC PLC | (b) | 83,121 | 1,170,624 | |||||||
ASOS PLC | (a)(b) | 39,761 | 762,957 | |||||||
Britvic PLC | (b) | 196,249 | 979,660 | |||||||
Burberry Group PLC | (b) | 33,714 | 619,920 | |||||||
Croda International PLC | (b) | 27,840 | 779,364 | |||||||
Dialog Semiconductor PLC | (a)(b) | 42,600 | 691,190 | |||||||
Domino’s Pizza UK & IRL PLC | (b) | 87,322 | 545,704 | |||||||
Intercontinental Hotels Group PLC | (b) | 45,708 | 821,823 | |||||||
John Wood Group PLC | (b) | 103,656 | 1,031,039 | |||||||
Johnson Matthey PLC | (b) | 11,783 | 335,722 | |||||||
Kingfisher PLC | (b) | 108,190 | 420,426 | |||||||
Rightmove PLC | (b) | 44,570 | 861,158 | |||||||
Soco International PLC | (a)(b) | 124,873 | 566,811 | |||||||
Telecity Group PLC | (a)(b) | 72,338 | 726,862 | |||||||
Weir Group PLC / The | (b) | 33,242 | 1,049,242 | |||||||
|
| |||||||||
| 12,626,747 | ||||||||||
|
| |||||||||
Japan – 10.8% | ||||||||||
Asics Corp. | (b) | 25,000 | 281,004 | |||||||
Chiyoda Corp. | (b) | 60,000 | 609,173 | |||||||
CyberAgent, Inc. | (b) | 81 | 262,405 | |||||||
Daihatsu Motor Co. Ltd. | (b) | 40,000 | 711,312 | |||||||
Don Quijote Co. Ltd. | (b) | 11,600 | 398,271 | |||||||
Fuji Heavy Industries Ltd. | (b) | 48,000 | 287,895 | |||||||
JGC Corp. | (b) | 25,000 | 600,216 | |||||||
JSR Corp. | (b) | 50,000 | 921,509 | |||||||
Nabtesco Corp. | (b) | 22,000 | 400,188 | |||||||
Teijin Ltd. | (b) | 180,000 | 552,244 | |||||||
THK Co. Ltd. | (b) | 28,700 | 565,325 | |||||||
Ube Industries Ltd. | (b) | 96,000 | 262,396 | |||||||
Yaskawa Electric Corp. | (b) | 46,000 | 389,559 | |||||||
|
| |||||||||
| 6,241,497 | ||||||||||
|
| |||||||||
Canada – 8.5% | ||||||||||
Agrium, Inc. | 10,900 | 731,624 | ||||||||
Ensign Energy Services, Inc. | 38,439 | 613,137 | ||||||||
Finning International, Inc. | 20,000 | 436,024 | ||||||||
National Bank of Canada | 11,000 | 778,935 | ||||||||
Nexen, Inc. | 37,100 | 590,322 | ||||||||
Precision Drilling Corp. | (a) | 55,200 | 566,352 | |||||||
SNC-Lavalin Group, Inc. | 23,718 | 1,189,218 | ||||||||
|
| |||||||||
| 4,905,612 | ||||||||||
|
| |||||||||
France – 7.6% | ||||||||||
Accor SA | (b) | 21,757 | 548,309 | |||||||
Bureau Veritas SA | (b) | 7,152 | 519,488 | |||||||
Edenred | (b) | 14,304 | 350,877 | |||||||
Faurecia | (b) | 18,326 | 345,393 | |||||||
JCDecaux SA | (a)(b) | 12,934 | 296,962 | |||||||
Publicis Groupe SA | (b) | 16,020 | 735,225 | |||||||
Remy Cointreau SA | (b) | 7,867 | 630,939 | |||||||
Technip SA | (b) | 9,870 | 925,312 | |||||||
|
| |||||||||
| 4,352,505 | ||||||||||
|
| |||||||||
Germany – 5.4% | ||||||||||
Adidas AG | (b) | 17,130 | 1,112,988 | |||||||
Commerzbank AG | (a)(b) | 224,794 | 378,350 | |||||||
GEA Group AG | (b) | 24,804 | 700,241 | |||||||
Hochtief AG | (b) | 4,176 | 241,122 | |||||||
Leoni AG | (b) | 10,607 | 352,786 | |||||||
Rheinmetall AG | (b) | 6,925 | 306,675 | |||||||
|
| |||||||||
| 3,092,162 | ||||||||||
|
| |||||||||
Singapore – 4.1% | ||||||||||
City Developments Ltd. | (b) | 68,000 | 466,016 | |||||||
Keppel Corp. Ltd. | (b) | 119,900 | 858,224 | |||||||
Sakari Resources Ltd. | (b) | 171,646 | 243,559 | |||||||
SembCorp Marine Ltd. | (b) | 281,000 | 825,825 | |||||||
|
| |||||||||
| 2,393,624 | ||||||||||
|
| |||||||||
| Common Stocks (Continued) | Shares | Value | ||||||||
Italy – 4.1% | ||||||||||
Davide Campari-Milano SpA | (b) | 48,633 | $ | 323,249 | ||||||
Prada SpA | (a)(b) | 110,740 | 498,398 | |||||||
Salvatore Ferragamo Italia SpA | (a)(b) | 43,000 | 564,529 | |||||||
Yoox SpA | (a)(b) | 88,700 | 953,692 | |||||||
|
| |||||||||
| 2,339,868 | ||||||||||
|
| |||||||||
Netherlands – 3.7% | ||||||||||
Fugro NV | (b) | 10,520 | 608,954 | |||||||
Imtech NV | (b) | 27,127 | 699,613 | |||||||
Koninklijke DSM NV | (b) | 17,761 | 820,939 | |||||||
|
| |||||||||
| 2,129,506 | ||||||||||
|
| |||||||||
Bermuda – 3.5% | ||||||||||
Invesco Ltd. | 47,202 | 948,288 | ||||||||
Signet Jewelers Ltd. | 24,200 | 1,063,832 | ||||||||
|
| |||||||||
| 2,012,120 | ||||||||||
|
| |||||||||
Sweden – 3.2% | ||||||||||
Assa Abloy AB | (b) | 44,600 | 1,115,252 | |||||||
Getinge AB | (b) | 28,757 | 727,169 | |||||||
|
| |||||||||
| 1,842,421 | ||||||||||
|
| |||||||||
Cayman Islands – 2.9% | ||||||||||
Golden Eagle Retail Group Ltd. | (b) | 283,769 | 598,190 | |||||||
Herbalife Ltd. | 20,800 | 1,074,736 | ||||||||
|
| |||||||||
| 1,672,926 | ||||||||||
|
| |||||||||
Norway – 2.7% | ||||||||||
Fred Olsen Energy ASA | (b) | 9,708 | 325,450 | |||||||
Opera Software ASA | (b) | 62,862 | 304,794 | |||||||
Petroleum Geo-Services ASA | (a)(b) | 47,881 | 521,831 | |||||||
Yara International ASA | (b) | 10,353 | 413,288 | |||||||
|
| |||||||||
| 1,565,363 | ||||||||||
|
| |||||||||
Brazil – 1.9% | ||||||||||
Cia Brasileira de Distribuicao Grupo Pao de | 16,388 | 597,015 | ||||||||
PDG Realty SA Empreendimentos e Participacoes | 151,872 | 480,389 | ||||||||
|
| |||||||||
| 1,077,404 | ||||||||||
|
| |||||||||
Austria – 1.8% | ||||||||||
Andritz AG | (b) | 12,842 | 1,062,048 | |||||||
|
| |||||||||
Switzerland – 1.5% | ||||||||||
Adecco SA | (a)(b) | 20,808 | 867,200 | |||||||
|
| |||||||||
Indonesia – 1.3% | ||||||||||
Indocement Tunggal Prakarsa Tbk PT | (b) | 261,500 | 491,009 | |||||||
United Tractors Tbk PT | (b) | 93,787 | 272,130 | |||||||
|
| |||||||||
| 763,139 | ||||||||||
|
| |||||||||
Israel – 1.1% | ||||||||||
NICE Systems Ltd. – ADR | (a) | 17,800 | 613,210 | |||||||
|
| |||||||||
Thailand – 1.0% | ||||||||||
Bangkok Bank PCL | (b) | 57,200 | 277,896 | |||||||
Bank of Ayudhya PCL | (b) | 421,000 | 293,028 | |||||||
|
| |||||||||
| 570,924 | ||||||||||
|
| |||||||||
Ireland – 1.0% | ||||||||||
Ingersoll-Rand PLC | 18,600 | 566,742 | ||||||||
|
| |||||||||
Australia – 0.9% | ||||||||||
Boart Longyear Ltd. | (b) | 185,950 | 528,982 | |||||||
|
| |||||||||
Mexico – 0.9% | ||||||||||
Mexichem SAB de CV | 158,961 | 497,796 | ||||||||
|
| |||||||||
Panama – 0.8% | ||||||||||
Copa Holdings SA | 7,400 | 434,158 | ||||||||
|
| |||||||||
Luxembourg – 0.6% | ||||||||||
SAF-Holland SA | (a)(b) | 74,981 | 344,179 | |||||||
|
| |||||||||
| 34 | (continued) |
| Ohio National Fund, Inc. | International Small-Mid Company Portfolio (Continued) |
Schedule of Investments | December 31, 2011 |
| Common Stocks (Continued) | Shares | Value | ||||||||
Hong Kong – 0.5% | ||||||||||
Emperor Watch & Jewellery Ltd. | (b) | 2,170,000 | $ | 272,023 | ||||||
|
| |||||||||
Spain – 0.4% | ||||||||||
Obrascon Huarte Lain SA | (b) | 10,022 | 249,955 | |||||||
|
| |||||||||
Total Common Stocks (Cost $49,153,092) | $ | 53,022,111 | ||||||||
|
| |||||||||
| Preferred Stocks – 0.9% | Shares | Value | ||||||||
Germany – 0.9% | ||||||||||
Hugo Boss AG | (b) | 6,882 | $ | 505,882 | ||||||
|
| |||||||||
Total Preferred Stocks (Cost $509,914) | $ | 505,882 | ||||||||
|
| |||||||||
| Exchange Traded Funds – 2.1% | Shares | Value | ||||||||
iShares MSCI Emerging Markets Index Fund | 16,866 | $ | 639,896 | |||||||
iShares MSCI Japan Index Fund | 61,946 | 564,328 | ||||||||
|
| |||||||||
Total Exchange Traded Funds (Cost $1,280,600) | $ | 1,204,224 | ||||||||
|
| |||||||||
| Money Market Funds – 4.7% | Shares | Value | ||||||||
| State Street Institutional Liquid Reserves Fund Institutional Class 2 | 2,717,960 | $ | 2,717,960 | |||||||
|
| |||||||||
Total Money Market Funds (Cost $2,717,960) | $ | 2,717,960 | ||||||||
|
| |||||||||
Total Investments – 99.9% (Cost $53,661,566) | (c) | $ | 57,450,177 | |||||||
Other Assets in Excess of Liabilities – 0.1% | 35,130 | |||||||||
|
| |||||||||
Net Assets – 100.0% | $ | 57,485,307 | ||||||||
|
| |||||||||
Percentages are stated as a percent of net assets.
Abbreviations:
ADR: American Depositary Receipts
Footnotes:
| (a) | Non-Income producing security. |
| (b) | Security traded on a foreign exchange has been valued at an estimate of fair value that is different than the local market close price. These fair value estimates are determined by an independent fair valuation service that has been approved by the Board. These securities represent $42,346,215, or 73.7% of the Portfolio’s net assets. |
Other Portfolio securities are not subjected to fair valuation procedures because they are traded on domestic or foreign exchanges that have close times that are consistent with the U.S. market close, normally 4:00 pm Eastern Time. Exchange traded funds are also not evaluated by the fair valuation service.
| (c) | Represents cost for financial reporting purposes, which may differ from cost basis for federal income tax purposes. See also Note 7 of the Notes to Financial Statements. |
Sector Classifications (Common and preferred stocks): (Percent of net assets)
Industrials | 27.3% | |||
Consumer Discretionary | 25.5% | |||
Energy | 12.4% | |||
Materials | 10.1% | |||
Consumer Staples | 6.3% | |||
Financials | 5.5% | |||
Information Technology | 4.7% | |||
Health Care | 1.3% | |||
|
| |||
| 93.1% | ||||
|
|
The accompanying notes are an integral part of these financial statements.
| 35 |
| Ohio National Fund, Inc. | Aggressive Growth Portfolio |
Objective/Strategy
The Aggressive Growth Portfolio seeks long-term capital growth by investing primarily in domestic and foreign equity securities selected for growth potential.
Performance as of December 31, 2011
Average Annual Total Returns: | ||||
One year | -5.26% | |||
Five years | 1.63% | |||
Ten years | 2.98% |
Past performance does not guarantee future results. The performance data quoted represents past performance and current returns may be lower or higher. Total return figures include change in share price and reinvestment of dividends and capital gains. The investment return and principal value will fluctuate so that an investor’s shares, when redeemed, may be worth more or less than the original cost. To obtain performance information up to the most recent month end, call toll-free 1-877-781-6392.
The Portfolio is not open to direct retail investment. Beneficial interest in shares is obtained solely by purchase of variable life insurance policies and variable annuity contracts. Actual performance results for variable annuity and variable universal life contracts will be lower due to contract charges. Consult your contract for applicable charges.
Comments
For the year ended December 31, 2011, the Aggressive Growth Portfolio returned -5.26% versus 2.11% for the current benchmark, the S&P 500 Index.
Volatility and correlations remained near record levels as the markets traded around geopolitical and macroeconomic issues, including fears of a recession in Europe and a hard landing in China. While the U.S. recovery remains fragile, leading economic indicators and consumer confidence showed signs of improvement in the fourth quarter. U.S. stocks recovered toward the end of the year to finish the year with modest gains.
The Portfolio’s performance was disappointing in the year. Many of our holdings have continued to perform well from an operating perspective, yet their stock prices have not responded as much as we had expected. This has been frustrating to us, but it is not surprising. In a highly correlated, macro-driven market, where news out of Europe dominates the headlines, it can be difficult for individual stocks to break out. We don’t discount the challenges that Europe’s debt crisis poses or its impact on demand for risk assets. We, however, maintain a high level of conviction in our holdings that have characteristics such as long-duration growth opportunities, potential for market share gains, and competitive advantages that we think will eventually be rewarded with higher multiples and prices.(1)
Information Technology was the Portfolio’s weakest sector versus the benchmark. Some large-cap and mega-cap names that we didn’t own were large out-performers in the benchmark, detracting from relative performance. We believe the long-term growth drivers of our holdings remain intact, however, and we maintained most positions. Our Energy holdings also underperformed, mainly due to weak relative performance in Halliburton Co., an energy field services company. The stock declined amid concerns of overcapacity in the industry. Long term, we feel the company is a natural beneficiary of increased drilling activity in North America. Much of the world’s easy-to-extract oil has been found and exploration companies are now tapping on-shore, horizontal shale formations for new
production. We think this is resulting in greater usage of services and equipment, creating a long-term opportunity for the energy field services company.(1)
On a positive note, our Financials selections contributed to relative results. We own shares in several companies with significant exposure to emerging Asian markets, where adoption of banking and insurance services is expanding as per capita income and gross domestic product rise. These stocks, such as insurance company AIA Group Ltd., were generally strong performers.(1)
Detractors from the Portfolio’s performance were Ford Motor Co., EMC Corp., Halliburton Co., ON Semiconductor Corp., and The Charles Schwab Corp. While the stock price has been weak, Ford Motor Co. has continued to improve its business. It has cut capacity, lowered labor costs, and improved profitability. We like the automaker’s improved financial position and potential to benefit from the ongoing recovery in auto sales.(1)
EMC Corp., an enterprise storage products company, declined on concerns of weakening hardware demand. Long term, the company’s product portfolio in hardware and software is well positioned to benefit from improving fundamentals in high-end and mid-range storage, which has become one of the fastest growth areas of enterprise information technology. Halliburton Co.’s shares came under pressure on concerns of overcapacity in the industry. Long term, we feel the oil-field services company is a natural beneficiary of increased drilling activity in North America. ON Semiconductor Corp.’s stock declined on concerns of a cyclical slowdown in the semiconductor supply chain. We think the semiconductor company has a long-term business model advantage in that it spends less on marketing and research and development than its competitors. We think that the company can generate attractive levels of profit and free cash flows in its competitive markets. Financial services firm The Charles Schwab Corp. continued to suffer from the very low interest rate environment. While the company could face continued pressure, we believe The Charles Schwab Corp. has a strong franchise in wealth management and back-office services. We think that this will position the firm to do well when the interest rate environment becomes more favorable. We trimmed the position, however.(1)
Contributors to the Portfolio’s performance were Hansen Natural Corp., Apple, Inc., Limited Brands, Inc., News Corp., and Intuitive Surgical, Inc. Hansen Natural Corp., a U.S. beverage provider, is winning share in the rapidly growing energy drink market due to its Monster brand. We think it has a strong position in the industry and good opportunities to expand its international business. Apple, Inc.’s stock was a top contributor for the year and remained a top position in the Portfolio largely because of its highly successful line of differentiated mobile computing products, from the iPad to the iPhone, and because of its growing market share in personal computers. The company continues to leverage its vertical integration, innovate its product portfolio, and demonstrate sales strength in international markets. We like Apple, Inc.’s long-term growth prospects and demonstrated ability to win in various economic environments. Limited Brands, Inc.’s sales have been improving, which has helped drive incremental margins higher. Its key franchise is Victoria’s Secret, which has strong brand recognition worldwide. The company has been aggressive in reducing costs and managing inventory. We think the market has been slow to recognize Limited Brand, Inc.’s potential margin expansion and the opportunity to develop its international business. News Corp.’s shares rose, overcoming weakness in the stock after the global media company became involved in a phone-hacking scandal involving one of its newspapers in the U.K. While we continue to monitor the situation,
| 36 | (continued) |
| Ohio National Fund, Inc. | Aggressive Growth Portfolio (Continued) |
we feel the company’s non-newspaper businesses continue to be strong and are well positioned to gain market share. We also like the company’s role as a provider of content, which we think will be highly valued going forward. Intuitive Surgical, Inc. remains a compelling opportunity, in our opinion, given the success of its da Vinci surgical system. The technology improves efficiency in operating rooms and reduces recovery times, and it has continued to see greater placement and procedural growth. We think the company’s competitive advantage is in its technology, which is difficult and expensive to replace once the system has been installed in a hospital.(1)
The macro challenges today are significant, but companies look well-positioned to handle them. The financial system is better capitalized than it was in 2008 and relatively well prepared for a bad outcome in Europe. U.S. companies have dealt with high unemployment for over two years; they have already lost those customers and the fact that they are not coming back is less of a headwind than the market seems to think. The increase in energy prices has been more gradual than the spike in 2007, and companies have adjusted their cost structures or added “energy escalators” to their contracts, enabling them to pass on higher prices to customers.
Even if the macro environment weakens, we think companies in the Portfolio can continue to execute well on their strategies. We are finding plenty of businesses that are gaining share, improving margins, and strengthening their competitive moats. This is likely to pay off in stronger earnings growth going forward, which we think the market is not recognizing in current valuations. Indeed, multiples look cheap, especially for the earnings growth and returns on capital we are seeing.
Investors seem to be anticipating a global slowdown or expect near-record margins to revert to the mean. We don’t discount those concerns but think companies in the Portfolio can improve their competitive positions and returns. In a volatile and uncertain environment, we feel positive about what companies in the Portfolio are doing. We think the longer the market ignores their strong fundamentals, the more opportunity there is in these mis-priced, long duration growth companies.
| (1) | The Portfolio’s composition is subject to change. Holdings and weightings are as of December 31, 2011. |
Change in Value of $10,000 Investment
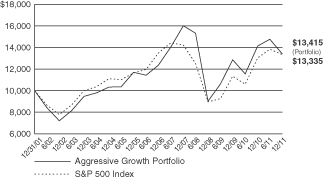
Hypothetical illustration based on past performance. Future performance will vary. The Portfolio’s returns reflect reinvested dividends. The Portfolio’s holdings may differ significantly from the securities in the index. The index is unmanaged and therefore does not reflect the cost of portfolio management and accounting.
The S&P 500 Index is a capitalization-weighted index designed to measure performance of the broad domestic economy through changes in the aggregate market value of 500 stocks representing all major industries. The index presented herein includes the effects of reinvested dividends.
| 37 | (continued) |
| Ohio National Fund, Inc. | Aggressive Growth Portfolio (Continued) |
Portfolio Composition as of December 31, 2011 (1)
| % of Net Assets | ||||
Common Stocks (3) | 97.7 | |||
Money Market Funds | 2.3 | |||
|
| |||
| 100.0 | ||||
|
|
Top 10 Portfolio Holdings as of December 31, 2011 (1) (2)
| % of Net Assets | ||||
1. eBay, Inc. | 7.1 | |||
2. Apple, Inc. | 5.1 | |||
3. Celgene Corp. | 4.8 | |||
4. Medco Health Solutions, Inc. | 4.3 | |||
5. Crown Castle International Corp. | 4.3 | |||
6. FANUC Corp. | 4.3 | |||
7. Microsoft Corp. | 3.8 | |||
8. News Corp. Class A | 3.8 | |||
9. Hansen Natural Corp. | 3.7 | |||
10. Limited Brands, Inc. | 3.6 | |||
| (1) | Composition of Portfolio subject to change. |
| (2) | Short-term investments have been excluded from the list of Top 10 Portfolio Holdings. |
| (3) | Sectors: |
| % of Net Assets | ||||
Information Technology | 28.1 | |||
Health Care | 14.9 | |||
Consumer Discretionary | 14.3 | |||
Industrials | 13.7 | |||
Consumer Staples | 9.6 | |||
Financials | 9.3 | |||
Telecommunication Services | 4.3 | |||
Materials | 1.9 | |||
Energy | 1.6 | |||
|
| |||
| 97.7 | ||||
|
|
| 38 |
| Ohio National Fund, Inc. | Aggressive Growth Portfolio |
Schedule of Investments | December 31, 2011 |
| Common Stocks – 97.7% | Shares | Value | ||||||||
CONSUMER DISCRETIONARY – 14.3% | ||||||||||
Ford Motor Co. (Automobiles) | (a) | 40,940 | $ | 440,514 | ||||||
MGM Resorts International (Hotels, Restaurants & Leisure) | (a) | 43,041 | 448,918 | |||||||
Amazon.com, Inc. (Internet & Catalog Retail) | (a) | 1,100 | 190,410 | |||||||
News Corp. Class A (Media) | 54,725 | 976,294 | ||||||||
Limited Brands, Inc. (Specialty Retail) | 23,005 | 928,252 | ||||||||
Cie Financiere Richemont SA (Textiles, Apparel & Luxury Goods) | (b) | 10,463 | 526,317 | |||||||
Prada SpA (Textiles, Apparel & Luxury Goods) | (a)(b) | 35,700 | 160,672 | |||||||
|
| |||||||||
| 3,671,377 | ||||||||||
|
| |||||||||
CONSUMER STAPLES – 9.6% | ||||||||||
Davide Campari-Milano SpA (Beverages) | (b) | 124,306 | 826,224 | |||||||
Hansen Natural Corp. (Beverages) | (a) | 10,260 | 945,356 | |||||||
Pernod-Ricard SA (Beverages) | (b) | 2,794 | 258,609 | |||||||
Mead Johnson Nutrition Co. (Food Products) | 6,345 | 436,092 | ||||||||
|
| |||||||||
| 2,466,281 | ||||||||||
|
| |||||||||
ENERGY – 1.6% | ||||||||||
Halliburton Co. (Energy Equip. & Svs.) | 5,595 | 193,083 | ||||||||
Southwestern Energy Co. (Oil, Gas & Consumable Fuels) | (a) | 7,065 | 225,656 | |||||||
|
| |||||||||
| 418,739 | ||||||||||
|
| |||||||||
FINANCIALS – 9.3% | ||||||||||
Charles Schwab Corp. / The (Capital Markets) | 28,000 | 315,280 | ||||||||
CapitalSource, Inc. (Commercial Banks) | 42,864 | 287,189 | ||||||||
Standard Chartered PLC (Commercial Banks) | (b) | 15,995 | 349,848 | |||||||
AIA Group Ltd. (Insurance) | (b) | 113,800 | 354,251 | |||||||
Prudential PLC (Insurance) | (b) | 40,143 | 397,179 | |||||||
Walker & Dunlop, Inc. (Thrifts & Mortgage Finance) | (a) | 54,955 | 690,235 | |||||||
|
| |||||||||
| 2,393,982 | ||||||||||
|
| |||||||||
HEALTH CARE – 14.9% | ||||||||||
Celgene Corp. (Biotechnology) | (a) | 18,355 | 1,240,798 | |||||||
Vertex Pharmaceuticals, Inc. (Biotechnology) | (a) | 15,066 | 500,342 | |||||||
Intuitive Surgical, Inc. (Health Care Equip. & Supplies) | (a) | 629 | 291,233 | |||||||
Express Scripts, Inc. (Health Care Providers & Svs.) | (a) | 15,540 | 694,483 | |||||||
Medco Health Solutions, Inc. (Health Care Providers & Svs.) | (a) | 19,945 | 1,114,926 | |||||||
|
| |||||||||
| 3,841,782 | ||||||||||
|
| |||||||||
INDUSTRIALS – 13.7% | ||||||||||
Precision Castparts Corp. (Aerospace & Defense) | 1,170 | 192,804 | ||||||||
C.H. Robinson Worldwide, Inc. (Air Freight & Logistics) | 8,060 | 562,427 | ||||||||
| Common Stocks (Continued) | Shares | Value | ||||||||
INDUSTRIALS (continued) | ||||||||||
United Parcel Service, Inc. Class B (Air Freight & Logistics) | 10,875 | $ | 795,941 | |||||||
Iron Mountain, Inc. (Commercial Svs. & Supplies) | 16,215 | 499,422 | ||||||||
FANUC Corp. (Machinery) | (b) | 7,200 | 1,098,232 | |||||||
CoStar Group, Inc. (Professional Svs.) | (a) | 5,450 | 363,679 | |||||||
|
| |||||||||
| 3,512,505 | ||||||||||
|
| |||||||||
INFORMATION TECHNOLOGY – 28.1% | ||||||||||
Apple, Inc. (Computers & Peripherals) | (a) | 3,230 | 1,308,150 | |||||||
EMC Corp. (Computers & Peripherals) | (a) | 40,970 | 882,494 | |||||||
Amphenol Corp. Class A | 5,730 | 260,085 | ||||||||
TE Connectivity Ltd. | 15,825 | 487,568 | ||||||||
Trimble Navigation Ltd. | (a) | 15,210 | 660,114 | |||||||
eBay, Inc. (Internet Software & Svs.) | (a) | 60,170 | 1,824,956 | |||||||
VistaPrint NV (Internet Software & Svs.) | (a) | 11,150 | 341,190 | |||||||
ON Semiconductor Corp. | (a) | 50,445 | 389,435 | |||||||
Microsoft Corp. (Software) | 37,995 | 986,350 | ||||||||
Zynga, Inc. Class A (Software) | (a) | 11,245 | 105,815 | |||||||
|
| |||||||||
| 7,246,157 | ||||||||||
|
| |||||||||
MATERIALS – 1.9% | ||||||||||
Ivanhoe Mines Ltd. (Metals & Mining) | (a) | 27,775 | 492,173 | |||||||
|
| |||||||||
TELECOMMUNICATION SERVICES – 4.3% | ||||||||||
Crown Castle International Corp. | (a) | 24,795 | 1,110,816 | |||||||
|
| |||||||||
Total Common Stocks (Cost $23,427,455) | $ | 25,153,812 | ||||||||
|
| |||||||||
| VVPR Strips – 0.0% | (e) | Quantity | Value | |||||||
CONSUMER STAPLES – 0.0% | ||||||||||
Anheuser-Busch InBev NV (Beverages) | (a)(c)(d) | 6,992 | $ | 9 | ||||||
|
| |||||||||
Total VVPR Strips (Cost $0) | $ | 9 | ||||||||
|
| |||||||||
| Money Market Funds – 2.4% | Shares | Value | ||||||||
Fidelity Institutional Money Market Funds | 624,000 | $ | 624,000 | |||||||
|
| |||||||||
Total Money Market Funds (Cost $624,000) | $ | 624,000 | ||||||||
|
| |||||||||
Total Investments – 100.1% (Cost $24,051,455) | (f) | $ | 25,777,821 | |||||||
Liabilities in Excess of Other Assets – (0.1)% | (22,476) | |||||||||
|
| |||||||||
Net Assets – 100.0% | $ | 25,755,345 | ||||||||
|
| |||||||||
Percentages are stated as a percent of net assets.
Footnotes:
| (a) | Non-income producing security. |
| (b) | Security traded on a foreign exchange has been valued at an estimate of fair value that is different than the local market close price. These fair value estimates are determined by an independent fair valuation service that has been approved by the Board. These securities represent $3,971,332, or 15.4% of the Portfolio’s net assets. |
| Other Portfolio securities are not subjected to fair value procedures because they are traded on domestic or foreign exchanges that have close times that are consistent with the U.S. market close, normally 4:00 pm Eastern Time. |
| (c) | As discussed in Note 2 of the Notes to Financial Statements, not all investments that are traded on a foreign exchange are valued at an estimate that is different from the local close price. In some instances, the independent fair valuation service uses a stock’s local close price because the service’s measure of predictability related to the valuation model of a stock is below a chosen threshold. These securities represent $9, or 0.0% of the Portfolio’s net assets. |
| (d) | A market quotation for this investment was not readily available at December 31, 2011. As discussed in Note 2 of the Notes to Financial Statements, the price for this issue was derived from an estimate of fair market value using methods determined in good faith by the Fund’s Pricing Committee under the supervision of the Board. This security represents $9, or 0.0% of the Portfolio’s net assets. |
| (e) | A VVPR Strip is a coupon attached to specific ordinary common shares that offers tax advantages. The coupon entitles a holder to reduced withholding tax rates on the dividends generated from the related common shares. |
| (f) | Represents cost for financial reporting purposes, which may differ from cost basis for federal income tax purposes. See also Note 7 of the Notes to Financial Statements. |
The accompanying notes are an integral part of these financial statements.
| 39 |
| Ohio National Fund, Inc. | Small Cap Growth Portfolio |
Objective/Strategy
The Small Cap Growth Portfolio seeks long-term capital appreciation by investing at least 80% of its net assets in stocks of small companies.
Performance as of December 31, 2011
Average Annual Total Returns: | ||||
One year | 2.72% | |||
Five years | 3.84% | |||
Ten years | 6.37% |
Past performance does not guarantee future results. The performance data quoted represents past performance and current returns may be lower or higher. Total return figures include change in share price and reinvestment of dividends and capital gains. The investment return and principal value will fluctuate so that an investor’s shares, when redeemed, may be worth more or less than the original cost. To obtain performance information up to the most recent month end, call toll-free 1-877-781-6392.
The Portfolio is not open to direct retail investment. Beneficial interest in shares is obtained solely by purchase of variable life insurance policies and variable annuity contracts. Actual performance results for variable annuity and variable universal life contracts will be lower due to contract charges. Consult your contract for applicable charges.
Comments
For the year ended December 31, 2011, the Small Cap Growth Portfolio returned 2.72% versus -2.91% for the current benchmark, the Russell 2000 Growth Index.
Macro concerns around Europe’s debt crisis and the U.S. fiscal situation remained elevated, resulting in extreme volatility and high correlations for much of the year. Leading indicators in the U.S. showed signs of improvement and the unemployment rate fell, indicating potential stability in the labor market. Small-cap stocks underperformed large caps in this environment. Top performing sectors for the Portfolio included our holdings in Energy, Industrials, and Consumer Discretionary. Detractors included our holdings in Consumer Staples, Health Care, and Materials.(1)
Our selections in Consumer Discretionary were the largest contributor to the Portfolio’s out-performance versus the benchmark. While we have long held a tepid view of the recovery, we have maintained exposure to Consumer Discretionary names that we felt could create value irrespective of the macro environment. For example, we own shares in Polaris Industries, Inc., a company with a history of product innovations and competitive advantages in its supply chain and manufacturing. The company has been a market share gainer and we think it is well positioned to continue growing.(1)
Our Energy selections and slight underweight in the sector also contributed to out-performance versus benchmark. We own shares in companies that do not depend on a strong commodity price for growth. Our top performer in the sector was a master limited partnership (MLP), Targa Resources Corp., which focuses on midstream natural gas and natural gas liquid services in the U.S. We like the company’s predictable revenue streams and its expectations to grow distributions 10-15% in 2012, implying upside to the stock.(1)
A third key contributor to out-performance was our selections in Industrials. The top individual performer in the sector was Wabtec Corp., a provider of technology-based equipment and services for the global rail industry. The company operates through two segments: freight and transit. We like the company’s international expansion
opportunities, and we think the company has the potential to expand margins through its higher-growth, higher-margin freight division, which continues to rebound. We also like its high returns on capital and higher growth rate, relative to other Industrials.(1)
Our holdings in Information Technology also outperformed. The top individual contributors in the sector were automated teller machine (ATM) company Cardtronics, Inc. and Ceva, Inc., a company that makes digital signal processing (DSP) technology. We like Ceva, Inc.’s business model and competitive positioning following the exit of a large competitor from its DSP licensing business. Ceva, Inc. receives up-front licensing fees and ongoing royalties on each device, mobile phones typically, that include its DSP technology. Such recurring revenue streams are important to our investment process.(1)
Our selections in Health Care detracted from performance. Companies are being impacted by slower volume growth and lower levels of health care utilization. The macro backdrop has been unfavorable with uncertainty over potential Medicare cuts and a U.S. Supreme Court ruling on the 2010 health care law expected this summer. Companies in the Portfolio are demonstrating growth but have been impacted by the slowdown. For example, a detractor in the sector is Volcano Corp., a medical technology company that makes products for the diagnosis and treatment of cardiovascular disease. The business has 16% penetration in the U.S. (versus 75% in Japan) and saves costs by helping produce better outcomes for patients. Its guidance for 2012 was cautious, with a lower estimate for revenues than its previous forecast. Nonetheless, we think the company has a large addressable market and long runway for growth. We added to our position on weakness in the stock price.(1)
In terms of new holdings, we initiated a position in Bankrate, Inc., a publisher and distributor of personal finance content on the Internet. The company is becoming a category king in personal finance with a high quality website and network, and investments in content that give it a competitive advantage. The company has a large and growing addressable market as consumers increasingly shop for insurance, CDs and other financial products online. We also think the company can gain market share, in part, because it is more cost-effective for companies to reach potential customers through such sites than direct mail marketing.(1)
Contributors to the Portfolio’s performance include MarketAxess Holdings, Inc., Polaris Industries, Inc., Targa Resources Corp., Cardtronics, Inc., and Epoch Holding Corp. MarketAxess Holdings Inc., an electronic trading platform operator, continued to gain market share from traditional methods of trading fixed income securities. It has also benefited from an improved trading environment and higher liquidity. Polaris Industries Inc., a maker of recreational vehicles and ATVs, has delivered strong results primarily from market share gains as a result of continued product innovation, product line extensions, and international expansion efforts. We believe the company’s manufacturing and supply chain are key differentiators that will enable Polaris Industries, Inc. to perform well despite the overall industry headwinds. Targa Resources Corp. is the general partner of Targa Resources Partners, a master limited partnership (MLP), focused on midstream natural gas and natural gas liquid services in the U.S. We feel that the management of the general partner is incentivized to grow distributions for the MLP, which we like for its predictable, fee-based business. Cardtronics, Inc., the world’s largest owner and operator of ATMs, continued its strong performance. We continue to see our margin improvement thesis playing out and are comfortable with this stable business given its long-term contracts and associated barriers to entry.
| 40 | (continued) |
| Ohio National Fund, Inc. | Small Cap Growth Portfolio (Continued) |
Epoch Holding Corp., a global asset manager, has been steadily growing revenues and assets under management. The company has a good mix of domestic and international funds, and redemption rates have been relatively low. We like asset managers such as Epoch Holding Corp. because they tend to have strong, un-leveraged balance sheets and control more of their own destiny than banks, which face an uncertain interest rate and regulatory environment.(1)
Detractors from the Portfolio’s performance were RealD, Inc., DTS, Inc., National CineMedia, Inc., Masimo Corp., and Resources Connection, Inc. RealD, Inc. licenses 3D technology to movie theaters and is well positioned to begin collecting royalties from consumer electronics manufacturers as 3D TVs become more popular. We like the company for its long-term contracts with movie theaters owners and the large market opportunity as 3D penetrates the living room. The company operates a high fixed cost business so as the top line grows, a high percentage of incremental revenues should drop to the bottom line. We like DTS, Inc., an audio technology licensing company, for its business model which historically has generated high returns and consistent growth. DTS, Inc. benefits as Blu-ray players gradually obsolete standard definition DVD players. The company’s technology is a mandated standard in Blu-ray and allows DTS, Inc. to capture a royalty for every Blu-ray drive shipped. National CineMedia, Inc. is a company that provides pre-feature advertising in movie theaters. We like the National CineMedia, Inc. for its long-term exclusive agreements with the three largest theater owners, which together control a majority of the top markets in the U.S. Masimo Corp. is a medical technology company that focuses on patient monitoring. The company has differentiated product technology and will continue to grow market share, in our view. Resources Connection, Inc., a professional services company focused on accounting and finance, has a cost advantage compared to the traditional “Big Four” audit firms with which it competes. Additionally, Resources Connection, Inc. has historically been able to recruit more experienced professionals which, when combined with low bill rates, provides tremendous value to the company’s clients. As the economy improves and the major accounting firms no longer offer unusually low rates to attract business, Resources Connection, Inc. should be well positioned to gain market share.(1)
We don’t know what gross domestic product growth will be in 2012, how Europe’s debt crisis will play out, or if China will have a hard or soft landing. Rather than spending our time trying to predict these outcomes, we focus on finding high quality, small cap companies that can control their own destiny and do not need a strong macro environment to grow. High quality companies, in our view, have recurring revenue streams, high returns on equity, and operating leverage that can result in higher incremental margins as revenues grow. We also like companies with strong balance sheets and management teams that are disciplined about capital allocation. If we can find businesses with these attributes then all the headline noise and market volatility ultimately will not matter.
While many of our peers look for alpha in the smaller, riskier names of our stock universe, we seek to invest in higher quality companies that can do well in a bad environment and great in a good environment. This does not mean that we favor classically defensive stocks or avoid cyclicals. In fact, some of the most attractive companies, in our view, have a high degree of cyclicality related to their end markets. The common thread is a unique, differentiated business model that can not only survive but thrive by taking share from the competition when confronted with tough macro conditions. We think these types of companies offer the most attractive risk/reward
opportunities and are likely to result in strong out-performance over a full market cycle.
| (1) | The Portfolio’s composition is subject to change. Holdings and weightings are as of December 31, 2011. |
Change in Value of $10,000 Investment
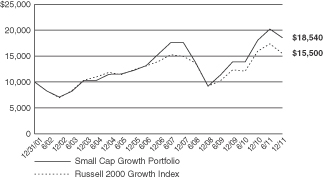
Hypothetical illustration based on past performance. Future performance will vary. The Portfolio’s returns reflect reinvested dividends. The Portfolio’s holdings may differ significantly from the securities in the index. The index is unmanaged and therefore does not reflect the cost of portfolio management and accounting.
The Russell 2000 Growth Index is a market-weighted total return index that measures the performance of companies within the Russell 2000 Index having higher price to book ratios and higher forecasted growth values. The Russell 2000 Index includes the 2000 firms from the Russell 3000 Index with the smallest market capitalizations. The Russell 3000 Index represents 98% of the investable U.S. equity markets. The index presented herein includes the effects of reinvested dividends.
| 41 | (continued) |
| Ohio National Fund, Inc. | Small Cap Growth Portfolio (Continued) |
Portfolio Composition as of December 31, 2011 (1)
| % of Net Assets | ||||||
Common Stocks (3) | 99.2 | |||||
Money Market Funds and | 0.8 | |||||
|
| |||||
| 100.0 | ||||||
|
|
| ||||
Top 10 Portfolio Holdings as of December 31, 2011 (1) (2)
| % of Net Assets | ||||
1. Dresser-Rand Group, Inc. | 2.7 | |||
2. CoStar Group, Inc. | 2.6 | |||
3. World Fuel Services Corp. | 2.5 | |||
4. VistaPrint NV | 2.2 | |||
5. HEICO Corp. Class A | 2.0 | |||
6. WESCO International, Inc. | 1.9 | |||
7. Euronet Worldwide, Inc. | 1.9 | |||
8. Targa Resources Corp. | 1.9 | |||
9. Ceva, Inc. | 1.9 | |||
10. PSS World Medical, Inc. | 1.9 | |||
| (1) | Composition of Portfolio subject to change. |
| (2) | Short-term investments have been excluded from the list of Top 10 Portfolio Holdings. |
| (3) | Sectors: |
| % of Net Assets | ||||
Information Technology | 26.1 | |||
Health Care | 20.3 | |||
Industrials | 20.0 | |||
Consumer Discretionary | 13.6 | |||
Energy | 8.4 | |||
Financials | 6.5 | |||
Consumer Staples | 1.7 | |||
Telecommunication Services | 1.6 | |||
Materials | 1.0 | |||
|
| |||
| 99.2 | ||||
|
|
| 42 |
| Ohio National Fund, Inc. | Small Cap Growth Portfolio |
Schedule of Investments | December 31, 2011 |
| Common Stocks – 99.2% | Shares | Value | ||||||||
CONSUMER DISCRETIONARY – 13.6% | ||||||||||
Peet’s Coffee & Tea, Inc. (Hotels, Restaurants & Leisure) | (a) | 2,800 | $ | 175,504 | ||||||
Skullcandy, Inc. (Household Durables) | (a) | 9,730 | 121,820 | |||||||
SodaStream International Ltd. (Household Durables) | (a) | 6,345 | 207,418 | |||||||
Polaris Industries, Inc. (Leisure Equip. & Products) | 7,900 | 442,242 | ||||||||
National CineMedia, Inc. (Media) | 43,540 | 539,896 | ||||||||
Gordmans Stores, Inc. (Multiline Retail) | (a) | 18,115 | 227,706 | |||||||
Hibbett Sports, Inc. (Specialty Retail) | (a) | 10,590 | 478,456 | |||||||
Lumber Liquidators Holdings, Inc. (Specialty Retail) | (a) | 12,870 | 227,284 | |||||||
Monro Muffler Brake, Inc. (Specialty Retail) | 3,885 | 150,699 | ||||||||
Carter’s, Inc. (Textiles, Apparel & Luxury Goods) | (a) | 8,680 | 345,551 | |||||||
Maidenform Brands, Inc. (Textiles, Apparel & Luxury Goods) | (a) | 22,045 | 403,424 | |||||||
Quiksilver, Inc. (Textiles, Apparel & Luxury Goods) | (a) | 98,648 | 356,119 | |||||||
Under Armour, Inc. Class A (Textiles, Apparel & Luxury Goods) | (a) | 2,075 | 148,964 | |||||||
Wolverine World Wide, Inc. (Textiles, Apparel & Luxury Goods) | 13,080 | 466,171 | ||||||||
|
| |||||||||
| 4,291,254 | ||||||||||
|
| |||||||||
CONSUMER STAPLES – 1.7% | ||||||||||
Casey’s General Stores, Inc. (Food & Staples Retailing) | 6,530 | 336,360 | ||||||||
Snyders-Lance, Inc. (Food Products) | 9,315 | 209,588 | ||||||||
|
| |||||||||
| 545,948 | ||||||||||
|
| |||||||||
ENERGY – 8.4% | ||||||||||
Dresser-Rand Group, Inc. (Energy Equip. & Svs.) | (a) | 16,925 | 844,727 | |||||||
Dril-Quip, Inc. (Energy Equip. & Svs.) | (a) | 6,135 | 403,806 | |||||||
Targa Resources Corp. (Oil, Gas & Consumable Fuels) | 14,717 | 598,835 | ||||||||
World Fuel Services Corp. (Oil, Gas & Consumable Fuels) | 18,818 | 789,980 | ||||||||
|
| |||||||||
| 2,637,348 | ||||||||||
|
| |||||||||
FINANCIALS – 6.5% | ||||||||||
Epoch Holding Corp. (Capital Markets) | 17,879 | 397,450 | ||||||||
Financial Engines, Inc. (Capital Markets) | (a) | 7,898 | 176,362 | |||||||
Gluskin Sheff + Associates, Inc. (Capital Markets) | 14,996 | 219,475 | ||||||||
Cash Store Financial Services, Inc. / The (Consumer Finance) | 19,690 | 116,762 | ||||||||
Credit Acceptance Corp. (Consumer Finance) | (a) | 2,615 | 215,162 | |||||||
Netspend Holdings, Inc. (Consumer Finance) | (a) | 15,256 | 123,726 | |||||||
MarketAxess Holdings, Inc. (Diversified Financial Svs.) | 15,771 | 474,865 | ||||||||
MSCI, Inc. Class A (Diversified Financial Svs.) | (a) | 9,536 | 314,020 | |||||||
|
| |||||||||
| 2,037,822 | ||||||||||
|
| |||||||||
HEALTH CARE – 20.3% | ||||||||||
Achillion Pharmaceuticals, Inc. (Biotechnology) | (a) | 21,202 | 161,559 | |||||||
Ariad Pharmaceuticals, Inc. (Biotechnology) | (a) | 14,200 | 173,950 | |||||||
Immunogen, Inc. (Biotechnology) | (a) | 13,604 | 157,534 | |||||||
Incyte Corp Ltd. (Biotechnology) | (a) | 12,255 | 183,948 | |||||||
Pharmacyclics, Inc. (Biotechnology) | (a) | 10,313 | 152,839 | |||||||
Seattle Genetics, Inc. (Biotechnology) | (a) | 12,765 | 213,367 | |||||||
Conceptus, Inc. (Health Care Equip. & Supplies) | (a) | 15,025 | 189,916 | |||||||
Endologix, Inc. (Health Care Equip. & Supplies) | (a) | 16,529 | 189,753 | |||||||
Gen-Probe, Inc. (Health Care Equip. & Supplies) | (a) | 8,410 | 497,199 | |||||||
HeartWare International, Inc. (Health Care Equip. & Supplies) | (a) | 2,810 | 193,890 | |||||||
Masimo Corp. (Health Care Equip. & Supplies) | (a) | 25,140 | 469,741 | |||||||
Quidel Corp. (Health Care Equip. & Supplies) | (a) | 27,836 | 421,159 | |||||||
Volcano Corp. (Health Care Equip. & Supplies) | (a) | 19,115 | 454,746 | |||||||
Catalyst Health Solutions, Inc. (Health Care Providers & Svs.) | (a) | 5,902 | 306,904 | |||||||
ExamWorks Group, Inc. (Health Care Providers & Svs.) | (a) | 19,385 | 183,770 | |||||||
MWI Veterinary Supply, Inc. (Health Care Providers & Svs.) | (a) | 2,383 | 158,327 | |||||||
PSS World Medical, Inc. (Health Care Providers & Svs.) | (a) | 24,467 | 591,857 | |||||||
| Common Stocks (Continued) | Shares | Value | ||||||||
HEALTH CARE (continued) | ||||||||||
athenahealth, Inc. (Health Care Technology) | (a) | 9,667 | $ | 474,843 | ||||||
Omnicell, Inc. (Health Care Technology) | (a) | 13,820 | 228,306 | |||||||
SXC Health Solutions Corp. (Health Care Technology) | (a) | 7,763 | 438,454 | |||||||
Techne Corp. (Life Sciences Tools & Svs.) | 5,407 | 369,082 | ||||||||
Impax Laboratories, Inc. (Pharmaceuticals) | (a) | 8,365 | 168,722 | |||||||
|
| |||||||||
| 6,379,866 | ||||||||||
|
| |||||||||
INDUSTRIALS – 20.0% | ||||||||||
HEICO Corp. Class A (Aerospace & Defense) | 15,937 | 627,121 | ||||||||
TransDigm Group, Inc. (Aerospace & Defense) | (a) | 3,330 | 318,614 | |||||||
HUB Group, Inc. Class A (Air Freight & Logistics) | (a) | 14,425 | 467,803 | |||||||
Heritage-Crystal Clean, Inc. (Commercial Svs. & Supplies) | (a) | 10,570 | 175,039 | |||||||
Ritchie Bros Auctioneers, Inc. (Commercial Svs. & Supplies) | 17,806 | 393,156 | ||||||||
Standard Parking Corp. (Commercial Svs. & Supplies) | (a) | 23,375 | 417,711 | |||||||
Nordson Corp. (Machinery) | 8,795 | 362,178 | ||||||||
Wabtec Corp. (Machinery) | 6,638 | 464,328 | ||||||||
Acacia Research – Acacia Technologies (Professional Svs.) | (a) | 4,285 | 156,445 | |||||||
CoStar Group, Inc. (Professional Svs.) | (a) | 12,093 | 806,966 | |||||||
Resources Connection, Inc. (Professional Svs.) | 28,297 | 299,665 | ||||||||
Landstar System, Inc. (Road & Rail) | 7,545 | 361,556 | ||||||||
Old Dominion Freight Line, Inc. (Road & Rail) | (a) | 13,040 | 528,511 | |||||||
Rush Enterprises, Inc. Class B (Trading Companies & Distributors) | (a) | 18,459 | 316,941 | |||||||
WESCO International, Inc. (Trading Companies & Distributors) | (a) | 11,475 | 608,290 | |||||||
|
| |||||||||
| 6,304,324 | ||||||||||
|
| |||||||||
INFORMATION TECHNOLOGY – 26.1% | ||||||||||
Stratasys, Inc. (Computers & Peripherals) | (a) | 7,525 | 228,835 | |||||||
DTS, Inc. (Electronic Equip., Instr. & Comp.) | (a) | 18,146 | 494,297 | |||||||
Measurement Specialties, Inc. (Electronic Equip., Instr. & Comp.) | (a) | 18,551 | 518,686 | |||||||
RealD, Inc. (Electronic Equip., Instr. & Comp.) | (a) | 45,937 | 364,740 | |||||||
Angie’s List, Inc. (Internet Software & Svs.) | (a) | 3,141 | 50,570 | |||||||
Bankrate, Inc. (Internet Software & Svs.) | (a) | 5,275 | 113,413 | |||||||
Cornerstone OnDemand, Inc. (Internet Software & Svs.) | (a) | 10,905 | 198,907 | |||||||
Envestnet, Inc. (Internet Software & Svs.) | (a) | 15,475 | 185,081 | |||||||
LivePerson, Inc. (Internet Software & Svs.) | (a) | 18,060 | 226,653 | |||||||
VistaPrint NV (Internet Software & Svs.) | (a) | 22,979 | 703,157 | |||||||
Vocus, Inc. (Internet Software & Svs.) | (a) | 21,797 | 481,496 | |||||||
Zillow, Inc. (Internet Software & Svs.) | (a) | 3,975 | 89,358 | |||||||
Broadridge Financial Solutions, Inc. (IT Svs.) | 15,225 | 343,324 | ||||||||
Cardtronics, Inc. (IT Svs.) | (a) | 15,850 | 428,901 | |||||||
Euronet Worldwide, Inc. (IT Svs.) | (a) | 32,827 | 606,643 | |||||||
Gartner, Inc. (IT Svs.) | (a) | 11,415 | 396,900 | |||||||
Higher One Holdings, Inc. (IT Svs.) | (a) | 13,685 | 252,351 | |||||||
Ceva, Inc. (Semiconductors & Equip.) | (a) | 19,700 | 596,122 | |||||||
International Rectifier Corp. (Semiconductors & Equip.) | (a) | 15,380 | 298,680 | |||||||
Convio, Inc. (Software) | (a) | 31,781 | 351,498 | |||||||
RealPage, Inc. (Software) | (a) | 19,648 | 496,505 | |||||||
SS&C Technologies Holdings, Inc. (Software) | (a) | 24,400 | 440,664 | |||||||
Tyler Technologies, Inc. (Software) | (a) | 11,430 | 344,157 | |||||||
|
| |||||||||
| 8,210,938 | ||||||||||
|
| |||||||||
MATERIALS – 1.0% | ||||||||||
Intrepid Potash, Inc. (Chemicals) | (a) | 14,470 | 327,456 | |||||||
|
| |||||||||
TELECOMMUNICATION SERVICES – 1.6% | ||||||||||
SBA Communications Corp. Class A | (a) | 11,841 | 508,689 | |||||||
|
| |||||||||
Total Common Stocks (Cost $28,907,941) | $ | 31,243,645 | ||||||||
|
| |||||||||
| 43 | (continued) |
| Ohio National Fund, Inc. | Small Cap Growth Portfolio (Continued) |
Schedule of Investments | December 31, 2011 |
| Money Market Funds – 0.8% | Shares | Value | ||||||||
Fidelity Institutional Money Market Funds | 243,000 | $ | 243,000 | |||||||
|
| |||||||||
Total Money Market Funds (Cost $243,000) | $ | 243,000 | ||||||||
|
| |||||||||
Total Investments – 100.0% (Cost $29,150,941) | (b) | $ | 31,486,645 | |||||||
Other Assets in Excess of Liabilities – 0.0% | 12,102 | |||||||||
|
| |||||||||
Net Assets – 100.0% | $ | 31,498,747 | ||||||||
|
| |||||||||
Percentages are stated as a percent of net assets.
Footnotes:
| (a) | Non-income producing security. |
| (b) | Represents cost for financial reporting purposes, which may differ from cost basis for federal income tax purposes. See also Note 7 of the Notes to Financial Statements. |
The accompanying notes are an integral part of these financial statements.
| 44 |
| Ohio National Fund, Inc. | Mid Cap Opportunity Portfolio |
Objective/Strategy
The Mid Cap Opportunity Portfolio seeks long-term total return by investing at least 80% of its net assets in equity securities of mid-cap companies, primarily those that are strategically positioned for long-term growth.
Performance as of December 31, 2011
Average Annual Total Returns: | ||||
One year | -3.36% | |||
Five years | -1.38% | |||
Ten years | 3.35% |
Past performance does not guarantee future results. The performance data quoted represents past performance and current returns may be lower or higher. Total return figures include change in share price and reinvestment of dividends and capital gains. The investment return and principal value will fluctuate so that an investor’s shares, when redeemed, may be worth more or less than the original cost. To obtain performance information up to the most recent month end, call toll-free 1-877-781-6392.
The Portfolio is not open to direct retail investment. Beneficial interest in shares is obtained solely by purchase of variable life insurance policies and variable annuity contracts. Actual performance results for variable annuity and variable universal life contracts will be lower due to contract charges. Consult your contract for applicable charges.
Comments
For the year ended December 31, 2011, the Mid Cap Opportunity Portfolio returned -3.36% versus -1.65% for the current benchmark, the Russell Midcap Growth Index.
Despite significant volatility during the year, U.S. equity markets ended 2011 almost flat. The S&P 500 Index returned 2.11%, with the help of dividends, while price returns alone were virtually 0%, the smallest percentage change since 1947. Reflecting optimism that the domestic economy was improving, the S&P 500 Index started the year with the best first quarter in more than a decade and ended with a fourth quarter gain of 11.82%. However, a sharp decline in the third quarter mostly offset these gains. In August, Standard & Poor’s downgraded U.S. debt from AAA for the first time in the history of its ratings. Toward the end of September, markets were further shaken by the Federal Reserve Board’s announcement of a plan for additional monetary easing on the grounds of general weakness in the labor market and lackluster consumer spending growth. Furthermore, the prospect of contagion from Europe’s debt crisis and the lack of agreement on a solution weighed on global equity markets. However, U.S. equities rallied sharply in October following a preliminary European debt plan and a relatively strong third quarter gross domestic product growth number. All sectors made gains in the fourth quarter, led by Energy, which rose along with higher oil prices. In addition, cyclical sectors generally outperformed defensive ones. For the full year, sector performance widely varied. Financial stocks bore the brunt of the fallout from debt woes in the U.S. and Europe, including increased regulation. Defensive sectors, such as Utilities, Consumer Staples, and Health Care significantly outperformed.
The Portfolio trailed its benchmark, the Russell Midcap Growth Index. Relative underperformance was driven primarily by weakness in select Consumer Discretionary and Consumer Staples holdings, while positive stock selection in the Health Care and Materials sectors contributed to relative returns. At the sector level, the Portfolio’s relative performance was driven by relative overweight positions in the Telecommunication Services, Information Technology, Energy,
and Financials sectors, which underperformed the benchmark. The Portfolio’s relative underperformance was also driven by relative underweight positions in the Consumer Staples, Consumer Discretionary, and Health Care sectors which outperformed the benchmark.(1)
During the year, four of the Portfolio’s top contributors to performance were companies that were acquired. We believe that acquisitions demonstrate one method by which the valuation gap between a company’s stock price and the intrinsic worth of the franchise can close quickly when other business buyers recognize the company’s long-term growth potential. Within Energy, Petrohawk Energy Corp., an oil and natural gas exploration and production company, agreed to be acquired by BHP Billiton at a significant premium to the previous close. Similarly, Nalco Holding Co., a company that holds dominant market share in water treatment services to industrial and institutional end markets, as well as integrated water treatment and process improvement services for the petroleum and petrochemical industries, was acquired by Ecolab, Inc. Pharmasset, Inc. was also a top contributor to relative returns after the company agreed to be acquired by Gilead Sciences, Inc. at a significant premium to the previous close. Lastly, SuccessFactors, Inc., a business execution software provider, contributed to relative performance. Its shares rose during the fourth quarter after the company agreed to be acquired by SAP at a significant premium to the previous close.(1)
PetSmart, Inc., the leading provider of pet related supplies, contributed to performance as the company continued to report better than expected sales, earnings growth, and improved margins. We believe PetSmart, Inc. is well positioned to benefit from inflation in pet food and has successfully taken market share from its competitors through unique partnerships with suppliers such as Martha Stewart and GNC.(1)
RealD, Inc., a company that designs, manufactures, and licenses 3D technology, detracted from performance. The company reported disappointing earnings results as the revenues from recently released 3D blockbuster movies lagged those of 3D films that were released previously. Despite the near term headwind, we believe RealD, Inc. is well positioned for growth as its technology continues to be implemented into theatres and more movies are released in 3D. Furthermore, we believe RealD, Inc. will be a beneficiary as 3D movies begin to gain share of the total box office revenues.(1)
We exited our position in Staples, Inc. as its shares continued to detract from performance. While we continue to see long-term opportunity for the company, we sold out of the position as we believe ongoing cyclical challenges and macroeconomic headwinds may weigh on the business for a more extended period of time than we previously believed. We felt it was prudent to exit our position and reallocate the capital to higher conviction ideas in the Portfolio.(1)
Shares of Lamar Advertising Co., the largest outdoor advertising company in the U.S. detracted from performance. Weaker than expected revenue trends in local advertising put pressure on its shares. While, over the longer term, we believe outdoor advertising may gain share of local advertising dollars, we decided to exit our position and allocate capital to higher conviction ideas in the Portfolio.(1)
Within Consumer Staples, Avon Products, Inc. detracted from performance. Its shares declined after the company announced weaker than expected third quarter earnings and lowered fiscal year 2011 revenue guidance. Avon Products, Inc.’s earnings were impacted by disappointing sales in select markets and softer margins due to higher input costs. We continue to believe Avon Products, Inc. may be poised to deliver higher operating margins over the next few
| 45 | (continued) |
| Ohio National Fund, Inc. | Mid Cap Opportunity Portfolio (Continued) |
years as its broad geographic footprint, particularly in Latin America, provides exposure to numerous growing markets. However, we decided to trim our position and allocate capital to higher conviction ideas in the Portfolio.(1)
Northern Trust Corp. detracted from performance. Its shares have come under pressure due to the low interest rate environment, regulatory uncertainty, and macroeconomic headwinds. Despite the challenges presented by a low rate environment, we believe Northern Trust Corp. remains a high quality franchise focused on expanding its business in core markets. In our view, the company has a solid balance sheet and cash position, and we believe that management is focused on rationalizing expenses and carefully managing risk (particularly their European exposure) which we view very positively in the current environment.(1)
We purchased Pioneer Natural Resources Co., an independent oil and gas exploration and production company, during the year. In our view, the company is led by an efficient management team that is dedicated to the growth of the company. We believe Pioneer Natural Resources Co. is well positioned to deliver strong results over the long-term.(1)
During the year, we initiated a position in Urban Outfitters, Inc. The specialty retailer operates numerous successful brands, including Urban Outfitters, Anthropologie, Free People, and Terrain. The company has been rapidly expanding its store base and has demonstrated success in introducing brands to the global marketplace. In addition, we believe management has a demonstrated history of strong execution, producing disciplined capital allocation and consistent sales growth over a multi-year period.(1)
Within Industrials, Iron Mountain, Inc., a leader in records management, data storage, and online backup, contributed to relative performance. Its shares rose after management announced a strategic plan for enhancing shareholder value. While we continue to believe that Iron Mountain, Inc. holds dominant market share position and scale advantages, we decided to take advantage of the run-up in share price and exited our position in the second quarter as the gap between stock price and the economic value of its business closed.(1)
In 2011, macro concerns and swings in sentiment overshadowed the strength of individual company fundamentals, resulting in a volatile year and a difficult one for active managers. While risks remain over strains in Europe, emerging market inflation, slowing global growth and political uncertainty, we remain cautiously optimistic on the U.S. equity market going forward. Company fundamentals remain stronger than ever, as well-capitalized corporations have over one trillion on their balance sheets and are beginning to redeploy cash, signaling confidence in the economy. In our view, earnings should remain resilient given companies’ exposures to secular and global growth and increased financial and operational flexibility. We believe future expected market conditions should favor our approach, as high quality, U.S. large-cap stocks are on sale. U.S. large-cap equities are attractively valued both relative to fixed income as well as to its own history. Finally, fundamentals should be rewarded more as there is more dispersion at the stock level, which should bode well for an active approach.
We continue to invest in companies that are participating in secular growth trends and that are benefiting from exposure to faster growing growth market economies. Our team continues to identify businesses that have strong fundamental characteristics, that possess the ability to preserve or increase their earnings power and generate strong free cash flow, maintain healthy balance sheets, and that are led by quality management teams. While there will continue to be surprises over the course of 2012, we remain encouraged regarding the opportunities for our growth companies. We continue to maintain our investment discipline of buying high quality growth businesses that are trading at attractive valuations for the long-term, a strategy that has served us well historically. In addition, we are increasingly cognizant of risk management at the Portfolio level, particularly in a market environment where periods of extreme volatility and correlations persist.
| (1) | The Portfolio’s composition is subject to change. Holdings and weightings are as of December 31, 2011. |
Change in Value of $10,000 Investment
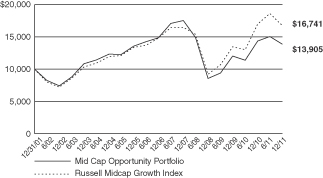
Hypothetical illustration based on past performance. Future performance will vary. The Portfolio’s returns reflect reinvested dividends. The Portfolio’s holdings may differ significantly from the securities in the index. The index is unmanaged and therefore does not reflect the cost of portfolio management and accounting.
The Russell Midcap Growth Index is a subset of the Russell Midcap Index, which measures the performance of the 800 smallest companies in the Russell 1000 Index. The Russell Midcap Growth Index measures the performance of those stocks of the Russell Midcap Index with higher price-to-book ratios and higher relative forecasted growth rates. The index presented herein includes the effects of reinvested dividends.
| 46 | (continued) |
| Ohio National Fund, Inc. | Mid Cap Opportunity Portfolio (Continued) |
Portfolio Composition as of December 31, 2011 (1)
| % of Net Assets | ||||
Common Stocks (3) | 99.7 | |||
Money Market Funds | 0.3 | |||
|
| |||
| 100.0 | ||||
|
|
Top 10 Portfolio Holdings as of December 31, 2011 (1) (2)
| % of Net Assets | ||||
1. SBA Communications Corp. Class A | 3.0 | |||
2. PVH Corp. | 2.7 | |||
3. Cameron International Corp. | 2.4 | |||
4. C.R. Bard, Inc. | 2.3 | |||
5. PetSmart, Inc. | 2.3 | |||
6. Global Payments, Inc. | 2.2 | |||
7. Amphenol Corp. Class A | 2.2 | |||
8. Whiting Petroleum Corp. | 2.1 | |||
9. Pioneer Natural Resources Co. | 2.1 | |||
10. Equinix, Inc. | 2.0 | |||
| (1) | Composition of Portfolio subject to change. |
| (2) | Short-term investments have been excluded from the list of Top 10 Portfolio Holdings. |
| (3) | Sectors: |
| % of Net Assets | ||||
Information Technology | 24.6 | |||
Consumer Discretionary | 18.7 | |||
Financials | 12.7 | |||
Health Care | 12.2 | |||
Energy | 11.2 | |||
Industrials | 9.7 | |||
Telecommunication Services | 5.8 | |||
Materials | 3.1 | |||
Consumer Staples | 1.7 | |||
|
| |||
| 99.7 | ||||
|
|
| 47 |
| Ohio National Fund, Inc. | Mid Cap Opportunity Portfolio |
Schedule of Investments | December 31, 2011 |
| Common Stocks – 99.7% | Shares | Value | ||||||||
CONSUMER DISCRETIONARY – 18.7% | ||||||||||
Coinstar, Inc. (Diversified Consumer Svs.) | (a) | 24,047 | $ | 1,097,505 | ||||||
Marriott International, Inc. Class A (Hotels, Restaurants & Leisure) | 36,784 | 1,072,989 | ||||||||
Newell Rubbermaid, Inc. (Household Durables) | 67,374 | 1,088,090 | ||||||||
Groupon, Inc. (Internet & Catalog Retail) | (a) | 17,348 | 357,889 | |||||||
Discovery Communications, Inc. Class A (Media) | (a) | 11,510 | 471,565 | |||||||
Scripps Networks Interactive, Inc. Class A (Media) | 20,684 | 877,415 | ||||||||
Bed Bath & Beyond, Inc. (Specialty Retail) | (a) | 8,533 | 494,658 | |||||||
Dick’s Sporting Goods, Inc. (Specialty Retail) | 15,022 | 554,011 | ||||||||
PetSmart, Inc. (Specialty Retail) | 27,227 | 1,396,473 | ||||||||
Tiffany & Co. (Specialty Retail) | 9,404 | 623,109 | ||||||||
Urban Outfitters, Inc. (Specialty Retail) | (a) | 41,676 | 1,148,591 | |||||||
Lululemon Athletica, Inc. (Textiles, Apparel & Luxury Goods) | (a) | 5,602 | 261,389 | |||||||
PVH Corp. (Textiles, Apparel & Luxury Goods) | 22,972 | 1,619,296 | ||||||||
Ralph Lauren Corp. (Textiles, Apparel & Luxury Goods) | 2,745 | 379,030 | ||||||||
|
| |||||||||
| 11,442,011 | ||||||||||
|
| |||||||||
CONSUMER STAPLES – 1.7% | ||||||||||
TreeHouse Foods, Inc. (Food Products) | (a) | 4,617 | 301,859 | |||||||
Avon Products, Inc. (Personal Products) | 42,797 | 747,664 | ||||||||
|
| |||||||||
| 1,049,523 | ||||||||||
|
| |||||||||
ENERGY – 11.2% | ||||||||||
Cameron International Corp. (Energy Equip. & Svs.) | (a) | 29,419 | 1,447,121 | |||||||
Core Laboratories NV (Energy Equip. & Svs.) | 7,695 | 876,845 | ||||||||
Dril-Quip, Inc. (Energy Equip. & Svs.) | (a) | 17,190 | 1,131,446 | |||||||
Pioneer Natural Resources Co. (Oil, Gas & Consumable Fuels) | 14,372 | 1,286,007 | ||||||||
Rosetta Resources, Inc. (Oil, Gas & Consumable Fuels) | (a) | 18,284 | 795,354 | |||||||
Whiting Petroleum Corp. (Oil, Gas & Consumable Fuels) | (a) | 27,843 | 1,299,990 | |||||||
|
| |||||||||
| 6,836,762 | ||||||||||
|
| |||||||||
FINANCIALS – 12.7% | ||||||||||
Lazard Ltd. Class A (Capital Markets) | 27,373 | 714,709 | ||||||||
Northern Trust Corp. (Capital Markets) | 24,938 | 989,041 | ||||||||
T. Rowe Price Group, Inc. (Capital Markets) | 14,749 | 839,956 | ||||||||
First Republic Bank (Commercial Banks) | (a) | 34,401 | 1,053,015 | |||||||
SLM Corp. (Consumer Finance) | 23,530 | 315,302 | ||||||||
IntercontinentalExchange, Inc. (Diversified Financial Svs.) | (a) | 9,961 | 1,200,799 | |||||||
MSCI, Inc. Class A (Diversified Financial Svs.) | (a) | 25,507 | �� | 839,946 | ||||||
Principal Financial Group, Inc. (Insurance) | 31,838 | 783,215 | ||||||||
CBRE Group, Inc. (Real Estate Mgmt. & Development) | (a) | 67,753 | 1,031,201 | |||||||
|
| |||||||||
| 7,767,182 | ||||||||||
|
| |||||||||
HEALTH CARE – 12.2% | ||||||||||
Alexion Pharmaceuticals, Inc. (Biotechnology) | (a) | 8,526 | 609,609 | |||||||
BioMarin Pharmaceutical, Inc. (Biotechnology) | (a) | 3,826 | 131,538 | |||||||
Vertex Pharmaceuticals, Inc. (Biotechnology) | (a) | 17,054 | 566,363 | |||||||
CareFusion Corp. (Health Care Equip. & Supplies) | (a) | 38,727 | 984,053 | |||||||
C.R. Bard, Inc. (Health Care Equip. & Supplies) | 16,734 | 1,430,757 | ||||||||
Intuitive Surgical, Inc. (Health Care Equip. & Supplies) | (a) | 1,285 | 594,968 | |||||||
St. Jude Medical, Inc. (Health Care Equip. & Supplies) | 32,116 | 1,101,579 | ||||||||
Henry Schein, Inc. (Health Care Providers & Svs.) | (a) | 17,192 | 1,107,681 | |||||||
Agilent Technologies, Inc. (Life Sciences Tools & Svs.) | (a) | 13,936 | 486,784 | |||||||
Mettler-Toledo International, Inc. (Life Sciences Tools & Svs.) | (a) | 2,783 | 411,077 | |||||||
|
| |||||||||
| 7,424,409 | ||||||||||
|
| |||||||||
| Common Stocks (Continued) | Shares | Value | ||||||||
INDUSTRIALS – 9.7% | ||||||||||
DigitalGlobe, Inc. (Aerospace & Defense) | (a) | 22,084 | $ | 377,857 | ||||||
C.H. Robinson Worldwide, Inc. (Air Freight & Logistics) | 7,381 | 515,046 | ||||||||
Ritchie Bros Auctioneers, Inc. (Commercial Svs. & Supplies) | 27,996 | 618,152 | ||||||||
Quanta Services, Inc. (Construction & Engineering) | (a) | 47,103 | 1,014,599 | |||||||
Rockwell Automation, Inc. (Electrical Equip.) | 6,713 | 492,533 | ||||||||
Roper Industries, Inc. (Electrical Equip.) | 12,949 | 1,124,880 | ||||||||
Kennametal, Inc. (Machinery) | 32,961 | 1,203,736 | ||||||||
Verisk Analytics, Inc. Class A (Professional Svs.) | (a) | 14,095 | 565,632 | |||||||
|
| |||||||||
| 5,912,434 | ||||||||||
|
| |||||||||
INFORMATION TECHNOLOGY – 24.6% | ||||||||||
Juniper Networks, Inc. (Communications Equip.) | (a) | 11,111 | 226,776 | |||||||
NetApp, Inc. (Computers & Peripherals) | (a) | 27,942 | 1,013,456 | |||||||
Amphenol Corp. Class A (Electronic Equip., Instr. & Comp.) | 29,388 | 1,333,921 | ||||||||
FLIR Systems, Inc. (Electronic Equip., Instr. & Comp.) | 28,304 | 709,581 | ||||||||
RealD, Inc. (Electronic Equip., Instr. & Comp.) | (a) | 44,926 | 356,712 | |||||||
Equinix, Inc. (Internet Software & Svs.) | (a) | 12,201 | 1,237,181 | |||||||
Rackspace Hosting, Inc. (Internet Software & Svs.) | (a) | 16,959 | 729,407 | |||||||
FleetCor Technologies, Inc. (IT Svs.) | (a) | 9,730 | 290,635 | |||||||
Genpact Ltd. (IT Svs.) | (a) | 44,714 | 668,474 | |||||||
Global Payments, Inc. (IT Svs.) | 28,518 | 1,351,183 | ||||||||
VeriFone Systems, Inc. (IT Svs.) | (a) | 21,811 | 774,727 | |||||||
Western Union Co. / The (IT Svs.) | 54,339 | 992,230 | ||||||||
Altera Corp. (Semiconductors & Equip.) | 9,841 | 365,101 | ||||||||
Linear Technology Corp. (Semiconductors & Equip.) | 11,139 | 334,504 | ||||||||
NVIDIA Corp. (Semiconductors & Equip.) | (a) | 53,438 | 740,651 | |||||||
Xilinx, Inc. (Semiconductors & Equip.) | 35,395 | 1,134,764 | ||||||||
Citrix Systems, Inc. (Software) | (a) | 12,732 | 773,087 | |||||||
MICROS Systems, Inc. (Software) | (a) | 6,743 | 314,089 | |||||||
Rovi Corp. (Software) | (a) | 15,197 | 373,542 | |||||||
Salesforce.com, Inc. (Software) | (a) | 9,725 | 986,699 | |||||||
Zynga, Inc. Class A (Software) | (a) | 29,992 | 282,225 | |||||||
|
| |||||||||
| 14,988,945 | ||||||||||
|
| |||||||||
MATERIALS – 3.1% | ||||||||||
Airgas, Inc. (Chemicals) | 8,700 | 679,296 | ||||||||
Ecolab, Inc. (Chemicals) | 21,218 | 1,226,613 | ||||||||
|
| |||||||||
| 1,905,909 | ||||||||||
|
| |||||||||
TELECOMMUNICATION SERVICES – 5.8% | ||||||||||
tw telecom, Inc. (Diversified Telecom. Svs.) | (a) | 45,217 | 876,305 | |||||||
Crown Castle International Corp. (Wireless Telecom. Svs.) | (a) | 19,305 | 864,864 | |||||||
SBA Communications Corp. Class A (Wireless Telecom. Svs.) | (a) | 42,167 | 1,811,494 | |||||||
|
| |||||||||
| 3,552,664 | ||||||||||
|
| |||||||||
Total Common Stocks (Cost $58,897,511) | $ | 60,879,838 | ||||||||
|
| |||||||||
| 48 | (continued) |
| Ohio National Fund, Inc. | Mid Cap Opportunity Portfolio (Continued) |
Schedule of Investments | December 31, 2011 |
| Money Market Funds – 0.4% | Shares | Value | ||||||||
Fidelity Institutional Money Market Funds | 220,000 | $ | 220,000 | |||||||
|
| |||||||||
Total Money Market Funds (Cost $220,000) | $ | 220,000 | ||||||||
|
| |||||||||
Total Investments – 100.1% (Cost $59,117,511) | (b) | $ | 61,099,838 | |||||||
Liabilities in Excess of Other Assets – (0.1)% | (36,848) | |||||||||
|
| |||||||||
Net Assets – 100.0% | $ | 61,062,990 | ||||||||
|
| |||||||||
Percentages are stated as a percent of net assets.
Footnotes:
| (a) | Non-income producing security. |
| (b) | Represents cost for financial reporting purposes, which may differ from cost basis for federal income tax purposes. See also Note 7 of the Notes to Financial Statements. |
The accompanying notes are an integral part of these financial statements.
| 49 |
| Ohio National Fund, Inc. | S&P 500® Index Portfolio |
Objective/Strategy
The S&P 500® Index Portfolio seeks total return that approximates the total return of the Standard & Poor’s 500® Index (S&P 500® Index), at a risk level consistent with that of the Standard & Poor’s 500® Index.
Performance as of December 31, 2011
Average Annual Total Returns: | ||||
One year | 1.77% | |||
Five years | -0.70% | |||
Ten years | 2.41% |
Past performance does not guarantee future results. The performance data quoted represents past performance and current returns may be lower or higher. Total return figures include change in share price and reinvestment of dividends and capital gains. The investment return and principal value will fluctuate so that an investor’s shares, when redeemed, may be worth more or less than the original cost. To obtain performance information up to the most recent month end, call toll-free 1-877-781-6392.
The Portfolio is not open to direct retail investment. Beneficial interest in shares is obtained solely by purchase of variable life insurance policies and variable annuity contracts. Actual performance results for variable annuity and variable universal life contracts will be lower due to contract charges. Consult your contract for applicable charges.
Comments
For the year ended December 31, 2011, the S&P 500® Index Portfolio returned 1.77% versus 2.11% for the current benchmark, the S&P 500® Index.
The Portfolio’s correlation with the S&P 500® Index was 99.9%. The high correlation is due to the fact that the Portfolio invests in each of the 500 stocks in the index. The Portfolio also invests in the SPDR S&P 500 ETF Trust, an exchange traded fund that mimics the holdings and returns of the S&P 500® Index.(1)
The largest contributors to the index return for 2011 were Apple, Inc., Exxon Mobil Corp., International Business Machines Corp., Philip Morris International, Inc., and Pfizer, Inc. The largest detractors from the index return for 2011 were Bank of America Corp., Citigroup, Inc., The Goldman Sachs Group, Inc., JPMorgan Chase & Co., and Hewlett-Packard Co.(1)
Stocks managed to have positive returns in 2011 despite the European debt crisis, gridlock in Washington, and worries about the strength of the U.S. economic recovery. The year was marked by above average volatility as equities were moved by macro economic events. Fundamental financial analysis took a backseat to news of the strength of the Euro, U.S. budget fights on Capitol Hill, and sovereign credit downgrades.
Moving into 2012, we see the U.S. economy continuing to improve. Equity indices are trading at very low historical price to earning ratios, with companies’ earnings expected to continue to rise in 2012. We expect 2012 to be a good year for equities.
| (1) | The Portfolio’s composition is subject to change. Holdings and weightings are as of December 31, 2011. |
“Standard & Poor’s®”, “S&P®”, “S&P 500®” and “Standard & Poor’s 500” are trademarks of The McGraw-Hill Companies, Inc. and have been licensed for use by Ohio National Investments, Inc. (ONI). The S&P 500® Index Portfolio is not sponsored, endorsed, sold or promoted by Standard & Poor’s (“S&P”) and S&P makes no representation regarding the advisability of investing in the S&P 500® Index Portfolio. S&P makes no representation or warranty, express or implied, to the owners of the Portfolio or any member of the public regarding the advisability
of investing in securities generally or in the Portfolio particularly or the ability of the S&P 500® Index to track general stock market performance. S&P’s only relationship to ONI is the licensing of certain trademarks and trade names of S&P® and of the S&P 500® Index which is determined, composed and calculated by S&P® without regard to ONI or the S&P 500® Index Portfolio. S&P® has no obligation to take the needs of ONI or the owners of the Portfolio into consideration in determining, composing or calculating the S&P 500® Index. S&P® is not responsible for and has not participated in the determination of the prices and amount of the Portfolio or the timing of the issuance or sale of the Portfolio or in the determination or calculation of the equation by which the Portfolio is to be converted into cash. S&P® has no obligation or liability in connection with the administration, marketing or trading of the Portfolio.
Change in Value of $10,000 Investment
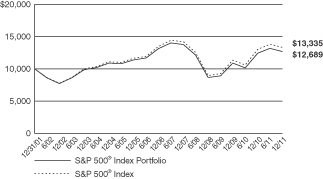
Hypothetical illustration based on past performance. Future performance will vary. The Portfolio’s returns reflect reinvested dividends. The Portfolio’s holdings may differ significantly from the securities in the index. The index is unmanaged and therefore does not reflect the cost of portfolio management and accounting. Investors cannot invest directly in an index, although they can invest in its underlying securities or funds.
The S&P 500® Index is a capitalization-weighted index designed to measure performance of the broad domestic economy through changes in the aggregate market value of 500 stocks representing all major industries. The index presented herein includes the effects of reinvested dividends.
| 50 | (continued) |
| Ohio National Fund, Inc. | S&P 500® Index Portfolio (Continued) |
Portfolio Composition as of December 31, 2011 (1)
| % of Net Assets | ||||
Common Stocks (3) | 98.2 | |||
Exchange Traded Funds | 1.6 | |||
Commercial Paper | 0.2 | |||
|
| |||
| 100.0 | ||||
|
|
Top 10 Portfolio Holdings as of December 31, 2011 (1) (2)
| % of Net Assets | ||||
1. Exxon Mobil Corp. | 3.5 | |||
2. Apple, Inc. | 3.3 | |||
3. International Business Machines Corp. | 1.9 | |||
4. Chevron Corp. | 1.8 | |||
5. Microsoft Corp. | 1.7 | |||
6. General Electric Co. | 1.6 | |||
7. SPDR S&P 500 ETF Trust | 1.6 | |||
8. Procter & Gamble Co. / The | 1.6 | |||
9. AT&T, Inc. | 1.5 | |||
10. Johnson & Johnson | 1.5 | |||
| (1) | Composition of Portfolio subject to change. |
| (2) | Short-term investments have been excluded from the list of Top 10 Portfolio Holdings. |
| (3) | Sectors: |
| % of Net Assets | ||||
Information Technology | 18.7 | |||
Financials | 13.4 | |||
Energy | 12.0 | |||
Health Care | 11.7 | |||
Consumer Staples | 11.3 | |||
Consumer Discretionary | 10.5 | |||
Industrials | 10.5 | |||
Utilities | 3.8 | |||
Materials | 3.4 | |||
Telecommunication Services | 2.9 | |||
|
| |||
| 98.2 | ||||
|
|
| 51 |
| Ohio National Fund, Inc. | S&P 500® Index Portfolio |
Schedule of Investments | December 31, 2011 |
| Common Stocks – 98.2% | Shares | Value | ||||||||
CONSUMER DISCRETIONARY – 10.5% |
| |||||||||
BorgWarner, Inc. (Auto Components) | (a) | 1,600 | $ | 101,984 | ||||||
Goodyear Tire & Rubber Co. / The (Auto Components) | (a) | 3,600 | 51,012 | |||||||
Johnson Controls, Inc. (Auto Components) | 10,000 | 312,600 | ||||||||
Ford Motor Co. (Automobiles) | (a) | 55,987 | 602,420 | |||||||
Harley-Davidson, Inc. (Automobiles) | 3,400 | 132,158 | ||||||||
Genuine Parts Co. (Distributors) | 2,300 | 140,760 | ||||||||
Apollo Group, Inc. Class A (Diversified Consumer Svs.) | (a) | 1,700 | 91,579 | |||||||
DeVry, Inc. (Diversified Consumer Svs.) | 900 | 34,614 | ||||||||
H&R Block, Inc. (Diversified Consumer Svs.) | 4,300 | 70,219 | ||||||||
Carnival Corp. (Hotels, Restaurants & Leisure) | 6,700 | 218,688 | ||||||||
Chipotle Mexican Grill, Inc. (Hotels, Restaurants & Leisure) | (a) | 450 | 151,983 | |||||||
Darden Restaurants, Inc. (Hotels, Restaurants & Leisure) | 1,900 | 86,602 | ||||||||
International Game Technology (Hotels, Restaurants & Leisure) | 4,400 | 75,680 | ||||||||
Marriott International, Inc. Class A (Hotels, Restaurants & Leisure) | 3,946 | 115,105 | ||||||||
McDonald’s Corp. (Hotels, Restaurants & Leisure) | 15,100 | 1,514,983 | ||||||||
Starbucks Corp. (Hotels, Restaurants & Leisure) | 11,000 | 506,110 | ||||||||
Starwood Hotels & Resorts Worldwide, Inc. (Hotels, Restaurants & Leisure) | 2,800 | 134,316 | ||||||||
Wyndham Worldwide Corp. (Hotels, Restaurants & Leisure) | 2,260 | 85,496 | ||||||||
Wynn Resorts Ltd. (Hotels, Restaurants & Leisure) | 1,200 | 132,588 | ||||||||
Yum! Brands, Inc. (Hotels, Restaurants & Leisure) | 6,800 | 401,268 | ||||||||
D.R. Horton, Inc. (Household Durables) | 4,100 | 51,701 | ||||||||
Harman International Industries, Inc. (Household Durables) | 1,000 | 38,040 | ||||||||
Leggett & Platt, Inc. (Household Durables) | 2,000 | 46,080 | ||||||||
Lennar Corp. Class A (Household Durables) | 2,400 | 47,160 | ||||||||
Newell Rubbermaid, Inc. (Household Durables) | 4,300 | 69,445 | ||||||||
PulteGroup, Inc. (Household Durables) | (a) | 4,950 | 31,234 | |||||||
Whirlpool Corp. (Household Durables) | 1,155 | 54,805 | ||||||||
Amazon.com, Inc. (Internet & Catalog Retail) | (a) | 5,350 | 926,085 | |||||||
Expedia, Inc. (Internet & Catalog Retail) | 1,400 | 40,628 | ||||||||
Netflix, Inc. (Internet & Catalog Retail) | (a) | 850 | 58,896 | |||||||
priceline.com, Inc. (Internet & Catalog Retail) | (a) | 725 | 339,090 | |||||||
TripAdvisor, Inc. (Internet & Catalog Retail) | (a) | 1,400 | 35,294 | |||||||
Hasbro, Inc. (Leisure Equip. & Products) | 1,700 | 54,213 | ||||||||
Mattel, Inc. (Leisure Equip. & Products) | 5,000 | 138,800 | ||||||||
Cablevision Systems Corp. Class A (Media) | 3,200 | 45,504 | ||||||||
CBS Corp. Class B (Media) | 9,650 | 261,901 | ||||||||
Comcast Corp. Class A (Media) | 40,153 | 952,028 | ||||||||
DIRECTV Class A (Media) | (a) | 10,400 | 444,704 | |||||||
Discovery Communications, Inc. Class A (Media) | (a) | 3,900 | 159,783 | |||||||
Gannett Co., Inc. (Media) | 3,500 | 46,795 | ||||||||
Interpublic Group of Cos., Inc. / The (Media) | 6,823 | 66,388 | ||||||||
McGraw-Hill Cos., Inc. / The (Media) | 4,300 | 193,371 | ||||||||
News Corp. Class A (Media) | 32,300 | 576,232 | ||||||||
Omnicom Group, Inc. (Media) | 4,100 | 182,778 | ||||||||
Scripps Networks Interactive, Inc. Class A (Media) | 1,400 | 59,388 | ||||||||
Time Warner Cable, Inc. (Media) | 4,732 | 300,813 | ||||||||
Time Warner, Inc. (Media) | 14,766 | 533,643 | ||||||||
Viacom, Inc. Class B (Media) | 8,150 | 370,091 | ||||||||
Walt Disney Co. / The (Media) | 26,400 | 990,000 | ||||||||
Washington Post Co. / The Class B (Media) | 75 | 28,261 | ||||||||
Big Lots, Inc. (Multiline Retail) | (a) | 1,000 | 37,760 | |||||||
Dollar Tree, Inc. (Multiline Retail) | (a) | 1,800 | 149,598 | |||||||
Family Dollar Stores, Inc. (Multiline Retail) | 1,700 | 98,022 | ||||||||
J.C. Penney Co., Inc. (Multiline Retail) | 2,100 | 73,815 | ||||||||
Kohl’s Corp. (Multiline Retail) | 3,700 | 182,595 | ||||||||
Macy’s, Inc. (Multiline Retail) | 6,176 | 198,744 | ||||||||
Nordstrom, Inc. (Multiline Retail) | 2,400 | 119,304 | ||||||||
Sears Holdings Corp. (Multiline Retail) | (a) | 601 | 19,100 | |||||||
Target Corp. (Multiline Retail) | 9,900 | 507,078 | ||||||||
Abercrombie & Fitch Co. Class A (Specialty Retail) | 1,300 | 63,492 | ||||||||
| Common Stocks (Continued) | Shares | Value | ||||||||
CONSUMER DISCRETIONARY (continued) |
| |||||||||
AutoNation, Inc. (Specialty Retail) | (a) | 700 | $ | 25,809 | ||||||
AutoZone, Inc. (Specialty Retail) | (a) | 425 | 138,112 | |||||||
Bed Bath & Beyond, Inc. (Specialty Retail) | (a) | 3,500 | 202,895 | |||||||
Best Buy Co., Inc. (Specialty Retail) | 4,275 | 99,907 | ||||||||
CarMax, Inc. (Specialty Retail) | (a) | 3,300 | 100,584 | |||||||
GameStop Corp. Class A (Specialty Retail) | (a) | 2,000 | 48,260 | |||||||
Gap, Inc. / The (Specialty Retail) | 5,150 | 95,532 | ||||||||
Home Depot, Inc. / The (Specialty Retail) | 22,700 | 954,308 | ||||||||
Lowe’s Cos., Inc. (Specialty Retail) | 18,400 | 466,992 | ||||||||
Limited Brands, Inc. (Specialty Retail) | 3,600 | 145,260 | ||||||||
Orchard Supply Hardware Stores Corp. Class A (Specialty Retail) | (a)(b) | 27 | 99 | |||||||
O’Reilly Automotive, Inc. (Specialty Retail) | (a) | 1,900 | 151,905 | |||||||
Ross Stores, Inc. (Specialty Retail) | 3,400 | 161,602 | ||||||||
Staples, Inc. (Specialty Retail) | 10,300 | 143,067 | ||||||||
Tiffany & Co. (Specialty Retail) | 1,900 | 125,894 | ||||||||
TJX Cos., Inc. (Specialty Retail) | 5,600 | 361,480 | ||||||||
Urban Outfitters, Inc. (Specialty Retail) | (a) | 1,600 | 44,096 | |||||||
Coach, Inc. (Textiles, Apparel & Luxury Goods) | 4,300 | 262,472 | ||||||||
NIKE, Inc. Class B (Textiles, Apparel & Luxury Goods) | 5,500 | 530,035 | ||||||||
Ralph Lauren Corp. (Textiles, Apparel & Luxury Goods) | 900 | 124,272 | ||||||||
V.F. Corp. (Textiles, Apparel & Luxury Goods) | 1,300 | 165,087 | ||||||||
|
| |||||||||
| 17,900,492 | ||||||||||
|
| |||||||||
CONSUMER STAPLES – 11.3% | ||||||||||
Beam, Inc. (Beverages) | 2,300 | 117,829 | ||||||||
Brown-Forman Corp. Class B (Beverages) | 1,450 | 116,739 | ||||||||
Coca-Cola Co. / The (Beverages) | 33,400 | 2,336,998 | ||||||||
Coca-Cola Enterprises, Inc. (Beverages) | 4,600 | 118,588 | ||||||||
Constellation Brands, Inc. Class A (Beverages) | (a) | 2,600 | 53,742 | |||||||
Dr Pepper Snapple Group, Inc. (Beverages) | 3,200 | 126,336 | ||||||||
Molson Coors Brewing Co. Class B (Beverages) | 2,300 | 100,142 | ||||||||
PepsiCo, Inc. (Beverages) | 23,047 | 1,529,168 | ||||||||
Costco Wholesale Corp. (Food & Staples Retailing) | 6,400 | 533,248 | ||||||||
CVS Caremark Corp. (Food & Staples Retailing) | 19,120 | 779,714 | ||||||||
Kroger Co. / The (Food & Staples Retailing) | 8,800 | 213,136 | ||||||||
Safeway, Inc. (Food & Staples Retailing) | 5,000 | 105,200 | ||||||||
SUPERVALU, Inc. (Food & Staples Retailing) | 3,119 | 25,326 | ||||||||
Sysco Corp. (Food & Staples Retailing) | 8,700 | 255,171 | ||||||||
Walgreen Co. (Food & Staples Retailing) | 13,100 | 433,086 | ||||||||
Wal-Mart Stores, Inc. (Food & Staples Retailing) | 25,700 | 1,535,832 | ||||||||
Whole Foods Market, Inc. (Food & Staples Retailing) | 2,400 | 166,992 | ||||||||
Archer-Daniels-Midland Co. (Food Products) | 9,850 | 281,710 | ||||||||
Campbell Soup Co. (Food Products) | 2,600 | 86,424 | ||||||||
ConAgra Foods, Inc. (Food Products) | 6,100 | 161,040 | ||||||||
Dean Foods Co. (Food Products) | (a) | 2,700 | 30,240 | |||||||
General Mills, Inc. (Food Products) | 9,500 | 383,895 | ||||||||
Hershey Co. / The (Food Products) | 2,300 | 142,094 | ||||||||
H.J. Heinz Co. (Food Products) | 4,700 | 253,988 | ||||||||
Hormel Foods Corp. (Food Products) | 2,000 | 58,580 | ||||||||
J.M. Smucker Co. / The (Food Products) | 1,700 | 132,889 | ||||||||
Kellogg Co. (Food Products) | 3,600 | 182,052 | ||||||||
Kraft Foods, Inc. Class A (Food Products) | 25,976 | 970,463 | ||||||||
McCormick & Co., Inc. (Food Products) | 2,000 | 100,840 | ||||||||
Mead Johnson Nutrition Co. (Food Products) | 2,951 | 202,822 | ||||||||
Sara Lee Corp. (Food Products) | 8,700 | 164,604 | ||||||||
Tyson Foods, Inc. Class A (Food Products) | 4,300 | 88,752 | ||||||||
Clorox Co. / The (Household Products) | 1,900 | 126,464 | ||||||||
Colgate-Palmolive Co. (Household Products) | 7,100 | 655,969 | ||||||||
Kimberly-Clark Corp. (Household Products) | 5,800 | 426,648 | ||||||||
Procter & Gamble Co. / The (Household Products) | 40,522 | 2,703,223 | ||||||||
Avon Products, Inc. (Personal Products) | 6,300 | 110,061 | ||||||||
Estee Lauder Cos., Inc. / The Class A (Personal Products) | 1,600 | 179,712 | ||||||||
Altria Group, Inc. (Tobacco) | 30,300 | 898,395 | ||||||||
| 52 | (continued) |
| Ohio National Fund, Inc. | S&P 500® Index Portfolio (Continued) |
Schedule of Investments | December 31, 2011 |
| Common Stocks (Continued) | Shares | Value | ||||||||
CONSUMER STAPLES (continued) | ||||||||||
Lorillard, Inc. (Tobacco) | 1,997 | $ | 227,658 | |||||||
Philip Morris International, Inc. (Tobacco) | 25,600 | 2,009,088 | ||||||||
Reynolds American, Inc. (Tobacco) | 5,000 | 207,100 | ||||||||
|
| |||||||||
| 19,331,958 | ||||||||||
|
| |||||||||
ENERGY – 12.0% | ||||||||||
Baker Hughes, Inc. (Energy Equip. & Svs.) | 6,441 | 313,290 | ||||||||
Cameron International Corp. (Energy Equip. & Svs.) | (a) | 3,600 | 177,084 | |||||||
Diamond Offshore Drilling, Inc. (Energy Equip. & Svs.) | 1,000 | 55,260 | ||||||||
FMC Technologies, Inc. (Energy Equip. & Svs.) | (a) | 3,500 | 182,805 | |||||||
Halliburton Co. (Energy Equip. & Svs.) | 13,500 | 465,885 | ||||||||
Helmerich & Payne, Inc. (Energy Equip. & Svs.) | 1,600 | 93,376 | ||||||||
Nabors Industries Ltd. (Energy Equip. & Svs.) | (a) | 4,200 | 72,828 | |||||||
National Oilwell Varco, Inc. (Energy Equip. & Svs.) | 6,200 | 421,538 | ||||||||
Noble Corp. (Energy Equip. & Svs.) | (a) | 3,700 | 111,814 | |||||||
Rowan Cos., Inc. (Energy Equip. & Svs.) | (a) | 1,800 | 54,594 | |||||||
Schlumberger Ltd. (Energy Equip. & Svs.) | 19,747 | 1,348,918 | ||||||||
Alpha Natural Resources, Inc. (Oil, Gas & Consumable Fuels) | (a) | 3,240 | 66,193 | |||||||
Anadarko Petroleum Corp. (Oil, Gas & Consumable Fuels) | 7,300 | 557,209 | ||||||||
Apache Corp. (Oil, Gas & Consumable Fuels) | 5,672 | 513,770 | ||||||||
Cabot Oil & Gas Corp. (Oil, Gas & Consumable Fuels) | 1,500 | 113,850 | ||||||||
Chesapeake Energy Corp. (Oil, Gas & Consumable Fuels) | 9,700 | 216,213 | ||||||||
Chevron Corp. (Oil, Gas & Consumable Fuels) | 29,338 | 3,121,563 | ||||||||
ConocoPhillips (Oil, Gas & Consumable Fuels) | 19,500 | 1,420,965 | ||||||||
Consol Energy, Inc. (Oil, Gas & Consumable Fuels) | 3,300 | 121,110 | ||||||||
Denbury Resources, Inc. (Oil, Gas & Consumable Fuels) | (a) | 5,800 | 87,580 | |||||||
Devon Energy Corp. (Oil, Gas & Consumable Fuels) | 5,900 | 365,800 | ||||||||
El Paso Corp. (Oil, Gas & Consumable Fuels) | 11,400 | 302,898 | ||||||||
EOG Resources, Inc. (Oil, Gas & Consumable Fuels) | 3,950 | 389,115 | ||||||||
EQT Corp. (Oil, Gas & Consumable Fuels) | 2,200 | 120,538 | ||||||||
Exxon Mobil Corp. (Oil, Gas & Consumable Fuels) | 70,564 | 5,981,005 | ||||||||
Hess Corp. (Oil, Gas & Consumable Fuels) | 4,400 | 249,920 | ||||||||
Marathon Oil Corp. (Oil, Gas & Consumable Fuels) | 10,320 | 302,066 | ||||||||
Marathon Petroleum Corp. (Oil, Gas & Consumable Fuels) | 5,260 | 175,105 | ||||||||
Murphy Oil Corp. (Oil, Gas & Consumable Fuels) | 2,800 | 156,072 | ||||||||
Newfield Exploration Co. (Oil, Gas & Consumable Fuels) | (a) | 2,000 | 75,460 | |||||||
Noble Energy, Inc. (Oil, Gas & Consumable Fuels) | 2,600 | 245,414 | ||||||||
Occidental Petroleum Corp. (Oil, Gas & Consumable Fuels) | 11,900 | 1,115,030 | ||||||||
Peabody Energy Corp. (Oil, Gas & Consumable Fuels) | 4,000 | 132,440 | ||||||||
Pioneer Natural Resources Co. (Oil, Gas & Consumable Fuels) | 1,800 | 161,064 | ||||||||
QEP Resources, Inc. (Oil, Gas & Consumable Fuels) | 2,600 | 76,180 | ||||||||
Range Resources Corp. (Oil, Gas & Consumable Fuels) | 2,300 | 142,462 | ||||||||
Southwestern Energy Co. (Oil, Gas & Consumable Fuels) | (a) | 5,100 | 162,894 | |||||||
Spectra Energy Corp. (Oil, Gas & Consumable Fuels) | 9,618 | 295,754 | ||||||||
Sunoco, Inc. (Oil, Gas & Consumable Fuels) | 1,600 | 65,632 | ||||||||
Tesoro Corp. (Oil, Gas & Consumable Fuels) | (a) | 2,100 | 49,056 | |||||||
Valero Energy Corp. (Oil, Gas & Consumable Fuels) | 8,200 | 172,610 | ||||||||
Williams Cos., Inc. / The (Oil, Gas & Consumable Fuels) | 8,700 | 287,274 | ||||||||
|
| |||||||||
| 20,539,634 | ||||||||||
|
| |||||||||
FINANCIALS – 13.4% | ||||||||||
Ameriprise Financial, Inc. (Capital Markets) | 3,380 | 167,783 | ||||||||
Bank of New York Mellon Corp. / The (Capital Markets) | 17,811 | 354,617 | ||||||||
BlackRock, Inc. (Capital Markets) | 1,500 | 267,360 | ||||||||
Charles Schwab Corp. / The (Capital Markets) | 15,900 | 179,034 | ||||||||
| Common Stocks (Continued) | Shares | Value | ||||||||
FINANCIALS (continued) | ||||||||||
E*Trade Financial Corp. (Capital Markets) | (a) | 3,690 | $ | 29,372 | ||||||
Federated Investors, Inc. Class B (Capital Markets) | 1,400 | 21,210 | ||||||||
Franklin Resources, Inc. (Capital Markets) | 2,100 | 201,726 | ||||||||
Goldman Sachs Group, Inc. / The (Capital Markets) | 7,250 | 655,618 | ||||||||
Invesco Ltd. (Capital Markets) | 6,600 | 132,594 | ||||||||
Legg Mason, Inc. (Capital Markets) | 1,800 | 43,290 | ||||||||
Morgan Stanley (Capital Markets) | 21,800 | 329,834 | ||||||||
Northern Trust Corp. (Capital Markets) | 3,500 | 138,810 | ||||||||
State Street Corp. (Capital Markets) | 7,200 | 290,232 | ||||||||
T. Rowe Price Group, Inc. (Capital Markets) | 3,700 | 210,715 | ||||||||
BB&T Corp. (Commercial Banks) | 10,300 | 259,251 | ||||||||
Comerica, Inc. (Commercial Banks) | 2,900 | 74,820 | ||||||||
Fifth Third Bancorp (Commercial Banks) | 13,550 | 172,356 | ||||||||
First Horizon National Corp. (Commercial Banks) | 3,864 | 30,912 | ||||||||
Huntington Bancshares, Inc. (Commercial Banks) | 12,700 | 69,723 | ||||||||
KeyCorp (Commercial Banks) | 14,000 | 107,660 | ||||||||
M&T Bank Corp. (Commercial Banks) | 1,800 | 137,412 | ||||||||
PNC Financial Services Group, Inc. (Commercial Banks) | 7,742 | 446,481 | ||||||||
Regions Financial Corp. (Commercial Banks) | 18,575 | 79,873 | ||||||||
SunTrust Banks, Inc. (Commercial Banks) | 7,900 | 139,830 | ||||||||
U.S. Bancorp (Commercial Banks) | 28,090 | 759,835 | ||||||||
Wells Fargo & Co. (Commercial Banks) | 77,613 | 2,139,014 | ||||||||
Zions Bancorporation (Commercial Banks) | 2,700 | 43,956 | ||||||||
American Express Co. (Consumer Finance) | 14,900 | 702,833 | ||||||||
Capital One Financial Corp. (Consumer Finance) | 6,773 | 286,430 | ||||||||
Discover Financial Services (Consumer Finance) | 8,050 | 193,200 | ||||||||
SLM Corp. (Consumer Finance) | 7,500 | 100,500 | ||||||||
Bank of America Corp. (Diversified Financial Svs.) | 149,227 | 829,702 | ||||||||
Citigroup, Inc. (Diversified Financial Svs.) | 43,036 | 1,132,277 | ||||||||
CME Group, Inc. (Diversified Financial Svs.) | 975 | 237,578 | ||||||||
IntercontinentalExchange, Inc. (Diversified Financial Svs.) | (a) | 1,100 | 132,605 | |||||||
JPMorgan Chase & Co. (Diversified Financial Svs.) | 55,943 | 1,860,105 | ||||||||
Leucadia National Corp. (Diversified Financial Svs.) | 2,900 | 65,946 | ||||||||
Moody’s Corp. (Diversified Financial Svs.) | 2,900 | 97,672 | ||||||||
NASDAQ OMX Group, Inc. / The (Diversified Financial Svs.) | (a) | 1,900 | 46,569 | |||||||
NYSE Euronext (Diversified Financial Svs.) | 3,900 | 101,790 | ||||||||
ACE Ltd. (Insurance) | 5,000 | 350,600 | ||||||||
Aflac, Inc. (Insurance) | 6,900 | 298,494 | ||||||||
Allstate Corp. / The (Insurance) | 7,400 | 202,834 | ||||||||
American International Group, Inc. (Insurance) | (a) | 6,395 | 148,364 | |||||||
Aon Corp. (Insurance) | 4,800 | 224,640 | ||||||||
Assurant, Inc. (Insurance) | 1,400 | 57,484 | ||||||||
Berkshire Hathaway, Inc. Class B (Insurance) | (a) | 25,891 | 1,975,483 | |||||||
Chubb Corp. / The (Insurance) | 4,100 | 283,802 | ||||||||
Cincinnati Financial Corp. (Insurance) | 2,366 | 72,068 | ||||||||
Genworth Financial, Inc. Class A (Insurance) | (a) | 7,200 | 47,160 | |||||||
Hartford Financial Services Group, Inc. (Insurance) | 6,600 | 107,250 | ||||||||
Lincoln National Corp. (Insurance) | 4,486 | 87,118 | ||||||||
Loews Corp. (Insurance) | 4,461 | 167,957 | ||||||||
Marsh & McLennan Cos., Inc. (Insurance) | 7,900 | 249,798 | ||||||||
MetLife, Inc. (Insurance) | 15,600 | 486,408 | ||||||||
Principal Financial Group, Inc. (Insurance) | 4,500 | 110,700 | ||||||||
Progressive Corp. / The (Insurance) | 9,100 | 177,541 | ||||||||
Prudential Financial, Inc. (Insurance) | 6,900 | 345,828 | ||||||||
Torchmark Corp. (Insurance) | 1,550 | 67,255 | ||||||||
Travelers Cos., Inc. / The (Insurance) | 6,059 | 358,511 | ||||||||
Unum Group (Insurance) | 4,300 | 90,601 | ||||||||
XL Group Plc (Insurance) | 4,700 | 92,919 | ||||||||
American Tower Corp. Class A (Real Estate Investment Trusts) | 5,800 | 348,058 | ||||||||
Apartment Investment & Management Co. Class A (Real Estate Investment Trusts) | 1,773 | 40,619 | ||||||||
AvalonBay Communities, Inc. (Real Estate Investment Trusts) | 1,431 | 186,889 | ||||||||
Boston Properties, Inc. (Real Estate Investment Trusts) | 2,200 | 219,120 | ||||||||
| 53 | (continued) |
| Ohio National Fund, Inc. | S&P 500® Index Portfolio (Continued) |
Schedule of Investments | December 31, 2011 |
| Common Stocks (Continued) | Shares | Value | ||||||||
FINANCIALS (continued) | ||||||||||
Equity Residential (Real Estate Investment Trusts) | 4,400 | $ | 250,932 | |||||||
HCP, Inc. (Real Estate Investment Trusts) | 6,000 | 248,580 | ||||||||
Health Care REIT, Inc. (Real Estate Investment Trusts) | 2,800 | 152,684 | ||||||||
Host Hotels & Resorts, Inc. (Real Estate Investment Trusts) | 10,402 | 153,638 | ||||||||
Kimco Realty Corp. (Real Estate Investment Trusts) | 6,000 | 97,440 | ||||||||
Plum Creek Timber Co., Inc. (Real Estate Investment Trusts) | 2,400 | 87,744 | ||||||||
ProLogis, Inc. (Real Estate Investment Trusts) | 6,739 | 192,668 | ||||||||
Public Storage (Real Estate Investment Trusts) | 2,100 | 282,366 | ||||||||
Simon Property Group, Inc. (Real Estate Investment Trusts) | 4,362 | 562,436 | ||||||||
Ventas, Inc. (Real Estate Investment Trusts) | 4,200 | 231,546 | ||||||||
Vornado Realty Trust (Real Estate Investment Trusts) | 2,693 | 206,984 | ||||||||
Weyerhaeuser Co. (Real Estate Investment Trusts) | 7,863 | 146,802 | ||||||||
CBRE Group, Inc. (Real Estate Mgmt. & Development) | (a) | 4,800 | 73,056 | |||||||
Hudson City Bancorp, Inc. (Thrifts & Mortgage Finance) | 7,800 | 48,750 | ||||||||
People’s United Financial, Inc. (Thrifts & Mortgage Finance) | 5,300 | 68,105 | ||||||||
|
| |||||||||
| 22,871,757 | ||||||||||
|
| |||||||||
HEALTH CARE – 11.7% | ||||||||||
Amgen, Inc. (Biotechnology) | 11,706 | 751,642 | ||||||||
Biogen Idec, Inc. (Biotechnology) | (a) | 3,545 | 390,127 | |||||||
Celgene Corp. (Biotechnology) | (a) | 6,500 | 439,400 | |||||||
Gilead Sciences, Inc. (Biotechnology) | (a) | 11,100 | 454,323 | |||||||
Baxter International, Inc. (Health Care Equip. & Supplies) | 8,300 | 410,684 | ||||||||
Becton Dickinson and Co. (Health Care Equip. & Supplies) | 3,200 | 239,104 | ||||||||
Boston Scientific Corp. (Health Care Equip. & Supplies) | (a) | 21,803 | 116,428 | |||||||
C.R. Bard, Inc. (Health Care Equip. & Supplies) | 1,300 | 111,150 | ||||||||
CareFusion Corp. (Health Care Equip. & Supplies) | (a) | 3,350 | 85,124 | |||||||
Covidien PLC (Health Care Equip. & Supplies) | 7,100 | 319,571 | ||||||||
DENTSPLY International, Inc. (Health Care Equip. & Supplies) | 2,100 | 73,479 | ||||||||
Edwards Lifesciences Corp. (Health Care Equip. & Supplies) | (a) | 1,700 | 120,190 | |||||||
Intuitive Surgical, Inc. (Health Care Equip. & Supplies) | (a) | 575 | 266,231 | |||||||
Medtronic, Inc. (Health Care Equip. & Supplies) | 15,500 | 592,875 | ||||||||
St. Jude Medical, Inc. (Health Care Equip. & Supplies) | 4,700 | 161,210 | ||||||||
Stryker Corp. (Health Care Equip. & Supplies) | 4,800 | 238,608 | ||||||||
Varian Medical Systems, Inc. (Health Care Equip. & Supplies) | (a) | 1,700 | 114,121 | |||||||
Zimmer Holdings, Inc. (Health Care Equip. & Supplies) | (a) | 2,670 | 142,631 | |||||||
Aetna, Inc. (Health Care Providers & Svs.) | 5,300 | 223,607 | ||||||||
AmerisourceBergen Corp. (Health Care Providers & Svs.) | 3,800 | 141,322 | ||||||||
Cardinal Health, Inc. (Health Care Providers & Svs.) | 5,100 | 207,111 | ||||||||
Cigna Corp. (Health Care Providers & Svs.) | 4,200 | 176,400 | ||||||||
Coventry Health Care, Inc. (Health Care Providers & Svs.) | (a) | 2,100 | 63,777 | |||||||
DaVita, Inc. (Health Care Providers & Svs.) | (a) | 1,400 | 106,134 | |||||||
Express Scripts, Inc. (Health Care Providers & Svs.) | (a) | 7,200 | 321,768 | |||||||
Humana, Inc. (Health Care Providers & Svs.) | 2,400 | 210,264 | ||||||||
Laboratory Corp of America Holdings (Health Care Providers & Svs.) | (a) | 1,500 | 128,955 | |||||||
McKesson Corp. (Health Care Providers & Svs.) | 3,600 | 280,476 | ||||||||
Medco Health Solutions, Inc. (Health Care Providers & Svs.) | (a) | 5,676 | 317,288 | |||||||
Patterson Cos., Inc. (Health Care Providers & Svs.) | 1,400 | 41,328 | ||||||||
Quest Diagnostics, Inc. (Health Care Providers & Svs.) | 2,300 | 133,538 | ||||||||
| Common Stocks (Continued) | Shares | Value | ||||||||
HEALTH CARE (continued) | ||||||||||
Tenet Healthcare Corp. (Health Care Providers & Svs.) | (a) | 6,350 | $ | 32,576 | ||||||
UnitedHealth Group, Inc. (Health Care Providers & Svs.) | 15,700 | 795,676 | ||||||||
WellPoint, Inc. (Health Care Providers & Svs.) | 5,100 | 337,875 | ||||||||
Cerner Corp. (Health Care Technology) | (a) | 2,100 | 128,625 | |||||||
Agilent Technologies, Inc. (Life Sciences Tools & Svs.) | (a) | 5,100 | 178,143 | |||||||
Life Technologies Corp. (Life Sciences Tools & Svs.) | (a) | 2,617 | 101,827 | |||||||
PerkinElmer, Inc. (Life Sciences Tools & Svs.) | 1,700 | 34,000 | ||||||||
Thermo Fisher Scientific, Inc. (Life Sciences Tools & Svs.) | (a) | 5,600 | 251,832 | |||||||
Waters Corp. (Life Sciences Tools & Svs.) | (a) | 1,300 | 96,265 | |||||||
Abbott Laboratories (Pharmaceuticals) | 22,900 | 1,287,667 | ||||||||
Allergan, Inc. (Pharmaceuticals) | 4,500 | 394,830 | ||||||||
Bristol-Myers Squibb Co. (Pharmaceuticals) | 24,969 | 879,908 | ||||||||
Eli Lilly & Co. (Pharmaceuticals) | 15,000 | 623,400 | ||||||||
Forest Laboratories, Inc. (Pharmaceuticals) | (a) | 3,900 | 118,014 | |||||||
Hospira, Inc. (Pharmaceuticals) | (a) | 2,410 | 73,192 | |||||||
Johnson & Johnson (Pharmaceuticals) | 40,200 | 2,636,316 | ||||||||
Merck & Co., Inc. (Pharmaceuticals) | 44,894 | 1,692,504 | ||||||||
Mylan, Inc. (Pharmaceuticals) | (a) | 6,300 | 135,198 | |||||||
Perrigo Co. (Pharmaceuticals) | 1,400 | 136,220 | ||||||||
Pfizer, Inc. (Pharmaceuticals) | 113,110 | 2,447,700 | ||||||||
Watson Pharmaceuticals, Inc. (Pharmaceuticals) | (a) | 1,900 | 114,646 | |||||||
|
| |||||||||
| 19,875,280 | ||||||||||
|
| |||||||||
INDUSTRIALS – 10.5% | ||||||||||
Boeing Co. / The (Aerospace & Defense) | 10,900 | 799,515 | ||||||||
General Dynamics Corp. (Aerospace & Defense) | 5,200 | 345,332 | ||||||||
Goodrich Corp. (Aerospace & Defense) | 1,800 | 222,660 | ||||||||
Honeywell International, Inc. (Aerospace & Defense) | 11,400 | 619,590 | ||||||||
L-3 Communications Holdings, Inc. (Aerospace & Defense) | 1,500 | 100,020 | ||||||||
Lockheed Martin Corp. (Aerospace & Defense) | 3,900 | 315,510 | ||||||||
Northrop Grumman Corp. (Aerospace & Defense) | 3,800 | 222,224 | ||||||||
Precision Castparts Corp. (Aerospace & Defense) | 2,100 | 346,059 | ||||||||
Raytheon Co. (Aerospace & Defense) | 5,100 | 246,738 | ||||||||
Rockwell Collins, Inc. (Aerospace & Defense) | 2,200 | 121,814 | ||||||||
Textron, Inc. (Aerospace & Defense) | 4,100 | 75,809 | ||||||||
United Technologies Corp. (Aerospace & Defense) | 13,300 | 972,097 | ||||||||
C.H. Robinson Worldwide, Inc. (Air Freight & Logistics) | 2,400 | 167,472 | ||||||||
Expeditors International of Washington, Inc. (Air Freight & Logistics) | 3,100 | 126,976 | ||||||||
FedEx Corp. (Air Freight & Logistics) | 4,700 | 392,497 | ||||||||
United Parcel Service, Inc. Class B (Air Freight & Logistics) | 14,200 | 1,039,298 | ||||||||
Southwest Airlines Co. (Airlines) | 11,500 | 98,440 | ||||||||
Masco Corp. (Building Products) | 5,300 | 55,544 | ||||||||
Avery Dennison Corp. (Commercial Svs. & Supplies) | 1,500 | 43,020 | ||||||||
Cintas Corp. (Commercial Svs. & Supplies) | 1,600 | 55,696 | ||||||||
Iron Mountain, Inc. (Commercial Svs. & Supplies) | 2,700 | 83,160 | ||||||||
Pitney Bowes, Inc. (Commercial Svs. & Supplies) | 2,900 | 53,766 | ||||||||
Republic Services, Inc. (Commercial Svs. & Supplies) | 4,680 | 128,934 | ||||||||
R.R. Donnelley & Sons Co. (Commercial Svs. & Supplies) | 2,800 | 40,404 | ||||||||
Stericycle, Inc. (Commercial Svs. & Supplies) | (a) | 1,300 | 101,296 | |||||||
Waste Management, Inc. (Commercial Svs. & Supplies) | 6,800 | 222,428 | ||||||||
Fluor Corp. (Construction & Engineering) | 2,500 | 125,625 | ||||||||
Jacobs Engineering Group, Inc. (Construction & Engineering) | (a) | 1,900 | 77,102 | |||||||
Quanta Services, Inc. (Construction & Engineering) | (a) | 3,100 | 66,774 | |||||||
Cooper Industries PLC (Electrical Equip.) | 2,300 | 124,545 | ||||||||
Emerson Electric Co. (Electrical Equip.) | 10,800 | 503,172 | ||||||||
Rockwell Automation, Inc. (Electrical Equip.) | 2,100 | 154,077 | ||||||||
| 54 | (continued) |
| Ohio National Fund, Inc. | S&P 500® Index Portfolio (Continued) |
Schedule of Investments | December 31, 2011 |
| Common Stocks (Continued) | Shares | Value | ||||||||
INDUSTRIALS (continued) | ||||||||||
Roper Industries, Inc. (Electrical Equip.) | 1,400 | $ | 121,618 | |||||||
3M Co. (Industrial Conglomerates) | 10,300 | 841,819 | ||||||||
Danaher Corp. (Industrial Conglomerates) | 8,400 | 395,136 | ||||||||
General Electric Co. (Industrial Conglomerates) | 155,400 | 2,783,214 | ||||||||
Tyco International Ltd. (Industrial Conglomerates) | 6,800 | 317,628 | ||||||||
Caterpillar, Inc. (Machinery) | 9,500 | 860,700 | ||||||||
Cummins, Inc. (Machinery) | 2,800 | 246,456 | ||||||||
Deere & Co. (Machinery) | 6,100 | 471,835 | ||||||||
Dover Corp. (Machinery) | 2,700 | 156,735 | ||||||||
Eaton Corp. (Machinery) | 4,900 | 213,297 | ||||||||
Flowserve Corp. (Machinery) | 800 | 79,456 | ||||||||
Illinois Tool Works, Inc. (Machinery) | 7,100 | 331,641 | ||||||||
Ingersoll-Rand PLC (Machinery) | 4,600 | 140,162 | ||||||||
Joy Global, Inc. (Machinery) | 1,500 | 112,455 | ||||||||
PACCAR, Inc. (Machinery) | 5,312 | 199,041 | ||||||||
Pall Corp. (Machinery) | 1,700 | 97,155 | ||||||||
Parker Hannifin Corp. (Machinery) | 2,200 | 167,750 | ||||||||
Snap-On, Inc. (Machinery) | 900 | 45,558 | ||||||||
Stanley Black & Decker, Inc. (Machinery) | 2,447 | 165,417 | ||||||||
Xylem, Inc. (Machinery) | 2,700 | 69,363 | ||||||||
Dun & Bradstreet Corp. / The (Professional Svs.) | 700 | 52,381 | ||||||||
Equifax, Inc. (Professional Svs.) | 1,800 | 69,732 | ||||||||
Robert Half International, Inc. (Professional Svs.) | 2,100 | 59,766 | ||||||||
CSX Corp. (Road & Rail) | 15,500 | 326,430 | ||||||||
Norfolk Southern Corp. (Road & Rail) | 4,900 | 357,014 | ||||||||
Ryder System, Inc. (Road & Rail) | 800 | 42,512 | ||||||||
Union Pacific Corp. (Road & Rail) | 7,100 | 752,174 | ||||||||
Fastenal Co. (Trading Companies & Distributors) | 4,300 | 187,523 | ||||||||
W.W. Grainger, Inc. (Trading Companies & Distributors) | 900 | 168,471 | ||||||||
|
| |||||||||
| 17,880,033 | ||||||||||
|
| |||||||||
INFORMATION TECHNOLOGY – 18.7% | ||||||||||
Cisco Systems, Inc. (Communications Equip.) | 79,100 | 1,430,128 | ||||||||
F5 Networks, Inc. (Communications Equip.) | (a) | 1,200 | 127,344 | |||||||
Harris Corp. (Communications Equip.) | 1,700 | 61,268 | ||||||||
JDS Uniphase Corp. (Communications Equip.) | (a) | 3,375 | 35,235 | |||||||
Juniper Networks, Inc. (Communications Equip.) | (a) | 7,700 | 157,157 | |||||||
Motorola Mobility Holdings, Inc. (Communications Equip.) | (a) | 3,875 | 150,350 | |||||||
Motorola Solutions, Inc. (Communications Equip.) | 4,214 | 195,066 | ||||||||
QUALCOMM, Inc. (Communications Equip.) | 24,700 | 1,351,090 | ||||||||
Apple, Inc. (Computers & Peripherals) | (a) | 13,700 | 5,548,500 | |||||||
Dell, Inc. (Computers & Peripherals) | (a) | 22,500 | 329,175 | |||||||
EMC Corp. (Computers & Peripherals) | (a) | �� | 30,000 | 646,200 | ||||||
Hewlett-Packard Co. (Computers & Peripherals) | 29,200 | 752,192 | ||||||||
Lexmark International, Inc. Class A (Computers & Peripherals) | 1,100 | 36,377 | ||||||||
NetApp, Inc. (Computers & Peripherals) | (a) | 5,300 | 192,231 | |||||||
SanDisk Corp. (Computers & Peripherals) | (a) | 3,500 | 172,235 | |||||||
Western Digital Corp. (Computers & Peripherals) | (a) | 3,400 | 105,230 | |||||||
Amphenol Corp. Class A (Electronic Equip., Instr. & Comp.) | 2,400 | 108,936 | ||||||||
Corning, Inc. (Electronic Equip., Instr. & Comp.) | 23,100 | 299,838 | ||||||||
FLIR Systems, Inc. (Electronic Equip., Instr. & Comp.) | 2,300 | 57,661 | ||||||||
Jabil Circuit, Inc. (Electronic Equip., Instr. & Comp.) | 2,700 | 53,082 | ||||||||
Molex, Inc. (Electronic Equip., Instr. & Comp.) | 2,000 | 47,720 | ||||||||
TE Connectivity Ltd. (Electronic Equip., Instr. & Comp.) | 6,200 | 191,022 | ||||||||
Akamai Technologies, Inc. (Internet Software & Svs.) | (a) | 2,600 | 83,928 | |||||||
eBay, Inc. (Internet Software & Svs.) | (a) | 16,900 | 512,577 | |||||||
Google, Inc. Class A (Internet Software & Svs.) | (a) | 3,725 | 2,405,978 | |||||||
VeriSign, Inc. (Internet Software & Svs.) | 2,300 | 82,156 | ||||||||
Yahoo!, Inc. (Internet Software & Svs.) | (a) | 18,300 | 295,179 | |||||||
Accenture PLC Class A (IT Svs.) | 9,400 | 500,362 | ||||||||
Automatic Data Processing, Inc. (IT Svs.) | 7,200 | 388,872 | ||||||||
Cognizant Technology Solutions Corp. Class A (IT Svs.) | (a) | 4,400 | 282,964 | |||||||
| Common Stocks (Continued) | Shares | Value | ||||||||
INFORMATION TECHNOLOGY (continued) | ||||||||||
Computer Sciences Corp. (IT Svs.) | 2,300 | $ | 54,510 | |||||||
Fidelity National Information Services, Inc. (IT Svs.) | 3,600 | 95,724 | ||||||||
Fiserv, Inc. (IT Svs.) | (a) | 2,100 | 123,354 | |||||||
International Business Machines Corp. (IT Svs.) | 17,350 | 3,190,318 | ||||||||
Mastercard, Inc. Class A (IT Svs.) | 1,575 | 587,192 | ||||||||
Paychex, Inc. (IT Svs.) | 4,700 | 141,517 | ||||||||
SAIC, Inc. (IT Svs.) | (a) | 4,100 | 50,389 | |||||||
Teradata Corp. (IT Svs.) | (a) | 2,500 | 121,275 | |||||||
Total System Services, Inc. (IT Svs.) | 2,377 | 46,494 | ||||||||
Visa, Inc. (IT Svs.) | 7,500 | 761,475 | ||||||||
Western Union Co. / The (IT Svs.) | 9,147 | 167,024 | ||||||||
Xerox Corp. (Office Electronics) | 20,402 | 162,400 | ||||||||
Advanced Micro Devices, Inc. (Semiconductors & Equip.) | (a) | 8,600 | 46,440 | |||||||
Altera Corp. (Semiconductors & Equip.) | 4,700 | 174,370 | ||||||||
Analog Devices, Inc. (Semiconductors & Equip.) | 4,400 | 157,432 | ||||||||
Applied Materials, Inc. (Semiconductors & Equip.) | 19,200 | 205,632 | ||||||||
Broadcom Corp. Class A (Semiconductors & Equip.) | (a) | 7,150 | 209,924 | |||||||
First Solar, Inc. (Semiconductors & Equip.) | (a) | 850 | 28,696 | |||||||
Intel Corp. (Semiconductors & Equip.) | 75,000 | 1,818,750 | ||||||||
KLA-Tencor Corp. (Semiconductors & Equip.) | 2,500 | 120,625 | ||||||||
Linear Technology Corp. (Semiconductors & Equip.) | 3,400 | 102,102 | ||||||||
LSI Corp. (Semiconductors & Equip.) | (a) | 8,300 | 49,385 | |||||||
Microchip Technology, Inc. (Semiconductors & Equip.) | 2,800 | 102,564 | ||||||||
Micron Technology, Inc. (Semiconductors & Equip.) | (a) | 14,500 | 91,205 | |||||||
Novellus Systems, Inc. (Semiconductors & Equip.) | (a) | 1,000 | 41,290 | |||||||
NVIDIA Corp. (Semiconductors & Equip.) | (a) | 9,000 | 124,740 | |||||||
Teradyne, Inc. (Semiconductors & Equip.) | (a) | 2,700 | 36,801 | |||||||
Texas Instruments, Inc. (Semiconductors & Equip.) | 16,800 | 489,048 | ||||||||
Xilinx, Inc. (Semiconductors & Equip.) | 3,900 | 125,034 | ||||||||
Adobe Systems, Inc. (Software) | (a) | 7,200 | 203,544 | |||||||
Autodesk, Inc. (Software) | (a) | 3,300 | 100,089 | |||||||
BMC Software, Inc. (Software) | (a) | 2,500 | 81,950 | |||||||
CA, Inc. (Software) | 5,400 | 109,161 | ||||||||
Citrix Systems, Inc. (Software) | (a) | 2,700 | 163,944 | |||||||
Electronic Arts, Inc. (Software) | (a) | 4,900 | 100,940 | |||||||
Intuit, Inc. (Software) | 4,400 | 231,396 | ||||||||
Microsoft Corp. (Software) | 110,200 | 2,860,792 | ||||||||
Oracle Corp. (Software) | 57,900 | 1,485,135 | ||||||||
Red Hat, Inc. (Software) | (a) | 2,800 | 115,612 | |||||||
Salesforce.com, Inc. (Software) | (a) | 2,000 | 202,920 | |||||||
Symantec Corp. (Software) | (a) | 10,894 | 170,491 | |||||||
|
| |||||||||
| 31,851,737 | ||||||||||
|
| |||||||||
MATERIALS – 3.4% | ||||||||||
Air Products & Chemicals, Inc. (Chemicals) | 3,100 | 264,089 | ||||||||
Airgas, Inc. (Chemicals) | 1,000 | 78,080 | ||||||||
CF Industries Holdings, Inc. (Chemicals) | 950 | 137,731 | ||||||||
Dow Chemical Co. / The (Chemicals) | 17,400 | 500,424 | ||||||||
Eastman Chemical Co. (Chemicals) | 2,000 | 78,120 | ||||||||
Ecolab, Inc. (Chemicals) | 4,400 | 254,364 | ||||||||
E.I. du Pont de Nemours & Co. (Chemicals) | 13,600 | 622,608 | ||||||||
FMC Corp. (Chemicals) | 1,000 | 86,040 | ||||||||
International Flavors & Fragrances, Inc. (Chemicals) | 1,200 | 62,904 | ||||||||
Monsanto Co. (Chemicals) | 7,886 | 552,572 | ||||||||
Mosaic Co. / The (Chemicals) | 4,400 | 221,892 | ||||||||
PPG Industries, Inc. (Chemicals) | 2,300 | 192,027 | ||||||||
Praxair, Inc. (Chemicals) | 4,400 | 470,360 | ||||||||
Sherwin-Williams Co. / The (Chemicals) | 1,300 | 116,051 | ||||||||
Sigma-Aldrich Corp. (Chemicals) | 1,800 | 112,428 | ||||||||
Vulcan Materials Co. (Construction Materials) | 1,900 | 74,765 | ||||||||
Ball Corp. (Containers & Packaging) | 2,400 | 85,704 | ||||||||
Bemis Co., Inc. (Containers & Packaging) | 1,500 | 45,120 | ||||||||
Owens-Illinois, Inc. (Containers & Packaging) | (a) | 2,400 | 46,512 | |||||||
Sealed Air Corp. (Containers & Packaging) | 2,400 | 41,304 | ||||||||
Alcoa, Inc. (Metals & Mining) | 15,700 | 135,805 | ||||||||
Allegheny Technologies, Inc. (Metals & Mining) | 1,600 | 76,480 | ||||||||
Cliffs Natural Resources, Inc. (Metals & Mining) | 2,100 | 130,935 | ||||||||
| 55 | (continued) |
| Ohio National Fund, Inc. | S&P 500® Index Portfolio (Continued) |
Schedule of Investments | December 31, 2011 |
| Common Stocks (Continued) | Shares | Value | ||||||||
MATERIALS (continued) | ||||||||||
Freeport-McMoRan Copper & Gold, Inc. (Metals & Mining) | 13,952 | $ | 513,294 | |||||||
Newmont Mining Corp. (Metals & Mining) | 7,300 | 438,073 | ||||||||
Nucor Corp. (Metals & Mining) | 4,700 | 185,979 | ||||||||
Titanium Metals Corp. (Metals & Mining) | 1,200 | 17,976 | ||||||||
United States Steel Corp. (Metals & Mining) | 2,100 | 55,566 | ||||||||
International Paper Co. (Paper & Forest Products) | 6,400 | 189,440 | ||||||||
MeadWestvaco Corp. (Paper & Forest Products) | 2,500 | 74,875 | ||||||||
|
| |||||||||
| 5,861,518 | ||||||||||
|
| |||||||||
TELECOMMUNICATION SERVICES – 2.9% | ||||||||||
AT&T, Inc. (Diversified Telecom. Svs.) | 87,278 | 2,639,287 | ||||||||
CenturyLink, Inc. (Diversified Telecom. Svs.) | 9,072 | 337,478 | ||||||||
Frontier Communications Corp. (Diversified Telecom. Svs.) | 14,641 | 75,401 | ||||||||
Verizon Communications, Inc. (Diversified Telecom. Svs.) | 41,700 | 1,673,004 | ||||||||
Windstream Corp. (Diversified Telecom. Svs.) | 8,596 | 100,917 | ||||||||
MetroPCS Communications, Inc. (Wireless Telecom. Svs.) | (a) | 4,300 | 37,324 | |||||||
Sprint Nextel Corp. (Wireless Telecom. Svs.) | (a) | 44,132 | 103,269 | |||||||
|
| |||||||||
| 4,966,680 | ||||||||||
|
| |||||||||
UTILITIES – 3.8% | ||||||||||
American Electric Power Co., Inc. (Electric Utilities) | 7,100 | 293,301 | ||||||||
Duke Energy Corp. (Electric Utilities) | 19,636 | 431,992 | ||||||||
Edison International (Electric Utilities) | 4,800 | 198,720 | ||||||||
Entergy Corp. (Electric Utilities) | 2,600 | 189,930 | ||||||||
Exelon Corp. (Electric Utilities) | 9,800 | 425,026 | ||||||||
FirstEnergy Corp. (Electric Utilities) | 6,134 | 271,736 | ||||||||
NextEra Energy, Inc. (Electric Utilities) | 6,200 | 377,456 | ||||||||
Northeast Utilities (Electric Utilities) | 2,600 | 93,782 | ||||||||
Pepco Holdings, Inc. (Electric Utilities) | 3,300 | 66,990 | ||||||||
Pinnacle West Capital Corp. (Electric Utilities) | 1,600 | 77,088 | ||||||||
PPL Corp. (Electric Utilities) | 8,500 | 250,070 | ||||||||
Progress Energy, Inc. (Electric Utilities) | 4,300 | 240,886 | ||||||||
Southern Co. / The (Electric Utilities) | 12,700 | 587,883 | ||||||||
AGL Resources, Inc. (Gas Utilities) | 1,686 | 71,250 | ||||||||
ONEOK, Inc. (Gas Utilities) | 1,500 | 130,035 | ||||||||
AES Corp. / The (Ind. Power Prod. & Energy Traders) | (a) | 9,500 | 112,480 | |||||||
Constellation Energy Group, Inc. (Ind. Power Prod. & Energy Traders) | 3,000 | 119,010 | ||||||||
NRG Energy, Inc. (Ind. Power Prod. & Energy Traders) | (a) | 3,400 | 61,608 | |||||||
| Common Stocks (Continued) | Shares | Value | ||||||||
UTILITIES (continued) | ||||||||||
Ameren Corp. (Multi-Utilities) | 3,600 | $ | 119,268 | |||||||
CenterPoint Energy, Inc. (Multi-Utilities) | 6,300 | 126,567 | ||||||||
CMS Energy Corp. (Multi-Utilities) | 3,700 | 81,696 | ||||||||
Consolidated Edison, Inc. (Multi-Utilities) | 4,300 | 266,729 | ||||||||
Dominion Resources, Inc. (Multi-Utilities) | 8,400 | 445,872 | ||||||||
DTE Energy Co. (Multi-Utilities) | 2,500 | 136,125 | ||||||||
Integrys Energy Group, Inc. (Multi-Utilities) | 1,112 | 60,248 | ||||||||
NiSource, Inc. (Multi-Utilities) | 4,100 | 97,621 | ||||||||
PG&E Corp. (Multi-Utilities) | 6,000 | 247,320 | ||||||||
Public Service Enterprise Group, Inc. (Multi-Utilities) | 7,400 | 244,274 | ||||||||
SCANA Corp. (Multi-Utilities) | 1,700 | 76,602 | ||||||||
Sempra Energy (Multi-Utilities) | 3,500 | 192,500 | ||||||||
TECO Energy, Inc. (Multi-Utilities) | 3,200 | 61,248 | ||||||||
Wisconsin Energy Corp. (Multi-Utilities) | 3,400 | 118,864 | ||||||||
Xcel Energy, Inc. (Multi-Utilities) | 7,100 | 196,244 | ||||||||
|
| |||||||||
| 6,470,421 | ||||||||||
|
| |||||||||
Total Common Stocks (Cost $142,813,541) | $ | 167,549,510 | ||||||||
|
| |||||||||
| Preferred Stocks – 0.0% | Shares | Value | ||||||||
CONSUMER DISCRETIONARY – 0.0% | ||||||||||
Orchard Supply Hardware Stores Corp. (Specialty Retail) | (b) | 27 | $ | 99 | ||||||
|
| |||||||||
Total Preferred Stocks (Cost $0) | $ | 99 | ||||||||
|
| |||||||||
| Exchange Traded Funds – 1.6% | Shares | Value | ||||||||
SPDR S&P 500 ETF Trust | 21,675 | $ | 2,720,213 | |||||||
|
| |||||||||
Total Exchange Traded Funds (Cost $2,683,562) | $ | 2,720,213 | ||||||||
|
| |||||||||
| Commercial Paper – 0.2% | Face Amount | Amortized Cost | ||||||||
HSBC Finance Corp. 0.030%, 01/03/2012 | $ | 441,000 | $ | 441,000 | ||||||
|
| |||||||||
Total Commercial Paper (Cost $441,000) | $ | 441,000 | ||||||||
|
| |||||||||
Total Investments – 100.0% (Cost $145,938,103) | (c) | $ | 170,710,822 | |||||||
Liabilities in Excess of Other Assets – 0.0% | (31,615) | |||||||||
|
| |||||||||
Net Assets – 100.0% | $ | 170,679,207 | ||||||||
|
| |||||||||
Percentages are stated as a percent of net assets.
Footnotes:
| (a) | Non-income producing security. |
| (b) | A market quotation for this investment was not readily available at December 31, 2011. As discussed in Note 2 of the Notes to Financial Statements, the prices for these issues were derived from estimates of fair market value using methods determined in good faith by the Fund’s Pricing Committee under the supervision of the Board. These securities represent $198, or 0.0% of the Portfolio’s net assets. |
| (c) | Represents cost for financial reporting purposes, which may differ from cost basis for federal income tax purposes. See also Note 7 of the Notes to Financial Statements. |
The accompanying notes are an integral part of these financial statements.
| 56 |
| Ohio National Fund, Inc. | Strategic Value Portfolio |
Objective/Strategy
The Strategic Value Portfolio seeks growth of capital and income by investing primarily in securities of high dividend yielding, undervalued stocks with dividend growth potential.
Performance as of December 31, 2011
Average Annual Total Returns: | ||||
One year | 14.03% | |||
Five years | -1.39% | |||
Ten years | 2.42% |
Past performance does not guarantee future results. The performance data quoted represents past performance and current returns may be lower or higher. Total return figures include change in share price and reinvestment of dividends and capital gains. The investment return and principal value will fluctuate so that an investor’s shares, when redeemed, may be worth more or less than the original cost. To obtain performance information up to the most recent month end, call toll-free 1-877-781-6392.
The Portfolio is not open to direct retail investment. Beneficial interest in shares is obtained solely by purchase of variable life insurance policies and variable annuity contracts. Actual performance results for variable annuity and variable universal life contracts will be lower due to contract charges. Consult your contract for applicable charges.
Comments
For the year ended December 31, 2011, the Strategic Value Portfolio returned 14.03% versus 12.42% for the current benchmark, the Dow Jones U.S. Select Dividend Index.
The year began full of hope and optimism as robust consumer spending and domestic manufacturing data translated to expectations of continued and sustainable growth for 2011. Corporate earnings got off to a good start and the markets responded accordingly, jumping up handsomely in January and February. However, events in March took some luster off of the first quarter’s shine. Japan endured a horrific earthquake, tsunami, and nuclear disaster while war waged in Libya, courtesy of Moammar Gadhafi. Domestically, housing continued to weaken and consumer confidence took a hit, but the quarter was still able to pull off a positive return.
With the arrival of spring came continued cause for concern. The global economy was beginning to feel the effects of March’s natural disaster in Japan as supply chain issues began to impact business, especially automobile inventories. The rapid growth in China appeared to be slowing. U.S. debt ceiling talks in Congress were not progressing well and the inability to reach compromises on spending cuts foreshadowed future difficulties. The U.S. labor market was struggling, and manufacturing reports that had been positive at the beginning of the year began to turn sour. European debt concerns then came into the spotlight, roiling markets. Debt downgrades hit several countries within the European Union including Greece, Italy, and Spain, and a Greek default began to seem more and more plausible. Contagion fears among European sovereigns spooked investors, especially as political leaders in Europe seemed unable to come up with a resolution to their problems. The quarter finished rather flat, but the momentum of the markets was clearly negative as the year reached its halfway point.
As the market headed south, economic data within the U.S. did too. Unemployment ticked up in July and, consequently, manufacturing and consumer spending slowed as businesses and consumers prepared for a downturn. While the European debt crisis and its lack of a resolution continued to plague the market, another situation started
becoming more prevalent, also to the chagrin of investors. The U.S. debt ceiling debate escalated, and an August 2nd deadline to raise the debt ceiling got closer and closer without any Congressional action. America’s legislators finally reached an agreement at the 11th hour to avoid a U.S. default, but the so-called resolution left many issues unresolved and followed a much too familiar pattern of kicking the can down the road. This act of Congress also failed to prevent Standard & Poor’s from downgrading U.S. debt from AAA to AA+, the first such downgrade in the nation’s history. Topping off the turmoil, first quarter and second quarter gross domestic product figures were revised lower, suggesting the slowest period of economic expansion since the recession ended. These events prompted the Federal Reserve to take action, and they responded with Operation Twist. This easing measure, also dubbed by some as QE 2 1/2, was designed to drive long term interest rates down as the Federal Reserve began extending its holdings’ maturities by replacing short-term Treasuries with long-term Treasuries.
As summer turned to fall, things finally began to look a little rosier for investors. A tentative EuroZone bailout plan emerged and companies began to show good third quarter earnings. Auto and retail sales swung up and reports indicated a strong back-to-school season, raising hopes for strong sales in the upcoming holiday season. As the fourth quarter went on, other positives emerged. China made a surprise easing move by cutting its reserve requirement for the first time in three years, demonstrating a desire to foster more economic growth. In Europe, officials attempted to calm contagion fears with a coordinated action from the Federal Reserve, the European Central Bank, and central banks in Canada, England, Japan, and Switzerland. A joint move was launched to provide cheap, emergency U.S. dollar loans to banks in Europe and elsewhere, if needed, to alleviate concerns about potential stresses in the global financial system. Better jobs data emerged, as well as better manufacturing and consumer spending data. The year ended with a positive return for the fourth quarter, and overall, the market advanced modestly over the course of another volatile year.
The Portfolio posted a 14.03% return for the year, besting the 12.42% return of the Dow Jones U.S. Select Dividend Index, which aims to reflect the domestic dividend-paying universe. The Portfolio invests in high yielding, high quality, defensive stocks in order to meet its objectives of delivering high dividend yield and dividend growth. Fortunately for the Portfolio, these types of stocks turned out to be the top performers of 2011. Utilities, Consumer Staples, and Health Care led the way among sectors, and the Portfolio’s respective weights of 16.4%, 24.7%, and 19.3% proved to be a tailwind for returns. These sectors provided the highest contributions to total return, as did the stocks within them. The top five stock contributors were Bristol-Myers Squibb Co., Philip Morris International, Inc., Duke Energy Corp., Eli Lilly & Co., and GlaxoSmithKline PLC. The Consumer Staples and Health Care sectors also accounted for four of the five best performing stocks of the year, Lorillard, Inc., Philip Morris International Inc., Bristol-Myers Squibb Co., McDonald’s Corp., Reynolds American, Inc.(1)
The Portfolio further benefited from foregoing investments within the cyclical Industrials and Materials sectors, which were laggards for the year. The Portfolio’s absence in these non-dividend-friendly sectors prevented exposure to their negative returns and contributed to significant out-performance relative to the Dow Jones U.S. Select Dividend Index, which had notable weights in Industrials (14.3%) and Materials (6.5%). The Portfolio only saw negative returns from one sector, Financials. One of the holdings in this sector, New York Community Bancorp, Inc., was the Portfolio’s largest detractor from total return. The other largest detractors from total
| 57 | (continued) |
| Ohio National Fund, Inc. | Strategic Value Portfolio (Continued) |
return were Telefonica SA, CenturyLink, Inc., Avon Products, Inc., and Windstream Corp.(1)
In spite of its negative return, the Financials sector still provided out-performance relative to the Dow Jones U.S. Select Dividend Index, as the Portfolio’s small weight of 5.7% minimized losses. That being said, two of the Portfolio’s five worst performing securities came from the Financials sector: Avon Products, Inc., New York Community Bancorp, Inc., Commonwealth REIT, Telefonica SA, and CenturyLink, Inc.(1)
Collectively, the weights of the five worst performing securities accounted for only 7.7% of the Portfolio, so although these stocks negatively impacted total return, the weights were small enough to prevent any significant detriment to the Portfolio’s overall return. (1)
As a dividend-focused product, the Portfolio achieved its goals of delivering high dividend yield and moderate dividend growth, which ultimately translated into attractive long-term total return for its investors, as expected. The Portfolio ended the year with a dividend yield of 4.7%, eclipsing the 4.0% yield of the Dow Jones U.S. Select Dividend Index. There was also ample dividend growth in 2011. Of its 42 holdings, the Portfolio experienced an impressive 37 dividend increases throughout the year. A notable increase in December came from BCE, Inc., which has now increased its dividend six times over the past three years. BCE, Inc. is also one of nine holdings within the Portfolio to raise their dividends by 10% or more in 2011. Additionally, the Portfolio experienced a special dividend during the year as Vodafone Group PLC announced that it would be distributing £2.0 billion (approximately $3.1 billion) to shareholders following the cash inflow it received courtesy of Verizon Wireless. The Portfolio experienced one dividend cut in December as Telefonica SA announced that it will adjust its fiscal 2012 dividend to €1.30 from the current level of €1.60, reducing the dividend yield from 10.1% to 8.2%. Despite the cut, Telefonica SA continues to be an attractive dividend stock with an extremely high yield. (1)
The Portfolio’s ability to meet its dividend yield and dividend growth objectives is extremely important given our belief that these factors are the primary drivers of total return. In addition to the obvious total return impact of dividends received, we believe that returns are also affected by dividend growth. We believe that dividend growth will ultimately propel a security’s price higher since a stock’s value should rise as its dividend trajectory rises. As such, we believe that a Portfolio comprised of stocks that have the ability and inclination to pay and increase their dividends will provide superior long-term total returns. This turned out to be the case in 2011, as the Portfolio succeeded in achieving its dividend-related objectives and total return benefited accordingly.
As we enter 2012, several issues are likely to impact the market. We expect that the ongoing debt crisis in Europe will be closely watched and the markets will continue to seesaw with each resolution and setback until investors can believe that the issue is resolved one way or another. Domestically, the U.S. will be going through a presidential election year and candidates will be pressured for job creation ideas to lower unemployment and instigate economic growth. How the election swings will be of significant interest. Until that time, the domestic labor and housing markets will be in focus as investors hope for signs of growth as the country enters another year of a near-zero interest rate environment. Investors will also have an eye on emerging markets as countries like China continue to have a larger impact on the global economy.
Regardless of what plays out in 2012, the Portfolio provides a consistent, unwavering approach to investing that is focused on the basic principle that dividend yield and dividend growth are the drivers of long-term total return. With a Portfolio comprised of high yielding, high quality, low beta stocks that consistently and reliably pay and increase their dividends to shareholders, the Portfolio is able to provide investors with both a generous income stream and a strategy positioned to achieve superior long-term total returns.
| (1) | The Portfolio’s composition is subject to change. Holdings and weightings are as of December 31, 2011. |
Change in Value of $10,000 Investment
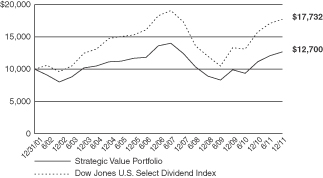
Hypothetical illustration based on past performance. Future performance will vary. The Portfolio’s returns reflect reinvested dividends. The Portfolio’s holdings may differ significantly from the securities in the index. The index is unmanaged and therefore does not reflect the cost of portfolio management and accounting.
The Dow Jones U.S. Select Dividend Index is comprised of all dividend-paying companies in the Dow Jones U.S. Index that have a non-negative historical five-year dividend-per-share growth rate, a five-year average dividend to earnings-per-share ratio of less than or equal to 60%, and a three-month average daily trading volume of 200,000 shares. Current index components are included in the universe regardless of their dividend payout ratio. The Dow Jones U.S. Index aims to consistently represent the top 95% of U.S. companies based on float-adjusted market capitalization, excluding the very smallest and least-liquid stocks. The index presented includes the effects of reinvested dividends.
| 58 | (continued) |
| Ohio National Fund, Inc. | Strategic Value Portfolio (Continued) |
Portfolio Composition as of December 31, 2011 (1)
| % of Net Assets | ||||
Common Stocks (3) | 94.2 | |||
Money Market Funds and | 5.8 | |||
|
| |||
| 100.0 | ||||
|
|
Top 10 Portfolio Holdings as of December 31, 2011 (1) (2)
| % of Net Assets | ||||
1. AT&T, Inc. | 4.1 | |||
2. Verizon Communications, Inc. | 3.7 | |||
3. Johnson & Johnson | 3.6 | |||
4. Eli Lilly & Co. | 3.5 | |||
5. Total S.A. | 3.5 | |||
6. AstraZeneca PLC | 3.3 | |||
7. Royal Dutch Shell PLC | 3.3 | |||
8. National Grid PLC | 3.3 | |||
9. Bristol-Myers Squibb Co. | 3.2 | |||
10. Altria Group, Inc. | 3.2 | |||
| (1) | Composition of Portfolio subject to change. |
| (2) | Short-term investments have been excluded from the list of Top 10 Portfolio Holdings. |
| (3) | Sectors: |
| % of Net Assets | ||||
Consumer Staples | 27.2 | |||
Health Care | 19.7 | |||
Telecommunication Services | 18.6 | |||
Utilities | 14.8 | |||
Energy | 10.7 | |||
Consumer Discretionary | 1.7 | |||
Financials | 1.5 | |||
|
| |||
| 94.2 | ||||
|
|
| 59 |
| Ohio National Fund, Inc. | Strategic Value Portfolio |
Schedule of Investments | December 31, 2011 |
| Common Stocks – 94.2% | Shares | Value | ||||||||
CONSUMER DISCRETIONARY – 1.7% | ||||||||||
McDonald’s Corp. (Hotels, Restaurants & Leisure) | 7,025 | $ | 704,818 | |||||||
|
| |||||||||
CONSUMER STAPLES – 27.2% | ||||||||||
Coca-Cola Co. / The (Beverages) | 4,115 | 287,927 | ||||||||
PepsiCo, Inc. (Beverages) | 13,100 | 869,185 | ||||||||
General Mills, Inc. (Food Products) | 15,800 | 638,478 | ||||||||
H.J. Heinz Co. (Food Products) | 19,175 | 1,036,217 | ||||||||
Kellogg Co. (Food Products) | 19,700 | 996,229 | ||||||||
Unilever PLC (Food Products) | (a) | 30,610 | 1,026,471 | |||||||
Kimberly-Clark Corp. (Household Products) | 17,075 | 1,256,037 | ||||||||
Procter & Gamble Co. / The (Household Products) | 16,760 | 1,118,060 | ||||||||
Avon Products, Inc. (Personal Products) | 18,200 | 317,954 | ||||||||
Altria Group, Inc. (Tobacco) | 45,120 | 1,337,808 | ||||||||
Lorillard, Inc. (Tobacco) | 2,750 | 313,500 | ||||||||
Philip Morris International, Inc. (Tobacco) | 14,235 | 1,117,163 | ||||||||
Reynolds American, Inc. (Tobacco) | 26,820 | 1,110,884 | ||||||||
|
| |||||||||
| 11,425,913 | ||||||||||
|
| |||||||||
ENERGY – 10.7% | ||||||||||
Chevron Corp. (Oil, Gas & Consumable Fuels) | 4,350 | 462,840 | ||||||||
ConocoPhillips (Oil, Gas & Consumable Fuels) | 16,505 | 1,202,719 | ||||||||
Royal Dutch Shell PLC (Oil, Gas & Consumable Fuels) | (a) | 36,520 | 1,389,133 | |||||||
Total S.A. (Oil, Gas & Consumable Fuels) | (a) | 28,520 | 1,455,312 | |||||||
|
| |||||||||
| 4,510,004 | ||||||||||
|
| |||||||||
FINANCIALS – 1.5% | ||||||||||
Cincinnati Financial Corp. (Insurance) | 10,000 | 304,600 | ||||||||
New York Community Bancorp, Inc. (Thrifts & Mortgage Finance) | 24,400 | 301,828 | ||||||||
|
| |||||||||
| 606,428 | ||||||||||
|
| |||||||||
HEALTH CARE – 19.7% | ||||||||||
Abbott Laboratories (Pharmaceuticals) | 22,350 | 1,256,741 | ||||||||
AstraZeneca PLC (Pharmaceuticals) | (a) | 30,100 | 1,390,369 | |||||||
Bristol-Myers Squibb Co. (Pharmaceuticals) | 38,275 | 1,348,811 | ||||||||
Eli Lilly & Co. (Pharmaceuticals) | 35,600 | 1,479,536 | ||||||||
GlaxoSmithKline PLC (Pharmaceuticals) | (a) | 57,316 | 1,305,988 | |||||||
Johnson & Johnson (Pharmaceuticals) | 22,960 | 1,505,717 | ||||||||
|
| |||||||||
| 8,287,162 | ||||||||||
|
| |||||||||
| Common Stocks (Continued) | Shares | Value | ||||||||
TELECOMMUNICATION SERVICES – 18.6% | ||||||||||
AT&T, Inc. (Diversified Telecom. Svs.) | 56,300 | $ | 1,702,512 | |||||||
BCE, Inc. (Diversified Telecom. Svs.) | 21,280 | 887,128 | ||||||||
CenturyLink, Inc. (Diversified Telecom. Svs.) | 30,225 | 1,124,370 | ||||||||
Telefonica SA (Diversified Telecom. Svs.) | (a) | 43,464 | 748,803 | |||||||
Verizon Communications, Inc. (Diversified Telecom. Svs.) | 38,220 | 1,533,386 | ||||||||
Windstream Corp. (Diversified Telecom. Svs.) | 43,105 | 506,053 | ||||||||
Vodafone Group PLC–ADR (Wireless Telecom. Svs.) | 46,770 | 1,310,963 | ||||||||
|
| |||||||||
| 7,813,215 | ||||||||||
|
| |||||||||
UTILITIES – 14.8% | ||||||||||
Duke Energy Corp. (Electric Utilities) | 53,920 | 1,186,240 | ||||||||
Pepco Holdings, Inc. (Electric Utilities) | 21,200 | 430,360 | ||||||||
Pinnacle West Capital Corp. (Electric Utilities) | 7,200 | 346,896 | ||||||||
PPL Corp. (Electric Utilities) | 25,200 | 741,384 | ||||||||
Southern Co. / The (Electric Utilities) | 24,560 | 1,136,882 | ||||||||
Consolidated Edison, Inc. (Multi-Utilities) | 6,000 | 372,180 | ||||||||
Dominion Resources, Inc. (Multi-Utilities) | 5,025 | 266,727 | ||||||||
National Grid PLC (Multi-Utilities) | (a) | 141,400 | 1,366,732 | |||||||
SCANA Corp. (Multi-Utilities) | 7,875 | 354,847 | ||||||||
|
| |||||||||
| 6,202,248 | ||||||||||
|
| |||||||||
Total Common Stocks (Cost $35,051,835) | $ | 39,549,788 | ||||||||
|
| |||||||||
| Money Market Funds – 1.6% | Shares | Value | ||||||||
Fidelity Institutional Money Market Funds | 656,000 | $ | 656,000 | |||||||
|
| |||||||||
Total Money Market Funds (Cost $656,000) | $ | 656,000 | ||||||||
|
| |||||||||
Total Investments – 95.8% (Cost $35,707,835) | (b) | $ | 40,205,788 | |||||||
Other Assets in Excess of Liabilities – 4.2% | 1,778,073 | |||||||||
|
| |||||||||
Net Assets – 100.0% | $ | 41,983,861 | ||||||||
|
| |||||||||
Percentages are stated as a percent of net assets.
Abbreviations:
ADR: American Depositary Receipts
Footnotes:
| (a) | Security traded on a foreign exchange has been valued at an estimate of fair value that is different than the local market close price. These fair value estimates are determined by an independent fair valuation service that has been approved by the Board. These securities represent $8,682,808, or 20.7% of the Portfolio’s net assets. |
Other Portfolio securities are not subjected to fair value procedures because they are traded on domestic or foreign exchanges that have close times that are consistent with the U.S. market close, normally 4:00 pm Eastern Time.
| (b) | Represents cost for financial reporting purposes, which may differ from cost basis for federal income tax purposes. See also Note 7 of the Notes to Financial Statements. |
The accompanying notes are an integral part of these financial statements.
| 60 |
| Ohio National Fund, Inc. | High Income Bond Portfolio |
Objective/Strategy
The High Income Bond Portfolio seeks high current income by investing at least 80% of its net assets in lower rated corporate debt obligations commonly referred to as “junk bonds”. The Portfolio’s investments are generally rated Ba or lower by Moody’s, or BB or lower by Standard & Poor’s or Fitch.
Performance as of December 31, 2011
Average Annual Total Returns: | ||||
One year | 5.36% | |||
Five years | 6.76% | |||
Ten years | 8.31% |
Past performance does not guarantee future results. The performance data quoted represents past performance and current returns may be lower or higher. Total return figures include change in share price and reinvestment of dividends and capital gains. The investment return and principal value will fluctuate so that an investor’s shares, when redeemed, may be worth more or less than the original cost. To obtain performance information up to the most recent month end, call toll-free 1-877-781-6392.
The Portfolio is not open to direct retail investment. Beneficial interest in shares is obtained solely by purchase of variable life insurance policies and variable annuity contracts. Actual performance results for variable annuity and variable universal life contracts will be lower due to contract charges. Consult your contract for applicable charges.
Comments
For the year ended December 31, 2011, the High Income Bond Portfolio returned 5.36% versus 4.96% for the current benchmark, the Barclays Capital High Yield 2% Issuer Constrained Index (“BCHY2%ICI”).
The high yield market endured substantial month-to-month volatility during the year. Two major factors drove the volatility. First, there was substantial uncertainty as to the strength of the U.S. economy. While the year started and ended with some optimism that a path of slow but sustainable economic growth was the most likely outcome, the middle part of the year was characterized by concerns that growth was faltering and a “double-dip” recession was at hand. Second, substantial uncertainty was generated by government debt concerns in the EuroZone. At the beginning of the year, these concerns were focused mainly on Greece and Portugal. However, by the end of the year, concerns had spread to Italy, Spain, and France. Concerns about economic growth for the region as a whole also persisted as fiscal austerity plans in many countries will likely slow overall economic activity in the EuroZone. Despite these macro uncertainties, the one constant from a high yield perspective has been the overall strength in corporate credit conditions. Strong earnings, large cash balances, solid balance sheets, and a desire to reduce overall financial risk characterized corporate credit markets. For example, the default rate, as calculated by the Altman & Kuehne High-Yield Bond Default and Return Report and New York University, was 0.66% for the first nine months of 2011 after totaling just 1.13% for all of 2010. Both of these rates are well below the 3.56% average rate between 1978 and 2010. However, the overall macro concerns tended to offset the positive of corporate credit conditions as shown by a widening in the yield spread between high yield bonds and U.S. Treasury securities which, according to the Credit Suisse High Yield Bond Index, increased from 571 basis points on December 31, 2010 to 728 basis points on December 31, 2011.
Within the high-yield market, major industry sectors that substantially outperformed the overall BCHY2%ICI included the media-cable,
natural gas utilities, food & beverage, energy, and lodging sectors. Major industry sectors that substantially underperformed the overall BCHY2%ICI included the home construction, transportation, wireless communications, consumer products, and industrial-other. From a ratings quality perspective, the higher quality more interest rate sensitive BB-rated sector led the way with a total return of 6.81% followed by the B-rated sector at 5.41% with the lower quality CCC-rated sector well behind at 1.18%.
The Portfolio outperformed the BCHY2%ICI. The main reason for the Portfolio’s out-performance was outstanding security selection, which more than offset an overweight to the poor performing CCC-rated quality sector and an underweight to the strong performing BB-rated quality sector. Security selection was particularly strong in the gaming, paper, services, technology, transportation, and wireless telecommunication industry sectors. Strong security selection in the consumer products and media — non cable sectors more than offset over weights in these weak performing industry sectors while strong security selection in the Energy sector more than offset an underweight in the strong performing Industrials sector. A substantial underweight in the weak performing home construction sector also aided performance. Specific Portfolio holdings that substantially outperformed the BCHY2%ICI included: Petrohawk Energy Corp., Universal City Development Partners Ltd./UCDP Finance, Inc., Diversey Holdings, Inc., Nalco Co., Sealed Air Corp., Brigham Exploration Co., and Macy’s Retail Holdings, Inc.(1)
The Portfolio was negatively impacted by poor security selection in the automotive and electric utility sectors. Also, an overweight to the poor performing industrial-other sector and an underweight to the strong performing wireline and electric utility sectors hindered performance. Specific Portfolio holdings that substantially underperformed the BCHY2%ICI included: Aquilex Holdings LLC/Aquilex Finance Corp., Texas Competitive Electric Holdings Co. LLC/TCEH Finance, Inc., American Standard Americas, ATP Oil, and Gas Corp., Momentive Performance Materials, Inc., Exide Technologies, and Houghton Mifflin Harcourt Publishers, Inc./Houghton Mifflin Harcourt Publishing.(1)
Domestic economic performance will likely prove to be the main performance driver of high yield bonds in early 2012. It is encouraging that the economy seemed to exit 2011 on a strong note. However, debt problems in the EuroZone and inaction by domestic politicians on U.S. budget and debt issues will most likely continue to dominate headlines, providing a somber tone. From a high yield prospective, above average yield spreads and strong corporate credit conditions should continue to benefit high yield securities.
| (1) | The Portfolio’s composition is subject to change. Holdings and weightings are as of December 31, 2011. |
| 61 | (continued) |
| Ohio National Fund, Inc. | High Income Bond Portfolio (Continued) |
Change in Value of $10,000 Investment
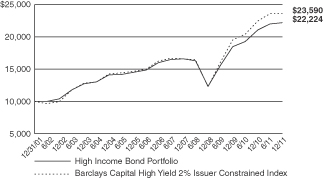
Hypothetical illustration based on past performance. Future performance will vary. All returns reflect reinvested dividends. The Portfolio’s holdings may differ significantly from the securities in the index. The index is unmanaged and therefore does not reflect the cost of Portfolio management or trading. Neither the Portfolio nor the index is open to direct investment.
The Barclays Capital High Yield 2% Issuer Constrained Index is the 2% Issuer Cap component of the Barclays Capital U.S. Corporate High Yield Bond Index. The Barclays Capital U.S. Corporate High Yield Bond Index is an unmanaged index that includes all fixed income securities having a maximum quality rating of Ba1, a minimum amount outstanding of $150 million, and a least 1 year to maturity. The 2% Issuer Cap component limits an issuer to 2% of the aggregate market capitalization. The index is presented on a total return basis.
Portfolio Composition as of December 31, 2011 (1)
| % of Net Assets | ||||
Corporate Bonds (3) | 96.2 | |||
Preferred Stocks (3) | 0.1 | |||
Money Market Funds and | 3.7 | |||
|
| |||
| 100.0 | ||||
|
|
Top 10 Portfolio Holdings as of December 31, 2011 (1) (2)
| % of Net Assets | ||||
1. CIT Group, Inc. | 2.1 | |||
2. Ford Motor Credit Co. LLC | 1.2 | |||
3. Biomet, Inc. | 1.0 | |||
4. Ally Financial, Inc. | 1.0 | |||
5. International Lease Finance Corp. 8.750%, 03/15/2017 | 0.9 | |||
6. HCA, Inc. | 0.9 | |||
7. Intelsat Jackson Holdings SA | 0.8 | |||
8. VWR Funding, Inc. | 0.8 | |||
9. Michael Foods, Inc. | 0.8 | |||
10. Sprint Capital Corp. | 0.8 | |||
| (1) | Composition of Portfolio subject to change. |
| (2) | Short-term investments have been excluded from the list of Top 10 Portfolio Holdings. |
| (3) | Sectors (combined): |
| % of Net Assets | ||||
Consumer Discretionary | 29.1 | |||
Industrials | 12.7 | |||
Information Technology | 9.8 | |||
Health Care | 9.3 | |||
Materials | 8.6 | |||
Energy | 8.1 | |||
Financials | 7.2 | |||
Telecommunication Services | 5.1 | |||
Consumer Staples | 4.6 | |||
Utilities | 1.8 | |||
|
| |||
| 96.3 | ||||
|
|
| 62 |
| Ohio National Fund, Inc. | High Income Bond Portfolio |
Schedule of Investments | December 31, 2011 |
| Corporate Bonds – 96.2% | Rate | Maturity | Face Amount | Value | ||||||||||||
CONSUMER DISCRETIONARY – 29.1% | ||||||||||||||||
Allison Transmission, Inc. (Auto Components) | (b) | 7.125% | 05/15/2019 | $ | 600,000 | $ | 591,000 | |||||||||
American Axle & Manufacturing Holdings, Inc. (Auto Components) | (b) | 9.250% | 01/15/2017 | 720,000 | 784,800 | |||||||||||
American Tire Distributors, Inc. (Auto Components) | 9.750% | 06/01/2017 | 650,000 | 672,750 | ||||||||||||
Cooper-Standard Automotive, Inc. (Auto Components) | 8.500% | 05/01/2018 | 775,000 | 814,719 | ||||||||||||
Dana Holding Corp. (Auto Components) | 6.750% | 02/15/2021 | 100,000 | 103,000 | ||||||||||||
Dana Holding Corp. (Auto Components) | 6.500% | 02/15/2019 | 100,000 | 101,500 | ||||||||||||
Exide Technologies (Auto Components) | 8.625% | 02/01/2018 | 1,275,000 | 988,125 | ||||||||||||
International Automotive Components Group SL (Auto Components) | (b) | 9.125% | 06/01/2018 | 1,150,000 | 1,035,000 | |||||||||||
Lear Corp. (Auto Components) | 8.125% | 03/15/2020 | 75,000 | 82,875 | ||||||||||||
Pittsburgh Glass Works LLC (Auto Components) | (b) | 8.500% | 04/15/2016 | 925,000 | 894,937 | |||||||||||
Stoneridge, Inc. (Auto Components) | (b) | 9.500% | 10/15/2017 | 725,000 | 746,750 | |||||||||||
Tenneco, Inc. (Auto Components) | 7.750% | 08/15/2018 | 325,000 | 346,125 | ||||||||||||
Tenneco, Inc. (Auto Components) | 6.875% | 12/15/2020 | 450,000 | 463,500 | ||||||||||||
Tomkins LLC (Auto Components) | 9.000% | 10/01/2018 | 725,000 | 807,469 | ||||||||||||
Tower Automotive Holdings U.S.A. LLC / T.A. Holdings Finance, Inc. (Auto Components) | (b) | 10.625% | 09/01/2017 | 450,000 | 454,500 | |||||||||||
UCI International, Inc. (Auto Components) | 8.625% | 02/15/2019 | 1,275,000 | 1,243,125 | ||||||||||||
Chrysler Group LLC / CG Co-Issuer, Inc. (Automobiles) | (b) | 8.250% | 06/15/2021 | 1,050,000 | 960,750 | |||||||||||
Chrysler Group LLC / CG Co-Issuer, Inc. (Automobiles) | (b) | 8.000% | 06/15/2019 | 525,000 | 483,000 | |||||||||||
Jaguar Holding Co. II / Jaguar Merger Sub, Inc. (Automobiles) | (b) | 9.500% | 12/01/2019 | 875,000 | 923,125 | |||||||||||
Jaguar Land Rover PLC (Automobiles) | (b) | 8.125% | 05/15/2021 | 725,000 | 685,125 | |||||||||||
Affinia Group, Inc. (Distributors) | (b) | 10.750% | 08/15/2016 | 475,000 | 517,750 | |||||||||||
Affinia Group, Inc. (Distributors) | 9.000% | 11/30/2014 | 450,000 | 447,750 | ||||||||||||
Knowledge Learning Corp. (Diversified Consumer Svs.) | (b) | 7.750% | 02/01/2015 | 1,150,000 | 1,078,125 | |||||||||||
American Casino & Entertainment Properties LLC (Hotels, Restaurants & Leisure) | 11.000% | 06/15/2014 | 825,000 | 843,562 | ||||||||||||
Ameristar Casinos, Inc. (Hotels, Restaurants & Leisure) | 7.500% | 04/15/2021 | 550,000 | 569,250 | ||||||||||||
Caesars Entertainment Operating Co., Inc. (Hotels, Restaurants & Leisure) | 11.250% | 06/01/2017 | 1,500,000 | 1,599,375 | ||||||||||||
Cedar Fair LP / Canada’s Wonderland Co. / Magnum Management Corp. (Hotels, Restaurants & Leisure) | 9.125% | 08/01/2018 | 1,000,000 | 1,092,500 | ||||||||||||
DineEquity, Inc. (Hotels, Restaurants & Leisure) | 9.500% | 10/30/2018 | 1,575,000 | 1,699,031 | ||||||||||||
Great Canadian Gaming Corp. (Hotels, Restaurants & Leisure) | (b) | 7.250% | 02/15/2015 | 1,325,000 | 1,344,875 | |||||||||||
Jacobs Entertainment, Inc. (Hotels, Restaurants & Leisure) | 9.750% | 06/15/2014 | 1,100,000 | 1,023,000 | ||||||||||||
MGM Resorts International (Hotels, Restaurants & Leisure) | 7.500% | 06/01/2016 | 1,900,000 | 1,828,750 | ||||||||||||
MGM Resorts International (Hotels, Restaurants & Leisure) | 11.125% | 11/15/2017 | 225,000 | 257,625 | ||||||||||||
NPC International, Inc. / NPC Operating Co. A, Inc. / NPC Operating Co. B, Inc. (Hotels, Restaurants & Leisure) | (b) | 10.500% | 01/15/2020 | 1,300,000 | 1,313,000 | |||||||||||
Peninsula Gaming LLC / Peninsula Gaming Corp. (Hotels, Restaurants & Leisure) | 10.750% | 08/15/2017 | 700,000 | 736,750 | ||||||||||||
Peninsula Gaming LLC / Peninsula Gaming Corp. (Hotels, Restaurants & Leisure) | 8.375% | 08/15/2015 | 375,000 | 399,375 | ||||||||||||
San Pasqual Casino (Hotels, Restaurants & Leisure) | (b) | 8.000% | 09/15/2013 | 350,000 | 346,500 | |||||||||||
Seminole Hard Rock Entertainment, Inc. (Hotels, Restaurants & Leisure) | (b)(e) | 3.046% | 03/15/2014 | 1,075,000 | 1,010,500 | |||||||||||
Seminole Indian Tribe of Florida (Hotels, Restaurants & Leisure) | (b) | 7.804% | 10/01/2020 | 770,000 | 751,358 | |||||||||||
Seminole Indian Tribe of Florida (Hotels, Restaurants & Leisure) | (b) | 7.750% | 10/01/2017 | 150,000 | 156,750 | |||||||||||
Sugarhouse HSP Gaming Prop. Mezz. LP / Sugarhouse HSP Gaming Finance Corp. (Hotels, Restaurants & Leisure) | (b) | 8.625% | 04/15/2016 | 875,000 | 901,250 | |||||||||||
Hillman Group, Inc. (Household Durables) | 10.875% | 06/01/2018 | 900,000 | 895,500 | ||||||||||||
Jarden Corp. (Household Durables) | 7.500% | 05/01/2017 | 725,000 | 772,125 | ||||||||||||
Jarden Corp. (Household Durables) | 8.000% | 05/01/2016 | 225,000 | 244,125 | ||||||||||||
Libbey Glass, Inc. (Household Durables) | 10.000% | 02/15/2015 | 719,000 | 772,925 | ||||||||||||
Norcraft Cos. LP / Norcraft Finance Corp. (Household Durables) | 10.500% | 12/15/2015 | 1,375,000 | 1,289,062 | ||||||||||||
Sealy Mattress Co. (Household Durables) | 8.250% | 06/15/2014 | 1,700,000 | 1,691,500 | ||||||||||||
Sealy Mattress Co. (Household Durables) | (b) | 10.875% | 04/15/2016 | 303,000 | 332,542 | |||||||||||
Simmons Bedding Co. (Household Durables) | (b) | 11.250% | 07/15/2015 | 1,200,000 | 1,245,000 | |||||||||||
Yankee Candle Co., Inc. (Household Durables) | 9.750% | 02/15/2017 | 1,725,000 | 1,690,500 | ||||||||||||
YCC Holdings LLC / Yankee Finance, Inc. (Household Durables) | (d) | 10.250% | 02/15/2016 | 700,000 | 616,000 | |||||||||||
CDW LLC / CDW Finance Corp. (Internet & Catalog Retail) | 12.535% | 10/12/2017 | 400,000 | 404,000 | ||||||||||||
CDW LLC / CDW Finance Corp. (Internet & Catalog Retail) | 8.500% | 04/01/2019 | 1,850,000 | 1,873,125 | ||||||||||||
Easton-Bell Sports, Inc. (Leisure Equip. & Products) | 9.750% | 12/01/2016 | 925,000 | 1,012,875 | ||||||||||||
AMC Networks, Inc. (Media) | (b) | 7.750% | 07/15/2021 | 575,000 | 628,187 | |||||||||||
CCO Holdings LLC / CCO Holdings Capital Corp. (Media) | 8.125% | 04/30/2020 | 75,000 | 82,500 | ||||||||||||
CCO Holdings LLC / CCO Holdings Capital Corp. (Media) | 7.875% | 04/30/2018 | 1,025,000 | 1,098,031 | ||||||||||||
CCO Holdings LLC / CCO Holdings Capital Corp. (Media) | 7.000% | 01/15/2019 | 425,000 | 445,187 | ||||||||||||
Cequel Communications Holdings I LLC and Cequel Capital Corp. (Media) | (b) | 8.625% | 11/15/2017 | 175,000 | 186,375 | |||||||||||
Cinemark U.S.A, Inc. (Media) | 8.625% | 06/15/2019 | 950,000 | 1,037,875 | ||||||||||||
Cinemark U.S.A, Inc. (Media) | 7.375% | 06/15/2021 | 500,000 | 513,750 | ||||||||||||
Clear Channel Communications, Inc. (Media) | 9.000% | 03/01/2021 | 1,325,000 | 1,122,937 | ||||||||||||
Clear Channel Worldwide Holdings, Inc. (Media) | 9.250% | 12/15/2017 | 925,000 | 1,003,625 | ||||||||||||
Clear Channel Worldwide Holdings, Inc. (Media) | 9.250% | 12/15/2017 | 325,000 | 351,000 | ||||||||||||
Crown Media Holdings, Inc. (Media) | 10.500% | 07/15/2019 | 1,000,000 | 1,057,500 | ||||||||||||
Cumulus Media, Inc. (Media) | (b) | 7.750% | 05/01/2019 | 1,025,000 | 914,812 | |||||||||||
Entercom Radio LLC (Media) | (b) | 10.500% | 12/01/2019 | 925,000 | 929,625 | |||||||||||
Entravision Communications Corp. (Media) | 8.750% | 08/01/2017 | 850,000 | 837,250 | ||||||||||||
Fox Acquisition Sub LLC (Media) | (b) | 13.375% | 07/15/2016 | 1,000,000 | 1,096,250 | |||||||||||
Houghton Mifflin Harcourt Publishers, Inc. / Houghton Mifflin Harcourt Publishing (Media) | (b) | 10.500% | 06/01/2019 | 375,000 | 230,625 | |||||||||||
Intelsat Jackson Holdings S.A. (Media) | 11.250% | 06/15/2016 | 2,025,000 | 2,132,578 | ||||||||||||
Intelsat Jackson Holdings, S.A. (Media) | (b) | 7.250% | 04/01/2019 | 550,000 | 559,625 | |||||||||||
Intelsat Jackson Holdings, S.A. (Media) | (b) | 7.500% | 04/01/2021 | 450,000 | 456,187 | |||||||||||
| 63 | (continued) |
| Ohio National Fund, Inc. | High Income Bond Portfolio (Continued) |
Schedule of Investments | December 31, 2011 |
| Corporate Bonds (Continued) | Rate | Maturity | Face Amount | Value | ||||||||||||
CONSUMER DISCRETIONARY (continued) | ||||||||||||||||
Intelsat Jackson Holdings, S.A. (Media) | 8.500% | 11/01/2019 | $ | 675,000 | $ | 717,187 | ||||||||||
Intelsat Luxembourg, S.A. (Media) | (d) | 11.500% | 02/04/2017 | 450,000 | 435,375 | |||||||||||
Lamar Media Corp. (Media) | 6.625% | 08/15/2015 | 950,000 | 971,375 | ||||||||||||
Lamar Media Corp. (Media) | 6.625% | 08/15/2015 | 375,000 | 383,437 | ||||||||||||
MDC Partners, Inc. (Media) | 11.000% | 11/01/2016 | 1,175,000 | 1,263,125 | ||||||||||||
MDC Partners, Inc. (Media) | (b) | 11.000% | 11/01/2016 | 250,000 | 266,250 | |||||||||||
Nexstar Broadcasting, Inc. / Mission Broadcasting, Inc. (Media) | 8.875% | 04/15/2017 | 550,000 | 566,500 | ||||||||||||
Nexstar Broadcasting, Inc. (Media) | 7.000% | 01/15/2014 | 225,000 | 220,781 | ||||||||||||
Nexstar Broadcasting, Inc. (Media) | 7.000% | 01/15/2014 | 433,346 | 425,221 | ||||||||||||
Nielsen Finance LLC / Nielsen Finance Co. (Media) | 7.750% | 10/15/2018 | 400,000 | 434,000 | ||||||||||||
ProQuest LLC / ProQuest Notes Co. (Media) | (b) | 9.000% | 10/15/2018 | 750,000 | 611,250 | |||||||||||
Regal Cinemas Corp. (Media) | 8.625% | 07/15/2019 | 1,050,000 | 1,139,250 | ||||||||||||
Sitel LLC / Sitel Finance Corp. (Media) | 11.500% | 04/01/2018 | 1,075,000 | 798,187 | ||||||||||||
Virgin Media Finance PLC (Media) | 9.500% | 08/15/2016 | 1,025,000 | 1,155,687 | ||||||||||||
Visant Corp. (Media) | 10.000% | 10/01/2017 | 1,775,000 | 1,633,000 | ||||||||||||
XM Satellite Radio, Inc. (Media) | (b) | 7.625% | 11/01/2018 | 475,000 | 501,125 | |||||||||||
Academy Ltd. / Academy Finance Corp. (Specialty Retail) | (b) | 9.250% | 08/01/2019 | 875,000 | 868,437 | |||||||||||
Gymboree Corp. (Specialty Retail) | 9.125% | 12/01/2018 | 1,325,000 | 1,166,000 | ||||||||||||
Michaels Stores, Inc. (Specialty Retail) | 7.750% | 11/01/2018 | 800,000 | 812,000 | ||||||||||||
Needle Merger Sub Corp. (Specialty Retail) | (b) | 8.125% | 03/15/2019 | 1,550,000 | 1,484,125 | |||||||||||
Penske Automotive Group, Inc. (Specialty Retail) | 7.750% | 12/15/2016 | 1,275,000 | 1,313,250 | ||||||||||||
Petco Animal Supplies, Inc. (Specialty Retail) | (b) | 9.250% | 12/01/2018 | 1,350,000 | 1,454,625 | |||||||||||
Sally Holdings LLC , Inc. (Specialty Retail) | (b) | 6.875% | 11/15/2019 | 550,000 | 577,500 | |||||||||||
|
| |||||||||||||||
| 77,820,136 | ||||||||||||||||
|
| |||||||||||||||
CONSUMER STAPLES – 4.6% | ||||||||||||||||
U.S. Foodservice (Food & Staples Retailing) | (b) | 8.500% | 06/30/2019 | 1,325,000 | 1,288,562 | |||||||||||
B&G Foods, Inc. (Food Products) | 7.625% | 01/15/2018 | 525,000 | 560,437 | ||||||||||||
Darling International, Inc. (Food Products) | 8.500% | 12/15/2018 | 125,000 | 139,375 | ||||||||||||
Dean Foods Co. (Food Products) | 7.000% | 06/01/2016 | 1,200,000 | 1,191,000 | ||||||||||||
Dean Foods Co. (Food Products) | 9.750% | 12/15/2018 | 975,000 | 1,043,250 | ||||||||||||
Del Monte Corp. (Food Products) | 7.625% | 02/15/2019 | 875,000 | 844,375 | ||||||||||||
Michael Foods, Inc. (Food Products) | 9.750% | 07/15/2018 | 1,975,000 | 2,088,562 | ||||||||||||
Pinnacle Foods Finance LLC / Pinnacle Foods Finance Corp. (Food Products) | 9.250% | 04/01/2015 | 875,000 | 902,344 | ||||||||||||
Pinnacle Foods Finance LLC / Pinnacle Foods Finance Corp. (Food Products) | 10.625% | 04/01/2017 | 425,000 | 448,375 | ||||||||||||
Pinnacle Foods Finance LLC / Pinnacle Foods Finance Corp. (Food Products) | 8.250% | 09/01/2017 | 500,000 | 522,500 | ||||||||||||
Central Garden and Pet Co. (Household Products) | 8.250% | 03/01/2018 | 550,000 | 541,750 | ||||||||||||
Spectrum Brands Holdings, Inc. (Household Products) | (d) | 12.000% | 08/28/2019 | 1,221,650 | 1,334,653 | |||||||||||
Spectrum Brands Holdings, Inc. (Household Products) | 9.500% | 06/15/2018 | 300,000 | 329,625 | ||||||||||||
Spectrum Brands Holdings, Inc. (Household Products) | (b) | 9.500% | 06/15/2018 | 150,000 | 164,812 | |||||||||||
Prestige Brands, Inc. (Personal Products) | 8.250% | 04/01/2018 | 825,000 | 849,750 | ||||||||||||
|
| |||||||||||||||
| 12,249,370 | ||||||||||||||||
|
| |||||||||||||||
ENERGY – 8.1% | ||||||||||||||||
Basic Energy Services, Inc. (Energy Equip. & Svs.) | 7.125% | 04/15/2016 | 850,000 | 856,375 | ||||||||||||
Basic Energy Services, Inc. (Energy Equip. & Svs.) | 7.750% | 02/15/2019 | 425,000 | 430,312 | ||||||||||||
Cie Generale de Geophysique – Veritas (Energy Equip. & Svs.) | 7.750% | 05/15/2017 | 1,100,000 | 1,119,250 | ||||||||||||
Cie Generale de Geophysique – Veritas (Energy Equip. & Svs.) | 9.500% | 05/15/2016 | 400,000 | 434,000 | ||||||||||||
Complete Production Services, Inc. (Energy Equip. & Svs.) | 8.000% | 12/15/2016 | 600,000 | 627,000 | ||||||||||||
Crosstex Energy LP / Crosstex Energy Finance Corp. (Energy Equip. & Svs.) | 8.875% | 02/15/2018 | 1,275,000 | 1,399,312 | ||||||||||||
Forbes Energy Services Ltd. (Energy Equip. & Svs.) | 9.000% | 06/15/2019 | 800,000 | 752,000 | ||||||||||||
PHI, Inc. (Energy Equip. & Svs.) | 8.625% | 10/15/2018 | 775,000 | 780,812 | ||||||||||||
SESI LLC (Energy Equip. & Svs.) | (b) | 7.125% | 12/15/2021 | 250,000 | 263,125 | |||||||||||
SESI LLC (Energy Equip. & Svs.) | 6.375% | 05/01/2019 | 275,000 | 281,187 | ||||||||||||
ATP Oil & Gas Corp. (Oil, Gas & Consumable Fuels) | 11.875% | 05/01/2015 | 1,050,000 | 695,625 | ||||||||||||
Berry Petroleum Co. (Oil, Gas & Consumable Fuels) | 6.750% | 11/01/2020 | 150,000 | 152,250 | ||||||||||||
Carrizo Oil & Gas, Inc. (Oil, Gas & Consumable Fuels) | (b) | 8.625% | 10/15/2018 | 250,000 | 252,500 | |||||||||||
Chaparral Energy, Inc. (Oil, Gas & Consumable Fuels) | 9.875% | 10/01/2020 | 1,075,000 | 1,166,375 | ||||||||||||
Chesapeake Energy Corp. (Oil, Gas & Consumable Fuels) | 6.875% | 11/15/2020 | 425,000 | 456,875 | ||||||||||||
Chesapeake Energy Corp. (Oil, Gas & Consumable Fuels) | 6.875% | 08/15/2018 | 325,000 | 349,375 | ||||||||||||
Coffeyville Resources LLC / Coffeyville Finance, Inc. (Oil, Gas & Consumable Fuels) | (b) | 10.875% | 04/01/2017 | 875,000 | 984,375 | |||||||||||
Comstock Resources, Inc. (Oil, Gas & Consumable Fuels) | 7.750% | 04/01/2019 | 550,000 | 525,250 | ||||||||||||
Concho Resources, Inc. (Oil, Gas & Consumable Fuels) | 7.000% | 01/15/2021 | 525,000 | 566,344 | ||||||||||||
Copano Energy LLC / Copano Energy Finance Corp. (Oil, Gas & Consumable Fuels) | 7.125% | 04/01/2021 | 300,000 | 304,500 | ||||||||||||
Denbury Resources, Inc. (Oil, Gas & Consumable Fuels) | 8.250% | 02/15/2020 | 273,000 | 306,442 | ||||||||||||
Denbury Resources, Inc. (Oil, Gas & Consumable Fuels) | 9.750% | 03/01/2016 | 125,000 | 138,437 | ||||||||||||
Denbury Resources, Inc. (Oil, Gas & Consumable Fuels) | 6.375% | 08/15/2021 | 275,000 | 288,750 | ||||||||||||
Energy Transfer Equity LP (Oil, Gas & Consumable Fuels) | 7.500% | 10/15/2020 | 1,400,000 | 1,536,500 | ||||||||||||
Energy XXI Gulf Coast, Inc. (Oil, Gas & Consumable Fuels) | 9.250% | 12/15/2017 | 325,000 | 354,250 | ||||||||||||
Energy XXI Gulf Coast, Inc. (Oil, Gas & Consumable Fuels) | 7.750% | 06/15/2019 | 200,000 | 205,000 | ||||||||||||
EXCO Resources, Inc. (Oil, Gas & Consumable Fuels) | 7.500% | 09/15/2018 | 575,000 | 546,250 | ||||||||||||
Holly Energy Partners LP / Holly Energy Finance Corp. (Oil, Gas & Consumable Fuels) | 6.250% | 03/01/2015 | 650,000 | 658,125 | ||||||||||||
Inergy LP / Inergy Finance Corp. (Oil, Gas & Consumable Fuels) | 7.000% | 10/01/2018 | 250,000 | 255,000 | ||||||||||||
Inergy LP / Inergy Finance Corp. (Oil, Gas & Consumable Fuels) | 6.875% | 08/01/2021 | 600,000 | 606,000 | ||||||||||||
Linn Energy LLC / Linn Energy Finance Corp. (Oil, Gas & Consumable Fuels) | 8.625% | 04/15/2020 | 675,000 | 735,750 | ||||||||||||
| 64 | (continued) |
| Ohio National Fund, Inc. | High Income Bond Portfolio (Continued) |
Schedule of Investments | December 31, 2011 |
| Corporate Bonds (Continued) | Rate | Maturity | Face Amount | Value | ||||||||||||
ENERGY (continued) | ||||||||||||||||
Linn Energy LLC / Linn Energy Finance Corp. (Oil, Gas & Consumable Fuels) | (b) | 6.500% | 05/15/2019 | $ | 50,000 | $ | 49,875 | |||||||||
Linn Energy LLC / Linn Energy Finance Corp. (Oil, Gas & Consumable Fuels) | 7.750% | 02/01/2021 | 500,000 | 522,500 | ||||||||||||
Plains Exploration & Production Co. (Oil, Gas & Consumable Fuels) | 6.750% | 02/01/2022 | 625,000 | 657,812 | ||||||||||||
Regency Energy Partners LP / Regency Energy Finance Corp. (Oil, Gas & Consumable Fuels) | 6.875% | 12/01/2018 | 275,000 | 293,562 | ||||||||||||
Regency Energy Partners LP / Regency Energy Finance Corp. (Oil, Gas & Consumable Fuels) | 9.375% | 06/01/2016 | 600,000 | 663,000 | ||||||||||||
SM Energy Co. (Oil, Gas & Consumable Fuels) | (b) | 6.500% | 11/15/2021 | 275,000 | 284,625 | |||||||||||
Southern Star Central Corp. (Oil, Gas & Consumable Fuels) | 6.750% | 03/01/2016 | 225,000 | 230,062 | ||||||||||||
W&T Offshore, Inc. (Oil, Gas & Consumable Fuels) | (b) | 8.500% | 06/15/2019 | 775,000 | 806,000 | |||||||||||
|
| |||||||||||||||
| 21,534,782 | ||||||||||||||||
|
| |||||||||||||||
FINANCIALS – 7.1% | ||||||||||||||||
Nuveen Investments, Inc. (Capital Markets) | 10.500% | 11/15/2015 | 1,975,000 | 1,970,062 | ||||||||||||
CIT Group, Inc. (Commercial Banks) | (b) | 6.625% | 04/01/2018 | 275,000 | 286,000 | |||||||||||
CIT Group, Inc. (Commercial Banks) | (b) | 7.000% | 05/02/2017 | 5,500,000 | 5,500,000 | |||||||||||
Ally Financial, Inc. (Consumer Finance) | 7.000% | 02/01/2012 | 425,000 | 427,125 | ||||||||||||
Ally Financial, Inc. (Consumer Finance) | 8.000% | 11/01/2031 | 225,000 | 218,250 | ||||||||||||
Ally Financial, Inc. (Consumer Finance) | 8.300% | 02/12/2015 | 2,425,000 | 2,564,438 | ||||||||||||
Ally Financial, Inc. (Consumer Finance) | 8.000% | 03/15/2020 | 375,000 | 385,312 | ||||||||||||
Ally Financial, Inc. (Consumer Finance) | 7.500% | 09/15/2020 | 250,000 | 253,437 | ||||||||||||
Ally Financial, Inc. (Consumer Finance) | 6.250% | 12/01/2017 | 300,000 | 290,505 | ||||||||||||
Ford Motor Credit Co. LLC (Consumer Finance) | 8.000% | 12/15/2016 | 2,825,000 | 3,212,333 | ||||||||||||
Ford Motor Credit Co. LLC (Consumer Finance) | 8.125% | 01/15/2020 | 150,000 | 177,123 | ||||||||||||
Express LLC / Express Finance Corp. (Diversified Financial Svs.) | 8.750% | 03/01/2018 | 550,000 | 598,125 | ||||||||||||
Interactive Data Corp. (Diversified Financial Svs.) | 10.250% | 08/01/2018 | 1,150,000 | 1,265,000 | ||||||||||||
TransUnion LLC / TransUnion Financing Corp. (Diversified Financial Svs.) | 11.375% | 06/15/2018 | 825,000 | 946,687 | ||||||||||||
Reliance Intermediate Holdings LP (Insurance) | (b) | 9.500% | 12/15/2019 | 550,000 | 585,750 | |||||||||||
Host Hotels & Resorts LP (Real Estate Investment Trusts) | 6.750% | 06/01/2016 | 100,000 | 103,250 | ||||||||||||
Host Hotels & Resorts LP (Real Estate Investment Trusts) | 6.875% | 11/01/2014 | 250,000 | 256,250 | ||||||||||||
|
| |||||||||||||||
| 19,039,647 | ||||||||||||||||
|
| |||||||||||||||
HEALTH CARE – 9.3% | ||||||||||||||||
Grifols, Inc. (Biotechnology) | 8.250% | 02/01/2018 | 625,000 | 659,375 | ||||||||||||
Alere, Inc. (Health Care Equip. & Supplies) | 7.875% | 02/01/2016 | 525,000 | 528,937 | ||||||||||||
Alere, Inc. (Health Care Equip. & Supplies) | 9.000% | 05/15/2016 | 925,000 | 938,875 | ||||||||||||
Bausch & Lomb, Inc. (Health Care Equip. & Supplies) | 9.875% | 11/01/2015 | 950,000 | 1,002,250 | ||||||||||||
Biomet, Inc. (Health Care Equip. & Supplies) | 11.625% | 10/15/2017 | 2,425,000 | 2,643,250 | ||||||||||||
DJO Finance LLC / DJO Finance Corp. (Health Care Equip. & Supplies) | 9.750% | 10/15/2017 | 250,000 | 195,625 | ||||||||||||
DJO Finance LLC / DJO Finance Corp. (Health Care Equip. & Supplies) | 7.750% | 04/15/2018 | 550,000 | 424,875 | ||||||||||||
Kinetic Concepts, Inc. (Health Care Equip. & Supplies) | (b) | 10.500% | 11/01/2018 | 775,000 | 761,437 | |||||||||||
VWR Funding, Inc. (Health Care Equip. & Supplies) | 10.250% | 07/15/2015 | 2,054,843 | 2,131,900 | ||||||||||||
CRC Health Corp. (Acquired 01/25/2006 through 08/21/2009, Cost $492,259)(Health Care Providers & Svs.) | (h) | 10.750% | 02/01/2016 | 550,000 | 525,250 | |||||||||||
Emergency Medical Services Corp. (Health Care Providers & Svs.) | 8.125% | 06/01/2019 | 1,450,000 | 1,453,625 | ||||||||||||
ExamWorks Group, Inc. (Health Care Providers & Svs.) | (b) | 9.000% | 07/15/2019 | 625,000 | 568,750 | |||||||||||
HCA Holdings, Inc. (Health Care Providers & Svs.) | 7.750% | 05/15/2021 | 925,000 | 945,813 | ||||||||||||
HCA, Inc. (Health Care Providers & Svs.) | 7.500% | 11/06/2033 | 225,000 | 195,750 | ||||||||||||
HCA, Inc. (Health Care Providers & Svs.) | 7.875% | 02/15/2020 | 275,000 | 298,375 | ||||||||||||
HCA, Inc. (Health Care Providers & Svs.) | 9.875% | 02/15/2017 | 145,000 | 159,138 | ||||||||||||
HCA, Inc. (Health Care Providers & Svs.) | 7.500% | 02/15/2022 | 2,425,000 | 2,485,625 | ||||||||||||
HCA, Inc. (Health Care Providers & Svs.) | 6.500% | 02/15/2020 | 275,000 | 286,000 | ||||||||||||
IASIS Healthcare LLC / IASIS Capital Corp. (Health Care Providers & Svs.) | 8.375% | 05/15/2019 | 925,000 | 811,688 | ||||||||||||
inVentiv Health, Inc. (Health Care Providers & Svs.) | (b) | 10.000% | 08/15/2018 | 825,000 | 759,000 | |||||||||||
Multiplan, Inc. (Health Care Providers & Svs.) | (b) | 9.875% | 09/01/2018 | 1,550,000 | 1,619,750 | |||||||||||
Omnicare, Inc. (Health Care Providers & Svs.) | 7.750% | 06/01/2020 | 625,000 | 674,219 | ||||||||||||
United Surgical Partners International, Inc. (Health Care Providers & Svs.) | (d) | 9.250% | 05/01/2017 | 1,250,000 | 1,262,500 | |||||||||||
Universal Hospital Services, Inc. (Health Care Providers & Svs.) | 8.500% | 06/01/2015 | 1,475,000 | 1,497,125 | ||||||||||||
Universal Hospital Services, Inc. (Health Care Providers & Svs.) | (e) | 4.121% | 06/01/2015 | 150,000 | 136,125 | |||||||||||
Vanguard Health Holding Co. II LLC / Vanguard Holding Co II, Inc. (Health Care Providers & Svs.) | 8.000% | 02/01/2018 | 1,550,000 | 1,546,125 | ||||||||||||
Emdeon, Inc. (Health Care Technology) | (b) | 11.000% | 12/31/2019 | 375,000 | 394,219 | |||||||||||
|
| |||||||||||||||
| 24,905,601 | ||||||||||||||||
|
| |||||||||||||||
INDUSTRIALS – 12.7% | ||||||||||||||||
Alliant Techsystems, Inc. (Aerospace & Defense) | 6.750% | 04/01/2016 | 250,000 | 257,500 | ||||||||||||
Sequa Corp. (Aerospace & Defense) | (b) | 11.750% | 12/01/2015 | 575,000 | 615,250 | |||||||||||
Sequa Corp. (Aerospace & Defense) | (b) | 13.500% | 12/01/2015 | 183,054 | 196,783 | |||||||||||
TransDigm, Inc. (Aerospace & Defense) | 7.750% | 12/15/2018 | 1,200,000 | 1,296,000 | ||||||||||||
CHC Helicopter S.A. (Air Freight & Logistics) | (b) | 9.250% | 10/15/2020 | 975,000 | 882,375 | |||||||||||
American Standard Americas (Acquired 01/13/2011, Cost $100,000)(Building Products) | (b)(f)(h) | 10.750% | 01/15/2016 | 100,000 | 60,000 | |||||||||||
Associated Materials LLC (Building Products) | 9.125% | 11/01/2017 | 775,000 | 680,063 | ||||||||||||
Building Materials Corp. of America (Building Products) | (b) | 7.500% | 03/15/2020 | 225,000 | 244,125 | |||||||||||
| 65 | (continued) |
| Ohio National Fund, Inc. | High Income Bond Portfolio (Continued) |
Schedule of Investments | December 31, 2011 |
| Corporate Bonds (Continued) | Rate | Maturity | Face Amount | Value | ||||||||||||
INDUSTRIALS (continued) | ||||||||||||||||
Building Materials Corp. of America (Building Products) | (b) | 6.750% | 05/01/2021 | $ | 375,000 | $ | 394,688 | |||||||||
Masonite International Corp. (Building Products) | (b) | 8.250% | 04/15/2021 | 875,000 | 861,875 | |||||||||||
Nortek, Inc. (Building Products) | (b) | 10.000% | 12/01/2018 | 600,000 | 571,500 | |||||||||||
Nortek, Inc. (Building Products) | (b) | 8.500% | 04/15/2021 | 875,000 | 743,750 | |||||||||||
Ply Gem Industries, Inc. (Building Products) | 8.250% | 02/15/2018 | 825,000 | 722,906 | ||||||||||||
RBS Global, Inc. / Rexnord LLC (Building Products) | 8.500% | 05/01/2018 | 1,250,000 | 1,331,250 | ||||||||||||
Thermon Industries, Inc. (Building Products) | 9.500% | 05/01/2017 | 393,000 | 425,423 | ||||||||||||
Altegrity, Inc. (Acquired 10/19/2007 through 02/08/2011, Cost $583,498)(Commercial Svs. & Supplies) | (b)(f)(h) | 11.750% | 05/01/2016 | 625,000 | 550,000 | |||||||||||
Altegrity, Inc. (Commercial Svs. & Supplies) | (b) | 10.500% | 11/01/2015 | 200,000 | 181,000 | |||||||||||
ARAMARK Corp. (Commercial Svs. & Supplies) | 8.500% | 02/01/2015 | 950,000 | 978,500 | ||||||||||||
ARAMARK Corp. (Commercial Svs. & Supplies) | (e) | 3.929% | 02/01/2015 | 150,000 | 145,500 | |||||||||||
ARAMARK Holdings Corp. (Commercial Svs. & Supplies) | (b)(d) | 8.625% | 05/01/2016 | 1,125,000 | 1,164,375 | |||||||||||
Garda World Security Corp. (Commercial Svs. & Supplies) | (b) | 9.750% | 03/15/2017 | 1,175,000 | 1,198,500 | |||||||||||
International Lease Finance Corp. (Commercial Svs. & Supplies) | 8.250% | 12/15/2020 | 275,000 | 278,438 | ||||||||||||
International Lease Finance Corp. (Commercial Svs. & Supplies) | 8.625% | 09/15/2015 | 450,000 | 462,938 | ||||||||||||
International Lease Finance Corp. (Commercial Svs. & Supplies) | 8.750% | 03/15/2017 | 2,425,000 | 2,503,813 | ||||||||||||
International Lease Finance Corp. (Commercial Svs. & Supplies) | 5.750% | 05/15/2016 | 250,000 | 232,103 | ||||||||||||
International Lease Finance Corp. (Commercial Svs. & Supplies) | 6.250% | 05/15/2019 | 225,000 | 208,151 | ||||||||||||
Iron Mountain, Inc. (Commercial Svs. & Supplies) | 7.750% | 10/01/2019 | 525,000 | 557,156 | ||||||||||||
Maxim Crane Works LP (Commercial Svs. & Supplies) | (b) | 12.250% | 04/15/2015 | 725,000 | 656,125 | |||||||||||
RSC Equipment Rental, Inc. / RSC Holdings III LLC (Commercial Svs. & Supplies) | 9.500% | 12/01/2014 | 304,000 | 313,880 | ||||||||||||
RSC Equipment Rental, Inc. / RSC Holdings III LLC (Commercial Svs. & Supplies) | (b) | 10.000% | 07/15/2017 | 175,000 | 204,750 | |||||||||||
RSC Equipment Rental, Inc. / RSC Holdings III LLC (Commercial Svs. & Supplies) | 10.250% | 11/15/2019 | 625,000 | 684,375 | ||||||||||||
RSC Equipment Rental, Inc. / RSC Holdings III LLC (Commercial Svs. & Supplies) | 8.250% | 02/01/2021 | 200,000 | 203,500 | ||||||||||||
SGS International, Inc. (Commercial Svs. & Supplies) | 12.000% | 12/15/2013 | 823,000 | 831,230 | ||||||||||||
United Rentals North America, Inc. (Commercial Svs. & Supplies) | 8.375% | 09/15/2020 | 1,325,000 | 1,298,500 | ||||||||||||
West Corp. (Commercial Svs. & Supplies) | 11.000% | 10/15/2016 | 1,000,000 | 1,057,500 | ||||||||||||
West Corp. (Commercial Svs. & Supplies) | 8.625% | 10/01/2018 | 175,000 | 177,625 | ||||||||||||
West Corp. (Commercial Svs. & Supplies) | 7.875% | 01/15/2019 | 800,000 | 798,000 | ||||||||||||
Atkore International, Inc. (Electrical Equip.) | 9.875% | 01/01/2018 | 275,000 | 264,688 | ||||||||||||
Belden, Inc. (Electrical Equip.) | 7.000% | 03/15/2017 | 450,000 | 451,688 | ||||||||||||
Belden, Inc. (Electrical Equip.) | 9.250% | 06/15/2019 | 200,000 | 214,500 | ||||||||||||
CommScope, Inc. (Electrical Equip.) | (b) | 8.250% | 01/15/2019 | 1,375,000 | 1,381,875 | |||||||||||
General Cable Corp. (Electrical Equip.) | 7.125% | 04/01/2017 | 600,000 | 601,500 | ||||||||||||
International Wire Group Holdings, Inc. (Electrical Equip.) | (b) | 9.750% | 04/15/2015 | 625,000 | 634,375 | |||||||||||
Viasystems, Inc. (Electrical Equip.) | (b) | 12.000% | 01/15/2015 | 275,000 | 295,969 | |||||||||||
Amsted Industries, Inc. (Machinery) | (b) | 8.125% | 03/15/2018 | 200,000 | 213,000 | |||||||||||
Dynacast International LLC / Dynacast Finance, Inc. (Machinery) | (b) | 9.250% | 07/15/2019 | 625,000 | 590,625 | |||||||||||
Meritor, Inc. (Machinery) | 10.625% | 03/15/2018 | 775,000 | 732,375 | ||||||||||||
Mueller Water Products, Inc. (Machinery) | 7.375% | 06/01/2017 | 675,000 | 617,625 | ||||||||||||
Mueller Water Products, Inc. (Machinery) | 8.750% | 09/01/2020 | 600,000 | 654,750 | ||||||||||||
Navistar International Corp. (Machinery) | 8.250% | 11/01/2021 | 300,000 | 320,625 | ||||||||||||
Stena AB (Marine) | 7.000% | 12/01/2016 | 175,000 | 161,656 | ||||||||||||
Avis Budget Car Rental LLC / Avis Budget Finance, Inc. (Road & Rail) | 9.625% | 03/15/2018 | 750,000 | 780,000 | ||||||||||||
Avis Budget Car Rental LLC / Avis Budget Finance, Inc. (Road & Rail) | 8.250% | 01/15/2019 | 575,000 | 573,563 | ||||||||||||
Hertz Corp. / The (Road & Rail) | 8.875% | 01/01/2014 | 74,000 | 74,740 | ||||||||||||
Hertz Corp. / The (Road & Rail) | 7.500% | 10/15/2018 | 100,000 | 105,000 | ||||||||||||
Hertz Corp. / The (Road & Rail) | 6.750% | 04/15/2019 | 1,025,000 | 1,032,688 | ||||||||||||
Interline Brands, Inc. (Trading Companies & Distributors) | 7.000% | 11/15/2018 | 400,000 | 416,000 | ||||||||||||
|
| |||||||||||||||
| 34,086,689 | ||||||||||||||||
|
| |||||||||||||||
INFORMATION TECHNOLOGY – 9.8% | ||||||||||||||||
Seagate HDD Cayman (Computers & Peripherals) | (b) | 7.750% | 12/15/2018 | 400,000 | 427,500 | |||||||||||
Seagate HDD Cayman (Computers & Peripherals) | (b) | 7.000% | 11/01/2021 | 300,000 | 309,000 | |||||||||||
Seagate HDD Cayman (Computers & Peripherals) | 6.875% | 05/01/2020 | 375,000 | 387,188 | ||||||||||||
Seagate Technology HDD Holdings (Computers & Peripherals) | 6.800% | 10/01/2016 | 575,000 | 618,125 | ||||||||||||
Cleaver-Brooks, Inc. (Electronic Equip., Instr. & Comp.) | (b) | 12.250% | 05/01/2016 | 775,000 | 782,750 | |||||||||||
Kemet Corp. (Electronic Equip., Instr. & Comp.) | 10.500% | 05/01/2018 | 825,000 | 876,563 | ||||||||||||
Ceridian Corp. (IT Svs.) | 11.250% | 11/15/2015 | 250,000 | 196,250 | ||||||||||||
Compucom Systems, Inc. (IT Svs.) | (b) | 12.500% | 10/01/2015 | 1,125,000 | 1,153,125 | |||||||||||
CoreLogic, Inc. (IT Svs.) | (b) | 7.250% | 06/01/2021 | 1,025,000 | 986,563 | |||||||||||
Fidelity National Information Services, Inc. (IT Svs.) | 7.875% | 07/15/2020 | 125,000 | 135,625 | ||||||||||||
Fidelity National Information Services, Inc. (IT Svs.) | 7.625% | 07/15/2017 | 1,025,000 | 1,114,688 | ||||||||||||
First Data Corp. (IT Svs.) | (b)(d) | 8.750% | 01/15/2022 | 700,000 | 605,500 | |||||||||||
First Data Corp. (IT Svs.) | (b) | 8.250% | 01/15/2021 | 475,000 | 427,500 | |||||||||||
iGate Corp. (IT Svs.) | (b) | 9.000% | 05/01/2016 | 1,050,000 | 1,089,375 | |||||||||||
Lender Processing Services, Inc. (IT Svs.) | 8.125% | 07/01/2016 | 1,250,000 | 1,234,375 | ||||||||||||
Mantech International Corp. (IT Svs.) | 7.250% | 04/15/2018 | 200,000 | 204,750 | ||||||||||||
Stream Global Services, Inc. (IT Svs.) | 11.250% | 10/01/2014 | 775,000 | 790,500 | ||||||||||||
| 66 | (continued) |
| Ohio National Fund, Inc. | High Income Bond Portfolio (Continued) |
Schedule of Investments | December 31, 2011 |
| Corporate Bonds (Continued) | Rate | Maturity | Face Amount | Value | ||||||||||||
INFORMATION TECHNOLOGY (continued) | ||||||||||||||||
SunGard Data Systems, Inc. (IT Svs.) | 10.250% | 08/15/2015 | $ | 900,000 | $ | 937,125 | ||||||||||
SunGard Data Systems, Inc. (IT Svs.) | 10.625% | 05/15/2015 | 975,000 | 1,043,250 | ||||||||||||
SunGard Data Systems, Inc. (IT Svs.) | 7.625% | 11/15/2020 | 175,000 | 180,688 | ||||||||||||
SunGard Data Systems, Inc. (IT Svs.) | 7.375% | 11/15/2018 | 175,000 | 180,031 | ||||||||||||
Advanced Micro Devices, Inc. (Semiconductors & Equip.) | 8.125% | 12/15/2017 | 725,000 | 755,813 | ||||||||||||
Advanced Micro Devices, Inc. (Semiconductors & Equip.) | 7.750% | 08/01/2020 | 675,000 | 696,938 | ||||||||||||
Freescale Semiconductor, Inc. (Semiconductors & Equip.) | (b) | 9.250% | 04/15/2018 | 725,000 | 778,469 | |||||||||||
Freescale Semiconductor, Inc. (Semiconductors & Equip.) | 10.750% | 08/01/2020 | 1,300,000 | 1,361,750 | ||||||||||||
MagnaChip Semiconductor SA / MagnaChip Semiconductor Finance Co. (Semiconductors & Equip.) | 10.500% | 04/15/2018 | 925,000 | 966,625 | ||||||||||||
Spansion LLC (Semiconductors & Equip.) | 7.875% | 11/15/2017 | 900,000 | 823,500 | ||||||||||||
Allen Systems Group, Inc. (Software) | (b) | 10.500% | 11/15/2016 | 1,075,000 | 940,625 | |||||||||||
Aspect Software, Inc. (Software) | 10.625% | 05/15/2017 | 1,050,000 | 1,094,625 | ||||||||||||
Audatex North America, Inc. (Software) | (b) | 6.750% | 06/15/2018 | 750,000 | 761,250 | |||||||||||
Eagle Parent, Inc. (Software) | (b) | 8.625% | 05/01/2019 | 1,300,000 | 1,248,000 | |||||||||||
Lawson Software, Inc. (Software) | (b) | 11.500% | 07/15/2018 | 900,000 | 877,500 | |||||||||||
Serena Software, Inc. (Software) | 10.375% | 03/15/2016 | 850,000 | 875,500 | ||||||||||||
SSI Investments II / SSI Co-Issuer LLC (Software) | 11.125% | 06/01/2018 | 1,200,000 | 1,275,000 | ||||||||||||
|
| |||||||||||||||
| 26,136,066 | ||||||||||||||||
|
| |||||||||||||||
MATERIALS – 8.6% | ||||||||||||||||
Ferro Corp. (Chemicals) | 7.875% | 08/15/2018 | 1,050,000 | 1,060,500 | ||||||||||||
Hexion U.S. Finance Corp. / Hexion Nova Scotia Finance ULC (Chemicals) | 8.875% | 02/01/2018 | 925,000 | 871,813 | ||||||||||||
Hexion U.S. Finance Corp. / Hexion Nova Scotia Finance ULC (Chemicals) | 9.000% | 11/15/2020 | 550,000 | 456,500 | ||||||||||||
Huntsman International LLC (Chemicals) | 5.500% | 06/30/2016 | 725,000 | 714,125 | ||||||||||||
Huntsman International LLC (Chemicals) | 8.625% | 03/15/2020 | 550,000 | 585,750 | ||||||||||||
Huntsman International LLC (Chemicals) | 8.625% | 03/15/2021 | 525,000 | 559,125 | ||||||||||||
Koppers, Inc. (Chemicals) | 7.875% | 12/01/2019 | 575,000 | 612,375 | ||||||||||||
Momentive Performance Materials, Inc. (Chemicals) | 9.000% | 01/15/2021 | 675,000 | 516,375 | ||||||||||||
Nalco Co. (Chemicals) | 8.250% | 05/15/2017 | 575,000 | 652,625 | ||||||||||||
Nalco Co. (Chemicals) | (b) | 6.625% | 01/15/2019 | 250,000 | 289,375 | |||||||||||
Omnova Solutions, Inc. (Chemicals) | 7.875% | 11/01/2018 | 750,000 | 652,500 | ||||||||||||
OXEA Finance & Cy SCA (Chemicals) | (b) | 9.500% | 07/15/2017 | 634,000 | 637,170 | |||||||||||
Scotts Miracle-Gro Co. / The (Chemicals) | (b) | 6.625% | 12/15/2020 | 550,000 | 561,000 | |||||||||||
Solutia, Inc. (Chemicals) | 8.750% | 11/01/2017 | 1,025,000 | 1,124,938 | ||||||||||||
Solutia, Inc. (Chemicals) | 7.875% | 03/15/2020 | 150,000 | 163,875 | ||||||||||||
Union Carbide Corp. (Chemicals) | 7.875% | 04/01/2023 | 100,000 | 120,190 | ||||||||||||
Ardagh Packaging Finance Plc (Containers & Packaging) | (b) | 9.125% | 10/15/2020 | 1,000,000 | 995,000 | |||||||||||
Berry Plastics Corp. (Containers & Packaging) | 9.500% | 05/15/2018 | 550,000 | 555,500 | ||||||||||||
BWAY Holding Co. (Containers & Packaging) | 10.000% | 06/15/2018 | 900,000 | 963,000 | ||||||||||||
BWAY Parent Co., Inc. (Containers & Packaging) | (d) | 10.125% | 11/01/2015 | 640,147 | 624,143 | |||||||||||
Cascades, Inc. (Containers & Packaging) | 7.875% | 01/15/2020 | 400,000 | 390,000 | ||||||||||||
Crown Americas LLC / Crown Americas Capital Corp. II (Containers & Packaging) | 7.625% | 05/15/2017 | 75,000 | 82,219 | ||||||||||||
Crown Americas LLC / Crown Americas Capital Corp. II (Containers & Packaging) | 6.250% | 02/01/2021 | 450,000 | 472,500 | ||||||||||||
Graphic Packaging International, Inc. (Containers & Packaging) | 9.500% | 06/15/2017 | 950,000 | 1,045,000 | ||||||||||||
Greif, Inc. (Containers & Packaging) | 7.750% | 08/01/2019 | 475,000 | 515,375 | ||||||||||||
Owens-Brockway Glass Container, Inc. (Containers & Packaging) | 7.375% | 05/15/2016 | 200,000 | 220,000 | ||||||||||||
Packaging Dynamics Corp. (Containers & Packaging) | (b) | 8.750% | 02/01/2016 | 875,000 | 879,375 | |||||||||||
Reynolds Group Issuer, Inc. / Reynolds Group Issuer LLC (Containers & Packaging) | (b) | 8.750% | 10/15/2016 | 550,000 | 581,625 | |||||||||||
Reynolds Group Issuer, Inc. / Reynolds Group Issuer LLC (Containers & Packaging) | (b) | 9.250% | 05/15/2018 | 775,000 | 745,938 | |||||||||||
Reynolds Group Issuer, Inc. / Reynolds Group Issuer LLC (Containers & Packaging) | (b) | 9.000% | 04/15/2019 | 675,000 | 644,625 | |||||||||||
Reynolds Group Issuer, Inc. / Reynolds Group Issuer LLC (Containers & Packaging) | (b) | 7.125% | 04/15/2019 | 175,000 | 178,938 | |||||||||||
Reynolds Group Issuer, Inc. / Reynolds Group Issuer LLC (Containers & Packaging) | (b) | 8.250% | 02/15/2021 | 1,475,000 | 1,312,750 | |||||||||||
Reynolds Group Issuer, Inc. / Reynolds Group Issuer LLC (Containers & Packaging) | (b) | 9.875% | 08/15/2019 | 625,000 | 609,375 | |||||||||||
Sealed Air Corp. (Containers & Packaging) | (b) | 8.375% | 09/15/2021 | 1,200,000 | 1,332,000 | |||||||||||
Compass Minerals International, Inc. (Metals & Mining) | 8.000% | 06/01/2019 | 275,000 | 297,688 | ||||||||||||
Clearwater Paper Corp. (Paper & Forest Products) | 10.625% | 06/15/2016 | 125,000 | 140,000 | ||||||||||||
Clearwater Paper Corp. (Paper & Forest Products) | 7.125% | 11/01/2018 | 125,000 | 130,625 | ||||||||||||
Longview Fibre Paper & Packaging, Inc. (Paper & Forest Products) | (b) | 8.000% | 06/01/2016 | 575,000 | 577,875 | |||||||||||
|
| |||||||||||||||
| 22,871,787 | ||||||||||||||||
|
| |||||||||||||||
TELECOMMUNICATION SERVICES – 5.1% | ||||||||||||||||
GXS Worldwide, Inc. (Diversified Telecom. Svs.) | 9.750% | 06/15/2015 | 1,150,000 | 1,069,500 | ||||||||||||
Level 3 Escrow, Inc. (Diversified Telecom. Svs.) | (b) | 8.125% | 07/01/2019 | 675,000 | 666,563 | |||||||||||
tw telecom holdings, Inc. (Diversified Telecom. Svs.) | 8.000% | 03/01/2018 | 375,000 | 401,250 | ||||||||||||
Windstream Corp. (Diversified Telecom. Svs.) | 8.125% | 09/01/2018 | 650,000 | 699,563 | ||||||||||||
Digicel Group Ltd. (Wireless Telecom. Svs.) | (b) | 8.875% | 01/15/2015 | 425,000 | 420,750 | |||||||||||
Digicel Group Ltd. (Wireless Telecom. Svs.) | (b) | 9.125% | 01/15/2015 | 987,000 | 972,195 | |||||||||||
Digicel Ltd. (Wireless Telecom. Svs.) | (b) | 12.000% | 04/01/2014 | 650,000 | 731,250 | |||||||||||
Digicel Ltd. (Wireless Telecom. Svs.) | (b) | 8.250% | 09/01/2017 | 425,000 | 431,375 | |||||||||||
MetroPCS Wireless, Inc. (Wireless Telecom. Svs.) | 7.875% | 09/01/2018 | 925,000 | 942,344 | ||||||||||||
| 67 | (continued) |
| Ohio National Fund, Inc. | High Income Bond Portfolio (Continued) |
Schedule of Investments | December 31, 2011 |
| Corporate Bonds (Continued) | Rate | Maturity | Face Amount | Value | ||||||||||||||
TELECOMMUNICATION SERVICES (Continued) | ||||||||||||||||||
MetroPCS Wireless, Inc. (Wireless Telecom. Svs.) | 6.625% | 11/15/2020 | $ | 875,000 | $ | 818,125 | ||||||||||||
Nextel Communications, Inc. (Wireless Telecom. Svs.) | 7.375% | 08/01/2015 | 750,000 | 690,000 | ||||||||||||||
Sprint Capital Corp. (Wireless Telecom. Svs.) | 6.875% | 11/15/2028 | 750,000 | 539,063 | ||||||||||||||
Sprint Capital Corp. (Wireless Telecom. Svs.) | 6.900% | 05/01/2019 | 2,500,000 | 2,068,750 | ||||||||||||||
Sprint Nextel Corp. (Wireless Telecom. Svs.) | 6.000% | 12/01/2016 | 500,000 | 417,500 | ||||||||||||||
Sprint Nextel Corp. (Wireless Telecom. Svs.) | (b) | 11.500% | 11/15/2021 | 275,000 | 272,938 | |||||||||||||
Sprint Nextel Corp. (Wireless Telecom. Svs.) | (b) | 9.000% | 11/15/2018 | 1,025,000 | 1,078,813 | |||||||||||||
Syniverse Holdings, Inc. (Wireless Telecom. Svs.) | 9.125% | 01/15/2019 | 1,400,000 | 1,484,000 | ||||||||||||||
|
| |||||||||||||||||
| 13,703,979 | ||||||||||||||||||
|
| |||||||||||||||||
UTILITIES – 1.8% | ||||||||||||||||||
Edison Mission Energy (Electric Utilities) | 7.000% | 05/15/2017 | 600,000 | 393,000 | ||||||||||||||
Energy Future Intermediate Holding Co. LLC / EFIH Finance, Inc. (Electric Utilities) | 10.000% | 12/01/2020 | 500,000 | 530,000 | ||||||||||||||
Texas Competitive Electric Holdings Co. LLC / TCEH Finance, Inc. (Electric Utilities) | 10.250% | 11/01/2015 | 575,000 | 207,000 | ||||||||||||||
Texas Competitive Electric Holdings Co. LLC / TCEH Finance, Inc. (Electric Utilities) | (b) | 11.500% | 10/01/2020 | 125,000 | 106,719 | |||||||||||||
Ferrellgas LP / Ferrellgas Finance Corp. (Gas Utilities) | 6.500% | 05/01/2021 | 250,000 | 221,250 | ||||||||||||||
Calpine Corp. (Ind. Power Prod. & Energy Traders) | (b) | 7.500% | 02/15/2021 | 925,000 | 994,375 | |||||||||||||
NRG Energy, Inc. (Ind. Power Prod. & Energy Traders) | 7.375% | 01/15/2017 | 200,000 | 208,000 | ||||||||||||||
NRG Energy, Inc. (Ind. Power Prod. & Energy Traders) | 8.250% | 09/01/2020 | 750,000 | 757,500 | ||||||||||||||
NRG Energy, Inc. (Ind. Power Prod. & Energy Traders) | (b) | 7.875% | 05/15/2021 | 475,000 | 465,500 | |||||||||||||
NRG Energy, Inc. (Ind. Power Prod. & Energy Traders) | (b) | 7.625% | 05/15/2019 | 700,000 | 689,500 | |||||||||||||
FPL Energy National Wind Portfolio LLC (Acquired 05/27/2009, Cost $155,829)(Multi-Utilities) | (b)(f)(h) | 6.125% | 03/25/2019 | 182,513 | 179,684 | |||||||||||||
|
| |||||||||||||||||
| 4,752,528 | ||||||||||||||||||
|
| |||||||||||||||||
Total Corporate Bonds (Cost $253,768,306) | $ | 257,100,585 | ||||||||||||||||
|
| |||||||||||||||||
| Common Stocks – 0.0% | Shares | Value | ||||||||||||||||
CONSUMER DISCRETIONARY – 0.0% | ||||||||||||||||||
General Motors Co. (Automobiles) | 4,443 | $ | 90,060 | |||||||||||||||
|
| |||||||||||||||||
Total Common Stocks (Cost $415,829) | $ | 90,060 | ||||||||||||||||
|
| |||||||||||||||||
| Preferred Stocks – 0.1% | Shares | Value | ||||||||||||||||
FINANCIALS – 0.1% | ||||||||||||||||||
Ally Financial, Inc. (Consumer Finance) | (b) | 346 | $ | 248,050 | ||||||||||||||
|
| |||||||||||||||||
Total Preferred Stocks (Cost $0) | $ | 248,050 | ||||||||||||||||
|
| |||||||||||||||||
| Warrants – 0.0% | Quantity | Value | ||||||||||||||||
CONSUMER DISCRETIONARY – 0.0% | ||||||||||||||||||
General Motors Co. (Automobiles) Expiration: 07/10/16, Exercise Price: $10.00 | (a) | 4,039 | $ | 47,377 | ||||||||||||||
General Motors Co. (Automobiles) Expiration: 07/10/19, Exercise Price: $18.33 | (a) | 4,039 | 31,585 | |||||||||||||||
|
| |||||||||||||||||
Total Warrants (Cost $476,540) | $ | 78,962 | ||||||||||||||||
|
| |||||||||||||||||
| Other – 0.0% | Shares | Value | ||||||||||||||||
General Motors Corp. (Acquired 04/22/2011, Cost $0) | (a)(c)(f)(g)(h) | 1,100,000 | $ | 13,750 | ||||||||||||||
SuperMedia, Inc. Litigation Trust Interests (Acquired 01/04/2010, Cost $0) | (a)(c)(h) | 625,000 | 7,031 | |||||||||||||||
|
| |||||||||||||||||
Total Other (Cost $0) | $ | 20,781 | ||||||||||||||||
|
| |||||||||||||||||
| Money Market Funds – 1.4% | Shares | Value | ||||||||||||||||
Fidelity Institutional Money Market Funds | 3,814,000 | $ | 3,814,000 | |||||||||||||||
|
| |||||||||||||||||
Total Money Market Funds (Cost $3,814,000) | $ | 3,814,000 | ||||||||||||||||
|
| |||||||||||||||||
Total Investments (Cost $258,474,675) – 97.7% | (i) | $ | 261,352,438 | |||||||||||||||
Other Assets in Excess of Liabilities – 2.3% | 6,109,440 | |||||||||||||||||
|
| |||||||||||||||||
Net Assets – 100.0% | $ | 267,461,878 | ||||||||||||||||
|
| |||||||||||||||||
Percentages are stated as a percent of net assets.
Footnotes:
| (a) | Non-income producing security. |
| (b) | Security exempt from registration under Regulation D of the Securities Act of 1933. These securities may be resold in transactions exempt form registration, normally to qualified buyers under Rule 144A. At December 31, 2011, the value of these securities totaled $80,521,270, or 30.1% of the Portfolio’s net assets. Unless also noted with (h), as defined below, these securities were deemed liquid pursuant to procedures approved by the Board of Directors. |
| 68 | (continued) |
| Ohio National Fund, Inc. | High Income Bond Portfolio (Continued) |
Schedule of Investments | December 31, 2011 |
| (c) | A market quotation for this investment was not readily available at December 31, 2011. As discussed in Note 2 of the Notes to Financial Statements, the prices for these issues were derived from estimates of fair market value using methods determined in good faith by the Fund’s Pricing Committee under the supervision of the Board. These securities represent $20,781, or 0.0% of the Portfolio’s net assets. |
| (d) | Issuer of the security has the option to make coupon payments in cash or in additional par value of this bond. Rate presented is the coupon rate for the cash option. |
| (e) | Security is a variable rate instrument in which the coupon rate is adjusted quarterly, or semi-annually, in concert with U.S. LIBOR. Interest rates stated are those in effect at December 31, 2011. |
| (f) | Denotes a restricted security that is subject to a contractual restriction on public sales. At December 31, 2011, the value of these securities totaled $803,434, or 0.3% of the Portfolio’s net assets. |
| (g) | Represents a security that is in default. Unless also noted by (h), as defined below, these securities were deemed liquid pursuant to procedures approved by the Board of Directors. |
| (h) | Represents a security deemed to be illiquid. At December 31, 2011, the value of illiquid securities in the Portfolio totaled $1,335,715, or 0.5% of the Portfolio’s net assets. |
| (i) | Represents cost for financial reporting purposes, which may differ from cost basis for federal income tax purposes. See also Note 7 of the Notes to Financial Statements. |
| 69 |
The accompanying notes are an integral part of these financial statements.
| Ohio National Fund, Inc. | Capital Growth Portfolio |
Objective/Strategy
The Capital Growth Portfolio seeks long-term capital appreciation by investing primarily in an actively managed portfolio of equity securities of small-cap growth companies.
Performance as of December 31, 2011
Average Annual Total Returns: | ||||
One year | -2.46% | |||
Five years | 4.97% | |||
Ten years | 4.32% |
Past performance does not guarantee future results. The performance data quoted represents past performance and current returns may be lower or higher. Total return figures include change in share price and reinvestment of dividends and capital gains. The investment return and principal value will fluctuate so that an investor’s shares, when redeemed, may be worth more or less than the original cost. To obtain performance information up to the most recent month end, call toll-free 1-877-781-6392.
The Portfolio is not open to direct retail investment. Beneficial interest in shares is obtained solely by purchase of variable life insurance policies and variable annuity contracts. Actual performance results for variable annuity and variable universal life contracts will be lower due to contract charges. Consult your contract for applicable charges.
Comments
For the year ended December 31, 2011, the Capital Growth Portfolio returned -2.46% versus -2.91% for the current benchmark, the Russell 2000 Growth Index.
Equity markets in 2011 were characterized by violent moves with frequent one-day reversals. Headlines from Europe regarding the sovereign-debt crisis prompted that behavior. Slowing growth in China was also was a major concern. The year could be further characterized by a flight to safety as Treasuries traded at historic highs, large caps trounced small caps, and the leading sectors were Utilities and Consumer Staples. When all was said and done, though, equity markets were little changed overall. We believe the fear clearly evident in investor behavior is at least in part an overreaction to the financial collapse of 2008. We expect that Europe will come out of this crisis via the only socially acceptable short-term solution: printing money. In our view, China’s governing body will keep its controlled economy on an even keel. The U.S. Federal Reserve will likely continue accommodative monetary policy that should push out the inevitable rise in interest rates. We would expect modest economic growth in the range of 2 percent to 3 percent for gross domestic product. In an election year, the administration will likely pull out all stops to stimulate and create jobs. Given currently depressed valuations and terrible consumer sentiment, we believe equity markets could have a strong year. It is important to remember that bull markets, historically, have not started with positive economic news.
The Portfolio slightly outperformed the Russell 2000 Growth Index benchmark. Contributing sectors were led by Consumer Discretionary and Health Care, largely due to solid stock selection. Our top-performing stocks were Genesco, Inc., NetLogic Microsystems, EMS Technologies, Inc., Varian Semiconductor Equipment, and American Medical Systems. Genesco, Inc. is a retailer of headwear, footwear and clothing accessories. Genesco, Inc. is already benefiting from its early 2011 acquisition of Schuh Group and continues to leverage its strong positioning in the footwear and headwear lines to grow earnings. It has top market share in the absence of direct competitors. Broadcom bought Portfolio holding NetLogic Micro-
systems, a semiconductor manufacturer, in the second half of 2011. Honeywell International bought Portfolio holding EMS Technologies, a developer of wireless communications solutions, earlier in the year. Applied Materials bought Portfolio holding Varian Semiconductor in the first half of 2011. Finally, Endo Pharmaceuticals purchased Portfolio holding American Medical Systems, a maker of surgical equipment, earlier in the year. These four contributing companies each received significant premiums due to these events. (1)
Sectors detracting from 2011 relative performance were Industrials and Materials, reflecting modest cyclical exposure over the course of the year. Our worst-performing stocks were Meritor, Inc., DTS, Inc., WABCO Holdings, Inc., Monster Worldwide, Inc., and Veeco Instruments, Inc. Meritor, Inc. is a supplier of automotive components, including drive trains used in commercial trucking. The North American trucking cycle is showing signs of recovery and the average fleet age is at historically high levels. We believe that is likely to support near-term growth prospects in light of concerns over the current economic environment. DTS, Inc. is a provider of high-quality entertainment technologies, products and related services. Blu-ray device price-point declines leveled off toward the end of the year; moderating demand for those units from which DTS, Inc. sees roughly one-third of its revenue. As Blu-ray continues to establish itself as the industry norm for physical media, we believe meaningful upside is likely to exist in the long run. WABCO Holdings, Inc. manufactures electromechanical products for commercial trucks as well as passenger vehicles. WABCO Holdings, Inc. navigated through modest cyclical and European exposure during 2011 and looks to leverage its strong balance sheet and operating efficiency to generate growth in the near-term. Monster Worldwide, Inc. provides online recruitment services. Its growth has moderated as recent competition in the space has intensified along with notable macro uncertainty about hiring trends. Monster Worldwide, Inc. has continued to invest in the improvement of its offerings such as BeKnown and SeeMore to maintain and further the differentiation of its products. Veeco Instruments is a manufacturer of equipment used in the production of light-emitting diodes (LEDs), solar panels and hard-disk drives. The company’s modest revenue exposure to growing economic slowdown concerns in Asian pressured shares of the stock toward the back half of the year. Veeco Instrument’s strong balance sheet and business model provide solid positioning in the LED segment, although visibility in the industry is somewhat reduced in the near term.(1)
The five top-performing holdings were Regeneron Pharmaceuticals, Inc., EMS Technologies, Inc., Varian Semiconductor Equipment, Genesco, Inc., and American Medical Systems. Three of the top-five performing positions (EMS Technologies, Inc., Varian Semiconductor Equipment and American Medical Systems) landed on the list largely due to significant premiums paid by acquiring firms as the stocks were taken out over the course of the year. The five worst-performing holdings were Delcath Systems, Inc., Meritor, Inc., Monster Worldwide, Inc., MedAssets, Inc., and Veeco Instruments, Inc.(1)
Oil prices should remain range-bound as weaker U.S. demand trends continue to be offset by rising geopolitical concerns with the threat of Iran responding to sanctions. Importantly, we believe Saudi Arabia will be vigilant in curbing production, if necessary, because it has announced another significant increase in social programs that will require an average oil price of $80 per barrel to fund. With natural gas prices expected to remain depressed for the foreseeable future, drilling activity in the U.S. will likely continue its rapid shift away from natural gas to oil. In fact, during the fourth quarter, the
| 70 | (continued) |
| Ohio National Fund, Inc. | Capital Growth Portfolio (Continued) |
natural-gas rig count declined 126 rigs while the oil rig count increased 123 rigs. The oil-rig count provides an excellent leading indicator for demand for pumping services, or artificial lift, because every oil well is put “on pump” within the first year of production. As the massive backlog of “uncompleted” wells has finally begun to decline, there have been encouraging reports of price increases for pumping units. Against this backdrop, we believe artificial lift will be the strongest segment of the oil-services industry in 2012; consequently, we continue to hold an overweight position in Lufkin Industries, Inc.(1)
Within the Industrials and Materials sectors, concerns over global economic activity appear to be well-understood and factored into current valuations. Earnings visibility for most cyclical companies is extremely limited in the current environment, but many of these stocks ended 2011 trading close to their historic trough multiples. Within both sectors, we remain over-weighted in companies with exposure to the aerospace cycle. Perhaps the biggest surprise in the Industrials sector in 2011 was the unexpected strength in orders for commercial aircraft at both Boeing and Airbus that, in aggregate, totaled roughly 2,500 aircraft. Boeing and Airbus announced production-rate increases that provide visible growth opportunities for companies throughout the aerospace-supply chain. Specifically, we continue to like Triumph Group, Inc. as well as titanium producers Titanium Metals Corp. and RTI Metals, all of which are both well-positioned to benefit from the shift in production to wide-body models such as the Boeing 787. Beyond aerospace, other end markets that continue to have solid near-term prospects are energy, agriculture, North American commercial trucks, and utility spending. Additionally, there have been encouraging signs of a budding recovery in both commercial and residential construction markets in North America.(1)
Many Health Care industries appear cheap on a relative basis but the real question is what will get the sector to move upward. At this point, the sector is facing multiple headwinds including: 1) a sluggish economy causing patients to avoid medical care; 2) Centers for Medicare and Medicaid Services (CMS) continuing to cut reimbursement for areas in the health care industry that it deems are making excessive profits; 3) European economic woes forcing many regions to ration health care and delay discretionary purchases of equipment and technology; 4) some uncertainty as to whether the Supreme Court will uphold the constitutionality of President Obama’s healthcare reform bill; and 5) the U.S. Food and Drug Administration’s sustained level of risk-aversion and unpredictable approval proceedings.
In this context, we have attempted to identify stocks that are largely immune from the potential for reimbursement cuts from Washington. Some are tied to consumer discretionary spending for such things as cosmetic procedures, air-medical transport (e.g., Air Methods Corp.) or dental procedures (e.g., Sirona Dental Systems, Inc.). Some of the stocks in these areas are affected by a sluggish economy but there exists a greater interest in these kinds of stocks because they are unencumbered by any reimbursement or regulatory overhangs from Washington. We also continue to be invested in Medicaid-managed-care companies (e.g., Centene Corp. and AMERIGROUP Corp.) as both Washington, D.C., and state governments recognize the cost-savings benefit from these firms and, therefore, view them as part of the solution rather than the problem.(1)
In the Information Technology sector, we are cautious on the macroeconomic outlook given the weakness in the U.S. consumer environment, coupled with domestic and European government debt concerns. As such, we expect stock-price volatility to increase,
which should allow for investment opportunities but also requires vigilant risk management. Secular growth remains a focus through themes such as security software, Internet-based enterprise applications, consumer adoption of mobile devices, increasing video data traffic, and real-time analytics. We will look to increase our semiconductor exposure in anticipation of an improving product cycle. Continued acquisition activity is also expected as companies use their cash to bolster modest growth rates as well as to consolidate strategic assets.
Within the Financials sector, we believe that small-cap banks will continue to be challenged by costly regulatory compliance that falls disproportionally on smaller institutions. We also do not see much light on the housing front until potentially later in the year. Our largest weight in Financials remains in pawn-shop operators, represented by Cash America International, Inc. and EZCorp, Inc. (1)
Small-cap consumer stocks declined modestly in 2011, probably more due to domestic issues (e.g., high unemployment, poor consumer-sentiment numbers and a tepid economy) than global concerns (e.g., the sovereign-debt crisis in Europe and slowing growth in China) because small-cap consumer companies have little direct exposure to those potential landmines. We reduced our exposure somewhat as both retailers and restaurants have difficult same-store-sales comparisons in 2012. Genesco, Inc. remains our largest weight and we expect it to continue to do well. With the expected proliferation of new gaming jurisdictions, as well as possible limited approvals of online gaming, we expect both Bally Technologies, Inc. and Pinnacle Entertainment, Inc. to prosper.(1)
| (1) | The Portfolio’s composition is subject to change. Holdings and weightings are as of December 31, 2011. |
Change in Value of $10,000 Investment
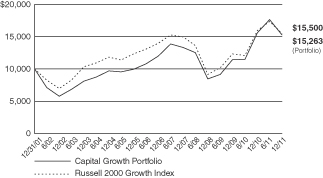
Hypothetical illustration based on past performance. Future performance will vary. The Portfolio’s returns reflect reinvested dividends. The Portfolio’s holdings may differ significantly from the securities in the index. The index is unmanaged and therefore does not reflect the cost of portfolio management and accounting.
The Russell 2000 Growth Index is a market-weighted total return index that measures the performance of companies within the Russell 2000 Index having higher price-to-book ratios and higher forecasted growth values. The Russell 2000 Index includes the 2000 firms from the Russell 3000 Index with the smallest market capitalizations. The Russell 3000 Index represents 98% of the investable U.S. equity market. The index presented herein includes the effects of reinvested dividends.
| 71 | (continued) |
| Ohio National Fund, Inc. | Capital Growth Portfolio (Continued) |
Portfolio Composition as of December 31, 2011 (1)
| % of Net Assets | ||||
Common Stocks (3) | 99.8 | |||
Money Market Funds | 0.2 | |||
|
| |||
| 100.0 | ||||
|
|
Top 10 Portfolio Holdings as of December 31, 2011 (1) (2)
| % of Net Assets | ||||
1. Genesco, Inc. | 4.1 | |||
2. Lufkin Industries, Inc. | 3.2 | |||
3. Vitamin Shoppe, Inc. | 2.1 | |||
4. Shuffle Master, Inc. | 2.0 | |||
5. Triumph Group, Inc. | 2.0 | |||
6. Cash America International, Inc. | 1.9 | |||
7. Oasis Petroleum, Inc. | 1.9 | |||
8. Quality Systems, Inc. | 1.8 | |||
9. Salix Pharmaceuticals Ltd. | 1.8 | |||
10. Bally Technologies, Inc. | 1.7 | |||
| (1) | Composition of Portfolio subject to change. |
| (2) | Short-term investments have been excluded from the list of Top 10 Portfolio Holdings. |
| (3) | Sectors: |
| % of Net Assets | ||||
Information Technology | 22.4 | |||
Health Care | 22.1 | |||
Consumer Discretionary | 18.2 | |||
Industrials | 15.2 | |||
Energy | 8.4 | |||
Materials | 6.1 | |||
Financials | 5.8 | |||
Consumer Staples | 1.6 | |||
|
| |||
| 99.8 | ||||
|
|
| 72 |
| Ohio National Fund, Inc. | Capital Growth Portfolio |
Schedule of Investments | December 31, 2011 |
| Common Stocks – 99.8% | Shares | Value | ||||||||
CONSUMER DISCRETIONARY – 18.2% | ||||||||||
Sotheby’s (Diversified Consumer Svs.) | 12,870 | $ | 367,181 | |||||||
Bally Technologies, Inc. (Hotels, Restaurants & Leisure) | (a) | 21,831 | 863,634 | |||||||
BJ’s Restaurants, Inc. (Hotels, Restaurants & Leisure) | (a) | 16,981 | 769,579 | |||||||
Orient-Express Hotels Ltd. Class A (Hotels, Restaurants & Leisure) | (a) | 39,810 | 297,381 | |||||||
Pinnacle Entertainment, Inc. (Hotels, Restaurants & Leisure) | (a) | 40,799 | 414,518 | |||||||
Shuffle Master, Inc. (Hotels, Restaurants & Leisure) | (a) | 88,259 | 1,034,395 | |||||||
Universal Electronics, Inc. (Household Durables) | (a) | 30,531 | 515,058 | |||||||
Chico’s FAS, Inc. (Specialty Retail) | 22,550 | 251,207 | ||||||||
Genesco, Inc. (Specialty Retail) | (a) | 34,298 | 2,117,559 | |||||||
GNC Holdings, Inc. Class A (Specialty Retail) | (a) | 24,854 | 719,523 | |||||||
Sally Beauty Holdings, Inc. (Specialty Retail) | (a) | 14,340 | 303,004 | |||||||
Vitamin Shoppe, Inc. (Specialty Retail) | (a) | 26,706 | 1,065,035 | |||||||
Steven Madden Ltd. (Textiles, Apparel & Luxury Goods) | (a) | 16,271 | 561,349 | |||||||
|
| |||||||||
| 9,279,423 | ||||||||||
|
| |||||||||
CONSUMER STAPLES – 1.6% | ||||||||||
Fresh Market, Inc. / The (Food & Staples Retailing) | (a) | 14,469 | 577,313 | |||||||
Herbalife Ltd. (Personal Products) | 4,620 | 238,715 | ||||||||
|
| |||||||||
| 816,028 | ||||||||||
|
| |||||||||
ENERGY – 8.4% | ||||||||||
Dril-Quip, Inc. (Energy Equip. & Svs.) | (a) | 4,649 | 305,997 | |||||||
Lufkin Industries, Inc. (Energy Equip. & Svs.) | 24,155 | 1,625,873 | ||||||||
OYO Geospace Corp. (Energy Equip. & Svs.) | (a) | 10,337 | 799,360 | |||||||
Cloud Peak Energy, Inc. (Oil, Gas & Consumable Fuels) | (a) | 11,970 | 231,260 | |||||||
Gulfport Energy Corp. (Oil, Gas & Consumable Fuels) | (a) | 11,643 | 342,886 | |||||||
Oasis Petroleum, Inc. (Oil, Gas & Consumable Fuels) | (a) | 33,300 | 968,697 | |||||||
|
| |||||||||
| 4,274,073 | ||||||||||
|
| |||||||||
FINANCIALS – 5.8% | ||||||||||
Duff & Phelps Corp. Class A (Capital Markets) | 22,433 | 325,278 | ||||||||
UMB Financial Corp. (Commercial Banks) | 7,075 | 263,544 | ||||||||
Cash America International, Inc. (Consumer Finance) | 21,299 | 993,172 | ||||||||
EZCorp, Inc. Class A (Consumer Finance) | (a) | 7,080 | 186,700 | |||||||
KKR Financial Holdings LLC (Diversified Financial Svs.) | 30,255 | 264,126 | ||||||||
Validus Holdings Ltd. (Insurance) | 19,355 | 609,683 | ||||||||
Redwood Trust, Inc. (Real Estate Investment Trusts) | 33,491 | 340,938 | ||||||||
|
| |||||||||
| 2,983,441 | ||||||||||
|
| |||||||||
HEALTH CARE – 22.1% | ||||||||||
BioMarin Pharmaceutical, Inc. (Biotechnology) | (a) | 9,015 | 309,936 | |||||||
Cepheid, Inc. (Biotechnology) | (a) | 15,886 | 546,637 | |||||||
Onyx Pharmaceuticals, Inc. (Biotechnology) | (a) | 4,608 | 202,522 | |||||||
Seattle Genetics, Inc. (Biotechnology) | (a) | 12,815 | 214,203 | |||||||
Theravance, Inc. (Biotechnology) | (a) | 11,578 | 255,874 | |||||||
United Therapeutics Corp. (Biotechnology) | (a) | 11,485 | 542,666 | |||||||
Arthrocare Corp. (Health Care Equip. & Supplies) | (a) | 25,330 | 802,454 | |||||||
Cooper Cos., Inc. / The (Health Care Equip. & Supplies) | 7,720 | 544,414 | ||||||||
Sirona Dental Systems, Inc. (Health Care Equip. & Supplies) | (a) | 16,515 | 727,321 | |||||||
Thoratec Corp. (Health Care Equip. & Supplies) | (a) | 19,763 | 663,246 | |||||||
Air Methods Corp. (Health Care Providers & Svs.) | (a) | 5,890 | 497,411 | |||||||
AMERIGROUP Corp. (Health Care Providers & Svs.) | (a) | 8,084 | 477,603 | |||||||
Catalyst Health Solutions, Inc. (Health Care Providers & Svs.) | (a) | 14,074 | 731,848 | |||||||
Centene Corp. (Health Care Providers & Svs.) | (a) | 21,646 | 856,965 | |||||||
Allscripts Healthcare Solutions, Inc. (Health Care Technology) | (a) | 28,664 | 542,896 | |||||||
MedAssets, Inc. (Health Care Technology) | (a) | 24,646 | 227,976 | |||||||
Medidata Solutions, Inc. (Health Care Technology) | (a) | 11,393 | 247,798 | |||||||
Quality Systems, Inc. (Health Care Technology) | 24,964 | 923,418 | ||||||||
Bruker Corp. (Life Sciences Tools & Svs.) | (a) | 34,319 | 426,242 | |||||||
ICON PLC – ADR (Life Sciences Tools & Svs.) | (a) | 13,678 | 234,031 | |||||||
| Common Stocks (Continued) | Shares | Value | ||||||||
HEALTH CARE (continued) | ||||||||||
PAREXEL International Corp. (Life Sciences Tools & Svs.) | (a) | 19,926 | $ | 413,265 | ||||||
Salix Pharmaceuticals Ltd. (Pharmaceuticals) | (a) | 19,225 | 919,916 | |||||||
|
| |||||||||
| 11,308,642 | ||||||||||
|
| |||||||||
INDUSTRIALS – 15.2% | ||||||||||
Hexcel Corp. (Aerospace & Defense) | (a) | 16,542 | 400,482 | |||||||
Triumph Group, Inc. (Aerospace & Defense) | 17,114 | 1,000,313 | ||||||||
Atlas Air Worldwide Holdings, Inc. (Air Freight & Logistics) | (a) | 12,025 | 462,121 | |||||||
JetBlue Airways Corp. (Airlines) | (a) | 94,805 | 492,986 | |||||||
Geo Group, Inc. / The (Commercial Svs. & Supplies) | (a) | 37,710 | 631,643 | |||||||
Waste Connections, Inc. (Commercial Svs. & Supplies) | 23,387 | 775,045 | ||||||||
Northwest Pipe Co. (Construction & Engineering) | (a) | 16,838 | 384,917 | |||||||
GrafTech International Ltd. (Electrical Equip.) | (a) | 40,765 | 556,442 | |||||||
Polypore International, Inc. (Electrical Equip.) | (a) | 10,360 | 455,736 | |||||||
Regal-Beloit Corp. (Electrical Equip.) | 8,748 | 445,886 | ||||||||
Meritor, Inc. (Machinery) | (a) | 41,510 | 220,833 | |||||||
WABCO Holdings, Inc. (Machinery) | (a) | 16,311 | 707,897 | |||||||
Acacia Research – Acacia Technologies (Professional Svs.) | (a) | 17,474 | 637,976 | |||||||
Landstar System, Inc. (Road & Rail) | 12,690 | 608,105 | ||||||||
|
| |||||||||
| 7,780,382 | ||||||||||
|
| |||||||||
INFORMATION TECHNOLOGY – 22.4% | ||||||||||
Riverbed Technology, Inc. (Communications Equip.) | (a) | 12,275 | 288,463 | |||||||
3D Systems Corp. (Computers & Peripherals) | (a) | 13,060 | 188,064 | |||||||
Coherent, Inc. (Electronic Equip., Instr. & Comp.) | (a) | 15,755 | 823,514 | |||||||
DTS, Inc. (Electronic Equip., Instr. & Comp.) | (a) | 22,596 | 615,515 | |||||||
IPG Photonics Corp. (Electronic Equip., Instr. & Comp.) | (a) | 7,440 | 251,993 | |||||||
Universal Display Corp. (Electronic Equip., Instr. & Comp.) | (a) | 7,597 | 278,734 | |||||||
Monster Worldwide, Inc. (Internet Software & Svs.) | (a) | 40,285 | 319,460 | |||||||
Sapient Corp. (IT Svs.) | 68,488 | 862,949 | ||||||||
Cavium, Inc. (Semiconductors & Equip.) | (a) | 8,725 | 248,052 | |||||||
Cymer, Inc. (Semiconductors & Equip.) | (a) | 10,211 | 508,099 | |||||||
EZchip Semiconductor Ltd. (Semiconductors & Equip.) | (a) | 9,365 | 265,310 | |||||||
Teradyne, Inc. (Semiconductors & Equip.) | (a) | 48,080 | 655,330 | |||||||
Veeco Instruments, Inc. (Semiconductors & Equip.) | (a) | 15,240 | 316,992 | |||||||
ANSYS, Inc. (Software) | (a) | 11,580 | 663,302 | |||||||
Compuware Corp. (Software) | (a) | 85,733 | 713,299 | |||||||
Fortinet, Inc. (Software) | (a) | 36,992 | 806,796 | |||||||
Informatica Corp. (Software) | (a) | 11,045 | 407,892 | |||||||
NICE Systems Ltd. – ADR (Software) | (a) | 20,017 | 689,586 | |||||||
Opnet Technologies, Inc. (Software) | 7,410 | 271,725 | ||||||||
Progress Software Corp. (Software) | (a) | 21,627 | 418,482 | |||||||
Qlik Technologies, Inc. (Software) | (a) | 24,825 | 600,765 | |||||||
SuccessFactors, Inc. (Software) | (a) | 18,762 | 748,041 | |||||||
TIBCO Software, Inc. (Software) | (a) | 20,326 | 485,995 | |||||||
|
| |||||||||
| 11,428,358 | ||||||||||
|
| |||||||||
MATERIALS – 6.1% | ||||||||||
Huntsman Corp. (Chemicals) | 51,471 | 514,710 | ||||||||
Intrepid Potash, Inc. (Chemicals) | (a) | 14,162 | 320,486 | |||||||
Quaker Chemical Corp. (Chemicals) | 12,658 | 492,270 | ||||||||
Texas Industries, Inc. (Construction Materials) | 13,677 | 420,978 | ||||||||
RTI International Metals, Inc. (Metals & Mining) | (a) | 30,701 | 712,570 | |||||||
Titanium Metals Corp. (Metals & Mining) | 43,556 | 652,469 | ||||||||
|
| |||||||||
| 3,113,483 | ||||||||||
|
| |||||||||
Total Common Stocks (Cost $44,539,746) | $ | 50,983,830 | ||||||||
|
| |||||||||
| 73 | (continued) |
| Ohio National Fund, Inc. | Capital Growth Portfolio (Continued) |
Schedule of Investments | December 31, 2011 |
| Money Market Funds – 0.8% | Shares | Value | ||||||||
Fidelity Institutional Money Market Funds | 443,000 | $ | 443,000 | |||||||
|
| |||||||||
Total Money Market Funds (Cost $443,000) | $ | 443,000 | ||||||||
|
| |||||||||
Total Investments – 100.6% (Cost $44,982,746) | (b) | $ | 51,426,830 | |||||||
Liabilities in Excess of Other Assets – (0.6)% | (321,445) | |||||||||
|
| |||||||||
Net Assets – 100.0% | $ | 51,105,385 | ||||||||
|
| |||||||||
Percentages are stated as a percent of net assets.
Abbreviations:
ADR: American Depositary Receipts
Footnotes:
| (a) | Non-income producing security. |
| (b) | Represents cost for financial reporting purposes, which may differ from cost basis for federal income tax purposes. See also Note 7 of the Notes to Financial Statements. |
The accompanying notes are an integral part of these financial statements.
| 74 |
| Ohio National Fund, Inc. | Nasdaq-100® Index Portfolio |
Objective/Strategy
The Nasdaq-100® Index Portfolio seeks long-term growth of capital by investing primarily in stocks that are included in the Nasdaq-100® Index. Unlike the other Portfolios of the Fund, the Nasdaq-100® Index Portfolio is a non-diversified portfolio for purposes of Section 5(b) of the Investment Company Act of 1940, as amended.
Performance as of December 31, 2011
Average Annual Total Returns: | ||||
One year | 3.19% | |||
Five years | 5.43% | |||
Ten years | 3.69% |
Past performance does not guarantee future results. The performance data quoted represents past performance and current returns may be lower or higher. Total return figures include change in share price and reinvestment of dividends and capital gains. The investment return and principal value will fluctuate so that an investor’s shares, when redeemed, may be worth more or less than the original cost. To obtain performance information up to the most recent month end, call toll-free 1-877-781-6392.
The Portfolio is not open to direct retail investment. Beneficial interest in shares is obtained solely by purchase of variable life insurance policies and variable annuity contracts. Actual performance results for variable annuity and variable universal life contracts will be lower due to contract charges. Consult your contract for applicable charges.
Comments
For the year ended December 31, 2011, the Nasdaq-100® Index Portfolio returned 3.19% versus 3.66% for the current benchmark, the Nasdaq-100® Index.
The correlation to the index for the year was 99.9%. The high correlation is due to the fact that the Portfolio invests in each of the 100 stocks in the index. The Portfolio also invests in PowerShares QQQ, an exchange traded fund that mimics the holdings and returns of the Nasdaq-100® Index.
The largest contributors to the index return for 2011 were Apple, Inc., Google, Inc., QUALCOMM, Inc., Biogen Idec, Inc., and Starbucks Corp. The largest detractors from the index return for 2011 were Oracle Corp., Research in Motion Ltd., Teva Pharmaceuticals Industries Ltd., First Solar, Inc., and Paccar Inc. (1)
Stocks managed to have positive returns in 2011 despite the European debt crisis, gridlock in Washington, and worries about the strength of the U.S. economic recovery. The year was marked by above average volatility as equities were moved by macro economic events. Fundamental financial analysis took a backseat to news of the strength of the Euro, U.S. budget fights on Capitol Hill, and sovereign credit downgrades.
Moving into 2012, we see the U.S. economy continuing to improve. Equity indices are trading at very low historical price to earning ratios, with companies’ earnings expected to continue to rise in 2012. We expect 2012 to be a good year for equities.
| (1) | The Portfolio’s composition is subject to change. Holdings and weightings are as of December 31, 2011. |
The Nasdaq-100®, Nasdaq-100 Index®, and Nasdaq® are registered trademarks of The NASDAQ OMX Group, Inc. (which with its affiliates is referred to as “NASDAQ OMX”). Ohio National Investments, Inc. has licensed these marks for the Portfolio’s use. NASDAQ OMX has not passed on the Portfolio’s legality or suitability. NASDAQ OMX does not sponsor, endorse, sell or promote the Portfolio. NASDAQ OMX MAKES NO WARRANTIES AND BEARS NO LIABILITY WITH RESPECT TO THE PORTFOLIO.
Change in Value of $10,000 Investment
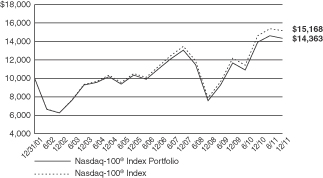
Hypothetical illustration based on past performance. Future performance will vary. The Portfolio’s returns reflect reinvested dividends. The Portfolio’s holdings may differ significantly from the securities in the index. The index is unmanaged and therefore does not reflect the cost of portfolio management and accounting. Investors cannot invest in an index. Although they can invest in its underlying securities or funds.
The Nasdaq-100® Index is a modified capitalization-weighted index of the 100 largest domestic and international non-financial companies listed on the National Market tier of The NASDAQ Stock Market. The index presented herein includes the effects of reinvested dividends.
| 75 | (continued) |
| Ohio National Fund, Inc. | Nasdaq-100® Index Portfolio (Continued) |
Portfolio Composition as of December 31, 2011 (1)
| % of Net Assets | ||||
Common Stocks (3) | 99.1 | |||
Exchange Traded Funds | 0.8 | |||
Commercial Paper | 0.1 | |||
|
| |||
| 100.0 | ||||
|
|
Top 10 Portfolio Holdings as of December 31, 2011 (1) (2)
| % of Net Assets | ||||
1. Apple, Inc. | 14.9 | |||
2. Microsoft Corp. | 8.6 | |||
3. Google, Inc. Class A | 6.5 | |||
4. Oracle Corp. | 5.1 | |||
5. Intel Corp. | 4.9 | |||
6. Cisco Systems, Inc. | 3.8 | |||
7. QUALCOMM, Inc. | 3.6 | |||
8. Amazon.com, Inc. | 3.1 | |||
9. Amgen, Inc. | 2.2 | |||
10. Comcast Corp. Class A | 2.0 |
| (1) | Composition of Portfolio subject to change. |
| (2) | Short-term investments have been excluded from the list of Top 10 Portfolio Holdings. |
| (3) | Sectors: |
| % of Net Assets | ||||
Information Technology | 66.6 | |||
Consumer Discretionary | 15.1 | |||
Health Care | 11.2 | |||
Consumer Staples | 2.5 | |||
Industrials | 2.1 | |||
Telecommunication Services | 1.0 | |||
Materials | 0.6 | |||
|
| |||
| 99.1 | ||||
|
|
| 76 |
| Ohio National Fund, Inc. | Nasdaq-100® Index Portfolio |
Schedule of Investments | December 31, 2011 |
| Common Stocks – 99.1% | Shares | Value | ||||||||
CONSUMER DISCRETIONARY – 15.1% |
| |||||||||
Apollo Group, Inc. Class A (Diversified Consumer Svs.) | (a) | 2,850 | $ | 153,529 | ||||||
Ctrip.com International Ltd. – ADR (Hotels, Restaurants & Leisure) | (a) | 3,250 | 76,050 | |||||||
Starbucks Corp. (Hotels, Restaurants & Leisure) | 16,375 | 753,414 | ||||||||
Wynn Resorts Ltd. (Hotels, Restaurants & Leisure) | 2,750 | 303,847 | ||||||||
Garmin Ltd. (Household Durables) | 4,275 | 170,188 | ||||||||
Amazon.com, Inc. (Internet & Catalog Retail) | (a) | 10,000 | 1,731,000 | |||||||
Expedia, Inc. (Internet & Catalog Retail) | 2,650 | 76,903 | ||||||||
Liberty Interactive Corp. Class A (Internet & Catalog Retail) | (a) | 12,325 | 199,850 | |||||||
Netflix, Inc. (Internet & Catalog Retail) | (a) | 1,225 | 84,880 | |||||||
priceline.com, Inc. (Internet & Catalog Retail) | (a) | 1,100 | 514,481 | |||||||
Mattel, Inc. (Leisure Equip. & Products) | 7,450 | 206,812 | ||||||||
Comcast Corp. Class A (Media) | 45,972 | 1,089,996 | ||||||||
DIRECTV Class A (Media) | (a) | 15,500 | 662,780 | |||||||
News Corp. Class A (Media) | 37,825 | 674,798 | ||||||||
Sirius XM Radio, Inc. (Media) | (a) | 82,375 | 149,922 | |||||||
Virgin Media, Inc. (Media) | 6,600 | 141,108 | ||||||||
Dollar Tree, Inc. (Multiline Retail) | (a) | 2,625 | 218,164 | |||||||
Sears Holdings Corp. (Multiline Retail) | (a) | 2,350 | 74,683 | |||||||
Bed Bath & Beyond, Inc. (Specialty Retail) | (a) | 5,375 | 311,589 | |||||||
Orchard Supply Hardware Stores Corp. Class A (Specialty Retail) | (a)(b) | 106 | 388 | |||||||
O’Reilly Automotive, Inc. (Specialty Retail) | (a) | 2,825 | 225,859 | |||||||
Ross Stores, Inc. (Specialty Retail) | 5,075 | 241,215 | ||||||||
Staples, Inc. (Specialty Retail) | 15,375 | 213,559 | ||||||||
Fossil, Inc. (Textiles, Apparel & Luxury Goods) | (a) | 1,375 | 109,120 | |||||||
|
| |||||||||
| 8,384,135 | ||||||||||
|
| |||||||||
CONSUMER STAPLES – 2.5% |
| |||||||||
Hansen Natural Corp. (Beverages) | (a) | 1,925 | 177,369 | |||||||
Costco Wholesale Corp. (Food & Staples Retailing) | 9,510 | 792,373 | ||||||||
Whole Foods Market, Inc. (Food & Staples Retailing) | 3,950 | 274,841 | ||||||||
Green Mountain Coffee Roasters, Inc. (Food Products) | (a) | 3,400 | 152,490 | |||||||
|
| |||||||||
| 1,397,073 | ||||||||||
|
| |||||||||
HEALTH CARE – 11.2% |
| |||||||||
Alexion Pharmaceuticals, Inc. (Biotechnology) | (a) | 4,075 | 291,362 | |||||||
Amgen, Inc. (Biotechnology) | 19,247 | 1,235,850 | ||||||||
Biogen Idec, Inc. (Biotechnology) | (a) | 5,325 | 586,016 | |||||||
Celgene Corp. (Biotechnology) | (a) | 9,750 | 659,100 | |||||||
Gilead Sciences, Inc. (Biotechnology) | (a) | 16,500 | 675,345 | |||||||
Vertex Pharmaceuticals, Inc. (Biotechnology) | (a) | 4,575 | 151,936 | |||||||
DENTSPLY International, Inc. (Health Care Equip. & Supplies) | 3,100 | 108,469 | ||||||||
Intuitive Surgical, Inc. (Health Care Equip. & Supplies) | (a) | 850 | 393,558 | |||||||
Express Scripts, Inc. (Health Care Providers & Svs.) | (a) | 10,675 | 477,066 | |||||||
Henry Schein, Inc. (Health Care Providers & Svs.) | (a) | 1,975 | 127,249 | |||||||
Cerner Corp. (Health Care Technology) | (a) | 3,725 | 228,156 | |||||||
Life Technologies Corp. (Life Sciences Tools & Svs.) | (a) | 3,925 | 152,722 | |||||||
Mylan, Inc. (Pharmaceuticals) | (a) | 9,375 | 201,187 | |||||||
Perrigo Co. (Pharmaceuticals) | 2,050 | 199,465 | ||||||||
Teva Pharmaceutical Industries Ltd. – ADR (Pharmaceuticals) | 15,385 | 620,939 | ||||||||
Warner Chilcott PLC Class A (Pharmaceuticals) | (a) | 5,575 | 84,350 | |||||||
|
| |||||||||
| 6,192,770 | ||||||||||
|
| |||||||||
INDUSTRIALS – 2.1% |
| |||||||||
C.H. Robinson Worldwide, Inc. (Air Freight & Logistics) | 3,600 | 251,208 | ||||||||
Expeditors International of Washington, Inc. (Air Freight & Logistics) | 4,650 | 190,464 | ||||||||
Stericycle, Inc. (Commercial Svs. & Supplies) | (a) | 1,875 | 146,100 | |||||||
PACCAR, Inc. (Machinery) | 7,864 | 294,664 | ||||||||
| Common Stocks (Continued) | Shares | Value | ||||||||
INDUSTRIALS (continued) |
| |||||||||
Fastenal Co. (Trading Companies & Distributors) | 6,475 | $ | 282,375 | |||||||
|
| |||||||||
| 1,164,811 | ||||||||||
|
| |||||||||
INFORMATION TECHNOLOGY – 66.6% |
| |||||||||
Cisco Systems, Inc. (Communications Equip.) | 118,075 | 2,134,796 | ||||||||
F5 Networks, Inc. (Communications Equip.) | (a) | 1,750 | 185,710 | |||||||
QUALCOMM, Inc. (Communications Equip.) | 36,920 | 2,019,524 | ||||||||
Research In Motion Ltd. (Communications Equip.) | (a) | 11,425 | 165,662 | |||||||
Apple, Inc. (Computers & Peripherals) | (a) | 20,420 | 8,270,100 | |||||||
Dell, Inc. (Computers & Peripherals) | (a) | 39,450 | 577,153 | |||||||
NetApp, Inc. (Computers & Peripherals) | (a) | 8,085 | 293,243 | |||||||
SanDisk Corp. (Computers & Peripherals) | (a) | 5,275 | 259,583 | |||||||
Seagate Technology PLC (Computers & Peripherals) | 10,200 | 167,280 | ||||||||
Flextronics International Ltd. (Electronic Equip., | (a) | 15,675 | 88,720 | |||||||
Akamai Technologies, Inc. (Internet Software & Svs.) | (a) | 3,950 | 127,506 | |||||||
Baidu, Inc. – ADR (Internet Software & Svs.) | (a) | 5,950 | 692,996 | |||||||
eBay, Inc. (Internet Software & Svs.) | (a) | 28,360 | 860,159 | |||||||
Google, Inc. Class A (Internet Software & Svs.) | (a) | 5,625 | 3,633,187 | |||||||
VeriSign, Inc. (Internet Software & Svs.) | 3,505 | 125,199 | ||||||||
Yahoo!, Inc. (Internet Software & Svs.) | (a) | 27,235 | 439,301 | |||||||
Automatic Data Processing, Inc. (IT Svs.) | 10,725 | 579,257 | ||||||||
Cognizant Technology Solutions Corp. Class A (IT Svs.) | (a) | 6,625 | 426,054 | |||||||
Fiserv, Inc. (IT Svs.) | (a) | 3,087 | 181,330 | |||||||
Infosys Ltd. – ADR (IT Svs.) | 1,725 | 88,630 | ||||||||
Paychex, Inc. (IT Svs.) | 7,970 | 239,977 | ||||||||
Altera Corp. (Semiconductors & Equip.) | 7,050 | 261,555 | ||||||||
Applied Materials, Inc. (Semiconductors & Equip.) | 28,950 | 310,055 | ||||||||
Avago Technologies Ltd. (Semiconductors & Equip.) | 5,400 | 155,844 | ||||||||
Broadcom Corp. Class A (Semiconductors & Equip.) | (a) | 10,675 | 313,418 | |||||||
First Solar, Inc. (Semiconductors & Equip.) | (a) | 1,900 | 64,144 | |||||||
Intel Corp. (Semiconductors & Equip.) | 111,845 | 2,712,241 | ||||||||
KLA-Tencor Corp. (Semiconductors & Equip.) | 3,650 | 176,113 | ||||||||
Lam Research Corp. (Semiconductors & Equip.) | (a) | 2,625 | 97,178 | |||||||
Linear Technology Corp. (Semiconductors & Equip.) | 5,005 | 150,300 | ||||||||
Marvell Technology Group Ltd. (Semiconductors & Equip.) | (a) | 13,300 | 184,205 | |||||||
Maxim Integrated Products, Inc. (Semiconductors & Equip.) | 6,400 | 166,656 | ||||||||
Microchip Technology, Inc. (Semiconductors & Equip.) | 4,200 | 153,846 | ||||||||
Micron Technology, Inc. (Semiconductors & Equip.) | (a) | 21,700 | 136,493 | |||||||
NVIDIA Corp. (Semiconductors & Equip.) | (a) | 13,412 | 185,890 | |||||||
| Xilinx, Inc. (Semiconductors & Equip.) | 5,755 | 184,505 | ||||||||
Activision Blizzard, Inc. (Software) | 25,125 | 309,540 | ||||||||
Adobe Systems, Inc. (Software) | (a) | 10,780 | 304,751 | |||||||
Autodesk, Inc. (Software) | (a) | 4,975 | 150,892 | |||||||
BMC Software, Inc. (Software) | (a) | 3,750 | 122,925 | |||||||
CA, Inc. (Software) | 10,825 | 218,827 | ||||||||
Check Point Software Technologies Ltd. (Software) | (a) | 4,570 | 240,108 | |||||||
Citrix Systems, Inc. (Software) | (a) | 4,100 | 248,952 | |||||||
Electronic Arts, Inc. (Software) | (a) | 7,280 | 149,968 | |||||||
Intuit, Inc. (Software) | 6,530 | 343,413 | ||||||||
Microsoft Corp. (Software) | 184,775 | 4,796,759 | ||||||||
Nuance Communications, Inc. (Software) | (a) | 6,600 | 166,056 | |||||||
Oracle Corp. (Software) | 110,810 | 2,842,277 | ||||||||
Symantec Corp. (Software) | (a) | 16,198 | 253,499 | |||||||
|
| |||||||||
| 36,955,777 | ||||||||||
|
| |||||||||
MATERIALS – 0.6% |
| |||||||||
Sigma-Aldrich Corp. (Chemicals) | 2,650 | 165,519 | ||||||||
Randgold Resources Ltd. – ADR (Metals & Mining) | 1,275 | 130,178 | ||||||||
|
| |||||||||
| 295,697 | ||||||||||
|
| |||||||||
TELECOMMUNICATION SERVICES – 1.0% |
| |||||||||
Vodafone Group PLC – ADR (Wireless Telecom. Svs.) | 20,175 | 565,505 | ||||||||
|
| |||||||||
Total Common Stocks (Cost $46,188,192) | $ | 54,955,768 | ||||||||
|
| |||||||||
| 77 | (continued) |
| Ohio National Fund, Inc. | Nasdaq-100® Index Portfolio (Continued) |
Schedule of Investments | December 31, 2011 |
| Preferred Stocks – 0.0% | Shares | Value | ||||||||
CONSUMER DISCRETIONARY – 0.0% |
| |||||||||
Orchard Supply Hardware Stores Corp. (Specialty Retail) | (b) | 106 | $ | 388 | ||||||
|
| |||||||||
Total Preferred Stocks (Cost $0) | $ | 388 | ||||||||
|
| |||||||||
| Exchange Traded Funds – 0.8% | Shares | Value | ||||||||
PowerShares QQQ Trust Series 1 | 7,765 | $ | 433,520 | |||||||
|
| |||||||||
Total Exchange Traded Funds (Cost $440,097) | $ | 433,520 | ||||||||
|
| |||||||||
| Commercial Paper – 0.3% | Face Amount | Amortized Cost | ||||||||
| HSBC Finance Corp. 0.030%, 01/03/2012 | $ | 175,000 | $ | 175,000 | ||||||
|
| |||||||||
Total Commercial Paper (Cost $175,000) | $ | 175,000 | ||||||||
|
| |||||||||
Total Investments – 100.2% (Cost $46,803,289) | (c) | $ | 55,564,676 | |||||||
Liabilities in Excess of Other Assets – (0.2)% | (93,739) | |||||||||
|
| |||||||||
Net Assets – 100.0% | $ | 55,470,937 | ||||||||
|
| |||||||||
Percentages are stated as a percent of net assets.
Abbreviations:
ADR: American Depositary Receipts
Footnotes:
| (a) | Non-income producing security. |
| (b) | A market quotation for this investment was not readily available at December 31, 2011. As discussed in Note 2 of the Notes to Financial Statements, the prices for these issues were derived from estimates of fair market value using methods determined in good faith by the Fund’s Pricing Committee under the supervision of the Board. These securities represent $776, or 0.0% of the Portfolio’s net assets. |
| (c) | Represents cost for financial reporting purposes, which may differ from cost basis for federal income tax purposes. See also Note 7 of the Notes to Financial Statements. |
The accompanying notes are an integral part of these financial statements.
| 78 |
| Ohio National Fund, Inc. | Bristol Portfolio |
Objective/Strategy
The Bristol Portfolio seeks long-term growth of capital by investing primarily in common stocks of the 1,000 largest publicly traded U.S. companies in terms of market capitalization.
Performance as of December 31, 2011
Average Annual Total Returns: | ||||
One year | -7.16% | |||
Five years | -1.79% | |||
Since inception (5/1/02) | 3.19% |
Past performance does not guarantee future results. The performance data quoted represents past performance and current returns may be lower or higher. Total return figures include change in share price and reinvestment of dividends and capital gains. The investment return and principal value will fluctuate so that an investor’s shares, when redeemed, may be worth more or less than the original cost. To obtain performance information up to the most recent month end, call toll-free 1-877-781-6392.
The Portfolio is not open to direct retail investment. Beneficial interest in shares is obtained solely by purchase of variable life insurance policies and variable annuity contracts. Actual performance results for variable annuity and variable universal life contracts will be lower due to contract charges. Consult your contract for applicable charges.
Comments
For the year ended December 31, 2011, the Bristol Portfolio returned -7.16% versus 2.11% for the current benchmark, the S&P 500 Index.
The overweight in the Financials sector was a major reason for the under-performance relative to the benchmark index. Continued worries about the debt crisis in Europe, the lack of clarity on resolution of the mortgage meltdown in the U.S., and lower than expected interest rates combined to negatively impact the sector. We also suffered from our traditional absence from Utilities, hardly a growth prospect, but which benefited by a flight to quality in a down year.(1)
The Portfolio’s best performers were SunPower Corp., Pharmasset, Inc., Medicis Pharmaceutical Corp., Rockwell Automation, Inc., and Allergan, Inc. The Portfolio’s worst performers were Royal Caribbean Cruises Ltd., Warner Chilcott PLC., Morgan Stanley, Hartford Financial Services Group, Inc., and United Continental Holdings, Inc. The top contributors to performance were SunPower Corp., Apple, Inc., International Business Machines Corp., Pharmasset, Inc., and UnitedHealth Group, Inc. The top detractors from performance were Bank of America Corp., Morgan Stanley, Royal Caribbean Cruises Ltd., Warner Chilcott PLC, and Citigroup, Inc.(1)
The top contributor to the Portfolio’s performance was SunPower Corp., which boosted performance when Total, a French multi-national oil company, took over a controlling stake of SunPower Corp., contributing 87 basis points. Apple, Inc., which continued its great American success story with its tablet and iPhone 4s market share, contributed 76 basis points to the Portfolio’s performance for the year. International Business Machine Corp.’s positive revisions from strong bookings and product backlogs added 54 basis points. Pharmasset, Inc. had strong trial data for the next generation Hepatitis C drug and generated 44 basis points. Finally, UnitedHealth Group, Inc. had positive revisions from better margins, due to low utilization, and contributed 42 basis points.(1)
Detractors from the Portfolio’s performance included Bank of America Corp. which underperformed by 94 basis points as a series of mortgage repurchase settlements were more costly than investor expectations. Morgan Stanley underperformed by 87 basis points as
trading revenue and earnings expectations for the industry declined
over the course of the year, driven by lower client activity levels. Royal Caribbean Cruises Ltd., which underperformed by 86 basis points due to high oil prices and weak demand in Europe. Warner Chilcott PLC appeared cheap with good prospects but cost us 75 basis points. Citigroup, Inc. cost us 75 basis points, but remains a great franchise, although hurt by overdone concerns about Europe and continues to trade at a discount to banks with similar businesses.(1)
The major impact of sector selection this year was our traditional absence from any exposure to Utilities, noted above, which cost us 56 basis points and an overexposure to Consumer Staples in down year which cost us 54 basis points. Only our overexposure to Consumer Discretionary generated positive returns, giving us 22 basis points. During the year, our main sector weight changes were adding to Industrials, which went from 10.8% to 20.1% (as a percentage of total common stocks) (versus the benchmark’s 10.7% as a percentage of total common stocks) while lowering our exposure to Financials, but still maintaining an overweight, which went from 23.9% to 16.5% (versus the benchmark’s 13.4%). This reflects our continuing belief in a recovery, and specifically our expectations for the Financials sector. This was also the basis for increasing Information Technology by 3.9% and Energy by 3%, at the expense of Materials (reduced by 6%) and Health Care (reduced by 2.3%).(1)
Early in 2011 many in the investment community believed that it was going to be the year for growth management styles. Many of the basic requirements were already in place: the widespread belief that this was the year of recovery following a three year recession, a corporate sector awash with cash in a lean, a low wage environment, robust earnings, and the end of the Financials sector uncertainties. A year later, in hindsight, we see little evidence for such optimism but the factors are still in place for a better 2012.
Certainly, the year had its fair share of exogenous events: the Arab Spring – a tectonic shift in conventional thinking that promised long term benefits but offered short term disruptions in oil supplies; the Japanese tsunami – that turned a huge natural catastrophe into a potential nuclear disaster that may affect global energy planning for generations to come; the subprime loans of yesteryear - threatening to come home, like unwelcome chickens, to roost in the balance sheets of domestic banks; and finally, the theatre of the absurd in Europe - as repeated European conferences failed to acknowledge the reality of debt that had to be hugely discounted to approach reality.
In such times it can be of value to record what didn’t happen. We did not have the feared double dip recession and an 8,000 S&P 500 Index. War did not break out in the Middle East following the death of Gaddafi or the arrest of Mubarak. Nuclear fallout was contained in Japan and the yo-yo effect of European markets did not create a European recession that would have badly damaged the U.S. export sector.
The market remained cautious throughout the year and favored defensive large cap stocks, but we will remain committed to our style and process and hope that, with the same positive factors at work, 2012 will finally offer those higher expected returns.
| (1) | The Portfolio’s composition is subject to change. Holdings and weightings are as of December 31, 2011. |
| 79 | (continued) |
| Ohio National Fund, Inc. | Bristol Portfolio (Continued) |
Change in Value of $10,000 Investment
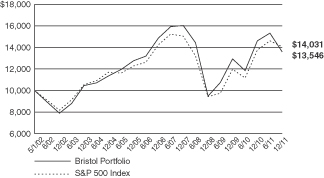
Hypothetical illustration based on past performance. Future performance will vary. The Portfolio’s returns reflect reinvested dividends. The Portfolio’s holdings may differ significantly from the securities in the index. The index is unmanaged and therefore does not reflect the cost of portfolio management and accounting.
The S&P 500 Index is a capitalization-weighted index designed to measure performance of the broad domestic economy through changes in the aggregate market value of 500 stocks representing all major industries. The index presented herein includes the effects of reinvested dividends.
Portfolio Composition as of December 31, 2011 (1)
| % of Net Assets | ||||
Common Stocks (3) | 94.9 | |||
Money Market Funds and | 5.1 | |||
|
| |||
| 100.0 | ||||
|
|
Top 10 Portfolio Holdings as of December 31, 2011 (1) (2)
| % of Net Assets | ||||
1. Apple, Inc. | 4.8 | |||
2. JPMorgan Chase & Co. | 2.3 | |||
3. FedEx Corp. | 2.1 | |||
4. Honeywell International, Inc. | 2.1 | |||
5. Citigroup, Inc. | 2.0 | |||
6. Rockwell Automation, Inc. | 2.0 | |||
7. Bank of New York Mellon Corp. / The | 2.0 | |||
8. United Parcel Service, Inc. Class B | 2.0 | |||
9. Wells Fargo & Co. | 2.0 | |||
10. Amgen, Inc. | 2.0 |
| (1) | Composition of Portfolio subject to change. |
| (2) | Short-term investments have been excluded from the list of Top 10 Portfolio Holdings. |
| (3) | Sectors: |
| % of Net Assets | ||||
Information Technology | 24.6 | |||
Industrials | 19.1 | |||
Financials | 15.7 | |||
Energy | 12.2 | |||
Consumer Discretionary | 10.9 | |||
Health Care | 7.5 | |||
Consumer Staples | 3.0 | |||
Materials | 1.9 | |||
|
| |||
| 94.9 | ||||
|
|
| 80 |
| Ohio National Fund, Inc. | Bristol Portfolio |
Schedule of Investments | December 31, 2011 |
| Common Stocks – 94.9% | Shares | Value | ||||||||
CONSUMER DISCRETIONARY – 10.9% | ||||||||||
Johnson Controls, Inc. (Auto Components) | 112,300 | $ | 3,510,498 | |||||||
Las Vegas Sands Corp. (Hotels, Restaurants & Leisure) | (a) | 82,500 | 3,525,225 | |||||||
Yum! Brands, Inc. (Hotels, Restaurants & Leisure) | 54,200 | 3,198,342 | ||||||||
Amazon.com, Inc. (Internet & Catalog Retail) | (a) | 15,100 | 2,613,810 | |||||||
Lowe’s Cos., Inc. (Specialty Retail) | 151,000 | 3,832,380 | ||||||||
Tiffany & Co. (Specialty Retail) | 39,900 | 2,643,774 | ||||||||
Hanesbrands, Inc. (Textiles, Apparel & Luxury Goods) | (a) | 78,400 | 1,713,824 | |||||||
|
| |||||||||
| 21,037,853 | ||||||||||
|
| |||||||||
CONSUMER STAPLES – 3.0% | ||||||||||
Anheuser-Busch InBev NV - ADR (Beverages) | 59,000 | 3,598,410 | ||||||||
Tyson Foods, Inc. Class A (Food Products) | 102,700 | 2,119,728 | ||||||||
|
| |||||||||
| 5,718,138 | ||||||||||
|
| |||||||||
ENERGY – 12.2% | ||||||||||
Baker Hughes, Inc. (Energy Equip. & Svs.) | 74,600 | 3,628,544 | ||||||||
Dresser-Rand Group, Inc. (Energy Equip. & Svs.) | (a) | 72,900 | 3,638,439 | |||||||
Schlumberger Ltd. (Energy Equip. & Svs.) | 50,700 | 3,463,317 | ||||||||
Apache Corp. (Oil, Gas & Consumable Fuels) | 37,900 | 3,432,982 | ||||||||
Devon Energy Corp. (Oil, Gas & Consumable Fuels) | 57,100 | 3,540,200 | ||||||||
Forest Oil Corp. (Oil, Gas & Consumable Fuels) | (a) | 169,900 | 2,302,145 | |||||||
Hess Corp. (Oil, Gas & Consumable Fuels) | 62,000 | 3,521,600 | ||||||||
|
| |||||||||
| 23,527,227 | ||||||||||
|
| |||||||||
FINANCIALS – 15.7% | ||||||||||
Bank of New York Mellon Corp. / The (Capital Markets) | 197,400 | 3,930,234 | ||||||||
Wells Fargo & Co. (Commercial Banks) | 140,800 | 3,880,448 | ||||||||
Citigroup, Inc. (Diversified Financial Svs.) | 149,900 | 3,943,869 | ||||||||
JPMorgan Chase & Co. (Diversified Financial Svs.) | 134,000 | 4,455,500 | ||||||||
Hartford Financial Services Group, Inc. (Insurance) | 211,800 | 3,441,750 | ||||||||
Lincoln National Corp. (Insurance) | 169,700 | 3,295,574 | ||||||||
MetLife, Inc. (Insurance) | 116,200 | 3,623,116 | ||||||||
Prudential Financial, Inc. (Insurance) | 71,600 | 3,588,592 | ||||||||
|
| |||||||||
| 30,159,083 | ||||||||||
|
| |||||||||
HEALTH CARE – 7.5% | ||||||||||
Amarin Corp PLC - ADR (Biotechnology) | (a) | 142,800 | 1,069,572 | |||||||
Amgen, Inc. (Biotechnology) | 60,100 | 3,859,021 | ||||||||
UnitedHealth Group, Inc. (Health Care Providers & Svs.) | 75,500 | 3,826,340 | ||||||||
WellPoint, Inc. (Health Care Providers & Svs.) | 54,600 | 3,617,250 | ||||||||
Warner Chilcott PLC Class A (Pharmaceuticals) | (a) | 140,600 | 2,127,278 | |||||||
|
| |||||||||
| 14,499,461 | ||||||||||
|
| |||||||||
| Common Stocks (Continued) | Shares | Value | ||||||||
INDUSTRIALS – 19.1% | ||||||||||
Honeywell International, Inc. (Aerospace & Defense) | 75,600 | $ | 4,108,860 | |||||||
United Technologies Corp. (Aerospace & Defense) | 48,000 | 3,508,320 | ||||||||
FedEx Corp. (Air Freight & Logistics) | 49,300 | 4,117,043 | ||||||||
United Parcel Service, Inc. Class B (Air Freight & Logistics) | 53,300 | 3,901,027 | ||||||||
United Continental Holdings, Inc. (Airlines) | (a) | 193,000 | 3,641,910 | |||||||
Rockwell Automation, Inc. (Electrical Equip.) | 53,600 | 3,932,632 | ||||||||
Caterpillar, Inc. (Machinery) | 33,000 | 2,989,800 | ||||||||
Pentair, Inc. (Machinery) | 99,600 | 3,315,684 | ||||||||
Snap-On, Inc. (Machinery) | 37,600 | 1,903,312 | ||||||||
Stanley Black & Decker, Inc. (Machinery) | 38,700 | 2,616,120 | ||||||||
Xylem, Inc. (Machinery) | 108,400 | 2,784,796 | ||||||||
|
| |||||||||
| 36,819,504 | ||||||||||
|
| |||||||||
INFORMATION TECHNOLOGY – 24.6% | ||||||||||
Cisco Systems, Inc. (Communications Equip.) | 186,800 | 3,377,344 | ||||||||
QUALCOMM, Inc. (Communications Equip.) | 69,800 | 3,818,060 | ||||||||
Apple, Inc. (Computers & Peripherals) | (a) | 22,800 | 9,234,000 | |||||||
EMC Corp. (Computers & Peripherals) | (a) | 145,700 | 3,138,378 | |||||||
Google, Inc. Class A (Internet Software & Svs.) | (a) | 5,600 | 3,617,040 | |||||||
International Business Machines Corp. (IT Svs.) | 18,800 | 3,456,944 | ||||||||
Altera Corp. (Semiconductors & Equip.) | 92,500 | 3,431,750 | ||||||||
Maxim Integrated Products, Inc. (Semiconductors & Equip.) | 143,100 | 3,726,324 | ||||||||
Texas Instruments, Inc. (Semiconductors & Equip.) | 126,200 | 3,673,682 | ||||||||
Citrix Systems, Inc. (Software) | (a) | 57,300 | 3,479,256 | |||||||
Electronic Arts, Inc. (Software) | (a) | 165,200 | 3,403,120 | |||||||
Oracle Corp. (Software) | 114,400 | 2,934,360 | ||||||||
|
| |||||||||
| 47,290,258 | ||||||||||
|
| |||||||||
MATERIALS – 1.9% | ||||||||||
Monsanto Co. (Chemicals) | 53,500 | 3,748,745 | ||||||||
|
| |||||||||
Total Common Stocks (Cost $188,310,371) | $ | 182,800,269 | ||||||||
|
| |||||||||
| Money Market Funds – 2.4% | Shares | Value | ||||||||
Fidelity Institutional Money Market Funds | 4,667,000 | $ | 4,667,000 | |||||||
|
| |||||||||
Total Money Market Funds (Cost $4,667,000) | $ | 4,667,000 | ||||||||
|
| |||||||||
Total Investments – 97.3% (Cost $192,977,371) | (b) | $ | 187,467,269 | |||||||
Other Assets in Excess of Liabilities – 2.7% | 5,204,866 | |||||||||
|
| |||||||||
Net Assets – 100.0% | $ | 192,672,135 | ||||||||
|
| |||||||||
Percentages are stated as a percent of net assets.
Abbreviations:
ADR: American Depositary Receipts
Footnotes:
| (a) | Non-income producing security. |
| (b) | Represents cost for financial reporting purposes, which may differ from cost basis for federal income tax purposes. See also Note 7 of the Notes to Financial Statements. |
The accompanying notes are an integral part of these financial statements.
| 81 |
| Ohio National Fund, Inc. | Bryton Growth Portfolio |
Objective/Strategy
The Bryton Growth Portfolio seeks long-term growth of capital by investing primarily in common stocks of growth-oriented U.S. companies smaller than the 500 largest publicly traded U.S. companies in terms of market capitalization.
Performance as of December 31, 2011
Average Annual Total Returns: | ||||
One year | -9.29% | |||
Five years | 0.30% | |||
Since inception (5/1/02) | 2.24% |
Past performance does not guarantee future results. The performance data quoted represents past performance and current returns may be lower or higher. Total return figures include change in share price and reinvestment of dividends and capital gains. The investment return and principal value will fluctuate so that an investor’s shares, when redeemed, may be worth more, or less than the original cost. To obtain performance information up to the most recent month end, call toll-free 1-877-781-6392.
The Portfolio is not open to direct retail investment. Beneficial interest in shares is obtained solely by purchase of variable life insurance policies and variable annuity contracts. Actual performance results for variable annuity and variable universal life contracts will be lower due to contract charges. Consult your contract for applicable charges.
Comments
For the year ended December 31, 2011, the Bryton Growth Portfolio returned -9.29% versus -2.91% for the current benchmark, the Russell 2000 Growth Index.
It was a year of natural disaster, political change, and huge financial problems in Europe that turned U.S. investors defensive and in favor of large cap stocks, but there were still ample opportunities for specific company growth. We benefited from the acquisition of RSC Holdings, Inc. by United Rentals, Inc. at a healthy premium and had a significant investment in bio-technology stocks that contributed positively.(1)
The tragedy in Japan significantly impacted the Portfolio’s performance. One of the companies the Portfolio owned, Paladin Energy Ltd., a uranium producer, was down significantly as the nuclear disaster in Japan undermined the prospect of global nuclear power utilization. Other holdings, particularly our Consumer Discretionary and semiconductor stocks, were also affected. Hawaiian Holdings, Inc. saw substantial drop off in passenger traffic from Japan. MaxLinear, Inc. and Silicon Image, Inc. underperformed partly due to direct exposure to the Japanese market.(1)
Several of our holdings, OCZ Technology Group, Inc., Northern Oil & Gas, Inc., and Ebix, Inc. were subjects of short seller attacks. Though no wrong-doing by the companies was found, the performance of the stocks was negatively impacted.(1)
The Portfolio’s top performers were RSC Holdings, Inc., Pharmasset, Inc., Inhibitex Inc., Pharmacyclics, Inc., and RightNow Technologies, Inc. The Portfolio’s worst performers were Velti PLC, Anadigics, Inc., Pacific Biosciences of California, Inc., Targacet, Inc., and Ciena Corp. The Portfolio’s top contributors to performance were RSC Holdings, Inc., Pharmasset, Inc., Inhibitex, Inc., Pharmacyclics, Inc., and RightNow Technologies, Inc. The Portfolio’s largest detractors from performance were Velti PLC, St. Helier, Anadigics, Inc., Targacet, Inc., Pacific Biosciences of California, Inc., and Stillwater Mining Co.(1)
The top contributor to the Portfolio was RSC Holdings, Inc., an equipment rental firm that was bought by United Rentals, Inc. and added 244 basis points in performance. Two biotechs Pharmasset, Inc. and Pharmacyclics, Inc. saw positive clinical and regulatory news, which contributed 202 basis points and 157 basis points, respectively.
Inhibitex, Inc. added 172 basis points, while RightNow Technologies, Inc., a leading call center software company was bought by Oracle and contributed 134 basis points.(1)
The top detractor from performance was Velti PLC, a leading mobile advertising platform that cost us 155 basis points in performance for the year, but which we still hold as the market for such services is growing at 50% per year, (although the firm does face threats from Apple/Google). Anadigics, Inc., a supplier of power amplifiers with significant exposure to the handset market, cost us 144 basis points. Through the year, there were concerns that macro weakness, a slow ramp of 3G phones in China, and Japan’s impact on inventory levels would ultimately hurt end-market demand. Anadigics, Inc. also struggled with design changes at key customers that raised concerns for near-term sales. Targacet, Inc., a drug company working on a promising anti-depression treatment, cost us 140 basis points when the firm released trial results that were quite negative. Another disappointment was Pacific Biosciences of California, Inc., a leading DNA sequencing firm for hospitals and clinics that has suffered as budget constraints led to slower adoptions of the company’s new platforms. Finally, our exposure to Stillwater Mining Co. cost us 124 basis points when management turned a pure palladium play (benefiting from strong demand as a substitute for platinum in catalytic convertors) into just another diversified mining company by the disastrous acquisition of a copper/gold field that is both a long way from production and extremely costly to develop.(1)
The best sector allocation decisions were our continued underweight of Industrials, which generated 62 basis points, and an underweight in Consumer Staples that added 16 basis points. Our major changes in sector weightings included Health Care at 10.3%, down from 19.3% (as the percentage of total common stocks versus the index weighting of 20%). At 15.2% we have an Energy sector overweight of 6.4%, against the index weighting of 8.8% and our exposure last year of only 7.9%. We added Consumer Staples stocks this year (at 3%, still underweighted to the index 4.2%) and reduced our holdings of Consumer Discretionary from 17.7% to 11.4% compared to the benchmark’s 14.4%. We sold Liz Claiborne, Inc. and Talbots, Inc. as they continued to struggle in trying to turn around their business. Our holdings in Financials stayed unchanged at 1.8%, as did our strong exposure to Information Technology (32%, versus the index at 23.3%) and Materials remained largely unchanged.(1)
Early in 2011 many in the investment community believed that it was going to be the year for growth management styles. Many of the basic requirements were already in place: the widespread belief that this was the year of recovery following a three year recession, a corporate sector awash with cash in a lean, low wage environment, robust earnings, and the end of the financial sector uncertainties. A year later, in hindsight, we see little evidence for such optimism, but the factors are still in place for a better 2012.
Certainly, the year had its fair share of exogenous events: the Arab Spring, a tectonic shift in conventional thinking that promised long term benefits but offered short term disruptions in oil supplies; the Japanese tsunami, which turned a huge natural catastrophe into a potential nuclear disaster that may affect global energy planning for generations to come; the sub-prime loans of yesteryear, which threatened to come home, like unwelcome chickens, to roost in the balance sheets of domestic banks; and finally, the theatre of the absurd in Europe, as repeated European conferences failed to acknowledge the reality of debt that had to be hugely discounted to approach reality.
In such times it can be of value to record what didn’t happen. We did not have the feared double dip recession and an 8,000 S&P 500 Index. War did not break out in the Middle East following the death of Gaddafi or the arrest of Mubarak. Nuclear fallout was contained in Japan and the yo-yo effect of European markets did not create a European recession that would have badly damaged the U.S. export sector.
| 82 | (continued) |
| Ohio National Fund, Inc. | Bryton Growth Portfolio (Continued) |
The market remained cautious throughout the year and favored defensive large cap stocks, but we will remain committed to our style and process and hope that, with the same positive factors at work, 2012 will finally offer those higher expected returns.
| (1) | The Portfolio’s composition is subject to change. Holdings and weightings are as of December 31, 2011. |
Change in Value of $10,000 Investment
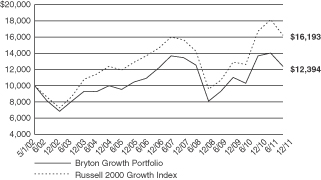
Hypothetical illustration based on past performance. Future performance will vary. The Portfolio’s returns reflect reinvested dividends. The Portfolio’s holdings may differ significantly from the securities in the index. The index is unmanaged and therefore does not reflect the cost of portfolio management and accounting.
The Russell 2000 Growth Index is a market-weighted total return index that measures the performance of companies within the Russell 2000 Index having higher price-to-book ratios and higher forecasted growth values. The Russell 2000 Index includes the 2000 firms from the Russell 3000 Index with the smallest market capitalizations. The Russell 3000 Index represents 98% of the investable U.S. equity market. The index presented herein includes the effects of reinvested dividends.
Portfolio Composition as of December 31, 2011 (1)
| % of Net Assets | ||||
Common Stocks (3) | 91.0 | |||
Money Market Funds and | ||||
Other Net Assets | 9.0 | |||
|
| |||
| 100.0 | ||||
|
|
Top 10 Portfolio Holdings as of December 31, 2011 (1) (2)
| % of Net Assets | ||||
1. United Rentals, Inc. | 2.5 | |||
2. Kenexa Corp. | 2.5 | |||
3. Middleby Corp. | 2.3 | |||
4. Genesee & Wyoming, Inc. Class A | 2.3 | |||
5. OCZ Technology Group, Inc. | 2.2 | |||
6. Acuity Brands, Inc. | 2.2 | |||
7. Orient-Express Hotels Ltd. Class A | 2.1 | |||
8. TriQuint Semiconductor, Inc. | 2.1 | |||
9. Rosetta Resources, Inc. | 2.1 | |||
10. Internap Network Services Corp. | 2.1 |
| (1) | Composition of Portfolio subject to change. |
| (2) | Short-term investments have been excluded from the list of Top 10 Portfolio Holdings. |
| (3) | Sectors: |
| % of Net Assets | ||||
Information Technology | 27.9 | |||
Industrials | 19.7 | |||
Energy | 14.6 | |||
Consumer Discretionary | 9.9 | |||
Health Care | 9.0 | |||
Materials | 6.3 | |||
Consumer Staples | 2.0 | |||
Financials | 1.6 | |||
|
| |||
| 91.0 | ||||
|
|
| 83 |
| Ohio National Fund, Inc. | Bryton Growth Portfolio |
Schedule of Investments | December 31, 2011 |
| Common Stocks – 91.0% | Shares | Value | ||||||||
CONSUMER DISCRETIONARY – 9.9% |
| |||||||||
Caribou Coffee Co., Inc. (Hotels, Restaurants & Leisure) | (a) | 229,377 | $ | 3,199,809 | ||||||
Orient-Express Hotels Ltd. Class A (Hotels, Restaurants & Leisure) | (a) | 444,900 | 3,323,403 | |||||||
Finish Line, Inc. / The Class A (Specialty Retail) | 156,600 | 3,020,031 | ||||||||
Crocs, Inc. (Textiles, Apparel & Luxury Goods) | (a) | 183,713 | 2,713,441 | |||||||
True Religion Apparel, Inc. (Textiles, Apparel & Luxury Goods) | (a) | 92,200 | 3,188,276 | |||||||
|
| |||||||||
| 15,444,960 | ||||||||||
|
| |||||||||
CONSUMER STAPLES – 2.0% | ||||||||||
Elizabeth Arden, Inc. (Personal Products) | (a) | 83,100 | 3,078,024 | |||||||
|
| |||||||||
ENERGY – 14.6% | ||||||||||
Dril-Quip, Inc. (Energy Equip. & Svs.) | (a) | 48,700 | 3,205,434 | |||||||
OYO Geospace Corp. (Energy Equip. & Svs.) | (a) | 37,441 | 2,895,313 | |||||||
Western Energy Services Corp. (Energy Equip. & Svs.) | (a) | 379,200 | 3,152,711 | |||||||
Americas Petrogas, Inc. (Oil, Gas & Consumable Fuels) | (a) | 631,200 | 1,856,359 | |||||||
Antrim Energy, Inc. (Oil, Gas & Consumable Fuels) | (a) | 2,298,700 | 2,735,453 | |||||||
Clean Energy Fuels Corp. (Oil, Gas & Consumable Fuels) | (a) | 208,900 | 2,602,894 | |||||||
Energy Partners Ltd. (Oil, Gas & Consumable Fuels) | (a) | 198,400 | 2,896,640 | |||||||
Rosetta Resources, Inc. (Oil, Gas & Consumable Fuels) | (a) | 75,400 | 3,279,900 | |||||||
|
| |||||||||
| 22,624,704 | ||||||||||
|
| |||||||||
FINANCIALS – 1.6% | ||||||||||
First Midwest Bancorp, Inc. (Commercial Banks) | 243,700 | 2,468,681 | ||||||||
|
| |||||||||
HEALTH CARE – 9.0% | ||||||||||
Amarin Corp PLC–ADR (Biotechnology) | (a) | 196,800 | 1,474,032 | |||||||
Cubist Pharmaceuticals, Inc. (Biotechnology) | (a) | 71,784 | 2,844,082 | |||||||
Enzon Pharmaceuticals, Inc. (Biotechnology) | (a) | 131,000 | 877,700 | |||||||
Oncothyreon, Inc. (Biotechnology) | (a) | 220,100 | 1,668,358 | |||||||
Pharmacyclics, Inc. (Biotechnology) | (a) | 127,400 | 1,888,068 | |||||||
YM Biosciences, Inc. (Biotechnology) | (a) | 994,860 | 1,631,570 | |||||||
NxStage Medical, Inc. (Health Care Equip. & Supplies) | (a) | 107,040 | 1,903,171 | |||||||
Nektar Therapeutics (Pharmaceuticals) | (a) | 290,100 | 1,623,110 | |||||||
|
| |||||||||
| 13,910,091 | ||||||||||
|
| |||||||||
INDUSTRIALS – 19.7% | ||||||||||
Hexcel Corp. (Aerospace & Defense) | (a) | 131,200 | 3,176,352 | |||||||
Black Diamond Group Ltd. (Commercial Svs. & Supplies) | 70,500 | 1,277,477 | ||||||||
Acuity Brands, Inc. (Electrical Equip.) | 63,800 | 3,381,400 | ||||||||
Middleby Corp. (Machinery) | (a) | 38,300 | 3,601,732 | |||||||
Titan International, Inc. (Machinery) | 165,000 | 3,210,900 | ||||||||
Avis Budget Group, Inc. (Road & Rail) | (a) | 240,500 | 2,578,160 | |||||||
Genesee & Wyoming, Inc. Class A (Road & Rail) | (a) | 58,300 | 3,531,814 | |||||||
Roadrunner Transportation Systems, Inc. (Road & Rail) | (a) | 209,000 | 2,953,170 | |||||||
| Common Stocks (Continued) | Shares | Value | ||||||||
INDUSTRIALS (continued) | ||||||||||
Titan Machinery, Inc. (Trading Companies & Distributors) | (a) | 138,300 | $ | 3,005,259 | ||||||
United Rentals, Inc. (Trading Companies & Distributors) | (a) | 133,500 | 3,944,925 | |||||||
|
| |||||||||
| 30,661,189 | ||||||||||
|
| |||||||||
INFORMATION TECHNOLOGY – 27.9% | ||||||||||
Ciena Corp. (Communications Equip.) | (a) | 247,500 | 2,994,750 | |||||||
Finisar Corp. (Communications Equip.) | (a) | 153,000 | 2,561,985 | |||||||
Sycamore Networks, Inc. (Communications Equip.) | (a) | 73,700 | 1,319,230 | |||||||
Cray, Inc. (Computers & Peripherals) | (a) | 225,886 | 1,461,482 | |||||||
NCR Corp. (Computers & Peripherals) | (a) | 153,800 | 2,531,548 | |||||||
OCZ Technology Group, Inc. (Computers & Peripherals) | (a) | 513,900 | 3,396,879 | |||||||
Fabrinet (Electronic Equip., Instr. & Comp.) | (a) | 201,005 | 2,749,748 | |||||||
Internap Network Services Corp. (Internet Software & Svs.) | (a) | 541,425 | 3,216,065 | |||||||
Velti PLC (Internet Software & Svs.) | (a) | 366,800 | 2,494,240 | |||||||
Amkor Technology, Inc. (Semiconductors & Equip.) | (a) | 609,200 | 2,656,112 | |||||||
Cavium, Inc. (Semiconductors & Equip.) | (a) | 87,000 | 2,473,410 | |||||||
Fairchild Semiconductor International, Inc. (Semiconductors & Equip.) | (a) | 219,100 | 2,637,964 | |||||||
RF Micro Devices, Inc. (Semiconductors & Equip.) | (a) | 520,200 | 2,809,080 | |||||||
TriQuint Semiconductor, Inc. (Semiconductors & Equip.) | (a) | 680,600 | 3,314,522 | |||||||
ClickSoftware Technologies Ltd. (Software) | 302,500 | 2,900,975 | ||||||||
Kenexa Corp. (Software) | (a) | 145,000 | 3,871,500 | |||||||
|
| |||||||||
| 43,389,490 | ||||||||||
|
| |||||||||
MATERIALS – 6.3% | ||||||||||
Intrepid Potash, Inc. (Chemicals) | (a) | 138,600 | 3,136,518 | |||||||
Kronos Worldwide, Inc. (Chemicals) | 143,200 | 2,583,328 | ||||||||
Capstone Mining Corp. (Metals & Mining) | (a) | 525,000 | 1,424,115 | |||||||
Cline Mining Corp. (Metals & Mining) | (a) | 1,756,000 | 2,651,560 | |||||||
|
| |||||||||
| 9,795,521 | ||||||||||
|
| |||||||||
Total Common Stocks (Cost $147,005,291) | $ | 141,372,660 | ||||||||
|
| |||||||||
| Money Market Funds – 6.1% | Shares | Value | ||||||||
Federated Prime Cash Obligations Fund | 1,814,000 | $ | 1,814,000 | |||||||
Fidelity Institutional Money Market Funds | 7,675,000 | 7,675,000 | ||||||||
|
| |||||||||
Total Money Market Funds (Cost $9,489,000) | $ | 9,489,000 | ||||||||
|
| |||||||||
Total Investments – 97.1% (Cost $156,494,291) | (b) | $ | 150,861,660 | |||||||
Other Assets in Excess of Liabilities – 2.9% | 4,578,925 | |||||||||
|
| |||||||||
Net Assets – 100.0% | $ | 155,440,585 | ||||||||
|
| |||||||||
Percentages are stated as a percent of net assets.
Abbreviations:
ADR: American Depositary Receipts
Footnotes:
| (a) | Non-income producing security. |
| (b) | Represents cost for financial reporting purposes, which may differ from cost basis for federal income tax purposes. See also Note 7 of the Notes to Financial Statements. |
The accompanying notes are an integral part of these financial statements.
| 84 |
| Ohio National Fund, Inc. | U.S. Equity Portfolio |
Objective/Strategy
The U.S. Equity Portfolio seeks capital appreciation with a secondary objective of capital preservation to provide long term growth by investing at least 80% of its net assets in equity securities traded in the U.S. within under-priced sectors and industries.
Performance as of December 31, 2011
Average Annual Total Returns: | ||||
One year | -1.96% | |||
Five years | -5.42% | |||
Since inception (5/1/04) | 0.51% |
Past performance does not guarantee future results. The performance data quoted represents past performance and current returns may be lower or higher. Total return figures include change in share price and reinvestment of dividends and capital gains. The investment return and principal value will fluctuate so that an investor’s shares, when redeemed, may be worth more or less than the original cost. To obtain performance information up to the most recent month end, call toll-free 1-877-781-6392.
The Portfolio is not open to direct retail investment. Beneficial interest in shares is obtained solely by purchase of variable life insurance policies and variable annuity contracts. Actual performance results for variable annuity and variable universal life contracts will be lower due to contract charges. Consult your contract for applicable charges.
Comments
For the year ended December 31, 2011, the U.S. Equity Portfolio returned -1.96% versus 1.75% for the current benchmark, the S&P Composite 1500 Index.
We believe the stock market is in a multi-year recovery from the lows of 2009 and that the market decline in the summer of 2011, principally due to the European debt crisis, will prove to be a temporary setback similar to the Cuban Missile Crisis, the invasion of Kuwait, and the Asian Contagion. During those events, the market declined sharply, experienced much greater than normal volatility, and then rebounded and resumed its previous upward path. Expecting a similar scenario this time and possessing no ability to “time” such an emotionally charged event, we chose to ride through the decline and subsequent rebound, as evidenced by the low turnover. Our primary guide was our overall market value-to-price (“V/P”) ratio, which indicated that stocks, on average, were under-priced relative to our estimate of intrinsic value. In fact, at the bottom in early October, we recorded a 1.60 V/P.
During 2011, the Portfolio was positioned for an upward market, generally holding stocks in cyclical, economically-sensitive sectors and industries that we viewed as the best bargains available. As a result, the Portfolio beat the market during the four month advance through April 29, 2011, but fell more than the market during the drop from April 29 through October 3, 2011. In the final three months of 2011, the Portfolio gained more than the market, but not enough to be positive for the entire year ended December 31, 2011, nor enough to beat the benchmark for the year. It is difficult for our system to handle quick four and five month theme reversals.(1)
It was a frustrating year for equity value investors because of the disconnect we observed between company and investment fundamentals and investor behavior. Earnings per share (EPS) for the companies in the S&P 500 Index, as reported in the third quarter of 2011, grew 15% on average from those values reported one year earlier. As 2011 drew to a close, EPS for the companies in the S&P 500 were estimated to grow more than 12% over the course of the next year. Declining interest rates, another fundamental that is usually
positive for stocks, should have provided support for higher equity valuations. Investors, though, did not embrace these fundamentals and, instead, focused on worries surrounding the slowing U.S. economy, China’s slowing economy, the European sovereign debt crisis, and the U.S. Federal government’s bitter in-fighting over its country’s deficit.
The biggest positive contribution came from the Consumer Discretionary sector, which was held at slightly more than double its benchmark weight. Another significant positive contribution came from the underweighting of the Financials sector, which had attractive valuation readings, but lacked the relative strength required in our system. The Portfolio’s underweight positions in the Consumer Staples and Health Care sectors detracted from performance as those sectors held up better than average during the market decline from April 29 through October 3, 2011.(1)
The Consumer Discretionary sector contributed to performance not only because it was overweight, but also because of the positive industry selection within the sector.
The five individual stocks contributing the most positive performance were TJX Cos., Inc., Apple, Inc., Kirby Corp., NIKE, Inc., and Ross Stores, Inc. The five largest gainers were TJX Cos., Inc., W.W. Grainger, Inc., Kirby Corp., Ross Stores, Inc., and Tupperware Brands Corp.(1)
Although the Energy sector was held at about benchmark weight, the industries and stocks proved to be a drag on performance. In particular, the coal & consumable fuels, drilling, and equipment & services industries pulled down returns.
The five largest negative contributors were Alpha Natural Resources, Inc., Bio-Reference Laboratories, Siemens AG, Steel Dynamics, Inc., and Corning, Inc. The five stocks with the largest losses were Alpha Natural Resources, Inc., Walter Energy, Inc., Bio-Reference Laboratories, Corning, Inc., and Steel Dynamics, Inc.(1)
From a Portfolio allocation perspective, the industry and stock selection in the under-weighted Financials sector is also noteworthy. Until September, when JPMorgan Chase & Co. and Wells Fargo & Co. were purchased, the exposure was primarily in consumer finance, not the large investment and diversified banks.
As of January 6, 2012, our market V/P stands at an attractive 1.36 and would seem to reflect all the financial and economic concerns bothering investors. We expect prices to continue their move up toward value and we expect underlying valuations to continue to improve as well. As the best bargains at the low in early October were the cyclical, economically-sensitive sectors and industries, the Portfolio remains heavily tilted toward the Industrials, Consumer Discretionary, Information Technology, Energy, and Materials sectors. These sectors have generally performed well the last three months and we expect the sector and industry theme to continue into 2012.
| (1) | The Portfolio’s composition is subject to change. Holdings and weightings are as of December 31, 2011. |
| 85 | (continued) |
| Ohio National Fund, Inc. | U.S. Equity Portfolio (Continued) |
Change in Value of $10,000 Investment
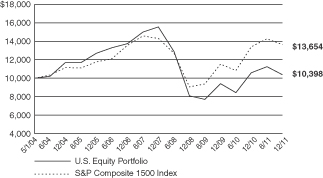
Hypothetical illustration based on past performance. Future performance will vary. The Portfolio’s returns reflect reinvested dividends. The Portfolio’s holdings may differ significantly from the securities in the index. The index is unmanaged and therefore does not reflect the cost of portfolio management and accounting.
The S&P Composite 1500 Index is a broad-based capitalization-weighted index of 1500 U.S. companies and is comprised of the S&P 400, S&P 500, and the S&P 600. The index was developed with a base value of 100 as of December 30, 1994. The index presented herein includes the effects of reinvested dividends.
Portfolio Composition as of December 31, 2011 (1)
| % of Net Assets | ||||
Common Stocks (3) | 99.8 | |||
Money Market Funds and | 0.2 | |||
|
| |||
| 100.0 | ||||
|
|
Top 10 Portfolio Holdings as of December 31, 2011 (1) (2)
| % of Net Assets | ||||
1. Apple, Inc. | 5.7 | |||
2. Praxair, Inc. | 4.2 | |||
3. TJX Cos., Inc. | 4.0 | |||
4. NIKE, Inc. Class B | 3.8 | |||
5. Caterpillar, Inc. | 3.8 | |||
6. Comcast Corp. Class A | 3.7 | |||
7. International Business Machines Corp. | 3.3 | |||
8. Time Warner Cable, Inc. | 3.2 | |||
9. Emerson Electric Co. | 3.0 | |||
10. Siemens AG - ADR | 3.0 |
| (1) | Composition of Portfolio subject to change. |
| (2) | Short-term investments have been excluded from the list of Top 10 Portfolio Holdings. |
| (3) | Sectors: |
| % of Net Assets | ||||
Industrials | 26.2 | |||
Consumer Discretionary | 24.3 | |||
Information Technology | 17.0 | |||
Energy | 11.4 | |||
Materials | 9.8 | |||
Financials | 8.6 | |||
Health Care | 2.5 | |||
|
| |||
| 99.8 | ||||
|
|
| 86 |
| Ohio National Fund, Inc. | U.S. Equity Portfolio |
Schedule of Investments | December 31, 2011 |
| Common Stocks – 99.8% | Shares | Value | ||||||||
CONSUMER DISCRETIONARY – 24.3% | ||||||||||
Helen of Troy Ltd. (Household Durables) | (a) | 9,990 | $ | 306,693 | ||||||
Comcast Corp. Class A (Media) | 20,940 | 496,487 | ||||||||
Time Warner Cable, Inc. (Media) | 6,810 | 432,912 | ||||||||
Viacom, Inc. Class B (Media) | 5,410 | 245,668 | ||||||||
Walt Disney Co. / The (Media) | 8,090 | 303,375 | ||||||||
Lowe’s Cos., Inc. (Specialty Retail) | 12,680 | 321,818 | ||||||||
TJX Cos., Inc. (Specialty Retail) | 8,290 | 535,119 | ||||||||
NIKE, Inc. Class B (Textiles, Apparel & Luxury Goods) | 5,280 | 508,834 | ||||||||
Wolverine World Wide, Inc. (Textiles, Apparel & Luxury Goods) | 2,480 | 88,387 | ||||||||
|
| |||||||||
| 3,239,293 | ||||||||||
|
| |||||||||
ENERGY – 11.4% | ||||||||||
Halliburton Co. (Energy Equip. & Svs.) | 5,680 | 196,017 | ||||||||
National Oilwell Varco, Inc. (Energy Equip. & Svs.) | 3,160 | 214,848 | ||||||||
Noble Corp. (Energy Equip. & Svs.) | (a) | 10,120 | 305,826 | |||||||
Schlumberger Ltd. (Energy Equip. & Svs.) | 2,960 | 202,198 | ||||||||
Alpha Natural Resources, Inc. (Oil, Gas & Consumable Fuels) | (a) | 9,290 | 189,795 | |||||||
Valero Energy Corp. (Oil, Gas & Consumable Fuels) | 9,310 | 195,975 | ||||||||
World Fuel Services Corp. (Oil, Gas & Consumable Fuels) | 5,220 | 219,136 | ||||||||
|
| |||||||||
| 1,523,795 | ||||||||||
|
| |||||||||
FINANCIALS – 8.6% | ||||||||||
Wells Fargo & Co. (Commercial Banks) | 11,800 | 325,208 | ||||||||
Cash America International, Inc. (Consumer Finance) | 2,030 | 94,659 | ||||||||
EZCorp, Inc. Class A (Consumer Finance) | (a) | 7,980 | 210,433 | |||||||
CME Group, Inc. (Diversified Financial Svs.) | 1,050 | 255,853 | ||||||||
JPMorgan Chase & Co. (Diversified Financial Svs.) | 7,740 | 257,355 | ||||||||
|
| |||||||||
| 1,143,508 | ||||||||||
|
| |||||||||
HEALTH CARE – 2.5% | ||||||||||
Celgene Corp. (Biotechnology) | (a) | 4,890 | 330,564 | |||||||
|
| |||||||||
INDUSTRIALS – 26.2% | ||||||||||
FedEx Corp. (Air Freight & Logistics) | 1,780 | 148,648 | ||||||||
Cooper Industries PLC (Electrical Equip.) | 6,060 | 328,149 | ||||||||
Emerson Electric Co. (Electrical Equip.) | 8,660 | 403,469 | ||||||||
General Electric Co. (Industrial Conglomerates) | 17,030 | 305,007 | ||||||||
| Common Stocks (continued) | Shares | Value | ||||||||
INDUSTRIALS (continued) | ||||||||||
Siemens AG – ADR (Industrial Conglomerates) | 4,170 | $ | 398,694 | |||||||
Caterpillar, Inc. (Machinery) | 5,530 | 501,018 | ||||||||
Dover Corp. (Machinery) | 4,730 | 274,577 | ||||||||
Eaton Corp. (Machinery) | 2,800 | 121,884 | ||||||||
Illinois Tool Works, Inc. (Machinery) | 4,060 | 189,643 | ||||||||
Parker Hannifin Corp. (Machinery) | 820 | 62,525 | ||||||||
CSX Corp. (Road & Rail) | 11,310 | 238,189 | ||||||||
Union Pacific Corp. (Road & Rail) | 2,490 | 263,791 | ||||||||
W.W. Grainger, Inc. (Trading Companies & Distributors) | 1,390 | 260,194 | ||||||||
|
| |||||||||
| 3,495,788 | ||||||||||
|
| |||||||||
INFORMATION TECHNOLOGY – 17.0% | ||||||||||
Juniper Networks, Inc. (Communications Equip.) | (a) | 14,000 | 285,740 | |||||||
Apple, Inc. (Computers & Peripherals) | (a) | 1,890 | 765,450 | |||||||
NetApp, Inc. (Computers & Peripherals) | (a) | 6,510 | 236,118 | |||||||
Accenture PLC Class A (IT Svs.) | 4,080 | 217,178 | ||||||||
CACI International, Inc. Class A (IT Svs.) | (a) | 5,870 | 328,250 | |||||||
International Business Machines Corp. (IT Svs.) | 2,370 | 435,796 | ||||||||
|
| |||||||||
| 2,268,532 | ||||||||||
|
| |||||||||
MATERIALS – 9.8% | ||||||||||
Praxair, Inc. (Chemicals) | 5,260 | 562,294 | ||||||||
Cliffs Natural Resources, Inc. (Metals & Mining) | 2,460 | 153,381 | ||||||||
Nucor Corp. (Metals & Mining) | 4,820 | 190,727 | ||||||||
Steel Dynamics, Inc. (Metals & Mining) | 24,380 | 320,597 | ||||||||
Walter Energy, Inc. (Metals & Mining) | 1,230 | 74,489 | ||||||||
|
| |||||||||
| 1,301,488 | ||||||||||
|
| |||||||||
Total Common Stocks (Cost $12,487,305) | $ | 13,302,968 | ||||||||
|
| |||||||||
| Money Market Funds – 0.2% | Shares | Value | ||||||||
Fidelity Institutional Money Market Funds | 31,000 | $ | 31,000 | |||||||
|
| |||||||||
Total Money Market Funds (Cost $31,000) | $ | 31,000 | ||||||||
|
| |||||||||
Total Investments – 100.0% (Cost $12,518,305) | (b) | $ | 13,333,968 | |||||||
Other Assets in Excess of Liabilities – 0.0% | 2,043 | |||||||||
|
| |||||||||
Net Assets – 100.0% | $ | 13,336,011 | ||||||||
|
| |||||||||
Percentages are stated as a percent of net assets.
Abbreviations:
ADR: American Depositary Receipts
Footnotes:
| (a) | Non-income producing security. |
| (b) | Represents cost for financial reporting purposes, which may differ from cost basis for federal income tax purposes. See also Note 7 of the Notes to Financial Statements. |
The accompanying notes are an integral part of these financial statements.
| 87 |
| Ohio National Fund, Inc. | Balanced Portfolio |
Objective/Strategy
The Balanced Portfolio seeks capital appreciation and income by investing normally up to 75% of its assets in equity securities within under-priced sectors and industries while maintaining a minimum of 25% of its assets in fixed income securities.
Performance as of December 31, 2011
Average Annual Total Returns: | ||||
One year | 2.29% | |||
Five years | 2.47% | |||
Since inception (5/1/04) | 5.42% |
Past performance does not guarantee future results. The performance data quoted represents past performance and current returns may be lower or higher. Total return figures include change in share price and reinvestment of dividends and capital gains. The investment return and principal value will fluctuate so that an investor’s shares, when redeemed, may be worth more or less than the original cost. To obtain performance information up to the most recent month end, call toll-free 1-877-781-6392.
The Portfolio is not open to direct retail investment. Beneficial interest in shares is obtained solely by purchase of variable life insurance policies and variable annuity contracts. Actual performance results for variable annuity and variable universal life contracts will be lower due to contract charges. Consult your contract for applicable charges.
Comments
For the year ended December 31, 2011, the Balanced Portfolio returned 2.29% versus 4.29% for the current benchmark, which is composed of 60% S&P Composite 1500 Index and 40% Barclays Capital U.S. Universal Index. Over the course of the year, we maintained an approximate 65/35 split between stocks and bonds. Generally speaking, our equity positions outperformed the S&P Composite 1500 Index while the bond portion’s overweight in corporate bonds relative to the broad-based Barclays Capital U.S. Universal Index resulted in fixed income underperformance.
We believe the stock market is in a multi-year recovery from the lows of 2009 and that the market decline in the summer of 2011, principally due to the European debt crisis, will prove to be a temporary setback similar to the Cuban Missile Crisis, the invasion of Kuwait, and the Asian Contagion. During those events, the market declined sharply, experienced much greater than normal volatility, and then rebounded and resumed its previous upward path. Expecting a similar scenario this time and possessing no ability to “time” such an emotionally charged event, we chose to ride through the decline and subsequent rebound, as evidenced by the low turnover. Our primary guide was our overall market value-to-price (“V/P”) ratio, which indicated that stocks, on average, were under-priced relative to our estimate of intrinsic value. In fact, at the bottom in early October, we recorded a 1.60 V/P.
It was a frustrating year for equity value investors because of the disconnect we observed between company and investment fundamentals and investor behavior. Earnings per share (“EPS”) for the companies in the S&P 500 Index, as reported in the third quarter of 2011, grew 15% on average from those values reported one year earlier. As 2011 drew to a close, EPS for the companies in the S&P 500 Index were estimated to grow more than 12% over the course of the next year. Declining interest rates, another fundamental that is usually positive for stocks, should have provided support for higher equity valuations. Investors, though, did not embrace these fundamentals and, instead, focused on worries surrounding the slowing U.S. economy, China’s slowing economy, the European sovereign debt crisis, and the U.S. Federal government��s bitter in-fighting over its country’s deficit.
While the majority of headline news focused on volatility in the equity market, the fixed income space experienced similar movement. This volatility also created an extremely challenging environ-
ment for our fixed income valuation methodology. The bond market began the year with a strong corporate bond rally, with specific emphasis on the high yield space, as investors became more and more confident in the underlying economic environment. This euphoria changed course rather abruptly due to many of the same factors affecting the equity market. This change in course resulted in a massive flight to safety as the yield on the U.S. 10-year Treasury dropped from a high of 3.73% in February 2011 to a low of 1.72% by September. Utilizing our fixed income valuation system, which is quantitatively based on comparing historical relationships across the credit curve to current relationships, the Portfolio maintained an overweight position in corporate bonds and underweight position in Treasury securities over the course of 2011. Unfortunately, this positioning resulted in relative underperformance as the best performing asset class in 2011 turned out to be long-term Treasury securities.(1)
In assessing the equity portion of the Portfolio, the Health Care sector was the largest contributor to performance. The overweight position in the sector contributed almost 1.5% to performance. Within the sector, positions in the Pharmaceuticals and Managed Healthcare industries were the main drivers of contribution. In the Pharmaceuticals industry, Pfizer Inc. and Abbott Laboratories accounted for approximately 0.65% of positive performance. In the Managed Healthcare industry, Aetna Inc. and UnitedHealth Group Inc. contributed approximately 0.55%.
Another significant positive contribution came from the underweighting of the Financials sector, which had attractive valuation readings but lacked the relative strength required in our system. The Portfolio was positioned in the smaller industries such as consumer finance and avoided much of the losses of the major banks and asset managers. Consumer Finance company World Acceptance Corp., a 1.0% position in the Fund that rose significantly over the year, contributed 0.35% to the Portfolio’s performance.(1)
At the other end of the spectrum, overweight positions in the Industrials and Materials sectors detracted from the equity portion of the Portfolio. Combined, these two sectors comprised just over a 23% average weight in the Portfolio over the year versus a 15.6% weighting in the benchmark. Both sectors underperformed, detracting about 1.6% from the Portfolio’s performance.
Within the Industrials sector, positions in the Industrial Machinery and Industrial Conglomerate industries were the primary detractors. Combined, these two industries comprised about 6.2% of the Portfolio on average over the year and detracted almost 0.9% from the Portfolio’s performance. Industrials stocks Dover Corp. and Eaton Corp both fell over the year, taking away approximately 0.30% from the Portfolio’s return. Siemens AD, in the Industrials Conglomerates industry, fell significantly over the year, detracting almost 0.40%.
Within the Materials sector, industry positions in Diversified Metals & Mining and Fertilizers & Agricultural Chemicals were the primary detractors. Positions in these two industries comprised just over 2.5% of the Portfolio on average over the year and detracted approximately 0.90% from performance. Diversified Metals & Mining company Freeport-McMoran Copper & Gold Inc detracted just over 0.40%, making it the Portfolio’s biggest drag on performance. Mosaic Co. in the Fertilizer & Agricultural Chemicals industry detracted almost 0.30% from performance.
The top five stocks with the greatest contribution to return were TJX Cos., Inc., Mastercard, Inc., International Business Machines Corp., Exxon Mobil Corp., and Chevron Corp. The top five stocks with the greatest gains were Mastercard, Inc. TJX Cos., Inc., Aetna, Inc., World Acceptance Corp., and Marathon Petroleum Corp. The biggest detractor from the Portfolio’s relative performance came from the Materials sector. The Materials sector was overweight for most of the year. Investments in the gold, diversified metals & mining, and fertilizer & agricultural chemicals industries produced negative returns for the year. The five largest
| 88 | (continued) |
| Ohio National Fund, Inc. | Balanced Portfolio (Continued) |
detractors from performance were RWE AG, Aeropostale, Inc., Lender Processing Services, Inc., Siemens AG, and Freeport-McMoRan Copper & Gold, Inc. The five stocks with the lowest returns were Lender Processing Services, Inc., RWE AG, Aeropostale, Inc., The Mosaic Co., and Freeport-McMoRan Copper & Gold, Inc.(1)
Going into the new year, our valuation system indicates that the overall equity market has plenty of value. On average, stocks are trading at around 40% below our calculation of fair value. Because of this the Portfolio has a slightly higher allocation to equities with a 70% equity and 30% bond split. We view the sharp declines in the late summer months of 2011 to be an overreaction to worries of European default and congressional deadlock, which leaves a good opportunity to buy stocks at a discount and make gains off a continuation of the rally that started in 2009. We expect prices to continue their move up and we expect underlying valuations to continue to improve as well. As the best bargains at the low in early October were the cyclical, economically-sensitive sectors and industries, the Portfolio remains heavily tilted toward the Industrials, Consumer Discretionary, and Energy sectors. These sectors have generally performed well the last three months and we expect the sector and industry theme to continue into 2012. In the bond market, we expect to see a general reversal in the flight to safety trend that resulted in such strong Treasury returns during 2011. In turn, this should allow investors to focus on both the declining default rate and improving balance sheet fundamentals that have historically resulted in corporate bond out-performance.(1)
| (1) | The Portfolio’s composition is subject to change. Holdings and weightings are as of December 31, 2011. |
Top 10 Portfolio Holdings as of December 31, 2011 (1) (2)
| % of Net Assets | ||||
1. Exxon Mobil Corp. | 2.0 | |||
2. International Business Machines Corp. | 1.7 | |||
3. PPL Energy Supply LLC | 1.7 | |||
4. Chevron Corp. | 1.4 | |||
5. Apple, Inc. | 1.4 | |||
6. Wells Fargo & Co. | 1.4 | |||
7. TJX Cos., Inc. | 1.4 | |||
8. General Electric Co. | 1.3 | |||
9. Comcast Corp. Class A | 1.3 | |||
10. American International Group, Inc. | 1.2 |
Portfolio Composition as of December 31, 2011 (1)
| % of Net Assets | ||||
Common Stocks (3) | 66.5 | |||
Corporate Bonds (3) | 32.2 | |||
U.S. Treasury Obligations | 0.6 | |||
Money Market Funds and | 0.7 | |||
|
| |||
| 100.0 | ||||
|
|
Change in Value of $10,000 Investment
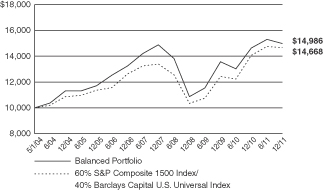
Hypothetical illustration based on past performance. Future performance will vary. The Portfolio’s returns reflect reinvested dividends. The Portfolio’s holdings may differ significantly from the securities in the index. The index is unmanaged and therefore does not reflect the cost of portfolio management and accounting.
The S&P Composite 1500 Index is a broad-based capitalization-weighted index of 1500 U.S. companies and is comprised of the S&P 400, S&P 500, and the S&P 600. The index was developed with a base value of 100 as of December 30, 1994. The index presented herein includes the effects of reinvested dividends.
The Barclays Capital U.S. Universal Index represents the union of the U.S. Aggregate Index, the U.S. High-Yield Corporate Index, the 144A Index, the Eurodollar Index, the Emerging Markets Index, the non-ERISA portion of the Commercial Mortgage-Backed Securities (CMBS) Index and the CMBS High-Yield Index. All securities in this market-value weighted index have at least one year remaining to maturity and meet certain minimum issue size criteria.
| (1) | Composition of Portfolio subject to change. |
| (2) | Short-term investments have been excluded from the list of Top 10 Portfolio Holdings. |
| (3) | Sectors (combined): |
| % of Net Assets | ||||
Industrials | 17.9 | |||
Financials | 16.5 | |||
Consumer Discretionary | 11.8 | |||
Information Technology | 11.4 | |||
Consumer Staples | 8.9 | |||
Health Care | 8.8 | |||
Materials | 8.2 | |||
Energy | 8.2 | |||
Utilities | 4.5 | |||
Telecommunication Services | 2.5 | |||
|
| |||
| 98.7 | ||||
|
|
| 89 |
| Ohio National Fund, Inc. | Balanced Portfolio |
Schedule of Investments | December 31, 2011 |
| Common Stocks – 66.5% | Shares | Value | ||||||||
CONSUMER DISCRETIONARY – 8.6% |
| |||||||||
Comcast Corp. Class A (Media) | 9,000 | $ | 213,390 | |||||||
Time Warner Cable, Inc. (Media) | 2,580 | 164,011 | ||||||||
Walt Disney Co. / The (Media) | 4,670 | 175,125 | ||||||||
Dollar Tree, Inc. (Multiline Retail) | (a) | 990 | 82,279 | |||||||
Target Corp. (Multiline Retail) | 3,150 | 161,343 | ||||||||
Aeropostale, Inc. (Specialty Retail) | (a) | 3,500 | 53,375 | |||||||
GameStop Corp. Class A (Specialty Retail) | (a) | 2,500 | 60,325 | |||||||
Guess?, Inc. (Specialty Retail) | 1,500 | 44,730 | ||||||||
Lowe’s Cos., Inc. (Specialty Retail) | 3,000 | 76,140 | ||||||||
TJX Cos., Inc. (Specialty Retail) | 3,590 | 231,734 | ||||||||
NIKE, Inc. Class B (Textiles, Apparel & Luxury Goods) | 2,140 | 206,232 | ||||||||
|
| |||||||||
| 1,468,684 | ||||||||||
|
| |||||||||
CONSUMER STAPLES – 5.0% | ||||||||||
CVS Caremark Corp. (Food & Staples Retailing) | 1,820 | 74,220 | ||||||||
Walgreen Co. (Food & Staples Retailing) | 1,940 | 64,136 | ||||||||
Bunge Ltd. (Food Products) | 1,120 | 64,064 | ||||||||
Corn Products International, Inc. (Food Products) | 1,530 | 80,463 | ||||||||
Colgate-Palmolive Co. (Household Products) | 2,070 | 191,247 | ||||||||
Kimberly-Clark Corp. (Household Products) | 2,640 | 194,198 | ||||||||
Procter & Gamble Co. / The (Household Products) | 2,680 | 178,783 | ||||||||
|
| |||||||||
| 847,111 | ||||||||||
|
| |||||||||
ENERGY – 6.6% | ||||||||||
Nabors Industries Ltd. (Energy Equip. & Svs.) | (a) | 4,150 | 71,961 | |||||||
Noble Corp. (Energy Equip. & Svs.) | (a) | 5,510 | 166,512 | |||||||
Transocean Ltd. (Energy Equip. & Svs.) | 1,480 | 56,817 | ||||||||
Chevron Corp. (Oil, Gas & Consumable Fuels) | 2,280 | 242,592 | ||||||||
Exxon Mobil Corp. (Oil, Gas & Consumable Fuels) | 4,100 | 347,516 | ||||||||
Marathon Oil Corp. (Oil, Gas & Consumable Fuels) | 2,200 | 64,394 | ||||||||
Marathon Petroleum Corp. (Oil, Gas & Consumable Fuels) | 1,100 | 36,619 | ||||||||
Valero Energy Corp. (Oil, Gas & Consumable Fuels) | 6,340 | 133,457 | ||||||||
|
| |||||||||
| 1,119,868 | ||||||||||
|
| |||||||||
FINANCIALS – 4.9% | ||||||||||
U.S. Bancorp (Commercial Banks) | 3,000 | 81,150 | ||||||||
Wells Fargo & Co. (Commercial Banks) | 8,450 | 232,882 | ||||||||
World Acceptance Corp. (Consumer Finance) | (a) | 1,660 | 122,010 | |||||||
IntercontinentalExchange, Inc. (Diversified Financial Svs.) | (a) | 1,000 | 120,550 | |||||||
JPMorgan Chase & Co. (Diversified Financial Svs.) | 3,600 | 119,700 | ||||||||
Travelers Cos., Inc. / The (Insurance) | 1,500 | 88,755 | ||||||||
Annaly Capital Management, Inc. (Real Estate Investment Trusts) | 4,210 | 67,192 | ||||||||
|
| |||||||||
| 832,239 | ||||||||||
|
| |||||||||
HEALTH CARE – 8.1% | ||||||||||
Celgene Corp. (Biotechnology) | (a) | 1,700 | 114,920 | |||||||
PDL BioPharma, Inc. (Biotechnology) | 15,730 | 97,526 | ||||||||
Covidien PLC (Health Care Equip. & Supplies) | 2,170 | 97,672 | ||||||||
Stryker Corp. (Health Care Equip. & Supplies) | 740 | 36,785 | ||||||||
Aetna, Inc. (Health Care Providers & Svs.) | 3,000 | 126,570 | ||||||||
AmerisourceBergen Corp. (Health Care Providers & Svs.) | 2,000 | 74,380 | ||||||||
McKesson Corp. (Health Care Providers & Svs.) | 2,000 | 155,820 | ||||||||
UnitedHealth Group, Inc. (Health Care Providers & Svs.) | 1,750 | 88,690 | ||||||||
Abbott Laboratories (Pharmaceuticals) | 3,450 | 193,993 | ||||||||
Eli Lilly & Co. (Pharmaceuticals) | 1,000 | 41,560 | ||||||||
Johnson & Johnson (Pharmaceuticals) | 2,660 | 174,443 | ||||||||
Merck & Co., Inc. (Pharmaceuticals) | 2,000 | 75,400 | ||||||||
Pfizer, Inc. (Pharmaceuticals) | 5,000 | 108,200 | ||||||||
|
| |||||||||
| 1,385,959 | ||||||||||
|
| |||||||||
INDUSTRIALS – 15.0% | ||||||||||
General Dynamics Corp. (Aerospace & Defense) | 1,500 | 99,615 | ||||||||
L-3 Communications Holdings, Inc. (Aerospace & Defense) | 1,300 | 86,684 | ||||||||
Lockheed Martin Corp. (Aerospace & Defense) | 1,520 | 122,968 | ||||||||
Northrop Grumman Corp. (Aerospace & Defense) | 500 | 29,240 | ||||||||
United Technologies Corp. (Aerospace & Defense) | 950 | 69,435 | ||||||||
| Common Stocks (continued) | Shares | Value | ||||||||
INDUSTRIALS (continued) | ||||||||||
FedEx Corp. (Air Freight & Logistics) | 2,090 | $ | 174,536 | |||||||
Cooper Industries PLC (Electrical Equip.) | 1,220 | 66,063 | ||||||||
Emerson Electric Co. (Electrical Equip.) | 1,990 | 92,714 | ||||||||
Hubbell, Inc. Class B (Electrical Equip.) | 2,000 | 133,720 | ||||||||
Thomas & Betts Corp. (Electrical Equip.) | (a) | 1,500 | 81,900 | |||||||
Danaher Corp. (Industrial Conglomerates) | 3,080 | 144,883 | ||||||||
General Electric Co. (Industrial Conglomerates) | 11,970 | 214,383 | ||||||||
Siemens AG - ADR (Industrial Conglomerates) | 960 | 91,786 | ||||||||
Caterpillar, Inc. (Machinery) | 1,820 | 164,892 | ||||||||
Dover Corp. (Machinery) | 1,930 | 112,036 | ||||||||
Eaton Corp. (Machinery) | 3,940 | 171,508 | ||||||||
Parker Hannifin Corp. (Machinery) | 1,220 | 93,025 | ||||||||
Valmont Industries, Inc. (Machinery) | 1,290 | 117,119 | ||||||||
Canadian National Railway Co. (Road & Rail) | 1,760 | 138,266 | ||||||||
CSX Corp. (Road & Rail) | 6,480 | 136,469 | ||||||||
Union Pacific Corp. (Road & Rail) | 1,970 | 208,702 | ||||||||
|
| |||||||||
| 2,549,944 | ||||||||||
|
| |||||||||
INFORMATION TECHNOLOGY – 11.4% | ||||||||||
Apple, Inc. (Computers & Peripherals) | (a) | 590 | 238,950 | |||||||
Anixter International, Inc. (Electronic Equip., Instr. & Comp.) | (a) | 1,480 | 88,267 | |||||||
Arrow Electronics, Inc. (Electronic Equip., Instr. & Comp.) | (a) | 4,130 | 154,503 | |||||||
Flextronics International Ltd. (Electronic Equip., Instr. & Comp.) | (a) | 9,410 | 53,261 | |||||||
Ingram Micro, Inc. Class A (Electronic Equip., Instr. & Comp.) | (a) | 3,940 | 71,669 | |||||||
Multi-Fineline Electronix, Inc. (Electronic Equip., Instr. & Comp.) | (a) | 2,580 | 53,019 | |||||||
SYNNEX Corp. (Electronic Equip., Instr. & Comp.) | (a) | 3,140 | 95,644 | |||||||
Tech Data Corp. (Electronic Equip., Instr. & Comp.) | (a) | 1,810 | 89,432 | |||||||
Accenture PLC Class A (IT Svs.) | 2,930 | 155,964 | ||||||||
Automatic Data Processing, Inc. (IT Svs.) | 2,500 | 135,025 | ||||||||
CACI International, Inc. Class A (IT Svs.) | (a) | 2,590 | 144,833 | |||||||
Cognizant Technology Solutions Corp. Class A (IT Svs.) | (a) | 1,910 | 122,832 | |||||||
International Business Machines Corp. (IT Svs.) | 1,600 | 294,208 | ||||||||
Lender Processing Services, Inc. (IT Svs.) | 2,370 | 35,716 | ||||||||
Mastercard, Inc. Class A (IT Svs.) | 230 | 85,749 | ||||||||
Microsoft Corp. (Software) | 5,020 | 130,319 | ||||||||
|
| |||||||||
| 1,949,391 | ||||||||||
|
| |||||||||
MATERIALS – 3.9% | ||||||||||
Air Products & Chemicals, Inc. (Chemicals) | 1,410 | 120,118 | ||||||||
Cabot Corp. (Chemicals) | 2,280 | 73,279 | ||||||||
Ecolab, Inc. (Chemicals) | 2,620 | 151,462 | ||||||||
Mosaic Co. / The (Chemicals) | 980 | 49,421 | ||||||||
Potash Corp of Saskatchewan, Inc. (Chemicals) | 1,360 | 56,141 | ||||||||
Praxair, Inc. (Chemicals) | 1,240 | 132,556 | ||||||||
Freeport-McMoRan Copper & Gold, Inc. (Metals & Mining) | 2,000 | 73,580 | ||||||||
|
| |||||||||
| 656,557 | ||||||||||
|
| |||||||||
TELECOMMUNICATION SERVICES – 1.4% | ||||||||||
AT&T, Inc. (Diversified Telecom. Svs.) | 2,300 | 69,552 | ||||||||
Nippon Telegraph & Telephone Corp. – ADR (Diversified Telecom. Svs.) | 3,580 | 90,681 | ||||||||
Rogers Communications, Inc. Class B (Wireless Telecom. Svs.) | 2,190 | 84,337 | ||||||||
|
| |||||||||
| 244,570 | ||||||||||
|
| |||||||||
UTILITIES – 1.6% | ||||||||||
Public Service Enterprise Group, Inc. (Multi-Utilities) | 1,950 | 64,370 | ||||||||
RWE AG – ADR (Multi-Utilities) | 1,000 | 34,930 | ||||||||
American Water Works Co., Inc. (Water Utilities) | 5,620 | 179,053 | ||||||||
|
| |||||||||
| 278,353 | ||||||||||
|
| |||||||||
Total Common Stocks (Cost $10,635,231) | $ | 11,332,676 | ||||||||
|
| |||||||||
| 90 | (continued) |
| Ohio National Fund, Inc. | Balanced Portfolio (Continued) |
Schedule of Investments | December 31, 2011 |
| Corporate Bonds – 32.2% | Rate | Maturity | Face Amount | Value | ||||||||||||
CONSUMER DISCRETIONARY – 3.2% | ||||||||||||||||
Cooper Tire & Rubber Co. (Auto Components) | 7.625% | 03/15/2027 | $ | 100,000 | $ | 93,500 | ||||||||||
J.C. Penney Corp, Inc. (Multiline Retail) | 7.950% | 04/01/2017 | 25,300 | 27,704 | ||||||||||||
Best Buy Co., Inc. (Specialty Retail) | 5.500% | 03/15/2021 | 150,000 | 143,741 | ||||||||||||
Gap, Inc. / The (Specialty Retail) | 5.950% | 04/12/2021 | 100,000 | 95,547 | ||||||||||||
Toys R Us, Inc. (Specialty Retail) | 7.375% | 10/15/2018 | 200,000 | 180,500 | ||||||||||||
|
| |||||||||||||||
| 540,992 | ||||||||||||||||
|
| |||||||||||||||
CONSUMER STAPLES – 3.9% | ||||||||||||||||
Coca-Cola Co. / The (Beverages) | 4.875% | 03/15/2019 | 50,000 | 58,646 | ||||||||||||
PepsiCo, Inc. (Beverages) | 5.000% | 06/01/2018 | 100,000 | 116,337 | ||||||||||||
Dean Foods Co. (Food Products) | 6.900% | 10/15/2017 | 50,000 | 48,438 | ||||||||||||
Dole Food Co., Inc. (Food Products) | 8.750% | 07/15/2013 | 68,000 | 72,250 | ||||||||||||
Altria Group, Inc. (Tobacco) | 9.950% | 11/10/2038 | 50,000 | 76,280 | ||||||||||||
Altria Group, Inc. (Tobacco) | 9.250% | 08/06/2019 | 50,000 | 67,235 | ||||||||||||
Lorillard Tobacco Co. (Tobacco) | 6.875% | 05/01/2020 | 100,000 | 111,924 | ||||||||||||
Reynolds American, Inc. (Tobacco) | 7.250% | 06/01/2013 | 100,000 | 107,287 | ||||||||||||
|
| |||||||||||||||
| 658,397 | ||||||||||||||||
|
| |||||||||||||||
ENERGY – 1.6% | ||||||||||||||||
Petrobras International Finance Co. – Pifco (Oil, Gas & Consumable Fuels) | 7.750% | 09/15/2014 | 50,000 | 57,190 | ||||||||||||
Petrobras International Finance Co. – Pifco (Oil, Gas & Consumable Fuels) | 5.375% | 01/27/2021 | 200,000 | 211,120 | ||||||||||||
|
| |||||||||||||||
| 268,310 | ||||||||||||||||
|
| |||||||||||||||
FINANCIALS – 11.6% | ||||||||||||||||
Goldman Sachs Group, Inc. / The (Capital Markets) | 5.125% | 01/15/2015 | 100,000 | 102,282 | ||||||||||||
Goldman Sachs Group, Inc. / The (Capital Markets) | 5.950% | 01/15/2027 | 100,000 | 93,959 | ||||||||||||
Merrill Lynch & Co., Inc. (Capital Markets) | 5.000% | 02/03/2014 | 10,000 | 9,953 | ||||||||||||
Merrill Lynch & Co., Inc. (Capital Markets) | 5.450% | 02/05/2013 | 150,000 | 151,130 | ||||||||||||
Morgan Stanley (Capital Markets) | 5.375% | 10/15/2015 | 100,000 | 97,795 | ||||||||||||
Morgan Stanley (Capital Markets) | (b) | 0.883% | 10/15/2015 | 100,000 | 84,144 | |||||||||||
Morgan Stanley (Capital Markets) | (c) | 3.500% | 10/15/2020 | 50,000 | 43,998 | |||||||||||
UBS AG (Capital Markets) | 5.875% | 12/20/2017 | 100,000 | 104,235 | ||||||||||||
Wells Fargo Bank NA (Commercial Banks) | (b) | 0.671% | 05/16/2016 | 100,000 | 87,998 | |||||||||||
HSBC Finance Corp. (Consumer Finance) | 7.000% | 05/15/2012 | 50,000 | 50,937 | ||||||||||||
HSBC Finance Corp. (Consumer Finance) | 6.375% | 11/27/2012 | 50,000 | 51,438 | ||||||||||||
Bank of America Corp. (Diversified Financial Svs.) | 5.625% | 07/01/2020 | 200,000 | 185,050 | ||||||||||||
Bank of America Corp. (Diversified Financial Svs.) | 6.800% | 03/15/2028 | 100,000 | 86,601 | ||||||||||||
Bank of America NA (Diversified Financial Svs.) | (b) | 0.846% | 06/15/2017 | 50,000 | 36,307 | |||||||||||
Citigroup, Inc. (Diversified Financial Svs.) | 5.125% | 05/05/2014 | 40,000 | 40,959 | ||||||||||||
Citigroup, Inc. (Diversified Financial Svs.) | 5.300% | 10/17/2012 | 50,000 | 50,822 | ||||||||||||
Citigroup, Inc. (Diversified Financial Svs.) | 6.000% | 08/15/2017 | 50,000 | 52,460 | ||||||||||||
American International Group, Inc. (Insurance) | 4.250% | 05/15/2013 | 100,000 | 99,963 | ||||||||||||
American International Group, Inc. (Insurance) | 8.250% | 08/15/2018 | 200,000 | 212,240 | ||||||||||||
Aspen Insurance Holdings Ltd. (Insurance) | 6.000% | 12/15/2020 | 100,000 | 100,905 | ||||||||||||
Delphi Financial Group, Inc. (Insurance) | 7.875% | 01/31/2020 | 50,000 | 56,927 | ||||||||||||
Hartford Financial Services Group, Inc. (Insurance) | 6.300% | 03/15/2018 | 100,000 | 105,441 | ||||||||||||
Swiss Re Solutions Holding Corp. (Insurance) | 7.000% | 02/15/2026 | 40,000 | 46,400 | ||||||||||||
Unum Group (Insurance) | 7.190% | 02/01/2028 | 30,000 | 34,358 | ||||||||||||
|
| |||||||||||||||
| 1,986,302 | ||||||||||||||||
|
| |||||||||||||||
HEALTH CARE – 0.7% | ||||||||||||||||
Novartis Capital Corp. (Pharmaceuticals) | 4.400% | 04/24/2020 | 100,000 | 114,183 | ||||||||||||
|
| |||||||||||||||
INDUSTRIALS – 2.9% | ||||||||||||||||
Lockheed Martin Corp. (Aerospace & Defense) | 4.250% | 11/15/2019 | 100,000 | 106,544 | ||||||||||||
R.R. Donnelley & Sons Co. (Commercial Svs. & Supplies) | 6.125% | 01/15/2017 | 150,000 | 140,250 | ||||||||||||
R.R. Donnelley & Sons Co. (Commercial Svs. & Supplies) | 6.625% | 04/15/2029 | 100,000 | 74,000 | ||||||||||||
Valmont Industries, Inc. (Machinery) | 6.625% | 04/20/2020 | 150,000 | 173,899 | ||||||||||||
|
| |||||||||||||||
| 494,693 | ||||||||||||||||
|
| |||||||||||||||
MATERIALS – 4.3% | ||||||||||||||||
Alcoa, Inc. (Metals & Mining) | 5.720% | 02/23/2019 | 150,000 | 155,422 | ||||||||||||
Alcoa, Inc. (Metals & Mining) | 6.750% | 01/15/2028 | 100,000 | 103,078 | ||||||||||||
AngloGold Ashanti Holdings PLC (Metals & Mining) | 5.375% | 04/15/2020 | 100,000 | 99,510 | ||||||||||||
ArcelorMittal (Metals & Mining) | 5.500% | 03/01/2021 | 100,000 | 91,951 | ||||||||||||
Southern Copper Corp. (Metals & Mining) | 5.375% | 04/16/2020 | 150,000 | 159,707 | ||||||||||||
Vale Overseas Ltd. (Metals & Mining) | 8.250% | 01/17/2034 | 100,000 | 129,413 | ||||||||||||
|
| |||||||||||||||
| 739,081 | ||||||||||||||||
|
| |||||||||||||||
| 91 | (continued) |
| Ohio National Fund, Inc. | Balanced Portfolio (Continued) |
Schedule of Investments | December 31, 2011 |
| Corporate Bonds (Continued) | Rate | Maturity | Face Amount | Value | ||||||||||||
TELECOMMUNICATION SERVICES – 1.1% | ||||||||||||||||
AT&T, Inc. (Diversified Telecom. Svs.) | 5.800% | 02/15/2019 | $ | 100,000 | $ | 118,179 | ||||||||||
Comcast Cable Communications Holdings, Inc. (Wireless Telecom. Svs.) | 9.455% | 11/15/2022 | 50,000 | 71,379 | ||||||||||||
|
| |||||||||||||||
| 189,558 | ||||||||||||||||
|
| |||||||||||||||
UTILITIES – 2.9% | ||||||||||||||||
Exelon Generation Co. LLC (Ind. Power Prod. & Energy Traders) | 5.350% | 01/15/2014 | 100,000 | 106,866 | ||||||||||||
Exelon Generation Co. LLC (Ind. Power Prod. & Energy Traders) | 4.000% | 10/01/2020 | 100,000 | 102,988 | ||||||||||||
PPL Energy Supply LLC (Ind. Power Prod. & Energy Traders) | 6.500% | 05/01/2018 | 250,000 | 284,635 | ||||||||||||
|
| |||||||||||||||
| 494,489 | ||||||||||||||||
|
| |||||||||||||||
Total Corporate Bonds (Cost $5,477,316) | $ | 5,486,005 | ||||||||||||||
|
| |||||||||||||||
| U.S. Treasury Obligations – 0.6% | Rate | Maturity | Face Amount | Value | ||||||||||||
U.S. Treasury Note | 2.625% | 11/15/2020 | $ | 100,000 | $ | 107,672 | ||||||||||
|
| |||||||||||||||
Total U.S. Treasury Obligations (Cost $94,655) | $ | 107,672 | ||||||||||||||
|
| |||||||||||||||
| Money Market Funds – 0.2% | Shares | Value | ||||||||||||||
Fidelity Institutional Money Market Funds | 48,000 | $ | 48,000 | |||||||||||||
|
| |||||||||||||||
Total Money Market Funds (Cost $48,000) | $ | 48,000 | ||||||||||||||
|
| |||||||||||||||
Total Investments – 99.5% (Cost 16,255,202) | (d) | $ | 16,974,353 | |||||||||||||
Other Assets in Excess of Liabilities – 0.5% | 82,375 | |||||||||||||||
|
| |||||||||||||||
Net Assets – 100.0% | $ | 17,056,728 | ||||||||||||||
|
| |||||||||||||||
Percentages are stated as a percent of net assets.
Abbreviations:
ADR: American Depositary Receipts
Footnotes:
| (a) | Non-income producing security. |
| (b) | Securities are variable rate instruments in which the coupon rates are adjusted quarterly in concert with U.S. LIBOR. Interest rates stated are those in effect at December 31, 2011. |
| (c) | Security was initially issued at one coupon rate, but the coupon rate is scheduled to be updated at later specified dates. The coupon rate shown is the rate that is in effect at December 31, 2011. |
| (d) | Represents cost for financial reporting purposes, which may differ from cost basis for federal income tax purposes. See also Note 7 of the Notes to Financial Statements. |
The accompanying notes are an integral part of these financial statements.
| 92 |
| Ohio National Fund, Inc. | Income Opportunity Portfolio |
Objective/Strategy
The Income Opportunity Portfolio seeks modest capital appreciation and maximization of realized gains by investing in equity securities traded in the U.S.
Performance as of December 31, 2011
Average Annual Total Returns: | ||||
One year | -1.08% | |||
Five years | 0.57% | |||
Since inception (5/1/04) | 2.25% |
Past performance does not guarantee future results. The performance data quoted represents past performance and current returns may be lower or higher. Total return figures include change in share price and reinvestment of dividends and capital gains. The investment return and principal value will fluctuate so that an investor’s shares, when redeemed, may be worth more or less than the original cost. To obtain performance information up to the most recent month end, call toll-free 1-877-781-6392.
The Portfolio is not open to direct retail investment. Beneficial interest in shares is obtained solely by purchase of variable life insurance policies and variable annuity contracts. Actual performance results for variable annuity and variable universal life contracts will be lower due to contract charges. Consult your contract for applicable charges.
Comments
For the year ended December 31, 2011, the Income Opportunity Portfolio returned -1.08% versus 1.75% for the current benchmark, the S&P Composite 1500 Index.
The year was marked by almost unprecedented volatility. Stock swings were double the five-decade average for the S&P 500 Index according to Bloomberg. The primary cause of the volatility was the debt crisis in the EuroZone. Global markets appeared to hang on every bit of news that came out of Europe, resulting in violent day-to-day swings in the market. Another factor in the extreme volatility was the uprisings in the Middle East. The “Arab Spring” created additional uncertainty fueling the extreme volatility. Despite the turbulent global markets, which caused significant investor uncertainty, the S&P 500 Index managed to end the calendar year unchanged on a simple price appreciation basis.
Domestic economic news also appeared to worry investors. Ongoing malaise in the housing sector, weak manufacturing numbers, and stubbornly high unemployment raised questions about a possible double-dip recession. These concerns exacerbated the sovereign debt fears in Europe and the worries over instability in the Middle East.
Further adding to investor fear, in the first week of August, Standard & Poor’s cut its rating of long-term U.S. federal debt one notch below its top grade: from AAA to AA+. This downgrade was the first ever for U.S. debt. The combinations of these issues seemed to be too much for investors to bear as the S&P 500 Index plunged just over 18% from July 8, 2011 to October 3, 2011. Over that same period, the yield on the 10-year Treasury fell from 3.03% to 1.76% as investors continued to rush to the perceived safety of U.S. Treasuries. It appeared that these investors viewed Standard & Poor’s downgrade of U.S. debt as a more symbolic event reflective of the extreme bipartisan climate in Washington. Congress wrangled bitterly over raising the debt ceiling, suggesting that political leaders were becoming increasingly unable to reach important debt-related decisions in a timely manner.
In early October, the U.S. stock market suddenly turned around and rallied sharply into the end of the year. It appeared that investors rushed in to buy stocks in search of what they perceived as an
oversold situation. As the stock market rose and investors’ fears seemed to abate, the flight to quality Treasury trade began to reverse. By year’s end, the U.S. 10-year Treasury yield had risen back up to 1.88%.
Through all this tumult, the hedging strategy of the Portfolio reduced volatility relative to the market as measured by the S&P Composite 1500 Index. The beta of the Portfolio was 0.61. By adhering to the disciplined overlay strategy of writing index call options and buying index put options, a significant portion of the market volatility was reduced.(1)
While the hedging strategy accomplished its objective of reducing volatility, the equities within the Portfolio underperformed the benchmark. This resulted in the sub-par performance of the Portfolio. Our valuation readings tilted the Portfolio toward overweight positions in the Industrials and Materials sectors. In the Industrials sector, the average weight for the Portfolio was 17.7% vs. the benchmark weight of 11.7%. The Materials sector had an average weight of 6.7% vs. 3.9% for the benchmark. Combined, these two sectors detracted about 1.8% from the Portfolio’s return. On a positive note, the Portfolio was underweight the Financials sector, 12.0% vs. 15.5%, which was the worst performing sector in the benchmark index.(1)
Drilling down to industry level positions, the Industrial Conglomerates and Steel industries were the largest detractors from the Portfolio’s performance. The two industries, in the Industrials and Materials sectors, respectively, detracted about a combined 1.4% from performance. The Portfolio’s position in the Industrial Conglomerates industry detracted approximately 0.85% from performance, while the Portfolio’s position in the Steel industry detracted almost 0.60% from performance.(1)
At the other side of the spectrum, the Information Technology Consulting & Services and Apparel Retail industries were the two largest positive contributors to performance. Information Technology Consulting & Services was the second largest industry holding in the Portfolio at an average weight of 5.5% vs. the benchmark weight of 2.1%. The industry contributed about 0.70% to performance. The Portfolio’s position in the Apparel Retail industry contributed 0.63% to performance.(1)
At the stock level, the five best performers were Delphi Financial Group, Inc., Ross Stores, Inc., TJX Cos., Inc, Aetna, Inc., and CF Industries Holdings, Inc. The five worst performing stocks were Vale S.A., Guess?, Inc., Ingersoll-Rand PLC, The Bank of New York Mellon Corp., and Siemens AG. The five highest contributors to performance were International Business Machines Corp., Apple, Inc., TJX Cos., Inc, Chevron Corp., and Ross Stores, Inc. The five largest detractors from performance were Siemens AG, Vale S.A., Guess?, Inc., Hewlett-Packard Co., and The Goldman Sachs Group, Inc.(1)
As 2012 begins, we believe there is upside potential in the U.S. equity market. The turnaround in equities that began in March of 2009 paused during this past calendar year. However, based on our value based model, we expect stocks to regain strength this year and move higher. No doubt, top down macroeconomic investors can point to many risks in the market, but we believe that many of these risks may have already been priced in.
The Portfolio enters 2012 with overweight positions in the Industrials and Materials sectors. The Portfolio also has a slight overweight in the Consumer Discretionary sector. The most significant sector underweight positions are in the Consumer Staples and Health Care sectors. The tilt of the Portfolio remains toward economically-sensitive areas of the market. The use of options to hedge the Portfolio will also continue to be implemented within the Portfolio’s strategy.(1)
| (1) | The Portfolio’s composition is subject to change. Holdings and weightings are as of December 31, 2011. |
| 93 | (continued) |
| Ohio National Fund, Inc. | Income Opportunity Portfolio (Continued) |
Change in Value of $10,000 Investment
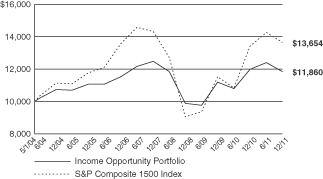
Hypothetical illustration based on past performance. Future performance will vary. The Portfolio’s returns reflect reinvested dividends. The Portfolio’s holdings may differ significantly from the securities in the index. The index is unmanaged and therefore does not reflect the cost of portfolio management and accounting.
The S&P Composite 1500 Index is a broad-based capitalization-weighted index of 1500 U.S. companies and is comprised of the S&P 400, S&P 500, and the S&P 600. The index was developed with a base value of 100 as of December 30, 1994. The index presented herein includes the effects of reinvested dividends.
Portfolio Composition as of December 31, 2011 (1)
| % of Net Assets | ||||
Common Stocks (3) | 100.8 | |||
Purchased Options | 0.1 | |||
Written Options Outstanding | (1.2 | ) | ||
Money Market Funds | 0.3 | |||
|
| |||
| 100.0 | ||||
|
|
Top 10 Portfolio Holdings as of December 31, 2011 (1) (2)
| % of Net Assets | ||||
1. International Business Machines Corp. | 3.7 | |||
2. Apple, Inc. | 3.0 | |||
3. TJX Cos., Inc. | 2.6 | |||
4. Chevron Corp. | 2.1 | |||
5. CSX Corp. | 2.1 | |||
6. Union Pacific Corp. | 2.1 | |||
7. Caterpillar, Inc. | 2.0 | |||
8. National Oilwell Varco, Inc. | 1.9 | |||
9. JPMorgan Chase & Co. | 1.9 | |||
10. Dover Corp. | 1.8 |
| (1) | Composition of Portfolio subject to change. |
| (2) | Short-term investments have been excluded from the list of Top 10 Portfolio Holdings. |
| (3) | Sectors: |
| % of Net Assets | ||||
Industrials | 20.9 | |||
Information Technology | 18.2 | |||
Consumer Discretionary | 13.6 | |||
Financials | 12.8 | |||
Energy | 11.7 | |||
Health Care | 7.2 | |||
Materials | 7.1 | |||
Consumer Staples | 5.0 | |||
Utilities | 4.3 | |||
|
| |||
| 100.8 | ||||
|
|
| 94 |
| Ohio National Fund, Inc. | Income Opportunity Portfolio |
Schedule of Investments | December 31, 2011 |
| Common Stocks – 100.8% | Shares | Value | ||||||||
CONSUMER DISCRETIONARY – 13.6% |
| |||||||||
Johnson Controls, Inc. (Auto Components) | 4,600 | $ | 143,796 | |||||||
Genuine Parts Co. (Distributors) | 1,400 | 85,680 | ||||||||
Carnival Corp. (Hotels, Restaurants & Leisure) | 2,300 | 75,072 | ||||||||
McDonald’s Corp. (Hotels, Restaurants & Leisure) | 600 | 60,198 | ||||||||
Tupperware Brands Corp. (Household Durables) | 1,000 | 55,970 | ||||||||
Walt Disney Co. / The (Media) | (b) | 4,100 | 153,750 | |||||||
Target Corp. (Multiline Retail) | (b) | 2,400 | 122,928 | |||||||
Best Buy Co., Inc. (Specialty Retail) | 4,200 | 98,154 | ||||||||
Jos. A Bank Clothiers, Inc. (Specialty Retail) | (a)(b) | 1,050 | 51,198 | |||||||
Lowe’s Cos., Inc. (Specialty Retail) | 6,500 | 164,970 | ||||||||
Ross Stores, Inc. (Specialty Retail) | 2,200 | 104,566 | ||||||||
TJX Cos., Inc. (Specialty Retail) | (b) | 4,400 | 284,020 | |||||||
NIKE, Inc. Class B (Textiles, Apparel & Luxury Goods) | 800 | 77,096 | ||||||||
|
| |||||||||
| 1,477,398 | ||||||||||
|
| |||||||||
CONSUMER STAPLES – 5.0% |
| |||||||||
Costco Wholesale Corp. (Food & Staples Retailing) | (b) | 800 | 66,656 | |||||||
Wal-Mart Stores, Inc. (Food & Staples Retailing) | 2,200 | 131,472 | ||||||||
Corn Products International, Inc. (Food Products) | 1,500 | 78,885 | ||||||||
Altria Group, Inc. (Tobacco) | (b) | 4,300 | 127,495 | |||||||
Philip Morris International, Inc. (Tobacco) | 1,700 | 133,416 | ||||||||
|
| |||||||||
| 537,924 | ||||||||||
|
| |||||||||
ENERGY – 11.7% |
| |||||||||
Baker Hughes, Inc. (Energy Equip. & Svs.) | 1,600 | 77,824 | ||||||||
Halliburton Co. (Energy Equip. & Svs.) | 3,100 | 106,981 | ||||||||
Helmerich & Payne, Inc. (Energy Equip. & Svs.) | 2,200 | 128,392 | ||||||||
National Oilwell Varco, Inc. (Energy Equip. & Svs.) | 3,100 | 210,769 | ||||||||
Chevron Corp. (Oil, Gas & Consumable Fuels) | (b) | 2,100 | 223,440 | |||||||
ConocoPhillips (Oil, Gas & Consumable Fuels) | 2,300 | 167,601 | ||||||||
Exxon Mobil Corp. (Oil, Gas & Consumable Fuels) | (b) | 1,400 | 118,664 | |||||||
Murphy Oil Corp. (Oil, Gas & Consumable Fuels) | (b) | 1,200 | 66,888 | |||||||
Occidental Petroleum Corp. (Oil, Gas & Consumable Fuels) | (b) | 1,000 | 93,700 | |||||||
Valero Energy Corp. (Oil, Gas & Consumable Fuels) | 3,600 | 75,780 | ||||||||
|
| |||||||||
| 1,270,039 | ||||||||||
|
| |||||||||
FINANCIALS – 12.8% |
| |||||||||
Ameriprise Financial, Inc. (Capital Markets) | (b) | 1,400 | 69,496 | |||||||
Bank of New York Mellon Corp. / The (Capital Markets) | (b) | 3,700 | 73,667 | |||||||
Goldman Sachs Group, Inc. / The (Capital Markets) | (b) | 900 | 81,387 | |||||||
Morgan Stanley (Capital Markets) | 4,400 | 66,572 | ||||||||
BB&T Corp. (Commercial Banks) | 4,700 | 118,299 | ||||||||
M&T Bank Corp. (Commercial Banks) | 1,600 | 122,144 | ||||||||
PNC Financial Services Group, Inc. (Commercial Banks) | 1,300 | 74,971 | ||||||||
U.S. Bancorp (Commercial Banks) | (b) | 3,000 | 81,150 | |||||||
Wells Fargo & Co. (Commercial Banks) | 4,500 | 124,020 | ||||||||
CME Group, Inc. (Diversified Financial Svs.) | (b) | 200 | 48,734 | |||||||
JPMorgan Chase & Co. (Diversified Financial Svs.) | (b) | 6,100 | 202,825 | |||||||
Assurant, Inc. (Insurance) | 1,100 | 45,166 | ||||||||
Prudential Financial, Inc. (Insurance) | (b) | 2,700 | 135,324 | |||||||
Torchmark Corp. (Insurance) | (b) | 3,350 | 145,357 | |||||||
|
| |||||||||
| 1,389,112 | ||||||||||
|
| |||||||||
HEALTH CARE – 7.2% |
| |||||||||
Amgen, Inc. (Biotechnology) | 2,000 | 128,420 | ||||||||
Medtronic, Inc. (Health Care Equip. & Supplies) | 3,400 | 130,050 | ||||||||
Varian Medical Systems, Inc. (Health Care Equip. & Supplies) | (a)(b) | 1,800 | 120,834 | |||||||
AmerisourceBergen Corp. (Health Care Providers & Svs.) | (b) | 700 | 26,033 | |||||||
Cardinal Health, Inc. (Health Care Providers & Svs.) | (b) | 700 | 28,427 | |||||||
Express Scripts, Inc. (Health Care Providers & Svs.) | (a)(b) | 1,500 | 67,035 | |||||||
Laboratory Corp. of America Holdings (Health Care Providers & Svs.) | (a) | 600 | 51,582 | |||||||
| Common Stocks (Continued) | Shares | Value | ||||||||
HEALTH CARE (continued) |
| |||||||||
Lincare Holdings, Inc. (Health Care Providers & Svs.) | (b) | 4,400 | $ | 113,124 | ||||||
Abbott Laboratories (Pharmaceuticals) | 2,000 | 112,460 | ||||||||
|
| |||||||||
| 777,965 | ||||||||||
|
| |||||||||
INDUSTRIALS – 20.9% |
| |||||||||
United Technologies Corp. (Aerospace & Defense) | (b) | 1,400 | 102,326 | |||||||
FedEx Corp. (Air Freight & Logistics) | 1,800 | 150,318 | ||||||||
United Parcel Service, Inc. Class B (Air Freight & Logistics) | (b) | 600 | 43,914 | |||||||
Cooper Industries PLC (Electrical Equip.) | 2,000 | 108,300 | ||||||||
Hubbell, Inc. Class B (Electrical Equip.) | 2,100 | 140,406 | ||||||||
3M Co. (Industrial Conglomerates) | (b) | 2,200 | 179,806 | |||||||
Danaher Corp. (Industrial Conglomerates) | (b) | 1,600 | 75,264 | |||||||
Caterpillar, Inc. (Machinery) | (b) | 2,400 | 217,440 | |||||||
Cummins, Inc. (Machinery) | 500 | 44,010 | ||||||||
Deere & Co. (Machinery) | (b) | 500 | 38,675 | |||||||
Dover Corp. (Machinery) | (b) | 3,400 | 197,370 | |||||||
Ingersoll-Rand PLC (Machinery) | 2,000 | 60,940 | ||||||||
Joy Global, Inc. (Machinery) | 1,300 | 97,461 | ||||||||
Parker Hannifin Corp. (Machinery) | 1,500 | 114,375 | ||||||||
SPX Corp. (Machinery) | (b) | 1,800 | 108,486 | |||||||
CSX Corp. (Road & Rail) | (b) | 10,600 | 223,236 | |||||||
Ryder System, Inc. (Road & Rail) | 2,700 | 143,478 | ||||||||
Union Pacific Corp. (Road & Rail) | (b) | 2,100 | 222,474 | |||||||
|
| |||||||||
| 2,268,279 | ||||||||||
|
| |||||||||
INFORMATION TECHNOLOGY – 18.2% |
| |||||||||
QUALCOMM, Inc. (Communications Equip.) | 800 | 43,760 | ||||||||
Apple, Inc. (Computers & Peripherals) | (a)(b) | 800 | 324,000 | |||||||
Arrow Electronics, Inc. (Electronic Equip., Instr. & Comp.) | (a) | 3,100 | 115,971 | |||||||
Google, Inc. Class A (Internet Software & Svs.) | (a) | 200 | 129,180 | |||||||
Accenture PLC Class A (IT Svs.) | 2,800 | 149,044 | ||||||||
Automatic Data Processing, Inc. (IT Svs.) | (b) | 3,000 | 162,030 | |||||||
Cognizant Technology Solutions Corp. Class A (IT Svs.) | (a) | 1,400 | 90,034 | |||||||
International Business Machines Corp. (IT Svs.) | (b) | 2,200 | 404,536 | |||||||
Intel Corp. (Semiconductors & Equip.) | (b) | 6,900 | 167,325 | |||||||
Texas Instruments, Inc. (Semiconductors & Equip.) | 3,500 | 101,885 | ||||||||
Microsoft Corp. (Software) | (b) | 7,600 | 197,296 | |||||||
Oracle Corp. (Software) | 3,300 | 84,645 | ||||||||
|
| |||||||||
| 1,969,706 | ||||||||||
|
| |||||||||
MATERIALS – 7.1% |
| |||||||||
Air Products & Chemicals, Inc. (Chemicals) | 1,300 | 110,747 | ||||||||
E.I. du Pont de Nemours & Co. (Chemicals) | (b) | 3,400 | 155,652 | |||||||
PPG Industries, Inc. (Chemicals) | (b) | 900 | 75,141 | |||||||
Praxair, Inc. (Chemicals) | 1,100 | 117,590 | ||||||||
Rock-Tenn Co. Class A (Containers & Packaging) | 2,100 | 121,170 | ||||||||
Cliffs Natural Resources, Inc. (Metals & Mining) | 1,500 | 93,525 | ||||||||
Reliance Steel & Aluminum Co. (Metals & Mining) | 1,900 | 92,511 | ||||||||
|
| |||||||||
| 766,336 | ||||||||||
|
| |||||||||
UTILITIES – 4.3% |
| |||||||||
Southern Co. / The (Electric Utilities) | (b) | 2,900 | 134,241 | |||||||
AGL Resources, Inc. (Gas Utilities) | (b) | 2,700 | 114,102 | |||||||
UGI Corp. (Gas Utilities) | 2,500 | 73,500 | ||||||||
Sempra Energy (Multi-Utilities) | 1,500 | 82,500 | ||||||||
Xcel Energy, Inc. (Multi-Utilities) | 2,200 | 60,808 | ||||||||
|
| |||||||||
| 465,151 | ||||||||||
|
| |||||||||
Total Common Stocks (Cost $10,214,633) | $ | 10,921,910 | ||||||||
|
| |||||||||
| 95 | (continued) |
| Ohio National Fund, Inc. | Income Opportunity Portfolio (Continued) |
Schedule of Investments | December 31, 2011 |
| Purchased Options – 0.1% | Contracts (c) | Value | ||||||||
S&P 500 Index Put Option | ||||||||||
Expiration: January 2012, Exercise Price: $1,060.00 | 15 | $ | 1,050 | |||||||
S&P 500 Index Put Option | ||||||||||
Expiration: January 2012, Exercise Price: $1,170.00 | 25 | 10,425 | ||||||||
|
| |||||||||
Total Purchased Options (Cost $78,441) | $ | 11,475 | ||||||||
|
| |||||||||
| Money Market Funds – 0.8% | Shares | Value | ||||||||
Fidelity Institutional Money Market Funds | ||||||||||
Money Market Portfolio – Class I | 81,000 | $ | 81,000 | |||||||
|
| |||||||||
Total Money Market Funds (Cost $81,000) | $ | 81,000 | ||||||||
|
| |||||||||
Total Investments – 101.7% (Cost $10,374,074) | (d) | $ | 11,014,385 | |||||||
Total Written Options Outstanding – (1.2)% | (125,000) | |||||||||
Liabilities in Excess of Other Assets – (0.5)% | (55,313) | |||||||||
|
| |||||||||
Net Assets – 100.0% | $ | 10,834,072 | ||||||||
|
| |||||||||
Percentages are stated as a percent of net assets.
Footnotes:
| (a) | Non-income producing security. |
| (b) | Security is fully or partially pledged as collateral for written call options outstanding. Outstanding written call options are presented in the following schedule. |
| (c) | 100 shares per contract. |
| (d) | Represents cost for financial reporting purposes, which may differ from cost basis for federal income tax purposes. See also Note 7 of the Notes to Financials Statements. |
Schedule of Written Options Outstanding | December 31, 2011 |
| Contracts* | Value | |||||
S&P 500 Index Call Option |
| |||||
Expiration: January 2012, Exercise Price: $1,250.00 | 40 | $ | 112,800 | |||
S&P 500 Index Call Option |
| |||||
Expiration: January 2012, Exercise Price: $1,280.00 | 10 | 12,200 | ||||
|
|
| ||||
Total Written Options Outstanding (Premiums received $102,249) | 50 | $ | 125,000 | |||
|
|
| ||||
| * | 100 shares per contract. |
The accompanying notes are an integral part of these financial statements.
| 96 |
| Ohio National Fund, Inc. | Target VIP Portfolio |
Objective/Strategy
The Target VIP Portfolio seeks an above average total return by investing in the common stocks of companies which are identified by a model that applies separate uniquely specialized strategies.
Performance as of December 31, 2011
Average Annual Total Returns: | ||||
One year | -1.41% | |||
Five years | -3.41% | |||
Since inception (11/2/05) | -0.93% |
Past performance does not guarantee future results. The performance data quoted represents past performance and current returns may be lower or higher. Total return figures include change in share price and reinvestment of dividends and capital gains. The investment return and principal value will fluctuate so that an investor’s shares, when redeemed, may be worth more or less than the original cost. To obtain performance information up to the most recent month end, call toll-free 1-877-781-6392.
The Portfolio is not open to direct retail investment. Beneficial interest in shares is obtained solely by purchase of variable life insurance policies and variable annuity contracts. Actual performance results for variable annuity and variable universal life contracts will be lower due to contract charges. Consult your contract for applicable charges.
Comments
For the year ended December 31, 2011, the Target VIP Portfolio returned -1.41% versus 1.03% for the current benchmark, the Russell 3000 Index.
The Utilities sector was the biggest drag on relative performance. A positive allocation effect was more than offset by the underperformance from the Portfolio’s holdings in the sector. The Portfolio’s holdings in the sector were dominated by foreign stocks, which underperformed U.S. stocks for the year. Stock selection in the Industrials sector also detracted from Portfolio performance. Consumer Discretionary and Telecommunication Services also weighed on relative results due to stock selection.(1)
The Financials sector was the biggest positive contributor to relative performance. An underweight position contributed to relative performance as Financials was the worst performing sector in the benchmark. The positive allocation combined with positive stock selection boosted relative Portfolio performance. An underweight in Materials, the second worst performing sector in the benchmark, also contributed positively to relative performance.(1)
The Portfolio’s best performers were Sturm Ruger & Co., Biogen Idec, Inc., Cardtronics, Inc., Ross Stores, Inc., and Dollar Tree, Inc. The worst performers were Smith Micro Software, Inc., USEC, Inc., Oclaro, Inc., Power-One, Inc., and TriQuint Semiconductor, Inc. The Portfolio’s top contributors to performance were McDonald’s Corp., Home Depot, Inc., International Business Machines Corp., Apple, Inc., and Philip Morris International, Inc. The top detractors from performance were Ford Motor Co., Tata Motors Ltd., Netflix, Inc., TRW Automotive Holdings Corp., and RWE AG.(1)
U.S. stocks eked out a gain in 2011. Though the gains were modest, equity markets experienced significant volatility at times as the lingering effects of the recession, politics, and natural disasters impacted global markets throughout the year.
U.S. stocks posted solid gains in the first half of 2011, building on the rally that started in March 2009. Strong corporate earnings growth helped fuel the gains. The year was not without its share of
turbulence, however, as unrest in the Middle East and Africa, a tsunami and resultant nuclear disaster in Japan, and moderating economic growth at home weighed on stocks. The Middle East tensions pushed oil well above $100/barrel and took energy shares along with it.
The first half of 2011 ended with growing jitters over the resilience of the economy here at home and the re-emergence of sovereign debt worries in Europe. Defensive sectors such as Health Care and Utilities took over market leadership as investors grew wary of risk. As the third quarter got underway, the debate over the debt ceiling and ultimate downgrade of U.S. Government debt by Standard & Poor’s caused equity volatility to spike. These issues, combined with the looming end of the Federal Reserve’s asset purchase program (QE2), caused equities to sell off significantly during third quarter.
The fourth quarter brought evidence of the resilience of the domestic economy and equities regained most of what was lost in the third quarter. Employment reports showed modest job creation and improving trends, while consumer spending held up better than many expected. Although the sovereign debt worries in Europe persisted, the emergence of a framework for handling the situation toward the end of the year helped calm equity markets.
As we look to 2012, we have a cautiously optimistic outlook for the economy and equity markets. Recent data indicates the domestic economy is moving in the right direction albeit at a sluggish pace. After a year of strong corporate profit growth (according to Standard & Poor’s, the S&P 500 Index’s constituent earnings per share for the year ended September 30, 2011 was up 20% over the similar prior year period) and a flat market, price to earnings ratio multiples have compressed to attractive levels. While the sovereign debt situation in Europe and our own debt/deficit issues cannot be overlooked, we view equities as compelling at current valuations and poised for gains in 2012. Given the Portfolio’s well diversified holdings, we expect it to participate in the upside.
| (1) | The Portfolio’s composition is subject to change. Holdings and weightings are as of December 31, 2011. |
Change in Value of $10,000 Investment
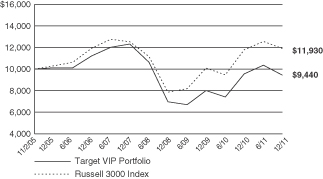
Hypothetical illustration based on past performance. Future performance will vary. The Portfolio’s returns reflect reinvested dividends. The Portfolio’s holdings may differ significantly from the securities in the index. The index is unmanaged and therefore does not reflect the cost of portfolio management and accounting.
The Russell 3000 Index measures the performance of the largest 3000 U.S. companies representing approximately 98% of the investable U.S. equity market. The Russell 3000 Index is constructed to provide a comprehensive, unbiased, and stable barometer of the broad market and is completely reconstituted annually to ensure new and growing equities are reflected. The index presented includes the effects of reinvested dividends.
| 97 | (continued) |
| Ohio National Fund, Inc. | Target VIP Portfolio (Continued) |
Portfolio Composition as of December 31, 2011 (1)
| % of Net Assets | ||||
Common Stocks (3) | 98.5 | |||
Money Market Funds and | 1.5 | |||
|
| |||
| 100.0 | ||||
|
|
Top 10 Portfolio Holdings as of December 31, 2011 (1) (2)
| % of Net Assets | ||||
1. Apple, Inc. | 4.5 | |||
2. McDonald’s Corp. | 4.5 | |||
3. International Business Machines Corp. | 4.3 | |||
4. Home Depot, Inc. / The | 4.1 | |||
5. AT&T, Inc. | 3.5 | |||
6. Microsoft Corp. | 3.2 | |||
7. Ford Motor Co. | 2.8 | |||
8. eBay, Inc. | 2.6 | |||
9. Exxon Mobil Corp. | 2.3 | |||
10. Texas Instruments, Inc. | 2.3 |
| (1) | Composition of Portfolio subject to change. |
| (2) | Short-term investments have been excluded from the list of Top 10 Portfolio Holdings. |
| (3) | Sectors: |
| % of Net Assets | ||||
Information Technology | 29.2 | |||
Consumer Discretionary | 27.8 | |||
Financials | 8.2 | |||
Telecommunication Services | 8.0 | |||
Health Care | 6.8 | |||
Utilities | 5.1 | |||
Energy | 4.7 | |||
Industrials | 4.0 | |||
Consumer Staples | 3.1 | |||
Materials | 1.6 | |||
|
| |||
| 98.5 | ||||
|
|
| 98 |
| Ohio National Fund, Inc. | Target VIP Portfolio |
Schedule of Investments | December 31, 2011 |
| Common Stocks – 98.5% | Shares | Value | ||||||||
CONSUMER DISCRETIONARY – 27.8% | ||||||||||
Autoliv, Inc. (Auto Components) | 3,029 | $ | 162,021 | |||||||
Tenneco, Inc. (Auto Components) | (a) | 2,080 | 61,942 | |||||||
TRW Automotive Holdings Corp. (Auto Components) | (a) | 4,112 | 134,051 | |||||||
Ford Motor Co. (Automobiles) | (a) | 52,619 | 566,180 | |||||||
Tata Motors Ltd. – ADR (Automobiles) | 18,171 | 307,090 | ||||||||
McDonald’s Corp. (Hotels, Restaurants & Leisure) | 9,157 | 918,722 | ||||||||
Texas Roadhouse, Inc. (Hotels, Restaurants & Leisure) | 6,556 | 97,684 | ||||||||
Liberty Interactive Corp. Class A (Internet & Catalog Retail) | (a) | 7,656 | 124,142 | |||||||
Netflix, Inc. (Internet & Catalog Retail) | (a) | 1,486 | 102,965 | |||||||
priceline.com, Inc. (Internet & Catalog Retail) | (a) | 662 | 309,624 | |||||||
Sturm Ruger & Co., Inc. (Leisure Equip. & Products) | 1,719 | 57,518 | ||||||||
Arbitron, Inc. (Media) | 2,493 | 85,784 | ||||||||
Valassis Communications, Inc. (Media) | (a) | 1,696 | 32,614 | |||||||
Virgin Media, Inc. (Media) | 4,275 | 91,400 | ||||||||
Dillard’s, Inc. Class A (Multiline Retail) | 1,994 | 89,491 | ||||||||
Dollar Tree, Inc. (Multiline Retail) | (a) | 1,681 | 139,708 | |||||||
Family Dollar Stores, Inc. (Multiline Retail) | 1,806 | 104,134 | ||||||||
AutoZone, Inc. (Specialty Retail) | (a) | 628 | 204,081 | |||||||
Childrens Place Retail Stores, Inc. / The (Specialty Retail) | (a) | 2,372 | 126,001 | |||||||
Hibbett Sports, Inc. (Specialty Retail) | (a) | 2,563 | 115,796 | |||||||
Home Depot, Inc. / The (Specialty Retail) | 20,206 | 849,460 | ||||||||
Monro Muffler Brake, Inc. (Specialty Retail) | 2,768 | 107,371 | ||||||||
Pier 1 Imports, Inc. (Specialty Retail) | (a) | 3,319 | 46,234 | |||||||
Ross Stores, Inc. (Specialty Retail) | 3,208 | 152,476 | ||||||||
Sally Beauty Holdings, Inc. (Specialty Retail) | (a) | 6,172 | 130,414 | |||||||
Vitamin Shoppe, Inc. (Specialty Retail) | (a) | 2,572 | 102,571 | |||||||
Deckers Outdoor Corp. (Textiles, Apparel & Luxury Goods) | (a) | 1,357 | 102,549 | |||||||
Fossil, Inc. (Textiles, Apparel & Luxury Goods) | (a) | 2,283 | 181,179 | |||||||
G-III Apparel Group Ltd. (Textiles, Apparel & Luxury Goods) | (a) | 1,769 | 44,066 | |||||||
Maidenform Brands, Inc. (Textiles, Apparel & Luxury Goods) | (a) | 2,161 | 39,546 | |||||||
Steven Madden Ltd. (Textiles, Apparel & Luxury Goods) | (a) | 3,861 | 133,205 | |||||||
|
| |||||||||
| 5,720,019 | ||||||||||
|
| |||||||||
CONSUMER STAPLES – 3.1% | ||||||||||
Diamond Foods, Inc. (Food Products) | 2,023 | 65,282 | ||||||||
Mead Johnson Nutrition Co. (Food Products) | 669 | 45,980 | ||||||||
Lorillard, Inc. (Tobacco) | 484 | 55,176 | ||||||||
Philip Morris International, Inc. (Tobacco) | 5,876 | 461,149 | ||||||||
|
| |||||||||
| 627,587 | ||||||||||
|
| |||||||||
ENERGY – 4.7% | ||||||||||
FMC Technologies, Inc. (Energy Equip. & Svs.) | (a) | 265 | 13,841 | |||||||
RPC, Inc. (Energy Equip. & Svs.) | 5,129 | 93,604 | ||||||||
ENI SpA – ADR (Oil, Gas & Consumable Fuels) | 4,246 | 175,232 | ||||||||
Exxon Mobil Corp. (Oil, Gas & Consumable Fuels) | 5,689 | 482,200 | ||||||||
Newfield Exploration Co. (Oil, Gas & Consumable Fuels) | (a) | 151 | 5,697 | |||||||
Total S.A. – ADR (Oil, Gas & Consumable Fuels) | 3,457 | 176,687 | ||||||||
USEC, Inc. (Oil, Gas & Consumable Fuels) | (a) | 10,686 | 12,182 | |||||||
|
| |||||||||
| 959,443 | ||||||||||
|
| |||||||||
FINANCIALS – 8.2% | ||||||||||
Banco Bilbao Vizcaya Argentaria SA – ADR | 18,441 | 158,039 | ||||||||
Banco Santander SA – ADR (Commercial Banks) | 17,915 | 134,721 | ||||||||
Bank of the Ozarks, Inc. (Commercial Banks) | 3,128 | 92,683 | ||||||||
Community Bank System, Inc. (Commercial Banks) | 3,080 | 85,624 | ||||||||
FNB Corp. (Commercial Banks) | 10,608 | 119,977 | ||||||||
Susquehanna Bancshares, Inc. (Commercial Banks) | 12,057 | 101,038 | ||||||||
EZCorp, Inc. Class A (Consumer Finance) | (a) | 4,295 | 113,259 | |||||||
World Acceptance Corp. (Consumer Finance) | (a) | 1,465 | 107,678 | |||||||
ACE Ltd. (Insurance) | 1,654 | 115,979 | ||||||||
Berkshire Hathaway, Inc. Class B (Insurance) | (a) | 5,063 | 386,307 | |||||||
| Common Stocks (Continued) | Shares | Value | ||||||||
FINANCIALS (continued) | ||||||||||
Chubb Corp. / The (Insurance) | 1,488 | $ | 102,999 | |||||||
Zurich Financial Services AG – ADR (Insurance) | (a) | 7,168 | 162,570 | |||||||
|
| |||||||||
| 1,680,874 | ||||||||||
|
| |||||||||
HEALTH CARE – 6.8% | ||||||||||
Biogen Idec, Inc. (Biotechnology) | (a) | 2,937 | 323,217 | |||||||
C.R. Bard, Inc. (Health Care Equip. & Supplies) | 1,150 | 98,325 | ||||||||
Cyberonics, Inc. (Health Care Equip. & Supplies) | (a) | 2,574 | 86,229 | |||||||
Varian Medical Systems, Inc. (Health Care Equip. & Supplies) | (a) | 1,487 | 99,822 | |||||||
Air Methods Corp. (Health Care Providers & Svs.) | (a) | 1,149 | 97,033 | |||||||
Hanger Orthopedic Group, Inc. (Health Care Providers & Svs.) | (a) | 3,043 | 56,874 | |||||||
PAREXEL International Corp. (Life Sciences Tools & Svs.) | (a) | 5,381 | 111,602 | |||||||
AstraZeneca PLC – ADR (Pharmaceuticals) | 4,017 | 185,947 | ||||||||
GlaxoSmithKline PLC – ADR (Pharmaceuticals) | 4,724 | 215,556 | ||||||||
Impax Laboratories, Inc. (Pharmaceuticals) | (a) | 5,905 | 119,104 | |||||||
|
| |||||||||
| 1,393,709 | ||||||||||
|
| |||||||||
INDUSTRIALS – 4.0% | ||||||||||
GeoEye, Inc. (Aerospace & Defense) | (a) | 2,043 | 45,395 | |||||||
Northrop Grumman Corp. (Aerospace & Defense) | 3,420 | 200,002 | ||||||||
Park-Ohio Holdings Corp. (Air Freight & Logistics) | (a) | 1,659 | 29,597 | |||||||
U.S. Airways Group, Inc. (Airlines) | (a) | 5,459 | 27,677 | |||||||
Portfolio Recovery Associates, Inc. (Commercial Svs. & Supplies) | (a) | 1,581 | 106,749 | |||||||
Joy Global, Inc. (Machinery) | 1,401 | 105,033 | ||||||||
NN, Inc. (Machinery) | (a) | 2,912 | 17,472 | |||||||
Pall Corp. (Machinery) | 1,360 | 77,724 | ||||||||
United Rentals, Inc. (Trading Companies & Distributors) | (a) | 2,096 | 61,937 | |||||||
W.W. Grainger, Inc. (Trading Companies & Distributors) | 811 | 151,811 | ||||||||
|
| |||||||||
| 823,397 | ||||||||||
|
| |||||||||
INFORMATION TECHNOLOGY – 29.2% | ||||||||||
Finisar Corp. (Communications Equip.) | (a) | 2,823 | 47,271 | |||||||
Netgear, Inc. (Communications Equip.) | (a) | 3,320 | 111,452 | |||||||
Oclaro, Inc. (Communications Equip.) | (a) | 4,549 | 12,828 | |||||||
Apple, Inc. (Computers & Peripherals) | (a) | 2,273 | 920,565 | |||||||
SanDisk Corp. (Computers & Peripherals) | (a) | 3,194 | 157,177 | |||||||
DTS, Inc. (Electronic Equip., Instr. & Comp.) | (a) | 1,571 | 42,794 | |||||||
Power-One, Inc. (Electronic Equip., Instr. & Comp.) | (a) | 3,392 | 13,263 | |||||||
Vishay Intertechnology, Inc. (Electronic Equip., Instr. & Comp.) | (a) | 5,202 | 46,766 | |||||||
Baidu, Inc. – ADR (Internet Software & Svs.) | (a) | 3,585 | 417,545 | |||||||
eBay, Inc. (Internet Software & Svs.) | (a) | 17,621 | 534,445 | |||||||
j2 Global, Inc. (Internet Software & Svs.) | 4,216 | 118,638 | ||||||||
Cardtronics, Inc. (IT Svs.) | (a) | 3,904 | 105,642 | |||||||
Cognizant Technology Solutions Corp. Class A (IT Svs.) | (a) | 4,048 | 260,327 | |||||||
International Business Machines Corp. (IT Svs.) | 4,811 | 884,647 | ||||||||
Teradata Corp. (IT Svs.) | (a) | 2,296 | 111,379 | |||||||
Altera Corp. (Semiconductors & Equip.) | 4,223 | 156,673 | ||||||||
Atmel Corp. (Semiconductors & Equip.) | (a) | 16,006 | 129,649 | |||||||
Fairchild Semiconductor International, Inc. (Semiconductors & Equip.) | (a) | 4,291 | 51,664 | |||||||
GT Advanced Technologies, Inc. (Semiconductors & Equip.) | (a) | 13,266 | 96,046 | |||||||
Lam Research Corp. (Semiconductors & Equip.) | (a) | 1,665 | 61,638 | |||||||
RF Micro Devices, Inc. (Semiconductors & Equip.) | (a) | 9,623 | 51,964 | |||||||
Texas Instruments, Inc. (Semiconductors & Equip.) | 15,946 | 464,188 | ||||||||
TriQuint Semiconductor, Inc. (Semiconductors & Equip.) | (a) | 5,491 | 26,741 | |||||||
Xilinx, Inc. (Semiconductors & Equip.) | 3,551 | 113,845 | ||||||||
ACI Worldwide, Inc. (Software) | (a) | 3,030 | 86,779 | |||||||
Microsoft Corp. (Software) | 25,203 | 654,270 | ||||||||
Netscout Systems, Inc. (Software) | (a) | 3,802 | 66,915 | |||||||
Smith Micro Software, Inc. (Software) | (a) | 3,219 | 3,637 | |||||||
| 99 | (continued) |
| Ohio National Fund, Inc. | Target VIP Portfolio (Continued) |
Schedule of Investments | December 31, 2011 |
| Common Stocks (Continued) | Shares | Value | ||||||||
INFORMATION TECHNOLOGY (continued) | ||||||||||
Synchronoss Technologies, Inc. (Software) | (a) | 3,356 | $ | 101,385 | ||||||
Ultimate Software Group, Inc. (Software) | (a) | 2,315 | 150,753 | |||||||
|
| |||||||||
| 6,000,886 | ||||||||||
|
| |||||||||
MATERIALS – 1.6% | ||||||||||
Innophos Holdings, Inc. (Chemicals) | 1,977 | 96,003 | ||||||||
PPG Industries, Inc. (Chemicals) | 284 | 23,711 | ||||||||
Sherwin-Williams Co. / The (Chemicals) | 190 | 16,961 | ||||||||
Boise, Inc. (Containers & Packaging) | 7,827 | 55,728 | ||||||||
Freeport-McMoRan Copper & Gold, Inc. (Metals & Mining) | 1,645 | 60,520 | ||||||||
KapStone Paper and Packaging Corp. (Paper & Forest Products) | (a) | 4,254 | 66,958 | |||||||
|
| |||||||||
| 319,881 | ||||||||||
|
| |||||||||
TELECOMMUNICATION SERVICES – 8.0% | ||||||||||
AT&T, Inc. (Diversified Telecom. Svs.) | 24,050 | 727,272 | ||||||||
Deutsche Telekom AG – ADR (Diversified Telecom. Svs.) | 14,517 | 166,220 | ||||||||
France Telecom SA – ADR (Diversified Telecom. Svs.) | 8,839 | 138,419 | ||||||||
General Communication, Inc. Class A (Diversified Telecom. Svs.) | (a) | 2,659 | 26,032 | |||||||
Koninklijke KPN NV – ADR (Diversified Telecom. Svs.) | 12,663 | 150,943 | ||||||||
Telefonica SA – ADR (Diversified Telecom. Svs.) | 8,159 | 140,253 | ||||||||
MetroPCS Communications, Inc. (Wireless Telecom. Svs.) | (a) | 12,384 | 107,493 | |||||||
| Common Stocks (Continued) | Shares | Value | ||||||||
TELECOMMUNICATION SERVICES (continued) | ||||||||||
Vodafone Group PLC – ADR (Wireless Telecom. Svs.) | 7,048 | $ | 197,555 | |||||||
|
| |||||||||
| 1,654,187 | ||||||||||
|
| |||||||||
UTILITIES – 5.1% | ||||||||||
E.ON AG – ADR (Electric Utilities) | 6,127 | 131,057 | ||||||||
Enel SpA – ADR (Electric Utilities) | 37,104 | 148,416 | ||||||||
Iberdrola SA – ADR (Electric Utilities) | 6,042 | 145,612 | ||||||||
SSE PLC – ADR (Electric Utilities) | 9,532 | 191,498 | ||||||||
GDF Suez – ADR (Multi-Utilities) | 5,118 | 139,056 | ||||||||
National Grid PLC – ADR (Multi-Utilities) | 4,167 | 202,016 | ||||||||
RWE AG – ADR (Multi-Utilities) | 2,809 | 98,118 | ||||||||
|
| |||||||||
| 1,055,773 | ||||||||||
|
| |||||||||
Total Common Stocks (Cost $20,122,352) | $ | 20,235,756 | ||||||||
|
| |||||||||
| Money Market Funds – 1.5% | Shares | Value | ||||||||
Fidelity Institutional Money Market Funds | 297,000 | $ | 297,000 | |||||||
|
| |||||||||
Total Money Market Funds (Cost $297,000) | $ | 297,000 | ||||||||
|
| |||||||||
Total Investments – 100.0% (Cost $20,419,352) | (b) | $ | 20,532,756 | |||||||
Other Assets in Excess of Liabilities – 0.0% | 3,625 | |||||||||
|
| |||||||||
Net Assets – 100.0% | $ | 20,536,381 | ||||||||
|
| |||||||||
Percentages are stated as a percent of net assets.
Abbreviations:
ADR: American Depositary Receipts
Footnotes:
| (a) | Non-income producing security. |
| (b) | Represents cost for financial reporting purposes, which may differ from cost basis for federal income tax purposes. See also Note 7 of the Notes to Financial Statements. |
The accompanying notes are an integral part of these financial statements.
| 100 |
| Ohio National Fund, Inc. | Target Equity/Income Portfolio |
Objective/Strategy
The Target Equity/Income Portfolio seeks an above average total return by adhering to a disciplined, quantitative investment process that incorporates two distinct strategy methodologies.
Performance as of December 31, 2011
Average Annual Total Returns: | ||||
One year | -11.09% | |||
Five years | -5.68% | |||
Since inception (11/2/05) | -3.04% |
Past performance does not guarantee future results. The performance data quoted represents past performance and current returns may be lower or higher. Total return figures include change in share price and reinvestment of dividends and capital gains. The investment return and principal value will fluctuate so that an investor’s shares, when redeemed, may be worth more or less than the original cost. To obtain performance information up to the most recent month end, call toll-free 1-877-781-6392.
The Portfolio is not open to direct retail investment. Beneficial interest in shares is obtained solely by purchase of variable life insurance policies and variable annuity contracts. Actual performance results for variable annuity and variable universal life contracts will be lower due to contract charges. Consult your contract for applicable charges.
Comments
For the year ended December 31, 2011, the Target Equity/Income Portfolio returned -11.09% versus 1.03% for the current benchmark, the Russell 3000 Index.
Stock selection in the Consumer Discretionary sector was the biggest drag on relative performance. The Portfolio had significant exposure to the auto industry, which underperformed in 2011. The Portfolio’s auto exposure came from the Value Line 25 strategy component of the Portfolio. Stock selection in the Industrials and Information Technology sectors also weighed on relative performance. Transportation and construction related names within the Portfolio’s Industrials holdings and the Portfolio’s semiconductor-related holdings in Information Technology accounted for the underperformance. The Portfolio had no holdings in the Consumer Staples or Health Care sectors, which detracted from Portfolio performance, as these sectors were among the top performers in the benchmark for 2011.(1)
The Utilities sector was the biggest positive contributor to relative performance over the year due mostly to a large overweight position. Utilities was the best performing sector in the benchmark for 2011. The Portfolio gained its exposure from the Dow Dividend strategy component of the Portfolio. Out-performance from the Portfolio’s holdings in this sector also added to relative performance. An underweight in Financials, the worst performing sector in the benchmark, also boosted relative performance. Positive stock selection in Financials further contributed to the Portfolio.(1)
The Portfolio’s best performers were Sally Beauty Holdings, Inc., NiSource, Inc., Pier 1 Imports, Inc., United Rentals, Inc., and Cleco Corp. The worst performers were Power-One, Inc., TriQuint Semiconductor, Inc., NN, Inc., US Airways Group, Inc., and Finisar Corp. The Portfolio’s top contributors to performance were NiSource Inc., Cleco Corp., Alliant Energy Corp., Sally Beauty Holdings, Inc., and Pinnacle West Capital Corp. The top detractors from performance were Ford Motor Co., Tata Motors Ltd., TRW Automotive Holdings Corp., Atmel Corp., and Autoliv, Inc.(1)
U.S. stocks eked out a gain in 2011. Though the gains were modest, equity markets experienced significant volatility at times as the lingering effects of the recession, politics and natural disasters impacted global markets throughout the year.
U.S. stocks posted solid gains in the first half of 2011, building on the rally that started in March 2009. Strong corporate earnings growth helped fuel the gains. The year was not without its share of turbulence, however, as unrest in the Middle East and Africa, a tsunami and resultant nuclear disaster in Japan, and moderating economic growth at home weighed on stocks. The Middle East tensions pushed oil well above $100/barrel and took energy shares along with it.
The first half of 2011 ended with growing jitters over the resilience of the economy here at home and the re-emergence of sovereign debt worries in Europe. Defensive sectors such as Health Care and Utilities took over market leadership as investors grew wary of risk. As the third quarter got underway, the debate over the debt ceiling and ultimate downgrade of U.S. Government debt by Standard & Poor’s caused equity volatility to spike. These issues, combined with the looming end of the Federal Reserve’s asset purchase program (QE2), caused equities to sell off significantly during the third quarter.
The fourth quarter brought evidence of the resilience of the domestic economy and equities regained most of what was lost in the third quarter. Employment reports showed modest job creation and improving trends, while consumer spending held up better than many expected. Although the sovereign debt worries in Europe persisted, the emergence of a framework for handling the situation toward the end of the year helped calm equity markets.
As we look to 2012, we have a cautiously optimistic outlook for the economy and equity markets. Recent data indicates the domestic economy is moving in the right direction albeit at a sluggish pace. After a year of strong corporate profit growth (according to Standard & Poor’s, the S&P 500 Index’s constituent earnings per share for the year ended September 30, 2011 was up 20% over the similar prior year period) and a flat market, price to earnings ratio multiples have compressed to attractive levels. While the sovereign debt situation in Europe and our own debt/deficit issues cannot be overlooked, we view equities as compelling at current valuations and poised for gains in 2012. Additionally, roughly half of the Portfolio is dedicated to dividend paying stocks. Considering the outlook for fixed income securities in today’s interest rate environment, we expect dividend paying stocks to remain a favored alternative for those seeking income. Given the Portfolio’s balance between dividend-paying stocks and growth companies we expect it to perform well relative to the overall market in the coming year.(1)
| (1) | The Portfolio’s composition is subject to change. Holdings and weightings are as of December 31, 2011. |
| 101 | (continued) |
| Ohio National Fund, Inc. | Target Equity/Income Portfolio (Continued) |
Change in Value of $10,000 Investment
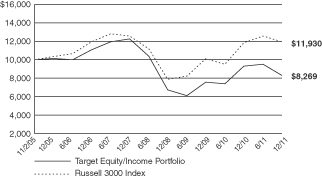
Hypothetical illustration based on past performance. Future performance will vary. The Portfolio’s returns reflect reinvested dividends. The Portfolio’s holdings may differ significantly from the securities in the index. The index is unmanaged and therefore does not reflect the cost of portfolio management and accounting.
The Russell 3000 Index measures the performance of the largest 3000 U.S. companies representing approximately 98% of the investable U.S. equity market. The Russell 3000 index is constructed to provide a comprehensive, unbiased, and stable barometer of the broad market and is completely reconstituted annually to ensure new and growing equities are reflected. The index presented includes the effects of reinvested dividends.
Portfolio Composition as of December 31, 2011 (1)
| % of Net Assets | ||||
Common Stocks (3) | 98.1 | |||
Money Market Funds | ||||
Less Net Liabilities | 1.9 | |||
|
| |||
| 100.0 | ||||
|
|
Top 10 Portfolio Holdings as of December 31, 2011 (1) (2)
| % of Net Assets | ||||
1. Ford Motor Co. | 9.0 | |||
2. Tata Motors Ltd. - ADR | 4.9 | |||
3. NiSource, Inc. | 3.8 | |||
4. Cleco Corp. | 3.4 | |||
5. Alliant Energy Corp. | 3.4 | |||
6. Chevron Corp. | 3.3 | |||
7. Pinnacle West Capital Corp. | 3.2 | |||
8. MeadWestvaco Corp. | 3.2 | |||
9. FNB Corp. | 3.2 | |||
10. Black Hills Corp. | 3.1 |
| (1) | Composition of Portfolio subject to change. |
| (2) | Short-term investments have been excluded from the list of Top 10 Portfolio Holdings. |
| (3) | Sectors: |
| % of Net Assets | ||||
Consumer Discretionary | 31.7 | |||
Utilities | 25.9 | |||
Financials | 10.0 | |||
Industrials | 9.4 | |||
Telecommunication Services | 7.3 | |||
Information Technology | 5.8 | |||
Energy | 4.8 | |||
Materials | 3.2 | |||
|
| |||
| 98.1 | ||||
|
|
| 102 |
| Ohio National Fund, Inc. | Target Equity/Income Portfolio |
Schedule of Investments | December 31, 2011 |
| Common Stocks – 98.1% | Shares | Value | ||||||||
CONSUMER DISCRETIONARY – 31.7% | ||||||||||
Autoliv, Inc. (Auto Components) | 10,435 | $ | 558,168 | |||||||
Tenneco, Inc. (Auto Components) | (a) | 7,162 | 213,284 | |||||||
TRW Automotive Holdings Corp. (Auto Components) | (a) | 14,168 | 461,877 | |||||||
Ford Motor Co. (Automobiles) | (a) | 181,295 | 1,950,734 | |||||||
Tata Motors Ltd. – ADR (Automobiles) | 62,608 | 1,058,075 | ||||||||
Leggett & Platt, Inc. (Household Durables) | 26,309 | 606,159 | ||||||||
Valassis Communications, Inc. (Media) | (a) | 5,840 | 112,303 | |||||||
Dillard’s, Inc. Class A (Multiline Retail) | 6,871 | 308,371 | ||||||||
Pier 1 Imports, Inc. (Specialty Retail) | (a) | 11,435 | 159,290 | |||||||
Sally Beauty Holdings, Inc. (Specialty Retail) | (a) | 21,266 | 449,351 | |||||||
Deckers Outdoor Corp. (Textiles, Apparel & Luxury Goods) | (a) | 4,671 | 352,988 | |||||||
Fossil, Inc. (Textiles, Apparel & Luxury Goods) | (a) | 7,867 | 624,325 | |||||||
|
| |||||||||
| 6,854,925 | ||||||||||
|
| |||||||||
ENERGY – 4.8% | ||||||||||
RPC, Inc. (Energy Equip. & Svs.) | 17,673 | 322,532 | ||||||||
Chevron Corp. (Oil, Gas & Consumable Fuels) | 6,646 | 707,135 | ||||||||
|
| |||||||||
| 1,029,667 | ||||||||||
|
| |||||||||
FINANCIALS – 10.0% | ||||||||||
First Niagara Financial Group, Inc. (Commercial Banks) | 42,733 | 368,786 | ||||||||
FNB Corp. (Commercial Banks) | 60,540 | 684,707 | ||||||||
Allstate Corp. / The (Insurance) | 19,029 | 521,585 | ||||||||
Cincinnati Financial Corp. (Insurance) | 18,993 | 578,527 | ||||||||
|
| |||||||||
| 2,153,605 | ||||||||||
|
| |||||||||
INDUSTRIALS – 9.4% | ||||||||||
Northrop Grumman Corp. (Aerospace & Defense) | 9,359 | 547,314 | ||||||||
Park-Ohio Holdings Corp. (Air Freight & Logistics) | (a) | 5,718 | 102,009 | |||||||
U.S. Airways Group, Inc. (Airlines) | (a) | 18,804 | 95,336 | |||||||
Masco Corp. (Building Products) | 47,774 | 500,672 | ||||||||
R.R. Donnelley & Sons Co. (Commercial Svs. & Supplies) | 35,510 | 512,409 | ||||||||
NN, Inc. (Machinery) | (a) | 10,028 | 60,168 | |||||||
United Rentals, Inc. (Trading Companies & Distributors) | (a) | 7,223 | 213,440 | |||||||
|
| |||||||||
| 2,031,348 | ||||||||||
|
| |||||||||
INFORMATION TECHNOLOGY – 5.8% | ||||||||||
Finisar Corp. (Communications Equip.) | (a) | 9,730 | 162,929 | |||||||
Power-One, Inc. (Electronic Equip., Instr. & Comp.) | (a) | 11,689 | 45,704 | |||||||
| Common Stocks (Continued) | Shares | Value | ||||||||
INFORMATION TECHNOLOGY (continued) | ||||||||||
Vishay Intertechnology, Inc. (Electronic Equip., Instr. & Comp.) | (a) | 17,924 | $ | 161,137 | ||||||
Atmel Corp. (Semiconductors & Equip.) | (a) | 55,150 | 446,715 | |||||||
Fairchild Semiconductor International, Inc. (Semiconductors & Equip.) | (a) | 14,782 | 177,975 | |||||||
RF Micro Devices, Inc. (Semiconductors & Equip.) | (a) | 33,158 | 179,053 | |||||||
TriQuint Semiconductor, Inc. (Semiconductors & Equip.) | (a) | 18,921 | 92,145 | |||||||
|
| |||||||||
| 1,265,658 | ||||||||||
|
| |||||||||
MATERIALS – 3.2% | ||||||||||
MeadWestvaco Corp. (Paper & Forest Products) | 23,053 | 690,437 | ||||||||
|
| |||||||||
TELECOMMUNICATION SERVICES – 7.3% | ||||||||||
AT&T, Inc. (Diversified Telecom. Svs.) | 20,717 | 626,482 | ||||||||
CenturyLink, Inc. (Diversified Telecom. Svs.) | 13,129 | 488,399 | ||||||||
General Communication, Inc. Class A (Diversified Telecom. Svs.) | (a) | 9,160 | 89,676 | |||||||
MetroPCS Communications, Inc. (Wireless Telecom. Svs.) | (a) | 42,669 | 370,367 | |||||||
|
| |||||||||
| 1,574,924 | ||||||||||
|
| |||||||||
UTILITIES – 25.9% | ||||||||||
Cleco Corp. (Electric Utilities) | 19,564 | 745,388 | ||||||||
Edison International (Electric Utilities) | 15,674 | 648,904 | ||||||||
Entergy Corp. (Electric Utilities) | 8,544 | 624,139 | ||||||||
Pinnacle West Capital Corp. (Electric Utilities) | 14,562 | 701,597 | ||||||||
Alliant Energy Corp. (Multi-Utilities) | 16,478 | 726,845 | ||||||||
Black Hills Corp. (Multi-Utilities) | 20,000 | 671,600 | ||||||||
Integrys Energy Group, Inc. (Multi-Utilities) | 12,385 | 671,019 | ||||||||
NiSource, Inc. (Multi-Utilities) | 34,443 | 820,088 | ||||||||
|
| |||||||||
| 5,609,580 | ||||||||||
|
| |||||||||
Total Common Stocks (Cost $24,059,553) | $ | 21,210,144 | ||||||||
|
| |||||||||
| Money Market Funds – 1.9% | Shares | Value | ||||||||
| Fidelity Institutional Money Market Funds | ||||||||||
Money Market Portfolio – Class I | 423,000 | $ | 423,000 | |||||||
|
| |||||||||
Total Money Market Funds (Cost $423,000) | $ | 423,000 | ||||||||
|
| |||||||||
Total Investments – 100.0% (Cost $24,482,553) | (b) | $ | 21,633,144 | |||||||
Liabilities in Excess of Other Assets – (0.0)% | (3,372) | |||||||||
|
| |||||||||
Net Assets – 100.0% | $ | 21,629,772 | ||||||||
|
| |||||||||
Percentages are stated as a percent of net assets.
Abbreviations:
ADR: American Depositary Receipts
Footnotes:
| (a) | Non-income producing security. |
| (b) | Represents cost for financial reporting purposes, which may differ from cost basis for federal income tax purposes. See also Note 7 of the Notes to Financial Statements. |
The accompanying notes are an integral part of these financial statements.
| 103 |
| Ohio National Fund, Inc. | Bristol Growth Portfolio |
Objective/Strategy
The Bristol Growth Portfolio seeks long-term growth of capital by investing primarily in common stocks of the 1,000 largest publicly traded U.S. companies in terms of market capitalization.
Performance as of December 31, 2011
Average Annual Total Returns: | ||||
One year | -1.77% | |||
Since inception (5/1/07) | -0.68% |
Past performance does not guarantee future results. The performance data quoted represents past performance and current returns may be lower or higher. Total return figures include change in share price and reinvestment of dividends and capital gains. The investment return and principal value will fluctuate so that an investor’s shares, when redeemed, may be worth more or less than the original cost. To obtain performance information up to the most recent month end, call toll-free 1-877-781-6392.
The Portfolio is not open to direct retail investment. Beneficial interest in shares is obtained solely by purchase of variable life insurance policies and variable annuity contracts. Actual performance results for variable annuity and variable universal life contracts will be lower due to contract charges. Consult your contract for applicable charges.
Comments
For the year ended December 31, 2011, the Bristol Growth Portfolio returned -1.77% versus 2.64% for the current benchmark, the Russell 1000 Growth Index.
The overweight in the Financials sector was a major reason for the under-performance relative to the benchmark index. Continued worries about the debt crisis in Europe, the lack of clarity on resolution of the mortgage meltdown in the U.S., and lower than expected interest rates combined to negatively impact the sector.(1)
The Portfolio’s best performers were SunPower Corp., Medicis Pharmaceutical Corp., Rockwell Automation, Inc., UnitedHealth Group, Inc., and Pharmasset, Inc. The Portfolio’s worst performers were Royal Caribbean Cruises Ltd., Bank of America Corp., Warner Chilcott PLC., Hartford Financial Services Group, Inc., and Advanced Micro Devices, Inc. The top contributors to performance were Apple, Inc., SunPower Corp., International Business Machines Corp., Exxon Mobil Corp., and Pharmasset, Inc. The top detractors from performance were Royal Caribbean Cruises Ltd., Bank of America Corp., Warner Chilcott PLC, Hartford Financial Services Group, Inc., and Advanced Micro Devices, Inc.(1)
The top contributor to the Portfolio’s performance was Apple, Inc., which continued its great American success story with their tablet and iPhone 4s market share contributed 103 basis points to the Portfolio’s performance for the year. SunPower Corp., which boosted performance when Total, a French multi-national oil company took over a controlling stake of SunPower Corp., contributed 83 basis points. International Business Machine Corp.’s positive revisions from strong bookings and product backlogs added 80 basis points. Exxon Mobil Corp. contributed 53 basis points. Finally, Pharmasset, Inc. had strong trial data for the next generation Hepatitis C drug and generated 44 basis points.(1)
Detractors from the Portfolio’s annual performance were led by Royal Caribbean Cruises Ltd., which underperformed by 94 basis points due to high oil prices and weak demand in Europe. Bank of America Corp. detracted 82 basis points as a series of mortgage repurchase settlements were more costly than investor expectations. Warner Chilcot PLC appeared cheap with good prospects,
but cost us 74 basis points. Hartford Financial Services Group, Inc. suffered the fate of much of the Financials sector and cost us 67 basis points. Finally, Advanced Micro Devices, Inc. underperformed due to low yields and production issues for new microprocessors and cost us 61 basis points.(1)
The Portfolio’s main sector weight changes were adding to Industrials, which went from 10.9% to 21.4% (as a percentage of total common stocks) (versus the benchmark’s 12.7% as a percentage of total common stocks) while lowering our exposure to Financials, which went from 9.1% to 8.5% (versus the benchmark’s 3.9%). This reflects our continuing belief in a recovery, and specifically our expectations for the Financials sector. These increases in weights were at the expense of Materials (reduced by 6.8%) and Consumer Discretionary (reduced by 2%).(1)
Early in 2011 many in the investment community believed that it was going to be the year for growth management styles. Many of the basic requirements were already in place: the widespread belief that this was the year of recovery following a three year recession, a corporate sector awash with cash in a lean, a low wage environment, robust earnings, and the end of the Financials sector uncertainties. A year later, in hindsight, we see little evidence for such optimism, but the factors are still in place for a better 2012.
Certainly, the year had its fair share of exogenous events: the Arab Spring-a tectonic shift in conventional thinking that promised long term benefits but offered short term disruptions in oil supplies; the Japanese tsunami-that turned a huge natural catastrophe into a potential nuclear disaster that may affect global energy planning for generations to come; the subprime loans of yesteryear-threatening to come home, like unwelcome chickens, to roost in the balance sheets of domestic banks; and finally, the theatre of the absurd in Europe-as repeated European conferences failed to acknowledge the reality of debt that had to be hugely discounted to approach reality.
In such times it can be of value to record what didn’t happen. We did not have the feared double dip recession and an 8,000 S&P 500 Index. War did not break out in the Middle East following the death of Gaddafi or the arrest of Mubarak. Nuclear fallout was contained in Japan and the yo-yo effect of European markets did not create a European recession that would have badly damaged the U.S. export sector.
The market remained cautious throughout the year and favored stocks with good fundamentals, but far too expensive for our taste, and high dividend-paying stocks. Neither of which are areas of interest for our investment process. We will remain committed to our style and process and hope that, with the same positive factors at work, 2012 will finally offer those higher expected returns.
| (1) | The Portfolio’s composition is subject to change. Holdings and weightings are as of December 31, 2011. |
| 104 | (continued) |
| Ohio National Fund, Inc. | Bristol Growth Portfolio (Continued) |
Change in Value of $10,000 Investment
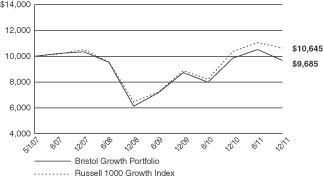
Hypothetical illustration based on past performance. Future performance will vary. The Portfolio’s returns reflect reinvested dividends. The Portfolio’s holdings may differ significantly from the securities in the index. The index is unmanaged and therefore does not reflect the cost of portfolio management and accounting.
The Russell 1000 Growth Index is a market-capitalization weighted index of those firms in the Russell 1000 with higher price-to-book ratios and higher forecasted growth values. The index presented herein includes the effects of requested dividends.
Portfolio Composition as of December 31, 2011 (1)
| % of Net Assets | ||||
Common Stocks (3) | 94.3 | |||
Money Market Funds and | | 5.7 | | |
|
| |||
| 100.0 | ||||
|
|
Top 10 Portfolio Holdings as of December 31, 2011 (1) (2)
| % of Net Assets | ||||
1. Apple, Inc. | 4.7 | |||
2. International Business Machines Corp. | 3.2 | |||
3. Google, Inc. Class A | 2.6 | |||
4. Exxon Mobil Corp. | 2.6 | |||
5. QUALCOMM, Inc. | 2.3 | |||
6. Amgen, Inc. | 2.0 | |||
7. Rockwell Automation, Inc. | 2.0 | |||
8. United Parcel Service, Inc. Class B | 2.0 | |||
9. UnitedHealth Group, Inc. | 2.0 | |||
10. Lowe’s Cos., Inc. | 2.0 |
| (1) | Composition of Portfolio subject to change. |
| (2) | Short-term investments have been excluded from the list of Top 10 Portfolio Holdings. |
| (3) | Sectors: |
| % of Net Assets | ||||
Information Technology | 29.5 | |||
Industrials | 20.2 | |||
Energy | 11.7 | |||
Consumer Discretionary | 10.8 | |||
Financials | 8.0 | |||
Health Care | 7.3 | |||
Consumer Staples | 4.9 | |||
Materials | 1.9 | |||
|
| |||
| 94.3 | ||||
|
|
| 105 |
| Ohio National Fund, Inc. | Bristol Growth Portfolio |
Schedule of Investments | December 31, 2011 |
| Common Stocks – 94.3% | Shares | Value | ||||||
CONSUMER DISCRETIONARY – 10.8% | ||||||||
Johnson Controls, Inc. (Auto Components) | 56,400 | $ 1,763,064 | ||||||
Las Vegas Sands Corp. (Hotels, Restaurants & Leisure) | (a) | 41,700 | 1,781,841 | |||||
Yum! Brands, Inc. (Hotels, Restaurants & Leisure) | 31,100 | 1,835,211 | ||||||
Amazon.com, Inc. (Internet & Catalog Retail) | (a) | 7,700 | 1,332,870 | |||||
Lowe’s Cos., Inc. (Specialty Retail) | 77,300 | 1,961,874 | ||||||
Tiffany & Co. (Specialty Retail) | 18,500 | 1,225,810 | ||||||
Hanesbrands, Inc. (Textiles, Apparel & Luxury Goods) | (a) | 40,200 | 878,772 | |||||
| ||||||||
| 10,779,442 | ||||||||
| ||||||||
CONSUMER STAPLES – 4.9% | ||||||||
Anheuser-Busch InBev NV – ADR (Beverages) | 26,400 | 1,610,136 | ||||||
Colgate-Palmolive Co. (Household Products) | 18,900 | 1,746,171 | ||||||
Procter & Gamble Co. / The (Household Products) | 22,600 | 1,507,646 | ||||||
| ||||||||
| 4,863,953 | ||||||||
| ||||||||
ENERGY – 11.7% | ||||||||
Baker Hughes, Inc. (Energy Equip. & Svs.) | 38,700 | 1,882,368 | ||||||
Dresser-Rand Group, Inc. (Energy Equip. & Svs.) | (a) | 32,000 | 1,597,120 | |||||
Schlumberger Ltd. (Energy Equip. & Svs.) | 25,900 | 1,769,229 | ||||||
Apache Corp. (Oil, Gas & Consumable Fuels) | 19,500 | 1,766,310 | ||||||
Devon Energy Corp. (Oil, Gas & Consumable Fuels) | 15,400 | 954,800 | ||||||
Exxon Mobil Corp. (Oil, Gas & Consumable Fuels) | 30,400 | 2,576,704 | ||||||
Forest Oil Corp. (Oil, Gas & Consumable Fuels) | (a) | 87,500 | 1,185,625 | |||||
| ||||||||
| 11,732,156 | ||||||||
| ||||||||
FINANCIALS – 8.0% | ||||||||
Bank of New York Mellon Corp. / The (Capital Markets) | 87,200 | 1,736,152 | ||||||
Wells Fargo & Co. (Commercial Banks) | 71,100 | 1,959,516 | ||||||
JPMorgan Chase & Co. (Diversified Financial Svs.) | 29,200 | 970,900 | ||||||
Hartford Financial Services Group, Inc. (Insurance) | 100,500 | 1,633,125 | ||||||
Lincoln National Corp. (Insurance) | 85,700 | 1,664,294 | ||||||
| ||||||||
| 7,963,987 | ||||||||
| ||||||||
HEALTH CARE – 7.3% | ||||||||
Amarin Corp PLC – ADR (Biotechnology) | (a) | 72,400 | 542,276 | |||||
Amgen, Inc. (Biotechnology) | 31,200 | 2,003,352 | ||||||
UnitedHealth Group, Inc. (Health Care Providers & Svs.) | 38,900 | 1,971,452 | ||||||
WellPoint, Inc. (Health Care Providers & Svs.) | 28,200 | 1,868,250 | ||||||
Warner Chilcott PLC Class A (Pharmaceuticals) | (a) | 64,500 | 975,885 | |||||
| ||||||||
| 7,361,215 | ||||||||
| ||||||||
INDUSTRIALS – 20.2% | ||||||||
Honeywell International, Inc. (Aerospace & Defense) | 34,600 | 1,880,510 | ||||||
United Technologies Corp. (Aerospace & Defense) | 24,800 | 1,812,632 | ||||||
FedEx Corp. (Air Freight & Logistics) | 22,800 | 1,904,028 | ||||||
| Common Stocks (Continued) | Shares | Value | ||||||
INDUSTRIALS (continued) | ||||||||
United Parcel Service, Inc. Class B (Air Freight & Logistics) | 27,000 | $ 1,976,130 | ||||||
United Continental Holdings, Inc. (Airlines) | (a) | 97,800 | 1,845,486 | |||||
Rockwell Automation, Inc. (Electrical Equip.) | 27,100 | 1,988,327 | ||||||
Danaher Corp. (Industrial Conglomerates) | 39,500 | 1,858,080 | ||||||
Caterpillar, Inc. (Machinery) | 16,200 | 1,467,720 | ||||||
Pentair, Inc. (Machinery) | 49,300 | 1,641,197 | ||||||
Snap-On, Inc. (Machinery) | 19,600 | 992,152 | ||||||
Stanley Black & Decker, Inc. (Machinery) | 20,000 | 1,352,000 | ||||||
Xylem, Inc. (Machinery) | 56,100 | 1,441,209 | ||||||
| ||||||||
| 20,159,471 | ||||||||
| ||||||||
INFORMATION TECHNOLOGY – 29.5% | ||||||||
F5 Networks, Inc. (Communications Equip.) | (a) | 13,200 | 1,400,784 | |||||
QUALCOMM, Inc. (Communications Equip.) | 41,600 | 2,275,520 | ||||||
Apple, Inc. (Computers & Peripherals) | (a) | 11,500 | 4,657,500 | |||||
EMC Corp. (Computers & Peripherals) | (a) | 76,800 | 1,654,272 | |||||
Google, Inc. Class A (Internet Software & Svs.) | (a) | 4,010 | 2,590,059 | |||||
Accenture PLC Class A (IT Svs.) | 18,300 | 974,109 | ||||||
International Business Machines Corp. (IT Svs.) | 17,300 | 3,181,124 | ||||||
Advanced Micro Devices, Inc. (Semiconductors & Equip.) | (a) | 170,500 | 920,700 | |||||
Altera Corp. (Semiconductors & Equip.) | 44,700 | 1,658,370 | ||||||
Maxim Integrated Products, Inc. (Semiconductors & Equip.) | 72,400 | 1,885,296 | ||||||
Texas Instruments, Inc. (Semiconductors & Equip.) | 64,000 | 1,863,040 | ||||||
Citrix Systems, Inc. (Software) | (a) | 31,100 | 1,888,392 | |||||
Electronic Arts, Inc. (Software) | (a) | 81,800 | 1,685,080 | |||||
Microsoft Corp. (Software) | 36,269 | 941,543 | ||||||
Oracle Corp. (Software) | 73,800 | 1,892,970 | ||||||
| ||||||||
| 29,468,759 | ||||||||
| ||||||||
MATERIALS – 1.9% | ||||||||
Monsanto Co. (Chemicals) | 27,400 | 1,919,918 | ||||||
| ||||||||
Total Common Stocks (Cost $93,240,517) | $94,248,901 | |||||||
| ||||||||
| Money Market Funds – 2.8% | Shares | Value | ||||||
Fidelity Institutional Money Market Funds | ||||||||
Money Market Portfolio – Class I | 2,753,000 | $ 2,753,000 | ||||||
| ||||||||
Total Money Market Funds (Cost $2,753,000) | $ 2,753,000 | |||||||
| ||||||||
Total Investments – 97.1% (Cost $95,993,517) | (b) | $97,001,901 | ||||||
Other Assets in Excess of Liabilities – 2.9% | 2,911,476 | |||||||
| ||||||||
Net Assets – 100.0% | $99,913,377 | |||||||
| ||||||||
Percentages are stated as a percent of net assets.
Abbreviations:
ADR: American Depositary Receipts
Footnotes:
| (a) | Non-income producing security. |
| (b) | Represents cost for financial reporting purposes, which may differ from cost basis for federal income tax purposes. See also Note 7 of the Notes to Financial Statements. |
The accompanying notes are an integral part of these financial statements
| 106 |
| Ohio National Fund, Inc. |
| December 31, 2011 |
| Equity Portfolio | Money Market Portfolio | Bond Portfolio | Omni Portfolio | International Portfolio | Capital Appreciation Portfolio | Millennium Portfolio | International Small-Mid Company Portfolio | |||||||||||||||||||||||||
Assets: | ||||||||||||||||||||||||||||||||
Investments in securities, at value* | $ | 183,750,246 | $ | 189,357,021 | $ | 157,834,532 | $ | 34,631,212 | $ | 161,746,280 | $ | 114,705,732 | $ | 36,163,623 | $ | 57,450,177 | ||||||||||||||||
Repurchase agreements | 3,379,939 | 14,000,000 | 2,857,000 | — | — | — | — | — | ||||||||||||||||||||||||
Cash | — | 83,197,548 | 25,191 | 448 | 118,887 | 754 | — | — | ||||||||||||||||||||||||
Foreign currencies, at value** | — | — | — | — | 10,432,894 | — | — | 1,405 | ||||||||||||||||||||||||
Receivable for securities sold | 1,529,201 | — | — | 411,850 | 364,110 | — | 486,157 | — | ||||||||||||||||||||||||
Variation margin receivable from broker | — | — | — | — | 21,163 | — | — | — | ||||||||||||||||||||||||
Due from adviser | — | 69,981 | — | — | — | — | — | — | ||||||||||||||||||||||||
Receivable for fund shares sold | 13,935 | 119,036 | 156,680 | 4,788 | 9,344 | 49,432 | 3,124 | 11,680 | ||||||||||||||||||||||||
Dividends and accrued interest receivable | 296,030 | 1,369 | 1,609,002 | 126,133 | 76,513 | 100,119 | 5,303 | 76,101 | ||||||||||||||||||||||||
Foreign tax reclaim receivable | — | — | — | — | 121,309 | — | — | 39,303 | ||||||||||||||||||||||||
Prepaid expenses and other assets | 3,535 | 1,254 | 635 | 658 | 3,166 | 2,077 | 694 | 1,135 | ||||||||||||||||||||||||
Net unrealized appreciation on foreign currency contracts | — | — | — | — | 1,985,208 | — | — | — | ||||||||||||||||||||||||
|
|
|
|
|
|
|
|
|
|
|
|
|
|
|
| |||||||||||||||||
Total assets | 188,972,886 | 286,746,209 | 162,483,040 | 35,175,089 | 174,878,874 | 114,858,114 | 36,658,901 | 57,579,801 | ||||||||||||||||||||||||
|
|
|
|
|
|
|
|
|
|
|
|
|
|
|
| |||||||||||||||||
Liabilities: | ||||||||||||||||||||||||||||||||
Cash overdraft | — | — | — | — | — | — | 122,436 | — | ||||||||||||||||||||||||
Payable for securities purchased | 822,393 | — | — | 479,734 | 1,841,710 | — | — | — | ||||||||||||||||||||||||
Payable for fund shares redeemed | 135,573 | 453,481 | 340,650 | 7,267 | 64,880 | 85,817 | 19,631 | 15,669 | ||||||||||||||||||||||||
Payable for investment management services | 126,052 | 60,557 | 75,663 | 17,679 | 122,420 | 77,088 | 25,152 | 48,821 | ||||||||||||||||||||||||
Accrued custody expense | 915 | 1,093 | 661 | 394 | 19,553 | 870 | 784 | 10,009 | ||||||||||||||||||||||||
Accrued professional fees | 10,792 | 10,792 | 10,792 | 10,792 | 10,792 | 10,792 | 10,792 | 10,792 | ||||||||||||||||||||||||
Accrued accounting fees | 10,930 | 17,427 | 12,291 | 4,494 | 469 | 7,318 | 2,995 | 469 | ||||||||||||||||||||||||
Accrued printing and filing fees | 9,473 | 14,762 | 8,006 | 1,746 | 8,914 | 5,751 | 1,883 | 2,937 | ||||||||||||||||||||||||
Withholding tax payable | — | — | — | — | 153 | — | — | 5,797 | ||||||||||||||||||||||||
|
|
|
|
|
|
|
|
|
|
|
|
|
|
|
| |||||||||||||||||
Total liabilities | 1,116,128 | 558,112 | 448,063 | 522,106 | 2,068,891 | 187,636 | 183,673 | 94,494 | ||||||||||||||||||||||||
|
|
|
|
|
|
|
|
|
|
|
|
|
|
|
| |||||||||||||||||
Net assets | $ | 187,856,758 | $ | 286,188,097 | $ | 162,034,977 | $ | 34,652,983 | $ | 172,809,983 | $ | 114,670,478 | $ | 36,475,228 | $ | 57,485,307 | ||||||||||||||||
|
|
|
|
|
|
|
|
|
|
|
|
|
|
|
| |||||||||||||||||
Net assets consist of: | ||||||||||||||||||||||||||||||||
Par value, $1 per share | $ | 9,947,574 | $ | 28,618,822 | $ | 11,531,200 | $ | 2,278,165 | $ | 16,745,902 | $ | 5,748,644 | $ | 1,696,718 | $ | 2,998,478 | ||||||||||||||||
Paid-in capital in excess of par value | 287,907,489 | 257,569,275 | 149,168,441 | �� | 38,153,413 | 238,110,137 | 123,974,006 | 43,505,702 | 63,712,358 | |||||||||||||||||||||||
Accumulated net realized gain (loss) on investments | (125,059,407 | ) | — | (14,525,950 | ) | (5,495,206 | ) | (97,677,018 | ) | (17,244,541 | ) | (11,322,079 | ) | (13,735,270 | ) | |||||||||||||||||
Net unrealized appreciation (depreciation) on: | ||||||||||||||||||||||||||||||||
Investments | 14,739,595 | — | 10,216,682 | (355,540 | ) | 14,915,240 | 2,150,230 | 2,594,887 | 3,788,611 | |||||||||||||||||||||||
Foreign currency contracts | — | — | — | — | 1,985,208 | — | — | — | ||||||||||||||||||||||||
Futures contracts | — | — | — | — | 39,604 | — | — | — | ||||||||||||||||||||||||
Other foreign currency related transactions | — | — | — | — | (333,247 | ) | — | — | (8,204 | ) | ||||||||||||||||||||||
Undistributed net investment income (loss) | 321,507 | — | 5,644,604 | 72,151 | (975,843 | ) | 42,139 | — | 729,334 | |||||||||||||||||||||||
|
|
|
|
|
|
|
|
|
|
|
|
|
|
|
| |||||||||||||||||
Net assets | $ | 187,856,758 | $ | 286,188,097 | $ | 162,034,977 | $ | 34,652,983 | $ | 172,809,983 | $ | 114,670,478 | $ | 36,475,228 | $ | 57,485,307 | ||||||||||||||||
|
|
|
|
|
|
|
|
|
|
|
|
|
|
|
| |||||||||||||||||
* Investments in securities, at cost | $ | 169,010,651 | $ | 189,357,021 | $ | 147,617,850 | $ | 34,986,752 | $ | 146,831,040 | $ | 112,555,502 | $ | 33,568,736 | $ | 53,661,566 | ||||||||||||||||
|
|
|
|
|
|
|
|
|
|
|
|
|
|
|
| |||||||||||||||||
** Foreign currencies, at cost | $ | — | $ | — | $ | — | $ | — | $ | 10,754,205 | $ | — | $ | — | $ | 1,420 | ||||||||||||||||
|
|
|
|
|
|
|
|
|
|
|
|
|
|
|
| |||||||||||||||||
Shares outstanding | 9,947,574 | 28,618,822 | 11,531,200 | 2,278,165 | 16,745,902 | 5,748,644 | 1,696,718 | 2,998,478 | ||||||||||||||||||||||||
|
|
|
|
|
|
|
|
|
|
|
|
|
|
|
| |||||||||||||||||
Authorized Fund shares allocated to Portfolio | 30,000,000 | 80,000,000 | 30,000,000 | 10,000,000 | 45,000,000 | 15,000,000 | 10,000,000 | 10,000,000 | ||||||||||||||||||||||||
|
|
|
|
|
|
|
|
|
|
|
|
|
|
|
| |||||||||||||||||
Net asset value per share | $ | 18.88 | $ | 10.00 | $ | 14.05 | $ | 15.21 | $ | 10.32 | $ | 19.95 | $ | 21.50 | $ | 19.17 | ||||||||||||||||
|
|
|
|
|
|
|
|
|
|
|
|
|
|
|
| |||||||||||||||||
The accompanying notes are an integral part of these financial statements.
| 107 |
| Ohio National Fund, Inc. |
Statements of Assets and Liabilities | December 31, 2011 |
| Aggressive Growth Portfolio | Small Cap Growth Portfolio | Mid Cap Opportunity Portfolio | S&P 500® Index Portfolio | Strategic Value Portfolio | High Income Bond Portfolio | Capital Growth Portfolio | Nasdaq-100® Index Portfolio | |||||||||||||||||||||||||
Assets: | ||||||||||||||||||||||||||||||||
Investments in securities, at value* | $ | 25,777,821 | $ | 31,486,645 | $ | 61,099,838 | $ | 170,710,822 | $ | 40,205,788 | $ | 261,352,438 | $ | 51,426,830 | $ | 55,564,676 | ||||||||||||||||
Cash | 960 | 98 | 149 | 668 | 975 | 284 | 4,198 | 1,341 | ||||||||||||||||||||||||
Receivable for securities sold | — | 27,609 | — | 26,911 | — | — | — | — | ||||||||||||||||||||||||
Receivable for fund shares sold | 8,955 | 8,903 | 15,732 | 119,025 | 1,637,437 | 1,092,108 | 41,978 | 7,901 | ||||||||||||||||||||||||
Dividends and accrued interest receivable | 8,771 | 19,955 | 29,547 | 259,887 | 208,384 | 5,329,040 | 7,471 | 40,093 | ||||||||||||||||||||||||
Foreign tax reclaim receivable | 4,546 | — | — | — | 366 | — | — | — | ||||||||||||||||||||||||
Prepaid expenses and other assets | 481 | 562 | 1,113 | 3,042 | 582 | 1,163 | 923 | 1,001 | ||||||||||||||||||||||||
|
|
|
|
|
|
|
|
|
|
|
|
|
|
|
| |||||||||||||||||
Total assets | 25,801,534 | 31,543,772 | 61,146,379 | 171,120,355 | 42,053,532 | 267,775,033 | 51,481,400 | 55,615,012 | ||||||||||||||||||||||||
|
|
|
|
|
|
|
|
|
|
|
|
|
|
|
| |||||||||||||||||
Liabilities: | ||||||||||||||||||||||||||||||||
Payable for securities purchased | — | — | — | 75,924 | — | — | 297,082 | 71,354 | ||||||||||||||||||||||||
Payable for fund shares redeemed | 11,425 | 4,850 | 20,450 | 278,132 | 20,552 | 111,197 | 22,781 | 35,723 | ||||||||||||||||||||||||
Payable for investment management services | 17,386 | 24,317 | 44,252 | 54,147 | 24,278 | 152,711 | 38,660 | 18,917 | ||||||||||||||||||||||||
Accrued custody expense | 2,616 | 640 | 469 | 745 | 429 | 1,054 | 292 | 239 | ||||||||||||||||||||||||
Accrued professional fees | 10,792 | 10,792 | 10,792 | 11,055 | 13,453 | 10,792 | 10,792 | 10,792 | ||||||||||||||||||||||||
Accrued accounting fees | 2,666 | 2,825 | 4,298 | 12,784 | 2,928 | 24,037 | 3,864 | 4,217 | ||||||||||||||||||||||||
Accrued printing and filing fees | 1,304 | 1,601 | 3,128 | 8,361 | 1,857 | 13,364 | 2,544 | 2,833 | ||||||||||||||||||||||||
Withholding tax payable | — | — | — | — | 6,174 | — | — | — | ||||||||||||||||||||||||
|
|
|
|
|
|
|
|
|
|
|
|
|
|
|
| |||||||||||||||||
Total liabilities | 46,189 | 45,025 | 83,389 | 441,148 | 69,671 | 313,155 | 376,015 | 144,075 | ||||||||||||||||||||||||
|
|
|
|
|
|
|
|
|
|
|
|
|
|
|
| |||||||||||||||||
Net assets | $ | 25,755,345 | $ | 31,498,747 | $ | 61,062,990 | $ | 170,679,207 | $ | 41,983,861 | $ | 267,461,878 | $ | 51,105,385 | $ | 55,470,937 | ||||||||||||||||
|
|
|
|
|
|
|
|
|
|
|
|
|
|
|
| |||||||||||||||||
Net assets consist of: | ||||||||||||||||||||||||||||||||
Par value, $1 per share | $ | 3,326,684 | $ | 2,385,054 | $ | 3,427,654 | $ | 12,885,463 | $ | 3,997,676 | $ | 20,623,501 | $ | 1,892,448 | $ | 9,481,945 | ||||||||||||||||
Paid-in capital in excess of par value | 21,344,542 | 25,477,084 | 84,515,470 | 137,575,211 | 40,274,613 | 221,256,596 | 40,177,949 | 33,179,172 | ||||||||||||||||||||||||
Accumulated net realized gain (loss) on investments | (645,526 | ) | 1,300,905 | (28,862,461 | ) | (4,991,860 | ) | (7,346,208 | ) | 1,571,833 | 2,590,904 | 4,028,046 | ||||||||||||||||||||
Net unrealized appreciation (depreciation) on: | ||||||||||||||||||||||||||||||||
Investments | 1,726,366 | 2,335,704 | 1,982,327 | 24,772,719 | 4,497,953 | 2,877,763 | 6,444,084 | 8,761,387 | ||||||||||||||||||||||||
Foreign currency related transactions | 228 | — | — | — | (476 | ) | — | — | — | |||||||||||||||||||||||
Undistributed net investment income (loss) | 3,051 | — | — | 437,674 | 560,303 | 21,132,185 | — | 20,387 | ||||||||||||||||||||||||
|
|
|
|
|
|
|
|
|
|
|
|
|
|
|
| |||||||||||||||||
Net assets | $ | 25,755,345 | $ | 31,498,747 | $ | 61,062,990 | $ | 170,679,207 | $ | 41,983,861 | $ | 267,461,878 | $ | 51,105,385 | $ | 55,470,937 | ||||||||||||||||
|
|
|
|
|
|
|
|
|
|
|
|
|
|
|
| |||||||||||||||||
* Investments in securities, at cost | $ | 24,051,455 | $ | 29,150,941 | $ | 59,117,511 | $ | 145,938,103 | $ | 35,707,835 | $ | 258,474,675 | $ | 44,982,746 | $ | 46,803,289 | ||||||||||||||||
|
|
|
|
|
|
|
|
|
|
|
|
|
|
|
| |||||||||||||||||
Shares outstanding | 3,326,684 | 2,385,054 | 3,427,654 | 12,885,463 | 3,997,676 | 20,623,501 | 1,892,448 | 9,481,945 | ||||||||||||||||||||||||
|
|
|
|
|
|
|
|
|
|
|
|
|
|
|
| |||||||||||||||||
Authorized Fund shares allocated to Portfolio | 10,000,000 | 10,000,000 | 10,000,000 | 35,000,000 | 10,000,000 | 60,000,000 | 10,000,000 | 25,000,000 | ||||||||||||||||||||||||
|
|
|
|
|
|
|
|
|
|
|
|
|
|
|
| |||||||||||||||||
Net asset value per share | $ | 7.74 | $ | 13.21 | $ | 17.81 | $ | 13.25 | $ | 10.50 | $ | 12.97 | $ | 27.00 | $ | 5.85 | ||||||||||||||||
|
|
|
|
|
|
|
|
|
|
|
|
|
|
|
| |||||||||||||||||
The accompanying notes are an integral part of these financial statements.
| 108 |
| Ohio National Fund, Inc. |
Statements of Assets and Liabilities | December 31, 2011 |
| Bristol Portfolio | Bryton Growth Portfolio | U.S. Equity Portfolio | Balanced Portfolio | Income Opportunity Portfolio | Target VIP Portfolio | Target Equity/Income Portfolio | Bristol Growth Portfolio | |||||||||||||||||||||||||
Assets: | ||||||||||||||||||||||||||||||||
Investments in securities, at value* | $ | 187,467,269 | $ | 150,861,660 | $ | 13,333,968 | $ | 16,974,353 | $ | 11,014,385 | $ | 20,532,756 | $ | 21,633,144 | $ | 97,001,901 | ||||||||||||||||
Cash | 476 | 454 | 816 | 194 | — | 149 | 364 | 867 | ||||||||||||||||||||||||
Receivable for securities sold | 8,763,071 | 5,723,305 | — | — | 65,676 | — | — | 4,748,052 | ||||||||||||||||||||||||
Receivable for fund shares sold | 96,358 | 70,824 | 671 | 1,177 | 107 | 270 | 1,527 | 53,074 | ||||||||||||||||||||||||
Dividends and accrued interest receivable | 131,339 | 4,832 | 23,228 | 106,955 | 17,861 | 28,998 | 24,509 | 63,030 | ||||||||||||||||||||||||
Foreign tax reclaim receivable | — | — | — | — | — | 2,425 | — | — | ||||||||||||||||||||||||
Prepaid expenses and other assets | 3,181 | 2,279 | 247 | 310 | 197 | 383 | 404 | 1,636 | ||||||||||||||||||||||||
|
|
|
|
|
|
|
|
|
|
|
|
|
|
|
| |||||||||||||||||
Total assets | 196,461,694 | 156,663,354 | 13,358,930 | 17,082,989 | 11,098,226 | 20,564,981 | 21,659,948 | 101,868,560 | ||||||||||||||||||||||||
|
|
|
|
|
|
|
|
|
|
|
|
|
|
|
| |||||||||||||||||
Liabilities: | ||||||||||||||||||||||||||||||||
Cash overdraft | — | — | — | — | 117,637 | — | — | — | ||||||||||||||||||||||||
Options written, at value** | — | — | — | — | 125,000 | — | — | — | ||||||||||||||||||||||||
Payable for securities purchased | 3,580,762 | 1,054,589 | — | — | — | — | — | 1,843,323 | ||||||||||||||||||||||||
Payable for fund shares redeemed | 52,319 | 32,901 | 1,377 | 1,547 | 519 | 2,692 | 5,258 | 21,356 | ||||||||||||||||||||||||
Payable for investment management services | 123,539 | 106,283 | 8,498 | 9,287 | 7,178 | 10,464 | 10,912 | 67,860 | ||||||||||||||||||||||||
Accrued custody expense | 985 | 1,162 | 60 | 92 | 692 | 78 | 194 | 617 | ||||||||||||||||||||||||
Accrued professional fees | 10,792 | 10,792 | 10,792 | 10,792 | 10,792 | 10,792 | 10,792 | 10,792 | ||||||||||||||||||||||||
Accrued accounting fees | 11,309 | 9,139 | 1,516 | 3,514 | 1,801 | 2,440 | 1,957 | 6,147 | ||||||||||||||||||||||||
Accrued printing and filing fees | 9,853 | 7,828 | 676 | 830 | 535 | 1,036 | 1,063 | 5,088 | ||||||||||||||||||||||||
Withholding tax payable | — | 75 | — | 199 | — | 1,098 | — | — | ||||||||||||||||||||||||
|
|
|
|
|
|
|
|
|
|
|
|
|
|
|
| |||||||||||||||||
Total liabilities | 3,789,559 | 1,222,769 | 22,919 | 26,261 | 264,154 | 28,600 | 30,176 | 1,955,183 | ||||||||||||||||||||||||
|
|
|
|
|
|
|
|
|
|
|
|
|
|
|
| |||||||||||||||||
Net assets | $ | 192,672,135 | $ | 155,440,585 | $ | 13,336,011 | $ | 17,056,728 | $ | 10,834,072 | $ | 20,536,381 | $ | 21,629,772 | $ | 99,913,377 | ||||||||||||||||
|
|
|
|
|
|
|
|
|
|
|
|
|
|
|
| |||||||||||||||||
Net assets consist of: | ||||||||||||||||||||||||||||||||
Par value, $1 per share | $ | 16,663,266 | $ | 12,624,613 | $ | 1,328,998 | $ | 1,226,301 | $ | 913,811 | $ | 2,309,689 | $ | 2,875,198 | $ | 10,376,423 | ||||||||||||||||
Paid-in capital in excess of par value | 179,653,408 | 126,170,070 | 17,399,347 | 15,741,758 | 9,310,688 | 25,126,064 | 34,389,336 | 80,901,820 | ||||||||||||||||||||||||
Accumulated net realized gain (loss) on investments | 1,795,449 | 21,448,090 | (6,295,149 | ) | (687,861 | ) | (115,830 | ) | (7,036,860 | ) | (12,835,769 | ) | 7,609,344 | |||||||||||||||||||
Net unrealized appreciation (depreciation) on: | ||||||||||||||||||||||||||||||||
Investments | (5,510,102 | ) | (5,632,631 | ) | 815,663 | 719,151 | 640,311 | 113,404 | (2,849,409 | ) | 1,008,384 | |||||||||||||||||||||
Written options | — | — | — | — | (22,751 | ) | — | — | — | |||||||||||||||||||||||
Undistributed net investment income (loss) | 70,114 | 830,443 | 87,152 | 57,379 | 107,843 | 24,084 | 50,416 | 17,406 | ||||||||||||||||||||||||
|
|
|
|
|
|
|
|
|
|
|
|
|
|
|
| |||||||||||||||||
Net assets | $ | 192,672,135 | $ | 155,440,585 | $ | 13,336,011 | $ | 17,056,728 | $ | 10,834,072 | $ | 20,536,381 | $ | 21,629,772 | $ | 99,913,377 | ||||||||||||||||
|
|
|
|
|
|
|
|
|
|
|
|
|
|
|
| |||||||||||||||||
* Investments in securities, at cost | $ | 192,977,371 | $ | 156,494,291 | $ | 12,518,305 | $ | 16,255,202 | $ | 10,374,074 | $ | 20,419,352 | $ | 24,482,553 | $ | 95,993,517 | ||||||||||||||||
|
|
|
|
|
|
|
|
|
|
|
|
|
|
|
| |||||||||||||||||
** Premiums received on options written | $ | — | $ | — | $ | — | $ | — | $ | 102,249 | $ | — | $ | — | $ | — | ||||||||||||||||
|
|
|
|
|
|
|
|
|
|
|
|
|
|
|
| |||||||||||||||||
Shares outstanding | 16,663,266 | 12,624,613 | 1,328,998 | 1,226,301 | 913,811 | 2,309,689 | 2,875,198 | 10,376,423 | ||||||||||||||||||||||||
|
|
|
|
|
|
|
|
|
|
|
|
|
|
|
| |||||||||||||||||
Authorized Fund shares allocated to Portfolio | 40,000,000 | 35,000,000 | 10,000,000 | 10,000,000 | 10,000,000 | 10,000,000 | 10,000,000 | 25,000,000 | ||||||||||||||||||||||||
|
|
|
|
|
|
|
|
|
|
|
|
|
|
|
| |||||||||||||||||
Net asset value per share | $ | 11.56 | $ | 12.31 | $ | 10.03 | $ | 13.91 | $ | 11.86 | $ | 8.89 | $ | 7.52 | $ | 9.63 | ||||||||||||||||
|
|
|
|
|
|
|
|
|
|
|
|
|
|
|
| |||||||||||||||||
The accompanying notes are an integral part of these financial statements.
| 109 |
| Ohio National Fund, Inc. |
| For the Year Ended December 31, 2011 |
| Equity Portfolio | Money Market Portfolio | Bond Portfolio | Omni Portfolio | International Portfolio | Capital Appreciation Portfolio | Millennium Portfolio | International Small-Mid Company Portfolio | |||||||||||||||||||||||||||||||||
Investment income: | ||||||||||||||||||||||||||||||||||||||||
Interest | $ | 1,810 | $ | 316,796 | $ | 6,647,738 | $ | 453,515 | $ | 223 | $ | 5,852 | $ | 1,183 | $ | — | ||||||||||||||||||||||||
Dividends, net of taxes withheld* | 3,839,222 | — | — | 382,605 | 4,763,780 | 1,602,694 | 120,639 | 1,610,979 | ||||||||||||||||||||||||||||||||
|
|
|
|
|
|
|
|
|
|
|
|
|
|
|
| |||||||||||||||||||||||||
Total investment income | 3,841,032 | 316,796 | 6,647,738 | 836,120 | 4,764,003 | 1,608,546 | 121,822 | 1,610,979 | ||||||||||||||||||||||||||||||||
|
|
|
|
|
|
|
|
|
|
|
|
|
|
|
| |||||||||||||||||||||||||
Expenses: | ||||||||||||||||||||||||||||||||||||||||
Management fees | 1,620,785 | 776,625 | 861,684 | 231,230 | 1,615,635 | 983,923 | 328,568 | 707,122 | ||||||||||||||||||||||||||||||||
Custodian fees | 17,941 | 18,207 | 8,279 | 6,423 | 233,610 | 8,762 | 7,605 | 73,957 | ||||||||||||||||||||||||||||||||
Directors’ fees | 20,085 | 29,222 | 15,045 | 3,783 | 19,144 | 12,126 | 3,983 | 6,918 | ||||||||||||||||||||||||||||||||
Professional fees | 20,353 | 24,371 | 18,549 | 13,586 | 19,892 | 17,086 | 13,696 | 14,770 | ||||||||||||||||||||||||||||||||
Accounting fees | 69,479 | 100,649 | 71,871 | 27,833 | 64,024 | 45,705 | 19,078 | 29,528 | ||||||||||||||||||||||||||||||||
Printing and filing fees | 27,779 | 42,247 | 20,986 | 5,194 | 27,308 | 17,101 | 5,636 | 9,727 | ||||||||||||||||||||||||||||||||
Compliance expense | 6,899 | 6,899 | 6,899 | 6,899 | 6,899 | 6,899 | 6,899 | 6,899 | ||||||||||||||||||||||||||||||||
Other | 7,481 | 5,454 | 2,485 | 1,394 | 13,589 | 4,352 | 1,604 | 2,578 | ||||||||||||||||||||||||||||||||
|
|
|
|
|
|
|
|
|
|
|
|
|
|
|
| |||||||||||||||||||||||||
Total expenses | 1,790,802 | 1,003,674 | 1,005,798 | 296,342 | 2,000,101 | 1,095,954 | 387,069 | 851,499 | ||||||||||||||||||||||||||||||||
|
|
|
|
|
|
|
|
|
|
|
|
|
|
|
| |||||||||||||||||||||||||
Less expenses reduced or reimbursed by adviser | — | (686,878 | ) | — | — | — | — | — | — | |||||||||||||||||||||||||||||||
|
|
|
|
|
|
|
|
|
|
|
|
|
|
|
| |||||||||||||||||||||||||
Net expenses | 1,790,802 | 316,796 | 1,005,798 | 296,342 | 2,000,101 | 1,095,954 | 387,069 | 851,499 | ||||||||||||||||||||||||||||||||
|
|
|
|
|
|
|
|
|
|
|
|
|
|
|
| |||||||||||||||||||||||||
Net investment income (loss) | 2,050,230 | — | 5,641,940 | 539,778 | 2,763,902 | 512,592 | (265,247 | ) | 759,480 | |||||||||||||||||||||||||||||||
|
|
|
|
|
|
|
|
|
|
|
|
|
|
|
| |||||||||||||||||||||||||
Realized/unrealized gain (loss) on investments, futures contracts, foreign currency contracts, and other foreign currency related transactions: | ||||||||||||||||||||||||||||||||||||||||
Net realized gain (loss) on: | ||||||||||||||||||||||||||||||||||||||||
Investments | (1,586,673 | ) | — | 824,712 | 2,378,864 | 6,840,585 | 13,378,785 | 5,455,807 | 7,178,006 | |||||||||||||||||||||||||||||||
Futures contracts | — | — | — | — | 931,996 | — | — | — | ||||||||||||||||||||||||||||||||
Foreign currency contracts | — | — | — | — | (1,792,761 | ) | — | — | — | |||||||||||||||||||||||||||||||
Other foreign currency related transactions | — | — | — | (2 | ) | (354,688 | ) | 1,341 | — | (126,900 | ) | |||||||||||||||||||||||||||||
Change in unrealized appreciation/depreciation on: | ||||||||||||||||||||||||||||||||||||||||
Investments | (7,441,587 | ) | — | 2,856,388 | (4,379,083 | ) | (38,929,900 | ) | (15,407,876 | ) | (5,423,430 | ) | (20,273,014 | ) | ||||||||||||||||||||||||||
Futures contracts | — | — | — | — | 63,214 | — | — | — | ||||||||||||||||||||||||||||||||
Foreign currency contracts | — | — | — | — | 2,258,702 | — | — | — | ||||||||||||||||||||||||||||||||
Other foreign currency related transactions | — | — | — | — | (354,234 | ) | — | — | 88,943 | |||||||||||||||||||||||||||||||
|
|
|
|
|
|
|
|
|
|
|
|
|
|
|
| |||||||||||||||||||||||||
Net realized/unrealized gain (loss) on investments, futures contracts, foreign currency contracts, and other foreign currency related transactions | (9,028,260 | ) | — | 3,681,100 | (2,000,221 | ) | (31,337,086 | ) | (2,027,750 | ) | 32,377 | (13,132,965 | ) | |||||||||||||||||||||||||||
|
|
|
|
|
|
|
|
|
|
|
|
|
|
|
| |||||||||||||||||||||||||
Change in net assets from operations | $ | (6,978,030 | ) | $ | — | $ | 9,323,040 | $ | (1,460,443 | ) | $ | (28,573,184 | ) | $ | (1,515,158 | ) | $ | (232,870 | ) | $ | (12,373,485 | ) | ||||||||||||||||||
|
|
|
|
|
|
|
|
|
|
|
|
|
|
|
| |||||||||||||||||||||||||
* Taxes withheld | $ | 5,661 | $ | — | $ | — | $ | 521 | $ | 796,854 | $ | 13,301 | $ | 1,573 | $ | 126,560 | ||||||||||||||||||||||||
|
|
|
|
|
|
|
|
|
|
|
|
|
|
|
| |||||||||||||||||||||||||
The accompanying notes are an integral part of these financial statements.
| 110 |
| Ohio National Fund, Inc. |
Statements of Operations | For the Year Ended December 31, 2011 |
| Aggressive Growth Portfolio | Small Cap Growth Portfolio | Mid Cap Opportunity Portfolio | S&P | Strategic Value Portfolio | High Income Bond Portfolio | Capital Growth Portfolio | Nasdaq-100® Index Portfolio | |||||||||||||||||||||||||
Investment income: | ||||||||||||||||||||||||||||||||
Interest | $ | 928 | $ | 1,219 | $ | 1,825 | $ | 160 | $ | 822 | $ | 23,249,129 | $ | 898 | $ | 78 | ||||||||||||||||
Dividends, net of taxes withheld* | 294,504 | 158,610 | 449,411 | 3,664,831 | 1,494,846 | 24,220 | 205,564 | 515,814 | ||||||||||||||||||||||||
|
|
|
|
|
|
|
|
|
|
|
|
|
|
|
| |||||||||||||||||
Total investment income | 295,432 | 159,829 | 451,236 | 3,664,991 | 1,495,668 | 23,273,349 | 206,462 | 515,892 | ||||||||||||||||||||||||
|
|
|
|
|
|
|
|
|
|
|
|
|
|
|
| |||||||||||||||||
Expenses: | ||||||||||||||||||||||||||||||||
Management fees | 223,133 | 298,825 | 565,630 | 662,660 | 223,153 | 1,873,051 | 494,205 | 222,301 | ||||||||||||||||||||||||
Custodian fees | 23,355 | 13,588 | 9,682 | 15,145 | 4,888 | 15,098 | 4,436 | 6,859 | ||||||||||||||||||||||||
Directors’ fees | 2,726 | 3,249 | 6,491 | 17,084 | 2,886 | 27,193 | 5,327 | 5,459 | ||||||||||||||||||||||||
Professional fees | 13,161 | 13,479 | 14,745 | 20,504 | 26,857 | 23,421 | 14,264 | 14,367 | ||||||||||||||||||||||||
Accounting fees | 16,724 | 17,530 | 27,013 | 78,858 | 16,077 | 153,708 | 24,169 | 24,902 | ||||||||||||||||||||||||
Printing and filing fees | 3,798 | 4,642 | 9,142 | 23,943 | 4,283 | 37,470 | 7,690 | 7,544 | ||||||||||||||||||||||||
Compliance expense | 6,899 | 6,899 | 6,899 | 6,899 | 6,899 | 6,899 | 6,899 | 6,899 | ||||||||||||||||||||||||
Other | 950 | 1,002 | 2,354 | 5,867 | 864 | 4,324 | 1,649 | 1,759 | ||||||||||||||||||||||||
|
|
|
|
|
|
|
|
|
|
|
|
|
|
|
| |||||||||||||||||
Total expenses | 290,746 | 359,214 | 641,956 | 830,960 | 285,907 | 2,141,164 | 558,639 | 290,090 | ||||||||||||||||||||||||
|
|
|
|
|
|
|
|
|
|
|
|
|
|
|
| |||||||||||||||||
Net investment income (loss) | 4,686 | (199,385 | ) | (190,720 | ) | 2,834,031 | 1,209,761 | 21,132,185 | (352,177 | ) | 225,802 | |||||||||||||||||||||
|
|
|
|
|
|
|
|
|
|
|
|
|
|
|
| |||||||||||||||||
Realized/unrealized gain (loss) on investments, foreign currency contracts, and other foreign currency related transactions: | ||||||||||||||||||||||||||||||||
Net realized gain (loss) on: | ||||||||||||||||||||||||||||||||
Investments | 2,027,485 | 4,917,359 | 5,767,671 | (572,071 | ) | 926,887 | 4,997,438 | 8,111,683 | 7,286,117 | |||||||||||||||||||||||
Foreign currency contracts | — | — | — | — | 57,516 | — | — | — | ||||||||||||||||||||||||
Other foreign currency related transactions | 128 | 21 | — | — | (26,545 | ) | — | — | — | |||||||||||||||||||||||
Change in unrealized appreciation/depreciation on: | ||||||||||||||||||||||||||||||||
Investments | (3,410,927 | ) | (3,905,022 | ) | (7,616,332 | ) | 489,142 | 2,127,978 | (13,026,934 | ) | (9,323,741 | ) | (5,817,310 | ) | ||||||||||||||||||
Foreign currency contracts | — | — | — | — | (57,516 | ) | — | — | — | |||||||||||||||||||||||
Other foreign currency related transactions | (132 | ) | — | — | — | (256 | ) | — | — | — | ||||||||||||||||||||||
|
|
|
|
|
|
|
|
|
|
|
|
|
|
|
| |||||||||||||||||
Net realized/unrealized gain (loss) on investments, foreign currency contracts, and other foreign currency related transactions | (1,383,446 | ) | 1,012,358 | (1,848,661 | ) | (82,929 | ) | 3,028,064 | (8,029,496 | ) | (1,212,058 | ) | 1,468,807 | |||||||||||||||||||
|
|
|
|
|
|
|
|
|
|
|
|
|
|
|
| |||||||||||||||||
Change in net assets from operations | $ | (1,378,760 | ) | $ | 812,973 | $ | (2,039,381 | ) | $ | 2,751,102 | $ | 4,237,825 | $ | 13,102,689 | $ | (1,564,235 | ) | $ | 1,694,609 | |||||||||||||
|
|
|
|
|
|
|
|
|
|
|
|
|
|
|
| |||||||||||||||||
* Taxes withheld | $ | 10,610 | $ | 5,918 | $ | 2,380 | $ | — | $ | 52,446 | $ | — | $ | — | $ | 1,619 | ||||||||||||||||
|
|
|
|
|
|
|
|
|
|
|
|
|
|
|
| |||||||||||||||||
The accompanying notes are an integral part of these financial statements.
| 111 |
| Ohio National Fund, Inc. |
Statements of Operations | For the Year Ended December 31, 2011 |
| Bristol Portfolio | Bryton Growth Portfolio | U.S. Equity Portfolio | Balanced Portfolio | Income Opportunity Portfolio | Target VIP Portfolio | Target Equity/Income Portfolio | Bristol Growth Portfolio | |||||||||||||||||||||||||
Investment income: | ||||||||||||||||||||||||||||||||
Interest | $ | 6,937 | $ | 8,249 | $ | 453 | $ | 314,544 | $ | 264 | $ | 573 | $ | 626 | $ | 4,125 | ||||||||||||||||
Dividends, net of taxes withheld* | 2,552,291 | 337,334 | 226,905 | 222,160 | 229,357 | 414,781 | 611,382 | 1,222,834 | ||||||||||||||||||||||||
|
|
|
|
|
|
|
|
|
|
|
|
|
|
|
| |||||||||||||||||
Total investment income | 2,559,228 | 345,583 | 227,358 | 536,704 | 229,621 | 415,354 | 612,008 | 1,226,959 | ||||||||||||||||||||||||
|
|
|
|
|
|
|
|
|
|
|
|
|
|
|
| |||||||||||||||||
Expenses: | ||||||||||||||||||||||||||||||||
Management fees | 1,421,514 | 1,169,004 | 106,342 | 106,823 | 82,663 | 130,698 | 145,237 | 750,990 | ||||||||||||||||||||||||
Custodian fees | 13,401 | 10,665 | 1,248 | 1,507 | 6,255 | 10,874 | 4,079 | 8,732 | ||||||||||||||||||||||||
Directors’ fees | 18,404 | 13,773 | 1,379 | 1,603 | 997 | 2,111 | 2,354 | 9,158 | ||||||||||||||||||||||||
Professional fees | 20,022 | 18,219 | 12,615 | 12,730 | 12,469 | 12,923 | 12,997 | 16,076 | ||||||||||||||||||||||||
Accounting fees | 65,416 | 51,063 | 9,315 | 21,789 | 10,760 | 14,863 | 12,331 | 35,189 | ||||||||||||||||||||||||
Printing and filing fees | 26,594 | 20,466 | 1,931 | 2,299 | 1,442 | 3,005 | 3,306 | 13,309 | ||||||||||||||||||||||||
Compliance expense | 6,899 | 6,899 | 6,899 | 6,899 | 6,899 | 6,899 | 6,899 | 6,899 | ||||||||||||||||||||||||
Other | 6,046 | 4,531 | 477 | 545 | 314 | 743 | 844 | 2,705 | ||||||||||||||||||||||||
|
|
|
|
|
|
|
|
|
|
|
|
|
|
|
| |||||||||||||||||
Total expenses | 1,578,296 | 1,294,620 | 140,206 | 154,195 | 121,799 | 182,116 | 188,047 | 843,058 | ||||||||||||||||||||||||
|
|
|
|
|
|
|
|
|
|
|
|
|
|
|
| |||||||||||||||||
Net investment income (loss) | 980,932 | (949,037 | ) | 87,152 | 382,509 | 107,822 | 233,238 | 423,961 | 383,901 | |||||||||||||||||||||||
|
|
|
|
|
|
|
|
|
|
|
|
|
|
|
| |||||||||||||||||
Realized/unrealized gain (loss) on investments, foreign currency related transactions, and written options: | ||||||||||||||||||||||||||||||||
Net realized gain (loss) on: | ||||||||||||||||||||||||||||||||
Investments | 13,130,784 | 23,283,240 | 890,153 | 351,531 | 470,895 | 2,534,963 | 3,694,903 | 7,769,014 | ||||||||||||||||||||||||
Foreign currency related transactions | (13 | ) | — | — | (20 | ) | — | — | — | (6 | ) | |||||||||||||||||||||
Written options | — | — | — | — | (20,363 | ) | — | — | — | |||||||||||||||||||||||
Change in unrealized appreciation/depreciation on: | ||||||||||||||||||||||||||||||||
Investments | (26,663,794 | ) | (33,319,384 | ) | (1,205,424 | ) | (479,142 | ) | (768,994 | ) | (3,060,087 | ) | (6,895,822 | ) | (9,674,876 | ) | ||||||||||||||||
Written options | — | — | — | — | 81,745 | — | — | — | ||||||||||||||||||||||||
|
|
|
|
|
|
|
|
|
|
|
|
|
|
|
| |||||||||||||||||
Net realized/unrealized gain (loss) on investments, foreign currency related transactions, and written options | (13,533,023 | ) | (10,036,144 | ) | (315,271 | ) | (127,631 | ) | (236,717 | ) | (525,124 | ) | (3,200,919 | ) | (1,905,868 | ) | ||||||||||||||||
|
|
|
|
|
|
|
|
|
|
|
|
|
|
|
| |||||||||||||||||
Change in net assets from operations | $ | (12,552,091 | ) | $ | (10,985,181 | ) | $ | (228,119 | ) | $ | 254,878 | $ | (128,895 | ) | $ | (291,886 | ) | $ | (2,776,958 | ) | $ | (1,521,967 | ) | |||||||||
|
|
|
|
|
|
|
|
|
|
|
|
|
|
|
| |||||||||||||||||
* Taxes withheld | $ | 3,389 | $ | 4,532 | $ | 847 | $ | 3,160 | $ | 809 | $ | 31,293 | $ | — | $ | 1,639 | ||||||||||||||||
|
|
|
|
|
|
|
|
|
|
|
|
|
|
|
| |||||||||||||||||
The accompanying notes are an integral part of these financial statements.
| 112 |
| Ohio National Fund, Inc. |
| Equity Portfolio | Money Market Portfolio | Bond Portfolio | Omni Portfolio | |||||||||||||||||||||||||||||
| Year Ended December 31, 2011 | Year Ended December 31, 2010 | Year Ended December 31, 2011 | Year Ended December 31, 2010 | Year Ended December 31, 2011 | Year Ended December 31, 2010 | Year Ended December 31, 2011 | Year Ended December 31, 2010 | |||||||||||||||||||||||||
Increase (Decrease) in Net Assets: | ||||||||||||||||||||||||||||||||
Operations: | ||||||||||||||||||||||||||||||||
Net investment income (loss) | $ | 2,050,230 | $ | 450,304 | $ | — | $ | — | $ | 5,641,940 | $ | 5,839,374 | $ | 539,778 | $ | 693,415 | ||||||||||||||||
Net realized gain (loss) on investments and foreign currency related transactions | (1,586,673 | ) | (1,138,078 | ) | — | — | 824,712 | 1,961,700 | 2,378,862 | 2,963,526 | ||||||||||||||||||||||
Change in unrealized appreciation/depreciation on investments | (7,441,587 | ) | 17,726,044 | — | — | 2,856,388 | 3,535,443 | (4,379,083 | ) | 1,338,298 | ||||||||||||||||||||||
|
|
|
|
|
|
|
|
|
|
|
|
|
|
|
| |||||||||||||||||
Change in net assets from operations | (6,978,030 | ) | 17,038,270 | — | — | 9,323,040 | 11,336,517 | (1,460,443 | ) | 4,995,239 | ||||||||||||||||||||||
|
|
|
|
|
|
|
|
|
|
|
|
|
|
|
| |||||||||||||||||
Distributions to shareholders: | ||||||||||||||||||||||||||||||||
Distributions from net investment income | (1,709,149 | ) | (425,944 | ) | — | — | — | — | (467,625 | ) | (606,516 | ) | ||||||||||||||||||||
|
|
|
|
|
|
|
|
|
|
|
|
|
|
|
| |||||||||||||||||
Capital transactions: | ||||||||||||||||||||||||||||||||
Received from shares sold | 18,469,577 | 21,954,910 | 325,508,308 | 305,026,132 | 54,452,714 | 57,209,206 | 3,650,326 | 3,734,570 | ||||||||||||||||||||||||
Received from dividends reinvested | 1,709,149 | 425,944 | — | — | — | — | 467,625 | 606,516 | ||||||||||||||||||||||||
Paid for shares redeemed | (43,066,271 | ) | (46,072,388 | ) | (332,767,148 | ) | (352,822,395 | ) | (49,917,819 | ) | (58,280,990 | ) | (8,714,120 | ) | (9,069,964 | ) | ||||||||||||||||
|
|
|
|
|
|
|
|
|
|
|
|
|
|
|
| |||||||||||||||||
Change in net assets from capital transactions | (22,887,545 | ) | (23,691,534 | ) | (7,258,840 | ) | (47,796,263 | ) | 4,534,895 | (1,071,784 | ) | (4,596,169 | ) | (4,728,878 | ) | |||||||||||||||||
|
|
|
|
|
|
|
|
|
|
|
|
|
|
|
| |||||||||||||||||
Change in net assets | (31,574,724 | ) | (7,079,208 | ) | (7,258,840 | ) | (47,796,263 | ) | 13,857,935 | 10,264,733 | (6,524,237 | ) | (340,155 | ) | ||||||||||||||||||
Net Assets: | ||||||||||||||||||||||||||||||||
Beginning of year | 219,431,482 | 226,510,690 | 293,446,937 | 341,243,200 | 148,177,042 | 137,912,309 | 41,177,220 | 41,517,375 | ||||||||||||||||||||||||
|
|
|
|
|
|
|
|
|
|
|
|
|
|
|
| |||||||||||||||||
End of year | $ | 187,856,758 | $ | 219,431,482 | $ | 286,188,097 | $ | 293,446,937 | $ | 162,034,977 | $ | 148,177,042 | $ | 34,652,983 | $ | 41,177,220 | ||||||||||||||||
|
|
|
|
|
|
|
|
|
|
|
|
|
|
|
| |||||||||||||||||
Undistributed net investment income | $ | 321,507 | $ | 24,360 | $ | — | $ | — | $ | 5,644,604 | $ | 5,842,038 | $ | 72,151 | $ | 86,728 | ||||||||||||||||
|
|
|
|
|
|
|
|
|
|
|
|
|
|
|
| |||||||||||||||||
The accompanying notes are an integral part of these financial statements.
| 113 |
| Ohio National Fund, Inc. |
Statements of Changes in Net Assets |
| International Portfolio | Capital Appreciation Portfolio | Millennium Portfolio | International Small-Mid Company Portfolio | |||||||||||||||||||||||||||||
| Year Ended December 31, 2011 | Year Ended December 31, 2010 | Year Ended December 31, 2011 | Year Ended December 31, 2010 | Year Ended December 31, 2011 | Year Ended December 31, 2010 | Year Ended December 31, 2011 | Year Ended December 31, 2010 | |||||||||||||||||||||||||
Increase (Decrease) in Net Assets: | ||||||||||||||||||||||||||||||||
Operations: | ||||||||||||||||||||||||||||||||
Net investment income (loss) | $ | 2,763,902 | $ | 2,332,430 | $ | 512,592 | $ | 387,840 | $ | (265,247 | ) | $ | (527,603 | ) | $ | 759,480 | $ | 218,206 | ||||||||||||||
Net realized gain (loss) on investments, futures contracts, foreign currency contracts, and other foreign currency related transactions | 5,625,132 | 24,752,616 | 13,380,126 | 11,430,819 | 5,455,807 | 16,124,928 | 7,051,106 | 6,361,321 | ||||||||||||||||||||||||
Change in unrealized appreciation/depreciation on investments, futures contracts, foreign currency contracts, and other foreign currency related transactions | (36,962,218 | ) | 5,614,028 | (15,407,876 | ) | 7,958,092 | (5,423,430 | ) | (9,539,756 | ) | (20,184,071 | ) | 5,982,508 | |||||||||||||||||||
|
|
|
|
|
|
|
|
|
|
|
|
|
|
|
| |||||||||||||||||
Change in net assets from operations | (28,573,184 | ) | 32,699,074 | (1,515,158 | ) | 19,776,751 | (232,870 | ) | 6,057,569 | (12,373,485 | ) | 12,562,035 | ||||||||||||||||||||
|
|
|
|
|
|
|
|
|
|
|
|
|
|
|
| |||||||||||||||||
Distributions to shareholders: | ||||||||||||||||||||||||||||||||
Distributions from net investment income | — | — | (471,108 | ) | (284,477 | ) | — | — | — | — | ||||||||||||||||||||||
|
|
|
|
|
|
|
|
|
|
|
|
|
|
|
| |||||||||||||||||
Capital transactions: | ||||||||||||||||||||||||||||||||
Received from shares sold | 26,491,894 | 24,045,087 | 13,034,340 | 12,695,267 | 6,473,011 | 20,100,436 | 11,780,860 | 12,335,886 | ||||||||||||||||||||||||
Received from dividends reinvested | — | — | 471,108 | 284,477 | — | — | — | — | ||||||||||||||||||||||||
Paid for shares redeemed | (38,194,519 | ) | (53,704,699 | ) | (26,649,763 | ) | (28,925,158 | ) | (11,842,246 | ) | (94,390,633 | ) | (20,534,648 | ) | (17,349,611 | ) | ||||||||||||||||
|
|
|
|
|
|
|
|
|
|
|
|
|
|
|
| |||||||||||||||||
Change in net assets from capital transactions | (11,702,625 | ) | (29,659,612 | ) | (13,144,315 | ) | (15,945,414 | ) | (5,369,235 | ) | (74,290,197 | ) | (8,753,788 | ) | (5,013,725 | ) | ||||||||||||||||
|
|
|
|
|
|
|
|
|
|
|
|
|
|
|
| |||||||||||||||||
Change in net assets | (40,275,809 | ) | 3,039,462 | (15,130,581 | ) | 3,546,860 | (5,602,105 | ) | (68,232,628 | ) | (21,127,273 | ) | 7,548,310 | |||||||||||||||||||
Net Assets: | ||||||||||||||||||||||||||||||||
Beginning of year | 213,085,792 | 210,046,330 | 129,801,059 | 126,254,199 | 42,077,333 | 110,309,961 | 78,612,580 | 71,064,270 | ||||||||||||||||||||||||
|
|
|
|
|
|
|
|
|
|
|
|
|
|
|
| |||||||||||||||||
End of year | $ | 172,809,983 | $ | 213,085,792 | $ | 114,670,478 | $ | 129,801,059 | $ | 36,475,228 | $ | 42,077,333 | $ | 57,485,307 | $ | 78,612,580 | ||||||||||||||||
|
|
|
|
|
|
|
|
|
|
|
|
|
|
|
| |||||||||||||||||
Undistributed net investment income (loss) | $ | (975,843 | ) | $ | 3,106,271 | $ | 42,139 | $ | 85,152 | $ | — | $ | — | $ | 729,334 | $ | 87,320 | |||||||||||||||
|
|
|
|
|
|
|
|
|
|
|
|
|
|
|
| |||||||||||||||||
The accompanying notes are an integral part of these financial statements.
| 114 |
| Ohio National Fund, Inc. |
Statements of Changes in Net Assets |
| Aggressive Growth Portfolio | Small Cap Growth Portfolio | Mid Cap Opportunity Portfolio | S&P 500® Index Portfolio | |||||||||||||||||||||||||||||
| Year Ended December 31, 2011 | Year Ended December 31, 2010 | Year Ended December 31, 2011 | Year Ended December 31, 2010 | Year Ended December 31, 2011 | Year Ended December 31, 2010 | Year Ended December 31, 2011 | Year Ended December 31, 2010 | |||||||||||||||||||||||||
Increase (Decrease) in Net Assets: | ||||||||||||||||||||||||||||||||
Operations: | ||||||||||||||||||||||||||||||||
Net investment income (loss) | $ | 4,686 | $ | 46,348 | $ | (199,385 | ) | $ | (173,333 | ) | $ | (190,720 | ) | $ | (221,534 | ) | $ | 2,834,031 | $ | 2,555,633 | ||||||||||||
Net realized gain (loss) on investments and foreign currency related transactions | 2,027,613 | 340,613 | 4,917,380 | 2,457,211 | 5,767,671 | 5,891,311 | (572,071 | ) | (322,308 | ) | ||||||||||||||||||||||
Change in unrealized appreciation/depreciation on investments and foreign currency related transactions | (3,411,059 | ) | 2,014,140 | (3,905,022 | ) | 4,610,166 | (7,616,332 | ) | 6,025,662 | 489,142 | 20,060,180 | |||||||||||||||||||||
|
|
|
|
|
|
|
|
|
|
|
|
|
|
|
| |||||||||||||||||
Change in net assets from operations | (1,378,760 | ) | 2,401,101 | 812,973 | 6,894,044 | (2,039,381 | ) | 11,695,439 | 2,751,102 | 22,293,505 | ||||||||||||||||||||||
|
|
|
|
|
|
|
|
|
|
|
|
|
|
|
| |||||||||||||||||
Distributions to shareholders: | ||||||||||||||||||||||||||||||||
Distributions from net investment income | — | — | — | — | — | — | (2,390,576 | ) | (2,196,659 | ) | ||||||||||||||||||||||
|
|
|
|
|
|
|
|
|
|
|
|
|
|
|
| |||||||||||||||||
Capital transactions: | ||||||||||||||||||||||||||||||||
Received from shares sold | 6,293,281 | 9,372,757 | 10,807,715 | 10,622,179 | 9,234,055 | 9,304,135 | 39,553,518 | 32,754,237 | ||||||||||||||||||||||||
Received from dividends reinvested | — | — | — | — | — | — | 2,390,576 | 2,196,659 | ||||||||||||||||||||||||
Paid for shares redeemed | (8,916,428 | ) | (9,193,403 | ) | (12,221,376 | ) | (8,178,329 | ) | (16,499,127 | ) | (14,133,909 | ) | (47,804,467 | ) | (39,577,141 | ) | ||||||||||||||||
|
|
|
|
|
|
|
|
|
|
|
|
|
|
|
| |||||||||||||||||
Change in net assets from capital transactions | (2,623,147 | ) | 179,354 | (1,413,661 | ) | 2,443,850 | (7,265,072 | ) | (4,829,774 | ) | (5,860,373 | ) | (4,626,245 | ) | ||||||||||||||||||
|
|
|
|
|
|
|
|
|
|
|
|
|
|
|
| |||||||||||||||||
Change in net assets | (4,001,907 | ) | 2,580,455 | (600,688 | ) | 9,337,894 | (9,304,453 | ) | 6,865,665 | (5,499,847 | ) | 15,470,601 | ||||||||||||||||||||
Net Assets: | ||||||||||||||||||||||||||||||||
Beginning of year | 29,757,252 | 27,176,797 | 32,099,435 | 22,761,541 | 70,367,443 | 63,501,778 | 176,179,054 | 160,708,453 | ||||||||||||||||||||||||
|
|
|
|
|
|
|
|
|
|
|
|
|
|
|
| |||||||||||||||||
End of year | $ | 25,755,345 | $ | 29,757,252 | $ | 31,498,747 | $ | 32,099,435 | $ | 61,062,990 | $ | 70,367,443 | $ | 170,679,207 | $ | 176,179,054 | ||||||||||||||||
|
|
|
|
|
|
|
|
|
|
|
|
|
|
|
| |||||||||||||||||
Undistributed net investment income (loss) | $ | 3,051 | $ | 111,728 | $ | — | $ | (5 | ) | $ | — | $ | — | $ | 437,674 | $ | 368,226 | |||||||||||||||
|
|
|
|
|
|
|
|
|
|
|
|
|
|
|
| |||||||||||||||||
The accompanying notes are an integral part of these financial statements.
| 115 |
| Ohio National Fund, Inc. |
Statements of Changes in Net Assets |
| Strategic Value Portfolio | High Income Bond Portfolio | Capital Growth Portfolio | Nasdaq-100® Index Portfolio | |||||||||||||||||||||||||||||
| Year Ended December 31, 2011 | Year Ended December 31, 2010 | Year Ended December 31, 2011 | Year Ended December 31, 2010 | Year Ended December 31, 2011 | Year Ended December 31, 2010 | Year Ended December 31, 2011 | Year Ended December 31, 2010 | |||||||||||||||||||||||||
Increase (Decrease) in Net Assets: | ||||||||||||||||||||||||||||||||
Operations: | ||||||||||||||||||||||||||||||||
Net investment income (loss) | $ | 1,209,761 | $ | 876,152 | $ | 21,132,185 | $ | 17,715,261 | $ | (352,177 | ) | $ | (200,594 | ) | $ | 225,802 | $ | 180,606 | ||||||||||||||
Net realized gain (loss) on investments, foreign currency contracts, and foreign currency related transactions | 957,858 | (439,471 | ) | 4,997,438 | (1,283,156 | ) | 8,111,683 | 4,848,954 | 7,286,117 | 2,684,393 | ||||||||||||||||||||||
Change in unrealized appreciation/depreciation on investments, foreign currency contracts, and other foreign currency related transactions | 2,070,206 | 2,138,874 | (13,026,934 | ) | 13,632,138 | (9,323,741 | ) | 8,739,357 | (5,817,310 | ) | 5,413,358 | |||||||||||||||||||||
|
|
|
|
|
|
|
|
|
|
|
|
|
|
|
| |||||||||||||||||
Change in net assets from operations | 4,237,825 | 2,575,555 | 13,102,689 | 30,064,243 | (1,564,235 | ) | 13,387,717 | 1,694,609 | 8,278,357 | |||||||||||||||||||||||
|
|
|
|
|
|
|
|
|
|
|
|
|
|
|
| |||||||||||||||||
Distributions to shareholders: | ||||||||||||||||||||||||||||||||
Distributions from net investment income | (599,193 | ) | (591,141 | ) | — | — | — | — | (205,415 | ) | (158,375 | ) | ||||||||||||||||||||
Return of capital distributions | — | (175,066 | ) | — | — | — | — | — | — | |||||||||||||||||||||||
|
|
|
|
|
|
|
|
|
|
|
|
|
|
|
| |||||||||||||||||
Total distributions | (599,193 | ) | (766,207 | ) | — | — | — | — | (205,415 | ) | (158,375 | ) | ||||||||||||||||||||
|
|
|
|
|
|
|
|
|
|
|
|
|
|
|
| |||||||||||||||||
Capital transactions: | ||||||||||||||||||||||||||||||||
Received from shares sold | 23,250,524 | 9,495,133 | 88,330,748 | 152,858,080 | 21,876,325 | 13,911,151 | 21,724,700 | 18,796,999 | ||||||||||||||||||||||||
Received from dividends reinvested | 599,193 | 766,207 | — | — | — | — | 205,415 | 158,375 | ||||||||||||||||||||||||
Paid for shares redeemed | (9,851,748 | ) | (7,486,436 | ) | (103,758,722 | ) | (73,042,369 | ) | (21,618,111 | ) | (11,671,289 | ) | (22,886,769 | ) | (19,725,238 | ) | ||||||||||||||||
|
|
|
|
|
|
|
|
|
|
|
|
|
|
|
| |||||||||||||||||
Change in net assets from capital transactions | 13,997,969 | 2,774,904 | (15,427,974 | ) | 79,815,711 | 258,214 | 2,239,862 | (956,654 | ) | (769,864 | ) | |||||||||||||||||||||
|
|
|
|
|
|
|
|
|
|
|
|
|
|
|
| |||||||||||||||||
Change in net assets | 17,636,601 | 4,584,252 | (2,325,285 | ) | 109,879,954 | (1,306,021 | ) | 15,627,579 | 532,540 | 7,350,118 | ||||||||||||||||||||||
Net Assets: | ||||||||||||||||||||||||||||||||
Beginning of year | 24,347,260 | 19,763,008 | 269,787,163 | 159,907,209 | 52,411,406 | 36,783,827 | 54,938,397 | 47,588,279 | ||||||||||||||||||||||||
|
|
|
|
|
|
|
|
|
|
|
|
|
|
|
| |||||||||||||||||
End of year | $ | 41,983,861 | $ | 24,347,260 | $ | 267,461,878 | $ | 269,787,163 | $ | 51,105,385 | $ | 52,411,406 | $ | 55,470,937 | $ | 54,938,397 | ||||||||||||||||
|
|
|
|
|
|
|
|
|
|
|
|
|
|
|
| |||||||||||||||||
Undistributed net investment income (loss) | $ | 560,303 | $ | (46,569 | ) | $ | 21,132,185 | $ | 17,781,200 | $ | — | $ | 35,049 | $ | 20,387 | $ | 22,231 | |||||||||||||||
|
|
|
|
|
|
|
|
|
|
|
|
|
|
|
| |||||||||||||||||
The accompanying notes are an integral part of these financial statements.
| 116 |
| Ohio National Fund, Inc. |
Statements of Changes in Net Assets |
| Bristol Portfolio | Bryton Growth Portfolio | U.S. Equity Portfolio | Balanced Portfolio | |||||||||||||||||||||||||||||
| Year Ended December 31, 2011 | Year Ended December 31, 2010 | Year Ended December 31, 2011 | Year Ended December 31, 2010 | Year Ended December 31, 2011 | Year Ended December 31, 2010 | Year Ended December 31, 2011 | Year Ended December 31, 2010 | |||||||||||||||||||||||||
Increase (Decrease) in Net Assets: | ||||||||||||||||||||||||||||||||
Operations: | ||||||||||||||||||||||||||||||||
Net investment income (loss) | $ | 980,932 | $ | 1,099,120 | $ | (949,037 | ) | $ | (594,575 | ) | $ | 87,152 | $ | 114,584 | $ | 382,509 | $ | 331,961 | ||||||||||||||
Net realized gain (loss) on investments and foreign currency related transactions | 13,130,771 | 13,165,753 | 23,283,240 | 15,009,999 | 890,153 | 1,360,515 | 351,511 | 680,867 | ||||||||||||||||||||||||
Change in unrealized appreciation/depreciation on investments and foreign currency related transactions | (26,663,794 | ) | 8,557,768 | (33,319,384 | ) | 12,578,232 | (1,205,424 | ) | 160,094 | (479,142 | ) | (1,024 | ) | |||||||||||||||||||
|
|
|
|
|
|
|
|
|
|
|
|
|
|
|
| |||||||||||||||||
Change in net assets from operations | (12,552,091 | ) | 22,822,641 | (10,985,181 | ) | 26,993,656 | (228,119 | ) | 1,635,193 | 254,878 | 1,011,804 | |||||||||||||||||||||
|
|
|
|
|
|
|
|
|
|
|
|
|
|
|
| |||||||||||||||||
Distributions to shareholders: | ||||||||||||||||||||||||||||||||
Distributions from net investment income | (910,805 | ) | (995,109 | ) | — | — | — | (99,183 | ) | (324,529 | ) | (282,940 | ) | |||||||||||||||||||
|
|
|
|
|
|
|
|
|
|
|
|
|
|
|
| |||||||||||||||||
Capital transactions: | ||||||||||||||||||||||||||||||||
Received from shares sold | 51,481,798 | 51,108,856 | 51,927,445 | 38,665,672 | 2,353,412 | 1,837,204 | 7,783,601 | 3,408,481 | ||||||||||||||||||||||||
Received from dividends reinvested | 910,805 | 995,109 | — | — | — | 99,183 | 324,529 | 282,940 | ||||||||||||||||||||||||
Paid for shares redeemed | (28,902,202 | ) | (34,085,789 | ) | (22,913,491 | ) | (41,681,638 | ) | (3,298,269 | ) | (3,593,412 | ) | (5,474,697 | ) | (3,509,686 | ) | ||||||||||||||||
|
|
|
|
|
|
|
|
|
|
|
|
|
|
|
| |||||||||||||||||
Change in net assets from capital transactions | 23,490,401 | 18,018,176 | 29,013,954 | (3,015,966 | ) | (944,857 | ) | (1,657,025 | ) | 2,633,433 | 181,735 | |||||||||||||||||||||
|
|
|
|
|
|
|
|
|
|
|
|
|
|
|
| |||||||||||||||||
Change in net assets | 10,027,505 | 39,845,708 | 18,028,773 | 23,977,690 | (1,172,976 | ) | (121,015 | ) | 2,563,782 | 910,599 | ||||||||||||||||||||||
Net Assets: | ||||||||||||||||||||||||||||||||
Beginning of year | 182,644,630 | 142,798,922 | 137,411,812 | 113,434,122 | 14,508,987 | 14,630,002 | 14,492,946 | 13,582,347 | ||||||||||||||||||||||||
|
|
|
|
|
|
|
|
|
|
|
|
|
|
|
| |||||||||||||||||
End of year | $ | 192,672,135 | $ | 182,644,630 | $ | 155,440,585 | $ | 137,411,812 | $ | 13,336,011 | $ | 14,508,987 | $ | 17,056,728 | $ | 14,492,946 | ||||||||||||||||
|
|
|
|
|
|
|
|
|
|
|
|
|
|
|
| |||||||||||||||||
Undistributed net investment income (loss) | $ | 70,114 | $ | 103,294 | $ | 830,443 | $ | — | $ | 87,152 | $ | 15,401 | $ | 57,379 | $ | 49,058 | ||||||||||||||||
|
|
|
|
|
|
|
|
|
|
|
|
|
|
|
| |||||||||||||||||
The accompanying notes are an integral part of these financial statements.
| 117 |
| Ohio National Fund, Inc. |
Statements of Changes in Net Assets |
| Income Opportunity Portfolio | Target VIP Portfolio | Target Equity/Income Portfolio | Bristol Growth Portfolio | |||||||||||||||||||||||||||||
| Year Ended December 31, 2011 | Year Ended December 31, 2010 | Year Ended December 31, 2011 | Year Ended December 31, 2010 | Year Ended December 31, 2011 | Year Ended December 31, 2010 | Year Ended December 31, 2011 | Year Ended December 31, 2010 | |||||||||||||||||||||||||
Increase (Decrease) in Net Assets: | ||||||||||||||||||||||||||||||||
Operations: | ||||||||||||||||||||||||||||||||
Net investment income (loss) | $ | 107,822 | $ | 70,078 | $ | 233,238 | $ | 297,878 | $ | 423,961 | $ | 363,652 | $ | 383,901 | $ | 276,215 | ||||||||||||||||
Net realized gain (loss) on investments, foreign currency related transactions, and written options | 450,532 | (15,176 | ) | 2,534,963 | 1,642,994 | 3,694,903 | 1,618,442 | 7,769,008 | 5,178,457 | |||||||||||||||||||||||
Change in unrealized appreciation/depreciation on investments, foreign currency related transactions, and written options | (687,249 | ) | 525,550 | (3,060,087 | ) | 1,712,578 | (6,895,822 | ) | 3,054,237 | (9,674,876 | ) | 9,642,592 | ||||||||||||||||||||
|
|
|
|
|
|
|
|
|
|
|
|
|
|
|
| |||||||||||||||||
Change in net assets from operations | (128,895 | ) | 580,452 | (291,886 | ) | 3,653,450 | (2,776,958 | ) | 5,036,331 | (1,521,967 | ) | 15,097,264 | ||||||||||||||||||||
|
|
|
|
|
|
|
|
|
|
|
|
|
|
|
| |||||||||||||||||
Distributions to shareholders: | ||||||||||||||||||||||||||||||||
Distributions from net investment income | — | — | (209,154 | ) | (266,234 | ) | (373,545 | ) | (305,152 | ) | (366,489 | ) | (259,134 | ) | ||||||||||||||||||
|
|
|
|
|
|
|
|
|
|
|
|
|
|
|
| |||||||||||||||||
Capital transactions: | ||||||||||||||||||||||||||||||||
Received from shares sold | 3,882,060 | 3,876,875 | 3,992,391 | 3,229,205 | 4,881,643 | 6,337,967 | 31,340,964 | 73,946,057 | ||||||||||||||||||||||||
Received from dividends reinvested | — | — | 209,154 | 266,234 | 373,545 | 305,152 | 366,489 | 259,134 | ||||||||||||||||||||||||
Paid for shares redeemed | (2,567,327 | ) | (1,500,541 | ) | (5,020,379 | ) | (5,607,398 | ) | (7,036,529 | ) | (7,429,363 | ) | (15,201,793 | ) | (14,244,723 | ) | ||||||||||||||||
|
|
|
|
|
|
|
|
|
|
|
|
|
|
|
| |||||||||||||||||
Change in net assets from capital transactions | 1,314,733 | 2,376,334 | (818,834 | ) | (2,111,959 | ) | (1,781,341 | ) | (786,244 | ) | 16,505,660 | 59,960,468 | ||||||||||||||||||||
|
|
|
|
|
|
|
|
|
|
|
|
|
|
|
| |||||||||||||||||
Change in net assets | 1,185,838 | 2,956,786 | (1,319,874 | ) | 1,275,257 | (4,931,844 | ) | 3,944,935 | 14,617,204 | 74,798,598 | ||||||||||||||||||||||
Net Assets: | ||||||||||||||||||||||||||||||||
Beginning of year | 9,648,234 | 6,691,448 | 21,856,255 | 20,580,998 | 26,561,616 | 22,616,681 | 85,296,173 | 10,497,575 | ||||||||||||||||||||||||
|
|
|
|
|
|
|
|
|
|
|
|
|
|
|
| |||||||||||||||||
End of year | $ | 10,834,072 | $ | 9,648,234 | $ | 20,536,381 | $ | 21,856,255 | $ | 21,629,772 | $ | 26,561,616 | $ | 99,913,377 | $ | 85,296,173 | ||||||||||||||||
|
|
|
|
|
|
|
|
|
|
|
|
|
|
|
| |||||||||||||||||
Undistributed net investment income | $ | 107,843 | $ | 70,089 | $ | 24,084 | $ | 28,667 | $ | 50,416 | $ | 58,500 | $ | 17,406 | $ | 16,958 | ||||||||||||||||
|
|
|
|
|
|
|
|
|
|
|
|
|
|
|
| |||||||||||||||||
The accompanying notes are an integral part of these financial statements.
| 118 |
| Ohio National Fund, Inc. |
| Equity Portfolio | Money Market Portfolio | |||||||||||||||||||||||||||||||||||||||||||||||||
| Years Ended December 31, | Years Ended December 31, | |||||||||||||||||||||||||||||||||||||||||||||||||
| 2011 | 2010 | 2009 | 2008 | 2007 | 2011 | 2010 | 2009 | 2008 | 2007 | |||||||||||||||||||||||||||||||||||||||||
Selected Per-Share Data: | ||||||||||||||||||||||||||||||||||||||||||||||||||
Net asset value, beginning of year | $ | 19.72 | $ | 18.31 | $ | 13.19 | $ | 29.65 | $ | 31.52 | $ | 10.00 | $ | 10.00 | $ | 10.00 | $ | 10.00 | $ | 10.00 | ||||||||||||||||||||||||||||||
Operations: | ||||||||||||||||||||||||||||||||||||||||||||||||||
Net investment income | 0.21 | 0.04 | 0.05 | 0.22 | 0.02 | — | — | — | 0.17 | 0.48 | ||||||||||||||||||||||||||||||||||||||||
Net realized and unrealized gain (loss) on investments and | (0.88 | ) | 1.41 | 5.11 | (16.48 | ) | (1.88 | ) | — | — | — | — | — | |||||||||||||||||||||||||||||||||||||
|
|
|
|
|
|
|
|
|
|
|
|
|
|
|
|
|
|
|
| |||||||||||||||||||||||||||||||
Total from operations | (0.67 | ) | 1.45 | 5.16 | (16.26 | ) | (1.86 | ) | — | — | — | 0.17 | 0.48 | |||||||||||||||||||||||||||||||||||||
|
|
|
|
|
|
|
|
|
|
|
|
|
|
|
|
|
|
|
| |||||||||||||||||||||||||||||||
Distributions: | ||||||||||||||||||||||||||||||||||||||||||||||||||
Distributions from net investment income | (0.17 | ) | (0.04 | ) | (0.04 | ) | (0.20 | ) | (0.01 | ) | — | — | — | (0.17 | ) | (0.48 | ) | |||||||||||||||||||||||||||||||||
|
|
|
|
|
|
|
|
|
|
|
|
|
|
|
|
|
|
|
| |||||||||||||||||||||||||||||||
Net asset value, end of year | $ | 18.88 | $ | 19.72 | $ | 18.31 | $ | 13.19 | $ | 29.65 | $ | 10.00 | $ | 10.00 | $ | 10.00 | $ | 10.00 | $ | 10.00 | ||||||||||||||||||||||||||||||
|
|
|
|
|
|
|
|
|
|
|
|
|
|
|
|
|
|
|
| |||||||||||||||||||||||||||||||
Total return | –3.38 | % | 7.91 | % | 39.11 | % | –54.81 | % | –5.89 | % | 0.00 | % | 0.00 | % | 0.00 | % | 1.77 | % | 4.92 | % | ||||||||||||||||||||||||||||||
Ratios and supplemental data: | ||||||||||||||||||||||||||||||||||||||||||||||||||
Net assets at end of year (millions) | $ | 187.9 | $ | 219.4 | $ | 226.5 | $ | 187.5 | $ | 505.1 | $ | 286.2 | $ | 293.4 | $ | 341.2 | $ | 402.5 | $ | 336.2 | ||||||||||||||||||||||||||||||
Ratios to average net assets: | ||||||||||||||||||||||||||||||||||||||||||||||||||
Ratios net of expenses reduced or reimbursed by adviser: | ||||||||||||||||||||||||||||||||||||||||||||||||||
Expenses | 0.87 | % | 0.87 | % | 0.88 | % | 0.84 | % | 0.84 | % | 0.11 | % | 0.17 | % | 0.19 | % | 0.32 | % | 0.31 | % | ||||||||||||||||||||||||||||||
Net investment income | 1.00 | % | 0.21 | % | 0.27 | % | 0.89 | % | 0.05 | % | 0.00 | % | 0.00 | % | 0.00 | % | 1.72 | % | 4.79 | % | ||||||||||||||||||||||||||||||
Ratios assuming no expenses reduced or reimbursed by adviser: | ||||||||||||||||||||||||||||||||||||||||||||||||||
Expenses | 0.87 | % | 0.87 | % | 0.88 | % | 0.84 | % | 0.84 | % | 0.34 | % | 0.35 | % | 0.36 | % | 0.35 | % | 0.32 | % | ||||||||||||||||||||||||||||||
Net investment income (loss) | 1.00 | % | 0.21 | % | 0.27 | % | 0.89 | % | 0.05 | % | –0.23 | % | –0.18 | % | –0.17 | % | 1.68 | % | 4.77 | % | ||||||||||||||||||||||||||||||
Portfolio turnover rate | 54 | % | 50 | % | 24 | % | 39 | % | 23 | % | 0 | % | 0 | % | 0 | % | 0 | % | 0 | % | ||||||||||||||||||||||||||||||
The accompanying notes are an integral part of these financial statements.
| 119 |
| Ohio National Fund, Inc. |
Financial Highlights |
| Bond Portfolio | Omni Portfolio | |||||||||||||||||||||||||||||||||||||||
| Years Ended December 31, | Years Ended December 31, | |||||||||||||||||||||||||||||||||||||||
| 2011 | 2010 | 2009 | 2008 | 2007 | 2011 | 2010 | 2009 | 2008 | 2007 | |||||||||||||||||||||||||||||||
Selected Per-Share Data: | ||||||||||||||||||||||||||||||||||||||||
Net asset value, beginning of year | $ | 13.21 | $ | 12.25 | $ | 10.13 | $ | 11.44 | $ | 11.03 | $ | 16.08 | $ | 14.42 | $ | 11.02 | $ | 16.60 | $ | 15.79 | ||||||||||||||||||||
Operations: | ||||||||||||||||||||||||||||||||||||||||
Net investment income | 0.48 | 0.52 | 0.49 | 1.04 | 0.58 | 0.25 | 0.28 | 0.29 | 0.40 | 0.34 | ||||||||||||||||||||||||||||||
Net realized and unrealized gain (loss) on investments and foreign currency related transactions | 0.36 | 0.44 | 1.63 | (2.35 | ) | (0.17 | ) | (0.91 | ) | 1.62 | 3.36 | (5.63 | ) | 0.76 | ||||||||||||||||||||||||||
|
|
|
|
|
|
|
|
|
|
|
|
|
|
|
|
|
|
|
| |||||||||||||||||||||
Total from operations | 0.84 | 0.96 | 2.12 | (1.31 | ) | 0.41 | (0.66 | ) | 1.90 | 3.65 | (5.23 | ) | 1.10 | |||||||||||||||||||||||||||
|
|
|
|
|
|
|
|
|
|
|
|
|
|
|
|
|
|
|
| |||||||||||||||||||||
Distributions: | ||||||||||||||||||||||||||||||||||||||||
Distributions from net investment income | — | — | — | — | — | (0.21 | ) | (0.24 | ) | (0.25 | ) | (0.35 | ) | (0.29 | ) | |||||||||||||||||||||||||
|
|
|
|
|
|
|
|
|
|
|
|
|
|
|
|
|
|
|
| |||||||||||||||||||||
Net asset value, end of year | $ | 14.05 | $ | 13.21 | $ | 12.25 | $ | 10.13 | $ | 11.44 | $ | 15.21 | $ | 16.08 | $ | 14.42 | $ | 11.02 | $ | 16.60 | ||||||||||||||||||||
|
|
|
|
|
|
|
|
|
|
|
|
|
|
|
|
|
|
|
| |||||||||||||||||||||
Total return | 6.36 | % | 7.84 | % | 20.93 | % | –11.45 | % | 3.72 | % | –4.12 | % | 13.19 | % | 33.15 | % | –31.46 | % | 6.99 | % | ||||||||||||||||||||
Ratios and supplemental data: | ||||||||||||||||||||||||||||||||||||||||
Net assets at end of year (millions) | $ | 162.0 | $ | 148.2 | $ | 137.9 | $ | 107.8 | $ | 177.7 | $ | 34.7 | $ | 41.2 | $ | 41.5 | $ | 34.9 | $ | 61.8 | ||||||||||||||||||||
Ratios to average net assets: | ||||||||||||||||||||||||||||||||||||||||
Expenses | 0.66 | % | 0.67 | % | 0.69 | % | 0.66 | % | 0.63 | % | 0.77 | % | 0.78 | % | 0.79 | % | 0.74 | % | 0.71 | % | ||||||||||||||||||||
Net investment income | 3.70 | % | 3.91 | % | 5.06 | % | 5.35 | % | 4.99 | % | 1.40 | % | 1.71 | % | 2.18 | % | 2.43 | % | 1.85 | % | ||||||||||||||||||||
Portfolio turnover rate | 15 | % | 22 | % | 27 | % | 15 | % | 13 | % | 147 | % | 182 | % | 157 | % | 128 | % | 143 | % | ||||||||||||||||||||
The accompanying notes are an integral part of these financial statements.
| 120 |
| Ohio National Fund, Inc. |
Financial Highlights |
| International Portfolio | Capital Appreciation Portfolio | |||||||||||||||||||||||||||||||||||||||
| Years Ended December 31, | Years Ended December 31, | |||||||||||||||||||||||||||||||||||||||
| 2011 | 2010 | 2009 | 2008 | 2007 | 2011 | 2010 | 2009 | 2008 | 2007 | |||||||||||||||||||||||||||||||
Selected Per-Share Data: | ||||||||||||||||||||||||||||||||||||||||
Net asset value, beginning of year | $ | 12.20 | $ | 10.45 | $ | 7.56 | $ | 14.02 | $ | 12.81 | $ | 20.37 | $ | 17.45 | $ | 12.35 | $ | 20.45 | $ | 19.79 | ||||||||||||||||||||
Operations: | ||||||||||||||||||||||||||||||||||||||||
Net investment income | 0.17 | 0.14 | 0.14 | 0.13 | 0.09 | 0.09 | 0.06 | 0.22 | 0.14 | 0.11 | ||||||||||||||||||||||||||||||
Net realized and unrealized gain (loss) on investments, futures contracts, foreign currency contracts, and other foreign currency related transactions | (2.05 | ) | 1.61 | 2.75 | (6.59 | ) | 1.12 | (0.43 | ) | 2.90 | 5.07 | (8.12 | ) | 0.65 | ||||||||||||||||||||||||||
|
|
|
|
|
|
|
|
|
|
|
|
|
|
|
|
|
|
|
| |||||||||||||||||||||
Total from operations | (1.88 | ) | 1.75 | 2.89 | (6.46 | ) | 1.21 | (0.34 | ) | 2.96 | 5.29 | (7.98 | ) | 0.76 | ||||||||||||||||||||||||||
|
|
|
|
|
|
|
|
|
|
|
|
|
|
|
|
|
|
|
| |||||||||||||||||||||
Distributions: | ||||||||||||||||||||||||||||||||||||||||
Distributions from net investment income | — | — | — | — | — | (0.08 | ) | (0.04 | ) | (0.19 | ) | (0.12 | ) | (0.10 | ) | |||||||||||||||||||||||||
|
|
|
|
|
|
|
|
|
|
|
|
|
|
|
|
|
|
|
| |||||||||||||||||||||
Net asset value, end of year | $ | 10.32 | $ | 12.20 | $ | 10.45 | $ | 7.56 | $ | 14.02 | $ | 19.95 | $ | 20.37 | $ | 17.45 | $ | 12.35 | $ | 20.45 | ||||||||||||||||||||
|
|
|
|
|
|
|
|
|
|
|
|
|
|
|
|
|
|
|
| |||||||||||||||||||||
Total return | –15.41 | % | 16.75 | % | 38.23 | % | –46.08 | % | 9.45 | % | –1.65 | % | 16.99 | % | 42.84 | % | –39.01 | % | 3.82 | % | ||||||||||||||||||||
Ratios and supplemental data: | ||||||||||||||||||||||||||||||||||||||||
Net assets at end of year (millions) | $ | 172.8 | $ | 213.1 | $ | 210.0 | $ | 179.7 | $ | 389.2 | $ | 114.7 | $ | 129.8 | $ | 126.3 | $ | 103.6 | $ | 197.6 | ||||||||||||||||||||
Ratios to average net assets: | ||||||||||||||||||||||||||||||||||||||||
Expenses | 1.02 | % | 1.03 | % | 1.07 | % | 0.91 | % | 0.99 | % | 0.88 | % | 0.89 | % | 0.90 | % | 0.87 | % | 0.84 | % | ||||||||||||||||||||
Net investment income | 1.41 | % | 1.15 | % | 1.47 | % | 1.03 | % | 0.66 | % | 0.41 | % | 0.31 | % | 1.38 | % | 0.71 | % | 0.46 | % | ||||||||||||||||||||
Portfolio turnover rate | 58 | % | 67 | % | 168 | % | 214 | % | 123 | % | 61 | % | 58 | % | 84 | % | 79 | % | 69 | % | ||||||||||||||||||||
The accompanying notes are an integral part of these financial statements.
| 121 |
| Ohio National Fund, Inc. |
Financial Highlights |
| Millennium Portfolio | International Small-Mid Company Portfolio | |||||||||||||||||||||||||||||||||||||||
| Years Ended December 31, | Years Ended December 31, | |||||||||||||||||||||||||||||||||||||||
| 2011 | 2010 | 2009 | 2008 | 2007 | 2011 | 2010 | 2009 | 2008 | 2007 | |||||||||||||||||||||||||||||||
Selected Per-Share Data: | ||||||||||||||||||||||||||||||||||||||||
Net asset value, beginning of year | $ | 21.69 | $ | 17.45 | $ | 14.44 | $ | 25.13 | $ | 19.94 | $ | 23.24 | $ | 19.41 | $ | 13.29 | $ | 27.29 | $ | 23.23 | ||||||||||||||||||||
Operations: | ||||||||||||||||||||||||||||||||||||||||
Net investment income (loss) | (0.16 | ) | (0.27 | ) | (0.07 | ) | (0.16 | ) | (0.16 | ) | 0.26 | 0.07 | 0.07 | 0.08 | 0.07 | |||||||||||||||||||||||||
Net realized and unrealized gain (loss) on investments and foreign currency related transactions | (0.03 | ) | 4.51 | 3.08 | (10.53 | ) | 5.35 | (4.33 | ) | 3.76 | 6.05 | (14.08 | ) | 3.99 | ||||||||||||||||||||||||||
|
|
|
|
|
|
|
|
|
|
|
|
|
|
|
|
|
|
|
| |||||||||||||||||||||
Total from operations | (0.19 | ) | 4.24 | 3.01 | (10.69 | ) | 5.19 | (4.07 | ) | 3.83 | 6.12 | (14.00 | ) | 4.06 | ||||||||||||||||||||||||||
|
|
|
|
|
|
|
|
|
|
|
|
|
|
|
|
|
|
|
| |||||||||||||||||||||
Net asset value, end of year | $ | 21.50 | $ | 21.69 | $ | 17.45 | $ | 14.44 | $ | 25.13 | $ | 19.17 | $ | 23.24 | $ | 19.41 | $ | 13.29 | $ | 27.29 | ||||||||||||||||||||
|
|
|
|
|
|
|
|
|
|
|
|
|
|
|
|
|
|
|
| |||||||||||||||||||||
Total return | –0.88 | % | 24.30 | % | 20.84 | % | –42.54 | % | 26.03 | % | –17.51 | % | 19.73 | % | 46.05 | % | –51.30 | % | 17.48 | % | ||||||||||||||||||||
Ratios and supplemental data: | ||||||||||||||||||||||||||||||||||||||||
Net assets at end of year (millions) | $ | 36.5 | $ | 42.1 | $ | 110.3 | $ | 34.2 | $ | 71.1 | $ | 57.5 | $ | 78.6 | $ | 71.1 | $ | 52.7 | $ | 113.0 | ||||||||||||||||||||
Ratios to average net assets: | ||||||||||||||||||||||||||||||||||||||||
Expenses | 0.94 | % | 0.92 | % | 0.93 | % | 0.92 | % | 0.89 | % | 1.20 | % | 1.25 | % | 1.28 | % | 1.19 | % | 1.29 | % | ||||||||||||||||||||
Net investment income (loss) | –0.65 | % | –0.69 | % | –0.67 | % | –0.70 | % | –0.70 | % | 1.07 | % | 0.32 | % | 0.47 | % | 0.36 | % | 0.27 | % | ||||||||||||||||||||
Portfolio turnover rate | 228 | % | 254 | % | 248 | % | 224 | % | 156 | % | 67 | % | 81 | % | 125 | % | 75 | % | 53 | % | ||||||||||||||||||||
The accompanying notes are an integral part of these financial statements.
| 122 |
| Ohio National Fund, Inc. |
Financial Highlights |
| Aggressive Growth Portfolio | Small Cap Growth Portfolio | |||||||||||||||||||||||||||||||||||||||
| Years Ended December 31, | Years Ended December 31, | |||||||||||||||||||||||||||||||||||||||
| 2011 | 2010 | 2009 | 2008 | 2007 | 2011 | 2010 | 2009 | 2008 | 2007 | |||||||||||||||||||||||||||||||
Selected Per-Share Data: | ||||||||||||||||||||||||||||||||||||||||
Net asset value, beginning of year | $ | 8.17 | $ | 7.43 | $ | 5.21 | $ | 9.25 | $ | 7.14 | $ | 12.86 | $ | 9.89 | $ | 6.56 | $ | 12.54 | $ | 10.94 | ||||||||||||||||||||
Operations: | ||||||||||||||||||||||||||||||||||||||||
Net investment income (loss) | — | 0.01 | (0.02 | ) | (0.01 | ) | 0.02 | (0.08 | ) | (0.07 | ) | (0.06 | ) | (0.08 | ) | (0.09 | ) | |||||||||||||||||||||||
Net realized and unrealized gain (loss) on investments and foreign currency related transactions | (0.43 | ) | 0.73 | 2.24 | (4.03 | ) | 2.09 | 0.43 | 3.04 | 3.39 | (5.90 | ) | 1.69 | |||||||||||||||||||||||||||
|
|
|
|
|
|
|
|
|
|
|
|
|
|
|
|
|
|
|
| |||||||||||||||||||||
Total from operations | (0.43 | ) | 0.74 | 2.22 | (4.04 | ) | 2.11 | 0.35 | 2.97 | 3.33 | (5.98 | ) | 1.60 | |||||||||||||||||||||||||||
|
|
|
|
|
|
|
|
|
|
|
|
|
|
|
|
|
|
|
| |||||||||||||||||||||
Net asset value, end of year | $ | 7.74 | $ | 8.17 | $ | 7.43 | $ | 5.21 | $ | 9.25 | $ | 13.21 | $ | 12.86 | $ | 9.89 | $ | 6.56 | $ | 12.54 | ||||||||||||||||||||
|
|
|
|
|
|
|
|
|
|
|
|
|
|
|
|
|
|
|
| |||||||||||||||||||||
Total return | –5.26 | % | 9.96 | % | 42.61 | % | –43.68 | % | 29.55 | % | 2.72 | % | 30.03 | % | 50.76 | % | –47.69 | % | 14.63 | % | ||||||||||||||||||||
Ratios and supplemental data: | ||||||||||||||||||||||||||||||||||||||||
Net assets at end of year (millions) | $ | 25.8 | $ | 29.8 | $ | 27.2 | $ | 18.0 | $ | 28.8 | $ | 31.5 | $ | 32.1 | $ | 22.8 | $ | 13.2 | $ | 27.0 | ||||||||||||||||||||
Ratios to average net assets: | ||||||||||||||||||||||||||||||||||||||||
Expenses | 1.04 | % | 1.05 | % | 1.04 | % | 0.98 | % | 0.97 | % | 1.08 | % | 1.13 | % | 1.21 | % | 1.18 | % | 1.15 | % | ||||||||||||||||||||
Net investment income (loss) | 0.02 | % | 0.17 | % | –0.23 | % | –0.04 | % | 0.34 | % | –0.60 | % | –0.70 | % | –0.77 | % | –0.84 | % | –0.77 | % | ||||||||||||||||||||
Portfolio turnover rate | 47 | % | 37 | % | 28 | % | 43 | % | 29 | % | 58 | % | 94 | % | 50 | % | 37 | % | 74 | % | ||||||||||||||||||||
The accompanying notes are an integral part of these financial statements.
| 123 |
| Ohio National Fund, Inc. |
Financial Highlights |
| Mid Cap Opportunity Portfolio | S&P 500® Index Portfolio | |||||||||||||||||||||||||||||||||||||||
| Years Ended December 31, | Years Ended December 31, | |||||||||||||||||||||||||||||||||||||||
| 2011 | 2010 | 2009 | 2008 | 2007 | 2011 | 2010 | 2009 | 2008 | 2007 | |||||||||||||||||||||||||||||||
Selected Per-Share Data: | ||||||||||||||||||||||||||||||||||||||||
Net asset value, beginning of year | $ | 18.43 | $ | 15.41 | $ | 10.96 | $ | 22.50 | $ | 19.09 | $ | 13.21 | $ | 11.69 | $ | 9.41 | $ | 15.36 | $ | 14.82 | ||||||||||||||||||||
Operations: | ||||||||||||||||||||||||||||||||||||||||
Net investment income (loss) | (0.06 | ) | (0.06 | ) | (0.05 | ) | (0.07 | ) | (0.09 | ) | 0.22 | 0.19 | 0.17 | 0.24 | 0.24 | |||||||||||||||||||||||||
Net realized and unrealized gain (loss) on investments | (0.56 | ) | 3.08 | 4.50 | (11.47 | ) | 3.50 | 0.01 | 1.50 | 2.26 | (5.98 | ) | 0.51 | |||||||||||||||||||||||||||
|
|
|
|
|
|
|
|
|
|
|
|
|
|
|
|
|
|
|
| |||||||||||||||||||||
Total from operations | (0.62 | ) | 3.02 | 4.45 | (11.54 | ) | 3.41 | 0.23 | 1.69 | 2.43 | (5.74 | ) | 0.75 | |||||||||||||||||||||||||||
|
|
|
|
|
|
|
|
|
|
|
|
|
|
|
|
|
|
|
| |||||||||||||||||||||
Distributions: | ||||||||||||||||||||||||||||||||||||||||
Distributions from net investment income | — | — | — | — | — | (0.19 | ) | (0.17 | ) | (0.15 | ) | (0.21 | ) | (0.21 | ) | |||||||||||||||||||||||||
|
|
|
|
|
|
|
|
|
|
|
|
|
|
|
|
|
|
|
| |||||||||||||||||||||
Net asset value, end of year | $ | 17.81 | $ | 18.43 | $ | 15.41 | $ | 10.96 | $ | 22.50 | $ | 13.25 | $ | 13.21 | $ | 11.69 | $ | 9.41 | $ | 15.36 | ||||||||||||||||||||
|
|
|
|
|
|
|
|
|
|
|
|
|
|
|
|
|
|
|
| |||||||||||||||||||||
Total return | –3.36 | % | 19.60 | % | 40.60 | % | –51.29 | % | 17.86 | % | 1.77 | % | 14.45 | % | 25.83 | % | –37.30 | % | 5.06 | % | ||||||||||||||||||||
Ratios and supplemental data: | ||||||||||||||||||||||||||||||||||||||||
Net assets at end of year (millions) | $ | 61.1 | $ | 70.4 | $ | 63.5 | $ | 79.6 | $ | 115.4 | $ | 170.7 | $ | 176.2 | $ | 160.7 | $ | 106.2 | $ | 179.4 | ||||||||||||||||||||
Ratios to average net assets: | ||||||||||||||||||||||||||||||||||||||||
Expenses | 0.96 | % | 0.98 | % | 0.97 | % | 0.94 | % | 0.93 | % | 0.47 | % | 0.49 | % | 0.51 | % | 0.48 | % | 0.45 | % | ||||||||||||||||||||
Net investment income (loss) | –0.29 | % | –0.35 | % | –0.27 | % | –0.53 | % | –0.45 | % | 1.62 | % | 1.59 | % | 1.85 | % | 1.85 | % | 1.50 | % | ||||||||||||||||||||
Portfolio turnover rate | 51 | % | 56 | % | 276 | % | 297 | % | 267 | % | 9 | % | 8 | % | 21 | % | 12 | % | 7 | % | ||||||||||||||||||||
The accompanying notes are an integral part of these financial statements.
| 124 |
| Ohio National Fund, Inc. |
Financial Highlights |
| Strategic Value Portfolio | High Income Bond Portfolio | |||||||||||||||||||||||||||||||||||||||
| Years Ended December 31, | Years Ended December 31, | |||||||||||||||||||||||||||||||||||||||
| 2011 | 2010 | 2009 | 2008 | 2007 | 2011 | 2010 | 2009 | 2008 | 2007 | |||||||||||||||||||||||||||||||
Selected Per-Share Data: | ||||||||||||||||||||||||||||||||||||||||
Net asset value, beginning of year | $ | 9.36 | $ | 8.64 | $ | 7.97 | $ | 11.81 | $ | 13.10 | $ | 12.31 | $ | 10.79 | $ | 7.21 | $ | 9.68 | $ | 9.35 | ||||||||||||||||||||
Operations: | ||||||||||||||||||||||||||||||||||||||||
Net investment income | 0.33 | 0.35 | 0.27 | 0.56 | 0.17 | 1.08 | 0.58 | 0.46 | 0.68 | 0.59 | ||||||||||||||||||||||||||||||
Net realized and unrealized gain (loss) on investments and foreign currency related transactions | 0.98 | 0.68 | 0.65 | (3.91 | ) | (1.31 | ) | (0.42 | ) | 0.94 | 3.12 | (3.15 | ) | (0.26 | ) | |||||||||||||||||||||||||
|
|
|
|
|
|
|
|
|
|
|
|
|
|
|
|
|
|
|
| |||||||||||||||||||||
Total from operations | 1.31 | 1.03 | 0.92 | (3.35 | ) | (1.14 | ) | 0.66 | 1.52 | 3.58 | (2.47 | ) | 0.33 | |||||||||||||||||||||||||||
|
|
|
|
|
|
|
|
|
|
|
|
|
|
|
|
|
|
|
| |||||||||||||||||||||
Distributions: | ||||||||||||||||||||||||||||||||||||||||
Distributions from net investment income | (0.17 | ) | (0.24 | ) | (0.25 | ) | (0.49 | ) | (0.15 | ) | — | — | — | — | — | |||||||||||||||||||||||||
Return of capital distributions | — | (0.07 | ) | — | — | — | — | — | — | — | — | |||||||||||||||||||||||||||||
|
|
|
|
|
|
|
|
|
|
|
|
|
|
|
|
|
|
|
| |||||||||||||||||||||
Total distributions | (0.17 | ) | (0.31 | ) | (0.25 | ) | (0.49 | ) | (0.15 | ) | — | — | — | — | — | |||||||||||||||||||||||||
|
|
|
|
|
|
|
|
|
|
|
|
|
|
|
|
|
|
|
| |||||||||||||||||||||
Net asset value, end of year | $ | 10.50 | $ | 9.36 | $ | 8.64 | $ | 7.97 | $ | 11.81 | $ | 12.97 | $ | 12.31 | $ | 10.79 | $ | 7.21 | $ | 9.68 | ||||||||||||||||||||
|
|
|
|
|
|
|
|
|
|
|
|
|
|
|
|
|
|
|
| |||||||||||||||||||||
Total return | 14.03 | % | 11.98 | % | 11.52 | % | –28.27 | % | –8.74 | % | 5.36 | % | 14.09 | % | 49.65 | % | –25.52 | % | 3.53 | % | ||||||||||||||||||||
Ratios and supplemental data: | ||||||||||||||||||||||||||||||||||||||||
Net assets at end of year (millions) | $ | 42.0 | $ | 24.3 | $ | 19.8 | $ | 13.3 | $ | 28.4 | $ | 267.5 | $ | 269.8 | $ | 159.9 | $ | 71.3 | $ | 89.0 | ||||||||||||||||||||
Ratios to average net assets: | ||||||||||||||||||||||||||||||||||||||||
Expenses | 0.96 | % | 0.96 | % | 1.02 | % | 0.96 | % | 0.87 | % | 0.78 | % | 0.81 | % | 0.88 | % | 0.88 | % | 0.87 | % | ||||||||||||||||||||
Net investment income | 4.07 | % | 4.11 | % | 4.31 | % | 4.68 | % | 1.18 | % | 7.69 | % | 8.03 | % | 9.14 | % | 8.77 | % | 7.05 | % | ||||||||||||||||||||
Portfolio turnover rate | 19 | % | 31 | % | 42 | % | 162 | % | 63 | % | 35 | % | 33 | % | 20 | % | 18 | % | 32 | % | ||||||||||||||||||||
The accompanying notes are an integral part of these financial statements.
| 125 |
| Ohio National Fund, Inc. |
Financial Highlights |
| Capital Growth Portfolio | Nasdaq-100® Index Portfolio | |||||||||||||||||||||||||||||||||||||||
| Years Ended December 31, | Years Ended December 31, | |||||||||||||||||||||||||||||||||||||||
| 2011 | 2010 | 2009 | 2008 | 2007 | 2011 | 2010 | 2009 | 2008 | 2007 | |||||||||||||||||||||||||||||||
Selected Per-Share Data: | ||||||||||||||||||||||||||||||||||||||||
Net asset value, beginning of year | $ | 27.68 | $ | 20.29 | $ | 15.00 | $ | 23.57 | $ | 21.19 | $ | 5.69 | $ | 4.78 | $ | 3.11 | $ | 5.36 | $ | 4.52 | ||||||||||||||||||||
Operations: | ||||||||||||||||||||||||||||||||||||||||
Net investment income (loss) | (0.19 | ) | (0.11 | ) | — | (0.12 | ) | (0.16 | ) | 0.02 | 0.02 | 0.01 | — | — | ||||||||||||||||||||||||||
Net realized and unrealized gain (loss) on investments | (0.49 | ) | 7.50 | 5.29 | (8.45 | ) | 2.54 | 0.16 | 0.91 | 1.66 | (2.25 | ) | 0.84 | |||||||||||||||||||||||||||
|
|
|
|
|
|
|
|
|
|
|
|
|
|
|
|
|
|
|
| |||||||||||||||||||||
Total from operations | (0.68 | ) | 7.39 | 5.29 | (8.57 | ) | 2.38 | 0.18 | 0.93 | 1.67 | (2.25 | ) | 0.84 | |||||||||||||||||||||||||||
|
|
|
|
|
|
|
|
|
|
|
|
|
|
|
|
|
|
|
| |||||||||||||||||||||
Distributions: | ||||||||||||||||||||||||||||||||||||||||
Distributions from net investment income | — | — | — | — | — | (0.02 | ) | (0.02 | ) | — | — | — | ||||||||||||||||||||||||||||
|
|
|
|
|
|
|
|
|
|
|
|
|
|
|
|
|
|
|
| |||||||||||||||||||||
Net asset value, end of year | $ | 27.00 | $ | 27.68 | $ | 20.29 | $ | 15.00 | $ | 23.57 | $ | 5.85 | $ | 5.69 | $ | 4.78 | $ | 3.11 | $ | 5.36 | ||||||||||||||||||||
|
|
|
|
|
|
|
|
|
|
|
|
|
|
|
|
|
|
|
| |||||||||||||||||||||
Total return | –2.46 | % | 36.42 | % | 35.27 | % | –36.36 | % | 11.23 | % | 3.19 | % | 19.38 | % | 53.70 | % | –41.98 | % | 18.58 | % | ||||||||||||||||||||
Ratios and supplemental data: | ||||||||||||||||||||||||||||||||||||||||
Net assets at end of year (millions) | $ | 51.1 | $ | 52.4 | $ | 36.8 | $ | 27.1 | $ | 38.2 | $ | 55.5 | $ | 54.9 | $ | 47.6 | $ | 28.1 | $ | 48.6 | ||||||||||||||||||||
Ratios to average net assets: | ||||||||||||||||||||||||||||||||||||||||
Expenses | 1.02 | % | 1.04 | % | 1.07 | % | 1.04 | % | 1.02 | % | 0.52 | % | 0.54 | % | 0.56 | % | 0.54 | % | 0.51 | % | ||||||||||||||||||||
Net investment income (loss) | –0.64 | % | –0.50 | % | 0.02 | % | –0.66 | % | –0.70 | % | 0.41 | % | 0.39 | % | 0.19 | % | 0.01 | % | –0.01 | % | ||||||||||||||||||||
Portfolio turnover rate | 44 | % | 56 | % | 67 | % | 63 | % | 63 | % | 44 | % | 30 | % | 29 | % | 27 | % | 13 | % | ||||||||||||||||||||
The accompanying notes are an integral part of these financial statements.
| 126 |
| Ohio National Fund, Inc. |
Financial Highlights |
| Bristol Portfolio | Bryton Growth Portfolio | |||||||||||||||||||||||||||||||||||||||
| Years Ended December 31, | Years Ended December 31, | |||||||||||||||||||||||||||||||||||||||
| 2011 | 2010 | 2009 | 2008 | 2007 | 2011 | 2010 | 2009 | 2008 | 2007 | |||||||||||||||||||||||||||||||
Selected Per-Share Data: | ||||||||||||||||||||||||||||||||||||||||
Net asset value, beginning of year | $ | 12.51 | $ | 11.12 | $ | 8.23 | $ | 14.02 | $ | 13.08 | $ | 13.57 | $ | 10.94 | $ | 8.06 | $ | 13.33 | $ | 12.13 | ||||||||||||||||||||
Operations: | ||||||||||||||||||||||||||||||||||||||||
Net investment income (loss) | 0.06 | 0.07 | 0.06 | 0.11 | 0.08 | (0.08 | ) | (0.06 | ) | (0.05 | ) | (0.05 | ) | (0.05 | ) | |||||||||||||||||||||||||
Net realized and unrealized gain (loss) on investments and foreign currency related transactions | (0.95 | ) | 1.39 | 2.89 | (5.80 | ) | 0.93 | (1.18 | ) | 2.69 | 2.93 | (5.22 | ) | 1.25 | ||||||||||||||||||||||||||
|
|
|
|
|
|
|
|
|
|
|
|
|
|
|
|
|
|
|
| |||||||||||||||||||||
Total from operations | (0.89 | ) | 1.46 | 2.95 | (5.69 | ) | 1.01 | (1.26 | ) | 2.63 | 2.88 | (5.27 | ) | 1.20 | ||||||||||||||||||||||||||
|
|
|
|
|
|
|
|
|
|
|
|
|
|
|
|
|
|
|
| |||||||||||||||||||||
Distributions: | ||||||||||||||||||||||||||||||||||||||||
Distributions from net investment income | (0.06 | ) | (0.07 | ) | (0.06 | ) | (0.10 | ) | (0.07 | ) | — | — | — | — | — | |||||||||||||||||||||||||
|
|
|
|
|
|
|
|
|
|
|
|
|
|
|
|
|
|
|
| |||||||||||||||||||||
Net asset value, end of year | $ | 11.56 | $ | 12.51 | $ | 11.12 | $ | 8.23 | $ | 14.02 | $ | 12.31 | $ | 13.57 | $ | 10.94 | $ | 8.06 | $ | 13.33 | ||||||||||||||||||||
|
|
|
|
|
|
|
|
|
|
|
|
|
|
|
|
|
|
|
| |||||||||||||||||||||
Total return | –7.16 | % | 13.10 | % | 35.83 | % | –40.54 | % | 7.75 | % | –9.29 | % | 24.04 | % | 35.73 | % | –39.53 | % | 9.89 | % | ||||||||||||||||||||
Ratios and supplemental data: | ||||||||||||||||||||||||||||||||||||||||
Net assets at end of year (millions) | $ | 192.7 | $ | 182.6 | $ | 142.8 | $ | 81.5 | $ | 97.1 | $ | 155.4 | $ | 137.4 | $ | 113.4 | $ | 59.0 | $ | 65.2 | ||||||||||||||||||||
Ratios to average net assets: | ||||||||||||||||||||||||||||||||||||||||
Expenses | 0.84 | % | 0.86 | % | 0.89 | % | 0.90 | % | 0.89 | % | 0.91 | % | 0.93 | % | 0.96 | % | 0.96 | % | 0.96 | % | ||||||||||||||||||||
Net investment income (loss) | 0.52 | % | 0.70 | % | 0.79 | % | 1.13 | % | 0.69 | % | –0.67 | % | –0.49 | % | –0.64 | % | –0.62 | % | –0.54 | % | ||||||||||||||||||||
Portfolio turnover rate | 198 | % | 253 | % | 223 | % | 184 | % | 176 | % | 156 | % | 118 | % | 82 | % | 54 | % | 55 | % | ||||||||||||||||||||
The accompanying notes are an integral part of these financial statements.
| 127 |
| Ohio National Fund, Inc. |
Financial Highlights |
| U.S. Equity Portfolio | Balanced Portfolio | |||||||||||||||||||||||||||||||||||||||
| Years Ended December 31, | Years Ended December 31, | |||||||||||||||||||||||||||||||||||||||
| 2011 | 2010 | 2009 | 2008 | 2007 | 2011 | 2010 | 2009 | 2008 | 2007 | |||||||||||||||||||||||||||||||
Selected Per-Share Data: | ||||||||||||||||||||||||||||||||||||||||
Net asset value, beginning of year | $ | 10.23 | $ | 9.16 | $ | 7.91 | $ | 15.45 | $ | 13.70 | $ | 13.87 | $ | 13.13 | $ | 10.74 | $ | 14.70 | $ | 13.09 | ||||||||||||||||||||
Operations: | ||||||||||||||||||||||||||||||||||||||||
Net investment income | 0.07 | 0.08 | 0.07 | 0.14 | 0.06 | 0.31 | 0.32 | 0.29 | 0.25 | 0.20 | ||||||||||||||||||||||||||||||
Net realized and unrealized gain (loss) on investments and foreign currency related transactions | (0.27 | ) | 1.06 | 1.24 | (7.56 | ) | 1.74 | — | 0.70 | 2.39 | (4.21 | ) | 1.41 | |||||||||||||||||||||||||||
|
|
|
|
|
|
|
|
|
|
|
|
|
|
|
|
|
|
|
| |||||||||||||||||||||
Total from operations | (0.20 | ) | 1.14 | 1.31 | (7.42 | ) | 1.80 | 0.31 | 1.02 | 2.68 | (3.96 | ) | 1.61 | |||||||||||||||||||||||||||
|
|
|
|
|
|
|
|
|
|
|
|
|
|
|
|
|
|
|
| |||||||||||||||||||||
Distributions: | ||||||||||||||||||||||||||||||||||||||||
Distributions from net investment income | — | (0.07 | ) | (0.06 | ) | (0.12 | ) | (0.05 | ) | (0.27 | ) | (0.28 | ) | (0.29 | ) | — | — | |||||||||||||||||||||||
|
|
|
|
|
|
|
|
|
|
|
|
|
|
|
|
|
|
|
| |||||||||||||||||||||
Net asset value, end of year | $ | 10.03 | $ | 10.23 | $ | 9.16 | $ | 7.91 | $ | 15.45 | $ | 13.91 | $ | 13.87 | $ | 13.13 | �� | $ | 10.74 | $ | 14.70 | |||||||||||||||||||
|
|
|
|
|
|
|
|
|
|
|
|
|
|
|
|
|
|
|
| |||||||||||||||||||||
Total return | –1.96 | % | 12.46 | % | 16.57 | % | –47.98 | % | 13.17 | % | 2.29 | % | 7.78 | % | 24.92 | % | –26.94 | % | 12.30 | % | ||||||||||||||||||||
Ratios and supplemental data: | ||||||||||||||||||||||||||||||||||||||||
Net assets at end of year (millions) | $ | 13.3 | $ | 14.5 | $ | 14.6 | $ | 13.0 | $ | 24.8 | $ | 17.1 | $ | 14.5 | $ | 13.6 | $ | 9.6 | $ | 11.0 | ||||||||||||||||||||
Ratios to average net assets: | ||||||||||||||||||||||||||||||||||||||||
Expenses | 0.99 | % | 1.01 | % | 1.04 | % | 0.96 | % | 0.91 | % | 0.94 | % | 0.99 | % | 1.08 | % | 1.09 | % | 1.13 | % | ||||||||||||||||||||
Net investment income | 0.61 | % | 0.86 | % | 0.90 | % | 1.19 | % | 0.41 | % | 2.33 | % | 2.48 | % | 2.99 | % | 2.29 | % | 1.77 | % | ||||||||||||||||||||
Portfolio turnover rate | 75 | % | 98 | % | 173 | % | 216 | % | 128 | % | 47 | % | 56 | % | 72 | % | 80 | % | 81 | % | ||||||||||||||||||||
The accompanying notes are an integral part of these financial statements.
| 128 |
| Ohio National Fund, Inc. |
Financial Highlights |
| Income Opportunity Portfolio | Target VIP Portfolio | |||||||||||||||||||||||||||||||||||||||
| Years Ended December 31, | Years Ended December 31, | |||||||||||||||||||||||||||||||||||||||
| 2011 | 2010 | 2009 | 2008 | 2007 | 2011 | 2010 | 2009 | 2008 | 2007 | |||||||||||||||||||||||||||||||
Selected Per-Share Data: | ||||||||||||||||||||||||||||||||||||||||
Net asset value, beginning of year | $ | 11.99 | $ | 11.19 | $ | 9.89 | $ | 12.49 | $ | 11.53 | $ | 9.11 | $ | 7.72 | $ | 6.81 | $ | 12.23 | $ | 11.23 | ||||||||||||||||||||
Operations: | ||||||||||||||||||||||||||||||||||||||||
Net investment income (loss) | 0.11 | 0.08 | 0.01 | 0.10 | 0.00 | 0.10 | 0.13 | 0.11 | 0.12 | 0.09 | ||||||||||||||||||||||||||||||
Net realized and unrealized gain (loss) on investments, foreign currency related transactions, and written options | (0.24 | ) | 0.72 | 1.29 | (2.70 | ) | 0.96 | (0.23 | ) | 1.37 | 0.90 | (5.42 | ) | 1.00 | ||||||||||||||||||||||||||
|
|
|
|
|
|
|
|
|
|
|
|
|
|
|
|
|
|
|
| |||||||||||||||||||||
Total from operations | (0.13 | ) | 0.80 | 1.30 | (2.60 | ) | 0.96 | (0.13 | ) | 1.50 | 1.01 | (5.30 | ) | 1.09 | ||||||||||||||||||||||||||
|
|
|
|
|
|
|
|
|
|
|
|
|
|
|
|
|
|
|
| |||||||||||||||||||||
Distributions: | ||||||||||||||||||||||||||||||||||||||||
Distributions from net investment income | — | — | — | — | — | (0.09 | ) | (0.11 | ) | (0.10 | ) | (0.12 | ) | (0.09 | ) | |||||||||||||||||||||||||
|
|
|
|
|
|
|
|
|
|
|
|
|
|
|
|
|
|
|
| |||||||||||||||||||||
Net asset value, end of year | $ | 11.86 | $ | 11.99 | $ | 11.19 | $ | 9.89 | $ | 12.49 | $ | 8.89 | $ | 9.11 | $ | 7.72 | $ | 6.81 | $ | 12.23 | ||||||||||||||||||||
|
|
|
|
|
|
|
|
|
|
|
|
|
|
|
|
|
|
|
| |||||||||||||||||||||
Total return | –1.08 | % | 7.15 | % | 13.14 | % | –20.82 | % | 8.33 | % | –1.41 | % | 19.47 | % | 14.77 | % | –43.34 | % | 9.74 | % | ||||||||||||||||||||
Ratios and supplemental data: | ||||||||||||||||||||||||||||||||||||||||
Net assets at end of year (millions) | $ | 10.8 | $ | 9.6 | $ | 6.7 | $ | 4.5 | $ | 5.2 | $ | 20.5 | $ | 21.9 | $ | 20.6 | $ | 18.2 | $ | 23.1 | ||||||||||||||||||||
Ratios to average net assets: | ||||||||||||||||||||||||||||||||||||||||
Ratios net of expenses reduced or reimbursed by adviser: | ||||||||||||||||||||||||||||||||||||||||
Expenses | 1.18 | % | 1.27 | % | 1.56 | % | 1.62 | % | 1.46 | % | 0.84 | % | 0.82 | % | 0.83 | % | 0.80 | % | 0.83 | % | ||||||||||||||||||||
Net investment income (loss) | 1.04 | % | 0.89 | % | 0.40 | % | 0.98 | % | –0.04 | % | 1.07 | % | 1.50 | % | 1.53 | % | 1.45 | % | 1.22 | % | ||||||||||||||||||||
Ratios assuming no expenses reduced or reimbursed by adviser: | ||||||||||||||||||||||||||||||||||||||||
Expenses | 1.18 | % | 1.30 | % | 1.56 | % | 1.62 | % | 1.46 | % | 0.84 | % | 0.82 | % | 0.83 | % | 0.80 | % | 0.83 | % | ||||||||||||||||||||
Net investment income (loss) | 1.04 | % | 0.87 | % | 0.40 | % | 0.98 | % | –0.04 | % | 1.07 | % | 1.50 | % | 1.53 | % | 1.45 | % | 1.22 | % | ||||||||||||||||||||
Portfolio turnover rate | 114 | % | 92 | % | 200 | % | 203 | % | 159 | % | 79 | % | 92 | % | 91 | % | 79 | % | 52 | % | ||||||||||||||||||||
The accompanying notes are an integral part of these financial statements.
| 129 |
| Ohio National Fund, Inc. |
Financial Highlights |
| Target Equity/Income Portfolio | Bristol Growth Portfolio | |||||||||||||||||||||||||||||||||||||||
| Years Ended December 31, | Years Ended December 31, | Period from May 1, 2007* to December 31, 2007 | ||||||||||||||||||||||||||||||||||||||
| 2011 | 2010 | 2009 | 2008 | 2007 | 2011 | 2010 | 2009 | 2008 | ||||||||||||||||||||||||||||||||
Selected Per-Share Data: | ||||||||||||||||||||||||||||||||||||||||
Net asset value, beginning of period | $ | 8.61 | $ | 7.07 | $ | 6.41 | $ | 12.00 | $ | 11.01 | $ | 9.84 | $ | 8.75 | $ | 6.15 | $ | 10.35 | $ | 10.00 | ||||||||||||||||||||
Operations: | ||||||||||||||||||||||||||||||||||||||||
Net investment income | 0.15 | 0.12 | 0.15 | 0.19 | 0.16 | 0.04 | 0.02 | 0.01 | 0.01 | 0.01 | ||||||||||||||||||||||||||||||
Net realized and unrealized gain (loss) on investments | (1.11 | ) | 1.52 | 0.64 | (5.61 | ) | 0.99 | (0.21 | ) | 1.10 | 2.59 | (4.21 | ) | 0.34 | ||||||||||||||||||||||||||
|
|
|
|
|
|
|
|
|
|
|
|
|
|
|
|
|
|
|
| |||||||||||||||||||||
Total from operations | (0.96 | ) | 1.64 | 0.79 | (5.42 | ) | 1.15 | (0.17 | ) | 1.12 | 2.60 | (4.20 | ) | 0.35 | ||||||||||||||||||||||||||
|
|
|
|
|
|
|
|
|
|
|
|
|
|
|
|
|
|
|
| |||||||||||||||||||||
Distributions: | ||||||||||||||||||||||||||||||||||||||||
Distributions from net investment income | (0.13 | ) | (0.10 | ) | (0.13 | ) | (0.17 | ) | (0.16 | ) | (0.04 | ) | (0.03 | ) | — | — | — | |||||||||||||||||||||||
|
|
|
|
|
|
|
|
|
|
|
|
|
|
|
|
|
|
|
| |||||||||||||||||||||
Net asset value, end of period | $ | 7.52 | $ | 8.61 | $ | 7.07 | $ | 6.41 | $ | 12.00 | $ | 9.63 | $ | 9.84 | $ | 8.75 | $ | 6.15 | $ | 10.35 | ||||||||||||||||||||
|
|
|
|
|
|
|
|
|
|
|
|
|
|
|
|
|
|
|
| |||||||||||||||||||||
Total return | –11.09 | % | 23.23 | % | 12.33 | % | –45.07 | % | 10.42 | % | –1.77 | % | 12.79 | % | 42.28 | % | –40.58 | % | 3.50 | %(b) | ||||||||||||||||||||
Ratios and supplemental data: | ||||||||||||||||||||||||||||||||||||||||
Net assets at end of period (millions) | $ | 21.6 | $ | 26.6 | $ | 22.6 | $ | 24.1 | $ | 40.4 | $ | 99.9 | $ | 85.3 | $ | 10.5 | $ | 4.8 | $ | 7.3 | ||||||||||||||||||||
Ratios to average net assets: | ||||||||||||||||||||||||||||||||||||||||
Expenses | 0.78 | % | 0.78 | % | 0.79 | % | 0.74 | % | 0.73 | % | 0.90 | % | 0.93 | % | 1.29 | % | 1.26 | % | 1.30 | %(a) | ||||||||||||||||||||
Net investment income | 1.75 | % | 1.56 | % | 2.03 | % | 2.05 | % | 1.83 | % | 0.41 | % | 0.63 | % | 0.26 | % | 0.18 | % | 0.10 | %(a) | ||||||||||||||||||||
Portfolio turnover rate | 99 | % | 90 | % | 95 | % | 105 | % | 54 | % | 187 | % | 268 | % | 218 | % | 175 | % | 107 | % | ||||||||||||||||||||
| (a) | Annualized. |
| (b) | Not annualized. |
| * | Represents date of commencement of operations. |
The accompanying notes are an integral part of these financial statements.
| 130 |
| Ohio National Fund, Inc. |
| December 31, 2011 |
| (1) | Organization |
Ohio National Fund, Inc. (the “Fund”) is a Maryland corporation registered under the Investment Company Act of 1940, as amended (the “40 Act”), as an open-end management investment company. The Fund consists of twenty-four separate investment portfolios (the “Portfolios”) that seek the following objectives and strategies:
| ¢ | Equity Portfolio — Long-term growth of capital by investing at least 80% of its assets in equity securities. |
| ¢ | Money Market Portfolio — Maximum current income consistent with preservation of capital and liquidity by investing in high quality money market instruments. |
| ¢ | Bond Portfolio — High level of income and opportunity for capital appreciation consistent with preservation of capital by investing primarily in intermediate-term and long-term fixed income securities. |
| ¢ | Omni Portfolio — High level of long-term total return consistent with preservation of capital by investing in stocks, bonds, and money market instruments. |
| ¢ | International Portfolio — Total return on assets by investing at least 80% of its assets in securities of foreign companies. |
| ¢ | Capital Appreciation Portfolio — Long-term capital growth by investing primarily in common stocks of established companies with either current or emerging earnings growth not fully appreciated or recognized by the market. |
| ¢ | Millennium Portfolio — Capital growth by investing primarily in common stocks of small sized companies. |
| ¢ | International Small-Mid Company Portfolio — Long-term growth of capital by investing at least 80% of its assets in equity securities of foreign small and mid-cap companies. |
| ¢ | Aggressive Growth Portfolio — Long-term capital growth by investing primarily in domestic and foreign equity securities selected for growth potential. |
| ¢ | Small Cap Growth Portfolio — Long-term capital appreciation by investing at least 80% of its net assets in stocks of small companies. |
| ¢ | Mid Cap Opportunity Portfolio — Long-term total return by investing at least 80% of its net assets in equity securities of mid-cap companies, primarily those that are strategically positioned for long-term growth. |
| ¢ | S&P 500® Index Portfolio — Total return that approximates the total return of the Standard & Poor’s 500® Index, at a risk level consistent with that of the Standard & Poor’s 500® Index. |
| ¢ | Strategic Value Portfolio — Growth of capital and income by investing primarily in securities of high dividend yielding, undervalued stocks with dividend growth potential. |
| ¢ | High Income Bond Portfolio — High current income by investing at least 80% of its net assets in lower rated corporate debt obligations commonly referred to as “junk bonds”. The Portfolio’s investments are generally rated Ba or lower by Moody’s, or BB or lower by Standard & Poor’s or Fitch. |
| ¢ | Capital Growth Portfolio — Long-term capital appreciation by investing primarily in an actively managed portfolio of equity securities of small cap growth companies. |
| ¢ | Nasdaq-100® Index Portfolio — Long-term growth of capital by investing primarily in stocks that are included in the Nasdaq-100® Index. Unlike the other Portfolios of the Fund, the Nasdaq-100® Index Portfolio is a non-diversified portfolio for purposes of Section 5(b) of the 40 Act. |
| ¢ | Bristol Portfolio — Long-term growth of capital by investing primarily in common stocks of the 1,000 largest publicly traded U.S. companies in terms of market capitalization. |
| ¢ | Bryton Growth Portfolio — Long-term growth of capital by investing primarily in common stocks of growth-oriented U.S. companies smaller than the 500 largest publicly traded U.S. companies in terms of market capitalization. |
| ¢ | U.S. Equity Portfolio — Capital appreciation with a secondary objective of capital preservation to provide long term growth by investing at least 80% of its net assets in equity securities traded in the U.S. within under-priced sectors and industries. |
| 131 | (continued) |
| Ohio National Fund, Inc. |
Notes to Financial Statements (Continued) | December 31, 2011 |
| ¢ | Balanced Portfolio — Capital appreciation and income by investing normally up to 75% of its assets in equity securities within under-priced sectors and industries while maintaining a minimum of 25% of its assets in fixed income securities. |
| ¢ | Income Opportunity Portfolio — Modest capital appreciation and maximization of realized gains by investing in equity securities traded in the U.S. |
| ¢ | Target VIP Portfolio — Above average total return by investing in the common stocks of companies which are identified by a model that applies separate uniquely specialized strategies. |
| ¢ | Target Equity/Income Portfolio — Above average total return by adhering to a disciplined, quantitative investment process that incorporates two distinct strategy methodologies. |
| ¢ | Bristol Growth Portfolio — Long-term growth of capital by investing primarily in common stocks of the 1,000 largest publicly traded U.S. companies in terms of market capitalization. |
Additional detail regarding portfolio-specific objectives, policies, and investment strategies is provided in the prospectus and Statement of Additional Information of Ohio National Fund, Inc. There are no assurances that these objectives will be met. Each Portfolio, except the Nasdaq-100® Index Portfolio, is classified as diversified for purposes of Section 5(b) of the 40 Act.
At present, the Fund sells its shares only to separate accounts of The Ohio National Life Insurance Company (“ONLIC”), Ohio National Life Assurance Corporation (“ONLAC”), and National Security Life and Annuity Company (“NSLA”) to support certain benefits under variable contracts issued by those entities. In the future, Fund shares may be used for other purposes but, unless there is a change in applicable law, they will not be sold directly to the public.
Interest in each Portfolio is represented by a separate class of the Fund’s capital stock, par value $1. Each share of a Portfolio participates equally in the Portfolio’s dividends, distributions, net assets, and voting matters.
The Fund is authorized to issue 550 million of its capital shares. These authorized shares have been allocated to specific Portfolios of the Fund as follows:
Portfolio | Authorized Shares | |||
Equity | 30,000,000 | |||
Money Market | 80,000,000 | |||
Bond | 30,000,000 | |||
Omni | 10,000,000 | |||
International | 45,000,000 | |||
Capital Appreciation | 15,000,000 | |||
Millennium | 10,000,000 | |||
International Small-Mid Company | 10,000,000 | |||
Aggressive Growth | 10,000,000 | |||
Small Cap Growth | 10,000,000 | |||
Mid Cap Opportunity | 10,000,000 | |||
S&P 500® Index | 35,000,000 | |||
Portfolio | Authorized Shares | |||
Strategic Value | 10,000,000 | |||
High Income Bond | 60,000,000 | |||
Capital Growth | 10,000,000 | |||
Nasdaq-100® Index | 25,000,000 | |||
Bristol | 40,000,000 | |||
Bryton Growth | 35,000,000 | |||
U.S. Equity | 10,000,000 | |||
Balanced | 10,000,000 | |||
Income Opportunity | 10,000,000 | |||
Target VIP | 10,000,000 | |||
Target Equity/Income | 10,000,000 | |||
Bristol Growth | 25,000,000 | |||
The Fund’s Board of Directors (the “Board”) periodically reallocates authorized shares among the Portfolios of the Fund and may authorize additional shares as deemed necessary.
Under the Fund’s organizational documents, its Officers and Directors are indemnified against certain liabilities arising out of the performance of their duties to the Fund. In addition, in the normal course of business, the Fund enters into contracts with its vendors and others that provide for general indemnifications. The Fund’s maximum exposure under these arrangements is unknown as this would involve future claims that may be made against the Fund. However, based on experience, the risk of loss to the Fund is expected to be remote.
| 132 | (continued) |
| Ohio National Fund, Inc. |
Notes to Financial Statements (Continued) | December 31, 2011 |
| (2) | Significant Accounting Policies |
The following is a summary of significant accounting policies followed by the Fund in preparation of its financial statements:
Use of Estimates
The preparation of financial statements in conformity with U.S. generally accepted accounting principles (“GAAP”) requires management to make estimates and assumptions that affect the reported amounts of assets and liabilities and disclosure of contingent assets and liabilities at the date of the financial statements and the reported amounts of increases and decreases in net assets from operations during the reporting period. Actual results could differ from those estimates.
Security Valuation
Investments are valued using pricing procedures approved by the Board.
Various investments in the Money Market Portfolio are valued at amortized cost in accordance with Rule 2a-7 of the 40 Act. In all Portfolios of the Fund, fixed income instruments that mature in sixty days or less, and of sufficient credit quality, are valued at amortized cost. Amortized cost valuation involves valuing a security at its cost initially and thereafter amortizing to maturity any discounts or premiums on the level-yield method, regardless of the impact of fluctuating market interest rates on the value of the security. In these instances, amortized cost approximates fair value.
Investments, other than those securities aforementioned, are valued as follows:
Domestic equity securities that are traded on U.S. exchanges, with the exception of options, are valued at the last trade price reported by the primary exchange of each security (4:00 pm Eastern Time for normal trading sessions). Option securities are valued on a composite close price basis. Over-the-counter domestic equity securities are valued at the last trade price reported daily as of 4:00 pm Eastern Time (normal trading sessions). Over-the-counter traded ADRs may be valued at an evaluated price based on the value of the underlying securities. If a domestic equity security is not traded on a particular day, the mean between the bid and ask prices reported at 4:00 pm Eastern Time (normal trading sessions) by the primary exchange will generally be used for valuation purposes. The principal sources for market quotations are independent pricing services that have been approved by the Board.
Fixed income securities that have a remaining maturity exceeding sixty days are generally valued at the mean between the daily close bid and ask prices, as provided by independent pricing services approved by the Board.
Shares of open-end mutual funds are valued at each fund’s last calculated net asset value per share.
Repurchase agreements are valued at amortized cost, which approximates fair value.
Restricted securities, illiquid securities, or other investments for which market quotations or other observable market inputs are not readily available are valued at an estimate of value using methods determined in good faith by the Fund’s Pricing Committee under the supervision of the Board.
Foreign equity securities are initially priced at the reported close price of the exchange on which a security is primarily traded. Securities not traded on a particular day are valued at the mean between the last reported bid and ask quotes at daily close, or the last sale price when appropriate. The principal sources for market quotations are independent pricing services that have been approved by the Board.
Equity securities that are primarily traded on foreign exchanges, other than those in North or South America, are further subjected to fair valuation pricing procedures provided by an independent fair valuation service. The service provides data that can be used to estimate the price of a foreign issue that would prevail in a liquid market given market information available daily at 4:00 pm Eastern Time (normal trading sessions). Multiple factors may be considered in performing this valuation, including an issue’s local close price, relevant general and sector indices, currency fluctuations, and pricing of related depository receipts, exchange traded funds, and futures. The pricing procedures are performed for each individual security for which there is a fairly large degree of certainty that the local close price is not the liquid market price at the time of U.S. market close. The procedures are performed each day there is a change in a consistently used market index from the time of local close to the U.S. market close. Backtesting analysis is performed on a quarterly basis to monitor the
| 133 | (continued) |
| Ohio National Fund, Inc. |
Notes to Financial Statements (Continued) | December 31, 2011 |
effectiveness of these procedures. The testing is reviewed by management of the Fund as well as the Fund’s Board. Prior results have indicated that these procedures have been effective in reaching valuation objectives.
The differences between the aggregate cost and values of investments are reflected as unrealized appreciation or unrealized depreciation.
Pricing inputs used in the Fund’s determination of its investment values are categorized according to a three-tier hierarchy framework. The hierarchy is summarized in three broad levels:
| Level 1: | Quoted prices in active markets for identical securities. |
| Level 2: | Other significant observable inputs, including quoted prices for similar securities, interest rates, prepayment speeds, credit risk, etc. |
| Level 3: | Significant unobservable inputs, including the Fund’s own assumptions used to determine the value of securities. |
The following is a summary of the inputs used in valuing each of the Portfolio’s assets (liabilities) at value as of December 31, 2011:
Portfolio | Financial Instrument Type | Level 1 | Level 2 | Level 3 | ||||||||||
Equity | Common Stocks | $ | 181,558,246 | $ | — | $ | — | |||||||
| Preferred Stocks | 2,192,000 | — | — | |||||||||||
| Repurchase Agreements | — | 3,379,939 | — | |||||||||||
|
|
|
|
|
| |||||||||
| $ | 183,750,246 | $ | 3,379,939 | $ | ��� | |||||||||
|
|
|
|
|
| |||||||||
Money Market* | Commercial Paper | $ | — | $ | 186,988,681 | $ | — | |||||||
| Asset-Backed Securities | — | 2,368,340 | — | |||||||||||
| Repurchase Agreements | — | 14,000,000 | — | |||||||||||
|
|
|
|
|
| |||||||||
| $ | — | $ | 203,357,021 | $ | — | |||||||||
|
|
|
|
|
| |||||||||
Bond | Corporate Bonds | $ | — | $ | 146,359,075 | $ | — | |||||||
| U.S. Treasury Obligations | — | 4,475,469 | — | |||||||||||
| Commercial Paper | — | 6,999,988 | — | |||||||||||
| Repurchase Agreements | — | 2,857,000 | — | |||||||||||
|
|
|
|
|
| |||||||||
| $ | — | $ | 160,691,532 | $ | — | |||||||||
|
|
|
|
|
| |||||||||
Omni | Common Stocks | $ | 24,366,501 | $ | — | $ | — | |||||||
| Corporate Bonds | — | 8,173,688 | — | |||||||||||
| U.S. Treasury Obligations | — | 342,023 | — | |||||||||||
| Money Market Funds | 1,749,000 | — | — | |||||||||||
|
|
|
|
|
| |||||||||
| $ | 26,115,501 | $ | 8,515,711 | $ | — | |||||||||
|
|
|
|
|
| |||||||||
International | Common Stocks | $ | 36,407,083 | $ | 121,998,613 | $ | — | |||||||
| U.S. Treasury Obligations | — | 1,149,963 | — | |||||||||||
| Money Market Funds | 2,190,621 | — | — | |||||||||||
|
|
|
|
|
| |||||||||
| $ | 38,597,704 | $ | 123,148,576 | $ | — | |||||||||
|
|
|
|
|
| |||||||||
| Foreign currency contracts | $ | 1,985,208 | $ | — | $ | — | ||||||||
|
|
|
|
|
| |||||||||
| Futures contracts | $ | 39,604 | $ | — | $ | — | ||||||||
|
|
|
|
|
| |||||||||
Capital Appreciation | Common Stocks | $ | 109,172,805 | $ | 2,612,927 | $ | — | |||||||
| Money Market Funds | 2,920,000 | — | — | |||||||||||
|
|
|
|
|
| |||||||||
| $ | 112,092,805 | $ | 2,612,927 | $ | — | |||||||||
|
|
|
|
|
| |||||||||
Millennium | Common Stocks | $ | 36,163,623 | $ | — | $ | — | |||||||
|
|
|
|
|
| |||||||||
| $ | 36,163,623 | $ | — | $ | — | |||||||||
|
|
|
|
|
| |||||||||
| 134 | (continued) |
| Ohio National Fund, Inc. |
Notes to Financial Statements (Continued) | December 31, 2011 |
Portfolio | Financial Instrument Type | Level 1 | Level 2 | Level 3 | ||||||||||
International Small-Mid Company | Common Stocks | $ | 11,181,778 | $ | 41,840,333 | $ | — | |||||||
| Preferred Stocks | — | 505,882 | — | |||||||||||
| Exchange Traded Funds | 1,204,224 | — | — | |||||||||||
| Money Market Funds | 2,717,960 | — | — | |||||||||||
|
|
|
|
|
| |||||||||
| $ | 15,103,962 | $ | 42,346,215 | $ | — | |||||||||
|
|
|
|
|
| |||||||||
Aggressive Growth | Common Stocks | $ | 21,182,480 | $ | 3,971,332 | $ | — | |||||||
| VVPR Strips | — | — | 9 | |||||||||||
| Money Market Funds | 624,000 | — | — | |||||||||||
|
|
|
|
|
| |||||||||
| $ | 21,806,480 | $ | 3,971,332 | $ | 9 | |||||||||
|
|
|
|
|
| |||||||||
Small Cap Growth | Common Stocks | $ | 31,243,645 | $ | — | $ | — | |||||||
| Money Market Funds | 243,000 | — | — | |||||||||||
|
|
|
|
|
| |||||||||
| $ | 31,486,645 | $ | — | $ | — | |||||||||
|
|
|
|
|
| |||||||||
Mid Cap Opportunity | Common Stocks | $ | 60,879,838 | $ | — | $ | — | |||||||
| Money Market Funds | 220,000 | — | — | |||||||||||
|
|
|
|
|
| |||||||||
| $ | 61,099,838 | $ | — | $ | — | |||||||||
|
|
|
|
|
| |||||||||
S&P 500® Index | Common Stocks | $ | 167,549,411 | $ | — | $ | 99 | |||||||
| Preferred Stocks | — | — | 99 | |||||||||||
| Exchange Traded Funds | 2,720,213 | — | — | |||||||||||
| Commercial Paper | — | 441,000 | — | |||||||||||
|
|
|
|
|
| |||||||||
| $ | 170,269,624 | $ | 441,000 | $ | 198 | |||||||||
|
|
|
|
|
| |||||||||
Strategic Value | Common Stocks | $ | 30,866,980 | $ | 8,682,808 | $ | — | |||||||
| Money Market Funds | 656,000 | — | — | |||||||||||
|
|
|
|
|
| |||||||||
| $ | 31,522,980 | $ | 8,682,808 | $ | — | |||||||||
|
|
|
|
|
| |||||||||
High Income Bond | Corporate Bonds | $ | — | $ | 257,100,585 | $ | — | |||||||
| Common Stocks | 90,060 | — | — | |||||||||||
| Preferred Stocks | — | 248,050 | — | |||||||||||
| Warrants | 78,962 | — | — | |||||||||||
| Other | — | — | 20,781 | |||||||||||
| Money Market Funds | 3,814,000 | — | — | |||||||||||
|
|
|
|
|
| |||||||||
| $ | 3,983,022 | $ | 257,348,635 | $ | 20,781 | |||||||||
|
|
|
|
|
| |||||||||
Capital Growth | Common Stocks | $ | 50,983,830 | $ | — | $ | — | |||||||
| Money Market Funds | 443,000 | — | — | |||||||||||
|
|
|
|
|
| |||||||||
| $ | 51,426,830 | $ | — | $ | — | |||||||||
|
|
|
|
|
| |||||||||
Nasdaq-100® Index | Common Stocks | $ | 54,955,380 | $ | — | $ | 388 | |||||||
| Preferred Stocks | — | — | 388 | |||||||||||
| Exchange Traded Funds | 433,520 | — | — | |||||||||||
| Commercial Paper | — | 175,000 | — | |||||||||||
|
|
|
|
|
| |||||||||
| $ | 55,388,900 | $ | 175,000 | $ | 776 | |||||||||
|
|
|
|
|
| |||||||||
Bristol | Common Stocks | $ | 182,800,269 | $ | — | $ | — | |||||||
| Money Market Funds | 4,667,000 | — | — | |||||||||||
|
|
|
|
|
| |||||||||
| $ | 187,467,269 | $ | — | $ | — | |||||||||
|
|
|
|
|
| |||||||||
Bryton Growth | Common Stocks | $ | 141,372,660 | $ | — | $ | — | |||||||
| Money Market Funds | 9,489,000 | — | — | |||||||||||
|
|
|
|
|
| |||||||||
| $ | 150,861,660 | $ | — | $ | — | |||||||||
|
|
|
|
|
| |||||||||
| 135 | (continued) |
| Ohio National Fund, Inc. |
Notes to Financial Statements (Continued) | December 31, 2011 |
Portfolio | Financial Instrument Type | Level 1 | Level 2 | Level 3 | ||||||||||
U.S. Equity | Common Stocks | $ | 13,302,968 | $ | — | $ | — | |||||||
| Money Market Funds | 31,000 | — | — | |||||||||||
|
|
|
|
|
| |||||||||
| $ | 13,333,968 | $ | — | $ | — | |||||||||
|
|
|
|
|
| |||||||||
Balanced | Common Stocks | $ | 11,332,676 | $ | — | $ | — | |||||||
| Corporate Bonds | — | 5,486,005 | — | |||||||||||
| U.S. Treasury Obligations | — | 107,672 | — | |||||||||||
| Money Market Funds | 48,000 | — | — | |||||||||||
|
|
|
|
|
| |||||||||
| $ | 11,380,676 | $ | 5,593,677 | $ | — | |||||||||
|
|
|
|
|
| |||||||||
Income Opportunity | Common Stocks | $ | 10,921,910 | $ | — | $ | — | |||||||
| Purchased Options | 11,475 | — | — | |||||||||||
| Money Market Funds | 81,000 | — | — | |||||||||||
|
|
|
|
|
| |||||||||
| $ | 11,014,385 | $ | — | $ | — | |||||||||
|
|
|
|
|
| |||||||||
| Written Options Outstanding | $ | (125,000 | ) | $ | — | $ | — | |||||||
|
|
|
|
|
| |||||||||
Target VIP | Common Stocks | $ | 20,235,756 | $ | — | $ | — | |||||||
| Money Market Funds | 297,000 | — | — | |||||||||||
|
|
|
|
|
| |||||||||
| $ | 20,532,756 | $ | — | $ | — | |||||||||
|
|
|
|
|
| |||||||||
Target Equity/Income | Common Stocks | $ | 21,210,144 | $ | — | $ | — | |||||||
| Money Market Funds | 423,000 | — | — | |||||||||||
|
|
|
|
|
| |||||||||
| $ | 21,633,144 | $ | — | $ | — | |||||||||
|
|
|
|
|
| |||||||||
Bristol Growth | Common Stocks | $ | 94,248,901 | $ | — | $ | — | |||||||
| Money Market Funds | 2,753,000 | — | — | |||||||||||
|
|
|
|
|
| |||||||||
| $97,001,901 | $ | — | $ | — | ||||||||||
|
|
|
|
|
| |||||||||
| * | At December 31, 2011, the Money Market Portfolio’s investments were valued using amortized cost, in accordance with rules under the 40 Act. Amortized cost approximates the current fair value of a security, but since the value is not obtained from a quoted price in an active market, such securities are considered to be valued using Level 2 inputs. |
As stated above, the value assigned to the Fund’s foreign securities will, in most cases, not be the quoted or published prices of the investments on their respective primary markets or exchanges. Securities that are priced using fair value estimates are categorized as Level 2 in the fair value hierarchy, whereas securities that do not meet the established criteria are categorized as Level 1. The valuation of a foreign security from one valuation period to the next may result in a transfer between Levels 1 and 2 if the degree of certainty that the local close price is not the liquid market price at the time of U.S. market close is not similar for both periods. The Fund’s policy is to recognize significant transfers between fair value hierarchy levels at the reporting period end. There were no significant transfers between Level 1 and Level 2 during the year ended December 31, 2011.
Below is a reconciliation that details the activity of securities in Level 3 during the year ended December 31, 2011:
| Aggressive Growth | S&P 500® Index | High Income Bond | Nasdaq-100® Index | |||||||||||||
Beginning Balance – January 1, 2011 | $ | — | $ | — | $ | 4,688 | $ | — | ||||||||
Total gains or losses (realized/unrealized): | ||||||||||||||||
Included in earnings (or changes in net assets) | — | — | 2,343 | — | ||||||||||||
Issuances | — | 198 | 13,750 | 776 | ||||||||||||
Transfers in and/or out of Level 3 | 9 | — | — | — | ||||||||||||
|
|
|
|
|
|
|
| |||||||||
Ending Balance – December 31, 2011 | $ | 9 | $ | 198 | $ | 20,781 | $ | 776 | ||||||||
|
|
|
|
|
|
|
| |||||||||
The amount of total gains or losses for the period included in earnings (or changes in net assets) attributable to the change in unrealized gains or losses relating to assets still held at the reporting date | $ | — | $ | — | $ | 2,343 | $ | — | ||||||||
|
|
|
|
|
|
|
| |||||||||
| 136 | (continued) |
| Ohio National Fund, Inc. |
Notes to Financial Statements (Continued) | December 31, 2011 |
Foreign Securities and Currency
The books and records of all the Portfolios are maintained in U.S. dollars. All investments and cash quoted in foreign currencies are valued daily in U.S. dollars on the basis of the foreign currency exchange rates provided by an independent source. These exchange rates are currently determined daily, at 4:00 pm Eastern Time for normal trading sessions. Purchases and sales of foreign-denominated investments are recorded at rates of exchange prevailing on the respective dates of such transactions.
The Fund may not fully isolate that portion of the results of operations resulting from changes in foreign exchange rates from fluctuations arising from changes in market prices on foreign currency-denominated investments. However, for tax purposes, the Fund does fully isolate the effect of fluctuations in foreign exchange rates when determining the gain or loss upon sale or maturity of such investments to the extent required by federal income tax regulations.
All Portfolios of the Fund, other than the Target VIP and Target Equity/Income Portfolios, may invest in securities of foreign issuers, although foreign securities purchased by the Money Market Portfolio must be denominated in U.S. dollars and held in custody in the United States of America. The International and International Small-Mid Company Portfolios may be invested entirely in foreign securities. Investments in securities of foreign issuers, including investments in foreign companies through the use of depositary receipts, carry certain risks not ordinarily associated with investments in securities of domestic issuers. Such risks include future political and economic developments, and the possible imposition of exchange controls or other foreign governmental laws and restrictions. In addition, with respect to certain countries, there is the possibility of expropriation of assets, confiscatory taxation, political or social instability, or diplomatic developments that could adversely affect capital investment within those countries.
Repurchase Agreements
The Portfolios may acquire repurchase agreements from member banks of the Federal Reserve System which are deemed creditworthy under guidelines approved by the Board, subject to the seller’s agreement to repurchase such securities at a mutually agreed upon date and price. The repurchase price generally equals the price paid by a Portfolio plus interest negotiated on the basis of current short-term rates, which may be more or less than the rate on the underlying securities. The maturities of these instruments vary from overnight to one week. The seller, under a repurchase agreement, is required to maintain as collateral for the repurchase transaction securities in which the Portfolio has a perfected security interest with a value not less than 100% of the repurchase price (including accrued interest). Securities subject to repurchase agreements are held by the Portfolio’s custodian or another qualified custodian or in the Federal Reserve/Treasury book-entry system. In the event of counterparty default, the Fund has the right to use the collateral to offset losses incurred. There is potential for loss to the Fund in the event the Fund is delayed or prevented from exercising its rights to dispose of the collateral securities, including the risk of a possible decline in the value of the underlying securities during the period while the Fund seeks to assert its rights.
Restricted and Illiquid Securities
Restricted securities are those securities purchased through a private offering and cannot be resold to the general public without prior registration under the Securities Act of 1933 (“the 1933 Act”) or pursuant to the resale limitations provided by Rule 144A under the 1933 Act, or an exemption from the registration requirements of the 1933 Act. 144A securities are issued by corporations without registration in reliance on 1933 Act provisions allowing for the private resale of unregistered securities to qualified institutional buyers. Section 4(2) commercial paper is issued pursuant to Section 4(2) of the 1933 Act which exempts an issue from registration. This paper may be used to finance non-current transactions, such as acquisitions, stock repurchase programs, and other long-term assets. Investments by a portfolio in Rule 144A and Section 4(2) securities could have the effect of decreasing the liquidity of a Portfolio during any period in which qualified institutional investors were no longer interested in purchasing these securities.
Typically, the restricted securities noted above are not considered illiquid. The criteria used to determine if a restricted security is illiquid includes frequency of trades and quotes, available dealers willing to make transactions, availability of market makers in the security, and the nature of the security and its trades. The Money Market, Bond, and Omni Portfolios may invest up to 10% of their respective assets in illiquid securities. Each of the other Portfolios of the Fund may invest up to 15% of its net assets in illiquid securities.
| 137 | (continued) |
| Ohio National Fund, Inc. |
Notes to Financial Statements (Continued) | December 31, 2011 |
Investment Transactions and Related Income
For financial reporting purposes, investment transactions are accounted for on a trade date basis. For purposes of executing separate account shareholder transactions in the normal course of business, however, the Fund’s investment transactions are recorded no later than the first calculation on the first business day following the trade date in accordance with Rule 2a-4 of the 40 Act. Accordingly, differences between the net asset values for financial reporting and for executing separate account shareholder transactions may arise.
Dividend income is recognized on the ex-dividend date, except in the case of those Portfolios holding foreign securities, in which dividends are recorded as soon after the ex-dividend date as the Fund’s information agents become aware of such dividends. Interest income is accrued daily as earned and includes the amortization of premium and accretion of discount. Net realized gain or loss on investments and foreign exchange transactions are determined using the specific identification method.
Distributions to Shareholders and Federal Taxes
Net investment income of the Money Market Portfolio is declared and paid daily as a dividend to shareholders immediately before the computation of the net asset value of Money Market Portfolio shares. Dividends are automatically reinvested in additional Money Market Portfolio shares at the net asset value immediately following such computation. Distributions arising from net investment income and net capital gains from the remaining Portfolios are declared and paid to shareholders periodically as required for each of the Portfolios to continue to qualify as a regulated investment company pursuant to Subchapter M of the Internal Revenue Code. The Fund, excluding the Money Market Portfolio, may also satisfy its distribution requirements by using consent dividends rather than cash dividends. The Fund has the intent to continue to comply with tax provisions pertaining to regulated investment companies and make distributions of taxable income sufficient to relieve it from substantially all federal income and excise taxes. As such, no provisions for federal income or excise taxes have been recorded.
The character of income and realized capital gains distributions are determined in accordance with federal income tax regulations and may differ from net investment income and realized gains for financial reporting purposes. These “book/tax” differences are either considered temporary or permanent in nature. To the extent these differences are permanent in nature they are reclassified within the composition of net assets; temporary differences do not require such reclassification. Distributions to shareholders that exceed taxable income and net taxable realized gains are reported as return of capital distributions.
The Fund’s management and its tax agent, U.S. Bancorp Fund Services, LLC, perform an affirmative evaluation of tax positions taken or expected to be taken in the course of preparing the Fund’s tax returns to determine whether it is more-likely-than-not (i.e. greater than 50-percent) that each tax position will be sustained upon examination by a taxing authority based on the technical merits of the position. A tax position that meets the more-likely-than-not recognition threshold is measured to determine the amount of benefit to recognize in the financial statements. Differences between tax positions taken in a tax return and amounts recognized in the financial statements will generally result in an increase in a liability for taxes payable (or a reduction of a tax refund receivable), including the recognition of any related interest and penalties as an operating expense. Implementation of the evaluation included a review of tax positions taken in tax years that remain subject to examination by all major tax jurisdictions, including federal tax and the state of Maryland (i.e., the last four tax year ends and the interim tax period since then). The determination has been made that there are no uncertain tax positions that would require the Portfolios to record a tax liability and, therefore, there is no impact to the Portfolios’ financial statements.
Expense Allocation
Expenses directly attributable to a Portfolio are charged to that Portfolio. Expenses that cannot be directly attributed to a Portfolio are allocated among all the benefited Portfolios on a basis of relative net assets or other appropriate method.
Foreign Withholding Taxes
Certain Portfolios in the Fund may be subject to taxes imposed by countries in which they invest with respect to their investments in issuers existing or operating in such countries. Such taxes are generally withheld based on income earned. These Portfolios accrue such taxes as the related income is earned.
| 138 | (continued) |
| Ohio National Fund, Inc. |
Notes to Financial Statements (Continued) | December 31, 2011 |
Subsequent Events
In a special meeting held January 19, 2012, the Fund’s Board of Directors approved a proxy solicitation proposed by the Fund’s management. The proxy solicitation seeks to obtain the approvals of several issues from the shareholders of the Fund. The owners of variable contracts having contract values allocated to investments in the Fund’s Portfolios as of January 23, 2012 will be solicited in order to instruct the shareholders on the manner in which to vote on these issues. The issues included in the proxy solicitation for each Fund Portfolio are:
| 1. | To elect two Directors to the Board of Directors of Ohio National Fund, Inc. |
| 2. | To approve amendments to certain fundamental policies of each Portfolio, approve the reclassification of certain investment policies as non-fundamental policies of each Portfolio and approve the elimination of certain fundamental policies of each Portfolio. |
| 3. | To approve the reclassification of each Portfolio’s investments objective as non-fundamental. |
| 4. | To transact such other business as may properly come before the meeting or any adjournments or postponements thereof. |
Management has evaluated events and transactions through the date the financial statements were issued, for purposes of recognition or disclosure in these financial statements, and there are no other subsequent events to report.
| (3) | Related Party and Other Transactions |
The Fund has an Investment Advisory Agreement with Ohio National Investments, Inc. (“ONI”), a wholly-owned subsidiary of ONLIC. Under the terms of this agreement, ONI provides portfolio management and investment advice to the Fund and administers its operations, subject to the supervision of the Fund’s Board. This agreement is renewed annually upon the approval by the Board. As compensation for its services, ONI receives advisory fees from the Fund calculated on the basis of each Portfolio’s average daily net assets and the following current schedule of Board-approved annualized fee breakpoints.
Equity |
| 0.79% of first $200 million |
| 0.74% of next $800 million |
| 0.70% over $1 billion |
Bond |
| 0.60% of first $100 million |
| 0.50% of next $150 million |
| 0.45% of next $250 million |
| 0.40% of next $500 million |
| 0.30% of next $1 billion |
| 0.25% over $2 billion |
International |
| 0.85% of first $100 million |
| 0.80% of next $100 million |
| 0.70% over $200 million |
Millennium |
| 0.80% of first $150 million |
| 0.75% of next $150 million |
| 0.70% of next $300 million |
| 0.65% over $600 million |
Aggressive Growth |
| 0.80% of first $100 million |
| 0.75% of next $400 million |
| 0.70% over $500 million |
Mid Cap Opportunity |
| 0.85% of first $100 million |
| 0.80% of next $100 million |
| 0.75% of next $300 million |
| 0.70% over $500 million |
Money Market |
| 0.30% of first $100 million (1) |
| 0.25% of next $150 million |
| 0.23% of next $250 million |
| 0.20% of next $500 million |
| 0.15% over $1 billion |
Omni |
| 0.60% of first $100 million |
| 0.50% of next $150 million |
| 0.45% of next $250 million |
| 0.40% of next $500 million |
| 0.30% of next $1 billion |
| 0.25% over $2 billion |
Capital Appreciation |
| 0.80% of first $100 million |
| 0.75% of next $300 million |
| 0.65% of next $600 million |
| 0.60% over $1 billion |
International Small-Mid Company |
| 1.00% of first $100 million |
| 0.90% of next $100 million |
| 0.85% over $200 million |
Small Cap Growth |
| 0.90% of first $150 million |
| 0.80% of next $150 million |
| 0.75% over $300 million |
S&P 500® Index |
| 0.40% of first $100 million |
| 0.35% of next $150 million |
| 0.33% over $250 million |
| 139 | (continued) |
| Ohio National Fund, Inc. |
Notes to Financial Statements (Continued) | December 31, 2011 |
Strategic Value |
| 0.75% of first $100 million |
| 0.70% of next $400 million |
| 0.65% over $500 million |
Capital Growth |
| 0.90% of first $100 million |
| 0.85% of next $100 million |
| 0.80% of next $300 million |
| 0.75% over $500 million |
Bristol |
| 0.80% of first $100 million |
| 0.70% of next $400 million |
| 0.65% over $500 million |
U.S. Equity |
| 0.75% of first $200 million |
| 0.70% of next $300 million |
| 0.65% over $500 million |
Balanced |
| 0.65% of first $200 million |
| 0.60% of next $300 million |
| 0.55% over $500 million |
Target VIP |
| 0.60% of first $100 million |
| 0.55% of next $400 million |
| 0.50% over $500 million |
High Income Bond |
| 0.75% of first $75 million |
| 0.70% of next $75 million |
| 0.65% of next $75 million |
| 0.60% over $225 million |
Nasdaq-100® Index |
| 0.40% of first $100 million |
| 0.35% of next $150 million |
| 0.33% over $250 million |
Bryton Growth |
| 0.85% of first $100 million |
| 0.75% of next $400 million |
| 0.70% over $500 million |
Income Opportunity |
| 0.80% of first $200 million |
| 0.75% of next $300 million |
| 0.70% over $500 million |
Target Equity/Income |
| 0.60% of first $100 million |
| 0.55% of next $400 million |
| 0.50% over $500 million |
Bristol Growth |
| 0.80% of first $100 million |
| 0.70% of next $400 million |
| 0.65% over $500 million |
| (1) | For the year ended December 31, 2011, ONI waived advisory fees in excess of an annualized rate of 0.25% of the first $100 million of average daily net assets in the Money Market Portfolio. Waivers related to the Money Market Portfolio are voluntary and are not subject to recoupment in subsequent periods. The amount of the waiver for the year ended December 31, 2011 was $50,000. If ONI did not agree to reimburse these expenses, the total expenses incurred by the Money Market Portfolio for the year ended December 31, 2011 would have been higher than the net expenses reflected in the Statements of Operations. |
Under the Investment Advisory Agreement, the Fund authorizes ONI to retain sub-advisers (“the Sub-Advisers”) for the Equity, Omni, International, Capital Appreciation, Millennium, International Small-Mid Company, Aggressive Growth, Small Cap Growth, Mid Cap Opportunity, Strategic Value, High Income Bond, Capital Growth, Bristol, Bryton Growth, U.S. Equity, Balanced, Income Opportunity, Target VIP, Target Equity/Income, and Bristol Growth Portfolios subject to the approval of the Board. ONI has entered into sub-advisory agreements with Legg Mason Capital Management, Inc. (“Legg Mason”), Suffolk Capital Management, LLC (“Suffolk”), Federated Global Investment Management Corp. (“Federated Global”), Jennison Associates LLC (“Jennison”), Neuberger Berman Management LLC (“Neuberger Berman”), Janus Capital Management LLC (“Janus”), Goldman Sachs Asset Management, L.P. (“Goldman Sachs”), Federated Equity Management Company of Pennsylvania (“Federated Equity”), Federated Investment Management Company (“Federated Investment”), Eagle Asset Management, Inc. (“Eagle”), ICON Advisers, Inc. (“ICON”), and First Trust Advisors L.P. (“First Trust”), to manage the investment of those Portfolios’ assets, subject to the supervision of ONI. As compensation for their services, the Sub-Advisers receive from ONI a sub-advisory fee calculated on the basis of each of the aforementioned Portfolio’s average daily net assets and the following current Board-approved schedule of annualized fee breakpoints.
Equity (Legg Mason) |
| 0.40% of first $200 million |
| 0.38% over $200 million |
International (Federated Global) |
| 0.40% of first $200 million |
| 0.35% over $200 million |
Omni (Suffolk) |
| 0.30% of first $100 million |
| 0.25% of next $150 million |
| 0.225% of next $250 million |
| 0.20% of next $500 million |
| 0.15% of next $1 billion |
| 0.125% over $2 billion |
| 140 | (continued) |
| Ohio National Fund, Inc. |
Notes to Financial Statements (Continued) | December 31, 2011 |
Capital Appreciation (Jennison) |
| 0.75% of first $10 million |
| 0.50% of next $30 million |
| 0.35% of next $25 million |
| 0.25% of next $335 million |
| 0.22% of next $600 million |
| 0.20% over $1 billion |
Aggressive Growth (Janus) |
| 0.55% of first $100 million |
| 0.50% of next $400 million |
| 0.45% over $500 million |
Mid Cap Opportunity (GSAM) |
| 0.60% of first $100 million |
| 0.55% of next $100 million |
| 0.50% over $200 million |
High Income Bond (Federated Investment) |
| 0.50% of first $30 million |
| 0.40% of next $20 million |
| 0.30% of next $25 million |
| 0.25% over $75 million |
Bristol (Suffolk) |
| 0.45% of first $100 million |
| 0.40% of next $400 million |
| 0.35% over $500 million |
U.S. Equity (ICON) |
| 0.50% of first $200 million |
| 0.45% of next $300 million |
| 0.40% over $500 million |
Income Opportunity (ICON) |
| 0.55% of first $200 million |
| 0.50% of next $300 million |
| 0.45% over $500 million |
Bristol Growth (Suffolk) |
| 0.45% of first $100 million |
| 0.40% of next $400 million |
| 0.35% over $500 million |
Millennium (Neuberger Berman) |
| 0.55% of first $150 million |
| 0.50% of next $150 million |
| 0.40% over $300 million |
International Small-Mid Company (Federated Global) |
| 0.75% of first $100 million |
| 0.65% over $100 million |
Small Cap Growth (Janus) |
| 0.60% of next $150 million |
| 0.50% over $150 million |
Strategic Value (Federated Equity) |
| 0.50% of first $35 million |
| 0.35% of next $65 million |
| 0.25% over $100 million |
Capital Growth (Eagle) |
| 0.59% of first $100 million |
| 0.55% of next $100 million |
| 0.50% over $200 million |
Bryton Growth (Suffolk) |
| 0.50% of first $100 million |
| 0.45% of next $400 million |
| 0.40% over $500 million |
Balanced (ICON) |
| 0.40% of first $200 million |
| 0.35% of next $300 million |
| 0.30% over $500 million |
Target VIP and Target Equity/Income (First Trust) |
| 0.35% of first $500 million |
| 0.25% over $500 million |
Suffolk, the sub-adviser for the Omni, Bristol, Bryton Growth, and Bristol Growth Portfolios has an affiliation with ONI. Ohio National Financial Services, Inc. (ONFS) owns 100% of ONLIC, the parent company of ONI, and also owns 83% of the voting securities of Suffolk. There were no Fund liabilities payable to Suffolk at December 31, 2011 and fees paid to Suffolk are an expense of ONI, not of the Fund.
Pursuant to a service agreement among ONI, ONLIC and the Fund, ONLIC has agreed to provide personnel and facilities to ONI on a cost-reimbursement basis. These personnel members include officers of the Fund. ONLIC also provides clerical and administrative services and such supplies and equipment as may be reasonably required in order for ONI to properly perform its advisory function pursuant to the Investment Advisory Agreement. ONLIC further performs duties to fulfill the transfer agent function on behalf of the Fund. Performance of these duties by ONLIC and availability of facilities, personnel, supplies, and equipment does not represent an expense to the Fund in excess of the advisory fees paid to ONI.
Pursuant to the Investment Advisory Agreement, if the total expenses applicable to any Portfolio during any calendar quarter (excluding taxes, brokerage commissions, interest expense and management fees) exceed 1%, on an annualized basis, evaluated quarterly, of such Portfolio’s average daily net asset value, ONI will reimburse the Portfolio for such excess expenses. There were no expense reimbursements associated with this agreement during the year ended December 31, 2011.
| 141 | (continued) |
| Ohio National Fund, Inc. |
Notes to Financial Statements (Continued) | December 31, 2011 |
During the year ended December 31, 2011, ONI voluntarily reimbursed the amount of daily gross expenses of the Money Market Portfolio in excess of daily income earned by the Portfolio. The amount reimbursed to the Portfolio for the year ended December 31, 2011 was $636,878, of which $69,981 was receivable from ONI at December 31, 2011. This reimbursement is also not subject to recoupment in subsequent periods.
The Investment Advisory Agreement allows for a portion of the expenses related to the Fund’s Chief Compliance Officer and staff to be incurred by the Fund and paid from the Fund to the Fund’s adviser, ONI. Pursuant to the service agreement among ONI, ONLIC, and the Fund, ONLIC has provided the personnel, services, and equipment necessary to perform the Fund’s regulation-mandated compliance function and ONI has reimbursed ONLIC for such costs. For the year ended December 31, 2011, the Fund incurred compliance expenses totaling $165,576, which was equally allocated to the Portfolios. Expenses incurred by the Portfolios are reflected on the Statements of Operations as “Compliance expense”.
Each director of the Board is currently paid a quarterly retainer fee of $8,000, $3,000 for each Board meeting attended, $1,000 for each Audit Committee meeting attended, and $500 for each other Board committee or independent directors meetings attended. The Board chair receives an additional quarterly retainer fee of $3,750, the lead independent director of the Board receives an additional quarterly retainer fee of $3,125, and the Audit Committee chair receives an additional quarterly retainer fee of $1,250. For the year ended December 31, 2011, compensation of these directors by the Fund totaled $230,500.
U.S. Bancorp Fund Services, LLC, 615 East Michigan Street, Milwaukee, Wisconsin, serves as the accounting agent for all but the International and International Small-Mid Company Portfolios. U.S. Bank Institutional Trust & Custody, 425 Walnut Street, Cincinnati, Ohio serves as the custodian for all but the International and International Small-Mid Company Portfolios. The accounting agent and custodian for the International and International Small-Mid Company Portfolios is State Street Bank-Kansas City, 801 Pennsylvania Ave., Kansas City, Missouri. For assets held outside the United States, U.S. Bank and State Street Bank-Kansas City enter into sub-custodial agreements, subject to approval by the Board.
| (4) | Capital Share Transactions |
Capital share transactions for the years ended December 31, 2011 and 2010 were as follows:
| Equity | Money Market | Bond | ||||||||||||||||||||||
| Year Ended 12/31/2011 | Year Ended 12/31/2010 | Year Ended 12/31/2011 | Year Ended 12/31/2010 | Year Ended 12/31/2011 | Year Ended 12/31/2010 | |||||||||||||||||||
Capital shares issued on sales | 941,226 | 1,223,514 | 32,550,831 | 30,502,612 | 3,958,882 | 4,431,294 | ||||||||||||||||||
Capital shares issued on reinvested dividends | 91,840 | 21,933 | — | — | — | — | ||||||||||||||||||
Capital shares redeemed | (2,212,809 | ) | (2,490,299 | ) | (33,276,715 | ) | (35,282,239 | ) | (3,646,628 | ) | (4,470,717 | ) | ||||||||||||
|
|
|
|
|
|
|
|
|
|
|
| |||||||||||||
Net increase/(decrease) | (1,179,743 | ) | (1,244,852 | ) | (725,884 | ) | (4,779,627 | ) | 312,254 | (39,423 | ) | |||||||||||||
|
|
|
|
|
|
|
|
|
|
|
| |||||||||||||
| Omni | International | Capital Appreciation | ||||||||||||||||||||||
| Year Ended 12/31/2011 | Year Ended 12/31/2010 | Year Ended 12/31/2011 | Year Ended 12/31/2010 | Year Ended 12/31/2011 | Year Ended 12/31/2010 | |||||||||||||||||||
Capital shares issued on sales | 229,768 | 250,970 | 2,497,915 | 2,373,065 | 651,665 | 707,427 | ||||||||||||||||||
Capital shares issued on reinvested dividends | 30,504 | 38,339 | — | — | 24,159 | 14,274 | ||||||||||||||||||
Capital shares redeemed | (543,608 | ) | (607,491 | ) | (3,222,960 | ) | (5,011,586 | ) | (1,300,067 | ) | (1,582,714 | ) | ||||||||||||
|
|
|
|
|
|
|
|
|
|
|
| |||||||||||||
Net increase/(decrease) | (283,336 | ) | (318,182 | ) | (725,045 | ) | (2,638,521 | ) | (624,243 | ) | (861,013 | ) | ||||||||||||
|
|
|
|
|
|
|
|
|
|
|
| |||||||||||||
| Millennium | International Small-Mid Company | Aggressive Growth | ||||||||||||||||||||||
| Year Ended 12/31/2011 | Year Ended 12/31/2010 | Year Ended 12/31/2011 | Year Ended 12/31/2010 | Year Ended 12/31/2011 | Year Ended 12/31/2010 | |||||||||||||||||||
Capital shares issued on sales | 286,300 | 1,118,283 | 537,442 | 610,069 | 776,637 | 1,232,038 | ||||||||||||||||||
Capital shares issued on reinvested dividends | — | — | — | — | — | — | ||||||||||||||||||
Capital shares redeemed | (529,962 | ) | (5,500,575 | ) | (922,145 | ) | (888,134 | ) | (1,093,898 | ) | (1,244,007 | ) | ||||||||||||
|
|
|
|
|
|
|
|
|
|
|
| |||||||||||||
Net increase/(decrease) | (243,662 | ) | (4,382,292 | ) | (384,703 | ) | (278,065 | ) | (317,261 | ) | (11,969 | ) | ||||||||||||
|
|
|
|
|
|
|
|
|
|
|
| |||||||||||||
| 142 | (continued) |
| Ohio National Fund, Inc. |
Notes to Financial Statements (Continued) | December 31, 2011 |
| Small Cap Growth | Mid Cap Opportunity | S&P 500® Index | ||||||||||||||||||||||
| Year Ended 12/31/2011 | Year Ended 12/31/2010 | Year Ended 12/31/2011 | Year Ended 12/31/2010 | Year Ended 12/31/2011 | Year Ended 12/31/2010 | |||||||||||||||||||
Capital shares issued on sales | 810,468 | 964,480 | 509,487 | 574,210 | 2,954,040 | 2,719,718 | ||||||||||||||||||
Capital shares issued on reinvested dividends | — | — | — | — | 184,032 | 169,365 | ||||||||||||||||||
Capital shares redeemed | (921,986 | ) | (769,998 | ) | (899,024 | ) | (878,425 | ) | (3,584,999 | ) | (3,306,639 | ) | ||||||||||||
|
|
|
|
|
|
|
|
|
|
|
| |||||||||||||
Net increase/(decrease) | (111,518 | ) | 194,482 | (389,537 | ) | (304,215 | ) | (446,927 | ) | (417,556 | ) | |||||||||||||
|
|
|
|
|
|
|
|
|
|
|
| |||||||||||||
| Strategic Value | High Income Bond | Capital Growth | ||||||||||||||||||||||
| Year Ended 12/31/2011 | Year Ended 12/31/2010 | Year Ended 12/31/2011 | Year Ended 12/31/2010 | Year Ended 12/31/2011 | Year Ended 12/31/2010 | |||||||||||||||||||
Capital shares issued on sales | 2,328,044 | 1,068,567 | 6,947,607 | 13,405,135 | 771,713 | 597,843 | ||||||||||||||||||
Capital shares issued on reinvested dividends | 59,209 | 82,744 | — | — | — | — | ||||||||||||||||||
Capital shares redeemed | (990,362 | ) | (838,057 | ) | (8,236,398 | ) | (6,312,809 | ) | (772,696 | ) | (517,165 | ) | ||||||||||||
|
|
|
|
|
|
|
|
|
|
|
| |||||||||||||
Net increase/(decrease) | 1,396,891 | 313,254 | (1,288,791 | ) | 7,092,326 | (983 | ) | 80,678 | ||||||||||||||||
|
|
|
|
|
|
|
|
|
|
|
| |||||||||||||
| Nasdaq-100® Index | Bristol | Bryton Growth | ||||||||||||||||||||||
| Year Ended 12/31/2011 | Year Ended 12/31/2010 | Year Ended 12/31/2011 | Year Ended 12/31/2010 | Year Ended 12/31/2011 | Year Ended 12/31/2010 | |||||||||||||||||||
Capital shares issued on sales | 3,696,576 | 3,638,876 | 4,320,041 | 4,647,343 | 4,275,291 | 3,395,424 | ||||||||||||||||||
Capital shares issued on reinvested dividends | 35,054 | 27,981 | 77,847 | 80,969 | — | — | ||||||||||||||||||
Capital shares redeemed | (3,897,497 | ) | (3,966,054 | ) | (2,334,927 | ) | (2,975,049 | ) | (1,779,694 | ) | (3,633,074 | ) | ||||||||||||
|
|
|
|
|
|
|
|
|
|
|
| |||||||||||||
Net increase/(decrease) | (165,867 | ) | (299,197 | ) | 2,062,961 | 1,753,263 | 2,495,597 | (237,650 | ) | |||||||||||||||
|
|
|
|
|
|
|
|
|
|
|
| |||||||||||||
| U.S. Equity | Balanced | Income Opportunity | ||||||||||||||||||||||
| Year Ended 12/31/2011 | Year Ended 12/31/2010 | Year Ended 12/31/2011 | Year Ended 12/31/2010 | Year Ended 12/31/2011 | Year Ended 12/31/2010 | |||||||||||||||||||
Capital shares issued on sales | 232,873 | 202,103 | 550,440 | 255,879 | 326,009 | 339,658 | ||||||||||||||||||
Capital shares issued on reinvested dividends | — | 9,859 | 23,706 | 20,743 | — | — | ||||||||||||||||||
Capital shares redeemed | (322,718 | ) | (390,570 | ) | (392,980 | ) | (266,039 | ) | (217,024 | ) | (132,957 | ) | ||||||||||||
|
|
|
|
|
|
|
|
|
|
|
| |||||||||||||
Net increase/(decrease) | (89,845 | ) | (178,608 | ) | 181,166 | 10,583 | 108,985 | 206,701 | ||||||||||||||||
|
|
|
|
|
|
|
|
|
|
|
| |||||||||||||
| Target VIP | Target Equity/Income | Bristol Growth | ||||||||||||||||||||||
| Year Ended 12/31/2011 | Year Ended 12/31/2010 | Year Ended 12/31/2011 | Year Ended 12/31/2010 | Year Ended 12/31/2011 | Year Ended 12/31/2010 | |||||||||||||||||||
Capital shares issued on sales | 420,361 | 397,747 | 596,268 | 830,343 | 3,189,221 | 9,076,046 | ||||||||||||||||||
Capital shares issued on reinvested dividends | 23,633 | 29,483 | 50,753 | 36,027 | 37,666 | 26,660 | ||||||||||||||||||
Capital shares redeemed | (533,998 | ) | (693,534 | ) | (857,927 | ) | (981,024 | ) | (1,519,700 | ) | (1,633,468 | ) | ||||||||||||
|
|
|
|
|
|
|
|
|
|
|
| |||||||||||||
Net increase/(decrease) | (90,004 | ) | (266,304 | ) | (210,906 | ) | (114,654 | ) | 1,707,187 | 7,469,238 | ||||||||||||||
|
|
|
|
|
|
|
|
|
|
|
| |||||||||||||
| (5) | Investment Transactions |
Cost of purchases and proceeds from sales of investments (excluding short-term and government securities) for the year ended December 31, 2011 were as follows:
| Equity | Bond | Omni | International | Capital Appreciation | ||||||||||||||||
Cost of purchases | $ 109,915,821 | $ 22,394,775 | $ 54,124,832 | $ 110,764,760 | $ 74,269,412 | |||||||||||||||
Proceeds from sales | $ 130,617,086 | $ 11,708,451 | $ 58,552,405 | $ 134,157,252 | $ 87,080,677 | |||||||||||||||
| Millennium | International Small-Mid Company | Aggressive Growth | Small Cap Growth | Mid Cap Opportunity | ||||||||||||||||
Cost of purchases | $ 93,292,491 | $ 45,140,372 | $ 13,024,484 | $ 19,036,275 | $ 34,008,231 | |||||||||||||||
Proceeds from sales | $ 98,790,788 | $ 55,852,903 | $ 14,763,306 | $ 20,035,570 | $ 38,950,495 | |||||||||||||||
| 143 | (continued) |
| Ohio National Fund, Inc. |
Notes to Financial Statements (Continued) | December 31, 2011 |
| S&P 500® Index | Strategic Value | High Income Bond | Capital Growth | Nasdaq-100® Index | ||||||||||||||||
Cost of purchases | $ 15,711,687 | $ 18,508,106 | $ 95,965,278 | $ 24,341,012 | $ 24,404,945 | |||||||||||||||
Proceeds from sales | $ 21,096,284 | $ 5,725,931 | $ 94,464,951 | $ 24,165,428 | $ 25,735,975 | |||||||||||||||
| Bristol | Bryton Growth | U.S. Equity | Balanced | Income Opportunity | ||||||||||||||||
Cost of purchases | $ 383,829,682 | $ 233,932,419 | $ 10,785,810 | $ 10,632,855 | $ 13,130,932 | |||||||||||||||
Proceeds from sales | $ 367,448,743 | $ 217,132,495 | $ 10,526,481 | $ 6,547,428 | $ 11,906,867 | |||||||||||||||
| Target VIP | Target Equity/Income | Bristol Growth | ||||||||||||||||||
Cost of purchases | $ 17,076,581 | $ 23,705,379 | $ 184,951,063 | |||||||||||||||||
Proceeds from sales | $ 17,759,078 | $ 25,317,481 | $ 171,954,027 | |||||||||||||||||
Cost of purchases and proceeds from sales of government securities for the year ended December 31, 2011 were as follows:
| Bond | Omni | Balanced | ||||||||||
Cost of purchases | $ | 9,297,031 | $ | 153,750 | $ | — | ||||||
Proceeds from sales | $ | 9,471,563 | $ | — | $ | 984,029 | ||||||
| (6) | Financial Instruments |
The Fund’s Portfolios may trade in financial instruments with off-balance sheet risk for hedging purposes or, otherwise, in accordance with stated investing objectives. These financial instruments may include options, futures, and foreign currency contracts that may involve, to a varying degree, elements of risk in excess of the amounts recognized on financial statements.
Options
Each Portfolio, other than the Money Market Portfolio, for hedging purposes, may (a) write call options traded on a registered national securities exchange if such Portfolio owns the underlying securities subject to such options, and purchase call options for the purpose of closing out positions it has written, (b) purchase put options on securities owned, and sell such options in order to close its positions in put options, (c) purchase and sell financial futures and options thereon, and (d) purchase and sell financial index options; provided, however, that no option or futures contract shall be purchased or sold if, as a result, more than one-third of the total assets of the Portfolio would be hedged by options or futures contracts, and no more than 5% of any Portfolio’s total assets, at fair value, may be used for premiums on open options and initial margin deposits on futures contracts. The Small Cap Growth Portfolio may also participate in the above activities to protect against adverse changes in security prices or interest rates and may, for these purposes or hedging purposes, sell put options or purchase call options at any time. The S&P 500® Index and Income Opportunity Portfolios are not subject to the above limitations, as these Portfolios may engage in the purchase or selling of put or call options in accordance with those Portfolios’ stated investment objectives. The Portfolios making use of options bear the market risk of an unfavorable change in the price of securities or indices underlying the options and, for purchase options, are subject to the risk that the options will expire before being exercised. A further risk associated with investing in options is that there may not be enough buyers and sellers in the market to permit a Portfolio to close a position. To limit the risk, a Portfolio will invest only where there is an established market.
When a Portfolio writes a put or call option, an amount equal to the premium received is included on the Statement of Assets and Liabilities as a liability. The amount of the liability is subsequently marked-to-market to reflect the current market value of the option. Such liability is subject to off balance sheet risks to the extent of any future increases in market value of the written options. If an option expires on its stipulated expiration date or if the Portfolio enters into a closing purchase transaction, a gain or loss is realized. If a written call option on an individual security is exercised, a gain or loss is realized for the sale of the underlying security, and the proceeds from the sale are increased by the premium originally received. If a written call option on a securities index is exercised, a gain or loss is realized as determined by the premium originally received, the exercise price and the market value of the index. If a written put option on an individual security is exercised, the cost of the security acquired is decreased by the premium originally received. When a Portfolio purchases a put or call option, an amount equal to the premium paid is included on the Portfolio’s Statement of Assets and Liabilities as an investment, and is subsequently marked-to-market to reflect the current market value of the option. If an option expires on the stipulated expiration date or if the Portfolio enters into a closing sale transaction, a gain or loss is realized. If a Portfolio exercises a call option on an individual security, the cost of the security acquired is increased by the premium paid for the call. If the Portfolio exercises a put option on an individual security, a
| 144 | (continued) |
| Ohio National Fund, Inc. |
Notes to Financial Statements (Continued) | December 31, 2011 |
gain or loss is realized from the sale of the underlying security, and the proceeds from such a sale are decreased by the premium originally paid. If the Portfolio exercises a put option on a security index, a gain or loss is realized as determined by the premium originally paid, the exercise price and the market value of the index.
The Income Opportunity Portfolio wrote call options and purchased put options on the S&P 500 Index during the year ended December 31, 2011. These instruments are used by the Portfolio to provide a hedge against equity price risk. During a period in which the prices of the Portfolio’s common stocks may decline, these instruments are designed to increase in value, thus providing price accumulation gains that partially offset the price accumulation losses of the common stocks in the Portfolio.
The Income Opportunity Portfolio’s written call options are collateralized by cash and/or securities held with the Portfolio’s prime broker and in a segregated account at the Portfolio’s custodian. Such collateral for the Portfolio is restricted from use. The cash collateral or borrowings from the prime broker, if necessary, are included on the Statement of Assets and Liabilities. The securities pledged as collateral are noted as such on the Portfolio’s Schedule of Investments. Written and purchased options are non-income producing securities.
The activity in the number of option contracts written and the premiums received by the Income Opportunity Portfolio for the year ended December 31, 2011 were as follows:
| Number of Contracts | Premiums Received | |||||||
Options outstanding, beginning of year | 64 | $ | 190,784 | |||||
Options written | 888 | 2,211,795 | ||||||
Options exercised | — | — | ||||||
Options expired | — | — | ||||||
Options closed | (902 | ) | (2,300,330 | ) | ||||
|
|
|
| |||||
Options outstanding, end of year | 50 | $ | 102,249 | |||||
|
|
|
| |||||
Transactions involving purchased options by the Income Opportunity Portfolio for the year ended December 31, 2011 were: Cost of purchases: $1,163,836, Proceeds from sales: $785,846, Expirations: $170,168.
Futures Contracts
Each Portfolio, other than the Money Market Portfolio may, primarily for hedging purposes, purchase and sell futures contracts. Futures contracts are used for the purpose of hedging existing Portfolio securities, or securities that the Portfolio intends to purchase, against fluctuations in value caused by variations in market rates. Upon entering into a futures contract, a Portfolio is required to pledge to the broker an amount of cash or securities equal to a percentage of the contract amount, known as the initial margin deposit. Subsequent payments, known as “variation margin”, are made or received by the Portfolios each day, depending on the daily fluctuations in the value of the underlying contacts. The Portfolios recognize unrealized appreciation (depreciation) equal to the cumulative daily variation margin transactions. When the contracts are closed, a Portfolio records a realized gain or loss equal to the difference between the value of the contracts at the time they were opened and the value at the time they were closed.
Should market conditions move unexpectedly, the Portfolios may not achieve the anticipated benefits of the futures contracts and may realize a loss. The use of futures transactions involves the risk of imperfect correlation in movements in the price of futures contracts interest rates, and the underlying hedged assets. A further risk associated with investing in futures contracts is that there may not be enough buyers and sellers in the market to permit a Portfolio to close a position when it wants to do so. To limit the risk, a Portfolio will invest only where there is an established market. The S&P 500® Index Portfolio may purchase or sell stock index futures contracts and the Nasdaq-100® Index Portfolio may purchase or sell derivative securities designed to replicate the Nasdaq-100® Index in accordance with their stated investment objectives.
| 145 | (continued) |
| Ohio National Fund, Inc. |
Notes to Financial Statements (Continued) | December 31, 2011 |
At December 31, 2011, there was one outstanding futures contract in the International Portfolio. Details of this contract were as follows:
Type | Description | Expiration | Number of contracts | Counterparty | Contract at value | Initial contract amount | Unrealized Appreciation (Depreciation) | Variation Margin Receivable (Payable) | ||||||||||||||||
Long | DAX Index Futures | March 16, 2012 | 10 | JP Morgan Securities Inc. | $ | 1,909,019 | $ | 1,869,415 | $ | 39,604 | $ | 21,163 | ||||||||||||
The International Portfolio’s holdings of U.S. Treasury Bills, as noted on the Portfolio’s Schedule of Investments, were pledged at December 31, 2011 as collateral for this contract. The cost and value of these instruments at December 31, 2011 were $1,149,963 and $1,149,963, respectively.
This futures contract was executed for the purpose of increasing exposure to an attractive equities market, beyond that evidenced by the Portfolio’s investment in common stocks, while maintaining a significant cash balance that could be used for potentially higher-than-average shareholder transactions. There were other index futures contracts that were executed and closed in the International Portfolio during the year ended December 31, 2011. These were executed for similar purposes as those for futures contracts outstanding at December 31, 2011. For the year ended December 31, 2011, the notional values of futures contracts opened and closed prior to contract settlement date by the International Portfolio were approximately $24.5 million and $25.7 million, respectively.
Foreign Currency Contracts
In order to hedge against changes in the exchange rates of foreign currencies in relation to the U.S. dollar, each Portfolio, other than the Money Market Portfolio, may engage in forward foreign currency contracts. A forward foreign currency contract involves an obligation to purchase or sell a foreign currency at a future date, at a negotiated rate. The value of a foreign currency contract will typically fluctuate with changes in forward currency exchange rates. All commitments are marked to market daily at the applicable exchange rates and any resulting unrealized appreciation or depreciation is recorded. With respect to sales of currency exchange contracts, a Portfolio would incur a realized loss if the value of the contract increases between the date the forward contract is opened and the date the forward contract is closed. A Portfolio incurs a realized gain if the value of the contract decreases between those dates. With respect to purchases of currency exchange contracts, a Portfolio would incur a realized loss if the value of the contract decreases between the date the forward contract is opened and the date the forward contract is closed.
The use of foreign currency contracts might not successfully protect a Portfolio against a loss resulting from the movements of foreign currency in relation to the U.S. dollar and does not eliminate fluctuations in the prices of other currencies or securities. A Portfolio is also exposed to credit risk associated with counterparty nonperformance on these currency exchange contracts, which is typically limited to the unrealized gain on each open contract.
Details of the contracts outstanding at December 31, 2011 are as follows:
Contracts to buy foreign currency:
International | ||||||||||||||||
Date of contract | Exchange date | Counterparty | Currency to receive | Currency to | Contract at value | Unrealized Appreciation (Depreciation) | ||||||||||
December 8, 2011 | March 9, 2012 | HSBC | 5,500,000 CAD | $ 5,377,658 | $ | 5,390,905 | $ | 13,247 | ||||||||
December 13, 2011 | March 9, 2012 | JPM | 4,575,550 GBP | $ 7,095,854 | $ | 7,101,457 | $ | 5,603 | ||||||||
December 13, 2011 | March 9, 2012 | JPM | 13,763,230 NZD | $10,437,345 | $ | 10,666,885 | $ | 229,540 | ||||||||
December 16, 2011 | January 17, 2012 | BONY | 3,350,000 EUR | $ 4,370,276 | $ | 4,336,082 | $ | (34,194 | ) | |||||||
|
|
|
|
| ||||||||||||
| $27,281,133 | $ | 27,495,329 | $ | 214,196 | ||||||||||||
|
|
|
|
| ||||||||||||
| 146 | (continued) |
| Ohio National Fund, Inc. |
Notes to Financial Statements (Continued) | December 31, 2011 |
Contracts to sell foreign currency:
International | ||||||||||||||||
Date of contract | Exchange date | Counterparty | Currency to | Currency to | Contract at value | Unrealized Appreciation (Depreciation) | ||||||||||
November 11, 2011 | January 17, 2012 | BONY | $ 20,769,144 | 15,100,000 EUR | $ | 19,544,728 | $ | 1,224,416 | ||||||||
November 11, 2011 | January 17, 2012 | HSBC | $ 6,752,444 | 38,168,190 NOK | $ | 6,379,103 | $ | 373,341 | ||||||||
December 9, 2011 | March 9, 2012 | BONY | $ 5,377,658 | 31,200,096 NOK | $ | 5,204,403 | $ | 173,255 | ||||||||
|
|
|
|
| ||||||||||||
$ 32,899,246 | $ | 31,128,234 | $ | 1,771,012 | ||||||||||||
|
|
|
|
| ||||||||||||
Counterparties | Currencies | |
BONY – Bank of New York Mellon | CAD – Canadian Dollar | |
HSBC – HSBC Bank USA | GBP – British Pound | |
JPM – JPMorgan Securities, Inc. | NZD – New Zealand Dollar | |
EUR – Euro | ||
NOK – Norwegian Krone |
Foreign currency contracts were executed in the International Portfolio in order to mitigate the effect that exchange rate volatility had on the valuation of the Portfolio’s investments that were either under-weighted or over-weighted in relation to the Portfolio’s benchmark index. The Portfolio was under-weighted in equity investments within the countries of Great Britain, New Zealand, and Canada. The Portfolio executed contracts to buy those countries’ currencies to mitigate the effects that volatility in those currencies’ exchange rates might otherwise have on the Portfolio’s performance relative to the benchmark. The Portfolio was over-weighted in investments denominated in Euros and the Norwegian Krone and, likewise, executed contracts to sell those currencies in order to mitigate the effect that volatility in the exchange rate might otherwise have on relative performance.
The Portfolio entered into other foreign currency contracts during the year for similar benchmark performance hedging purposes. The Portfolio also entered into contracts that were the inverse of previously executed contracts to effectively exit prior contracts earlier than stated contract delivery dates, as over-weights or under-weights were reduced, or as previously executed contracts resulted in an attractive return to the Portfolio. For the year ended December 31, 2011, the notional value of other foreign currency contracts that were both opened and closed by the International Portfolio was approximately $298.0 million for currencies bought and approximately $303.3 million for currencies sold.
For the year ended December 31, 2011, the notional value of foreign currency contracts that were closed by the Strategic Value Portfolio was approximately $2.9 million for currencies bought and approximately $2.9 million for currencies sold. There were no new contracts executed in the Strategic Value Portfolio during the year ended December 31, 2011.
The values and financial statement effects of derivative instruments that were not accounted for as hedging instruments as of, and for the year ended, December 31, 2011 were as follows:
Portfolio | Instrument | Primary Risk Type | Value - Asset Derivatives | Value - Liability Derivatives | Location on Statements of Assets and Liabilities | |||||||||||
International | Contracts to buy foreign currencies | Currency exchange rate | $ | 27,495,329 | $ | (27,281,133 | ) | (1 | ) | |||||||
|
|
|
| |||||||||||||
Contracts to sell foreign currencies | Currency exchange rate | $ | 32,899,246 | $ | (31,128,234 | ) | (1 | ) | ||||||||
|
|
|
| |||||||||||||
Futures contracts | Equity price | $ | 1,909,019 | $ | (1,869,415 | ) | (2 | ) | ||||||||
|
|
|
| |||||||||||||
Income Opportunity | Purchased options | Equity price | $ | 11,475 | $ | — | (3 | ) | ||||||||
|
|
|
| |||||||||||||
Written options | Equity price | $ | — | $ | (125,000 | ) | (4 | ) | ||||||||
|
|
|
| |||||||||||||
| (1) | Net unrealized appreciation on foreign currency contacts |
| (2) | Net unrealized appreciation on futures contracts |
| (3) | Investments in securities, at value |
| (4) | Options written, at value |
| 147 | (continued) |
| Ohio National Fund, Inc. |
Notes to Financial Statements (Continued) | December 31, 2011 |
Portfolio | Instrument | Risk Type | Realized Gain (Loss) on Derivatives Recognized in Income | Change in Unrealized Appreciation/ Depreciation on Derivatives Recognized in Income | Location on Statements of Operations | |||||||||||
International | Currency contracts | Currency exchange rate | $ | (1,792,761 | ) | $ | 2,258,702 | (1 | ), (2) | |||||||
|
|
|
| |||||||||||||
Futures contracts | Equity price | $ | 931,996 | $ | 63,214 | (3 | ), (4) | |||||||||
|
|
|
| |||||||||||||
Strategic Value | Currency contracts | Currency exchange rate | $ | 57,516 | $ | (57,516 | ) | (1 | ), (2) | |||||||
|
|
|
| |||||||||||||
Income Opportunity | Purchased options | Equity price | $ | (324,452 | ) | $ | (47,013 | ) | (5 | ), (6) | ||||||
|
|
|
| |||||||||||||
Written options | Equity price | $ | (20,363 | ) | $ | 81,745 | (7 | ), (8) | ||||||||
|
|
|
| |||||||||||||
| (1) | Net realized gain (loss) on foreign currency contracts |
| (2) | Change in unrealized appreciation/depreciation on foreign currency contracts |
| (3) | Net realized gain (loss) on futures contracts |
| (4) | Change in unrealized appreciation/depreciation on futures contracts |
| (5) | Net realized gain (loss) on investments |
| (6) | Change in unrealized appreciation/depreciation on investments |
| (7) | Net realized gain (loss) on written options |
| (8) | Change in unrealized appreciation/depreciation on written options |
| (7) | Federal Income Tax Information |
At December 31, 2011, the components of accumulated earnings (deficit) on a tax basis were as follows:
Portfolio | Undistributed Ordinary Income | Undistributed Long-Term Capital Gains (Losses) | Accumulated Earnings | Accumulated Capital and Other Losses | Unrealized Appreciation (Depreciation) (1) | Total Accumulated Earnings (Deficit) | ||||||||||||||||||
Equity | $ | 321,507 | $ | — | $ | 321,507 | $ | (123,643,544 | ) | $ | 13,323,732 | $ | (109,998,305 | ) | ||||||||||
Money Market | — | — | — | — | — | — | ||||||||||||||||||
Bond | 5,641,940 | — | 5,641,940 | (14,525,950 | ) | 10,219,346 | 1,335,336 | |||||||||||||||||
Omni | 73,015 | — | 73,015 | (5,321,740 | ) | (529,870 | ) | (5,778,595 | ) | |||||||||||||||
International | 1,009,365 | — | 1,009,365 | (97,289,081 | ) | 14,233,660 | (82,046,056 | ) | ||||||||||||||||
Capital Appreciation | 42,139 | — | 42,139 | (16,735,939 | ) | 1,641,628 | (15,052,172 | ) | ||||||||||||||||
Millennium | — | — | — | (10,965,136 | ) | 2,237,944 | (8,727,192 | ) | ||||||||||||||||
International Small-Mid Company | 729,334 | — | 729,334 | (13,721,891 | ) | 3,767,028 | (9,225,529 | ) | ||||||||||||||||
Aggressive Growth | 3,051 | — | 3,051 | (705,633 | ) | 1,786,701 | 1,084,119 | |||||||||||||||||
Small Cap Growth | — | 1,520,144 | 1,520,144 | — | 2,116,465 | 3,636,609 | ||||||||||||||||||
Mid Cap Opportunity | — | — | — | (28,753,502 | ) | 1,873,368 | (26,880,134 | ) | ||||||||||||||||
S&P 500® Index | 410,227 | — | 410,227 | (3,391,706 | ) | 23,200,012 | 20,218,533 | |||||||||||||||||
Strategic Value | 560,303 | — | 560,303 | (7,328,383 | ) | 4,479,652 | (2,288,428 | ) | ||||||||||||||||
High Income Bond | 21,132,185 | 1,571,833 | 22,704,018 | — | 2,877,763 | 25,581,781 | ||||||||||||||||||
Capital Growth | — | 2,703,559 | 2,703,559 | — | 6,331,429 | 9,034,988 | ||||||||||||||||||
Nasdaq-100® Index | 20,387 | 4,861,825 | 4,882,212 | — | 7,927,608 | 12,809,820 | ||||||||||||||||||
Bristol | 76,535 | 3,031,350 | 3,107,885 | — | (6,752,424 | ) | (3,644,539 | ) | ||||||||||||||||
Bryton Growth | 7,687,190 | 14,729,329 | 22,416,519 | — | (5,770,617 | ) | 16,645,902 | |||||||||||||||||
U.S. Equity | 87,152 | — | 87,152 | (6,285,039 | ) | 805,553 | (5,392,334 | ) | ||||||||||||||||
Balanced | 57,379 | — | 57,379 | (687,861 | ) | 719,151 | 88,669 | |||||||||||||||||
Income Opportunity | 107,766 | — | 107,766 | (193,049 | ) | 694,856 | 609,573 | |||||||||||||||||
Target VIP | 24,084 | — | 24,084 | (6,954,077 | ) | 30,621 | (6,899,372 | ) | ||||||||||||||||
Target Equity/Income | 50,416 | — | 50,416 | (12,624,380 | ) | (3,060,798 | ) | (15,634,762 | ) | |||||||||||||||
Bristol Growth | 5,824,008 | 1,990,368 | 7,814,376 | — | 820,758 | 8,635,134 | ||||||||||||||||||
| (1) | The differences between book-basis and tax-basis unrealized appreciation/(depreciation) are attributed primarliy to tax deferral of losses on wash sales and the realization for tax purposes of unrealized gains/(losses) on certain instruments. |
| 148 | (continued) |
| Ohio National Fund, Inc. |
Notes to Financial Statements (Continued) | December 31, 2011 |
For Federal income tax purposes, the following Portfolios had capital loss carry forwards as of December 31, 2011 that are available to offset future realized gains, if any:
| Total Loss Carryforward | Expiration | |||||||||||||||||||||||||||
Portfolio | 2012 | 2016 | 2017 | 2018 | No Expiration Short Term | No Expiration Long Term | ||||||||||||||||||||||
Equity | $ | 123,643,544 | $ | — | $ | 68,747,789 | $ | 47,422,387 | $ | 3,017,740 | $ | 2,735,422 | $ | 1,720,206 | ||||||||||||||
Bond | 14,525,950 | — | 5,003,196 | 9,522,754 | — | — | — | |||||||||||||||||||||
Omni | 5,321,740 | — | 26,015 | 5,295,725 | — | — | — | |||||||||||||||||||||
International | 97,289,081 | — | 31,496,951 | 65,792,130 | — | — | — | |||||||||||||||||||||
Capital Appreciation | 16,735,939 | — | — | 16,735,939 | — | — | — | |||||||||||||||||||||
Millennium | 10,965,136 | — | 3,453,066 | 7,512,070 | — | — | — | |||||||||||||||||||||
International Small-Mid Company | 13,721,891 | — | 2,829,458 | 10,892,433 | — | — | — | |||||||||||||||||||||
Aggressive Growth | 705,633 | — | — | 705,633 | — | — | — | |||||||||||||||||||||
Mid Cap Opportunity | 28,753,502 | — | 15,102,042 | 13,651,460 | — | — | — | |||||||||||||||||||||
S&P 500® Index | 3,391,706 | 134,482 | 1,597,902 | 218,356 | 1,311,938 | — | 129,028 | |||||||||||||||||||||
Strategic Value | 7,328,383 | — | 4,861,930 | 2,272,799 | 193,654 | — | — | |||||||||||||||||||||
U.S. Equity | 6,285,039 | — | 2,278,621 | 4,006,418 | — | — | — | |||||||||||||||||||||
Balanced | 687,861 | — | 146,267 | 541,594 | — | — | — | |||||||||||||||||||||
Income Opportunity | 193,049 | — | — | 52,609 | 140,440 | — | — | |||||||||||||||||||||
Target VIP | 6,954,077 | — | — | 6,954,077 | — | — | — | |||||||||||||||||||||
Target Equity/Income | 12,624,380 | — | — | 12,624,380 | — | — | — | |||||||||||||||||||||
The Board does not intend to authorize a distribution of any realized gain for a Portfolio until the capital loss carry over has been offset or expires.
The Regulated Investment Company Modernization Act of 2010 (the “Act”) was enacted on December 22, 2010. The Act makes changes to several tax rules impacting the Fund. In general, the provisions of the Act were effective for the Fund’s fiscal year ending December 31, 2011. Although the Act provides several benefits, including the unlimited carryover of future capital losses, there may be a greater likelihood that all or a portion of each Portfolio’s pre-enactment capital loss carryovers may expire without being utilized due to the Act’s requirement that post-enactment capital losses be utilized before pre-enactment capital loss carryovers.
During the prior year, the Fund recorded reclassifications within the composition of net assets for permanent book/tax differences. These classifications were due principally to net operating losses, which for tax purposes cannot be used to offset future taxable income, and consent dividends. Consent dividends are constructive dividends in which distributions are deemed, for tax purposes, to be passed through from the Fund to shareholders upon written consent from all shareholders of the Fund. These classifications have no impact on the net asset values of the Fund and are designed to present the Fund’s accumulated net realized income and gain (loss) accounts on a tax basis.
The tax characteristics of distributions paid to shareholders for the year ended December 31, 2011 were as follows:
Portfolio | Ordinary Income | Net Long-Term Capital Gains | Total Distribution Paid | |||||||||
Equity | $ | 1,709,149 | $ | — | $ | 1,709,149 | ||||||
Omni | 467,625 | — | 467,625 | |||||||||
Capital Appreciation | 471,108 | — | 471,108 | |||||||||
S&P 500® Index | 2,390,576 | — | 2,390,576 | |||||||||
Strategic Value | 599,193 | — | 599,193 | |||||||||
Nasdaq-100® Index | 205,415 | — | 205,415 | |||||||||
Bristol | 910,805 | — | 910,805 | |||||||||
Balanced | 324,529 | — | 324,529 | |||||||||
Target VIP | 209,154 | — | 209,154 | |||||||||
Target Equity/Income | 373,545 | — | 373,545 | |||||||||
Bristol Growth | 366,489 | — | 366,489 | |||||||||
| 149 | (continued) |
| Ohio National Fund, Inc. |
Notes to Financial Statements (Continued) | December 31, 2011 |
The tax characteristics of distributions paid to shareholders for the year ended December 31, 2010 were as follows:
Portfolio | Ordinary Income | Net Long-Term Capital Gains | Return of Capital | Total Distribution Paid | ||||||||||||
Equity | $ | 425,944 | $ | — | $ | — | $ | 425,944 | ||||||||
Omni | 606,516 | — | — | 606,516 | ||||||||||||
Capital Appreciation | 284,477 | — | — | 284,477 | ||||||||||||
S&P 500® Index | 2,196,659 | — | — | 2,196,659 | ||||||||||||
Strategic Value. | 591,141 | — | 175,066 | 766,207 | ||||||||||||
Nasdaq-100® Index | 158,375 | — | — | 158,375 | ||||||||||||
Bristol | 995,109 | — | — | 995,109 | ||||||||||||
U.S. Equity | 99,183 | — | — | 99,183 | ||||||||||||
Balanced | 282,940 | — | — | 282,940 | ||||||||||||
Target VIP | 266,234 | — | — | 266,234 | ||||||||||||
Target Equity/Income | 305,152 | — | — | 305,152 | ||||||||||||
Bristol Growth | 259,134 | — | — | 259,134 | ||||||||||||
The cost basis for Federal income tax purposes may differ from the cost basis for financial reporting purposes. The table below details the unrealized appreciation (depreciation) and aggregate cost of securities at December 31, 2011 for Federal income tax purposes.
| Equity | Bond | Omni | International | Capital Appreciation | Millennium | |||||||||||||||||||
Gross unrealized: | ||||||||||||||||||||||||
Appreciation | $ | 23,409,769 | $ | 10,766,799 | $ | 1,986,479 | $ | 16,802,012 | $ | 11,391,458 | $ | 3,304,670 | ||||||||||||
Depreciation | (10,086,037 | ) | (547,453 | ) | (2,516,349 | ) | (2,568,352 | ) | (9,749,830 | ) | (1,066,726 | ) | ||||||||||||
|
|
|
|
|
|
|
|
|
|
|
| |||||||||||||
Net unrealized appreciation (depreciation) | $ | 13,323,732 | $ | 10,219,346 | $ | (529,870 | ) | $ | 14,233,660 | $ | 1,641,628 | $ | 2,237,944 | |||||||||||
|
|
|
|
|
|
|
|
|
|
|
| |||||||||||||
Aggregate cost of securities: | $ | 173,806,453 | $ | 150,472,186 | $ | 35,161,082 | $ | 147,512,620 | $ | 113,064,104 | $ | 33,925,679 | ||||||||||||
|
|
|
|
|
|
|
|
|
|
|
| |||||||||||||
| International Small-Mid Company | Aggressive Growth | Small Cap Growth | Mid Cap Opportunity | S&P 500® Index | Strategic Value | |||||||||||||||||||
Gross unrealized: | ||||||||||||||||||||||||
Appreciation | $ | 5,599,398 | $ | 4,335,393 | $ | 4,882,781 | $ | 6,628,459 | �� | $ | 51,025,448 | $ | 5,431,237 | |||||||||||
Depreciation | (1,832,370 | ) | (2,548,692 | ) | (2,766,316 | ) | (4,755,091 | ) | (27,825,436 | ) | (951,585 | ) | ||||||||||||
|
|
|
|
|
|
|
|
|
|
|
| |||||||||||||
Net unrealized appreciation (depreciation) | $ | 3,767,028 | $ | 1,786,701 | $ | 2,116,465 | $ | 1,873,368 | $ | 23,200,012 | $ | 4,479,652 | ||||||||||||
|
|
|
|
|
|
|
|
|
|
|
| |||||||||||||
Aggregate cost of securities: | $ | 53,683,149 | $ | 23,991,120 | $ | 29,370,180 | $ | 59,226,470 | $ | 147,510,810 | $ | 35,726,136 | ||||||||||||
|
|
|
|
|
|
|
|
|
|
|
| |||||||||||||
| High Income Bond | Capital Growth | Nasdaq-100® Index | Bristol | Bryton Growth | U.S. Equity | |||||||||||||||||||
Gross unrealized: | ||||||||||||||||||||||||
Appreciation | $ | 10,150,640 | $ | 10,944,022 | $ | 12,812,142 | $ | 9,360,287 | $ | 13,232,795 | $ | 1,553,373 | ||||||||||||
Depreciation | (7,272,877 | ) | (4,612,593 | ) | (4,884,534 | ) | (16,112,711 | ) | (19,003,412 | ) | (747,820 | ) | ||||||||||||
|
|
|
|
|
|
|
|
|
|
|
| |||||||||||||
Net unrealized appreciation (depreciation) | $ | 2,877,763 | $ | 6,331,429 | $ | 7,927,608 | $ | (6,752,424 | ) | $ | (5,770,617 | ) | $ | 805,553 | ||||||||||
|
|
|
|
|
|
|
|
|
|
|
| |||||||||||||
Aggregate cost of securities: | $ | 258,474,675 | $ | 45,095,401 | $ | 47,637,068 | $ | 194,219,693 | $ | 156,632,277 | $ | 12,528,415 | ||||||||||||
|
|
|
|
|
|
|
|
|
|
|
| |||||||||||||
| Balanced | Income Opportunity | Target VIP | Target Equity/Income | Bristol Growth | ||||||||||||||||||||
Gross unrealized: | ||||||||||||||||||||||||
Appreciation | $ | 1,584,289 | $ | 1,113,956 | $ | 2,660,659 | $ | 1,703,644 | $ | 6,604,080 | ||||||||||||||
Depreciation | (865,138 | ) | (419,100 | ) | (2,630,038 | ) | (4,764,442 | ) | (5,783,322 | ) | ||||||||||||||
|
|
|
|
|
|
|
|
|
| |||||||||||||||
Net unrealized appreciation (depreciation) | $ | 719,151 | $ | 694,856 | $ | 30,621 | $ | (3,060,798 | ) | $ | 820,758 | |||||||||||||
|
|
|
|
|
|
|
|
|
| |||||||||||||||
Aggregate cost of securities: | $ | 16,255,202 | $ | 10,319,529 | $ | 20,502,135 | $ | 24,693,942 | $ | 96,181,143 | ||||||||||||||
|
|
|
|
|
|
|
|
|
| |||||||||||||||
| 150 | (continued) |
| Ohio National Fund, Inc. |
Notes to Financial Statements (Continued) | December 31, 2011 |
| (8) | New Accounting Pronouncements |
In May 2011, the Financial Accounting Standards Board issued an Accounting Standards Update No. 2011-04 (“ASU 2011-04”), “Amendments to Achieve Common Fair Value Measurement and Disclosure Requirements in U.S. GAAP and IFRSs”. ASU 2011-04 includes common requirements for measurement of and disclosure about fair value between U.S. GAAP and IFRS. ASU 2011-04 will require reporting entities to disclose quantitative information about the unobservable inputs used in the fair value measurements categorized within Level 3 of the fair value hierarchy. In addition, ASU 2011-04 will require reporting entities to make disclosures about amounts and reasons for all transfers in and out of Level 1 and Level 2 fair value measurements. The new and revised disclosures are effective for interim and annual reporting periods beginning after December 15, 2011. Management is currently evaluating the implications of ASU No. 2011-04 and its impact on the financial statements has not been determined.
| (9) | Legal Matters |
In December 2007, the Target Equity/Income Portfolio, as a shareholder of Lyondell Chemical Company (“Lyondell”), participated in a cash out merger of Lyondell in which it received consideration in the amount of $48 per share (the “Merger”). Lyondell later filed for bankruptcy and two entities created by the Lyondell bankruptcy plan of reorganization have initiated lawsuits seeking to recover, or clawback, proceeds received by shareholders in the December 2007 merger based on fraudulent transfer claims.
The first action, Edward S. Weisfelner, as Trustee of the LB Creditor Trust v. Morgan Stanley & Co., Inc., et. al., was initiated on October 22, 2010 (the “Creditor Trust Action”), in the Supreme Court of the State of New York in the County of New York but has subsequently been removed to the U.S. Bankruptcy Court for the Southern District of New York. The second action, Edward S. Weisfelner, as Trustee of the LB Litigation Trust v. Holmes TTEE, et. al., was initiated on December 23, 2010 (the “Litigation Trust Action”), in the U.S. Bankruptcy Court for the Southern District of New York. Both actions attempt to recover the proceeds paid out to the holders of Lyondell shares at the time of the 2007 merger.
On January 4, 2012, the Fund was named in a second amended complaint in the Creditor Trust Action. The Target Equity/Income Portfolio composes part of the Fund. The value of the proceeds received by the Target Equity/Income Portfolio as a result of the Merger was $1,772,400. The outcome of these proceedings on the Portfolio cannot be predicted. Management of the Fund is currently assessing the cases and has not yet determined the potential effect, if any, on the net asset value of the Target Equity/Income Portfolio.
Also, in December 2007, the S&P 500® Index and Strategic Value Portfolios, shareholders of the Tribune Company, participated in a similar cash out merger in which shareholders received consideration in the amount of $34 per share. The company subsequently filed for bankruptcy and several legal complaints have been initiated by groups of Tribune Company creditors seeking to recover, or clawback, proceeds received by shareholders based on fraudulent transfer claims.
The first action, Official Committee of Unsecured Creditors of Tribune Company v. FitzSimons et al., was initiated on November 1, 2010 in the U.S. Bankruptcy Court for the District of Delaware (the “Tribune Bankruptcy”). As a result of these proceedings, the Court agreed to allow individual creditors to file similar complaints in U.S. state courts. The Fund is specifically named in a complaint in the U.S. District Court Southern District of Ohio Western Division, Deutsche Bank Trust Company Americas et al. v. American Electric Power et al., that was initiated in June of 2011. The Fund, along with the Strategic Value Portfolio is also named in a similar complaint in the U.S. District Court Eastern District of Pennsylvania, Deutsche Bank Trust Company Americas, et al. v. Ametek Inc. Employees Master Retirement Trust, et al. Subsequently, all consolidated cases related to the Tribune Bankruptcy were stayed on December 28, 2011. The value of the proceeds received by the S&P 500® Index and Strategic Value Portfolios, was $37,910 and $384,200, respectively. The outcome of these proceedings on the two Portfolios of the Fund cannot be predicted. Management of the Fund is currently assessing the complaints and has not yet determined the potential effect, if any, on the respective net assets values of those Portfolios.
| 151 |
| Ohio National Fund, Inc. |
The Shareholders and Board of Directors of Ohio National Fund, Inc.:
We have audited the accompanying statements of assets and liabilities of the Equity Portfolio, Money Market Portfolio, Bond Portfolio, Omni Portfolio, International Portfolio, Capital Appreciation Portfolio, Millennium Portfolio, International Small-Mid Company Portfolio, Aggressive Growth Portfolio, Small Cap Growth Portfolio, Mid Cap Opportunity Portfolio, S&P 500 Index Portfolio, Strategic Value Portfolio, High Income Bond Portfolio, Capital Growth Portfolio, Nasdaq-100 Index Portfolio, Bristol Portfolio, Bryton Growth Portfolio, U.S. Equity Portfolio, Balanced Portfolio, Income Opportunity Portfolio, Target VIP Portfolio, Target Equity/Income Portfolio and Bristol Growth Portfolio (each a Portfolio and collectively, the Portfolios, of the Ohio National Fund, Inc.), including the schedules of investments, as of December 31, 2011, and the related statements of operations for the year then ended, the statements of changes in net assets for each of the years in the two-year period then ended, and the financial highlights for each of the years or periods in the five-year period then ended. These financial statements and financial highlights are the responsibility of the Portfolios’ management. Our responsibility is to express an opinion on these financial statements and financial highlights based on our audits.
We conducted our audits in accordance with the standards of the Public Company Accounting Oversight Board (United States). Those standards require that we plan and perform the audit to obtain reasonable assurance about whether the financial statements and financial highlights are free of material misstatement. An audit includes examining, on a test basis, evidence supporting the amounts and disclosures in the financial statements. Our procedures included confirmation of securities owned as of December 31, 2011, by correspondence with custodians and brokers or by other appropriate auditing procedures where replies from brokers were not received. An audit also includes assessing the accounting principles used and significant estimates made by management, as well as evaluating the overall financial statement presentation. We believe that our audits provide a reasonable basis for our opinion.
In our opinion, the financial statements and financial highlights referred to above present fairly, in all material respects, the financial position of the Portfolios as of December 31, 2011, the results of their operations for the year then ended, the changes in their net assets for each of the years in the two-year period then ended, and the financial highlights for each of the years or periods in the five-year period then ended, in conformity with U.S. generally accepted accounting principles.
KPMG LLP
Columbus, Ohio
February 17, 2012
| 152 |
| Ohio National Fund, Inc. |
| December 31, 2011 |
| (1) | Review and Approval of Advisory and Sub-advisory Agreements |
At a meeting held on November 7, 2011, the Board of Directors, including a majority of the Directors who are not “interested persons” of the Fund (the “Independent Directors”), approved the continuation of the Investment Advisory Agreement with ONI (the “Adviser”) and, as applicable, the sub-advisory agreement with the Sub-Adviser (each a “Sub-Adviser,” and together the “Sub-Advisers”) for each of the Portfolios identified below. The Independent Directors were separately represented by independent legal counsel in connection with their consideration of the approval of the continuation of these agreements.
The Directors noted that the Adviser is responsible for monitoring the investment performance and other responsibilities of the various Sub-Advisers that have day-to-day responsibility for the decisions made for certain of the Fund’s investment portfolios. They also noted that the Adviser reports to the Fund’s Board on its analysis of each Sub-Adviser’s performance at the regular meetings of the Board, which are held at least quarterly. Where warranted, the Adviser will add or remove a particular Sub-Adviser from a watchlist that it maintains. Watchlist criteria include, for example: (a) fund performance over various time periods; (b) fund risk issues, such as changes in key personnel involved with fund management or changes in investment philosophy or process; and (c) organizational risk issues, such as regulatory, compliance or legal concerns, or changes in the ownership of the Sub-Adviser.
In considering the Investment Advisory and sub-advisory agreements, the Board requested and reviewed a significant amount of information relating to each Portfolio, the Adviser and the Sub-Advisers, including the following: (1) performance data for each Portfolio for various time periods, including year-to-date through September 30, 2011, (2) comparative performance, advisory fee and expense ratio information for a peer group of funds in the respective Portfolio’s Morningstar category (a “Morningstar Peer Group”); (3) comparable performance information for each Portfolio’s relevant benchmark index or indices; (4) comparative data regarding advisory fees, including data regarding the fees charged by the Adviser and Sub-Advisers for managing other institutional funds and institutional accounts using investment strategies and techniques similar to those used in managing the Portfolios; (5) comparative data regarding the expense ratio of each Portfolio, as compared to its Morningstar Peer Group; (6) profitability analyses for the Adviser with respect to each Portfolio; and (7) other information regarding the nature, extent and quality of services provided by the Adviser and the Sub-Advisers, as applicable. The Directors also took into account information on the services provided by the Adviser and each Sub-Adviser and performance, fee and expense ratio information regarding each Portfolio provided to them periodically throughout the year. They also met with an independent consultant to review the relative performance of each Portfolio, as compared with its benchmark(s) and peers, and in particular discussed those Portfolios that were on the watchlist.
The Independent Directors were assisted by experienced independent legal counsel throughout the contract review process. They discussed the proposed continuances in private session with such counsel at which no representatives of management, the Adviser or any Sub-Adviser were present. The Independent Directors relied upon the advice of independent legal counsel and their own business judgment in determining the material factors to be considered in evaluating each Advisory and sub-advisory agreement and the weight to be given to each such factor. The conclusions reached by the Independent Directors were based on a comprehensive evaluation of all of the information provided and were not the result of any one factor. Moreover, each Independent Director may have afforded different weight to the various factors in reaching his conclusions with respect to each Advisory and sub-advisory agreement.
Nature, Extent and Quality of Services
The Board evaluated the nature, extent and quality of the advisory services provided to the Portfolios by the Adviser. As part of its review, the Board reviewed information regarding the Adviser’s operations, procedures and personnel. The Directors took into account information they received during the previous year at Board meetings and other discussions and through periodic reports regarding the Adviser’s performance of its duties. The Directors considered the capabilities and resources that the Adviser has dedicated to performing services on behalf of the Fund and its Portfolios. The quality of administrative and other services, including the Adviser’s role in monitoring the performance and quality of compliance of the Sub-Advisers, also was considered. The Directors also considered the quality of the compliance programs of the Adviser and its responsiveness to inquiries and requests from the Board.
For each Portfolio subject to a sub-advisory agreement (all Portfolios other than the Money Market Portfolio, Bond Portfolio, S&P 500® Index Portfolio, Nasdaq-100® Index Portfolio and the fixed income portion of the Omni Portfolio), the Board considered similar criteria as applied to each Sub-Adviser, including the nature, extent and quality of the sub-advisory services provided by each Sub-Adviser. In addition to the criteria used to review the Adviser, the Directors reviewed biographical information on each Sub-Adviser’s portfolio management and other professional staff, and each Sub-Adviser’s brokerage practices. The Directors also reviewed the performance record of each Portfolio or portion of a Portfolio managed by the applicable Sub-Adviser. The Board also considered the quality of each Sub-Adviser’s compliance program as it relates to the applicable Portfolio. It was the Directors’ conclusion that overall, they were satisfied with the nature, extent and quality of services provided to the Fund and each of the Portfolios.
| 153 | (continued) |
| Ohio National Fund, Inc. |
Additional Information (Unaudited) (Continued) | December 31, 2011 |
Investment Performance
A representative of the Adviser reviewed with the Directors each Portfolio’s performance year-to-date and for the 1-, 3- and 5-year periods ended September 30, 2011, as compared to the Portfolio’s Morningstar Peer Group and benchmark(s). The Board noted that on a quarterly basis it receives a report from an independent consultant with detailed information about each Portfolio’s performance results and investment strategies. The Board also receives a report from the consultant on those Portfolios that the consultant has identified as underperforming. The Board also considered the Adviser’s effectiveness in monitoring the performance of each Sub-Adviser and the Adviser’s timeliness in responding to performance issues. A Portfolio-by-Portfolio discussion of each Portfolio’s performance and the Board’s conclusions regarding that performance is set forth below.
Fees and Expenses
The Board considered the advisory fee for each Portfolio, as well as the fee’s difference from the average advisory fee for the Portfolio’s Morningstar Peer Group and the fee’s percentile ranking within the peer group. The Board also considered the difference between each Portfolio’s overall expense ratio and that of its Morningstar Peer Group, as well as the expense ratio’s percentile ranking within the peer group.
Additionally, the Board considered certain adjusted statistics for Portfolios whose Morningstar Peer Group’s average advisory fee was likely to be skewed by the inclusion of index funds and funds of funds. The Board looked at the average assets for each fund in the respective peer group, excluding index funds and funds of funds (the “Adjusted Peer Group”) and then compared the advisory fee that would have been paid by the Portfolio if the Portfolio had had assets equal to the adjusted peer group’s average assets. The Board considered that comparison on an absolute and percentile ranking basis.
The Board also considered the fees paid to Sub-Advisers. With respect to the Portfolios sub-advised by Suffolk, an affiliate of the Adviser, the Board evaluated the reasonableness of the total fees received by the Adviser. With respect to those Portfolios sub-advised by a Sub-Adviser that is not affiliated with the Adviser, the Board relied to a degree on the Adviser’s negotiation of each sub-advisory agreement on an arm’s-length basis, noting that in the past the Adviser has negotiated decreases in the sub-advisory fee for certain Portfolios and that the Adviser had always passed on the decrease by reducing its advisory fee by the same amount. Additionally, the Board considered the fees charged by the Adviser and Sub-Advisers to their separately managed institutional accounts and other accounts, and had no concerns with those rates relative to the fees charged to the Portfolio. The Directors also recognized that it is difficult to make comparisons of advisory fees because there are variations in the services that are included in the fees paid by other funds and separately managed accounts.
Profitability
The Board considered the advisory fee paid to the Adviser for each Portfolio and noted the pre-tax profit margins reported by the Adviser for each Portfolio. The Directors noted that the Adviser, and not the Portfolios, is responsible for paying sub-advisory fees to the Portfolio Sub-Advisers. The Board also evaluated whether the net advisory fee received by the Adviser for each Portfolio, after paying sub-advisory fees to the Sub-Adviser, was reasonable, given the level of the Adviser’s services to the Portfolio. The Directors took into account the fact that the Adviser is contractually obligated to reimburse each Portfolio for certain of its expenses should they exceed a specified amount. Additionally, the Directors acknowledged that calculating the Adviser’s profitability related to a specific Portfolio can be challenging and imprecise because of the difficulties in appropriately allocating the Adviser’s expenses across the Portfolios.
The Board also noted that the Adviser has been subsidizing the Money Market Portfolio to assure that it continues to be available to all of Ohio National Fund, Inc.’s shareholders (i.e., the shareholders of every Portfolio), so that shareholders in other Portfolios can elect to invest in the Money Market Portfolio to the extent they want to take a more defensive posture. Consequently, because the Adviser’s subsidization of the Money Market Portfolio benefits the shareholders of every Portfolio, the Board acknowledged that a portion of the costs incurred by the Adviser in subsidizing the Money Market Portfolio should be considered with respect to the Adviser’s profitability from managing each of the other Portfolios.
The Board also considered the reasonableness of the sub-advisory fees paid by the Adviser to each Sub-Adviser. The Directors relied on the ability of the Adviser to negotiate the terms of each sub-advisory agreement, including the sub-advisory fee, at arm’s-length, noting that the Adviser is not affiliated with any Portfolio Sub-Adviser other than Suffolk. Accordingly, the cost of services provided by each unaffiliated Sub-Adviser and the profitability to the Sub-Adviser of its relationship with the applicable Portfolio, were not material factors in the Board’s deliberations. For similar reasons, the Board concluded that the potential realization of economies of scale by the Portfolios from the sub-advisory arrangements with the unaffiliated Sub-Advisers should not be a material factor in the Board’s deliberations.
In considering the reasonableness of the sub-advisory fees payable by the Adviser to Suffolk, the Directors noted that the Adviser, not the Portfolios, is responsible for paying sub-advisory fees to Suffolk and therefore concluded that the profitability to Suffolk of its relationship to the applicable Portfolios should not be a material factor in the Board’s deliberations. For similar reasons, the Board concluded that the potential realization of economies of scale by the applicable Portfolios from the sub-advisory arrangements with Suffolk should not be a material factor in the Board’s deliberations.
| 154 | (continued) |
| Ohio National Fund, Inc. |
Additional Information (Unaudited) (Continued) | December 31, 2011 |
Economies of Scale
The Directors noted that all of the advisory and sub-advisory fee schedules contain breakpoints that would reduce the applicable advisory or sub-advisory fees on assets above a specified level as the applicable Portfolio’s assets increase. The Directors also noted that a Portfolio would realize additional economies of scale if the Portfolio’s assets increase over time proportionately more than certain other expenses. The Directors took into account that many of the Portfolios had relatively few assets under management. After considering each Portfolio’s current size and potential for growth, the Board concluded that each Portfolio is likely to benefit from economies of scale as the Portfolio’s assets increase.
Portfolio-by-Portfolio Analysis
In addition to the foregoing, the Directors considered the specific factors and related conclusions set forth below with respect to each Portfolio’s performance and fees and expenses. Except as otherwise indicated, the performance data described below for each Portfolio is for periods ending September 30, 2011 and the advisory fee and expense data described below is through August 31, 2011 for a Portfolio’s Morningstar peer group and its Adjusted Peer Group.
Equity Portfolio (Adviser – ONI, Sub-Adviser – Legg Mason). The Portfolio underperformed its benchmark index and peer group average for the year-to-date and 1-, 3-, and 5-year periods. While expressing significant concern about the underperformance, the Adviser noted that recent performance (for September 7, 2011 through November 3, 2011) exceeded the benchmark by 97 basis points (0.97%) and that the Sub-Adviser has implemented changes designed to reduce volatility that appear to be working on a relative basis. The Directors noted that the Portfolio’s advisory fee was higher than the peer group average, but recognized that the Portfolio’s expense ratio was below average. After a lengthy discussion, the Directors determined that, given the recent improvement in performance and reduction in volatility (admittedly over too short a period to demonstrate a longer-term trend), they wanted to see whether the Sub-Adviser is able to show sustained improvement in relative performance. Accordingly, based on its review and the Adviser’s representation that it would monitor performance closely, the Board concluded that appropriate action was being taken to address performance and that the advisory and sub-advisory fees were reasonable.
Money Market Portfolio (Adviser – ONI). The Portfolio outperformed its peer group average for the year-to-date and trailing 1-year periods, but underperformed its peer group average for the 3- and 5-year periods. The Directors noted that the Portfolio’s advisory fee and expense ratio were well below average relative to its peer group and that the Adviser has a negative profit margin for the Portfolio. Overall, the Board concluded that the Portfolio’s performance was satisfactory and that the advisory fee was reasonable.
Bond Portfolio (Adviser – ONI). Although the Portfolio underperformed its benchmark index for the year-to-date and 1-, 3- and 5-year periods and its peer group average for the 1- and 5-year periods, its recent performance has improved. The Board noted that for the year-to date and 3-year periods, the Portfolio’s performance was in the 46th and 25th percentile, respectively, for its peer group. The Board acknowledged that the Portfolio’s underperformance relative to its benchmark index reflected the volatility in interest rates and credit spreads during the past year. The Directors noted that, although the Portfolio’s advisory fee was above the peer group average, the Portfolio’s expense ratio was below the peer group average. The Board considered the Adviser’s profitability for the Portfolio to be reasonable. Overall, the Board concluded that the Portfolio’s performance was satisfactory and that the advisory fee was reasonable.
Omni Portfolio (Adviser – ONI, Sub-Adviser – Suffolk). The Omni Portfolio underperformed its benchmark index and peer group average for the year-to-date, 1-, 3- and 5-year periods. The Adviser noted, however, that the Portfolio had outperformed in calendar years 2009 and 2010, finishing in the 7th and 26th percentile, respectively, for its peer group. The Adviser also noted that recent performance (for September 7, 2011 through November 3, 2011) exceeded the benchmark by 150 basis points (1.50%). The Portfolio’s advisory fee and expense ratio were below the Portfolio’s peer group average. Overall, the Board concluded that the Portfolio’s performance was satisfactory and that the advisory and sub-advisory fees were reasonable.
International Portfolio (Adviser – ONI, Sub-Adviser – Federated Global). The International Portfolio outperformed its benchmark index and its peer group average for the 1- and 3-year periods, while trailing both year-to-date. The Board noted that year-to-date the markets have favored companies in emerging markets and that the Portfolio’s performance has been hurt by its underexposure to those markets. The Board also noted that while the Portfolio’s advisory fee was above the peer group average, its expense ratio was below average. Overall, the Board concluded that the Portfolio’s performance was satisfactory and that the advisory and sub-advisory fees were reasonable.
Capital Appreciation Portfolio (Adviser – ONI, Sub-Adviser – Jennison). The Portfolio outperformed its benchmark index for the 3- and 5-year periods and its peer group average for the 1-,3- and 5-year periods, but underperformed both year-to-date. The Portfolio’s advisory fee was higher than the peer group average, but the expense ratio was below average. Overall, the Board concluded that the Portfolio’s performance was satisfactory and that the advisory and sub-advisory fees were reasonable.
Millennium Portfolio (Adviser – ONI, Sub-Adviser – Neuberger Berman). The Millennium Portfolio outperformed its benchmark index and its peer group average year-to-date and for the 1- and 5-year periods, while underperforming both for the 3-year period. The Board noted that the Portfolio had been removed from the Adviser’s watchlist because of its improved performance. The Directors remarked that the advisory fee and expense ratio for the Portfolio were below average. Overall, the Board concluded that the Portfolio’s performance was satisfactory and that the advisory and sub-advisory fees were reasonable.
| 155 | (continued) |
| Ohio National Fund, Inc. |
Additional Information (Unaudited) (Continued) | December 31, 2011 |
International Small-Mid Company Portfolio (Adviser – ONI, Sub-Adviser – Federated Global). The Portfolio underperformed its benchmark index and peer group average for the year-to-date and 1-, 3- and 5-year periods. The Board noted that the volatile nature of the Portfolio would result in strong performance during periods of economic growth and weaker performance during more negative economic periods. They also considered that the Portfolio has generally been hurt by its underexposure to emerging markets. The Portfolio’s advisory fee and expense ratio were both above average relative to the peer group. Overall, the Board concluded that the Portfolio’s performance was satisfactory and that the advisory and sub-advisory fees were reasonable.
Aggressive Growth Portfolio (Adviser – ONI, Sub-Adviser – Janus). The Portfolio underperformed its benchmark index and peer group average for the year-to-date and 1-year periods; outperformed the index and underperformed the peer group average for the 3-year period; and outperformed the index and peer group average for the 5-year period. The Board noted that the nature of the Portfolio would result in strong performance during periods of economic growth and weaker performance during more negative economic periods. The Adviser also pointed out that the Sub-Adviser’s style has been out of favor recently. The Portfolio’s advisory fee and expense ratio were both above average compared to its peer group. Overall, the Board concluded that the Portfolio’s performance was satisfactory and that the advisory and sub-advisory fees were reasonable.
Small Cap Growth Portfolio (Adviser – ONI, Sub-Adviser – Janus). The Portfolio has significantly outperformed its benchmark and peer group average for the year-to-date and the 1-, 3- and 5-year periods. The Adviser noted that the Portfolio underwent a change in portfolio managers in 2009, which has correlated to an improvement in the Portfolio’s performance relative to its benchmark. The Portfolio’s advisory fee and expense ratio were above its peer group average. Overall, the Board concluded that the Portfolio’s performance was satisfactory and that the advisory and sub-advisory fees were reasonable.
Mid Cap Opportunity Portfolio (Adviser – ONI, Sub-Adviser – Goldman Sachs). The Adviser reminded the Board that the Portfolio had changed to a new Sub-Adviser effective in December 2009, and thus only the more recent performance is relevant. The Board noted that the Portfolio underperformed its benchmark index and peer group average for the year-to-date and 1-year periods, although the Directors indicated that performance should be looked at over a longer term. The Adviser pointed out that recent performance has improved, as the Portfolio outperformed its peer group average over the third quarter of 2011 and the period from September 7, 2011 to November 3, 2011. The Portfolio’s advisory fee was above the peer group average, although the Portfolio’s expense ratio was below the peer group average. Overall, the Board concluded that the Portfolio’s performance was satisfactory and that the advisory and sub-advisory fees were reasonable.
S&P 500® Index Portfolio (Adviser – ONI). While the Portfolio underperformed its benchmark year-to-date, the Board noted that its performance generally was in line with the S&P 500® Index when expenses were excluded. The Board did not rely on peer group comparison figures for the Portfolio because the Board considers peer groups for index funds to be generally irrelevant. The Board noted that the overall expense ratio is the statistic most important to index fund shareholders, and the Portfolio’s expense ratio was in line with the average for the peer group. Overall, the Board concluded that the Portfolio’s performance was satisfactory and that the advisory fees were reasonable.
Strategic Value Portfolio (Adviser – ONI, Sub-Adviser – Federated Equity). The Portfolio outperformed its benchmark index for the year-to-date and 1- and 3-year periods, and outperformed its peer group average for the year-to-date and 1-, 3- and 5-year periods. The Board noted that for both the year-to date and 1-year periods the Portfolio’s performance was in the 1st percentile for its peer group. The Directors also noted that the Portfolio’s advisory fee and expense ratio were above the peer group average. Overall, the Board concluded that the Portfolio’s performance was satisfactory and that the advisory and sub-advisory fees were reasonable.
High Income Bond Portfolio (Adviser – ONI, Sub-Adviser – Federated Investment). The Portfolio’s performance outperformed its benchmark index for the year-to-date and 1-year period, and outperformed its peer group average for the year-to-date and 1-, 3- and 5-year periods. The Directors noted that the advisory fee was above the peer group average, while the expense ratio was below the peer group average. Overall, the Board concluded that the Portfolio’s performance was satisfactory and that the advisory and sub-advisory fees were reasonable.
Capital Growth Portfolio (Adviser – ONI, Sub-Adviser – Eagle). The Portfolio has outperformed its benchmark index and peer group average for the year-to-date and 1-, 3- and 5-year periods. The Directors noted that although the advisory fee was above average for the peer group, the expense ratio was below average. Overall, the Board concluded that the Portfolio’s performance was satisfactory and that the advisory and sub-advisory fees were reasonable.
Nasdaq-100® Index Portfolio (Adviser – ONI). While the Portfolio underperformed its benchmark year-to-date, the Board noted that its performance generally was in line with the Nasdaq-100® Index when expenses were excluded. The Board did not rely on peer group comparison figures for the Portfolio because the Board considers peer groups for index funds to be generally irrelevant. The Board noted that the overall expense ratio is the statistic most important to index fund shareholders, and the Portfolio’s expense ratio was significantly below the average for the peer group. Overall, the Board concluded that the Portfolio’s performance was satisfactory and that the advisory fees were reasonable.
Bristol Portfolio (Adviser – ONI, Sub-Adviser – Suffolk). The Portfolio underperformed its benchmark and peer group average for the year-to-date and 1-, 3- and 5-year periods. The Adviser noted, however, that the Portfolio had outperformed in 2009, and that recent performance (for September 7, 2011 through November 3, 2011) exceeded its benchmark index by 177 basis points (1.77%). The Directors noted
| 156 | (continued) |
| Ohio National Fund, Inc. |
Additional Information (Unaudited) (Continued) | December 31, 2011 |
that the Portfolio’s advisory fee was above average and that the Portfolio’s expense ratio was below average. Overall, the Board concluded that the Portfolio’s performance was satisfactory and that the advisory and sub-advisory fees were reasonable.
Bryton Growth Portfolio (Adviser – ONI, Sub-Adviser – Suffolk). The Portfolio underperformed its benchmark index and peer group average year-to-date and for the 1-, 3- and 5-year periods. The Adviser noted, however, that the Portfolio had outperformed in 2009, and that recent performance (for September 7, 2011 through November 3, 2011) exceeded its benchmark index by 360 basis points (3.60%). The Board considered that the Portfolio’s advisory fee and expense ratio were below the peer group average. Overall, the Board concluded that the Portfolio’s performance was satisfactory and that the advisory and sub-advisory fees were reasonable.
U.S. Equity Portfolio (Adviser – ONI, Sub-Adviser – ICON). The Portfolio has underperformed its benchmark index for all periods and its peer group average for the year-to-date and 3- and 5-year periods. The Adviser noted, however, that the Portfolio had outperformed its peer group average for the 1-year period and that recent performance (from September 7, 2011 through November 3, 2011) exceeded the benchmark index by 99 basis points (0.99%). The Adviser indicated that the Portfolio remains on its watchlist. The Directors also noted that the Portfolio’s advisory fee and expense ratio were above average. Overall, the Board concluded that the Portfolio’s performance was satisfactory and that the advisory and sub-advisory fees were reasonable.
Balanced Portfolio (Adviser – ONI, Sub-Adviser – ICON). The Portfolio underperformed its benchmark for the year-to-date and 1-, 3- and 5-year periods, but outperformed its peer group average year-to-date and for the 1- and 5-year periods. The Adviser pointed out that the trend of underperforming the benchmark while outperforming the peer group has continued in the most recent quarterly and monthly performance. The Directors considered that the Portfolio’s advisory fee was slightly above the peer group average, and its expense ratio was above the peer group average. Overall, the Board concluded that the Portfolio’s performance was satisfactory and that the advisory and sub-advisory fees were reasonable.
Income Opportunity Portfolio (Adviser – ONI, Sub-Adviser – ICON). The Portfolio outperformed its benchmark index for the year-to-date and 5-year periods and its peer group average for the year-to-date and 1-, 3- and 5-year periods. The Adviser pointed out that it would expect the Portfolio to trail in rising markets and outperform in falling markets. The Board considered that the Portfolio’s strategy is to provide downside protection at the expense of upside returns and noted that the Portfolio had outperformed when the market was down. The Board also noted that the Portfolio had been removed from the Adviser’s watchlist because of its improved performance. The Board considered that the Portfolio’s advisory fee and expense ratio were above average. Overall, the Board concluded that the Portfolio’s performance was satisfactory and that the advisory and sub-advisory fees were reasonable.
Target VIP Portfolio (Adviser – ONI, Sub-Adviser – First Trust). The Portfolio has outperformed its benchmark index and its peer group average for the year-to-date, but has underperformed both for the 3- and 5-year periods. The Board considered that the Portfolio is based on a quantitative model that had fallen out of favor with the market, but has been performing better recently. The Board noted that, because the Portfolio is not actively managed, its performance does not reflect on the Adviser, but is a function of the effectiveness of the model. The Directors also noted that the Adviser had taken the Portfolio off the watchlist due to the good performance in 2011. The Portfolio’s advisory fee and expense ratio were below its peer group average. Overall, the Board concluded that the performance of the Portfolio was satisfactory and that the advisory and sub-advisory fees were reasonable.
Target Equity/Income Portfolio (Adviser – ONI, Sub-Adviser – First Trust). The Portfolio has significantly underperformed its benchmark index and peer group average for the year-to-date and 1-, 3- and 5-year periods. The Adviser noted, however, that the Portfolio had outperformed in 2010, and that recent performance (for September 7, 2011 through November 3, 2011) exceeded its benchmark index by 110 basis points (1.10%). The Board also considered that the Portfolio is based on a quantitative model that has fallen out of favor with the market. The Board noted that, because the Portfolio is not actively managed, its performance does not reflect on the Adviser, but is a function of the effectiveness of the model. The Directors also noted that the advisory fee and expense ratio were below its peer group average. Overall, the Board concluded that the performance of the Portfolio was satisfactory and that the advisory and sub-advisory fees were reasonable.
Bristol Growth Portfolio (Adviser – ONI, Sub-Adviser – Suffolk). The Portfolio underperformed its benchmark index and peer group average for the year-to-date and 1- and 3-year periods. The Adviser noted, however, that the Portfolio had outperformed in 2009, and that recent performance (for September 7, 2011 through November 3, 2011) exceeded the benchmark index by 171 basis points (1.71%). The Directors considered that the Portfolio’s advisory fee and overall expense ratio were above its peer group average. Overall, the Board concluded that the Portfolio’s performance was satisfactory and that the advisory and sub-advisory fees were reasonable.
After consideration of the foregoing, the Board reached the following conclusions regarding the Investment Advisory Agreement and, as applicable, the sub-advisory agreement with respect to each Portfolio, in addition to the conclusions set forth above: (a) ONI and the Sub-Adviser had demonstrated that they possessed the capability and resources to perform the duties required of them under the Investment Advisory Agreement and applicable sub-advisory agreement, respectively; (b) the investment philosophy, strategies and techniques of ONI (with respect to the Portfolios without a Sub-Adviser) and the Sub-Adviser were appropriate for pursuing the applicable Portfolio’s investment objective; (c) ONI (with respect to the Portfolios without a Sub-Adviser) and the Sub-Adviser were likely to execute their investment philosophy, strategies and techniques consistently over time; and (d) ONI and the Sub-Adviser maintained appropriate compliance programs. Based on all
| 157 | (continued) |
| Ohio National Fund, Inc. |
Additional Information (Unaudited) (Continued) | December 31, 2011 |
of the all above-mentioned factors and their related conclusions, with no single factor or conclusion being determinative and with each Director not necessarily attributing the same weight to each factor, the Directors unanimously concluded that approval of the continuation of the Investment Advisory Agreement and, as applicable, the sub-advisory agreement was in the best interests of each Portfolio and its shareholders. Accordingly, the Board, including all of the Independent Directors, voted unanimously to approve the continuation of the Investment Advisory Agreement and, as applicable, the sub-advisory agreement for each Portfolio.
| (2) | Expense Disclosure |
An individual may not buy or own membership interests of the Fund directly. An individual acquires an indirect interest in the Fund by purchasing a variable annuity contract or variable insurance policy and allocating premiums or purchase payments to Fund Portfolios available through the separate accounts of ONLIC, ONLAC, and NSLA. Separate accounts of these entities are the shareholders of the Fund.
As a shareholder of the Fund, a separate account incurs ongoing costs, including management fees and other Fund expenses. This example is intended to help a policy/contract owner understand ongoing costs (in dollars) associated with the underlying investment in the Fund’s Portfolios by the separate account shareholder and to compare these costs with the ongoing costs associated with investing in other mutual funds.
The example is based on an investment of $1,000 invested at July 1, 2011 and held through December 31, 2011.
Actual Expenses
The table below provides information about investment values and actual expenses associated with each Portfolio of the Fund. The information below, together with the amount of an underlying investment, can be used to estimate expenses paid over the period. An estimate can be obtained by simply dividing an underlying investment value by $1,000 (for example, an $8,600 investment value divided by $1,000 = 8.6), then multiplying the result by the number in the table under the heading entitled “Expenses Paid During Period”.
Portfolio | Beginning Investment Value 7/1/2011 | Ending Investment Value 12/31/2011 | Expense Paid During Period* 7/1/2011 – 12/31/2011 | Expense Ratio During Period 7/1/2011 – 12/31/2011 (Annualized) | ||||||||||||
Equity | $ | 1,000.00 | $ | 950.79 | $ | 4.28 | 0.87 | % | ||||||||
Money Market | 1,000.00 | 1,000.00 | 0.40 | 0.08 | % | |||||||||||
Bond | 1,000.00 | 1,029.30 | 3.38 | 0.66 | % | |||||||||||
Omni | 1,000.00 | 916.65 | 3.77 | 0.78 | % | |||||||||||
International | 1,000.00 | 801.24 | 4.63 | 1.02 | % | |||||||||||
Capital Appreciation | 1,000.00 | 914.35 | 4.29 | 0.89 | % | |||||||||||
Millennium | 1,000.00 | 888.06 | 4.52 | 0.95 | % | |||||||||||
International Small-Mid Company | 1,000.00 | 778.64 | 5.47 | 1.22 | % | |||||||||||
Aggressive Growth | 1,000.00 | 908.45 | 5.10 | 1.06 | % | |||||||||||
Small Cap Growth | 1,000.00 | 916.09 | 5.22 | 1.08 | % | |||||||||||
Mid Cap Opportunity | 1,000.00 | 920.89 | 4.70 | 0.97 | % | |||||||||||
S&P 500® Index | 1,000.00 | 961.61 | 2.37 | 0.48 | % | |||||||||||
Strategic Value | 1,000.00 | 1,050.49 | 5.12 | 0.99 | % | |||||||||||
High Income Bond | 1,000.00 | 1,010.12 | 3.95 | 0.78 | % | |||||||||||
Capital Growth | 1,000.00 | 864.55 | 4.79 | 1.02 | % | |||||||||||
Nasdaq-100® Index | 1,000.00 | 981.88 | 2.65 | 0.53 | % | |||||||||||
Bristol | 1,000.00 | 886.61 | 3.99 | 0.84 | % | |||||||||||
Bryton Growth | 1,000.00 | 884.97 | 4.32 | 0.91 | % | |||||||||||
U.S. Equity | 1,000.00 | 923.57 | 4.85 | 1.00 | % | |||||||||||
Balanced | 1,000.00 | 978.46 | 4.69 | 0.94 | % | |||||||||||
Income Opportunity | 1,000.00 | 955.68 | 5.77 | 1.17 | % | |||||||||||
Target VIP | 1,000.00 | 909.07 | 4.09 | 0.85 | % | |||||||||||
Target Equity/Income | 1,000.00 | 868.89 | 3.77 | 0.80 | % | |||||||||||
Bristol Growth | 1,000.00 | 920.52 | 4.36 | 0.90 | % | |||||||||||
| 158 | (continued) |
| Ohio National Fund, Inc. |
Additional Information (Unaudited) (Continued) | December 31, 2011 |
Hypothetical Example for Comparison Purposes
The table below provides information about hypothetical investment values and hypothetical expenses based on each respective Portfolio’s actual expense ratio and an assumed rate of return of 5% per year before expenses, which is not an actual return. The hypothetical investment values and expenses may not be used to estimate the actual ending investment balance or expenses actually paid for the period by the shareholders. A policy/contract holder may use this information to compare this 5% hypothetical example with the 5% hypothetical examples that appear in the shareholder reports of other funds.
Portfolio | Beginning Investment Value 7/1/2011 | Ending Investment Value 12/31/2011 | Expense Paid During Period* 7/1/2011 – 12/31/2011 | Expense Ratio During Period 7/1/2011 –12/31/2011 (Annualized) | ||||||||||||
Equity | $ | 1,000.00 | $ | 1,020.82 | $ | 4.43 | 0.87 | % | ||||||||
Money Market | 1,000.00 | 1,024.80 | 0.41 | 0.08 | % | |||||||||||
Bond | 1,000.00 | 1,021.88 | 3.36 | 0.66 | % | |||||||||||
Omni | 1,000.00 | 1,021.27 | 3.97 | 0.78 | % | |||||||||||
International | 1,000.00 | 1,020.06 | 5.19 | 1.02 | % | |||||||||||
Capital Appreciation | 1,000.00 | 1,020.72 | 4.53 | 0.89 | % | |||||||||||
Millennium | 1,000.00 | 1,020.42 | 4.84 | 0.95 | % | |||||||||||
International Small-Mid Company | 1,000.00 | 1,019.06 | 6.21 | 1.22 | % | |||||||||||
Aggressive Growth | 1,000.00 | 1,019.86 | 5.40 | 1.06 | % | |||||||||||
Small Cap Growth | 1,000.00 | 1,019.76 | 5.50 | 1.08 | % | |||||||||||
Mid Cap Opportunity | 1,000.00 | 1,020.32 | 4.94 | 0.97 | % | |||||||||||
S&P 500® Index | 1,000.00 | 1,022.79 | 2.45 | 0.48 | % | |||||||||||
Strategic Value | 1,000.00 | 1,020.21 | 5.04 | 0.99 | % | |||||||||||
High Income Bond | 1,000.00 | 1,021.27 | 3.97 | 0.78 | % | |||||||||||
Capital Growth | 1,000.00 | 1,020.06 | 5.19 | 1.02 | % | |||||||||||
Nasdaq-100® Index | 1,000.00 | 1,022.53 | 2.70 | 0.53 | % | |||||||||||
Bristol | 1,000.00 | 1,020.97 | 4.28 | 0.84 | % | |||||||||||
Bryton Growth | 1,000.00 | 1,020.62 | 4.63 | 0.91 | % | |||||||||||
U.S. Equity | 1,000.00 | 1,020.16 | 5.09 | 1.00 | % | |||||||||||
Balanced | 1,000.00 | 1,020.47 | 4.79 | 0.94 | % | |||||||||||
Income Opportunity | 1,000.00 | 1,019.31 | 5.96 | 1.17 | % | |||||||||||
Target VIP | 1,000.00 | 1,020.92 | 4.33 | 0.85 | % | |||||||||||
Target Equity/Income | 1,000.00 | 1,021.17 | 4.08 | 0.80 | % | |||||||||||
Bristol Growth | 1,000.00 | 1,020.67 | 4.58 | 0.90 | % | |||||||||||
| * | Expenses are equal to the average account value times the Fund’s annualized expense ratio multiplied by the number of days in the most recent fiscal half-year divided by the number of days in the fiscal year. Please note that the expenses shown in these tables are meant to highlight ongoing Fund costs only and do not reflect any contract-level expenses or Fund transactional costs, such as sales charges (loads) or exchange fees (if any). Therefore, these tables are useful in comparing ongoing fund costs only, and will not fully assist a policy/contract owner in determining the relative total expenses of different funds. In addition, if transactional costs were included, costs may have been higher for these Portfolios as well as for a fund being compared. |
| (3) | Other Federal Tax Information |
For corporate shareholders, the percentages of the total ordinary income dividends paid in 2011, and ordinary income consent dividends that were incurred in the 2011 tax year, that qualify for the corporate dividends received deduction are as follows:
Equity | 100.00 | % | ||
Money Market | 0.00 | % | ||
Bond | 0.00 | % | ||
Omni | 65.81 | % | ||
International | 0.00 | % | ||
Capital Appreciation | 100.00 | % | ||
Millennium | 0.00 | % | ||
International Small-Mid Company | 0.00 | % | ||
Aggressive Growth | 100.00 | % | ||
Small Cap Growth | 0.00 | % | ||
Mid Cap Opportunity | 0.00 | % | ||
S&P 500® Index | 100.00 | % |
Strategic Value | 87.06 | % | ||
High Income Bond | 0.00 | % | ||
Capital Growth | 0.00 | % | ||
Nasdaq-100® Index | 100.00 | % | ||
Bristol | 100.00 | % | ||
Bryton Growth | 0.00 | % | ||
U.S. Equity | 100.00 | % | ||
Balanced | 48.14 | % | ||
Income Opportunity | 0.00 | % | ||
Target VIP | 90.61 | % | ||
Target Equity/Income | 100.00 | % | ||
Bristol Growth | 18.06 | % |
| 159 | (continued) |
| Ohio National Fund, Inc. |
Additional Information (Unaudited) (Continued) | December 31, 2011 |
Pursuant to Section 853 of the Internal Revenue Code, the Fund designates the following amounts as foreign taxes paid for the year ended December 31, 2011:
| Creditable Foreign Taxes Paid | Per Share Amount | Portion of Ordinary Income Distribution Derived from Foreign Sourced Income | ||||||||||
International | $ | 719,463 | 0.0430 | 100.00 | % | |||||||
International Small-Mid Company | $ | 109,765 | 0.0366 | 100.00 | % | |||||||
Foreign taxes paid for purposes of Section 853 may be less than actual foreign taxes paid for financial statement purposes. None of the Portfolios listed above derived any income from ineligible foreign sources, as defined under Section 901(j) of the Internal Revenue Code.
| 160 |
| Ohio National Fund, Inc. |
| December 31, 2011 (Unaudited) |
Name and Address | Age | Position(s) with the Fund | Term of Office | Number of Portfolios | Principal Occupation(s) and Other Directorships During Past Five Years | |||||||
Independent Directors | ||||||||||||
| James E. Bushman One Financial Way Cincinnati, Ohio | 67 | Director, Chairman of Audit Committee and Member of Independent Directors Committee | Indefinite; Since March 2000 | 24 | Director, Chairman and CEO: Cast-Fab Technologies, Inc. (a manufacturing company); Director: The Midland Company (1998-2008), Air Transport Services Group, Inc., The Littleford Group, Inc. (1984-2010), Hilltop Basic Resources, Inc., The Elizabeth Gamble Deaconess Home Association, The Christ Hospital, The University of Cincinnati Foundation, and Dow Target Variable Fund LLC. | |||||||
| George M. Vredeveld One Financial Way Cincinnati, Ohio | 69 | Lead Independent Director, Member of Audit and Independent Directors Committees | Indefinite; Since March 1996 | 24 | Alpaugh Professor of Economics: University of Cincinnati; President: Economics Center for Education & Research; Director: Dow Target Variable Fund LLC. | |||||||
| John I. Von Lehman One Financial Way Cincinnati, Ohio | 59 | Director, Member of Audit and Independent Directors Committees | Indefinite; Since August 2007 | 24 | Former Executive Vice President, CFO, Secretary: The Midland Company (1988-2007); Director, Audit Committee and Corporate Governance Committee Member: American Financial Group, Inc.; Finance Committee and Investment Committee member: Life Enriching Communities; Investment Committee: Xavier University Foundation; Director: Dow Target Variable Fund LLC | |||||||
Interested Director | ||||||||||||
| John J. Palmer One Financial Way Cincinnati, Ohio | 72 | Chairman of the Board and Director | Indefinite; Since July 1997 | 24 | Insurance industry consultant (April 2010 to present), Director: NSLA and Fiduciary Capital Management, Inc. (Ohio National-affiliated companies); Director: Dow Target Variable Fund LLC and Cincinnati Symphony Orchestra; Trustee: Cincinnati Opera. Prior to March 2010, was President of the Fund, Director and Vice Chairman of ONLIC; Prior to May 2010 was President and CEO of NSLA, Director of ONI and various other Ohio National-affiliated companies. | |||||||
Officers | ||||||||||||
| Christopher A. Carlson One Financial Way Cincinnati, Ohio | 52 | President | Indefinite; Since March 2000 | 24 | Executive Vice President and Chief Investment Officer: ONLIC; President and Director: ONI; Chief Investment Officer: NSLA; Officer and Director of various other Ohio National-affiliated companies. Prior to March 2010, was Vice President of the Fund. | |||||||
| Thomas A. Barefield One Financial Way Cincinnati, Ohio | 58 | Vice President | Indefinite; Since February 1998 | 24 | Executive Vice President and Chief Marketing Officer—Institutional Sales: ONLIC; Director and Vice President—Marketing: NSLA; Director: ONI; Senior Vice President: Ohio National Equities, Inc.; Recent graduate of class XXIX of Leadership Cincinnati. | |||||||
| Dennis R. Taney One Financial Way Cincinnati, Ohio | 64 | Chief Compliance Officer | Indefinite; Since August 2004 | 24 | Second Vice President: ONLIC, Chief Compliance Officer: ONLIC, ONI, NSLA, and other Ohio National-affiliated companies. | |||||||
| R. Todd Brockman One Financial Way Cincinnati, Ohio | 43 | Treasurer | Indefinite; Since August 2004 | 24 | Second Vice President, Mutual Fund Operations: ONLIC and NSLA; Treasurer: ONI. | |||||||
| Kimberly A. Plante One Financial Way Cincinnati, Ohio | 37 | Secretary | Indefinite; Since March 2005 | 24 | Senior Associate Counsel: ONLIC; Secretary: ONI; Officer of various other Ohio National-affiliated companies. Prior to August 2007 was Assistant Secretary, | |||||||
| 161 | (continued) |
| Ohio National Fund, Inc. |
Information about Directors and Officers (Continued) | December 31, 2011 (Unaudited) |
Name and Address | Age | Position(s) with the Fund | Term of Office | Number of Portfolios | Principal Occupation(s) and Other Directorships During Past Five Years | |||||||
| Catherine E. Gehr One Financial Way Cincinnati, Ohio | 39 | Assistant Treasurer | Indefinite; Since March 2005 | 24 | Manager, Mutual Fund Operations: ONLIC; Assistant Treasurer: ONI. | |||||||
| Katherine L. Scott One Financial Way Cincinnati, Ohio | 32 | Assistant Secretary | Indefinite; Since August 2007 | 24 | Assistant Counsel: ONLIC; Prior to July 2007 was Compliance Officer with Fifth Third Securities, Inc. | |||||||
| 162 |
Ohio National Fund, Inc.
Post Office Box 371
Cincinnati, Ohio 45201
Form 1320 Rev. 2-12
| Item 2. | Code Of Ethics. |
As of the end of the period covered by this report, Ohio National Fund, Inc. (the “Fund”) has adopted a code of ethics that applies to the Fund’s principal executive officer and principal financial officer. There were no substantive amendments or waivers to the Code of Ethics during the period covered by this report.
A copy of this Code of Ethics is filed as Exhibit EX-99.CODE to this Form N-CSR and is also available, without charge, upon request, by calling 877-781-6392 toll free.
| Item 3. | Audit Committee Financial Expert. |
The Fund’s Board of Directors has determined that the Fund has an audit committee financial expert serving on its Audit Committee. The Audit Committee financial expert is Mr. James E. Bushman. Mr. Bushman is independent for purposes of Item 3 of Form N-CSR.
| Item 4. | Principal Accountant Fees And Services. |
The aggregate fees for each of the last two fiscal years for professional services rendered by the principal accountant for the audit of the Fund’s annual financial statements or services that are normally provided by the accountant in connection with statutory and regulatory filings or engagements for those fiscal years are listed below.
| (a) | Audit Fees. |
Fiscal year ended December 31, 2011: $284,000
Fiscal year ended December 31, 2010: $276,000
| (b) | Audit-Related Fees. |
Professional services rendered in connection with the consent on the Fund’s N1A filing.
Fiscal year ended December 31, 2011: $5,000
Fiscal year ended December 31, 2010: $4,750
| (c) | Tax Fees. None. |
| (d) | All Other Fees. None. |
(e)(1) Audit Committee Pre-Approval Policies and Procedures:
The Fund’s Audit Committee has adopted an Audit Committee Charter that requires that the Audit Committee oversee the quality and appropriateness of the accounting methods used in the preparation of the Fund’s financial statements, and the independent audit thereof; approve the selection and compensation of the independent auditors; and pre-approve the performance, by the independent auditors, of non-audit services for the Fund, its investment adviser, or any affiliated entity controlling, controlled by or under common control with the investment adviser that provides ongoing services to the Fund.
(e)(2) Services Approved Pursuant to Paragraph (c)(7)(i)(C) of Rule 2-01 of Regulation S-X:
During the fiscal years ended December 31, 2011 and 2010, there were no non-audit services provided by the Fund’s principal accountant that would have required pre-approval by the Fund’s Audit Committee. The audit related fees aforementioned were pre-approved by the Fund’s Audit Committee, although not required by paragraph (c) (7) (ii) of Regulation S-X as the audit-related fees were less than five percent of the total amount of revenues paid to the Fund’s principal accountant.
| (f) | Not applicable. |
| (g) | There were no non-audit services provided by the Fund’s principal accountant, other than items disclosed in item (b) above, in which a fee was billed to the Fund, the Fund’s adviser, and any entity controlling, controlled by, or under common control with the adviser that provides ongoing services to the registrant for the last two fiscal years. |
| (h) | Not applicable, as there were no non-audit services performed by the Fund’s principal accountant that were rendered to the Fund, the Fund’s adviser, or any entity controlling, controlled by, or under common control with the adviser that provided ongoing services to the registrant that were not pre-approved for the last two fiscal years. |
| Item 5. | Audit Committee Of Listed Registrants. |
Not applicable.
| Item 6. | Schedule of Investments. |
Not applicable.
| Item 7. | Disclosure Of Proxy Voting Policies And Procedures For Closed-End Management Investment Companies. |
Not Applicable.
| Item 8. | Portfolio Managers of Closed-End Management Investment Companies. |
Not Applicable.
| Item 9. | Purchases of Equity Securities by Closed-End Management Investment Company and Affiliated Purchasers. |
Not Applicable.
| Item 10. | Submission of Matters to a Vote of Security Holders. |
There were no material changes to the procedures by which shareholders may recommend nominees to the Fund’s Board of Directors.
| Item 11. | Controls and Procedures. |
| (a) | The Fund’s principal executive officer and principal financial officer have concluded, based on their evaluation conducted as of a date within 90 days of the filing of this report, that the Fund’s disclosure controls and procedures are adequately designed and are operating effectively to ensure (i) that material information relating to the Fund, including its consolidated subsidiaries, is made known to them by others within those entities, particularly during the period in which this report is being prepared; and (ii) that information required to be disclosed by the Fund on Form N-CSR is recorded, processed, summarized and reported within the time periods specified in the Securities and Exchange Commission’s rules and forms. |
| (b) | There were no changes in the Fund’s internal control over financial reporting that occurred during the second fiscal quarter of the period covered by this report that have materially affected, or are reasonably likely to materially affect, the Fund’s internal control over financial reporting. |
| Item 12. | Exhibits. |
(a)(1) | The Fund’s Code of Ethics pursuant to Item 2 of Form N-CSR is filed and attached hereto as EX-99.CODE. | |
(a)(2) | A separate certification for each principal executive officer and principal financial officer of the Fund as required by Rule 30a-2(a) under the Investment Company Act of 1940 (17 CFR 270.30a-2(a)) is attached hereto as EX-99.CERT. | |
| The certifications required by Section 906 of the Sarbanes-Oxley Act of 2002 are attached hereto as EX-99.906CERT. | ||
SIGNATURES
Pursuant to the requirements of the Securities Exchange Act of 1934 and the Investment Company Act of 1940, the registrant has duly caused this report to be signed on its behalf by the undersigned, thereunto duly authorized.
Ohio National Fund, Inc.
| By: | /s/ Christopher A. Carlson | |
| Christopher A. Carlson | ||
| President | ||
| March 8, 2012 |
Pursuant to the requirements of the Securities Exchange Act of 1934 and the Investment Company Act of 1940, this report has been signed below by the following persons on behalf of the registrant and in the capacities and on the dates indicated.
Ohio National Fund, Inc.
| By: | /s/ Christopher A. Carlson | |
| Christopher A. Carlson | ||
| President | ||
| March 8, 2012 |
| By: | /s/ R. Todd Brockman | |
| R. Todd Brockman | ||
| Treasurer | ||
| March 8, 2012 |