UNITED STATES
SECURITIES AND EXCHANGE COMMISSION
Washington, D.C. 20549
FORM N-CSR
CERTIFIED SHAREHOLDER REPORT OF REGISTERED
MANAGEMENT INVESTMENT COMPANIES
Investment Company Act file number 811-03015
Ohio National Fund, Inc.
(Exact name of registrant as specified in charter)
| One Financial Way, Cincinnati, Ohio | 45242 | |
| (Address of principal executive offices) | (Zip code) |
CT Corporation 300 E. Lombard St. Suite 1400 Baltimore, MD 21202
(Name and address of agent for service)
Registrant’s telephone number, including area code: 513-794-6971
Date of fiscal year end: December 31
Date of reporting period: December 31, 2013
Form N-CSR is to be used by management investment companies to file reports with the Commission not later than 10 days after the transmission to stockholders of any report that is required to be transmitted to stockholders under Rule 30e-1 under the Investment Company Act of 1940 (17 CFR 270.30e-1). The Commission may use the information provided on Form N-CSR in its regulatory, disclosure review, inspection, and policymaking roles.
A registrant is required to disclose the information specified by Form N-CSR, and the Commission will make this information public. A registrant is not required to respond to the collection of information contained in Form N-CSR unless the Form displays a currently valid Office of Management and Budget (“OMB”) control number. Please direct comments concerning the accuracy of the information collection burden estimate and any suggestions for reducing the burden to Secretary, Securities and Exchange Commission, 450 Fifth Street, NW, Washington, DC 20549-0609. The OMB has reviewed this collection of information under the clearance requirements of 44 U.S.C. § 3507.
| Item 1. | Reports To Stockholders. |
WEALTH BUILDING OPPORTUNITY
Ohio National Fund, Inc.
Annual Report
December 31, 2013
Ohio National Fund, Inc.
OHIO NATIONAL FUND, INC.
| 1 | ||||
| 3 | ||||
The following pages contain Performance, Management’s Comments, Change in Value of $10,000 Investment, Portfolio Composition, Top Holdings, and Schedule of Investments for each of the Fund’s Portfolios: | ||||
| 4 | ||||
| 8 | ||||
| 10 | ||||
| 15 | ||||
| 20 | ||||
| 25 | ||||
| 30 | ||||
| 35 | ||||
| 38 | ||||
| 43 | ||||
| 47 | ||||
| 54 | ||||
| 57 | ||||
| 67 | ||||
| 71 | ||||
| 75 | ||||
| 78 | ||||
| 81 | ||||
| 89 | ||||
| 93 | ||||
| 96 | ||||
| 99 | ||||
| 102 | ||||
| 107 | ||||
| 117 | ||||
| 141 | ||||
| 142 | ||||
| 150 | ||||
Message |  |
Dear Investor:
The year 2013 was outstanding for equity market returns with the S&P 500® Index up an astonishing 32.4 percent. The S&P 500® Index has now achieved five consecutive years of positive equity market returns, with 2012 and 2013 delivering two consecutive years of double-digit returns. It is noteworthy that the 2013 S&P 500® Index return was triple the long-term average of 10.8 percent.
Looking Ahead
While past performance is not a predictor of the future, historical patterns often reflect long-term averages that may continue. Noted above, at the end of 2013 the market had delivered five consecutive years of positive returns, two consecutive years of double-digit returns and positive performance that exceeded 30 percent. Now consider that in the past 85 years, the S&P 500® Index has:
| ¢ | Experienced five or more consecutive years of positive annual returns five times. The subsequent sixth-year performance was also positive in 60 percent of these five instances. |
| ¢ | Achieved two consecutive years of double-digit returns twenty-two times. The subsequent year’s performance was also positive in 64 percent of these twenty-two instances. |
| ¢ | Exceeded 30 percent fifteen times. In 73 percent of those fifteen instances, the following year’s return was positive. |
| ¢ | Posted positive annual returns 72 percent of the time, a long-term average consistent with the range of performance averages noted above. |
There is no reason to believe, based on historical patterns, that the recent positive performance will be followed by corrective negatives in 2014, especially considering that
stocks are not significantly overvalued by long-term price-to-earnings ratios. However, more interesting is the comparison of the average return in years subsequent to successive periods that ended similarly to 2013.
The average annual return for the year following five consecutive years of positive returns has been 15.3 percent, a very good return. In the year following consecutive years of double-digit returns, the average annual return has been 6.1 percent. While positive, the return is below the historical average. Now also consider that the average annual return in the year following a 30 percent or greater return has been 10.3 percent, which is very close to the 85-year time frame average.
A Balanced, Long-Term Approach
When you look at the relative return of stocks versus bonds (using the S&P 500® Index and the Barclays Capital U.S. Aggregate Bond Index), 2013 was the best of the past 38 years. Even with the commonly held belief that interest rates are rising and will depress fixed income returns, it is hard to believe 2014 can repeat last year’s performance. Remember that while rising interest rates lower fixed income total returns, the cash income provided by a bond’s yield can help generate a positive return. In fact, in the 43 years since 1926 in which interest rates rose, intermediate U.S. Treasury bonds still managed a positive return in all but nine of those years. Admittedly, interest rates were higher in many of those time frames, so current income represented a larger portion of total return.
Given historical data and the current relative return of stocks versus bonds, investors’ expectations for 2014 should reflect that while no significant problems are
| 1 |
obvious, a return to more normal annual returns is likely. This argues for a balanced approach to investing to minimize exposure to potential asset bubbles, and a long-term focus rather than short-sighted attempts to outguess the market.
What are some of the key themes to expect in 2014? Perhaps most important is the return of rational market reactions to economic news. In the last President’s Message, I spoke of the “bad news is good news and good news is bad news” effect. This referred to the market reacting negatively to positive economic news, fearing that the Fed would soon end its unprecedented stimulus. Conversely, when there was negative economic news, the market reacted positively, believing that the “easy” money days would continue. While this irrational behavior was the norm for much of 2013, it was unsustainable. The Fed’s monetary stimulus cannot last forever. The longer it lasts, the greater concern there is of it creating an equity market bubble.
Toward the end of the year, the market reaction seemed to normalize. When we finally saw positive economic news, and as unemployment moved closer to the Fed’s target rate, the market reaction to the Fed’s announcement of a gradual tapering was not negative. In fact, all of the U.S. broad market indices were positive by 2 percent or more during the month of December. Unfortunately, the start of 2014 has not been as kind. We will have to wait and see if this is merely a needed pause or something larger.
The Ohio National Fund, Inc.
I am pleased to report that many of the Ohio National Fund, Inc. Portfolios strongly participated in the 2013
equity market rally. Thirteen of our twenty Portfolios yielded over 30 percent, and three of our Portfolios, the Bristol and Bryton Growth Portfolios subadvised by Suffolk Capital Management, LLC and the Small Cap Growth Portfolio subadvised by Janus Capital Management LLC, yielded over 40 percent. While a number of Portfolios – including some whose returns exceeded 30 percent – underperformed their benchmarks, they still delivered very attractive absolute returns.
You may recall in the closing remarks of my last President’s Message that I stated, “There is no indication of concern as we look ahead to the second half of 2013.” While I’m less comfortable making such a statement going into 2014, I do not see significant storm clouds on the horizon. Equity markets still appear to be reasonably valued, indicating that a significant decline is not warranted. The greatest uncertainty is the market’s continued reaction to the Fed’s gradual monetary easing. We may have already gleaned its impact in early 2014, especially in emerging markets and currencies. Now, more than ever, it is important to consult your financial adviser to make sure your assets are positioned appropriately.
Thank you for entrusting your assets to the Ohio National Fund, Inc. We look forward to continuing to serve your investment needs.
Sincerely,

Christopher A. Carlson
President
| 2 |
Directors and Officers of Ohio National Fund, Inc.
John J. Palmer, Director
Madeleine W. Ludlow, Director
George M. Vredeveld, Director
John I. Von Lehman, Director
Christopher A. Carlson, President
Thomas A. Barefield, Vice President
R. Todd Brockman, Treasurer
Kimberly A. Plante, Secretary
Julie T. Thomas, Chief Compliance Officer
Catherine E. Gehr, Assistant Treasurer
Emily Bae, Assistant Secretary
The Statement of Additional Information of Ohio National Fund, Inc. (the “Fund”) includes additional information about the Fund’s Board of Directors (the “Board”) and is available at http://www.ohionationalfund.com or upon request, without charge, by calling 877-781-6392 (toll-free).
A description of the policies and procedures that the Fund uses in voting proxies relating to Fund securities, as well as information regarding how the Fund voted proxies during the most recent twelve-month period ended June 30, is available without charge, upon request, by calling 877-781-6392 (toll-free) and on the Securities and Exchange Commission (the “Commission”) website at http://www.sec.gov.
The Fund has filed its Schedules of Investments as of March 31 and September 30 with the Commission, as required, on Form N-Q. Form N-Q is required to be filed with the Commission for the first and third quarters of each fiscal year within sixty days after the end of each period and is available on the Commission website upon acceptance of each submission. The Fund’s Forms N-Q may be reviewed and copied at the Commission’s Public Reference Room in Washington, DC. Information about the Public Reference Room is available by calling 1-800-SEC-0330 (toll-free).
This report and the financial statements contained herein are submitted for the general information of the shareholders of the Fund. This report is not authorized for distribution to prospective investors in the Fund unless preceded or accompanied by an effective prospectus of Ohio National Fund, Inc. For a prospectus containing more complete information, including charges and expenses, please contact Ohio National Investments, Inc., One Financial Way, Cincinnati, OH 45242, telephone 877-781-6392 (toll-free).
| 3 |
| Ohio National Fund, Inc. | Equity Portfolio |
Objective/Strategy
The Equity Portfolio seeks long-term growth of capital by investing at least 80% of its assets in equity securities.
Performance as of December 31, 2013
Average Annual Total Returns: | ||||
One year | 37.69% | |||
Five years | 18.23% | |||
Ten years | 2.26% |
Past performance does not guarantee future results. The performance data quoted represents past performance and current returns may be lower or higher. Total return figures include change in share price and reinvestment of dividends and capital gains. The investment return and principal value will fluctuate so that an investor’s shares, when redeemed, may be worth more or less than the original cost. To obtain performance information up to the most recent month end, call toll-free 1-877-781-6392.
The Portfolio is not open to direct retail investment. Beneficial interest in shares is obtained solely by purchase of variable life insurance policies and variable annuity contracts. Actual performance results for variable annuity and variable universal life contracts will be lower due to contract charges. Consult your contract for applicable charges.
Comments
For the year ended December 31, 2013, the Equity Portfolio returned 37.69% versus 32.39% for the current benchmark, the S&P 500 Index.
The Portfolio’s relative outperformance was primarily driven by security selection effects and sector allocation effects. Underweight positions in the Utilities and Telecommunication Services sectors and an overweight in Health Care generated the largest contributions to sector allocation, as the former two sectors underperformed the benchmark while the latter outperformed. In terms of specific holdings, Celgene Corp., MetLife, Inc., JPMorgan Chase & Co., Genworth Financial, Inc. and United Continental Holdings, Inc. were the largest contributors to performance, while ARIAD Pharmaceuticals, Inc., Teradata Corp., Aflac, Inc., Apache Corp. and Cisco Systems, Inc. were the largest detractors.(1)
The start of 2013 echoed the beginning of 2012 as stocks again posted double-digit returns, pushing the S&P 500 Index and Dow Jones Industrial Average to all-time highs despite concerns of low growth, the European debt crisis and tightening government budgets. Housing starts were above 900,000 for all three monthly reports during the first quarter for the first time in nearly five years.
In the second quarter, volatility increased, U.S. Treasury yields surged and 30-year mortgage rates soared, as the Federal Reserve indicated that quantitative easing programs may be tapered. Although the Federal Reserve’s monetary policy-setting committee left the target short-term interest rate unchanged at 0% to 0.25% and maintained the $85 billion-a-month bond-buying program, Chairman Ben Bernanke said the central bank may start reducing asset purchases later in the year and end them in mid-2014 if the economy continues to improve in line with the Federal Reserve’s projection.
The S&P 500 Index breached the 1700 threshold in the third quarter, as investors focused on U.S. output, Federal Reserve tapering timing, tensions in Syria and the Congressional budget debate. The biggest surprise in terms of economic data was an upward revision in second quarter gross domestic product growth from +1.7% to +2.5%. August saw a sell-off, however, as the U.S. weighed its options concerning Syria’s civil unrest. In mid-September, the Federal Reserve unexpectedly announced plans to maintain its
current accommodative policy, while economists had forecasted a $10 billion reduction in bond purchases. Though stocks rallied on the decision, they subsided as House Republicans and the Democrat-controlled Senate squabbled over the 2014 budget, with health care reform in the spotlight. Congress remained stubborn and deadlocked, ultimately resulting in a partial government shutdown beginning in October.
Equities eventually recovered after Congress ended the partial government shutdown by approving temporary spending measures and pushing the debt ceiling debate out to early 2014. Investors quickly shifted focus from Washington to the corporate sector as companies began unveiling third quarter operating results. Nearly 70% of the S&P 500 Index’s constituents announced earnings above consensus estimates. In economic headlines, U.S. gross domestic product for the third quarter was revised again to a 4.1% annualized rate, marking the best quarter since the end of 2011. Additionally, November’s jobs report showed the unemployment rate hitting 7.0%, the lowest level since 2008. Finally, Federal Reserve Chairman Ben Bernanke addressed the country following the Federal Reserve’s December meeting and announced a $10 billion reduction in monthly bond purchases starting in January 2014, effectively kicking off the quantitative easing (QE) tapering process that consumed market attention for much of the year.
The Nasdaq Composite Index rose 40.1%, the S&P 500 Index gained 32.4%, and the Dow Jones Industrial Average added 29.7% in 2013. Looking across the market, the small-cap Russell 2000 Index advanced 38.8%, the Russell Midcap Index rose 34.8%, and the large-cap Russell 1000 Index climbed 33.1% this year. From the style perspective, growth-oriented stocks edged out stocks classified as value, as the Russell 1000 Growth Index was up 33.5% versus 32.6% for the Russell 1000 Value Index over the past 12 months. At a sector level, Consumer Discretionary, Health Care and Industrials were the top performers, up more than 40.0% each, followed by Financials, which gained 35.6%. Telecommunication Services and Utilities lagged all other sectors after trading up only 11.5% and 13.2%, respectively.
ARIAD Pharmaceuticals, Inc. detracted from performance as the stock suffered following an adverse ruling by the FDA that restricted the use of ARIAD Pharmaceuticals, Inc.’s primary drug, Iclusig. This ruling invalidated the major tenets of our investment thesis and our subsequent analysis led to a significant reduction in our estimate of the stock’s intrinsic value. We, therefore, eliminated ARIAD Pharmaceuticals, Inc. from the Portfolio and redeployed the funds to better risk-adjusted opportunities.(1)
Teradata Corp. shares weighed on returns specifically in the fourth quarter as third quarter results missed analyst forecasts and management lowered its top- and bottom-line guidance for the fiscal year, citing troubles in non-U.S. markets. The news preannouncement heightened fears that the company’s core enterprise data warehouse and analytics business is being disrupted by low-cost alternatives. The Company’s management acknowledged that customers are evaluating other technologies given cost pressures on information technology budgets, but reiterated confidence in the company’s competitive position. Additionally, the company launched a new cloud-based service and signed two significant new customers this quarter, suggesting fears of its demise may be greatly exaggerated. Our analysis finds that current prices embed only low-single digit revenue growth, whereas we believe the company is capable of high-single or low-double digit growth. To this point, we are encouraged by Teradata Corp.’s high-single digit growth in U.S. markets during a tough quarter for the industry. (1)
| 4 | (continued) |
| Ohio National Fund, Inc. | Equity Portfolio (Continued) |
Aflac, Inc. relinquished some of its 2012 gains in the first quarter of 2013 as a weakening yen dragged on earnings, while the lower interest rate environment in Japan caused concern for diminishing returns for new business. We removed Aflac, Inc. from the Portfolio, as we prefer insurance businesses that enjoy the opportunities for higher incremental returns that we find in several other current Portfolio holdings. Aflac, Inc. performed well in 2012, but we expect the company’s 20% return on equity will attract competition, as well as unwanted attention from regulators.(1)
Shares of Celgene Corp. surged nearly 50% in the first quarter of 2013 and more than doubled over 2013. The company’s management reported positive phase III test results for two key pipeline drugs and issued bullish long-term earnings guidance to open the year. These announcements coincided with subsiding concerns over label expansion opportunities for the company’s flagship drug, Revlimid. Most recently, Celgene Corp. released trial results for Revlimid in first-line maintenance myeloma that exceeded already lofty expectations for the data. The company reported excellent financial results all year, beating sales expectations broadly and handily. The business continues to deliver operating leverage, even as it invests in the new product launches. Psoriasis treatment Apremilast and pancreatic cancer drug Abraxane are both projected to drive over $1 billion in sales each to complement Revlimid sales. Celgene Corp.’s management is first-class in terms of creating value, and remains shareholder-friendly.(1)
MetLife, Inc. shares contributed to the Portfolio’s outperformance during the year thanks to an unexpected 50% increase in its quarterly dividend, several quarters of consensus-beating results, and rising interest rates. The dividend increase, along with recent accretive acquisitions, indicates the company’s strong ability to meet the capital reserve levels required of systemically important financial institutions (SIFIs) while still returning cash to shareholders and deploying capital effectively. Rising interest rates during the second half of the year also boosted shares because higher rates reduce the present value of the company’s outstanding liabilities. Although MetLife, Inc. shares have climbed to a five-year high, they still trade at a discount to their peers in terms of price-to-earnings and price-to-book multiples, which we believe is unwarranted given MetLife, Inc.’s strong fundamentals and a favorable macro environment.(1)
JPMorgan Chase & Co. shares were re-rated higher during the year after the company reported earnings beats four quarters in a row, thanks to better-than-expected credit costs, securities gains, tax benefits and rising rates. Consensus 2013 earnings-per-share estimates for JPMorgan Chase & Co. increased throughout the year while the price-to-earnings multiple eventually hit double digits. Although JPMorgan Chase & Co. shares have nearly doubled off the June 2012 bottom, the stock still embeds a significant decline in the earning power of JPMorgan Chase & Co.’s franchise. We believe this is overly pessimistic in light of management’s efforts to lower expenses and net charge-offs to offset weaker revenue trends, potential upside from a more favorable interest-rate environment, and a shareholder-friendly capital allocation strategy.(1)
Bearish investors continue to create drama around U.S. equity valuations, arguing that the market is in bubble territory based on normalized or cyclically-adjusted price to earnings ratios. Bears will continue to overreact to multiple expansion and assign too high of a probability to a valuation-led market swoon. We think valuations, in aggregate, are not attractively cheap or excessively expensive, but we do think stocks will ultimately overshoot fair value before falling
back to earth. We will be closely watching the march towards greed as 2014 progresses.
Valuation opportunities are still very attractive and are evolving in an interesting and exploitable manner at the sector level. Specifically, parts of Health Care, Information Technology, Energy and most of Financials continue to sell near multi-decade low levels. Valuation multiples are expanding in aggregate, but the gap between secular growth and traditional value holdings is continuing to widen. If we get a sixth year of positive market return and accelerating economic growth in 2014, we would expect many of the traditional value stocks within these sectors to play some relative catch-up. This does not mean all secular growth names are selling above business value and should be sold outright, but it does mean that as overall growth expands, tailwinds should increase for the valuation laggards. Finally, while we certainly do not think quantitative easing was the dominant driver of higher equity prices, we do think the path to higher interest rates will cause some turbulence across asset classes. We are confident we are well positioned, but we will tweak our positioning as the central bank experiment of quantitative easing unfolds.
| (1) | The Portfolio’s composition is subject to change. Holdings and weightings are as of December 31, 2013. |
Change in Value of $10,000 Investment
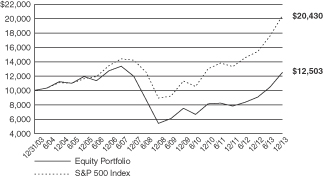
Hypothetical illustration based on past performance. Future performance will vary. The Portfolio’s returns reflect reinvested dividends. The Portfolio’s holdings may differ significantly from the securities in the index. The index is unmanaged and therefore does not reflect the cost of portfolio management and accounting.
The S&P 500 Index is a capitalization-weighted index designed to measure performance of the broad domestic economy through changes in the aggregate market value of 500 stocks representing all major industries. The index presented herein includes the effects of reinvested dividends.
| 5 | (continued) |
| Ohio National Fund, Inc. | Equity Portfolio (Continued) |
Portfolio Composition as of December 31, 2013 (1)
| % of Net Assets | ||||
Common Stocks (3) | 99.5 | |||
Money Market Funds | 0.5 | |||
|
| |||
| 100.0 | ||||
|
|
Top 10 Portfolio Holdings as of December 31, 2013 (1) (2)
| % of Net Assets | ||||
1. Apple, Inc. | 4.4 | |||
2. JPMorgan Chase & Co. | 4.0 | |||
3. Microsoft Corp. | 3.6 | |||
4. Citigroup, Inc. | 3.0 | |||
5. MetLife, Inc. | 2.9 | |||
6. Merck & Co., Inc. | 2.8 | |||
7. UnitedHealth Group, Inc. | 2.8 | |||
8. Phillips 66 | 2.6 | |||
9. Cisco Systems, Inc. | 2.6 | |||
10. Broadcom Corp. Class A | 2.6 |
| (1) | Composition of Portfolio subject to change. |
| (2) | Short-term investments have been excluded from the list of Top 10 Portfolio Holdings. |
| (3) | Sectors: |
| % of Net Assets | ||||
Financials | 22.9 | |||
Information Technology | 19.8 | |||
Health Care | 17.6 | |||
Consumer Discretionary | 11.4 | |||
Energy | 11.2 | |||
Industrials | 9.9 | |||
Consumer Staples | 3.3 | |||
Materials | 2.2 | |||
Utilities | 1.2 | |||
|
| |||
| 99.5 | ||||
|
|
| 6 |
| Ohio National Fund, Inc. | Equity Portfolio |
Schedule of Investments | December 31, 2013 |
| Common Stocks – 99.5% | Shares | Value | ||||||||
CONSUMER DISCRETIONARY – 11.4% | ||||||||||
Ford Motor Co. (Automobiles) | 242,850 | $ | 3,747,176 | |||||||
McDonald’s Corp. (Hotels, Restaurants & Leisure) | 50,610 | 4,910,688 | ||||||||
Amazon.com, Inc. (Internet & Catalog Retail) | (a) | 12,670 | 5,052,669 | |||||||
Expedia, Inc. (Internet & Catalog Retail) | 51,570 | 3,592,366 | ||||||||
Target Corp. (Multiline Retail) | 59,370 | 3,756,340 | ||||||||
Coach, Inc. (Textiles, Apparel & Luxury Goods) | 34,390 | 1,930,311 | ||||||||
Ralph Lauren Corp. (Textiles, Apparel & Luxury Goods) | 12,360 | 2,182,405 | ||||||||
|
| |||||||||
| 25,171,955 | ||||||||||
|
| |||||||||
CONSUMER STAPLES – 3.3% | ||||||||||
Dr Pepper Snapple Group, Inc. (Beverages) | 60,030 | 2,924,662 | ||||||||
Colgate-Palmolive Co. (Household Products) | 65,730 | 4,286,253 | ||||||||
|
| |||||||||
| 7,210,915 | ||||||||||
|
| |||||||||
ENERGY – 11.2% | ||||||||||
Halliburton Co. (Energy Equip. & Svs.) | 74,900 | 3,801,175 | ||||||||
Apache Corp. (Oil, Gas & Consumable Fuels) | 41,960 | 3,606,042 | ||||||||
Chevron Corp. (Oil, Gas & Consumable Fuels) | 45,170 | 5,642,185 | ||||||||
CONSOL Energy, Inc. (Oil, Gas & Consumable Fuels) | 99,850 | 3,798,294 | ||||||||
Phillips 66 (Oil, Gas & Consumable Fuels) | 75,730 | 5,841,055 | ||||||||
Southwestern Energy Co. (Oil, Gas & Consumable Fuels) | (a) | 55,600 | 2,186,748 | |||||||
|
| |||||||||
| 24,875,499 | ||||||||||
|
| |||||||||
FINANCIALS – 22.9% | ||||||||||
E*TRADE Financial Corp. (Capital Markets) | (a) | 133,870 | 2,629,207 | |||||||
KKR & Co. LP (Capital Markets) | 86,540 | 2,106,384 | ||||||||
Banco Bilbao Vizcaya Argentaria SA – ADR (Commercial Banks) | 215,050 | 2,664,470 | ||||||||
Wells Fargo & Co. (Commercial Banks) | 119,480 | 5,424,392 | ||||||||
Capital One Financial Corp. (Consumer Finance) | 59,440 | 4,553,698 | ||||||||
Citigroup, Inc. (Diversified Financial Svs.) | 127,050 | 6,620,575 | ||||||||
JPMorgan Chase & Co. (Diversified Financial Svs.) | 152,450 | 8,915,276 | ||||||||
Genworth Financial, Inc. Class A (Insurance) | (a) | 330,520 | 5,132,976 | |||||||
Hartford Financial Services Group, Inc. (Insurance) | 102,910 | 3,728,429 | ||||||||
MetLife, Inc. (Insurance) | 118,610 | 6,395,451 | ||||||||
American Homes 4 Rent (Real Estate Investment Trusts) | 156,340 | 2,532,708 | ||||||||
|
| |||||||||
| 50,703,566 | ||||||||||
|
| |||||||||
HEALTH CARE – 17.6% | ||||||||||
Celgene Corp. (Biotechnology) | (a) | 20,280 | 3,426,509 | |||||||
Medtronic, Inc. (Health Care Equip. & Supplies) | 98,730 | 5,666,115 | ||||||||
| Common Stocks (Continued) | Shares | Value | ||||||||
HEALTH CARE (continued) | ||||||||||
Express Scripts Holding Co. (Health Care Providers & Svs.) | (a) | 59,560 | $ | 4,183,494 | ||||||
UnitedHealth Group, Inc. (Health Care Providers & Svs.) | 81,970 | 6,172,341 | ||||||||
Forest Laboratories, Inc. (Pharmaceuticals) | (a) | 67,100 | 4,028,013 | |||||||
GlaxoSmithKline PLC – ADR (Pharmaceuticals) | 81,080 | 4,328,861 | ||||||||
Merck & Co., Inc. (Pharmaceuticals) | 125,980 | 6,305,299 | ||||||||
Pfizer, Inc. (Pharmaceuticals) | 160,470 | 4,915,196 | ||||||||
|
| |||||||||
| 39,025,828 | ||||||||||
|
| |||||||||
INDUSTRIALS – 9.9% | ||||||||||
United Technologies Corp. (Aerospace & Defense) | 41,800 | 4,756,840 | ||||||||
United Continental Holdings, Inc. (Airlines) | (a) | 120,250 | 4,549,057 | |||||||
PACCAR, Inc. (Machinery) | 59,575 | 3,525,053 | ||||||||
Parker Hannifin Corp. (Machinery) | 34,090 | 4,385,338 | ||||||||
Norfolk Southern Corp. (Road & Rail) | 51,010 | 4,735,258 | ||||||||
|
| |||||||||
| 21,951,546 | ||||||||||
|
| |||||||||
INFORMATION TECHNOLOGY – 19.8% | ||||||||||
Cisco Systems, Inc. (Communications Equip.) | 257,510 | 5,781,099 | ||||||||
Apple, Inc. (Computers & Peripherals) | 17,415 | 9,771,731 | ||||||||
EMC Corp. (Computers & Peripherals) | 212,920 | 5,354,938 | ||||||||
eBay, Inc. (Internet Software & Svs.) | (a) | 85,180 | 4,675,530 | |||||||
Teradata Corp. (IT Svs.) | (a) | 100,930 | 4,591,306 | |||||||
Broadcom Corp. Class A (Semiconductors & Equip.) | 192,280 | 5,701,102 | ||||||||
Microsoft Corp. (Software) | 211,490 | 7,916,071 | ||||||||
|
| |||||||||
| 43,791,777 | ||||||||||
|
| |||||||||
MATERIALS – 2.2% | ||||||||||
LyondellBasell Industries NV Class A (Chemicals) | 59,740 | 4,795,927 | ||||||||
|
| |||||||||
UTILITIES – 1.2% | ||||||||||
AES Corp. (Ind. Power Prod. & Energy Traders) | 187,770 | 2,724,543 | ||||||||
|
| |||||||||
Total Common Stocks (Cost $160,716,141) | $ | 220,251,556 | ||||||||
|
| |||||||||
| Money Market Funds – 1.6% | Shares | Value | ||||||||
Fidelity Institutional Money Market Funds | 3,524,000 | $ | 3,524,000 | |||||||
|
| |||||||||
Total Money Market Funds (Cost $3,524,000) | $ | 3,524,000 | ||||||||
|
| |||||||||
Total Investments – 101.1% (Cost $164,240,141) | (b) | $ | 223,775,556 | |||||||
Liabilities in Excess of Other Assets – (1.1)% | (2,341,514) | |||||||||
|
| |||||||||
Net Assets – 100.0% | $ | 221,434,042 | ||||||||
|
| |||||||||
Percentages are stated as a percent of net assets.
Abbreviations:
ADR: American Depositary Receipts
Footnotes:
| (a) | Non-income producing security. |
| (b) | Represents cost for financial reporting purposes, which may differ from cost basis for federal income tax purposes. See also Note 7 of the Notes to Financial Statements. |
The accompanying notes are an integral part of these financial statements.
| 7 |
| Ohio National Fund, Inc. | Money Market Portfolio |
Portfolio Composition as of December 31, 2013 (1)
| % of Net Assets | ||||
Commercial Paper (2) | 53.6 | |||
U.S. Government Agency Issues | 2.9 | |||
U.S. Treasury Obligations | 4.6 | |||
Money Market Funds and | 38.9 | |||
|
| |||
| 100.0 | ||||
|
|
Top 10 Portfolio Holdings as of December 31, 2013 (1)
| % of Net Assets | ||||
1. Prudential Funding LLC | 4.6 | |||
2. U.S. Bank | 4.6 | |||
3. Wal-Mart Stores, Inc. | 4.6 | |||
4. Exxon Mobil Corp. | 4.6 | |||
5. General Electric Capital Corp. | 4.6 | |||
6. International Business Machines Corp. | 4.6 | |||
7. U.S. Treasury Bill | 4.6 | |||
8. Federated Prime Cash Obligations | 3.8 | |||
9. Fidelity Institutional Money Market Funds | 3.8 | |||
10. First American Prime Obligations | 3.8 |
| (1) | Composition of Portfolio subject to change. |
| (2) | Sectors: |
| % of Net Assets | ||||
Financials | 25.3 | |||
Consumer Staples | 9.6 | |||
Energy | 8.4 | |||
Information Technology | 4.6 | |||
Consumer Discretionary | 3.8 | |||
Health Care | 1.9 | |||
|
| |||
| 53.6 | ||||
|
|
| 8 |
| Ohio National Fund, Inc. | Money Market Portfolio |
Schedule of Investments | December 31, 2013 |
| Commercial Paper – 53.6% | (b) Rate | Maturity | Face Amount | Amortized Cost | ||||||||||||
CONSUMER DISCRETIONARY – 3.8% | ||||||||||||||||
Walt Disney Co. / The (Media) | (a) | 0.060% | 02/27/2014 | $ | 10,000,000 | $ | 9,999,050 | |||||||||
|
| |||||||||||||||
CONSUMER STAPLES – 9.6% | ||||||||||||||||
Coca-Cola Co. / The (Beverages) | (a) | 0.070% | 01/06/2014 | 10,000,000 | 9,999,903 | |||||||||||
Wal-Mart Stores, Inc. (Food & Staples Retailing) | (a) | 0.050% | 01/06/2014 | 12,000,000 | 11,999,917 | |||||||||||
Nestle Capital Corp. (Food Products) | (a) | 0.060% | 01/06/2014 | 3,000,000 | 2,999,975 | |||||||||||
|
| |||||||||||||||
| 24,999,795 | ||||||||||||||||
|
| |||||||||||||||
ENERGY – 8.4% | ||||||||||||||||
Chevron Corp. (Oil, Gas & Consumable Fuels) | (a) | 0.050% | 01/02/2014 | 10,000,000 | 9,999,986 | |||||||||||
Exxon Mobil Corp. (Oil, Gas & Consumable Fuels) | 0.060% | 01/08/2014 | 12,000,000 | 11,999,860 | ||||||||||||
|
| |||||||||||||||
| 21,999,846 | ||||||||||||||||
|
| |||||||||||||||
FINANCIALS – 25.3% | ||||||||||||||||
U.S. Bank (Commercial Banks) | 0.050% | 01/02/2014 | 12,000,000 | 11,999,983 | ||||||||||||
American Honda Finance Corp. (Consumer Finance) | 0.110% | 01/22/2014 | 10,000,000 | 9,999,358 | ||||||||||||
John Deere Capital Corp. (Consumer Finance) | (a) | 0.070% | 01/16/2014 | 10,000,000 | 9,999,708 | |||||||||||
Toyota Motor Credit Corp. (Consumer Finance) | 0.050% | 01/07/2014 | 10,000,000 | 9,999,917 | ||||||||||||
General Electric Capital Corp. (Diversified Financial Services) | 0.050% | 01/15/2014 | 12,000,000 | 11,999,767 | ||||||||||||
Prudential Funding LLC (Insurance) | 0.040% | 01/02/2014 | 12,000,000 | 11,999,987 | ||||||||||||
|
| |||||||||||||||
| 65,998,720 | ||||||||||||||||
|
| |||||||||||||||
HEALTH CARE – 1.9% | ||||||||||||||||
Pfizer, Inc. (Pharmaceuticals) | (a) | 0.070% | 03/05/2014 | 5,000,000 | 4,999,388 | |||||||||||
|
| |||||||||||||||
INFORMATION TECHNOLOGY – 4.6% | ||||||||||||||||
International Business Machines Corp. (IT Services) | (a) | 0.050% | 01/17/2014 | 12,000,000 | 11,999,733 | |||||||||||
|
| |||||||||||||||
Total Commercial Paper (Cost $139,996,532) | $ | 139,996,532 | ||||||||||||||
|
| |||||||||||||||
| U.S. Government Agency Issues – 2.9% | Rate | Maturity | Face Amount | Amortized Cost | ||||||||||||
Federal Home Loan Bank | 0.050% | 01/10/2014 | $ | 7,500,000 | $ | 7,499,906 | ||||||||||
|
| |||||||||||||||
Total U.S. Government Agency Issues (Cost $7,499,906) | $ | 7,499,906 | ||||||||||||||
|
| |||||||||||||||
| U.S. Treasury Obligations – 4.6% | Rate | Maturity | Face Amount | Amortized Cost | ||||||||||||
U.S. Treasury Bill | 0.020% | 02/13/2014 | $ | 12,000,000 | $ | 11,999,713 | ||||||||||
|
| |||||||||||||||
Total U.S. Treasury Obligations (Cost $11,999,713) | $ | 11,999,713 | ||||||||||||||
|
| |||||||||||||||
| Money Market Funds – 11.5% | Shares | Value | ||||||||||||||
Federated Prime Cash Obligations Fund – Institutional Class | 10,000,000 | $ | 10,000,000 | |||||||||||||
Fidelity Institutional Money Market Funds Money Market Portfolio – Class I | 10,000,000 | 10,000,000 | ||||||||||||||
First American Prime Obligations Fund – Class Z | 10,000,000 | 10,000,000 | ||||||||||||||
|
| |||||||||||||||
Total Money Market Funds (Cost $30,000,000) | $ | 30,000,000 | ||||||||||||||
|
| |||||||||||||||
Total Investments – 72.6% (Cost $189,496,151) | (c) | $ | 189,496,151 | |||||||||||||
Other Assets in Excess of Liabilities – 27.4% | 71,602,520 | |||||||||||||||
|
| |||||||||||||||
Net Assets – 100.0% | $ | 261,098,671 | ||||||||||||||
|
| |||||||||||||||
Percentages are stated as a percent of net assets.
Footnotes:
| (a) | Security exempt from registration under Section 4 (2) of the Securities Act of 1933. These securities may be resold in transactions exempt from registration, normally to qualified buyers under Rule 144A. At December 31, 2013, the value of these securities totaled $71,997,660, or 27.6% of the Portfolio’s net assets. These securities were deemed liquid pursuant to procedures approved by the Board of Directors. |
| (b) | Rate represented is the effective yield at the time of purchase. |
| (c) | Represents cost for federal income tax and financial reporting purposes. See also Note 2 regarding the use of amortized cost for valuation of instruments in this Portfolio. |
The accompanying notes are an integral part of these financial statements.
| 9 |
| Ohio National Fund, Inc. | Bond Portfolio |
Objective/Strategy
The Bond Portfolio seeks to obtain a high level of income and opportunity for capital appreciation consistent with the preservation of capital by investing primarily in intermediate-term and long-term fixed income securities.
Performance as of December 31, 2013
Average Annual Total Returns: | ||||
One year | -1.92% | |||
Five years | 7.85% | |||
Ten years | 4.05% |
Past performance does not guarantee future results. The performance data quoted represents past performance and current returns may be lower or higher. Total return figures include change in share price and reinvestment of dividends and capital gains. The investment return and principal value will fluctuate so that an investor’s shares, when redeemed, may be worth more or less than the original cost. To obtain performance information up to the most recent month end, call toll-free 1-877-781-6392.
The Portfolio is not open to direct retail investment. Beneficial interest in shares is obtained solely by purchase of variable life insurance policies and variable annuity contracts. Actual performance results for variable annuity and variable universal life contracts will be lower due to contract charges. Consult your contract for applicable charges.
Comments
For the year ended December 31, 2013, the Bond Portfolio returned -1.92% versus -1.46% for the current benchmark, the BofA Merrill Lynch U.S. Corporate Master Index (the “Index”).
Both the Portfolio and the Index had negative returns because U.S. Treasury yields increased during 2013. For the year, the ten-year Treasury yield increased 127 basis points, primarily because the Federal Reserve hinted at, and then actually began, reducing its monthly purchases of mortgage-backed and Treasury securities. The increase in Treasury yields was partially offset by a tightening in credit spreads. For the year 2013, the credit spread of the Index tightened by 26 basis points. Credit spreads tightened because the outlook for corporate earnings and leverage was positive and there was strong demand for the higher yields that corporate bonds earned over Treasury securities.(1)
The Portfolio under-performed the Index by 46 basis points in 2013 primarily because of the expense ratio of the Portfolio. The expense ratio of the Portfolio was 66 basis points. The Portfolio benefitted during the year from its duration positioning versus the Index. During 2013, the duration of the Portfolio was approximately 1.5 years shorter than the Index during a time when Treasury yields rose. During a period of increase in Treasury yields, having a shorter duration resulted in less bond price depreciation than the Index.(1)
Several industry weightings had an impact on relative performance versus the Index. The approximate 9% under-weighting in banks and 2% under-weighting in autos had a negative impact on relative performance because these two industry segments performed well in 2013. Relative performance was benefitted by the slight over-weighting in the financials sector, because this sector outperformed. The slight over-weighting in the media and energy sectors hurt relative performance as these sectors under-performed in 2013. The slight under-weighting in telecommunication services aided relative performance because this sector under-performed.(1)
Because the U.S. economy continued to grow in 2013, albeit at a slow rate, the credit quality of the holdings in the Portfolio was
maintained. That being said, the five bonds that performed the worst were Time Warner Cable, Inc., Newmont Mining Corp., Verizon Communications, Inc., The Walt Disney Co. and Allstate Corp. With the exception of Newmont Mining Corp., which matures in 2022, the other four poor performing bonds mature in 2042, and these bonds’ prices were negatively impacted by their long durations during a period of rising interest rates. Time Warner Cable, Inc.’s bond price was also hurt because the company is the subject of a leveraged buyout offer. Newmont Mining Corp. performed poorly because it is a mining company and mining companies have been negatively impacted by weak commodity prices. The five best performing bonds were Texas Utilities Electric Co., Tenaska Georgia Partners, L.P., Deutsche Bank Capital Funding Trust VII, Computer Sciences Corp. and Weatherford International Ltd.(1)
We expect that the growth rate of the U.S. economy will continue to be modest in 2014. We also expect that the Federal Reserve will continue to reduce its purchases of mortgage-backed and Treasury securities as the year progresses. Because we expect the Federal Reserve to continue tapering its quantitative easing program, we believe Treasury yields will continue to increase in 2014. For this reason, the duration of the Portfolio will likely be maintained short of the Index duration. Because of low Treasury yields, demand for corporate bonds will likely be high, keeping corporate spreads tight. We plan to continue purchasing what we consider to be solid investment grade bonds that are slightly lower in quality than the average for the Index.
| (1) | The Portfolio’s composition is subject to change. Holdings and weightings are as of December 31, 2013. |
Change in Value of $10,000 Investment
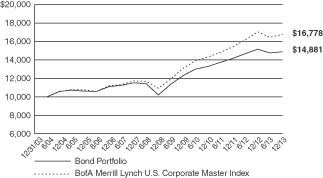
Hypothetical illustration based on past performance. Future performance will vary. The Portfolio’s returns reflect reinvested dividends. The Portfolio’s holdings may differ significantly from the securities in the index. The index is unmanaged and therefore does not reflect the cost of portfolio management and accounting.
The BofA Merrill Lynch U.S. Corporate Master Index tracks the performance of all U.S. dollar-denominated, investment grade corporate public debt issued in the U.S. domestic bond market. Qualifying bonds must have an investment grade rating (based on an average of Moody’s, S&P, and Fitch). In addition, qualifying securities must have at least one year remaining term to maturity, a fixed coupon schedule, and a minimum amount outstanding of $250 million.
| 10 | (continued) |
| Ohio National Fund, Inc. | Bond Portfolio (Continued) |
Portfolio Composition as of December 31, 2013 (1)
| % of Net Assets | ||||
Corporate Bonds (3) | 86.6 | |||
U.S. Treasury Obligations | 6.1 | |||
Money Market Funds and | 7.3 | |||
|
| |||
| 100.0 | ||||
|
|
Top 10 Portfolio Holdings as of December 31, 2013 (1) (2)
| % of Net Assets | ||||
1. U.S. Treasury Note | 3.6 | |||
2. U.S. Treasury Note | 2.5 | |||
3. Fifth Third Bancorp | 1.2 | |||
4. Union Electric Co. | 1.1 | |||
5. Prudential Financial, Inc. | 1.1 | |||
6. Comerica Bank | 1.1 | |||
7. CSX Corp. | 1.1 | |||
8. Weatherford International Ltd. | 1.1 | |||
9. Commonwealth Edison Co. | 1.1 | |||
10. Janus Capital Group, Inc. | 1.1 |
| (1) | Composition of Portfolio subject to change. |
| (2) | Short-term investments have been excluded from the list of Top 10 Portfolio Holdings. |
| (3) | Sectors: |
| % of Net Assets | ||||
Financials | 22.8 | |||
Utilities | 14.1 | |||
Energy | 10.4 | |||
Consumer Discretionary | 9.4 | |||
Industrials | 9.1 | |||
Consumer Staples | 7.6 | |||
Health Care | 5.3 | |||
Materials | 4.6 | |||
Telecommunication Services | 2.5 | |||
Information Technology | 0.8 | |||
|
| |||
| 86.6 | ||||
|
|
| 11 |
| Ohio National Fund, Inc. | Bond Portfolio |
Schedule of Investments | December 31, 2013 |
| Corporate Bonds – 86.6% | Rate | Maturity | Face Amount | Value | ||||||||||||
CONSUMER DISCRETIONARY – 9.4% | ||||||||||||||||
Darden Restaurants, Inc. (Hotels, Restaurants & Leisure) | 3.350% | 11/01/2022 | $ | 1,425,000 | $ | 1,226,355 | ||||||||||
Newell Rubbermaid, Inc. (Household Durables) | 6.250% | 04/15/2018 | 500,000 | 566,497 | ||||||||||||
Mattel, Inc. (Leisure Equip. & Products) | 3.150% | 03/15/2023 | 625,000 | 576,167 | ||||||||||||
21st Century Fox America, Inc. (Media) | 4.500% | 02/15/2021 | 1,250,000 | 1,340,205 | ||||||||||||
Comcast Corp. (Media) | 4.250% | 01/15/2033 | 750,000 | 696,827 | ||||||||||||
Discovery Communications, LLC (Media) | 4.375% | 06/15/2021 | 1,000,000 | 1,033,621 | ||||||||||||
Discovery Communications, LLC (Media) | 3.300% | 05/15/2022 | 275,000 | 260,453 | ||||||||||||
Time Warner Cable, Inc. (Media) | 5.850% | 05/01/2017 | 1,000,000 | 1,091,143 | ||||||||||||
Time Warner Cable, Inc. (Media) | 4.500% | 09/15/2042 | 425,000 | 322,036 | ||||||||||||
Time Warner, Inc. (Media) | 3.150% | 07/15/2015 | 1,250,000 | 1,295,477 | ||||||||||||
Walt Disney Co. / The (Media) | 3.700% | 12/01/2042 | 925,000 | 772,700 | ||||||||||||
Kohl’s Corp. (Multiline Retail) | 4.000% | 11/01/2021 | 1,250,000 | 1,249,836 | ||||||||||||
Macy’s Retail Holdings, Inc. (Multiline Retail) | 5.900% | 12/01/2016 | 425,000 | 477,001 | ||||||||||||
Target Corp. (Multiline Retail) | 2.900% | 01/15/2022 | 1,500,000 | 1,439,341 | ||||||||||||
AutoZone, Inc. (Specialty Retail) | 3.125% | 07/15/2023 | 925,000 | 837,911 | ||||||||||||
Lowe’s Cos., Inc. (Specialty Retail) | 3.800% | 11/15/2021 | 1,000,000 | 1,031,302 | ||||||||||||
|
| |||||||||||||||
| 14,216,872 | ||||||||||||||||
|
| |||||||||||||||
CONSUMER STAPLES – 7.6% | ||||||||||||||||
Anheuser-Busch Cos., LLC (Beverages) | 5.500% | 01/15/2018 | 750,000 | 853,015 | ||||||||||||
Anheuser-Busch InBev Finance, Inc. (Beverages) | 4.000% | 01/17/2043 | 750,000 | 666,910 | ||||||||||||
CVS Caremark Corp. (Food & Staples Retailing) | 5.750% | 06/01/2017 | 487,000 | 552,545 | ||||||||||||
CVS Caremark Corp. (Food & Staples Retailing) | 4.000% | 12/05/2023 | 1,000,000 | 998,246 | ||||||||||||
Kroger Co. / The (Food & Staples Retailing) | 2.200% | 01/15/2017 | 1,500,000 | 1,518,844 | ||||||||||||
Wal-Mart Stores, Inc. (Food & Staples Retailing) | 1.500% | 10/25/2015 | 1,250,000 | 1,274,356 | ||||||||||||
Bunge NA Finance LP (Food Products) | 5.900% | 04/01/2017 | 1,500,000 | 1,638,410 | ||||||||||||
Hillshire Brands Co. (Food Products) | 2.750% | 09/15/2015 | 1,250,000 | 1,285,940 | ||||||||||||
Tyson Foods, Inc. (Food Products) | (b) | 6.600% | 04/01/2016 | 1,000,000 | 1,116,785 | |||||||||||
Procter & Gamble Co. / The (Household Products) | 4.700% | 02/15/2019 | 250,000 | 279,407 | ||||||||||||
Philip Morris International, Inc. (Tobacco) | 4.125% | 05/17/2021 | 1,250,000 | 1,300,230 | ||||||||||||
|
| |||||||||||||||
| 11,484,688 | ||||||||||||||||
|
| |||||||||||||||
ENERGY – 10.4% | ||||||||||||||||
Weatherford International Ltd. (Energy Equip. & Svs.) | 6.000% | 03/15/2018 | 1,500,000 | 1,684,279 | ||||||||||||
Anadarko Petroleum Corp. (Oil, Gas & Consumable Fuels) | 5.950% | 09/15/2016 | 1,000,000 | 1,114,693 | ||||||||||||
Buckeye Partners LP (Oil, Gas & Consumable Fuels) | 4.875% | 02/01/2021 | 1,000,000 | 1,023,619 | ||||||||||||
Devon Energy Corp. (Oil, Gas & Consumable Fuels) | 3.250% | 05/15/2022 | 500,000 | 476,928 | ||||||||||||
EOG Resources, Inc. (Oil, Gas & Consumable Fuels) | 2.950% | 06/01/2015 | 1,250,000 | 1,294,286 | ||||||||||||
Kinder Morgan Energy Partners LP (Oil, Gas & Consumable Fuels) | 4.150% | 03/01/2022 | 1,000,000 | 993,029 | ||||||||||||
Magellan Midstream Partners LP (Oil, Gas & Consumable Fuels) | 4.250% | 02/01/2021 | 1,000,000 | 1,035,758 | ||||||||||||
Murphy Oil Corp. (Oil, Gas & Consumable Fuels) | 4.000% | 06/01/2022 | 1,250,000 | 1,189,634 | ||||||||||||
Occidental Petroleum Corp. (Oil, Gas & Consumable Fuels) | 3.125% | 02/15/2022 | 1,000,000 | 974,280 | ||||||||||||
ONEOK Partners LP (Oil, Gas & Consumable Fuels) | 3.250% | 02/01/2016 | 1,000,000 | 1,040,213 | ||||||||||||
Phillips 66 (Oil, Gas & Consumable Fuels) | 4.300% | 04/01/2022 | 1,300,000 | 1,321,488 | ||||||||||||
Plains All American Pipeline LP / PAA Finance Corp. (Oil, Gas & Consumable Fuels) | 2.850% | 01/31/2023 | 1,000,000 | 909,515 | ||||||||||||
Shell International Finance BV (Oil, Gas & Consumable Fuels) | 4.375% | 03/25/2020 | 1,250,000 | 1,370,644 | ||||||||||||
TransCanada PipeLines Ltd. (Oil, Gas & Consumable Fuels) | 2.500% | 08/01/2022 | 1,425,000 | 1,300,146 | ||||||||||||
|
| |||||||||||||||
| 15,728,512 | ||||||||||||||||
|
| |||||||||||||||
FINANCIALS – 22.8% | ||||||||||||||||
Credit Suisse (Capital Markets) | 3.500% | 03/23/2015 | 1,250,000 | 1,294,556 | ||||||||||||
Franklin Resources, Inc. (Capital Markets) | 3.125% | 05/20/2015 | 1,000,000 | 1,031,729 | ||||||||||||
Goldman Sachs Group, Inc. / The (Capital Markets) | 6.150% | 04/01/2018 | 1,250,000 | 1,434,076 | ||||||||||||
Janus Capital Group, Inc. (Capital Markets) | (b) | 6.700% | 06/15/2017 | 1,500,000 | 1,671,064 | |||||||||||
Morgan Stanley (Capital Markets) | 3.750% | 02/25/2023 | 1,250,000 | 1,216,746 | ||||||||||||
Northern Trust Corp. (Capital Markets) | 3.450% | 11/04/2020 | 1,000,000 | 1,028,766 | ||||||||||||
State Street Corp. (Capital Markets) | 4.375% | 03/07/2021 | 1,250,000 | 1,357,571 | ||||||||||||
BB&T Corp. (Commercial Banks) | 5.200% | 12/23/2015 | 1,000,000 | 1,081,021 | ||||||||||||
Comerica Bank (Commercial Banks) | 5.750% | 11/21/2016 | 1,500,000 | 1,688,631 | ||||||||||||
Fifth Third Bancorp (Commercial Banks) | 4.500% | 06/01/2018 | 1,750,000 | 1,867,159 | ||||||||||||
KeyCorp (Commercial Banks) | 5.100% | 03/24/2021 | 500,000 | 546,605 | ||||||||||||
PNC Funding Corp. (Commercial Banks) | 5.250% | 11/15/2015 | 1,500,000 | 1,611,514 | ||||||||||||
SunTrust Bank (Commercial Banks) | 5.000% | 09/01/2015 | 229,000 | 242,724 | ||||||||||||
Wells Fargo & Co. (Commercial Banks) | 4.600% | 04/01/2021 | 1,250,000 | 1,370,664 | ||||||||||||
Discover Financial Services (Consumer Finance) | 6.450% | 06/12/2017 | 750,000 | 850,212 | ||||||||||||
Bank of America Corp. (Diversified Financial Svs.) | 5.650% | 05/01/2018 | 1,000,000 | 1,138,864 | ||||||||||||
Citigroup, Inc. (Diversified Financial Svs.) | 6.125% | 05/15/2018 | 1,250,000 | 1,447,367 | ||||||||||||
General Electric Capital Corp. (Diversified Financial Svs.) | 5.625% | 05/01/2018 | 1,000,000 | 1,148,970 | ||||||||||||
JPMorgan Chase & Co. (Diversified Financial Svs.) | 5.150% | 10/01/2015 | 1,500,000 | 1,603,875 | ||||||||||||
National Rural Utilities Cooperative Finance Corp. (Diversified Financial Svs.) | 1.900% | 11/01/2015 | 1,000,000 | 1,024,352 | ||||||||||||
| 12 | (continued) |
| Ohio National Fund, Inc. | Bond Portfolio (Continued) |
Schedule of Investments | December 31, 2013 |
| Corporate Bonds (Continued) | Rate | Maturity | Face Amount | Value | ||||||||||||
FINANCIALS (continued) | ||||||||||||||||
Allstate Corp. / The (Insurance) | 5.200% | 01/15/2042 | $ | 500,000 | $ | 507,155 | ||||||||||
Hartford Financial Services Group, Inc. (Insurance) | 5.375% | 03/15/2017 | 1,500,000 | 1,653,535 | ||||||||||||
Loews Corp. (Insurance) | 5.250% | 03/15/2016 | 750,000 | 817,935 | ||||||||||||
Prudential Financial, Inc. (Insurance) | 6.100% | 06/15/2017 | 1,500,000 | 1,708,176 | ||||||||||||
Boston Properties LP (Real Estate Investment Trusts) | 3.125% | 09/01/2023 | 925,000 | 845,194 | ||||||||||||
Camden Property Trust (Real Estate Investment Trusts) | 4.250% | 01/15/2024 | 500,000 | 494,607 | ||||||||||||
Equity One, Inc. (Real Estate Investment Trusts) | 6.250% | 01/15/2017 | 1,250,000 | 1,396,868 | ||||||||||||
Federal Realty Investment Trust (Real Estate Investment Trusts) | 3.000% | 08/01/2022 | 1,425,000 | 1,332,104 | ||||||||||||
HCP, Inc. (Real Estate Investment Trusts) | 5.375% | 02/01/2021 | 1,000,000 | 1,088,857 | ||||||||||||
|
| |||||||||||||||
| 34,500,897 | ||||||||||||||||
|
| |||||||||||||||
HEALTH CARE – 5.3% | ||||||||||||||||
Amgen, Inc. (Biotechnology) | 4.100% | 06/15/2021 | 1,000,000 | 1,042,360 | ||||||||||||
Celgene Corp. (Biotechnology) | 2.450% | 10/15/2015 | 1,250,000 | 1,284,668 | ||||||||||||
Becton Dickinson and Co. (Health Care Equip. & Supplies) | 5.000% | 05/15/2019 | 500,000 | 560,992 | ||||||||||||
Covidien International Finance SA (Health Care Equip. & Supplies) | 2.800% | 06/15/2015 | 1,250,000 | 1,285,804 | ||||||||||||
AmerisourceBergen Corp. (Health Care Providers & Svs.) | 4.875% | 11/15/2019 | 500,000 | 550,844 | ||||||||||||
Laboratory Corp. of America Holdings (Health Care Providers & Svs.) | 3.750% | 08/23/2022 | 425,000 | 411,807 | ||||||||||||
AbbVie, Inc. (Pharmaceuticals) | 2.900% | 11/06/2022 | 1,425,000 | 1,332,342 | ||||||||||||
Merck Sharp & Dohme Corp. (Pharmaceuticals) | 5.000% | 06/30/2019 | 1,000,000 | 1,133,429 | ||||||||||||
Teva Pharmaceutical Finance II BV / Teva Pharmaceutical Finance III LLC (Pharmaceuticals) | 3.000% | 06/15/2015 | 500,000 | 516,202 | ||||||||||||
|
| |||||||||||||||
| 8,118,448 | ||||||||||||||||
|
| |||||||||||||||
INDUSTRIALS – 9.1% | ||||||||||||||||
BAE Systems Holdings, Inc. (Aerospace & Defense) | (a) | 6.375% | 06/01/2019 | 750,000 | 868,530 | |||||||||||
Lockheed Martin Corp. (Aerospace & Defense) | 3.350% | 09/15/2021 | 1,000,000 | 992,499 | ||||||||||||
Raytheon Co. (Aerospace & Defense) | 4.400% | 02/15/2020 | 1,250,000 | 1,339,779 | ||||||||||||
Republic Services, Inc. (Commercial Svs. & Supplies) | 3.800% | 05/15/2018 | 1,000,000 | 1,059,707 | ||||||||||||
Waste Management, Inc. (Commercial Svs. & Supplies) | 6.100% | 03/15/2018 | 500,000 | 575,575 | ||||||||||||
Emerson Electric Co. (Electrical Equip.) | 4.250% | 11/15/2020 | 1,250,000 | 1,338,155 | ||||||||||||
Caterpillar, Inc. (Machinery) | 5.700% | 08/15/2016 | 1,000,000 | 1,115,504 | ||||||||||||
Deere & Co. (Machinery) | 4.375% | 10/16/2019 | 1,250,000 | 1,385,250 | ||||||||||||
Illinois Tool Works, Inc. (Machinery) | 3.375% | 09/15/2021 | 500,000 | 497,758 | ||||||||||||
CSX Corp. (Road & Rail) | 5.600% | 05/01/2017 | 1,500,000 | 1,684,686 | ||||||||||||
Norfolk Southern Corp. (Road & Rail) | 3.000% | 04/01/2022 | 600,000 | 567,040 | ||||||||||||
Ryder System, Inc. (Road & Rail) | 3.600% | 03/01/2016 | 1,000,000 | 1,043,776 | ||||||||||||
Union Pacific Corp. (Road & Rail) | 4.000% | 02/01/2021 | 1,250,000 | 1,304,699 | ||||||||||||
|
| |||||||||||||||
| 13,772,958 | ||||||||||||||||
|
| |||||||||||||||
INFORMATION TECHNOLOGY – 0.8% | ||||||||||||||||
Computer Sciences Corp. (IT Svs.) | 6.500% | 03/15/2018 | 1,000,000 | 1,148,048 | ||||||||||||
|
| |||||||||||||||
MATERIALS – 4.6% | ||||||||||||||||
Eastman Chemical Co. (Chemicals) | 3.600% | 08/15/2022 | 1,000,000 | 960,372 | ||||||||||||
FMC Corp. (Chemicals) | 3.950% | 02/01/2022 | 1,000,000 | 999,886 | ||||||||||||
Packaging Corp. of America (Containers & Packaging) | 4.500% | 11/01/2023 | 675,000 | 677,012 | ||||||||||||
Freeport-McMoRan Copper & Gold, Inc. (Metals & Mining) | 3.550% | 03/01/2022 | 1,250,000 | 1,188,371 | ||||||||||||
Newmont Mining Corp. (Metals & Mining) | 3.500% | 03/15/2022 | 1,425,000 | 1,213,312 | ||||||||||||
Rio Tinto Finance U.S.A. Ltd. (Metals & Mining) | 1.875% | 11/02/2015 | 1,000,000 | 1,020,249 | ||||||||||||
Teck Resources Ltd. (Metals & Mining) | 3.750% | 02/01/2023 | 1,000,000 | 932,440 | ||||||||||||
|
| |||||||||||||||
| 6,991,642 | ||||||||||||||||
|
| |||||||||||||||
TELECOMMUNICATION SERVICES – 2.5% | ||||||||||||||||
AT&T, Inc. (Diversified Telecom. Svs.) | 3.875% | 08/15/2021 | 1,000,000 | 1,013,397 | ||||||||||||
AT&T, Inc. (Diversified Telecom. Svs.) | 3.000% | 02/15/2022 | 500,000 | 471,227 | ||||||||||||
Verizon Communications, Inc. (Diversified Telecom. Svs.) | 4.600% | 04/01/2021 | 1,250,000 | 1,320,750 | ||||||||||||
Verizon Communications, Inc. (Diversified Telecom. Svs.) | 3.850% | 11/01/2042 | 425,000 | 347,228 | ||||||||||||
Rogers Communications, Inc. (Wireless Telecom. Svs.) | 3.000% | 03/15/2023 | 700,000 | 645,960 | ||||||||||||
|
| |||||||||||||||
| 3,798,562 | ||||||||||||||||
|
| |||||||||||||||
UTILITIES – 14.1% | ||||||||||||||||
Appalachian Power Co. (Electric Utilities) | 4.600% | 03/30/2021 | 1,000,000 | 1,073,003 | ||||||||||||
Commonwealth Edison Co. (Electric Utilities) | 5.950% | 08/15/2016 | 1,500,000 | 1,677,932 | ||||||||||||
Duke Energy Corp. (Electric Utilities) | 3.350% | 04/01/2015 | 1,250,000 | 1,288,610 | ||||||||||||
Duke Energy Florida, Inc. (Electric Utilities) | 4.550% | 04/01/2020 | 500,000 | 543,774 | ||||||||||||
Kansas City Power & Light Co. (Electric Utilities) | 5.850% | 06/15/2017 | 1,500,000 | 1,656,054 | ||||||||||||
Pepco Holdings, Inc. (Electric Utilities) | 2.700% | 10/01/2015 | 750,000 | 769,372 | ||||||||||||
South Carolina Electric & Gas Co. (Electric Utilities) | 4.350% | 02/01/2042 | 1,000,000 | 929,027 | ||||||||||||
Tenaska Georgia Partners LP (Electric Utilities) | 9.500% | 02/01/2030 | 459,989 | 542,205 | ||||||||||||
Union Electric Co. (Electric Utilities) | 6.400% | 06/15/2017 | 1,500,000 | 1,720,421 | ||||||||||||
Virginia Electric and Power Co. (Electric Utilities) | 5.400% | 01/15/2016 | 1,500,000 | 1,632,759 | ||||||||||||
| 13 | (continued) |
| Ohio National Fund, Inc. | Bond Portfolio (Continued) |
Schedule of Investments | December 31, 2013 |
| Corporate Bonds (Continued) | Rate | Maturity | Face Amount | Value | ||||||||||||
UTILITIES (continued) | ||||||||||||||||
Westar Energy, Inc. (Electric Utilities) | 4.125% | 03/01/2042 | $ | 500,000 | $ | 455,823 | ||||||||||
Xcel Energy, Inc. (Electric Utilities) | 4.700% | 05/15/2020 | 1,000,000 | 1,097,748 | ||||||||||||
AGL Capital Corp. (Gas Utilities) | 5.250% | 08/15/2019 | 1,000,000 | 1,119,715 | ||||||||||||
Southwest Gas Corp. (Gas Utilities) | 3.875% | 04/01/2022 | 1,250,000 | 1,260,581 | ||||||||||||
Spectra Energy Capital LLC (Gas Utilities) | 3.300% | 03/15/2023 | 1,425,000 | 1,262,439 | ||||||||||||
Energy Future Competitive Holdings Co. LLC (Ind. Power Prod. & Energy Traders) | 7.480% | 01/01/2017 | 306,964 | 291,098 | ||||||||||||
Avista Corp. (Multi-Utilities) | 5.950% | 06/01/2018 | 1,000,000 | 1,146,702 | ||||||||||||
LG&E and KU Energy LLC (Multi-Utilities) | 4.375% | 10/01/2021 | 1,000,000 | 1,028,652 | ||||||||||||
NextEra Energy Capital Holdings, Inc. (Multi-Utilities) | 2.600% | 09/01/2015 | 1,250,000 | 1,283,719 | ||||||||||||
Public Service Electric & Gas Co. (Multi-Utilities) | 3.950% | 05/01/2042 | 750,000 | 668,486 | ||||||||||||
|
| |||||||||||||||
| 21,448,120 | ||||||||||||||||
|
| |||||||||||||||
Total Corporate Bonds (Cost $126,102,833) | $ | 131,208,747 | ||||||||||||||
|
| |||||||||||||||
| U.S. Treasury Obligations – 6.1% | Rate | Maturity | Face Amount | Value | ||||||||||||
U.S. Treasury Note | 1.750% | 05/15/2023 | $ | 6,000,000 | $ | 5,398,830 | ||||||||||
U.S. Treasury Note | 3.750% | 11/15/2043 | 4,000,000 | 3,850,936 | ||||||||||||
|
| |||||||||||||||
Total U.S. Treasury Obligations (Cost $9,447,390) | $ | 9,249,766 | ||||||||||||||
|
| |||||||||||||||
| Money Market Funds – 5.1% | Shares | Value | ||||||||||||||
Fidelity Institutional Money Market Funds Money Market Portfolio – Class I | 7,728,000 | $ | 7,728,000 | |||||||||||||
|
| |||||||||||||||
Total Money Market Funds (Cost $7,728,000) | $ | 7,728,000 | ||||||||||||||
|
| |||||||||||||||
Total Investments – 97.8% (Cost $143,278,223) | (c) | $ | 148,186,513 | |||||||||||||
Other Assets in Excess of Liabilities – 2.2% | 3,391,250 | |||||||||||||||
|
| |||||||||||||||
Net Assets – 100.0% | $ | 151,577,763 | ||||||||||||||
|
| |||||||||||||||
Percentages are stated as a percent of net assets.
Footnotes:
| (a) | Security exempt from registration under Regulation D of the Securities Act of 1933. These securities may be resold in transactions exempt from registration, normally to qualified buyers under Rule 144A. At December 31, 2013, the value of these securities totaled $868,530, or 0.6% of the Portfolio’s net assets. These securities were deemed liquid pursuant to procedures approved by the Board of Directors. |
| (b) | These securities are credit sensitive bonds. The coupon rates are variable rates subject to adjustment based on changes in national credit rating agency ratings. |
| (c) | Represents cost for financial reporting purposes, which may differ from cost basis for federal income tax purposes. See also Note 7 of the Notes to Financial Statements. |
The accompanying notes are an integral part of these financial statements.
| 14 |
| Ohio National Fund, Inc. | Omni Portfolio |
Objective/Strategy
The Omni Portfolio seeks a high level of long-term total return consistent with preservation of capital by investing in stocks, bonds, and money market instruments.
Performance as of December 31, 2013
Average Annual Total Returns: | ||||
One year | 30.53% | |||
Five years | 16.15% | |||
Ten years | 7.49% |
Past performance does not guarantee future results. The performance data quoted represents past performance and current returns may be lower or higher. Total return figures include change in share price and reinvestment of dividends and capital gains. The investment return and principal value will fluctuate so that an investor’s shares, when redeemed, may be worth more or less than the original cost. To obtain performance information up to the most recent month end, call toll-free 1-877-781-6392.
The Portfolio is not open to direct retail investment. Beneficial interest in shares is obtained solely by purchase of variable life insurance policies and variable annuity contracts. Actual performance results for variable annuity and variable universal life contracts will be lower due to contract charges. Consult your contract for applicable charges.
Comments
For the year ended December 31, 2013, the Omni Portfolio returned 30.53% versus 21.33% for the current benchmark, which is composed of 70% S&P 500 Index and 30% BofA Merrill Lynch U.S. Corporate Master Index (the “Merrill Index”).
The outperformance of the Portfolio versus the benchmark is the result of the outperformance by the equity portion of the Portfolio versus the S&P 500 Index exceeding the under-performance of the bond portion of the Portfolio versus the Merrill Index. The asset allocation decision to overweight stocks and underweight bonds versus the blended benchmark also benefited relative performance because stocks significantly outperformed bonds for the year 2013.
Stocks performed very well in 2013, primarily because the Federal Reserve was able to convince the equity market that the Federal Reserve would reduce its quantitative easing program gradually over an extended period of time. Stocks also benefited from stronger profits in 2013, the result of corporations exiting the recession with a leaner workforce and reduced costs.
The equity portion of the Portfolio returned 43.44% versus 32.39% for the S&P 500 Index, for outperformance of 11.66%. This significant outperformance is the result of excellent stock selection throughout all sectors, along with positive effects of sector weightings versus the S&P 500 Index.
The Portfolio’s best performing stocks for the year were Delta Air Lines, Inc., Facebook, Inc., Lincoln National Corp., Hanesbrands, Inc. and Celgene Corp. The Portfolio’s worst performers were Infinity Pharmaceuticals, Inc., Amarin Corp., Abercrombie & Fitch Co., Altera Corp. and ARIAD Pharmaceuticals, Inc. The top contributors to stock performance were Facebook, Inc., Vertex Pharmaceuticals, Inc., Lincoln National Corp., Delta Air Lines, Inc. and Hanesbrands, Inc. The top detractors from stock performance were Infinity Pharmaceuticals, Inc., Altera Corp., Abercrombie & Fitch Co., Amarin Corp. and Hewlett-Packard Co.(1)
The bond portion of the Portfolio had a return of -2.32% versus -1.46% for the Merrill Index. Both the bond portion of the Portfolio and the Merrill Index had negative returns because U.S. Treasury yields increased during 2013. Treasury yields increased as the year progressed, primarily due to the Federal Reserve cutting back on its purchases of government securities. The bond portion of the Portfolio had a duration that was approximately 1.5 years shorter than the Merrill Index, thus resulting in less bond price depreciation than the Merrill Index as Treasury yields rose. The only difference in industry weighting to have an impact on relative bond performance was the approximate 9% under-weighting in the banking sector, which hurt performance because the banking sector outperformed. The overall credit quality of the Portfolio’s bond portfolio was Baa1 and this benefited relative performance marginally because the average credit quality of the Merrill Index was A3, and bonds rated Baa performed better in 2013 than did higher-rated bonds.(1)
Because the U.S. economy continued to grow, albeit at a slow rate, the credit quality of the bond holdings in the Portfolio was maintained. That being said, the five bonds that performed the worst were Time Warner Cable, Inc., Newmont Mining Corp., Verizon Communications, Inc., The Walt Disney Co. and Westar Energy, Inc. Newmont Mining Corp. underperformed because it is a mining company, and mining companies were hurt by weak commodity prices. The other four underperforming bonds had very long maturities, and their bond prices declined as interest rates rose. In addition to having a long maturity, Time Warner Cable, Inc. is the subject of a leveraged buyout offer. The five best performing bonds were Bank of America Corp., Deutsche Bank Capital Funding Trust VII, Key Bank NA, Computer Sciences Corp. and Boardwalk Pipelines LLC.(1)
Looking ahead at 2014, it appears that the benefits of quantitative easing will likely continue for much of the year, and possibly into 2015. Quantitative easing has benefited investors for the past four years and will likely continue to provide strong support for equities for the balance of the coming year. We remain committed to the idea that economic growth will be driven by consumer spending, which generates 70% of economic activity, and, thus, we remain over-weighted in Consumer Discretionary stocks. The Federal Reserve projects economic growth in the area of 3% in 2014 and unemployment falling to as low as 6.3%, all harbingers of growth in stocks. We intend to continue being over-weighted in stocks versus bonds because the outlook for stocks is reasonably good and bonds will be negatively impacted by our expectation of higher Treasury yields. Because we expect higher interest rates, the duration of the bond portion of the Portfolio will likely be maintained shorter than the Merrill Index.(1)
| (1) | The Portfolio’s composition is subject to change. Holdings and weightings are as of December 31, 2013. |
| 15 | (continued) |
| Ohio National Fund, Inc. | Omni Portfolio (Continued) |
Change in Value of $10,000 Investment
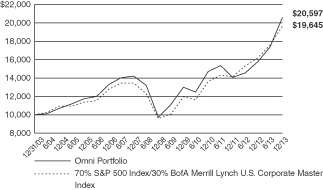
Hypothetical illustration based on past performance. Future performance will vary. The Portfolio’s returns reflect reinvested dividends. The Portfolio’s holdings may differ significantly from the securities in the index. The index is unmanaged and therefore does not reflect the cost of portfolio management and accounting.
The S&P 500 Index is a capitalization-weighted index designed to measure performance of the broad domestic market through changes in the aggregate market value of 500 stocks representing all major industries. The index presented herein includes the effects of reinvested dividends.
The BofA Merrill Lynch U.S. Corporate Master Index tracks the performance of all U.S. dollar-denominated, investment grade corporate public debt issued in the U.S. domestic bond market. Qualifying bonds must have an investment grade rating (based on an average of Moody’s, S&P, and Fitch). In addition, qualifying securities must have at least one year remaining term to maturity, a fixed coupon schedule, and a minimum amount outstanding of $250 million.
Portfolio Composition as of December 31, 2013 (1)
| % of Net Assets | ||||
Common Stocks (3) | 80.2 | |||
Corporate Bonds (3) | 17.1 | |||
U.S. Treasury Obligations | 0.8 | |||
Money Market Funds and | 1.9 | |||
|
| |||
| 100.0 | ||||
|
|
Top 10 Portfolio Holdings as of December 31, 2013 (1) (2)
| % of Net Assets | ||||
1. Apple, Inc. | 2.3 | |||
2. Valeant Pharmaceuticals International, Inc. | 2.1 | |||
3. Google, Inc. Class A | 2.1 | |||
4. MetLife, Inc. | 1.9 | |||
5. Walt Disney Co. / The | 1.7 | |||
6. International Business Machines Corp. | 1.6 | |||
7. Prudential Financial, Inc. | 1.6 | |||
8. Adobe Systems, Inc. | 1.6 | |||
9. Cisco Systems, Inc. | 1.6 | |||
10. PVH Corp. | 1.6 |
| (1) | Composition of Portfolio subject to change. |
| (2) | Short-term investments have been excluded from the list of Top 10 Portfolio Holdings. |
| (3) | Sectors (combined): |
| % of Net Assets | ||||
Information Technology | 18.0 | |||
Consumer Discretionary | 17.2 | |||
Financials | 16.5 | |||
Health Care | 15.6 | |||
Industrials | 15.0 | |||
Energy | 5.5 | |||
Materials | 3.7 | |||
Utilities | 2.8 | |||
Consumer Staples | 2.2 | |||
Telecommunication Services | 0.8 | |||
|
| |||
| 97.3 | ||||
|
|
| 16 |
| Ohio National Fund, Inc. | Omni Portfolio |
Schedule of Investments | December 31, 2013 |
| Common Stocks – 80.2% | Shares | Value | ||||||||||||
CONSUMER DISCRETIONARY – 15.4% | ||||||||||||||
General Motors Co. (Automobiles) | (a) | 13,000 | $ | 531,310 | ||||||||||
Las Vegas Sands Corp. (Hotels, Restaurants & Leisure) | 7,200 | 567,864 | ||||||||||||
Amazon.com, Inc. (Internet & Catalog Retail) | (a) | 1,330 | 530,391 | |||||||||||
CBS Corp. Class B (Media) | 7,420 | 472,951 | ||||||||||||
Comcast Corp. Class A (Media) | 11,300 | 587,204 | ||||||||||||
Time Warner, Inc. (Media) | 3,800 | 264,936 | ||||||||||||
Walt Disney Co. / The (Media) | 8,300 | 634,120 | ||||||||||||
Nordstrom, Inc. (Multiline Retail) | 7,300 | 451,140 | ||||||||||||
Hanesbrands, Inc. (Textiles, Apparel & Luxury Goods) | 8,200 | 576,214 | ||||||||||||
NIKE, Inc. Class B (Textiles, Apparel & Luxury Goods) | 7,480 | 588,227 | ||||||||||||
PVH Corp. (Textiles, Apparel & Luxury Goods) | 4,520 | 614,810 | ||||||||||||
|
| |||||||||||||
| 5,819,167 | ||||||||||||||
|
| |||||||||||||
CONSUMER STAPLES – 0.8% | ||||||||||||||
Constellation Brands, Inc. Class A (Beverages) | (a) | 4,100 | 288,558 | |||||||||||
|
| |||||||||||||
ENERGY – 3.2% | ||||||||||||||
Halliburton Co. (Energy Equip. & Svs.) | 3,500 | 177,625 | ||||||||||||
Schlumberger Ltd. (Energy Equip. & Svs.) | 6,400 | 576,704 | ||||||||||||
Pioneer Natural Resources Co. (Oil, Gas & Consumable Fuels) | 1,670 | 307,397 | ||||||||||||
Whiting Petroleum Corp. (Oil, Gas & Consumable Fuels) | (a) | 2,500 | 154,675 | |||||||||||
|
| |||||||||||||
| 1,216,401 | ||||||||||||||
|
| |||||||||||||
FINANCIALS – 12.2% | ||||||||||||||
Citigroup, Inc. (Diversified Financial Svs.) | 11,420 | 595,096 | ||||||||||||
JPMorgan Chase & Co. (Diversified Financial Svs.) | 10,200 | 596,496 | ||||||||||||
Allstate Corp. / The (Insurance) | 8,220 | 448,319 | ||||||||||||
American International Group, Inc. (Insurance) | 9,050 | 462,002 | ||||||||||||
Hartford Financial Services Group, Inc. (Insurance) | 16,550 | 599,607 | ||||||||||||
Lincoln National Corp. (Insurance) | 11,500 | 593,630 | ||||||||||||
MetLife, Inc. (Insurance) | 13,503 | 728,082 | ||||||||||||
Prudential Financial, Inc. (Insurance) | 6,700 | 617,874 | ||||||||||||
|
| |||||||||||||
| 4,641,106 | ||||||||||||||
|
| |||||||||||||
HEALTH CARE – 14.6% | ||||||||||||||
Celgene Corp. (Biotechnology) | (a) | 3,240 | 547,430 | |||||||||||
Gilead Sciences, Inc. (Biotechnology) | (a) | 7,000 | 526,050 | |||||||||||
Pharmacyclics, Inc. (Biotechnology) | (a) | 2,900 | 306,762 | |||||||||||
Vertex Pharmaceuticals, Inc. (Biotechnology) | (a) | 6,600 | 490,380 | |||||||||||
Cardinal Health, Inc. (Health Care Providers & Svs.) | 4,100 | 273,921 | ||||||||||||
UnitedHealth Group, Inc. (Health Care Providers & Svs.) | 6,900 | 519,570 | ||||||||||||
Thermo Fisher Scientific, Inc. (Life Sciences Tools & Svs.) | 5,300 | 590,155 | ||||||||||||
Merck & Co., Inc. (Pharmaceuticals) | 11,950 | 598,098 | ||||||||||||
Mylan, Inc. (Pharmaceuticals) | (a) | 14,100 | 611,940 | |||||||||||
Pfizer, Inc. (Pharmaceuticals) | 9,400 | 287,922 | ||||||||||||
Valeant Pharmaceuticals International, Inc. (Pharmaceuticals) | (a) | 6,800 | 798,320 | |||||||||||
|
| |||||||||||||
| 5,550,548 | ||||||||||||||
|
| |||||||||||||
INDUSTRIALS – 13.7% | ||||||||||||||
Boeing Co. / The (Aerospace & Defense) | 3,030 | 413,565 | ||||||||||||
Precision Castparts Corp. (Aerospace & Defense) | 1,935 | 521,096 | ||||||||||||
FedEx Corp. (Air Freight & Logistics) | 4,200 | 603,834 | ||||||||||||
Delta Air Lines, Inc. (Airlines) | 17,200 | 472,484 | ||||||||||||
Tyco International Ltd. (Commercial Svs. & Supplies) | 14,750 | 605,340 | ||||||||||||
Eaton Corp. PLC (Electrical Equip.) | 7,568 | 576,076 | ||||||||||||
Pentair Ltd. (Machinery) | 6,700 | 520,389 | ||||||||||||
Terex Corp. (Machinery) | 13,100 | 550,069 | ||||||||||||
Xylem, Inc. (Machinery) | 13,300 | 460,180 | ||||||||||||
Hertz Global Holdings, Inc. (Road & Rail) | (a) | 16,200 | 463,644 | |||||||||||
|
| |||||||||||||
| 5,186,677 | ||||||||||||||
|
| |||||||||||||
INFORMATION TECHNOLOGY – 17.5% | ||||||||||||||
Cisco Systems, Inc. (Communications Equip.) | 27,440 | 616,028 | ||||||||||||
Apple, Inc. (Computers & Peripherals) | 1,559 | 874,770 | ||||||||||||
Google, Inc. Class A (Internet Software & Svs.) | (a) | 710 | 795,704 | |||||||||||
International Business Machines Corp. (IT Svs.) | 3,310 | 620,857 | ||||||||||||
MasterCard, Inc. Class A (IT Svs.) | 394 | 329,171 | ||||||||||||
Altera Corp. (Semiconductors & Equip.) | 15,500 | 504,215 | ||||||||||||
Avago Technologies Ltd. (Semiconductors & Equip.) | 11,600 | 613,524 | ||||||||||||
Intel Corp. (Semiconductors & Equip.) | 23,300 | 604,868 | ||||||||||||
Adobe Systems, Inc. (Software) | (a) | 10,300 | 616,764 | |||||||||||
| 17 | (continued) |
| Ohio National Fund, Inc. | Omni Portfolio (Continued) |
Schedule of Investments | December 31, 2013 |
| Common Stocks (Continued) | Shares | Value | ||||||||||||||||
INFORMATION TECHNOLOGY (continued) | ||||||||||||||||||
Microsoft Corp. (Software) | 15,700 | $ | 587,651 | |||||||||||||||
Oracle Corp. (Software) | 12,100 | 462,946 | ||||||||||||||||
|
| |||||||||||||||||
| 6,626,498 | ||||||||||||||||||
|
| |||||||||||||||||
MATERIALS – 2.8% | ||||||||||||||||||
Huntsman Corp. (Chemicals) | 22,900 | 563,340 | ||||||||||||||||
Monsanto Co. (Chemicals) | 4,400 | 512,820 | ||||||||||||||||
|
| |||||||||||||||||
| 1,076,160 | ||||||||||||||||||
|
| |||||||||||||||||
Total Common Stocks (Cost $25,269,649) | $ | 30,405,115 | ||||||||||||||||
|
| |||||||||||||||||
| Corporate Bonds – 17.1% | Rate | Maturity | Face Amount | Value | ||||||||||||||
CONSUMER DISCRETIONARY – 1.8% | ||||||||||||||||||
Darden Restaurants, Inc. (Hotels, Restaurants & Leisure) | 3.350% | 11/01/2022 | $ | 75,000 | $ | 64,545 | ||||||||||||
Mattel, Inc. (Leisure Equip. & Products) | 3.150% | 03/15/2023 | 75,000 | 69,140 | ||||||||||||||
Comcast Corp. (Media) | 5.875% | 02/15/2018 | 75,000 | 86,067 | ||||||||||||||
Discovery Communications LLC (Media) | 3.300% | 05/15/2022 | 75,000 | 71,033 | ||||||||||||||
Time Warner Cable, Inc. (Media) | 4.500% | 09/15/2042 | 75,000 | 56,830 | ||||||||||||||
Viacom, Inc. (Media) | 4.250% | 09/01/2023 | 75,000 | 74,870 | ||||||||||||||
Walt Disney Co. / The (Media) | 3.700% | 12/01/2042 | 75,000 | 62,651 | ||||||||||||||
Kohl’s Corp. (Multiline Retail) | 4.000% | 11/01/2021 | 75,000 | 74,990 | ||||||||||||||
Macy’s Retail Holdings, Inc. (Multiline Retail) | 5.900% | 12/01/2016 | 42,000 | 47,139 | ||||||||||||||
AutoZone, Inc. (Specialty Retail) | 3.125% | 07/15/2023 | 75,000 | 67,939 | ||||||||||||||
|
| |||||||||||||||||
| 675,204 | ||||||||||||||||||
|
| |||||||||||||||||
CONSUMER STAPLES – 1.4% | ||||||||||||||||||
Anheuser-Busch Cos. LLC (Beverages) | 5.500% | 01/15/2018 | 150,000 | 170,603 | ||||||||||||||
CVS Caremark Corp. (Food & Staples Retailing) | 5.750% | 06/01/2017 | 73,000 | 82,825 | ||||||||||||||
Bunge NA Finance LP (Food Products) | 5.900% | 04/01/2017 | 150,000 | 163,841 | ||||||||||||||
Procter & Gamble Co. / The (Household Products) | 4.700% | 02/15/2019 | 100,000 | 111,763 | ||||||||||||||
|
| |||||||||||||||||
| 529,032 | ||||||||||||||||||
|
| |||||||||||||||||
ENERGY – 2.3% | ||||||||||||||||||
Weatherford International Ltd. (Energy Equip. & Svs.) | 6.000% | 03/15/2018 | 150,000 | 168,428 | ||||||||||||||
Anadarko Petroleum Corp. (Oil, Gas & Consumable Fuels) | 5.950% | 09/15/2016 | 100,000 | 111,469 | ||||||||||||||
Boardwalk Pipelines LP (Oil, Gas & Consumable Fuels) | 5.500% | 02/01/2017 | 100,000 | 108,916 | ||||||||||||||
Enterprise Products Operating LLC (Oil, Gas & Consumable Fuels) | 5.000% | 03/01/2015 | 75,000 | 78,580 | ||||||||||||||
Kinder Morgan Energy Partners LP (Oil, Gas & Consumable Fuels) | 4.150% | 03/01/2022 | 75,000 | 74,477 | ||||||||||||||
Magellan Midstream Partners LP (Oil, Gas & Consumable Fuels) | 6.400% | 07/15/2018 | 150,000 | 176,171 | ||||||||||||||
Murphy Oil Corp. (Oil, Gas & Consumable Fuels) | 4.000% | 06/01/2022 | 75,000 | 71,378 | ||||||||||||||
TransCanada PipeLines Ltd. (Oil, Gas & Consumable Fuels) | 2.500% | 08/01/2022 | 75,000 | 68,429 | ||||||||||||||
|
| |||||||||||||||||
| 857,848 | ||||||||||||||||||
|
| |||||||||||||||||
FINANCIALS – 4.3% | ||||||||||||||||||
Mellon Funding Corp. (Capital Markets) | 5.500% | 11/15/2018 | 100,000 | 113,307 | ||||||||||||||
Morgan Stanley (Capital Markets) | 3.750% | 02/25/2023 | 75,000 | 73,005 | ||||||||||||||
Northern Trust Corp. (Capital Markets) | 3.950% | 10/30/2025 | 75,000 | 73,118 | ||||||||||||||
BB&T Corp. (Commercial Banks) | 5.200% | 12/23/2015 | 100,000 | 108,102 | ||||||||||||||
KeyBank NA (Commercial Banks) | 5.700% | 11/01/2017 | 150,000 | 168,622 | ||||||||||||||
PNC Funding Corp. (Commercial Banks) | 5.250% | 11/15/2015 | 75,000 | 80,576 | ||||||||||||||
Wells Fargo & Co. (Commercial Banks) | 3.500% | 03/08/2022 | 75,000 | 75,044 | ||||||||||||||
Discover Financial Services (Consumer Finance) | 6.450% | 06/12/2017 | 150,000 | 170,042 | ||||||||||||||
Bank of America Corp. (Diversified Financial Svs.) | 5.750% | 08/15/2016 | 75,000 | 82,756 | ||||||||||||||
Citigroup, Inc. (Diversified Financial Svs.) | 5.850% | 08/02/2016 | 75,000 | 83,505 | ||||||||||||||
General Electric Capital Corp. (Diversified Financial Svs.) | 5.000% | 01/08/2016 | 100,000 | 108,118 | ||||||||||||||
JPMorgan Chase & Co. (Diversified Financial Svs.) | 5.150% | 10/01/2015 | 100,000 | 106,925 | ||||||||||||||
Allstate Corp. / The (Insurance) | 3.150% | 06/15/2023 | 75,000 | 71,151 | ||||||||||||||
Boston Properties LP (Real Estate Investment Trusts) | 3.125% | 09/01/2023 | 75,000 | 68,529 | ||||||||||||||
Federal Realty Investment Trust (Real Estate Investment Trusts) | 3.000% | 08/01/2022 | 75,000 | 70,111 | ||||||||||||||
HCP, Inc. (Real Estate Investment Trusts) | 6.000% | 01/30/2017 | 150,000 | 168,174 | ||||||||||||||
|
| |||||||||||||||||
| 1,621,085 | ||||||||||||||||||
|
| |||||||||||||||||
HEALTH CARE – 1.0% | ||||||||||||||||||
Laboratory Corp. of America Holdings (Health Care Providers & Svs.) | 3.750% | 08/23/2022 | 75,000 | 72,672 | ||||||||||||||
WellPoint, Inc. (Health Care Providers & Svs.) | 5.875% | 06/15/2017 | 150,000 | 169,308 | ||||||||||||||
AbbVie, Inc. (Pharmaceuticals) | 2.900% | 11/06/2022 | 75,000 | 70,123 | ||||||||||||||
Hospira, Inc. (Pharmaceuticals) | 6.050% | 03/30/2017 | 75,000 | 82,787 | ||||||||||||||
|
| |||||||||||||||||
| 394,890 | ||||||||||||||||||
|
| |||||||||||||||||
| 18 | (continued) |
| Ohio National Fund, Inc. | Omni Portfolio (Continued) |
Schedule of Investments | December 31, 2013 |
| Corporate Bonds (Continued) | Rate | Maturity | Face Amount | Value | ||||||||||||||
INDUSTRIALS – 1.3% | ||||||||||||||||||
Waste Management, Inc. (Commercial Svs. & Supplies) | 6.100% | 03/15/2018 | $ | 75,000 | $ | 86,336 | ||||||||||||
CSX Corp. (Road & Rail) | 5.600% | 05/01/2017 | 150,000 | 168,469 | ||||||||||||||
ERAC U.S.A. Finance LLC (Road & Rail) | (b) | 6.375% | 10/15/2017 | 150,000 | 173,657 | |||||||||||||
Norfolk Southern Corp. (Road & Rail) | 3.000% | 04/01/2022 | 75,000 | 70,880 | ||||||||||||||
|
| |||||||||||||||||
| 499,342 | ||||||||||||||||||
|
| |||||||||||||||||
INFORMATION TECHNOLOGY – 0.5% | ||||||||||||||||||
Computer Sciences Corp. (IT Svs.) | 6.500% | 03/15/2018 | 150,000 | 172,207 | ||||||||||||||
|
| |||||||||||||||||
MATERIALS – 0.9% | ||||||||||||||||||
CF Industries, Inc. (Chemicals) | 3.450% | 06/01/2023 | 75,000 | 68,516 | ||||||||||||||
Packaging Corp. of America (Containers & Packaging) | 4.500% | 11/01/2023 | 75,000 | 75,224 | ||||||||||||||
Freeport-McMoRan Copper & Gold, Inc. (Metals & Mining) | 3.550% | 03/01/2022 | 75,000 | 71,302 | ||||||||||||||
Newmont Mining Corp. (Metals & Mining) | 3.500% | 03/15/2022 | 75,000 | 63,859 | ||||||||||||||
Teck Resources Ltd. (Metals & Mining) | 3.750% | 02/01/2023 | 75,000 | 69,933 | ||||||||||||||
|
| |||||||||||||||||
| 348,834 | ||||||||||||||||||
|
| |||||||||||||||||
TELECOMMUNICATION SERVICES – 0.8% | ||||||||||||||||||
AT&T, Inc. (Diversified Telecom. Svs.) | 3.000% | 02/15/2022 | 75,000 | 70,684 | ||||||||||||||
Verizon Communications, Inc. (Diversified Telecom. Svs.) | 3.850% | 11/01/2042 | 75,000 | 61,276 | ||||||||||||||
America Movil SAB de CV (Wireless Telecom. Svs.) | 5.750% | 01/15/2015 | 100,000 | 104,950 | ||||||||||||||
Rogers Communications, Inc. (Wireless Telecom. Svs.) | 3.000% | 03/15/2023 | 75,000 | 69,210 | ||||||||||||||
|
| |||||||||||||||||
| 306,120 | ||||||||||||||||||
|
| |||||||||||||||||
UTILITIES – 2.8% | ||||||||||||||||||
Commonwealth Edison Co. (Electric Utilities) | 5.950% | 08/15/2016 | 75,000 | 83,897 | ||||||||||||||
Kansas City Power & Light Co. (Electric Utilities) | 5.850% | 06/15/2017 | 150,000 | 165,605 | ||||||||||||||
Nevada Power Co. (Electric Utilities) | 5.950% | 03/15/2016 | 75,000 | 82,897 | ||||||||||||||
Pennsylvania Electric Co. (Electric Utilities) | 6.050% | 09/01/2017 | 150,000 | 167,273 | ||||||||||||||
South Carolina Electric & Gas Co. (Electric Utilities) | 4.350% | 02/01/2042 | 75,000 | 69,677 | ||||||||||||||
Union Electric Co. (Electric Utilities) | 6.400% | 06/15/2017 | 150,000 | 172,042 | ||||||||||||||
Westar Energy, Inc. (Electric Utilities) | 4.125% | 03/01/2042 | 75,000 | 68,373 | ||||||||||||||
Southwest Gas Corp. (Gas Utilities) | 3.875% | 04/01/2022 | 75,000 | 75,635 | ||||||||||||||
Spectra Energy Capital, LLC (Gas Utilities) | 3.300% | 03/15/2023 | 75,000 | 66,444 | ||||||||||||||
Southern Power Co. (Ind. Power Prod. & Energy Traders) | 4.875% | 07/15/2015 | 100,000 | 106,136 | ||||||||||||||
|
| |||||||||||||||||
| 1,057,979 | ||||||||||||||||||
|
| |||||||||||||||||
Total Corporate Bonds (Cost $6,181,914) | $ | 6,462,541 | ||||||||||||||||
|
| |||||||||||||||||
| U.S. Treasury Obligations – 0.8% | Rate | Maturity | Face Amount | Value | ||||||||||||||
United States Treasury Note | 3.375% | 11/15/2019 | $ | 200,000 | $ | 214,969 | ||||||||||||
United States Treasury Note | 1.625% | 08/15/2022 | 100,000 | 90,719 | ||||||||||||||
|
| |||||||||||||||||
Total U.S. Treasury Obligations (Cost $302,110) | $ | 305,688 | ||||||||||||||||
|
| |||||||||||||||||
| Money Market Funds – 1.8% | Shares | Value | ||||||||||||||||
Fidelity Institutional Money Market Funds | 666,000 | $ | 666,000 | |||||||||||||||
|
| |||||||||||||||||
Total Money Market Funds (Cost $666,000) | $ | 666,000 | ||||||||||||||||
|
| |||||||||||||||||
Total Investments – 99.9% (Cost $32,419,673) | (c) | $ | 37,839,344 | |||||||||||||||
Other Assets in Excess of Liabilities – 0.1% | 49,187 | |||||||||||||||||
|
| |||||||||||||||||
Net Assets – 100.0% | $ | 37,888,531 | ||||||||||||||||
|
| |||||||||||||||||
Percentages are stated as a percent of net assets.
Footnotes:
| (a) | Non-income producing security. |
| (b) | Security exempt from registration under Regulation D of the Securities Act of 1933. This security may be resold in transactions exempt from registration, normally to qualified buyers under Rule 144A. At December 31, 2013, the value of this security totaled $173,657, or 0.5% of the Portfolio’s net assets. This security was deemed liquid pursuant to procedures approved by the Board of Directors. |
| (c) | Represents cost for financial reporting purposes, which may differ from cost basis for federal income tax purposes. See also Note 7 of the Notes to Financial Statements. |
The accompanying notes are an integral part of these financial statements.
| 19 |
| Ohio National Fund, Inc. | International Portfolio |
Objective/Strategy
The International Portfolio seeks long-term growth of capital by investing at least 80% of its assets in securities of foreign companies.
Performance as of December 31, 2013
Average Annual Returns | ||||
One year | 11.60% | |||
Five years | 12.87% | |||
Ten years | 4.77% |
Past performance does not guarantee future results. The performance data quoted represents past performance and current returns may be lower or higher. Total return figures include change in share price and reinvestment of dividends and capital gains. The investment return and principal value will fluctuate so that an investor’s shares, when redeemed, may be worth more or less than the original cost. To obtain performance information up to the most recent month end, call toll-free 1-877-781-6392.
The Portfolio is not open to direct retail investment. Beneficial interest in shares is obtained solely by purchase of variable life insurance policies and variable annuity contracts. Actual performance results for variable annuity and variable universal life contracts will be lower due to contract charges. Consult your contract for applicable charges.
Comments
For the year ended December 31, 2013, the International Portfolio returned 11.60% versus 15.29% for the current benchmark, the MSCI All Country World ex-USA Index (Net-USD).
The global stock market rallied over the year as the growth outlook improved and economic risks diminished across the United States and Europe. Several key markets hit all-time highs. Investors gained confidence despite the U.S. debt ceiling and budget crisis and the European debt crisis, both of which were a source of market volatility in previous years. While monetary policy diverged across the world, the U.S. Federal Reserve (“Fed”), the European Central Bank (“ECB”) and the Bank of Japan (“BoJ”) maintained accommodative monetary policy in the face of fiscal headwinds. The “risk-on/risk-off” investing environment that had driven markets in previous years became less important than global divergences, which were most evident between developed and emerging markets. As developed markets recovered, the growth outlook in emerging markets deteriorated and inflation expectations rose. As G3 (Fed, ECB and BoJ) central banks increased liquidity, several key central banks in the developing world, such as India and Brazil, began to tighten policy. Those conditions, coupled with concerns over an eventual withdrawal of extraordinary liquidity by the Fed, or “Fed tapering,” caused a broad selloff in emerging markets stocks, bonds and currencies.
The U.S. economy improved during the year, and re-emerged as a leading driver of global growth. A robust corporate sector was able to add over two million jobs, while the corporate earnings outlook remained strong. Despite repeated debt ceiling and budget debates, consumer spending and corporate investment remained healthy and improved. The major U.S. stock benchmarks hit all-time highs, and the U.S. dollar remained strong. As the employment picture continued to improve and industrial production grew past pre-recession highs, the focus shifted to the strength of the U.S. economy and the timing of the U.S. Federal Reserve’s tapering of its asset purchasing program. Fed tapering news caused volatility in yield-sensitive assets. Signs that investors were re-allocating to stocks aided positive sentiment for equities during the reporting period.
European markets performed strongly during the year as the broader economy shifted from a recession to initial stages of a recovery. The European economy exhibited “very green shoots,” according to the ECB. During the year, the euro-zone Purchasing Manager (“PMI”) Survey moved from contraction to expansion for the first time in over two years. The economic performance of the region is still widely varied, with Germany firing on multiple cylinders with above-trend real gross domestic product (“GDP”) growth, while Italy is slowly emerging from its worst recession since World War II. Across Europe, economic confidence moved to multi-year highs and was given a further boost as ECB President Mario Draghi stated that the bank was willing to enact another long-term refinancing operation (“LTRO”), if needed, to assure bank funding costs remained low. In November, the ECB cut its policy rate by a quarter-point to 0.25%, the lowest rate since the monetary union began in 1999. Political continuity was strong as pro-euro governments were confirmed. In Germany, Chancellor Merkel won a third term, and a stable technocrat government emerged in Italy. During the year, the European Parliament approved a single supervisory mechanism (“SSM”) for European banks. While the SSM is just the first step towards a banking union, it is an important institution that will help ensure the future stability in the euro area.
In Japan, the stock market had its best returns in more than a decade, as measured by the MSCI Japan Index, which appreciated 54.6% in local terms. The weak Yen was a headwind for U.S. dollar based returns. Prime Minister Abe’s sweeping economic revitalization plan and aggressive BoJ easing surprised markets. Japanese economic data improved consistently throughout the year. Important surveys such as the Tankan and Manufacturing PMI reflected an accelerating growth trend. After fifteen years of deflation, consumer prices stabilized and then signaled moderate inflation. The BoJ continued to provide record low interest rates and maintained quantitative easing. Prime Minister Abe’s broad plan for economic revitalization includes creation of three new business councils directing economic and fiscal policy, industrial competitiveness and regulatory reforms. Concurrent with a hike in the consumption tax, the government announced a stimulus plan targeted at incentivizing domestic corporate investment. Collectively, the structural reforms, fiscal and monetary policies, represent the “three arrows” of Japan’s makeover under “Abenomics.”
Emerging markets showed their widest underperformance to developed markets since the Asian crisis in 1998. While no economies entered into a recession during the year, the backdrop of tighter monetary policy in major emerging economies like Brazil and India, coupled with higher than expected inflation across many markets, hurt investor sentiment. More positive news from China helped improve the outlook during the end of the period, as the new government released further details about its long range economic reform plans. While the economic data showed mixed signs of growth and stability, real GDP growth is expected to be about 7 1/2 percent. The Chinese government’s action for domestic modernization and urbanization encouraged investors, particularly in the consumer sector. Furthermore, Chinese exports will be supported by the synchronized recovery underway in its major end markets, the United States, Europe and Japan.
For the twelve month reporting period ended December 31, 2013, the MSCI USA Index (+31.8%) outperformed both the MSCI Emerging Markets Index (-2.6%) and MSCI EAFE Index (+22.8%). The MSCI EAFE Index consists of the MSCI country indices that represent developed markets outside of North America (Europe, Australasia and the Far East). There was a strong divergence amongst country returns. Select major developed countries led the markets, including MSCI Germany
| 20 | (continued) |
| Ohio National Fund, Inc. | International Portfolio (Continued) |
(+31.4%) and MSCI Spain (+31.3%). The top performing major emerging markets were MSCI Taiwan (+9.1%) and MSCI Korea (+3.9%).
Country allocation remained a key driver of performance for the year, which it has been for over the past five years. Our country allocation process seeks to identify healthy economies trading at reasonable valuation levels and favorable macro-economic outlooks. The Portfolio maintained exposure to select healthy and high sovereign quality, developed & emerging markets. We continue to find country and stock holdings attractive for the long-term.
In the euro area, performance was positive. The Portfolio’s top performer from a country perspective was Germany, where a strong domestic economy, with the lowest unemployment rate in over 20 years, was boosted by improvement in the euro area economy and improving global growth. Demand for autos and capital goods drove sales and earnings of companies such as Daimler AG, up 67.5% for the year, and Siemens AG, up 34.9%. Media company Kabel Deutschland, up 47.9%, was acquired as the sector continued to consolidate. In Denmark, shipping & logistics companies, such as A.P. Moller Maersk A/S, up 46.7%, and DSV A/S, up 26.6%, benefited from improving volumes in Europe and continued growth out of Asia. Norway, the Portfolio’s second largest overweight allocation at plus 11.6% relative to the benchmark, underperformed, as shares in energy service companies such as Subsea7 ASA, down 17.0%, and TGS-Nopec Geophysical Company ASA, down 15.5%, declined. More broadly in Europe, our underweight in stocks in the UK and Switzerland, which outperformed, was largely offset by our long position in pound sterling. The decision to take a small position in Turkish stocks negatively impacted performance as the stock market and currency sold off towards the end of the year due to a widespread government corruption investigation. Our positions in Turkish banks Turkiye Halk Bankasi, down 34.9%, and Tuerkiye Vakiflar Bankasi, down 31.0%, negatively impacted performance.(1)
In the Asia Pacific region, the Portfolio’s overweight allocation in Japan and short Yen position helped performance. Exporters such as Toto Ltd., up 90.0%, and Kubota Corp., up 48.3%, outperformed as Yen weakness drove sentiment and earnings. Chinese holdings contributed positively to performance as internet companies such as Ctrip.com International Ltd., up 130.7%, and Tencent Holdings Ltd., up 96.9%, benefitted from increased domestic consumption as well as the strong trends towards mobile media and e-commerce. Chinese demand for SUVs remained robust, driving up the shares of Great Wall Motor Co., up 74.5%. However, the Portfolio’s holdings in Korea had a negative impact on Portfolio performance, as labor issues and a weak Yen (versus the Korean won) hurt investor sentiment for domestic auto & parts makers. Holdings in automotive companies Kia Motors, up 0.6%, and Mando Corp., down 44.8%, underperformed. Elsewhere in Asia, the “Fed tapering” news led to a steep selloff in fiscally weaker emerging market countries. The Portfolio’s holdings in Indonesia, such as PT Bank Negara Indonesia Tbk, down 29.2%, detracted from Portfolio performance. Portfolio performance was helped by our underweight in Australia.(1)
In the Americas, the Portfolio’s holdings in Brazil detracted from performance as domestic economic growth disappointed and persistent inflation resulted in a higher interest rate environment. In addition, a nascent recovery in commodity exports was insufficient to boost positive sentiment on stocks. Iron ore mining company Vale SA down 35.0% and construction company Mills Estruturas E Servicos De Engenharia SA, down 29.4%, contributed negatively to performance. Portfolio performance was helped by Portfolio underweight in Canada, as the commodity rich country lagged in performance.
The Portfolio used foreign exchange (“FX”) currency contracts to reduce currency risk. During the period, the overall net returns of the FX forward positions contributed positively to performance. Positive contribution from our long British pound (versus the U.S. dollar) and short Japanese Yen (versus the U.S. dollar) was partially offset by our short position in Brazilian real (versus the. U.S. dollar) and our long Australian Dollar position (versus the U.S. dollar).(1)
The Portfolio maintained exposure to select healthy, high quality developed markets. Our highest conviction overweight investments included Germany, Denmark and Norway. We under weighted European peripheral debt-laden economies such as Spain, Italy and Portugal. The Portfolio maintained its overweight in Germany (+16.3%) on the belief that strong long-term fundamentals will be the key driver of stock returns and that German shares will benefit from continued low European Central Bank rates, a competitive currency and low unemployment. The Portfolio is overweight Norway (+12.2%) as the country has strong public finances and is benefiting from the long-run boom in off-shore oil and gas exploration and production. Due to the positive economic effects of improving domestic growth and a recovery in Europe, the Portfolio invested in fundamentally attractive Central European economies: Austria, Czech Republic and Poland.(1)
The Portfolio is overweight Japan on the belief that economic conditions in Japan are improving and will continue to remain on an upward trajectory which will provide support for the stock market going forward. Prime Minister Shinzo Abe has acted aggressively to revitalize the economy under his “Three Arrows” strategy which is expected to boost the labor market and provide relief from years of deflation. The Japanese stocks positions are composed mainly of exporting companies which will benefit from the weaker Yen and the recovery in global economic growth. Elsewhere in Asia, we maintained an overweight position in South Korea, where stock valuations are attractive given improving economic growth and the country’s solid fiscal position. The Portfolio weight in China was close to benchmark weight with a focus on stocks in the domestic consumer sector.(1)
Provided that credit conditions do not deteriorate meaningfully, developing economies generally have better long-term growth prospects supported by both structural demand and changing demographics. The Portfolio emerging markets weight stood at 28.9%. Excluding South Korea (11.6%), which some key benchmark providers consider a developed market, our emerging market weight is 16.9%, which is more in line with the benchmark. Portfolio positions in Brazil are concentrated in companies that benefit from domestic economic growth and consumer spending.(1)
We continue to monitor our investment universe for signs of countries and companies with poor credit quality (or unmanageable debt levels), preferring to focus on countries and companies with healthy balance sheets and strategic expansion opportunities. As developed economies continue to adjust to new debt levels, and investors continue to fear a reoccurrence of a global financial crisis, markets may see periods of volatility. However, as long-term investors, we feel that fundamentals are supportive of global growth in the mid to long term. The Portfolio managers expect the winners to maintain higher profitability and gain market share, while the weaker players, who continue to struggle to gain footing, may underperform. Despite ‘Fed tapering,’ we expect global financial conditions to remain accommodative for some time to come.
| (1) | The Portfolio’s composition is subject to change. Holdings and weightings are as of December 31, 2013. |
| 21 | (continued) |
| Ohio National Fund, Inc. | International Portfolio (Continued) |
Change in Value of $10,000 Investment
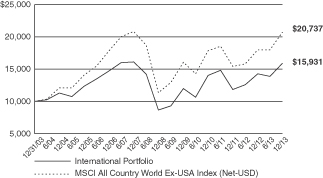
Hypothetical illustration based on past performance. Future performance will vary. The Portfolio’s returns reflect reinvested dividends. The Portfolio’s holdings may differ significantly from the securities in the index. The index is unmanaged and therefore does not reflect the cost of portfolio management and accounting.
The MSCI All Country World Ex-USA Index (Net-USD) is a free float-adjusted market capitalization weighted index that is designed to measure the equity market performance of the developed and emerging markets. The MSCI All Country World Index consists of 24 developed and 21 emerging market country indices.
Portfolio Composition as of December 31, 2013 (1)
| % of Net Assets | ||||
Common Stocks (3) | 95.7 | |||
U.S. Treasury Obligations | 0.1 | |||
Money Market Funds and | 4.2 | |||
|
| |||
| 100.0 | ||||
|
|
Top 10 Portfolio Holdings as of December 31, 2013 (1) (2)
| % of Net Assets | ||||
1. TOTO Ltd. | 3.3 | |||
2. Daimler AG | 3.3 | |||
3. Samsung Electronics Co. Ltd. | 3.0 | |||
4. Siemens AG | 2.8 | |||
5. Statoil ASA | 2.7 | |||
6. Kubota Corp. | 2.5 | |||
7. Bayerische Motoren Werke AG | 2.1 | |||
8. Murata Manufacturing Co. Ltd. | 2.1 | |||
9. Aisin Seiki Co. Ltd. | 2.0 | |||
10. DNB ASA | 2.0 |
| (1) | Composition of Portfolio subject to change. |
| (2) | Short-term investments have been excluded from the list of Top 10 Portfolio Holdings. |
| (3) | Top 10 Country Weightings: |
| % of Net Assets | ||||
Japan | 30.1 | |||
Germany | 16.1 | |||
South Korea | 11.5 | |||
Norway | 9.8 | |||
Denmark | 6.4 | |||
Brazil | 5.1 | |||
Poland | 3.9 | |||
China | 2.5 | |||
Austria | 2.4 | |||
Turkey | 1.9 |
Sector Classifications:
| % of Net Assets | ||||
Consumer Discretionary | 22.2 | |||
Financials | 18.0 | |||
Industrials | 17.3 | |||
Information Technology | 10.5 | |||
Energy | 8.8 | |||
Materials | 6.0 | |||
Consumer Staples | 5.6 | |||
Health Care | 5.4 | |||
Utilities | 1.4 | |||
Telecommunication Services | 0.5 | |||
|
| |||
| 95.7 | ||||
|
|
| 22 |
| Ohio National Fund, Inc. | International Portfolio |
Schedule of Investments | December 31, 2013 |
| Common Stocks – 95.7% | Shares | Value | ||||||||
Japan – 30.1% | ||||||||||
Aisin Seiki Co. Ltd. | (b) | 93,300 | $ | 3,793,211 | ||||||
Ajinomoto Co., Inc. | (b) | 60,000 | 868,600 | |||||||
Asahi Kasei Corp. | (b) | 384,000 | 3,012,024 | |||||||
Astellas Pharma, Inc. | (b) | 14,000 | 830,015 | |||||||
Chugai Pharmaceutical Co. Ltd. | (b) | 35,000 | 774,727 | |||||||
Daiwa House Industry Co. Ltd. | (b) | 25,000 | 484,380 | |||||||
Disco Corp. | (b) | 23,500 | 1,559,766 | |||||||
Fuji Heavy Industries Ltd. | (b) | 79,000 | 2,270,377 | |||||||
Hitachi Ltd. | (b) | 220,000 | 1,668,073 | |||||||
Honda Motor Co. Ltd. | (b) | 64,400 | 2,658,245 | |||||||
Japan Tobacco, Inc. | (b) | 99,900 | 3,250,621 | |||||||
Kaneka Corp. | (b) | 240,000 | 1,575,875 | |||||||
Kubota Corp. | (b) | 285,000 | 4,727,360 | |||||||
LIXIL Group Corp. | (b) | 23,000 | 631,404 | |||||||
Mitsubishi Chemical Holdings Corp. | (b) | 186,500 | 863,072 | |||||||
Mitsui & Co. Ltd. | (b) | 167,000 | 2,328,170 | |||||||
Murata Manufacturing Co. Ltd. | (b) | 44,700 | 3,975,318 | |||||||
Nippon Express Co. Ltd. | (b) | 216,000 | 1,045,573 | |||||||
Nomura Holdings, Inc. | (b) | 160,000 | 1,236,450 | |||||||
NTT Data Corp. | (b) | 17,000 | 628,040 | |||||||
ORIX Corp. | (b) | 124,000 | 2,178,911 | |||||||
Sekisui House Ltd. | (b) | 196,000 | 2,742,667 | |||||||
Shionogi & Co. Ltd. | (b) | 101,600 | 2,205,702 | |||||||
Shiseido Co. Ltd. | (b) | 122,300 | 1,966,752 | |||||||
Tokio Marine Holdings, Inc. | (b) | 27,300 | 913,722 | |||||||
TOTO Ltd. | (b) | 390,408 | 6,192,312 | |||||||
United Arrows Ltd. | (b) | 68,300 | 2,555,787 | |||||||
|
| |||||||||
| 56,937,154 | ||||||||||
|
| |||||||||
Germany – 16.1% | ||||||||||
Allianz SE | (b) | 19,010 | 3,420,387 | |||||||
Bayer AG | (b) | 10,800 | 1,516,433 | |||||||
Bayerische Motoren Werke AG | (b) | 34,300 | 4,027,940 | |||||||
Continental AG | (b) | 6,718 | 1,475,873 | |||||||
Daimler AG | (b) | 71,300 | 6,187,729 | |||||||
Deutsche Post AG | (b) | 74,900 | 2,735,720 | |||||||
Gerresheimer AG | (b) | 22,400 | 1,569,454 | |||||||
Gerry Weber International AG | (b) | 9,300 | 395,266 | |||||||
HeidelbergCement AG | (b) | 21,300 | 1,617,419 | |||||||
MorphoSys AG | (a)(b) | 5,000 | 385,478 | |||||||
Rheinmetall AG | (b) | 32,300 | 1,992,731 | |||||||
Siemens AG | (b) | 38,114 | 5,226,136 | |||||||
|
| |||||||||
| 30,550,566 | ||||||||||
|
| |||||||||
South Korea – 11.5% | ||||||||||
Binggrae Co. Ltd. | (b) | 3,400 | 313,256 | |||||||
Cheil Worldwide, Inc. | (a)(b) | 41,500 | 1,083,323 | |||||||
Coway Co. Ltd. | (b) | 16,973 | 1,069,256 | |||||||
Hyundai Motor Co. | (b) | 16,800 | 3,771,041 | |||||||
Kia Motors Corp. | (b) | 48,600 | 2,588,025 | |||||||
Korea Electric Power Corp. | (a)(b) | 31,800 | 1,050,230 | |||||||
LG Display Co. Ltd. | (a)(b) | 26,900 | 649,590 | |||||||
Samsung Electronics Co. Ltd. | (b) | 4,393 | 5,724,286 | |||||||
Samsung Heavy Industries Co. Ltd. | (b) | 61,500 | 2,222,693 | |||||||
Samsung SDI Co. Ltd. | (b) | 15,900 | 2,448,092 | |||||||
SK Innovation Co. Ltd. | (b) | 6,900 | 927,739 | |||||||
|
| |||||||||
| 21,847,531 | ||||||||||
|
| |||||||||
Norway – 9.8% | ||||||||||
DNB ASA | (b) | 210,885 | 3,784,994 | |||||||
DNO International ASA | (a)(b) | 220,000 | 880,497 | |||||||
Fred Olsen Energy ASA | (b) | 49,966 | 2,038,889 | |||||||
Norwegian Air Shuttle AS | (a)(b) | 33,397 | 1,041,010 | |||||||
Statoil ASA | (b) | 210,300 | 5,113,760 | |||||||
Telenor ASA | (b) | 42,600 | 1,017,867 | |||||||
TGS Nopec Geophysical Co. ASA | (b) | 46,100 | 1,224,954 | |||||||
Yara International ASA | (b) | 81,500 | 3,514,948 | |||||||
|
| |||||||||
| 18,616,919 | ||||||||||
|
| |||||||||
| Common Stocks (Continued) | Shares | Value | ||||||||
Denmark – 6.4% | ||||||||||
AP Moeller – Maersk A/S | (b) | 156 | $ | 1,688,225 | ||||||
Carlsberg A/S | (b) | 7,800 | 863,099 | |||||||
Danske Bank A/S | (a)(b) | 83,300 | 1,913,539 | |||||||
DSV A/S | (b) | 70,500 | 2,314,692 | |||||||
Jyske Bank A/S | (a)(b) | 29,732 | 1,607,592 | |||||||
Novo Nordisk A/S – ADR | 16,300 | 3,011,588 | ||||||||
Sydbank A/S | (a)(b) | 30,000 | 797,695 | |||||||
|
| |||||||||
| 12,196,430 | ||||||||||
|
| |||||||||
Brazil – 5.1% | ||||||||||
AMBEV SA – ADR | 269,500 | 1,980,825 | ||||||||
Arezzo Industria e Comercio SA | (b) | 65,000 | 819,338 | |||||||
BB Seguridade Participacoes SA | (c) | 145,333 | 1,509,233 | |||||||
Cia Brasileira de Distribuicao Grupo Pao de Acucar – ADR | 13,300 | 594,111 | ||||||||
Cielo SA | (b) | 68,280 | 1,891,234 | |||||||
Itau Unibanco Holding SA – ADR | 136,390 | 1,850,812 | ||||||||
Tractebel Energia SA | (b) | 60,000 | 914,471 | |||||||
|
| |||||||||
| 9,560,024 | ||||||||||
|
| |||||||||
Poland – 3.9% | ||||||||||
mBank | (b) | 8,400 | 1,392,517 | |||||||
Polskie Gornictwo Naftowe i Gazownictwo SA | (b) | 752,000 | 1,276,838 | |||||||
Powszechna Kasa Oszczednosci Bank Polski SA | (b) | 192,400 | 2,508,497 | |||||||
Powszechny Zaklad Ubezpieczen SA | (b) | 9,700 | 1,441,401 | |||||||
Tauron Polska Energia SA | (b) | 470,000 | 681,147 | |||||||
|
| |||||||||
| 7,300,400 | ||||||||||
|
| |||||||||
China – 2.5% | ||||||||||
Ctrip.com International Ltd. – ADR | (a) | 44,700 | 2,218,014 | |||||||
Great Wall Motor Co. Ltd. | (b) | 205,000 | 1,133,129 | |||||||
Tencent Holdings Ltd. | (b) | 20,600 | 1,317,365 | |||||||
|
| |||||||||
| 4,668,508 | ||||||||||
|
| |||||||||
Austria – 2.4% | ||||||||||
Erste Group Bank AG | (b) | 42,000 | 1,464,137 | |||||||
OMV AG | (b) | 20,000 | 957,627 | |||||||
UNIQA Insurance Group AG | (b) | 30,700 | 392,722 | |||||||
Vienna Insurance Group AG Wiener Versicherung Gruppe | (b) | 19,300 | 964,572 | |||||||
Voestalpine AG | (b) | 16,100 | 773,674 | |||||||
|
| |||||||||
| 4,552,732 | ||||||||||
|
| |||||||||
Turkey – 1.9% | ||||||||||
BIM Birlesik Magazalar AS | (b) | 34,800 | 702,815 | |||||||
Tofas Turk Otomobil Fabrikasi AS | (b) | 70,000 | 436,985 | |||||||
Trakya Cam Sanayii AS | (b) | 468,192 | 553,849 | |||||||
Turkiye Halk Bankasi AS | (b) | 171,000 | 967,431 | |||||||
Turkiye Vakiflar Bankasi Tao | (b) | 560,000 | 996,594 | |||||||
|
| |||||||||
| 3,657,674 | ||||||||||
|
| |||||||||
United Kingdom – 1.6% | ||||||||||
Burberry Group PLC | (b) | 54,127 | 1,363,746 | |||||||
Subsea 7 SA | (b) | 91,530 | 1,754,711 | |||||||
|
| |||||||||
| 3,118,457 | ||||||||||
|
| |||||||||
Bermuda – 1.4% | ||||||||||
Seadrill Ltd. | (b) | 62,966 | 2,580,627 | |||||||
|
| |||||||||
Italy – 1.2% | ||||||||||
Prada SpA | (b) | 153,000 | 1,361,759 | |||||||
UniCredit SpA | (b) | 117,000 | 863,068 | |||||||
|
| |||||||||
| 2,224,827 | ||||||||||
|
| |||||||||
Sweden – 0.8% | ||||||||||
Nordea Bank AB | (b) | 108,300 | 1,460,187 | |||||||
|
| |||||||||
Hong Kong – 0.7% | ||||||||||
China Overseas Land & Investment Ltd. | (b) | 492,000 | 1,388,741 | |||||||
|
| |||||||||
Czech Republic – 0.3% | ||||||||||
Komercni Banka AS | (b) | 2,100 | 468,405 | |||||||
|
| |||||||||
Total Common Stocks (Cost $136,957,173) | $ | 181,129,182 | ||||||||
|
| |||||||||
| 23 | (continued) |
| Ohio National Fund, Inc. | International Portfolio (Continued) |
Schedule of Investments | December 31, 2013 |
| U.S. Treasury Obligations – 0.1% | Face Amount | Value | ||||||||
U.S. Treasury Bill | (d) | $ | 220,000 | $ | 219,982 | |||||
|
| |||||||||
Total U.S. Treasury Obligations (Cost $219,982) | $ | 219,982 | ||||||||
|
| |||||||||
| Money Market Funds – 2.7% | Shares | Value | ||||||||
State Street Institutional Liquid Reserves Fund Institutional Class | 5,175,480 | $ | 5,175,480 | |||||||
|
| |||||||||
Total Money Market Funds (Cost $5,175,480) | $ | 5,175,480 | ||||||||
|
| |||||||||
Total Investments – 98.5% (Cost $142,352,635) | (e) | $ | 186,524,644 | |||||||
Other Assets in Excess of Liabilities – 1.5% | 2,902,396 | |||||||||
|
| |||||||||
Net Assets – 100.0% | $ | 189,427,040 | ||||||||
|
| |||||||||
Percentages are stated as a percent of net assets.
Abbreviations:
ADR: American Depositary Receipts
Footnotes:
| (a) | Non-income producing security. |
| (b) | Security traded on a foreign exchange has been valued at an estimate of fair value that is different than the local market close price. These fair value estimates are determined by an independent fair valuation service that has been approved by the Board. These securities represent $169,964,599, or 89.7% of the Portfolio’s net assets. |
| (c) | As discussed in Note 2 of the Notes to Financial Statements, not all investments that are traded on a foreign exchange are valued at an estimate that is different from the local close price. In some instances, the independent fair valuation service uses a stock’s local close price because the service’s measure of predictability related to their valuation model of a stock is below a chosen threshold. These securities represent $1,509,233, or 0.8% of the Portfolio’s net assets. |
Other Portfolio securities are not subjected to fair valuation procedures because they are traded on domestic or foreign exchanges that have close times that are consistent with the U.S. market close, normally 4:00 pm Eastern Time.
| (d) | Security is fully or partially pledged as collateral for the following futures contracts outstanding at December 31, 2013: |
Type | Description | Expiration | Number of Contracts | Counterparty | Contract at Value | Initial Contract Amount | Unrealized Appreciation (Depreciation) | |||||||||||||||
Long | Mini MSCI EAFE March14 | March 21, 2014 | 40 | J.P. Morgan Securities LLC | $ | 3,835,600 | $ | 3,665,070 | $ | 170,530 | ||||||||||||
| (e) | Represents cost for financial reporting purposes, which may differ from cost basis for federal income tax purposes. See also Note 7 of the Notes to Financial Statements. |
Details of the foreign currency contracts outstanding in the International Portfolio at December 31, 2013 are as follows:
Contracts to buy foreign currency:
Date of contract | Exchange date | Counterparty | Currency to receive | Currency to deliver | Contract at value | Unrealized appreciation (depreciation) | ||||||||||||
October 4, 2013 | January 10, 2014 | HSBC | 77,750,000 RUB | $ | 2,380,442 | $ | 2,362,248 | $ | (18,194 | ) | ||||||||
December 16, 2013 | March 14, 2014 | BARC | 4,010,000 AUD | $ | 3,575,557 | $ | 3,564,077 | $ | (11,480 | ) | ||||||||
December 16, 2013 | March 14, 2014 | BOA | 6,150,000 GBP | $10,020,995 | $ | 10,179,059 | $ | 158,064 | ||||||||||
|
|
|
|
|
| |||||||||||||
| $ | 15,976,994 | $ | 16,105,384 | $ | 128,390 | |||||||||||||
|
|
|
|
|
| |||||||||||||
Contracts to sell foreign currency:
Date of contract | Exchange date | Counterparty | Currency to | Currency to | Contract at value | Unrealized appreciation (depreciation) | ||||||||||
December 9, 2013 | January 10, 2014 | HSBC | $ 2,359,743 | 77,750,000 RUB | $ | 2,362,248 | $ | (2,505 | ) | |||||||
December 16, 2013 | March 14, 2014 | HSBC | $ 29,413,208 | 3,027,575,000 JPY | $ | 28,758,694 | $ | 654,514 | ||||||||
|
|
|
|
| ||||||||||||
$ 31,772,951 | $ | 31,120,942 | $ | 652,009 | ||||||||||||
|
|
|
|
| ||||||||||||
Counterparties | Currencies | |
BARC – Barclays Bank PLC | RUB – New Russian Ruble | |
HSBC – HSBC Bank USA, N.A. | AUD – Australian Dollar | |
BOA – Bank of America N.A. | GBP – British Pound | |
JPY – Japanese Yen |
The accompanying notes are an integral part of these financial statements.
| 24 |
| Ohio National Fund, Inc. | Capital Appreciation Portfolio |
Objective/Strategy
The Capital Appreciation Portfolio seeks long-term capital growth by investing primarily in common stocks of established companies with either current or emerging earnings growth not fully appreciated or recognized by the market.
Performance as of December 31, 2013
Average Annual Returns | ||||
One year | 34.51% | |||
Five years | 21.05% | |||
Ten years | 8.54% |
Past performance does not guarantee future results. The performance data quoted represents past performance and current returns may be lower or higher. Total return figures include change in share price and reinvestment of dividends and capital gains. The investment return and principal value will fluctuate so that an investor’s shares, when redeemed, may be worth more or less than the original cost. To obtain performance information up to the most recent month end, call toll-free 1-877-781-6392.
The Portfolio is not open to direct retail investment. Beneficial interest in shares is obtained solely by purchase of variable life insurance policies and variable annuity contracts. Actual performance results for variable annuity and variable universal life contracts will be lower due to contract charges. Consult your contract for applicable charges.
Comments
For the year ended December 31, 2013, the Capital Appreciation Portfolio returned 34.51% versus 32.39% for the current benchmark, the S&P 500 Index.
Equity markets posted robust, broad-based gains in the fourth quarter, capping a strong year for most U.S. indexes. Continued positive earnings momentum (S&P 500 earnings increased approximately 8% in 2013) and the first sustained expansion of price/earnings multiples since the 2008 financial crisis supported the advances. Accelerating U.S. gross domestic product growth and other measures of improved activity bolstered investor confidence. Indications of strength gained momentum into the new year.
The federal budget sequestration in January and the federal government shutdown in early October had only fleeting effects on economic activity and investor confidence. The absence of serious headwinds abroad for the first time in a number of years added to the favorable environment. The pace and scope of mergers, acquisitions, and initial public offerings benefitted from rising confidence.
Bond prices fell for the first time since 2009, as interest rates rose from early May on talk of reduced bond purchases by the Federal Reserve. The move to taper Federal Reserve bond purchases was formalized in mid-December. The initial reduction was modest, and the Federal Reserve indicated that it would maintain a historically low federal funds rate even if the prior target trigger of 6.5% unemployment is achieved.
The broad markets, as represented by the S&P 500 Index and the Russell 3000 Index, finished 2013 with strong gains. The S&P 500 Index advanced 32.39%, while the Russell 3000 Index was up 33.55%. All sectors had double-digit gains; Consumer Discretionary, Health Care, and Industrials showed the greatest strength. Telecommunication Services and Utilities had the most modest gains. Growth stocks outperformed value stocks, especially in the smaller capitalizations. The Portfolio performed in line with the Russell 3000 Index and marginally outperformed the S&P 500 Index.
Stock selection in the robust Consumer Discretionary sector, combined with an overweight position in the sector, had the strongest positive impact on relative performance. A dozen strong performers in the sector were led by Live Nation Entertainment, Inc., GameStop Corp., and The Wendy’s Co. Stock selection in Financials (MetLife, Inc. and The Charles Schwab Corp.) and Industrials (The Boeing Company and Delta Air Lines, Inc.) also made an important contribution to relative returns; however, an underweight in Industrials was slightly offsetting.(1)
Stock selection in Energy (Peabody Energy Corp. and Cobalt International Energy, Inc.), Information Technology (Broadcom Corp. and Teradata Corp.), and Health Care (Amarin Corp.) detracted most from relative returns. An underweight in Information Technology slightly lessened the negative impact of stock selection.(1)
The five largest contributors were Live Nation Entertainment, Inc., Vertex Pharmaceuticals, Inc., GameStop Corp., The Wendy’s Co., and MetLife, Inc. Live Nation Entertainment, Inc., a producer of live music concerts worldwide, reported several successive strong quarters, driven particularly by its sponsorship business and concert revenue. We believe that Live Nation Entertainment, Inc. is making astute investments to build its business, including improving the technology used in its ticketing business, expanding its promotions and ticketing businesses internationally, and increasing its sponsorships and e-commerce activities.(1)
Vertex Pharmaceuticals, Inc. announced during the period that its Phase 2 trial data for its second cystic fibrosis drug, VX-661, in combination with Kalydeco, indicated that the drug was significantly more effective than anticipated. The results are a very favorable indicator for Vertex Pharmaceuticals, Inc.’s pipeline of cystic fibrosis drugs. Shares rose sharply on the news, pricing in much of the upside potential. As a result of the price appreciation, we exited the position. We began rebuilding a position in the stock in November, taking advantage of what we believed to be a temporary decline in valuation.(1)
GameStop Corp., the leading video game retailer, is well positioned, in our view, to benefit from the new console cycle. GameStop Corp. continues to take significant market share in both the new and used software categories, and we believe that sales growth will improve with the release of new games and increased traction from multiple digital initiatives. We continue to believe that GameStop Corp. is the best positioned retailer for the transition of the video game industry from a pure console driven model to a combination of both console and digital options.(1)
The Wendy’s Co. has embarked on a two-pronged approach to turn around the company: menu changes led by a new product pipeline of premium sandwiches, that have been met with solid demand, and image reactivation, which would be a welcome major remodeling of a tired store look and layout. These two initiatives should drive sales and take market share from other quick-serve competitors. The company also plans to sell 425 of its company-owned stores to a major franchisee, a move that should be cash flow neutral and accretive to valuation.(1)
We consider MetLife, Inc. to be one of the top life insurance franchises, ably protecting itself against potential risk, improving its business mix, and continuing to see growth in its emerging markets business, while remaining attractively valued at under a 10 times price to earnings multiple.(1)
The five largest detractors were Peabody Energy Corp., Amarin Corp., Broadcom Corp., United States Steel Corp., and Teradata
| 25 | (continued) |
| Ohio National Fund, Inc. | Capital Appreciation Portfolio (Continued) |
Corp. Peabody Energy Corp.’s shares fell on continuing forecasts of declining metallurgical coal prices on rising global supply and weak demand. Weakness in the Chinese and other emerging market economies accentuated the risk to the secular demand growth outlook for metallurgical coal and, thus, Peabody Energy Corp.’s Australian operations. We believe the company did a solid job of restructuring those operations, but cannot easily deflect the negative perception of having bought the metallurgical assets at peak prices. Given the negative macroeconomic backdrop for the coal market and the lack of flow through of positive developments to Peabody Energy Corp.’s share price, we exited the position in the company as the risk-reward narrowed.(1)
Amarin Corp.’s shares fell after the U.S. Food and Drug Administration (FDA) announced it would not approve a label expansion of the company’s triglyceride-lowering drug, Vascepa. The decision was a surprise because it represented a policy shift in the agency. Since there is now a question as to whether lowering triglycerides improves cardiovascular outcomes, the FDA appears to be discouraging the use of cardiovascular drugs without proven outcome studies, even though the drugs are safe and effective at improving common markers. We have sold our position in the stock.(1)
Broadcom Corp., a provider of semiconductors for wired and wireless communications, reported in-line second quarter earnings and revenues, but its third-quarter earnings and revenue guidance was below expectations. Results stemmed from a delay in LTE baseband revenue and lower than expected 3G revenues. We have exited the position.(1)
United States Steel Corp. announced fourth quarter earnings losses that were less than anticipated due to improved costs. Growth in steel imports has prevented our expected steel pricing cycle and, as a result, we exited our position in the company.(1)
Teradata Corp. is a pioneer in providing enterprise data warehousing systems that store and transform information amassed about customers, financials, and operations into data that can be mined to improve sales, profitability, inventory management, and customer responsiveness. In October, it pre-announced that revenue and earnings for the third quarter would fall short of expectations and it lowered earnings and revenue guidance for the full year. In our view, too many uncertainties have arisen around Teradata Corp.’s growth prospects and we exited our position in the stock.(1)
The five best performing holdings were Delta Air Lines, Inc., Live Nation Entertainment, Inc., Vertex Pharmaceuticals, Inc., GameStop Corp. and Evercore Partners, Inc. The five worst performing holdings were Amarin Corp., Peabody Energy Corp., Cobalt International Energy, Inc., Silver Spring Networks, Inc., and Teradata Corp.(1)
The gradual recovery in the U.S. appears to be picking up strength, albeit slowly, after being quite uneven throughout 2013. The U.S. government reported in December that the economy grew 4.2% in the third quarter and added 203,000 jobs in November, Unemployment fell to 7% from 7.3%, the lowest level since 2008. Because of the accumulating strength, the Federal Reserve has begun gradually winding down quantitative easing (QE) and plans to reduce its bond purchases to zero by the end of 2014. Congress, meanwhile, has indicated it will avoid another impasse over the budget.
With the recession and budget crises in the rear-view mirror, macroeconomic factors are likely to play a lesser role in the near term, enabling the company-specific, microeconomic drivers that are at the core of our investment process to assume a more dominant role.
In addition, the robust performance of the markets in the past year has led to the normalization of valuations. As a result, the importance of identifying companies that are likely to experience catalyst-driven growth will be especially crucial in the year ahead. We will continue to look for stocks that offer the greatest reward versus risk opportunities and that we expect to experience dynamic earnings cycles or other catalysts over the next 12-18 months, or that are demonstrating good growth characteristics but are being mispriced by the market.
| (1) | The Portfolio’s composition is subject to change. Holdings and weightings are as of December 31, 2013. |
Change in Value of $10,000 Investment
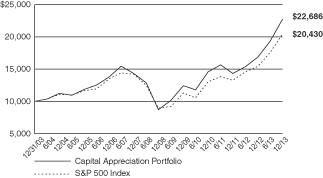
Hypothetical illustration based on past performance. Future performance will vary. The Portfolio’s returns reflect reinvested dividends. The Portfolio’s holdings may differ significantly from the securities in the index. The index is unmanaged and therefore does not reflect the cost of portfolio management and accounting.
The S&P 500 Index is a capitalization-weighted index designed to measure performance of the broad domestic economy through changes in the aggregate market value of 500 stocks representing all major industries. The index presented herein includes the effects of reinvested dividends.
| 26 | (continued) |
| Ohio National Fund, Inc. | Capital Appreciation Portfolio (Continued) |
Portfolio Composition as of December 31, 2013 (1)
| % of Net Assets | ||||
Common Stocks (3) | 99.5 | |||
Money Market Funds | 0.5 | |||
|
| |||
| 100.0 | ||||
|
|
Top 10 Portfolio Holdings as of December 31, 2013 (1) (2)
| % of Net Assets | ||||
1. MetLife, Inc. | 2.3 | |||
2. Schlumberger Ltd. | 2.1 | |||
3. CONSOL Energy, Inc. | 2.0 | |||
4. PNC Financial Services Group, Inc. / The | 1.9 | |||
5. Pfizer, Inc. | 1.9 | |||
6. Vivendi SA | 1.9 | |||
7. Mondelez International, Inc. Class A | 1.8 | |||
8. Merck & Co., Inc. | 1.8 | |||
9. United Technologies Corp. | 1.8 | |||
10. JPMorgan Chase & Co. | 1.7 |
| (1) | Composition of Portfolio subject to change. |
| (2) | Short-term investments have been excluded from the list of Top 10 Portfolio Holdings. |
| (3) | Sectors: |
| % of Net Assets | ||||
Consumer Discretionary | 20.0 | |||
Information Technology | 16.7 | |||
Financials | 13.7 | |||
Health Care | 13.5 | |||
Energy | 11.3 | |||
Industrials | 10.4 | |||
Consumer Staples | 6.1 | |||
Materials | 4.4 | |||
Telecommunication Services | 1.9 | |||
Utilities | 1.5 | |||
|
| |||
| 99.5 | ||||
|
|
| 27 |
| Ohio National Fund, Inc. | Capital Appreciation Portfolio |
Schedule of Investments | December 31, 2013 |
| Common Stocks – 99.5% | Shares | Value | ||||||||
CONSUMER DISCRETIONARY – 20.0% | ||||||||||
Lear Corp. (Auto Components) | 21,165 | $ | 1,713,730 | |||||||
Toyota Motor Corp. – ADR (Automobiles) | 15,707 | 1,914,997 | ||||||||
Houghton Mifflin Harcourt Co. (Diversified Consumer Svs.) | (a) | 51,832 | 879,071 | |||||||
Accor SA (Hotels, Restaurants & Leisure) | (c) | 35,727 | 1,687,389 | |||||||
Carnival Corp. (Hotels, Restaurants & Leisure) | 48,413 | 1,944,750 | ||||||||
Hilton Worldwide Holdings, Inc. (Hotels, Restaurants & Leisure) | (a) | 14,063 | 312,902 | |||||||
Hyatt Hotels Corp. Class A (Hotels, Restaurants & Leisure) | (a) | 44,263 | 2,189,248 | |||||||
International Game Technology (Hotels, Restaurants & Leisure) | 131,211 | 2,382,792 | ||||||||
Pinnacle Entertainment, Inc. (Hotels, Restaurants & Leisure) | (a) | 89,729 | 2,332,057 | |||||||
Wendy’s Co. / The (Hotels, Restaurants & Leisure) | 245,167 | 2,137,856 | ||||||||
Comcast Corp. Class A (Media) | 32,779 | 1,635,016 | ||||||||
Live Nation Entertainment, Inc. (Media) | (a) | 107,678 | 2,127,717 | |||||||
Nine Entertainment Co. Holdings Ltd. (Media) | (a)(b)(d) | 768,484 | 1,351,769 | |||||||
Thomson Reuters Corp. (Media) | 40,553 | 1,533,714 | ||||||||
Twenty-First Century Fox, Inc. Class A (Media) | 34,981 | 1,230,632 | ||||||||
Viacom, Inc. Class B (Media) | 6,381 | 557,317 | ||||||||
GameStop Corp. Class A (Specialty Retail) | 33,004 | 1,625,777 | ||||||||
|
| |||||||||
| 27,556,734 | ||||||||||
|
| |||||||||
CONSUMER STAPLES – 6.1% | ||||||||||
CVS Caremark Corp. (Food & Staples Retailing) | 26,352 | 1,886,013 | ||||||||
Wal-Mart Stores, Inc. (Food & Staples Retailing) | 25,693 | 2,021,782 | ||||||||
Bunge Ltd. (Food Products) | 13,290 | 1,091,242 | ||||||||
Diamond Foods, Inc. (Food Products) | (a) | 32,571 | 841,635 | |||||||
Mondelez International, Inc. Class A (Food Products) | 72,302 | 2,552,261 | ||||||||
|
| |||||||||
| 8,392,933 | ||||||||||
|
| |||||||||
ENERGY – 11.3% | ||||||||||
Cameron International Corp. (Energy Equip. & Svs.) | (a) | 38,220 | 2,275,237 | |||||||
Schlumberger Ltd. (Energy Equip. & Svs.) | 32,430 | 2,922,267 | ||||||||
Superior Energy Services, Inc. (Energy Equip. & Svs.) | (a) | 71,579 | 1,904,717 | |||||||
Cobalt International Energy, Inc. (Oil, Gas & Consumable Fuels) | (a) | 46,872 | 771,044 | |||||||
CONSOL Energy, Inc. (Oil, Gas & Consumable Fuels) | 73,793 | 2,807,086 | ||||||||
EOG Resources, Inc. (Oil, Gas & Consumable Fuels) | 11,411 | 1,915,222 | ||||||||
Southwestern Energy Co. (Oil, Gas & Consumable Fuels) | (a) | 34,285 | 1,348,429 | |||||||
Suncor Energy, Inc. (Oil, Gas & Consumable Fuels) | 47,482 | 1,664,244 | ||||||||
|
| |||||||||
| 15,608,246 | ||||||||||
|
| |||||||||
FINANCIALS – 13.7% | ||||||||||
Charles Schwab Corp. / The (Capital Markets) | 73,701 | 1,916,226 | ||||||||
Evercore Partners, Inc. Class A (Capital Markets) | 21,722 | 1,298,541 | ||||||||
Goldman Sachs Group, Inc. / The (Capital Markets) | 9,821 | 1,740,870 | ||||||||
PNC Financial Services Group, Inc. / The (Commercial Banks) | 34,229 | 2,655,486 | ||||||||
Wells Fargo & Co. (Commercial Banks) | 51,629 | 2,343,957 | ||||||||
ING U.S., Inc. (Diversified Financial Svs.) | 54,236 | 1,906,395 | ||||||||
JPMorgan Chase & Co. (Diversified Financial Svs.) | 41,104 | 2,403,762 | ||||||||
MetLife, Inc. (Insurance) | 59,416 | 3,203,711 | ||||||||
Symetra Financial Corp. (Insurance) | 73,955 | 1,402,187 | ||||||||
|
| |||||||||
| 18,871,135 | ||||||||||
|
| |||||||||
| Common Stocks (Continued) | Shares | Value | ||||||||
HEALTH CARE – 13.5% | ||||||||||
Vertex Pharmaceuticals, Inc. (Biotechnology) | (a) | 20,441 | $ | 1,518,766 | ||||||
Hologic, Inc. (Health Care Equip. & Supplies) | (a) | 66,796 | 1,492,891 | |||||||
Express Scripts Holding Co. (Health Care Providers & Svs.) | (a) | 30,088 | 2,113,381 | |||||||
Universal Health Services, Inc. Class B (Health Care Providers & Svs.) | 23,492 | 1,908,960 | ||||||||
Allscripts Healthcare Solutions, Inc. (Health Care Technology) | (a) | 88,458 | 1,367,561 | |||||||
Agilent Technologies, Inc. (Life Sciences Tools & Svs.) | 33,897 | 1,938,569 | ||||||||
Allergan, Inc. (Pharmaceuticals) | 14,673 | 1,629,877 | ||||||||
Impax Laboratories, Inc. (Pharmaceuticals) | (a) | 63,667 | 1,600,588 | |||||||
Merck & Co., Inc. (Pharmaceuticals) | 49,314 | 2,468,166 | ||||||||
Pfizer, Inc. (Pharmaceuticals) | 84,561 | 2,590,103 | ||||||||
|
| |||||||||
| 18,628,862 | ||||||||||
|
| |||||||||
INDUSTRIALS – 10.4% | ||||||||||
Boeing Co. / The (Aerospace & Defense) | 15,370 | 2,097,851 | ||||||||
United Technologies Corp. (Aerospace & Defense) | 21,346 | 2,429,175 | ||||||||
FedEx Corp. (Air Freight & Logistics) | 15,042 | 2,162,588 | ||||||||
Delta Air Lines, Inc. (Airlines) | 35,425 | 973,125 | ||||||||
Brink’s Co. / The (Commercial Svs. & Supplies) | 53,199 | 1,816,214 | ||||||||
Siemens AG (Industrial Conglomerates) | (c) | 7,373 | 1,010,980 | |||||||
Dover Corp. (Machinery) | 10,805 | 1,043,115 | ||||||||
Terex Corp. (Machinery) | 39,373 | 1,653,272 | ||||||||
Kirby Corp. (Marine) | (a) | 12,466 | 1,237,251 | |||||||
|
| |||||||||
| 14,423,571 | ||||||||||
|
| |||||||||
INFORMATION TECHNOLOGY – 16.7% | ||||||||||
Brocade Communications Systems, Inc. (Communications Equip.) | (a) | 235,467 | 2,088,592 | |||||||
Juniper Networks, Inc. (Communications Equip.) | (a) | 78,895 | 1,780,660 | |||||||
Apple, Inc. (Computers & Peripherals) | 4,183 | 2,347,123 | ||||||||
Diebold, Inc. (Computers & Peripherals) | 54,352 | 1,794,159 | ||||||||
Google, Inc. Class A (Internet Software & Svs.) | (a) | 1,969 | 2,206,678 | |||||||
Altera Corp. (Semiconductors & Equip.) | 45,470 | 1,479,139 | ||||||||
International Rectifier Corp. (Semiconductors & Equip.) | (a) | 45,931 | 1,197,421 | |||||||
Xilinx, Inc. (Semiconductors & Equip.) | 39,160 | 1,798,227 | ||||||||
Activision Blizzard, Inc. (Software) | 83,695 | 1,492,282 | ||||||||
Cadence Design Systems, Inc. (Software) | (a) | 154,374 | 2,164,323 | |||||||
Fortinet, Inc. (Software) | (a) | 63,107 | 1,207,237 | |||||||
Microsoft Corp. (Software) | 60,742 | 2,273,573 | ||||||||
Rovi Corp. (Software) | (a) | 60,117 | 1,183,704 | |||||||
|
| |||||||||
| 23,013,118 | ||||||||||
|
| |||||||||
MATERIALS – 4.4% | ||||||||||
Monsanto Co. (Chemicals) | 18,574 | 2,164,800 | ||||||||
PPG Industries, Inc. (Chemicals) | 8,447 | 1,602,058 | ||||||||
Constellium NV Class A (Metals & Mining) | (a) | 100,885 | 2,347,594 | |||||||
|
| |||||||||
| 6,114,452 | ||||||||||
|
| |||||||||
TELECOMMUNICATION SERVICES – 1.9% | ||||||||||
Vivendi SA (Diversified Telecom. Svs.) | (c) | 97,550 | 2,573,126 | |||||||
|
| |||||||||
UTILITIES – 1.5% | ||||||||||
Calpine Corp. (Ind. Power Prod. & Energy Traders) | (a) | 106,694 | 2,081,600 | |||||||
|
| |||||||||
Total Common Stocks (Cost $99,112,716) | $ | 137,263,777 | ||||||||
|
| |||||||||
| Money Market Funds – 1.7% | Shares | Value | ||||||||
Fidelity Institutional Money Market Funds | 2,353,000 | $ | 2,353,000 | |||||||
|
| |||||||||
Total Money Market Funds (Cost $2,353,000) | $ | 2,353,000 | ||||||||
|
| |||||||||
Total Investments – 101.2% (Cost $101,465,716) | (e) | $ | 139,616,777 | |||||||
Liabilities in Excess of Other Assets – (1.2)% | (1,609,135) | |||||||||
|
| |||||||||
Net Assets – 100.0% | $ | 138,007,642 | ||||||||
|
| |||||||||
| 28 | (continued) |
| Ohio National Fund, Inc. | Capital Appreciation Portfolio (Continued) |
Schedule of Investments | December 31, 2013 |
Percentages are stated as a percent of net assets.
Abbreviations:
ADR: American Depositary Receipts
Footnotes:
| (a) | Non-income producing security. |
| (b) | Security exempt from registration under Regulation D of the Securities Act of 1933. These securities may be resold in transactions exempt form registration, normally to qualified buyers under Rule 144A. At December 31, 2013, the value of these securities totaled $1,351,769, or 1.0% of the Portfolio’s net assets. These securities were deemed liquid pursuant to procedures approved by the Board of Directors. |
| (c) | Security traded on a foreign exchange has been valued at an estimate of fair value that is different than the local market close price. These fair value estimates are determined by an independent fair valuation service that has been approved by the Board. These securities represent $5,271,495, or 3.8% of the Portfolio’s net assets. |
| (d) | As discussed in Note 2 of the Notes to Financial Statements, not all investments that are traded on a foreign exchange are valued at an estimate that is different from the local close price. In some instances, the independent fair valuation service uses a stock’s local close price because the service’s measure of predictability related to their valuation model of a stock is below a chosen threshold. These securities represent $1,351,769, or 1.0% of the Portfolio’s net assets. |
Other Portfolio securities are not subjected to fair valuation procedures because they are traded on domestic or foreign exchanges that have close times that are consistent with the U.S. market close, normally 4:00 pm Eastern Time.
| (e) | Represents cost for financial reporting purposes, which may differ from cost basis for federal income tax purposes. See also Note 7 of the Notes to Financial Statements. |
The accompanying notes are an integral part of these financial statements.
| 29 |
| Ohio National Fund, Inc. | International Small-Mid Company Portfolio |
Objective/Strategy
The International Small-Mid Company Portfolio seeks long-term growth of capital by investing at least 80% of its assets in equity securities of foreign small and mid-cap companies.
Performance as of December 31, 2013
Average Annual Total Returns: | ||||
One year | 27.68% | |||
Five years | 17.71% | |||
Ten years | 9.80% |
Past performance does not guarantee future results. The performance data quoted represents past performance and current returns may be lower or higher. Total return figures include change in share price and reinvestment of dividends and capital gains. The investment return and principal value will fluctuate so that an investor’s shares, when redeemed, may be worth more or less than the original cost. To obtain performance information up to the most recent month end, call toll-free 1-877-781-6392.
The Portfolio is not open to direct retail investment. Beneficial interest in shares is obtained solely by purchase of variable life insurance policies and variable annuity contracts. Actual performance results for variable annuity and variable universal life contracts will be lower due to contract charges. Consult your contract for applicable charges.
Comments
For the year ended December 31, 2013, the International Small-Mid Company Portfolio returned 27.68% versus 24.03% for the current benchmark, the S&P Developed Small Cap Ex-U.S. Growth Index.
During this reporting period, global markets continued their upward march from 2012, as global confidence improved and tail risks subsided. The global markets rallied off their mid-year lows, as moderate growth was supported by accommodative monetary policy and structural reforms helped boost investor sentiment. Developed markets outperformed emerging markets, as talk of bond buying tapering by the U.S. Federal Reserve and the moderated economic growth in China weighed on the markets, especially emerging markets, and related commodities and foreign currencies.
Since Prime Minister Abe took office in November of 2012, the Japanese stock market has accelerated to the highest levels since 2007, producing one of the best absolute global market returns. New fiscal and monetary policies provided stimulus to the economy and depreciated the Yen to the benefit of Japanese exporters. Economic data improved consistently throughout the year, as evidenced by the major improvement in gross domestic product during the second calendar quarter. After fifteen years of deflation, consumer prices began to stabilize and then indicate signs of moderate inflation. By mid-year elections, Prime Minister Abe’s party, the LDP, effectively took control of the Diet, giving it control of both the Upper and Lower Parliaments. By October, production growth hit a 46-month high, signaling that Japan’s economy had improved markedly since the beginning of the year. Companies’ earnings reflected the improvement in economic conditions and the weakened yen helped increase their competitiveness and sales overseas.
China, the world’s second largest economy, continued to show signs of slower economic growth. A new leadership was installed, which moderated market expectations with a new economic plan that is more domestically-focused than the historic manufacturing, exporting, and polluting China. Official guidance is that China will no longer grow at the historically torrid pace of 10%, but that a more moderate 7% is acceptable. Industrial overcapacity, environmental issues, a migration to the cities, and corruption were the result of the boom
years. As such, the government looked inward to its domestic needs to get its house in order before resuming its historical growth pattern. These policy initiatives included the elimination of government corruption, addressing environmental concerns, and building out proper infrastructure.
Despite the concerns of a collapsing currency and economy, European markets were resilient and strong. In fact, the broader European markets this year behaved very much like 2012, when they lagged the U.S. markets in the first-half of the year only to have a stronger finish at the end. At its May meeting, the European Central Bank (“ECB”) cut its key rate to 0.50%, the first reduction since July of 2012. As meltdown scenarios became less likely and tail risks faded, sovereign borrowing costs remained subdued and companies repaired their balance sheets. During the third quarter, European markets performed strongly, as the broader economy exhibited “very green shoots”, according to the ECB, and pulled out from a recession to initial stages of a recovery. The Eurozone Purchasing Manager (PMI) Survey also moved from contraction to expansion for the first time in over two years during the third quarter. Across Europe, economic confidence moved to multi-year highs, and was given a further boost as ECB President Mario Draghi stated that the bank was willing to enact another long-term refinancing operation (LTRO), if needed, to assure bank portfolioing costs remained low. In November, the ECB cut its policy rate by 0.25%, to an all-time low of 0.25%, as inflation fell below 1.0%.
The U.S. economy and government also had its share of economic and political issues that weighed on global markets and investor sentiment. The year started with concerns over the impending “fiscal cliff”, then moved towards talks regarding the U.S. Federal Reserve’s decision to taper its asset purchase program in early summer (which negatively impacted emerging markets harshly), and then, the U.S. government shutdown in October.
On a regional basis, the S&P Europe Small Cap Growth Index rose 35.2% on a gross return basis, while the S&P Asia Pacific Ex-Japan Small Cap Growth Index was relatively flat, gaining only 0.9%. Japanese small caps gained 23.6% as measured by the S&P Japan Small Cap Growth Index, on a U.S. dollar gross return basis during the reporting period.
The U.S. dollar had mixed results against most major currencies over this reporting period. Currencies that appreciated against the U.S. dollar included British sterling, up 1.9%, and the Euro, up 4.2%. Currencies which depreciated against the U.S. dollar included the Japanese Yen, down 21.4%, and the Canadian dollar, down 7.1%. The West Texas Intermediate (WTI) oil price increased 7.2% over this period, finishing at $98.42 per barrel. Oil spiked as high as $110.53 in September.
Positive performance, relative to the benchmark, came from strong stock selection in Consumer Discretionary, Materials, and Industrials. From a regional perspective, the Portfolio benefited from a mix of strong stock selection and weighting in Canada, Italy, Hong Kong, and South Korea. The Portfolio’s non-exposure to Australia had the most positive impact on the Portfolio’s relative performance, as Australia had a negative return during this reporting period. While Japan had an explosive year, the Portfolio started the year underweight in the country. However, excellent stock selection in Japan produced returns, up 28.8%, greater than the 23.6% return of the Japan small cap benchmark.(1)
Several individual stocks contributed significantly to the Portfolio’s performance. Yoox SpA, an Italian-based global Internet retailing partner for leading fashion and design brands, successfully manages
| 30 | (continued) |
| Ohio National Fund, Inc. | International Small-Mid Company Portfolio (Continued) |
the online sites for many luxury brands, including Brioni, Balenciaga, Stella McCartney, and Armani. ASOS PLC, a UK online fashion retailer selling branded and own-label products, targets 16-25 year olds in the United Kingdom and internationally. The company recently launched a retail website in China. China Everbright International Ltd., a Chinese environmental, waste management, and energy company has benefited from winning a number of contracts with local Chinese governments in their efforts to ease pollution in waste water and solid waste treatment stemming from urbanization and increased consumption. Azimut Holding SpA is an Italian investment management services company which has exceeded its 2013 goals set at the beginning of the year for net inflows of 1.5 billion Euro.(1)
The Portfolio’s relative performance was weakened by stock in the Health Care, Energy, and Financials sectors. Poor stock selection in Norway, principally energy-related, had the largest negative country returns for the Portfolio. Weaker stock investments were in Mexico, Thailand, and Sweden. Despite absolute positive returns in these countries, stocks underperformed in these countries versus the benchmark, largely due to underweighting.(1)
Stocks that held back relative performance included Mexichem SAB de CV, down 25.1%, a Mexican producer of petrochemical products including PVC products. The company had difficulty and delays integrating its most recent and largest ever acquisition of Wavin NV, a Dutch-listed PVC manufacturer. Petroleum Geo-Services ASA, a Norwegian oil service company providing seismic studies for its clients, declined heavily this year on permitting and project delays. The stock price declined all year long on increasing concerns that energy producers may cut exploration spending as energy prices stagnated. City Developments Ltd. is Singapore’s second-largest commercial and investment property developer. The government imposed new rules governing how financial institutions make property loans to home buyers in an effort to curb property price increases. Consequently, the residential segment of the Singapore property market has seen an increase in units available, creating an oversupply situation. The company said developers were beginning to cut prices and take lower profit margins to sell the properties.(1)
Strong relative performance was supported by the appreciation of British sterling, together with a relative overweight in the United Kingdom. The Portfolio’s performance was slightly dented by its relative average underweight in Japan during the period, along with a depreciation of the Yen. As the Portfolio does not typically hedge its currency positions, it stands to benefit or suffer from corresponding currency fluctuations.(1)
| (1) | The Portfolio’s composition is subject to change. Holdings and weightings are as of December 31, 2013. |
Change in Value of $10,000 Investment
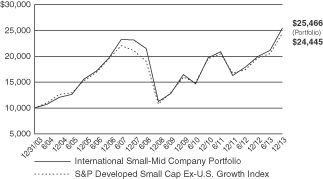
Hypothetical illustration based on past performance. Future performance will vary. The Portfolios returns reflect reinvested dividends. The Portfolios holdings may differ significantly from the securities in the index. The index is unmanaged and therefore does not reflect the cost of portfolio management and accounting.
The S&P Developed Small Cap Ex-U.S. Growth Index is a subset of the S&P Global Broad Market Index (BMI), a broad index including all publicly listed equities with float-adjusted market values of US$ 100 million or more and annual dollar value traded of at least US$ 50 million in all included countries. The Developed Small Cap component of the BMI includes the equities in the bottom 15% of the market capitalization within each “developed” local market. Ex-U.S. denotes the use of all developed markets excluding the United States. The “Growth” subset includes those companies in each local market that exhibit the characteristics of growth. The index presented includes the effects of reinvested dividends.
| 31 | (continued) |
| Ohio National Fund, Inc. | International Small-Mid Company Portfolio (Continued) |
Portfolio Composition as of December 31, 2013 (1)
| % of Net Assets | ||||
Common Stocks (3) | 91.7 | |||
Exchange Traded Funds Money Market Funds | 1.3 | |||
Less Net Liabilities | 7.0 | |||
|
| |||
| 100.0 | ||||
|
|
Top 10 Portfolio Holdings as of December 31,
2013 (1) (2)
| % of Net Assets | ||||
1. Yoox SpA | 2.3 | |||
2. China Everbright International Ltd. | 2.2 | |||
3. Ashtead Group PLC | 2.2 | |||
4. Rightmove PLC | 2.1 | |||
5. ASOS PLC | 2.0 | |||
6. Wirecard AG | 2.0 | |||
7. Publicis Groupe SA | 1.9 | |||
8. Azimut Holding SpA | 1.8 | |||
9. Copa Holdings SA | 1.7 | |||
10. InterContinental Hotels Group PLC | 1.7 |
| (1) | Composition of Portfolio subject to change. |
| (2) | Short-term investments have been excluded from the list of Top 10 Portfolio Holdings. |
| (3) | Top 10 Country Weightings: |
| % of Net Assets | ||||
United Kingdom | 25.1 | |||
Japan | 17.6 | |||
France | 8.2 | |||
Germany | 6.0 | |||
Hong Kong | 5.6 | |||
Italy | 4.7 | |||
United States | 3.6 | |||
Switzerland | 3.3 | |||
Singapore | 2.3 | |||
Panama | 1.7 |
Sector Classifications:
| % of Net Assets | ||||
Consumer Discretionary | 30.0 | |||
Industrials | 24.8 | |||
Financials | 10.2 | |||
Information Technology | 8.4 | |||
Health Care | 8.1 | |||
Energy | 5.4 | |||
Materials | 4.3 | |||
Consumer Staples | 0.5 | |||
|
| |||
| 91.7 | ||||
|
|
| 32 |
| Ohio National Fund, Inc. | International Small-Mid Company Portfolio |
Schedule of Investments | December 31, 2013 |
| Common Stocks – 91.7% | Shares | Value | ||||||
United Kingdom – 25.1% | ||||||||
Aberdeen Asset Management PLC | (b) | 105,374 | $ 876,254 | |||||
AMEC PLC | (b) | 20,951 | 378,266 | |||||
Ashtead Group PLC | (b) | 131,834 | 1,663,051 | |||||
ASOS PLC | (a)(b) | 15,443 | 1,573,458 | |||||
Babcock International Group PLC | (b) | 22,000 | 494,341 | |||||
Blinkx PLC | (a)(b) | 113,950 | 387,577 | |||||
Burberry Group PLC | (b) | 37,629 | 948,074 | |||||
Countrywide PLC | (c) | 67,000 | 660,144 | |||||
Croda International PLC | (b) | 22,054 | 898,986 | |||||
Delphi Automotive PLC | 11,355 | 682,776 | ||||||
Essentra PLC | (b) | 77,000 | 1,096,889 | |||||
Globo PLC | (a)(c) | 208,000 | 205,801 | |||||
Howden Joinery Group PLC | (b) | 137,965 | 789,399 | |||||
InterContinental Hotels Group PLC | (b) | 40,245 | 1,342,427 | |||||
John Wood Group PLC | (b) | 88,702 | 1,011,206 | |||||
Jupiter Fund Management PLC | (b) | 165,000 | 1,053,707 | |||||
Rightmove PLC | (b) | 35,434 | 1,609,219 | |||||
Schroders PLC | (b) | 20,000 | 862,585 | |||||
Soco International PLC | (b) | 139,373 | 912,531 | |||||
Subsea 7 SA | (b) | 23,000 | 440,930 | |||||
Telecity Group PLC | (b) | 54,238 | 652,471 | |||||
Travis Perkins PLC | (b) | 17,000 | 528,088 | |||||
Vectura Group PLC | (a)(c) | 108,000 | 250,380 | |||||
| ||||||||
| 19,318,560 | ||||||||
| ||||||||
Japan – 17.6% | ||||||||
Aisin Seiki Co. Ltd. | (b) | 17,400 | 707,416 | |||||
Daifuku Co. Ltd. | (b) | 75,000 | 960,021 | |||||
Don Quijote Holdings Co. Ltd. | (b) | 12,900 | 781,999 | |||||
Ebara Corp. | (b) | 84,000 | 540,744 | |||||
Fuji Heavy Industries Ltd. | (b) | 23,000 | 660,996 | |||||
JGC Corp. | (b) | 18,000 | 706,389 | |||||
Kakaku.com, Inc. | (b) | 53,000 | 931,020 | |||||
Livesense, Inc. | (a)(b) | 17,200 | 421,773 | |||||
LIXIL Group Corp. | (b) | 33,000 | 905,927 | |||||
MISUMI Group, Inc. | (b) | 21,000 | 660,251 | |||||
NGK Spark Plug Co. Ltd. | (b) | 21,000 | 497,713 | |||||
Nihon Kohden Corp. | (b) | 19,000 | 663,112 | |||||
NSK Ltd. | (b) | 59,000 | 735,278 | |||||
Park24 Co. Ltd. | (b) | 34,800 | 656,289 | |||||
Shionogi & Co. Ltd. | (b) | 46,400 | 1,007,328 | |||||
Ship Healthcare Holdings, Inc. | (b) | 28,000 | 1,087,274 | |||||
United Arrows Ltd. | (b) | 16,800 | 628,656 | |||||
Yaskawa Electric Corp. | (b) | 62,000 | 982,427 | |||||
| ||||||||
| 13,534,613 | ||||||||
| ||||||||
France – 8.2% | ||||||||
Accor SA | (b) | 16,283 | 769,044 | |||||
Bureau Veritas SA | (b) | 31,748 | 926,874 | |||||
Criteo SA – ADR | (a) | 5,586 | 191,041 | |||||
Edenred | (b) | 15,965 | 534,547 | |||||
JCDecaux SA | (b) | 14,436 | 595,963 | |||||
Publicis Groupe SA | (b) | 15,834 | 1,450,794 | |||||
Teleperformance | (b) | 11,500 | 701,364 | |||||
Zodiac Aerospace | (b) | 6,662 | 1,180,573 | |||||
| ||||||||
| 6,350,200 | ||||||||
| ||||||||
Germany – 6.0% | ||||||||
GEA Group AG | (b) | 9,022 | 430,218 | |||||
Gerresheimer AG | (b) | 11,129 | 779,752 | |||||
HeidelbergCement AG | (b) | 8,249 | 626,389 | |||||
MorphoSys AG | (a)(b) | 4,800 | 370,059 | |||||
Rheinmetall AG | (b) | 6,300 | 388,675 | |||||
SAF-Holland SA | (a)(b) | 32,032 | 477,639 | |||||
Wirecard AG | (b) | 38,276 | 1,515,052 | |||||
| ||||||||
| 4,587,784 | ||||||||
| ||||||||
Hong Kong – 5.6% | ||||||||
Brilliance China Automotive Holdings Ltd. | (b) | 668,000 | 1,089,391 | |||||
China Everbright International Ltd. | (b) | 1,268,000 | 1,696,891 | |||||
| Common Stocks (Continued) | Shares | Value | ||||||
Hong Kong (continued) | ||||||||
Shun Tak Holdings Ltd. | (b) | 1,700,000 | $ 1,005,955 | |||||
Techtronic Industries Co. | (b) | 189,000 | 539,556 | |||||
| ||||||||
| 4,331,793 | ||||||||
| ||||||||
Italy – 4.7% | ||||||||
Azimut Holding SpA | (b) | 51,843 | 1,414,494 | |||||
Brembo SpA | (b) | 14,000 | 376,618 | |||||
Yoox SpA | (a)(b) | 39,900 | 1,788,989 | |||||
| ||||||||
| 3,580,101 | ||||||||
| ||||||||
United States – 3.6% | ||||||||
Catamaran Corp. | (a) | 7,800 | 370,344 | |||||
Invesco Ltd. | 22,533 | 820,201 | ||||||
Nexteer Automotive Group Ltd. | (a)(c) | 735,000 | 418,955 | |||||
Samsonite International SA | (b) | 370,000 | 1,123,723 | |||||
| ||||||||
| 2,733,223 | ||||||||
| ||||||||
Switzerland – 3.3% | ||||||||
Adecco SA | (b) | 12,424 | 986,300 | |||||
Cembra Money Bank AG | (a)(c) | 3,750 | 246,132 | |||||
GAM Holding AG | (b) | 32,000 | 623,053 | |||||
Partners Group Holding AG | (b) | 2,700 | 719,328 | |||||
| ||||||||
| 2,574,813 | ||||||||
| ||||||||
Singapore – 2.3% | ||||||||
City Developments Ltd. | (b) | 76,000 | 580,716 | |||||
Ezion Holdings Ltd. | (b) | 682,800 | 1,204,833 | |||||
| ||||||||
| 1,785,549 | ||||||||
| ||||||||
Panama – 1.7% | ||||||||
Copa Holdings SA | 8,400 | 1,344,924 | ||||||
| ||||||||
Bermuda – 1.6% | ||||||||
Signet Jewelers Ltd. | 16,000 | 1,259,200 | ||||||
| ||||||||
Canada – 1.6% | ||||||||
Dollarama, Inc. | 14,951 | 1,241,542 | ||||||
| ||||||||
Denmark – 1.6% | ||||||||
Pandora A/S | (b) | 7,700 | 418,548 | |||||
Rockwool International A/S | (b) | 4,400 | 779,180 | |||||
| ||||||||
| 1,197,728 | ||||||||
| �� |
| |||||||
Sweden – 1.3% | ||||||||
Getinge AB | (b) | 12,000 | 411,336 | |||||
Swedish Orphan Biovitrum AB | (a)(b) | 55,000 | 570,608 | |||||
| ||||||||
| 981,944 | ||||||||
| ||||||||
Israel – 1.0% | ||||||||
NICE Systems Ltd. – ADR | 19,600 | 802,816 | ||||||
| ||||||||
South Korea – 1.0% | ||||||||
Hotel Shilla Co. Ltd. | (b) | 11,960 | 753,873 | |||||
| ||||||||
Mexico – 0.9% | ||||||||
Grupo Aeroportuario del Sureste SAB de CV – ADR | 5,700 | 710,391 | ||||||
| ||||||||
Luxembourg – 0.9% | ||||||||
Eurofins Scientific SE | (b) | 2,587 | 700,198 | |||||
| ||||||||
Netherlands – 0.9% | ||||||||
Koninklijke DSM NV | (b) | 8,500 | 668,936 | |||||
| ||||||||
Ireland – 0.8% | ||||||||
Grafton Group PLC | (b) | 55,000 | 590,319 | |||||
| ||||||||
China – 0.7% | ||||||||
China ZhengTong Auto Services Holdings Ltd. | (a)(b) | 850,000 | 546,598 | |||||
| ||||||||
Cayman Islands – 0.5% | ||||||||
Fabrinet | (a) | 19,627 | 403,531 | |||||
| ||||||||
Brazil – 0.5% | ||||||||
Cia Brasileira de Distribuicao Grupo Pao de Acucar – ADR | 8,504 | 379,874 | ||||||
| ||||||||
| 33 | (continued) |
| Ohio National Fund, Inc. | International Small-Mid Company Portfolio (Continued) |
Schedule of Investments | December 31, 2013 |
| Common Stocks (Continued) | Shares | Value | ||||||
Norway – 0.3% | ||||||||
Fred Olsen Energy ASA | (b) | 5,636 | $ 229,980 | |||||
| ||||||||
Total Common Stocks (Cost $46,577,228) | $70,608,490 | |||||||
| ||||||||
| Exchange Traded Funds – 1.3% | Shares | Value | ||||||
iShares MSCI Japan ETF | 82,000 | $ 994,660 | ||||||
| ||||||||
Total Exchange Traded Funds (Cost $896,662) | $ 994,660 | |||||||
| ||||||||
| Money Market Funds – 7.0% | Shares | Value | ||||||
State Street Institutional Liquid Reserves Fund Institutional Class | 3,833,292 | $ 3,833,292 | ||||||
State Street Institutional U.S. Government Money Market Fund Institutional Class | 1,565,014 | 1,565,014 | ||||||
| ||||||||
Total Money Market Funds (Cost $5,398,306) | $ 5,398,306 | |||||||
| ||||||||
Total Investments – 100.0% (Cost $52,872,196) | (d) | $77,001,456 | ||||||
Liabilities in Excess of Other Assets – (0.0)% | (18,548) | |||||||
| ||||||||
Net Assets – 100.0% | $76,982,908 | |||||||
| ||||||||
Percentages are stated as a percent of net assets.
Abbreviations:
ADR: American Depositary Receipts
Footnotes:
| (a) | Non-income producing security. |
| (b) | Security traded on a foreign exchange has been valued at an estimate of fair value that is different than the local market close price. These fair value estimates are determined by an independent fair valuation service that has been approved by the Board. These securities represent $60,620,438, or 78.7% of the Portfolio’s net assets. |
| (c) | As discussed in Note 2 of the Notes to Financial Statements, not all investments that are traded on a foreign exchange are valued at an estimate that is different from the local close price. In some instances, the independent fair valuation service uses a stock’s local close price because the service’s measure of predictability related to their valuation model of a stock is below a chosen threshold. These securities represent $1,781,412, or 2.3% of the Portfolio’s net assets. |
Other Portfolio securities are not subjected to fair valuation procedures because they are traded on domestic or foreign exchanges that have close times that are consistent with the U.S. market close, normally 4:00 pm Eastern Time.
| (d) | Represents cost for financial reporting purposes, which may differ from cost basis for federal income tax purposes. See also Note 7 of the Notes to Financial Statements. |
The accompanying notes are an integral part of these financial statements.
| 34 |
| Ohio National Fund, Inc. | Aggressive Growth Portfolio |
Objective/Strategy
The Aggressive Growth Portfolio seeks long-term capital growth by investing primarily in domestic and foreign equity securities selected for growth potential.
Performance as of December 31, 2013
Average Annual Total Returns: | ||||
One year | 31.44% | |||
Five years | 19.13% | |||
Ten years | 8.62% |
Past performance does not guarantee future results. The performance data quoted represents past performance and current returns may be lower or higher. Total return figures include change in share price and reinvestment of dividends and capital gains. The investment return and principal value will fluctuate so that an investor’s shares, when redeemed, may be worth more or less than the original cost. To obtain performance information up to the most recent month end, call toll-free 1-877-781-6392.
The Portfolio is not open to direct retail investment. Beneficial interest in shares is obtained solely by purchase of variable life insurance policies and variable annuity contracts. Actual performance results for variable annuity and variable universal life contracts will be lower due to contract charges. Consult your contract for applicable charges.
Comments
For the year ended December 31, 2013, the Aggressive Growth Portfolio returned 31.44% versus 32.39% for the current benchmark, the S&P 500 Index.
Equities enjoyed strong gains during the year, as markets received clear indicators that the U.S. economy turned the corner from the financial crisis and Europe finally showed signs of a recovery. Stock correlations fell during the period, as fears of a showdown over the U.S. budget and debt ceiling subsided.
Loose monetary policy also provided a supportive backdrop for equities during the year, though fears about how, and when, the Federal Reserve would taper its quantitative easing program caused bouts of volatility. However, stocks climbed at the end of December when the Federal Reserve’s announced a more gradual pace of tapering than expected.
In terms of sector weightings, the Portfolio’s relative performance was helped by an overweight in the Consumer Discretionary sector and an underweight in the Energy sector. Meanwhile, an overweight in the Information Technology sector and underweight in the Industrials sector detracted from relative performance.(1)
Relative performance was impacted by weak stock selection in the Industrials and Information Technology sectors. In both sectors, some of the largest detractors from performance were sold during the year as part of the transition to a new portfolio manager. Apple, Inc. was our largest detractor in the Information Technology sector. While Apple, Inc. has dominated the high-end smartphone market for some time now, we feel growth in that market is slowing. Meanwhile, despite the new smartphone launches, we think Apple, Inc. still lacks a phone with a low enough price point to attract most first-time smartphone users in emerging markets. We also think innovation has slowed for the company, making Apple, Inc.’s risk/reward opportunity less attractive than it was earlier in the company’s product cycle. We sold our position during the year to pursue investment opportunities we believed had more long-term growth potential.(1)
Teradata Corp. was another Information Technology company that negatively impacted performance, though we continue to have conviction in the company. A weak information technology capital spending environment has been a headwind for Teradata Corp. this year. Concern about competition from other analytics companies has also weighed on the stock. However, we believe perceived secular threats from competition are overstated. In our view, Teradata Corp. has a competitive advantage in its ability to mine deeper analytical insights from data than other analytics companies, and we believe the company is well positioned to benefit from ongoing trends associated with the need for more insight from the vast amounts of data being created.(1)
Within the Industrials sector, FANUC Corp. was the largest detractor from performance. The company makes industrial automation equipment. We exited the position because we felt the company’s future was too dependent on demand from China’s manufacturing sector.(1)
Other detractors from Portfolio performance included Turquoise Hill Resources Ltd. and DaVita HealthCare Partners, Inc. Turquoise Hill Resources Ltd. owns a large copper mine in Mongolia. We sold the position to pursue other companies that we believed had better risk/reward profiles. DaVita HealthCare Partners, Inc. provides a range of dialysis treatments and support services for patients living with chronic kidney failure. We believe DaVita HealthCare Partners, Inc. is in a strong competitive position as one of the two largest dialysis providers, but we sold the position because we felt there were better growth opportunities within the sector.(1)
Portfolio stock selection was strongest in the Health Care and Consumer Discretionary sectors during the period. Within the Health Care sector, we own several biotech companies developing innovative therapies that substantially improve patient outcomes for a number of highly unmet medical needs. Many of these companies enjoyed substantial gains this year, as the market came to realize the potential of these drugs. Celgene Corp., for example, was up 114% for the year and was the top contributor to the entire Portfolio’s performance. During the year, a global study pointed to the benefits of using Celgene Corp.’s drug Revlimid as a first-line treatment for multiple myeloma. Currently, the drug is only approved as a second-line treatment for the disease, and using Revlimid earlier in the treatment cycle could meaningfully expand its addressable market, especially outside the United States. Other drugs in Celgene Corp.’s pipeline also offer promising potential. We think the company is in the early stages of a major new product cycle, with other potential meaningful contributors, including Abraxane for pancreatic cancer, Pomalyst for refractory multiple myeloma, and Apremilast, an oral drug to treat psoriatic arthritis and psoriasis. The stock has risen as management has explained to the market that multi-year growth will be driven by four different drug franchises, and that Celgene Corp. is much more than a one-product company.(1)
Within the Consumer Discretionary sector, the top contributor to performance was Twenty-First Century Fox, Inc. The stock rose after the company announced multi-year earnings growth guidance that was well above market expectations. We think Twenty-First Century Fox, Inc. has one of the broadest global content libraries of any studio, and much of its unique programming resonates strongly with its customer base. We also think value is poised to increase as content is spread internationally and as new digital platforms offer expanded viewing opportunities.(1)
MGM Resorts International was another large contributor within the Consumer Discretionary sector. The company is using much of its free cash flow to pay down debt, and, as that happens, it transfers
| 35 | (continued) |
| Ohio National Fund, Inc. | Aggressive Growth Portfolio (Continued) |
| 36 |
the value of the company to equity holders. Going forward, we think that value could be significant. The 2014 convention calendar is improving and should drive higher rates for many of MGM Resorts International’s Las Vegas properties, resulting in meaningful revenue growth. Meanwhile, the company has a property in Macau that should benefit from strong growth in gaming in that region.(1)
Other contributors to Portfolio performance included Google, Inc. and CoStar Group, Inc. Google, Inc., the internet search engine leader, is benefiting from strong growth in mobile search (particularly in emerging markets) through its Android software for mobile devices. We think Android’s rapidly growing installed base will provide the company significant control over its mobile search and display advertising destiny. We also believe the company’s better-than-expected mobile and tablet search business has more than neutralized its slowing desktop computer search business in developed markets, and the company should offset market share losses in e-commerce by launching a new paid listing shopping search engine. We like the potential of the recurring revenue streams associated with CoStar Group, Inc.’s subscription-based commercial real estate database. In our view, building a network among real estate brokers across the country is a wide competitive moat business that would be difficult for any competitor to replicate.(1)
We are optimistic that the global economy will continue to improve in 2014. We believe the housing market will remain strong, even if rates rise slowly, and we also expect unemployment levels to tick down during the year. We also believe earnings can grow for many companies as macroeconomic headwinds, such as austerity programs in Europe and the threat of another round of sequester cuts, have abated.
While we believe the economy will strengthen, we expect volatility for equities as the market adjusts to a scaling back of the easy
monetary policies that have played a large role in boosting equities over most of the last five years. We will generally look past short-term volatility and use those periods to add to competitively advantaged companies we believe can grow in excess of the market over longer time horizons.
| (1) | The Portfolio’s composition is subject to change. Holdings and weightings are as of December 31, 2013. |
Change in Value of $10,000 Investment

Hypothetical illustration based on past performance. Future performance will vary. The Portfolio’s returns reflect reinvested dividends. The Portfolio’s holdings may differ significantly from the securities in the index. The index is unmanaged and therefore does not reflect the cost of portfolio management and accounting.
The S&P 500 Index is a capitalization-weighted index designed to measure performance of the broad domestic economy through changes in the aggregate market value of 500 stocks representing all major industries. The index presented herein includes the effects of reinvested dividends.
Portfolio Composition as of December 31, 2013 (1)
| % of Net Assets | ||||
Common Stocks (3) | 98.9 | |||
Money Market Funds | 1.1 | |||
|
| |||
| 100.0 | ||||
|
|
Top 10 Portfolio Holdings as of December 31, 2013 (1) (2)
| % of Net Assets | ||||
1. Google, Inc. Class A | 6.3 | |||
2. Celgene Corp. | 5.6 | |||
3. Twenty-First Century Fox, Inc. Class A | 4.9 | |||
4. Canadian Pacific Railway Ltd. | 3.5 | |||
5. Zoetis, Inc. | 3.2 | |||
6. Express Scripts Holding Co. | 3.2 | |||
7. eBay, Inc. | 3.1 | |||
8. Monsanto Co. | 3.0 | |||
9. L Brands, Inc. | 3.0 | |||
10. Valeant Pharmaceuticals International, Inc. | 3.0 |
| (1) | Composition of Portfolio subject to change. |
| (2) | Short-term investments have been excluded from the list of Top 10 Portfolio Holdings. |
| (3) | Sectors: |
| % of Net Assets | ||||
Consumer Discretionary | 26.8 | |||
Information Technology | 24.5 | |||
Health Care | 23.5 | |||
Industrials | 7.4 | |||
Financials | 6.7 | |||
Telecommunication Services | 4.5 | |||
Materials | 3.0 | |||
Consumer Staples | 2.5 | |||
|
| |||
| 98.9 | ||||
|
|
| Ohio National Fund, Inc. | Aggressive Growth Portfolio |
Schedule of Investments | December 31, 2013 |
| Common Stocks – 98.9% | Shares | Value | ||||||
CONSUMER DISCRETIONARY – 26.8% | ||||||||
Delphi Automotive PLC (Auto Components) | 17,565 | $ 1,056,183 | ||||||
MGM Resorts International (Hotels, Restaurants & Leisure) | (a) | 48,113 | 1,131,618 | |||||
Panera Bread Co. Class A (Hotels, Restaurants & Leisure) | (a) | 2,875 | 507,984 | |||||
Starbucks Corp. (Hotels, Restaurants & Leisure) | 3,944 | 309,170 | ||||||
Amazon.com, Inc. (Internet & Catalog Retail) | (a) | 2,396 | 955,501 | |||||
priceline.com, Inc. (Internet & Catalog Retail) | (a) | 817 | 949,681 | |||||
zulily, Inc. Class A (Internet & Catalog Retail) | (a) | 2,844 | 117,827 | |||||
Twenty-First Century Fox, Inc. Class A (Media) | 54,602 | 1,920,898 | ||||||
L Brands, Inc. (Specialty Retail) | 18,819 | 1,163,955 | ||||||
Lowe’s Cos., Inc. (Specialty Retail) | 15,911 | 788,390 | ||||||
TJX Cos., Inc. (Specialty Retail) | 16,497 | 1,051,354 | ||||||
Prada SpA (Textiles, Apparel & Luxury Goods) | (b) | 67,000 | 598,495 | |||||
| ||||||||
| 10,551,056 | ||||||||
| ||||||||
CONSUMER STAPLES – 2.5% | ||||||||
Monster Beverage Corp. (Beverages) | (a) | 9,757 | 661,232 | |||||
Pernod Ricard SA (Beverages) | (b) | 2,898 | 330,174 | |||||
| ||||||||
| 991,406 | ||||||||
| ||||||||
FINANCIALS – 6.7% | ||||||||
PacWest Bancorp (Commercial Banks) | 21,066 | 889,406 | ||||||
U.S. Bancorp (Commercial Banks) | 28,399 | 1,147,320 | ||||||
AIA Group Ltd. (Insurance) | (b) | 118,000 | 593,951 | |||||
| ||||||||
| 2,630,677 | ||||||||
| ||||||||
HEALTH CARE – 23.5% | ||||||||
Celgene Corp. (Biotechnology) | (a) | 12,980 | 2,193,101 | |||||
Gilead Sciences, Inc. (Biotechnology) | (a) | 13,429 | 1,009,189 | |||||
Medivation, Inc. (Biotechnology) | (a) | 13,389 | 854,486 | |||||
Express Scripts Holding Co. (Health Care Providers & Svs.) | (a) | 17,845 | 1,253,433 | |||||
athenahealth, Inc. (Health Care Technology) | (a) | 6,266 | 842,777 | |||||
Endo Health Solutions, Inc. (Pharmaceuticals) | (a) | 10,058 | 678,513 | |||||
Valeant Pharmaceuticals International, Inc. (Pharmaceuticals) | (a) | 9,914 | 1,163,904 | |||||
Zoetis, Inc. (Pharmaceuticals) | 38,476 | 1,257,780 | ||||||
| ||||||||
| 9,253,183 | ||||||||
| ||||||||
INDUSTRIALS – 7.4% | ||||||||
Precision Castparts Corp. (Aerospace & Defense) | 4,062 | 1,093,897 | ||||||
Cummins, Inc. (Machinery) | 3,225 | 454,628 | ||||||
| Common Stocks (Continued) | Shares | Value | ||||||
INDUSTRIALS (continued) | ||||||||
Canadian Pacific Railway Ltd. (Road & Rail) | 9,212 | $ 1,393,960 | ||||||
| ||||||||
| 2,942,485 | ||||||||
| ||||||||
INFORMATION TECHNOLOGY – 24.5% | ||||||||
Amphenol Corp. Class A (Electronic Equip., Instr. & Comp.) | 4,853 | 432,790 | ||||||
TE Connectivity Ltd. (Electronic Equip., Instr. & Comp.) | 16,417 | 904,741 | ||||||
Trimble Navigation Ltd. (Electronic Equip., Instr. & Comp.) | (a) | 31,568 | 1,095,410 | |||||
CoStar Group, Inc. (Internet Software & Svs.) | (a) | 4,421 | 816,028 | |||||
eBay, Inc. (Internet Software & Svs.) | (a) | 22,025 | 1,208,952 | |||||
Google, Inc. Class A (Internet Software & Svs.) | (a) | 2,228 | 2,496,942 | |||||
LinkedIn Corp. (Internet Software & Svs.) | (a) | 1,324 | 287,083 | |||||
Youku Tudou, Inc. – ADR (Internet Software & Svs.) | (a) | 7,056 | 213,797 | |||||
MasterCard, Inc. Class A (IT Svs.) | 1,193 | 996,704 | ||||||
Teradata Corp. (IT Svs.) | (a) | 13,988 | 636,314 | |||||
ARM Holdings PLC – ADR (Semiconductors & Equip.) | 7,692 | 421,060 | ||||||
Salesforce.com, Inc. (Software) | (a) | 2,631 | 145,205 | |||||
| ||||||||
| 9,655,026 | ||||||||
| ||||||||
MATERIALS – 3.0% | ||||||||
Monsanto Co. (Chemicals) | 10,141 | 1,181,933 | ||||||
| ||||||||
TELECOMMUNICATION SERVICES – 4.5% | ||||||||
Iliad SA (Diversified Telecom. Svs.) | (b) | 2,310 | 473,300 | |||||
Crown Castle International Corp. (Wireless Telecom. Svs.) | (a) | 9,687 | 711,316 | |||||
T-Mobile U.S., Inc. (Wireless Telecom. Svs.) | 17,717 | 596,000 | ||||||
| ||||||||
| 1,780,616 | ||||||||
| ||||||||
Total Common Stocks (Cost $26,832,756) | $38,986,382 | |||||||
| ||||||||
| Money Market Funds – 2.0% | Shares | Value | ||||||
Fidelity Institutional Money Market Funds Money Market Portfolio – Class I | 794,000 | $794,000 | ||||||
| ||||||||
Total Money Market Funds (Cost $794,000) | $794,000 | |||||||
| ||||||||
Total Investments – 100.9% (Cost $27,626,756) | (c) | $39,780,382 | ||||||
Liabilities in Excess of Other Assets – (0.9)% | (377,385) | |||||||
| ||||||||
Net Assets – 100.0% | $39,402,997 | |||||||
| ||||||||
Percentages are stated as a percent of net assets.
Abbreviations:
ADR: American Depositary Receipts
Footnotes:
| (a) | Non-income producing security. |
| (b) | Security traded on a foreign exchange has been valued at an estimate of fair value that is different than the local market close price. These fair value estimates are determined by an independent fair valuation service that has been approved by the Board. These securities represent $1,995,920, or 5.1% of the Portfolio’s net assets. |
Other Portfolio securities are not subjected to fair value procedures because they are traded on domestic or foreign exchanges that have close times that are consistent with the U.S. market close, normally 4:00 pm Eastern Time.
| (c) | Represents cost for financial reporting purposes, which may differ from cost basis for federal income tax purposes. See also Note 7 of the Notes to Financial Statements. |
The accompanying notes are an integral part of these financial statements.
| 37 |
| Ohio National Fund, Inc. | Small Cap Growth Portfolio |
Objective/Strategy
The Small Cap Growth Portfolio seeks long-term capital appreciation by investing at least 80% of its net assets in stocks of small companies.
Performance as of December 31, 2013
Average Annual Total Returns: | ||||
One year | 45.29% | |||
Five years | 28.12% | |||
Ten years | 11.93% |
Past performance does not guarantee future results. The performance data quoted represents past performance and current returns may be lower or higher. Total return figures include change in share price and reinvestment of dividends and capital gains. The investment return and principal value will fluctuate so that an investor’s shares, when redeemed, may be worth more or less than the original cost. To obtain performance information up to the most recent month end, call toll-free 1-877-781-6392.
The Portfolio is not open to direct retail investment. Beneficial interest in shares is obtained solely by purchase of variable life insurance policies and variable annuity contracts. Actual performance results for variable annuity and variable universal life contracts will be lower due to contract charges. Consult your contract for applicable charges.
Comments
For the year ended December 31, 2013, the Small Cap Growth Portfolio returned 45.29% versus 43.30% for the current benchmark, the Russell 2000 Growth Index.
Small cap equities enjoyed significant gains during the year, as markets received indicators that the U.S. economy was picking up and Europe was also improving. Easy monetary policy was also a supportive backdrop for equities, though concerns the Federal Reserve would taper its quantitative easing program caused brief periods of volatility at different points during the year. However, markets responded favorably in late December when the Federal Reserve announced a more gradual pace of tapering than many expected. Stocks with high valuations, but low or negative earnings growth and low returns on invested capital, enjoyed the most substantial rise for much of the year. Momentum around those stocks, however, began to slow in the fourth quarter.
As part of our investment process, we focus on identifying companies with higher-quality business models and predictable, growing revenue streams. These companies often serve large unaddressed markets, or have sustainable competitive advantages, such as high barriers to entry in their respective industry, or a differentiated product or service that gives them pricing power that should help the company grow in a variety of market and economic environments. Given our emphasis on predictability and stability, we expect the Portfolio to outperform the benchmark index in weak or uncertain economic environments. During sharp market rallies like the one experienced this year, we expect performance to be more in line, or even to trail, the benchmark. Given the sharp climb by the benchmark index, we were pleased to see the Portfolio beat its benchmark, even though it is not our most ideal environment for relative outperformance.
We were pleased to see that much of the Portfolio’s relative outperformance was driven by stock selection. Stock selection was particularly strong in the Information Technology sector. Many of the Information Technology companies owned by the Portfolio have predictable or recurring revenue streams from diverse end markets outside the Information Technology sector, and these companies were among our top-performing Information Technology stocks
during the year. SS&C Technologies Holdings, Inc., for example, provides a number of investment and financial software-enabled services to companies in the financial services industry. Most of its revenue comes from subscription services or software maintenance, which creates a steadier and recurring revenue source for the company. SS&C Technologies Holdings, Inc. has made some strategic acquisitions in recent years that have broadened its array of service offerings to financial firms. Last year, SS&C Technologies Holdings, Inc. acquired another company that provides back-office services to hedge funds, and we think SS&C Technologies Holdings, Inc. will have success in cross-selling the products of the company it acquired. The stock has been a top contributor to performance, as the market has come to appreciate the predictability of SS&C Technologies Holdings, Inc.’s business model and future growth prospects.(1)
Envestnet, Inc. was another top contributor from the Information Technology sector, and serves as an example of the diverse end markets many of the Portfolio’s Information Technology companies serve. Envestnet, Inc. provides a range of practice management and reporting solutions to financial advisors. Financial advisors depend on Envestnet, Inc.’s services to run their practices more efficiently. Since Envestnet, Inc.’s revenue is based on the asset bases of the advisors it serves, we think this creates a predictable revenue stream for the company.(1)
While stock selection in the Information Technology sector was a large driver of relative outperformance, a number of holdings outside the sector also played a large role in our outperformance. Wolverine WorldWide, Inc. was our top contributor outside the Information Technology sector. The company manufactures and markets a wide range of casual footwear and apparel products. We like the company for its ability to acquire and improve the management of brands, and then increase the sales of those brands through Wolverine WorldWide, Inc.’s strong global distribution network. The stock’s performance has been driven this year by the company’s acquisition of several new brands, including Sperry. Sperry went through a period of disinvestment prior to the acquisition, but Wolverine WorldWide, Inc. is now reviving the brand and opening proprietary Sperry stores.(1)
While generally pleased with overall performance this year, the stock selection in the Industrials sector detracted from relative performance. The Portfolio’s Industrials holdings returned 28.7%, but did not keep up with the benchmark. Polypore International, Inc. was the largest detractor within the sector. The company makes a separator that goes into a variety of batteries, including those used in electric and hybrid automobiles, consumer electronics and other devices. The company experienced lower demand for its products from the consumer electronics channel, where many companies went through an inventory destocking early in the year, and Polypore International, Inc. lost market share due to capacity that it had allocated to electric vehicles. One of the main hybrid vehicles using Polypore International, Inc.’s battery separators also destocked inventory as the company prepared to move its production plant. We view the drop in demand as temporary in nature, and continue to have conviction in the company.(1)
Outside the Industrials sector, we also had a few holdings that were large detractors from performance during the year. Liveperson, Inc. was the Portfolio’s largest detractor. The company helps retailers manage their online interactions with customers. We sold the position during the year due to concerns about the company’s strategy to move to services beyond being a customer service center for its retailers.(1)
| 38 | (continued) |
| Ohio National Fund, Inc. | Small Cap Growth Portfolio (Continued) |
Intrepid Potash, Inc. was the Portfolio’s next largest detractor. The stock was down after a breakup of a marketing consortium of potash suppliers in Belarus and Russia created fear that pricing dynamics for the industry could break down, affecting all potash companies. We sold the position to pursue other companies we felt offered greater risk/reward opportunities.(1)
Broadridge Financial Solutions, Inc. contributed to Portfolio performance. Broadridge Financial Solutions, Inc. provides investor communications and technology-driven solutions to banks, broker-dealers, mutual funds and corporations globally. We think the company’s wide network of broker dealers and banks is a competitive advantage that makes the company the preferable choice for distributing proxy information.(1)
HEICO Corp. is a value-added supplier of aftermarket aerospace components. The company benefits from having FAA approval to manufacture and repair highly engineered, mission-critical parts that extend over the entire aircraft. HEICO Corp. operates in very large markets with a small market share that has enabled the company to deliver strong results. Given the company’s strong balance sheet, market growth and market share opportunities, we believe the company is well positioned to deliver robust top and bottom line growth.(1)
Achillion Pharmaceuticals, Inc. was a detractor from Portfolio performance. We exited our position in the biotech company due to concerns about the company’s lead clinical compound, a protease inhibitor for hepatitis C treatment.(1)
Another detractor from Portfolio performance was Volcano Corp. Volcano Corp. has proprietary medical technology for the diagnosis and treatment of cardiovascular diseases. We think the company is well positioned because it helps to save costs in the system, often eliminating the need for retreatment of patients.(1)
After considerable gains for small-cap stocks this year, we think that valuations look stretched for a number of companies and that the prospect for future appreciation is generally more limited than last year. Multiples have expanded for many small-cap stocks, as earnings growth has not kept up with the rise in stock prices. Against a backdrop of more stretched valuations, we think companies will need to put up real earnings growth to experience gains in 2014. This was not the case for much of 2013, as companies with negative earnings outperformed those with positive earnings growth in the first three quarters of the year.
While finding attractively valued growth companies will likely be tougher next year, after the more than 40% rise in U.S. small-cap growth markets over the last 12 months, we think it favors our bottom-up, fundamental research process. Through our research process, we strive to identify those select companies that have strong competitive advantages and are serving large and growing addressable markets or are expanding market share in their existing marketplaces. These companies often have more predictable revenue streams, which should allow them to grow earnings regardless of the economic backdrop.
| (1) | The Portfolio’s composition is subject to change. Holdings and weightings are as of December 31, 2013. |
Change in Value of $10,000 Investment
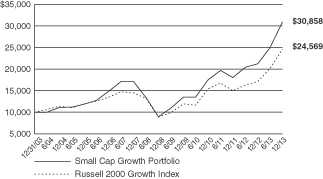
Hypothetical illustration based on past performance. Future performance will vary. The Portfolio’s returns reflect reinvested dividends. The Portfolio’s holdings may differ significantly from the securities in the index. The index is unmanaged and therefore does not reflect the cost of portfolio management and accounting.
The Russell 2000 Growth Index measures the performance of the small-cap growth segment of the U.S. equity universe. It includes the Russell 2000 Index companies with higher price-to-value ratios and higher forcasted growth values. The Russell 2000 Index includes the 2000 firms from the Russell 3000 Index with the smallest market capitalizations. The Russell 3000 Index represents 98% of the investable U.S. equity markets. The index presented herein includes the effects of reinvested dividends.
| 39 | (continued) |
| Ohio National Fund, Inc. | Small Cap Growth Portfolio (Continued) |
Portfolio Composition as of December 31, 2013 (1)
| % of Net Assets | ||||
Common Stocks (3) | 92.8 | |||
Exchange Traded Funds | 1.9 | |||
Money Market Funds | 5.3 | |||
|
| |||
| 100.0 | ||||
|
|
Top 10 Portfolio Holdings as of December 31, 2013 (1) (2)
| % of Net Assets | ||||
1. SS&C Technologies Holdings, Inc. | 3.0 | |||
2. Wolverine World Wide, Inc. | 2.1 | |||
3. HEICO Corp. Class A | 2.1 | |||
4. Blackbaud, Inc. | 2.0 | |||
5. Carter’s, Inc. | 1.9 | |||
6. iShares Russell 2000 Growth ETF | 1.9 | |||
7. Kennametal, Inc. | 1.8 | |||
8. Broadridge Financial Solutions, Inc. | 1.8 | |||
9. Solera Holdings, Inc. | 1.8 | |||
10. Wabtec Corp. | 1.7 |
| (1) | Composition of Portfolio subject to change. |
| (2) | Short-term investments have been excluded from the list of Top 10 Portfolio Holdings. |
| (3) | Sectors: |
| % of Net Assets | ||||
Information Technology | 28.3 | |||
Industrials | 20.7 | |||
Health Care | 15.4 | |||
Consumer Discretionary | 13.3 | |||
| Financials | 7.6 | |||
Energy | 5.0 | |||
Consumer Staples | 1.2 | |||
Materials | 1.0 | |||
Telecommunication Services | 0.3 | |||
|
| |||
| 92.8 | ||||
|
|
| 40 |
| Ohio National Fund, Inc. | Small Cap Growth Portfolio |
Schedule of Investments | December 31, 2013 |
| Common Stocks – 92.8% | Shares | Value | ||||||
CONSUMER DISCRETIONARY – 13.3% | ||||||||
Ascent Capital Group, Inc. Class A (Diversified Consumer Svs.) | (a) | 6,698 | $ 573,081 | |||||
AFC Enterprises, Inc. (Hotels, Restaurants & Leisure) | (a) | 14,527 | 559,290 | |||||
Biglari Holdings, Inc. (Hotels, Restaurants & Leisure) | (a) | 2,746 | 1,391,233 | |||||
Diamond Resorts International, Inc. (Hotels, Restaurants & Leisure) | (a) | 14,682 | 271,030 | |||||
SodaStream International Ltd. (Household Durables) | (a) | 16,625 | 825,265 | |||||
HomeAway, Inc. (Internet & Catalog Retail) | (a) | 11,624 | 475,189 | |||||
Arctic Cat, Inc. (Leisure Equip. & Products) | 16,885 | 962,107 | ||||||
National CineMedia, Inc. (Media) | 77,527 | 1,547,439 | ||||||
SFX Entertainment, Inc. (Media) | (a) | 40,099 | 481,188 | |||||
Gordmans Stores, Inc. (Multiline Retail) | 31,204 | 239,335 | ||||||
Hibbett Sports, Inc. (Specialty Retail) | (a) | 24,733 | 1,662,305 | |||||
Monro Muffler Brake, Inc. (Specialty Retail) | 10,325 | 581,917 | ||||||
Carter’s, Inc. (Textiles, Apparel & Luxury Goods) | 29,113 | 2,090,022 | ||||||
Vince Holding Corp. (Textiles, Apparel & Luxury Goods) | (a) | 18,991 | 582,454 | |||||
Wolverine World Wide, Inc. (Textiles, Apparel & Luxury Goods) | 68,480 | 2,325,581 | ||||||
| ||||||||
| 14,567,436 | ||||||||
| ||||||||
CONSUMER STAPLES – 1.2% | ||||||||
Casey’s General Stores, Inc. (Food & Staples Retailing) | 10,975 | 770,994 | ||||||
WhiteWave Foods Co. Class A (Food Products) | (a) | 24,763 | 568,063 | |||||
| ||||||||
| 1,339,057 | ||||||||
| ||||||||
ENERGY – 5.0% | ||||||||
Dresser-Rand Group, Inc. (Energy Equip. & Svs.) | (a) | 19,080 | 1,137,740 | |||||
Dril-Quip, Inc. (Energy Equip. & Svs.) | (a) | 10,489 | 1,153,056 | |||||
DCP Midstream Partners LP (Oil, Gas & Consumable Fuels) | 27,683 | 1,393,839 | ||||||
Midcoast Energy Partners LP (Oil, Gas & Consumable Fuels) | (a) | 30,417 | 594,652 | |||||
Phillips 66 Partners LP (Oil, Gas & Consumable Fuels) | (a) | 14,979 | 568,153 | |||||
Targa Resources Corp. (Oil, Gas & Consumable Fuels) | 7,452 | 657,043 | ||||||
| ||||||||
| 5,504,483 | ||||||||
| ||||||||
FINANCIALS – 7.6% | ||||||||
Artisan Partners Asset Management, Inc. Class A (Capital Markets) | 7,040 | 458,938 | ||||||
Financial Engines, Inc. (Capital Markets) | 8,513 | 591,483 | ||||||
LPL Financial Holdings, Inc. (Capital Markets) | 33,383 | 1,570,002 | ||||||
WisdomTree Investments, Inc. (Capital Markets) | (a) | 37,780 | 669,084 | |||||
Bank of the Ozarks, Inc. (Commercial Banks) | 12,490 | 706,809 | ||||||
MarketAxess Holdings, Inc. (Diversified Financial Svs.) | 6,165 | 412,254 | ||||||
MSCI, Inc. (Diversified Financial Svs.) | (a) | 26,223 | 1,146,470 | |||||
Jones Lang LaSalle, Inc. (Real Estate Mgmt. & Development) | 15,019 | 1,537,795 | ||||||
RE/MAX Holdings, Inc. (Real Estate Mgmt. & Development) | (a) | 15,572 | 499,394 | |||||
St. Joe Co. / The (Real Estate Mgmt. & Development) | (a) | 36,541 | 701,222 | |||||
| ||||||||
| 8,293,451 | ||||||||
| ||||||||
HEALTH CARE – 15.4% | ||||||||
ACADIA Pharmaceuticals, Inc. (Biotechnology) | (a) | 11,352 | 283,686 | |||||
Alkermes PLC (Biotechnology) | (a) | 14,685 | 597,092 | |||||
Exact Sciences Corp. (Biotechnology) | (a) | 27,620 | 322,878 | |||||
Incyte Corp. Ltd. (Biotechnology) | (a) | 9,109 | 461,189 | |||||
Ironwood Pharmaceuticals, Inc. (Biotechnology) | (a) | 39,551 | 459,187 | |||||
Medivation, Inc. (Biotechnology) | (a) | 8,809 | 562,190 | |||||
NPS Pharmaceuticals, Inc. (Biotechnology) | (a) | 23,040 | 699,494 | |||||
| Common Stocks (Continued) | Shares | Value | ||||||
HEALTH CARE (continued) | ||||||||
Swedish Orphan Biovitrum AB (Biotechnology) | (a)(b) | 56,763 | $ 588,899 | |||||
Synageva BioPharma Corp. (Biotechnology) | (a) | 9,063 | 586,557 | |||||
Endologix, Inc. (Health Care Equip. & Supplies) | (a) | 69,741 | 1,216,283 | |||||
HeartWare International, Inc. (Health Care Equip. & Supplies) | (a) | 4,918 | 462,095 | |||||
LDR Holding Corp. (Health Care Equip. & Supplies) | (a) | 30,531 | 720,532 | |||||
Masimo Corp. (Health Care Equip. & Supplies) | (a) | 43,785 | 1,279,836 | |||||
Novadaq Technologies, Inc. (Health Care Equip. & Supplies) | (a) | 69,549 | 1,146,863 | |||||
Quidel Corp. (Health Care Equip. & Supplies) | (a) | 42,544 | 1,314,184 | |||||
Volcano Corp. (Health Care Equip. & Supplies) | (a) | 17,500 | 382,375 | |||||
Zeltiq Aesthetics, Inc. (Health Care Equip. & Supplies) | (a) | 20,989 | 396,902 | |||||
Capital Senior Living Corp. (Health Care Providers & Svs.) | (a) | 25,518 | 612,177 | |||||
ExamWorks Group, Inc. (Health Care Providers & Svs.) | (a) | 27,580 | 823,815 | |||||
athenahealth, Inc. (Health Care Technology) | (a) | 7,782 | 1,046,679 | |||||
HMS Holdings Corp. (Health Care Technology) | (a) | 19,891 | 452,122 | |||||
Techne Corp. (Life Sciences Tools & Svs.) | 11,951 | 1,131,401 | ||||||
Akorn, Inc. (Pharmaceuticals) | (a) | 17,527 | 431,690 | |||||
Prestige Brands Holdings, Inc. (Pharmaceuticals) | (a) | 23,324 | 834,999 | |||||
| ||||||||
| 16,813,125 | ||||||||
| ||||||||
INDUSTRIALS – 20.7% | ||||||||
DigitalGlobe, Inc. (Aerospace & Defense) | (a) | 13,231 | 544,456 | |||||
HEICO Corp. Class A (Aerospace & Defense) | 53,552 | 2,255,610 | ||||||
Sparton Corp. (Aerospace & Defense) | (a) | 1,938 | 54,167 | |||||
Hub Group, Inc. Class A (Air Freight & Logistics) | (a) | 39,419 | 1,572,030 | |||||
Clean Harbors, Inc. (Commercial Svs. & Supplies) | (a) | 7,110 | 426,316 | |||||
Heritage-Crystal Clean, Inc. (Commercial Svs. & Supplies) | (a) | 36,831 | 754,667 | |||||
Ritchie Bros Auctioneers, Inc. (Commercial Svs. & Supplies) | 48,613 | 1,114,696 | ||||||
SP Plus Corp. (Commercial Svs. & Supplies) | (a) | 63,322 | 1,648,905 | |||||
GrafTech International Ltd. (Electrical Equip.) | (a) | 132,875 | 1,492,186 | |||||
Polypore International, Inc. (Electrical Equip.) | (a) | 35,007 | 1,361,772 | |||||
Kennametal, Inc. (Machinery) | 38,853 | 2,023,076 | ||||||
Nordson Corp. (Machinery) | 16,179 | 1,202,100 | ||||||
Tennant Co. (Machinery) | 9,644 | 653,960 | ||||||
Wabtec Corp. (Machinery) | 25,629 | 1,903,466 | ||||||
Corporate Executive Board Co. / The (Professional Svs.) | 12,343 | 955,718 | ||||||
Landstar System, Inc. (Road & Rail) | 15,783 | 906,733 | ||||||
Old Dominion Freight Line, Inc. (Road & Rail) | (a) | 21,726 | 1,151,913 | |||||
Saia, Inc. (Road & Rail) | (a) | 23,058 | 739,009 | |||||
WESCO International, Inc. (Trading Companies & Distributors) | (a) | 20,889 | 1,902,361 | |||||
| ||||||||
| 22,663,141 | ||||||||
| ||||||||
INFORMATION TECHNOLOGY – 28.3% | ||||||||
Stratasys Ltd. (Computers & Peripherals) | (a) | 3,522 | 474,413 | |||||
Belden, Inc. (Electronic Equip., Instr. & Comp.) | 14,753 | 1,039,349 | ||||||
CTS Corp. (Electronic Equip., Instr. & Comp.) | 7,711 | 153,526 | ||||||
DTS, Inc. (Electronic Equip., Instr. & Comp.) | (a) | 11,378 | 272,844 | |||||
IPG Photonics Corp. (Electronic Equip., Instr. & Comp.) | (a) | 6,474 | 502,447 | |||||
Measurement Specialties, Inc. (Electronic Equip., Instr. & Comp.) | (a) | 19,347 | 1,174,169 | |||||
| 41 | (continued) |
| Ohio National Fund, Inc. | Small Cap Growth Portfolio (Continued) |
Schedule of Investments | December 31, 2013 |
| Common Stocks (Continued) | Shares | Value | ||||||
INFORMATION TECHNOLOGY (continued) | ||||||||
National Instruments Corp. (Electronic Equip., Instr. & Comp.) | 23,515 | $ 752,950 | ||||||
RealD, Inc. (Electronic Equip., Instr. & Comp.) | (a) | 51,590 | 440,579 | |||||
ChannelAdvisor Corp. (Internet Software & Svs.) | (a) | 14,065 | 586,651 | |||||
Cornerstone OnDemand, Inc. (Internet Software & Svs.) | (a) | 11,891 | 634,266 | |||||
CoStar Group, Inc. (Internet Software & Svs.) | (a) | 3,448 | 636,432 | |||||
Envestnet, Inc. (Internet Software & Svs.) | (a) | 10,059 | 405,378 | |||||
j2 Global, Inc. (Internet Software & Svs.) | 12,673 | 633,777 | ||||||
VistaPrint NV (Internet Software & Svs.) | (a) | 26,168 | 1,487,651 | |||||
Zillow, Inc. Class A (Internet Software & Svs.) | (a) | 9,083 | 742,354 | |||||
Broadridge Financial Solutions, Inc. (IT Svs.) | 50,123 | 1,980,861 | ||||||
Euronet Worldwide, Inc. (IT Svs.) | (a) | 22,887 | 1,095,143 | |||||
MAXIMUS, Inc. (IT Svs.) | 10,325 | 454,197 | ||||||
QIWI PLC – ADR (IT Svs.) | 6,678 | 373,968 | ||||||
WEX, Inc. (IT Svs.) | (a) | 6,083 | 602,399 | |||||
Atmel Corp. (Semiconductors & Equip.) | (a) | 179,196 | 1,403,105 | |||||
Advent Software, Inc. (Software) | 35,362 | 1,237,316 | ||||||
Blackbaud, Inc. (Software) | 59,165 | 2,227,562 | ||||||
Cadence Design Systems, Inc. (Software) | (a) | 124,819 | 1,749,962 | |||||
FleetMatics Group PLC (Software) | (a) | 13,918 | 601,953 | |||||
Guidewire Software, Inc. (Software) | (a) | 12,495 | 613,130 | |||||
NICE Systems Ltd. – ADR (Software) | 27,509 | 1,126,769 | ||||||
Rally Software Development Corp. (Software) | (a) | 8,640 | 168,048 | |||||
RealPage, Inc. (Software) | (a) | 73,934 | 1,728,577 | |||||
Solera Holdings, Inc. (Software) | 27,237 | 1,927,290 | ||||||
| Common Stocks (Continued) | Shares | Value | ||||||
INFORMATION TECHNOLOGY (continued) | ||||||||
SS&C Technologies Holdings, Inc. (Software) | (a) | 74,988 | $ 3,318,969 | |||||
Tyler Technologies, Inc. (Software) | (a) | 4,928 | 503,297 | |||||
| ||||||||
| 31,049,332 | ||||||||
| ||||||||
MATERIALS – 1.0% | ||||||||
Sensient Technologies Corp. (Chemicals) | 22,533 | 1,093,301 | ||||||
| ||||||||
TELECOMMUNICATION SERVICES – 0.3% | ||||||||
RingCentral, Inc. Class A (Wireless Telecom. Svs.) | (a) | 16,121 | 296,143 | |||||
| ||||||||
Total Common Stocks (Cost $87,150,305) | $101,619,469 | |||||||
| ||||||||
| Exchange Traded Funds – 1.9% | Shares | Value | ||||||
iShares Russell 2000 Growth ETF | 15,000 | $ 2,032,650 | ||||||
| ||||||||
Total Exchange Traded Funds (Cost $1,876,174) | $ 2,032,650 | |||||||
| ||||||||
| Money Market Funds – 5.7% | Shares | Value | ||||||
| Fidelity Institutional Money Market Funds Money Market Portfolio – Class I | 6,268,000 | $6,268,000 | ||||||
| ||||||||
Total Money Market Funds (Cost $6,268,000) | $6,268,000 | |||||||
| ||||||||
Total Investments – 100.4% (Cost $95,294,479) | (c) | $109,920,119 | ||||||
Liabilities in Excess of Other Assets – (0.4)% | (383,310) | |||||||
| ||||||||
Net Assets – 100.0% | $109,536,809 | |||||||
| ||||||||
Percentages are stated as a percent of net assets.
Abbreviations:
ADR: American Depositary Receipts
Footnotes:
| (a) | Non-income producing security. |
| (b) | Security traded on a foreign exchange has been valued at an estimate of fair value that is different than the local market close price. These fair value estimates are determined by an independent fair valuation service that has been approved by the Board. These securities represent $588,899, or 0.5% of the Portfolio’s net assets. |
Other Portfolio securities are not subjected to fair value procedures because they are traded on domestic or foreign exchanges that have close times that are consistent with the U.S. market close, normally 4:00 pm Eastern Time.
| (c) | Represents cost for financial reporting purposes, which may differ from cost basis for federal income tax purposes. See also Note 7 of the Notes to Financial Statements. |
The accompanying notes are an integral part of these financial statements.
| 42 |
| Ohio National Fund, Inc. | Mid Cap Opportunity Portfolio |
Objective/Strategy
The Mid Cap Opportunity Portfolio seeks long-term total return by investing at least 80% of its net assets in equity securities of mid-cap companies, primarily those that are strategically positioned for long-term growth.
Performance as of December 31, 2013
Average Annual Total Returns: | ||||
One year | 32.46% | |||
Five years | 20.84% | |||
Ten years | 7.31% |
Past performance does not guarantee future results. The performance data quoted represents past performance and current returns may be lower or higher. Total return figures include change in share price and reinvestment of dividends and capital gains. The investment return and principal value will fluctuate so that an investor’s shares, when redeemed, may be worth more or less than the original cost. To obtain performance information up to the most recent month end, call toll-free 1-877-781-6392.
The Portfolio is not open to direct retail investment. Beneficial interest in shares is obtained solely by purchase of variable life insurance policies and variable annuity contracts. Actual performance results for variable annuity and variable universal life contracts will be lower due to contract charges. Consult your contract for applicable charges.
Comments
For the year ended December 31, 2013, the Mid Cap Opportunity Portfolio returned 32.46% versus 35.74% for the current benchmark, the Russell Midcap Growth Index.
In 2013, the Portfolio delivered a positive absolute return but underperformed relative to its benchmark. Weakness in Industrials and Information Technology sectors detracted from relative returns, while positive stock selection in the Financials and Materials sectors contributed to performance. The Portfolio’s best performers were Pandora Media, Inc., FleetCor Technologies, Inc., Deckers Outdoor Corp., IntercontinentalExchange Group, Inc., and Chipotle Mexican Grill, Inc. The Portfolio’s worst performers were ARIAD Pharmaceuticals, Inc., VeriFone Systems, Inc., Rackspace Hosting, Inc., Equinix, Inc., and Linkedin Corp. The Portfolio’s top contributors to returns were Pandora Media, Inc., Deckers Outdoor Corp., Vertex Pharmaceuticals, Inc., FleetCor Technologies, Inc., and IntercontinentalExchange Group, Inc. The Portfolio’s largest detractors from returns were Equinix, Inc., Rackspace Holdings, Inc., ARIAD Pharmaceuticals, Inc., Ritchie Bros. Auctioneers, Inc., and PetSmart, Inc.(1)
Pandora Media, Inc.’s outperformance was driven by strong growth in key audience metrics. In particular, listener hours, share of total U.S. radio listening and number of active listeners have all increased from a year ago. The stock was also bolstered by the announcement of a new CEO. In our view, Pandora Media, Inc. is uniquely positioned to monetize mobile and gain market share within the terrestrial radio market as it grows its active user base. Pandora Media, Inc.’s differentiated business model, first-mover advantage and strong brand recognition, along with a continued shift in ad spending, should also support sustainable growth.(1)
Deckers Outdoor Corp., a footwear and retail company, whose brands include UGG and Teva, contributed to the Portfolio’s returns. We felt that the market was beginning to realize that Deckers Outdoor Corp. was more likely to meet, and potentially beat, earnings expectations during its important winter selling season. This belief was realized in the fourth quarter, as colder weather at the start of
the winter selling season drove optimism that the company will report better results in early 2014. In our view, the company is well positioned for long-term growth, as the UGG brand is transforming into a global lifestyle brand and the company is expanding its product lineup and store count.(1)
Equinix, Inc., a leading data center solutions company, detracted from returns during the year. Its shares declined when the company reported results that were below expectations and lowered 2013 earnings and revenue guidance. The potential for rising interest rates continued to weigh broadly on yield-sensitive securities such as bonds and real estate investment trusts (REITs). While this has been a short-term headwind for the company, we do not believe there has been any deterioration in fundamentals. We believe that Equinix, Inc. remains well positioned as a market leader in data center and co-location services. We also feel that the company’s unique assets will continue to command a premium lease rate relative to its peers, highlighted by the solid third quarter results. Equinix, Inc.’s customer churn and pricing recently improved, which was important, as this had been a source of controversy for the company. Additionally, we believe that Equinix, Inc. is well positioned to benefit from secular growth trends, including growth in cloud computing, internet traffic, enterprise outsourcing and rising demand for optimized network performance.(1)
We sold our position in Rackspace Hosting, Inc. during the fourth quarter. In 2013, Rackspace Hosting, Inc. was plagued with an inability to gain traction with its new cloud offering, causing a slowdown in sales growth. The company also indicated that it would have to spend more to acquire new customers. In addition, we realized that there were many new entrants into this space, some of which are large, established competitors that we believe could lead to price degradation.(1)
Despite strong 2013 performance, we believe U.S. equities have further upside as the U.S. economy accelerates and as real earnings growth serves as a fundamental driver of performance. We believe that U.S. corporate fundamentals remain solid, evidenced by both healthy balance sheets and earnings resilience. In our view, this should provide companies with a number of options to increase shareholder value. While we acknowledge that the potential for headwinds remains, such as geopolitical risks associated with developments in the Middle East, or political gridlock in Washington D.C., we ultimately remain positive on the direction of U.S. equity markets. We believe that there are ample tailwinds, including the strengthening U.S. housing and employment markets, which should continue to provide a favorable backdrop for equities. Looking forward, we believe that as the U.S. economy improves, companies will likely reinvest for future growth by increasing capital expenditures, research and development, hiring, and merger and acquisition activity rather than keeping excess cash on balance sheets. From a valuation perspective, U.S. equities remain reasonably valued relative to history and inexpensive relative to fixed income. Lastly, we believe improved investor sentiment and increased flows into U.S. equities could be additional catalysts for the market in the months ahead. We believe a forward-looking analysis is critical in this investing environment and, as revenue growth in select companies will propel the stocks of these companies to higher levels, selectivity will be increasingly important.
Our fundamental, bottom-up research process continues to drive our stock selection, while short-term “noise” in the market - headlines or sentiment - enables us to manage position sizes opportunistically. We have high conviction in the companies that we own and believe they have the potential to outperform relative to the broader
| 43 | (continued) |
| Ohio National Fund, Inc. | Mid Cap Opportunity Portfolio (Continued) |
market, regardless of the growth environment. We maintain our discipline in identifying what we believe are well-positioned companies with defensible franchises, high barriers to entry and strong growth prospects, led by quality management teams. We believe that these ingredients, combined with our long-term focus, are the recipe for alpha generation over time.
| (1) | The Portfolio’s composition is subject to change. Holdings and weightings are as of December 31, 2013. |
Change in Value of $10,000 Investment
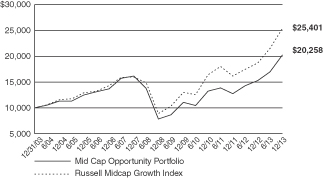
Hypothetical illustration based on past performance. Future performance will vary. The Portfolio’s returns reflect reinvested dividends. The Portfolio’s holdings may differ significantly from the securities in the index. The index is unmanaged and therefore does not reflect the cost of portfolio management and accounting.
The Russell Midcap Growth Index is a subset of the Russell Midcap Index, which measures the performance of the 800 smallest companies in the Russell 1000 Index. The Russell Midcap Growth Index measures the performance of those stocks of the Russell Midcap Index with higher price-to-book ratios and higher relative forecasted growth rates. The index presented herein includes the effects of reinvested dividends.
Portfolio Composition as of December 31, 2013 (1)
| % of Net Assets | ||||
Common Stocks (3) | 98.2 | |||
Money Market Funds | 1.8 | |||
|
| |||
| 100.0 | ||||
|
|
Top 10 Portfolio Holdings as of December 31, 2013 (1) (2)
| % of Net Assets | ||||
1. CBRE Group, Inc. | 2.5 | |||
2. SBA Communications Corp. Class A | 2.4 | |||
3. L Brands, Inc. | 2.2 | |||
4. Equinix, Inc. | 2.2 | |||
5. PVH Corp. | 2.2 | |||
6. C.R. Bard, Inc. | 2.1 | |||
7. Agilent Technologies, Inc. | 2.1 | |||
8. Dollar General Corp. | 2.1 | |||
9. MSCI, Inc. | 1.9 | |||
10. Cameron International Corp. | 1.9 |
| (1) | Composition of Portfolio subject to change. |
| (2) | Short-term investments have been excluded from the list of Top 10 Portfolio Holdings. |
| (3) | Sectors: |
| % of Net Assets | ||||
Consumer Discretionary | 22.4 | |||
Health Care | 16.4 | |||
Information Technology | 13.8 | |||
Financials | 12.9 | |||
Industrials | 10.3 | |||
Consumer Staples | 8.4 | |||
Energy | 5.5 | |||
Materials | 4.8 | |||
Telecommunication Services | 3.7 | |||
|
| |||
| 98.2 | ||||
|
|
| 44 |
| Ohio National Fund, Inc. | Mid Cap Opportunity Portfolio |
Schedule of Investments | December 31, 2013 |
| Common Stocks – 98.2% | Shares | Value | ||||||||
CONSUMER DISCRETIONARY – 22.4% |
| |||||||||
Chipotle Mexican Grill, Inc. (Hotels, Restaurants & Leisure) | (a) | 2,332 | $ | 1,242,443 | ||||||
Marriott International, Inc. Class A (Hotels, Restaurants & Leisure) | 13,804 | 681,365 | ||||||||
Norwegian Cruise Line Holdings Ltd. (Hotels, Restaurants & Leisure) | (a) | 22,164 | 786,157 | |||||||
Panera Bread Co. Class A (Hotels, Restaurants & Leisure) | (a) | 4,505 | 795,988 | |||||||
Tim Hortons, Inc. (Hotels, Restaurants & Leisure) | 17,454 | 1,018,965 | ||||||||
Discovery Communications, Inc. Class A (Media) | (a) | 9,635 | 871,197 | |||||||
Scripps Networks Interactive, Inc. Class A (Media) | 12,889 | 1,113,738 | ||||||||
Dollar General Corp. (Multiline Retail) | (a) | 28,766 | 1,735,165 | |||||||
Dick’s Sporting Goods, Inc. (Specialty Retail) | 12,690 | 737,289 | ||||||||
Five Below, Inc. (Specialty Retail) | (a) | 12,772 | 551,750 | |||||||
L Brands, Inc. (Specialty Retail) | 29,555 | 1,827,977 | ||||||||
PetSmart, Inc. (Specialty Retail) | 18,969 | 1,379,995 | ||||||||
Restoration Hardware Holdings, Inc. (Specialty Retail) | (a) | 4,949 | 333,068 | |||||||
Tiffany & Co. (Specialty Retail) | 8,128 | 754,116 | ||||||||
Deckers Outdoor Corp. (Textiles, Apparel & Luxury Goods) | (a) | 10,298 | 869,769 | |||||||
Fifth & Pacific Cos., Inc. (Textiles, Apparel & Luxury Goods) | (a) | 34,275 | 1,099,199 | |||||||
PVH Corp. (Textiles, Apparel & Luxury Goods) | 13,379 | 1,819,812 | ||||||||
Ralph Lauren Corp. (Textiles, Apparel & Luxury Goods) | 5,604 | 989,498 | ||||||||
|
| |||||||||
| 18,607,491 | ||||||||||
|
| |||||||||
CONSUMER STAPLES – 8.4% | ||||||||||
Beam, Inc. (Beverages) | 15,795 | 1,075,008 | ||||||||
Whole Foods Market, Inc. (Food & Staples Retailing) | 24,027 | 1,389,481 | ||||||||
Green Mountain Coffee Roasters, Inc. (Food Products) | (a) | 17,223 | 1,301,714 | |||||||
Hain Celestial Group, Inc. / The (Food Products) | (a) | 14,895 | 1,352,168 | |||||||
TreeHouse Foods, Inc. (Food Products) | (a) | 12,138 | 836,551 | |||||||
Church & Dwight Co., Inc. (Household Products) | 15,429 | 1,022,634 | ||||||||
|
| |||||||||
| 6,977,556 | ||||||||||
|
| |||||||||
ENERGY – 5.5% | ||||||||||
Cameron International Corp. (Energy Equip. & Svs.) | (a) | 26,730 | 1,591,237 | |||||||
Core Laboratories NV (Energy Equip. & Svs.) | 2,937 | 560,820 | ||||||||
Dril-Quip, Inc. (Energy Equip. & Svs.) | (a) | 10,490 | 1,153,166 | |||||||
Antero Resources Corp. (Oil, Gas & Consumable Fuels) | (a) | 6,873 | 436,023 | |||||||
Whiting Petroleum Corp. (Oil, Gas & Consumable Fuels) | (a) | 13,778 | 852,445 | |||||||
|
| |||||||||
| 4,593,691 | ||||||||||
|
| |||||||||
FINANCIALS – 12.9% | ||||||||||
Lazard Ltd. Class A (Capital Markets) | 26,786 | 1,213,942 | ||||||||
T. Rowe Price Group, Inc. (Capital Markets) | 17,305 | 1,449,640 | ||||||||
First Republic Bank (Commercial Banks) | 20,702 | 1,083,750 | ||||||||
SLM Corp. (Consumer Finance) | 38,772 | 1,018,928 | ||||||||
IntercontinentalExchange Group, Inc. (Diversified Financial Svs.) | 6,956 | 1,564,544 | ||||||||
MSCI, Inc. (Diversified Financial Svs.) | (a) | 36,904 | 1,613,443 | |||||||
CBRE Group, Inc. (Real Estate Mgmt. & Development) | (a) | 79,993 | 2,103,816 | |||||||
MGIC Investment Corp. (Thrifts & Mortgage Finance) | (a) | 75,972 | 641,204 | |||||||
|
| |||||||||
| 10,689,267 | ||||||||||
|
| |||||||||
HEALTH CARE – 16.4% | ||||||||||
Alexion Pharmaceuticals, Inc. (Biotechnology) | (a) | 3,932 | 523,192 | |||||||
BioMarin Pharmaceutical, Inc. (Biotechnology) | (a) | 5,150 | 361,891 | |||||||
Cepheid, Inc. (Biotechnology) | (a) | 18,361 | 857,826 | |||||||
Incyte Corp. Ltd. (Biotechnology) | (a) | 5,915 | 299,476 | |||||||
Medivation, Inc. (Biotechnology) | (a) | 7,866 | 502,008 | |||||||
Pharmacyclics, Inc. (Biotechnology) | (a) | 4,840 | 511,975 | |||||||
Regeneron Pharmaceuticals, Inc. (Biotechnology) | (a) | 2,203 | 606,354 | |||||||
Vertex Pharmaceuticals, Inc. (Biotechnology) | (a) | 12,330 | 916,119 | |||||||
CareFusion Corp. (Health Care Equip. & Supplies) | (a) | 24,315 | 968,223 | |||||||
| Common Stocks (Continued) | Shares | Value | ||||||||
HEALTH CARE (continued) | ||||||||||
C.R. Bard, Inc. (Health Care Equip. & Supplies) | 13,239 | $ | 1,773,232 | |||||||
Henry Schein, Inc. (Health Care Providers & Svs.) | (a) | 9,683 | 1,106,380 | |||||||
MEDNAX, Inc. (Health Care Providers & Svs.) | (a) | 7,798 | 416,257 | |||||||
HMS Holdings Corp. (Health Care Technology) | (a) | 25,500 | 579,615 | |||||||
Agilent Technologies, Inc. (Life Sciences Tools & Svs.) | 30,830 | 1,763,168 | ||||||||
Mettler-Toledo International, Inc. (Life Sciences Tools & Svs.) | (a) | 2,382 | 577,849 | |||||||
PerkinElmer, Inc. (Life Sciences Tools & Svs.) | 15,145 | 624,428 | ||||||||
Shire PLC – ADR (Pharmaceuticals) | 5,643 | 797,299 | ||||||||
Zoetis, Inc. (Pharmaceuticals) | 14,372 | 469,821 | ||||||||
|
| |||||||||
| 13,655,113 | ||||||||||
|
| |||||||||
INDUSTRIALS – 10.3% | ||||||||||
Healthcare Services Group, Inc. (Commercial Svs. & Supplies) | 14,131 | 400,896 | ||||||||
Quanta Services, Inc. (Construction & Engineering) | (a) | 23,305 | 735,506 | |||||||
AMETEK, Inc. (Electrical Equip.) | 12,661 | 666,855 | ||||||||
Hubbell, Inc. Class B (Electrical Equip.) | 11,174 | 1,216,849 | ||||||||
Roper Industries, Inc. (Electrical Equip.) | 3,386 | 469,570 | ||||||||
Sensata Technologies Holding NV (Electrical Equip.) | (a) | 39,146 | 1,517,690 | |||||||
Graco, Inc. (Machinery) | 18,807 | 1,469,203 | ||||||||
Kennametal, Inc. (Machinery) | 21,679 | 1,128,826 | ||||||||
W.W. Grainger, Inc. (Trading Companies & Distributors) | 3,708 | 947,097 | ||||||||
|
| |||||||||
| 8,552,492 | ||||||||||
|
| |||||||||
INFORMATION TECHNOLOGY – 13.8% | ||||||||||
Juniper Networks, Inc. (Communications Equip.) | (a) | 13,841 | 312,391 | |||||||
Amphenol Corp. Class A (Electronic Equip., Instr. & Comp.) | 14,074 | 1,255,119 | ||||||||
Equinix, Inc. (Internet Software & Svs.) | (a) | 10,272 | 1,822,766 | |||||||
LinkedIn Corp. (Internet Software & Svs.) | (a) | 3,422 | 741,992 | |||||||
Pandora Media, Inc. (Internet Software & Svs.) | (a) | 28,117 | 747,912 | |||||||
FleetCor Technologies, Inc. (IT Svs.) | (a) | 8,474 | 992,899 | |||||||
Altera Corp. (Semiconductors & Equip.) | 29,745 | 967,605 | ||||||||
Linear Technology Corp. (Semiconductors & Equip.) | 16,575 | 754,991 | ||||||||
Xilinx, Inc. (Semiconductors & Equip.) | 34,369 | 1,578,224 | ||||||||
Guidewire Software, Inc. (Software) | (a) | 8,259 | 405,269 | |||||||
MICROS Systems, Inc. (Software) | (a) | 11,811 | 677,597 | |||||||
Salesforce.com, Inc. (Software) | (a) | 14,470 | 798,599 | |||||||
ServiceNow, Inc. (Software) | (a) | 7,401 | 414,530 | |||||||
|
| |||||||||
| 11,469,894 | ||||||||||
|
| |||||||||
MATERIALS – 4.8% | ||||||||||
Airgas, Inc. (Chemicals) | 12,298 | 1,375,531 | ||||||||
Ecolab, Inc. (Chemicals) | 5,702 | 594,548 | ||||||||
International Flavors & Fragrances, Inc. (Chemicals) | 12,819 | 1,102,178 | ||||||||
Sherwin-Williams Co. / The (Chemicals) | 4,737 | 869,240 | ||||||||
|
| |||||||||
| 3,941,497 | ||||||||||
|
| |||||||||
TELECOMMUNICATION SERVICES – 3.7% | ||||||||||
tw telecom, Inc. (Diversified Telecom. Svs.) | (a) | 34,382 | 1,047,620 | |||||||
SBA Communications Corp. Class A (Wireless Telecom. Svs.) | (a) | 22,593 | 2,029,755 | |||||||
|
| |||||||||
| 3,077,375 | ||||||||||
|
| |||||||||
Total Common Stocks (Cost $59,295,824) | $ | 81,564,376 | ||||||||
| Money Market Funds – 2.0% | Shares | Value | ||||||||
Fidelity Institutional Money Market Funds Prime Money Market Portfolio – Class I | 1,633,000 | $ | 1,633,000 | |||||||
|
| |||||||||
Total Money Market Funds (Cost $1,633,000) | $ | 1,633,000 | ||||||||
|
| |||||||||
Total Investments – 100.2% (Cost $60,928,824) | (b) | $ | 83,197,376 | |||||||
Liabilities in Excess of Other Assets – (0.2)% | (185,417) | |||||||||
|
| |||||||||
Net Assets – 100.0% | $ | 83,011,959 | ||||||||
|
| |||||||||
| 45 | (continued) |
| Ohio National Fund, Inc. | Mid Cap Opportunity Portfolio (Continued) |
Schedule of Investments | December 31, 2013 |
Percentages are stated as a percent of net assets.
Abbreviations:
ADR: American Depositary Receipts
Footnotes:
| (a) | Non-income producing security. |
| (b) | Represents cost for financial reporting purposes, which may differ from cost basis for federal income tax purposes. See also Note 7 of the Notes to Financial Statements. |
The accompanying notes are an integral part of these financial statements.
| 46 |
| Ohio National Fund, Inc. | S&P 500® Index Portfolio |
Objective/Strategy
The S&P 500® Index Portfolio seeks total return that approximates the total return of the Standard & Poor’s 500® Index (S&P 500® Index), at a risk level consistent with that of the Standard & Poor’s 500® Index.
Performance as of December 31, 2013
Average Annual Total Returns: | ||||
One year | 31.74% | |||
Five years | 17.38% | |||
Ten years | 6.91% |
Past performance does not guarantee future results. The performance data quoted represents past performance and current returns may be lower or higher. Total return figures include change in share price and reinvestment of dividends and capital gains. The investment return and principal value will fluctuate so that an investor’s shares, when redeemed, may be worth more or less than the original cost. To obtain performance information up to the most recent month end, call toll-free 1-877-781-6392.
The Portfolio is not open to direct retail investment. Beneficial interest in shares is obtained solely by purchase of variable life insurance policies and variable annuity contracts. Actual performance results for variable annuity and variable universal life contracts will be lower due to contract charges. Consult your contract for applicable charges.
Comments
For the year ended December 31, 2013, the S&P 500® Index Portfolio returned 31.74% versus 32.39% for the current benchmark, the S&P 500® Index.
The Portfolio’s correlation with the S&P 500® Index was 99.9%. The high correlation is due to the fact that the Portfolio invests in each of the 500 stocks in the index. The Portfolio also invests in SPDR S&P 500 ETF Trust, an exchange traded fund that mimics the holdings and returns of the S&P 500® Index.(1)
The largest contributors to the index return for 2013 were Google, Inc, Microsoft Corp., General Electric Co., Exxon Mobil Corp., and Johnson & Johnson. The largest detractors in 2013 were Newmont Mining Corp., CenturyLink, Inc., HCP, Inc., Intuitive Surgical, Inc., and FirstEnergy Corp.(1)
The year 2013 was very good for equities, as the market was fueled by a very accommodating Federal Reserve. In 2013, we saw continued improvement in the economy, an improvement in the housing market, and less public policy uncertainty. Multiples for the S&P 500® Index expanded in 2013, with the price to earnings ratio starting at 14.21 times at the end of 2012 to 17.37 times at the end of 2013, as investors priced in the impact of the improving economic environment and improving company earnings.
We believe that 2014 should be another good year for equities. As quantitative easing (“QE”) comes to an end, we expect stock prices to be supported by earnings growth, which is expected to be in the high single digits. We would also expect some volatility, as investors pay close attention to the Federal Reserve’s actions and the speed of the “taper” of QE.
| (1) | The Portfolio’s composition is subject to change. Holdings and weightings are as of December 31, 2013. |
“Standard & Poor’s®”, “S&P®”, “S&P 500®” and “Standard & Poor’s 500” are trademarks of The McGraw-Hill Companies, Inc. and have been licensed for use by Ohio National Investments, Inc. (ONI). The S&P 500® Index Portfolio is not sponsored, endorsed, sold or promoted by Standard & Poor’s (“S&P”) and S&P makes no representation regarding the advisability of investing in the S&P 500® Index Portfolio. S&P makes no representation or warranty, express or implied, to the owners of the Portfolio or any member of the public regarding the advisability of investing in securities generally or in the Portfolio particularly or the ability of the S&P 500® Index to track general stock market performance. S&P’s only relationship to ONI is the licensing of certain trademarks and trade names of S&P® and of the S&P 500® Index which is determined, composed and calculated by S&P® without regard to ONI or the S&P 500® Index Portfolio. S&P® has no obligation to take the needs of ONI or the owners of the Portfolio into consideration in determining, composing or calculating the S&P 500® Index. S&P® is not responsible for and has not participated in the determination of the prices and amount of the Portfolio or the timing of the issuance or sale of the Portfolio or in the determination or calculation of the equation by which the Portfolio is to be converted into cash. S&P® has no obligation or liability in connection with the administration, marketing or trading of the Portfolio.
Change in Value of $10,000 Investment
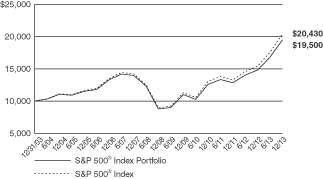
Hypothetical illustration based on past performance. Future performance will vary. The Portfolio’s returns reflect reinvested dividends. The Portfolio’s holdings may differ significantly from the securities in the index. The index is unmanaged and therefore does not reflect the cost of portfolio management and accounting. Investors cannot invest directly in an index, although they can invest in its underlying securities or funds.
The S&P 500® Index is a capitalization-weighted index designed to measure performance of the broad domestic economy through changes in the aggregate market value of 500 stocks representing all major industries. The index presented herein includes the effects of reinvested dividends.
| 47 | (continued) |
| Ohio National Fund, Inc. | S&P 500® Index Portfolio (Continued) |
Portfolio Composition as of December 31, 2013 (1)
| % of Net Assets | ||||
Common Stocks (3) | 96.2 | |||
Exchange Traded Funds and | 3.8 | |||
|
| |||
| 100.0 | ||||
|
|
Top 10 Portfolio Holdings as of December 31, 2013 (1) (2)
| % of Net Assets | ||||
1. SPDR S&P 500 ETF Trust | 3.8 | |||
2. Apple, Inc. | 2.9 | |||
3. Exxon Mobil Corp. | 2.6 | |||
4. Google, Inc. Class A | 1.8 | |||
5. Microsoft Corp. | 1.7 | |||
6. General Electric Co. | 1.7 | |||
7. Johnson & Johnson | 1.5 | |||
8. Chevron Corp. | 1.4 | |||
9. Procter & Gamble Co. / The | 1.3 | |||
10. JPMorgan Chase & Co. | 1.3 |
| (1) | Composition of Portfolio subject to change. |
| (2) | Short-term investments have been excluded from the list of Top 10 Portfolio Holdings. |
| (3) | Sectors: |
| % of Net Assets | ||||
Information Technology | 17.9 | |||
Financials | 15.6 | |||
Health Care | 12.5 | |||
Consumer Discretionary | 12.0 | |||
Industrials | 10.5 | |||
Energy | 9.9 | |||
Consumer Staples | 9.4 | |||
Materials | 3.4 | |||
Utilities | 2.8 | |||
Telecommunication Services | 2.2 | |||
|
| |||
| 96.2 | ||||
|
|
| 48 |
| Ohio National Fund, Inc. | S&P 500® Index Portfolio |
Schedule of Investments | December 31, 2013 |
| Common Stocks – 96.2% | Shares | Value | ||||||||
CONSUMER DISCRETIONARY – 12.0% | ||||||||||
BorgWarner, Inc. (Auto Components) | 4,200 | $ | 234,822 | |||||||
Delphi Automotive PLC (Auto Components) | 5,100 | 306,663 | ||||||||
Goodyear Tire & Rubber Co. / The (Auto Components) | 4,500 | 107,325 | ||||||||
Johnson Controls, Inc. (Auto Components) | 12,600 | 646,380 | ||||||||
Ford Motor Co. (Automobiles) | 72,487 | 1,118,474 | ||||||||
General Motors Co. (Automobiles) | (a) | 20,900 | 854,183 | |||||||
Harley-Davidson, Inc. (Automobiles) | 4,100 | 283,884 | ||||||||
Genuine Parts Co. (Distributors) | 2,800 | 232,932 | ||||||||
Graham Holdings Co. Class B (Diversified Consumer Svs.) | 75 | 49,749 | ||||||||
H&R Block, Inc. (Diversified Consumer Svs.) | 5,000 | 145,200 | ||||||||
Carnival Corp. (Hotels, Restaurants & Leisure) | 8,000 | 321,360 | ||||||||
Chipotle Mexican Grill, Inc. (Hotels, Restaurants & Leisure) | (a) | 550 | 293,029 | |||||||
Darden Restaurants, Inc. (Hotels, Restaurants & Leisure) | 2,400 | 130,488 | ||||||||
International Game Technology (Hotels, Restaurants & Leisure) | 4,600 | 83,536 | ||||||||
Marriott International, Inc. Class A (Hotels, Restaurants & Leisure) | 4,146 | 204,647 | ||||||||
McDonald’s Corp. (Hotels, Restaurants & Leisure) | 18,300 | 1,775,649 | ||||||||
Starbucks Corp. (Hotels, Restaurants & Leisure) | 13,800 | 1,081,782 | ||||||||
Starwood Hotels & Resorts Worldwide, Inc. (Hotels, Restaurants & Leisure) | 3,500 | 278,075 | ||||||||
Wyndham Worldwide Corp. (Hotels, Restaurants & Leisure) | 2,360 | 173,908 | ||||||||
Wynn Resorts Ltd. (Hotels, Restaurants & Leisure) | 1,500 | 291,315 | ||||||||
Yum! Brands, Inc. (Hotels, Restaurants & Leisure) | 8,200 | 620,002 | ||||||||
D.R. Horton, Inc. (Household Durables) | 5,200 | 116,064 | ||||||||
Garmin Ltd. (Household Durables) | 2,300 | 106,306 | ||||||||
Harman International Industries, Inc. (Household Durables) | 1,200 | 98,220 | ||||||||
Leggett & Platt, Inc. (Household Durables) | 2,600 | 80,444 | ||||||||
Lennar Corp. Class A (Household Durables) | 3,100 | 122,636 | ||||||||
Mohawk Industries, Inc. (Household Durables) | (a) | 1,100 | 163,790 | |||||||
Newell Rubbermaid, Inc. (Household Durables) | 5,300 | 171,773 | ||||||||
PulteGroup, Inc. (Household Durables) | 6,350 | 129,350 | ||||||||
Whirlpool Corp. (Household Durables) | 1,455 | 228,231 | ||||||||
Amazon.com, Inc. (Internet & Catalog Retail) | (a) | 6,800 | 2,711,772 | |||||||
Expedia, Inc. (Internet & Catalog Retail) | 1,900 | 132,354 | ||||||||
Netflix, Inc. (Internet & Catalog Retail) | (a) | 1,050 | 386,579 | |||||||
priceline.com, Inc. (Internet & Catalog Retail) | (a) | 950 | 1,104,280 | |||||||
TripAdvisor, Inc. (Internet & Catalog Retail) | (a) | 2,000 | 165,660 | |||||||
Hasbro, Inc. (Leisure Equip. & Products) | 2,100 | 115,521 | ||||||||
Mattel, Inc. (Leisure Equip. & Products) | 6,200 | 294,996 | ||||||||
Cablevision Systems Corp. Class A (Media) | 3,900 | 69,927 | ||||||||
CBS Corp. Class B (Media) | 10,250 | 653,335 | ||||||||
Comcast Corp. Class A (Media) | 47,853 | 2,486,681 | ||||||||
DIRECTV (Media) | (a) | 9,000 | 621,810 | |||||||
Discovery Communications, Inc. Class A (Media) | (a) | 4,100 | 370,722 | |||||||
Gannett Co., Inc. (Media) | 4,200 | 124,236 | ||||||||
Interpublic Group of Cos., Inc. / The (Media) | 7,623 | 134,927 | ||||||||
News Corp. Class A (Media) | (a) | 9,175 | 165,334 | |||||||
Omnicom Group, Inc. (Media) | 4,700 | 349,539 | ||||||||
Scripps Networks Interactive, Inc. Class A (Media) | 2,000 | 172,820 | ||||||||
Time Warner Cable, Inc. (Media) | 5,132 | 695,386 | ||||||||
Time Warner, Inc. (Media) | 16,666 | 1,161,954 | ||||||||
Twenty-First Century Fox, Inc. Class A (Media) | 36,000 | 1,266,480 | ||||||||
Viacom, Inc. Class B (Media) | 7,450 | 650,683 | ||||||||
Walt Disney Co. / The (Media) | 30,000 | 2,292,000 | ||||||||
Dollar General Corp. (Multiline Retail) | (a) | 5,400 | 325,728 | |||||||
Dollar Tree, Inc. (Multiline Retail) | (a) | 3,800 | 214,396 | |||||||
Family Dollar Stores, Inc. (Multiline Retail) | 1,800 | 116,946 | ||||||||
Kohl’s Corp. (Multiline Retail) | 3,700 | 209,975 | ||||||||
Macy’s, Inc. (Multiline Retail) | 6,776 | 361,838 | ||||||||
Nordstrom, Inc. (Multiline Retail) | 2,600 | 160,680 | ||||||||
Target Corp. (Multiline Retail) | 11,600 | 733,932 | ||||||||
AutoNation, Inc. (Specialty Retail) | (a) | 1,200 | 59,628 | |||||||
AutoZone, Inc. (Specialty Retail) | (a) | 625 | 298,713 | |||||||
| Common Stocks (Continued) | Shares | Value | ||||||||
CONSUMER DISCRETIONARY (continued) | ||||||||||
Bed Bath & Beyond, Inc. (Specialty Retail) | (a) | 3,900 | $ | 313,170 | ||||||
Best Buy Co., Inc. (Specialty Retail) | 4,975 | 198,403 | ||||||||
CarMax, Inc. (Specialty Retail) | (a) | 4,100 | 192,782 | |||||||
GameStop Corp. Class A (Specialty Retail) | 2,100 | 103,446 | ||||||||
Gap, Inc. / The (Specialty Retail) | 4,850 | 189,538 | ||||||||
Home Depot, Inc. / The (Specialty Retail) | 25,900 | 2,132,606 | ||||||||
L Brands, Inc. (Specialty Retail) | 4,500 | 278,325 | ||||||||
Lowe’s Cos., Inc. (Specialty Retail) | 19,200 | 951,360 | ||||||||
O’Reilly Automotive, Inc. (Specialty Retail) | (a) | 2,000 | 257,420 | |||||||
PetSmart, Inc. (Specialty Retail) | 1,900 | 138,225 | ||||||||
Ross Stores, Inc. (Specialty Retail) | 4,000 | 299,720 | ||||||||
Staples, Inc. (Specialty Retail) | 12,100 | 192,269 | ||||||||
Tiffany & Co. (Specialty Retail) | 2,000 | 185,560 | ||||||||
TJX Cos., Inc. (Specialty Retail) | 13,100 | 834,863 | ||||||||
Urban Outfitters, Inc. (Specialty Retail) | (a) | 2,000 | 74,200 | |||||||
Coach, Inc. (Textiles, Apparel & Luxury Goods) | 5,200 | 291,876 | ||||||||
Fossil Group, Inc. (Textiles, Apparel & Luxury Goods) | (a) | 900 | 107,946 | |||||||
Michael Kors Holdings Ltd. (Textiles, Apparel & Luxury Goods) | (a) | 3,300 | 267,927 | |||||||
NIKE, Inc. Class B (Textiles, Apparel & Luxury Goods) | 13,700 | 1,077,368 | ||||||||
PVH Corp. (Textiles, Apparel & Luxury Goods) | 1,500 | 204,030 | ||||||||
Ralph Lauren Corp. (Textiles, Apparel & Luxury Goods) | 1,100 | 194,227 | ||||||||
V.F. Corp. (Textiles, Apparel & Luxury Goods) | 6,500 | 405,210 | ||||||||
|
| |||||||||
| 37,949,520 | ||||||||||
|
| |||||||||
CONSUMER STAPLES – 9.4% | ||||||||||
Beam, Inc. (Beverages) | 3,000 | 204,180 | ||||||||
Brown-Forman Corp. Class B (Beverages) | 2,975 | 224,821 | ||||||||
Coca-Cola Co. / The (Beverages) | 69,700 | 2,879,307 | ||||||||
Coca-Cola Enterprises, Inc. (Beverages) | 4,400 | 194,172 | ||||||||
Constellation Brands, Inc. Class A (Beverages) | (a) | 3,100 | 218,178 | |||||||
Dr Pepper Snapple Group, Inc. (Beverages) | 3,700 | 180,264 | ||||||||
Molson Coors Brewing Co. Class B (Beverages) | 2,900 | 162,835 | ||||||||
Monster Beverage Corp. (Beverages) | (a) | 2,500 | 169,425 | |||||||
PepsiCo, Inc. (Beverages) | 28,147 | 2,334,512 | ||||||||
Costco Wholesale Corp. (Food & Staples Retailing) | 8,000 | 952,080 | ||||||||
CVS Caremark Corp. (Food & Staples Retailing) | 21,820 | 1,561,657 | ||||||||
Kroger Co. / The (Food & Staples Retailing) | 9,600 | 379,488 | ||||||||
Safeway, Inc. (Food & Staples Retailing) | 4,500 | 146,565 | ||||||||
Sysco Corp. (Food & Staples Retailing) | 10,700 | 386,270 | ||||||||
Walgreen Co. (Food & Staples Retailing) | 16,000 | 919,040 | ||||||||
Wal-Mart Stores, Inc. (Food & Staples Retailing) | 29,700 | 2,337,093 | ||||||||
Whole Foods Market, Inc. (Food & Staples Retailing) | 6,800 | 393,244 | ||||||||
Archer-Daniels-Midland Co. (Food Products) | 12,050 | 522,970 | ||||||||
Campbell Soup Co. (Food Products) | 3,300 | 142,824 | ||||||||
ConAgra Foods, Inc. (Food Products) | 7,700 | 259,490 | ||||||||
General Mills, Inc. (Food Products) | 11,600 | 578,956 | ||||||||
Hershey Co. / The (Food Products) | 2,800 | 272,244 | ||||||||
Hormel Foods Corp. (Food Products) | 2,500 | 112,925 | ||||||||
J.M. Smucker Co. / The (Food Products) | 1,900 | 196,878 | ||||||||
Kellogg Co. (Food Products) | 4,700 | 287,029 | ||||||||
Kraft Foods Group, Inc. (Food Products) | 10,925 | 589,076 | ||||||||
McCormick & Co., Inc. (Food Products) | 2,400 | 165,408 | ||||||||
Mead Johnson Nutrition Co. (Food Products) | 3,751 | 314,184 | ||||||||
Mondelez International, Inc. Class A (Food Products) | 32,176 | 1,135,813 | ||||||||
Tyson Foods, Inc. Class A (Food Products) | 5,000 | 167,300 | ||||||||
Clorox Co. / The (Household Products) | 2,400 | 222,624 | ||||||||
Colgate-Palmolive Co. (Household Products) | 16,100 | 1,049,881 | ||||||||
Kimberly-Clark Corp. (Household Products) | 7,000 | 731,220 | ||||||||
Procter & Gamble Co. / The (Household Products) | 49,922 | 4,064,150 | ||||||||
Avon Products, Inc. (Personal Products) | 8,000 | 137,760 | ||||||||
Estee Lauder Cos., Inc. / The Class A (Personal Products) | 4,700 | 354,004 | ||||||||
Altria Group, Inc. (Tobacco) | 36,700 | 1,408,913 | ||||||||
Lorillard, Inc. (Tobacco) | 6,791 | 344,168 | ||||||||
Philip Morris International, Inc. (Tobacco) | 29,400 | 2,561,622 | ||||||||
Reynolds American, Inc. (Tobacco) | 5,800 | 289,942 | ||||||||
|
| |||||||||
| 29,552,512 | ||||||||||
|
| |||||||||
| 49 | (continued) |
| Ohio National Fund, Inc. | S&P 500® Index Portfolio (Continued) |
Schedule of Investments | December 31, 2013 |
| Common Stocks (Continued) | Shares | Value | ||||||||
ENERGY – 9.9% | ||||||||||
Baker Hughes, Inc. (Energy Equip. & Svs.) | 8,141 | $ | 449,872 | |||||||
Cameron International Corp. (Energy Equip. & Svs.) | (a) | 4,400 | 261,932 | |||||||
Diamond Offshore Drilling, Inc. (Energy Equip. & Svs.) | 1,300 | 73,996 | ||||||||
Ensco PLC Class A (Energy Equip. & Svs.) | 4,300 | 245,874 | ||||||||
FMC Technologies, Inc. (Energy Equip. & Svs.) | (a) | 4,300 | 224,503 | |||||||
Halliburton Co. (Energy Equip. & Svs.) | 15,600 | 791,700 | ||||||||
Helmerich & Payne, Inc. (Energy Equip. & Svs.) | 2,000 | 168,160 | ||||||||
Nabors Industries Ltd. (Energy Equip. & Svs.) | 4,800 | 81,552 | ||||||||
National Oilwell Varco, Inc. (Energy Equip. & Svs.) | 7,900 | 628,287 | ||||||||
Noble Corp. PLC (Energy Equip. & Svs.) | 4,700 | 176,109 | ||||||||
Rowan Cos. PLC Class A (Energy Equip. & Svs.) | (a) | 2,300 | 81,328 | |||||||
Schlumberger Ltd. (Energy Equip. & Svs.) | 24,147 | 2,175,886 | ||||||||
Transocean Ltd. (Energy Equip. & Svs.) | 6,200 | 306,404 | ||||||||
Anadarko Petroleum Corp. (Oil, Gas & Consumable Fuels) | 9,200 | 729,744 | ||||||||
Apache Corp. (Oil, Gas & Consumable Fuels) | 7,372 | 633,550 | ||||||||
Cabot Oil & Gas Corp. (Oil, Gas & Consumable Fuels) | 7,700 | 298,452 | ||||||||
Chesapeake Energy Corp. (Oil, Gas & Consumable Fuels) | 9,300 | 252,402 | ||||||||
Chevron Corp. (Oil, Gas & Consumable Fuels) | 35,338 | 4,414,070 | ||||||||
ConocoPhillips (Oil, Gas & Consumable Fuels) | 22,500 | 1,589,625 | ||||||||
CONSOL Energy, Inc. (Oil, Gas & Consumable Fuels) | 4,200 | 159,768 | ||||||||
Denbury Resources, Inc. (Oil, Gas & Consumable Fuels) | (a) | 6,700 | 110,081 | |||||||
Devon Energy Corp. (Oil, Gas & Consumable Fuels) | 7,000 | 433,090 | ||||||||
EOG Resources, Inc. (Oil, Gas & Consumable Fuels) | 5,050 | 847,592 | ||||||||
EQT Corp. (Oil, Gas & Consumable Fuels) | 2,800 | 251,384 | ||||||||
Exxon Mobil Corp. (Oil, Gas & Consumable Fuels) | 80,264 | 8,122,717 | ||||||||
Hess Corp. (Oil, Gas & Consumable Fuels) | 5,200 | 431,600 | ||||||||
Kinder Morgan, Inc. (Oil, Gas & Consumable Fuels) | 12,373 | 445,428 | ||||||||
Marathon Oil Corp. (Oil, Gas & Consumable Fuels) | 12,820 | 452,546 | ||||||||
Marathon Petroleum Corp. (Oil, Gas & Consumable Fuels) | 5,560 | 510,019 | ||||||||
Murphy Oil Corp. (Oil, Gas & Consumable Fuels) | 3,200 | 207,616 | ||||||||
Newfield Exploration Co. (Oil, Gas & Consumable Fuels) | (a) | 2,500 | 61,575 | |||||||
Noble Energy, Inc. (Oil, Gas & Consumable Fuels) | 6,600 | 449,526 | ||||||||
Occidental Petroleum Corp. (Oil, Gas & Consumable Fuels) | 14,800 | 1,407,480 | ||||||||
Peabody Energy Corp. (Oil, Gas & Consumable Fuels) | 5,000 | 97,650 | ||||||||
Phillips 66 (Oil, Gas & Consumable Fuels) | 11,050 | 852,286 | ||||||||
Pioneer Natural Resources Co. (Oil, Gas & Consumable Fuels) | 2,600 | 478,582 | ||||||||
QEP Resources, Inc. (Oil, Gas & Consumable Fuels) | 3,300 | 101,145 | ||||||||
Range Resources Corp. (Oil, Gas & Consumable Fuels) | 3,000 | 252,930 | ||||||||
Southwestern Energy Co. (Oil, Gas & Consumable Fuels) | (a) | 6,400 | 251,712 | |||||||
Spectra Energy Corp. (Oil, Gas & Consumable Fuels) | 12,318 | 438,767 | ||||||||
Tesoro Corp. (Oil, Gas & Consumable Fuels) | 2,400 | 140,400 | ||||||||
Valero Energy Corp. (Oil, Gas & Consumable Fuels) | 9,900 | 498,960 | ||||||||
Williams Cos., Inc. / The (Oil, Gas & Consumable Fuels) | 12,600 | 485,982 | ||||||||
WPX Energy, Inc. (Oil, Gas & Consumable Fuels) | (a) | 3,700 | 75,406 | |||||||
|
| |||||||||
| 31,147,688 | ||||||||||
|
| |||||||||
FINANCIALS – 15.6% | ||||||||||
Ameriprise Financial, Inc. (Capital Markets) | 3,580 | 411,879 | ||||||||
Bank of New York Mellon Corp. / The (Capital Markets) | 21,111 | 737,618 | ||||||||
BlackRock, Inc. (Capital Markets) | 2,300 | 727,881 | ||||||||
Charles Schwab Corp. / The (Capital Markets) | 21,300 | 553,800 | ||||||||
E*TRADE Financial Corp. (Capital Markets) | (a) | 5,290 | 103,896 | |||||||
Franklin Resources, Inc. (Capital Markets) | 7,400 | 427,202 | ||||||||
Goldman Sachs Group, Inc. / The (Capital Markets) | 7,750 | 1,373,765 | ||||||||
Invesco Ltd. (Capital Markets) | 8,100 | 294,840 | ||||||||
Legg Mason, Inc. (Capital Markets) | 1,900 | 82,612 | ||||||||
| Common Stocks (Continued) | Shares | Value | ||||||||
FINANCIALS (continued) | ||||||||||
Morgan Stanley (Capital Markets) | 25,400 | $ | 796,544 | |||||||
Northern Trust Corp. (Capital Markets) | 4,100 | 253,749 | ||||||||
State Street Corp. (Capital Markets) | 8,100 | 594,459 | ||||||||
T. Rowe Price Group, Inc. (Capital Markets) | 4,800 | 402,096 | ||||||||
BB&T Corp. (Commercial Banks) | 12,900 | 481,428 | ||||||||
Comerica, Inc. (Commercial Banks) | 3,400 | 161,636 | ||||||||
Fifth Third Bancorp (Commercial Banks) | 16,250 | 341,738 | ||||||||
Huntington Bancshares, Inc. (Commercial Banks) | 15,300 | 147,645 | ||||||||
KeyCorp (Commercial Banks) | 16,500 | 221,430 | ||||||||
M&T Bank Corp. (Commercial Banks) | 2,400 | 279,408 | ||||||||
PNC Financial Services Group, Inc. / The (Commercial Banks) | 9,742 | 755,784 | ||||||||
Regions Financial Corp. (Commercial Banks) | 25,275 | 249,970 | ||||||||
SunTrust Banks, Inc. (Commercial Banks) | 9,800 | 360,738 | ||||||||
U.S. Bancorp (Commercial Banks) | 33,590 | 1,357,036 | ||||||||
Wells Fargo & Co. (Commercial Banks) | 88,013 | 3,995,790 | ||||||||
Zions Bancorporation (Commercial Banks) | 3,400 | 101,864 | ||||||||
American Express Co. (Consumer Finance) | 16,900 | 1,533,337 | ||||||||
Capital One Financial Corp. (Consumer Finance) | 10,573 | 809,998 | ||||||||
Discover Financial Services (Consumer Finance) | 8,750 | 489,562 | ||||||||
SLM Corp. (Consumer Finance) | 8,000 | 210,240 | ||||||||
Bank of America Corp. (Diversified Financial Svs.) | 195,927 | 3,050,583 | ||||||||
Berkshire Hathaway, Inc. Class B (Diversified Financial Svs.) | (a) | 33,091 | 3,923,269 | |||||||
Citigroup, Inc. (Diversified Financial Svs.) | 55,736 | 2,904,403 | ||||||||
CME Group, Inc. (Diversified Financial Svs.) | 5,775 | 453,107 | ||||||||
IntercontinentalExchange Group, Inc. (Diversified Financial Svs.) | 2,132 | 479,529 | ||||||||
JPMorgan Chase & Co. (Diversified Financial Svs.) | 69,043 | 4,037,635 | ||||||||
Leucadia National Corp. (Diversified Financial Svs.) | 5,800 | 164,372 | ||||||||
McGraw Hill Financial, Inc. (Diversified Financial Svs.) | 5,000 | 391,000 | ||||||||
Moody’s Corp. (Diversified Financial Svs.) | 3,500 | 274,645 | ||||||||
NASDAQ OMX Group, Inc. / The (Diversified Financial Svs.) | 2,100 | 83,580 | ||||||||
ACE Ltd. (Insurance) | 6,200 | 641,886 | ||||||||
Aflac, Inc. (Insurance) | 8,600 | 574,480 | ||||||||
Allstate Corp. / The (Insurance) | 8,400 | 458,136 | ||||||||
American International Group, Inc. (Insurance) | 26,995 | 1,378,095 | ||||||||
Aon PLC (Insurance) | 5,500 | 461,395 | ||||||||
Assurant, Inc. (Insurance) | 1,300 | 86,281 | ||||||||
Chubb Corp. / The (Insurance) | 4,600 | 444,498 | ||||||||
Cincinnati Financial Corp. (Insurance) | 2,666 | 139,618 | ||||||||
Genworth Financial, Inc. Class A (Insurance) | (a) | 9,100 | 141,323 | |||||||
Hartford Financial Services Group, Inc. (Insurance) | 8,200 | 297,086 | ||||||||
Lincoln National Corp. (Insurance) | 4,786 | 247,053 | ||||||||
Loews Corp. (Insurance) | 5,661 | 273,087 | ||||||||
Marsh & McLennan Cos., Inc. (Insurance) | 10,100 | 488,436 | ||||||||
MetLife, Inc. (Insurance) | 20,600 | 1,110,752 | ||||||||
Principal Financial Group, Inc. (Insurance) | 5,000 | 246,550 | ||||||||
Progressive Corp. / The (Insurance) | 10,100 | 275,427 | ||||||||
Prudential Financial, Inc. (Insurance) | 8,500 | 783,870 | ||||||||
Torchmark Corp. (Insurance) | 1,650 | 128,948 | ||||||||
Travelers Cos., Inc. / The (Insurance) | 6,659 | 602,906 | ||||||||
Unum Group (Insurance) | 4,800 | 168,384 | ||||||||
XL Group PLC (Insurance) | 5,200 | 165,568 | ||||||||
American Tower Corp. (Real Estate Investment Trusts) | 7,200 | 574,704 | ||||||||
Apartment Investment & Management Co. Class A (Real Estate Investment Trusts) | 2,673 | 69,257 | ||||||||
AvalonBay Communities, Inc. (Real Estate Investment Trusts) | 2,231 | 263,771 | ||||||||
Boston Properties, Inc. (Real Estate Investment Trusts) | 2,800 | 281,036 | ||||||||
Equity Residential (Real Estate Investment Trusts) | 6,200 | 321,594 | ||||||||
General Growth Properties, Inc. (Real Estate Investment Trusts) | 9,900 | 198,693 | ||||||||
HCP, Inc. (Real Estate Investment Trusts) | 8,400 | 305,088 | ||||||||
Health Care REIT, Inc. (Real Estate Investment Trusts) | 5,300 | 283,921 | ||||||||
| 50 | (continued) |
| Ohio National Fund, Inc. | S&P 500® Index Portfolio (Continued) |
Schedule of Investments | December 31, 2013 |
| Common Stocks (Continued) | Shares | Value | ||||||||
FINANCIALS (continued) | ||||||||||
Host Hotels & Resorts, Inc. (Real Estate Investment Trusts) | 13,902 | $ | 270,255 | |||||||
Kimco Realty Corp. (Real Estate Investment Trusts) | 7,500 | 148,125 | ||||||||
Macerich Co. / The (Real Estate Investment Trusts) | 2,600 | 153,114 | ||||||||
Plum Creek Timber Co., Inc. (Real Estate Investment Trusts) | 3,200 | 148,832 | ||||||||
Prologis, Inc. (Real Estate Investment Trusts) | 9,139 | 337,686 | ||||||||
Public Storage (Real Estate Investment Trusts) | 2,700 | 406,404 | ||||||||
Simon Property Group, Inc. (Real Estate Investment Trusts) | 5,662 | 861,530 | ||||||||
Ventas, Inc. (Real Estate Investment Trusts) | 5,400 | 309,312 | ||||||||
Vornado Realty Trust (Real Estate Investment Trusts) | 3,193 | 283,506 | ||||||||
Weyerhaeuser Co. (Real Estate Investment Trusts) | 10,663 | 336,631 | ||||||||
CBRE Group, Inc. (Real Estate Mgmt. & Development) | (a) | 5,100 | 134,130 | |||||||
Hudson City Bancorp, Inc. (Thrifts & Mortgage Finance) | 8,700 | 82,041 | ||||||||
People’s United Financial, Inc. (Thrifts & Mortgage Finance) | 5,800 | 87,696 | ||||||||
|
| |||||||||
| 48,991,173 | ||||||||||
|
| |||||||||
HEALTH CARE – 12.5% | ||||||||||
Alexion Pharmaceuticals, Inc. (Biotechnology) | (a) | 3,600 | 479,016 | |||||||
Amgen, Inc. (Biotechnology) | 13,806 | 1,576,093 | ||||||||
Biogen Idec, Inc. (Biotechnology) | (a) | 4,345 | 1,215,514 | |||||||
Celgene Corp. (Biotechnology) | (a) | 7,600 | 1,284,096 | |||||||
Gilead Sciences, Inc. (Biotechnology) | (a) | 28,200 | 2,119,230 | |||||||
Regeneron Pharmaceuticals, Inc. (Biotechnology) | (a) | 1,450 | 399,098 | |||||||
Vertex Pharmaceuticals, Inc. (Biotechnology) | (a) | 4,300 | 319,490 | |||||||
Abbott Laboratories (Health Care Equip. & Supplies) | 28,400 | 1,088,572 | ||||||||
Baxter International, Inc. (Health Care Equip. & Supplies) | 10,000 | 695,500 | ||||||||
Becton Dickinson and Co. (Health Care Equip. & Supplies) | 3,600 | 397,764 | ||||||||
Boston Scientific Corp. (Health Care Equip. & Supplies) | (a) | 24,503 | 294,526 | |||||||
CareFusion Corp. (Health Care Equip. & Supplies) | (a) | 3,850 | 153,307 | |||||||
Covidien PLC (Health Care Equip. & Supplies) | 8,400 | 572,040 | ||||||||
C.R. Bard, Inc. (Health Care Equip. & Supplies) | 1,400 | 187,516 | ||||||||
DENTSPLY International, Inc. (Health Care Equip. & Supplies) | 2,600 | 126,048 | ||||||||
Edwards Lifesciences Corp. (Health Care Equip. & Supplies) | (a) | 2,000 | 131,520 | |||||||
Intuitive Surgical, Inc. (Health Care Equip. & Supplies) | (a) | 725 | 278,458 | |||||||
Medtronic, Inc. (Health Care Equip. & Supplies) | 18,300 | 1,050,237 | ||||||||
St. Jude Medical, Inc. (Health Care Equip. & Supplies) | 5,400 | 334,530 | ||||||||
Stryker Corp. (Health Care Equip. & Supplies) | 5,400 | 405,756 | ||||||||
Varian Medical Systems, Inc. (Health Care Equip. & Supplies) | (a) | 1,900 | 147,611 | |||||||
Zimmer Holdings, Inc. (Health Care Equip. & Supplies) | 3,170 | 295,412 | ||||||||
Aetna, Inc. (Health Care Providers & Svs.) | 6,754 | 463,257 | ||||||||
AmerisourceBergen Corp. (Health Care Providers & Svs.) | 4,200 | 295,302 | ||||||||
Cardinal Health, Inc. (Health Care Providers & Svs.) | 6,300 | 420,903 | ||||||||
Cigna Corp. (Health Care Providers & Svs.) | 5,100 | 446,148 | ||||||||
DaVita HealthCare Partners, Inc. (Health Care Providers & Svs.) | (a) | 3,200 | 202,784 | |||||||
Express Scripts Holding Co. (Health Care Providers & Svs.) | (a) | 14,778 | 1,038,007 | |||||||
Humana, Inc. (Health Care Providers & Svs.) | 2,900 | 299,338 | ||||||||
Laboratory Corp. of America Holdings (Health Care Providers & Svs.) | (a) | 1,600 | 146,192 | |||||||
McKesson Corp. (Health Care Providers & Svs.) | 4,200 | 677,880 | ||||||||
Patterson Cos., Inc. (Health Care Providers & Svs.) | 1,500 | 61,800 | ||||||||
Quest Diagnostics, Inc. (Health Care Providers & Svs.) | 2,700 | 144,558 | ||||||||
| Common Stocks (Continued) | Shares | Value | ||||||||
HEALTH CARE (continued) | ||||||||||
Tenet Healthcare Corp. (Health Care Providers & Svs.) | (a) | 1,812 | $ | 76,321 | ||||||
UnitedHealth Group, Inc. (Health Care Providers & Svs.) | 18,500 | 1,393,050 | ||||||||
WellPoint, Inc. (Health Care Providers & Svs.) | 5,400 | 498,906 | ||||||||
Cerner Corp. (Health Care Technology) | (a) | 5,400 | 300,996 | |||||||
Agilent Technologies, Inc. (Life Sciences Tools & Svs.) | 6,100 | 348,859 | ||||||||
Life Technologies Corp. (Life Sciences Tools & Svs.) | (a) | 3,217 | 243,849 | |||||||
PerkinElmer, Inc. (Life Sciences Tools & Svs.) | 2,100 | 86,583 | ||||||||
Thermo Fisher Scientific, Inc. (Life Sciences Tools & Svs.) | 6,600 | 734,910 | ||||||||
Waters Corp. (Life Sciences Tools & Svs.) | (a) | 1,600 | 160,000 | |||||||
AbbVie, Inc. (Pharmaceuticals) | 29,200 | 1,542,052 | ||||||||
Actavis PLC (Pharmaceuticals) | (a) | 3,200 | 537,600 | |||||||
Allergan, Inc. (Pharmaceuticals) | 5,500 | 610,940 | ||||||||
Bristol-Myers Squibb Co. (Pharmaceuticals) | 30,269 | 1,608,797 | ||||||||
Eli Lilly & Co. (Pharmaceuticals) | 18,200 | 928,200 | ||||||||
Forest Laboratories, Inc. (Pharmaceuticals) | (a) | 4,400 | 264,132 | |||||||
Hospira, Inc. (Pharmaceuticals) | (a) | 3,010 | 124,253 | |||||||
Johnson & Johnson (Pharmaceuticals) | 51,800 | 4,744,362 | ||||||||
Merck & Co., Inc. (Pharmaceuticals) | 53,694 | 2,687,385 | ||||||||
Mylan, Inc. (Pharmaceuticals) | (a) | 7,000 | 303,800 | |||||||
Perrigo Co. PLC (Pharmaceuticals) | 2,400 | 368,304 | ||||||||
Pfizer, Inc. (Pharmaceuticals) | 119,010 | 3,645,276 | ||||||||
Zoetis, Inc. (Pharmaceuticals) | 9,200 | 300,748 | ||||||||
|
| |||||||||
| 39,256,826 | ||||||||||
|
| |||||||||
INDUSTRIALS – 10.5% | ||||||||||
Boeing Co. / The (Aerospace & Defense) | 12,700 | 1,733,423 | ||||||||
General Dynamics Corp. (Aerospace & Defense) | 6,100 | 582,855 | ||||||||
Honeywell International, Inc. (Aerospace & Defense) | 14,400 | 1,315,728 | ||||||||
L-3 Communications Holdings, Inc. (Aerospace & Defense) | 1,600 | 170,976 | ||||||||
Lockheed Martin Corp. (Aerospace & Defense) | 4,900 | 728,434 | ||||||||
Northrop Grumman Corp. (Aerospace & Defense) | 4,100 | 469,901 | ||||||||
Precision Castparts Corp. (Aerospace & Defense) | 2,700 | 727,110 | ||||||||
Raytheon Co. (Aerospace & Defense) | 5,900 | 535,130 | ||||||||
Rockwell Collins, Inc. (Aerospace & Defense) | 2,500 | 184,800 | ||||||||
Textron, Inc. (Aerospace & Defense) | 5,200 | 191,152 | ||||||||
United Technologies Corp. (Aerospace & Defense) | 15,500 | 1,763,900 | ||||||||
C.H. Robinson Worldwide, Inc. (Air Freight & Logistics) | 2,800 | 163,352 | ||||||||
Expeditors International of Washington, Inc. (Air Freight & Logistics) | 3,800 | 168,150 | ||||||||
FedEx Corp. (Air Freight & Logistics) | 5,500 | 790,735 | ||||||||
United Parcel Service, Inc. Class B (Air Freight & Logistics) | 13,100 | 1,376,548 | ||||||||
Delta Air Lines, Inc. (Airlines) | 15,700 | 431,279 | ||||||||
Southwest Airlines Co. (Airlines) | 12,800 | 241,152 | ||||||||
Allegion PLC (Building Products) | (a) | 1,600 | 70,704 | |||||||
Masco Corp. (Building Products) | 6,600 | 150,282 | ||||||||
ADT Corp. / The (Commercial Svs. & Supplies) | 3,650 | 147,716 | ||||||||
Cintas Corp. (Commercial Svs. & Supplies) | 1,800 | 107,262 | ||||||||
Iron Mountain, Inc. (Commercial Svs. & Supplies) | 3,084 | 93,599 | ||||||||
Pitney Bowes, Inc. (Commercial Svs. & Supplies) | 3,700 | 86,210 | ||||||||
Republic Services, Inc. (Commercial Svs. & Supplies) | 4,980 | 165,336 | ||||||||
Stericycle, Inc. (Commercial Svs. & Supplies) | (a) | 1,600 | 185,872 | |||||||
Tyco International Ltd. (Commercial Svs. & Supplies) | 8,500 | 348,840 | ||||||||
Waste Management, Inc. (Commercial Svs. & Supplies) | 8,000 | 358,960 | ||||||||
Fluor Corp. (Construction & Engineering) | 3,000 | 240,870 | ||||||||
Jacobs Engineering Group, Inc. (Construction & Engineering) | (a) | 2,400 | 151,176 | |||||||
Quanta Services, Inc. (Construction & Engineering) | (a) | 4,000 | 126,240 | |||||||
AMETEK, Inc. (Electrical Equip.) | 4,500 | 237,015 | ||||||||
Eaton Corp. PLC (Electrical Equip.) | 8,736 | 664,984 | ||||||||
Emerson Electric Co. (Electrical Equip.) | 12,900 | 905,322 | ||||||||
| 51 | (continued) |
| Ohio National Fund, Inc. | S&P 500® Index Portfolio (Continued) |
Schedule of Investments | December 31, 2013 |
| Common Stocks (Continued) | Shares | Value | ||||||||
INDUSTRIALS (continued) | ||||||||||
Rockwell Automation, Inc. (Electrical Equip.) | 2,500 | $ | 295,400 | |||||||
Roper Industries, Inc. (Electrical Equip.) | 1,800 | 249,624 | ||||||||
3M Co. (Industrial Conglomerates) | 11,700 | 1,640,925 | ||||||||
Danaher Corp. (Industrial Conglomerates) | 11,000 | 849,200 | ||||||||
General Electric Co. (Industrial Conglomerates) | 185,800 | 5,207,974 | ||||||||
Caterpillar, Inc. (Machinery) | 11,700 | 1,062,477 | ||||||||
Cummins, Inc. (Machinery) | 3,200 | 451,104 | ||||||||
Deere & Co. (Machinery) | 7,000 | 639,310 | ||||||||
Dover Corp. (Machinery) | 3,100 | 299,274 | ||||||||
Flowserve Corp. (Machinery) | 2,600 | 204,958 | ||||||||
Illinois Tool Works, Inc. (Machinery) | 7,500 | 630,600 | ||||||||
Ingersoll-Rand PLC (Machinery) | 4,900 | 301,840 | ||||||||
Joy Global, Inc. (Machinery) | 2,000 | 116,980 | ||||||||
PACCAR, Inc. (Machinery) | 6,512 | 385,315 | ||||||||
Pall Corp. (Machinery) | 2,000 | 170,700 | ||||||||
Parker Hannifin Corp. (Machinery) | 2,700 | 347,328 | ||||||||
Pentair Ltd. (Machinery) | 3,703 | 287,612 | ||||||||
Snap-on, Inc. (Machinery) | 1,100 | 120,472 | ||||||||
Stanley Black & Decker, Inc. (Machinery) | 2,847 | 229,724 | ||||||||
Xylem, Inc. (Machinery) | 3,400 | 117,640 | ||||||||
Dun & Bradstreet Corp. / The (Professional Svs.) | 700 | 85,925 | ||||||||
Equifax, Inc. (Professional Svs.) | 2,200 | 151,998 | ||||||||
Nielsen Holdings NV (Professional Svs.) | 4,600 | 211,094 | ||||||||
Robert Half International, Inc. (Professional Svs.) | 2,500 | 104,975 | ||||||||
CSX Corp. (Road & Rail) | 18,600 | 535,122 | ||||||||
Kansas City Southern (Road & Rail) | 2,000 | 247,660 | ||||||||
Norfolk Southern Corp. (Road & Rail) | 5,700 | 529,131 | ||||||||
Ryder System, Inc. (Road & Rail) | 1,000 | 73,780 | ||||||||
Union Pacific Corp. (Road & Rail) | 8,500 | 1,428,000 | ||||||||
Fastenal Co. (Trading Companies & Distributors) | 5,000 | 237,550 | ||||||||
W.W. Grainger, Inc. (Trading Companies & Distributors) | 1,100 | 280,962 | ||||||||
|
| |||||||||
| 33,109,667 | ||||||||||
|
| |||||||||
INFORMATION TECHNOLOGY – 17.9% | ||||||||||
Cisco Systems, Inc. (Communications Equip.) | 98,200 | 2,204,590 | ||||||||
F5 Networks, Inc. (Communications Equip.) | (a) | 1,400 | 127,204 | |||||||
Harris Corp. (Communications Equip.) | 2,000 | 139,620 | ||||||||
Juniper Networks, Inc. (Communications Equip.) | (a) | 9,300 | 209,901 | |||||||
Motorola Solutions, Inc. (Communications Equip.) | 4,214 | 284,445 | ||||||||
QUALCOMM, Inc. (Communications Equip.) | 31,000 | 2,301,750 | ||||||||
Apple, Inc. (Computers & Peripherals) | 16,500 | 9,258,315 | ||||||||
EMC Corp. (Computers & Peripherals) | 37,800 | 950,670 | ||||||||
Hewlett-Packard Co. (Computers & Peripherals) | 35,300 | 987,694 | ||||||||
NetApp, Inc. (Computers & Peripherals) | 6,300 | 259,182 | ||||||||
SanDisk Corp. (Computers & Peripherals) | 4,100 | 289,214 | ||||||||
Seagate Technology PLC (Computers & Peripherals) | 6,000 | 336,960 | ||||||||
Western Digital Corp. (Computers & Peripherals) | 3,900 | 327,210 | ||||||||
Amphenol Corp. Class A (Electronic Equip., Instr. & Comp.) | 2,900 | 258,622 | ||||||||
Corning, Inc. (Electronic Equip., Instr. & Comp.) | 26,600 | 474,012 | ||||||||
FLIR Systems, Inc. (Electronic Equip., Instr. & Comp.) | 2,600 | 78,260 | ||||||||
Jabil Circuit, Inc. (Electronic Equip., Instr. & Comp.) | 3,400 | 59,296 | ||||||||
TE Connectivity Ltd. (Electronic Equip., Instr. & Comp.) | 7,500 | 413,325 | ||||||||
Akamai Technologies, Inc. (Internet Software & Svs.) | (a) | 3,300 | 155,694 | |||||||
eBay, Inc. (Internet Software & Svs.) | (a) | 21,400 | 1,174,646 | |||||||
Facebook, Inc. Class A (Internet Software & Svs.) | (a) | 30,200 | 1,650,732 | |||||||
Google, Inc. Class A (Internet Software & Svs.) | (a) | 5,150 | 5,771,656 | |||||||
VeriSign, Inc. (Internet Software & Svs.) | (a) | 2,400 | 143,472 | |||||||
Yahoo!, Inc. (Internet Software & Svs.) | (a) | 17,300 | 699,612 | |||||||
Accenture PLC Class A (IT Svs.) | 11,700 | 961,974 | ||||||||
Alliance Data Systems Corp. (IT Svs.) | (a) | 900 | 236,637 | |||||||
Automatic Data Processing, Inc. (IT Svs.) | 8,800 | 711,128 | ||||||||
Cognizant Technology Solutions Corp. Class A (IT Svs.) | (a) | 5,600 | 565,488 | |||||||
Computer Sciences Corp. (IT Svs.) | 2,700 | 150,876 | ||||||||
Fidelity National Information Services, Inc. (IT Svs.) | 5,300 | 284,504 | ||||||||
| Common Stocks (Continued) | Shares | Value | ||||||||
INFORMATION TECHNOLOGY (continued) | ||||||||||
Fiserv, Inc. (IT Svs.) | (a) | 4,700 | $ | 277,535 | ||||||
International Business Machines Corp. (IT Svs.) | 18,750 | 3,516,937 | ||||||||
MasterCard, Inc. Class A (IT Svs.) | 1,900 | 1,587,374 | ||||||||
Paychex, Inc. (IT Svs.) | 6,000 | 273,180 | ||||||||
Teradata Corp. (IT Svs.) | (a) | 3,000 | 136,470 | |||||||
Total System Services, Inc. (IT Svs.) | 3,077 | 102,403 | ||||||||
Visa, Inc. (IT Svs.) | 9,400 | 2,093,192 | ||||||||
Western Union Co. / The (IT Svs.) | 10,147 | 175,036 | ||||||||
Xerox Corp. (Office Electronics) | 21,302 | 259,245 | ||||||||
Altera Corp. (Semiconductors & Equip.) | 5,900 | 191,927 | ||||||||
Analog Devices, Inc. (Semiconductors & Equip.) | 5,700 | 290,301 | ||||||||
Applied Materials, Inc. (Semiconductors & Equip.) | 22,100 | 390,949 | ||||||||
Broadcom Corp. Class A (Semiconductors & Equip.) | 9,950 | 295,018 | ||||||||
First Solar, Inc. (Semiconductors & Equip.) | (a) | 1,250 | 68,300 | |||||||
Intel Corp. (Semiconductors & Equip.) | 91,300 | 2,370,148 | ||||||||
KLA-Tencor Corp. (Semiconductors & Equip.) | 3,100 | 199,826 | ||||||||
Lam Research Corp. (Semiconductors & Equip.) | (a) | 3,025 | 164,711 | |||||||
Linear Technology Corp. (Semiconductors & Equip.) | 4,300 | 195,865 | ||||||||
LSI Corp. (Semiconductors & Equip.) | 10,000 | 110,200 | ||||||||
Microchip Technology, Inc. (Semiconductors & Equip.) | 3,600 | 161,100 | ||||||||
Micron Technology, Inc. (Semiconductors & Equip.) | (a) | 19,300 | 419,968 | |||||||
NVIDIA Corp. (Semiconductors & Equip.) | 10,600 | 169,812 | ||||||||
Texas Instruments, Inc. (Semiconductors & Equip.) | 20,100 | 882,591 | ||||||||
Xilinx, Inc. (Semiconductors & Equip.) | 4,900 | 225,008 | ||||||||
Adobe Systems, Inc. (Software) | (a) | 8,500 | 508,980 | |||||||
Autodesk, Inc. (Software) | (a) | 4,100 | 206,353 | |||||||
CA, Inc. (Software) | 6,000 | 201,900 | ||||||||
Citrix Systems, Inc. (Software) | (a) | 3,400 | 215,050 | |||||||
Electronic Arts, Inc. (Software) | (a) | 5,700 | 130,758 | |||||||
Intuit, Inc. (Software) | 5,200 | 396,864 | ||||||||
Microsoft Corp. (Software) | 139,500 | 5,221,485 | ||||||||
Oracle Corp. (Software) | 64,500 | 2,467,770 | ||||||||
Red Hat, Inc. (Software) | (a) | 3,500 | 196,140 | |||||||
Salesforce.com, Inc. (Software) | (a) | 10,200 | 562,938 | |||||||
Symantec Corp. (Software) | 12,794 | 301,683 | ||||||||
|
| |||||||||
| 56,433,706 | ||||||||||
|
| |||||||||
MATERIALS – 3.4% | ||||||||||
Air Products & Chemicals, Inc. (Chemicals) | 3,900 | 435,942 | ||||||||
Airgas, Inc. (Chemicals) | 1,200 | 134,220 | ||||||||
CF Industries Holdings, Inc. (Chemicals) | 1,100 | 256,344 | ||||||||
Dow Chemical Co. / The (Chemicals) | 22,300 | 990,120 | ||||||||
Eastman Chemical Co. (Chemicals) | 2,800 | 225,960 | ||||||||
Ecolab, Inc. (Chemicals) | 5,000 | 521,350 | ||||||||
E.I. du Pont de Nemours & Co. (Chemicals) | 17,000 | 1,104,490 | ||||||||
FMC Corp. (Chemicals) | 2,400 | 181,104 | ||||||||
International Flavors & Fragrances, Inc. (Chemicals) | 1,500 | 128,970 | ||||||||
LyondellBasell Industries NV Class A (Chemicals) | 8,000 | 642,240 | ||||||||
Monsanto Co. (Chemicals) | 9,686 | 1,128,903 | ||||||||
Mosaic Co. / The (Chemicals) | 6,300 | 297,801 | ||||||||
PPG Industries, Inc. (Chemicals) | 2,600 | 493,116 | ||||||||
Praxair, Inc. (Chemicals) | 5,400 | 702,162 | ||||||||
Sherwin-Williams Co. / The (Chemicals) | 1,600 | 293,600 | ||||||||
Sigma-Aldrich Corp. (Chemicals) | 2,200 | 206,822 | ||||||||
Vulcan Materials Co. (Construction Materials) | 2,400 | 142,608 | ||||||||
Avery Dennison Corp. (Containers & Packaging) | 1,800 | 90,342 | ||||||||
Ball Corp. (Containers & Packaging) | 2,700 | 139,482 | ||||||||
Bemis Co., Inc. (Containers & Packaging) | 1,900 | 77,824 | ||||||||
MeadWestvaco Corp. (Containers & Packaging) | 3,300 | 121,869 | ||||||||
Owens-Illinois, Inc. (Containers & Packaging) | (a) | 3,000 | 107,340 | |||||||
Sealed Air Corp. (Containers & Packaging) | 3,600 | 122,580 | ||||||||
Alcoa, Inc. (Metals & Mining) | 19,600 | 208,348 | ||||||||
Allegheny Technologies, Inc. (Metals & Mining) | 2,000 | 71,260 | ||||||||
Cliffs Natural Resources, Inc. (Metals & Mining) | 2,800 | 73,388 | ||||||||
Freeport-McMoRan Copper & Gold, Inc. (Metals & Mining) | 19,052 | 719,022 | ||||||||
Newmont Mining Corp. (Metals & Mining) | 9,100 | 209,573 | ||||||||
Nucor Corp. (Metals & Mining) | 5,800 | 309,604 | ||||||||
| 52 | (continued) |
| Ohio National Fund, Inc. | S&P 500® Index Portfolio (Continued) |
Schedule of Investments | December 31, 2013 |
| Common Stocks (Continued) | Shares | Value | ||||||||
MATERIALS (continued) | ||||||||||
United States Steel Corp. (Metals & Mining) | 2,700 | $ | 79,650 | |||||||
International Paper Co. (Paper & Forest Products) | 8,100 | 397,143 | ||||||||
|
| |||||||||
| 10,613,177 | ||||||||||
|
| |||||||||
TELECOMMUNICATION SERVICES – 2.2% | ||||||||||
AT&T, Inc. (Diversified Telecom. Svs.) | 96,778 | 3,402,714 | ||||||||
CenturyLink, Inc. (Diversified Telecom. Svs.) | 10,872 | 346,273 | ||||||||
Frontier Communications Corp. (Diversified Telecom. Svs.) | 18,341 | 85,286 | ||||||||
Verizon Communications, Inc. (Diversified Telecom. Svs.) | 52,600 | 2,584,764 | ||||||||
Windstream Holdings, Inc. (Diversified Telecom. Svs.) | 10,996 | 87,748 | ||||||||
Crown Castle International Corp. (Wireless Telecom. Svs.) | (a) | 6,100 | 447,923 | |||||||
|
| |||||||||
| 6,954,708 | ||||||||||
|
| |||||||||
UTILITIES – 2.8% | ||||||||||
American Electric Power Co., Inc. (Electric Utilities) | 8,900 | 415,986 | ||||||||
Duke Energy Corp. (Electric Utilities) | 12,943 | 893,196 | ||||||||
Edison International (Electric Utilities) | 6,000 | 277,800 | ||||||||
Entergy Corp. (Electric Utilities) | 3,300 | 208,791 | ||||||||
Exelon Corp. (Electric Utilities) | 15,690 | 429,749 | ||||||||
FirstEnergy Corp. (Electric Utilities) | 7,634 | 251,769 | ||||||||
NextEra Energy, Inc. (Electric Utilities) | 7,900 | 676,398 | ||||||||
Northeast Utilities (Electric Utilities) | 5,800 | 245,862 | ||||||||
Pepco Holdings, Inc. (Electric Utilities) | 4,600 | 87,998 | ||||||||
Pinnacle West Capital Corp. (Electric Utilities) | 2,000 | 105,840 | ||||||||
PPL Corp. (Electric Utilities) | 11,600 | 349,044 | ||||||||
Southern Co. / The (Electric Utilities) | 16,200 | 665,982 | ||||||||
Xcel Energy, Inc. (Electric Utilities) | 9,100 | 254,254 | ||||||||
| Common Stocks (Continued) | Shares | Value | ||||||||
UTILITIES (continued) | ||||||||||
AGL Resources, Inc. (Gas Utilities) | 2,186 | $ | 103,245 | |||||||
ONEOK, Inc. (Gas Utilities) | 3,800 | 236,284 | ||||||||
AES Corp. (Ind. Power Prod. & Energy Traders) | 12,100 | 175,571 | ||||||||
NRG Energy, Inc. (Ind. Power Prod. & Energy Traders) | 5,900 | 169,448 | ||||||||
Ameren Corp. (Multi-Utilities) | 4,500 | 162,720 | ||||||||
CenterPoint Energy, Inc. (Multi-Utilities) | 7,900 | 183,122 | ||||||||
CMS Energy Corp. (Multi-Utilities) | 4,900 | 131,173 | ||||||||
Consolidated Edison, Inc. (Multi-Utilities) | 5,400 | 298,512 | ||||||||
Dominion Resources, Inc. (Multi-Utilities) | 10,700 | 692,183 | ||||||||
DTE Energy Co. (Multi-Utilities) | 3,200 | 212,448 | ||||||||
Integrys Energy Group, Inc. (Multi-Utilities) | 1,512 | 82,268 | ||||||||
NiSource, Inc. (Multi-Utilities) | 5,800 | 190,704 | ||||||||
PG&E Corp. (Multi-Utilities) | 8,300 | 334,324 | ||||||||
Public Service Enterprise Group, Inc. (Multi-Utilities) | 9,300 | 297,972 | ||||||||
SCANA Corp. (Multi-Utilities) | 2,600 | 122,018 | ||||||||
Sempra Energy (Multi-Utilities) | 4,200 | 376,992 | ||||||||
TECO Energy, Inc. (Multi-Utilities) | 3,800 | 65,512 | ||||||||
Wisconsin Energy Corp. (Multi-Utilities) | 4,200 | 173,628 | ||||||||
|
| |||||||||
| 8,870,793 | ||||||||||
|
| |||||||||
Total Common Stocks (Cost $195,966,317) | $ | 302,879,770 | ||||||||
|
| |||||||||
| Exchange Traded Funds – 3.7% | Shares | Value | ||||||||
| SPDR S&P 500 ETF Trust | 64,075 | $ | 11,832,730 | |||||||
|
| |||||||||
Total Exchange Traded Funds (Cost $11,274,158) | $ | 11,832,730 | ||||||||
|
| |||||||||
Total Investments – 99.9% (Cost $207,240,475) | (b) | $ | 314,712,500 | |||||||
Other Assets in Excess of Liabilities – 0.1% | 220,529 | |||||||||
|
| |||||||||
Net Assets – 100.0% | $ | 314,933,029 | ||||||||
|
| |||||||||
Percentages are stated as a percent of net assets.
Footnotes:
| (a) | Non-income producing security. |
| (b) | Represents cost for financial reporting purposes, which may differ from cost basis for federal income tax purposes. See also Note 7 of the Notes to Financial Statements. |
The accompanying notes are an integral part of these financial statements.
| 53 |
| Ohio National Fund, Inc. | Strategic Value Portfolio |
Objective/Strategy
The Strategic Value Portfolio seeks growth of capital and income by investing primarily in securities of high dividend yielding, undervalued stocks with dividend growth potential.
Performance as of December 31, 2013
Average Annual Total Returns: | ||||
One year | 21.00% | |||
Five years | 13.06% | |||
Ten years | 4.91% |
Past performance does not guarantee future results. The performance data quoted represents past performance and current returns may be lower or higher. Total return figures include change in share price and reinvestment of dividends and capital gains. The investment return and principal value will fluctuate so that an investor’s shares, when redeemed, may be worth more or less than the original cost. To obtain performance information up to the most recent month end, call toll-free 1-877-781-6392.
The Portfolio is not open to direct retail investment. Beneficial interest in shares is obtained solely by purchase of variable life insurance policies and variable annuity contracts. Actual performance results for variable annuity and variable universal life contracts will be lower due to contract charges. Consult your contract for applicable charges.
Comments
For the year ended December 31, 2013, the Strategic Value Portfolio returned 21.00% versus 29.06% for the current benchmark, the Dow Jones U.S. Select Dividend Index (DJSDI).
Staying focused on its objectives of providing a consistent and growing income stream, the Portfolio ended the fiscal year with a gross weighted average dividend yield of 4.4%. This was greater than the yield of the 10-Year Treasury bond (3.0%), the yield of the broad market (2.0%), and the yield of the Dow Jones U.S. Select Dividend Index (3.6%), which aims to represent the domestic dividend-paying universe. In addition to its higher-than-market yield, the Portfolio continues to identify high-quality companies that raise their dividends. Thirty five of the holdings increased their dividends over the past 12 months, with one company raising its dividends twice during the year for a total of 36 increases. Some of the most generous increases have come from General Mills, Inc., Chevron Corp., Unilever PLC and Phillip Morris International, Inc. These companies have increased their dividend by 15.2%, 11.1%, 10.7%, and 10.6%, respectively. The Portfolio experienced a dividend cut from CenturyLink, Inc. in February, when the company’s management team unexpectedly chose to pursue a different capital allocation strategy. Following the announcement of the dividend cut, CenturyLink, Inc. was sold since it was no longer supportive of a dividend-based investment strategy.(1)
Even with the Portfolio’s low Beta of 0.47, the Portfolio posted a favorable total return of 21.00% for the twelve month period. The Portfolio primarily invests in high yield, low beta, large cap, high quality holdings, which are representative of a dividend oriented strategy. Unfortunately, these characteristics were out of favor during the fiscal year. Among equities in the broad market, low quality stocks outperformed high quality stocks by 18.5%, high beta stocks eclipsed low beta stocks by 13.7%, small cap stocks outperformed large cap stocks by 9.7%, and lowest yielding stocks exceeded highest yielding stocks by 18.4%.(1)
During the fiscal year, the DJSDI saw the greatest returns in cyclical sectors, including Information Technology (84.2%) and Industrials (55.3%), which afford little reliable dividend yield and dividend
growth opportunity. A significant drawback to relative performance was having no exposure to the cyclical Industrials sector, which had a notable position in the DJSDI of 17.1%. This accounted for two thirds of the Portfolio’s underperformance versus the DJSDI. The Portfolio was further penalized relative to the benchmark due to its higher market capitalization, higher dividend yield and lower risk tilt; factors that underperformed in the period.(1)
Although high quality, dividend paying, defensive sectors lagged in the overall market, the largest positive contribution to relative performance came from the dividend-friendly Health Care sector, which returned 38.5% in the Portfolio versus 30.3% in the DJSDI. Bristol-Myers Squibb Co., up 69.9%, AbbVie, Inc., up 48.45%, Johnson & Johnson, up up 34.6%, and AstraZeneca PLC, up 32.7%, led the way for the Health Care sector.(1)
On an absolute performance basis, the Portfolio’s international investments contributed positively, as the foreign holdings returned 26.4% for the year, outperforming the Portfolio’s domestic investments. This was driven by the United Kingdom, which returned 27.4% as Vodafone Group PLC, up 63.4%, AstraZeneca PLC, up 32.7%, GlaxoSmithKline PLC, up 29.1%, National Grid PLC, up 20.6%, and BP PLC, up 15.7%, all posted double digit returns.(1)
The Portfolio’s five best performing securities were Bristol-Myers Squibb Co., up 69.9%, Vodafone Group PLC, up 63.4%, Abbvie, Inc., up 48.4%, Lorillard, Inc., up 37.1%, and Johnson & Johnson, up 34.6%. Of note, Vodafone Group PLC advanced after the September 2 announcement that Verizon Communications reached an agreement to acquire Vodafone Group PLC’s 45% interest in Verizon Wireless for $130 billion. Vodafone Group PLC is planning to pay out 71% of the net proceeds to shareholders as a special dividend in 2014.(1)
The Portfolio’s five worst performing securities, which included four of the Portfolio’s real estate investment trusts (REITS), were Digital Realty Trust, Inc., down 15.8%, CenturyLink, Inc., down 15.6%. Health Care REIT, Inc., down 14.6%, HCP, Inc., down 12.2%, and Ventas, Inc., down 8.0%. Short-term performance pressure resulted from the threat of rising interest rates and investor preference for risky assets. We continue to find our small subset of the REIT universe to be quite attractive and are confident in their dividend integrity. The aforementioned CenturyLink, Inc. was the fifth notable laggard with a return of -15.6%.(1)
The Portfolio has not changed its basic positioning, as it continues to invest in companies that exhibit both the ability and the inclination to pay and increase their dividends, although the security makeup of the Portfolio has changed modestly over the trailing one-year. Changes to sector exposures included a 5.2% increase in Financials and a 4.0% increase in the Energy exposure. Energy increased from 12.8% to 16.8% as a result of establishing positions in BP PLC and Williams Companies. With a dividend yield of 4.7% at year end, BP PLC also has an attractive dividend growth profile as evidenced by the 25% growth in its distribution since reinstituting its dividend policy in February 2011. Williams Companies is a high-yielding, energy infrastructure company with an attractive dividend yield (3.9%) that is expected to grow by double digits over the next few years. The Financials weight also increased by 5.2%, driven by the addition of five REITS, Realty Income Corp., Ventas, Inc., HCP, Inc., Digital Realty Trust, Inc., and Health Care REIT; all of which have effectively migrated through the financial crisis without having to cut their dividends. Further, the health care REITS are expected to benefit from the 7.4% forecasted increase in national health care expenditures in 2014, according to Centers for Medicare and Medicaid Services. At year end, the REITS in the Portfolio provided
| 54 | (continued) |
| Ohio National Fund, Inc. | Strategic Value Portfolio (Continued) |
an average dividend yield of 5.8%. New additions to the Portfolio were funded through a 4% reduction in each of Utilities and Telecommunication Services. Within Telecommunication Services, CenturyLink, Inc. was sold after its unexpected dividend cut and Windstream Corp. was eliminated after its investment thesis failed to materialize.(1)
2013 proved to be a strong year for stocks, with major indexes achieving record highs in spite of heightened volatility surrounding notable events such as the discussion of tapering quantitative easing, the government shutdown, and the fear of a U.S. default. In looking ahead to 2014, generally improving economic data continues to be supportive of a broad global stabilization. However, some investors fear the market has gone too far and has a pull-back in the cards. Further, volatility may continue as the Federal Reserve continues its delicate dismantling of quantitative easing. Despite the ups and downs of the market now and in the future, we believe that the Portfolio will remain positioned to effectively provide positive income streams, reliable dividend growth, and downside protection.
| (1) | The Portfolio’s composition is subject to change. Holdings and weightings are as of December 31, 2013. |
Change in Value of $10,000 Investment
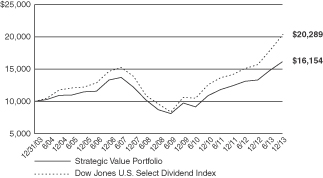
Hypothetical illustration based on past performance. Future performance will vary. The Portfolio’s returns reflect reinvested dividends. The Portfolio’s holdings may differ significantly from the securities in the index. The index is unmanaged and therefore does not reflect the cost of portfolio management and accounting.
The Dow Jones U.S. Select Dividend Index is comprised of all dividend-paying companies in the Dow Jones U.S. Index that have a non-negative historical five-year dividend-per-share growth rate, a five-year average dividend to earnings-per-share ratio of less than or equal to 60%, paid dividends in each of the previous five years, and a three-month average daily trading volume of 200,000 shares. Current index components are included in the universe regardless of their dividend payout ratio or trading volume. The Dow Jones U.S. Index aims to consistently represent the top 95% of U.S. companies based on float-adjusted market capitalization, excluding non common issues and illiquid stocks. The index presented includes the effects of reinvested dividends.
Portfolio Composition as of December 31, 2013 (1)
| % of Net Assets | ||||
Common Stocks (3) | 99.1 | |||
Money Market Funds | 0.9 | |||
|
| |||
| 100.0 | ||||
|
|
Top 10 Portfolio Holdings as of
December 31, 2013 (1) (2)
| % of Net Assets | ||||
1. AstraZeneca PLC | 4.4 | |||
2. Altria Group, Inc. | 4.3 | |||
3. AT&T, Inc. | 4.3 | |||
4. ConocoPhillips | 4.2 | |||
5. Vodafone Group PLC – ADR | 4.1 | |||
6. Royal Dutch Shell PLC | 4.0 | |||
7. Kraft Foods Group, Inc. | 3.9 | |||
8. Verizon Communications, Inc. | 3.8 | |||
9. Reynolds American, Inc. | 3.6 | |||
10. GlaxoSmithKline PLC | 3.5 |
| (1) | Composition of Portfolio subject to change. |
| (2) | Short-term investments have been excluded from the list of Top 10 Portfolio Holdings. |
| (3) | Sectors: |
| % of Net Assets | ||||
Consumer Staples | 26.4 | |||
Health Care | 18.5 | |||
Energy | 16.9 | |||
Utilities | 16.0 | |||
Telecommunication Services | 13.2 | |||
Financials | 5.2 | |||
Consumer Discretionary | 2.9 | |||
|
| |||
| 99.1 | ||||
|
|
| 55 |
| Ohio National Fund, Inc. | Strategic Value Portfolio |
Schedule of Investments | December 31, 2013 |
| Common Stocks – 99.1% | Shares | Value | ||||||||
CONSUMER DISCRETIONARY – 2.9% | ||||||||||
McDonald’s Corp. (Hotels, Restaurants & Leisure) | 120,325 | $ | 11,675,135 | |||||||
|
| |||||||||
CONSUMER STAPLES – 26.4% | ||||||||||
Coca-Cola Co. / The (Beverages) | 100,530 | 4,152,894 | ||||||||
PepsiCo, Inc. (Beverages) | 47,900 | 3,972,826 | ||||||||
General Mills, Inc. (Food Products) | 79,400 | 3,962,854 | ||||||||
Kellogg Co. (Food Products) | 64,775 | 3,955,809 | ||||||||
Kraft Foods Group, Inc. (Food Products) | 290,330 | 15,654,594 | ||||||||
Unilever PLC (Food Products) | (a) | 98,560 | 4,055,351 | |||||||
Kimberly-Clark Corp. (Household Products) | 102,175 | 10,673,200 | ||||||||
Procter & Gamble Co. / The (Household Products) | 50,360 | 4,099,808 | ||||||||
Altria Group, Inc. (Tobacco) | 443,200 | 17,014,448 | ||||||||
Lorillard, Inc. (Tobacco) | 246,500 | 12,492,620 | ||||||||
Philip Morris International, Inc. (Tobacco) | 121,735 | 10,606,770 | ||||||||
Reynolds American, Inc. (Tobacco) | 288,920 | 14,443,111 | ||||||||
|
| |||||||||
| 105,084,285 | ||||||||||
|
| |||||||||
ENERGY – 16.9% | ||||||||||
BP PLC (Oil, Gas & Consumable Fuels) | (a) | 1,468,600 | 11,901,762 | |||||||
Chevron Corp. (Oil, Gas & Consumable Fuels) | 47,950 | 5,989,434 | ||||||||
ConocoPhillips (Oil, Gas & Consumable Fuels) | 238,305 | 16,836,248 | ||||||||
Royal Dutch Shell PLC (Oil, Gas & Consumable Fuels) | (a) | 418,520 | 15,786,731 | |||||||
Total SA (Oil, Gas & Consumable Fuels) | (a) | 198,720 | 12,197,373 | |||||||
Williams Cos., Inc. / The (Oil, Gas & Consumable Fuels) | 111,400 | 4,296,698 | ||||||||
|
| |||||||||
| 67,008,246 | ||||||||||
|
| |||||||||
FINANCIALS – 5.2% | ||||||||||
Digital Realty Trust, Inc. (Real Estate Investment Trusts) | 71,700 | 3,521,904 | ||||||||
HCP, Inc. (Real Estate Investment Trusts) | 93,000 | 3,377,760 | ||||||||
Health Care REIT, Inc. (Real Estate Investment Trusts) | 122,000 | 6,535,540 | ||||||||
Realty Income Corp. (Real Estate Investment Trusts) | 95,800 | 3,576,214 | ||||||||
Ventas, Inc. (Real Estate Investment Trusts) | 61,900 | 3,545,632 | ||||||||
|
| |||||||||
| 20,557,050 | ||||||||||
|
| |||||||||
HEALTH CARE – 18.5% | ||||||||||
AbbVie, Inc. (Pharmaceuticals) | 255,300 | 13,482,393 | ||||||||
| Common Stocks (Continued) | Shares | Value | ||||||||
HEALTH CARE (continued) | ||||||||||
AstraZeneca PLC (Pharmaceuticals) | (a) | 293,000 | $ | 17,382,885 | ||||||
Bristol-Myers Squibb Co. (Pharmaceuticals) | 82,275 | 4,372,916 | ||||||||
Eli Lilly & Co. (Pharmaceuticals) | 79,490 | 4,053,990 | ||||||||
GlaxoSmithKline PLC (Pharmaceuticals) | (a) | 514,516 | 13,746,643 | |||||||
Johnson & Johnson (Pharmaceuticals) | 91,960 | 8,422,616 | ||||||||
Merck & Co., Inc. (Pharmaceuticals) | 245,000 | 12,262,250 | ||||||||
|
| |||||||||
| 73,723,693 | ||||||||||
|
| |||||||||
TELECOMMUNICATION SERVICES – 13.2% | ||||||||||
AT&T, Inc. (Diversified Telecom. Svs.) | 482,600 | 16,968,216 | ||||||||
BCE, Inc. (Diversified Telecom. Svs.) | 97,380 | 4,216,973 | ||||||||
Verizon Communications, Inc. (Diversified Telecom. Svs.) | 310,020 | 15,234,383 | ||||||||
Vodafone Group PLC – ADR (Wireless Telecom. Svs.) | 410,270 | 16,127,714 | ||||||||
|
| |||||||||
| 52,547,286 | ||||||||||
|
| |||||||||
UTILITIES – 16.0% | ||||||||||
American Electric Power Co., Inc. (Electric Utilities) | 97,100 | 4,538,454 | ||||||||
Duke Energy Corp. (Electric Utilities) | 169,206 | 11,676,906 | ||||||||
PPL Corp. (Electric Utilities) | 328,400 | 9,881,556 | ||||||||
Southern Co. / The (Electric Utilities) | 254,060 | 10,444,407 | ||||||||
SSE PLC (Electric Utilities) | (a) | 387,100 | 8,796,588 | |||||||
Dominion Resources, Inc. (Multi-Utilities) | 79,825 | 5,163,879 | ||||||||
National Grid PLC (Multi-Utilities) | (a) | 1,002,100 | 13,106,742 | |||||||
|
| |||||||||
| 63,608,532 | ||||||||||
|
| |||||||||
Total Common Stocks (Cost $353,453,281) | $ | 394,204,227 | ||||||||
|
| |||||||||
| Money Market Funds – 1.0% | Shares | Value | ||||||||
Fidelity Institutional Money Market Funds | 4,054,000 | $ | 4,054,000 | |||||||
|
| |||||||||
Total Money Market Funds (Cost $4,054,000) | $ | 4,054,000 | ||||||||
|
| |||||||||
Total Investments – 100.1% (Cost $357,507,281) | (b) | $ | 398,258,227 | |||||||
Liabilities in Excess of Other Assets – (0.1)% | (593,412) | |||||||||
|
| |||||||||
Net Assets – 100.0% | $ | 397,664,815 | ||||||||
|
| |||||||||
Percentages are stated as a percent of net assets.
Abbreviations:
ADR: American Depositary Receipts
Footnotes:
| (a) | Security traded on a foreign exchange has been valued at an estimate of fair value that is different than the local market close price. These fair value estimates are determined by an independent fair valuation service that has been approved by the Board. These securities represent $96,974,075, or 24.4% of the Portfolio’s net assets. Other Portfolio securities are not subjected to fair value procedures because they are traded on domestic or foreign exchanges that have close times that are consistent with the U.S. market close, normally 4:00 pm Eastern Time. |
| (b) | Represents cost for financial reporting purposes, which may differ from cost basis for federal income tax purposes. See also Note 7 of the Notes to Financial Statements. |
The accompanying notes are an integral part of these financial statements.
| 56 |
| Ohio National Fund, Inc. | High Income Bond Portfolio |
Objective/Strategy
The High Income Bond Portfolio seeks high current income by investing at least 80% of its net assets in lower rated corporate debt obligations commonly referred to as “junk bonds”. The Portfolio’s investments are generally rated Ba or lower by Moody’s, or BB or lower by Standard & Poor’s or Fitch.
Performance as of December 31, 2013
Average Annual Total Returns: | ||||
One year | 7.08% | |||
Five years | 17.11% | |||
Ten years | 7.86% |
Past performance does not guarantee future results. The performance data quoted represents past performance and current returns may be lower or higher. Total return figures include change in share price and reinvestment of dividends and capital gains. The investment return and principal value will fluctuate so that an investor’s shares, when redeemed, may be worth more or less than the original cost. To obtain performance information up to the most recent month end, call toll-free 1-877-781-6392.
The Portfolio is not open to direct retail investment. Beneficial interest in shares is obtained solely by purchase of variable life insurance policies and variable annuity contracts. Actual performance results for variable annuity and variable universal life contracts will be lower due to contract charges. Consult your contract for applicable charges.
Comments
For the year ended December 31, 2013, the High Income Bond Portfolio returned 7.08% versus 7.44% for the current benchmark, the Barclays Capital U.S. Corporate High-Yield 2% Issuer Capped Index (“BCHY2%”).
The high-yield market generated attractive total returns during the twelve month period, especially in light of the substantial increase in interest rates on U.S. Treasury securities of comparable maturities during the reporting period. For example, the yield on a 10-year U.S. Treasury security increased 127 basis points during the reporting period while the yield-to-worst on the BCHY2% actually declined 49 basis points. The high-yield market was also able to do well despite any number of potential political crises, including the fiscal cliff (automatic spending cuts that were slated to occur at the onset of 2013), sequestration, debt ceiling negotiations and the government shutdown. Two key factors led to the high-yield market’s strength. First, the U.S. economy’s growth has remained somewhat slow, but steady. The economy has continued to benefit from very accommodative monetary policy from the Federal Reserve. Second, corporate credit quality remains strong, as earnings were growing, cash flow generation was robust and companies were extending their debt maturity schedules and taking advantage of low interest rates to reduce their cost of capital. Risky lending, last seen in overabundance just prior to the financial crisis, remained in check. The default rate as calculated by the Altman & Kuehne High-Yield Bond Default and Return Report and New York University was 1.40% for the 12 months ending September 30, 2013, which compared favorably to the 4.00% arithmetic average annual default rate from 1985 through 2012. In fact, the market is poised to complete its fourth consecutive calendar year of sub-2% default rates. The impact of a good economy and strong corporate credit measures was illustrated by the declining spread between high-yield bonds and U.S. Treasury securities with comparable maturities, which, according to the Credit Suisse High Yield Bond Index, began the reporting period at 554 basis points and ended the reporting period at 436 basis points.
Within the high-yield market, major industry sectors that substantially outperformed the overall BCHY2% included: consumer products, industrial – other, technology, media – non cable and services. Major industry sectors that substantially underperformed the overall BCHY2% included: natural gas utilities, media cable, home construction, electric utilities and wireline telecommunications. From a ratings quality perspective, the lower-quality and more economically sensitive “CCC”-rated sector led the way with a return of 13.82%, followed by the “B”-rated sector, which returned 7.25%, and the more interest rate sensitive “BB”-rated sector turning in a respectable 5.05%.
During the twelve month reporting period, the most significant factors affecting the Portfolio’s performance relative to the BCHY2% was the selection of individual securities. The Portfolio benefited from strong security selection in the health care, gaming, automotive, packaging, energy and retail industry sectors. The Portfolio also benefitted by having limited holdings relative to the BCHY2%, in the underperforming wireline telecommunications and electric utility industry sectors. The Portfolio’s large exposure in the strong-performing technology sector also benefitted performance. Specific Portfolio holdings that substantially outperformed the BCHY2% included: Clear Channel Communications, Inc., Advanced Micro Devices, Inc., International Automotive Components Group SL, Iasis Healthcare and Pittsburgh Glass Works LLC.(1)
The Portfolio was negatively affected by poor security selection in the financial institutions, wireless communications and food & beverage industry segments. The Portfolio’s lack of exposure in the supermarket sector negatively impacted performance. The Portfolio’s holdings in the media – non cable and industrial-other industry categories underperformed, but overweights in these strong performing sectors offset most of the negative. Specific Portfolio holdings that substantially underperformed the BCHY2% included: Lone Pine Resources Canada Ltd., Mmodal, Exide Communications, Ball Corp. and long duration securities of Sprint Capital Corp.(1)
| (1) | The Portfolio’s composition is subject to change. Holdings and weightings are as of December 31, 2013. |
| 57 | (continued) |
| Ohio National Fund, Inc. | High Income Bond Portfolio (Continued) |
Change in Value of $10,000 Investment
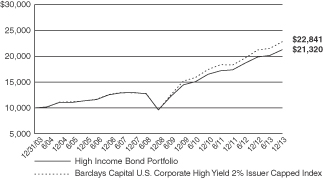
Hypothetical illustration based on past performance. Future performance will vary. All returns reflect reinvested dividends. The Portfolio’s holdings may differ significantly from the securities in the index. The index is unmanaged and therefore does not reflect the cost of Portfolio management or trading. Neither the Portfolio nor the index is open to direct investment.
The Barclays Capital U.S. Corporate High Yield 2% Issuer Capped Index is the 2% Issuer Cap component of the Barclays Capital U.S. Corporate High Yield Bond Index. The Barclays Capital U.S. Corporate High Yield Bond Index is an unmanaged index that includes all fixed income securities having a maximum quality rating of Ba1/BB+/BB+, a minimum amount outstanding of $150 million, and a least 1 year to maturity. The 2% Issuer Cap component limits the exposure of each issuer to 2% of the total market value and distributes any excess market value index–wide on a pro–rata basis. The index is presented on a total return basis.
Portfolio Composition as of December 31, 2013 (1)
| % of Net Assets | ||||
Corporate Bonds (3) | 95.5 | |||
Common Stocks (3) | 0.1 | |||
Preferred Stocks (3) | 0.1 | |||
Warrants (3) | 0.1 | |||
Money Market Funds and | ||||
Other Net Assets | 4.2 | |||
|
| |||
| 100.0 | ||||
|
|
Top 10 Portfolio Holdings as of December 31,
2013 (1) (2)
| % of Net Assets | ||||
1. U.S. Foods, Inc. | 1.0 | |||
2. First Data Corp. | 1.0 | |||
3. HCA, Inc. | 0.9 | |||
4. International Lease Finance Corp. 8.750%, 03/15/2017 | 0.7 | |||
5. Del Monte Corp. | 0.7 | |||
6. Ally Financial, Inc. | 0.7 | |||
7. Sprint Capital Corp. | 0.7 | |||
8. CDW LLC / CDW Finance Corp. | 0.7 | |||
9. Reynolds Group Issuer, Inc. / Reynolds Group Issuer LLC | 0.7 | |||
10. HCA Holdings, Inc. | 0.6 |
| (1) | Composition of Portfolio subject to change. |
| (2) | Short-term investments have been excluded from the list of Top 10 Portfolio Holdings. |
| (3) | Sectors (combined): |
| % of Net Assets | ||||
Consumer Discretionary | 28.6 | |||
Industrials | 11.5 | |||
Information Technology | 10.9 | |||
Energy | 10.3 | |||
Health Care | 10.2 | |||
Materials | 7.5 | |||
Consumer Staples | 5.7 | |||
Telecommunication Services | 5.2 | |||
Financials | 4.4 | |||
Utilities | 1.5 | |||
|
| |||
| 95.8 | ||||
|
|
| 58 |
| Ohio National Fund, Inc. | High Income Bond Portfolio |
Schedule of Investments | December 31, 2013 |
| Corporate Bonds – 95.5% | Rate | Maturity | Face Amount | Value | ||||||||||||
CONSUMER DISCRETIONARY – 28.4% | ||||||||||||||||
Allison Transmission, Inc. (Auto Components) | (b) | 7.125% | 05/15/2019 | $ | 600,000 | $ | 649,500 | |||||||||
American Axle & Manufacturing, Inc. (Auto Components) | 7.750% | 11/15/2019 | 625,000 | 714,062 | ||||||||||||
American Axle & Manufacturing, Inc. (Auto Components) | 6.625% | 10/15/2022 | 700,000 | 740,250 | ||||||||||||
American Axle & Manufacturing, Inc. (Auto Components) | 6.250% | 03/15/2021 | 400,000 | 427,000 | ||||||||||||
American Axle & Manufacturing, Inc. (Auto Components) | 5.125% | 02/15/2019 | 75,000 | 77,437 | ||||||||||||
Exide Technologies (Acquired 06/03/2011 through 01/05/2012, Cost $637,665)(Auto Components) | (d) | 8.625% | 02/01/2018 | 650,000 | 468,000 | |||||||||||
IDQ Holdings, Inc. (Auto Components) | (b) | 11.500% | 04/01/2017 | 600,000 | 627,000 | |||||||||||
International Automotive Components Group SL (Auto Components) | (b) | 9.125% | 06/01/2018 | 850,000 | 890,375 | |||||||||||
J.B. Poindexter & Co., Inc. (Auto Components) | (b) | 9.000% | 04/01/2022 | 725,000 | 777,562 | |||||||||||
Lear Corp. (Auto Components) | (b) | 4.750% | 01/15/2023 | 325,000 | 306,312 | |||||||||||
Stackpole International Intermediate / Stackpole International Powder (Auto Components) | (b) | 7.750% | 10/15/2021 | 450,000 | 470,250 | |||||||||||
Tenneco, Inc. (Auto Components) | 7.750% | 08/15/2018 | 325,000 | 349,375 | ||||||||||||
Tenneco, Inc. (Auto Components) | 6.875% | 12/15/2020 | 450,000 | 493,875 | ||||||||||||
Tomkins LLC (Auto Components) | 9.000% | 10/01/2018 | 427,000 | 469,700 | ||||||||||||
UCI International, Inc. (Auto Components) | 8.625% | 02/15/2019 | 1,675,000 | 1,683,375 | ||||||||||||
Chrysler Group LLC / CG Co-Issuer, Inc. (Automobiles) | 8.250% | 06/15/2021 | 750,000 | 856,875 | ||||||||||||
General Motors Financial Co., Inc. (Automobiles) | (b) | 4.250% | 05/15/2023 | 325,000 | 309,969 | |||||||||||
Jaguar Land Rover PLC (Automobiles) | (b) | 8.125% | 05/15/2021 | 1,050,000 | 1,199,625 | |||||||||||
Jaguar Land Rover Automotive PLC (Automobiles) | (b) | 5.625% | 02/01/2023 | 200,000 | 201,000 | |||||||||||
Affinia Group, Inc. (Distributors) | 7.750% | 05/01/2021 | 750,000 | 791,250 | ||||||||||||
Monitronics International, Inc. (Diversified Consumer Svs.) | 9.125% | 04/01/2020 | 650,000 | 692,250 | ||||||||||||
ServiceMaster Co. (Diversified Consumer Svs.) | 7.100% | 03/01/2018 | 450,000 | 441,000 | ||||||||||||
ServiceMaster Co. (Diversified Consumer Svs.) | 7.450% | 08/15/2027 | 300,000 | 255,000 | ||||||||||||
ServiceMaster Co. (Diversified Consumer Svs.) | 8.000% | 02/15/2020 | 750,000 | 768,750 | ||||||||||||
ServiceMaster Co. (Diversified Consumer Svs.) | 7.000% | 08/15/2020 | 1,000,000 | 996,250 | ||||||||||||
Affinity Gaming LLC / Affinity Gaming Finance Corp. (Hotels, Restaurants & Leisure) | 9.000% | 05/15/2018 | 775,000 | 833,125 | ||||||||||||
Caesars Entertainment Operating Co., Inc. (Hotels, Restaurants & Leisure) | 11.250% | 06/01/2017 | 625,000 | 637,500 | ||||||||||||
Cedar Fair LP / Canada’s Wonderland Co. / Magnum Management Corp. (Hotels, Restaurants & Leisure) | 9.125% | 08/01/2018 | 775,000 | 844,750 | ||||||||||||
Cedar Fair LP / Canada’s Wonderland Co. / Magnum Management Corp. (Hotels, Restaurants & Leisure) | 5.250% | 03/15/2021 | 125,000 | 124,062 | ||||||||||||
Chester Downs & Marina LLC (Hotels, Restaurants & Leisure) | (b) | 9.250% | 02/01/2020 | 600,000 | 604,500 | |||||||||||
Choice Hotels International, Inc. (Hotels, Restaurants & Leisure) | 5.750% | 07/01/2022 | 275,000 | 288,406 | ||||||||||||
Churchill Downs, Inc. (Hotels, Restaurants & Leisure) | (b) | 5.375% | 12/15/2021 | 225,000 | 229,500 | |||||||||||
DineEquity, Inc. (Hotels, Restaurants & Leisure) | 9.500% | 10/30/2018 | 1,000,000 | 1,115,000 | ||||||||||||
GLP Capital LP / GLP Financing II, Inc. (Hotels, Restaurants & Leisure) | (b) | 5.375% | 11/01/2023 | 375,000 | 370,312 | |||||||||||
GLP Capital LP / GLP Financing II, Inc. (Hotels, Restaurants & Leisure) | (b) | 4.875% | 11/01/2020 | 625,000 | 626,562 | |||||||||||
Hilton Worldwide Finance LLC / Hilton Worldwide Finance Corp. (Hotels, Restaurants & Leisure) | (b) | 5.625% | 10/15/2021 | 300,000 | 311,812 | |||||||||||
MGM Resorts International (Hotels, Restaurants & Leisure) | 7.500% | 06/01/2016 | 575,000 | 646,875 | ||||||||||||
MGM Resorts International (Hotels, Restaurants & Leisure) | 7.750% | 03/15/2022 | 550,000 | 617,375 | ||||||||||||
MGM Resorts International (Hotels, Restaurants & Leisure) | 8.625% | 02/01/2019 | 600,000 | 706,500 | ||||||||||||
MGM Resorts International (Hotels, Restaurants & Leisure) | 6.750% | 10/01/2020 | 425,000 | 455,812 | ||||||||||||
Mohegan Tribal Gaming Authority (Hotels, Restaurants & Leisure) | (b) | 9.750% | 09/01/2021 | 925,000 | 1,001,312 | |||||||||||
NPC International, Inc. / NPC Operating Co. A, Inc. / NPC Operating Co. B, Inc. (Hotels, Restaurants & Leisure) | 10.500% | 01/15/2020 | 1,200,000 | 1,392,000 | ||||||||||||
Penn National Gaming, Inc. (Hotels, Restaurants & Leisure) | (b) | 5.875% | 11/01/2021 | 500,000 | 495,000 | |||||||||||
Pinnacle Entertainment, Inc. (Hotels, Restaurants & Leisure) | 7.500% | 04/15/2021 | 550,000 | 599,500 | ||||||||||||
PNK Finance Corp. (Hotels, Restaurants & Leisure) | (b) | 6.375% | 08/01/2021 | 750,000 | 770,625 | |||||||||||
Rivers Pittsburgh Borrower LP / Rivers Pittsburgh Finance Corp. (Hotels, Restaurants & Leisure) | (b) | 9.500% | 06/15/2019 | 693,000 | 764,032 | |||||||||||
Royal Caribbean Cruises Ltd. (Hotels, Restaurants & Leisure) | 5.250% | 11/15/2022 | 475,000 | 477,375 | ||||||||||||
Seminole Hard Rock Entertainment, Inc. / Seminole Hard Rock International LLC (Hotels, Restaurants & Leisure) | (b) | 5.875% | 05/15/2021 | 775,000 | 765,312 | |||||||||||
Seminole Indian Tribe of Florida (Hotels, Restaurants & Leisure) | (b) | 7.804% | 10/01/2020 | 860,000 | 950,300 | |||||||||||
Six Flags Entertainment Corp. (Hotels, Restaurants & Leisure) | (b) | 5.250% | 01/15/2021 | 800,000 | 784,000 | |||||||||||
Station Casinos LLC (Hotels, Restaurants & Leisure) | 7.500% | 03/01/2021 | 825,000 | 882,750 | ||||||||||||
B.C. Mountain LLC / B.C. Mountain Finance, Inc. (Household Durables) | (b) | 7.000% | 02/01/2021 | 450,000 | 456,750 | |||||||||||
Hillman Group, Inc. / The (Household Durables) | 10.875% | 06/01/2018 | 1,225,000 | 1,329,125 | ||||||||||||
Libbey Glass, Inc. (Household Durables) | 6.875% | 05/15/2020 | 810,000 | 878,850 | ||||||||||||
RSI Home Products, Inc. (Household Durables) | (b) | 6.875% | 03/01/2018 | 725,000 | 763,062 | |||||||||||
Serta Simmons Holdings LLC (Household Durables) | (b) | 8.125% | 10/01/2020 | 1,425,000 | 1,556,812 | |||||||||||
SIWF Merger Sub, Inc. / Springs Industries, Inc. (Household Durables) | (b) | 6.250% | 06/01/2021 | 300,000 | 303,375 | |||||||||||
CDW LLC / CDW Finance Corp. (Internet & Catalog Retail) | 12.535% | 10/12/2017 | 51,000 | 53,550 | ||||||||||||
CDW LLC / CDW Finance Corp. (Internet & Catalog Retail) | 8.500% | 04/01/2019 | 1,850,000 | 2,053,500 | ||||||||||||
FGI Operating Co. LLC / FGI Finance, Inc. (Leisure Equip. & Products) | 7.875% | 05/01/2020 | 1,025,000 | 1,101,875 | ||||||||||||
AMC Networks, Inc. (Media) | 7.750% | 07/15/2021 | 575,000 | 649,750 | ||||||||||||
AMC Networks, Inc. (Media) | 4.750% | 12/15/2022 | 350,000 | 335,125 | ||||||||||||
CCO Holdings LLC / CCO Holdings Capital Corp. (Media) | 8.125% | 04/30/2020 | 75,000 | 81,750 | ||||||||||||
CCO Holdings LLC / CCO Holdings Capital Corp. (Media) | 7.000% | 01/15/2019 | 425,000 | 448,906 | ||||||||||||
CCO Holdings LLC / CCO Holdings Capital Corp. (Media) | 6.625% | 01/31/2022 | 500,000 | 517,500 | ||||||||||||
| 59 | (continued) |
| Ohio National Fund, Inc. | High Income Bond Portfolio (Continued) |
Schedule of Investments | December 31, 2013 |
| Corporate Bonds (Continued) | Rate | Maturity | Face Amount | Value | ||||||||||||
CONSUMER DISCRETIONARY (continued) |
| |||||||||||||||
CCO Holdings LLC / CCO Holdings Capital Corp. (Media) | 5.125% | 02/15/2023 | $ | 150,000 | $ | 139,875 | ||||||||||
CCO Holdings LLC / CCO Holdings Capital Corp. (Media) | (b) | 5.750% | 09/01/2023 | 325,000 | 309,562 | |||||||||||
CCO Holdings LLC / CCO Holdings Capital Corp. (Media) | 5.750% | 01/15/2024 | 1,125,000 | 1,065,937 | ||||||||||||
Cequel Communications Holdings I LLC / Cequel Capital Corp. (Media) | (b) | 6.375% | 09/15/2020 | 350,000 | 360,500 | |||||||||||
Cequel Communications Holdings I LLC / Cequel Capital Corp. (Media) | (b) | 5.125% | 12/15/2021 | 400,000 | 377,000 | |||||||||||
Cinemark U.S.A., Inc. (Media) | 7.375% | 06/15/2021 | 500,000 | 555,000 | ||||||||||||
Clear Channel Communications, Inc. (Media) | 9.000% | 03/01/2021 | 1,550,000 | 1,573,250 | ||||||||||||
Clear Channel Communications, Inc. (Media) | 11.250% | 03/01/2021 | 350,000 | 378,000 | ||||||||||||
Clear Channel Worldwide Holdings, Inc. (Media) | 7.625% | 03/15/2020 | 175,000 | 182,875 | ||||||||||||
Clear Channel Worldwide Holdings, Inc. (Media) | 7.625% | 03/15/2020 | 600,000 | 633,750 | ||||||||||||
Clear Channel Worldwide Holdings, Inc. (Media) | 6.500% | 11/15/2022 | 275,000 | 280,156 | ||||||||||||
Clear Channel Worldwide Holdings, Inc. (Media) | 6.500% | 11/15/2022 | 1,250,000 | 1,282,812 | ||||||||||||
Crown Media Holdings, Inc. (Media) | 10.500% | 07/15/2019 | 1,525,000 | 1,738,500 | ||||||||||||
Cumulus Media Holdings, Inc. (Media) | 7.750% | 05/01/2019 | 1,025,000 | 1,086,500 | ||||||||||||
DISH DBS Corp. (Media) | 5.875% | 07/15/2022 | 1,875,000 | 1,884,375 | ||||||||||||
DISH DBS Corp. (Media) | 4.625% | 07/15/2017 | 200,000 | 210,000 | ||||||||||||
DISH DBS Corp. (Media) | 5.125% | 05/01/2020 | 150,000 | 150,750 | ||||||||||||
Entercom Radio LLC (Media) | 10.500% | 12/01/2019 | 825,000 | 938,437 | ||||||||||||
Expo Event Transco, Inc. (Media) | (b) | 9.000% | 06/15/2021 | 950,000 | 971,375 | |||||||||||
Gannett Co., Inc. (Media) | (b) | 6.375% | 10/15/2023 | 775,000 | 804,062 | |||||||||||
Gannett Co., Inc. (Media) | (b) | 5.125% | 10/15/2019 | 200,000 | 208,500 | |||||||||||
Gray Television, Inc. (Media) | 7.500% | 10/01/2020 | 575,000 | 613,812 | ||||||||||||
Igloo Holdings Corp. (Media) | (b)(c) | 8.250% | 12/15/2017 | 1,000,000 | 1,020,000 | |||||||||||
Intelsat Jackson Holdings, S.A. (Media) | 8.500% | 11/01/2019 | 675,000 | 739,125 | ||||||||||||
Intelsat Jackson Holdings, S.A. (Media) | 7.500% | 04/01/2021 | 450,000 | 498,375 | ||||||||||||
Intelsat Jackson Holdings, S.A. (Media) | 7.250% | 04/01/2019 | 550,000 | 596,750 | ||||||||||||
Intelsat Jackson Holdings, S.A. (Media) | 7.250% | 10/15/2020 | 150,000 | 164,812 | ||||||||||||
Intelsat Jackson Holdings, S.A. (Media) | (b) | 5.500% | 08/01/2023 | 550,000 | 525,250 | |||||||||||
Intelsat Jackson Holdings, S.A. (Media) | 6.625% | 12/15/2022 | 175,000 | 181,125 | ||||||||||||
Intelsat Luxembourg S.A. (Media) | (b) | 7.750% | 06/01/2021 | 650,000 | 699,562 | |||||||||||
Intelsat Luxembourg S.A. (Media) | (b) | 8.125% | 06/01/2023 | 750,000 | 807,187 | |||||||||||
Lamar Media Corp. (Media) | 5.875% | 02/01/2022 | 250,000 | 257,500 | ||||||||||||
Lamar Media Corp. (Media) | 5.000% | 05/01/2023 | 725,000 | 692,375 | ||||||||||||
Lynx II Corp. (Media) | (b) | 6.375% | 04/15/2023 | 200,000 | 204,500 | |||||||||||
Nielsen Co. Luxembourg SARL / The (Media) | (b) | 5.500% | 10/01/2021 | 50,000 | 50,875 | |||||||||||
Nielsen Finance LLC / Nielsen Finance Co. (Media) | 7.750% | 10/15/2018 | 550,000 | 596,750 | ||||||||||||
Nielsen Finance LLC / Nielsen Finance Co. (Media) | 4.500% | 10/01/2020 | 450,000 | 439,875 | ||||||||||||
Regal Entertainment Group (Media) | 5.750% | 02/01/2025 | 325,000 | 307,937 | ||||||||||||
Sirius XM Radio, Inc. (Media) | (b) | 5.250% | 08/15/2022 | 1,150,000 | 1,167,250 | |||||||||||
Sirius XM Radio, Inc. (Media) | (b) | 4.250% | 05/15/2020 | 150,000 | 142,125 | |||||||||||
Sirius XM Radio, Inc. (Media) | (b) | 4.625% | 05/15/2023 | 475,000 | 431,062 | |||||||||||
Sirius XM Radio, Inc. (Media) | (b) | 5.875% | 10/01/2020 | 100,000 | 102,250 | |||||||||||
Townsquare Radio LLC / Townsquare Radio, Inc. (Media) | (b) | 9.000% | 04/01/2019 | 950,000 | 1,033,125 | |||||||||||
Visant Corp. (Media) | 10.000% | 10/01/2017 | 825,000 | 804,375 | ||||||||||||
Academy Ltd. / Academy Finance Corp. (Specialty Retail) | (b) | 9.250% | 08/01/2019 | 1,025,000 | 1,137,750 | |||||||||||
Claire’s Stores, Inc. (Specialty Retail) | (b) | 6.125% | 03/15/2020 | 600,000 | 582,000 | |||||||||||
Gymboree Corp. / The (Specialty Retail) | 9.125% | 12/01/2018 | 475,000 | 439,969 | ||||||||||||
Jo-Ann Stores Holdings, Inc. (Specialty Retail) | (b)(c) | 9.750% | 10/15/2019 | 850,000 | 893,562 | |||||||||||
Jo-Ann Stores, Inc. (Specialty Retail) | (b) | 8.125% | 03/15/2019 | 1,625,000 | 1,708,281 | |||||||||||
L Brands, Inc. (Specialty Retail) | 5.625% | 02/15/2022 | 725,000 | 744,937 | ||||||||||||
Michaels FinCo Holdings LLC / Michaels FinCo, Inc. (Specialty Retail) | (b)(c) | 7.500% | 08/01/2018 | 1,200,000 | 1,254,000 | |||||||||||
Michaels Stores, Inc. (Specialty Retail) | 7.750% | 11/01/2018 | 1,275,000 | 1,389,750 | ||||||||||||
Neiman Marcus Group LTD, Inc. (Specialty Retail) | (b)(c) | 8.750% | 10/15/2021 | 675,000 | 710,437 | |||||||||||
Neiman Marcus Group LTD, Inc. (Specialty Retail) | (b) | 8.000% | 10/15/2021 | 275,000 | 288,750 | |||||||||||
New Academy Finance Co. LLC / New Academy Finance Corp. (Specialty Retail) | (b)(c) | 8.000% | 06/15/2018 | 1,200,000 | 1,236,012 | |||||||||||
Party City Holdings, Inc. (Specialty Retail) | 8.875% | 08/01/2020 | 550,000 | 618,750 | ||||||||||||
PC Nextco Holdings LLC / PC Nextco Finance, Inc. (Specialty Retail) | (b)(c) | 8.750% | 08/15/2019 | 1,250,000 | 1,289,062 | |||||||||||
Penske Automotive Group, Inc. (Specialty Retail) | 5.750% | 10/01/2022 | 300,000 | 308,250 | ||||||||||||
Petco Animal Supplies, Inc. (Specialty Retail) | (b) | 9.250% | 12/01/2018 | 1,350,000 | 1,454,625 | |||||||||||
Petco Holdings, Inc. (Specialty Retail) | (b)(c) | 8.500% | 10/15/2017 | 1,225,000 | 1,255,625 | |||||||||||
Sally Holdings LLC , Inc. (Specialty Retail) | 5.750% | 06/01/2022 | 125,000 | 130,625 | ||||||||||||
Sally Holdings LLC , Inc. (Specialty Retail) | 6.875% | 11/15/2019 | 700,000 | 777,000 | ||||||||||||
PVH Corp. (Textiles, Apparel & Luxury Goods) | 4.500% | 12/15/2022 | 200,000 | 190,500 | ||||||||||||
Wolverine World Wide, Inc. (Textiles, Apparel & Luxury Goods) | 6.125% | 10/15/2020 | 250,000 | 268,750 | ||||||||||||
|
| |||||||||||||||
| 87,366,117 | ||||||||||||||||
|
| |||||||||||||||
CONSUMER STAPLES – 5.7% | ||||||||||||||||
Constellation Brands, Inc. (Beverages) | 6.000% | 05/01/2022 | 675,000 | 723,937 | ||||||||||||
U.S. Foods, Inc. (Food & Staples Retailing) | 8.500% | 06/30/2019 | 2,800,000 | 3,069,500 | ||||||||||||
| 60 | (continued) |
| Ohio National Fund, Inc. | High Income Bond Portfolio (Continued) |
Schedule of Investments | December 31, 2013 |
| Corporate Bonds (Continued) | Rate | Maturity | Face Amount | Value | ||||||||||||
CONSUMER STAPLES (continued) |
| |||||||||||||||
B&G Foods, Inc. (Food Products) | 4.625% | 06/01/2021 | $ | 525,000 | $ | 505,312 | ||||||||||
Darling Escrow Corp. (Food Products) | (b) | 5.375% | 01/15/2022 | 250,000 | 252,187 | |||||||||||
Dean Foods Co. (Food Products) | 7.000% | 06/01/2016 | 487,000 | 540,570 | ||||||||||||
Del Monte Corp. (Food Products) | 7.625% | 02/15/2019 | 2,100,000 | 2,186,625 | ||||||||||||
Hawk Acquisition Sub, Inc. (Food Products) | (b) | 4.250% | 10/15/2020 | 1,750,000 | 1,697,500 | |||||||||||
Michael Foods Group, Inc. (Food Products) | 9.750% | 07/15/2018 | 1,075,000 | 1,174,437 | ||||||||||||
Michael Foods Holding, Inc. (Food Products) | (b)(c) | 8.500% | 07/15/2018 | 1,500,000 | 1,590,000 | |||||||||||
Pinnacle Foods Finance LLC / Pinnacle Foods Finance Corp. (Food Products) | (b) | 4.875% | 05/01/2021 | 1,300,000 | 1,235,000 | |||||||||||
Shearer’s Foods LLC / Chip Finance Corp. (Food Products) | (b) | 9.000% | 11/01/2019 | 625,000 | 662,500 | |||||||||||
Smithfield Foods, Inc. (Food Products) | 6.625% | 08/15/2022 | 1,350,000 | 1,437,750 | ||||||||||||
Sun Merger Sub., Inc. (Food Products) | (b) | 5.875% | 08/01/2021 | 100,000 | 102,750 | |||||||||||
Sun Merger Sub., Inc. (Food Products) | (b) | 5.250% | 08/01/2018 | 100,000 | 105,000 | |||||||||||
Spectrum Brands, Inc. (Household Products) | 6.750% | 03/15/2020 | 1,150,000 | 1,243,437 | ||||||||||||
First Quality Finance Co., Inc. (Personal Products) | (b) | 4.625% | 05/15/2021 | 475,000 | 453,625 | |||||||||||
Prestige Brands, Inc. (Personal Products) | 8.125% | 02/01/2020 | 175,000 | 196,875 | ||||||||||||
Prestige Brands, Inc. (Personal Products) | (b) | 5.375% | 12/15/2021 | 425,000 | 431,375 | |||||||||||
|
| |||||||||||||||
| 17,608,380 | ||||||||||||||||
|
| |||||||||||||||
ENERGY – 10.3% | ||||||||||||||||
Basic Energy Services, Inc. (Energy Equip. & Svs.) | 7.750% | 02/15/2019 | 425,000 | 446,250 | ||||||||||||
Basic Energy Services, Inc. (Energy Equip. & Svs.) | 7.750% | 10/15/2022 | 300,000 | 311,250 | ||||||||||||
Compagnie Generale de Geophysique – Veritas SA (Energy Equip. & Svs.) | 7.750% | 05/15/2017 | 1,100,000 | 1,135,750 | ||||||||||||
Compagnie Generale de Geophysique – Veritas SA (Energy Equip. & Svs.) | 9.500% | 05/15/2016 | 253,000 | 267,547 | ||||||||||||
Chaparral Energy, Inc. (Energy Equip. & Svs.) | 9.875% | 10/01/2020 | 1,075,000 | 1,220,125 | ||||||||||||
Chaparral Energy, Inc. (Energy Equip. & Svs.) | 7.625% | 11/15/2022 | 250,000 | 268,750 | ||||||||||||
Drill Rigs Holdings, Inc. (Energy Equip. & Svs.) | (b) | 6.500% | 10/01/2017 | 350,000 | 379,750 | |||||||||||
PHI, Inc. (Energy Equip. & Svs.) | 8.625% | 10/15/2018 | 850,000 | 918,000 | ||||||||||||
SESI LLC (Energy Equip. & Svs.) | 6.375% | 05/01/2019 | 275,000 | 294,937 | ||||||||||||
SESI LLC (Energy Equip. & Svs.) | 7.125% | 12/15/2021 | 250,000 | 280,000 | ||||||||||||
Access Midstream Partners LP / ACMP Finance Corp. (Oil, Gas & Consumable Fuels) | 6.125% | 07/15/2022 | 525,000 | 564,375 | ||||||||||||
Access Midstream Partners LP / ACMP Finance Corp. (Oil, Gas & Consumable Fuels) | 4.875% | 05/15/2023 | 900,000 | 873,000 | ||||||||||||
Antero Resources Finance Corp. (Oil, Gas & Consumable Fuels) | 6.000% | 12/01/2020 | 1,150,000 | 1,213,250 | ||||||||||||
Antero Resources Finance Corp. (Oil, Gas & Consumable Fuels) | (b) | 5.375% | 11/01/2021 | 175,000 | 176,859 | |||||||||||
Approach Resources, Inc. (Oil, Gas & Consumable Fuels) | 7.000% | 06/15/2021 | 600,000 | 618,000 | ||||||||||||
Athlon Holdings LP / Athlon Finance Corp. (Oil, Gas & Consumable Fuels) | (b) | 7.375% | 04/15/2021 | 550,000 | 580,250 | |||||||||||
BreitBurn Energy Partners LP / BreitBurn Finance Corp. (Oil, Gas & Consumable Fuels) | 7.875% | 04/15/2022 | 525,000 | 548,625 | ||||||||||||
Carrizo Oil & Gas, Inc. (Oil, Gas & Consumable Fuels) | 7.500% | 09/15/2020 | 575,000 | 632,500 | ||||||||||||
Chesapeake Energy Corp. (Oil, Gas & Consumable Fuels) | 6.875% | 11/15/2020 | 675,000 | 766,125 | ||||||||||||
Chesapeake Energy Corp. (Oil, Gas & Consumable Fuels) | 5.750% | 03/15/2023 | 450,000 | 465,750 | ||||||||||||
Chesapeake Energy Corp. (Oil, Gas & Consumable Fuels) | 5.375% | 06/15/2021 | 525,000 | 546,000 | ||||||||||||
Chesapeake Oilfield Operating LLC / Chesapeake Oilfield Finance, Inc. (Oil, Gas & Consumable Fuels) | 6.625% | 11/15/2019 | 800,000 | 842,000 | ||||||||||||
Crestwood Midstream Partners LP / Crestwood Midstream Finance Corp. (Oil, Gas & Consumable Fuels) | (b) | 6.125% | 03/01/2022 | 225,000 | 231,750 | |||||||||||
Crestwood Midstream Partners LP / Crestwood Midstream Finance Corp. (Oil, Gas & Consumable Fuels) | 6.000% | 12/15/2020 | 400,000 | 414,000 | ||||||||||||
El Paso LLC (Oil, Gas & Consumable Fuels) | 7.250% | 06/01/2018 | 225,000 | 257,880 | ||||||||||||
El Paso LLC (Oil, Gas & Consumable Fuels) | 6.500% | 09/15/2020 | 900,000 | 968,512 | ||||||||||||
Energy Transfer Equity LP (Oil, Gas & Consumable Fuels) | 5.875% | 01/15/2024 | 600,000 | 594,750 | ||||||||||||
Energy XXI Gulf Coast, Inc. (Oil, Gas & Consumable Fuels) | 7.750% | 06/15/2019 | 200,000 | 215,500 | ||||||||||||
Energy XXI Gulf Coast, Inc. (Oil, Gas & Consumable Fuels) | (b) | 7.500% | 12/15/2021 | 1,175,000 | 1,230,812 | |||||||||||
EP Energy LLC / EP Energy Finance, Inc. (Oil, Gas & Consumable Fuels) | 9.375% | 05/01/2020 | 275,000 | 318,656 | ||||||||||||
EP Energy LLC / Everest Acquisition Finance, Inc. (Oil, Gas & Consumable Fuels) | 6.875% | 05/01/2019 | 250,000 | 270,312 | ||||||||||||
EPE Holdings LLC / EP Energy Bond Co., Inc. (Oil, Gas & Consumable Fuels) | (b)(c) | 8.125% | 12/15/2017 | 435,669 | 449,828 | |||||||||||
Forest Oil Corp. (Oil, Gas & Consumable Fuels) | 7.250% | 06/15/2019 | 460,000 | 450,225 | ||||||||||||
Holly Energy Partners LP / Holly Energy Finance Corp. (Oil, Gas & Consumable Fuels) | 6.500% | 03/01/2020 | 475,000 | 498,750 | ||||||||||||
Kinder Morgan, Inc. (Oil, Gas & Consumable Fuels) | (b) | 5.625% | 11/15/2023 | 325,000 | 315,822 | |||||||||||
Kodiak Oil & Gas Corp. (Oil, Gas & Consumable Fuels) | 5.500% | 02/01/2022 | 275,000 | 275,000 | ||||||||||||
Kodiak Oil & Gas Corp. (Oil, Gas & Consumable Fuels) | 5.500% | 01/15/2021 | 200,000 | 200,500 | ||||||||||||
Linn Energy LLC / Linn Energy Finance Corp. (Oil, Gas & Consumable Fuels) | 8.625% | 04/15/2020 | 750,000 | 813,750 | ||||||||||||
Linn Energy LLC / Linn Energy Finance Corp. (Oil, Gas & Consumable Fuels) | 7.750% | 02/01/2021 | 650,000 | 690,625 | ||||||||||||
Linn Energy LLC / Linn Energy Finance Corp. (Oil, Gas & Consumable Fuels) | (b) | 7.000% | 11/01/2019 | 150,000 | 152,250 | |||||||||||
Linn Energy LLC / Linn Energy Finance Corp. (Oil, Gas & Consumable Fuels) | 6.500% | 05/15/2019 | 50,000 | 51,250 | ||||||||||||
Lone Pine Resources Canada Ltd. (Acquired 07/10/2012, Cost $97,156)(Oil, Gas & Consumable Fuels) | (d)(e) | 10.375% | 02/15/2017 | 100,000 | 30,500 | |||||||||||
MarkWest Energy Partners LP / MarkWest Energy Finance Corp. (Oil, Gas & Consumable Fuels) | 5.500% | 02/15/2023 | 600,000 | 607,500 | ||||||||||||
MarkWest Energy Partners LP / MarkWest Energy Finance Corp. (Oil, Gas & Consumable Fuels) | 4.500% | 07/15/2023 | 300,000 | 282,750 | ||||||||||||
Newfield Exploration Co. (Oil, Gas & Consumable Fuels) | 5.625% | 07/01/2024 | 825,000 | 825,000 | ||||||||||||
Northern Oil and Gas, Inc. (Oil, Gas & Consumable Fuels) | 8.000% | 06/01/2020 | 825,000 | 868,312 | ||||||||||||
Oasis Petroleum, Inc. (Oil, Gas & Consumable Fuels) | 6.500% | 11/01/2021 | 750,000 | 806,250 | ||||||||||||
Oasis Petroleum, Inc. (Oil, Gas & Consumable Fuels) | 6.875% | 01/15/2023 | 300,000 | 321,000 | ||||||||||||
| 61 | (continued) |
| Ohio National Fund, Inc. | High Income Bond Portfolio (Continued) |
Schedule of Investments | December 31, 2013 |
| Corporate Bonds (Continued) | Rate | Maturity | Face Amount | Value | ||||||||||||
ENERGY (continued) |
| |||||||||||||||
Oasis Petroleum, Inc. (Oil, Gas & Consumable Fuels) | (b) | 6.875% | 03/15/2022 | $ | 250,000 | $ | 266,250 | |||||||||
Plains Exploration & Production Co. (Oil, Gas & Consumable Fuels) | 6.750% | 02/01/2022 | 275,000 | 302,957 | ||||||||||||
Range Resources Corp. (Oil, Gas & Consumable Fuels) | 5.000% | 03/15/2023 | 225,000 | 221,062 | ||||||||||||
Regency Energy Partners LP / Regency Energy Finance Corp. (Oil, Gas & Consumable Fuels) | 6.875% | 12/01/2018 | 275,000 | 296,313 | ||||||||||||
Regency Energy Partners LP / Regency Energy Finance Corp. (Oil, Gas & Consumable Fuels) | 5.500% | 04/15/2023 | 175,000 | 171,500 | ||||||||||||
Regency Energy Partners LP / Regency Energy Finance Corp. (Oil, Gas & Consumable Fuels) | 4.500% | 11/01/2023 | 225,000 | 205,875 | ||||||||||||
Sabine Pass Liquefaction LLC (Oil, Gas & Consumable Fuels) | (b) | 5.625% | 02/01/2021 | 850,000 | 835,125 | |||||||||||
Sabine Pass Liquefaction LLC (Oil, Gas & Consumable Fuels) | (b) | 5.625% | 04/15/2023 | 225,000 | 211,500 | |||||||||||
Sabine Pass Liquefaction LLC (Oil, Gas & Consumable Fuels) | (b) | 6.250% | 03/15/2022 | 300,000 | 298,125 | |||||||||||
SandRidge Energy, Inc. (Oil, Gas & Consumable Fuels) | 7.500% | 03/15/2021 | 525,000 | 552,562 | ||||||||||||
SandRidge Energy, Inc. (Oil, Gas & Consumable Fuels) | 8.125% | 10/15/2022 | 625,000 | 665,625 | ||||||||||||
SandRidge Energy, Inc. (Oil, Gas & Consumable Fuels) | 7.500% | 02/15/2023 | 200,000 | 204,000 | ||||||||||||
Southern Star Central Corp. (Oil, Gas & Consumable Fuels) | 6.750% | 03/01/2016 | 125,000 | 126,094 | ||||||||||||
Tesoro Logistics LP / Tesoro Logistics Finance Corp. (Oil, Gas & Consumable Fuels) | 6.125% | 10/15/2021 | 325,000 | 336,375 | ||||||||||||
Tesoro Logistics LP / Tesoro Logistics Finance Corp. (Oil, Gas & Consumable Fuels) | 5.875% | 10/01/2020 | 225,000 | 231,188 | ||||||||||||
Tesoro Logistics LP / Tesoro Logistics Finance Corp. (Oil, Gas & Consumable Fuels) | (b) | 5.875% | 10/01/2020 | 300,000 | 308,250 | |||||||||||
W&T Offshore, Inc. (Oil, Gas & Consumable Fuels) | 8.500% | 06/15/2019 | 775,000 | 823,438 | ||||||||||||
|
| |||||||||||||||
| 31,810,128 | ||||||||||||||||
|
| |||||||||||||||
FINANCIALS – 4.3% | ||||||||||||||||
Nuveen Investments, Inc. (Capital Markets) | (b) | 9.500% | 10/15/2020 | 1,450,000 | 1,460,875 | |||||||||||
CIT Group, Inc. (Commercial Banks) | (b) | 6.625% | 04/01/2018 | 700,000 | 790,125 | |||||||||||
CIT Group, Inc. (Commercial Banks) | 5.250% | 03/15/2018 | 675,000 | 726,469 | ||||||||||||
CIT Group, Inc. (Commercial Banks) | 5.375% | 05/15/2020 | 225,000 | 240,188 | ||||||||||||
CIT Group, Inc. (Commercial Banks) | 5.000% | 05/15/2017 | 575,000 | 616,688 | ||||||||||||
CIT Group, Inc. (Commercial Banks) | 4.250% | 08/15/2017 | 600,000 | 627,000 | ||||||||||||
Ally Financial, Inc. (Consumer Finance) | 8.300% | 02/12/2015 | 1,975,000 | 2,128,063 | ||||||||||||
Ally Financial, Inc. (Consumer Finance) | 8.000% | 03/15/2020 | 375,000 | 451,406 | ||||||||||||
Ally Financial, Inc. (Consumer Finance) | 7.500% | 09/15/2020 | 625,000 | 730,469 | ||||||||||||
Ally Financial, Inc. (Consumer Finance) | 6.250% | 12/01/2017 | 300,000 | 335,625 | ||||||||||||
Ally Financial, Inc. (Consumer Finance) | 8.000% | 11/01/2031 | 225,000 | 270,281 | ||||||||||||
Ally Financial, Inc. (Consumer Finance) | 5.500% | 02/15/2017 | 250,000 | 271,875 | ||||||||||||
Ally Financial, Inc. (Consumer Finance) | 4.750% | 09/10/2018 | 300,000 | 315,000 | ||||||||||||
Interactive Data Corp. (Diversified Financial Svs.) | 10.250% | 08/01/2018 | 800,000 | 881,000 | ||||||||||||
TransUnion Holding Co., Inc. (Diversified Financial Svs.) | 9.625% | 06/15/2018 | 1,125,000 | 1,215,000 | ||||||||||||
TransUnion Holding Co., Inc. (Diversified Financial Svs.) | 8.125% | 06/15/2018 | 525,000 | 556,500 | ||||||||||||
Reliance Intermediate Holdings LP (Insurance) | (b) | 9.500% | 12/15/2019 | 550,000 | 605,000 | |||||||||||
Host Hotels & Resorts LP (Real Estate Investment Trusts) | 6.750% | 06/01/2016 | 19,000 | 19,274 | ||||||||||||
|
| |||||||||||||||
| 13,177,338 | ||||||||||||||||
|
| |||||||||||||||
HEALTH CARE – 10.2% | ||||||||||||||||
Grifols, Inc. (Biotechnology) | 8.250% | 02/01/2018 | 650,000 | 693,875 | ||||||||||||
Biomet, Inc. (Health Care Equip. & Supplies) | 6.500% | 10/01/2020 | 1,000,000 | 1,035,000 | ||||||||||||
Biomet, Inc. (Health Care Equip. & Supplies) | 6.500% | 08/01/2020 | 1,175,000 | 1,239,625 | ||||||||||||
DJO Finance LLC / DJO Finance Corp. (Health Care Equip. & Supplies) | 7.750% | 04/15/2018 | 1,275,000 | 1,303,688 | ||||||||||||
DJO Finance LLC / DJO Finance Corp. (Health Care Equip. & Supplies) | 8.750% | 03/15/2018 | 75,000 | 82,688 | ||||||||||||
Hologic, Inc. (Health Care Equip. & Supplies) | 6.250% | 08/01/2020 | 525,000 | 556,500 | ||||||||||||
VWR Funding, Inc. (Health Care Equip. & Supplies) | 7.250% | 09/15/2017 | 1,600,000 | 1,724,000 | ||||||||||||
DaVita HealthCare Partners, Inc. (Health Care Providers & Svs.) | 5.750% | 08/15/2022 | 450,000 | 457,875 | ||||||||||||
Envision Healthcare Corp. (Health Care Providers & Svs.) | 8.125% | 06/01/2019 | 1,039,000 | 1,131,211 | ||||||||||||
HCA Holdings, Inc. (Health Care Providers & Svs.) | 7.750% | 05/15/2021 | 1,725,000 | 1,888,875 | ||||||||||||
HCA Holdings, Inc. (Health Care Providers & Svs.) | 6.250% | 02/15/2021 | 225,000 | 235,969 | ||||||||||||
HCA, Inc. (Health Care Providers & Svs.) | 7.500% | 11/06/2033 | 225,000 | 227,250 | ||||||||||||
HCA, Inc. (Health Care Providers & Svs.) | 7.500% | 02/15/2022 | 2,475,000 | 2,722,500 | ||||||||||||
HCA, Inc. (Health Care Providers & Svs.) | 6.500% | 02/15/2020 | 275,000 | 302,844 | ||||||||||||
HCA, Inc. (Health Care Providers & Svs.) | 5.875% | 05/01/2023 | 950,000 | 940,500 | ||||||||||||
IASIS Healthcare LLC / IASIS Capital Corp. (Health Care Providers & Svs.) | 8.375% | 05/15/2019 | 1,450,000 | 1,544,250 | ||||||||||||
Jaguar Holding Co. I (Health Care Providers & Svs.) | (b)(c) | 9.375% | 10/15/2017 | 925,000 | 982,812 | |||||||||||
Jaguar Holding Co. II / Jaguar Merger Sub, Inc. (Health Care Providers & Svs.) | (b) | 9.500% | 12/01/2019 | 1,050,000 | 1,186,500 | |||||||||||
LifePoint Hospitals, Inc. (Health Care Providers & Svs.) | (b) | 5.500% | 12/01/2021 | 575,000 | 578,594 | |||||||||||
MPH Intermediate Holding Co. 2 (Health Care Providers & Svs.) | (b)(c) | 8.375% | 08/01/2018 | 1,050,000 | 1,095,938 | |||||||||||
Multiplan, Inc. (Health Care Providers & Svs.) | (b) | 9.875% | 09/01/2018 | 1,700,000 | 1,878,500 | |||||||||||
Tenet Healthcare Corp. (Health Care Providers & Svs.) | 4.500% | 04/01/2021 | 575,000 | 546,969 | ||||||||||||
Tenet Healthcare Corp. (Health Care Providers & Svs.) | 8.125% | 04/01/2022 | 675,000 | 729,000 | ||||||||||||
Tenet Healthcare Corp. (Health Care Providers & Svs.) | 4.375% | 10/01/2021 | 850,000 | 803,250 | ||||||||||||
United Surgical Partners International, Inc. (Health Care Providers & Svs.) | 9.000% | 04/01/2020 | 850,000 | 956,250 | ||||||||||||
Universal Hospital Services, Inc. (Health Care Providers & Svs.) | 7.625% | 08/15/2020 | 1,000,000 | 1,060,000 | ||||||||||||
| 62 | (continued) |
| Ohio National Fund, Inc. | High Income Bond Portfolio (Continued) |
Schedule of Investments | December 31, 2013 |
| Corporate Bonds (Continued) | Rate | Maturity | Face Amount | Value | ||||||||||||
HEALTH CARE (continued) |
| |||||||||||||||
Emdeon, Inc. (Health Care Technology) | 11.000% | 12/31/2019 | $ | 1,100,000 | $ | 1,278,750 | ||||||||||
Healthcare Technology Intermediate, Inc. (Health Care Technology) | (b)(c) | 7.375% | 09/01/2018 | 1,200,000 | 1,254,000 | |||||||||||
Truven Health Analytics, Inc. (Health Care Technology) | 10.625% | 06/01/2020 | 700,000 | 795,375 | ||||||||||||
VPII Escrow Corp. (Pharmaceuticals) | (b) | 6.750% | 08/15/2018 | 125,000 | 137,969 | |||||||||||
VPII Escrow Corp. (Pharmaceuticals) | (b) | 7.500% | 07/15/2021 | 1,600,000 | 1,764,000 | |||||||||||
Valeant Pharmaceuticals International, Inc. (Pharmaceuticals) | (b) | 5.625% | 12/01/2021 | 300,000 | 302,250 | |||||||||||
|
| |||||||||||||||
| 31,436,807 | ||||||||||||||||
|
| |||||||||||||||
INDUSTRIALS – 11.5% | ||||||||||||||||
Silver II Borrower / Silver II U.S. Holdings LLC (Aerospace & Defense) | (b) | 7.750% | 12/15/2020 | 1,025,000 | 1,091,625 | |||||||||||
B/E Aerospace, Inc. (Aerospace & Defense) | 5.250% | 04/01/2022 | 750,000 | 765,000 | ||||||||||||
TransDigm, Inc. (Aerospace & Defense) | 7.750% | 12/15/2018 | 1,200,000 | 1,293,000 | ||||||||||||
TransDigm, Inc. (Aerospace & Defense) | 5.500% | 10/15/2020 | 275,000 | 270,188 | ||||||||||||
TransDigm, Inc. (Aerospace & Defense) | 7.500% | 07/15/2021 | 300,000 | 324,000 | ||||||||||||
Allegion U.S. Holding Co., Inc. (Building Products) | (b) | 5.750% | 10/01/2021 | 325,000 | 339,625 | |||||||||||
Building Materials Corp. of America (Building Products) | (b) | 7.500% | 03/15/2020 | 225,000 | 244,125 | |||||||||||
Building Materials Corp. of America (Building Products) | (b) | 6.750% | 05/01/2021 | 375,000 | 406,875 | |||||||||||
CPG Merger Sub. LLC (Building Products) | (b) | 8.000% | 10/01/2021 | 450,000 | 470,250 | |||||||||||
Masonite International Corp. (Building Products) | (b) | 8.250% | 04/15/2021 | 750,000 | 828,750 | |||||||||||
Nortek, Inc. (Building Products) | 10.000% | 12/01/2018 | 600,000 | 665,250 | ||||||||||||
Nortek, Inc. (Building Products) | 8.500% | 04/15/2021 | 1,250,000 | 1,390,625 | ||||||||||||
Ply Gem Industries, Inc. (Building Products) | 8.250% | 02/15/2018 | 800,000 | 856,000 | ||||||||||||
Ply Gem Industries, Inc. (Building Products) | 9.375% | 04/15/2017 | 180,000 | 195,300 | ||||||||||||
Roofing Supply Group LLC / Roofing Supply Finance, Inc. (Building Products) | (b) | 10.000% | 06/01/2020 | 700,000 | 791,000 | |||||||||||
Unifrax I LLC / Unifrax Holding Co. (Building Products) | (b) | 7.500% | 02/15/2019 | 625,000 | 650,000 | |||||||||||
USG Corp. (Building Products) | (b) | 5.875% | 11/01/2021 | 175,000 | 182,219 | |||||||||||
ADS Waste Holdings, Inc. (Commercial Svs. & Supplies) | 8.250% | 10/01/2020 | 250,000 | 272,500 | ||||||||||||
ARAMARK Corp. (Commercial Svs. & Supplies) | (b) | 5.750% | 03/15/2020 | 1,350,000 | 1,417,500 | |||||||||||
Garda World Security Corp. (Commercial Svs. & Supplies) | (b) | 7.250% | 11/15/2021 | 450,000 | 455,625 | |||||||||||
Iron Mountain, Inc. (Commercial Svs. & Supplies) | 7.750% | 10/01/2019 | 525,000 | 588,000 | ||||||||||||
Maxim Crane Works LP / Maxim Finance Corp. (Commercial Svs. & Supplies) | (b) | 12.250% | 04/15/2015 | 300,000 | 309,735 | |||||||||||
Mustang Merger Corp. (Commercial Svs. & Supplies) | (b) | 8.500% | 08/15/2021 | 450,000 | 488,250 | |||||||||||
Logo Merger Sub Corp. (Commercial Svs. & Supplies) | (b) | 8.375% | 10/15/2020 | 1,150,000 | 1,196,000 | |||||||||||
United Rentals North America, Inc. (Commercial Svs. & Supplies) | 8.375% | 09/15/2020 | 1,150,000 | 1,288,000 | ||||||||||||
United Rentals North America, Inc. (Commercial Svs. & Supplies) | 7.375% | 05/15/2020 | 100,000 | 111,375 | ||||||||||||
MasTec, Inc. (Construction & Engineering) | 4.875% | 03/15/2023 | 275,000 | 260,563 | ||||||||||||
CommScope, Inc. (Electrical Equip.) | (b) | 8.250% | 01/15/2019 | 1,044,000 | 1,149,705 | |||||||||||
General Cable Corp. (Electrical Equip.) | (b) | 6.500% | 10/01/2022 | 750,000 | 738,750 | |||||||||||
Viasystems, Inc. (Electrical Equip.) | (b) | 7.875% | 05/01/2019 | 375,000 | 407,344 | |||||||||||
Amsted Industries, Inc. (Machinery) | (b) | 8.125% | 03/15/2018 | 175,000 | 184,844 | |||||||||||
Dematic SA / DH Services Luxembourg Sarl (Machinery) | (b) | 7.750% | 12/15/2020 | 825,000 | 880,688 | |||||||||||
Dynacast International LLC / Dynacast Finance, Inc. (Machinery) | 9.250% | 07/15/2019 | 825,000 | 913,688 | ||||||||||||
Gardner Denver, Inc. (Machinery) | (b) | 6.875% | 08/15/2021 | 600,000 | 601,500 | |||||||||||
Mcron Finance Sub. LLC / Mcron Finance Corp. (Machinery) | (b) | 8.375% | 05/15/2019 | 425,000 | 476,000 | |||||||||||
Milacron LLC / Mcron Finance Corp. (Machinery) | (b) | 7.750% | 02/15/2021 | 200,000 | 211,000 | |||||||||||
Mueller Water Products, Inc. (Machinery) | 8.750% | 09/01/2020 | 480,000 | 540,000 | ||||||||||||
Mueller Water Products, Inc. (Machinery) | 7.375% | 06/01/2017 | 675,000 | 695,250 | ||||||||||||
Schaeffler Finance BV (Machinery) | (b) | 8.500% | 02/15/2019 | 875,000 | 988,750 | |||||||||||
Schaeffler Finance BV (Machinery) | (b) | 7.750% | 02/15/2017 | 475,000 | 541,500 | |||||||||||
Schaeffler Finance BV (Machinery) | (b) | 4.750% | 05/15/2021 | 375,000 | 375,938 | |||||||||||
Schaeffler Holding Finance BV (Machinery) | (b)(c) | 6.875% | 08/15/2018 | 475,000 | 505,875 | |||||||||||
Titan International, Inc. (Machinery) | (b) | 6.875% | 10/01/2020 | 400,000 | 419,000 | |||||||||||
Hertz Corp. / The (Road & Rail) | 6.750% | 04/15/2019 | 1,025,000 | 1,109,563 | ||||||||||||
Hertz Corp. / The (Road & Rail) | 7.500% | 10/15/2018 | 100,000 | 108,250 | ||||||||||||
American Builders & Contractors Supply Co., Inc. (Trading Companies & Distributors) | (b) | 5.625% | 04/15/2021 | 125,000 | 125,938 | |||||||||||
Interline Brands, Inc. (Trading Companies & Distributors) | 7.500% | 11/15/2018 | 700,000 | 743,750 | ||||||||||||
Interline Brands, Inc. (Trading Companies & Distributors) | (c) | 10.000% | 11/15/2018 | 1,025,000 | 1,124,938 | |||||||||||
International Lease Finance Corp. (Trading Companies & Distributors) | 8.750% | 03/15/2017 | 1,900,000 | 2,246,750 | ||||||||||||
International Lease Finance Corp. (Trading Companies & Distributors) | 5.750% | 05/15/2016 | 250,000 | 268,438 | ||||||||||||
International Lease Finance Corp. (Trading Companies & Distributors) | 5.875% | 08/15/2022 | 700,000 | 701,750 | ||||||||||||
International Lease Finance Corp. (Trading Companies & Distributors) | 4.625% | 04/15/2021 | 350,000 | 334,906 | ||||||||||||
Rexel SA (Trading Companies & Distributors) | (b) | 6.125% | 12/15/2019 | 1,000,000 | 1,050,000 | |||||||||||
Rexel SA (Trading Companies & Distributors) | (b) | 5.250% | 06/15/2020 | 750,000 | 757,500 | |||||||||||
|
| |||||||||||||||
| 35,352,995 | ||||||||||||||||
|
| |||||||||||||||
INFORMATION TECHNOLOGY – 10.9% | ||||||||||||||||
CommScope Holding Co., Inc. (Communications Equip.) | (b)(c) | 6.625% | 06/01/2020 | 950,000 | 992,750 | |||||||||||
NCR Corp. (Computers & Peripherals) | 5.000% | 07/15/2022 | 450,000 | 430,313 | ||||||||||||
NCR Corp. (Computers & Peripherals) | 4.625% | 02/15/2021 | 475,000 | 457,188 | ||||||||||||
NCR Escrow Corp. (Computers & Peripherals) | (b) | 5.875% | 12/15/2021 | 225,000 | 230,344 | |||||||||||
| 63 | (continued) |
| Ohio National Fund, Inc. | High Income Bond Portfolio (Continued) |
Schedule of Investments | December 31, 2013 |
| Corporate Bonds (Continued) | Rate | Maturity | Face Amount | Value | ||||||||||||
INFORMATION TECHNOLOGY (continued) |
| |||||||||||||||
NCR Escrow Corp. (Computers & Peripherals) | (b) | 6.375% | 12/15/2023 | $ | 375,000 | $ | 384,844 | |||||||||
Seagate HDD Cayman (Computers & Peripherals) | 6.875% | 05/01/2020 | 375,000 | 407,344 | ||||||||||||
Seagate HDD Cayman (Computers & Peripherals) | 7.000% | 11/01/2021 | 125,000 | 138,594 | ||||||||||||
Seagate HDD Cayman (Computers & Peripherals) | (b) | 4.750% | 06/01/2023 | 1,300,000 | 1,222,000 | |||||||||||
Anixter, Inc. (Electronic Equip., Instr. & Comp.) | 5.625% | 05/01/2019 | 300,000 | 316,875 | ||||||||||||
Belden, Inc. (Electronic Equip., Instr. & Comp.) | (b) | 5.500% | 09/01/2022 | 925,000 | 911,125 | |||||||||||
Cleaver-Brooks, Inc. (Electronic Equip., Instr. & Comp.) | (b) | 8.750% | 12/15/2019 | 575,000 | 626,750 | |||||||||||
Flextronics International Ltd. (Electronic Equip., Instr. & Comp.) | 5.000% | 02/15/2023 | 325,000 | 306,313 | ||||||||||||
Flextronics International Ltd. (Electronic Equip., Instr. & Comp.) | 4.625% | 02/15/2020 | 300,000 | 294,000 | ||||||||||||
Kemet Corp. (Electronic Equip., Instr. & Comp.) | 10.500% | 05/01/2018 | 400,000 | 397,000 | ||||||||||||
Blackboard, Inc. (Internet Software & Svs.) | (b) | 7.750% | 11/15/2019 | 350,000 | 349,125 | |||||||||||
IAC/InterActiveCorp (Internet Software & Svs.) | 4.750% | 12/15/2022 | 825,000 | 773,438 | ||||||||||||
IAC/InterActiveCorp (Internet Software & Svs.) | (b) | 4.875% | 11/30/2018 | 150,000 | 154,125 | |||||||||||
VeriSign, Inc. (Internet Software & Svs.) | 4.625% | 05/01/2023 | 250,000 | 240,000 | ||||||||||||
Compiler Finance Sub, Inc. (IT Svs.) | (b) | 7.000% | 05/01/2021 | 650,000 | 648,375 | |||||||||||
CoreLogic, Inc. (IT Svs.) | 7.250% | 06/01/2021 | 975,000 | 1,062,750 | ||||||||||||
First Data Corp. (IT Svs.) | (b)(c) | 8.750% | 01/15/2022 | 2,825,000 | 3,029,813 | |||||||||||
First Data Corp. (IT Svs.) | (b) | 8.250% | 01/15/2021 | 475,000 | 507,656 | |||||||||||
First Data Corp. (IT Svs.) | (b) | 11.250% | 01/15/2021 | 400,000 | 443,500 | |||||||||||
iGATE Corp. (IT Svs.) | 9.000% | 05/01/2016 | 1,000,000 | 1,067,500 | ||||||||||||
Lender Processing Services, Inc. (IT Svs.) | 5.750% | 04/15/2023 | 1,075,000 | 1,118,000 | ||||||||||||
SunGard Data Systems, Inc. (IT Svs.) | 7.625% | 11/15/2020 | 200,000 | 219,000 | ||||||||||||
SunGard Data Systems, Inc. (IT Svs.) | 7.375% | 11/15/2018 | 175,000 | 185,719 | ||||||||||||
SunGard Data Systems, Inc. (IT Svs.) | 6.625% | 11/01/2019 | 625,000 | 659,375 | ||||||||||||
Advanced Micro Devices, Inc. (Semiconductors & Equip.) | 7.750% | 08/01/2020 | 200,000 | 199,500 | ||||||||||||
Advanced Micro Devices, Inc. (Semiconductors & Equip.) | 7.500% | 08/15/2022 | 300,000 | 292,500 | ||||||||||||
Freescale Semiconductor, Inc. (Semiconductors & Equip.) | 10.750% | 08/01/2020 | 425,000 | 484,500 | ||||||||||||
Freescale Semiconductor, Inc. (Semiconductors & Equip.) | (b) | 6.000% | 01/15/2022 | 750,000 | 761,250 | |||||||||||
MagnaChip Semiconductor Corp. (Semiconductors & Equip.) | 6.625% | 07/15/2021 | 525,000 | 536,813 | ||||||||||||
NXP BV / NXP Funding LLC (Semiconductors & Equip.) | (b) | 5.750% | 02/15/2021 | 200,000 | 210,000 | |||||||||||
NXP BV / NXP Funding LLC (Semiconductors & Equip.) | (b) | 5.750% | 03/15/2023 | 200,000 | 204,000 | |||||||||||
NXP BV / NXP Funding LLC (Semiconductors & Equip.) | (b) | 3.750% | 06/01/2018 | 375,000 | 379,688 | |||||||||||
ACI Worldwide, Inc. (Software) | (b) | 6.375% | 08/15/2020 | 175,000 | 183,313 | |||||||||||
Activision Blizzard, Inc. (Software) | (b) | 6.125% | 09/15/2023 | 375,000 | 391,875 | |||||||||||
Activision Blizzard, Inc. (Software) | (b) | 5.625% | 09/15/2021 | 175,000 | 181,563 | |||||||||||
Aspect Software, Inc. (Software) | 10.625% | 05/15/2017 | 375,000 | 379,688 | ||||||||||||
Audatex North America, Inc. (Software) | (b) | 6.000% | 06/15/2021 | 575,000 | 605,188 | |||||||||||
Audatex North America, Inc. (Software) | (b) | 6.125% | 11/01/2023 | 100,000 | 103,500 | |||||||||||
BMC Software Finance, Inc. (Software) | (b) | 8.125% | 07/15/2021 | 1,250,000 | 1,293,750 | |||||||||||
Eagle Midco, Inc. (Software) | (b) | 9.000% | 06/15/2018 | 975,000 | 1,021,313 | |||||||||||
Epicor Software Corp. (Software) | 8.625% | 05/01/2019 | 1,525,000 | 1,662,250 | ||||||||||||
Infor (U.S.), Inc. (Software) | 9.375% | 04/01/2019 | 925,000 | 1,045,250 | ||||||||||||
Infor (U.S.), Inc. (Software) | 11.500% | 07/15/2018 | 1,050,000 | 1,215,375 | ||||||||||||
Nuance Communications, Inc. (Software) | (b) | 5.375% | 08/15/2020 | 1,050,000 | 1,031,625 | |||||||||||
Serena Software, Inc. (Software) | 10.375% | 03/15/2016 | 200,000 | 201,000 | ||||||||||||
Sophia Holding Finance LP / Sophia Holding Finance, Inc. (Software) | (b)(c) | 9.625% | 12/01/2018 | 375,000 | 388,125 | |||||||||||
Sophia LP / Sophia Finance, Inc. (Software) | (b) | 9.750% | 01/15/2019 | 1,650,000 | 1,835,625 | |||||||||||
SSI Investments II Ltd. / SSI Co-Issuer LLC (Software) | 11.125% | 06/01/2018 | 1,250,000 | 1,362,500 | ||||||||||||
|
| |||||||||||||||
| 33,544,007 | ||||||||||||||||
|
| |||||||||||||||
MATERIALS – 7.5% | ||||||||||||||||
Ashland, Inc. (Chemicals) | 4.750% | 08/15/2022 | 275,000 | 262,625 | ||||||||||||
Axiall Corp. (Chemicals) | (b) | 4.875% | 05/15/2023 | 100,000 | 94,875 | |||||||||||
Eagle Spinco, Inc. (Chemicals) | (b) | 4.625% | 02/15/2021 | 200,000 | 196,750 | |||||||||||
Hexion U.S. Finance Corp / Hexion Nova Scotia Finance ULC (Chemicals) | 8.875% | 02/01/2018 | 900,000 | 939,375 | ||||||||||||
Hexion U.S. Finance Corp / Hexion Nova Scotia Finance ULC (Chemicals) | 9.000% | 11/15/2020 | 550,000 | 551,375 | ||||||||||||
Hexion U.S. Finance Corp. (Chemicals) | 6.625% | 04/15/2020 | 425,000 | 437,750 | ||||||||||||
Huntsman International LLC (Chemicals) | 8.625% | 03/15/2020 | 325,000 | 361,156 | ||||||||||||
Huntsman International LLC (Chemicals) | 4.875% | 11/15/2020 | 250,000 | 247,500 | ||||||||||||
Koppers, Inc. (Chemicals) | 7.875% | 12/01/2019 | 275,000 | 298,375 | ||||||||||||
Momentive Performance Materials, Inc. (Chemicals) | 10.000% | 10/15/2020 | 300,000 | 315,750 | ||||||||||||
OMNOVA Solutions, Inc. (Chemicals) | 7.875% | 11/01/2018 | 800,000 | 864,000 | ||||||||||||
Scotts Miracle-Gro Co. / The (Chemicals) | 6.625% | 12/15/2020 | 550,000 | 595,375 | ||||||||||||
U.S. Coatings Acquisition, Inc. / Flash Dutch 2 BV (Chemicals) | (b) | 7.375% | 05/01/2021 | 1,125,000 | 1,205,156 | |||||||||||
Union Carbide Corp. (Chemicals) | 7.875% | 04/01/2023 | 100,000 | 119,171 | ||||||||||||
Ardagh Packaging Finance Plc (Containers & Packaging) | (b) | 9.125% | 10/15/2020 | 1,325,000 | 1,457,500 | |||||||||||
Ardagh Packaging Finance PLC / Ardagh MP Holdings U.S.A., Inc. (Containers & Packaging) | (b) | 9.125% | 10/15/2020 | 425,000 | 465,375 | |||||||||||
Ardagh Packaging Finance PLC / Ardagh MP Holdings U.S.A., Inc. (Containers & Packaging) | (b) | 7.000% | 11/15/2020 | 275,000 | 279,125 | |||||||||||
Ball Corp. (Containers & Packaging) | 4.000% | 11/15/2023 | 875,000 | 787,500 | ||||||||||||
| 64 | (continued) |
| Ohio National Fund, Inc. | High Income Bond Portfolio (Continued) |
Schedule of Investments | December 31, 2013 |
| Corporate Bonds (Continued) | Rate | Maturity | Face Amount | Value | ||||||||||||
MATERIALS (continued) |
| |||||||||||||||
Berry Plastics Corp. (Containers & Packaging) | 9.500% | 05/15/2018 | $ | 550,000 | $ | 592,625 | ||||||||||
Beverage Packaging Holdings Luxembourg II SA / Beverage Packaging Holdings II Issuer (Containers & Packaging) | (b) | 6.000% | 06/15/2017 | 275,000 | 279,125 | |||||||||||
BOE Merger Corp. (Containers & Packaging) | (b)(c) | 9.500% | 11/01/2017 | 825,000 | 880,688 | |||||||||||
BWAY Holding Co. (Containers & Packaging) | 10.000% | 06/15/2018 | 900,000 | 978,750 | ||||||||||||
Crown Americas LLC / Crown Americas Capital Corp. IV (Containers & Packaging) | 4.500% | 01/15/2023 | 175,000 | 164,500 | ||||||||||||
Greif, Inc. (Containers & Packaging) | 7.750% | 08/01/2019 | 475,000 | 541,500 | ||||||||||||
Packaging Dynamics Corp. (Containers & Packaging) | (b) | 8.750% | 02/01/2016 | 750,000 | 772,969 | |||||||||||
Pactiv LLC (Containers & Packaging) | 7.950% | 12/15/2025 | 225,000 | 212,063 | ||||||||||||
Reynolds Group Issuer, Inc. / Reynolds Group Issuer LLC (Containers & Packaging) | 8.500% | 05/15/2018 | 775,000 | 821,500 | ||||||||||||
Reynolds Group Issuer, Inc. / Reynolds Group Issuer LLC (Containers & Packaging) | 9.000% | 04/15/2019 | 675,000 | 727,313 | ||||||||||||
Reynolds Group Issuer, Inc. / Reynolds Group Issuer LLC (Containers & Packaging) | 8.250% | 02/15/2021 | 1,875,000 | 2,010,938 | ||||||||||||
Reynolds Group Issuer, Inc. / Reynolds Group Issuer LLC (Containers & Packaging) | 9.875% | 08/15/2019 | 1,275,000 | 1,424,813 | ||||||||||||
Reynolds Group Issuer, Inc. / Reynolds Group Issuer LLC (Containers & Packaging) | 7.125% | 04/15/2019 | 175,000 | 187,250 | ||||||||||||
Reynolds Group Issuer, Inc. / Reynolds Group Issuer LLC (Containers & Packaging) | 5.750% | 10/15/2020 | 1,000,000 | 1,025,000 | ||||||||||||
Sealed Air Corp. (Containers & Packaging) | (b) | 8.375% | 09/15/2021 | 1,350,000 | 1,539,000 | |||||||||||
Sealed Air Corp. (Containers & Packaging) | (b) | 6.500% | 12/01/2020 | 125,000 | 135,000 | |||||||||||
Century Aluminum Co. (Metals & Mining) | (b) | 7.500% | 06/01/2021 | 450,000 | 441,000 | |||||||||||
Compass Minerals International, Inc. (Metals & Mining) | 8.000% | 06/01/2019 | 275,000 | 293,219 | ||||||||||||
Steel Dynamics, Inc. (Metals & Mining) | 5.250% | 04/15/2023 | 125,000 | 125,625 | ||||||||||||
Wise Metals Group LLC / Wise Alloys Finance Corp. (Metals & Mining) | (b) | 8.750% | 12/15/2018 | 300,000 | 317,250 | |||||||||||
Clearwater Paper Corp. (Paper & Forest Products) | 4.500% | 02/01/2023 | 275,000 | 248,875 | ||||||||||||
|
| |||||||||||||||
| 23,197,736 | ||||||||||||||||
|
| |||||||||||||||
TELECOMMUNICATION SERVICES – 5.2% | ||||||||||||||||
Level 3 Communications, Inc. (Diversified Telecom. Svs.) | 8.875% | 06/01/2019 | 350,000 | 384,125 | ||||||||||||
Level 3 Financing, Inc. (Diversified Telecom. Svs.) | 8.125% | 07/01/2019 | 925,000 | 1,019,813 | ||||||||||||
Level 3 Financing, Inc. (Diversified Telecom. Svs.) | 8.625% | 07/15/2020 | 275,000 | 309,375 | ||||||||||||
Level 3 Financing, Inc. (Diversified Telecom. Svs.) | 7.000% | 06/01/2020 | 475,000 | 505,875 | ||||||||||||
Digicel Group Ltd. (Wireless Telecom. Svs.) | (b) | 8.250% | 09/30/2020 | 1,575,000 | 1,639,969 | |||||||||||
Digicel Ltd. (Wireless Telecom. Svs.) | (b) | 8.250% | 09/01/2017 | 675,000 | 705,375 | |||||||||||
Digicel Ltd. (Wireless Telecom. Svs.) | (b) | 6.000% | 04/15/2021 | 600,000 | 580,500 | |||||||||||
MetroPCS Wireless, Inc. (Wireless Telecom. Svs.) | 7.875% | 09/01/2018 | 725,000 | 780,281 | ||||||||||||
MetroPCS Wireless, Inc. (Wireless Telecom. Svs.) | 6.625% | 11/15/2020 | 875,000 | 930,781 | ||||||||||||
MetroPCS Wireless, Inc. (Wireless Telecom. Svs.) | (b) | 6.625% | 04/01/2023 | 450,000 | 466,313 | |||||||||||
Sprint Capital Corp. (Wireless Telecom. Svs.) | 6.875% | 11/15/2028 | 1,100,000 | 1,042,250 | ||||||||||||
Sprint Capital Corp. (Wireless Telecom. Svs.) | 6.900% | 05/01/2019 | 1,875,000 | 2,057,813 | ||||||||||||
Sprint Communications, Inc. (Wireless Telecom. Svs.) | 6.000% | 11/15/2022 | 1,100,000 | 1,078,000 | ||||||||||||
Sprint Corp. (Wireless Telecom. Svs.) | (b) | 7.875% | 09/15/2023 | 675,000 | 727,313 | |||||||||||
Sprint Nextel Corp. (Wireless Telecom. Svs.) | (b) | 9.000% | 11/15/2018 | 1,025,000 | 1,237,688 | |||||||||||
Sprint Nextel Corp. (Wireless Telecom. Svs.) | (b) | 7.000% | 03/01/2020 | 350,000 | 392,000 | |||||||||||
Syniverse Holdings, Inc. (Wireless Telecom. Svs.) | 9.125% | 01/15/2019 | 1,600,000 | 1,756,000 | ||||||||||||
T-Mobile U.S.A., Inc. (Wireless Telecom. Svs.) | 6.731% | 04/28/2022 | 75,000 | 78,469 | ||||||||||||
T-Mobile U.S.A., Inc. (Wireless Telecom. Svs.) | 6.500% | 01/15/2024 | 200,000 | 203,000 | ||||||||||||
T-Mobile U.S.A., Inc. (Wireless Telecom. Svs.) | 6.125% | 01/15/2022 | 200,000 | 204,000 | ||||||||||||
|
| |||||||||||||||
| 16,098,940 | ||||||||||||||||
|
| |||||||||||||||
UTILITIES – 1.5% | ||||||||||||||||
Energy Future Intermediate Holding Co. LLC / EFIH Finance, Inc. (Electric Utilities) | 10.000% | 12/01/2020 | 900,000 | 960,750 | ||||||||||||
Energy Future Intermediate Holding Co. LLC / EFIH Finance, Inc. (Electric Utilities) | (b) | 6.875% | 08/15/2017 | 375,000 | 390,000 | |||||||||||
Suburban Propane Partners LP / Suburban Energy Finance Corp. (Gas Utilities) | 7.500% | 10/01/2018 | 211,000 | 227,353 | ||||||||||||
Suburban Propane Partners LP / Suburban Energy Finance Corp. (Gas Utilities) | 7.375% | 08/01/2021 | 372,000 | 407,340 | ||||||||||||
Calpine Corp. (Ind. Power Prod. & Energy Traders) | (b) | 6.000% | 01/15/2022 | 175,000 | 180,250 | |||||||||||
Dynegy, Inc. (Ind. Power Prod. & Energy Traders) | (b) | 5.875% | 06/01/2023 | 175,000 | 166,250 | |||||||||||
NRG Energy, Inc. (Ind. Power Prod. & Energy Traders) | 8.250% | 09/01/2020 | 750,000 | 834,375 | ||||||||||||
NRG Energy, Inc. (Ind. Power Prod. & Energy Traders) | 7.875% | 05/15/2021 | 475,000 | 528,438 | ||||||||||||
NRG Energy, Inc. (Ind. Power Prod. & Energy Traders) | 7.625% | 05/15/2019 | 700,000 | 743,750 | ||||||||||||
FPL Energy National Wind Portfolio LLC (Acquired 05/27/2009, Cost $95,719)(Multi-Utilities) | (b)(e) | 6.125% | 03/25/2019 | 108,090 | 103,207 | |||||||||||
|
| |||||||||||||||
| 4,541,713 | ||||||||||||||||
|
| |||||||||||||||
Total Corporate Bonds (Cost $279,864,107) | $ | 294,134,161 | ||||||||||||||
|
| |||||||||||||||
| Common Stocks – 0.1% | Shares | Value | ||||||||||||||
CONSUMER DISCRETIONARY – 0.1% | ||||||||||||||||
General Motors Co. (Automobiles) | (a) | 4,679 | $ | 191,232 | ||||||||||||
|
| |||||||||||||||
Total Common Stocks (Cost $415,829) | $ | 191,232 | ||||||||||||||
|
| |||||||||||||||
| 65 | (continued) |
| Ohio National Fund, Inc. | High Income Bond Portfolio (Continued) |
Schedule of Investments | December 31, 2013 |
| Preferred Stocks – 0.1% | Shares | Value | ||||||||||||
FINANCIALS – 0.1% | ||||||||||||||
Ally Financial, Inc. (Consumer Finance) | (b) | 346 | $ | 332,193 | ||||||||||
|
| |||||||||||||
Total Preferred Stocks (Cost $0) | $ | 332,193 | ||||||||||||
|
| |||||||||||||
| Warrants – 0.1% | Quantity | Value | ||||||||||||
CONSUMER DISCRETIONARY – 0.1% | ||||||||||||||
General Motors Co. (Automobiles) Expiration: 07/10/16, Exercise Price: $10.00 | (a) | 4,254 | $ | 132,542 | ||||||||||
General Motors Co. (Automobiles) Expiration: 07/10/19, Exercise Price: $18.33 | (a) | 4,254 | 98,385 | |||||||||||
|
| |||||||||||||
Total Warrants (Cost $476,540) | $ | 230,927 | ||||||||||||
|
| |||||||||||||
| Other – 0.0% | Shares | Value | ||||||||||||
CONSUMER DISCRETIONARY – 0.0% | ||||||||||||||
Motors Liquidation Co. GUC Trust (Automobiles) | (a) | 1,116 | $ | 35,879 | ||||||||||
|
| |||||||||||||
Total Other (Cost $0) | $ | 35,879 | ||||||||||||
|
| |||||||||||||
| Money Market Funds – 1.8% | Shares | Value | ||||||||||||
Fidelity Institutional Money Market Funds | 5,678,000 | $ | 5,678,000 | |||||||||||
|
| |||||||||||||
Total Money Market Funds (Cost $5,678,000) | $ | 5,678,000 | ||||||||||||
|
| |||||||||||||
Total Investments – 97.6% (Cost $286,434,476) | (f) | $ | 300,602,392 | |||||||||||
Other Assets in Excess of Liabilities – 2.4% | 7,282,451 | |||||||||||||
|
| |||||||||||||
Net Assets – 100.0% | $ | 307,884,843 | ||||||||||||
|
| |||||||||||||
Percentages are stated as a percent of net assets.
Footnotes:
| (a) | Non-income producing security. |
| (b) | Security exempt from registration under Regulation D of the Securities Act of 1933. These securities may be resold in transactions exempt form registration, normally to qualified buyers under Rule 144A. At December 31, 2013, the value of these securities totaled $113,774,035, or 37.0% of the Portfolio’s net assets. Unless also noted with (e), as defined below, these securities were deemed liquid pursuant to procedures approved by the Board of Directors. |
| (c) | Issuer of the security has the option to make coupon payments in cash or in additional par value of this bond. Rate presented is the coupon rate for the cash option. |
| (d) | Represents a security that is in default. Unless noted by (e), as defined below, these securities were deemed liquid pursuant to procedures approved by the Board of Directors. |
| (e) | Represents a security deemed to be illiquid. At December 31, 2013, the value of illiquid securities in the Portfolio totaled $133,707, or 0.0% of the Portfolio’s net assets. |
| (f) | Represents cost for financial reporting purposes, which may differ from cost basis for federal income tax purposes. See also Note 7 of the Notes to Financial Statements. |
The accompanying notes are an integral part of these financial statements.
| 66 |
| Ohio National Fund, Inc. | Capital Growth Portfolio |
Objective/Strategy
The Capital Growth Portfolio seeks long-term capital appreciation by investing primarily in an actively managed portfolio of equity securities of small cap growth companies.
Performance as of December 31, 2013
Average Annual Total Returns: | ||||
One year | 30.26% | |||
Five years | 21.69% | |||
Ten years | 10.80% |
Past performance does not guarantee future results. The performance data quoted represents past performance and current returns may be lower or higher. Total return figures include change in share price and reinvestment of dividends and capital gains. The investment return and principal value will fluctuate so that an investor’s shares, when redeemed, may be worth more or less than the original cost. To obtain performance information up to the most recent month end, call toll-free 1-877-781-6392.
The Portfolio is not open to direct retail investment. Beneficial interest in shares is obtained solely by purchase of variable life insurance policies and variable annuity contracts. Actual performance results for variable annuity and variable universal life contracts will be lower due to contract charges. Consult your contract for applicable charges.
Comments
For the year ended December 31, 2013, the Capital Growth Portfolio returned 30.26% versus 43.30% for the current benchmark, the Russell 2000 Growth Index.
For the year, the return of the Russell 2000 Growth Index (+43.3%) outpaced the return of the Russell 2000 Value Index (+34.5%), in what was the index’s strongest performance year in a decade. Strength in returns was broad-based during 2013, led by Health Care (51.6%), Consumer Staples (48.5%) and Information Technology (44.9%), while Materials came in light (+27.5%) relative to the benchmark’s extremely strong performance during 2013.
The Portfolio was outpaced by the benchmark. Underperforming sectors were Information Technology, Health Care and, to a lesser extent, Consumer Discretionary. Energy was the sole bright spot on the sector level for the strategy, generating slight outperformance over the course of the year.(1)
The Portfolio’s worst performing holdings for the year were ARIAD Pharmaceuticals, Inc., Vocera Communications, Inc., Fusion-io, Inc., Francesca’s Holdings Corp. and Monster Worldwide, Inc.(1)
ARIAD Pharmaceuticals, Inc. focuses on therapies used to target drug-resistant, difficult-to-treat cancers. Investors were caught off-guard by an unexpected U.S. Food and Drug Administration (FDA) halt placed on ARIAD Pharmaceuticals, Inc.’s late-stage clinical trial that was analyzing the firm’s leukemia drug candidate. The FDA expressed concerns about a greater than acceptable incidence of blood clots reported by trial patients. We sold the stock.(1)
Vocera Communications, Inc. makes hands-free devices used by physicians and many hospital personnel. These devices simplify communication between highly mobile and often difficult to locate individuals in a fast-paced hospital environment. The company reported a substantially weaker than expected quarter earlier in the period and lowered guidance on reduced growth visibility in the near term.(1)
Fusion-io, Inc. is a producer of commercial data storage that utilizes “flash” memory. Customer-concentration issues have continued to
plague the firm in recent periods, exacerbated by multiple management departures earlier in the year. Despite a solid product offering, Fusion-io, Inc. appears to have lost its strategic footing for the time being and the stock has suffered as a result.(1)
Francesca’s Collections, a subsidiary of Francesca’s Holdings Corp., is a specialty women’s retailer. Francesca’s missed quarterly estimates and substantially reduced guidance. We sold the stock due to very poor results, particularly in its non-mall locations.(1)
Monster Worldwide, Inc. provides online employment solutions (e.g., searchable job postings for prospective employees and resume database access for recruiters). The firm has proceeded with some selective restructuring as part of a cost-savings initiative, while continuing to entertain and evaluate strategic alternatives through a possible sale of the company. Shares of the stock have suffered as the anticipated sale of the company has taken longer than expected.(1)
The Portfolio’s top performing holdings for the year were United Therapeutics Corp., Salix Pharmaceuticals Ltd., Natural Grocers by Vitamin Cottage, Inc., Bally Technologies, Inc. and Genesco, Inc. (1)
United Therapeutics Corp. is a biotechnology company focused on the medical needs of patients with chronic and life-threatening conditions. Shares jumped toward the end of the period as the FDA announced approval of United Therapeutic Corp.’s new drug designed to improve the ability to exercise for sufferers of pulmonary arterial hypertension (effectively high blood pressure in the lungs).(1)
Salix Pharmaceuticals Ltd. specializes in drugs for gastrointestinal (GI) diseases and conditions. The firm continues to benefit from its diverse lineup and has upside potential from the recent acquisition of a competitor that is expected to enhance the scale of Salix Pharmaceuticals Ltd.’s operations in the GI pharmaceutical industry.(1)
Natural Grocers by Vitamin Cottage, Inc. operates natural and organic grocery and dietary supplement stores throughout the United States. The firm beat top- and bottom-line estimates earlier in the year. Secular trends supporting healthy lifestyles have provided tailwinds for Natural Grocers by Vitamin Cottage, Inc. as it expands square footage, maintains disciplined expense controls and enhances marketing.(1)
Bally Technologies, Inc., a producer of casino gaming systems and equipment, announced the acquisition of competitor SHFL Entertainment, in what is largely expected to be a synergistic and highly accretive transaction. The acquisition should provide Bally Technologies, Inc. with the valuable additions of SHFL’s product offerings and exposure to Asian gaming markets.(1)
Genesco, Inc. is a retailer of headwear, sporting goods, footwear and clothing accessories. The firm has continued to leverage its strong positioning in the Journeys footwear and Lids headwear lines to grow earnings. It maintains top market share in those spaces in the absence of direct competitors.(1)
Our outlook comments have been fairly consistent toward the latter half of the reporting period, as the market shrugged off the U.S. Federal Reserve’s tapering and rallied to new highs. Once again, particular strength was evident in the small-cap space as the “risk-on” trade continued. Valuations increase, and the possibility of a correction also increases as the market rises. Nevertheless, valuations, while not cheap, are not excessive either. Important metrics, such as domestic housing and autos, continue to be strong, employment statistics are getting better, and recent economic data from Europe and China also has been encouraging. Finally, the
| 67 | (continued) |
| Ohio National Fund, Inc. | Capital Growth Portfolio (Continued) |
Federal Reserve’s gradual tapering has been well-received. We continue to believe higher interest rates are inevitable and, consequently, we continue to believe investors will move money out of fixed income and into those asset classes producing the highest returns. That transfer could provide continued fuel for the rally. It appears to us that conditions remain in place for the market to continue higher, but gains of the magnitude of 2013 would be an unrealistic expectation.
| (1) | The Portfolio’s composition is subject to change. Holdings and weightings are as of December 31, 2013. |
Change in Value of $10,000 Investment
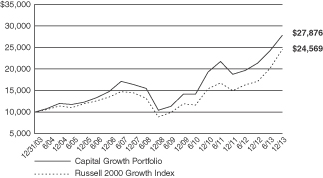
Hypothetical illustration based on past performance. Future performance will vary. The Portfolio’s returns reflect reinvested dividends. The Portfolio’s holdings may differ significantly from the securities in the index. The index is unmanaged and therefore does not reflect the cost of portfolio management and accounting.
The Russell 2000 Growth Index measures the performance of the small-cap growth segment of the U.S. equity universe. It includes those Russell 2000 Index companies with higher price-to-value ratios and higher forecasted growth values. The Russell 2000 Index includes the 2000 firms from the Russell 3000 Index with the smallest market capitalizations. The Russell 3000 Index represents 98% of the investable U.S. equity market. The index presented herein includes the effects of reinvested dividends.
Portfolio Composition as of December 31, 2013 (1)
| % of Net Assets | ||||
Common Stocks (3) | 99.7 | |||
Other Net Assets | 0.3 | |||
|
| |||
| 100.0 | ||||
|
|
Top 10 Portfolio Holdings as of December 31, 2013 (1) (2)
| % of Net Assets | ||||
1. Genesco, Inc. | 3.0 | |||
2. United Therapeutics Corp. | 2.7 | |||
3. Vitamin Shoppe, Inc. | 2.3 | |||
4. Geospace Technologies Corp. | 2.2 | |||
5. Bally Technologies, Inc. | 2.1 | |||
6. Hexcel Corp. | 1.8 | |||
7. Natural Grocers by Vitamin Cottage, Inc. | 1.8 | |||
8. WhiteWave Foods Co. Class A | 1.7 | |||
9. Cornerstone OnDemand, Inc. | 1.6 | |||
10. Centene Corp. | 1.6 |
| (1) | Composition of Portfolio subject to change. |
| (2) | Short-term investments have been excluded from the list of Top 10 Portfolio Holdings. |
| (3) | Sectors: |
| % of Net Assets | ||||
Information Technology | 22.9 | |||
Health Care | 22.8 | |||
Consumer Discretionary | 16.8 | |||
Industrials | 15.5 | |||
Financials | 6.0 | |||
Materials | 5.7 | |||
Consumer Staples | 5.3 | |||
Energy | 4.7 | |||
|
| |||
| 99.7 | ||||
|
|
| 68 |
| Ohio National Fund, Inc. | Capital Growth Portfolio |
Schedule of Investments | December 31, 2013 |
| Common Stocks – 99.7% | Shares | Value | ||||||||
CONSUMER DISCRETIONARY – 16.8% | ||||||||||
Tenneco, Inc. (Auto Components) | (a) | 12,170 | �� | $ | 688,457 | |||||
Grand Canyon Education, Inc. (Diversified Consumer Svs.) | (a) | 7,665 | 334,194 | |||||||
Sotheby’s (Diversified Consumer Svs.) | 5,995 | 318,934 | ||||||||
Bally Technologies, Inc. (Hotels, Restaurants & Leisure) | (a) | 21,791 | 1,709,504 | |||||||
Chuy’s Holdings, Inc. (Hotels, Restaurants & Leisure) | (a) | 12,215 | 439,984 | |||||||
Orient-Express Hotels Ltd. Class A (Hotels, Restaurants & Leisure) | (a) | 59,255 | 895,343 | |||||||
Pinnacle Entertainment, Inc. (Hotels, Restaurants & Leisure) | (a) | 17,728 | 460,751 | |||||||
Universal Electronics, Inc. (Household Durables) | (a) | 24,045 | 916,355 | |||||||
Chico’s FAS, Inc. (Specialty Retail) | 22,859 | 430,664 | ||||||||
Container Store Group, Inc. / The (Specialty Retail) | (a) | 2,130 | 99,279 | |||||||
Genesco, Inc. (Specialty Retail) | (a) | 33,544 | 2,450,725 | |||||||
Outerwall, Inc. (Specialty Retail) | (a) | 7,252 | 487,842 | |||||||
TravelCenters of America LLC (Specialty Retail) | (a) | 25,225 | 245,692 | |||||||
Vitamin Shoppe, Inc. (Specialty Retail) | (a) | 35,361 | 1,839,126 | |||||||
Deckers Outdoor Corp. (Textiles, Apparel & Luxury Goods) | (a) | 10,255 | 866,137 | |||||||
Steven Madden Ltd. (Textiles, Apparel & Luxury Goods) | (a) | 24,083 | 881,197 | |||||||
Vince Holding Corp. (Textiles, Apparel & Luxury Goods) | (a) | 14,962 | 458,885 | |||||||
|
| |||||||||
| 13,523,069 | ||||||||||
|
| |||||||||
CONSUMER STAPLES – 5.3% | ||||||||||
Fresh Market, Inc. / The (Food & Staples Retailing) | (a) | 18,019 | 729,770 | |||||||
Natural Grocers by Vitamin Cottage, Inc. (Food & Staples Retailing) | (a) | 33,914 | 1,439,649 | |||||||
United Natural Foods, Inc. (Food & Staples Retailing) | (a) | 7,040 | 530,746 | |||||||
Pinnacle Foods, Inc. (Food Products) | 7,415 | 203,616 | ||||||||
WhiteWave Foods Co. Class A (Food Products) | (a) | 57,930 | 1,328,914 | |||||||
|
| |||||||||
| 4,232,695 | ||||||||||
|
| |||||||||
ENERGY – 4.7% | ||||||||||
Geospace Technologies Corp. (Energy Equip. & Svs.) | (a) | 18,563 | 1,760,329 | |||||||
Diamondback Energy, Inc. (Oil, Gas & Consumable Fuels) | (a) | 5,290 | 279,629 | |||||||
Gulfport Energy Corp. (Oil, Gas & Consumable Fuels) | (a) | 18,790 | 1,186,588 | |||||||
Oasis Petroleum, Inc. (Oil, Gas & Consumable Fuels) | (a) | 8,375 | 393,374 | |||||||
Western Refining, Inc. (Oil, Gas & Consumable Fuels) | 4,710 | 199,751 | ||||||||
|
| |||||||||
| 3,819,671 | ||||||||||
|
| |||||||||
FINANCIALS – 6.0% | ||||||||||
Stifel Financial Corp. (Capital Markets) | (a) | 13,039 | 624,829 | |||||||
UMB Financial Corp. (Commercial Banks) | 11,537 | 741,598 | ||||||||
Validus Holdings Ltd. (Insurance) | 24,325 | 980,054 | ||||||||
Geo Group, Inc. / The (Real Estate Investment Trusts) | 39,171 | 1,262,090 | ||||||||
Two Harbors Investment Corp. (Real Estate Investment Trusts) | 47,140 | 437,459 | ||||||||
Home Loan Servicing Solutions Ltd. (Thrifts & Mortgage Finance) | 34,914 | 801,975 | ||||||||
|
| |||||||||
| 4,848,005 | ||||||||||
|
| |||||||||
HEALTH CARE – 22.8% | ||||||||||
Acorda Therapeutics, Inc. (Biotechnology) | (a) | 20,726 | 605,199 | |||||||
Aegerion Pharmaceuticals, Inc. (Biotechnology) | (a) | 6,875 | 487,850 | |||||||
Cubist Pharmaceuticals, Inc. (Biotechnology) | (a) | 10,131 | 697,722 | |||||||
Isis Pharmaceuticals, Inc. (Biotechnology) | (a) | 10,205 | 406,567 | |||||||
Ophthotech Corp. (Biotechnology) | (a) | 12,474 | 403,534 | |||||||
Seattle Genetics, Inc. (Biotechnology) | (a) | 16,815 | 670,750 | |||||||
Theravance, Inc. (Biotechnology) | (a) | 21,113 | 752,678 | |||||||
United Therapeutics Corp. (Biotechnology) | (a) | 19,230 | 2,174,528 | |||||||
Align Technology, Inc. (Health Care Equip. & Supplies) | (a) | 10,488 | 599,389 | |||||||
ArthroCare Corp. (Health Care Equip. & Supplies) | (a) | 31,910 | 1,284,058 | |||||||
Cooper Cos., Inc. / The (Health Care Equip. & Supplies) | 8,920 | 1,104,653 | ||||||||
Cyberonics, Inc. (Health Care Equip. & Supplies) | (a) | 3,160 | 207,012 | |||||||
| Common Stocks (Continued) | Shares | Value | ||||||||
HEALTH CARE (continued) | ||||||||||
Endologix, Inc. (Health Care Equip. & Supplies) | (a) | 10,827 | $ | 188,823 | ||||||
Natus Medical, Inc. (Health Care Equip. & Supplies) | (a) | 8,891 | 200,048 | |||||||
Sirona Dental Systems, Inc. (Health Care Equip. & Supplies) | (a) | 11,347 | 796,559 | |||||||
Thoratec Corp. (Health Care Equip. & Supplies) | (a) | 31,862 | 1,166,149 | |||||||
Air Methods Corp. (Health Care Providers & Svs.) | (a) | 20,987 | 1,224,172 | |||||||
Centene Corp. (Health Care Providers & Svs.) | (a) | 22,202 | 1,308,808 | |||||||
MWI Veterinary Supply, Inc. (Health Care Providers & Svs.) | (a) | 1,063 | 181,337 | |||||||
Team Health Holdings, Inc. (Health Care Providers & Svs.) | (a) | 19,044 | 867,454 | |||||||
athenahealth, Inc. (Health Care Technology) | (a) | 2,985 | 401,483 | |||||||
MedAssets, Inc. (Health Care Technology) | (a) | 46,456 | 921,222 | |||||||
Medidata Solutions, Inc. (Health Care Technology) | (a) | 4,434 | 268,567 | |||||||
Furiex Pharmaceuticals, Inc. (Life Sciences Tools & Svs.) | (a) | 5,913 | 248,405 | |||||||
PAREXEL International Corp. (Life Sciences Tools & Svs.) | (a) | 8,906 | 402,373 | |||||||
Salix Pharmaceuticals Ltd. (Pharmaceuticals) | (a) | 8,907 | 801,096 | |||||||
|
| |||||||||
| 18,370,436 | ||||||||||
|
| |||||||||
INDUSTRIALS – 15.5% | ||||||||||
Hexcel Corp. (Aerospace & Defense) | (a) | 32,457 | 1,450,503 | |||||||
American Airlines Group, Inc. (Airlines) | (a) | 16,483 | 416,196 | |||||||
JetBlue Airways Corp. (Airlines) | (a) | 94,010 | 803,785 | |||||||
PGT, Inc. (Building Products) | (a) | 48,339 | 489,191 | |||||||
Trex Co., Inc. (Building Products) | (a) | 10,483 | 833,713 | |||||||
USG Corp. (Building Products) | (a) | 15,085 | 428,112 | |||||||
Waste Connections, Inc. (Commercial Svs. & Supplies) | 22,682 | 989,616 | ||||||||
Foster Wheeler AG (Construction & Engineering) | (a) | 22,881 | 755,531 | |||||||
Northwest Pipe Co. (Construction & Engineering) | (a) | 20,161 | 761,279 | |||||||
Thermon Group Holdings, Inc. (Electrical Equip.) | (a) | 21,215 | 579,806 | |||||||
Chart Industries, Inc. (Machinery) | (a) | 6,972 | 666,802 | |||||||
Colfax Corp. (Machinery) | (a) | 15,039 | 957,834 | |||||||
Manitowoc Co., Inc. / The (Machinery) | 28,174 | 657,018 | ||||||||
Trimas Corp. (Machinery) | (a) | 12,008 | 478,999 | |||||||
WABCO Holdings, Inc. (Machinery) | (a) | 5,572 | 520,481 | |||||||
Woodward, Inc. (Machinery) | 12,464 | 568,483 | ||||||||
Landstar System, Inc. (Road & Rail) | 10,655 | 612,130 | ||||||||
Quality Distribution, Inc. (Road & Rail) | (a) | 36,439 | 467,512 | |||||||
|
| |||||||||
| 12,436,991 | ||||||||||
|
| |||||||||
INFORMATION TECHNOLOGY – 22.9% | ||||||||||
Aruba Networks, Inc. (Communications Equip.) | (a) | 29,745 | 532,436 | |||||||
Ixia (Communications Equip.) | (a) | 11,993 | 159,627 | |||||||
Palo Alto Networks, Inc. (Communications Equip.) | (a) | 8,425 | 484,185 | |||||||
Coherent, Inc. (Electronic Equip., Instr. & Comp.) | (a) | 12,368 | 920,056 | |||||||
InvenSense, Inc. (Electronic Equip., Instr. & Comp.) | (a) | 49,816 | 1,035,176 | |||||||
IPG Photonics Corp. (Electronic Equip., Instr. & Comp.) | (a) | 14,365 | 1,114,868 | |||||||
Angie’s List, Inc. (Internet Software & Svs.) | (a) | 31,756 | 481,103 | |||||||
Cornerstone OnDemand, Inc. (Internet Software & Svs.) | (a) | 24,811 | 1,323,419 | |||||||
Demandware, Inc. (Internet Software & Svs.) | (a) | 12,843 | 823,493 | |||||||
Marin Software, Inc. (Internet Software & Svs.) | (a) | 23,342 | 239,022 | |||||||
Rocket Fuel, Inc. (Internet Software & Svs.) | (a) | 3,732 | 229,481 | |||||||
Trulia, Inc. (Internet Software & Svs.) | (a) | 26,489 | 934,267 | |||||||
Cavium, Inc. (Semiconductors & Equip.) | (a) | 25,755 | 888,805 | |||||||
EZchip Semiconductor Ltd. (Semiconductors & Equip.) | (a) | 13,353 | 328,617 | |||||||
Kulicke & Soffa Industries, Inc. (Semiconductors & Equip.) | (a) | 18,263 | 242,898 | |||||||
SunEdison, Inc. (Semiconductors & Equip.) | (a) | 32,995 | 430,585 | |||||||
Teradyne, Inc. (Semiconductors & Equip.) | (a) | 44,860 | 790,433 | |||||||
Veeco Instruments, Inc. (Semiconductors & Equip.) | (a) | 19,545 | 643,226 | |||||||
Aspen Technology, Inc. (Software) | (a) | 19,843 | 829,437 | |||||||
Concur Technologies, Inc. (Software) | (a) | 8,000 | 825,440 | |||||||
Fortinet, Inc. (Software) | (a) | 45,077 | 862,323 | |||||||
Guidewire Software, Inc. (Software) | (a) | 10,398 | 510,230 | |||||||
| 69 | (continued) |
| Ohio National Fund, Inc. | Capital Growth Portfolio (Continued) |
Schedule of Investments | December 31, 2013 |
| Common Stocks (Continued) | Shares | Value | ||||||||
INFORMATION TECHNOLOGY (continued) | ||||||||||
Imperva, Inc. (Software) | (a) | 15,951 | $ | 767,722 | ||||||
NICE Systems Ltd. – ADR (Software) | 19,587 | 802,284 | ||||||||
PTC, Inc. (Software) | (a) | 11,710 | 414,417 | |||||||
Qlik Technologies, Inc. (Software) | (a) | 30,475 | 811,549 | |||||||
TIBCO Software, Inc. (Software) | (a) | 15,351 | 345,090 | |||||||
Ultimate Software Group, Inc. / The (Software) | (a) | 3,997 | 612,420 | |||||||
|
| |||||||||
| 18,382,609 | ||||||||||
|
| |||||||||
MATERIALS – 5.7% | ||||||||||
Huntsman Corp. (Chemicals) | 40,616 | 999,154 | ||||||||
Quaker Chemical Corp. (Chemicals) | 16,949 | 1,306,259 | ||||||||
| Common Stocks (Continued) | Shares | Value | ||||||||
MATERIALS (continued) | ||||||||||
Texas Industries, Inc. (Construction Materials) | (a) | 18,066 | $ | 1,242,579 | ||||||
RTI International Metals, Inc. (Metals & Mining) | (a) | 30,739 | 1,051,581 | |||||||
|
| |||||||||
| 4,599,573 | ||||||||||
|
| |||||||||
Total Common Stocks (Cost $58,521,428) | $ | 80,213,049 | ||||||||
|
| |||||||||
Total Investments – 99.7% (Cost $58,521,428) | (b) | $ | 80,213,049 | |||||||
Other Assets in Excess of Liabilities – 0.3% | 219,311 | |||||||||
|
| |||||||||
Net Assets – 100.0% | $ | 80,432,360 | ||||||||
|
| |||||||||
Percentages are stated as a percent of net assets.
Abbreviations:
ADR: American Depositary Receipts
Footnotes:
| (a) | Non-income producing security. |
| (b) | Represents cost for financial reporting purposes, which may differ from cost basis for federal income tax purposes. See also Note 7 of the Notes to Financial Statements. |
The accompanying notes are an integral part of these financial statements.
| 70 |
| Ohio National Fund, Inc. | Nasdaq-100® Index Portfolio |
Objective/Strategy
The Nasdaq-100® Index Portfolio seeks long-term growth of capital by investing primarily in stocks that are included in the Nasdaq-100® Index. Unlike the other Portfolios of the Fund, the Nasdaq-100® Index Portfolio is a non-diversified portfolio for purposes of Section 5(b) of the Investment Company Act of 1940, as amended.
Performance as of December 31, 2013
Average Annual Total Returns: | ||||
One year | 35.98% | |||
Five years | 24.86% | |||
Ten years | 9.52% |
Past performance does not guarantee future results. The performance data quoted represents past performance and current returns may be lower or higher. Total return figures include change in share price and reinvestment of dividends and capital gains. The investment return and principal value will fluctuate so that an investor’s shares, when redeemed, may be worth more or less than the original cost. To obtain performance information up to the most recent month end, call toll-free 1-877-781-6392.
The Portfolio is not open to direct retail investment. Beneficial interest in shares is obtained solely by purchase of variable life insurance policies and variable annuity contracts. Actual performance results for variable annuity and variable universal life contracts will be lower due to contract charges. Consult your contract for applicable charges.
Comments
For the year ended December 31, 2013, the Nasdaq-100® Index Portfolio returned 35.98% versus 36.92% for the current benchmark, the Nasdaq-100® Index.
The Portfolio’s correlation to the index for the year was 99.8%. The high correlation is due to the fact that the Portfolio invests in each of the 100 stocks in the index. The Portfolio also invests in PowerShares QQQ Trust Series 1, an exchange traded fund that mimics the holdings and returns of the Nasdaq-100® Index.(1)
The largest contributors to the index return for 2013 were Google, Inc., Microsoft, Inc., Amazon.com Inc., Gilead Sciences, Inc., and Facebook, Inc. The largest detractors in 2013 were Oracle Corp., Intuitive Surgical. Inc., Nuance Communications. Inc., VimpelCom Ltd. - ADR, and Broadcom Corp. Class A.(1)
The year 2013 was very good for equities, as the market was fueled by a very accommodating Federal Reserve. In 2013, we saw continued improvement in the economy, an improvement in the housing market, and less public policy uncertainty. Multiples for the Nasdaq 100® Index expanded in 2013, with the price to earnings ratio starting at 16.79 times at the end of 2012 to 21.77 times at the end of 2013, as investors priced in the impact of the improving economic environment and improving company earnings.
We believe that 2014 should be another good year for equities. As quantitative easing (“QE”) comes to an end, we expect stock prices to be supported by earnings growth, which is expected to be in the high single digits. We would also expect some volatility, as investors pay close attention to the Federal Reserve’s actions and the speed of the “taper” of QE.
| (1) | The Portfolio’s composition is subject to change. Holdings and weightings are as of December 31, 2013. |
The Nasdaq-100®, Nasdaq-100 Index®, and Nasdaq® are registered trademarks of The NASDAQ OMX Group, Inc. (which with its affiliates is referred to as “NASDAQ OMX”). Ohio National Investments, Inc. has licensed these marks for the Portfolio’s use. NASDAQ OMX has not passed on the Portfolio’s legality or suitability. NASDAQ OMX does not sponsor, endorse, sell or promote the Portfolio. NASDAQ OMX MAKES NO WARRANTIES AND BEARS NO LIABILITY WITH RESPECT TO THE PORTFOLIO.
Change in Value of $10,000 Investment
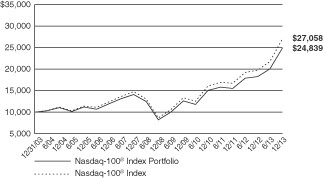
Hypothetical illustration based on past performance. Future performance will vary. The Portfolio’s returns reflect reinvested dividends. The Portfolio’s holdings may differ significantly from the securities in the index. The index is unmanaged and therefore does not reflect the cost of portfolio management and accounting. Investors cannot invest in an index. Although they can invest in its underlying securities or funds.
The Nasdaq-100® Index is a modified capitalization-weighted index of the 100 largest domestic and international non-financial companies listed on the NASDAQ Stock Market. The index presented herein includes the effects of reinvested dividends.
| 71 | (continued) |
| Ohio National Fund, Inc. | Nasdaq-100® Index Portfolio (Continued) |
Portfolio Composition as of December 31, 2013 (1)
| % of Net Assets | ||||
Common Stocks (3) | 97.3 | |||
Exchange Traded Funds | 2.7 | |||
|
| |||
| 100.0 | ||||
|
|
Top 10 Portfolio Holdings as of December 31,
2013 (1) (2)
| % of Net Assets | ||||
1. Apple, Inc. | 12.2 | |||
2. Microsoft Corp. | 7.5 | |||
3. Google, Inc. Class A | 7.5 | |||
4. Amazon.com, Inc. | 4.4 | |||
5. PowerShares QQQ Trust Series 1 | 3.2 | |||
6. Intel Corp. | 3.1 | |||
7. QUALCOMM, Inc. | 3.0 | |||
8. Cisco Systems, Inc. | 2.9 | |||
9. Gilead Sciences, Inc. | 2.8 | |||
10. Comcast Corp. Class A | 2.7 |
| (1) | Composition of Portfolio subject to change. |
| (2) | Short-term investments have been excluded from the list of Top 10 Portfolio Holdings. |
| (3) | Sectors: |
| % of Net Assets | ||||
Information Technology | 55.4 | |||
Consumer Discretionary | 20.3 | |||
Health Care | 13.2 | |||
Consumer Staples | 4.6 | |||
Industrials | 1.8 | |||
Telecommunication Services | 1.7 | |||
Materials | 0.3 | |||
|
| |||
| 97.3 | ||||
|
|
| 72 |
| Ohio National Fund, Inc. | Nasdaq-100® Index Portfolio |
Schedule of Investments | December 31, 2013 |
| Common Stocks – 97.3% | Shares | Value | ||||||||
CONSUMER DISCRETIONARY – 20.3% | ||||||||||
Tesla Motors, Inc. (Automobiles) | (a) | 2,825 | $ | 424,823 | ||||||
Marriott International, Inc. Class A (Hotels, Restaurants & Leisure) | 6,925 | 341,818 | ||||||||
Starbucks Corp. (Hotels, Restaurants & Leisure) | 17,400 | 1,363,986 | ||||||||
Wynn Resorts Ltd. (Hotels, Restaurants & Leisure) | 2,325 | 451,538 | ||||||||
Garmin Ltd. (Household Durables) | 4,500 | 207,990 | ||||||||
Amazon.com, Inc. (Internet & Catalog Retail) | (a) | 10,575 | 4,217,204 | |||||||
Expedia, Inc. (Internet & Catalog Retail) | 2,725 | 189,824 | ||||||||
Liberty Interactive Corp. Class A (Internet & Catalog Retail) | (a) | 11,075 | 325,051 | |||||||
Netflix, Inc. (Internet & Catalog Retail) | (a) | 1,375 | 506,234 | |||||||
priceline.com, Inc. (Internet & Catalog Retail) | (a) | 1,190 | 1,383,256 | |||||||
TripAdvisor, Inc. (Internet & Catalog Retail) | (a) | 2,975 | 246,419 | |||||||
Mattel, Inc. (Leisure Equip. & Products) | 7,825 | 372,313 | ||||||||
Charter Communications, Inc. Class A (Media) | (a) | 2,400 | 328,224 | |||||||
Comcast Corp. Class A (Media) | 49,322 | 2,563,018 | ||||||||
DIRECTV (Media) | (a) | 12,125 | 837,716 | |||||||
Discovery Communications, Inc. Class A (Media) | (a) | 3,375 | 305,167 | |||||||
DISH Network Corp. Class A (Media) | (a) | 5,075 | 293,944 | |||||||
Liberty Global PLC Class A (Media) | (a) | 5,125 | 456,074 | |||||||
Liberty Media Corp. (Media) | (a) | 2,400 | 351,480 | |||||||
Sirius XM Holdings, Inc. (Media) | (a) | 141,625 | 494,271 | |||||||
Twenty-First Century Fox, Inc. Class A (Media) | 34,250 | 1,204,915 | ||||||||
Viacom, Inc. Class B (Media) | 9,125 | 796,977 | ||||||||
Dollar Tree, Inc. (Multiline Retail) | (a) | 4,800 | 270,816 | |||||||
Bed Bath & Beyond, Inc. (Specialty Retail) | (a) | 4,950 | 397,485 | |||||||
O’Reilly Automotive, Inc. (Specialty Retail) | (a) | 2,475 | 318,557 | |||||||
Ross Stores, Inc. (Specialty Retail) | 5,000 | 374,650 | ||||||||
Staples, Inc. (Specialty Retail) | 15,100 | 239,939 | ||||||||
Tractor Supply Co. (Specialty Retail) | 3,225 | 250,195 | ||||||||
|
| |||||||||
| 19,513,884 | ||||||||||
|
| |||||||||
CONSUMER STAPLES – 4.6% | ||||||||||
Monster Beverage Corp. (Beverages) | (a) | 3,875 | 262,609 | |||||||
Costco Wholesale Corp. (Food & Staples Retailing) | 10,085 | 1,200,216 | ||||||||
Whole Foods Market, Inc. (Food & Staples Retailing) | 8,600 | 497,338 | ||||||||
Green Mountain Coffee Roasters, Inc. (Food Products) | (a) | 3,450 | 260,751 | |||||||
Kraft Foods Group, Inc. (Food Products) | 13,750 | 741,400 | ||||||||
Mondelez International, Inc. Class A (Food Products) | 40,475 | 1,428,768 | ||||||||
|
| |||||||||
| 4,391,082 | ||||||||||
|
| |||||||||
HEALTH CARE – 13.2% | ||||||||||
Alexion Pharmaceuticals, Inc. (Biotechnology) | (a) | 4,525 | 602,096 | |||||||
Amgen, Inc. (Biotechnology) | 17,397 | 1,986,042 | ||||||||
Biogen Idec, Inc. (Biotechnology) | (a) | 5,450 | 1,524,638 | |||||||
Celgene Corp. (Biotechnology) | (a) | 9,525 | 1,609,344 | |||||||
Gilead Sciences, Inc. (Biotechnology) | (a) | 35,400 | 2,660,310 | |||||||
Regeneron Pharmaceuticals, Inc. (Biotechnology) | (a) | 2,250 | 619,290 | |||||||
Vertex Pharmaceuticals, Inc. (Biotechnology) | (a) | 5,400 | 401,220 | |||||||
Intuitive Surgical, Inc. (Health Care Equip. & Supplies) | (a) | 875 | 336,070 | |||||||
Catamaran Corp. (Health Care Providers & Svs.) | (a) | 4,750 | 225,530 | |||||||
Express Scripts Holding Co. (Health Care Providers & Svs.) | (a) | 18,600 | 1,306,464 | |||||||
Henry Schein, Inc. (Health Care Providers & Svs.) | (a) | 1,975 | 225,664 | |||||||
Cerner Corp. (Health Care Technology) | (a) | 7,925 | 441,739 | |||||||
Illumina, Inc. (Life Sciences Tools & Svs.) | (a) | 2,925 | 323,563 | |||||||
Mylan, Inc. (Pharmaceuticals) | (a) | 8,850 | 384,090 | |||||||
|
| |||||||||
| 12,646,060 | ||||||||||
|
| |||||||||
INDUSTRIALS – 1.8% | ||||||||||
C.H. Robinson Worldwide, Inc. (Air Freight & Logistics) | 3,500 | 204,190 | ||||||||
Expeditors International of Washington, Inc. (Air Freight & Logistics) | 4,750 | 210,188 | ||||||||
Stericycle, Inc. (Commercial Svs. & Supplies) | (a) | 1,975 | 229,436 | |||||||
PACCAR, Inc. (Machinery) | 8,164 | 483,064 | ||||||||
| Common Stocks (Continued) | Shares | Value | ||||||||
INDUSTRIALS (continued) | ||||||||||
Verisk Analytics, Inc. Class A (Professional Svs.) | (a) | 3,875 | $ | 254,665 | ||||||
Fastenal Co. (Trading Companies & Distributors) | 6,850 | 325,444 | ||||||||
|
| |||||||||
| 1,706,987 | ||||||||||
|
| |||||||||
INFORMATION TECHNOLOGY – 55.4% | ||||||||||
Cisco Systems, Inc. (Communications Equip.) | 123,425 | 2,770,891 | ||||||||
F5 Networks, Inc. (Communications Equip.) | (a) | 1,800 | 163,548 | |||||||
QUALCOMM, Inc. (Communications Equip.) | 38,995 | 2,895,379 | ||||||||
Apple, Inc. (Computers & Peripherals) | 20,770 | 11,654,255 | ||||||||
NetApp, Inc. (Computers & Peripherals) | 7,860 | 323,360 | ||||||||
SanDisk Corp. (Computers & Peripherals) | 5,225 | 368,572 | ||||||||
Seagate Technology PLC (Computers & Peripherals) | 7,525 | 422,604 | ||||||||
Western Digital Corp. (Computers & Peripherals) | 5,450 | 457,255 | ||||||||
Akamai Technologies, Inc. (Internet Software & Svs.) | (a) | 4,125 | 194,618 | |||||||
Baidu, Inc. – ADR (Internet Software & Svs.) | (a) | 6,350 | 1,129,538 | |||||||
eBay, Inc. (Internet Software & Svs.) | (a) | 29,885 | 1,640,388 | |||||||
Equinix, Inc. (Internet Software & Svs.) | (a) | 1,150 | 204,068 | |||||||
Facebook, Inc. Class A (Internet Software & Svs.) | (a) | 43,250 | 2,364,045 | |||||||
Google, Inc. Class A (Internet Software & Svs.) | (a) | 6,400 | 7,172,544 | |||||||
Yahoo!, Inc. (Internet Software & Svs.) | (a) | 23,410 | 946,700 | |||||||
Automatic Data Processing, Inc. (IT Svs.) | 11,125 | 899,011 | ||||||||
Cognizant Technology Solutions Corp. Class A (IT Svs.) | (a) | 6,975 | 704,335 | |||||||
Fiserv, Inc. (IT Svs.) | (a) | 5,949 | 351,288 | |||||||
Paychex, Inc. (IT Svs.) | 8,420 | 383,363 | ||||||||
Altera Corp. (Semiconductors & Equip.) | 7,425 | 241,535 | ||||||||
Analog Devices, Inc. (Semiconductors & Equip.) | 7,175 | 365,423 | ||||||||
Applied Materials, Inc. (Semiconductors & Equip.) | 27,775 | 491,340 | ||||||||
Avago Technologies Ltd. (Semiconductors & Equip.) | 5,725 | 302,795 | ||||||||
Broadcom Corp. Class A (Semiconductors & Equip.) | 11,950 | 354,317 | ||||||||
Intel Corp. (Semiconductors & Equip.) | 114,745 | 2,978,780 | ||||||||
KLA-Tencor Corp. (Semiconductors & Equip.) | 3,850 | 248,171 | ||||||||
Linear Technology Corp. (Semiconductors & Equip.) | 5,405 | 246,198 | ||||||||
Maxim Integrated Products, Inc. (Semiconductors & Equip.) | 6,525 | 182,113 | ||||||||
Micron Technology, Inc. (Semiconductors & Equip.) | (a) | 24,275 | 528,224 | |||||||
NVIDIA Corp. (Semiconductors & Equip.) | 13,137 | 210,455 | ||||||||
NXP Semiconductor NV (Semiconductors & Equip.) | (a) | 5,675 | 260,653 | |||||||
Texas Instruments, Inc. (Semiconductors & Equip.) | 25,275 | 1,109,825 | ||||||||
Xilinx, Inc. (Semiconductors & Equip.) | 6,205 | 284,934 | ||||||||
Activision Blizzard, Inc. (Software) | 16,050 | 286,172 | ||||||||
Adobe Systems, Inc. (Software) | (a) | 11,530 | 690,416 | |||||||
Autodesk, Inc. (Software) | (a) | 5,200 | 261,716 | |||||||
CA, Inc. (Software) | 10,425 | 350,801 | ||||||||
Check Point Software Technologies Ltd. (Software) | (a) | 4,545 | 293,243 | |||||||
Citrix Systems, Inc. (Software) | (a) | 4,300 | 271,975 | |||||||
Intuit, Inc. (Software) | 6,580 | 502,186 | ||||||||
Microsoft Corp. (Software) | 192,700 | 7,212,761 | ||||||||
Symantec Corp. (Software) | 16,073 | 379,001 | ||||||||
|
| |||||||||
| 53,098,796 | ||||||||||
|
| |||||||||
MATERIALS – 0.3% | ||||||||||
Sigma-Aldrich Corp. (Chemicals) | 2,750 | 258,528 | ||||||||
|
| |||||||||
TELECOMMUNICATION SERVICES – 1.7% | ||||||||||
SBA Communications Corp. Class A (Wireless Telecom. Svs.) | (a) | 2,975 | 267,274 | |||||||
VimpelCom Ltd. – ADR (Wireless Telecom. Svs.) | 38,150 | 493,661 | ||||||||
Vodafone Group PLC – ADR (Wireless Telecom. Svs.) | 22,800 | 896,268 | ||||||||
|
| |||||||||
| 1,657,203 | ||||||||||
|
| |||||||||
Total Common Stocks (Cost $57,843,800) | $ | 93,272,540 | ||||||||
|
| |||||||||
| Exchange Traded Funds – 3.2% | Shares | Value | ||||||||
PowerShares QQQ Trust Series 1 | 35,115 | $ | 3,088,715 | |||||||
|
| |||||||||
Total Exchange Traded Funds (Cost $3,001,780) | $ | 3,088,715 | ||||||||
|
| |||||||||
Total Investments – 100.5% (Cost $60,845,580) | (b) | $ | 96,361,255 | |||||||
Liabilities in Excess of Other Assets – (0.5)% | (513,669) | |||||||||
|
| |||||||||
Net Assets – 100.0% | $ | 95,847,586 | ||||||||
|
| |||||||||
| 73 | (continued) |
| Ohio National Fund, Inc. | Nasdaq-100® Index Portfolio (Continued) |
Schedule of Investments | December 31, 2013 |
Percentages are stated as a percent of net assets.
Abbreviations:
ADR: American Depositary Receipts
Footnotes:
| (a) | Non-income producing security. |
| (b) | Represents cost for financial reporting purposes, which may differ from cost basis for federal income tax purposes. See also Note 7 of the Notes to Financial Statements. |
The accompanying notes are an integral part of these financial statements.
| 74 |
| Ohio National Fund, Inc. | Bristol Portfolio |
Objective/Strategy
The Bristol Portfolio seeks long-term growth of capital by investing primarily in common stocks of the 1,000 largest publicly traded U.S. companies in terms of market capitalization.
Performance as of December 31, 2013
Average Annual Total Returns: | ||||
One year | 41.21% | |||
Five years | 17.92% | |||
Ten years | 7.54% |
Past performance does not guarantee future results. The performance data quoted represents past performance and current returns may be lower or higher. Total return figures include change in share price and reinvestment of dividends and capital gains. The investment return and principal value will fluctuate so that an investor’s shares, when redeemed, may be worth more or less than the original cost. To obtain performance information up to the most recent month end, call toll-free 1-877-781-6392.
The Portfolio is not open to direct retail investment. Beneficial interest in shares is obtained solely by purchase of variable life insurance policies and variable annuity contracts. Actual performance results for variable annuity and variable universal life contracts will be lower due to contract charges. Consult your contract for applicable charges.
Comments
For the year ended December 31, 2013, the Bristol Portfolio returned 41.21% versus 32.39% for the current benchmark, the S&P 500 Index.
Following a strong 2012, January 2013 saw the best “January effect” in sixteen years for U.S. stocks and set the tone for the rest of the year. In the past fifty years, the 2013 return has been significantly exceeded only three times, in 1975, 1995 and 1997. The most important downturn during the year occurred after an all time high on May 21. The market corrected downwards in reaction to the remarks of Federal Reserve Chairman Ben Bernanke, which were interpreted that Quantitative Easing (“QE”) might “taper off” in the near term. As QE has been seen as powering the equity markets’ rise, it took subsequent remarks of Federal Reserve members to suggest that tapering may be a long way off, possibly at the end of 2014. With this response, the markets recovered, but it left the S&P 500 Index down 3.8% from the record high and ended a streak of seven monthly advances and the longest run since 2009. Overall, the returns had the best performance for the first six months of a calendar year since 1998. The market rise restarted in late June and the markets were better prepared when actual tapering started in late December. The Federal Reserve announced that it would reduce the monthly purchases of $85 billion by a total of $10 billion. This action contrasted very favorably with the clumsiness of the Federal Reserve in May and seemed to hit the “sweet spot” of acknowledging rising economic growth and reduced unemployment, while at the same time not scaring the markets with the prospect of a huge cutback. Corporations are exiting the recession and enjoying the usual bonus of a leaner workforce and reduced costs. As a result, profits for the S&P 500 Index components increased to $100 per share this year, compared with about $60 a share in 2008. Clearly, the debt markets’ modest returns and the prospect of higher interest rates in the future made the equity markets the better choice for most investors in the near term.
The largest contributors to the significant out-performance relative to the benchmark were stock selections in Financials, Industrials and Consumer Discretionary. Overweights in Consumer Discretionary and Industrials, along with underweights in the under-performing Consumer Staples and Utilities sectors, also had positive effects.(1)
The Portfolio’s best performers from an individual holding perspective were Delta Air Lines, Inc., Facebook,, Inc., Lincoln National Corp., Hanesbrands, Inc. and Celgene Corp. The Portfolio’s worst performers were Infinity Pharmaceuticals, Inc., Amarin Corp., Abercrombie & Fitch Co., Altera Corp. and ARIAD Pharmaceuticals, Inc. The top contributors to performance were Facebook,, Inc., Vertex Pharmaceuticals, Inc., Lincoln National Corp., Delta Air Lines, Inc., and Hertz Global Holdings, Inc. The top detractors from performance were Infinity Pharmaceuticals, Inc., Altera Corp., Abercrombie & Fitch Co., Amarin Corp. and Hewlett-Packard Co.(1)
The top stock contributor to the Portfolio’s performance was Facebook, Inc. which generated 225 basis points with its continued domination of social media sites. Vertex Pharmaceuticals, Inc. contributed 208 basis points as a result of positive drug trails that resulted in a stock price surge in April. Lincoln National Corp. contributed 175 basis points as part of our continued commitment to the Financials sector in anticipation of future interest rates increases. Delta Air Lines, Inc. contributed 170 basis points as growth reappeared in the economy and oil prices weakened. Hertz Global Holdings, Inc. added 152 basis points, having benefited from the purchase of Dollar Thrifty, a 20% stake in China Auto Rental, the largest rental firm in China, and increased revenues as a result of the end of the recession.(1)
Detractors from performance during the year included Infinity Pharmaceuticals, Inc., which lost the Portfolio 132 basis points as a result of adverse health reports in a drug trial. Programmable chip maker Altera Corp. lost the Portfolio 32 basis points as a result of a November downgrade by a big name analyst that grew concerned with delays in revenue development. Abercrombie & Fitch Co. lost the Portfolio 29 basis points after reporting a larger than expected loss for the first quarter, and Amarin Corp. lost the Portfolio 22 basis points when a recently approved drug did not get the expected unqualified approval of the FDA.(1)
Looking to 2014, it appears that the impact of quantitative easing will likely continue for much of the year, and possibly into 2015. The newly appointed Federal Reserve chair will likely continue the tapering, at modest amounts of $10 billion every one or two months, and keep interest rates low for the near term. Unemployment, at 7%, is at a five year low, factory output is up, and the concerns regarding Obamacare’s uncertain medical insurance costs have been somewhat muted. The Federal Reserve projects growth in the area of 3% in 2014 and unemployment falling as low as 6.3%. Even the high returns of 2013 need not be a concern. While past performance is no guarantee of future returns, the historical results since 1870 have a total of thirty examples when the market climbed more than 25%. In twenty-three of these years, the market rose further the following year, with a mean return of 12%. This is a reminder that, in a rising market, December 31st is just an arbitrary date. The fixed income investor’s dilemma regarding what to do about low-to-near-zero interest rates, enshrined in current Federal Reserve policy, suggests strong continued support for equities for 2014.
| (1) | The Portfolio’s composition is subject to change. Holdings and weightings are as of December 31, 2013. |
| 75 | (continued) |
| Ohio National Fund, Inc. | Bristol Portfolio (Continued) |
Change in Value of $10,000 Investment
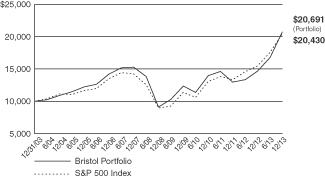
Hypothetical illustration based on past performance. Future performance will vary. The Portfolio’s returns reflect reinvested dividends. The Portfolio’s holdings may differ significantly from the securities in the index. The index is unmanaged and therefore does not reflect the cost of portfolio management and accounting.
The S&P 500 Index is a capitalization-weighted index designed to measure performance of the broad domestic economy through changes in the aggregate market value of 500 stocks representing all major industries. The index presented herein includes the effects of reinvested dividends.
Portfolio Composition as of December 31, 2013 (1)
| % of Net Assets | ||||
Common Stocks (3) | 99.4 | |||
Money Market Funds | 0.6 | |||
|
| |||
| 100.0 | ||||
|
|
Top 10 Portfolio Holdings as of December 31,
2013 (1) (2)
| % of Net Assets | ||||
1. Apple, Inc. | 3.1 | |||
2. Google, Inc. Class A | 2.6 | |||
3. Valeant Pharmaceuticals International, Inc. | 2.6 | |||
4. Microsoft Corp. | 2.3 | |||
5. MetLife, Inc. | 2.2 | |||
6. Cisco Systems, Inc. | 2.1 | |||
7. Prudential Financial, Inc. | 2.1 | |||
8. Tyco International Ltd. | 2.1 | |||
9. Huntsman Corp. | 2.1 | |||
10. Walt Disney Co. / The | 2.1 |
| (1) | Composition of Portfolio subject to change. |
| (2) | Short-term investments have been excluded from the list of Top 10 Portfolio Holdings. |
| (3) | Sectors: |
| % of Net Assets | ||||
Information Technology | 22.1 | |||
Consumer Discretionary | 19.3 | |||
Health Care | 17.8 | |||
Industrials | 16.8 | |||
Financials | 14.9 | |||
Energy | 3.9 | |||
Materials | 3.7 | |||
Consumer Staples | 0.9 | |||
|
| |||
| 99.4 | ||||
|
|
| 76 |
| Ohio National Fund, Inc. | Bristol Portfolio |
Schedule of Investments | December 31, 2013 |
| Common Stocks – 99.4% | Shares | Value | ||||||||
CONSUMER DISCRETIONARY – 19.3% | ||||||||||
General Motors Co. (Automobiles) | (a) | 108,300 | $ | 4,426,221 | ||||||
Las Vegas Sands Corp. (Hotels, Restaurants & Leisure) | 54,100 | 4,266,867 | ||||||||
Amazon.com, Inc. (Internet & Catalog Retail) | (a) | 9,800 | 3,908,142 | |||||||
CBS Corp. Class B (Media) | 55,400 | 3,531,196 | ||||||||
Comcast Corp. Class A (Media) | 90,500 | 4,702,833 | ||||||||
Time Warner, Inc. (Media) | 32,900 | 2,293,788 | ||||||||
Walt Disney Co. / The (Media) | 62,200 | 4,752,080 | ||||||||
Nordstrom, Inc. (Multiline Retail) | 54,700 | 3,380,460 | ||||||||
Hanesbrands, Inc. (Textiles, Apparel & Luxury Goods) | 61,300 | 4,307,551 | ||||||||
NIKE, Inc. Class B (Textiles, Apparel & Luxury Goods) | 55,800 | 4,388,112 | ||||||||
PVH Corp. (Textiles, Apparel & Luxury Goods) | 34,000 | 4,624,680 | ||||||||
|
| |||||||||
| 44,581,930 | ||||||||||
|
| |||||||||
CONSUMER STAPLES – 0.9% | ||||||||||
Constellation Brands, Inc. Class A (Beverages) | (a) | 30,150 | 2,121,957 | |||||||
|
| |||||||||
ENERGY – 3.9% | ||||||||||
Halliburton Co. (Energy Equip. & Svs.) | 25,900 | 1,314,425 | ||||||||
Schlumberger Ltd. (Energy Equip. & Svs.) | 46,400 | 4,181,104 | ||||||||
Pioneer Natural Resources Co. (Oil, Gas & Consumable Fuels) | 12,400 | 2,282,468 | ||||||||
Whiting Petroleum Corp. (Oil, Gas & Consumable Fuels) | (a) | 18,600 | 1,150,782 | |||||||
|
| |||||||||
| 8,928,779 | ||||||||||
|
| |||||||||
FINANCIALS – 14.9% | ||||||||||
Citigroup, Inc. (Diversified Financial Svs.) | 85,400 | 4,450,194 | ||||||||
JPMorgan Chase & Co. (Diversified Financial Svs.) | 75,800 | 4,432,784 | ||||||||
Allstate Corp. / The (Insurance) | 61,400 | 3,348,756 | ||||||||
American International Group, Inc. (Insurance) | 67,800 | 3,461,190 | ||||||||
Hartford Financial Services Group, Inc. (Insurance) | 124,000 | 4,492,520 | ||||||||
Lincoln National Corp. (Insurance) | 82,200 | 4,243,164 | ||||||||
MetLife, Inc. (Insurance) | 96,519 | 5,204,304 | ||||||||
Prudential Financial, Inc. (Insurance) | 52,300 | 4,823,106 | ||||||||
|
| |||||||||
| 34,456,018 | ||||||||||
|
| |||||||||
HEALTH CARE – 17.8% | ||||||||||
Celgene Corp. (Biotechnology) | (a) | 22,800 | 3,852,288 | |||||||
Gilead Sciences, Inc. (Biotechnology) | (a) | 56,500 | 4,245,975 | |||||||
Pharmacyclics, Inc. (Biotechnology) | (a) | 21,500 | 2,274,270 | |||||||
Vertex Pharmaceuticals, Inc. (Biotechnology) | (a) | 49,800 | 3,700,140 | |||||||
Cardinal Health, Inc. (Health Care Providers & Svs.) | 31,200 | 2,084,472 | ||||||||
UnitedHealth Group, Inc. (Health Care Providers & Svs.) | 47,100 | 3,546,630 | ||||||||
Thermo Fisher Scientific, Inc. (Life Sciences Tools & Svs.) | 41,600 | 4,632,160 | ||||||||
Merck & Co., Inc. (Pharmaceuticals) | 89,300 | 4,469,465 | ||||||||
Mylan, Inc. (Pharmaceuticals) | (a) | 97,800 | 4,244,520 | |||||||
| Common Stocks (Continued) | Shares | Value | ||||||||
HEALTH CARE (continued) | ||||||||||
Pfizer, Inc. (Pharmaceuticals) | 70,000 | $ | 2,144,100 | |||||||
Valeant Pharmaceuticals International, Inc. (Pharmaceuticals) | (a) | 50,700 | 5,952,180 | |||||||
|
| |||||||||
| 41,146,200 | ||||||||||
|
| |||||||||
INDUSTRIALS – 16.8% | ||||||||||
Boeing Co. / The (Aerospace & Defense) | 21,600 | 2,948,184 | ||||||||
Precision Castparts Corp. (Aerospace & Defense) | 14,366 | 3,868,764 | ||||||||
FedEx Corp. (Air Freight & Logistics) | 31,900 | 4,586,263 | ||||||||
Delta Air Lines, Inc. (Airlines) | 128,200 | 3,521,654 | ||||||||
Tyco International Ltd. (Commercial Svs. & Supplies) | 117,100 | 4,805,784 | ||||||||
Eaton Corp. PLC (Electrical Equip.) | 55,946 | 4,258,610 | ||||||||
Pentair Ltd. (Machinery) | 53,100 | 4,124,277 | ||||||||
Terex Corp. (Machinery) | 94,000 | 3,947,060 | ||||||||
Xylem, Inc. (Machinery) | 98,800 | 3,418,480 | ||||||||
Hertz Global Holdings, Inc. (Road & Rail) | (a) | 122,600 | 3,508,812 | |||||||
|
| |||||||||
| 38,987,888 | ||||||||||
|
| |||||||||
INFORMATION TECHNOLOGY – 22.1% | ||||||||||
Cisco Systems, Inc. (Communications Equip.) | 218,010 | 4,894,325 | ||||||||
Apple, Inc. (Computers & Peripherals) | 12,664 | 7,105,897 | ||||||||
Google, Inc. Class A (Internet Software & Svs.) | (a) | 5,340 | 5,984,591 | |||||||
International Business Machines Corp. (IT Svs.) | 24,700 | 4,632,979 | ||||||||
MasterCard, Inc. Class A (IT Svs.) | 2,753 | 2,300,021 | ||||||||
Altera Corp. (Semiconductors & Equip.) | 115,900 | 3,770,227 | ||||||||
Avago Technologies Ltd. (Semiconductors & Equip.) | 86,900 | 4,596,141 | ||||||||
Intel Corp. (Semiconductors & Equip.) | 174,400 | 4,527,424 | ||||||||
Adobe Systems, Inc. (Software) | (a) | 76,800 | 4,598,784 | |||||||
Microsoft Corp. (Software) | 142,600 | 5,337,518 | ||||||||
Oracle Corp. (Software) | 91,200 | 3,489,312 | ||||||||
|
| |||||||||
| 51,237,219 | ||||||||||
|
| |||||||||
MATERIALS – 3.7% | ||||||||||
Huntsman Corp. (Chemicals) | 194,100 | 4,774,860 | ||||||||
Monsanto Co. (Chemicals) | 32,900 | 3,834,495 | ||||||||
|
| |||||||||
| 8,609,355 | ||||||||||
|
| |||||||||
Total Common Stocks (Cost $192,157,490) | $ | 230,069,346 | ||||||||
|
| |||||||||
| Money Market Funds – 0.9% | Shares | Value | ||||||||
Fidelity Institutional Money Market Funds Money Market Portfolio – Class I | 2,188,000 | $ | 2,188,000 | |||||||
|
| |||||||||
Total Money Market Funds (Cost $2,188,000) | $ | 2,188,000 | ||||||||
|
| |||||||||
Total Investments – 100.3% (Cost $194,345,490) | (b) | $ | 232,257,346 | |||||||
Liabilities in Excess of Other Assets – (0.3)% | (715,876) | |||||||||
|
| |||||||||
Net Assets – 100.0% | $ | 231,541,470 | ||||||||
|
| |||||||||
Percentages are stated as a percent of net assets.
Footnotes:
| (a) | Non-income producing security. |
| (b) | Represents cost for financial reporting purposes, which may differ from cost basis for federal income tax purposes. See also Note 7 of the Notes to Financial Statements. |
The accompanying notes are an integral part of these financial statements.
| 77 |
| Ohio National Fund, Inc. | Bryton Growth Portfolio |
Objective/Strategy
The Bryton Growth Portfolio seeks long-term growth of capital by investing primarily in common stocks of growth-oriented U.S. companies smaller than the 500 largest publicly traded U.S. companies in terms of market capitalization.
Performance as of December 31, 2013
Average Annual Total Returns: | ||||
One year | 40.73% | |||
Five years | 19.06% | |||
Ten years | 7.60% |
Past performance does not guarantee future results. The performance data quoted represents past performance and current returns may be lower or higher. Total return figures include change in share price and reinvestment of dividends and capital gains. The investment return and principal value will fluctuate so that an investor’s shares, when redeemed, may be worth more, or less than the original cost. To obtain performance information up to the most recent month end, call toll-free 1-877-781-6392.
The Portfolio is not open to direct retail investment. Beneficial interest in shares is obtained solely by purchase of variable life insurance policies and variable annuity contracts. Actual performance results for variable annuity and variable universal life contracts will be lower due to contract charges. Consult your contract for applicable charges.
Comments
For the year ended December 31, 2013, the Bryton Growth Portfolio returned 40.73% versus 43.30% for the current benchmark, the Russell 2000 Growth Index.
Following a strong 2012, January 2013 saw the best “January effect” in sixteen years for U.S. stocks and set the tone for the rest of the year. In the past fifty years, the 2013 return has been significantly exceeded only three times, in 1975, 1995 and 1997. The most important downturn during the year occurred after an all time high on May 21. The market corrected downwards in reaction to the remarks of Federal Reserve Chairman Ben Bernanke, which were interpreted that Quantitative Easing (“QE”) might “taper off” in the near term. As QE has been seen as powering the equity markets’ rise, it took subsequent remarks of Federal Reserve members to suggest that tapering may be a long way off, possibly at the end of 2014. With this response, the markets recovered, but it left the S&P 500 Index down 3.8% from the record high and ended a streak of seven monthly advances and the longest run since 2009. Overall, the returns had the best performance for the first six months of a calendar year since 1998. The market rise restarted in late June and the markets were better prepared when actual tapering started in late December. The Federal Reserve announced that it would reduce the monthly purchases of $85 billion by a total of $10 billion. This action contrasted very favorably with the clumsiness of the Federal Reserve in May and seemed to hit the “sweet spot” of acknowledging rising economic growth and reduced unemployment, while at the same time not scaring the markets with the prospect of a huge cutback. Corporations are exiting the recession and enjoying the usual bonus of a leaner workforce and reduced costs. As a result, profits for the S&P 500 Index components increased to $100 per share this year, compared with about $60 a share in 2008. Clearly, the debt markets’ modest returns and the prospect of higher interest rates in the future made the equity markets the better choice for most investors in the near term.
The under-performance relative to the benchmark was largely due to under-performing stock selections in Health Care and Information Technology. This was partially offset by positive stock selections in
Consumer Discretionary and Industrials. An overweight in Consumer Staples and an underweight in Financials also contributed to relative performance.(1)
The Portfolio’s best performers from an individual holding perspective were Celldex Therapeutics, Inc., Fifth & Pacific Cos., Inc., G-III Apparel Group Ltd., Himax Technologies, Inc. and Unilife Corp. The Portfolio’s worst performers were Affymax, Inc., Peregrine Semiconductor Corp., Infinity Pharmaceuticals, Inc., Amarin Corp. and Rally Software Development Corp. The top contributors to performance were Celldex Therapeutics, Inc., Fifth & Pacific Cos., Inc., G-III Apparel Group Ltd., Himax Technologies, Inc. and The Middleby Corp. The top detractors from performance were Affymax, Inc., Peregrine Semiconductor Corp., Infinity Pharmaceuticals, Inc., Mistras Group, Inc. and EveryWare Global, Inc.(1)
The top contributor to the Portfolio’s performance was Celldex Therapeutics, Inc. which generated 201 basis points following a very successful cancer drug result. Clothing designer Fifth & Pacific Cos., Inc., which had recently sold off two minor lines to concentrate on its flagship Kate Spade brand, added 182 basis points. G-III Apparel Group Ltd. had a strong earnings revision and contributed 157 basis points. Micro display maker Himax Technologies, Inc. had a strong run up as a result of its links to Google glasses and contributed 133 basis points. Food service equipment maker The Middleby Corp. reported very strong earnings and added 128 basis points.(1)
Detractors from performance included Affymax, Inc., a kidney drug maker, which lost the Portfolio 168 basis points as a result of withdrawal of its drug from the market following adverse reactions from patients. Peregrine Semiconductor Corp. lost the Portfolio 128 basis points as a result of an earnings disappointment in its iPhone component segment. Infinity Pharmaceuticals, Inc. lost the Portfolio 82 basis points as a result of adverse health reports in a drug trial. Energy and industrial service provider Mistras Group, Inc. lost the Portfolio 75 basis points after the firm lowered guidance following reduced operating margins, and food preparation product maker EveryWare Global, Inc. lost the Portfolio 70 basis points after an earnings disappointment.(1)
Looking to 2014, it appears that the impact of quantitative easing will likely continue for much of the year, and possibly into 2015. The newly appointed Federal Reserve chair will likely continue the tapering, at modest amounts of $10 billion every one or two months, and keep interest rates low for the near term. Unemployment, at 7%, is at a five year low, factory output is up, and the concerns regarding Obamacare’s uncertain medical insurance costs have been somewhat muted. The Federal Reserve projects growth in the area of 3% in 2014 and unemployment falling as low as 6.3%. Even the high returns of 2013 need not be a concern. While past performance is no guarantee of future returns, the historical results since 1870 have a total of thirty examples when the market climbed more than 25%. In twenty-three of these years, the market rose further the following year, with a mean return of 12%. This is a reminder that, in a rising market, December 31st is just an arbitrary date. The fixed income investor’s dilemma regarding what to do about low-to-near-zero interest rates, enshrined in current Federal Reserve policy, suggests strong continued support for equities for 2014.
| (1) | The Portfolio’s composition is subject to change. Holdings and weightings are as of December 31, 2013. |
| 78 | (continued) |
| Ohio National Fund, Inc. | Bryton Growth Portfolio (Continued) |
Change in Value of $10,000 Investment
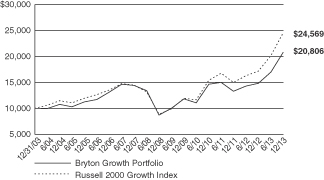
Hypothetical illustration based on past performance. Future performance will vary. The Portfolio’s returns reflect reinvested dividends. The Portfolio’s holdings may differ significantly from the securities in the index. The index is unmanaged and therefore does not reflect the cost of portfolio management and accounting.
The Russell 2000 Growth Index measures the performance of the small-cap growth segment of the U.S. equity universe. It includes the Russell 2000 Index companies with higher price-to-value ratios and higher forecasted growth values. The Russell 2000 Index includes the 2000 firms from the Russell 3000 Index with the smallest market capitalizations. The Russell 3000 Index represents 98% of the investable U.S. equity market. The index presented herein includes the effects of reinvested dividends.
Portfolio Composition as of December 31, 2013 (1)
| % of Net Assets | ||||
Common Stocks (3) | 99.3 | |||
Money Market Funds | 0.7 | |||
|
| |||
| 100.0 | ||||
|
|
Top 10 Portfolio Holdings as of December 31,
2013 (1) (2)
| % of Net Assets | ||||
1. Craft Brew Alliance, Inc. | 2.0 | |||
2. PolyOne Corp. | 2.0 | |||
3. PTC, Inc. | 1.8 | |||
4. Willbros Group, Inc. | 1.8 | |||
5. Dana Holding Corp. | 1.8 | |||
6. Geospace Technologies Corp. | 1.8 | |||
7. Cvent, Inc. | 1.8 | |||
8. Rally Software Development Corp. | 1.8 | |||
9. Endologix, Inc. | 1.7 | |||
10. Semtech Corp. | 1.7 |
| (1) | Composition of Portfolio subject to change. |
| (2) | Short-term investments have been excluded from the list of Top 10 Portfolio Holdings. |
| (3) | Sectors: |
| % of Net Assets | ||||
Industrials | 28.6 | |||
Information Technology | 26.2 | |||
Consumer Discretionary | 15.0 | |||
Health Care | 10.5 | |||
Energy | 7.0 | |||
Consumer Staples | 6.7 | |||
Financials | 3.3 | |||
Materials | 2.0 | |||
|
| |||
| 99.3 | ||||
|
|
| 79 |
| Ohio National Fund, Inc. | Bryton Growth Portfolio |
Schedule of Investments | December 31, 2013 |
| Common Stocks – 99.3% | Shares | Value | ||||||||
CONSUMER DISCRETIONARY – 15.0% | ||||||||||
Dana Holding Corp. (Auto Components) | 166,400 | $ | 3,264,768 | |||||||
Motorcar Parts of America, Inc. (Auto Components) | (a) | 137,775 | 2,659,058 | |||||||
Remy International, Inc. (Auto Components) | 130,864 | 3,051,749 | ||||||||
Bob Evans Farms, Inc. (Hotels, Restaurants & Leisure) | 53,700 | 2,716,683 | ||||||||
EveryWare Global, Inc. (Household Durables) | (a) | 282,714 | 2,340,872 | |||||||
Callaway Golf Co. (Leisure Equip. & Products) | 327,700 | 2,762,511 | ||||||||
Fifth & Pacific Cos., Inc. (Textiles, Apparel & Luxury Goods) | (a) | 54,200 | 1,738,194 | |||||||
G-III Apparel Group Ltd. (Textiles, Apparel & Luxury Goods) | (a) | 37,257 | 2,749,194 | |||||||
Movado Group, Inc. (Textiles, Apparel & Luxury Goods) | 64,400 | 2,834,244 | ||||||||
Vera Bradley, Inc. (Textiles, Apparel & Luxury Goods) | (a) | 124,900 | 3,002,596 | |||||||
|
| |||||||||
| 27,119,869 | ||||||||||
|
| |||||||||
CONSUMER STAPLES – 6.7% | ||||||||||
Craft Brew Alliance, Inc. (Beverages) | (a) | 222,257 | 3,649,460 | |||||||
J&J Snack Foods Corp. (Food Products) | 31,961 | 2,831,425 | ||||||||
TreeHouse Foods, Inc. (Food Products) | (a) | 39,800 | 2,743,016 | |||||||
Spectrum Brands Holdings, Inc. (Household Products) | 40,091 | 2,828,420 | ||||||||
|
| |||||||||
| 12,052,321 | ||||||||||
|
| |||||||||
ENERGY – 7.0% | ||||||||||
Geospace Technologies Corp. (Energy Equip. & Svs.) | (a) | 34,207 | 3,243,850 | |||||||
Willbros Group, Inc. (Energy Equip. & Svs.) | (a) | 347,744 | 3,275,748 | |||||||
Energy XXI Bermuda Ltd. (Oil, Gas & Consumable Fuels) | 63,800 | 1,726,428 | ||||||||
Goodrich Petroleum Corp. (Oil, Gas & Consumable Fuels) | (a) | 150,500 | 2,561,510 | |||||||
Triangle Petroleum Corp. (Oil, Gas & Consumable Fuels) | (a) | 212,200 | 1,765,504 | |||||||
|
| |||||||||
| 12,573,040 | ||||||||||
|
| |||||||||
FINANCIALS – 3.3% | ||||||||||
ICG Group, Inc. (Capital Markets) | (a) | 151,403 | 2,820,638 | |||||||
Regional Management Corp. (Consumer Finance) | (a) | 90,600 | 3,074,058 | |||||||
|
| |||||||||
| 5,894,696 | ||||||||||
|
| |||||||||
HEALTH CARE – 10.5% | ||||||||||
Array BioPharma, Inc. (Biotechnology) | (a) | 465,313 | 2,331,218 | |||||||
Celldex Therapeutics, Inc. (Biotechnology) | (a) | 116,159 | 2,812,209 | |||||||
Intercept Pharmaceuticals, Inc. (Biotechnology) | (a) | 41,200 | 2,813,136 | |||||||
NPS Pharmaceuticals, Inc. (Biotechnology) | (a) | 86,900 | 2,638,284 | |||||||
Endologix, Inc. (Health Care Equip. & Supplies) | (a) | 180,825 | 3,153,588 | |||||||
Centene Corp. (Health Care Providers & Svs.) | (a) | 46,200 | 2,723,490 | |||||||
Team Health Holdings, Inc. (Health Care Providers & Svs.) | (a) | 57,600 | 2,623,680 | |||||||
|
| |||||||||
| 19,095,605 | ||||||||||
|
| |||||||||
INDUSTRIALS – 28.6% | ||||||||||
DigitalGlobe, Inc. (Aerospace & Defense) | (a) | 66,700 | 2,744,705 | |||||||
GenCorp, Inc. (Aerospace & Defense) | (a) | 170,075 | 3,064,752 | |||||||
Hub Group, Inc. Class A (Air Freight & Logistics) | (a) | 45,100 | 1,798,588 | |||||||
XPO Logistics, Inc. (Air Freight & Logistics) | (a) | 106,686 | 2,804,775 | |||||||
JetBlue Airways Corp. (Airlines) | (a) | 217,000 | 1,855,350 | |||||||
| Common Stocks (Continued) | Shares | Value | ||||||||
INDUSTRIALS (continued) | ||||||||||
Spirit Airlines, Inc. (Airlines) | (a) | 38,400 | $ | 1,743,744 | ||||||
PGT, Inc. (Building Products) | (a) | 267,466 | 2,706,756 | |||||||
EnerNOC, Inc. (Commercial Svs. & Supplies) | (a) | 162,000 | 2,788,020 | |||||||
Healthcare Services Group, Inc. (Commercial Svs. & Supplies) | 99,784 | 2,830,872 | ||||||||
Acuity Brands, Inc. (Electrical Equip.) | 20,500 | 2,241,060 | ||||||||
Capstone Turbine Corp. (Electrical Equip.) | (a) | 1,711,346 | 2,207,636 | |||||||
Power Solutions International, Inc. (Electrical Equip.) | (a) | 39,901 | 2,996,565 | |||||||
Chart Industries, Inc. (Machinery) | (a) | 23,500 | 2,247,540 | |||||||
Graham Corp. (Machinery) | 84,121 | 3,052,751 | ||||||||
Middleby Corp. / The (Machinery) | (a) | 12,100 | 2,903,637 | |||||||
Mueller Water Products, Inc. Class A (Machinery) | 326,400 | 3,058,368 | ||||||||
Titan International, Inc. (Machinery) | 171,700 | 3,087,166 | ||||||||
Heartland Express, Inc. (Road & Rail) | 94,204 | 1,848,282 | ||||||||
Roadrunner Transportation Systems, Inc. (Road & Rail) | (a) | 108,404 | 2,921,488 | |||||||
Textainer Group Holdings Ltd. (Trading Companies & Distributors) | 71,570 | 2,878,545 | ||||||||
|
| |||||||||
| 51,780,600 | ||||||||||
|
| |||||||||
INFORMATION TECHNOLOGY – 26.2% | ||||||||||
Infinera Corp. (Communications Equip.) | (a) | 300,926 | 2,943,056 | |||||||
Cognex Corp. (Electronic Equip., Instr. & Comp.) | 71,050 | 2,712,689 | ||||||||
FEI Co. (Electronic Equip., Instr. & Comp.) | 29,000 | 2,591,440 | ||||||||
InvenSense, Inc. (Electronic Equip., Instr. & Comp.) | (a) | 134,100 | 2,786,598 | |||||||
Cvent, Inc. (Internet Software & Svs.) | (a) | 87,692 | 3,191,112 | |||||||
Marin Software, Inc. (Internet Software & Svs.) | (a) | 257,116 | 2,632,868 | |||||||
Xoom Corp. (Internet Software & Svs.) | (a) | 93,300 | 2,553,621 | |||||||
Cavium, Inc. (Semiconductors & Equip.) | (a) | 80,800 | 2,788,408 | |||||||
Himax Technologies, Inc. – ADR (Semiconductors & Equip.) | 188,900 | 2,778,719 | ||||||||
Lattice Semiconductor Corp. (Semiconductors & Equip.) | (a) | 331,061 | 1,824,146 | |||||||
Monolithic Power Systems, Inc. (Semiconductors & Equip.) | (a) | 72,900 | 2,526,714 | |||||||
Peregrine Semiconductor Corp. (Semiconductors & Equip.) | (a) | 374,464 | 2,774,778 | |||||||
Power Integrations, Inc. (Semiconductors & Equip.) | 48,500 | 2,707,270 | ||||||||
Semtech Corp. (Semiconductors & Equip.) | (a) | 122,733 | 3,102,690 | |||||||
PTC, Inc. (Software) | (a) | 94,100 | 3,330,199 | |||||||
Qlik Technologies, Inc. (Software) | (a) | 112,100 | 2,985,223 | |||||||
Rally Software Development Corp. (Software) | (a) | 163,519 | 3,180,445 | |||||||
|
| |||||||||
| 47,409,976 | ||||||||||
|
| |||||||||
MATERIALS – 2.0% | ||||||||||
PolyOne Corp. (Chemicals) | 99,800 | 3,527,930 | ||||||||
|
| |||||||||
Total Common Stocks (Cost $158,574,835) | $ | 179,454,037 | ||||||||
|
| |||||||||
| Money Market Funds – 1.6% | Shares | Value | ||||||||
Fidelity Institutional Money Market Funds Money Market Portfolio – Class I | 2,959,000 | $ | 2,959,000 | |||||||
|
| |||||||||
Total Money Market Funds (Cost $2,959,000) | $ | 2,959,000 | ||||||||
|
| |||||||||
Total Investments – 100.9% (Cost $161,533,835) | (b) | $ | 182,413,037 | |||||||
Liabilities in Excess of Other Assets – (0.9)% | (1,634,182) | |||||||||
|
| |||||||||
Net Assets – 100.0% | $ | 180,778,855 | ||||||||
|
| |||||||||
Percentages are stated as a percent of net assets.
Abbreviations:
ADR: American Depositary Receipts
Footnotes:
| (a) | Non-income producing security. |
| (b) | Represents cost for financial reporting purposes, which may differ from cost basis for federal income tax purposes. See also Note 7 of the Notes to Financial Statements. |
The accompanying notes are an integral part of these financial statements.
| 80 |
| Ohio National Fund, Inc. | Balanced Portfolio |
Objective/Strategy
The Balanced Portfolio seeks capital appreciation and income by investing normally up to 75% of its assets in equity securities within under-priced sectors and industries while maintaining a minimum of 25% of its assets in fixed income securities.
Performance as of December 31, 2013
Average Annual Total Returns: | ||||
One year | 15.26% | |||
Five years | 12.46% | |||
Since inception (5/1/04) | 7.19% |
Past performance does not guarantee future results. The performance data quoted represents past performance and current returns may be lower or higher. Total return figures include change in share price and reinvestment of dividends and capital gains. The investment return and principal value will fluctuate so that an investor’s shares, when redeemed, may be worth more or less than the original cost. To obtain performance information up to the most recent month end, call toll-free 1-877-781-6392.
The Portfolio is not open to direct retail investment. Beneficial interest in shares is obtained solely by purchase of variable life insurance policies and variable annuity contracts. Actual performance results for variable annuity and variable universal life contracts will be lower due to contract charges. Consult your contract for applicable charges.
Comments
For the year ended December 31, 2013, the Balanced Portfolio returned 15.26% versus 18.10% for the current benchmark, which is composed of 60% S&P Composite 1500 Index and 40% Barclays Capital U.S. Universal Index.
As we entered the beginning of 2013, we saw significant upside potential in the equity market. Our valuation model indicated that stocks were poised for a rally that would be a continuation of the bull market that began way back in March of 2009. Because of the significant opportunity in equities, we began the year with a rather aggressive 70% equity/30% fixed income allocation within the Portfolio. We maintained a minimal hedge on our equity holdings using S&P 500 Index out-of-the-money puts. Over the course of the year, the stock market continued to rally with brief corrections along the way. At the same time, the Treasury market was experiencing falling prices and significant volatility, as the possibility of Federal Reserve tapering began to increase. As Treasury yields backed up and stock prices moved higher, our equity valuations decreased. This resulted in a steady reduction to the equity portion of the Portfolio and a corresponding increase in the fixed income component. In addition, the hedge on the equity portion of the Portfolio was tightened. By mid-year, our equity to fixed income allocation was about 60%/40%. After a minor correction in equities in the early fall, the stock market went on a run, and equities moved closer to fair value. While we still saw opportunities within the market, they were no longer as prevalent as they had been earlier in the period. We adjusted our allocation accordingly, reducing the Portfolio’s equity exposure to 55% and increasing our fixed income weight to 45%. At the same time, we steadily tightened the options hedge on the equity portion of the Portfolio in an attempt to reduce overall volatility.
For the year, the equity portion of the Portfolio beat the S&P Composite 1500 Index, though the outperformance of the equities was diminished by the options hedge overlay. We had a small hedge at the beginning of the year because we saw significant value in the market. This enabled the equity portion of the Portfolio to participate in most of the early gains. As the market rallied strongly, value steadily decreased. Consistent with our discipline, as value
decreased, we increased the hedge on the equities, which detracted from the strong performance of the equities. However, the hedge did achieve its objective of reducing Portfolio volatility. For the year, the Portfolio’s equity to fixed income allocation was tilted slightly toward equities relative to the benchmark weighting. This tilt was a positive contributor to benchmark-relative performance. The options hedge is what detracted from benchmark-relative performance, as it limited the upside of the Portfolio’s equity position.(1)
In looking more closely at the performance of equities, the Portfolio was overweight within the Consumer Discretionary, Energy, and Materials sectors. All three of these tactical positions contributed positively to benchmark-relative performance. On the flipside, positions in the more defensive Consumer Staples and Utilities sectors detracted from benchmark-relative performance.(1)
Stock selection was the major driver of the positive performance of the Portfolio. Tractor Supply Co., which was among the Portfolio’s largest overweight positions, contributed the most to positive benchmark-relative performance. Additional positive benchmark-relative performers were Kapstone Paper and Packaging Corp., Waddell & Reed Financial, Inc. Class A, Actavis PLC, and Oceaneering International, Inc. The five stocks that were major detractors from benchmark-relative performance were DFC Global Corp., Fastenal Co., Xcel Energy, Inc., Costco Wholesale Corp., and ConAgra Foods, Inc.(1)
Looking at the fixed income portion of the Portfolio, the year proved to be a volatile time period within the fixed income market, as bonds (as measured by the Barclays U.S. Aggregate Index) posted their first negative year since 1999 and only the third annual loss since 1976. Over the course of twelve months, the yield on the U.S. Generic Government 10-year Treasury varied widely from a low of 1.63% in early May to a high of 3.03% on the last trading day of the year. The key driver of this volatility was the combination of an improving economic environment and the emergence of the term “Fed Tapering”, as investors tried to decipher messages from the Federal Reserve regarding the reduction of asset purchases that have been taking place over the last few years. In spite of this volatility, the fixed income portion of the Portfolio was able to nimbly navigate the environment and outperform the broad-based fixed income benchmark over the course of 2013.
The fixed income portion of the Portfolio was able to outperform the broad-based Barclays Capital U.S. Universal Index through a combination of active duration management and strategic allocation among three specific segments of the fixed income space: U.S. Treasuries, corporate bonds, and closed-end funds. The fixed income portion of the Portfolio began the year with a large Treasury underweight and heavy corporate bond overweight, as attractive valuations and strong economic conditions pointed us in that direction. More specifically, corporate bond selections in the REIT (real estate investment trust), aerospace & defense, materials, and high yield segment of the market produced strong relative returns and contributed to the Portfolio’s fixed income outperformance. In the latter part of the first quarter, we began to see improvement in our Treasury valuation numbers and a corresponding decline in the value of some of the riskier segments of the corporate bond market, as credit spreads tightened to a level that seemed relatively expensive. This valuation shift resulted in a reallocation of the fixed income portion of the Portfolio; U.S. Treasuries were increased while both lower investment grade & high yield corporate bonds were trimmed back in the Portfolio. While this reallocation didn’t result in significant fixed income outperformance, it did allow the Portfolio to participate in the Treasury rally that took place from
| 81 | (continued) |
| Ohio National Fund, Inc. | Balanced Portfolio (Continued) |
mid-March to early May. As Treasury yields fell below 1.65% in early May, our valuation numbers once again shifted as the risk / return relationship of such low rates pointed us away from the U.S. Treasury market. In response to this change in relative valuations, the fixed income portion of the Portfolio not only decreased its exposure to Treasury securities, but also purchased some floating rate securities and held a slightly larger cash balance in order to decrease Portfolio duration and manage interest rate risk. The reduction in duration resulted in fixed income outperformance during the initial phase of this interest rate-based sell-off. As the sell-off continued into early September, investors sold out of virtually all fixed income asset classes, and the fixed income portion of the Portfolio slightly underperformed the broad-based Barclays index during this last move. While this broad-based fixed income sell-off was rather painful for investors, it did create some fundamental disconnects and value-based opportunities that we were able to exploit during the last quarter of the year. Specifically, many fixed income-based closed end funds were trading at huge discounts to NAV (net asset value), and we purchased a select few to take advantage of this disconnect. Additionally, investors’ general fear of bonds led to broad selling of all types of corporate bonds, regardless of value. This created individual bond opportunities that we were able to exploit, specifically in the high yield and lower investment grade space. The end result of these Portfolio moves was a strong twelve months of relative outperformance for fixed income in spite of an overall down year for bond investors. Our value-based, bottom-up methodology was able to capitalize on opportunities and still provide value in the fixed income space.(1)
As we move into 2014, our equity model indicates that the broad market is about fairly valued. Thus, we do not anticipate a repeat of the high returns we saw in 2013. Nevertheless, we still see attractive opportunities within various sectors, industries, and stocks. We believe this market environment is one in which our active, tactical investment approach may provide us with an advantage over passive strategies. We begin 2014 with an equity to fixed income allocation of 55% / 45%. We are also utilizing S&P 500 Index puts and calls to maintain a hedge on the equity portion of the Portfolio.
From a fixed income standpoint, our valuation metrics point to a rather expensive high yield market, as credit spreads tightened rather aggressively over the course of the last few months. This has us focusing on bonds with callability features in order to insulate ourselves from market-based sell-offs. While the market moves of 2013 made interest rates more attractive, general fear about fixed income remains, which could likely create more volatility in the coming year. However, our mid- to long-term outlook for interest rates falls within a range of 2 percent to 4 percent on the U.S. Generic 10 Year Treasury. This outlook is driven by the macroeconomic environment, inflation expectations, and an expected return to more historic interest rate norms. Overall, this outlook bodes extremely well for our bottom-up, opportunistic investment methodology, which looks to find individual bonds that are showing unique characteristics that we can exploit. Our methodology allows us to be relatively interest rate-agnostic and remain focused on hopefully providing strong returns for our shareholders, which is exactly what we are looking to accomplish in 2014.(1)
| (1) | The Portfolio’s composition is subject to change. Holdings and weightings are as of December 31, 2013. |
Change in Value of $10,000 Investment
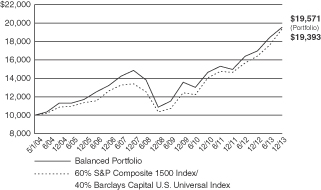
Hypothetical illustration based on past performance. Future performance will vary. The Portfolio’s returns reflect reinvested dividends. The Portfolio’s holdings may differ significantly from the securities in the index. The index is unmanaged and therefore does not reflect the cost of portfolio management and accounting.
The S&P Composite 1500 Index is a broad-based capitalization-weighted index of 1500 U.S. companies and is comprised of the S&P MidCap 400, S&P 500, and the S&P SmallCap 600. It is designed for investors seeking to replicate to the performance of the U.S. equity market or benchmark against a representative universe of tradable stocks. The index presented herein includes the effects of reinvested dividends.
The Barclays Capital U.S. Universal Index represents the union of the U.S. Aggregate Index, U.S. Corporate High Yield Index. Investment Grade 144A Index, Eurodollar Index, U.S. Emerging Markets Index, and the non-ERISA portion of the Commercial Mortgage-Backed Securities (CMBS) Index. The index covers USD-denominated, taxable bonds that are rated either investment grade or high-yield.
| 82 | (continued) |
| Ohio National Fund, Inc. | Balanced Portfolio (Continued) |
Portfolio Composition as of December 31, 2013 (1)
| % of Net Assets | ||||
Common Stocks (3) | 55.2 | |||
Corporate Bonds (3) | 31.3 | |||
U.S. Treasury Obligations | 6.3 | |||
Closed-End Mutual Funds | 2.9 | |||
Purchased Options | 0.2 | |||
Written Options Outstanding | (0.7 | ) | ||
Money Market Funds and | 4.8 | |||
|
| |||
| 100.0 | ||||
|
|
Top 10 Portfolio Holdings as of December 31,
2013 (1) (2)
| % of Net Assets | ||||
1. Costco Wholesale Corp. | 1.6 | |||
2. Genesee & Wyoming, Inc. Class A | 1.6 | |||
3. Biogen Idec, Inc. | 1.4 | |||
4. LyondellBasell Industries NV Class A | 1.4 | |||
5. Oceaneering International, Inc. | 1.4 | |||
6. Dril-Quip, Inc. | 1.4 | |||
7. W.W. Grainger, Inc. | 1.3 | |||
8. Healthcare Services Group, Inc. | 1.3 | |||
9. Altria Group, Inc. 9.250%, 08/06/2019 | 1.3 | |||
10. BCE, Inc. | 1.3 |
| (1) | Composition of Portfolio subject to change. |
| (2) | Short-term investments have been excluded from the list of Top 10 Portfolio Holdings. |
| (3) | Sectors (combined): |
| % of Net Assets | ||||
Financials | 12.1 | |||
Industrials | 11.3 | |||
Consumer Discretionary | 11.2 | |||
Energy | 10.3 | |||
Materials | 8.8 | |||
Consumer Staples | 8.7 | |||
Information Technology | 7.9 | |||
Health Care | 7.8 | |||
Utilities | 5.7 | |||
Telecommunication Services | 2.7 | |||
|
| |||
| 86.5 | ||||
|
|
| 83 |
| Ohio National Fund, Inc. | Balanced Portfolio |
Schedule of Investments | December 31, 2013 |
| Common Stocks – 55.2% | Shares | Value | ||||||||||||
CONSUMER DISCRETIONARY – 6.5% | ||||||||||||||
General Motors Co. (Automobiles) | (a) | 53,000 | $ | 2,166,110 | ||||||||||
Jarden Corp. (Household Durables) | (a) | 22,865 | 1,402,768 | |||||||||||
Comcast Corp. Class A (Media) | 27,500 | 1,429,037 | ||||||||||||
Discovery Communications, Inc. Class A (Media) | (a) | 7,700 | 696,234 | |||||||||||
Time Warner Cable, Inc. (Media) | 19,940 | 2,701,870 | ||||||||||||
Walt Disney Co. / The (Media) | 35,280 | 2,695,392 | ||||||||||||
Hibbett Sports, Inc. (Specialty Retail) | (a) | 6,940 | 466,437 | |||||||||||
Home Depot, Inc. / The (Specialty Retail) | 19,500 | 1,605,630 | ||||||||||||
Tractor Supply Co. (Specialty Retail) | (f) | 37,700 | 2,924,766 | |||||||||||
|
| |||||||||||||
| 16,088,244 | ||||||||||||||
|
| |||||||||||||
CONSUMER STAPLES – 6.0% | ||||||||||||||
Coca-Cola Co. / The (Beverages) | 61,900 | 2,557,089 | ||||||||||||
Costco Wholesale Corp. (Food & Staples Retailing) | (f) | 33,930 | 4,038,009 | |||||||||||
Wal-Mart Stores, Inc. (Food & Staples Retailing) | 4,140 | 325,777 | ||||||||||||
Bunge Ltd. (Food Products) | 10,060 | 826,027 | ||||||||||||
ConAgra Foods, Inc. (Food Products) | 78,400 | 2,642,080 | ||||||||||||
Ingredion, Inc. (Food Products) | 21,100 | 1,444,506 | ||||||||||||
Kimberly-Clark Corp. (Household Products) | 800 | 83,568 | ||||||||||||
Philip Morris International, Inc. (Tobacco) | 11,330 | 987,183 | ||||||||||||
Reynolds American, Inc. (Tobacco) | 41,120 | 2,055,589 | ||||||||||||
|
| |||||||||||||
| 14,959,828 | ||||||||||||||
|
| |||||||||||||
ENERGY – 7.2% | ||||||||||||||
Atwood Oceanics, Inc. (Energy Equip. & Svs.) | (a) | 25,540 | 1,363,581 | |||||||||||
Dril-Quip, Inc. (Energy Equip. & Svs.) | (a)(f) | 30,850 | 3,391,340 | |||||||||||
FMC Technologies, Inc. (Energy Equip. & Svs.) | (a) | 38,130 | 1,990,767 | |||||||||||
Oceaneering International, Inc. (Energy Equip. & Svs.) | (f) | 43,500 | 3,431,280 | |||||||||||
ConocoPhillips (Oil, Gas & Consumable Fuels) | 19,300 | 1,363,545 | ||||||||||||
Exxon Mobil Corp. (Oil, Gas & Consumable Fuels) | (f) | 22,100 | 2,236,520 | |||||||||||
Marathon Petroleum Corp. (Oil, Gas & Consumable Fuels) | 5,000 | 458,650 | ||||||||||||
Phillips 66 (Oil, Gas & Consumable Fuels) | 10,900 | 840,717 | ||||||||||||
Southwestern Energy Co. (Oil, Gas & Consumable Fuels) | (a) | 50,900 | 2,001,897 | |||||||||||
Tesoro Corp. (Oil, Gas & Consumable Fuels) | 15,050 | 880,425 | ||||||||||||
|
| |||||||||||||
| 17,958,722 | ||||||||||||||
|
| |||||||||||||
FINANCIALS – 3.8% | ||||||||||||||
Franklin Resources, Inc. (Capital Markets) | 11,410 | 658,699 | ||||||||||||
Invesco Ltd. (Capital Markets) | 37,900 | 1,379,560 | ||||||||||||
Northern Trust Corp. (Capital Markets) | 20,180 | 1,248,940 | ||||||||||||
State Street Corp. (Capital Markets) | 5,450 | 399,975 | ||||||||||||
Discover Financial Services (Consumer Finance) | 33,800 | 1,891,110 | ||||||||||||
Encore Capital Group, Inc. (Consumer Finance) | (a) | 23,500 | 1,181,110 | |||||||||||
World Acceptance Corp. (Consumer Finance) | (a)(f) | 19,740 | 1,727,842 | |||||||||||
Aon PLC (Insurance) | 4,350 | 364,921 | ||||||||||||
W.R. Berkley Corp. (Insurance) | 17,200 | 746,308 | ||||||||||||
|
| |||||||||||||
| 9,598,465 | ||||||||||||||
|
| |||||||||||||
HEALTH CARE – 3.4% | ||||||||||||||
Biogen Idec, Inc. (Biotechnology) | (a) | 12,800 | 3,580,800 | |||||||||||
Celgene Corp. (Biotechnology) | (a) | 2,210 | 373,402 | |||||||||||
Express Scripts Holding Co. (Health Care Providers & Svs.) | (a) | 10,290 | 722,770 | |||||||||||
McKesson Corp. (Health Care Providers & Svs.) | 4,510 | 727,914 | ||||||||||||
Actavis PLC (Pharmaceuticals) | (a) | 15,800 | 2,654,400 | |||||||||||
Questcor Pharmaceuticals, Inc. (Pharmaceuticals) | 9,390 | 511,286 | ||||||||||||
|
| |||||||||||||
| 8,570,572 | ||||||||||||||
|
| |||||||||||||
INDUSTRIALS – 9.1% | ||||||||||||||
General Dynamics Corp. (Aerospace & Defense) | 10,530 | 1,006,142 | ||||||||||||
United Technologies Corp. (Aerospace & Defense) | 13,180 | 1,499,884 | ||||||||||||
Healthcare Services Group, Inc. (Commercial Svs. & Supplies) | 114,750 | 3,255,458 | ||||||||||||
Tyco International Ltd. (Commercial Svs. & Supplies) | 69,300 | 2,844,072 | ||||||||||||
Fluor Corp. (Construction & Engineering) | (f) | 15,280 | 1,226,831 | |||||||||||
Dover Corp. (Machinery) | 5,430 | 524,212 | ||||||||||||
Genesee & Wyoming, Inc. Class A (Road & Rail) | (a)(f) | 40,200 | 3,861,210 | |||||||||||
Norfolk Southern Corp. (Road & Rail) | 10,700 | 993,281 | ||||||||||||
Union Pacific Corp. (Road & Rail) | (f) | 16,580 | 2,785,440 | |||||||||||
Fastenal Co. (Trading Companies & Distributors) | 26,580 | 1,262,816 | ||||||||||||
W.W. Grainger, Inc. (Trading Companies & Distributors) | 13,050 | 3,333,231 | ||||||||||||
|
| |||||||||||||
| 22,592,577 | ||||||||||||||
|
| |||||||||||||
| 84 | (continued) |
| Ohio National Fund, Inc. | Balanced Portfolio (Continued) |
Schedule of Investments | December 31, 2013 |
| Common Stocks (Continued) | Shares | Value | ||||||||||||||||
INFORMATION TECHNOLOGY – 6.6% | ||||||||||||||||||
Apple, Inc. (Computers & Peripherals) | (f) | 4,130 | $ | 2,317,384 | ||||||||||||||
eBay, Inc. (Internet Software & Svs.) | (a) | 56,000 | 3,073,840 | |||||||||||||||
Google, Inc. Class A (Internet Software & Svs.) | (a) | 700 | 784,497 | |||||||||||||||
Accenture PLC Class A (IT Svs.) | 13,570 | 1,115,725 | ||||||||||||||||
International Business Machines Corp. (IT Svs.) | 10,010 | 1,877,576 | ||||||||||||||||
MasterCard, Inc. Class A (IT Svs.) | (f) | 2,660 | 2,222,324 | |||||||||||||||
MAXIMUS, Inc. (IT Svs.) | 42,110 | 1,852,419 | ||||||||||||||||
Visa, Inc. (IT Svs.) | 13,500 | 3,006,180 | ||||||||||||||||
Mentor Graphics Corp. (Software) | 5,900 | 142,013 | ||||||||||||||||
|
| |||||||||||||||||
| 16,391,958 | ||||||||||||||||||
|
| |||||||||||||||||
MATERIALS – 6.7% | ||||||||||||||||||
Ecolab, Inc. (Chemicals) | 6,090 | 635,004 | ||||||||||||||||
FMC Corp. (Chemicals) | 38,400 | 2,897,664 | ||||||||||||||||
Koppers Holdings, Inc. (Chemicals) | 15,300 | 699,975 | ||||||||||||||||
LyondellBasell Industries NV Class A (Chemicals) | (f) | 43,600 | 3,500,208 | |||||||||||||||
Methanex Corp. (Chemicals) | 37,600 | 2,227,424 | ||||||||||||||||
Nucor Corp. (Metals & Mining) | 38,700 | 2,065,806 | ||||||||||||||||
Steel Dynamics, Inc. (Metals & Mining) | 100,840 | 1,970,414 | ||||||||||||||||
KapStone Paper and Packaging Corp. (Paper & Forest Products) | (a)(f) | 47,600 | 2,658,936 | |||||||||||||||
|
| |||||||||||||||||
| 16,655,431 | ||||||||||||||||||
|
| |||||||||||||||||
TELECOMMUNICATION SERVICES – 1.3% | ||||||||||||||||||
BCE, Inc. (Diversified Telecom. Svs.) | (f) | 73,820 | 3,195,668 | |||||||||||||||
|
| |||||||||||||||||
UTILITIES – 4.6% | ||||||||||||||||||
UIL Holdings Corp. (Electric Utilities) | 23,000 | 891,250 | ||||||||||||||||
Westar Energy, Inc. (Electric Utilities) | 52,730 | 1,696,324 | ||||||||||||||||
Atmos Energy Corp. (Gas Utilities) | 41,900 | 1,903,098 | ||||||||||||||||
Laclede Group, Inc. / The (Gas Utilities) | 19,300 | 878,922 | ||||||||||||||||
Piedmont Natural Gas Co., Inc. (Gas Utilities) | 44,800 | 1,485,568 | ||||||||||||||||
CMS Energy Corp. (Multi-Utilities) | 106,300 | 2,845,651 | ||||||||||||||||
SCANA Corp. (Multi-Utilities) | 37,030 | 1,737,818 | ||||||||||||||||
|
| |||||||||||||||||
| 11,438,631 | ||||||||||||||||||
|
| |||||||||||||||||
Total Common Stocks (Cost $116,373,098) | $ | 137,450,096 | ||||||||||||||||
|
| |||||||||||||||||
| Corporate Bonds – 31.3% | Rate | Maturity | Face Amount | Value | ||||||||||||||
CONSUMER DISCRETIONARY – 4.7% | ||||||||||||||||||
NVR, Inc. (Household Durables) | 3.950% | 09/15/2022 | $ | 662,000 | $ | 625,877 | ||||||||||||
American Achievement Corp. (Media) | (b) | 10.875% | 04/15/2016 | 1,000,000 | 1,055,000 | |||||||||||||
DIRECTV Holdings LLC / DIRECTV Financing Co., Inc. (Media) | 3.800% | 03/15/2022 | 2,000,000 | 1,921,870 | ||||||||||||||
NBCUniversal Media, LLC (Media) | 5.150% | 04/30/2020 | 500,000 | 559,009 | ||||||||||||||
Walt Disney Co. / The (Media) | 6.000% | 07/17/2017 | 1,700,000 | 1,967,619 | ||||||||||||||
Dollar General Corp. (Multiline Retail) | 3.250% | 04/15/2023 | 2,000,000 | 1,840,378 | ||||||||||||||
Kohl’s Corp. (Multiline Retail) | 4.750% | 12/15/2023 | 2,000,000 | 2,030,926 | ||||||||||||||
Gap, Inc. / The (Specialty Retail) | 5.950% | 04/12/2021 | 1,500,000 | 1,657,902 | ||||||||||||||
|
| |||||||||||||||||
| 11,658,581 | ||||||||||||||||||
|
| |||||||||||||||||
CONSUMER STAPLES – 2.7% | ||||||||||||||||||
Coca-Cola Co. / The (Beverages) | 4.875% | 03/15/2019 | 150,000 | 168,255 | ||||||||||||||
PepsiCo, Inc. (Beverages) | 5.000% | 06/01/2018 | 150,000 | 168,349 | ||||||||||||||
ConAgra Foods, Inc. (Food Products) | 1.900% | 01/25/2018 | 1,500,000 | 1,473,265 | ||||||||||||||
Kellogg Co. (Food Products) | 4.000% | 12/15/2020 | 600,000 | 622,813 | ||||||||||||||
Procter & Gamble Co. / The (Household Products) | 1.450% | 08/15/2016 | 500,000 | 507,587 | ||||||||||||||
Altria Group, Inc. (Tobacco) | 9.250% | 08/06/2019 | 2,467,000 | 3,251,805 | ||||||||||||||
Altria Group, Inc. (Tobacco) | 4.125% | 09/11/2015 | 300,000 | 316,703 | ||||||||||||||
Lorillard Tobacco Co. (Tobacco) | 6.875% | 05/01/2020 | 100,000 | 115,434 | ||||||||||||||
|
| |||||||||||||||||
| 6,624,211 | ||||||||||||||||||
|
| |||||||||||||||||
ENERGY – 3.1% | ||||||||||||||||||
Drill Rigs Holdings, Inc. (Energy Equip. & Svs.) | (b) | 6.500% | 10/01/2017 | 2,000,000 | 2,170,000 | |||||||||||||
Permian Holdings, Inc. (Energy Equip. & Svs.) | (b) | 10.500% | 01/15/2018 | 451,000 | 446,490 | |||||||||||||
SESI LLC (Energy Equip. & Svs.) | 7.125% | 12/15/2021 | 1,500,000 | 1,680,000 | ||||||||||||||
Shelf Drilling Holdings Ltd. (Energy Equip. & Svs.) | (b) | 8.625% | 11/01/2018 | 1,500,000 | 1,627,500 | |||||||||||||
Petrobras International Finance Co. (Oil, Gas & Consumable Fuels) | 7.750% | 09/15/2014 | 50,000 | 52,250 | ||||||||||||||
Regency Energy Partners LP / Regency Energy Finance Corp. (Oil, Gas & Consumable Fuels) | 5.500% | 04/15/2023 | 1,250,000 | 1,225,000 | ||||||||||||||
United Refining Co. (Oil, Gas & Consumable Fuels) | 10.500% | 02/28/2018 | 500,000 | 562,500 | ||||||||||||||
|
| |||||||||||||||||
| 7,763,740 | ||||||||||||||||||
|
| |||||||||||||||||
| 85 | (continued) |
| Ohio National Fund, Inc. | Balanced Portfolio (Continued) |
Schedule of Investments | December 31, 2013 |
| Corporate Bonds (Continued) | Rate | Maturity | Face Amount | Value | ||||||||||||||
FINANCIALS – 8.3% | ||||||||||||||||||
Morgan Stanley (Capital Markets) | (d) | 3.500% | 10/15/2020 | $ | 50,000 | $ | 50,246 | |||||||||||
Valley National Bancorp (Commercial Banks) | 5.125% | 09/27/2023 | 1,000,000 | 986,646 | ||||||||||||||
American Express Co. (Consumer Finance) | 7.250% | 05/20/2014 | 500,000 | 513,196 | ||||||||||||||
American Express Co. (Consumer Finance) | 5.500% | 09/12/2016 | 500,000 | 556,456 | ||||||||||||||
Berkshire Hathaway, Inc. (Diversified Financial Svs.) | 3.400% | 01/31/2022 | 1,000,000 | 994,998 | ||||||||||||||
Citigroup, Inc. (Diversified Financial Svs.) | 5.125% | 05/05/2014 | 1,000 | 1,015 | ||||||||||||||
Alleghany Corp. (Insurance) | 5.625% | 09/15/2020 | 1,000,000 | 1,094,537 | ||||||||||||||
Aspen Insurance Holdings Ltd. (Insurance) | 4.650% | 11/15/2023 | 2,000,000 | 1,980,196 | ||||||||||||||
ProAssurance Corp. (Insurance) | 5.300% | 11/15/2023 | 1,000,000 | 1,019,091 | ||||||||||||||
Prudential Financial, Inc. (Insurance) | (c) | 8.875% | 06/15/2038 | 1,000,000 | 1,221,250 | |||||||||||||
Reinsurance Group of America, Inc. (Insurance) | 4.700% | 09/15/2023 | 2,000,000 | 2,023,010 | ||||||||||||||
Reinsurance Group of America, Inc. (Insurance) | 6.450% | 11/15/2019 | 1,000,000 | 1,153,880 | ||||||||||||||
Torchmark Corp. (Insurance) | 7.875% | 05/15/2023 | 2,000,000 | 2,484,888 | ||||||||||||||
CNL Lifestyle Properties, Inc. (Real Estate Investment Trusts) | 7.250% | 04/15/2019 | 1,000,000 | 1,035,000 | ||||||||||||||
EPR Properties (Real Estate Investment Trusts) | 5.250% | 07/15/2023 | 2,500,000 | 2,443,070 | ||||||||||||||
HCP, Inc. (Real Estate Investment Trusts) | 6.700% | 01/30/2018 | 1,000,000 | 1,162,887 | ||||||||||||||
Health Care REIT, Inc. (Real Estate Investment Trusts) | 4.125% | 04/01/2019 | 650,000 | 684,843 | ||||||||||||||
Ventas Realty LP / Ventas Capital Corp. (Real Estate Investment Trusts) | 4.000% | 04/30/2019 | 150,000 | 157,715 | ||||||||||||||
Washington Real Estate Investment Trust (Real Estate Investment Trusts) | 4.950% | 10/01/2020 | 1,000,000 | 1,052,514 | ||||||||||||||
|
| |||||||||||||||||
| 20,615,438 | ||||||||||||||||||
|
| |||||||||||||||||
HEALTH CARE – 4.4% | ||||||||||||||||||
Amgen, Inc. (Biotechnology) | 2.125% | 05/15/2017 | 400,000 | 405,238 | ||||||||||||||
Celgene Corp. (Biotechnology) | 3.250% | 08/15/2022 | 2,500,000 | 2,367,675 | ||||||||||||||
Gilead Sciences, Inc. (Biotechnology) | 4.400% | 12/01/2021 | 700,000 | 747,782 | ||||||||||||||
CHS/Community Health Systems, Inc. (Health Care Providers & Svs.) | 8.000% | 11/15/2019 | 1,250,000 | 1,362,500 | ||||||||||||||
Laboratory Corp. of America Holdings (Health Care Providers & Svs.) | 2.200% | 08/23/2017 | 500,000 | 501,865 | ||||||||||||||
UnitedHealth Group, Inc. (Health Care Providers & Svs.) | 3.875% | 10/15/2020 | 1,500,000 | 1,582,540 | ||||||||||||||
Life Technologies Corp. (Life Sciences Tools & Svs.) | 6.000% | 03/01/2020 | 1,000,000 | 1,149,289 | ||||||||||||||
Thermo Fisher Scientific, Inc. (Life Sciences Tools & Svs.) | 4.500% | 03/01/2021 | 200,000 | 210,603 | ||||||||||||||
Thermo Fisher Scientific, Inc. (Life Sciences Tools & Svs.) | 2.250% | 08/15/2016 | 1,000,000 | 1,023,259 | ||||||||||||||
Thermo Fisher Scientific, Inc. (Life Sciences Tools & Svs.) | 3.600% | 08/15/2021 | 1,000,000 | 991,335 | ||||||||||||||
Hospira, Inc. (Pharmaceuticals) | 6.050% | 03/30/2017 | 50,000 | 55,191 | ||||||||||||||
Merck & Co., Inc. (Pharmaceuticals) | 6.000% | 09/15/2017 | 200,000 | 231,310 | ||||||||||||||
Novartis Capital Corp. (Pharmaceuticals) | 4.400% | 04/24/2020 | 200,000 | 217,881 | ||||||||||||||
|
| |||||||||||||||||
| 10,846,468 | ||||||||||||||||||
|
| |||||||||||||||||
INDUSTRIALS – 2.2% | ||||||||||||||||||
United Parcel Service, Inc. (Air Freight & Logistics) | 5.125% | 04/01/2019 | 500,000 | 569,055 | ||||||||||||||
Steelcase, Inc. (Commercial Svs. & Supplies) | 6.375% | 02/15/2021 | 2,125,000 | 2,334,287 | ||||||||||||||
Valmont Industries, Inc. (Machinery) | 6.625% | 04/20/2020 | 150,000 | 168,335 | ||||||||||||||
Brightstar Corp. (Trading Companies & Distributors) | (b) | 9.500% | 12/01/2016 | 1,000,000 | 1,105,000 | |||||||||||||
International Lease Finance Corp. (Trading Companies & Distributors) | 8.750% | 03/15/2017 | 1,000,000 | 1,182,500 | ||||||||||||||
|
| |||||||||||||||||
| 5,359,177 | ||||||||||||||||||
|
| |||||||||||||||||
INFORMATION TECHNOLOGY – 1.3% | ||||||||||||||||||
Harris Corp. (Communications Equip.) | 6.375% | 06/15/2019 | 1,000,000 | 1,158,553 | ||||||||||||||
Google, Inc. (Internet Software & Svs.) | 3.625% | 05/19/2021 | 1,000,000 | 1,042,999 | ||||||||||||||
iGATE Corp. (IT Svs.) | 9.000% | 05/01/2016 | 1,000,000 | 1,067,500 | ||||||||||||||
|
| |||||||||||||||||
| 3,269,052 | ||||||||||||||||||
|
| |||||||||||||||||
MATERIALS – 2.1% | ||||||||||||||||||
Ecolab, Inc. (Chemicals) | 4.350% | 12/08/2021 | 700,000 | 726,069 | ||||||||||||||
LyondellBasell Industries NV (Chemicals) | 6.000% | 11/15/2021 | 700,000 | 805,308 | ||||||||||||||
LyondellBasell Industries NV (Chemicals) | 5.000% | 04/15/2019 | 2,500,000 | 2,778,300 | ||||||||||||||
PPG Industries, Inc. (Chemicals) | 6.650% | 03/15/2018 | 500,000 | 578,486 | ||||||||||||||
MeadWestvaco Corp. (Containers & Packaging) | 7.375% | 09/01/2019 | 200,000 | 237,524 | ||||||||||||||
Reliance Steel & Aluminum Co. (Metals & Mining) | 6.200% | 11/15/2016 | 200,000 | 219,223 | ||||||||||||||
|
| |||||||||||||||||
| 5,344,910 | ||||||||||||||||||
|
| |||||||||||||||||
TELECOMMUNICATION SERVICES – 1.4% | ||||||||||||||||||
AT&T, Inc. (Diversified Telecom. Svs.) | 2.625% | 12/01/2022 | 1,500,000 | 1,353,866 | ||||||||||||||
Telefonica Emisiones S.A.U. (Diversified Telecom. Svs.) | 6.421% | 06/20/2016 | 200,000 | 223,356 | ||||||||||||||
Comcast Cable Communications Holdings, Inc. (Wireless Telecom. Svs.) | 9.455% | 11/15/2022 | 1,450,000 | 2,008,945 | ||||||||||||||
|
| |||||||||||||||||
| 3,586,167 | ||||||||||||||||||
|
| |||||||||||||||||
UTILITIES – 1.1% | ||||||||||||||||||
Black Hills Corp. (Multi-Utilities) | 5.875% | 07/15/2020 | 2,500,000 | 2,789,743 | ||||||||||||||
|
| |||||||||||||||||
Total Corporate Bonds (Cost $78,185,958) | $ | 77,857,487 | ||||||||||||||||
|
| |||||||||||||||||
| 86 | (continued) |
| Ohio National Fund, Inc. | Balanced Portfolio (Continued) |
Schedule of Investments | December 31, 2013 |
| U.S. Treasury Obligations – 6.3% | Rate | Maturity | Face Amount | Value | ||||||||||||||
U.S. Treasury Note | 0.250% | 01/31/2015 | $ | 1,500,000 | $ | 1,501,318 | ||||||||||||
U.S. Treasury Note | 0.250% | 02/28/2015 | 1,500,000 | 1,501,054 | ||||||||||||||
U.S. Treasury Note | 0.375% | 03/15/2016 | 1,500,000 | 1,497,833 | ||||||||||||||
U.S. Treasury Note | 0.500% | 06/15/2016 | 2,000,000 | 1,998,046 | ||||||||||||||
U.S. Treasury Note | 3.250% | 03/31/2017 | 800,000 | 859,875 | ||||||||||||||
U.S. Treasury Note | 0.625% | 08/31/2017 | 1,500,000 | 1,471,875 | ||||||||||||||
U.S. Treasury Note | 0.750% | 02/28/2018 | 1,500,000 | 1,460,097 | ||||||||||||||
U.S. Treasury Note | 1.000% | 05/31/2018 | 1,000,000 | 977,891 | ||||||||||||||
U.S. Treasury Note | 1.375% | 06/30/2018 | 1,000,000 | 992,148 | ||||||||||||||
U.S. Treasury Note | 1.250% | 01/31/2019 | 700,000 | 682,391 | ||||||||||||||
U.S. Treasury Note | 1.125% | 12/31/2019 | 1,500,000 | 1,415,684 | ||||||||||||||
U.S. Treasury Note | 1.375% | 05/31/2020 | 1,500,000 | 1,420,079 | ||||||||||||||
|
| |||||||||||||||||
Total U.S. Treasury Obligations (Cost $15,930,761) | $ | 15,778,291 | ||||||||||||||||
|
| |||||||||||||||||
| Closed-End Mutual Funds – 2.9% | Shares | Value | ||||||||||||||||
American Strategic Income Portfolio, Inc. III | 372,176 | $ | 2,441,474 | |||||||||||||||
American Strategic Income Portfolio, Inc. II | 322,290 | 2,484,856 | ||||||||||||||||
BlackRock Enhanced Government Fund, Inc. | 151,784 | 2,117,387 | ||||||||||||||||
Helios Strategic Income Fund, Inc. | 25,000 | 166,500 | ||||||||||||||||
|
| |||||||||||||||||
Total Closed-End Mutual Funds (Cost $7,504,025) | $ | 7,210,217 | ||||||||||||||||
|
| |||||||||||||||||
| Purchased Options – 0.2% | Contracts (e) | Value | ||||||||||||||||
S&P 500 Index Put Option | ||||||||||||||||||
Expiration: February 2014, Exercise Price: $1,720.00 | 670 | $ | 515,900 | |||||||||||||||
|
| |||||||||||||||||
Total Purchased Options (Cost $1,035,306) | $ | 515,900 | ||||||||||||||||
|
| |||||||||||||||||
| Money Market Funds – 3.1% | Shares | Value | ||||||||||||||||
Fidelity Institutional Money Market Funds | 7,855,000 | $ | 7,855,000 | |||||||||||||||
|
| |||||||||||||||||
Total Money Market Funds (Cost $7,855,000) | $ | 7,855,000 | ||||||||||||||||
|
| |||||||||||||||||
Total Investments – 99.0% (Cost $226,884,148) | (g) | $ | 246,666,991 | |||||||||||||||
Total Written Options Outstanding – (0.7)% (see following schedule) | (1,794,000) | |||||||||||||||||
Other Assets in Excess of Liabilities – 1.7% | 4,187,351 | |||||||||||||||||
|
| |||||||||||||||||
Net Assets – 100.0% | $ | 249,060,342 | ||||||||||||||||
|
| |||||||||||||||||
Percentages are stated as a percent of net assets.
Footnotes:
| (a) | Non-income producing security. |
| (b) | Security exempt from registration under Regulation D of the Securities Act of 1933. These securities may be resold in transactions exempt form registration, normally to qualified buyers under Rule 144A. At December 31, 2013, the value of these securities totaled $6,403,990, or 2.6% of the Portfolio’s net assets. These securities were deemed liquid pursuant to procedures approved by the Board of Directors. |
| (c) | Security is a variable rate instruments in which the coupon rate is fixed until June 15, 2018, then is adjusted quarterly in concert with U.S. LIBOR. Interest rates stated are those in effect at December 31, 2013. |
| (d) | Security was initially issued at one coupon rate, but the coupon rate is scheduled to be updated at later specified dates. The coupon rate shown is the rate that is in effect at December 31, 2013. |
| (e) | 100 shares per contract. |
| (f) | Security is fully or partially pledged as collateral for written call options outstanding. Outstanding written call options are presented in the following schedule. |
| (g) | Represents cost for financial reporting purposes, which may differ from cost basis for federal income tax purposes. See also Note 7 of the Notes to Financial Statements. |
The accompanying notes are an integral part of these financial statements.
| 87 |
| Ohio National Fund, Inc. | Balanced Portfolio (Continued) |
Schedule of Written Options Outstanding | December 31, 2013 |
| Contracts* | Value | |||||
S&P 500 Index Call Option | ||||||
Expiration: February 2014, Exercise Price: $1,815.00 | 345 | $ | 1,794,000 | |||
|
|
| ||||
Total Written Options Outstanding (Premiums received $1,073,788) | 345 | $ | 1,794,000 | |||
|
|
| ||||
| * | 100 shares per contract. |
The accompanying notes are an integral part of these financial statements.
| 88 |
| Ohio National Fund, Inc. | Target VIP Portfolio |
Objective/Strategy
The Target VIP Portfolio seeks an above average total return by investing in the common stocks of companies which are identified by a model that applies separate uniquely specialized strategies.
Performance as of December 31, 2013
Average Annual Total Returns: | ||||
One year | 36.71% | |||
Five years | 16.32% | |||
Since inception (11/2/05) | 4.98% |
Past performance does not guarantee future results. The performance data quoted represents past performance and current returns may be lower or higher. Total return figures include change in share price and reinvestment of dividends and capital gains. The investment return and principal value will fluctuate so that an investor’s shares, when redeemed, may be worth more or less than the original cost. To obtain performance information up to the most recent month end, call toll-free 1-877-781-6392.
The Portfolio is not open to direct retail investment. Beneficial interest in shares is obtained solely by purchase of variable life insurance policies and variable annuity contracts. Actual performance results for variable annuity and variable universal life contracts will be lower due to contract charges. Consult your contract for applicable charges.
Comments
For the year ended December 31, 2013, the Target VIP Portfolio returned 36.71% versus 33.55% for the current benchmark, the Russell 3000 Index.
U.S. equities climbed steadily higher throughout 2013 with just a few brief, shallow pullbacks during the year. With the economy continuing to expand at a moderate pace, corporate profits grew at a respectable rate in 2013. Equity market gains, however, were largely the result of multiple expansions as stock prices far outpaced earnings growth over the year. The year was not without bumps in the road as Washington added its usual mix of drama, including the sequestration and the government shutdown, and tensions flared in the Middle East at times. The prospect of Federal Reserve tapering was a constant source of conversation throughout the year, as the economy continued to improve. As the end of the year approached, the Federal Reserve finally announced its intention to begin tapering its bond purchases in early 2014. Despite all of these potential headwinds, equities continued to rise and finished the year at all-time highs. The S&P 500 Index had its best year since 1997.
The Portfolio had its annual rebalance in early January 2013. Though the selection process for the underlying strategies did not change, there were changes in the sector exposures as a result of the rebalance. The rebalance resulted in additional exposure to the Consumer Discretionary and Health Care sectors, both of which are overweight relative to the benchmark. Energy moved from slightly overweight to underweight following the rebalance, while overweight positions in Information Technology and Telecommunication Services names were reduced.(1)
Stock selection in the Health Care sector was the biggest contributor to the Portfolio’s relative performance for the year and accounted for about one-third of the outperformance. Biotech holdings Gilead Sciences, Inc. and Regeneron Pharmaceuticals, Inc., along with insurer UnitedHealth Group, Inc., were among the top five stocks in the Portfolio by contribution to return and paced the sector. Stock selection in Information Technology and Financials was also a positive contributor to performance. A large overweight in Consumer Discretionary stocks, the top performing sector in the
benchmark, also added to relative performance. The positive allocation effect more than offset a negative selection effect in the sector.(1)
Stock selection in Energy stocks resulted in the sector being the biggest detractor from relative performance. An overweight in Utilities stocks was also a drag on relative performance, as the sector was one of the worst performing for the year in the benchmark.(1)
The Portfolio’s best performers were Medidata Solutions, Inc., DXP Enterprises, Inc., Western Alliance Bancorp, Multimedia Game Holding Co., Inc. and Gilead Sciences, Inc. The worst performers were InnerWorkings, Inc., Ixia, American Vanguard Corp., Ultratech, Inc. and Riverbed Technology, Inc. The Portfolio’s top contributors to performance were Yahoo!, Inc., Gilead Sciences, Inc., Regeneron Pharmaceuticals, Inc., The Home Depot, Inc. and UnitedHealth Group, Inc. The top detractors from performance were InnerWorkings, Inc., Ixia, RWE AG, Ultratech, Inc. and Urban Outfitters, Inc.(1)
As we look to 2014, equity valuations are higher than a year ago, though equities remain attractive relative to other asset classes. With the economy forecasted to post solid growth in 2014 and the Federal Reserve pulling back on quantitative easing due to improvement in the underlying economy, equities are likely to remain in favor. The new year is not without risks, however. Here at home, Congress must revisit the debt limit and the Federal budget, along with mid-term elections later in the year. Looking abroad, Europe has emerged from recession and Japan has instituted reforms aimed at ending decades of deflation, though both situations remain fragile. China’s ability to maintain strong gross domestic product growth also bears watching. While unlikely to repeat the strong gains of 2013, we look for equities to provide upside for investors who maintain their conviction and discipline. We remain consistent in the application of the six strategies underlying the Portfolio. The result is a Portfolio with broad exposures across the size and sector spectrum, that provides diversification along with upside potential.
| (1) | The Portfolio’s composition is subject to change. Holdings and weightings are as of December 31, 2013. |
Change in Value of $10,000 Investment
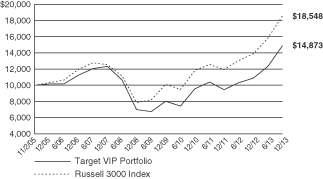
Hypothetical illustration based on past performance. Future performance will vary. The Portfolio’s returns reflect reinvested dividends. The Portfolio’s holdings may differ significantly from the securities in the index. The index is unmanaged and therefore does not reflect the cost of portfolio management and accounting.
The Russell 3000 Index measures the performance of the largest 3000 U.S. companies representing approximately 98% of the investable U.S. equity market. The Russell 3000 Index is constructed to provide a comprehensive, unbiased, and stable barometer of the broad market and is completely reconstituted annually to ensure new and growing equities are reflected. The index presented includes the effects of reinvested dividends.
| 89 | (continued) |
| Ohio National Fund, Inc. | Target VIP Portfolio (Continued) |
Portfolio Composition as of December 31, 2013 (1)
| % of Net Assets | ||||
Common Stocks (3) | 97.0 | |||
Money Market Funds and | 3.0 | |||
|
| |||
| 100.0 | ||||
|
|
Top 10 Portfolio Holdings as of December 31, 2013 (1) (2)
| % of Net Assets | ||||
1. Exxon Mobil Corp. | 4.3 | |||
2. Yahoo!, Inc. | 4.1 | |||
3. Home Depot, Inc. / The | 4.0 | |||
4. Oracle Corp. | 3.4 | |||
5. UnitedHealth Group, Inc. | 3.3 | |||
6. Regeneron Pharmaceuticals, Inc. | 3.2 | |||
7. Travelers Cos., Inc. / The | 3.0 | |||
8. Gilead Sciences, Inc. | 3.0 | |||
9. Pfizer, Inc. | 2.9 | |||
10. Comcast Corp. Class A | 2.9 |
| (1) | Composition of Portfolio subject to change. |
| (2) | Short-term investments have been excluded from the list of Top 10 Portfolio Holdings. |
| (3) | Sectors: |
| % of Net Assets | ||||
Consumer Discretionary | 23.8 | |||
Health Care | 21.1 | |||
Information Technology | 17.4 | |||
Financials | 7.9 | |||
Energy | 6.9 | |||
Industrials | 6.2 | |||
Utilities | 4.9 | |||
Telecommunication Services | 4.7 | |||
Consumer Staples | 2.2 | |||
Materials | 1.9 | |||
|
| |||
| 97.0 | ||||
|
|
| 90 |
| Ohio National Fund, Inc. | Target VIP Portfolio |
Schedule of Investments | December 31, 2013 |
| Common Stocks – 97.0% | Shares | Value | ||||||
CONSUMER DISCRETIONARY – 23.8% | ||||||||
Dorman Products, Inc. (Auto Components) | (a) | 1,868 | $ 104,739 | |||||
Daimler AG (Automobiles) | 5,890 | 511,959 | ||||||
Thor Industries, Inc. (Automobiles) | 2,815 | 155,472 | ||||||
Winnebago Industries, Inc. (Automobiles) | (a) | 3,815 | 104,722 | |||||
Carriage Services, Inc. (Diversified Consumer Svs.) | 5,475 | 106,927 | ||||||
Grand Canyon Education, Inc. (Diversified Consumer Svs.) | (a) | 8,137 | 354,773 | |||||
H&R Block, Inc. (Diversified Consumer Svs.) | 3,215 | 93,364 | ||||||
AFC Enterprises, Inc. (Hotels, Restaurants & Leisure) | (a) | 2,485 | 95,673 | |||||
Domino’s Pizza, Inc. (Hotels, Restaurants & Leisure) | 2,997 | 208,741 | ||||||
Interval Leisure Group, Inc. (Hotels, Restaurants & Leisure) | 10,284 | 317,776 | ||||||
Krispy Kreme Doughnuts, Inc. (Hotels, Restaurants & Leisure) | (a) | 11,693 | 225,558 | |||||
Multimedia Games Holding Co., Inc. (Hotels, Restaurants & Leisure) | (a) | 5,235 | 164,170 | |||||
Papa John’s International, Inc. (Hotels, Restaurants & Leisure) | 8,378 | 380,361 | ||||||
Pinnacle Entertainment, Inc. (Hotels, Restaurants & Leisure) | (a) | 10,843 | 281,810 | |||||
D.R. Horton, Inc. (Household Durables) | 17,277 | 385,623 | ||||||
Lennar Corp. Class A (Household Durables) | 8,399 | 332,264 | ||||||
Arctic Cat, Inc. (Leisure Equip. & Products) | 2,414 | 137,550 | ||||||
Mattel, Inc. (Leisure Equip. & Products) | 4,839 | 230,240 | ||||||
Comcast Corp. Class A (Media) | 30,002 | 1,559,054 | ||||||
DIRECTV (Media) | (a) | 7,113 | 491,437 | |||||
Discovery Communications, Inc. Class A (Media) | (a) | 2,044 | 184,818 | |||||
Liberty Global PLC Class A (Media) | (a) | 976 | 86,854 | |||||
Liberty Global PLC Class C (Media) | (a) | 729 | 61,469 | |||||
Liberty Media Corp. (Media) | (a) | 1,550 | 226,998 | |||||
Sirius XM Holdings, Inc. (Media) | (a) | 73,209 | 255,499 | |||||
Starz (Media) | (a) | 1,550 | 45,322 | |||||
Asbury Automotive Group, Inc. (Specialty Retail) | (a) | 5,698 | 306,211 | |||||
Gap, Inc. / The (Specialty Retail) | 25,142 | 982,549 | ||||||
Home Depot, Inc. / The (Specialty Retail) | 26,282 | 2,164,060 | ||||||
Lithia Motors, Inc. Class A (Specialty Retail) | 4,131 | 286,774 | ||||||
Lumber Liquidators Holdings, Inc. (Specialty Retail) | (a) | 1,237 | 127,275 | |||||
Stage Stores, Inc. (Specialty Retail) | 8,468 | 188,159 | ||||||
TJX Cos., Inc. (Specialty Retail) | 8,517 | 542,788 | ||||||
Urban Outfitters, Inc. (Specialty Retail) | (a) | 7,665 | 284,372 | |||||
Williams-Sonoma, Inc. (Specialty Retail) | 5,166 | 301,074 | ||||||
Gildan Activewear, Inc. (Textiles, Apparel & Luxury Goods) | 6,348 | 338,412 | ||||||
Movado Group, Inc. (Textiles, Apparel & Luxury Goods) | 3,446 | 151,658 | ||||||
| ||||||||
| 12,776,505 | ||||||||
| ||||||||
CONSUMER STAPLES – 2.2% | ||||||||
Coca-Cola Enterprises, Inc. (Beverages) | 1,448 | 63,900 | ||||||
Susser Holdings Corp. (Food & Staples Retailing) | (a) | 3,795 | 248,535 | |||||
Clorox Co. / The (Household Products) | 656 | 60,851 | ||||||
Medifast, Inc. (Personal Products) | (a) | 2,822 | 73,739 | |||||
Philip Morris International, Inc. (Tobacco) | 8,458 | 736,946 | ||||||
| ||||||||
| 1,183,971 | ||||||||
| ||||||||
ENERGY – 6.9% | ||||||||
BP PLC – ADR (Oil, Gas & Consumable Fuels) | 7,737 | 376,096 | ||||||
Eni SpA – ADR (Oil, Gas & Consumable Fuels) | 6,580 | 319,064 | ||||||
EPL Oil & Gas, Inc. (Oil, Gas & Consumable Fuels) | (a) | 7,231 | 206,084 | |||||
Exxon Mobil Corp. (Oil, Gas & Consumable Fuels) | 22,604 | 2,287,525 | ||||||
Marathon Petroleum Corp. (Oil, Gas & Consumable Fuels) | 563 | 51,644 | ||||||
Phillips 66 (Oil, Gas & Consumable Fuels) | 1,044 | 80,524 | ||||||
Total SA – ADR (Oil, Gas & Consumable Fuels) | 6,201 | 379,935 | ||||||
| ||||||||
| 3,700,872 | ||||||||
| ||||||||
| Common Stocks (Continued) | Shares | Value | ||||||
FINANCIALS – 7.9% | ||||||||
Franklin Resources, Inc. (Capital Markets) | 10,236 | $ 590,924 | ||||||
PrivateBancorp, Inc. (Commercial Banks) | 13,318 | 385,290 | ||||||
ViewPoint Financial Group, Inc. (Commercial Banks) | 7,091 | 194,648 | ||||||
Western Alliance Bancorp (Commercial Banks) | (a) | 15,441 | 368,422 | |||||
Discover Financial Services (Consumer Finance) | 8,001 | 447,656 | ||||||
Allstate Corp. / The (Insurance) | 7,694 | 419,631 | ||||||
Horace Mann Educators Corp. (Insurance) | 7,141 | 225,227 | ||||||
Travelers Cos., Inc. / The (Insurance) | 17,907 | 1,621,300 | ||||||
| ||||||||
| 4,253,098 | ||||||||
| ||||||||
HEALTH CARE – 21.1% | ||||||||
Amgen, Inc. (Biotechnology) | 6,978 | 796,609 | ||||||
Gilead Sciences, Inc. (Biotechnology) | (a) | 21,259 | 1,597,614 | |||||
Regeneron Pharmaceuticals, Inc. (Biotechnology) | (a) | 6,263 | 1,723,828 | |||||
Becton Dickinson and Co. (Health Care Equip. & Supplies) | 1,794 | 198,219 | ||||||
C.R. Bard, Inc. (Health Care Equip. & Supplies) | 749 | 100,321 | ||||||
Cyberonics, Inc. (Health Care Equip. & Supplies) | (a) | 4,989 | 326,829 | |||||
Neogen Corp. (Health Care Equip. & Supplies) | (a) | 6,617 | 302,397 | |||||
Sirona Dental Systems, Inc. (Health Care Equip. & Supplies) | (a) | 2,859 | 200,702 | |||||
AMN Healthcare Services, Inc. (Health Care Providers & Svs.) | (a) | 5,605 | 82,394 | |||||
Gentiva Health Services, Inc. (Health Care Providers & Svs.) | (a) | 5,379 | 66,753 | |||||
Hanger, Inc. (Health Care Providers & Svs.) | (a) | 6,119 | 240,721 | |||||
MWI Veterinary Supply, Inc. (Health Care Providers & Svs.) | (a) | 2,301 | 392,528 | |||||
UnitedHealth Group, Inc. (Health Care Providers & Svs.) | 23,686 | 1,783,556 | ||||||
Medidata Solutions, Inc. (Health Care Technology) | (a) | 9,162 | 554,942 | |||||
AstraZeneca PLC – ADR (Pharmaceuticals) | 6,803 | 403,894 | ||||||
GlaxoSmithKline PLC – ADR (Pharmaceuticals) | 7,377 | 393,858 | ||||||
Mylan, Inc. (Pharmaceuticals) | (a) | 5,791 | 251,329 | |||||
Pfizer, Inc. (Pharmaceuticals) | 51,254 | 1,569,910 | ||||||
Prestige Brands Holdings, Inc. (Pharmaceuticals) | (a) | 9,186 | 328,859 | |||||
| ||||||||
| 11,315,263 | ||||||||
| ||||||||
INDUSTRIALS – 6.2% | ||||||||
Northrop Grumman Corp. (Aerospace & Defense) | 3,310 | 379,359 | ||||||
A.O. Smith Corp. (Building Products) | 4,114 | 221,909 | ||||||
Apogee Enterprises, Inc. (Building Products) | 2,761 | 99,148 | ||||||
InnerWorkings, Inc. (Commercial Svs. & Supplies) | (a) | 8,982 | 69,970 | |||||
Aegion Corp. (Construction & Engineering) | (a) | 7,147 | 156,448 | |||||
AZZ, Inc. (Electrical Equip.) | 4,512 | 220,456 | ||||||
Flowserve Corp. (Machinery) | 9,944 | 783,886 | ||||||
Illinois Tool Works, Inc. (Machinery) | 6,228 | 523,650 | ||||||
Trimas Corp. (Machinery) | (a) | 6,979 | 278,392 | |||||
On Assignment, Inc. (Professional Svs.) | (a) | 9,480 | 331,042 | |||||
DXP Enterprises, Inc. (Trading Companies & Distributors) | (a) | 2,523 | 290,650 | |||||
| ||||||||
| 3,354,910 | ||||||||
| ||||||||
INFORMATION TECHNOLOGY – 17.4% | ||||||||
Ixia (Communications Equip.) | (a) | 13,235 | 176,158 | |||||
Seagate Technology PLC (Computers & Peripherals) | 17,515 | 983,642 | ||||||
Western Digital Corp. (Computers & Peripherals) | 3,457 | 290,042 | ||||||
Badger Meter, Inc. (Electronic Equip., Instr. & Comp.) | 2,603 | 141,864 | ||||||
Rogers Corp. (Electronic Equip., Instr. & Comp.) | (a) | 1,327 | 81,611 | |||||
eBay, Inc. (Internet Software & Svs.) | (a) | 18,273 | 1,003,005 | |||||
Yahoo!, Inc. (Internet Software & Svs.) | (a) | 54,682 | 2,211,340 | |||||
International Business Machines Corp. (IT Svs.) | 6,720 | 1,260,470 | ||||||
Monolithic Power Systems, Inc. (Semiconductors & Equip.) | (a) | 6,428 | 222,794 | |||||
Ultratech, Inc. (Semiconductors & Equip.) | (a) | 4,865 | 141,085 | |||||
Manhattan Associates, Inc. (Software) | (a) | 4,680 | 549,806 | |||||
NetScout Systems, Inc. (Software) | (a) | 7,577 | 224,203 | |||||
| 91 | (continued) |
| Ohio National Fund, Inc. | Target VIP Portfolio (Continued) |
Schedule of Investments | December 31, 2013 |
| Common Stocks (Continued) | Shares | Value | ||||||
INFORMATION TECHNOLOGY (continued) | ||||||||
Oracle Corp. (Software) | 48,274 | $ 1,846,963 | ||||||
Symantec Corp. (Software) | 9,737 | 229,598 | ||||||
| ||||||||
| 9,362,581 | ||||||||
| ||||||||
MATERIALS – 1.9% | ||||||||
American Vanguard Corp. (Chemicals) | 2,098 | 50,960 | ||||||
CF Industries Holdings, Inc. (Chemicals) | 435 | 101,372 | ||||||
FMC Corp. (Chemicals) | 952 | 71,838 | ||||||
LyondellBasell Industries NV Class A (Chemicals) | 5,745 | 461,209 | ||||||
NewMarket Corp. (Chemicals) | 703 | 234,907 | ||||||
Sherwin-Williams Co. / The (Chemicals) | 714 | 131,019 | ||||||
| ||||||||
| 1,051,305 | ||||||||
| ||||||||
TELECOMMUNICATION SERVICES – 4.7% | ||||||||
Deutsche Telekom AG – ADR (Diversified Telecom. Svs.) | 28,224 | 487,146 | ||||||
Orange SA – ADR (Diversified Telecom. Svs.) | 29,448 | 363,683 | ||||||
Swisscom AG – ADR (Diversified Telecom. Svs.) | 7,443 | 393,660 | ||||||
TeliaSonera AB – ADR (Diversified Telecom. Svs.) | 23,712 | 395,516 | ||||||
Vivendi SA – ADR (Diversified Telecom. Svs.) | 14,225 | 375,113 | ||||||
Vodafone Group PLC – ADR (Wireless Telecom. Svs.) | 12,752 | 501,281 | ||||||
| ||||||||
| 2,516,399 | ||||||||
| ||||||||
| Common Stocks (Continued) | Shares | Value | ||||||
UTILITIES – 4.9% | ||||||||
Electricite de France – ADR (Electric Utilities) | 88,837 | $ 622,747 | ||||||
Enel SpA – ADR (Electric Utilities) | 77,409 | 336,265 | ||||||
SSE PLC – ADR (Electric Utilities) | 13,753 | 313,018 | ||||||
E.ON SE – ADR (Multi-Utilities) | 17,418 | 321,883 | ||||||
GDF Suez – ADR (Multi-Utilities) | 15,603 | 369,323 | ||||||
National Grid PLC – ADR (Multi-Utilities) | 5,632 | 367,882 | ||||||
RWE AG – ADR (Multi-Utilities) | 7,798 | 286,966 | ||||||
| ||||||||
| 2,618,084 | ||||||||
| ||||||||
Total Common Stocks (Cost $43,535,868) | $52,132,988 | |||||||
| ||||||||
| Money Market Funds – 2.9% | Shares | Value | ||||||
Fidelity Institutional Money Market Funds Money Market Portfolio – Class I | 1,534,000 | $ 1,534,000 | ||||||
| ||||||||
Total Money Market Funds (Cost $1,534,000) | $ 1,534,000 | |||||||
| ||||||||
Total Investments – 99.9% (Cost $45,069,868) | (b) | $53,666,988 | ||||||
Other Assets in Excess of Liabilities – 0.1% | 51,082 | |||||||
| ||||||||
Net Assets – 100.0% | $53,718,070 | |||||||
| ||||||||
Percentages are stated as a percent of net assets.
Abbreviations:
ADR: American Depositary Receipts
Footnotes:
| (a) | Non-income producing security. |
| (b) | Represents cost for financial reporting purposes, which may differ from cost basis for federal income tax purposes. See also Note 7 of the Notes to Financial Statements. |
The accompanying notes are an integral part of these financial statements.
| 92 |
| Ohio National Fund, Inc. | Bristol Growth Portfolio |
Objective/Strategy
The Bristol Growth Portfolio seeks long-term growth of capital by investing primarily in common stocks of the 1,000 largest publicly traded U.S. companies in terms of market capitalization.
Performance as of December 31, 2013
Average Annual Total Returns: | ||||
One year | 38.62% | |||
Five years | 19.43% | |||
Since inception (5/1/07) | 6.19% |
Past performance does not guarantee future results. The performance data quoted represents past performance and current returns may be lower or higher. Total return figures include change in share price and reinvestment of dividends and capital gains. The investment return and principal value will fluctuate so that an investor’s shares, when redeemed, may be worth more or less than the original cost. To obtain performance information up to the most recent month end, call toll-free 1-877-781-6392.
The Portfolio is not open to direct retail investment. Beneficial interest in shares is obtained solely by purchase of variable life insurance policies and variable annuity contracts. Actual performance results for variable annuity and variable universal life contracts will be lower due to contract charges. Consult your contract for applicable charges.
Comments
For the year ended December 31, 2013, the Bristol Growth Portfolio returned 38.62% versus 33.48% for the current benchmark, the Russell 1000 Growth Index.
Following a strong 2012, January 2013 saw the best “January effect” in sixteen years for U.S. stocks and set the tone for the rest of the year. In the past fifty years, the 2013 return has been significantly exceeded only three times, in 1975, 1995 and 1997. The most important downturn during the year occurred after an all time high on May 21. The market corrected downwards in reaction to the remarks of Federal Reserve Chairman Ben Bernanke, which were interpreted that Quantitative Easing (“QE”) might “taper off” in the near term. As QE has been seen as powering the equity markets’ rise, it took subsequent remarks of Federal Reserve members to suggest that tapering may be a long way off, possibly at the end of 2014. With this response, the markets recovered, but it left the S&P 500 Index down 3.8% from the record high and ended a streak of seven monthly advances and the longest run since 2009. Overall, the returns had the best performance for the first six months of a calendar year since 1998. The market rise restarted in late June and the markets were better prepared when actual tapering started in late December. The Federal Reserve announced that it would reduce the monthly purchases of $85 billion by a total of $10 billion. This action contrasted very favorably with the clumsiness of the Federal Reserve in May and seemed to hit the “sweet spot” of acknowledging rising economic growth and reduced unemployment, while at the same time not scaring the markets with the prospect of a huge cutback. Corporations are exiting the recession and enjoying the usual bonus of a leaner workforce and reduced costs. As a result, profits for the S&P 500 Index components increased to $100 per share this year, compared with about $60 a share in 2008. Clearly, the debt markets’ modest returns and the prospect of higher interest rates in the future made the equity markets the better choice for most investors in the near term.
The significant out-performance relative to the benchmark was mainly due to strong stock selections in Industrials, Information Technology and Financials. An underweight in the poorer-performing
Consumer Staples sector, along with an overweight in Industrials, also contributed to relative performance.(1)
The Portfolio’s best performers from an individual holding perspective were Delta Air Lines, Inc., Facebook, Inc., Hanesbrands, Inc., Celgene Corp. and Vertex Pharmaceuticals, Inc. The Portfolio’s worst performers were Infinity Pharmaceuticals, Inc., Amarin Corp., F5 Networks, Inc., ARIAD Pharmaceuticals, Inc. and Avon Products, Inc. The top contributors to performance were Facebook, Inc., Google, Inc., Vertex Pharmaceuticals, Inc., Delta Air Lines, Inc. and Hanesbrands, Inc. The top detractors from performance were Infinity Pharmaceuticals, Inc., F5 Networks, Inc., Amarin Corp., ARIAD Pharmaceuticals, Inc. and Conagra Foods, Inc.(1)
The top contributor to the Portfolio’s performance was Facebook, Inc. which generated 222 basis points with its continued domination of social media sites. Google, Inc. added 191 basis points, reflecting its move beyond its search engine dominance to include mobile devices. Vertex Pharmaceuticals, Inc. contributed 188 basis points as a result of positive drug trails that resulted in a stock price surge in April that outperformed larger competitors Bristol-Myers Squibb Co. and Merck & Co., Inc. Delta Air Lines, Inc. contributed 172 basis points, as growth reappeared in the economy and oil prices weakened. Hanesbrands, Inc. had a good year, adding 150 basis points following the acquisition of Maidenform, which the company hopes to increase its access to younger generation markets.(1)
Detractors from performance included Infinity Pharmaceuticals, Inc. which lost the Portfolio 131 basis points as a result of adverse health reports in a drug trial. Programmable chip maker Altera Corp. lost the Portfolio six basis points as a result of a November downgrade by a big name analyst concerned with delays in revenue development. F5 Networks, Inc. lost the Portfolio 48 basis points when it missed earnings and Amarin Corp. lost the Portfolio 22 basis points when a recently approved drug did not get the expected unqualified approval of the FDA. ARIAD Pharmaceuticals, Inc. lost the Portfolio 16 basis points after the FDA first halted sales of its flagship Leukemia drug and then permitted a resumption of sales, and Conagra Foods, Inc. was hit by an adverse court judgment related to a 13 year old lead paint lawsuit and lost the Portfolio a further 15 basis points.(1)
Looking to 2014, it appears that the impact of quantitative easing will likely continue for much of the year, and possibly into 2015. The newly appointed Federal Reserve chair will likely continue the tapering, at modest amounts of $10 billion every one or two months, and keep interest rates low for the near term. Unemployment, at 7%, is at a five year low, factory output is up, and the concerns regarding Obamacare’s uncertain medical insurance costs have been somewhat muted. The Federal Reserve projects growth in the area of 3% in 2014 and unemployment falling as low as 6.3%. Even the high returns of 2013 need not be a concern. While past performance is no guarantee of future returns, the historical results since 1870 have a total of thirty examples when the market climbed more than 25%. In twenty-three of these years, the market rose further the following year, with a mean return of 12%. This is a reminder that, in a rising market, December 31st is just an arbitrary date. The fixed income investor’s dilemma regarding what to do about low-to-near-zero interest rates, enshrined in current Federal Reserve policy, suggests strong continued support for equities for 2014.
| (1) | The Portfolio’s composition is subject to change. Holdings and weightings are as of December 31, 2013. |
| 93 | (continued) |
| Ohio National Fund, Inc. | Bristol Growth Portfolio (Continued) |
Change in Value of $10,000 Investment
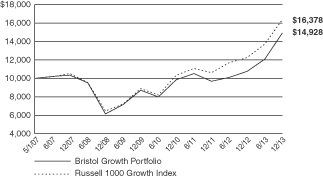
Hypothetical illustration based on past performance. Future performance will vary. The Portfolio’s returns reflect reinvested dividends. The Portfolio’s holdings may differ significantly from the securities in the index. The index is unmanaged and therefore does not reflect the cost of portfolio management and accounting.
The Russell 1000 Growth Index is a market-capitalization weighted index of those firms in the Russell 1000 Index with higher price-to-book ratios and higher forecasted growth values. The Russell 1000 Index measures the performance of the large-cap segment of the U.S. equity universe. The index presented herein includes the effects of requested dividends.
Portfolio Composition as of December 31, 2013 (1)
| % of Net Assets | ||||
Common Stocks (3) | 99.4 | |||
Money Market Funds | 0.6 | |||
|
| |||
| 100.0 | ||||
|
|
Top 10 Portfolio Holdings as of December 31, 2013 (1) (2)
| % of Net Assets | ||||
1. Apple, Inc. | 3.8 | |||
2. Google, Inc. Class A | 3.8 | |||
3. Microsoft Corp. | 3.7 | |||
4. International Business Machines Corp. | 2.8 | |||
5. Valeant Pharmaceuticals International, Inc. | 2.6 | |||
6. Adobe Systems, Inc. | 2.3 | |||
7. Oracle Corp. | 2.2 | |||
8. Celgene Corp. | 2.1 | |||
9. Walt Disney Co. / The | 2.1 | |||
10. Intel Corp. | 2.1 |
| (1) | Composition of Portfolio subject to change. |
| (2) | Short-term investments have been excluded from the list of Top 10 Portfolio Holdings. |
| (3) | Sectors: |
| % of Net Assets | ||||
Information Technology | 26.6 | |||
Consumer Discretionary | 20.1 | |||
Industrials | 19.4 | |||
Health Care | 16.3 | |||
Energy | 5.4 | |||
Materials | 4.1 | |||
Financials | 4.0 | |||
Consumer Staples | 2.6 | |||
Telecommunication Services | 0.9 | |||
|
| |||
| 99.4 | ||||
|
|
| 94 |
| Ohio National Fund, Inc. | Bristol Growth Portfolio |
Schedule of Investments | December 31, 2013 |
| Common Stocks – 99.4% | Shares | Value | ||||||
CONSUMER DISCRETIONARY – 20.1% | ||||||||
McDonald’s Corp. (Hotels, Restaurants & Leisure) | 23,800 | $ 2,309,314 | ||||||
Starbucks Corp. (Hotels, Restaurants & Leisure) | 28,500 | 2,234,115 | ||||||
Amazon.com, Inc. (Internet & Catalog Retail) | (a) | 6,390 | 2,548,268 | |||||
CBS Corp. Class B (Media) | 29,300 | 1,867,582 | ||||||
Comcast Corp. Class A (Media) | 47,400 | 2,463,141 | ||||||
Walt Disney Co. / The (Media) | 33,800 | 2,582,320 | ||||||
Nordstrom, Inc. (Multiline Retail) | 28,600 | 1,767,480 | ||||||
Lowe’s Cos., Inc. (Specialty Retail) | 36,500 | 1,808,575 | ||||||
Hanesbrands, Inc. (Textiles, Apparel & Luxury Goods) | 32,200 | 2,262,694 | ||||||
NIKE, Inc. Class B (Textiles, Apparel & Luxury Goods) | 29,720 | 2,337,181 | ||||||
PVH Corp. (Textiles, Apparel & Luxury Goods) | 18,000 | 2,448,360 | ||||||
| ||||||||
| 24,629,030 | ||||||||
| ||||||||
CONSUMER STAPLES – 2.6% | ||||||||
Coca-Cola Co. / The (Beverages) | 50,600 | 2,090,286 | ||||||
Constellation Brands, Inc. Class A (Beverages) | (a) | 16,100 | 1,133,118 | |||||
| ||||||||
| 3,223,404 | ||||||||
| ||||||||
ENERGY – 5.4% | ||||||||
Halliburton Co. (Energy Equip. & Svs.) | 27,400 | 1,390,550 | ||||||
Schlumberger Ltd. (Energy Equip. & Svs.) | 26,200 | 2,360,882 | ||||||
Pioneer Natural Resources Co. (Oil, Gas & Consumable Fuels) | 11,900 | 2,190,433 | ||||||
Whiting Petroleum Corp. (Oil, Gas & Consumable Fuels) | (a) | 9,900 | 612,513 | |||||
| ||||||||
| 6,554,378 | ||||||||
| ||||||||
FINANCIALS – 4.0% | ||||||||
Hartford Financial Services Group, Inc. (Insurance) | 65,600 | 2,376,688 | ||||||
Prudential Financial, Inc. (Insurance) | 27,400 | 2,526,828 | ||||||
| ||||||||
| 4,903,516 | ||||||||
| ||||||||
HEALTH CARE – 16.3% | ||||||||
Celgene Corp. (Biotechnology) | (a) | 15,450 | 2,610,432 | |||||
Gilead Sciences, Inc. (Biotechnology) | (a) | 25,700 | 1,931,355 | |||||
Pharmacyclics, Inc. (Biotechnology) | (a) | 11,400 | 1,205,892 | |||||
Vertex Pharmaceuticals, Inc. (Biotechnology) | (a) | 26,400 | 1,961,520 | |||||
UnitedHealth Group, Inc. (Health Care Providers & Svs.) | 23,800 | 1,792,140 | ||||||
Thermo Fisher Scientific, Inc. (Life Sciences Tools & Svs.) | 22,200 | 2,471,970 | ||||||
Mylan, Inc. (Pharmaceuticals) | (a) | 55,400 | 2,404,360 | |||||
Pfizer, Inc. (Pharmaceuticals) | 76,900 | 2,355,447 | ||||||
Valeant Pharmaceuticals International, Inc. (Pharmaceuticals) | (a) | 26,910 | 3,159,234 | |||||
| ||||||||
| 19,892,350 | ||||||||
| ||||||||
| Common Stocks (Continued) | Shares | Value | ||||||
INDUSTRIALS – 19.4% | ||||||||
Boeing Co. / The (Aerospace & Defense) | 13,500 | $ 1,842,615 | ||||||
Precision Castparts Corp. (Aerospace & Defense) | 7,642 | 2,057,990 | ||||||
United Technologies Corp. (Aerospace & Defense) | 21,400 | 2,435,320 | ||||||
FedEx Corp. (Air Freight & Logistics) | 16,900 | 2,429,713 | ||||||
Delta Air Lines, Inc. (Airlines) | 67,600 | 1,856,972 | ||||||
Tyco International Ltd. (Commercial Svs. & Supplies) | 31,000 | 1,272,240 | ||||||
Eaton Corp. PLC (Electrical Equip.) | 29,708 | 2,261,373 | ||||||
Danaher Corp. (Industrial Conglomerates) | 31,000 | 2,393,200 | ||||||
Pentair Ltd. (Machinery) | 26,500 | 2,058,255 | ||||||
Terex Corp. (Machinery) | 35,000 | 1,469,650 | ||||||
Xylem, Inc. (Machinery) | 52,500 | 1,816,500 | ||||||
Hertz Global Holdings, Inc. (Road & Rail) | (a) | 64,700 | 1,851,714 | |||||
| ||||||||
| 23,745,542 | ||||||||
| ||||||||
INFORMATION TECHNOLOGY – 26.6% | ||||||||
Apple, Inc. (Computers & Peripherals) | 8,300 | 4,657,213 | ||||||
Google, Inc. Class A (Internet Software & Svs.) | (a) | 4,110 | 4,606,118 | |||||
International Business Machines Corp. (IT Svs.) | 18,410 | 3,453,164 | ||||||
MasterCard, Inc. Class A (IT Svs.) | 2,895 | 2,418,657 | ||||||
Altera Corp. (Semiconductors & Equip.) | 74,900 | 2,436,497 | ||||||
Avago Technologies Ltd. (Semiconductors & Equip.) | 46,000 | 2,432,940 | ||||||
Intel Corp. (Semiconductors & Equip.) | 98,600 | 2,559,656 | ||||||
Adobe Systems, Inc. (Software) | (a) | 46,500 | 2,784,420 | |||||
Microsoft Corp. (Software) | 121,100 | 4,532,773 | ||||||
Oracle Corp. (Software) | 69,000 | 2,639,940 | ||||||
| ||||||||
| 32,521,378 | ||||||||
| ||||||||
MATERIALS – 4.1% | ||||||||
Huntsman Corp. (Chemicals) | 102,700 | 2,526,420 | ||||||
Monsanto Co. (Chemicals) | 20,800 | 2,424,240 | ||||||
| ||||||||
| 4,950,660 | ||||||||
| ||||||||
TELECOMMUNICATION SERVICES – 0.9% | ||||||||
Verizon Communications, Inc. (Diversified Telecom. Svs.) | 22,400 | 1,100,736 | ||||||
| ||||||||
Total Common Stocks (Cost $102,079,575) | $121,520,994 | |||||||
| ||||||||
| Money Market Funds – 1.3% | Shares | Value | ||||||
Fidelity Institutional Money Market Funds Money Market Portfolio – Class I | 1,645,000 | $ 1,645,000 | ||||||
| ||||||||
Total Money Market Funds (Cost $1,645,000) | $ 1,645,000 | |||||||
| ||||||||
Total Investments – 100.7% (Cost $103,724,575) | (b) | $123,165,994 | ||||||
Liabilities in Excess of Other Assets – (0.7)% | (904,032) | |||||||
| ||||||||
Net Assets – 100.0% | $122,261,962 | |||||||
| ||||||||
Percentages are stated as a percent of net assets.
Footnotes:
| (a) | Non-income producing security. |
| (b) | Represents cost for financial reporting purposes, which may differ from cost basis for federal income tax purposes. See also Note 7 of the Notes to Financial Statements. |
The accompanying notes are an integral part of these financial statements.
| 95 |
| Ohio National Fund, Inc. |
| December 31, 2013 |
| Equity Portfolio | Money Market Portfolio | Bond Portfolio | Omni Portfolio | International Portfolio | Capital Appreciation Portfolio | International Small-Mid Company Portfolio | Aggressive Growth Portfolio | |||||||||||||||||||||||||
Assets: | ||||||||||||||||||||||||||||||||
Investments in securities, at value* | $ | 223,775,556 | $ | 189,496,151 | $ | 148,186,513 | $ | 37,839,344 | $ | 186,524,644 | $ | 139,616,777 | $ | 77,001,456 | $ | 39,780,382 | ||||||||||||||||
Cash | 46 | 70,181,668 | 645 | 3,315 | — | 584 | — | 509 | ||||||||||||||||||||||||
Foreign currencies, at value** | — | — | — | — | 444 | — | — | — | ||||||||||||||||||||||||
Receivable for securities sold | — | — | — | 1,096,921 | — | — | — | — | ||||||||||||||||||||||||
Due from adviser | — | 63,711 | — | — | — | — | — | — | ||||||||||||||||||||||||
Receivable for fund shares sold | 27,556 | 2,539,483 | 2,297,862 | 38,048 | 2,183,314 | 90,345 | 53,999 | 107,150 | ||||||||||||||||||||||||
Dividends and accrued interest receivable | 263,764 | 768 | 1,379,736 | 110,076 | 67,829 | 81,755 | 63,230 | 10,433 | ||||||||||||||||||||||||
Foreign tax reclaim receivable | — | — | — | — | 153,377 | — | 27,960 | 3,828 | ||||||||||||||||||||||||
Prepaid expenses and other assets | 2,246 | 897 | 539 | 383 | 1,946 | 1,399 | 739 | 366 | ||||||||||||||||||||||||
Variation margin on futures contracts | — | — | — | — | 11,000 | — | — | — | ||||||||||||||||||||||||
Unrealized appreciation on foreign currency contracts | — | — | — | — | 812,578 | — | — | — | ||||||||||||||||||||||||
|
|
|
|
|
|
|
|
|
|
|
|
|
|
|
| |||||||||||||||||
Total assets | 224,069,168 | 262,282,678 | 151,865,295 | 39,088,087 | 189,755,132 | 139,790,860 | 77,147,384 | 39,902,668 | ||||||||||||||||||||||||
|
|
|
|
|
|
|
|
|
|
|
|
|
|
|
| |||||||||||||||||
Liabilities: | ||||||||||||||||||||||||||||||||
Payable for securities purchased | — | — | — | 985,945 | — | 9,322 | — | 297,279 | ||||||||||||||||||||||||
Payable for fund shares redeemed | 2,459,270 | 1,101,090 | 195,454 | 182,823 | 191,131 | 1,665,455 | 82,431 | 165,328 | ||||||||||||||||||||||||
Payable for investment management services | 146,940 | 55,497 | 72,034 | 18,963 | 60,845 | 91,013 | 63,231 | 25,939 | ||||||||||||||||||||||||
Accrued custody expense | 839 | 1,009 | 475 | 587 | 16,450 | 730 | 4,509 | 434 | ||||||||||||||||||||||||
Accrued professional fees | 7,467 | 7,467 | 7,467 | 7,467 | 7,467 | 7,467 | 7,467 | 7,467 | ||||||||||||||||||||||||
Accrued accounting fees | 4,978 | 6,382 | 5,159 | 2,168 | 5,753 | 3,330 | 2,297 | 1,235 | ||||||||||||||||||||||||
Accrued printing and filing fees | 9,440 | 12,562 | 6,943 | 1,603 | 8,062 | 5,901 | 3,097 | 1,533 | ||||||||||||||||||||||||
Withholding tax payable | 6,192 | — | — | — | 6,205 | — | 1,444 | 456 | ||||||||||||||||||||||||
Unrealized depreciation on foreign currency contracts | — | — | — | — | 32,179 | — | — | — | ||||||||||||||||||||||||
|
|
|
|
|
|
|
|
|
|
|
|
|
|
|
| |||||||||||||||||
Total liabilities | 2,635,126 | 1,184,007 | 287,532 | 1,199,556 | 328,092 | 1,783,218 | 164,476 | 499,671 | ||||||||||||||||||||||||
|
|
|
|
|
|
|
|
|
|
|
|
|
|
|
| |||||||||||||||||
Net assets | $ | 221,434,042 | $ | 261,098,671 | $ | 151,577,763 | $ | 37,888,531 | $ | 189,427,040 | $ | 138,007,642 | $ | 76,982,908 | $ | 39,402,997 | ||||||||||||||||
|
|
|
|
|
|
|
|
|
|
|
|
|
|
|
| |||||||||||||||||
Net assets consist of: | ||||||||||||||||||||||||||||||||
Par value, $1 per share | $ | 7,528,316 | $ | 26,109,880 | $ | 10,258,924 | $ | 1,742,822 | $ | 13,676,583 | $ | 4,417,290 | $ | 2,563,448 | $ | 3,152,084 | ||||||||||||||||
Paid-in capital in excess of par value | 235,667,700 | 234,988,791 | 142,651,478 | 29,549,799 | 210,440,719 | 93,244,505 | 55,114,458 | 19,745,858 | ||||||||||||||||||||||||
Accumulated net realized gain (loss) on investments | (81,492,704 | ) | — | (11,377,250 | ) | 1,128,383 | (82,882,026 | ) | 2,156,303 | (5,020,864 | ) | 4,351,264 | ||||||||||||||||||||
Net unrealized appreciation (depreciation) on: | ||||||||||||||||||||||||||||||||
Investments | 59,535,415 | — | 4,908,290 | 5,419,671 | 44,172,009 | 38,151,061 | 24,129,260 | 12,153,626 | ||||||||||||||||||||||||
Foreign currency contracts | — | — | — | — | 780,399 | — | — | — | ||||||||||||||||||||||||
Futures contracts | — | — | — | — | 170,530 | — | — | — | ||||||||||||||||||||||||
Other foreign currency related transactions | — | — | — | — | 5,604 | — | 159 | 165 | ||||||||||||||||||||||||
Undistributed net investment income (loss) | 195,315 | — | 5,136,321 | 47,856 | 3,063,222 | 38,483 | 196,447 | — | ||||||||||||||||||||||||
|
|
|
|
|
|
|
|
|
|
|
|
|
|
|
| |||||||||||||||||
Net assets | $ | 221,434,042 | $ | 261,098,671 | $ | 151,577,763 | $ | 37,888,531 | $ | 189,427,040 | $ | 138,007,642 | $ | 76,982,908 | $ | 39,402,997 | ||||||||||||||||
|
|
|
|
|
|
|
|
|
|
|
|
|
|
|
| |||||||||||||||||
* Investments in securities, at cost | $ | 164,240,141 | $ | 189,496,151 | $ | 143,278,223 | $ | 32,419,673 | $ | 142,352,635 | $ | 101,465,716 | $ | 52,872,196 | $ | 27,626,756 | ||||||||||||||||
|
|
|
|
|
|
|
|
|
|
|
|
|
|
|
| |||||||||||||||||
** Foreign currencies, at cost | $ | — | $ | — | $ | — | $ | — | $ | 448 | $ | — | $ | — | $ | — | ||||||||||||||||
|
|
|
|
|
|
|
|
|
|
|
|
|
|
|
| |||||||||||||||||
Shares outstanding | 7,528,316 | 26,109,880 | 10,258,924 | 1,742,822 | 13,676,583 | 4,417,290 | 2,563,448 | 3,152,084 | ||||||||||||||||||||||||
|
|
|
|
|
|
|
|
|
|
|
|
|
|
|
| |||||||||||||||||
Authorized Fund shares allocated to Portfolio | 25,000,000 | 55,000,000 | 30,000,000 | 10,000,000 | 45,000,000 | 15,000,000 | 10,000,000 | 10,000,000 | ||||||||||||||||||||||||
|
|
|
|
|
|
|
|
|
|
|
|
|
|
|
| |||||||||||||||||
Net asset value per share | $ | 29.41 | $ | 10.00 | $ | 14.78 | $ | 21.74 | $ | 13.85 | $ | 31.24 | $ | 30.03 | $ | 12.50 | ||||||||||||||||
|
|
|
|
|
|
|
|
|
|
|
|
|
|
|
| |||||||||||||||||
The accompanying notes are an integral part of these financial statements.
| 96 |
| Ohio National Fund, Inc. |
Statements of Assets and Liabilities | December 31, 2013 |
| Small Cap Growth Portfolio | Mid Cap Opportunity Portfolio | S&P 500® Index Portfolio | Strategic Value Portfolio | High Income Bond Portfolio | Capital Growth Portfolio | Nasdaq-100® Index Portfolio | Bristol Portfolio | |||||||||||||||||||||||||
Assets: | ||||||||||||||||||||||||||||||||
Investments in securities, at value* | $ | 109,920,119 | $ | 83,197,376 | $ | 314,712,500 | $ | 398,258,227 | $ | 300,602,392 | $ | 80,213,049 | $ | 96,361,255 | $ | 232,257,346 | ||||||||||||||||
Cash | 49 | 47,424 | 558,364 | 726 | 443 | — | 250,510 | 23,644 | ||||||||||||||||||||||||
Receivable for securities sold | 14,440 | — | 3,678,136 | — | 75,000 | 756,289 | — | 20,238,666 | ||||||||||||||||||||||||
Receivable for fund shares sold | 204,068 | 40,245 | 586,918 | 508,650 | 3,027,521 | 161,799 | 151,309 | 139,694 | ||||||||||||||||||||||||
Dividends and accrued interest receivable | 64,462 | 18,813 | 478,679 | 1,857,470 | 5,201,319 | 11,591 | 51,102 | 219,568 | ||||||||||||||||||||||||
Foreign tax reclaim receivable | — | — | — | 5,355 | — | — | — | — | ||||||||||||||||||||||||
Prepaid expenses and other assets | 2,260 | 819 | 2,676 | 3,140 | 1,060 | 717 | 787 | 2,455 | ||||||||||||||||||||||||
|
|
|
|
|
|
|
|
|
|
|
|
|
|
|
| |||||||||||||||||
Total assets | 110,205,398 | 83,304,677 | 320,017,273 | 400,633,568 | 308,907,735 | 81,143,445 | 96,814,963 | 252,881,373 | ||||||||||||||||||||||||
|
|
|
|
|
|
|
|
|
|
|
|
|
|
|
| |||||||||||||||||
Liabilities: | ||||||||||||||||||||||||||||||||
Cash overdraft | — | — | — | — | — | 206,106 | — | — | ||||||||||||||||||||||||
Payable for securities purchased | 310,146 | — | 4,162,709 | — | 250,000 | 355,758 | 87,400 | 7,496,875 | ||||||||||||||||||||||||
Payable for fund shares redeemed | 286,039 | 219,805 | 796,611 | 2,648,405 | 561,616 | 76,667 | 834,316 | 13,668,739 | ||||||||||||||||||||||||
Payable for investment management services | 57,867 | 59,058 | 94,500 | 237,808 | 174,616 | 59,223 | 31,700 | 149,909 | ||||||||||||||||||||||||
Accrued custody expense | 1,970 | 701 | 3,544 | 1,483 | 1,242 | 636 | 776 | 1,284 | ||||||||||||||||||||||||
Accrued professional fees | 7,467 | 7,467 | 7,523 | 8,032 | 7,467 | 7,467 | 7,467 | 7,467 | ||||||||||||||||||||||||
Accrued accounting fees | 2,899 | 2,227 | 7,979 | 7,976 | 13,831 | 2,198 | 2,448 | 5,308 | ||||||||||||||||||||||||
Accrued printing and filing fees | 2,201 | 3,460 | 11,378 | 13,302 | 14,120 | 3,030 | 3,270 | 10,321 | ||||||||||||||||||||||||
Withholding tax payable | — | — | — | 51,747 | — | — | — | — | ||||||||||||||||||||||||
|
|
|
|
|
|
|
|
|
|
|
|
|
|
|
| |||||||||||||||||
Total liabilities | 668,589 | 292,718 | 5,084,244 | 2,968,753 | 1,022,892 | 711,085 | 967,377 | 21,339,903 | ||||||||||||||||||||||||
|
|
|
|
|
|
|
|
|
|
|
|
|
|
|
| |||||||||||||||||
Net assets | $ | 109,536,809 | $ | 83,011,959 | $ | 314,933,029 | $ | 397,664,815 | $ | 307,884,843 | $ | 80,432,360 | $ | 95,847,586 | $ | 231,541,470 | ||||||||||||||||
|
|
|
|
|
|
|
|
|
|
|
|
|
|
|
| |||||||||||||||||
Net assets consist of: | ||||||||||||||||||||||||||||||||
Par value, $1 per share | $ | 4,837,130 | $ | 2,939,931 | $ | 16,047,426 | $ | 30,378,804 | $ | 19,384,108 | $ | 2,009,059 | $ | 10,360,823 | $ | 12,657,430 | ||||||||||||||||
Paid-in capital in excess of par value | 75,614,224 | 73,955,397 | 190,122,073 | 321,092,180 | 251,291,668 | 51,404,488 | 45,157,380 | 133,893,680 | ||||||||||||||||||||||||
Accumulated net realized gain (loss) on investments | 14,482,407 | (16,151,921 | ) | 693,626 | 3,865,615 | 3,478,257 | 5,327,192 | 4,720,693 | 46,988,708 | |||||||||||||||||||||||
Net unrealized appreciation (depreciation) on: | ||||||||||||||||||||||||||||||||
Investments | 14,625,640 | 22,268,552 | 107,472,025 | 40,750,946 | 14,167,916 | 21,691,621 | 35,515,675 | 37,911,856 | ||||||||||||||||||||||||
Foreign currency related transactions | (5,462 | ) | — | — | 8,779 | — | — | — | — | |||||||||||||||||||||||
Undistributed net investment income (loss) | (17,130 | ) | — | 597,879 | 1,568,491 | 19,562,894 | — | 93,015 | 89,796 | |||||||||||||||||||||||
|
|
|
|
|
|
|
|
|
|
|
|
|
|
|
| |||||||||||||||||
Net assets | $ | 109,536,809 | $ | 83,011,959 | $ | 314,933,029 | $ | 397,664,815 | $ | 307,884,843 | $ | 80,432,360 | $ | 95,847,586 | $ | 231,541,470 | ||||||||||||||||
|
|
|
|
|
|
|
|
|
|
|
|
|
|
|
| |||||||||||||||||
* Investments in securities, at cost | $ | 95,294,479 | $ | 60,928,824 | $ | 207,240,475 | $ | 357,507,281 | $ | 286,434,476 | $ | 58,521,428 | $ | 60,845,580 | $ | 194,345,490 | ||||||||||||||||
|
|
|
|
|
|
|
|
|
|
|
|
|
|
|
| |||||||||||||||||
Shares outstanding | 4,837,130 | 2,939,931 | 16,047,426 | 30,378,804 | 19,384,108 | 2,009,059 | 10,360,823 | 12,657,430 | ||||||||||||||||||||||||
|
|
|
|
|
|
|
|
|
|
|
|
|
|
|
| |||||||||||||||||
Authorized Fund shares allocated to Portfolio | 10,000,000 | 10,000,000 | 35,000,000 | 65,000,000 | 50,000,000 | 10,000,000 | 25,000,000 | 40,000,000 | ||||||||||||||||||||||||
|
|
|
|
|
|
|
|
|
|
|
|
|
|
|
| |||||||||||||||||
Net asset value per share | $ | 22.65 | $ | 28.24 | $ | 19.63 | $ | 13.09 | $ | 15.88 | $ | 40.03 | $ | 9.25 | $ | 18.29 | ||||||||||||||||
|
|
|
|
|
|
|
|
|
|
|
|
|
|
|
| |||||||||||||||||
The accompanying notes are an integral part of these financial statements.
| 97 |
| Ohio National Fund, Inc. |
Statements of Assets and Liabilities | December 31, 2013 |
| Bryton Growth Portfolio | Balanced Portfolio | Target VIP Portfolio | Bristol Growth Portfolio | |||||||||||||
Assets: | ||||||||||||||||
Investments in securities, at value* | $ | 182,413,037 | $ | 246,666,991 | $ | 53,666,988 | $ | 123,165,994 | ||||||||
Cash | 641 | — | 780 | 12,436 | ||||||||||||
Receivable for securities sold | 5,625,225 | 7,702,708 | — | 8,940,954 | ||||||||||||
Receivable for fund shares sold | 53,717 | 1,672,898 | 45,522 | 37,921 | ||||||||||||
Dividends and accrued interest receivable | 19,247 | 1,458,144 | 61,862 | 78,681 | ||||||||||||
Foreign tax reclaim receivable | — | 5,906 | 8,470 | — | ||||||||||||
Prepaid expenses and other assets | 1,883 | 1,357 | 254 | 1,289 | ||||||||||||
|
|
|
|
|
|
|
| |||||||||
Total assets | 188,113,750 | 257,508,004 | 53,783,876 | 132,237,275 | ||||||||||||
|
|
|
|
|
|
|
| |||||||||
Liabilities: | ||||||||||||||||
Cash overdraft | — | 575,499 | — | — | ||||||||||||
Options written, at value** | — | �� | 1,794,000 | — | — | |||||||||||
Payable for securities purchased | 1,194,241 | 5,681,445 | — | 2,847,713 | ||||||||||||
Payable for fund shares redeemed | 5,995,525 | 248,633 | 34,110 | 7,027,708 | ||||||||||||
Payable for investment management services | 123,909 | 120,530 | 18,146 | 83,145 | ||||||||||||
Accrued custody expense | 1,633 | 1,119 | 331 | 833 | ||||||||||||
Accrued professional fees | 7,467 | 7,467 | 7,467 | 7,467 | ||||||||||||
Accrued accounting fees | 4,255 | 6,781 | 1,897 | 3,016 | ||||||||||||
Accrued printing and filing fees | 7,865 | 6,099 | 1,106 | 5,431 | ||||||||||||
Withholding tax payable | — | 6,089 | 2,749 | — | ||||||||||||
|
|
|
|
|
|
|
| |||||||||
Total liabilities | 7,334,895 | 8,447,662 | 65,806 | 9,975,313 | ||||||||||||
|
|
|
|
|
|
|
| |||||||||
Net assets | $ | 180,778,855 | $ | 249,060,342 | $ | 53,718,070 | $ | 122,261,962 | ||||||||
|
|
|
|
|
|
|
| |||||||||
Net assets consist of: | ||||||||||||||||
Par value, $1 per share | $ | 9,377,515 | $ | 13,823,591 | $ | 3,921,589 | $ | 8,307,723 | ||||||||
Paid-in capital in excess of par value | 113,591,119 | 213,791,761 | 54,385,214 | 71,263,830 | ||||||||||||
Accumulated net realized gain (loss) on investments | 36,931,019 | 2,097,395 | (13,211,533 | ) | 23,227,257 | |||||||||||
Net unrealized appreciation (depreciation) on: | ||||||||||||||||
Investments | 20,879,202 | 19,782,843 | 8,597,120 | 19,441,419 | ||||||||||||
Written options | — | (720,212 | ) | — | — | |||||||||||
Foreign currency related transactions | — | (96 | ) | — | — | |||||||||||
Undistributed net investment income (loss) | — | 285,060 | 25,680 | 21,733 | ||||||||||||
|
|
|
|
|
|
|
| |||||||||
Net assets | $ | 180,778,855 | $ | 249,060,342 | $ | 53,718,070 | $ | 122,261,962 | ||||||||
|
|
|
|
|
|
|
| |||||||||
* Investments in securities, at cost | $ | 161,533,835 | $ | 226,884,148 | $ | 45,069,868 | $ | 103,724,575 | ||||||||
|
|
|
|
|
|
|
| |||||||||
** Premiums received on options written | $ | — | $ | 1,073,788 | $ | — | $ | — | ||||||||
|
|
|
|
|
|
|
| |||||||||
Shares outstanding | 9,377,515 | 13,823,591 | 3,921,589 | 8,307,723 | ||||||||||||
|
|
|
|
|
|
|
| |||||||||
Authorized Fund shares allocated to Portfolio | 35,000,000 | 35,000,000 | 10,000,000 | 25,000,000 | ||||||||||||
|
|
|
|
|
|
|
| |||||||||
Net asset value per share | $ | 19.28 | $ | 18.02 | $ | 13.70 | $ | 14.72 | ||||||||
|
|
|
|
|
|
|
| |||||||||
The accompanying notes are an integral part of these financial statements.
| 98 |
| Ohio National Fund, Inc. |
| For the Year Ended December 31, 2013 |
| Equity Portfolio | Money Market Portfolio | Bond Portfolio | Omni Portfolio | International Portfolio | Capital Appreciation Portfolio | International Small-Mid Company Portfolio | Aggressive Growth Portfolio | |||||||||||||||||||||||||
Investment income: | ||||||||||||||||||||||||||||||||
Interest | $ | — | $ | 129,770 | $ | 6,145,314 | $ | 326,874 | $ | 194 | $ | — | $ | 355 | $ | 234 | ||||||||||||||||
Dividends, net of taxes withheld* | 3,808,534 | 14,608 | 2,151 | 364,392 | 4,178,030 | 1,713,195 | 1,103,462 | 251,905 | ||||||||||||||||||||||||
|
|
|
|
|
|
|
|
|
|
|
|
|
|
|
| |||||||||||||||||
Total investment income | 3,808,534 | 144,378 | 6,147,465 | 691,266 | 4,178,224 | 1,713,195 | 1,103,817 | 252,139 | ||||||||||||||||||||||||
|
|
|
|
|
|
|
|
|
|
|
|
|
|
|
| |||||||||||||||||
Expenses: | ||||||||||||||||||||||||||||||||
Management fees | 1,627,773 | 701,446 | 869,571 | 211,444 | 1,522,561 | 1,013,936 | 693,854 | 278,927 | ||||||||||||||||||||||||
Custodian fees | 10,807 | 12,245 | 6,135 | 7,022 | 188,134 | 9,833 | 58,135 | 10,050 | ||||||||||||||||||||||||
Directors’ fees | 24,946 | 31,442 | 18,686 | 4,249 | 22,375 | 15,464 | 8,377 | 4,157 | ||||||||||||||||||||||||
Professional fees | 19,754 | 21,689 | 18,021 | 13,842 | 18,972 | 17,054 | 15,011 | 13,816 | ||||||||||||||||||||||||
Accounting fees | 60,004 | 77,330 | 66,125 | 25,797 | 65,912 | 40,908 | 29,362 | 16,016 | ||||||||||||||||||||||||
Printing and filing fees | 26,242 | 36,313 | 19,264 | 4,666 | 22,855 | 16,782 | 8,949 | 4,649 | ||||||||||||||||||||||||
Compliance expense | 11,108 | 11,108 | 11,108 | 11,108 | 11,108 | 11,108 | 11,108 | 11,108 | ||||||||||||||||||||||||
Other | 5,915 | 3,603 | 2,234 | 1,036 | 6,276 | 3,653 | 2,073 | 943 | ||||||||||||||||||||||||
|
|
|
|
|
|
|
|
|
|
|
|
|
|
|
| |||||||||||||||||
Total expenses | 1,786,549 | 895,176 | 1,011,144 | 279,164 | 1,858,193 | 1,128,738 | 826,869 | 339,666 | ||||||||||||||||||||||||
|
|
|
|
|
|
|
|
|
|
|
|
|
|
|
| |||||||||||||||||
Less expenses reduced or reimbursed by adviser | — | (750,798 | ) | — | — | (474,945 | ) | — | — | — | ||||||||||||||||||||||
|
|
|
|
|
|
|
|
|
|
|
|
|
|
|
| |||||||||||||||||
Net expenses | 1,786,549 | 144,378 | 1,011,144 | 279,164 | 1,383,248 | 1,128,738 | 826,869 | 339,666 | ||||||||||||||||||||||||
|
|
|
|
|
|
|
|
|
|
|
|
|
|
|
| |||||||||||||||||
Net investment income (loss) | 2,021,985 | — | 5,136,321 | 412,102 | 2,794,976 | 584,457 | 276,948 | (87,527 | ) | |||||||||||||||||||||||
|
|
|
|
|
|
|
|
|
|
|
|
|
|
|
| |||||||||||||||||
Realized/unrealized gain (loss) on investments, futures contracts, foreign currency contracts, and other foreign currency related transactions: | ||||||||||||||||||||||||||||||||
Net realized gain (loss) on: | ||||||||||||||||||||||||||||||||
Investments | 28,393,403 | — | 1,717,938 | 5,570,305 | 9,102,578 | 12,162,800 | 7,413,504 | 5,282,237 | ||||||||||||||||||||||||
Futures contracts | — | — | — | — | 85,295 | — | — | — | ||||||||||||||||||||||||
Foreign currency contracts | — | — | — | — | 1,613,554 | — | — | — | ||||||||||||||||||||||||
Other foreign currency related transactions | — | — | — | — | (595,839 | ) | (923 | ) | (80,501 | ) | (796 | ) | ||||||||||||||||||||
Change in unrealized appreciation/depreciation on: | ||||||||||||||||||||||||||||||||
Investments | 35,131,231 | — | (9,876,691 | ) | 3,438,117 | 7,455,420 | 25,016,691 | 9,410,303 | 4,447,593 | |||||||||||||||||||||||
Futures contracts | — | — | — | — | 186,528 | — | — | — | ||||||||||||||||||||||||
Foreign currency contracts | — | — | — | — | 31,040 | — | — | — | ||||||||||||||||||||||||
Other foreign currency related transactions | — | — | — | — | 5,317 | — | 19,521 | 124 | ||||||||||||||||||||||||
|
|
|
|
|
|
|
|
|
|
|
|
|
|
|
| |||||||||||||||||
Net realized/unrealized gain (loss) on investments, futures contracts, foreign currency contracts, and other foreign currency related transactions | 63,524,634 | — | (8,158,753 | ) | 9,008,422 | 17,883,893 | 37,178,568 | 16,762,827 | 9,729,158 | |||||||||||||||||||||||
|
|
|
|
|
|
|
|
|
|
|
|
|
|
|
| |||||||||||||||||
Change in net assets from operations | $ | 65,546,619 | $ | — | $ | (3,022,432 | ) | $ | 9,420,524 | $ | 20,678,869 | $ | 37,763,025 | $ | 17,039,775 | $ | 9,641,631 | |||||||||||||||
|
|
|
|
|
|
|
|
|
|
|
|
|
|
|
| |||||||||||||||||
* Taxes withheld | $ | 14,695 | $ | — | $ | — | $ | — | $ | 575,108 | $ | 36,925 | $ | 124,218 | $ | 9,082 | ||||||||||||||||
|
|
|
|
|
|
|
|
|
|
|
|
|
|
|
| |||||||||||||||||
The accompanying notes are an integral part of these financial statements.
| 99 |
| Ohio National Fund, Inc. |
Statements of Operations | For the Year Ended December 31, 2013 |
| Small Cap Growth Portfolio | Mid Cap Opportunity Portfolio | S&P 500® Index Portfolio | Strategic Value Portfolio | High Income Bond Portfolio | Capital Growth Portfolio | Nasdaq-100® Index Portfolio | Bristol Portfolio | |||||||||||||||||||||||||
Investment income: | ||||||||||||||||||||||||||||||||
Interest | $ | 484 | $ | — | $ | 2 | $ | — | $ | 21,898,399 | $ | — | $ | 3 | $ | — | ||||||||||||||||
Dividends, net of taxes withheld* | 382,260 | 516,518 | 5,406,907 | 13,597,922 | 26,205 | 383,793 | 1,118,458 | 2,976,555 | ||||||||||||||||||||||||
|
|
|
|
|
|
|
|
|
|
|
|
|
|
|
| |||||||||||||||||
Total investment income | 382,744 | 516,518 | 5,406,909 | 13,597,922 | 21,924,604 | 383,793 | 1,118,461 | 2,976,555 | ||||||||||||||||||||||||
|
|
|
|
|
|
|
|
|
|
|
|
|
|
|
| |||||||||||||||||
Expenses: | ||||||||||||||||||||||||||||||||
Management fees | 451,880 | 643,307 | 932,752 | 2,228,645 | 2,071,730 | 606,315 | 309,603 | 1,662,772 | ||||||||||||||||||||||||
Custodian fees | 17,494 | 8,860 | 25,202 | 26,305 | 15,261 | 6,101 | 9,543 | 15,012 | ||||||||||||||||||||||||
Directors’ fees | 5,883 | 9,102 | 30,236 | 37,360 | 37,119 | 8,049 | 9,280 | 27,010 | ||||||||||||||||||||||||
Professional fees | 14,297 | 15,229 | 21,563 | 26,036 | 23,350 | 14,919 | 15,287 | 20,370 | ||||||||||||||||||||||||
Accounting fees | 20,080 | 26,425 | 90,499 | 88,278 | 160,666 | 25,117 | 27,634 | 64,369 | ||||||||||||||||||||||||
Printing and filing fees | 6,463 | 9,928 | 30,644 | 35,979 | 38,297 | 8,520 | 9,449 | 28,447 | ||||||||||||||||||||||||
Compliance expense | 11,108 | 11,108 | 11,108 | 11,108 | 11,108 | 11,108 | 11,108 | 11,108 | ||||||||||||||||||||||||
Other | 1,201 | 2,156 | 6,510 | 5,830 | 4,179 | 1,795 | 2,048 | 6,323 | ||||||||||||||||||||||||
|
|
|
|
|
|
|
|
|
|
|
|
|
|
|
| |||||||||||||||||
Total expenses | 528,406 | 726,115 | 1,148,514 | 2,459,541 | 2,361,710 | 681,924 | 393,952 | 1,835,411 | ||||||||||||||||||||||||
|
|
|
|
|
|
|
|
|
|
|
|
|
|
|
| |||||||||||||||||
Net investment income (loss) | (145,662 | ) | (209,597 | ) | 4,258,395 | 11,138,381 | 19,562,894 | (298,131 | ) | 724,509 | 1,141,144 | |||||||||||||||||||||
|
|
|
|
|
|
|
|
|
|
|
|
|
|
|
| |||||||||||||||||
Realized/unrealized gain (loss) on investments and foreign currency related transactions: | ||||||||||||||||||||||||||||||||
Net realized gain (loss) on: | ||||||||||||||||||||||||||||||||
Investments | 15,028,244 | 8,674,285 | 3,688,356 | 9,911,967 | 3,478,257 | 5,469,110 | 5,521,100 | 48,232,798 | ||||||||||||||||||||||||
Foreign currency related transactions | 191 | (86 | ) | — | (35,518 | ) | — | — | — | — | ||||||||||||||||||||||
Change in unrealized appreciation/depreciation on: | ||||||||||||||||||||||||||||||||
Investments | 4,064,408 | 12,646,891 | 61,348,239 | 39,070,854 | (1,974,076 | ) | 12,232,870 | 18,052,218 | 27,351,718 | |||||||||||||||||||||||
Foreign currency related transactions | (5,462 | ) | — | — | 2,338 | — | — | — | — | |||||||||||||||||||||||
|
|
|
|
|
|
|
|
|
|
|
|
|
|
|
| |||||||||||||||||
Net realized/unrealized gain (loss) on investments and foreign currency related transactions | 19,087,381 | 21,321,090 | 65,036,595 | 48,949,641 | 1,504,181 | 17,701,980 | 23,573,318 | 75,584,516 | ||||||||||||||||||||||||
|
|
|
|
|
|
|
|
|
|
|
|
|
|
|
| |||||||||||||||||
Change in net assets from operations | $ | 18,941,719 | $ | 21,111,493 | $ | 69,294,990 | $ | 60,088,022 | $ | 21,067,075 | $ | 17,403,849 | $ | 24,297,827 | $ | 76,725,660 | ||||||||||||||||
|
|
|
|
|
|
|
|
|
|
|
|
|
|
|
| |||||||||||||||||
* Taxes withheld | $ | 3,064 | $ | 3,928 | $ | 922 | $ | 458,850 | $ | — | $ | 1,410 | $ | 2,543 | $ | — | ||||||||||||||||
|
|
|
|
|
|
|
|
|
|
|
|
|
|
|
| |||||||||||||||||
The accompanying notes are an integral part of these financial statements.
| 100 |
| Ohio National Fund, Inc. |
Statements of Operations | For the Year Ended December 31, 2013 |
| Bryton Growth Portfolio | Balanced Portfolio | Target VIP Portfolio | Bristol Growth Portfolio | |||||||||||||
Investment income: | ||||||||||||||||
Interest | $ | — | $ | 1,366,858 | $ | — | $ | — | ||||||||
Dividends, net of taxes withheld* | 518,006 | 1,631,630 | 427,765 | 1,528,380 | ||||||||||||
|
|
|
|
|
|
|
| |||||||||
Total investment income | 518,006 | 2,998,488 | 427,765 | 1,528,380 | ||||||||||||
|
|
|
|
|
|
|
| |||||||||
Expenses: | ||||||||||||||||
Management fees | 1,389,516 | 887,860 | 147,712 | 923,189 | ||||||||||||
Custodian fees | 15,995 | 10,365 | 7,677 | 10,452 | ||||||||||||
Directors’ fees | 20,673 | 15,917 | 2,854 | 14,227 | ||||||||||||
Professional fees | 18,600 | 17,113 | 13,467 | 16,705 | ||||||||||||
Accounting fees | 51,345 | 59,329 | 14,211 | 36,395 | ||||||||||||
Printing and filing fees | 21,992 | 17,086 | 3,012 | 15,437 | ||||||||||||
Compliance expense | 11,108 | 11,108 | 11,108 | 11,108 | ||||||||||||
Other | 4,896 | 2,237 | 677 | 3,323 | ||||||||||||
|
|
|
|
|
|
|
| |||||||||
Total expenses | 1,534,125 | 1,021,015 | 200,718 | 1,030,836 | ||||||||||||
|
|
|
|
|
|
|
| |||||||||
Net investment income (loss) | (1,016,119 | ) | 1,977,473 | 227,047 | 497,544 | |||||||||||
|
|
|
|
|
|
|
| |||||||||
Realized/unrealized gain (loss) on investments, foreign currency related transactions, and written options: | ||||||||||||||||
Net realized gain (loss) on: | ||||||||||||||||
Investments | 38,865,947 | 7,836,779 | 6,638,251 | 23,724,595 | ||||||||||||
Foreign currency related transactions | — | (208 | ) | 38 | — | |||||||||||
Written options | — | (1,261,352 | ) | — | — | |||||||||||
Change in unrealized appreciation/depreciation on: | ||||||||||||||||
Investments | 20,607,365 | 9,661,886 | 1,076,715 | 14,073,672 | ||||||||||||
Foreign currency related transactions | — | (74 | ) | — | — | |||||||||||
Written options | — | (720,212 | ) | — | — | |||||||||||
|
|
|
|
|
|
|
| |||||||||
Net realized/unrealized gain (loss) on investments, foreign currency related transactions, and written options | 59,473,312 | 15,516,819 | 7,715,004 | 37,798,267 | ||||||||||||
|
|
|
|
|
|
|
| |||||||||
Change in net assets from operations | $ | 58,457,193 | $ | 17,494,292 | $ | 7,942,051 | $ | 38,295,811 | ||||||||
|
|
|
|
|
|
|
| |||||||||
* Taxes withheld | $ | — | $ | 12,875 | $ | 25,329 | $ | — | ||||||||
|
|
|
|
|
|
|
| |||||||||
The accompanying notes are an integral part of these financial statements.
| 101 |
| Ohio National Fund, Inc. |
| Equity Portfolio | Money Market Portfolio | Bond Portfolio | Omni Portfolio | |||||||||||||||||||||||||||||
| Year Ended December 31, 2013 | Year Ended December 31, 2012 | Year Ended December 31, 2013 | Year Ended December 31, 2012 | Year Ended December 31, 2013 | Year Ended December 31, 2012 | Year Ended December 31, 2013 | Year Ended December 31, 2012 | |||||||||||||||||||||||||
Increase (Decrease) in net assets: | ||||||||||||||||||||||||||||||||
Operations: | ||||||||||||||||||||||||||||||||
Net investment income (loss) | $ | 2,021,985 | $ | 2,937,620 | $ | — | $ | — | $ | 5,136,321 | $ | 5,756,080 | $ | 412,102 | $ | 512,127 | ||||||||||||||||
Net realized gain (loss) on investments and foreign currency related transactions | 28,393,403 | 15,135,180 | — | — | 1,717,938 | 1,428,098 | 5,570,305 | 1,090,857 | ||||||||||||||||||||||||
Change in unrealized appreciation/depreciation on investments | 35,131,231 | 9,664,589 | — | — | (9,876,691 | ) | 4,568,299 | 3,438,117 | 2,337,094 | |||||||||||||||||||||||
|
|
|
|
|
|
|
|
|
|
|
|
|
|
|
| |||||||||||||||||
Change in net assets from operations | 65,546,619 | 27,737,389 | — | — | (3,022,432 | ) | 11,752,477 | 9,420,524 | 3,940,078 | |||||||||||||||||||||||
|
|
|
|
|
|
|
|
|
|
|
|
|
|
|
| |||||||||||||||||
Distributions to shareholders: | ||||||||||||||||||||||||||||||||
Distributions from net investment income | (1,826,670 | ) | (2,551,766 | ) | — | — | — | — | (362,024 | ) | (434,512 | ) | ||||||||||||||||||||
|
|
|
|
|
|
|
|
|
|
|
|
|
|
|
| |||||||||||||||||
Capital transactions: | ||||||||||||||||||||||||||||||||
Received from shares sold | 13,409,441 | 12,859,425 | 235,857,734 | 178,859,238 | 41,763,271 | 50,714,394 | 3,461,743 | 2,645,867 | ||||||||||||||||||||||||
Received from dividends reinvested | 1,826,670 | 2,551,766 | — | — | — | — | 362,024 | 434,512 | ||||||||||||||||||||||||
Paid for shares redeemed | (44,049,301 | ) | (41,926,289 | ) | (233,365,275 | ) | (206,441,123 | ) | (59,347,526 | ) | (52,317,398 | ) | (8,198,425 | ) | (8,034,239 | ) | ||||||||||||||||
|
|
|
|
|
|
|
|
|
|
|
|
|
|
|
| |||||||||||||||||
Change in net assets from capital transactions | (28,813,190 | ) | (26,515,098 | ) | 2,492,459 | (27,581,885 | ) | (17,584,255 | ) | (1,603,004 | ) | (4,374,658 | ) | (4,953,860 | ) | |||||||||||||||||
|
|
|
|
|
|
|
|
|
|
|
|
|
|
|
| |||||||||||||||||
Change in net assets | 34,906,759 | (1,329,475 | ) | 2,492,459 | (27,581,885 | ) | (20,606,687 | ) | 10,149,473 | 4,683,842 | (1,448,294 | ) | ||||||||||||||||||||
Net assets: | ||||||||||||||||||||||||||||||||
Beginning of year | 186,527,283 | 187,856,758 | 258,606,212 | 286,188,097 | 172,184,450 | 162,034,977 | 33,204,689 | 34,652,983 | ||||||||||||||||||||||||
|
|
|
|
|
|
|
|
|
|
|
|
|
|
|
| |||||||||||||||||
End of year | $ | 221,434,042 | $ | 186,527,283 | $ | 261,098,671 | $ | 258,606,212 | $ | 151,577,763 | $ | 172,184,450 | $ | 37,888,531 | $ | 33,204,689 | ||||||||||||||||
|
|
|
|
|
|
|
|
|
|
|
|
|
|
|
| |||||||||||||||||
Undistributed net investment income | $ | 195,315 | $ | 367,208 | $ | — | $ | — | $ | 5,136,321 | $ | 5,756,080 | $ | 47,856 | $ | 109,020 | ||||||||||||||||
|
|
|
|
|
|
|
|
|
|
|
|
|
|
|
| |||||||||||||||||
The accompanying notes are an integral part of these financial statements.
| 102 |
| Ohio National Fund, Inc. |
Statements of Changes in Net Assets |
| International Portfolio | Capital Appreciation Portfolio | International Small-Mid Company Portfolio | Aggressive Growth Portfolio | |||||||||||||||||||||||||||||
| Year Ended December 31, 2013 | Year Ended December 31, 2012 | Year Ended December 31, 2013 | Year Ended December 31, 2012 | Year Ended December 31, 2013 | Year Ended December 31, 2012 | Year Ended December 31, 2013 | Year Ended December 31, 2012 | |||||||||||||||||||||||||
Increase (Decrease) in net assets: | ||||||||||||||||||||||||||||||||
Operations: | ||||||||||||||||||||||||||||||||
Net investment income (loss) | $ | 2,794,976 | $ | 2,974,730 | $ | 584,457 | $ | 765,103 | $ | 276,948 | $ | 399,238 | $ | (87,527 | ) | $ | 104,016 | |||||||||||||||
Net realized gain (loss) on investments, futures contracts, foreign currency contracts, and other foreign currency related transactions | 10,205,588 | 9,475,139 | 12,161,877 | 7,244,718 | 7,333,003 | 1,226,014 | 5,281,441 | (286,285 | ) | |||||||||||||||||||||||
Change in unrealized appreciation/depreciation on investments, futures contracts, foreign currency contracts, and other foreign currency related transactions | 7,678,305 | 20,843,432 | 25,016,691 | 10,984,140 | 9,429,824 | 10,919,188 | 4,447,717 | 5,979,480 | ||||||||||||||||||||||||
|
|
|
|
|
|
|
|
|
|
|
|
|
|
|
| |||||||||||||||||
Change in net assets from operations | 20,678,869 | 33,293,301 | 37,763,025 | 18,993,961 | 17,039,775 | 12,544,440 | 9,641,631 | 5,797,211 | ||||||||||||||||||||||||
|
|
|
|
|
|
|
|
|
|
|
|
|
|
|
| |||||||||||||||||
Distributions to shareholders: | ||||||||||||||||||||||||||||||||
Distributions from net investment income | — | — | (545,051 | ) | (681,205 | ) | — | — | — | — | ||||||||||||||||||||||
|
|
|
|
|
|
|
|
|
|
|
|
|
|
|
| |||||||||||||||||
Capital transactions: | ||||||||||||||||||||||||||||||||
Received from shares sold | 24,664,519 | 16,648,592 | 16,336,182 | 11,383,622 | 10,691,131 | 10,692,767 | 8,319,694 | 9,567,587 | ||||||||||||||||||||||||
Received from dividends reinvested | — | — | 545,051 | 681,205 | — | — | — | — | ||||||||||||||||||||||||
Paid for shares redeemed | (36,260,480 | ) | (42,407,744 | ) | (31,759,424 | ) | (29,380,202 | ) | (15,230,589 | ) | (16,239,923 | ) | (11,703,009 | ) | (7,975,462 | ) | ||||||||||||||||
|
|
|
|
|
|
|
|
|
|
|
|
|
|
|
| |||||||||||||||||
Change in net assets from capital transactions | (11,595,961 | ) | (25,759,152 | ) | (14,878,191 | ) | (17,315,375 | ) | (4,539,458 | ) | (5,547,156 | ) | (3,383,315 | ) | 1,592,125 | |||||||||||||||||
|
|
|
|
|
|
|
|
|
|
|
|
|
|
|
| |||||||||||||||||
Change in net assets | 9,082,908 | 7,534,149 | 22,339,783 | 997,381 | 12,500,317 | 6,997,284 | 6,258,316 | 7,389,336 | ||||||||||||||||||||||||
Net assets: | ||||||||||||||||||||||||||||||||
Beginning of year | 180,344,132 | 172,809,983 | 115,667,859 | 114,670,478 | 64,482,591 | 57,485,307 | 33,144,681 | 25,755,345 | ||||||||||||||||||||||||
|
|
|
|
|
|
|
|
|
|
|
|
|
|
|
| |||||||||||||||||
End of year | $ | 189,427,040 | $ | 180,344,132 | $ | 138,007,642 | $ | 115,667,859 | $ | 76,982,908 | $ | 64,482,591 | $ | 39,402,997 | $ | 33,144,681 | ||||||||||||||||
|
|
|
|
|
|
|
|
|
|
|
|
|
|
|
| |||||||||||||||||
Undistributed net investment income (loss) | $ | 3,063,222 | $ | 4,857,652 | $ | 38,483 | $ | 83,350 | $ | 196,447 | $ | 324,350 | $ | — | $ | 103,178 | ||||||||||||||||
|
|
|
|
|
|
|
|
|
|
|
|
|
|
|
| |||||||||||||||||
The accompanying notes are an integral part of these financial statements.
| 103 |
| Ohio National Fund, Inc. |
Statements of Changes in Net Assets |
| Small Cap Growth Portfolio | Mid Cap Opportunity Portfolio | S&P 500® Index Portfolio | Strategic Value Portfolio | |||||||||||||||||||||||||||||
| Year Ended December 31, 2013 | Year Ended December 31, 2012 | Year Ended December 31, 2013 | Year Ended December 31, 2012 | Year Ended December 31, 2013 | Year Ended December 31, 2012 | Year Ended December 31, 2013 | Year Ended December 31, 2012 | |||||||||||||||||||||||||
Increase (Decrease) in net assets: | ||||||||||||||||||||||||||||||||
Operations: | ||||||||||||||||||||||||||||||||
Net investment income (loss) | $ | (145,662 | ) | $ | (69,166 | ) | $ | (209,597 | ) | $ | (57,981 | ) | $ | 4,258,395 | $ | 3,608,504 | $ | 11,138,381 | $ | 5,810,288 | ||||||||||||
Net realized gain (loss) on investments and foreign currency related transactions | 15,028,435 | 5,846,202 | 8,674,199 | 4,035,775 | 3,688,356 | 1,892,406 | 9,876,449 | 1,644,996 | ||||||||||||||||||||||||
Change in unrealized appreciation/depreciation on investments and foreign currency related transactions | 4,058,946 | (231,728 | ) | 12,646,891 | 7,639,334 | 61,348,239 | 21,351,067 | 39,073,192 | (2,810,944 | ) | ||||||||||||||||||||||
|
|
|
|
|
|
|
|
|
|
|
|
|
|
|
| |||||||||||||||||
Change in net assets from operations | 18,941,719 | 5,545,308 | 21,111,493 | 11,617,128 | 69,294,990 | 26,851,977 | 60,088,022 | 4,644,340 | ||||||||||||||||||||||||
|
|
|
|
|
|
|
|
|
|
|
|
|
|
|
| |||||||||||||||||
Distributions to shareholders: | ||||||||||||||||||||||||||||||||
Distributions from net investment income | — | — | — | — | (3,617,496 | ) | (2,826,655 | ) | (9,524,108 | ) | (3,918,367 | ) | ||||||||||||||||||||
|
|
|
|
|
|
|
|
|
|
|
|
|
|
|
| |||||||||||||||||
Capital transactions: | ||||||||||||||||||||||||||||||||
Received from shares sold | 31,291,065 | 9,304,509 | 15,330,951 | 11,126,601 | 97,436,649 | 54,598,878 | 131,585,498 | 257,036,279 | ||||||||||||||||||||||||
Received from shares issued in merger | 40,746,730 | — | — | — | — | — | — | — | ||||||||||||||||||||||||
Received from dividends reinvested | — | — | — | — | 3,617,496 | 2,826,655 | 9,524,108 | 3,918,367 | ||||||||||||||||||||||||
Paid for shares redeemed | (16,426,684 | ) | (11,364,585 | ) | (20,492,091 | ) | (16,745,113 | ) | (59,579,130 | ) | (44,349,542 | ) | (62,172,415 | ) | (35,500,770 | ) | ||||||||||||||||
|
|
|
|
|
|
|
|
|
|
|
|
|
|
|
| |||||||||||||||||
Change in net assets from capital transactions | 55,611,111 | (2,060,076 | ) | (5,161,140 | ) | (5,618,512 | ) | 41,475,015 | 13,075,991 | 78,937,191 | 225,453,876 | |||||||||||||||||||||
|
|
|
|
|
|
|
|
|
|
|
|
|
|
|
| |||||||||||||||||
Change in net assets | 74,552,830 | 3,485,232 | 15,950,353 | 5,998,616 | 107,152,509 | 37,101,313 | 129,501,105 | 226,179,849 | ||||||||||||||||||||||||
Net assets: | ||||||||||||||||||||||||||||||||
Beginning of year | 34,983,979 | 31,498,747 | 67,061,606 | 61,062,990 | 207,780,520 | 170,679,207 | 268,163,710 | 41,983,861 | ||||||||||||||||||||||||
|
|
|
|
|
|
|
|
|
|
|
|
|
|
|
| |||||||||||||||||
End of year | $ | 109,536,809 | $ | 34,983,979 | $ | 83,011,959 | $ | 67,061,606 | $ | 314,933,029 | $ | 207,780,520 | $ | 397,664,815 | $ | 268,163,710 | ||||||||||||||||
|
|
|
|
|
|
|
|
|
|
|
|
|
|
|
| |||||||||||||||||
Undistributed net investment income (loss) | $ | (17,130 | ) | $ | — | $ | — | $ | — | $ | 597,879 | $ | 744,172 | $ | 1,568,491 | $ | 2,248,868 | |||||||||||||||
|
|
|
|
|
|
|
|
|
|
|
|
|
|
|
| |||||||||||||||||
The accompanying notes are an integral part of these financial statements.
| 104 |
| Ohio National Fund, Inc. |
Statements of Changes in Net Assets |
| High Income Bond Portfolio | Capital Growth Portfolio | Nasdaq-100® Index Portfolio | Bristol Portfolio | |||||||||||||||||||||||||||||
| Year Ended December 31, 2013 | Year Ended December 31, 2012 | Year Ended December 31, 2013 | Year Ended December 31, 2012 | Year Ended December 31, 2013 | Year Ended December 31, 2012 | Year Ended December 31, 2013 | Year Ended December 31, 2012 | |||||||||||||||||||||||||
Increase (Decrease) in net assets: | ||||||||||||||||||||||||||||||||
Operations: | ||||||||||||||||||||||||||||||||
Net investment income (loss) | $ | 19,562,894 | $ | 21,277,132 | $ | (298,131 | ) | $ | (53,366 | ) | $ | 724,509 | $ | 644,168 | $ | 1,141,144 | $ | 1,353,479 | ||||||||||||||
Net realized gain (loss) on investments and foreign currency related transactions | 3,478,257 | 4,698,612 | 5,469,110 | 3,854,057 | 5,521,100 | 513,180 | 48,232,798 | 8,239,659 | ||||||||||||||||||||||||
Change in unrealized appreciation/depreciation on investments and foreign currency related transactions | (1,974,076 | ) | 13,264,229 | 12,232,870 | 3,014,667 | 18,052,218 | 8,702,070 | 27,351,718 | 16,070,240 | |||||||||||||||||||||||
|
|
|
|
|
|
|
|
|
|
|
|
|
|
|
| |||||||||||||||||
Change in net assets from operations | 21,067,075 | 39,239,973 | 17,403,849 | 6,815,358 | 24,297,827 | 9,859,418 | 76,725,660 | 25,663,378 | ||||||||||||||||||||||||
|
|
|
|
|
|
|
|
|
|
|
|
|
|
|
| |||||||||||||||||
Distributions to shareholders: | ||||||||||||||||||||||||||||||||
Distributions from net investment income | — | — | — | — | (631,494 | ) | (447,911 | ) | (1,050,451 | ) | (1,149,626 | ) | ||||||||||||||||||||
|
|
|
|
|
|
|
|
|
|
|
|
|
|
|
| |||||||||||||||||
Capital transactions: | ||||||||||||||||||||||||||||||||
Received from shares sold | 54,569,050 | 84,212,118 | 24,739,894 | 12,566,131 | 35,003,296 | 26,139,975 | 14,986,415 | 33,161,237 | ||||||||||||||||||||||||
Received from dividends reinvested | — | — | — | — | 631,494 | 447,911 | 1,050,451 | 1,149,626 | ||||||||||||||||||||||||
Paid for shares redeemed | (79,666,219 | ) | (78,999,032 | ) | (16,826,118 | ) | (15,372,139 | ) | (31,995,740 | ) | (22,928,127 | ) | (65,074,351 | ) | (46,593,004 | ) | ||||||||||||||||
|
|
|
|
|
|
|
|
|
|
|
|
|
|
|
| |||||||||||||||||
Change in net assets from capital transactions | (25,097,169 | ) | 5,213,086 | 7,913,776 | (2,806,008 | ) | 3,639,050 | 3,659,759 | (49,037,485 | ) | (12,282,141 | ) | ||||||||||||||||||||
|
|
|
|
|
|
|
|
|
|
|
|
|
|
|
| |||||||||||||||||
Change in net assets | (4,030,094 | ) | 44,453,059 | 25,317,625 | 4,009,350 | 27,305,383 | 13,071,266 | 26,637,724 | 12,231,611 | |||||||||||||||||||||||
Net assets: | ||||||||||||||||||||||||||||||||
Beginning of year | 311,914,937 | 267,461,878 | 55,114,735 | 51,105,385 | 68,542,203 | 55,470,937 | 204,903,746 | 192,672,135 | ||||||||||||||||||||||||
|
|
|
|
|
|
|
|
|
|
|
|
|
|
|
| |||||||||||||||||
End of year | $ | 307,884,843 | $ | 311,914,937 | $ | 80,432,360 | $ | 55,114,735 | $ | 95,847,586 | $ | 68,542,203 | $ | 231,541,470 | $ | 204,903,746 | ||||||||||||||||
|
|
|
|
|
|
|
|
|
|
|
|
|
|
|
| |||||||||||||||||
Undistributed net investment income (loss) | $ | 19,562,894 | $ | 21,277,132 | $ | — | $ | — | $ | 93,015 | $ | 196,220 | $ | 89,796 | $ | 436,010 | ||||||||||||||||
|
|
|
|
|
|
|
|
|
|
|
|
|
|
|
| |||||||||||||||||
The accompanying notes are an integral part of these financial statements.
| 105 |
| Ohio National Fund, Inc. |
Statements of Changes in Net Assets |
| Bryton Growth Portfolio | Balanced Portfolio | Target VIP Portfolio | Bristol Growth Portfolio | |||||||||||||||||||||||||||||
| Year Ended December 31, 2013 | Year Ended December 31, 2012 | Year Ended December 31, 2013 | Year Ended December 31, 2012 | Year Ended December 31, 2013 | Year Ended December 31, 2012 | Year Ended December 31, 2013 | Year Ended December 31, 2012 | |||||||||||||||||||||||||
Increase (Decrease) in net assets: | ||||||||||||||||||||||||||||||||
Operations: | ||||||||||||||||||||||||||||||||
Net investment income (loss) | $ | (1,016,119 | ) | $ | (887,077 | ) | $ | 1,977,473 | $ | 651,931 | $ | 227,047 | $ | 377,630 | $ | 497,544 | $ | 594,594 | ||||||||||||||
Net realized gain (loss) on investments, foreign currency related transactions, and written options | 38,865,947 | 12,311,997 | 6,575,219 | 358,264 | 6,638,289 | 632,490 | 23,724,595 | 6,499,048 | ||||||||||||||||||||||||
Change in unrealized appreciation/depreciation on investments, foreign currency related transactions, and written options | 20,607,365 | 5,904,468 | 8,941,600 | 2,012,821 | 1,076,715 | 2,048,046 | 14,073,672 | 4,359,363 | ||||||||||||||||||||||||
|
|
|
|
|
|
|
|
|
|
|
|
|
|
|
| |||||||||||||||||
Change in net assets from operations | 58,457,193 | 17,329,388 | 17,494,292 | 3,023,016 | 7,942,051 | 3,058,166 | 38,295,811 | 11,453,005 | ||||||||||||||||||||||||
|
|
|
|
|
|
|
|
|
|
|
|
|
|
|
| |||||||||||||||||
Distributions to shareholders: | ||||||||||||||||||||||||||||||||
Distributions from net investment income | — | — | (1,674,034 | ) | — | (201,405 | ) | (297,777 | ) | (476,090 | ) | (473,865 | ) | |||||||||||||||||||
|
|
|
|
|
|
|
|
|
|
|
|
|
|
|
| |||||||||||||||||
Capital transactions: | ||||||||||||||||||||||||||||||||
Received from shares sold | 14,529,378 | 33,597,917 | 149,308,124 | 64,188,382 | 2,641,232 | 2,834,544 | 9,727,458 | 21,509,893 | ||||||||||||||||||||||||
Received from shares issued in mergers | — | — | 30,903,821 | — | 26,663,158 | — | — | — | ||||||||||||||||||||||||
Received from dividends reinvested | — | — | 1,674,034 | — | 201,405 | 297,777 | 476,090 | 473,865 | ||||||||||||||||||||||||
Paid for shares redeemed | (49,864,240 | ) | (48,711,366 | ) | (25,782,822 | ) | (7,131,199 | ) | (4,710,713 | ) | (5,246,749 | ) | (33,794,446 | ) | (24,843,136 | ) | ||||||||||||||||
|
|
|
|
|
|
|
|
|
|
|
|
|
|
|
| |||||||||||||||||
Change in net assets from capital transactions | (35,334,862 | ) | (15,113,449 | ) | 156,103,157 | 57,057,183 | 24,795,082 | (2,114,428 | ) | (23,590,898 | ) | (2,859,378 | ) | |||||||||||||||||||
|
|
|
|
|
|
|
|
|
|
|
|
|
|
|
| |||||||||||||||||
Change in net assets | 23,122,331 | 2,215,939 | 171,923,415 | 60,080,199 | 32,535,728 | 645,961 | 14,228,823 | 8,119,762 | ||||||||||||||||||||||||
Net assets: | ||||||||||||||||||||||||||||||||
Beginning of year | 157,656,524 | 155,440,585 | 77,136,927 | 17,056,728 | 21,182,342 | 20,536,381 | 108,033,139 | 99,913,377 | ||||||||||||||||||||||||
|
|
|
|
|
|
|
|
|
|
|
|
|
|
|
| |||||||||||||||||
End of year | $ | 180,778,855 | $ | 157,656,524 | $ | 249,060,342 | $ | 77,136,927 | $ | 53,718,070 | $ | 21,182,342 | $ | 122,261,962 | $ | 108,033,139 | ||||||||||||||||
|
|
|
|
|
|
|
|
|
|
|
|
|
|
|
| |||||||||||||||||
Undistributed net investment income (loss) | $ | — | $ | (9,839 | ) | $ | 285,060 | $ | 651,938 | $ | 25,680 | $ | 79,804 | $ | 21,733 | $ | 221,599 | |||||||||||||||
|
|
|
|
|
|
|
|
|
|
|
|
|
|
|
| |||||||||||||||||
The accompanying notes are an integral part of these financial statements.
| 106 |
| Ohio National Fund, Inc. |
| Equity Portfolio | Money Market Portfolio | |||||||||||||||||||||||||||||||||||||||
| Years Ended December 31, | Years Ended December 31, | |||||||||||||||||||||||||||||||||||||||
| 2013 | 2012 | 2011 | 2010 | 2009 | 2013 | 2012 | 2011 | 2010 | 2009 | |||||||||||||||||||||||||||||||
Selected per-share data: | ||||||||||||||||||||||||||||||||||||||||
Net asset value, beginning of year | $ | 21.54 | $ | 18.88 | $ | 19.72 | $ | 18.31 | $ | 13.19 | $ | 10.00 | $ | 10.00 | $ | 10.00 | $ | 10.00 | $ | 10.00 | ||||||||||||||||||||
Operations: | ||||||||||||||||||||||||||||||||||||||||
Net investment income | 0.27 | 0.35 | 0.21 | 0.04 | 0.05 | — | — | — | — | — | ||||||||||||||||||||||||||||||
Net realized and unrealized gain (loss) on investments and | 7.84 | 2.61 | (0.88 | ) | 1.41 | 5.11 | — | — | — | — | — | |||||||||||||||||||||||||||||
|
|
|
|
|
|
|
|
|
|
|
|
|
|
|
|
|
|
|
| |||||||||||||||||||||
Total from operations | 8.11 | 2.96 | (0.67 | ) | 1.45 | 5.16 | — | — | — | — | — | |||||||||||||||||||||||||||||
|
|
|
|
|
|
|
|
|
|
|
|
|
|
|
|
|
|
|
| |||||||||||||||||||||
Distributions: | ||||||||||||||||||||||||||||||||||||||||
Distributions from net investment income | (0.24 | ) | (0.30 | ) | (0.17 | ) | (0.04 | ) | (0.04 | ) | — | — | — | — | — | |||||||||||||||||||||||||
|
|
|
|
|
|
|
|
|
|
|
|
|
|
|
|
|
|
|
| |||||||||||||||||||||
Net asset value, end of year | $ | 29.41 | $ | 21.54 | $ | 18.88 | $ | 19.72 | $ | 18.31 | $ | 10.00 | $ | 10.00 | $ | 10.00 | $ | 10.00 | $ | 10.00 | ||||||||||||||||||||
|
|
|
|
|
|
|
|
|
|
|
|
|
|
|
|
|
|
|
| |||||||||||||||||||||
Total return | 37.69 | % | 15.69 | % | –3.38 | % | 7.91 | % | 39.11 | % | 0.00 | % | 0.00 | % | 0.00 | % | 0.00 | % | 0.00 | % | ||||||||||||||||||||
Ratios and supplemental data: | ||||||||||||||||||||||||||||||||||||||||
Net assets at end of year (in millions) | $ | 221.4 | $ | 186.5 | $ | 187.9 | $ | 219.4 | $ | 226.5 | $ | 261.1 | $ | 258.6 | $ | 286.2 | $ | 293.4 | $ | 341.2 | ||||||||||||||||||||
Ratios to average net assets: | ||||||||||||||||||||||||||||||||||||||||
Ratios net of expenses reduced or reimbursed by adviser: | ||||||||||||||||||||||||||||||||||||||||
Expenses | 0.87 | % | 0.89 | % | 0.87 | % | 0.87 | % | 0.88 | % | 0.06 | % | 0.09 | % | 0.11 | % | 0.17 | % | 0.19 | % | ||||||||||||||||||||
Net investment income | 0.98 | % | 1.55 | % | 1.00 | % | 0.21 | % | 0.27 | % | 0.00 | % | 0.00 | % | 0.00 | % | 0.00 | % | 0.00 | % | ||||||||||||||||||||
Ratios assuming no expenses reduced or reimbursed by adviser: | ||||||||||||||||||||||||||||||||||||||||
Expenses | 0.87 | % | 0.89 | % | 0.87 | % | 0.87 | % | 0.88 | % | 0.34 | % | 0.35 | % | 0.34 | % | 0.35 | % | 0.36 | % | ||||||||||||||||||||
Net investment income (loss) | 0.98 | % | 1.55 | % | 1.00 | % | 0.21 | % | 0.27 | % | –0.28 | % | –0.26 | % | –0.23 | % | –0.18 | % | –0.17 | % | ||||||||||||||||||||
Portfolio turnover rate | 43 | % | 48 | % | 54 | % | 50 | % | 24 | % | 0 | % | 0 | % | 0 | % | 0 | % | 0 | % | ||||||||||||||||||||
The accompanying notes are an integral part of these financial statements.
| 107 |
| Ohio National Fund, Inc. |
Financial Highlights |
| Bond Portfolio | Omni Portfolio | |||||||||||||||||||||||||||||||||||||||
| Years Ended December 31, | Years Ended December 31, | |||||||||||||||||||||||||||||||||||||||
| 2013 | 2012 | 2011 | 2010 | 2009 | 2013 | 2012 | 2011 | 2010 | 2009 | |||||||||||||||||||||||||||||||
Selected per-share data: | ||||||||||||||||||||||||||||||||||||||||
Net asset value, beginning of year | $ | 15.07 | $ | 14.05 | $ | 13.21 | $ | 12.25 | $ | 10.13 | $ | 16.82 | $ | 15.21 | $ | 16.08 | $ | 14.42 | $ | 11.02 | ||||||||||||||||||||
Operations: | ||||||||||||||||||||||||||||||||||||||||
Net investment income | 0.56 | 0.51 | 0.48 | 0.52 | 0.49 | 0.24 | 0.26 | 0.25 | 0.28 | 0.29 | ||||||||||||||||||||||||||||||
Net realized and unrealized gain (loss) on investments and | (0.85 | ) | 0.51 | 0.36 | 0.44 | 1.63 | 4.89 | 1.57 | (0.91 | ) | 1.62 | 3.36 | ||||||||||||||||||||||||||||
|
|
|
|
|
|
|
|
|
|
|
|
|
|
|
|
|
|
|
| |||||||||||||||||||||
Total from operations | (0.29 | ) | 1.02 | 0.84 | 0.96 | 2.12 | 5.13 | 1.83 | (0.66 | ) | 1.90 | 3.65 | ||||||||||||||||||||||||||||
|
|
|
|
|
|
|
|
|
|
|
|
|
|
|
|
|
|
|
| |||||||||||||||||||||
Distributions: | ||||||||||||||||||||||||||||||||||||||||
Distributions from net investment income | — | — | — | — | — | (0.21 | ) | (0.22 | ) | (0.21 | ) | (0.24 | ) | (0.25 | ) | |||||||||||||||||||||||||
|
|
|
|
|
|
|
|
|
|
|
|
|
|
|
|
|
|
|
| |||||||||||||||||||||
Net asset value, end of year | $ | 14.78 | $ | 15.07 | $ | 14.05 | $ | 13.21 | $ | 12.25 | $ | 21.74 | $ | 16.82 | $ | 15.21 | $ | 16.08 | $ | 14.42 | ||||||||||||||||||||
|
|
|
|
|
|
|
|
|
|
|
|
|
|
|
|
|
|
|
| |||||||||||||||||||||
Total return | –1.92 | % | 7.26 | % | 6.36 | % | 7.84 | % | 20.93 | % | 30.53 | % | 12.04 | % | –4.12 | % | 13.19 | % | 33.15 | % | ||||||||||||||||||||
Ratios and supplemental data: | ||||||||||||||||||||||||||||||||||||||||
Net assets at end of year (in millions) | $ | 151.6 | $ | 172.2 | $ | 162.0 | $ | 148.2 | $ | 137.9 | $ | 37.9 | $ | 33.2 | $ | 34.7 | $ | 41.2 | $ | 41.5 | ||||||||||||||||||||
Ratios to average net assets: | ||||||||||||||||||||||||||||||||||||||||
Expenses | 0.66 | % | 0.66 | % | 0.66 | % | 0.67 | % | 0.69 | % | 0.79 | % | 0.81 | % | 0.77 | % | 0.78 | % | 0.79 | % | ||||||||||||||||||||
Net investment income | 3.34 | % | 3.41 | % | 3.70 | % | 3.91 | % | 5.06 | % | 1.17 | % | 1.49 | % | 1.40 | % | 1.71 | % | 2.18 | % | ||||||||||||||||||||
Portfolio turnover rate | 15 | % | 18 | % | 15 | % | 22 | % | 27 | % | 210 | % | 179 | % | 147 | % | 182 | % | 157 | % | ||||||||||||||||||||
The accompanying notes are an integral part of these financial statements.
| 108 |
| Ohio National Fund, Inc. |
Financial Highlights |
| International Portfolio | Capital Appreciation Portfolio | |||||||||||||||||||||||||||||||||||||||
| Years Ended December 31, | Years Ended December 31, | |||||||||||||||||||||||||||||||||||||||
| 2013 | 2012 | 2011 | 2010 | 2009 | 2013 | 2012 | 2011 | 2010 | 2009 | |||||||||||||||||||||||||||||||
Selected per-share data: | ||||||||||||||||||||||||||||||||||||||||
Net asset value, beginning of year | $ | 12.41 | $ | 10.32 | $ | 12.20 | $ | 10.45 | $ | 7.56 | $ | 23.32 | $ | 19.95 | $ | 20.37 | $ | 17.45 | $ | 12.35 | ||||||||||||||||||||
Operations: | ||||||||||||||||||||||||||||||||||||||||
Net investment income | 0.23 | 0.20 | 0.17 | 0.14 | 0.14 | 0.13 | 0.15 | 0.09 | 0.06 | 0.22 | ||||||||||||||||||||||||||||||
Net realized and unrealized gain (loss) on investments, futures contracts, foreign currency contracts, and other foreign currency related transactions | 1.21 | 1.89 | (2.05 | ) | 1.61 | 2.75 | 7.91 | 3.36 | (0.43 | ) | 2.90 | 5.07 | ||||||||||||||||||||||||||||
|
|
|
|
|
|
|
|
|
|
|
|
|
|
|
|
|
|
|
| |||||||||||||||||||||
Total from operations | 1.44 | 2.09 | (1.88 | ) | 1.75 | 2.89 | 8.04 | 3.51 | (0.34 | ) | 2.96 | 5.29 | ||||||||||||||||||||||||||||
|
|
|
|
|
|
|
|
|
|
|
|
|
|
|
|
|
|
|
| |||||||||||||||||||||
Distributions: | ||||||||||||||||||||||||||||||||||||||||
Distributions from net investment income | — | — | — | — | — | (0.12 | ) | (0.14 | ) | (0.08 | ) | (0.04 | ) | (0.19 | ) | |||||||||||||||||||||||||
|
|
|
|
|
|
|
|
|
|
|
|
|
|
|
|
|
|
|
| |||||||||||||||||||||
Net asset value, end of year | $ | 13.85 | $ | 12.41 | $ | 10.32 | $ | 12.20 | $ | 10.45 | $ | 31.24 | $ | 23.32 | $ | 19.95 | $ | 20.37 | $ | 17.45 | ||||||||||||||||||||
|
|
|
|
|
|
|
|
|
|
|
|
|
|
|
|
|
|
|
| |||||||||||||||||||||
Total return | 11.60 | % | 20.25 | % | –15.41 | % | 16.75 | % | 38.23 | % | 34.51 | % | 17.59 | % | –1.65 | % | 16.99 | % | 42.84 | % | ||||||||||||||||||||
Ratios and supplemental data: | ||||||||||||||||||||||||||||||||||||||||
Net assets at end of year (in millions) | $ | 189.4 | $ | 180.3 | $ | 172.8 | $ | 213.1 | $ | 210.0 | $ | 138.0 | $ | 115.7 | $ | 114.7 | $ | 129.8 | $ | 126.3 | ||||||||||||||||||||
Ratios to average net assets: | ||||||||||||||||||||||||||||||||||||||||
Ratios net of expenses reduced or reimbursed by adviser: | ||||||||||||||||||||||||||||||||||||||||
Expenses | 0.75 | % | 1.02 | % | 1.02 | % | 1.03 | % | 1.07 | % | 0.88 | % | 0.90 | % | 0.88 | % | 0.89 | % | 0.90 | % | ||||||||||||||||||||
Net investment income | 1.52 | % | 1.65 | % | 1.41 | % | 1.15 | % | 1.47 | % | 0.45 | % | 0.66 | % | 0.41 | % | 0.31 | % | 1.38 | % | ||||||||||||||||||||
Ratios assuming no expenses reduced or reimbursed by adviser: | ||||||||||||||||||||||||||||||||||||||||
Expenses | 1.01 | % | 1.02 | % | 1.02 | % | 1.03 | % | 1.07 | % | 0.88 | % | 0.90 | % | 0.88 | % | 0.89 | % | 0.90 | % | ||||||||||||||||||||
Net investment income | 1.26 | % | 1.65 | % | 1.41 | % | 1.15 | % | 1.47 | % | 0.45 | % | 0.66 | % | 0.41 | % | 0.31 | % | 1.38 | % | ||||||||||||||||||||
Portfolio turnover rate | 53 | % | 61 | % | 58 | % | 67 | % | 168 | % | 49 | % | 39 | % | 61 | % | 58 | % | 84 | % | ||||||||||||||||||||
The accompanying notes are an integral part of these financial statements.
| 109 |
| Ohio National Fund, Inc. |
Financial Highlights |
| International Small-Mid Company Portfolio | Aggressive Growth Portfolio | |||||||||||||||||||||||||||||||||||||||
| Years Ended December 31, | Years Ended December 31, | |||||||||||||||||||||||||||||||||||||||
| 2013 | 2012 | 2011 | 2010 | 2009 | 2013 | 2012 | 2011 | 2010 | 2009 | |||||||||||||||||||||||||||||||
Selected per-share data: | ||||||||||||||||||||||||||||||||||||||||
Net asset value, beginning of year | $ | 23.52 | $ | 19.17 | $ | 23.24 | $ | 19.41 | $ | 13.29 | $ | 9.51 | $ | 7.74 | $ | 8.17 | $ | 7.43 | $ | 5.21 | ||||||||||||||||||||
Operations: | ||||||||||||||||||||||||||||||||||||||||
Net investment income (loss) | 0.12 | 0.17 | 0.26 | 0.07 | 0.07 | (0.02 | ) | 0.03 | — | 0.01 | (0.02 | ) | ||||||||||||||||||||||||||||
Net realized and unrealized gain (loss) on investments and | 6.39 | 4.18 | (4.33 | ) | 3.76 | 6.05 | 3.01 | 1.74 | (0.43 | ) | 0.73 | 2.24 | ||||||||||||||||||||||||||||
|
|
|
|
|
|
|
|
|
|
|
|
|
|
|
|
|
|
|
| |||||||||||||||||||||
Total from operations | 6.51 | 4.35 | (4.07 | ) | 3.83 | 6.12 | 2.99 | 1.77 | (0.43 | ) | 0.74 | 2.22 | ||||||||||||||||||||||||||||
|
|
|
|
|
|
|
|
|
|
|
|
|
|
|
|
|
|
|
| |||||||||||||||||||||
Net asset value, end of year | $ | 30.03 | $ | 23.52 | $ | 19.17 | $ | 23.24 | $ | 19.41 | $ | 12.50 | $ | 9.51 | $ | 7.74 | $ | 8.17 | $ | 7.43 | ||||||||||||||||||||
|
|
|
|
|
|
|
|
|
|
|
|
|
|
|
|
|
|
|
| |||||||||||||||||||||
Total return | 27.68 | % | 22.69 | % | –17.51 | % | 19.73 | % | 46.05 | % | 31.44 | % | 22.87 | % | –5.26 | % | 9.96 | % | 42.61 | % | ||||||||||||||||||||
Ratios and supplemental data: | ||||||||||||||||||||||||||||||||||||||||
Net assets at end of year (in millions) | $ | 77.0 | $ | 64.5 | $ | 57.5 | $ | 78.6 | $ | 71.1 | $ | 39.4 | $ | 33.1 | $ | 25.8 | $ | 29.8 | $ | 27.2 | ||||||||||||||||||||
Ratios to average net assets: | ||||||||||||||||||||||||||||||||||||||||
Expenses | 1.19 | % | 1.21 | % | 1.20 | % | 1.25 | % | 1.28 | % | 0.97 | % | 0.99 | % | 1.04 | % | 1.05 | % | 1.04 | % | ||||||||||||||||||||
Net investment income (loss) | 0.40 | % | 0.64 | % | 1.07 | % | 0.32 | % | 0.47 | % | –0.25 | % | 0.34 | % | 0.02 | % | 0.17 | % | –0.23 | % | ||||||||||||||||||||
Portfolio turnover rate | 51 | % | 55 | % | 67 | % | 81 | % | 125 | % | 60 | % | 17 | % | 47 | % | 37 | % | 28 | % | ||||||||||||||||||||
The accompanying notes are an integral part of these financial statements.
| 110 |
| Ohio National Fund, Inc. |
Financial Highlights |
| Small Cap Growth Portfolio | Mid Cap Opportunity Portfolio | |||||||||||||||||||||||||||||||||||||||
| Years Ended December 31, | Years Ended December 31, | |||||||||||||||||||||||||||||||||||||||
| 2013 | 2012 | 2011 | 2010 | 2009 | 2013 | 2012 | 2011 | 2010 | 2009 | |||||||||||||||||||||||||||||||
Selected per-share data: | ||||||||||||||||||||||||||||||||||||||||
Net asset value, beginning of year | $ | 15.59 | $ | 13.21 | $ | 12.86 | $ | 9.89 | $ | 6.56 | $ | 21.32 | $ | 17.81 | $ | 18.43 | $ | 15.41 | $ | 10.96 | ||||||||||||||||||||
Operations: | ||||||||||||||||||||||||||||||||||||||||
Net investment income (loss) | (0.03 | ) | (0.03 | ) | (0.08 | ) | (0.07 | ) | (0.06 | ) | (0.07 | ) | (0.02 | ) | (0.06 | ) | (0.06 | ) | (0.05 | ) | ||||||||||||||||||||
Net realized and unrealized gain (loss) on investments and | 7.09 | 2.41 | 0.43 | 3.04 | 3.39 | 6.99 | 3.53 | (0.56 | ) | 3.08 | 4.50 | |||||||||||||||||||||||||||||
|
|
|
|
|
|
|
|
|
|
|
|
|
|
|
|
|
|
|
| |||||||||||||||||||||
Total from operations | 7.06 | 2.38 | 0.35 | 2.97 | 3.33 | 6.92 | 3.51 | (0.62 | ) | 3.02 | 4.45 | |||||||||||||||||||||||||||||
|
|
|
|
|
|
|
|
|
|
|
|
|
|
|
|
|
|
|
| |||||||||||||||||||||
Distributions: | ||||||||||||||||||||||||||||||||||||||||
Distributions from net investment income | — | — | — | — | — | — | — | — | — | — | ||||||||||||||||||||||||||||||
|
|
|
|
|
|
|
|
|
|
|
|
|
|
|
|
|
|
|
| |||||||||||||||||||||
Net asset value, end of year | $ | 22.65 | $ | 15.59 | $ | 13.21 | $ | 12.86 | $ | 9.89 | $ | 28.24 | $ | 21.32 | $ | 17.81 | $ | 18.43 | $ | 15.41 | ||||||||||||||||||||
|
|
|
|
|
|
|
|
|
|
|
|
|
|
|
|
|
|
|
| |||||||||||||||||||||
Total return | 45.29 | % | 18.02 | % | 2.72 | % | 30.03 | % | 50.76 | % | 32.46 | % | 19.71 | % | –3.36 | % | 19.60 | % | 40.60 | % | ||||||||||||||||||||
Ratios and supplemental data: | ||||||||||||||||||||||||||||||||||||||||
Net assets at end of year (in millions) | $ | 109.5 | $ | 35.0 | $ | 31.5 | $ | 32.1 | $ | 22.8 | $ | 83.0 | $ | 67.1 | $ | 61.1 | $ | 70.4 | $ | 63.5 | ||||||||||||||||||||
Ratios to average net assets: | ||||||||||||||||||||||||||||||||||||||||
Expenses | 1.04 | % | 1.10 | % | 1.08 | % | 1.13 | % | 1.21 | % | 0.96 | % | 0.98 | % | 0.96 | % | 0.98 | % | 0.97 | % | ||||||||||||||||||||
Net investment income (loss) | –0.29 | % | –0.20 | % | –0.60 | % | –0.70 | % | –0.77 | % | –0.28 | % | –0.09 | % | –0.29 | % | –0.35 | % | –0.27 | % | ||||||||||||||||||||
Portfolio turnover rate | 69 | % (a) | 65 | % | 58 | % | 94 | % | 50 | % | 44 | % | 45 | % | 51 | % | 56 | % | 276 | % | ||||||||||||||||||||
| (a) | The cost of purchases and proceeds from sales of securities that were incurred to realign the Portfolio’s holdings subsequent to the December 20, 2013 reorganization are excluded from the portfolio turnover rate calculation. See Note 8 of the Notes to Financial Statements for further information regarding this reorganization. If such amounts had not been excluded, the portfolio turnover rate would have been 146%. |
The accompanying notes are an integral part of these financial statements.
| 111 |
| Ohio National Fund, Inc. |
Financial Highlights |
| S&P 500® Index Portfolio | Strategic Value Portfolio | |||||||||||||||||||||||||||||||||||||||
| Years Ended December 31, | Years Ended December 31, | |||||||||||||||||||||||||||||||||||||||
| 2013 | 2012 | 2011 | 2010 | 2009 | 2013 | 2012 | 2011 | 2010 | 2009 | |||||||||||||||||||||||||||||||
Selected per-share data: | ||||||||||||||||||||||||||||||||||||||||
Net asset value, beginning of year | $ | 15.08 | $ | 13.25 | $ | 13.21 | $ | 11.69 | $ | 9.41 | $ | 11.09 | $ | 10.50 | $ | 9.36 | $ | 8.64 | $ | 7.97 | ||||||||||||||||||||
Operations: | ||||||||||||||||||||||||||||||||||||||||
Net investment income | 0.26 | 0.26 | 0.22 | 0.19 | 0.17 | 0.35 | 0.13 | 0.33 | 0.35 | 0.27 | ||||||||||||||||||||||||||||||
Net realized and unrealized gain (loss) on investments and | 4.52 | 1.78 | 0.01 | 1.50 | 2.26 | 1.97 | 0.63 | 0.98 | 0.68 | 0.65 | ||||||||||||||||||||||||||||||
|
|
|
|
|
|
|
|
|
|
|
|
|
|
|
|
|
|
|
| |||||||||||||||||||||
Total from operations | 4.78 | 2.04 | 0.23 | 1.69 | 2.43 | 2.32 | 0.76 | 1.31 | 1.03 | 0.92 | ||||||||||||||||||||||||||||||
|
|
|
|
|
|
|
|
|
|
|
|
|
|
|
|
|
|
|
| |||||||||||||||||||||
Distributions: | ||||||||||||||||||||||||||||||||||||||||
Distributions from net investment income | (0.23 | ) | (0.21 | ) | (0.19 | ) | (0.17 | ) | (0.15 | ) | (0.32 | ) | (0.17 | ) | (0.17 | ) | (0.24 | ) | (0.25 | ) | ||||||||||||||||||||
Return of capital distributions | — | — | — | — | — | — | — | — | (0.07 | ) | — | |||||||||||||||||||||||||||||
|
|
|
|
|
|
|
|
|
|
|
|
|
|
|
|
|
|
|
| |||||||||||||||||||||
Total distributions | (0.23 | ) | (0.21 | ) | (0.19 | ) | (0.17 | ) | (0.15 | ) | (0.32 | ) | (0.17 | ) | (0.17 | ) | (0.31 | ) | (0.25 | ) | ||||||||||||||||||||
|
|
|
|
|
|
|
|
|
|
|
|
|
|
|
|
|
|
|
| |||||||||||||||||||||
Net asset value, end of year | $ | 19.63 | $ | 15.08 | $ | 13.25 | $ | 13.21 | $ | 11.69 | $ | 13.09 | $ | 11.09 | $ | 10.50 | $ | 9.36 | $ | 8.64 | ||||||||||||||||||||
|
|
|
|
|
|
|
|
|
|
|
|
|
|
|
|
|
|
|
| |||||||||||||||||||||
Total return | 31.74 | % | 15.40 | % | 1.77 | % | 14.45 | % | 25.83 | % | 21.00 | % | 7.21 | % | 14.03 | % | 11.98 | % | 11.52 | % | ||||||||||||||||||||
Ratios and supplemental data: | ||||||||||||||||||||||||||||||||||||||||
Net assets at end of year (in millions) | $ | 314.9 | $ | 207.8 | $ | 170.7 | $ | 176.2 | $ | 160.7 | $ | 397.7 | $ | 268.2 | $ | 42.0 | $ | 24.3 | $ | 19.8 | ||||||||||||||||||||
Ratios to average net assets: | ||||||||||||||||||||||||||||||||||||||||
Expenses | 0.45 | % | 0.48 | % | 0.47 | % | 0.49 | % | 0.51 | % | 0.79 | % | 0.82 | % | 0.96 | % | 0.96 | % | 1.02 | % | ||||||||||||||||||||
Net investment income | 1.68 | % | 1.87 | % | 1.62 | % | 1.59 | % | 1.85 | % | 3.58 | % | 3.84 | % | 4.07 | % | 4.11 | % | 4.31 | % | ||||||||||||||||||||
Portfolio turnover rate | 15 | % | 7 | % | 9 | % | 8 | % | 21 | % | 22 | % | 30 | % | 19 | % | 31 | % | 42 | % | ||||||||||||||||||||
The accompanying notes are an integral part of these financial statements.
| 112 |
| Ohio National Fund, Inc. |
Financial Highlights |
| High Income Bond Portfolio | Capital Growth Portfolio | |||||||||||||||||||||||||||||||||||||||
| Years Ended December 31, | Years Ended December 31, | |||||||||||||||||||||||||||||||||||||||
| 2013 | 2012 | 2011 | 2010 | 2009 | 2013 | 2012 | 2011 | 2010 | 2009 | |||||||||||||||||||||||||||||||
Selected per-share data: | ||||||||||||||||||||||||||||||||||||||||
Net asset value, beginning of year | $ | 14.83 | $ | 12.97 | $ | 12.31 | $ | 10.79 | $ | 7.21 | $ | 30.73 | $ | 27.00 | $ | 27.68 | $ | 20.29 | $ | 15.00 | ||||||||||||||||||||
Operations: | ||||||||||||||||||||||||||||||||||||||||
Net investment income (loss) | 1.10 | 0.99 | 1.08 | 0.58 | 0.46 | (0.15 | ) | (0.03 | ) | (0.19 | ) | (0.11 | ) | — | ||||||||||||||||||||||||||
Net realized and unrealized gain (loss) on investments and | (0.05 | ) | 0.87 | (0.42 | ) | 0.94 | 3.12 | 9.45 | 3.76 | (0.49 | ) | 7.50 | 5.29 | |||||||||||||||||||||||||||
|
|
|
|
|
|
|
|
|
|
|
|
|
|
|
|
|
|
|
| |||||||||||||||||||||
Total from operations | 1.05 | 1.86 | 0.66 | 1.52 | 3.58 | 9.30 | 3.73 | (0.68 | ) | 7.39 | 5.29 | |||||||||||||||||||||||||||||
|
|
|
|
|
|
|
|
|
|
|
|
|
|
|
|
|
|
|
| |||||||||||||||||||||
Net asset value, end of year | $ | 15.88 | $ | 14.83 | $ | 12.97 | $ | 12.31 | $ | 10.79 | $ | 40.03 | $ | 30.73 | $ | 27.00 | $ | 27.68 | $ | 20.29 | ||||||||||||||||||||
|
|
|
|
|
|
|
|
|
|
|
|
|
|
|
|
|
|
|
| |||||||||||||||||||||
Total return | 7.08 | % | 14.34 | % | 5.36 | % | 14.09 | % | 49.65 | % | 30.26 | % | 13.81 | % | –2.46 | % | 36.42 | % | 35.27 | % | ||||||||||||||||||||
Ratios and supplemental data: | ||||||||||||||||||||||||||||||||||||||||
Net assets at end of year (in millions) | $ | 307.9 | $ | 311.9 | $ | 267.5 | $ | 269.8 | $ | 159.9 | $ | 80.4 | $ | 55.1 | $ | 51.1 | $ | 52.4 | $ | 36.8 | ||||||||||||||||||||
Ratios to average net assets: | ||||||||||||||||||||||||||||||||||||||||
Expenses | 0.77 | % | 0.79 | % | 0.78 | % | 0.81 | % | 0.88 | % | 1.01 | % | 1.04 | % | 1.02 | % | 1.04 | % | 1.07 | % | ||||||||||||||||||||
Net investment income (loss) | 6.36 | % | 7.17 | % | 7.69 | % | 8.03 | % | 9.14 | % | –0.44 | % | –0.10 | % | –0.64 | % | –0.50 | % | 0.02 | % | ||||||||||||||||||||
Portfolio turnover rate | 29 | % | 35 | % | 35 | % | 33 | % | 20 | % | 42 | % | 42 | % | 44 | % | 56 | % | 67 | % | ||||||||||||||||||||
The accompanying notes are an integral part of these financial statements.
| 113 |
| Ohio National Fund, Inc. |
Financial Highlights |
| Nasdaq-100® Index Portfolio | Bristol Portfolio | |||||||||||||||||||||||||||||||||||||||
| Years Ended December 31, | Years Ended December 31, | |||||||||||||||||||||||||||||||||||||||
| 2013 | 2012 | 2011 | 2010 | 2009 | 2013 | 2012 | 2011 | 2010 | 2009 | |||||||||||||||||||||||||||||||
Selected per-share data: | ||||||||||||||||||||||||||||||||||||||||
Net asset value, beginning of year | $ | 6.85 | $ | 5.85 | $ | 5.69 | $ | 4.78 | $ | 3.11 | $ | 13.01 | $ | 11.56 | $ | 12.51 | $ | 11.12 | $ | 8.23 | ||||||||||||||||||||
Operations: | ||||||||||||||||||||||||||||||||||||||||
Net investment income | 0.07 | 0.06 | 0.02 | 0.02 | 0.01 | 0.09 | 0.09 | 0.06 | 0.07 | 0.06 | ||||||||||||||||||||||||||||||
Net realized and unrealized gain (loss) on investments | 2.39 | 0.99 | 0.16 | 0.91 | 1.66 | 5.27 | 1.43 | (0.95 | ) | 1.39 | 2.89 | |||||||||||||||||||||||||||||
|
|
|
|
|
|
|
|
|
|
|
|
|
|
|
|
|
|
|
| |||||||||||||||||||||
Total from operations | 2.46 | 1.05 | 0.18 | 0.93 | 1.67 | 5.36 | 1.52 | (0.89 | ) | 1.46 | 2.95 | |||||||||||||||||||||||||||||
|
|
|
|
|
|
|
|
|
|
|
|
|
|
|
|
|
|
|
| |||||||||||||||||||||
Distributions: | ||||||||||||||||||||||||||||||||||||||||
Distributions from net investment income | (0.06 | ) | (0.05 | ) | (0.02 | ) | (0.02 | ) | — | (0.08 | ) | (0.07 | ) | (0.06 | ) | (0.07 | ) | (0.06 | ) | |||||||||||||||||||||
|
|
|
|
|
|
|
|
|
|
|
|
|
|
|
|
|
|
|
| |||||||||||||||||||||
Net asset value, end of year | $ | 9.25 | $ | 6.85 | $ | 5.85 | $ | 5.69 | $ | 4.78 | $ | 18.29 | $ | 13.01 | $ | 11.56 | $ | 12.51 | $ | 11.12 | ||||||||||||||||||||
|
|
|
|
|
|
|
|
|
|
|
|
|
|
|
|
|
|
|
| |||||||||||||||||||||
Total return | 35.98 | % | 17.88 | % | 3.19 | % | 19.38 | % | 53.70 | % | 41.21 | % | 13.19 | % | –7.16 | % | 13.10 | % | 35.83 | % | ||||||||||||||||||||
Ratios and supplemental data: | ||||||||||||||||||||||||||||||||||||||||
Net assets at end of year (in millions) | $ | 95.8 | $ | 68.5 | $ | 55.5 | $ | 54.9 | $ | 47.6 | $ | 231.5 | $ | 204.9 | $ | 192.7 | $ | 182.6 | $ | 142.8 | ||||||||||||||||||||
Ratios to average net assets: | ||||||||||||||||||||||||||||||||||||||||
Expenses | 0.51 | % | 0.53 | % | 0.52 | % | 0.54 | % | 0.56 | % | 0.82 | % | 0.85 | % | 0.84 | % | 0.86 | % | 0.89 | % | ||||||||||||||||||||
Net investment income | 0.94 | % | 0.98 | % | 0.41 | % | 0.39 | % | 0.19 | % | 0.51 | % | 0.68 | % | 0.52 | % | 0.70 | % | 0.79 | % | ||||||||||||||||||||
Portfolio turnover rate | 43 | % | 25 | % | 44 | % | 30 | % | 29 | % | 269 | % | 244 | % | 198 | % | 253 | % | 223 | % | ||||||||||||||||||||
The accompanying notes are an integral part of these financial statements.
| 114 |
| Ohio National Fund, Inc. |
Financial Highlights |
| Bryton Growth Portfolio | Balanced Portfolio | |||||||||||||||||||||||||||||||||||||||
| Years Ended December 31, | Years Ended December 31, | |||||||||||||||||||||||||||||||||||||||
| 2013 | 2012 | 2011 | 2010 | 2009 | 2013 | 2012 | 2011 | 2010 | 2009 | |||||||||||||||||||||||||||||||
Selected per-share data: | ||||||||||||||||||||||||||||||||||||||||
Net asset value, beginning of year | $ | 13.70 | $ | 12.31 | $ | 13.57 | $ | 10.94 | $ | 8.06 | $ | 15.76 | $ | 13.91 | $ | 13.87 | $ | 13.13 | $ | 10.74 | ||||||||||||||||||||
Operations: | ||||||||||||||||||||||||||||||||||||||||
Net investment income (loss) | (0.11 | ) | (0.07 | ) | (0.08 | ) | (0.06 | ) | (0.05 | ) | 0.08 | 0.10 | 0.31 | 0.32 | 0.29 | |||||||||||||||||||||||||
Net realized and unrealized gain (loss) on investments and | 5.69 | 1.46 | (1.18 | ) | 2.69 | 2.93 | 2.32 | 1.75 | (0.00 | ) | 0.70 | 2.39 | ||||||||||||||||||||||||||||
|
|
|
|
|
|
|
|
|
|
|
|
|
|
|
|
|
|
|
| |||||||||||||||||||||
Total from operations | 5.58 | 1.39 | (1.26 | ) | 2.63 | 2.88 | 2.40 | 1.85 | 0.31 | 1.02 | 2.68 | |||||||||||||||||||||||||||||
|
|
|
|
|
|
|
|
|
|
|
|
|
|
|
|
|
|
|
| |||||||||||||||||||||
Distributions: | ||||||||||||||||||||||||||||||||||||||||
Distributions from net investment income | — | — | — | — | — | (0.14 | ) | — | (0.27 | ) | (0.28 | ) | (0.29 | ) | ||||||||||||||||||||||||||
|
|
|
|
|
|
|
|
|
|
|
|
|
|
|
|
|
|
|
| |||||||||||||||||||||
Net asset value, end of year | $ | 19.28 | $ | 13.70 | $ | 12.31 | $ | 13.57 | $ | 10.94 | $ | 18.02 | $ | 15.76 | $ | 13.91 | $ | 13.87 | $ | 13.13 | ||||||||||||||||||||
|
|
|
|
|
|
|
|
|
|
|
|
|
|
|
|
|
|
|
| |||||||||||||||||||||
Total return | 40.73 | % | 11.29 | % | –9.29 | % | 24.04 | % | 35.73 | % | 15.26 | % | 13.30 | % | 2.29 | % | 7.78 | % | 24.92 | % | ||||||||||||||||||||
Ratios and supplemental data: | ||||||||||||||||||||||||||||||||||||||||
Net assets at end of year (in millions) | $ | 180.8 | $ | 157.7 | $ | 155.4 | $ | 137.4 | $ | 113.4 | $ | 249.1 | $ | 77.1 | $ | 17.1 | $ | 14.5 | $ | 13.6 | ||||||||||||||||||||
Ratios to average net assets: | ||||||||||||||||||||||||||||||||||||||||
Expenses | 0.89 | % | 0.93 | % | 0.91 | % | 0.93 | % | 0.96 | % | 0.75 | % | 0.86 | % | 0.94 | % | 0.99 | % | 1.08 | % | ||||||||||||||||||||
Net investment income (loss) | –0.59 | % | –0.57 | % | –0.67 | % | –0.49 | % | –0.64 | % | 1.45 | % | 1.90 | % | 2.33 | % | 2.48 | % | 2.99 | % | ||||||||||||||||||||
Portfolio turnover rate | 185 | % | 152 | % | 156 | % | 118 | % | 82 | % | 82 | % (a) | 60 | % | 47 | % | 56 | % | 72 | % | ||||||||||||||||||||
| (a) | The cost of purchases and proceeds from sales of securities that were incurred to realign the Portfolio’s holdings subsequent to the December 20, 2013 reorganization are excluded from the portfolio turnover rate calculation. See Note 8 of the Notes to Financial Statements for further information regarding this reorganization. If such amounts had not been excluded, the portfolio turnover rate would have been 89%. |
The accompanying notes are an integral part of these financial statements.
| 115 |
| Ohio National Fund, Inc. |
Financial Highlights |
| Target VIP Portfolio | Bristol Growth Portfolio | |||||||||||||||||||||||||||||||||||||||
| Years Ended December 31, | Years Ended December 31, | |||||||||||||||||||||||||||||||||||||||
| 2013 | 2012 | 2011 | 2010 | 2009 | 2013 | 2012 | 2011 | 2010 | 2009 | |||||||||||||||||||||||||||||||
Selected per-share data: | ||||||||||||||||||||||||||||||||||||||||
Net asset value, beginning of year | $ | 10.10 | $ | 8.89 | $ | 9.11 | $ | 7.72 | $ | 6.81 | $ | 10.66 | $ | 9.63 | $ | 9.84 | $ | 8.75 | $ | 6.15 | ||||||||||||||||||||
Operations: | ||||||||||||||||||||||||||||||||||||||||
Net investment income | 0.09 | 0.18 | 0.10 | 0.13 | 0.11 | 0.06 | 0.06 | 0.04 | 0.02 | 0.01 | ||||||||||||||||||||||||||||||
Net realized and unrealized gain (loss) on investments, foreign currency related transactions, and written options | 3.61 | 1.17 | (0.23 | ) | 1.37 | 0.90 | 4.05 | 1.02 | (0.21 | ) | 1.10 | 2.59 | ||||||||||||||||||||||||||||
|
|
|
|
|
|
|
|
|
|
|
|
|
|
|
|
|
|
|
| |||||||||||||||||||||
Total from operations | 3.70 | 1.35 | (0.13 | ) | 1.50 | 1.01 | 4.11 | 1.08 | (0.17 | ) | 1.12 | 2.60 | ||||||||||||||||||||||||||||
|
|
|
|
|
|
|
|
|
|
|
|
|
|
|
|
|
|
|
| |||||||||||||||||||||
Distributions: | ||||||||||||||||||||||||||||||||||||||||
Distributions from net investment income | (0.10 | ) | (0.14 | ) | (0.09 | ) | (0.11 | ) | (0.10 | ) | (0.05 | ) | (0.05 | ) | (0.04 | ) | (0.03 | ) | — | |||||||||||||||||||||
|
|
|
|
|
|
|
|
|
|
|
|
|
|
|
|
|
|
|
| |||||||||||||||||||||
Net asset value, end of year | $ | 13.70 | $ | 10.10 | $ | 8.89 | $ | 9.11 | $ | 7.72 | $ | 14.72 | $ | 10.66 | $ | 9.63 | $ | 9.84 | $ | 8.75 | ||||||||||||||||||||
|
|
|
|
|
|
|
|
|
|
|
|
|
|
|
|
|
|
|
| |||||||||||||||||||||
Total return | 36.71 | % | 15.24 | % | –1.41 | % | 19.47 | % | 14.77 | % | 38.62 | % | 11.20 | % | –1.77 | % | 12.79 | % | 42.28 | % | ||||||||||||||||||||
Ratios and supplemental data: | ||||||||||||||||||||||||||||||||||||||||
Net assets at end of year (in millions) | $ | 53.7 | $ | 21.2 | $ | 20.5 | $ | 21.9 | $ | 20.6 | $ | 122.3 | $ | 108.0 | $ | 99.9 | $ | 85.3 | $ | 10.5 | ||||||||||||||||||||
Ratios to average net assets: | ||||||||||||||||||||||||||||||||||||||||
Expenses | 0.82 | % | 0.87 | % | 0.84 | % | 0.82 | % | 0.83 | % | 0.88 | % | 0.92 | % | 0.90 | % | 0.93 | % | 1.29 | % | ||||||||||||||||||||
Net investment income | 0.92 | % | 1.73 | % | 1.07 | % | 1.50 | % | 1.53 | % | 0.42 | % | 0.57 | % | 0.41 | % | 0.63 | % | 0.26 | % | ||||||||||||||||||||
Portfolio turnover rate | 57 | % (a) | 70 | % | 79 | % | 92 | % | 91 | % | 237 | % | 229 | % | 187 | % | 268 | % | 218 | % | ||||||||||||||||||||
| (a) | The cost of purchases and proceeds from sales of securities that were incurred to realign the Portfolio’s holdings subsequent to the December 20, 2013 reorganization are excluded from the portfolio turnover rate calculation. See Note 8 of the Notes to Financial Statements for further information regarding this reorganization. If such amounts had not been excluded, the portfolio turnover rate would have been 138%. |
The accompanying notes are an integral part of these financial statements.
| 116 |
| Ohio National Fund, Inc. |
| December 31, 2013 |
| (1) | Organization |
Ohio National Fund, Inc. (the “Fund”) is a Maryland corporation registered under the Investment Company Act of 1940, as amended (the “40 Act”), as an open-end management investment company. The Fund consists of twenty separate investment portfolios (the “Portfolios”) that seek the following objectives and strategies:
| ¢ | Equity Portfolio — Long-term growth of capital by investing at least 80% of its assets in equity securities. |
| ¢ | Money Market Portfolio — Maximum current income consistent with preservation of capital and liquidity by investing in high quality money market instruments. |
| ¢ | Bond Portfolio — High level of income and opportunity for capital appreciation consistent with preservation of capital by investing primarily in intermediate-term and long-term fixed income securities. |
| ¢ | Omni Portfolio — High level of long-term total return consistent with preservation of capital by investing in stocks, bonds, and money market instruments. |
| ¢ | International Portfolio — Long term growth of capital by investing at least 80% of its assets in securities of foreign companies. |
| ¢ | Capital Appreciation Portfolio — Long-term capital growth by investing primarily in common stocks of established companies with either current or emerging earnings growth not fully appreciated or recognized by the market. |
| ¢ | International Small-Mid Company Portfolio — Long-term growth of capital by investing at least 80% of its assets in equity securities of foreign small and mid-cap companies. |
| ¢ | Aggressive Growth Portfolio — Long-term capital growth by investing primarily in domestic and foreign equity securities selected for growth potential. |
| ¢ | Small Cap Growth Portfolio — Long-term capital appreciation by investing at least 80% of its net assets in stocks of small companies. |
| ¢ | Mid Cap Opportunity Portfolio — Long-term total return by investing at least 80% of its net assets in equity securities of mid-cap companies, primarily those that are strategically positioned for long-term growth. |
| ¢ | S&P 500® Index Portfolio — Total return that approximates the total return of the Standard & Poor’s 500® Index, at a risk level consistent with that of the Standard & Poor’s 500® Index. |
| ¢ | Strategic Value Portfolio — Growth of capital and income by investing primarily in securities of high dividend yielding, undervalued stocks with dividend growth potential. |
| ¢ | High Income Bond Portfolio — High current income by investing at least 80% of its net assets in lower rated corporate debt obligations commonly referred to as “junk bonds”. The Portfolio’s investments are generally rated Ba or lower by Moody’s, or BB or lower by Standard & Poor’s or Fitch. |
| ¢ | Capital Growth Portfolio — Long-term capital appreciation by investing primarily in an actively managed portfolio of equity securities of small cap growth companies. |
| ¢ | Nasdaq-100® Index Portfolio — Long-term growth of capital by investing primarily in stocks that are included in the Nasdaq-100® Index. Unlike the other Portfolios of the Fund, the Nasdaq-100® Index Portfolio is a non-diversified portfolio for purposes of Section 5(b) of the 40 Act. |
| ¢ | Bristol Portfolio — Long-term growth of capital by investing primarily in common stocks of the 1,000 largest publicly traded U.S. companies in terms of market capitalization. |
| ¢ | Bryton Growth Portfolio — Long-term growth of capital by investing primarily in common stocks of growth-oriented U.S. companies smaller than the 500 largest publicly traded U.S. companies in terms of market capitalization. |
| ¢ | Balanced Portfolio — Capital appreciation and income by investing normally up to 75% of its assets in equity securities within under-priced sectors and industries while maintaining a minimum of 25% of its assets in fixed income securities. |
| ¢ | Target VIP Portfolio — Above average total return by investing in the common stocks of companies which are identified by a model that applies separate uniquely specialized strategies. |
| 117 | (continued) |
| Ohio National Fund, Inc. |
Notes to Financial Statements (Continued) | December 31, 2013 |
| ¢ | Bristol Growth Portfolio — Long-term growth of capital by investing primarily in common stocks of the 1,000 largest publicly traded U.S. companies in terms of market capitalization. |
Additional detail regarding portfolio-specific objectives, policies, and investment strategies is provided in the prospectus and Statement of Additional Information of Ohio National Fund, Inc. There are no assurances that these objectives will be met. Each Portfolio, except the Nasdaq-100® Index Portfolio, is classified as diversified for purposes of Section 5(b) of the 40 Act.
At present, the Fund sells its shares only to separate accounts of The Ohio National Life Insurance Company (“ONLIC”), Ohio National Life Assurance Corporation (“ONLAC”), and National Security Life and Annuity Company (“NSLA”) to support certain benefits under variable contracts issued by those entities. In the future, Fund shares may be used for other purposes but, unless there is a change in applicable law, they will not be sold directly to the public.
Interest in each Portfolio is represented by a separate class of the Fund’s capital stock, par value $1. Each share of a Portfolio participates equally in the Portfolio’s dividends, distributions, net assets, and voting matters.
The Fund is authorized to issue 550 million of its capital shares. These authorized shares have been allocated to specific Portfolios of the Fund as follows:
Portfolio | Authorized Shares | |||
Equity | 25,000,000 | |||
Money Market | 55,000,000 | |||
Bond | 30,000,000 | |||
Omni | 10,000,000 | |||
International | 45,000,000 | |||
Capital Appreciation | 15,000,000 | |||
International Small-Mid Company | 10,000,000 | |||
Aggressive Growth | 10,000,000 | |||
Small Cap Growth | 10,000,000 | |||
Mid Cap Opportunity | 10,000,000 | |||
Portfolio | Authorized Shares | |||
S&P 500® Index | 35,000,000 | |||
Strategic Value | 65,000,000 | |||
High Income Bond | 50,000,000 | |||
Capital Growth | 10,000,000 | |||
Nasdaq-100® Index | 25,000,000 | |||
Bristol | 40,000,000 | |||
Bryton Growth | 35,000,000 | |||
Balanced | 35,000,000 | |||
Target VIP | 10,000,000 | |||
Bristol Growth | 25,000,000 | |||
The Fund’s Board of Directors (the “Board”) periodically reallocates authorized shares among the Portfolios of the Fund and may authorize additional shares as deemed necessary.
Under the Fund’s organizational documents, its Officers and Directors are indemnified against certain liabilities arising out of the performance of their duties to the Fund. In addition, in the normal course of business, the Fund enters into contracts with its vendors and others that provide for general indemnifications. The Fund’s maximum exposure under these arrangements is unknown as this would involve future claims that may be made against the Fund. However, based on experience, the risk of loss to the Fund is expected to be remote.
| (2) | Significant Accounting Policies |
The following is a summary of significant accounting policies followed by the Fund in preparation of its financial statements:
Use of Estimates
The preparation of financial statements in conformity with U.S. generally accepted accounting principles (“U.S. GAAP”) requires management to make estimates and assumptions that affect the reported amounts of assets and liabilities and disclosure of contingent assets and liabilities at the date of the financial statements and the reported amounts of increases and decreases in net assets from operations during the reporting period. Actual results could differ from those estimates.
Security Valuation
Investments are valued using pricing procedures approved by the Board.
Various investments in the Money Market Portfolio are valued at amortized cost in accordance with Rule 2a-7 of the 40 Act. In all Portfolios of the Fund, fixed income instruments that mature in sixty days or less, and of sufficient credit quality, are valued at amortized cost. Amortized cost valuation involves valuing a security at its cost initially and thereafter amortizing to maturity any discounts or premiums on the level-yield method, regardless of the impact of fluctuating market interest rates on the value of the security. In these instances, amortized cost approximates fair value.
| 118 | (continued) |
| Ohio National Fund, Inc. |
Notes to Financial Statements (Continued) | December 31, 2013 |
Investments, other than those securities aforementioned, are valued as follows:
Domestic equity securities that are traded on U.S. exchanges are valued at the last trade price reported by the primary exchange of each security (4:00 pm Eastern Time for normal trading sessions). Over-the-counter domestic equity securities are valued at the last trade price reported daily as of 4:00 pm Eastern Time (normal trading sessions). Over-the-counter traded ADRs may also be valued at an evaluated price based on the value of the underlying securities. If a domestic equity security is not traded on a particular day, the mean between the bid and ask prices reported at 4:00 pm Eastern Time (normal trading sessions) by the primary exchange will generally be used for valuation purposes. The principal sources for market quotations are independent pricing services that have been approved by the Board.
Fixed income securities that have a remaining maturity exceeding sixty days are generally valued at the mean between the daily close bid and ask prices reported at 4:00 pm Eastern Time (normal trading sessions), as provided by independent pricing services approved by the Board.
Shares of open-end mutual funds are valued at each fund’s last calculated net asset value per share.
Repurchase agreements are valued at amortized cost, which approximates fair value.
Restricted securities, illiquid securities, or other investments for which market quotations or other observable market inputs are not readily available are valued at an estimate of value using methods determined in good faith by the Fund’s Pricing Committee under the supervision of the Board.
Foreign equity securities are initially priced at the reported close price of the exchange on which a security is primarily traded. Securities not traded on a particular day are valued at the mean between the last reported bid and ask quotes at daily close, or the last sale price when appropriate. The principal sources for market quotations are independent pricing services that have been approved by the Board.
Equity securities that are primarily traded on foreign exchanges, other than those with close times that are consistent with the normal 4:00 pm Eastern Time close of U.S. equity markets, are further subjected to fair valuation pricing procedures provided by an independent fair valuation service. The service provides data that can be used to estimate the price of a foreign issue that would prevail in a liquid market given market information available daily at 4:00 pm Eastern Time (normal trading sessions). Multiple factors may be considered in performing this valuation, including an issue’s local close price, relevant general and sector indices, currency fluctuations, and pricing of related depository receipts, exchange traded funds, and futures. The pricing procedures are performed for each individual security for which there is a fairly large degree of certainty that the local close price is not the liquid market price at the time of U.S. market close. The procedures are performed each day there is a change in a consistently used market index from the time of local close to the U.S. market close. Backtesting analysis is performed on a quarterly basis to monitor the effectiveness of these procedures. The testing is reviewed by management of the Fund as well as the Fund’s Board. Prior results have indicated that these procedures have been effective in reaching valuation objectives.
The differences between the aggregate cost and values of investments are reflected as unrealized appreciation or unrealized depreciation.
Pricing inputs used in the Fund’s determination of its investment values are categorized according to a three-tier hierarchy framework. The hierarchy is summarized in three broad levels:
| Level 1: | Quoted prices in active markets for identical securities. |
| Level 2: | Other significant observable inputs, including quoted prices for similar securities, interest rates, prepayment speeds, credit risk, etc. |
| Level 3: | Significant unobservable inputs, including the Fund’s own assumptions used to determine the value of securities. |
The following is a summary of the inputs used in valuing each of the Portfolio’s assets (liabilities) at value as of December 31, 2013:
Portfolio | Financial Instrument Type | Level 1 | Level 2 | Level 3 | ||||||||||
Equity | Common Stocks** | $ | 220,251,556 | $ | — | $ | — | |||||||
| Money Market Funds | 3,524,000 | — | — | |||||||||||
|
|
|
|
|
| |||||||||
| $ | 223,775,556 | $ | — | $ | — | |||||||||
|
|
|
|
|
| |||||||||
| 119 | (continued) |
| Ohio National Fund, Inc. |
Notes to Financial Statements (Continued) | December 31, 2013 |
Portfolio | Financial Instrument Type | Level 1 | Level 2 | Level 3 | ||||||||||
Money Market* | Commercial Paper** | $ | — | $ | 139,996,532 | $ | — | |||||||
| U.S. Government Agency Issues | — | 7,499,906 | — | |||||||||||
| U.S. Treasury Obligations | — | 11,999,713 | — | |||||||||||
| Money Market Funds | 30,000,000 | — | — | |||||||||||
|
|
|
|
|
| |||||||||
| $ | 30,000,000 | $ | 159,496,151 | $ | — | |||||||||
|
|
|
|
|
| |||||||||
Bond | Corporate Bonds** | $ | — | $ | 131,208,747 | $ | — | |||||||
| U.S. Treasury Obligations | — | 9,249,766 | — | |||||||||||
| Money Market Funds | 7,728,000 | — | — | |||||||||||
|
|
|
|
|
| |||||||||
| $ | 7,728,000 | $ | 140,458,513 | $ | — | |||||||||
|
|
|
|
|
| |||||||||
Omni | Common Stocks** | $ | 30,405,115 | $ | — | $ | — | |||||||
| Corporate Bonds** | — | 6,462,541 | — | |||||||||||
| U.S. Treasury Obligations | — | 305,688 | — | |||||||||||
| Money Market Funds | 666,000 | — | — | |||||||||||
|
|
|
|
|
| |||||||||
| $ | 31,071,115 | $ | 6,768,229 | $ | — | |||||||||
|
|
|
|
|
| |||||||||
International | Common Stocks** | $ | 11,164,583 | $ | 169,964,599 | $ | — | |||||||
| U.S. Treasury Obligations | — | 219,982 | — | |||||||||||
| Money Market Funds | 5,175,480 | — | — | |||||||||||
|
|
|
|
|
| |||||||||
| $ | 16,340,063 | $ | 170,184,581 | $ | — | |||||||||
|
|
|
|
|
| |||||||||
| Foreign currency contracts | $ | 780,399 | $ | — | $ | — | ||||||||
|
|
|
|
|
| |||||||||
| Futures contracts | $ | 170,530 | $ | — | $ | — | ||||||||
|
|
|
|
|
| |||||||||
Capital Appreciation | Common Stocks** | $ | 131,992,282 | $ | 5,271,495 | $ | — | |||||||
| Money Market Funds | 2,353,000 | — | — | |||||||||||
|
|
|
|
|
| |||||||||
| $ | 134,345,282 | $ | 5,271,495 | $ | — | |||||||||
|
|
|
|
|
| |||||||||
International Small-Mid Company | Common Stocks** | $ | 9,988,052 | $ | 60,620,438 | $ | — | |||||||
| Exchange Traded Funds | 994,660 | — | — | |||||||||||
| Money Market Funds | 5,398,306 | — | — | |||||||||||
|
|
|
|
|
| |||||||||
| $ | 16,381,018 | $ | 60,620,438 | $ | — | |||||||||
|
|
|
|
|
| |||||||||
Aggressive Growth | Common Stocks** | $ | 36,990,462 | $ | 1,995,920 | $ | — | |||||||
| Money Market Funds | 794,000 | — | — | |||||||||||
|
|
|
|
|
| |||||||||
| $ | 37,784,462 | $ | 1,995,920 | $ | — | |||||||||
|
|
|
|
|
| |||||||||
Small Cap Growth | Common Stocks** | $ | 101,030,570 | $ | 588,899 | $ | — | |||||||
| Exchange Traded Funds | 2,032,650 | — | — | |||||||||||
| Money Market Funds | 6,268,000 | — | — | |||||||||||
|
|
|
|
|
| |||||||||
| $ | 109,331,220 | $ | 588,899 | $ | — | |||||||||
|
|
|
|
|
| |||||||||
Mid Cap Opportunity | Common Stocks** | $ | 81,564,376 | $ | — | $ | — | |||||||
| Money Market Funds | 1,633,000 | — | — | |||||||||||
|
|
|
|
|
| |||||||||
| $ | 83,197,376 | $ | — | $ | — | |||||||||
|
|
|
|
|
| |||||||||
S&P 500® Index | Common Stocks** | $ | 302,879,770 | $ | — | $ | — | |||||||
| Exchange Traded Funds | 11,832,730 | — | — | |||||||||||
|
|
|
|
|
| |||||||||
| $ | 314,712,500 | $ | — | $ | — | |||||||||
|
|
|
|
|
| |||||||||
Strategic Value | Common Stocks** | $ | 297,230,152 | $ | 96,974,075 | $ | — | |||||||
| Money Market Funds | 4,054,000 | — | — | |||||||||||
|
|
|
|
|
| |||||||||
| $ | 301,284,152 | $ | 96,974,075 | $ | — | |||||||||
|
|
|
|
|
| |||||||||
| 120 | (continued) |
| Ohio National Fund, Inc. |
Notes to Financial Statements (Continued) | December 31, 2013 |
Portfolio | Financial Instrument Type | Level 1 | Level 2 | Level 3 | ||||||||||
High Income Bond | Corporate Bonds** | $ | — | $ | 294,134,161 | $ | — | |||||||
| Common Stocks** | 191,232 | — | — | |||||||||||
| Preferred Stocks** | 332,193 | — | — | |||||||||||
| Warrants** | 230,927 | — | — | |||||||||||
| Other** | 35,879 | — | — | |||||||||||
| Money Market Funds | 5,678,000 | — | — | |||||||||||
|
|
|
|
|
| |||||||||
| $ | 6,468,231 | $ | 294,134,161 | $ | — | |||||||||
|
|
|
|
|
| |||||||||
Capital Growth | Common Stocks** | $ | 80,213,049 | $ | — | $ | — | |||||||
|
|
|
|
|
| |||||||||
| $ | 80,213,049 | $ | — | $ | — | |||||||||
|
|
|
|
|
| |||||||||
Nasdaq-100® Index | Common Stocks** | $ | 93,272,540 | $ | — | $ | — | |||||||
| Exchange Traded Funds | 3,088,715 | — | — | |||||||||||
|
|
|
|
|
| |||||||||
| $ | 96,361,255 | $ | — | $ | — | |||||||||
|
|
|
|
|
| |||||||||
Bristol | Common Stocks** | $ | 230,069,346 | $ | — | $ | — | |||||||
| Money Market Funds | 2,188,000 | — | — | |||||||||||
|
|
|
|
|
| |||||||||
| $ | 232,257,346 | $ | — | $ | — | |||||||||
|
|
|
|
|
| |||||||||
Bryton Growth | Common Stocks** | $ | 179,454,037 | $ | — | $ | — | |||||||
| Money Market Funds | 2,959,000 | — | — | |||||||||||
|
|
|
|
|
| |||||||||
| $ | 182,413,037 | $ | — | $ | — | |||||||||
|
|
|
|
|
| |||||||||
Balanced | Common Stocks** | $ | 137,450,096 | $ | — | $ | — | |||||||
| Corporate Bonds** | — | 77,857,487 | — | |||||||||||
| U.S. Treasury Obligations | — | 15,778,291 | — | |||||||||||
| Closed-End Mutual Funds | 7,210,217 | — | — | |||||||||||
| Purchased Options | 515,900 | — | — | |||||||||||
| Money Market Funds | 7,855,000 | — | — | |||||||||||
|
|
|
|
|
| |||||||||
| $ | 153,031,213 | $ | 93,635,778 | $ | — | |||||||||
|
|
|
|
|
| |||||||||
| Written Options | $ | (1,794,000 | ) | $ | — | $ | — | |||||||
|
|
|
|
|
| |||||||||
Target VIP | Common Stocks** | $ | 52,132,988 | $ | — | $ | — | |||||||
| Money Market Funds | 1,534,000 | — | — | |||||||||||
|
|
|
|
|
| |||||||||
| $ | 53,666,988 | $ | — | $ | — | |||||||||
|
|
|
|
|
| |||||||||
Bristol Growth | Common Stocks** | $ | 121,520,994 | $ | — | $ | — | |||||||
| Money Market Funds | 1,645,000 | — | — | |||||||||||
|
|
|
|
|
| |||||||||
| $ | 123,165,994 | $ | — | $ | — | |||||||||
|
|
|
|
|
| |||||||||
| * | At December 31, 2013, the Money Market Portfolio’s investments, with the exception of money market funds, were valued using amortized cost, in accordance with rules under the 40 Act. Amortized cost approximates the current fair value of a security, but since the value is not obtained from a quoted price in an active market, such securities are considered to be valued using Level 2 inputs. |
| ** | For detailed industry descriptions, see the accompanying Schedules of Investments. |
As stated above, the value assigned to the Fund’s foreign securities will, in most cases, not be the quoted or published prices of the investments on their respective primary markets or exchanges. Securities that are priced using fair value estimates are categorized as Level 2 in the fair value hierarchy, whereas securities that do not meet the established criteria are categorized as Level 1. The valuation of a foreign security from one valuation period to the next may result in a transfer between Levels 1 and 2 if the degree of certainty that the local close price is not the liquid market price at the time of U.S. market close is not similar for both periods. The Fund’s policy is to recognize transfers between fair value hierarchy levels at the reporting period end. In the International Portfolio, there were two transfers of securities, which were reported in the Level 1 pricing category at December 31, 2012, to Level 2 at December 31, 2013. These securities were that Portfolio’s holdings of Cielo SA and Tractebel Energia SA common stocks. The fair valuation service provider, by policy, did not include any such securities traded on South American exchanges within its population of researched securities at December 31, 2012, and, therefore, those stocks were not
| 121 | (continued) |
| Ohio National Fund, Inc. |
Notes to Financial Statements (Continued) | December 31, 2013 |
fair valued in the prior period. At December 31, 2013, the securities were included in the population of securities and, further, met the criteria to be fair valued. The aggregate value of these holdings were $2,805,705 and $2,380,120 at December 31, 2013 and December 31, 2012, respectively.
There were no securities in Level 3 during the year ended December 31, 2013.
Foreign Securities and Currency
The books and records of all the Portfolios are maintained in U.S. dollars. All investments and cash quoted in foreign currencies are valued daily in U.S. dollars on the basis of the foreign currency exchange rates provided by an independent source. These exchange rates are currently determined daily, at 4:00 pm Eastern Time for normal trading sessions. Purchases and sales of foreign-denominated investments are recorded at rates of exchange prevailing on the respective dates of such transactions.
The Fund may not fully isolate that portion of the results of operations resulting from changes in foreign exchange rates from fluctuations arising from changes in market prices on foreign currency-denominated investments. For the portion that is isolated, amounts are reflected in the Statements of Operations as other foreign currency related transactions. However, for tax purposes, the Fund does fully isolate the effect of fluctuations in foreign exchange rates when determining the gain or loss upon sale or maturity of such investments to the extent required by federal income tax regulations.
All Portfolios of the Fund may invest in securities of foreign issuers. Securities of foreign issuers that are purchased by the Money Market Portfolio are limited to 50% of that Portfolio’s assets and must be denominated in U.S. dollars and held in custody in the United States of America. The International and International Small-Mid Company Portfolios may be invested entirely in foreign securities. Investments in securities of foreign issuers, including investments in foreign companies through the use of depositary receipts, carry certain risks not ordinarily associated with investments in securities of domestic issuers. Such risks include future political and economic developments, and the possible imposition of exchange controls or other foreign governmental laws and restrictions. In addition, with respect to certain countries, there is the possibility of expropriation of assets, confiscatory taxation, political or social instability, or diplomatic developments that could adversely affect capital investment within those countries.
Restricted and Illiquid Securities
Restricted securities are those securities purchased through a private offering and cannot be resold to the general public without prior registration under the Securities Act of 1933 (“the 1933 Act”) or pursuant to the resale limitations provided by Rule 144A under the 1933 Act, or an exemption from the registration requirements of the 1933 Act. 144A securities are issued by corporations without registration in reliance on 1933 Act provisions allowing for the private resale of unregistered securities to qualified institutional buyers. Section 4(2) commercial paper is issued pursuant to Section 4(2) of the 1933 Act which exempts an issue from registration. This paper may be used to finance non-current transactions, such as acquisitions, stock repurchase programs, and other long-term assets. Investments by a portfolio in Rule 144A and Section 4(2) securities could have the effect of decreasing the liquidity of a Portfolio during any period in which qualified institutional investors were no longer interested in purchasing these securities.
Typically, the restricted securities noted above are not considered illiquid. The criteria used to determine if a restricted security is illiquid includes frequency of trades and quotes, available dealers willing to make transactions, availability of market makers in the security, and the nature of the security and its trades. The Money Market, Bond, and Omni Portfolios may invest up to 10% of their respective assets in illiquid securities. Each of the other Portfolios of the Fund may invest up to 15% of its net assets in illiquid securities.
Investment Transactions and Related Income
For financial reporting purposes, investment transactions are accounted for on a trade date basis. For purposes of executing separate account shareholder transactions in the normal course of business, however, the Fund’s investment transactions are recorded no later than the first calculation on the first business day following the trade date in accordance with Rule 2a-4 of the 40 Act. Accordingly, differences between the net asset values for financial reporting and for executing separate account shareholder transactions may arise.
Dividend income is recognized on the ex-dividend date, except in the case of those Portfolios holding foreign securities, in which dividends are recorded as soon after the ex-dividend date as the Fund’s information agents become aware of such dividends.
| 122 | (continued) |
| Ohio National Fund, Inc. |
Notes to Financial Statements (Continued) | December 31, 2013 |
Interest income is accrued daily as earned and includes the amortization of premium and accretion of discount. Net realized gain or loss on investments and foreign exchange transactions are determined using the specific identification method.
Distributions to Shareholders and Federal Taxes
Net investment income of the Money Market Portfolio is declared and paid daily as a dividend to shareholders immediately before the computation of the net asset value of Money Market Portfolio shares. Dividends are automatically reinvested in additional Money Market Portfolio shares at the net asset value immediately following such computation. Distributions arising from net investment income and net capital gains from the remaining Portfolios are declared and paid to shareholders periodically as required for each of the Portfolios to continue to qualify as a regulated investment company pursuant to Subchapter M of the Internal Revenue Code. The Fund, excluding the Money Market Portfolio, may also fully or partially satisfy its distribution requirements by using consent dividends rather than cash dividends. The Fund has the intent to continue to comply with tax provisions pertaining to regulated investment companies and make distributions of taxable income sufficient to relieve it from substantially all federal income and excise taxes. As such, no provisions for federal income or excise taxes have been recorded.
The character of income and realized capital gains distributions are determined in accordance with federal income tax regulations and may differ from net investment income and realized gains for financial reporting purposes. These “book/tax” differences are either considered temporary or permanent in nature. To the extent these differences are permanent in nature they are reclassified within the composition of net assets; temporary differences do not require such reclassification. Distributions to shareholders that exceed taxable income and net taxable realized gains are reported as return of capital distributions.
The Fund’s management and its tax agent, U.S. Bancorp Fund Services, LLC, perform an affirmative evaluation of tax positions taken or expected to be taken in the course of preparing the Fund’s tax returns to determine whether it is more-likely-than-not (i.e. greater than 50-percent) that each tax position will be sustained upon examination by a taxing authority based on the technical merits of the position. A tax position that meets the more-likely-than-not recognition threshold is measured to determine the amount of benefit to recognize in the financial statements. Differences between tax positions taken in a tax return and amounts recognized in the financial statements will generally result in an increase in a liability for taxes payable (or a reduction of a tax refund receivable), including the recognition of any related interest and penalties as an operating expense. Implementation of the evaluation included a review of tax positions taken in tax years that remain subject to examination by all major tax jurisdictions, including federal tax and the state of Maryland (i.e., the last four tax year ends and the interim tax period since then). The determination has been made that there are no uncertain tax positions that would require the Portfolios to record a tax liability and, therefore, there is no impact to the Portfolios’ financial statements.
Expense Allocation
Expenses directly attributable to a Portfolio are charged to that Portfolio. Expenses that cannot be directly attributed to a Portfolio are allocated among all the benefited Portfolios on a basis of relative net assets or other appropriate method.
Foreign Withholding Taxes
Certain Portfolios in the Fund may be subject to taxes imposed by countries in which they invest with respect to their investments in issuers existing or operating in such countries. Such taxes are generally withheld based on income earned. These Portfolios accrue such taxes as the related income is earned.
Subsequent Events
Management has evaluated events and transactions through the date the financial statements were issued, for purposes of recognition or disclosure in these financial statements, and there are no other subsequent events to report.
| (3) | Related Party and Other Transactions |
The Fund has an Investment Advisory Agreement with Ohio National Investments, Inc. (“ONI”), a wholly-owned subsidiary of ONLIC. Under the terms of this agreement, ONI provides portfolio management and investment advice to the Fund and administers its operations, subject to the supervision of the Fund’s Board. This agreement is renewed annually upon the approval
| 123 | (continued) |
| Ohio National Fund, Inc. |
Notes to Financial Statements (Continued) | December 31, 2013 |
by the Board. As compensation for its services, ONI receives advisory fees from the Fund calculated on the basis of each Portfolio’s average daily net assets and the following current schedule of Board-approved annualized fee breakpoints.
Equity |
| 0.79% of first $200 million |
| 0.74% of next $800 million |
| 0.70% over $1 billion |
Bond |
| 0.60% of first $100 million |
| 0.50% of next $150 million |
| 0.45% of next $250 million |
| 0.40% of next $500 million |
| 0.30% of next $1 billion |
| 0.25% over $2 billion |
International2 |
| 0.85% of first $100 million |
| 0.80% of next $100 million |
| 0.70% over $200 million |
International Small-Mid Company |
| 1.00% of first $100 million |
| 0.90% of next $100 million |
| 0.85% over $200 million |
Small Cap Growth3 |
| 0.80% of first $150 million |
| 0.75% of next $150 million |
| 0.70% of next $300 million |
| 0.65% over $600 million |
S&P 500® Index |
| 0.40% of first $100 million |
| 0.35% of next $150 million |
| 0.33% over $250 million |
High Income Bond |
| 0.75% of first $75 million |
| 0.70% of next $75 million |
| 0.65% of next $75 million |
| 0.60% over $225 million |
Nasdaq-100® Index |
| 0.40% of first $100 million |
| 0.35% of next $150 million |
| 0.33% over $250 million |
Bryton Growth |
| 0.85% of first $100 million |
| 0.75% of next $400 million |
| 0.70% over $500 million |
Target VIP |
| 0.60% of first $100 million |
| 0.55% of next $400 million |
| 0.50% over $500 million |
Money Market |
| 0.30% of first $100 million1 |
| 0.25% of next $150 million |
| 0.23% of next $250 million |
| 0.20% of next $500 million |
| 0.15% over $1 billion |
Omni |
| 0.60% of first $100 million |
| 0.50% of next $150 million |
| 0.45% of next $250 million |
| 0.40% of next $500 million |
| 0.30% of next $1 billion |
| 0.25% over $2 billion |
Capital Appreciation |
| 0.80% of first $100 million |
| 0.75% of next $300 million |
| 0.65% of next $600 million |
| 0.60% over $1 billion |
Aggressive Growth |
| 0.80% of first $100 million |
| 0.75% of next $400 million |
| 0.70% over $500 million |
Mid Cap Opportunity |
| 0.85% of first $100 million |
| 0.80% of next $100 million |
| 0.75% of next $300 million |
| 0.70% over $500 million |
Strategic Value |
| 0.75% of first $100 million |
| 0.70% of next $400 million |
| 0.65% over $500 million |
Capital Growth |
| 0.90% of first $100 million |
| 0.85% of next $100 million |
| 0.80% of next $300 million |
| 0.75% over $500 million |
Bristol |
| 0.80% of first $100 million |
| 0.70% of next $400 million |
| 0.65% over $500 million |
Balanced |
| 0.65% of first $200 million |
| 0.60% of next $300 million |
| 0.55% over $500 million |
Bristol Growth |
| 0.80% of first $100 million |
| 0.70% of next $400 million |
| 0.65% over $500 million |
| 1 | For the year ended December 31, 2013, ONI waived advisory fees in excess of an annualized rate of 0.25% of the first $100 million of average daily net assets in the Money Market Portfolio. Waivers related to the Money Market Portfolio are voluntary and are not subject to recoupment in subsequent periods. The amount of the waiver for the year ended December 31, 2013 |
| 124 | (continued) |
| Ohio National Fund, Inc. |
Notes to Financial Statements (Continued) | December 31, 2013 |
| was $50,000. If ONI did not agree to waive these fees, the total expenses incurred by the Money Market Portfolio for the year ended December 31, 2013 would have been higher than the net expenses reflected in the Statements of Operations. |
| 2 | Effective June 1, 2013, ONI agreed to waive advisory fees equal to an annualized rate of 0.44% of the first $200 million of average daily net assets, and 0.39% of the average daily net assets thereafter. Waivers related to the International Portfolio are voluntary and are not subject to recoupment in subsequent periods. This waiver will continue for a yet undetermined amount of time. The amount of the waiver for the year ended December 31, 2013 was $474,945. If ONI did not agree to waive these fees, the total expenses incurred by the International Portfolio for the year ended December 31, 2013 would have been higher than the net expenses reflected in the Statements of Operations. |
| 3 | In its November 19, 2013 meeting, the Board approved a revision of the rates used to calculate advisory fees for the Small Cap Growth Portfolio. Effective December 21, 2013, advisory fees were lowered to the current advisory fee breakpoint schedule from the prior breakpoint schedule. The advisory fee breakpoint schedule for the Small Cap Growth Portfolio prior to December 21, 2013 was: |
| 0.90% of first $150 million of average daily net assets |
| 0.80% of next $150 million of average daily net assets |
| 0.75% over $300 million of average daily net assets. |
Under the Investment Advisory Agreement, the Fund authorizes ONI to retain sub-advisers (“the Sub-Advisers”) for the Equity, Omni, International, Capital Appreciation, International Small-Mid Company, Aggressive Growth, Small Cap Growth, Mid Cap Opportunity, Strategic Value, High Income Bond, Capital Growth, Bristol, Bryton Growth, Balanced, Target VIP, and Bristol Growth Portfolios subject to the approval of the Board. ONI has entered into sub-advisory agreements with Legg Mason Capital Management, Inc. (“Legg Mason”), Suffolk Capital Management, LLC (“Suffolk”), Federated Global Investment Management Corp. (“Federated Global”), Jennison Associates LLC (“Jennison”), Janus Capital Management LLC (“Janus”), Goldman Sachs Asset Management, L.P. (“Goldman Sachs”), Federated Equity Management Company of Pennsylvania (“Federated Equity”), Federated Investment Management Company (“Federated Investment”), Eagle Asset Management, Inc. (“Eagle”), ICON Advisers, Inc. (“ICON”), and First Trust Advisors L.P. (“First Trust”), to manage the investment of those Portfolios’ assets, subject to the supervision of ONI. As compensation for their services, the Sub-Advisers receive from ONI a sub-advisory fee calculated on the basis of each of the aforementioned Portfolio’s average daily net assets and the following current Board-approved schedule of annualized fee breakpoints.
Equity (Legg Mason) |
| 0.40% of first $200 million |
| 0.38% over $200 million |
International (Federated Global)4 |
| 0.40% of first $200 million |
| 0.35% over $200 million |
Capital Appreciation (Jennison) |
| 0.75% of first $10 million |
| 0.50% of next $30 million |
| 0.35% of next $25 million |
| 0.25% of next $335 million |
| 0.22% of next $600 million |
| 0.20% over $1 billion |
Small Cap Growth (Janus)5 |
| 0.55% of first $150 million |
| 0.45% over $150 million |
Strategic Value (Federated Equity) |
| 0.50% of first $35 million |
| 0.35% of next $65 million |
| 0.25% over $100 million |
Capital Growth (Eagle) |
| 0.59% of first $100 million |
| 0.55% of next $100 million |
| 0.50% over $200 million |
Omni (Suffolk) |
| 0.30% of first $100 million |
| 0.25% of next $150 million |
| 0.225% of next $250 million |
| 0.20% of next $500 million |
| 0.15% of next $1 billion |
| 0.125% over $2 billion |
International Small-Mid Company (Federated Global) |
| 0.75% of first $100 million |
| 0.65% over $100 million |
Aggressive Growth (Janus) |
| 0.55% of first $100 million |
| 0.50% of next $400 million |
| 0.45% over $500 million |
Mid Cap Opportunity (Goldman Sachs) |
| 0.60% of first $100 million |
| 0.55% of next $100 million |
| 0.50% over $200 million |
High Income Bond (Federated Investment) |
| 0.50% of first $30 million |
| 0.40% of next $20 million |
| 0.30% of next $25 million |
| 0.25% over $75 million |
| 125 | (continued) |
| Ohio National Fund, Inc. |
Notes to Financial Statements (Continued) | December 31, 2013 |
Bristol (Suffolk) |
| 0.45% of first $100 million |
| 0.40% of next $400 million |
| 0.35% over $500 million |
Balanced (ICON) |
| 0.40% of first $200 million |
| 0.35% of next $300 million |
| 0.30% over $500 million |
Bristol Growth (Suffolk) |
| 0.45% of first $100 million |
| 0.40% of next $400 million |
| 0.35% over $500 million |
Bryton Growth (Suffolk) |
| 0.50% of first $100 million |
| 0.45% of next $400 million |
| 0.40% over $500 million |
Target VIP (First Trust) |
| 0.35% of first $500 million |
| 0.25% over $500 million |
| 4 | Effective June 1, 2013, Federated Global agreed to waive sub-advisory fees, with respect to the International Portfolio, at an annualized rate of 0.40% of the Portfolio’s first $200 million of average daily net assets, and 0.35% of the Portfolio’s average daily net assets thereafter. Waivers related to the International Portfolio are voluntary and are not subject to recoupment in subsequent periods. This waiver will continue for a yet undetermined amount of time. The amount of the waiver for the year ended December 31, 2013 was $429,788. As sub-advisory fees represent an expense of ONI rather than the Fund, the expenses of the International Portfolio are unaffected by the sub-advisory fee waiver. |
| 5 | Effective December 21, 2013, Janus, the sub-advisor for the Small Cap Growth Portfolio, agreed to revise the rates used to calculate the sub-advisory fees for the Small Cap Growth Portfolio. The sub-advisory fee breakpoint schedule for the Small Cap Growth Portfolio prior to December 21, 2013 was: |
| 0.60% of first $150 million of average daily net assets |
| 0.50% over $150 million of average daily net assets. |
Suffolk, the sub-adviser for the Omni, Bristol, Bryton Growth, and Bristol Growth Portfolios has an affiliation with ONI. Ohio National Financial Services, Inc. (ONFS) owns 100% of ONLIC, the parent company of ONI, and also owns 84.7% of the voting securities of Suffolk. There were no Fund liabilities payable to Suffolk at December 31, 2013 and fees paid to Suffolk are an expense of ONI, not of the Fund.
Pursuant to a service agreement among ONI, ONLIC and the Fund, ONLIC has agreed to provide personnel and facilities to ONI on a cost-reimbursement basis. These personnel members include officers of the Fund. ONLIC also provides clerical and administrative services and such supplies and equipment as may be reasonably required in order for ONI to properly perform its advisory function pursuant to the Investment Advisory Agreement. ONLIC further performs duties to fulfill the transfer agent function on behalf of the Fund. Performance of these duties by ONLIC and availability of facilities, personnel, supplies, and equipment does not represent an expense to the Fund in excess of the advisory fees paid to ONI.
Pursuant to the Investment Advisory Agreement, if the total expenses applicable to any Portfolio during any calendar quarter (excluding taxes, brokerage commissions, interest expense and management fees) exceed 1%, on an annualized basis, evaluated quarterly, of such Portfolio’s average daily net asset value, ONI will reimburse the Portfolio for such excess expenses. There were no expense reimbursements associated with this agreement during the year ended December 31, 2013.
During the year ended December 31, 2013, ONI voluntarily reimbursed the amount of daily gross expenses of the Money Market Portfolio in excess of daily income earned by the Portfolio. The amount reimbursed to the Portfolio for the year ended December 31, 2013 was $700,798, of which $63,711 was receivable from ONI at December 31, 2013. This reimbursement is also not subject to recoupment in subsequent periods.
The Investment Advisory Agreement allows for a portion of the expenses related to the Fund’s Chief Compliance Officer and staff to be incurred by the Fund and paid from the Fund to the Fund’s adviser, ONI. Pursuant to the service agreement among ONI, ONLIC, and the Fund, ONLIC has provided the personnel, services, and equipment necessary to perform the Fund’s regulation-mandated compliance function and ONI has reimbursed ONLIC for such costs. For the year ended December 31, 2013, the Fund incurred compliance expenses totaling $222,160, which was equally allocated to the Portfolios. Expenses incurred by the Portfolios are reflected on the Statements of Operations as “Compliance expense”.
| 126 | (continued) |
| Ohio National Fund, Inc. |
Notes to Financial Statements (Continued) | December 31, 2013 |
Each director of the Board is currently paid a quarterly retainer fee of $11,000, $3,000 for each Board meeting attended, $1,000 for each Audit Committee meeting attended, and $500 for each other Board committee or independent directors meetings attended. The Board chair receives an additional quarterly retainer fee of $3,750, the lead independent director of the Board receives an additional quarterly retainer fee of $3,125, and the Audit Committee chair receives an additional quarterly retainer fee of $1,250. For the year ended December 31, 2013, directors’ compensation and reimbursement of director expenses by the Portfolios of the Fund totaled $347,406.
U.S. Bancorp Fund Services, LLC, 615 East Michigan Street, Milwaukee, Wisconsin, serves as the accounting agent for all but the International and International Small-Mid Company Portfolios. U.S. Bank Institutional Trust & Custody, 425 Walnut Street, Cincinnati, Ohio serves as the custodian for all but the International and International Small-Mid Company Portfolios. The accounting agent and custodian for the International and International Small-Mid Company Portfolios is State Street Bank-Kansas City, 801 Pennsylvania Ave., Kansas City, Missouri. For assets held outside the United States, U.S. Bank and State Street Bank-Kansas City enter into sub-custodial agreements, subject to approval by the Board.
| (4) | Capital Share Transactions |
Capital share transactions for the years ended December 31, 2013 and 2012, respectively, were as follows:
| Equity | Money Market | Bond | ||||||||||||||||||||||
| Year Ended 12/31/2013 | Year Ended 12/31/2012 | Year Ended 12/31/2013 | Year Ended 12/31/2012 | Year Ended 12/31/2013 | Year Ended 12/31/2012 | |||||||||||||||||||
Capital shares issued on sales | 515,918 | 623,661 | 23,585,774 | 17,885,924 | 2,809,937 | 3,488,174 | ||||||||||||||||||
Capital shares issued in mergers | — | — | — | — | — | — | ||||||||||||||||||
Capital shares issued on reinvested dividends | 64,139 | 121,339 | — | — | — | — | ||||||||||||||||||
Capital shares redeemed | (1,711,261 | ) | (2,033,054 | ) | (23,336,528 | ) | (20,644,112 | ) | (3,976,364 | ) | (3,594,023 | ) | ||||||||||||
|
|
|
|
|
|
|
|
|
|
|
| |||||||||||||
Net increase/(decrease) | (1,131,204 | ) | (1,288,054 | ) | 249,246 | (2,758,188 | ) | (1,166,427 | ) | (105,849 | ) | |||||||||||||
|
|
|
|
|
|
|
|
|
|
|
| |||||||||||||
| Omni | International | Capital Appreciation | ||||||||||||||||||||||
| Year Ended 12/31/2013 | Year Ended 12/31/2012 | Year Ended 12/31/2013 | Year Ended 12/31/2012 | Year Ended 12/31/2013 | Year Ended 12/31/2012 | |||||||||||||||||||
Capital shares issued on sales | 176,693 | 161,999 | 1,926,632 | 1,497,944 | 593,769 | 519,553 | ||||||||||||||||||
Capital shares issued in mergers | — | — | — | — | — | — | ||||||||||||||||||
Capital shares issued on reinvested dividends | 17,206 | 26,019 | — | — | 18,126 | 30,035 | ||||||||||||||||||
Capital shares redeemed | (425,132 | ) | (492,128 | ) | (2,786,945 | ) | (3,706,950 | ) | (1,153,773 | ) | (1,339,064 | ) | ||||||||||||
|
|
|
|
|
|
|
|
|
|
|
| |||||||||||||
Net increase/(decrease) | (231,233 | ) | (304,110 | ) | (860,313 | ) | (2,209,006 | ) | (541,878 | ) | (789,476 | ) | ||||||||||||
|
|
|
|
|
|
|
|
|
|
|
| |||||||||||||
| International Small-Mid Company | Aggressive Growth | Small Cap Growth | ||||||||||||||||||||||
| Year Ended 12/31/2013 | Year Ended 12/31/2012 | Year Ended 12/31/2013 | Year Ended 12/31/2012 | Year Ended 12/31/2013 | Year Ended 12/31/2012 | |||||||||||||||||||
Capital shares issued on sales | 402,135 | 485,545 | 782,997 | 1,042,101 | 1,619,206 | 626,681 | ||||||||||||||||||
Capital shares issued in mergers | — | — | — | — | 1,827,307 | — | ||||||||||||||||||
Capital shares issued on reinvested dividends | — | — | — | — | — | — | ||||||||||||||||||
Capital shares redeemed | (579,882 | ) | (742,828 | ) | (1,116,885 | ) | (882,813 | ) | (853,578 | ) | (767,540 | ) | ||||||||||||
|
|
|
|
|
|
|
|
|
|
|
| |||||||||||||
Net increase/(decrease) | (177,747 | ) | (257,283 | ) | (333,888 | ) | 159,288 | 2,592,935 | (140,859 | ) | ||||||||||||||
|
|
|
|
|
|
|
|
|
|
|
| |||||||||||||
| Mid Cap Opportunity | S&P 500® Index | Strategic Value | ||||||||||||||||||||||
| Year Ended 12/31/2013 | Year Ended 12/31/2012 | Year Ended 12/31/2013 | Year Ended 12/31/2012 | Year Ended 12/31/2013 | Year Ended 12/31/2012 | |||||||||||||||||||
Capital shares issued on sales | 627,288 | 549,005 | 5,465,467 | 3,730,507 | 10,435,476 | 23,078,732 | ||||||||||||||||||
Capital shares issued in mergers | — | — | — | — | — | — | ||||||||||||||||||
Capital shares issued on reinvested dividends | — | — | 190,796 | 189,836 | 748,162 | 351,423 | ||||||||||||||||||
Capital shares redeemed | (832,398 | ) | (831,618 | ) | (3,383,311 | ) | (3,031,332 | ) | (4,995,971 | ) | (3,236,694 | ) | ||||||||||||
|
|
|
|
|
|
|
|
|
|
|
| |||||||||||||
Net increase/(decrease) | (205,110 | ) | (282,613 | ) | 2,272,952 | 889,011 | 6,187,667 | 20,193,461 | ||||||||||||||||
|
|
|
|
|
|
|
|
|
|
|
| |||||||||||||
| 127 | (continued) |
| Ohio National Fund, Inc. |
Notes to Financial Statements (Continued) | December 31, 2013 |
| High Income Bond | Capital Growth | Nasdaq-100® Index | ||||||||||||||||||||||
| Year Ended 12/31/2013 | Year Ended 12/31/2012 | Year Ended 12/31/2013 | Year Ended 12/31/2012 | Year Ended 12/31/2013 | Year Ended 12/31/2012 | |||||||||||||||||||
Capital shares issued on sales | 3,549,427 | 6,070,090 | 691,020 | 427,102 | 4,349,341 | 3,852,022 | ||||||||||||||||||
Capital shares issued in mergers | — | — | — | — | — | — | ||||||||||||||||||
Capital shares issued on reinvested dividends | — | — | — | — | 70,558 | 65,966 | ||||||||||||||||||
Capital shares redeemed | (5,196,081 | ) | (5,662,829 | ) | (475,222 | ) | (526,289 | ) | (4,066,393 | ) | (3,392,616 | ) | ||||||||||||
|
|
|
|
|
|
|
|
|
|
|
| |||||||||||||
Net increase/(decrease) | (1,646,654 | ) | 407,261 | 215,798 | (99,187 | ) | 353,506 | 525,372 | ||||||||||||||||
|
|
|
|
|
|
|
|
|
|
|
| |||||||||||||
| Bristol | Bryton Growth | Balanced | ||||||||||||||||||||||
| Year Ended 12/31/2013 | Year Ended 12/31/2012 | Year Ended 12/31/2013 | Year Ended 12/31/2012 | Year Ended 12/31/2013 | Year Ended 12/31/2012 | |||||||||||||||||||
Capital shares issued on sales | 969,452 | 2,698,502 | 885,169 | 2,464,569 | 8,612,004 | 4,132,176 | ||||||||||||||||||
Capital shares issued in mergers | — | — | — | — | 1,724,803 | — | ||||||||||||||||||
Capital shares issued on reinvested dividends | 59,821 | 89,395 | — | — | 93,889 | — | ||||||||||||||||||
Capital shares redeemed | (4,117,944 | ) | (3,705,062 | ) | (3,016,683 | ) | (3,580,153 | ) | (1,500,790 | ) | (464,792 | ) | ||||||||||||
|
|
|
|
|
|
|
|
|
|
|
| |||||||||||||
Net increase/(decrease) | (3,088,671 | ) | (917,165 | ) | (2,131,514 | ) | (1,115,584 | ) | 8,929,906 | 3,667,384 | ||||||||||||||
|
|
|
|
|
|
|
|
|
|
|
| |||||||||||||
| Target VIP | Bristol Growth | |||||||||||||||||||||||
| Year Ended 12/31/2013 | Year Ended 12/31/2012 | Year Ended 12/31/2013 | Year Ended 12/31/2012 | |||||||||||||||||||||
Capital shares issued on sales | 212,729 | 292,064 | 781,980 | 2,078,689 | ||||||||||||||||||||
Capital shares issued in mergers | 1,982,908 | — | — | — | ||||||||||||||||||||
Capital shares issued on reinvested dividends | 15,316 | 29,837 | 33,717 | 44,746 | ||||||||||||||||||||
Capital shares redeemed | (385,906 | ) | (535,048 | ) | (2,642,261 | ) | (2,365,571 | ) | ||||||||||||||||
|
|
|
|
|
|
|
| |||||||||||||||||
Net increase/(decrease) | 1,825,047 | (213,147 | ) | (1,826,564 | ) | (242,136 | ) | |||||||||||||||||
|
|
|
|
|
|
|
| |||||||||||||||||
| (5) | Investment Transactions |
Cost of purchases and proceeds from sales of investments (excluding short-term and government securities) for the year ended December 31, 2013 were as follows:
| Equity | Bond | Omni | International | Capital Appreciation | ||||||||||||||||
Cost of purchases | $ | 87,504,898 | $ | 9,548,629 | $ | 71,360,560 | $ | 95,057,140 | $ | 60,055,059 | ||||||||||
Proceeds from sales | $ | 114,575,418 | $ | 28,623,979 | $ | 74,933,219 | $ | 104,893,219 | $ | 70,787,981 | ||||||||||
| International Small-Mid Company | Aggressive Growth | Small Cap Growth | Mid Cap Opportunity | S&P 500® Index | ||||||||||||||||
Cost of purchases | $ | 33,541,765 | $ | 19,777,459 | $ | 44,679,227 | $ | 32,915,276 | $ | 80,196,698 | ||||||||||
Proceeds from sales | $ | 39,866,731 | $ | 21,247,835 | $ | 34,092,577 | $ | 39,303,380 | $ | 38,314,094 | ||||||||||
| Strategic Value | High Income Bond | Capital Growth | Nasdaq-100® Index | Bristol | ||||||||||||||||
Cost of purchases | $ | 153,149,470 | $ | 87,648,824 | $ | 35,544,234 | $ | 38,173,571 | $ | 587,234,410 | ||||||||||
Proceeds from sales | $ | 66,366,499 | $ | 100,768,072 | $ | 28,047,351 | $ | 33,073,092 | $ | 633,389,368 | ||||||||||
| Bryton Growth | Balanced | Target VIP | Bristol Growth | |||||||||||||||||
Cost of purchases | $ | 306,132,198 | $ | 202,213,170 | $ | 14,535,204 | $ | 271,547,268 | ||||||||||||
Proceeds from sales | $ | 336,677,245 | $ | 99,623,020 | $ | 16,381,469 | $ | 292,034,380 | ||||||||||||
Cost of purchases and proceeds from sales of government securities for the year ended December 31, 2013 were as follows:
| Bond | Omni | Balanced | ||||||||||
Cost of purchases | $ | 13,394,219 | $ | — | $ | 23,839,542 | ||||||
Proceeds from sales | $ | 11,959,375 | $ | 113,844 | $ | 11,202,078 | ||||||
| 128 | (continued) |
| Ohio National Fund, Inc. |
Notes to Financial Statements (Continued) | December 31, 2013 |
| (6) | Financial Instruments |
The Fund’s Portfolios, other than the Money Market Portfolio, may trade in financial instruments with off-balance sheet risk for hedging purposes or, otherwise, in accordance with stated investing objectives. These financial instruments may include options, futures, and foreign currency contracts that may involve, to a varying degree, elements of risk in excess of the amounts recognized on financial statements.
Options
A Portfolio may buy and write (i.e., sell) call and put options. In writing call options, the Portfolio gives the purchaser of the call option the right to purchase the underlying securities from the Portfolio at a specified “exercise” price at any time prior to the expiration of the option, normally within nine months. A Portfolio writes a covered call option when it owns the underlying securities and an uncovered call option when it does not. In purchasing put options, a Portfolio pays the seller of the put option a premium for the right of the Portfolio to sell the underlying securities to the seller at a specified exercise price prior to the expiration of the option. When a Portfolio sells a put option, it has the obligation to buy, and the purchaser of the put the right to sell, the underlying security at the exercise price during the option period. Whenever a Portfolio has a written covered call option outstanding, the underlying securities will be segregated by the Custodian and held in an escrow account to assure that such securities will be delivered to the option holder if the option is exercised. While the underlying securities are subject to the option, the Portfolio remains the record owner of the securities, entitling it to receive dividends and to exercise any voting rights. Whenever a Portfolio has a written uncovered call option outstanding, it will segregate with the Custodian cash or liquid assets that, when added to the amounts deposited with the broker as margin, equal to the market value of the securities underlying the call option (but not less than the exercise price of the call option). To cover a written put option, the Portfolio writing the option deposits cash or liquid securities in a segregated account at the Custodian. In order to terminate its position as the writer or the purchaser of an option, the Portfolio may enter into a “closing” transaction, which is the purchase (if the Portfolio has written the option) or sale (if the Portfolio is the purchaser of the option) of an option on the same underlying securities and having the same exercise price and expiration date as the option previously written or purchased by the Portfolio.
When a Portfolio writes a put or call option, an amount equal to the premium received is included on the Statement of Assets and Liabilities as a liability. The amount of the liability is subsequently marked-to-market to reflect the current market value of the option. Such liability is subject to off balance sheet risks to the extent of any future increases in market value of the written options. If an option expires on its stipulated expiration date or if the Portfolio enters into a closing purchase transaction, a gain or loss is realized. If a written call option on an individual security is exercised, a gain or loss is realized for the sale of the underlying security, and the proceeds from the sale are increased by the premium originally received. If a written call option on a securities index is exercised, a gain or loss is realized as determined by the premium originally received, the exercise price and the market value of the index. If a written put option on an individual security is exercised, the cost of the security acquired is decreased by the premium originally received. When a Portfolio purchases a put or call option, an amount equal to the premium paid is included on the Portfolio’s Statement of Assets and Liabilities as an investment, and is subsequently marked-to-market to reflect the current market value of the option. If an option expires on the stipulated expiration date or if the Portfolio enters into a closing sale transaction, a gain or loss is realized. If a Portfolio exercises a call option on an individual security, the cost of the security acquired is increased by the premium paid for the call. If the Portfolio exercises a put option on an individual security, a gain or loss is realized from the sale of the underlying security, and the proceeds from such a sale are decreased by the premium originally paid. If the Portfolio exercises a put option on a security index, a gain or loss is realized as determined by the premium originally paid, the exercise price and the market value of the index.
The Balanced Portfolio wrote call options and purchased put options associated with the S&P 500 Index during the year ended December 31, 2013. These instruments were used by the Portfolio to provide a hedge against equity price risk. During a period in which the prices of the Portfolio’s common stocks may decline, these instruments are designed to increase in value, thus providing price accumulation gains that partially offset the price accumulation losses of the common stocks in the Portfolio.
The Balanced Portfolio’s written call options are collateralized by cash and/or securities held with the Portfolio’s prime broker and in segregated accounts at the Portfolio’s custodian. Such collateral holdings are restricted from use. The cash collateral or borrowings from the prime broker, if necessary, are included on the Statement of Assets and Liabilities. The securities pledged as collateral are noted as such on the Portfolio’s Schedules of Investments. Written and purchased options are non-income producing securities.
| 129 | (continued) |
| Ohio National Fund, Inc. |
Notes to Financial Statements (Continued) | December 31, 2013 |
The activity in the number of option contracts written and the premiums received by the Balanced Portfolio for the year ended December 31, 2013 are as follows:
| Number of Contracts | Premiums Received | |||||||
Options outstanding, beginning of year | — | $ | — | |||||
Options written | 2,599 | 5,327,559 | ||||||
Options exercised | — | — | ||||||
Options expired | — | — | ||||||
Options closed | (2,254 | ) | (4,253,771 | ) | ||||
|
|
|
| |||||
Options outstanding, end of year | 345 | $ | 1,073,788 | |||||
|
|
|
| |||||
Transactions involving purchased options by the Balanced Portfolio for the year ended December 31, 2013 were: Cost of purchases: $ 6,135,095, Proceeds from sales: $1,904,062, Expirations: $1,571,300.
Futures Contracts
A Portfolio may buy or sell two kinds of financial futures contracts: stock index futures contracts and interest rate futures contracts. Stock index futures contracts are contracts developed by and traded on national commodity exchanges whereby the buyer will, on a specified future date, pay or receive a final cash payment equal to the difference between the actual value of the stock index on the last day of the contract and the value of the stock index established by the contract multiplied by the specific dollar amount set by the exchange. Futures contracts may be based on broad-based stock indexes such as the S&P 500 Index or on narrow-based stock indexes. A particular index will be selected according to the Adviser’s investment strategy for the particular Portfolio. An interest rate futures contract is an agreement whereby one party agrees to sell and another party agrees to purchase a specified amount of a specified financial instrument (debt security) at a specified price at a specified date, time and place. Although interest rate futures contracts typically require actual future delivery of and payment for financial instruments, the contracts are usually closed out before the delivery date. A public market exists in interest rate futures contracts covering primarily the following financial instruments: U.S. Treasury bonds; U.S. Treasury notes; Government National Mortgage Association (GNMA) modified pass-through mortgage-backed securities; three-month U.S. Treasury bills; 90-day commercial paper; bank certificates of deposit; and Eurodollar certificates of deposit. U.S. futures contracts are traded on exchanges which have been designated “contract markets” by the Commodities Futures Trading Commission (“CFTC”) and must be executed through a futures commission merchant (“FCM”), or brokerage firm, which is a member of the relevant contract market. It is expected that futures contracts trading in additional financial instruments will be authorized.
The Fund, on behalf of each Portfolio, has filed with the National Futures Association, a notice claiming an exclusion from the definition of the term “commodity pool operator” under the Commodity Exchange Act, as amended, and the rules of the Commodity Futures Trading Commission promulgated thereunder, with respect to each Portfolio’s operation. Accordingly, the Portfolios are not subject to registration or regulation as a commodity pool operator.
The buyer or seller of a futures contract is not required to deliver or pay for the underlying instrument unless the contract is held until the delivery date. However, both the buyer and seller are required to deposit “initial margin” for the benefit of the broker when the contract is entered into. Initial margin deposits are equal to a percentage of the contract’s value, as set by the exchange on which the contract is traded, and are similar to good faith deposits or performance bonds.
Unlike margin extended by a securities broker, initial margin payments do not constitute purchasing securities on margin for purposes of a Portfolio’s investment limitations. A Portfolio, its futures commission merchant and the Custodian retain control of the initial margin until the contract is liquidated. If the value of either party’s position declines, that party will be required to make additional “variation margin” payments to settle the change in value on a daily basis. The party that has a gain may be entitled to receive all or a portion of this amount. In the event of the bankruptcy of the FCM that holds margin on behalf of a Portfolio, the Portfolio may be entitled to return of margin owed to the Portfolio only in proportion to the amount received by the FCM’s other customers. ONI and the Sub-Advisers will attempt to minimize this risk by carefully monitoring the creditworthiness of the FCMs with which the Portfolios do business. In addition to the margin restrictions discussed above, transactions in futures contracts and options on futures contracts may involve the segregation of funds pursuant to requirements imposed by the SEC. Under those requirements, where a Portfolio has a long position in a futures contract or sells a put option, it will be required to establish a segregated account (not with an FCM or broker) containing cash or certain liquid assets equal to the purchase price of the
| 130 | (continued) |
| Ohio National Fund, Inc. |
Notes to Financial Statements (Continued) | December 31, 2013 |
contract or the exercise price of the option (less any margin on deposit). For a short position in futures contacts held by a Portfolio or call options sold by a Portfolio, those requirements mandate the establishment of a segregated account (not with a futures commission merchant or broker) containing cash or certain liquid assets that, when added to the amounts deposited as margin, equal the market value of the instruments underlying the futures contracts or call options. However, segregation of assets is not required if a Portfolio “covers” its position.
At December 31, 2013, there was one outstanding futures contract in the International Portfolio. Details of this contract were as follows:
Type | Description | Expiration | Number of Contracts | Counterparty | Contract at Value | Initial Contract Amount | Unrealized Appreciation (Depreciation) | Variation Margin Receivable (Payable) | ||||||||||||||||||
Long | Mini MSCI EAFE March14 | March 21, 2014 | 40 | J.P. Morgan Securities LLC | $ | 3,835,600 | $ | 3,665,070 | $ | 170,530 | $ | 11,000 | ||||||||||||||
The International Portfolio’s holdings of U.S. Treasury Bills, as noted on the Portfolio’s Schedule of Investments, were pledged at December 31, 2013 as collateral for this contract. The cost and value of the amount pledged at December 31, 2013 were each $219,982.
This futures contract was executed for the purpose of increasing exposure to an attractive equities market, beyond that evidenced by the Portfolio’s investment in common stocks, while maintaining a significant cash balance that could be used for potentially higher-than-average shareholder transactions. There were other index futures contracts that were executed and closed in the International Portfolio during the year ended December 31, 2013. These were executed for similar purposes as those for futures contracts outstanding at December 31, 2013. For the year ended December 31, 2013, the notional values of futures contracts opened and closed prior to contract settlement date by the International Portfolio were approximately $26.5 million and $24.8 million, respectively.
Foreign Currency Contracts
In order to hedge against changes in the exchange rates of foreign currencies in relation to the U.S. dollar, each Portfolio, other than the Money Market Portfolio, may engage in forward foreign currency contracts, foreign currency options and foreign currency futures contracts in connection with the purchase, sale or ownership of a specific security. The International Portfolio, International Small-Mid Company Portfolio, Strategic Value Portfolio and High Income Bond Portfolio may engage in non-hedging related transactions to implement their investment strategies.
The Portfolios generally conduct their foreign currency exchange transactions on a spot (i.e., cash) basis at the spot rate prevailing in the foreign exchange currency market. When a Portfolio purchases or sells a security denominated in or exposed to a foreign currency, it may enter into a forward foreign currency contract (“forward contract”) for the purchase or sale, for a fixed amount of dollars, of the amount of currency involved in the underlying security transaction. A forward contract involves an obligation to purchase or sell a specific currency at a future date, which may be any fixed number of days from the date of the contract agreed upon by the parties, at a price set at the time of the contract. In this manner, a Portfolio may obtain protection against a possible loss resulting from an adverse change in the relationship between the U.S. dollar and the foreign currency during the period between the date the security is purchased or sold and the date upon which payment is made or received. Although such contracts tend to minimize the risk of loss due to the decline in the value of the hedged currency, at the same time they tend to limit any potential gain which might result should the value of such currency increase.
Forward contracts are traded in the interbank market conducted directly between currency traders (usually large commercial banks) and their customers. Generally a forward contract has no deposit requirement, and no commissions are charged. Although foreign exchange dealers do not charge a fee for conversion, they do realize a profit based on the difference between the prices at which they buy and sell various currencies. When the Portfolio manager believes that the currency of a particular foreign country may suffer a substantial decline against the U.S. dollar, a Portfolio may enter into a forward contract to sell, for a fixed amount of dollars, the amount of foreign currency approximating the value of some or all of that Portfolio’s securities denominated in or exposed to such foreign currency. No Portfolio will enter into such forward contracts or maintain a net exposure to such contracts where the consummation of the contracts would obligate the Portfolio to deliver an amount of foreign currency in excess of the value of its assets denominated in or exposed to that currency. At the consummation of a forward contract for delivery by a Portfolio of a foreign currency, the Portfolio may either make delivery of the foreign currency or
| 131 | (continued) |
| Ohio National Fund, Inc. |
Notes to Financial Statements (Continued) | December 31, 2013 |
terminate its contractual obligation to deliver the foreign currency by purchasing an offsetting contract obligating it to purchase, at the same maturity date, the same amount of the foreign currency. If the Portfolio chooses to make delivery of the foreign currency, it may be required to obtain such currency through the sale of its securities denominated in such currency or through conversion of other Portfolio assets into such currency. It is impossible to forecast the market value of Portfolio securities at the expiration of the forward contract. Accordingly, it may be necessary for the Portfolio to purchase additional foreign currency on the spot market (and bear the expense of such purchase) if the market value of the security is less than the amount of foreign currency the Portfolio is obligated to deliver, and if a decision is made to sell the security and make delivery of the foreign currency. Conversely, it may be necessary for the Portfolio to sell on the spot market some of the foreign currency received on the sale of its hedged security if the security’s market value exceeds the amount of foreign currency the Portfolio is obligated to deliver.
If the Portfolio retains the hedged security and engages in an offsetting transaction, it will incur a gain or loss to the extent that there has been movement in spot or forward contract prices. If a Portfolio engages in an offsetting transaction, it may subsequently enter into a new forward contract to sell the foreign currency. Should forward prices decline during the period between the Portfolio’s entering into a forward contract for the sale of a foreign currency and the date it enters into an offsetting contract for the purchase of the foreign currency, the Portfolio will realize a gain to the extent the price of the currency it has agreed to sell exceeds the price of the currency it has agreed to purchase. Should forward prices increase, the Portfolio will suffer a loss to the extent the price of the currency it has agreed to purchase exceeds the price of the currency it has agreed to sell.
Buyers and sellers of foreign currency options and futures contracts are subject to the same risks previously described with respect to options and futures generally. In addition, settlement of currency options and futures contracts with respect to most currencies must occur at a bank located in the issuing nation. The ability to establish and close out positions on such options is subject to the maintenance of a liquid market that may not always be available. Currency rates may fluctuate based on political considerations and governmental actions as opposed to purely economic factors.
Predicting the movements of foreign currency in relation to the U.S. dollar is difficult and requires different skills than those necessary to predict movements in the securities market. There is no assurance that the use of foreign currency hedging transactions can successfully protect a Portfolio against loss resulting from the movements of foreign currency in relation to the U.S. dollar. In addition, it must be remembered that these methods of protecting the value of a Portfolio’s securities against a decline in the value of a currency does not eliminate fluctuations in the underlying prices of the securities. It simply establishes a rate of exchange which can be achieved at some future point in time. Additionally, although such contracts tend to minimize the risk of loss due to the decline in the value of the hedged currency, at the same time they tend to limit any potential gain which might result should the value of such currency increase.
Foreign currency contracts were executed in the International Portfolio in order to mitigate the effect that exchange rate volatility had on the valuation of the Portfolio’s investments that were either under-weighted or over-weighted in relation to the Portfolio’s benchmark index. The Portfolio was under-weighted in equity investments within the countries of Australia and Great Britain. The Portfolio executed contracts to buy those countries’ currencies to mitigate the effects that volatility in those currencies’ exchange rates might otherwise have on the Portfolio’s performance relative to the benchmark. The Portfolio was over-weighted in equity investments within Japan and, likewise, executed contracts to sell the Japanese Yen in order to mitigate the effect that volatility in the exchange rate might otherwise have on relative performance.
The Portfolio entered into other foreign currency contracts during the year for similar benchmark performance hedging purposes. The Portfolio also entered into contracts that were the inverse of previously executed contracts to effectively exit prior contracts earlier than stated contract delivery dates, as investment over-weights or under-weights were reduced, or as previously executed contracts resulted in an attractive return to the Portfolio. For the year ended December 31, 2013, the notional value of foreign currency contracts executed by the International Portfolio were approximately $248.0 million for currencies bought and approximately $265.4 million for currencies sold.
| 132 | (continued) |
| Ohio National Fund, Inc. |
Notes to Financial Statements (Continued) | December 31, 2013 |
The values and financial statement effects of derivative instruments that were not accounted for as hedging instruments as of, and for the year ended December 31, 2013, are as follows:
Portfolio | Instrument | Primary Risk Type | Value- Asset Derivatives | Value-Liability Derivatives | Location on Statements of Assets and Liabilities | |||||||||||
International | Contracts to buy foreign currencies | Currency exchange rate | $ | 16,105,384 | $ | (15,976,994 | ) | (1 | ) | |||||||
|
|
|
| |||||||||||||
Contracts to sell foreign currencies | Currency exchange rate | $ | 31,772,951 | $ | (31,120,942 | ) | (1 | ) | ||||||||
|
|
|
| |||||||||||||
Futures contracts | Equity price | $ | 3,835,600 | $ | (3,665,070 | ) | (2 | ) | ||||||||
|
|
|
| |||||||||||||
Balanced | Purchased options | Equity price | $ | 515,900 | $ | — | (3 | ) | ||||||||
|
|
|
| |||||||||||||
Written options | Equity price | $ | — | $ | (1,794,000 | ) | (4 | ) | ||||||||
|
|
|
| |||||||||||||
| (1) | Net unrealized appreciation on foreign currency contacts |
| (2) | Net unrealized appreciation on futures contracts |
| (3) | Investments in securities, at value |
| (4) | Options written, at value |
Portfolio | Instrument | Risk Type | Realized Gain (Loss) on Derivatives Recognized in Income | Change in Unrealized Appreciation/ Depreciation on Derivatives Recognized in Income | Location on Statements of Operations | |||||||||||
International | Contracts to buy foreign currencies | Currency exchange rate | $ | 1,613,554 | $ | 31,040 | (1 | ), (2) | ||||||||
|
|
|
| |||||||||||||
Futures contracts | Equity price | $ | 85,295 | $ | 186,528 | (3 | ), (4) | |||||||||
|
|
|
| |||||||||||||
Balanced | Purchased options | Equity price | $ | (3,614,333 | ) | $ | (501,900 | ) | (5 | ), (6) | ||||||
|
|
|
| |||||||||||||
Written options | Equity price | $ | (1,261,352 | ) | $ | (720,212 | ) | (7 | ), (8) | |||||||
|
|
|
| |||||||||||||
| (1) | Net realized gain (loss) on foreign currency contracts |
| (2) | Change in unrealized appreciation/depreciation on foreign currency contracts |
| (3) | Net realized gain (loss) on futures contracts |
| (4) | Change in unrealized appreciation/depreciation on futures contracts |
| (5) | Net realized gain (loss) on investments |
| (6) | Change in unrealized appreciation/depreciation on investments |
| (7) | Net realized gain (loss) on written options |
| (8) | Change in unrealized appreciation/depreciation on written options |
The Portfolios may enter into International Swaps and Derivatives Association, Inc. Master Agreements (“ISDA Master Agreement”) or similar agreements with their derivative contract counterparties whereby the Portfolios may, under certain circumstances, offset with the counterparty certain derivative financial instruments’ payables and/or receivables and create one single net payment. Under certain of the ISDA Master Agreements in place at December 31, 2013, the Portfolios are subject to master netting agreements (“MNA”) that allows for amounts owed between each Portfolio and the counterparty to their transactions to be netted. The party that has the larger payable pays the excess of the larger amount over the smaller amount to the other party. The MNAs do not apply to amounts owed to or from different counterparties; further, certain of the MNAs limit offsetting for forward foreign currency contracts to amounts owed in the same currency and on the same exchange date.
For financial reporting purposes, the Portfolios offset derivative assets and liabilities that are subject to netting arrangements in the Statement of Assets and Liabilities.
| 133 | (continued) |
| Ohio National Fund, Inc. |
Notes to Financial Statements (Continued) | December 31, 2013 |
Contracts Subject to Master Netting Agreements:
The following table presents the Portfolios' derivative assets by counterparty net of amounts available for offset under a MNA as of December 31, 2013:
Portfolio | Counterparty | Currency | Exchange Date | Derivative Asset Subject to a MNA by Counterparty | Derivative Liability Available for Offset | Net Asset presented in the Statement of Assets and Liabilities | ||||||||||||
| $ | — | $ | — | $ | — | |||||||||||||
The following table presents the Portfolios' derivative liabilities by counterparty net of amounts available for offset under a MNA as of December 31, 2013:
Portfolio | Counterparty | Currency | Exchange Date | Derivative Liability Subject to a MNA by Counterparty | Derivative Asset Available for Offset | Net Liability presented in the Statement of Assets and Liabilities | ||||||||||||||||||
International | | HSBC Bank USA, N.A. | | | New Russian Ruble | | 1/10/2014 | $ | (2,505 | ) | $ | — | $ | (2,505 | ) | |||||||||
International | | HSBC Bank USA, N.A. | | | New Russian Ruble | | 1/10/2014 | (18,194 | ) | — | (18,194 | ) | ||||||||||||
| (7) | Federal Income Tax Information |
At December 31, 2013, the components of accumulated earnings (deficit) on a tax basis were as follows:
Portfolio | Undistributed Ordinary Income | Undistributed Long-Term Capital Gains (Losses) | Accumulated Earnings | Accumulated Capital and Other Losses | Unrealized Appreciation (Depreciation)(1) | Total Accumulated Earnings (Deficit) | ||||||||||||||||||
Equity | $ | 195,315 | $ | — | $ | 195,315 | $ | (80,847,968 | ) | $ | 58,890,679 | $ | (21,761,974 | ) | ||||||||||
Money Market | — | — | — | — | — | — | ||||||||||||||||||
Bond | 5,136,321 | — | 5,136,321 | (11,359,324 | ) | 4,890,364 | (1,332,639 | ) | ||||||||||||||||
Omni | 47,856 | 1,392,053 | 1,439,909 | — | 5,156,001 | 6,595,910 | ||||||||||||||||||
International | 4,327,327 | — | 4,327,327 | (82,441,780 | ) | 43,424,191 | (34,690,262 | ) | ||||||||||||||||
Capital Appreciation | 38,483 | 2,473,177 | 2,511,660 | — | 37,834,187 | 40,345,847 | ||||||||||||||||||
International Small-Mid Company | 196,447 | — | 196,447 | (4,996,215 | ) | 24,104,770 | 19,305,002 | |||||||||||||||||
Aggressive Growth | — | 4,354,957 | 4,354,957 | — | 12,150,098 | 16,505,055 | ||||||||||||||||||
Small Cap Growth | 9,138,338 | 5,632,628 | 14,770,966 | — | 14,314,489 | 29,085,455 | ||||||||||||||||||
Mid Cap Opportunity | — | — | — | (16,040,289 | ) | 22,156,920 | 6,116,631 | |||||||||||||||||
S&P 500® Index | 1,619,406 | 1,815,582 | 3,434,988 | — | 105,328,542 | 108,763,530 | ||||||||||||||||||
Strategic Value | 1,494,003 | 3,914,512 | 5,408,515 | — | 40,785,316 | 46,193,831 | ||||||||||||||||||
High Income Bond | 20,030,437 | 3,010,714 | 23,041,151 | — | 14,167,916 | 37,209,067 | ||||||||||||||||||
Capital Growth | — | 5,394,332 | 5,394,332 | — | 21,624,481 | 27,018,813 | ||||||||||||||||||
Nasdaq-100® Index | 620,118 | 4,823,541 | 5,443,659 | — | 34,885,724 | 40,329,383 | ||||||||||||||||||
Bristol | 33,732,626 | 15,725,437 | 49,458,063 | — | 35,532,297 | 84,990,360 | ||||||||||||||||||
Bryton Growth | 29,437,097 | 8,632,382 | 38,069,479 | — | 19,740,742 | 57,810,221 | ||||||||||||||||||
Balanced | 3,029,753 | 2,158,843 | 5,188,596 | (4,045,759 | ) | 20,302,153 | 21,444,990 | |||||||||||||||||
Target VIP | 25,680 | 41,541 | 67,221 | (13,226,124 | ) | 8,570,170 | (4,588,733 | ) | ||||||||||||||||
Bristol Growth | 16,110,913 | 7,443,807 | 23,554,720 | — | 19,135,689 | 42,690,409 | ||||||||||||||||||
| (1) | The differences between book-basis and tax-basis unrealized appreciation/(depreciation) are attributed primarily to tax deferral of losses on wash sales and the realization for tax purposes of unrealized gains/(losses) on certain instruments. |
| 134 | (continued) |
| Ohio National Fund, Inc. |
Notes to Financial Statements (Continued) | December 31, 2013 |
For Federal income tax purposes, the following Portfolios had capital loss carry forwards as of December 31, 2013 that are available to offset future realized gains, if any:
| Total Loss Carryforward | Expiration | |||||||||||||||||||||||||||
Portfolio | 2015 | 2016 | 2017 | 2018 | No Expiration Short Term | No Expiration Long Term | ||||||||||||||||||||||
Equity | $ | 80,847,968 | $ | — | $ | 30,407,841 | $ | 47,422,387 | $ | 3,017,740 | $ | — | $ | — | ||||||||||||||
Bond | 11,359,324 | — | 1,836,570 | 9,522,754 | — | — | — | |||||||||||||||||||||
International. | 82,441,780 | — | 16,649,650 | 65,792,130 | — | — | — | |||||||||||||||||||||
International Small-Mid Company | 4,996,215 | — | — | 4,996,215 | — | — | — | |||||||||||||||||||||
Mid Cap Opportunity | 16,040,289 | — | 2,388,829 | 13,651,460 | — | — | — | |||||||||||||||||||||
Balanced | 4,045,759 | 39,341 | 4,006,418 | — | — | — | — | |||||||||||||||||||||
Target VIP | 13,226,124 | — | 12,624,380 | — | — | 583,431 | 18,313 | |||||||||||||||||||||
The tax characteristics of distributions paid to shareholders for the year ended December 31, 2013 were as follows:
Portfolio | Ordinary Income | Net Long-Term Capital Gains | Total Distribution Paid | |||||||||
Equity | $ | 1,826,670 | $ | — | $ | 1,826,670 | ||||||
Omni | 362,024 | — | 362,024 | |||||||||
Capital Appreciation | 545,051 | — | 545,051 | |||||||||
S&P 500® Index | 3,617,496 | — | 3,617,496 | |||||||||
Strategic Value | 9,524,108 | — | 9,524,108 | |||||||||
Nasdaq-100® Index | 631,494 | — | 631,494 | |||||||||
Bristol | 1,050,451 | — | 1,050,451 | |||||||||
Balanced | 1,674,034 | — | 1,674,034 | |||||||||
Target VIP | 201,405 | — | 201,405 | |||||||||
Bristol Growth | 476,090 | — | 476,090 | |||||||||
The tax characteristics of distributions paid to shareholders for the year ended December 31, 2012 were as follows:
Portfolio | Ordinary Income | Net Long-Term Capital Gains | Total Distribution Paid | |||||||||
Equity | $ | 2,551,766 | $ | — | $ | 2,551,766 | ||||||
Omni | 434,512 | — | 434,512 | |||||||||
Capital Appreciation | 681,205 | — | 681,205 | |||||||||
S&P 500® Index | 2,826,655 | — | 2,826,655 | |||||||||
Strategic Value | 3,918,367 | — | 3,918,367 | |||||||||
Nasdaq-100® Index | 447,911 | — | 447,911 | |||||||||
Bristol | 1,149,626 | — | 1,149,626 | |||||||||
Target VIP | 297,777 | — | 297,777 | |||||||||
Bristol Growth | 473,865 | — | 473,865 | |||||||||
| 135 | (continued) |
Ohio National Fund, Inc.
Notes to Financial Statements (Continued) | December 31, 2013 |
During the year, the Fund recorded classifications within the composition of net assets for permanent book/tax differences. These classifications were as follows:
| Equity | Money Market | Bond | Omni | International | Capital Appreciation | International Small-Mid Company | Aggressive Growth | Small Cap Growth | Mid Cap Opportunity | |||||||||||||||||||||||||||||||
Consent distributions | ||||||||||||||||||||||||||||||||||||||||
Paid in capital in excess of par value | $ | 345,167 | $ | — | $ | 5,756,080 | $ | 116,546 | $ | 5,607,011 | $ | 89,207 | $ | 324,350 | $ | 103,178 | $ | 5,887,844 | $ | — | ||||||||||||||||||||
Undistributed net investment income | (345,167 | ) | — | (5,756,080 | ) | (116,546 | ) | (5,607,011 | ) | (89,207 | ) | (324,350 | ) | (103,178 | ) | — | — | |||||||||||||||||||||||
Accumulated net realized gain (loss) on investments | — | — | — | — | — | — | — | — | (5,887,844 | ) | — | |||||||||||||||||||||||||||||
Undistributed net investment losses | ||||||||||||||||||||||||||||||||||||||||
Paid in capital in excess of par value | — | — | — | — | — | — | — | (88,323 | ) | — | (177,380 | ) | ||||||||||||||||||||||||||||
Undistributed net investment income | — | — | — | — | — | — | — | 88,323 | 223,881 | 209,683 | ||||||||||||||||||||||||||||||
Accumulated net realized gain (loss) on investments | — | — | — | — | — | — | — | — | (223,881 | ) | (32,303 | ) | ||||||||||||||||||||||||||||
Foreign currency related reclassifications | ||||||||||||||||||||||||||||||||||||||||
Paid in capital in excess of par value | — | — | — | — | — | — | — | — | — | — | ||||||||||||||||||||||||||||||
Undistributed net investment income | — | — | — | — | 1,017,605 | (923 | ) | (80,501 | ) | (796 | ) | 191 | (86 | ) | ||||||||||||||||||||||||||
Accumulated net realized gain (loss) on investments | — | — | — | — | (1,017,605 | ) | 923 | 80,501 | 796 | (191 | ) | 86 | ||||||||||||||||||||||||||||
Real estate investment trust (REIT) reclassifications | ||||||||||||||||||||||||||||||||||||||||
Undistributed net investment income | (22,041 | ) | — | — | — | — | — | — | — | — | — | |||||||||||||||||||||||||||||
Accumulated net realized gain (loss) on investments | 22,041 | — | — | — | — | — | — | — | — | — | ||||||||||||||||||||||||||||||
Passive Foreign Investment Company (PFIC) reclassifications | ||||||||||||||||||||||||||||||||||||||||
Undistributed net investment income | — | — | — | 5,304 | — | — | — | — | — | — | ||||||||||||||||||||||||||||||
Accumulated net realized gain (loss) on investments | — | — | — | (5,304 | ) | — | — | — | — | — | — | |||||||||||||||||||||||||||||
Loss carryforward transfers (Reorganizations) | ||||||||||||||||||||||||||||||||||||||||
Paid in capital in excess of par value | — | — | — | — | — | — | — | — | — | — | ||||||||||||||||||||||||||||||
Accumulated net realized gain (loss) on investments | — | — | — | — | — | — | — | — | — | — | ||||||||||||||||||||||||||||||
Wash sale transfers (Reorganizations) | ||||||||||||||||||||||||||||||||||||||||
Paid in capital in excess of par value | — | — | — | — | — | — | — | — | 87,457 | — | ||||||||||||||||||||||||||||||
Accumulated net realized gain (loss) on investments | — | — | — | — | — | — | — | — | (87,457 | ) | — | |||||||||||||||||||||||||||||
Reclassifications for partnership sales/basis | ||||||||||||||||||||||||||||||||||||||||
Undistributed net investment income | — | — | — | — | — | 5,857 | — | — | (95,548 | ) | — | |||||||||||||||||||||||||||||
Accumulated net realized gain (loss) on investments | — | — | — | — | — | (5,857 | ) | — | — | 95,548 | — | |||||||||||||||||||||||||||||
Other permanent differences | ||||||||||||||||||||||||||||||||||||||||
Paid in capital in excess of par value | — | — | — | — | — | — | — | — | (9 | ) | — | |||||||||||||||||||||||||||||
Undistributed net investment income | — | — | — | — | — | — | — | — | 8 | — | ||||||||||||||||||||||||||||||
Accumulated net realized gain (loss) on investments | — | — | — | — | — | — | — | — | 1 | — | ||||||||||||||||||||||||||||||
| 136 | (continued) |
Ohio National Fund, Inc.
Notes to Financial Statements (Continued) | December 31, 2013 |
| S&P 500® Index | Strategic Value | High Income Bond | Capital Growth | Nasdaq-100® Index | Bristol | Bryton Growth | Balanced | Target VIP | Bristol Growth | |||||||||||||||||||||||||||||||
Consent distributions | ||||||||||||||||||||||||||||||||||||||||
Paid in capital in excess of par value | $749,028 | $ | 2,248,422 | $ | 25,975,744 | $ | 3,848,793 | $ | 676,065 | $ | 8,446,177 | $ | 12,205,743 | $ | 652,789 | $ | 79,803 | $ | 6,929,210 | |||||||||||||||||||||
Undistributed net investment income | (749,028) | (2,248,422 | ) | (21,277,132 | ) | — | (196,220 | ) | (492,524 | ) | — | (652,789 | ) | (79,803 | ) | (250,386 | ) | |||||||||||||||||||||||
Accumulated net realized gain (loss) on investments | — | — | (4,698,612 | ) | (3,848,793 | ) | (479,845 | ) | (7,953,653 | ) | (12,205,743 | ) | — | — | (6,678,824 | ) | ||||||||||||||||||||||||
Undistributed net investment losses | ||||||||||||||||||||||||||||||||||||||||
Paid in capital in excess of par value | — | — | — | (322,730 | ) | — | — | — | — | — | — | |||||||||||||||||||||||||||||
Undistributed net investment income | — | — | — | 322,730 | — | — | 1,025,958 | — | — | — | ||||||||||||||||||||||||||||||
Accumulated net realized gain (loss) on investments | — | — | — | — | — | — | (1,025,958 | ) | — | — | — | |||||||||||||||||||||||||||||
Foreign currency related reclassifications | ||||||||||||||||||||||||||||||||||||||||
Paid in capital in excess of par value | — | — | — | — | — | — | — | (43,159 | ) | — | — | |||||||||||||||||||||||||||||
Undistributed net investment income | — | (35,518 | ) | — | — | — | — | — | (208 | ) | 38 | — | ||||||||||||||||||||||||||||
Accumulated net realized gain (loss) on investments | — | 35,518 | — | — | — | — | — | 43,367 | (38 | ) | — | |||||||||||||||||||||||||||||
Real estate investment trust (REIT) reclassifications | ||||||||||||||||||||||||||||||||||||||||
Undistributed net investment income | (38,056) | (10,264 | ) | — | (2,413 | ) | — | — | — | — | — | — | ||||||||||||||||||||||||||||
Accumulated net realized gain (loss) on investments | 38,056 | 10,264 | — | 2,413 | — | — | — | — | — | — | ||||||||||||||||||||||||||||||
Passive Foreign Investment Company (PFIC) reclassifications | ||||||||||||||||||||||||||||||||||||||||
Undistributed net investment income | — | — | — | — | — | 55,617 | — | — | — | 29,066 | ||||||||||||||||||||||||||||||
Accumulated net realized gain (loss) on investments | — | — | — | — | — | (55,617 | ) | — | — | — | (29,066 | ) | ||||||||||||||||||||||||||||
Loss carryforward transfers (Reorganizations) | ||||||||||||||||||||||||||||||||||||||||
Paid in capital in excess of par value | — | — | — | — | — | — | — | 4,208,831 | 13,423,600 | — | ||||||||||||||||||||||||||||||
Accumulated net realized gain (loss) on investments | — | — | — | — | — | — | — | (4,208,831 | ) | (13,423,600 | ) | — | ||||||||||||||||||||||||||||
Wash sale transfers (Reorganizations) | ||||||||||||||||||||||||||||||||||||||||
Paid in capital in excess of par value | — | — | — | — | — | — | — | — | 21,864 | — | ||||||||||||||||||||||||||||||
Accumulated net realized gain (loss) on investments | — | — | — | — | — | — | — | — | (21,864 | ) | — | |||||||||||||||||||||||||||||
Reclassifications for partnership sales/basis | ||||||||||||||||||||||||||||||||||||||||
Undistributed net investment income | 90 | — | — | (22,186 | ) | — | — | — | (17,320 | ) | — | — | ||||||||||||||||||||||||||||
Accumulated net realized gain (loss) on investments | (90) | — | — | 22,186 | — | — | — | 17,320 | — | — | ||||||||||||||||||||||||||||||
Other permanent differences | ||||||||||||||||||||||||||||||||||||||||
Paid in capital in excess of par value | — | — | — | 1 | — | — | — | — | 1 | — | ||||||||||||||||||||||||||||||
Undistributed net investment income | (198) | (446 | ) | — | — | — | — | — | — | (1 | ) | — | ||||||||||||||||||||||||||||
Accumulated net realized gain (loss) on investments | 198 | 446 | — | (1 | ) | — | — | — | — | — | — | |||||||||||||||||||||||||||||
| 137 | (continued) |
| Ohio National Fund, Inc. |
Notes to Financial Statements (Continued) | December 31, 2013 |
The cost basis for Federal income tax purposes may differ from the cost basis for financial reporting purposes. The table below details the unrealized appreciation (depreciation) and aggregate cost of securities at December 31, 2013 for Federal income tax purposes.
| Equity | Bond | Omni | International | Capital Appreciation | International Small-Mid Company | |||||||||||||||||||
Gross unrealized: | ||||||||||||||||||||||||
Appreciation | $ | 60,600,725 | $ | 7,575,519 | $ | 5,693,931 | $ | 47,656,415 | $ | 38,894,427 | $ | 24,706,477 | ||||||||||||
Depreciation | (1,710,046 | ) | (2,685,155 | ) | (537,930 | ) | (4,232,224 | ) | (1,060,240 | ) | (601,707 | ) | ||||||||||||
|
|
|
|
|
|
|
|
|
|
|
| |||||||||||||
Net unrealized appreciation (depreciation) | $ | 58,890,679 | $ | 4,890,364 | $ | 5,156,001 | $ | 43,424,191 | $ | 37,834,187 | $ | 24,104,770 | ||||||||||||
|
|
|
|
|
|
|
|
|
|
|
| |||||||||||||
Aggregate cost of securities: | $ | 164,884,877 | $ | 143,296,149 | $ | 32,683,343 | $ | 143,100,453 | $ | 101,782,590 | $ | 52,896,686 | ||||||||||||
|
|
|
|
|
|
|
|
|
|
|
| |||||||||||||
| Aggressive Growth | Small Cap Growth | Mid Cap Opportunity | S&P 500® Index | Strategic Value | High Income Bond | |||||||||||||||||||
Gross unrealized: | ||||||||||||||||||||||||
Appreciation | $ | 12,327,851 | $ | 15,382,641 | $ | 22,678,656 | $ | 120,701,544 | $ | 45,364,672 | $ | 16,614,511 | ||||||||||||
Depreciation | (177,753 | ) | (1,068,152 | ) | (521,736 | ) | (15,373,002 | ) | (4,579,356 | ) | (2,446,595 | ) | ||||||||||||
|
|
|
|
|
|
|
|
|
|
|
| |||||||||||||
Net unrealized appreciation (depreciation) | $ | 12,150,098 | $ | 14,314,489 | $ | 22,156,920 | $ | 105,328,542 | $ | 40,785,316 | $ | 14,167,916 | ||||||||||||
|
|
|
|
|
|
|
|
|
|
|
| |||||||||||||
Aggregate cost of securities: | $ | 27,630,284 | $ | 95,605,630 | $ | 61,040,456 | $ | 209,383,958 | $ | 357,472,911 | $ | 286,434,476 | ||||||||||||
|
|
|
|
|
|
|
|
|
|
|
| |||||||||||||
| Capital Growth | Nasdaq-100® Index | Bristol | Bryton Growth | Balanced | Target VIP | |||||||||||||||||||
Gross unrealized: | ||||||||||||||||||||||||
Appreciation | $ | 22,855,799 | $ | 36,055,223 | $ | 38,631,517 | $ | 27,142,790 | $ | 23,340,824 | $ | 9,134,122 | ||||||||||||
Depreciation | (1,231,318 | ) | (1,169,499 | ) | (3,099,220 | ) | (7,402,048 | ) | (3,038,671 | ) | (563,952 | ) | ||||||||||||
|
|
|
|
|
|
|
|
|
|
|
| |||||||||||||
Net unrealized appreciation (depreciation) | $ | 21,624,481 | $ | 34,885,724 | $ | 35,532,297 | $ | 19,740,742 | $ | 20,302,153 | $ | 8,570,170 | ||||||||||||
|
|
|
|
|
|
|
|
|
|
|
| |||||||||||||
Aggregate cost of securities: | $ | 58,588,568 | $ | 61,475,531 | $ | 196,725,049 | $ | 162,672,295 | $ | 226,364,838 | $ | 45,096,818 | ||||||||||||
|
|
|
|
|
|
|
|
|
|
|
| |||||||||||||
| Bristol Growth | ||||||||||||||||||||||||
Gross unrealized: | ||||||||||||||||||||||||
Appreciation | $ | 19,785,498 | ||||||||||||||||||||||
Depreciation | (649,809 | ) | ||||||||||||||||||||||
|
| |||||||||||||||||||||||
Net unrealized appreciation (depreciation) | $ | 19,135,689 | ||||||||||||||||||||||
|
| |||||||||||||||||||||||
Aggregate cost of securities: | $ | 104,030,305 | ||||||||||||||||||||||
|
| |||||||||||||||||||||||
| (8) | Portfolio Reorganizations |
On August 15, 2013 the Board approved reorganizations pursuant to which the assets of each of the Millennium Portfolio, U.S. Equity Portfolio, Income Opportunity Portfolio, Target Equity/Income Portfolio (the “Target Portfolios”) assets were acquired, and each of the Portfolio’s liabilities were assumed, by the Portfolio (the “Survivor Portfolio”) listed opposite the Target Portfolio in the chart below, in exchange for shares of the Survivor Portfolio.
Target Portfolios | Reorganized into | Survivor Portfolios | ||
Millennium Portfolio | –> | Small Cap Growth Portfolio | ||
U.S. Equity Portfolio | –> | Balanced Portfolio | ||
Income Opportunity Portfolio | –> | Balanced Portfolio | ||
Target Equity/Income Portfolio | –> | Target VIP Portfolio |
| 138 | (continued) |
| Ohio National Fund, Inc. |
Notes to Financial Statements (Continued) | December 31, 2013 |
The combination of assets for each reorganization presented opportunities for operational efficiencies, which should translate to a decrease in the rate of future expenses borne by the shareholders of the Survivor Portfolios. It is anticipated that no gain or loss for Federal income tax purposes will be recognized by Portfolio shareholders as a result of the reorganizations. All fees and expenses incurred directly as a result of the reorganizations were borne by ONI.
Pursuant to the reorganizations, effective as of the end of business on December 20, 2013, the shares of each Target Portfolio were liquidated, and shares of each Survivor Portfolio were distributed to the Target Portfolio shareholders at the same aggregate dollar value as those of the Target Portfolio. The liquidation of Target Portfolio shares and distribution of Survivor Portfolio shares resulting from the reorganizations are summarized below:
Target Portfolios prior to the reorganizations: |
| |||||||||||||||
| Millennium | U.S. Equity | Income Opportunity | Target Equity/Income | |||||||||||||
Investment portfolio fair value | $ | 43,849,121 | $ | 20,528,779 | $ | 10,379,448 | $ | 26,630,851 | ||||||||
Investment portfolio cost | $ | 35,391,865 | $ | 15,033,647 | $ | 8,485,600 | $ | 21,271,896 | ||||||||
Net assets | $ | 40,746,730 | $ | 20,548,098 | $ | 10,355,723 | $ | 26,663,158 | ||||||||
Net asset value (per share, extended) | $ | 33.555758 | $ | 14.981354 | $ | 13.539697 | $ | 10.421887 | ||||||||
Shares | 1,214,299 | 1,371,578 | 764,842 | 2,558,381 | ||||||||||||
Survivor Portfolios prior to the reorganizations: | ||||||||||||
| Small Cap Growth | Balanced | Target VIP | ||||||||||
Investment portfolio fair value | $ | 67,507,607 | $ | 213,044,965 | $ | 26,371,063 | ||||||
Investment portfolio cost | $ | 55,193,157 | $ | 199,844,176 | $ | 19,483,116 | ||||||
Net assets | $ | 67,423,458 | $ | 212,172,596 | $ | 26,394,891 | ||||||
Net asset value (per share, extended) | $ | 22.298786 | $ | 17.917306 | $ | 13.446489 | ||||||
Shares | 3,023,638 | 11,841,769 | 1,962,958 | |||||||||
Survivor Portfolios subsequent to the reorganizations: | ||||||||||||
| Small Cap Growth | Balanced | Target VIP | ||||||||||
Investment portfolio fair value | $ | 111,356,728 | $ | 243,953,192 | $ | 53,001,914 | ||||||
Investment portfolio cost | $ | 90,585,022 | $ | 223,363,422 | $ | 40,755,013 | ||||||
Net assets | $ | 108,170,188 | $ | 243,076,418 | $ | 53,058,048 | ||||||
Net asset value (per share, extended) | $ | 22.298786 | $ | 17.917306 | $ | 13.446489 | ||||||
Shares | 4,850,945 | 13,566,572 | 3,945,866 | |||||||||
Assuming that each transaction had been completed on January 1, 2013, the beginning of the annual reporting period for the Fund, the pro forma results of operations for each Survivor Portfolio for the year ended December 31, 2013, are as follows:
Small Cap Growth Portfolio | ||||
Net investment loss | $ | (273,480 | ) | |
Net realized/unrealized gains | 33,706,684 | |||
|
| |||
Change in net assets resulting from operations | $ | 33,433,204 | ||
|
| |||
Balanced Portfolio | ||||
Net investment income | $ | 2,214,840 | ||
Net realized/unrealized gains | 22,460,256 | |||
|
| |||
Change in net assets resulting from operations | $ | 24,675,096 | ||
|
| |||
Target VIP Portfolio | ||||
Net investment income | $ | 631,958 | ||
Net realized/unrealized gains | 13,534,467 | |||
|
| |||
Change in net assets resulting from operations | $ | 14,166,425 | ||
|
| |||
| 139 | (continued) |
| Ohio National Fund, Inc. |
Notes to Financial Statements (Continued) | December 31, 2013 |
| (9) | Legal Matters |
In December 2007, the Target Equity/Income Portfolio, as a shareholder of Lyondell Chemical Company (“Lyondell”), participated in a cash out merger of Lyondell in which it received $48 per share of consideration (the “Merger”). The value of the proceeds received by the Target Equity/Income Portfolio as a result of the Merger was $1,772,400. Lyondell later filed for bankruptcy and two entities created by the Lyondell bankruptcy plan of reorganization have initiated lawsuits seeking to recover, or clawback, proceeds received by shareholders in the December 2007 merger based on fraudulent transfer claims.
The first action, Edward S. Weisfelner, as Trustee of the LB Creditor Trust v. Morgan Stanley & Co., Inc., et. al., was initiated on October 22, 2010 (the “Creditor Trust Action”), in the Supreme Court of the State of New York in the County of New York but has subsequently been removed to the U.S. Bankruptcy Court for the Southern District of New York. The second action, Edward S. Weisfelner, as Trustee of the LB Litigation Trust v. Holmes TTEE, et. al., was initiated on December 23, 2010 (the “Litigation Trust Action”), in the U.S. Bankruptcy Court for the Southern District of New York. Both actions attempt to recover the proceeds paid out to the holders of Lyondell shares at the time of the 2007 merger.
On January 4, 2012, the Fund was named in a second amended complaint in the Creditor Trust Action. The Target Equity/Income Portfolio composes part of the Fund. On March 2, 2012, the Fund moved the U.S. Bankruptcy Court for the Southern District of New York to dismiss it from the Creditor Trust Action. On January 14, 2014, the Court denied the motion to dismiss. The outcome of these proceedings on the Portfolio cannot be predicted. As a result of the aforementioned reorganization involving the Target Equity/Income Portfolio, any future claim that may result from these complaints will be assumed by the Target VIP Portfolio as the Survivor Portfolio. Management of the Fund continues to assess the cases and has not yet determined the potential effect, if any, on the net asset value of the Target VIP Portfolio.
Also, in December 2007, the S&P 500® Index and Strategic Value Portfolios, shareholders of the Tribune Company, participated in a similar cash out merger in which shareholders received $34 per share of consideration. The value of the proceeds received by the S&P 500® Index and Strategic Value Portfolios, was $37,910 and $384,200, respectively. The company subsequently filed for bankruptcy and several legal complaints have been initiated by groups of Tribune Company creditors seeking to recover, or clawback, proceeds received by shareholders based on fraudulent transfer claims (the “Tribune Bankruptcy”).
The first action, Official Committee of Unsecured Creditors of Tribune Company v. FitzSimons, et. al. (“FitzSimons”) was initiated on November 1, 2010 in the U.S. Bankruptcy Court for the District of Delaware. As a result of these proceedings, the Court agreed to allow individual creditors to file similar complaints in U.S. state courts. The Fund is specifically named in a complaint in the U.S. District Court, Southern District of Ohio, Western Division, Deutsche Bank Trust Company Americas, et. al. v. American Electric Power, et. al., that was initiated in June of 2011. The Fund, along with the Strategic Value Portfolio, is also named in a similar complaint in the U.S. District Court, Eastern District of Pennsylvania, Deutsche Bank Trust Company Americas, et. al. v. Ametek Inc. Employees Master Retirement Trust, et. al. These Tribune litigation actions have been consolidated into a single Multidistrict Litigation (“MDL”) in the U.S. District Court, Southern District of New York. Pursuant to a Court order dated September 7, 2012, certain defendants in the MDL, including the Fund, filed a motion to dismiss on November 6, 2012. The Court granted the motion to dismiss on September 23, 2013. Pending an appeal, only the actual fraudulent transfer claims as alleged in FitzSimons remain. The outcome of these proceedings on the two Portfolios of the Fund cannot be predicted. Management of the Fund continues to assess the litigation and any offers of settlement.
| 140 |
| Ohio National Fund, Inc. |
The Board of Directors and Shareholders Ohio National Fund, Inc.:
We have audited the accompanying statements of assets and liabilities of the Equity Portfolio, Money Market Portfolio, Bond Portfolio, Omni Portfolio, International Portfolio, Capital Appreciation Portfolio, International Small-Mid Company Portfolio, Aggressive Growth Portfolio, Small Cap Growth Portfolio, Mid Cap Opportunity Portfolio, S&P 500 Index Portfolio, Strategic Value Portfolio, High Income Bond Portfolio, Capital Growth Portfolio, Nasdaq-100 Index Portfolio, Bristol Portfolio, Bryton Growth Portfolio, Balanced Portfolio, Target VIP Portfolio, and Bristol Growth Portfolio (each a Portfolio and collectively, the Portfolios of the Ohio National Fund, Inc.), including the schedules of investments, as of December 31, 2013, and the related statements of operations for the year then ended, the statements of changes in net assets for each of the years in the two-year period then ended, and the financial highlights for each of the years in the five-year period then ended. These financial statements and financial highlights are the responsibility of the Portfolios’ management. Our responsibility is to express an opinion on these financial statements and financial highlights based on our audits.
We conducted our audits in accordance with the standards of the Public Company Accounting Oversight Board (United States). Those standards require that we plan and perform the audits to obtain reasonable assurance about whether the financial statements and financial highlights are free of material misstatement. An audit includes examining, on a test basis, evidence supporting the amounts and disclosures in the financial statements. Our procedures included confirmation of securities owned as of December 31, 2013, by correspondence with custodians and brokers or by other appropriate auditing procedures. An audit also includes assessing the accounting principles used and significant estimates made by management, as well as evaluating the overall financial statement presentation. We believe that our audits provide a reasonable basis for our opinion.
In our opinion, the financial statements and financial highlights referred to above present fairly, in all material respects, the financial position of the Portfolios as of December 31, 2013, the results of their operations for the year then ended, the changes in their net assets for each of the years in the two-year period then ended, and the financial highlights for each of the years in the five-year period then ended, in conformity with U.S. generally accepted accounting principles.
/s/ KPMG LLP
Columbus, Ohio
February 19, 2014
| 141 |
| Ohio National Fund, Inc. |
| December 31, 2013 |
| (1) | Review and Approval of Advisory and Sub-advisory Agreements |
At a meeting held on November 19, 2013, the Board of Directors, including a majority of the Directors who are not “interested persons” of the Fund (the “Independent Directors”), approved the continuation of the Investment Advisory Agreement with ONI (the “Adviser”) and, as applicable, the sub-advisory agreement with the Sub-Adviser (each a “Sub-Adviser,” and together the “Sub-Advisers”) for each of the Portfolios identified below. The Independent Directors were separately represented by independent legal counsel in connection with their consideration of the approval of the continuation of these agreements.
The Directors noted that the Adviser is responsible for monitoring the investment performance and other responsibilities of the various Sub-Advisers that have day-to-day responsibility for the decisions made for certain of the Fund’s investment portfolios. They also noted that the Adviser reports to the Fund’s Board on its analysis of each Sub-Adviser’s performance at the regular meetings of the Board, which are held at least quarterly. Where warranted, the Adviser will add or remove a particular Sub-Adviser from a watchlist that it maintains. Watchlist criteria include, for example: (a) fund performance over various time periods; (b) fund risk issues, such as changes in key personnel involved with fund management or changes in investment philosophy or process; and (c) organizational risk issues, such as regulatory, compliance or legal concerns, or changes in the ownership of the Sub-Adviser.
In considering the Investment Advisory and sub-advisory agreements, the Board requested and reviewed a significant amount of information relating to each Portfolio, the Adviser and the Sub-Advisers, including the following: (1) performance data for each Portfolio for various time periods, including year-to-date through October 31, 2013, (2) comparative performance, advisory fee and expense ratio information for a peer group of funds in the respective Portfolio’s Morningstar category (a “Morningstar Peer Group”), as well as management fee peer comparison charts showing where each Portfolio’s advisory fee was located in the dispersion of its peer funds’ advisory fees; (3) comparable performance information for each Portfolio’s relevant benchmark index or indices; (4) comparative data regarding advisory fees, including data regarding the fees charged by the Adviser and Sub-Advisers for managing other institutional funds and institutional accounts using investment strategies and techniques similar to those used in managing the Portfolios; (5) comparative data regarding the expense ratio of each Portfolio, as compared to its Morningstar Peer Group; (6) profitability analyses for the Adviser with respect to each Portfolio; and (7) other information regarding the nature, extent and quality of services provided by the Adviser and the Sub-Advisers, as applicable. The Directors also took into account information on the services provided by the Adviser and each Sub-Adviser and performance, fee and expense ratio information regarding each Portfolio provided to them periodically throughout the year. They also met with a representative of the Adviser to review the relative performance of each Portfolio, as compared with its benchmark(s) and peers, and in particular discussed those Portfolios that were on the watchlist.
The Directors, including all of the Independent Directors, were assisted by experienced independent legal counsel throughout the contract review process. The Independent Directors discussed the proposed continuances in private session with such counsel at which no representatives of management, the Adviser or any Sub-Adviser were present. The Directors, including all of the Independent Directors, relied upon the advice of independent legal counsel and their own business judgment in determining the material factors to be considered in evaluating the Advisory Agreement and each sub-advisory agreement and the weight to be given to each such factor. The conclusions reached by the Directors were based on a comprehensive evaluation of all of the information provided and were not the result of any one factor. Moreover, each Director may have afforded different weight to the various factors in reaching his or her conclusions with respect to the Advisory Agreement and each sub-advisory agreement.
Nature, Extent and Quality of Services
The Board evaluated the nature, extent and quality of the advisory services provided to the Portfolios by the Adviser. As part of its review, the Board reviewed information regarding the Adviser’s operations, procedures and personnel. The Directors took into account information they received during the previous year at Board meetings and other discussions and through periodic reports regarding the Adviser’s performance of its duties. The Directors considered the capabilities and resources that the Adviser has dedicated to performing services on behalf of the Fund and its Portfolios. The quality of administrative and other services, including the Adviser’s role in monitoring the performance and quality of compliance of the Sub-Advisers, also was considered. The Directors also considered the quality of the compliance programs of the Adviser and its responsiveness to inquiries and requests from the Board.
For each Portfolio subject to a sub-advisory agreement (all Portfolios other than the Money Market Portfolio, Bond Portfolio, S&P 500® Index Portfolio, Nasdaq-100® Index Portfolio and the fixed income portion of the Omni Portfolio), the Board considered similar criteria as applied to each Sub-Adviser, including the nature, extent and quality of the sub-advisory services provided by each Sub-Adviser. In addition to the criteria used to review the Adviser, the Directors reviewed biographical information on each Sub-Adviser’s portfolio management and other professional staff, and each Sub-Adviser’s brokerage practices, including any soft dollar benefits received. The Directors also reviewed the performance record of each Portfolio or portion of a Portfolio managed by the applicable Sub-Adviser. The Board also considered the quality of each Sub-Adviser’s compliance program as it relates to the applicable Portfolio. It was the Directors’ conclusion that overall, they were satisfied with the nature, extent and quality of services provided to the Fund and each of the Portfolios.
| 142 | (continued) |
| Ohio National Fund, Inc. |
Additional Information (Unaudited) (Continued) | December 31, 2013 |
Investment Performance
A representative of the Adviser reviewed with the Directors each Portfolio’s performance year-to-date and for the 1-, 3- and 5-year periods ended October 31, 2013, as compared to the Portfolio’s Morningstar Peer Group and benchmark(s). The Board also considered the Adviser’s effectiveness in monitoring the performance of each Sub-Adviser and the Adviser’s timeliness in responding to performance issues. A Portfolio-by-Portfolio discussion of each Portfolio’s performance and the Board’s conclusions regarding that performance is set forth below.
Fees and Expenses
The Board considered the advisory fee for each Portfolio, as well as the fee’s difference from the average advisory fee for the Portfolio’s Morningstar Peer Group and the fee’s percentile ranking within the peer group. The Board also considered charts showing, for each Portfolio, how the Portfolio’s advisory fees compared to the advisory fees of the funds in its peer group. The charts showed the number of funds in the peer group within each defined range of advisory fees, and the range that included the Portfolio. The Board also reviewed the difference between each Portfolio’s overall expense ratio and that of its Morningstar Peer Group, as well as the expense ratio’s percentile ranking within the peer group. For these purposes, the Morningstar Peer Group excluded funds with assets over $1 billion, funds of funds and index funds (non-index funds for the S&P 500® Index Portfolio and the Nasdaq-100® Index Portfolio.
In addition, the Board looked at the average assets for each fund in the respective peer group, and then compared the advisory fee that would have been paid by the Portfolio if the Portfolio had had assets equal to the peer group’s average assets. The Board considered that comparison on an absolute and percentile ranking basis.
For all Portfolios other than those sub-advised by Suffolk, an affiliate of the Adviser, the Board also considered the amount of net advisory fee retained by the Adviser, after payment of the sub-advisory fee, as well as the proportion the net fee represented of the total advisory fee, in light of the services provided by the Adviser to the Portfolio. In this regard, in those cases where the Sub-Adviser provides sub-advisory services to a similar fund with an unaffiliated investment adviser, the Board reviewed a comparison of the advisory and sub-advisory fees paid by the similar fund to the fees that would have been paid by the Portfolio if the Portfolio had assets equal to the assets of the similar fund.
The Board also considered the fees paid to Sub-Advisers. With respect to the Portfolios sub-advised by Suffolk, the Board evaluated the reasonableness of the total fees received by the Adviser. With respect to those Portfolios sub-advised by a Sub-Adviser that is not affiliated with the Adviser, the Board relied to a degree on the Adviser’s negotiation of each sub-advisory agreement on an arm’s-length basis, noting that in the past the Adviser has negotiated decreases in the sub-advisory fee for certain Portfolios and that the Adviser had always passed on the decrease by reducing its advisory fee by the same amount. Additionally, the Board considered the fees charged by the Adviser and Sub-Advisers to their separately managed institutional accounts and other accounts, and had no concerns with those rates relative to the fees charged to the Portfolio. The Directors also recognized that it is difficult to make comparisons of advisory fees because there are variations in the services that are included in the fees paid by other funds and separately managed accounts.
Profitability
The Board considered the advisory fee paid to the Adviser for each Portfolio and noted the pre-tax profit margins reported by the Adviser for each Portfolio. The Directors noted that the profit margins, with respect to the Portfolios that were profitable to the Adviser, were all within the range of profit margins reported in Lipper’s Investment Management Profitability Analysis reviewing the profitability of 26 investment managers in 2011 comprising nearly a quarter of investment company assets at the end of that year. The Directors also noted that the Adviser, and not the Portfolios, is responsible for paying sub-advisory fees to the Portfolio Sub-Advisers. The Board also evaluated whether the net advisory fee received by the Adviser for each Portfolio, after paying sub-advisory fees to the Sub-Adviser, was reasonable, given the level of the Adviser’s services to the Portfolio. The Directors took into account the fact that the Adviser is contractually obligated to reimburse each Portfolio for certain of its expenses should they exceed a specified amount. Additionally, the Directors acknowledged that calculating the Adviser’s profitability related to a specific Portfolio can be challenging and imprecise because of the difficulties in appropriately allocating the Adviser’s expenses across the Portfolios.
The Board also noted that the Adviser has been subsidizing the Money Market Portfolio to assure that it continues to be available to all of Ohio National Fund, Inc.’s shareholders (i.e., the shareholders of every Portfolio), so that shareholders in other Portfolios can elect to invest in the Money Market Portfolio to the extent they want to take a more defensive posture. Consequently, because the Adviser’s subsidization of the Money Market Portfolio benefits the shareholders of every Portfolio, the Board acknowledged that a portion of the costs incurred by the Adviser in subsidizing the Money Market Portfolio should be considered with respect to the Adviser’s profitability from managing each of the other Portfolios.
The Board also considered the reasonableness of the sub-advisory fees paid by the Adviser to each Sub-Adviser. The Directors relied on the ability of the Adviser to negotiate the terms of each sub-advisory agreement, including the sub-advisory fee, at arm’s-length, noting that the Adviser is not affiliated with any Portfolio Sub-Adviser other than Suffolk. Accordingly, the cost of services provided by each unaffiliated Sub-Adviser and the profitability to the Sub-Adviser of its relationship with the applicable Portfolio were not material factors in the Board’s deliberations. For similar reasons, the Board concluded that the potential realization of economies of scale by the Portfolios from the sub-advisory arrangements with the unaffiliated Sub-Advisers should not be a material factor in the Board’s deliberations.
| 143 | (continued) |
| Ohio National Fund, Inc. |
Additional Information (Unaudited) (Continued) | December 31, 2013 |
In considering the reasonableness of the sub-advisory fees payable by the Adviser to Suffolk, the Directors noted that the Adviser, not the Portfolios, is responsible for paying sub-advisory fees to Suffolk and therefore concluded that the profitability to Suffolk of its relationship to the applicable Portfolios should not be a material factor in the Board’s deliberations. For similar reasons, the Board concluded that the potential realization of economies of scale by the applicable Portfolios from the sub-advisory arrangements with Suffolk should not be a material factor in the Board’s deliberations.
After considering all of the above, the Board concluded that the profitability of the Adviser with respect to each Portfolio was reasonable.
Economies of Scale
The Directors noted that all of the advisory and sub-advisory fee schedules contain breakpoints that would reduce the applicable advisory or sub-advisory fees on assets above a specified level as the applicable Portfolio’s assets increase. The Directors also noted that a Portfolio would realize additional economies of scale if the Portfolio’s assets increase over time proportionately more than certain other expenses. The Directors took into account that many of the Portfolios had relatively few assets under management. After considering each Portfolio’s current size and potential for growth, the Board concluded that each Portfolio is likely to benefit from economies of scale as the Portfolio’s assets increase.
Portfolio-by-Portfolio Analysis
In addition to the foregoing, the Directors considered the specific factors and related conclusions set forth below with respect to each Portfolio’s performance and fees and expenses. Except as otherwise indicated, the performance data described below for each Portfolio is for periods ending October 31, 2013 and the advisory fee and expense data described below is through August 31, 2012 for a Portfolio’s Morningstar peer group and its Adjusted Peer Group.
Equity Portfolio (Adviser — ONI, Sub-Adviser — Legg Mason). The Portfolio outperformed its benchmark index and peer group average for the year-to-date and 1 year period, while underperforming its benchmark index and peer group average for the 3-year and 5-year periods. The Adviser noted that the Portfolio’s long-term performance was weighed down by underperformance in 2011, but that recent performance has been strong. The Directors noted that the Portfolio’s advisory fee was higher than the peer group average, but still within the range of its peers, and recognized that the Portfolio’s expense ratio was slightly above the peer group average. Overall, the Board concluded that the Portfolio’s performance was satisfactory and that the advisory and sub-advisory fees were reasonable.
Money Market Portfolio (Adviser — ONI). The Portfolio outperformed its peer group average for the year-to-date and trailing 1- and 3-year periods, but underperformed its peer group average for the 5-year period. The Directors noted that the Portfolio’s advisory fee and expense ratio were well below average relative to its peer group and that the Adviser has a negative profit margin for the Portfolio. Overall, the Board concluded that the Portfolio’s performance was satisfactory and that the advisory fee was reasonable.
Bond Portfolio (Adviser — ONI). Although the Portfolio underperformed its benchmark index and peer group average for the year-to-date, 1-, 3- and 5-year periods, it outperformed the peer group median for the 3-year and 5-year periods. The Adviser pointed out that recent periods had been difficult for active managers, and he noted that the Portfolio was in the top 9% of its peer group for 5-year performance. The Directors noted that, although the Portfolio’s advisory fee was slightly above the peer group average, the Portfolio’s expense ratio was below the peer group average. Overall, the Board concluded that the Portfolio’s performance was satisfactory and that the advisory fee was reasonable.
Omni Portfolio (Adviser — ONI, Sub-Adviser — Suffolk). The Omni Portfolio outperformed its benchmark index for the year-to-date, 1 and 5-year periods and its peer group average for the year-to-date, 1-, 3- and 5-year periods, while underperforming the benchmark index for the 3 year period. The Adviser pointed out that the Portfolio had performed in the top 1 percent of its peer group for the year-to-date and 1-year periods. The Board noted that the Portfolio’s advisory fee and expense ratio were below the Portfolio’s peer group average. Overall, the Board concluded that the Portfolio’s performance was satisfactory and that the advisory and sub-advisory fees were reasonable.
International Portfolio (Adviser — ONI, Sub-Adviser — Federated Global). The International Portfolio underperformed its benchmark index and peer group average for the year-to-date, 1- and 3-year periods, and outperformed its benchmark index and peer group average for the 5-year period. The Adviser pointed out that the Sub-Adviser’s early decision to invest in Japan had led to recent underperformance, and noted that while the Portfolio remained on the watchlist, its recent relative performance had improved significantly, and that it was in the top 8% of its peer group for 5-year performance. The Board noted that while the Portfolio’s advisory fee was above the peer group average, its expense ratio was at the peer group average. Overall, the Board concluded that the Portfolio’s performance was satisfactory and that the advisory and sub-advisory fees were reasonable.
Capital Appreciation Portfolio (Adviser — ONI, Sub-Adviser — Jennison). The Portfolio outperformed its benchmark index for the year-to-date, 1- and 5-year periods and its peer group average for the year-to-date 1-, 3- and 5-year periods, but underperformed the benchmark index for the 3-year period. The Board noted that the Portfolio’s advisory fee was higher than the peer group average, but still within the range of its peers, and recognized that the expense ratio was only slightly above average. Overall, the Board concluded that the Portfolio’s performance was satisfactory and that the advisory and sub-advisory fees were reasonable.
| 144 | (continued) |
| Ohio National Fund, Inc. |
Additional Information (Unaudited) (Continued) | December 31, 2013 |
International Small-Mid Company Portfolio (Adviser — ONI, Sub-Adviser — Federated Global). The Portfolio outperformed its benchmark index for the year-to-date, 1- and 3-year periods and peer group average for the year-to-date and 1-year periods, while underperforming the peer group average for the 3-year period and both the benchmark index and the peer group average for the 5-year period. The Board noted that the Portfolio’s advisory fee was slightly below the peer group average, and the expense ratio was below average relative to the peer group. Overall, the Board concluded that the Portfolio’s performance was satisfactory and that the advisory and sub-advisory fees were reasonable.
Aggressive Growth Portfolio (Adviser — ONI, Sub-Adviser — Janus). The Portfolio underperformed its benchmark index for the year-to-date, 1- and 3-year periods and peer group average for the year-to-date, 1-, 3- and 5-year periods. The Adviser pointed out that while the Portfolio remained on the watchlist, its performance since a new portfolio manager took over in June 2013 had been significantly better than its benchmark’s. The Board noted that the Portfolio’s advisory fee and expense ratio were both above average compared to its peer group, but that the advisory fee was still within the range of its peers. Overall, the Board concluded that the Portfolio’s performance was satisfactory and that the advisory and sub-advisory fees were reasonable.
Small Cap Growth Portfolio (Adviser — ONI, Sub-Adviser — Janus). The Portfolio has outperformed its benchmark for the 3- and 5-year periods and the peer group average for the year-to-date, 1-, 3- and 5-year periods, while underperforming the benchmark for the year-to-date and 1-year periods. The Board noted that the Portfolio’s advisory fee and expense ratio were both above average compared to its peer group, but that the advisory fee was still within the range of its peers. Overall, the Board concluded that the Portfolio’s performance was satisfactory and that the advisory and sub-advisory fees were reasonable.
Mid Cap Opportunity Portfolio (Adviser — ONI, Sub-Adviser — Goldman Sachs). The Board noted that the Portfolio underperformed its benchmark index for the year-to-date, 1-, 3- and 5-year periods and its peer group average for the year-to-date, 1- and 5-year periods, while outperforming the peer group average in the 3-year period. The Board also noted that the Portfolio remained on the watchlist. The Adviser pointed out that the Portfolio is not going to have good relative performance in strong upward markets. The Portfolio’s strategy is designed to capture smaller comparative gains in upward-trending markets and to capture comparatively smaller losses in downward-trending markets. The Board also noted that the Portfolio’s advisory fee was above the peer group average, although the Portfolio’s expense ratio was below the peer group average. Overall, the Board concluded that the Portfolio’s performance was satisfactory and that the advisory and sub-advisory fees were reasonable.
S&P 500® Index Portfolio (Adviser — ONI). While the Portfolio underperformed its benchmark for the year-to-date, 1-, 3- and 5-year periods, the Board noted that its performance generally was in line with the S&P 500® Index when expenses were excluded. The Board did not rely on peer group comparison figures for the Portfolio because the Board considers peer groups for index funds to be generally irrelevant. The Board noted that, while the advisory fee was above the peer group average, the overall expense ratio is the statistic most important to index fund shareholders, and the Portfolio’s expense ratio was slightly lower than the average for the peer group. Overall, the Board concluded that the Portfolio’s performance was satisfactory and that the advisory fees were reasonable.
Strategic Value Portfolio (Adviser — ONI, Sub-Adviser — Federated Equity). The Portfolio underperformed its benchmark index and its peer group average for the year-to-date, 1-, 3- and 5-year periods. The Board noted that the Portfolio remained on the watchlist. The Adviser pointed out that there is no good benchmark or peer group for this Portfolio, and that the benchmark and peer groups are not good indicators of how the Portfolio is performing. Instead, the Adviser said that the focus should be on whether the Portfolio is delivering dividend return and dividend growth, which it has been doing. The Directors noted that the Portfolio’s advisory fee was above average for the peer group, while the expense ratio was below the peer group average. Overall, the Board concluded that the Portfolio’s performance was satisfactory and that the advisory and sub-advisory fees were reasonable.
High Income Bond Portfolio (Adviser — ONI, Sub-Adviser — Federated Investment). The Portfolio underperformed its benchmark index for the year-to-date, 1-, 3- and 5-year periods, while outperforming its peer group average for the year-to-date, 3- and 5-year periods and underperforming its peer group average for the 1-year period. The Directors noted that the advisory fee was above the peer group average, while the expense ratio was below the peer group average. Overall, the Board concluded that the Portfolio’s performance was satisfactory and that the advisory and sub-advisory fees were reasonable.
Capital Growth Portfolio (Adviser — ONI, Sub-Adviser — Eagle). The Portfolio has underperformed its benchmark index and peer group average for the year-to-date, 1-, 3- and 5-year periods. The Board noted that the Portfolio remained on the watchlist. The Adviser pointed out that the Portfolio’s performance over 2013 has had a detrimental impact on comparative performance over each time period. The Directors noted that although the advisory fee was above average for the peer group, the expense ratio was below average. Overall, the Board concluded that the Portfolio’s performance was satisfactory and that the advisory and sub-advisory fees were reasonable.
Nasdaq-100® Index Portfolio (Adviser — ONI). While the Portfolio underperformed its benchmark for the year-to-date, 1-, 3- and 5-year periods, the Board noted that its performance generally was in line with the Nasdaq-100® Index when expenses were excluded. The Board did not rely on peer group comparison figures for the Portfolio because the Board considers peer groups for index funds to be generally irrelevant. The Board noted that the overall expense ratio is the statistic most important to index fund shareholders, and the Portfolio’s expense ratio was significantly below the average for the peer group. Overall, the Board concluded that the Portfolio’s performance was satisfactory and that the advisory fees were reasonable.
| 145 | (continued) |
| Ohio National Fund, Inc. |
Additional Information (Unaudited) (Continued) | December 31, 2013 |
Bristol Portfolio (Adviser — ONI, Sub-Adviser — Suffolk). The Portfolio outperformed its benchmark index for the year-to-date and 1-year periods and its peer group average for the year-to-date, 1- and 5-year periods, while the Portfolio underperformed its benchmark index for the 3- and 5-year periods and its peer group average for the 3-year period. The Directors noted that, although the Portfolio’s advisory fee was above the peer group average, the Portfolio’s expense ratio was below the peer group average. Overall, the Board concluded that the Portfolio’s performance was satisfactory and that the advisory and sub-advisory fees were reasonable.
Bryton Growth Portfolio (Adviser — ONI, Sub-Adviser — Suffolk). The Portfolio underperformed its benchmark index and peer group average for the year-to-date, 1-, 3- and 5-year periods. The Adviser noted that while the Portfolio remained on the watchlist, its recent relative performance had improved. The Board considered that the Portfolio’s advisory fee and expense ratio were below the peer group average. Overall, the Board concluded that the Portfolio’s performance was satisfactory and that the advisory and sub-advisory fees were reasonable.
Balanced Portfolio (Adviser — ONI, Sub-Adviser — ICON). The Portfolio underperformed its benchmark for the year-to-date, 1-, 3- and 5-year periods and its peer group average for the 1-year period, while performing at the same level as the peer group average for the year-to-date period and outperforming its peer group average in the 3- and 5-year periods. The Directors noted that, although the Portfolio’s advisory fee was slightly above the peer group average, its expense ratio was below the peer group average. Overall, the Board concluded that the Portfolio’s performance was satisfactory and that the advisory and sub-advisory fees were reasonable.
Target VIP Portfolio (Adviser — ONI, Sub-Adviser — First Trust). The Portfolio has outperformed its benchmark index for the year-to-date and 1-year period and its peer group average for the year-to-date and 3-year periods, but has underperformed its benchmark index for the 3- and 5-year periods and its peer group average for the 1- and 5-year periods. The Portfolio’s advisory fee and expense ratio were below its peer group average. Overall, the Board concluded that the performance of the Portfolio was satisfactory and that the advisory and sub-advisory fees were reasonable.
Bristol Growth Portfolio (Adviser — ONI, Sub-Adviser — Suffolk). The Portfolio outperformed its benchmark index and peer group average for the year-to-date and 1-year periods, but underperformed its benchmark index and peer group average for the 3- and 5-year periods. The Directors considered that, although the Portfolio’s advisory fee was above its peer group average, it was still within the range of its peers, and its overall expense ratio was the same as its peer group average. Overall, the Board concluded that the Portfolio’s performance was satisfactory and that the advisory and sub-advisory fees were reasonable.
After consideration of the foregoing, the Board reached the following conclusions regarding the Investment Advisory Agreement and, as applicable, the sub-advisory agreement with respect to each Portfolio, in addition to the conclusions set forth above: (a) ONI and the Sub-Adviser had demonstrated that they possessed the capability and resources to perform the duties required of them under the Investment Advisory Agreement and applicable sub-advisory agreement, respectively; (b) the investment philosophy, strategies and techniques of ONI (with respect to the Portfolios without a Sub-Adviser) and the Sub-Adviser were appropriate for pursuing the applicable Portfolio’s investment objective; (c) ONI (with respect to the Portfolios without a Sub-Adviser) and the Sub-Adviser were likely to execute their investment philosophy, strategies and techniques consistently over time; and (d) ONI and the Sub-Adviser maintained appropriate compliance programs. Based on all of the above-mentioned factors and their related conclusions, with no single factor or conclusion being determinative and with each Director not necessarily attributing the same weight to each factor, the Directors unanimously concluded that approval of the continuation of the Investment Advisory Agreement and, as applicable, the sub-advisory agreement was in the best interests of each Portfolio and its shareholders. Accordingly, the Board, including all of the Independent Directors, voted unanimously to approve the continuation of the Investment Advisory Agreement and, as applicable, the sub-advisory agreement for each Portfolio.
| (2) | Expense Disclosure |
An individual may not buy or own membership interests of the Fund directly. An individual acquires an indirect interest in the Fund by purchasing a variable annuity contract or variable insurance policy and allocating premiums or purchase payments to Fund Portfolios available through the separate accounts of ONLIC, ONLAC, and NSLA. Separate accounts of these entities are the shareholders of the Fund.
As a shareholder of the Fund, a separate account incurs ongoing costs, including management fees and other Fund expenses. This example is intended to help a policy/contract owner understand ongoing costs (in dollars) associated with the underlying investment in the Fund’s Portfolios by the separate account shareholder and to compare these costs with the ongoing costs associated with investing in other mutual funds.
The example is based on an investment of $1,000 invested at July 1, 2013 and held through December 31, 2013.
| 146 | (continued) |
| Ohio National Fund, Inc. |
Additional Information (Unaudited) (Continued) | December 31, 2013 |
Actual Expenses
The table below provides information about investment values and actual expenses associated with each Portfolio of the Fund. The information below, together with the amount of an underlying investment, can be used to estimate expenses paid over the period. An estimate can be obtained by simply dividing an underlying investment value by $1,000 (for example, an $8,600 investment value divided by $1,000 = 8.6), then multiplying the result by the number in the table under the heading entitled “Expenses Paid During Period”.
Portfolio | Beginning Investment Value 7/1/2013 | Ending Investment Value 12/31/2013 | Expense Paid During Period* 7/1/2013 – 12/31/2013 | Expense Ratio During Period 7/1/2013 – 12/31/2013 (Annualized) | ||||||||||||
Equity | $ | 1,000.00 | $ | 1,194.00 | $ | 4.76 | 0.86 | % | ||||||||
Money Market | 1,000.00 | 1,000.00 | 0.25 | 0.05 | % | |||||||||||
Bond | 1,000.00 | 1,008.20 | 3.34 | 0.66 | % | |||||||||||
Omni | 1,000.00 | 1,184.90 | 4.35 | 0.79 | % | |||||||||||
International | 1,000.00 | 1,148.40 | 3.09 | 0.57 | % | |||||||||||
Capital Appreciation | 1,000.00 | 1,177.00 | 4.77 | 0.87 | % | |||||||||||
International Small-Mid Company | 1,000.00 | 1,206.00 | 6.56 | 1.18 | % | |||||||||||
Aggressive Growth | 1,000.00 | 1,237.60 | 5.53 | 0.98 | % | |||||||||||
Small Cap Growth | 1,000.00 | 1,235.00 | 5.75 | 1.02 | % | |||||||||||
Mid Cap Opportunity | 1,000.00 | 1,193.60 | 5.31 | 0.96 | % | |||||||||||
S&P 500® Index | 1,000.00 | 1,160.50 | 2.45 | 0.45 | % | |||||||||||
Strategic Value | 1,000.00 | 1,090.90 | 4.16 | 0.79 | % | |||||||||||
High Income Bond | 1,000.00 | 1,054.40 | 3.99 | 0.77 | % | |||||||||||
Capital Growth | 1,000.00 | 1,152.90 | 5.48 | 1.01 | % | |||||||||||
Nasdaq-100® Index | 1,000.00 | 1,238.60 | 2.82 | 0.50 | % | |||||||||||
Bristol | 1,000.00 | 1,233.80 | 4.62 | 0.82 | % | |||||||||||
Bryton Growth | 1,000.00 | 1,224.90 | 4.99 | 0.89 | % | |||||||||||
Balanced | 1,000.00 | 1,060.50 | 3.84 | 0.74 | % | |||||||||||
Target VIP | 1,000.00 | 1,207.00 | 4.45 | 0.80 | % | |||||||||||
Bristol Growth | 1,000.00 | 1,235.50 | 4.90 | 0.87 | % | |||||||||||
| 147 | (continued) |
| Ohio National Fund, Inc. |
Additional Information (Unaudited) (Continued) | December 31, 2013 |
Hypothetical Example for Comparison Purposes
The table below provides information about hypothetical investment values and hypothetical expenses based on each respective Portfolio’s actual expense ratio and an assumed rate of return of 5% per year before expenses, which is not an actual return. The hypothetical investment values and expenses may not be used to estimate the actual ending investment balance or expenses actually paid for the period by the shareholders. A policy/contract holder may use this information to compare this 5% hypothetical example with the 5% hypothetical examples that appear in the shareholder reports of other funds.
Portfolio | Beginning Investment Value 7/1/2013 | Ending Investment Value 12/31/2013 | Expense Paid During Period* 7/1/2013 – 12/31/2013 | Expense Ratio During Period 7/1/2013 – 12/31/2013 (Annualized) | ||||||||||||
Equity | $ | 1,000.00 | $ | 1,020.87 | $ | 4.38 | 0.86 | % | ||||||||
Money Market | 1,000.00 | 1,024.95 | 0.26 | 0.05 | % | |||||||||||
Bond | 1,000.00 | 1,021.88 | 3.36 | 0.66 | % | |||||||||||
Omni | 1,000.00 | 1,021.22 | 4.02 | 0.79 | % | |||||||||||
International | 1,000.00 | 1,022.33 | 2.91 | 0.57 | % | |||||||||||
Capital Appreciation | 1,000.00 | 1,020.82 | 4.43 | 0.87 | % | |||||||||||
International Small-Mid Company | 1,000.00 | 1,019.26 | 6.01 | 1.18 | % | |||||||||||
Aggressive Growth | 1,000.00 | 1,020.27 | 4.99 | 0.98 | % | |||||||||||
Small Cap Growth | 1,000.00 | 1,020.06 | 5.19 | 1.02 | % | |||||||||||
Mid Cap Opportunity | 1,000.00 | 1,020.37 | 4.89 | 0.96 | % | |||||||||||
S&P 500® Index | 1,000.00 | 1,022.94 | 2.29 | 0.45 | % | |||||||||||
Strategic Value | 1,000.00 | 1,021.22 | 4.02 | 0.79 | % | |||||||||||
High Income Bond | 1,000.00 | 1,021.32 | 3.92 | 0.77 | % | |||||||||||
Capital Growth | 1,000.00 | 1,020.11 | 5.14 | 1.01 | % | |||||||||||
Nasdaq-100® Index | 1,000.00 | 1,022.68 | 2.55 | 0.50 | % | |||||||||||
Bristol | 1,000.00 | 1,021.07 | 4.18 | 0.82 | % | |||||||||||
Bryton Growth | 1,000.00 | 1,020.72 | 4.53 | 0.89 | % | |||||||||||
Balanced | 1,000.00 | 1,021.48 | 3.77 | 0.74 | % | |||||||||||
Target VIP | 1,000.00 | 1,021.17 | 4.08 | 0.80 | % | |||||||||||
Bristol Growth | 1,000.00 | 1,020.82 | 4.43 | 0.87 | % | |||||||||||
| * | Expenses are equal to the average account value times the Fund’s annualized expense ratio multiplied by the number of days in the most recent fiscal half-year (184 days) divided by the number of days in the fiscal year (365 days). Please note that the expenses shown in these tables are meant to highlight ongoing Fund costs only and do not reflect any contract-level expenses or Fund transactional costs, such as sales charges (loads) or exchange fees (if any). Therefore, these tables are useful in comparing ongoing fund costs only, and will not fully assist a policy/contract owner in determining the relative total expenses of different funds. In addition, if transactional costs were included, costs may have been higher for these Portfolios as well as for a fund being compared. |
| (3) | Other Federal Tax Information |
For corporate shareholders, the percentages of the total ordinary income dividends paid in 2013, and ordinary income consent dividends that were incurred in the 2013 tax year, that qualify for the corporate dividends received deduction are as follows:
Equity | 100.00 | % | ||
Money Market | 0.00 | % | ||
Bond | 0.00 | % | ||
Omni | 75.72 | % | ||
International | 0.00 | % | ||
Capital Appreciation | 100.00 | % | ||
International Small-Mid Company | 0.00 | % | ||
Aggressive Growth | 0.00 | % | ||
Small Cap Growth | 3.93 | % | ||
Mid Cap Opportunity | 0.00 | % |
S&P 500® Index | 92.92 | % | ||
Strategic Value | 78.48 | % | ||
High Income Bond | 0.12 | % | ||
Capital Growth | 0.00 | % | ||
Nasdaq-100® Index | 81.68 | % | ||
Bristol | 7.27 | % | ||
Bryton Growth | 0.00 | % | ||
Balanced | 27.47 | % | ||
Target VIP | 100.00 | % | ||
Bristol Growth | 7.98 | % |
| 148 |
| Ohio National Fund, Inc. |
Additional Information (Unaudited) (Continued) | December 31, 2013 |
Pursuant to Section 853 of the Internal Revenue Code, the Fund designates the following amounts as foreign taxes paid for the year ended December 31, 2013:
| Creditable Foreign Taxes Paid | Per Share Amount | Portion of Ordinary Income Distribution Derived from Foreign Sourced Income | ||||||||||
International | $ | 495,172 | $ | 0.0362 | 100.00 | % | ||||||
International Small-Mid Company | $ | 81,235 | $ | 0.0317 | 100.00 | % | ||||||
Foreign taxes paid for purposes of Section 853 may be less than actual foreign taxes paid for financial statement purposes. None of the Portfolios listed above derived any income from ineligible foreign sources, as defined under Section 901(j) of the Internal Revenue Code.
| 149 |
| Ohio National Fund, Inc. |
| December 31, 2013 |
Name and Address | Age | Position(s) with the Fund | Term of Office | Number of Portfolios | Principal Occupation(s) and Other | |||||||
Independent Directors | ||||||||||||
George M. Vredeveld One Financial Way Cincinnati, Ohio | 71 | Lead Independent Director, Member of Audit and Independent Directors Committees | Indefinite; Since March 1996 | 20 | Professor of Economics: University of Cincinnati | |||||||
John I. Von Lehman One Financial Way Cincinnati, Ohio | 61 | Director, Member of Audit and Independent Directors Committees | Indefinite; Since August 2007 | 20 | Executive Vice President, CFO, Secretary, and Director: The Midland Company (1988-2007); Director, Audit Committee and Corporate Governance Committee Member: American Financial Group, Inc.; Finance Committee and Investment Commitee Member: Life Enriching Communities; Investment Committee: Xavier University Foundation. | |||||||
Madeleine W. Ludlow One Financial Way Cincinnati, Ohio | 59 | Director, Member of Audit and Independent Directors Committees | Indefinite; Since April 2012 | 20 | Founder/Managing Director: West Capital Partners LLC (2010-present), Ludlow Ward Capital Advisors LLC (2005-2009); Director, ALLETE, Inc. (2004-present) | |||||||
Interested Director | ||||||||||||
John J. Palmer One Financial Way Cincinnati, Ohio | 74 | Chairman and Director | Indefinite; Since July 1997 | 20 | Insurance industry consultant (April 2010 to present), President: Ohio National Fund, Inc. (1997-2010); Director and Vice Chairman: ONLIC (1997-2010); President, CEO, and Director: NSLA (2002-2010), Director: ONI and various affiliated companies (1997-2010), Cincinnati Symphony Orchestra, Tucson Symphony Orchestra, and Pima Canyon Estates Homeowners’ Association. | |||||||
Officers | ||||||||||||
Christopher A. Carlson One Financial Way Cincinnati, Ohio | 54 | President | Indefinite; Since March 2000 | 20 | Vice Chairman and Chief Investment Officer: ONLIC; President and Director: ONI; Chief Investment Officer: NSLA; Officer and Director of various other Ohio National-affiliated companies. Prior to March 2010, was Vice President of the Fund. | |||||||
Thomas A. Barefield One Financial Way Cincinnati, Ohio | 60 | Vice President | Indefinite; Since February 1998 | 20 | Vice Chairman and Chief Distribution Officer: ONLIC; Director and Vice President — Marketing: NSLA; Director: ONI; Senior Vice President: Ohio National Equities, Inc.; Recent graduate of class XXIX of Leadership Cincinnati. | |||||||
R. Todd Brockman One Financial Way Cincinnati, Ohio | 45 | Treasurer | Indefinite; Since August 2004 | 20 | Second Vice President, Mutual Fund Operations: ONLIC and NSLA; Treasurer: ONI. | |||||||
Kimberly A. Plante One Financial Way Cincinnati, Ohio | 39 | Secretary | Indefinite; Since March 2005 | 20 | Senior Associate Counsel: ONLIC; Secretary: ONI; Officer of various other Ohio National-affiliated companies. | |||||||
Julie T. Thomas One Financial Way Cincinnati, Ohio | 51 | Chief Compliance Officer | Indefinite; Since June 2013 | 20 | Second Vice President: ONLIC; Chief Compliance Officer: ONI, Suffolk, and other Ohio National-affiliated companies. | |||||||
Catherine E. Gehr One Financial Way Cincinnati, Ohio | 41 | Assistant Treasurer | Indefinite; Since March 2005 | 20 | Manager, Mutual Fund Operations: ONLIC; Assistant Treasurer: ONI. | |||||||
Emily Bae One Financial Way Cincinnati, Ohio | 28 | Assistant Secretary | Indefinite; Since May 2013 | 20 | Assistant Secretary: ONI; Assistant Counsel: ONLIC. Prior to May 2013, was Counsel with Goodyear Tire & Rubber Company. | |||||||
| 150 |
Ohio National Fund, Inc.
Post Office Box 371
Cincinnati, Ohio 45201
Form 1320 Rev. 2-14
| Item 2. | Code Of Ethics. |
As of the end of the period covered by this report, Ohio National Fund, Inc. (the “Fund”) has adopted a code of ethics that applies to the Fund’s principal executive officer and principal financial officer. There were no substantive amendments or waivers to the Code of Ethics during the period covered by this report.
A copy of this Code of Ethics is filed as Exhibit EX-99.CODE to this Form N-CSR and is also available, without charge, upon request, by calling 877-781-6392 toll free.
| Item 3. | Audit Committee Financial Expert. |
The Fund’s Board of Directors has determined that the Fund has an audit committee financial expert serving on its Audit Committee. The Audit Committee financial expert is Mr. John I. Von Lehman. Mr. Von Lehman is independent for purposes of Item 3 of Form N-CSR.
| Item 4. | Principal Accountant Fees And Services. |
The aggregate fees for each of the last two fiscal years for professional services rendered by the principal accountant for the audit of the Fund’s annual financial statements or services that are normally provided by the accountant in connection with statutory and regulatory filings or engagements for those fiscal years are listed below.
| (a) | Audit Fees. |
Audits of the Portfolios for the year ended.
Fiscal year ended December 31, 2013: $248,333
Fiscal year ended December 31, 2012: $292,000
Consent on N-1A Annual Registration Statement filed with the SEC.
Fiscal year ended December 31, 2013: $5,000
Fiscal year ended December 31, 2012: $5,000
Merger related audit testwork.
Fiscal year ended December 31, 2013: $5,000
| (b) | Audit-Related Fees. |
Consent on N-14 Filing filed with the SEC.
Fiscal year ended December 31, 2013: $6,000
Professional services rendered in connection with the consent on the Fund’s N-14 merger filing (paid by the Fund’s adviser (ONI)
| (c) | Tax Fees. | None. | ||
| (d) | All Other Fees. | None. | ||
| (e)(1) | Audit Committee Pre-Approval Policies and Procedures: |
The Fund’s Audit Committee has adopted an Audit Committee Charter that requires that the Audit Committee oversee the quality and appropriateness of the accounting methods used in the preparation of the Fund’s financial statements, and the independent audit thereof; approve the selection and compensation of the independent auditors; and pre-approve the performance, by the independent auditors, of non-audit services for the Fund, its investment adviser, or any affiliated entity controlling, controlled by or under common control with the investment adviser that provides ongoing services to the Fund.
| (e)(2) | Services Approved Pursuant to Paragraph (c)(7)(i)(C) of Rule 2-01 of Regulation S-X: |
During the fiscal years ended December 31, 2013 and 2012, there were no non-audit services provided by the Fund’s principal accountant that would have required pre-approval by the Fund’s Audit Committee. The audit related fees aforementioned were pre-approved by the Fund’s Audit Committee chairman, although not required by paragraph (c) (7) (ii) of Regulation S-X, as the audit-related fees were less than five percent of the total amount of revenues paid to the Fund’s principal accountant.
| (f) | Not applicable. |
| (g) | There were no other non-audit services provided by the Fund’s principal accountant, other than items disclosed in item (b) above, in which a fee was billed to the Fund, the Fund’s adviser, and any entity controlling, controlled by, or under common control with the adviser that provides ongoing services to the registrant for the last two fiscal years. |
| (h) | Not applicable, as there were no non-audit services performed by the Fund’s principal accountant that were rendered to the Fund, the Fund’s adviser, or any entity controlling, controlled by, or under common control with the adviser that provided ongoing services to the registrant that were not pre-approved for the last two fiscal years. |
| Item 5. | Audit Committee Of Listed Registrants. |
Not applicable.
| Item 6. | Schedule of Investments. |
Not applicable.
| Item 7. | Disclosure Of Proxy Voting Policies And Procedures For Closed-End Management Investment Companies. |
Not Applicable.
| Item 8. | Portfolio Managers of Closed-End Management Investment Companies. |
Not Applicable.
| Item 9. | Purchases of Equity Securities by Closed-End Management Investment Company and Affiliated Purchasers. |
Not Applicable.
| Item 10. | Submission of Matters to a Vote of Security Holders. |
There were no material changes to the procedures by which shareholders may recommend nominees to the Fund’s Board of Directors.
| Item 11. | Controls and Procedures. |
| (a) | The Fund’s principal executive officer and principal financial officer have concluded, based on their evaluation conducted as of a date within 90 days of the filing of this report, that the Fund’s disclosure controls and procedures are adequately designed and are operating effectively to ensure (i) that material information relating to the Fund, including its consolidated subsidiaries, is made known to them by others within those entities, particularly during the period in which this report is being prepared; and (ii) that information required to be disclosed by the Fund on Form N-CSR is recorded, processed, summarized and reported within the time periods specified in the Securities and Exchange Commission’s rules and forms. |
| (b) | There were no changes in the Fund’s internal control over financial reporting that occurred during the second fiscal quarter of the period covered by this report that have materially affected, or are reasonably likely to materially affect, the Fund’s internal control over financial reporting. |
| Item 12. | Exhibits. |
| (a)(1) | The Fund’s Code of Ethics pursuant to Item 2 of Form N-CSR is filed and attached hereto as EX-99.CODE. | |
| (a)(2) | A separate certification for each principal executive officer and principal financial officer of the Fund as required by Rule 30a-2(a) under the Investment Company Act of 1940 (17 CFR 270.30a-2(a)) is attached hereto as EX-99.CERT. | |
| The certifications required by Section 906 of the Sarbanes-Oxley Act of 2002 are attached hereto as EX-99.906CERT. | ||
SIGNATURES
Pursuant to the requirements of the Securities Exchange Act of 1934 and the Investment Company Act of 1940, the registrant has duly caused this report to be signed on its behalf by the undersigned, thereunto duly authorized.
| Ohio National Fund, Inc. | ||
| By: | /s/ Christopher A. Carlson | |
| Christopher A. Carlson | ||
| President | ||
| March 6, 2014 | ||
Pursuant to the requirements of the Securities Exchange Act of 1934 and the Investment Company Act of 1940, this report has been signed below by the following persons on behalf of the registrant and in the capacities and on the dates indicated.
| Ohio National Fund, Inc. | ||
| By: | /s/ Christopher A. Carlson | |
| Christopher A. Carlson | ||
| President | ||
| March 6, 2014 | ||
| By: | /s/ R. Todd Brockman | |
| R. Todd Brockman | ||
| Treasurer | ||
| March 6, 2014 | ||