UNITED STATES
SECURITIES AND EXCHANGE COMMISSION
Washington, D.C. 20549
FORM N-CSR
CERTIFIED SHAREHOLDER REPORT OF REGISTERED
MANAGEMENT INVESTMENT COMPANIES
Investment Company Act file number 811-03015
Ohio National Fund, Inc.
(Exact name of registrant as specified in charter)
| One Financial Way, Cincinnati, Ohio | 45242 | |
| (Address of principal executive offices) | (Zip code) |
CT Corporation 300 E. Lombard St. Suite 1400 Baltimore, MD 21202
(Name and address of agent for service)
Registrant’s telephone number, including area code: 513-794-6971
Date of fiscal year end: December 31
Date of reporting period: December 31, 2012
Form N-CSR is to be used by management investment companies to file reports with the Commission not later than 10 days after the transmission to stockholders of any report that is required to be transmitted to stockholders under Rule 30e-1 under the Investment Company Act of 1940 (17 CFR 270.30e-1). The Commission may use the information provided on Form N-CSR in its regulatory, disclosure review, inspection, and policymaking roles.
A registrant is required to disclose the information specified by Form N-CSR, and the Commission will make this information public. A registrant is not required to respond to the collection of information contained in Form N-CSR unless the Form displays a currently valid Office of Management and Budget (“OMB”) control number. Please direct comments concerning the accuracy of the information collection burden estimate and any suggestions for reducing the burden to Secretary, Securities and Exchange Commission, 450 Fifth Street, NW, Washington, DC 20549-0609. The OMB has reviewed this collection of information under the clearance requirements of 44 U.S.C. § 3507.
| Item 1. | Reports To Stockholders. |
WEALTH BUILDING OPPORTUNITY
Ohio National Fund, Inc.
Annual Report
December 31, 2012
Ohio National Fund, Inc.
OHIO NATIONAL FUND, INC.
| 1 | ||||
| 3 | ||||
The following pages contain Performance, Management’s Comments, Change in Value of $10,000 Investment, Portfolio Composition, Top Holdings, and Schedule of Investments for each of the Fund’s Portfolios: | ||||
| 4 | ||||
| 8 | ||||
| 11 | ||||
| 16 | ||||
| 21 | ||||
| 26 | ||||
| 31 | ||||
| 34 | ||||
| 38 | ||||
| 41 | ||||
| 44 | ||||
| 48 | ||||
| 55 | ||||
| 58 | ||||
| 68 | ||||
| 72 | ||||
| 76 | ||||
| 79 | ||||
| 82 | ||||
| 85 | ||||
| 91 | ||||
| 94 | ||||
| 98 | ||||
| 101 | ||||
| 104 | ||||
| 107 | ||||
| 110 | ||||
| 116 | ||||
| 128 | ||||
| 153 | ||||
| 154 | ||||
| 162 | ||||
Message |  |
Dear Investor:
The year 2012 was very good for equity market returns. The S&P 500® Index returned 16.0 percent, which was the second highest annual return over the past nine years. In addition, 2012 was one of only eight years since 1928 in which the S&P 500® Index never closed a day lower than the closing level of the previous year. We have now experienced four consecutive years of positive equity returns in the United States, rivaling the pre-financial crisis years of 2003 through 2007 and the “dot-com bubble years”. Of course, the dot-com bubble years represented a longer period of positive U.S. equity returns, spanning nine years and generating a total return of 432 percent, or 18.7 percent compounded annually. At the end of 2012, the S&P 500® Index was within 139 points of the high-water mark set in October 2007, erasing almost all the losses from the great recession.
However, all is far from well. A chart of the S&P 500® Index’s daily 2012 performance depicts a highly erratic line. From January to early April, the S&P 500® Index was up 13.4 percent. From early April to early June, it was down 9.6 percent. Then, from early June to mid-September, it was up 15.4 percent. Through the remainder of the year, the S&P 500® Index was again down, by 2 percent. Although we ended up at a good place, it was a circuitous ride. For many investors, the experience was painful, causing them to enter or exit the market at precisely the wrong time. This pattern of market volatility often drives investors to behave in ways contrary to their best interests.
While the U.S. economy appears to be on firmer ground, there is still cause for concern: The United States has yet to recover 3.2 million of the 8.7 million jobs that were
lost in the great recession of 2009; and the unemployment rate was 7.8 percent at year’s end, compared to 4.9 percent in February 2008.
In spite of stubbornly high unemployment, there is much to feel good about regarding the U.S. economy. Most people would be surprised to learn that the United States only imports about 20% of its energy needs, will surpass Saudi Arabia’s oil production by 2017 and will become a net exporter of oil by around 2030 and a net exporter of natural gas by 2020, according to the International Energy Agency World Energy Outlook 2012. In addition, a January 29 report by the Wall Street economic and policy and research firm International Strategy and Investment essentially said the United States could be energy independent by the end of this decade due to technological advances in exploration and production of natural gas and oil and continued progress in energy efficiency. Regardless of when our energy independence day comes, United States manufacturing will be far more competitive than it has been in a long time.
The housing market, a leading indicator of economic development, is just now showing signs of life. In November 2012, home prices rose 5.5 percent from just one year ago, the biggest year-over-year gain since August 2006 (according to the S&P/Case-Shiller Home Price Index). With mortgage interest rates remaining historically low and housing in limited supply, home prices should continue to rise.
Another positive sign is that equity markets appear to be fairly valued. According to financial theory, company earnings and the expectation for earnings support equity prices. Based on historic earnings, the S&P 500® Index
| 1 |
closed the year with a price-to-earnings ratio of 17, compared to just under 12 at the beginning of 2012.
Based on expected future earnings, the S&P 500® Index is now selling at 13 times projected earnings. When compared to a 140-year average price-to-earnings ratio of 15.5, the S&P 500® Index appears to be well priced. An analysis of dividend yield, another stock price fundamental measurement, shows a similar result. The conclusion: it is unlikely that we would see an equity correction based on valuation absent some unforeseen event. In short, there does not appear to be an equity bubble forming. The same cannot be said in the bond markets. The Fed continues to be one of the largest buyers of U.S. government debt and one cannot help but wonder what will happen when it decides to slow or stop these purchases. Either of these actions would likely lead to rising interest rates and falling fixed income values.
However, none of these economic indicators or fundamental valuations are driving the market higher. Rather, the fourth quarter choppiness and the equity rally in early 2013 were the result of political maneuvering in Washington, DC. With the fiscal cliff and the debt ceiling debate delayed for a while longer, the market is free to push higher. This political risk is the greatest threat to the U.S. economy and the equity markets. Will our elected officials show the political will to make decisions that will put us back on a sustainable economic path? As I have said in the past, politicians tend to wait until the last possible moment to take action, and then do not move far enough. Kicking the can down the road has become a national pastime.
I said at the start of 2012 that the market volatility we’re experiencing makes it difficult for active managers to position their portfolios. Portfolios positioned for growth do
very well when markets go up. Conversely, more defensively positioned portfolios do better on a relative basis when markets go down. Some portfolios were able to perform well throughout the year, or at least provide enough outperformance when the market moved in their favor to offset the underperformance when the market did not. Outperforming portfolios include the International Small-Mid Company Portfolio subadvised by Federated Global Investment Management Corp., the Mid Cap Opportunity Portfolio subadvised by Goldman Sachs Asset Management, L.P., the Aggressive Growth and Small Cap Growth Portfolios subadvised by Janus Capital Management LLC, the Capital Appreciation Portfolio subadvised by Jennison Associates LLC and the Balanced Portfolio subadvised by ICON Advisers, Inc. You may recall that changes were made to the Balanced Portfolio in May 2012 to give the sub-adviser the ability to provide more downside protection, and it was good to see the Portfolio perform well in 2012.
Considering the challenges inherent with actively managing the ups-and-downs of the equity market environment, it is more important than ever to consult your financial adviser to make sure your assets are properly diversified.
Thank you for entrusting your assets to the Ohio National Fund, Inc. We look forward to continuing to serve your investment needs.
Sincerely

Christopher A. Carlson
President
| 2 |
Directors and Officers of Ohio National Fund, Inc.
| John J. Palmer, Director |
| James E. Bushman, Director |
| Madeline W. Ludlow, Director |
| George M. Vredeveld, Director |
| John I. Von Lehman, Director |
| Christopher A. Carlson, President |
| Thomas A. Barefield, Vice President |
| Dennis R. Taney, Chief Compliance Officer |
| R. Todd Brockman, Treasurer |
| Kimberly A. Plante, Secretary |
| Catherine E. Gehr, Assistant Treasurer |
The Statement of Additional Information of Ohio National Fund, Inc. (the “Fund”) includes additional information about the Fund’s Board of Directors (the “Board”) and is available at http://www.ohionationalfund.com or upon request, without charge, by calling 877-781-6392 (toll-free).
A description of the policies and procedures that the Fund uses in voting proxies relating to Fund securities, as well as information regarding how the Fund voted proxies during the most recent twelve-month period ended June 30, is available without charge, upon request, by calling 877-781-6392 (toll-free) and on the Securities and Exchange Commission (the “Commission”) website at http://www.sec.gov.
The Fund has filed its Schedules of Investments as of March 31 and September 30 with the Commission, as required, on Form N-Q. Form N-Q is required to be filed with the Commission for the first and third quarters of each fiscal year within sixty days after the end of each period and is available on the Commission website upon acceptance of each submission. The Fund’s Forms N-Q may be reviewed and copied at the Commission’s Public Reference Room in Washington, DC. Information about the Public Reference Room is available by calling 1-800-SEC-0330 (toll-free).
This report and the financial statements contained herein are submitted for the general information of the shareholders of the Fund. This report is not authorized for distribution to prospective investors in the Fund unless preceded or accompanied by an effective prospectus of Ohio National Fund, Inc. For a prospectus containing more complete information, including charges and expenses, please contact Ohio National Investments, Inc., One Financial Way, Cincinnati, OH 45242, telephone 513-794-6100.
| 3 |
| Ohio National Fund, Inc. | Equity Portfolio |
Objective/Strategy
The Equity Portfolio seeks long-term growth of capital by investing at least 80% of its assets in equity securities.
Performance as of December 31, 2012
Average Annual Total Returns: | ||||
One year | 15.69% | |||
Five years | -5.39% | |||
Ten years | 2.74% |
Past performance does not guarantee future results. The performance data quoted represents past performance and current returns may be lower or higher. Total return figures include change in share price and reinvestment of dividends and capital gains. The investment return and principal value will fluctuate so that an investor’s shares, when redeemed, may be worth more or less than the original cost. To obtain performance information up to the most recent month end, call toll-free 1-877-781-6392.
The Portfolio is not open to direct retail investment. Beneficial interest in shares is obtained solely by purchase of variable life insurance policies and variable annuity contracts. Actual performance results for variable annuity and variable universal life contracts will be lower due to contract charges. Consult your contract for applicable charges.
Comments
For the year ended December 31, 2012, the Equity Portfolio returned 15.69% versus 16.00% for the current benchmark, the S&P 500 Index.
Security selection detracted from the Portfolio’s relative performance while sector allocations contributed to relative performance. At the security level, Apple, Inc., eBay, Inc., Citigroup, Inc., Lowe’s Cos., Inc., and JPMorgan Chase & Co. were the top five contributors to performance while Marvell Technology Group Ltd., Groupon, Inc., Best Buy Co., Inc., Hess Corp., and Norfolk Southern Corp. were the top detractors from performance during 2012.(1)
Equities extended 2011’s fourth quarter rally into the first quarter of this year, reacting to improving domestic economic data, strong corporate earnings and increasingly positive headlines from Europe. The European Union, the European Central Bank (ECB), and other central banks continued to buy the additional time needed for European banks to deleverage and take losses in an orderly fashion.
Stocks subsequently cooled their torrid pace set during the first quarter, as non-farm payrolls missed consensus estimates by wide margins and reports out of China pointed to slowing economic growth out of the world’s second largest economy. Additionally, reports postulating Greece’s exit from the euro currency swirled during the second quarter, but the Greek population ultimately decided to elect the pro-bailout and pro-euro New Democracy party. As conditions deteriorated, heads of state and central banks stood ready to implement policy changes and provide further easing. In the U.S., the Federal Reserve added $267 billion to “Operation Twist” and extended the program through the end of 2012 due to slowing consumer spending and employment growth. Spain also announced a $24 billion bailout for troubled lender Bankia, effectively nationalizing Spain’s third largest banking institution. Finally, during the late June European Union summit, leaders decided to speed the creation of a singular regulatory body for banks and bolstered support for European Union bailout funds.
Equities recovered in the third quarter largely due to additional central bank stimulus and improving economic data. After Federal Reserve chairman Ben Bernanke described the unemployment problem in the U.S. as a “grave concern”, the Federal Open Markets
Committee announced a third round of asset purchases, colloquially known as “QE3”. This program aimed to purchase $40 billion of mortgage-backed securities each month with no stated termination date. Across the Atlantic, European Central Bank (ECB) president Mario Draghi bolstered markets after promising “whatever it takes to preserve the euro”, beginning with plans to purchase EuroZone government bonds with no purchase limits.
The U.S. Congressional and Presidential elections, and debate surrounding the fiscal cliff, drove the market during the final months of 2012. Ultimately, President Obama was reelected, Republicans came away with 234 seats, or 54%, of the House of Representatives and Democrats ended up with a 55 to 45 advantage in the Senate. Congress debated the fiscal cliff up until the final minute, but passed the American Taxpayer Relief Act of 2012, which added $600 billion of tax revenue over the next ten years, and delayed sequestration for two months. The market responded favorably to fiscal cliff developments going into year-end, as the S&P 500 Index jumped 8.3% off the November 15th low for the fourth quarter. Many domestic economic indicators also picked up during the quarter, including a drop in the unemployment rate, rising housing starts, and an expansion in manufacturing output.
The S&P 500 Index ended the year at 1,461.82, which provided investors with a total return of 16.0%. The Nasdaq Composite Index fared even better, up 17.8% on the year, while the Dow Jones Industrial Average Index added 10.2%. In terms of size, mid-cap companies prevailed in 2012, besting the gains of small- and large-cap companies. Specifically, the Russell Midcap Index climbed 17.7% compared to the Russell 2000 Index and Russell 1000 Index, which rose 16.4% and 16.5%, respectively. Value-oriented stocks out-performed growth companies, as the Russell 1000 Value Index returned 17.5% against the Russell 1000 Growth Index’s 15.3% gains. At a sector level, Financials and Consumer Discretionary were the leading sectors after returning 28.9% and 24.1% for the year, respectively. Consumer Staples, Health Care, Industrials, Information Technology, Materials, and Telecommunication Services each rose between 11.1% and 18.3%. Energy and Utilities lagged all other sectors, with returns of 4.6% and 1.3%, respectively.
Fabless semiconductor manufacturer, Marvell Technology Group Ltd., detracted from Portfolio performance during the year as skepticism over hard disk drive (HDD) unit growth weighed on the semiconductor industry compounded by turnover in company management. In addition, a recent unfavorable court ruling threatens to limit the company’s ability to return capital to shareholders. Despite a difficult HDD market, Marvell Technology Group Ltd.’s networking business is executing well and the company is well positioned with new solid state drive (SSD) products. In October, Marvell Technology Group Ltd. announced the unexpected resignation of CFO Clyde Hosein and lowered revenue guidance for the quarter. Also, at year-end, the company disclosed an unanticipated adverse patent case ruling resulting in a $1.2 billion award to Carnegie Mellon, with the potential for the damages to triple. The risk to Marvell Technology Group Ltd.’s $2 billion cash balance is real; however, there remains considerable potential for the verdict to be overturned in appellate courts as the process unfolds. We believe the company has ample resources to continue repurchasing its stock and support its recently initiated dividend while the networking and storage businesses grow, but the threat of a large cash settlement potentially brings a meaningful change to how management allocates capital. Although the company has become a repeat underperformer, the stock price reflects substantial deterioration, which we find unwarranted considering the company's long-term growth opportunities. While we believe the market underestimates Marvell
| 4 | (continued) |
| Ohio National Fund, Inc. | Equity Portfolio (Continued) |
Technology Group Ltd.’s growth potential in HDDs and SSD controllers, and that the stock has a compelling valuation and significant upside potential, the recent patent ruling has widened the range of potential outcomes.(1)
Groupon, Inc. has proved to be one of the most controversial initial public offerings in history, as evidenced by its elevated trading volatility and poor performance. At the end of March, Groupon, Inc. restated their fourth-quarter income statement due to an increase in reserve accruals for returns and disclosed that its auditors reported that the company had a “material weakness in controls” related to its financial statement close process. Despite this recent negative development, we believe investors are too pessimistic about the potential for earnings to disappear quickly, which is atypical for an advertising platform generating this level of revenues. Subsequently, Groupon, Inc. experienced knee-jerk reactions to several headlines throughout the year. Management reported sales that fell short of estimates, as well as softer-than-expected sales and operating income guidance for the third quarter. On the other hand, second-quarter earnings per share surprised to the upside. Groupon, Inc. struggled to navigate a period of rapid growth, but is now poised to offer a lineup of products, which could cement it as a leader in local advertising and drive shareholder value. We believe the company’s business model continues to be misunderstood by the market and current prices provide significant upside potential for patient, long-term investors.(1)
Shares of Best Buy Co., Inc. were a top detractor from Portfolio performance as the shrinking retailer struggled to deal with consumers shifting to competing e-commerce platforms such as Amazon.com. The investment was built around the premise that the low-embedded expectations retailer was facing significant challenges, but was taking the steps necessary to turn around the business. However, Best Buy Co., Inc. reported two disappointing quarters that included declining gross margins and worse-than-expected comparable-store sales. The most disconcerting issue was Best Buy Co., Inc.’s two consecutive quarters of negative free cash flow. This implied that the market was correct about a very steep decline in free cash flow, ultimately leading us to conclude that Best Buy Co., Inc. was more likely a value trap than a company successfully addressing its competitive weaknesses. As such, capital was deployed into more attractively valued companies with stronger competitive moats.(1)
Apple, Inc. reported blockbuster results for its fiscal first quarter, sending the stock on a tear to above $600 per share. The technology giant reported earnings nearly 40% above consensus estimates as iPhones and iPads units sold more than doubled over last year, and gross margin expanded over 600 basis points. Management also announced new capital allocation priorities in returning cash to shareholders in the form of a $2.65-per-share quarterly dividend for a 2% yield, and a $10 billion share repurchase plan. Shares of Apple, Inc. pulled back slightly in late July due to below-consensus second quarter earnings and sales numbers, but the stock extended its incredible rise in the third quarter, more than 800 basis points above the market to top a $700 share price. Analysts and investors rightfully anticipated the iPhone 5 release in September which saw over two million unit orders in the first day, a pace which more than doubled that of the preceding model and caused Apple, Inc. stores and wireless carriers to sell out of initial inventory. The company continues to develop new products with fanatic subsequent demand and has significant room to grow internationally, most specifically in China. Though shares of the technology giant cooled off in the fourth quarter, capping a historic year, we believe the current valuation is attractive at just under 11 times forward earnings. This multiple is
lower than the market despite the company growing earnings at nearly twice the market's rate.(1)
eBay, Inc. shares climbed steadily throughout 2012, providing nearly 70% in returns to shareholders as the e-commerce platform reported four straight quarters of earnings over estimates. Despite competing in, arguably, an European recession and mixed economic conditions in the U.S., Marketplaces continues to post double-digit growth in non-vehicle gross merchandise value (GMV) traded on the site and company revenue. Investors had previously worried that the Marketplaces business would continue to lose market share in e-commerce, but we believe management's prediction of maintaining market share is more than possible if growth remains at current levels. Additionally, PayPal continues to increase revenues and improve take rates, and is also well positioned for mobile transition, solidifying eBay, Inc.'s spot as a leading payments platform. eBay, Inc.’s management has also restructured the PayPal unit and partnered with Discover to bring the service to over seven million offline merchants; growth that we welcome.(1)
Lowe’s Cos., Inc. leverage to the housing cycle materialized in the second half of the year as housing starts picked up and related stocks followed suit. Shares of the home improvement retailer extended their third quarter ascent into October and earned a substantial bid in late November following a positive quarterly performance report. Earnings were reported above consensus estimates, comparable store sales grew by nearly 2% year-over-year, and gross margins expanded wider than projected. Meanwhile, management boosted its revenue guidance for the year as the ongoing housing recovery continues to drive sales from renovations and big ticket items that accompany housing turnover. Though the stock appreciated significantly in the second half of 2012, the improvement in the industry’s fundamentals, coupled with management’s continued efforts to reduce sharecount, leaves attractive upside at current prices.(1)
After strong equity returns in 2012, we continue to be optimistic about the outlook for stocks heading into 2013. While the current environment offers ample reasons for worry, including the ongoing EuroZone sovereign debt concerns, slowing Chinese growth, and squabbling in Washington over the fiscal cliff and debt ceiling, we regard these risks as manageable in most scenarios and fairly well discounted by the market at this point. Many stocks currently embed little growth into perpetuity, or in some cases, negative growth. Even though the U.S. economy continues to grow, albeit at a pace slower than we would like, the market is discounting negative long-term earnings growth based on our research. In our opinion, the U.S. economy is getting better. Fourth quarter 2012 gross domestic product is forecast at 1.4% and full-year 2013 growth is estimated at 2.0. In 2012, the economy added an average of 158,000 jobs per month, which lowered the unemployment rate from 8.5% at the beginning of the year to 7.8%. Despite all of the lingering macro-economic issues, corporate profits are strong and growing. Additionally, cash is near record levels on corporate balance sheets and buybacks remain strong. In addition to strong share buyback activity, half of the S&P 500 Index members sport a dividend yield in excess of the 10-year U.S. Treasury.
| (1) | The Portfolio’s composition is subject to change. Holdings and weightings are as of December 31, 2012. |
| 5 | (continued) |
| Ohio National Fund, Inc. | Equity Portfolio (Continued) |
Change in Value of $10,000 Investment
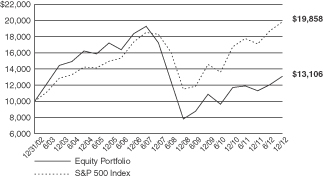
Hypothetical illustration based on past performance. Future performance will vary. The Portfolio’s returns reflect reinvested dividends. The Portfolio’s holdings may differ significantly from the securities in the index. The index is unmanaged and therefore does not reflect the cost of portfolio management and accounting.
The S&P 500 Index is a capitalization-weighted index designed to measure performance of the broad domestic economy through changes in the aggregate market value of 500 stocks representing all major industries. The index presented herein includes the effects of reinvested dividends.
Portfolio Composition as of December 31, 2012 (1)
| | % of Net Assets | | ||
Common Stocks (3) | 97.1 | |||
Preferred Stocks (3) | 1.6 | |||
Money Market Funds and | 1.3 | |||
|
| |||
| 100.0 | ||||
|
|
Top 10 Portfolio Holdings as of December 31, 2012 (1) (2)
| % of Net Assets | ||||
1. Apple, Inc. | 4.9 | |||
2. JPMorgan Chase & Co. | 3.6 | |||
3. Ford Motor Co. | 3.6 | |||
4. McDonald’s Corp. | 3.0 | |||
5. Chevron Corp. | 3.0 | |||
6. Johnson & Johnson | 2.9 | |||
7. Citigroup, Inc. | 2.7 | |||
8. United Technologies Corp. | 2.6 | |||
9. Cognizant Technology Solutions Corp. Class A | 2.5 | |||
10. Pfizer, Inc. | 2.5 |
| (1) | Composition of Portfolio subject to change. |
| (2) | Short-term investments have been excluded from the list of Top 10 Portfolio Holdings. |
| (3) | Sectors (combined): |
| % of Net Assets | ||||
Financials | 21.1 | |||
Information Technology | 20.7 | |||
Consumer Discretionary | 15.8 | |||
Industrials | 14.7 | |||
Health Care | 14.1 | |||
Energy | 8.2 | |||
Consumer Staples | 2.1 | |||
Materials | 2.0 | |||
|
| |||
| 98.7 | ||||
|
|
| 6 |
| Ohio National Fund, Inc. | Equity Portfolio |
Schedule of Investments | December 31, 2012 |
| Common Stocks – 97.1% | Shares | Value | ||||||||
CONSUMER DISCRETIONARY – 14.2% | ||||||||||
Ford Motor Co. (Automobiles) | 513,900 | $ | 6,655,005 | |||||||
McDonald’s Corp. (Hotels, Restaurants & Leisure) | 64,300 | 5,671,903 | ||||||||
Amazon.com, Inc. (Internet & Catalog Retail) | (a) | 17,125 | 4,300,772 | |||||||
Groupon, Inc. (Internet & Catalog Retail) | (a) | 271,700 | 1,325,896 | |||||||
Viacom, Inc. Class B (Media) | 77,200 | 4,071,528 | ||||||||
Lowe’s Cos., Inc. (Specialty Retail) | 127,500 | 4,528,800 | ||||||||
|
| |||||||||
| 26,553,904 | ||||||||||
|
| |||||||||
CONSUMER STAPLES – 2.1% | ||||||||||
Colgate-Palmolive Co. (Household Products) | 37,900 | 3,962,066 | ||||||||
|
| |||||||||
ENERGY – 8.2% | ||||||||||
Halliburton Co. (Energy Equip. & Svs.) | 93,800 | 3,253,922 | ||||||||
Chevron Corp. (Oil, Gas & Consumable Fuels) | 51,300 | 5,547,582 | ||||||||
Phillips 66 (Oil, Gas & Consumable Fuels) | 67,350 | 3,576,285 | ||||||||
Southwestern Energy Co. (Oil, Gas & Consumable Fuels) | (a) | 85,100 | 2,843,191 | |||||||
|
| |||||||||
| 15,220,980 | ||||||||||
|
| |||||||||
FINANCIALS – 21.1% | ||||||||||
BlackRock, Inc. (Capital Markets) | 19,400 | 4,010,174 | ||||||||
Fifth Third Bancorp (Commercial Banks) | 254,300 | 3,862,817 | ||||||||
Wells Fargo & Co. (Commercial Banks) | 135,500 | 4,631,390 | ||||||||
Citigroup, Inc. (Diversified Financial Svs.) | 127,500 | 5,043,900 | ||||||||
JPMorgan Chase & Co. (Diversified Financial Svs.) | 154,000 | 6,771,380 | ||||||||
Aflac, Inc. (Insurance) | 85,505 | 4,542,026 | ||||||||
Genworth Financial, Inc. Class A (Insurance) | (a) | 170,000 | 1,276,700 | |||||||
Hartford Financial Services Group, Inc. (Insurance) | 137,100 | 3,076,524 | ||||||||
MetLife, Inc. (Insurance) | 136,900 | 4,509,486 | ||||||||
Realogy Holdings Corp. (Real Estate Mgmt. & Development) | (a) | 40,900 | 1,716,164 | |||||||
|
| |||||||||
| 39,440,561 | ||||||||||
|
| |||||||||
HEALTH CARE – 14.1% | ||||||||||
Celgene Corp. (Biotechnology) | (a) | 50,800 | 3,998,976 | |||||||
Medtronic, Inc. (Health Care Equip. & Supplies) | 102,700 | 4,212,754 | ||||||||
UnitedHealth Group, Inc. (Health Care Providers & Svs.) | 68,600 | 3,720,864 | ||||||||
GlaxoSmithKline PLC – ADR (Pharmaceuticals) | 98,500 | 4,281,795 | ||||||||
Johnson & Johnson (Pharmaceuticals) | 78,200 | 5,481,820 | ||||||||
Pfizer, Inc. (Pharmaceuticals) | 187,200 | 4,694,976 | ||||||||
|
| |||||||||
| 26,391,185 | ||||||||||
|
| |||||||||
| Common Stocks (Continued) | Shares | Value | ||||||||
INDUSTRIALS – 14.7% | ||||||||||
United Technologies Corp. (Aerospace & Defense) | 59,850 | $ | 4,908,299 | |||||||
United Continental Holdings, Inc. (Airlines) | (a) | 170,900 | 3,995,642 | |||||||
Emerson Electric Co. (Electrical Equip.) | 50,700 | 2,685,072 | ||||||||
General Electric Co. (Industrial Conglomerates) | 187,600 | 3,937,724 | ||||||||
PACCAR, Inc. (Machinery) | 50,525 | 2,284,235 | ||||||||
Parker Hannifin Corp. (Machinery) | 38,000 | 3,232,280 | ||||||||
Stanley Black & Decker, Inc. (Machinery) | 43,200 | 3,195,504 | ||||||||
Norfolk Southern Corp. (Road & Rail) | 50,600 | 3,129,104 | ||||||||
|
| |||||||||
| 27,367,860 | ||||||||||
|
| |||||||||
INFORMATION TECHNOLOGY – 20.7% | ||||||||||
QUALCOMM, Inc. (Communications Equip.) | 68,500 | 4,248,370 | ||||||||
Apple, Inc. (Computers & Peripherals) | 17,125 | 9,128,139 | ||||||||
EMC Corp. (Computers & Peripherals) | (a) | 152,500 | 3,858,250 | |||||||
eBay, Inc. (Internet Software & Svs.) | (a) | 67,500 | 3,443,850 | |||||||
Facebook, Inc. Class A (Internet Software & Svs.) | (a) | 84,300 | 2,244,909 | |||||||
Cognizant Technology Solutions Corp. Class A (IT Svs.) | (a) | 64,200 | 4,754,010 | |||||||
Marvell Technology Group Ltd. (Semiconductors & Equip.) | 496,800 | 3,606,768 | ||||||||
Texas Instruments, Inc. (Semiconductors & Equip.) | 102,600 | 3,174,444 | ||||||||
Microsoft Corp. (Software) | 154,200 | 4,121,766 | ||||||||
|
| |||||||||
| 38,580,506 | ||||||||||
|
| |||||||||
MATERIALS – 2.0% | ||||||||||
LyondellBasell Industries NV Class A (Chemicals) | 64,100 | 3,659,469 | ||||||||
|
| |||||||||
Total Common Stocks (Cost $156,895,857) | $ | 181,176,531 | ||||||||
|
| |||||||||
| Preferred Stocks – 1.6% | Shares | Value | ||||||||
CONSUMER DISCRETIONARY – 1.6% | ||||||||||
General Motors Co. – Series B (Automobiles) | (b) | 68,900 | $ | 3,040,557 | ||||||
|
| |||||||||
Total Preferred Stocks (Cost $2,917,047) | $ | 3,040,557 | ||||||||
|
| |||||||||
| Money Market Funds – 1.0% | Shares | Value | ||||||||
Fidelity Institutional Money Market Funds | 1,775,000 | $ | 1,775,000 | |||||||
|
| |||||||||
Total Money Market Funds (Cost $1,775,000) | $ | 1,775,000 | ||||||||
|
| |||||||||
Total Investments – 99.7% (Cost $161,587,904) | (c) | $ | 185,992,088 | |||||||
Other Assets in Excess of Liabilities – 0.3% | 535,195 | |||||||||
|
| |||||||||
Net Assets – 100.0% | $ | 186,527,283 | ||||||||
|
| |||||||||
Percentages are stated as a percent of net assets.
Abbreviations:
ADR: American Depositary Receipts
Footnotes:
| (a) | Non-income producing security. |
| (b) | This preferred stock is convertible at a 20% conversion premium until 12/01/2013. There is a mandatory conversion at 12/01/2013, at which time the conversion proceeds will be determined by the General Motors, Inc. common share price on that date. |
| (c) | Represents cost for financial reporting purposes, which may differ from cost basis for federal income tax purposes. See also Note 7 of the Notes to Financial Statements. |
The accompanying notes are an integral part of these financial statements.
| 7 |
| Ohio National Fund, Inc. | Money Market Portfolio |
Portfolio Composition as of December 31, 2012 (1)
| % of Net Assets | ||||
Commercial Paper (2) | 62.2 | |||
Asset-Backed Securities (2) | 0.5 | |||
U.S. Government Agency Issues | 4.6 | |||
U.S. Treasury Obligations | 3.9 | |||
Money Market Funds and | 28.8 | |||
|
| |||
| 100.0 | ||||
|
|
Top 10 Portfolio Holdings as of December 31, 2012 (1) (2)
| % of Net Assets | ||||
1. U.S. Bank | 4.6 | |||
2. Prudential Funding LLC | 4.6 | |||
3. General Electric Capital Corp. | 4.6 | |||
4. Federal Home Loan Bank | 4.6 | |||
5. Federated Prime Cash Obligations | 3.9 | |||
6. Fidelity Institutional Money Market Funds Money Market Portfolio – Class I | 3.9 | |||
7. First American Prime Obligations | 3.9 | |||
8. International Business Machines Corp. 0.070%, 01/04/2013 | 3.9 | |||
9. Toyota Motor Credit Corp. | 3.9 | |||
10. Exxon Mobil Corp. | 3.9 |
| (1) | Composition of Portfolio subject to change. |
| (2) | Sectors (combined): |
| % of Net Assets | ||||
Financials | 22.1 | |||
Consumer Staples | 12.0 | |||
Health Care | 11.6 | |||
Energy | 8.5 | |||
Consumer Discretionary | 4.6 | |||
Information Technology | 3.9 | |||
|
| |||
| 62.7 | ||||
|
|
| 8 |
| Ohio National Fund, Inc. | Money Market Portfolio |
Schedule of Investments | December 31, 2012 |
| Commercial Paper – 62.2% | (b) Rate | Maturity | Face Amount | Amortized Cost | ||||||||||||
CONSUMER DISCRETIONARY – 4.6% | ||||||||||||||||
Walt Disney Co. / The (Media) | (a) | 0.120% | 03/22/2013 | $ | 2,000,000 | $ | 1,999,467 | |||||||||
Walt Disney Co. / The (Media) | (a) | 0.110% | 01/18/2013 | 10,000,000 | 9,999,481 | |||||||||||
|
| |||||||||||||||
| 11,998,948 | ||||||||||||||||
|
| |||||||||||||||
CONSUMER STAPLES – 12.0% | ||||||||||||||||
Coca-Cola Co. / The (Beverages) | (a) | 0.170% | 02/08/2013 | 2,000,000 | 1,999,641 | |||||||||||
Coca-Cola Co. / The (Beverages) | (a) | 0.110% | 01/16/2013 | 8,000,000 | 7,999,633 | |||||||||||
Wal-Mart Stores, Inc. (Food & Staples Retailing) | (a) | 0.100% | 01/22/2013 | 5,000,000 | 4,999,708 | |||||||||||
Wal-Mart Stores, Inc. (Food & Staples Retailing) | (a) | 0.090% | 01/03/2013 | 6,000,000 | 5,999,970 | |||||||||||
Procter & Gamble Co. / The (Household Products) | (a) | 0.140% | 03/04/2013 | 5,000,000 | 4,998,794 | |||||||||||
Procter & Gamble Co. / The (Household Products) | (a) | 0.160% | 03/01/2013 | 3,000,000 | 2,999,213 | |||||||||||
Procter & Gamble Co. / The (Household Products) | (a) | 0.150% | 02/06/2013 | 2,000,000 | 1,999,700 | |||||||||||
|
| |||||||||||||||
| 30,996,659 | ||||||||||||||||
|
| |||||||||||||||
ENERGY – 8.5% | ||||||||||||||||
Chevron Corp. (Oil, Gas & Consumable Fuels) | (a) | 0.100% | 01/09/2013 | 10,000,000 | 9,999,778 | |||||||||||
Exxon Mobil Corp. (Oil, Gas & Consumable Fuels) | 0.040% | 01/17/2013 | 10,000,000 | 9,999,822 | ||||||||||||
Exxon Mobil Corp. (Oil, Gas & Consumable Fuels) | 0.020% | 01/03/2013 | 2,000,000 | 1,999,998 | ||||||||||||
|
| |||||||||||||||
| 21,999,598 | ||||||||||||||||
|
| |||||||||||||||
FINANCIALS – 21.6% | ||||||||||||||||
U.S. Bank (Commercial Banks) | 0.050% | 01/02/2013 | 12,000,000 | 11,999,983 | ||||||||||||
American Honda Finance Corp. (Consumer Finance) | 0.150% | 02/05/2013 | 2,000,000 | 1,999,708 | ||||||||||||
American Honda Finance Corp. (Consumer Finance) | 0.130% | 01/09/2013 | 2,000,000 | 1,999,942 | ||||||||||||
American Honda Finance Corp. (Consumer Finance) | 0.150% | 01/04/2013 | 6,000,000 | 5,999,925 | ||||||||||||
Toyota Motor Credit Corp. (Consumer Finance) | 0.090% | 01/08/2013 | 10,000,000 | 9,999,825 | ||||||||||||
General Electric Capital Corp. (Diversified Financial Services) | 0.040% | 01/14/2013 | 12,000,000 | 11,999,827 | ||||||||||||
Prudential Funding LLC (Insurance) | 0.050% | 01/02/2013 | 12,000,000 | 11,999,983 | ||||||||||||
|
| |||||||||||||||
| 55,999,193 | ||||||||||||||||
|
| |||||||||||||||
HEALTH CARE – 11.6% | ||||||||||||||||
Merck & Co., Inc. (Pharmaceuticals) | (a) | 0.130% | 01/07/2013 | 10,000,000 | 9,999,783 | |||||||||||
Pfizer, Inc. (Pharmaceuticals) | (a) | 0.060% | 01/15/2013 | 10,000,000 | 9,999,767 | |||||||||||
Johnson & Johnson (Pharmaceuticals) | (a) | 0.080% | 02/25/2013 | 10,000,000 | 9,998,778 | |||||||||||
|
| |||||||||||||||
| 29,998,328 | ||||||||||||||||
|
| |||||||||||||||
INFORMATION TECHNOLOGY – 3.9% | ||||||||||||||||
International Business Machines Corp. | (a) | 0.070% | 01/04/2013 | 10,000,000 | 9,999,942 | |||||||||||
|
| |||||||||||||||
Total Commercial Paper (Cost $160,992,668) | $ | 160,992,668 | ||||||||||||||
|
| |||||||||||||||
| Asset-Backed Securities – 0.5% | Rate | Maturity | Face Amount | Amortized Cost | ||||||||||||
FINANCIALS – 0.5% | ||||||||||||||||
CNH Equipment Trust 2012-B, Class A1 (Consumer Finance) | 0.383% | 07/12/2013 | $ | 478,368 | $ | 478,368 | ||||||||||
Ford Credit Auto Owner Trust 2012-C, Class A1 (Consumer Finance) | 0.272% | 08/15/2013 | 87,943 | 87,943 | ||||||||||||
Hyundai Auto Receivables Trust 2012-C, Class A1 (Consumer Finance) | 0.230% | 10/15/2013 | 671,602 | 671,602 | ||||||||||||
|
| |||||||||||||||
Total Asset-Backed Securities (Cost $1,237,913) | $ | 1,237,913 | ||||||||||||||
|
| |||||||||||||||
| U.S. Government Agency Issues – 4.6% | Rate | Maturity | Face Amount | Amortized Cost | ||||||||||||
Federal Home Loan Bank | 0.131% | 02/15/2013 | $ | 12,000,000 | $ | 11,998,035 | ||||||||||
|
| |||||||||||||||
Total U.S. Government Agency Issues (Cost $11,998,035) | $ | 11,998,035 | ||||||||||||||
|
| |||||||||||||||
| U.S. Treasury Obligations – 3.9% | Rate | Maturity | Face Amount | Amortized Cost | ||||||||||||
U.S. Treasury Bill | 0.040% | 03/07/2013 | $ | 10,000,000 | $ | 9,999,278 | ||||||||||
|
| |||||||||||||||
Total U.S. Treasury Obligations (Cost $9,999,278) | $ | 9,999,278 | ||||||||||||||
|
| |||||||||||||||
| Money Market Funds – 11.6% | Shares | Value | ||||||||||||||
Federated Prime Cash Obligations Fund – Institutional Class | 10,000,000 | $ | 10,000,000 | |||||||||||||
Fidelity Institutional Money Market Funds Money Market Portfolio – Class I | 10,000,000 | 10,000,000 | ||||||||||||||
First American Prime Obligations Fund – Class Z | 10,000,000 | 10,000,000 | ||||||||||||||
|
| |||||||||||||||
Total Money Market Funds (Cost $30,000,000) | $ | 30,000,000 | ||||||||||||||
|
| |||||||||||||||
Total Investments – 82.8% (Cost $214,227,894) | (c) | $ | 214,227,894 | |||||||||||||
Other Assets in Excess of Liabilities – 17.2% | 44,378,318 | |||||||||||||||
|
| |||||||||||||||
Net Assets – 100.0% | $ | 258,606,212 | ||||||||||||||
|
| |||||||||||||||
Percentages are stated as a percent of net assets.
| 9 | (continued) |
| Ohio National Fund, Inc. | Money Market Portfolio (Continued) |
Schedule of Investments | December 31, 2012 |
Footnotes:
| (a) | Security exempt from registration under Section 4 (2) of the Securities Act of 1933. These securities may be resold in transactions exempt from registration, normally to qualified buyers under Rule 144A. At December 31, 2012, the value of these securities totaled $92,993,655, or 36.0% of the Portfolio’s net assets. These securities were deemed liquid pursuant to procedures approved by the Board of Directors. |
| (b) | Rate presented is the effective yield at the time of purchase. |
| (c) | Represents cost for federal income tax and financial reporting purposes. See also Note 2 regarding the use of amortized cost for valuation of instruments in this Portfolio. |
The accompanying notes are an integral part of these financial statements.
| 10 |
| Ohio National Fund, Inc. | Bond Portfolio |
Objective/Strategy
The Bond Portfolio seeks to obtain a high level of income and opportunity for capital appreciation consistent with the preservation of capital by investing primarily in intermediate-term and long-term fixed income securities.
Performance as of December 31, 2012
Average Annual Total Returns: | ||||
One year | 7.26% | |||
Five years | 5.67% | |||
Ten years | 5.30% |
Past performance does not guarantee future results. The performance data quoted represents past performance and current returns may be lower or higher. Total return figures include change in share price and reinvestment of dividends and capital gains. The investment return and principal value will fluctuate so that an investor’s shares, when redeemed, may be worth more or less than the original cost. To obtain performance information up to the most recent month end, call toll-free 1-877-781-6392.
The Portfolio is not open to direct retail investment. Beneficial interest in shares is obtained solely by purchase of variable life insurance policies and variable annuity contracts. Actual performance results for variable annuity and variable universal life contracts will be lower due to contract charges. Consult your contract for applicable charges.
Comments
For the year ended December 31, 2012, the Bond Portfolio returned 7.26% versus 10.37% for the current benchmark, the BofA Merrill Lynch U.S. Corporate Master Index (the “Merrill Lynch Index”).
Both the Portfolio and the Index had very good absolute positive total returns for the year because credit spreads tightened considerably during 2012. The credit spread for the Index tightened 104 basis points during the year. Credit spreads tightened because U.S. Treasury yields were so low that investors sought investments which yielded more than Treasuries, hence the strong demand for corporate bonds. Corporate spreads also benefited from continued improvement in corporate credit quality. Treasury yields, while very low, did not impact performance very much because the 10-year Treasury only declined 12 basis points in 2012. The yield for the 30-year Treasury actually increased slightly during the year.
The Portfolio under-performed the Index primarily because of differences between the Portfolio and the Index with regard to duration and the industry weightings in banks and electric utilities. The Portfolio had a duration that was approximately two years short of the Index and this hurt performance relative to the Index because credit spreads tightened and bonds that were longer in maturity had greater price appreciation. The Portfolio was also under-weighted in banks by approximately 10%, and this hurt relative performance because the banking industry was the best performing industry during 2012. The Portfolio was over-weighted in electric utilities by approximately 6% and this had a negative impact on relative performance because electric utilities were among the weaker performing industries for the year.(1)
Other differences between the Portfolio and the Index regarding industry weightings had less of an impact on relative performance. The Portfolio’s 3% over-weighting in insurance benefited performance because insurance out-performed. The 2% under-weighting in consumer products and the 2% under-weighting in Telecommunication Services benefited performance because these two industries under-performed. The Portfolio’s approximately 5% holdings of U.S. Treasury bonds also weighed on performance because these bonds do not benefit from spread tightening. The overall credit
quality of the Portfolio had little impact on relative performance because both the Portfolio and the Index had an average quality of A3 (Moody’s rating).(1)
Because the U.S. economy continued to grow, albeit at a slow rate, the credit quality of the holdings in the Portfolio was maintained. There were not any real credit problems during the year with any of the holdings in the Portfolio. Of the bonds that were held for the entire year, the five bonds that performed the worst were Baxter International, Inc., Cisco Systems, Inc., Thermo Fisher Scientific, Inc., CenterPoint Energy Resources Corp., and Berkshire Hathaway, Inc. These bonds are all very good quality credits. These securities under-performed solely because they were very short in maturity. The five best performing bonds were Deutsche Bank Capital Funding Trust VII, Bank of America Corp., Computer Sciences Corp., The Allstate Corp., and Telecom Italia Capital SA. With the exception of The Allstate Corp. which was purchased early in 2012, the other four “best performing” bonds were among the worst performing bonds for the year 2011, so these securities recovered their value in 2012. Also, of the ten best performing bonds for the year, eight were in the banking and finance industries.(1)
We expect that the growth rate of the U.S. economy will continue to be tepid in 2013. We also expect that the Federal Reserve will continue to purchase mortgage-backed and Treasury securities throughout 2013 in an effort to keep U.S. Treasury rates at their low levels. Both of these factors suggest that the very low levels of yields in the U.S. will not change. Because of low Treasury yields, demand for corporate bonds will be high, keeping a lid on corporate credit spreads. All that being said, it is difficult to see Treasury yields declining and corporate credit spreads tightening in 2013. For these reasons, the total returns on bonds will likely be low for the year, and could actually be negative if either Treasury yields rise or credit spreads widen. We will continue to maintain a Portfolio duration that is shorter than the Index and purchase what we consider to be solid Baa investment grade bonds, which are slightly lower in quality than the average for the Merrill Lynch Index.
| (1) | The Portfolio’s composition is subject to change. Holdings and weightings are as of December 31, 2012. |
Change in Value of $10,000 Investment
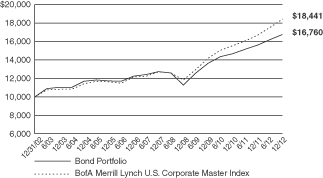
Hypothetical illustration based on past performance. Future performance will vary. The Portfolio’s returns reflect reinvested dividends. The Portfolio’s holdings may differ significantly from the securities in the index. The index is unmanaged and therefore does not reflect the cost of portfolio management and accounting.
The BofA Merrill Lynch U.S. Corporate Master Index tracks the performance of all U.S. dollar-denominated, investment grade corporate public debt issued in the U.S. domestic bond market. Qualifying bonds must have an investment grade rating (based on an average of Moody’s, S&P, and Fitch). In addition, qualifying securities must have at least one year remaining term to maturity, a fixed coupon schedule, and a minimum amount outstanding of $250 million.
| 11 | (continued) |
| Ohio National Fund, Inc. | Bond Portfolio (Continued) |
Portfolio Composition as of December 31, 2012 (1)
| % of Net Assets | ||||
Corporate Bonds (3) | 91.8 | |||
U.S. Treasury Obligations | 4.7 | |||
Money Market Funds and | 3.5 | |||
|
| |||
| 100.0 | ||||
|
|
Top 10 Portfolio Holdings as of December 31,
2012 (1) (2)
| % of Net Assets | ||||
1. United States Treasury Note | 2.4 | |||
2. United States Treasury Note | 2.3 | |||
3. Fifth Third Bancorp | 1.1 | |||
4. Union Electric Co. | 1.1 | |||
5. UnitedHealth Group, Inc. | 1.1 | |||
6. Mondelez International, Inc. | 1.1 | |||
7. Prudential Financial, Inc. | 1.0 | |||
8. CSX Corp. 5.600%, 05/01/2017 | 1.0 | |||
9. Computer Sciences Corp. | 1.0 | |||
10. Commonwealth Edison Co. | 1.0 |
| (1) | Composition of Portfolio subject to change. |
| (2) | Short-term investments have been excluded from the list of Top 10 Portfolio Holdings. |
| (3) | Sectors: |
| % of Net Assets | ||||
Financials | 26.0 | |||
Utilities | 14.9 | |||
Energy | 10.9 | |||
Consumer Discretionary | 8.8 | |||
Industrials | 8.4 | |||
Consumer Staples | 7.5 | |||
Health Care | 6.3 | |||
Materials | 4.0 | |||
Telecommunication Services | 3.8 | |||
Information Technology | 1.2 | |||
|
| |||
| 91.8 | ||||
|
|
| 12 |
| Ohio National Fund, Inc. | Bond Portfolio |
Schedule of Investments | December 31, 2012 |
| Corporate Bonds – 91.8% | Rate | Maturity | Face Amount | Value | ||||||||||||
CONSUMER DISCRETIONARY – 8.8% |
| |||||||||||||||
Darden Restaurants, Inc. (Hotels, Restaurants & Leisure) | 3.350% | 11/01/2022 | $ | 1,425,000 | $ | 1,380,122 | ||||||||||
Newell Rubbermaid, Inc. (Household Durables) | 6.250% | 04/15/2018 | 500,000 | 582,836 | ||||||||||||
Comcast Corp. (Media) | 5.875% | 02/15/2018 | 750,000 | 904,483 | ||||||||||||
Discovery Communications LLC (Media) | 4.375% | 06/15/2021 | 1,000,000 | 1,117,373 | ||||||||||||
Discovery Communications LLC (Media) | 3.300% | 05/15/2022 | 275,000 | 282,707 | ||||||||||||
News America, Inc. (Media) | 4.500% | 02/15/2021 | 1,250,000 | 1,429,140 | ||||||||||||
Time Warner Cable, Inc. (Media) | 5.850% | 05/01/2017 | 1,000,000 | 1,182,102 | ||||||||||||
Time Warner Cable, Inc. (Media) | 4.500% | 09/15/2042 | 425,000 | 414,881 | ||||||||||||
Time Warner, Inc. (Media) | 3.150% | 07/15/2015 | 1,250,000 | 1,322,581 | ||||||||||||
Viacom, Inc. (Media) | 4.375% | 09/15/2014 | 1,000,000 | 1,059,953 | ||||||||||||
Walt Disney Co. / The (Media) | 3.700% | 12/01/2042 | 925,000 | 926,977 | ||||||||||||
Kohl’s Corp. (Multiline Retail) | 4.000% | 11/01/2021 | 1,250,000 | 1,323,045 | ||||||||||||
Macy’s Retail Holdings, Inc. (Multiline Retail) | 5.900% | 12/01/2016 | 425,000 | 499,683 | ||||||||||||
Target Corp. (Multiline Retail) | 2.900% | 01/15/2022 | 1,500,000 | 1,591,278 | ||||||||||||
Lowe’s Cos., Inc. (Specialty Retail) | 3.800% | 11/15/2021 | 1,000,000 | 1,105,523 | ||||||||||||
|
| |||||||||||||||
| 15,122,684 | ||||||||||||||||
|
| |||||||||||||||
CONSUMER STAPLES – 7.5% |
| |||||||||||||||
Anheuser-Busch Cos., Inc. (Beverages) | 5.500% | 01/15/2018 | 750,000 | 899,789 | ||||||||||||
CVS Caremark Corp. (Food & Staples Retailing) | 5.750% | 06/01/2017 | 487,000 | 582,637 | ||||||||||||
Kroger Co. / The (Food & Staples Retailing) | 2.200% | 01/15/2017 | 1,500,000 | 1,551,139 | ||||||||||||
Wal-Mart Stores, Inc. (Food & Staples Retailing) | 1.500% | 10/25/2015 | 1,250,000 | 1,287,365 | ||||||||||||
Bunge NA Finance LP (Food Products) | 5.900% | 04/01/2017 | 1,500,000 | 1,704,166 | ||||||||||||
Hillshire Brands Co. (Food Products) | 2.750% | 09/15/2015 | 1,250,000 | 1,288,526 | ||||||||||||
Mead Johnson Nutrition Co. (Food Products) | 3.500% | 11/01/2014 | 800,000 | 836,483 | ||||||||||||
Mondelez International, Inc. (Food Products) | 6.125% | 02/01/2018 | 1,500,000 | 1,826,545 | ||||||||||||
Tyson Foods, Inc. (Food Products) | (b) | 6.600% | 04/01/2016 | 1,000,000 | 1,150,674 | |||||||||||
Procter & Gamble Co. / The (Household Products) | 4.700% | 02/15/2019 | 250,000 | 295,543 | ||||||||||||
Philip Morris International, Inc. (Tobacco) | 4.125% | 05/17/2021 | 1,250,000 | 1,414,156 | ||||||||||||
|
| |||||||||||||||
| 12,837,023 | ||||||||||||||||
|
| |||||||||||||||
ENERGY – 10.9% |
| |||||||||||||||
Weatherford International Ltd. (Energy Equip. & Svs.) | 6.000% | 03/15/2018 | 1,500,000 | 1,715,170 | ||||||||||||
Anadarko Petroleum Corp. (Oil, Gas & Consumable Fuels) | 5.950% | 09/15/2016 | 1,000,000 | 1,151,791 | ||||||||||||
Apache Corp. (Oil, Gas & Consumable Fuels) | 2.625% | 01/15/2023 | 1,000,000 | 999,087 | ||||||||||||
Buckeye Partners LP (Oil, Gas & Consumable Fuels) | 4.875% | 02/01/2021 | 1,000,000 | 1,036,438 | ||||||||||||
Cenovus Energy, Inc. (Oil, Gas & Consumable Fuels) | 5.700% | 10/15/2019 | 1,000,000 | 1,213,426 | ||||||||||||
Devon Energy Corp. (Oil, Gas & Consumable Fuels) | 3.250% | 05/15/2022 | 500,000 | 522,298 | ||||||||||||
EOG Resources, Inc. (Oil, Gas & Consumable Fuels) | 2.950% | 06/01/2015 | 1,250,000 | 1,314,691 | ||||||||||||
Kinder Morgan Energy Partners LP (Oil, Gas & Consumable Fuels) | 4.150% | 03/01/2022 | 1,000,000 | 1,084,394 | ||||||||||||
Magellan Midstream Partners LP (Oil, Gas & Consumable Fuels) | 4.250% | 02/01/2021 | 1,000,000 | 1,105,301 | ||||||||||||
Murphy Oil Corp. (Oil, Gas & Consumable Fuels) | 4.000% | 06/01/2022 | 1,250,000 | 1,260,999 | ||||||||||||
Occidental Petroleum Corp. (Oil, Gas & Consumable Fuels) | 3.125% | 02/15/2022 | 1,000,000 | 1,064,595 | ||||||||||||
ONEOK Partners LP (Oil, Gas & Consumable Fuels) | 3.250% | 02/01/2016 | 1,000,000 | 1,055,563 | ||||||||||||
Phillips 66 (Oil, Gas & Consumable Fuels) | (a) | 4.300% | 04/01/2022 | 1,300,000 | 1,453,878 | |||||||||||
Plains All American Pipeline LP / PAA Finance Corp. (Oil, Gas & Consumable Fuels) | 2.850% | 01/31/2023 | 1,000,000 | 991,719 | ||||||||||||
Shell International Finance BV (Oil, Gas & Consumable Fuels) | 4.375% | 03/25/2020 | 1,250,000 | 1,450,941 | ||||||||||||
TransCanada PipeLines Ltd. (Oil, Gas & Consumable Fuels) | 2.500% | 08/01/2022 | 1,425,000 | 1,429,218 | ||||||||||||
|
| |||||||||||||||
| 18,849,509 | ||||||||||||||||
|
| |||||||||||||||
FINANCIALS – 26.0% |
| |||||||||||||||
Credit Suisse (Capital Markets) | 3.500% | 03/23/2015 | 1,250,000 | 1,318,807 | ||||||||||||
Franklin Resources, Inc. (Capital Markets) | 3.125% | 05/20/2015 | 1,000,000 | 1,052,791 | ||||||||||||
Goldman Sachs Group, Inc. / The (Capital Markets) | 6.150% | 04/01/2018 | 1,250,000 | 1,469,601 | ||||||||||||
Janus Capital Group, Inc. (Capital Markets) | (b) | 6.700% | 06/15/2017 | 1,500,000 | 1,715,511 | |||||||||||
Jefferies Group, Inc. (Capital Markets) | 5.875% | 06/08/2014 | 1,000,000 | 1,057,500 | ||||||||||||
Morgan Stanley (Capital Markets) | 4.750% | 04/01/2014 | 1,250,000 | 1,294,736 | ||||||||||||
Northern Trust Corp. (Capital Markets) | 3.450% | 11/04/2020 | 1,000,000 | 1,079,401 | ||||||||||||
State Street Corp. (Capital Markets) | 4.375% | 03/07/2021 | 1,250,000 | 1,453,956 | ||||||||||||
TD Ameritrade Holding Corp. (Capital Markets) | 4.150% | 12/01/2014 | 1,000,000 | 1,066,245 | ||||||||||||
BB&T Corp. (Commercial Banks) | 5.200% | 12/23/2015 | 1,000,000 | 1,115,545 | ||||||||||||
Comerica Bank (Commercial Banks) | 5.750% | 11/21/2016 | 1,500,000 | 1,736,575 | ||||||||||||
Deutsche Bank Capital Funding Trust VII (Commercial Banks) | (a)(c) | 5.628% | Perpetual | 1,500,000 | 1,440,000 | |||||||||||
Fifth Third Bancorp (Commercial Banks) | 4.500% | 06/01/2018 | 1,750,000 | 1,944,897 | ||||||||||||
KeyCorp (Commercial Banks) | 5.100% | 03/24/2021 | 500,000 | 582,943 | ||||||||||||
PNC Funding Corp. (Commercial Banks) | 5.250% | 11/15/2015 | 1,500,000 | 1,677,024 | ||||||||||||
SunTrust Bank (Commercial Banks) | 5.000% | 09/01/2015 | 229,000 | 250,337 | ||||||||||||
Wells Fargo & Co. (Commercial Banks) | 4.600% | 04/01/2021 | 1,250,000 | 1,438,904 | ||||||||||||
Capital One Bank U.S.A. NA (Consumer Finance) | 5.125% | 02/15/2014 | 750,000 | 787,052 | ||||||||||||
Discover Financial Services (Consumer Finance) | 6.450% | 06/12/2017 | 750,000 | 877,616 | ||||||||||||
| 13 | (continued) |
| Ohio National Fund, Inc. | Bond Portfolio (Continued) |
Schedule of Investments | December 31, 2012 |
| Corporate Bonds (Continued) | Rate | Maturity | Face Amount | Value | ||||||||||||
FINANCIALS (continued) |
| |||||||||||||||
Bank of America Corp. (Diversified Financial Svs.) | 5.650% | 05/01/2018 | $ | 1,000,000 | $ | 1,164,368 | ||||||||||
Citigroup, Inc. (Diversified Financial Svs.) | 6.125% | 05/15/2018 | 1,250,000 | 1,499,206 | ||||||||||||
General Electric Capital Corp. (Diversified Financial Svs.) | 5.625% | 05/01/2018 | 1,000,000 | 1,188,483 | ||||||||||||
JPMorgan Chase & Co. (Diversified Financial Svs.) | 5.150% | 10/01/2015 | 1,500,000 | 1,649,658 | ||||||||||||
National Rural Utilities Cooperative Finance Corp. (Diversified Financial Svs.) | 1.900% | 11/01/2015 | 1,000,000 | 1,032,142 | ||||||||||||
Allstate Corp. / The (Insurance) | 5.200% | 01/15/2042 | 500,000 | 593,995 | ||||||||||||
Assurant, Inc. (Insurance) | 5.625% | 02/15/2014 | 1,500,000 | 1,565,432 | ||||||||||||
Axis Capital Holdings Ltd. (Insurance) | 5.750% | 12/01/2014 | 1,000,000 | 1,072,959 | ||||||||||||
Berkshire Hathaway, Inc. (Insurance) | 3.200% | 02/11/2015 | 1,250,000 | 1,316,571 | ||||||||||||
Hartford Financial Services Group, Inc. (Insurance) | 5.375% | 03/15/2017 | 1,500,000 | 1,695,872 | ||||||||||||
Liberty Mutual Group, Inc. (Insurance) | (a) | 5.750% | 03/15/2014 | 1,000,000 | 1,047,559 | |||||||||||
Loews Corp. (Insurance) | 5.250% | 03/15/2016 | 750,000 | 836,315 | ||||||||||||
Prudential Financial, Inc. (Insurance) | 6.100% | 06/15/2017 | 1,500,000 | 1,770,471 | ||||||||||||
Equity One, Inc. (Real Estate Investment Trusts) | 6.250% | 01/15/2017 | 1,250,000 | 1,427,911 | ||||||||||||
Federal Realty Investment Trust (Real Estate Investment Trusts) | 3.000% | 08/01/2022 | 1,425,000 | 1,411,847 | ||||||||||||
HCP, Inc. (Real Estate Investment Trusts) | 5.375% | 02/01/2021 | 1,000,000 | 1,139,590 | ||||||||||||
Mack-Cali Realty LP (Real Estate Investment Trusts) | 4.600% | 06/15/2013 | 1,000,000 | 1,015,284 | ||||||||||||
|
| |||||||||||||||
| 44,787,104 | ||||||||||||||||
|
| |||||||||||||||
HEALTH CARE – 6.3% |
| |||||||||||||||
Amgen, Inc. (Biotechnology) | 4.100% | 06/15/2021 | 1,000,000 | 1,108,721 | ||||||||||||
Celgene Corp. (Biotechnology) | 2.450% | 10/15/2015 | 1,250,000 | 1,297,905 | ||||||||||||
Baxter International, Inc. (Health Care Equip. & Supplies) | 1.800% | 03/15/2013 | 250,000 | 250,706 | ||||||||||||
Becton Dickinson and Co. (Health Care Equip. & Supplies) | 5.000% | 05/15/2019 | 500,000 | 593,018 | ||||||||||||
Covidien International Finance SA (Health Care Equip. & Supplies) | 2.800% | 06/15/2015 | 1,250,000 | 1,308,073 | ||||||||||||
AmerisourceBergen Corp. (Health Care Providers & Svs.) | 4.875% | 11/15/2019 | 500,000 | 580,131 | ||||||||||||
Laboratory Corp of America Holdings (Health Care Providers & Svs.) | 3.750% | 08/23/2022 | 425,000 | 451,092 | ||||||||||||
UnitedHealth Group, Inc. (Health Care Providers & Svs.) | 6.000% | 02/15/2018 | 1,500,000 | 1,827,180 | ||||||||||||
Thermo Fisher Scientific, Inc. (Life Sciences Tools & Svs.) | 3.250% | 11/20/2014 | 300,000 | 313,828 | ||||||||||||
AbbVie, Inc. (Pharmaceuticals) | (a) | 2.900% | 11/06/2022 | 1,425,000 | 1,452,554 | |||||||||||
Merck & Co., Inc. (Pharmaceuticals) | 5.000% | 06/30/2019 | 1,000,000 | 1,204,401 | ||||||||||||
Teva Pharmaceutical Finance II BV / Teva Pharmaceutical Finance III LLC (Pharmaceuticals) | 3.000% | 06/15/2015 | 500,000 | 525,958 | ||||||||||||
|
| |||||||||||||||
| 10,913,567 | ||||||||||||||||
|
| |||||||||||||||
INDUSTRIALS – 8.4% |
| |||||||||||||||
BAE Systems Holdings, Inc. (Aerospace & Defense) | (a) | 6.375% | 06/01/2019 | 750,000 | 895,884 | |||||||||||
Lockheed Martin Corp. (Aerospace & Defense) | 3.350% | 09/15/2021 | 1,000,000 | 1,057,635 | ||||||||||||
Raytheon Co. (Aerospace & Defense) | 4.400% | 02/15/2020 | 1,250,000 | 1,431,545 | ||||||||||||
Republic Services, Inc. (Commercial Svs. & Supplies) | 3.800% | 05/15/2018 | 1,000,000 | 1,100,299 | ||||||||||||
Waste Management, Inc. (Commercial Svs. & Supplies) | 6.100% | 03/15/2018 | 500,000 | 603,798 | ||||||||||||
Emerson Electric Co. (Electrical Equip.) | 4.250% | 11/15/2020 | 1,250,000 | 1,443,425 | ||||||||||||
Caterpillar, Inc. (Machinery) | 5.700% | 08/15/2016 | 1,000,000 | 1,160,755 | ||||||||||||
Deere & Co. (Machinery) | 4.375% | 10/16/2019 | 1,250,000 | 1,448,228 | ||||||||||||
Illinois Tool Works, Inc. (Machinery) | 3.375% | 09/15/2021 | 500,000 | 544,416 | ||||||||||||
CSX Corp. (Road & Rail) | 5.600% | 05/01/2017 | 1,500,000 | 1,753,373 | ||||||||||||
Norfolk Southern Corp. (Road & Rail) | 3.000% | 04/01/2022 | 600,000 | 615,978 | ||||||||||||
Ryder System, Inc. (Road & Rail) | 3.600% | 03/01/2016 | 1,000,000 | 1,050,358 | ||||||||||||
Union Pacific Corp. (Road & Rail) | 4.000% | 02/01/2021 | 1,250,000 | 1,402,390 | ||||||||||||
|
| |||||||||||||||
| 14,508,084 | ||||||||||||||||
|
| |||||||||||||||
INFORMATION TECHNOLOGY – 1.2% |
| |||||||||||||||
Cisco Systems, Inc. (Communications Equip.) | 2.900% | 11/17/2014 | 300,000 | 313,250 | ||||||||||||
Computer Sciences Corp. (IT Svs.) | 6.500% | 03/15/2018 | 1,500,000 | 1,751,028 | ||||||||||||
|
| |||||||||||||||
| 2,064,278 | ||||||||||||||||
|
| |||||||||||||||
MATERIALS – 4.0% |
| |||||||||||||||
Eastman Chemical Co. (Chemicals) | 3.600% | 08/15/2022 | 1,000,000 | 1,048,239 | ||||||||||||
FMC Corp. (Chemicals) | 3.950% | 02/01/2022 | 1,000,000 | 1,062,434 | ||||||||||||
Freeport-McMoRan Copper & Gold, Inc. (Metals & Mining) | 3.550% | 03/01/2022 | 1,250,000 | 1,240,778 | ||||||||||||
Newmont Mining Corp. (Metals & Mining) | 3.500% | 03/15/2022 | 1,425,000 | 1,470,933 | ||||||||||||
Rio Tinto Finance U.S.A. Ltd. (Metals & Mining) | 1.875% | 11/02/2015 | 1,000,000 | 1,026,929 | ||||||||||||
Teck Resources Ltd. (Metals & Mining) | 3.750% | 02/01/2023 | 1,000,000 | 1,026,623 | ||||||||||||
|
| |||||||||||||||
| 6,875,936 | ||||||||||||||||
|
| |||||||||||||||
TELECOMMUNICATION SERVICES – 3.8% |
| |||||||||||||||
AT&T, Inc. (Diversified Telecom. Svs.) | 3.875% | 08/15/2021 | 1,000,000 | 1,115,416 | ||||||||||||
AT&T, Inc. (Diversified Telecom. Svs.) | 3.000% | 02/15/2022 | 500,000 | 520,468 | ||||||||||||
Telecom Italia Capital SA (Diversified Telecom. Svs.) | 5.250% | 10/01/2015 | 750,000 | 799,875 | ||||||||||||
Verizon Communications, Inc. (Diversified Telecom. Svs.) | 4.600% | 04/01/2021 | 1,250,000 | 1,460,150 | ||||||||||||
Verizon Communications, Inc. (Diversified Telecom. Svs.) | 3.850% | 11/01/2042 | 425,000 | 418,456 | ||||||||||||
| 14 | (continued) |
| Ohio National Fund, Inc. | Bond Portfolio (Continued) |
Schedule of Investments | December 31, 2012 |
| Corporate Bonds (Continued) | Rate | Maturity | Face Amount | Value | ||||||||||||
TELECOMMUNICATION SERVICES (continued) |
| |||||||||||||||
America Movil SAB de CV (Wireless Telecom. Svs.) | 5.750% | 01/15/2015 | $ | 1,000,000 | $ | 1,102,413 | ||||||||||
Rogers Communications, Inc. (Wireless Telecom. Svs.) | 5.500% | 03/15/2014 | 1,000,000 | 1,058,168 | ||||||||||||
|
| |||||||||||||||
| 6,474,946 | ||||||||||||||||
|
| |||||||||||||||
UTILITIES – 14.9% |
| |||||||||||||||
Appalachian Power Co. (Electric Utilities) | 4.600% | 03/30/2021 | 1,000,000 | 1,152,683 | ||||||||||||
Commonwealth Edison Co. (Electric Utilities) | 5.950% | 08/15/2016 | 1,500,000 | 1,749,152 | ||||||||||||
Duke Energy Corp. (Electric Utilities) | 3.350% | 04/01/2015 | 1,250,000 | 1,321,356 | ||||||||||||
Florida Power Corp. (Electric Utilities) | 4.550% | 04/01/2020 | 500,000 | 575,202 | ||||||||||||
Kansas City Power & Light Co. (Electric Utilities) | 5.850% | 06/15/2017 | 1,500,000 | 1,748,244 | ||||||||||||
Metropolitan Edison Co. (Electric Utilities) | 4.875% | 04/01/2014 | 750,000 | 786,072 | ||||||||||||
Pepco Holdings, Inc. (Electric Utilities) | 2.700% | 10/01/2015 | 750,000 | 776,789 | ||||||||||||
South Carolina Electric & Gas Co. (Electric Utilities) | 4.350% | 02/01/2042 | 1,000,000 | 1,056,613 | ||||||||||||
Tenaska Georgia Partners LP (Electric Utilities) | 9.500% | 02/01/2030 | 471,240 | 562,233 | ||||||||||||
Union Electric Co. (Electric Utilities) | 6.400% | 06/15/2017 | 1,500,000 | 1,833,425 | ||||||||||||
Virginia Electric and Power Co. (Electric Utilities) | 5.400% | 01/15/2016 | 1,500,000 | 1,703,994 | ||||||||||||
Westar Energy, Inc. (Electric Utilities) | 4.125% | 03/01/2042 | 500,000 | 522,330 | ||||||||||||
Xcel Energy, Inc. (Electric Utilities) | 4.700% | 05/15/2020 | 1,000,000 | 1,170,249 | ||||||||||||
AGL Capital Corp. (Gas Utilities) | 5.250% | 08/15/2019 | 1,000,000 | 1,192,600 | ||||||||||||
CenterPoint Energy Resources Corp. (Gas Utilities) | 5.950% | 01/15/2014 | 500,000 | 524,979 | ||||||||||||
Southwest Gas Corp. (Gas Utilities) | 3.875% | 04/01/2022 | 1,250,000 | 1,380,776 | ||||||||||||
Spectra Energy Capital LLC (Gas Utilities) | 5.500% | 03/01/2014 | 750,000 | 789,158 | ||||||||||||
Energy Future Competitive Holdings Co. (Ind. Power Prod. & Energy Traders) | 7.480% | 01/01/2017 | 393,963 | 361,924 | ||||||||||||
Alliant Energy Corp. (Multi-Utilities) | 4.000% | 10/15/2014 | 1,000,000 | 1,054,234 | ||||||||||||
Avista Corp. (Multi-Utilities) | 5.950% | 06/01/2018 | 1,000,000 | 1,210,227 | ||||||||||||
Consumers Energy Co. (Multi-Utilities) | 6.000% | 02/15/2014 | 1,000,000 | 1,059,119 | ||||||||||||
LG&E and KU Energy LLC (Multi-Utilities) | 4.375% | 10/01/2021 | 1,000,000 | 1,098,169 | ||||||||||||
NextEra Energy Capital Holdings, Inc. (Multi-Utilities) | 2.600% | 09/01/2015 | 1,250,000 | 1,303,088 | ||||||||||||
Public Service Electric & Gas Co. (Multi-Utilities) | 3.950% | 05/01/2042 | 750,000 | 771,373 | ||||||||||||
|
| |||||||||||||||
| 25,703,989 | ||||||||||||||||
|
| |||||||||||||||
Total Corporate Bonds (Cost $143,475,815) | $ | 158,137,120 | ||||||||||||||
|
| |||||||||||||||
| U.S. Treasury Obligations – 4.7% | Rate | Maturity | Face Amount | Value | ||||||||||||
United States Treasury Note | 2.000% | 11/15/2021 | $ | 4,000,000 | $ | 4,147,812 | ||||||||||
United States Treasury Note | 1.625% | 08/15/2022 | 4,000,000 | 3,970,000 | ||||||||||||
|
| |||||||||||||||
Total U.S. Treasury Obligations (Cost $7,994,136) | $ | 8,117,812 | ||||||||||||||
|
| |||||||||||||||
| Money Market Funds – 2.3% | Shares | Value | ||||||||||||||
Fidelity Institutional Money Market Funds | 3,883,000 | $ | 3,883,000 | |||||||||||||
|
| |||||||||||||||
Total Money Market Funds (Cost $3,883,000) | $ | 3,883,000 | ||||||||||||||
|
| |||||||||||||||
Total Investments – 98.8% (Cost $155,352,951) | (d) | $ | 170,137,932 | |||||||||||||
Other Assets in Excess of Liabilities – 1.2% | 2,046,518 | |||||||||||||||
|
| |||||||||||||||
Net Assets – 100.0% | $ | 172,184,450 | ||||||||||||||
|
| |||||||||||||||
Percentages are stated as a percent of net assets.
Footnotes:
| (a) | Security exempt from registration under Regulation D of the Securities Act of 1933. These securities may be resold in transactions exempt from registration, normally to qualified buyers under Rule 144A. At December 31, 2012, the value of these securities totaled $6,289,875, or 3.7% of the Portfolio’s net assets. These securities were deemed liquid pursuant to procedures approved by the Board of Directors. |
| (b) | These securities are credit sensitive bonds. The coupon rates are variable rates subject to adjustment based on changes in national credit rating agency ratings. |
| (c) | Fixed-to-floating rate, callable, perpetual life trust preferred security. Interest rates stated are those in effect at December 31, 2012. |
| (d) | Represents cost for financial reporting purposes, which may differ from cost basis for federal income tax purposes. See also Note 7 of the Notes to Financial Statements. |
The accompanying notes are an integral part of these financial statements.
| 15 |
| Ohio National Fund, Inc. | Omni Portfolio |
Objective/Strategy
The Omni Portfolio seeks a high level of long-term total return consistent with preservation of capital by investing in stocks, bonds, and money market instruments.
Performance as of December 31, 2012
Average Annual Total Returns: | ||||
One year | 12.04% | |||
Five years | 2.11% | |||
Ten years | 7.13% |
Past performance does not guarantee future results. The performance data quoted represents past performance and current returns may be lower or higher. Total return figures include change in share price and reinvestment of dividends and capital gains. The investment return and principal value will fluctuate so that an investor’s shares, when redeemed, may be worth more or less than the original cost. To obtain performance information up to the most recent month end, call toll-free 1-877-781-6392.
The Portfolio is not open to direct retail investment. Beneficial interest in shares is obtained solely by purchase of variable life insurance policies and variable annuity contracts. Actual performance results for variable annuity and variable universal life contracts will be lower due to contract charges. Consult your contract for applicable charges.
Comments
For the year ended December 31, 2012, the Omni Portfolio returned 12.04% versus 14.42% for the current benchmark, which is composed of 70% S&P 500 Index and 30% BofA Merrill Lynch U.S. Corporate Master Index (the “Merrill Lynch Index”).
The under-performance of the Portfolio versus the blended benchmark is the result of several factors, including under-performance by both the equity portion of the Portfolio versus the S&P 500 Index and under-performance of the bond portion of the Portfolio versus the Merrill Lynch Index. Holding approximately 3.0% of the Portfolio in cash equivalents during a year in which both common stocks and bonds had strong positive returns also weighed on performance. The asset allocation decision to under-weight bonds and over-weight stocks versus the blended index benefited relative performance because stocks outperformed bonds for the year.
The equity portion of the Portfolio returned 15.08% versus 16.00% for the S&P 500 Index. The largest detractors from relative performance were stock selections in Energy, Materials, and Health Care, which were somewhat offset by positive stock selection in Industrials. Sector weightings, overall, contributed positively to relative performance. The Portfolio’s best performing stocks for the year were Lowe’s Cos., Inc., Hanesbrands, Inc., Snap-On Inc., Whirpool Corp., and Pentair Ltd. The Portfolio’s worst performers were Forest Oil Corp., Abercrombie & Fitch Co., Stillwater Mining Co., Facebook, Inc., and Vertex Pharmaceuticals, Inc. The top contributors to performance were Apple, Inc., Whirlpool Corp., Pentair Ltd., Snap-On, Inc., and Lowe’s Cos., Inc. The top detractors to performance were Forest Oil Corp., Abercrombie & Fitch Co., Facebook, Inc., Stillwater Mining Co., and Vertex Pharmaceuticals, Inc.(1)
During 2012, the main changes in sector weightings in the equity portion of the Portfolio included increasing Consumer Discretionary, from 11.6% to 14.9%, and reducing the Energy exposure from 12.8% to 7.9%. The already over-weighted Industrials sector was increased from 19.3% to 23.0% (versus the S&P 500 Index’s 10.1%). Stocks from the Materials sector were increased to 4.9% from 2.1%. These sector changes reflect the continuing belief in an economic recovery. Finally, the exposure to Financials was lowered to a near market
weight of 15.8% from 16.9% (versus the S&P 500 Index’s 15.6%) in the face of impending legal settlements over mortgages.(1)
The bond portion of the Portfolio had a total return of 8.44% versus 10.37% for the Merrill Lynch Index. Both the bond portion of the Portfolio and the Merrill Lynch Index had reasonably good absolute positive total returns because credit spreads tightened considerably during 2012. Credit spreads tightened because U.S. Treasury yields were so low that bond investors sought the “extra” yield offered by corporate bonds. Credit spreads also improved because of continued improvement in corporate credit quality. Treasury yields did not impact performance very much because Treasury yields did not change materially over the year.
The bond portion of the Portfolio under-performed the Merrill Lynch Index primarily because of differences between the Portfolio’s bond holdings and the Merrill Lynch Index with regard to duration and the industry weightings in banks and electric utilities. The bond portion of the Portfolio has a duration that was approximately two years short of the Merrill Lynch Index and this hurt performance relative to the index because credit spreads tightened and bonds that were longer in maturity had greater price appreciation. The bond portion of the Portfolio was also under-weighted in banks by approximately 9%, and this detracted from relative performance because the banking industry was the best performing industry during 2012. The bond portion of the Portfolio was also over-weighted in electric utilities by approximately 8% and this had a negative impact on relative performance because electric utilities were among the weaker performing industries for the year.(1)
Because the U.S. economy continued to grow, albeit at a slow rate, the credit quality of the bond holdings in the Portfolio was maintained. Of the bonds that were held for the entire year, the five poorest performing bonds were Rogers Communications, Inc., Duke Capital Corp., Enterprise Products Operating, L.P., Capital One Bank USA, NA, and The Procter & Gamble Company. These bonds are all good quality credits. These securities under-performed because they were short in maturity or of very high quality. The five best performing bonds were Deutsche Bank Capital Funding Trust VII, Computer Sciences Corp., Bank of America Corp., Telecom Italia Capital SA, and Discover Financial Services. With the exception of Discover Financial Services, the other four “best performing” bonds were among the worst performing bonds for the year 2011, so these bonds recovered their value in 2012.(1)
Looking forward into 2013, there are plenty of overseas worries that could negatively affect the stock market, including Iran, Syria, Egypt, Mali and possible conflicts between Japan and China over historical claims to a few rocky islands. However, concerns over the European Union debt problems are now much less of a threat and Chinese manufacturing is back on track. In the U.S., there are continuing indications of growth, and the Federal Reserve’s actions have also done much to stabilize the equity markets. As the domestic economy shakes off the problems of the past four years, there is a likelihood of stronger equity markets in 2013 and 2014. The equity portion of the Portfolio should benefit from continued economic growth in the U.S. If the Federal Reserve begins to reduce its stimulus later in 2013 and interest rates begin to rise, the bond portion of the Portfolio is well positioned because its duration is shorter than the Merrill Lynch Index.
| (1) | The Portfolio’s composition is subject to change. Holdings and weightings are as of December 31, 2012. |
| 16 | (continued) |
| Ohio National Fund, Inc. | Omni Portfolio (Continued) |
Change in Value of $10,000 Investment
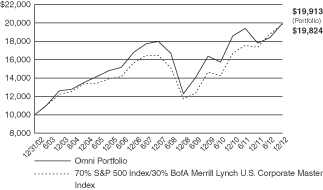
Hypothetical illustration based on past performance. Future performance will vary. The Portfolio’s returns reflect reinvested dividends. The Portfolio’s holdings may differ significantly from the securities in the index. The index is unmanaged and therefore does not reflect the cost of portfolio management and accounting.
The BofA Merrill Lynch U.S. Corporate Master Index tracks the performance of all U.S. dollar-denominated, investment grade corporate public debt issued in the U.S. domestic bond market. Qualifying bonds must have an investment grade rating (based on an average of Moody’s, S&P, and Fitch). In addition, qualifying securities must have at least one year remaining term to maturity, a fixed coupon schedule, and a minimum amount outstanding of $250 million.
The S&P 500 Index is a capitalization-weighted index designed to measure performance of the broad domestic market through changes in the aggregate market value of 500 stocks representing all major industries. The index presented herein includes the effects of reinvested dividends.
Portfolio Composition as of December 31, 2012 (1)
| % of Net Assets | ||||
Common Stocks (3) | 72.5 | |||
Corporate Bonds (3) | 22.1 | |||
U.S. Treasury Obligations | 1.3 | |||
Money Market Funds and | 4.1 | |||
|
| |||
| 100.0 | ||||
|
|
Top 10 Portfolio Holdings as of December 31, 2012 (1) (2)
| % of Net Assets | ||||
1. Apple, Inc. | 1.8 | |||
2. Hertz Global Holdings, Inc. | 1.7 | |||
3. Honeywell International, Inc. | 1.6 | |||
4. Hanesbrands, Inc. | 1.6 | |||
5. Snap-On, Inc. | 1.6 | |||
6. Lincoln National Corp. | 1.6 | |||
7. Xylem, Inc. | 1.6 | |||
8. TIBCO Software, Inc. | 1.6 | |||
9. Eaton Corp. PLC | 1.6 | |||
10. Marathon Oil Corp. | 1.5 |
| (1) | Composition of Portfolio subject to change. |
| (2) | Short-term investments have been excluded from the list of Top 10 Portfolio Holdings. |
| (3) | Sectors (combined): |
| % of Net Assets | ||||
Industrials | 18.3 | |||
Information Technology | 17.9 | |||
Financials | 17.4 | |||
Consumer Discretionary | 12.6 | |||
Energy | 8.4 | |||
Health Care | 6.9 | |||
Materials | 4.3 | |||
Utilities | 4.1 | |||
Consumer Staples | 3.1 | |||
Telecommunication Services | 1.6 | |||
|
| |||
| 94.6 | ||||
|
|
| 17 |
| Ohio National Fund, Inc. | Omni Portfolio |
Schedule of Investments | December 31, 2012 |
| Common Stocks – 72.5% | Shares | Value | ||||||||||||
CONSUMER DISCRETIONARY – 10.8% |
| |||||||||||||
CBS Corp. Class B (Media) | 7,500 | $ | 285,375 | |||||||||||
Time Warner, Inc. (Media) | 10,400 | 497,432 | ||||||||||||
Walt Disney Co. / The (Media) | 9,900 | 492,921 | ||||||||||||
Macy’s, Inc. (Multiline Retail) | 4,300 | 167,786 | ||||||||||||
Target Corp. (Multiline Retail) | 7,400 | 437,858 | ||||||||||||
AutoZone, Inc. (Specialty Retail) | (a) | 900 | 318,987 | |||||||||||
Lowe’s Cos., Inc. (Specialty Retail) | 10,200 | 362,304 | ||||||||||||
Hanesbrands, Inc. (Textiles, Apparel & Luxury Goods) | (a) | 14,800 | 530,136 | |||||||||||
Michael Kors Holdings Ltd. (Textiles, Apparel & Luxury Goods) | (a) | 4,700 | 239,841 | |||||||||||
Wolverine World Wide, Inc. (Textiles, Apparel & Luxury Goods) | 6,400 | 262,272 | ||||||||||||
|
| |||||||||||||
| 3,594,912 | ||||||||||||||
|
| |||||||||||||
CONSUMER STAPLES – 1.4% |
| |||||||||||||
Constellation Brands, Inc. Class A (Beverages) | (a) | 13,500 | 477,765 | |||||||||||
|
| |||||||||||||
ENERGY – 5.7% |
| |||||||||||||
Schlumberger Ltd. (Energy Equip. & Svs.) | 6,700 | 464,243 | ||||||||||||
ConocoPhillips (Oil, Gas & Consumable Fuels) | 8,800 | 510,312 | ||||||||||||
Marathon Oil Corp. (Oil, Gas & Consumable Fuels) | 16,700 | 512,022 | ||||||||||||
Whiting Petroleum Corp. (Oil, Gas & Consumable Fuels) | (a) | 9,700 | 420,689 | |||||||||||
|
| |||||||||||||
| 1,907,266 | ||||||||||||||
|
| |||||||||||||
FINANCIALS – 11.5% |
| |||||||||||||
PNC Financial Services Group, Inc. (Commercial Banks) | 8,400 | 489,804 | ||||||||||||
Wells Fargo & Co. (Commercial Banks) | 13,000 | 444,340 | ||||||||||||
Citigroup, Inc. (Diversified Financial Svs.) | 10,700 | 423,292 | ||||||||||||
JPMorgan Chase & Co. (Diversified Financial Svs.) | 11,400 | 501,258 | ||||||||||||
Hartford Financial Services Group, Inc. (Insurance) | 22,500 | 504,900 | ||||||||||||
Lincoln National Corp. (Insurance) | 20,100 | 520,590 | ||||||||||||
MetLife, Inc. (Insurance) | 14,000 | 461,160 | ||||||||||||
Prudential Financial, Inc. (Insurance) | 8,800 | 469,304 | ||||||||||||
|
| |||||||||||||
| 3,814,648 | ||||||||||||||
|
| |||||||||||||
HEALTH CARE – 5.4% |
| |||||||||||||
Amarin Corp PLC – ADR (Biotechnology) | (a) | 36,100 | 292,049 | |||||||||||
Ariad Pharmaceuticals, Inc. (Biotechnology) | (a) | 13,600 | 260,848 | |||||||||||
Vertex Pharmaceuticals, Inc. (Biotechnology) | (a) | 8,400 | 352,296 | |||||||||||
UnitedHealth Group, Inc. (Health Care Providers & Svs.) | 7,400 | 401,376 | ||||||||||||
Pfizer, Inc. (Pharmaceuticals) | 19,300 | 484,044 | ||||||||||||
|
| |||||||||||||
| 1,790,613 | ||||||||||||||
|
| |||||||||||||
INDUSTRIALS – 16.7% |
| |||||||||||||
Honeywell International, Inc. (Aerospace & Defense) | 8,400 | 533,148 | ||||||||||||
United Technologies Corp. (Aerospace & Defense) | 5,900 | 483,859 | ||||||||||||
FedEx Corp. (Air Freight & Logistics) | 5,500 | 504,460 | ||||||||||||
Delta Air Lines, Inc. (Airlines) | (a) | 41,600 | 493,792 | |||||||||||
Quanta Services, Inc. (Construction & Engineering) | (a) | 9,200 | 251,068 | |||||||||||
Eaton Corp. PLC (Electrical Equip.) | 9,500 | 514,900 | ||||||||||||
General Electric Co. (Industrial Conglomerates) | 11,200 | 235,088 | ||||||||||||
Deere & Co. (Machinery) | 3,421 | 295,643 | ||||||||||||
Pentair Ltd. (Machinery) | 10,000 | 491,500 | ||||||||||||
Snap-On, Inc. (Machinery) | 6,700 | 529,233 | ||||||||||||
Stanley Black & Decker, Inc. (Machinery) | 1,400 | 103,558 | ||||||||||||
Xylem, Inc. (Machinery) | 19,200 | 520,320 | ||||||||||||
Hertz Global Holdings, Inc. (Road & Rail) | (a) | 35,200 | 572,704 | |||||||||||
|
| |||||||||||||
| 5,529,273 | ||||||||||||||
|
| |||||||||||||
INFORMATION TECHNOLOGY – 17.4% |
| |||||||||||||
QUALCOMM, Inc. (Communications Equip.) | 8,000 | 496,160 | ||||||||||||
Apple, Inc. (Computers & Peripherals) | 1,150 | 612,984 | ||||||||||||
EMC Corp. (Computers & Peripherals) | (a) | 17,500 | 442,750 | |||||||||||
eBay, Inc. (Internet Software & Svs.) | (a) | 7,500 | 382,650 | |||||||||||
Facebook, Inc. Class A (Internet Software & Svs.) | (a) | 17,000 | 452,710 | |||||||||||
Google, Inc. Class A (Internet Software & Svs.) | (a) | 700 | 496,559 | |||||||||||
Altera Corp. (Semiconductors & Equip.) | 14,000 | 482,160 | ||||||||||||
Avago Technologies Ltd. (Semiconductors & Equip.) | 14,300 | 452,738 | ||||||||||||
Xilinx, Inc. (Semiconductors & Equip.) | 13,700 | 491,830 | ||||||||||||
Citrix Systems, Inc. (Software) | (a) | 7,400 | 486,550 | |||||||||||
Oracle Corp. (Software) | 14,400 | 479,808 | ||||||||||||
TIBCO Software, Inc. (Software) | (a) | 23,500 | 517,235 | |||||||||||
|
| |||||||||||||
| 5,794,134 | ||||||||||||||
|
| |||||||||||||
| 18 | (continued) |
| Ohio National Fund, Inc. | Omni Portfolio (Continued) |
Schedule of Investments | December 31, 2012 |
| Common Stocks (Continued) | Shares | Value | ||||||||||||||||
MATERIALS – 3.6% |
| |||||||||||||||||
Air Products & Chemicals, Inc. (Chemicals) | 5,700 | $ | 478,914 | |||||||||||||||
E.I. du Pont de Nemours & Co. (Chemicals) | 5,800 | 260,826 | ||||||||||||||||
Monsanto Co. (Chemicals) | 2,400 | 227,160 | ||||||||||||||||
Freeport–McMoRan Copper & Gold, Inc. (Metals & Mining) | 6,200 | 212,040 | ||||||||||||||||
|
| |||||||||||||||||
| 1,178,940 | ||||||||||||||||||
|
| |||||||||||||||||
Total Common Stocks (Cost $22,894,005) | $ | 24,087,551 | ||||||||||||||||
|
| |||||||||||||||||
| Corporate Bonds – 22.1% | Rate | Maturity | Face Amount | Value | ||||||||||||||
CONSUMER DISCRETIONARY – 1.8% | ||||||||||||||||||
Darden Restaurants, Inc. (Hotels, Restaurants & Leisure) | 3.350% | 11/01/2022 | $ | 75,000 | $ | 72,638 | ||||||||||||
Comcast Corp. (Media) | 5.875% | 02/15/2018 | 150,000 | 180,897 | ||||||||||||||
Discovery Communications LLC (Media) | 3.300% | 05/15/2022 | 75,000 | 77,102 | ||||||||||||||
Time Warner Cable, Inc. (Media) | 4.500% | 09/15/2042 | 75,000 | 73,214 | ||||||||||||||
Walt Disney Co. / The (Media) | 3.700% | 12/01/2042 | 75,000 | 75,160 | ||||||||||||||
Kohl’s Corp. (Multiline Retail) | 4.000% | 11/01/2021 | 75,000 | 79,383 | ||||||||||||||
Macy’s Retail Holdings, Inc. (Multiline Retail) | 5.900% | 12/01/2016 | 42,000 | 49,380 | ||||||||||||||
|
| |||||||||||||||||
| 607,774 | ||||||||||||||||||
|
| |||||||||||||||||
CONSUMER STAPLES – 1.7% | ||||||||||||||||||
Anheuser-Busch Cos., Inc. (Beverages) | 5.500% | 01/15/2018 | 150,000 | 179,958 | ||||||||||||||
CVS Caremark Corp. (Food & Staples Retailing) | 5.750% | 06/01/2017 | 73,000 | 87,336 | ||||||||||||||
Bunge NA Finance LP (Food Products) | 5.900% | 04/01/2017 | 150,000 | 170,417 | ||||||||||||||
Procter & Gamble Co. / The (Household Products) | 4.700% | 02/15/2019 | 100,000 | 118,217 | ||||||||||||||
|
| |||||||||||||||||
| 555,928 | ||||||||||||||||||
|
| |||||||||||||||||
ENERGY – 2.7% | ||||||||||||||||||
Weatherford International Ltd. (Energy Equip. & Svs.) | 6.000% | 03/15/2018 | 150,000 | 171,517 | ||||||||||||||
Anadarko Petroleum Corp. (Oil, Gas & Consumable Fuels) | 5.950% | 09/15/2016 | 100,000 | 115,179 | ||||||||||||||
Boardwalk Pipelines LP (Oil, Gas & Consumable Fuels) | 5.500% | 02/01/2017 | 100,000 | 110,541 | ||||||||||||||
Enterprise Products Operating LLC (Oil, Gas & Consumable Fuels) | 5.000% | 03/01/2015 | 75,000 | 81,180 | ||||||||||||||
Kinder Morgan Energy Partners LP (Oil, Gas & Consumable Fuels) | 4.150% | 03/01/2022 | 75,000 | 81,330 | ||||||||||||||
Magellan Midstream Partners LP (Oil, Gas & Consumable Fuels) | 6.400% | 07/15/2018 | 150,000 | 183,712 | ||||||||||||||
Murphy Oil Corp. (Oil, Gas & Consumable Fuels) | 4.000% | 06/01/2022 | 75,000 | 75,660 | ||||||||||||||
TransCanada PipeLines Ltd. (Oil, Gas & Consumable Fuels) | 2.500% | 08/01/2022 | 75,000 | 75,222 | ||||||||||||||
|
| |||||||||||||||||
| 894,341 | ||||||||||||||||||
|
| |||||||||||||||||
FINANCIALS – 5.9% | ||||||||||||||||||
Jefferies Group, Inc. (Capital Markets) | 5.875% | 06/08/2014 | 75,000 | 79,312 | ||||||||||||||
Mellon Funding Corp. (Capital Markets) | 5.500% | 11/15/2018 | 100,000 | 117,531 | ||||||||||||||
Morgan Stanley (Capital Markets) | 4.750% | 04/01/2014 | 100,000 | 103,579 | ||||||||||||||
BB&T Corp. (Commercial Banks) | 5.200% | 12/23/2015 | 100,000 | 111,554 | ||||||||||||||
Deutsche Bank Capital Funding Trust VII (Commercial Banks) | (b)(c) | 5.628% | Perpetual | 100,000 | 96,000 | |||||||||||||
KeyBank NA (Commercial Banks) | 5.700% | 11/01/2017 | 150,000 | 169,517 | ||||||||||||||
PNC Funding Corp. (Commercial Banks) | 5.250% | 11/15/2015 | 75,000 | 83,851 | ||||||||||||||
Wells Fargo & Co. (Commercial Banks) | 3.500% | 03/08/2022 | 75,000 | 80,068 | ||||||||||||||
Capital One Bank U.S.A. NA (Consumer Finance) | 5.125% | 02/15/2014 | 100,000 | 104,940 | ||||||||||||||
Discover Financial Services (Consumer Finance) | 6.450% | 06/12/2017 | 150,000 | 175,523 | ||||||||||||||
Bank of America Corp. (Diversified Financial Svs.) | 5.750% | 08/15/2016 | 75,000 | 82,061 | ||||||||||||||
Citigroup, Inc. (Diversified Financial Svs.) | 5.850% | 08/02/2016 | 75,000 | 85,769 | ||||||||||||||
General Electric Capital Corp. (Diversified Financial Svs.) | 5.000% | 01/08/2016 | 100,000 | 111,155 | ||||||||||||||
JPMorgan Chase & Co. (Diversified Financial Svs.) | 5.150% | 10/01/2015 | 100,000 | 109,977 | ||||||||||||||
Assurant, Inc. (Insurance) | 5.625% | 02/15/2014 | 100,000 | 104,362 | ||||||||||||||
Liberty Mutual Group, Inc. (Insurance) | (b) | 5.750% | 03/15/2014 | 100,000 | 104,756 | |||||||||||||
Federal Realty Investment Trust (Real Estate Investment Trusts) | 3.000% | 08/01/2022 | 75,000 | 74,308 | ||||||||||||||
HCP, Inc. (Real Estate Investment Trusts) | 6.000% | 01/30/2017 | 150,000 | 172,420 | ||||||||||||||
|
| |||||||||||||||||
| 1,966,683 | ||||||||||||||||||
|
| |||||||||||||||||
HEALTH CARE – 1.5% | ||||||||||||||||||
Laboratory Corp. of America Holdings (Health Care Providers & Svs.) | 3.750% | 08/23/2022 | 75,000 | 79,604 | ||||||||||||||
WellPoint, Inc. (Health Care Providers & Svs.) | 5.875% | 06/15/2017 | 150,000 | 178,154 | ||||||||||||||
AbbVie, Inc. (Pharmaceuticals) | (b) | 2.900% | 11/06/2022 | 75,000 | 76,450 | |||||||||||||
Hospira, Inc. (Pharmaceuticals) | 6.050% | 03/30/2017 | 150,000 | 174,257 | ||||||||||||||
|
| |||||||||||||||||
| 508,465 | ||||||||||||||||||
|
| |||||||||||||||||
INDUSTRIALS – 1.6% | ||||||||||||||||||
Waste Management, Inc. (Commercial Svs. & Supplies) | 6.100% | 03/15/2018 | 75,000 | 90,570 | ||||||||||||||
CSX Corp. (Road & Rail) | 5.600% | 05/01/2017 | 150,000 | 175,337 | ||||||||||||||
ERAC U.S.A. Finance LLC (Road & Rail) | (b) | 6.375% | 10/15/2017 | 150,000 | 181,550 | |||||||||||||
| 19 | (continued) |
| Ohio National Fund, Inc. | Omni Portfolio (Continued) |
Schedule of Investments | December 31, 2012 |
| Corporate Bonds (Continued) | Rate | Maturity | Face Amount | Value | ||||||||||||||
INDUSTRIALS (continued) | ||||||||||||||||||
Norfolk Southern Corp. (Road & Rail) | 3.000% | 04/01/2022 | $ | 75,000 | $ | 76,997 | ||||||||||||
|
| |||||||||||||||||
| 524,454 | ||||||||||||||||||
|
| |||||||||||||||||
INFORMATION TECHNOLOGY – 0.5% | ||||||||||||||||||
Computer Sciences Corp. (IT Svs.) | 6.500% | 03/15/2018 | 150,000 | 175,103 | ||||||||||||||
|
| |||||||||||||||||
MATERIALS – 0.7% | ||||||||||||||||||
Freeport-McMoRan Copper & Gold, Inc. (Metals & Mining) | 3.550% | 03/01/2022 | 75,000 | 74,447 | ||||||||||||||
Newmont Mining Corp. (Metals & Mining) | 3.500% | 03/15/2022 | 75,000 | 77,418 | ||||||||||||||
Teck Resources Ltd. (Metals & Mining) | 3.750% | 02/01/2023 | 75,000 | 76,997 | ||||||||||||||
|
| |||||||||||||||||
| 228,862 | ||||||||||||||||||
|
| |||||||||||||||||
TELECOMMUNICATION SERVICES – 1.6% | ||||||||||||||||||
AT&T, Inc. (Diversified Telecom. Svs.) | 3.000% | 02/15/2022 | 75,000 | 78,070 | ||||||||||||||
Telecom Italia Capital SA (Diversified Telecom. Svs.) | 5.250% | 10/01/2015 | 100,000 | 106,650 | ||||||||||||||
Verizon Communications, Inc. (Diversified Telecom. Svs.) | 3.850% | 11/01/2042 | 75,000 | 73,845 | ||||||||||||||
America Movil SAB de CV (Wireless Telecom. Svs.) | 5.750% | 01/15/2015 | 100,000 | 110,241 | ||||||||||||||
Rogers Communications, Inc. (Wireless Telecom. Svs.) | 5.500% | 03/15/2014 | 150,000 | 158,725 | ||||||||||||||
|
| |||||||||||||||||
| 527,531 | ||||||||||||||||||
|
| |||||||||||||||||
UTILITIES – 4.1% | ||||||||||||||||||
Commonwealth Edison Co. (Electric Utilities) | 5.950% | 08/15/2016 | 75,000 | 87,458 | ||||||||||||||
Kansas City Power & Light Co. (Electric Utilities) | 5.850% | 06/15/2017 | 150,000 | 174,824 | ||||||||||||||
Nevada Power Co. (Electric Utilities) | 5.950% | 03/15/2016 | 75,000 | 86,025 | ||||||||||||||
Pennsylvania Electric Co. (Electric Utilities) | 6.050% | 09/01/2017 | 150,000 | 175,816 | ||||||||||||||
South Carolina Electric & Gas Co. (Electric Utilities) | 4.350% | 02/01/2042 | 75,000 | 79,246 | ||||||||||||||
Union Electric Co. (Electric Utilities) | 6.400% | 06/15/2017 | 150,000 | 183,342 | ||||||||||||||
Westar Energy, Inc. (Electric Utilities) | 4.125% | 03/01/2042 | 75,000 | 78,349 | ||||||||||||||
Southwest Gas Corp. (Gas Utilities) | 3.875% | 04/01/2022 | 75,000 | 82,847 | ||||||||||||||
Spectra Energy Capital LLC (Gas Utilities) | 5.500% | 03/01/2014 | 100,000 | 105,221 | ||||||||||||||
Southern Power Co. (Ind. Power Prod. & Energy Traders) | 4.875% | 07/15/2015 | 100,000 | 109,593 | ||||||||||||||
American Water Capital Corp. (Water Utilities) | 6.085% | 10/15/2017 | 150,000 | 179,411 | ||||||||||||||
|
| |||||||||||||||||
| 1,342,132 | ||||||||||||||||||
|
| |||||||||||||||||
Total Corporate Bonds (Cost $6,577,552) | $ | 7,331,273 | ||||||||||||||||
|
| |||||||||||||||||
| U.S. Treasury Obligations – 1.3% | Rate | Maturity | Face Amount | Value | ||||||||||||||
United States Treasury Note | 3.375% | 11/15/2019 | $ | 300,000 | $ | 344,602 | ||||||||||||
United States Treasury Note | 1.625% | 08/15/2022 | 100,000 | 99,250 | ||||||||||||||
|
| |||||||||||||||||
Total U.S. Treasury Obligations (Cost $409,565) | $ | 443,852 | ||||||||||||||||
|
| |||||||||||||||||
| Money Market Funds – 3.4% | Shares | Value | ||||||||||||||||
Fidelity Institutional Money Market Funds | 1,118,000 | $ | 1,118,000 | |||||||||||||||
|
| |||||||||||||||||
Total Money Market Funds (Cost $1,118,000) | $ | 1,118,000 | ||||||||||||||||
|
| |||||||||||||||||
Total Investments – 99.3% (Cost $30,999,122) | (d) | $ | 32,980,676 | |||||||||||||||
Other Assets in Excess of Liabilities – 0.7% | 224,013 | |||||||||||||||||
|
| |||||||||||||||||
Net Assets – 100.0% | $ | 33,204,689 | ||||||||||||||||
|
| |||||||||||||||||
Percentages are stated as a percent of net assets.
Abbreviations:
ADR: American Depositary Receipts
Footnotes:
| (a) | Non-income producing security. |
| (b) | Security exempt from registration under Regulation D of the Securities Act of 1933. These securities may be resold in transactions exempt from registration, normally to qualified buyers under Rule 144A. At December 31, 2012, the value of these securities totaled $458,756, or 1.4% of the Portfolio’s net assets. These securities were deemed liquid pursuant to procedures approved by the Board of Directors. |
| (c) | Fixed-to-floating rate, callable, perpetual life trust preferred security. Interest rates stated are those in effect at December 31, 2012. |
| (d) | Represents cost for financial reporting purposes, which may differ from cost basis for federal income tax purposes. See also Note 7 of the Notes to Financial Statements. |
The accompanying notes are an integral part of these financial statements.
| 20 |
| Ohio National Fund, Inc. | International Portfolio |
Objective/Strategy
The International Portfolio seeks total return on assets by investing at least 80% of its assets in securities of foreign companies.
Performance as of December 31, 2012
Average Annual Total Returns: | ||||
One year | 20.25% | |||
Five years | -2.41% | |||
Ten years | 6.59% |
Past performance does not guarantee future results. The performance data quoted represents past performance and current returns may be lower or higher. Total return figures include change in share price and reinvestment of dividends and capital gains. The investment return and principal value will fluctuate so that an investor’s shares, when redeemed, may be worth more or less than the original cost. To obtain performance information up to the most recent month end, call toll-free 1-877-781-6392.
The Portfolio is not open to direct retail investment. Beneficial interest in shares is obtained solely by purchase of variable life insurance policies and variable annuity contracts. Actual performance results for variable annuity and variable universal life contracts will be lower due to contract charges. Consult your contract for applicable charges.
Comments
For the year ended December 31, 2012, the International Portfolio returned 20.25% versus 16.83% for the current benchmark, the MSCI All Country World ex-USA Index (Net-USD).
The market rallied over the year as moderate growth and supportive monetary policy across the globe boosted investor sentiment. News flow surrounding the debt crisis in the EuroZone, U.S. jobs growth and the “fiscal cliff”, and economic growth in China drove markets as the “risk-on/risk-off” environment continued to be a major influence in performance. While actions taken during the year lessened the risks, long-term solutions to these major issues are a work in progress. Uncertainty about leadership changes in the U.S., Japan, and China also weighed on markets through the end of the year. While leadership transitions in these countries neared completion, many challenges remain for the world’s three largest economies.
In 2012, global equity markets had their best start since 1998. Attempts by central banks to push the global economy further along the path of recovery continued. The European Central Bank (ECB) injected over €525 billion euros of liquidity as part of the Long Term Refinancing Operation (LTRO) in an attempt to improve balance sheets and restore confidence in the banking system. As a result, long term sovereign yields in Spain and Italy, for example, fell during the year from the “danger zone” (greater than 7%) down to a manageable 4 to 5% range. Meanwhile, Greece completed the largest debt restructuring of the modern era in order to avoid defaulting on its obligations.
Global growth was unclear at times during the year, but markets rallied over time on valuation, lower volatility, and liquidity support. In August, a major policy announcement by the ECB to do “whatever it takes” to avoid a melt-down in the EuroZone, combined with the Federal Reserve’s launching of another round of quantitative easing (QE3), extended the stock market rally. Globally, the equity indices were led higher by deep value stocks, select emerging markets and Europe. As positive economic and corporate news buttressed policy response, equity volatility hit a five year low. In addition, during the third quarter, the ECB cut its benchmark rate by 0.25% to a record low of 0.75% to help fight economic weakness. As we entered September, Germany’s Constitutional Court approved the formation of
the European Stability Mechanism (the “ESM”), a permanent EuroZone bailout fund designed to lend governments the necessary funds to recapitalize their banking systems. At year end, the situation surrounding the European sovereign debt crisis had improved.
While headlines focused on China’s slowing growth, the world’s second largest economy continued to expand rapidly as the country shifted its focus from low-end exports to higher value-added goods and to domestic-led growth. Gross domestic product (GDP) in the third quarter grew at 7.4%, while industrial production recovered from summer lows to close the year above 10%. The Chinese labor market remained healthy, with the unemployment rate at only 4.1% in September. In addition to monetary easing, the Chinese government continued to invest in infrastructure by spending over $158 billion on subway projects, highway construction, and sewage treatment plants. The Chinese political leadership transition was completed in November, with positive trends developing late in 2012. Growth, solid retail sales, and the improving industrial production drove equity market performance.
In Latin America, the Brazilian central bank surprised the market by lowering its key target interest rate from 11.0% to 7.25%. Reduced borrowing rates and solid demand meant many emerging markets, such as Brazil and Mexico, experienced improving economic growth driven by domestic demand, foreign direct investment, and favorable demographics.
For the year ended December 31, 2012, the MSCI Emerging Markets Index returned 18.2%, out-performing the MSCI EAFE Index that returned 17.3%. The MSCI EAFE Index represents developed markets outside of North America. Furthermore, there was a divergence amongst country returns. Select developed countries beat MSCI USA Index (+15.3%) returns, including MSCI Belgium (+39.6%), MSCI Denmark (+31.3%), and MSCI Germany (+30.9%). MSCI Turkey (+64.2%) topped the emerging country index returns.
Country allocation remained the primary driver of performance as it has consistently been over the past four years. Our country ranking process seeks to identify healthy economies trading at reasonable valuation levels and favorable macro-economic outlooks. The Portfolio maintained exposure to select healthy and high sovereign quality markets, both developed and emerging.
In Europe, the Portfolio maintained its overweight in Germany as strength in German companies supported the labor market with unemployment hovering around new post-reunification lows below 7%. Low borrowing costs and solid product offerings boosted performance of re-insurer Munich Re (+52.3%) and financial giant Allianz SE (+50.4%). Strong global demand for autos drove tire and parts supplier Continental AG (+88.0%) upward. Norway, the Portfolio’s second largest overweight allocation, contributed to performance as companies benefited from continued demand for commodities. Our Norwegian basket was led by fertilizer producer Yara International ASA (+25.7%), and petroleum exploration companies TGS Nopec Geophysical Co. ASA (+52.9%), and Fred Olsen Energy ASA (+42.7%).(1)
Mexico was the Portfolio’s second best performer as the country continued to benefit from a return to growth in U.S. manufacturing, solid domestic demand, positive consumer trends, and strong foreign direct investment. Companies such as Grupo Financiero Banorte SAB de CV (+113.7%), Alfa SAB de CV (+96.5%) and Fomento Economico Mexicano SAB de CV (+45.6%) turned in positive performance as demand for domestic banking services, auto manufacturing and consumer goods supported growth.(1)
| 21 | (continued) |
| Ohio National Fund, Inc. | International Portfolio (Continued) |
South Korea was the Portfolio’s best performing Asian exposure. While the domestic economy experienced subpar growth despite stimulus measures, the export economy provided some signs that the Korean economy is in the early stages of a recovery as electronics and industrial companies benefitted from global demand. Samsung Electronics Co. Ltd. (+54.9%) and Samsung Heavy Industries Co. Ltd. (+48.7%) out-performed during the year.(1)
The Portfolio’s weakest performing country allocation on a relative basis was Japan. Japan’s economy began the year with a rebound; however growth moderated in the second quarter as the recovery from the 2011 earthquake slowed. By the third quarter Japan’s economy began to shrink amid declining exports and domestic demand. A political row with China over disputed territories hurt Japanese exporters and investor sentiment. At the end of the year, there was a landslide election for the opposition party (LDP). Expectations for new economic policies, including quantitative easing, by the incoming administration led to dramatic weakening of the yen, which offset in part a recovery in the stock market. During the year, Portfolio holdings such as: Daiichi Sankyo Co. Ltd. (-20.6%), Nidec Corp. (-32.2%) and Shiseido Co. Ltd. (-16.9%), underperformed.(1)
The Portfolio used foreign exchange currency forwards to reduce risk. During the year, the overall net returns of the forward positions contributed positively to performance. Meaningful contributions came from our short yen (vs. U.S. dollar) and long New Zealand dollar (vs. U.S. dollar) positions.(1)
We are consistently applying our long-term methodology that seeks to identify countries and stocks with growth and stability in earnings and cash flows. Our country ranking process seeks to identify high quality economies trading at reasonable valuation levels with favorable macro-economic outlooks. We continue to find country and stock holdings that are attractive for the long-term. The latest research shows that country effects have remained the most influential driver of returns in a well-diversified international portfolio. Portfolio management believes the importance of country allocation is likely to persist, given the increasing fundamental divergences between countries (even within the EuroZone) and increased macro-economic instability related to sovereign indebtedness. The Portfolio maintained exposure to select healthy, high-quality developed markets. Our highest conviction overweight investments include Germany and Norway, while we underweighted European peripheral, debt-laden economies such as Spain, Ireland, and Portugal. The Portfolio maintained its overweight in Germany on the belief that long term fundamentals will be the key driver of stock returns and that German shares will benefit from continued low European Central Bank rates and a competitive euro. The Portfolio is overweight in Norway, as the country has strong public finances and is benefiting most from the boom in off-shore oil and gas exploration.(1)
| (1) | The Portfolio’s composition is subject to change. Holdings and weightings are as of December 31, 2012. |
Change in Value of $10,000 Investment
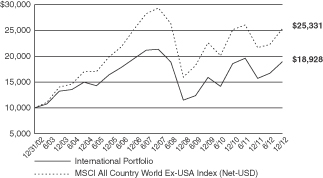
Hypothetical illustration based on past performance. Future performance will vary. The Portfolio’s returns reflect reinvested dividends. The Portfolio’s holdings may differ significantly from the securities in the index. The index is unmanaged and therefore does not reflect the cost of portfolio management and accounting.
The MSCI All Country World Ex-USA Index (Net-USD) is a free float-adjusted market capitalization weighted index that is designed to measure the equity market performance of the developed and emerging markets. The MSCI All Country World Index consists of 24 developed and 21 emerging market country indices.
| 22 | (continued) |
| Ohio National Fund, Inc. | International Portfolio (Continued) |
Portfolio Composition as of December 31, 2012 (1)
| % of Net Assets | ||||
Common Stocks (3) | 96.0 | |||
Preferred Stocks (3) | 0.7 | |||
U.S. Treasury Obligations | 0.2 | |||
Money Market Funds | 3.1 | |||
|
| |||
| 100.0 | ||||
|
|
Top 10 Portfolio Holdings as of December 31, 2012 (1)(2)
| % of Net Assets | ||||
1. Samsung Electronics Co. Ltd. | 3.7 | |||
2. Siemens AG | 3.1 | |||
3. Statoil ASA | 2.9 | |||
4. Yara International ASA | 2.3 | |||
5. HSBC Holdings PLC | 2.2 | |||
6. Novo Nordisk A/S – ADR | 2.1 | |||
7. Allianz SE | 2.1 | |||
8. Daimler AG | 2.1 | |||
9. BASF SE | 1.9 | |||
10. Hyundai Motor Co. | 1.9 |
| (1) | Composition of Portfolio subject to change. |
| (2) | Short-term investments have been excluded from the list of Top 10 Portfolio Holdings. |
| (3) | Top 10 Country Weightings (combined): |
| % of Net Assets | ||||
Germany | 20.7 | |||
Japan | 12.0 | |||
South Korea | 11.4 | |||
Norway | 11.2 | |||
Mexico | 10.5 | |||
Brazil | 9.2 | |||
Denmark | 7.3 | |||
China | 6.0 | |||
United Kingdom | 3.9 | |||
Hong Kong | 2.9 |
| 23 |
| Ohio National Fund, Inc. | International Portfolio |
Schedule of Investments | December 31, 2012 |
| Common Stocks – 96.0% | Shares | Value | ||||||||
Germany – 20.7% | ||||||||||
Allianz SE | (b) | 27,100 | $ | 3,777,658 | ||||||
Axel Springer AG | (b) | 10,000 | 428,099 | |||||||
BASF SE | (b) | 37,100 | 3,508,172 | |||||||
Bayer AG | (b) | 7,800 | 743,822 | |||||||
Bayerische Motoren Werke AG | (b) | 30,300 | 2,948,523 | |||||||
Continental AG | (b) | 15,518 | 1,808,674 | |||||||
Daimler AG | (b) | 67,400 | 3,710,744 | |||||||
Deutsche Telekom AG | (b) | 69,200 | 787,697 | |||||||
Deutsche Wohnen AG | (b) | 39,250 | 728,677 | |||||||
Fresenius SE & Co. KGaA | (b) | 4,900 | 563,835 | |||||||
Gerresheimer AG | (b) | 17,400 | 924,548 | |||||||
Gerry Weber International AG | (b) | 12,200 | 590,917 | |||||||
Hannover Rueckversicherung AG | (b) | 25,300 | 1,981,590 | |||||||
Hugo Boss AG | (b) | 8,200 | 871,457 | |||||||
Kabel Deutschland Holding AG | (b) | 11,800 | 888,134 | |||||||
Leoni AG | (b) | 14,800 | 563,048 | |||||||
Muenchener Rueckversicherungs AG | (b) | 17,710 | 3,197,146 | |||||||
RWE AG | (b) | 18,200 | 754,890 | |||||||
SAP AG – ADR | 13,300 | 1,069,054 | ||||||||
Siemens AG | (b) | 51,314 | 5,611,216 | |||||||
Suedzucker AG | (b) | 27,800 | 1,141,108 | |||||||
TAG Immobilien AG | (c) | 57,100 | 715,630 | |||||||
|
| |||||||||
| 37,314,639 | ||||||||||
|
| |||||||||
Japan – 12.0% | ||||||||||
Aisin Seiki Co. Ltd. | (b) | 43,200 | 1,349,011 | |||||||
Asahi Kasei Corp. | (b) | 485,000 | 2,867,859 | |||||||
Astellas Pharma, Inc. | (b) | 31,200 | 1,402,801 | |||||||
Chugai Pharmaceutical Co. Ltd. | (b) | 40,000 | 766,403 | |||||||
Hitachi Ltd. | (b) | 220,000 | 1,294,591 | |||||||
Japan Tobacco, Inc. | (b) | 73,600 | 2,079,153 | |||||||
Kaneka Corp. | (b) | 251,000 | 1,269,971 | |||||||
Kuraray Co. Ltd. | (b) | 61,500 | 806,213 | |||||||
Mitsubishi Chemical Holdings Corp. | (b) | 211,500 | 1,053,603 | |||||||
Murata Manufacturing Co. Ltd. | (b) | 27,000 | 1,592,767 | |||||||
Nitto Denko Corp. | (b) | 17,800 | 876,626 | |||||||
Shionogi & Co. Ltd. | (b) | 115,000 | 1,916,340 | |||||||
Shiseido Co. Ltd. | (b) | 144,000 | 2,032,624 | |||||||
Taiyo Nippon Sanso Corp. | (b) | 190,000 | 1,093,114 | |||||||
Takeda Pharmaceutical Co. Ltd. | (b) | 28,900 | 1,291,685 | |||||||
|
| |||||||||
| 21,692,761 | ||||||||||
|
| |||||||||
South Korea – 11.4% | ||||||||||
Coway Co. Ltd. | (a)(b) | 18,973 | 771,356 | |||||||
Hyundai Heavy Industries Co. Ltd. | (b) | 3,580 | 814,532 | |||||||
Hyundai Marine & Fire Insurance Co. Ltd. | (b) | 17,000 | 530,662 | |||||||
Hyundai Motor Co. | (b) | 16,800 | 3,463,220 | |||||||
Kia Motors Corp. | (b) | 48,600 | 2,584,235 | |||||||
Korea Electric Power Corp. | (a)(b) | 14,800 | 420,248 | |||||||
Mando Corp. | (b) | 5,600 | 677,763 | |||||||
Samsung Electronics Co. Ltd. | (b) | 4,693 | 6,742,900 | |||||||
Samsung Heavy Industries Co. Ltd. | (b) | 36,500 | 1,333,643 | |||||||
Samsung SDI Co. Ltd. | (b) | 10,300 | 1,461,936 | |||||||
Samsung Techwin Co. Ltd. | (b) | 10,000 | 561,333 | |||||||
SK Innovation Co. Ltd. | (b) | 6,900 | 1,141,699 | |||||||
|
| |||||||||
| 20,503,527 | ||||||||||
|
| |||||||||
Norway – 11.2% | ||||||||||
DNB ASA | (b) | 207,985 | 2,658,393 | |||||||
Fred Olsen Energy ASA | (b) | 49,966 | 2,193,757 | |||||||
Norwegian Air Shuttle AS | (a)(b) | 28,697 | 750,021 | |||||||
Seadrill Ltd. | (b) | 60,466 | 2,227,682 | |||||||
Statoil ASA | (b) | 207,800 | 5,237,516 | |||||||
Telenor ASA | (b) | 49,800 | 1,014,019 | |||||||
TGS Nopec Geophysical Co. ASA | (b) | 55,600 | 1,836,229 | |||||||
Yara International ASA | (b) | 84,500 | 4,213,054 | |||||||
|
| |||||||||
| 20,130,671 | ||||||||||
|
| |||||||||
| Common Stocks (Continued) | Shares | Value | ||||||||
Mexico – 10.5% | ||||||||||
Alfa SAB de CV | 998,000 | $ | 2,121,647 | |||||||
America Movil SAB de CV – ADR | 120,400 | 2,786,056 | ||||||||
Fomento Economico Mexicano SAB de | 34,000 | 3,423,800 | ||||||||
Genomma Lab Internacional SAB de CV | (a) | 336,900 | 692,237 | |||||||
Grupo Aeroportuario del Sureste SAB de | 7,600 | 866,400 | ||||||||
Grupo Financiero Banorte SAB de CV | 414,400 | 2,675,937 | ||||||||
Grupo Financiero Santander Mexico SAB de | (a) | 57,595 | 931,887 | |||||||
Grupo Mexico SAB de CV | 487,609 | 1,758,988 | ||||||||
Grupo Televisa SAB – ADR | 28,600 | 760,188 | ||||||||
Industrias Penoles SAB de CV | 22,500 | 1,134,913 | ||||||||
Wal-Mart de Mexico SAB de CV | 539,200 | 1,759,471 | ||||||||
|
| |||||||||
| 18,911,524 | ||||||||||
|
| |||||||||
Brazil – 8.5% | ||||||||||
Banco do Brasil SA | 109,600 | 1,370,335 | ||||||||
BM&FBovespa SA | 118,000 | 806,838 | ||||||||
Cia Brasileira de Distribuicao Grupo Pao de Acucar – ADR | 19,600 | 870,044 | ||||||||
Cia de Bebidas das Americas – ADR | 34,900 | 1,465,451 | ||||||||
Cielo SA | 50,400 | 1,402,831 | ||||||||
Itau Unibanco Holding SA – ADR | 52,900 | 870,734 | ||||||||
Localiza Rent a Car SA | 56,300 | 1,031,136 | ||||||||
Mills Estruturas e Servicos de Engenharia SA | 52,000 | 863,492 | ||||||||
Petroleo Brasileiro SA – ADR | 51,700 | 997,810 | ||||||||
Porto Seguro SA | 51,500 | 590,835 | ||||||||
Tim Participacoes SA – ADR | 42,600 | 844,332 | ||||||||
Tractebel Energia SA | 60,000 | 977,289 | ||||||||
Vale SA – ADR | 165,100 | 3,351,530 | ||||||||
|
| |||||||||
| 15,442,657 | ||||||||||
|
| |||||||||
Denmark – 7.3% | ||||||||||
AP Moeller – Maersk A/S | (b) | 155 | 1,173,761 | |||||||
Carlsberg A/S | (b) | 19,000 | 1,871,812 | |||||||
Chr. Hansen Holding A/S | (b) | 45,200 | 1,472,021 | |||||||
Danske Bank A/S | (a)(b) | 95,800 | 1,627,083 | |||||||
DSV A/S | (b) | 52,500 | 1,358,302 | |||||||
GN Store Nord A/S | (b) | 56,000 | 813,847 | |||||||
Novo Nordisk A/S – ADR | 23,200 | 3,786,472 | ||||||||
Rockwool International A/S | (b) | 9,900 | 1,113,010 | |||||||
|
| |||||||||
| 13,216,308 | ||||||||||
|
| |||||||||
China – 6.0% | ||||||||||
Air China Ltd. | (b) | 1,908,000 | 1,636,328 | |||||||
Baidu, Inc. – ADR | (a) | 4,700 | 471,363 | |||||||
Bank of China Ltd. | (b) | 2,090,000 | 951,996 | |||||||
CNOOC Ltd. – ADR | 8,800 | 1,936,000 | ||||||||
Datang International Power Generation Co. Ltd. | (b) | 1,150,000 | 442,181 | |||||||
Dongfeng Motor Group Co. Ltd. | (b) | 482,000 | 758,862 | |||||||
Golden Eagle Retail Group Ltd. | (b) | 340,000 | 847,703 | |||||||
Great Wall Motor Co. Ltd. | (b) | 290,000 | 923,196 | |||||||
PetroChina Co. Ltd. – ADR | 7,400 | 1,063,972 | ||||||||
PICC Property & Casualty Co. Ltd. | (b) | 460,000 | 657,002 | |||||||
Tencent Holdings Ltd. | (b) | 37,000 | 1,210,554 | |||||||
|
| |||||||||
| 10,899,157 | ||||||||||
|
| |||||||||
United Kingdom – 3.9% | ||||||||||
Burberry Group PLC | (b) | 53,865 | 1,082,766 | |||||||
HSBC Holdings PLC | (b) | 377,575 | 4,001,073 | |||||||
Subsea 7 SA | (b) | 80,530 | 1,935,321 | |||||||
|
| |||||||||
| 7,019,160 | ||||||||||
|
| |||||||||
Hong Kong – 2.9% | ||||||||||
Bosideng International Holdings Ltd. | (b) | 2,700,000 | 809,281 | |||||||
China Mobile Ltd. – ADR | 33,200 | 1,949,504 | ||||||||
China Overseas Land & Investment Ltd. | (b) | 512,000 | 1,556,699 | |||||||
Guangdong Investment Ltd. | (b) | 1,080,000 | 853,985 | |||||||
|
| |||||||||
| 5,169,469 | ||||||||||
|
| |||||||||
| 24 | (continued) |
| Ohio National Fund, Inc. | International Portfolio (Continued) |
Schedule of Investments | December 31, 2012 |
| Common Stocks (Continued) | Shares | Value | ||||||||
Italy – 0.7% | ||||||||||
Prada SpA | (b) | 138,000 | $ | 1,341,822 | ||||||
|
| |||||||||
Sweden – 0.6% | ||||||||||
Nordea Bank AB | (b) | 111,800 | 1,075,395 | |||||||
|
| |||||||||
Ireland – 0.3% | ||||||||||
Shire PLC | (b) | 15,000 | 461,417 | |||||||
|
| |||||||||
Total Common Stocks (Cost $136,638,308) | $ | 173,178,507 | ||||||||
|
| |||||||||
| Preferred Stocks – 0.7% | Shares | Value | ||||||||
Brazil – 0.7% | ||||||||||
Marcopolo SA | 103,000 | $ | 648,938 | |||||||
Randon Participacoes SA | 95,000 | 588,791 | ||||||||
|
| |||||||||
Total Preferred Stocks (Cost $1,061,388) | $ | 1,237,729 | ||||||||
|
| |||||||||
| U.S. Treasury Obligations – 0.2% | Face Amount | Value | ||||||||
U.S. Treasury Bill | (d) | $ | 150,000 | $ | 150,000 | |||||
U.S. Treasury Bill | (d) | 175,000 | 174,989 | |||||||
|
| |||||||||
Total U.S. Treasury Obligations (Cost $324,940) | $ | 324,989 | ||||||||
|
| |||||||||
| Money Market Funds – 5.3% | Shares | Value | ||||||||
State Street Institutional Liquid Reserves Fund Institutional Class 2 | 9,151,560 | $ | 9,151,560 | |||||||
State Street Institutional U.S. Government Money Market Fund Institutional Class | 400,484 | 400,484 | ||||||||
|
| |||||||||
Total Money Market Funds (Cost $9,552,044) | $ | 9,552,044 | ||||||||
|
| |||||||||
Total Investments – 102.2% (Cost $147,576,680) | (e) | $ | 184,293,269 | |||||||
Liabilities in Excess of Other Assets – (2.2)% | (3,949,137) | |||||||||
|
| |||||||||
Net Assets – 100.0% | $ | 180,344,132 | ||||||||
|
| |||||||||
Percentages are stated as a percent of net assets.
Abbreviations:
ADR: American Depositary Receipts
Footnotes:
| (a) | Non-Income producing security. |
| (b) | Security traded on a foreign exchange has been valued at an estimate of fair value that is different than the local market close price. These fair value estimates are determined by an independent fair valuation service that has been approved by the Board. These securities represent $127,832,331, or 70.9% of the Portfolio’s net assets. |
| (c) | As discussed in Note 2 of the Notes to Financial Statements, not all investments that are traded on a foreign exchange are valued at an estimate that is different from the local close price. In some instances, the independent fair valuation service uses a stock’s local close price because the service’s measure of predictability related to their valuation model of a stock is below a chosen threshold. These securities represent $715,630, or 0.4% of the Portfolio’s net assets. |
Other Portfolio securities are not subjected to fair valuation procedures because they are traded on domestic or foreign exchanges that have close times that are consistent with the U.S. market close, normally 4:00 pm Eastern Time.
| (d) | Security is fully or partially pledged as collateral for the Portfolio’s futures contracts outstanding at December 31, 2012. See also Note 6 of the Notes to Financial Statements. |
| (e) | Represents cost for financial reporting purposes, which may differ from cost basis for federal income tax purposes. See also Note 7 of the Notes to Financial Statements. |
Sector Classifications (Common and preferred stocks): (Percent of net assets)
Financials | 17.0 | % | ||
Consumer Discretionary | 15.1 | % | ||
Materials | 13.0 | % | ||
Industrials | 11.4 | % | ||
Energy | 10.3 | % | ||
Information Technology | 8.4 | % | ||
Consumer Staples | 8.1 | % | ||
Health Care | 7.4 | % | ||
Telecommunication Services | 4.1 | % | ||
Utilities | 1.9 | % | ||
|
| |||
| 96.7 | % | |||
|
|
The accompanying notes are an integral part of these financial statements.
| 25 |
| Ohio National Fund, Inc. | Capital Appreciation Portfolio |
Objective/Strategy
The Capital Appreciation Portfolio seeks long-term capital growth by investing primarily in common stocks of established companies with either current or emerging earnings growth not fully appreciated or recognized by the market.
Performance as of December 31, 2012
Average Annual Total Returns: | ||||
One year | 17.59% | |||
Five years | 3.34% | |||
Ten years | 8.29% |
Past performance does not guarantee future results. The performance data quoted represents past performance and current returns may be lower or higher. Total return figures include change in share price and reinvestment of dividends and capital gains. The investment return and principal value will fluctuate so that an investor’s shares, when redeemed, may be worth more or less than the original cost. To obtain performance information up to the most recent month end, call toll-free 1-877-781-6392.
The Portfolio is not open to direct retail investment. Beneficial interest in shares is obtained solely by purchase of variable life insurance policies and variable annuity contracts. Actual performance results for variable annuity and variable universal life contracts will be lower due to contract charges. Consult your contract for applicable charges.
Comments
For the year ended December 31, 2012, the Capital Appreciation Portfolio returned 17.59% versus 16.00% for the current benchmark, the S&P 500 Index.
Despite some modest losses in the fourth quarter, U.S. equity markets posted solid gains in 2012: the broad market S&P 500 Index advanced 16% for the year, while the Russell 3000 Index rose 17%. For much of 2012, investor sentiment ebbed and flowed with macro-economic events, most notably Europe’s economic malaise and China’s slowdown. In the fourth quarter, investors also focused on the U.S. presidential election and negotiations to avert the so-called “fiscal cliff” — legislatively-mandated tax increases and spending cuts set to take effect in 2013. Away from Washington, investors gauged the strength of retail spending into the important holiday season. The U.S. housing market continued to recover, employment continued to modestly improve, and corporate profitability met expectations.
U.S. Federal Reserve policy remained accommodative, with a new round of quantitative easing that included Treasury purchases of non-government obligations, primarily U.S. mortgage-backed securities. With European economies stalled and a dearth of policy measures to boost growth, the U.S. dollar held firm against the euro. In Japan, December’s elections resulted in a new administration and plans for fiscal easing, which had the effect of checking the yen’s persistent strength against the U.S. dollar. China completed its leadership transition, setting the country’s political landscape through the end of the decade. The political handoff coincided with signs of renewed economic growth and higher domestic stock prices.
All sectors in the S&P 500 Index and the Russell 3000 Index gained well into the double digits, except for Utilities and Energy, which had single digit returns. The Financials and Consumer Discretionary sectors were the standout performers. Overall, larger cap stocks significantly out-performed small caps, and value stocks had a slight edge over growth stocks.
Stock picking in the Consumer Discretionary, Financials, and Energy sectors, along with an overweight position in Consumer Discretionary, accounted for most of the Portfolio’s out-performance. Stock selection in Information Technology and Industrials detracted most from relative performance. An overweight position in Energy and an underweight position in Financials were also detrimental.(1)
The five best performing holdings were The Ryland Group, Inc., Morgan Stanley, Expedia, Inc., PPG Industries, Inc., and Cobalt International Energy, Inc. The five worst performing holdings were Peabody Energy Corp., Monster Worldwide, Inc., Navistar International, Dell, Inc., and Newfield Exploration Co. The five largest contributors to returns were Comcast Corp., The Ryland Group, Inc., Pinnacle Entertainment, Inc., News Corp., and Morgan Stanley. The five largest detractors from returns were International Game Technology, Exelon Corp., Navistar International, CONSOL Energy, Inc., and Newfield Exploration Co.(1)
Within Consumer Discretionary, media companies were the source of most gains, and were led by Comcast Corp. and News Corp. Comcast Corp., the largest cable provider in the U.S., continues to gain share at accretive cash margins in broadband, voice, and business telecommunications. With higher pricing and a fairly stable non-programming operating expense base, the company has been generating double-digit growth in free cash flow that we believe is sustainable due to high barriers to entry. Moreover, the substantial cash generation and under-leveraged balance sheet are likely to drive rising dividends and buybacks in 2013. A possible increase in video subscriptions in the fourth quarter, reversing a recent multi-year trend, could provide a major catalyst for 2013. The shares continue to trade at a material discount to intrinsic value. Nevertheless, we have trimmed our position over the past several months as the risk/reward has narrowed.(1)
The Ryland Group, Inc., a homebuilder and mortgage finance company, was also a major individual contributor from the Consumer Discretionary sector. The Ryland Group, Inc. has seen its stock steadily rise along with those of industry peers since midyear as signs of a revival in the housing market accumulated. The stock approached full valuation and we exited our position.(1)
Also in Consumer Discretionary, Pinnacle Entertainment, Inc. was particularly strong. Shares of Pinnacle Entertainment, Inc. surged after the company announced it would acquire Ameristar Casinos, Inc., another regional casino operator. The merger would substantially increase the size of Pinnacle Entertainment, Inc. and give it a majority market share in St. Louis. Pinnacle Entertainment, Inc. is also likely to realize substantial synergies and a boost in earnings and free cash flow. The acquisition could also position Pinnacle Entertainment, Inc. to form a real estate investment trust (REIT). Earlier in the year, Pinnacle Entertainment, Inc. reported a strong third quarter, with earnings exceeding expectations. We continue to believe the reward/risk in the shares is above 2:1, though we trimmed our position at the end of the quarter as that reward/risk relationship narrowed.(1)
News Corp. shares have remained elevated since the company announced a spin off of its publishing businesses, its lowest multiple and slowest growing unit. A spin off, long sought by investors, would separate the company’s shrinking newspapers, book publishing, and education businesses from its faster growing cable, film, and television production businesses. The company also continues to repurchase shares and rationalize its extensive portfolio of minority investments. We believe the reward/risk in the shares remains above 2:1.(1)
| 26 | (continued) |
| Ohio National Fund, Inc. | Capital Appreciation Portfolio (Continued) |
In the robust Financials sector, Morgan Stanley was the leading individual contributor in the Portfolio. We took advantage of a strong first quarter rally in the stock to exit the position as we expected brokers’ trading volumes to slow during the second half of 2013 due to worries over the fiscal cliff and the European crisis. Following a threat at midyear of a downgrade from Moody’s, which knocked down shares of Morgan Stanley by over 40%, we re-established a position with the stock selling at 60% of tangible book value. Morgan Stanley shares got a boost from a favorable settlement of the company’s arbitration with Citigroup over the price to be paid for the remainder of Citigroup’s Smith Barney retail brokerage unit. We believe Morgan Stanley remains an undervalued capital markets franchise that will receive a majority of revenues from global wealth management, a business which should have better margins and less cyclicality than the institutional brokerage business.(1)
While Consumer Discretionary produced most of the top individual contributors, it also yielded the largest detractor, International Game Technology, an electronic gaming equipment producer. The setback came after the company acquired an internet gaming company in the first quarter and then missed June quarter earnings expectations following dampened play by high spending customers and some pressure on game lease pricing due to the sluggish economy. Although not enough to erase earlier losses, shares of International Game Technology came off midyear lows as equipment and replacement sales and margins in North America began to pick up and the company issued guidance for 2013 that was above expectations. On top of that, International Game Technology announced a large multiyear buyback, much of which was completed in the final six months of 2012. The company continues to generate substantial sustainable free cash flow and the risk/reward and valuation remain attractive.(1)
Stock selection in Information Technology and Industrials detracted from relative performance the most, with Navistar International, a manufacturer of commercial and military trucks, buses, diesel engines, and other parts, producing the greatest losses in Industrials. Navistar International reported earnings earlier in the year that reflected a deterioration in its core trucking business and a downturn in its international business that was attributable to a slowdown in Brazil. In addition, doubts persisted about whether Navistar International would receive Environmental Protection Agency approval for its HD engine. Even if approval was granted, it was unlikely that Navistar International could reach its second half market share goals. We exited our position in the stock.(1)
Several other major detractors came from the generally weaker-performing Utilities and Energy sectors, including Exelon Corp. in Utilities and CONSOL Energy, Inc. in Energy. Shares of Exelon Corp., a nuclear power company, were weighed down by weak power prices undermined by reduced demand. Exelon Corp.’s shares came under increasing pressure as the market believed downward revisions of earnings estimates could accelerate as third quarter reporting approached and as compression in long-dated forward power prices in 2015 and 2016 reduced the long-term earnings per share growth trajectory for Exelon Corp. We have exited our position in the stock.(1)
Shares of CONSOL Energy, Inc., a natural gas and coal producer, have been under pressure through much of the period due to low prices for both natural gas and coal. As demand for coal has weakened, CONSOL Energy, Inc., acting prudently, temporarily shut down production at two of its mines to avoid building inventories or selling into a weak spot coal market. Shares were further weakened following the reelection of President Obama on renewed concerns about
potentially new regulations affecting the coal industry. We believe coal will continue to be the source of at least 40% of U.S. electricity because of the country’s sizeable coal reserves. The company is selling at a discount to net asset value and maintains its position as a low-cost producer of both coal and natural gas. This could drive attractive earnings growth over the next several years as domestic and seaborne coal prices rebound and CONSOL Energy, Inc.’s gas operations fulfill their production target of a 20% compound annual growth rate (CAGR) through 2015.(1)
Newfield Exploration Co. is an oil and gas exploration and production company with operations in the U.S., Malaysia, and China. Its shares fell sharply after it announced that production from its fields in Malaysia had reached payout limits under production sharing contracts (PSCs) earlier than expected, therefore reducing Newfield Exploration Co.’s share of barrels produced in 2013 as the payout shifted more in favor of the Malaysian government. Although the net present value of the project was not impacted, the market reacted negatively to lowered production growth in 2013. We continue to think the shares are undervalued and feel the company’s exposure to the new South Central Oklahoma Oil Province (SCOOP) play in the Cana Woodford area of Oklahoma offers solid upside potential to the shares.(1)
As we begin 2013, the global economy seems to be in a nascent recovery; although the recovery is not well developed, the economy is moving in the right direction. The broad markets have significantly rebounded from the credit crisis lows of 2009, but significant fiscal and structural risks remain and need to be carefully monitored.
Although markets have rallied on the averting of the “fiscal cliff”, we see this as only a temporary fix because the compromise does very little to solve the budget deficit. Current projections indicate that in the next few years, spending will rise much more than revenue expected from the recent tax increases on higher incomes, resulting in the deficit increasing unless government spending is reduced. Through our company interactions, it will be interesting to hear if the fiscal agreement instills enough confidence in company management to spur the capital expenditures needed to strengthen the recovery. As we approach the country’s debt ceiling and a new date for the spending “sequester,” uncertainty will inevitably rise and, as such, we expect the markets to remain volatile throughout 2013. As always, stock picking will be key to long-term performance, bearing in mind that political and macro-economic concerns may trump company fundamentals in the very short term.
We continue to be vigilant in culling our more fully valued positions and redeploying into securities with highly attractive reward/risk profiles. We remain focused on finding the best reward/risk opportunities that we can regardless of market cap or style.
| (1) | The Portfolio’s composition is subject to change. Holdings and weightings are as of December 31, 2012. |
| 27 | (continued) |
| Ohio National Fund, Inc. | Capital Appreciation Portfolio (Continued) |
Change in Value of $10,000 Investment
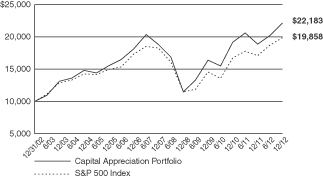
Hypothetical illustration based on past performance. Future performance will vary. The Portfolio’s returns reflect reinvested dividends. The Portfolio’s holdings may differ significantly from the securities in the index. The index is unmanaged and therefore does not reflect the cost of portfolio management and accounting.
The S&P 500 Index is a capitalization-weighted index designed to measure performance of the broad domestic economy through changes in the aggregate market value of 500 stocks representing all major industries. The index presented herein includes the effects of reinvested dividends.
Portfolio Composition as of December 31, 2012 (1)
| % of Net Assets | ||||
Common Stocks (3) | 95.8 | |||
Money Market Funds | 4.2 | |||
|
| |||
| 100.0 | ||||
|
|
Top 10 Portfolio Holdings as of December 31, 2012 (1) (2)
| % of Net Assets | ||||
1. Monsanto Co. | 2.3 | |||
2. Pfizer, Inc. | 2.1 | |||
3. Cameron International Corp. | 2.0 | |||
4. Schlumberger Ltd. | 2.0 | |||
5. Google, Inc. Class A | 2.0 | |||
6. Goldman Sachs Group, Inc. / The | 1.9 | |||
7. Pinnacle Entertainment, Inc. | 1.9 | |||
8. Comcast Corp. Class A | 1.9 | |||
9. News Corp. Class A | 1.8 | |||
10. Microsoft Corp. | 1.8 | |||
| (1) | Composition of Portfolio subject to change. |
| (2) | Short-term investments have been excluded from the list of Top 10 Portfolio Holdings. |
| (3) | Sectors: |
| % of Net Assets | ||||
Consumer Discretionary | 20.2 | |||
Information Technology | 14.5 | |||
Energy | 11.9 | |||
Financials | 11.3 | |||
Industrials | 11.0 | |||
Health Care | 10.8 | |||
Consumer Staples | 7.7 | |||
Materials | 4.9 | |||
Utilities | 1.8 | |||
Telecommunication Services | 1.7 | |||
|
| |||
| 95.8 | ||||
|
|
| 28 |
| Ohio National Fund, Inc. | Capital Appreciation Portfolio |
Schedule of Investments | December 31, 2012 |
| Common Stocks – 95.8% | Shares | Value | ||||||||
CONSUMER DISCRETIONARY – 20.2% | ||||||||||
Lear Corp. (Auto Components) | 40,392 | $ | 1,891,961 | |||||||
Toyota Motor Corp. - ADR (Automobiles) | 19,590 | 1,826,768 | ||||||||
Accor SA (Hotels, Restaurants & Leisure) | (b) | 41,144 | 1,467,491 | |||||||
Hyatt Hotels Corp. Class A (Hotels, Restaurants & Leisure) | (a) | 41,299 | 1,592,902 | |||||||
International Game Technology (Hotels, Restaurants & Leisure) | 131,211 | 1,859,260 | ||||||||
Pinnacle Entertainment, Inc. (Hotels, Restaurants & Leisure) | (a) | 141,020 | 2,232,347 | |||||||
Wendy’s Co. / The (Hotels, Restaurants & Leisure) | 378,219 | 1,777,629 | ||||||||
Comcast Corp. Class A (Media) | 60,399 | 2,171,344 | ||||||||
Liberty Global, Inc. (Media) | (a) | 20,838 | 1,224,233 | |||||||
Live Nation Entertainment, Inc. (Media) | (a) | 151,134 | 1,407,058 | |||||||
News Corp. Class A (Media) | 83,269 | 2,126,690 | ||||||||
Thomson Reuters Corp. (Media) | 41,159 | 1,196,081 | ||||||||
Viacom, Inc. Class B (Media) | 24,264 | 1,279,683 | ||||||||
GameStop Corp. Class A (Specialty Retail) | 51,097 | 1,282,024 | ||||||||
|
| |||||||||
| 23,335,471 | ||||||||||
|
| |||||||||
CONSUMER STAPLES – 7.7% | ||||||||||
CVS Caremark Corp. (Food & Staples Retailing) | 35,924 | 1,736,925 | ||||||||
Wal-Mart Stores, Inc. (Food & Staples Retailing) | 23,974 | 1,635,746 | ||||||||
Bunge Ltd. (Food Products) | 25,401 | 1,846,399 | ||||||||
Kraft Foods Group, Inc. (Food Products) | 16,750 | 761,623 | ||||||||
Mondelez International, Inc. Class A (Food Products) | 62,140 | 1,582,706 | ||||||||
Tyson Foods, Inc. Class A (Food Products) | 66,258 | 1,285,405 | ||||||||
|
| |||||||||
| 8,848,804 | ||||||||||
|
| |||||||||
ENERGY – 11.9% | ||||||||||
Cameron International Corp. (Energy Equip. & Svs.) | (a) | 40,546 | 2,289,227 | |||||||
Ensco PLC Class A (Energy Equip. & Svs.) | 20,624 | 1,222,591 | ||||||||
Schlumberger Ltd. (Energy Equip. & Svs.) | 32,915 | 2,280,680 | ||||||||
Cobalt International Energy, Inc. (Oil, Gas & Consumable Fuels) | (a) | 57,599 | 1,414,631 | |||||||
CONSOL Energy, Inc. (Oil, Gas & Consumable Fuels) | 62,326 | 2,000,665 | ||||||||
EOG Resources, Inc. (Oil, Gas & Consumable Fuels) | 11,581 | 1,398,869 | ||||||||
Newfield Exploration Co. (Oil, Gas & Consumable Fuels) | (a) | 38,255 | 1,024,469 | |||||||
Peabody Energy Corp. (Oil, Gas & Consumable Fuels) | 78,876 | 2,098,890 | ||||||||
|
| |||||||||
| 13,730,022 | ||||||||||
|
| |||||||||
FINANCIALS – 11.3% | ||||||||||
Charles Schwab Corp. / The (Capital Markets) | 97,726 | 1,403,345 | ||||||||
Evercore Partners, Inc. Class A (Capital Markets) | 43,312 | 1,307,589 | ||||||||
Goldman Sachs Group, Inc. / The (Capital Markets) | 17,528 | 2,235,872 | ||||||||
Morgan Stanley (Capital Markets) | 96,733 | 1,849,535 | ||||||||
Wells Fargo & Co. (Commercial Banks) | 52,400 | 1,791,032 | ||||||||
JPMorgan Chase & Co. (Diversified Financial Svs.) | 25,806 | 1,134,690 | ||||||||
MetLife, Inc. (Insurance) | 60,304 | 1,986,414 | ||||||||
Symetra Financial Corp. (Insurance) | 102,466 | 1,330,009 | ||||||||
|
| |||||||||
| 13,038,486 | ||||||||||
|
| |||||||||
HEALTH CARE – 10.8% | ||||||||||
Amarin Corp. PLC – ADR (Biotechnology) | (a) | 86,443 | 699,324 | |||||||
Vertex Pharmaceuticals, Inc. (Biotechnology) | (a) | 32,613 | 1,367,789 | |||||||
Hologic, Inc. (Health Care Equip. & Supplies) | (a) | 77,574 | 1,553,807 | |||||||
Express Scripts Holding Co. (Health Care Providers & Svs.) | (a) | 27,728 | 1,497,312 | |||||||
Quest Diagnostics, Inc. (Health Care Providers & Svs.) | 20,325 | 1,184,338 | ||||||||
Universal Health Services, Inc. Class B (Health Care Providers & Svs.) | 36,771 | 1,777,878 | ||||||||
Thermo Fisher Scientific, Inc. (Life Sciences Tools & Svs.) | 12,640 | 806,179 | ||||||||
Impax Laboratories, Inc. (Pharmaceuticals) | (a) | 60,408 | 1,237,760 | |||||||
Pfizer, Inc. (Pharmaceuticals) | 95,174 | 2,386,964 | ||||||||
|
| |||||||||
| 12,511,351 | ||||||||||
|
| |||||||||
| Common Stocks (Continued) | Shares | Value | ||||||||
INDUSTRIALS – 11.0% | ||||||||||
Boeing Co. / The (Aerospace & Defense) | 24,473 | $ | 1,844,285 | |||||||
Exelis, Inc. (Aerospace & Defense) | 129,451 | 1,458,913 | ||||||||
Teledyne Technologies, Inc. (Aerospace & Defense) | (a) | 9,633 | 626,819 | |||||||
United Technologies Corp. (Aerospace & Defense) | 22,207 | 1,821,196 | ||||||||
Delta Air Lines, Inc. (Airlines) | (a) | 97,913 | 1,162,227 | |||||||
Brink’s Co. / The (Commercial Svs. & Supplies) | 30,645 | 874,302 | ||||||||
Dover Corp. (Machinery) | 12,595 | 827,617 | ||||||||
Xylem, Inc. (Machinery) | 51,386 | 1,392,561 | ||||||||
Kirby Corp. (Marine) | (a) | 22,011 | 1,362,261 | |||||||
Manpower, Inc. (Professional Svs.) | 32,878 | 1,395,342 | ||||||||
|
| |||||||||
| 12,765,523 | ||||||||||
|
| |||||||||
INFORMATION TECHNOLOGY – 14.5% | ||||||||||
EchoStar Corp. Class A (Communications Equip.) | (a) | 11,642 | 398,389 | |||||||
Juniper Networks, Inc. (Communications Equip.) | (a) | 82,336 | 1,619,549 | |||||||
EMC Corp. (Computers & Peripherals) | (a) | 45,659 | 1,155,173 | |||||||
Google, Inc. Class A (Internet Software & Svs.) | (a) | 3,192 | 2,264,309 | |||||||
Monster Worldwide, Inc. (Internet Software & Svs.) | (a) | 92,108 | 517,647 | |||||||
Broadcom Corp. Class A (Semiconductors & Equip.) | 51,653 | 1,715,396 | ||||||||
Maxim Integrated Products, Inc. (Semiconductors & Equip.) | 39,799 | 1,170,091 | ||||||||
NVIDIA Corp. (Semiconductors & Equip.) | 84,149 | 1,034,191 | ||||||||
Xilinx, Inc. (Semiconductors & Equip.) | 48,647 | 1,746,427 | ||||||||
Activision Blizzard, Inc. (Software) | 95,618 | 1,015,463 | ||||||||
Cadence Design Systems, Inc. (Software) | (a) | 144,148 | 1,947,440 | |||||||
Microsoft Corp. (Software) | 79,560 | 2,126,639 | ||||||||
Splunk, Inc. (Software) | (a) | 3,900 | 113,178 | |||||||
|
| |||||||||
| 16,823,892 | ||||||||||
|
| |||||||||
MATERIALS – 4.9% | ||||||||||
Monsanto Co. (Chemicals) | 28,054 | 2,655,311 | ||||||||
PPG Industries, Inc. (Chemicals) | 8,815 | 1,193,110 | ||||||||
Goldcorp, Inc. (Metals & Mining) | 22,457 | 824,172 | ||||||||
United States Steel Corp. (Metals & Mining) | 42,212 | 1,007,600 | ||||||||
|
| |||||||||
| 5,680,193 | ||||||||||
|
| |||||||||
TELECOMMUNICATION SERVICES – 1.7% | ||||||||||
Vivendi SA (Diversified Telecom. Svs.) | (b) | 88,841 | 2,009,234 | |||||||
|
| |||||||||
UTILITIES – 1.8% | ||||||||||
Calpine Corp. (Ind. Power Prod. & Energy Traders) | (a) | 115,963 | 2,102,409 | |||||||
|
| |||||||||
Total Common Stocks (Cost $97,711,015) | $ | 110,845,385 | ||||||||
|
| |||||||||
| Money Market Funds – 4.4% | Shares | Value | ||||||||
Fidelity Institutional Money Market Funds | 5,110,000 | $ | 5,110,000 | |||||||
|
| |||||||||
Total Money Market Funds (Cost $5,110,000) | $ | 5,110,000 | ||||||||
|
| |||||||||
Total Investments – 100.2% (Cost $102,821,015) | (c) | $ | 115,955,385 | |||||||
Liabilities in Excess of Other Assets – (0.2)% | (287,526) | |||||||||
|
| |||||||||
Net Assets – 100.0% | $ | 115,667,859 | ||||||||
|
| |||||||||
| 29 | (continued) |
| Ohio National Fund, Inc. | Capital Appreciation Portfolio (Continued) |
Schedule of Investments | December 31, 2012 |
Percentages are stated as a percent of net assets.
Abbreviations:
ADR: American Depositary Receipts
Footnotes:
| (a) | Non-income producing security. |
| (b) | Security traded on a foreign exchange has been valued at an estimate of fair value that is different than the local market close price. These fair value estimates are determined by an independent fair valuation service that has been approved by the Board. These securities represent $3,476,725, or 3.0% of the Portfolio’s net assets. Other Portfolio securities are not subjected to fair valuation procedures because they are traded on domestic or foreign exchanges that have close times that are consistent with the U.S. market close, normally 4:00 pm Eastern Time. |
| (c) | Represents cost for financial reporting purposes, which may differ from cost basis for federal income tax purposes. See also Note 7 of the Notes to Financial Statements. |
The accompanying notes are an integral part of these financial statements.
| 30 |
| Ohio National Fund, Inc. | Millennium Portfolio |
Objective/Strategy
The Millennium Portfolio seeks capital growth by investing primarily in common stocks of small sized companies.
Performance as of December 31, 2012
Average Annual Total Returns: | ||||
One year | 9.44% | |||
Five years | -1.31% | |||
Ten years | 6.82% |
Past performance does not guarantee future results. The performance data quoted represents past performance and current returns may be lower or higher. Total return figures include change in share price and reinvestment of dividends and capital gains. The investment return and principal value will fluctuate so that an investor’s shares, when redeemed, may be worth more or less than the original cost. To obtain performance information up to the most recent month end, call toll-free 1-877-781-6392.
The Portfolio is not open to direct retail investment. Beneficial interest in shares is obtained solely by purchase of variable life insurance policies and variable annuity contracts. Actual performance results for variable annuity and variable universal life contracts will be lower due to contract charges. Consult your contract for applicable charges.
Comments
For the year ended December 31, 2012, the Millennium Portfolio returned 9.44% versus 14.59% for the current benchmark, the Russell 2000 Growth Index.
The year 2012 offered two distinct stylistic environments. The first three quarters of the year were generally receptive to our more seasoned small cap companies, featuring higher sales and earnings growth and strong bottom-line fundamentals, despite a slight valuation premium to match the elevated expectations. However, the fourth quarter ushered in a “risk-off” environment, likely fueled by political and fiscal uncertainty, which saw the market rotate away from higher growth and higher price per earnings companies, regardless of their fundamentals, in favor of those with lower expectations and perceived risk. The stylistic headwinds of the last three months ended up being the defining period for the Portfolio in 2012.
Broadly looking at the Portfolio’s sector positioning for the year, the strategy was meaningfully overweighted in Information Technology and Consumer Discretionary and underweighted in Materials, Financials, Industrials, and Health Care. With respect to 2012 performance attribution, stock selection was the primary driver of alpha in the Portfolio. While stock selection in Information Technology, Consumer Discretionary, and Consumer Staples was positive, it was ultimately unable to offset poor selection across the other sectors.(1)
Drilling down to the Portfolio’s holdings, Catamaran Corp., a provider of pharmacy benefit management (PBM) services and health care information technology solutions designed to assist customers in reducing the cost and complexity of their prescription drug programs, was the top contributor to performance for the full year. Earlier in the year, the company reached an agreement to acquire and merge with Catalyst Health Solutions. The market viewed this deal positively, due to the accretive nature and potential synergies of the combined entity.(1)
Acco Brands Corp., a supplier of office products to the office merchandise resale industry, was the leading detractor from relative performance. Acco Brands Corp. designs, develops, manufactures, and markets a variety of traditional and computer-related office products, supplies, and equipment. The company’s results faltered as a sustained slowdown in the office products industry unfortunately offset expected synergies from their MeadWestvaco Corp. merger. We subsequently sold the position.(1)
As we look ahead into the New Year, we just can’t quite shake that feeling of déjà vu. We are once again faced with dire deadlines complicated by substantial ideological differences, a political environment ripe for acrimony, and an appalling disregard for effective political compromise. The end result is that we expect the confidence and market gains from this year-end cliff deal to be fleeting as we enter 2013, with the first quarter likely to be characterized by more uncertainty-driven market volatility. However, we also feel it is important to remember the lesson of 2012, which is not to under-estimate the resiliency of both our economy and the financial markets. Valuations are currently reasonable and we’re confident that higher-quality companies that offer unique catalysts and competitive attributes, along with compelling top-line growth that efficiently translates through to the bottom line, will be rewarded by a market that is seeking positive differentiation. To that end, and in spite of the uncertainty that lies ahead, we remain cautiously optimistic that 2013 can be another positive year for small-cap equities.
| (1) | The Portfolio’s composition is subject to change. Holdings and weightings are as of December 31, 2012. |
Change in Value of $10,000 Investment
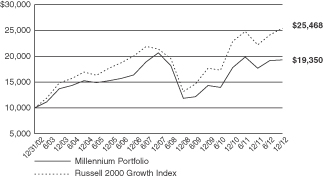
Hypothetical illustration based on past performance. Future performance will vary. The Portfolio’s returns reflect reinvested dividends. The Portfolio’s holdings may differ significantly from the securities in the index. The index is unmanaged and therefore does not reflect the cost of portfolio management and accounting.
The Russell 2000 Growth Index measures the performance of the small-cap growth segment of the U.S. equity universe. It includes those Russell 2000 Index companies with higher price-to-value ratios and higher forecasted growth values. The Russell 2000 Index includes the 2000 firms from the Russell 3000 Index with the smallest market capitalizations. The Russell 3000 Index represents 98% of the investable U.S. equity markets. The index presented herein includes the effects of reinvested dividends.
| 31 | (continued) |
| Ohio National Fund, Inc. | Millennium Portfolio (Continued) |
Portfolio Composition as of December 31, 2012 (1)
| % of Net Assets | ||||
Common Stocks (3) | 98.8 | |||
Money Market Funds | 1.2 | |||
|
| |||
| 100.0 | ||||
|
|
Top 10 Portfolio Holdings as of December 31,
2012 (1) (2)
| % of Net Assets | ||||
1. Ultimate Software Group, Inc. | 1.9 | |||
2. Tyler Technologies, Inc. | 1.7 | |||
3. Stratasys Ltd. | 1.6 | |||
4. Bonanza Creek Energy, Inc. | 1.6 | |||
5. MWI Veterinary Supply, Inc. | 1.6 | |||
6. Pricesmart, Inc. | 1.6 | |||
7. ICU Medical, Inc. | 1.6 | |||
8. Generac Holdings, Inc. | 1.5 | |||
9. Marlin Business Services Corp. | 1.5 | |||
10. Healthcare Services Group, Inc. | 1.5 |
| (1) | Composition of Portfolio subject to change. |
| (2) | Short-term investments have been excluded from the list of Top 10 Portfolio Holdings. |
| (3) | Sectors: |
| % of Net Assets | ||||
Information Technology | 25.5 | |||
Health Care | 19.0 | |||
Consumer Discretionary | 18.5 | |||
Industrials | 15.8 | |||
Financials | 6.9 | |||
Energy | 5.3 | |||
Consumer Staples | 4.2 | |||
Materials | 3.6 | |||
|
| |||
| 98.8 | ||||
|
|
| 32 |
| Ohio National Fund, Inc. | Millennium Portfolio |
Schedule of Investments | December 31, 2012 |
| Common Stocks – 98.8% | Shares | Value | ||||||||
CONSUMER DISCRETIONARY – 18.5% | ||||||||||
Steiner Leisure Ltd. (Diversified Consumer Svs.) | (a) | 7,300 | $ | 351,787 | ||||||
Bloomin’ Brands, Inc. (Hotels, Restaurants & Leisure) | (a) | 20,900 | 326,876 | |||||||
Orient-Express Hotels Ltd. Class A (Hotels, Restaurants & Leisure) | (a) | 31,700 | 370,573 | |||||||
HSN, Inc. (Internet & Catalog Retail) | 6,700 | 369,036 | ||||||||
Brunswick Corp. (Leisure Equip. & Products) | 13,200 | 383,988 | ||||||||
Lions Gate Entertainment Corp. (Media) | (a) | 28,600 | 469,040 | |||||||
ANN, Inc. (Specialty Retail) | (a) | 9,400 | 318,096 | |||||||
Cabela’s, Inc. (Specialty Retail) | (a) | 8,000 | 334,000 | |||||||
Chico’s FAS, Inc. (Specialty Retail) | 19,900 | 367,354 | ||||||||
Hibbett Sports, Inc. (Specialty Retail) | (a) | 8,200 | 432,140 | |||||||
Lithia Motors, Inc. Class A (Specialty Retail) | 11,000 | 411,620 | ||||||||
Tile Shop Holdings, Inc. (Specialty Retail) | (a) | 28,000 | 471,240 | |||||||
Tilly’s, Inc. (Specialty Retail) | (a) | 26,800 | 361,532 | |||||||
Tractor Supply Co. (Specialty Retail) | 5,000 | 441,800 | ||||||||
Ulta Salon Cosmetics & Fragrance, Inc. (Specialty Retail) | 5,100 | 501,126 | ||||||||
Vitamin Shoppe, Inc. (Specialty Retail) | (a) | 6,900 | 395,784 | |||||||
|
| |||||||||
| 6,305,992 | ||||||||||
|
| |||||||||
CONSUMER STAPLES – 4.2% | ||||||||||
Pricesmart, Inc. (Food & Staples Retailing) | 7,100 | 547,055 | ||||||||
United Natural Foods, Inc. (Food & Staples Retailing) | (a) | 7,800 | 418,002 | |||||||
Smart Balance, Inc. (Food Products) | (a) | 35,400 | 456,660 | |||||||
|
| |||||||||
| 1,421,717 | ||||||||||
|
| |||||||||
ENERGY – 5.3% | ||||||||||
Bonanza Creek Energy, Inc. (Oil, Gas & Consumable Fuels) | (a) | 19,800 | 550,242 | |||||||
Kodiak Oil & Gas Corp. (Oil, Gas & Consumable Fuels) | (a) | 38,100 | 337,185 | |||||||
Oasis Petroleum, Inc. (Oil, Gas & Consumable Fuels) | (a) | 15,100 | 480,180 | |||||||
Rosetta Resources, Inc. (Oil, Gas & Consumable Fuels) | (a) | 10,000 | 453,600 | |||||||
|
| |||||||||
| 1,821,207 | ||||||||||
|
| |||||||||
FINANCIALS – 6.9% | ||||||||||
SCBT Financial Corp. (Commercial Banks) | 10,900 | 437,962 | ||||||||
Signature Bank (Commercial Banks) | (a) | 7,000 | 499,380 | |||||||
Texas Capital Bancshares, Inc. (Commercial Banks) | (a) | 10,900 | 488,538 | |||||||
Marlin Business Services Corp. (Diversified Financial Svs.) | 25,800 | 517,548 | ||||||||
Jones Lang LaSalle, Inc. (Real Estate Mgmt. & Development) | 5,000 | 419,700 | ||||||||
|
| |||||||||
| 2,363,128 | ||||||||||
|
| |||||||||
HEALTH CARE – 19.0% | ||||||||||
Alkermes PLC (Biotechnology) | (a) | 18,100 | 335,212 | |||||||
Cubist Pharmaceuticals, Inc. (Biotechnology) | (a) | 7,500 | 315,450 | |||||||
Cyberonics, Inc. (Health Care Equip. & Supplies) | (a) | 9,700 | 509,541 | |||||||
DexCom, Inc. (Health Care Equip. & Supplies) | (a) | 32,600 | 443,686 | |||||||
Endologix, Inc. (Health Care Equip. & Supplies) | (a) | 27,100 | 385,904 | |||||||
ICU Medical, Inc. (Health Care Equip. & Supplies) | (a) | 8,700 | 530,091 | |||||||
Quidel Corp. (Health Care Equip. & Supplies) | (a) | 21,900 | 408,873 | |||||||
Volcano Corp. (Health Care Equip. & Supplies) | (a) | 15,100 | 356,511 | |||||||
Acadia Healthcare Co., Inc. (Health Care Providers & Svs.) | (a) | 19,600 | 457,268 | |||||||
Air Methods Corp. (Health Care Providers & Svs.) | 12,600 | 464,814 | ||||||||
Hanger, Inc. (Health Care Providers & Svs.) | (a) | 14,400 | 393,984 | |||||||
MWI Veterinary Supply, Inc. (Health Care Providers & Svs.) | (a) | 5,000 | 550,000 | |||||||
U.S. Physical Therapy, Inc. (Health Care Providers & Svs.) | 17,400 | 479,196 | ||||||||
| Common Stocks (Continued) | Shares | Value | ||||||||
HEALTH CARE (continued) | ||||||||||
ICON PLC – ADR (Life Sciences Tools & Svs.) | (a) | 12,400 | $ | 344,224 | ||||||
Akorn, Inc. (Pharmaceuticals) | (a) | 37,300 | 498,328 | |||||||
|
| |||||||||
| 6,473,082 | ||||||||||
|
| |||||||||
INDUSTRIALS – 15.8% | ||||||||||
DigitalGlobe, Inc. (Aerospace & Defense) | (a) | 18,000 | 439,920 | |||||||
HEICO Corp. (Aerospace & Defense) | 10,000 | 447,600 | ||||||||
Hexcel Corp. (Aerospace & Defense) | (a) | 15,500 | 417,880 | |||||||
Echo Global Logistics, Inc. (Air Freight & Logistics) | (a) | 19,100 | 343,227 | |||||||
Healthcare Services Group, Inc. (Commercial Svs. & Supplies) | 22,000 | 511,060 | ||||||||
InnerWorkings, Inc. (Commercial Svs. & Supplies) | (a) | 31,800 | 438,204 | |||||||
Tetra Tech, Inc. (Commercial Svs. & Supplies) | (a) | 14,000 | 370,300 | |||||||
Generac Holdings, Inc. (Electrical Equip.) | 15,200 | 521,512 | ||||||||
Polypore International, Inc. (Electrical Equip.) | (a) | 9,700 | 451,050 | |||||||
Trimas Corp. (Machinery) | (a) | 17,800 | 497,688 | |||||||
Old Dominion Freight Line, Inc. (Road & Rail) | (a) | 13,900 | 476,492 | |||||||
AerCap Holdings NV (Trading Companies & Distributors) | (a) | 33,800 | 463,736 | |||||||
|
| |||||||||
| 5,378,669 | ||||||||||
|
| |||||||||
INFORMATION TECHNOLOGY – 25.5% | ||||||||||
Aruba Networks, Inc. (Communications Equip.) | (a) | 20,300 | 421,225 | |||||||
Ixia (Communications Equip.) | (a) | 21,600 | 366,768 | |||||||
Stratasys Ltd. (Computers & Peripherals) | (a) | 7,000 | 561,050 | |||||||
Cornerstone OnDemand, Inc. (Internet Software & Svs.) | (a) | 12,800 | 377,984 | |||||||
CoStar Group, Inc. (Internet Software & Svs.) | (a) | 5,500 | 491,535 | |||||||
CoreLogic, Inc. (IT Svs.) | (a) | 13,300 | 358,036 | |||||||
EPAM Systems, Inc. (IT Svs.) | (a) | 17,800 | 322,180 | |||||||
InterXion Holding NV (IT Svs.) | (a) | 21,500 | 510,840 | |||||||
MAXIMUS, Inc. (IT Svs.) | 6,400 | 404,608 | ||||||||
Virtusa Corp. (IT Svs.) | (a) | 23,500 | 386,105 | |||||||
Cavium, Inc. (Semiconductors & Equip.) | (a) | 10,400 | 324,584 | |||||||
Silicon Laboratories, Inc. (Semiconductors & Equip.) | (a) | 10,300 | 430,643 | |||||||
Accelrys, Inc. (Software) | (a) | 35,000 | 316,750 | |||||||
Aspen Technology, Inc. (Software) | (a) | 13,200 | 364,848 | |||||||
Bottomline Technologies, Inc. (Software) | (a) | 19,100 | 504,049 | |||||||
CommVault Systems, Inc. (Software) | (a) | 6,000 | 418,260 | |||||||
Guidance Software, Inc. (Software) | (a) | 35,100 | 416,637 | |||||||
NetSuite, Inc. (Software) | (a) | 7,100 | 477,830 | |||||||
Tyler Technologies, Inc. (Software) | (a) | 12,300 | 595,812 | |||||||
Ultimate Software Group, Inc. (Software) | (a) | 7,000 | 660,870 | |||||||
|
| |||||||||
| 8,710,614 | ||||||||||
|
| |||||||||
MATERIALS – 3.6% | ||||||||||
American Vanguard Corp. (Chemicals) | 13,600 | 422,552 | ||||||||
Chemtura Corp. (Chemicals) | (a) | 16,500 | 350,790 | |||||||
Minerals Technologies, Inc. (Chemicals) | 11,500 | 459,080 | ||||||||
|
| |||||||||
| 1,232,422 | ||||||||||
|
| |||||||||
Total Common Stocks (Cost $31,623,715) | $ | 33,706,831 | ||||||||
|
| |||||||||
| Money Market Funds – 1.5% | Shares | Value | ||||||||
Fidelity Institutional Money Market Funds Money Market Portfolio – Class I | 504,000 | $ | 504,000 | |||||||
|
| |||||||||
Total Money Market Funds (Cost $504,000) | $ | 504,000 | ||||||||
|
| |||||||||
Total Investments – 100.3% (Cost $32,127,715) | (b) | $ | 34,210,831 | |||||||
Liabilities in Excess of Other Assets – (0.3)% | (99,748) | |||||||||
|
| |||||||||
Net Assets – 100.0% | $ | 34,111,083 | ||||||||
|
| |||||||||
Percentages are stated as a percent of net assets.
Footnotes:
| (a) | Non-income producing security. |
| (b) | Represents cost for financial reporting purposes, which may differ from cost basis for federal income tax purposes. See also Note 7 of the Notes to Financial Statements. |
The accompanying notes are an integral part of these financial statements.
| 33 |
| Ohio National Fund, Inc. | International Small-Mid Company Portfolio |
Objective/Strategy
The International Small-Mid Company Portfolio seeks long-term growth of capital by investing at least 80% of its assets in equity securities of foreign small and mid-cap companies.
Performance as of December 31, 2012
Average Annual Total Returns: | ||||
One year | 22.69% | |||
Five years | -2.93% | |||
Ten years | 11.87% |
Past performance does not guarantee future results. The performance data quoted represents past performance and current returns may be lower or higher. Total return figures include change in share price and reinvestment of dividends and capital gains. The investment return and principal value will fluctuate so that an investor’s shares, when redeemed, may be worth more or less than the original cost. To obtain performance information up to the most recent month end, call toll-free 1-877-781-6392.
The Portfolio is not open to direct retail investment. Beneficial interest in shares is obtained solely by purchase of variable life insurance policies and variable annuity contracts. Actual performance results for variable annuity and variable universal life contracts will be lower due to contract charges. Consult your contract for applicable charges.
Comments
For the year ended December 31, 2012, the International Small-Mid Company Portfolio returned 22.69% versus 17.84% for the current benchmark, the S&P Developed Small Cap Ex-U.S. Growth Index.
In 2012, global equity markets had their best start to the year since 1998. However, markets have endured a year of macro-economic ups and downs. The beginning of the year started with all eyes towards the European crisis and ended with all eyes towards the U.S. fiscal cliff. Attempts by central banks to push the global economy further along the path of recovery continued. The European Central Bank (ECB) injected over €525 billion euros of liquidity as part of the Long Term Refinancing Operation (LTRO) in an attempt to improve balance sheets and restore confidence in the banking system. As a result, bond yields in Italy and Spain fell from “the danger zone” of greater than 7% down to a manageable 4% to 5%. Meanwhile, Greece completed the largest debt restructuring of the modern era in order to avoid defaulting on its obligations.
In Latin America, Brazil surprised by lowering its key interest rate from 11% to 7.25%. Reduced borrowing rates and strong global demand meant many emerging markets, such as Indonesia, experienced strong economic growth driven by domestic demand and foreign direct investment from developed countries such as the U.S. and Japan. However, overall emerging market equities lagged their developed peers as investors focused on slowing growth in Brazil and China.
During the first half of 2012, equity markets reacted to sluggish global growth, concerns regarding Southern Europe, and a slowing U.S. economy. After a decline in April and May, markets rallied in June due to attractive valuations and strong corporate earnings. A major policy announcement by the ECB to do “whatever it takes” to avoid a melt-down in the EuroZone, combined with the Federal Reserve’s launching of quantitative easing (QE3), extended the stock market rally through August. Globally, the equity indices were led higher by select emerging markets, North America, and Europe, as well as deep value stocks overall. As positive economic and corporate news buttressed policy response, equity volatility hit a five-year low. In addition, the ECB cut its benchmark rate by 0.25% to a record low of 0.75% to help fight economic weakness. Furthermore, as we entered September, Germany’s Constitutional Court approved the
formation of the European Stability Mechanism, a permanent EuroZone bailout fund designed to lend governments the necessary funds to recapitalize their banking systems.
The soft landing continued in China during the year as real gross domestic product (GDP) and industrial production continued to slow. However, the Chinese labor market remains healthy with the unemployment rate at only 4.1% in September. In addition to monetary easing, the Chinese government continues to invest in infrastructure, spending over $158 billion on subway projects, highway construction, and sewage treatment plants. HSBC’s China Manufacturing Purchasing Managers Index reached 51.5 in December, from 49.8 at the end of third quarter, providing the best reading for the index since May 2011. During the year, the Bank of Japan increased asset purchases to counteract slowing economic growth. Japan had a late year-end rally in December as Shinzo Abe returned as the nation’s newly elected prime minister. His sharp, market-moving comments indicated that he would pressure the central bank to engage in unlimited monetary easing and double the target inflation rate to two percent.
On a regional basis, the S&P Europe Small Cap Growth Index rose the most, gaining 27.9% while the S&P Asia Pacific Ex-Japan Small Cap Growth Index increased 14.2%. Japanese small caps posted one of the weakest gains amongst all countries as the S&P Japan Small Cap Growth Index gained only 3.4% during the year.
The U.S. dollar largely depreciated against most major currencies over the year. Currencies that appreciated against the U.S. dollar include British sterling (4.6%), the Canadian dollar (2.9%), and the euro (1.8%). The Japanese yen is the only major currency to have depreciated against the U.S. dollar, declining 12.8% over the year. Oil prices declined 7.1% over the year as measured by the West Texas Intermediate spot oil price.
In summary, the primary drivers of the international markets during the year included: (1) global monetary easing, (2) fiscal austerity, (3) concerns about slowing economic growth, (4) mixed economic results in the U.S., and (5) political transitions in major economies.
Positive relative performance came from strong stock selection in Energy, Materials, and Consumer Discretionary sectors. From a regional perspective, the Portfolio benefited from a mix of strong stock selection and weightings in Mexico, Norway, and Singapore. The Portfolio’s underweight exposure in Japan relative to the benchmark also positively impacted the Portfolio’s relative performance.(1)
Individual stocks that contributed most significantly to the Portfolio’s performance included: Mexichem Sab de CV, a Mexican chemical company specializing in PVC products; ASOS PLC, a UK online retailer targeting 16-25 year olds in the United Kingdom and internationally; Andritz AG, an Austrian capital goods company manufacturing hydro power plants and machinery for the pulp and paper industries among others; and Petroleum Geo-Services ASA, a Norwegian oil service company providing seismic studies for its clients. Strong relative performance was supported by the appreciated British sterling together with a relative overweight in the United Kingdom. The Portfolio’s performance was also aided by the relative underweight in Japan, along with a depreciated yen. As the Portfolio does not typically hedge currency positions, it stands to benefit or suffer from corresponding currency fluctuations.(1)
The Portfolio’s relative performance was weakened by weaker stock price performance in Consumer Staples, Health Care, and Financials sectors. The Portfolio’s non-benchmark investments in Brazil also weakened the Portfolio’s performance. Weak Hong Kong stock investments also held back the Portfolio’s relative performance.(1)
| 34 | (continued) |
| Ohio National Fund, Inc. | International Small-Mid Company Portfolio (Continued) |
Stocks that detracted from relative performance included: SNC-Lavalin, a Canadian engineering and construction company embroiled in possible illegal payments that replaced their CEO; PDG Realty SA, a Brazilian residential developer which surprisingly lowered its guidance for new projects in 2012; Bombardier, Inc., a Canadian aircraft and rail car manufacturer which had multiple delays in first flight and entry of its new CSeries aircraft; and Herbalife Ltd., a global nutritional and personal care direct marketing company whose stock price struggled when their business model was questioned on a conference call despite delivering outstanding results each quarter. The stock was severely punished again in December as heavy shorting by hedge funds was once again highlighted.(1)
The macro-environment continues to be more of the same, with announcements and headlines moving the markets as reflected by the risk-on, risk-off trade. The global environment will remain challenging, but not without opportunities. We’ll be closely following new policies and initiatives that will surely come from the new leaderships in many countries, principally China, Japan, and Mexico. European equity markets have clearly detached from the performance of local economies for the most part. While the returns in Europe have been surprisingly good, the underlying economic news is still not comforting. We stick to fundamentals that support our investment theses, convictions, and valuations.
Our bottom-up process continues to identify those individual investment opportunities that provide future growth and participation in the local and global economies. Central banks and governments remain committed to providing stimulative policies to encourage economic growth.
| (1) | The Portfolio’s composition is subject to change. Holdings and weightings are as of December 31, 2012. |
Portfolio Composition as of December 31, 2012 (1)
| % of Net Assets | ||||
Common Stocks (3) | 94.9 | |||
Money Market Funds | 5.1 | |||
|
| |||
| 100.0 | ||||
|
|
Change in Value of $10,000 Investment
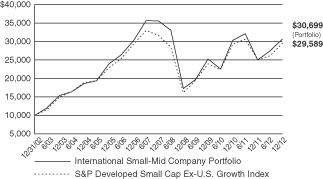
Hypothetical illustration based on past performance. Future performance will vary. The Portfolios returns reflect reinvested dividends. The Portfolios holdings may differ significantly from the securities in the index. The index is unmanaged and therefore does not reflect the cost of portfolio management and accounting.
The S&P Developed Small Cap Ex-U.S. Growth Index is a subset of the S&P Global Broad Market Index (BMI), a broad index including all publicly listed equities with float-adjusted market values of US$ 100 million or more and annual dollar value traded of at least US$ 50 million in all included countries. The Developed Small Cap component of the BMI includes the equities in the bottom 15% of the market capitalization within each “developed” local market. Ex-U.S. denotes the use of all developed markets excluding the United States. The “Growth” subset includes those companies in each local market that exhibit the characteristics of growth. The index presented includes the effects of reinvested dividends.
Top 10 Portfolio Holdings as of December 31, 2012 (1) (2)
| % of Net Assets | ||||
1. Signet Jewelers Ltd. | 2.0 | |||
2. Andritz AG | 2.0 | |||
3. Getinge AB | 2.0 | |||
4. Invesco Ltd. | 2.0 | |||
5. Adecco SA | 1.9 | |||
6. Koninklijke DSM NV | 1.9 | |||
7. Bureau Veritas SA | 1.8 | |||
8. InterContinental Hotels Group PLC | 1.8 | |||
9. Mexichem SAB de CV | 1.7 | |||
10. Petroleum Geo-Services ASA | 1.7 |
| (1) | Composition of Portfolio subject to change. |
| (2) | Short-term investments have been excluded from the list of Top 10 Portfolio Holdings. |
| (3) | Top 10 Country Weightings: |
| % of Net Assets | ||||
United Kingdom | 19.3 | |||
France | 9.3 | |||
Japan | 9.1 | |||
Canada | 7.1 | |||
Germany | 7.0 | |||
Singapore | 5.1 | |||
Mexico | 4.1 | |||
Sweden | 3.7 | |||
United States | 3.0 | |||
China | 2.5 |
| 35 |
| Ohio National Fund, Inc. | International Small-Mid Company Portfolio |
Schedule of Investments | December 31, 2012 |
| Common Stocks – 94.9% | Shares | Value | ||||||||
United Kingdom – 19.3% | ||||||||||
Aberdeen Asset Management PLC | (b) | 87,807 | $ | 528,371 | ||||||
Aggreko PLC | (b) | 19,292 | 550,566 | |||||||
AMEC PLC | (b) | 53,951 | 891,861 | |||||||
Ashtead Group PLC | (b) | 76,834 | 540,406 | |||||||
ASOS PLC | (a)(b) | 18,196 | 802,593 | |||||||
Burberry Group PLC | (b) | 37,629 | 756,398 | |||||||
Croda International PLC | (b) | 22,054 | 861,981 | |||||||
Delphi Automotive PLC | (a) | 20,355 | 778,579 | |||||||
Filtrona PLC | (b) | 77,000 | 692,501 | |||||||
InterContinental Hotels Group PLC | (b) | 40,245 | 1,128,484 | |||||||
John Wood Group PLC | (b) | 88,702 | 1,060,391 | |||||||
Johnson Matthey PLC | (b) | 12,553 | 493,121 | |||||||
Kingfisher PLC | (b) | 153,263 | 716,132 | |||||||
Rightmove PLC | (b) | 32,807 | 771,281 | |||||||
Soco International PLC | (a)(b) | 139,373 | 819,568 | |||||||
Telecity Group PLC | (b) | 80,738 | 1,042,685 | |||||||
|
| |||||||||
| 12,434,918 | ||||||||||
|
| |||||||||
France – 9.3% | ||||||||||
Accor SA | (b) | 24,283 | 866,101 | |||||||
Bureau Veritas SA | (b) | 10,537 | 1,181,511 | |||||||
Edenred | (b) | 15,965 | 493,770 | |||||||
JCDecaux SA | (b) | 14,436 | 344,572 | |||||||
Publicis Groupe SA | (b) | 17,881 | 1,075,777 | |||||||
Remy Cointreau SA | (c) | 2,714 | 296,368 | |||||||
Technip SA | (b) | 9,173 | 1,060,729 | |||||||
Zodiac Aerospace | (b) | 6,162 | 682,203 | |||||||
|
| |||||||||
| 6,001,031 | ||||||||||
|
| |||||||||
Japan – 9.1% | ||||||||||
Aisin Seiki Co. Ltd. | (b) | 24,900 | 777,555 | |||||||
Chiyoda Corp. | (b) | 41,000 | 587,332 | |||||||
Daihatsu Motor Co. Ltd. | (b) | 44,000 | 876,605 | |||||||
Don Quijote Co. Ltd. | (b) | 12,900 | 474,537 | |||||||
Fuji Heavy Industries Ltd. | (b) | 29,000 | 365,699 | |||||||
JGC Corp. | (b) | 18,000 | 560,906 | |||||||
Lawson, Inc. | (b) | 7,000 | 474,846 | |||||||
Nikon Corp. | (b) | 16,100 | 475,343 | |||||||
Park24 Co. Ltd. | (b) | 23,200 | 366,396 | |||||||
Shionogi & Co. Ltd. | (b) | 19,900 | 331,610 | |||||||
Ship Healthcare Holdings, Inc. | (b) | 21,700 | 576,747 | |||||||
|
| |||||||||
| 5,867,576 | ||||||||||
|
| |||||||||
Canada – 7.1% | ||||||||||
Agrium, Inc. | 9,200 | 916,948 | ||||||||
Bombardier, Inc. | 150,700 | 569,651 | ||||||||
Dollarama, Inc. | 16,444 | 974,869 | ||||||||
Ensign Energy Services, Inc. | 13,567 | 209,636 | ||||||||
Finning International, Inc. | 19,400 | 479,198 | ||||||||
National Bank of Canada | 12,300 | 955,114 | ||||||||
Tim Hortons, Inc. | 9,300 | 457,374 | ||||||||
|
| |||||||||
| 4,562,790 | ||||||||||
|
| |||||||||
Germany – 7.0% | ||||||||||
Adidas AG | (b) | 9,718 | 867,324 | |||||||
GEA Group AG | (b) | 20,022 | 651,030 | |||||||
Gerresheimer AG | (b) | 14,393 | 764,771 | |||||||
HeidelbergCement AG | (b) | 8,249 | 504,771 | |||||||
Hugo Boss AG | (b) | 4,068 | 432,328 | |||||||
SAF-Holland SA | (a)(b) | 58,032 | 405,534 | |||||||
Wirecard AG | (b) | 35,587 | 878,552 | |||||||
|
| |||||||||
| 4,504,310 | ||||||||||
|
| |||||||||
Singapore – 5.1% | ||||||||||
City Developments Ltd. | (b) | 76,000 | 812,818 | |||||||
Ezion Holdings Ltd. | (b) | 569,000 | 804,184 | |||||||
Keppel Corp. Ltd. | (b) | 88,900 | 811,796 | |||||||
SembCorp Marine Ltd. | (b) | 218,000 | 832,803 | |||||||
|
| |||||||||
| 3,261,601 | ||||||||||
|
| |||||||||
| Common Stocks (Continued) | Shares | Value | ||||||||
Mexico – 4.1% | ||||||||||
Cemex SAB de CV – ADR | (a) | 103,100 | $ | 1,017,597 | ||||||
Grupo Aeroportuario del Sureste SAB de CV – ADR | 4,400 | 501,600 | ||||||||
Mexichem SAB de CV | 200,268 | 1,112,557 | ||||||||
|
| |||||||||
| 2,631,754 | ||||||||||
|
| |||||||||
Sweden – 3.7% | ||||||||||
Assa Abloy AB | (b) | 28,000 | 1,053,995 | |||||||
Getinge AB | (b) | 38,483 | 1,308,146 | |||||||
|
| |||||||||
| 2,362,141 | ||||||||||
|
| |||||||||
United States – 3.0% | ||||||||||
Catamaran Corp. | (a) | 13,800 | 650,118 | |||||||
Invesco Ltd. | 48,533 | 1,266,226 | ||||||||
|
| |||||||||
| 1,916,344 | ||||||||||
|
| |||||||||
China – 2.5% | ||||||||||
AAC Technologies Holdings, Inc. | (b) | 67,696 | 239,152 | |||||||
China BlueChemical Ltd. | (b) | 830,000 | 566,192 | |||||||
China National Building Material Co. Ltd. | (b) | 318,000 | 477,474 | |||||||
Shenguan Holdings Group Ltd. | (b) | 638,000 | 348,240 | |||||||
|
| |||||||||
| 1,631,058 | ||||||||||
|
| |||||||||
Netherlands – 2.4% | ||||||||||
ASM International NV | (b) | 9,725 | 351,631 | |||||||
Koninklijke DSM NV | (b) | 19,823 | 1,208,126 | |||||||
|
| |||||||||
| 1,559,757 | ||||||||||
|
| |||||||||
Norway – 2.4% | ||||||||||
Fred Olsen Energy ASA | (b) | 10,836 | 475,754 | |||||||
Petroleum Geo-Services ASA | (b) | 61,895 | 1,078,048 | |||||||
|
| |||||||||
| 1,553,802 | ||||||||||
|
| |||||||||
Italy – 2.3% | ||||||||||
Azimut Holding SpA | (b) | 57,066 | 821,221 | |||||||
Yoox SpA | (a)(b) | 43,200 | 684,234 | |||||||
|
| |||||||||
| 1,505,455 | ||||||||||
|
| |||||||||
Bermuda – 2.1% | ||||||||||
Signet Jewelers Ltd. | 24,700 | 1,318,980 | ||||||||
|
| |||||||||
Austria – 2.0% | ||||||||||
Andritz AG | (b) | 20,395 | 1,310,558 | |||||||
|
| |||||||||
Switzerland – 1.9% | ||||||||||
Adecco SA | (b) | 23,224 | 1,229,902 | |||||||
|
| |||||||||
Hong Kong – 1.9% | ||||||||||
Brilliance China Automotive Holdings Ltd. | (a)(b) | 510,000 | 642,925 | |||||||
China Everbright International Ltd. | (b) | 1,143,000 | 586,368 | |||||||
|
| |||||||||
| 1,229,293 | ||||||||||
|
| |||||||||
Thailand – 1.8% | ||||||||||
Amata Corp. PCL | (b) | 835,100 | 445,340 | |||||||
Bangkok Dusit Medical Services PCL | (b) | 191,600 | 712,588 | |||||||
|
| |||||||||
| 1,157,928 | ||||||||||
|
| |||||||||
Ireland – 1.5% | ||||||||||
Ingersoll-Rand PLC | 20,800 | 997,568 | ||||||||
|
| |||||||||
South Korea – 1.5% | ||||||||||
Hotel Shilla Co. Ltd. | (b) | 23,950 | 992,701 | |||||||
|
| |||||||||
Brazil – 1.2% | ||||||||||
Cia Brasileira de Distribuicao Grupo Pao de Acucar – ADR | 17,399 | 772,342 | ||||||||
|
| |||||||||
Panama – 1.2% | ||||||||||
Copa Holdings SA | 7,700 | 765,765 | ||||||||
|
| |||||||||
Israel – 1.0% | ||||||||||
NICE Systems Ltd. – ADR | (a) | 19,600 | 656,208 | |||||||
|
| |||||||||
Luxembourg – 0.5% | ||||||||||
Eurofins Scientific | (b) | 2,087 | 339,484 | |||||||
|
| |||||||||
| 36 | (continued) |
| Ohio National Fund, Inc. | International Small-Mid Company Portfolio (Continued) |
Schedule of Investments | December 31, 2012 |
| Common Stocks (Continued) | Shares | Value | ||||||||
Indonesia – 0.5% | ||||||||||
Mitra Adiperkasa Tbk PT | (b) | 489,639 | $ | 338,408 | ||||||
|
| |||||||||
Cayman Islands – 0.5% | ||||||||||
Fabrinet | (a) | 23,000 | 302,220 | |||||||
|
| |||||||||
Total Common Stocks (Cost $46,484,937) | $ | 61,203,894 | ||||||||
|
| |||||||||
| Money Market Funds – 5.4% | Shares | Value | ||||||||
State Street Institutional Liquid Reserves Fund Institutional Class 2 | 3,186,361 | $ | 3,186,361 | |||||||
State Street Institutional U.S. Government Money Market Fund Institutional Class | 292,530 | 292,530 | ||||||||
|
| |||||||||
Total Money Market Funds (Cost $3,478,891) | $ | 3,478,891 | ||||||||
|
| |||||||||
Total Investments – 100.3% (Cost $49,963,828) | (d) | $ | 64,682,785 | |||||||
Liabilities in Excess of Other Assets – (0.3)% | (200,194) | |||||||||
|
| |||||||||
Net Assets – 100.0% | $ | 64,482,591 | ||||||||
|
| |||||||||
Percentages are stated as a percent of net assets.
Abbreviations:
ADR: American Depositary Receipts
Footnotes:
| (a) | Non-Income producing security. |
| (b) | Security traded on a foreign exchange has been valued at an estimate of fair value that is different than the local market close price. These fair value estimates are determined by an independent fair valuation service that has been approved by the Board. These securities represent $46,204,976, or 71.7% of the Portfolio’s net assets. |
| (c) | As discussed in Note 2 of the Notes to Financial Statements, not all investments that are traded on a foreign exchange are valued at an estimate that is different from the local close price. In some instances, the independent fair valuation service uses a stock’s local close price because the service’s measure of predictability related to their valuation model of a stock is below a chosen threshold. These securities represent $296,368, or 0.5% of the Portfolio’s net assets. |
Other Portfolio securities are not subjected to fair valuation procedures because they are traded on domestic or foreign exchanges that have close times that are consistent with the U.S. market close, normally 4:00 pm Eastern Time.
| (d) | Represents cost for financial reporting purposes, which may differ from cost basis for federal income tax purposes. See also Note 7 of the Notes to Financial Statements. |
Sector Classifications (Common stocks): (Percent of net assets)
Consumer Discretionary | 26.9% | |||
Industrials | 22.9% | |||
Materials | 12.2% | |||
Energy | 9.9% | |||
Financials | 7.5% | |||
Health Care | 7.2% | |||
Information Technology | 5.4% | |||
Consumer Staples | 2.9% | |||
|
| |||
| 94.9% | ||||
|
|
The accompanying notes are an integral part of these financial statements.
| 37 |
| Ohio National Fund, Inc. | Aggressive Growth Portfolio |
Objective/Strategy
The Aggressive Growth Portfolio seeks long-term capital growth by investing primarily in domestic and foreign equity securities selected for growth potential.
Performance as of December 31, 2012
Average Annual Total Returns: | ||||
One year | 22.87% | |||
Five years | 0.56% | |||
Ten years | 8.62% |
Past performance does not guarantee future results. The performance data quoted represents past performance and current returns may be lower or higher. Total return figures include change in share price and reinvestment of dividends and capital gains. The investment return and principal value will fluctuate so that an investor’s shares, when redeemed, may be worth more or less than the original cost. To obtain performance information up to the most recent month end, call toll-free 1-877-781-6392.
The Portfolio is not open to direct retail investment. Beneficial interest in shares is obtained solely by purchase of variable life insurance policies and variable annuity contracts. Actual performance results for variable annuity and variable universal life contracts will be lower due to contract charges. Consult your contract for applicable charges.
Comments
For the year ended December 31, 2012, the Aggressive Growth Portfolio returned 22.87% versus 16.00% for the current benchmark, the S&P 500 Index.
We believe the Portfolio’s performance this year validates the emphasis we have put on identifying long-duration growth companies. We focus on identifying companies with long-duration growth characteristics such as wide competitive moats, a proven ability to gain market share, or the potential to expand into new markets with enduring and innovative products. In 2011, as correlations rose and the market traded around macro-economic events, the strong fundamentals and underlying growth drivers of these companies went largely unrecognized, in our view. In 2012, we believe investors began to recognize the underlying fundamentals of individual businesses once again. We were pleased to see many of the companies we invest in get rewarded by the market for executing on the individual business drivers we think set them apart from their competitors. We have said previously that the companies we invest in have durable growth characteristics, which should help them perform in any market environment. We’ve seen that happen this year, with the Portfolio out-performing in the third quarter, when markets were stronger, and again in the fourth quarter, when macro-economic fears like the looming fiscal cliff weighed on general market sentiment.
Stock selection in Information Technology was one of the biggest drivers of Portfolio out-performance. In Information Technology, we are seeing a proliferation of data usage through mobile devices at work and at home, with broad implications for content owners, internet companies, and device manufacturers. We believe this backdrop provides a multi-year growth opportunity for wide moat companies such as Apple, Inc., eBay, Inc., and Crown Castle International Corp., our three top performing stocks for the Portfolio this year. We also see the value of data increasing, creating opportunities for technologies that help customers store, access, and analyze data. An example of this is EMC Corp., a data storage and organization business that we believe is well positioned to benefit from growth in availability and value of data.(1)
Stock selection in the Consumer Discretionary sector was also a strong driver of relative out-performance. We think meeting the needs of the newly wealthy in emerging markets appears to be a multi-year growth opportunity for companies with durable competitive moats. We believe companies with strong brands and growth prospects in their core markets should be able to capture growth from emerging markets as consumers in these markets are willing to pay a premium for premium brands that they view as guarantees of quality or outward evidence of their success. We’ve identified and invested in luxury goods, lifestyle, and fashion brands including Cie Financiere Richemont SA and Prada SpA, that we believe are capable of delivering rapid earnings growth in emerging economies while continuing to deliver strong earnings in their more mature markets.(1)
Contributors to the Portfolio’s performance were eBay, Inc., Crown Castle International Corp., Apple, Inc., News Corp., and Cie Financiere Richemont SA. eBay, Inc. has been seeing a reacceleration in its core marketplace business and continued growth in PayPal online and offline globally. We like the value proposition eBay, Inc.’s e-commerce platform offers retailers and consumers, and also believe there is a growing opportunity set for the PayPal franchise. Crown Castle International Corp. owns and operates cellular towers that are used by mobile carriers. We like Crown Castle International Corp.’s recurring revenue stream it receives from mobile carriers who rent tower space. We believe the company is positioned for future growth as mobile carriers are likely to increase capital expenditures to keep up with the increase in mobile data use. We believe Apple, Inc. has developed a strong ecosystem with multiple devices bringing consumers and businesses into the Apple, Inc. family. Once introduced to the Apple, Inc. brand, customers tend to increase spending on its products, and they become more loyal and profitable to the company. We feel the fundamental growth rates for News Corp.’s non-newspaper businesses continue to be strong and are well positioned to gain market share. We also like News Corp.’s role as a provider of content, which we think will be highly valued going forward. We believe Cie Financiere Richemont SA’s strong Cartier brand will give it competitive advantages in the high-growth Chinese market, and the company will benefit from a global trend of consumers migrating to trusted names.(1)
Detractors from the Portfolio’s performance included Turquoise Hill Resources Ltd., Zynga, Inc., Facebook, Inc., Ford Motor Co., and C.H. Robinson Worldwide, Inc. Our largest detractor was Turquoise Hill Resources Ltd., formerly known as Ivanhoe Mines Ltd. The stock was down this year, reflecting investor concern about how a rights offering would affect future earnings per share. Over the long term, we still feel positive about the potential of the company’s Mongolian mine, which represents one of the largest, high grade copper deposits in the world. We believe the mine’s value will eventually accrue to shareholders. Another large detractor was Zynga, Inc. The company faces significant headwinds now that Facebook has stopped promoting the games its users are playing. We sold the position in the third quarter to pursue companies which we feel have better long-term growth prospects. Although the company is the leading social media network, Facebook, Inc. has been challenged in monetizing this asset. We sold the position to pursue other companies which we believe have better risk/reward profiles. We believe cost-cutting measures and investment in new products has positioned Ford Motor Co. to generate better cash flows and capture market share in the U.S. However, the timeframe to get its business in Europe fixed will take longer than we initially thought. We also sold Ford Motor Co. during the year. C.H. Robinson Worldwide, Inc. was impacted by a shortage of trucking capacity earlier in the year,
| 38 | (continued) |
| Ohio National Fund, Inc. | Aggressive Growth Portfolio (Continued) |
which reduced profitability as truckers demanded better pricing. We like C.H. Robinson’s business model, however, and we think the long-term opportunity and value of the business remains intact.(1)
We have been encouraged to see the market respond more to the underlying fundamentals of companies this year. We think this will be the case going into 2013. Much attention has been paid to today’s macro-economic risks and uncertainties. We believe these are “known unknowns” that are already priced into the market, so we expect business fundamentals to be the biggest driver of stock performance in the coming months. In that environment, we believe the type of wide moat, long-duration growth companies we seek to identify should be recognized by the market for the strength of their businesses and the elements that set them apart from their competitors.
| (1) | The Portfolio’s composition is subject to change. Holdings and weightings are as of December 31, 2012. |
Change in Value of $10,000 Investment
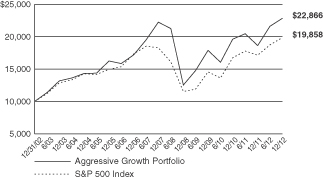
Hypothetical illustration based on past performance. Future performance will vary. The Portfolio’s returns reflect reinvested dividends. The Portfolio’s holdings may differ significantly from the securities in the index. The index is unmanaged and therefore does not reflect the cost of portfolio management and accounting.
The S&P 500 Index is a capitalization-weighted index designed to measure performance of the broad domestic economy through changes in the aggregate market value of 500 stocks representing all major industries. The index presented herein includes the effects of reinvested dividends.
Portfolio Composition as of December 31, 2012 (1)
| % of Net Assets | ||||
Common Stocks (3) | 92.7 | |||
Commercial Paper | 0.3 | |||
Money Market Funds | 7.0 | |||
|
| |||
| 100.0 | ||||
|
|
Top 10 Portfolio Holdings as of December 31, 2012 (1) (2)
| % of Net Assets | ||||
1. Apple, Inc. | 8.3 | |||
2. eBay, Inc. | 6.7 | |||
3. Crown Castle International Corp. | 5.5 | |||
4. Express Scripts Holding Co. | 4.7 | |||
5. News Corp. Class A | 4.4 | |||
6. FANUC Corp. | 4.2 | |||
7. Celgene Corp. | 4.1 | |||
8. Limited Brands, Inc. | 3.4 | |||
9. EMC Corp. | 3.2 | |||
10. Medivation, Inc. | 3.1 |
| (1) | Composition of Portfolio subject to change. |
| (2) | Short-term investments have been excluded from the list of Top 10 Portfolio Holdings. |
| (3) | Sectors: |
| % of Net Assets | ||||
Information Technology | 31.0 | |||
Health Care | 15.6 | |||
Consumer Discretionary | 14.2 | |||
Industrials | 10.7 | |||
Consumer Staples | 8.0 | |||
Financials | 6.1 | |||
Telecommunication Services | 6.0 | |||
Materials | 1.1 | |||
|
| |||
| 92.7 | ||||
|
|
| 39 |
| Ohio National Fund, Inc. | Aggressive Growth Portfolio |
Schedule of Investments | December 31, 2012 |
| Common Stocks – 92.7% | Shares | Value | ||||||||
CONSUMER DISCRETIONARY – 14.2% | ||||||||||
MGM Resorts International (Hotels, Restaurants & Leisure) | (a) | 53,914 | $ | 627,559 | ||||||
Amazon.com, Inc. (Internet & Catalog Retail) | (a) | 1,144 | 287,304 | |||||||
News Corp. Class A (Media) | 56,782 | 1,450,212 | ||||||||
Limited Brands, Inc. (Specialty Retail) | 23,873 | 1,123,463 | ||||||||
Cie Financiere Richemont SA (Textiles, Apparel & Luxury Goods) | (b) | 10,856 | 852,148 | |||||||
Prada SpA (Textiles, Apparel & Luxury Goods) | (b) | 36,900 | 358,549 | |||||||
|
| |||||||||
| 4,699,235 | ||||||||||
|
| |||||||||
CONSUMER STAPLES – 8.0% | ||||||||||
Davide Campari-Milano SpA (Beverages) | (b) | 128,976 | 991,167 | |||||||
Monster Beverage Corp. (Beverages) | (a) | 17,034 | 900,758 | |||||||
Pernod-Ricard SA (Beverages) | (b) | 2,898 | 336,231 | |||||||
Mead Johnson Nutrition Co. (Food Products) | 6,583 | 433,754 | ||||||||
|
| |||||||||
| 2,661,910 | ||||||||||
|
| |||||||||
FINANCIALS – 6.1% | ||||||||||
AIA Group Ltd. (Insurance) | (b) | 118,000 | 468,028 | |||||||
Prudential PLC (Insurance) | (b) | 41,650 | 594,238 | |||||||
Walker & Dunlop, Inc. (Thrifts & Mortgage Finance) | (a) | 57,016 | 949,887 | |||||||
|
| |||||||||
| 2,012,153 | ||||||||||
|
| |||||||||
HEALTH CARE – 15.6% | ||||||||||
Celgene Corp. (Biotechnology) | (a) | 17,210 | 1,354,771 | |||||||
Gilead Sciences, Inc. (Biotechnology) | (a) | 5,002 | 367,397 | |||||||
Medivation, Inc. (Biotechnology) | (a) | 20,347 | 1,040,953 | |||||||
Vertex Pharmaceuticals, Inc. (Biotechnology) | (a) | 12,716 | 533,309 | |||||||
Intuitive Surgical, Inc. (Health Care Equip. & Supplies) | (a) | 653 | 320,212 | |||||||
Express Scripts Holding Co. (Health Care Providers & Svs.) | (a) | 29,028 | 1,567,512 | |||||||
|
| |||||||||
| 5,184,154 | ||||||||||
|
| |||||||||
INDUSTRIALS – 10.7% | ||||||||||
Precision Castparts Corp. (Aerospace & Defense) | 1,219 | 230,903 | ||||||||
C.H. Robinson Worldwide, Inc. (Air Freight & Logistics) | 8,360 | 528,519 | ||||||||
United Parcel Service, Inc. Class B (Air Freight & Logistics) | 11,282 | 831,822 | ||||||||
Iron Mountain, Inc. (Commercial Svs. & Supplies) | 18,321 | 568,867 | ||||||||
FANUC Corp. (Machinery) | (b) | 7,500 | 1,395,372 | |||||||
|
| |||||||||
| 3,555,483 | ||||||||||
|
| |||||||||
INFORMATION TECHNOLOGY – 31.0% | ||||||||||
Apple, Inc. (Computers & Peripherals) | 5,179 | 2,760,562 | ||||||||
EMC Corp. (Computers & Peripherals) | (a) | 42,510 | 1,075,503 | |||||||
Amphenol Corp. Class A (Electronic Equip., Instr. & Comp.) | 4,853 | 313,989 | ||||||||
| Common Stocks (Continued) | Shares | Value | ||||||||
INFORMATION TECHNOLOGY (continued) | ||||||||||
TE Connectivity Ltd. (Electronic Equip., Instr. & Comp.) | 16,417 | $ | 609,399 | |||||||
Trimble Navigation Ltd. (Electronic Equip., Instr. & Comp.) | (a) | 15,784 | 943,567 | |||||||
CoStar Group, Inc. (Internet Software & Svs.) | (a) | 5,656 | 505,477 | |||||||
eBay, Inc. (Internet Software & Svs.) | (a) | 43,230 | 2,205,595 | |||||||
Yelp, Inc. (Internet Software & Svs.) | (a) | 2,807 | 52,912 | |||||||
Mastercard, Inc. Class A (IT Svs.) | 750 | 368,460 | ||||||||
ON Semiconductor Corp. (Semiconductors & Equip.) | (a) | 52,338 | 368,983 | |||||||
Microsoft Corp. (Software) | 34,463 | 921,196 | ||||||||
Workday, Inc. Class A (Software) | (a) | 2,815 | 153,417 | |||||||
|
| |||||||||
| 10,279,060 | ||||||||||
|
| |||||||||
MATERIALS – 1.1% | ||||||||||
Turquoise Hill Resources Ltd. (Metals & Mining) | (a) | 47,207 | 359,245 | |||||||
|
| |||||||||
TELECOMMUNICATION SERVICES – 6.0% | ||||||||||
Ziggo NV (Diversified Telecom. Svs.) | (c) | 4,844 | 158,312 | |||||||
Crown Castle International Corp. (Wireless Telecom. Svs.) | (a) | 25,256 | 1,822,473 | |||||||
|
| |||||||||
| 1,980,785 | ||||||||||
|
| |||||||||
Total Common Stocks (Cost $23,026,001) | $ | 30,732,025 | ||||||||
|
| |||||||||
| VVPR Strips – 0.0% | (d) | Quantity | Value | |||||||
CONSUMER STAPLES – 0.0% | ||||||||||
Anheuser-Busch InBev NV (Beverages) | (a)(c) | 7,148 | $ | 9 | ||||||
|
| |||||||||
Total VVPR Strips (Cost $0) | $ | 9 | ||||||||
|
| |||||||||
| Commercial Paper – 0.3% | Face Amount | Amortized Cost | ||||||||
BNP Paribas SA 0.000%, 01/02/2013 | $ | 100,000 | $ | 100,000 | ||||||
|
| |||||||||
Total Commercial Paper (Cost $100,000) | $ | 100,000 | ||||||||
|
| |||||||||
| Money Market Funds – 7.1% | Shares | Value | ||||||||
Fidelity Institutional Money Market Funds Money Market Portfolio – Class I | 1,625,000 | $ | 1,625,000 | |||||||
Fidelity Institutional Money Market Funds Government Portfolio – Class I | 111,000 | 111,000 | ||||||||
| Invesco STIC Prime Portfolio Institutional Class | 614,000 | 614,000 | ||||||||
|
| |||||||||
Total Money Market Funds (Cost $2,350,000) | $ | 2,350,000 | ||||||||
|
| |||||||||
Total Investments – 100.1% (Cost $25,476,001) | (e) | $ | 33,182,034 | |||||||
Liabilities in Excess of Other Assets – (0.1)% | (37,353) | |||||||||
|
| |||||||||
Net Assets – 100.0% | $ | 33,144,681 | ||||||||
|
| |||||||||
Percentages are stated as a percent of net assets.
Footnotes:
| (a) | Non-income producing security. |
| (b) | Security traded on a foreign exchange has been valued at an estimate of fair value that is different than the local market close price. These fair value estimates are determined by an independent fair valuation service that has been approved by the Board. These securities represent $4,995,733, or 15.1% of the Portfolio’s net assets. |
| (c) | As discussed in Note 2 of the Notes to Financial Statements, not all investments that are traded on a foreign exchange are valued at an estimate that is different from the local close price. In some instances, the independent fair valuation service uses a stock’s local close price because the service’s measure of predictability related to the valuation model of a stock is below a chosen threshold. These securities represent $158,321, or 0.5% of the Portfolio’s net assets. |
Other Portfolio securities are not subjected to fair value procedures because they are traded on domestic or foreign exchanges that have close times that are consistent with the U.S. market close, normally 4:00 pm Eastern Time.
| (d) | A VVPR Strip is a coupon attached to specific ordinary common shares that offers tax advantages. The coupon entitles a holder to reduced withholding tax rates on the dividends generated from the related common shares. |
| (e) | Represents cost for financial reporting purposes, which may differ from cost basis for federal income tax purposes. See also Note 7 of the Notes to Financial Statements. |
The accompanying notes are an integral part of these financial statements.
| 40 |
| Ohio National Fund, Inc. | Small Cap Growth Portfolio |
Objective/Strategy
The Small Cap Growth Portfolio seeks long-term capital appreciation by investing at least 80% of its net assets in stocks of small companies.
Performance as of December 31, 2012
Average Annual Total Returns: | ||||
One year | 18.02% | |||
Five years | 4.45% | |||
Ten years | 11.93% |
Past performance does not guarantee future results. The performance data quoted represents past performance and current returns may be lower or higher. Total return figures include change in share price and reinvestment of dividends and capital gains. The investment return and principal value will fluctuate so that an investor’s shares, when redeemed, may be worth more or less than the original cost. To obtain performance information up to the most recent month end, call toll-free 1-877-781-6392.
The Portfolio is not open to direct retail investment. Beneficial interest in shares is obtained solely by purchase of variable life insurance policies and variable annuity contracts. Actual performance results for variable annuity and variable universal life contracts will be lower due to contract charges. Consult your contract for applicable charges.
Comments
For the year ended December 31, 2012, the Small Cap Growth Portfolio returned 18.02% versus 14.59% for the current benchmark, the Russell 2000 Growth Index.
Our investment process focuses on identifying companies with higher-quality business models and predictable, growing revenue streams. These companies operate in large or growing addressable markets providing the opportunity for their differentiated business models and/or services to gain considerable market share. The key criteria of sustainable competitive advantage means that the companies we own can continue to outgrow their peers even once their opportunity becomes more appreciated. In threatening or uncertain economic environments, the emphasis on stability and predictability should help the Portfolio out-perform, and we saw that play out in the second and fourth quarters of this year. In our view, the power of compounding is a powerful force in investing. Out-performing in tougher economic environments, as well as adding positive returns when times are good, is the recipe for long term durable growth.
The bulk of the relative out-performance was driven by stock selection this year. Stock selection in the Health Care and Energy sectors was particularly strong. Within the Health Care sector, we have gravitated to medical device companies with proprietary technologies and growing addressable markets. The Portfolio’s investments in athenahealth, Inc. and Gen-Probe, Inc., two of the Portfolio’s top contributors to performance this year, demonstrate these characteristics. athenahealth, Inc. helps physicians groups become more efficient by providing technology solutions around practice management, electronic recordkeeping, and care coordination services. As more emphasis has been placed on wringing costs from the health care system, athenahealth, Inc.’s value proposition continues to be recognized by the market. The stock rose significantly this year after the company announced a new partnership with Health Management Association that will expand athenahealth, Inc.’s services to Health Management Association’s physician network. Gen-Probe, Inc. develops, manufactures, and markets products for clinical diagnostics and blood screening. We believe Gen-Probe, Inc.’s core genetic testing business exhibits
solid growth, and its blood testing business has been a steady cash generator. The unique nature of this high quality business was highlighted as the company was acquired during the year.(1)
Stock selection in the Energy sector was also a large contributor to relative performance during the year. Within this sector, we typically avoid exploration and production companies. We think those businesses are too closely tied to the price of the commodity, which is a variable we can’t forecast. Instead, we invest in services companies that can benefit from the fact that many energy and production companies are undisciplined in the area of capital allocation. As long as they’re drilling, services companies benefit. We also like midstream Master Limited Partnerships (MLPs) for their predictable revenue streams, lower sensitivity to the commodity price, and discipline around capital allocation.(1)
Stock selection detracted from relative performance in the Consumer Discretionary sector, due largely to two companies, CafePress, Inc. and Skullcandy, Inc. CafePress, Inc. sells personalized products online. The company specializes in manufacturing small volumes of customized products at a large scale, which is very difficult to do. The company has struggled since its initial public offering earlier in the year due to the macro-economic slowdown in Europe and minimal spending on political products around the election. We sold the position in favor of better opportunities with more control over their own destiny.(1)
Top contributors to performance were Stratsys, Pharmacyclics, Inc., Catamaran Corp., Gen-Probe, Inc., and athenahealth, Inc. Stratsys makes and sells three-dimensional printing services, which companies use in computer assisted design. We believe we are in the early innings of the use of 3D printers, which should gain wider adoption since they speed up the design process from concept to physical product. We also like the recurring revenue that Stratsys receives from the proprietary consumable materials that are used by its printers. Pharmacyclics, a biopharmaceutical company, develops small-molecule drugs for the treatment of cancer and immune mediated diseases. During the quarter, the company released positive data on its drug for treating chronic lymphocytic leukemia. We believe the drug has the potential to serve a large global market. Catamaran Corp., formerly known as SXC Health Solutions prior to its acquisition of Catalyst Health Solutions, is a pharmacy benefit manager. We like the critical role pharmacy benefit managers play in reducing health care expenditures and think the new company will benefit from increased scale after its acquisition. However, we sold the position because the combined entity is out of our market cap range.(1)
Top detractors from performance were DTS, Inc., Ceva, Inc., Vocus, Inc., Higher One Holdings, Inc., and CafePress, Inc. The largest detractor was DTS, Inc. The company licenses technology to consumer electronic devices and products, such as Blu-ray players. The company had a negative surprise this quarter after having to absorb more costs from an acquisition than expected. The company has also been hurt by an overall downturn in consumer electronics demand. We still like the company for the recurring revenue it receives from royalty payments for products that use its technology. Another large detractor was Ceva, Inc., a company that makes digital signal processing chips. The company had benefited from the exit of Texas Instruments from Ceva, Inc.’s core market as well as its focus on wins at specific customers. While we like the business model, we sold the position earlier in the year because we felt customer concentration risk had risen as a result of this new focus. Vocus, Inc. provides software for public relations management. The stock declined early in the year after the company announced it would purchase an email marketing company. We were concerned
| 41 | (continued) |
| Ohio National Fund, Inc. | Small Cap Growth Portfolio (Continued) |
about the company’s capital allocation decision making and sold the position. Higher One Holdings, Inc. processes student financial aid refunds for colleges and universities. The company charges schools very little for these services and, instead, makes its money by offering to place refunds onto a debit card. Regulatory risk increased through the year for this business model, causing us to exit the position.(1)
The consumer is still deleveraging and foregoing consumption, and businesses are holding off on spending as they wait for a more permanent fiscal solution than the narrow agreement reached as we brought in the New Year. As long as businesses and consumers hold back, we expect tepid economic growth.
In a slow growth environment, we think many of our companies should be favored for the higher quality nature of their businesses. These companies have stable, resilient business models and revenue streams, and are early enough in their growth cycle that they are still taking share from competition and/or tapping into previously unaddressed markets. We believe these companies should thrive when the economy is strong, but continue to experience solid growth even when economic growth slows.
| (1) | The Portfolio’s composition is subject to change. Holdings and weightings are as of December 31, 2012. |
Change in Value of $10,000 Investment
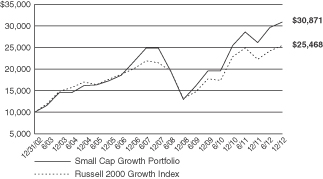
Hypothetical illustration based on past performance. Future performance will vary. The Portfolio’s returns reflect reinvested dividends. The Portfolio’s holdings may differ significantly from the securities in the index. The index is unmanaged and therefore does not reflect the cost of portfolio management and accounting.
The Russell 2000 Growth Index measures the performance of the small-cap growth segment of the U.S. equity universe. It includes the Russell 2000 Index companies with higher price-to-value ratios and higher forcasted growth values. The Russell 2000 Index includes the 2000 firms from the Russell 3000 Index with the smallest market capitalizations. The Russell 3000 Index represents 98% of the investable U.S. equity markets. The index presented herein includes the effects of reinvested dividends.
Portfolio Composition as of December 31, 2012 (1)
| % of Net Assets | ||||
Common Stocks (3) | 96.0 | |||
Commercial Paper | 0.3 | |||
Money Market Funds | 3.7 | |||
|
| |||
| 100.0 | ||||
|
|
Top 10 Portfolio Holdings as of December 31, 2012 (1) (2)
| % of Net Assets | ||||
1. Dresser-Rand Group, Inc. | 2.5 | |||
2. HEICO Corp. Class A | 2.2 | |||
3. SS&C Technologies Holdings, Inc. | 2.2 | |||
4. Wolverine World Wide, Inc. | 2.2 | |||
5. Euronet Worldwide, Inc. | 2.1 | |||
6. National CineMedia, Inc. | 2.1 | |||
7. Hub Group, Inc. Class A | 2.0 | |||
8. Polypore International, Inc. | 2.0 | |||
9. Quidel Corp. | 1.9 | |||
10. RealPage, Inc. | 1.9 |
| (1) | Composition of Portfolio subject to change. |
| (2) | Short-term investments have been excluded from the list of Top 10 Portfolio Holdings. |
| (3) | Sectors: |
| % of Net Assets | ||||
Information Technology | 25.7 | |||
Industrials | 21.7 | |||
Consumer Discretionary | 16.4 | |||
Health Care | 15.5 | |||
| Energy | 8.5 | |||
Financials | 5.8 | |||
Materials | 1.6 | |||
Consumer Staples | 0.8 | |||
|
| |||
| 96.0 | ||||
|
|
| 42 |
| Ohio National Fund, Inc. | Small Cap Growth Portfolio |
Schedule of Investments | December 31, 2012 |
| Common Stocks – 96.0% | Shares | Value | ||||||||
CONSUMER DISCRETIONARY – 16.4% | ||||||||||
K12, Inc. (Diversified Consumer Svs.) | (a) | 20,498 | $ | 418,979 | ||||||
SodaStream International Ltd. (Household Durables) | (a) | 12,934 | 580,607 | |||||||
National CineMedia, Inc. (Media) | 51,587 | 728,924 | ||||||||
Gordmans Stores, Inc. (Multiline Retail) | (a) | 22,138 | 332,513 | |||||||
Hibbett Sports, Inc. (Specialty Retail) | (a) | 8,266 | 435,618 | |||||||
Monro Muffler Brake, Inc. (Specialty Retail) | 13,218 | 462,233 | ||||||||
Carter’s, Inc. (Textiles, Apparel & Luxury Goods) | (a) | 10,516 | 585,215 | |||||||
Deckers Outdoor Corp. (Textiles, Apparel & Luxury Goods) | (a) | 12,877 | 518,557 | |||||||
Maidenform Brands, Inc. (Textiles, Apparel & Luxury Goods) | (a) | 23,384 | 455,754 | |||||||
Quiksilver, Inc. (Textiles, Apparel & Luxury Goods) | (a) | 107,689 | 457,678 | |||||||
Wolverine World Wide, Inc. (Textiles, Apparel & Luxury Goods) | 18,424 | 755,016 | ||||||||
|
| |||||||||
| 5,731,094 | ||||||||||
|
| |||||||||
CONSUMER STAPLES – 0.8% | ||||||||||
Casey’s General Stores, Inc. (Food & Staples Retailing) | 5,447 | 289,236 | ||||||||
|
| |||||||||
ENERGY – 8.5% | ||||||||||
Dresser-Rand Group, Inc. (Energy Equip. & Svs.) | (a) | 15,301 | 858,998 | |||||||
Dril-Quip, Inc. (Energy Equip. & Svs.) | (a) | 6,049 | 441,879 | |||||||
Copano Energy LLC (Oil, Gas & Consumable Fuels) | 14,834 | 469,199 | ||||||||
DCP Midstream Partners LP (Oil, Gas & Consumable Fuels) | 9,875 | 412,281 | ||||||||
Targa Resources Corp. (Oil, Gas & Consumable Fuels) | 6,890 | 364,068 | ||||||||
World Fuel Services Corp. (Oil, Gas & Consumable Fuels) | 9,971 | 410,506 | ||||||||
|
| |||||||||
| 2,956,931 | ||||||||||
|
| |||||||||
FINANCIALS – 5.8% | ||||||||||
Financial Engines, Inc. (Capital Markets) | (a) | 15,029 | 417,055 | |||||||
WisdomTree Investments, Inc. (Capital Markets) | (a) | 58,067 | 355,370 | |||||||
Credit Acceptance Corp. (Consumer Finance) | (a) | 1,959 | 199,191 | |||||||
MarketAxess Holdings, Inc. (Diversified Financial Svs.) | 15,230 | 537,619 | ||||||||
MSCI, Inc. (Diversified Financial Svs.) | (a) | 16,885 | 523,266 | |||||||
|
| |||||||||
| 2,032,501 | ||||||||||
|
| |||||||||
HEALTH CARE – 15.5% | ||||||||||
Achillion Pharmaceuticals, Inc. (Biotechnology) | (a) | 22,432 | 179,905 | |||||||
Ariad Pharmaceuticals, Inc. (Biotechnology) | (a) | 9,686 | 185,777 | |||||||
Immunogen, Inc. (Biotechnology) | (a) | 13,114 | 167,204 | |||||||
Incyte Corp. Ltd. (Biotechnology) | (a) | 12,285 | 204,054 | |||||||
Seattle Genetics, Inc. (Biotechnology) | (a) | 6,986 | 162,075 | |||||||
Synageva BioPharma Corp. (Biotechnology) | (a) | 4,290 | 198,584 | |||||||
Conceptus, Inc. (Health Care Equip. & Supplies) | (a) | 15,073 | 316,684 | |||||||
Endologix, Inc. (Health Care Equip. & Supplies) | (a) | 38,950 | 554,648 | |||||||
Masimo Corp. (Health Care Equip. & Supplies) | 26,499 | 556,744 | ||||||||
Novadaq Technologies, Inc. (Health Care Equip. & Supplies) | (a) | 24,609 | 218,528 | |||||||
Quidel Corp. (Health Care Equip. & Supplies) | (a) | 36,205 | 675,947 | |||||||
Volcano Corp. (Health Care Equip. & Supplies) | (a) | 16,836 | 397,498 | |||||||
ExamWorks Group, Inc. (Health Care Providers & Svs.) | (a) | 35,538 | 497,177 | |||||||
athenahealth, Inc. (Health Care Technology) | (a) | 6,630 | 486,974 | |||||||
Techne Corp. (Life Sciences Tools & Svs.) | 6,695 | 457,536 | ||||||||
Impax Laboratories, Inc. (Pharmaceuticals) | (a) | 7,638 | 156,503 | |||||||
|
| |||||||||
| 5,415,838 | ||||||||||
|
| |||||||||
INDUSTRIALS – 21.7% | ||||||||||
HEICO Corp. Class A (Aerospace & Defense) | 24,547 | 785,013 | ||||||||
Hub Group, Inc. Class A (Air Freight & Logistics) | (a) | 21,275 | 714,840 | |||||||
Heritage-Crystal Clean, Inc. (Commercial Svs. & Supplies) | (a) | 24,153 | 362,537 | |||||||
| Common Stocks (Continued) | Shares | Value | ||||||||
INDUSTRIALS (continued) | ||||||||||
Ritchie Bros. Auctioneers, Inc. (Commercial Svs. & Supplies) | 21,515 | $ | 449,448 | |||||||
Standard Parking Corp. (Commercial Svs. & Supplies) | (a) | 23,559 | 518,062 | |||||||
GrafTech International Ltd. (Electrical Equip.) | (a) | 58,390 | 548,282 | |||||||
Polypore International, Inc. (Electrical Equip.) | (a) | 15,217 | 707,591 | |||||||
Nordson Corp. (Machinery) | 6,867 | 433,445 | ||||||||
Tennant Co. (Machinery) | 792 | 34,808 | ||||||||
Wabtec Corp. (Machinery) | 6,422 | 562,182 | ||||||||
Resources Connection, Inc. (Professional Svs.) | 46,300 | 552,822 | ||||||||
Landstar System, Inc. (Road & Rail) | 10,442 | 547,787 | ||||||||
Old Dominion Freight Line, Inc. (Road & Rail) | (a) | 11,784 | 403,956 | |||||||
Rush Enterprises, Inc. Class B (Trading Companies & Distributors) | (a) | 21,659 | 374,917 | |||||||
WESCO International, Inc. (Trading Companies & Distributors) | (a) | 8,917 | 601,273 | |||||||
|
| |||||||||
| 7,596,963 | ||||||||||
|
| |||||||||
INFORMATION TECHNOLOGY – 25.7% | ||||||||||
Stratasys Ltd. (Computers & Peripherals) | (a) | 4,946 | 396,422 | |||||||
DTS, Inc. (Electronic Equip., Instr. & Comp.) | (a) | 22,452 | 374,948 | |||||||
Measurement Specialties, Inc. (Electronic Equip., Instr. & Comp.) | (a) | 19,607 | 673,697 | |||||||
RealD, Inc. (Electronic Equip., Instr. & Comp.) | (a) | 43,374 | 486,223 | |||||||
Cornerstone OnDemand, Inc. (Internet Software & Svs.) | (a) | 7,908 | 233,523 | |||||||
CoStar Group, Inc. (Internet Software & Svs.) | (a) | 3,834 | 342,645 | |||||||
Envestnet, Inc. (Internet Software & Svs.) | (a) | 32,051 | 447,111 | |||||||
LivePerson, Inc. (Internet Software & Svs.) | (a) | 27,105 | 356,160 | |||||||
VistaPrint NV (Internet Software & Svs.) | (a) | 12,630 | 415,022 | |||||||
Yelp, Inc. (Internet Software & Svs.) | (a) | 8,771 | 165,333 | |||||||
Broadridge Financial Solutions, Inc. (IT Svs.) | 28,944 | 662,239 | ||||||||
Cardtronics, Inc. (IT Svs.) | (a) | 6,557 | 155,663 | |||||||
Euronet Worldwide, Inc. (IT Svs.) | (a) | 31,331 | 739,412 | |||||||
Gartner, Inc. (IT Svs.) | (a) | 7,828 | 360,245 | |||||||
International Rectifier Corp. (Semiconductors & Equip.) | (a) | 28,669 | 508,301 | |||||||
Blackbaud, Inc. (Software) | 29,433 | 671,955 | ||||||||
FleetMatics Group PLC (Software) | (a) | 2,169 | 54,572 | |||||||
Guidewire Software, Inc. (Software) | (a) | 3,439 | 102,207 | |||||||
RealPage, Inc. (Software) | (a) | 31,241 | 673,868 | |||||||
SS&C Technologies Holdings, Inc. (Software) | (a) | 32,667 | 755,261 | |||||||
Tyler Technologies, Inc. (Software) | (a) | 8,272 | 400,696 | |||||||
|
| |||||||||
| 8,975,503 | ||||||||||
|
| |||||||||
MATERIALS – 1.6% | ||||||||||
Intrepid Potash, Inc. (Chemicals) | 26,981 | 574,426 | ||||||||
|
| |||||||||
Total Common Stocks (Cost $31,468,516) | $ | 33,572,492 | ||||||||
|
| |||||||||
| Commercial Paper – 0.3% | Face Amount | Amortized Cost | ||||||||
BNP Paribas SA 0.000%, 01/02/2013 (Commercial Banks) | $ | 100,000 | $ | 100,000 | ||||||
|
| |||||||||
Total Commercial Paper (Cost $100,000) | $ | 100,000 | ||||||||
|
| |||||||||
| Money Market Funds – 3.9% | Shares | Value | ||||||||
Fidelity Institutional Money Market Funds Money Market Portfolio – Class I | 1,371,000 | $ | 1,371,000 | |||||||
|
| |||||||||
Total Money Market Funds (Cost $1,371,000) | $ | 1,371,000 | ||||||||
|
| |||||||||
Total Investments – 100.2% (Cost $32,939,516) | (b) | $ | 35,043,492 | |||||||
Liabilities in Excess of Other Assets – (0.2)% | (59,513) | |||||||||
|
| |||||||||
Net Assets – 100.0% | $ | 34,983,979 | ||||||||
|
| |||||||||
Percentages are stated as a percent of net assets.
Footnotes:
| (a) | Non-income producing security. |
| (b) | Represents cost for financial reporting purposes, which may differ from cost basis for federal income tax purposes. See also Note 7 of the Notes to Financial Statements. |
| 43 |
| Ohio National Fund, Inc. | Mid Cap Opportunity Portfolio |
Objective/Strategy
The Mid Cap Opportunity Portfolio seeks long-term total return by investing at least 80% of its net assets in equity securities of mid-cap companies, primarily those that are strategically positioned for long-term growth.
Performance as of December 31, 2012
Average Annual Total Returns: | ||||
One year | 19.71% | |||
Five years | -1.07% | |||
Ten years | 8.39% |
Past performance does not guarantee future results. The performance data quoted represents past performance and current returns may be lower or higher. Total return figures include change in share price and reinvestment of dividends and capital gains. The investment return and principal value will fluctuate so that an investor’s shares, when redeemed, may be worth more or less than the original cost. To obtain performance information up to the most recent month end, call toll-free 1-877-781-6392.
The Portfolio is not open to direct retail investment. Beneficial interest in shares is obtained solely by purchase of variable life insurance policies and variable annuity contracts. Actual performance results for variable annuity and variable universal life contracts will be lower due to contract charges. Consult your contract for applicable charges.
Comments
For the year ended December 31, 2012, the Mid Cap Opportunity Portfolio returned 19.71% versus 15.81% for the current benchmark, the Russell Midcap Growth Index.
After a strong 2012, we look beyond the headlines to find attractive growth opportunities in 2013. Despite negative equity sentiment in the market, we remain positive on U.S. equities due to solid underlying corporate fundamentals and reasonable valuations. Corporate balance sheets remain strong, which we believe provides companies the flexibility needed to generate shareholder value, even in a slow-growth economic environment. The S&P 500 Index is trading below its 20-year historical average forward price-to-earnings multiple, and we believe its dividend yield is attractive relative to the yield on the 10-year U.S. Treasury bond. However, we recognize that fiscal policy may lead to a drag on economic growth over the short term, and that the Federal Reserve Board’s additional monetary measures may not fully offset the impact. While the U.S. recently averted the “fiscal cliff,” we believe this is only temporary as uncertainty around the political climate will linger until the next deadline.
Throughout this environment, our time-tested investment process and philosophy - buying high-quality growth franchises trading at reasonable valuations - remains unchanged. Our research-intensive, bottom-up, fundamental approach leverages our team’s industry expertise to identify well positioned companies that we believe are mispriced. We construct the Portfolio around businesses that we believe should generate long-term growth for shareholders through their exposure to secular growth trends, rather than short-term events such as political outcomes or macro-economic expectations.
Positive stock selection in the Information Technology and Telecommunication Services sectors contributed to relative performance, while weakness in select Industrials and Health Care holdings detracted from relative returns.(1)
The five top performers were Equinix, Inc., Amylin Pharmaceuticals, Inc., FleetCor Technologies, Inc., Rackspace Hosting, Inc., and
Salesforce.com, Inc. The five bottom performers were Rovi Corp., Deckers Outdoor Corp., Groupon, Inc., DigitalGlobe, Inc., and VeriSign, Inc. The top five contributors were Equinix, Inc., SBA Communications Corp., PVH Corp., Salesforce.com, Inc., and Rackspace Hosting, Inc. The top detractors were Deckers Outdoor Corp., Rovi Corp., NetApp, Inc., Whiting Petroleum Corp., and MICROS Systems, Inc.(1)
Equinix, Inc., a leading data center solutions company, was the top contributor to relative performance. The company’s core business remains strong and pricing is up in the three main areas in which it operates; the U.S., Europe and Asia. In 2012, Equinix, Inc. also acquired data centers in Frankfurt, Hong Kong, Shanghai, and Singapore to further drive growth. During the third quarter, the company announced its plans to convert to a real estate investment trust (REIT), which should provide tax and valuation benefits. The market has begun to recognize that Equinix, Inc. is trading at a discount to other data center operators that are publicly traded REITs, and appreciate the growth and stability of Equinix, Inc.’s revenue stream. We continue to have conviction in the company’s ability to drive revenue growth as it benefits from several secular growth drivers, including cloud computing, growth in internet traffic and enterprise outsourcing, and rising demand for optimized network performance.(1)
SBA Communications Corp. performed well in 2012 as it benefited from the current secular growth trends that are driving the wireless communication industry. Organic leasing revenues have continued to grow, which we believe is sustainable as wireless providers build out their 4G networks to support increasing demand for mobile data usage. Furthermore, management has indicated that it is evaluating the potential to convert to a REIT, which we believe would unlock further shareholder value. In our view, the secular growth trends of the wireless communication industry remain intact, as the industry continues to evolve from primarily voice to data usage, demand on the networks increases, and carriers make additional investments to build out their networks. In our view, SBA Communications Corp. is well positioned to benefit from increased data usage, network upgrades, improved coverage, and inherent industry regulations that govern the construction of new towers and create high barriers to entry.(1)
Deckers Outdoor Corp. was the top detractor from relative performance. The company’s earnings and guidance were disappointing during 2012 as the company continued to battle headwinds from the impact of an unseasonably warm winter in 2011, which pressured the company’s inventory position and profitability. We expect the inventory pressure to subside through the course of 2013. We still believe in the strength of the company’s UGG brand and expect the company to show improved sales and margin expansion in 2013.(1)
During the third quarter, we decided to cut losses and exit out of our position in Rovi Corp., a company that holds patents on interactive program guides (IPGs) for video delivery services and devices. We owned the company largely due to the growth potential in their electronic programming guide (EPG) business. However, after some management execution errors and delays in the market development of this key business, we lost confidence in the company’s ability to capitalize on the opportunity and sold Rovi Corp. in favor of companies with a better risk/reward profile.(1)
| (1) | The Portfolio’s composition is subject to change. Holdings and weightings are as of December 31, 2012. |
| 44 | (continued) |
| Ohio National Fund, Inc. | Mid Cap Opportunity Portfolio (Continued) |
Change in Value of $10,000 Investment
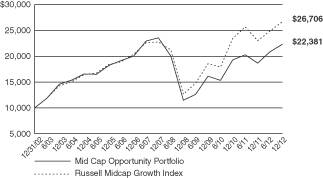
Hypothetical illustration based on past performance. Future performance will vary. The Portfolio’s returns reflect reinvested dividends. The Portfolio’s holdings may differ significantly from the securities in the index. The index is unmanaged and therefore does not reflect the cost of portfolio management and accounting.
The Russell Midcap Growth Index is a subset of the Russell Midcap Index, which measures the performance of the 800 smallest companies in the Russell 1000 Index. The Russell Midcap Growth Index measures the performance of those stocks of the Russell Midcap Index with higher price-to-book ratios and higher relative forecasted growth rates. The index presented herein includes the effects of reinvested dividends.
Portfolio Composition as of December 31, 2012 (1)
| % of Net Assets | ||||
Common Stocks (3) | 99.5 | |||
Money Market Funds | 0.5 | |||
|
| |||
| 100.0 | ||||
|
|
Top 10 Portfolio Holdings as of December 31, 2012 (1) (2)
| % of Net Assets | ||||
1. SBA Communications Corp. Class A | 3.6 | |||
2. PVH Corp. | 2.7 | |||
3. CBRE Group, Inc. | 2.3 | |||
4. Equinix, Inc. | 2.2 | |||
5. Rackspace Hosting, Inc. | 2.1 | |||
6. PetSmart, Inc. | 2.1 | |||
7. Amphenol Corp. Class A | 2.0 | |||
8. Agilent Technologies, Inc. | 2.0 | |||
9. Xilinx, Inc. | 1.9 | |||
10. Crown Castle International Corp. | 1.9 |
| (1) | Composition of Portfolio subject to change. |
| (2) | Short-term investments have been excluded from the list of Top 10 Portfolio Holdings. |
| (3) | Sectors: |
| % of Net Assets | ||||
Information Technology | 22.6 | |||
Consumer Discretionary | 21.5 | |||
Health Care | 12.8 | |||
Financials | 12.6 | |||
Industrials | 8.1 | |||
Telecommunication Services | 6.9 | |||
Consumer Staples | 5.6 | |||
Materials | 4.8 | |||
Energy | 4.6 | |||
|
| |||
| 99.5 | ||||
|
|
| 45 |
| Ohio National Fund, Inc. | Mid Cap Opportunity Portfolio |
Schedule of Investments | December 31, 2012 |
| Common Stocks – 99.5% | Shares | Value | ||||||||
CONSUMER DISCRETIONARY – 21.5% | ||||||||||
Coinstar, Inc. (Diversified Consumer Svs.) | (a) | 24,244 | $ | 1,260,930 | ||||||
Chipotle Mexican Grill, Inc. (Hotels, Restaurants & Leisure) | (a) | 3,585 | 1,066,394 | |||||||
Dunkin’ Brands Group, Inc. (Hotels, Restaurants & Leisure) | 17,124 | 568,174 | ||||||||
Marriott International, Inc. Class A (Hotels, Restaurants & Leisure) | 25,549 | 952,211 | ||||||||
Discovery Communications, Inc. Class A (Media) | (a) | 10,433 | 662,287 | |||||||
Pandora Media, Inc. (Media) | (a) | 54,202 | 497,574 | |||||||
Scripps Networks Interactive, Inc. Class A (Media) | 13,808 | 799,759 | ||||||||
Dollar General Corp. (Multiline Retail) | (a) | 8,995 | 396,590 | |||||||
Family Dollar Stores, Inc. (Multiline Retail) | 18,529 | 1,174,924 | ||||||||
Bed Bath & Beyond, Inc. (Specialty Retail) | (a) | 10,503 | 587,223 | |||||||
Dick’s Sporting Goods, Inc. (Specialty Retail) | 13,494 | 613,842 | ||||||||
PetSmart, Inc. (Specialty Retail) | 20,545 | 1,404,045 | ||||||||
Tiffany & Co. (Specialty Retail) | 8,936 | 512,390 | ||||||||
Urban Outfitters, Inc. (Specialty Retail) | (a) | 19,377 | 762,679 | |||||||
Deckers Outdoor Corp. (Textiles, Apparel & Luxury Goods) | (a) | 18,328 | 738,069 | |||||||
Lululemon Athletica, Inc. (Textiles, Apparel & Luxury Goods) | (a) | 7,882 | 600,845 | |||||||
PVH Corp. (Textiles, Apparel & Luxury Goods) | 16,594 | 1,842,100 | ||||||||
| �� |
|
| ||||||||
| 14,440,036 | ||||||||||
|
| |||||||||
CONSUMER STAPLES – 5.6% | ||||||||||
Beam, Inc. (Beverages) | 14,283 | 872,548 | ||||||||
Hain Celestial Group, Inc. / The (Food Products) | (a) | 16,350 | 886,497 | |||||||
TreeHouse Foods, Inc. (Food Products) | (a) | 9,914 | 516,817 | |||||||
Church & Dwight Co., Inc. (Household Products) | 16,492 | 883,476 | ||||||||
Estee Lauder Cos., Inc. / The Class A (Personal Products) | 10,017 | 599,618 | ||||||||
|
| |||||||||
| 3,758,956 | ||||||||||
|
| |||||||||
ENERGY – 4.6% | ||||||||||
Cameron International Corp. (Energy Equip. & Svs.) | (a) | 14,386 | 812,234 | |||||||
Core Laboratories NV (Energy Equip. & Svs.) | 4,340 | 474,405 | ||||||||
Dril-Quip, Inc. (Energy Equip. & Svs.) | (a) | 9,799 | 715,817 | |||||||
Pioneer Natural Resources Co. (Oil, Gas & Consumable Fuels) | 5,172 | 551,283 | ||||||||
Whiting Petroleum Corp. (Oil, Gas & Consumable Fuels) | (a) | 12,161 | 527,423 | |||||||
|
| |||||||||
| 3,081,162 | ||||||||||
|
| |||||||||
FINANCIALS – 12.6% | ||||||||||
Lazard Ltd. Class A (Capital Markets) | 29,134 | 869,359 | ||||||||
Northern Trust Corp. (Capital Markets) | 22,578 | 1,132,512 | ||||||||
T. Rowe Price Group, Inc. (Capital Markets) | 13,441 | 875,412 | ||||||||
First Republic Bank (Commercial Banks) | 32,798 | 1,075,118 | ||||||||
SLM Corp. (Consumer Finance) | 42,551 | 728,899 | ||||||||
IntercontinentalExchange, Inc. (Diversified Financial Svs.) | (a) | 7,879 | 975,499 | |||||||
MSCI, Inc. (Diversified Financial Svs.) | (a) | 39,964 | 1,238,484 | |||||||
CBRE Group, Inc. (Real Estate Mgmt. & Development) | (a) | 77,963 | 1,551,464 | |||||||
|
| |||||||||
| 8,446,747 | ||||||||||
|
| |||||||||
HEALTH CARE – 12.8% | ||||||||||
Alexion Pharmaceuticals, Inc. (Biotechnology) | (a) | 4,322 | 405,447 | |||||||
Ariad Pharmaceuticals, Inc. (Biotechnology) | (a) | 16,482 | 316,125 | |||||||
BioMarin Pharmaceutical, Inc. (Biotechnology) | (a) | 8,375 | 412,469 | |||||||
Cepheid, Inc. (Biotechnology) | (a) | 16,173 | 546,809 | |||||||
Vertex Pharmaceuticals, Inc. (Biotechnology) | (a) | 22,703 | 952,164 | |||||||
CareFusion Corp. (Health Care Equip. & Supplies) | (a) | 26,465 | 756,370 | |||||||
C.R. Bard, Inc. (Health Care Equip. & Supplies) | 11,572 | 1,131,047 | ||||||||
Henry Schein, Inc. (Health Care Providers & Svs.) | (a) | 10,475 | 842,819 | |||||||
HMS Holdings Corp. (Health Care Providers & Svs.) | (a) | 11,662 | 302,279 | |||||||
MEDNAX, Inc. (Health Care Providers & Svs.) | (a) | 4,161 | 330,883 | |||||||
| Common Stocks (Continued) | Shares | Value | ||||||||
HEALTH CARE (continued) | ||||||||||
Agilent Technologies, Inc. (Life Sciences Tools & Svs.) | 32,936 | $ | 1,348,400 | |||||||
Mettler-Toledo International, Inc. (Life Sciences Tools & Svs.) | (a) | 2,594 | 501,420 | |||||||
Shire PLC – ADR (Pharmaceuticals) | 8,255 | 760,946 | ||||||||
|
| |||||||||
| 8,607,178 | ||||||||||
|
| |||||||||
INDUSTRIALS – 8.1% | ||||||||||
C.H. Robinson Worldwide, Inc. (Air Freight & Logistics) | 6,971 | 440,707 | ||||||||
Ritchie Bros Auctioneers, Inc. (Commercial Svs. & Supplies) | 46,800 | 977,652 | ||||||||
Quanta Services, Inc. (Construction & Engineering) | (a) | 24,699 | 674,036 | |||||||
Rockwell Automation, Inc. (Electrical Equip.) | 8,218 | 690,230 | ||||||||
Roper Industries, Inc. (Electrical Equip.) | 6,978 | 777,907 | ||||||||
Graco, Inc. (Machinery) | 13,694 | 705,104 | ||||||||
Kennametal, Inc. (Machinery) | 28,573 | 1,142,920 | ||||||||
|
| |||||||||
| 5,408,556 | ||||||||||
|
| |||||||||
INFORMATION TECHNOLOGY – 22.6% | ||||||||||
Juniper Networks, Inc. (Communications Equip.) | (a) | 19,075 | 375,205 | |||||||
NetApp, Inc. (Computers & Peripherals) | (a) | 31,522 | 1,057,563 | |||||||
Amphenol Corp. Class A (Electronic Equip., Instr. & Comp.) | 21,072 | 1,363,358 | ||||||||
RealD, Inc. (Electronic Equip., Instr. & Comp.) | (a) | 41,440 | 464,542 | |||||||
Equinix, Inc. (Internet Software & Svs.) | (a) | 7,241 | 1,493,094 | |||||||
Rackspace Hosting, Inc. (Internet Software & Svs.) | (a) | 19,375 | 1,438,981 | |||||||
Cognizant Technology Solutions Corp. Class A (IT Svs.) | (a) | 8,682 | 642,902 | |||||||
FleetCor Technologies, Inc. (IT Svs.) | (a) | 17,881 | 959,316 | |||||||
Genpact Ltd. (IT Svs.) | 32,471 | 503,301 | ||||||||
VeriFone Systems, Inc. (IT Svs.) | (a) | 10,209 | 303,003 | |||||||
Altera Corp. (Semiconductors & Equip.) | 32,220 | 1,109,657 | ||||||||
Linear Technology Corp. (Semiconductors & Equip.) | 18,223 | 625,049 | ||||||||
Xilinx, Inc. (Semiconductors & Equip.) | 36,062 | 1,294,626 | ||||||||
Activision Blizzard, Inc. (Software) | 104,851 | 1,113,518 | ||||||||
Citrix Systems, Inc. (Software) | (a) | 9,598 | 631,068 | |||||||
MICROS Systems, Inc. (Software) | (a) | 20,831 | 884,068 | |||||||
Salesforce.com, Inc. (Software) | (a) | 5,300 | 890,930 | |||||||
|
| |||||||||
| 15,150,181 | ||||||||||
|
| |||||||||
MATERIALS – 4.8% | ||||||||||
Airgas, Inc. (Chemicals) | 13,400 | 1,223,286 | ||||||||
Ecolab, Inc. (Chemicals) | 14,262 | 1,025,438 | ||||||||
International Flavors & Fragrances, Inc. (Chemicals) | 13,954 | 928,499 | ||||||||
|
| |||||||||
| 3,177,223 | ||||||||||
|
| |||||||||
TELECOMMUNICATION SERVICES – 6.9% | ||||||||||
tw telecom, Inc. (Diversified Telecom. Svs.) | (a) | 37,060 | 943,918 | |||||||
Crown Castle International Corp. (Wireless Telecom. Svs.) | (a) | 17,534 | 1,265,253 | |||||||
SBA Communications Corp. Class A (Wireless Telecom. Svs.) | (a) | 34,248 | 2,432,293 | |||||||
|
| |||||||||
| 4,641,464 | ||||||||||
|
| |||||||||
Total Common Stocks (Cost $57,089,842) | $ | 66,711,503 | ||||||||
|
| |||||||||
| Money Market Funds – 1.0% | Shares | Value | ||||||||
Fidelity Institutional Money Market Funds Prime Money Market Portfolio – Class I | 701,000 | $ | 701,000 | |||||||
|
| |||||||||
Total Money Market Funds (Cost $701,000) | $ | 701,000 | ||||||||
|
| |||||||||
Total Investments – 100.5% (Cost $57,790,842) | (b) | $ | 67,412,503 | |||||||
Liabilities in Excess of Other Assets – (0.5)% | (350,897) | |||||||||
|
| |||||||||
Net Assets – 100.0% | $ | 67,061,606 | ||||||||
|
| |||||||||
| 46 | (continued) |
| Ohio National Fund, Inc. | Mid Cap Opportunity Portfolio (Continued) |
Schedule of Investments | December 31, 2012 |
Percentages are stated as a percent of net assets.
Abbreviations:
ADR: American Depositary Receipts
Footnotes:
| (a) | Non-income producing security. |
| (b) | Represents cost for financial reporting purposes, which may differ from cost basis for federal income tax purposes. See also Note 7 of the Notes to Financial Statements. |
The accompanying notes are an integral part of these financial statements.
| 47 |
| Ohio National Fund, Inc. | S&P 500® Index Portfolio |
Objective/Strategy
The S&P 500® Index Portfolio seeks total return that approximates the total return of the Standard & Poor’s 500® Index (S&P 500® Index), at a risk level consistent with that of the Standard & Poor’s 500® Index.
Performance as of December 31, 2012
Average Annual Total Returns: | ||||
One year | 15.40% | |||
Five years | 1.18% | |||
Ten years | 6.59% |
Past performance does not guarantee future results. The performance data quoted represents past performance and current returns may be lower or higher. Total return figures include change in share price and reinvestment of dividends and capital gains. The investment return and principal value will fluctuate so that an investor’s shares, when redeemed, may be worth more or less than the original cost. To obtain performance information up to the most recent month end, call toll-free 1-877-781-6392.
The Portfolio is not open to direct retail investment. Beneficial interest in shares is obtained solely by purchase of variable life insurance policies and variable annuity contracts. Actual performance results for variable annuity and variable universal life contracts will be lower due to contract charges. Consult your contract for applicable charges.
Comments
For the year ended December 31, 2012, the S&P 500® Index Portfolio returned 15.40% versus 16.00% for the current benchmark, the S&P 500® Index.
The Portfolio’s correlation with the S&P 500® Index was 99.9%. The high correlation is due to the fact that the Portfolio invests in each of the 500 stocks in the index. The Portfolio also invests in the SPDR S&P 500 ETF Trust, an exchange traded fund that mimics the holdings and returns of the S&P 500® Index.(1)
The largest contributors to the index return for 2012 were Apple, Inc., Bank of America Corp., JPMorgan Chase & Co., Citigroup, Inc., and Comcast Corp. The largest detractors for the index in 2012 were Hewlett-Packard Co., Intel Corp., Occidental Petroleum Corp., McDonald’s Corp., and Exelon Corp.
The year 2012 was action packed. From the presidential elections, to the debt negotiations/“fiscal cliff”, to Hurricane Sandy, to renewed economic fears out of Eastern Europe, the stock market had a bumpy year. Equities indices, however, ended 2012 in positive territory. There appears to be more uncertainty in 2013 as Congress still needs to reach an agreement to raise the debt ceiling and make certain budget cuts.
We believe that 2013 should end up being another good year for equities once we get past the near term political risk. Equity indices are relatively undervalued compared to other assets and historical measures. The economy and unemployment will likely improve, albeit at a slow pace, and the Federal Reserve should continue to be accommodative.
| (1) | The Portfolio’s composition is subject to change. Holdings and weightings are as of December 31, 2012. |
“Standard & Poor’s®”, “S&P®”, “S&P 500®” and “Standard & Poor’s 500” are trademarks of The McGraw-Hill Companies, Inc. and have been licensed for use by Ohio National Investments, Inc. (ONI). The S&P 500® Index Portfolio is not sponsored, endorsed, sold or promoted by Standard & Poor’s (“S&P”) and S&P makes no representation regarding the advisability of investing in the S&P 500® Index Portfolio. S&P makes no representation or warranty, express or implied, to the owners of the Portfolio or any member of the public regarding the advisability of investing in securities generally or in the Portfolio particularly or the ability of the S&P 500® Index to track general stock market performance. S&P’s only relationship to ONI is the licensing of certain trademarks and trade names of S&P® and of the S&P 500® Index which is determined, composed and calculated by S&P® without regard to ONI or the S&P 500® Index Portfolio. S&P® has no obligation to take the needs of ONI or the owners of the Portfolio into consideration in determining, composing or calculating the S&P 500® Index. S&P® is not responsible for and has not participated in the determination of the prices and amount of the Portfolio or the timing of the issuance or sale of the Portfolio or in the determination or calculation of the equation by which the Portfolio is to be converted into cash. S&P® has no obligation or liability in connection with the administration, marketing or trading of the Portfolio.
Change in Value of $10,000 Investment
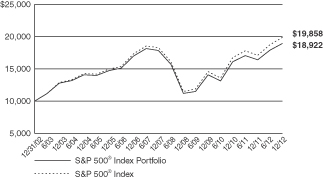
Hypothetical illustration based on past performance. Future performance will vary. The Portfolio’s returns reflect reinvested dividends. The Portfolio’s holdings may differ significantly from the securities in the index. The index is unmanaged and therefore does not reflect the cost of portfolio management and accounting. Investors cannot invest directly in an index, although they can invest in its underlying securities or funds.
The S&P 500® Index is a capitalization-weighted index designed to measure performance of the broad domestic economy through changes in the aggregate market value of 500 stocks representing all major industries. The index presented herein includes the effects of reinvested dividends.
| 48 | (continued) |
| Ohio National Fund, Inc. | S&P 500® Index Portfolio (Continued) |
Portfolio Composition as of December 31, 2012 (1)
| % of Net Assets | ||||
Common Stocks (3) | 96.2 | |||
Exchange Traded Funds | 3.8 | |||
|
| |||
| 100.0 | ||||
|
|
Top 10 Portfolio Holdings as of December 31,
2012 (1) (2)
| % of Net Assets | ||||
1. SPDR S&P 500 ETF Trust | 3.8 | |||
2. Apple, Inc. | 3.8 | |||
3. Exxon Mobil Corp. | 3.0 | |||
4. General Electric Co. | 1.7 | |||
5. Chevron Corp. | 1.6 | |||
6. International Business Machines Corp. | 1.5 | |||
7. Microsoft Corp. | 1.5 | |||
8. Johnson & Johnson | 1.5 | |||
9. AT&T, Inc. | 1.4 | |||
10. Google, Inc. Class A | 1.4 | |||
| (1) | Composition of Portfolio subject to change. |
| (2) | Short-term investments have been excluded from the list of Top 10 Portfolio Holdings. |
| (3) | Sectors: |
| % of Net Assets | ||||
Information Technology | 18.3 | |||
Financials | 15.0 | |||
Health Care | 11.6 | |||
Consumer Discretionary | 11.1 | |||
Energy | 10.6 | |||
Consumer Staples | 10.2 | |||
Industrials | 9.7 | |||
Materials | 3.5 | |||
Utilities | 3.3 | |||
Telecommunication Services | 2.9 | |||
|
| |||
| 96.2 | ||||
|
|
| 49 |
| Ohio National Fund, Inc. | S&P 500® Index Portfolio |
Schedule of Investments | December 31, 2012 |
| Common Stocks – 96.2% | Shares | Value | ||||||||
CONSUMER DISCRETIONARY – 11.1% | ||||||||||
BorgWarner, Inc. (Auto Components) | (a) | 1,800 | $ | 128,916 | ||||||
Delphi Automotive PLC (Auto Components) | (a) | 4,600 | 175,950 | |||||||
Goodyear Tire & Rubber Co. / The (Auto Components) | (a) | 3,800 | 52,478 | |||||||
Johnson Controls, Inc. (Auto Components) | 10,700 | 328,490 | ||||||||
Ford Motor Co. (Automobiles) | 59,887 | 775,537 | ||||||||
Harley-Davidson, Inc. (Automobiles) | 3,600 | 175,824 | ||||||||
Genuine Parts Co. (Distributors) | 2,400 | 152,592 | ||||||||
Apollo Group, Inc. Class A (Diversified Consumer Svs.) | (a) | 1,600 | 33,472 | |||||||
H&R Block, Inc. (Diversified Consumer Svs.) | 4,300 | 79,851 | ||||||||
Carnival Corp. (Hotels, Restaurants & Leisure) | 7,000 | 257,390 | ||||||||
Chipotle Mexican Grill, Inc. (Hotels, Restaurants & Leisure) | (a) | 500 | 148,730 | |||||||
Darden Restaurants, Inc. (Hotels, Restaurants & Leisure) | 2,000 | 90,140 | ||||||||
International Game Technology (Hotels, Restaurants & Leisure) | 4,200 | 59,514 | ||||||||
Marriott International, Inc. Class A (Hotels, Restaurants & Leisure) | 3,846 | 143,340 | ||||||||
McDonald’s Corp. (Hotels, Restaurants & Leisure) | 15,800 | 1,393,718 | ||||||||
Starbucks Corp. (Hotels, Restaurants & Leisure) | 11,700 | 627,354 | ||||||||
Starwood Hotels & Resorts Worldwide, Inc. (Hotels, Restaurants & Leisure) | 3,100 | 177,816 | ||||||||
Wyndham Worldwide Corp. (Hotels, Restaurants & Leisure) | 2,160 | 114,934 | ||||||||
Wynn Resorts Ltd. (Hotels, Restaurants & Leisure) | 1,200 | 134,988 | ||||||||
Yum! Brands, Inc. (Hotels, Restaurants & Leisure) | 7,100 | 471,440 | ||||||||
D.R. Horton, Inc. (Household Durables) | 4,400 | 87,032 | ||||||||
Garmin Ltd. (Household Durables) | 1,700 | 69,394 | ||||||||
Harman International Industries, Inc. (Household Durables) | 1,100 | 49,104 | ||||||||
Leggett & Platt, Inc. (Household Durables) | 2,200 | 59,884 | ||||||||
Lennar Corp. Class A (Household Durables) | 2,600 | 100,542 | ||||||||
Newell Rubbermaid, Inc. (Household Durables) | 4,500 | 100,215 | ||||||||
PulteGroup, Inc. (Household Durables) | (a) | 5,350 | 97,156 | |||||||
Whirlpool Corp. (Household Durables) | 1,255 | 127,696 | ||||||||
Amazon.com, Inc. (Internet & Catalog Retail) | (a) | 5,650 | 1,418,941 | |||||||
Expedia, Inc. (Internet & Catalog Retail) | 1,500 | 92,175 | ||||||||
Netflix, Inc. (Internet & Catalog Retail) | (a) | 850 | 78,863 | |||||||
priceline.com, Inc. (Internet & Catalog Retail) | (a) | 775 | 481,430 | |||||||
TripAdvisor, Inc. (Internet & Catalog Retail) | (a) | 1,700 | 71,332 | |||||||
Hasbro, Inc. (Leisure Equip. & Products) | 1,800 | 64,620 | ||||||||
Mattel, Inc. (Leisure Equip. & Products) | 5,400 | 197,748 | ||||||||
Cablevision Systems Corp. Class A (Media) | 3,400 | 50,796 | ||||||||
CBS Corp. Class B (Media) | 9,250 | 351,962 | ||||||||
Comcast Corp. Class A (Media) | 41,753 | 1,560,727 | ||||||||
DIRECTV (Media) | (a) | 9,500 | 476,520 | |||||||
Discovery Communications, Inc. Class A (Media) | (a) | 3,700 | 234,876 | |||||||
Gannett Co., Inc. (Media) | 3,600 | 64,836 | ||||||||
Interpublic Group of Cos., Inc. / The (Media) | 6,723 | 74,087 | ||||||||
McGraw-Hill Cos., Inc. / The (Media) | 4,400 | 240,548 | ||||||||
News Corp. Class A (Media) | 31,600 | 807,064 | ||||||||
Omnicom Group, Inc. (Media) | 4,100 | 204,836 | ||||||||
Scripps Networks Interactive, Inc. Class A (Media) | 1,400 | 81,088 | ||||||||
Time Warner Cable, Inc. (Media) | 4,732 | 459,903 | ||||||||
Time Warner, Inc. (Media) | 14,866 | 711,041 | ||||||||
Viacom, Inc. Class B (Media) | 7,250 | 382,365 | ||||||||
Walt Disney Co. / The (Media) | 27,800 | 1,384,162 | ||||||||
Washington Post Co. / The Class B (Media) | 75 | 27,391 | ||||||||
Big Lots, Inc. (Multiline Retail) | (a) | 900 | 25,614 | |||||||
Dollar General Corp. (Multiline Retail) | (a) | 4,100 | 180,769 | |||||||
Dollar Tree, Inc. (Multiline Retail) | (a) | 3,600 | 146,016 | |||||||
Family Dollar Stores, Inc. (Multiline Retail) | 1,500 | 95,115 | ||||||||
J.C. Penney Co., Inc. (Multiline Retail) | 2,200 | 43,362 | ||||||||
Kohl’s Corp. (Multiline Retail) | 3,300 | 141,834 | ||||||||
Macy’s, Inc. (Multiline Retail) | 6,176 | 240,988 | ||||||||
Nordstrom, Inc. (Multiline Retail) | 2,400 | 128,400 | ||||||||
Target Corp. (Multiline Retail) | 10,200 | 603,534 | ||||||||
Abercrombie & Fitch Co. Class A (Specialty Retail) | 1,200 | 57,564 | ||||||||
| Common Stocks (Continued) | Shares | Value | ||||||||
CONSUMER DISCRETIONARY (continued) | ||||||||||
AutoNation, Inc. (Specialty Retail) | (a) | 600 | $ | 23,820 | ||||||
AutoZone, Inc. (Specialty Retail) | (a) | 600 | 212,658 | |||||||
Bed Bath & Beyond, Inc. (Specialty Retail) | (a) | 3,600 | 201,276 | |||||||
Best Buy Co., Inc. (Specialty Retail) | 4,175 | 49,474 | ||||||||
CarMax, Inc. (Specialty Retail) | (a) | 3,600 | 135,144 | |||||||
GameStop Corp. Class A (Specialty Retail) | 1,900 | 47,671 | ||||||||
Gap, Inc. / The (Specialty Retail) | 4,650 | 144,336 | ||||||||
Home Depot, Inc. / The (Specialty Retail) | 23,500 | 1,453,475 | ||||||||
Lowe’s Cos., Inc. (Specialty Retail) | 17,700 | 628,704 | ||||||||
Limited Brands, Inc. (Specialty Retail) | 3,800 | 178,828 | ||||||||
O’Reilly Automotive, Inc. (Specialty Retail) | (a) | 1,800 | 160,956 | |||||||
PetSmart, Inc. (Specialty Retail) | 1,700 | 116,178 | ||||||||
Ross Stores, Inc. (Specialty Retail) | 3,500 | 189,525 | ||||||||
Staples, Inc. (Specialty Retail) | 10,600 | 120,840 | ||||||||
Tiffany & Co. (Specialty Retail) | 1,900 | 108,946 | ||||||||
TJX Cos., Inc. (Specialty Retail) | 11,400 | 483,930 | ||||||||
Urban Outfitters, Inc. (Specialty Retail) | (a) | 1,700 | 66,912 | |||||||
Coach, Inc. (Textiles, Apparel & Luxury Goods) | 4,500 | 249,795 | ||||||||
Fossil, Inc. (Textiles, Apparel & Luxury Goods) | (a) | 800 | 74,480 | |||||||
NIKE, Inc. Class B (Textiles, Apparel & Luxury Goods) | 11,400 | 588,240 | ||||||||
Ralph Lauren Corp. (Textiles, Apparel & Luxury Goods) | 1,000 | 149,920 | ||||||||
V.F. Corp. (Textiles, Apparel & Luxury Goods) | 1,400 | 211,358 | ||||||||
|
| |||||||||
| 22,990,470 | ||||||||||
|
| |||||||||
CONSUMER STAPLES – 10.2% | ||||||||||
Beam, Inc. (Beverages) | 2,500 | 152,725 | ||||||||
Brown-Forman Corp. Class B (Beverages) | 2,375 | 150,219 | ||||||||
Coca-Cola Co. / The (Beverages) | 60,500 | 2,193,125 | ||||||||
Coca-Cola Enterprises, Inc. (Beverages) | 4,200 | 133,266 | ||||||||
Constellation Brands, Inc. Class A (Beverages) | (a) | 2,400 | 84,936 | |||||||
Dr Pepper Snapple Group, Inc. (Beverages) | 3,300 | 145,794 | ||||||||
Molson Coors Brewing Co. Class B (Beverages) | 2,400 | 102,696 | ||||||||
Monster Beverage Corp. (Beverages) | (a) | 2,300 | 121,624 | |||||||
PepsiCo, Inc. (Beverages) | 24,247 | 1,659,222 | ||||||||
Costco Wholesale Corp. (Food & Staples Retailing) | 6,800 | 671,636 | ||||||||
CVS Caremark Corp. (Food & Staples Retailing) | 19,520 | 943,792 | ||||||||
Kroger Co. / The (Food & Staples Retailing) | 8,100 | 210,762 | ||||||||
Safeway, Inc. (Food & Staples Retailing) | 3,800 | 68,742 | ||||||||
Sysco Corp. (Food & Staples Retailing) | 9,200 | 291,272 | ||||||||
Walgreen Co. (Food & Staples Retailing) | 13,500 | 499,635 | ||||||||
Wal-Mart Stores, Inc. (Food & Staples Retailing) | 26,300 | 1,794,449 | ||||||||
Whole Foods Market, Inc. (Food & Staples Retailing) | 2,700 | 246,591 | ||||||||
Archer-Daniels-Midland Co. (Food Products) | 10,350 | 283,486 | ||||||||
Campbell Soup Co. (Food Products) | 2,800 | 97,692 | ||||||||
ConAgra Foods, Inc. (Food Products) | 6,400 | 188,800 | ||||||||
Dean Foods Co. (Food Products) | (a) | 2,900 | 47,879 | |||||||
General Mills, Inc. (Food Products) | 10,100 | 408,141 | ||||||||
Hershey Co. / The (Food Products) | 2,300 | 166,106 | ||||||||
H.J. Heinz Co. (Food Products) | 5,000 | 288,400 | ||||||||
Hormel Foods Corp. (Food Products) | 2,100 | 65,541 | ||||||||
J.M. Smucker Co. / The (Food Products) | 1,700 | 146,608 | ||||||||
Kellogg Co. (Food Products) | 3,900 | 217,815 | ||||||||
Kraft Foods Group, Inc. (Food Products) | 9,325 | 424,008 | ||||||||
McCormick & Co., Inc. (Food Products) | 2,100 | 133,413 | ||||||||
Mead Johnson Nutrition Co. (Food Products) | 3,151 | 207,619 | ||||||||
Mondelez International, Inc. Class A (Food Products) | 27,876 | 710,002 | ||||||||
Tyson Foods, Inc. Class A (Food Products) | 4,500 | 87,300 | ||||||||
Clorox Co. / The (Household Products) | 2,000 | 146,440 | ||||||||
Colgate-Palmolive Co. (Household Products) | 7,000 | 731,780 | ||||||||
Kimberly-Clark Corp. (Household Products) | 6,100 | 515,023 | ||||||||
Procter & Gamble Co. / The (Household Products) | 42,922 | 2,913,974 | ||||||||
Avon Products, Inc. (Personal Products) | 6,800 | 97,648 | ||||||||
Estee Lauder Cos., Inc. / The Class A (Personal Products) | 3,800 | 227,468 | ||||||||
Altria Group, Inc. (Tobacco) | 31,800 | 999,156 | ||||||||
Lorillard, Inc. (Tobacco) | 1,997 | 232,990 | ||||||||
Philip Morris International, Inc. (Tobacco) | 26,200 | 2,191,368 | ||||||||
Reynolds American, Inc. (Tobacco) | 5,100 | 211,293 | ||||||||
|
| |||||||||
| 21,210,436 | ||||||||||
|
| |||||||||
| 50 | (continued) |
| Ohio National Fund, Inc. | S&P 500® Index Portfolio (Continued) |
Schedule of Investments | December 31, 2012 |
| Common Stocks (Continued) | Shares | Value | ||||||||
ENERGY – 10.6% | ||||||||||
Baker Hughes, Inc. (Energy Equip. & Svs.) | 6,941 | $ | 283,470 | |||||||
Cameron International Corp. (Energy Equip. & Svs.) | (a) | 3,900 | 220,194 | |||||||
Diamond Offshore Drilling, Inc. (Energy Equip. & Svs.) | 1,100 | 74,756 | ||||||||
Ensco PLC Class A (Energy Equip. & Svs.) | 3,600 | 213,408 | ||||||||
FMC Technologies, Inc. (Energy Equip. & Svs.) | (a) | 3,700 | 158,471 | |||||||
Halliburton Co. (Energy Equip. & Svs.) | 14,600 | 506,474 | ||||||||
Helmerich & Payne, Inc. (Energy Equip. & Svs.) | 1,700 | 95,217 | ||||||||
Nabors Industries Ltd. (Energy Equip. & Svs.) | (a) | 4,600 | 66,470 | |||||||
National Oilwell Varco, Inc. (Energy Equip. & Svs.) | 6,700 | 457,945 | ||||||||
Noble Corp. (Energy Equip. & Svs.) | 4,000 | 139,280 | ||||||||
Rowan Cos. Plc Class A (Energy Equip. & Svs.) | (a) | 1,900 | 59,413 | |||||||
Schlumberger Ltd. (Energy Equip. & Svs.) | 20,847 | 1,444,489 | ||||||||
Anadarko Petroleum Corp. (Oil, Gas & Consumable Fuels) | 7,800 | 579,618 | ||||||||
Apache Corp. (Oil, Gas & Consumable Fuels) | 6,172 | 484,502 | ||||||||
Cabot Oil & Gas Corp. (Oil, Gas & Consumable Fuels) | 3,300 | 164,142 | ||||||||
Chesapeake Energy Corp. (Oil, Gas & Consumable Fuels) | 8,100 | 134,622 | ||||||||
Chevron Corp. (Oil, Gas & Consumable Fuels) | 30,738 | 3,324,007 | ||||||||
ConocoPhillips (Oil, Gas & Consumable Fuels) | 19,100 | 1,107,609 | ||||||||
CONSOL Energy, Inc. (Oil, Gas & Consumable Fuels) | 3,600 | 115,560 | ||||||||
Denbury Resources, Inc. (Oil, Gas & Consumable Fuels) | (a) | 6,100 | 98,820 | |||||||
Devon Energy Corp. (Oil, Gas & Consumable Fuels) | 5,900 | 307,036 | ||||||||
EOG Resources, Inc. (Oil, Gas & Consumable Fuels) | 4,250 | 513,357 | ||||||||
EQT Corp. (Oil, Gas & Consumable Fuels) | 2,300 | 135,654 | ||||||||
Exxon Mobil Corp. (Oil, Gas & Consumable Fuels) | 71,564 | 6,193,864 | ||||||||
Hess Corp. (Oil, Gas & Consumable Fuels) | 4,700 | 248,912 | ||||||||
Kinder Morgan, Inc. (Oil, Gas & Consumable Fuels) | 9,973 | 352,346 | ||||||||
Marathon Oil Corp. (Oil, Gas & Consumable Fuels) | 11,120 | 340,939 | ||||||||
Marathon Petroleum Corp. (Oil, Gas & Consumable Fuels) | 5,360 | 337,680 | ||||||||
Murphy Oil Corp. (Oil, Gas & Consumable Fuels) | 2,900 | 172,695 | ||||||||
Newfield Exploration Co. (Oil, Gas & Consumable Fuels) | (a) | 2,100 | 56,238 | |||||||
Noble Energy, Inc. (Oil, Gas & Consumable Fuels) | 2,800 | 284,872 | ||||||||
Occidental Petroleum Corp. (Oil, Gas & Consumable Fuels) | 12,700 | 972,947 | ||||||||
Peabody Energy Corp. (Oil, Gas & Consumable Fuels) | 4,200 | 111,762 | ||||||||
Phillips 66 (Oil, Gas & Consumable Fuels) | 9,850 | 523,035 | ||||||||
Pioneer Natural Resources Co. (Oil, Gas & Consumable Fuels) | 1,900 | 202,521 | ||||||||
QEP Resources, Inc. (Oil, Gas & Consumable Fuels) | 2,800 | 84,756 | ||||||||
Range Resources Corp. (Oil, Gas & Consumable Fuels) | 2,600 | 163,358 | ||||||||
Southwestern Energy Co. (Oil, Gas & Consumable Fuels) | (a) | 5,500 | 183,755 | |||||||
Spectra Energy Corp. (Oil, Gas & Consumable Fuels) | 10,418 | 285,245 | ||||||||
Tesoro Corp. (Oil, Gas & Consumable Fuels) | 2,200 | 96,910 | ||||||||
Valero Energy Corp. (Oil, Gas & Consumable Fuels) | 8,700 | 296,844 | ||||||||
Williams Cos., Inc. / The (Oil, Gas & Consumable Fuels) | 10,600 | 347,044 | ||||||||
WPX Energy, Inc. (Oil, Gas & Consumable Fuels) | (a) | 3,100 | 46,128 | |||||||
|
| |||||||||
| 21,986,365 | ||||||||||
|
| |||||||||
FINANCIALS – 15.0% | ||||||||||
Ameriprise Financial, Inc. (Capital Markets) | 3,280 | 205,426 | ||||||||
Bank of New York Mellon Corp. / The (Capital Markets) | 18,311 | 470,593 | ||||||||
BlackRock, Inc. (Capital Markets) | 2,000 | 413,420 | ||||||||
Charles Schwab Corp. / The (Capital Markets) | 17,200 | 246,992 | ||||||||
E*TRADE Financial Corp. (Capital Markets) | (a) | 4,090 | 36,606 | |||||||
Franklin Resources, Inc. (Capital Markets) | 2,200 | 276,540 | ||||||||
Goldman Sachs Group, Inc. / The (Capital Markets) | 6,950 | 886,542 | ||||||||
Invesco Ltd. (Capital Markets) | 7,000 | 182,630 | ||||||||
Legg Mason, Inc. (Capital Markets) | 1,800 | 46,296 | ||||||||
Morgan Stanley (Capital Markets) | 21,700 | 414,904 | ||||||||
| Common Stocks (Continued) | Shares | Value | ||||||||
FINANCIALS (continued) | ||||||||||
Northern Trust Corp. (Capital Markets) | 3,400 | $ | 170,544 | |||||||
State Street Corp. (Capital Markets) | 7,300 | 343,173 | ||||||||
T. Rowe Price Group, Inc. (Capital Markets) | 4,000 | 260,520 | ||||||||
BB&T Corp. (Commercial Banks) | 11,000 | 320,210 | ||||||||
Comerica, Inc. (Commercial Banks) | 3,000 | 91,020 | ||||||||
Fifth Third Bancorp (Commercial Banks) | 14,050 | 213,420 | ||||||||
First Horizon National Corp. (Commercial Banks) | �� | 3,864 | 38,292 | |||||||
Huntington Bancshares, Inc. (Commercial Banks) | 13,400 | 85,626 | ||||||||
KeyCorp (Commercial Banks) | 14,700 | 123,774 | ||||||||
M&T Bank Corp. (Commercial Banks) | 1,900 | 187,093 | ||||||||
PNC Financial Services Group, Inc. (Commercial Banks) | 8,342 | 486,422 | ||||||||
Regions Financial Corp. (Commercial Banks) | 22,175 | 157,886 | ||||||||
SunTrust Banks, Inc. (Commercial Banks) | 8,500 | 240,975 | ||||||||
U.S. Bancorp (Commercial Banks) | 29,490 | 941,911 | ||||||||
Wells Fargo & Co. (Commercial Banks) | 76,813 | 2,625,468 | ||||||||
Zions Bancorporation (Commercial Banks) | 2,900 | 62,060 | ||||||||
American Express Co. (Consumer Finance) | 15,300 | 879,444 | ||||||||
Capital One Financial Corp. (Consumer Finance) | 9,173 | 531,392 | ||||||||
Discover Financial Services (Consumer Finance) | 7,950 | 306,473 | ||||||||
SLM Corp. (Consumer Finance) | 7,300 | 125,049 | ||||||||
Bank of America Corp. (Diversified Financial Svs.) | 169,127 | 1,961,873 | ||||||||
Citigroup, Inc. (Diversified Financial Svs.) | 46,036 | 1,821,184 | ||||||||
CME Group, Inc. (Diversified Financial Svs.) | 4,775 | 242,140 | ||||||||
IntercontinentalExchange, Inc. (Diversified Financial Svs.) | (a) | 1,100 | 136,191 | |||||||
JPMorgan Chase & Co. (Diversified Financial Svs.) | 59,643 | 2,622,503 | ||||||||
Leucadia National Corp. (Diversified Financial Svs.) | 3,100 | 73,749 | ||||||||
Moody’s Corp. (Diversified Financial Svs.) | 3,000 | 150,960 | ||||||||
NASDAQ OMX Group, Inc. / The (Diversified Financial Svs.) | 1,800 | 45,018 | ||||||||
NYSE Euronext (Diversified Financial Svs.) | 3,800 | 119,852 | ||||||||
ACE Ltd. (Insurance) | 5,300 | 422,940 | ||||||||
Aflac, Inc. (Insurance) | 7,400 | 393,088 | ||||||||
Allstate Corp. / The (Insurance) | 7,600 | 305,292 | ||||||||
American International Group, Inc. (Insurance) | (a) | 23,195 | 818,784 | |||||||
Aon PLC (Insurance) | 5,000 | 278,000 | ||||||||
Assurant, Inc. (Insurance) | 1,200 | 41,640 | ||||||||
Berkshire Hathaway, Inc. Class B (Insurance) | (a) | 28,591 | 2,564,613 | |||||||
Chubb Corp. / The (Insurance) | 4,100 | 308,812 | ||||||||
Cincinnati Financial Corp. (Insurance) | 2,266 | 88,737 | ||||||||
Genworth Financial, Inc. Class A (Insurance) | (a) | 7,700 | 57,827 | |||||||
Hartford Financial Services Group, Inc. (Insurance) | 6,800 | 152,592 | ||||||||
Lincoln National Corp. (Insurance) | 4,286 | 111,007 | ||||||||
Loews Corp. (Insurance) | 4,861 | 198,086 | ||||||||
Marsh & McLennan Cos., Inc. (Insurance) | 8,500 | 292,995 | ||||||||
MetLife, Inc. (Insurance) | 17,100 | 563,274 | ||||||||
Principal Financial Group, Inc. (Insurance) | 4,300 | 122,636 | ||||||||
Progressive Corp. / The (Insurance) | 8,700 | 183,570 | ||||||||
Prudential Financial, Inc. (Insurance) | 7,300 | 389,309 | ||||||||
Torchmark Corp. (Insurance) | 1,450 | 74,922 | ||||||||
Travelers Cos., Inc. / The (Insurance) | 5,959 | 427,975 | ||||||||
Unum Group (Insurance) | 4,300 | 89,526 | ||||||||
XL Group PLC (Insurance) | 4,700 | 117,782 | ||||||||
American Tower Corp. (Real Estate Investment Trusts) | 6,200 | 479,074 | ||||||||
Apartment Investment & Management Co. Class A (Real Estate Investment Trusts) | 2,273 | 61,507 | ||||||||
AvalonBay Communities, Inc. (Real Estate Investment Trusts) | 1,831 | 248,265 | ||||||||
Boston Properties, Inc. (Real Estate Investment Trusts) | 2,400 | 253,944 | ||||||||
Equity Residential (Real Estate Investment Trusts) | 5,000 | 283,350 | ||||||||
HCP, Inc. (Real Estate Investment Trusts) | 7,100 | 320,778 | ||||||||
Health Care REIT, Inc. (Real Estate Investment Trusts) | 4,100 | 251,289 | ||||||||
Host Hotels & Resorts, Inc. (Real Estate Investment Trusts) | 11,402 | 178,669 | ||||||||
Kimco Realty Corp. (Real Estate Investment Trusts) | 6,400 | 123,648 | ||||||||
| 51 | (continued) |
| Ohio National Fund, Inc. | S&P 500® Index Portfolio (Continued) |
Schedule of Investments | December 31, 2012 |
| Common Stocks (Continued) | Shares | Value | ||||||||
FINANCIALS (continued) | ||||||||||
Plum Creek Timber Co., Inc. (Real Estate Investment Trusts) | 2,500 | $ | 110,925 | |||||||
Prologis, Inc. (Real Estate Investment Trusts) | 7,239 | 264,151 | ||||||||
Public Storage (Real Estate Investment Trusts) | 2,300 | 333,408 | ||||||||
Simon Property Group, Inc. (Real Estate Investment Trusts) | 4,862 | 768,634 | ||||||||
Ventas, Inc. (Real Estate Investment Trusts) | 4,600 | 297,712 | ||||||||
Vornado Realty Trust (Real Estate Investment Trusts) | 2,693 | 215,655 | ||||||||
Weyerhaeuser Co. (Real Estate Investment Trusts) | 8,463 | 235,441 | ||||||||
CBRE Group, Inc. (Real Estate Mgmt. & Development) | (a) | 4,700 | 93,530 | |||||||
Hudson City Bancorp, Inc. (Thrifts & Mortgage Finance) | 7,500 | 60,975 | ||||||||
People’s United Financial, Inc. (Thrifts & Mortgage Finance) | 5,500 | 66,495 | ||||||||
|
| |||||||||
| 31,195,028 | ||||||||||
|
| |||||||||
HEALTH CARE – 11.6% | ||||||||||
Alexion Pharmaceuticals, Inc. (Biotechnology) | (a) | 3,000 | 281,430 | |||||||
Amgen, Inc. (Biotechnology) | 12,006 | 1,036,358 | ||||||||
Biogen Idec, Inc. (Biotechnology) | (a) | 3,745 | 549,279 | |||||||
Celgene Corp. (Biotechnology) | (a) | 6,600 | 519,552 | |||||||
Gilead Sciences, Inc. (Biotechnology) | (a) | 11,900 | 874,055 | |||||||
Abbott Laboratories (Health Care Equip. & Supplies) | 24,800 | 1,624,400 | ||||||||
Baxter International, Inc. (Health Care Equip. & Supplies) | 8,600 | 573,276 | ||||||||
Becton Dickinson and Co. (Health Care Equip. & Supplies) | 3,100 | 242,389 | ||||||||
Boston Scientific Corp. (Health Care Equip. & Supplies) | (a) | 21,503 | 123,212 | |||||||
CareFusion Corp. (Health Care Equip. & Supplies) | (a) | 3,450 | 98,601 | |||||||
Covidien PLC (Health Care Equip. & Supplies) | 7,400 | 427,276 | ||||||||
C.R. Bard, Inc. (Health Care Equip. & Supplies) | 1,200 | 117,288 | ||||||||
DENTSPLY International, Inc. (Health Care Equip. & Supplies) | 2,200 | 87,142 | ||||||||
Edwards Lifesciences Corp. (Health Care Equip. & Supplies) | (a) | 1,800 | 162,306 | |||||||
Intuitive Surgical, Inc. (Health Care Equip. & Supplies) | (a) | 625 | 306,481 | |||||||
Medtronic, Inc. (Health Care Equip. & Supplies) | 15,900 | 652,218 | ||||||||
St. Jude Medical, Inc. (Health Care Equip. & Supplies) | 4,800 | 173,472 | ||||||||
Stryker Corp. (Health Care Equip. & Supplies) | 4,500 | 246,690 | ||||||||
Varian Medical Systems, Inc. (Health Care Equip. & Supplies) | (a) | 1,700 | 119,408 | |||||||
Zimmer Holdings, Inc. (Health Care Equip. & Supplies) | 2,770 | 184,648 | ||||||||
Aetna, Inc. (Health Care Providers & Svs.) | 5,300 | 245,390 | ||||||||
AmerisourceBergen Corp. (Health Care Providers & Svs.) | 3,700 | 159,766 | ||||||||
Cardinal Health, Inc. (Health Care Providers & Svs.) | 5,300 | 218,254 | ||||||||
Cigna Corp. (Health Care Providers & Svs.) | 4,500 | 240,570 | ||||||||
Coventry Health Care, Inc. (Health Care Providers & Svs.) | 2,100 | 94,143 | ||||||||
DaVita HealthCare Partners, Inc. (Health Care Providers & Svs.) | (a) | 1,300 | 143,689 | |||||||
Express Scripts Holding Co. (Health Care Providers & Svs.) | (a) | 12,778 | 690,012 | |||||||
Humana, Inc. (Health Care Providers & Svs.) | 2,500 | 171,575 | ||||||||
Laboratory Corp. of America Holdings (Health Care Providers & Svs.) | (a) | 1,500 | 129,930 | |||||||
McKesson Corp. (Health Care Providers & Svs.) | 3,700 | 358,752 | ||||||||
Patterson Cos., Inc. (Health Care Providers & Svs.) | 1,300 | 44,499 | ||||||||
Quest Diagnostics, Inc. (Health Care Providers & Svs.) | 2,500 | 145,675 | ||||||||
Tenet Healthcare Corp. (Health Care Providers & Svs.) | (a) | 1,712 | 55,589 | |||||||
UnitedHealth Group, Inc. (Health Care Providers & Svs.) | 16,000 | 867,840 | ||||||||
| Common Stocks (Continued) | Shares | Value | ||||||||
HEALTH CARE (continued) | ||||||||||
WellPoint, Inc. (Health Care Providers & Svs.) | 4,800 | $ | 292,416 | |||||||
Cerner Corp. (Health Care Technology) | (a) | 2,300 | 178,572 | |||||||
Agilent Technologies, Inc. (Life Sciences Tools & Svs.) | 5,500 | 225,170 | ||||||||
Life Technologies Corp. (Life Sciences Tools & Svs.) | (a) | 2,717 | 133,350 | |||||||
PerkinElmer, Inc. (Life Sciences Tools & Svs.) | 1,800 | 57,132 | ||||||||
Thermo Fisher Scientific, Inc. (Life Sciences Tools & Svs.) | 5,700 | 363,546 | ||||||||
Waters Corp. (Life Sciences Tools & Svs.) | (a) | 1,400 | 121,968 | |||||||
Allergan, Inc. (Pharmaceuticals) | 4,800 | 440,304 | ||||||||
Bristol-Myers Squibb Co. (Pharmaceuticals) | 25,869 | 843,071 | ||||||||
Eli Lilly & Co. (Pharmaceuticals) | 16,000 | 789,120 | ||||||||
Forest Laboratories, Inc. (Pharmaceuticals) | (a) | 3,700 | 130,684 | |||||||
Hospira, Inc. (Pharmaceuticals) | (a) | 2,610 | 81,536 | |||||||
Johnson & Johnson (Pharmaceuticals) | 43,500 | 3,049,350 | ||||||||
Merck & Co., Inc. (Pharmaceuticals) | 47,694 | 1,952,592 | ||||||||
Mylan, Inc. (Pharmaceuticals) | (a) | 6,400 | 175,872 | |||||||
Perrigo Co. (Pharmaceuticals) | 1,400 | 145,642 | ||||||||
Pfizer, Inc. (Pharmaceuticals) | 115,510 | 2,896,991 | ||||||||
Watson Pharmaceuticals, Inc. (Pharmaceuticals) | (a) | 2,000 | 172,000 | |||||||
|
| |||||||||
| 24,014,481 | ||||||||||
|
| |||||||||
INDUSTRIALS – 9.7% | ||||||||||
Boeing Co. / The (Aerospace & Defense) | 10,700 | 806,352 | ||||||||
General Dynamics Corp. (Aerospace & Defense) | 5,200 | 360,204 | ||||||||
Honeywell International, Inc. (Aerospace & Defense) | 12,300 | 780,681 | ||||||||
L-3 Communications Holdings, Inc. (Aerospace & Defense) | 1,500 | 114,930 | ||||||||
Lockheed Martin Corp. (Aerospace & Defense) | 4,200 | 387,618 | ||||||||
Northrop Grumman Corp. (Aerospace & Defense) | 3,900 | 263,562 | ||||||||
Precision Castparts Corp. (Aerospace & Defense) | 2,300 | 435,666 | ||||||||
Raytheon Co. (Aerospace & Defense) | 5,200 | 299,312 | ||||||||
Rockwell Collins, Inc. (Aerospace & Defense) | 2,200 | 127,974 | ||||||||
Textron, Inc. (Aerospace & Defense) | 4,400 | 109,076 | ||||||||
United Technologies Corp. (Aerospace & Defense) | 13,200 | 1,082,532 | ||||||||
C.H. Robinson Worldwide, Inc. (Air Freight & Logistics) | 2,500 | 158,050 | ||||||||
Expeditors International of Washington, Inc. (Air Freight & Logistics) | 3,300 | 130,515 | ||||||||
FedEx Corp. (Air Freight & Logistics) | 4,600 | 421,912 | ||||||||
United Parcel Service, Inc. Class B (Air Freight & Logistics) | 11,200 | 825,776 | ||||||||
Southwest Airlines Co. (Airlines) | 11,600 | 118,784 | ||||||||
Masco Corp. (Building Products) | 5,600 | 93,296 | ||||||||
ADT Corp. / The (Commercial Svs. & Supplies) | 3,650 | 169,689 | ||||||||
Avery Dennison Corp. (Commercial Svs. & Supplies) | 1,600 | 55,872 | ||||||||
Cintas Corp. (Commercial Svs. & Supplies) | 1,700 | 69,530 | ||||||||
Iron Mountain, Inc. (Commercial Svs. & Supplies) | 2,584 | 80,233 | ||||||||
Pitney Bowes, Inc. (Commercial Svs. & Supplies) | 3,200 | 34,048 | ||||||||
Republic Services, Inc. (Commercial Svs. & Supplies) | 4,680 | 137,264 | ||||||||
Stericycle, Inc. (Commercial Svs. & Supplies) | (a) | 1,300 | 121,251 | |||||||
Tyco International Ltd. (Commercial Svs. & Supplies) | 7,300 | 213,525 | ||||||||
Waste Management, Inc. (Commercial Svs. & Supplies) | 6,800 | 229,432 | ||||||||
Fluor Corp. (Construction & Engineering) | 2,600 | 152,724 | ||||||||
Jacobs Engineering Group, Inc. (Construction & Engineering) | (a) | 2,000 | 85,140 | |||||||
Quanta Services, Inc. (Construction & Engineering) | (a) | 3,300 | 90,057 | |||||||
Eaton Corp. PLC (Electrical Equip.) | 7,236 | 392,191 | ||||||||
Emerson Electric Co. (Electrical Equip.) | 11,400 | 603,744 | ||||||||
Rockwell Automation, Inc. (Electrical Equip.) | 2,200 | 184,778 | ||||||||
Roper Industries, Inc. (Electrical Equip.) | 1,500 | 167,220 | ||||||||
3M Co. (Industrial Conglomerates) | 10,000 | 928,500 | ||||||||
Danaher Corp. (Industrial Conglomerates) | 9,100 | 508,690 | ||||||||
General Electric Co. (Industrial Conglomerates) | 164,600 | 3,454,954 | ||||||||
Caterpillar, Inc. (Machinery) | 10,300 | 922,674 | ||||||||
Cummins, Inc. (Machinery) | 2,800 | 303,380 | ||||||||
| 52 | (continued) |
| Ohio National Fund, Inc. | S&P 500® Index Portfolio (Continued) |
Schedule of Investments | December 31, 2012 |
| Common Stocks (Continued) | Shares | Value | ||||||||
INDUSTRIALS (continued) | ||||||||||
Deere & Co. (Machinery) | 6,100 | $ | 527,162 | |||||||
Dover Corp. (Machinery) | 2,800 | 183,988 | ||||||||
Flowserve Corp. (Machinery) | 800 | 117,440 | ||||||||
Illinois Tool Works, Inc. (Machinery) | 6,700 | 407,427 | ||||||||
Ingersoll-Rand PLC (Machinery) | 4,400 | 211,024 | ||||||||
Joy Global, Inc. (Machinery) | 1,700 | 108,426 | ||||||||
PACCAR, Inc. (Machinery) | 5,512 | 249,198 | ||||||||
Pall Corp. (Machinery) | 1,700 | 102,442 | ||||||||
Parker Hannifin Corp. (Machinery) | 2,300 | 195,638 | ||||||||
Pentair Ltd. (Machinery) | 3,303 | 162,342 | ||||||||
Snap-on, Inc. (Machinery) | 900 | 71,091 | ||||||||
Stanley Black & Decker, Inc. (Machinery) | 2,647 | 195,799 | ||||||||
Xylem, Inc. (Machinery) | 2,900 | 78,590 | ||||||||
Dun & Bradstreet Corp. / The (Professional Svs.) | 700 | 55,055 | ||||||||
Equifax, Inc. (Professional Svs.) | 1,900 | 102,828 | ||||||||
Robert Half International, Inc. (Professional Svs.) | 2,200 | 70,004 | ||||||||
CSX Corp. (Road & Rail) | 16,200 | 319,626 | ||||||||
Norfolk Southern Corp. (Road & Rail) | 5,000 | 309,200 | ||||||||
Ryder System, Inc. (Road & Rail) | 800 | 39,944 | ||||||||
Union Pacific Corp. (Road & Rail) | 7,400 | 930,328 | ||||||||
Fastenal Co. (Trading Companies & Distributors) | 4,200 | 196,098 | ||||||||
W.W. Grainger, Inc. (Trading Companies & Distributors) | 900 | 182,133 | ||||||||
|
| |||||||||
| 20,236,919 | ||||||||||
|
| |||||||||
INFORMATION TECHNOLOGY – 18.3% | ||||||||||
Cisco Systems, Inc. (Communications Equip.) | 83,300 | 1,636,845 | ||||||||
F5 Networks, Inc. (Communications Equip.) | (a) | 1,200 | 116,580 | |||||||
Harris Corp. (Communications Equip.) | 1,800 | 88,128 | ||||||||
JDS Uniphase Corp. (Communications Equip.) | (a) | 3,675 | 49,760 | |||||||
Juniper Networks, Inc. (Communications Equip.) | (a) | 8,100 | 159,327 | |||||||
Motorola Solutions, Inc. (Communications Equip.) | 4,414 | 245,772 | ||||||||
QUALCOMM, Inc. (Communications Equip.) | 26,700 | 1,655,934 | ||||||||
Apple, Inc. (Computers & Peripherals) | 14,775 | 7,875,518 | ||||||||
Dell, Inc. (Computers & Peripherals) | 22,900 | 231,977 | ||||||||
EMC Corp. (Computers & Peripherals) | (a) | 33,100 | 837,430 | |||||||
Hewlett-Packard Co. (Computers & Peripherals) | 30,900 | 440,325 | ||||||||
NetApp, Inc. (Computers & Peripherals) | (a) | 5,600 | 187,880 | |||||||
SanDisk Corp. (Computers & Peripherals) | (a) | 3,800 | 165,528 | |||||||
Seagate Technology PLC (Computers & Peripherals) | 5,300 | 161,544 | ||||||||
Western Digital Corp. (Computers & Peripherals) | 3,400 | 144,466 | ||||||||
Amphenol Corp. Class A (Electronic Equip., Instr. & Comp.) | 2,500 | 161,750 | ||||||||
Corning, Inc. (Electronic Equip., Instr. & Comp.) | 23,200 | 292,784 | ||||||||
FLIR Systems, Inc. (Electronic Equip., Instr. & Comp.) | 2,400 | 53,544 | ||||||||
Jabil Circuit, Inc. (Electronic Equip., Instr. & Comp.) | 2,900 | 55,941 | ||||||||
Molex, Inc. (Electronic Equip., Instr. & Comp.) | 2,200 | 60,126 | ||||||||
TE Connectivity Ltd. (Electronic Equip., Instr. & Comp.) | 6,600 | 244,992 | ||||||||
Akamai Technologies, Inc. (Internet Software & Svs.) | (a) | 2,800 | 114,548 | |||||||
eBay, Inc. (Internet Software & Svs.) | (a) | 18,300 | 933,666 | |||||||
Google, Inc. Class A (Internet Software & Svs.) | (a) | 4,150 | 2,943,886 | |||||||
VeriSign, Inc. (Internet Software & Svs.) | (a) | 2,400 | 93,168 | |||||||
Yahoo!, Inc. (Internet Software & Svs.) | (a) | 16,300 | 324,370 | |||||||
Accenture PLC Class A (IT Svs.) | 10,000 | 665,000 | ||||||||
Automatic Data Processing, Inc. (IT Svs.) | 7,600 | 433,276 | ||||||||
Cognizant Technology Solutions Corp. Class A (IT Svs.) | (a) | 4,700 | 348,035 | |||||||
Computer Sciences Corp. (IT Svs.) | 2,400 | 96,120 | ||||||||
Fidelity National Information Services, Inc. (IT Svs.) | 3,900 | 135,759 | ||||||||
Fiserv, Inc. (IT Svs.) | (a) | 2,100 | 165,963 | |||||||
International Business Machines Corp. (IT Svs.) | 16,650 | 3,189,308 | ||||||||
Mastercard, Inc. Class A (IT Svs.) | 1,675 | 822,894 | ||||||||
Paychex, Inc. (IT Svs.) | 5,100 | 158,814 | ||||||||
SAIC, Inc. (IT Svs.) | 4,500 | 50,940 | ||||||||
Teradata Corp. (IT Svs.) | (a) | 2,700 | 167,103 | |||||||
Total System Services, Inc. (IT Svs.) | 2,477 | 53,057 | ||||||||
Visa, Inc. (IT Svs.) | 8,200 | 1,242,956 | ||||||||
Western Union Co. / The (IT Svs.) | 9,347 | 127,213 | ||||||||
| Common Stocks (Continued) | Shares | Value | ||||||||
INFORMATION TECHNOLOGY (continued) | ||||||||||
Xerox Corp. (Office Electronics) | 19,802 | $ | 135,050 | |||||||
Advanced Micro Devices, Inc. (Semiconductors & Equip.) | (a) | 9,500 | 22,800 | |||||||
Altera Corp. (Semiconductors & Equip.) | 5,000 | 172,200 | ||||||||
Analog Devices, Inc. (Semiconductors & Equip.) | 4,700 | 197,682 | ||||||||
Applied Materials, Inc. (Semiconductors & Equip.) | 18,800 | 215,072 | ||||||||
Broadcom Corp. Class A (Semiconductors & Equip.) | 8,150 | 270,662 | ||||||||
First Solar, Inc. (Semiconductors & Equip.) | (a) | 950 | 29,336 | |||||||
Intel Corp. (Semiconductors & Equip.) | 78,100 | 1,611,203 | ||||||||
KLA-Tencor Corp. (Semiconductors & Equip.) | 2,600 | 124,176 | ||||||||
Lam Research Corp. (Semiconductors & Equip.) | (a) | 2,725 | 98,454 | |||||||
Linear Technology Corp. (Semiconductors & Equip.) | 3,600 | 123,480 | ||||||||
LSI Corp. (Semiconductors & Equip.) | (a) | 8,700 | 61,596 | |||||||
Microchip Technology, Inc. (Semiconductors & Equip.) | 3,100 | 101,029 | ||||||||
Micron Technology, Inc. (Semiconductors & Equip.) | (a) | 16,000 | 101,600 | |||||||
NVIDIA Corp. (Semiconductors & Equip.) | 9,800 | 120,442 | ||||||||
Teradyne, Inc. (Semiconductors & Equip.) | (a) | 2,900 | 48,981 | |||||||
Texas Instruments, Inc. (Semiconductors & Equip.) | 17,600 | 544,544 | ||||||||
Xilinx, Inc. (Semiconductors & Equip.) | 4,100 | 147,190 | ||||||||
Adobe Systems, Inc. (Software) | (a) | 7,800 | 293,904 | |||||||
Autodesk, Inc. (Software) | (a) | 3,500 | 123,725 | |||||||
BMC Software, Inc. (Software) | (a) | 2,200 | 87,252 | |||||||
CA, Inc. (Software) | 5,300 | 116,494 | ||||||||
Citrix Systems, Inc. (Software) | (a) | 2,900 | 190,675 | |||||||
Electronic Arts, Inc. (Software) | (a) | 4,800 | 69,744 | |||||||
Intuit, Inc. (Software) | 4,400 | 261,800 | ||||||||
Microsoft Corp. (Software) | 118,900 | 3,178,197 | ||||||||
Oracle Corp. (Software) | 59,000 | 1,965,880 | ||||||||
Red Hat, Inc. (Software) | (a) | 3,000 | 158,880 | |||||||
Salesforce.com, Inc. (Software) | (a) | 2,100 | 353,010 | |||||||
Symantec Corp. (Software) | (a) | 10,894 | 204,916 | |||||||
|
| |||||||||
| 38,062,201 | ||||||||||
|
| |||||||||
MATERIALS – 3.5% | ||||||||||
Air Products & Chemicals, Inc. (Chemicals) | 3,300 | 277,266 | ||||||||
Airgas, Inc. (Chemicals) | 1,100 | 100,419 | ||||||||
CF Industries Holdings, Inc. (Chemicals) | 1,000 | 203,160 | ||||||||
Dow Chemical Co. / The (Chemicals) | 18,800 | 607,616 | ||||||||
Eastman Chemical Co. (Chemicals) | 2,400 | 163,320 | ||||||||
Ecolab, Inc. (Chemicals) | 4,100 | 294,790 | ||||||||
E.I. du Pont de Nemours & Co. (Chemicals) | 14,600 | 656,562 | ||||||||
FMC Corp. (Chemicals) | 2,200 | 128,744 | ||||||||
International Flavors & Fragrances, Inc. (Chemicals) | 1,300 | 86,502 | ||||||||
LyondellBasell Industries NV Class A (Chemicals) | 6,000 | 342,540 | ||||||||
Monsanto Co. (Chemicals) | 8,386 | 793,735 | ||||||||
Mosaic Co. / The (Chemicals) | 4,300 | 243,509 | ||||||||
PPG Industries, Inc. (Chemicals) | 2,400 | 324,840 | ||||||||
Praxair, Inc. (Chemicals) | 4,700 | 514,415 | ||||||||
Sherwin-Williams Co. / The (Chemicals) | 1,300 | 199,966 | ||||||||
Sigma-Aldrich Corp. (Chemicals) | 1,900 | 139,802 | ||||||||
Vulcan Materials Co. (Construction Materials) | 2,000 | 104,100 | ||||||||
Ball Corp. (Containers & Packaging) | 2,400 | 107,400 | ||||||||
Bemis Co., Inc. (Containers & Packaging) | 1,600 | 53,536 | ||||||||
Owens-Illinois, Inc. (Containers & Packaging) | (a) | 2,600 | 55,302 | |||||||
Sealed Air Corp. (Containers & Packaging) | 3,100 | 54,281 | ||||||||
Alcoa, Inc. (Metals & Mining) | 16,800 | 145,824 | ||||||||
Allegheny Technologies, Inc. (Metals & Mining) | 1,700 | 51,612 | ||||||||
Cliffs Natural Resources, Inc. (Metals & Mining) | 2,200 | 84,832 | ||||||||
Freeport-McMoRan Copper & Gold, Inc. (Metals & Mining) | 14,852 | 507,938 | ||||||||
Newmont Mining Corp. (Metals & Mining) | 7,800 | 362,232 | ||||||||
Nucor Corp. (Metals & Mining) | 5,000 | 215,900 | ||||||||
Titanium Metals Corp. (Metals & Mining) | 1,200 | 19,812 | ||||||||
United States Steel Corp. (Metals & Mining) | 2,300 | 54,901 | ||||||||
International Paper Co. (Paper & Forest Products) | 6,900 | 274,896 | ||||||||
MeadWestvaco Corp. (Paper & Forest Products) | 2,700 | 86,049 | ||||||||
|
| |||||||||
| 7,255,801 | ||||||||||
|
| |||||||||
| 53 | (continued) |
| Ohio National Fund, Inc. | S&P 500® Index Portfolio (Continued) |
Schedule of Investments | December 31, 2012 |
| Common Stocks (Continued) | Shares | Value | ||||||||
TELECOMMUNICATION SERVICES – 2.9% | ||||||||||
AT&T, Inc. (Diversified Telecom. Svs.) | 89,178 | $ | 3,006,190 | |||||||
CenturyLink, Inc. (Diversified Telecom. Svs.) | 9,772 | 382,281 | ||||||||
Frontier Communications Corp. (Diversified Telecom. Svs.) | 15,641 | 66,943 | ||||||||
Verizon Communications, Inc. (Diversified Telecom. Svs.) | 44,800 | 1,938,496 | ||||||||
Windstream Corp. (Diversified Telecom. Svs.) | 9,196 | 76,143 | ||||||||
Crown Castle International Corp. (Wireless Telecom. Svs.) | (a) | 4,600 | 331,936 | |||||||
MetroPCS Communications, Inc. (Wireless Telecom. Svs.) | (a) | 5,000 | 49,700 | |||||||
Sprint Nextel Corp. (Wireless Telecom. Svs.) | (a) | 47,132 | 267,238 | |||||||
|
| |||||||||
| 6,118,927 | ||||||||||
|
| |||||||||
UTILITIES – 3.3% | ||||||||||
American Electric Power Co., Inc. (Electric Utilities) | 7,600 | 324,368 | ||||||||
Duke Energy Corp. (Electric Utilities) | 11,043 | 704,543 | ||||||||
Edison International (Electric Utilities) | 5,100 | 230,469 | ||||||||
Entergy Corp. (Electric Utilities) | 2,800 | 178,500 | ||||||||
Exelon Corp. (Electric Utilities) | 13,390 | 398,219 | ||||||||
FirstEnergy Corp. (Electric Utilities) | 6,534 | 272,860 | ||||||||
NextEra Energy, Inc. (Electric Utilities) | 6,600 | 456,654 | ||||||||
Northeast Utilities (Electric Utilities) | 4,900 | 191,492 | ||||||||
Pepco Holdings, Inc. (Electric Utilities) | 3,600 | 70,596 | ||||||||
Pinnacle West Capital Corp. (Electric Utilities) | 1,700 | 86,666 | ||||||||
PPL Corp. (Electric Utilities) | 9,100 | 260,533 | ||||||||
Southern Co. / The (Electric Utilities) | 13,700 | 586,497 | ||||||||
Xcel Energy, Inc. (Electric Utilities) | 7,700 | 205,667 | ||||||||
AGL Resources, Inc. (Gas Utilities) | 1,886 | 75,383 | ||||||||
ONEOK, Inc. (Gas Utilities) | 3,200 | 136,800 | ||||||||
| Common Stocks (Continued) | Shares | Value | ||||||||
UTILITIES (continued) | ||||||||||
AES Corp. (Ind. Power Prod. & Energy Traders) | 9,700 | $ | 103,790 | |||||||
NRG Energy, Inc. (Ind. Power Prod. & Energy Traders) | 5,100 | 117,249 | ||||||||
Ameren Corp. (Multi-Utilities) | 3,800 | 116,736 | ||||||||
CenterPoint Energy, Inc. (Multi-Utilities) | 6,700 | 128,975 | ||||||||
CMS Energy Corp. (Multi-Utilities) | 4,100 | 99,958 | ||||||||
Consolidated Edison, Inc. (Multi-Utilities) | 4,600 | 255,484 | ||||||||
Dominion Resources, Inc. (Multi-Utilities) | 9,000 | 466,200 | ||||||||
DTE Energy Co. (Multi-Utilities) | 2,700 | 162,135 | ||||||||
Integrys Energy Group, Inc. (Multi-Utilities) | 1,212 | 63,291 | ||||||||
NiSource, Inc. (Multi-Utilities) | 4,900 | 121,961 | ||||||||
PG&E Corp. (Multi-Utilities) | 6,700 | 269,206 | ||||||||
Public Service Enterprise Group, Inc. (Multi-Utilities) | 7,900 | 241,740 | ||||||||
SCANA Corp. (Multi-Utilities) | 2,100 | 95,844 | ||||||||
Sempra Energy (Multi-Utilities) | 3,500 | 248,290 | ||||||||
TECO Energy, Inc. (Multi-Utilities) | 3,200 | 53,632 | ||||||||
Wisconsin Energy Corp. (Multi-Utilities) | 3,600 | 132,660 | ||||||||
|
| |||||||||
| 6,856,398 | ||||||||||
|
| |||||||||
Total Common Stocks (Cost $153,938,003) | $ | 199,927,026 | ||||||||
|
| |||||||||
| Exchange Traded Funds – 3.8% | Shares | Value | ||||||||
SPDR S&P 500 ETF Trust | 55,275 | $ | 7,877,793 | |||||||
|
| |||||||||
Total Exchange Traded Funds (Cost $7,743,030) | $ | 7,877,793 | ||||||||
|
| |||||||||
Total Investments – 100.0% (Cost $161,681,033) | (b) | $ | 207,804,819 | |||||||
Liabilities in Excess of Other Assets – (0.0)% | (24,299) | |||||||||
|
| |||||||||
Net Assets – 100.0% | $ | 207,780,520 | ||||||||
|
| |||||||||
Percentages are stated as a percent of net assets.
Footnotes:
| (a) | Non-income producing security. |
| (b) | Represents cost for financial reporting purposes, which may differ from cost basis for federal income tax purposes. See also Note 7 of the Notes to Financial Statements. |
The accompanying notes are an integral part of these financial statements.
| 54 |
| Ohio National Fund, Inc. | Strategic Value Portfolio |
Objective/Strategy
The Strategic Value Portfolio seeks growth of capital and income by investing primarily in securities of high dividend yielding, undervalued stocks with dividend growth potential.
Performance as of December 31, 2012
Average Annual Total Returns: | ||||
One year | 7.21% | |||
Five years | 1.84% | |||
Ten years | 5.39% |
Past performance does not guarantee future results. The performance data quoted represents past performance and current returns may be lower or higher. Total return figures include change in share price and reinvestment of dividends and capital gains. The investment return and principal value will fluctuate so that an investor’s shares, when redeemed, may be worth more or less than the original cost. To obtain performance information up to the most recent month end, call toll-free 1-877-781-6392.
The Portfolio is not open to direct retail investment. Beneficial interest in shares is obtained solely by purchase of variable life insurance policies and variable annuity contracts. Actual performance results for variable annuity and variable universal life contracts will be lower due to contract charges. Consult your contract for applicable charges.
Comments
For the year ended December 31, 2012, the Strategic Value Portfolio returned 7.21% versus 10.84% for the current benchmark, the Dow Jones U.S. Select Dividend Index (DJSDI).
At the onset of 2012, equities were driven higher by better-than-expected economic reports and further easing of EuroZone concerns. The Federal Reserve also contributed to the market’s optimistic tone, as it hinted toward the possibility of a third round of quantitative easing (QE3).
The markets reversed course as the second quarter of 2012 began. Much of the major economic data disappointed as job growth slowed, jobless claims rose, business investment tailed off, and the initial read on first quarter gross domestic product (GDP) came in below expectations. There were some positives, such as good corporate earnings and robust consumer spending, but the negative data points, combined with concerns about Europe, were enough to stall the equity market’s sprint out of 2012’s gate.
At mid-year, European Union (EU) leaders defied expectations and agreed to the immediate and direct use of bailout funds to aid struggling European banks. The EU leaders’ agreement also dictated that a central EuroZone authority would be created to oversee the region’s banks. Even though the details of these measures still needed to be ironed out, the agreement reduced uncertainty in the markets and consequently catapulted stocks higher.
Despite weakening economic reports, stocks continued to rise during the third quarter, driven largely by the Federal Reserve’s actions. At its September meeting, the Federal Reserve unveiled QE3, which surprised many in its magnitude. Unlike the past two rounds of quantitative easing, QE3 did not specify time limits or dollar limits to its actions. Thus, the move became known as “QE Infinity.” The Federal Reserve also extended its 0% target funds rate policy to at least mid-2015 from the previous late-2014 date.
The calendar year ended with equity prices on a downward course, as multiple factors drove stocks lower. Domestically, corporate earnings were largely disappointing, and the upcoming U.S. fiscal
cliff increased investor anxiety. Elsewhere, the EuroZone was battling through a recession and China was experiencing a slowdown.
The Portfolio pursues capital appreciation derived from dividend growth and a high level of current dividend income while targeting less risk. The Portfolio did well in accomplishing its dividend yield and dividend growth targets. The Portfolio ended the year with a gross dividend yield of 4.9%, which was well above that of both the S&P 500 Index, at 2.3%, and the DJSDI, at 4.0%. Additionally, dividend growth was strong as the Portfolio’s holdings experienced thirty three dividend increases and one special dividend. Within the Portfolio, companies announcing some of the highest dividend increases included: Lorillard, Inc., Chevron Corp., Phillip Morris International, and McDonald’s Corp., which raised their dividends by 19.2%, 11.1%, 10.4%, and 10.0%, respectively. The special dividend came courtesy of GlaxoSmithKline PLC following the sale of several of the company’s non-core, over-the-counter brands. The Portfolio also experienced no dividend cuts in the year.(1)
The Portfolio invests in high quality, high-yielding, defensive stocks in order to meet its objectives of delivering capital appreciation driven by dividend growth, a high dividend yield, and lower downside risk. Sectors containing stocks that fit this description were out of favor for much of the year and turned out to be the biggest detractors from relative performance. These sectors included Utilities, Energy, and Consumer Staples that returned 1.4%, 4.6%, and 10.8%, respectively. The highest returns in the broad market were found in Financials and Consumer Discretionary, which posted total returns of 28.8% and 23.9%, respectively. The Portfolio had little to no exposure to these sectors as they provide little in the way of reliable dividend opportunity.(1)
Regardless of market preferences, most sectors within the Portfolio contributed positively to the Portfolio’s total return. The largest contributions came from the Health Care and Consumer Staples sectors, which returned 10.6% and 11.4%, respectively. These non-cyclical, dividend-friendly sectors were led by Abbott Laboratories (+32.3%) and Eli Lilly & Co. (+24.3%) in Health Care and Kimberly-Clark Corp. and Unilever PLC (+19.0% each) in Consumer Staples. To the detriment of the Portfolio, previously held stocks Telefonica SA (-21.4%) and Exelon Corp. (-22.0%) detracted from overall performance due to stock-specific events.(1)
In a year marked by dramatic swings in investor preferences, the Portfolio was steadfast in its pursuit of high dividend income and dividend growth. As a result, the Portfolio’s performance did not track closely to any benchmark for the year. This was evidenced by the Portfolio’s low weighted-average 5-year beta of 0.55 versus the S&P 500 Index. This low beta indicates that the Portfolio does not move lock-step with the market, typically falling less in times of market distress and rising less during the sharp market rallies that are typically characterized by investor preferences for low-quality, low-yielding stocks.(1)
In late 2012, market performance was rather muted as uncertainty over a positive resolution to the fiscal cliff stifled investor enthusiasm. 2013 has offered a satisfying start for the dividend investor, however. While U.S. income and capital gains taxes will increase for the highest earners, we were pleased to see that rates were increased to 23.8% rather than the 43.6% initially feared. Of greater consequence, dividends will continue to enjoy equal footing with capital gains and will not suffer under a punitive tax differential. The markets have reacted positively to this news.
| 55 | (continued) |
| Ohio National Fund, Inc. | Strategic Value Portfolio (Continued) |
Regardless of what occurs in the future, the Portfolio provides a consistent, unwavering approach to investing, focusing on the basic principle that dividend yield and dividend growth are the drivers of long-term total return. With a portfolio comprised of high quality, high-yielding, defensive stocks that consistently and reliably pay and increase their dividends to shareholders, we believe that the Portfolio is able to provide investors with both a generous income stream and a strategy positioned to achieve superior long-term total returns.
| (1) | The Portfolio’s composition is subject to change. Holdings and weightings are as of December 31, 2012. |
Change in Value of $10,000 Investment
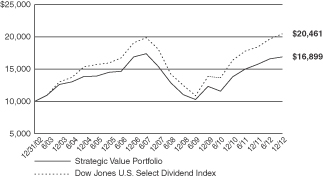
Hypothetical illustration based on past performance. Future performance will vary. The Portfolio’s returns reflect reinvested dividends. The Portfolio’s holdings may differ significantly from the securities in the index. The index is unmanaged and therefore does not reflect the cost of portfolio management and accounting.
The Dow Jones U.S. Select Dividend Index is comprised of all dividend-paying companies in the Dow Jones U.S. Index that have a non-negative historical five-year dividend-per-share growth rate, a five-year average dividend to earnings-per-share ratio of less than or equal to 60%, paid dividends in each of the previous five years, and a three-month average daily trading volume of 200,000 shares. Current index components are included in the universe regardless of their dividend payout ratio or trading volume. The Dow Jones U.S. Index aims to consistently represent the top 95% of U.S. companies based on float-adjusted market capitalization, excluding non common issues and illiquid stocks. The index presented includes the effects of reinvested dividends.
Portfolio Composition as of December 31, 2012 (1)
| % of Net Assets | ||||
Common Stocks (3) | 96.4 | |||
Money Market Funds and | 3.6 | |||
|
| |||
| 100.0 | ||||
|
|
Top 10 Portfolio Holdings as of December 31, 2012 (1) (2)
| % of Net Assets | ||||
1. ConocoPhillips | 4.5 | |||
2. AstraZeneca PLC | 4.3 | |||
3. National Grid PLC | 4.3 | |||
4. GlaxoSmithKline PLC | 4.1 | |||
5. Royal Dutch Shell PLC | 4.0 | |||
6. Verizon Communications, Inc. | 3.8 | |||
7. Vodafone Group PLC - ADR | 3.8 | |||
8. Altria Group, Inc. | 3.7 | |||
9. CenturyLink, Inc. | 3.7 | |||
10. Duke Energy Corp. | 3.6 |
| (1) | Composition of Portfolio subject to change. |
| (2) | Short-term investments have been excluded from the list of Top 10 Portfolio Holdings. |
| (3) | Sectors: |
| % of Net Assets | ||||
Consumer Staples | 26.0 | |||
Health Care | 19.4 | |||
Utilities | 19.3 | |||
Telecommunication Services | 16.9 | |||
Energy | 12.5 | |||
Consumer Discretionary | 2.3 | |||
|
| |||
| 96.4 | ||||
|
|
| 56 |
| Ohio National Fund, Inc. | Strategic Value Portfolio |
Schedule of Investments | December 31, 2012 |
| Common Stocks – 96.4% | Shares | Value | ||||||||
CONSUMER DISCRETIONARY – 2.3% | ||||||||||
McDonald’s Corp. (Hotels, Restaurants & Leisure) | 69,125 | $ | 6,097,516 | |||||||
|
| |||||||||
CONSUMER STAPLES – 26.0% | ||||||||||
Coca-Cola Co. / The (Beverages) | 47,630 | 1,726,588 | ||||||||
PepsiCo, Inc. (Beverages) | 55,500 | 3,797,865 | ||||||||
General Mills, Inc. (Food Products) | 75,700 | 3,059,037 | ||||||||
H.J. Heinz Co. (Food Products) | 110,775 | 6,389,502 | ||||||||
Kellogg Co. (Food Products) | 126,800 | 7,081,780 | ||||||||
Kraft Foods Group, Inc. (Food Products) | 173,600 | 7,893,592 | ||||||||
Unilever PLC (Food Products) | (a) | 75,160 | 2,921,552 | |||||||
Kimberly-Clark Corp. (Household Products) | 61,875 | 5,224,106 | ||||||||
Procter & Gamble Co. / The (Household Products) | 87,160 | 5,917,292 | ||||||||
Altria Group, Inc. (Tobacco) | 316,200 | 9,935,004 | ||||||||
Lorillard, Inc. (Tobacco) | 32,350 | 3,774,275 | ||||||||
Philip Morris International, Inc. (Tobacco) | 34,235 | 2,863,416 | ||||||||
Reynolds American, Inc. (Tobacco) | 224,220 | 9,289,435 | ||||||||
|
| |||||||||
| 69,873,444 | ||||||||||
|
| |||||||||
ENERGY – 12.5% | ||||||||||
Chevron Corp. (Oil, Gas & Consumable Fuels) | 25,150 | 2,719,721 | ||||||||
ConocoPhillips (Oil, Gas & Consumable Fuels) | 205,905 | 11,940,431 | ||||||||
Royal Dutch Shell PLC (Oil, Gas & Consumable Fuels) | (a) | 301,720 | 10,764,314 | |||||||
Total SA (Oil, Gas & Consumable Fuels) | (a) | 154,220 | 8,024,559 | |||||||
|
| |||||||||
| 33,449,025 | ||||||||||
|
| |||||||||
HEALTH CARE – 19.4% | ||||||||||
AstraZeneca PLC (Pharmaceuticals) | (a) | 244,500 | 11,586,844 | |||||||
Bristol-Myers Squibb Co. (Pharmaceuticals) | 276,775 | 9,020,097 | ||||||||
Eli Lilly & Co. (Pharmaceuticals) | 137,400 | 6,776,568 | ||||||||
GlaxoSmithKline PLC (Pharmaceuticals) | (a) | 509,816 | 11,099,924 | |||||||
Johnson & Johnson (Pharmaceuticals) | 113,660 | 7,967,566 | ||||||||
Merck & Co., Inc. (Pharmaceuticals) | 140,400 | 5,747,976 | ||||||||
|
| |||||||||
| 52,198,975 | ||||||||||
|
| |||||||||
| Common Stocks (Continued) | Shares | Value | ||||||||
TELECOMMUNICATION SERVICES – 16.9% | ||||||||||
AT&T, Inc. (Diversified Telecom. Svs.) | 253,000 | $ | 8,528,630 | |||||||
BCE, Inc. (Diversified Telecom. Svs.) | 94,080 | 4,032,000 | ||||||||
CenturyLink, Inc. (Diversified Telecom. Svs.) | 251,325 | 9,831,834 | ||||||||
Verizon Communications, Inc. (Diversified Telecom. Svs.) | 234,120 | 10,130,372 | ||||||||
Windstream Corp. (Diversified Telecom. Svs.) | 314,105 | 2,600,789 | ||||||||
Vodafone Group PLC – ADR (Wireless Telecom. Svs.) | 401,170 | 10,105,472 | ||||||||
|
| |||||||||
| 45,229,097 | ||||||||||
|
| |||||||||
UTILITIES – 19.3% | ||||||||||
American Electric Power Co., Inc. (Electric Utilities) | 97,100 | 4,144,228 | ||||||||
Duke Energy Corp. (Electric Utilities) | 153,206 | 9,774,543 | ||||||||
PPL Corp. (Electric Utilities) | 305,300 | 8,740,739 | ||||||||
Southern Co. / The (Electric Utilities) | 163,360 | 6,993,442 | ||||||||
SSE PLC (Electric Utilities) | (a) | 387,100 | 9,005,583 | |||||||
Dominion Resources, Inc. (Multi-Utilities) | 29,025 | 1,503,495 | ||||||||
National Grid PLC (Multi-Utilities) | (a) | 1,002,100 | 11,493,559 | |||||||
|
| |||||||||
| 51,655,589 | ||||||||||
|
| |||||||||
Total Common Stocks (Cost $256,823,554) | $ | 258,503,646 | ||||||||
|
| |||||||||
| Money Market Funds – 0.5% | Shares | Value | ||||||||
Fidelity Institutional Money Market Funds | 1,331,000 | $ | 1,331,000 | |||||||
|
| |||||||||
Total Money Market Funds (Cost $1,331,000) | $ | 1,331,000 | ||||||||
|
| |||||||||
Total Investments – 96.9% (Cost $258,154,554) | (b) | $ | 259,834,646 | |||||||
Other Assets in Excess of Liabilities – 3.1% | 8,329,064 | |||||||||
|
| |||||||||
Net Assets – 100.0% | $ | 268,163,710 | ||||||||
|
| |||||||||
Percentages are stated as a percent of net assets.
Abbreviations:
ADR: American Depositary Receipts
Footnotes:
| (a) | Security traded on a foreign exchange has been valued at an estimate of fair value that is different than the local market close price. These fair value estimates are determined by an independent fair valuation service that has been approved by the Board. These securities represent $64,896,335, or 24.2% of the Portfolio’s net assets. |
Other Portfolio securities are not subjected to fair value procedures because they are traded on domestic or foreign exchanges that have close times that are consistent with the U.S. market close, normally 4:00 pm Eastern Time.
| (b) | Represents cost for financial reporting purposes, which may differ from cost basis for federal income tax purposes. See also Note 7 of the Notes to Financial Statements. |
The accompanying notes are an integral part of these financial statements.
| 57 |
| Ohio National Fund, Inc. | High Income Bond Portfolio |
Objective/Strategy
The High Income Bond Portfolio seeks high current income by investing at least 80% of its net assets in lower rated corporate debt obligations commonly referred to as “junk bonds”. The Portfolio’s investments are generally rated Ba or lower by Moody’s, or BB or lower by Standard & Poor’s or Fitch.
Performance as of December 31, 2012
Average Annual Total Returns: | ||||
One year | 14.34% | |||
Five years | 8.91% | |||
Ten years | 9.35% |
Past performance does not guarantee future results. The performance data quoted represents past performance and current returns may be lower or higher. Total return figures include change in share price and reinvestment of dividends and capital gains. The investment return and principal value will fluctuate so that an investor’s shares, when redeemed, may be worth more or less than the original cost. To obtain performance information up to the most recent month end, call toll-free 1-877-781-6392.
The Portfolio is not open to direct retail investment. Beneficial interest in shares is obtained solely by purchase of variable life insurance policies and variable annuity contracts. Actual performance results for variable annuity and variable universal life contracts will be lower due to contract charges. Consult your contract for applicable charges.
Comments
For the year ended December 31, 2012, the High Income Bond Portfolio returned 14.34% versus 15.78% for the current benchmark, the Barclays Capital U.S. Corporate High Yield 2% Issuer Capped Index (“BCHY2%”).
The high yield market had its fourth straight year of attractive total returns in 2012. Several factors led to the attractive returns. First, the U.S. economy continued to experience slow but positive growth despite very weak economic conditions in Europe and concerns about the fiscal cliff in the U.S. Also, worldwide central banks adopted aggressive, pro-growth policies designed to ward off recession. In addition, corporate credit measures, led by expanding earnings and cash flow, remained strong resulting in below average default rates. Finally, low interest rates on a global scale encouraged investors to increase their risk appetite, resulting in strong demand for high yield securities. The benefit of these factors can be illustrated by the decline in the yield spread between high yield bonds and U.S. Treasury securities which, according to the Credit Suisse High Yield Bond Index, went from 728 basis points on December 31, 2011 to 554 basis points on December 31, 2012.
Within the high-yield market, major industry sectors that substantially out-performed the overall BCHY2% included home construction, wireless telecommunications, financial institutions, and building materials and services. Major industry sectors that substantially underperformed the overall BCHY2% included metals, consumer products, energy, media cable, and electric utilities. Consistent with the strong absolute total returns for the BCHY2%, the lowest quality CCC-rated sector led the way, returning 18.34%, followed by the B-rated sector, which returned 15.53%. The highest quality BB-rated sector lagged the other two ratings sectors at a still attractive absolute return of 14.49%.
The Portfolio’s relative performance was negatively impacted by poor security selection in the consumer products, technology, and chemical sectors. Poor security section and an underweight within the strong performing financial institution segment also negatively
impacted returns. An underweight within the strong performing home construction sector also detracted from relative performance. The Portfolio’s cash position also negatively impacted returns, given low cash rates and strong returns for the overall market. Specific Portfolio holdings that substantially underperformed the BCHY2% included: ATP Oil & Gas Corp., Edison Mission Energy, Advanced Micro Devices, Inc., Allen Systems Group, Inc., and Altegrity, Inc.(1)
The Portfolio benefitted from strong security selection in the healthcare, building material, packaging, and retail sectors. The Portfolio was also helped by an underweight within the poor performing metals & mining, media-cable, energy, and supermarket sectors. Specific Portfolio holdings that substantially out-performed the BCHY2% included: Sprint Capital Corp., Lawson Software, Inc., DJO Finance LLC, Ply Gem Industries, Inc., and Ally Financial, Inc.(1)
| (1) | The Portfolio’s composition is subject to change. Holdings and weightings are as of December 31, 2012. |
Change in Value of $10,000 Investment
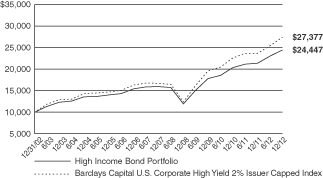
Hypothetical illustration based on past performance. Future performance will vary. All returns reflect reinvested dividends. The Portfolio’s holdings may differ significantly from the securities in the index. The index is unmanaged and therefore does not reflect the cost of Portfolio management or trading. Neither the Portfolio nor the index is open to direct investment.
The Barclays Capital U.S. Corporate High Yield 2% Issuer Capped Index is the 2% Issuer Cap component of the Barclays Capital U.S. Corporate High Yield Bond Index. The Barclays Capital U.S. Corporate High Yield Bond Index is an unmanaged index that includes all fixed income securities having a maximum quality rating of Ba1/BB+/BB+, a minimum amount outstanding of $150 million, and a least 1 year to maturity. The 2% Issuer Cap component limits the exposure of each issuer to 2% of the total market value and distributes any excess market value index–wide on a pro–rata basis. The index is presented on a total return basis.
| 58 | (continued) |
| Ohio National Fund, Inc. | High Income Bond Portfolio (Continued) |
Portfolio Composition as of December 31, 2012 (1)
| % of Net Assets | ||||
Corporate Bonds (3) | 98.2 | |||
Preferred Stocks (3) | 0.1 | |||
Money Market Funds and | 1.7 | |||
|
| |||
| 100.0 | ||||
|
|
Top 10 Portfolio Holdings as of December 31, 2012 (1)(2)
| % of Net Assets | ||||
1. HCA, Inc. | 1.0 | |||
2. First Data Corp. | 0.9 | |||
3. Sprint Capital Corp. | 0.9 | |||
4. Ally Financial, Inc. | 0.9 | |||
5. U.S. Foodservice | 0.8 | |||
6. International Lease Finance Corp. | 0.8 | |||
7. Michael Foods Group, Inc. | 0.7 | |||
8. Energy Transfer Equity LP | 0.7 | |||
9. CDW LLC / CDW Finance Corp. | 0.6 | |||
10. Multiplan, Inc. | 0.6 |
| (1) | Composition of Portfolio subject to change. |
| (2) | Short-term investments have been excluded from the list of Top 10 Portfolio Holdings. |
| (3) | Sectors (combined): |
| % of Net Assets | ||||
Consumer Discretionary | 28.2 | |||
Industrials | 12.1 | |||
Energy | 11.8 | |||
Information Technology | 10.6 | |||
Health Care | 10.6 | |||
Materials | 7.6 | |||
Financials | 5.2 | |||
Telecommunication Services | 5.2 | |||
Consumer Staples | 5.2 | |||
Utilities | 1.8 | |||
|
| |||
| 98.3 | ||||
|
|
| 59 |
| Ohio National Fund, Inc. | High Income Bond Portfolio |
Schedule of Investments | December 31, 2012 |
| Corporate Bonds – 98.2% | Rate | Maturity | Face Amount | Value | ||||||||||||
CONSUMER DISCRETIONARY – 28.2% | ||||||||||||||||
Allison Transmission, Inc. (Auto Components) | (b) | 7.125% | 05/15/2019 | $ | 600,000 | $ | 643,500 | |||||||||
American Axle & Manufacturing, Inc. (Auto Components) | 7.750% | 11/15/2019 | 625,000 | 681,250 | ||||||||||||
American Axle & Manufacturing, Inc. (Auto Components) | 6.625% | 10/15/2022 | 700,000 | 714,000 | ||||||||||||
American Tire Distributors, Inc. (Auto Components) | 9.750% | 06/01/2017 | 175,000 | 186,375 | ||||||||||||
Cooper-Standard Automotive, Inc. (Auto Components) | 8.500% | 05/01/2018 | 775,000 | 837,000 | ||||||||||||
Exide Technologies (Auto Components) | 8.625% | 02/01/2018 | 1,400,000 | 1,193,500 | ||||||||||||
IDQ Holdings, Inc. (Auto Components) | (b) | 11.500% | 04/01/2017 | 600,000 | 649,500 | |||||||||||
International Automotive Components Group SL (Auto Components) | (b) | 9.125% | 06/01/2018 | 1,200,000 | 1,119,000 | |||||||||||
J.B. Poindexter & Co., Inc. (Auto Components) | (b) | 9.000% | 04/01/2022 | 825,000 | 856,969 | |||||||||||
Pittsburgh Glass Works LLC (Auto Components) | (b) | 8.500% | 04/15/2016 | 1,100,000 | 1,017,500 | |||||||||||
Stoneridge, Inc. (Auto Components) | (b) | 9.500% | 10/15/2017 | 725,000 | 775,750 | |||||||||||
Tenneco, Inc. (Auto Components) | 7.750% | 08/15/2018 | 325,000 | 354,250 | ||||||||||||
Tenneco, Inc. (Auto Components) | 6.875% | 12/15/2020 | 450,000 | 492,187 | ||||||||||||
Tomkins LLC (Auto Components) | 9.000% | 10/01/2018 | 576,000 | 648,000 | ||||||||||||
Tower Automotive Holdings U.S.A. LLC / T.A. Holdings Finance, Inc. (Auto Components) | (b) | 10.625% | 09/01/2017 | 700,000 | 770,000 | |||||||||||
UCI International, Inc. (Auto Components) | 8.625% | 02/15/2019 | 1,675,000 | 1,668,719 | ||||||||||||
Chrysler Group LLC / CG Co-Issuer, Inc. (Automobiles) | 8.250% | 06/15/2021 | 850,000 | 939,250 | ||||||||||||
Jaguar Land Rover PLC (Automobiles) | (b) | 8.125% | 05/15/2021 | 1,150,000 | 1,270,750 | |||||||||||
Affinia Group, Inc. (Distributors) | (b) | 10.750% | 08/15/2016 | 245,000 | 266,131 | |||||||||||
Affinia Group, Inc. (Distributors) | 9.000% | 11/30/2014 | 875,000 | 877,187 | ||||||||||||
Knowledge Learning Corp. (Diversified Consumer Svs.) | (b) | 7.750% | 02/01/2015 | 550,000 | 514,250 | |||||||||||
Monitronics International, Inc. (Diversified Consumer Svs.) | 9.125% | 04/01/2020 | 650,000 | 672,750 | ||||||||||||
ServiceMaster Co. (Diversified Consumer Svs.) | 7.100% | 03/01/2018 | 450,000 | 429,750 | ||||||||||||
ServiceMaster Co. (Diversified Consumer Svs.) | 7.450% | 08/15/2027 | 175,000 | 142,625 | ||||||||||||
ServiceMaster Co. (Diversified Consumer Svs.) | 8.000% | 02/15/2020 | 675,000 | 707,062 | ||||||||||||
ServiceMaster Co. (Diversified Consumer Svs.) | (b) | 7.000% | 08/15/2020 | 1,000,000 | 1,007,500 | |||||||||||
Affinity Gaming LLC / Affinity Gaming Finance Corp. (Hotels, Restaurants & Leisure) | (b) | 9.000% | 05/15/2018 | 975,000 | 1,023,750 | |||||||||||
American Casino & Entertainment Properties LLC Corp. (Hotels, Restaurants & Leisure) | 11.000% | 06/15/2014 | 900,000 | 929,250 | ||||||||||||
Ameristar Casinos, Inc. (Hotels, Restaurants & Leisure) | 7.500% | 04/15/2021 | 550,000 | 598,812 | ||||||||||||
Caesars Entertainment Operating Co., Inc. (Hotels, Restaurants & Leisure) | 11.250% | 06/01/2017 | 1,575,000 | 1,695,094 | ||||||||||||
Caesars Entertainment Operating Co., Inc. (Hotels, Restaurants & Leisure) | 8.500% | 02/15/2020 | 150,000 | 149,344 | ||||||||||||
Carlson Wagonlit BV (Hotels, Restaurants & Leisure) | (b) | 6.875% | 06/15/2019 | 875,000 | 927,500 | |||||||||||
Cedar Fair LP / Canada’s Wonderland Co. / Magnum Management Corp. (Hotels, Restaurants & Leisure) | 9.125% | 08/01/2018 | 775,000 | 875,750 | ||||||||||||
Chester Downs & Marina LLC (Hotels, Restaurants & Leisure) | (b) | 9.250% | 02/01/2020 | 550,000 | 543,125 | |||||||||||
Choice Hotels International, Inc. (Hotels, Restaurants & Leisure) | 5.750% | 07/01/2022 | 275,000 | 305,937 | ||||||||||||
DineEquity, Inc. (Hotels, Restaurants & Leisure) | 9.500% | 10/30/2018 | 1,575,000 | 1,797,469 | ||||||||||||
MGM Resorts International (Hotels, Restaurants & Leisure) | 7.500% | 06/01/2016 | 900,000 | 969,750 | ||||||||||||
MGM Resorts International (Hotels, Restaurants & Leisure) | (b) | 8.625% | 02/01/2019 | 600,000 | 672,000 | |||||||||||
MGM Resorts International (Hotels, Restaurants & Leisure) | 7.750% | 03/15/2022 | 525,000 | 564,375 | ||||||||||||
MGM Resorts International (Hotels, Restaurants & Leisure) | (b) | 6.750% | 10/01/2020 | 250,000 | 255,937 | |||||||||||
NPC International, Inc. / NPC Operating Co. A, Inc. / NPC Operating Co. B, Inc. (Hotels, Restaurants & Leisure) | 10.500% | 01/15/2020 | 1,200,000 | 1,398,000 | ||||||||||||
Rivers Pittsburgh Borrower LP / Rivers Pittsburgh Finance Corp. (Hotels, Restaurants & Leisure) | (b) | 9.500% | 06/15/2019 | 700,000 | 763,000 | |||||||||||
Royal Caribbean Cruises Ltd. (Hotels, Restaurants & Leisure) | 5.250% | 11/15/2022 | 325,000 | 345,312 | ||||||||||||
Seminole Hard Rock Entertainment, Inc. (Hotels, Restaurants & Leisure) | (b)(d) | 2.808% | 03/15/2014 | 1,075,000 | 1,072,312 | |||||||||||
Seminole Indian Tribe of Florida (Hotels, Restaurants & Leisure) | (b) | 7.804% | 10/01/2020 | 950,000 | 976,980 | |||||||||||
Seminole Indian Tribe of Florida (Hotels, Restaurants & Leisure) | (b) | 7.750% | 10/01/2017 | 150,000 | 162,937 | |||||||||||
Six Flags Entertainment Corp. (Hotels, Restaurants & Leisure) | (b) | 5.250% | 01/15/2021 | 800,000 | 802,000 | |||||||||||
Sugarhouse HSP Gaming Prop. Mezz. LP / Sugarhouse HSP Gaming Finance Corp. (Hotels, Restaurants & Leisure) | (b) | 8.625% | 04/15/2016 | 575,000 | 619,562 | |||||||||||
Hillman Group, Inc. (Household Durables) | 10.875% | 06/01/2018 | 975,000 | 1,053,000 | ||||||||||||
Hillman Group, Inc. (Household Durables) | (b) | 10.875% | 05/31/2018 | 250,000 | 270,000 | |||||||||||
Jarden Corp. (Household Durables) | 7.500% | 05/01/2017 | 750,000 | 848,437 | ||||||||||||
Libbey Glass, Inc. (Household Durables) | 6.875% | 05/15/2020 | 900,000 | 972,000 | ||||||||||||
Norcraft Cos. LP / Norcraft Finance Corp. (Household Durables) | 10.500% | 12/15/2015 | 1,275,000 | 1,290,937 | ||||||||||||
Sealy Mattress Co. (Household Durables) | 8.250% | 06/15/2014 | 1,200,000 | 1,204,512 | ||||||||||||
Sealy Mattress Co. (Household Durables) | (b) | 10.875% | 04/15/2016 | 277,000 | 294,312 | |||||||||||
Serta Simmons Holdings LLC (Household Durables) | (b) | 8.125% | 10/01/2020 | 900,000 | 904,500 | |||||||||||
Yankee Candle Co., Inc. (Household Durables) | 9.750% | 02/15/2017 | 1,725,000 | 1,800,486 | ||||||||||||
YCC Holdings LLC / Yankee Finance, Inc. (Household Durables) | (c) | 10.250% | 02/15/2016 | 700,000 | 726,320 | |||||||||||
CDW LLC / CDW Finance Corp. (Internet & Catalog Retail) | 12.535% | 10/12/2017 | 345,000 | 370,444 | ||||||||||||
CDW LLC / CDW Finance Corp. (Internet & Catalog Retail) | 8.500% | 04/01/2019 | 1,850,000 | 2,011,875 | ||||||||||||
FGI Operating Co. LLC / FGI Finance, Inc. (Leisure Equip. & Products) | (b) | 7.875% | 05/01/2020 | 1,000,000 | 1,035,000 | |||||||||||
AMC Networks, Inc. (Media) | 7.750% | 07/15/2021 | 575,000 | 661,250 | ||||||||||||
AMC Networks, Inc. (Media) | 4.750% | 12/15/2022 | 350,000 | 353,500 | ||||||||||||
CCO Holdings LLC / CCO Holdings Capital Corp. (Media) | 8.125% | 04/30/2020 | 75,000 | 84,375 | ||||||||||||
CCO Holdings LLC / CCO Holdings Capital Corp. (Media) | 7.875% | 04/30/2018 | 1,025,000 | 1,108,281 | ||||||||||||
CCO Holdings LLC / CCO Holdings Capital Corp. (Media) | 7.000% | 01/15/2019 | 425,000 | 460,594 | ||||||||||||
| 60 | (continued) |
| Ohio National Fund, Inc. | High Income Bond Portfolio (Continued) |
Schedule of Investments | December 31, 2012 |
| Corporate Bonds (Continued) | Rate | Maturity | Face Amount | Value | ||||||||||||
CONSUMER DISCRETIONARY (continued) | ||||||||||||||||
CCO Holdings LLC / CCO Holdings Capital Corp. (Media) | 6.625% | 01/31/2022 | $ | 500,000 | $ | 548,750 | ||||||||||
CCO Holdings LLC / CCO Holdings Capital Corp. (Media) | 5.125% | 02/15/2023 | 150,000 | 150,375 | ||||||||||||
Cequel Communications Holdings I LLC / Cequel Capital Corp. (Media) | (b) | 6.375% | 09/15/2020 | 350,000 | 366,187 | |||||||||||
Cinemark U.S.A., Inc. (Media) | 8.625% | 06/15/2019 | 950,000 | 1,056,875 | ||||||||||||
Cinemark U.S.A., Inc. (Media) | 7.375% | 06/15/2021 | 500,000 | 555,000 | ||||||||||||
Clear Channel Communications, Inc. (Media) | 9.000% | 03/01/2021 | 1,550,000 | 1,391,125 | ||||||||||||
Clear Channel Worldwide Holdings, Inc. (Media) | 7.625% | 03/15/2020 | 175,000 | 175,437 | ||||||||||||
Clear Channel Worldwide Holdings, Inc. (Media) | 7.625% | 03/15/2020 | 1,200,000 | 1,215,000 | ||||||||||||
Clear Channel Worldwide Holdings, Inc. (Media) | (b) | 6.500% | 11/15/2022 | 275,000 | 283,937 | |||||||||||
Clear Channel Worldwide Holdings, Inc. (Media) | (b) | 6.500% | 11/15/2022 | 750,000 | 781,875 | |||||||||||
Crown Media Holdings, Inc. (Media) | 10.500% | 07/15/2019 | 1,500,000 | 1,696,875 | ||||||||||||
Cumulus Media Holdings, Inc. (Media) | 7.750% | 05/01/2019 | 1,025,000 | 1,012,187 | ||||||||||||
DISH DBS Corp. (Media) | 5.875% | 07/15/2022 | 1,250,000 | 1,350,000 | ||||||||||||
DISH DBS Corp. (Media) | 4.625% | 07/15/2017 | 200,000 | 209,500 | ||||||||||||
Entercom Radio LLC (Media) | 10.500% | 12/01/2019 | 925,000 | 1,022,125 | ||||||||||||
Entravision Communications Corp. (Media) | 8.750% | 08/01/2017 | 717,000 | 781,530 | ||||||||||||
Igloo Holdings Corp. (Media) | (b)(c) | 8.250% | 12/15/2017 | 800,000 | 794,000 | |||||||||||
Intelsat Jackson Holdings, S.A. (Media) | 8.500% | 11/01/2019 | 675,000 | 757,687 | ||||||||||||
Intelsat Jackson Holdings, S.A. (Media) | 7.500% | 04/01/2021 | 450,000 | 498,375 | ||||||||||||
Intelsat Jackson Holdings, S.A. (Media) | 7.250% | 04/01/2019 | 550,000 | 594,000 | ||||||||||||
Intelsat Jackson Holdings, S.A. (Media) | (b) | 7.250% | 10/15/2020 | 150,000 | 163,500 | |||||||||||
Intelsat Jackson Holdings, S.A. (Media) | (b) | 6.625% | 12/15/2022 | 175,000 | 181,344 | |||||||||||
Lamar Media Corp. (Media) | 5.875% | 02/01/2022 | 250,000 | 272,500 | ||||||||||||
Lamar Media Corp. (Media) | (b) | 5.000% | 05/01/2023 | 725,000 | 748,562 | |||||||||||
Nexstar Broadcasting, Inc. / Mission Broadcasting, Inc. (Media) | 8.875% | 04/15/2017 | 550,000 | 606,375 | ||||||||||||
Nielsen Finance LLC / Nielsen Finance Co. (Media) | 7.750% | 10/15/2018 | 550,000 | 617,375 | ||||||||||||
Nielsen Finance LLC / Nielsen Finance Co. (Media) | (b) | 4.500% | 10/01/2020 | 450,000 | 450,000 | |||||||||||
Sirius XM Radio, Inc. (Media) | (b) | 5.250% | 08/15/2022 | 1,025,000 | 1,040,375 | |||||||||||
Sitel LLC / Sitel Finance Corp. (Media) | 11.500% | 04/01/2018 | 625,000 | 443,750 | ||||||||||||
Townsquare Radio LLC / Townsquare Radio, Inc. (Media) | (b) | 9.000% | 04/01/2019 | 725,000 | 799,312 | |||||||||||
Virgin Media Finance PLC (Media) | 4.875% | 02/15/2022 | 575,000 | 590,812 | ||||||||||||
Visant Corp. (Media) | 10.000% | 10/01/2017 | 1,775,000 | 1,601,937 | ||||||||||||
XM Satellite Radio, Inc. (Media) | (b) | 7.625% | 11/01/2018 | 475,000 | 532,000 | |||||||||||
Academy Ltd. / Academy Finance Corp. (Specialty Retail) | (b) | 9.250% | 08/01/2019 | 1,025,000 | 1,142,875 | |||||||||||
Gymboree Corp. (Specialty Retail) | 9.125% | 12/01/2018 | 1,025,000 | 917,375 | ||||||||||||
Jo-Ann Stores Holdings, Inc. (Specialty Retail) | (b)(c) | 9.750% | 10/15/2019 | 850,000 | 861,687 | |||||||||||
Jo-Ann Stores, Inc. (Specialty Retail) | (b) | 8.125% | 03/15/2019 | 1,775,000 | 1,814,937 | |||||||||||
Limited Brands, Inc. (Specialty Retail) | 5.625% | 02/15/2022 | 725,000 | 792,062 | ||||||||||||
Michaels Stores, Inc. (Specialty Retail) | 7.750% | 11/01/2018 | 1,125,000 | 1,240,312 | ||||||||||||
Michaels Stores, Inc. (Specialty Retail) | (b) | 7.750% | 11/01/2018 | 150,000 | 165,375 | |||||||||||
New Academy Finance Co. LLC / New Academy Finance Corp. (Specialty Retail) | (b)(c) | 8.000% | 06/15/2018 | 450,000 | 457,875 | |||||||||||
Party City Holdings, Inc. (Specialty Retail) | (b) | 8.875% | 08/01/2020 | 375,000 | 404,062 | |||||||||||
Penske Automotive Group, Inc. (Specialty Retail) | (b) | 5.750% | 10/01/2022 | 300,000 | 310,500 | |||||||||||
Petco Animal Supplies, Inc. (Specialty Retail) | (b) | 9.250% | 12/01/2018 | 1,350,000 | 1,505,250 | |||||||||||
Petco Holdings, Inc. (Specialty Retail) | (b)(c) | 8.500% | 10/15/2017 | 1,225,000 | 1,264,812 | |||||||||||
Sally Holdings LLC , Inc. (Specialty Retail) | 5.750% | 06/01/2022 | 125,000 | 136,250 | ||||||||||||
Sally Holdings LLC , Inc. (Specialty Retail) | 6.875% | 11/15/2019 | 700,000 | 777,000 | ||||||||||||
PVH Corp. (Textiles, Apparel & Luxury Goods) | 4.500% | 12/15/2022 | 200,000 | 203,000 | ||||||||||||
Wolverine World Wide, Inc. (Textiles, Apparel & Luxury Goods) | (b) | 6.125% | 10/15/2020 | 250,000 | 263,750 | |||||||||||
|
| |||||||||||||||
| 87,878,578 | ||||||||||||||||
|
| |||||||||||||||
CONSUMER STAPLES – 5.2% | ||||||||||||||||
Constellation Brands, Inc. (Beverages) | 6.000% | 05/01/2022 | 725,000 | 833,750 | ||||||||||||
U.S. Foodservice (Food & Staples Retailing) | (b) | 8.500% | 06/30/2019 | 2,450,000 | 2,511,250 | |||||||||||
Darling International, Inc. (Food Products) | 8.500% | 12/15/2018 | 125,000 | 144,219 | ||||||||||||
Dean Foods Co. (Food Products) | 7.000% | 06/01/2016 | 1,200,000 | 1,323,000 | ||||||||||||
Dean Foods Co. (Food Products) | 9.750% | 12/15/2018 | 825,000 | 952,875 | ||||||||||||
Del Monte Corp. (Food Products) | 7.625% | 02/15/2019 | 1,700,000 | 1,780,750 | ||||||||||||
Michael Foods Group, Inc. (Food Products) | 9.750% | 07/15/2018 | 1,975,000 | 2,192,250 | ||||||||||||
Michael Foods Holding, Inc. (Food Products) | (b)(c) | 8.500% | 07/15/2018 | 650,000 | 664,625 | |||||||||||
Pinnacle Foods Finance LLC / Pinnacle Foods Finance Corp. (Food Products) | 9.250% | 04/01/2015 | 662,000 | 675,240 | ||||||||||||
Pinnacle Foods Finance LLC / Pinnacle Foods Finance Corp. (Food Products) | 8.250% | 09/01/2017 | 500,000 | 535,000 | ||||||||||||
Shearer’s Foods LLC / Chip Finance Corp. (Food Products) | (b) | 9.000% | 11/01/2019 | 550,000 | 578,875 | |||||||||||
Smithfield Foods, Inc. (Food Products) | 6.625% | 08/15/2022 | 1,325,000 | 1,467,437 | ||||||||||||
Spectrum Brands, Inc. (Household Products) | 9.500% | 06/15/2018 | 150,000 | 171,000 | ||||||||||||
Spectrum Brands, Inc. (Household Products) | (b) | 6.750% | 03/15/2020 | 1,150,000 | 1,236,250 | |||||||||||
Prestige Brands, Inc. (Personal Products) | 8.250% | 04/01/2018 | 750,000 | 835,312 | ||||||||||||
Prestige Brands, Inc. (Personal Products) | 8.125% | 02/01/2020 | 175,000 | 195,562 | ||||||||||||
|
| |||||||||||||||
| 16,097,395 | ||||||||||||||||
|
| |||||||||||||||
| 61 | (continued) |
| Ohio National Fund, Inc. | High Income Bond Portfolio (Continued) |
Schedule of Investments | December 31, 2012 |
| Corporate Bonds (Continued) | Rate | Maturity | Face Amount | Value | ||||||||||||
ENERGY – 11.8% | ||||||||||||||||
Basic Energy Services, Inc. (Energy Equip. & Svs.) | 7.750% | 02/15/2019 | $ | 425,000 | $ | 425,000 | ||||||||||
Basic Energy Services, Inc. (Energy Equip. & Svs.) | (b) | 7.750% | 10/15/2022 | 300,000 | 294,000 | |||||||||||
Chaparral Energy, Inc. (Energy Equip. & Svs.) | 9.875% | 10/01/2020 | 1,075,000 | 1,228,187 | ||||||||||||
Chaparral Energy, Inc. (Energy Equip. & Svs.) | 7.625% | 11/15/2022 | 125,000 | 131,875 | ||||||||||||
Cie Generale de Geophysique – Veritas (Energy Equip. & Svs.) | 7.750% | 05/15/2017 | 1,100,000 | 1,149,500 | ||||||||||||
Cie Generale de Geophysique – Veritas (Energy Equip. & Svs.) | 9.500% | 05/15/2016 | 400,000 | 431,000 | ||||||||||||
Crosstex Energy LP / Crosstex Energy Finance Corp. (Energy Equip. & Svs.) | 8.875% | 02/15/2018 | 975,000 | 1,057,875 | ||||||||||||
Drill Rigs Holdings, Inc. (Energy Equip. & Svs.) | (b) | 6.500% | 10/01/2017 | 350,000 | 350,000 | |||||||||||
Forbes Energy Services Ltd. (Energy Equip. & Svs.) | 9.000% | 06/15/2019 | 900,000 | 805,500 | ||||||||||||
PHI, Inc. (Energy Equip. & Svs.) | 8.625% | 10/15/2018 | 850,000 | 913,750 | ||||||||||||
SESI LLC (Energy Equip. & Svs.) | 6.375% | 05/01/2019 | 275,000 | 295,625 | ||||||||||||
SESI LLC (Energy Equip. & Svs.) | 7.125% | 12/15/2021 | 250,000 | 279,375 | ||||||||||||
Access Midstream Partners LP / ACMP Finance Corp. (Oil, Gas & Consumable Fuels) | 6.125% | 07/15/2022 | 525,000 | 568,312 | ||||||||||||
Access Midstream Partners LP / ACMP Finance Corp. (Oil, Gas & Consumable Fuels) | 4.875% | 05/15/2023 | 900,000 | 914,625 | ||||||||||||
Antero Resources Finance Corp. (Oil, Gas & Consumable Fuels) | (b) | 6.000% | 12/01/2020 | 825,000 | 839,437 | |||||||||||
ATP Oil & Gas Corp. (Acquired 04/19/2010 through 02/11/2011, Cost $727,229)(Oil, Gas & Consumable Fuels) | (e) | 11.875% | 05/01/2015 | 775,000 | 89,125 | |||||||||||
Berry Petroleum Co. (Oil, Gas & Consumable Fuels) | 6.750% | 11/01/2020 | 150,000 | 162,000 | ||||||||||||
Berry Petroleum Co. (Oil, Gas & Consumable Fuels) | 6.375% | 09/15/2022 | 275,000 | 287,375 | ||||||||||||
Chesapeake Energy Corp. (Oil, Gas & Consumable Fuels) | 6.875% | 11/15/2020 | 550,000 | 598,812 | ||||||||||||
Chesapeake Energy Corp. (Oil, Gas & Consumable Fuels) | 6.875% | 08/15/2018 | 325,000 | 344,500 | ||||||||||||
Chesapeake Energy Corp. (Oil, Gas & Consumable Fuels) | 6.775% | 03/15/2019 | 1,225,000 | 1,228,062 | ||||||||||||
Chesapeake Oilfield Operating LLC / Chesapeake Oilfield Finance, Inc. (Oil, Gas & Consumable Fuels) | (b) | 6.625% | 11/15/2019 | 700,000 | 663,250 | |||||||||||
Coffeyville Resources LLC / Coffeyville Finance, Inc. (Oil, Gas & Consumable Fuels) | (b) | 10.875% | 04/01/2017 | 375,000 | 414,375 | |||||||||||
Comstock Resources, Inc. (Oil, Gas & Consumable Fuels) | 7.750% | 04/01/2019 | 300,000 | 306,000 | ||||||||||||
Comstock Resources, Inc. (Oil, Gas & Consumable Fuels) | 9.500% | 06/15/2020 | 375,000 | 405,000 | ||||||||||||
Concho Resources, Inc. (Oil, Gas & Consumable Fuels) | 7.000% | 01/15/2021 | 525,000 | 588,000 | ||||||||||||
Concho Resources, Inc. (Oil, Gas & Consumable Fuels) | 5.500% | 04/01/2023 | 300,000 | 315,750 | ||||||||||||
Copano Energy LLC / Copano Energy Finance Corp. (Oil, Gas & Consumable Fuels) | 7.125% | 04/01/2021 | 725,000 | 782,094 | ||||||||||||
Denbury Resources, Inc. (Oil, Gas & Consumable Fuels) | 8.250% | 02/15/2020 | 273,000 | 308,490 | ||||||||||||
El Paso LLC (Oil, Gas & Consumable Fuels) | 7.250% | 06/01/2018 | 225,000 | 261,094 | ||||||||||||
El Paso LLC (Oil, Gas & Consumable Fuels) | 6.500% | 09/15/2020 | 775,000 | 878,201 | ||||||||||||
Energy Transfer Equity LP (Oil, Gas & Consumable Fuels) | 7.500% | 10/15/2020 | 1,750,000 | 2,030,000 | ||||||||||||
Energy XXI Gulf Coast, Inc. (Oil, Gas & Consumable Fuels) | 9.250% | 12/15/2017 | 725,000 | 831,937 | ||||||||||||
Energy XXI Gulf Coast, Inc. (Oil, Gas & Consumable Fuels) | 7.750% | 06/15/2019 | 200,000 | 219,500 | ||||||||||||
EP Energy LLC / EP Energy Finance, Inc. (Oil, Gas & Consumable Fuels) | 9.375% | 05/01/2020 | 1,150,000 | 1,302,375 | ||||||||||||
EP Energy LLC / Everest Acquisition Finance, Inc. (Oil, Gas & Consumable Fuels) | 6.875% | 05/01/2019 | 250,000 | 272,500 | ||||||||||||
EPE Holdings LLC / EP Energy Bond Co., Inc. (Oil, Gas & Consumable Fuels) | (b)(c) | 8.125% | 12/15/2017 | 400,000 | 397,500 | |||||||||||
Forest Oil Corp. (Oil, Gas & Consumable Fuels) | 7.250% | 06/15/2019 | 975,000 | 984,750 | ||||||||||||
Forest Oil Corp. (Oil, Gas & Consumable Fuels) | (b) | 7.500% | 09/15/2020 | 400,000 | 422,000 | |||||||||||
Halcon Resources Corp. (Oil, Gas & Consumable Fuels) | (b) | 9.750% | 07/15/2020 | 900,000 | 976,500 | |||||||||||
Halcon Resources Corp. (Oil, Gas & Consumable Fuels) | (b) | 8.875% | 05/15/2021 | 525,000 | 559,125 | |||||||||||
Holly Energy Partners LP / Holly Energy Finance Corp. (Oil, Gas & Consumable Fuels) | (b) | 6.500% | 03/01/2020 | 475,000 | 510,625 | |||||||||||
Inergy Midstream LP / NRGM Finance Corp. (Oil, Gas & Consumable Fuels) | (b) | 6.000% | 12/15/2020 | 400,000 | 414,000 | |||||||||||
Linn Energy LLC / Linn Energy Finance Corp. (Oil, Gas & Consumable Fuels) | 8.625% | 04/15/2020 | 750,000 | 821,250 | ||||||||||||
Linn Energy LLC / Linn Energy Finance Corp. (Oil, Gas & Consumable Fuels) | 7.750% | 02/01/2021 | 650,000 | 695,500 | ||||||||||||
Linn Energy LLC / Linn Energy Finance Corp. (Oil, Gas & Consumable Fuels) | 6.500% | 05/15/2019 | 50,000 | 50,750 | ||||||||||||
Lone Pine Resources Canada Ltd. (Oil, Gas & Consumable Fuels) | 10.375% | 02/15/2017 | 425,000 | 403,750 | ||||||||||||
MarkWest Energy Partners LP / MarkWest Energy Finance Corp. (Oil, Gas & Consumable Fuels) | 5.500% | 02/15/2023 | 600,000 | 654,000 | ||||||||||||
Newfield Exploration Co. (Oil, Gas & Consumable Fuels) | 5.625% | 07/01/2024 | 725,000 | 784,812 | ||||||||||||
Oasis Petroleum, Inc. (Oil, Gas & Consumable Fuels) | 6.500% | 11/01/2021 | 750,000 | 800,625 | ||||||||||||
Oasis Petroleum, Inc. (Oil, Gas & Consumable Fuels) | 6.875% | 01/15/2023 | 300,000 | 323,250 | ||||||||||||
Penn Virginia Resource Partners LP / Penn Virginia Resource Finance Corp. II (Oil, Gas & Consumable Fuels) | (b) | 8.375% | 06/01/2020 | 375,000 | 405,937 | |||||||||||
Penn Virginia Resource Partners LP / Penn Virginia Resource Finance Corp. (Oil, Gas & Consumable Fuels) | 8.250% | 04/15/2018 | 300,000 | 319,500 | ||||||||||||
Plains Exploration & Production Co. (Oil, Gas & Consumable Fuels) | 6.750% | 02/01/2022 | 275,000 | 310,062 | ||||||||||||
Plains Exploration & Production Co. (Oil, Gas & Consumable Fuels) | 6.125% | 06/15/2019 | 300,000 | 328,500 | ||||||||||||
Regency Energy Partners LP / Regency Energy Finance Corp. (Oil, Gas & Consumable Fuels) | 6.875% | 12/01/2018 | 275,000 | 301,125 | ||||||||||||
Regency Energy Partners LP / Regency Energy Finance Corp. (Oil, Gas & Consumable Fuels) | 9.375% | 06/01/2016 | 389,000 | 419,147 | ||||||||||||
Regency Energy Partners LP / Regency Energy Finance Corp. (Oil, Gas & Consumable Fuels) | 5.500% | 04/15/2023 | 175,000 | 187,687 | ||||||||||||
SandRidge Energy, Inc. (Oil, Gas & Consumable Fuels) | 7.500% | 03/15/2021 | 325,000 | 349,375 | ||||||||||||
SandRidge Energy, Inc. (Oil, Gas & Consumable Fuels) | 8.125% | 10/15/2022 | 775,000 | 852,500 | ||||||||||||
SandRidge Energy, Inc. (Oil, Gas & Consumable Fuels) | 7.500% | 02/15/2023 | 200,000 | 215,000 | ||||||||||||
Southern Star Central Corp. (Oil, Gas & Consumable Fuels) | 6.750% | 03/01/2016 | 225,000 | 229,500 | ||||||||||||
Targa Resources Partners LP / Targa Resources Partners Finance Corp. (Oil, Gas & Consumable Fuels) | (b) | 6.375% | 08/01/2022 | 250,000 | 273,750 | |||||||||||
Targa Resources Partners LP / Targa Resources Partners Finance Corp. (Oil, Gas & Consumable Fuels) | 6.875% | 02/01/2021 | 200,000 | 220,000 | ||||||||||||
Tesoro Logistics LP / Tesoro Logistics Finance Corp. (Oil, Gas & Consumable Fuels) | (b) | 5.875% | 10/01/2020 | 225,000 | 234,562 | |||||||||||
W&T Offshore, Inc. (Oil, Gas & Consumable Fuels) | 8.500% | 06/15/2019 | 950,000 | 1,026,000 | ||||||||||||
W&T Offshore, Inc. (Oil, Gas & Consumable Fuels) | (b) | 8.500% | 06/15/2019 | 425,000 | 459,000 | |||||||||||
|
| |||||||||||||||
| 36,902,583 | ||||||||||||||||
|
| |||||||||||||||
| 62 | (continued) |
| Ohio National Fund, Inc. | High Income Bond Portfolio (Continued) |
Schedule of Investments | December 31, 2012 |
| Corporate Bonds (Continued) | Rate | Maturity | Face Amount | Value | ||||||||||||
FINANCIALS – 5.1% | ||||||||||||||||
Neuberger Berman Group LLC / Neuberger Berman Finance Corp. (Capital Markets) | (b) | 5.875% | 03/15/2022 | $ | 650,000 | $ | 692,250 | |||||||||
Neuberger Berman Group LLC / Neuberger Berman Finance Corp. (Capital Markets) | (b) | 5.625% | 03/15/2020 | 250,000 | 263,125 | |||||||||||
Nuveen Investments, Inc. (Capital Markets) | (b) | 9.500% | 10/15/2020 | 1,375,000 | 1,375,000 | |||||||||||
CIT Group, Inc. (Commercial Banks) | (b) | 6.625% | 04/01/2018 | 700,000 | 794,500 | |||||||||||
CIT Group, Inc. (Commercial Banks) | 5.250% | 03/15/2018 | 675,000 | 725,625 | ||||||||||||
CIT Group, Inc. (Commercial Banks) | 5.375% | 05/15/2020 | 225,000 | 246,937 | ||||||||||||
CIT Group, Inc. (Commercial Banks) | 5.000% | 05/15/2017 | 575,000 | 612,375 | ||||||||||||
CIT Group, Inc. (Commercial Banks) | 4.250% | 08/15/2017 | 600,000 | 620,450 | ||||||||||||
Ally Financial, Inc. (Consumer Finance) | 8.000% | 11/01/2031 | 225,000 | 286,031 | ||||||||||||
Ally Financial, Inc. (Consumer Finance) | 8.300% | 02/12/2015 | 2,425,000 | 2,706,906 | ||||||||||||
Ally Financial, Inc. (Consumer Finance) | 8.000% | 03/15/2020 | 375,000 | 461,250 | ||||||||||||
Ally Financial, Inc. (Consumer Finance) | 7.500% | 09/15/2020 | 775,000 | 938,719 | ||||||||||||
Ally Financial, Inc. (Consumer Finance) | 6.250% | 12/01/2017 | 300,000 | 333,177 | ||||||||||||
Ally Financial, Inc. (Consumer Finance) | 5.500% | 02/15/2017 | 250,000 | 268,594 | ||||||||||||
Ford Motor Credit Co. LLC (Consumer Finance) | 8.000% | 12/15/2016 | 625,000 | 756,021 | ||||||||||||
Ford Motor Credit Co. LLC (Consumer Finance) | 5.000% | 05/15/2018 | 325,000 | 359,293 | ||||||||||||
Ford Motor Credit Co. LLC (Consumer Finance) | 4.250% | 02/03/2017 | 550,000 | 589,587 | ||||||||||||
Express LLC / Express Finance Corp. (Diversified Financial Svs.) | 8.750% | 03/01/2018 | 250,000 | 271,875 | ||||||||||||
Interactive Data Corp. (Diversified Financial Svs.) | 10.250% | 08/01/2018 | 1,150,000 | 1,299,500 | ||||||||||||
TransUnion Holding Co., Inc. (Diversified Financial Svs.) | 9.625% | 06/15/2018 | 1,125,000 | 1,195,312 | ||||||||||||
TransUnion Holding Co., Inc. (Diversified Financial Svs.) | (b)(c) | 8.125% | 06/15/2018 | 525,000 | 544,687 | |||||||||||
Reliance Intermediate Holdings LP (Insurance) | (b) | 9.500% | 12/15/2019 | 550,000 | 627,000 | |||||||||||
Host Hotels & Resorts LP (Real Estate Investment Trusts) | 6.750% | 06/01/2016 | 69,000 | 70,898 | ||||||||||||
|
| |||||||||||||||
| 16,039,112 | ||||||||||||||||
|
| |||||||||||||||
HEALTH CARE – 10.6% | ||||||||||||||||
Grifols, Inc. (Biotechnology) | 8.250% | 02/01/2018 | 1,050,000 | 1,161,563 | ||||||||||||
Biomet, Inc. (Health Care Equip. & Supplies) | (b) | 6.500% | 08/01/2020 | 1,175,000 | 1,252,844 | |||||||||||
Biomet, Inc. (Health Care Equip. & Supplies) | (b) | 6.500% | 10/01/2020 | 1,075,000 | 1,073,656 | |||||||||||
DJO Finance LLC / DJO Finance Corp. (Health Care Equip. & Supplies) | 9.750% | 10/15/2017 | 250,000 | 223,750 | ||||||||||||
DJO Finance LLC / DJO Finance Corp. (Health Care Equip. & Supplies) | 7.750% | 04/15/2018 | 1,425,000 | 1,378,688 | ||||||||||||
DJO Finance LLC / DJO Finance Corp. (Health Care Equip. & Supplies) | (b) | 8.750% | 03/15/2018 | 75,000 | 82,313 | |||||||||||
DJO Finance LLC / DJO Finance Corp. (Health Care Equip. & Supplies) | (b) | 9.875% | 04/15/2018 | 625,000 | 648,438 | |||||||||||
Hologic, Inc. (Health Care Equip. & Supplies) | (b) | 6.250% | 08/01/2020 | 525,000 | 568,313 | |||||||||||
VWR Funding, Inc. (Health Care Equip. & Supplies) | (b) | 7.250% | 09/15/2017 | 1,600,000 | 1,688,000 | |||||||||||
CDRT Holding Corp. (Health Care Providers & Svs.) | (b)(c) | 9.250% | 10/01/2017 | 1,050,000 | 1,076,250 | |||||||||||
CRC Health Corp. (Acquired 01/25/2006 through 04/30/2012, Cost $595,611)(Health Care Providers & Svs.) | (f) | 10.750% | 02/01/2016 | 650,000 | 637,000 | |||||||||||
DaVita HealthCare Partners, Inc. (Health Care Providers & Svs.) | 5.750% | 08/15/2022 | 450,000 | 476,438 | ||||||||||||
Emergency Medical Services Corp. (Health Care Providers & Svs.) | 8.125% | 06/01/2019 | 1,600,000 | 1,765,000 | ||||||||||||
HCA Holdings, Inc. (Health Care Providers & Svs.) | 7.750% | 05/15/2021 | 1,725,000 | 1,880,250 | ||||||||||||
HCA Holdings, Inc. (Health Care Providers & Svs.) | 6.250% | 02/15/2021 | 225,000 | 231,188 | ||||||||||||
HCA, Inc. (Health Care Providers & Svs.) | 7.500% | 11/06/2033 | 225,000 | 227,250 | ||||||||||||
HCA, Inc. (Health Care Providers & Svs.) | 7.875% | 02/15/2020 | 275,000 | 307,313 | ||||||||||||
HCA, Inc. (Health Care Providers & Svs.) | 9.875% | 02/15/2017 | 145,000 | 153,881 | ||||||||||||
HCA, Inc. (Health Care Providers & Svs.) | 7.500% | 02/15/2022 | 2,725,000 | 3,133,750 | ||||||||||||
HCA, Inc. (Health Care Providers & Svs.) | 6.500% | 02/15/2020 | 550,000 | 620,125 | ||||||||||||
HCA, Inc. (Health Care Providers & Svs.) | 5.875% | 05/01/2023 | 950,000 | 985,625 | ||||||||||||
IASIS Healthcare LLC / IASIS Capital Corp. (Health Care Providers & Svs.) | 8.375% | 05/15/2019 | 1,450,000 | 1,377,500 | ||||||||||||
Jaguar Holding Co. I (Health Care Providers & Svs.) | (b)(c) | 9.375% | 10/15/2017 | 575,000 | 606,625 | |||||||||||
Jaguar Holding Co. II / Jaguar Merger Sub, Inc. (Health Care Providers & Svs.) | (b) | 9.500% | 12/01/2019 | 1,050,000 | 1,197,000 | |||||||||||
Multiplan, Inc. (Health Care Providers & Svs.) | (b) | 9.875% | 09/01/2018 | 1,700,000 | 1,904,000 | |||||||||||
Omnicare, Inc. (Health Care Providers & Svs.) | 7.750% | 06/01/2020 | 850,000 | 947,750 | ||||||||||||
Physiotherapy Associates Holdings, Inc. (Health Care Providers & Svs.) | (b) | 11.875% | 05/01/2019 | 725,000 | 652,500 | |||||||||||
PSS World Medical, Inc. (Health Care Providers & Svs.) | 6.375% | 03/01/2022 | 875,000 | 1,036,875 | ||||||||||||
Truven Health Analytics, Inc. (Health Care Providers & Svs.) | (b) | 10.625% | 06/01/2020 | 700,000 | 749,000 | |||||||||||
United Surgical Partners International, Inc. (Health Care Providers & Svs.) | 9.000% | 04/01/2020 | 850,000 | 947,750 | ||||||||||||
Universal Hospital Services, Inc. (Health Care Providers & Svs.) | (d) | 3.902% | 06/01/2015 | 150,000 | 150,094 | |||||||||||
Universal Hospital Services, Inc. (Health Care Providers & Svs.) | (b) | 7.625% | 08/15/2020 | 750,000 | 792,188 | |||||||||||
Vanguard Health Holding Co. II LLC / Vanguard Holding Co. II, Inc. (Health Care Providers & Svs.) | 8.000% | 02/01/2018 | 1,500,000 | 1,560,000 | ||||||||||||
Emdeon, Inc. (Health Care Technology) | 11.000% | 12/31/2019 | 800,000 | 928,000 | ||||||||||||
Legend Acquisition Sub, Inc. (Health Care Technology) | (b) | 10.750% | 08/15/2020 | 725,000 | 663,375 | |||||||||||
|
| |||||||||||||||
| 33,084,292 | ||||||||||||||||
|
| |||||||||||||||
INDUSTRIALS – 12.1% | ||||||||||||||||
B/E Aerospace, Inc. (Aerospace & Defense) | 5.250% | 04/01/2022 | 750,000 | 798,750 | ||||||||||||
Silver II Borrower / Silver II U.S. Holdings LLC (Aerospace & Defense) | (b) | 7.750% | 12/15/2020 | 150,000 | 156,000 | |||||||||||
TransDigm, Inc. (Aerospace & Defense) | 7.750% | 12/15/2018 | 1,200,000 | 1,333,500 | ||||||||||||
TransDigm, Inc. (Aerospace & Defense) | (b) | 5.500% | 10/15/2020 | 275,000 | 287,375 | |||||||||||
| 63 | (continued) |
| Ohio National Fund, Inc. | High Income Bond Portfolio (Continued) |
Schedule of Investments | December 31, 2012 |
| Corporate Bonds (Continued) | Rate | Maturity | Face Amount | Value | ||||||||||||
INDUSTRIALS (continued) | ||||||||||||||||
Building Materials Corp. of America (Building Products) | (b) | 7.500% | 03/15/2020 | $ | 225,000 | $ | 248,625 | |||||||||
Building Materials Corp. of America (Building Products) | (b) | 6.750% | 05/01/2021 | 375,000 | 415,313 | |||||||||||
Masonite International Corp. (Building Products) | (b) | 8.250% | 04/15/2021 | 1,000,000 | 1,075,000 | |||||||||||
Nortek, Inc. (Building Products) | 10.000% | 12/01/2018 | 600,000 | 670,500 | ||||||||||||
Nortek, Inc. (Building Products) | 8.500% | 04/15/2021 | 1,025,000 | 1,142,875 | ||||||||||||
Nortek, Inc. (Building Products) | (b) | 8.500% | 04/15/2021 | 225,000 | 250,313 | |||||||||||
Ply Gem Industries, Inc. (Building Products) | 8.250% | 02/15/2018 | 1,125,000 | 1,220,625 | ||||||||||||
Ply Gem Industries, Inc. (Building Products) | (b) | 9.375% | 04/15/2017 | 300,000 | 320,250 | |||||||||||
RBS Global, Inc. / Rexnord LLC (Building Products) | 8.500% | 05/01/2018 | 1,075,000 | 1,170,406 | ||||||||||||
Roofing Supply Group LLC / Roofing Supply Finance, Inc. (Building Products) | (b) | 10.000% | 06/01/2020 | 700,000 | 787,500 | |||||||||||
Thermon Industries, Inc. (Building Products) | 9.500% | 05/01/2017 | 334,000 | 372,410 | ||||||||||||
ADS Waste Holdings, Inc. (Commercial Svs. & Supplies) | (b) | 8.250% | 10/01/2020 | 700,000 | 738,500 | |||||||||||
Altegrity, Inc. (Acquired 06/10/2009 through 02/08/2011, Cost $437,533)(Commercial Svs. & Supplies) | (b)(f) | 11.750% | 05/01/2016 | 450,000 | 339,750 | |||||||||||
ARAMARK Corp. (Commercial Svs. & Supplies) | 8.500% | 02/01/2015 | 950,000 | 955,947 | ||||||||||||
ARAMARK Corp. (Commercial Svs. & Supplies) | (d) | 3.813% | 02/01/2015 | 150,000 | 150,188 | |||||||||||
ARAMARK Holdings Corp. (Commercial Svs. & Supplies) | (b)(c) | 8.625% | 05/01/2016 | 1,125,000 | 1,154,543 | |||||||||||
Garda World Security Corp. (Commercial Svs. & Supplies) | (b) | 9.750% | 03/15/2017 | 1,200,000 | 1,269,000 | |||||||||||
Iron Mountain, Inc. (Commercial Svs. & Supplies) | 7.750% | 10/01/2019 | 525,000 | 594,563 | ||||||||||||
Iron Mountain, Inc. (Commercial Svs. & Supplies) | 5.750% | 08/15/2024 | 200,000 | 203,500 | ||||||||||||
Logo Merger Sub Corp. (Commercial Svs. & Supplies) | (b) | 8.375% | 10/15/2020 | 1,075,000 | 1,085,750 | |||||||||||
Maxim Crane Works LP / Maxim Finance Corp. (Commercial Svs. & Supplies) | (b) | 12.250% | 04/15/2015 | 625,000 | 643,750 | |||||||||||
United Rentals North America, Inc. (Commercial Svs. & Supplies) | 10.250% | 11/15/2019 | 625,000 | 728,125 | ||||||||||||
United Rentals North America, Inc. (Commercial Svs. & Supplies) | 8.375% | 09/15/2020 | 1,325,000 | 1,474,063 | ||||||||||||
United Rentals North America, Inc. (Commercial Svs. & Supplies) | 8.250% | 02/01/2021 | 200,000 | 226,500 | ||||||||||||
U.R. Financing Escrow Corp. (Commercial Svs. & Supplies) | (b) | 7.375% | 05/15/2020 | 100,000 | 110,250 | |||||||||||
West Corp. (Commercial Svs. & Supplies) | 7.875% | 01/15/2019 | 275,000 | 286,000 | ||||||||||||
Belden, Inc. (Electrical Equip.) | (b) | 5.500% | 09/01/2022 | 925,000 | 955,063 | |||||||||||
CommScope, Inc. (Electrical Equip.) | (b) | 8.250% | 01/15/2019 | 1,425,000 | 1,567,500 | |||||||||||
General Cable Corp. (Electrical Equip.) | (b) | 5.750% | 10/01/2022 | 750,000 | 780,000 | |||||||||||
Viasystems, Inc. (Electrical Equip.) | (b) | 7.875% | 05/01/2019 | 725,000 | 714,125 | |||||||||||
Amsted Industries, Inc. (Machinery) | (b) | 8.125% | 03/15/2018 | 200,000 | 215,000 | |||||||||||
Dematic SA / DH Services Luxembourg Sarl (Machinery) | (b) | 7.750% | 12/15/2020 | 475,000 | 477,375 | |||||||||||
Dynacast International LLC / Dynacast Finance, Inc. (Machinery) | 9.250% | 07/15/2019 | 825,000 | 886,875 | ||||||||||||
Mcron Finance Sub. LLC / Mcron Finance Corp. (Machinery) | (b) | 8.375% | 05/15/2019 | 425,000 | 437,750 | |||||||||||
Mueller Water Products, Inc. (Machinery) | 7.375% | 06/01/2017 | 675,000 | 700,313 | ||||||||||||
Mueller Water Products, Inc. (Machinery) | 8.750% | 09/01/2020 | 540,000 | 618,300 | ||||||||||||
Schaeffler Finance BV (Machinery) | (b) | 8.500% | 02/15/2019 | 875,000 | 993,125 | |||||||||||
Schaeffler Finance BV (Machinery) | (b) | 7.750% | 02/15/2017 | 475,000 | 529,625 | |||||||||||
Stena AB (Marine) | 7.000% | 12/01/2016 | 175,000 | 175,438 | ||||||||||||
Hertz Corp. / The (Road & Rail) | 7.500% | 10/15/2018 | 100,000 | 111,000 | ||||||||||||
Hertz Corp. / The (Road & Rail) | 6.750% | 04/15/2019 | 1,025,000 | 1,123,656 | ||||||||||||
Interline Brands, Inc. (Trading Companies & Distributors) | 7.500% | 11/15/2018 | 700,000 | 759,500 | ||||||||||||
Isabelle Acquisition Sub, Inc. (Trading Companies & Distributors) | (b)(c) | 10.000% | 11/15/2018 | 1,025,000 | 1,117,250 | |||||||||||
International Lease Finance Corp. (Trading Companies & Distributors) | 8.250% | 12/15/2020 | 275,000 | 328,625 | ||||||||||||
International Lease Finance Corp. (Trading Companies & Distributors) | 8.625% | 09/15/2015 | 450,000 | 507,375 | ||||||||||||
International Lease Finance Corp. (Trading Companies & Distributors) | 8.750% | 03/15/2017 | 2,075,000 | 2,407,000 | ||||||||||||
International Lease Finance Corp. (Trading Companies & Distributors) | 5.750% | 05/15/2016 | 250,000 | 264,708 | ||||||||||||
International Lease Finance Corp. (Trading Companies & Distributors) | 5.875% | 08/15/2022 | 700,000 | 742,050 | ||||||||||||
Rexel SA (Trading Companies & Distributors) | (b) | 6.125% | 12/15/2019 | 1,000,000 | 1,055,000 | |||||||||||
|
| |||||||||||||||
| 37,676,524 | ||||||||||||||||
|
| |||||||||||||||
INFORMATION TECHNOLOGY – 10.6% | ||||||||||||||||
MMI International Ltd. (Computers & Peripherals) | (b) | 8.000% | 03/01/2017 | 250,000 | 266,250 | |||||||||||
NCR Corp. (Computers & Peripherals) | (b) | 5.000% | 07/15/2022 | 450,000 | 459,563 | |||||||||||
NCR Corp. (Computers & Peripherals) | (b) | 4.625% | 02/15/2021 | 475,000 | 477,375 | |||||||||||
Seagate HDD Cayman (Computers & Peripherals) | 6.875% | 05/01/2020 | 375,000 | 400,781 | ||||||||||||
Seagate HDD Cayman (Computers & Peripherals) | 7.750% | 12/15/2018 | 400,000 | 441,500 | ||||||||||||
Seagate HDD Cayman (Computers & Peripherals) | 7.000% | 11/01/2021 | 300,000 | 323,250 | ||||||||||||
Seagate Technology HDD Holdings (Computers & Peripherals) | 6.800% | 10/01/2016 | 575,000 | 646,875 | ||||||||||||
Anixter, Inc. (Electronic Equip., Instr. & Comp.) | 5.625% | 05/01/2019 | 300,000 | 317,250 | ||||||||||||
Cleaver-Brooks, Inc. (Electronic Equip., Instr. & Comp.) | (b) | 8.750% | 12/15/2019 | 375,000 | 388,125 | |||||||||||
Kemet Corp. (Electronic Equip., Instr. & Comp.) | 10.500% | 05/01/2018 | 1,250,000 | 1,239,063 | ||||||||||||
IAC/InterActiveCorp (Internet Software & Svs.) | (b) | 4.750% | 12/15/2022 | 375,000 | 375,000 | |||||||||||
CoreLogic, Inc. (IT Svs.) | 7.250% | 06/01/2021 | 1,125,000 | 1,229,063 | ||||||||||||
Fidelity National Information Services, Inc. (IT Svs.) | 7.875% | 07/15/2020 | 125,000 | 142,031 | ||||||||||||
Fidelity National Information Services, Inc. (IT Svs.) | 7.625% | 07/15/2017 | 1,025,000 | 1,119,813 | ||||||||||||
First Data Corp. (IT Svs.) | (b)(c) | 8.750% | 01/15/2022 | 2,825,000 | 2,902,688 | |||||||||||
First Data Corp. (IT Svs.) | (b) | 8.250% | 01/15/2021 | 475,000 | 477,375 | |||||||||||
iGATE Corp. (IT Svs.) | 9.000% | 05/01/2016 | 1,050,000 | 1,143,188 | ||||||||||||
| 64 | (continued) |
| Ohio National Fund, Inc. | High Income Bond Portfolio (Continued) |
Schedule of Investments | December 31, 2012 |
| Corporate Bonds (Continued) | Rate | Maturity | Face Amount | Value | ||||||||||||
INFORMATION TECHNOLOGY (continued) | ||||||||||||||||
Lender Processing Services, Inc. (IT Svs.) | 5.750% | 04/15/2023 | $ | 1,325,000 | $ | 1,381,313 | ||||||||||
Mantech International Corp. (IT Svs.) | 7.250% | 04/15/2018 | 200,000 | 213,500 | ||||||||||||
Stream Global Services, Inc. (IT Svs.) | 11.250% | 10/01/2014 | 525,000 | 551,250 | ||||||||||||
SunGard Data Systems, Inc. (IT Svs.) | 7.625% | 11/15/2020 | 200,000 | 219,500 | ||||||||||||
SunGard Data Systems, Inc. (IT Svs.) | 7.375% | 11/15/2018 | 175,000 | 188,344 | ||||||||||||
SunGard Data Systems, Inc. (IT Svs.) | (b) | 6.625% | 11/01/2019 | 625,000 | 642,188 | |||||||||||
Advanced Micro Devices, Inc. (Semiconductors & Equip.) | 8.125% | 12/15/2017 | 725,000 | 665,188 | ||||||||||||
Advanced Micro Devices, Inc. (Semiconductors & Equip.) | 7.750% | 08/01/2020 | 675,000 | 568,688 | ||||||||||||
Freescale Semiconductor, Inc. (Semiconductors & Equip.) | (b) | 9.250% | 04/15/2018 | 725,000 | 795,688 | |||||||||||
Freescale Semiconductor, Inc. (Semiconductors & Equip.) | 10.750% | 08/01/2020 | 825,000 | 888,938 | ||||||||||||
MagnaChip Semiconductor SA / MagnaChip Semiconductor Finance Co. (Semiconductors & Equip.) | 10.500% | 04/15/2018 | 925,000 | 1,040,625 | ||||||||||||
Spansion LLC (Semiconductors & Equip.) | 7.875% | 11/15/2017 | 1,200,000 | 1,236,000 | ||||||||||||
Allen Systems Group, Inc. (Acquired 11/18/2010 through 02/28/2012, Cost $743,364)(Software) | (b)(f) | 10.500% | 11/15/2016 | 750,000 | 562,500 | |||||||||||
Aspect Software, Inc. (Software) | 10.625% | 05/15/2017 | 975,000 | 892,125 | ||||||||||||
Audatex North America, Inc. (Software) | (b) | 6.750% | 06/15/2018 | 1,275,000 | 1,370,625 | |||||||||||
Epicor Software Corp. (Software) | 8.625% | 05/01/2019 | 1,625,000 | 1,714,375 | ||||||||||||
Infor U.S., Inc. (Software) | 9.375% | 04/01/2019 | 1,150,000 | 1,296,625 | ||||||||||||
Infor U.S., Inc. (Software) | 11.500% | 07/15/2018 | 1,575,000 | 1,850,625 | ||||||||||||
Nuance Communications, Inc. (Software) | (b) | 5.375% | 08/15/2020 | 900,000 | 945,000 | |||||||||||
Serena Software, Inc. (Software) | 10.375% | 03/15/2016 | 550,000 | 566,500 | ||||||||||||
Sophia LP / Sophia Finance, Inc. (Software) | (b) | 9.750% | 01/15/2019 | 1,575,000 | 1,704,938 | |||||||||||
SSI Investments II Ltd. / SSI Co-Issuer LLC (Software) | 11.125% | 06/01/2018 | 1,250,000 | 1,389,063 | ||||||||||||
|
| |||||||||||||||
| 33,032,788 | ||||||||||||||||
|
| |||||||||||||||
MATERIALS – 7.6% | ||||||||||||||||
Ferro Corp. (Chemicals) | 7.875% | 08/15/2018 | 1,150,000 | 1,043,625 | ||||||||||||
Hexion U.S. Finance Corp / Hexion Nova Scotia Finance ULC (Chemicals) | 8.875% | 02/01/2018 | 900,000 | 929,250 | ||||||||||||
Hexion U.S. Finance Corp / Hexion Nova Scotia Finance ULC (Chemicals) | 9.000% | 11/15/2020 | 650,000 | 596,375 | ||||||||||||
Huntsman International LLC (Chemicals) | 5.500% | 06/30/2016 | 241,000 | 241,603 | ||||||||||||
Huntsman International LLC (Chemicals) | 8.625% | 03/15/2020 | 325,000 | 369,688 | ||||||||||||
Koppers, Inc. (Chemicals) | 7.875% | 12/01/2019 | 575,000 | 635,375 | ||||||||||||
Momentive Performance Materials, Inc. (Chemicals) | 9.000% | 01/15/2021 | 275,000 | 202,125 | ||||||||||||
Momentive Performance Materials, Inc. (Chemicals) | (b) | 10.000% | 10/15/2020 | 600,000 | 594,000 | |||||||||||
OMNOVA Solutions, Inc. (Chemicals) | 7.875% | 11/01/2018 | 1,050,000 | 1,088,063 | ||||||||||||
OXEA Finance & Cy SCA (Chemicals) | (b) | 9.500% | 07/15/2017 | 727,000 | 799,700 | |||||||||||
Rockwood Specialties Group, Inc. (Chemicals) | 4.625% | 10/15/2020 | 400,000 | 415,500 | ||||||||||||
Scotts Miracle-Gro Co. / The (Chemicals) | 6.625% | 12/15/2020 | 550,000 | 606,375 | ||||||||||||
Union Carbide Corp. (Chemicals) | 7.875% | 04/01/2023 | 100,000 | 126,645 | ||||||||||||
Ardagh Packaging Finance Plc (Containers & Packaging) | (b) | 9.125% | 10/15/2020 | 1,325,000 | 1,450,875 | |||||||||||
Ardagh Packaging Finance Plc / Ardagh MP Holdings U.S.A., Inc. (Containers & Packaging) | (b) | 9.125% | 10/15/2020 | 425,000 | 463,250 | |||||||||||
Berry Plastics Corp. (Containers & Packaging) | 9.500% | 05/15/2018 | 550,000 | 607,750 | ||||||||||||
BOE Merger Corp. (Containers & Packaging) | (b)(c) | 9.500% | 11/01/2017 | 775,000 | 778,875 | |||||||||||
BWAY Holding Co. (Containers & Packaging) | 10.000% | 06/15/2018 | 900,000 | 1,003,500 | ||||||||||||
Crown Americas LLC / Crown Americas Capital Corp. II (Containers & Packaging) | 7.625% | 05/15/2017 | 75,000 | 79,594 | ||||||||||||
Graphic Packaging International, Inc. (Containers & Packaging) | 9.500% | 06/15/2017 | 950,000 | 1,030,750 | ||||||||||||
Greif, Inc. (Containers & Packaging) | 7.750% | 08/01/2019 | 475,000 | 551,000 | ||||||||||||
Packaging Dynamics Corp. (Containers & Packaging) | (b) | 8.750% | 02/01/2016 | 875,000 | 918,750 | |||||||||||
Pactiv LLC (Containers & Packaging) | 7.950% | 12/15/2025 | 225,000 | 186,750 | ||||||||||||
Reynolds Group Issuer, Inc. / Reynolds Group Issuer LLC (Containers & Packaging) | 8.500% | 05/15/2018 | 775,000 | 798,250 | ||||||||||||
Reynolds Group Issuer, Inc. / Reynolds Group Issuer LLC (Containers & Packaging) | 9.000% | 04/15/2019 | 675,000 | 705,375 | ||||||||||||
Reynolds Group Issuer, Inc. / Reynolds Group Issuer LLC (Containers & Packaging) | 8.250% | 02/15/2021 | 1,750,000 | 1,785,000 | ||||||||||||
Reynolds Group Issuer, Inc. / Reynolds Group Issuer LLC (Containers & Packaging) | 9.875% | 08/15/2019 | 1,275,000 | 1,370,625 | ||||||||||||
Reynolds Group Issuer, Inc. / Reynolds Group Issuer LLC (Containers & Packaging) | 7.125% | 04/15/2019 | 175,000 | 189,000 | ||||||||||||
Reynolds Group Issuer, Inc. / Reynolds Group Issuer LLC (Containers & Packaging) | (b) | 5.750% | 10/15/2020 | 1,000,000 | 1,035,000 | |||||||||||
Sealed Air Corp. (Containers & Packaging) | (b) | 8.375% | 09/15/2021 | 1,350,000 | 1,549,125 | |||||||||||
Sealed Air Corp. (Containers & Packaging) | (b) | 6.500% | 12/01/2020 | 125,000 | 135,625 | |||||||||||
Compass Minerals International, Inc. (Metals & Mining) | 8.000% | 06/01/2019 | 275,000 | 298,375 | ||||||||||||
Clearwater Paper Corp. (Paper & Forest Products) | 10.625% | 06/15/2016 | 125,000 | 136,875 | ||||||||||||
Clearwater Paper Corp. (Paper & Forest Products) | 7.125% | 11/01/2018 | 125,000 | 136,875 | ||||||||||||
Longview Fibre Paper & Packaging, Inc. (Paper & Forest Products) | (b) | 8.000% | 06/01/2016 | 650,000 | 685,750 | |||||||||||
|
| |||||||||||||||
| 23,545,293 | ||||||||||||||||
|
| |||||||||||||||
TELECOMMUNICATION SERVICES – 5.2% | ||||||||||||||||
GXS Worldwide, Inc. (Diversified Telecom. Svs.) | 9.750% | 06/15/2015 | 225,000 | 235,406 | ||||||||||||
Level 3 Communications, Inc. (Diversified Telecom. Svs.) | (b) | 8.875% | 06/01/2019 | 350,000 | 374,063 | |||||||||||
Level 3 Financing, Inc. (Diversified Telecom. Svs.) | 8.125% | 07/01/2019 | 925,000 | 1,012,875 | ||||||||||||
Level 3 Financing, Inc. (Diversified Telecom. Svs.) | 8.625% | 07/15/2020 | 275,000 | 306,281 | ||||||||||||
Level 3 Financing, Inc. (Diversified Telecom. Svs.) | (b) | 7.000% | 06/01/2020 | 475,000 | 498,156 | |||||||||||
tw telecom holdings, Inc. (Diversified Telecom. Svs.) | (b) | 5.375% | 10/01/2022 | 175,000 | 183,969 | |||||||||||
| 65 | (continued) |
| Ohio National Fund, Inc. | High Income Bond Portfolio (Continued) |
Schedule of Investments | December 31, 2012 |
| Corporate Bonds (Continued) | Rate | Maturity | Face Amount | Value | ||||||||||||
TELECOMMUNICATION SERVICES (continued) | ||||||||||||||||
Windstream Corp. (Diversified Telecom. Svs.) | 8.125% | 09/01/2018 | $ | 650,000 | $ | 713,375 | ||||||||||
Digicel Group Ltd. (Wireless Telecom. Svs.) | (b) | 8.250% | 09/30/2020 | 1,575,000 | 1,740,375 | |||||||||||
Digicel Ltd. (Wireless Telecom. Svs.) | (b) | 12.000% | 04/01/2014 | 650,000 | 710,125 | |||||||||||
Digicel Ltd. (Wireless Telecom. Svs.) | (b) | 8.250% | 09/01/2017 | 675,000 | 729,000 | |||||||||||
MetroPCS Wireless, Inc. (Wireless Telecom. Svs.) | 7.875% | 09/01/2018 | 925,000 | 1,005,938 | ||||||||||||
MetroPCS Wireless, Inc. (Wireless Telecom. Svs.) | 6.625% | 11/15/2020 | 875,000 | 932,969 | ||||||||||||
Sprint Capital Corp. (Wireless Telecom. Svs.) | 6.875% | 11/15/2028 | 1,100,000 | 1,149,500 | ||||||||||||
Sprint Capital Corp. (Wireless Telecom. Svs.) | 6.900% | 05/01/2019 | 2,500,000 | 2,737,500 | ||||||||||||
Sprint Nextel Corp. (Wireless Telecom. Svs.) | (b) | 9.000% | 11/15/2018 | 1,025,000 | 1,268,438 | |||||||||||
Sprint Nextel Corp. (Wireless Telecom. Svs.) | (b) | 7.000% | 03/01/2020 | 350,000 | 407,750 | |||||||||||
Sprint Nextel Corp. (Wireless Telecom. Svs.) | 6.000% | 11/15/2022 | 475,000 | 490,438 | ||||||||||||
Syniverse Holdings, Inc. (Wireless Telecom. Svs.) | 9.125% | 01/15/2019 | 1,600,000 | 1,716,000 | ||||||||||||
|
| |||||||||||||||
| 16,212,158 | ||||||||||||||||
|
| |||||||||||||||
UTILITIES – 1.8% | ||||||||||||||||
Energy Future Intermediate Holding Co. LLC / EFIH Finance, Inc. (Electric Utilities) | 10.000% | 12/01/2020 | 500,000 | 566,250 | ||||||||||||
Energy Future Intermediate Holding Co. LLC / EFIH Finance, Inc. (Electric Utilities) | (b) | 11.750% | 03/01/2022 | 625,000 | 696,875 | |||||||||||
Energy Future Intermediate Holding Co. LLC / EFIH Finance, Inc. (Electric Utilities) | (b) | 6.875% | 08/15/2017 | 375,000 | 401,250 | |||||||||||
Texas Competitive Electric Holdings Co. LLC / TCEH Finance, Inc. (Electric Utilities) | (b) | 11.500% | 10/01/2020 | 125,000 | 98,438 | |||||||||||
Suburban Propane Partners LP / Suburban Energy Finance Corp. (Gas Utilities) | 7.500% | 10/01/2018 | 211,000 | 228,408 | ||||||||||||
Suburban Propane Partners LP / Suburban Energy Finance Corp. (Gas Utilities) | 7.375% | 08/01/2021 | 506,000 | 552,805 | ||||||||||||
Calpine Corp. (Ind. Power Prod. & Energy Traders) | (b) | 7.500% | 02/15/2021 | 833,000 | 924,630 | |||||||||||
NRG Energy, Inc. (Ind. Power Prod. & Energy Traders) | 8.250% | 09/01/2020 | 750,000 | 843,750 | ||||||||||||
NRG Energy, Inc. (Ind. Power Prod. & Energy Traders) | 7.875% | 05/15/2021 | 475,000 | 529,625 | ||||||||||||
NRG Energy, Inc. (Ind. Power Prod. & Energy Traders) | 7.625% | 05/15/2019 | 700,000 | 752,500 | ||||||||||||
FPL Energy National Wind Portfolio LLC (Acquired 05/27/2009, Cost $126,243)(Multi-Utilities) | (b)(f) | 6.125% | 03/25/2019 | 145,275 | 123,873 | |||||||||||
|
| |||||||||||||||
| 5,718,404 | ||||||||||||||||
|
| |||||||||||||||
Total Corporate Bonds (Cost $289,773,573) | $ | 306,187,127 | ||||||||||||||
|
| |||||||||||||||
| Common Stocks – 0.0% | Shares | Value | ||||||||||||||
CONSUMER DISCRETIONARY – 0.0% | ||||||||||||||||
General Motors Co. (Automobiles) | (a) | 4,443 | $ | 128,092 | ||||||||||||
|
| |||||||||||||||
Total Common Stocks (Cost $415,829) | $ | 128,092 | ||||||||||||||
|
| |||||||||||||||
| Preferred Stocks – 0.1% | Shares | Value | ||||||||||||||
FINANCIALS – 0.1% | ||||||||||||||||
Ally Financial, Inc. (Consumer Finance) | (b) | 346 | $ | 339,848 | ||||||||||||
|
| |||||||||||||||
Total Preferred Stocks (Cost $0) | $ | 339,848 | ||||||||||||||
|
| |||||||||||||||
| Warrants – 0.0% | Quantity | Value | ||||||||||||||
CONSUMER DISCRETIONARY – 0.0% | ||||||||||||||||
General Motors Co. (Automobiles) Expiration: 07/10/16, Exercise Price: $10.00 | (a) | 4,039 | $ | 78,761 | ||||||||||||
General Motors Co. (Automobiles) Expiration: 07/10/19, Exercise Price: $18.33 | (a) | 4,039 | 50,447 | |||||||||||||
|
| |||||||||||||||
Total Warrants (Cost $476,540) | $ | 129,208 | ||||||||||||||
|
| |||||||||||||||
| Other – 0.0% | Shares | Value | ||||||||||||||
CONSUMER DISCRETIONARY – 0.0% | ||||||||||||||||
Motors Liquidation Co. GUC Trust (Automobiles) | (a) | 1,116 | $ | 23,659 | ||||||||||||
|
| |||||||||||||||
Total Other (Cost $0) | $ | 23,659 | ||||||||||||||
|
| |||||||||||||||
| Money Market Funds – 0.5% | Shares | Value | ||||||||||||||
Fidelity Institutional Money Market Funds | 1,440,000 | $ | 1,440,000 | |||||||||||||
|
| |||||||||||||||
Total Money Market Funds (Cost $1,440,000) | $ | 1,440,000 | ||||||||||||||
|
| |||||||||||||||
Total Investments – 98.8% (Cost $292,105,942) | (g) | $ | 308,247,934 | |||||||||||||
Other Assets in Excess of Liabilities – 1.2% | 3,667,003 | |||||||||||||||
|
| |||||||||||||||
Net Assets – 100.0% | $ | 311,914,937 | ||||||||||||||
|
| |||||||||||||||
Percentages are stated as a percent of net assets.
Footnotes:
| (a) | Non-income producing security. |
| 66 | (continued) |
| Ohio National Fund, Inc. | High Income Bond Portfolio (Continued) |
Schedule of Investments | December 31, 2012 |
| (b) | Security exempt from registration under Regulation D of the Securities Act of 1933. These securities may be resold in transactions exempt from registration, normally to qualified buyers under Rule 144A. At December 31, 2012, the value of these securities totaled $109,000,892, or 34.9% of the Portfolio’s net assets. Unless also noted with (f), as defined below, these securities were deemed liquid pursuant to procedures approved by the Board of Directors. |
| (c) | Issuer of the security has the option to make coupon payments in cash or in additional par value of this bond. Rate presented is the coupon rate for the cash option. |
| (d) | Security is a variable rate instrument in which the coupon rate is adjusted quarterly, or semi-annually, in concert with U.S. LIBOR. Interest rates stated are those in effect at December 31, 2012. |
| (e) | Represents a security that is in default. Unless noted by (f), as defined below, these securities were deemed liquid pursuant to procedures approved by the Board of Directors. |
| (f) | Represents a security deemed to be illiquid. At December 31, 2012, the value of illiquid securities in the Portfolio totaled $1,663,123, or 0.5% of the Portfolio’s net assets. |
| (g) | Represents cost for financial reporting purposes, which may differ from cost basis for federal income tax purposes. See also Note 7 of the Notes to Financial Statements. |
The accompanying notes are an integral part of these financial statements.
| 67 |
| Ohio National Fund, Inc. | Capital Growth Portfolio |
Objective/Strategy
The Capital Growth Portfolio seeks long-term capital appreciation by investing primarily in an actively managed portfolio of equity securities of small cap growth companies.
Performance as of December 31, 2012
Average Annual Total Returns: | ||||
One year | 13.81% | |||
Five years | 5.45% | |||
Ten years | 11.61% |
Past performance does not guarantee future results. The performance data quoted represents past performance and current returns may be lower or higher. Total return figures include change in share price and reinvestment of dividends and capital gains. The investment return and principal value will fluctuate so that an investor’s shares, when redeemed, may be worth more or less than the original cost. To obtain performance information up to the most recent month end, call toll-free 1-877-781-6392.
The Portfolio is not open to direct retail investment. Beneficial interest in shares is obtained solely by purchase of variable life insurance policies and variable annuity contracts. Actual performance results for variable annuity and variable universal life contracts will be lower due to contract charges. Consult your contract for applicable charges.
Comments
For the year ended December 31, 2012, the Capital Growth Portfolio returned 13.81% versus 14.59% for the current benchmark, the Russell 2000 Growth Index.
For the full year, the Russell 2000 Growth Index trailed the Russell 2000 Value Index. After running a tight race through the first nine months, weak results from some of the growth index’s largest biotech names allowed value to push ahead. There were solid absolute returns during 2012 within the benchmark, led by the Materials (21.5 percent), Consumer Discretionary (21.5 percent), and Financials (18.5 percent) sectors; Energy (-7.2 percent) was the only negative sector. On a relative basis, Information Technology and Health Care were in line while Financials and Energy trailed most notably.
The Portfolio was essentially in line with the benchmark Russell 2000 Growth Index on a gross (no fund expense) basis. Contributing sectors for the year were led by Energy and Materials, largely due to solid stock selection. Our top contributing stocks for the year were Geospace Technologies Corp., The Geo Group, Inc., Catalyst Health Solutions, Inc., Vitamin Shoppe, Inc., and Onyx Pharmaceuticals, Inc.(1)
Geospace Technologies Corp. makes seismic instruments used in monitoring oil and natural-gas reserves. The company continues to see demand strength and order growth for its geospace seismic recorders (GSRs) as well as increasing order traction for the company’s seabed reservoir-monitoring systems.(1)
The Geo Group, Inc. manages correctional and mental health facilities primarily with United States governmental agencies. The Geo Group, Inc.’s shares rose sharply toward the end of the period when it announced its plan to convert to a real estate investment trust (REIT) and pay a large special dividend.(1)
Catalyst Health Solutions, Inc. provides pharmacy-benefit-management services. The company was acquired by SXC Health Solutions, a slightly larger peer, at a modest premium during the period.(1)
Vitamin Shoppe, Inc. is a specialty retailer of vitamins, sports nutrition, and health and beauty-aid products. Benefitting from favorable U.S. demographics and increased vitamin and supplement utilization among the aging “Baby Boomer” generation, Vitamin Shoppe, Inc. continues to grow both earnings and its retail footprint across the country.(1)
Onyx Pharmaceuticals, Inc. focuses on the development of drug therapies for kidney, blood-based and other forms of cancer. Positive news regarding the U.S. Food and Drug Administration advisory panel’s vote in favor of approving Onyx Pharmaceuticals, Inc.’s multiple myeloma drug candidate, Kyprolis, boosted shares of the company’s stock. The drug treatment was subsequently approved by the FDA and initial launch feedback has been substantially positive thus far.(1)
Detracting sectors for 2012 were Information Technology and, to a lesser extent, Consumer Discretionary and Financials. The Portfolio’s largest detracting stocks for the year were Monster Worldwide, Inc., Quality Systems, Inc., Allscripts Healthcare Solutions, Inc., Genesco, Inc., and Quality Distribution, Inc.(1)
Monster Worldwide, Inc. provides online employment solutions (e.g., searchable job postings for prospective employees and resume database access for recruiters). The company has proceeded with some selective restructuring as part of a cost-savings initiative, while continuing to entertain and evaluate strategic alternatives through a possible sale of the company. Shares of the stock have waned as the anticipated sale of the company has taken longer than expected. At current levels, we can hold the stock on fundamentals alone and perhaps the company will still be sold. Quality Systems, Inc. sells electronic health records and revenue-cycle management applications to medical practices and hospitals. The industry dynamic for electronic health records has incurred a noticeable shift away from relatively smaller physician groups toward the larger hospital setting as hospitals attempt to bolster their revenue streams through the acquisition of these smaller practices. We believe that stark change in the industry landscape substantially eroded Quality Systems, Inc.’s previously strong positioning in the market. Allscripts Healthcare Solutions, Inc. provides clinical software and service solutions to physicians and other healthcare providers. The company missed earnings estimates earlier in the year as integration of its legacy Eclipsys platform had proven logistically more complex than originally determined, raising costs and compressing its near-term margins. Genesco, Inc. is a retailer of headwear, sporting goods, footwear and clothing accessories. Despite beating estimates in the third quarter and raising guidance for 2013, Genesco, Inc. traded down in the fourth quarter as investors became concerned with declining same-store sales at its Lids cap subsidiary. We continue to hold Genesco, Inc. and believe it will be a strong contributor to 2013 performance. Quality Distribution, Inc. is a provider of bulk transportation services through the use of tank-truck carriers throughout North America. Muted North American transport volumes, coupled with added expenses related to the acquisition of a troubled affiliate’s assets, led Quality Distribution, Inc. to miss estimates for the most recently reported quarter and trade downward as a result.(1)
The five top-performing holdings (without regard for position size) were Geospace Technologies Corp., The Geo Group, Inc., IPG Photonics Corp., MedAssets, Inc., and Redwood Trust, Inc. The five worst-performing holdings (without regard for position size) included Quality Distribution, Inc., Twin Disc, Inc. Allscripts Healthcare Solutions,, Inc., Halozyme Therapeutics, Inc., and Quality Systems.(1)
| 68 | (continued) |
| Ohio National Fund, Inc. | Capital Growth Portfolio (Continued) |
We believe the strong equity performance of recent years will continue into 2013. The focus on the “fiscal cliff” has now shifted to concerns over the national debt ceiling and resultant reductions in federal spending. Like the “fiscal-cliff” debate, we believe the immediate concerns will be addressed in the 24th hour. Congress will lift the ceiling, nominally cut federal spending, and both Republicans and Democrats will be unhappy. Recent economic data from China has been encouraging and Europe seems to have successfully “kicked the can down the road” on its fiscal crisis. Domestically, we should benefit from recoveries from both autos and housing. Current consensus forecasts of two percent to three percent domestic gross domestic product (GDP) growth could prove conservative. Given our expectations of a reasonably strong economy, we believe interest rates will start creeping up but be offset somewhat by Federal Reserve actions to keep rates in check. Weakness in fixed-income markets could enable a return to equity markets by retail investors who abandoned equity markets in 2008 to 2009 in favor of the relative safety of bonds. We continue to favor companies leveraged to housing. We believe Financials should continue to perform well, as should cyclical groups such as Energy and Materials. After a very strong 2012, consumer stocks could lag as higher taxes could prove to be a drag on consumer spending.
| (1) | The Portfolio’s composition is subject to change. Holdings and weightings are as of December 31, 2012. |
Change in Value of $10,000 Investment
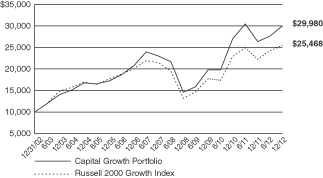
Hypothetical illustration based on past performance. Future performance will vary. The Portfolio’s returns reflect reinvested dividends. The Portfolio’s holdings may differ significantly from the securities in the index. The index is unmanaged and therefore does not reflect the cost of portfolio management and accounting.
The Russell 2000 Growth Index measures the performance of the small-cap growth segment of the U.S. equity universe. It includes those Russell 2000 Index companies with higher price-to-value ratios and higher forecasted growth values. The Russell 2000 Index includes the 2000 firms from the Russell 3000 Index with the smallest market capitalizations. The Russell 3000 Index represents 98% of the investable U.S. equity market. The index presented herein includes the effects of reinvested dividends.
Portfolio Composition as of December 31, 2012 (1)
| % of Net Assets | ||||
Common Stocks (3) | 99.8 | |||
Money Market Funds | 0.2 | |||
|
| |||
| 100.0 | ||||
|
|
Top 10 Portfolio Holdings as of December 31, 2012 (1) (2)
| % of Net Assets | ||||
1. Geospace Technologies Corp. | 3.1 | |||
2. Genesco, Inc. | 3.1 | |||
3. Vitamin Shoppe, Inc. | 2.1 | |||
4. Geo Group, Inc. / The | 1.9 | |||
5. Lufkin Industries, Inc. | 1.9 | |||
6. SHFL Entertainment, Inc. | 1.7 | |||
7. Sirona Dental Systems, Inc. | 1.7 | |||
8. Bally Technologies, Inc. | 1.6 | |||
9. ArthroCare Corp. | 1.6 | |||
10. Hexcel Corp. | 1.5 |
| (1) | Composition of Portfolio subject to change. |
| (2) | Short-term investments have been excluded from the list of Top 10 Portfolio Holdings. |
| (3) | Sectors: |
| % of Net Assets | ||||
Health Care | 20.9 | |||
Information Technology | 19.0 | |||
Industrials | 17.4 | |||
Consumer Discretionary | 17.3 | |||
Energy | 8.8 | |||
Financials | 7.1 | |||
Materials | 6.3 | |||
Consumer Staples | 3.0 | |||
|
| |||
| 99.8 | ||||
|
|
| 69 |
| Ohio National Fund, Inc. | Capital Growth Portfolio |
Schedule of Investments | December 31, 2012 |
| Common Stocks – 99.8% | Shares | Value | ||||||||
CONSUMER DISCRETIONARY – 17.3% | ||||||||||
Sotheby’s (Diversified Consumer Svs.) | 13,085 | $ | 439,918 | |||||||
Bally Technologies, Inc. (Hotels, Restaurants & Leisure) | (a) | 19,796 | 885,079 | |||||||
BJ’s Restaurants, Inc. (Hotels, Restaurants & Leisure) | (a) | 13,941 | 458,659 | |||||||
Orient-Express Hotels Ltd. Class A (Hotels, Restaurants & Leisure) | (a) | 42,035 | 491,389 | |||||||
Pinnacle Entertainment, Inc. (Hotels, Restaurants & Leisure) | (a) | 28,377 | 449,208 | |||||||
SHFL Entertainment, Inc. (Hotels, Restaurants & Leisure) | (a) | 65,544 | 950,388 | |||||||
Meritage Homes Corp. (Household Durables) | (a) | 20,225 | 755,404 | |||||||
Universal Electronics, Inc. (Household Durables) | (a) | 26,177 | 506,525 | |||||||
Chico’s FAS, Inc. (Specialty Retail) | 31,355 | 578,813 | ||||||||
Francesca’s Holdings Corp. (Specialty Retail) | (a) | 23,920 | 620,963 | |||||||
Genesco, Inc. (Specialty Retail) | (a) | 30,890 | 1,698,950 | |||||||
Sally Beauty Holdings, Inc. (Specialty Retail) | (a) | 2,222 | 52,373 | |||||||
Vitamin Shoppe, Inc. (Specialty Retail) | (a) | 19,872 | 1,139,858 | |||||||
Steven Madden Ltd. (Textiles, Apparel & Luxury Goods) | (a) | 12,409 | 524,528 | |||||||
|
| |||||||||
| 9,552,055 | ||||||||||
|
| |||||||||
CONSUMER STAPLES – 3.0% | ||||||||||
Fresh Market, Inc. / The (Food & Staples Retailing) | (a) | 13,734 | 660,468 | |||||||
Natural Grocers by Vitamin Cottage, Inc. (Food & Staples Retailing) | (a) | 23,594 | 450,409 | |||||||
WhiteWave Foods Co. (Food Products) | (a) | 36,415 | 565,889 | |||||||
|
| |||||||||
| 1,676,766 | ||||||||||
|
| |||||||||
ENERGY – 8.8% | ||||||||||
Dril-Quip, Inc. (Energy Equip. & Svs.) | (a) | 5,531 | 404,040 | |||||||
Geospace Technologies Corp. (Energy Equip. & Svs.) | (a) | 19,141 | 1,701,061 | |||||||
Lufkin Industries, Inc. (Energy Equip. & Svs.) | 17,750 | 1,031,807 | ||||||||
Ocean Rig UDW, Inc. (Energy Equip. & Svs.) | (a) | 14,217 | 212,828 | |||||||
Gulfport Energy Corp. (Oil, Gas & Consumable Fuels) | (a) | 17,581 | 671,946 | |||||||
Oasis Petroleum, Inc. (Oil, Gas & Consumable Fuels) | (a) | 26,755 | 850,809 | |||||||
|
| |||||||||
| 4,872,491 | ||||||||||
|
| |||||||||
FINANCIALS – 7.1% | ||||||||||
Duff & Phelps Corp. Class A (Capital Markets) | 24,359 | 380,488 | ||||||||
Citizens Republic Bancorp, Inc. (Commercial Banks) | (a) | 21,802 | 413,584 | |||||||
UMB Financial Corp. (Commercial Banks) | 9,237 | 404,950 | ||||||||
Cash America International, Inc. (Consumer Finance) | 13,316 | 528,246 | ||||||||
KKR Financial Holdings LLC (Diversified Financial Svs.) | 30,000 | 316,800 | ||||||||
Validus Holdings Ltd. (Insurance) | 22,370 | 773,555 | ||||||||
Redwood Trust, Inc. (Real Estate Investment Trusts) | 20,146 | 340,266 | ||||||||
Two Harbors Investment Corp. (Real Estate Investment Trusts) | 41,045 | 454,779 | ||||||||
Home Loan Servicing Solutions Ltd. (Thrifts & Mortgage Finance) | 14,389 | 271,952 | ||||||||
|
| |||||||||
| 3,884,620 | ||||||||||
|
| |||||||||
HEALTH CARE – 20.9% | ||||||||||
Acorda Therapeutics, Inc. (Biotechnology) | (a) | 18,331 | 455,709 | |||||||
Ariad Pharmaceuticals, Inc. (Biotechnology) | (a) | 27,900 | 535,122 | |||||||
BioMarin Pharmaceutical, Inc. (Biotechnology) | (a) | 6,829 | 336,328 | |||||||
Halozyme Therapeutics, Inc. (Biotechnology) | (a) | 63,545 | 426,387 | |||||||
Onyx Pharmaceuticals, Inc. (Biotechnology) | (a) | 8,559 | 646,461 | |||||||
Seattle Genetics, Inc. (Biotechnology) | (a) | 12,705 | 294,756 | |||||||
Theravance, Inc. (Biotechnology) | (a) | 21,293 | 474,195 | |||||||
United Therapeutics Corp. (Biotechnology) | (a) | 15,360 | 820,531 | |||||||
ArthroCare Corp. (Health Care Equip. & Supplies) | (a) | 25,120 | 868,901 | |||||||
Cooper Cos., Inc. / The (Health Care Equip. & Supplies) | 7,660 | 708,397 | ||||||||
HeartWare International, Inc. (Health Care Equip. & Supplies) | (a) | 7,032 | 590,336 | |||||||
Sirona Dental Systems, Inc. (Health Care Equip. & Supplies) | (a) | 14,740 | 950,140 | |||||||
Thoratec Corp. (Health Care Equip. & Supplies) | (a) | 16,768 | 629,135 | |||||||
Air Methods Corp. (Health Care Providers & Svs.) | 17,637 | 650,629 | ||||||||
Catamaran Corp. (Health Care Providers & Svs.) | (a) | 9,702 | 457,061 | |||||||
Centene Corp. (Health Care Providers & Svs.) | (a) | 19,181 | 786,421 | |||||||
MedAssets, Inc. (Health Care Technology) | (a) | 39,616 | 664,360 | |||||||
| Common Stocks (Continued) | Shares | Value | ||||||||
HEALTH CARE (continued) | ||||||||||
PAREXEL International Corp. (Life Sciences Tools & Svs.) | (a) | 21,161 | $ | 626,154 | ||||||
Salix Pharmaceuticals Ltd. (Pharmaceuticals) | (a) | 15,249 | 617,280 | |||||||
|
| |||||||||
| 11,538,303 | ||||||||||
|
| |||||||||
INDUSTRIALS – 17.4% | ||||||||||
Hexcel Corp. (Aerospace & Defense) | (a) | 31,644 | 853,122 | |||||||
Triumph Group, Inc. (Aerospace & Defense) | 11,606 | 757,872 | ||||||||
Atlas Air Worldwide Holdings, Inc. (Air Freight & Logistics) | (a) | 9,981 | 442,258 | |||||||
JetBlue Airways Corp. (Airlines) | (a) | 94,010 | 536,797 | |||||||
U.S. Airways Group, Inc. (Airlines) | (a) | 20,738 | 279,963 | |||||||
Apogee Enterprises, Inc. (Building Products) | 3,918 | 93,914 | ||||||||
Geo Group, Inc. / The (Commercial Svs. & Supplies) | 36,657 | 1,033,718 | ||||||||
Waste Connections, Inc. (Commercial Svs. & Supplies) | 23,242 | 785,347 | ||||||||
Northwest Pipe Co. (Construction & Engineering) | (a) | 16,693 | 398,295 | |||||||
General Cable Corp. (Electrical Equip.) | (a) | 14,263 | 433,738 | |||||||
Regal-Beloit Corp. (Electrical Equip.) | 8,185 | 576,797 | ||||||||
Thermon Group Holdings, Inc. (Electrical Equip.) | (a) | 17,660 | 397,880 | |||||||
Chart Industries, Inc. (Machinery) | (a) | 4,080 | 272,014 | |||||||
Colfax Corp. (Machinery) | (a) | 13,079 | 527,738 | |||||||
Terex Corp. (Machinery) | (a) | 26,544 | 746,152 | |||||||
WABCO Holdings, Inc. (Machinery) | (a) | 6,027 | 392,900 | |||||||
Woodward, Inc. (Machinery) | 9,544 | 363,913 | ||||||||
Landstar System, Inc. (Road & Rail) | 10,170 | 533,518 | ||||||||
Quality Distribution, Inc. (Road & Rail) | (a) | 31,184 | 187,104 | |||||||
|
| |||||||||
| 9,613,040 | ||||||||||
|
| |||||||||
INFORMATION TECHNOLOGY – 19.0% | ||||||||||
Riverbed Technology, Inc. (Communications Equip.) | (a) | 35,009 | 690,377 | |||||||
Fusion-io, Inc. (Computers & Peripherals) | (a) | 13,355 | 306,230 | |||||||
Coherent, Inc. (Electronic Equip., Instr. & Comp.) | 15,333 | 776,156 | ||||||||
InvenSense, Inc. (Electronic Equip., Instr. & Comp.) | (a) | 39,505 | 438,901 | |||||||
IPG Photonics Corp. (Electronic Equip., Instr. & Comp.) | 9,650 | 643,172 | ||||||||
Universal Display Corp. (Electronic Equip., Instr. & Comp.) | (a) | 7,939 | 203,397 | |||||||
Cornerstone OnDemand, Inc. (Internet Software & Svs.) | (a) | 19,011 | 561,395 | |||||||
Demandware, Inc. (Internet Software & Svs.) | (a) | 9,743 | 266,179 | |||||||
Monster Worldwide, Inc. (Internet Software & Svs.) | (a) | 128,765 | 723,659 | |||||||
Trulia, Inc. (Internet Software & Svs.) | (a) | 22,384 | 363,516 | |||||||
Cavium, Inc. (Semiconductors & Equip.) | (a) | 19,815 | 618,426 | |||||||
EZchip Semiconductor Ltd. (Semiconductors & Equip.) | (a) | 13,353 | 441,584 | |||||||
Teradyne, Inc. (Semiconductors & Equip.) | (a) | 39,150 | 661,243 | |||||||
Veeco Instruments, Inc. (Semiconductors & Equip.) | (a) | 15,740 | 464,645 | |||||||
Compuware Corp. (Software) | (a) | 28,941 | 314,589 | |||||||
Concur Technologies, Inc. (Software) | (a) | 5,930 | 400,394 | |||||||
Fortinet, Inc. (Software) | (a) | 36,682 | 772,890 | |||||||
NICE Systems Ltd. – ADR (Software) | (a) | 21,967 | 735,455 | |||||||
QLIK Technologies, Inc. (Software) | (a) | 30,310 | 658,333 | |||||||
TIBCO Software, Inc. (Software) | (a) | 18,776 | 413,260 | |||||||
|
| |||||||||
| 10,453,801 | ||||||||||
|
| |||||||||
MATERIALS – 6.3% | ||||||||||
Georgia Gulf Corp. (Chemicals) | 16,181 | 667,952 | ||||||||
Huntsman Corp. (Chemicals) | 34,431 | 547,453 | ||||||||
Quaker Chemical Corp. (Chemicals) | 13,705 | 738,151 | ||||||||
Texas Industries, Inc. (Construction Materials) | (a) | 14,311 | 730,004 | |||||||
RTI International Metals, Inc. (Metals & Mining) | (a) | 27,619 | 761,180 | |||||||
|
| |||||||||
| 3,444,740 | ||||||||||
|
| |||||||||
Total Common Stocks (Cost $45,577,065) | $ | 55,035,816 | ||||||||
|
| |||||||||
| 70 | (continued) |
| Ohio National Fund, Inc. | Capital Growth Portfolio (Continued) |
Schedule of Investments | December 31, 2012 |
| Money Market Funds – 1.4% | Shares | Value | ||||||||
Fidelity Institutional Money Market Funds | 764,000 | $ | 764,000 | |||||||
|
| |||||||||
Total Money Market Funds (Cost $764,000) | $ | 764,000 | ||||||||
|
| |||||||||
Total Investments – 101.2% (Cost $46,341,065) | (b) | $ | 55,799,816 | |||||||
Liabilities in Excess of Other Assets – (1.2)% | (685,081) | |||||||||
|
| |||||||||
Net Assets – 100.0% | $ | 55,114,735 | ||||||||
|
| |||||||||
Percentages are stated as a percent of net assets.
Abbreviations:
ADR: American Depositary Receipts
Footnotes:
| (a) | Non-income producing security. |
| (b) | Represents cost for financial reporting purposes, which may differ from cost basis for federal income tax purposes. See also Note 7 of the Notes to Financial Statements. |
The accompanying notes are an integral part of these financial statements.
| 71 |
| Ohio National Fund, Inc. | Nasdaq-100® Index Portfolio |
Objective/Strategy
The Nasdaq-100® Index Portfolio seeks long-term growth of capital by investing primarily in stocks that are included in the Nasdaq-100® Index. Unlike the other Portfolios of the Fund, the Nasdaq-100® Index Portfolio is a non-diversified portfolio for purposes of Section 5(b) of the Investment Company Act of 1940, as amended.
Performance as of December 31, 2012
Average Annual Total Returns: | ||||
One year | 17.88% | |||
Five years | 5.31% | |||
Ten years | 10.45% |
Past performance does not guarantee future results. The performance data quoted represents past performance and current returns may be lower or higher. Total return figures include change in share price and reinvestment of dividends and capital gains. The investment return and principal value will fluctuate so that an investor’s shares, when redeemed, may be worth more or less than the original cost. To obtain performance information up to the most recent month end, call toll-free 1-877-781-6392.
The Portfolio is not open to direct retail investment. Beneficial interest in shares is obtained solely by purchase of variable life insurance policies and variable annuity contracts. Actual performance results for variable annuity and variable universal life contracts will be lower due to contract charges. Consult your contract for applicable charges.
Comments
For the year ended December 31, 2012, the Nasdaq-100® Index Portfolio returned 17.88% versus 18.35% for the current benchmark, the Nasdaq-100® Index.
The correlation to the index for the year was 99.8%. The high correlation is due to the fact that the Portfolio invests in each of the 100 stocks in the index. The Portfolio also invests in PowerShares QQQ, an exchange traded fund that mimics the holdings and returns of the Nasdaq-100® Index.(1)
The largest contributors to the index return for 2012 were Apple, Inc., Oracle Corp., Amazon.com, Inc., Comcast Corp., and eBay, Inc. The largest detractors for the index in 2012 were Intel Corp., Dell, Inc., Baidu, Inc., Apollo Group, Inc., and Marvell Technology Group Ltd.(1)
The year 2012 was action packed. From the presidential elections, to the debt negotiations/“fiscal cliff”, to Hurricane Sandy, to renewed economic fears out of Eastern Europe, the stock market had a bumpy year. Equities indices, however, ended 2012 in positive territory. There appears to be more uncertainty in 2013 as Congress still needs to reach an agreement to raise the debt ceiling and make certain budget cuts.
We believe that 2013 should end up being another good year for equities once we get past the near term political risk. Equity indices are relatively undervalued compared to other assets and historical measures. The economy and unemployment will likely improve, albeit at a slow pace, and the Federal Reserve should continue to be accommodative.
| (1) | The Portfolio’s composition is subject to change. Holdings and weightings are as of December 31, 2012. |
The Nasdaq-100®, Nasdaq-100 Index®, and Nasdaq® are registered trademarks of The NASDAQ OMX Group, Inc. (which with its affiliates is referred to as “NASDAQ OMX”). Ohio National Investments, Inc. has licensed these marks for the Portfolio’s use. NASDAQ OMX has not passed on the Portfolio’s legality or suitability. NASDAQ OMX does not sponsor, endorse, sell or promote the Portfolio. NASDAQ OMX MAKES NO WARRANTIES AND BEARS NO LIABILITY WITH RESPECT TO THE PORTFOLIO.
Change in Value of $10,000 Investment
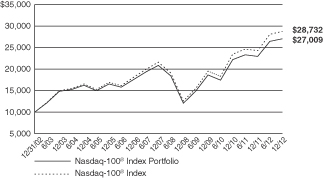
Hypothetical illustration based on past performance. Future performance will vary. The Portfolio’s returns reflect reinvested dividends. The Portfolio’s holdings may differ significantly from the securities in the index. The index is unmanaged and therefore does not reflect the cost of portfolio management and accounting. Investors cannot invest in an index. Although they can invest in its underlying securities or funds.
The Nasdaq-100® Index is a modified capitalization-weighted index of the 100 largest domestic and international non-financial companies listed on the NASDAQ Stock Market. The index presented herein includes the effects of reinvested dividends.
| 72 | (continued) |
| Ohio National Fund, Inc. | Nasdaq-100® Index Portfolio (Continued) |
Portfolio Composition as of December 31, 2012 (1)
| % of Net Assets | ||||
Common Stocks (3) | 96.9 | |||
Exchange Traded Funds and | 3.1 | |||
|
| |||
| 100.0 | ||||
|
|
Top 10 Portfolio Holdings as of December 31,
2012 (1) (2)
| % of Net Assets | ||||
1. Apple, Inc. | 15.8 | |||
2. Microsoft Corp. | 7.1 | |||
3. Google, Inc. Class A | 5.9 | |||
4. Oracle Corp. | 5.1 | |||
5. Amazon.com, Inc. | 3.6 | |||
6. QUALCOMM, Inc. | 3.3 | |||
7. Cisco Systems, Inc. | 3.3 | |||
8. Intel Corp. | 3.2 | |||
9. Comcast Corp. Class A | 2.5 | |||
10. Amgen, Inc. | 2.1 |
| (1) | Composition of Portfolio subject to change. |
| (2) | Short-term investments have been excluded from the list of Top 10 Portfolio Holdings. |
| (3) | Sectors: |
| % of Net Assets | ||||
Information Technology | 61.8 | |||
Consumer Discretionary | 16.6 | |||
Health Care | 11.4 | |||
Consumer Staples | 3.6 | |||
Industrials | 2.0 | |||
Telecommunication Services | 1.1 | |||
Materials | 0.4 | |||
|
| |||
| 96.9 | ||||
|
|
| 73 |
| Ohio National Fund, Inc. | Nasdaq-100® Index Portfolio |
Schedule of Investments | December 31, 2012 |
| Common Stocks – 96.9% | Shares | Value | ||||||||
CONSUMER DISCRETIONARY – 16.6% | ||||||||||
Starbucks Corp. (Hotels, Restaurants & Leisure) | 16,075 | $ | 861,941 | |||||||
Wynn Resorts Ltd. (Hotels, Restaurants & Leisure) | 2,175 | 244,666 | ||||||||
Garmin Ltd. (Household Durables) | 4,225 | 172,464 | ||||||||
Amazon.com, Inc. (Internet & Catalog Retail) | (a) | 9,800 | 2,461,172 | |||||||
Expedia, Inc. (Internet & Catalog Retail) | 2,650 | 162,842 | ||||||||
Liberty Interactive Corp. Class A (Internet & Catalog Retail) | (a) | 11,125 | 218,940 | |||||||
priceline.com, Inc. (Internet & Catalog Retail) | (a) | 1,075 | 667,790 | |||||||
Mattel, Inc. (Leisure Equip. & Products) | 7,425 | 271,903 | ||||||||
Comcast Corp. Class A (Media) | 45,822 | 1,712,826 | ||||||||
DIRECTV (Media) | (a) | 13,075 | 655,842 | |||||||
Discovery Communications, Inc. Class A (Media) | (a) | 3,125 | 198,375 | |||||||
Liberty Global, Inc. Class A (Media) | (a) | 3,125 | 196,844 | |||||||
Liberty Media Corp. – Liberty Capital Class A (Media) | (a) | 2,375 | 275,524 | |||||||
News Corp. Class A (Media) | 33,425 | 853,674 | ||||||||
Sirius XM Radio, Inc. (Media) | 112,600 | 325,414 | ||||||||
Viacom, Inc. Class B (Media) | 9,750 | 514,215 | ||||||||
Virgin Media, Inc. (Media) | 5,800 | 213,150 | ||||||||
Dollar Tree, Inc. (Multiline Retail) | (a) | 4,925 | 199,758 | |||||||
Sears Holdings Corp. (Multiline Retail) | (a) | 2,300 | 95,128 | |||||||
Bed Bath & Beyond, Inc. (Specialty Retail) | (a) | 4,950 | 276,754 | |||||||
O’Reilly Automotive, Inc. (Specialty Retail) | (a) | 2,475 | 221,314 | |||||||
Ross Stores, Inc. (Specialty Retail) | 4,850 | 262,627 | ||||||||
Staples, Inc. (Specialty Retail) | 14,575 | 166,155 | ||||||||
Fossil, Inc. (Textiles, Apparel & Luxury Goods) | (a) | 1,300 | 121,030 | |||||||
|
| |||||||||
| 11,350,348 | ||||||||||
|
| |||||||||
CONSUMER STAPLES – 3.6% | ||||||||||
Monster Beverage Corp. (Beverages) | (a) | 3,700 | 195,656 | |||||||
Costco Wholesale Corp. (Food & Staples Retailing) | 9,360 | 924,487 | ||||||||
Whole Foods Market, Inc. (Food & Staples Retailing) | 4,000 | 365,320 | ||||||||
Mondelez International, Inc. Class A (Food Products) | 38,425 | 978,685 | ||||||||
|
| |||||||||
| 2,464,148 | ||||||||||
|
| |||||||||
HEALTH CARE – 11.4% | ||||||||||
Alexion Pharmaceuticals, Inc. (Biotechnology) | (a) | 4,200 | 394,002 | |||||||
Amgen, Inc. (Biotechnology) | 16,597 | 1,432,653 | ||||||||
Biogen Idec, Inc. (Biotechnology) | (a) | 5,125 | 751,684 | |||||||
Celgene Corp. (Biotechnology) | (a) | 9,150 | 720,288 | |||||||
Gilead Sciences, Inc. (Biotechnology) | (a) | 16,375 | 1,202,744 | |||||||
Regeneron Pharmaceuticals, Inc. (Biotechnology) | (a) | 2,050 | 350,693 | |||||||
Vertex Pharmaceuticals, Inc. (Biotechnology) | (a) | 4,700 | 197,118 | |||||||
DENTSPLY International, Inc. (Health Care Equip. & Supplies) | 3,075 | 121,801 | ||||||||
Intuitive Surgical, Inc. (Health Care Equip. & Supplies) | (a) | 850 | 416,814 | |||||||
Catamaran Corp. (Health Care Providers & Svs.) | (a) | 4,425 | 208,462 | |||||||
Express Scripts Holding Co. (Health Care Providers & Svs.) | (a) | 17,650 | 953,100 | |||||||
Henry Schein, Inc. (Health Care Providers & Svs.) | (a) | 1,900 | 152,874 | |||||||
Cerner Corp. (Health Care Technology) | (a) | 3,700 | 287,268 | |||||||
Life Technologies Corp. (Life Sciences Tools & Svs.) | (a) | 3,725 | 182,823 | |||||||
Mylan, Inc. (Pharmaceuticals) | (a) | 8,825 | 242,511 | |||||||
Perrigo Co. (Pharmaceuticals) | 2,025 | 210,661 | ||||||||
|
| |||||||||
| 7,825,496 | ||||||||||
|
| |||||||||
INDUSTRIALS – 2.0% | ||||||||||
C.H. Robinson Worldwide, Inc. (Air Freight & Logistics) | 3,475 | 219,689 | ||||||||
Expeditors International of Washington, Inc. (Air Freight & Logistics) | 4,525 | 178,964 | ||||||||
Stericycle, Inc. (Commercial Svs. & Supplies) | (a) | 1,850 | 172,550 | |||||||
PACCAR, Inc. (Machinery) | 7,639 | 345,359 | ||||||||
Verisk Analytics, Inc. Class A (Professional Svs.) | (a) | 3,600 | 183,600 | |||||||
Fastenal Co. (Trading Companies & Distributors) | 6,400 | 298,816 | ||||||||
|
| |||||||||
| 1,398,978 | ||||||||||
|
| |||||||||
INFORMATION TECHNOLOGY – 61.8% | ||||||||||
Cisco Systems, Inc. (Communications Equip.) | 114,825 | 2,256,311 | ||||||||
F5 Networks, Inc. (Communications Equip.) | (a) | 1,700 | 165,155 | |||||||
| Common Stocks (Continued) | Shares | Value | ||||||||
INFORMATION TECHNOLOGY (continued) |
| |||||||||
QUALCOMM, Inc. (Communications Equip.) | 36,845 | $ | 2,285,127 | |||||||
Apple, Inc. (Computers & Peripherals) | 20,345 | 10,844,495 | ||||||||
Dell, Inc. (Computers & Peripherals) | 37,500 | 379,875 | ||||||||
NetApp, Inc. (Computers & Peripherals) | (a) | 7,760 | 260,348 | |||||||
SanDisk Corp. (Computers & Peripherals) | (a) | 5,225 | 227,601 | |||||||
Seagate Technology PLC (Computers & Peripherals) | 8,175 | 249,174 | ||||||||
Western Digital Corp. (Computers & Peripherals) | 5,275 | 224,135 | ||||||||
Akamai Technologies, Inc. (Internet Software & Svs.) | (a) | 3,850 | 157,504 | |||||||
Baidu, Inc. – ADR (Internet Software & Svs.) | (a) | 5,925 | 594,218 | |||||||
eBay, Inc. (Internet Software & Svs.) | (a) | 27,985 | 1,427,795 | |||||||
Equinix, Inc. (Internet Software & Svs.) | (a) | 1,050 | 216,510 | |||||||
Facebook, Inc. Class A (Internet Software & Svs.) | (a) | 23,775 | 633,128 | |||||||
Google, Inc. Class A (Internet Software & Svs.) | (a) | 5,725 | 4,061,143 | |||||||
Yahoo!, Inc. (Internet Software & Svs.) | (a) | 25,585 | 509,142 | |||||||
Automatic Data Processing, Inc. (IT Svs.) | 10,500 | 598,605 | ||||||||
Cognizant Technology Solutions Corp. Class A (IT Svs.) | (a) | 6,500 | 481,325 | |||||||
Fiserv, Inc. (IT Svs.) | (a) | 2,887 | 228,160 | |||||||
Paychex, Inc. (IT Svs.) | 7,870 | 245,072 | ||||||||
Altera Corp. (Semiconductors & Equip.) | 6,925 | 238,497 | ||||||||
Analog Devices, Inc. (Semiconductors & Equip.) | 6,525 | 274,442 | ||||||||
Applied Materials, Inc. (Semiconductors & Equip.) | 26,750 | 306,020 | ||||||||
Avago Technologies Ltd. (Semiconductors & Equip.) | 5,300 | 167,798 | ||||||||
Broadcom Corp. Class A (Semiconductors & Equip.) | 11,075 | 367,801 | ||||||||
Intel Corp. (Semiconductors & Equip.) | 107,595 | 2,219,685 | ||||||||
KLA-Tencor Corp. (Semiconductors & Equip.) | 3,600 | 171,936 | ||||||||
Linear Technology Corp. (Semiconductors & Equip.) | 5,005 | 171,672 | ||||||||
Maxim Integrated Products, Inc. (Semiconductors & Equip.) | 6,300 | 185,220 | ||||||||
Microchip Technology, Inc. (Semiconductors & Equip.) | 4,200 | 136,878 | ||||||||
Micron Technology, Inc. (Semiconductors & Equip.) | (a) | 22,000 | 139,700 | |||||||
NVIDIA Corp. (Semiconductors & Equip.) | 13,512 | 166,062 | ||||||||
Texas Instruments, Inc. (Semiconductors & Equip.) | 24,225 | 749,522 | ||||||||
Xilinx, Inc. (Semiconductors & Equip.) | 5,630 | 202,117 | ||||||||
Activision Blizzard, Inc. (Software) | 24,050 | 255,411 | ||||||||
Adobe Systems, Inc. (Software) | (a) | 10,705 | 403,364 | |||||||
Autodesk, Inc. (Software) | (a) | 4,850 | 171,448 | |||||||
BMC Software, Inc. (Software) | (a) | 3,350 | 132,861 | |||||||
CA, Inc. (Software) | 9,925 | 218,152 | ||||||||
Check Point Software Technologies Ltd. (Software) | (a) | 4,420 | 210,569 | |||||||
Citrix Systems, Inc. (Software) | (a) | 4,050 | 266,288 | |||||||
Intuit, Inc. (Software) | 6,405 | 381,098 | ||||||||
Microsoft Corp. (Software) | 182,000 | 4,864,860 | ||||||||
Nuance Communications, Inc. (Software) | (a) | 6,750 | 150,660 | |||||||
Oracle Corp. (Software) | 104,210 | 3,472,277 | ||||||||
Symantec Corp. (Software) | (a) | 14,998 | 282,112 | |||||||
|
| |||||||||
| 42,351,273 | ||||||||||
|
| |||||||||
MATERIALS – 0.4% | ||||||||||
Sigma-Aldrich Corp. (Chemicals) | 2,600 | 191,308 | ||||||||
Randgold Resources Ltd. – ADR (Metals & Mining) | 1,125 | 111,656 | ||||||||
|
| |||||||||
| 302,964 | ||||||||||
|
| |||||||||
TELECOMMUNICATION SERVICES – 1.1% | ||||||||||
SBA Communications Corp. Class A (Wireless Telecom. Svs.) | (a) | 2,725 | 193,530 | |||||||
Vodafone Group PLC – ADR (Wireless Telecom. Svs.) | 21,075 | 530,879 | ||||||||
|
| |||||||||
| 724,409 | ||||||||||
|
| |||||||||
Total Common Stocks (Cost $48,938,519) | $ | 66,417,616 | ||||||||
|
| |||||||||
| Exchange Traded Funds – 1.8% | Shares | Value | ||||||||
PowerShares QQQ Trust Series 1 | 19,465 | $ | 1,267,366 | |||||||
|
| |||||||||
Total Exchange Traded Funds (Cost $1,283,006) | $ | 1,267,366 | ||||||||
|
| |||||||||
Total Investments – 98.7% (Cost $50,221,525) | (b) | $ | 67,684,982 | |||||||
Other Assets in Excess of Liabilities – 1.3% | 857,221 | |||||||||
|
| |||||||||
Net Assets – 100.0% | $ | 68,542,203 | ||||||||
|
| |||||||||
| 74 | (continued) |
| Ohio National Fund, Inc. | Nasdaq-100® Index Portfolio (Continued) |
Schedule of Investments | December 31, 2012 |
Percentages are stated as a percent of net assets.
Abbreviations:
ADR: American Depositary Receipts
Footnotes:
| (a) | Non-income producing security. |
| (b) | Represents cost for financial reporting purposes, which may differ from cost basis for federal income tax purposes. See also Note 7 of the Notes to Financial Statements. |
The accompanying notes are an integral part of these financial statements.
| 75 |
| Ohio National Fund, Inc. | Bristol Portfolio |
Objective/Strategy
The Bristol Portfolio seeks long-term growth of capital by investing primarily in common stocks of the 1,000 largest publicly traded U.S. companies in terms of market capitalization.
Performance as of December 31, 2012
Average Annual Total Returns: | ||||
One year | 13.19% | |||
Five years | -0.82% | |||
Ten years | 6.86% |
Past performance does not guarantee future results. The performance data quoted represents past performance and current returns may be lower or higher. Total return figures include change in share price and reinvestment of dividends and capital gains. The investment return and principal value will fluctuate so that an investor’s shares, when redeemed, may be worth more or less than the original cost. To obtain performance information up to the most recent month end, call toll-free 1-877-781-6392.
The Portfolio is not open to direct retail investment. Beneficial interest in shares is obtained solely by purchase of variable life insurance policies and variable annuity contracts. Actual performance results for variable annuity and variable universal life contracts will be lower due to contract charges. Consult your contract for applicable charges.
Comments
For the year ended December 31, 2012, the Bristol Portfolio returned 13.19% versus 16.00% for the current benchmark, the S&P 500 Index.
The fourth quarter concluded a year that saw the S&P 500 Index offer the largest broad market annual return since 2009. It was far from a steady positive return throughout the year, however. The Portfolio experienced a very strong first quarter, a weak second quarter, a strong third quarter, and a close to flat fourth quarter. The fourth quarter was not without its dramas: a closely fought presidential campaign with dramatically different economic philosophies, and a largely self-created “fiscal cliff” that saw some form of resolution only after the close of trading on the last day of the year.
The Portfolio’s best performers for the year were Lowe’s Cos., Inc., Hanesbrands, Inc., Snap-On, Inc., Whirlpool Corp., and Pentair Ltd. The Portfolio’s worst performers were Forest Oil Corp., Abercrombie & Fitch Co., Stillwater Mining Co., Facebook, Inc., and Vertex Pharmaceuticals, Inc. The top contributors to performance were Apple, Inc., Whirlpool Corp., Pentair Ltd., Lowe’s Cos., Inc., and Snap-On, Inc. The top detractors from performance were Forest Oil Corp., Abercrombie & Fitch Co., Facebook, Inc., Vertex Pharmaceuticals, Inc., and Stillwater Mining Co.(1)
The largest detractors from relative performance were stock selections in the Energy and Health Care sectors. At an individual stock level, detractors from performance included Forest Oil Corp., a Denver-based Energy company that suffered from steep declines in its natural gas prices, and lost 88 basis points. Abercrombie & Fitch
Co. suffered from two earnings resets and lost 83 basis points. Facebook, Inc., although not bought at the initial public offering price, lost 68 basis points. Vertex Pharmaceuticals, Inc. reflected the usual volatility in the Health Care sector and lost 51 basis points. Stillwater Mining Co., since sold, departed from its earlier strategy of high value mining and lost 51 basis points.(1)
The top contributor to the Portfolio’s performance was Apple, Inc., which fought off the challenges of competing products and contributed 174 basis points. Whirlpool Corp. benefited from success in an anti-dumping Korean lawsuit and added 101 basis points. Pentair Ltd., a pool supplier, guided higher for 2013 and had a favorable market response to its merger with Tyco, contributing 92 basis points. Lowe’s Cos., Inc. added 86 basis points, reflecting a perceived bottom in the real estate market. Snap-On, Inc. offered an increased dividend and strong fundamentals, and contributed 82 basis points.(1)
Our main sector weight changes were to add to Consumer Discretionary, from 11.5% to 14.5%, and reduce Energy exposure from 12.9% to 7.8%. We increased the Portfolio’s already over-weighted Industrials, which went from 20.1% to 22.2% (versus the benchmark’s 10.1% weighting). Materials were increased to 6.2% from 2.1%. These changes reflect our continuing belief in an economic recovery. Finally, we lowered our exposure to Financials to a near market weight of 15.7% from 16.5% (versus the benchmark’s 15.6% weighting) in the face of impending banking settlements over mortgages.(1)
Looking to 2013, there are plenty of overseas worries about the deteriorating situation in Iran and Syria, constitutional challenges in Egypt, and possible conflicts between Japan and China over historical claims for a few rocky islands that promise vast mineral rights. However, concerns over the European Union debt problems are much less of a threat and China manufacturing expansion is back on track. Back home, there are the continuing indications of growth in the domestic economy, with real estate viewed by many as having bottomed and the positive long term prospect of cheap U.S. shale oil energy for domestic manufacturers. Bernanke’s printing of money has stabilized the equity markets, although the stimulus may end this year and interest rates may rise. Our long term commitment to the Financials sector may be rewarded with wider spreads and life insurance companies could benefit with higher bond returns. As the domestic economy shakes off the problems of the past four years, there is a likelihood of stronger markets in 2013 and 2014.(1)
| (1) | The Portfolio’s composition is subject to change. Holdings and weightings are as of December 31, 2012. |
| 76 | (continued) |
| Ohio National Fund, Inc. | Bristol Portfolio (Continued) |
Change in Value of $10,000 Investment
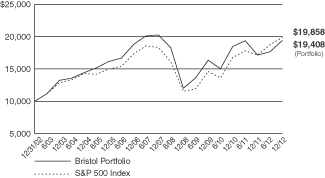
Hypothetical illustration based on past performance. Future performance will vary. The Portfolio’s returns reflect reinvested dividends. The Portfolio’s holdings may differ significantly from the securities in the index. The index is unmanaged and therefore does not reflect the cost of portfolio management and accounting.
The S&P 500 Index is a capitalization-weighted index designed to measure performance of the broad domestic economy through changes in the aggregate market value of 500 stocks representing all major industries. The index presented herein includes the effects of reinvested dividends.
Portfolio Composition as of December 31, 2012 (1)
| % of Net Assets | ||||
Common Stocks (3) | 97.9 | |||
Money Market Funds and | 2.1 | |||
|
| |||
| 100.0 | ||||
|
|
Top 10 Portfolio Holdings as of December 31,
2012 (1) (2)
| % of Net Assets | ||||
1. Apple, Inc. | 2.6 | |||
2. Hertz Global Holdings, Inc. | 2.3 | |||
3. Eaton Corp. PLC | 2.1 | |||
4. TIBCO Software, Inc. | 2.1 | |||
5. Lincoln National Corp. | 2.1 | |||
6. Marathon Oil Corp. | 2.0 | |||
7. Google, Inc. Class A | 2.0 | |||
8. ConocoPhillips | 2.0 | |||
9. FedEx Corp. | 2.0 | |||
10. JPMorgan Chase & Co. | 2.0 |
| (1) | Composition of Portfolio subject to change. |
| (2) | Short-term investments have been excluded from the list of Top 10 Portfolio Holdings. |
| (3) | Sectors: |
| % of Net Assets | ||||
Information Technology | 23.5 | |||
Industrials | 21.7 | |||
Financials | 15.3 | |||
Consumer Discretionary | 14.2 | |||
Energy | 7.7 | |||
Health Care | 7.5 | |||
Materials | 6.1 | |||
Consumer Staples | 1.9 | |||
|
| |||
| 97.9 | ||||
|
|
| 77 |
| Ohio National Fund, Inc. | Bristol Portfolio |
Schedule of Investments | December 31, 2012 |
| Common Stocks – 97.9% | Shares | Value | ||||||||
CONSUMER DISCRETIONARY – 14.2% | ||||||||||
CBS Corp. Class B (Media) | 61,900 | $ | 2,355,295 | |||||||
Time Warner, Inc. (Media) | 83,200 | 3,979,456 | ||||||||
Walt Disney Co. / The (Media) | 81,000 | 4,032,990 | ||||||||
Macy’s, Inc. (Multiline Retail) | 35,600 | 1,389,112 | ||||||||
Target Corp. (Multiline Retail) | 60,100 | 3,556,117 | ||||||||
AutoZone, Inc. (Specialty Retail) | (a) | 7,500 | 2,658,225 | |||||||
Lowe’s Cos., Inc. (Specialty Retail) | 84,000 | 2,983,680 | ||||||||
Hanesbrands, Inc. (Textiles, Apparel & Luxury Goods) | (a) | 112,800 | 4,040,496 | |||||||
Michael Kors Holdings Ltd. (Textiles, Apparel & Luxury Goods) | (a) | 38,900 | 1,985,067 | |||||||
Wolverine World Wide, Inc. (Textiles, Apparel & Luxury Goods) | 52,500 | 2,151,450 | ||||||||
|
| |||||||||
| 29,131,888 | ||||||||||
|
| |||||||||
CONSUMER STAPLES – 1.9% | ||||||||||
Constellation Brands, Inc. Class A (Beverages) | (a) | 110,600 | 3,914,134 | |||||||
|
| |||||||||
ENERGY – 7.7% | ||||||||||
Schlumberger Ltd. (Energy Equip. & Svs.) | 55,500 | 3,845,595 | ||||||||
ConocoPhillips (Oil, Gas & Consumable Fuels) | 71,800 | 4,163,682 | ||||||||
Marathon Oil Corp. (Oil, Gas & Consumable Fuels) | 136,600 | 4,188,156 | ||||||||
Whiting Petroleum Corp. (Oil, Gas & Consumable Fuels) | (a) | 79,600 | 3,452,252 | |||||||
|
| |||||||||
| 15,649,685 | ||||||||||
|
| |||||||||
FINANCIALS – 15.3% | ||||||||||
PNC Financial Services Group, Inc. (Commercial Banks) | 68,500 | 3,994,235 | ||||||||
Wells Fargo & Co. (Commercial Banks) | 106,600 | 3,643,588 | ||||||||
Citigroup, Inc. (Diversified Financial Svs.) | 96,700 | 3,825,452 | ||||||||
JPMorgan Chase & Co. (Diversified Financial Svs.) | 93,700 | 4,119,989 | ||||||||
Hartford Financial Services Group, Inc. (Insurance) | 182,500 | 4,095,300 | ||||||||
Lincoln National Corp. (Insurance) | 163,100 | 4,224,290 | ||||||||
MetLife, Inc. (Insurance) | 112,200 | 3,695,868 | ||||||||
Prudential Financial, Inc. (Insurance) | 71,400 | 3,807,762 | ||||||||
|
| |||||||||
| 31,406,484 | ||||||||||
|
| |||||||||
HEALTH CARE – 7.5% | ||||||||||
Amarin Corp. PLC – ADR (Biotechnology) | (a) | 288,800 | 2,336,392 | |||||||
Ariad Pharmaceuticals, Inc. (Biotechnology) | (a) | 112,000 | 2,148,160 | |||||||
Vertex Pharmaceuticals, Inc. (Biotechnology) | (a) | 69,800 | 2,927,412 | |||||||
UnitedHealth Group, Inc. (Health Care Providers & Svs.) | 74,000 | 4,013,760 | ||||||||
Pfizer, Inc. (Pharmaceuticals) | 159,400 | 3,997,752 | ||||||||
|
| |||||||||
| 15,423,476 | ||||||||||
|
| |||||||||
INDUSTRIALS – 21.7% | ||||||||||
Honeywell International, Inc. (Aerospace & Defense) | 63,600 | 4,036,692 | ||||||||
United Technologies Corp. (Aerospace & Defense) | 48,000 | 3,936,480 | ||||||||
| Common Stocks (Continued) | Shares | Value | ||||||||
INDUSTRIALS (continued) | ||||||||||
FedEx Corp. (Air Freight & Logistics) | 45,100 | $ | 4,136,572 | |||||||
Delta Air Lines, Inc. (Airlines) | (a) | 343,100 | 4,072,597 | |||||||
Quanta Services, Inc. (Construction & Engineering) | (a) | 75,900 | 2,071,311 | |||||||
Eaton Corp. PLC (Electrical Equip.) | 79,000 | 4,281,800 | ||||||||
General Electric Co. (Industrial Conglomerates) | 92,600 | 1,943,674 | ||||||||
Deere & Co. (Machinery) | 27,765 | 2,399,451 | ||||||||
Pentair Ltd. (Machinery) | 83,100 | 4,084,365 | ||||||||
Snap-On, Inc. (Machinery) | 50,300 | 3,973,197 | ||||||||
Stanley Black & Decker, Inc. (Machinery) | 11,300 | 835,861 | ||||||||
Xylem, Inc. (Machinery) | 147,100 | 3,986,410 | ||||||||
Hertz Global Holdings, Inc. (Road & Rail) | (a) | 290,200 | 4,721,554 | |||||||
|
| |||||||||
| 44,479,964 | ||||||||||
|
| |||||||||
INFORMATION TECHNOLOGY – 23.5% | ||||||||||
QUALCOMM, Inc. (Communications Equip.) | 66,100 | 4,099,522 | ||||||||
Apple, Inc. (Computers & Peripherals) | 10,000 | 5,330,300 | ||||||||
EMC Corp. (Computers & Peripherals) | (a) | 144,100 | 3,645,730 | |||||||
eBay, Inc. (Internet Software & Svs.) | (a) | 61,300 | 3,127,526 | |||||||
Facebook, Inc. Class A (Internet Software & Svs.) | (a) | 140,500 | 3,741,515 | |||||||
Google, Inc. Class A (Internet Software & Svs.) | (a) | 5,900 | 4,185,283 | |||||||
Altera Corp. (Semiconductors & Equip.) | 116,600 | 4,015,704 | ||||||||
Avago Technologies Ltd. (Semiconductors & Equip.) | 117,000 | 3,704,220 | ||||||||
Xilinx, Inc. (Semiconductors & Equip.) | 112,900 | 4,053,110 | ||||||||
Citrix Systems, Inc. (Software) | (a) | 61,400 | 4,037,050 | |||||||
Oracle Corp. (Software) | 120,000 | 3,998,400 | ||||||||
TIBCO Software, Inc. (Software) | (a) | 193,600 | 4,261,136 | |||||||
|
| |||||||||
| 48,199,496 | ||||||||||
|
| |||||||||
MATERIALS – 6.1% | ||||||||||
Air Products & Chemicals, Inc. (Chemicals) | 47,200 | 3,965,744 | ||||||||
E.I. du Pont de Nemours & Co. (Chemicals) | 59,200 | 2,662,224 | ||||||||
Monsanto Co. (Chemicals) | 43,200 | 4,088,880 | ||||||||
Freeport-McMoRan Copper & Gold, Inc. (Metals & Mining) | 50,300 | 1,720,260 | ||||||||
|
| |||||||||
| 12,437,108 | ||||||||||
|
| |||||||||
Total Common Stocks (Cost $190,082,097) | $ | 200,642,235 | ||||||||
|
| |||||||||
| Money Market Funds – 1.5% | Shares | Value | ||||||||
Fidelity Institutional Money Market Funds | 2,966,000 | $ | 2,966,000 | |||||||
|
| |||||||||
Total Money Market Funds (Cost $2,966,000) | $ | 2,966,000 | ||||||||
|
| |||||||||
Total Investments – 99.4% (Cost $193,048,097) | (b) | $ | 203,608,235 | |||||||
Other Assets in Excess of Liabilities – 0.6% | 1,295,511 | |||||||||
|
| |||||||||
Net Assets – 100.0% | $ | 204,903,746 | ||||||||
|
| |||||||||
Percentages are stated as a percent of net assets.
Abbreviations:
ADR: American Depositary Receipts
Footnotes:
| (a) | Non-income producing security. |
| (b) | Represents cost for financial reporting purposes, which may differ from cost basis for federal income tax purposes. See also Note 7 of the Notes to Financial Statements. |
The accompanying notes are an integral part of these financial statements.
| 78 |
| Ohio National Fund, Inc. | Bryton Growth Portfolio |
Objective/Strategy
The Bryton Growth Portfolio seeks long-term growth of capital by investing primarily in common stocks of growth-oriented U.S. companies smaller than the 500 largest publicly traded U.S. companies in terms of market capitalization.
Performance as of December 31, 2012
Average Annual Total Returns: | ||||
One year | 11.29% | |||
Five years | 0.55% | |||
Ten years | 7.20% |
Past performance does not guarantee future results. The performance data quoted represents past performance and current returns may be lower or higher. Total return figures include change in share price and reinvestment of dividends and capital gains. The investment return and principal value will fluctuate so that an investor’s shares, when redeemed, may be worth more, or less than the original cost. To obtain performance information up to the most recent month end, call toll-free 1-877-781-6392.
The Portfolio is not open to direct retail investment. Beneficial interest in shares is obtained solely by purchase of variable life insurance policies and variable annuity contracts. Actual performance results for variable annuity and variable universal life contracts will be lower due to contract charges. Consult your contract for applicable charges.
Comments
For the year ended December 31, 2012, the Bryton Growth Portfolio returned 11.29% versus 14.59% for the current benchmark, the Russell 2000 Growth Index.
The fourth quarter concluded a year that saw the S&P 500 index offer the largest broad market annual return since 2009. It was far from a steady positive return throughout the year, however. Small cap growth stocks experienced a very strong first quarter, a weak second quarter, a positive yet underperforming third quarter, and a mixed but close to flat fourth quarter. The fourth quarter was not without its dramas: a closely fought presidential campaign with dramatically different economic philosophies, and a largely self-created “fiscal cliff” that saw some form of resolution only after the close of trading on the last day of the year.
The Portfolio’s best performers for the year were Cray, Inc., Geospace Technologies Corp., Sarepta Therapeutics, Avis Budget Group, Inc., and Kenexa Corp. The Portfolio’s worst performers were Oncothyreon, Inc., Audience, Inc., Responsys, Inc., Questar Pharmaceuticals, and Americas Petrogas. The top contributors to performance were Cray, Inc., Geospace Technologies Corp., Avis Budget Group, Inc., Kenexa Corp., and Clean Energy. The top detractors from performance were GSE Holdings, Inc., Tangoe, Inc., Audience, Inc., Stillwater Mining Co., and Oncothyreon, Inc.(1)
The largest detractors from relative performance were stock selections in the Materials and Health Care sectors. The largest detractors from performance at the individual stock level included GSE Holdings, Inc., a Materials company, which lost 127 basis points following the surprise resignation of the CFO in August. Tangoe, Inc., a telecom software vendor, lost 101 basis points after unfavorable press comments were released in August. Audience, Inc, specializing in noise suppression, lost 94 basis points when the market learned that Apple, Inc. would not extend their relationship with the company to work with the latest iPhone 5. Stillwater Mining Co., which departed from its strategy of high value mining lost 93 basis points, and Oncothyreon, Inc. lost, 91 basis points, following the failure of an important Phase III trial with partner Merck & Co, Inc.(1)
The top contributor to the Portfolio’s performance was Cray, Inc., which contributed 192 basis points having spun out its interconnect technology to Intel and is now seeing some success ramping its big data and data analytics businesses. Geospace Technologies Corp. added 150 basis points after a second consecutive year of record earnings. Avis Budget Group, Inc. contributed 137 basis points, partly as a result of the market’s positive reaction to the plan to buy Zipcar following rival Hertz’s successful purchase of Dollar Thrifty. Kenexa Corp. added 125 basis points, following its purchase by International Business Machines Corp., and Clean Energy, which added 115 basis points, is leveraged to the rapidly expanding compressed natural gas vehicle market, and is benefitting from cheap natural gas prices.(1)
The Portfolio’s main sector weight changes were to reduce the over-weighted exposure in Information Technology from 32.0% to 28.1% (but still over-weighted versus the benchmark’s 21.5%) and reduce the Materials sector from 12.8% to 4.4% (close to the Index weighting of 4.7%). We also reduced Energy from 11.5% to 7.1% (but are still over weighted against the Index at 5.7%). Funds were redeployed with an increase in Health Care from 10.3% to 14.9% (but still under the Index at 20.3%) and an increase in Consumer Staples from 2.3% to 10.6%. Finally, the Portfolio has no exposure to Financials (versus the benchmark’s exposure of 7.4%).(1)
Looking to 2013 there are plenty of overseas worries about the deteriorating situation in Iran and Syria, constitutional challenges in Egypt, and possible conflicts between Japan and China over historical claims for a few rocky islands that promise vast mineral rights. However, concerns over the European Union debt problems are much less of a threat and China manufacturing expansion is back on track. Back home, there are the continuing indications of growth in the domestic economy, with real estate viewed by many as having bottomed and the positive long term prospect of cheap U.S. shale oil energy for domestic manufacturers. Bernanke’s printing of money has stabilized the equity markets, although the stimulus may end this year and interest rates may rise. As the domestic economy shakes off the problems of the past four years, there is a likelihood of stronger markets in 2013 and 2014.
| (1) | The Portfolio’s composition is subject to change. Holdings and weightings are as of December 31, 2012. |
| 79 | (continued) |
| Ohio National Fund, Inc. | Bryton Growth Portfolio (Continued) |
Change in Value of $10,000 Investment
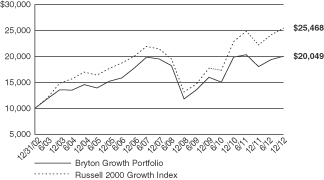
Hypothetical illustration based on past performance. Future performance will vary. The Portfolio’s returns reflect reinvested dividends. The Portfolio’s holdings may differ significantly from the securities in the index. The index is unmanaged and therefore does not reflect the cost of portfolio management and accounting.
The Russell 2000 Growth Index measures the performance of the small-cap growth segment of the U.S. equity universe. It includes the Russell 2000 Index companies with higher price-to-value ratios and higher forecasted growth values. The Russell 2000 Index includes the 2000 firms from the Russell 3000 Index with the smallest market capitalizations. The Russell 3000 Index represents 98% of the investable U.S. equity market. The index presented herein includes the effects of reinvested dividends.
Portfolio Composition as of December 31, 2012 (1)
| % of Net Assets | ||||
Common Stocks (3) | 95.5 | |||
Money Market Funds and | 4.5 | |||
|
| |||
| 100.0 | ||||
|
|
Top 10 Portfolio Holdings as of December 31,
2012 (1) (2)
| % of Net Assets | ||||
1. Fabrinet | 2.0 | |||
2. Avis Budget Group, Inc. | 1.9 | |||
3. Power Integrations, Inc. | 1.9 | |||
4. Monolithic Power Systems, Inc. | 1.9 | |||
5. Callaway Golf Co. | 1.9 | |||
6. Wolverine World Wide, Inc. | 1.9 | |||
7. Affymax, Inc. | 1.9 | |||
8. Iridium Communications, Inc. | 1.9 | |||
9. Elizabeth Arden, Inc. | 1.9 | |||
10. Titan International, Inc. | 1.9 |
| (1) | Composition of Portfolio subject to change. |
| (2) | Short-term investments have been excluded from the list of Top 10 Portfolio Holdings. |
| (3) | Sectors: |
| % of Net Assets | ||||
Information Technology | 26.9 | |||
Industrials | 20.4 | |||
Health Care | 14.2 | |||
Consumer Discretionary | 11.0 | |||
Consumer Staples | 10.1 | |||
Energy | 6.8 | |||
Materials | 4.2 | |||
Telecommunication Services | 1.9 | |||
|
| |||
| 95.5 | ||||
|
|
| 80 |
| Ohio National Fund, Inc. | Bryton Growth Portfolio |
Schedule of Investments | December 31, 2012 |
| Common Stocks – 95.5% | Shares | Value | ||||||||
CONSUMER DISCRETIONARY – 11.0% |
| |||||||||
Jack in the Box, Inc. (Hotels, Restaurants & Leisure) | (a) | 79,700 | $ | 2,279,420 | ||||||
Callaway Golf Co. (Leisure Equip. & Products) | 462,500 | 3,006,250 | ||||||||
ANN, Inc. (Specialty Retail) | (a) | 69,900 | 2,365,416 | |||||||
Tilly’s, Inc. (Specialty Retail) | (a) | 116,171 | 1,567,147 | |||||||
Fifth & Pacific Cos., Inc. (Textiles, Apparel & Luxury Goods) | (a) | 227,800 | 2,836,110 | |||||||
G-III Apparel Group Ltd. (Textiles, Apparel & Luxury Goods) | (a) | 66,000 | 2,259,180 | |||||||
Wolverine World Wide, Inc. (Textiles, Apparel & Luxury Goods) | 73,200 | 2,999,736 | ||||||||
|
| |||||||||
| 17,313,259 | ||||||||||
|
| |||||||||
CONSUMER STAPLES – 10.1% | ||||||||||
Annie’s, Inc. (Food Products) | (a) | 77,200 | 2,580,796 | |||||||
J&J Snack Foods Corp. (Food Products) | 39,300 | 2,512,842 | ||||||||
TreeHouse Foods, Inc. (Food Products) | (a) | 53,800 | 2,804,594 | |||||||
Spectrum Brands Holdings, Inc. (Household Products) | 61,791 | 2,776,270 | ||||||||
Elizabeth Arden, Inc. (Personal Products) | (a) | 65,500 | 2,948,155 | |||||||
Prestige Brands Holdings, Inc. (Personal Products) | (a) | 115,830 | 2,320,075 | |||||||
|
| |||||||||
| 15,942,732 | ||||||||||
|
| |||||||||
ENERGY – 6.8% |
| |||||||||
Dril-Quip, Inc. (Energy Equip. & Svs.) | (a) | 22,500 | 1,643,625 | |||||||
Geospace Technologies Corp. (Energy Equip. & Svs.) | (a) | 15,264 | 1,356,512 | |||||||
Emerald Oil, Inc. (Oil, Gas & Consumable Fuels) | (a) | 328,610 | 1,721,916 | |||||||
Energy XXI Bermuda Ltd. (Oil, Gas & Consumable Fuels) | 55,600 | 1,789,764 | ||||||||
Oasis Petroleum, Inc. (Oil, Gas & Consumable Fuels) | (a) | 82,526 | 2,624,327 | |||||||
Triangle Petroleum Corp. (Oil, Gas & Consumable Fuels) | (a) | 261,098 | 1,563,977 | |||||||
|
| |||||||||
| 10,700,121 | ||||||||||
|
| |||||||||
HEALTH CARE – 14.2% |
| |||||||||
Affymax, Inc. (Biotechnology) | (a) | 157,100 | 2,984,900 | |||||||
Amarin Corp. PLC – ADR (Biotechnology) | (a) | 240,800 | 1,948,072 | |||||||
Ariad Pharmaceuticals, Inc. (Biotechnology) | (a) | 106,300 | 2,038,834 | |||||||
Coronado Biosciences, Inc. (Biotechnology) | (a) | 307,151 | 1,385,251 | |||||||
Curis, Inc. (Biotechnology) | (a) | 530,000 | 1,817,900 | |||||||
Infinity Pharmaceuticals, Inc. (Biotechnology) | (a) | 42,978 | 1,504,230 | |||||||
NewLink Genetics Corp. (Biotechnology) | (a) | 119,581 | 1,494,762 | |||||||
NPS Pharmaceuticals, Inc. (Biotechnology) | (a) | 1,300 | 11,830 | |||||||
Oncothyreon, Inc. (Biotechnology) | (a) | 230,650 | 442,848 | |||||||
Sunesis Pharmaceuticals, Inc. (Biotechnology) | (a) | 412,052 | 1,730,618 | |||||||
Endologix, Inc. (Health Care Equip. & Supplies) | (a) | 204,725 | 2,915,284 | |||||||
NxStage Medical, Inc. (Health Care Equip. & Supplies) | (a) | 234,640 | 2,639,700 | |||||||
Unilife Corp. (Health Care Equip. & Supplies) | (a) | 683,512 | 1,551,572 | |||||||
|
| |||||||||
| 22,465,801 | ||||||||||
|
| |||||||||
INDUSTRIALS – 20.4% |
| |||||||||
Hub Group, Inc. Class A (Air Freight & Logistics) | (a) | 86,600 | 2,909,760 | |||||||
Alaska Air Group, Inc. (Airlines) | (a) | 53,000 | 2,283,770 | |||||||
U.S. Airways Group, Inc. (Airlines) | (a) | 122,100 | 1,648,350 | |||||||
Healthcare Services Group, Inc. (Commercial Svs. & Supplies) | 102,500 | 2,381,075 | ||||||||
Capstone Turbine Corp. (Electrical Equip.) | (a) | 3,108,768 | 2,766,804 | |||||||
Actuant Corp. Class A (Machinery) | 80,800 | 2,255,128 | ||||||||
| Common Stocks (Continued) | Shares | Value | ||||||||
INDUSTRIALS (continued) |
| |||||||||
Middleby Corp. (Machinery) | (a) | 13,600 | $ | 1,743,656 | ||||||
Titan International, Inc. (Machinery) | 134,500 | 2,921,340 | ||||||||
Mistras Group, Inc. (Professional Svs.) | (a) | 102,317 | 2,526,207 | |||||||
Avis Budget Group, Inc. (Road & Rail) | (a) | 153,600 | 3,044,352 | |||||||
Genesee & Wyoming, Inc. Class A (Road & Rail) | (a) | 33,000 | 2,510,640 | |||||||
Roadrunner Transportation Systems, Inc. (Road & Rail) | (a) | 151,536 | 2,748,863 | |||||||
Titan Machinery, Inc. (Trading Companies & Distributors) | (a) | 96,800 | 2,390,960 | |||||||
|
| |||||||||
| 32,130,905 | ||||||||||
|
| |||||||||
INFORMATION TECHNOLOGY – 26.9% |
| |||||||||
Ciena Corp. (Communications Equip.) | (a) | 135,600 | 2,128,920 | |||||||
Infinera Corp. (Communications Equip.) | (a) | 368,100 | 2,138,661 | |||||||
Cray, Inc. (Computers & Peripherals) | (a) | 163,322 | 2,604,986 | |||||||
Fabrinet (Electronic Equip., Instr. & Comp.) | (a) | 240,705 | 3,162,864 | |||||||
Internap Network Services Corp. (Internet Software & Svs.) | (a) | 347,925 | 2,414,599 | |||||||
Velti PLC (Internet Software & Svs.) | (a) | 352,500 | 1,586,250 | |||||||
EPAM Systems, Inc. (IT Svs.) | (a) | 127,965 | 2,316,167 | |||||||
Cavium, Inc. (Semiconductors & Equip.) | (a) | 63,600 | 1,984,956 | |||||||
Lattice Semiconductor Corp. (Semiconductors & Equip.) | (a) | 618,661 | 2,468,457 | |||||||
Monolithic Power Systems, Inc. (Semiconductors & Equip.) | 135,500 | 3,018,940 | ||||||||
Peregrine Semiconductor Corp. (Semiconductors & Equip.) | (a) | 146,582 | 2,244,170 | |||||||
Power Integrations, Inc. (Semiconductors & Equip.) | 90,400 | 3,038,344 | ||||||||
RF Micro Devices, Inc. (Semiconductors & Equip.) | (a) | 396,900 | 1,778,112 | |||||||
Semtech Corp. (Semiconductors & Equip.) | (a) | 95,300 | 2,758,935 | |||||||
TriQuint Semiconductor, Inc. (Semiconductors & Equip.) | (a) | 492,900 | 2,385,636 | |||||||
Guidewire Software, Inc. (Software) | (a) | 77,620 | 2,306,866 | |||||||
QLIK Technologies, Inc. (Software) | (a) | 81,800 | 1,776,696 | |||||||
Tangoe, Inc. (Software) | (a) | 188,100 | 2,232,747 | |||||||
|
| |||||||||
| 42,346,306 | ||||||||||
|
| |||||||||
MATERIALS – 4.2% |
| |||||||||
GSE Holding, Inc. (Chemicals) | (a) | 330,209 | 2,047,296 | |||||||
Kronos Worldwide, Inc. (Chemicals) | 91,148 | �� | 1,777,386 | |||||||
PolyOne Corp. (Chemicals) | 139,000 | 2,838,380 | ||||||||
|
| |||||||||
| 6,663,062 | ||||||||||
|
| |||||||||
TELECOMMUNICATION SERVICES – 1.9% |
| |||||||||
Iridium Communications, Inc. (Diversified Telecom. Svs.) | (a) | 442,100 | 2,979,754 | |||||||
|
| |||||||||
Total Common Stocks (Cost $150,270,103) | $ | 150,541,940 | ||||||||
|
| |||||||||
| Money Market Funds – 3.0% | Shares | Value | ||||||||
Fidelity Institutional Money Market Funds | 4,766,000 | $ | 4,766,000 | |||||||
|
| |||||||||
Total Money Market Funds (Cost $4,766,000) | $ | 4,766,000 | ||||||||
|
| |||||||||
Total Investments – 98.5% (Cost $155,036,103) | (b) | $ | 155,307,940 | |||||||
Other Assets in Excess of Liabilities – 1.5% | 2,348,584 | |||||||||
|
| |||||||||
Net Assets – 100.0% | $ | 157,656,524 | ||||||||
|
| |||||||||
Percentages are stated as a percent of net assets.
Abbreviations:
ADR: American Depositary Receipts
Footnotes:
| (a) | Non-income producing security. |
| (b) | Represents cost for financial reporting purposes, which may differ from cost basis for federal income tax purposes. See also Note 7 of the Notes to Financial Statements. |
The accompanying notes are an integral part of these financial statements.
| 81 |
| Ohio National Fund, Inc. | U.S. Equity Portfolio |
Objective/Strategy
The U.S. Equity Portfolio seeks capital appreciation with a secondary objective of capital preservation to provide long term growth by investing at least 80% of its net assets in equity securities traded in the U.S. within under-priced sectors and industries.
Performance as of December 31, 2012
Average Annual Total Returns: | ||||
One year | 14.61% | |||
Five years | -5.18% | |||
Since inception (5/1/04) | 2.04% |
Past performance does not guarantee future results. The performance data quoted represents past performance and current returns may be lower or higher. Total return figures include change in share price and reinvestment of dividends and capital gains. The investment return and principal value will fluctuate so that an investor’s shares, when redeemed, may be worth more or less than the original cost. To obtain performance information up to the most recent month end, call toll-free 1-877-781-6392.
The Portfolio is not open to direct retail investment. Beneficial interest in shares is obtained solely by purchase of variable life insurance policies and variable annuity contracts. Actual performance results for variable annuity and variable universal life contracts will be lower due to contract charges. Consult your contract for applicable charges.
Comments
For the year ended December 31, 2012, the U.S. Equity Portfolio returned 14.61% versus 16.17% for the current benchmark, the S&P Composite 1500 Index.
Based on our valuation readings, we remained bullish during 2012, minimized cash in the Portfolio, and participated in what turned out to be a better than average year in the domestic stock market. Since 1926, the S&P 500 Index has returned an average of 12% per year. In 2012, however, the S&P 500 Index returned 16%. Our bullish posture proved beneficial and significant. As Bloomberg reported on January 4, 2013 in an article titled Almost All of Wall Street Got 2012 Market Calls Wrong, “from John Paulson’s call for a collapse in Europe to Morgan Stanley’s warning that U.S. stocks would decline, Wall Street got little right in its prognosis for the year just ended.” Moreover, investors let fear dictate their investing. “Instead of looking at what’s going on around them”, Bloomberg quotes one strategist as saying, investors let ‘these macro events cause fear to creep into the equation.” Last year in this space we wrote that we “believe the stock market is in a multi-year recovery from the lows of 2009 and that the market decline in the summer of 2011, principally due to the European debt crisis, will prove to be a temporary setback similar to the Cuban Missile Crisis, the invasion of Kuwait, and the Asian Contagion.” We concluded by writing that “as of January 6, 2012, our market stands at an attractive 1.36 value to price ratio and would seem to reflect all the financial and economic concerns bothering investors. We expect prices to continue their move up toward value and we expect underlying valuations to continue to improve as well.” This bullish outlook explains much of the Portfolio’s tactical behavior during the year, including a fairly aggressive sector tilt and riding through occasional market setbacks.(1)
Despite the bullish posture, sector tilts, and the discipline to ride through turbulence, the Portfolio lagged the Index by 156 basis points. The Portfolio had no exposure to three sectors: Consumer Staples, Telecommunication Services, and Utilities. The void in
Telecommunication Services detracted from relative performance. The Portfolio’s heavy tilts toward Consumer Discretionary and Industrials benefitted relative performance, however, as those sectors experienced good returns. Being under-weighted in Financials proved to be the largest drag on the Portfolio’s relative performance. Although many stocks in the Financials sector were on sale, according to our system, we thought they were poor risks. Our aversion to speculating on turnaround situations also proved a drag on performance this year.(1)
The five stocks contributing the most to performance were Comcast Corp., Apple, Inc., Time Warner Cable, Inc., TJX Cos., Inc., and Valero Energy Corp. The Portfolio held overweight positions in each of these companies and each out-performed the S&P 1500 Composite Index. The single largest detractor from performance was Questcor Pharmaceuticals, Inc., which fell victim to short-sellers and bloggers and analysts who issued scathing reports about the company. The reports were refuted by sell-side analysts, but the damage was done. Questcor Pharmaceuticals, Inc. has since recovered somewhat and remains in the Portfolio. The next four negative contributors were Bed Bath & Beyond, Inc., CACI International, Inc., EZCorp, Inc., and Siemens AG. Each of these stocks dropped concurrently with downward revisions in earnings forecasts, as analysts anticipated a temporary economic slowdown for fourth quarter 2012 and first quarter 2013.(1)
During the year, we saw a market condition that generally proves unfavorable for the Portfolio. Specifically, across the broad market, performance was inversely related to quality. We rate stocks on their quality, examining factors that include management, leverage, and efficiency. We assign each stock in our database a numerical value of 1 through 5, with 1 being the highest quality, 2 being the next highest and so forth. In 2012, low quality companies generally out-performed higher quality companies, with 5s out-performing 4s, 4s out-performing 3s, etc. As we generally prefer to hold well-managed companies with quality ratings of 1 or 2, the market’s low quality bias served as a strong headwind.(1)
Rapidly changing industry themes, likewise, created a strong headwind for the Portfolio. The market went up for three months through March 30th, then down two months in April and May. It subsequently went up again in June through mid-September and declined through mid-November. It ended the year with a six week advance. Each phase featured different industry and sector leadership. In general, the sector and industry leaders during the advances dropped the most during the declines. As the Portfolio is designed to capture industry and sector themes that typically last one to two years, rapid theme reversals present some unique difficulties. Nonetheless, given our bullish overall posture, we chose to ride through the short term reversals.
We remain convinced that the stock market is only about half way through a multi-year recovery from the decline of 2008 and early 2009. With an overall market value-to-price ratio of 1.26 at year end, we expect stock prices to move higher in 2013 and, as in 2012, we hope to see better than average returns by historical standards.
| (1) | The Portfolio’s composition is subject to change. Holdings and weightings are as of December 31, 2012. |
| 82 | (continued) |
| Ohio National Fund, Inc. | U.S. Equity Portfolio (Continued) |
Change in Value of $10,000 Investment
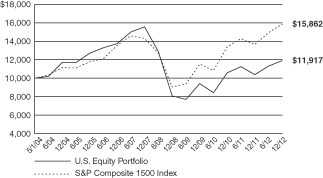
Hypothetical illustration based on past performance. Future performance will vary. The Portfolio’s returns reflect reinvested dividends. The Portfolio’s holdings may differ significantly from the securities in the index. The index is unmanaged and therefore does not reflect the cost of portfolio management and accounting.
The S&P Composite 1500 Index is a broad-based capitalization-weighted index of 1500 U.S. companies and is comprised of the S&P MidCap 400, S&P 500, and the S&P SmallCap 600. It is designed for investors seeking to replicate the performance of the U.S. equity market or benchmark against a representative universe of tradable stocks. The index presented herein includes the effects of reinvested dividends.
Portfolio Composition as of December 31, 2012 (1)
| % of Net Assets | ||||
Common Stocks (3) | 100.3 | |||
Less Net Liabilities | (0.3 | ) | ||
|
| |||
| 100.0 | ||||
|
|
Top 10 Portfolio Holdings as of December 31,
2012 (1) (2)
| % of Net Assets | ||||
1. Apple, Inc. | 5.1 | |||
2. Time Warner Cable, Inc. | 4.8 | |||
3. NIKE, Inc. Class B | 4.8 | |||
4. TJX Cos., Inc. | 4.2 | |||
5. Emerson Electric Co. | 4.0 | |||
6. Praxair, Inc. | 3.7 | |||
7. Caterpillar, Inc. | 3.2 | |||
8. FMC Technologies, Inc. | 3.2 | |||
9. Dril-Quip, Inc. | 3.1 | |||
10. Oceaneering International, Inc. | 3.1 |
| (1) | Composition of Portfolio subject to change. |
| (2) | Short-term investments have been excluded from the list of Top 10 Portfolio Holdings. |
| (3) | Sectors: |
| % of Net Assets | ||||
Consumer Discretionary | 34.7 | |||
Industrials | 18.5 | |||
Information Technology | 17.3 | |||
Energy | 12.0 | |||
Financials | 7.1 | |||
Health Care | 7.0 | |||
Materials | 3.7 | |||
|
| |||
| 100.3 | ||||
|
|
| 83 |
| Ohio National Fund, Inc. | U.S. Equity Portfolio |
Schedule of Investments | December 31, 2012 |
| Common Stocks – 100.3% | Shares | Value | ||||||||
CONSUMER DISCRETIONARY – 34.7% | ||||||||||
Panera Bread Co. Class A (Hotels, Restaurants & Leisure) | (a) | 2,260 | $ | 358,956 | ||||||
Time Warner Cable, Inc. (Media) | 7,740 | 752,251 | ||||||||
Viacom, Inc. Class B (Media) | 6,010 | 316,967 | ||||||||
Walt Disney Co. / The (Media) | 8,090 | 402,801 | ||||||||
Bed Bath & Beyond, Inc. (Specialty Retail) | (a) | 6,140 | 343,287 | |||||||
Hibbett Sports, Inc. (Specialty Retail) | (a) | 6,940 | 365,738 | |||||||
TJX Cos., Inc. (Specialty Retail) | 15,460 | 656,277 | ||||||||
Tractor Supply Co. (Specialty Retail) | 4,010 | 354,323 | ||||||||
Lululemon Athletica, Inc. (Textiles, Apparel & Luxury Goods) | (a) | 4,940 | 376,576 | |||||||
NIKE, Inc. Class B (Textiles, Apparel & Luxury Goods) | 14,420 | 744,072 | ||||||||
V.F. Corp. (Textiles, Apparel & Luxury Goods) | 3,010 | 454,420 | ||||||||
Wolverine World Wide, Inc. (Textiles, Apparel & Luxury Goods) | 6,670 | 273,337 | ||||||||
|
| |||||||||
| 5,399,005 | ||||||||||
|
| |||||||||
ENERGY – 12.0% | ||||||||||
Dril-Quip, Inc. (Energy Equip. & Svs.) | (a) | 6,680 | 487,974 | |||||||
FMC Technologies, Inc. (Energy Equip. & Svs.) | (a) | 11,530 | 493,830 | |||||||
Oceaneering International, Inc. (Energy Equip. & Svs.) | 9,010 | 484,648 | ||||||||
Valero Energy Corp. (Oil, Gas & Consumable Fuels) | 11,790 | 402,275 | ||||||||
|
| |||||||||
| 1,868,727 | ||||||||||
|
| |||||||||
FINANCIALS – 7.1% | ||||||||||
BB&T Corp. (Commercial Banks) | 8,030 | 233,753 | ||||||||
Wells Fargo & Co. (Commercial Banks) | 11,800 | 403,324 | ||||||||
Cash America International, Inc. (Consumer Finance) | 2,030 | 80,530 | ||||||||
JPMorgan Chase & Co. (Diversified Financial Svs.) | 8,940 | 393,092 | ||||||||
|
| |||||||||
| 1,110,699 | ||||||||||
|
| |||||||||
HEALTH CARE – 7.0% | ||||||||||
Celgene Corp. (Biotechnology) | (a) | 4,890 | 384,941 | |||||||
| Common Stocks (Continued) | Shares | Value | ||||||||
HEALTH CARE (continued) | ||||||||||
Bio-Reference Labs, Inc. (Health Care Providers & Svs.) | (a) | 15,560 | $ | 446,416 | ||||||
Questcor Pharmaceuticals, Inc. (Pharmaceuticals) | 9,390 | 250,901 | ||||||||
|
| |||||||||
| 1,082,258 | ||||||||||
|
| |||||||||
INDUSTRIALS – 18.5% | ||||||||||
FedEx Corp. (Air Freight & Logistics) | 1,780 | 163,262 | ||||||||
Eaton Corp. PLC (Electrical Equip.) | 4,140 | 224,388 | ||||||||
Emerson Electric Co. (Electrical Equip.) | 11,680 | 618,573 | ||||||||
General Electric Co. (Industrial Conglomerates) | 14,290 | 299,947 | ||||||||
Caterpillar, Inc. (Machinery) | 5,530 | 495,377 | ||||||||
Dover Corp. (Machinery) | 4,730 | 310,808 | ||||||||
CSX Corp. (Road & Rail) | 14,840 | 292,793 | ||||||||
Union Pacific Corp. (Road & Rail) | 3,790 | 476,479 | ||||||||
|
| |||||||||
| 2,881,627 | ||||||||||
|
| |||||||||
INFORMATION TECHNOLOGY – 17.3% | ||||||||||
F5 Networks, Inc. (Communications Equip.) | (a) | 4,910 | 477,007 | |||||||
Apple, Inc. (Computers & Peripherals) | 1,480 | 788,884 | ||||||||
EMC Corp. (Computers & Peripherals) | (a) | 13,610 | 344,333 | |||||||
Accenture PLC Class A (IT Svs.) | 4,080 | 271,320 | ||||||||
International Business Machines Corp. (IT Svs.) | 2,370 | 453,974 | ||||||||
Tyler Technologies, Inc. (Software) | (a) | 7,200 | 348,768 | |||||||
|
| |||||||||
| 2,684,286 | ||||||||||
|
| |||||||||
MATERIALS – 3.7% | ||||||||||
Praxair, Inc. (Chemicals) | 5,260 | 575,707 | ||||||||
|
| |||||||||
Total Common Stocks (Cost $13,453,650) | $ | 15,602,309 | ||||||||
|
| |||||||||
Total Investments – 100.3% (Cost $13,453,650) | (b) | $ | 15,602,309 | |||||||
Liabilities in Excess of Other Assets – (0.3)% | (40,012) | |||||||||
|
| |||||||||
Net Assets – 100.0% | $ | 15,562,297 | ||||||||
|
| |||||||||
Percentages are stated as a percent of net assets.
Footnotes:
| (a) | Non-income producing security. |
| (b) | Represents cost for financial reporting purposes, which may differ from cost basis for federal income tax purposes. See also Note 7 of the Notes to Financial Statements. |
The accompanying notes are an integral part of these financial statements.
| 84 |
| Ohio National Fund, Inc. | Balanced Portfolio |
Objective/Strategy
The Balanced Portfolio seeks capital appreciation and income by investing normally up to 75% of its assets in equity securities within under-priced sectors and industries while maintaining a minimum of 25% of its assets in fixed income securities.
Performance as of December 31, 2012
Average Annual Total Returns: | ||||
One year | 13.30% | |||
Five years | 2.66% | |||
Since inception (5/1/04) | 6.30% |
Past performance does not guarantee future results. The performance data quoted represents past performance and current returns may be lower or higher. Total return figures include change in share price and reinvestment of dividends and capital gains. The investment return and principal value will fluctuate so that an investor’s shares, when redeemed, may be worth more or less than the original cost. To obtain performance information up to the most recent month end, call toll-free 1-877-781-6392.
The Portfolio is not open to direct retail investment. Beneficial interest in shares is obtained solely by purchase of variable life insurance policies and variable annuity contracts. Actual performance results for variable annuity and variable universal life contracts will be lower due to contract charges. Consult your contract for applicable charges.
Comments
For the year ended December 31, 2012, the Balanced Portfolio returned 13.30% versus 11.95% for the current benchmark, which is composed of 60% S&P Composite 1500 Index and 40% Barclays Capital U.S. Universal Index.
As we entered the beginning of 2012, we saw significant upside potential in the U.S. equity market. Our valuation model indicated that stocks were poised for a strong rally that would be a continuation of the bull market that began in March of 2009. Due to our bullish market reading, we maintained a rather aggressive 70% equity and 30% fixed income allocation over the majority of the year within the Portfolio. This bullish position proved advantageous, with equities, as measured by the S&P Composite 1500 Index, rising 16.17% during the year. The rally, however, was not without significant volatility. Macro-economic concerns, including speculation about what steps the Federal Reserve was or was not going to take with regard to monetary policy, worries over the prospect of a significant rise in inflation, uncertainty about the U.S. presidential election, and ongoing concern about resolution of the debt crisis in the EuroZone were catalysts for the wild swings in the markets.(1)
By way of summarizing the turbulent market action, the S&P 500 Price Index started the year at 1257 and rallied sharply to 1419 in early April for a gain of 12.9%. It then dropped to 1278 in early June before rallying back to 1465 in mid-September, its highest level since the March 2009 rally began and just 6.4% below the October 2007 high reached before the housing bubble burst. The market then spiraled downward again to 1353 by mid-November before it rallied into the end of the year, closing at 1426. Start to finish in 2012, the market returned a healthy double digit gain for those who had the mettle to ride through the turbulence. The Portfolio’s systematic, disciplined approach to bottom-up value investing was the guide to riding through the “risk on/risk-off” trading environment that dominated the year. We kept cash levels to a minimum, staying fully invested with the belief that investors would recognize the value that our model indicated existed in the equity market. We stuck with our discipline and that worked to our investors’ collective benefit.
Through the implementation of an option hedging overlay strategy, we were also able to dampen the impact market volatility might have
otherwise had on the Portfolio. Using an options hedging strategy of buying and selling S&P 500 Index options to decrease the Portfolio’s exposure to volatile swings in the market, we kept the beta of the equity positions below one.(1)
Within the equity component of the Portfolio, we tilted toward those industries and sectors that offered the most attractive upside potential according to our valuation model. These tilts were responsible for the out-performance achieved on the equity side of the Portfolio. At the sector level, the Portfolio’s overweight position in the Consumer Discretionary sector and underweight position in the Utilities sector were two of the drivers of benchmark-relative out-performance. The Portfolio had about a 17.9% average position in the Consumer Discretionary sector versus an 11.4% weight in the benchmark. This was the second best performing sector of the 10 sectors in the S&P 1500 Composite Index. The Portfolio’s significant underweight in the Utilities sector was also a major factor in out-performance. The Portfolio had about a 2.0% position in Utilities stocks versus the benchmark weight of 3.7%. Because this sector was the worst performer in the S&P 1500 Composite Index by a wide margin, our underweight position had a significant positive impact on benchmark-relative performance. With respect to the best and worst pure total return contributors to the Portfolio, the Consumer Discretionary sector was the top performer. The Utilities and Telecommunications Services sectors, while not detracting from Portfolio performance, produced a negligible positive contribution to the Portfolio’s total return.(1)
Drilling down to the stock level, the five best benchmark relative performers were Comcast Corp., Time Warner Cable, Inc., Costco Wholesale Corp., TJX Cos., Inc., and Tesoro Corp. TJX Cos., Inc. and Time Warner Cable, Inc. were also two of the top total return contributors to the Portfolio’s performance. The five stocks that had the most negative benchmark-relative performance were EZCorp, Inc., Dollar Tree, Inc., CSX Corp., CACI International, Inc., and Caterpillar, Inc. EZCorp, Inc., and Dollar Tree, Inc. were also among the largest detractors from Portfolio performance.(1)
In spite of numerous concerns regarding the long term sustainability of low overall interest rates, 2012 turned out to be an extremely strong year for fixed income investors as well. Virtually all segments of the fixed income market produced positive returns during 2012, but the corporate bond segment led the way as investors took advantage of strong corporate balance sheets and record issuance. While the returns in the fixed income market were rather strong, 2012 followed the same risk-on/risk-off pattern that we have seen numerous times over the course of the last few years. Fortunately, we were able to navigate those shifts in sentiment and provide market-beating returns on the fixed income side (as measured by the Barclays Capital U.S. Universal Index) over the year. We began the year with our largest overall corporate bond tilt, with special focus on both the financial and high yield segment of the corporate market. This position contributed to significant out-performance as strong domestic economic growth and relatively benign news out of Europe allowed investors to focus on the fixed income segment’s strong credit fundamentals. Additionally, our large U.S. Treasury underweight proved to be beneficial as yields on the constant maturity 10-year Treasury rose by approximately 33 basis points during the first quarter. After this initial move, our valuations began to point us in a different direction and we increased our overall Treasury exposure and improved the credit quality of the corporate bond segment of the Portfolio. This adjustment allowed us to keep pace with the Barclays Capital U.S. Universal Index benchmark, as overall sentiment shifted in the market place due to increased concerns regarding the European debt crisis and slowing domestic growth and investors placed more of their money in Treasuries and high quality corporate bonds during the second quarter of the year. Finally, the last half of the year saw a slight increase in Treasury
| 85 | (continued) |
| Ohio National Fund, Inc. | Balanced Portfolio (Continued) |
yields while corporate bonds again continued their upward rise. The end result was a solid twelve months of out-performance for the fixed income portion of the Portfolio.(1)
Looking ahead to 2013, we continue to believe there is upside potential in the U.S. equity market. Our valuation model indicates that stocks are undervalued and represent a clear buying opportunity, particularly with Treasury yields remaining at multi-year lows. Using value as our guide, we plan to continue maintaining the Portfolio’s 70% equity and 30% fixed income allocation. Additionally, we plan to take advantage of the option hedging overlay strategy to allow more exposure to the upside opportunities we see within the equity market. With a battle over the debt ceiling looming, volatility might again dominate the first few months of the year. We expect uncertainty to give way to better clarity, however, and we remain optimistic that the volatility that has roiled the market will in time decrease dramatically. Our bottom-up systematic approach to investing suggests that with company profits still rising and bond yields holding at low levels, macro-economic fears are most likely the major factor dampening investor enthusiasm for stocks. We believe, however, that positive company fundamentals will ultimately be recognized and both stocks and corporate bonds will continue their upward trend.(1)
| (1) | The Portfolio’s composition is subject to change. Holdings and weightings are as of December 31, 2012. |
Portfolio Composition as of December 31, 2012 (1)
| % of Net Assets | ||||
Common Stocks (3) | 68.6 | |||
Corporate Bonds (3) | 24.4 | |||
U.S. Treasury Obligations | 4.8 | |||
Purchased Options | 0.5 | |||
Money Market Funds and | 1.7 | |||
|
| |||
| 100.0 | ||||
|
|
Change in Value of $10,000 Investment
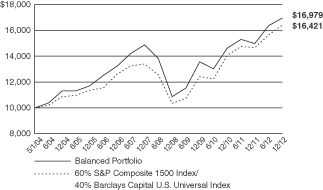
Hypothetical illustration based on past performance. Future performance will vary. The Portfolio’s returns reflect reinvested dividends. The Portfolio’s holdings may differ significantly from the securities in the index. The index is unmanaged and therefore does not reflect the cost of portfolio management and accounting.
The S&P Composite 1500 Index is a broad-based capitalization-weighted index of 1500 U.S. companies and is comprised of the S&P MidCap 400, S&P 500, and the S&P SmallCap 600. It is designed for investors seeking to replicate to the performance of the U.S. equity market or benchmark against a representative universe of tradable stocks. The index presented herein includes the effects of reinvested dividends.
The Barclays Capital U.S. Universal Index represents the union of the U.S. Aggregate Index, U.S. Corporate High Yield Index. Investment Grade 144A Index, Eurodollar Index, U.S. Emerging Markets Index, and the non-ERISA portion of the Commercial Mortgage-Backed Securities (CMBS) Index. The index covers USD-denominated, taxable bonds that are rated either investment grade or high-yield.
Top 10 Portfolio Holdings as of December 31, 2012 (1) (2)
| % of Net Assets | ||||
1. W.W. Grainger, Inc. | 2.1 | |||
2. Tractor Supply Co. | 1.9 | |||
3. Dril-Quip, Inc. | 1.9 | |||
4. TJX Cos., Inc. | 1.9 | |||
5. Oceaneering International, Inc. | 1.9 | |||
6. AMETEK, Inc. | 1.8 | |||
7. Wells Fargo & Co. | 1.7 | |||
8. Apple, Inc. | 1.6 | |||
9. Costco Wholesale Corp. | 1.6 | |||
10. International Business Machines Corp. | 1.6 |
| (1) | Composition of Portfolio subject to change. |
| (2) | Short-term investments have been excluded from the list of Top 10 Portfolio Holdings. |
| (3) | Sectors (combined): |
| % of Net Assets | ||||
Consumer Discretionary | 17.7 | |||
Industrials | 15.9 | |||
Financials | 13.0 | |||
Consumer Staples | 12.2 | |||
Information Technology | 10.5 | |||
Energy | 10.3 | |||
Health Care | 7.6 | |||
Telecommunication Services | 2.5 | |||
Materials | 2.3 | |||
Utilities | 1.0 | |||
|
| |||
| 93.0 | ||||
|
|
| 86 |
| Ohio National Fund, Inc. | Balanced Portfolio |
Schedule of Investments | December 31, 2012 |
| Common Stocks – 68.6% | Shares | Value | ||||||||||||
CONSUMER DISCRETIONARY – 13.9% |
| |||||||||||||
LKQ Corp. (Distributors) | (a) | 16,080 | $ | 339,288 | ||||||||||
Jarden Corp. (Household Durables) | 13,010 | 672,617 | ||||||||||||
DIRECTV (Media) | (a) | 8,420 | 422,347 | |||||||||||
Time Warner Cable, Inc. (Media) | 3,590 | 348,912 | ||||||||||||
Viacom, Inc. Class B (Media) | 9,250 | 487,845 | ||||||||||||
Walt Disney Co. / The (Media) | 21,790 | 1,084,924 | ||||||||||||
Dollar Tree, Inc. (Multiline Retail) | (a) | 12,730 | 516,329 | |||||||||||
Nordstrom, Inc. (Multiline Retail) | 12,230 | 654,305 | ||||||||||||
Target Corp. (Multiline Retail) | 9,170 | 542,589 | ||||||||||||
Home Depot, Inc. / The (Specialty Retail) | 12,200 | 754,570 | ||||||||||||
Jos. A Bank Clothiers, Inc. (Specialty Retail) | (a) | 3,760 | 160,101 | |||||||||||
Tiffany & Co. (Specialty Retail) | 11,670 | 669,158 | ||||||||||||
TJX Cos., Inc. (Specialty Retail) | 34,190 | 1,451,365 | ||||||||||||
Tractor Supply Co. (Specialty Retail) | 16,590 | 1,465,892 | ||||||||||||
NIKE, Inc. Class B (Textiles, Apparel & Luxury Goods) | 3,680 | 189,888 | ||||||||||||
V.F. Corp. (Textiles, Apparel & Luxury Goods) | 5,610 | 846,942 | ||||||||||||
Wolverine World Wide, Inc. (Textiles, Apparel & Luxury Goods) | 3,770 | 154,495 | ||||||||||||
|
| |||||||||||||
| 10,761,567 | ||||||||||||||
|
| |||||||||||||
CONSUMER STAPLES – 7.6% | ||||||||||||||
Costco Wholesale Corp. (Food & Staples Retailing) | 12,530 | 1,237,588 | ||||||||||||
Wal-Mart Stores, Inc. (Food & Staples Retailing) | 4,140 | 282,472 | ||||||||||||
Bunge Ltd. (Food Products) | 9,410 | 684,013 | ||||||||||||
Ingredion, Inc. (Food Products) | 9,360 | 603,065 | ||||||||||||
Nestle SA - ADR (Food Products) | 6,230 | 406,009 | ||||||||||||
Kimberly-Clark Corp. (Household Products) | 3,620 | 305,637 | ||||||||||||
British American Tobacco PLC - ADR (Tobacco) | 6,000 | 607,500 | ||||||||||||
Lorillard, Inc. (Tobacco) | 2,570 | 299,842 | ||||||||||||
Philip Morris International, Inc. (Tobacco) | 8,820 | 737,705 | ||||||||||||
Reynolds American, Inc. (Tobacco) | 16,020 | 663,709 | ||||||||||||
|
| |||||||||||||
| 5,827,540 | ||||||||||||||
|
| |||||||||||||
ENERGY – 9.7% | ||||||||||||||
Atwood Oceanics, Inc. (Energy Equip. & Svs.) | (a) | 11,500 | 526,585 | |||||||||||
Dril-Quip, Inc. (Energy Equip. & Svs.) | (a) | 20,000 | 1,461,000 | |||||||||||
National Oilwell Varco, Inc. (Energy Equip. & Svs.) | 8,460 | 578,241 | ||||||||||||
Noble Corp. (Energy Equip. & Svs.) | 10,050 | 349,941 | ||||||||||||
Oceaneering International, Inc. (Energy Equip. & Svs.) | 26,940 | 1,449,103 | ||||||||||||
Energy Transfer Partners LP (Oil, Gas & Consumable Fuels) | 15,750 | 676,147 | ||||||||||||
Exxon Mobil Corp. (Oil, Gas & Consumable Fuels) | 7,020 | 607,581 | ||||||||||||
Tesoro Corp. (Oil, Gas & Consumable Fuels) | 20,750 | 914,037 | ||||||||||||
Valero Energy Corp. (Oil, Gas & Consumable Fuels) | 26,220 | 894,626 | ||||||||||||
|
| |||||||||||||
| 7,457,261 | ||||||||||||||
|
| |||||||||||||
FINANCIALS – 7.1% | ||||||||||||||
Franklin Resources, Inc. (Capital Markets) | 3,470 | 436,179 | ||||||||||||
Northern Trust Corp. (Capital Markets) | 17,480 | 876,797 | ||||||||||||
Waddell & Reed Financial, Inc. Class A (Capital Markets) | 13,900 | 483,998 | ||||||||||||
U.S. Bancorp (Commercial Banks) | 25,000 | 798,500 | ||||||||||||
Wells Fargo & Co. (Commercial Banks) | 38,160 | 1,304,309 | ||||||||||||
American Express Co. (Consumer Finance) | 17,500 | 1,005,900 | ||||||||||||
World Acceptance Corp. (Consumer Finance) | (a) | 2,840 | 211,750 | |||||||||||
JPMorgan Chase & Co. (Diversified Financial Svs.) | 7,390 | 324,938 | ||||||||||||
|
| |||||||||||||
| 5,442,371 | ||||||||||||||
|
| |||||||||||||
HEALTH CARE – 4.5% | ||||||||||||||
Amgen, Inc. (Biotechnology) | 4,510 | 389,303 | ||||||||||||
Celgene Corp. (Biotechnology) | (a) | 2,260 | 177,907 | |||||||||||
Abbott Laboratories (Health Care Equip. & Supplies) | 5,010 | 328,155 | ||||||||||||
Covidien PLC (Health Care Equip. & Supplies) | 4,130 | 238,466 | ||||||||||||
Stryker Corp. (Health Care Equip. & Supplies) | 4,500 | 246,690 | ||||||||||||
Express Scripts Holding Co. (Health Care Providers & Svs.) | (a) | 8,790 | 474,660 | |||||||||||
McKesson Corp. (Health Care Providers & Svs.) | 4,380 | 424,685 | ||||||||||||
Johnson & Johnson (Pharmaceuticals) | 3,860 | 270,586 | ||||||||||||
Pfizer, Inc. (Pharmaceuticals) | 7,270 | 182,332 | ||||||||||||
Watson Pharmaceuticals, Inc. (Pharmaceuticals) | (a) | 8,900 | 765,400 | |||||||||||
|
| |||||||||||||
| 3,498,184 | ||||||||||||||
|
| |||||||||||||
| 87 | (continued) |
| Ohio National Fund, Inc. | Balanced Portfolio (Continued) |
Schedule of Investments | December 31, 2012 |
| Common Stocks (Continued) | Shares | Value | ||||||||||||||
INDUSTRIALS – 13.6% | ||||||||||||||||
General Dynamics Corp. (Aerospace & Defense) | 11,630 | $ | 805,610 | |||||||||||||
United Technologies Corp. (Aerospace & Defense) | 6,480 | 531,425 | ||||||||||||||
Healthcare Services Group, Inc. (Commercial Svs. & Supplies) | 24,000 | 557,520 | ||||||||||||||
Fluor Corp. (Construction & Engineering) | 20,000 | 1,174,800 | ||||||||||||||
AMETEK, Inc. (Electrical Equip.) | 37,440 | 1,406,621 | ||||||||||||||
Eaton Corp PLC (Electrical Equip.) | 6,290 | 340,918 | ||||||||||||||
Hubbell, Inc. Class B (Electrical Equip.) | 1,580 | 133,715 | ||||||||||||||
Danaher Corp. (Industrial Conglomerates) | 4,420 | 247,078 | ||||||||||||||
Caterpillar, Inc. (Machinery) | 5,070 | 454,171 | ||||||||||||||
Crane Co. (Machinery) | 12,000 | 555,360 | ||||||||||||||
Dover Corp. (Machinery) | 5,230 | 343,663 | ||||||||||||||
Canadian National Railway Co. (Road & Rail) | 4,140 | 376,781 | ||||||||||||||
Union Pacific Corp. (Road & Rail) | 7,030 | 883,812 | ||||||||||||||
Fastenal Co. (Trading Companies & Distributors) | 22,400 | 1,045,856 | ||||||||||||||
W.W. Grainger, Inc. (Trading Companies & Distributors) | 8,090 | 1,637,173 | ||||||||||||||
|
| |||||||||||||||
| 10,494,503 | ||||||||||||||||
|
| |||||||||||||||
INFORMATION TECHNOLOGY – 8.9% | ||||||||||||||||
Apple, Inc. (Computers & Peripherals) | 2,350 | 1,252,621 | ||||||||||||||
EMC Corp. (Computers & Peripherals) | (a) | 14,180 | 358,754 | |||||||||||||
Google, Inc. Class A (Internet Software & Svs.) | (a) | 500 | 354,685 | |||||||||||||
Accenture PLC Class A (IT Svs.) | 7,760 | 516,040 | ||||||||||||||
Automatic Data Processing, Inc. (IT Svs.) | 3,820 | 217,778 | ||||||||||||||
CACI International, Inc. Class A (IT Svs.) | (a) | 3,960 | 217,919 | |||||||||||||
Cognizant Technology Solutions Corp. Class A (IT Svs.) | (a) | 7,370 | 545,749 | |||||||||||||
International Business Machines Corp. (IT Svs.) | 6,310 | 1,208,680 | ||||||||||||||
Mastercard, Inc. Class A (IT Svs.) | 1,910 | 938,345 | ||||||||||||||
Visa, Inc. (IT Svs.) | 5,570 | 844,301 | ||||||||||||||
Microsoft Corp. (Software) | 14,870 | 397,475 | ||||||||||||||
|
| |||||||||||||||
| 6,852,347 | ||||||||||||||||
|
| |||||||||||||||
MATERIALS – 1.1% | ||||||||||||||||
Ecolab, Inc. (Chemicals) | 6,090 | 437,871 | ||||||||||||||
Praxair, Inc. (Chemicals) | 3,900 | 426,855 | ||||||||||||||
|
| |||||||||||||||
| 864,726 | ||||||||||||||||
|
| |||||||||||||||
TELECOMMUNICATION SERVICES – 1.5% | ||||||||||||||||
AT&T, Inc. (Diversified Telecom. Svs.) | 9,720 | 327,661 | ||||||||||||||
Verizon Communications, Inc. (Diversified Telecom. Svs.) | 19,600 | 848,092 | ||||||||||||||
|
| |||||||||||||||
| 1,175,753 | ||||||||||||||||
|
| |||||||||||||||
UTILITIES – 0.7% | ||||||||||||||||
Southern Co. / The (Electric Utilities) | 8,970 | 384,006 | ||||||||||||||
American Water Works Co., Inc. (Water Utilities) | 4,910 | 182,308 | ||||||||||||||
|
| |||||||||||||||
| 566,314 | ||||||||||||||||
|
| |||||||||||||||
Total Common Stocks (Cost $50,385,599) | $ | 52,940,566 | ||||||||||||||
|
| |||||||||||||||
| Corporate Bonds – 24.4% | Rate | Maturity | Face Amount | Value | ||||||||||||
CONSUMER DISCRETIONARY – 3.8% | ||||||||||||||||
Jarden Corp. (Household Durables) | 7.500% | 01/15/2020 | $ | 200,000 | $ | 220,500 | ||||||||||
Toll Brothers Finance Corp. (Household Durables) | 6.750% | 11/01/2019 | 100,000 | 119,285 | ||||||||||||
DIRECTV Holdings LLC / DIRECTV Financing Co., Inc. (Media) | 2.400% | 03/15/2017 | 300,000 | 307,503 | ||||||||||||
DISH DBS Corp. (Media) | 7.125% | 02/01/2016 | 300,000 | 337,500 | ||||||||||||
Dollar General Corp. (Multiline Retail) | 4.125% | 07/15/2017 | 300,000 | 316,500 | ||||||||||||
J.C. Penney Corp., Inc. (Multiline Retail) | 7.950% | 04/01/2017 | 25,300 | 24,414 | ||||||||||||
J.C. Penney Corp., Inc. (Multiline Retail) | 5.750% | 02/15/2018 | 200,000 | 177,000 | ||||||||||||
Target Corp. (Multiline Retail) | 3.875% | 07/15/2020 | 300,000 | 336,589 | ||||||||||||
AutoNation, Inc. (Specialty Retail) | 5.500% | 02/01/2020 | 200,000 | 215,750 | ||||||||||||
Gap, Inc. / The (Specialty Retail) | 5.950% | 04/12/2021 | 500,000 | 572,436 | ||||||||||||
Limited Brands, Inc. (Specialty Retail) | 5.625% | 02/15/2022 | 150,000 | 163,875 | ||||||||||||
Limited Brands, Inc. (Specialty Retail) | 6.950% | 03/01/2033 | 150,000 | 153,375 | ||||||||||||
|
| |||||||||||||||
| 2,944,727 | ||||||||||||||||
|
| |||||||||||||||
CONSUMER STAPLES – 4.6% | ||||||||||||||||
Coca-Cola Co. / The (Beverages) | 4.875% | 03/15/2019 | 150,000 | 179,029 | ||||||||||||
Coca-Cola Co. / The (Beverages) | 3.300% | 09/01/2021 | 500,000 | 551,656 | ||||||||||||
Constellation Brands, Inc. (Beverages) | 7.250% | 09/01/2016 | 200,000 | 232,000 | ||||||||||||
PepsiCo, Inc. (Beverages) | 5.000% | 06/01/2018 | 150,000 | 178,053 | ||||||||||||
PepsiCo, Inc. (Beverages) | 3.125% | 11/01/2020 | 500,000 | 536,246 | ||||||||||||
| 88 | (continued) |
| Ohio National Fund, Inc. | Balanced Portfolio (Continued) |
Schedule of Investments | December 31, 2012 |
| Corporate Bonds (Continued) | Rate | Maturity | Face Amount | Value | ||||||||||||
CONSUMER STAPLES (continued) | ||||||||||||||||
Wal-Mart Stores, Inc. (Food & Staples Retailing) | 7.550% | 02/15/2030 | $ | 200,000 | $ | 294,445 | ||||||||||
Wal-Mart Stores, Inc. (Food & Staples Retailing) | 3.250% | 10/25/2020 | 300,000 | 326,875 | ||||||||||||
Wal-Mart Stores, Inc. (Food & Staples Retailing) | 4.250% | 04/15/2021 | 100,000 | 116,224 | ||||||||||||
Wal-Mart Stores, Inc. (Food & Staples Retailing) | 4.125% | 02/01/2019 | 100,000 | 113,852 | ||||||||||||
Dean Holding Co. (Food Products) | 6.900% | 10/15/2017 | 50,000 | 54,750 | ||||||||||||
Kellogg Co. (Food Products) | 4.000% | 12/15/2020 | 100,000 | 111,478 | ||||||||||||
Central Garden and Pet Co. (Household Products) | 8.250% | 03/01/2018 | 50,000 | 53,125 | ||||||||||||
Energizer Holdings, Inc. (Household Products) | 4.700% | 05/24/2022 | 200,000 | 214,344 | ||||||||||||
Altria Group, Inc. (Tobacco) | 9.950% | 11/10/2038 | 50,000 | 82,433 | ||||||||||||
Altria Group, Inc. (Tobacco) | 9.250% | 08/06/2019 | 51,000 | 70,989 | ||||||||||||
Altria Group, Inc. (Tobacco) | 4.125% | 09/11/2015 | 300,000 | 325,818 | ||||||||||||
Lorillard Tobacco Co. (Tobacco) | 6.875% | 05/01/2020 | 100,000 | 121,967 | ||||||||||||
|
| |||||||||||||||
| 3,563,284 | ||||||||||||||||
|
| |||||||||||||||
ENERGY – 0.6% | ||||||||||||||||
Petrobras International Finance Co. – Pifco (Oil, Gas & Consumable Fuels) | 7.750% | 09/15/2014 | 50,000 | 55,375 | ||||||||||||
Tesoro Corp. (Oil, Gas & Consumable Fuels) | 4.250% | 10/01/2017 | 400,000 | 416,000 | ||||||||||||
|
| |||||||||||||||
| 471,375 | ||||||||||||||||
|
| |||||||||||||||
FINANCIALS – 5.9% | ||||||||||||||||
Merrill Lynch & Co., Inc. (Capital Markets) | 5.450% | 02/05/2013 | 150,000 | 150,655 | ||||||||||||
Morgan Stanley (Capital Markets) | (b) | 0.820% | 10/15/2015 | 300,000 | 290,889 | |||||||||||
Morgan Stanley (Capital Markets) | (c) | 3.500% | 10/15/2020 | 50,000 | 50,037 | |||||||||||
Morgan Stanley (Capital Markets) | (b) | 0.651% | 01/09/2014 | 400,000 | 397,276 | |||||||||||
CIT Group, Inc. (Commercial Banks) | 5.000% | 08/15/2022 | 200,000 | 214,045 | ||||||||||||
Wachovia Corp. (Commercial Banks) | (b) | 0.578% | 06/15/2017 | 200,000 | 195,513 | |||||||||||
Wells Fargo & Co. (Commercial Banks) | (b) | 0.513% | 10/28/2015 | 300,000 | 297,534 | |||||||||||
Wells Fargo Bank NA (Commercial Banks) | (b) | 0.520% | 05/16/2016 | 100,000 | 97,956 | |||||||||||
Ford Motor Credit Co. LLC (Consumer Finance) | 8.000% | 06/01/2014 | 100,000 | 109,076 | ||||||||||||
Bank of America NA (Diversified Financial Svs.) | (b) | 0.608% | 06/15/2017 | 50,000 | 46,393 | |||||||||||
Citigroup, Inc. (Diversified Financial Svs.) | 5.125% | 05/05/2014 | 1,000 | 1,054 | ||||||||||||
General Electric Capital Corp. (Diversified Financial Svs.) | 4.750% | 09/15/2014 | 200,000 | 213,606 | ||||||||||||
General Electric Capital Corp. (Diversified Financial Svs.) | (b) | 0.480% | 02/15/2017 | 300,000 | 292,153 | |||||||||||
JPMorgan Chase Bank NA (Diversified Financial Svs.) | (b) | 0.639% | 06/13/2016 | 250,000 | 243,247 | |||||||||||
American International Group, Inc. (Insurance) | 4.250% | 05/15/2013 | 100,000 | 101,252 | ||||||||||||
Berkshire Hathaway Finance Corp. (Insurance) | 5.400% | 05/15/2018 | 300,000 | 361,155 | ||||||||||||
Berkshire Hathaway Finance Corp. (Insurance) | 3.000% | 05/15/2022 | 300,000 | 312,835 | ||||||||||||
Berkshire Hathaway Finance Corp. (Insurance) | 4.250% | 01/15/2021 | 150,000 | 172,231 | ||||||||||||
Berkshire Hathaway, Inc. (Insurance) | 3.400% | 01/31/2022 | 200,000 | 215,627 | ||||||||||||
HCP, Inc. (Real Estate Investment Trusts) | 6.700% | 01/30/2018 | 200,000 | 241,398 | ||||||||||||
Health Care REIT, Inc. (Real Estate Investment Trusts) | 4.125% | 04/01/2019 | 150,000 | 161,459 | ||||||||||||
Ventas Realty LP l Corp. (Real Estate Investment Trusts) | 4.000% | 04/30/2019 | 150,000 | 161,337 | ||||||||||||
Vornado Realty LP (Real Estate Investment Trusts) | 4.250% | 04/01/2015 | 200,000 | 211,503 | ||||||||||||
|
| |||||||||||||||
| 4,538,231 | ||||||||||||||||
|
| |||||||||||||||
HEALTH CARE – 3.1% | ||||||||||||||||
Gilead Sciences, Inc. (Biotechnology) | 4.400% | 12/01/2021 | 200,000 | 228,176 | ||||||||||||
Medco Health Solutions, Inc. (Health Care Providers & Svs.) | 2.750% | 09/15/2015 | 150,000 | 156,447 | ||||||||||||
Thermo Fisher Scientific, Inc. (Life Sciences Tools & Svs.) | 4.500% | 03/01/2021 | 200,000 | 226,152 | ||||||||||||
Thermo Fisher Scientific, Inc. (Life Sciences Tools & Svs.) | 3.200% | 03/01/2016 | 200,000 | 212,504 | ||||||||||||
Endo Health Solutions, Inc. (Pharmaceuticals) | 7.000% | 07/15/2019 | 200,000 | 214,250 | ||||||||||||
Hospira, Inc. (Pharmaceuticals) | 6.050% | 03/30/2017 | 50,000 | 58,086 | ||||||||||||
Johnson & Johnson (Pharmaceuticals) | 2.950% | 09/01/2020 | 300,000 | 324,694 | ||||||||||||
Johnson & Johnson (Pharmaceuticals) | 5.550% | 08/15/2017 | 400,000 | 482,934 | ||||||||||||
Merck & Co., Inc. (Pharmaceuticals) | 6.000% | 09/15/2017 | 200,000 | 245,291 | ||||||||||||
Novartis Capital Corp. (Pharmaceuticals) | 4.400% | 04/24/2020 | 200,000 | 233,443 | ||||||||||||
|
| |||||||||||||||
| 2,381,977 | ||||||||||||||||
|
| |||||||||||||||
INDUSTRIALS – 2.3% | ||||||||||||||||
Lockheed Martin Corp. (Aerospace & Defense) | 4.250% | 11/15/2019 | 200,000 | 225,663 | ||||||||||||
Lockheed Martin Corp. (Aerospace & Defense) | 2.125% | 09/15/2016 | 300,000 | 311,017 | ||||||||||||
TransDigm, Inc. (Aerospace & Defense) | 7.750% | 12/15/2018 | 200,000 | 222,250 | ||||||||||||
United Parcel Service, Inc. (Air Freight & Logistics) | 5.125% | 04/01/2019 | 500,000 | 608,477 | ||||||||||||
Pitney Bowes, Inc. (Commercial Svs. & Supplies) | 5.750% | 09/15/2017 | 200,000 | 213,972 | ||||||||||||
Valmont Industries, Inc. (Machinery) | 6.625% | 04/20/2020 | 150,000 | 176,721 | ||||||||||||
|
| |||||||||||||||
| 1,758,100 | ||||||||||||||||
|
| |||||||||||||||
INFORMATION TECHNOLOGY – 1.6% | ||||||||||||||||
Google, Inc. (Internet Software & Svs.) | 3.625% | 05/19/2021 | 300,000 | 334,119 | ||||||||||||
Fiserv, Inc. (IT Svs.) | 3.500% | 10/01/2022 | 300,000 | 305,712 | ||||||||||||
| 89 | (continued) |
| Ohio National Fund, Inc. | Balanced Portfolio (Continued) |
Schedule of Investments | December 31, 2012 |
| Corporate Bonds (Continued) | Rate | Maturity | Face Amount | Value | ||||||||||||
INFORMATION TECHNOLOGY (continued) | ||||||||||||||||
Microsoft Corp. (Software) | 4.200% | 06/01/2019 | $ | 500,000 | $ | 576,765 | ||||||||||
|
| |||||||||||||||
| 1,216,596 | ||||||||||||||||
|
| |||||||||||||||
MATERIALS – 1.2% | ||||||||||||||||
Ecolab, Inc. (Chemicals) | 4.350% | 12/08/2021 | 200,000 | 223,420 | ||||||||||||
Ball Corp. (Containers & Packaging) | 5.000% | 03/15/2022 | 200,000 | 215,000 | ||||||||||||
AngloGold Ashanti Holdings PLC (Metals & Mining) | 5.375% | 04/15/2020 | 100,000 | 103,274 | ||||||||||||
Reliance Steel & Aluminum Co. (Metals & Mining) | 6.200% | 11/15/2016 | 200,000 | 227,906 | ||||||||||||
Southern Copper Corp. (Metals & Mining) | 5.375% | 04/16/2020 | 150,000 | �� | 172,741 | |||||||||||
|
| |||||||||||||||
| 942,341 | ||||||||||||||||
|
| |||||||||||||||
TELECOMMUNICATION SERVICES – 1.0% | ||||||||||||||||
AT&T, Inc. (Diversified Telecom. Svs.) | 5.800% | 02/15/2019 | 200,000 | 245,549 | ||||||||||||
Telefonica Emisiones SAU (Diversified Telecom. Svs.) | 6.421% | 06/20/2016 | 200,000 | 221,800 | ||||||||||||
Windstream Corp. (Diversified Telecom. Svs.) | 8.125% | 08/01/2013 | 50,000 | 52,125 | ||||||||||||
Comcast Cable Communications Holdings, Inc. (Wireless Telecom. Svs.) | 9.455% | 11/15/2022 | 150,000 | 226,958 | ||||||||||||
|
| |||||||||||||||
| 746,432 | ||||||||||||||||
|
| |||||||||||||||
UTILITIES – 0.3% | ||||||||||||||||
Entergy Corp. (Electric Utilities) | 3.625% | 09/15/2015 | 50,000 | 52,354 | ||||||||||||
AmeriGas Finance LLC / AmeriGas Finance Corp. (Gas Utilities) | 7.000% | 05/20/2022 | 150,000 | 167,625 | ||||||||||||
|
| |||||||||||||||
| 219,979 | ||||||||||||||||
|
| |||||||||||||||
Total Corporate Bonds (Cost $18,606,396) | $ | 18,783,042 | ||||||||||||||
|
| |||||||||||||||
| U.S. Treasury Obligations – 4.8% | Rate | Maturity | Face Amount | Value | ||||||||||||
U.S. Treasury Note | 3.250% | 03/31/2017 | $ | 800,000 | $ | 889,625 | ||||||||||
U.S. Treasury Note | 0.625% | 08/31/2017 | 800,000 | 799,125 | ||||||||||||
U.S. Treasury Note | 1.250% | 01/31/2019 | 700,000 | 712,305 | ||||||||||||
U.S. Treasury Note | 2.625% | 11/15/2020 | 400,000 | 438,656 | ||||||||||||
U.S. Treasury Note | 2.125% | 08/15/2021 | 300,000 | 315,141 | ||||||||||||
U.S. Treasury Note | 2.000% | 02/15/2022 | 500,000 | 516,602 | ||||||||||||
|
| |||||||||||||||
Total U.S. Treasury Obligations (Cost $3,653,585) | $ | 3,671,454 | ||||||||||||||
|
| |||||||||||||||
| Purchased Options – 0.5% | Contracts (d) | Value | ||||||||||||||
S&P 500 Index Put Option Expiration: February 2013, Exercise Price: $1,375.00 | 210 | $ | 401,100 | |||||||||||||
|
| |||||||||||||||
Total Purchased Options (Cost $418,606) | $ | 401,100 | ||||||||||||||
|
| |||||||||||||||
| Money Market Funds – 1.2% | Shares | Value | ||||||||||||||
Fidelity Institutional Money Market Funds | 966,000 | $ | 966,000 | |||||||||||||
|
| |||||||||||||||
Total Money Market Funds (Cost $966,000) | $ | 966,000 | ||||||||||||||
|
| |||||||||||||||
Total Investments – 99.5% (Cost $74,030,186) | (e) | $ | 76,762,162 | |||||||||||||
Other Assets in Excess of Liabilities – 0.5% | 374,765 | |||||||||||||||
|
| |||||||||||||||
Net Assets – 100.0% | $ | 77,136,927 | ||||||||||||||
|
| |||||||||||||||
Percentages are stated as a percent of net assets.
Abbreviations:
ADR: American Depositary Receipts
Footnotes:
| (a) | Non-income producing security. |
| (b) | Securities are variable rate instruments in which the coupon rates are adjusted quarterly or semi-annually in concert with U.S. LIBOR. Interest rates stated are those in effect at December 31, 2012. |
| (c) | Security was initially issued at one coupon rate, but the coupon rate is scheduled to be updated at later specified dates. The coupon rate shown is the rate that is in effect at December 31, 2012. |
| (d) | 100 shares per contract. |
| (e) | Represents cost for financial reporting purposes, which may differ from cost basis for federal income tax purposes. See also Note 7 of the Notes to Financial Statements. |
The accompanying notes are an integral part of these financial statements.
| 90 |
| Ohio National Fund, Inc. | Income Opportunity Portfolio |
Objective/Strategy
The Income Opportunity Portfolio seeks modest capital appreciation and maximization of realized gains by investing in equity securities traded in the U.S.
Performance as of December 31, 2012
Average Annual Total Returns: | ||||
One year | 7.34% | |||
Five years | 0.38% | |||
Since inception (5/1/04) | 2.82% |
Past performance does not guarantee future results. The performance data quoted represents past performance and current returns may be lower or higher. Total return figures include change in share price and reinvestment of dividends and capital gains. The investment return and principal value will fluctuate so that an investor’s shares, when redeemed, may be worth more or less than the original cost. To obtain performance information up to the most recent month end, call toll-free 1-877-781-6392.
The Portfolio is not open to direct retail investment. Beneficial interest in shares is obtained solely by purchase of variable life insurance policies and variable annuity contracts. Actual performance results for variable annuity and variable universal life contracts will be lower due to contract charges. Consult your contract for applicable charges.
Comments
For the year ended December 31, 2012, the Income Opportunity Portfolio returned 7.34% versus 16.17% for the current benchmark, the S&P Composite 1500 Index.
As we entered 2012, we saw significant upside potential in the U.S. equity market. Our valuation model indicated that stocks were poised for a strong rally that would be a continuation of the bull market that began off the March 2009 low. This bullish position proved advantageous with equities as the S&P 1500 Composite Index rose 16.17% for the year. The rally, however, was not without significant volatility. Macro-economic concerns, including speculation about what steps the Federal Reserve was or was not going to take with regard to monetary policy, worries over the prospect of a significant rise in inflation, uncertainty about the U.S. presidential election, and ongoing concern about resolution of the debt crisis in the EuroZone were catalysts for the wild swings in the equity market.
By way of summarizing the turbulent market action, the S&P 500 Price Index started the year at 1257 and rallied sharply to 1419 in early April for a gain of 12.9%. It then plunged to 1278 in early June before rallying back to 1465 in mid-September, its highest level since the March 2009 rally began and just 6.4% below the October 2007 high reached before the housing bubble burst. The market then spiraled downward again to 1353 by mid-November before it rallied into the end of the year, closing at 1426. Start to finish, in 2012, the market returned a healthy double digit gain for those who had the mettle to ride through the turbulence. The Portfolio’s systematic, disciplined approach to bottom-up value investing was the guide to riding through the “risk on / risk-off” trading environment that dominated the year. We kept cash levels to a minimum, staying fully invested with the belief that investors would recognize the value that our model indicated existed in the equity market. Although we did not capture all of the positive return of the S&P 1500 Composite Index benchmark, we steadfastly continued to follow our methodology, ultimately working to our investors’ collective benefit. The option hedge overlay that is utilized to dampen volatility and provide some downside protection also limits upside potential. During 2012,
a year in which the market performed exceedingly well, the option overlay eliminated a significant portion of the benchmark return. The Portfolio’s beta over the period was about 0.73. Its standard deviation was 11.9 versus the benchmark’s 15.6.(1)
Turning to the Portfolio’s sector and industry active tilts, the two largest overweight sector positions were Consumer Discretionary and Industrials. The Consumer Discretionary sector had an average weight of about 15.8% in the Portfolio versus 11.4% in the benchmark. The Industrials sector comprised approximately 15.4% of the Portfolio versus the benchmark weight of about 11.0%. While the overweight position in the Consumer Discretionary sector negatively impacted relative performance, the heavy tilt toward the Industrials sector had a positive benchmark-relative impact. The tilt towards Industrials stocks, however, did not perform as well as the overweight in Consumer Discretionary stocks, yielding an overall net negative impact on benchmark-relative performance from these two sectors. From a pure contribution level, however, the Industrials and Consumer Discretionary sectors were the best contributors to Portfolio performance while the Utilities sector was the largest detractor.(1)
The two most significant sector underweight tilts were in the Financials and Telecommunication Services sectors. The Financials sector of the Portfolio comprised approximately 10.1% on average for the year versus 15.4% for the benchmark. The sector was among the leading performers over the period, resulting in negative benchmark-relative performance. The Portfolio did not have a position in the Telecommunication Services sector which comprised about 2.8% of the benchmark and also performed well relative to other sectors in the benchmark, detracting from relative performance.(1)
Drilling down to the security level, the five best benchmark-relative performers were Lincare Holdings, Inc., Lowe’s Cos., Inc., TJX Cos., Inc., Amgen, Inc., and Valero Energy Corp. TJX Cos., Inc. and Lowe’s Cos., Inc. were also two of the top contributors to the Portfolio’s performance. The five stocks that had the most negative benchmark relative performance were CSX Corp., Helmerich & Payne, Inc., EZCorp, Inc., Jos. A. Bank Clothiers, Inc., and International Business Machines Corp. EZCorp, Inc. and Helmerich & Payne, Inc. were also among the largest detractors from Portfolio performance.(1)
Looking ahead to 2013, we continue to believe there is upside potential in the U.S. equity market. Our valuation model indicates that stocks are undervalued and represent a clear buying opportunity, particularly with Treasury yields remaining at multi-year lows. With the battle over the debt ceiling looming, volatility might again dominate the first few months of the year. We expect uncertainty to give way to better clarity, however, and we remain optimistic that the volatility that has roiled the market will in time decrease dramatically. Our bottom-up, systematic approach to investing suggests that with company profits still rising and bond yields holding at low levels, macro-economic fears are most likely the major factor dampening investor enthusiasm for stocks. We believe, however, that positive company fundamentals will ultimately be recognized and stocks will continue their upward trend.
| (1) | The Portfolio’s composition is subject to change. Holdings and weightings are as of December 31, 2012. |
| 91 | (continued) |
| Ohio National Fund, Inc. | Income Opportunity Portfolio (Continued) |
Change in Value of $10,000 Investment
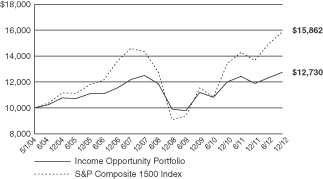
Hypothetical illustration based on past performance. Future performance will vary. The Portfolio’s returns reflect reinvested dividends. The Portfolio’s holdings may differ significantly from the securities in the index. The index is unmanaged and therefore does not reflect the cost of portfolio management and accounting.
The S&P Composite 1500 Index is a broad-based capitalization-weighted index of 1500 U.S. companies and is comprised of the S&P 400 MidCap, S&P 500, and the S&P SmallCap 600. It is designed for investors seeking to replicate the performance of the U.S. equity market or benchmark against a representative universe of tradable stocks. The index presented herein includes the effects of reinvested dividends.
Portfolio Composition as of December 31, 2012 (1)
| % of Net Assets | ||||
Common Stocks (3) | 101.7 | |||
Purchased Options | 0.6 | |||
Less Net Liabilities | (2.3 | ) | ||
|
| |||
| 100.0 | ||||
|
|
Top 10 Portfolio Holdings as of December 31, 2012 (1) (2)
| % of Net Assets | ||||
1. Apple, Inc. | 5.1 | |||
2. International Business Machines Corp. | 4.3 | |||
3. TJX Cos., Inc. | 3.7 | |||
4. Walt Disney Co. / The | 2.9 | |||
5. Amgen, Inc. | 2.8 | |||
6. Tractor Supply Co. | 2.5 | |||
7. Union Pacific Corp. | 2.4 | |||
8. Dover Corp. | 2.4 | |||
9. Accenture PLC Class A | 2.3 | |||
10. AMETEK, Inc. | 2.3 |
| (1) | Composition of Portfolio subject to change. |
| (2) | Short-term investments have been excluded from the list of Top 10 Portfolio Holdings. |
| (3) | Sectors: |
| % of Net Assets | ||||
Consumer Discretionary | 20.9 | |||
Information Technology | 20.2 | |||
Industrials | 15.3 | |||
Health Care | 11.0 | |||
Energy | 10.9 | |||
Consumer Staples | 10.7 | |||
Financials | 9.0 | |||
Materials | 2.4 | |||
Utilities | 1.3 | |||
|
| |||
| 101.7 | ||||
|
|
| 92 |
| Ohio National Fund, Inc. | Income Opportunity Portfolio |
Schedule of Investments | December 31, 2012 |
| Common Stocks – 101.7% | Shares | Value | ||||||
CONSUMER DISCRETIONARY – 20.9% | ||||||||
Genuine Parts Co. (Distributors) | 1,400 | $ 89,012 | ||||||
Jarden Corp. (Household Durables) | 2,700 | 139,590 | ||||||
DIRECTV (Media) | (a) | 1,500 | 75,240 | |||||
Walt Disney Co. / The (Media) | 5,400 | 268,866 | ||||||
Dollar Tree, Inc. (Multiline Retail) | (a) | 1,100 | 44,616 | |||||
Nordstrom, Inc. (Multiline Retail) | 2,600 | 139,100 | ||||||
Target Corp. (Multiline Retail) | 3,200 | 189,344 | ||||||
Jos. A Bank Clothiers, Inc. (Specialty Retail) | (a) | 2,250 | 95,805 | |||||
Tiffany & Co. (Specialty Retail) | 2,900 | 166,286 | ||||||
TJX Cos., Inc. (Specialty Retail) | 8,300 | 352,335 | ||||||
Tractor Supply Co. (Specialty Retail) | 2,700 | 238,572 | ||||||
NIKE, Inc. Class B (Textiles, Apparel & Luxury Goods) | 600 | 30,960 | ||||||
V.F. Corp. (Textiles, Apparel & Luxury Goods) | 900 | 135,873 | ||||||
| ||||||||
| 1,965,599 | ||||||||
| ||||||||
CONSUMER STAPLES – 10.7% | ||||||||
Costco Wholesale Corp. (Food & Staples Retailing) | 2,100 | 207,417 | ||||||
Wal-Mart Stores, Inc. (Food & Staples Retailing) | 2,100 | 143,283 | ||||||
Archer-Daniels-Midland Co. (Food Products) | 2,600 | 71,214 | ||||||
Ingredion, Inc. (Food Products) | 2,200 | 141,746 | ||||||
Kimberly-Clark Corp. (Household Products) | 2,000 | 168,860 | ||||||
Philip Morris International, Inc. (Tobacco) | 1,900 | 158,916 | ||||||
Reynolds American, Inc. (Tobacco) | 2,900 | 120,147 | ||||||
| ||||||||
| 1,011,583 | ||||||||
| ||||||||
ENERGY – 10.9% | ||||||||
Dril-Quip, Inc. (Energy Equip. & Svs.) | (a) | 1,500 | 109,575 | |||||
National Oilwell Varco, Inc. (Energy Equip. & Svs.) | 2,900 | 198,215 | ||||||
Oceaneering International, Inc. (Energy Equip. & Svs.) | 3,000 | 161,370 | ||||||
Chevron Corp. (Oil, Gas & Consumable Fuels) | 700 | 75,698 | ||||||
Exxon Mobil Corp. (Oil, Gas & Consumable Fuels) | 1,200 | 103,860 | ||||||
Tesoro Corp. (Oil, Gas & Consumable Fuels) | 4,900 | 215,845 | ||||||
Valero Energy Corp. (Oil, Gas & Consumable Fuels) | 4,700 | 160,364 | ||||||
| ||||||||
| 1,024,927 | ||||||||
| ||||||||
FINANCIALS – 9.0% | ||||||||
Franklin Resources, Inc. (Capital Markets) | 600 | 75,420 | ||||||
Northern Trust Corp. (Capital Markets) | 2,200 | 110,352 | ||||||
Waddell & Reed Financial, Inc. Class A (Capital Markets) | 2,200 | 76,604 | ||||||
BB&T Corp. (Commercial Banks) | 1,300 | 37,843 | ||||||
M&T Bank Corp. (Commercial Banks) | 500 | 49,235 | ||||||
U.S. Bancorp (Commercial Banks) | 3,000 | 95,820 | ||||||
Wells Fargo & Co. (Commercial Banks) | 5,500 | 187,990 | ||||||
World Acceptance Corp. (Consumer Finance) | (a) | 1,100 | 82,016 | |||||
JPMorgan Chase & Co. (Diversified Financial Svs.) | 3,100 | 136,307 | ||||||
| ||||||||
| 851,587 | ||||||||
| ||||||||
HEALTH CARE – 11.0% | ||||||||
Amgen, Inc. (Biotechnology) | 3,100 | 267,592 | ||||||
Celgene Corp. (Biotechnology) | (a) | 1,200 | 94,464 | |||||
Abbott Laboratories (Health Care Equip. & Supplies) | 3,100 | 203,050 | ||||||
Varian Medical Systems, Inc. (Health Care Equip. & Supplies) | (a) | 900 | 63,216 | |||||
| Common Stocks (Continued) | Shares | Value | ||||||
HEALTH CARE (continued) | ||||||||
Express Scripts Holding Co. (Health Care Providers & Svs.) | (a) | 1,500 | $ 81,000 | |||||
Laboratory Corp. of America Holdings | (a) | 600 | 51,972 | |||||
McKesson Corp. (Health Care Providers & Svs.) | 1,500 | 145,440 | ||||||
Watson Pharmaceuticals, Inc. (Pharmaceuticals) | (a) | 1,500 | 129,000 | |||||
| ||||||||
| 1,035,734 | ||||||||
| ||||||||
INDUSTRIALS – 15.3% | ||||||||
United Technologies Corp. (Aerospace & Defense) | 1,400 | 114,814 | ||||||
Delta Air Lines, Inc. (Airlines) | (a) | 5,300 | 62,911 | |||||
Fluor Corp. (Construction & Engineering) | 3,000 | 176,220 | ||||||
AMETEK, Inc. (Electrical Equip.) | 5,800 | 217,906 | ||||||
3M Co. (Industrial Conglomerates) | 800 | 74,280 | ||||||
Danaher Corp. (Industrial Conglomerates) | 1,000 | 55,900 | ||||||
Caterpillar, Inc. (Machinery) | 1,800 | 161,244 | ||||||
Dover Corp. (Machinery) | 3,400 | 223,414 | ||||||
Parker Hannifin Corp. (Machinery) | 1,500 | 127,590 | ||||||
Union Pacific Corp. (Road & Rail) | 1,800 | 226,296 | ||||||
| ||||||||
| 1,440,575 | ||||||||
| ||||||||
INFORMATION TECHNOLOGY – 20.2% | ||||||||
Apple, Inc. (Computers & Peripherals) | 900 | 479,727 | ||||||
Google, Inc. Class A (Internet | (a) | 200 | 141,874 | |||||
Accenture PLC Class A (IT Svs.) | 3,300 | 219,450 | ||||||
Automatic Data Processing, Inc. (IT Svs.) | 2,700 | 153,927 | ||||||
Cognizant Technology Solutions Corp. | (a) | 1,400 | 103,670 | |||||
International Business Machines Corp. (IT Svs.) | 2,100 | 402,255 | ||||||
Mastercard, Inc. Class A (IT Svs.) | 400 | 196,512 | ||||||
Intel Corp. (Semiconductors & Equip.) | 3,800 | 78,394 | ||||||
Microsoft Corp. (Software) | 4,600 | 122,958 | ||||||
| ||||||||
| 1,898,767 | ||||||||
| ||||||||
MATERIALS – 2.4% | ||||||||
Air Products & Chemicals, Inc. (Chemicals) | 900 | 75,618 | ||||||
Praxair, Inc. (Chemicals) | 1,400 | 153,230 | ||||||
| ||||||||
| 228,848 | ||||||||
| ||||||||
UTILITIES – 1.3% | ||||||||
Southern Co. / The (Electric Utilities) | 2,900 | 124,149 | ||||||
| ||||||||
Total Common Stocks (Cost $8,255,243) | $9,581,769 | |||||||
| ||||||||
| Purchased Options – 0.6% | Contracts (b) | Value | ||||||
S&P 500 Index Put Option Expiration: February 2013, Exercise Price: $1,375.00 | 30 | $ 57,300 | ||||||
| ||||||||
Total Purchased Options (Cost $59,801) | $ 57,300 | |||||||
| ||||||||
Total Investments – 102.3% (Cost $8,315,044) | (c) | $9,639,069 | ||||||
Liabilities in Excess of Other Assets – (2.3)% | (214,573) | |||||||
| ||||||||
Net Assets – 100.0% | $9,424,496 | |||||||
| ||||||||
Percentages are stated as a percent of net assets.
Footnotes:
| (a) | Non-income producing security. |
| (b) | 100 shares per contract. |
| (c) | Represents cost for financial reporting purposes, which may differ from cost basis for federal income tax purposes. See also Note 7 of the Notes to Financial Statements. |
The accompanying notes are an integral part of these financial statements.
| 93 |
| Ohio National Fund, Inc. | Target VIP Portfolio |
Objective/Strategy
The Target VIP Portfolio seeks an above average total return by investing in the common stocks of companies which are identified by a model that applies separate uniquely specialized strategies.
Performance as of December 31, 2012
Average Annual Total Returns: | ||||
One year | 15.24% | |||
Five years | -2.46% | |||
Since inception (11/2/05) | 1.18% |
Past performance does not guarantee future results. The performance data quoted represents past performance and current returns may be lower or higher. Total return figures include change in share price and reinvestment of dividends and capital gains. The investment return and principal value will fluctuate so that an investor’s shares, when redeemed, may be worth more or less than the original cost. To obtain performance information up to the most recent month end, call toll-free 1-877-781-6392.
The Portfolio is not open to direct retail investment. Beneficial interest in shares is obtained solely by purchase of variable life insurance policies and variable annuity contracts. Actual performance results for variable annuity and variable universal life contracts will be lower due to contract charges. Consult your contract for applicable charges.
Comments
For the year ended December 31, 2012, the Target VIP Portfolio returned 15.24% versus 16.42% for the current benchmark, the Russell 3000 Index.
The year started with a strong first quarter, which saw U.S. equities post their best first quarter since 1998. Gains were fueled by growth in corporate profits, continued accommodative policy by the Federal Reserve, and generally strong economic data. Data turned more mixed and anxieties returned about the European debt situation in the second quarter and equities gave up some of their gains. Profit growth estimates also started to recede as the Chinese economy cooled and political events in both Europe and the U.S. conspired to send equities lower. Equity markets rebounded in the third quarter as Europe announced a plan to contain its debt situation and the Federal Reserve announced further stimulus measures. Corporate profit growth and analyst earnings per share estimates steadily fell throughout the second half of the year. The final quarter of the year saw modest equity losses as the fiscal cliff fight in Washington dominated the headlines, especially in December. Investors and businesses were content to sit on the sidelines and wait for more clarity on the tax front before committing aggressively to the market or spending.
The Portfolio had its annual rebalance in early January 2012. Though the selection process for the underlying strategies did not change, there were changes in the sector exposures as a result of the rebalance. The rebalance resulted in a reduction in the overweight positions in Consumer Discretionary and Information Technology stocks, while Energy and Health Care went from underweight to roughly neutral with the benchmark.(1)
Stock selection in the Telecommunication Services sector was the biggest detractor from relative performance. The Portfolio held several European telecommunications companies as part of the European 20 strategy that were responsible for the relative under-performance in Telecommunication Services. An overweight position in the sector, which was a top three sector in the benchmark,
helped mitigate some of the relative under-performance. An underweight position in Financials also detracted from relative performance as the sector was the top performer in the benchmark for 2012.(1)
Stock selection in the Health Care sector was the biggest contributor to relative performance. Strong performance from several biotech holdings (Gilead Sciences, Inc., Amgen, Inc., and Biogen Idec, Inc.) were largely responsible for the strong performance in the Portfolio’s Health Care holdings. Stock selection in the Energy sector, led by top performing Delek U.S. Holdings, Inc. and Alon U.S.A. Energy, Inc., also contributed positively to overall performance. A significant overweight in Consumer Discretionary stocks also boosted relative performance as the sector was the second best performer in the benchmark for the year.(1)
The Portfolio’s best performers were Delek U.S. Holdings, Inc., 8x8, Inc., Alon U.S.A. Energy, Inc., Seagate Technology PLC, and Gilead Sciences, Inc. The worst performers were Apollo Group, Inc., Body Central Corp., Royal KPN NV, Ceva, Inc. and Keynote Systems, Inc. The Portfolio’s top contributors to performance were The Home Depot, Inc., Apple, Inc., Gilead Sciences, Inc., The Walt Disney Co., and Pfizer, Inc. The top detractors from performance were Royal KPN NV, Apollo Group, Inc., Intel Corp., Humana, Inc., and Nokia OYJ.(1)
As we look to 2013, equities remain attractive, especially relative to other asset classes. Trading could be volatile in the first quarter as delayed action by Congress regarding the debt ceiling, federal spending, and sequestration will have to be dealt with in the coming months. While few expect a grand bargain that will put the country on a sustainable fiscal path, progress in dealing with our deficit would lay the ground work for positive equity performance for the remainder of the year. As always, we remain consistent in the application of the six strategies underlying the Portfolio. The result is a Portfolio with broad exposures across the size and sector spectrum, which provides diversification along with upside potential.
| (1) | The Portfolio’s composition is subject to change. Holdings and weightings are as of December 31, 2012. |
Change in Value of $10,000 Investment
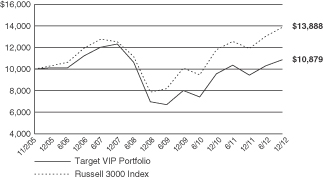
Hypothetical illustration based on past performance. Future performance will vary. The Portfolio’s returns reflect reinvested dividends. The Portfolio’s holdings may differ significantly from the securities in the index. The index is unmanaged and therefore does not reflect the cost of portfolio management and accounting.
The Russell 3000 Index measures the performance of the largest 3000 U.S. companies representing approximately 98% of the investable U.S. equity market. The Russell 3000 Index is constructed to provide a comprehensive, unbiased, and stable barometer of the broad market and is completely reconstituted annually to ensure new and growing equities are reflected. The index presented includes the effects of reinvested dividends.
| 94 | (continued) |
| Ohio National Fund, Inc. | Target VIP Portfolio (Continued) |
Portfolio Composition as of December 31, 2012 (1)
| % of Net Assets | ||||
Common Stocks (3) | 98.3 | |||
Money Market Funds and | 1.7 | |||
|
| |||
| 100.0 | ||||
|
|
Top 10 Portfolio Holdings as of December 31, 2012 (1) (2)
| % of Net Assets | ||||
1. Walt Disney Co. / The | 4.4 | |||
2. Home Depot, Inc. / The | 4.3 | |||
3. Chevron Corp. | 4.1 | |||
4. Microsoft Corp. | 3.9 | |||
5. Pfizer, Inc. | 3.8 | |||
6. Apple, Inc. | 3.8 | |||
7. Exxon Mobil Corp. | 3.4 | |||
8. Intel Corp. | 3.3 | |||
9. Gilead Sciences, Inc. | 2.6 | |||
10. BCE, Inc. | 2.4 |
| (1) | Composition of Portfolio subject to change. |
| (2) | Short-term investments have been excluded from the list of Top 10 Portfolio Holdings. |
| (3) | Sectors: |
| % of Net Assets | ||||
Information Technology | 20.9 | |||
Consumer Discretionary | 19.9 | |||
Health Care | 12.7 | |||
Energy | 10.5 | |||
Financials | 8.9 | |||
Telecommunication Services | 8.7 | |||
Utilities | 6.0 | |||
Industrials | 4.9 | |||
Consumer Staples | 4.1 | |||
Materials | 1.7 | |||
|
| |||
| 98.3 | ||||
|
|
| 95 |
| Ohio National Fund, Inc. | Target VIP Portfolio |
Schedule of Investments | December 31, 2012 |
| Common Stocks – 98.3% | Shares | Value | ||||||||
CONSUMER DISCRETIONARY – 19.9% | ||||||||||
Standard Motor Products, Inc. (Auto Components) | 1,954 | $ | 43,418 | |||||||
Apollo Group, Inc. Class A (Diversified Consumer Svs.) | (a) | 2,632 | 55,061 | |||||||
Buffalo Wild Wings, Inc. (Hotels, Restaurants & Leisure) | (a) | 1,747 | 127,217 | |||||||
Caribou Coffee Co., Inc. (Hotels, Restaurants & Leisure) | (a) | 1,966 | 31,830 | |||||||
Papa John’s International, Inc. (Hotels, Restaurants & Leisure) | (a) | 2,294 | 126,032 | |||||||
Red Robin Gourmet Burgers, Inc. (Hotels, Restaurants & Leisure) | (a) | 1,391 | 49,088 | |||||||
Starbucks Corp. (Hotels, Restaurants & Leisure) | 4,206 | 225,526 | ||||||||
Mattel, Inc. (Leisure Equip. & Products) | 7,708 | 282,267 | ||||||||
DISH Network Corp. Class A (Media) | 3,394 | 123,542 | ||||||||
Sinclair Broadcast Group, Inc. Class A (Media) | 4,865 | 61,396 | ||||||||
Walt Disney Co. / The (Media) | 18,614 | 926,791 | ||||||||
Dollar Tree, Inc. (Multiline Retail) | (a) | 4,746 | 192,498 | |||||||
Macy’s, Inc. (Multiline Retail) | 6,688 | 260,966 | ||||||||
Advance Auto Parts, Inc. (Specialty Retail) | 1,216 | 87,978 | ||||||||
AutoZone, Inc. (Specialty Retail) | (a) | 508 | 180,050 | |||||||
Bed Bath & Beyond, Inc. (Specialty Retail) | (a) | 1,561 | 87,275 | |||||||
Body Central Corp. (Specialty Retail) | (a) | 1,520 | 15,139 | |||||||
Genesco, Inc. (Specialty Retail) | (a) | 640 | 35,200 | |||||||
Home Depot, Inc. / The (Specialty Retail) | 14,560 | 900,536 | ||||||||
Lithia Motors, Inc. Class A (Specialty Retail) | 2,122 | 79,405 | ||||||||
PetSmart, Inc. (Specialty Retail) | 1,844 | 126,019 | ||||||||
Ross Stores, Inc. (Specialty Retail) | 1,555 | 84,203 | ||||||||
Sonic Automotive, Inc. Class A (Specialty Retail) | 2,708 | 56,570 | ||||||||
True Religion Apparel, Inc. (Textiles, Apparel & Luxury Goods) | 2,413 | 61,338 | ||||||||
|
| |||||||||
| 4,219,345 | ||||||||||
|
| |||||||||
CONSUMER STAPLES – 4.1% | ||||||||||
Coca-Cola Co. / The (Beverages) | 6,400 | 232,000 | ||||||||
Monster Beverage Corp. (Beverages) | (a) | 1,064 | 56,264 | |||||||
Casey’s General Stores, Inc. (Food & Staples Retailing) | 777 | 41,259 | ||||||||
B&G Foods, Inc. (Food Products) | 4,441 | 125,725 | ||||||||
Smithfield Foods, Inc. (Food Products) | (a) | 2,756 | 59,447 | |||||||
Elizabeth Arden, Inc. (Personal Products) | (a) | 2,769 | 124,633 | |||||||
Lorillard, Inc. (Tobacco) | 253 | 29,517 | ||||||||
Philip Morris International, Inc. (Tobacco) | 2,464 | 206,089 | ||||||||
|
| |||||||||
| 874,934 | ||||||||||
|
| |||||||||
ENERGY – 10.5% | ||||||||||
Halliburton Co. (Energy Equip. & Svs.) | 1,738 | 60,291 | ||||||||
Helmerich & Payne, Inc. (Energy Equip. & Svs.) | 313 | 17,531 | ||||||||
Newpark Resources, Inc. (Energy Equip. & Svs.) | (a) | 8,574 | 67,306 | |||||||
Alon U.S.A. Energy, Inc. (Oil, Gas & Consumable Fuels) | 5,163 | 93,399 | ||||||||
Approach Resources, Inc. (Oil, Gas & Consumable Fuels) | (a) | 3,105 | 77,656 | |||||||
Chevron Corp. (Oil, Gas & Consumable Fuels) | 8,041 | 869,554 | ||||||||
Delek U.S. Holdings, Inc. (Oil, Gas & Consumable Fuels) | 5,432 | 137,538 | ||||||||
Eni SpA – ADR (Oil, Gas & Consumable Fuels) | 3,891 | 191,204 | ||||||||
Exxon Mobil Corp. (Oil, Gas & Consumable Fuels) | 8,232 | 712,480 | ||||||||
|
| |||||||||
| 2,226,959 | ||||||||||
|
| |||||||||
FINANCIALS – 8.9% | ||||||||||
Banco Santander SA – ADR (Commercial Banks) | 21,406 | 174,887 | ||||||||
Bank of the Ozarks, Inc. (Commercial Banks) | 3,246 | 108,644 | ||||||||
BNP Paribas SA – ADR (Commercial Banks) | 8,177 | 238,850 | ||||||||
Texas Capital Bancshares, Inc. (Commercial Banks) | (a) | 3,457 | 154,943 | |||||||
World Acceptance Corp. (Consumer Finance) | (a) | 1,390 | 103,638 | |||||||
MarketAxess Holdings, Inc. (Diversified Financial Svs.) | 3,356 | 118,467 | ||||||||
AXA SA – ADR (Insurance) | 12,471 | 227,222 | ||||||||
Chubb Corp. / The (Insurance) | 3,202 | 241,175 | ||||||||
Marsh & McLennan Cos., Inc. (Insurance) | 6,187 | 213,266 | ||||||||
| Common Stocks (Continued) | Shares | Value | ||||||||
FINANCIALS (continued) | ||||||||||
Muenchener Rueckversicherungs AG – ADR (Insurance) | 13,146 | $ | 237,022 | |||||||
Torchmark Corp. (Insurance) | 1,296 | 66,964 | ||||||||
|
| |||||||||
| 1,885,078 | ||||||||||
|
| |||||||||
HEALTH CARE – 12.7% | ||||||||||
Amgen, Inc. (Biotechnology) | 3,817 | 329,483 | ||||||||
Biogen Idec, Inc. (Biotechnology) | (a) | 1,419 | 208,125 | |||||||
Gilead Sciences, Inc. (Biotechnology) | (a) | 7,621 | 559,762 | |||||||
Intuitive Surgical, Inc. (Health Care Equip. & Supplies) | (a) | 238 | 116,708 | |||||||
Air Methods Corp. (Health Care Providers & Svs.) | 3,597 | 132,693 | ||||||||
Humana, Inc. (Health Care Providers & Svs.) | 2,569 | 176,310 | ||||||||
PharMerica Corp. (Health Care Providers & Svs.) | (a) | 2,776 | 39,530 | |||||||
Cambrex Corp. (Life Sciences Tools & Svs.) | (a) | 5,497 | 62,556 | |||||||
AstraZeneca PLC – ADR (Pharmaceuticals) | 3,490 | 164,972 | ||||||||
Forest Laboratories, Inc. (Pharmaceuticals) | (a) | 1,395 | 49,271 | |||||||
Hi-Tech Pharmacal Co., Inc. (Pharmaceuticals) | 1,212 | 42,396 | ||||||||
Pfizer, Inc. (Pharmaceuticals) | 32,333 | 810,912 | ||||||||
|
| |||||||||
| 2,692,718 | ||||||||||
|
| |||||||||
INDUSTRIALS – 4.9% | ||||||||||
General Dynamics Corp. (Aerospace & Defense) | 1,592 | 110,278 | ||||||||
Triumph Group, Inc. (Aerospace & Defense) | 674 | 44,012 | ||||||||
Alaska Air Group, Inc. (Airlines) | (a) | 1,055 | 45,460 | |||||||
Cintas Corp. (Commercial Svs. & Supplies) | 763 | 31,207 | ||||||||
3M Co. (Industrial Conglomerates) | 3,002 | 278,736 | ||||||||
Colfax Corp. (Machinery) | (a) | 4,158 | 167,775 | |||||||
Sauer-Danfoss, Inc. (Machinery) | 1,099 | 58,654 | ||||||||
Kirby Corp. (Marine) | (a) | 961 | 59,476 | |||||||
Advisory Board Co. / The (Professional Svs.) | (a) | 3,103 | 145,189 | |||||||
Fastenal Co. (Trading Companies & Distributors) | 1,919 | 89,598 | ||||||||
|
| |||||||||
| 1,030,385 | ||||||||||
|
| |||||||||
INFORMATION TECHNOLOGY – 20.9% | ||||||||||
Nokia OYJ – ADR (Communications Equip.) | 33,569 | 132,598 | ||||||||
Riverbed Technology, Inc. (Communications Equip.) | (a) | 592 | 11,668 | |||||||
Apple, Inc. (Computers & Peripherals) | 1,518 | 809,140 | ||||||||
Seagate Technology PLC (Computers & Peripherals) | 7,480 | 227,990 | ||||||||
FARO Technologies, Inc. (Electronic Equip., Instr. & Comp.) | (a) | 1,580 | 56,374 | |||||||
OSI Systems, Inc. (Electronic Equip., Instr. & Comp.) | (a) | 1,871 | 119,819 | |||||||
PC Connection, Inc. (Electronic Equip., Instr. & Comp.) | 3,536 | 40,664 | ||||||||
Zygo Corp. (Electronic Equip., Instr. & Comp.) | (a) | 2,324 | 36,487 | |||||||
Dealertrack Technologies, Inc. (Internet Software & Svs.) | (a) | 3,880 | 111,434 | |||||||
Keynote Systems, Inc. (Internet Software & Svs.) | 1,646 | 23,192 | ||||||||
NIC, Inc. (Internet Software & Svs.) | 6,000 | 98,040 | ||||||||
Cardtronics, Inc. (IT Svs.) | (a) | 4,133 | 98,117 | |||||||
Heartland Payment Systems, Inc. (IT Svs.) | 3,692 | 108,914 | ||||||||
International Business Machines Corp. (IT Svs.) | 2,041 | 390,954 | ||||||||
Mastercard, Inc. Class A (IT Svs.) | 227 | 111,521 | ||||||||
NeuStar, Inc. Class A (IT Svs.) | (a) | 1,171 | 49,100 | |||||||
Ceva, Inc. (Semiconductors & Equip.) | (a) | 2,209 | 34,792 | |||||||
Intel Corp. (Semiconductors & Equip.) | 34,024 | 701,915 | ||||||||
KLA-Tencor Corp. (Semiconductors & Equip.) | 1,022 | 48,811 | ||||||||
Nanometrics, Inc. (Semiconductors & Equip.) | (a) | 2,127 | 30,671 | |||||||
BroadSoft, Inc. (Software) | (a) | 2,626 | 95,403 | |||||||
Microsoft Corp. (Software) | 30,613 | 818,285 | ||||||||
Sourcefire, Inc. (Software) | (a) | 2,684 | 126,738 | |||||||
Tyler Technologies, Inc. (Software) | (a) | 2,776 | 134,469 | |||||||
|
| |||||||||
| 4,417,096 | ||||||||||
|
| |||||||||
MATERIALS – 1.7% | ||||||||||
CF Industries Holdings, Inc. (Chemicals) | 1,041 | 211,490 | ||||||||
Buckeye Technologies, Inc. (Paper & Forest Products) | 3,627 | 104,131 | ||||||||
Schweitzer-Mauduit International, Inc. (Paper & Forest Products) | 1,201 | 46,875 | ||||||||
|
| |||||||||
| 362,496 | ||||||||||
|
| |||||||||
| 96 | (continued) |
| Ohio National Fund, Inc. | Target VIP Portfolio (Continued) |
Schedule of Investments | December 31, 2012 |
| Common Stocks (Continued) | Shares | Value | ||||||||
TELECOMMUNICATION SERVICES – 8.7% | ||||||||||
8x8, Inc. (Diversified Telecom. Svs.) | (a) | 6,781 | $ | 50,112 | ||||||
BCE, Inc. (Diversified Telecom. Svs.) | 11,911 | 511,458 | ||||||||
BT Group PLC – ADR (Diversified Telecom. Svs.) | 11,881 | 451,834 | ||||||||
Deutsche Telekom AG – ADR (Diversified Telecom. Svs.) | 14,046 | 159,591 | ||||||||
France Telecom SA – ADR (Diversified Telecom. Svs.) | 10,289 | 113,693 | ||||||||
Koninklijke KPN NV – ADR (Diversified Telecom. Svs.) | 13,411 | 66,787 | ||||||||
Swisscom AG – ADR (Diversified Telecom. Svs.) | 4,297 | 185,845 | ||||||||
Telefonica SA – ADR (Diversified Telecom. Svs.) | 9,616 | 129,720 | ||||||||
Vivendi SA – ADR (Diversified Telecom. Svs.) | 7,571 | 172,694 | ||||||||
|
| |||||||||
| 1,841,734 | ||||||||||
|
| |||||||||
UTILITIES – 6.0% | ||||||||||
Electricite de France SA – ADR (Electric Utilities) | 33,359 | 123,762 | ||||||||
Enel SpA – ADR (Electric Utilities) | 40,433 | 167,393 | ||||||||
Southern Co. / The (Electric Utilities) | 1,601 | 68,539 | ||||||||
SSE PLC – ADR (Electric Utilities) | 8,070 | 187,708 | ||||||||
Dominion Resources, Inc. (Multi-Utilities) | 1,091 | 56,514 | ||||||||
| Common Stocks (Continued) | Shares | Value | ||||||||
UTILITIES (continued) | ||||||||||
E.ON SE – ADR (Multi-Utilities) | 7,486 | $ | 140,625 | |||||||
GDF Suez – ADR (Multi-Utilities) | 5,896 | 124,052 | ||||||||
National Grid PLC – ADR (Multi-Utilities) | 3,293 | 189,150 | ||||||||
RWE AG – ADR (Multi-Utilities) | 4,642 | 193,293 | ||||||||
Wisconsin Energy Corp. (Multi-Utilities) | 609 | 22,442 | ||||||||
|
| |||||||||
| 1,273,478 | ||||||||||
|
| |||||||||
Total Common Stocks (Cost $18,662,773) | $ | 20,824,223 | ||||||||
|
| |||||||||
| Money Market Funds – 1.3% | Shares | Value | ||||||||
Fidelity Institutional Money Market Funds | 275,000 | $ | 275,000 | |||||||
|
| |||||||||
Total Money Market Funds (Cost $275,000) | $ | 275,000 | ||||||||
|
| |||||||||
Total Investments – 99.6% (Cost $18,937,773) | (b) | $ | 21,099,223 | |||||||
Other Assets in Excess of Liabilities – 0.4% | 83,119 | |||||||||
|
| |||||||||
Net Assets – 100.0% | $ | 21,182,342 | ||||||||
|
| |||||||||
Percentages are stated as a percent of net assets.
Abbreviations:
ADR: American Depositary Receipts
Footnotes:
| (a) | Non-income producing security. |
| (b) | Represents cost for financial reporting purposes, which may differ from cost basis for federal income tax purposes. See also Note 7 of the Notes to Financial Statements. |
The accompanying notes are an integral part of these financial statements.
| 97 |
| Ohio National Fund, Inc. | Target Equity/Income Portfolio |
Objective/Strategy
The Target Equity/Income Portfolio seeks an above average total return by adhering to a disciplined, quantitative investment process that incorporates two distinct strategy methodologies.
Performance as of December 31, 2012
Average Annual Total Returns: | ||||
One year | 11.08% | |||
Five years | -5.57% | |||
Since inception (11/2/05) | -1.18% |
Past performance does not guarantee future results. The performance data quoted represents past performance and current returns may be lower or higher. Total return figures include change in share price and reinvestment of dividends and capital gains. The investment return and principal value will fluctuate so that an investor’s shares, when redeemed, may be worth more or less than the original cost. To obtain performance information up to the most recent month end, call toll-free 1-877-781-6392.
The Portfolio is not open to direct retail investment. Beneficial interest in shares is obtained solely by purchase of variable life insurance policies and variable annuity contracts. Actual performance results for variable annuity and variable universal life contracts will be lower due to contract charges. Consult your contract for applicable charges.
Comments
For the year ended December 31, 2012, the Target Equity/Income Portfolio returned 11.08% versus 16.42% for the current benchmark, the Russell 3000 Index.
The year started with a strong first quarter, which saw U.S. equities post their best first quarter since 1998. Gains were fueled by growth in corporate profits, continued accommodative policy by the Federal Reserve, and generally strong economic data. Data turned more mixed and anxieties returned about the European debt situation in the second quarter and equities gave up some of their gains. Profit growth estimates also started to recede as the Chinese economy cooled and political events in both Europe and the U.S. conspired to send equities lower. Equity markets rebounded in the third quarter as Europe announced a plan to contain its debt situation and the Federal Reserve announced further stimulus measures. Corporate profit growth and analyst earnings per share estimates steadily fell throughout the second half of the year. The final quarter of the year saw modest equity losses as the fiscal cliff fight in Washington dominated the headlines, especially in December. Investors and businesses were content to sit on the sidelines and wait for more clarity on the tax front before committing aggressively to the market or spending.
The Portfolio had its annual rebalance in early January 2012. Though the selection process for the two underlying strategies did not change, there were changes in the sector exposures as a result of the rebalance. The rebalance resulted in a significant reduction in the overweight positions in Consumer Discretionary and Utilities stocks, while Energy, Financials, Materials, and Health Care all gained exposure in the Portfolio.(1)
Most of the relative under-performance in 2012 came from holdings of the Dow Target Dividend strategy within the Portfolio. The strategy provided all of the Financials exposure within the Portfolio, and that sector was the biggest detractor from relative performance. The Portfolio’s holdings in small to mid-sized banks underperformed over the period. The strategy also provided the Portfolio’s overweight exposure to Utilities. While stock selection in the sector was positive, the overweight position led to under-performance as the
sector lagged the broader market. Stock selection in the Health Care and Industrials sectors also dragged down relative performance.(1)
The Information Technology sector was the largest contributor to relative performance for the year. Strong stock selection, led by Seagate Technology PLC, produced the positive performance. An underweight position in the sector also contributed as the sector lagged the broader market. Stock selection in the Consumer Discretionary sector also added to relative performance during the year.(1)
The Portfolio’s best performers were Seagate Technology PLC, Cambrex Corp., Sauer-Danfoss, Inc., Sonic Automotive, Inc., and PetSmart, Inc. The worst performers were ACCO Brands Corp., R.R. Donnelley & Sons Co., Humana, Inc., Smithfield Foods, Inc., and Zygo Corp. The Portfolio’s top contributors to performance were Seagate Technology PLC, BT Group PLC, Sempra Energy, CF Industries Holdings, Inc., and Mattel, Inc. The top detractors from performance were Humana, Inc., R.R. Donnelley & Sons Co., First Niagara Financial Group, Inc., FirstMerit Corp., and Smithfield Foods, Inc.(1)
As we look to 2013, equities remain attractive, especially relative to other asset classes. Trading could be volatile in the first quarter as delayed action by Congress regarding the debt ceiling, federal spending, and sequestration will now have to be dealt with in the coming months. While few expect a grand bargain that will put the country on a sustainable fiscal path, progress in dealing with our deficit would lay the ground work for positive equity performance for the remainder of the year. The Portfolio remains consistent in its application of the two strategies underlying the Portfolio. The result is a Portfolio with balanced exposure to both dividend paying stocks and growth companies.
| (1) | The Portfolio’s composition is subject to change. Holdings and weightings are as of December 31, 2012. |
Change in Value of $10,000 Investment
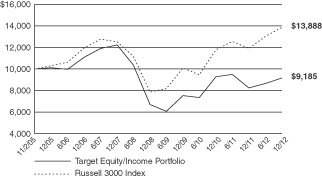
Hypothetical illustration based on past performance. Future performance will vary. The Portfolio’s returns reflect reinvested dividends. The Portfolio’s holdings may differ significantly from the securities in the index. The index is unmanaged and therefore does not reflect the cost of portfolio management and accounting.
The Russell 3000 Index measures the performance of the largest 3000 U.S. companies representing approximately 98% of the investable U.S. equity market. The Russell 3000 index is constructed to provide a comprehensive, unbiased, and stable barometer of the broad market and is completely reconstituted annually to ensure new and growing equities are reflected. The index presented includes the effects of reinvested dividends.
| 98 | (continued) |
| Ohio National Fund, Inc. | Target Equity/Income Portfolio (Continued) |
Portfolio Composition as of December 31, 2012 (1)
| % of Net Assets | ||||
Common Stocks (3) | 97.9 | |||
Money Market Funds and | ||||
Other Net Assets | 2.1 | |||
|
| |||
| 100.0 | ||||
|
|
Top 10 Portfolio Holdings as of December 31, 2012 (1) (2)
| % of Net Assets | ||||
1. Chevron Corp. | 11.8 | |||
2. BCE, Inc. | 6.2 | |||
3. BT Group PLC - ADR | 5.4 | |||
4. Macy’s, Inc. | 3.7 | |||
5. Seagate Technology PLC | 3.2 | |||
6. Sempra Energy | 3.0 | |||
7. CF Industries Holdings, Inc. | 2.9 | |||
8. Mattel, Inc. | 2.7 | |||
9. Pfizer, Inc. | 2.7 | |||
10. BB&T Corp. | 2.7 |
| (1) | Composition of Portfolio subject to change. |
| (2) | Short-term investments have been excluded from the list of Top 10 Portfolio Holdings. |
| (3) | Sectors: |
| % of Net Assets | ||||
Utilities | 14.7 | |||
Financials | 13.9 | |||
Consumer Discretionary | 12.9 | |||
Energy | 11.8 | |||
Telecommunication Services | 11.5 | |||
Materials | 11.2 | |||
Industrials | 9.6 | |||
Health Care | 6.0 | |||
Information Technology | 4.9 | |||
Consumer Staples | 1.4 | |||
|
| |||
| 97.9 | ||||
|
|
| 99 |
| Ohio National Fund, Inc. | Target Equity/Income Portfolio |
Schedule of Investments | December 31, 2012 |
| Common Stocks – 97.9% | Shares | Value | ||||||||
CONSUMER DISCRETIONARY – 12.9% | ||||||||||
Standard Motor Products, Inc. (Auto Components) | 5,729 | $ | 127,298 | |||||||
Mattel, Inc. (Leisure Equip. & Products) | 16,354 | 598,884 | ||||||||
DISH Network Corp. Class A (Media) | 10,290 | 374,556 | ||||||||
Macy’s, Inc. (Multiline Retail) | 20,528 | 801,003 | ||||||||
Advance Auto Parts, Inc. (Specialty Retail) | 3,681 | 266,320 | ||||||||
Genesco, Inc. (Specialty Retail) | (a) | 1,881 | 103,455 | |||||||
PetSmart, Inc. (Specialty Retail) | 5,594 | 382,294 | ||||||||
Sonic Automotive, Inc. Class A (Specialty Retail) | 7,942 | 165,908 | ||||||||
|
| |||||||||
| 2,819,718 | ||||||||||
|
| |||||||||
CONSUMER STAPLES – 1.4% | ||||||||||
Casey’s General Stores, Inc. (Food & Staples Retailing) | �� | 2,278 | 120,962 | |||||||
Smithfield Foods, Inc. (Food Products) | (a) | 8,278 | 178,556 | |||||||
|
| |||||||||
| 299,518 | ||||||||||
|
| |||||||||
ENERGY – 11.8% | ||||||||||
Chevron Corp. (Oil, Gas & Consumable Fuels) | 24,011 | 2,596,550 | ||||||||
|
| |||||||||
| 2,596,550 | ||||||||||
|
| |||||||||
FINANCIALS – 13.9% | ||||||||||
BB&T Corp. (Commercial Banks) | 20,293 | 590,729 | ||||||||
First Niagara Financial Group, Inc. (Commercial Banks) | 59,015 | 467,989 | ||||||||
FirstMerit Corp. (Commercial Banks) | 33,656 | 477,579 | ||||||||
FNB Corp. (Commercial Banks) | 45,221 | 480,247 | ||||||||
Astoria Financial Corp. (Thrifts & Mortgage Finance) | 59,630 | 558,137 | ||||||||
People’s United Financial, Inc. (Thrifts & Mortgage Finance) | 39,860 | 481,907 | ||||||||
|
| |||||||||
| 3,056,588 | ||||||||||
|
| |||||||||
HEALTH CARE – 6.0% | ||||||||||
Humana, Inc. (Health Care Providers & Svs.) | 7,886 | 541,216 | ||||||||
Cambrex Corp. (Life Sciences Tools & Svs.) | (a) | 16,133 | 183,594 | |||||||
Pfizer, Inc. (Pharmaceuticals) | 23,704 | 594,496 | ||||||||
|
| |||||||||
| 1,319,306 | ||||||||||
|
| |||||||||
INDUSTRIALS – 9.6% | ||||||||||
Northrop Grumman Corp. (Aerospace & Defense) | 8,738 | 590,514 | ||||||||
Triumph Group, Inc. (Aerospace & Defense) | 1,973 | 128,837 | ||||||||
Alaska Air Group, Inc. (Airlines) | (a) | 3,094 | 133,320 | |||||||
ACCO Brands Corp. (Commercial Svs. & Supplies) | (a) | 5,742 | 42,146 | |||||||
Republic Services, Inc. (Commercial Svs. & Supplies) | 18,646 | 546,887 | ||||||||
R.R. Donnelley & Sons Co. (Commercial Svs. & Supplies) | 35,637 | 320,733 | ||||||||
Sauer-Danfoss, Inc. (Machinery) | 3,224 | 172,065 | ||||||||
| Common Stocks (Continued) | Shares | Value | ||||||||
INDUSTRIALS (continued) | ||||||||||
Kirby Corp. (Marine) | (a) | 2,879 | $ | 178,181 | ||||||
|
| |||||||||
| 2,112,683 | ||||||||||
|
| |||||||||
INFORMATION TECHNOLOGY – 4.9% | ||||||||||
Seagate Technology PLC (Computers & Peripherals) | 22,768 | 693,969 | ||||||||
PC Connection, Inc. (Electronic Equip., Instr. & Comp.) | 10,375 | 119,313 | ||||||||
Zygo Corp. (Electronic Equip., Instr. & Comp.) | (a) | 6,817 | 107,027 | |||||||
NeuStar, Inc. Class A (IT Svs.) | (a) | 3,433 | 143,946 | |||||||
|
| |||||||||
| 1,064,255 | ||||||||||
|
| |||||||||
MATERIALS – 11.2% | ||||||||||
CF Industries Holdings, Inc. (Chemicals) | 3,182 | 646,455 | ||||||||
Olin Corp. (Chemicals) | 26,017 | 561,707 | ||||||||
Commercial Metals Co. (Metals & Mining) | 37,290 | 554,129 | ||||||||
MeadWestvaco Corp. (Paper & Forest Products) | 17,137 | 546,156 | ||||||||
Schweitzer-Mauduit International, Inc. (Paper & Forest Products) | 3,524 | 137,542 | ||||||||
|
| |||||||||
| 2,445,989 | ||||||||||
|
| |||||||||
TELECOMMUNICATION SERVICES – 11.5% | ||||||||||
BCE, Inc. (Diversified Telecom. Svs.) | 31,498 | 1,352,524 | ||||||||
BT Group PLC – ADR (Diversified Telecom. Svs.) | 30,989 | 1,178,512 | ||||||||
|
| |||||||||
| 2,531,036 | ||||||||||
|
| |||||||||
UTILITIES – 14.7% | ||||||||||
American Electric Power Co., Inc. (Electric Utilities) | 12,388 | 528,720 | ||||||||
PPL Corp. (Electric Utilities) | 17,297 | 495,213 | ||||||||
Avista Corp. (Multi-Utilities) | 19,770 | 476,655 | ||||||||
DTE Energy Co. (Multi-Utilities) | 9,353 | 561,648 | ||||||||
Integrys Energy Group, Inc. (Multi-Utilities) | 9,464 | 494,210 | ||||||||
Sempra Energy (Multi-Utilities) | 9,298 | 659,600 | ||||||||
|
| |||||||||
| 3,216,046 | ||||||||||
|
| |||||||||
Total Common Stocks (Cost $20,052,700) | $ | 21,461,689 | ||||||||
|
| |||||||||
| Money Market Funds – 1.9% | Shares | Value | ||||||||
Fidelity Institutional Money Market Funds | 430,000 | $ | 430,000 | |||||||
|
| |||||||||
Total Money Market Funds (Cost $430,000) | $ | 430,000 | ||||||||
|
| |||||||||
Total Investments – 99.8% (Cost $20,482,700) | (b) | $ | 21,891,689 | |||||||
Other Assets in Excess of Liabilities – 0.2% | 34,814 | |||||||||
|
| |||||||||
Net Assets – 100.0% | $ | 21,926,503 | ||||||||
|
| |||||||||
Percentages are stated as a percent of net assets.
Abbreviations:
ADR: American Depositary Receipts
Footnotes:
| (a) | Non-income producing security. |
| (b) | Represents cost for financial reporting purposes, which may differ from cost basis for federal income tax purposes. See also Note 7 of the Notes to Financial Statements. |
The accompanying notes are an integral part of these financial statements.
| 100 |
| Ohio National Fund, Inc. | Bristol Growth Portfolio |
Objective/Strategy
The Bristol Growth Portfolio seeks long-term growth of capital by investing primarily in common stocks of the 1,000 largest publicly traded U.S. companies in terms of market capitalization.
Performance as of December 31, 2012
Average Annual Total Returns: | ||||
One year | 11.20% | |||
Five years | 0.82% | |||
Since inception (5/1/07) | 1.32% |
Past performance does not guarantee future results. The performance data quoted represents past performance and current returns may be lower or higher. Total return figures include change in share price and reinvestment of dividends and capital gains. The investment return and principal value will fluctuate so that an investor’s shares, when redeemed, may be worth more or less than the original cost. To obtain performance information up to the most recent month end, call toll-free 1-877-781-6392.
The Portfolio is not open to direct retail investment. Beneficial interest in shares is obtained solely by purchase of variable life insurance policies and variable annuity contracts. Actual performance results for variable annuity and variable universal life contracts will be lower due to contract charges. Consult your contract for applicable charges.
Comments
For the year ended December 31, 2012, the Bristol Growth Portfolio returned 11.20% versus 15.26% for the current benchmark, the Russell 1000 Growth Index.
The fourth quarter concluded a year that saw the S&P 500 Index offer the largest broad market annual return since 2009 versus a return of only 2.11% for 2011. It was far from a steady positive return throughout the year. The Portfolio experienced a very strong first quarter, a weak second quarter, a strong third quarter, and a weak fourth quarter. The fourth quarter was not without its dramas: a closely fought presidential campaign with dramatically different economic philosophies, and a largely self-created “fiscal cliff” that saw some form of resolution only after the close of trading on the last day of the year.
The Portfolio’s best performers for the year were Lowe’s Cos., Inc., Hanesbrands, Inc., Snap-On, Inc., Pentair Ltd., and Hartford Financial Services Group, Inc. The Portfolio’s worst performers were Forest Oil Corp., Abercrombie & Fitch Co., Facebook, Inc., Kronos Worldwide, Inc., and Vertex Pharmaceuticals, Inc. The top contributors to performance were Apple, Inc., Snap-On, Inc., Pentair Ltd., Lowe’s Cos., Inc., and Monsanto Co. The top detractors from performance were Forest Oil Corp., Abercrombie & Fitch Co., Facebook, Inc., Vertex Pharmaceuticals, Inc., and Las Vegas Sands Corp.(1)
The largest detractors from relative performance were stock selections in the Health Care and Information Technology sectors. At an individual stock level, detractors from performance during the year included Forest Oil Corp., a Denver-based energy company that suffered from steep declines in its natural gas prices, lost 83 basis points. Abercrombie & Fitch Co. suffered from two earnings resets and lost 82 basis points. Facebook, Inc. although not bought at the initial public offering price, lost 71 basis points. Vertex Pharmaceuticals, Inc. reflected the usual volatility in its sector and lost 52 basis points and Las Vegas Sands Corp. lost 45 basis points following the economic slow down in China and reduction in gaming revenues.(1)
The top contributor to the Portfolio’s performance was Apple, Inc., which fought off the challenges of competing products and contributed 162 basis points. Snap-On, Inc. offered an increased dividend and strong fundamentals and contributed 90 basis points.
Pentair Ltd., a pool supplier, guided higher for 2013 and had a favorable market response to its merger with Tyco, contributing 89 basis points. Lowe’s Cos., Inc. added 82 basis points, reflecting a perceived bottom in the real estate market. Lastly, Monsanto Co., with the prospect of a third straight year of earnings growth, added 77 basis points.(1)
During the year, we added to our already over-weighted Industrials, which went from 21.4% to 24.6% (versus the benchmark’s 12.7% weighting). Materials were increased to 4.8% from 2.0%. These changes reflect our continuing belief in a recovery. Finally, we lowered our exposure to Financials to a near market weight of 4.5% from 8.5% (versus the benchmark’s 4.6% weighting) in the face of impending banking settlements over mortgages.(1)
Looking to 2013, there are plenty of overseas worries about the deteriorating situation in Iran and Syria, constitutional challenges in Egypt, and possible conflicts between Japan and China over historical claims for a few rocky islands that promise vast mineral rights. However, concerns over the European Union debt problems are much less of a threat and China manufacturing expansion is back on track. Back home, there are the continuing indications of growth in the domestic economy, with real estate viewed by many as having bottomed and the positive long term prospect of cheap U.S. shale oil energy for domestic manufacturers. Bernanke’s printing of money has stabilized the equity markets, although the stimulus may end this year and interest rates may rise. Our long term commitment to the Financials sector may be rewarded with wider spreads and life insurance companies could benefit with higher bond returns. As the domestic economy shakes off the problems of the past four years, there is a likelihood of stronger markets in 2013 and 2014.(1)
| (1) | The Portfolio’s composition is subject to change. Holdings and weightings are as of December 31, 2012. |
Change in Value of $10,000 Investment
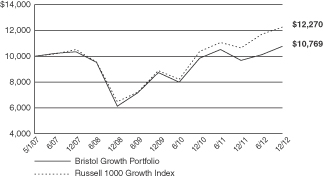
Hypothetical illustration based on past performance. Future performance will vary. The Portfolio’s returns reflect reinvested dividends. The Portfolio’s holdings may differ significantly from the securities in the index. The index is unmanaged and therefore does not reflect the cost of portfolio management and accounting.
The Russell 1000 Growth Index is a market-capitalization weighted index of those firms in the Russell 1000 Index with higher price-to-book ratios and higher forecasted growth values. The Russell 1000 Index measures the performance of the large-cap segment of the U.S. equity universe. The index presented herein includes the effects of requested dividends.
| 101 | (continued) |
| Ohio National Fund, Inc. | Bristol Growth Portfolio (Continued) |
Portfolio Composition as of December 31, 2012 (1)
| % of Net Assets | ||||
Common Stocks (3) | 96.5 | |||
Money Market Funds and | 3.5 | |||
|
| |||
| 100.0 | ||||
|
|
Top 10 Portfolio Holdings as of December 31,
2012 (1) (2)
| % of Net Assets | ||||
1. Google, Inc. Class A | 3.0 | |||
2. Apple, Inc. | 2.9 | |||
3. QUALCOMM, Inc. | 2.5 | |||
4. Oracle Corp. | 2.4 | |||
5. Hertz Global Holdings, Inc. | 2.3 | |||
6. Eaton Corp. PLC | 2.3 | |||
7. Snap-On, Inc. | 2.2 | |||
8. Monsanto Co. | 2.1 | |||
9. TIBCO Software, Inc. | 2.0 | |||
10. EMC Corp. | 2.0 |
| 102 |
| (1) | Composition of Portfolio subject to change. |
| (2) | Short-term investments have been excluded from the list of Top 10 Portfolio Holdings. |
| (3) | Sectors: |
| % of Net Assets | ||||
Information Technology | 31.9 | |||
Industrials | 23.8 | |||
Consumer Discretionary | 15.0 | |||
Health Care | 7.2 | |||
Consumer Staples | 5.2 | |||
Materials | 4.6 | |||
Financials | 4.4 | |||
Energy | 3.5 | |||
Telecommunication Services | 0.9 | |||
|
| |||
| 96.5 | ||||
|
|
| Ohio National Fund, Inc. | Bristol Growth Portfolio |
Schedule of Investments | December 31, 2012 |
| Common Stocks – 96.5% | Shares | Value | ||||||||
CONSUMER DISCRETIONARY – 15.0% | ||||||||||
Starbucks Corp. (Hotels, Restaurants & Leisure) | 21,700 | $ | 1,163,554 | |||||||
CBS Corp. Class B (Media) | 23,500 | 894,175 | ||||||||
Walt Disney Co. / The (Media) | 42,100 | 2,096,159 | ||||||||
Macy’s, Inc. (Multiline Retail) | 18,400 | 717,968 | ||||||||
Target Corp. (Multiline Retail) | 31,300 | 1,852,021 | ||||||||
AutoZone, Inc. (Specialty Retail) | (a) | 4,000 | 1,417,720 | |||||||
Lowe’s Cos., Inc. (Specialty Retail) | 43,700 | 1,552,224 | ||||||||
Hanesbrands, Inc. (Textiles, Apparel & Luxury Goods) | (a) | 59,200 | 2,120,544 | |||||||
Michael Kors Holdings Ltd. (Textiles, Apparel & Luxury Goods) | (a) | 20,200 | 1,030,806 | |||||||
Under Armour, Inc. Class A (Textiles, Apparel & Luxury Goods) | (a) | 40,000 | 1,941,200 | |||||||
Wolverine World Wide, Inc. (Textiles, Apparel & Luxury Goods) | 34,500 | 1,413,810 | ||||||||
|
| |||||||||
| 16,200,181 | ||||||||||
|
| |||||||||
CONSUMER STAPLES – 5.2% | ||||||||||
Beam, Inc. (Beverages) | 17,500 | 1,069,075 | ||||||||
Constellation Brands, Inc. Class A (Beverages) | (a) | 28,700 | 1,015,693 | |||||||
PepsiCo, Inc. (Beverages) | 22,200 | 1,519,146 | ||||||||
Campbell Soup Co. (Food Products) | 56,900 | 1,985,241 | ||||||||
|
| |||||||||
| 5,589,155 | ||||||||||
|
| |||||||||
ENERGY – 3.5% | ||||||||||
Schlumberger Ltd. (Energy Equip. & Svs.) | 28,800 | 1,995,552 | ||||||||
Whiting Petroleum Corp. (Oil, Gas & Consumable Fuels) | (a) | 41,700 | 1,808,529 | |||||||
|
| |||||||||
| 3,804,081 | ||||||||||
|
| |||||||||
FINANCIALS – 4.4% | ||||||||||
Citigroup, Inc. (Diversified Financial Svs.) | 37,900 | 1,499,324 | ||||||||
Hartford Financial Services Group, Inc. (Insurance) | 70,800 | 1,588,752 | ||||||||
Lincoln National Corp. (Insurance) | 62,700 | 1,623,930 | ||||||||
|
| |||||||||
| 4,712,006 | ||||||||||
|
| |||||||||
HEALTH CARE – 7.2% | ||||||||||
Amarin Corp. PLC – ADR (Biotechnology) | (a) | 153,800 | 1,244,242 | |||||||
Ariad Pharmaceuticals, Inc. (Biotechnology) | (a) | 72,600 | 1,392,468 | |||||||
Vertex Pharmaceuticals, Inc. (Biotechnology) | (a) | 36,100 | 1,514,034 | |||||||
UnitedHealth Group, Inc. (Health Care Providers & Svs.) | 38,300 | 2,077,392 | ||||||||
Pfizer, Inc. (Pharmaceuticals) | 61,100 | 1,532,388 | ||||||||
|
| |||||||||
| 7,760,524 | ||||||||||
|
| |||||||||
INDUSTRIALS – 23.8% | ||||||||||
Honeywell International, Inc. (Aerospace & Defense) | 33,000 | 2,094,510 | ||||||||
United Technologies Corp. (Aerospace & Defense) | 25,200 | 2,066,652 | ||||||||
FedEx Corp. (Air Freight & Logistics) | 22,500 | 2,063,700 | ||||||||
Delta Air Lines, Inc. (Airlines) | (a) | 178,100 | 2,114,047 | |||||||
Quanta Services, Inc. (Construction & Engineering) | (a) | 39,400 | 1,075,226 | |||||||
Eaton Corp. PLC (Electrical Equip.) | 45,900 | 2,487,780 | ||||||||
| Common Stocks (Continued) | Shares | Value | ||||||||
INDUSTRIALS (continued) | ||||||||||
Danaher Corp. (Industrial Conglomerates) | 35,700 | $ | 1,995,630 | |||||||
General Electric Co. (Industrial Conglomerates) | 48,000 | 1,007,520 | ||||||||
Deere & Co. (Machinery) | 14,037 | 1,213,078 | ||||||||
Pentair Ltd. (Machinery) | 43,100 | 2,118,365 | ||||||||
Snap-On, Inc. (Machinery) | 30,500 | 2,409,195 | ||||||||
Stanley Black & Decker, Inc. (Machinery) | 5,000 | 369,850 | ||||||||
Xylem, Inc. (Machinery) | 78,400 | 2,124,640 | ||||||||
Hertz Global Holdings, Inc. (Road & Rail) | (a) | 155,800 | 2,534,866 | |||||||
|
| |||||||||
| 25,675,059 | ||||||||||
|
| |||||||||
INFORMATION TECHNOLOGY – 31.9% | ||||||||||
F5 Networks, Inc. (Communications Equip.) | (a) | 19,600 | 1,904,140 | |||||||
QUALCOMM, Inc. (Communications Equip.) | 42,900 | 2,660,658 | ||||||||
Apple, Inc. (Computers & Peripherals) | 5,900 | 3,144,877 | ||||||||
EMC Corp. (Computers & Peripherals) | (a) | 84,800 | 2,145,440 | |||||||
eBay, Inc. (Internet Software & Svs.) | (a) | 34,400 | 1,755,088 | |||||||
Facebook, Inc. Class A (Internet Software & Svs.) | (a) | 73,000 | 1,943,990 | |||||||
Google, Inc. Class A (Internet Software & Svs.) | (a) | 4,610 | 3,270,196 | |||||||
Accenture PLC Class A (IT Svs.) | 16,900 | 1,123,850 | ||||||||
International Business Machines Corp. (IT Svs.) | 7,100 | 1,360,005 | ||||||||
Altera Corp. (Semiconductors & Equip.) | 60,400 | 2,080,176 | ||||||||
Avago Technologies Ltd. (Semiconductors & Equip.) | 61,600 | 1,950,256 | ||||||||
Xilinx, Inc. (Semiconductors & Equip.) | 58,700 | 2,107,330 | ||||||||
Citrix Systems, Inc. (Software) | (a) | 31,900 | 2,097,425 | |||||||
Microsoft Corp. (Software) | 77,269 | 2,065,400 | ||||||||
Oracle Corp. (Software) | 79,200 | 2,638,944 | ||||||||
TIBCO Software, Inc. (Software) | (a) | 100,600 | 2,214,206 | |||||||
|
| |||||||||
| 34,461,981 | ||||||||||
|
| |||||||||
MATERIALS – 4.6% | ||||||||||
E.I. du Pont de Nemours & Co. (Chemicals) | 46,900 | 2,109,093 | ||||||||
Monsanto Co. (Chemicals) | 23,400 | 2,214,810 | ||||||||
Freeport-McMoRan Copper & Gold, Inc. (Metals & Mining) | 19,500 | 666,900 | ||||||||
|
| |||||||||
| 4,990,803 | ||||||||||
|
| |||||||||
TELECOMMUNICATION SERVICES – 0.9% | ||||||||||
Verizon Communications, Inc. (Diversified Telecom. Svs.) | 23,500 | 1,016,845 | ||||||||
|
| |||||||||
Total Common Stocks (Cost $98,842,888) | $ | 104,210,635 | ||||||||
|
| |||||||||
| Money Market Funds – 1.6% | Shares | Value | ||||||||
Fidelity Institutional Money Market Funds | 1,744,000 | $ | 1,744,000 | |||||||
|
| |||||||||
Total Money Market Funds (Cost $1,744,000) | $ | 1,744,000 | ||||||||
|
| |||||||||
Total Investments – 98.1% (Cost $100,586,888) | (b) | $ | 105,954,635 | |||||||
Other Assets in Excess of Liabilities – 1.9% | 2,078,504 | |||||||||
|
| |||||||||
Net Assets – 100.0% | $ | 108,033,139 | ||||||||
|
| |||||||||
Percentages are stated as a percent of net assets.
Abbreviations:
ADR: American Depositary Receipts
Footnotes:
| (a) | Non-income producing security. |
| (b) | Represents cost for financial reporting purposes, which may differ from cost basis for federal income tax purposes. See also Note 7 of the Notes to Financial Statements. |
The accompanying notes are an integral part of these financial statements.
| 103 |
| Ohio National Fund, Inc. |
| December 31, 2012 |
| Equity Portfolio | Money Market Portfolio | Bond Portfolio | Omni Portfolio | International Portfolio | Capital Appreciation Portfolio | Millennium Portfolio | International Small-Mid Company Portfolio | |||||||||||||||||||||||||
Assets: | ||||||||||||||||||||||||||||||||
Investments in securities, at value* | $ | 185,992,088 | $ | 214,227,894 | $ | 170,137,932 | $ | 32,980,676 | $ | 184,293,269 | $ | 115,955,385 | $ | 34,210,831 | $ | 64,682,785 | ||||||||||||||||
Cash | 145,417 | 43,959,992 | 503 | 618 | — | 380 | 564 | — | ||||||||||||||||||||||||
Foreign currencies, at value** | — | — | — | — | 15,454 | — | — | 3,332 | ||||||||||||||||||||||||
Receivable for securities sold | 294,452 | — | — | 524,959 | — | 618,653 | 433,443 | — | ||||||||||||||||||||||||
Variation margin receivable from broker | — | — | — | — | 21 | — | — | — | ||||||||||||||||||||||||
Due from adviser | — | 49,787 | — | — | — | — | — | — | ||||||||||||||||||||||||
Receivable for fund shares sold | 447,841 | 1,905,656 | 949,328 | 64,665 | 393,508 | 299,283 | 28,338 | 49,860 | ||||||||||||||||||||||||
Dividends and accrued interest receivable | 151,836 | 2,456 | 1,676,821 | 105,732 | 117,953 | 54,424 | 61 | 45,330 | ||||||||||||||||||||||||
Foreign tax reclaim receivable | — | — | — | — | 33,681 | — | — | 30,570 | ||||||||||||||||||||||||
Prepaid expenses and other assets | 2,355 | 1,086 | 643 | 425 | 2,210 | 1,440 | 470 | 760 | ||||||||||||||||||||||||
Net unrealized apppreciation on foreign currency contracts | — | — | — | — | 749,359 | — | — | — | ||||||||||||||||||||||||
|
|
|
|
|
|
|
|
|
|
|
|
|
|
|
| |||||||||||||||||
Total assets | 187,033,989 | 260,146,871 | 172,765,227 | 33,677,075 | 185,605,455 | 116,929,565 | 34,673,707 | 64,812,637 | ||||||||||||||||||||||||
|
|
|
|
|
|
|
|
|
|
|
|
|
|
|
| |||||||||||||||||
Liabilities: | ||||||||||||||||||||||||||||||||
Payable for securities purchased | — | — | — | 380,479 | — | 274,122 | 442,260 | 86,419 | ||||||||||||||||||||||||
Payable for fund shares redeemed | 358,631 | 1,457,394 | 475,014 | 61,684 | 5,089,054 | 891,709 | 84,829 | 148,971 | ||||||||||||||||||||||||
Payable for investment management services | 124,195 | 53,859 | 81,235 | 16,915 | 127,954 | 77,483 | 22,999 | 54,411 | ||||||||||||||||||||||||
Accrued custody expense | 1,153 | 1,167 | 659 | 442 | 20,718 | 560 | 541 | 5,059 | ||||||||||||||||||||||||
Accrued professional fees | 9,042 | 9,042 | 9,042 | 9,042 | 9,042 | 9,042 | 9,042 | 9,042 | ||||||||||||||||||||||||
Accrued accounting fees | 4,839 | 6,805 | 6,405 | 2,218 | 244 | 3,260 | 1,304 | 2,250 | ||||||||||||||||||||||||
Accrued printing and filing fees | 8,846 | 12,392 | 8,422 | 1,606 | 8,804 | 5,530 | 1,649 | 3,134 | ||||||||||||||||||||||||
Withholding tax payable | — | — | — | — | 5,507 | — | — | 20,760 | ||||||||||||||||||||||||
|
|
|
|
|
|
|
|
|
|
|
|
|
|
|
| |||||||||||||||||
Total liabilities | 506,706 | 1,540,659 | 580,777 | 472,386 | 5,261,323 | 1,261,706 | 562,624 | 330,046 | ||||||||||||||||||||||||
|
|
|
|
|
|
|
|
|
|
|
|
|
|
|
| |||||||||||||||||
Net assets | $ | 186,527,283 | $ | 258,606,212 | $ | 172,184,450 | $ | 33,204,689 | $ | 180,344,132 | $ | 115,667,859 | $ | 34,111,083 | $ | 64,482,591 | ||||||||||||||||
|
|
|
|
|
|
|
|
|
|
|
|
|
|
|
| |||||||||||||||||
Net assets consist of: | ||||||||||||||||||||||||||||||||
Par value, $1 per share | $ | 8,659,520 | $ | 25,860,634 | $ | 11,425,351 | $ | 1,974,055 | $ | 14,536,896 | $ | 4,959,168 | $ | 1,449,857 | $ | 2,741,195 | ||||||||||||||||
Paid-in capital in excess of par value | 263,004,519 | 232,745,578 | 153,313,226 | 33,576,678 | 215,569,356 | 107,491,611 | 37,836,421 | 59,151,819 | ||||||||||||||||||||||||
Accumulated net realized gain (loss) on investments | (109,908,148 | ) | — | (13,095,188 | ) | (4,436,618 | ) | (92,070,009 | ) | (10,000,640 | ) | (7,258,311 | ) | (12,434,368 | ) | |||||||||||||||||
Net unrealized appreciation (depreciation) on: | ||||||||||||||||||||||||||||||||
Investments | 24,404,184 | — | 14,784,981 | 1,981,554 | 36,716,589 | 13,134,370 | 2,083,116 | 14,718,957 | ||||||||||||||||||||||||
Foreign currency contracts | — | — | — | — | 749,359 | — | — | — | ||||||||||||||||||||||||
Futures contracts | — | — | — | — | (15,998 | ) | — | — | — | |||||||||||||||||||||||
Other foreign currency related transactions | — | — | — | — | 287 | — | — | (19,362 | ) | |||||||||||||||||||||||
Undistributed net investment income (loss) | 367,208 | — | 5,756,080 | 109,020 | 4,857,652 | 83,350 | — | 324,350 | ||||||||||||||||||||||||
|
|
|
|
|
|
|
|
|
|
|
|
|
|
|
| |||||||||||||||||
Net assets | $ | 186,527,283 | $ | 258,606,212 | $ | 172,184,450 | $ | 33,204,689 | $ | 180,344,132 | $ | 115,667,859 | $ | 34,111,083 | $ | 64,482,591 | ||||||||||||||||
|
|
|
|
|
|
|
|
|
|
|
|
|
|
|
| |||||||||||||||||
* Investments in securities, at cost | $ | 161,587,904 | $ | 214,227,894 | $ | 155,352,951 | $ | 30,999,122 | $ | 147,576,680 | $ | 102,821,015 | $ | 32,127,715 | $ | 49,963,828 | ||||||||||||||||
|
|
|
|
|
|
|
|
|
|
|
|
|
|
|
| |||||||||||||||||
** Foreign currencies, at cost | $ | — | $ | — | $ | — | $ | — | $ | 15,513 | $ | — | $ | — | $ | 3,327 | ||||||||||||||||
|
|
|
|
|
|
|
|
|
|
|
|
|
|
|
| |||||||||||||||||
Shares outstanding | 8,659,520 | 25,860,634 | 11,425,351 | 1,974,055 | 14,536,896 | 4,959,168 | 1,449,857 | 2,741,195 | ||||||||||||||||||||||||
|
|
|
|
|
|
|
|
|
|
|
|
|
|
|
| |||||||||||||||||
Authorized Fund shares allocated to Portfolio | 30,000,000 | 80,000,000 | 30,000,000 | 10,000,000 | 45,000,000 | 15,000,000 | 10,000,000 | 10,000,000 | ||||||||||||||||||||||||
|
|
|
|
|
|
|
|
|
|
|
|
|
|
|
| |||||||||||||||||
Net asset value per share | $ | 21.54 | $ | 10.00 | $ | 15.07 | $ | 16.82 | $ | 12.41 | $ | 23.32 | $ | 23.53 | $ | 23.52 | ||||||||||||||||
|
|
|
|
|
|
|
|
|
|
|
|
|
|
|
| |||||||||||||||||
The accompanying notes are an integral part of these financial statements.
| 104 |
| Ohio National Fund, Inc. |
| December 31, 2012 |
| Aggressive Growth Portfolio | Small Cap Growth Portfolio | Mid Cap Opportunity Portfolio | S&P 500® Index Portfolio | Strategic Value Portfolio | High Income Bond Portfolio | Capital Growth Portfolio | Nasdaq-100® Index Portfolio | |||||||||||||||||||||||||
Assets: | ||||||||||||||||||||||||||||||||
Investments in securities, at value* | $ | 33,182,034 | $ | 35,043,492 | $ | 67,412,503 | $ | 207,804,819 | $ | 259,834,646 | $ | 308,247,934 | $ | 55,799,816 | $ | 67,684,982 | ||||||||||||||||
Cash | 480 | 106 | 134 | 202,181 | 442 | 6,827 | 44,148 | — | ||||||||||||||||||||||||
Receivable for securities sold | — | — | — | 29,729 | — | — | 28,394 | 314,403 | ||||||||||||||||||||||||
Receivable for fund shares sold | 15,378 | 10,620 | 137,940 | 188,409 | 7,354,944 | 326,074 | 21,937 | 850,055 | ||||||||||||||||||||||||
Dividends and accrued interest receivable | 7,731 | 8,545 | 8,511 | 276,695 | 1,400,937 | 5,686,839 | 25,932 | 30,801 | ||||||||||||||||||||||||
Foreign tax reclaim receivable | 2,371 | — | — | 153 | — | — | — | — | ||||||||||||||||||||||||
Prepaid expenses and other assets | 363 | 429 | 802 | 2,356 | 848 | 1,090 | 679 | 788 | ||||||||||||||||||||||||
|
|
|
|
|
|
|
|
|
|
|
|
|
|
|
| |||||||||||||||||
Total assets | 33,208,357 | 35,063,192 | 67,559,890 | 208,504,342 | 268,591,817 | 314,268,764 | 55,920,906 | 68,881,029 | ||||||||||||||||||||||||
|
|
|
|
|
|
|
|
|
|
|
|
|
|
|
| |||||||||||||||||
Liabilities: | ||||||||||||||||||||||||||||||||
Cash overdraft | — | — | — | — | — | — | — | 186,638 | ||||||||||||||||||||||||
Payable for securities purchased | — | 1,350 | 101,354 | — | — | — | 638,409 | — | ||||||||||||||||||||||||
Payable for fund shares redeemed | 28,807 | 38,316 | 333,626 | 630,531 | 184,680 | 2,137,035 | 112,439 | 114,229 | ||||||||||||||||||||||||
Payable for investment management services | 22,272 | 26,214 | 48,222 | 65,672 | 160,165 | 178,031 | 41,267 | 22,993 | ||||||||||||||||||||||||
Accrued custody expense | 571 | 1,289 | 702 | 1,512 | 1,373 | 1,304 | 557 | 443 | ||||||||||||||||||||||||
Accrued professional fees | 9,042 | 9,042 | 9,042 | 9,367 | 12,335 | 9,042 | 9,042 | 9,042 | ||||||||||||||||||||||||
Accrued accounting fees | 1,393 | 1,331 | 2,106 | 6,856 | 6,780 | 13,214 | 1,850 | 2,212 | ||||||||||||||||||||||||
Accrued printing and filing fees | 1,591 | 1,671 | 3,232 | 9,884 | 12,641 | 15,201 | 2,607 | 3,269 | ||||||||||||||||||||||||
Withholding tax payable | — | — | — | — | 50,133 | — | — | — | ||||||||||||||||||||||||
|
|
|
|
|
|
|
|
|
|
|
|
|
|
|
| |||||||||||||||||
Total liabilities ... | 63,676 | 79,213 | 498,284 | 723,822 | 428,107 | 2,353,827 | 806,171 | 338,826 | ||||||||||||||||||||||||
|
|
|
|
|
|
|
|
|
|
|
|
|
|
|
| |||||||||||||||||
Net assets | $ | 33,144,681 | $ | 34,983,979 | $ | 67,061,606 | $ | 207,780,520 | $ | 268,163,710 | $ | 311,914,937 | $ | 55,114,735 | $ | 68,542,203 | ||||||||||||||||
|
|
|
|
|
|
|
|
|
|
|
|
|
|
|
| |||||||||||||||||
Net assets consist of: | ||||||||||||||||||||||||||||||||
Par value, $1 per share | $ | 3,485,972 | $ | 2,244,195 | $ | 3,145,041 | $ | 13,774,474 | $ | 24,191,137 | $ | 21,030,762 | $ | 1,793,261 | $ | 10,007,317 | ||||||||||||||||
Paid-in capital in excess of par value | 22,780,430 | 25,078,012 | 79,088,807 | 150,170,982 | 246,094,234 | 248,766,439 | 40,180,446 | 41,195,771 | ||||||||||||||||||||||||
Accumulated net realized gain (loss) on investments | (930,973 | ) | 5,557,796 | (24,793,903 | ) | (3,032,894 | ) | (6,057,062 | ) | 4,698,612 | 3,682,277 | (320,562 | ) | |||||||||||||||||||
Net unrealized appreciation (depreciation) on: | ||||||||||||||||||||||||||||||||
Investments | 7,706,033 | 2,103,976 | 9,621,661 | 46,123,786 | 1,680,092 | 16,141,992 | 9,458,751 | 17,463,457 | ||||||||||||||||||||||||
Foreign currency related transactions | 41 | — | — | — | 6,441 | — | — | — | ||||||||||||||||||||||||
Undistributed net investment income (loss) | 103,178 | — | — | 744,172 | 2,248,868 | 21,277,132 | — | 196,220 | ||||||||||||||||||||||||
|
|
|
|
|
|
|
|
|
|
|
|
|
|
|
| |||||||||||||||||
Net assets | $ | 33,144,681 | $ | 34,983,979 | $ | 67,061,606 | $ | 207,780,520 | $ | 268,163,710 | $ | 311,914,937 | $ | 55,114,735 | $ | 68,542,203 | ||||||||||||||||
|
|
|
|
|
|
|
|
|
|
|
|
|
|
|
| |||||||||||||||||
* Investments in securities, at cost | $ | 25,476,001 | $ | 32,939,516 | $ | 57,790,842 | $ | 161,681,033 | $ | 258,154,554 | $ | 292,105,942 | $ | 46,341,065 | $ | 50,221,525 | ||||||||||||||||
|
|
|
|
|
|
|
|
|
|
|
|
|
|
|
| |||||||||||||||||
Shares outstanding | 3,485,972 | 2,244,195 | 3,145,041 | 13,774,474 | 24,191,137 | 21,030,762 | 1,793,261 | 10,007,317 | ||||||||||||||||||||||||
|
|
|
|
|
|
|
|
|
|
|
|
|
|
|
| |||||||||||||||||
Authorized Fund shares allocated to Portfolio | 10,000,000 | 10,000,000 | 10,000,000 | 35,000,000 | 10,000,000 | 60,000,000 | 10,000,000 | 25,000,000 | ||||||||||||||||||||||||
|
|
|
|
|
|
|
|
|
|
|
|
|
|
|
| |||||||||||||||||
Net asset value per share | $ | 9.51 | $ | 15.59 | $ | 21.32 | $ | 15.08 | $ | 11.09 | $ | 14.83 | $ | 30.73 | $ | 6.85 | ||||||||||||||||
|
|
|
|
|
|
|
|
|
|
|
|
|
|
|
| |||||||||||||||||
The accompanying notes are an integral part of these financial statements.
| 105 |
| Ohio National Fund, Inc. |
| December 31, 2012 |
| Bristol Portfolio | Bryton Growth Portfolio | U.S. Equity Portfolio | Balanced Portfolio | Income Opportunity Portfolio | Target VIP Portfolio | Target Equity/Income Portfolio | Bristol Growth Portfolio | |||||||||||||||||||||||||
Assets: | ||||||||||||||||||||||||||||||||
Investments in securities, at value* | $ | 203,608,235 | $ | 155,307,940 | $ | 15,602,309 | $ | 76,762,162 | $ | 9,639,069 | $ | 21,099,223 | $ | 21,891,689 | $ | 105,954,635 | ||||||||||||||||
Cash | 691 | 657 | — | — | — | 826 | 675 | 928 | ||||||||||||||||||||||||
Receivable for securities sold | 3,735,790 | 1,247,712 | — | — | — | 77,961 | — | 1,590,239 | ||||||||||||||||||||||||
Receivable for fund shares sold | 978,299 | 2,428,578 | 47,232 | 288,374 | 28,119 | 6,956 | 24,468 | 2,220,872 | ||||||||||||||||||||||||
Dividends and accrued interest receivable | 83,852 | 17,054 | 6,955 | 258,947 | 10,884 | 28,595 | 62,745 | 37,184 | ||||||||||||||||||||||||
Foreign tax reclaim receivable | — | — | 1,847 | 425 | — | 4,999 | — | — | ||||||||||||||||||||||||
Prepaid expenses and other assets | 2,395 | 1,867 | 183 | 294 | 138 | 276 | 285 | 1,265 | ||||||||||||||||||||||||
|
|
|
|
|
|
|
|
|
|
|
|
|
|
|
| |||||||||||||||||
Total assets | 208,409,262 | 159,003,808 | 15,658,526 | 77,310,202 | 9,678,210 | 21,218,836 | 21,979,862 | 109,805,123 | ||||||||||||||||||||||||
|
|
|
|
|
|
|
|
|
|
|
|
|
|
|
| |||||||||||||||||
Liabilities: | ||||||||||||||||||||||||||||||||
Cash overdraft | — | — | 38,426 | 87,739 | 222,506 | — | — | — | ||||||||||||||||||||||||
Payable for securities purchased | 3,144,596 | 1,136,688 | — | — | — | — | — | 1,628,798 | ||||||||||||||||||||||||
Payable for fund shares redeemed | 206,675 | 81,655 | 37,467 | 29,677 | 14,395 | 12,302 | 28,331 | 54,238 | ||||||||||||||||||||||||
Payable for investment management services | 129,004 | 106,788 | 9,745 | 39,400 | 6,466 | 10,735 | 11,096 | 71,102 | ||||||||||||||||||||||||
Accrued custody expense | 1,076 | 1,318 | 75 | 573 | 137 | 472 | 224 | 722 | ||||||||||||||||||||||||
Accrued professional fees | 9,042 | 9,042 | 9,042 | 9,042 | 9,042 | 9,042 | 9,042 | 9,042 | ||||||||||||||||||||||||
Accrued accounting fees | 5,305 | 4,210 | 743 | 3,279 | 701 | 1,152 | 911 | 2,971 | ||||||||||||||||||||||||
Accrued printing and filing fees | 9,818 | 7,583 | 731 | 3,330 | 467 | 1,013 | 1,036 | 5,111 | ||||||||||||||||||||||||
Withholding tax payable | — | — | — | 235 | — | 1,778 | 2,719 | — | ||||||||||||||||||||||||
|
|
|
|
|
|
|
|
|
|
|
|
|
|
|
| |||||||||||||||||
Total liabilities | 3,505,516 | 1,347,284 | 96,229 | 173,275 | 253,714 | 36,494 | 53,359 | 1,771,984 | ||||||||||||||||||||||||
|
|
|
|
|
|
|
|
|
|
|
|
|
|
|
| |||||||||||||||||
Net assets | $ | 204,903,746 | $ | 157,656,524 | $ | 15,562,297 | $ | 77,136,927 | $ | 9,424,496 | $ | 21,182,342 | $ | 21,926,503 | $ | 108,033,139 | ||||||||||||||||
|
|
|
|
|
|
|
|
|
|
|
|
|
|
|
| |||||||||||||||||
Net assets consist of: | ||||||||||||||||||||||||||||||||
Par value, $1 per share | $ | 15,746,101 | $ | 11,509,029 | $ | 1,360,936 | $ | 4,893,685 | $ | 740,338 | $ | 2,096,542 | $ | 2,681,061 | $ | 10,134,287 | ||||||||||||||||
Paid-in capital in excess of par value | 171,396,317 | 134,588,724 | 17,796,595 | 69,189,012 | 7,416,071 | 23,248,866 | 33,035,225 | 86,098,954 | ||||||||||||||||||||||||
Accumulated net realized gain (loss) on investments | 6,765,180 | 11,296,773 | (5,766,338 | ) | (329,680 | ) | (175,697 | ) | (6,404,320 | ) | (15,314,959 | ) | 6,210,552 | |||||||||||||||||||
Net unrealized appreciation (depreciation) on: | ||||||||||||||||||||||||||||||||
Investments | 10,560,138 | 271,837 | 2,148,659 | 2,731,976 | 1,324,025 | 2,161,450 | 1,408,989 | 5,367,747 | ||||||||||||||||||||||||
Foreign currency related transactions | — | — | — | (4 | ) | — | — | — | — | |||||||||||||||||||||||
Undistributed net investment income (loss) | 436,010 | (9,839 | ) | 22,445 | 651,938 | 119,759 | 79,804 | 116,187 | 221,599 | |||||||||||||||||||||||
|
|
|
|
|
|
|
|
|
|
|
|
|
|
|
| |||||||||||||||||
Net assets | $ | 204,903,746 | $ | 157,656,524 | $ | 15,562,297 | $ | 77,136,927 | $ | 9,424,496 | $ | 21,182,342 | $ | 21,926,503 | $ | 108,033,139 | ||||||||||||||||
|
|
|
|
|
|
|
|
|
|
|
|
|
|
|
| |||||||||||||||||
* Investments in securities, at cost | $ | 193,048,097 | $ | 155,036,103 | $ | 13,453,650 | $ | 74,030,186 | $ | 8,315,044 | $ | 18,937,773 | $ | 20,482,700 | $ | 100,586,888 | ||||||||||||||||
|
|
|
|
|
|
|
|
|
|
|
|
|
|
|
| |||||||||||||||||
Shares outstanding | 15,746,101 | 11,509,029 | 1,360,936 | 4,893,685 | 740,338 | 2,096,542 | 2,681,061 | 10,134,287 | ||||||||||||||||||||||||
|
|
|
|
|
|
|
|
|
|
|
|
|
|
|
| |||||||||||||||||
Authorized Fund shares allocated to Portfolio | 40,000,000 | 35,000,000 | 10,000,000 | 10,000,000 | 10,000,000 | 10,000,000 | 10,000,000 | 25,000,000 | ||||||||||||||||||||||||
|
|
|
|
|
|
|
|
|
|
|
|
|
|
|
| |||||||||||||||||
Net asset value per share | $ | 13.01 | $ | 13.70 | $ | 11.43 | $ | 15.76 | $ | 12.73 | $ | 10.10 | $ | 8.18 | $ | 10.66 | ||||||||||||||||
|
|
|
|
|
|
|
|
|
|
|
|
|
|
|
| |||||||||||||||||
The accompanying notes are an integral part of these financial statements.
| 106 |
| Ohio National Fund, Inc. |
| For the Year Ended December 31, 2012 |
| Equity Portfolio | Money Market Portfolio | Bond Portfolio | Omni Portfolio | International Portfolio | Capital Appreciation Portfolio | Millennium Portfolio | International Small-Mid Company Portfolio | |||||||||||||||||||||||||
Investment income: | ||||||||||||||||||||||||||||||||
Interest | $ | 1,235 | $ | 222,773 | $ | 6,875,464 | $ | 404,015 | $ | 163 | $ | 8,773 | $ | 1,010 | $ | — | ||||||||||||||||
Dividends, net of taxes withheld* | 4,613,023 | — | — | 385,725 | 4,806,669 | 1,797,504 | 189,358 | 1,156,587 | ||||||||||||||||||||||||
|
|
|
|
|
|
|
|
|
|
|
|
|
|
|
| |||||||||||||||||
Total investment income | 4,614,258 | 222,773 | 6,875,464 | 789,740 | 4,806,832 | 1,806,277 | 190,368 | 1,156,587 | ||||||||||||||||||||||||
|
|
|
|
|
|
|
|
|
|
|
|
|
|
|
| |||||||||||||||||
Expenses: | ||||||||||||||||||||||||||||||||
Management fees | 1,496,004 | 699,656 | 944,829 | 206,512 | 1,490,415 | 919,974 | 293,781 | 624,354 | ||||||||||||||||||||||||
Custodian fees | 13,666 | 14,001 | 8,397 | 5,722 | 176,121 | 7,917 | 6,610 | 55,989 | ||||||||||||||||||||||||
Directors’ fees | 21,031 | 28,781 | 18,867 | 3,847 | 20,034 | 12,925 | 4,082 | 6,997 | ||||||||||||||||||||||||
Professional fees | 25,968 | 30,729 | 23,947 | 14,864 | 25,355 | 20,665 | 15,019 | 16,853 | ||||||||||||||||||||||||
Accounting fees | 61,760 | 84,975 | 78,226 | 26,443 | 66,431 | 41,325 | 16,992 | 26,458 | ||||||||||||||||||||||||
Printing and filing fees | 40,339 | 47,244 | 32,057 | 8,301 | 35,018 | 23,418 | 9,116 | 13,596 | ||||||||||||||||||||||||
Compliance expense | 10,583 | 10,583 | 10,583 | 10,583 | 10,583 | 10,583 | 10,583 | 10,583 | ||||||||||||||||||||||||
Other | 7,287 | 4,482 | 2,478 | 1,341 | 8,145 | 4,367 | 1,433 | 2,519 | ||||||||||||||||||||||||
|
|
|
|
|
|
|
|
|
|
|
|
|
|
|
| |||||||||||||||||
Total expenses | 1,676,638 | 920,451 | 1,119,384 | 277,613 | 1,832,102 | 1,041,174 | 357,616 | 757,349 | ||||||||||||||||||||||||
|
|
|
|
|
|
|
|
|
|
|
|
|
|
|
| |||||||||||||||||
Less expenses reduced or reimbursed by adviser | — | (697,678 | ) | — | — | — | — | — | — | |||||||||||||||||||||||
|
|
|
|
|
|
|
|
|
|
|
|
|
|
|
| |||||||||||||||||
Net expenses | 1,676,638 | 222,773 | 1,119,384 | 277,613 | 1,832,102 | 1,041,174 | 357,616 | 757,349 | ||||||||||||||||||||||||
|
|
|
|
|
|
|
|
|
|
|
|
|
|
|
| |||||||||||||||||
Net investment income (loss) | 2,937,620 | — | 5,756,080 | 512,127 | 2,974,730 | 765,103 | (167,248 | ) | 399,238 | |||||||||||||||||||||||
|
|
|
|
|
|
|
|
|
|
|
|
|
|
|
| |||||||||||||||||
Realized/unrealized gain (loss) on investments, futures contracts, foreign currency contracts, and other foreign currency related transactions: | ||||||||||||||||||||||||||||||||
Net realized gain (loss) on: | ||||||||||||||||||||||||||||||||
Investments | 15,135,180 | — | 1,428,098 | 1,090,841 | 5,503,639 | 7,245,366 | 4,063,768 | 1,300,902 | ||||||||||||||||||||||||
Futures contracts | — | — | — | — | 103,370 | — | — | — | ||||||||||||||||||||||||
Foreign currency contracts | — | — | — | — | 4,177,750 | — | — | — | ||||||||||||||||||||||||
Other foreign currency related transactions | — | — | — | 16 | (309,620 | ) | (648 | ) | — | (74,888 | ) | |||||||||||||||||||||
Change in unrealized appreciation/depreciation on: | ||||||||||||||||||||||||||||||||
Investments | 9,664,589 | — | 4,568,299 | 2,337,094 | 21,801,349 | 10,984,140 | (511,771 | ) | 10,930,346 | |||||||||||||||||||||||
Futures contracts | — | — | — | — | (55,602 | ) | — | — | — | |||||||||||||||||||||||
Foreign currency contracts | — | — | — | — | (1,235,849 | ) | — | — | — | |||||||||||||||||||||||
Other foreign currency related transactions | — | — | — | — | 333,534 | — | — | (11,158 | ) | |||||||||||||||||||||||
|
|
|
|
|
|
|
|
|
|
|
|
|
|
|
| |||||||||||||||||
Net realized/unrealized gain (loss) on investments, futures contracts, foreign currency contracts, and other foreign currency related transactions | 24,799,769 | — | 5,996,397 | 3,427,951 | 30,318,571 | 18,228,858 | 3,551,997 | 12,145,202 | ||||||||||||||||||||||||
|
|
|
|
|
|
|
|
|
|
|
|
|
|
|
| |||||||||||||||||
Change in net assets from operations | $ | 27,737,389 | $ | — | $ | 11,752,477 | $ | 3,940,078 | $ | 33,293,301 | $ | 18,993,961 | $ | 3,384,749 | $ | 12,544,440 | ||||||||||||||||
|
|
|
|
|
|
|
|
|
|
|
|
|
|
|
| |||||||||||||||||
* Taxes withheld | $ | 52,830 | $ | — | $ | — | $ | 300 | $ | 532,093 | $ | 36,567 | $ | 278 | $ | 89,293 | ||||||||||||||||
|
|
|
|
|
|
|
|
|
|
|
|
|
|
|
| |||||||||||||||||
The accompanying notes are an integral part of these financial statements.
| 107 |
| Ohio National Fund, Inc. |
| For the Year Ended December 31, 2012 |
| Aggressive Growth Portfolio | Small Cap Growth Portfolio | Mid Cap Opportunity Portfolio | S&P 500® Index Portfolio | Strategic Value Portfolio | High Income Bond Portfolio | Capital Growth Portfolio | Nasdaq-100® Index Portfolio | |||||||||||||||||||||||||
Investment income: | ||||||||||||||||||||||||||||||||
Interest | $ | 2,275 | $ | 1,986 | $ | 1,547 | $ | 228 | $ | 2,599 | $ | 23,588,405 | $ | 1,130 | $ | 87 | ||||||||||||||||
Dividends, net of taxes withheld* | 399,681 | 306,096 | 580,006 | 4,530,875 | 7,049,197 | 24,220 | 515,307 | 992,003 | ||||||||||||||||||||||||
|
|
|
|
|
|
|
|
|
|
|
|
|
|
|
| |||||||||||||||||
Total investment income | 401,956 | 308,082 | 581,553 | 4,531,103 | 7,051,796 | 23,612,625 | 516,437 | 992,090 | ||||||||||||||||||||||||
|
|
|
|
|
|
|
|
|
|
|
|
|
|
|
| |||||||||||||||||
Expenses: | ||||||||||||||||||||||||||||||||
Management fees | 241,204 | 308,222 | 553,663 | 726,354 | 1,096,042 | 2,004,768 | 494,691 | 262,904 | ||||||||||||||||||||||||
Custodian fees | 3,766 | 14,128 | 8,536 | 15,701 | 13,727 | 15,817 | 5,534 | 7,252 | ||||||||||||||||||||||||
Directors’ fees | 3,361 | 3,789 | 7,272 | 21,475 | 16,252 | 33,234 | 6,147 | 7,351 | ||||||||||||||||||||||||
Professional fees | 14,404 | 14,754 | 16,987 | 27,009 | 31,864 | 32,412 | 16,296 | 16,946 | ||||||||||||||||||||||||
Accounting fees | 16,540 | 16,868 | 25,836 | 81,931 | 51,119 | 156,630 | 23,410 | 26,980 | ||||||||||||||||||||||||
Printing and filing fees | 7,231 | 7,681 | 14,269 | 32,896 | 20,328 | 77,838 | 11,164 | 13,711 | ||||||||||||||||||||||||
Compliance expense | 10,583 | 10,583 | 10,583 | 10,583 | 10,583 | 10,583 | 10,583 | 10,583 | ||||||||||||||||||||||||
Other | 851 | 1,223 | 2,388 | 6,650 | 1,593 | 4,211 | 1,978 | 2,195 | ||||||||||||||||||||||||
|
|
|
|
|
|
|
|
|
|
|
|
|
|
|
| |||||||||||||||||
Total expenses | 297,940 | 377,248 | 639,534 | 922,599 | 1,241,508 | 2,335,493 | 569,803 | 347,922 | ||||||||||||||||||||||||
|
|
|
|
|
|
|
|
|
|
|
|
|
|
|
| |||||||||||||||||
Net investment income (loss) | 104,016 | (69,166 | ) | (57,981 | ) | 3,608,504 | 5,810,288 | 21,277,132 | (53,366 | ) | 644,168 | |||||||||||||||||||||
|
|
|
|
|
|
|
|
|
|
|
|
|
|
|
| |||||||||||||||||
Realized/unrealized gain (loss) on investments and foreign currency related transactions: | ||||||||||||||||||||||||||||||||
Net realized gain (loss) on: | ||||||||||||||||||||||||||||||||
Investments | (286,293 | ) | 5,846,220 | 4,035,775 | 1,892,406 | 1,288,010 | 4,698,612 | 3,854,057 | 513,217 | |||||||||||||||||||||||
Foreign currency related transactions | 8 | (18 | ) | — | — | 356,986 | — | — | (37 | ) | ||||||||||||||||||||||
Change in unrealized appreciation/depreciation on: | ||||||||||||||||||||||||||||||||
Investments | 5,979,667 | (231,728 | ) | 7,639,334 | 21,351,067 | (2,817,861 | ) | 13,264,229 | 3,014,667 | 8,702,070 | ||||||||||||||||||||||
Foreign currency related transactions | (187 | ) | — | — | — | 6,917 | — | — | — | |||||||||||||||||||||||
|
|
|
|
|
|
|
|
|
|
|
|
|
|
|
| |||||||||||||||||
Net realized/unrealized gain (loss) on investments and foreign currency related transactions | 5,693,195 | 5,614,474 | 11,675,109 | 23,243,473 | (1,165,948 | ) | 17,962,841 | 6,868,724 | 9,215,250 | |||||||||||||||||||||||
|
|
|
|
|
|
|
|
|
|
|
|
|
|
|
| |||||||||||||||||
Change in net assets from operations | $ | 5,797,211 | $ | 5,545,308 | $ | 11,617,128 | $ | 26,851,977 | $ | 4,644,340 | $ | 39,239,973 | $ | 6,815,358 | $ | 9,859,418 | ||||||||||||||||
|
|
|
|
|
|
|
|
|
|
|
|
|
|
|
| |||||||||||||||||
* Taxes withheld | $ | 8,596 | $ | 3,098 | $ | 3,740 | $ | 2,619 | $ | 234,087 | $ | — | $ | — | $ | 2,027 | ||||||||||||||||
|
|
|
|
|
|
|
|
|
|
|
|
|
|
|
| |||||||||||||||||
The accompanying notes are an integral part of these financial statements.
| 108 |
| Ohio National Fund, Inc. |
Statements of Operations | For the Year Ended December 31, 2012 |
| Bristol Portfolio | Bryton Growth Portfolio | U.S. Equity Portfolio | Balanced Portfolio | Income Opportunity Portfolio | Target VIP Portfolio | Target Equity/Income Portfolio | Bristol Growth Portfolio | |||||||||||||||||||||||||
Investment income: | ||||||||||||||||||||||||||||||||
Interest | $ | 7,067 | $ | 9,803 | $ | 220 | $ | 366,235 | $ | 341 | $ | 689 | $ | 717 | $ | 4,606 | ||||||||||||||||
Dividends, net of taxes withheld* | 3,053,176 | 537,371 | 260,931 | 579,679 | 246,697 | 566,965 | 757,290 | 1,557,245 | ||||||||||||||||||||||||
|
|
|
|
|
|
|
|
|
|
|
|
|
|
|
| |||||||||||||||||
Total investment income | 3,060,243 | 547,174 | 261,151 | 945,914 | 247,038 | 567,654 | 758,007 | 1,561,851 | ||||||||||||||||||||||||
|
|
|
|
|
|
|
|
|
|
|
|
|
|
|
| |||||||||||||||||
Expenses: | ||||||||||||||||||||||||||||||||
Management fees | 1,500,387 | 1,258,148 | 112,365 | 223,191 | 85,412 | 131,340 | 136,796 | 834,211 | ||||||||||||||||||||||||
Custodian fees | 13,535 | 14,042 | 930 | 4,751 | 3,756 | 11,523 | 4,047 | 9,270 | ||||||||||||||||||||||||
Directors’ fees | 22,323 | 17,292 | 1,673 | 3,693 | 1,195 | 2,444 | 2,540 | 11,750 | ||||||||||||||||||||||||
Professional fees | 26,602 | 23,811 | 13,417 | 13,988 | 13,150 | 13,901 | 20,413 | 19,828 | ||||||||||||||||||||||||
Accounting fees | 65,060 | 51,964 | 9,130 | 29,299 | 9,249 | 14,373 | 11,481 | 36,722 | ||||||||||||||||||||||||
Printing and filing fees | 61,275 | 53,110 | 3,877 | 7,389 | 3,494 | 5,050 | 5,265 | 41,253 | ||||||||||||||||||||||||
Compliance expense | 10,583 | 10,583 | 10,583 | 10,583 | 10,583 | 10,583 | 10,583 | 10,583 | ||||||||||||||||||||||||
Other | 6,999 | 5,301 | 528 | 1,089 | 440 | 810 | 846 | 3,640 | ||||||||||||||||||||||||
|
|
|
|
|
|
|
|
|
|
|
|
|
|
|
| |||||||||||||||||
Total expenses | 1,706,764 | 1,434,251 | 152,503 | 293,983 | 127,279 | 190,024 | 191,971 | 967,257 | ||||||||||||||||||||||||
|
|
|
|
|
|
|
|
|
|
|
|
|
|
|
| |||||||||||||||||
Net investment income (loss) | 1,353,479 | (887,077 | ) | 108,648 | 651,931 | 119,759 | 377,630 | 566,036 | 594,594 | |||||||||||||||||||||||
|
|
|
|
|
|
|
|
|
|
|
|
|
|
|
| |||||||||||||||||
Realized/unrealized gain (loss) on investments, foreign currency related transactions, and written options: | ||||||||||||||||||||||||||||||||
Net realized gain (loss) on: | ||||||||||||||||||||||||||||||||
Investments | 8,239,529 | 12,311,861 | 528,811 | 498,190 | 203,573 | 632,540 | (2,479,190 | ) | 6,499,048 | |||||||||||||||||||||||
Foreign currency related transactions | 130 | 136 | — | 7 | — | (50 | ) | (145 | ) | — | ||||||||||||||||||||||
Written options | — | — | — | (139,933 | ) | (263,013 | ) | — | — | — | ||||||||||||||||||||||
Change in unrealized appreciation/depreciation on: | ||||||||||||||||||||||||||||||||
Investments | 16,070,240 | 5,904,468 | 1,332,996 | 2,012,825 | 683,714 | 2,048,046 | 4,258,398 | 4,359,363 | ||||||||||||||||||||||||
Foreign currency related transactions | — | — | — | (4 | ) | — | — | — | — | |||||||||||||||||||||||
Written options | — | — | — | — | 22,751 | — | — | — | ||||||||||||||||||||||||
|
|
|
|
|
|
|
|
|
|
|
|
|
|
|
| |||||||||||||||||
Net realized/unrealized gain (loss) on investments, foreign currency related transactions, and written options | 24,309,899 | 18,216,465 | 1,861,807 | 2,371,085 | 647,025 | 2,680,536 | 1,779,063 | 10,858,411 | ||||||||||||||||||||||||
|
|
|
|
|
|
|
|
|
|
|
|
|
|
|
| |||||||||||||||||
Change in net assets from operations | $ | 25,663,378 | $ | 17,329,388 | $ | 1,970,455 | $ | 3,023,016 | $ | 766,784 | $ | 3,058,166 | $ | 2,345,099 | $ | 11,453,005 | ||||||||||||||||
|
|
|
|
|
|
|
|
|
|
|
|
|
|
|
| |||||||||||||||||
* Taxes withheld | $ | 2,448 | $ | 38,083 | $ | 2,435 | $ | 1,731 | $ | 231 | $ | 38,550 | $ | 11,151 | $ | — | ||||||||||||||||
|
|
|
|
|
|
|
|
|
|
|
|
|
|
|
| |||||||||||||||||
The accompanying notes are an integral part of these financial statements.
| 109 |
| Ohio National Fund, Inc. |
| Equity Portfolio | Money Market Portfolio | Bond Portfolio | Omni Portfolio | |||||||||||||||||||||||||||||
| Year Ended December 31, 2012 | Year Ended December 31, 2011 | Year Ended December 31, 2012 | Year Ended December 31, 2011 | Year Ended December 31, 2012 | Year Ended December 31, 2011 | Year Ended December 31, 2012 | Year Ended December 31, 2011 | |||||||||||||||||||||||||
Increase (Decrease) in Net Assets: | ||||||||||||||||||||||||||||||||
Operations: | ||||||||||||||||||||||||||||||||
Net investment income (loss) | $ | 2,937,620 | $ | 2,050,230 | $ | — | $ | — | $ | 5,756,080 | $ | 5,641,940 | $ | 512,127 | $ | 539,778 | ||||||||||||||||
Net realized gain (loss) on investments and foreign currency related transactions | 15,135,180 | (1,586,673 | ) | — | — | 1,428,098 | 824,712 | 1,090,857 | 2,378,862 | |||||||||||||||||||||||
Change in unrealized appreciation/depreciation on investments | 9,664,589 | (7,441,587 | ) | — | — | 4,568,299 | 2,856,388 | 2,337,094 | (4,379,083 | ) | ||||||||||||||||||||||
|
|
|
|
|
|
|
|
|
|
|
|
|
|
|
| |||||||||||||||||
Change in net assets from operations | 27,737,389 | (6,978,030 | ) | — | — | 11,752,477 | 9,323,040 | 3,940,078 | (1,460,443 | ) | ||||||||||||||||||||||
|
|
|
|
|
|
|
|
|
|
|
|
|
|
|
| |||||||||||||||||
Distributions to shareholders: | ||||||||||||||||||||||||||||||||
Distributions from net investment income | (2,551,766 | ) | (1,709,149 | ) | — | — | — | — | (434,512 | ) | (467,625 | ) | ||||||||||||||||||||
|
|
|
|
|
|
|
|
|
|
|
|
|
|
|
| |||||||||||||||||
Capital transactions: | ||||||||||||||||||||||||||||||||
Received from shares sold | 12,859,425 | 18,469,577 | 178,859,238 | 325,508,308 | 50,714,394 | 54,452,714 | 2,645,867 | 3,650,326 | ||||||||||||||||||||||||
Received from dividends reinvested | 2,551,766 | 1,709,149 | — | — | — | — | 434,512 | 467,625 | ||||||||||||||||||||||||
Paid for shares redeemed | (41,926,289 | ) | (43,066,271 | ) | (206,441,123 | ) | (332,767,148 | ) | (52,317,398 | ) | (49,917,819 | ) | (8,034,239 | ) | (8,714,120 | ) | ||||||||||||||||
|
|
|
|
|
|
|
|
|
|
|
|
|
|
|
| |||||||||||||||||
Change in net assets from capital transactions | (26,515,098 | ) | (22,887,545 | ) | (27,581,885 | ) | (7,258,840 | ) | (1,603,004 | ) | 4,534,895 | (4,953,860 | ) | (4,596,169 | ) | |||||||||||||||||
|
|
|
|
|
|
|
|
|
|
|
|
|
|
|
| |||||||||||||||||
Change in net assets | (1,329,475 | ) | (31,574,724 | ) | (27,581,885 | ) | (7,258,840 | ) | 10,149,473 | 13,857,935 | (1,448,294 | ) | (6,524,237 | ) | ||||||||||||||||||
Net Assets: | ||||||||||||||||||||||||||||||||
Beginning of year | 187,856,758 | 219,431,482 | 286,188,097 | 293,446,937 | 162,034,977 | 148,177,042 | 34,652,983 | 41,177,220 | ||||||||||||||||||||||||
|
|
|
|
|
|
|
|
|
|
|
|
|
|
|
| |||||||||||||||||
End of year | $ | 186,527,283 | $ | 187,856,758 | $ | 258,606,212 | $ | 286,188,097 | $ | 172,184,450 | $ | 162,034,977 | $ | 33,204,689 | $ | 34,652,983 | ||||||||||||||||
|
|
|
|
|
|
|
|
|
|
|
|
|
|
|
| |||||||||||||||||
Undistributed net investment income | $ | 367,208 | $ | 321,507 | $ | — | $ | — | $ | 5,756,080 | $ | 5,644,604 | $ | 109,020 | $ | 72,151 | ||||||||||||||||
|
|
|
|
|
|
|
|
|
|
|
|
|
|
|
| |||||||||||||||||
The accompanying notes are an integral part of these financial statements.
| 110 |
| Ohio National Fund, Inc. |
Statements of Changes in Net Assets |
| International Portfolio | Capital Appreciation Portfolio | Millennium Portfolio | International Small-Mid Company Portfolio | |||||||||||||||||||||||||||||
| Year Ended December 31, 2012 | Year Ended December 31, 2011 | Year Ended December 31, 2012 | Year Ended December 31, 2011 | Year Ended December 31, 2012 | Year Ended December 31, 2011 | Year Ended December 31, 2012 | Year Ended December 31, 2011 | |||||||||||||||||||||||||
Increase (Decrease) in Net Assets: | ||||||||||||||||||||||||||||||||
Operations: | ||||||||||||||||||||||||||||||||
Net investment income (loss) | $ | 2,974,730 | $ | 2,763,902 | $ | 765,103 | $ | 512,592 | $ | (167,248 | ) | $ | (265,247 | ) | $ | 399,238 | $ | 759,480 | ||||||||||||||
Net realized gain (loss) on investments, futures contracts, foreign currency contracts, and other foreign currency related transactions .. | 9,475,139 | 5,625,132 | 7,244,718 | 13,380,126 | 4,063,768 | 5,455,807 | 1,226,014 | 7,051,106 | ||||||||||||||||||||||||
Change in unrealized appreciation/depreciation on investments, futures contracts, foreign currency contracts, and other foreign currency related transactions | 20,843,432 | (36,962,218 | ) | 10,984,140 | (15,407,876 | ) | (511,771 | ) | (5,423,430 | ) | 10,919,188 | (20,184,071 | ) | |||||||||||||||||||
|
|
|
|
|
|
|
|
|
|
|
|
|
|
|
| |||||||||||||||||
Change in net assets from operations | 33,293,301 | (28,573,184 | ) | 18,993,961 | (1,515,158 | ) | 3,384,749 | (232,870 | ) | 12,544,440 | (12,373,485 | ) | ||||||||||||||||||||
|
|
|
|
|
|
|
|
|
|
|
|
|
|
|
| |||||||||||||||||
Distributions to shareholders: | ||||||||||||||||||||||||||||||||
Distributions from net investment income | — | — | (681,205 | ) | (471,108 | ) | — | — | — | — | ||||||||||||||||||||||
|
|
|
|
|
|
|
|
|
|
|
|
|
|
|
| |||||||||||||||||
Capital transactions: | ||||||||||||||||||||||||||||||||
Received from shares sold | 16,648,592 | 26,491,894 | 11,383,622 | 13,034,340 | 3,189,215 | 6,473,011 | 10,692,767 | 11,780,860 | ||||||||||||||||||||||||
Received from dividends reinvested | — | — | 681,205 | 471,108 | — | — | — | — | ||||||||||||||||||||||||
Paid for shares redeemed | (42,407,744 | ) | (38,194,519 | ) | (29,380,202 | ) | (26,649,763 | ) | (8,938,109 | ) | (11,842,246 | ) | (16,239,923 | ) | (20,534,648 | ) | ||||||||||||||||
|
|
|
|
|
|
|
|
|
|
|
|
|
|
|
| |||||||||||||||||
Change in net assets from capital transactions | (25,759,152 | ) | (11,702,625 | ) | (17,315,375 | ) | (13,144,315 | ) | (5,748,894 | ) | (5,369,235 | ) | (5,547,156 | ) | (8,753,788 | ) | ||||||||||||||||
|
|
|
|
|
|
|
|
|
|
|
|
|
|
|
| |||||||||||||||||
Change in net assets | 7,534,149 | (40,275,809 | ) | 997,381 | (15,130,581 | ) | (2,364,145 | ) | (5,602,105 | ) | 6,997,284 | (21,127,273 | ) | |||||||||||||||||||
Net Assets: | ||||||||||||||||||||||||||||||||
Beginning of year | 172,809,983 | 213,085,792 | 114,670,478 | 129,801,059 | 36,475,228 | 42,077,333 | 57,485,307 | 78,612,580 | ||||||||||||||||||||||||
|
|
|
|
|
|
|
|
|
|
|
|
|
|
|
| |||||||||||||||||
End of year | $ | 180,344,132 | $ | 172,809,983 | $ | 115,667,859 | $ | 114,670,478 | $ | 34,111,083 | $ | 36,475,228 | $ | 64,482,591 | $ | 57,485,307 | ||||||||||||||||
|
|
|
|
|
|
|
|
|
|
|
|
|
|
|
| |||||||||||||||||
Undistributed net investment income (loss) | $ | 4,857,652 | $ | (975,843 | ) | $ | 83,350 | $ | 42,139 | $ | — | $ | — | $ | 324,350 | $ | 729,334 | |||||||||||||||
|
|
|
|
|
|
|
|
|
|
|
|
|
|
|
| |||||||||||||||||
The accompanying notes are an integral part of these financial statements.
| 111 |
| Ohio National Fund, Inc. |
Statements of Changes in Net Assets |
| Aggressive Growth Portfolio | Small Cap Growth Portfolio | Mid Cap Opportunity Portfolio | S&P 500® Index Portfolio | |||||||||||||||||||||||||||||
| Year Ended December 31, 2012 | Year Ended December 31, 2011 | Year Ended December 31, 2012 | Year Ended December 31, 2011 | Year Ended December 31, 2012 | Year Ended December 31, 2011 | Year Ended December 31, 2012 | Year Ended December 31, 2011 | |||||||||||||||||||||||||
Increase (Decrease) in Net Assets: | ||||||||||||||||||||||||||||||||
Operations: | ||||||||||||||||||||||||||||||||
Net investment income (loss) | $ | 104,016 | $ | 4,686 | $ | (69,166 | ) | $ | (199,385 | ) | $ | (57,981 | ) | $ | (190,720 | ) | $ | 3,608,504 | $ | 2,834,031 | ||||||||||||
Net realized gain (loss) on investments and foreign currency related transactions | (286,285 | ) | 2,027,613 | 5,846,202 | 4,917,380 | 4,035,775 | 5,767,671 | 1,892,406 | (572,071 | ) | ||||||||||||||||||||||
Change in unrealized appreciation/depreciation on investments and foreign currency related transactions | 5,979,480 | (3,411,059 | ) | (231,728 | ) | (3,905,022 | ) | 7,639,334 | (7,616,332 | ) | 21,351,067 | 489,142 | ||||||||||||||||||||
|
|
|
|
|
|
|
|
|
|
|
|
|
|
|
| |||||||||||||||||
Change in net assets from operations | 5,797,211 | (1,378,760 | ) | 5,545,308 | 812,973 | 11,617,128 | (2,039,381 | ) | 26,851,977 | 2,751,102 | ||||||||||||||||||||||
|
|
|
|
|
|
|
|
|
|
|
|
|
|
|
| |||||||||||||||||
Distributions to shareholders: | ||||||||||||||||||||||||||||||||
Distributions from net investment income | — | — | — | — | — | — | (2,826,655 | ) | (2,390,576 | ) | ||||||||||||||||||||||
|
|
|
|
|
|
|
|
|
|
|
|
|
|
|
| |||||||||||||||||
Capital transactions: | ||||||||||||||||||||||||||||||||
Received from shares sold | 9,567,587 | 6,293,281 | 9,304,509 | 10,807,715 | 11,126,601 | 9,234,055 | 54,598,878 | 39,553,518 | ||||||||||||||||||||||||
Received from dividends reinvested | — | — | — | — | — | — | 2,826,655 | 2,390,576 | ||||||||||||||||||||||||
Paid for shares redeemed | (7,975,462 | ) | (8,916,428 | ) | (11,364,585 | ) | (12,221,376 | ) | (16,745,113 | ) | (16,499,127 | ) | (44,349,542 | ) | (47,804,467 | ) | ||||||||||||||||
|
|
|
|
|
|
|
|
|
|
|
|
|
|
|
| |||||||||||||||||
Change in net assets from capital transactions | 1,592,125 | (2,623,147 | ) | (2,060,076 | ) | (1,413,661 | ) | (5,618,512 | ) | (7,265,072 | ) | 13,075,991 | (5,860,373 | ) | ||||||||||||||||||
|
|
|
|
|
|
|
|
|
|
|
|
|
|
|
| |||||||||||||||||
Change in net assets | 7,389,336 | (4,001,907 | ) | 3,485,232 | (600,688 | ) | 5,998,616 | (9,304,453 | ) | 37,101,313 | (5,499,847 | ) | ||||||||||||||||||||
Net Assets: | ||||||||||||||||||||||||||||||||
Beginning of year | 25,755,345 | 29,757,252 | 31,498,747 | 32,099,435 | 61,062,990 | 70,367,443 | 170,679,207 | 176,179,054 | ||||||||||||||||||||||||
|
|
|
|
|
|
|
|
|
|
|
|
|
|
|
| |||||||||||||||||
End of year | $ | 33,144,681 | $ | 25,755,345 | $ | 34,983,979 | $ | 31,498,747 | $ | 67,061,606 | $ | 61,062,990 | $ | 207,780,520 | $ | 170,679,207 | ||||||||||||||||
|
|
|
|
|
|
|
|
|
|
|
|
|
|
|
| |||||||||||||||||
Undistributed net investment income (loss) | $ | 103,178 | $ | 3,051 | $ | — | $ | — | $ | — | $ | — | $ | 744,172 | $ | 437,674 | ||||||||||||||||
|
|
|
|
|
|
|
|
|
|
|
|
|
|
|
| |||||||||||||||||
The accompanying notes are an integral part of these financial statements.
| 112 |
| Ohio National Fund, Inc. |
Statements of Changes in Net Assets |
| Strategic Value Portfolio | High Income Bond Portfolio | Capital Growth Portfolio | Nasdaq-100® Index Portfolio | |||||||||||||||||||||||||||||
| Year Ended December 31, 2012 | Year Ended December 31, 2011 | Year Ended December 31, 2012 | Year Ended December 31, 2011 | Year Ended December 31, 2012 | Year Ended December 31, 2011 | Year Ended December 31, 2012 | Year Ended December 31, 2011 | |||||||||||||||||||||||||
Increase (Decrease) in Net Assets: | ||||||||||||||||||||||||||||||||
Operations: | ||||||||||||||||||||||||||||||||
Net investment income (loss) | $ | 5,810,288 | $ | 1,209,761 | $ | 21,277,132 | $ | 21,132,185 | $ | (53,366 | ) | $ | (352,177 | ) | $ | 644,168 | $ | 225,802 | ||||||||||||||
Net realized gain (loss) on investments, foreign currency contracts, and other foreign currency related transactions | 1,644,996 | 957,858 | 4,698,612 | 4,997,438 | 3,854,057 | 8,111,683 | 513,180 | 7,286,117 | ||||||||||||||||||||||||
Change in unrealized appreciation/depreciation on investments, foreign currency contracts, and other foreign currency related transactions | (2,810,944 | ) | 2,070,206 | 13,264,229 | (13,026,934 | ) | 3,014,667 | (9,323,741 | ) | 8,702,070 | (5,817,310 | ) | ||||||||||||||||||||
|
|
|
|
|
|
|
|
|
|
|
|
|
|
|
| |||||||||||||||||
Change in net assets from operations | 4,644,340 | 4,237,825 | 39,239,973 | 13,102,689 | 6,815,358 | (1,564,235 | ) | 9,859,418 | 1,694,609 | |||||||||||||||||||||||
|
|
|
|
|
|
|
|
|
|
|
|
|
|
|
| |||||||||||||||||
Distributions to shareholders: | ||||||||||||||||||||||||||||||||
Distributions from net investment income | (3,918,367 | ) | (599,193 | ) | — | — | — | — | (447,911 | ) | (205,415 | ) | ||||||||||||||||||||
|
|
|
|
|
|
|
|
|
|
|
|
|
|
|
| |||||||||||||||||
Capital transactions: | ||||||||||||||||||||||||||||||||
Received from shares sold | 257,036,279 | 23,250,524 | 84,212,118 | 88,330,748 | 12,566,131 | 21,876,325 | 26,139,975 | 21,724,700 | ||||||||||||||||||||||||
Received from dividends reinvested | 3,918,367 | 599,193 | — | — | — | — | 447,911 | 205,415 | ||||||||||||||||||||||||
Paid for shares redeemed | (35,500,770 | ) | (9,851,748 | ) | (78,999,032 | ) | (103,758,722 | ) | (15,372,139 | ) | (21,618,111 | ) | (22,928,127 | ) | (22,886,769 | ) | ||||||||||||||||
|
|
|
|
|
|
|
|
|
|
|
|
|
|
|
| |||||||||||||||||
Change in net assets from capital transactions | 225,453,876 | 13,997,969 | 5,213,086 | (15,427,974 | ) | (2,806,008 | ) | 258,214 | 3,659,759 | (956,654 | ) | |||||||||||||||||||||
|
|
|
|
|
|
|
|
|
|
|
|
|
|
|
| |||||||||||||||||
Change in net assets | 226,179,849 | 17,636,601 | 44,453,059 | (2,325,285 | ) | 4,009,350 | (1,306,021 | ) | 13,071,266 | 532,540 | ||||||||||||||||||||||
Net Assets: | ||||||||||||||||||||||||||||||||
Beginning of year | 41,983,861 | 24,347,260 | 267,461,878 | 269,787,163 | 51,105,385 | 52,411,406 | 55,470,937 | 54,938,397 | ||||||||||||||||||||||||
|
|
|
|
|
|
|
|
|
|
|
|
|
|
|
| |||||||||||||||||
End of year | $ | 268,163,710 | $ | 41,983,861 | $ | 311,914,937 | $ | 267,461,878 | $ | 55,114,735 | $ | 51,105,385 | $ | 68,542,203 | $ | 55,470,937 | ||||||||||||||||
|
|
|
|
|
|
|
|
|
|
|
|
|
|
|
| |||||||||||||||||
Undistributed net investment income (loss) | $ | 2,248,868 | $ | 560,303 | $ | 21,277,132 | $ | 21,132,185 | $ | — | $ | — | $ | 196,220 | $ | 20,387 | ||||||||||||||||
|
|
|
|
|
|
|
|
|
|
|
|
|
|
|
| |||||||||||||||||
The accompanying notes are an integral part of these financial statements.
| 113 |
| Ohio National Fund, Inc. |
Statements of Changes in Net Assets |
| Bristol Portfolio | Bryton Growth Portfolio | U.S. Equity Portfolio | Balanced Portfolio | |||||||||||||||||||||||||||||
| Year Ended December 31, 2012 | Year Ended December 31, 2011 | Year Ended December 31, 2012 | Year Ended December 31, 2011 | Year Ended December 31, 2012 | Year Ended December 31, 2011 | Year Ended December 31, 2012 | Year Ended December 31, 2011 | |||||||||||||||||||||||||
Increase (Decrease) in Net Assets: | ||||||||||||||||||||||||||||||||
Operations: | ||||||||||||||||||||||||||||||||
Net investment income (loss) | $ | 1,353,479 | $ | 980,932 | $ | (887,077 | ) | $ | (949,037 | ) | $ | 108,648 | $ | 87,152 | $ | 651,931 | $ | 382,509 | ||||||||||||||
Net realized gain (loss) on investments, foreign currency related transactions, and written options | 8,239,659 | 13,130,771 | 12,311,997 | 23,283,240 | 528,811 | 890,153 | 358,264 | 351,511 | ||||||||||||||||||||||||
Change in unrealized appreciation/depreciation on investments and foreign currency related transactions | 16,070,240 | (26,663,794 | ) | 5,904,468 | (33,319,384 | ) | 1,332,996 | (1,205,424 | ) | 2,012,821 | (479,142 | ) | ||||||||||||||||||||
|
|
|
|
|
|
|
|
|
|
|
|
|
|
|
| |||||||||||||||||
Change in net assets from operations | 25,663,378 | (12,552,091 | ) | 17,329,388 | (10,985,181 | ) | 1,970,455 | (228,119 | ) | 3,023,016 | 254,878 | |||||||||||||||||||||
|
|
|
|
|
|
|
|
|
|
|
|
|
|
|
| |||||||||||||||||
Distributions to shareholders: | ||||||||||||||||||||||||||||||||
Distributions from net investment income | (1,149,626 | ) | (910,805 | ) | — | — | (86,203 | ) | — | — | (324,529 | ) | ||||||||||||||||||||
|
|
|
|
|
|
|
|
|
|
|
|
|
|
|
| |||||||||||||||||
Capital transactions: | ||||||||||||||||||||||||||||||||
Received from shares sold | 33,161,237 | 51,481,798 | 33,597,917 | 51,927,445 | 2,935,494 | 2,353,412 | 64,188,382 | 7,783,601 | ||||||||||||||||||||||||
Received from dividends reinvested | 1,149,626 | 910,805 | — | — | 86,203 | — | — | 324,529 | ||||||||||||||||||||||||
Paid for shares redeemed | (46,593,004 | ) | (28,902,202 | ) | (48,711,366 | ) | (22,913,491 | ) | (2,679,663 | ) | (3,298,269 | ) | (7,131,199 | ) | (5,474,697 | ) | ||||||||||||||||
|
|
|
|
|
|
|
|
|
|
|
|
|
|
|
| |||||||||||||||||
Change in net assets from capital transactions | (12,282,141 | ) | 23,490,401 | (15,113,449 | ) | 29,013,954 | 342,034 | (944,857 | ) | 57,057,183 | 2,633,433 | |||||||||||||||||||||
|
|
|
|
|
|
|
|
|
|
|
|
|
|
|
| |||||||||||||||||
Change in net assets | 12,231,611 | 10,027,505 | 2,215,939 | 18,028,773 | 2,226,286 | (1,172,976 | ) | 60,080,199 | 2,563,782 | |||||||||||||||||||||||
Net Assets: | ||||||||||||||||||||||||||||||||
Beginning of year | 192,672,135 | 182,644,630 | 155,440,585 | 137,411,812 | 13,336,011 | 14,508,987 | 17,056,728 | 14,492,946 | ||||||||||||||||||||||||
|
|
|
|
|
|
|
|
|
|
|
|
|
|
|
| |||||||||||||||||
End of year | $ | 204,903,746 | $ | 192,672,135 | $ | 157,656,524 | $ | 155,440,585 | $ | 15,562,297 | $ | 13,336,011 | $ | 77,136,927 | $ | 17,056,728 | ||||||||||||||||
|
|
|
|
|
|
|
|
|
|
|
|
|
|
|
| |||||||||||||||||
Undistributed net investment income (loss) | $ | 436,010 | $ | 70,114 | $ | (9,839 | ) | $ | 830,443 | $ | 22,445 | $ | 87,152 | $ | 651,938 | $ | 57,379 | |||||||||||||||
|
|
|
|
|
|
|
|
|
|
|
|
|
|
|
| |||||||||||||||||
The accompanying notes are an integral part of these financial statements.
| 114 |
| Ohio National Fund, Inc. |
Statements of Changes in Net Assets |
| Income Opportunity Portfolio | Target VIP Portfolio | Target Equity/Income Portfolio | Bristol Growth Portfolio | |||||||||||||||||||||||||||||
| Year Ended December 31, 2012 | Year Ended December 31, 2011 | Year Ended December 31, 2012 | Year Ended December 31, 2011 | Year Ended December 31, 2012 | Year Ended December 31, 2011 | Year Ended December 31, 2012 | Year Ended December 31, 2011 | |||||||||||||||||||||||||
Increase (Decrease) in Net Assets: | ||||||||||||||||||||||||||||||||
Operations: | ||||||||||||||||||||||||||||||||
Net investment income (loss) | $ | 119,759 | $ | 107,822 | $ | 377,630 | $ | 233,238 | $ | 566,036 | $ | 423,961 | $ | 594,594 | $ | 383,901 | ||||||||||||||||
Net realized gain (loss) on investments, foreign currency related transactions, and written options | (59,440 | ) | 450,532 | 632,490 | 2,534,963 | (2,479,335 | ) | 3,694,903 | 6,499,048 | 7,769,008 | ||||||||||||||||||||||
Change in unrealized appreciation/depreciation on investments, foreign currency related transactions, and written options | 706,465 | (687,249 | ) | 2,048,046 | (3,060,087 | ) | 4,258,398 | (6,895,822 | ) | 4,359,363 | (9,674,876 | ) | ||||||||||||||||||||
|
|
|
|
|
|
|
|
|
|
|
|
|
|
|
| |||||||||||||||||
Change in net assets from operations | 766,784 | (128,895 | ) | 3,058,166 | (291,886 | ) | 2,345,099 | (2,776,958 | ) | 11,453,005 | (1,521,967 | ) | ||||||||||||||||||||
|
|
|
|
|
|
|
|
|
|
|
|
|
|
|
| |||||||||||||||||
Distributions to shareholders: | ||||||||||||||||||||||||||||||||
Distributions from net investment income | — | — | (297,777 | ) | (209,154 | ) | (449,704 | ) | (373,545 | ) | (473,865 | ) | (366,489 | ) | ||||||||||||||||||
|
|
|
|
|
|
|
|
|
|
|
|
|
|
|
| |||||||||||||||||
Capital transactions: | ||||||||||||||||||||||||||||||||
Received from shares sold | 3,644,658 | 3,882,060 | 2,834,544 | 3,992,391 | 4,614,373 | 4,881,643 | 21,509,893 | 31,340,964 | ||||||||||||||||||||||||
Received from dividends reinvested | — | — | 297,777 | 209,154 | 449,704 | 373,545 | 473,865 | 366,489 | ||||||||||||||||||||||||
Paid for shares redeemed | (5,821,018 | ) | (2,567,327 | ) | (5,246,749 | ) | (5,020,379 | ) | (6,662,741 | ) | (7,036,529 | ) | (24,843,136 | ) | (15,201,793 | ) | ||||||||||||||||
|
|
|
|
|
|
|
|
|
|
|
|
|
|
|
| |||||||||||||||||
Change in net assets from capital transactions | (2,176,360 | ) | 1,314,733 | (2,114,428 | ) | (818,834 | ) | (1,598,664 | ) | (1,781,341 | ) | (2,859,378 | ) | 16,505,660 | ||||||||||||||||||
|
|
|
|
|
|
|
|
|
|
|
|
|
|
|
| |||||||||||||||||
Change in net assets | (1,409,576 | ) | 1,185,838 | 645,961 | (1,319,874 | ) | 296,731 | (4,931,844 | ) | 8,119,762 | 14,617,204 | |||||||||||||||||||||
Net Assets: | ||||||||||||||||||||||||||||||||
Beginning of year | 10,834,072 | 9,648,234 | 20,536,381 | 21,856,255 | 21,629,772 | 26,561,616 | 99,913,377 | 85,296,173 | ||||||||||||||||||||||||
|
|
|
|
|
|
|
|
|
|
|
|
|
|
|
| |||||||||||||||||
End of year | $ | 9,424,496 | $ | 10,834,072 | $ | 21,182,342 | $ | 20,536,381 | $ | 21,926,503 | $ | 21,629,772 | $ | 108,033,139 | $ | 99,913,377 | ||||||||||||||||
|
|
|
|
|
|
|
|
|
|
|
|
|
|
|
| |||||||||||||||||
Undistributed net investment income | $ | 119,759 | $ | 107,843 | $ | 79,804 | $ | 24,084 | $ | 116,187 | $ | 50,416 | $ | 221,599 | $ | 17,406 | ||||||||||||||||
|
|
|
|
|
|
|
|
|
|
|
|
|
|
|
| |||||||||||||||||
The accompanying notes are an integral part of these financial statements.
| 115 |
| Ohio National Fund, Inc. |
| Equity Portfolio | Money Market Portfolio | |||||||||||||||||||||||||||||||||||||||
| Years Ended December 31, | Years Ended December 31, | |||||||||||||||||||||||||||||||||||||||
| 2012 | 2011 | 2010 | 2009 | 2008 | 2012 | 2011 | 2010 | 2009 | 2008 | |||||||||||||||||||||||||||||||
Selected Per-Share Data: | ||||||||||||||||||||||||||||||||||||||||
Net asset value, beginning of year | $ | 18.88 | $ | 19.72 | $ | 18.31 | $ | 13.19 | $ | 29.65 | $ | 10.00 | $ | 10.00 | $ | 10.00 | $ | 10.00 | $ | 10.00 | ||||||||||||||||||||
Operations: | ||||||||||||||||||||||||||||||||||||||||
Net investment income | 0.35 | 0.21 | 0.04 | 0.05 | 0.22 | — | — | — | — | 0.17 | ||||||||||||||||||||||||||||||
Net realized and unrealized gain (loss) on investments and foreign currency related transactions | 2.61 | (0.88 | ) | 1.41 | 5.11 | (16.48 | ) | — | — | — | — | — | ||||||||||||||||||||||||||||
|
|
|
|
|
|
|
|
|
|
|
|
|
|
|
|
|
|
|
| |||||||||||||||||||||
Total from operations | 2.96 | (0.67 | ) | 1.45 | 5.16 | (16.26 | ) | — | — | — | — | 0.17 | ||||||||||||||||||||||||||||
|
|
|
|
|
|
|
|
|
|
|
|
|
|
|
|
|
|
|
| |||||||||||||||||||||
Distributions: | ||||||||||||||||||||||||||||||||||||||||
Distributions from net investment income | (0.30 | ) | (0.17 | ) | (0.04 | ) | (0.04 | ) | (0.20 | ) | — | — | — | — | (0.17 | ) | ||||||||||||||||||||||||
|
|
|
|
|
|
|
|
|
|
|
|
|
|
|
|
|
|
|
| |||||||||||||||||||||
Net asset value, end of year | $ | 21.54 | $ | 18.88 | $ | 19.72 | $ | 18.31 | $ | 13.19 | $ | 10.00 | $ | 10.00 | $ | 10.00 | $ | 10.00 | $ | 10.00 | ||||||||||||||||||||
|
|
|
|
|
|
|
|
|
|
|
|
|
|
|
|
|
|
|
| |||||||||||||||||||||
Total return | 15.69 | % | –3.38 | % | 7.91 | % | 39.11 | % | –54.81 | % | 0.00 | % | 0.00 | % | 0.00 | % | 0.00 | % | 1.77 | % | ||||||||||||||||||||
Ratios and supplemental data: | ||||||||||||||||||||||||||||||||||||||||
Net assets at end of year (millions) | $ | 186.5 | $ | 187.9 | $ | 219.4 | $ | 226.5 | $ | 187.5 | $ | 258.6 | $ | 286.2 | $ | 293.4 | $ | 341.2 | $ | 402.5 | ||||||||||||||||||||
Ratios to average net assets: | ||||||||||||||||||||||||||||||||||||||||
Ratios net of expenses reduced or reimbursed by adviser: | ||||||||||||||||||||||||||||||||||||||||
Expenses | 0.89 | % | 0.87 | % | 0.87 | % | 0.88 | % | 0.84 | % | 0.09 | % | 0.11 | % | 0.17 | % | 0.19 | % | 0.32 | % | ||||||||||||||||||||
Net investment income | 1.55 | % | 1.00 | % | 0.21 | % | 0.27 | % | 0.89 | % | 0.00 | % | 0.00 | % | 0.00 | % | 0.00 | % | 1.72 | % | ||||||||||||||||||||
Ratios assuming no expenses reduced or reimbursed by adviser: | ||||||||||||||||||||||||||||||||||||||||
Expenses .. | 0.89 | % | 0.87 | % | 0.87 | % | 0.88 | % | 0.84 | % | 0.35 | % | 0.34 | % | 0.35 | % | 0.36 | % | 0.35 | % | ||||||||||||||||||||
Net investment income (loss) | 1.55 | % | 1.00 | % | 0.21 | % | 0.27 | % | 0.89 | % | –0.26 | % | –0.23 | % | –0.18 | % | –0.17 | % | 1.68 | % | ||||||||||||||||||||
Portfolio turnover rate | 48 | % | 54 | % | 50 | % | 24 | % | 39 | % | 0 | % | 0 | % | 0 | % | 0 | % | 0 | % | ||||||||||||||||||||
The accompanying notes are an integral part of these financial statements.
| 116 |
| Ohio National Fund, Inc. |
Financial Highlights |
| Bond Portfolio | Omni Portfolio | |||||||||||||||||||||||||||||||||||||||
| Years Ended December 31, | Years Ended December 31, | |||||||||||||||||||||||||||||||||||||||
| 2012 | 2011 | 2010 | 2009 | 2008 | 2012 | 2011 | 2010 | 2009 | 2008 | |||||||||||||||||||||||||||||||
Selected Per-Share Data: | ||||||||||||||||||||||||||||||||||||||||
Net asset value, beginning of year | $ | 14.05 | $ | 13.21 | $ | 12.25 | $ | 10.13 | $ | 11.44 | $ | 15.21 | $ | 16.08 | $ | 14.42 | $ | 11.02 | $ | 16.60 | ||||||||||||||||||||
Operations: | ||||||||||||||||||||||||||||||||||||||||
Net investment income | 0.51 | 0.48 | 0.52 | 0.49 | 1.04 | 0.26 | 0.25 | 0.28 | 0.29 | 0.40 | ||||||||||||||||||||||||||||||
Net realized and unrealized gain (loss) on investments and foreign currency related transactions | 0.51 | 0.36 | 0.44 | 1.63 | (2.35 | ) | 1.57 | (0.91 | ) | 1.62 | 3.36 | (5.63 | ) | |||||||||||||||||||||||||||
|
|
|
|
|
|
|
|
|
|
|
|
|
|
|
|
|
|
|
| |||||||||||||||||||||
Total from operations | 1.02 | 0.84 | 0.96 | 2.12 | (1.31 | ) | 1.83 | (0.66 | ) | 1.90 | 3.65 | (5.23 | ) | |||||||||||||||||||||||||||
|
|
|
|
|
|
|
|
|
|
|
|
|
|
|
|
|
|
|
| |||||||||||||||||||||
Distributions: | ||||||||||||||||||||||||||||||||||||||||
Distributions from net investment income | — | — | — | — | — | (0.22 | ) | (0.21 | ) | (0.24 | ) | (0.25 | ) | (0.35 | ) | |||||||||||||||||||||||||
|
|
|
|
|
|
|
|
|
|
|
|
|
|
|
|
|
|
|
| |||||||||||||||||||||
Net asset value, end of year | $ | 15.07 | $ | 14.05 | $ | 13.21 | $ | 12.25 | $ | 10.13 | $ | 16.82 | $ | 15.21 | $ | 16.08 | $ | 14.42 | $ | 11.02 | ||||||||||||||||||||
|
|
|
|
|
|
|
|
|
|
|
|
|
|
|
|
|
|
|
| |||||||||||||||||||||
Total return | 7.26 | % | 6.36 | % | 7.84 | % | 20.93 | % | –11.45 | % | 12.04 | % | –4.12 | % | 13.19 | % | 33.15 | % | –31.46 | % | ||||||||||||||||||||
Ratios and supplemental data: | ||||||||||||||||||||||||||||||||||||||||
Net assets at end of year (millions) | $ | 172.2 | $ | 162.0 | $ | 148.2 | $ | 137.9 | $ | 107.8 | $ | 33.2 | $ | 34.7 | $ | 41.2 | $ | 41.5 | $ | 34.9 | ||||||||||||||||||||
Ratios to average net assets: | ||||||||||||||||||||||||||||||||||||||||
Expenses | 0.66 | % | 0.66 | % | 0.67 | % | 0.69 | % | 0.66 | % | 0.81 | % | 0.77 | % | 0.78 | % | 0.79 | % | 0.74 | % | ||||||||||||||||||||
Net investment income | 3.41 | % | 3.70 | % | 3.91 | % | 5.06 | % | 5.35 | % | 1.49 | % | 1.40 | % | 1.71 | % | 2.18 | % | 2.43 | % | ||||||||||||||||||||
Portfolio turnover rate | 18 | % | 15 | % | 22 | % | 27 | % | 15 | % | 179 | % | 147 | % | 182 | % | 157 | % | 128 | % | ||||||||||||||||||||
The accompanying notes are an integral part of these financial statements.
| 117 |
| Ohio National Fund, Inc. |
Financial Highlights |
| International Portfolio | Capital Appreciation Portfolio | |||||||||||||||||||||||||||||||||||||||
| Years Ended December 31, | Years Ended December 31, | |||||||||||||||||||||||||||||||||||||||
| 2012 | 2011 | 2010 | 2009 | 2008 | 2012 | 2011 | 2010 | 2009 | 2008 | |||||||||||||||||||||||||||||||
Selected Per-Share Data: | ||||||||||||||||||||||||||||||||||||||||
Net asset value, beginning of year | $ | 10.32 | $ | 12.20 | $ | 10.45 | $ | 7.56 | $ | 14.02 | $ | 19.95 | $ | 20.37 | $ | 17.45 | $ | 12.35 | $ | 20.45 | ||||||||||||||||||||
Operations: | ||||||||||||||||||||||||||||||||||||||||
Net investment income | 0.20 | 0.17 | 0.14 | 0.14 | 0.13 | 0.15 | 0.09 | 0.06 | 0.22 | 0.14 | ||||||||||||||||||||||||||||||
Net realized and unrealized gain (loss) on investments, futures contracts, foreign currency contracts, and other foreign currency related transactions | 1.89 | (2.05 | ) | 1.61 | 2.75 | (6.59 | ) | 3.36 | (0.43 | ) | 2.90 | 5.07 | (8.12 | ) | ||||||||||||||||||||||||||
|
|
|
|
|
|
|
|
|
|
|
|
|
|
|
|
|
|
|
| |||||||||||||||||||||
Total from operations | 2.09 | (1.88 | ) | 1.75 | 2.89 | (6.46 | ) | 3.51 | (0.34 | ) | 2.96 | 5.29 | (7.98 | ) | ||||||||||||||||||||||||||
|
|
|
|
|
|
|
|
|
|
|
|
|
|
|
|
|
|
|
| |||||||||||||||||||||
Distributions: | ||||||||||||||||||||||||||||||||||||||||
Distributions from net investment income | — | — | — | — | — | (0.14 | ) | (0.08 | ) | (0.04 | ) | (0.19 | ) | (0.12 | ) | |||||||||||||||||||||||||
|
|
|
|
|
|
|
|
|
|
|
|
|
|
|
|
|
|
|
| |||||||||||||||||||||
Net asset value, end of year | $ | 12.41 | $ | 10.32 | $ | 12.20 | $ | 10.45 | $ | 7.56 | $ | 23.32 | $ | 19.95 | $ | 20.37 | $ | 17.45 | $ | 12.35 | ||||||||||||||||||||
|
|
|
|
|
|
|
|
|
|
|
|
|
|
|
|
|
|
|
| |||||||||||||||||||||
Total return | 20.25 | % | –15.41 | % | 16.75 | % | 38.23 | % | –46.08 | % | 17.59 | % | –1.65 | % | 16.99 | % | 42.84 | % | –39.01 | % | ||||||||||||||||||||
Ratios and supplemental data: | ||||||||||||||||||||||||||||||||||||||||
Net assets at end of year (millions) | $ | 180.3 | $ | 172.8 | $ | 213.1 | $ | 210.0 | $ | 179.7 | $ | 115.7 | $ | 114.7 | $ | 129.8 | $ | 126.3 | $ | 103.6 | ||||||||||||||||||||
Ratios to average net assets: | ||||||||||||||||||||||||||||||||||||||||
Expenses | 1.02 | % | 1.02 | % | 1.03 | % | 1.07 | % | 0.91 | % | 0.90 | % | 0.88 | % | 0.89 | % | 0.90 | % | 0.87 | % | ||||||||||||||||||||
Net investment income | 1.65 | % | 1.41 | % | 1.15 | % | 1.47 | % | 1.03 | % | 0.66 | % | 0.41 | % | 0.31 | % | 1.38 | % | 0.71 | % | ||||||||||||||||||||
Portfolio turnover rate | 61 | % | 58 | % | 67 | % | 168 | % | 214 | % | 39 | % | 61 | % | 58 | % | 84 | % | 79 | % | ||||||||||||||||||||
The accompanying notes are an integral part of these financial statements.
| 118 |
| Ohio National Fund, Inc. |
Financial Highlights |
| Millennium Portfolio | International Small-Mid Company Portfolio | |||||||||||||||||||||||||||||||||||||||
| Years Ended December 31, | Years Ended December 31, | |||||||||||||||||||||||||||||||||||||||
| 2012 | 2011 | 2010 | 2009 | 2008 | 2012 | 2011 | 2010 | 2009 | 2008 | |||||||||||||||||||||||||||||||
Selected Per-Share Data: | ||||||||||||||||||||||||||||||||||||||||
Net asset value, beginning of year | $ | 21.50 | $ | 21.69 | $ | 17.45 | $ | 14.44 | $ | 25.13 | $ | 19.17 | $ | 23.24 | $ | 19.41 | $ | 13.29 | $ | 27.29 | ||||||||||||||||||||
Operations: | ||||||||||||||||||||||||||||||||||||||||
Net investment income (loss) | (0.12 | ) | (0.16 | ) | (0.27 | ) | (0.07 | ) | (0.16 | ) | 0.17 | 0.26 | 0.07 | 0.07 | 0.08 | |||||||||||||||||||||||||
Net realized and unrealized gain (loss) on investments and foreign currency related transactions | 2.15 | (0.03 | ) | 4.51 | 3.08 | (10.53 | ) | 4.18 | (4.33 | ) | 3.76 | 6.05 | (14.08 | ) | ||||||||||||||||||||||||||
|
|
|
|
|
|
|
|
|
|
|
|
|
|
|
|
|
|
|
| |||||||||||||||||||||
Total from operations | 2.03 | (0.19 | ) | 4.24 | 3.01 | (10.69 | ) | 4.35 | (4.07 | ) | 3.83 | 6.12 | (14.00 | ) | ||||||||||||||||||||||||||
|
|
|
|
|
|
|
|
|
|
|
|
|
|
|
|
|
|
|
| |||||||||||||||||||||
Net asset value, end of year | $ | 23.53 | $ | 21.50 | $ | 21.69 | $ | 17.45 | $ | 14.44 | $ | 23.52 | $ | 19.17 | $ | 23.24 | $ | 19.41 | $ | 13.29 | ||||||||||||||||||||
|
|
|
|
|
|
|
|
|
|
|
|
|
|
|
|
|
|
|
| |||||||||||||||||||||
Total return | 9.44 | % | –0.88 | % | 24.30 | % | 20.84 | % | –42.54 | % | 22.69 | % | –17.51 | % | 19.73 | % | 46.05 | % | –51.30 | % | ||||||||||||||||||||
Ratios and supplemental data: | ||||||||||||||||||||||||||||||||||||||||
Net assets at end of year (millions) | $ | 34.1 | $ | 36.5 | $ | 42.1 | $ | 110.3 | $ | 34.2 | $ | 64.5 | $ | 57.5 | $ | 78.6 | $ | 71.1 | $ | 52.7 | ||||||||||||||||||||
Ratios to average net assets: | ||||||||||||||||||||||||||||||||||||||||
Expenses | 0.97 | % | 0.94 | % | 0.92 | % | 0.93 | % | 0.92 | % | 1.21 | % | 1.20 | % | 1.25 | % | 1.28 | % | 1.19 | % | ||||||||||||||||||||
Net investment income (loss) | –0.46 | % | –0.65 | % | –0.69 | % | –0.67 | % | –0.70 | % | 0.64 | % | 1.07 | % | 0.32 | % | 0.47 | % | 0.36 | % | ||||||||||||||||||||
Portfolio turnover rate | 282 | % | 228 | % | 254 | % | 248 | % | 224 | % | 55 | % | 67 | % | 81 | % | 125 | % | 75 | % | ||||||||||||||||||||
The accompanying notes are an integral part of these financial statements.
| 119 |
| Ohio National Fund, Inc. |
Financial Highlights |
| Aggressive Growth Portfolio | Small Cap Growth Portfolio | |||||||||||||||||||||||||||||||||||||||
| Years Ended December 31, | Years Ended December 31, | |||||||||||||||||||||||||||||||||||||||
| 2012 | 2011 | 2010 | 2009 | 2008 | 2012 | 2011 | 2010 | 2009 | 2008 | |||||||||||||||||||||||||||||||
Selected Per-Share Data: | ||||||||||||||||||||||||||||||||||||||||
Net asset value, beginning of year | $ | 7.74 | $ | 8.17 | $ | 7.43 | $ | 5.21 | $ | 9.25 | $ | 13.21 | $ | 12.86 | $ | 9.89 | $ | 6.56 | $ | 12.54 | ||||||||||||||||||||
Operations: | ||||||||||||||||||||||||||||||||||||||||
Net investment income (loss) | 0.03 | — | 0.01 | (0.02 | ) | (0.01 | ) | (0.03 | ) | (0.08 | ) | (0.07 | ) | (0.06 | ) | (0.08 | ) | |||||||||||||||||||||||
Net realized and unrealized gain (loss) on investments and foreign currency related transactions | 1.74 | (0.43 | ) | 0.73 | 2.24 | (4.03 | ) | 2.41 | 0.43 | 3.04 | 3.39 | (5.90 | ) | |||||||||||||||||||||||||||
|
|
|
|
|
|
|
|
|
|
|
|
|
|
|
|
|
|
|
| |||||||||||||||||||||
Total from operations | 1.77 | (0.43 | ) | 0.74 | 2.22 | (4.04 | ) | 2.38 | 0.35 | 2.97 | 3.33 | (5.98 | ) | |||||||||||||||||||||||||||
|
|
|
|
|
|
|
|
|
|
|
|
|
|
|
|
|
|
|
| |||||||||||||||||||||
Net asset value, end of year | $ | 9.51 | $ | 7.74 | $ | 8.17 | $ | 7.43 | $ | 5.21 | $ | 15.59 | $ | 13.21 | $ | 12.86 | $ | 9.89 | $ | 6.56 | ||||||||||||||||||||
|
|
|
|
|
|
|
|
|
|
|
|
|
|
|
|
|
|
|
| |||||||||||||||||||||
Total return | 22.87 | % | –5.26 | % | 9.96 | % | 42.61 | % | –43.68 | % | 18.02 | % | 2.72 | % | 30.03 | % | 50.76 | % | –47.69 | % | ||||||||||||||||||||
Ratios and supplemental data: | ||||||||||||||||||||||||||||||||||||||||
Net assets at end of year (millions) | $ | 33.1 | $ | 25.8 | $ | 29.8 | $ | 27.2 | $ | 18.0 | $ | 35.0 | $ | 31.5 | $ | 32.1 | $ | 22.8 | $ | 13.2 | ||||||||||||||||||||
Ratios to average net assets: | ||||||||||||||||||||||||||||||||||||||||
Expenses | 0.99 | % | 1.04 | % | 1.05 | % | 1.04 | % | 0.98 | % | 1.10 | % | 1.08 | % | 1.13 | % | 1.21 | % | 1.18 | % | ||||||||||||||||||||
Net investment income (loss) | 0.34 | % | 0.02 | % | 0.17 | % | –0.23 | % | –0.04 | % | –0.20 | % | –0.60 | % | –0.70 | % | –0.77 | % | –0.84 | % | ||||||||||||||||||||
Portfolio turnover rate | 17 | % | 47 | % | 37 | % | 28 | % | 43 | % | 65 | % | 58 | % | 94 | % | 50 | % | 37 | % | ||||||||||||||||||||
The accompanying notes are an integral part of these financial statements.
| 120 |
| Ohio National Fund, Inc. |
Financial Highlights |
| Mid Cap Opportunity Portfolio | S&P 500® Index Portfolio | |||||||||||||||||||||||||||||||||||||||
| Years Ended December 31, | Years Ended December 31, | |||||||||||||||||||||||||||||||||||||||
| 2012 | 2011 | 2010 | 2009 | 2008 | 2012 | 2011 | 2010 | 2009 | 2008 | |||||||||||||||||||||||||||||||
Selected Per-Share Data: | ||||||||||||||||||||||||||||||||||||||||
Net asset value, beginning of year | $ | 17.81 | $ | 18.43 | $ | 15.41 | $ | 10.96 | $ | 22.50 | $ | 13.25 | $ | 13.21 | $ | 11.69 | $ | 9.41 | $ | 15.36 | ||||||||||||||||||||
Operations: | ||||||||||||||||||||||||||||||||||||||||
Net investment income (loss) | (0.02 | ) | (0.06 | ) | (0.06 | ) | (0.05 | ) | (0.07 | ) | 0.26 | 0.22 | 0.19 | 0.17 | 0.24 | |||||||||||||||||||||||||
Net realized and unrealized gain (loss) on investments | 3.53 | (0.56 | ) | 3.08 | 4.50 | (11.47 | ) | 1.78 | 0.01 | 1.50 | 2.26 | (5.98 | ) | |||||||||||||||||||||||||||
|
|
|
|
|
|
|
|
|
|
|
|
|
|
|
|
|
|
|
| |||||||||||||||||||||
Total from operations | 3.51 | (0.62 | ) | 3.02 | 4.45 | (11.54 | ) | 2.04 | 0.23 | 1.69 | 2.43 | (5.74 | ) | |||||||||||||||||||||||||||
|
|
|
|
|
|
|
|
|
|
|
|
|
|
|
|
|
|
|
| |||||||||||||||||||||
Distributions: | ||||||||||||||||||||||||||||||||||||||||
Distributions from net investment income | — | — | — | — | — | (0.21 | ) | (0.19 | ) | (0.17 | ) | (0.15 | ) | (0.21 | ) | |||||||||||||||||||||||||
|
|
|
|
|
|
|
|
|
|
|
|
|
|
|
|
|
|
|
| |||||||||||||||||||||
Net asset value, end of year | $ | 21.32 | $ | 17.81 | $ | 18.43 | $ | 15.41 | $ | 10.96 | $ | 15.08 | $ | 13.25 | $ | 13.21 | $ | 11.69 | $ | 9.41 | ||||||||||||||||||||
|
|
|
|
|
|
|
|
|
|
|
|
|
|
|
|
|
|
|
| |||||||||||||||||||||
Total return | 19.71 | % | –3.36 | % | 19.60 | % | 40.60 | % | –51.29 | % | 15.40 | % | 1.77 | % | 14.45 | % | 25.83 | % | –37.30 | % | ||||||||||||||||||||
Ratios and supplemental data: | ||||||||||||||||||||||||||||||||||||||||
Net assets at end of year (millions) | $ | 67.1 | $ | 61.1 | $ | 70.4 | $ | 63.5 | $ | 79.6 | $ | 207.8 | $ | 170.7 | $ | 176.2 | $ | 160.7 | $ | 106.2 | ||||||||||||||||||||
Ratios to average net assets: | ||||||||||||||||||||||||||||||||||||||||
Expenses | 0.98 | % | 0.96 | % | 0.98 | % | 0.97 | % | 0.94 | % | 0.48 | % | 0.47 | % | 0.49 | % | 0.51 | % | 0.48 | % | ||||||||||||||||||||
Net investment income (loss) | –0.09 | % | –0.29 | % | –0.35 | % | –0.27 | % | –0.53 | % | 1.87 | % | 1.62 | % | 1.59 | % | 1.85 | % | 1.85 | % | ||||||||||||||||||||
Portfolio turnover rate | 45 | % | 51 | % | 56 | % | 276 | % | 297 | % | 7 | % | 9 | % | 8 | % | 21 | % | 12 | % | ||||||||||||||||||||
The accompanying notes are an integral part of these financial statements.
| 121 |
| Ohio National Fund, Inc. |
Financial Highlights |
| Strategic Value Portfolio | High Income Bond Portfolio | |||||||||||||||||||||||||||||||||||||||
| Years Ended December 31, | Years Ended December 31, | |||||||||||||||||||||||||||||||||||||||
| 2012 | 2011 | 2010 | 2009 | 2008 | 2012 | 2011 | 2010 | 2009 | 2008 | |||||||||||||||||||||||||||||||
Selected Per-Share Data: | ||||||||||||||||||||||||||||||||||||||||
Net asset value, beginning of year | $ | 10.50 | $ | 9.36 | $ | 8.64 | $ | 7.97 | $ | 11.81 | $ | 12.97 | $ | 12.31 | $ | 10.79 | $ | 7.21 | $ | 9.68 | ||||||||||||||||||||
Operations: | ||||||||||||||||||||||||||||||||||||||||
Net investment income | 0.13 | 0.33 | 0.35 | 0.27 | 0.56 | 0.99 | 1.08 | 0.58 | 0.46 | 0.68 | ||||||||||||||||||||||||||||||
Net realized and unrealized gain (loss) on investments and foreign currency related transactions | 0.63 | 0.98 | 0.68 | 0.65 | (3.91 | ) | 0.87 | (0.42 | ) | 0.94 | 3.12 | (3.15 | ) | |||||||||||||||||||||||||||
|
|
|
|
|
|
|
|
|
|
|
|
|
|
|
|
|
|
|
| |||||||||||||||||||||
Total from operations | 0.76 | 1.31 | 1.03 | 0.92 | (3.35 | ) | 1.86 | 0.66 | 1.52 | 3.58 | (2.47 | ) | ||||||||||||||||||||||||||||
|
|
|
|
|
|
|
|
|
|
|
|
|
|
|
|
|
|
|
| |||||||||||||||||||||
Distributions: | ||||||||||||||||||||||||||||||||||||||||
Distributions from net investment income | (0.17 | ) | (0.17 | ) | (0.24 | ) | (0.25 | ) | (0.49 | ) | — | — | — | — | — | |||||||||||||||||||||||||
Return of capital distributions | — | — | (0.07 | ) | — | — | — | — | — | — | — | |||||||||||||||||||||||||||||
|
|
|
|
|
|
|
|
|
|
|
|
|
|
|
|
|
|
|
| |||||||||||||||||||||
Total distributions | (0.17 | ) | (0.17 | ) | (0.31 | ) | (0.25 | ) | (0.49 | ) | — | — | — | — | — | |||||||||||||||||||||||||
|
|
|
|
|
|
|
|
|
|
|
|
|
|
|
|
|
|
|
| |||||||||||||||||||||
Net asset value, end of year | $ | 11.09 | $ | 10.50 | $ | 9.36 | $ | 8.64 | $ | 7.97 | $ | 14.83 | $ | 12.97 | $ | 12.31 | $ | 10.79 | $ | 7.21 | ||||||||||||||||||||
|
|
|
|
|
|
|
|
|
|
|
|
|
|
|
|
|
|
|
| |||||||||||||||||||||
Total return | 7.21 | % | 14.03 | % | 11.98 | % | 11.52 | % | –28.27 | % | 14.34 | % | 5.36 | % | 14.09 | % | 49.65 | % | –25.52 | % | ||||||||||||||||||||
Ratios and supplemental data: | ||||||||||||||||||||||||||||||||||||||||
Net assets at end of year (millions) | $ | 268.2 | $ | 42.0 | $ | 24.3 | $ | 19.8 | $ | 13.3 | $ | 311.9 | $ | 267.5 | $ | 269.8 | $ | 159.9 | $ | 71.3 | ||||||||||||||||||||
Ratios to average net assets: | ||||||||||||||||||||||||||||||||||||||||
Expenses | 0.82 | % | 0.96 | % | 0.96 | % | 1.02 | % | 0.96 | % | 0.79 | % | 0.78 | % | 0.81 | % | 0.88 | % | 0.88 | % | ||||||||||||||||||||
Net investment income | 3.84 | % | 4.07 | % | 4.11 | % | 4.31 | % | 4.68 | % | 7.17 | % | 7.69 | % | 8.03 | % | 9.14 | % | 8.77 | % | ||||||||||||||||||||
Portfolio turnover rate | 30 | % | 19 | % | 31 | % | 42 | % | 162 | % | 35 | % | 35 | % | 33 | % | 20 | % | 18 | % | ||||||||||||||||||||
The accompanying notes are an integral part of these financial statements.
| 122 |
| Ohio National Fund, Inc. |
Financial Highlights |
| Capital Growth Portfolio | Nasdaq-100® Index Portfolio | |||||||||||||||||||||||||||||||||||||||
| Years Ended December 31, | Years Ended December 31, | |||||||||||||||||||||||||||||||||||||||
| 2012 | 2011 | 2010 | 2009 | 2008 | 2012 | 2011 | 2010 | 2009 | 2008 | |||||||||||||||||||||||||||||||
Selected Per-Share Data: | ||||||||||||||||||||||||||||||||||||||||
Net asset value, beginning of year | $ | 27.00 | $ | 27.68 | $ | 20.29 | $ | 15.00 | $ | 23.57 | $ | 5.85 | $ | 5.69 | $ | 4.78 | $ | 3.11 | $ | 5.36 | ||||||||||||||||||||
Operations: | ||||||||||||||||||||||||||||||||||||||||
Net investment income (loss) | (0.03 | ) | (0.19 | ) | (0.11 | ) | — | (0.12 | ) | 0.06 | 0.02 | 0.02 | 0.01 | — | ||||||||||||||||||||||||||
Net realized and unrealized gain (loss) on investments | 3.76 | (0.49 | ) | 7.50 | 5.29 | (8.45 | ) | 0.99 | 0.16 | 0.91 | 1.66 | (2.25 | ) | |||||||||||||||||||||||||||
|
|
|
|
|
|
|
|
|
|
|
|
|
|
|
|
|
|
|
| |||||||||||||||||||||
Total from operations | 3.73 | (0.68 | ) | 7.39 | 5.29 | (8.57 | ) | 1.05 | 0.18 | 0.93 | 1.67 | (2.25 | ) | |||||||||||||||||||||||||||
|
|
|
|
|
|
|
|
|
|
|
|
|
|
|
|
|
|
|
| |||||||||||||||||||||
Distributions: | ||||||||||||||||||||||||||||||||||||||||
Distributions from net investment income | — | — | — | — | — | (0.05 | ) | (0.02 | ) | (0.02 | ) | — | — | |||||||||||||||||||||||||||
|
|
|
|
|
|
|
|
|
|
|
|
|
|
|
|
|
|
|
| |||||||||||||||||||||
Net asset value, end of year | $ | 30.73 | $ | 27.00 | $ | 27.68 | $ | 20.29 | $ | 15.00 | $ | 6.85 | $ | 5.85 | $ | 5.69 | $ | 4.78 | $ | 3.11 | ||||||||||||||||||||
|
|
|
|
|
|
|
|
|
|
|
|
|
|
|
|
|
|
|
| |||||||||||||||||||||
Total return | 13.81 | % | –2.46 | % | 36.42 | % | 35.27 | % | –36.36 | % | 17.88 | % | 3.19 | % | 19.38 | % | 53.70 | % | –41.98 | % | ||||||||||||||||||||
Ratios and supplemental data: | ||||||||||||||||||||||||||||||||||||||||
Net assets at end of year (millions) | $ | 55.1 | $ | 51.1 | $ | 52.4 | $ | 36.8 | $ | 27.1 | $ | 68.5 | $ | 55.5 | $ | 54.9 | $ | 47.6 | $ | 28.1 | ||||||||||||||||||||
Ratios to average net assets: | ||||||||||||||||||||||||||||||||||||||||
Expenses | 1.04 | % | 1.02 | % | 1.04 | % | 1.07 | % | 1.04 | % | 0.53 | % | 0.52 | % | 0.54 | % | 0.56 | % | 0.54 | % | ||||||||||||||||||||
Net investment income (loss) | –0.10 | % | –0.64 | % | –0.50 | % | 0.02 | % | –0.66 | % | 0.98 | % | 0.41 | % | 0.39 | % | 0.19 | % | 0.01 | % | ||||||||||||||||||||
Portfolio turnover rate | 42 | % | 44 | % | 56 | % | 67 | % | 63 | % | 25 | % | 44 | % | 30 | % | 29 | % | 27 | % | ||||||||||||||||||||
The accompanying notes are an integral part of these financial statements.
| 123 |
| Ohio National Fund, Inc. |
Financial Highlights |
| Bristol Portfolio | Bryton Growth Portfolio | |||||||||||||||||||||||||||||||||||||||
| Years Ended December 31, | Years Ended December 31, | |||||||||||||||||||||||||||||||||||||||
| 2012 | 2011 | 2010 | 2009 | 2008 | 2012 | 2011 | 2010 | 2009 | 2008 | |||||||||||||||||||||||||||||||
Selected Per-Share Data: | ||||||||||||||||||||||||||||||||||||||||
Net asset value, beginning of year | $ | 11.56 | $ | 12.51 | $ | 11.12 | $ | 8.23 | $ | 14.02 | $ | 12.31 | $ | 13.57 | $ | 10.94 | $ | 8.06 | $ | 13.33 | ||||||||||||||||||||
Operations: | ||||||||||||||||||||||||||||||||||||||||
Net investment income (loss) | 0.09 | 0.06 | 0.07 | 0.06 | 0.11 | (0.07 | ) | (0.08 | ) | (0.06 | ) | (0.05 | ) | (0.05 | ) | |||||||||||||||||||||||||
Net realized and unrealized gain (loss) on investments and foreign currency related transactions | 1.43 | (0.95 | ) | 1.39 | 2.89 | (5.80 | ) | 1.46 | (1.18 | ) | 2.69 | 2.93 | (5.22 | ) | ||||||||||||||||||||||||||
|
|
|
|
|
|
|
|
|
|
|
|
|
|
|
|
|
|
|
| |||||||||||||||||||||
Total from operations | 1.52 | (0.89 | ) | 1.46 | 2.95 | (5.69 | ) | 1.39 | (1.26 | ) | 2.63 | 2.88 | (5.27 | ) | ||||||||||||||||||||||||||
|
|
|
|
|
|
|
|
|
|
|
|
|
|
|
|
|
|
|
| |||||||||||||||||||||
Distributions: | ||||||||||||||||||||||||||||||||||||||||
Distributions from net investment income | (0.07 | ) | (0.06 | ) | (0.07 | ) | (0.06 | ) | (0.10 | ) | — | — | — | — | — | |||||||||||||||||||||||||
|
|
|
|
|
|
|
|
|
|
|
|
|
|
|
|
|
|
|
| |||||||||||||||||||||
Net asset value, end of year | $ | 13.01 | $ | 11.56 | $ | 12.51 | $ | 11.12 | $ | 8.23 | $ | 13.70 | $ | 12.31 | $ | 13.57 | $ | 10.94 | $ | 8.06 | ||||||||||||||||||||
|
|
|
|
|
|
|
|
|
|
|
|
|
|
|
|
|
|
|
| |||||||||||||||||||||
Total return | 13.19 | % | –7.16 | % | 13.10 | % | 35.83 | % | –40.54 | % | 11.29 | % | –9.29 | % | 24.04 | % | 35.73 | % | –39.53 | % | ||||||||||||||||||||
Ratios and supplemental data: | ||||||||||||||||||||||||||||||||||||||||
Net assets at end of year (millions) | $ | 204.9 | $ | 192.7 | $ | 182.6 | $ | 142.8 | $ | 81.5 | $ | 157.7 | $ | 155.4 | $ | 137.4 | $ | 113.4 | $ | 59.0 | ||||||||||||||||||||
Ratios to average net assets: | ||||||||||||||||||||||||||||||||||||||||
Expenses. | 0.85 | % | 0.84 | % | 0.86 | % | 0.89 | % | 0.90 | % | 0.93 | % | 0.91 | % | 0.93 | % | 0.96 | % | 0.96 | % | ||||||||||||||||||||
Net investment income (loss) | 0.68 | % | 0.52 | % | 0.70 | % | 0.79 | % | 1.13 | % | –0.57 | % | –0.67 | % | –0.49 | % | –0.64 | % | –0.62 | % | ||||||||||||||||||||
Portfolio turnover rate | 244 | % | 198 | % | 253 | % | 223 | % | 184 | % | 152 | % | 156 | % | 118 | % | 82 | % | 54 | % | ||||||||||||||||||||
The accompanying notes are an integral part of these financial statements.
| 124 |
| Ohio National Fund, Inc. |
Financial Highlights |
| U.S. Equity Portfolio | Balanced Portfolio | |||||||||||||||||||||||||||||||||||||||
| Years Ended December 31, | Years Ended December 31, | |||||||||||||||||||||||||||||||||||||||
| 2012 | 2011 | 2010 | 2009 | 2008 | 2012 | 2011 | 2010 | 2009 | 2008 | |||||||||||||||||||||||||||||||
Selected Per-Share Data: | ||||||||||||||||||||||||||||||||||||||||
Net asset value, beginning of year | $ | 10.03 | $ | 10.23 | $ | 9.16 | $ | 7.91 | $ | 15.45 | $ | 13.91 | $ | 13.87 | $ | 13.13 | $ | 10.74 | $ | 14.70 | ||||||||||||||||||||
Operations: | ||||||||||||||||||||||||||||||||||||||||
Net investment income | 0.08 | 0.07 | 0.08 | 0.07 | 0.14 | 0.10 | 0.31 | 0.32 | 0.29 | 0.25 | ||||||||||||||||||||||||||||||
Net realized and unrealized gain (loss) on investments foreign currency related transactions, and written options | 1.38 | (0.27 | ) | 1.06 | 1.24 | (7.56 | ) | 1.75 | (0.00 | ) | 0.70 | 2.39 | (4.21 | ) | ||||||||||||||||||||||||||
|
|
|
|
|
|
|
|
|
|
|
|
|
|
|
|
|
|
|
| |||||||||||||||||||||
Total from operation | 1.46 | (0.20 | ) | 1.14 | 1.31 | (7.42 | ) | 1.85 | 0.31 | 1.02 | 2.68 | (3.96 | ) | |||||||||||||||||||||||||||
|
|
|
|
|
|
|
|
|
|
|
|
|
|
|
|
|
|
|
| |||||||||||||||||||||
Distributions: | ||||||||||||||||||||||||||||||||||||||||
Distributions from net investment income | (0.06 | ) | — | (0.07 | ) | (0.06 | ) | (0.12 | ) | — | (0.27 | ) | (0.28 | ) | (0.29 | ) | — | |||||||||||||||||||||||
|
|
|
|
|
|
|
|
|
|
|
|
|
|
|
|
|
|
|
| |||||||||||||||||||||
Net asset value, end of year | $ | 11.43 | $ | 10.03 | $ | 10.23 | $ | 9.16 | $ | 7.91 | $ | 15.76 | $ | 13.91 | $ | 13.87 | $ | 13.13 | $ | 10.74 | ||||||||||||||||||||
|
|
|
|
|
|
|
|
|
|
|
|
|
|
|
|
|
|
|
| |||||||||||||||||||||
Total return | 14.61 | % | –1.96 | % | 12.46 | % | 16.57 | % | –47.98 | % | 13.30 | % | 2.29 | % | 7.78 | % | 24.92 | % | –26.94 | % | ||||||||||||||||||||
Ratios and supplemental data: | ||||||||||||||||||||||||||||||||||||||||
Net assets at end of year (millions) | $ | 15.6 | $ | 13.3 | $ | 14.5 | $ | 14.6 | $ | 13.0 | $ | 77.1 | $ | 17.1 | $ | 14.5 | $ | 13.6 | $ | 9.6 | ||||||||||||||||||||
Ratios to average net assets: | ||||||||||||||||||||||||||||||||||||||||
Expenses | 1.02 | % | 0.99 | % | 1.01 | % | 1.04 | % | 0.96 | % | 0.86 | % | 0.94 | % | 0.99 | % | 1.08 | % | 1.09 | % | ||||||||||||||||||||
Net investment income | 0.73 | % | 0.61 | % | 0.86 | % | 0.90 | % | 1.19 | % | 1.90 | % | 2.33 | % | 2.48 | % | 2.99 | % | 2.29 | % | ||||||||||||||||||||
Portfolio turnover rate | 53 | % | 75 | % | 98 | % | 173 | % | 216 | % | 60 | % | 47 | % | 56 | % | 72 | % | 80 | % | ||||||||||||||||||||
The accompanying notes are an integral part of these financial statements.
| 125 |
| Ohio National Fund, Inc. |
Financial Highlights |
| Income Opportunity Portfolio | Target VIP Portfolio | |||||||||||||||||||||||||||||||||||||||
| Years Ended December 31, | Years Ended December 31, | |||||||||||||||||||||||||||||||||||||||
| 2012 | 2011 | 2010 | 2009 | 2008 | 2012 | 2011 | 2010 | 2009 | 2008 | |||||||||||||||||||||||||||||||
Selected Per-Share Data: | ||||||||||||||||||||||||||||||||||||||||
Net asset value, beginning of year | $ | 11.86 | $ | 11.99 | $ | 11.19 | $ | 9.89 | $ | 12.49 | $ | 8.89 | $ | 9.11 | $ | 7.72 | $ | 6.81 | $ | 12.23 | ||||||||||||||||||||
Operations: | ||||||||||||||||||||||||||||||||||||||||
Net investment income (loss) | 0.19 | 0.11 | 0.08 | 0.01 | 0.10 | 0.18 | 0.10 | 0.13 | 0.11 | 0.12 | ||||||||||||||||||||||||||||||
Net realized and unrealized gain (loss) on investments, foreign currency related transactions, and written options | 0.68 | (0.24 | ) | 0.72 | 1.29 | (2.70 | ) | 1.17 | (0.23 | ) | 1.37 | 0.90 | (5.42 | ) | ||||||||||||||||||||||||||
|
|
|
|
|
|
|
|
|
|
|
|
|
|
|
|
|
|
|
| |||||||||||||||||||||
Total from operations | 0.87 | (0.13 | ) | 0.80 | 1.30 | (2.60 | ) | 1.35 | (0.13 | ) | 1.50 | 1.01 | (5.30 | ) | ||||||||||||||||||||||||||
|
|
|
|
|
|
|
|
|
|
|
|
|
|
|
|
|
|
|
| |||||||||||||||||||||
Distributions: | ||||||||||||||||||||||||||||||||||||||||
Distributions from net investment income | — | — | — | — | — | (0.14 | ) | (0.09 | ) | (0.11 | ) | (0.10 | ) | (0.12 | ) | |||||||||||||||||||||||||
|
|
|
|
|
|
|
|
|
|
|
|
|
|
|
|
|
|
|
| |||||||||||||||||||||
Net asset value, end of year | $ | 12.73 | $ | 11.86 | $ | 11.99 | $ | 11.19 | $ | 9.89 | $ | 10.10 | $ | 8.89 | $ | 9.11 | $ | 7.72 | $ | 6.81 | ||||||||||||||||||||
|
|
|
|
|
|
|
|
|
|
|
|
|
|
|
|
|
|
|
| |||||||||||||||||||||
Total return | 7.34 | % | –1.08 | % | 7.15 | % | 13.14 | % | –20.82 | % | 15.24 | % | –1.41 | % | 19.47 | % | 14.77 | % | –43.34 | % | ||||||||||||||||||||
Ratios and supplemental data: | ||||||||||||||||||||||||||||||||||||||||
Net assets at end of year (millions) | $ | 9.4 | $ | 10.8 | $ | 9.6 | $ | 6.7 | $ | 4.5 | $ | 21.2 | $ | 20.5 | $ | 21.9 | $ | 20.6 | $ | 18.2 | ||||||||||||||||||||
Ratios to average net assets: | ||||||||||||||||||||||||||||||||||||||||
Ratios net of expenses reduced or reimbursed by adviser: | ||||||||||||||||||||||||||||||||||||||||
Expenses | 1.19 | % | 1.18 | % | 1.27 | % | 1.56 | % | 1.62 | % | 0.87 | % | 0.84 | % | 0.82 | % | 0.83 | % | 0.80 | % | ||||||||||||||||||||
Net investment income (loss) | 1.12 | % | 1.04 | % | 0.89 | % | 0.40 | % | 0.98 | % | 1.73 | % | 1.07 | % | 1.50 | % | 1.53 | % | 1.45 | % | ||||||||||||||||||||
Ratios assuming no expenses reduced or reimbursed by adviser: | ||||||||||||||||||||||||||||||||||||||||
Expenses | 1.19 | % | 1.18 | % | 1.30 | % | 1.56 | % | 1.62 | % | 0.87 | % | 0.84 | % | 0.82 | % | 0.83 | % | 0.80 | % | ||||||||||||||||||||
Net investment income (loss) | 1.12 | % | 1.04 | % | 0.87 | % | 0.40 | % | 0.98 | % | 1.73 | % | 1.07 | % | 1.50 | % | 1.53 | % | 1.45 | % | ||||||||||||||||||||
Portfolio turnover rate | 53 | % | 114 | % | 92 | % | 200 | % | 203 | % | 70 | % | 79 | % | 92 | % | 91 | % | 79 | % | ||||||||||||||||||||
The accompanying notes are an integral part of these financial statements.
| 126 |
| Ohio National Fund, Inc. |
Financial Highlights |
| Target Equity/Income Portfolio | Bristol Growth Portfolio | |||||||||||||||||||||||||||||||||||||||
| Years Ended December 31, | Years Ended December 31, | |||||||||||||||||||||||||||||||||||||||
| 2012 | 2011 | 2010 | 2009 | 2008 | 2012 | 2011 | 2010 | 2009 | 2008 | |||||||||||||||||||||||||||||||
Selected Per-Share Data: | ||||||||||||||||||||||||||||||||||||||||
Net asset value, beginning of period | $ | 7.52 | $ | 8.61 | $ | 7.07 | $ | 6.41 | $ | 12.00 | $ | 9.63 | $ | 9.84 | $ | 8.75 | $ | 6.15 | $ | 10.35 | ||||||||||||||||||||
Operations: | ||||||||||||||||||||||||||||||||||||||||
Net investment income | 0.22 | 0.15 | 0.12 | 0.15 | 0.19 | 0.06 | 0.04 | 0.02 | 0.01 | 0.01 | ||||||||||||||||||||||||||||||
Net realized and unrealized gain (loss) on investments | 0.61 | (1.11 | ) | 1.52 | 0.64 | (5.61 | ) | 1.02 | (0.21 | ) | 1.10 | 2.59 | (4.21 | ) | ||||||||||||||||||||||||||
|
|
|
|
|
|
|
|
|
|
|
|
|
|
|
|
|
|
|
| |||||||||||||||||||||
Total from operations. | 0.83 | (0.96 | ) | 1.64 | 0.79 | (5.42 | ) | 1.08 | (0.17 | ) | 1.12 | 2.60 | (4.20 | ) | ||||||||||||||||||||||||||
|
|
|
|
|
|
|
|
|
|
|
|
|
|
|
|
|
|
|
| |||||||||||||||||||||
Distributions: | ||||||||||||||||||||||||||||||||||||||||
Distributions from net investment income | (0.17 | ) | (0.13 | ) | (0.10 | ) | (0.13 | ) | (0.17 | ) | (0.05 | ) | (0.04 | ) | (0.03 | ) | — | — | ||||||||||||||||||||||
|
|
|
|
|
|
|
|
|
|
|
|
|
|
|
|
|
|
|
| |||||||||||||||||||||
Net asset value, end of period | $ | 8.18 | $ | 7.52 | $ | 8.61 | $ | 7.07 | $ | 6.41 | $ | 10.66 | $ | 9.63 | $ | 9.84 | $ | 8.75 | $ | 6.15 | ||||||||||||||||||||
|
|
|
|
|
|
|
|
|
|
|
|
|
|
|
|
|
|
|
| |||||||||||||||||||||
Total return | 11.08 | % | –11.09 | % | 23.23 | % | 12.33 | % | –45.07 | % | 11.20 | % | –1.77 | % | 12.79 | % | 42.28 | % | –40.58 | % | ||||||||||||||||||||
Ratios and supplemental data: | ||||||||||||||||||||||||||||||||||||||||
Net assets at end of period (millions) | $ | 21.9 | $ | 21.6 | $ | 26.6 | $ | 22.6 | $ | 24.1 | $ | 108.0 | $ | 99.9 | $ | 85.3 | $ | 10.5 | $ | 4.8 | ||||||||||||||||||||
Ratios to average net assets: | ||||||||||||||||||||||||||||||||||||||||
Expenses | 0.84 | % | 0.78 | % | 0.78 | % | 0.79 | % | 0.74 | % | 0.92 | % | 0.90 | % | 0.93 | % | 1.29 | % | 1.26 | % | ||||||||||||||||||||
Net investment income | 2.48 | % | 1.75 | % | 1.56 | % | 2.03 | % | 2.05 | % | 0.57 | % | 0.41 | % | 0.63 | % | 0.26 | % | 0.18 | % | ||||||||||||||||||||
Portfolio turnover rate | 83 | % | 99 | % | 90 | % | 95 | % | 105 | % | 229 | % | 187 | % | 268 | % | 218 | % | 175 | % | ||||||||||||||||||||
The accompanying notes are an integral part of these financial statements.
| 127 |
| Ohio National Fund, Inc. |
| December 31, 2012 |
| (1) | Organization |
Ohio National Fund, Inc. (the “Fund”) is a Maryland corporation registered under the Investment Company Act of 1940, as amended (the “40 Act”), as an open-end management investment company. The Fund consists of twenty-four separate investment portfolios (the “Portfolios”) that seek the following objectives and strategies:
| ¢ | Equity Portfolio — Long-term growth of capital by investing at least 80% of its assets in equity securities. |
| ¢ | Money Market Portfolio — Maximum current income consistent with preservation of capital and liquidity by investing in high quality money market instruments. |
| ¢ | Bond Portfolio — High level of income and opportunity for capital appreciation consistent with preservation of capital by investing primarily in intermediate-term and long-term fixed income securities. |
| ¢ | Omni Portfolio — High level of long-term total return consistent with preservation of capital by investing in stocks, bonds, and money market instruments. |
| ¢ | International Portfolio — Long term growth of capital by investing at least 80% of its assets in securities of foreign companies. |
| ¢ | Capital Appreciation Portfolio — Long-term capital growth by investing primarily in common stocks of established companies with either current or emerging earnings growth not fully appreciated or recognized by the market. |
| ¢ | Millennium Portfolio — Capital growth by investing primarily in common stocks of small sized companies. |
| ¢ | International Small-Mid Company Portfolio — Long-term growth of capital by investing at least 80% of its assets in equity securities of foreign small and mid-cap companies. |
| ¢ | Aggressive Growth Portfolio — Long-term capital growth by investing primarily in domestic and foreign equity securities selected for growth potential. |
| ¢ | Small Cap Growth Portfolio — Long-term capital appreciation by investing at least 80% of its net assets in stocks of small companies. |
| ¢ | Mid Cap Opportunity Portfolio — Long-term total return by investing at least 80% of its net assets in equity securities of mid-cap companies, primarily those that are strategically positioned for long-term growth. |
| ¢ | S&P 500® Index Portfolio — Total return that approximates the total return of the Standard & Poor’s 500® Index, at a risk level consistent with that of the Standard & Poor’s 500® Index. |
| ¢ | Strategic Value Portfolio — Growth of capital and income by investing primarily in securities of high dividend yielding, undervalued stocks with dividend growth potential. |
| ¢ | High Income Bond Portfolio — High current income by investing at least 80% of its net assets in lower rated corporate debt obligations commonly referred to as “junk bonds”. The Portfolio’s investments are generally rated Ba or lower by Moody’s, or BB or lower by Standard & Poor’s or Fitch. |
| ¢ | Capital Growth Portfolio — Long-term capital appreciation by investing primarily in an actively managed portfolio of equity securities of small cap growth companies. |
| ¢ | Nasdaq-100® Index Portfolio — Long-term growth of capital by investing primarily in stocks that are included in the Nasdaq-100® Index. Unlike the other Portfolios of the Fund, the Nasdaq-100® Index Portfolio is a non-diversified portfolio for purposes of Section 5(b) of the 40 Act. |
| ¢ | Bristol Portfolio — Long-term growth of capital by investing primarily in common stocks of the 1,000 largest publicly traded U.S. companies in terms of market capitalization. |
| ¢ | Bryton Growth Portfolio — Long-term growth of capital by investing primarily in common stocks of growth-oriented U.S. companies smaller than the 500 largest publicly traded U.S. companies in terms of market capitalization. |
| ¢ | U.S. Equity Portfolio — Capital appreciation with a secondary objective of capital preservation to provide long term growth by investing at least 80% of its net assets in equity securities traded in the U.S. within under-priced sectors and industries. |
| 128 | (continued) |
| Ohio National Fund, Inc. |
Notes to Financial Statements (Continued) | December 31, 2012 |
| ¢ | Balanced Portfolio — Capital appreciation and income by investing normally up to 75% of its assets in equity securities within under-priced sectors and industries while maintaining a minimum of 25% of its assets in fixed income securities. |
| ¢ | Income Opportunity Portfolio — Modest capital appreciation and maximization of realized gains by investing in equity securities traded in the U.S. |
| ¢ | Target VIP Portfolio — Above average total return by investing in the common stocks of companies which are identified by a model that applies separate uniquely specialized strategies. |
| ¢ | Target Equity/Income Portfolio — Above average total return by adhering to a disciplined, quantitative investment process that incorporates two distinct strategy methodologies. |
| ¢ | Bristol Growth Portfolio — Long-term growth of capital by investing primarily in common stocks of the 1,000 largest publicly traded U.S. companies in terms of market capitalization. |
Additional detail regarding portfolio-specific objectives, policies, and investment strategies is provided in the prospectus and Statement of Additional Information of Ohio National Fund, Inc. There are no assurances that these objectives will be met. Each Portfolio, except the Nasdaq-100® Index Portfolio, is classified as diversified for purposes of Section 5(b) of the 40 Act.
At present, the Fund sells its shares only to separate accounts of The Ohio National Life Insurance Company (“ONLIC”), Ohio National Life Assurance Corporation (“ONLAC”), and National Security Life and Annuity Company (“NSLA”) to support certain benefits under variable contracts issued by those entities. In the future, Fund shares may be used for other purposes but, unless there is a change in applicable law, they will not be sold directly to the public.
Interest in each Portfolio is represented by a separate class of the Fund’s capital stock, par value $1. Each share of a Portfolio participates equally in the Portfolio’s dividends, distributions, net assets, and voting matters.
The Fund is authorized to issue 550 million of its capital shares. These authorized shares have been allocated to specific Portfolios of the Fund as follows:
Portfolio | Authorized Shares | |||
Equity | 30,000,000 | |||
Money Market | 80,000,000 | |||
Bond | 30,000,000 | |||
Omni | 10,000,000 | |||
International | 45,000,000 | |||
Capital Appreciation | 15,000,000 | |||
Millennium | 10,000,000 | |||
International Small-Mid Company | 10,000,000 | |||
Aggressive Growth | 10,000,000 | |||
Small Cap Growth | 10,000,000 | |||
Mid Cap Opportunity | 10,000,000 | |||
S&P 500® Index | 35,000,000 | |||
Portfolio | Authorized Shares | |||
Strategic Value | 10,000,000 | |||
High Income Bond | 60,000,000 | |||
Capital Growth | 10,000,000 | |||
Nasdaq-100® Index | 25,000,000 | |||
Bristol | 40,000,000 | |||
Bryton Growth | 35,000,000 | |||
U.S. Equity | 10,000,000 | |||
Balanced | 10,000,000 | |||
Income Opportunity | 10,000,000 | |||
Target VIP | 10,000,000 | |||
Target Equity/Income | 10,000,000 | |||
Bristol Growth | 25,000,000 | |||
The Fund’s Board of Directors (the “Board”) periodically reallocates authorized shares among the Portfolios of the Fund and may authorize additional shares as deemed necessary.
Under the Fund’s organizational documents, its Officers and Directors are indemnified against certain liabilities arising out of the performance of their duties to the Fund. In addition, in the normal course of business, the Fund enters into contracts with its vendors and others that provide for general indemnifications. The Fund’s maximum exposure under these arrangements is unknown as this would involve future claims that may be made against the Fund. However, based on experience, the risk of loss to the Fund is expected to be remote.
| 129 | (continued) |
| Ohio National Fund, Inc. |
Notes to Financial Statements (Continued) | December 31, 2012 |
| (2) | Significant Accounting Policies |
The following is a summary of significant accounting policies followed by the Fund in preparation of its financial statements:
Use of Estimates
The preparation of financial statements in conformity with U.S. generally accepted accounting principles (“GAAP”) requires management to make estimates and assumptions that affect the reported amounts of assets and liabilities and disclosure of contingent assets and liabilities at the date of the financial statements and the reported amounts of increases and decreases in net assets from operations during the reporting period. Actual results could differ from those estimates.
Security Valuation
Investments are valued using pricing procedures approved by the Board.
Various investments in the Money Market Portfolio are valued at amortized cost in accordance with Rule 2a-7 of the 40 Act. In all Portfolios of the Fund, fixed income instruments that mature in sixty days or less, and of sufficient credit quality, are valued at amortized cost. Amortized cost valuation involves valuing a security at its cost initially and thereafter amortizing to maturity any discounts or premiums on the level-yield method, regardless of the impact of fluctuating market interest rates on the value of the security. In these instances, amortized cost approximates fair value.
Investments, other than those securities aforementioned, are valued as follows:
Domestic equity securities that are traded on U.S. exchanges are valued at the last trade price reported by the primary exchange of each security (4:00 pm Eastern Time for normal trading sessions). Over-the-counter domestic equity securities are valued at the last trade price reported daily as of 4:00 pm Eastern Time (normal trading sessions). Over-the-counter traded ADRs may also be valued at an evaluated price based on the value of the underlying securities. If a domestic equity security is not traded on a particular day, the mean between the bid and ask prices reported at 4:00 pm Eastern Time (normal trading sessions) by the primary exchange will generally be used for valuation purposes. The principal sources for market quotations are independent pricing services that have been approved by the Board.
Fixed income securities that have a remaining maturity exceeding sixty days are generally valued at the mean between the daily close bid and ask prices reported at 4:00 pm Eastern Time (normal trading sessions), as provided by independent pricing services approved by the Board.
Shares of open-end mutual funds are valued at each fund’s last calculated net asset value per share.
Repurchase agreements are valued at amortized cost, which approximates fair value.
Restricted securities, illiquid securities, or other investments for which market quotations or other observable market inputs are not readily available are valued at an estimate of value using methods determined in good faith by the Fund’s Pricing Committee under the supervision of the Board.
Foreign equity securities are initially priced at the reported close price of the exchange on which a security is primarily traded. Securities not traded on a particular day are valued at the mean between the last reported bid and ask quotes at daily close, or the last sale price when appropriate. The principal sources for market quotations are independent pricing services that have been approved by the Board.
Equity securities that are primarily traded on foreign exchanges, other than those in North or South America, are further subjected to fair valuation pricing procedures provided by an independent fair valuation service. The service provides data that can be used to estimate the price of a foreign issue that would prevail in a liquid market given market information available daily at 4:00 pm Eastern Time (normal trading sessions). Multiple factors may be considered in performing this valuation, including an issue’s local close price, relevant general and sector indices, currency fluctuations, and pricing of related depository receipts, exchange traded funds, and futures. The pricing procedures are performed for each individual security for which there is a fairly large degree of certainty that the local close price is not the liquid market price at the time of U.S. market close. The procedures are performed each day there is a change in a consistently used market index from the time of local close to the U.S. market close. Backtesting analysis is performed on a quarterly basis to monitor the effectiveness of these procedures. The testing is reviewed by management of the Fund as well as the Fund’s Board. Prior results have indicated that these procedures have been effective in reaching valuation objectives.
| 130 | (continued) |
| Ohio National Fund, Inc. |
Notes to Financial Statements (Continued) | December 31, 2012 |
The differences between the aggregate cost and values of investments are reflected as unrealized appreciation or unrealized depreciation.
Pricing inputs used in the Fund’s determination of its investment values are categorized according to a three-tier hierarchy framework. The hierarchy is summarized in three broad levels:
| Level 1: | Quoted prices in active markets for identical securities. |
| Level 2: | Other significant observable inputs, including quoted prices for similar securities, interest rates, prepayment speeds, credit risk, etc. |
| Level 3: | Significant unobservable inputs, including the Fund’s own assumptions used to determine the value of securities. |
The following is a summary of the inputs used in valuing each of the Portfolio’s assets (liabilities) at value as of December 31, 2012:
Portfolio | Financial Instrument Type | Level 1 | Level 2 | Level 3 | ||||||||||
Equity | Common Stocks** | $ | 181,176,531 | $ | — | $ | — | |||||||
| Preferred Stocks** | 3,040,557 | — | — | |||||||||||
| Money Market Funds | 1,775,000 | — | — | |||||||||||
|
|
|
|
|
| |||||||||
| $ | 185,992,088 | $ | — | $ | — | |||||||||
|
|
|
|
|
| |||||||||
Money Market* | Commercial Paper** | $ | — | $ | 160,992,668 | $ | — | |||||||
| Asset-Backed Securities** | — | 1,237,913 | — | |||||||||||
| U.S. Government Agency Issues | — | 11,998,035 | — | |||||||||||
| U.S. Treasury Obligations | — | 9,999,278 | — | |||||||||||
| Money Market Funds | 30,000,000 | — | — | |||||||||||
|
|
|
|
|
| |||||||||
| $ | 30,000,000 | $ | 184,227,894 | $ | — | |||||||||
|
|
|
|
|
| |||||||||
Bond | Corporate Bonds** | $ | — | $ | 158,137,120 | $ | — | |||||||
| U.S. Treasury Obligations | — | 8,117,812 | — | |||||||||||
| Money Market Funds | 3,883,000 | — | — | |||||||||||
|
|
|
|
|
| |||||||||
| $ | 3,883,000 | $ | 166,254,932 | $ | — | |||||||||
|
|
|
|
|
| |||||||||
Omni | Common Stocks** | $ | 24,087,551 | $ | — | $ | — | |||||||
| Corporate Bonds** | — | 7,331,273 | — | |||||||||||
| U.S. Treasury Obligations | — | 443,852 | — | |||||||||||
| Money Market Funds | 1,118,000 | — | — | |||||||||||
|
|
|
|
|
| |||||||||
| $ | 25,205,551 | $ | 7,775,125 | $ | — | |||||||||
|
|
|
|
|
| |||||||||
International | Common Stocks** | $ | 45,346,176 | $ | 127,832,331 | $ | — | |||||||
| Preferred Stocks** | 1,237,729 | — | — | |||||||||||
| U.S. Treasury Obligations | — | 324,989 | — | |||||||||||
| Money Market Funds | 9,552,044 | — | — | |||||||||||
|
|
|
|
|
| |||||||||
| $ | 56,135,949 | $ | 128,157,320 | $ | — | |||||||||
|
|
|
|
|
| |||||||||
| Foreign currency contracts | $ | 749,359 | $ | — | $ | — | ||||||||
|
|
|
|
|
| |||||||||
| Futures contracts | $ | (15,998 | ) | $ | — | $ | — | |||||||
|
|
|
|
|
| |||||||||
Capital Appreciation | Common Stocks** | $ | 107,368,660 | $ | 3,476,725 | $ | — | |||||||
| Money Market Funds | 5,110,000 | — | — | |||||||||||
|
|
|
|
|
| |||||||||
| $ | 112,478,660 | $ | 3,476,725 | $ | — | |||||||||
|
|
|
|
|
| |||||||||
Millennium | Common Stocks** | $ | 33,706,831 | $ | — | $ | — | |||||||
| Money Market Funds | 504,000 | — | — | |||||||||||
|
|
|
|
|
| |||||||||
| $ | 34,210,831 | $ | — | $ | — | |||||||||
|
|
|
|
|
| |||||||||
International Small-Mid Company | Common Stocks** | $ | 14,998,918 | $ | 46,204,976 | $ | — | |||||||
| Money Market Funds | 3,478,891 | — | — | |||||||||||
|
|
|
|
|
| |||||||||
| $ | 18,477,809 | $ | 46,204,976 | $ | — | |||||||||
|
|
|
|
|
| |||||||||
| 131 | (continued) |
| Ohio National Fund, Inc. |
Notes to Financial Statements (Continued) | December 31, 2012 |
Portfolio | Financial Instrument Type | Level 1 | Level 2 | Level 3 | ||||||||||
Aggressive Growth | Common Stocks** | $ | 25,736,292 | $ | 4,995,733 | $ | — | |||||||
| VVPR Strips** | 9 | — | — | |||||||||||
| Commercial Paper | — | 100,000 | — | |||||||||||
| Money Market Funds | 2,350,000 | — | — | |||||||||||
|
|
|
|
|
| |||||||||
| $ | 28,086,301 | $ | 5,095,733 | $ | — | |||||||||
|
|
|
|
|
| |||||||||
Small Cap Growth | Common Stocks** | $ | 33,572,492 | $ | — | $ | — | |||||||
| Commercial Paper | — | 100,000 | — | |||||||||||
| Money Market Funds | 1,371,000 | — | — | |||||||||||
|
|
|
|
|
| |||||||||
| $ | 34,943,492 | $ | 100,000 | $ | — | |||||||||
|
|
|
|
|
| |||||||||
Mid Cap Opportunity | Common Stocks** | $ | 66,711,503 | $ | — | $ | — | |||||||
| Money Market Funds | 701,000 | — | — | |||||||||||
|
|
|
|
|
| |||||||||
| $ | 67,412,503 | $ | — | $ | — | |||||||||
|
|
|
|
|
| |||||||||
S&P 500® Index | Common Stocks** | $ | 199,927,026 | $ | — | $ | — | |||||||
| Exchange Traded Funds | 7,877,793 | — | — | |||||||||||
|
|
|
|
|
| |||||||||
| $ | 207,804,819 | $ | — | $ | — | |||||||||
|
|
|
|
|
| |||||||||
Strategic Value | Common Stocks** | $ | 193,607,311 | $ | 64,896,335 | $ | — | |||||||
| Money Market Funds | 1,331,000 | — | — | |||||||||||
|
|
|
|
|
| |||||||||
| $ | 194,938,311 | $ | 64,896,335 | $ | — | |||||||||
|
|
|
|
|
| |||||||||
High Income Bond | Corporate Bonds** | $ | — | $ | 306,187,127 | $ | — | |||||||
| Common Stocks** | 128,092 | — | — | |||||||||||
| Preferred Stocks** | 339,848 | — | — | |||||||||||
| Warrants** | 129,208 | — | — | |||||||||||
| Other** | 23,659 | — | — | |||||||||||
| Money Market Funds | 1,440,000 | — | — | |||||||||||
|
|
|
|
|
| |||||||||
| $ | 2,060,807 | $ | 306,187,127 | $ | — | |||||||||
|
|
|
|
|
| |||||||||
Capital Growth | Common Stocks** | $ | 55,035,816 | $ | — | $ | — | |||||||
| Money Market Funds | 764,000 | — | — | |||||||||||
|
|
|
|
|
| |||||||||
| $ | 55,799,816 | $ | — | $ | — | |||||||||
|
|
|
|
|
| |||||||||
Nasdaq-100® Index | Common Stocks** | $ | 66,417,616 | $ | — | $ | — | |||||||
| Exchange Traded Funds | 1,267,366 | — | — | |||||||||||
|
|
|
|
|
| |||||||||
| $ | 67,684,982 | $ | — | $ | — | |||||||||
|
|
|
|
|
| |||||||||
Bristol | Common Stocks** | $ | 200,642,235 | $ | — | $ | — | |||||||
| Money Market Funds | 2,966,000 | — | — | |||||||||||
|
|
|
|
|
| |||||||||
| $ | 203,608,235 | $ | — | $ | — | |||||||||
|
|
|
|
|
| |||||||||
Bryton Growth | Common Stocks** | $ | 150,541,940 | $ | — | $ | — | |||||||
| Money Market Funds | 4,766,000 | — | — | |||||||||||
|
|
|
|
|
| |||||||||
| $ | 155,307,940 | $ | — | $ | — | |||||||||
|
|
|
|
|
| |||||||||
U.S. Equity | Common Stocks** | $ | 15,602,309 | $ | — | $ | — | |||||||
|
|
|
|
|
| |||||||||
Balanced | Common Stocks** | $ | 52,940,566 | $ | — | $ | — | |||||||
| Corporate Bonds** | — | 18,783,042 | — | |||||||||||
| U.S. Treasury Obligations | — | 3,671,454 | — | |||||||||||
| Purchased Options | 401,100 | — | — | |||||||||||
| Money Market Funds | 966,000 | — | — | |||||||||||
|
|
|
|
|
| |||||||||
| $ | 54,307,666 | $ | 22,454,496 | $ | — | |||||||||
|
|
|
|
|
| |||||||||
| 132 | (continued) |
| Ohio National Fund, Inc. |
Notes to Financial Statements (Continued) | December 31, 2012 |
Portfolio | Financial Instrument Type | Level 1 | Level 2 | Level 3 | ||||||||||
Income Opportunity | Common Stocks** | $ | 9,581,769 | $ | — | $ | — | |||||||
| Purchased Options | 57,300 | — | — | |||||||||||
|
|
|
|
|
| |||||||||
| $ | 9,639,069 | $ | — | $ | — | |||||||||
|
|
|
|
|
| |||||||||
Target VIP | Common Stocks** | $ | 20,824,223 | $ | — | $ | — | |||||||
| Money Market Funds | 275,000 | — | — | |||||||||||
|
|
|
|
|
| |||||||||
| $ | 21,099,223 | $ | — | $ | — | |||||||||
|
|
|
|
|
| |||||||||
Target Equity/Income | Common Stocks** | $ | 21,461,689 | $ | — | $ | — | |||||||
| Money Market Funds | 430,000 | — | — | |||||||||||
|
|
|
|
|
| |||||||||
| $ | 21,891,689 | $ | — | $ | — | |||||||||
|
|
|
|
|
| |||||||||
Bristol Growth | Common Stocks** | $ | 104,210,635 | $ | — | $ | — | |||||||
| Money Market Funds | 1,744,000 | — | — | |||||||||||
|
|
|
|
|
| |||||||||
| $ | 105,954,635 | $ | — | $ | — | |||||||||
|
|
|
|
|
| |||||||||
| * | At December 31, 2012, the Money Market Portfolio’s investments, with the exception of money market funds, were valued using amortized cost, in accordance with rules under the 40 Act. Amortized cost approximates the current fair value of a security, but since the value is not obtained from a quoted price in an active market, such securities are considered to be valued using Level 2 inputs. |
| ** | For detailed industry descriptions see the accompanying Schedules of Investments. |
As stated above, the value assigned to the Fund’s foreign securities will, in most cases, not be the quoted or published prices of the investments on their respective primary markets or exchanges. Securities that are priced using fair value estimates are categorized as Level 2 in the fair value hierarchy, whereas securities that do not meet the established criteria are categorized as Level 1. The valuation of a foreign security from one valuation period to the next may result in a transfer between Levels 1 and 2 if the degree of certainty that the local close price is not the liquid market price at the time of U.S. market close is not similar for both periods. The Fund’s policy is to recognize transfers between fair value hierarchy levels at the reporting period end. In the International Small-Mid Company Portfolio, there was one transfer of a security, which was reported in the Level 2 pricing category at December 31, 2011, to Level 1 at December 31, 2012. This security was that Portfolio’s holding of Remy Cointreau SA common stock . The fair valuation service provider reported that the security did not meet the minimum predictability threshold at December 31, 2012, and was not fair valued in the current year; whereas in the prior year, the security met the threshold to be fair valued. The value of this holding was $296,368 and $630,939 at December 31, 2012 and 2011, respectively.
Below is a reconciliation that details the activity of securities in Level 3 during the year ended December 31, 2012:
| Aggressive Growth | S&P 500® Index | High Income Bond | Nasdaq-100® Index | |||||||||||||
Beginning Balance – December 31, 2011 | $ | 9 | $ | 198 | $ | 20,781 | $ | 776 | ||||||||
Total gains or losses (realized/unrealized): | ||||||||||||||||
Included in earnings (or changes in net assets) | — | 427 | (5,156 | ) | 1,669 | |||||||||||
Issuances | — | — | — | — | ||||||||||||
Settlements | — | (625 | ) | (15,625 | ) | (2,445 | ) | |||||||||
Transfers out of Level 3 to Level 1 (due to availability of active market quotation) | (9 | ) | — | — | — | |||||||||||
|
|
|
|
|
|
|
| |||||||||
Ending Balance – December 31, 2012 | $ | — | $ | — | $ | — | $ | — | ||||||||
|
|
|
|
|
|
|
| |||||||||
The amount of total gains or losses for the period included in earnings (or changes in net assets) attributable to the change in unrealized gains or losses relating to assets still held at the reporting date | $ | — | $ | 427 | $ | (5,156 | ) | $ | 1,669 | |||||||
|
|
|
|
|
|
|
| |||||||||
Foreign Securities and Currency
The books and records of all the Portfolios are maintained in U.S. dollars. All investments and cash quoted in foreign currencies are valued daily in U.S. dollars on the basis of the foreign currency exchange rates provided by an independent source. These
| 133 | (continued) |
| Ohio National Fund, Inc. |
Notes to Financial Statements (Continued) | December 31, 2012 |
exchange rates are currently determined daily, at 4:00 pm Eastern Time for normal trading sessions. Purchases and sales of foreign-denominated investments are recorded at rates of exchange prevailing on the respective dates of such transactions.
The Fund may not fully isolate that portion of the results of operations resulting from changes in foreign exchange rates from fluctuations arising from changes in market prices on foreign currency-denominated investments. For the portion that is isolated, amounts are reflected as the Statements of Operations as other foreign currency related transactions. However, for tax purposes, the Fund does fully isolate the effect of fluctuations in foreign exchange rates when determining the gain or loss upon sale or maturity of such investments to the extent required by federal income tax regulations.
All Portfolios of the Fund may invest in securities of foreign issuers. Securities of foreign issuers that are purchased by the Money Market Portfolio are limited to 50% of that Portfolio’s assets and must be denominated in U.S. dollars and held in custody in the United States of America. The International and International Small-Mid Company Portfolios may be invested entirely in foreign securities. Investments in securities of foreign issuers, including investments in foreign companies through the use of depositary receipts, carry certain risks not ordinarily associated with investments in securities of domestic issuers. Such risks include future political and economic developments, and the possible imposition of exchange controls or other foreign governmental laws and restrictions. In addition, with respect to certain countries, there is the possibility of expropriation of assets, confiscatory taxation, political or social instability, or diplomatic developments that could adversely affect capital investment within those countries.
Repurchase Agreements
The Portfolios may acquire repurchase agreements from member banks of the Federal Reserve System which are deemed creditworthy under guidelines approved by the Board, subject to the seller’s agreement to repurchase such securities at a mutually agreed upon date and price. The repurchase price generally equals the price paid by a Portfolio plus interest negotiated on the basis of current short-term rates, which may be more or less than the rate on the underlying securities. The maturities of these instruments vary from overnight to one week. The seller, under a repurchase agreement, is required to maintain as collateral for the repurchase transaction securities in which the Portfolio has a perfected security interest with a value not less than 100% of the repurchase price (including accrued interest). Securities subject to repurchase agreements are held by the Portfolio’s custodian or another qualified custodian or in the Federal Reserve/Treasury book-entry system. In the event of counterparty default, the Fund has the right to use the collateral to offset losses incurred. There is potential for loss to the Fund in the event the Fund is delayed or prevented from exercising its rights to dispose of the collateral securities, including the risk of a possible decline in the value of the underlying securities during the period while the Fund seeks to assert its rights.
Restricted and Illiquid Securities
Restricted securities are those securities purchased through a private offering and cannot be resold to the general public without prior registration under the Securities Act of 1933 (“the 1933 Act”) or pursuant to the resale limitations provided by Rule 144A under the 1933 Act, or an exemption from the registration requirements of the 1933 Act. 144A securities are issued by corporations without registration in reliance on 1933 Act provisions allowing for the private resale of unregistered securities to qualified institutional buyers. Section 4(2) commercial paper is issued pursuant to Section 4(2) of the 1933 Act which exempts an issue from registration. This paper may be used to finance non-current transactions, such as acquisitions, stock repurchase programs, and other long-term assets. Investments by a portfolio in Rule 144A and Section 4(2) securities could have the effect of decreasing the liquidity of a Portfolio during any period in which qualified institutional investors were no longer interested in purchasing these securities.
Typically, the restricted securities noted above are not considered illiquid. The criteria used to determine if a restricted security is illiquid includes frequency of trades and quotes, available dealers willing to make transactions, availability of market makers in the security, and the nature of the security and its trades. The Money Market, Bond, and Omni Portfolios may invest up to 10% of their respective assets in illiquid securities. Each of the other Portfolios of the Fund may invest up to 15% of its net assets in illiquid securities.
Investment Transactions and Related Income
For financial reporting purposes, investment transactions are accounted for on a trade date basis. For purposes of executing separate account shareholder transactions in the normal course of business, however, the Fund’s investment transactions are recorded no later than the first calculation on the first business day following the trade date in accordance with Rule 2a-4 of the 40 Act. Accordingly, differences between the net asset values for financial reporting and for executing separate account shareholder transactions may arise.
| 134 | (continued) |
| Ohio National Fund, Inc. |
Notes to Financial Statements (Continued) | December 31, 2012 |
Dividend income is recognized on the ex-dividend date, except in the case of those Portfolios holding foreign securities, in which dividends are recorded as soon after the ex-dividend date as the Fund’s information agents become aware of such dividends. Interest income is accrued daily as earned and includes the amortization of premium and accretion of discount. Net realized gain or loss on investments and foreign exchange transactions are determined using the specific identification method.
Distributions to Shareholders and Federal Taxes
Net investment income of the Money Market Portfolio is declared and paid daily as a dividend to shareholders immediately before the computation of the net asset value of Money Market Portfolio shares. Dividends are automatically reinvested in additional Money Market Portfolio shares at the net asset value immediately following such computation. Distributions arising from net investment income and net capital gains from the remaining Portfolios are declared and paid to shareholders periodically as required for each of the Portfolios to continue to qualify as a regulated investment company pursuant to Subchapter M of the Internal Revenue Code. The Fund, excluding the Money Market Portfolio, may also fully or partially satisfy its distribution requirements by using consent dividends rather than cash dividends. The Fund has the intent to continue to comply with tax provisions pertaining to regulated investment companies and make distributions of taxable income sufficient to relieve it from substantially all federal income and excise taxes. As such, no provisions for federal income or excise taxes have been recorded.
The character of income and realized capital gains distributions are determined in accordance with federal income tax regulations and may differ from net investment income and realized gains for financial reporting purposes. These “book/tax” differences are either considered temporary or permanent in nature. To the extent these differences are permanent in nature they are reclassified within the composition of net assets; temporary differences do not require such reclassification. Distributions to shareholders that exceed taxable income and net taxable realized gains are reported as return of capital distributions.
The Fund’s management and its tax agent, U.S. Bancorp Fund Services, LLC, perform an affirmative evaluation of tax positions taken or expected to be taken in the course of preparing the Fund’s tax returns to determine whether it is more-likely-than-not (i.e. greater than 50-percent) that each tax position will be sustained upon examination by a taxing authority based on the technical merits of the position. A tax position that meets the more-likely-than-not recognition threshold is measured to determine the amount of benefit to recognize in the financial statements. Differences between tax positions taken in a tax return and amounts recognized in the financial statements will generally result in an increase in a liability for taxes payable (or a reduction of a tax refund receivable), including the recognition of any related interest and penalties as an operating expense. Implementation of the evaluation included a review of tax positions taken in tax years that remain subject to examination by all major tax jurisdictions, including federal tax and the state of Maryland (i.e., the last four tax year ends and the interim tax period since then). The determination has been made that there are no uncertain tax positions that would require the Portfolios to record a tax liability and, therefore, there is no impact to the Portfolios’ financial statements.
Expense Allocation
Expenses directly attributable to a Portfolio are charged to that Portfolio. Expenses that cannot be directly attributed to a Portfolio are allocated among all the benefited Portfolios on a basis of relative net assets or other appropriate method.
Foreign Withholding Taxes
Certain Portfolios in the Fund may be subject to taxes imposed by countries in which they invest with respect to their investments in issuers existing or operating in such countries. Such taxes are generally withheld based on income earned. These Portfolios accrue such taxes as the related income is earned.
Subsequent Events
Management has evaluated events and transactions through the date the financial statements were issued, for purposes of recognition or disclosure in these financial statements, and there are no subsequent events to report.
| (3) | Related Party and Other Transactions |
The Fund has an Investment Advisory Agreement with Ohio National Investments, Inc. (“ONI”), a wholly-owned subsidiary of ONLIC. Under the terms of this agreement, ONI provides portfolio management and investment advice to the Fund and
| 135 | (continued) |
| Ohio National Fund, Inc. |
Notes to Financial Statements (Continued) | December 31, 2012 |
administers its operations, subject to the supervision of the Fund’s Board. This agreement is renewed annually upon the approval by the Board. As compensation for its services, ONI receives advisory fees from the Fund calculated on the basis of each Portfolio’s average daily net assets and the following current schedule of Board-approved annualized fee breakpoints.
Equity |
| 0.79% of first $200 million |
| 0.74% of next $800 million |
| 0.70% over $1 billion |
Bond |
| 0.60% of first $100 million |
| 0.50% of next $150 million |
| 0.45% of next $250 million |
| 0.40% of next $500 million |
| 0.30% of next $1 billion |
| 0.25% over $2 billion |
International |
| 0.85% of first $100 million |
| 0.80% of next $100 million |
| 0.70% over $200 million |
Millennium |
| 0.80% of first $150 million |
| 0.75% of next $150 million |
| 0.70% of next $300 million |
| 0.65% over $600 million |
Aggressive Growth |
| 0.80% of first $100 million |
| 0.75% of next $400 million |
| 0.70% over $500 million |
Mid Cap Opportunity |
| 0.85% of first $100 million |
| 0.80% of next $100 million |
| 0.75% of next $300 million |
| 0.70% over $500 million |
Strategic Value |
| 0.75% of first $100 million |
| 0.70% of next $400 million |
| 0.65% over $500 million |
Capital Growth |
| 0.90% of first $100 million |
| 0.85% of next $100 million |
| 0.80% of next $300 million |
| 0.75% over $500 million |
Bristol |
| 0.80% of first $100 million |
| 0.70% of next $400 million |
| 0.65% over $500 million |
U.S. Equity |
| 0.75% of first $200 million |
| 0.70% of next $300 million |
| 0.65% over $500 million |
Balanced |
| 0.65% of first $200 million |
| 0.60% of next $300 million |
| 0.55% over $500 million |
Money Market |
| 0.30% of first $100 million(1) |
| 0.25% of next $150 million |
| 0.23% of next $250 million |
| 0.20% of next $500 million |
| 0.15% over $1 billion |
Omni |
| 0.60% of first $100 million |
| 0.50% of next $150 million |
| 0.45% of next $250 million |
| 0.40% of next $500 million |
| 0.30% of next $1 billion |
| 0.25% over $2 billion |
Capital Appreciation |
| 0.80% of first $100 million |
| 0.75% of next $300 million |
| 0.65% of next $600 million |
| 0.60% over $1 billion |
International Small-Mid Company |
| 1.00% of first $100 million |
| 0.90% of next $100 million |
| 0.85% over $200 million |
Small Cap Growth |
| 0.90% of first $150 million |
| 0.80% of next $150 million |
| 0.75% over $300 million |
S&P 500® Index |
| 0.40% of first $100 million |
| 0.35% of next $150 million |
| 0.33% over $250 million |
High Income Bond |
| 0.75% of first $75 million |
| 0.70% of next $75 million |
| 0.65% of next $75 million |
| 0.60% over $225 million |
Nasdaq-100® Index |
| 0.40% of first $100 million |
| 0.35% of next $150 million |
| 0.33% over $250 million |
Bryton Growth |
| 0.85% of first $100 million |
| 0.75% of next $400 million |
| 0.70% over $500 million |
Income Opportunity |
| 0.80% of first $200 million |
| 0.75% of next $300 million |
| 0.70% over $500 million |
Target Equity/Income |
| 0.60% of first $100 million |
| 0.55% of next $400 million |
| 0.50% over $500 million |
| 136 | (continued) |
| Ohio National Fund, Inc. |
Notes to Financial Statements (Continued) | December 31, 2012 |
Target VIP |
| 0.60% of first $100 million |
| 0.55% of next $400 million |
| 0.50% over $500 million |
Bristol Growth |
| 0.80% of first $100 million |
| 0.70% of next $400 million |
| 0.65% over $500 million |
| (1) | For the year ended December 31, 2012, ONI waived advisory fees in excess of an annualized rate of 0.25% of the first $100 million of average daily net assets in the Money Market Portfolio. Waivers related to the Money Market Portfolio are voluntary and are not subject to recoupment in subsequent periods. The amount of the waiver for the year ended December 31, 2012 was $50,000. If ONI did not agree to reimburse these expenses, the total expenses incurred by the Money Market Portfolio for the six-month period ended December 31, 2012 would have been higher than the net expenses reflected in the Statements of Operations. |
Under the Investment Advisory Agreement, the Fund authorizes ONI to retain sub-advisers (“the Sub-Advisers”) for the Equity, Omni, International, Capital Appreciation, Millennium, International Small-Mid Company, Aggressive Growth, Small Cap Growth, Mid Cap Opportunity, Strategic Value, High Income Bond, Capital Growth, Bristol, Bryton Growth, U.S. Equity, Balanced, Income Opportunity, Target VIP, Target Equity/Income, and Bristol Growth Portfolios subject to the approval of the Board. ONI has entered into sub-advisory agreements with Legg Mason Capital Management, Inc. (“Legg Mason”), Suffolk Capital Management, LLC (“Suffolk”), Federated Global Investment Management Corp. (“Federated Global”), Jennison Associates LLC (“Jennison”), Neuberger Berman Management LLC (“Neuberger Berman”), Janus Capital Management LLC (“Janus”), Goldman Sachs Asset Management, L.P. (“Goldman Sachs”), Federated Equity Management Company of Pennsylvania (“Federated Equity”), Federated Investment Management Company (“Federated Investment”), Eagle Asset Management, Inc. (“Eagle”), ICON Advisers, Inc. (“ICON”), and First Trust Advisors L.P. (“First Trust”), to manage the investment of those Portfolios’ assets, subject to the supervision of ONI. As compensation for their services, the Sub-Advisers receive from ONI a sub-advisory fee calculated on the basis of each of the aforementioned Portfolio’s average daily net assets and the following current Board-approved schedule of annualized fee breakpoints.
Equity (Legg Mason) |
| 0.40% of first $200 million |
| 0.38% over $200 million |
International (Federated Global) |
| 0.40% of first $200 million |
| 0.35% over $200 million |
Millennium (Neuberger Berman) |
| 0.55% of first $150 million |
| 0.50% of next $150 million |
| 0.40% over $300 million |
Aggressive Growth (Janus) |
| 0.55% of first $100 million |
| 0.50% of next $400 million |
| 0.45% over $500 million |
Mid Cap Opportunity (GSAM) |
| 0.60% of first $100 million |
| 0.55% of next $100 million |
| 0.50% over $200 million |
High Income Bond (Federated Investment) |
| 0.50% of first $30 million |
| 0.40% of next $20 million |
| 0.30% of next $25 million |
| 0.25% over $75 million |
Bristol (Suffolk) |
| 0.45% of first $100 million |
| 0.40% of next $400 million |
| 0.35% over $500 million |
Omni (Suffolk) |
| 0.30% of first $100 million |
| 0.25% of next $150 million |
| 0.225% of next $250 million |
| 0.20% of next $500 million |
| 0.15% of next $1 billion |
| 0.125% over $2 billion |
Capital Appreciation (Jennison) |
| 0.75% of first $10 million |
| 0.50% of next $30 million |
| 0.35% of next $25 million |
| 0.25% of next $335 million |
| 0.22% of next $600 million |
| 0.20% over $1 billion |
International Small-Mid Company (Federated Global) |
| 0.75% of first $100 million |
| 0.65% over $100 million |
Small Cap Growth (Janus) |
| 0.60% of first $150 million |
| 0.50% over $150 million |
Strategic Value (Federated Equity) |
| 0.50% of first $35 million |
| 0.35% of next $65 million |
| 0.25% over $100 million |
Capital Growth (Eagle) |
| 0.59% of first $100 million |
| 0.55% of next $100 million |
| 0.50% over $200 million |
Bryton Growth (Suffolk) |
| 0.50% of first $100 million |
| 0.45% of next $400 million |
| 0.40% over $500 million |
| 137 | (continued) |
| Ohio National Fund, Inc. |
Notes to Financial Statements (Continued) | December 31, 2012 |
U.S. Equity (ICON) |
| 0.50% of first $200 million |
| 0.45% of next $300 million |
| 0.40% over $500 million |
Income Opportunity (ICON) |
| 0.55% of first $200 million |
| 0.50% of next $300 million |
| 0.45% over $500 million |
Bristol Growth (Suffolk) |
| 0.45% of first $100 million |
| 0.40% of next $400 million |
| 0.35% over $500 million |
Balanced (ICON) |
| 0.40% of first $200 million |
| 0.35% of next $300 million |
| 0.30% over $500 million |
Target VIP and Target Equity/Income (First Trust) |
| 0.35% of first $500 million |
| 0.25% over $500 million |
Suffolk, the sub-adviser for the Omni, Bristol, Bryton Growth, and Bristol Growth Portfolios has an affiliation with ONI. Ohio National Financial Services, Inc. (ONFS) owns 100% of ONLIC, the parent company of ONI, and also owns 84.7% of the voting securities of Suffolk. There were no Fund liabilities payable to Suffolk at December 31, 2012 and fees paid to Suffolk are an expense of ONI, not of the Fund.
Pursuant to a service agreement among ONI, ONLIC and the Fund, ONLIC has agreed to provide personnel and facilities to ONI on a cost-reimbursement basis. These personnel members include officers of the Fund. ONLIC also provides clerical and administrative services and such supplies and equipment as may be reasonably required in order for ONI to properly perform its advisory function pursuant to the Investment Advisory Agreement. ONLIC further performs duties to fulfill the transfer agent function on behalf of the Fund. Performance of these duties by ONLIC and availability of facilities, personnel, supplies, and equipment does not represent an expense to the Fund in excess of the advisory fees paid to ONI.
Pursuant to the Investment Advisory Agreement, if the total expenses applicable to any Portfolio during any calendar quarter (excluding taxes, brokerage commissions, interest expense and management fees) exceed 1%, on an annualized basis, evaluated quarterly, of such Portfolio’s average daily net asset value, ONI will reimburse the Portfolio for such excess expenses. There were no expense reimbursements associated with this agreement during the year ended December 31, 2012.
During the year ended December 31, 2012, ONI voluntarily reimbursed the amount of daily gross expenses of the Money Market Portfolio in excess of daily income earned by the Portfolio. The amount reimbursed to the Portfolio for the year ended December 31, 2012 was $647,678, of which $49,787 was receivable from ONI at December 31, 2012. This reimbursement is also not subject to recoupment in subsequent periods.
The Investment Advisory Agreement allows for a portion of the expenses related to the Fund’s Chief Compliance Officer and staff to be incurred by the Fund and paid from the Fund to the Fund’s adviser, ONI. Pursuant to the service agreement among ONI, ONLIC, and the Fund, ONLIC has provided the personnel, services, and equipment necessary to perform the Fund’s regulation-mandated compliance function and ONI has reimbursed ONLIC for such costs. For the year ended December 31, 2012, the Fund incurred compliance expenses totaling $253,992, which was equally allocated to the Portfolios. Expenses incurred by the Portfolios are reflected on the Statements of Operations as “Compliance expense”.
Each director of the Board is currently paid a quarterly retainer fee of $10,000, $3,000 for each Board meeting attended, $1,000 for each Audit Committee meeting attended, and $500 for each other Board committee or independent directors meetings attended. The Board chair receives an additional quarterly retainer fee of $3,750, the lead independent director of the Board receives an additional quarterly retainer fee of $3,125, and the Audit Committee chair receives an additional quarterly retainer fee of $1,250. For the year ended December 31, 2012, directors’ compensation and reimbursement of director expenses by the Fund totaled $278,355.
U.S. Bancorp Fund Services, LLC, 615 East Michigan Street, Milwaukee, Wisconsin, serves as the accounting agent for all but the International and International Small-Mid Company Portfolios. U.S. Bank Institutional Trust & Custody, 425 Walnut Street, Cincinnati, Ohio serves as the custodian for all but the International and International Small-Mid Company Portfolios. The accounting agent and custodian for the International and International Small-Mid Company Portfolios is State Street Bank-Kansas City, 801 Pennsylvania Ave., Kansas City, Missouri. For assets held outside the United States, U.S. Bank and State Street Bank-Kansas City enter into sub-custodial agreements, subject to approval by the Board.
| 138 | (continued) |
| Ohio National Fund, Inc. |
Notes to Financial Statements (Continued) | December 31, 2012 |
| (4) | Capital Share Transactions |
Capital share transactions for the years ended December 31, 2012 and 2011 were as follows:
| Equity | Money Market | Bond | ||||||||||||||||||||||
| Year Ended 12/31/2012 | Year Ended 12/31/2011 | Year Ended 12/31/2012 | Year Ended 12/31/2011 | Year Ended 12/31/2012 | Year Ended 12/31/2011 | |||||||||||||||||||
Capital shares issued on sales | 623,661 | 941,226 | 17,885,924 | 32,550,831 | 3,488,174 | 3,958,882 | ||||||||||||||||||
Capital shares issued on reinvested dividends | 121,339 | 91,840 | — | — | — | — | ||||||||||||||||||
Capital shares redeemed | (2,033,054 | ) | (2,212,809 | ) | (20,644,112 | ) | (33,276,715 | ) | (3,594,023 | ) | (3,646,628 | ) | ||||||||||||
|
|
|
|
|
|
|
|
|
|
|
| |||||||||||||
Net increase/(decrease) | (1,288,054 | ) | (1,179,743 | ) | (2,758,188 | ) | (725,884 | ) | (105,849 | ) | 312,254 | |||||||||||||
|
|
|
|
|
|
|
|
|
|
|
| |||||||||||||
| Omni | International | Capital Appreciation | ||||||||||||||||||||||
| Year Ended 12/31/2012 | Year Ended 12/31/2011 | Year Ended 12/31/2012 | Year Ended 12/31/2011 | Year Ended 12/31/2012 | Year Ended 12/31/2011 | |||||||||||||||||||
Capital shares issued on sales | 161,999 | 229,768 | 1,497,944 | 2,497,915 | 519,553 | 651,665 | ||||||||||||||||||
Capital shares issued on reinvested dividends | 26,019 | 30,504 | — | — | 30,035 | 24,159 | ||||||||||||||||||
Capital shares redeemed | (492,128 | ) | (543,608 | ) | (3,706,950 | ) | (3,222,960 | ) | (1,339,064 | ) | (1,300,067 | ) | ||||||||||||
|
|
|
|
|
|
|
|
|
|
|
| |||||||||||||
Net increase/(decrease) | (304,110 | ) | (283,336 | ) | (2,209,006 | ) | (725,045 | ) | (789,476 | ) | (624,243 | ) | ||||||||||||
|
|
|
|
|
|
|
|
|
|
|
| |||||||||||||
| Millennium | International Small-Mid Company | Aggressive Growth | ||||||||||||||||||||||
| Year Ended 12/31/2012 | Year Ended 12/31/2011 | Year Ended 12/31/2012 | Year Ended 12/31/2011 | Year Ended 12/31/2012 | Year Ended 12/31/2011 | |||||||||||||||||||
Capital shares issued on sales | 136,922 | 286,300 | 485,545 | 537,442 | 1,042,101 | 776,637 | ||||||||||||||||||
Capital shares issued on reinvested dividends | — | — | — | — | — | — | ||||||||||||||||||
Capital shares redeemed | (383,783 | ) | (529,962 | ) | (742,828 | ) | (922,145 | ) | (882,813 | ) | (1,093,898 | ) | ||||||||||||
|
|
|
|
|
|
|
|
|
|
|
| |||||||||||||
Net increase/(decrease) | (246,861 | ) | (243,662 | ) | (257,283 | ) | (384,703 | ) | 159,288 | (317,261 | ) | |||||||||||||
|
|
|
|
|
|
|
|
|
|
|
| |||||||||||||
| Small Cap Growth | Mid Cap Opportunity | S&P 500® Index | ||||||||||||||||||||||
| Year Ended 12/31/2012 | Year Ended 12/31/2011 | Year Ended 12/31/2012 | Year Ended 12/31/2011 | Year Ended 12/31/2012 | Year Ended 12/31/2011 | |||||||||||||||||||
Capital shares issued on sales | 626,681 | 810,468 | 549,005 | 509,487 | 3,730,507 | 2,954,040 | ||||||||||||||||||
Capital shares issued on reinvested dividends | — | — | — | — | 189,836 | 184,032 | ||||||||||||||||||
Capital shares redeemed | (767,540 | ) | (921,986 | ) | (831,618 | ) | (899,024 | ) | (3,031,332 | ) | (3,584,999 | ) | ||||||||||||
|
|
|
|
|
|
|
|
|
|
|
| |||||||||||||
Net increase/(decrease) | (140,859 | ) | (111,518 | ) | (282,613 | ) | (389,537 | ) | 889,011 | (446,927 | ) | |||||||||||||
|
|
|
|
|
|
|
|
|
|
|
| |||||||||||||
| Strategic Value | High Income Bond | Capital Growth | ||||||||||||||||||||||
| Year Ended 12/31/2012 | Year Ended 12/31/2011 | Year Ended 12/31/2012 | Year Ended 12/31/2011 | Year Ended 12/31/2012 | Year Ended 12/31/2011 | |||||||||||||||||||
Capital shares issued on sales | 23,078,732 | 2,328,044 | 6,070,090 | 6,947,607 | 427,102 | 771,713 | ||||||||||||||||||
Capital shares issued on reinvested dividends | 351,423 | 59,209 | — | — | — | — | ||||||||||||||||||
Capital shares redeemed | (3,236,694 | ) | (990,362 | ) | (5,662,829 | ) | (8,236,398 | ) | (526,289 | ) | (772,696 | ) | ||||||||||||
|
|
|
|
|
|
|
|
|
|
|
| |||||||||||||
Net increase/(decrease) | 20,193,461 | 1,396,891 | 407,261 | (1,288,791 | ) | (99,187 | ) | (983 | ) | |||||||||||||||
|
|
|
|
|
|
|
|
|
|
|
| |||||||||||||
| Nasdaq-100® Index | Bristol | Bryton Growth | ||||||||||||||||||||||
| Year Ended 12/31/2012 | Year Ended 12/31/2011 | Year Ended 12/31/2012 | Year Ended 12/31/2011 | Year Ended 12/31/2012 | Year Ended 12/31/2011 | |||||||||||||||||||
Capital shares issued on sales | 3,852,022 | 3,696,576 | 2,698,502 | 4,320,041 | 2,464,569 | 4,275,291 | ||||||||||||||||||
Capital shares issued on reinvested dividends | 65,966 | 35,054 | 89,395 | 77,847 | — | — | ||||||||||||||||||
Capital shares redeemed | (3,392,616 | ) | (3,897,497 | ) | (3,705,062 | ) | (2,334,927 | ) | (3,580,153 | ) | (1,779,694 | ) | ||||||||||||
|
|
|
|
|
|
|
|
|
|
|
| |||||||||||||
Net increase/(decrease) | 525,372 | (165,867 | ) | (917,165 | ) | 2,062,961 | (1,115,584 | ) | 2,495,597 | |||||||||||||||
|
|
|
|
|
|
|
|
|
|
|
| |||||||||||||
| 139 | (continued) |
| Ohio National Fund, Inc. |
Notes to Financial Statements (Continued) | December 31, 2012 |
| U.S. Equity | Balanced | Income Opportunity | ||||||||||||||||||||||
| Year Ended 12/31/2012 | Year Ended 12/31/2011 | Year Ended 12/31/2012 | Year Ended 12/31/2011 | Year Ended 12/31/2012 | Year Ended 12/31/2011 | |||||||||||||||||||
Capital shares issued on sales | 261,888 | 232,873 | 4,132,176 | 550,440 | 293,125 | 326,009 | ||||||||||||||||||
Capital shares issued on reinvested dividends | 7,717 | — | — | 23,706 | — | — | ||||||||||||||||||
Capital shares redeemed | (237,667 | ) | (322,718 | ) | (464,792 | ) | (392,980 | ) | (466,598 | ) | (217,024 | ) | ||||||||||||
|
|
|
|
|
|
|
|
|
|
|
| |||||||||||||
Net increase/(decrease) | 31,938 | (89,845 | ) | 3,667,384 | 181,166 | (173,473 | ) | 108,985 | ||||||||||||||||
|
|
|
|
| �� |
|
|
|
|
|
| |||||||||||||
| Target VIP | Target Equity/Income | Bristol Growth | ||||||||||||||||||||||
| Year Ended 12/31/2012 | Year Ended 12/31/2011 | Year Ended 12/31/2012 | Year Ended 12/31/2011 | Year Ended 12/31/2012 | Year Ended 12/31/2011 | |||||||||||||||||||
Capital shares issued on sales | 292,064 | 420,361 | 575,533 | 596,268 | 2,078,689 | 3,189,221 | ||||||||||||||||||
Capital shares issued on reinvested dividends | 29,837 | 23,633 | 55,864 | 50,753 | 44,746 | 37,666 | ||||||||||||||||||
Capital shares redeemed | (535,048 | ) | (533,998 | ) | (825,534 | ) | (857,927 | ) | (2,365,571 | ) | (1,519,700 | ) | ||||||||||||
|
|
|
|
|
|
|
|
|
|
|
| |||||||||||||
Net increase/(decrease) | (213,147 | ) | (90,004 | ) | (194,137 | ) | (210,906 | ) | (242,136 | ) | 1,707,187 | |||||||||||||
|
|
|
|
|
|
|
|
|
|
|
| |||||||||||||
| (5) | Investment Transactions |
Cost of purchases and proceeds from sales of investments (excluding short-term and government securities) for the year ended December 31, 2012 were as follows:
| Equity | Bond | Omni | International | Capital Appreciation | ||||||||||||||||
Cost of purchases | $ | 89,305,085 | $ | 26,096,392 | $ | 58,973,472 | $ | 100,712,931 | $ | 43,057,065 | ||||||||||
Proceeds from sales | $ | 113,271,625 | $ | 20,115,224 | $ | 63,490,428 | $ | 112,215,582 | $ | 62,120,645 | ||||||||||
| Millennium | International Small-Mid Company | Aggressive Growth | Small Cap Growth | Mid Cap Opportunity | ||||||||||||||||
Cost of purchases | $ | 102,000,992 | $ | 32,114,828 | $ | 5,130,124 | $ | 21,631,145 | $ | 28,764,478 | ||||||||||
Proceeds from sales | $ | 107,933,155 | $ | 37,867,109 | $ | 4,767,218 | $ | 24,891,086 | $ | 34,520,639 | ||||||||||
| S&P 500® Index | Strategic Value | High Income Bond | Capital Growth | Nasdaq-100® Index | ||||||||||||||||
Cost of purchases | $ | 28,947,693 | $ | 263,906,802 | $ | 131,316,427 | $ | 22,827,863 | $ | 19,279,948 | ||||||||||
Proceeds from sales | $ | 14,149,834 | $ | 43,419,735 | $ | 99,902,146 | $ | 24,544,959 | $ | 16,180,919 | ||||||||||
| Bristol | Bryton Growth | U.S. Equity | Balanced | Income Opportunity | ||||||||||||||||
Cost of purchases | $ | 477,169,049 | $ | 226,820,547 | $ | 8,308,368 | $ | 73,557,311 | $ | 6,980,219 | ||||||||||
Proceeds from sales | $ | 483,633,926 | $ | 235,789,555 | $ | 7,865,215 | $ | 20,659,481 | $ | 9,160,399 | ||||||||||
| Target VIP | Target Equity/Income | Bristol Growth | ||||||||||||||||||
Cost of purchases | $ | 14,984,309 | $ | 18,551,576 | $ | 234,291,357 | ||||||||||||||
Proceeds from sales | $ | 16,998,258 | $ | 20,077,569 | $ | 235,187,978 | ||||||||||||||
Cost of purchases and proceeds from sales of government securities for the year ended December 31, 2012 were as follows:
| Bond | Omni | Balanced | ||||||||||||||
Cost of purchases | $ | 13,428,594 | $ | 97,828 | $ | 4,534,540 | ||||||||||
Proceeds from sales | $ | 9,970,899 | $ | — | $ | 983,391 | ||||||||||
| (6) | Financial Instruments |
The Fund’s Portfolios, other than the Money Market Portfolio, may trade in financial instruments with off-balance sheet risk for hedging purposes or, otherwise, in accordance with stated investing objectives. These financial instruments may include options, futures, and foreign currency contracts that may involve, to a varying degree, elements of risk in excess of the amounts recognized on financial statements.
| 140 | (continued) |
| Ohio National Fund, Inc. |
Notes to Financial Statements (Continued) | December 31, 2012 |
Options
A Portfolio may buy and write (i.e., sell) call and put options. In writing call options, the Portfolio gives the purchaser of the call option the right to purchase the underlying securities from the Portfolio at a specified “exercise” price at any time prior to the expiration of the option, normally within nine months. A Portfolio writes a covered call option when it owns the underlying securities and an uncovered call option when it does not. In purchasing put options, a Portfolio pays the seller of the put option a premium for the right of the Portfolio to sell the underlying securities to the seller at a specified exercise price prior to the expiration of the option. When a Portfolio sells a put option, it has the obligation to buy, and the purchaser of the put the right to sell, the underlying security at the exercise price during the option period. Whenever a Portfolio has a written covered call option outstanding, the underlying securities will be segregated by the Custodian and held in an escrow account to assure that such securities will be delivered to the option holder if the option is exercised. While the underlying securities are subject to the option, the Portfolio remains the record owner of the securities, entitling it to receive dividends and to exercise any voting rights. Whenever a Portfolio has a written uncovered call option outstanding, it will segregate with the Custodian cash or liquid assets that, when added to the amounts deposited with the broker as margin, equal to the market value of the securities underlying the call option (but not less than the exercise price of the call option). To cover a written put option, the Portfolio writing the option deposits cash or liquid securities in a segregated account at the Custodian. In order to terminate its position as the writer or the purchaser of an option, the Portfolio may enter into a “closing” transaction, which is the purchase (if the Portfolio has written the option) or sale (if the Portfolio is the purchaser of the option) of an option on the same underlying securities and having the same exercise price and expiration date as the option previously written or purchased by the Portfolio.
When a Portfolio writes a put or call option, an amount equal to the premium received is included on the Statement of Assets and Liabilities as a liability. The amount of the liability is subsequently marked-to-market to reflect the current market value of the option. Such liability is subject to off balance sheet risks to the extent of any future increases in market value of the written options. If an option expires on its stipulated expiration date or if the Portfolio enters into a closing purchase transaction, a gain or loss is realized. If a written call option on an individual security is exercised, a gain or loss is realized for the sale of the underlying security, and the proceeds from the sale are increased by the premium originally received. If a written call option on a securities index is exercised, a gain or loss is realized as determined by the premium originally received, the exercise price and the market value of the index. If a written put option on an individual security is exercised, the cost of the security acquired is decreased by the premium originally received. When a Portfolio purchases a put or call option, an amount equal to the premium paid is included on the Portfolio’s Statement of Assets and Liabilities as an investment, and is subsequently marked-to-market to reflect the current market value of the option. If an option expires on the stipulated expiration date or if the Portfolio enters into a closing sale transaction, a gain or loss is realized. If a Portfolio exercises a call option on an individual security, the cost of the security acquired is increased by the premium paid for the call. If the Portfolio exercises a put option on an individual security, a gain or loss is realized from the sale of the underlying security, and the proceeds from such a sale are decreased by the premium originally paid. If the Portfolio exercises a put option on a security index, a gain or loss is realized as determined by the premium originally paid, the exercise price and the market value of the index.
The Balanced and Income Opportunity Portfolios wrote call options and purchased put options on the S&P 500 Index during the year ended December 31, 2012. These instruments were used by the Portfolios to provide a hedge against equity price risk. During a period in which the prices of the Portfolios’ common stocks may decline, these instruments are designed to increase in value, thus providing price accumulation gains that partially offset the price accumulation losses of the common stocks in the Portfolios.
The Balanced and Income Opportunity Portfolios’ written call options are collateralized by cash and/or securities held with the Portfolios’ prime broker and in segregated accounts at the Portfolios’ custodian. Such collateral for the Portfolios is restricted from use. The cash collateral or borrowings from the prime broker, if necessary, are included on the Statement of Assets and Liabilities. The securities pledged as collateral are noted as such on the Portfolios’ Schedules of Investments. Written and purchased options are non-income producing securities.
| 141 | (continued) |
| Ohio National Fund, Inc. |
Notes to Financial Statements (Continued) | December 31, 2012 |
The activity in the number of option contracts written and the premiums received by the Balanced Portfolio for the year ended December 31, 2012 were as follows:
| Number of Contracts | Premiums Received | |||||||
Options outstanding, beginning of year | — | $ | — | |||||
Options written | 375 | 506,684 | ||||||
Options exercised | — | — | ||||||
Options expired | — | — | ||||||
Options closed | (375 | ) | (506,684 | ) | ||||
|
|
|
| |||||
Options outstanding, end of year | — | $ | — | |||||
|
|
|
| |||||
Transactions involving purchased options by the Balanced Portfolio for the year ended December 31, 2012 were: Cost of purchases: $1,926,237, Proceeds from sales: $1,193,031, Expirations: $314,600.
The activity in the number of option contracts written and the premiums received by the Income Opportunity Portfolio for the year ended December 31, 2012 were as follows:
| Number of Contracts | Premiums Received | |||||||
Options outstanding, beginning of year | 50 | $ | 102,249 | |||||
Options written | 538 | 1,062,580 | ||||||
Options exercised | — | — | ||||||
Options expired | — | — | ||||||
Options closed | (588 | ) | (1,164,829 | ) | ||||
|
|
|
| |||||
Options outstanding, end of year | — | $ | — | |||||
|
|
|
| |||||
Transactions involving purchased options by the Income Opportunity Portfolio for the year ended December 31, 2012 were: Cost of purchases: $1,243,154, Proceeds from sales: $713,649, Expirations: $548,145.
Futures Contracts
A Portfolio may buy or sell two kinds of financial futures contracts: stock index futures contracts and interest rate futures contracts. Stock index futures contracts are contracts developed by and traded on national commodity exchanges whereby the buyer will, on a specified future date, pay or receive a final cash payment equal to the difference between the actual value of the stock index on the last day of the contract and the value of the stock index established by the contract multiplied by the specific dollar amount set by the exchange. Futures contracts may be based on broad-based stock indexes such as the S&P 500 Index or on narrow-based stock indexes. A particular index will be selected according to the Adviser’s investment strategy for the particular Portfolio. An interest rate futures contract is an agreement whereby one party agrees to sell and another party agrees to purchase a specified amount of a specified financial instrument (debt security) at a specified price at a specified date, time and place. Although interest rate futures contracts typically require actual future delivery of and payment for financial instruments, the contracts are usually closed out before the delivery date. A public market exists in interest rate futures contracts covering primarily the following financial instruments: U.S. Treasury bonds; U.S. Treasury notes; Government National Mortgage Association (GNMA) modified pass-through mortgage-backed securities; three-month U.S. Treasury bills; 90-day commercial paper; bank certificates of deposit; and Eurodollar certificates of deposit. U.S. futures contracts are traded on exchanges which have been designated “contract markets” by the Commodities Futures Trading Commission (“CFTC”) and must be executed through a futures commission merchant (“FCM”), or brokerage firm, which is a member of the relevant contract market. It is expected that futures contracts trading in additional financial instruments will be authorized.
The Fund, on behalf of each Portfolio, has filed with the National Futures Association, a notice claiming an exclusion from the definition of the term “commodity pool operator” under the Commodity Exchange Act, as amended, and the rules of the Commodity Futures Trading Commission promulgated thereunder, with respect to each Portfolio’s operation. Accordingly, the Portfolios are not subject to registration or regulation as a commodity pool operator.
The buyer or seller of a futures contract is not required to deliver or pay for the underlying instrument unless the contract is held until the delivery date. However, both the buyer and seller are required to deposit “initial margin” for the benefit of the broker when the contract is entered into. Initial margin deposits are equal to a percentage of the contract’s value, as set by the exchange on which the contract is traded, and are similar to good faith deposits or performance bonds.
| 142 | (continued) |
| Ohio National Fund, Inc. |
Notes to Financial Statements (Continued) | December 31, 2012 |
Unlike margin extended by a securities broker, initial margin payments do not constitute purchasing securities on margin for purposes of a Portfolio’s investment limitations. A Portfolio, its futures commission merchant and the Custodian retain control of the initial margin until the contract is liquidated. If the value of either party’s position declines, that party will be required to make additional “variation margin” payments to settle the change in value on a daily basis. The party that has a gain may be entitled to receive all or a portion of this amount. In the event of the bankruptcy of the FCM that holds margin on behalf of a Portfolio, the Portfolio may be entitled to return of margin owed to the Portfolio only in proportion to the amount received by the FCM’s other customers. ONI and the Sub-Advisers will attempt to minimize this risk by carefully monitoring the creditworthiness of the FCMs with which the Portfolios do business. In addition to the margin restrictions discussed above, transactions in futures contracts and options on futures contracts may involve the segregation of funds pursuant to requirements imposed by the SEC. Under those requirements, where a Portfolio has a long position in a futures contract or sells a put option, it will be required to establish a segregated account (not with an FCM or broker) containing cash or certain liquid assets equal to the purchase price of the contract or the exercise price of the option (less any margin on deposit). For a short position in futures contacts held by a Portfolio or call options sold by a Portfolio, those requirements mandate the establishment of a segregated account (not with a futures commission merchant or broker) containing cash or certain liquid assets that, when added to the amounts deposited as margin, equal the market value of the instruments underlying the futures contracts or call options. However, segregation of assets is not required if a Portfolio “covers” its position.
At December 31, 2012, there was one outstanding futures contract in the International Portfolio. Details of this contract were as follows:
Type | Description | Expiration | Number of contracts | Counterparty | Contract at value | Initial contract amount | Unrealized Appreciation (Depreciation) | Variation Margin Receivable (Payable) | ||||||||||||||||
Long | DAX Index Futures | March 15, 2013 | 8 | J.P. Morgan Securities LLC | $ | 2,011,209 | $ | 2,027,207 | $ | (15,998) | $ | 21 | ||||||||||||
The International Portfolio’s holdings of U.S. Treasury Bills, as noted on the Portfolio’s Schedule of Investments, were pledged at December 31, 2012 as collateral for this contract. The cost and value of the amount pledged at December 31, 2012 were $324,940 and $324,989, respectively.
This futures contract was executed for the purpose of increasing exposure to an attractive equities market, beyond that evidenced by the Portfolio’s investment in common stocks, while maintaining a significant cash balance that could be used for potentially higher-than-average shareholder transactions. There were other index futures contracts that were executed and closed in the International Portfolio during the year ended December 31, 2012. These were executed for similar purposes as those for futures contracts outstanding at December 31, 2012. For the year ended December 31, 2012, the notional values of futures contracts opened and closed prior to contract settlement date by the International Portfolio were approximately $11.5 million and $11.4 million, respectively.
Foreign Currency Contracts
In order to hedge against changes in the exchange rates of foreign currencies in relation to the U.S. dollar, each Portfolio, other than the Money Market Portfolio, may engage in forward foreign currency contracts, foreign currency options and foreign currency futures contracts in connection with the purchase, sale or ownership of a specific security. The International Portfolio, International Small-Mid Company Portfolio, Strategic Value Portfolio and High Income Bond Portfolio may engage in non-hedging related transactions to implement their investment strategies.
The Portfolios generally conduct their foreign currency exchange transactions on a spot (i.e., cash) basis at the spot rate prevailing in the foreign exchange currency market. When a Portfolio purchases or sells a security denominated in or exposed to a foreign currency, it may enter into a forward foreign currency contract (“forward contract”) for the purchase or sale, for a fixed amount of dollars, of the amount of currency involved in the underlying security transaction. A forward contract involves an obligation to purchase or sell a specific currency at a future date, which may be any fixed number of days from the date of the contract agreed upon by the parties, at a price set at the time of the contract. In this manner, a Portfolio may obtain protection against a possible loss resulting from an adverse change in the relationship between the U.S. dollar and the foreign currency during the period between the date the security is purchased or sold and the date upon which payment is made or received. Although such contracts tend to minimize the risk of loss due to the decline in the value of the hedged currency, at the same time they tend to limit any potential gain which might result should the value of such currency increase.
| 143 | (continued) |
| Ohio National Fund, Inc. |
Notes to Financial Statements (Continued) | December 31, 2012 |
Forward contracts are traded in the interbank market conducted directly between currency traders (usually large commercial banks) and their customers. Generally a forward contract has no deposit requirement, and no commissions are charged. Although foreign exchange dealers do not charge a fee for conversion, they do realize a profit based on the difference between the prices at which they buy and sell various currencies. When the Portfolio manager believes that the currency of a particular foreign country may suffer a substantial decline against the U.S. dollar, a Portfolio may enter into a forward contract to sell, for a fixed amount of dollars, the amount of foreign currency approximating the value of some or all of that Portfolio’s securities denominated in or exposed to such foreign currency. No Portfolio will enter into such forward contracts or maintain a net exposure to such contracts where the consummation of the contracts would obligate the Portfolio to deliver an amount of foreign currency in excess of the value of its assets denominated in or exposed to that currency. At the consummation of a forward contract for delivery by a Portfolio of a foreign currency, the Portfolio may either make delivery of the foreign currency or terminate its contractual obligation to deliver the foreign currency by purchasing an offsetting contract obligating it to purchase, at the same maturity date, the same amount of the foreign currency. If the Portfolio chooses to make delivery of the foreign currency, it may be required to obtain such currency through the sale of its securities denominated in such currency or through conversion of other Portfolio assets into such currency. It is impossible to forecast the market value of Portfolio securities at the expiration of the forward contract. Accordingly, it may be necessary for the Portfolio to purchase additional foreign currency on the spot market (and bear the expense of such purchase) if the market value of the security is less than the amount of foreign currency the Portfolio is obligated to deliver, and if a decision is made to sell the security and make delivery of the foreign currency. Conversely, it may be necessary for the Portfolio to sell on the spot market some of the foreign currency received on the sale of its hedged security if the security’s market value exceeds the amount of foreign currency the Portfolio is obligated to deliver.
If the Portfolio retains the hedged security and engages in an offsetting transaction, it will incur a gain or loss to the extent that there has been movement in spot or forward contract prices. If a Portfolio engages in an offsetting transaction, it may subsequently enter into a new forward contract to sell the foreign currency. Should forward prices decline during the period between the Portfolio’s entering into a forward contract for the sale of a foreign currency and the date it enters into an offsetting contract for the purchase of the foreign currency, the Portfolio will realize a gain to the extent the price of the currency it has agreed to sell exceeds the price of the currency it has agreed to purchase. Should forward prices increase, the Portfolio will suffer a loss to the extent the price of the currency it has agreed to purchase exceeds the price of the currency it has agreed to sell.
Buyers and sellers of foreign currency options and futures contracts are subject to the same risks previously described with respect to options and futures generally. In addition, settlement of currency options and futures contracts with respect to most currencies must occur at a bank located in the issuing nation. The ability to establish and close out positions on such options is subject to the maintenance of a liquid market that may not always be available. Currency rates may fluctuate based on political considerations and governmental actions as opposed to purely economic factors.
Predicting the movements of foreign currency in relation to the U.S. dollar is difficult and requires different skills than those necessary to predict movements in the securities market. There is no assurance that the use of foreign currency hedging transactions can successfully protect a Portfolio against loss resulting from the movements of foreign currency in relation to the U.S. dollar. In addition, it must be remembered that these methods of protecting the value of a Portfolio’s securities against a decline in the value of a currency does not eliminate fluctuations in the underlying prices of the securities. It simply establishes a rate of exchange which can be achieved at some future point in time. Additionally, although such contracts tend to minimize the risk of loss due to the decline in the value of the hedged currency, at the same time they tend to limit any potential gain which might result should the value of such currency increase.
| 144 | (continued) |
| Ohio National Fund, Inc. |
Notes to Financial Statements (Continued) | December 31, 2012 |
Details of the foreign currency contracts outstanding in the International Portfolio at December 31, 2012 are as follows:
Contracts to buy foreign currency:
Date of contract | Exchange date | Counterparty | Currency to receive | Currency to | Contract at value | Unrealized Appreciation (Depreciation) | ||||||||||
October 8, 2012 | January 10, 2013 | HSBC | 85,604,000 RUB | $2,715,002 | $ | 2,798,879 | $ | 83,877 | ||||||||
November 14, 2012 | January 22, 2013 | BARC | 96,805,000 INR | $1,744,234 | $ | 1,760,090 | $ | 15,856 | ||||||||
November 29, 2012 | January 22, 2013 | HSBC | 93,520,900 INR | $1,693,299 | $ | 1,700,379 | $ | 7,080 | ||||||||
November 27, 2012 | March 6, 2013 | HSBC | 4,400,000 NZD | $3,592,028 | $ | 3,621,753 | $ | 29,725 | ||||||||
December 14, 2012 | March 13, 2013 | HSBC | 227,900,000 JPY | $2,731,631 | $ | 2,631,958 | $ | (99,673 | ) | |||||||
December 18, 2012 | March 13, 2013 | HSBC | 154,620,300 JPY | $1,839,404 | $ | 1,785,670 | $ | (53,734 | ) | |||||||
December 11, 2012 | March 14, 2013 | HSBC | 1,870,000 GBP | $3,012,682 | $ | 3,037,061 | $ | 24,379 | ||||||||
December 11, 2012 | March 14, 2013 | HSBC | 3,390,000 CAD | $3,430,653 | $ | 3,402,996 | $ | (27,657 | ) | |||||||
December 11, 2012 | March 14, 2013 | JPM | 4,575,000 GBP | $7,366,473 | $ | 7,430,242 | $ | 63,769 | ||||||||
|
|
|
|
| ||||||||||||
$28,125,406 | $ | 28,169,028 | $ | 43,622 | ||||||||||||
|
|
|
|
| ||||||||||||
Contracts to sell foreign currency:
International | ||||||||||||||||
Date of contract | Exchange date | Counterparty | Currency to | Currency to deliver | Contract at value | Unrealized Appreciation (Depreciation) | ||||||||||
November 14, 2012 | January 22, 2013 | BARC | $ 3,426,657 | 7,160,000 BRL | $ | 3,488,198 | $ | (61,541 | ) | |||||||
December 4, 2012 | March 13, 2013 | HSBC | $ 13,988,415 | 1,144,811,910 JPY | $ | 13,221,137 | $ | 767,278 | ||||||||
|
|
|
|
| ||||||||||||
$ 17,415,072 | $ | 16,709,335 | $ | 705,737 | ||||||||||||
|
|
|
|
| ||||||||||||
Counterparties | Currencies | |
HSBC – HSBC Bank USA, N.A. | RUB – New Russian Rubel | |
JPM – JPMorgan Chase Bank, N.A. | INR – Indian Rupee | |
BARC – Barclays Bank PLC | NZD – New Zealand Dollar | |
JPY – Japanese Yen | ||
GBP – British Pound | ||
CAD – Canadian Dollar | ||
BRL – Brazilian Real |
Foreign currency contracts were executed in the International Portfolio in order to mitigate the effect that exchange rate volatility had on the valuation of the Portfolio’s investments that were either under-weighted or over-weighted in relation to the Portfolio’s benchmark index. The Portfolio was under-weighted in equity investments within the countries of Russia, India, New Zealand, Great Britain, and Canada. The Portfolio executed contracts to buy those countries’ currencies to mitigate the effects that volatility in those currencies’ exchange rates might otherwise have on the Portfolio’s performance relative to the benchmark. The Portfolio was over-weighted in equity investments within the countries of Brazil and Japan and, likewise, executed contracts to sell those countries’ currencies in order to mitigate the effect that volatility in the exchange rate might otherwise have on relative performance.
The Portfolio entered into other foreign currency contracts during the year for similar benchmark performance hedging purposes. The Portfolio also entered into contracts that were the inverse of previously executed contracts to effectively exit prior contracts earlier than stated contract delivery dates, as over-weights or under-weights were reduced, or as previously executed contracts resulted in an attractive return to the Portfolio. For the year ended December 31, 2012, the notional value of foreign currency contracts executed by the International Portfolio were approximately $326.9 million for currencies bought and approximately $319.4 million for currencies sold.
| 145 | (continued) |
| Ohio National Fund, Inc. |
Notes to Financial Statements (Continued) | December 31, 2012 |
The values and financial statement effects of derivative instruments that were not accounted for as hedging instruments as of, and for the year ended December 31, 2012, were as follows:
Portfolio | Instrument | Primary Risk Type | Value-Asset Derivatives | Value-Liability Derivatives | Location on Statements of Assets and Liabilities | |||||||||||
International | Contracts to buy foreign currencies | Currency exchange rate | $ | 28,169,028 | $ | (28,125,406 | ) | (1) | ||||||||
|
|
|
| |||||||||||||
Contracts to sell foreign currencies | Currency exchange rate | $ | 17,415,072 | $ | (16,709,335 | ) | (1) | |||||||||
|
|
|
| |||||||||||||
Futures contracts | Equity price | $ | 2,011,209 | $ | (2,027,207 | ) | (2) | |||||||||
|
|
|
| |||||||||||||
Balanced | Purchased options | Equity price | $ | 401,100 | $ | — | (3) | |||||||||
|
|
|
| |||||||||||||
Income Opportunity | Purchased options | Equity price | $ | 57,300 | $ | — | (3) | |||||||||
|
|
|
| |||||||||||||
| (1) | Net unrealized appreciation on foreign currency contacts |
| (2) | Net unrealized appreciation on futures contracts |
| (3) | Investments in securities, at value |
| (4) | Options written, at value |
Portfolio | Instrument | Risk Type | Realized Gain (Loss) on Derivatives Recognized in Income | Change in Unrealized Appreciation/ Depreciation on Derivatives Recognized in Income | Location on Statements of Operations | |||||||||||
International | Foreign currency contracts | Currency exchange rate | $ | 4,177,750 | $ | (1,235,849 | ) | (1), (2) | ||||||||
|
|
|
| |||||||||||||
Futures contracts | Equity price | $ | 103,370 | $ | (55,602 | ) | (3), (4) | |||||||||
|
|
|
| |||||||||||||
Balanced | Purchased options | Equity price | $ | (314,600 | ) | $ | (17,505 | ) | (5), (6) | |||||||
|
|
|
| |||||||||||||
Written options | Equity price | $ | (139,933 | ) | $ | — | (7), (8) | |||||||||
|
|
|
| |||||||||||||
Income Opportunity | Purchased options | Equity price | $ | (548,145 | ) | $ | 64,465 | (5), (6) | ||||||||
|
|
|
| |||||||||||||
Written options | Equity price | $ | (263,013 | ) | $ | 22,751 | (7), (8) | |||||||||
|
|
|
| |||||||||||||
| (1) | Net realized gain (loss) on foreign currency contracts |
| (2) | Change in unrealized appreciation/depreciation on foreign currency contracts |
| (3) | Net realized gain (loss) on futures contracts |
| (4) | Change in unrealized appreciation/depreciation on futures contracts |
| (5) | Net realized gain (loss) on investments |
| (6) | Change in unrealized appreciation/depreciation on investments |
| (7) | Net realized gain (loss) on written options |
| (8) | Change in unrealized appreciation/depreciation on written options |
| 146 | (continued) |
| Ohio National Fund, Inc. |
Notes to Financial Statements (Continued) | December 31, 2012 |
| (7) | Federal Income Tax Information |
At December 31, 2012, the components of accumulated earnings (deficit) on a tax basis were as follows:
Portfolio | Undistributed Ordinary Income | Undistributed Long-Term Capital Gains (Losses) | Accumulated Earnings | Accumulated Capital and Other Losses | Unrealized Appreciation (Depreciation)(1) | Total Accumulated Earnings (Deficit) | ||||||||||||||||||
Equity | $ | 367,208 | $ | — | $ | 367,208 | $ | (109,176,644 | ) | $ | 23,672,680 | $ | (85,136,756 | ) | ||||||||||
Money Market | — | — | — | — | — | — | ||||||||||||||||||
Bond | 5,756,080 | — | 5,756,080 | (13,095,188 | ) | 14,784,981 | 7,445,873 | |||||||||||||||||
Omni | 116,546 | — | 116,546 | (4,281,450 | ) | 1,818,860 | (2,346,044 | ) | ||||||||||||||||
International. | 5,607,011 | — | 5,607,011 | (91,803,628 | ) | 36,434,497 | (49,762,120 | ) | ||||||||||||||||
Capital Appreciation | 83,350 | — | 83,350 | (9,467,074 | ) | 12,600,804 | 3,217,080 | |||||||||||||||||
Millennium | — | — | — | (7,160,910 | ) | 1,985,715 | (5,175,195 | ) | ||||||||||||||||
International Small-Mid Company | 324,350 | — | 324,350 | (12,428,660 | ) | 14,693,887 | 2,589,577 | |||||||||||||||||
Aggressive Growth | 103,178 | — | 103,178 | (926,592 | ) | 7,701,693 | 6,878,279 | |||||||||||||||||
Small Cap Growth | 1,231,899 | 4,665,376 | 5,897,275 | — | 1,764,497 | 7,661,772 | ||||||||||||||||||
Mid Cap Opportunity. | — | — | — | (24,689,868 | ) | 9,517,626 | (15,172,242 | ) | ||||||||||||||||
S&P 500® Index | 741,137 | — | 741,137 | (1,370,102 | ) | 44,464,029 | 43,835,064 | |||||||||||||||||
Strategic Value | 2,248,868 | — | 2,248,868 | (6,052,041 | ) | 1,681,512 | (2,121,661 | ) | ||||||||||||||||
High Income Bond | 21,490,144 | 4,485,600 | 25,975,744 | — | 16,141,992 | 42,117,736 | ||||||||||||||||||
Capital Growth | 488,764 | 3,302,339 | 3,791,103 | — | 9,349,925 | 13,141,028 | ||||||||||||||||||
Nasdaq-100® Index | 431,659 | 244,406 | 676,065 | — | 16,663,050 | 17,339,115 | ||||||||||||||||||
Bristol | 563,023 | 7,883,154 | 8,446,177 | — | 9,315,151 | 17,761,328 | ||||||||||||||||||
Bryton Growth | 7,458,993 | 4,746,750 | 12,205,743 | — | (646,972 | ) | 11,558,771 | |||||||||||||||||
U.S. Equity | 22,445 | — | 22,445 | (5,766,338 | ) | 2,148,659 | (3,595,234 | ) | ||||||||||||||||
Balanced | 651,938 | — | 651,938 | (344,425 | ) | 2,746,717 | 3,054,230 | |||||||||||||||||
Income Opportunity | 119,759 | — | 119,759 | (178,081 | ) | 1,326,409 | 1,268,087 | |||||||||||||||||
Target VIP | 79,804 | — | 79,804 | (6,313,615 | ) | 2,070,745 | (4,163,066 | ) | ||||||||||||||||
Target Equity/Income | 116,187 | — | 116,187 | (15,288,008 | ) | 1,382,038 | (13,789,783 | ) | ||||||||||||||||
Bristol Growth | 1,134,150 | 5,795,060 | 6,929,210 | — | 4,870,688 | 11,799,898 | ||||||||||||||||||
| (1) | The differences between book-basis and tax-basis unrealized appreciation/(depreciation) are attributed primarliy to tax deferral of losses on wash sales and the realization for tax purposes of unrealized gains/(losses) on certain instruments. |
For Federal income tax purposes, the following Portfolios had capital loss carry forwards as of December 31, 2012 that are available to offset future realized gains, if any:
| Total Loss Carryforward | Expiration | |||||||||||||||||||||||
Portfolio | 2016 | 2017 | 2018 | No Expiration Short Term | No Expiration Long Term | |||||||||||||||||||
Equity | $ | 109,176,644 | $ | 58,736,517 | $ | 47,422,387 | $ | 3,017,740 | $ | — | $ | — | ||||||||||||
Bond | 13,095,188 | 3,572,434 | 9,522,754 | — | — | — | ||||||||||||||||||
Omni | 4,281,450 | — | 4,281,450 | — | — | — | ||||||||||||||||||
International. | 91,803,628 | 26,011,498 | 65,792,130 | — | — | — | ||||||||||||||||||
Capital Appreciation | 9,467,074 | — | 9,467,074 | — | — | — | ||||||||||||||||||
Millennium | 7,160,910 | — | 7,160,910 | — | — | — | ||||||||||||||||||
International Small-Mid Company | 12,428,660 | 1,536,227 | 10,892,433 | — | — | — | ||||||||||||||||||
Aggressive Growth | 926,592 | — | 705,621 | — | 220,971 | — | ||||||||||||||||||
Mid Cap Opportunity. | 24,689,868 | 11,038,408 | 13,651,460 | — | — | — | ||||||||||||||||||
S&P 500® Index | 1,370,102 | — | 58,164 | 1,311,938 | — | — | ||||||||||||||||||
Strategic Value | 6,052,041 | 3,585,588 | 2,272,799 | 193,654 | — | — | ||||||||||||||||||
U.S. Equity | 5,766,338 | 1,759,920 | 4,006,418 | — | — | — | ||||||||||||||||||
Balanced | 344,425 | — | 344,425 | — | — | — | ||||||||||||||||||
Income Opportunity | 178,081 | — | 37,641 | 140,440 | — | — | ||||||||||||||||||
Target VIP | 6,313,615 | — | 6,313,615 | — | — | — | ||||||||||||||||||
Target Equity/Income | 15,288,008 | — | 12,624,380 | — | 2,663,628 | — | ||||||||||||||||||
| 147 | (continued) |
| Ohio National Fund, Inc. |
Notes to Financial Statements (Continued) | December 31, 2012 |
The Board does not intend to authorize a distribution of any realized gain for a Portfolio until the capital loss carry over has been offset or expires.
The Regulated Investment Company Modernization Act of 2010 (the “Act”) was enacted on December 22, 2010. The Act makes changes to several tax rules impacting the Fund. In general, the provisions of the Act were effective for the Fund’s fiscal year ending December 31, 2012. Although the Act provides several benefits, including the unlimited carryover of future capital losses, there may be a greater likelihood that all or a portion of each Portfolio’s pre-enactment capital loss carryovers may expire without being utilized due to the Act’s requirement that post-enactment capital losses be utilized before pre-enactment capital loss carryovers.
The tax characteristics of distributions paid to shareholders for the year ended December 31, 2012 were as follows:
Portfolio | Ordinary Income | Net Long-Term Capital Gains | Total Distribution Paid | |||||||||
Equity | $ | 2,551,766 | $ | — | $ | 2,551,766 | ||||||
Omni | 434,512 | — | 434,512 | |||||||||
Capital Appreciation | 681,205 | — | 681,205 | |||||||||
S&P 500® Index | 2,826,655 | — | 2,826,655 | |||||||||
Strategic Value | 3,918,367 | — | 3,918,367 | |||||||||
Nasdaq-100® Index | 447,911 | — | 447,911 | |||||||||
Bristol | 1,149,626 | — | 1,149,626 | |||||||||
US Equity | 86,203 | — | 86,203 | |||||||||
Target VIP | 297,777 | — | 297,777 | |||||||||
Target Equity/Income | 449,704 | — | 449,704 | |||||||||
Bristol Growth | 473,865 | — | 473,865 | |||||||||
The tax characteristics of distributions paid to shareholders for the year ended December 31, 2011 were as follows:
Portfolio | Ordinary Income | Net Long-Term Capital Gains | Total Distribution Paid | |||||||||
Equity | $ | 1,709,149 | $ | — | $ | 1,709,149 | ||||||
Omni | 467,625 | — | 467,625 | |||||||||
Capital Appreciation | 471,108 | — | 471,108 | |||||||||
S&P 500® Index | 2,390,576 | — | 2,390,576 | |||||||||
Strategic Value | 599,193 | — | 599,193 | |||||||||
Nasdaq-100® Index | 205,415 | — | 205,415 | |||||||||
Bristol | 910,805 | — | 910,805 | |||||||||
Balanced | 324,529 | — | 324,529 | |||||||||
Target VIP | 209,154 | — | 209,154 | |||||||||
Target Equity/Income | 373,545 | — | 373,545 | |||||||||
Bristol Growth | 366,489 | — | 366,489 | |||||||||
| 148 | (continued) |
Ohio National Fund, Inc.
Notes to Financial Statements (Continued) | December 31, 2012 |
During the year, the Fund recorded classifications within the composition of net assets for permanent book/tax differences. These classifications were as follows:
| Equity | Money Market | Bond | Omni | International | Capital Appreciation | Millennium | International Small-Mid Company | Aggressive Growth | Small Cap Growth | Mid Cap Opportunity | S&P 500® Index | |||||||||||||||||||||||||||||||||||||
Consent distributions | ||||||||||||||||||||||||||||||||||||||||||||||||
Paid in capital in excess of par value | $ | 324,074 | $ | — | $ | 5,641,940 | $ | 73,015 | $ | 1,009,365 | $ | 43,504 | $ | — | $ | 729,334 | $ | 3,051 | $ | 1,520,145 | $ | — | $ | 408,791 | ||||||||||||||||||||||||
Undistributed net investment income | (324,074 | ) | — | (5,641,940 | ) | (73,015 | ) | (1,009,365 | ) | (43,504 | ) | — | (729,334 | ) | (3,051 | ) | — | — | (408,791 | ) | ||||||||||||||||||||||||||||
Accumulated net realized gain (loss) on investments | — | — | — | — | — | — | — | — | — | (1,520,145 | ) | — | — | |||||||||||||||||||||||||||||||||||
Undistributed net investment losses | ||||||||||||||||||||||||||||||||||||||||||||||||
Paid in capital in excess of par value | — | — | — | — | — | — | (167,248 | ) | — | — | — | (90,469 | ) | — | ||||||||||||||||||||||||||||||||||
Undistributed net investment income | — | — | — | — | — | — | 167,248 | — | — | 69,184 | 90,469 | — | ||||||||||||||||||||||||||||||||||||
Accumulated net realized gain (loss) on investments | — | — | — | — | — | — | — | — | — | (69,184 | ) | — | — | |||||||||||||||||||||||||||||||||||
Foreign currency related reclassifications | ||||||||||||||||||||||||||||||||||||||||||||||||
Undistributed net investment income | — | — | — | 16 | 3,868,130 | (648 | ) | — | (74,888 | ) | 8 | (18 | ) | — | — | |||||||||||||||||||||||||||||||||
Accumulated net realized gain (loss) on investments | — | — | — | (16 | ) | (3,868,130 | ) | 648 | — | 74,888 | (8 | ) | 18 | — | — | |||||||||||||||||||||||||||||||||
Real estate investment trust (REIT) reclassifications | ||||||||||||||||||||||||||||||||||||||||||||||||
Undistributed net investment income | (16,079 | ) | — | — | — | — | — | — | — | (846 | ) | — | — | (61,826 | ) | |||||||||||||||||||||||||||||||||
Accumulated net realized gain (loss) on investments | 16,079 | — | — | — | — | — | — | — | 846 | — | — | 61,826 | ||||||||||||||||||||||||||||||||||||
Passive Foreign Investment Company (PFIC) reclassifications | ||||||||||||||||||||||||||||||||||||||||||||||||
Undistributed net investment income | — | — | — | 32,253 | — | 5,991 | — | — | — | — | — | — | ||||||||||||||||||||||||||||||||||||
Accumulated net realized gain (loss) on investments | — | — | — | (32,253 | ) | — | (5,991 | ) | — | — | — | — | — | — | ||||||||||||||||||||||||||||||||||
Other permanent differences | ||||||||||||||||||||||||||||||||||||||||||||||||
Paid in capital in excess of par value | — | — | — | — | — | — | — | — | — | — | (295 | ) | — | |||||||||||||||||||||||||||||||||||
Undistributed net investment income | — | — | (2,664 | ) | — | — | (4,526 | ) | — | — | — | — | (32,488 | ) | (4,734 | ) | ||||||||||||||||||||||||||||||||
Accumulated net realized gain (loss) on investments | — | — | 2,664 | — | — | 4,526 | — | — | — | — | 32,783 | 4,734 | ||||||||||||||||||||||||||||||||||||
| 149 | (continued) |
Ohio National Fund, Inc.
Notes to Financial Statements (Continued) | December 31, 2012 |
| Strategic Value | High Income Bond | Capital Growth | Nasdaq-100® Index | Bristol | Bryton Growth | U.S. Equity | Balanced | Income Opportunity | Target VIP | Target Equity/Income | Bristol Growth | |||||||||||||||||||||||||||||||||||||
Consent distributions | ||||||||||||||||||||||||||||||||||||||||||||||||
Paid in capital in excess of par value | $ | 559,206 | $ | 22,704,018 | $ | 2,711,694 | $ | 4,882,212 | $ | 3,107,885 | $ | 22,416,519 | $ | 87,152 | $ | 57,455 | $ | 108,336 | $ | 24,083 | $ | 50,416 | $ | 7,814,376 | ||||||||||||||||||||||||
Undistributed net investment income | (559,206 | ) | (21,132,185 | ) | — | (20,387 | ) | (76,535 | ) | (830,922 | ) | (87,152 | ) | (57,455 | ) | (108,336 | ) | (24,083 | ) | (50,416 | ) | (20,648 | ) | |||||||||||||||||||||||||
Accumulated net realized gain (loss) on investments | — | (1,571,833 | ) | (2,711,694 | ) | (4,861,825 | ) | (3,031,350 | ) | (21,585,597 | ) | — | — | — | — | — | (7,793,728 | ) | ||||||||||||||||||||||||||||||
Undistributed net investment losses | ||||||||||||||||||||||||||||||||||||||||||||||||
Paid in capital in excess of par value | — | — | — | — | — | — | — | — | — | — | — | — | ||||||||||||||||||||||||||||||||||||
Undistributed net investment income | — | — | 96,135 | — | — | 766,536 | — | — | — | — | — | — | ||||||||||||||||||||||||||||||||||||
Accumulated net realized gain (loss) on investments | — | — | (96,135 | ) | — | — | (766,536 | ) | — | — | — | — | — | — | ||||||||||||||||||||||||||||||||||
Foreign currency related reclassifications | ||||||||||||||||||||||||||||||||||||||||||||||||
Undistributed net investment income | 356,986 | — | — | (37 | ) | 130 | 136 | — | 7 | — | (50 | ) | (145 | ) | — | |||||||||||||||||||||||||||||||||
Accumulated net realized gain (loss) on investments | (356,986 | ) | — | — | 37 | (130 | ) | (136 | ) | — | (7 | ) | — | 50 | 145 | — | ||||||||||||||||||||||||||||||||
Real estate investment trust (REIT) reclassifications | ||||||||||||||||||||||||||||||||||||||||||||||||
Undistributed net investment income | (39 | ) | — | (28,069 | ) | — | — | 111,045 | — | 76 | 7 | — | — | — | ||||||||||||||||||||||||||||||||||
Accumulated net realized gain (loss) on investments | 39 | — | 28,069 | — | — | (111,045 | ) | — | (76 | ) | (7 | ) | — | — | — | |||||||||||||||||||||||||||||||||
Passive Foreign Investment Company (PFIC) reclassifications | ||||||||||||||||||||||||||||||||||||||||||||||||
Undistributed net investment income | — | — | — | — | 238,448 | — | — | — | — | — | — | 104,112 | ||||||||||||||||||||||||||||||||||||
Accumulated net realized gain (loss) on investments | — | — | — | — | (238,448 | ) | — | — | — | — | — | — | (104,112 | ) | ||||||||||||||||||||||||||||||||||
Other permanent differences | ||||||||||||||||||||||||||||||||||||||||||||||||
Paid in capital in excess of par value | — | — | (2,376 | ) | — | — | — | — | — | (66 | ) | — | — | — | ||||||||||||||||||||||||||||||||||
Undistributed net investment income | (1,097 | ) | — | (14,700 | ) | — | — | — | — | — | 486 | — | — | — | ||||||||||||||||||||||||||||||||||
Accumulated net realized gain (loss) on investments | 1,097 | — | 17,076 | — | — | — | — | — | (420 | ) | — | — | — | |||||||||||||||||||||||||||||||||||
| 150 | (continued) |
| Ohio National Fund, Inc. |
Notes to Financial Statements (Continued) | December 31, 2012 |
The cost basis for Federal income tax purposes may differ from the cost basis for financial reporting purposes. The table below details the unrealized appreciation (depreciation) and aggregate cost of securities at December 31, 2012 for Federal income tax purposes.
| Equity | Bond | Omni | International | Capital Appreciation | Millennium | |||||||||||||||||||
Gross unrealized: | ||||||||||||||||||||||||
Appreciation | $ | 31,948,835 | $ | 15,004,072 | $ | 2,660,049 | $ | 40,269,309 | $ | 16,804,570 | $ | 2,553,854 | ||||||||||||
Depreciation | (8,276,155 | ) | (219,091 | ) | (841,189 | ) | (3,834,812 | ) | (4,203,766 | ) | (568,139 | ) | ||||||||||||
|
|
|
|
|
|
|
|
|
|
|
| |||||||||||||
Net unrealized appreciation (depreciation) | $ | 23,672,680 | $ | 14,784,981 | $ | 1,818,860 | $ | 36,434,497 | $ | 12,600,804 | $ | 1,985,715 | ||||||||||||
|
|
|
|
|
|
|
|
|
|
|
| |||||||||||||
Aggregate cost of securities: | $ | 162,319,408 | $ | 155,352,951 | $ | 31,161,816 | $ | 147,858,772 | $ | 103,354,581 | $ | 32,225,116 | ||||||||||||
|
|
|
|
|
|
|
|
|
|
|
| |||||||||||||
| International Small-Mid Company | Aggressive Growth | Small Cap Growth | Mid Cap Opportunity | S&P 500® Index | Strategic Value | |||||||||||||||||||
Gross unrealized: | ||||||||||||||||||||||||
Appreciation | $ | 15,184,297 | $ | 8,992,204 | $ | 4,028,478 | $ | 12,604,032 | $ | 67,493,585 | $ | 9,685,136 | ||||||||||||
Depreciation | (490,410 | ) | (1,290,511 | ) | (2,263,981 | ) | (3,086,406 | ) | (23,029,556 | ) | (8,003,624 | ) | ||||||||||||
|
|
|
|
|
|
|
|
|
|
|
| |||||||||||||
Net unrealized appreciation (depreciation) | $ | 14,693,887 | $ | 7,701,693 | $ | 1,764,497 | $ | 9,517,626 | $ | 44,464,029 | $ | 1,681,512 | ||||||||||||
|
|
|
|
|
|
|
|
|
|
|
| |||||||||||||
Aggregate cost of securities: | $ | 49,988,898 | $ | 25,480,341 | $ | 33,278,995 | $ | 57,894,877 | $ | 163,340,790 | $ | 258,153,134 | ||||||||||||
|
|
|
|
|
|
|
|
|
|
|
| |||||||||||||
| High Income Bond | Capital Growth | Nasdaq-100® Index | Bristol | Bryton Growth | U.S. Equity | |||||||||||||||||||
Gross unrealized: | ||||||||||||||||||||||||
Appreciation | $ | 19,884,012 | $ | 12,208,669 | $ | 19,572,754 | $ | 15,866,901 | $ | 13,452,745 | $ | 2,524,742 | ||||||||||||
Depreciation | (3,742,020 | ) | (2,858,744 | ) | (2,909,704 | ) | (6,551,750 | ) | (14,099,717 | ) | (376,083 | ) | ||||||||||||
|
|
|
|
|
|
|
|
|
|
|
| |||||||||||||
Net unrealized appreciation (depreciation) | $ | 16,141,992 | $ | 9,349,925 | $ | 16,663,050 | $ | 9,315,151 | $ | (646,972 | ) | $ | 2,148,659 | |||||||||||
|
|
|
|
|
|
|
|
|
|
|
| |||||||||||||
Aggregate cost of securities: | $ | 292,105,942 | $ | 46,449,891 | $ | 51,021,932 | $ | 194,293,084 | $ | 155,954,912 | $ | 13,453,650 | ||||||||||||
|
|
|
|
|
|
|
|
|
|
|
| |||||||||||||
| Balanced | Income Opportunity | Target VIP | Target Equity/Income | Bristol Growth | ||||||||||||||||||||
Gross unrealized: | ||||||||||||||||||||||||
Appreciation | $ | 3,866,192 | $ | 1,447,186 | $ | 3,496,576 | $ | 2,314,061 | $ | 8,002,507 | ||||||||||||||
Depreciation | (1,119,475 | ) | (120,777 | ) | (1,425,831 | ) | (932,023 | ) | (3,131,819 | ) | ||||||||||||||
|
|
|
|
|
|
|
|
|
| |||||||||||||||
Net unrealized appreciation (depreciation) | $ | 2,746,717 | $ | 1,326,409 | $ | 2,070,745 | $ | 1,382,038 | $ | 4,870,688 | ||||||||||||||
|
|
|
|
|
|
|
|
|
| |||||||||||||||
Aggregate cost of securities: | $ | 74,015,445 | $ | 8,312,660 | $ | 19,028,478 | $ | 20,509,651 | $ | 101,083,947 | ||||||||||||||
|
|
|
|
|
|
|
|
|
| |||||||||||||||
| (8) | Legal Matters |
In December 2007, the Target Equity/Income Portfolio, as a shareholder of Lyondell Chemical Company (“Lyondell”), participated in a cash out merger of Lyondell in which it received $48 per share of consideration (the “Merger”). Lyondell later filed for bankruptcy and two entities created by the Lyondell bankruptcy plan of reorganization have initiated lawsuits seeking to recover, or clawback, proceeds received by shareholders in the December 2007 merger based on fraudulent transfer claims.
The first action, Edward S. Weisfelner, as Trustee of the LB Creditor Trust v. Morgan Stanley & Co., Inc., et. al., was initiated on October 22, 2010 (the “Creditor Trust Action”), in the Supreme Court of the State of New York in the County of New York but has subsequently been removed to the U.S. Bankruptcy Court for the Southern District of New York. The second action, Edward S. Weisfelner, as Trustee of the LB Litigation Trust v. Holmes TTEE, et. al., was initiated on December 23, 2010 (the “Litigation Trust Action”), in the U.S. Bankruptcy Court for the Southern District of New York. Both actions attempt to recover the proceeds paid out to the holders of Lyondell shares at the time of the 2007 merger.
On January 4, 2012, the Fund was named in a second amended complaint in the Creditor Trust Action. The Target Equity/Income Portfolio composes part of the Fund. The value of the proceeds received by the Target Equity/Income Portfolio as a result of the Merger was $1,772,400. On March 2, 2012, the Fund moved the U.S. Bankruptcy Court for the Southern District of New York to dismiss it from the Creditor Trust Action. The Court has yet to take any action on the motion to dismiss. The outcome of these
| 151 | (continued) |
| Ohio National Fund, Inc. |
Notes to Financial Statements (Continued) | December 31, 2012 |
proceedings on the Portfolio cannot be predicted. Management of the Fund is currently assessing the cases and has not yet determined the potential effect, if any, on the net asset value of the Target Equity/Income Portfolio.
Also, in December 2007, the S&P 500® Index and Strategic Value Portfolios, shareholders of the Tribune Company, participated in a similar cash out merger in which shareholders received $34 per share of consideration. The company subsequently filed for bankruptcy and several legal complaints have been initiated by groups of Tribune Company creditors seeking to recover, or clawback, proceeds received by shareholders based on fraudulent transfer claims (the “Tribune Bankruptcy”).
The first action, Official Committee of Unsecured Creditors of Tribune Company v. FitzSimons, et. al., was initiated on November 1, 2010 in the U.S. Bankruptcy Court for the District of Delaware. As a result of these proceedings, the Court agreed to allow individual creditors to file similar complaints in U.S. state courts. The Fund is specifically named in a complaint in the U.S. District Court, Southern District of Ohio, Western Division, Deutsche Bank Trust Company Americas, et. al. v. American Electric Power, et. al., that was initiated in June of 2011. The Fund, along with the Strategic Value Portfolio, is also named in a similar complaint in the U.S. District Court, Eastern District of Pennsylvania, Deutsche Bank Trust Company Americas, et. al. v. Ametek Inc. Employees Master Retirement Trust, et. al. These Tribune litigation actions have been consolidated into a single Multidistrict Litigation (“MDL”) in the U.S. District Court, Southern District of New York. On November 6, 2012, the Fund, along with other similarly situated defendants in the MDL, filed a motion to dismiss the individual creditor actions. Subsequently, the Court scheduled oral arguments on the motion to dismiss for March 1, 2013. The value of the proceeds received by the S&P 500® Index and Strategic Value Portfolios, was $37,910 and $384,200, respectively. The outcome of these proceedings on the two Portfolios of the Fund cannot be predicted. Management of the Fund is currently assessing the complaints and has not yet determined the potential effect, if any, on the respective net assets values of those Portfolios.
| 152 |
| Ohio National Fund, Inc. |
The Board of Directors and Shareholders Ohio National Fund, Inc.:
We have audited the accompanying statements of assets and liabilities of the Equity Portfolio, Money Market Portfolio, Bond Portfolio, Omni Portfolio, International Portfolio, Capital Appreciation Portfolio, Millennium Portfolio, International Small-Mid Company Portfolio, Aggressive Growth Portfolio, Small Cap Growth Portfolio, Mid Cap Opportunity Portfolio, S&P 500 Index Portfolio, Strategic Value Portfolio, High Income Bond Portfolio, Capital Growth Portfolio, Nasdaq-100 Index Portfolio, Bristol Portfolio, Bryton Growth Portfolio, U.S. Equity Portfolio, Balanced Portfolio, Income Opportunity Portfolio, Target VIP Portfolio, Target Equity/Income Portfolio and Bristol Growth Portfolio (each a Portfolio and collectively, the Portfolios of the Ohio National Fund, Inc.), including the schedules of investments, as of December 31, 2012, and the related statements of operations for the year then ended, the statements of changes in net assets for each of the years in the two-year period then ended, and the financial highlights for each of the years in the five-year period then ended. These financial statements and financial highlights are the responsibility of the Portfolios’ management. Our responsibility is to express an opinion on these financial statements and financial highlights based on our audits.
We conducted our audits in accordance with the standards of the Public Company Accounting Oversight Board (United States). Those standards require that we plan and perform the audit to obtain reasonable assurance about whether the financial statements and financial highlights are free of material misstatement. An audit includes examining, on a test basis, evidence supporting the amounts and disclosures in the financial statements. Our procedures included confirmation of securities owned as of December 31, 2012, by correspondence with custodians and brokers. An audit also includes assessing the accounting principles used and significant estimates made by management, as well as evaluating the overall financial statement presentation. We believe that our audits provide a reasonable basis for our opinion.
In our opinion, the financial statements and financial highlights referred to above present fairly, in all material respects, the financial position of the Portfolios as of December 31, 2012, the results of their operations for the year then ended, the changes in their net assets for each of the years in the two-year period then ended, and the financial highlights for each of the years in the five-year period then ended, in conformity with U.S. generally accepted accounting principles.
/s/ KPMG LLP
Columbus, Ohio
February 18, 2013
| 153 |
| Ohio National Fund, Inc. |
| December 31, 2012 |
| (1) | Review and Approval of Advisory and Sub-advisory Agreements |
At a meeting held on November 13, 2012, the Board of Directors, including a majority of the Directors who are not “interested persons” of the Fund (the “Independent Directors”), approved the continuation of the Investment Advisory Agreement with ONI (the “Adviser”) and, as applicable, the sub-advisory agreement with the Sub-Adviser (each a “Sub-Adviser,” and together the “Sub-Advisers”) for each of the Portfolios identified below. The Independent Directors were separately represented by independent legal counsel in connection with their consideration of the approval of the continuation of these agreements.
The Directors noted that the Adviser is responsible for monitoring the investment performance and other responsibilities of the various Sub-Advisers that have day-to-day responsibility for the decisions made for certain of the Fund’s investment portfolios. They also noted that the Adviser reports to the Fund’s Board on its analysis of each Sub-Adviser’s performance at the regular meetings of the Board, which are held at least quarterly. Where warranted, the Adviser will add or remove a particular Sub-Adviser from a watchlist that it maintains. Watchlist criteria include, for example: (a) fund performance over various time periods; (b) fund risk issues, such as changes in key personnel involved with fund management or changes in investment philosophy or process; and (c) organizational risk issues, such as regulatory, compliance or legal concerns, or changes in the ownership of the Sub-Adviser.
In considering the Investment Advisory and sub-advisory agreements, the Board requested and reviewed a significant amount of information relating to each Portfolio, the Adviser and the Sub-Advisers, including the following: (1) performance data for each Portfolio for various time periods, including year-to-date through September 30, 2012, (2) comparative performance, advisory fee and expense ratio information for a peer group of funds in the respective Portfolio’s Morningstar category (a “Morningstar Peer Group”), as well as management fee peer comparison charts showing where each Portfolio’s advisory fee was located in the dispersion of its peer funds’ advisory fees; (3) comparable performance information for each Portfolio’s relevant benchmark index or indices; (4) comparative data regarding advisory fees, including data regarding the fees charged by the Adviser and Sub-Advisers for managing other institutional funds and institutional accounts using investment strategies and techniques similar to those used in managing the Portfolios; (5) comparative data regarding the expense ratio of each Portfolio, as compared to its Morningstar Peer Group; (6) profitability analyses for the Adviser with respect to each Portfolio; and (7) other information regarding the nature, extent and quality of services provided by the Adviser and the Sub-Advisers, as applicable. The Directors also took into account information on the services provided by the Adviser and each Sub-Adviser and performance, fee and expense ratio information regarding each Portfolio provided to them periodically throughout the year. They also met with a representative of the Adviser to review the relative performance of each Portfolio, as compared with its benchmark(s) and peers, and in particular discussed those Portfolios that were on the watchlist.
The Independent Directors were assisted by experienced independent legal counsel throughout the contract review process. They discussed the proposed continuances in private session with such counsel at which no representatives of management, the Adviser or any Sub-Adviser were present. The Independent Directors relied upon the advice of independent legal counsel and their own business judgment in determining the material factors to be considered in evaluating each Advisory and sub-advisory agreement and the weight to be given to each such factor. The conclusions reached by the Independent Directors were based on a comprehensive evaluation of all of the information provided and were not the result of any one factor. Moreover, each Independent Director may have afforded different weight to the various factors in reaching his or her conclusions with respect to each Advisory and sub-advisory agreement.
Nature, Extent and Quality of Services
The Board evaluated the nature, extent and quality of the advisory services provided to the Portfolios by the Adviser. As part of its review, the Board reviewed information regarding the Adviser’s operations, procedures and personnel. The Directors took into account information they received during the previous year at Board meetings and other discussions and through periodic reports regarding the Adviser’s performance of its duties. The Directors considered the capabilities and resources that the Adviser has dedicated to performing services on behalf of the Fund and its Portfolios. The quality of administrative and other services, including the Adviser’s role in monitoring the performance and quality of compliance of the Sub-Advisers, also was considered. The Directors also considered the quality of the compliance programs of the Adviser and its responsiveness to inquiries and requests from the Board.
For each Portfolio subject to a sub-advisory agreement (all Portfolios other than the Money Market Portfolio, Bond Portfolio, S&P 500® Index Portfolio, Nasdaq-100® Index Portfolio and the fixed income portion of the Omni Portfolio), the Board considered similar criteria as applied to each Sub-Adviser, including the nature, extent and quality of the sub-advisory services provided by each Sub-Adviser. In addition to the criteria used to review the Adviser, the Directors reviewed biographical information on each Sub-Adviser’s portfolio management and other professional staff, and each Sub-Adviser’s brokerage practices, including any soft dollar benefits received. The Directors also reviewed the performance record of each Portfolio or portion of a Portfolio managed by the applicable Sub-Adviser. The Board also considered the quality of each Sub-Adviser’s compliance program as it relates to the applicable Portfolio. It was the Directors’ conclusion that overall, they were satisfied with the nature, extent and quality of services provided to the Fund and each of the Portfolios.
Investment Performance
A representative of the Adviser reviewed with the Directors each Portfolio’s performance year-to-date and for the 1-, 3- and 5-year periods ended September 30, 2012, as compared to the Portfolio’s Morningstar Peer Group and benchmark(s). The Board also considered the Adviser’s
| 154 | (continued) |
| Ohio National Fund, Inc. |
Additional Information (Unaudited) (Continued) | December 31, 2012 |
effectiveness in monitoring the performance of each Sub-Adviser and the Adviser’s timeliness in responding to performance issues. A Portfolio-by-Portfolio discussion of each Portfolio’s performance and the Board’s conclusions regarding that performance is set forth below.
Fees and Expenses
The Board considered the advisory fee for each Portfolio, as well as the fee’s difference from the average advisory fee for the Portfolio’s Morningstar Peer Group and the fee’s percentile ranking within the peer group. The Board also considered the difference between each Portfolio’s overall expense ratio and that of its Morningstar Peer Group, as well as the expense ratio’s percentile ranking within the peer group.
Additionally, the Board considered certain adjusted statistics for Portfolios whose Morningstar Peer Group’s average advisory fee was likely to be skewed by the inclusion of index funds and funds of funds. The Board looked at the average assets for each fund in the respective peer group, excluding index funds and funds of funds (the “Adjusted Peer Group”) and then compared the advisory fee that would have been paid by the Portfolio if the Portfolio had assets equal to the adjusted peer group’s average assets. The Board considered that comparison on an absolute and percentile ranking basis.
The Board also considered the fees paid to Sub-Advisers. With respect to the Portfolios sub-advised by Suffolk, an affiliate of the Adviser, the Board evaluated the reasonableness of the total fees received by the Adviser. With respect to those Portfolios sub-advised by a Sub-Adviser that is not affiliated with the Adviser, the Board relied to a degree on the Adviser’s negotiation of each sub-advisory agreement on an arm’s-length basis, noting that in the past the Adviser has negotiated decreases in the sub-advisory fee for certain Portfolios and that the Adviser had always passed on the decrease by reducing its advisory fee by the same amount. Additionally, the Board considered the fees charged by the Adviser and Sub-Advisers to their separately managed institutional accounts and other accounts, and had no concerns with those rates relative to the fees charged to the Portfolio. The Directors also recognized that it is difficult to make comparisons of advisory fees because there are variations in the services that are included in the fees paid by other funds and separately managed accounts.
Profitability
The Board considered the advisory fee paid to the Adviser for each Portfolio and noted the pre-tax profit margins reported by the Adviser for each Portfolio. The Directors noted that the Adviser, and not the Portfolios, is responsible for paying sub-advisory fees to the Portfolio Sub-Advisers. The Board also evaluated whether the net advisory fee received by the Adviser for each Portfolio, after paying sub-advisory fees to the Sub-Adviser, was reasonable, given the level of the Adviser’s services to the Portfolio. The Directors took into account the fact that the Adviser is contractually obligated to reimburse each Portfolio for certain of its expenses should they exceed a specified amount. Additionally, the Directors acknowledged that calculating the Adviser’s profitability related to a specific Portfolio can be challenging and imprecise because of the difficulties in appropriately allocating the Adviser’s expenses across the Portfolios.
The Board also noted that the Adviser has been subsidizing the Money Market Portfolio to assure that it continues to be available to all of Ohio National Fund, Inc.’s shareholders (i.e., the shareholders of every Portfolio), so that shareholders in other Portfolios can elect to invest in the Money Market Portfolio to the extent they want to take a more defensive posture. Consequently, because the Adviser’s subsidization of the Money Market Portfolio benefits the shareholders of every Portfolio, the Board acknowledged that a portion of the costs incurred by the Adviser in subsidizing the Money Market Portfolio should be considered with respect to the Adviser’s profitability from managing each of the other Portfolios.
The Board also considered the reasonableness of the sub-advisory fees paid by the Adviser to each Sub-Adviser. The Directors relied on the ability of the Adviser to negotiate the terms of each sub-advisory agreement, including the sub-advisory fee, at arm’s-length, noting that the Adviser is not affiliated with any Portfolio Sub-Adviser other than Suffolk. Accordingly, the cost of services provided by each unaffiliated Sub-Adviser and the profitability to the Sub-Adviser of its relationship with the applicable Portfolio were not material factors in the Board’s deliberations. For similar reasons, the Board concluded that the potential realization of economies of scale by the Portfolios from the sub-advisory arrangements with the unaffiliated Sub-Advisers should not be a material factor in the Board’s deliberations.
In considering the reasonableness of the sub-advisory fees payable by the Adviser to Suffolk, the Directors noted that the Adviser, not the Portfolios, is responsible for paying sub-advisory fees to Suffolk and therefore concluded that the profitability to Suffolk of its relationship to the applicable Portfolios should not be a material factor in the Board’s deliberations. For similar reasons, the Board concluded that the potential realization of economies of scale by the applicable Portfolios from the sub-advisory arrangements with Suffolk should not be a material factor in the Board’s deliberations.
After considering all of the above, the Board concluded that the profitability of the Adviser with respect to each Portfolio was reasonable.
Economies of Scale
The Directors noted that all of the advisory and sub-advisory fee schedules contain breakpoints that would reduce the applicable advisory or sub-advisory fees on assets above a specified level as the applicable Portfolio’s assets increase. The Directors also noted that a Portfolio would realize additional economies of scale if the Portfolio’s assets increase over time proportionately more than certain other expenses. The Directors took into account that many of the Portfolios had relatively few assets under management. After considering each Portfolio’s current size and potential for growth, the Board concluded that each Portfolio is likely to benefit from economies of scale as the Portfolio’s assets increase.
| 155 | (continued) |
| Ohio National Fund, Inc. |
Additional Information (Unaudited) (Continued) | December 31, 2012 |
Portfolio-by-Portfolio Analysis
In addition to the foregoing, the Directors considered the specific factors and related conclusions set forth below with respect to each Portfolio’s performance and fees and expenses. Except as otherwise indicated, the performance data described below for each Portfolio is for periods ending September 30, 2012 and the advisory fee and expense data described below is through August 31, 2012 for a Portfolio’s Morningstar peer group and its Adjusted Peer Group.
Equity Portfolio (Adviser — ONI, Sub-Adviser — Legg Mason). The Portfolio underperformed its benchmark index and peer group average for the year-to-date and 1-, 3-, and 5-year periods. While expressing significant concern about the underperformance, the Adviser noted that the Portfolio outperformed its peer group average in 8 of the 11 months prior to the meeting, but that the Portfolio’s underperformance in the other 3 months was extensive enough to result in underperformance for the entire year-to-date period. The Adviser indicated that the Portfolio remains on its watchlist. The Directors noted that the Portfolio’s advisory fee was higher than the peer group average, and recognized that the Portfolio’s expense ratio was at the peer group average. After a lengthy discussion, the Adviser agreed to closely monitor the performance of the Portfolio and proposed that the agreement with the Sub-Adviser should be renewed only through May 31, 2013. Based upon its review, the Board concluded that approval of the continuation of the sub-advisory agreement only through May 31, 2013 was appropriate in order to address performance, and that the advisory and sub-advisory fees were reasonable.
Money Market Portfolio (Adviser — ONI). The Portfolio outperformed its peer group average for the year-to-date and trailing 1- and 3-year periods, but underperformed its peer group average for the 5-year period. The Directors noted that the Portfolio’s advisory fee and expense ratio were well below average relative to its peer group and that the Adviser has a negative profit margin for the Portfolio. Overall, the Board concluded that the Portfolio’s performance was satisfactory and that the advisory fee was reasonable.
Bond Portfolio (Adviser — ONI). Although the Portfolio underperformed its benchmark index for the year-to-date and 1-, 3- and 5-year periods and its peer group average for the 5-year period, the Directors noted that the Portfolio outperformed its peer group average for the year-to-date and 1- and 3-year periods. The Adviser pointed out that the relative performance of the peer group to the benchmark was indicative that the recent periods had been difficult for active managers, and he recommended that the Directors focus on the Portfolio’s performance relative to that of its peer group average. The Directors noted that, although the Portfolio’s advisory fee was slightly above the peer group average, the Portfolio’s expense ratio was below the peer group average. Overall, the Board concluded that the Portfolio’s performance was satisfactory and that the advisory fee was reasonable.
Omni Portfolio (Adviser — ONI, Sub-Adviser — Suffolk). The Omni Portfolio underperformed its benchmark index for the year-to-date, 1-, 3- and 5-year periods and its peer group average for the 3- and 5-year periods, while outperforming the peer group average in the year-to-date and 1-year periods. The Adviser pointed out, however, that the Portfolio had performed in the top 1 percent of the US Insurance Fund Moderate Allocation group over the 3-month period ending September 30, 2012, and outperformed the same group average over the trailing 10-year period. The Adviser also pointed out that the relative performance of the peer group to the benchmark was indicative that the recent periods had been difficult for active managers, and he recommended that the Directors focus on the Portfolio’s performance relative to that of its peer group average. The Board noted that the Portfolio’s advisory fee and expense ratio were below the Portfolio’s peer group average. Overall, the Board concluded that the Portfolio’s performance was satisfactory and that the advisory and sub-advisory fees were reasonable.
International Portfolio (Adviser — ONI, Sub-Adviser — Federated Global). The International Portfolio outperformed its peer group average for the year-to-date, 1-, 3-, and 5-year periods, and outperformed its benchmark index in each of the same periods except the 5-year period. The Board noted that while the Portfolio’s advisory fee was above the peer group average, its expense ratio was at the peer group average. Overall, the Board concluded that the Portfolio’s performance was satisfactory and that the advisory and sub-advisory fees were reasonable.
Capital Appreciation Portfolio (Adviser — ONI, Sub-Adviser — Jennison). The Portfolio outperformed its benchmark index for the 5-year period and its peer group average for the 3- and 5-year periods, but underperformed both for the year-to-date and 1-year periods and the benchmark index for the 3-year period. The Board noted that it focuses more on longer term performance, particularly because recent periods have been difficult for active managers. The Board noted that the Portfolio’s advisory fee was higher than the peer group average, but the expense ratio was only slightly above average. Overall, the Board concluded that the Portfolio’s performance was satisfactory and that the advisory and sub-advisory fees were reasonable.
Millennium Portfolio (Adviser — ONI, Sub-Adviser — Neuberger Berman). The Millennium Portfolio underperformed its benchmark index and its peer group average over the 1-, 3-, and 5-year periods, but outperformed its benchmark index year-to-date and kept pace with its peer group average over the same period. The Adviser noted that the Portfolio’s longer term relative performance was weighed down by underperformance in 2009 and 2010, when lower quality stocks outperformed. The Directors remarked that the advisory fee and expense ratio for the Portfolio were below the peer group average. Overall, the Board concluded that the Portfolio’s performance was satisfactory and that the advisory and sub-advisory fees were reasonable.
International Small-Mid Company Portfolio (Adviser — ONI, Sub-Adviser — Federated Global). The Portfolio outperformed its benchmark index and peer group average for the year-to-date and 1- and 3-year periods, while underperforming both for the 5-year period. The Board noted that the Portfolio’s advisory fee was higher than the peer group average, but the expense ratio was only slightly above average relative to the peer group. Overall, the Board concluded that the Portfolio’s performance was satisfactory and that the advisory and sub-advisory fees were reasonable.
| 156 | (continued) |
| Ohio National Fund, Inc. |
Additional Information (Unaudited) (Continued) | December 31, 2012 |
Aggressive Growth Portfolio (Adviser — ONI, Sub-Adviser — Janus). The Portfolio outperformed its benchmark index and peer group average for the year-to-date and 1-year periods, and underperformed the index and peer group average for the 3- and 5-year periods. The Adviser indicated that the Portfolio had outperformed over the 10-year period as well. The Board noted that the Portfolio’s advisory fee and expense ratio were both above average compared to its peer group, but that the advisory fee was still within the range of its peers. Overall, the Board concluded that the Portfolio’s performance was satisfactory and that the advisory and sub-advisory fees were reasonable.
Small Cap Growth Portfolio (Adviser — ONI, Sub-Adviser — Janus). The Portfolio has outperformed its benchmark and peer group average for the year-to-date and the 1-, 3- and 5-year periods. The Board noted that the Portfolio’s advisory fee and expense ratio were both above average compared to its peer group, but that the advisory fee was still within the range of its peers. Overall, the Board concluded that the Portfolio’s performance was satisfactory and that the advisory and sub-advisory fees were reasonable.
Mid Cap Opportunity Portfolio (Adviser — ONI, Sub-Adviser — Goldman Sachs). The Adviser reminded the Board that the Portfolio had changed to a new Sub-Adviser effective in December 2009, and thus only the more recent performance is relevant. The Board noted that the Portfolio underperformed its benchmark index for the 3- and 5-year periods and its peer group average for the 5-year period, while outperforming both in the year-to-date and 1-year periods and the peer group average in the 3-year period. The Board also noted that the Portfolio’s advisory fee was above the peer group average, although the Portfolio’s expense ratio was below the peer group average. Overall, the Board concluded that the Portfolio’s performance was satisfactory and that the advisory and sub-advisory fees were reasonable.
S&P 500® Index Portfolio (Adviser — ONI). While the Portfolio underperformed its benchmark over the year-to-date, 1-, 3-, and 5-year periods, the Board noted that its performance generally was in line with the S&P 500® Index when expenses were excluded. The Board did not rely on peer group comparison figures for the Portfolio because the Board considers peer groups for index funds to be generally irrelevant. The Board noted that the overall expense ratio is the statistic most important to index fund shareholders, and the Portfolio’s expense ratio was slightly lower than the average for the peer group. Overall, the Board concluded that the Portfolio’s performance was satisfactory and that the advisory fees were reasonable.
Strategic Value Portfolio (Adviser — ONI, Sub-Adviser — Federated Equity). The Portfolio underperformed its benchmark index for the year-to-date, 1-, 3- and 5-year periods, underperformed its peer group average for the year-to-date and 1-year periods, and outperformed its peer group average for the 3- and 5-year periods. The Adviser pointed out that the Portfolio invests in dividend paying stocks, and the recent performance was hurt by its overweighting in financial stocks. The Board noted that it focuses more on longer term performance, particularly because recent periods have been difficult for active managers. The Directors also noted that the Portfolio’s advisory fee and expense ratio were both above average compared to its peer group, but that the advisory fee was still within the range of its peers. Overall, the Board concluded that the Portfolio’s performance was satisfactory and that the advisory and sub-advisory fees were reasonable.
High Income Bond Portfolio (Adviser — ONI, Sub-Adviser — Federated Investment). The Portfolio underperformed its benchmark index for the year-to-date, 1-, 3-, and 5-year periods, while outperforming its peer group average over the same periods. The Directors noted that the advisory fee was above the peer group average, while the expense ratio was below the peer group average. Overall, the Board concluded that the Portfolio’s performance was satisfactory and that the advisory and sub-advisory fees were reasonable.
Capital Growth Portfolio (Adviser — ONI, Sub-Adviser — Eagle). The Portfolio has underperformed its benchmark index and peer group average for the year-to-date and 1-year periods, while outperforming its benchmark and peer group average over the 3- and 5-year periods. The Board noted that it focuses more on longer term performance, particularly because recent periods have been difficult for active managers. The Directors noted that although the advisory fee was above average for the peer group, the expense ratio was below average. Overall, the Board concluded that the Portfolio’s performance was satisfactory and that the advisory and sub-advisory fees were reasonable.
Nasdaq-100® Index Portfolio (Adviser — ONI). While the Portfolio underperformed its benchmark over the year-to-date, 1-, 3-, and 5-year periods, the Board noted that its performance generally was in line with the Nasdaq-100 Index when expenses were excluded. The Board did not rely on peer group comparison figures for the Portfolio because the Board considers peer groups for index funds to be generally irrelevant. The Board noted that the overall expense ratio is the statistic most important to index fund shareholders, and the Portfolio’s expense ratio was significantly below the average for the peer group. Overall, the Board concluded that the Portfolio’s performance was satisfactory and that the advisory fees were reasonable.
Bristol Portfolio (Adviser — ONI, Sub-Adviser — Suffolk). The Portfolio underperformed its benchmark and peer group average for the year-to-date and 1-, 3- and 5-year periods. The Adviser indicated that although the Portfolio remains on its watchlist, the Portfolio’s performance for the 10-year period exceeded the performance of the US Insurance Fund Large Blend category and its performance in the 3rd quarter of 2012 placed it in the top 2 percent of the US Insurance Fund Large Blend category. The Directors noted that the Portfolio’s advisory fee was above average, but that the Portfolio’s expense ratio was below average. Overall, the Board concluded that the Portfolio’s performance was satisfactory and that the advisory and sub-advisory fees were reasonable.
Bryton Growth Portfolio (Adviser — ONI, Sub-Adviser — Suffolk). The Portfolio underperformed its benchmark index and peer group average year-to-date and for the 3- and 5-year periods, while outperforming both the benchmark index and the peer group average over the 1-year period. The Board considered that the Portfolio’s advisory fee and expense ratio were below the peer group average. Overall, the Board concluded that the Portfolio’s performance was satisfactory and that the advisory and sub-advisory fees were reasonable.
| 157 | (continued) |
| Ohio National Fund, Inc. |
Additional Information (Unaudited) (Continued) | December 31, 2012 |
U.S. Equity Portfolio (Adviser — ONI, Sub-Adviser — ICON). The Portfolio has underperformed its benchmark index for the year-to-date, 1-, 3-, and 5-year periods and its peer group average for the 3- and 5-year periods, while outperforming the peer group average for the year-to-date and 1-year periods. The Adviser noted that it appears that the performance has turned around, as the Portfolio has outperformed its peer group average since the Sub-Adviser changed the Portfolio Manager. The Directors noted that the Portfolio’s advisory fee and expense ratio were both above average compared to its peer group, but that the advisory fee was still within the range of its peers. Overall, the Board concluded that the Portfolio’s performance was satisfactory and that the advisory and sub-advisory fees were reasonable.
Balanced Portfolio (Adviser — ONI, Sub-Adviser — ICON). The Portfolio outperformed its benchmark for the year-to-date and 1-year periods and its peer group average for the year-to-date, 1-, 3-, and 5-year periods, while underperforming the benchmark index in the 3- and 5-year periods. The Directors considered that the Portfolio’s advisory fee was slightly above the peer group average, and its expense ratio was above the peer group average. Overall, the Board concluded that the Portfolio’s performance was satisfactory and that the advisory and sub-advisory fees were reasonable.
Income Opportunity Portfolio (Adviser — ONI, Sub-Adviser — ICON). The Portfolio underperformed its benchmark index and its peer group average for the year-to-date, 1-, and 3-year periods, while outperforming its peer group average and slightly underperforming its benchmark index over the trailing 5-year period. The Adviser pointed out that it would expect the Portfolio to trail in rising markets and outperform in falling markets. The Board considered that the Portfolio’s strategy is to provide downside protection at the expense of upside returns and noted that the Portfolio had outperformed in 2008 when the market was down. The Adviser also pointed out the Portfolio did not have a peer group or benchmark that was good for comparison purposes, given the Portfolio’s strategy. The Board considered that the Portfolio’s advisory fee and expense ratio were both above average compared to its peer group, but that the advisory fee was still within the range of its peers. Overall, the Board concluded that the Portfolio’s performance was satisfactory and that the advisory and sub-advisory fees were reasonable.
Target VIP Portfolio (Adviser — ONI, Sub-Adviser — First Trust). The Portfolio has outperformed its benchmark index for the year-to-date and its peer group average for the year-to-date and 3-year periods, but has underperformed both for the 1- and 5-year periods and its benchmark for the 3-year period. The Board noted that, because the Portfolio is not actively managed, its performance does not reflect on the Sub-Adviser, but is a function of the effectiveness of the model. The Portfolio’s advisory fee and expense ratio were below its peer group average. Overall, the Board concluded that the performance of the Portfolio was satisfactory and that the advisory and sub-advisory fees were reasonable.
Target Equity/Income Portfolio (Adviser — ONI, Sub-Adviser — First Trust). The Portfolio has significantly underperformed its benchmark index and peer group average for the year-to-date and 1-, 3- and 5-year periods. The Adviser indicated that the Portfolio remains on its watchlist. The Directors also noted that the advisory fee and expense ratio were below its peer group average. After a lengthy discussion, the Adviser agreed to closely monitor the performance of the Portfolio and proposed that the agreement with the Sub-Adviser should be renewed only through May 31, 2013. Based upon its review, the Board concluded that approval of the continuation of the sub-advisory agreement only through May 31, 2013 was appropriate in order to address performance, and that the advisory and sub-advisory fees were reasonable.
Bristol Growth Portfolio (Adviser — ONI, Sub-Adviser — Suffolk). The Portfolio underperformed its benchmark index and peer group average for the year-to-date, 1-, 3-, and 5-year periods. The Adviser indicated that although the Portfolio remains on its watchlist, the Portfolio had performed well relative to its peer group average in 2008, 2009, and 2011, but not in 2010 and year-to-date 2012. The Directors considered that the Portfolio’s advisory fee was above its peer group average while its overall expense ratio was below its peer group average. Overall, the Board concluded that the Portfolio’s performance was satisfactory and that the advisory and sub-advisory fees were reasonable.
After consideration of the foregoing, the Board reached the following conclusions regarding the Investment Advisory Agreement and, as applicable, the sub-advisory agreement with respect to each Portfolio, in addition to the conclusions set forth above: (a) ONI and the Sub-Adviser had demonstrated that they possessed the capability and resources to perform the duties required of them under the Investment Advisory Agreement and applicable sub-advisory agreement, respectively; (b) the investment philosophy, strategies and techniques of ONI (with respect to the Portfolios without a Sub-Adviser) and the Sub-Adviser were appropriate for pursuing the applicable Portfolio’s investment objective; (c) ONI (with respect to the Portfolios without a Sub-Adviser) and the Sub-Adviser were likely to execute their investment philosophy, strategies and techniques consistently over time; and (d) ONI and the Sub-Adviser maintained appropriate compliance programs. Based on all of the above-mentioned factors and their related conclusions, with no single factor or conclusion being determinative and with each Director not necessarily attributing the same weight to each factor, the Directors unanimously concluded that approval of the continuation of the Investment Advisory Agreement and, as applicable, the sub-advisory agreement was in the best interests of each Portfolio and its shareholders. Accordingly, the Board, including all of the Independent Directors, voted unanimously to approve the continuation of the Investment Advisory Agreement and, as applicable, the sub-advisory agreement for each Portfolio.
| (2) | Expense Disclosure |
An individual may not buy or own membership interests of the Fund directly. An individual acquires an indirect interest in the Fund by purchasing a variable annuity contract or variable insurance policy and allocating premiums or purchase payments to Fund Portfolios available through the separate accounts of ONLIC, ONLAC, and NSLA. Separate accounts of these entities are the shareholders of the Fund.
| 158 | (continued) |
| Ohio National Fund, Inc. |
Additional Information (Unaudited) (Continued) | December 31, 2012 |
As a shareholder of the Fund, a separate account incurs ongoing costs, including management fees and other Fund expenses. This example is intended to help a policy/contract owner understand ongoing costs (in dollars) associated with the underlying investment in the Fund’s Portfolios by the separate account shareholder and to compare these costs with the ongoing costs associated with investing in other mutual funds.
The example is based on an investment of $1,000 invested at July 1, 2012 and held through December 31, 2012.
Actual Expenses
The table below provides information about investment values and actual expenses associated with each Portfolio of the Fund. The information below, together with the amount of an underlying investment, can be used to estimate expenses paid over the period. An estimate can be obtained by simply dividing an underlying investment value by $1,000 (for example, an $8,600 investment value divided by $1,000 = 8.6), then multiplying the result by the number in the table under the heading entitled “Expenses Paid During Period”.
Portfolio | Beginning Investment Value 7/1/2012 | Ending Investment Value 12/31/2012 | Expense Paid During Period* 7/1/2012 – 12/31/2012 | Expense Ratio During Period 7/1/2012 – 12/31/2012 (Annualized) | ||||||||||||
Equity | $ | 1,000.00 | $ | 1,086.71 | $ | 4.56 | 0.87 | % | ||||||||
Money Market | 1,000.00 | 1,000.00 | 0.50 | 0.10 | % | |||||||||||
Bond | 1,000.00 | 1,033.61 | 3.32 | 0.65 | % | |||||||||||
Omni | 1,000.00 | 1,084.08 | 4.24 | 0.81 | % | |||||||||||
International | 1,000.00 | 1,132.30 | 5.36 | 1.00 | % | |||||||||||
Capital Appreciation | 1,000.00 | 1,097.29 | 4.69 | 0.89 | % | |||||||||||
Millennium | 1,000.00 | 1,006.42 | 4.89 | 0.97 | % | |||||||||||
International Small-Mid Company | 1,000.00 | 1,115.75 | 6.44 | 1.21 | % | |||||||||||
Aggressive Growth | 1,000.00 | 1,057.84 | 5.17 | 1.00 | % | |||||||||||
Small Cap Growth | 1,000.00 | 1,042.81 | 5.70 | 1.11 | % | |||||||||||
Mid Cap Opportunity | 1,000.00 | 1,071.36 | 5.05 | 0.97 | % | |||||||||||
S&P 500® Index | 1,000.00 | 1,056.68 | 2.43 | 0.47 | % | |||||||||||
Strategic Value | 1,000.00 | 1,016.94 | 4.06 | 0.80 | % | |||||||||||
High Income Bond | 1,000.00 | 1,063.85 | 3.99 | 0.77 | % | |||||||||||
Capital Growth | 1,000.00 | 1,087.02 | 5.40 | 1.03 | % | |||||||||||
Nasdaq-100® Index | 1,000.00 | 1,023.11 | 2.64 | 0.52 | % | |||||||||||
Bristol | 1,000.00 | 1,098.60 | 4.38 | 0.83 | % | |||||||||||
Bryton Growth | 1,000.00 | 1,033.96 | 4.60 | 0.90 | % | |||||||||||
U.S. Equity | 1,000.00 | 1,053.68 | 5.32 | 1.03 | % | |||||||||||
Balanced | 1,000.00 | 1,036.16 | 4.25 | 0.83 | % | |||||||||||
Income Opportunity | 1,000.00 | 1,033.28 | 6.34 | 1.24 | % | |||||||||||
Target VIP | 1,000.00 | 1,056.16 | 4.50 | 0.87 | % | |||||||||||
Target Equity/Income | 1,000.00 | 1,060.04 | 4.30 | 0.83 | % | |||||||||||
Bristol Growth | 1,000.00 | 1,063.37 | 4.62 | 0.89 | % | |||||||||||
| 159 | (continued) |
| Ohio National Fund, Inc. |
Additional Information (Unaudited) (Continued) | December 31, 2012 |
Hypothetical Example for Comparison Purposes
The table below provides information about hypothetical investment values and hypothetical expenses based on each respective Portfolio’s actual expense ratio and an assumed rate of return of 5% per year before expenses, which is not an actual return. The hypothetical investment values and expenses may not be used to estimate the actual ending investment balance or expenses actually paid for the period by the shareholders. A policy/contract holder may use this information to compare this 5% hypothetical example with the 5% hypothetical examples that appear in the shareholder reports of other funds.
Portfolio | Beginning Investment Value 7/1/2012 | Ending Investment Value 12/31/2012 | Expense Paid During Period* 7/1/2012 – 12/31/2012 | Expense Ratio During Period 7/1/2012 – 12/31/2012 (Annualized) | ||||||||||||
Equity | $ | 1,000.00 | $ | 1,020.76 | $ | 4.42 | 0.87 | % | ||||||||
Money Market | 1,000.00 | 1,024.63 | 0.51 | 0.10 | % | |||||||||||
Bond | 1,000.00 | 1,021.87 | 3.30 | 0.65 | % | |||||||||||
Omni | 1,000.00 | 1,021.06 | 4.12 | 0.81 | % | |||||||||||
International | 1,000.00 | 1,020.11 | 5.08 | 1.00 | % | |||||||||||
Capital Appreciation | 1,000.00 | 1,020.66 | 4.52 | 0.89 | % | |||||||||||
Millennium | 1,000.00 | 1,020.26 | 4.93 | 0.97 | % | |||||||||||
International Small-Mid Company | 1,000.00 | 1,019.05 | 6.14 | 1.21 | % | |||||||||||
Aggressive Growth | 1,000.00 | 1,020.11 | 5.08 | 1.00 | % | |||||||||||
Small Cap Growth | 1,000.00 | 1,019.56 | 5.63 | 1.11 | % | |||||||||||
Mid Cap Opportunity | 1,000.00 | 1,020.26 | 4.93 | 0.97 | % | |||||||||||
S&P 500® Index | 1,000.00 | 1,022.77 | 2.39 | 0.47 | % | |||||||||||
Strategic Value | 1,000.00 | 1,021.11 | 4.06 | 0.80 | % | |||||||||||
High Income Bond | 1,000.00 | 1,021.27 | 3.91 | 0.77 | % | |||||||||||
Capital Growth | 1,000.00 | 1,019.96 | 5.23 | 1.03 | % | |||||||||||
Nasdaq-100® Index | 1,000.00 | 1,022.52 | 2.64 | 0.52 | % | |||||||||||
Bristol | 1,000.00 | 1,020.96 | 4.22 | 0.83 | % | |||||||||||
Bryton Growth | 1,000.00 | 1,020.61 | 4.57 | 0.90 | % | |||||||||||
U.S. Equity | 1,000.00 | 1,019.96 | 5.23 | 1.03 | % | |||||||||||
Balanced | 1,000.00 | 1,020.96 | 4.22 | 0.83 | % | |||||||||||
Income Opportunity | 1,000.00 | 1,018.90 | 6.29 | 1.24 | % | |||||||||||
Target VIP | 1,000.00 | 1,020.76 | 4.42 | 0.87 | % | |||||||||||
Target Equity/Income | 1,000.00 | 1,020.96 | 4.22 | 0.83 | % | |||||||||||
Bristol Growth | 1,000.00 | 1,020.66 | 4.52 | 0.89 | % | |||||||||||
| * | Expenses are equal to the average account value times the Fund’s annualized expense ratio multiplied by the number of days in the most recent fiscal half-year (184 days) divided by the number of days in the fiscal year (366 days). Please note that the expenses shown in these tables are meant to highlight ongoing Fund costs only and do not reflect any contract-level expenses or Fund transactional costs, such as sales charges (loads) or exchange fees (if any). Therefore, these tables are useful in comparing ongoing fund costs only, and will not fully assist a policy/contract owner in determining the relative total expenses of different funds. In addition, if transactional costs were included, costs may have been higher for these Portfolios as well as for a fund being compared. |
| (3) | Other Federal Tax Information |
For corporate shareholders, the percentages of the total ordinary income dividends paid in 2012, and ordinary income consent dividends that were incurred in the 2012 tax year, that qualify for the corporate dividends received deduction are as follows:
Equity | 100.00 | % | ||
Money Market | 0.00 | % | ||
Bond | 0.00 | % | ||
Omni | 67.18 | % | ||
International. | 0.00 | % | ||
Capital Appreciation | 100.00 | % | ||
Millennium | 0.00 | % | ||
International Small-Mid Company | 0.00 | % | ||
Aggressive Growth | 100.00 | % | ||
Small Cap Growth . | 23.42 | % | ||
Mid Cap Opportunity. | 0.00 | % | ||
S&P 500® Index | 100.00 | % |
Strategic Value | 69.68 | % | ||
High Income Bond | 0.11 | % | ||
Capital Growth | 95.94 | % | ||
Nasdaq-100® Index | 100.00 | % | ||
Bristol | 100.00 | % | ||
Bryton Growth | 4.63 | % | ||
U.S. Equity | 100.00 | % | ||
Balanced | 84.72 | % | ||
Income Opportunity | 100.00 | % | ||
Target VIP | 83.39 | % | ||
Target Equity/Income | 100.00 | % | ||
Bristol Growth | 91.03 | % |
| 160 | (continued) |
| Ohio National Fund, Inc. |
Additional Information (Unaudited) (Continued) | December 31, 2012 |
Pursuant to Section 853 of the Internal Revenue Code, the Fund designates the following amounts as foreign taxes paid for the year ended December 31, 2012:
| Creditable Foreign Taxes Paid | Per Share Amount | Portion of Ordinary Income Distribution Derived from Foreign Sourced Income | ||||||||||
International | $ | 421,154 | 0.0290 | 100.00 | % | |||||||
International Small-Mid Company | $ | 66,082 | 0.0241 | 100.00 | % | |||||||
Foreign taxes paid for purposes of Section 853 may be less than actual foreign taxes paid for financial statement purposes. None of the Portfolios listed above derived any income from ineligible foreign sources, as defined under Section 901(j) of the Internal Revenue Code.
| 161 |
| Ohio National Fund, Inc. |
| December 31, 2012 (Unaudited) |
Name and Address | Age | Position(s) with the Fund | Term of Office and Length of Time Served | Number of Portfolios | Principal Occupation(s) and Other Directorships During Past Five Years | |||||||
Independent Directors | ||||||||||||
James E. Bushman One Financial Way Cincinnati, Ohio | 68 | Director, Chairman of Audit Committee and Member of Independent Directors Committee | Indefinite; Since March 2000 | 24 | Director, Chairman and CEO: Cast-Fab Technologies, Inc. (a manufacturing company); Director: The Midland Company (1998-2008), Air Transport Services Group, Inc., The Littleford Group, Inc. (1984-2010), Hilltop Basic Resources, Inc., The Elizabeth Gamble Deaconess Home Association, The Christ Hospital, The University of Cincinnati Foundation. | |||||||
George M. Vredeveld One Financial Way Cincinnati, Ohio | 70 | Lead Independent Director, Member of Audit and Independent Directors Committees | Indefinite; Since March 1996 | 24 | Professor of Economics: University of Cincinnati | |||||||
John I. Von Lehman One Financial Way Cincinnati, Ohio | 60 | Director, Member of Audit and Independent Directors Committees | Indefinite; Since August 2007 | 24 | Executive Vice President, CFO, Secretary, and Director: The Midland Company (1988-2007); Director, Audit Committee and Corporate Governance Committee Member: American Financial Group, Inc.; Finance Committee and Investment Committee Member: Life Enriching Communities; Investment Committee: Xavier University Foundation. | |||||||
Madeleine W. Ludlow One Financial Way Cincinnati, Ohio | 58 | Director, Member of Audit and Independent Directors Committees | Indefinite; Since April 2012 | 24 | Founder/Managing Director: West Capital Partners LLC (2010-present), Ludlow Ward Capital Advisors LLC (2005-2009); Director, ALLETE, Inc. (2004-present) | |||||||
Interested Director | ||||||||||||
John J. Palmer One Financial Way Cincinnati, Ohio | 73 | Chairman and Director | Indefinite; Since July 1997 | 24 | Insurance industry consultant (April 2010 to present), President: Oho National Fund, Inc. (1997-2010); Director and Vice Chairman: ONLIC (1997-2010); President, CEO, and Director: NSLA (2002-2010), Director: ONI and various affiliated companies (1997-2010), Cincinnati Symphony Orchestra, Tucson Symphony Orchestra, and Pima Canyon Estates Homeowners' Association. | |||||||
Officers | ||||||||||||
Christopher A. Carlson One Financial Way Cincinnati, Ohio | 53 | President | Indefinite; Since March 2000 | 24 | Executive Vice President and Chief Investment Officer: ONLIC; President and Director: ONI; Chief Investment Officer: NSLA; Officer and Director of various other Ohio National-affiliated companies. Prior to March 2010, was Vice President of the Fund. | |||||||
Thomas A. Barefield One Financial Way Cincinnati, Ohio | 59 | Vice President | Indefinite; Since February 1998 | 24 | Executive Vice President — Distribution: ONLIC; Director and Vice President — Marketing: NSLA; Director: ONI; Senior Vice President: Ohio National Equities, Inc.; Recent graduate of class XXIX of Leadership Cincinnati. | |||||||
Dennis R. Taney One Financial Way Cincinnati, Ohio | 65 | Chief Compliance Officer | Indefinite; Since August 2004 | 24 | Second Vice President: ONLIC, Chief Compliance Officer: ONLIC, ONI, NSLA, and other Ohio National-affiliated companies. | |||||||
R. Todd Brockman One Financial Way Cincinnati, Ohio | 45 | Treasurer | Indefinite; Since August 2004 | 24 | Second Vice President, Mutual Fund Operations: ONLIC and NSLA; Treasurer: ONI. | |||||||
Kimberly A. Plante One Financial Way Cincinnati, Ohio | 39 | Secretary | Indefinite; Since March 2005 | 24 | Senior Associate Counsel: ONLIC; Secretary: ONI; Officer of various other Ohio National-affiliated companies. Prior to August 2007, was Assistant Secretary. | |||||||
Catherine E. Gehr One Financial Way Cincinnati, Ohio | 41 | Assistant Treasurer | Indefinite; Since March 2005 | 24 | Manager, Mutual Fund Operations: ONLIC; Assistant Treasurer: ONI. | |||||||
| 162 |
Ohio National Fund, Inc.
Post Office Box 371
Cincinnati, Ohio 45201
Form 1320 Rev. 2-13
| Item 2. | Code Of Ethics. |
As of the end of the period covered by this report, Ohio National Fund, Inc. (the “Fund”) has adopted a code of ethics that applies to the Fund’s principal executive officer and principal financial officer. There were no substantive amendments or waivers to the Code of Ethics during the period covered by this report.
A copy of this Code of Ethics is filed as Exhibit EX-99.CODE to this Form N-CSR and is also available, without charge, upon request, by calling 877-781-6392 toll free.
| Item 3. | Audit Committee Financial Expert. |
The Fund’s Board of Directors has determined that the Fund has an audit committee financial expert serving on its Audit Committee. The Audit Committee financial expert is Mr. John I. Von Lehman. Mr. Von Lehman is independent for purposes of Item 3 of Form N-CSR.
| Item 4. | Principal Accountant Fees And Services. |
The aggregate fees for each of the last two fiscal years for professional services rendered by the principal accountant for the audit of the Fund’s annual financial statements or services that are normally provided by the accountant in connection with statutory and regulatory filings or engagements for those fiscal years are listed below.
| (a) | Audit Fees. |
Fiscal year ended December 31, 2012: | $ | 292,000 | ||
Fiscal year ended December 31, 2011: | $ | 284,000 |
| (b) | Audit-Related Fees. |
Professional services rendered in connection with the consent on the Fund’s N1A filing.
Fiscal year ended December 31, 2012: | $5,000 | |
Fiscal year ended December 31, 2011: | $5,000 |
| (c) | Tax Fees. None. |
| (d) | All Other Fees. None. |
| (e)(1) | Audit Committee Pre-Approval Policies and Procedures: |
The Fund’s Audit Committee has adopted an Audit Committee Charter that requires that the Audit Committee oversee the quality and appropriateness of the accounting methods used in the preparation of the Fund’s financial statements, and the independent audit thereof; approve the selection and compensation of the independent auditors; and pre-approve the performance, by the independent auditors, of non-audit services for the Fund, its investment adviser, or any affiliated entity controlling, controlled by or under common control with the investment adviser that provides ongoing services to the Fund.
| (e)(2) | Services Approved Pursuant to Paragraph (c)(7)(i)(C) of Rule 2-01 of Regulation S-X: |
During the fiscal years ended December 31, 2012 and 2011, there were no non-audit services provided by the Fund’s principal accountant that would have required pre-approval by the Fund’s Audit Committee. The audit related fees aforementioned were pre-approved by the Fund’s Audit Committee, although not required by paragraph (c) (7) (ii) of Regulation S-X as the audit-related fees were less than five percent of the total amount of revenues paid to the Fund’s principal accountant.
| (f) | Not applicable. |
| (g) | There were no non-audit services provided by the Fund’s principal accountant, other than items disclosed in item (b) above, in which a fee was billed to the Fund, the Fund’s adviser, and any entity controlling, controlled by, or under common control with the adviser that provides ongoing services to the registrant for the last two fiscal years. |
| (h) | Not applicable, as there were no non-audit services performed by the Fund’s principal accountant that were rendered to the Fund, the Fund’s adviser, or any entity controlling, controlled by, or under common control with the adviser that provided ongoing services to the registrant that were not pre-approved for the last two fiscal years. |
| Item 5. | Audit Committee Of Listed Registrants. |
Not applicable.
| Item 6. | Schedule of Investments. |
Not applicable.
| Item 7. | Disclosure Of Proxy Voting Policies And Procedures For Closed-End Management Investment Companies. |
Not Applicable.
| Item 8. | Portfolio Managers of Closed-End Management Investment Companies. |
Not Applicable.
| Item 9. | Purchases of Equity Securities by Closed-End Management Investment Company and Affiliated Purchasers. |
Not Applicable.
| Item 10. | Submission of Matters to a Vote of Security Holders. |
There were no material changes to the procedures by which shareholders may recommend nominees to the Fund’s Board of Directors.
| Item 11. | Controls and Procedures. |
| (a) | The Fund’s principal executive officer and principal financial officer have concluded, based on their evaluation conducted as of a date within 90 days of the filing of this report, that the Fund’s disclosure controls and procedures are adequately designed and are operating effectively to ensure (i) that material information relating to the Fund, including its consolidated subsidiaries, is made known to them by others within those entities, particularly during the period in which this report is being prepared; and (ii) that information required to be disclosed by the Fund on Form N-CSR is recorded, processed, summarized and reported within the time periods specified in the Securities and Exchange Commission’s rules and forms. |
| (b) | There were no changes in the Fund’s internal control over financial reporting that occurred during the second fiscal quarter of the period covered by this report that have materially affected, or are reasonably likely to materially affect, the Fund’s internal control over financial reporting. |
| Item 12. | Exhibits. |
| (a)(1) | The Fund’s Code of Ethics pursuant to Item 2 of Form N-CSR is filed and attached hereto as EX-99.CODE. |
| (a)(2) | A separate certification for each principal executive officer and principal financial officer of the Fund as required by Rule 30a-2(a) under the Investment Company Act of 1940 (17 CFR 270.30a-2(a)) is attached hereto as |
The certifications required by Section 906 of the Sarbanes-Oxley Act of 2002 are attached hereto as
EX-99.906CERT.
SIGNATURES
Pursuant to the requirements of the Securities Exchange Act of 1934 and the Investment Company Act of 1940, the registrant has duly caused this report to be signed on its behalf by the undersigned, thereunto duly authorized.
Ohio National Fund, Inc. | ||
By: | /s/ Christopher A. Carlson | |
Christopher A. Carlson | ||
President | ||
March 8, 2013 | ||
Pursuant to the requirements of the Securities Exchange Act of 1934 and the Investment Company Act of 1940, this report has been signed below by the following persons on behalf of the registrant and in the capacities and on the dates indicated.
Ohio National Fund, Inc. | ||
By: | /s/ Christopher A. Carlson | |
Christopher A. Carlson | ||
President | ||
March 8, 2013 | ||
By: | /s/ R. Todd Brockman | |
R. Todd Brockman | ||
Treasurer | ||
March 8, 2013 | ||