UNITED STATES
SECURITIES AND EXCHANGE COMMISSION
Washington, D.C. 20549
FORM N-CSR
CERTIFIED SHAREHOLDER REPORT OF REGISTERED
MANAGEMENT INVESTMENT COMPANIES
Investment Company Act file number 811-03015
Ohio National Fund, Inc.
(Exact name of registrant as specified in charter)
| One Financial Way, Cincinnati, Ohio | 45242 | |
| (Address of principal executive offices) | (Zip code) |
CT Corporation 300 E. Lombard St. Suite 1400 Baltimore, MD 21202
(Name and address of agent for service)
Registrant’s telephone number, including area code: 513-794-6971
Date of fiscal year end: December 31
Date of reporting period: December 31, 2015
Form N-CSR is to be used by management investment companies to file reports with the Commission not later than 10 days after the transmission to stockholders of any report that is required to be transmitted to stockholders under Rule 30e-1 under the Investment Company Act of 1940 (17 CFR 270.30e-1). The Commission may use the information provided on Form N-CSR in its regulatory, disclosure review, inspection, and policymaking roles.
A registrant is required to disclose the information specified by Form N-CSR, and the Commission will make this information public. A registrant is not required to respond to the collection of information contained in Form N-CSR unless the Form displays a currently valid Office of Management and Budget (“OMB”) control number. Please direct comments concerning the accuracy of the information collection burden estimate and any suggestions for reducing the burden to Secretary, Securities and Exchange Commission, 450 Fifth Street, NW, Washington, DC 20549-0609. The OMB has reviewed this collection of information under the clearance requirements of 44 U.S.C. § 3507.
| Item 1. | Reports To Stockholders. |

OHIO NATIONAL FUND, INC.
| 1 | ||||
| 3 | ||||
| 4 | ||||
| 8 | ||||
| 10 | ||||
| 15 | ||||
| 21 | ||||
| 27 | ||||
| 31 | ||||
| 37 | ||||
| 40 | ||||
| 45 | ||||
| 48 | ||||
| 55 | ||||
| 58 | ||||
ClearBridge Small Cap Portfolio (formerly the Capital Growth Portfolio) | 68 | |||
| 73 | ||||
| 77 | ||||
| 80 | ||||
| 83 | ||||
| 91 | ||||
| 95 | ||||
| 98 | ||||
| 109 | ||||
| 112 | ||||
| 115 | ||||
| 121 | ||||
| 132 | ||||
| 157 | ||||
| 158 | ||||
| 167 | ||||
Message |  |
Dear Investor:
2015 proved to be a difficult year for investors to earn meaningful, positive returns. The year was characterized by an equity market with increased volatility that had significant lows and significant rebounds during the year, ultimately finishing little changed. Large cap domestic equity indexes provided a small, positive return, while most other domestic and international indexes provided negative returns, when converted to a U.S. currency basis. Fixed income markets were somewhat better, with the broad fixed income indexes providing a small positive return. Corporate bond indexes fared worse, producing small negative returns for the year, related primarily to spread widening.
Both equity and fixed income markets were impacted by global headwinds in 2015. A slowdown in China reduced worldwide growth for the year. Domestically, the U.S. economy performed reasonably well, with moderate GDP growth. Commodity prices declined worldwide, sparking the fear of deflation and lower interest rates. However, strong employment growth in the U.S., as well as the Federal Reserve’s view that inflation pressures were growing, prompted the Fed to raise short term interest rates by 0.25 percent in December, with the expectation of further increases in 2016. Meanwhile, central bankers in Europe and Asia have been pursuing lower interest rates with the objective of spurring growth. These events were significant in causing the U.S. dollar to strengthen during the year. The stronger dollar is expected to negatively impact the U.S. economy and corporate profits in the future.
Equity Markets
Looking back over the past 60 years, large cap equities have experienced only 15 years of negative returns. During this period, large cap equities have returned an average of 9.75 percent annually. Although 2015 was probably disappointing for most investors, the data clearly support including an allocation to stocks in any investor’s portfolio that has a long-term investment horizon.
In 2015, returns varied significantly among different sectors of the equity market. For example, large cap stocks, as measured by the Standard & Poor’s 500® Index, provided a return of 1.4 percent, while small cap stocks, as measured by the Russell 2000®, returned a negative 4.4 percent. In the low-growth world that we experienced in 2015, large cap growth stocks, as measured by the NASDAQ-100® Index, provided a 9.8 percent return. Meanwhile, international equities, as measured by the MSCI All Country World ex-U.S. Index, provided a negative return of 5.2 percent in U.S. dollar terms. These varied results illustrate that not all stocks perform the same in a given year, supporting the argument for a well-diversified portfolio.
Equity friendly activities such as share buybacks, increased dividends, and mergers and acquisitions (M&A) have helped buoy the stock market averages over the last few years. In fact, M&A activity set a record in 2015. All of these activities are expected to continue in 2016.
As we enter 2016, consensus among earnings forecasters is for a modest increase in U.S. corporate earnings. However, stock valuations are a function of both earnings and multiples. The current multiple for the S&P 500® is
| 1 |
modestly above its historical average over the last 60 years. By themselves, neither earnings nor multiples can predict the future direction of the equity markets, but they are a useful guide to current valuation.
Fixed Income Markets
Fixed income markets provided meager returns in 2015. The Barclays Capital U.S. Aggregate Bond Index provided a return of 0.55 percent for the year. Within the various sectors of the index, higher quality bonds outperformed lower quality bonds, as spreads widened. Corporate bonds performed the worst, providing a negative return of 0.7 percent.
The divergence in policy of central bankers worldwide has created a divergence in interest rates and currency valuations. While the yield on the 10-year U.S. Treasury note ended the year at 2.27 percent, the yield on a Japanese 10-year government bond was 0.25 percent. The 10-year yields on government bonds in Germany and France were 0.62 percent and 0.98 percent, respectively. Absent a material increase in U.S. inflation in 2016 and beyond, it is hard to envision that the Fed will significantly increase interest rates this year, even though it has indicated that a steady rise to normalized rates is not out of the question.
As we enter 2016, fixed income markets are faced with a mixed bag of data. Economic growth in the U.S. remains modest, while the global economy is clearly slowing. U.S. employment continues to improve, and the Fed’s economic models project an increase in inflation. However, global inflation appears to be moderating, and the fear of deflation is real in many developed countries.
The Ohio National Fund, Inc.
While meaningful positive returns were difficult to achieve in 2015, the collective funds offered through the Ohio National Fund, Inc. performed well. Both index funds
tracked their indexes very closely, and the actively managed money market fund performed as expected. Of the other actively managed funds, 12 of the 18 funds either beat their benchmark or placed in the top half of their peer group, while 11 of the 18 did both. We are proud of the performance of our fund family in what turned out to be a challenging year.
Looking Ahead
Entering 2016, the global economy appears to be in a low-growth, low-return environment. This year may well prove to be another challenging year for investors seeking meaningful positive returns. Only time will tell. Inevitably, there will be pockets of both strength and weakness in the future, which will drive the short-term market performance of various asset classes. In times like these, it is important to maintain a long-term view, set realistic financial goals and support those goals with a diversified asset allocation strategy that meets your individual, long-term risk/return objectives.
Thank you for entrusting your assets to the Ohio National Fund, Inc. We look forward to continuing to serve your financial needs.
Sincerely,

Christopher A. Carlson
President
| 2 |
Directors and Officers of Ohio National Fund, Inc.
John J. Palmer, Director
Madeleine W. Ludlow, Director
George M. Vredeveld, Director
John I. Von Lehman, Director
Geoffrey Keenan, Director
Christopher A. Carlson, President
Thomas A. Barefield, Vice President
R. Todd Brockman, Treasurer
Kimberly A. Plante, Secretary
Keith Dwyer, Interim Chief Compliance Officer
Catherine E. Gehr, Assistant Treasurer
Emily Bae, Assistant Secretary
The Statement of Additional Information of Ohio National Fund, Inc. (the “Fund”) includes additional information about the Fund’s Board of Directors (the “Board”) and is available at http://www.ohionationalfund.com or upon request, without charge, by calling 877-781-6392 (toll-free).
A description of the policies and procedures that the Fund uses in voting proxies relating to Fund securities, as well as information regarding how the Fund voted proxies during the most recent twelve-month period ended June 30, is available without charge, upon request, by calling 877-781-6392 (toll-free) and on the Securities and Exchange Commission (the “Commission”) website at http://www.sec.gov.
The Fund has filed its Schedules of Investments as of March 31 and September 30 with the Commission, as required, on Form N-Q. Form N-Q is required to be filed with the Commission for the first and third quarters of each fiscal year within sixty days after the end of each period and is available on the Commission website upon acceptance of each submission. The Fund’s Forms N-Q may be reviewed and copied at the Commission’s Public Reference Room in Washington, DC. Information about the Public Reference Room is available by calling 1-800-SEC-0330 (toll-free).
This report and the financial statements contained herein are submitted for the general information of the shareholders of the Fund. This report is not authorized for distribution to prospective investors in the Fund unless preceded or accompanied by an effective prospectus of Ohio National Fund, Inc. For a prospectus containing more complete information, including charges and expenses, please contact Ohio National Investments, Inc., One Financial Way, Cincinnati, OH 45242, telephone 877-781-6392 (toll-free).
| 3 |
| Ohio National Fund, Inc. | Equity Portfolio |
Objective/Strategy
The Equity Portfolio seeks long-term growth of capital by investing at least 80% of its assets in equity securities.
Performance as of December 31, 2015
Average Annual Returns | ||||
One year | -3.69% | |||
Five years | 11.08% | |||
Ten years | 1.42% |
Past performance does not guarantee future results. The performance data quoted represents past performance and current returns may be lower or higher. Total return figures include change in share price and reinvestment of dividends and capital gains. The investment return and principal value will fluctuate so that an investor’s shares, when redeemed, may be worth more or less than the original cost. To obtain performance information up to the most recent month end, call toll-free 1-877-781-6392.
The Portfolio is not open to direct retail investment. Beneficial interest in shares is obtained solely by purchase of variable life insurance policies and variable annuity contracts. Actual performance results for variable annuity and variable universal life contracts will be lower due to contract charges. Consult your contract for applicable charges.
Comments
For the year ended December 31, 2015, the Equity Portfolio returned -3.69% versus 1.38% for its benchmark, the S&P 500 Index.
Relative portfolio underperformance was due primarily to weak stock selection in Energy and Information Technology, which was partially offset by positive stock selection in Consumer Discretionary. An underweight position in Consumer Staples detracted the most from allocation effects, as the sector outperformed the index.
Amazon.com, Inc., Microsoft Corp., Expedia, Inc., Broadcom Corp. and NXP Semiconductors NV were the largest contributors to performance, while the biggest detractors included CONSOL Energy, Inc., Calpine Corp., Yahoo!, Inc., Genworth Financial, Inc. and Devon Energy Corp. (1)
The market appreciated through the first half of the year, largely buoyed by merger and acquisition (“M&A”) activity, but the third quarter of 2015 saw sharp declines erase the earlier gains. The selling was indiscriminate and the Chicago Board Options Exchange Volatility Index, commonly referred to as the VIX, spiked to the highest level since the U.S. lost its AAA credit rating in late 2011. Over the last several years, the market has appreciated significantly and has experienced very little volatility. Until late August, the broad averages had not seen a 10% correction in over three years - rare from a historical perspective. Growing concern for global growth, combined with sliding domestic crude oil prices, appeared to drive much of the volatility. The International Monetary Fund (“IMF”) twice lowered its global growth projections for 2015; most recently forecasting a 3.1% expansion while pointing to a weak first quarter in the U.S., lower commodity prices, and question marks about the Chinese economy as causes for the tempered expectations.
Major averages rebounded from third quarter losses by posting strong gains in the fourth quarter to close the year in positive territory. The S&P 500 Index advanced each week in October and recovered to approach the 2100 level in spite of mixed economic reports and uninspiring earnings results. After a flattish November, the equity markets closed the year relinquishing some of October’s gains in December, as the Federal Reserve’s rate decision, continued weakness in crude prices, and high-yield debt concerns
dominated the headlines. As of the end of the year, the S&P 500 Index is up 10.3% since its August low, but still down 2.8% from its May high.
As most predicted, the Federal Reserve wrapped up its bond-buying program in October of 2014, but month after month failed to raise the target lending rate from zero. Federal Reserve officials fixated on tepid inflation in the U.S. despite a decent pace of economic expansion and meaningful improvement in the labor market. Aside from a disappointing 0.6% annualized rate of expansion in the first quarter of 2015, U.S. gross domestic product (“GDP”) reports have been moderately strong over the past year. Notably, the economy expanded 3.9% in the second quarter of 2015, and roughly 2.0% in both the fourth quarter of 2014 and the third quarter of 2015. Meanwhile, U.S. employers added more than 2.3 million jobs throughout the year and the unemployment rate fell to 5.0% by the end of December from 5.6% a year ago. Federal Reserve Chair Janet Yellen commented that the U.S. is nearly at full employment, with only 100,000 new jobs per month needed to accommodate new entrants to the workforce.
The minutes from the Federal Reserve’s November meeting revealed sentiment among officials that “it may well become appropriate to initiate the normalization process at the next meeting.” However, officials also emphasized that “beginning the normalization process relatively soon would make it more likely that the policy trajectory after liftoff could be shallow.” Indeed, after months of speculation, the Federal Reserve finally raised target rates in December for the first time in seven years. The initial rate increase appeared to be priced into the market, as the S&P 500 Index gained 1.5% on the day of the announcement and the 10-Year U.S. Treasury yield oscillated between 2.20% and 2.30% for most of the month.
After opening 2015 at 1.92%, the 10-Year Treasury yield dropped as low as 1.64% in January but recovered to close above 2.25% at the end of the year. Corporations continued to take advantage of low borrowing rates as global M&A activity broke the previous record in 2007 by 9%. Dealogic reports that total volume for 2015 surpassed $5 trillion including ten deals worth $50 billion or more each. On the other hand, the U.S. dollar strengthened nearly 10% against a broad basket of foreign currencies over the past twelve months and more than 20% over the past eighteen months, driving material foreign exchange headwinds for U.S. corporate earnings.
Oil prices fluctuated between $55 and $65 per barrel throughout the first half of the year, but sold off sharply thereafter, largely reacting to reports that capacity in Cushing, Oklahoma is running out for crude supplies, as well as the potential for Iranian supply to come back to market. OPEC concluded its most recent meeting without agreeing on a production ceiling for the first time in history. The oil industry has typically relied on OPEC to control supply as a support to prices, but it appears several member countries are sticking to their recent strategy of drilling as much as possible to preserve market share. Crude prices subsequently slid further and approached $35 per barrel, roughly 30% below the August high. Perhaps related to the commodity price weakness, a mutual fund that invests in lower-quality, high-yield bonds ceased offering investors daily liquidity and the yield on the KDP High Yield Daily Index, a proxy for junk bonds, surged above 7.5% for the first time since 2011.
CONSOL Energy, Inc. has suffered, as the fundamentals of the thermal coal industry have deteriorated due to a slew of headwinds. Expectations are incredibly low for the stock despite CONSOL Energy, Inc. being one of the few well-capitalized coal and natural gas companies, with low-cost production assets in both segments.
| 4 | (continued) |
| Ohio National Fund, Inc. | Equity Portfolio (Continued) |
We believe the stock is being unfairly associated with pure coal players and highly levered exploration & production (“E&P”) companies that will soon face liquidity issues and breach debt covenants. Depressed commodity prices could continue to pressure the shares, but we expect CONSOL Energy, Inc. to survive this cycle and take advantage of eventual industry consolidation. In the meantime, particularly with cold months ahead, any improvement in natural gas prices will provide a meaningful tailwind for the stock.(1)
Calpine Corp. detracted from returns, as the power generation industry has suffered from depressed prices stemming from weak demand. Supply and demand fundamentals will improve with time, but we expect the retirement of many coal-fired power generation plants in the meantime. Fortunately, the lack of any current fundamental tailwinds is allowing us to buy trough fundamentals at trough valuation levels. Calpine Corp. generates very strong free-cash-flow (“FCF”) streams, is valued at a double-digit FCF yield, and will benefit from any improvements in power pricing. We believe the stock’s valuation does not reflect an incredibly cheap option on potential power price volatility, especially in the New England and Mid-Atlantic power markets. We also see long-term power pricing potential from power demand increases in Texas power markets. Additionally, management’s capital allocation history is excellent. The company’s management team consistently recognizes the inherent value of the business, and have reduced share count by nearly 25% over the past four years at prices well below fair value.(1)
Yahoo!, Inc. shares have pulled back, as Alibaba has faced headwinds from weak economic activity in China, and after the IRS refused to give its blessing on a tax-free spinoff of Yahoo!, Inc.’s stake in Alibaba. Yahoo!, Inc. has since announced that it plans to spin off the core Yahoo! search business, which will also unlock shareholder value, reduce costs dramatically and result in a far smaller tax bill than is currently embedded in the stock price. Starboard Value, an activist investor in the company, is pushing for more substantial measures, as well including replacing the current management team. As for weak fundamentals for Alibaba, our estimates for growth have certainly come down in recent months, but the market seems to be pricing in 20% growth next year and only 10% growth in the years following – overly bearish in our opinion. Even if consumption slows further in China, the continued shift from offline to online commerce should provide Alibaba with significant offset, especially given that prices are much lower online compared to brick-and-mortar stores.(1)
Amazon.com, Inc. was a top contributor each quarter, more than doubling in value over the year. The company reported four straight quarters of earnings above Street estimates due to stronger-than-expected growth and margin improvement. The other large driver of performance this year was the new disclosure of Amazon Web Services (“AWS”) economics, which demonstrates profitability far greater than the negative earnings before interest and taxes (“EBIT”) margin business that consensus anticipated. We expect this business to be a source of strong growth for Amazon.com, Inc. going forward. Finally, a new tone from management, focused on cost management and on transparency in operating reporting, encouraged investors that we could see a much more shareholder-friendly management team going forward. We believe Amazon.com, Inc. will continue to meet growth targets and reach double-digit EBIT margins at full scale, but embedded expectations are beginning to converge with our projections. Therefore, we are more cautious on the stock.(1)
Following both its first quarter and third quarter earnings reports, Microsoft Corp. shares jumped 10% after posting results well above
Street consensus estimates due to growth in sales and expense controls that improved margins. Recent top-line growth was driven by Microsoft Corp.’s cloud services and hardware businesses, indicating the company is executing well to diversify its historically PC-centric business. Microsoft Corp. is an example of our legacy technology investments that embeds disruption risk of the shift to mobile, but has durable cash flow streams that will allow it to transition and, perhaps, thrive in a mobile and cloud-based world. Management is also focused on cost controls, which will further elevate free cash flow to return to shareholders.(1)
Online travel company Expedia, Inc. outperformed over the year, as the market applauded strong operating results and several large acquisitions. The company posted better-than-expected earnings for the second and third quarters, as growth accelerated due to a combination of improved technology and website, expanded supply of properties and repeat customers from aggressive loyalty programs. Additionally, Expedia, Inc. showcased solid operating leverage, and expanding margins, as technology and general expenses as a percentage of sales fell. Management announced two major acquisitions in Orbitz and HomeAway during the year as well. Orbitz adds scale to the existing business while HomeAway will provide exposure to the fast-growing vacation rental market. Both deals will generate meaningful cost synergies, and management has a strong integration track record.(1)
Few of man’s inventions are as interconnected as markets. Yet, we often tend to simplify markets by studying things in isolation and treating certain variables as constants. Ultimately, these simplifications break down under the pressing weight of reality, as simple stories get pushed to extremes that cannot withstand the countering force of valuation and unachievable expectations. With this caveat in mind, we can address risk through the lens of crowding, and the current state of two well-known financial factors: price momentum and value. Through this two-variable simplification of markets, we will try to answer a question we get a lot: are we finally due for a turn in the market cycle that favors value?
The answer is not immediately, in our opinion, as the crowd will stay with the momentum devil they know until they experience the ultimate catalyst for behavioral change: psychological pain from either losing money from a big reversal in momentum or a lost opportunity from a big move in value. This behavioral reality is why value alone is not a good timing tool, except at dramatic extremes that we will detail below. On the momentum side, a reversal in momentum will likely require either an economic recession, odds of which we peg at less than 25% in 2016, or a big increase in global growth - which is extremely hard to forecast, but does not appear imminent.
What we can gauge more directly is the potential for a big move in value, and we do this continuously by looking at valuation spreads. Empirical Research Partners calculates the spread by taking the cheapest 20% of the market and gauging how cheap this value bucket is relative to the market average over time. The big thing to notice is that big valuation opportunities come along roughly once every ten years or so. These big value opportunities can ruin or make a career, and the key for value managers is to survive when the line is rising violently so that you have the capital to make the most of the extreme value opportunity when it peaks and turns the other way. Like all good exponential market moves, these events create violent spikes, so the art of timing is critical. At the peaks, the valuation math becomes incredibly easy, but the behavioral hurdle is incredibly difficult, as these opportunities are typically born of severe crises like the Great Financial Bubble, or generational diversity breakdowns like the Tech Bubble.
| 5 | (continued) |
| Ohio National Fund, Inc. | Equity Portfolio (Continued) |
Currently, valuation spreads are widening due to the developing pain in commodities. Quite simply, balance sheets and cost structures that reflect the halcyon days of the great 2000s commodity boom cannot withstand current distressed commodity prices. If current prices are sustained or move lower, stress will continue to build as legacy equity capital is wiped out, and the remaining debt is restructured. This violent process will ultimately set up the next up cycle as the collapse in capital spending will ultimately lead to an undersupplied market.
Our strategy is one of constant preparation and patience as the opportunity develops. We are still underweight energy and basic commodities, but we have some capital committed to companies we deem long-term survivors. As valuation spreads most likely continue to expand, and we get paid more for the risk, we will gradually commit more capital. If the pain is severe enough to cause a two to three standard deviation blowout in spreads, commodity-related equities will likely become a major part of the Portfolio. In this scenario, the extreme pain of past investment in commodities will certainly give rise to a value cycle, as the expected returns from betting on the surviving equities will be extraordinary.
Outside of this emerging drama and opportunity, the price-to-value return potential embedded in the Portfolio is at the most attractive levels in roughly three years. Our investment team continues to find long-term valuation opportunities in several different areas, which allows us to match the valuation-driven upside potential with the Portfolio construction discipline that we think is so critical to surviving the current headwinds for value managers. Even for value managers, it is important to be good at more than just one thing, and
appreciating the cyclical dance between momentum and value is critical.
| (1) | The Portfolio’s composition is subject to change. Holdings and weightings are as of December 31, 2015. |
Change in Value of $10,000 Investment
Hypothetical illustration based on past performance. Future performance will vary. The Portfolio’s returns reflect reinvested dividends. The Portfolio’s holdings may differ significantly from the securities in the index. The index is unmanaged and therefore does not reflect the cost of portfolio management and accounting.
The S&P 500 Index is a capitalization-weighted index designed to measure performance of the broad domestic economy through changes in the aggregate market value of 500 stocks representing all major industries. The index presented herein includes the effects of reinvested dividends.
Portfolio Composition as of December 31, 2015 (1)
| % of Net Assets | ||||
Common Stocks (4) | 98.7 | |||
Master Limited Partnerships (4) | 1.1 | |||
Money Market Funds | 0.2 | |||
|
| |||
| 100.0 | ||||
|
|
Top 10 Portfolio Holdings as of December 31, 2015 (1) (2) (3)
| % of Net��Assets | ||||
1. Microsoft Corp. | 4.6 | |||
2. Citigroup, Inc. | 3.8 | |||
3. Calpine Corp. | 3.6 | |||
4. Amazon.com, Inc | 3.5 | |||
5. Merck & Co., Inc. | 3.2 | |||
6. Wells Fargo & Co. | 3.2 | |||
7. Cisco Systems, Inc. | 3.1 | |||
8. American International Group, Inc. | 3.1 | |||
9. EMC Corp. | 2.8 | |||
10. JPMorgan Chase & Co. | 2.8 |
| (1) | Composition of Portfolio subject to change. |
| (2) | Short-term investments have been excluded from the list of Top 10 Portfolio Holdings. |
| (3) | Top 10 Portfolio Holdings is presented at an individual security level. Total investment exposure by issuer may be higher. |
| (4) | Sectors (Common Stocks, Master Limited Partnerships): |
| % of Net Assets | ||||
Financials | 23.4 | |||
Information Technology | 19.7 | |||
Health Care | 17.9 | |||
Consumer Discretionary | 13.6 | |||
Industrials | 7.6 | |||
Utilities | 6.4 | |||
Materials | 5.4 | |||
Energy | 4.1 | |||
Consumer Staples | 1.7 | |||
|
| |||
| 99.8 | ||||
|
|
| 6 |
| Ohio National Fund, Inc. | Equity Portfolio |
Schedule of Investments | December 31, 2015 |
| Common Stocks – 98.7% | Shares | Value | ||||||||
CONSUMER DISCRETIONARY – 13.6% |
| |||||||||
McDonald’s Corp. (Hotels, Restaurants & Leisure) | 112,849 | $ | 13,331,981 | |||||||
PulteGroup, Inc. (Household Durables) | 785,657 | 14,000,408 | ||||||||
Amazon.com, Inc. (Internet & Catalog Retail) | (a) | 27,770 | 18,769,465 | |||||||
Expedia, Inc. (Internet & Catalog Retail) | 53,080 | 6,597,844 | ||||||||
Lowe’s Cos., Inc. (Specialty Retail) | 146,690 | 11,154,308 | ||||||||
Ralph Lauren Corp. (Textiles, Apparel & Luxury Goods) | 79,060 | 8,813,609 | ||||||||
|
| |||||||||
| 72,667,615 | ||||||||||
|
| |||||||||
CONSUMER STAPLES – 1.7% | ||||||||||
Colgate-Palmolive Co. (Household Products) | 137,230 | 9,142,263 | ||||||||
|
| |||||||||
ENERGY – 4.1% | ||||||||||
Apache Corp. (Oil, Gas & Consumable Fuels) | 219,960 | 9,781,621 | ||||||||
CONSOL Energy, Inc. (Oil, Gas & Consumable Fuels) | 529,570 | 4,183,603 | ||||||||
Devon Energy Corp. (Oil, Gas & Consumable Fuels) | 254,680 | 8,149,760 | ||||||||
|
| |||||||||
| 22,114,984 | ||||||||||
|
| |||||||||
FINANCIALS – 22.3% | ||||||||||
Citigroup, Inc. (Banks) | 398,002 | 20,596,603 | ||||||||
JPMorgan Chase & Co. (Banks) | 229,380 | 15,145,961 | ||||||||
Wells Fargo & Co. (Banks) | 314,610 | 17,102,200 | ||||||||
American Express Co. (Consumer Finance) | 94,510 | 6,573,170 | ||||||||
Synchrony Financial (Consumer Finance) | (a) | 347,990 | 10,582,376 | |||||||
American International Group, Inc. (Insurance) | 263,780 | 16,346,447 | ||||||||
Genworth Financial, Inc. Class A (Insurance) | (a) | 1,235,670 | 4,609,049 | |||||||
Hartford Financial Services Group, Inc. / The (Insurance) | 181,373 | 7,882,471 | ||||||||
American Homes 4 Rent (Real Estate Investment Trusts) | 726,190 | 12,098,325 | ||||||||
Realogy Holdings Corp. (Real Estate Mgmt. & Development) | (a) | 228,500 | 8,379,095 | |||||||
|
| |||||||||
| 119,315,697 | ||||||||||
|
| |||||||||
HEALTH CARE – 17.9% | ||||||||||
AbbVie, Inc. (Biotechnology) | 147,796 | 8,755,435 | ||||||||
Alexion Pharmaceuticals, Inc. (Biotechnology) | (a) | 43,221 | 8,244,406 | |||||||
Amgen, Inc. (Biotechnology) | 89,250 | 14,487,952 | ||||||||
Biogen, Inc. (Biotechnology) | (a) | 28,810 | 8,825,943 | |||||||
Express Scripts Holding Co. (Health Care Providers & Svs.) | (a) | 153,850 | 13,448,028 | |||||||
UnitedHealth Group, Inc. (Health Care Providers & Svs.) | 96,474 | 11,349,201 | ||||||||
Jazz Pharmaceuticals PLC (Pharmaceuticals) | (a) | 35,890 | 5,044,698 | |||||||
Merck & Co., Inc. (Pharmaceuticals) | 325,740 | 17,205,587 | ||||||||
Perrigo Co. PLC (Pharmaceuticals) | 56,980 | 8,245,006 | ||||||||
|
| |||||||||
| 95,606,256 | ||||||||||
|
| |||||||||
| Common Stocks (Continued) | Shares | Value | ||||||||
INDUSTRIALS – 7.6% | ||||||||||
Boeing Co. / The (Aerospace & Defense) | 65,920 | $ | 9,531,373 | |||||||
United Continental Holdings, Inc. (Airlines) | (a) | 201,030 | 11,519,019 | |||||||
Rockwell Automation, Inc. (Electrical Equip.) | 92,060 | 9,446,277 | ||||||||
PACCAR, Inc. (Machinery) | 134,295 | 6,365,583 | ||||||||
United Rentals, Inc. (Trading Companies & Distributors) | (a) | 51,850 | 3,761,199 | |||||||
|
| |||||||||
| 40,623,451 | ||||||||||
|
| |||||||||
INFORMATION TECHNOLOGY – 19.7% | ||||||||||
Cisco Systems, Inc. (Communications Equip.) | 611,590 | 16,607,726 | ||||||||
eBay, Inc. (Internet Software & Svs.) | (a) | 224,010 | 6,155,795 | |||||||
Yahoo!, Inc. (Internet Software & Svs.) | (a) | 397,250 | 13,212,535 | |||||||
NXP Semiconductors NV (Semiconductors & Equip.) | (a) | 171,637 | 14,460,417 | |||||||
Microsoft Corp. (Software) | 445,310 | 24,705,799 | ||||||||
Oracle Corp. (Software) | 414,069 | 15,125,941 | ||||||||
EMC Corp. (Tech. Hardware, Storage & Periph.) | 589,900 | 15,148,632 | ||||||||
|
| |||||||||
| 105,416,845 | ||||||||||
|
| |||||||||
MATERIALS – 5.4% | ||||||||||
Albemarle Corp. (Chemicals) | 198,470 | 11,116,305 | ||||||||
LyondellBasell Industries NV Class A (Chemicals) | 99,579 | 8,653,415 | ||||||||
Steel Dynamics, Inc. (Metals & Mining) | 524,056 | 9,364,881 | ||||||||
|
| |||||||||
| 29,134,601 | ||||||||||
|
| |||||||||
UTILITIES – 6.4% | ||||||||||
AES Corp. (Ind. Power & Renewable Elec.) | 1,526,467 | 14,608,289 | ||||||||
Calpine Corp. (Ind. Power & Renewable Elec.) | (a) | 1,348,580 | 19,513,953 | |||||||
|
| |||||||||
| 34,122,242 | ||||||||||
|
| |||||||||
Total Common Stocks (Cost $522,938,985) | $ | 528,143,954 | ||||||||
|
| |||||||||
| Master Limited Partnerships – 1.1% | Shares | Value | ||||||||
FINANCIALS – 1.1% | ||||||||||
KKR & Co. LP (Capital Markets) | 386,610 | $ | 6,027,250 | |||||||
|
| |||||||||
Total Master Limited Partnerships (Cost $7,680,538) | $ | 6,027,250 | ||||||||
|
| |||||||||
| Money Market Funds – 3.5% | Shares | Value | ||||||||
Fidelity Institutional Money Market Funds Money Market Portfolio – Class I | 18,889,000 | $ | 18,889,000 | |||||||
|
| |||||||||
Total Money Market Funds (Cost $18,889,000) | $ | 18,889,000 | ||||||||
|
| |||||||||
Total Investments – 103.3% (Cost $549,508,523) | (b) | $ | 553,060,204 | |||||||
Liabilities in Excess of Other Assets – (3.3)% | (17,771,244) | |||||||||
|
| |||||||||
Net Assets – 100.0% | $ | 535,288,960 | ||||||||
|
| |||||||||
Percentages are stated as a percent of net assets.
Footnotes:
| (a) | Non-income producing security. |
| (b) | Represents cost for financial reporting purposes, which may differ from cost basis for federal income tax purposes. See also Note 7 of the Notes to Financial Statements. |
The accompanying notes are an integral part of these financial statements.
| 7 |
| Ohio National Fund, Inc. | Money Market Portfolio |
Portfolio Composition as of December 31, 2015 (1)
| % of Net Assets | ||||
Commercial Paper (3) | 49.2 | |||
U.S. Treasury Obligations | 4.5 | |||
U.S. Government Agency Issues | 4.4 | |||
Money Market Funds and | 41.9 | |||
|
| |||
| 100.0 | ||||
|
|
Top 10 Portfolio Holdings as of December 31, 2015 (1) (2)
| % of Net Assets | ||||
1. U.S. Bank | 4.4 | |||
2. U.S. Treasury Bill | 4.4 | |||
3. Prudential Funding LLC | 4.4 | |||
4. Federal Home Loan Bank | 4.4 | |||
5. Coca-Cola Co. / The | 4.2 | |||
6. Federated Prime Cash Obligations Fund – Institutional Class | 4.0 | |||
7. Fidelity Institutional Money Market Funds Money Market Portfolio – Class I | 4.0 | |||
8. First American Prime Obligations Fund – Class Z | 4.0 | |||
9. Exxon Mobil Corp. | 4.0 | |||
10. Nestle Capital Corp. | 4.0 |
| (1) | Composition of Portfolio subject to change. |
| (2) | Top 10 Portfolio Holdings is presented at an individual security level. Total investment exposure by issuer may be higher. |
| (3) | Sectors (Commercial Paper): |
| % of Net Assets | ||||
Financials | 20.9 | |||
Consumer Staples | 12.3 | |||
Energy | 8.0 | |||
Health Care | 8.0 | |||
|
| |||
| 49.2 | ||||
|
|
| 8 |
| Ohio National Fund, Inc. | Money Market Portfolio |
Schedule of Investments | December 31, 2015 |
| Commercial Paper – 49.2% | (b) Rate | Maturity | Face Amount | Amortized Cost | ||||||||||||
CONSUMER STAPLES – 12.3% | ||||||||||||||||
Coca-Cola Co. / The (Beverages) | (a) | 0.300% | 01/11/2016 | $ | 9,500,000 | $ | 9,499,208 | |||||||||
Nestle Capital Corp. (Food Products) | (a) | 0.180% | 01/05/2016 | 9,000,000 | 8,999,820 | |||||||||||
Procter & Gamble Co. / The (Household Products) | (a) | 0.330% | 01/25/2016 | 9,000,000 | 8,998,020 | |||||||||||
|
| |||||||||||||||
| 27,497,048 | ||||||||||||||||
|
| |||||||||||||||
ENERGY – 8.0% | ||||||||||||||||
Chevron Corp. (Oil, Gas & Consumable Fuels) | (a) | 0.120% | 01/06/2016 | 5,000,000 | 4,999,917 | |||||||||||
Chevron Corp. (Oil, Gas & Consumable Fuels) | (a) | 0.260% | 01/06/2016 | 4,000,000 | 3,999,856 | |||||||||||
Exxon Mobil Corp. (Oil, Gas & Consumable Fuels) | 0.130% | 01/04/2016 | 9,000,000 | 8,999,903 | ||||||||||||
|
| |||||||||||||||
| 17,999,676 | ||||||||||||||||
|
| |||||||||||||||
FINANCIALS – 20.9% | ||||||||||||||||
American Honda Finance Corp. (Consumer Finance) | 0.240% | 01/12/2016 | 5,000,000 | 4,999,633 | ||||||||||||
American Honda Finance Corp. (Consumer Finance) | 0.250% | 01/12/2016 | 4,000,000 | 3,999,694 | ||||||||||||
John Deere Capital Corp. (Consumer Finance) | (a) | 0.250% | 01/05/2016 | 9,000,000 | 8,999,750 | |||||||||||
Toyota Motor Credit Corp. (Consumer Finance) | 0.250% | 01/08/2016 | 9,000,000 | 8,999,562 | ||||||||||||
U.S. Bank (Commercial Banks) | 0.100% | 01/04/2016 | 10,000,000 | 9,999,917 | ||||||||||||
Prudential Funding LLC (Insurance) | 0.330% | 01/04/2016 | 10,000,000 | 9,999,725 | ||||||||||||
|
| |||||||||||||||
| 46,998,281 | ||||||||||||||||
|
| |||||||||||||||
HEALTH CARE – 8.0% | ||||||||||||||||
Johnson & Johnson (Pharmaceuticals) | (a) | 0.320% | 01/13/2016 | 9,000,000 | 8,999,040 | |||||||||||
Pfizer, Inc. (Pharmaceuticals) | (a) | 0.330% | 01/20/2016 | 9,000,000 | 8,998,433 | |||||||||||
|
| |||||||||||||||
| 17,997,473 | ||||||||||||||||
|
| |||||||||||||||
Total Commercial Paper (Cost $110,492,478) | $ | 110,492,478 | ||||||||||||||
|
| |||||||||||||||
| U.S. Treasury Obligations – 4.5% | Rate | Maturity | Face Amount | Value | ||||||||||||
U.S. Treasury Bill | 0.061% | 01/07/2016 | $ | 10,000,000 | $ | 9,999,898 | ||||||||||
|
| |||||||||||||||
Total U.S. Treasury Obligations (Cost $9,999,898) | $ | 9,999,898 | ||||||||||||||
|
| |||||||||||||||
| U.S. Government Agency Issues – 4.4% | Rate | Maturity | Face Amount | Value | ||||||||||||
Federal Home Loan Bank | 0.205% | 01/15/2016 | $ | 10,000,000 | $ | 9,999,203 | ||||||||||
|
| |||||||||||||||
Total U.S. Government Agency Issues (Cost $9,999,203) | $ | 9,999,203 | ||||||||||||||
|
| |||||||||||||||
| Money Market Funds – 12.0% | Shares | Value | ||||||||||||||
Federated Prime Cash Obligations Fund – Institutional Class | 9,000,000 | $ | 9,000,000 | |||||||||||||
Fidelity Institutional Money Market Funds Money Market Portfolio – Class I | 9,000,000 | 9,000,000 | ||||||||||||||
| First American Prime Obligations Fund – Class Z | 9,000,000 | 9,000,000 | ||||||||||||||
|
| |||||||||||||||
Total Money Market Funds (Cost $27,000,000) | $ | 27,000,000 | ||||||||||||||
|
| |||||||||||||||
Total Investments – 70.1% (Cost $157,491,579) | (c) | $ | 157,491,579 | |||||||||||||
Other Assets in Excess of Liabilities – 29.9% | 67,296,347 | |||||||||||||||
|
| |||||||||||||||
Net Assets – 100.0% | $ | 224,787,926 | ||||||||||||||
|
| |||||||||||||||
Percentages are stated as a percent of net assets.
Footnotes:
| (a) | Security exempt from registration under Section 4 (2) of the Securities Act of 1933. These securities may be resold in transactions exempt from registration, normally to qualified buyers under Rule 144A. At December 31, 2015, the value of these securities totaled $63,494,044, or 28.2% of the Portfolio’s net assets. These securities were deemed liquid pursuant to procedures approved by the Board of Directors. |
| (b) | Rate presented is the effective yield at the time of purchase. |
| (c) | Represents cost for federal income tax and financial reporting purposes. See also Note 2 regarding the use of amortized cost for valuation of instruments in this Portfolio. |
The accompanying notes are an integral part of these financial statements.
| 9 |
| Ohio National Fund, Inc. | Bond Portfolio |
Objective/Strategy
The Bond Portfolio seeks to obtain a high level of income and opportunity for capital appreciation consistent with the preservation of capital by investing primarily in intermediate-term and long-term fixed income securities.
Performance as of December 31, 2015
Average Annual Returns | ||||
One year | -2.04% | |||
Five years | 3.02% | |||
Ten years | 3.80% |
Past performance does not guarantee future results. The performance data quoted represents past performance and current returns may be lower or higher. Total return figures include change in share price and reinvestment of dividends and capital gains. The investment return and principal value will fluctuate so that an investor’s shares, when redeemed, may be worth more or less than the original cost. To obtain performance information up to the most recent month end, call toll-free 1-877-781-6392.
The Portfolio is not open to direct retail investment. Beneficial interest in shares is obtained solely by purchase of variable life insurance policies and variable annuity contracts. Actual performance results for variable annuity and variable universal life contracts will be lower due to contract charges. Consult your contract for applicable charges.
Comments
For the year ended December 31, 2015, the Bond Portfolio returned -2.04% versus -0.63% for its benchmark, the BofA Merrill Lynch U.S. Corporate Master Index (the “Index”).
Both the Portfolio and the Index had small negative returns for the year because U.S. Treasury yields increased across the yield curve and credit spreads widened. For the year 2015, the 10-year Treasury yield increased 10 basis points and the 30-year Treasury yield increased 26 basis points. Interest rates moved higher in anticipation of the Federal Reserve beginning to tighten credit, as it did in December. As measured by the Index, credit spreads widened 29 basis points during the year. While credit spreads widened across all industry sectors, the widening was most pronounced in the energy and mining sectors due to the collapse of energy and commodity prices.
The Portfolio under-performed the Index by 1.41% for the year 2015 due to a combination of factors, including the Portfolio’s allocation to several industry sectors, the overall credit quality of the Portfolio, certain holdings in the Portfolio, and the expense ratio of the Portfolio. The average credit quality of the Portfolio was Baa1 versus A3 for the Index, and this difference in credit quality detracted from relative performance because higher quality bonds outperformed lower quality bonds during 2015. The Portfolio’s duration positioning benefited relative performance marginally. The Portfolio’s duration was approximately 0.25 years shorter than the duration of the Index during a year in which Treasury yields rose and credit spreads widened.(1)
With the exception of two industry sectors, differences in industry weightings between the Portfolio and the Index had little impact on relative performance. The Portfolio was over-weighted in the Energy sector by approximately 5% in the second half of 2015, and this hurt relative performance because the Energy sector performed poorly late in the year. The approximate 10% under-weighting in the banking sector also detracted from relative performance because the banking sector was the best performing sector in 2015.(1)
The quality of corporate credit in the U.S. was largely maintained in 2015, with the exceptions of the energy and mining sectors. Indeed, the five securities in the Portfolio that performed the worst in 2015 were all from these two sectors, and include Chesapeake Energy Corp., Teck Resources Ltd., Freeport-McMoRan Inc., Noble Holding International Ltd., and The Williams Cos., Inc. The five best performing bonds in 2015 were Ally Financial, Inc., Aflac, Inc., Time Warner Cable, Inc., Packaging Corp. of America, and Union Pacific Corp.(1)
Despite economic weakness in China, we expect the U.S. economy to continue growing slowly. With the exception of energy and mining companies, this growth in the U.S. economy will be generally supportive of corporate profits. Even though the Federal Reserve may tighten short-term credit further in 2016 if economic data is strong, we do not believe Treasury yields will increase much in 2016 because inflation continues to be very low. Because credit spreads have widened and the outlook for corporate profits in most sectors looks reasonably good, we expect to continue to overweight what we consider to be solid BBB investment grade bonds. We plan to also add some BB high yield bonds to the Portfolio if credit spreads for these securities are attractive. Even though we do not expect Treasury yields to rise significantly in 2016, we plan to maintain the duration of the Portfolio short of the Index duration. We would rather take credit risk than interest rate risk given the low level of interest rates and the wider credit spreads available on corporate bonds.
| (1) | The Portfolio’s composition is subject to change. Holdings and weightings are as of December 31, 2015. |
Change in Value of $10,000 Investment
Hypothetical illustration based on past performance. Future performance will vary. The Portfolio’s returns reflect reinvested dividends. The Portfolio’s holdings may differ significantly from the securities in the index. The index is unmanaged and therefore does not reflect the cost of portfolio management and accounting.
The BofA Merrill Lynch U.S. Corporate Master Index tracks the performance of all U.S. dollar-denominated, investment grade corporate public debt issued in the U.S. domestic bond market. Qualifying bonds must have an investment grade rating (based on an average of Moody’s, S&P, and Fitch). In addition, qualifying securities must have at least one year remaining term to maturity, a fixed coupon schedule, and a minimum amount outstanding of $250 million.
| 10 | (continued) |
| Ohio National Fund, Inc. | Bond Portfolio (Continued) |
Portfolio Composition as of December 31, 2015 (1)
| % of Net Assets | ||||
Corporate Bonds (4) | 96.6 | |||
Asset-Backed Securities (4) | 0.6 | |||
U.S. Treasury Obligations | 0.6 | |||
Money Market Funds and | 2.2 | |||
|
| |||
| 100.0 | ||||
|
|
Top 10 Portfolio Holdings as of December 31, 2015 (1) (2) (3)
| % of Net Assets | ||||
1. Fifth Third Bancorp | 1.2 | |||
2. Union Electric Co. | 1.0 | |||
3. Prudential Financial, Inc. | 1.0 | |||
4. Kansas City Power & Light Co. | 1.0 | |||
5. CSX Corp. | 1.0 | |||
6. Hartford Financial | 1.0 | |||
7. Bunge NA Finance LP | 1.0 | |||
8. Comerica Bank | 1.0 | |||
9. Simon Property Group LP | 1.0 | |||
10. Metropolitan Life Global Funding I | 1.0 |
| (1) | Composition of Portfolio subject to change. |
| (2) | Short-term investments have been excluded from the list of Top 10 Portfolio Holdings. |
| (3) | Top 10 Portfolio Holdings is presented at an individual security level. Total investment exposure by issuer may be higher. |
| (4) | Sectors (Corporate Bonds, Asset-Backed Securities): |
| % of Net Assets | ||||
Financials | 25.8 | |||
Energy | 17.5 | |||
Utilities | 9.8 | |||
Industrials | 9.3 | |||
Information Technology | 8.3 | |||
Consumer Discretionary | 8.1 | |||
Health Care | 7.1 | |||
Materials | 4.6 | |||
Consumer Staples | 3.9 | |||
Telecommunication Services | 2.8 | |||
|
| |||
| 97.2 | ||||
|
|
| 11 |
| Ohio National Fund, Inc. | Bond Portfolio |
Schedule of Investments | December 31, 2015 |
| Corporate Bonds – 96.6% | Rate | Maturity | Face Amount | Value | ||||||||||||
CONSUMER DISCRETIONARY – 8.1% | ||||||||||||||||
Magna International, Inc. (Auto Components) | 3.625% | 06/15/2024 | $ | 1,000,000 | $ | 977,793 | ||||||||||
General Motors Co. (Automobiles) | 5.000% | 04/01/2035 | 900,000 | 838,912 | ||||||||||||
McDonald’s Corp. (Hotels, Restaurants & Leisure) | 4.875% | 12/09/2045 | 1,000,000 | 1,005,385 | ||||||||||||
Expedia, Inc. (Internet & Catalog Retail) | (a) | 5.000% | 02/15/2026 | 1,000,000 | 976,471 | |||||||||||
Mattel, Inc. (Leisure Products) | 3.150% | 03/15/2023 | 625,000 | 596,347 | ||||||||||||
21st Century Fox America, Inc. (Media) | 4.500% | 02/15/2021 | 1,250,000 | 1,345,655 | ||||||||||||
CCO Safari II, LLC (Media) | (a) | 3.579% | 07/23/2020 | 1,000,000 | 994,272 | |||||||||||
Comcast Corp. (Media) | 4.250% | 01/15/2033 | 750,000 | 736,951 | ||||||||||||
Discovery Communications, LLC (Media) | 4.375% | 06/15/2021 | 1,000,000 | 1,024,749 | ||||||||||||
Discovery Communications, LLC (Media) | 3.300% | 05/15/2022 | 275,000 | 259,370 | ||||||||||||
Time Warner Cable, Inc. (Media) | 6.550% | 05/01/2037 | 850,000 | 859,724 | ||||||||||||
Viacom, Inc. (Media) | 4.850% | 12/15/2034 | 1,500,000 | 1,224,921 | ||||||||||||
Kohl’s Corp. (Multiline Retail) | 4.000% | 11/01/2021 | 925,000 | 949,862 | ||||||||||||
Bed Bath & Beyond, Inc. (Specialty Retail) | 5.165% | 08/01/2044 | 900,000 | 762,356 | ||||||||||||
|
| |||||||||||||||
| 12,552,768 | ||||||||||||||||
|
| |||||||||||||||
CONSUMER STAPLES – 3.9% | ||||||||||||||||
Anheuser-Busch Cos., LLC (Beverages) | 5.500% | 01/15/2018 | 750,000 | 801,819 | ||||||||||||
Bunge NA Finance LP (Food Products) | 5.900% | 04/01/2017 | 1,500,000 | 1,563,828 | ||||||||||||
Mead Johnson Nutrition Co. (Food Products) | 3.000% | 11/15/2020 | 900,000 | 900,132 | ||||||||||||
Imperial Tobacco Finance PLC (Tobacco) | (a) | 3.750% | 07/21/2022 | 1,400,000 | 1,405,764 | |||||||||||
Philip Morris International, Inc. (Tobacco) | 4.125% | 05/17/2021 | 1,250,000 | 1,328,301 | ||||||||||||
|
| |||||||||||||||
| 5,999,844 | ||||||||||||||||
|
| |||||||||||||||
ENERGY – 17.5% | ||||||||||||||||
Ensco PLC (Energy Equip. & Svs.) | 5.200% | 03/15/2025 | 900,000 | 640,804 | ||||||||||||
Halliburton Co. (Energy Equip. & Svs.) | 4.850% | 11/15/2035 | 900,000 | 884,102 | ||||||||||||
Noble Holding International Ltd. (Energy Equip. & Svs.) | 4.000% | 03/16/2018 | 900,000 | 815,067 | ||||||||||||
Noble Holding International Ltd. (Energy Equip. & Svs.) | 5.950% | 04/01/2025 | 1,000,000 | 690,094 | ||||||||||||
Weatherford International Ltd. (Energy Equip. & Svs.) | 6.000% | 03/15/2018 | 1,500,000 | 1,383,150 | ||||||||||||
Anadarko Petroleum Corp. (Oil, Gas & Consumable Fuels) | 5.950% | 09/15/2016 | 1,000,000 | 1,027,577 | ||||||||||||
Buckeye Partners LP (Oil, Gas & Consumable Fuels) | 4.875% | 02/01/2021 | 1,000,000 | 972,808 | ||||||||||||
Chesapeake Energy Corp. (Oil, Gas & Consumable Fuels) | (a) | 8.000% | 12/15/2022 | 565,000 | 276,850 | |||||||||||
Columbia Pipeline Group, Inc. (Oil, Gas & Consumable Fuels) | (a) | 4.500% | 06/01/2025 | 900,000 | 815,744 | |||||||||||
ConocoPhillips Co. (Oil, Gas & Consumable Fuels) | 3.350% | 05/15/2025 | 1,350,000 | 1,220,129 | ||||||||||||
Devon Energy Corp. (Oil, Gas & Consumable Fuels) | 3.250% | 05/15/2022 | 900,000 | 765,350 | ||||||||||||
Devon Energy Corp. (Oil, Gas & Consumable Fuels) | 5.850% | 12/15/2025 | 1,000,000 | 972,631 | ||||||||||||
Energy Transfer Partners LP (Oil, Gas & Consumable Fuels) | 4.750% | 01/15/2026 | 400,000 | 344,283 | ||||||||||||
Enterprise Products Operating, LLC (Oil, Gas & Consumable Fuels) | 3.900% | 02/15/2024 | 1,000,000 | 933,368 | ||||||||||||
Kinder Morgan Energy Partners LP (Oil, Gas & Consumable Fuels) | 4.150% | 03/01/2022 | 1,000,000 | 888,924 | ||||||||||||
Kinder Morgan, Inc. (Oil, Gas & Consumable Fuels) | 5.300% | 12/01/2034 | 1,000,000 | 787,655 | ||||||||||||
Magellan Midstream Partners LP (Oil, Gas & Consumable Fuels) | 4.250% | 02/01/2021 | 1,000,000 | 1,000,156 | ||||||||||||
Marathon Oil Corp. (Oil, Gas & Consumable Fuels) | 3.850% | 06/01/2025 | 850,000 | 684,229 | ||||||||||||
Marathon Petroleum Corp. (Oil, Gas & Consumable Fuels) | 4.750% | 09/15/2044 | 1,000,000 | 817,397 | ||||||||||||
MPLX LP (Oil, Gas & Consumable Fuels) | (a) | 4.875% | 12/01/2024 | 1,000,000 | 897,500 | |||||||||||
Murphy Oil Corp. (Oil, Gas & Consumable Fuels) | (b) | 3.700% | 12/01/2022 | 1,400,000 | 1,071,130 | |||||||||||
Occidental Petroleum Corp. (Oil, Gas & Consumable Fuels) | 3.125% | 02/15/2022 | 1,000,000 | 978,149 | ||||||||||||
Phillips 66 (Oil, Gas & Consumable Fuels) | 4.300% | 04/01/2022 | 1,300,000 | 1,338,173 | ||||||||||||
Plains All American Pipeline LP / PAA Finance Corp. (Oil, Gas & Consumable Fuels) | 2.850% | 01/31/2023 | 1,000,000 | 825,241 | ||||||||||||
Plains All American Pipeline LP / PAA Finance Corp. (Oil, Gas & Consumable Fuels) | 4.650% | 10/15/2025 | 900,000 | 786,099 | ||||||||||||
Shell International Finance BV (Oil, Gas & Consumable Fuels) | 4.375% | 03/25/2020 | 1,250,000 | 1,342,710 | ||||||||||||
Southwestern Energy Co. (Oil, Gas & Consumable Fuels) | (b) | 4.050% | 01/23/2020 | 900,000 | 652,500 | |||||||||||
Spectra Energy Capital, LLC (Oil, Gas & Consumable Fuels) | 3.300% | 03/15/2023 | 1,425,000 | 1,219,712 | ||||||||||||
TransCanada PipeLines Ltd. (Oil, Gas & Consumable Fuels) | 2.500% | 08/01/2022 | 1,425,000 | 1,308,364 | ||||||||||||
Williams Cos., Inc. / The (Oil, Gas & Consumable Fuels) | 5.750% | 06/24/2044 | 1,000,000 | 593,793 | ||||||||||||
|
| |||||||||||||||
| 26,933,689 | ||||||||||||||||
|
| |||||||||||||||
FINANCIALS – 25.8% | ||||||||||||||||
Bank of America Corp. (Banks) | 4.200% | 08/26/2024 | 500,000 | 500,726 | ||||||||||||
Bank of America Corp. (Banks) | 3.875% | 08/01/2025 | 850,000 | 862,941 | ||||||||||||
Branch Banking & Trust Co. (Banks) | 3.625% | 09/16/2025 | 900,000 | 908,912 | ||||||||||||
Citigroup, Inc. (Banks) | 4.400% | 06/10/2025 | 900,000 | 909,432 | ||||||||||||
Comerica Bank (Banks) | 5.750% | 11/21/2016 | 1,500,000 | 1,553,676 | ||||||||||||
Fifth Third Bancorp (Banks) | 4.500% | 06/01/2018 | 1,750,000 | 1,843,054 | ||||||||||||
KeyCorp (Banks) | 5.100% | 03/24/2021 | 500,000 | 546,620 | ||||||||||||
PNC Bank NA (Banks) | 3.250% | 06/01/2025 | 850,000 | 845,697 | ||||||||||||
SunTrust Banks, Inc. (Banks) | 2.500% | 05/01/2019 | 1,400,000 | 1,407,130 | ||||||||||||
Wells Fargo & Co. (Banks) | 4.650% | 11/04/2044 | 1,000,000 | 972,940 | ||||||||||||
Goldman Sachs Group, Inc. / The (Capital Markets) | 3.750% | 05/22/2025 | 1,400,000 | 1,409,899 | ||||||||||||
Morgan Stanley (Capital Markets) | 3.750% | 02/25/2023 | 1,250,000 | 1,281,140 | ||||||||||||
Morgan Stanley (Capital Markets) | 3.950% | 04/23/2027 | 1,000,000 | 970,995 | ||||||||||||
| 12 | (continued) |
| Ohio National Fund, Inc. | Bond Portfolio (Continued) |
Schedule of Investments | December 31, 2015 |
| Corporate Bonds (Continued) | Rate | Maturity | Face Amount | Value | ||||||||||||
FINANCIALS (continued) | ||||||||||||||||
Northern Trust Corp. (Capital Markets) | 3.450% | 11/04/2020 | $ | 1,000,000 | $ | 1,045,536 | ||||||||||
State Street Corp. (Capital Markets) | 4.375% | 03/07/2021 | 1,250,000 | 1,356,456 | ||||||||||||
Capital One Financial Corp. (Consumer Finance) | 2.450% | 04/24/2019 | 925,000 | 926,901 | ||||||||||||
Discover Financial Services (Consumer Finance) | 6.450% | 06/12/2017 | 750,000 | 792,382 | ||||||||||||
Ford Motor Credit Co., LLC (Consumer Finance) | 3.157% | 08/04/2020 | 1,400,000 | 1,395,783 | ||||||||||||
Synchrony Financial (Consumer Finance) | 4.250% | 08/15/2024 | 900,000 | 887,920 | ||||||||||||
Intercontinental Exchange, Inc. (Diversified Financial Svs.) | 2.750% | 12/01/2020 | 900,000 | 900,152 | ||||||||||||
Intercontinental Exchange, Inc. (Diversified Financial Svs.) | 3.750% | 12/01/2025 | 1,000,000 | 1,003,386 | ||||||||||||
Moody’s Corp. (Diversified Financial Svs.) | 5.250% | 07/15/2044 | 1,000,000 | 1,020,566 | ||||||||||||
Aflac, Inc. (Insurance) | 3.625% | 06/15/2023 | 1,425,000 | 1,475,406 | ||||||||||||
Allstate Corp. / The (Insurance) | 5.200% | 01/15/2042 | 500,000 | 497,338 | ||||||||||||
American International Group, Inc. (Insurance) | 3.875% | 01/15/2035 | 1,400,000 | 1,234,681 | ||||||||||||
Hartford Financial Services Group, Inc. / The (Insurance) | 5.375% | 03/15/2017 | 1,500,000 | 1,564,537 | ||||||||||||
Marsh & McLennan Cos., Inc. (Insurance) | 3.500% | 06/03/2024 | 1,400,000 | 1,387,266 | ||||||||||||
Metropolitan Life Global Funding I (Insurance) | (a) | 2.300% | 04/10/2019 | 1,500,000 | 1,500,385 | |||||||||||
Prudential Financial, Inc. (Insurance) | 6.100% | 06/15/2017 | 1,500,000 | 1,589,178 | ||||||||||||
Boston Properties LP (Real Estate Investment Trusts) | 3.125% | 09/01/2023 | 925,000 | 901,047 | ||||||||||||
Camden Property Trust (Real Estate Investment Trusts) | 4.250% | 01/15/2024 | 500,000 | 517,923 | ||||||||||||
Equity One, Inc. (Real Estate Investment Trusts) | 6.250% | 01/15/2017 | 1,250,000 | 1,301,704 | ||||||||||||
Federal Realty Investment Trust (Real Estate Investment Trusts) | 3.000% | 08/01/2022 | 1,425,000 | 1,408,202 | ||||||||||||
HCP, Inc. (Real Estate Investment Trusts) | 4.000% | 06/01/2025 | 1,500,000 | 1,465,462 | ||||||||||||
Simon Property Group LP (Real Estate Investment Trusts) | 3.750% | 02/01/2024 | 1,475,000 | 1,533,465 | ||||||||||||
|
| |||||||||||||||
| 39,718,838 | ||||||||||||||||
|
| |||||||||||||||
HEALTH CARE – 7.1% | ||||||||||||||||
AbbVie, Inc. (Biotechnology) | 2.900% | 11/06/2022 | 1,425,000 | 1,379,598 | ||||||||||||
Amgen, Inc. (Biotechnology) | 4.100% | 06/15/2021 | 1,000,000 | 1,053,572 | ||||||||||||
Baxalta, Inc. (Biotechnology) | (a) | 4.000% | 06/23/2025 | 1,400,000 | 1,386,206 | |||||||||||
Celgene Corp. (Biotechnology) | 3.875% | 08/15/2025 | 1,350,000 | 1,345,710 | ||||||||||||
Gilead Sciences, Inc. (Biotechnology) | 4.500% | 02/01/2045 | 900,000 | 880,723 | ||||||||||||
Becton Dickinson and Co. (Health Care Equip. & Supplies) | 5.000% | 05/15/2019 | 500,000 | 540,047 | ||||||||||||
Express Scripts Holding Co. (Health Care Providers & Svs.) | 2.250% | 06/15/2019 | 900,000 | 894,793 | ||||||||||||
Laboratory Corp. of America Holdings (Health Care Providers & Svs.) | 3.750% | 08/23/2022 | 425,000 | 428,013 | ||||||||||||
Quest Diagnostics, Inc. (Health Care Providers & Svs.) | 2.700% | 04/01/2019 | 1,000,000 | 1,000,010 | ||||||||||||
Merck Sharp & Dohme Corp. (Pharmaceuticals) | 5.000% | 06/30/2019 | 1,000,000 | 1,103,649 | ||||||||||||
Mylan NV (Pharmaceuticals) | (a) | 3.000% | 12/15/2018 | 900,000 | 898,132 | |||||||||||
|
| |||||||||||||||
| 10,910,453 | ||||||||||||||||
|
| |||||||||||||||
INDUSTRIALS – 8.7% | ||||||||||||||||
BAE Systems Holdings, Inc. (Aerospace & Defense) | (a) | 6.375% | 06/01/2019 | 750,000 | 839,366 | |||||||||||
Lockheed Martin Corp. (Aerospace & Defense) | 3.350% | 09/15/2021 | 1,000,000 | 1,025,049 | ||||||||||||
Lockheed Martin Corp. (Aerospace & Defense) | 3.600% | 03/01/2035 | 1,000,000 | 894,211 | ||||||||||||
Raytheon Co. (Aerospace & Defense) | 4.400% | 02/15/2020 | 1,250,000 | 1,353,507 | ||||||||||||
FedEx Corp. (Air Freight & Logistics) | 4.900% | 01/15/2034 | 1,425,000 | 1,463,853 | ||||||||||||
American Airlines Group, Inc. (Airlines) | (a) | 4.625% | 03/01/2020 | 1,000,000 | 952,500 | |||||||||||
GE Capital International Funding Co. (Industrial Conglomerates) | (a) | 0.964% | 04/15/2016 | 14,000 | 14,006 | |||||||||||
Illinois Tool Works, Inc. (Machinery) | 3.375% | 09/15/2021 | 500,000 | 514,520 | ||||||||||||
Parker-Hannifin Corp. (Machinery) | 4.200% | 11/21/2034 | 1,400,000 | 1,420,945 | ||||||||||||
Burlington Northern Santa Fe, LLC (Road & Rail) | 4.550% | 09/01/2044 | 900,000 | 869,269 | ||||||||||||
CSX Corp. (Road & Rail) | 5.600% | 05/01/2017 | 1,500,000 | 1,577,816 | ||||||||||||
Norfolk Southern Corp. (Road & Rail) | 3.000% | 04/01/2022 | 600,000 | 593,116 | ||||||||||||
Penske Truck Leasing Co. LP / PTL Finance Corp. (Road & Rail) | (a) | 3.300% | 04/01/2021 | 900,000 | 887,732 | |||||||||||
Union Pacific Corp. (Road & Rail) | 3.250% | 08/15/2025 | 1,000,000 | 1,016,702 | ||||||||||||
|
| |||||||||||||||
| 13,422,592 | ||||||||||||||||
|
| |||||||||||||||
INFORMATION TECHNOLOGY – 8.3% | ||||||||||||||||
Harris Corp. (Communications Equip.) | 2.700% | 04/27/2020 | 900,000 | 883,256 | ||||||||||||
QUALCOMM, Inc. (Communications Equip.) | 3.450% | 05/20/2025 | 1,000,000 | 959,317 | ||||||||||||
Denali Borrower, LLC / Denali Finance Corp. (Computers & Peripherals) | (a) | 5.625% | 10/15/2020 | 900,000 | 942,750 | |||||||||||
Computer Sciences Corp. (IT Svs.) | 6.500% | 03/15/2018 | 1,000,000 | 1,079,173 | ||||||||||||
Fidelity National Information Services, Inc. (IT Svs.) | 2.850% | 10/15/2018 | 900,000 | 903,193 | ||||||||||||
Broadcom Corp. (Semiconductors & Equip.) | 3.500% | 08/01/2024 | 1,400,000 | 1,404,740 | ||||||||||||
Intel Corp. (Semiconductors & Equip.) | 4.000% | 12/15/2032 | 1,500,000 | 1,492,728 | ||||||||||||
KLA-Tencor Corp. (Semiconductors & Equip.) | (b) | 3.375% | 11/01/2019 | 900,000 | 909,327 | |||||||||||
Microsoft Corp. (Software) | 4.450% | 11/03/2045 | 900,000 | 928,164 | ||||||||||||
Oracle Corp. (Software) | 4.300% | 07/08/2034 | 1,500,000 | 1,491,132 | ||||||||||||
Apple, Inc. (Tech. Hardware, Storage & Periph.) | 2.500% | 02/09/2025 | 1,000,000 | 956,877 | ||||||||||||
Hewlett Packard Enterprise Co. (Tech. Hardware, Storage & Periph.) | (a) | 4.900% | 10/15/2025 | 850,000 | 834,769 | |||||||||||
|
| |||||||||||||||
| 12,785,426 | ||||||||||||||||
|
| |||||||||||||||
| 13 | (continued) |
| Ohio National Fund, Inc. | Bond Portfolio (Continued) |
Schedule of Investments | December 31, 2015 |
| Corporate Bonds (Continued) | Rate | Maturity | Face Amount | Value | ||||||||||||
MATERIALS – 4.6% | ||||||||||||||||
Airgas, Inc. (Chemicals) | 3.050% | 08/01/2020 | $ | 900,000 | $ | 905,686 | ||||||||||
Dow Chemical Co. / The (Chemicals) | 4.250% | 10/01/2034 | 1,400,000 | 1,263,269 | ||||||||||||
Eastman Chemical Co. (Chemicals) | 3.600% | 08/15/2022 | 1,000,000 | 995,661 | ||||||||||||
FMC Corp. (Chemicals) | 3.950% | 02/01/2022 | 1,000,000 | 988,429 | ||||||||||||
Packaging Corp. of America (Containers & Packaging) | 4.500% | 11/01/2023 | 675,000 | 709,105 | ||||||||||||
Freeport-McMoRan, Inc. (Metals & Mining) | 3.550% | 03/01/2022 | 925,000 | 536,500 | ||||||||||||
Newmont Mining Corp. (Metals & Mining) | 3.500% | 03/15/2022 | 1,425,000 | 1,270,594 | ||||||||||||
Teck Resources Ltd. (Metals & Mining) | 3.750% | 02/01/2023 | 1,000,000 | 462,500 | ||||||||||||
|
| |||||||||||||||
| 7,131,744 | ||||||||||||||||
|
| |||||||||||||||
TELECOMMUNICATION SERVICES – 2.8% | ||||||||||||||||
AT&T, Inc. (Diversified Telecom. Svs.) | 3.400% | 05/15/2025 | 900,000 | 865,094 | ||||||||||||
Frontier Communications Corp. (Diversified Telecom. Svs.) | 7.125% | 03/15/2019 | 1,000,000 | 999,900 | ||||||||||||
Verizon Communications, Inc. (Diversified Telecom. Svs.) | 4.600% | 04/01/2021 | 1,250,000 | 1,343,749 | ||||||||||||
Verizon Communications, Inc. (Diversified Telecom. Svs.) | 3.850% | 11/01/2042 | 425,000 | 347,345 | ||||||||||||
Rogers Communications, Inc. (Wireless Telecom. Svs.) | 3.000% | 03/15/2023 | 700,000 | 680,126 | ||||||||||||
|
| |||||||||||||||
| 4,236,214 | ||||||||||||||||
|
| |||||||||||||||
UTILITIES – 9.8% | ||||||||||||||||
Appalachian Power Co. (Electric Utilities) | 4.600% | 03/30/2021 | 1,000,000 | 1,066,968 | ||||||||||||
Commonwealth Edison Co. (Electric Utilities) | 4.350% | 11/15/2045 | 900,000 | 905,212 | ||||||||||||
DTE Electric Co. (Electric Utilities) | 3.375% | 03/01/2025 | 1,000,000 | 1,021,828 | ||||||||||||
Duke Energy Florida, LLC (Electric Utilities) | 4.550% | 04/01/2020 | 500,000 | 540,706 | ||||||||||||
ITC Holdings Corp. (Electric Utilities) | 3.650% | 06/15/2024 | 500,000 | 492,780 | ||||||||||||
Kansas City Power & Light Co. (Electric Utilities) | 5.850% | 06/15/2017 | 1,500,000 | 1,585,035 | ||||||||||||
LG&E and KU Energy, LLC (Electric Utilities) | 4.375% | 10/01/2021 | 1,000,000 | 1,056,973 | ||||||||||||
South Carolina Electric & Gas Co. (Electric Utilities) | 4.350% | 02/01/2042 | 1,000,000 | 958,245 | ||||||||||||
Union Electric Co. (Electric Utilities) | 6.400% | 06/15/2017 | 1,500,000 | 1,602,369 | ||||||||||||
Xcel Energy, Inc. (Electric Utilities) | 4.700% | 05/15/2020 | 1,000,000 | 1,075,097 | ||||||||||||
AGL Capital Corp. (Gas Utilities) | 5.250% | 08/15/2019 | 1,000,000 | 1,075,762 | ||||||||||||
Southwest Gas Corp. (Gas Utilities) | 3.875% | 04/01/2022 | 1,250,000 | 1,273,528 | ||||||||||||
Avista Corp. (Multi-Utilities) | 5.950% | 06/01/2018 | 1,000,000 | 1,091,040 | ||||||||||||
American Water Capital Corp. (Water Utilities) | 4.300% | 12/01/2042 | 1,400,000 | 1,415,749 | ||||||||||||
|
| |||||||||||||||
| 15,161,292 | ||||||||||||||||
|
| |||||||||||||||
Total Corporate Bonds (Cost $152,759,712) | $ | 148,852,860 | ||||||||||||||
|
| |||||||||||||||
| Asset-Backed Securities – 0.6% | Rate | Maturity | Face Amount | Value | ||||||||||||
INDUSTRIALS – 0.6.% | ||||||||||||||||
American Airlines 2015-1 Class B Pass Through Trust (Airlines) | 3.700% | 05/01/2023 | $ | 863,169 | $ | 843,748 | ||||||||||
|
| |||||||||||||||
Total Asset-Backed Securities (Cost $863,169) | $ | 843,748 | ||||||||||||||
|
| |||||||||||||||
| U.S. Treasury Obligations – 0.6% | Rate | Maturity | Face Amount | Value | ||||||||||||
U.S. Treasury Note | 1.500% | 01/31/2022 | $ | 1,000,000 | $ | 972,240 | ||||||||||
|
| |||||||||||||||
Total U.S. Treasury Obligations (Cost $971,977) | $ | 972,240 | ||||||||||||||
|
| |||||||||||||||
| Money Market Funds – 0.3% | Shares | Value | ||||||||||||||
Fidelity Institutional Money Market Funds | 441,000 | $ | 441,000 | |||||||||||||
|
| |||||||||||||||
Total Money Market Funds (Cost $441,000) | $ | 441,000 | ||||||||||||||
|
| |||||||||||||||
Total Investments – 98.1% (Cost $155,035,858) | (c) | $ | 151,109,848 | |||||||||||||
Other Assets in Excess of Liabilities – 1.9% | 2,930,563 | |||||||||||||||
|
| |||||||||||||||
Net Assets – 100.0% | $ | 154,040,411 | ||||||||||||||
|
| |||||||||||||||
Percentages are stated as a percent of net assets.
Footnotes:
| (a) | Security exempt from registration under Regulation D of the Securities Act of 1933. These securities may be resold in transactions exempt from registration, normally to qualified buyers under Rule 144A. At December 31, 2015, the value of these securities totaled $13,622,447, or 8.8% of the Portfolio’s net assets. These securities were deemed liquid pursuant to procedures approved by the Board of Directors. |
| (b) | Represents bonds that are credit sensitive. The coupon rates for these bonds are subject to adjustment based on changes in national credit rating agency ratings. |
| (c) | Represents cost for financial reporting purposes, which may differ from cost basis for federal income tax purposes. See also Note 7 of the Notes to Financial Statements. |
The accompanying notes are an integral part of these financial statements.
| 14 |
| Ohio National Fund, Inc. | Omni Portfolio |
Objective/Strategy
The Omni Portfolio seeks a high level of long-term total return consistent with preservation of capital by investing in stocks, bonds, and money market instruments.
Performance as of December 31, 2015
Average Annual returns | ||||
One year | 2.15% | |||
Five years | 9.94% | |||
Ten years | 7.24% |
Past performance does not guarantee future results. The performance data quoted represents past performance and current returns may be lower or higher. Total return figures include change in share price and reinvestment of dividends and capital gains. The investment return and principal value will fluctuate so that an investor’s shares, when redeemed, may be worth more or less than the original cost. To obtain performance information up to the most recent month end, call toll-free 1-877-781-6392.
The Portfolio is not open to direct retail investment. Beneficial interest in shares is obtained solely by purchase of variable life insurance policies and variable annuity contracts. Actual performance results for variable annuity and variable universal life contracts will be lower due to contract charges. Consult your contract for applicable charges.
Comments
For the year ended December 31, 2015, the Omni Portfolio returned 2.15% versus 0.97% for its benchmark, which is comprised of 70% S&P 500 Index and 30% BofA Merrill Lynch U.S. Corporate Master Index (the “Merrill Lynch Index”).
The 118 basis points of outperformance for the Portfolio versus the blended benchmark is the result of outperformance by the equity portion of the Portfolio versus the S&P 500 Index, somewhat offset by the underperformance of the bond portion of the Portfolio versus the Merrill Lynch Index. The asset allocation decision to overweight stocks and underweight bonds versus the blended benchmark also benefitted relative performance because stocks outperformed bonds for the year.(1)
For the year 2015, the equity portion of the Portfolio returned 4.09% versus 1.38% for the S&P 500 Index, for outperformance of 271 basis points. The Portfolio’s best performing stocks for the year were Amazon.com, Inc., Intercept Pharmaceuticals, Inc., Pharmacyclics, Inc., Receptos, Inc. and Humana, Inc. The Portfolio’s worst performing stocks were PVH Corp., Anadarko Petroleum Corp., Devon Energy Corp., Huntsman Corp. and HP, Inc. The top contributors to stock performance were Amazon.com, Inc., Clovis Oncology, Inc., Pharmacyclics, Inc., Intercept Pharmaceuticals, Inc. and Valeant Pharmaceuticals International, Inc. The top detractors from stock performance were PVH Corp., Devon Energy Corp., HP, Inc., Anadarko Petroleum Corp. and Huntsman Corp.(1)
Outperformance of the equity portion of the Portfolio was led by strong stock selection in Health Care, which contributed 469 basis points to relative performance, along with a sector allocation underweight in Energy that contributed 82 basis points. Overall, both stock selection and sector allocation impacts were positive contributors to relative performance.(1)
For the year 2015, the bond portion of the Portfolio had a return of -1.05% versus -0.63% for the Merrill Lynch Index, for underperformance of 42 basis points. Both the bond portion of the Portfolio and the Merrill Lynch Index had small negative returns because U. S. Treasury yields increased and credit spreads widened during the year.
The bond portion of the Portfolio underperformed the Merrill Lynch Index for several reasons. The bond portion of the Portfolio was overweighted in the Energy sector by approximately 6% in the second half of the year, and the Energy sector performed poorly late in 2015. The bond portion of the Portfolio was underweighted in the banking sector by approximately 8%, and the banking sector was the best performing sector for the year. The average credit quality of the bond portion of the Portfolio was Baa1 versus A3 for the Merrill Lynch Index, and this difference in credit quality detracted from relative performance because higher quality bonds outperformed lower quality bonds during 2015. Having a bond duration that was approximately 0.4 years shorter than the Merrill Lynch Index for much of the year benefitted relative performance marginally because Treasury yields increased and credit spreads widened during 2015. The bond portion of the Portfolio included a position in U.S. Treasury securities that ranged from 3% to 13% of bonds, and this also benefitted relative performance as credit spreads widened.(1)
The quality of corporate credit in the U.S. was largely maintained in 2015, with the exceptions of the energy and mining sectors. Indeed, the five bonds in the bond portion of the Portfolio that performed the worst in 2015 were all from these two sectors, and include Teck Resources Ltd., Freeport-McMoRan, Inc., Ensco PLC, Southwestern Energy Corp. and Marathon Oil Corp. The five best performing bonds in 2015 were Aflac, Inc., Time Warner Cable, Inc., Packaging Corp. of America, Northern Trust Corp. and Union Pacific Corp.(1)
The past year was volatile, as debate regarding the impact on the bond and stock markets from the imminent rate increase from the Federal Reserve played out. Weak consumer spending despite low oil prices weighed on the market, as did the terrorist attacks in Paris. The U.S. economy continued to slowly improve, as China continued to stimulate and employment in the U.S. remained solid. We continue to believe that the Federal Reserve will be measured in its rate increases (only increasing rates if economic data is strong) and, therefore, maintain a positive bias towards the stock market, as the Central Banks of all major economies continue to be supportive of growth. Our continued focus on companies with strong competitive positions and ability to gain market share will hopefully continue to benefit performance going forward.
| (1) | The Portfolio’s composition is subject to change. Holdings and weightings are as of December 31, 2015. |
| 15 | (continued) |
| Ohio National Fund, Inc. | Omni Portfolio (Continued) |
Change in Value of $10,000 Investment
Hypothetical illustration based on past performance. Future performance will vary. The Portfolio’s returns reflect reinvested dividends. The Portfolio’s holdings may differ significantly from the securities in the index. The index is unmanaged and therefore does not reflect the cost of portfolio management and accounting.
The S&P 500 Index is a capitalization-weighted index designed to measure performance of the broad domestic market through changes in the aggregate market value of 500 stocks representing all major industries. The index presented herein includes the effects of reinvested dividends.
The BofA Merrill Lynch U.S. Corporate Master Index tracks the performance of all U.S. dollar-denominated, investment grade corporate public debt issued in the U.S. domestic bond market. Qualifying bonds must have an investment grade rating (based on an average of Moody’s, S&P, and Fitch). In addition, qualifying securities must have at least one year remaining term to maturity, a fixed coupon schedule, and a minimum amount outstanding of $250 million.
Portfolio Composition as of December 31, 2015 (1)
| % of Net Assets | ||||
Common Stocks (4) | 75.6 | |||
Corporate Bonds (4) | 23.4 | |||
Asset-Backed Securities (4) | 0.2 | |||
U.S. Treasury Obligations | 0.7 | |||
Money Market Funds | 0.1 | |||
|
| |||
| 100.0 | ||||
|
|
Top 10 Portfolio Holdings as of December 31, 2015 (1) (2) (3)
| % of Net Assets | ||||
1. Apple, Inc. | 2.6 | |||
2. Microsoft Corp. | 2.2 | |||
3. Mylan NV | 2.2 | |||
4. Allergan plc | 2.0 | |||
5. Intel Corp. | 1.9 | |||
6. Amazon.com, Inc. | 1.9 | |||
7. NXP Semiconductors NV | 1.9 | |||
8. Facebook, Inc. Class A | 1.9 | |||
9. Citigroup, Inc. | 1.8 | |||
10. Alibaba Group Holding Ltd. – ADR | 1.8 |
| (1) | Composition of Portfolio subject to change. |
| (2) | Short-term investments have been excluded from the list of Top 10 Portfolio Holdings. |
| (3) | Top 10 Portfolio Holdings is presented at an individual security level. Total investment exposure by issuer may be higher. |
| (4) | Sectors (Common Stocks, Corporate Bonds, Asset-Backed Securities): |
| % of Net Assets | ||||
Information Technology | 28.0 | |||
Financials | 18.7 | |||
Health Care | 18.1 | |||
Consumer Discretionary | 10.7 | |||
Industrials | 9.6 | |||
Energy | 7.3 | |||
Consumer Staples | 3.6 | |||
Utilities | 1.7 | |||
Materials | 1.0 | |||
Telecommunication Services | 0.5 | |||
|
| |||
| 99.2 | ||||
|
|
| 16 |
| Ohio National Fund, Inc. | Omni Portfolio |
Schedule of Investments | December 31, 2015 |
| Common Stocks – 75.6% | Shares | Value | ||||||||
CONSUMER DISCRETIONARY – 9.0% |
| |||||||||
Delphi Automotive PLC (Auto Components) | 8,812 | $ | 755,453 | |||||||
Newell Rubbermaid, Inc. (Household Durables) | 17,043 | 751,255 | ||||||||
Amazon.com, Inc. (Internet & Catalog Retail) | (a) | 1,386 | 936,784 | |||||||
CBS Corp. Class B (Media) | 11,261 | 530,731 | ||||||||
Time Warner, Inc. (Media) | 11,320 | 732,064 | ||||||||
PVH Corp. (Textiles, Apparel & Luxury Goods) | 9,232 | 679,937 | ||||||||
|
| |||||||||
| 4,386,224 | ||||||||||
|
| |||||||||
CONSUMER STAPLES – 2.1% |
| |||||||||
Molson Coors Brewing Co. Class B (Beverages) | 3,757 | 352,857 | ||||||||
Mondelez International, Inc. Class A (Food Products) | 8,541 | 382,978 | ||||||||
Procter & Gamble Co. / The (Household Products) | 3,782 | 300,329 | ||||||||
|
| |||||||||
| 1,036,164 | ||||||||||
|
| |||||||||
ENERGY – 3.0% |
| |||||||||
Schlumberger Ltd. (Energy Equip. & Svs.) | 5,373 | 374,767 | ||||||||
Anadarko Petroleum Corp. (Oil, Gas & Consumable Fuels) | 7,175 | 348,562 | ||||||||
EOG Resources, Inc. (Oil, Gas & Consumable Fuels) | 5,109 | 361,666 | ||||||||
Newfield Exploration Co. (Oil, Gas & Consumable Fuels) | (a) | 11,038 | 359,397 | |||||||
|
| |||||||||
| 1,444,392 | ||||||||||
|
| |||||||||
FINANCIALS – 12.8% |
| |||||||||
Bank of America Corp. (Banks) | 21,939 | 369,233 | ||||||||
Citigroup, Inc. (Banks) | 17,399 | 900,398 | ||||||||
JPMorgan Chase & Co. (Banks) | 11,547 | 762,448 | ||||||||
KeyCorp (Banks) | 56,195 | 741,212 | ||||||||
Regions Financial Corp. (Banks) | 70,917 | 680,803 | ||||||||
Capital One Financial Corp. (Consumer Finance) | 9,735 | 702,672 | ||||||||
Discover Financial Services (Consumer Finance) | 14,599 | 782,798 | ||||||||
Hartford Financial Services Group, Inc. / The (Insurance) | 13,477 | 585,710 | ||||||||
Prudential Financial, Inc. (Insurance) | 9,018 | 734,155 | ||||||||
|
| |||||||||
| 6,259,429 | ||||||||||
|
| |||||||||
HEALTH CARE – 16.2% |
| |||||||||
Celgene Corp. (Biotechnology) | (a) | 5,444 | 651,973 | |||||||
Medtronic PLC (Health Care Equip. & Supplies) | 8,944 | 687,973 | ||||||||
Zimmer Biomet Holdings, Inc. (Health Care Equip. & Supplies) | 4,174 | 428,211 | ||||||||
Aetna, Inc. (Health Care Providers & Svs.) | 2,939 | 317,765 | ||||||||
Cigna Corp. (Health Care Providers & Svs.) | 5,011 | 733,260 | ||||||||
HCA Holdings, Inc. (Health Care Providers & Svs.) | (a) | 11,076 | 749,070 | |||||||
Thermo Fisher Scientific, Inc. (Life Sciences Tools & Svs.) | 5,936 | 842,022 | ||||||||
Allergan plc (Pharmaceuticals) | (a) | 3,048 | 952,500 | |||||||
Mylan NV (Pharmaceuticals) | (a) | 19,567 | 1,057,988 | |||||||
Pfizer, Inc. (Pharmaceuticals) | 22,432 | 724,105 | ||||||||
Valeant Pharmaceuticals International, Inc. (Pharmaceuticals) | (a) | 7,256 | 737,572 | |||||||
|
| |||||||||
| 7,882,439 | ||||||||||
|
| |||||||||
INDUSTRIALS – 7.4% |
| |||||||||
Hexcel Corp. (Aerospace & Defense) | 9,992 | 464,128 | ||||||||
Honeywell International, Inc. (Aerospace & Defense) | 2,977 | 308,328 | ||||||||
Raytheon Co. (Aerospace & Defense) | 6,001 | 747,305 | ||||||||
FedEx Corp. (Air Freight & Logistics) | 4,830 | 719,622 | ||||||||
Stanley Black & Decker, Inc. (Machinery) | 5,061 | 540,161 | ||||||||
Xylem, Inc. (Machinery) | 22,144 | 808,256 | ||||||||
|
| |||||||||
| 3,587,800 | ||||||||||
|
| |||||||||
INFORMATION TECHNOLOGY – 25.1% |
| |||||||||
Cisco Systems, Inc. (Communications Equip.) | 26,636 | 723,301 | ||||||||
Harris Corp. (Communications Equip.) | 8,923 | 775,409 | ||||||||
Alibaba Group Holding Ltd. – ADR (Internet Software & Svs.) | (a) | 10,644 | 865,038 | |||||||
Alphabet, Inc. Class A (Internet Software & Svs.) | (a) | 372 | 289,420 | |||||||
Alphabet, Inc. Class C (Internet Software & Svs.) | (a) | 963 | 730,801 | |||||||
Facebook, Inc. Class A (Internet Software & Svs.) | (a) | 8,644 | 904,681 | |||||||
MasterCard, Inc. Class A (IT Svs.) | 7,029 | 684,343 | ||||||||
Avago Technologies Ltd. (Semiconductors & Equip.) | 5,915 | 858,562 | ||||||||
Intel Corp. (Semiconductors & Equip.) | 27,482 | 946,755 | ||||||||
NXP Semiconductors NV (Semiconductors & Equip.) | (a) | 10,833 | 912,680 | |||||||
Adobe Systems, Inc. (Software) | (a) | 7,895 | 741,656 | |||||||
Microsoft Corp. (Software) | 19,307 | 1,071,152 | ||||||||
Oracle Corp. (Software) | 16,858 | 615,823 | ||||||||
Apple, Inc. (Tech. Hardware, Storage & Periph.) | 11,822 | 1,244,384 | ||||||||
Hewlett Packard Enterprise Co. (Tech. Hardware, Storage & Periph.) | 56,758 | 862,722 | ||||||||
|
| |||||||||
| 12,226,727 | ||||||||||
|
| |||||||||
Total Common Stocks (Cost $35,869,620) | $ | 36,823,175 | ||||||||
|
| |||||||||
| 17 | (continued) |
| Ohio National Fund, Inc. | Omni Portfolio (Continued) |
Schedule of Investments | December 31, 2015 |
| Corporate Bonds – 23.4% | Rate | Maturity | Face Amount | Value | ||||||||||||
CONSUMER DISCRETIONARY – 1.7% | ||||||||||||||||
General Motors Co. (Automobiles) | 5.000% | 04/01/2035 | $ | 100,000 | $ | 93,212 | ||||||||||
Mattel, Inc. (Leisure Products) | 3.150% | 03/15/2023 | 75,000 | 71,562 | ||||||||||||
21st Century Fox America, Inc. (Media) | 4.500% | 02/15/2021 | 100,000 | 107,652 | ||||||||||||
Comcast Corp. (Media) | 5.875% | 02/15/2018 | 75,000 | 81,695 | ||||||||||||
Discovery Communications, LLC (Media) | 3.300% | 05/15/2022 | 75,000 | 70,737 | ||||||||||||
Time Warner Cable, Inc. (Media) | 6.550% | 05/01/2037 | 150,000 | 151,716 | ||||||||||||
Viacom, Inc. (Media) | 4.250% | 09/01/2023 | 75,000 | 72,545 | ||||||||||||
Kohl’s Corp. (Multiline Retail) | 4.000% | 11/01/2021 | 75,000 | 77,016 | ||||||||||||
Bed Bath & Beyond, Inc. (Specialty Retail) | 5.165% | 08/01/2044 | 100,000 | 84,706 | ||||||||||||
|
| |||||||||||||||
| 810,841 | ||||||||||||||||
|
| |||||||||||||||
CONSUMER STAPLES – 1.5% | ||||||||||||||||
Anheuser-Busch Cos., LLC (Beverages) | 5.500% | 01/15/2018 | 150,000 | 160,364 | ||||||||||||
Bunge NA Finance LP (Food Products) | 5.900% | 04/01/2017 | 150,000 | 156,383 | ||||||||||||
Mead Johnson Nutrition Co. (Food Products) | 3.000% | 11/15/2020 | 100,000 | 100,015 | ||||||||||||
Procter & Gamble Co. / The (Household Products) | 4.700% | 02/15/2019 | 100,000 | 108,992 | ||||||||||||
Imperial Tobacco Finance PLC (Tobacco) | (b) | 3.750% | 07/21/2022 | 100,000 | 100,412 | |||||||||||
Philip Morris International, Inc. (Tobacco) | 3.375% | 08/11/2025 | 100,000 | 101,213 | ||||||||||||
|
| |||||||||||||||
| 727,379 | ||||||||||||||||
|
| |||||||||||||||
ENERGY – 4.3% | ||||||||||||||||
Ensco PLC (Energy Equip. & Svs.) | 5.200% | 03/15/2025 | 100,000 | 71,200 | ||||||||||||
Halliburton Co. (Energy Equip. & Svs.) | 4.850% | 11/15/2035 | 100,000 | 98,234 | ||||||||||||
Noble Holding International Ltd. (Energy Equip. & Svs.) | 4.000% | 03/16/2018 | 100,000 | 90,563 | ||||||||||||
Weatherford International Ltd. (Energy Equip. & Svs.) | 6.000% | 03/15/2018 | 150,000 | 138,315 | ||||||||||||
Anadarko Petroleum Corp. (Oil, Gas & Consumable Fuels) | 5.950% | 09/15/2016 | 100,000 | 102,758 | ||||||||||||
Boardwalk Pipelines LP (Oil, Gas & Consumable Fuels) | 5.500% | 02/01/2017 | 100,000 | 101,322 | ||||||||||||
Columbia Pipeline Group, Inc. (Oil, Gas & Consumable Fuels) | (b) | 4.500% | 06/01/2025 | 100,000 | 90,638 | |||||||||||
ConocoPhillips Co. (Oil, Gas & Consumable Fuels) | 3.350% | 05/15/2025 | 150,000 | 135,570 | ||||||||||||
Devon Energy Corp. (Oil, Gas & Consumable Fuels) | 3.250% | 05/15/2022 | 100,000 | 85,039 | ||||||||||||
Energy Transfer Partners LP (Oil, Gas & Consumable Fuels) | 4.750% | 01/15/2026 | 100,000 | 86,071 | ||||||||||||
Enterprise Products Operating, LLC (Oil, Gas & Consumable Fuels) | 3.900% | 02/15/2024 | 100,000 | 93,337 | ||||||||||||
EOG Resources, Inc. (Oil, Gas & Consumable Fuels) | 3.150% | 04/01/2025 | 100,000 | 94,625 | ||||||||||||
Kinder Morgan Energy Partners LP (Oil, Gas & Consumable Fuels) | 4.150% | 03/01/2022 | 75,000 | 66,669 | ||||||||||||
Magellan Midstream Partners LP (Oil, Gas & Consumable Fuels) | 6.400% | 07/15/2018 | 150,000 | 161,596 | ||||||||||||
Marathon Oil Corp. (Oil, Gas & Consumable Fuels) | 3.850% | 06/01/2025 | 150,000 | 120,746 | ||||||||||||
Murphy Oil Corp. (Oil, Gas & Consumable Fuels) | (c) | 3.700% | 12/01/2022 | 100,000 | 76,509 | |||||||||||
Phillips 66 (Oil, Gas & Consumable Fuels) | 4.300% | 04/01/2022 | 100,000 | 102,936 | ||||||||||||
Plains All American Pipeline LP / PAA Finance Corp. (Oil, Gas & Consumable Fuels) | 4.650% | 10/15/2025 | 100,000 | 87,344 | ||||||||||||
Shell International Finance BV (Oil, Gas & Consumable Fuels) | 3.250% | 05/11/2025 | 100,000 | 97,641 | ||||||||||||
Southwestern Energy Co. (Oil, Gas & Consumable Fuels) | (c) | 4.050% | 01/23/2020 | 100,000 | 72,500 | |||||||||||
Spectra Energy Capital, LLC (Oil, Gas & Consumable Fuels) | 3.300% | 03/15/2023 | 75,000 | 64,195 | ||||||||||||
TransCanada PipeLines Ltd. (Oil, Gas & Consumable Fuels) | 2.500% | 08/01/2022 | 75,000 | 68,861 | ||||||||||||
|
| |||||||||||||||
| 2,106,669 | ||||||||||||||||
|
| |||||||||||||||
FINANCIALS – 5.9% | ||||||||||||||||
Bank of America Corp. (Banks) | 3.875% | 08/01/2025 | 150,000 | 152,284 | ||||||||||||
Branch Banking & Trust Co. (Banks) | 3.625% | 09/16/2025 | 100,000 | 100,990 | ||||||||||||
Citigroup, Inc. (Banks) | 5.850% | 08/02/2016 | 75,000 | 76,939 | ||||||||||||
Citigroup, Inc. (Banks) | 4.400% | 06/10/2025 | 100,000 | 101,048 | ||||||||||||
Comerica, Inc. (Banks) | 3.800% | 07/22/2026 | 100,000 | 98,484 | ||||||||||||
JPMorgan Chase & Co. (Banks) | 3.250% | 09/23/2022 | 100,000 | 100,650 | ||||||||||||
KeyBank NA (Banks) | 5.700% | 11/01/2017 | 150,000 | 159,367 | ||||||||||||
PNC Bank NA (Banks) | 3.250% | 06/01/2025 | 150,000 | 149,241 | ||||||||||||
SunTrust Banks, Inc. (Banks) | 2.500% | 05/01/2019 | 100,000 | 100,509 | ||||||||||||
Wells Fargo & Co. (Banks) | 3.500% | 03/08/2022 | 75,000 | 77,321 | ||||||||||||
Goldman Sachs Group, Inc. / The (Capital Markets) | 3.750% | 05/22/2025 | 100,000 | 100,707 | ||||||||||||
Mellon Funding Corp. (Capital Markets) | 5.500% | 11/15/2018 | 100,000 | 109,623 | ||||||||||||
Morgan Stanley (Capital Markets) | 3.750% | 02/25/2023 | 75,000 | 76,868 | ||||||||||||
Morgan Stanley (Capital Markets) | 3.950% | 04/23/2027 | 100,000 | 97,099 | ||||||||||||
Northern Trust Corp. (Capital Markets) | 3.950% | 10/30/2025 | 75,000 | 78,587 | ||||||||||||
Capital One Financial Corp. (Consumer Finance) | 2.450% | 04/24/2019 | 75,000 | 75,154 | ||||||||||||
Discover Financial Services (Consumer Finance) | 6.450% | 06/12/2017 | 150,000 | 158,476 | ||||||||||||
Ford Motor Credit Co., LLC (Consumer Finance) | 3.157% | 08/04/2020 | 100,000 | 99,699 | ||||||||||||
Synchrony Financial (Consumer Finance) | 4.250% | 08/15/2024 | 100,000 | 98,658 | ||||||||||||
Intercontinental Exchange, Inc. (Diversified Financial Svs.) | 2.750% | 12/01/2020 | 100,000 | 100,017 | ||||||||||||
Aflac, Inc. (Insurance) | 3.625% | 06/15/2023 | 75,000 | 77,653 | ||||||||||||
Allstate Corp. / The (Insurance) | 3.150% | 06/15/2023 | 75,000 | 74,985 | ||||||||||||
American International Group, Inc. (Insurance) | 3.875% | 01/15/2035 | 100,000 | 88,192 | ||||||||||||
Marsh & McLennan Cos., Inc. (Insurance) | 3.500% | 06/03/2024 | 100,000 | 99,090 | ||||||||||||
| 18 | (continued) |
| Ohio National Fund, Inc. | Omni Portfolio (Continued) |
Schedule of Investments | December 31, 2015 |
| Corporate Bonds (Continued) | Rate | Maturity | Face Amount | Value | ||||||||||||
FINANCIALS (continued) | ||||||||||||||||
Boston Properties LP (Real Estate Investment Trusts) | 3.125% | 09/01/2023 | $ | 75,000 | $ | 73,058 | ||||||||||
Camden Property Trust (Real Estate Investment Trusts) | 3.500% | 09/15/2024 | 100,000 | 97,610 | ||||||||||||
Federal Realty Investment Trust (Real Estate Investment Trusts) | 3.000% | 08/01/2022 | 75,000 | 74,116 | ||||||||||||
HCP, Inc. (Real Estate Investment Trusts) | 4.000% | 06/01/2025 | 100,000 | 97,698 | ||||||||||||
Simon Property Group LP (Real Estate Investment Trusts) | 3.750% | 02/01/2024 | 75,000 | 77,973 | ||||||||||||
|
| |||||||||||||||
| 2,872,096 | ||||||||||||||||
|
| |||||||||||||||
HEALTH CARE – 1.9% | ||||||||||||||||
AbbVie, Inc. (Biotechnology) | 2.900% | 11/06/2022 | 75,000 | 72,610 | ||||||||||||
Baxalta, Inc. (Biotechnology) | (b) | 4.000% | 06/23/2025 | 100,000 | 99,015 | |||||||||||
Celgene Corp. (Biotechnology) | 3.875% | 08/15/2025 | 150,000 | 149,523 | ||||||||||||
Gilead Sciences, Inc. (Biotechnology) | 4.500% | 02/01/2045 | 100,000 | 97,858 | ||||||||||||
Anthem, Inc. (Health Care Providers & Svs.) | 5.875% | 06/15/2017 | 150,000 | 158,569 | ||||||||||||
Express Scripts Holding Co. (Health Care Providers & Svs.) | 2.250% | 06/15/2019 | 100,000 | 99,422 | ||||||||||||
Laboratory Corp. of America Holdings (Health Care Providers & Svs.) | 3.750% | 08/23/2022 | 75,000 | 75,532 | ||||||||||||
Mylan NV (Pharmaceuticals) | (b) | 3.000% | 12/15/2018 | 100,000 | 99,792 | |||||||||||
Pfizer, Inc. (Pharmaceuticals) | 6.050% | 03/30/2017 | 75,000 | 79,509 | ||||||||||||
|
| |||||||||||||||
| 931,830 | ||||||||||||||||
|
| |||||||||||||||
INDUSTRIALS – 2.0% | ||||||||||||||||
Lockheed Martin Corp. (Aerospace & Defense) | 3.600% | 03/01/2035 | 100,000 | 89,421 | ||||||||||||
FedEx Corp. (Air Freight & Logistics) | 4.900% | 01/15/2034 | 75,000 | 77,045 | ||||||||||||
Waste Management, Inc. (Commercial Svs. & Supplies) | 6.100% | 03/15/2018 | 75,000 | 81,760 | ||||||||||||
Parker-Hannifin Corp. (Machinery) | 4.200% | 11/21/2034 | 100,000 | 101,496 | ||||||||||||
Burlington Northern Santa Fe, LLC (Road & Rail) | 4.550% | 09/01/2044 | 100,000 | 96,585 | ||||||||||||
ERAC U.S.A. Finance, LLC (Road & Rail) | (b)(c) | 6.375% | 10/15/2017 | 150,000 | 161,088 | |||||||||||
Norfolk Southern Corp. (Road & Rail) | 3.000% | 04/01/2022 | 75,000 | 74,140 | ||||||||||||
Penske Truck Leasing Co. LP / PTL Finance Corp. (Road & Rail) | (b) | 3.300% | 04/01/2021 | 100,000 | 98,637 | |||||||||||
Ryder System, Inc. (Road & Rail) | 2.650% | 03/02/2020 | 100,000 | 98,384 | ||||||||||||
Union Pacific Corp. (Road & Rail) | 3.250% | 08/15/2025 | 100,000 | 101,670 | ||||||||||||
|
| |||||||||||||||
| 980,226 | ||||||||||||||||
|
| |||||||||||||||
INFORMATION TECHNOLOGY – 2.9% | ||||||||||||||||
Harris Corp. (Communications Equip.) | 2.700% | 04/27/2020 | 100,000 | 98,140 | ||||||||||||
QUALCOMM, Inc. (Communications Equip.) | 3.450% | 05/20/2025 | 100,000 | 95,932 | ||||||||||||
Denali Borrower, LLC / Denali Finance Corp. (Computers & Peripherals) | (b) | 5.625% | 10/15/2020 | 100,000 | 104,750 | |||||||||||
Amphenol Corp. (Electronic Equip., Instr. & Comp.) | 3.125% | 09/15/2021 | 100,000 | 98,928 | ||||||||||||
Computer Sciences Corp. (IT Svs.) | 6.500% | 03/15/2018 | 150,000 | 161,876 | ||||||||||||
Fidelity National Information Services, Inc. (IT Svs.) | 2.850% | 10/15/2018 | 100,000 | 100,355 | ||||||||||||
Broadcom Corp. (Semiconductors & Equip.) | 3.500% | 08/01/2024 | 100,000 | 100,339 | ||||||||||||
Intel Corp. (Semiconductors & Equip.) | 4.000% | 12/15/2032 | 100,000 | 99,515 | ||||||||||||
KLA-Tencor Corp. (Semiconductors & Equip.) | (c) | 3.375% | 11/01/2019 | 100,000 | 101,036 | |||||||||||
Microsoft Corp. (Software) | 4.450% | 11/03/2045 | 100,000 | 103,129 | ||||||||||||
Oracle Corp. (Software) | 4.300% | 07/08/2034 | 100,000 | 99,409 | ||||||||||||
Apple, Inc. (Tech. Hardware, Storage & Periph.) | 2.500% | 02/09/2025 | 100,000 | 95,688 | ||||||||||||
Hewlett Packard Enterprise Co. (Tech. Hardware, Storage & Periph.) | (b) | 4.900% | 10/15/2025 | 150,000 | 147,312 | |||||||||||
|
| |||||||||||||||
| 1,406,409 | ||||||||||||||||
|
| |||||||||||||||
MATERIALS – 1.0% | ||||||||||||||||
Airgas, Inc. (Chemicals) | 3.050% | 08/01/2020 | 100,000 | 100,632 | ||||||||||||
CF Industries, Inc. (Chemicals) | 3.450% | 06/01/2023 | 75,000 | 69,813 | ||||||||||||
Dow Chemical Co. / The (Chemicals) | 4.250% | 10/01/2034 | 100,000 | 90,234 | ||||||||||||
Packaging Corp. of America (Containers & Packaging) | 4.500% | 11/01/2023 | 75,000 | 78,789 | ||||||||||||
Freeport-McMoRan, Inc. (Metals & Mining) | 3.550% | 03/01/2022 | 75,000 | 43,500 | ||||||||||||
Newmont Mining Corp. (Metals & Mining) | 3.500% | 03/15/2022 | 75,000 | 66,873 | ||||||||||||
Teck Resources Ltd. (Metals & Mining) | 3.750% | 02/01/2023 | 75,000 | 34,688 | ||||||||||||
|
| |||||||||||||||
| 484,529 | ||||||||||||||||
|
| |||||||||||||||
TELECOMMUNICATION SERVICES – 0.5% | ||||||||||||||||
AT&T, Inc. (Diversified Telecom. Svs.) | 3.400% | 05/15/2025 | 100,000 | 96,122 | ||||||||||||
Verizon Communications, Inc. (Diversified Telecom. Svs.) | 3.850% | 11/01/2042 | 75,000 | 61,296 | ||||||||||||
Rogers Communications, Inc. (Wireless Telecom. Svs.) | 3.000% | 03/15/2023 | 75,000 | 72,871 | ||||||||||||
|
| |||||||||||||||
| 230,289 | ||||||||||||||||
|
| |||||||||||||||
UTILITIES – 1.7% | ||||||||||||||||
Commonwealth Edison Co. (Electric Utilities) | 4.350% | 11/15/2045 | 100,000 | 100,579 | ||||||||||||
Kansas City Power & Light Co. (Electric Utilities) | 5.850% | 06/15/2017 | 150,000 | 158,504 | ||||||||||||
| 19 | (continued) |
| Ohio National Fund, Inc. | Omni Portfolio (Continued) |
Schedule of Investments | December 31, 2015 |
| Corporate Bonds (Continued) | Rate | Maturity | Face Amount | Value | ||||||||||||
UTILITIES (continued) | ||||||||||||||||
Pennsylvania Electric Co. (Electric Utilities) | 6.050% | 09/01/2017 | $ | 150,000 | $ | 159,666 | ||||||||||
South Carolina Electric & Gas Co. (Electric Utilities) | 4.350% | 02/01/2042 | 75,000 | 71,868 | ||||||||||||
Union Electric Co. (Electric Utilities) | 6.400% | 06/15/2017 | 150,000 | 160,237 | ||||||||||||
Southwest Gas Corp. (Gas Utilities) | 3.875% | 04/01/2022 | 75,000 | 76,412 | ||||||||||||
American Water Capital Corp. (Water Utilities) | 4.300% | 12/01/2042 | 100,000 | 101,125 | ||||||||||||
|
| |||||||||||||||
| 828,391 | ||||||||||||||||
|
| |||||||||||||||
Total Corporate Bonds (Cost $11,621,778) | $ | 11,378,659 | ||||||||||||||
|
| |||||||||||||||
| Asset-Backed Securities – 0.2% | Rate | Maturity | Face Amount | Value | ||||||||||||
INDUSTRIALS – 0.2% | ||||||||||||||||
American Airlines 2015-1 Class B Pass Through Trust (Airlines) | 3.700% | 05/01/2023 | $ | 95,908 | $ | 93,750 | ||||||||||
|
| |||||||||||||||
Total Asset-Backed Securities (Cost $95,907) | $ | 93,750 | ||||||||||||||
|
| |||||||||||||||
| U.S. Treasury Obligations – 0.7% | Rate | Maturity | Face Amount | Value | ||||||||||||
United States Treasury Note | 1.125% | 04/30/2020 | $ | 100,000 | $ | 97,733 | ||||||||||
United States Treasury Note | 1.750% | 03/31/2022 | 150,000 | 147,710 | ||||||||||||
United States Treasury Note | 2.500% | 05/15/2024 | 100,000 | 102,177 | ||||||||||||
|
| |||||||||||||||
Total U.S. Treasury Obligations (Cost $348,585) | $ | 347,620 | ||||||||||||||
|
| |||||||||||||||
| Money Market Funds – 0.2% | Shares | Value | ||||||||||||||
Fidelity Institutional Money Market Funds | 102,000 | $ | 102,000 | |||||||||||||
|
| |||||||||||||||
Total Money Market Funds (Cost $102,000) | $ | 102,000 | ||||||||||||||
|
| |||||||||||||||
Total Investments – 100.1% (Cost $48,037,890) | (d) | $ | 48,745,204 | |||||||||||||
Liabilities in Excess of Other Assets – (0.1)% | (46,072) | |||||||||||||||
|
| |||||||||||||||
Net Assets – 100.0% | $ | 48,699,132 | ||||||||||||||
|
| |||||||||||||||
Percentages are stated as a percent of net assets.
Abbreviations:
ADR: American Depositary Receipts
Footnotes:
| (a) | Non-income producing security. |
| (b) | Security exempt from registration under Regulation D of the Securities Act of 1933. These securities may be resold in transactions exempt from registration, normally to qualified buyers under Rule 144A. At December 31, 2015, the value of these securities totaled $901,644, or 1.9% of the Portfolio’s net assets. These securities were deemed liquid pursuant to procedures approved by the Board of Directors. |
| (c) | Represents bonds that are credit sensitive. The coupon rates for these bonds are subject to adjustment based on changes in national credit rating agency ratings. |
| (d) | Represents cost for financial reporting purposes, which may differ from cost basis for federal income tax purposes. See also Note 7 of the Notes to Financial Statements. |
The accompanying notes are an integral part of these financial statements.
| 20 |
| Ohio National Fund, Inc. | International Portfolio |
Objective/Strategy
The International Portfolio seeks long-term growth of capital by investing at least 80% of its assets in securities of foreign companies.
Performance as of December 31, 2015
Average Annual Returns | ||||
One year | -0.40% | |||
Five years | 0.49% | |||
Ten years | 1.53% |
Past performance does not guarantee future results. The performance data quoted represents past performance and current returns may be lower or higher. Total return figures include change in share price and reinvestment of dividends and capital gains. The investment return and principal value will fluctuate so that an investor’s shares, when redeemed, may be worth more or less than the original cost. To obtain performance information up to the most recent month end, call toll-free 1-877-781-6392.
The Portfolio is not open to direct retail investment. Beneficial interest in shares is obtained solely by purchase of variable life insurance policies and variable annuity contracts. Actual performance results for variable annuity and variable universal life contracts will be lower due to contract charges. Consult your contract for applicable charges.
Comments
For the year ended December 31, 2015, the International Portfolio returned -0.40% versus -5.66% for its benchmark, the MSCI All Country World ex-USA Index (Net-USD).
Global equity markets performance was mixed over the reporting period, as regional divergence caused large currency moves that impacted overall performance for investors. Outside the U.S., central banks in Canada, Europe and Japan maintained aggressively loose monetary policies in an effort to fight deflation and support economic growth. Meanwhile, in the U.S., a stronger economy raised expectations for the first Federal Reserve interest rate hike in almost a decade. The anticipated divergence in global monetary policy drove up the value of the U.S. dollar relative to other major world currencies. Over the reporting period, developed markets, as measured by MSCI EAFE Index, rose 5.33% in local terms, but fell 0.81% for U.S. dollar-based investors, due to the strong U.S. dollar. Emerging markets declined over the reporting period, as China’s slowing economy and a decline in commodity prices negatively impacted the outlook for global growth. As measured by MSCI Emerging Markets Index, emerging markets returned -5.76% in local terms, and -14.92% for U.S. dollar based investors.
The European equity market, as measured by MSCI AC Europe Index, returned 4.71% in local terms, but declined 3.23% for U.S. dollar-based investors. Throughout the reporting period, aggressively loose monetary policy by the European Central Bank (“ECB”) and a weaker euro improved the outlook for economic growth for 2015 and 2016. Despite the mid-year political crisis in Greece, the sovereign debt crisis in the euro area continued to recede, as the major economies of Spain and Italy returned to higher growth and lower unemployment. Furthermore, as government budgets have improved and bond yields declined, the impact of fiscal austerity has diminished. As the period ended, the ECB cut deposit rates to a record low -0.30% and extended its 1.1 trillion euro asset purchase program into 2017. Despite geopolitical turmoil (tragic acts of terrorism and massive influx of refugees), domestic demand in Europe continued to improve, helped by record low interest rates, lower energy costs, and a relatively weaker currency.
The Japanese equity market, as measured by MSCI Japan Index, returned 9.57% for U.S. dollar-based investors. Japan’s equity market led the major developed markets and all Asian markets. Japanese corporate data has been very strong with ongoing earnings acceleration due to the sustained weakness of the yen, lower energy prices, and higher consumption driven by a tourist boom. Japanese retail sales increased during the year, Small Business Confidence improved and the service sector Purchasing Managers’ Index rose to its highest level in nearly two years. Japanese structural reforms under the “three arrows” of Abenomics are slowly changing the economic landscape; however, persistent zero to low real economic growth continues to trouble policy makers. The Bank of Japan remains accommodative, with an open commitment to maintain asset purchases of 80 trillion yen per month. Revisions to Prime Minister Abe’s structural reform plan will be released in 2016.
While the major developed markets were growing modestly, there were signs of a deceleration and slowing trade in several emerging markets. After a decade of double-digit growth driven by fixed asset investment and a mercantilist dependence on global trade, the Chinese government’s decision to transform to a more consumption-based economy has slowed the pace of growth. While in the long-term, this economic rebalancing is positive, in the near-term, it has resulted in slower Chinese economic activity and reduced the global demand for fixed assets and commodities. Countries whose economies benefited from commodity exports to China, such as Russia and Brazil, are now expecting recessions. The volatility of the local Chinese A-share market and the government’s sudden weakening of the Chinese yuan in August has fueled worries about economic stability. After a strong start to the year, Chinese equities, as measured by MSCI China, declined 7.82%. As with most developed economies, many emerging market central banks continue to ease monetary conditions by cutting interest rates and adding liquidity. For example, the People’s Bank of China continues to ease monetary policy, using multiple measures to stimulate the economy such as cutting the benchmark one-year lending rate and lowering the reserve requirement for banks.
Chinese economic weakness impacted South Korea, which experienced an overall drop in total exports for the first time in six years. In Taiwan, weaker exports to China were offset by stronger domestic demand amid a stable job market and rising household incomes. During the reporting period, MSCI Taiwan and MSCI South Korea fell 11.72% and 6.66%, respectively. An economic bright spot for the emerging markets was South East Asia. Solid domestic demand drove recoveries in India, Indonesia, and Thailand, which were also boosted by more responsible monetary and fiscal policies, and renewed political stability. Despite positive economic and reform progress, the stock markets and currencies declined during the reporting period amid a broad sell-off in emerging market assets.
For the reporting period, the MSCI USA Index (0.69%) outperformed both the MSCI EAFE Index (-0.81%) and MSCI Emerging Markets Index (-14.92%). Broadly across the world, there was a wide divergence among country returns. Within developed markets, the best performing major economy was MSCI Japan (9.57%), which was less impacted by currency depreciation. Within the Euro area (and euro pegged currencies), the depreciation of the euro by 10.2% versus the U.S. dollar was a major detractor from returns. Within the region, only MSCI Ireland (16.49%), MSCI Denmark (23.43%) and MSCI Belgium (12.10%) had positive returns. The major developed economies which underperformed the most were the ones most exposed to commodities and emerging markets: MSCI Canada (-24.16%), MSCI Singapore (-17.71%), MSCI Spain (-15.64%) and MSCI Norway (-14.99%). Within emerging markets, no major market
| 21 | (continued) |
| Ohio National Fund, Inc. | International Portfolio (Continued) |
had positive returns. The top performers were the ones with the strongest currencies: MSCI China (-7.82%), MSCI South Korea (-6.66%) and MSCI Philippines (-6.80%). Laggards in the emerging markets included: MSCI Brazil (-41.37%), MSCI Colombia (-41.80%) and MSCI Greece (-61.33%).
Country allocation remained a key driver of performance for the reporting period, as it consistently has been in the past. The Portfolio maintained exposure to select healthy, high sovereign quality, developed and emerging markets.(1)
In Japan, positive performance was driven by the Portfolio’s overweight allocation to Japanese equities. Japanese pharmaceuticals developer Shionogi & Co. Ltd. was one of the Portfolio’s top contributors. Broadly, exporters were the primary beneficiaries of the weaker yen. For example, our investment in Fuji Heavy Industries Ltd. benefited from strong demand for its Subaru brand of cars while Murata Manufacturing Co. Ltd., an electronic component producer, saw strong demand from global smart phone and tablet manufacturers. Domestic travel related stocks also turned in a strong performance, as a growing Chinese middle class took advantage of the weaker yen and looser visa requirements to visit Japan. Internet travel booking company Ikyu Corp. and hotel group Resorttrust, Inc. were among the Portfolio’s top performers. Contributions from home builder Sekisui House Ltd. were offset by losses from building materials company Asahi Kasei Corp.(1)
Contributions from Europe were mixed during the period. Danish companies sensitive to the improvement in regional economic growth and lower fuel costs, such as transportation company DSV A/S, outperformed. Danish pharmaceutical company, Novo Nordisk A/S, also outperformed due to continued global demand for its diabetes medications. Ireland and Germany also benefited from an improving European domestic growth outlook. Irish construction equipment company, CRH PLC, and German broadcaster, ProSiebenSat.1 Media SE, rose during the period. Elsewhere in Europe, the Portfolio’s positioning in Austria contributed negatively to results. Austrian insurance company UNIQA Insurance Group AG and steel maker voestalpine AG underperformed. In Turkey, the year began with an improvement in the economic outlook as inflation stabilized and the central bank cut rates. However, over the summer, with a failed election, political instability weighed on the market. The Portfolio’s overweight position to Turkey detracted from performance. Finally, an overweight position in Italy, led by banking service company Cerved Information Solutions SpA and Luxottica Group SpA, contributed positively to Portfolio performance. The Portfolio’s underweight position in France and Switzerland detracted from performance.(1)
The Portfolio’s underweight allocation to major commodity-producing countries helped performance. The Portfolio maintained underweights to Australia, Canada, and South Africa. Overcapacity and slowing global growth drove commodity prices broadly lower, as Brent crude oil and copper slumped 35.0% and 24.4%, respectively. The Portfolio was overweight Norway, which is a large oil and gas producing country; however, stock selection benefited performance. Royal Caribbean Cruises Ltd. outperformed on rising demand and lower operating costs.(1)
The Portfolio maintained its largest underweight to emerging market countries in many years, which generally benefited performance as emerging markets broadly underperformed developed markets. The biggest positive contribution came from our zero weight in Brazil, which declined 41.4%, as measured by MSCI Brazil. In China, Taiwan and Thailand, poor timing and asset selection hurt Portfolio
performance, while an overweight position in Indonesia also hurt performance.(1)
During the reporting period, the Portfolio hedged some currencies with currency forwards. The overall net returns of the currency forward positions contributed positively to Portfolio performance. Positive contribution from a short position in the Canadian dollar (versus the U.S. dollar) and a short position in the Euro (versus the U.S. dollar) aided performance, while a long position in the Swiss franc (versus the euro) was a drag on performance. The Portfolio also utilized equity index futures to assist in managing country weights and cash in the Portfolio. The Portfolio also utilized equity index futures to assist in managing country weights and cash. During the period, equity futures detracted from the Portfolio’s return. The key poor performer for futures was China H-Shares Futures, which declined in concert with the Chinese markets.(1)
The Portfolio was also positively impacted by purchases of Initial Public Offerings (IPOs) during the period. The two IPOs that provided the most contribution were Intertrust NV and Nordax Group AB.
We are consistently applying our long-term methodology, which seeks to identify countries and stocks with growth and stability in earnings and cash flows. Our country ranking process seeks to identify strong economies trading at reasonable valuation levels with favorable macroeconomic outlooks. We continue to find country and stock holdings attractive for the long-term.
The latest research shows that country effects have become increasing more influential in a well-diversified international portfolio. Portfolio management believes the greater importance of country divergences is likely to persist given the increasing fundamental divergences between countries (even within the euro area), increased macro instability related to sovereign indebtedness and varying trend growth.
The Portfolio maintained exposure to select healthy, high quality developed markets. In Europe, our core view is that the euro area recovery and growth cycle are genuine. The countries we have the highest conviction in are Germany, Netherlands and Ireland, which all benefit from quantitative easing. We are also overweight favored Scandinavian countries, such as Norway, Sweden, and Denmark. We expect that the resilient European economies will benefit from the weaker euro, low borrowing costs and an improving outlook. Additionally, we are also overweight Central Europe, specifically Turkey, Austria, Czech Republic and Hungary. In other major European markets, we remain underweight the UK, Switzerland, and France.(1)
At the end of the period, Japan represented the only investment in Asia. Japan was our highest conviction overweight, where we are allocated to both exporters and domestically- oriented stocks. We continue to believe the Japanese stock market is the most attractive over the medium to long-term. The reasons for maintaining our conviction include: (1) Japanese corporate earnings and sales revisions are among the strongest across all regions we monitor, (2) Japanese corporate profitability, measured by return on equity, is near a 25-year high due to rising margins, (3) the yen remains near a 9-year low, which is a strong support for Japanese equities and (4) the potential for further monetary easing. The Japanese stocks positions are composed mainly of exporting companies that will benefit from the weaker yen, and also domestic stocks focused on tourism, which is booming as richer Asian tourists visit for the first time.(1)
| 22 | (continued) |
| Ohio National Fund, Inc. | International Portfolio (Continued) |
In Latin America, we see long-term opportunities in Mexico. Mexican companies benefit from external demand from the U.S., where roughly 80% of their exports are destined. The cheaper peso, stable labor costs, and membership in NAFTA make the country an attractive destination for investments.
Across the Portfolio, we remain partially hedged vs. U.S. dollar appreciation, as we believe the divergence in growth expectations and inflation will continue to drive the dollar higher. We are currently underweight to emerging markets, as our view is the effects of the strong dollar and lower energy prices will benefit many emerging economies in the long-term; however, the slowdown in China and Asian export growth is a drag on sentiment.(1)
We continue to monitor our investment universe for signs of countries and companies with poor credit quality (or unmanageable debt levels), preferring to focus on countries and companies with healthy balance sheets and strategic expansion opportunities. As developed economies continue to adjust to new debt levels, and investors continue to fear a reoccurrence of a global financial crisis, markets may see periods of volatility. However, as long-term investors, we feel that fundamentals are supportive of global growth in the mid to long term. The Portfolio’s managers expect the winners to maintain higher profitability and gain market share, while the weaker players, who continue to struggle to gain footing, underperform. Despite the expectation of the U.S. Federal Reserve to raise rates, we expect global financial conditions to remain accommodative for some time to come.
| (1) | The Portfolio’s composition is subject to change. Holdings and weightings are as of December 31, 2015. |
Change in Value of $10,000 Investment
Hypothetical illustration based on past performance. Future performance will vary. The Portfolio’s returns reflect reinvested dividends. The Portfolio’s holdings may differ significantly from the securities in the index. The index is unmanaged and therefore does not reflect the cost of portfolio management and accounting.
The MSCI All Country World Ex-USA Index (Net-USD) is a free float-adjusted market capitalization weighted index that is designed to measure the equity market performance of the developed and emerging markets. The MSCI All Country World Index consists of 24 developed and 21 emerging market country indices.
Portfolio Composition as of December 31, 2015 (1)
| % of Net Assets | ||||
Common Stocks (4) | 96.3 | |||
Preferred Stocks (4) | 0.5 | |||
Money Market Funds and | 3.2 | |||
|
| |||
| 100.0 | ||||
|
|
Top 10 Portfolio Holdings as of December 31, 2015 (1) (2) (3)
| % of Net Assets | ||||
1. Novo Nordisk A/S – ADR | 3.0 | |||
2. Honda Motor Co. Ltd. | 2.5 | |||
3. Royal Caribbean Cruises Ltd. | 2.3 | |||
4. Kubota Corp. | 2.3 | |||
5. Fuji Heavy Industries Ltd. | 2.2 | |||
6. Sekisui House Ltd. | 2.2 | |||
7. CRH PLC | 2.2 | |||
8. Danske Bank A/S | 2.1 | |||
9. Shionogi & Co. Ltd. | 2.1 | |||
10. DSV A/S | 2.1 |
| (1) | Composition of Portfolio subject to change. |
| (2) | Short-term investments have been excluded from the list of Top 10 Portfolio Holdings. |
| (3) | Top 10 Portfolio Holdings is presented at an individual security level. Total investment exposure by issuer may be higher. |
| (4) | Top 10 Country Weightings (Common Stocks, Preferred Stocks): |
| % of Net Assets | ||||
Japan | 31.9 | |||
Germany | 11.9 | |||
Denmark | 10.3 | |||
Sweden | 9.3 | |||
Netherlands | 6.7 | |||
Ireland | 6.2 | |||
Mexico | 5.4 | |||
Austria | 3.3 | |||
Norway | 3.1 | |||
United Kingdom | 2.4 |
| 23 |
| Ohio National Fund, Inc. | International Portfolio |
Schedule of Investments | December 31, 2015 |
| Common Stocks – 96.3% | Shares | Value | ||||||||
Japan – 31.9% |
| |||||||||
Aisin Seiki Co. Ltd. | (c) | 74,600 | $ | 3,210,662 | ||||||
Alps Electric Co. Ltd. | (c) | 43,100 | 1,168,787 | |||||||
ANA Holdings, Inc. | (c) | 338,000 | 975,165 | |||||||
Chugai Pharmaceutical Co. Ltd. | (c) | 60,900 | 2,122,768 | |||||||
Disco Corp. | (c) | 21,600 | 2,034,102 | |||||||
Don Quijote Holdings Co. Ltd. | (c) | 24,300 | 853,385 | |||||||
Doutor Nichires Holdings Co. Ltd. | (c) | 29,900 | 462,477 | |||||||
Fuji Heavy Industries Ltd. | (c) | 86,700 | 3,571,716 | |||||||
HIS Co. Ltd. | (c) | 22,500 | 751,591 | |||||||
Hitachi Ltd. | (c) | 318,000 | 1,801,906 | |||||||
Honda Motor Co. Ltd. | (c) | 125,000 | 3,995,189 | |||||||
Hoshino Resorts REIT, Inc. | (c) | 138 | 1,431,781 | |||||||
Japan Airlines Co. Ltd. | (c) | 28,200 | 1,009,359 | |||||||
Japan Hotel REIT Investment Corp. | (c) | 2,550 | 1,885,323 | |||||||
Kawasaki Heavy Industries Ltd. | (c) | 246,000 | 910,174 | |||||||
Kubota Corp. | (c) | 232,700 | 3,594,900 | |||||||
Kyowa Hakko Kirin Co. Ltd. | (c) | 46,000 | 723,794 | |||||||
Murata Manufacturing Co. Ltd. | (c) | 21,300 | 3,064,669 | |||||||
Nippon Express Co. Ltd. | (c) | 307,000 | 1,442,662 | |||||||
Oriental Land Co. Ltd. | (c) | 26,000 | 1,572,908 | |||||||
Osaka Gas Co. Ltd. | (c) | 435,000 | 1,571,193 | |||||||
Resorttrust, Inc. | (c) | 55,400 | 1,461,441 | |||||||
Sekisui House Ltd. | (c) | 209,000 | 3,514,074 | |||||||
Shionogi & Co. Ltd. | (c) | 72,700 | 3,288,237 | |||||||
Sumitomo Mitsui Financial Group, Inc. | (c) | 76,000 | 2,868,319 | |||||||
Yamaha Motor Co. Ltd. | (c) | 61,900 | 1,387,507 | |||||||
|
| |||||||||
| 50,674,089 | ||||||||||
|
| |||||||||
Germany – 11.4% | ||||||||||
Allianz SE | (c) | 11,300 | 1,991,941 | |||||||
BASF SE | (c) | 22,000 | 1,675,916 | |||||||
Bayer AG | (c) | 15,800 | 1,973,267 | |||||||
Daimler AG | (c) | 25,700 | 2,147,337 | |||||||
Deutsche Pfandbriefbank AG | (a)(b)(d) | 47,923 | 583,300 | |||||||
Deutsche Telekom AG | (c) | 117,000 | 2,101,396 | |||||||
HeidelbergCement AG | (c) | 7,000 | 570,483 | |||||||
ProSiebenSat.1 Media SE | (c) | 41,600 | 2,098,775 | |||||||
SAP SE | (c) | 28,600 | 2,269,499 | |||||||
Siemens AG | (c) | 10,700 | 1,035,180 | |||||||
Symrise AG | (c) | 26,300 | 1,741,018 | |||||||
|
| |||||||||
| 18,188,112 | ||||||||||
|
| |||||||||
Denmark – 10.3% | ||||||||||
AP Moeller – Maersk A/S | (c) | 886 | 1,155,613 | |||||||
Danske Bank A/S | (c) | 124,000 | 3,327,204 | |||||||
DSV A/S | (c) | 83,300 | 3,278,993 | |||||||
ISS A/S | (c) | 24,000 | 865,121 | |||||||
NKT Holding A/S | (c) | 15,071 | 777,971 | |||||||
Novo Nordisk A/S – ADR | 81,800 | 4,750,944 | ||||||||
Sydbank A/S | (c) | 20,050 | 643,804 | |||||||
Vestas Wind Systems A/S | (c) | 22,200 | 1,550,421 | |||||||
|
| |||||||||
| 16,350,071 | ||||||||||
|
| |||||||||
Sweden – 9.3% | ||||||||||
Hennes & Mauritz AB | (c) | 78,900 | 2,806,495 | |||||||
Husqvarna AB | (c) | 199,900 | 1,319,219 | |||||||
JM AB | (c) | 41,600 | 1,238,423 | |||||||
Nordax Group AB | (a)(b)(d) | 134,790 | 814,349 | |||||||
Nordea Bank AB | (c) | 193,800 | 2,126,326 | |||||||
Peab AB | (c) | 160,400 | 1,228,231 | |||||||
Skandinaviska Enskilda Banken AB | (c) | 125,900 | 1,324,027 | |||||||
SKF AB | (c) | 36,700 | 592,752 | |||||||
Swedbank AB | (c) | 55,700 | 1,226,712 | |||||||
Telefonaktiebolaget LM Ericsson | (c) | 92,100 | 887,964 | |||||||
Volvo AB | (c) | 134,400 | 1,246,231 | |||||||
|
| |||||||||
| 14,810,729 | ||||||||||
|
| |||||||||
| Common Stocks (Continued) | Shares | Value | ||||||||
Netherlands – 6.7% | ||||||||||
ABN AMRO Group NV | (a)(b)(d) | 22,800 | $ | 512,159 | ||||||
Akzo Nobel NV | (c) | 8,847 | 591,145 | |||||||
ASML Holding NV | 7,700 | 683,529 | ||||||||
GrandVision NV | (b)(c) | 15,000 | 450,099 | |||||||
Heineken NV | (c) | 21,200 | 1,806,598 | |||||||
ING Groep NV | (d) | 150,800 | 2,040,329 | |||||||
Intertrust NV | (a)(b)(d) | 41,652 | 917,075 | |||||||
Koninklijke Philips NV | (c) | 29,600 | 755,518 | |||||||
NN Group NV | (c) | 16,500 | 582,168 | |||||||
Randstad Holding NV | (c) | 8,000 | 498,171 | |||||||
Royal Dutch Shell PLC – ADR | 39,237 | 1,796,662 | ||||||||
|
| |||||||||
| 10,633,453 | ||||||||||
|
| |||||||||
Ireland – 6.2% | ||||||||||
Bank of Ireland | (a)(c) | 6,915,000 | 2,531,957 | |||||||
CRH PLC | (c) | 120,944 | 3,487,896 | |||||||
Kerry Group PLC | (c) | 33,700 | 2,788,329 | |||||||
Smurfit Kappa Group PLC | (c) | 43,100 | 1,103,835 | |||||||
|
| |||||||||
| 9,912,017 | ||||||||||
|
| |||||||||
Mexico – 5.4% | ||||||||||
Alpek SAB de CV | 275,000 | 384,548 | ||||||||
Alsea SAB de CV | 312,000 | 1,086,012 | ||||||||
Fibra Uno Administracion SA de CV | 270,000 | 595,161 | ||||||||
Fomento Economico Mexicano SAB de CV – ADR | 8,700 | 803,445 | ||||||||
Gruma SAB de CV | 38,200 | 537,453 | ||||||||
Grupo Aeroportuario del Sureste SAB de CV – ADR | 5,700 | 801,819 | ||||||||
Grupo Financiero Banorte SAB de CV | 295,200 | 1,623,776 | ||||||||
Grupo Lala SAB de CV | 361,500 | 836,498 | ||||||||
Grupo Mexico SAB de CV | 70,000 | 149,427 | ||||||||
Infraestructura Energetica Nova SAB de CV | 126,500 | 528,548 | ||||||||
Wal-Mart de Mexico SAB de CV | 478,000 | 1,206,475 | ||||||||
|
| |||||||||
| 8,553,162 | ||||||||||
|
| |||||||||
Austria – 3.3% | ||||||||||
Erste Group Bank AG | (a)(c) | 61,500 | 1,924,339 | |||||||
OMV AG | (c) | 19,500 | 553,512 | |||||||
UNIQA Insurance Group AG | (c) | 89,700 | 730,956 | |||||||
voestalpine AG | (c) | 32,600 | 997,174 | |||||||
Wienerberger AG | (c) | 59,500 | 1,102,673 | |||||||
|
| |||||||||
| 5,308,654 | ||||||||||
|
| |||||||||
Norway – 3.1% | ||||||||||
DNB ASA | (c) | 92,885 | 1,144,457 | |||||||
Statoil ASA | (c) | 155,600 | 2,170,116 | |||||||
Yara International ASA | (c) | 35,898 | 1,543,911 | |||||||
|
| |||||||||
| 4,858,484 | ||||||||||
|
| |||||||||
United Kingdom – 2.4% | ||||||||||
BG Group PLC | (c) | 30,000 | 434,875 | |||||||
Dialog Semiconductor PLC | (a)(c) | 41,600 | 1,388,134 | |||||||
Fiat Chrysler Automobiles NV | (c) | 62,535 | 868,476 | |||||||
Unilever NV | (d) | 26,263 | 1,144,649 | |||||||
|
| |||||||||
| 3,836,134 | ||||||||||
|
| |||||||||
United States – 2.3% | ||||||||||
Royal Caribbean Cruises Ltd. | 35,650 | 3,608,137 | ||||||||
|
| |||||||||
Italy – 2.0% | ||||||||||
Azimut Holding SpA | (c) | 20,800 | 517,009 | |||||||
Cerved Information Solutions SpA | (c) | 129,100 | 1,072,354 | |||||||
Luxottica Group SpA | (c) | 11,300 | 736,365 | |||||||
UniCredit SpA | (c) | 146,996 | 812,695 | |||||||
|
| |||||||||
| 3,138,423 | ||||||||||
|
| |||||||||
| 24 | (continued) |
| Ohio National Fund, Inc. | International Portfolio (Continued) |
Schedule of Investments | December 31, 2015 |
| Common Stocks (Continued) | Shares | Value | ||||||||
Czech Republic – 1.1% | ||||||||||
CEZ AS | (c) | 39,800 | $ | 709,794 | ||||||
Komercni banka as | (c) | 5,100 | 1,012,507 | |||||||
|
| |||||||||
| 1,722,301 | ||||||||||
|
| |||||||||
Hungary – 0.9% | ||||||||||
MOL Hungarian Oil & Gas PLC | (c) | 9,900 | 482,850 | |||||||
OTP Bank PLC | (c) | 45,500 | 935,542 | |||||||
|
| |||||||||
| 1,418,392 | ||||||||||
|
| |||||||||
Taiwan – 0.0% | ||||||||||
Hon Hai Precision Industry Co. Ltd. | (c) | 12,150 | 29,735 | |||||||
|
| |||||||||
Total Common Stocks (Cost $142,692,346) | $ | 153,041,893 | ||||||||
|
| |||||||||
| Preferred Stocks – 0.5% | Shares | Value | ||||||||
Germany – 0.5% | ||||||||||
Henkel AG & Co. KGaA | (c) | 7,500 | $ | 837,014 | ||||||
|
| |||||||||
Total Preferred Stocks (Cost $904,221) | $ | 837,014 | ||||||||
|
| |||||||||
| Money Market Funds – 3.8% | Shares | Value | ||||||||
State Street Institutional Liquid Reserves Fund | ||||||||||
Institutional Class | 5,997,019 | $ | 5,997,019 | |||||||
|
| |||||||||
Total Money Market Funds (Cost $5,997,019) | $ | 5,997,019 | ||||||||
|
| |||||||||
Total Investments – 100.6% (Cost $149,593,586) | (e) | $ | 159,875,926 | |||||||
Liabilities in Excess of Other Assets – (0.6)% | (f) | (898,367) | ||||||||
|
| |||||||||
Net Assets – 100.0% | $ | 158,977,559 | ||||||||
|
| |||||||||
Percentages are stated as a percent of net assets.
Abbreviations:
ADR: American Depositary Receipts
Footnotes:
| (a) | Non-income producing security. |
| (b) | Security exempt from registration under Regulation D of the Securities Act of 1933. These securities may be resold in transactions exempt from registration, normally to qualified buyers under Rule 144A. At December 31, 2015, the value of these securities totaled $3,276,982, or 2.1% of the Portfolio’s net assets. These securities were deemed liquid pursuant to procedures approved by the Board of Directors. |
| (c) | Security traded on a foreign exchange has been valued at an estimate of fair value that is different than the local market close price. These fair value estimates are determined by an independent fair valuation service that has been approved by the Board. These securities represent $128,474,612, or 80.8% of the Portfolio’s net assets. |
| (d) | As discussed in Note 2 of the Notes to Financial Statements, not all investments that are traded on a foreign exchange are valued at an estimate that is different from the local close price. In some instances, the independent fair valuation service uses a stock’s local close price because the service’s measure of predictability related to its valuation model of a stock is below a chosen threshold. These securities represent $4,867,212, or 3.1% of the Portfolio’s net assets. |
Other Portfolio securities are not subjected to fair valuation procedures because they are traded on domestic or foreign exchanges that have close times that are consistent with the U.S. market close, normally 4:00 pm Eastern Time.
| (e) | Represents cost for financial reporting purposes, which may differ from cost basis for federal income tax purposes. See also Note 7 of the Notes to Financial Statements. |
| (f) | Includes $211,708 of cash pledged as collateral for the following futures contracts outstanding at December 31, 2015: |
Type | Description | Expiration | Number of Contracts | Contract at | Initial Contract Amount | Unrealized Appreciation (Depreciation) | Variation Margin Receivable (Payable) | |||||||||||||
Long | JPX-Nikkei Index 400 Future | March 10, 2016 | 211 | $2,448,896 | $ | 2,513,447 | $ | (64,551 | ) | $ | (177 | ) | ||||||||
Long | Borsa Istanbul (BIST) 30 Future | February 29, 2016 | 483 | $1,475,217 | $ | 1,534,981 | $ | (59,764 | ) | $ | (24,468 | ) | ||||||||
|
|
|
|
|
|
| ||||||||||||||
| $3,924,113 | $ | 4,048,428 | $ | (124,315 | ) | $ | (24,645 | ) | ||||||||||||
|
|
|
|
|
|
| ||||||||||||||
| Details of the foreign currency contracts outstanding in the International Portfolio at December 31, 2015 are as follows: |
Contracts to buy foreign currency:
Date of contract | Exchange date | Counterparty | Currency to receive | Currency to deliver | Contract at value | Unrealized Appreciation (Depreciation) | ||||||||||||||
October 22, 2015 | January 27, 2016 | GS | 10,749,562 CHF | $ | 11,100,000 | $ | 10,742,405 | $ | (357,595 | ) | ||||||||||
|
|
|
|
|
| |||||||||||||||
| $ | 11,100,000 | $ | 10,742,405 | $ | (357,595 | ) | ||||||||||||||
|
|
|
|
|
| |||||||||||||||
Contracts to sell foreign currency:
Date of contract | Exchange date | Counterparty | Currency to receive | Currency to deliver | Contract at value | Unrealized Appreciation (Depreciation) | ||||||||||||||
December 14, 2015 | March 15, 2016 | CITI | $ | 21,233,577 | 19,228,000 EUR | $ | 20,932,908 | $ | 300,669 | |||||||||||
December 14, 2015 | March 15, 2016 | HSBC | $ | 27,019,477 | 3,253,145,000 JPY | $ | 27,109,078 | $ | (89,601 | ) | ||||||||||
|
|
|
|
|
| |||||||||||||||
| $ | 48,253,054 | $ | 48,041,986 | $ | 211,068 | |||||||||||||||
|
|
|
|
|
| |||||||||||||||
| 25 | (continued) |
| Ohio National Fund, Inc. | International Portfolio (Continued) |
Counterparties | Currencies | |
CITI – Citigroup Global Markets, Inc. | CHF – Swiss Franc | |
GS – Goldman Sachs Bank USA | EUR – Euro | |
HSBC – HSBC Bank USA, N.A. | JPY – Japanese Yen |
Sector Classifications (Common stocks & Preferred Stocks): (Percent of net assets)
Consumer Discretionary | 23.4 | % | ||
Financials | 22.1 | % | ||
Industrials | 14.3 | % | ||
Information Technology | 8.4 | % | ||
Health Care | 8.1 | % | ||
Materials | 7.7 | % | ||
Consumer Staples | 6.3 | % | ||
Energy | 3.4 | % | ||
Utilities | 1.8 | % | ||
Telecommunication Services | 1.3 | % | ||
|
| |||
| 96.8 | % | |||
|
|
The accompanying notes are an integral part of these financial statements.
| 26 |
| Ohio National Fund, Inc. | Capital Appreciation Portfolio |
Objective/Strategy
The Capital Appreciation Portfolio seeks long-term capital growth by investing primarily in equity and equity related securities of established companies with either current or emerging earnings growth not fully appreciated or recognized by the market.
Performance as of December 31, 2015
Average Annual Returns | ||||
One year | -2.05% | |||
Five years | 10.59% | |||
Ten years | 7.37% |
Past performance does not guarantee future results. The performance data quoted represents past performance and current returns may be lower or higher. Total return figures include change in share price and reinvestment of dividends and capital gains. The investment return and principal value will fluctuate so that an investor’s shares, when redeemed, may be worth more or less than the original cost. To obtain performance information up to the most recent month end, call toll-free 1-877-781-6392.
The Portfolio is not open to direct retail investment. Beneficial interest in shares is obtained solely by purchase of variable life insurance policies and variable annuity contracts. Actual performance results for variable annuity and variable universal life contracts will be lower due to contract charges. Consult your contract for applicable charges.
Comments
For the year ended December 31, 2015, the Capital Appreciation Portfolio returned -2.05% versus 1.38% for its benchmark, the S&P 500 Index.
Overall, 2015 proved to be difficult for many active managers. It was a very narrow, macro driven market with only a few holdings driving the majority of gains in the broad market indices. The average stock in the Russell 3000 Index is down over 12% since the market high earlier this year, while the index itself is down 4% for the same period. Furthermore, the S&P 500 Equal Weighted Index, which returned -2.2%, lagged the S&P 500 Index by 3.6%; its smaller weightings in Amazon.com, Inc., Microsoft Corp., Alphabet, Inc. (f/k/a Google), and Facebook, Inc. accounted for nearly half of the shortfall. Media reports on “FANG” (Facebook, Amazon.com, Netflix, and Google) stocks have been widespread, rightfully so. In Information Technology, Facebook, Inc. and Alphabet, Inc. accounted for 83 basis points of the index’s return; in Consumer Discretionary, Amazon.com, Inc. and Netflix, Inc. contributed 72 basis points.
There was also significant disparity among market segments: the Russell 1000 Growth Index outperformed its value counterpart by more than 9% and the Russell 1000 Index outperformed the Russell 2000 Index by over 5%. From a sector perspective, those sectors most tied to commodity prices and global growth, like Energy, Materials, and Industrials declined. Health Care, Information Technology, and the Consumer sectors posted solid gains. This illustrates that the market was focused on top-line revenue growers, along with safety, in the face of slowing earnings growth, global turmoil, China/emerging market weakness, and the resulting volatility that ensued.
Against that backdrop, the calendar year relative performance fell short of the S&P 500 Index. This marks the first time in our history at Jennison to underperform for two consecutive calendar years. Several of our holdings, especially in Energy and Materials, were hurt by negative volatility in sectors overall; however, in most cases fundamentals are strong and earnings did not disappoint. Our positions in these sectors trailed the poor returns of the index and were the largest sources of absolute and relative weakness.(1)
Constellium NV hit new lows in October that were partly a function of mutual fund fiscal year tax loss selling. Earlier in the year, the stock was punished due to its increased leverage to purchase Wise Metals, which won’t add capacity in its key auto-panel sheet business until 2017/18. Shares rebounded recently, reflecting its fundamentals more accurately, in our view. We think that the current valuation already discounts negative scenarios and that there will be more market recognition of the long-term growth opportunity or specialty aluminum due to the light weighting in auto and aerospace markets going forward.(1)
Shares of Potash Corp. of Saskatchewan, Inc. performed poorly for two reasons: recent weakness in the potash market as pricing has retraced to the lows of last year at $300 per ton, and uncertainty around its bidding for a European competitor, K+S in Germany.(1) Although we continue to like the positive free cash flow metrics of Potash Corp. of Saskatchewan, Inc., which more than funds its almost 7% dividend, we eliminated the position due to the risk of the company’s biggest commodity, potash, going lower in price or staying under $300 for a prolonged period.(1)
In Energy, we invested in companies that we believed were major independent players, high quality, and had solid balance sheets. Unfortunately, two of our holdings were hurt by one-time company-specific events; however, we still maintain conviction in our investment thesis.(1)
Noble Energy, Inc. experienced delays in contract negotiations with the Israeli government over disposal of its assets in the Eastern Mediterranean. The company’s core U.S. assets are located in the Niobrara and Marcellus - two of the most economic onshore basins in the U.S., which should provide years of inventory. With its prospects for growth in the Middle East, efficient use of capital and prudent cost management, we believe Noble Energy, Inc. could benefit over the medium- to long-term given its inexpensive valuation relative to its peer group.(1)
Anadarko Petroleum Corp.’s attempts to takeover Apache Energy were viewed as negative by the markets and share price was penalized. We believe its assets are underappreciated by the market and like its strong management team and diversified portfolio that should allow it to grow both reserves and production faster than the industry over the longer-term.(1)
On the other hand, Health Care and Consumer Staples added value as a number of positions generated solid gains. Hologic, Inc. executed on a multi-year turnaround with a new management team capitalizing on a strong mammography upgrade cycle. While we think the cycle still has a runway, we eliminated the position as its valuation no longer justified our reward-to-risk assessments.(1)
As mentioned above, Bristol-Myers Squibb Co.’s overall immune-oncology program has significant potential and we think the company will continue to benefit from product momentum, new product launches, pipeline data, and strong business development deals. (1)
Shares of Impax Laboratories, Inc. benefited from FDA approval of IPXL’s Rytary treatment for Parkinson’s disease, ending the multi-year probation status for at least one of the company’s major manufacturing facilities. Like we did with Hologic, Inc., we exited this position with a solid gain, as its valuation no longer met our reward versus risk requirements.(1)
Diamond Foods, Inc. was restructuring its nut business when snacks maker Snyder’s-Lance announced it was bidding to buy the company with a combination of stock and cash. Snyder’s goal is to expand its presence in natural foods, as well as gain easier access to the European market.(1)
| 27 | (continued) |
| Ohio National Fund, Inc. | Capital Appreciation Portfolio (Continued) |
Mondelez International, Inc. manufactures and markets snack food and beverage products worldwide. We believe margin improvement will continue and a supply chain overhaul could contribute to additional upside.(1)
With recent broad equity market declines, valuations overall have improved; however, there has also been a notable uptick in the dispersion of fundamentals and valuations of companies within the same industry. In addition, deteriorating fundamentals in many emerging markets and tepid top line growth may imply that expectations for most U.S. companies are still high by historical standards. Our view is that these factors, along with the continued uncertainty around China’s economic growth trajectory, should contribute to heightened volatility for the remainder of the year. Against this backdrop, we think it is still premature to buy many companies based on valuations alone; however, we are well prepared to take advantage of irrational market behavior and near term volatility to capture opportunistic buys.
Two sectors we are frequently asked about are Materials and Energy. We are currently underweight both sectors, and feel comfortable with the few names that we have. Each company in our Portfolio has solid fundamentals and we expect those companies to be able to execute through a low price environment. They have differentiated assets and are well positioned for business growth, key facts that we believe market consensus is ignoring. Nevertheless, we are very cautious and closely watching for their business catalysts to develop over the next six months.(1)
In this environment, bottom-up research and understanding individual company business risk drivers are critical. We believe this
bodes well for our investment process, long-term approach, and the performance expectations of our clients.
| (1) | The Portfolio’s composition is subject to change. Holdings and weightings are as of December 31, 2015. |
Change in Value of $10,000 Investment
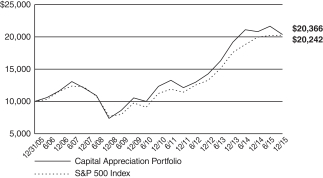
Hypothetical illustration based on past performance. Future performance will vary. The Portfolio’s returns reflect reinvested dividends. The Portfolio’s holdings may differ significantly from the securities in the index. The index is unmanaged and therefore does not reflect the cost of portfolio management and accounting.
The S&P 500 Index is a capitalization-weighted index designed to measure performance of the broad domestic economy through changes in the aggregate market value of 500 stocks representing all major industries. The index presented herein includes the effects of reinvested dividends.
Portfolio Composition as of December 31, 2015 (1)
| % of Net Assets | ||||
Common Stocks (4) | 95.7 | |||
Money Market Funds | 4.3 | |||
|
| |||
| 100.0 | ||||
|
|
Top 10 Portfolio Holdings as of December 31, 2015 (1) (2) (3)
| % of Net Assets | ||||
1. Bristol-Myers Squibb Co. | 2.4 | |||
2. Alphabet, Inc. Class C | 2.3 | |||
3. Express Scripts Holding Co. | 2.1 | |||
4. FirstEnergy Corp. | 2.0 | |||
5. MetLife, Inc. | 1.9 | |||
6. JPMorgan Chase & Co. | 1.9 | |||
7. Boeing Co. / The | 1.9 | |||
8. Microsoft Corp. | 1.9 | |||
9. Wells Fargo & Co. | 1.9 | |||
10. Mylan NV | 1.8 |
| (1) | Composition of Portfolio subject to change. |
| (2) | Short-term investments have been excluded from the list of Top 10 Portfolio Holdings. |
| (3) | Top 10 Portfolio Holdings is presented at an individual security level. Total investment exposure by issuer may be higher. |
| (4) | Sectors (Common Stocks): |
| % of Net Assets | ||||
Consumer Discretionary | 22.8 | |||
Information Technology | 17.3 | |||
Financials | 15.7 | |||
Health Care | 14.9 | |||
Industrials | 7.0 | |||
Energy | 6.0 | |||
Consumer Staples | 4.8 | |||
Utilities | 3.8 | |||
Materials | 2.3 | |||
Telecommunication Services | 1.1 | |||
|
| |||
| 95.7 | ||||
|
|
| 28 |
| Ohio National Fund, Inc. | Capital Appreciation Portfolio |
Schedule of Investments | December 31, 2015 |
| Common Stocks – 95.7% | Shares | Value | ||||||||
CONSUMER DISCRETIONARY – 22.8% | ||||||||||
Lear Corp. (Auto Components) | 36,551 | $ | 4,489,559 | |||||||
Carnival Corp. (Hotels, Restaurants & Leisure) | 135,695 | 7,392,664 | ||||||||
Hyatt Hotels Corp. Class A (Hotels, Restaurants & Leisure) | (a) | 133,555 | 6,279,756 | |||||||
MGM Resorts International (Hotels, Restaurants & Leisure) | (a) | 285,106 | 6,477,608 | |||||||
Pinnacle Entertainment, Inc. (Hotels, Restaurants & Leisure) | (a) | 106,802 | 3,323,678 | |||||||
SeaWorld Entertainment, Inc. (Hotels, Restaurants & Leisure) | 210,824 | 4,151,125 | ||||||||
Starwood Hotels & Resorts Worldwide, Inc. (Hotels, Restaurants & Leisure) | 47,313 | 3,277,845 | ||||||||
Wendy’s Co. / The (Hotels, Restaurants & Leisure) | 537,881 | 5,792,978 | ||||||||
CalAtlantic Group, Inc. (Household Durables) | 191,750 | 7,271,160 | ||||||||
Comcast Corp. Class A (Media) | 129,999 | 7,335,844 | ||||||||
Live Nation Entertainment, Inc. (Media) | (a) | 267,977 | 6,584,195 | |||||||
Twenty-First Century Fox, Inc. Class A (Media) | 129,621 | 3,520,506 | ||||||||
Viacom, Inc. Class B (Media) | 169,663 | 6,983,329 | ||||||||
Vivendi SA (Media) | (b) | 255,230 | 5,481,617 | |||||||
Target Corp. (Multiline Retail) | 100,757 | 7,315,966 | ||||||||
Coach, Inc. (Textiles, Apparel & Luxury Goods) | 178,671 | 5,847,902 | ||||||||
lululemon athletica, Inc. (Textiles, Apparel & Luxury Goods) | (a) | 125,915 | 6,606,760 | |||||||
|
| |||||||||
| 98,132,492 | ||||||||||
|
| |||||||||
CONSUMER STAPLES – 4.8% | ||||||||||
United Natural Foods, Inc. (Food & Staples Retailing) | (a) | 56,327 | 2,217,031 | |||||||
ConAgra Foods, Inc. (Food Products) | 178,710 | 7,534,414 | ||||||||
Diamond Foods, Inc. (Food Products) | (a) | 110,581 | 4,262,898 | |||||||
Mondelez International, Inc. Class A (Food Products) | 148,565 | 6,661,655 | ||||||||
|
| |||||||||
| 20,675,998 | ||||||||||
|
| |||||||||
ENERGY – 6.0% | ||||||||||
Patterson-UTI Energy, Inc. (Energy Equip. & Svs.) | 382,788 | 5,772,443 | ||||||||
Schlumberger Ltd. (Energy Equip. & Svs.) | 76,183 | 5,313,764 | ||||||||
Anadarko Petroleum Corp. (Oil, Gas & Consumable Fuels) | 41,440 | 2,013,155 | ||||||||
Cobalt International Energy, Inc. (Oil, Gas & Consumable Fuels) | (a) | 278,249 | 1,502,545 | |||||||
Laredo Petroleum, Inc. (Oil, Gas & Consumable Fuels) | (a) | 207,428 | 1,657,350 | |||||||
Noble Energy, Inc. (Oil, Gas & Consumable Fuels) | 193,539 | 6,373,239 | ||||||||
Plains GP Holdings LP Class A (Oil, Gas & Consumable Fuels) | 210,066 | 1,985,124 | ||||||||
Rice Energy, Inc. (Oil, Gas & Consumable Fuels) | (a) | 124,639 | 1,358,565 | |||||||
|
| |||||||||
| 25,976,185 | ||||||||||
|
| |||||||||
FINANCIALS – 15.7% | ||||||||||
Bank of America Corp. (Banks) | 391,275 | 6,585,158 | ||||||||
Citigroup, Inc. (Banks) | 141,916 | 7,344,153 | ||||||||
JPMorgan Chase & Co. (Banks) | 125,377 | 8,278,643 | ||||||||
PNC Financial Services Group, Inc. / The (Banks) | 66,979 | 6,383,768 | ||||||||
Wells Fargo & Co. (Banks) | 147,146 | 7,998,857 | ||||||||
Goldman Sachs Group, Inc. / The (Capital Markets) | 34,954 | 6,299,759 | ||||||||
Capital One Financial Corp. (Consumer Finance) | 65,850 | 4,753,053 | ||||||||
Synchrony Financial (Consumer Finance) | (a) | 155,410 | 4,726,018 | |||||||
Voya Financial, Inc. (Diversified Financial Svs.) | 179,688 | 6,632,284 | ||||||||
MetLife, Inc. (Insurance) | 173,930 | 8,385,165 | ||||||||
|
| |||||||||
| 67,386,858 | ||||||||||
|
| |||||||||
HEALTH CARE – 14.9% | ||||||||||
AbbVie, Inc. (Biotechnology) | 124,845 | 7,395,818 | ||||||||
Express Scripts Holding Co. (Health Care Providers & Svs.) | (a) | 104,489 | 9,133,383 | |||||||
| Common Stocks (Continued) | Shares | Value | ||||||||
HEALTH CARE (continued) | ||||||||||
Veeva Systems, Inc. Class A (Health Care Technology) | (a) | 201,393 | $ | 5,810,188 | ||||||
Allergan PLC (Pharmaceuticals) | (a) | 11,431 | 3,572,187 | |||||||
Bristol-Myers Squibb Co. (Pharmaceuticals) | 149,291 | 10,269,728 | ||||||||
Merck & Co., Inc. (Pharmaceuticals) | 111,751 | 5,902,688 | ||||||||
Mylan NV (Pharmaceuticals) | (a) | 144,907 | 7,835,121 | |||||||
Pfizer, Inc. (Pharmaceuticals) | 236,870 | 7,646,164 | ||||||||
Shire PLC – ADR (Pharmaceuticals) | 31,747 | 6,508,135 | ||||||||
|
| |||||||||
| 64,073,412 | ||||||||||
|
| |||||||||
INDUSTRIALS – 7.0% | ||||||||||
Boeing Co. / The (Aerospace & Defense) | 57,112 | 8,257,824 | ||||||||
ADT Corp. / The (Commercial Svs. & Supplies) | 230,576 | 7,604,396 | ||||||||
Eaton Corp. PLC (Electrical Equip.) | 82,900 | 4,314,116 | ||||||||
General Electric Co. (Industrial Conglomerates) | 138,047 | 4,300,164 | ||||||||
Hertz Global Holdings, Inc. (Road & Rail) | (a) | 392,911 | 5,591,124 | |||||||
|
| |||||||||
| 30,067,624 | ||||||||||
|
| |||||||||
INFORMATION TECHNOLOGY – 17.3% | ||||||||||
Brocade Communications Systems, Inc. (Communications Equip.) | 370,688 | 3,402,916 | ||||||||
Juniper Networks, Inc. (Communications Equip.) | 158,353 | 4,370,543 | ||||||||
Polycom, Inc. (Communications Equip.) | (a) | 357,903 | 4,505,999 | |||||||
Viavi Solutions, Inc. (Communications Equip.) | (a) | 492,605 | 2,999,964 | |||||||
Benchmark Electronics, Inc. (Electronic Equip., Instr. & Comp.) | (a) | 170,159 | 3,517,186 | |||||||
Alphabet, Inc. Class C (Internet Software & Svs.) | (a) | 13,214 | 10,027,840 | |||||||
Match Group, Inc. (Internet Software & Svs.) | (a) | 134,525 | 1,822,814 | |||||||
Cadence Design Systems, Inc. (Software) | (a) | 209,909 | 4,368,206 | |||||||
Fortinet, Inc. (Software) | (a) | 99,252 | 3,093,685 | |||||||
Guidewire Software, Inc. (Software) | (a) | 62,067 | 3,733,951 | |||||||
Microsoft Corp. (Software) | 145,900 | 8,094,532 | ||||||||
PTC, Inc. (Software) | (a) | 186,789 | 6,468,503 | |||||||
Rovi Corp. (Software) | (a) | 296,163 | 4,934,076 | |||||||
Apple, Inc. (Tech. Hardware, Storage & Periph.) | 53,397 | 5,620,568 | ||||||||
Diebold, Inc. (Tech. Hardware, Storage & Periph.) | 255,757 | 7,695,728 | ||||||||
|
| |||||||||
| 74,656,511 | ||||||||||
|
| |||||||||
MATERIALS – 2.3% | ||||||||||
Monsanto Co. (Chemicals) | 36,764 | 3,621,989 | ||||||||
Constellium NV Class A (Metals & Mining) | (a) | 253,511 | 1,952,035 | |||||||
Louisiana-Pacific Corp. (Paper & Forest Products) | (a) | 244,706 | 4,407,155 | |||||||
|
| |||||||||
| 9,981,179 | ||||||||||
|
| |||||||||
TELECOMMUNICATION SERVICES – 1.1% | ||||||||||
Frontier Communications Corp. (Diversified Telecom. Svs.) | 1,007,536 | 4,705,193 | ||||||||
|
| |||||||||
UTILITIES – 3.8% | ||||||||||
FirstEnergy Corp. (Electric Utilities) | 276,789 | 8,782,515 | ||||||||
Calpine Corp. (Ind. Power & Renewable Elec.) | (a) | 254,746 | 3,686,175 | |||||||
PG&E Corp. (Multi-Utilities) | 75,479 | 4,014,728 | ||||||||
|
| |||||||||
| 16,483,418 | ||||||||||
|
| |||||||||
Total Common Stocks (Cost $421,737,026) | $ | 412,138,870 | ||||||||
|
| |||||||||
| Money Market Funds – 6.2% | Shares | Value | ||||||||
Fidelity Institutional Money Market Funds | ||||||||||
Money Market Portfolio – Class I | 26,660,000 | $ | 26,660,000 | |||||||
|
| |||||||||
Total Money Market Funds (Cost $26,660,000) | $ | 26,660,000 | ||||||||
|
| |||||||||
Total Investments – 101.9% (Cost $448,397,026) | (c) | $ | 438,798,870 | |||||||
Liabilities in Excess of Other Assets – (1.9)% | (8,370,711) | |||||||||
|
| |||||||||
Net Assets – 100.0% | $ | 430,428,159 | ||||||||
|
| |||||||||
| 29 | (continued) |
| Ohio National Fund, Inc. | Capital Appreciation Portfolio (Continued) |
Schedule of Investments | December 31, 2015 |
Percentages are stated as a percent of net assets.
Abbreviations:
ADR: American Depositary Receipts
Footnotes:
| (a) | Non-income producing security. |
| (b) | Security traded on a foreign exchange has been valued at an estimate of fair value that is different than the local market close price. These fair value estimates are determined by an independent fair valuation service that has been approved by the Board. These securities represent $5,481,617, or 1.3% of the Portfolio’s net assets. |
Other Portfolio securities are not subjected to fair value procedures because they are traded on domestic or foreign exchanges that have close times that are consistent with the U.S. market close, normally 4:00 pm Eastern Time.
| (c) | Represents cost for financial reporting purposes, which may differ from cost basis for federal income tax purposes. See also Note 7 of the Notes to Financial Statements. |
The accompanying notes are an integral part of these financial statements.
| 30 |
| Ohio National Fund, Inc. | International Small-Mid Company Portfolio |
Objective/Strategy
The International Small-Mid Company Portfolio seeks long-term growth of capital by investing at least 80% of its assets in equity securities of non-U.S. small and mid-cap companies.
Performance as of December 31, 2015
Average Annual Returns | ||||
One year | 9.46% | |||
Five years | 5.23% | |||
Ten years | 5.01% |
Past performance does not guarantee future results. The performance data quoted represents past performance and current returns may be lower or higher. Total return figures include change in share price and reinvestment of dividends and capital gains. The investment return and principal value will fluctuate so that an investor’s shares, when redeemed, may be worth more or less than the original cost. To obtain performance information up to the most recent month end, call toll-free 1-877-781-6392.
The Portfolio is not open to direct retail investment. Beneficial interest in shares is obtained solely by purchase of variable life insurance policies and variable annuity contracts. Actual performance results for variable annuity and variable universal life contracts will be lower due to contract charges. Consult your contract for applicable charges.
Comments
For the year ended December 31, 2015, the International Small-Mid Company Portfolio returned 9.46% versus 0.44% for the current benchmark, the MSCI ACWI Ex USA SMID Cap Index (Net-USD) and 7.22% for the former benchmark, the S&P Developed Small Cap Ex-U.S. Growth Index.
Global equity markets performance was mixed over the reporting period, as regional divergence caused large currency moves that impacted overall performance for investors. Outside the U.S., central banks in Canada, Europe and Japan maintained aggressively loose monetary policies in an effort to fight deflation and support economic growth. Meanwhile, in the U.S., a stronger economy raised expectations for the first Federal Reserve interest rate hike in almost a decade. The anticipated divergence in global monetary policy drove up the value of the U.S. dollar relative to other major world currencies. Over the reporting period, developed markets, as measured by MSCI EAFE Index, rose 5.33% in local terms, but fell 0.81% for U.S. dollar-based investors, due to the strong U.S. dollar. Emerging markets declined over the reporting period, as China’s slowing economy and a decline in commodity prices negatively impacted the outlook for global growth. As measured by MSCI Emerging Markets Index, emerging markets returned -5.76% in local terms, and -14.92% for U.S. dollar based investors.
The European equity market, as measured by MSCI AC Europe Index, returned 4.71% in local terms, but declined 3.23% for U.S. dollar-based investors. Throughout the reporting period, aggressively loose monetary policy by the European Central Bank (“ECB”) and a weaker euro improved the outlook for economic growth for 2015 and 2016. Despite the mid-year political crisis in Greece, the sovereign debt crisis in the euro area continued to recede, as the major economies of Spain and Italy returned to higher growth and lower unemployment. Furthermore, as government budgets have improved and bond yields declined, the impact of fiscal austerity has diminished. As the period ended, the ECB cut deposit rates to a record low -0.30% and extended its 1.1 trillion euro asset purchase program into 2017. Despite geopolitical turmoil (tragic acts of terrorism and massive influx of refugees), domestic
demand in Europe continued to improve, helped by record low interest rates, lower energy costs, and a relatively weaker currency.
The Japanese equity market, as measured by MSCI Japan Index, returned 9.57% for U.S. dollar-based investors with limited impact from the yen volatility versus the U.S. dollar as it was range bound in the period. Japan’s equity market led the major developed markets and all Asian markets. Japanese corporate data has been very strong with ongoing earnings acceleration due to the sustained weakness of the yen, lower energy prices, and higher consumption driven by a tourist boom. Japanese retail sales increased during the year, Small Business Confidence improved and the service sector Purchasing Managers’ Index rose to its highest level in nearly two years. Japanese structural reforms under the “three arrows” of Abenomics are slowly changing the economic landscape; however, persistent zero to low real economic growth continues to trouble policy makers. The Bank of Japan remains accommodative with an open commitment to maintain asset purchases of 80 trillion yen per month. Revisions to Prime Minister Abe’s structural reform plan will be released in 2016.
While the major developed markets were growing modestly, there were signs of a deceleration and slowing trade in several emerging markets. After a decade of double-digit growth driven by fixed asset investment and a mercantilist dependence on global trade, the Chinese government’s decision to transform to a more consumption-based economy has slowed the pace of growth. While in the long-term, this economic rebalancing is positive, in the near-term, it has resulted in slower Chinese economic activity and reduced the global demand for fixed assets and commodities. Countries whose economies benefited from commodity exports to China, such as Russia and Brazil, are now expecting recessions. The volatility of the local Chinese A-share market and the government’s sudden weakening of the Chinese yuan in August has fueled worries about economic stability. After a strong start to the year, Chinese equities, as measured by MSCI China, declined 7.82%. As with most developed economies, many emerging market central banks continue to ease monetary conditions by cutting interest rates and adding liquidity. For example, the People’s Bank of China continues to ease monetary policy using multiple measures to stimulate the economy such as cutting the benchmark one-year lending rate and lowering the reserve requirement for banks.
Chinese economic weakness impacted South Korea, which experienced an overall drop in total exports for the first time in six years. In Taiwan, weaker exports to China were offset by stronger domestic demand amid a stable job market and rising household incomes. During the reporting period, MSCI Taiwan and MSCI South Korea fell 11.72% and 6.66%, respectively. An economic bright spot for the emerging markets was South East Asia. Solid domestic demand drove recoveries in India, Indonesia, and Thailand, which were also boosted by more responsible monetary and fiscal policies, and renewed political stability. Despite positive economic and reform progress, the stock markets and currencies declined during the reporting period amid a broad sell-off in emerging market assets.
For the reporting period, the MSCI USA Index (0.69%) outperformed both the MSCI EAFE Index (-0.81%) and MSCI Emerging Markets Index (-14.92%). Broadly across the world, there was a wide divergence among country returns. Within developed markets, the best performing major economy was MSCI Japan (9.57%), which was less impacted by currency depreciation. Within the euro area (and euro pegged currencies), the depreciation of the euro by 10.2% versus the U.S. dollar was a major detractor from returns. Within the region, only MSCI Ireland (16.49%), MSCI Denmark (23.43%) and
| 31 | (continued) |
| Ohio National Fund, Inc. | International Small-Mid Company Portfolio (Continued) |
MSCI Belgium (12.10%) had positive returns. The major developed economies which underperformed the most were the ones most exposed to commodities and emerging markets: MSCI Canada (-24.16%), MSCI Singapore (-17.71), MSCI Spain (-15.64%) and MSCI Norway (-14.99%). Within emerging markets, no major market had positive returns. The top performers were the ones with the strongest currencies: MSCI China (-7.82%), MSCI South Korea (-6.66%) and MSCI Philippines (-6.80%). Laggards in the emerging markets included: MSCI Brazil (-41.37%), MSCI Colombia (-41.80%) and MSCI Greece (-61.33%).
During the reporting period, the Portfolio significantly outperformed its benchmark. Strong stock selection in the Financials and Consumer Discretionary sectors were the biggest drivers of outperformance. Overweighting the outperforming Health Care and Information Technology sectors also contributed to the outperformance. Finally, the decision to hedge our exposure to the euro contributed positively to performance as well.(1)
Stocks that contributed to the positive stock selection in Consumer Discretionary were Pandora A/S and Yoox Net-A-Porter Group SpA. Pandora A/S is a global jeweler based in Denmark. High demand for its products along with declining silver prices helped the company deliver results above expectations and announce a large share buyback. Yoox Group SpA, an Italian online luxury goods retailer, announced a merger with UK’s Net-A-Porter Group, consolidating the online luxury goods market. The favorable terms of the merger for Yoox Net-A-Porter Group SpA shareholders and larger than expected synergies drove the share price outperformance. In Financials, UK financial advisor St. James Place PLC and Italian asset manager Anima Holding SpA added to the Portfolio’s outperformance. Both companies reported better than expected assets under management growth, benefitting from market share gains and ongoing quantitative easing by the ECB.(1)
Positive relative contributions also came from over-weighting two of the top performing sectors, Health Care and Information Technology, along with strong stock selection within these sectors. In Health Care, Japanese holdings Chugai Pharmaceutical Co. Ltd. and Shionogi & Co. Ltd. were top performers. Shionogi & Co. Ltd. earnings exceeded expectations following a successful global launch of its drug that treats HIV while Chugai Pharmaceutical Co. Ltd. benefitted from a robust pipeline and anticipated launches in early 2016. Stock selection in Information Technology was driven by French videogame maker UBISOFT Entertainment. UBISOFT Entertainment announced a strong product launch cycle and is also subject to ongoing takeover rumors as Vivendi SA continues to build a stake in the company.(1)
Two of the Portfolio’s Energy holdings were among the worst performers for the year, Tidewater, Inc. and Soco International PLC. Both companies were impacted by the sudden drop in the price of oil. Soco International PLC also took a write off on assets in Vietnam and the Democratic Republic of Congo, which put added pressure on its earnings. Lower oil also impacted one of the Portfolio’s financial holdings, Canadian Western Bank. The Alberta-based bank has minimal direct oil exposure but it services Western Canada where energy is a key component of the economy. Slowing gross domestic product growth in Alberta has translated into lower loan growth for Canadian Western Bank and that, along with uncertainties over the bank’s indirect oil exposure, has weighed on its share price.(1)
The Portfolio was also negatively impacted by two holdings in Consumer Discretionary, Prada SpA and Hudson’s Bay Co. Prada SpA has been a leading luxury goods company since its founding in 1913.
Earnings came under pressure as the company pursued an aggressive expansion strategy while the underlying market was slowing down. China and Hong Kong saw the largest slowdown in luxury demand, and these are two of Prada SpA’s biggest markets. Hudson’s Bay Co. is a leading department store operator in the United States, Canada and Germany, operating the Saks, Lord & Taylor, Hudson’s Bay and Galeria Kaufhof banners. Hudson’s Bay Co. shares came under pressure late in the year, as unseasonal weather and changing consumer behavior caused the company to revise its earnings outlook downward.(1)
During the reporting period, the Portfolio hedged a portion of its Euro exposure (versus the U.S. dollar) with currency forwards. The overall net return of the currency forward position contributed positively to Portfolio performance. The Portfolio also utilized equity index futures to assist in managing country weights and cash. These futures did not have a meaningful impact on total return.
During the reporting period, the Portfolio participated in a significant number of Initial Public Offerings (IPOs). The overall net returns of the IPOs contributed positively to Portfolio performance. Auto Trader Group Plc, Infrastrutture Wireless Italiane S.p.A. and Grandvision N.V. were the largest positive contributors to the Portfolio’s return, while Massimo Zanetti Beverage Group S.p.A. and Alimak Group AB were a drag on performance.(1)
The Portfolio’s positioning reflects our best long-term investment ideas combined with a portion of the Portfolio dedicated to more tactical holdings. During the first quarter, prior to the ECB’s quantitative easing (“QE”) announcement, we established a short position in the euro, effectively neutralizing our exposure relative to our benchmark to manage risk. We subsequently exited this position in the fourth quarter. Our expectation for a European recovery has not been altered in light of recent developments. We continue to expect the European economies to benefit from the tailwind of a weaker euro, ongoing QE, low borrowing costs and an improving macro outlook as we look into 2016 and beyond. Companies in countries such as France and Germany will be the largest beneficiaries of a weaker euro. Despite a more defensive stance on the part of investors during the quarter, we continued to pursue our interests in those markets and in companies exposed to a global economic recovery led by the U.S. and helped by the improving outlooks for both Europe and Japan. The Portfolio remains underweight emerging markets, with the majority of exposure to Asia.(1)
In terms of sector exposure, we continue to have a cyclical bias with an overweight to Consumer Discretionary and Information Technology, while we remain underweight the Energy sector. Our sector positioning stems from our belief that the economic recovery will be driven by advancements in technology and continued strength in consumer spending. These sectors should be beneficiaries from additional stimulus measures being discussed in Europe and Japan. Looking forward, we continue to see a healthy initial public offering pipeline and will participate in deals that fit our investment strategy and philosophy.(1)
| (1) | The Portfolio’s composition is subject to change. Holdings and weightings are as of December 31, 2015. |
| 32 | (continued) |
| Ohio National Fund, Inc. | International Small-Mid Company Portfolio (Continued) |
Change in Value of $10,000 Investment
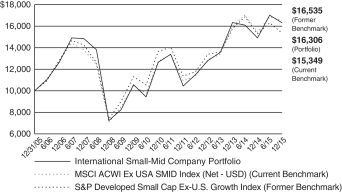
Hypothetical illustration based on past performance. Future performance will vary. The Portfolio’s returns reflect reinvested dividends. The Portfolio’s holdings may differ significantly from the securities in the index. The index is unmanaged and therefore does not reflect the cost of portfolio management and accounting.
Effective May 1, 2015, the Portfolio’s benchmark was changed from S&P Developed Small Cap Ex-U.S. Growth Index to MSCI ACWI ex USA SMID Cap Index. The change in the benchmark was made because the new benchmark was more comparable to the holdings selected by the sub-adviser’s investment strategy.
The MSCI ACWI ex USA SMID Cap Index captures mid and small cap representation across 22 of 23 developed market countries (excluding the U.S.) and 23 emerging markets countries. With over 5,000 constituents, the index covers approximately 28% of the free float-adjusted market capitalization in each country. The returns presented for this index include the effects of reinvested dividends, net of taxes, and adjustment to U.S Dollar denomination.
The S&P Developed Small Cap Ex-U.S. Growth Index is a subset of the S&P Global Broad Market Index (BMI), a broad index including all publicly listed equities with float-adjusted market values of US$ 100 million or more and annual dollar value traded of at least US$ 50 million in all included countries. The Developed Small Cap component of the BMI includes the equities in the bottom 15% of the market capitalization within each “developed” local market. Ex-U.S. denotes the use of all developed markets excluding the United States. The “Growth” subset includes those companies in each local market that exhibit the characteristics of growth. The returns presented for this index includes the effects of reinvested dividends, net of taxes, and adjustment to U.S. Dollar denomination.
Portfolio Composition as of December 31, 2015 (1)
| % of Net Assets | ||||
Common Stocks (4) | 94.6 | |||
Money Market Funds and | 5.4 | |||
|
| |||
| 100.0 | ||||
|
|
Top 10 Portfolio Holdings as of December 31, 2015 (1) (2) (3)
| % of Net Assets | ||||
1. St. James’s Place PLC | 1.8 | |||
2. Kakaku.com, Inc. | 1.6 | |||
3. Shawbrook Group PLC | 1.5 | |||
4. Daifuku Co. Ltd. | 1.5 | |||
5. Chugai Pharmaceutical Co. Ltd. | 1.5 | |||
6. Ashtead Group PLC | 1.5 | |||
7. Criteo SA – ADR | 1.3 | |||
8. Shionogi & Co. Ltd. | 1.3 | |||
9. Julius Baer Group Ltd. | 1.3 | |||
10. Babcock International Group PLC | 1.3 |
| (1) | Composition of Portfolio subject to change. |
| (2) | Short-term investments have been excluded from the list of Top 10 Portfolio Holdings. |
| (3) | Top 10 Portfolio Holdings is presented at an individual security level. Total investment exposure by issuer may be higher. |
| (4) | Top 10 Country Weightings (Common Stocks): |
| % of Net Assets | ||||
United Kingdom | 19.6 | |||
Japan | 17.7 | |||
France | 10.1 | |||
Germany | 8.4 | |||
Italy | 6.0 | |||
Hong Kong | 5.5 | |||
Netherlands | 4.4 | |||
Canada | 2.8 | |||
Ireland | 2.6 | |||
United States | 2.4 |
| 33 |
| Ohio National Fund, Inc. | International Small-Mid Company Portfolio |
Schedule of Investments | December 31, 2015 |
| Common Stocks – 94.6% | Shares | Value | ||||||||
United Kingdom – 19.6% | ||||||||||
Ashtead Group PLC | (d) | 69,241 | $ | 1,139,556 | ||||||
ASOS PLC | (a)(d) | 16,700 | 848,522 | |||||||
Babcock International Group PLC | (d) | 66,953 | 1,001,961 | |||||||
BTG PLC | (a)(d) | 30,642 | 310,493 | |||||||
Burberry Group PLC | (d) | 22,887 | 402,674 | |||||||
Croda International PLC | (d) | 15,633 | 700,435 | |||||||
Dialog Semiconductor PLC | (a)(d) | 17,700 | 590,625 | |||||||
Essentra PLC | (d) | 56,570 | 689,594 | |||||||
Howden Joinery Group PLC | (d) | 78,978 | 611,925 | |||||||
InterContinental Hotels Group PLC | (d) | 22,608 | 881,227 | |||||||
John Wood Group PLC | (d) | 61,045 | 549,784 | |||||||
LivaNova PLC | (a) | 15,097 | 896,301 | |||||||
London Stock Exchange Group PLC | (d) | 19,979 | 808,312 | |||||||
Michael Page International PLC | (d) | 59,025 | 421,695 | |||||||
Rightmove PLC | (d) | 9,688 | 588,740 | |||||||
Schroders PLC | (d) | 21,489 | 941,196 | |||||||
Shawbrook Group PLC | (a)(b)(e) | 233,545 | 1,205,366 | |||||||
St. James’s Place PLC | (d) | 96,611 | 1,431,937 | |||||||
Stock Spirits Group PLC | (e) | 245,343 | 504,550 | |||||||
Vectura Group PLC | (a)(e) | 124,833 | 323,891 | |||||||
Worldpay Group PLC | (a)(b)(e) | 100,930 | 457,235 | |||||||
|
| |||||||||
| 15,306,019 | ||||||||||
|
| |||||||||
Japan – 17.7% | ||||||||||
Aisin Seiki Co. Ltd. | (d) | 20,600 | 886,590 | |||||||
Alps Electric Co. Ltd. | (d) | 13,700 | 371,517 | |||||||
Chugai Pharmaceutical Co. Ltd. | (d) | 33,000 | 1,150,268 | |||||||
Daifuku Co. Ltd. | (d) | 67,900 | 1,156,272 | |||||||
Disco Corp. | (d) | 4,400 | 414,354 | |||||||
Don Quijote Holdings Co. Ltd. | (d) | 25,800 | 906,063 | |||||||
Doutor Nichires Holdings Co. Ltd. | (d) | 24,900 | 385,140 | |||||||
Horiba Ltd. | (d) | 22,500 | 868,792 | |||||||
Japan Hotel REIT Investment Corp. | (d) | 820 | 606,261 | |||||||
Kakaku.com, Inc. | (d) | 64,201 | 1,262,808 | |||||||
Kanamoto Co. Ltd. | (d) | 19,400 | 490,618 | |||||||
K’s Holdings Corp. | (d) | 12,900 | 439,268 | |||||||
Kyowa Hakko Kirin Co. Ltd. | (d) | 26,000 | 409,101 | |||||||
Nidec Corp. | (d) | 5,300 | 384,335 | |||||||
NSK Ltd. | (d) | 66,600 | 723,670 | |||||||
NTN Corp. | (d) | 56,000 | 236,133 | |||||||
Ono Pharmaceutical Co. Ltd. | (d) | 3,300 | 588,429 | |||||||
Shionogi & Co. Ltd. | (d) | 22,300 | 1,008,634 | |||||||
Sompo Japan Nipponkoa Holdings, Inc. | (d) | 18,000 | 591,024 | |||||||
Tadano Ltd. | (d) | 29,000 | 351,071 | |||||||
United Arrows Ltd. | (d) | 15,000 | 646,666 | |||||||
|
| |||||||||
| 13,877,014 | ||||||||||
|
| |||||||||
France – 10.1% | ||||||||||
Accor SA | (d) | 16,417 | 711,019 | |||||||
Advanced Accelerator Applications SA – ADR | (a) | 16,367 | 511,796 | |||||||
Criteo SA – ADR | (a) | 26,317 | 1,042,153 | |||||||
Edenred | (d) | 29,887 | 564,955 | |||||||
Ingenico Group SA | (d) | 3,610 | 455,658 | |||||||
Ipsen SA | (d) | 14,347 | 950,597 | |||||||
Publicis Groupe SA | (d) | 13,335 | 886,715 | |||||||
Societe Television Francaise 1 | (d) | 32,500 | 360,874 | |||||||
Teleperformance | (d) | 10,732 | 902,426 | |||||||
UBISOFT Entertainment | (a)(d) | 32,843 | 950,513 | |||||||
Zodiac Aerospace | (d) | 22,774 | 542,256 | |||||||
|
| |||||||||
| 7,878,962 | ||||||||||
|
| |||||||||
Germany – 8.4% | ||||||||||
Commerzbank AG | (a)(d) | 28,726 | 296,411 | |||||||
Deutsche Pfandbriefbank AG | (a)(b)(e) | 53,246 | 648,089 | |||||||
Deutz AG | (d) | 156,550 | 623,118 | |||||||
GEA Group AG | (d) | 10,189 | 411,644 | |||||||
HeidelbergCement AG | (d) | 10,586 | 862,733 | |||||||
Kloeckner & Co. SE | (d) | 79,733 | 689,622 | |||||||
OSRAM Licht AG | (d) | 9,837 | 410,980 | |||||||
| Common Stocks (Continued) | Shares | Value | ||||||||
Germany (continued) | ||||||||||
Rheinmetall AG | (d) | 12,044 | $ | 800,587 | ||||||
SAF-Holland SA | (d) | 39,243 | 531,276 | |||||||
Scout24 AG | (a)(b)(d) | 9,920 | 351,677 | |||||||
Siltronic AG | (a)(d) | 17,050 | 413,516 | |||||||
Wirecard AG | (d) | 10,761 | 537,889 | |||||||
|
| |||||||||
| 6,577,542 | ||||||||||
|
| |||||||||
Italy – 6.0% | ||||||||||
Anima Holding SpA | (b)(d) | 88,836 | 767,285 | |||||||
Azimut Holding SpA | (d) | 25,908 | 643,974 | |||||||
Banca Generali SpA | (d) | 14,856 | 467,310 | |||||||
Infrastrutture Wireless Italiane SpA | (a)(b)(d) | 157,319 | 857,794 | |||||||
Massimo Zanetti Beverage Group SpA | (a)(b)(d) | 60,835 | 627,542 | |||||||
Prada SpA | (e) | 171,000 | 531,751 | |||||||
Yoox Net-A-Porter Group SpA | (a)(d) | 22,035 | 820,822 | |||||||
|
| |||||||||
| 4,716,478 | ||||||||||
|
| |||||||||
Hong Kong – 5.5% | ||||||||||
Beijing Enterprises Water Group Ltd. | (d) | 900,000 | 630,049 | |||||||
China Everbright International Ltd. | (d) | 589,000 | 752,385 | |||||||
Haier Electronics Group Co. Ltd. | (d) | 246,000 | 496,553 | |||||||
PAX Global Technology Ltd. | (d) | 241,000 | 247,259 | |||||||
Regina Miracle International Holdings Ltd. | (a)(b)(e) | 291,000 | 425,796 | |||||||
Shun Tak Holdings Ltd. | (d) | 2,008,000 | 753,839 | |||||||
Techtronic Industries Co. Ltd. | (d) | 239,500 | 969,554 | |||||||
|
| |||||||||
| 4,275,435 | ||||||||||
|
| |||||||||
Netherlands – 4.4% | ||||||||||
ABN AMRO Group NV | (a)(b)(e) | 36,100 | 810,919 | |||||||
GrandVision NV | (b)(d) | 25,758 | 772,910 | |||||||
Intertrust NV | (a)(b)(e) | 19,673 | 433,151 | |||||||
Koninklijke DSM NV | (d) | 10,464 | 524,722 | |||||||
NN Group NV | (d) | 25,587 | 902,784 | |||||||
|
| |||||||||
| 3,444,486 | ||||||||||
|
| |||||||||
Canada – 2.8% | ||||||||||
Canadian Western Bank | 33,000 | 557,592 | ||||||||
Hudson’s Bay Co. | 57,171 | 747,846 | ||||||||
lululemon athletica, Inc. | (a) | 17,200 | 902,484 | |||||||
|
| |||||||||
| 2,207,922 | ||||||||||
|
| |||||||||
Ireland – 2.6% | ||||||||||
Grafton Group PLC | (d) | 53,983 | 589,476 | |||||||
Shire PLC | (d) | 11,010 | 755,367 | |||||||
Smurfit Kappa Group PLC | (d) | 27,300 | 699,181 | |||||||
|
| |||||||||
| 2,044,024 | ||||||||||
|
| |||||||||
United States – 2.4% | ||||||||||
Nexteer Automotive Group Ltd. | (d) | 836,000 | 924,089 | |||||||
Signet Jewelers Ltd. | 6,400 | 791,616 | ||||||||
Tidewater, Inc. | 27,100 | 188,616 | ||||||||
|
| |||||||||
| 1,904,321 | ||||||||||
|
| |||||||||
China – 2.1% | ||||||||||
CT Environmental Group Ltd. | (d) | 2,434,000 | 802,864 | |||||||
SouFun Holdings Ltd. – ADR | 81,995 | 605,943 | ||||||||
Sound Global Ltd. | (a)(c)(f) | 372,000 | 247,246 | |||||||
|
| |||||||||
| 1,656,053 | ||||||||||
|
| |||||||||
Taiwan – 1.5% | ||||||||||
Eclat Textile Co. Ltd. | (d) | 45,000 | 618,355 | |||||||
Makalot Industrial Co. Ltd. | (d) | 83,000 | 584,698 | |||||||
|
| |||||||||
| 1,203,053 | ||||||||||
|
| |||||||||
Switzerland – 1.3% | ||||||||||
Julius Baer Group Ltd. | (d) | 20,769 | 1,004,745 | |||||||
|
| |||||||||
Israel – 1.2% | ||||||||||
Caesarstone Sdot-Yam Ltd. | (a) | 8,614 | 373,331 | |||||||
NICE-Systems Ltd. – ADR | 10,300 | 590,396 | ||||||||
|
| |||||||||
| 963,727 | ||||||||||
|
| |||||||||
| 34 | (continued) |
| Ohio National Fund, Inc. | International Small-Mid Company Portfolio (Continued) |
Schedule of Investments | December 31, 2015 |
| Common Stocks (Continued) | Shares | Value | ||||||||
Sweden – 1.1% | ||||||||||
Hoist Finance AB | (a)(b)(d) | 53,059 | $ | 552,762 | ||||||
Nordax Group AB | (a)(b)(e) | 52,472 | 317,016 | |||||||
|
| |||||||||
| 869,778 | ||||||||||
|
| |||||||||
Spain – 1.1% | ||||||||||
Cellnex Telecom SAU | (b)(d) | 46,473 | 868,903 | |||||||
|
| |||||||||
Bermuda – 1.1% | ||||||||||
Arch Capital Group Ltd. | (a) | 12,100 | 843,975 | |||||||
|
| |||||||||
Denmark – 1.1% | ||||||||||
Pandora A/S | (d) | 6,673 | 841,357 | |||||||
|
| |||||||||
Belgium – 1.0% | ||||||||||
UCB SA | (d) | 8,991 | 811,555 | |||||||
|
| |||||||||
South Korea – 0.9% | ||||||||||
Hotel Shilla Co. Ltd. | (d) | 11,118 | 727,997 | |||||||
|
| |||||||||
Mexico – 0.7% | ||||||||||
Grupo Aeroportuario del Sureste SAB de CV –ADR | 4,020 | 565,493 | ||||||||
|
| |||||||||
| Common Stocks (Continued) | Shares | Value | ||||||||
Thailand – 0.7% | ||||||||||
Minor International PCL | (d) | 553,000 | $ | 553,830 | ||||||
|
| |||||||||
Australia – 0.7% | ||||||||||
Link Administration Holdings Ltd. | (a)(e) | 96,586 | 524,347 | |||||||
|
| |||||||||
Austria – 0.6% | ||||||||||
Erste Group Bank AG | (a)(d) | 15,200 | 475,609 | |||||||
|
| |||||||||
Total Common Stocks (Cost $63,039,247) | $ | 74,142,625 | ||||||||
|
| |||||||||
| Money Market Funds – 5.0% | Shares | Value | ||||||||
State Street Institutional Liquid Reserves Fund Institutional Class | 3,913,594 | $ | 3,913,594 | |||||||
|
| |||||||||
Total Money Market Funds (Cost $3,913,594) | $ | 3,913,594 | ||||||||
|
| |||||||||
Total Investments – 99.6% (Cost $66,952,841) | (g) | $ | 78,056,219 | |||||||
Other Assets in Excess of Liabilities – 0.4% | (h) | 270,704 | ||||||||
|
| |||||||||
Net Assets – 100.0% | $ | 78,326,923 | ||||||||
|
| |||||||||
Percentages are stated as a percent of net assets.
Abbreviations:
ADR: American Depositary Receipts
Footnotes:
| (a) | Non-income producing security. |
| (b) | Security exempt from registration under Regulation D of the Securities Act of 1933. These securities may be resold in transactions exempt from registration, normally to qualified buyers under Rule 144A. At December 31, 2015, the value of these securities totaled $9,096,445, or 11.6% of the Portfolio’s net assets. These securities were deemed liquid pursuant to procedures approved by the Board of Directors. |
| (c) | A market quotation for this investment was not readily available at December 31, 2015. As discussed in Note 2 of the Notes to Financial Statements, the price for this issue was derived from an estimate of fair market value using methods determined in good faith by the Fund’s Pricing Committee under supervision of the Board. This security represents $247,246, or 0.3% of the Portfolio’s net assets. |
| (d) | Security traded on a foreign exchange has been valued at an estimate of fair value that is different than the local market close price. These fair value estimates are determined by an independent fair valuation service that has been approved by the Board. These securities represent $59,095,726, or 75.4% of the Portfolio’s net assets. |
| (e) | As discussed in Note 2 of the Notes to Financial Statements, not all investments that are traded on a foreign exchange are valued at an estimate that is different from the local close price. In some instances, the independent fair valuation service uses a stock’s local close price because the service’s measure of predictability related to its valuation model of a stock is below a chosen threshold. These securities represent $6,182,111, or 7.9% of the Portfolio’s net assets. |
| (f) | Represents a security deemed to be illiquid. At December 31, 2015, the value of illiquid securities in the Portfolio totaled $247,246, or 0.3% of the Portfolio’s net assets. |
| (g) | Represents cost for financial reporting purposes, which may differ from cost basis for federal income tax purposes. See also Note 7 of the Notes to Financial Statements. |
| (h) | Includes $28,437 of cash pledged as collateral for the following futures contracts outstanding at December 31, 2015: |
Type | Description | Expiration | Number of Contracts | Contract | Initial Contract Amount | Unrealized Appreciation (Depreciation) | Variation Margin Receivable (Payable) | |||||||||||||
Long | JPX-Nikkei Index 400 Future | March 10, 2016 | 68 | $789,218 | $ | 810,021 | $ | (20,803 | ) | $ | (57 | ) | ||||||||
|
|
|
|
|
|
| ||||||||||||||
| $789,218 | $ | 810,021 | $ | (20,803 | ) | $ | (57 | ) | ||||||||||||
|
|
|
|
|
|
| ||||||||||||||
| Details of the foreign currency contracts outstanding in the International Small-Mid Company Portfolio at December 31, 2015 are as follows: |
Contracts to buy foreign currency:
Date of contract | Exchange date | Counterparty | Currency to receive | Currency to deliver | Contract at value | Unrealized Appreciation (Depreciation) | ||||||||||||||
November 2, 2015 | January 27, 2016 | JPM | 1,700,000 EUR | $ | 1,878,602 | $ | 1,848,484 | $ | (30,118 | ) | ||||||||||
December 3, 2015 | January 27, 2016 | JPM | 2,600,000 EUR | $ | 2,826,876 | $ | 2,827,093 | $ | 217 | |||||||||||
December 3, 2015 | January 27, 2016 | JPM | 2,600,000 EUR | $ | 2,793,173 | $ | 2,827,093 | $ | 33,920 | |||||||||||
December 3, 2015 | January 27, 2016 | JPM | 2,600,000 EUR | $ | 2,839,644 | $ | 2,827,093 | $ | (12,551 | ) | ||||||||||
|
|
|
|
|
| |||||||||||||||
| $ | 10,338,295 | $ | 10,329,763 | $ | (8,532 | ) | ||||||||||||||
|
|
|
|
|
| |||||||||||||||
| 35 | (continued) |
| Ohio National Fund, Inc. | International Small-Mid Company Portfolio (Continued) |
Schedule of Investments | December 31, 2015 |
Contracts to sell foreign currency:
Date of contract | Exchange date | Counterparty | Currency to receive | Currency to deliver | Contract at value | Unrealized Appreciation (Depreciation) | ||||||||||||||
October 21, 2015 | January 27, 2016 | JPM | $ | 10,801,405 | 9,500,000 EUR | $ | 10,329,763 | $ | 471,642 | |||||||||||
|
|
|
|
|
| |||||||||||||||
| $ | 10,801,405 | $ | 10,329,763 | $ | 471,642 | |||||||||||||||
|
|
|
|
|
| |||||||||||||||
Counterparties | Currencies | |
JPM – J.P. Morgan Chase Bank, N.A. | EUR – Euro |
Sector Classifications (Common stocks): (Percent of net assets)
Consumer Discretionary | 24.5 | % | ||
Financials | 18.3 | % | ||
Industrials | 17.7 | % | ||
Information Technology | 13.1 | % | ||
Health Care | 9.9 | % | ||
Materials | 4.4 | % | ||
Telecommunication Services | 2.2 | % | ||
Utilities | 2.1 | % | ||
Consumer Staples | 1.5 | % | ||
Energy | 0.9 | % | ||
|
| |||
| 94.6 | % | |||
|
|
The accompanying notes are an integral part of these financial statements.
| 36 |
| Ohio National Fund, Inc. | Aggressive Growth Portfolio |
Objective/Strategy
The Aggressive Growth Portfolio seeks long-term capital growth by investing primarily in domestic and foreign equity securities selected for growth potential.
Performance as of December 31, 2015
Average Annual Returns | ||||
One year | 10.15% | |||
Five years | 13.06% | |||
Ten years | 8.38% |
Past performance does not guarantee future results. The performance data quoted represents past performance and current returns may be lower or higher. Total return figures include change in share price and reinvestment of dividends and capital gains. The investment return and principal value will fluctuate so that an investor’s shares, when redeemed, may be worth more or less than the original cost. To obtain performance information up to the most recent month end, call toll-free 1-877-781-6392.
The Portfolio is not open to direct retail investment. Beneficial interest in shares is obtained solely by purchase of variable life insurance policies and variable annuity contracts. Actual performance results for variable annuity and variable universal life contracts will be lower due to contract charges. Consult your contract for applicable charges.
Comments
For the year ended December 31, 2015, the Aggressive Growth Portfolio returned 10.15% versus 1.38% for its benchmark, the S&P 500 Index.
As part of our investment strategy, we seek companies that have clear, sustainable competitive moats around their businesses that should help them grow market share within their respective industries over time. Important competitive advantages could include a strong brand, network effects from a product or service that would be hard for a competitor to replicate, a lower cost structure than competitors in the industry, a distribution advantage or patent protection over valuable intellectual property. We think emphasizing such sustainable competitive advantages can be a meaningful driver of outperformance over time because the market often underestimates the duration of growth for these companies and the long-term potential return to shareholders. The performance of many companies in our Portfolio validated our belief that they are well positioned to grow in excess of the market.
Our stock selection in the Consumer Discretionary sector and our underweight allocation to the Energy sector were the largest relative contributors to our outperformance. Our relative outperformance in the Consumer Discretionary sector was stock specific, rather than the result of a positive or negative underlying trend we were under or over exposed to. We have long maintained an underweight to the Energy sector in our Portfolio due to the sensitivity many businesses in the sector have to commodity prices. The decision to be underweight the sector was important during the year, as energy stocks continued to be impacted by plummeting oil prices.(1)
Relative detractors included our stock selection in the Industrials sector and our zero weighting to the Consumer Staples sector. The underperformance of the Industrials sector was due, in part, to weakness in Energy prices, which impacted some of our holdings that serve those end markets.(1)
During the year, we were pleased to see stock selection play a large role in driving our relative outperformance. Top Portfolio contrib-
utors were Amazon.com, Inc., Alphabet, Inc., Starbucks Corp., Pharmacyclics, Inc. and salesforce.com, Inc. Amazon.com, Inc., the online retailer, offers a wide range of products, including books, music, videotapes, computers, electronics, home and garden, and numerous other products. Amazon.com, Inc. offers personalized shopping services, Web-based credit card payment and direct shipping to customers. We believe the company’s competitive advantages of a low overhead cost structure, allowing an aggressive pricing structure, and faster shipping will cause consumers to shift an increasing amount of their general merchandise spending toward it. Given that over 90% of retail sales are still sold offline, we believe Amazon.com, Inc. has significant opportunities ahead, particularly as it expands into new business lines and geographies.(1)
Alphabet, Inc., the Internet search engine leader, which was formerly known as Google, is benefiting from strong growth in mobile search through its Android software for mobile devices. We think Android’s rapidly growing installed base will provide the company significant control over its mobile search and display advertising destiny. We also believe the company’s mobile and tablet search business will more than neutralize the impact of its declining desktop computer search business in developed markets. We also believe YouTube is well positioned to benefit from secular growth in online video.(1)
Starbucks Corp., the coffee retailer, which also offers other beverages and a variety of fresh food items through company-operated and licensed stores, is well positioned to continue gaining share in the coffee industry, including the premium packaged coffee and single cup markets. Lower coffee costs are allowing the company to increase investments in growth initiatives such as its Teavana tea shops and its newly launched Verismo single serve beverage system. We also believe Starbucks Corp.’s expansion into Asia will continue to add meaningfully to sales and profits given that region’s higher operating margin and Starbucks Corp.’s underpenetrated market positioning. We also believe that Starbucks Corp. has a unique long-term strategy to increase its penetration in the consumer packaged food channel by leveraging its brand name into new non-coffee products. Finally, we appreciate the company’s multiple levers to drive traffic into its stores and company-wide focus on growing comparable store sales.(1)
Pharmacyclics, Inc. was up significantly this year after it was announced that AbbVie had won a bidding war to acquire the company. The high interest Pharmacyclics, Inc. received from other companies validated our view that its blood cancer treatments offer significant growth potential.(1)
Salesforce.com, Inc. is a global cloud computing company best known for its customer relationship management (CRM) solutions. We believe the flexibility and low-cost nature of the company’s cloud-based offerings give it a competitive advantage over on-premises legacy solutions.(1)
The Portfolio’s detractors were Canadian Pacific Railway Ltd., Chipotle Mexican Grill, Inc., Alibaba Group Holding Ltd., Precision Castparts Corp., and Apple, Inc. Canadian Pacific Railway Ltd. operates a rail system connecting the major business centers in Canada. We like that the company operates in an industry that has significant barriers to entry. We believe a relatively new management team is improving the railroad company’s culture, operational performance and capital allocation decisions.(1)
We think Chipotle Mexican Grill, Inc. is still early in its store unit growth. As consumers continue to seek healthier, more natural
| 37 | (continued) |
| Ohio National Fund, Inc. | Aggressive Growth Portfolio (Continued) |
foods, we believe Chipotle Mexican Grill, Inc.’s commitment to simple, sustainably grown and produced food without the use of additives is a differentiator compared to other fast-food, family dining and fast-casual establishments.(1)
Alibaba Group Holding Ltd., a Chinese e-commerce company, provides consumer-to-consumer, business-to-consumer and business-to-business sales services via Web and mobile platforms. We exited our position during the period.(1)
Precision Castparts Corp. makes a number of parts for the aerospace industry and other end markets. We sold the position after disappointing results were reported by the company.(1)
Apple, Inc. is one of the world’s largest mobile device and computer makers. Apple, Inc. has been the beneficiary of incremental sales opportunities and increased penetration in new geographies, mobile service providers and product categories.(1)
We believe that volatility will stay elevated amid continuing questions about global economic growth. While household balance sheets are strong and improving employment and early signs of wage growth are supportive of U.S. consumer spending, modern consumers are also sober minded, as shown by their long-term focus on using savings from cheaper gas and utilities to build up their personal savings. We expect this mindset to continue for the foreseeable future.
While there are legitimate concerns about the global economy, we think it underscores the importance of finding those select companies with truly sustainable competitive advantages that can take market share and continue to grow earnings, even without the backdrop of a strong global economy. Such companies are more
appreciated in a world where growth is harder to come by, as they can create their own path to creating value.
| (1) | The Portfolio’s composition is subject to change. Holdings and weightings are as of December 31, 2015. |
Change in Value of $10,000 Investment
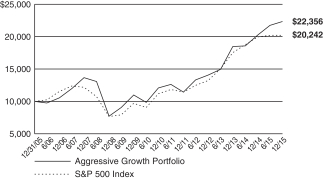
Hypothetical illustration based on past performance. Future performance will vary. The Portfolio’s returns reflect reinvested dividends. The Portfolio’s holdings may differ significantly from the securities in the index. The index is unmanaged and therefore does not reflect the cost of portfolio management and accounting.
The S&P 500 Index is a capitalization-weighted index designed to measure performance of the broad domestic economy through changes in the aggregate market value of 500 stocks representing all major industries. The index presented herein includes the effects of reinvested dividends.
Portfolio Composition as of December 31, 2015 (1)
| % of Net Assets | ||||
Common Stocks (4) | 97.8 | |||
Money Market Funds | 2.2 | |||
|
| |||
| 100.0 | ||||
|
|
Top 10 Portfolio Holdings as of December 31, 2015 (1) (2) (3)
| % of Net Assets | ||||
1. Alphabet, Inc. Class C | 6.1 | |||
2. Lowe’s Cos., Inc. | 4.7 | |||
3. General Electric Co. | 4.0 | |||
4. MasterCard, Inc. Class A | 3.6 | |||
5. Adobe Systems, Inc. | 3.6 | |||
6. Amgen, Inc. | 3.1 | |||
7. Amazon.com, Inc | 3.1 | |||
8. Norwegian Cruise Line Holdings Ltd. | 3.0 | |||
9. Nielsen Holdings PLC | 3.0 | |||
10. Crown Castle International Corp. | 2.7 |
| (1) | Composition of Portfolio subject to change. |
| (2) | Short-term investments have been excluded from the list of Top 10 Portfolio Holdings. |
| (3) | Top 10 Portfolio Holdings is presented at an individual security level. Total investment exposure by issuer may be higher. |
| (4) | Sectors (Common Stocks): |
| % of Net Assets | ||||
Information Technology | 28.6 | |||
Consumer Discretionary | 26.8 | |||
Health Care | 14.7 | |||
Financials | 13.5 | |||
Industrials | 10.3 | |||
Materials | 3.9 | |||
|
| |||
| 97.8 | ||||
|
|
| 38 |
| Ohio National Fund, Inc. | Aggressive Growth Portfolio |
Schedule of Investments | December 31, 2015 |
| Common Stocks – 97.8% | Shares | Value | ||||||||
CONSUMER DISCRETIONARY – 26.8% |
| |||||||||
Tesla Motors, Inc. (Automobiles) | (a) | 1,758 | $ | 421,937 | ||||||
Chipotle Mexican Grill, Inc. (Hotels, Restaurants & Leisure) | (a) | 2,633 | 1,263,445 | |||||||
Norwegian Cruise Line Holdings Ltd. (Hotels, Restaurants & Leisure) | (a) | 26,646 | 1,561,456 | |||||||
Starbucks Corp. (Hotels, Restaurants & Leisure) | 18,222 | 1,093,867 | ||||||||
Amazon.com, Inc. (Internet & Catalog Retail) | (a) | 2,325 | 1,571,444 | |||||||
Ctrip.com International Ltd. – ADR (Internet & Catalog Retail) | (a) | 16,564 | 767,410 | |||||||
Priceline Group, Inc. / The (Internet & Catalog Retail) | (a) | 1,055 | 1,345,072 | |||||||
Wayfair, Inc. Class A (Internet & Catalog Retail) | (a) | 5,196 | 247,433 | |||||||
Advance Auto Parts, Inc. (Specialty Retail) | 8,546 | 1,286,258 | ||||||||
Lowe’s Cos., Inc. (Specialty Retail) | 31,447 | 2,391,230 | ||||||||
TJX Cos., Inc. / The (Specialty Retail) | 7,627 | 540,831 | ||||||||
Gildan Activewear, Inc. (Textiles, Apparel & Luxury Goods) | 45,193 | 1,284,385 | ||||||||
|
| |||||||||
| 13,774,768 | ||||||||||
|
| |||||||||
FINANCIALS – 13.5% | ||||||||||
PacWest Bancorp (Banks) | 28,639 | 1,234,341 | ||||||||
Charles Schwab Corp. / The (Capital Markets) | 20,359 | 670,422 | ||||||||
E*TRADE Financial Corp. (Capital Markets) | (a) | 46,131 | 1,367,323 | |||||||
Synchrony Financial (Consumer Finance) | (a) | 30,107 | 915,554 | |||||||
Intercontinental Exchange, Inc. (Diversified Financial Svs.) | 5,247 | 1,344,596 | ||||||||
Crown Castle International Corp. (Real Estate Investment Trusts) | 16,017 | 1,384,670 | ||||||||
|
| |||||||||
| 6,916,906 | ||||||||||
|
| |||||||||
HEALTH CARE – 14.7% | ||||||||||
Amgen, Inc. (Biotechnology) | 9,790 | 1,589,211 | ||||||||
Celgene Corp. (Biotechnology) | (a) | 10,686 | 1,279,755 | |||||||
DBV Technologies SA – ADR (Biotechnology) | (a) | 8,731 | 317,023 | |||||||
Regeneron Pharmaceuticals, Inc. (Biotechnology) | (a) | 1,972 | 1,070,540 | |||||||
Boston Scientific Corp. (Health Care Equip. & Supplies) | (a) | 63,852 | 1,177,431 | |||||||
Teleflex, Inc. (Health Care Equip. & Supplies) | 3,878 | 509,763 | ||||||||
Phibro Animal Health Corp. Class A (Pharmaceuticals) | 12,185 | 367,134 | ||||||||
Zoetis, Inc. (Pharmaceuticals) | 25,662 | 1,229,723 | ||||||||
|
| |||||||||
| 7,540,580 | ||||||||||
|
| |||||||||
| Common Stocks (Continued) | Shares | Value | ||||||||
INDUSTRIALS – 10.3% | ||||||||||
General Electric Co. (Industrial Conglomerates) | 66,255 | $ | 2,063,843 | |||||||
Nielsen Holdings PLC (Professional Svs.) | 33,265 | 1,550,149 | ||||||||
Verisk Analytics, Inc. (Professional Svs.) | (a) | 6,947 | 534,085 | |||||||
Canadian Pacific Railway Ltd. (Road & Rail) | 8,942 | 1,140,999 | ||||||||
|
| |||||||||
| 5,289,076 | ||||||||||
|
| |||||||||
INFORMATION TECHNOLOGY – 28.6% | ||||||||||
Alphabet, Inc. Class C (Internet Software & Svs.) | (a) | 4,095 | 3,107,614 | |||||||
CoStar Group, Inc. (Internet Software & Svs.) | (a) | 6,149 | 1,270,937 | |||||||
Facebook, Inc. Class A (Internet Software & Svs.) | (a) | 12,757 | 1,335,148 | |||||||
SPS Commerce, Inc. (Internet Software & Svs.) | (a) | 10,796 | 757,987 | |||||||
MasterCard, Inc. Class A (IT Svs.) | 19,153 | 1,864,736 | ||||||||
WEX, Inc. (IT Svs.) | (a) | 5,535 | 489,294 | |||||||
NXP Semiconductors NV (Semiconductors & Equip.) | (a) | 11,329 | 954,468 | |||||||
Adobe Systems, Inc. (Software) | (a) | 19,530 | 1,834,648 | |||||||
Atlassian Corp. PLC Class A (Software) | (a) | 2,207 | 66,386 | |||||||
salesforce.com, Inc. (Software) | (a) | 17,224 | 1,350,362 | |||||||
Workday, Inc. Class A (Software) | (a) | 7,579 | 603,895 | |||||||
Apple, Inc. (Tech. Hardware, Storage & Periph.) | 10,216 | 1,075,336 | ||||||||
|
| |||||||||
| 14,710,811 | ||||||||||
|
| |||||||||
MATERIALS – 3.9% | ||||||||||
Summit Materials, Inc. Class A (Construction Materials) | (a) | 30,467 | 610,564 | |||||||
Vulcan Materials Co. (Construction Materials) | 14,375 | 1,365,194 | ||||||||
|
| |||||||||
| 1,975,758 | ||||||||||
|
| |||||||||
Total Common Stocks (Cost $42,790,634) | $ | 50,207,899 | ||||||||
|
| |||||||||
| Money Market Funds – 2.7% | Shares | Value | ||||||||
Fidelity Institutional Money Market Funds | 1,387,000 | $ | 1,387,000 | |||||||
|
| |||||||||
Total Money Market Funds (Cost $1,387,000) | $ | 1,387,000 | ||||||||
|
| |||||||||
Total Investments – 100.5% (Cost $44,177,634) | (b) | $ | 51,594,899 | |||||||
Liabilities in Excess of Other Assets – (0.5)% | (243,102) | |||||||||
|
| |||||||||
Net Assets – 100.0% | $ | 51,351,797 | ||||||||
|
| |||||||||
Percentages are stated as a percent of net assets.
Abbreviations:
ADR: American Depositary Receipts
Footnotes:
| (a) | Non-income producing security. |
| (b) | Represents cost for financial reporting purposes, which may differ from cost basis for federal income tax purposes. See also Note 7 of the Notes to Financial Statements. |
The accompanying notes are an integral part of these financial statements.
| 39 |
| Ohio National Fund, Inc. | Small Cap Growth Portfolio |
Objective/Strategy
The Small Cap Growth Portfolio seeks long-term capital appreciation by investing at least 80% of its net assets in stocks of small capitalization companies.
Performance as of December 31, 2015
Average Annual Returns | ||||
One year | -0.24% | |||
Five years | 14.23% | |||
Ten years | 11.12% |
Past performance does not guarantee future results. The performance data quoted represents past performance and current returns may be lower or higher. Total return figures include change in share price and reinvestment of dividends and capital gains. The investment return and principal value will fluctuate so that an investor’s shares, when redeemed, may be worth more or less than the original cost. To obtain performance information up to the most recent month end, call toll-free 1-877-781-6392.
The Portfolio is not open to direct retail investment. Beneficial interest in shares is obtained solely by purchase of variable life insurance policies and variable annuity contracts. Actual performance results for variable annuity and variable universal life contracts will be lower due to contract charges. Consult your contract for applicable charges.
Comments
For the year ended December 31, 2015, the Small Cap Growth Portfolio returned -0.24% versus -1.38% for its benchmark, the Russell 2000 Growth Index.
We have taken a high-quality approach to investing in small-caps, and that approach paid off during year. Many of the companies in our Portfolio have predictable, recurring revenue streams. Our companies also typically generate a high return on invested capital and have demonstrated a proven ability to expand profit margins. We also put a great emphasis on identifying companies with sustainable competitive advantages that should help them gain market share and grow in a variety of market environments. Given our high-quality focus, we expect our Portfolio to produce positive results during market rallies, and to outperform the benchmark in weak or uncertain market environments, creating a smoother path to investing in small caps and a better opportunity to generate higher compounded returns over full market cycles. We saw this play out during the year, as much of our outperformance came in the final six months of 2015, when the global economic outlook was less certain.
Most of our outperformance during the year was due to stock selection. Stock selection was particularly strong in the Consumer Staples, Consumer Discretionary and Information Technology sectors. Our sector weighting also contributed to relative performance, particularly our overweight to the Information Technology sector and underweight to the Materials sector.(1)
Within the Information Technology sector, many of the companies we own have predictable or recurring revenue streams from diverse end markets outside the technology sector, and these companies were among our top-performing technology stocks this year. Blackbaud, Inc., our top contributor to performance within the sector, serves as an example. Blackbaud, Inc. provides technology solutions designed to improve fundraising for the nonprofit industry. Fundraising is clearly a critical function for that industry, and Blackbaud, Inc.’s solutions have proved an effective proposition for improving those fundraising efforts. However, many nonprofits have been slow to integrate technology into the fundraising process,
which creates a potentially large addressable market for Blackbaud, Inc. going forward. The stock has been up as the market has received more confirmation about the growth potential of the company.(1)
Within the Materials sector, we’ve avoided a number of companies whose underlying performance is tied to a commodity price, and in a year of tumbling energy and materials prices, this also helped performance.(1)
With the Consumer Discretionary sector, a slow global economy and the transition toward more online and mobile shopping has created a challenging backdrop for many companies. We’ve managed that backdrop by identifying companies whose product sales are less economically sensitive, and that are also somewhat insulated from the threat of ecommerce. Some of those companies were among our top contributors to performance.(1)
Initial public offerings (IPOs) also contributed approximately 40 basis points to the Portfolio’s return in 2015. Top IPO contributors included SolarEdge Technologies Inc., Box Inc. and Easterly Government Properties Inc.
While pleased with our relative performance during the year, we did have areas that were disappointing. Our stock selection in the Industrials sector detracted from relative results. Within the sector, we didn’t appreciate the indirect impacts a weak energy sector would have on some of our holdings. Companies with more revenue exposure to energy end markets have now reduced prices in the non-energy industries in which they compete, and this has affected several of the companies we hold. While we like the long term prospects of these companies in a more rational pricing environment, we have reduced exposure to some of these holdings.(1)
Our underweight to the Health Care sector also detracted from relative performance, though it is worth highlighting that some of our top contributors to absolute performance came from the Health Care sector.(1)
Contributors to the Portfolio’s performance included Dyax Corp., Synageva BioPharma Corp., Blackbaud, Inc., Eagle Pharmaceuticals, Inc., and Euronet Worldwide, Inc. Dyax Corp. is a biotech company focused on hereditary angioedema (“HAE”). Current treatments include both prophylactic and acute-use options. We believe that Dyax Corp. will be able to dominate the prophylactic HAE market with a new self-injectable antibody. It is our view that the company should continue to generate revenues from its acute-use treatment, Kalbitor, and finally collect royalties on a portfolio of antibody therapeutics.(1)
Synageva BioPharma Corp. is focused on the development of enzyme replacement therapies, an attractive business model, in our view. We like Synageva BioPharma Corp. for its therapy for lysosomal acid lipase deficiency (“LAL-D”), a rare, unmet disorder. This enzyme plays an important role in breaking down fatty material in the body. Infants, children and adults who suffer from LAL-D experience a range of serious health problems. The company’s novel protein expression platform has also produced four additional pipeline drugs. The company was acquired by Alexion Pharmaceuticals during the period.(1)
Blackbaud, Inc. provides software solutions to the nonprofit industry. We believe the software company has long-duration growth potential as it penetrates the not-for-profit market, which has long been underserved. We also believe the company’s software as a service business creates attractive recurring revenues.(1)
| 40 | (continued) |
| Ohio National Fund, Inc. | Small Cap Growth Portfolio (Continued) |
Eagle Pharmaceuticals, Inc. focuses on improving formulations of existing hospital administered drugs. We believe the value of the company’s product pipeline remains underappreciated, particularly the potential of a licensing agreement with Teva Pharmaceuticals for a new formulation to treat chronic lymphocytic leukemia (“CLL”) and non-Hodgkin’s lymphoma (“NHL”).(1)
Euronet Worldwide, Inc. is a global electronic payments provider. The company offers payment and transaction processing and distribution solutions to financial institutions, retailers, service providers and individual consumers. We like the company for its distinct growth platforms in money transfer, prepaid and mobile, along with its recurring revenues and growth opportunities. We believe Euronet Worldwide, Inc. also has an attractive ATM outsourcing business with market leading positions in Europe.(1)
Detractors from the Portfolio’s performance included Rexnord Corp., Wolverine World Wide, Inc., Kennametal, Inc., WESCO International, Inc., and Belden, Inc. Rexford Corp.’s products enable process and motion control, as well as water management operations. Rexnord Corp. offers gears, seals, couplings, industrial and aerospace bearings, special components, industrial chain, conveying equipment, grade specification plumbing, water treatment and waste water control products. We consider Rexnord Corp. to be a high-quality industrial firm with stable core business segments and strengthening end markets. We appreciate its historical ability to generate high incremental margins and that its products are relatively low cost but mission critical to its customers, who give the firm high ratings.(1)
Wolverine World Wide, Inc. designs, manufactures and markets a range of casual footwear and apparel, performance outdoor footwear and apparel, industrial work shoes, boots and apparel, and uniform shoes and boots. We are reviewing the stock after some management changes at the company.(1)
Kennametal, Inc. makes cutting tools used in end markets serving the energy sector. While those end markets have been weak, we believe the new management team at Kennametal, Inc. will take some appropriate steps to restructure the company.(1)
WESCO International, Inc. is a distributor of electrical and industrial maintenance, repair and operating supplies to various end markets (mainly government and construction). We sold the position to pursue the companies we felt offered better risk/reward opportunities.(1)
Belden, Inc. is a supplier of cables, connectors and networking equipment that serves industrial, broadcast and enterprise information technology end markets. We believe management will continue to focus its product portfolio toward its higher-quality connector and networking products, and away from its legacy cable products, which have less pricing power. We also expect management will create value through acquisitions to improve its product portfolio and will drive productivity improvements to boost margins and returns on invested capital. Finally, we appreciate that Belden, Inc. serves large and growing markets and should benefit longer term from the Internet of Things (IoT), or the increasing connectivity of electronic devices.(1)
Heading into 2016, we expect a modest aggregate return environment for small-cap equities. However, there are a number of factors that make us excited about the potential for active management to add value going forward. With valuations of small-cap equities near normalized levels, earnings growth will be needed to drive further stock price appreciation. A slow-growth economy will make broad earnings growth less robust, but should be favorable for our
investment process, in our view. We tend to focus on companies that have demonstrated a steady path toward earnings growth through strong pricing power or market share gains. These companies should be more appreciated by the market when broad earnings growth is harder for many businesses to achieve.
Another important point to consider about small-cap valuations is the disparity between valuations for a set of momentum-driven stocks, which are yet to generate earnings, and the rest of the market. As it stands today, the percentage of loss-making companies in our benchmark index is at its highest level in any non-recessionary period over the last twenty years. Many of these stocks are tied to popular high-growth themes such as cloud computing and biotechnology. If one strips the loss-making companies out of the index, the valuation premium of other small-cap companies relative to large caps is actually much more reasonable.
While we do not deny the exciting innovation and growth potential tied to these industries – and hold a few companies that our health care and technology teams have identified with exciting new drugs on the horizon or a disruptive business model attacking a specific industry – not every company tied to cloud computing and biotechnology will be successful. As part of our investment process, we have sought to avoid many of the companies with negative earnings in the index. We believe this strategy will prove successful over the long term, as it will prove difficult for many of these companies to generate the future earnings currently implied in their valuations. We see more opportunity in companies that have more steady business models and can continue to generate earnings growth in 2016. Many of these businesses are heading into the new year with relatively attractive valuations that offer an interesting entry point for investing. We look forward to seeing how these companies perform in the coming months.
| (1) | The Portfolio’s composition is subject to change. Holdings and weightings are as of December 31, 2015. |
Change in Value of $10,000 Investment
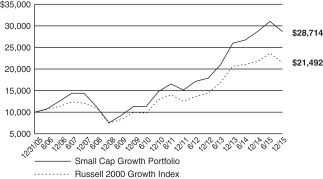
Hypothetical illustration based on past performance. Future performance will vary. The Portfolio’s returns reflect reinvested dividends. The Portfolio’s holdings may differ significantly from the securities in the index. The index is unmanaged and therefore does not reflect the cost of portfolio management and accounting.
The Russell 2000 Growth Index measures the performance of the small-cap growth segment of the U.S. equity universe. It includes the Russell 2000 Index companies with higher price-to-value ratios and higher forecasted growth values. The Russell 2000 Index includes the 2000 firms from the Russell 3000 Index with the smallest market capitalizations. The Russell 3000 Index represents 98% of the investable U.S. equity markets. The index presented herein includes the effects of reinvested dividends.
| 41 | (continued) |
| Ohio National Fund, Inc. | Small Cap Growth Portfolio (Continued) |
Portfolio Composition as of December 31, 2015 (1)
| % of Net Assets | ||||
Common Stocks (4) | 95.4 | |||
Master Limited Partnerships (4) | 1.9 | |||
Money Market Funds | 2.7 | |||
|
| |||
| 100.0 | ||||
|
|
Top 10 Portfolio Holdings as of December 31, 2015 (1) (2) (3)
| % of Net Assets | ||||
1. SS&C Technologies Holdings, Inc. | 2.5 | |||
2. Sensient Technologies Corp. | 2.1 | |||
3. Broadridge Financial Solutions, Inc. | 1.9 | |||
4. Blackbaud, Inc. | 1.9 | |||
5. ServiceMaster Global Holdings, Inc. | 1.8 | |||
6. Sally Beauty Holdings, Inc. | 1.8 | |||
7. Cadence Design Systems, Inc. | 1.8 | |||
8. NICE-Systems Ltd. – ADR | 1.7 | |||
9. Dyax Corp. | 1.6 | |||
10. Ontex Group NV | 1.6 |
| (1) | Composition of Portfolio subject to change. |
| (2) | Short-term investments have been excluded from the list of Top 10 Portfolio Holdings. |
| (3) | Top 10 Portfolio Holdings is presented at an individual security level. Total investment exposure by issuer may be higher. |
| (4) | Sectors (Common Stocks, Master Limited Partnerships): |
| % of Net Assets | ||||
Information Technology | 33.2 | |||
Health Care | 23.3 | |||
Consumer Discretionary | 13.7 | |||
Industrials | 11.6 | |||
Financials | 9.1 | |||
Consumer Staples | 2.7 | |||
Materials | 2.1 | |||
Energy | 1.6 | |||
|
| |||
| 97.3 | ||||
|
|
| 42 |
| Ohio National Fund, Inc. | Small Cap Growth Portfolio |
Schedule of Investments | December 31, 2015 |
| Common Stocks – 95.4% | Shares | Value | ||||||||
CONSUMER DISCRETIONARY – 12.8% |
| |||||||||
ServiceMaster Global Holdings, Inc. (Diversified Consumer Svs.) | (a) | 109,912 | $ | 4,312,947 | ||||||
Biglari Holdings, Inc. (Hotels, Restaurants & Leisure) | (a) | 9,449 | 3,078,673 | |||||||
Diamond Resorts International, Inc. (Hotels, Restaurants & Leisure) | (a) | 59,735 | 1,523,840 | |||||||
Domino’s Pizza Group PLC (Hotels, Restaurants & Leisure) | (b) | 117,208 | 1,816,618 | |||||||
Dunkin’ Brands Group, Inc. (Hotels, Restaurants & Leisure) | 46,408 | 1,976,517 | ||||||||
Manchester United PLC Class A (Media) | 75,977 | 1,353,150 | ||||||||
National CineMedia, Inc. (Media) | 149,546 | 2,349,368 | ||||||||
DavidsTea, Inc. (Specialty Retail) | (a) | 30,213 | 374,339 | |||||||
Monro Muffler Brake, Inc. (Specialty Retail) | 20,123 | 1,332,545 | ||||||||
Party City Holdco, Inc. (Specialty Retail) | (a) | 53,117 | 685,740 | |||||||
Sally Beauty Holdings, Inc. (Specialty Retail) | (a) | 152,944 | 4,265,608 | |||||||
Carter’s, Inc. (Textiles, Apparel & Luxury Goods) | 40,328 | 3,590,402 | ||||||||
Tumi Holdings, Inc. (Textiles, Apparel & Luxury Goods) | (a) | 93,986 | 1,562,987 | |||||||
Wolverine World Wide, Inc. (Textiles, Apparel & Luxury Goods) | 136,390 | 2,279,077 | ||||||||
|
| |||||||||
| 30,501,811 | ||||||||||
|
| |||||||||
CONSUMER STAPLES – 2.7% | ||||||||||
Britvic PLC (Beverages) | (b) | 40,633 | 435,353 | |||||||
Casey’s General Stores, Inc. (Food & Staples Retailing) | 18,333 | 2,208,210 | ||||||||
Ontex Group NV (Personal Products) | (b) | 105,993 | 3,768,618 | |||||||
|
| |||||||||
| 6,412,181 | ||||||||||
|
| |||||||||
ENERGY – 0.6% | ||||||||||
Dril-Quip, Inc. (Energy Equip. & Svs.) | (a) | 22,202 | 1,315,024 | |||||||
|
| |||||||||
FINANCIALS – 9.1% | ||||||||||
Bank of the Ozarks, Inc. (Banks) | 40,206 | 1,988,589 | ||||||||
Artisan Partners Asset Management, Inc. Class A (Capital Markets) | 43,933 | 1,584,224 | ||||||||
Financial Engines, Inc. (Capital Markets) | 37,936 | 1,277,305 | ||||||||
LPL Financial Holdings, Inc. (Capital Markets) | 79,930 | 3,409,014 | ||||||||
Pace Holdings Corp. (Capital Markets) | (a) | 84,896 | 857,450 | |||||||
WisdomTree Investments, Inc. (Capital Markets) | 104,311 | 1,635,596 | ||||||||
MSCI, Inc. (Diversified Financial Svs.) | 44,502 | 3,209,929 | ||||||||
RLI Corp. (Insurance) | 32,490 | 2,006,258 | ||||||||
Easterly Government Properties, Inc. (Real Estate Investment Trusts) | 76,645 | 1,316,761 | ||||||||
Jones Lang LaSalle, Inc. (Real Estate Mgmt. & Development) | 11,198 | 1,790,112 | ||||||||
St. Joe Co. / The (Real Estate Mgmt. & Development) | (a) | 68,635 | 1,270,434 | |||||||
LendingTree, Inc. (Thrifts & Mortgage Finance) | (a) | 15,377 | 1,372,859 | |||||||
|
| |||||||||
| 21,718,531 | ||||||||||
|
| |||||||||
HEALTH CARE – 23.3% | ||||||||||
ACADIA Pharmaceuticals, Inc. (Biotechnology) | (a) | 37,004 | 1,319,193 | |||||||
Anacor Pharmaceuticals, Inc. (Biotechnology) | (a) | 7,140 | 806,606 | |||||||
Chimerix, Inc. (Biotechnology) | (a) | 22,203 | 198,717 | |||||||
DBV Technologies SA – ADR (Biotechnology) | (a) | 37,345 | 1,355,997 | |||||||
Dyax Corp. (Biotechnology) | (a) | 103,366 | 3,888,629 | |||||||
Eagle Pharmaceuticals, Inc. (Biotechnology) | (a) | 29,812 | 2,643,430 | |||||||
Insys Therapeutics, Inc. (Biotechnology) | (a) | 55,384 | 1,585,644 | |||||||
Ironwood Pharmaceuticals, Inc. (Biotechnology) | (a) | 110,298 | 1,278,354 | |||||||
Ligand Pharmaceuticals, Inc. (Biotechnology) | (a) | 14,945 | 1,620,337 | |||||||
OvaScience, Inc. (Biotechnology) | (a) | 22,716 | 221,935 | |||||||
Puma Biotechnology, Inc. (Biotechnology) | (a) | 8,021 | 628,846 | |||||||
Atrion Corp. (Health Care Equip. & Supplies) | 956 | 364,427 | ||||||||
EndoChoice Holdings, Inc. (Health Care Equip. & Supplies) | (a) | 89,615 | 748,285 | |||||||
Endologix, Inc. (Health Care Equip. & Supplies) | (a) | 149,403 | 1,479,090 | |||||||
Globus Medical, Inc. (Health Care Equip. & Supplies) | (a) | 73,597 | 2,047,469 | |||||||
| Common Stocks (Continued) | Shares | Value | ||||||||
HEALTH CARE (continued) | ||||||||||
LDR Holding Corp. (Health Care Equip. & Supplies) | (a) | 58,569 | $ | 1,470,668 | ||||||
Masimo Corp. (Health Care Equip. & Supplies) | (a) | 32,499 | 1,349,033 | |||||||
Novadaq Technologies, Inc. (Health Care Equip. & Supplies) | (a) | 149,663 | 1,906,707 | |||||||
Quidel Corp. (Health Care Equip. & Supplies) | (a) | 71,261 | 1,510,733 | |||||||
STERIS PLC (Health Care Equip. & Supplies) | 36,125 | 2,721,658 | ||||||||
Trinity Biotech PLC – ADR (Health Care Equip. & Supplies) | 104,778 | 1,232,189 | ||||||||
Wright Medical Group NV (Health Care Equip. & Supplies) | (a) | 67,513 | 1,632,464 | |||||||
Aceto Corp. (Health Care Providers & Svs.) | 6,779 | 182,897 | ||||||||
Capital Senior Living Corp. (Health Care Providers & Svs.) | (a) | 59,086 | 1,232,534 | |||||||
ExamWorks Group, Inc. (Health Care Providers & Svs.) | (a) | 29,161 | 775,683 | |||||||
HealthEquity, Inc. (Health Care Providers & Svs.) | (a) | 59,240 | 1,485,147 | |||||||
athenahealth, Inc. (Health Care Technology) | (a) | 16,148 | 2,599,344 | |||||||
Medidata Solutions, Inc. (Health Care Technology) | (a) | 29,649 | 1,461,399 | |||||||
Bio-Techne Corp. (Life Sciences Tools & Svs.) | 23,625 | 2,126,250 | ||||||||
Catalent, Inc. (Pharmaceuticals) | (a) | 111,682 | 2,795,400 | |||||||
Flamel Technologies SA – ADR (Pharmaceuticals) | (a) | 92,620 | 1,130,890 | |||||||
GW Pharmaceuticals PLC – ADR (Pharmaceuticals) | (a) | 7,909 | 549,201 | |||||||
Pacira Pharmaceuticals, Inc. (Pharmaceuticals) | (a) | 14,564 | 1,118,370 | |||||||
Phibro Animal Health Corp. Class A (Pharmaceuticals) | 55,235 | 1,664,231 | ||||||||
POZEN, Inc. (Pharmaceuticals) | (a) | 76,323 | 521,286 | |||||||
Prestige Brands Holdings, Inc. (Pharmaceuticals) | (a) | 44,415 | 2,286,484 | |||||||
Relypsa, Inc. (Pharmaceuticals) | (a) | 46,444 | 1,316,223 | |||||||
Teligent, Inc. (Pharmaceuticals) | (a) | 122,398 | 1,089,342 | |||||||
XenoPort, Inc. (Pharmaceuticals) | (a) | 206,453 | 1,133,427 | |||||||
|
| |||||||||
| 55,478,519 | ||||||||||
|
| |||||||||
INDUSTRIALS – 11.6% | ||||||||||
HEICO Corp. Class A (Aerospace & Defense) | 66,539 | 3,273,719 | ||||||||
Sparton Corp. (Aerospace & Defense) | (a) | 38,896 | 777,531 | |||||||
A.O. Smith Corp. (Building Products) | 34,288 | 2,626,804 | ||||||||
SP Plus Corp. (Commercial Svs. & Supplies) | (a) | 66,046 | 1,578,499 | |||||||
EnerSys (Electrical Equip.) | 47,879 | 2,677,872 | ||||||||
Raven Industries, Inc. (Industrial Conglomerates) | 84,673 | 1,320,899 | ||||||||
Kennametal, Inc. (Machinery) | 101,747 | 1,953,542 | ||||||||
Nordson Corp. (Machinery) | 37,313 | 2,393,629 | ||||||||
Proto Labs, Inc. (Machinery) | (a) | 24,154 | 1,538,368 | |||||||
Rexnord Corp. (Machinery) | (a) | 154,843 | 2,805,755 | |||||||
Wabtec Corp. (Machinery) | 15,391 | 1,094,608 | ||||||||
Advisory Board Co. / The (Professional Svs.) | (a) | 45,130 | 2,238,899 | |||||||
CEB, Inc. (Professional Svs.) | 34,882 | 2,141,406 | ||||||||
Old Dominion Freight Line, Inc. (Road & Rail) | (a) | 21,574 | 1,274,376 | |||||||
|
| |||||||||
| 27,695,907 | ||||||||||
|
| |||||||||
INFORMATION TECHNOLOGY – 33.2% | ||||||||||
Belden, Inc. (Electronic Equip., Instr. & Comp.) | 56,091 | 2,674,419 | ||||||||
CTS Corp. (Electronic Equip., Instr. & Comp.) | 134,103 | 2,365,577 | ||||||||
FEI Co. (Electronic Equip., Instr. & Comp.) | 30,833 | 2,460,165 | ||||||||
National Instruments Corp. (Electronic Equip., Instr. & Comp.) | 50,265 | 1,442,103 | ||||||||
OSI Systems, Inc. (Electronic Equip., Instr. & Comp.) | (a) | 33,555 | 2,974,986 | |||||||
Alarm.com Holdings, Inc. (Internet Software & Svs.) | (a) | 44,180 | 736,922 | |||||||
ChannelAdvisor Corp. (Internet Software & Svs.) | (a) | 50,113 | 694,065 | |||||||
Cimpress NV (Internet Software & Svs.) | (a) | 18,411 | 1,493,869 | |||||||
CoStar Group, Inc. (Internet Software & Svs.) | (a) | 9,083 | 1,877,365 | |||||||
Endurance International Group Holdings, Inc. (Internet Software & Svs.) | (a) | 104,885 | 1,146,393 | |||||||
Envestnet, Inc. (Internet Software & Svs.) | (a) | 66,665 | 1,989,950 | |||||||
j2 Global, Inc. (Internet Software & Svs.) | 41,552 | 3,420,561 | ||||||||
| 43 | (continued) |
| Ohio National Fund, Inc. | Small Cap Growth Portfolio (Continued) |
Schedule of Investments | December 31, 2015 |
| Common Stocks (Continued) | Shares | Value | ||||||||
INFORMATION TECHNOLOGY (continued) | ||||||||||
Textura Corp. (Internet Software & Svs.) | (a) | 41,824 | $ | 902,562 | ||||||
Zillow Group, Inc. (Internet Software & Svs.) | (a) | 44,564 | 1,160,447 | |||||||
Blackhawk Network Holdings, Inc. (IT Svs.) | (a) | 24,089 | 1,064,975 | |||||||
Broadridge Financial Solutions, Inc. (IT Svs.) | 85,581 | 4,598,267 | ||||||||
Euronet Worldwide, Inc. (IT Svs.) | (a) | 49,942 | 3,617,299 | |||||||
MAXIMUS, Inc. (IT Svs.) | 41,733 | 2,347,481 | ||||||||
WEX, Inc. (IT Svs.) | (a) | 31,393 | 2,775,141 | |||||||
Atmel Corp. (Semiconductors & Equip.) | 332,671 | 2,864,297 | ||||||||
ON Semiconductor Corp. (Semiconductors & Equip.) | (a) | 278,651 | 2,730,780 | |||||||
SolarEdge Technologies, Inc. (Semiconductors & Equip.) | (a) | 48,715 | 1,372,302 | |||||||
ACI Worldwide, Inc. (Software) | (a) | 67,322 | 1,440,691 | |||||||
Blackbaud, Inc. (Software) | 69,044 | 4,547,238 | ||||||||
Cadence Design Systems, Inc. (Software) | (a) | 204,151 | 4,248,382 | |||||||
Fleetmatics Group PLC (Software) | (a) | 49,951 | 2,537,011 | |||||||
Guidewire Software, Inc. (Software) | (a) | 28,957 | 1,742,053 | |||||||
NICE-Systems Ltd. – ADR (Software) | 69,564 | 3,987,408 | ||||||||
Paylocity Holding Corp. (Software) | (a) | 27,155 | 1,101,135 | |||||||
RealPage, Inc. (Software) | (a) | 108,321 | 2,431,806 | |||||||
Solera Holdings, Inc. (Software) | 36,419 | 1,996,854 | ||||||||
SS&C Technologies Holdings, Inc. (Software) | 85,743 | 5,853,675 | ||||||||
Tyler Technologies, Inc. (Software) | (a) | 11,721 | 2,043,205 | |||||||
Stratasys Ltd. (Tech. Hardware, Storage & Periph.) | (a) | 23,885 | 560,820 | |||||||
|
| |||||||||
| 79,200,204 | ||||||||||
|
| |||||||||
| Common Stocks (Continued) | Shares | Value | ||||||||
MATERIALS – 2.1% | ||||||||||
Sensient Technologies Corp. (Chemicals) | 77,936 | $ | 4,895,940 | |||||||
|
| |||||||||
Total Common Stocks (Cost $209,164,551) | $ | 227,218,117 | ||||||||
|
| |||||||||
| Master Limited Partnerships – 1.9% | Shares | Value | ||||||||
CONSUMER DISCRETIONARY – 0.9% | ||||||||||
Cedar Fair LP (Hotels, Restaurants & Leisure) | 37,809 | $ | 2,111,255 | |||||||
|
| |||||||||
ENERGY – 1.0% | ||||||||||
DCP Midstream Partners LP (Oil, Gas & Consumable Fuels) | 95,422 | 2,354,061 | ||||||||
|
| |||||||||
Total Master Limited Partnerships (Cost $5,704,685) | $ | 4,465,316 | ||||||||
|
| |||||||||
| Money Market Funds – 3.8% | Shares | Value | ||||||||
Fidelity Institutional Money Market Funds | 9,074,000 | $ | 9,074,000 | |||||||
|
| |||||||||
Total Money Market Funds (Cost $9,074,000) | $ | 9,074,000 | ||||||||
|
| |||||||||
Total Investments – 101.1% (Cost $223,943,236) | (c) | $ | 240,757,433 | |||||||
Liabilities in Excess of Other Assets – (1.1)% | (2,522,427) | |||||||||
|
| |||||||||
Net Assets – 100.0% | $ | 238,235,006 | ||||||||
|
| |||||||||
Percentages are stated as a percent of net assets.
Abbreviations:
ADR: American Depositary Receipts
Footnotes:
| (a) | Non-income producing security. |
| (b) | Security traded on a foreign exchange has been valued at an estimate of fair value that is different than the local market close price. These fair value estimates are determined by an independent fair valuation service that has been approved by the Board. These securities represent $6,020,589, or 2.5% of the Portfolio’s net assets. |
Other Portfolio securities are not subjected to fair value procedures because they are traded on domestic or foreign exchanges that have close times that are consistent with the U.S. market close, normally 4:00 pm Eastern Time.
| (c) | Represents cost for financial reporting purposes, which may differ from cost basis for federal income tax purposes. See also Note 7 of the Notes to Financial Statements. |
The accompanying notes are an integral part of these financial statements.
| 44 |
| Ohio National Fund, Inc. | Mid Cap Opportunity Portfolio |
Objective/Strategy
The Mid Cap Opportunity Portfolio seeks long-term total return by investing at least 80% of its net assets in equity securities of mid-cap companies, primarily those that are strategically positioned for long-term growth.
Performance as of December 31, 2015
Average Annual Returns | ||||
One year | -5.05% | |||
Five years | 10.16% | |||
Ten years | 5.56% |
Past performance does not guarantee future results. The performance data quoted represents past performance and current returns may be lower or higher. Total return figures include change in share price and reinvestment of dividends and capital gains. The investment return and principal value will fluctuate so that an investor’s shares, when redeemed, may be worth more or less than the original cost. To obtain performance information up to the most recent month end, call toll-free 1-877-781-6392.
The Portfolio is not open to direct retail investment. Beneficial interest in shares is obtained solely by purchase of variable life insurance policies and variable annuity contracts. Actual performance results for variable annuity and variable universal life contracts will be lower due to contract charges. Consult your contract for applicable charges.
Comments
For the year ended December 31, 2015, the Mid Cap Opportunity Portfolio returned -5.05% versus -0.20% for its benchmark, the Russell Midcap Growth Index.
In 2015, the Portfolio delivered a negative absolute return and underperformed its benchmark, the Russell Midcap Growth Index. Weak stock selection in the Consumer Staples and Health Care sectors detracted from relative performance, while stock selection in the Information Technology and Financials sectors contributed to relative performance.(1)
Kate Spade & Co. was a top detractor from returns during the year. The company reported first and second quarter earnings that were disappointing overall. While revenues topped expectations in the first quarter, sales growth was light. However, toward the end of the year, the company released encouraging third quarter earnings that highlighted better than expected same store sales growth. Despite the company’s weakness in 2015, we believe its strong underlying fundamentals remain intact and the catalysts for growth are unchanged. In our view, wholesale expansion, merchandising initiatives and the company’s strategic partnership with Exclusive Brands, could potentially fuel revenue growth and support the company’s attractive valuation.(1)
PVH Corp., a global apparel company, was also a top detractor from returns during the year. The stock has been under ongoing pressure, driven by soft data points that suggested weakness in the U.S. retail environment. In our view, however, the concern is transitory and investors are overreacting to the news. We believe PVH Corp. is a leading franchise with dominant market share and strong fundamentals. In particular, established brand names Tommy Hilfiger and Calvin Klein have demonstrated international strength and have been a key source of growth. We believe PVH Corp. continues to be resilient despite macroeconomic and sector challenges. We also remain positive on the company’s long-term profile, quality of management and the stock’s return potential.(1)
Equinix, Inc. was a top contributor to returns during the year. The company has reported strong first, second and third quarter earn-
ings and, as a result, has raised guidance across key metrics for a third time. Most notably, revenue and earnings saw significant growth on a year-over-year basis. Additionally, operating leverage has returned to the business after a period of systems investment and international expansion. In our view, Equinix, Inc. continues to present an enduringly favorable outlook, as pricing has been net positive in the low churn rate environment. Going forward, we believe Equinix, Inc. can further benefit from its steady recurring revenue business model and a solid demand environment. We also feel that integration of recent acquisitions could unlock significant synergies.(1)
Netflix, Inc. was a top contributor to returns during the year. In April, the company reported first quarter earnings that exceeded market expectations on both earnings per share and key subscription metrics. The company’s second and third quarter earnings were largely in-line with market expectations and were received favorably by investors. New user additions continue to thrive due to improving content availability and increasing success of Netflix Original series offerings. In our view, sentiment around subscriber growth and pricing continues to show signs of improvement and reflects Netflix, Inc.’s ability to execute and deliver unique, high quality content. We continue to have conviction in the strength of Netflix, Inc.’s franchise and believe that the company’s international expansion initiatives and secular tailwinds will be key drivers of future growth. Given the exceptional move in the stock through the year, we took profits and exited our position as it grew beyond our market cap threshold for mid-cap companies.(1)
The Portfolio also benefitted from several Initial Public Offering (IPO) investments that provided a significant contribution to the Portfolio’s total return for the period. Positive performance resulting from the contribution of IPO investments may be difficult for the Portfolio to repeat in future periods.(1)
The Portfolio’s top performers were Netflix, Inc., Global Payment, Inc., Ulta Salon Cosmetics & Fragrance, Inc., Equinix, Inc., and Eagle Bancorp, Inc. The Portfolio’s worst performers were Bluebird Bio, Inc., Adeptus Health, Inc., Navient Corp., HMS Holdings Corp., and Kate Spade & Co. The Portfolio’s top contributors to returns were Equinix, Inc., Ulta Salon Cosmetics & Fragrance, Inc., Netflix, Inc., First Republic Bank, and Intercontinental Exchange, Inc. The Portfolio’s largest detractors from returns were Kate Spade & Co., PVH Corp., Kansas City Southern, Adeptus Health, Inc., and Navient Corp.(1)
Our overall global equity return expectations for 2016 are modest mid-single digits, in light of tepid economic growth forecasts and a dearth of outright cheap valuations. Yet, in our view, equities still look more attractive than other asset classes in a continued low-return environment. While the performance of the “FANGs” (Facebook, Amazon.com, Netflix, Google) has captured the headlines, we are more concerned with the other four hundred ninety six stocks that did not participate in the extreme growth-at-any price mentality. This phenomenon led to the narrowest trading breadth in thirty years for the S&P 500 Index. We are also well aware of the significant underperformance of value stocks, which deepened further in 2016. If history is any guide, the U.S. market could be filled with relative value opportunities.
While the lost art of active management has been tested in recent years, we remain committed to our core philosophy and process. We will maintain a long term time horizon, rather than forecast the next quarter. We will continue to favor high quality growth businesses over breathtaking concepts. We intend to invest when valuations are attractive, rather than following the trend. These core
| 45 | (continued) |
| Ohio National Fund, Inc. | Mid Cap Opportunity Portfolio (Continued) |
beliefs have guided our team over the past thirty years, and we believe they hold the answer for the next thirty.
| (1) | The Portfolio’s composition is subject to change. Holdings and weightings are as of December 31, 2015. |
Change in Value of $10,000 Investment
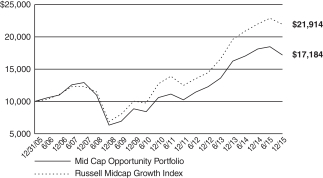
Hypothetical illustration based on past performance. Future performance will vary. The Portfolio’s returns reflect reinvested dividends. The Portfolio’s holdings may differ significantly from the securities in the index. The index is unmanaged and therefore does not reflect the cost of portfolio management and accounting.
The Russell Midcap Growth Index is a subset of the Russell Midcap Index, which measures the performance of the 800 smallest companies in the Russell 1000 Index. The Russell Midcap Growth Index measures the performance of those stocks of the Russell Midcap Index with higher price-to-book ratios and higher relative forecasted growth rates. The index presented herein includes the effects of reinvested dividends.
Portfolio Composition as of December 31, 2015 (1)
| % of Net Assets | ||||
Common Stocks (4) | 97.9 | |||
Money Market Funds | ||||
Less Net Liabilities | 2.1 | |||
|
| |||
| 100.0 | ||||
|
|
Top 10 Portfolio Holdings as of December 31, 2015 (1) (2) (3)
| % of Net Assets | ||||
1. Equinix, Inc. | 2.9 | |||
2. Ulta Salon Cosmetics & Fragrance, Inc. | 2.4 | |||
3. Panera Bread Co. Class A | 2.4 | |||
4. McCormick & Co., Inc. | 2.3 | |||
5. Intuit, Inc. | 2.3 | |||
6. Intercontinental Exchange, Inc. | 2.3 | |||
7. Tractor Supply Co. | 2.3 | |||
8. LinkedIn Corp. | 2.2 | |||
9. SBA Communications Corp. Class A | 2.2 | |||
10. Amphenol Corp. Class A | 2.1 |
| (1) | Composition of Portfolio subject to change. |
| (2) | Short-term investments have been excluded from the list of Top 10 Portfolio Holdings. |
| (3) | Top 10 Portfolio Holdings is presented at an individual security level. Total investment exposure by issuer may be higher. |
| (4) | Sectors (Common Stocks): |
| % of Net Assets | ||||
Consumer Discretionary | 23.4 | |||
Information Technology | 19.9 | |||
Health Care | 16.6 | |||
Industrials | 14.0 | |||
Financials | 9.3 | |||
Consumer Staples | 7.9 | |||
Telecommunication Services | 3.1 | |||
Materials | 3.1 | |||
Energy | 0.6 | |||
|
| |||
| 97.9 | ||||
|
|
| 46 |
| Ohio National Fund, Inc. | Mid Cap Opportunity Portfolio |
Schedule of Investments | December 31, 2015 |
| Common Stocks – 97.9% | Shares | Value | ||||||||
CONSUMER DISCRETIONARY – 23.4% | ||||||||||
BorgWarner, Inc. (Auto Components) | 29,527 | $ | 1,276,452 | |||||||
LKQ Corp. (Distributors) | (a) | 42,314 | 1,253,764 | |||||||
Hilton Worldwide Holdings, Inc. (Hotels, Restaurants & Leisure) | 43,054 | 921,356 | ||||||||
Panera Bread Co. Class A (Hotels, Restaurants & Leisure) | (a) | 9,596 | 1,869,109 | |||||||
Expedia, Inc. (Internet & Catalog Retail) | 10,218 | 1,270,097 | ||||||||
Advance Auto Parts, Inc. (Specialty Retail) | 8,810 | 1,325,993 | ||||||||
Five Below, Inc. (Specialty Retail) | (a) | 25,759 | 826,864 | |||||||
L Brands, Inc. (Specialty Retail) | 8,841 | 847,145 | ||||||||
O’Reilly Automotive, Inc. (Specialty Retail) | (a) | 1,542 | 390,774 | |||||||
Restoration Hardware Holdings, Inc. (Specialty Retail) | (a) | 11,827 | 939,655 | |||||||
Tractor Supply Co. (Specialty Retail) | 20,893 | 1,786,352 | ||||||||
Ulta Salon Cosmetics & Fragrance, Inc. (Specialty Retail) | (a) | 10,369 | 1,918,265 | |||||||
Kate Spade & Co. (Textiles, Apparel & Luxury Goods) | (a) | 69,235 | 1,230,306 | |||||||
PVH Corp. (Textiles, Apparel & Luxury Goods) | 13,705 | 1,009,373 | ||||||||
Under Armour, Inc. Class A (Textiles, Apparel & Luxury Goods) | (a) | 14,320 | 1,154,335 | |||||||
V.F. Corp. (Textiles, Apparel & Luxury Goods) | 6,394 | 398,027 | ||||||||
|
| |||||||||
| 18,417,867 | ||||||||||
|
| |||||||||
CONSUMER STAPLES – 7.9% | ||||||||||
Brown-Forman Corp. Class B (Beverages) | 11,668 | 1,158,399 | ||||||||
Whole Foods Market, Inc. (Food & Staples Retailing) | 38,044 | 1,274,474 | ||||||||
Blue Buffalo Pet Products, Inc. (Food Products) | (a) | 39,043 | 730,495 | |||||||
Hain Celestial Group, Inc. / The (Food Products) | (a) | 12,460 | 503,259 | |||||||
McCormick & Co., Inc. (Food Products) | 21,388 | 1,829,957 | ||||||||
TreeHouse Foods, Inc. (Food Products) | (a) | 9,090 | 713,201 | |||||||
|
| |||||||||
| 6,209,785 | ||||||||||
|
| |||||||||
ENERGY – 0.6% | ||||||||||
Dril-Quip, Inc. (Energy Equip. & Svs.) | (a) | 8,054 | 477,038 | |||||||
|
| |||||||||
FINANCIALS – 9.3% | ||||||||||
Eagle Bancorp, Inc. (Banks) | (a) | 13,659 | 689,370 | |||||||
First Republic Bank (Banks) | 24,761 | 1,635,712 | ||||||||
Affiliated Managers Group, Inc. (Capital Markets) | (a) | 2,202 | 351,792 | |||||||
SLM Corp. (Consumer Finance) | (a) | 89,066 | 580,710 | |||||||
Intercontinental Exchange, Inc. (Diversified Financial Svs.) | 7,056 | 1,808,171 | ||||||||
Equinix, Inc. (Real Estate Investment Trusts) | 7,427 | 2,245,925 | ||||||||
|
| |||||||||
| 7,311,680 | ||||||||||
|
| |||||||||
HEALTH CARE – 16.6% | ||||||||||
Alkermes PLC (Biotechnology) | (a) | 9,838 | 780,940 | |||||||
BioMarin Pharmaceutical, Inc. (Biotechnology) | (a) | 6,591 | 690,473 | |||||||
Cepheid (Biotechnology) | (a) | 31,393 | 1,146,786 | |||||||
Medivation, Inc. (Biotechnology) | (a) | 5,870 | 283,756 | |||||||
Vertex Pharmaceuticals, Inc. (Biotechnology) | (a) | 4,569 | 574,917 | |||||||
DexCom, Inc. (Health Care Equip. & Supplies) | (a) | 9,760 | 799,344 | |||||||
Teleflex, Inc. (Health Care Equip. & Supplies) | 6,228 | 818,671 | ||||||||
Adeptus Health, Inc. Class A (Health Care Providers & Svs.) | (a) | 16,121 | 878,917 | |||||||
Cardinal Health, Inc. (Health Care Providers & Svs.) | 10,260 | 915,910 | ||||||||
Henry Schein, Inc. (Health Care Providers & Svs.) | (a) | 9,800 | 1,550,262 | |||||||
Cerner Corp. (Health Care Technology) | (a) | 21,031 | 1,265,435 | |||||||
Agilent Technologies, Inc. (Life Sciences Tools & Svs.) | 23,267 | 972,793 | ||||||||
Mettler-Toledo International, Inc. (Life Sciences Tools & Svs.) | (a) | 2,597 | 880,721 | |||||||
| Common Stocks (Continued) | Shares | Value | ||||||||
HEALTH CARE (continued) | ||||||||||
Zoetis, Inc. (Pharmaceuticals) | 31,119 | $ | 1,491,222 | |||||||
|
| |||||||||
| 13,050,147 | ||||||||||
|
| |||||||||
INDUSTRIALS – 14.0% | ||||||||||
Fortune Brands Home & Security, Inc. (Building Products) | 22,947 | 1,273,559 | ||||||||
AMETEK, Inc. (Electrical Equip.) | 23,728 | 1,271,584 | ||||||||
Hubbell, Inc. (Electrical Equip.) | 9,259 | 935,529 | ||||||||
Sensata Technologies Holding NV (Electrical Equip.) | (a) | 35,241 | 1,623,200 | |||||||
Graco, Inc. (Machinery) | 18,523 | 1,334,953 | ||||||||
Middleby Corp. / The (Machinery) | (a) | 14,700 | 1,585,689 | |||||||
Xylem, Inc. (Machinery) | 17,228 | 628,822 | ||||||||
Kansas City Southern (Road & Rail) | 15,972 | 1,192,629 | ||||||||
W.W. Grainger, Inc. (Trading Companies & Distributors) | 5,944 | 1,204,195 | ||||||||
|
| |||||||||
| 11,050,160 | ||||||||||
|
| |||||||||
INFORMATION TECHNOLOGY – 19.9% | ||||||||||
Amphenol Corp. Class A (Electronic Equip., Instr. & Comp.) | 31,767 | 1,659,190 | ||||||||
LinkedIn Corp. (Internet Software & Svs.) | (a) | 7,700 | 1,733,116 | |||||||
Match Group, Inc. (Internet Software & Svs.) | (a) | 27,915 | 378,248 | |||||||
Twitter, Inc. (Internet Software & Svs.) | (a) | 12,424 | 287,491 | |||||||
Black Knight Financial Services, Inc. Class A (IT Svs.) | (a) | 41,316 | 1,365,907 | |||||||
Fidelity National Information Services, Inc. (IT Svs.) | 20,033 | 1,214,000 | ||||||||
FleetCor Technologies, Inc. (IT Svs.) | (a) | 8,996 | 1,285,798 | |||||||
Global Payments, Inc. (IT Svs.) | 10,155 | 655,099 | ||||||||
Sabre Corp. (IT Svs.) | 47,683 | 1,333,694 | ||||||||
Qorvo, Inc. (Semiconductors & Equip.) | (a) | 29,095 | 1,480,936 | |||||||
Intuit, Inc. (Software) | 18,932 | 1,826,938 | ||||||||
ServiceNow, Inc. (Software) | (a) | 15,957 | 1,381,238 | |||||||
Splunk, Inc. (Software) | (a) | 14,655 | 861,861 | |||||||
Pure Storage, Inc. Class A (Tech. Hardware, Storage & Periph.) | (a) | 12,200 | 189,954 | |||||||
|
| |||||||||
| 15,653,470 | ||||||||||
|
| |||||||||
MATERIALS – 3.1% | ||||||||||
Ashland, Inc. (Chemicals) | 9,422 | 967,639 | ||||||||
Axalta Coating Systems Ltd. (Chemicals) | (a) | 39,604 | 1,055,447 | |||||||
RPM International, Inc. (Chemicals) | 8,521 | 375,435 | ||||||||
|
| |||||||||
| 2,398,521 | ||||||||||
|
| |||||||||
TELECOMMUNICATION SERVICES – 3.1% | ||||||||||
Level 3 Communications, Inc. (Diversified Telecom. Svs.) | (a) | 13,876 | 754,299 | |||||||
SBA Communications Corp. Class A (Wireless Telecom. Svs.) | (a) | 16,188 | 1,700,873 | |||||||
|
| |||||||||
| 2,455,172 | ||||||||||
|
| |||||||||
Total Common Stocks (Cost $71,035,839) | $ | 77,023,840 | ||||||||
|
| |||||||||
| Money Market Funds – 2.3% | Shares | Value | ||||||||
| Fidelity Institutional Money Market Funds Money Market Portfolio – Class I | 1,847,000 | $ | 1,847,000 | |||||||
|
| |||||||||
Total Money Market Funds (Cost $1,847,000) | $ | 1,847,000 | ||||||||
|
| |||||||||
Total Investments – 100.2% (Cost $72,882,839) | (b) | $ | 78,870,840 | |||||||
Liabilities in Excess of Other Assets – (0.2)% | (167,469) | |||||||||
|
| |||||||||
Net Assets – 100.0% | $ | 78,703,371 | ||||||||
|
| |||||||||
Percentages are stated as a percent of net assets.
Footnotes:
| (a) | Non-income producing security. |
| (b) | Represents cost for financial reporting purposes, which may differ from cost basis for federal income tax purposes. See also Note 7 of the Notes to Financial Statements. |
The accompanying notes are an integral part of these financial statements.
| 47 |
| Ohio National Fund, Inc. | S&P 500® Index Portfolio |
Objective/Strategy
The S&P 500® Index Portfolio seeks total return that approximates the total return of the Standard & Poor’s 500® Index (S&P 500® Index), at a risk level consistent with that of the Standard & Poor’s 500® Index.
Performance as of December 31, 2015
Average Annual returns | ||||
One year | 0.91% | |||
Five years | 12.05% | |||
Ten years | 6.81% |
Past performance does not guarantee future results. The performance data quoted represents past performance and current returns may be lower or higher. Total return figures include change in share price and reinvestment of dividends and capital gains. The investment return and principal value will fluctuate so that an investor’s shares, when redeemed, may be worth more or less than the original cost. To obtain performance information up to the most recent month end, call toll-free 1-877-781-6392.
The Portfolio is not open to direct retail investment. Beneficial interest in shares is obtained solely by purchase of variable life insurance policies and variable annuity contracts. Actual performance results for variable annuity and variable universal life contracts will be lower due to contract charges. Consult your contract for applicable charges.
Comments
For the year ended December 31, 2015, the S&P 500® Index Portfolio returned 0.91% versus 1.38% for its benchmark, the S&P 500® Index.
The Portfolio’s correlation with the S&P 500® Index was 99.9%. The high correlation is due to the fact that the Portfolio invests in each of the 500 stocks in the index. The Portfolio also invests in the SPDR S&P ETF Trust, an exchange traded fund that mimics the holdings and returns of the S&P 500® Index.(1)
The largest contributors to the index return for 2015 were Amazon.com, Inc., Alphabet, Inc. Class A, Microsoft Corp., Alphabet, Inc. Class C and General Electric Co. The largest detractors from the index return for 2015 were Exxon Mobil Corp., Kinder Morgan, Inc., Chevron Corp., QUALCOMM, Inc., and Apple, Inc.
2015 had a few major developments that affected the equity market. One of the bigger moments of 2015 was the Federal Reserve’s decision to begin raising the Federal Funds rate off of the 0.00 to 0.25 range that had been in place since January 28, 2008. Another theme in 2015 was the continued poor performance of commodities. Oil prices continued to fall throughout the year, putting pressure on oil stocks such as Chevron Corp. and Exxon Corp. The slowing of the Chinese economy, and continued sluggish economic “growth” in the rest of the world also put pressure on stocks.
Going into 2016, the U.S. economy seems to be on solid ground, as the Federal Reserve has normalized monetary policy. Themes from 2015 will still be relevant in 2016. Chinese gross domestic product growth, oil and commodity prices, the strong U.S. dollar versus the rest of the world currencies, and the lack of any meaningful inflation (wage or otherwise) will be watched closely.
| (1) | The Portfolio’s composition is subject to change. Holdings and weightings are as of December 31, 2015. |
Change in Value of $10,000 Investment
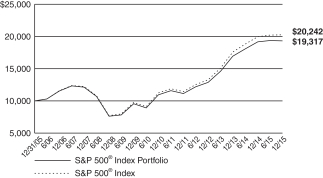
Hypothetical illustration based on past performance. Future performance will vary. The Portfolio’s returns reflect reinvested dividends. The Portfolio’s holdings may differ significantly from the securities in the index. The index is unmanaged and therefore does not reflect the cost of portfolio management and accounting. Investors cannot invest directly in an index, although they can invest in its underlying securities or funds.
The S&P 500® Index is a capitalization-weighted index designed to measure performance of the broad domestic economy through changes in the aggregate market value of 500 stocks representing all major industries. The index presented herein includes the effects of reinvested dividends.
“Standard & Poor’s®”, “S&P®”, “S&P 500®” and “Standard & Poor’s 500” are trademarks of The McGraw-Hill Companies, Inc. and have been licensed for use by Ohio National Investments, Inc. (ONI). The S&P 500® Index Portfolio is not sponsored, endorsed, sold or promoted by Standard & Poor’s (“S&P”) and S&P makes no representation regarding the advisability of investing in the S&P 500® Index Portfolio. S&P makes no representation or warranty, express or implied, to the owners of the Portfolio or any member of the public regarding the advisability of investing in securities generally or in the Portfolio particularly or the ability of the S&P 500® Index to track general stock market performance. S&P’s only relationship to ONI is the licensing of certain trademarks and trade names of S&P® and of the S&P 500® Index which is determined, composed and calculated by S&P® without regard to ONI or the S&P 500® Index Portfolio. S&P® has no obligation to take the needs of ONI or the owners of the Portfolio into consideration in determining, composing or calculating the S&P 500® Index. S&P® is not responsible for and has not participated in the determination of the prices and amount of the Portfolio or the timing of the issuance or sale of the Portfolio or in the determination or calculation of the equation by which the Portfolio is to be converted into cash. S&P® has no obligation or liability in connection with the administration, marketing or trading of the Portfolio.
| 48 | (continued) |
| Ohio National Fund, Inc. | S&P 500® Index Portfolio (Continued) |
Portfolio Composition as of December 31, 2015 (1)
| % of Net Assets | ||||
Common Stocks (4) | 95.6 | |||
Exchange Traded Funds and | 4.4 | |||
|
| |||
| 100.0 | ||||
|
|
Top 10 Portfolio Holdings as of December 31, 2015 (1) (2) (3)
| % of Net Assets | ||||
1. SPDR S&P 500 ETF Trust | 4.2 | |||
2. Apple, Inc. | 3.1 | |||
3. Microsoft Corp. | 2.4 | |||
4. Exxon Mobil Corp. | 1.7 | |||
5. General Electric Co. | 1.6 | |||
6. Johnson & Johnson | 1.5 | |||
7. Amazon.com, Inc | 1.4 | |||
8. Wells Fargo & Co. | 1.3 | |||
9. Berkshire Hathaway, Inc. Class B | 1.3 | |||
10. JPMorgan Chase & Co. | 1.3 |
| (1) | Composition of Portfolio subject to change. |
| (2) | Short-term investments have been excluded from the list of Top 10 Portfolio Holdings. |
| (3) | Top 10 Portfolio Holdings is presented at an individual security level. Total investment exposure by issuer may be higher. |
| (4) | Sectors (Common Stocks): |
| % of Net Assets | ||||
Information Technology | 19.8 | |||
Financials | 15.7 | |||
Health Care | 14.5 | |||
Consumer Discretionary | 12.4 | |||
Consumer Staples | 9.6 | |||
Industrials | 9.6 | |||
Energy | 6.2 | |||
Utilities | 2.9 | |||
Materials | 2.6 | |||
Telecommunication Services | 2.3 | |||
|
| |||
| 95.6 | ||||
|
|
| 49 |
| Ohio National Fund, Inc. | S&P 500® Index Portfolio |
Schedule of Investments | December 31, 2015 |
| Common Stocks – 95.6% | Shares | Value | ||||||||
CONSUMER DISCRETIONARY – 12.4% | ||||||||||
BorgWarner, Inc. (Auto Components) | 4,900 | $ | 211,827 | |||||||
Delphi Automotive PLC (Auto Components) | 6,100 | 522,953 | ||||||||
Goodyear Tire & Rubber Co. / The (Auto Components) | 5,900 | 192,753 | ||||||||
Johnson Controls, Inc. (Auto Components) | 14,200 | 560,758 | ||||||||
Ford Motor Co. (Automobiles) | 85,487 | 1,204,512 | ||||||||
General Motors Co. (Automobiles) | 31,100 | 1,057,711 | ||||||||
Harley-Davidson, Inc. (Automobiles) | 4,200 | 190,638 | ||||||||
Genuine Parts Co. (Distributors) | 3,300 | 283,437 | ||||||||
H&R Block, Inc. (Diversified Consumer Svs.) | 5,200 | 173,212 | ||||||||
Carnival Corp. (Hotels, Restaurants & Leisure) | 10,100 | 550,248 | ||||||||
Chipotle Mexican Grill, Inc. (Hotels, Restaurants & Leisure) | (a) | 650 | 311,902 | |||||||
Darden Restaurants, Inc. (Hotels, Restaurants & Leisure) | 2,500 | 159,100 | ||||||||
Marriott International, Inc. Class A (Hotels, Restaurants & Leisure) | 4,246 | 284,652 | ||||||||
McDonald’s Corp. (Hotels, Restaurants & Leisure) | 20,100 | 2,374,614 | ||||||||
Royal Caribbean Cruises Ltd. (Hotels, Restaurants & Leisure) | 3,800 | 384,598 | ||||||||
Starbucks Corp. (Hotels, Restaurants & Leisure) | 32,600 | 1,956,978 | ||||||||
Starwood Hotels & Resorts Worldwide, Inc. (Hotels, Restaurants & Leisure) | 3,700 | 256,336 | ||||||||
Wyndham Worldwide Corp. (Hotels, Restaurants & Leisure) | 2,560 | 185,984 | ||||||||
Wynn Resorts Ltd. (Hotels, Restaurants & Leisure) | 1,800 | 124,542 | ||||||||
Yum! Brands, Inc. (Hotels, Restaurants & Leisure) | 9,500 | 693,975 | ||||||||
D.R. Horton, Inc. (Household Durables) | 7,200 | 230,616 | ||||||||
Garmin Ltd. (Household Durables) | 2,600 | 96,642 | ||||||||
Harman International Industries, Inc. (Household Durables) | 1,600 | 150,736 | ||||||||
Leggett & Platt, Inc. (Household Durables) | 3,000 | 126,060 | ||||||||
Lennar Corp. Class A (Household Durables) | 3,900 | 190,749 | ||||||||
Mohawk Industries, Inc. (Household Durables) | (a) | 1,400 | 265,146 | |||||||
Newell Rubbermaid, Inc. (Household Durables) | 5,900 | 260,072 | ||||||||
PulteGroup, Inc. (Household Durables) | 6,950 | 123,849 | ||||||||
Whirlpool Corp. (Household Durables) | 1,755 | 257,757 | ||||||||
Amazon.com, Inc. (Internet & Catalog Retail) | (a) | 8,450 | 5,711,270 | |||||||
Expedia, Inc. (Internet & Catalog Retail) | 2,600 | 323,180 | ||||||||
Netflix, Inc. (Internet & Catalog Retail) | (a) | 9,400 | 1,075,172 | |||||||
Priceline Group, Inc. / The (Internet & Catalog Retail) | (a) | 1,100 | 1,402,445 | |||||||
TripAdvisor, Inc. (Internet & Catalog Retail) | (a) | 2,500 | 213,125 | |||||||
Hasbro, Inc. (Leisure Products) | 2,500 | 168,400 | ||||||||
Mattel, Inc. (Leisure Products) | 7,400 | 201,058 | ||||||||
Cablevision Systems Corp. Class A (Media) | 4,900 | 156,310 | ||||||||
CBS Corp. Class B (Media) | 9,550 | 450,092 | ||||||||
Comcast Corp. Class A (Media) | 53,553 | 3,021,996 | ||||||||
Discovery Communications, Inc. Class A (Media) | (a) | 3,300 | 88,044 | |||||||
Discovery Communications, Inc. Class C (Media) | (a) | 5,700 | 143,754 | |||||||
Interpublic Group of Cos., Inc. / The (Media) | 8,923 | 207,727 | ||||||||
News Corp. Class A (Media) | 8,375 | 111,890 | ||||||||
News Corp. Class B (Media) | 2,400 | 33,504 | ||||||||
Omnicom Group, Inc. (Media) | 5,300 | 400,998 | ||||||||
Scripps Networks Interactive, Inc. Class A (Media) | 2,100 | 115,941 | ||||||||
TEGNA, Inc. (Media) | 4,900 | 125,048 | ||||||||
Time Warner Cable, Inc. (Media) | 6,232 | 1,156,597 | ||||||||
Time Warner, Inc. (Media) | 17,566 | 1,135,993 | ||||||||
Twenty-First Century Fox, Inc. Class A (Media) | 25,700 | 698,012 | ||||||||
Twenty-First Century Fox, Inc. Class B (Media) | 9,500 | 258,685 | ||||||||
Viacom, Inc. Class B (Media) | 7,650 | 314,874 | ||||||||
Walt Disney Co. / The (Media) | 33,400 | 3,509,672 | ||||||||
Dollar General Corp. (Multiline Retail) | 6,400 | 459,968 | ||||||||
Dollar Tree, Inc. (Multiline Retail) | (a) | 5,121 | 395,444 | |||||||
Kohl’s Corp. (Multiline Retail) | 4,200 | 200,046 | ||||||||
Macy’s, Inc. (Multiline Retail) | 6,876 | 240,522 | ||||||||
Nordstrom, Inc. (Multiline Retail) | 3,000 | 149,430 | ||||||||
Target Corp. (Multiline Retail) | 13,500 | 980,235 | ||||||||
Advance Auto Parts, Inc. (Specialty Retail) | 1,600 | 240,816 | ||||||||
| Common Stocks (Continued) | Shares | Value | ||||||||
CONSUMER DISCRETIONARY (continued) | ||||||||||
AutoNation, Inc. (Specialty Retail) | (a) | 1,700 | $ | 101,422 | ||||||
AutoZone, Inc. (Specialty Retail) | (a) | 675 | 500,789 | |||||||
Bed Bath & Beyond, Inc. (Specialty Retail) | (a) | 3,700 | 178,525 | |||||||
Best Buy Co., Inc. (Specialty Retail) | 6,575 | 200,209 | ||||||||
CarMax, Inc. (Specialty Retail) | (a) | 4,400 | 237,468 | |||||||
GameStop Corp. Class A (Specialty Retail) | 2,300 | 64,492 | ||||||||
Gap, Inc. / The (Specialty Retail) | 5,050 | 124,735 | ||||||||
Home Depot, Inc. / The (Specialty Retail) | 27,800 | 3,676,550 | ||||||||
L Brands, Inc. (Specialty Retail) | 5,600 | 536,592 | ||||||||
Lowe’s Cos., Inc. (Specialty Retail) | 20,100 | 1,528,404 | ||||||||
O’Reilly Automotive, Inc. (Specialty Retail) | (a) | 2,200 | 557,524 | |||||||
Ross Stores, Inc. (Specialty Retail) | 8,900 | 478,909 | ||||||||
Signet Jewelers Ltd. (Specialty Retail) | 1,700 | 210,273 | ||||||||
Staples, Inc. (Specialty Retail) | 14,100 | 133,527 | ||||||||
Tiffany & Co. (Specialty Retail) | 2,400 | 183,096 | ||||||||
TJX Cos., Inc. / The (Specialty Retail) | 14,700 | 1,042,377 | ||||||||
Tractor Supply Co. (Specialty Retail) | 2,900 | 247,950 | ||||||||
Urban Outfitters, Inc. (Specialty Retail) | (a) | 1,900 | 43,225 | |||||||
Coach, Inc. (Textiles, Apparel & Luxury Goods) | 6,100 | 199,653 | ||||||||
Fossil Group, Inc. (Textiles, Apparel & Luxury Goods) | (a) | 900 | 32,904 | |||||||
Hanesbrands, Inc. (Textiles, Apparel & Luxury Goods) | 8,600 | 253,098 | ||||||||
Michael Kors Holdings Ltd. (Textiles, Apparel & Luxury Goods) | (a) | 4,000 | 160,240 | |||||||
NIKE, Inc. Class B (Textiles, Apparel & Luxury Goods) | 29,600 | 1,850,000 | ||||||||
PVH Corp. (Textiles, Apparel & Luxury Goods) | 1,800 | 132,570 | ||||||||
Ralph Lauren Corp. (Textiles, Apparel & Luxury Goods) | 1,300 | 144,924 | ||||||||
Under Armour, Inc. Class A (Textiles, Apparel & Luxury Goods) | (a) | 4,000 | 322,440 | |||||||
V.F. Corp. (Textiles, Apparel & Luxury Goods) | 7,500 | 466,875 | ||||||||
|
| |||||||||
| 50,681,376 | ||||||||||
|
| |||||||||
CONSUMER STAPLES – 9.6% | ||||||||||
Brown-Forman Corp. Class B (Beverages) | 2,275 | 225,862 | ||||||||
Coca-Cola Co. / The (Beverages) | 85,900 | 3,690,264 | ||||||||
Coca-Cola Enterprises, Inc. (Beverages) | 4,600 | 226,504 | ||||||||
Constellation Brands, Inc. Class A (Beverages) | 3,800 | 541,272 | ||||||||
Dr Pepper Snapple Group, Inc. (Beverages) | 4,100 | 382,120 | ||||||||
Molson Coors Brewing Co. Class B (Beverages) | 3,500 | 328,720 | ||||||||
Monster Beverage Corp. (Beverages) | (a) | 3,300 | 491,568 | |||||||
PepsiCo, Inc. (Beverages) | 31,947 | 3,192,144 | ||||||||
Costco Wholesale Corp. (Food & Staples Retailing) | 9,600 | 1,550,400 | ||||||||
CVS Health Corp. (Food & Staples Retailing) | 24,320 | 2,377,766 | ||||||||
Kroger Co. / The (Food & Staples Retailing) | 21,400 | 895,162 | ||||||||
Sysco Corp. (Food & Staples Retailing) | 11,500 | 471,500 | ||||||||
Walgreens Boots Alliance, Inc. (Food & Staples Retailing) | 19,100 | 1,626,461 | ||||||||
Wal-Mart Stores, Inc. (Food & Staples Retailing) | 34,400 | 2,108,720 | ||||||||
Whole Foods Market, Inc. (Food & Staples Retailing) | 7,500 | 251,250 | ||||||||
Archer-Daniels-Midland Co. (Food Products) | 13,050 | 478,674 | ||||||||
Campbell Soup Co. (Food Products) | 3,900 | 204,945 | ||||||||
ConAgra Foods, Inc. (Food Products) | 9,500 | 400,520 | ||||||||
General Mills, Inc. (Food Products) | 13,100 | 755,346 | ||||||||
Hershey Co. / The (Food Products) | 3,200 | 285,664 | ||||||||
Hormel Foods Corp. (Food Products) | 3,000 | 237,240 | ||||||||
J.M. Smucker Co. / The (Food Products) | 2,600 | 320,684 | ||||||||
Kellogg Co. (Food Products) | 5,600 | 404,712 | ||||||||
Keurig Green Mountain, Inc. (Food Products) | 2,500 | 224,950 | ||||||||
Kraft Heinz Co. / The (Food Products) | 13,025 | 947,699 | ||||||||
McCormick & Co., Inc. (Food Products) | 2,600 | 222,456 | ||||||||
Mead Johnson Nutrition Co. (Food Products) | 4,351 | 343,511 | ||||||||
Mondelez International, Inc. Class A (Food Products) | 34,876 | 1,563,840 | ||||||||
Tyson Foods, Inc. Class A (Food Products) | 6,500 | 346,645 | ||||||||
Church & Dwight Co., Inc. (Household Products) | 2,800 | 237,664 | ||||||||
Clorox Co. / The (Household Products) | 2,800 | 355,124 | ||||||||
| 50 | (continued) |
| Ohio National Fund, Inc. | S&P 500® Index Portfolio (Continued) |
Schedule of Investments | December 31, 2015 |
| Common Stocks (Continued) | Shares | Value | ||||||||
CONSUMER STAPLES (continued) | ||||||||||
Colgate-Palmolive Co. (Household Products) | 19,700 | $ | 1,312,414 | |||||||
Kimberly-Clark Corp. (Household Products) | 8,000 | 1,018,400 | ||||||||
Procter & Gamble Co. / The (Household Products) | 59,722 | 4,742,524 | ||||||||
Estee Lauder Cos., Inc. / The Class A (Personal Products) | 4,900 | 431,494 | ||||||||
Altria Group, Inc. (Tobacco) | 43,000 | 2,503,030 | ||||||||
Philip Morris International, Inc. (Tobacco) | 34,000 | 2,988,940 | ||||||||
Reynolds American, Inc. (Tobacco) | 18,174 | 838,730 | ||||||||
|
| |||||||||
| 39,524,919 | ||||||||||
|
| |||||||||
ENERGY – 6.2% | ||||||||||
Baker Hughes, Inc. (Energy Equip. & Svs.) | 9,541 | 440,317 | ||||||||
Cameron International Corp. (Energy Equip. & Svs.) | (a) | 4,200 | 265,440 | |||||||
Diamond Offshore Drilling, Inc. (Energy Equip. & Svs.) | 1,400 | 29,540 | ||||||||
Ensco PLC Class A (Energy Equip. & Svs.) | 5,200 | 80,028 | ||||||||
FMC Technologies, Inc. (Energy Equip. & Svs.) | (a) | 5,000 | 145,050 | |||||||
Halliburton Co. (Energy Equip. & Svs.) | 18,800 | 639,952 | ||||||||
Helmerich & Payne, Inc. (Energy Equip. & Svs.) | 2,400 | 128,520 | ||||||||
National Oilwell Varco, Inc. (Energy Equip. & Svs.) | 8,200 | 274,618 | ||||||||
Schlumberger Ltd. (Energy Equip. & Svs.) | 27,647 | 1,928,378 | ||||||||
Transocean Ltd. (Energy Equip. & Svs.) | 7,500 | 92,850 | ||||||||
Anadarko Petroleum Corp. (Oil, Gas & Consumable Fuels) | 11,100 | 539,238 | ||||||||
Apache Corp. (Oil, Gas & Consumable Fuels) | 8,272 | 367,856 | ||||||||
Cabot Oil & Gas Corp. (Oil, Gas & Consumable Fuels) | 9,100 | 160,979 | ||||||||
Chesapeake Energy Corp. (Oil, Gas & Consumable Fuels) | 11,400 | 51,300 | ||||||||
Chevron Corp. (Oil, Gas & Consumable Fuels) | 41,238 | 3,709,770 | ||||||||
Cimarex Energy Co. (Oil, Gas & Consumable Fuels) | 2,100 | 187,698 | ||||||||
Columbia Pipeline Group, Inc. (Oil, Gas & Consumable Fuels) | 8,500 | 170,000 | ||||||||
ConocoPhillips (Oil, Gas & Consumable Fuels) | 27,100 | 1,265,299 | ||||||||
CONSOL Energy, Inc. (Oil, Gas & Consumable Fuels) | 5,000 | 39,500 | ||||||||
Devon Energy Corp. (Oil, Gas & Consumable Fuels) | 8,500 | 272,000 | ||||||||
EOG Resources, Inc. (Oil, Gas & Consumable Fuels) | 12,100 | 856,559 | ||||||||
EQT Corp. (Oil, Gas & Consumable Fuels) | 3,300 | 172,029 | ||||||||
Exxon Mobil Corp. (Oil, Gas & Consumable Fuels) | 91,264 | 7,114,029 | ||||||||
Hess Corp. (Oil, Gas & Consumable Fuels) | 5,300 | 256,944 | ||||||||
Kinder Morgan, Inc. (Oil, Gas & Consumable Fuels) | 40,173 | 599,381 | ||||||||
Marathon Oil Corp. (Oil, Gas & Consumable Fuels) | 14,820 | 186,584 | ||||||||
Marathon Petroleum Corp. (Oil, Gas & Consumable Fuels) | 11,720 | 607,565 | ||||||||
Murphy Oil Corp. (Oil, Gas & Consumable Fuels) | 3,500 | 78,575 | ||||||||
Newfield Exploration Co. (Oil, Gas & Consumable Fuels) | (a) | 3,500 | 113,960 | |||||||
Noble Energy, Inc. (Oil, Gas & Consumable Fuels) | 9,300 | 306,249 | ||||||||
Occidental Petroleum Corp. (Oil, Gas & Consumable Fuels) | 16,800 | 1,135,848 | ||||||||
ONEOK, Inc. (Oil, Gas & Consumable Fuels) | 4,600 | 113,436 | ||||||||
Phillips 66 (Oil, Gas & Consumable Fuels) | 10,450 | 854,810 | ||||||||
Pioneer Natural Resources Co. (Oil, Gas & Consumable Fuels) | 3,300 | 413,754 | ||||||||
Range Resources Corp. (Oil, Gas & Consumable Fuels) | 3,700 | 91,057 | ||||||||
Southwestern Energy Co. (Oil, Gas & Consumable Fuels) | (a) | 8,400 | 59,724 | |||||||
Spectra Energy Corp. (Oil, Gas & Consumable Fuels) | 14,718 | 352,349 | ||||||||
Tesoro Corp. (Oil, Gas & Consumable Fuels) | 2,600 | 273,962 | ||||||||
Valero Energy Corp. (Oil, Gas & Consumable Fuels) | 10,600 | 749,526 | ||||||||
Williams Cos., Inc. / The (Oil, Gas & Consumable Fuels) | 15,000 | 385,500 | ||||||||
|
| |||||||||
| 25,510,174 | ||||||||||
|
| |||||||||
FINANCIALS – 15.7% | ||||||||||
Bank of America Corp. (Banks) | 228,427 | 3,844,426 | ||||||||
BB&T Corp. (Banks) | 17,100 | 646,551 | ||||||||
| Common Stocks (Continued) | Shares | Value | ||||||||
FINANCIALS (continued) | ||||||||||
Citigroup, Inc. (Banks) | 65,336 | $ | 3,381,138 | |||||||
Comerica, Inc. (Banks) | 3,900 | 163,137 | ||||||||
Fifth Third Bancorp (Banks) | 17,450 | 350,745 | ||||||||
Huntington Bancshares, Inc. (Banks) | 17,500 | 193,550 | ||||||||
JPMorgan Chase & Co. (Banks) | 80,743 | 5,331,460 | ||||||||
KeyCorp (Banks) | 18,300 | 241,377 | ||||||||
M&T Bank Corp. (Banks) | 3,500 | 424,130 | ||||||||
People’s United Financial, Inc. (Banks) | 6,800 | 109,820 | ||||||||
PNC Financial Services Group, Inc. / The (Banks) | 11,142 | 1,061,944 | ||||||||
Regions Financial Corp. (Banks) | 28,675 | 275,280 | ||||||||
SunTrust Banks, Inc. (Banks) | 11,200 | 479,808 | ||||||||
U.S. Bancorp (Banks) | 36,090 | 1,539,960 | ||||||||
Wells Fargo & Co. (Banks) | 101,913 | 5,539,991 | ||||||||
Zions Bancorporation (Banks) | 4,500 | 122,850 | ||||||||
Affiliated Managers Group, Inc. (Capital Markets) | (a) | 1,200 | 191,712 | |||||||
Ameriprise Financial, Inc. (Capital Markets) | 3,780 | 402,268 | ||||||||
Bank of New York Mellon Corp. / The (Capital Markets) | 24,011 | 989,733 | ||||||||
BlackRock, Inc. (Capital Markets) | 2,800 | 953,456 | ||||||||
Charles Schwab Corp. / The (Capital Markets) | 26,300 | 866,059 | ||||||||
E*TRADE Financial Corp. (Capital Markets) | (a) | 6,390 | 189,400 | |||||||
Franklin Resources, Inc. (Capital Markets) | 8,300 | 305,606 | ||||||||
Goldman Sachs Group, Inc. / The (Capital Markets) | 8,750 | 1,577,012 | ||||||||
Invesco Ltd. (Capital Markets) | 9,300 | 311,364 | ||||||||
Legg Mason, Inc. (Capital Markets) | 2,400 | 94,152 | ||||||||
Morgan Stanley (Capital Markets) | 33,100 | 1,052,911 | ||||||||
Northern Trust Corp. (Capital Markets) | 4,800 | 346,032 | ||||||||
State Street Corp. (Capital Markets) | 8,900 | 590,604 | ||||||||
T. Rowe Price Group, Inc. (Capital Markets) | 5,500 | 393,195 | ||||||||
American Express Co. (Consumer Finance) | 18,400 | 1,279,720 | ||||||||
Capital One Financial Corp. (Consumer Finance) | 11,673 | 842,557 | ||||||||
Discover Financial Services (Consumer Finance) | 9,350 | 501,347 | ||||||||
Navient Corp. (Consumer Finance) | 7,900 | 90,455 | ||||||||
Synchrony Financial (Consumer Finance) | (a) | 18,300 | 556,503 | |||||||
Berkshire Hathaway, Inc. Class B (Diversified Financial Svs.) | (a) | 41,091 | 5,425,656 | |||||||
CME Group, Inc. (Diversified Financial Svs.) | 7,375 | 668,175 | ||||||||
Intercontinental Exchange, Inc. (Diversified Financial Svs.) | 2,432 | 623,224 | ||||||||
Leucadia National Corp. (Diversified Financial Svs.) | 7,300 | 126,947 | ||||||||
McGraw Hill Financial, Inc. (Diversified Financial Svs.) | 5,900 | 581,622 | ||||||||
Moody’s Corp. (Diversified Financial Svs.) | 3,800 | 381,292 | ||||||||
Nasdaq, Inc. (Diversified Financial Svs.) | 2,500 | 145,425 | ||||||||
ACE Ltd. (Insurance) | 7,100 | 829,635 | ||||||||
Aflac, Inc. (Insurance) | 9,400 | 563,060 | ||||||||
Allstate Corp. / The (Insurance) | 8,500 | 527,765 | ||||||||
American International Group, Inc. (Insurance) | 27,095 | 1,679,077 | ||||||||
Aon PLC (Insurance) | 6,000 | 553,260 | ||||||||
Assurant, Inc. (Insurance) | 1,400 | 112,756 | ||||||||
Chubb Corp. / The (Insurance) | 5,000 | 663,200 | ||||||||
Cincinnati Financial Corp. (Insurance) | 3,266 | 193,249 | ||||||||
Hartford Financial Services Group, Inc. / The (Insurance) | 9,000 | 391,140 | ||||||||
Lincoln National Corp. (Insurance) | 5,386 | 270,700 | ||||||||
Loews Corp. (Insurance) | 6,161 | 236,582 | ||||||||
Marsh & McLennan Cos., Inc. (Insurance) | 11,400 | 632,130 | ||||||||
MetLife, Inc. (Insurance) | 24,400 | �� | 1,176,324 | |||||||
Principal Financial Group, Inc. (Insurance) | 6,000 | 269,880 | ||||||||
Progressive Corp. / The (Insurance) | 12,800 | 407,040 | ||||||||
Prudential Financial, Inc. (Insurance) | 9,800 | 797,818 | ||||||||
Torchmark Corp. (Insurance) | 2,475 | 141,471 | ||||||||
Travelers Cos., Inc. / The (Insurance) | 6,659 | 751,535 | ||||||||
Unum Group (Insurance) | 5,300 | 176,437 | ||||||||
XL Group PLC (Insurance) | 6,500 | 254,670 | ||||||||
American Tower Corp. (Real Estate Investment Trusts) | 9,300 | 901,635 | ||||||||
Apartment Investment & Management Co. Class A (Real Estate Investment Trusts) | 3,473 | 139,024 | ||||||||
| 51 | (continued) |
| Ohio National Fund, Inc. | S&P 500® Index Portfolio (Continued) |
Schedule of Investments | December 31, 2015 |
| Common Stocks (Continued) | Shares | Value | ||||||||
FINANCIALS (continued) | ||||||||||
AvalonBay Communities, Inc. (Real Estate Investment Trusts) | 3,031 | $ | 558,098 | |||||||
Boston Properties, Inc. (Real Estate Investment Trusts) | 3,400 | 433,636 | ||||||||
Crown Castle International Corp. (Real Estate Investment Trusts) | 7,300 | 631,085 | ||||||||
Equinix, Inc. (Real Estate Investment Trusts) | 1,344 | 406,426 | ||||||||
Equity Residential (Real Estate Investment Trusts) | 8,000 | 652,720 | ||||||||
Essex Property Trust, Inc. (Real Estate Investment Trusts) | 1,400 | 335,174 | ||||||||
General Growth Properties, Inc. (Real Estate Investment Trusts) | 12,800 | 348,288 | ||||||||
HCP, Inc. (Real Estate Investment Trusts) | 10,200 | 390,048 | ||||||||
Host Hotels & Resorts, Inc. (Real Estate Investment Trusts) | 16,502 | 253,141 | ||||||||
Iron Mountain, Inc. (Real Estate Investment Trusts) | 4,228 | 114,198 | ||||||||
Kimco Realty Corp. (Real Estate Investment Trusts) | 9,100 | 240,786 | ||||||||
Macerich Co. / The (Real Estate Investment Trusts) | 3,000 | 242,070 | ||||||||
Plum Creek Timber Co., Inc. (Real Estate Investment Trusts) | 3,800 | 181,336 | ||||||||
Prologis, Inc. (Real Estate Investment Trusts) | 11,539 | 495,254 | ||||||||
Public Storage (Real Estate Investment Trusts) | 3,200 | 792,640 | ||||||||
Realty Income Corp. (Real Estate Investment Trusts) | 5,500 | 283,965 | ||||||||
Simon Property Group, Inc. (Real Estate Investment Trusts) | 6,762 | 1,314,803 | ||||||||
SL Green Realty Corp. (Real Estate Investment Trusts) | �� | 2,200 | 248,556 | |||||||
Ventas, Inc. (Real Estate Investment Trusts) | 7,300 | 411,939 | ||||||||
Vornado Realty Trust (Real Estate Investment Trusts) | 3,893 | 389,144 | ||||||||
Welltower, Inc. (Real Estate Investment Trusts) | 7,800 | 530,634 | ||||||||
Weyerhaeuser Co. (Real Estate Investment Trusts) | 11,163 | 334,667 | ||||||||
CBRE Group, Inc. (Real Estate Mgmt. & Development) | (a) | 6,400 | 221,312 | |||||||
|
| |||||||||
| 64,670,902 | ||||||||||
|
| |||||||||
HEALTH CARE – 14.5% | ||||||||||
AbbVie, Inc. (Biotechnology) | 35,900 | 2,126,716 | ||||||||
Alexion Pharmaceuticals, Inc. (Biotechnology) | (a) | 4,900 | 934,675 | |||||||
Amgen, Inc. (Biotechnology) | 16,506 | 2,679,419 | ||||||||
Baxalta, Inc. (Biotechnology) | 11,900 | 464,457 | ||||||||
Biogen, Inc. (Biotechnology) | (a) | 4,845 | 1,484,266 | |||||||
Celgene Corp. (Biotechnology) | (a) | 17,200 | 2,059,872 | |||||||
Gilead Sciences, Inc. (Biotechnology) | 31,600 | 3,197,604 | ||||||||
Regeneron Pharmaceuticals, Inc. (Biotechnology) | (a) | 1,700 | 922,879 | |||||||
Vertex Pharmaceuticals, Inc. (Biotechnology) | (a) | 5,400 | 679,482 | |||||||
Abbott Laboratories (Health Care Equip. & Supplies) | 32,700 | 1,468,557 | ||||||||
Baxter International, Inc. (Health Care Equip. & Supplies) | 12,000 | 457,800 | ||||||||
Becton Dickinson and Co. (Health Care Equip. & Supplies) | 4,637 | 714,515 | ||||||||
Boston Scientific Corp. (Health Care Equip. & Supplies) | (a) | 29,503 | 544,035 | |||||||
C.R. Bard, Inc. (Health Care Equip. & Supplies) | 1,600 | 303,104 | ||||||||
DENTSPLY International, Inc. (Health Care Equip. & Supplies) | 3,100 | 188,635 | ||||||||
Edwards Lifesciences Corp. (Health Care Equip. & Supplies) | (a) | 4,700 | 371,206 | |||||||
Intuitive Surgical, Inc. (Health Care Equip. & Supplies) | (a) | 825 | 450,582 | |||||||
Medtronic PLC (Health Care Equip. & Supplies) | 30,890 | 2,376,059 | ||||||||
St. Jude Medical, Inc. (Health Care Equip. & Supplies) | 6,200 | 382,974 | ||||||||
Stryker Corp. (Health Care Equip. & Supplies) | 6,900 | 641,286 | ||||||||
Varian Medical Systems, Inc. (Health Care Equip. & Supplies) | (a) | 2,100 | 169,680 | |||||||
Zimmer Biomet Holdings, Inc. (Health Care Equip. & Supplies) | 3,770 | 386,764 | ||||||||
| Common Stocks (Continued) | Shares | Value | ||||||||
HEALTH CARE (continued) | ||||||||||
Aetna, Inc. (Health Care Providers & Svs.) | 7,654 | $ | 827,550 | |||||||
AmerisourceBergen Corp. (Health Care Providers & Svs.) | 4,300 | 445,953 | ||||||||
Anthem, Inc. (Health Care Providers & Svs.) | 5,700 | 794,808 | ||||||||
Cardinal Health, Inc. (Health Care Providers & Svs.) | 7,200 | 642,744 | ||||||||
Cigna Corp. (Health Care Providers & Svs.) | 5,700 | 834,081 | ||||||||
DaVita HealthCare Partners, Inc. (Health Care Providers & Svs.) | (a) | 3,700 | 257,927 | |||||||
Express Scripts Holding Co. (Health Care Providers & Svs.) | (a) | 14,878 | 1,300,486 | |||||||
HCA Holdings, Inc. (Health Care Providers & Svs.) | (a) | 6,900 | 466,647 | |||||||
Henry Schein, Inc. (Health Care Providers & Svs.) | (a) | 1,800 | 284,742 | |||||||
Humana, Inc. (Health Care Providers & Svs.) | 3,300 | 589,083 | ||||||||
Laboratory Corp. of America Holdings (Health Care Providers & Svs.) | (a) | 2,200 | 272,008 | |||||||
McKesson Corp. (Health Care Providers & Svs.) | 5,000 | 986,150 | ||||||||
Patterson Cos., Inc. (Health Care Providers & Svs.) | 1,800 | 81,378 | ||||||||
Quest Diagnostics, Inc. (Health Care Providers & Svs.) | 3,100 | 220,534 | ||||||||
Tenet Healthcare Corp. (Health Care Providers & Svs.) | (a) | 2,212 | 67,024 | |||||||
UnitedHealth Group, Inc. (Health Care Providers & Svs.) | 20,900 | 2,458,676 | ||||||||
Universal Health Services, Inc. Class B (Health Care Providers & Svs.) | 2,000 | 238,980 | ||||||||
Cerner Corp. (Health Care Technology) | (a) | 6,700 | 403,139 | |||||||
Agilent Technologies, Inc. (Life Sciences Tools & Svs.) | 7,300 | 305,213 | ||||||||
Illumina, Inc. (Life Sciences Tools & Svs.) | (a) | 3,200 | 614,224 | |||||||
PerkinElmer, Inc. (Life Sciences Tools & Svs.) | 2,500 | 133,925 | ||||||||
Thermo Fisher Scientific, Inc. (Life Sciences Tools & Svs.) | 8,800 | 1,248,280 | ||||||||
Waters Corp. (Life Sciences Tools & Svs.) | (a) | 1,800 | 242,244 | |||||||
Allergan PLC (Pharmaceuticals) | (a) | 8,640 | 2,700,000 | |||||||
Bristol-Myers Squibb Co. (Pharmaceuticals) | 36,569 | 2,515,582 | ||||||||
Eli Lilly & Co. (Pharmaceuticals) | 21,400 | 1,803,164 | ||||||||
Endo International PLC (Pharmaceuticals) | (a) | 4,600 | 281,612 | |||||||
Johnson & Johnson (Pharmaceuticals) | 60,700 | 6,235,104 | ||||||||
Mallinckrodt PLC (Pharmaceuticals) | (a) | 2,500 | 186,575 | |||||||
Merck & Co., Inc. (Pharmaceuticals) | 61,294 | 3,237,549 | ||||||||
Mylan NV (Pharmaceuticals) | (a) | 9,100 | 492,037 | |||||||
Perrigo Co. PLC (Pharmaceuticals) | 3,200 | 463,040 | ||||||||
Pfizer, Inc. (Pharmaceuticals) | 135,410 | 4,371,035 | ||||||||
Zoetis, Inc. (Pharmaceuticals) | 10,000 | 479,200 | ||||||||
|
| |||||||||
| 59,485,261 | ||||||||||
|
| |||||||||
INDUSTRIALS – 9.6% | ||||||||||
Boeing Co. / The (Aerospace & Defense) | 13,800 | 1,995,342 | ||||||||
General Dynamics Corp. (Aerospace & Defense) | 6,500 | 892,840 | ||||||||
Honeywell International, Inc. (Aerospace & Defense) | 16,900 | 1,750,333 | ||||||||
L-3 Communications Holdings, Inc. (Aerospace & Defense) | 1,700 | 203,167 | ||||||||
Lockheed Martin Corp. (Aerospace & Defense) | 5,800 | 1,259,470 | ||||||||
Northrop Grumman Corp. (Aerospace & Defense) | 4,000 | 755,240 | ||||||||
Precision Castparts Corp. (Aerospace & Defense) | 3,000 | 696,030 | ||||||||
Raytheon Co. (Aerospace & Defense) | 6,600 | 821,898 | ||||||||
Rockwell Collins, Inc. (Aerospace & Defense) | 2,900 | 267,670 | ||||||||
Textron, Inc. (Aerospace & Defense) | 6,000 | 252,060 | ||||||||
United Technologies Corp. (Aerospace & Defense) | 18,100 | 1,738,867 | ||||||||
C.H. Robinson Worldwide, Inc. (Air Freight & Logistics) | 3,200 | 198,464 | ||||||||
Expeditors International of Washington, Inc. (Air Freight & Logistics) | 4,100 | 184,910 | ||||||||
FedEx Corp. (Air Freight & Logistics) | 5,800 | 864,142 | ||||||||
United Parcel Service, Inc. Class B (Air Freight & Logistics) | 15,300 | 1,472,319 | ||||||||
American Airlines Group, Inc. (Airlines) | 13,800 | 584,430 | ||||||||
Delta Air Lines, Inc. (Airlines) | 17,300 | 876,937 | ||||||||
Southwest Airlines Co. (Airlines) | 14,300 | 615,758 | ||||||||
| 52 | (continued) |
| Ohio National Fund, Inc. | S&P 500® Index Portfolio (Continued) |
Schedule of Investments | December 31, 2015 |
| Common Stocks (Continued) | Shares | Value | ||||||||
INDUSTRIALS (continued) | ||||||||||
United Continental Holdings, Inc. (Airlines) | (a) | 8,200 | $ | 469,860 | ||||||
Allegion PLC (Building Products) | 2,100 | 138,432 | ||||||||
Masco Corp. (Building Products) | 7,400 | 209,420 | ||||||||
ADT Corp. / The (Commercial Svs. & Supplies) | 3,650 | 120,377 | ||||||||
Cintas Corp. (Commercial Svs. & Supplies) | 1,900 | 172,995 | ||||||||
Pitney Bowes, Inc. (Commercial Svs. & Supplies) | 4,300 | 88,795 | ||||||||
Republic Services, Inc. (Commercial Svs. & Supplies) | 5,280 | 232,267 | ||||||||
Stericycle, Inc. (Commercial Svs. & Supplies) | (a) | 1,900 | 229,140 | |||||||
Tyco International PLC (Commercial Svs. & Supplies) | 9,300 | 296,577 | ||||||||
Waste Management, Inc. (Commercial Svs. & Supplies) | 9,100 | 485,667 | ||||||||
Fluor Corp. (Construction & Engineering) | 3,100 | 146,382 | ||||||||
Jacobs Engineering Group, Inc. (Construction & Engineering) | (a) | 2,700 | 113,265 | |||||||
Quanta Services, Inc. (Construction & Engineering) | (a) | 3,500 | 70,875 | |||||||
AMETEK, Inc. (Electrical Equip.) | 5,200 | 278,668 | ||||||||
Eaton Corp. PLC (Electrical Equip.) | 10,136 | 527,477 | ||||||||
Emerson Electric Co. (Electrical Equip.) | 14,400 | 688,752 | ||||||||
Rockwell Automation, Inc. (Electrical Equip.) | 2,900 | 297,569 | ||||||||
3M Co. (Industrial Conglomerates) | 13,500 | 2,033,640 | ||||||||
Danaher Corp. (Industrial Conglomerates) | 13,100 | 1,216,728 | ||||||||
General Electric Co. (Industrial Conglomerates) | 207,000 | 6,448,050 | ||||||||
Roper Technologies, Inc. (Industrial Conglomerates) | 2,200 | 417,538 | ||||||||
Caterpillar, Inc. (Machinery) | 12,800 | 869,888 | ||||||||
Cummins, Inc. (Machinery) | 3,600 | 316,836 | ||||||||
Deere & Co. (Machinery) | 6,800 | 518,636 | ||||||||
Dover Corp. (Machinery) | 3,400 | 208,454 | ||||||||
Flowserve Corp. (Machinery) | 2,900 | 122,032 | ||||||||
Illinois Tool Works, Inc. (Machinery) | 7,200 | 667,296 | ||||||||
Ingersoll-Rand PLC (Machinery) | 5,700 | 315,153 | ||||||||
PACCAR, Inc. (Machinery) | 7,712 | 365,549 | ||||||||
Parker-Hannifin Corp. (Machinery) | 3,000 | 290,940 | ||||||||
Pentair PLC (Machinery) | 4,003 | 198,269 | ||||||||
Snap-on, Inc. (Machinery) | 1,300 | 222,859 | ||||||||
Stanley Black & Decker, Inc. (Machinery) | 3,247 | 346,552 | ||||||||
Xylem, Inc. (Machinery) | 3,900 | 142,350 | ||||||||
Dun & Bradstreet Corp. / The (Professional Svs.) | 800 | 83,144 | ||||||||
Equifax, Inc. (Professional Svs.) | 2,600 | 289,562 | ||||||||
Nielsen Holdings PLC (Professional Svs.) | 8,000 | 372,800 | ||||||||
Robert Half International, Inc. (Professional Svs.) | 2,900 | 136,706 | ||||||||
Verisk Analytics, Inc. (Professional Svs.) | (a) | 3,400 | 261,392 | |||||||
CSX Corp. (Road & Rail) | 21,400 | 555,330 | ||||||||
J.B. Hunt Transport Services, Inc. (Road & Rail) | 2,000 | 146,720 | ||||||||
Kansas City Southern (Road & Rail) | 2,400 | 179,208 | ||||||||
Norfolk Southern Corp. (Road & Rail) | 6,500 | 549,835 | ||||||||
Ryder System, Inc. (Road & Rail) | 1,200 | 68,196 | ||||||||
Union Pacific Corp. (Road & Rail) | 18,700 | 1,462,340 | ||||||||
Fastenal Co. (Trading Companies & Distributors) | 6,400 | 261,248 | ||||||||
United Rentals, Inc. (Trading Companies & Distributors) | (a) | 2,000 | 145,080 | |||||||
W.W. Grainger, Inc. (Trading Companies & Distributors) | 1,300 | 263,367 | ||||||||
|
| |||||||||
| 39,472,093 | ||||||||||
|
| |||||||||
INFORMATION TECHNOLOGY – 19.8% | ||||||||||
Cisco Systems, Inc. (Communications Equip.) | 111,300 | 3,022,352 | ||||||||
F5 Networks, Inc. (Communications Equip.) | (a) | 1,500 | 145,440 | |||||||
Harris Corp. (Communications Equip.) | 2,700 | 234,630 | ||||||||
Juniper Networks, Inc. (Communications Equip.) | 7,800 | 215,280 | ||||||||
Motorola Solutions, Inc. (Communications Equip.) | 3,514 | 240,533 | ||||||||
QUALCOMM, Inc. (Communications Equip.) | 33,000 | 1,649,505 | ||||||||
Amphenol Corp. Class A (Electronic Equip., Instr. & Comp.) | 6,800 | 355,164 | ||||||||
Corning, Inc. (Electronic Equip., Instr. & Comp.) | 25,900 | 473,452 | ||||||||
FLIR Systems, Inc. (Electronic Equip., Instr. & Comp.) | 3,000 | 84,210 | ||||||||
| Common Stocks (Continued) | Shares | Value | ||||||||
INFORMATION TECHNOLOGY (continued) | ||||||||||
TE Connectivity Ltd. (Electronic Equip., Instr. & Comp.) | 8,500 | $ | 549,185 | |||||||
Akamai Technologies, Inc. (Internet Software & Svs.) | (a) | 3,900 | 205,257 | |||||||
Alphabet, Inc. Class A (Internet Software & Svs.) | (a) | 6,375 | 4,959,814 | |||||||
Alphabet, Inc. Class C (Internet Software & Svs.) | (a) | 6,516 | 4,944,862 | |||||||
eBay, Inc. (Internet Software & Svs.) | (a) | 24,200 | 665,016 | |||||||
Facebook, Inc. Class A (Internet Software & Svs.) | (a) | 49,800 | 5,212,068 | |||||||
VeriSign, Inc. (Internet Software & Svs.) | (a) | 2,200 | 192,192 | |||||||
Yahoo!, Inc. (Internet Software & Svs.) | (a) | 19,100 | 635,266 | |||||||
Accenture PLC Class A (IT Svs.) | 13,700 | 1,431,650 | ||||||||
Alliance Data Systems Corp. (IT Svs.) | (a) | 1,300 | 359,541 | |||||||
Automatic Data Processing, Inc. (IT Svs.) | 10,100 | 855,672 | ||||||||
Cognizant Technology Solutions Corp. Class A (IT Svs.) | (a) | 13,300 | 798,266 | |||||||
CSRA, Inc. (IT Svs.) | 3,000 | 90,000 | ||||||||
Fidelity National Information Services, Inc. (IT Svs.) | 6,100 | 369,660 | ||||||||
Fiserv, Inc. (IT Svs.) | (a) | 5,000 | 457,300 | |||||||
International Business Machines Corp. (IT Svs.) | 19,550 | 2,690,471 | ||||||||
MasterCard, Inc. Class A (IT Svs.) | 21,700 | 2,112,712 | ||||||||
Paychex, Inc. (IT Svs.) | 7,000 | 370,230 | ||||||||
PayPal Holdings, Inc. (IT Svs.) | (a) | 24,400 | 883,280 | |||||||
Teradata Corp. (IT Svs.) | (a) | 2,900 | 76,618 | |||||||
Total System Services, Inc. (IT Svs.) | 3,677 | 183,115 | ||||||||
Visa, Inc. (IT Svs.) | 42,700 | 3,311,385 | ||||||||
Western Union Co. / The (IT Svs.) | 11,047 | 197,852 | ||||||||
Xerox Corp. (IT Svs.) | 20,902 | 222,188 | ||||||||
Analog Devices, Inc. (Semiconductors & Equip.) | 6,800 | 376,176 | ||||||||
Applied Materials, Inc. (Semiconductors & Equip.) | 25,200 | 470,484 | ||||||||
Avago Technologies Ltd. (Semiconductors & Equip.) | 5,800 | 841,870 | ||||||||
Broadcom Corp. Class A (Semiconductors & Equip.) | 12,350 | 714,077 | ||||||||
First Solar, Inc. (Semiconductors & Equip.) | (a) | 1,650 | 108,884 | |||||||
Intel Corp. (Semiconductors & Equip.) | 103,500 | 3,565,575 | ||||||||
KLA-Tencor Corp. (Semiconductors & Equip.) | 3,400 | 235,790 | ||||||||
Lam Research Corp. (Semiconductors & Equip.) | 3,425 | 272,014 | ||||||||
Linear Technology Corp. (Semiconductors & Equip.) | 5,200 | 220,844 | ||||||||
Microchip Technology, Inc. (Semiconductors & Equip.) | 4,500 | 209,430 | ||||||||
Micron Technology, Inc. (Semiconductors & Equip.) | (a) | 23,800 | 337,008 | |||||||
NVIDIA Corp. (Semiconductors & Equip.) | 11,200 | 369,152 | ||||||||
Qorvo, Inc. (Semiconductors & Equip.) | (a) | 3,100 | 157,790 | |||||||
Skyworks Solutions, Inc. (Semiconductors & Equip.) | 4,200 | 322,686 | ||||||||
Texas Instruments, Inc. (Semiconductors & Equip.) | 22,300 | 1,222,263 | ||||||||
Xilinx, Inc. (Semiconductors & Equip.) | 5,600 | 263,032 | ||||||||
Activision Blizzard, Inc. (Software) | 11,100 | 429,681 | ||||||||
Adobe Systems, Inc. (Software) | (a) | 10,900 | 1,023,946 | |||||||
Autodesk, Inc. (Software) | (a) | 5,000 | 304,650 | |||||||
CA, Inc. (Software) | 6,800 | 194,208 | ||||||||
Citrix Systems, Inc. (Software) | (a) | 3,400 | 257,210 | |||||||
Electronic Arts, Inc. (Software) | (a) | 6,800 | 467,296 | |||||||
Intuit, Inc. (Software) | 5,800 | 559,700 | ||||||||
Microsoft Corp. (Software) | 175,200 | 9,720,096 | ||||||||
Oracle Corp. (Software) | 70,200 | 2,564,406 | ||||||||
Red Hat, Inc. (Software) | (a) | 4,000 | 331,240 | |||||||
salesforce.com, Inc. (Software) | (a) | 13,700 | 1,074,080 | |||||||
Symantec Corp. (Software) | 14,794 | 310,674 | ||||||||
Apple, Inc. (Tech. Hardware, Storage & Periph.) | 122,300 | 12,873,298 | ||||||||
EMC Corp. (Tech. Hardware, Storage & Periph.) | 42,500 | 1,091,400 | ||||||||
Hewlett Packard Enterprise Co. (Tech. Hardware, Storage & Periph.) | 39,400 | 598,880 | ||||||||
HP, Inc. (Tech. Hardware, Storage & Periph.) | 39,600 | 468,864 | ||||||||
NetApp, Inc. (Tech. Hardware, Storage & Periph.) | 6,400 | 169,792 | ||||||||
SanDisk Corp. (Tech. Hardware, Storage & Periph.) | 4,400 | 334,356 | ||||||||
| 53 | (continued) |
| Ohio National Fund, Inc. | S&P 500® Index Portfolio (Continued) |
Schedule of Investments | December 31, 2015 |
| Common Stocks (Continued) | Shares | Value | ||||||||
INFORMATION TECHNOLOGY (continued) | ||||||||||
Seagate Technology PLC (Tech. Hardware, Storage & Periph.) | 6,600 | $ | 241,956 | |||||||
Western Digital Corp. (Tech. Hardware, Storage & Periph.) | 5,100 | 306,255 | ||||||||
|
| |||||||||
| 81,203,229 | ||||||||||
|
| |||||||||
MATERIALS – 2.6% | ||||||||||
Air Products & Chemicals, Inc. (Chemicals) | 4,300 | 559,473 | ||||||||
Airgas, Inc. (Chemicals) | 1,400 | 193,648 | ||||||||
CF Industries Holdings, Inc. (Chemicals) | 5,100 | 208,131 | ||||||||
Dow Chemical Co. / The (Chemicals) | 24,700 | 1,271,556 | ||||||||
Eastman Chemical Co. (Chemicals) | 3,300 | 222,783 | ||||||||
Ecolab, Inc. (Chemicals) | 5,800 | 663,404 | ||||||||
E.I. du Pont de Nemours & Co. (Chemicals) | 19,200 | 1,278,720 | ||||||||
FMC Corp. (Chemicals) | 2,900 | 113,477 | ||||||||
International Flavors & Fragrances, Inc. (Chemicals) | 1,800 | 215,352 | ||||||||
LyondellBasell Industries NV Class A (Chemicals) | 7,900 | 686,510 | ||||||||
Monsanto Co. (Chemicals) | 9,686 | 954,265 | ||||||||
Mosaic Co. / The (Chemicals) | 7,400 | 204,166 | ||||||||
PPG Industries, Inc. (Chemicals) | 5,900 | 583,038 | ||||||||
Praxair, Inc. (Chemicals) | 6,200 | 634,880 | ||||||||
Sherwin-Williams Co. / The (Chemicals) | 1,700 | 441,320 | ||||||||
Martin Marietta Materials, Inc. (Construction Materials) | 1,500 | 204,870 | ||||||||
Vulcan Materials Co. (Construction Materials) | 2,900 | 275,413 | ||||||||
Avery Dennison Corp. (Containers & Packaging) | 2,000 | 125,320 | ||||||||
Ball Corp. (Containers & Packaging) | 3,000 | 218,190 | ||||||||
International Paper Co. (Containers & Packaging) | 9,100 | 343,070 | ||||||||
Owens-Illinois, Inc. (Containers & Packaging) | (a) | 3,500 | 60,970 | |||||||
Sealed Air Corp. (Containers & Packaging) | 4,300 | 191,780 | ||||||||
WestRock Co. (Containers & Packaging) | 5,638 | 257,206 | ||||||||
Alcoa, Inc. (Metals & Mining) | 28,700 | 283,269 | ||||||||
Freeport-McMoRan, Inc. (Metals & Mining) | 25,352 | 171,633 | ||||||||
Newmont Mining Corp. (Metals & Mining) | 11,600 | 208,684 | ||||||||
Nucor Corp. (Metals & Mining) | 7,000 | 282,100 | ||||||||
|
| |||||||||
| 10,853,228 | ||||||||||
|
| |||||||||
TELECOMMUNICATION SERVICES – 2.3% | ||||||||||
AT&T, Inc. (Diversified Telecom. Svs.) | 134,911 | 4,642,288 | ||||||||
CenturyLink, Inc. (Diversified Telecom. Svs.) | 12,072 | 303,732 | ||||||||
Frontier Communications Corp. (Diversified Telecom. Svs.) | 25,641 | 119,743 | ||||||||
Level 3 Communications, Inc. (Diversified Telecom. Svs.) | (a) | 6,300 | 342,468 | |||||||
Verizon Communications, Inc. (Diversified Telecom. Svs.) | 89,200 | 4,122,824 | ||||||||
|
| |||||||||
| 9,531,055 | ||||||||||
|
| |||||||||
| Common Stocks (Continued) | Shares | Value | ||||||||
UTILITIES – 2.9% | ||||||||||
American Electric Power Co., Inc. (Electric Utilities) | 10,800 | $ | 629,316 | |||||||
Duke Energy Corp. (Electric Utilities) | 15,143 | 1,081,059 | ||||||||
Edison International (Electric Utilities) | 7,100 | 420,391 | ||||||||
Entergy Corp. (Electric Utilities) | 3,900 | 266,604 | ||||||||
Eversource Energy (Electric Utilities) | 7,000 | 357,490 | ||||||||
Exelon Corp. (Electric Utilities) | 20,190 | 560,676 | ||||||||
FirstEnergy Corp. (Electric Utilities) | 9,234 | 292,995 | ||||||||
NextEra Energy, Inc. (Electric Utilities) | 10,100 | 1,049,289 | ||||||||
Pepco Holdings, Inc. (Electric Utilities) | 5,600 | 145,656 | ||||||||
Pinnacle West Capital Corp. (Electric Utilities) | 2,400 | 154,752 | ||||||||
PPL Corp. (Electric Utilities) | 14,700 | 501,711 | ||||||||
Southern Co. / The (Electric Utilities) | 19,900 | 931,121 | ||||||||
Xcel Energy, Inc. (Electric Utilities) | 11,100 | 398,601 | ||||||||
AGL Resources, Inc. (Gas Utilities) | 2,686 | 171,394 | ||||||||
AES Corp. (Ind. Power & Renewable Elec.) | 14,800 | 141,636 | ||||||||
NRG Energy, Inc. (Ind. Power & Renewable Elec.) | 6,900 | 81,213 | ||||||||
Ameren Corp. (Multi-Utilities) | 5,300 | 229,119 | ||||||||
CenterPoint Energy, Inc. (Multi-Utilities) | 9,400 | 172,584 | ||||||||
CMS Energy Corp. (Multi-Utilities) | 6,100 | 220,088 | ||||||||
Consolidated Edison, Inc. (Multi-Utilities) | 6,400 | 411,328 | ||||||||
Dominion Resources, Inc. (Multi-Utilities) | 13,100 | 886,084 | ||||||||
DTE Energy Co. (Multi-Utilities) | 3,900 | 312,741 | ||||||||
NiSource, Inc. (Multi-Utilities) | 7,000 | 136,570 | ||||||||
PG&E Corp. (Multi-Utilities) | 10,800 | 574,452 | ||||||||
Public Service Enterprise Group, Inc. (Multi-Utilities) | 11,100 | 429,459 | ||||||||
SCANA Corp. (Multi-Utilities) | 3,100 | 187,519 | ||||||||
Sempra Energy (Multi-Utilities) | 5,200 | 488,852 | ||||||||
TECO Energy, Inc. (Multi-Utilities) | 5,200 | 138,580 | ||||||||
WEC Energy Group, Inc. (Multi-Utilities) | 6,931 | 355,630 | ||||||||
|
| |||||||||
| 11,726,910 | ||||||||||
|
| |||||||||
Total Common Stocks (Cost $261,563,270) | $ | 392,659,147 | ||||||||
|
| |||||||||
| Exchange Traded Funds – 4.2% | Shares | Value | ||||||||
SPDR S&P 500 ETF Trust | 84,725 | $ | 17,274,580 | |||||||
|
| |||||||||
Total Exchange Traded Funds (Cost $16,944,049) | $ | 17,274,580 | ||||||||
|
| |||||||||
Total Investments – 99.8% (Cost $278,507,319) | (b) | $ | 409,933,727 | |||||||
Other Assets in Excess of Liabilities – 0.2% | 789,914 | |||||||||
|
| |||||||||
Net Assets – 100.0% | $ | 410,723,641 | ||||||||
|
| |||||||||
Percentages are stated as a percent of net assets.
Abbreviations:
Footnotes:
| (a) | Non-income producing security. |
| (b) | Represents cost for financial reporting purposes, which may differ from cost basis for federal income tax purposes. See also Note 7 of the Notes to Financial Statements. |
The accompanying notes are an integral part of these financial statements.
| 54 |
| Ohio National Fund, Inc. | Strategic Value Portfolio |
Objective/Strategy
The Strategic Value Portfolio seeks growth of capital and income by investing primarily in high dividend yielding common stocks, with dividend growth potential.
Performance as of December 31, 2015
Average Annual returns | ||||
One year | 4.26% | |||
Five years | 11.63% | |||
Ten years | 5.13% |
Past performance does not guarantee future results. The performance data quoted represents past performance and current returns may be lower or higher. Total return figures include change in share price and reinvestment of dividends and capital gains. The investment return and principal value will fluctuate so that an investor’s shares, when redeemed, may be worth more or less than the original cost. To obtain performance information up to the most recent month end, call toll-free 1-877-781-6392.
The Portfolio is not open to direct retail investment. Beneficial interest in shares is obtained solely by purchase of variable life insurance policies and variable annuity contracts. Actual performance results for variable annuity and variable universal life contracts will be lower due to contract charges. Consult your contract for applicable charges.
Comments
For the year ended December 31, 2015, the Strategic Value Portfolio returned 4.26% versus -1.64% for its benchmark, the Dow Jones U.S. Select Dividend Index (“DJSDI”).
During the period, the DJSDI experienced its highest returns from the Consumer Staples (up 18.4%), Health Care (up 7.2%) and Industrials (up 3.9%) sectors. On a relative basis, the Portfolio’s highest contribution came from the strong performance in Consumer Staples. The Portfolio’s notable average weight of 32.4% returned 21.0% versus the average return of 18.4% in the benchmark. Notable performers include Reynolds American, Inc., The Kraft Heinz Co., and Altria Group, Inc., all of which have important weights greater than 4% in the Portfolio. Relative performance was further enhanced by the Portfolio’s 4.5% exposure to Consumer Discretionary, posting a return of 30.4% (versus -0.35% in the benchmark) driven by the sole sector holding of McDonald’s Corp. The Portfolio’s relative outperformance in Telecommunication Services was driven by having no exposure to CenturyLink, Inc. (down 31.8%). The Portfolio benefited further from avoiding Information Technology, which was the worst performer for the year in the benchmark, posting a return of -30.6%.(1)
Areas of relative weakness were Industrials and Health Care. The DJSDI has a notable weight in the Industrials sector, which advanced 3.9% for the year. The Portfolio has no exposure to this cyclical sector due to the lack of reliable dividend growth and yield opportunities. The index’s relative outperformance in Health Care was driven by strong performance from Eli Lilly & Co. and Bristol-Myers Squibb Co. Both names were previous holdings in the Portfolio but were sold due to strong price advances which exceeded their dividend growth trajectories, pushing the dividend yields well below 3%.(1)
From an absolute perspective, positive contributors to sector performance within the Portfolio were Consumer Staples and Consumer Discretionary. Consumer Staples outperformance was driven by Reynolds American, Inc., The Kraft Heinz Co., and Altria Group, Inc. The Kraft Heinz Co. returned 46.6% on news of the merger agreement between Kraft and Heinz. Reynolds American, Inc. and Altria
Group, Inc. posted total returns of 48.8% and 23.1% respectively. Both tobacco investments benefitted from increased convenience store traffic and stronger pricing in the U.S. tobacco industry. Reynolds American, Inc. benefitted further from its merger agreement with Lorillard. The sole investment within Consumer Discretionary, McDonald’s Corp., returned 30.4% due to improved investor confidence, driven by the addition of new premium sandwiches and the implementation of all-day breakfast.(1)
The Portfolio’s five best performing securities were Reynolds American, Inc. (up 48.8%), The Kraft Heinz Co. (up 46.6%), McDonald’s Corp. (up 30.4%), The Williams Cos., Inc. (up 26.0%) and Altria Group, Inc. (up 23.1%).(1)
Conversely, negative performance was noted in the Energy sector, with Portfolio holdings posting a return of -17.8% for the year, as oil prices continued their decline, driven by oversupply concerns and weakness in China. Laggards in the Portfolio included Kinder Morgan, Inc. (down 59.0%), Royal Dutch Shell PLC (down 29.8%), and Chevron Corp. (down 16.2%). The 1.4% exposure to Kinder Morgan, Inc. was ultimately sold due to concerns that a dramatic change in capital market funding prospects created material risk to the dividend. Subsequently, Kinder Morgan, Inc. did cut its dividend distribution.(1)
The Portfolio’s five worst performing securities were Kinder Morgan, Inc. (down 59.0%), Royal Dutch Shell PLC (down 29.8%), Chevron Corp. (down 16.2%), TOTAL SA (down 14.5%) and BCE, Inc. (down 12.8%).(1)
The Portfolio has not changed its basic positioning, as it continues to invest in companies that exhibit both the ability and the inclination to pay and increase their dividends. That said, the holdings of the Portfolio have changed modestly. Notable changes to sector exposures included a 7.2% decrease in Energy, a 2.6% increase in Consumer Staples and a 1.2% increase in Utilities. Energy decreased from 17.7% to 10.5%, a result of eliminating our positions in ConocoPhillips and The Williams Cos., Inc. We exited the position in ConocoPhillips because it did not have a downstream business. We exited The Williams Cos., Inc. after the shares soared based on the news of a potential buyout from Energy Transfer Equity L.P. causing the yield to decline. We also eliminated TOTAL SA in the Portfolio and used the proceeds to start a new position in Exxon Mobil Corp. The recent decline in commodity prices has generated a yield opportunity to tap into a high quality income stream of an AAA-rated, acknowledged industry leader. Exxon Mobil Corp.’s payout ratio/mix of business/balance sheet should allow it to continue to pay and increase its dividend through its current cycle, and emerge with fewer small-scale competitors. This is the first time in 18 years that Exxon Mobil Corp.’s yield has been above 4%.(1)
As Energy was reduced, the Portfolio’s Consumer Staples exposure was increased, driven by adding to existing names such as Philip Morris, Altria Group, Inc., and The Procter & Gamble Co. Exposure to Utilities increased due to increases to an existing position, National Grid PLC. National Grid PLC is a low risk and predominately regulated utility with a current yield of 4.6% and graphic diversity (U.S. and UK) that offers a compelling combination of dividend yield and growth potential of at least retail prices index inflation.(1)
The volatility of 2015 continued through year-end, as investors vacillated between preferences for safer havens, characterized by defensive securities, and preferences for riskier assets in anticipation of an eventual increase to the Federal Reserve Funds Rate. By December, it was evident that positive investor expectations succumbed to ongoing concerns regarding oil prices, weakness in
| 55 | (continued) |
| Ohio National Fund, Inc. | Strategic Value Portfolio (Continued) |
China, and tensions in the Middle East. Ultimately, these macro concerns dwarfed the market’s anticipation of the long-awaited rate hike, which ended up being more or less a non-event for dividend-friendly portfolios.
Notwithstanding the heightened volatility in the year, the Portfolio remained tenaciously focused on providing investors with a high dividend yield portfolio complemented by dividend growth.
Looking forward, we expect investor concerns and the resulting market volatility will continue well into 2016. We believe investors will continue to closely watch for ongoing concerns regarding oil prices, weakness in China, tensions in the Middle East and the trajectory for future Federal Reserve Fund Rate increases. Historically, the defensive features of high quality investments have provided less downside risk during periods of high volatility and during periods of slowing growth, which should benefit the strategy. Regardless of market conditions, we believe the Portfolio provides an unwavering, lower risk investment approach that can address a variety of investor needs, both in the short-term and the long-term.
| (1) | The Portfolio’s composition is subject to change. Holdings and weightings are as of December 31, 2015. |
Change in Value of $10,000 Investment
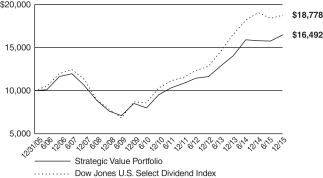
Hypothetical illustration based on past performance. Future performance will vary. The Portfolio’s returns reflect reinvested dividends. The Portfolio’s holdings may differ significantly from the securities in the index. The index is unmanaged and therefore does not reflect the cost of portfolio management and accounting.
The Dow Jones U.S. Select Dividend Index is comprised of all dividend-paying companies in the Dow Jones U.S. Index that have a non-negative historical five-year dividend-per-share growth rate, a five-year average dividend to earnings-per-share ratio of less than or equal to 60%, paid dividends in each of the previous five years, and a three-month average daily trading volume of 200,000 shares. Current index components are included in the universe regardless of their dividend payout ratio or trading volume. The Dow Jones U.S. Index aims to consistently represent the top 95% of U.S. companies based on float-adjusted market capitalization, excluding non common issues and illiquid stocks. The index presented includes the effects of reinvested dividends.
Portfolio Composition as of December 31, 2015 (1)
| % of Net Assets | ||||
Common Stocks (4) | 98.5 | |||
Money Market Funds | 1.5 | |||
|
| |||
| 100.0 | ||||
|
|
Top 10 Portfolio Holdings as of December 31, 2015 (1) (2) (3)
| % of Net Assets | ||||||
| 1. | McDonald’s Corp. | 4.9 | ||||
| 2. | Reynolds American, Inc. | 4.8 | ||||
| 3. | Altria Group, Inc. | 4.8 | ||||
| 4. | National Grid PLC | 4.7 | ||||
| 5. | Philip Morris International, Inc. | 4.7 | ||||
| 6. | Kraft Heinz Co. / The | 4.5 | ||||
| 7. | Verizon Communications, Inc. | 4.4 | ||||
| 8. | AT&T, Inc. | 4.1 | ||||
| 9. | GlaxoSmithKline PLC | 4.1 | ||||
| 10. | Procter & Gamble Co. / The | 3.6 |
| (1) | Composition of Portfolio subject to change. |
| (2) | Short-term investments have been excluded from the list of Top 10 Portfolio Holdings. |
| (3) | Top 10 Portfolio Holdings is presented at an individual security level. Total investment exposure by issuer may be higher. |
| (4) | Sectors (Common Stocks): |
| % of Net Assets | ||||
Consumer Staples | 34.2 | |||
Utilities | 17.0 | |||
Telecommunication Services | 13.4 | |||
Energy | 10.7 | |||
Health Care | 9.3 | |||
Financials | 8.9 | |||
Consumer Discretionary | 5.0 | |||
|
| |||
| 98.5 | ||||
|
|
| 56 |
| Ohio National Fund, Inc. | Strategic Value Portfolio |
Schedule of Investments | December 31, 2015 |
| Common Stocks – 98.5% | Shares | Value | ||||||||
CONSUMER DISCRETIONARY – 5.0% | ||||||||||
McDonald’s Corp. (Hotels, Restaurants & Leisure) | 129,645 | $ | 15,316,260 | |||||||
|
| |||||||||
CONSUMER STAPLES – 34.2% | ||||||||||
Coca-Cola Co. / The (Beverages) | 119,450 | 5,131,572 | ||||||||
PepsiCo, Inc. (Beverages) | 36,700 | 3,667,064 | ||||||||
General Mills, Inc. (Food Products) | 97,100 | 5,598,786 | ||||||||
Kellogg Co. (Food Products) | 54,075 | 3,908,000 | ||||||||
Kraft Heinz Co. / The (Food Products) | 189,930 | 13,819,307 | ||||||||
Kimberly-Clark Corp. (Household Products) | 71,475 | 9,098,767 | ||||||||
Procter & Gamble Co. / The (Household Products) | 140,350 | 11,145,194 | ||||||||
Unilever PLC (Personal Products) | (a) | 215,600 | 9,247,604 | |||||||
Altria Group, Inc. (Tobacco) | 255,195 | 14,854,901 | ||||||||
Philip Morris International, Inc. (Tobacco) | 164,045 | 14,421,196 | ||||||||
Reynolds American, Inc. (Tobacco) | 324,340 | 14,968,291 | ||||||||
|
| |||||||||
| 105,860,682 | ||||||||||
|
| |||||||||
ENERGY – 10.7% | ||||||||||
BP PLC (Oil, Gas & Consumable Fuels) | (a) | 1,685,300 | 8,758,025 | |||||||
Chevron Corp. (Oil, Gas & Consumable Fuels) | 110,980 | 9,983,761 | ||||||||
Exxon Mobil Corp. (Oil, Gas & Consumable Fuels) | 110,000 | 8,574,500 | ||||||||
Royal Dutch Shell PLC (Oil, Gas & Consumable Fuels) | (a) | 258,220 | 5,885,109 | |||||||
|
| |||||||||
| 33,201,395 | ||||||||||
|
| |||||||||
FINANCIALS – 8.9% | ||||||||||
Digital Realty Trust, Inc. (Real Estate Investment Trusts) | 65,900 | 4,983,358 | ||||||||
HCP, Inc. (Real Estate Investment Trusts) | 105,190 | 4,022,466 | ||||||||
National Retail Properties, Inc. (Real Estate Investment Trusts) | 83,000 | 3,324,150 | ||||||||
Realty Income Corp. (Real Estate Investment Trusts) | 80,800 | 4,171,704 | ||||||||
Ventas, Inc. (Real Estate Investment Trusts) | 97,530 | 5,503,618 | ||||||||
Welltower, Inc. (Real Estate Investment Trusts) | 81,800 | 5,564,854 | ||||||||
|
| |||||||||
| 27,570,150 | ||||||||||
|
| |||||||||
| Common Stocks (Continued) | Shares | Value | ||||||||
HEALTH CARE – 9.3% | ||||||||||
GlaxoSmithKline PLC (Pharmaceuticals) | (a) | 629,156 | $ | 12,706,410 | ||||||
Johnson & Johnson (Pharmaceuticals) | 51,860 | 5,327,059 | ||||||||
Merck & Co., Inc. (Pharmaceuticals) | 145,800 | 7,701,156 | ||||||||
Sanofi (Pharmaceuticals) | (a) | 37,036 | 3,156,290 | |||||||
|
| |||||||||
| 28,890,915 | ||||||||||
|
| |||||||||
TELECOMMUNICATION SERVICES – 13.4% | ||||||||||
AT&T, Inc. (Diversified Telecom. Svs.) | 373,223 | 12,842,603 | ||||||||
BCE, Inc. (Diversified Telecom. Svs.) | 156,280 | 6,037,963 | ||||||||
Verizon Communications, Inc. (Diversified Telecom. Svs.) | 294,101 | 13,593,348 | ||||||||
Vodafone Group PLC – ADR (Wireless Telecom. Svs.) | 283,393 | 9,142,258 | ||||||||
|
| |||||||||
| 41,616,172 | ||||||||||
|
| |||||||||
UTILITIES – 17.0% | ||||||||||
American Electric Power Co., Inc. (Electric Utilities) | 74,600 | 4,346,942 | ||||||||
Duke Energy Corp. (Electric Utilities) | 139,906 | 9,987,889 | ||||||||
PPL Corp. (Electric Utilities) | 251,900 | 8,597,347 | ||||||||
Southern Co. / The (Electric Utilities) | 234,860 | 10,989,099 | ||||||||
Dominion Resources, Inc. (Multi-Utilities) | 61,225 | 4,141,259 | ||||||||
National Grid PLC (Multi-Utilities) | (a) | 1,049,800 | 14,478,493 | |||||||
|
| |||||||||
| 52,541,029 | ||||||||||
|
| |||||||||
Total Common Stocks (Cost $280,777,460) | $ | 304,996,603 | ||||||||
|
| |||||||||
| Money Market Funds – 3.3% | Shares | Value | ||||||||
Fidelity Institutional Money Market Funds | 10,286,000 | $ | 10,286,000 | |||||||
|
| |||||||||
Total Money Market Funds (Cost $10,286,000) | $ | 10,286,000 | ||||||||
|
| |||||||||
Total Investments – 101.8% (Cost $291,063,460) | (b) | $ | 315,282,603 | |||||||
Liabilities in Excess of Other Assets – (1.8)% | (5,473,837) | |||||||||
|
| |||||||||
Net Assets – 100.0% | $ | 309,808,766 | ||||||||
|
| |||||||||
Percentages are stated as a percent of net assets.
Abbreviations:
ADR: American Depositary Receipts
Footnotes:
| (a) | Security traded on a foreign exchange has been valued at an estimate of fair value that is different than the local market close price. These fair value estimates are determined by an independent fair valuation service that has been approved by the Board. These securities represent $54,231,931, or 17.5% of the Portfolio’s net assets. |
| Other Portfolio securities are not subjected to fair value procedures because they are traded on domestic or foreign exchanges that have close times that are consistent with the U.S. market close, normally 4:00 pm Eastern Time. |
| (b) | Represents cost for financial reporting purposes, which may differ from cost basis for federal income tax purposes. See also Note 7 of the Notes to Financial Statements. |
The accompanying notes are an integral part of these financial statements.
| 57 |
| Ohio National Fund, Inc. | High Income Bond Portfolio |
Objective/Strategy
The High Income Bond Portfolio seeks high current income by investing at least 80% of its net assets in lower rated corporate debt obligations commonly referred to as “junk bonds”. The Portfolio’s investments are generally rated Ba or lower by Moody’s, or BB or lower by Standard & Poor’s or Fitch.
Performance as of December 31, 2015
Average Annual returns | ||||
One year | -3.06% | |||
Five years | 5.15% | |||
Ten years | 6.42% |
Past performance does not guarantee future results. The performance data quoted represents past performance and current returns may be lower or higher. Total return figures include change in share price and reinvestment of dividends and capital gains. The investment return and principal value will fluctuate so that an investor’s shares, when redeemed, may be worth more or less than the original cost. To obtain performance information up to the most recent month end, call toll-free 1-877-781-6392.
The Portfolio is not open to direct retail investment. Beneficial interest in shares is obtained solely by purchase of variable life insurance policies and variable annuity contracts. Actual performance results for variable annuity and variable universal life contracts will be lower due to contract charges. Consult your contract for applicable charges.
Comments
For the year ended December 31, 2015, the High Income Bond Portfolio returned -3.06% versus -4.43% for its benchmark, the Barclays Capital U.S. Corporate High Yield 2% Issuer Capped Index (“BCHY2%”).
The total return for the high yield market for the reporting period was disappointing on both an absolute and a relative basis. For example, the BCHY2%, returned -4.43% for the period, underperforming the Barclay’s U.S. Aggregate Bond Index, a measure of high quality bond performance, which returned 0.55% for the period. The main factor which negatively impacted the high yield market was the weakness in commodity prices, especially energy prices. Three major sectors were especially hard hit by the commodity price decline and drove the BCHY2%’s return into negative territory. Independent energy had a total return of -35.62%, oil field services had a total return of -20.91% and metals had a total return of -23.69%. The BCHY2%, excluding these three sectors, had a total return of -0.04% for the period. Also, late in the period, the Third Avenue Focused Credit Fund (“TFCIX”), an open-end mutual fund focusing on distressed securities had to halt redemptions and go into liquidation mode. While TFCIX’s security holdings were dramatically different than most open-end high yield mutual funds, the fact that it needed to halt redemptions sent a shiver down the back of the market. Liquidity concerns resulted in an uptick in mutual fund liquidations in December, putting considerable selling pressure on the market. The impact of these events can be seen in the spread between high-yield bonds and U.S. Treasury securities with comparable maturities. According to the Credit Suisse High Yield Bond Index, the spread began the reporting period at 564 basis points and ended the reporting period at 747 basis points.
Within the high-yield market, major industry sectors that substantially outperformed the overall BCHY2% included food & beverage, leisure, building materials, consumer products and packaging. Major industry sectors that substantially underperformed the overall BCHY2% included independent energy, metals, oil field services, aerospace/defense and midstream. From a credit quality per-
spective, the higher quality BB-rated sector led the way with a return of -1.00% followed by the B-rated and CCC-rated sectors which returned -4.63% and -12.11%, respectively.
The Portfolio was positively impacted by its underweight to the poor performing independent energy, oil field services and metals industry sectors. The Portfolio was also positively impacted by its overweight to the outperforming packaging, health care, gaming and consumer products sectors. The Portfolio was negatively impacted by its underweight in the strong performing home construction and financial institutions sectors.(1)
The Portfolio was positively impacted relative to the BCHY2% by strong security selection in the independent energy, media entertainment, gaming, retail, aerospace/defense and industrial other industry sectors. The Portfolio was negatively impacted by poor security selection in the cable satellite, midstream and wireless telecommunications industry sectors. Specific Portfolio holdings that substantially outperformed the BCHY2% included Hiland Partners LP/Hiland Partners Finance Corp., Regal Entertainment Group, The ServiceMaster Co. LLC, and Affinity Gaming LLC/Affinity Gaming Finance Corp. Specific Portfolio holdings that substantially underperformed the BCHY2% included SandRidge Energy, Inc., Linn Energy LLC/Linn Energy Finance Corp., Energy XXI Gulf Coast, Inc., Legacy Reserves LP/Legacy Reserves Finance Corp. and Chesapeake Energy Corp.(1)
The commodity sectors will continue to be a source of volatility for the high yield market as 2016 begins. We would expect debt restructurings to continue, if not increase, in the independent energy, oil field service and metals sector. Given the price levels that many of the securities in these sectors exited 2015 with, a significant portion of the negative impact has most likely been absorbed. The good news is that sectors not associated with energy and metals continue to be characterized by relatively good credit fundamentals and attractive credit spreads. If the U.S. economy continues its slow steady pace of growth, we would expect credit spreads to tighten in sectors away from commodities, leading to attractive returns for high yield in 2016. The key risks would be a slowing of U.S. economic growth or a further decline in commodity prices.
| (1) | The Portfolio’s composition is subject to change. Holdings and weightings are as of December 31, 2015. |
| 58 | (continued) |
| Ohio National Fund, Inc. | High Income Bond Portfolio (Continued) |
Change in Value of $10,000 Investment
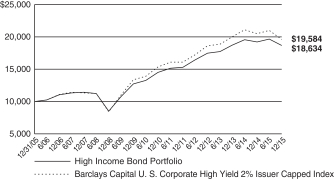
Hypothetical illustration based on past performance. Future performance will vary. All returns reflect reinvested dividends. The Portfolio’s holdings may differ significantly from the securities in the index. The index is unmanaged and therefore does not reflect the cost of Portfolio management or trading. Neither the Portfolio nor the index is open to direct investment.
The Barclays Capital U.S. Corporate High Yield 2% Issuer Capped Index is the 2% Issuer Cap component of the Barclays Capital U.S. Corporate High Yield Bond Index. The Barclays Capital U.S. Corporate High Yield Bond Index is an unmanaged index that includes all fixed income securities having a maximum quality rating of Ba1/BB+/BB+, a minimum amount outstanding of $150 million, and a least 1 year to maturity. The 2% Issuer Cap component limits the exposure of each issuer to 2% of the total market value and distributes any excess market value index–wide on a pro–rata basis. The index is presented on a total return basis.
Portfolio Composition as of December 31, 2015 (1)
| % of Net Assets | ||||
Corporate Bonds (4) | 95.1 | |||
Money Market Funds and | 4.9 | |||
|
| |||
| 100.0 | ||||
|
|
Top 10 Portfolio Holdings as of December 31, 2015 (1) (2) (3)
| % of Net Assets | ||||
1. HCA, Inc. | 1.1 | |||
2. First Data Corp. | 1.0 | |||
3. DISH DBS Corp. | 0.8 | |||
4. Berry Plastics Corp. | 0.7 | |||
5. Energy Transfer Equity LP | 0.7 | |||
6. Serta Simmons Holdings LLC | 0.7 | |||
7. CCO Holdings LLC / CCO Holdings Capital Corp. | 0.7 | |||
8. MPH Acquisition Holdings LLC | 0.7 | |||
9. Sirius XM Radio, Inc. | 0.7 | |||
10. Jaguar Holding Co II / Pharmaceutical Product Development LLC | 0.7 |
| (1) | Composition of Portfolio subject to change. |
| (2) | Short-term investments have been excluded from the list of Top 10 Portfolio Holdings. |
| (3) | Top 10 Portfolio Holdings is presented at an individual security level. Total investment exposure by issuer may be higher. |
| (4) | Sectors (Corporate Bonds): |
| % of Net Assets | ||||
Consumer Discretionary | 29.1 | |||
Health Care | 12.8 | |||
Information Technology | 10.8 | |||
Industrials | 10.1 | |||
Materials | 9.5 | |||
Energy | 9.4 | |||
Telecommunication Services | 5.0 | |||
Consumer Staples | 3.2 | |||
Financials | 2.9 | |||
Utilities | 2.3 | |||
|
| |||
| 95.1 | ||||
|
|
| 59 |
| Ohio National Fund, Inc. | High Income Bond Portfolio |
Schedule of Investments | December 31, 2015 |
| Corporate Bonds – 95.1% | Rate | Maturity | Face Amount | Value | ||||||||||||
CONSUMER DISCRETIONARY – 29.1% | ||||||||||||||||
Affinia Group, Inc. (Auto Components) | 7.750% | 05/01/2021 | $ | 1,125,000 | $ | 1,145,025 | ||||||||||
American Axle & Manufacturing, Inc. (Auto Components) | 6.625% | 10/15/2022 | 625,000 | 654,687 | ||||||||||||
American Axle & Manufacturing, Inc. (Auto Components) | 6.250% | 03/15/2021 | 400,000 | 414,000 | ||||||||||||
Gates Global LLC / Gates Global Co. (Auto Components) | (b) | 6.000% | 07/15/2022 | 900,000 | 648,000 | |||||||||||
Goodyear Tire & Rubber Co. / The (Auto Components) | 5.125% | 11/15/2023 | 300,000 | 307,500 | ||||||||||||
International Automotive Components Group SL (Acquired 05/26/2011 through 01/03/2012, Cost $550,675)(Auto Components) | (b)(f) | 9.125% | 06/01/2018 | 550,000 | 470,250 | |||||||||||
J.B. Poindexter & Co., Inc. (Auto Components) | (b) | 9.000% | 04/01/2022 | 725,000 | 757,625 | |||||||||||
Lear Corp. (Auto Components) | 4.750% | 01/15/2023 | 625,000 | 628,125 | ||||||||||||
Lear Corp. (Auto Components) | 5.375% | 03/15/2024 | 225,000 | 231,187 | ||||||||||||
Lear Corp. (Auto Components) | 5.250% | 01/15/2025 | 100,000 | 101,750 | ||||||||||||
MPG Holdco I, Inc. (Auto Components) | 7.375% | 10/15/2022 | 625,000 | 631,250 | ||||||||||||
Omega U.S. Sub, LLC (Auto Components) | (b) | 8.750% | 07/15/2023 | 325,000 | 299,812 | |||||||||||
UCI International, Inc. (Acquired 06/14/2011 through 09/18/2012, Cost $630,825)(Auto Components) | (f) | 8.625% | 02/15/2019 | 625,000 | 215,625 | |||||||||||
ZF North America Capital, Inc. (Auto Components) | (b) | 4.750% | 04/29/2025 | 325,000 | 309,562 | |||||||||||
ServiceMaster Co. LLC / The (Diversified Consumer Svs.) | 7.450% | 08/15/2027 | 300,000 | 298,500 | ||||||||||||
ServiceMaster Co. LLC / The (Diversified Consumer Svs.) | 7.100% | 03/01/2018 | 450,000 | 447,750 | ||||||||||||
1011778 B.C. ULC / New Red Finance, Inc. (Hotels, Restaurants & Leisure) | (b) | 6.000% | 04/01/2022 | 1,175,000 | 1,210,250 | |||||||||||
1011778 B.C. ULC / New Red Finance, Inc. (Hotels, Restaurants & Leisure) | (b) | 4.625% | 01/15/2022 | 375,000 | 375,937 | |||||||||||
Affinity Gaming LLC / Affinity Gaming Finance Corp. (Hotels, Restaurants & Leisure) | 9.000% | 05/15/2018 | 250,000 | 251,250 | ||||||||||||
Aramark Services, Inc. (Hotels, Restaurants & Leisure) | (b) | 5.125% | 01/15/2024 | 425,000 | 432,969 | |||||||||||
Boyd Gaming Corp. (Hotels, Restaurants & Leisure) | 6.875% | 05/15/2023 | 425,000 | 436,688 | ||||||||||||
Cedar Fair LP / Canada’s Wonderland Co. / Magnum Management Corp. (Hotels, Restaurants & Leisure) | 5.250% | 03/15/2021 | 125,000 | 128,750 | ||||||||||||
Cedar Fair LP / Canada’s Wonderland Co. / Magnum Management Corp. (Hotels, Restaurants & Leisure) | 5.375% | 06/01/2024 | 375,000 | 378,750 | ||||||||||||
Chester Downs & Marina LLC (Hotels, Restaurants & Leisure) | (b) | 9.250% | 02/01/2020 | 450,000 | 320,625 | |||||||||||
GLP Capital LP / GLP Financing II, Inc. (Hotels, Restaurants & Leisure) | 5.375% | 11/01/2023 | 375,000 | 365,625 | ||||||||||||
MGM Resorts International (Hotels, Restaurants & Leisure) | 6.750% | 10/01/2020 | 425,000 | 436,688 | ||||||||||||
MGM Resorts International (Hotels, Restaurants & Leisure) | 7.750% | 03/15/2022 | 1,125,000 | 1,195,312 | ||||||||||||
Mohegan Tribal Gaming Authority (Hotels, Restaurants & Leisure) | 9.750% | 09/01/2021 | 450,000 | 448,875 | ||||||||||||
NPC International, Inc. / NPC Operating Co. A, Inc. / NPC Operating Co. B, Inc. (Hotels, Restaurants & Leisure) | 10.500% | 01/15/2020 | 650,000 | 672,750 | ||||||||||||
Penn National Gaming, Inc. (Hotels, Restaurants & Leisure) | 5.875% | 11/01/2021 | 1,075,000 | 1,042,750 | ||||||||||||
Pinnacle Entertainment, Inc. (Hotels, Restaurants & Leisure) | 7.500% | 04/15/2021 | 225,000 | 234,563 | ||||||||||||
Pinnacle Entertainment, Inc. (Hotels, Restaurants & Leisure) | 6.375% | 08/01/2021 | 650,000 | 683,312 | ||||||||||||
Rivers Pittsburgh Borrower LP / Rivers Pittsburgh Finance Corp. (Hotels, Restaurants & Leisure) | (b) | 9.500% | 06/15/2019 | 540,000 | 558,900 | |||||||||||
Seminole Hard Rock Entertainment, Inc. / Seminole Hard Rock International LLC (Hotels, Restaurants & Leisure) | (b) | 5.875% | 05/15/2021 | 1,225,000 | 1,221,937 | |||||||||||
Seminole Indian Tribe of Florida (Hotels, Restaurants & Leisure) | (b) | 7.804% | 10/01/2020 | 630,000 | 648,900 | |||||||||||
Six Flags Entertainment Corp. (Hotels, Restaurants & Leisure) | (b) | 5.250% | 01/15/2021 | 475,000 | 480,937 | |||||||||||
Station Casinos LLC (Hotels, Restaurants & Leisure) | 7.500% | 03/01/2021 | 800,000 | 816,000 | ||||||||||||
RSI Home Products, Inc. (Household Durables) | (b) | 6.500% | 03/15/2023 | 675,000 | 695,250 | |||||||||||
Serta Simmons Holdings LLC (Household Durables) | (b) | 8.125% | 10/01/2020 | 1,275,000 | 1,332,375 | |||||||||||
CDW LLC / CDW Finance Corp. (Internet & Catalog Retail) | 6.000% | 08/15/2022 | 100,000 | 105,500 | ||||||||||||
CDW LLC / CDW Finance Corp. (Internet & Catalog Retail) | 5.500% | 12/01/2024 | 650,000 | 680,875 | ||||||||||||
CDW LLC / CDW Finance Corp. (Internet & Catalog Retail) | 5.000% | 09/01/2023 | 550,000 | 558,250 | ||||||||||||
FGI Operating Co. LLC / FGI Finance, Inc. (Leisure Products) | 7.875% | 05/01/2020 | 800,000 | 576,000 | ||||||||||||
Vista Outdoor, Inc. (Leisure Products) | (b) | 5.875% | 10/01/2023 | 275,000 | 281,875 | |||||||||||
Altice SA (Media) | (b) | 7.750% | 05/15/2022 | 975,000 | 879,938 | |||||||||||
Altice SA (Media) | (b) | 7.625% | 02/15/2025 | 250,000 | 215,625 | |||||||||||
Altice U.S. Finance I Corp. (Media) | (b) | 5.375% | 07/15/2023 | 375,000 | 375,937 | |||||||||||
Altice U.S. Finance II Corp. (Media) | (b) | 7.750% | 07/15/2025 | 325,000 | 299,000 | |||||||||||
CCO Holdings LLC / CCO Holdings Capital Corp. (Media) | 6.625% | 01/31/2022 | 400,000 | 421,500 | ||||||||||||
CCO Holdings LLC / CCO Holdings Capital Corp. (Media) | 5.125% | 02/15/2023 | 150,000 | 150,187 | ||||||||||||
CCO Holdings LLC / CCO Holdings Capital Corp. (Media) | 5.750% | 09/01/2023 | 325,000 | 333,125 | ||||||||||||
CCO Holdings LLC / CCO Holdings Capital Corp. (Media) | 5.750% | 01/15/2024 | 1,275,000 | 1,310,063 | ||||||||||||
CCO Holdings LLC / CCO Holdings Capital Corp. (Media) | (b) | 5.375% | 05/01/2025 | 175,000 | 174,125 | |||||||||||
CCO Holdings LLC / CCO Holdings Capital Corp. (Media) | (b) | 5.875% | 05/01/2027 | 150,000 | 149,250 | |||||||||||
Cequel Communications Holdings I LLC / Cequel Capital Corp. (Media) | (b) | 5.125% | 12/15/2021 | 750,000 | 675,000 | |||||||||||
Cequel Communications Holdings I LLC / Cequel Capital Corp. (Media) | (b) | 5.125% | 12/15/2021 | 100,000 | 90,000 | |||||||||||
Clear Channel International BV (Media) | (b) | 8.750% | 12/15/2020 | 50,000 | 49,750 | |||||||||||
Clear Channel Worldwide Holdings, Inc. (Media) | 6.500% | 11/15/2022 | 275,000 | 265,375 | ||||||||||||
Clear Channel Worldwide Holdings, Inc. (Media) | 6.500% | 11/15/2022 | 1,125,000 | 1,096,875 | ||||||||||||
Cumulus Media Holdings, Inc. (Media) | 7.750% | 05/01/2019 | 275,000 | 92,812 | ||||||||||||
DISH DBS Corp. (Media) | 5.875% | 07/15/2022 | 1,600,000 | 1,492,000 | ||||||||||||
Entercom Radio LLC (Media) | 10.500% | 12/01/2019 | 500,000 | 517,500 | ||||||||||||
Expo Event Transco, Inc. (Media) | (b) | 9.000% | 06/15/2021 | 800,000 | 760,000 | |||||||||||
Gray Television, Inc. (Media) | 7.500% | 10/01/2020 | 700,000 | 719,250 | ||||||||||||
| 60 | (continued) |
| Ohio National Fund, Inc. | High Income Bond Portfolio (Continued) |
Schedule of Investments | December 31, 2015 |
| Corporate Bonds (Continued) | Rate | Maturity | Face Amount | Value | ||||||||||||
CONSUMER DISCRETIONARY (continued) | ||||||||||||||||
Igloo Holdings Corp. (Media) | (b)(d) | 8.250%, 9.000% PIK | 12/15/2017 | $ | 875,000 | $ | 875,000 | |||||||||
iHeartCommunications, Inc. (Media) | 9.000% | 03/01/2021 | 700,000 | 488,250 | ||||||||||||
Intelsat Jackson Holdings SA (Media) | 6.625% | 12/15/2022 | 825,000 | 525,937 | ||||||||||||
Intelsat Jackson Holdings SA (Media) | 5.500% | 08/01/2023 | 550,000 | 431,750 | ||||||||||||
Intelsat Luxembourg SA (Media) | 7.750% | 06/01/2021 | 325,000 | 151,125 | ||||||||||||
Intelsat Luxembourg SA (Media) | 8.125% | 06/01/2023 | 750,000 | 337,500 | ||||||||||||
Lamar Media Corp. (Media) | 5.875% | 02/01/2022 | 125,000 | 131,250 | ||||||||||||
Lamar Media Corp. (Media) | 5.000% | 05/01/2023 | 450,000 | 455,625 | ||||||||||||
Lamar Media Corp. (Media) | 5.375% | 01/15/2024 | 275,000 | 283,250 | ||||||||||||
LIN Television Corp. (Media) | 5.875% | 11/15/2022 | 350,000 | 348,250 | ||||||||||||
Nexstar Broadcasting, Inc. (Media) | (b) | 6.125% | 02/15/2022 | 475,000 | 465,500 | |||||||||||
Nielsen Co. Luxembourg SARL / The (Media) | (b) | 5.500% | 10/01/2021 | 175,000 | 179,375 | |||||||||||
Nielsen Finance LLC / Nielsen Finance Co. (Media) | (b) | 5.000% | 04/15/2022 | 1,250,000 | 1,234,375 | |||||||||||
Numericable Group SA (Media) | (b) | 6.000% | 05/15/2022 | 575,000 | 557,750 | |||||||||||
Numericable Group SA (Media) | (b) | 6.250% | 05/15/2024 | 400,000 | 386,000 | |||||||||||
Outfront Media Capital LLC / Outfront Media Capital Corp. (Media) | 5.250% | 02/15/2022 | 300,000 | 306,750 | ||||||||||||
Outfront Media Capital LLC / Outfront Media Capital Corp. (Media) | 5.625% | 02/15/2024 | 300,000 | 308,250 | ||||||||||||
Radio One, Inc. (Media) | (b) | 9.250% | 02/15/2020 | 650,000 | 513,500 | |||||||||||
Radio One, Inc. (Media) | (b) | 7.375% | 04/15/2022 | 475,000 | 422,750 | |||||||||||
Regal Entertainment Group (Media) | 5.750% | 02/01/2025 | 550,000 | 530,750 | ||||||||||||
Regal Entertainment Group (Media) | 5.750% | 03/15/2022 | 100,000 | 100,000 | ||||||||||||
Sinclair Television Group, Inc. (Media) | (b) | 5.625% | 08/01/2024 | 875,000 | 850,937 | |||||||||||
Sinclair Television Group, Inc. (Media) | 6.125% | 10/01/2022 | 50,000 | 51,000 | ||||||||||||
Sirius XM Radio, Inc. (Media) | (b) | 4.625% | 05/15/2023 | 1,300,000 | 1,274,000 | |||||||||||
Sirius XM Radio, Inc. (Media) | (b) | 6.000% | 07/15/2024 | 275,000 | 287,375 | |||||||||||
Sirius XM Radio, Inc. (Media) | (b) | 5.375% | 04/15/2025 | 150,000 | 150,937 | |||||||||||
TEGNA, Inc. (Media) | 6.375% | 10/15/2023 | 775,000 | 817,625 | ||||||||||||
Gannett Co., Inc. (Media) | (b) | 4.875% | 09/15/2021 | 75,000 | 75,187 | |||||||||||
Gannett Co., Inc. (Media) | (b) | 5.500% | 09/15/2024 | 75,000 | 75,000 | |||||||||||
Time, Inc. (Media) | (b) | 5.750% | 04/15/2022 | 200,000 | 183,000 | |||||||||||
Townsquare Media, Inc. (Media) | (b) | 6.500% | 04/01/2023 | 500,000 | 457,500 | |||||||||||
Tribune Media Co. (Media) | (b) | 5.875% | 07/15/2022 | 650,000 | 650,000 | |||||||||||
Unitymedia KabelBW GmbH (Media) | (b) | 6.125% | 01/15/2025 | 425,000 | 419,964 | |||||||||||
Unitymedia Hessen GmbH & Co. KG / Unitymedia NRW GmbH (Media) | (b) | 5.500% | 01/15/2023 | 475,000 | 473,813 | |||||||||||
Unitymedia Hessen GmbH & Co. KG / Unitymedia NRW GmbH (Media) | (b) | 5.000% | 01/15/2025 | 200,000 | 191,000 | |||||||||||
Lynx II Corp. (Media) | (b) | 6.375% | 04/15/2023 | 475,000 | 482,125 | |||||||||||
Virgin Media Finance PLC (Media) | (b) | 5.750% | 01/15/2025 | 200,000 | 192,500 | |||||||||||
Virgin Media Secured Finance PLC (Media) | (b) | 5.250% | 01/15/2026 | 425,000 | 413,312 | |||||||||||
Family Tree Escrow, LLC (Multiline Retail) | (b) | 5.750% | 03/01/2023 | 250,000 | 260,625 | |||||||||||
Argos Merger Sub, Inc. (Specialty Retail) | (b) | 7.125% | 03/15/2023 | 1,000,000 | 991,500 | |||||||||||
Jo-Ann Stores Holdings, Inc. (Acquired 10/09/2012, Cost $296,292)(Specialty Retail) | (b)(d)(f) | 9.750%, 10.500% PIK | 10/15/2019 | 300,000 | 165,000 | |||||||||||
Jo-Ann Stores, Inc. (Specialty Retail) | (b) | 8.125% | 03/15/2019 | 50,000 | 40,000 | |||||||||||
L Brands, Inc. (Specialty Retail) | 5.625% | 02/15/2022 | 725,000 | 770,312 | ||||||||||||
Michaels Stores, Inc. (Specialty Retail) | (b) | 5.875% | 12/15/2020 | 800,000 | 827,000 | |||||||||||
Neiman Marcus Group LTD, Inc. (Specialty Retail) | (b)(d) | 8.750%, 9.500% PIK | 10/15/2021 | 575,000 | 356,500 | |||||||||||
Party City Holdings, Inc. (Specialty Retail) | (b) | 6.125% | 08/15/2023 | 500,000 | 485,000 | |||||||||||
Petco Animal Supplies, Inc. (Specialty Retail) | (b) | 9.250% | 12/01/2018 | 525,000 | 538,781 | |||||||||||
Petco Holdings, Inc. (Specialty Retail) | (b)(d) | 8.500%, 9.250% PIK | 10/15/2017 | 750,000 | 763,125 | |||||||||||
Sally Holdings LLC / Sally Capital, Inc. (Specialty Retail) | 5.625% | 12/01/2025 | 100,000 | 101,000 | ||||||||||||
PVH Corp. (Textiles, Apparel & Luxury Goods) | 4.500% | 12/15/2022 | 275,000 | 268,812 | ||||||||||||
Springs Industries, Inc. (Textiles, Apparel & Luxury Goods) | 6.250% | 06/01/2021 | 625,000 | 618,750 | ||||||||||||
|
| |||||||||||||||
| 56,464,470 | ||||||||||||||||
|
| |||||||||||||||
CONSUMER STAPLES – 3.2% | ||||||||||||||||
Constellation Brands, Inc. (Beverages) | 4.750% | 12/01/2025 | 175,000 | 178,281 | ||||||||||||
Rite Aid Corp. (Food & Staples Retailing) | (b) | 6.125% | 04/01/2023 | 550,000 | 569,250 | |||||||||||
U.S. Foods, Inc. (Food & Staples Retailing) | 8.500% | 06/30/2019 | 525,000 | 540,750 | ||||||||||||
Dean Foods Co. (Food Products) | (b) | 6.500% | 03/15/2023 | 475,000 | 494,000 | |||||||||||
Hearthside Group Holdings LLC / Hearthside Finance Co. (Food Products) | (b) | 6.500% | 05/01/2022 | 1,100,000 | 1,017,500 | |||||||||||
Pinnacle Foods Finance LLC / Pinnacle Foods Finance Corp. (Food Products) | 4.875% | 05/01/2021 | 1,175,000 | 1,128,000 | ||||||||||||
Post Holdings, Inc. (Food Products) | (b) | 7.750% | 03/15/2024 | 225,000 | 235,687 | |||||||||||
Post Holdings, Inc. (Food Products) | (b) | 8.000% | 07/15/2025 | 550,000 | 583,000 | |||||||||||
Sun Merger Sub., Inc. (Food Products) | (b) | 5.875% | 08/01/2021 | 100,000 | 103,000 | |||||||||||
TreeHouse Foods, Inc. (Food Products) | 4.875% | 03/15/2022 | 75,000 | 71,437 | ||||||||||||
Spectrum Brands, Inc. (Household Products) | (b) | 6.125% | 12/15/2024 | 175,000 | 182,000 | |||||||||||
Spectrum Brands, Inc. (Household Products) | (b) | 5.750% | 07/15/2025 | 400,000 | 410,000 | |||||||||||
First Quality Finance Co., Inc. (Personal Products) | (b) | 4.625% | 05/15/2021 | 700,000 | 637,000 | |||||||||||
|
| |||||||||||||||
| 6,149,905 | ||||||||||||||||
|
| |||||||||||||||
| 61 | (continued) |
| Ohio National Fund, Inc. | High Income Bond Portfolio (Continued) |
Schedule of Investments | December 31, 2015 |
| Corporate Bonds (Continued) | Rate | Maturity | Face Amount | Value | ||||||||||||
ENERGY – 9.4% | ||||||||||||||||
CGG SA (Energy Equip. & Svs.) | 6.875% | 01/15/2022 | $ | 300,000 | $ | 123,000 | ||||||||||
Chaparral Energy, Inc. (Energy Equip. & Svs.) | 7.625% | 11/15/2022 | 200,000 | 46,000 | ||||||||||||
FTS International, Inc. (Energy Equip. & Svs.) | 6.250% | 05/01/2022 | 325,000 | 91,000 | ||||||||||||
Antero Resources Corp. (Oil, Gas & Consumable Fuels) | 6.000% | 12/01/2020 | 775,000 | 647,125 | ||||||||||||
Antero Resources Corp. (Oil, Gas & Consumable Fuels) | 5.125% | 12/01/2022 | 200,000 | 152,000 | ||||||||||||
Antero Resources Corp. (Oil, Gas & Consumable Fuels) | (b) | 5.625% | 06/01/2023 | 125,000 | 97,500 | |||||||||||
Approach Resources, Inc. (Oil, Gas & Consumable Fuels) | 7.000% | 06/15/2021 | 550,000 | 195,250 | ||||||||||||
BreitBurn Energy Partners LP / BreitBurn Finance Corp. (Oil, Gas & Consumable Fuels) | 7.875% | 04/15/2022 | 225,000 | 40,500 | ||||||||||||
California Resources Corp. (Oil, Gas & Consumable Fuels) | 5.500% | 09/15/2021 | 150,000 | 47,250 | ||||||||||||
California Resources Corp. (Oil, Gas & Consumable Fuels) | 6.000% | 11/15/2024 | 725,000 | 221,125 | ||||||||||||
Carrizo Oil & Gas, Inc. (Oil, Gas & Consumable Fuels) | 7.500% | 09/15/2020 | 575,000 | 502,406 | ||||||||||||
Carrizo Oil & Gas, Inc. (Oil, Gas & Consumable Fuels) | 6.250% | 04/15/2023 | 100,000 | 81,000 | ||||||||||||
Chesapeake Energy Corp. (Oil, Gas & Consumable Fuels) | 6.875% | 11/15/2020 | 675,000 | 192,375 | ||||||||||||
Chesapeake Energy Corp. (Oil, Gas & Consumable Fuels) | 5.375% | 06/15/2021 | 525,000 | 141,750 | ||||||||||||
Crestwood Midstream Partners LP / Crestwood Midstream Finance Corp. (Oil, Gas & Consumable Fuels) | 6.125% | 03/01/2022 | 150,000 | 104,250 | ||||||||||||
Crestwood Midstream Partners LP / Crestwood Midstream Finance Corp. (Oil, Gas & Consumable Fuels) | (b) | 6.250% | 04/01/2023 | 625,000 | 435,937 | |||||||||||
CrownRock LP / CrownRock Finance, Inc. (Oil, Gas & Consumable Fuels) | (b) | 7.750% | 02/15/2023 | 175,000 | 164,500 | |||||||||||
CVR Refining LLC / Coffeyville Finance, Inc. (Oil, Gas & Consumable Fuels) | 6.500% | 11/01/2022 | 325,000 | 315,250 | ||||||||||||
Energy Transfer Equity LP (Oil, Gas & Consumable Fuels) | 5.875% | 01/15/2024 | 1,725,000 | 1,405,875 | ||||||||||||
Energy XXI Gulf Coast, Inc. (Oil, Gas & Consumable Fuels) | 7.500% | 12/15/2021 | 350,000 | 38,062 | ||||||||||||
Energy XXI Gulf Coast, Inc. (Oil, Gas & Consumable Fuels) | 6.875% | 03/15/2024 | 50,000 | 5,500 | ||||||||||||
EP Energy LLC / Everest Acquisition Finance, Inc. (Oil, Gas & Consumable Fuels) | 9.375% | 05/01/2020 | 350,000 | 223,125 | ||||||||||||
EP Energy LLC / Everest Acquisition Finance, Inc. (Oil, Gas & Consumable Fuels) | 7.750% | 09/01/2022 | 100,000 | 51,000 | ||||||||||||
EP Energy LLC / Everest Acquisition Finance, Inc. (Oil, Gas & Consumable Fuels) | 6.375% | 06/15/2023 | 250,000 | 125,000 | ||||||||||||
Gulfport Energy Corp. (Oil, Gas & Consumable Fuels) | 7.750% | 11/01/2020 | 350,000 | 313,250 | ||||||||||||
Gulfport Energy Corp. (Oil, Gas & Consumable Fuels) | 6.625% | 05/01/2023 | 225,000 | 187,875 | ||||||||||||
Halcon Resources Corp. (Oil, Gas & Consumable Fuels) | (b) | 8.625% | 02/01/2020 | 300,000 | 207,000 | |||||||||||
Hiland Partners LP / Hiland Partners Finance Corp. (Oil, Gas & Consumable Fuels) | (b) | 5.500% | 05/15/2022 | 250,000 | 240,000 | |||||||||||
Holly Energy Partners LP / Holly Energy Finance Corp. (Oil, Gas & Consumable Fuels) | 6.500% | 03/01/2020 | 475,000 | 470,250 | ||||||||||||
Kinder Morgan, Inc. (Oil, Gas & Consumable Fuels) | (b) | 5.625% | 11/15/2023 | 550,000 | 503,097 | |||||||||||
Laredo Petroleum, Inc. (Oil, Gas & Consumable Fuels) | 5.625% | 01/15/2022 | 225,000 | 195,750 | ||||||||||||
Laredo Petroleum, Inc. (Oil, Gas & Consumable Fuels) | 7.375% | 05/01/2022 | 100,000 | 92,000 | ||||||||||||
Laredo Petroleum, Inc. (Oil, Gas & Consumable Fuels) | 6.250% | 03/15/2023 | 125,000 | 108,750 | ||||||||||||
Legacy Reserves LP / Legacy Reserves Finance Corp. (Acquired 05/08/2014 through 08/26/2014, Cost $801,602)(Oil, Gas & Consumable Fuels) | 6.625% | 12/01/2021 | 700,000 | 147,000 | ||||||||||||
Linn Energy LLC / Linn Energy Finance Corp. (Oil, Gas & Consumable Fuels) | 8.625% | 04/15/2020 | 350,000 | 59,937 | ||||||||||||
Linn Energy LLC / Linn Energy Finance Corp. (Oil, Gas & Consumable Fuels) | 7.750% | 02/01/2021 | 300,000 | 43,500 | ||||||||||||
Linn Energy LLC / Linn Energy Finance Corp. (Oil, Gas & Consumable Fuels) | 6.500% | 09/15/2021 | 125,000 | 16,875 | ||||||||||||
MPLX LP (Oil, Gas & Consumable Fuels) | (b) | 5.500% | 02/15/2023 | 600,000 | 525,000 | |||||||||||
MPLX LP (Oil, Gas & Consumable Fuels) | (b) | 4.500% | 07/15/2023 | 325,000 | 290,778 | |||||||||||
MPLX LP (Oil, Gas & Consumable Fuels) | (b) | 4.875% | 12/01/2024 | 75,000 | 67,312 | |||||||||||
Northern Oil and Gas, Inc. (Oil, Gas & Consumable Fuels) | 8.000% | 06/01/2020 | 850,000 | 565,250 | ||||||||||||
Oasis Petroleum, Inc. (Oil, Gas & Consumable Fuels) | 6.875% | 03/15/2022 | 625,000 | 400,000 | ||||||||||||
PDC Energy, Inc. (Oil, Gas & Consumable Fuels) | 7.750% | 10/15/2022 | 125,000 | 120,000 | ||||||||||||
Range Resources Corp. (Oil, Gas & Consumable Fuels) | (b) | 4.875% | 05/15/2025 | 647,000 | 491,720 | |||||||||||
Regency Energy Partners LP / Regency Energy Finance Corp. (Oil, Gas & Consumable Fuels) | 5.875% | 03/01/2022 | 150,000 | 141,396 | ||||||||||||
Regency Energy Partners LP / Regency Energy Finance Corp. (Oil, Gas & Consumable Fuels) | 5.000% | 10/01/2022 | 200,000 | 177,253 | ||||||||||||
Regency Energy Partners LP / Regency Energy Finance Corp. (Oil, Gas & Consumable Fuels) | 5.500% | 04/15/2023 | 175,000 | 157,355 | ||||||||||||
Regency Energy Partners LP / Regency Energy Finance Corp. (Oil, Gas & Consumable Fuels) | 4.500% | 11/01/2023 | 225,000 | 194,749 | ||||||||||||
Rice Energy, Inc. (Oil, Gas & Consumable Fuels) | (b) | 7.250% | 05/01/2023 | 75,000 | 54,750 | |||||||||||
Rice Energy, Inc. (Oil, Gas & Consumable Fuels) | 6.250% | 05/01/2022 | 500,000 | 360,000 | ||||||||||||
Rose Rock Midstream LP / Rose Rock Finance Corp. (Oil, Gas & Consumable Fuels) | 5.625% | 07/15/2022 | 600,000 | 426,000 | ||||||||||||
Rose Rock Midstream LP / Rose Rock Finance Corp. (Oil, Gas & Consumable Fuels) | (b) | 5.625% | 11/15/2023 | 325,000 | 230,750 | |||||||||||
RSP Permian, Inc. (Oil, Gas & Consumable Fuels) | (b) | 6.625% | 10/01/2022 | 75,000 | 69,000 | |||||||||||
RSP Permian, Inc. (Oil, Gas & Consumable Fuels) | 6.625% | 10/01/2022 | 275,000 | 253,000 | ||||||||||||
Sabine Pass Liquefaction, LLC (Oil, Gas & Consumable Fuels) | 5.625% | 02/01/2021 | 950,000 | 874,000 | ||||||||||||
Sabine Pass Liquefaction, LLC (Oil, Gas & Consumable Fuels) | 6.250% | 03/15/2022 | 300,000 | 277,500 | ||||||||||||
Sabine Pass Liquefaction, LLC (Oil, Gas & Consumable Fuels) | 5.625% | 04/15/2023 | 225,000 | 197,437 | ||||||||||||
Sabine Pass Liquefaction, LLC (Oil, Gas & Consumable Fuels) | (b) | 5.625% | 03/01/2025 | 375,000 | 317,344 | |||||||||||
SandRidge Energy, Inc. (Oil, Gas & Consumable Fuels) | 7.500% | 03/15/2021 | 50,000 | 5,250 | ||||||||||||
SandRidge Energy, Inc. (Oil, Gas & Consumable Fuels) | 8.125% | 10/15/2022 | 500,000 | 55,000 | ||||||||||||
SandRidge Energy, Inc. (Oil, Gas & Consumable Fuels) | 7.500% | 02/15/2023 | 200,000 | 21,750 | ||||||||||||
SM Energy Co. (Oil, Gas & Consumable Fuels) | 6.500% | 01/01/2023 | 50,000 | 36,750 | ||||||||||||
SM Energy Co. (Oil, Gas & Consumable Fuels) | 5.000% | 01/15/2024 | 325,000 | 211,250 | ||||||||||||
SM Energy Co. (Oil, Gas & Consumable Fuels) | 5.625% | 06/01/2025 | 150,000 | 99,000 | ||||||||||||
Summit Midstream Holdings LLC / Summit Midstream Finance Corp. (Oil, Gas & Consumable Fuels) | 5.500% | 08/15/2022 | 700,000 | 518,000 | ||||||||||||
Targa Resources Partners LP / Targa Resources Partners Finance Corp. (Oil, Gas & Consumable Fuels) | 5.250% | 05/01/2023 | 350,000 | 283,500 | ||||||||||||
Targa Resources Partners LP / Targa Resources Partners Finance Corp. (Oil, Gas & Consumable Fuels) | 4.250% | 11/15/2023 | 175,000 | 134,750 | ||||||||||||
Tesoro Corp. (Oil, Gas & Consumable Fuels) | 5.125% | 04/01/2024 | 425,000 | 422,875 | ||||||||||||
| 62 | (continued) |
| Ohio National Fund, Inc. | High Income Bond Portfolio (Continued) |
Schedule of Investments | December 31, 2015 |
| Corporate Bonds (Continued) | Rate | Maturity | Face Amount | Value | ||||||||||||
ENERGY (continued) | ||||||||||||||||
Tesoro Logistics LP / Tesoro Logistics Finance Corp. (Oil, Gas & Consumable Fuels) | (b) | 5.500% | 10/15/2019 | $ | 50,000 | $ | 48,500 | |||||||||
Tesoro Logistics LP / Tesoro Logistics Finance Corp. (Oil, Gas & Consumable Fuels) | 5.875% | 10/01/2020 | 547,000 | 522,385 | ||||||||||||
Tesoro Logistics LP / Tesoro Logistics Finance Corp. (Oil, Gas & Consumable Fuels) | 6.125% | 10/15/2021 | 325,000 | 308,750 | ||||||||||||
Tesoro Logistics LP / Tesoro Logistics Finance Corp. (Oil, Gas & Consumable Fuels) | (b) | 6.250% | 10/15/2022 | 75,000 | 71,062 | |||||||||||
W&T Offshore, Inc. (Oil, Gas & Consumable Fuels) | 8.500% | 06/15/2019 | 775,000 | 271,250 | ||||||||||||
Western Refining Logistics LP / WNRL Finance Corp. (Oil, Gas & Consumable Fuels) | 7.500% | 02/15/2023 | 400,000 | 382,000 | ||||||||||||
Whiting Petroleum Corp. (Oil, Gas & Consumable Fuels) | 6.250% | 04/01/2023 | 700,000 | 504,000 | ||||||||||||
Williams Partners LP / ACMP Finance Corp. (Oil, Gas & Consumable Fuels) | 6.125% | 07/15/2022 | 225,000 | 212,906 | ||||||||||||
|
| |||||||||||||||
| 18,331,636 | ||||||||||||||||
|
| |||||||||||||||
FINANCIALS – 2.9% | ||||||||||||||||
CIT Group, Inc. (Banks) | 5.000% | 08/01/2023 | 475,000 | 482,125 | ||||||||||||
CIT Group, Inc. (Banks) | 5.375% | 05/15/2020 | 225,000 | 235,687 | ||||||||||||
Ally Financial, Inc. (Consumer Finance) | 3.250% | 11/05/2018 | 500,000 | 490,625 | ||||||||||||
Ally Financial, Inc. (Consumer Finance) | 4.125% | 03/30/2020 | 125,000 | 124,375 | ||||||||||||
Ally Financial, Inc. (Consumer Finance) | 4.125% | 02/13/2022 | 475,000 | 470,250 | ||||||||||||
Ally Financial, Inc. (Consumer Finance) | 4.625% | 05/19/2022 | 250,000 | 251,250 | ||||||||||||
Ally Financial, Inc. (Consumer Finance) | 4.625% | 03/30/2025 | 400,000 | 395,000 | ||||||||||||
Ally Financial, Inc. (Consumer Finance) | 5.750% | 11/20/2025 | 325,000 | 329,062 | ||||||||||||
MSCI, Inc. (Diversified Financial Svs.) | (b) | 5.250% | 11/15/2024 | 150,000 | 152,250 | |||||||||||
MSCI, Inc. (Diversified Financial Svs.) | (b) | 5.750% | 08/15/2025 | 325,000 | 333,125 | |||||||||||
Hockey Merger Sub 2, Inc. (Insurance) | (b) | 7.875% | 10/01/2021 | 925,000 | 832,500 | |||||||||||
RHP Hotel Properties LP / RHP Finance Corp. (Real Estate Investment Trusts) | 5.000% | 04/15/2023 | 100,000 | 100,000 | ||||||||||||
Hub Holdings, LLC / Hub Holdings Finance, Inc. (Real Estate Mgmt. & Development) | (b)(d) | 8.125%, 8.875% PIK | 07/15/2019 | 600,000 | 561,000 | |||||||||||
Quicken Loans, Inc. (Thrifts & Mortgage Finance) | (b) | 5.750% | 05/01/2025 | 900,000 | 857,250 | |||||||||||
|
| |||||||||||||||
| 5,614,499 | ||||||||||||||||
|
| |||||||||||||||
HEALTH CARE – 12.8% | ||||||||||||||||
Grifols Worldwide Operations Ltd. (Biotechnology) | 5.250% | 04/01/2022 | 675,000 | 678,375 | ||||||||||||
Crimson Merger Sub., Inc. (Health Care Equip. & Supplies) | (b) | 6.625% | 05/15/2022 | 1,775,000 | 1,215,875 | |||||||||||
Hill-Rom Holdings, Inc. (Health Care Equip. & Supplies) | (b) | 5.750% | 09/01/2023 | 125,000 | 127,500 | |||||||||||
Sterigenics-Nordion Holdings LLC (Health Care Equip. & Supplies) | (b) | 6.500% | 05/15/2023 | 775,000 | 740,125 | |||||||||||
Teleflex, Inc. (Health Care Equip. & Supplies) | 5.250% | 06/15/2024 | 275,000 | 273,625 | ||||||||||||
Air Medical Merger Sub Corp. (Health Care Providers & Svs.) | (b) | 6.375% | 05/15/2023 | 625,000 | 556,250 | |||||||||||
Amsurg Corp. (Health Care Providers & Svs.) | 5.625% | 07/15/2022 | 675,000 | 668,250 | ||||||||||||
CHS / Community Health Systems, Inc. (Health Care Providers & Svs.) | 5.125% | 08/01/2021 | 300,000 | 298,500 | ||||||||||||
CHS / Community Health Systems, Inc. (Health Care Providers & Svs.) | 6.875% | 02/01/2022 | 1,175,000 | 1,114,781 | ||||||||||||
DaVita HealthCare Partners, Inc. (Health Care Providers & Svs.) | 5.125% | 07/15/2024 | 450,000 | 450,000 | ||||||||||||
Envision Healthcare Corp. (Health Care Providers & Svs.) | (b) | 5.125% | 07/01/2022 | 875,000 | 857,500 | |||||||||||
HCA, Inc. (Health Care Providers & Svs.) | 5.875% | 05/01/2023 | 275,000 | 281,875 | ||||||||||||
HCA, Inc. (Health Care Providers & Svs.) | 5.000% | 03/15/2024 | 2,175,000 | 2,169,562 | ||||||||||||
HCA, Inc. (Health Care Providers & Svs.) | 5.375% | 02/01/2025 | 1,200,000 | 1,185,000 | ||||||||||||
HCA, Inc. (Health Care Providers & Svs.) | 5.250% | 04/15/2025 | 450,000 | 453,375 | ||||||||||||
HCA, Inc. (Health Care Providers & Svs.) | 5.875% | 02/15/2026 | 225,000 | 225,844 | ||||||||||||
IASIS Healthcare LLC / IASIS Capital Corp. (Health Care Providers & Svs.) | 8.375% | 05/15/2019 | 400,000 | 368,000 | ||||||||||||
Jaguar Holding Co II / Pharmaceutical Product Development LLC (Health Care Providers & Svs.) | (b) | 6.375% | 08/01/2023 | 1,300,000 | 1,267,500 | |||||||||||
LifePoint Hospitals, Inc. (Health Care Providers & Svs.) | 5.500% | 12/01/2021 | 750,000 | 763,125 | ||||||||||||
LifePoint Health, Inc. (Health Care Providers & Svs.) | 5.875% | 12/01/2023 | 75,000 | 76,125 | ||||||||||||
MEDNAX, Inc. (Health Care Providers & Svs.) | (b) | 5.250% | 12/01/2023 | 125,000 | 125,625 | |||||||||||
MPH Acquisition Holdings LLC (Health Care Providers & Svs.) | (b) | 6.625% | 04/01/2022 | 1,300,000 | 1,303,250 | |||||||||||
Surgical Care Affiliates, Inc. (Health Care Providers & Svs.) | (b) | 6.000% | 04/01/2023 | 600,000 | 585,000 | |||||||||||
Team Health, Inc. (Health Care Providers & Svs.) | (b) | 7.250% | 12/15/2023 | 300,000 | 310,500 | |||||||||||
Tenet Healthcare Corp. (Health Care Providers & Svs.) | 4.500% | 04/01/2021 | 350,000 | 341,250 | ||||||||||||
Tenet Healthcare Corp. (Health Care Providers & Svs.) | 4.375% | 10/01/2021 | 850,000 | 820,250 | ||||||||||||
Tenet Healthcare Corp. (Health Care Providers & Svs.) | 8.125% | 04/01/2022 | 900,000 | 897,750 | ||||||||||||
Tenet Healthcare Corp. (Health Care Providers & Svs.) | 6.750% | 06/15/2023 | 300,000 | 278,250 | ||||||||||||
Emdeon, Inc. (Health Care Technology) | 11.000% | 12/31/2019 | 400,000 | 417,000 | ||||||||||||
Emdeon, Inc. (Health Care Technology) | (b) | 6.000% | 02/15/2021 | 225,000 | 209,250 | |||||||||||
Truven Health Analytics, Inc. (Health Care Technology) | 10.625% | 06/01/2020 | 600,000 | 603,000 | ||||||||||||
Quintiles Transnational Corp. (Life Sciences Tools & Svs.) | (b) | 4.875% | 05/15/2023 | 250,000 | 251,250 | |||||||||||
Endo Finance LLC / Endo Ltd. / Endo Finco, Inc. (Pharmaceuticals) | (b) | 6.000% | 02/01/2025 | 625,000 | 615,625 | |||||||||||
Endo Finance LLC / Endo Ltd. / Endo Finco, Inc. (Pharmaceuticals) | (b) | 6.000% | 07/15/2023 | 475,000 | 472,625 | |||||||||||
Mallinckrodt International Finance SA (Pharmaceuticals) | 4.750% | 04/15/2023 | 475,000 | 420,375 | ||||||||||||
Mallinckrodt International Finance SA / Mallinckrodt CB LLC (Pharmaceuticals) | (b) | 4.875% | 04/15/2020 | 100,000 | 96,250 | |||||||||||
Mallinckrodt International Finance SA / Mallinckrodt CB LLC (Pharmaceuticals) | (b) | 5.500% | 04/15/2025 | 200,000 | 184,000 | |||||||||||
Mallinckrodt International Finance SA / Mallinckrodt CB LLC (Pharmaceuticals) | (b) | 5.625% | 10/15/2023 | 200,000 | 190,000 | |||||||||||
Prestige Brands, Inc. (Pharmaceuticals) | (b) | 5.375% | 12/15/2021 | 850,000 | 816,000 | |||||||||||
VPII Escrow Corp. (Pharmaceuticals) | (b) | 7.500% | 07/15/2021 | 825,000 | 822,937 | |||||||||||
Valeant Pharmaceuticals International, Inc. (Pharmaceuticals) | (b) | 5.500% | 03/01/2023 | 175,000 | 154,000 | |||||||||||
| 63 | (continued) |
| Ohio National Fund, Inc. | High Income Bond Portfolio (Continued) |
Schedule of Investments | December 31, 2015 |
| Corporate Bonds (Continued) | Rate | Maturity | Face Amount | Value | ||||||||||||
HEALTH CARE (continued) | ||||||||||||||||
VRX Escrow Corp. (Pharmaceuticals) | (b) | 5.375% | 03/15/2020 | $ | 50,000 | $ | 47,000 | |||||||||
VRX Escrow Corp. (Pharmaceuticals) | (b) | 5.875% | 05/15/2023 | 650,000 | 580,125 | |||||||||||
VRX Escrow Corp. (Pharmaceuticals) | (b) | 6.125% | 04/15/2025 | 675,000 | 602,437 | |||||||||||
|
| |||||||||||||||
| 24,914,936 | ||||||||||||||||
|
| |||||||||||||||
INDUSTRIALS – 10.1% | ||||||||||||||||
Silver II Borrower / Silver II U.S. Holdings LLC (Aerospace & Defense) | (b) | 7.750% | 12/15/2020 | 550,000 | 396,000 | |||||||||||
TransDigm, Inc. (Aerospace & Defense) | (b) | 6.500% | 05/15/2025 | 50,000 | 48,437 | |||||||||||
TransDigm, Inc. (Aerospace & Defense) | 5.500% | 10/15/2020 | 275,000 | 266,062 | ||||||||||||
TransDigm, Inc. (Aerospace & Defense) | 7.500% | 07/15/2021 | 300,000 | 310,500 | ||||||||||||
TransDigm, Inc. (Aerospace & Defense) | 6.000% | 07/15/2022 | 550,000 | 537,625 | ||||||||||||
TransDigm, Inc. (Aerospace & Defense) | 6.500% | 07/15/2024 | 475,000 | 472,387 | ||||||||||||
Allegion PLC (Building Products) | 5.875% | 09/15/2023 | 125,000 | 127,500 | ||||||||||||
Allegion U.S. Holding Co., Inc. (Building Products) | 5.750% | 10/01/2021 | 325,000 | 329,062 | ||||||||||||
Building Materials Corp. of America (Building Products) | (b) | 6.000% | 10/15/2025 | 225,000 | 229,500 | |||||||||||
Hillman Group, Inc. / The (Building Products) | (b) | 6.375% | 07/15/2022 | 625,000 | 518,750 | |||||||||||
Masonite International Corp. (Building Products) | (b) | 5.625% | 03/15/2023 | 150,000 | 154,875 | |||||||||||
NCI Building Systems, Inc. (Building Products) | (b) | 8.250% | 01/15/2023 | 450,000 | 472,500 | |||||||||||
USG Corp. (Building Products) | (b) | 5.875% | 11/01/2021 | 175,000 | 182,000 | |||||||||||
USG Corp. (Building Products) | (b) | 5.500% | 03/01/2025 | 50,000 | 50,750 | |||||||||||
Unifrax I LLC / Unifrax Holding Co. (Building Products) | (b) | 7.500% | 02/15/2019 | 775,000 | 685,875 | |||||||||||
Garda World Security Corp. (Commercial Svs. & Supplies) | (b) | 7.250% | 11/15/2021 | 600,000 | 516,000 | |||||||||||
Garda World Security Corp. (Commercial Svs. & Supplies) | (b) | 7.250% | 11/15/2021 | 650,000 | 559,000 | |||||||||||
Multi-Color Corp. (Commercial Svs. & Supplies) | (b) | 6.125% | 12/01/2022 | 650,000 | 643,500 | |||||||||||
Mustang Merger Corp. (Commercial Svs. & Supplies) | (b) | 8.500% | 08/15/2021 | 775,000 | 804,063 | |||||||||||
Southern Graphics, Inc. (Commercial Svs. & Supplies) | (b) | 8.375% | 10/15/2020 | 1,200,000 | 1,206,000 | |||||||||||
United Rentals North America, Inc. (Commercial Svs. & Supplies) | 7.375% | 05/15/2020 | 100,000 | 105,500 | ||||||||||||
United Rentals North America, Inc. (Commercial Svs. & Supplies) | 6.125% | 06/15/2023 | 100,000 | 102,250 | ||||||||||||
United Rentals North America, Inc. (Commercial Svs. & Supplies) | 4.625% | 07/15/2023 | 225,000 | 224,438 | ||||||||||||
United Rentals North America, Inc. (Commercial Svs. & Supplies) | 5.750% | 11/15/2024 | 100,000 | 99,000 | ||||||||||||
United Rentals North America, Inc. (Commercial Svs. & Supplies) | 5.500% | 07/15/2025 | 875,000 | 848,750 | ||||||||||||
EnerSys (Electrical Equip.) | (b) | 5.000% | 04/30/2023 | 225,000 | 223,875 | |||||||||||
Sensata Technologies BV (Electrical Equip.) | (b) | 5.625% | 11/01/2024 | 225,000 | 230,063 | |||||||||||
Sensata Technologies BV (Electrical Equip.) | (b) | 5.000% | 10/01/2025 | 300,000 | 293,250 | |||||||||||
Sensata Technologies UK Financing Co. PLC (Electrical Equip.) | (b) | 6.250% | 02/15/2026 | 225,000 | 234,000 | |||||||||||
Dematic SA / DH Services Luxembourg Sarl (Machinery) | (b) | 7.750% | 12/15/2020 | 1,100,000 | 1,105,500 | |||||||||||
Gardner Denver, Inc. (Machinery) | (b) | 6.875% | 08/15/2021 | 800,000 | 612,000 | |||||||||||
Milacron LLC / Mcron Finance Corp. (Machinery) | (b) | 7.750% | 02/15/2021 | 350,000 | 326,375 | |||||||||||
Schaeffler Finance BV (Machinery) | (b) | 4.750% | 05/15/2021 | 375,000 | 376,875 | |||||||||||
Schaeffler Finance BV (Machinery) | (b) | 4.250% | 05/15/2021 | 250,000 | 248,125 | |||||||||||
Schaeffler Finance BV (Machinery) | (b) | 4.750% | 05/15/2023 | 200,000 | 196,000 | |||||||||||
Schaeffler Holding Finance BV (Machinery) | (b)(d) | 6.750%, 7.500% PIK | 11/15/2022 | 400,000 | 430,000 | |||||||||||
IHS, Inc. (Professional Svs.) | 5.000% | 11/01/2022 | 175,000 | 177,188 | ||||||||||||
Anna Merger Sub., Inc. (Professional Svs.) | (b) | 7.750% | 10/01/2022 | 1,325,000 | 1,169,312 | |||||||||||
Hertz Corp. / The (Road & Rail) | 6.750% | 04/15/2019 | 625,000 | 638,438 | ||||||||||||
Hertz Corp. / The (Road & Rail) | 6.250% | 10/15/2022 | 375,000 | 388,125 | ||||||||||||
AerCap Ireland Capital Ltd. / AerCap Global Aviation Trust (Trading Companies & Distributors) | 4.625% | 07/01/2022 | 150,000 | 151,688 | ||||||||||||
AerCap Ireland Capital Ltd. / AerCap Global Aviation Trust (Trading Companies & Distributors) | 4.625% | 10/30/2020 | 200,000 | 204,750 | ||||||||||||
American Builders & Contractors Supply Co., Inc. (Trading Companies & Distributors) | (b) | 5.625% | 04/15/2021 | 625,000 | 632,813 | |||||||||||
American Builders & Contractors Supply Co., Inc. (Trading Companies & Distributors) | (b) | 5.750% | 12/15/2023 | 50,000 | 50,375 | |||||||||||
Beacon Roofing Supply, Inc. (Trading Companies & Distributors) | (b) | 6.375% | 10/01/2023 | 175,000 | 178,281 | |||||||||||
HD Supply, Inc. (Trading Companies & Distributors) | 7.500% | 07/15/2020 | 100,000 | 104,000 | ||||||||||||
HD Supply, Inc. (Trading Companies & Distributors) | (b) | 5.250% | 12/15/2021 | 225,000 | 229,500 | |||||||||||
International Lease Finance Corp. (Trading Companies & Distributors) | 5.875% | 08/15/2022 | 1,075,000 | 1,144,875 | ||||||||||||
WESCO Distribution, Inc. (Trading Companies & Distributors) | 5.375% | 12/15/2021 | 425,000 | 408,000 | ||||||||||||
|
| |||||||||||||||
| 19,643,732 | ||||||||||||||||
|
| |||||||||||||||
INFORMATION TECHNOLOGY – 10.8% | ||||||||||||||||
CommScope Holding Co., Inc. (Communications Equip.) | (b)(d) | 6.625%, 7.375% PIK | 06/01/2020 | 400,000 | 404,500 | |||||||||||
CommScope, Inc. (Communications Equip.) | (b) | 5.500% | 06/15/2024 | 525,000 | 498,750 | |||||||||||
Anixter, Inc. (Electronic Equip., Instr. & Comp.) | 5.625% | 05/01/2019 | 300,000 | 312,000 | ||||||||||||
Anixter, Inc. (Electronic Equip., Instr. & Comp.) | (b) | 5.500% | 03/01/2023 | 325,000 | 326,625 | |||||||||||
Belden, Inc. (Electronic Equip., Instr. & Comp.) | (b) | 5.500% | 09/01/2022 | 725,000 | 697,813 | |||||||||||
Belden, Inc. (Electronic Equip., Instr. & Comp.) | (b) | 5.250% | 07/15/2024 | 375,000 | 345,000 | |||||||||||
Cleaver-Brooks, Inc. (Electronic Equip., Instr. & Comp.) | (b) | 8.750% | 12/15/2019 | 575,000 | 554,875 | |||||||||||
Zebra Technologies Corp. (Electronic Equip., Instr. & Comp.) | 7.250% | 10/15/2022 | 650,000 | 679,250 | ||||||||||||
Blackboard, Inc. (Internet Software & Svs.) | (b) | 7.750% | 11/15/2019 | 400,000 | 346,000 | |||||||||||
Match Group, Inc. (Internet Software & Svs.) | (b) | 6.750% | 12/15/2022 | 1,100,000 | 1,089,000 | |||||||||||
| 64 | (continued) |
| Ohio National Fund, Inc. | High Income Bond Portfolio (Continued) |
Schedule of Investments | December 31, 2015 |
| Corporate Bonds (Continued) | Rate | Maturity | Face Amount | Value | ||||||||||||
INFORMATION TECHNOLOGY (continued) | ||||||||||||||||
VeriSign, Inc. (Internet Software & Svs.) | 4.625% | 05/01/2023 | $ | 300,000 | $ | 290,475 | ||||||||||
VeriSign, Inc. (Internet Software & Svs.) | 5.250% | 04/01/2025 | 125,000 | 125,625 | ||||||||||||
CoreLogic, Inc. (IT Svs.) | 7.250% | 06/01/2021 | 450,000 | 468,000 | ||||||||||||
First Data Corp. (IT Svs.) | (b) | 8.750% | 01/15/2022 | 750,000 | 783,638 | |||||||||||
First Data Corp. (IT Svs.) | (b) | 5.375% | 08/15/2023 | 550,000 | 552,750 | |||||||||||
First Data Corp. (IT Svs.) | (b) | 7.000% | 12/01/2023 | 175,000 | 175,000 | |||||||||||
First Data Corp. (IT Svs.) | (b) | 5.750% | 01/15/2024 | 2,000,000 | 1,970,000 | |||||||||||
Sabre GLBL, Inc. (IT Svs.) | (b) | 5.375% | 04/15/2023 | 450,000 | 447,750 | |||||||||||
Sabre GLBL, Inc. (IT Svs.) | (b) | 5.250% | 11/15/2023 | 75,000 | 74,156 | |||||||||||
Advanced Micro Devices, Inc. (Semiconductors & Equip.) | 7.500% | 08/15/2022 | 250,000 | 170,000 | ||||||||||||
Advanced Micro Devices, Inc. (Semiconductors & Equip.) | 7.000% | 07/01/2024 | 550,000 | 357,500 | ||||||||||||
Entegris, Inc. (Semiconductors & Equip.) | (b) | 6.000% | 04/01/2022 | 925,000 | 936,563 | |||||||||||
Micron Technology, Inc. (Semiconductors & Equip.) | (b) | 5.250% | 08/01/2023 | 400,000 | 359,000 | |||||||||||
Micron Technology, Inc. (Semiconductors & Equip.) | (b) | 5.250% | 01/15/2024 | 175,000 | 154,000 | |||||||||||
Qorvo, Inc. (Semiconductors & Equip.) | (b) | 7.000% | 12/01/2025 | 500,000 | 515,000 | |||||||||||
Audatex North America, Inc. (Software) | (b) | 6.000% | 06/15/2021 | 525,000 | 528,938 | |||||||||||
Audatex North America, Inc. (Software) | (b) | 6.125% | 11/01/2023 | 500,000 | 503,125 | |||||||||||
Blue Coat Holdings, Inc. (Software) | (b) | 8.375% | 06/01/2023 | 675,000 | 678,375 | |||||||||||
BMC Software Finance, Inc. (Software) | (b) | 8.125% | 07/15/2021 | 600,000 | 399,000 | |||||||||||
Boxer Parent Co., Inc. (Software) | (b)(d) | 9.000%, 9.750% PIK | 10/15/2019 | 775,000 | 480,500 | |||||||||||
Ensemble S Merger Sub, Inc. (Software) | (b) | 9.000% | 09/30/2023 | 675,000 | 652,219 | |||||||||||
Infor Software Parent LLC / Infor Software Parent, Inc. (Software) | (b)(d) | 7.125%, 7.875% PIK | 05/01/2021 | 1,725,000 | 1,246,313 | |||||||||||
Infor U.S., Inc. (Software) | (b) | 6.500% | 05/15/2022 | 775,000 | 654,875 | |||||||||||
Infor U.S., Inc. (Software) | (b) | 5.750% | 08/15/2020 | 75,000 | 75,563 | |||||||||||
Italics Merger Sub, Inc. (Software) | (b) | 7.125% | 07/15/2023 | 750,000 | 678,750 | |||||||||||
Nuance Communications, Inc. (Software) | (b) | 5.375% | 08/15/2020 | 900,000 | 901,188 | |||||||||||
SS&C Technologies Holdings, Inc. (Software) | (b) | 5.875% | 07/15/2023 | 400,000 | 413,000 | |||||||||||
NCR Corp. (Tech. Hardware, Storage & Periph.) | 4.625% | 02/15/2021 | 475,000 | 452,438 | ||||||||||||
NCR Corp. (Tech. Hardware, Storage & Periph.) | 5.000% | 07/15/2022 | 450,000 | 436,500 | ||||||||||||
NCR Corp. (Tech. Hardware, Storage & Periph.) | 6.375% | 12/15/2023 | 225,000 | 221,625 | ||||||||||||
|
| |||||||||||||||
| 20,955,679 | ||||||||||||||||
|
| |||||||||||||||
MATERIALS – 9.5% | ||||||||||||||||
Ashland, Inc. (Chemicals) | 4.750% | 08/15/2022 | 600,000 | 583,500 | ||||||||||||
Celanese U.S. Holdings LLC (Chemicals) | 4.625% | 11/15/2022 | 325,000 | 320,125 | ||||||||||||
Eco Services Operations LLC / Eco Finance Corp. (Chemicals) | (b) | 8.500% | 11/01/2022 | 325,000 | 276,250 | |||||||||||
Hexion, Inc. (Chemicals) | 6.625% | 04/15/2020 | 425,000 | 332,563 | ||||||||||||
Hexion, Inc. (Chemicals) | 8.875% | 02/01/2018 | 800,000 | 564,000 | ||||||||||||
Huntsman International LLC (Chemicals) | (b) | 5.125% | 11/15/2022 | 325,000 | 292,500 | |||||||||||
Huntsman International LLC (Chemicals) | 4.875% | 11/15/2020 | 250,000 | 228,125 | ||||||||||||
Platform Specialty Products Corp. (Chemicals) | (b) | 6.500% | 02/01/2022 | 900,000 | 778,500 | |||||||||||
Platform Specialty Products Corp. (Chemicals) | (b) | 10.375% | 05/01/2021 | 100,000 | 99,750 | |||||||||||
U.S. Coatings Acquisition, Inc. / Flash Dutch 2 BV (Chemicals) | (b) | 7.375% | 05/01/2021 | 400,000 | 421,750 | |||||||||||
W.R. Grace & Co. (Chemicals) | (b) | 5.125% | 10/01/2021 | 150,000 | 151,500 | |||||||||||
W.R. Grace & Co. (Chemicals) | (b) | 5.625% | 10/01/2024 | 200,000 | 202,000 | |||||||||||
Ardagh Packaging Finance PLC (Containers & Packaging) | (b) | 9.125% | 10/15/2020 | 675,000 | 695,250 | |||||||||||
Ardagh Packaging Finance PLC / Ardagh Holdings U.S.A., Inc. (Containers & Packaging) | (b) | 6.750% | 01/31/2021 | 200,000 | 192,000 | |||||||||||
Ardagh Packaging Finance PLC / Ardagh MP Holdings U.S.A., Inc. (Containers & Packaging) | (b) | 9.125% | 10/15/2020 | 425,000 | 435,625 | |||||||||||
Ardagh Packaging Finance PLC / Ardagh MP Holdings U.S.A., Inc. (Containers & Packaging) | (b) | 7.000% | 11/15/2020 | 48,529 | 47,680 | |||||||||||
Ardagh Packaging Finance PLC / Ardagh Holdings U.S.A., Inc. (Containers & Packaging) | (b)(e) | QL + 300 | 12/15/2019 | 200,000 | 195,500 | |||||||||||
Ardagh Packaging Finance PLC / Ardagh Holdings U.S.A., Inc. (Containers & Packaging) | (b) | 6.000% | 06/30/2021 | 200,000 | 186,500 | |||||||||||
Ball Corp. (Containers & Packaging) | 5.250% | 07/01/2025 | 325,000 | 332,313 | ||||||||||||
Ball Corp. (Containers & Packaging) | 4.000% | 11/15/2023 | 875,000 | 834,531 | ||||||||||||
Berry Plastics Corp. (Containers & Packaging) | 5.125% | 07/15/2023 | 250,000 | 243,125 | ||||||||||||
Berry Plastics Corp. (Containers & Packaging) | 5.500% | 05/15/2022 | 1,425,000 | 1,419,656 | ||||||||||||
Berry Plastics Corp. (Containers & Packaging) | (b) | 6.000% | 10/15/2022 | 75,000 | 76,313 | |||||||||||
BWAY Holding Co. (Containers & Packaging) | (b) | 9.125% | 08/15/2021 | 1,150,000 | 1,075,250 | |||||||||||
Crown Americas LLC / Crown Americas Capital Corp. IV (Containers & Packaging) | 4.500% | 01/15/2023 | 725,000 | 708,688 | ||||||||||||
Graphic Packaging International, Inc. (Containers & Packaging) | 4.875% | 11/15/2022 | 350,000 | 354,375 | ||||||||||||
Owens-Brockway Glass Container, Inc. (Containers & Packaging) | (b) | 5.875% | 08/15/2023 | 225,000 | 228,375 | |||||||||||
Owens-Brockway Glass Container, Inc. (Containers & Packaging) | (b) | 6.375% | 08/15/2025 | 250,000 | 256,875 | |||||||||||
Owens-Brockway Glass Container, Inc. (Containers & Packaging) | (b) | 5.000% | 01/15/2022 | 100,000 | 97,750 | |||||||||||
Owens-Brockway Glass Container, Inc. (Containers & Packaging) | (b) | 5.375% | 01/15/2025 | 325,000 | 317,688 | |||||||||||
Pactiv LLC (Containers & Packaging) | 7.950% | 12/15/2025 | 225,000 | 209,250 | ||||||||||||
Reynolds Group Issuer, Inc. / Reynolds Group Issuer LLC (Containers & Packaging) | 5.750% | 10/15/2020 | 1,025,000 | 1,042,620 | ||||||||||||
Reynolds Group Issuer, Inc. / Reynolds Group Issuer LLC (Containers & Packaging) | 8.250% | 02/15/2021 | 650,000 | 625,625 | ||||||||||||
Sealed Air Corp. (Containers & Packaging) | (b) | 4.875% | 12/01/2022 | 300,000 | 300,750 | |||||||||||
| 65 | (continued) |
| Ohio National Fund, Inc. | High Income Bond Portfolio (Continued) |
Schedule of Investments | December 31, 2015 |
| Corporate Bonds (Continued) | Rate | Maturity | Face Amount | Value | ||||||||||||
MATERIALS (continued) | ||||||||||||||||
Sealed Air Corp. (Containers & Packaging) | (b) | 5.250% | 04/01/2023 | $ | 100,000 | $ | 102,000 | |||||||||
Sealed Air Corp. (Containers & Packaging) | (b) | 5.125% | 12/01/2024 | 350,000 | 350,000 | |||||||||||
Sealed Air Corp. (Containers & Packaging) | (b) | 5.500% | 09/15/2025 | 400,000 | 408,000 | |||||||||||
Signode Industrial Group Lux SA / Signode Industrial Group U.S., Inc. (Containers & Packaging) | (b) | 6.375% | 05/01/2022 | 1,450,000 | 1,232,500 | |||||||||||
ArcelorMittal (Metals & Mining) | 6.125% | 06/01/2025 | 375,000 | 272,813 | ||||||||||||
Steel Dynamics, Inc. (Metals & Mining) | 5.125% | 10/01/2021 | 200,000 | 185,000 | ||||||||||||
Steel Dynamics, Inc. (Metals & Mining) | 5.250% | 04/15/2023 | 125,000 | 114,063 | ||||||||||||
Steel Dynamics, Inc. (Metals & Mining) | 5.500% | 10/01/2024 | 350,000 | 319,375 | ||||||||||||
Wise Metals Intermediate Holdings LLC / Wise Holdings Finance Corp. (Acquired 04/11/2014 through 04/15/2014, Cost $323,903)(Metals & Mining) | (b)(d)(f) | 9.750%, 10.500% PIK | 06/15/2019 | 325,000 | 161,688 | |||||||||||
Clearwater Paper Corp. (Paper & Forest Products) | 4.500% | 02/01/2023 | 750,000 | 705,000 | ||||||||||||
Clearwater Paper Corp. (Paper & Forest Products) | (b) | 5.375% | 02/01/2025 | 500,000 | 483,750 | |||||||||||
|
| |||||||||||||||
| 18,460,491 | ||||||||||||||||
|
| |||||||||||||||
TELECOMMUNICATION SERVICES – 5.0% | ||||||||||||||||
Level 3 Communications, Inc. (Diversified Telecom. Svs.) | 5.750% | 12/01/2022 | 475,000 | 485,688 | ||||||||||||
Level 3 Financing, Inc. (Diversified Telecom. Svs.) | (b) | 5.375% | 01/15/2024 | 100,000 | 100,500 | |||||||||||
Level 3 Financing, Inc. (Diversified Telecom. Svs.) | (b) | 5.375% | 05/01/2025 | 775,000 | 771,125 | |||||||||||
Neptune Finco Corp. (Diversified Telecom. Svs.) | (b) | 10.125% | 01/15/2023 | 300,000 | 312,750 | |||||||||||
Neptune Finco Corp. (Diversified Telecom. Svs.) | (b) | 6.625% | 10/15/2025 | 300,000 | 312,000 | |||||||||||
Neptune Finco Corp. (Diversified Telecom. Svs.) | (b) | 10.875% | 10/15/2025 | 750,000 | 785,625 | |||||||||||
Altice Financing SA (Wireless Telecom. Svs.) | (b) | 6.625% | 02/15/2023 | 100,000 | 98,750 | |||||||||||
Digicel Group Ltd. (Wireless Telecom. Svs.) | (b) | 8.250% | 09/30/2020 | 1,075,000 | 886,875 | |||||||||||
Sprint Capital Corp. (Wireless Telecom. Svs.) | 6.875% | 11/15/2028 | 1,225,000 | 857,500 | ||||||||||||
Sprint Nextel Corp. (Wireless Telecom. Svs.) | (b) | 7.000% | 03/01/2020 | 350,000 | 350,875 | |||||||||||
Sprint Communications, Inc. (Wireless Telecom. Svs.) | 6.000% | 11/15/2022 | 875,000 | 627,813 | ||||||||||||
Sprint Corp. (Wireless Telecom. Svs.) | 7.875% | 09/15/2023 | 675,000 | 506,925 | ||||||||||||
Sprint Corp. (Wireless Telecom. Svs.) | 7.125% | 06/15/2024 | 275,000 | 200,063 | ||||||||||||
Syniverse Holdings, Inc. (Wireless Telecom. Svs.) | 9.125% | 01/15/2019 | 725,000 | 328,063 | ||||||||||||
T-Mobile U.S.A., Inc. (Wireless Telecom. Svs.) | 6.625% | 11/15/2020 | 875,000 | 909,554 | ||||||||||||
T-Mobile U.S.A., Inc. (Wireless Telecom. Svs.) | 6.125% | 01/15/2022 | 200,000 | 205,500 | ||||||||||||
T-Mobile U.S.A., Inc. (Wireless Telecom. Svs.) | 6.731% | 04/28/2022 | 75,000 | 78,188 | ||||||||||||
T-Mobile U.S.A., Inc. (Wireless Telecom. Svs.) | 6.000% | 03/01/2023 | 150,000 | 151,875 | ||||||||||||
T-Mobile U.S.A., Inc. (Wireless Telecom. Svs.) | 6.625% | 04/01/2023 | 450,000 | 459,000 | ||||||||||||
T-Mobile U.S.A., Inc. (Wireless Telecom. Svs.) | 6.500% | 01/15/2024 | 625,000 | 637,500 | ||||||||||||
T-Mobile U.S.A., Inc. (Wireless Telecom. Svs.) | 6.375% | 03/01/2025 | 225,000 | 227,250 | ||||||||||||
T-Mobile U.S.A., Inc. (Wireless Telecom. Svs.) | 6.500% | 01/15/2026 | 325,000 | 328,084 | ||||||||||||
|
| |||||||||||||||
| 9,621,503 | ||||||||||||||||
|
| |||||||||||||||
UTILITIES – 2.3% | ||||||||||||||||
Ferrellgas LP / Ferrellgas Finance Corp. (Gas Utilities) | 6.500% | 05/01/2021 | 450,000 | 382,500 | ||||||||||||
Ferrellgas LP / Ferrellgas Finance Corp. (Gas Utilities) | 6.750% | 01/15/2022 | 500,000 | 421,250 | ||||||||||||
Ferrellgas LP / Ferrellgas Finance Corp. (Gas Utilities) | (b) | 6.750% | 06/15/2023 | 200,000 | 163,000 | |||||||||||
Suburban Propane Partners LP / Suburban Energy Finance Corp. (Gas Utilities) | 7.375% | 08/01/2021 | 372,000 | 357,120 | ||||||||||||
Suburban Propane Partners LP / Suburban Energy Finance Corp. (Gas Utilities) | 5.500% | 06/01/2024 | 825,000 | 664,125 | ||||||||||||
Calpine Corp. (Ind. Power & Renewable Elec.) | 5.750% | 01/15/2025 | 1,275,000 | 1,125,188 | ||||||||||||
Calpine Corp. (Ind. Power Prod. & Energy Traders) | (b) | 6.000% | 01/15/2022 | 175,000 | 180,633 | |||||||||||
NRG Energy, Inc. (Ind. Power & Renewable Elec.) | 6.250% | 05/01/2024 | 925,000 | 777,185 | ||||||||||||
TerraForm Power Operating, LLC (Ind. Power & Renewable Elec.) | (b) | 5.875% | 02/01/2023 | 375,000 | 310,313 | |||||||||||
TerraForm Power Operating, LLC (Ind. Power & Renewable Elec.) | (b) | 6.125% | 06/15/2025 | 150,000 | 120,750 | |||||||||||
FPL Energy National Wind Portfolio LLC (Acquired 05/27/2009, Cost $11,942)(Multi-Utilities) | (b)(f) | 6.125% | 03/25/2019 | 12,934 | 12,934 | |||||||||||
|
| |||||||||||||||
| 4,514,998 | ||||||||||||||||
|
| |||||||||||||||
Total Corporate Bonds (Cost $204,246,391) | $ | 184,671,849 | ||||||||||||||
|
| |||||||||||||||
| Common Stocks – 0.0% | Shares | Value | ||||||||||||||
ENERGY – 0.0% | ||||||||||||||||
Lone Pine Resources Canada Ltd. (Acquired 07/10/2012, Cost $48,614)(Oil, Gas & Consumable Fuels) | (a)(c)(f) | 6,236 | $ | 8,419 | ||||||||||||
|
| |||||||||||||||
Total Common Stocks (Cost $48,614) | $ | 8,419 | ||||||||||||||
|
| |||||||||||||||
| 66 | (continued) |
| Ohio National Fund, Inc. | High Income Bond Portfolio (Continued) |
Schedule of Investments | December 31, 2015 |
| Money Market Funds – 1.2% | Shares | Value | ||||||||||||
Fidelity Institutional Money Market Funds Money Market Portfolio – Class I | 2,293,000 | $ | 2,293,000 | |||||||||||
|
| |||||||||||||
Total Money Market Funds (Cost $2,293,000) | $ | 2,293,000 | ||||||||||||
|
| |||||||||||||
Total Investments – 96.3% (Cost $206,588,005) | (g) | $ | 186,973,268 | |||||||||||
Other Assets in Excess of Liabilities – 3.7% | 7,247,745 | |||||||||||||
|
| |||||||||||||
Net Assets – 100.0% | $ | 194,221,013 | ||||||||||||
|
| |||||||||||||
Percentages are stated as a percent of net assets.
Abbreviations:
PIK: Payment-in-Kind
QL: Quarterly U.S. LIBOR Rate, 0.613% on 12/31/2015
Footnotes:
| (a) | Non-income producing security. |
| (b) | Security exempt from registration under Regulation D of the Securities Act of 1933. These securities may be resold in transactions exempt from registration, normally to qualified buyers under Rule 144A. At December 31, 2015, the value of these securities totaled $95,782,430, or 49.3% of the Portfolio’s net assets. Unless also noted with (f), as defined below, these securities were deemed liquid pursuant to procedures approved by the Board of Directors. |
| (c) | A market quotation for this investment was not readily available at December 31, 2015. As discussed in Note 2 of the Notes to Financial Statements, the price for this issue was derived from an estimate of fair market value using methods determined in good faith by the Fund’s Pricing Committee under supervision of the Board. This security represents $8,419 or 0.0% of the Portfolio’s net assets. |
| (d) | Issuer of the security has the option to make coupon payments in cash or in additional par value of this bond (Payment-in-Kind). |
| (e) | Security is a variable rate instrument in which the coupon rate is adjusted quarterly in concert with U.S. LIBOR. |
| (f) | Represents a security deemed to be illiquid. At December 31, 2015, the value of illiquid securities in the Portfolio totaled $1,033,916, or 0.5% of the Portfolio’s net assets. |
| (g) | Represents cost for financial reporting purposes, which may differ from cost basis for federal income tax purposes. See also Note 7 of the Notes to Financial Statements. |
The accompanying notes are an integral part of these financial statements.
| 67 |
| Ohio National Fund, Inc. | ClearBridge Small Cap Portfolio (formerly the Capital Growth Portfolio) |
Objective/Strategy
The ClearBridge Small Cap Portfolio (formerly the Capital Growth Portfolio) seeks long-term capital appreciation by investing at least 80% of its net assets in common stocks and other equity securities of small capitalization companies or in other investments that the portfolio managers believe have similar economic characteristics.
Performance as of December 31, 2015
Average Annual returns | ||||
One year | -2.46% | |||
Five years | 7.64% | |||
Ten years | 8.53% |
Past performance does not guarantee future results. The performance data quoted represents past performance and current returns may be lower or higher. Total return figures include change in share price and reinvestment of dividends and capital gains. The investment return and principal value will fluctuate so that an investor’s shares, when redeemed, may be worth more or less than the original cost. To obtain performance information up to the most recent month end, call toll-free 1-877-781-6392.
The Portfolio is not open to direct retail investment. Beneficial interest in shares is obtained solely by purchase of variable life insurance policies and variable annuity contracts. Actual performance results for variable annuity and variable universal life contracts will be lower due to contract charges. Consult your contract for applicable charges.
Comments
For the year ended December 31, 2015, the ClearBridge Small Cap Portfolio returned -2.46% versus -4.41% for the current benchmark, the Russell 2000 Index, and -1.38% for the former benchmark, the Russell 2000 Growth Index.
For the period from January 1, 2015 to September 24, 2015 the Portfolio was known as the Capital Growth Portfolio, was sub-advised by Eagle Asset Management, Inc. (“Eagle”), and utilized the Russell 2000 Growth Index as its benchmark. During this period, the Portfolio returned -1.44% versus -0.90% for the Russell 2000 Growth Index. Also, during that period, the Russell 2000 Growth Index (down 0.9 percent) fared substantially better than the Russell 2000 Value Index (down 8.5 percent), primarily driven by strong performance within Health Care (up 10.8 percent), as the biotech industry performed well as a whole. Energy (down 21.3 percent) was the clear laggard for the year, as oil prices reached lows last seen more than a decade ago.
The Portfolio’s Industrials and Materials holdings contributed most notably to relative returns during this period, both faring substantially better than the holdings of the respective sectors of the benchmark. However, relative gains were offset by weak performance within the Portfolio’s Consumer Discretionary and Financials holdings that weighed on relative returns.
The Portfolio’s best performing stocks for this period were Anacor Pharmaceuticals, Inc., JetBlue Airways Corp., Thoratec Corp., Imperva, Inc. and Receptos, Inc. Anacor Pharmaceuticals, Inc.’s shares jumped as the firm reported positive phase-3 results for a potential eczema-treatment compound. JetBlue Airways Corp.’s plans to increase revenues and margins by adding checked-luggage fees and more seats to each plane, as well as a first-class section dubbed Mint, all have been largely well received by the investor community. Thoratec Corp. agreed to be acquired by St. Jude Medical during the period at a sizable premium. Imperva, Inc.’s shares appreciated as investors gained confidence in a new management team as well as its much stronger product, in our view, compared to
competitor IBM. Celgene announced that it is buying Receptos, Inc. at a substantial premium toward the end of the period.
The Portfolio’s worst performing stocks for this period were Genesco, Inc., FXCM, Universal Electronics, Inc., Vitamin Shoppe, Inc. and Spectranetics. Genesco, Inc. is a retailer of headwear, footwear and clothing accessories. Shares were off as its Lids segment reflected elevated promotional activity. Solid performance from its Journeys footwear division wasn’t enough to offset the drag from Lids. FXCM is an online provider of foreign-exchange trading and related services primarily focused on the retail investing community. The unexpected move by the Swiss National Bank to remove its currency peg to the euro caught many investors, including many FXCM clients who were holding positions that suffered as a result of the move, by surprise. Those losses significantly impaired FXCM’s balance sheet, resulting in the need to raise additional capital to meet regulatory capital requirements. Universal Electronics, Inc., largely a producer of universal remotes as well as related software, encountered substantial “destocking” on the part of its largest customer. Comcast, that customer, was scheduled to begin a voice-activated-remote initiative toward the end of 2015. We would expect Universal Electronics, Inc. to benefit from the renewed order growth as the next-generation product sales ramp up. Vitamin Shoppe, Inc.’s shares were down modestly after the firm reported lighter-than-expected same store sales growth and slightly tempered full-year guidance early on in the period. Spectranetics’ results came in just shy of revenue expectations; further, concerns of reimbursement cuts for some of Spectranetics’ devices also arose during the period.
For the period from September 25, 2015 to December 31, 2015, the Portfolio was sub-advised by ClearBridge, LLC (“ClearBridge”). The investment strategy utilized by ClearBridge is less growth focused and includes more value discipline than the strategy utilized by Eagle. The holdings of the Portfolio after the sub-adviser transition should be more of a mix of stocks with both growth and value characteristics and, therefore, more comparable to the new benchmark, the Russell 2000 Index, than the former benchmark, the Russell 2000 Growth Index. During this period, the Portfolio returned -1.04% versus its new benchmark, the Russell 2000 Index, which returned 0.31%. The Portfolio’s underperformance during that period was driven by security selection in Financial Services and Health Care, partially offset by positive stock selection in Consumer Discretionary and Energy.
CSG Systems International, Inc., WebMD Health Corp., Quotient Ltd., Woodward, Inc. and Semtech Corp. were the largest contributors to performance, while the biggest detractors included Exact Sciences Corp., PRA Group, Inc., Dynegy, Inc., OneMain Holdings, Inc. and Allegiant Travel Co. (1)
Major averages recovered from third quarter losses to post strong gains in the final quarter of the year. The market advanced each week in October in spite of mixed economic reports and uninspiring earnings results. After a flattish November, the market closed the year relinquishing some of October’s gains in December as the Federal Reserve’s rate decision, continued weakness in crude oil prices, and high-yield debt concerns dominated the headlines.
U.S. GDP for the third quarter was initially reported at a 1.5% annualized rate, but was later revised to 2.0%, still well short of the second quarter’s growth rate. Consumption growth was healthy, while the muted GDP figure was attributed to a broad reduction in business inventories. Elsewhere, the IMF released its World Economic Outlook, cutting its 2015 global growth forecast once again from 3.3% to 3.1%.
| 68 | (continued) |
| Ohio National Fund, Inc. | ClearBridge Small Cap Portfolio (formerly the Capital Growth Portfolio) (Continued) |
U.S. employers added only 145K jobs in September, but very strong October and November jobs reports indicated that employers added another half million jobs during the two months, well ahead of the Street’s consensus estimates and pushing the unemployment rate down to 5.0%. Federal Reserve Chair Janet Yellen commented that the U.S. is nearly at full employment, with only 100,000 new jobs per month needed to accommodate new entrants to the workforce.
Roughly 70% of S&P 500 constituents topped the Street’s bottom-line expectations for the third quarter. However, earnings season was uninspiring, as Street estimates had been tempered and, more importantly, nearly half the companies missed top-line expectations.
The minutes from the Federal Reserve’s November meeting revealed sentiment among officials that “it may well become appropriate to initiate the normalization process at the next meeting.” However, officials also emphasized that “beginning the normalization process relatively soon would make it more likely that the policy trajectory after liftoff could be shallow.” Indeed, after months of speculation, the Fed finally raised target rates in December for the first time in seven years. The initial rate increase appeared to be priced into the market as the S&P 500 Index gained 1.5% on the day of the announcement and the 10-Year U.S. Treasury yield oscillated between 2.20% and 2.30% for most of the month.
OPEC concluded its most recent meeting without agreeing on a production ceiling for the first time in history. The oil industry has typically relied on OPEC to control supply as a support to prices, but it appears several member countries are sticking to their recent strategy of drilling as much as possible to preserve market share. Crude oil prices subsequently slid further and approached $35 per barrel, roughly 30% below the August high. Perhaps related to the commodity price weakness, a mutual fund that invests in lower-quality, high-yield bonds ceased offering investors daily liquidity and the yield on the KDP High Yield Daily Index, a proxy for junk bonds, surged above 7.5% for the first time since 2011.
Exact Sciences Corp.’s stock opened the fourth quarter of 2015 with a drastic drop after the company received an unfavorable independent rating that will not require private insurance companies to cover Exact Sciences Corp.’s primary product, Cologuard, a colorectal cancer screening test. Though the product is approved for Medicare coverage, greater uncertainty surrounding the company’s private business prospects jeopardized our investment case for the company, and thus we exited the position.(1)
PRA Group, Inc. detracted from performance as concerns for the growth potential and profitability for the receivables industry weighed on the stock. While stricter regulation remains an overhang for the company, embedded expectations indicate the market expects a drastic decline in profitability that we find unwarranted. PRA Group, Inc. has delivered stable results that counter such expectations, and any sign of big banks re-initiating the sale of receivables should provide meaningful upside for the stock.(1)
Dynegy, Inc. was a top detractor during the period, as pricing in the U.S. power industry remains challenged. Depressed commodity prices, industry reports pointing to lower demand, fewer plant retirements, and regulatory concerns drove the stock lower throughout the second half of the year. We continue to own the position, however, as embedded expectations for free cash flow are far too pessimistic, and currently assign no value to Dynegy, Inc.’s coal business.(1)
CSG Systems International, Inc. was a top contributor, as the company reported a strong quarter highlighted by substantial margin
expansion. Comcast, a long-time client of the billing solutions provider, recently awarded CSG Systems International, Inc. with a contract covering the entirety of its customers. Through the first nine months of the year, 1.6 million of the remaining Comcast accounts had migrated to CSG Systems International, Inc., which is only one-third of accounts moving to CSG Systems International, Inc. under the new contract. The market is rewarding the stock, as the operating leverage from scaling the company’s processing business is boosting profitability, and we believe margin expansion will continue.(1)
WebMD Health Corp. reported solid earnings for the third quarter, and management boosted investor confidence by reiterating its guidance for a strong fourth quarter. We see this as evidence WebMD Health Corp.’s base business is healthy despite concerns from the shift to mobile users, and see upside in the company’s adjacent operating units as well as new business opportunities in an increasingly consumer-directed healthcare environment.(1)
Quotient Ltd. contributed to performance as shares recovered their third quarter losses. Management reported narrower-than-expected losses and provided commentary that clarified the product development timeline for its MosaiQ platform, an automation platform for blood grouping and serological disease screening. The status update for MosaiQ gives us confidence that the company will deliver on its plans for a commercial launch in Europe in the second half of 2016 and in the U.S. early in 2017.(1)
When we consider our outlook for the Portfolio, we focus on the number of investment opportunities that we find attractive. The criteria we use remain the same: risk of capital impairment, diversity, and potential upside are the keys. Based on those measures, our outlook is positive, especially because the diversity of undervalued investment candidates we are finding has increased considerably relative to the first half of 2015. There are certainly a lot of macro cross-currents that have dominated the headlines: Chinese economy, Federal Reserve interest rate hikes, commodity prices, etc. Our goal is not to forecast macro factors or to have the Portfolio exposed/dependent on a certain path. Instead, we observe what is discounted and compare it to our probabilistic assessment of future value for each investment candidate. For some time, we have observed the continued flow of capital into certain areas of the market such as real estate, and the public funding of early stage companies (in health care and technology). The lack of robust economic growth resulted in a market that placed extremely high valuations on the relatively few companies that continued to power through the economic malaise. That trend has begun to reverse, which should result in more investment opportunities for the Portfolio.
| (1) | The Portfolio’s composition is subject to change. Holdings and weightings are as of December 31, 2015. |
| 69 | (continued) |
| Ohio National Fund, Inc. | ClearBridge Small Cap Portfolio (formerly the Capital Growth Portfolio) (Continued) |
Change in Value of $10,000 Investment
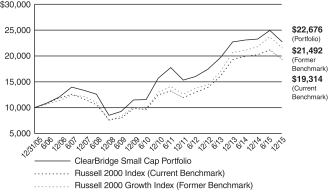
Hypothetical illustration based on past performance. Future performance will vary. The Portfolio’s returns reflect reinvested dividends. The Portfolio’s holdings may differ significantly from the securities in the index. The index is unmanaged and therefore does not reflect the cost of portfolio management and accounting.
Effective September 25, 2015, the Portfolio’s benchmark was changed from Russell 2000 Growth Index to Russell 2000 Index. The change in the benchmark was made because the strategy used by ClearBridge, LLC has more value discipline, and results in the selection of less growth-oriented stocks, than the strategy utilized by the prior sub-adviser.
The Russell 2000 Index measures the performance of the small-cap segment of the U.S equity universe. The Russell 2000 Index includes the 2000 firms from the Russell 3000 Index with the smallest market capitalizations. The Russell 3000 Index represents 98% of the investable U.S. equity market. The index presented herein includes the effects of reinvested dividends.
The Russell 2000 Growth Index measures the performance of the small-cap growth segment of the U.S. equity universe. It includes those Russell 2000 Index companies with higher price-to-value ratios and higher forecasted growth values. The Russell 2000 Index includes the 2000 firms from the Russell 3000 Index with the smallest market capitalizations. The Russell 3000 Index represents 98% of the investable U.S. equity market. The index presented herein includes the effects of reinvested dividends.
Portfolio Composition as of December 31, 2015 (1)
| % of Net Assets | ||||
Common Stocks (4) | 96.7 | |||
Money Market Funds and | 3.3 | |||
|
| |||
| 100.0 | ||||
|
|
Top 10 Portfolio Holdings as of December 31, 2015 (1) (2) (3)
| % of Net Assets | ||||
1. OneMain Holdings, Inc. | 2.6 | |||
2. CSG Systems International, Inc. | 2.3 | |||
3. Service Corp. International | 2.2 | |||
4. TreeHouse Foods, Inc. | 2.1 | |||
5. Quotient Ltd. | 2.1 | |||
6. Gentex Corp. | 1.9 | |||
7. First Interstate BancSystem, Inc. Class A | 1.9 | |||
8. MarketAxess Holdings, Inc. | 1.9 | |||
9. Portland General Electric Co. | 1.8 | |||
10. WebMD Health Corp. | 1.7 |
| (1) | Composition of Portfolio subject to change. |
| (2) | Short-term investments have been excluded from the list of Top 10 Portfolio Holdings. |
| (3) | Top 10 Portfolio Holdings is presented at an individual security level. Total investment exposure by issuer may be higher. |
| (4) | Sectors (Common Stocks): |
| % of Net Assets | ||||
Financials | 24.6 | |||
Information Technology | 19.0 | |||
Consumer Discretionary | 16.0 | |||
Industrials | 14.0 | |||
Health Care | 10.4 | |||
Utilities | 3.8 | |||
Energy | 3.5 | |||
Materials | 3.3 | |||
Consumer Staples | 2.1 | |||
|
| |||
| 96.7 | ||||
|
|
| 70 |
| Ohio National Fund, Inc. | ClearBridge Small Cap Portfolio (formerly the Capital Growth Portfolio) |
Schedule of Investments | December 31, 2015 |
| Common Stocks – 96.7% | Shares | Value | ||||||||
CONSUMER DISCRETIONARY – 16.0% | ||||||||||
Gentex Corp. (Auto Components) | 113,220 | $ | 1,812,652 | |||||||
Pool Corp. (Distributors) | 9,353 | 755,535 | ||||||||
2U, Inc. (Diversified Consumer Svs.) | (a) | 40,290 | 1,127,314 | |||||||
Service Corp. International (Diversified Consumer Svs.) | 77,850 | 2,025,657 | ||||||||
Chuy’s Holdings, Inc. (Hotels, Restaurants & Leisure) | (a) | 39,440 | 1,236,050 | |||||||
Fogo De Chao, Inc. (Hotels, Restaurants & Leisure) | (a) | 44,180 | 669,769 | |||||||
Planet Fitness, Inc. Class A (Hotels, Restaurants & Leisure) | (a) | 47,320 | 739,612 | |||||||
Potbelly Corp. (Hotels, Restaurants & Leisure) | (a) | 94,650 | 1,108,351 | |||||||
Red Robin Gourmet Burgers, Inc. (Hotels, Restaurants & Leisure) | (a) | 14,990 | 925,483 | |||||||
Taylor Morrison Home Corp. Class A (Household Durables) | (a) | 53,840 | 861,440 | |||||||
Carmike Cinemas, Inc. (Media) | (a) | 29,690 | 681,089 | |||||||
Monro Muffler Brake, Inc. (Specialty Retail) | 23,660 | 1,566,765 | ||||||||
Murphy U.S.A., Inc. (Specialty Retail) | (a) | 25,240 | 1,533,078 | |||||||
|
| |||||||||
| 15,042,795 | ||||||||||
|
| |||||||||
CONSUMER STAPLES – 2.1% | ||||||||||
TreeHouse Foods, Inc. (Food Products) | (a) | 25,240 | 1,980,330 | |||||||
|
| |||||||||
ENERGY – 3.5% | ||||||||||
Frank’s International NV (Energy Equip. & Svs.) | 78,870 | 1,316,340 | ||||||||
U.S. Silica Holdings, Inc. (Energy Equip. & Svs.) | 54,860 | 1,027,528 | ||||||||
Diamondback Energy, Inc. (Oil, Gas & Consumable Fuels) | (a) | 8,680 | 580,692 | |||||||
Sanchez Energy Corp. (Oil, Gas & Consumable Fuels) | (a) | 92,390 | 398,201 | |||||||
|
| |||||||||
| 3,322,761 | ||||||||||
|
| |||||||||
FINANCIALS – 24.6% | ||||||||||
First Interstate BancSystem, Inc. Class A (Banks) | 61,670 | 1,792,747 | ||||||||
Hancock Holding Co. (Banks) | 41,490 | 1,044,303 | ||||||||
LegacyTexas Financial Group, Inc. (Banks) | 37,260 | 932,245 | ||||||||
Talmer Bancorp, Inc. Class A (Banks) | 86,760 | 1,571,224 | ||||||||
Main Street Capital Corp. (Capital Markets) | 49,132 | 1,428,762 | ||||||||
PennantPark Investment Corp. (Capital Markets) | 97,977 | 605,496 | ||||||||
Triangle Capital Corp. (Capital Markets) | 46,989 | 897,952 | ||||||||
OneMain Holdings, Inc. (Consumer Finance) | (a) | 58,440 | 2,427,598 | |||||||
PRA Group, Inc. (Consumer Finance) | (a) | 25,237 | 875,472 | |||||||
MarketAxess Holdings, Inc. (Diversified Financial Svs.) | 15,770 | 1,759,774 | ||||||||
Assured Guaranty Ltd. (Insurance) | 47,320 | 1,250,668 | ||||||||
ProAssurance Corp. (Insurance) | 32,400 | 1,572,372 | ||||||||
American Homes 4 Rent (Real Estate Investment Trusts) | 85,180 | 1,419,099 | ||||||||
Lexington Realty Trust (Real Estate Investment Trusts) | 92,440 | 739,520 | ||||||||
Potlatch Corp. (Real Estate Investment Trusts) | 35,490 | 1,073,218 | ||||||||
Rouse Properties, Inc. (Real Estate Investment Trusts) | 77,040 | 1,121,702 | ||||||||
Summit Hotel Properties, Inc. (Real Estate Investment Trusts) | 90,230 | 1,078,248 | ||||||||
Washington Federal, Inc. (Thrifts & Mortgage Finance) | 62,740 | 1,495,094 | ||||||||
|
| |||||||||
| 23,085,494 | ||||||||||
|
| |||||||||
HEALTH CARE – 10.4% | ||||||||||
Amarin Corp. PLC – ADR (Biotechnology) | (a) | 271,230 | 512,625 | |||||||
Ligand Pharmaceuticals, Inc. (Biotechnology) | (a) | 8,520 | 923,738 | |||||||
Endologix, Inc. (Health Care Equip. & Supplies) | (a) | 83,610 | 827,739 | |||||||
Haemonetics Corp. (Health Care Equip. & Supplies) | (a) | 20,030 | 645,767 | |||||||
LivaNova PLC (Health Care Equip. & Supplies) | (a) | 26,030 | 1,545,401 | |||||||
Quotient Ltd. (Health Care Equip. & Supplies) | (a) | 123,000 | 1,968,000 | |||||||
Brookdale Senior Living, Inc. (Health Care Providers & Svs.) | (a) | 32,810 | 605,673 | |||||||
Surgical Care Affiliates, Inc. (Health Care Providers & Svs.) | (a) | 35,197 | 1,401,193 | |||||||
| Common Stocks (Continued) | Shares | Value | ||||||||
HEALTH CARE (continued) | ||||||||||
Press Ganey Holdings, Inc. (Health Care Technology) | (a) | 41,220 | $ | 1,300,491 | ||||||
|
| |||||||||
| 9,730,627 | ||||||||||
|
| |||||||||
INDUSTRIALS – 14.0% | ||||||||||
HEICO Corp. (Aerospace & Defense) | 25,240 | 1,372,046 | ||||||||
Allegiant Travel Co. (Airlines) | 5,520 | 926,422 | ||||||||
Continental Building Products, Inc. (Building Products) | (a) | 58,200 | 1,016,172 | |||||||
Copart, Inc. (Commercial Svs. & Supplies) | (a) | 41,800 | 1,588,818 | |||||||
CIRCOR International, Inc. (Machinery) | 17,350 | 731,302 | ||||||||
Woodward, Inc. (Machinery) | 29,105 | 1,445,354 | ||||||||
Matson, Inc. (Marine) | 19,720 | 840,664 | ||||||||
ICF International, Inc. (Professional Svs.) | (a) | 31,360 | 1,115,162 | |||||||
Landstar System, Inc. (Road & Rail) | 22,561 | 1,323,203 | ||||||||
Marten Transport Ltd. (Road & Rail) | 40,500 | 716,850 | ||||||||
GATX Corp. (Trading Companies & Distributors) | 25,130 | 1,069,281 | ||||||||
Rush Enterprises, Inc. Class A (Trading Companies & Distributors) | (a) | 47,320 | 1,035,835 | |||||||
|
| |||||||||
| 13,181,109 | ||||||||||
|
| |||||||||
INFORMATION TECHNOLOGY – 19.0% | ||||||||||
ePlus, Inc. (Electronic Equip., Instr. & Comp.) | (a) | 13,940 | 1,300,044 | |||||||
Knowles Corp. (Electronic Equip., Instr. & Comp.) | (a) | 56,000 | 746,480 | |||||||
Methode Electronics, Inc. (Electronic Equip., Instr. & Comp.) | 43,380 | 1,380,785 | ||||||||
Criteo SA – ADR (Internet Software & Svs.) | (a) | 22,260 | 881,496 | |||||||
DHI Group, Inc. (Internet Software & Svs.) | (a) | 115,160 | 1,056,017 | |||||||
Q2 Holdings, Inc. (Internet Software & Svs.) | (a) | 55,210 | 1,455,888 | |||||||
WebMD Health Corp. (Internet Software & Svs.) | (a) | 33,250 | 1,605,975 | |||||||
CSG Systems International, Inc. (IT Svs.) | 59,080 | 2,125,698 | ||||||||
EVERTEC, Inc. (IT Svs.) | 90,700 | 1,518,318 | ||||||||
Applied Micro Circuits Corp. (Semiconductors & Equip.) | (a) | 146,820 | 935,243 | |||||||
Power Integrations, Inc. (Semiconductors & Equip.) | 18,930 | 920,566 | ||||||||
Semtech Corp. (Semiconductors & Equip.) | (a) | 50,400 | 953,568 | |||||||
Veeco Instruments, Inc. (Semiconductors & Equip.) | (a) | 33,820 | 695,339 | |||||||
AVG Technologies NV (Software) | (a) | 61,520 | 1,233,476 | |||||||
Manhattan Associates, Inc. (Software) | (a) | 16,198 | 1,071,822 | |||||||
|
| |||||||||
| 17,880,715 | ||||||||||
|
| |||||||||
MATERIALS – 3.3% | ||||||||||
Balchem Corp. (Chemicals) | 25,240 | 1,534,592 | ||||||||
Steel Dynamics, Inc. (Metals & Mining) | 86,790 | 1,550,937 | ||||||||
|
| |||||||||
| 3,085,529 | ||||||||||
|
| |||||||||
UTILITIES – 3.8% | ||||||||||
PNM Resources, Inc. (Electric Utilities) | 40,700 | 1,244,199 | ||||||||
Portland General Electric Co. (Electric Utilities) | 45,270 | 1,646,470 | ||||||||
Dynegy, Inc. (Ind. Power & Renewable Elec.) | (a) | 53,040 | 710,736 | |||||||
|
| |||||||||
| 3,601,405 | ||||||||||
|
| |||||||||
Total Common Stocks (Cost $90,164,126) | $ | 90,910,765 | ||||||||
|
| |||||||||
| Money Market Funds – 2.7% | Shares | Value | ||||||||
Fidelity Institutional Money Market Funds | 2,518,000 | $ | 2,518,000 | |||||||
|
| |||||||||
Total Money Market Funds (Cost $2,518,000) | $ | 2,518,000 | ||||||||
|
| |||||||||
Total Investments – 99.4% (Cost $92,682,126) | (b) | $ | 93,428,765 | |||||||
Other Assets in Excess of Liabilities – 0.6% | 574,702 | |||||||||
|
| |||||||||
Net Assets – 100.0% | $ | 94,003,467 | ||||||||
|
| |||||||||
| 71 | (continued) |
| Ohio National Fund, Inc. | ClearBridge Small Cap Portfolio (formerly the Capital Growth Portfolio) (Continued) |
Schedule of Investments | December 31, 2015 |
Percentages are stated as a percent of net assets.
Abbreviations:
ADR: American Depositary Receipts
Footnotes:
| (a) | Non-income producing security. |
| (b) | Represents cost for financial reporting purposes, which may differ from cost basis for federal income tax purposes. See also Note 7 of the Notes to Financial Statements. |
The accompanying notes are an integral part of these financial statements.
| 72 |
| Ohio National Fund, Inc. | Nasdaq-100® Index Portfolio |
Objective/Strategy
The Nasdaq-100® Index Portfolio seeks long-term growth of capital by investing primarily in stocks that are included in the Nasdaq-100® Index. Unlike the other Portfolios of the Fund, the Nasdaq-100® Index Portfolio is a non-diversified portfolio for purposes of Section 5(b) of the Investment Company Act of 1940, as amended.
Performance as of December 31, 2015
Average Annual Returns | ||||
One year | 9.14% | |||
Five years | 16.48% | |||
Ten years | 11.18% |
Past performance does not guarantee future results. The performance data quoted represents past performance and current returns may be lower or higher. Total return figures include change in share price and reinvestment of dividends and capital gains. The investment return and principal value will fluctuate so that an investor’s shares, when redeemed, may be worth more or less than the original cost. To obtain performance information up to the most recent month end, call toll-free 1-877-781-6392.
The Portfolio is not open to direct retail investment. Beneficial interest in shares is obtained solely by purchase of variable life insurance policies and variable annuity contracts. Actual performance results for variable annuity and variable universal life contracts will be lower due to contract charges. Consult your contract for applicable charges.
Comments
For the year ended December 31, 2015, the Nasdaq-100® Index Portfolio returned 9.14% versus 9.75% for its benchmark, the Nasdaq-100® Index.
The Portfolio’s correlation to the index for the year was 99.9%. The high correlation is due to the fact that the Portfolio invests in each of the 100 stocks in the index. The Portfolio also invests in Powershares QQQ Trust Series 1, an exchange traded fund that mimics the holdings and returns of the Nasdaq-100® Index.(1)
The largest contributors to the index return for 2015 were Amazon.com, Inc., Alphabet, Inc. Class C, Alphabet, Inc. Class A, Microsoft Corp. and Facebook, Inc. The largest detractors from the index return for 2015 were QUALCOMM, Inc., Apple, Inc., Micron Technology, Inc., Yahoo!, Inc. and Twenty-First Century Fox Class A.
2015 had a few major developments that affected the equity market. One of the bigger moments of 2015 was the Federal Reserve’s decision to begin raising the Federal Funds rate off of the 0.00 to 0.25 range that had been in place since January 28, 2008. Another theme in 2015 was the continued poor performance of commodities. Oil prices continued to fall throughout the year, putting pressure on oil stocks such as Chevron Corp. and Exxon Corp. The slowing of the Chinese economy, and continued sluggish economic “growth” in the rest of the world also put pressure on stocks.
Going into 2016, the U.S. economy seems to be on solid ground, as the Federal Reserve has normalized monetary policy. Themes from 2015 will still be relevant in 2016. Chinese gross domestic product growth, oil and commodity prices, the strong U.S. dollar versus the rest of the world currencies, and the lack of any meaningful inflation (wage or otherwise) will be watched closely in 2016.
| (1) | The Portfolio’s composition is subject to change. Holdings and weightings are as of December 31, 2015. |
Change in Value of $10,000 Investment
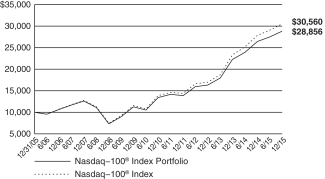
Hypothetical illustration based on past performance. Future performance will vary. The Portfolio’s returns reflect reinvested dividends. The Portfolio’s holdings may differ significantly from the securities in the index. The index is unmanaged and therefore does not reflect the cost of portfolio management and accounting. Investors cannot invest in an index. Although they can invest in its underlying securities or funds.
The Nasdaq-100® Index is a modified capitalization-weighted index of the 100 largest domestic and international non-financial companies listed on the NASDAQ Stock Market. The index presented herein includes the effects of reinvested dividends.
The Nasdaq-100®, Nasdaq-100 Index®, and Nasdaq® are registered trademarks of The NASDAQ OMX Group, Inc. (which with its affiliates is referred to as “NASDAQ OMX”). Ohio National Investments, Inc. has licensed these marks for the Portfolio’s use. NASDAQ OMX has not passed on the Portfolio’s legality or suitability. NASDAQ OMX does not sponsor, endorse, sell or promote the Portfolio. NASDAQ OMX MAKES NO WARRANTIES AND BEARS NO LIABILITY WITH RESPECT TO THE PORTFOLIO.
| 73 | (continued) |
| Ohio National Fund, Inc. | Nasdaq-100® Index Portfolio (Continued) |
Portfolio Composition as of December 31, 2015 (1)
| % of Net Assets | ||||
Common Stocks (4) | 96.1 | |||
Exchange Traded Funds | ||||
Less Net Liabilities | 3.9 | |||
|
| |||
| 100.0 | ||||
|
|
Top 10 Portfolio Holdings as of December 31, 2015 (1) (2) (3)
| % of Net Assets | ||||
1. Apple, Inc. | 10.7 | |||
2. Microsoft Corp. | 8.1 | |||
3. Amazon.com, Inc | 5.8 | |||
4. Alphabet, Inc. Class C | 4.8 | |||
5. Facebook, Inc. Class A | 4.3 | |||
6. Alphabet, Inc. Class A | 4.1 | |||
7. PowerShares QQQ Trust Series 1 | 4.1 | |||
8. Intel Corp. | 3.0 | |||
9. Gilead Sciences, Inc. | 2.7 | |||
10. Cisco Systems, Inc. | 2.5 |
| (1) | Composition of Portfolio subject to change. |
| (2) | Short-term investments have been excluded from the list of Top 10 Portfolio Holdings. |
| (3) | Top 10 Portfolio Holdings is presented at an individual security level. Total investment exposure by issuer may be higher. |
| (4) | Sectors (Common Stocks): |
| % of Net Assets | ||||
Information Technology | 53.0 | |||
Consumer Discretionary | 19.8 | |||
Health Care | 14.2 | |||
Consumer Staples | 6.6 | |||
Industrials | 1.4 | |||
Telecommunication Services | 1.1 | |||
|
| |||
| 96.1 | ||||
|
|
| 74 |
| Ohio National Fund, Inc. | Nasdaq-100® Index Portfolio |
Schedule of Investments | December 31, 2015 |
| Common Stocks – 96.1% | Shares | Value | ||||||||
CONSUMER DISCRETIONARY – 19.8% | ||||||||||
Tesla Motors, Inc. (Automobiles) | (a) | 3,300 | $ | 792,033 | ||||||
Marriott International, Inc. Class A (Hotels, Restaurants & Leisure) | 6,475 | 434,084 | ||||||||
Norwegian Cruise Line Holdings Ltd. (Hotels, Restaurants & Leisure) | (a) | 5,775 | 338,415 | |||||||
Starbucks Corp. (Hotels, Restaurants & Leisure) | 37,425 | 2,246,623 | ||||||||
Amazon.com, Inc. (Internet & Catalog Retail) | (a) | 11,825 | 7,992,399 | |||||||
Ctrip.com International Ltd. – ADR (Internet & Catalog Retail) | (a) | 7,875 | 364,849 | |||||||
Expedia, Inc. (Internet & Catalog Retail) | 2,950 | 366,685 | ||||||||
JD.com, Inc. – ADR (Internet & Catalog Retail) | (a) | 21,975 | 709,023 | |||||||
Liberty Interactive Corp. QVC Group Class A (Internet & Catalog Retail) | (a) | 11,775 | 321,693 | |||||||
Liberty Ventures (Internet & Catalog Retail) | (a) | 3,388 | 152,833 | |||||||
Netflix, Inc. (Internet & Catalog Retail) | (a) | 10,775 | 1,232,444 | |||||||
Priceline Group, Inc. / The (Internet & Catalog Retail) | (a) | 1,265 | 1,612,812 | |||||||
TripAdvisor, Inc. (Internet & Catalog Retail) | (a) | 3,300 | 281,325 | |||||||
Mattel, Inc. (Leisure Products) | 8,550 | 232,303 | ||||||||
Charter Communications, Inc. Class A (Media) | (a) | 2,825 | 517,257 | |||||||
Comcast Corp. Class A (Media) | 61,547 | 3,473,097 | ||||||||
Discovery Communications, Inc. Class A (Media) | (a) | 3,775 | 100,717 | |||||||
Discovery Communications, Inc. Class C (Media) | (a) | 6,925 | 174,648 | |||||||
DISH Network Corp. Class A (Media) | (a) | 5,675 | 324,496 | |||||||
Liberty Global PLC Class A (Media) | (a) | 6,375 | 270,045 | |||||||
Liberty Global PLC Class C (Media) | (a) | 14,875 | 606,454 | |||||||
Liberty Media Corp. Class A (Media) | (a) | 2,575 | 101,069 | |||||||
Liberty Media Corp. Class C (Media) | (a) | 5,600 | 213,248 | |||||||
Sirius XM Holdings, Inc. (Media) | (a) | 131,375 | 534,696 | |||||||
Twenty-First Century Fox, Inc. Class A (Media) | 29,500 | 801,220 | ||||||||
Twenty-First Century Fox, Inc. Class B (Media) | 20,125 | 548,004 | ||||||||
Viacom, Inc. Class B (Media) | 8,750 | 360,150 | ||||||||
Dollar Tree, Inc. (Multiline Retail) | (a) | 5,925 | 457,528 | |||||||
Bed Bath & Beyond, Inc. (Specialty Retail) | (a) | 4,200 | 202,650 | |||||||
O’Reilly Automotive, Inc. (Specialty Retail) | (a) | 2,475 | 627,214 | |||||||
Ross Stores, Inc. (Specialty Retail) | 10,275 | 552,898 | ||||||||
Tractor Supply Co. (Specialty Retail) | 3,375 | 288,562 | ||||||||
Ulta Salon Cosmetics & Fragrance, Inc. (Specialty Retail) | (a) | 1,600 | 296,000 | |||||||
|
| |||||||||
| 27,527,474 | ||||||||||
|
| |||||||||
CONSUMER STAPLES – 6.6% | ||||||||||
Monster Beverage Corp. (Beverages) | (a) | 5,100 | 759,696 | |||||||
Costco Wholesale Corp. (Food & Staples Retailing) | 11,035 | 1,782,152 | ||||||||
Walgreens Boots Alliance, Inc. (Food & Staples Retailing) | 26,375 | 2,245,963 | ||||||||
Whole Foods Market, Inc. (Food & Staples Retailing) | 8,600 | 288,100 | ||||||||
Kraft Heinz Co. / The (Food Products) | 30,575 | 2,224,637 | ||||||||
Mondelez International, Inc. Class A (Food Products) | 40,050 | 1,795,842 | ||||||||
|
| |||||||||
| 9,096,390 | ||||||||||
|
| |||||||||
HEALTH CARE – 14.2% | ||||||||||
Alexion Pharmaceuticals, Inc. (Biotechnology) | (a) | 5,675 | 1,082,506 | |||||||
Amgen, Inc. (Biotechnology) | 19,022 | 3,087,841 | ||||||||
Biogen, Inc. (Biotechnology) | (a) | 5,625 | 1,723,219 | |||||||
BioMarin Pharmaceutical, Inc. (Biotechnology) | (a) | 4,075 | 426,897 | |||||||
Celgene Corp. (Biotechnology) | (a) | 19,800 | 2,371,248 | |||||||
Gilead Sciences, Inc. (Biotechnology) | 36,325 | 3,675,727 | ||||||||
Incyte Corp. (Biotechnology) | (a) | 4,700 | 509,715 | |||||||
Regeneron Pharmaceuticals, Inc. (Biotechnology) | (a) | 2,575 | 1,397,890 | |||||||
Vertex Pharmaceuticals, Inc. (Biotechnology) | (a) | 6,200 | 780,146 | |||||||
Intuitive Surgical, Inc. (Health Care Equip. & Supplies) | (a) | 950 | 518,852 | |||||||
Express Scripts Holding Co. (Health Care Providers & Svs.) | (a) | 17,050 | 1,490,340 | |||||||
Henry Schein, Inc. (Health Care Providers & Svs.) | (a) | 2,100 | 332,199 | |||||||
Cerner Corp. (Health Care Technology) | (a) | 8,625 | 518,966 | |||||||
Illumina, Inc. (Life Sciences Tools & Svs.) | (a) | 3,700 | 710,196 | |||||||
| Common Stocks (Continued) | Shares | Value | ||||||||
HEALTH CARE (continued) | ||||||||||
Endo International PLC (Pharmaceuticals) | (a) | 5,700 | $ | 348,954 | ||||||
Mylan NV (Pharmaceuticals) | (a) | 12,400 | 670,468 | |||||||
|
| |||||||||
| 19,645,164 | ||||||||||
|
| |||||||||
INDUSTRIALS – 1.4% | ||||||||||
American Airlines Group, Inc. (Airlines) | 15,875 | 672,306 | ||||||||
Stericycle, Inc. (Commercial Svs. & Supplies) | (a) | 2,150 | 259,290 | |||||||
PACCAR, Inc. (Machinery) | 8,914 | 422,524 | ||||||||
Verisk Analytics, Inc. (Professional Svs.) | (a) | 4,275 | 328,662 | |||||||
Fastenal Co. (Trading Companies & Distributors) | 7,300 | 297,986 | ||||||||
|
| |||||||||
| 1,980,768 | ||||||||||
|
| |||||||||
INFORMATION TECHNOLOGY – 53.0% | ||||||||||
Cisco Systems, Inc. (Communications Equip.) | 127,925 | 3,473,803 | ||||||||
QUALCOMM, Inc. (Communications Equip.) | 37,895 | 1,894,182 | ||||||||
Akamai Technologies, Inc. (Internet Software & Svs.) | (a) | 4,475 | 235,519 | |||||||
Alphabet, Inc. Class A (Internet Software & Svs.) | (a) | 7,350 | 5,718,373 | |||||||
Alphabet, Inc. Class C (Internet Software & Svs.) | (a) | 8,698 | 6,600,738 | |||||||
Baidu, Inc. – ADR (Internet Software & Svs.) | (a) | 6,975 | 1,318,554 | |||||||
eBay, Inc. (Internet Software & Svs.) | (a) | 30,260 | 831,545 | |||||||
Facebook, Inc. Class A (Internet Software & Svs.) | (a) | 57,225 | 5,989,168 | |||||||
Yahoo!, Inc. (Internet Software & Svs.) | (a) | 23,810 | 791,921 | |||||||
Automatic Data Processing, Inc. (IT Svs.) | 11,625 | 984,870 | ||||||||
Cognizant Technology Solutions Corp. Class A (IT Svs.) | (a) | 15,325 | 919,806 | |||||||
Fiserv, Inc. (IT Svs.) | (a) | 5,749 | 525,804 | |||||||
Paychex, Inc. (IT Svs.) | 9,095 | 481,035 | ||||||||
PayPal Holdings, Inc. (IT Svs.) | (a) | 30,800 | 1,114,960 | |||||||
Analog Devices, Inc. (Semiconductors & Equip.) | 7,875 | 435,645 | ||||||||
Applied Materials, Inc. (Semiconductors & Equip.) | 30,250 | 564,768 | ||||||||
Avago Technologies Ltd. (Semiconductors & Equip.) | 6,950 | 1,008,792 | ||||||||
Intel Corp. (Semiconductors & Equip.) | 118,945 | 4,097,655 | ||||||||
KLA-Tencor Corp. (Semiconductors & Equip.) | 3,925 | 272,199 | ||||||||
Lam Research Corp. (Semiconductors & Equip.) | 4,000 | 317,680 | ||||||||
Linear Technology Corp. (Semiconductors & Equip.) | 6,030 | 256,094 | ||||||||
Maxim Integrated Products, Inc. (Semiconductors & Equip.) | 7,175 | 272,650 | ||||||||
Micron Technology, Inc. (Semiconductors & Equip.) | (a) | 27,375 | 387,630 | |||||||
NVIDIA Corp. (Semiconductors & Equip.) | 13,562 | 447,004 | ||||||||
NXP Semiconductors NV (Semiconductors & Equip.) | (a) | 6,350 | 534,988 | |||||||
Skyworks Solutions, Inc. (Semiconductors & Equip.) | 4,825 | 370,705 | ||||||||
Texas Instruments, Inc. (Semiconductors & Equip.) | 25,575 | 1,401,766 | ||||||||
Xilinx, Inc. (Semiconductors & Equip.) | 6,480 | 304,366 | ||||||||
Activision Blizzard, Inc. (Software) | 18,425 | 713,232 | ||||||||
Adobe Systems, Inc. (Software) | (a) | 12,580 | 1,181,765 | |||||||
Autodesk, Inc. (Software) | (a) | 5,700 | 347,301 | |||||||
CA, Inc. (Software) | 11,050 | 315,588 | ||||||||
Check Point Software Technologies Ltd. (Software) | (a) | 4,570 | 371,907 | |||||||
Citrix Systems, Inc. (Software) | (a) | 3,875 | 293,144 | |||||||
Electronic Arts, Inc. (Software) | (a) | 7,825 | 537,734 | |||||||
Intuit, Inc. (Software) | 6,655 | 642,208 | ||||||||
Microsoft Corp. (Software) | 201,325 | 11,169,511 | ||||||||
Symantec Corp. (Software) | 17,023 | 357,483 | ||||||||
Apple, Inc. (Tech. Hardware, Storage & Periph.) | 140,510 | 14,790,083 | ||||||||
NetApp, Inc. (Tech. Hardware, Storage & Periph.) | 7,435 | 197,251 | ||||||||
SanDisk Corp. (Tech. Hardware, Storage & Periph.) | 5,050 | 383,750 | ||||||||
Seagate Technology PLC (Tech. Hardware, Storage & Periph.) | 7,525 | 275,867 | ||||||||
Western Digital Corp. (Tech. Hardware, Storage & Periph.) | 5,850 | 351,293 | ||||||||
|
| |||||||||
| 73,480,337 | ||||||||||
|
| |||||||||
| 75 | (continued) |
| Ohio National Fund, Inc. | Nasdaq-100® Index Portfolio (Continued) |
Schedule of Investments | December 31, 2015 |
| Common Stocks (Continued) | Shares | Value | ||||||||
TELECOMMUNICATION SERVICES – 1.1% | ||||||||||
SBA Communications Corp. Class A (Wireless Telecom. Svs.) | (a) | 3,175 | $ | 333,597 | ||||||
T-Mobile U.S., Inc. (Wireless Telecom. Svs.) | (a) | 20,575 | 804,894 | |||||||
Vodafone Group PLC – ADR (Wireless Telecom. Svs.) | 10,004 | 322,729 | ||||||||
|
| |||||||||
| 1,461,220 | ||||||||||
|
| |||||||||
Total Common Stocks (Cost $78,794,895) | $ | 133,191,353 | ||||||||
|
| |||||||||
| Exchange Traded Funds – 4.1% | Shares | Value | ||||||
PowerShares QQQ Trust Series 1 | 50,675 | $ 5,668,506 | ||||||
| ||||||||
Total Exchange Traded Funds (Cost $5,592,491) | $ 5,668,506 | |||||||
| ||||||||
Total Investments – 100.2% (Cost $84,387,386) | (b) | $138,859,859 | ||||||
Liabilities in Excess of Other Assets – (0.2)% | (292,954) | |||||||
| ||||||||
Net Assets – 100.0% | $138,566,905 | |||||||
| ||||||||
Percentages are stated as a percent of net assets.
Abbreviations:
ADR: American Depositary Receipts
Footnotes:
| (a) | Non-income producing security. |
| (b) | Represents cost for financial reporting purposes, which may differ from cost basis for federal income tax purposes. See also Note 7 of the Notes to Financial Statements. |
The accompanying notes are an integral part of these financial statements.
| 76 |
| Ohio National Fund, Inc. | Bristol Portfolio |
Objective/Strategy
The Bristol Portfolio seeks long-term growth of capital by investing primarily in common stocks of the 1,000 largest publicly traded U.S. companies in terms of market capitalization.
Performance as of December 31, 2015
Average Annual returns | ||||
One year | 4.08% | |||
Five years | 11.96% | |||
Ten years | 7.26% |
Past performance does not guarantee future results. The performance data quoted represents past performance and current returns may be lower or higher. Total return figures include change in share price and reinvestment of dividends and capital gains. The investment return and principal value will fluctuate so that an investor’s shares, when redeemed, may be worth more or less than the original cost. To obtain performance information up to the most recent month end, call toll-free 1-877-781-6392.
The Portfolio is not open to direct retail investment. Beneficial interest in shares is obtained solely by purchase of variable life insurance policies and variable annuity contracts. Actual performance results for variable annuity and variable universal life contracts will be lower due to contract charges. Consult your contract for applicable charges.
Comments
For the year ended December 31, 2015, the Bristol Portfolio returned 4.08% versus 1.38% for its benchmark, the S&P 500 Index.
The Portfolio’s relative out-performance resulted primarily from strong stock selection in Health Care, which contributed 510 basis points to relative performance. This contribution was somewhat offset by weaker stock selection in Consumer Discretionary. Overall, sector allocations also contributed 182 basis points to relative performance, led by an underweight exposure to Energy.(1)
The Portfolio’s best performers for the full year were Amazon.com, Inc., Intercept Pharmaceuticals, Inc., Pharmacyclics, Inc., Receptos, Inc., and Humana, Inc. The Portfolio’s worst performers were PVH Corp., Anadarko Petroleum Corp., Devon Energy Corp., Huntsman Corp. and HP, Inc. The top contributors to performance were Amazon.com, Inc., Clovis Oncology, Inc., Pharmacyclics, Inc., Intercept Pharmaceuticals, Inc., and Valeant Pharmaceuticals International, Inc. The top detractors from performance were PVH Corp., Devon Energy Corp., Anadarko Petroleum Corp., HP, Inc., and Time Warner, Inc.(1)
The top contributor to the Portfolio’s performance for the reporting period was Amazon.com, Inc., which generated 140 basis points due to strong earnings reports and strong sales growth. Other top contributors to performance were mainly stocks in the Health Care sector. Clovis Oncology, Inc. contributed 124 basis points thanks to optimism around its lung cancer therapies. Pharmacyclics, Inc. was acquired by Abbvie, and contributed 115 basis points due to positive data on its cancer drug. Intercept Pharmaceuticals, Inc. added 105 basis points with positive data on its drug for NASH liver disease. Valeant Pharmaceuticals International, Inc. contributed 91 basis points due to increased earnings guidance for the year.(1)
Detractors from performance during the reporting period included PVH Corp., which detracted 124 basis points due to weak earnings reports and weakness in retail. Energy stocks such as Anadarko Petroleum Corp. and Devon Energy Corp. detracted 148 basis points as oil prices continued to plummet. HP, Inc. detracted 67 basis points due to weak earnings reports caused by slowing PC sales.
Time Warner, Inc. also saw sharp drops, due to concerns about cord cutting, weak ratings and an overall weak advertising environment, and detracted 53 basis points.(1)
The year was volatile, as continued debate regarding the impact of the imminent rate increase played out. Weak consumer spending despite low oil prices weighed on the market, as did the terrorist attacks in Paris. The economy continued to slowly improve, as China continued to move forward and employment in the U.S. remained solid. We continue to believe that the Federal Reserve will be measured in its increases (only if the economic data is strong) and, therefore, maintain a positive bias towards the market as the Central Banks of all the major economies continue to be supportive of growth. Our continued focus on companies with strong competitive positions and ability to gain market share will hopefully continue to benefit performance going forward.
| (1) | The Portfolio’s composition is subject to change. Holdings and weightings are as of December 31, 2015. |
Change in Value of $10,000 Investment
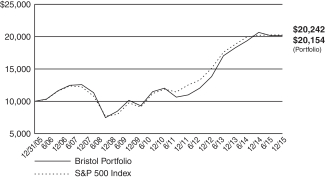
Hypothetical illustration based on past performance. Future performance will vary. The Portfolio’s returns reflect reinvested dividends. The Portfolio’s holdings may differ significantly from the securities in the index. The index is unmanaged and therefore does not reflect the cost of portfolio management and accounting.
The S&P 500 Index is a capitalization-weighted index designed to measure performance of the broad domestic economy through changes in the aggregate market value of 500 stocks representing all major industries. The index presented herein includes the effects of reinvested dividends.
| 77 | (continued) |
| Ohio National Fund, Inc. | Bristol Portfolio (Continued) |
Portfolio Composition as of December 31, 2015 (1)
| % of Net Assets | ||||
Common Stocks (4) | 99.6 | |||
Money Market Funds and | 0.4 | |||
|
| |||
| 100.0 | ||||
|
|
Top 10 Portfolio Holdings as of December 31, 2015 (1) (2) (3)
| % of Net Assets | ||||
1. Microsoft Corp. | 3.2 | |||
2. Apple, Inc. | 3.0 | |||
3. Allergan PLC | 2.6 | |||
4. Intel Corp. | 2.6 | |||
5. Amazon.com, Inc | 2.5 | |||
6. Thermo Fisher Scientific, Inc. | 2.5 | |||
7. Mylan NV | 2.5 | |||
8. NXP Semiconductors NV | 2.5 | |||
9. Facebook, Inc. Class A | 2.4 | |||
10. Citigroup, Inc. | 2.4 |
| (1) | Composition of Portfolio subject to change. |
| (2) | Short-term investments have been excluded from the list of Top 10 Portfolio Holdings. |
| (3) | Top 10 Portfolio Holdings is presented at an individual security level. Total investment exposure by issuer may be higher. |
| (4) | Sectors (Common Stocks): |
| % of Net Assets | ||||
Information Technology | 33.4 | |||
Health Care | 21.2 | |||
Financials | 16.7 | |||
Consumer Discretionary | 11.4 | |||
Industrials | 9.9 | |||
Energy | 3.9 | |||
Consumer Staples | 3.1 | |||
|
| |||
| 99.6 | ||||
|
|
| 78 |
| Ohio National Fund, Inc. | Bristol Portfolio |
Schedule of Investments | December 31, 2015 |
| Common Stocks – 99.6% | Shares | Value | ||||||||
CONSUMER DISCRETIONARY – 11.4% | ||||||||||
Delphi Automotive PLC (Auto Components) | 52,049 | $ | 4,462,161 | |||||||
Newell Rubbermaid, Inc. (Household Durables) | 100,584 | 4,433,743 | ||||||||
Amazon.com, Inc. (Internet & Catalog Retail) | (a) | 8,187 | 5,533,511 | |||||||
CBS Corp. Class B (Media) | 66,613 | 3,139,471 | ||||||||
Time Warner, Inc. (Media) | 62,251 | 4,025,772 | ||||||||
PVH Corp. (Textiles, Apparel & Luxury Goods) | 45,141 | 3,324,635 | ||||||||
|
| |||||||||
| 24,919,293 | ||||||||||
|
| |||||||||
CONSUMER STAPLES – 3.1% | ||||||||||
Molson Coors Brewing Co. Class B (Beverages) | 22,169 | 2,082,112 | ||||||||
Mondelez International, Inc. Class A (Food Products) | 50,377 | 2,258,905 | ||||||||
Procter & Gamble Co. / The (Household Products) | 31,316 | 2,486,803 | ||||||||
|
| |||||||||
| 6,827,820 | ||||||||||
|
| |||||||||
ENERGY – 3.9% | ||||||||||
Schlumberger Ltd. (Energy Equip. & Svs.) | 31,592 | 2,203,542 | ||||||||
Anadarko Petroleum Corp. (Oil, Gas & Consumable Fuels) | 42,881 | 2,083,159 | ||||||||
EOG Resources, Inc. (Oil, Gas & Consumable Fuels) | 29,825 | 2,111,312 | ||||||||
Newfield Exploration Co. (Oil, Gas & Consumable Fuels) | (a) | 64,830 | 2,110,865 | |||||||
|
| |||||||||
| 8,508,878 | ||||||||||
|
| |||||||||
FINANCIALS – 16.7% | ||||||||||
Bank of America Corp. (Banks) | 132,597 | 2,231,607 | ||||||||
Citigroup, Inc. (Banks) | 103,061 | 5,333,407 | ||||||||
JPMorgan Chase & Co. (Banks) | 72,565 | 4,791,467 | ||||||||
KeyCorp (Banks) | 331,812 | 4,376,600 | ||||||||
Regions Financial Corp. (Banks) | 430,598 | 4,133,741 | ||||||||
Capital One Financial Corp. (Consumer Finance) | 57,415 | 4,144,215 | ||||||||
Discover Financial Services (Consumer Finance) | 85,330 | 4,575,394 | ||||||||
Hartford Financial Services Group, Inc. / The (Insurance) | 60,167 | 2,614,858 | ||||||||
Prudential Financial, Inc. (Insurance) | 54,504 | 4,437,171 | ||||||||
|
| |||||||||
| 36,638,460 | ||||||||||
|
| |||||||||
HEALTH CARE – 21.2% | ||||||||||
Celgene Corp. (Biotechnology) | (a) | 32,100 | 3,844,296 | |||||||
Medtronic PLC (Health Care Equip. & Supplies) | 48,114 | 3,700,929 | ||||||||
Zimmer Biomet Holdings, Inc. (Health Care Equip. & Supplies) | 24,635 | 2,527,305 | ||||||||
Aetna, Inc. (Health Care Providers & Svs.) | 17,549 | 1,897,398 | ||||||||
Cigna Corp. (Health Care Providers & Svs.) | 29,615 | 4,333,563 | ||||||||
HCA Holdings, Inc. (Health Care Providers & Svs.) | (a) | 65,390 | 4,422,326 | |||||||
Thermo Fisher Scientific, Inc. (Life Sciences Tools & Svs.) | 38,996 | 5,531,583 | ||||||||
Allergan PLC (Pharmaceuticals) | (a) | 18,135 | 5,667,187 | |||||||
Mylan NV (Pharmaceuticals) | (a) | 102,002 | 5,515,248 | |||||||
| Common Stocks (Continued) | Shares | Value | ||||||||
HEALTH CARE (continued) | ||||||||||
Pfizer, Inc. (Pharmaceuticals) | 132,349 | $ | 4,272,226 | |||||||
Valeant Pharmaceuticals International, Inc. (Pharmaceuticals) | (a) | 44,502 | 4,523,628 | |||||||
|
| |||||||||
| 46,235,689 | ||||||||||
|
| |||||||||
INDUSTRIALS – 9.9% | ||||||||||
Hexcel Corp. (Aerospace & Defense) | 68,017 | 3,159,390 | ||||||||
Honeywell International, Inc. (Aerospace & Defense) | 18,350 | 1,900,509 | ||||||||
Raytheon Co. (Aerospace & Defense) | 34,790 | 4,332,399 | ||||||||
FedEx Corp. (Air Freight & Logistics) | 28,666 | 4,270,947 | ||||||||
Stanley Black & Decker, Inc. (Machinery) | 30,460 | 3,250,996 | ||||||||
Xylem, Inc. (Machinery) | 130,524 | 4,764,126 | ||||||||
|
| |||||||||
| 21,678,367 | ||||||||||
|
| |||||||||
INFORMATION TECHNOLOGY – 33.4% | ||||||||||
Cisco Systems, Inc. (Communications Equip.) | 151,658 | 4,118,273 | ||||||||
Harris Corp. (Communications Equip.) | 51,219 | 4,450,931 | ||||||||
Alibaba Group Holding Ltd. – ADR (Internet Software & Svs.) | (a) | 62,723 | 5,097,498 | |||||||
Alphabet, Inc. Class A (Internet Software & Svs.) | (a) | 3,360 | 2,614,114 | |||||||
Alphabet, Inc. Class C (Internet Software & Svs.) | (a) | 6,125 | 4,648,140 | |||||||
Facebook, Inc. Class A (Internet Software & Svs.) | (a) | 51,033 | 5,341,114 | |||||||
MasterCard, Inc. Class A (IT Svs.) | 40,371 | 3,930,520 | ||||||||
Avago Technologies Ltd. (Semiconductors & Equip.) | 34,954 | 5,073,573 | ||||||||
Intel Corp. (Semiconductors & Equip.) | 162,252 | 5,589,581 | ||||||||
NXP Semiconductors NV (Semiconductors & Equip.) | (a) | 63,741 | 5,370,179 | |||||||
Adobe Systems, Inc. (Software) | (a) | 46,497 | 4,367,928 | |||||||
Microsoft Corp. (Software) | 126,887 | 7,039,691 | ||||||||
Oracle Corp. (Software) | 97,849 | 3,574,424 | ||||||||
Apple, Inc. (Tech. Hardware, Storage & Periph.) | 63,291 | 6,662,011 | ||||||||
Hewlett Packard Enterprise Co. (Tech. Hardware, Storage & Periph.) | 334,270 | 5,080,904 | ||||||||
|
| |||||||||
| 72,958,881 | ||||||||||
|
| |||||||||
Total Common Stocks (Cost $210,029,224) | $ | 217,767,388 | ||||||||
|
| |||||||||
| Money Market Funds – 0.3% | Shares | Value | ||||||||
Fidelity Institutional Money Market Funds Money Market Portfolio – Class I | 758,000 | $ | 758,000 | |||||||
|
| |||||||||
Total Money Market Funds (Cost $758,000) | $ | 758,000 | ||||||||
|
| |||||||||
Total Investments – 99.9% (Cost $210,787,224) | (b) | $ | 218,525,388 | |||||||
Other Assets in Excess of Liabilities – 0.1% | 157,329 | |||||||||
|
| |||||||||
Net Assets – 100.0% | $ | 218,682,717 | ||||||||
|
| |||||||||
Percentages are stated as a percent of net assets.
Abbreviations:
ADR: American Depositary Receipts
Footnotes:
| (a) | Non-income producing security. |
| (b) | Represents cost for financial reporting purposes, which may differ from cost basis for federal income tax purposes. See also Note 7 of the Notes to Financial Statements. |
The accompanying notes are an integral part of these financial statements.
| 79 |
| Ohio National Fund, Inc. | Bryton Growth Portfolio |
Objective/Strategy
The Bryton Growth Portfolio seeks long-term growth of capital by investing primarily in common stocks of growth-oriented U.S. companies smaller than the 500 largest publicly traded U.S. companies in terms of market capitalization.
Performance as of December 31, 2015
Average Annual returns | ||||
One year | -4.25% | |||
Five years | 7.63% | |||
Ten years | 6.55% |
Past performance does not guarantee future results. The performance data quoted represents past performance and current returns may be lower or higher. Total return figures include change in share price and reinvestment of dividends and capital gains. The investment return and principal value will fluctuate so that an investor’s shares, when redeemed, may be worth more, or less than the original cost. To obtain performance information up to the most recent month end, call toll-free 1-877-781-6392.
The Portfolio is not open to direct retail investment. Beneficial interest in shares is obtained solely by purchase of variable life insurance policies and variable annuity contracts. Actual performance results for variable annuity and variable universal life contracts will be lower due to contract charges. Consult your contract for applicable charges.
Comments
For the year ended December 31, 2015, the Bryton Growth Portfolio returned -4.25% versus -1.38% for its benchmark, the Russell 2000 Growth Index.
The Portfolio’s relative underperformance resulted primarily from weaker stock selection in Health Care and Information Technology. Those negative results were somewhat offset by positive stock selection in Financials and Industrials. Overall, sector allocation impacts were positive, but not significant to relative performance for the period.(1)
The Portfolio’s best performers for the reporting period were Ligand Pharmaceuticals, Inc., Intercept Pharmaceuticals, Inc., Bluebird Bio, Inc., Flamel Technologies SA, and Rally Software. The Portfolio’s worst performers were Arbutus Biopharma Corp., Power Solutions International, Inc., Ovascience, Inc., GasLog Ltd. and Alliqua BioMedical, Inc. The top contributors to performance were Ligand Pharmaceuticals, Inc., Clovis Oncology, Inc., Rally Software, PGT, Inc. and Flamel Technologies SA. The top detractors from performance were Arbutus Biopharma Corp., Alliqua BioMedical, Inc., Performance Sports Group Ltd., Alimera Sciences, Inc. and Power Solutions International, Inc.(1)
The top contributor to the Portfolio’s performance for the reporting period was Ligand Pharmaceuticals, Inc., which generated 126 basis points. The stock steadily climbed after its partner Amgen reported interim data for a potentially blockbuster Myeloma drug, followed by another major partnership with Novartis, with the belief that the company has a rich drug pipeline ahead of it. Clovis Oncology, Inc. contributed 98 basis points thanks to optimism around its lung cancer therapies. Rally Software was a software company attempting to turn itself around, with its management beginning to reinvigorate growth before eventually selling itself to CA, Inc., generating 86 basis points to the Portfolio. PGT, Inc. benefited from improving demand for its storm windows and doors, combined with operational leverage as it integrated its acquisition of CGI Windows and Doors, and the stock contributed 76 basis points. Flamel Technologies SA added 75 basis points, as it continued to prove out its drug pipeline
and benefitted from FDA decisions that limited competition and improved its market share.(1)
Detractors from performance during the reporting period included Arbutus Biopharma Corp., which detracted 167 basis points. The stock had climbed due to interest in its Ebola drug, but as concerns of a global pandemic faded, the stock gave up its gains. Alliqua BioMedical, Inc. moved lower as investors grew concerned about the pace of growth in its wound care products, especially given FDA rulings that were more onerous than expected, and detracted 133 basis points. Performance Sports Group Ltd. struggled with adverse currency trends through the year, detracting 117 basis points. Alimera Sciences, Inc. saw issues with physician reimbursement, which negatively impacted its sales growth. This impacted the Portfolio negatively by 110 points. Power Solutions International, Inc. detracted 107 basis points as its end-demand, exposed to slumping energy, commodities and emerging markets, struggled despite an otherwise strong product portfolio.(1)
The Portfolio should be well-positioned for 2016. While the Federal Reserve may continue to increase interest rates through 2016, we are taking a wait and see approach to the Financials sector as we are unsure of the rate or size of the increases. The Portfolio is also taking a more balanced approach on emerging market demand, which we believe may also result in energy and commodity price volatility. That said, we think broader concerns about the global economy are overdone and feel confident in the Portfolio’s overweights in Health Care and Information Technology. We think that these sectors should benefit from strong product pipelines, growing market demand, and the potential for merger & acquisition activity.(1)
| (1) | The Portfolio’s composition is subject to change. Holdings and weightings are as of December 31, 2015. |
Change in Value of $10,000 Investment
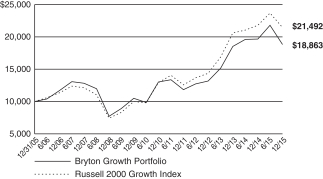
Hypothetical illustration based on past performance. Future performance will vary. The Portfolio’s returns reflect reinvested dividends. The Portfolio’s holdings may differ significantly from the securities in the index. The index is unmanaged and therefore does not reflect the cost of portfolio management and accounting.
The Russell 2000 Growth Index measures the performance of the small-cap growth segment of the U.S. equity universe. It includes the Russell 2000 Index companies with higher price-to-value ratios and higher forecasted growth values. The Russell 2000 Index includes the 2000 firms from the Russell 3000 Index with the smallest market capitalizations. The Russell 3000 Index represents 98% of the investable U.S. equity market. The index presented herein includes the effects of reinvested dividends.
| 80 | (continued) |
| Ohio National Fund, Inc. | Bryton Growth Portfolio (Continued) |
Portfolio Composition as of December 31, 2015 (1)
| % of Net Assets | ||||
Common Stocks (4) | 98.2 | |||
Money Market Funds | 1.8 | |||
|
| |||
| 100.0 | ||||
|
|
Top 10 Portfolio Holdings as of December 31, 2015 (1) (2) (3)
| % of Net Assets | ||||
1. Cepheid | 1.9 | |||
2. Radware Ltd. | 1.9 | |||
3. PolyOne Corp. | 1.8 | |||
4. Teligent, Inc. | 1.8 | |||
5. Prestige Brands Holdings, Inc. | 1.8 | |||
6. PowerSecure International, Inc. | 1.8 | |||
7. ClubCorp Holdings, Inc. | 1.8 | |||
8. Carrols Restaurant Group, Inc. | 1.8 | |||
9. Cvent, Inc. | 1.8 | |||
10. Astronics Corp. | 1.8 |
| (1) | Composition of Portfolio subject to change. |
| (2) | Short-term investments have been excluded from the list of Top 10 Portfolio Holdings. |
| (3) | Top 10 Portfolio Holdings is presented at an individual security level. Total investment exposure by issuer may be higher. |
| (4) | Sectors (Common Stocks): |
| % of Net Assets | ||||
Information Technology | 35.0 | |||
Health Care | 28.6 | |||
Consumer Discretionary | 15.8 | |||
Industrials | 10.5 | |||
Financials | 3.7 | |||
Materials | 1.8 | |||
Consumer Staples | 1.7 | |||
Energy | 1.1 | |||
|
| |||
| 98.2 | ||||
|
|
| 81 |
| Ohio National Fund, Inc. | Bryton Growth Portfolio |
Schedule of Investments | December 31, 2015 |
| Common Stocks – 98.2% | Shares | Value | ||||||||
CONSUMER DISCRETIONARY – 15.8% | ||||||||||
Gentherm, Inc. (Auto Components) | (a) | 55,380 | $ | 2,625,012 | ||||||
Motorcar Parts of America, Inc. (Auto Components) | (a) | 68,731 | 2,323,795 | |||||||
Carrols Restaurant Group, Inc. (Hotels, Restaurants & Leisure) | (a) | 247,952 | 2,910,956 | |||||||
ClubCorp Holdings, Inc. (Hotels, Restaurants & Leisure) | 159,858 | 2,920,606 | ||||||||
Jack in the Box, Inc. (Hotels, Restaurants & Leisure) | 33,942 | 2,603,691 | ||||||||
1-800-Flowers.com, Inc. Class A (Internet & Catalog Retail) | (a) | 305,187 | 2,221,761 | |||||||
Callaway Golf Co. (Leisure Products) | 274,859 | 2,589,172 | ||||||||
Performance Sports Group Ltd. (Leisure Products) | (a) | 284,824 | 2,742,855 | |||||||
Burlington Stores, Inc. (Multiline Retail) | (a) | 58,418 | 2,506,132 | |||||||
G-III Apparel Group Ltd. (Textiles, Apparel & Luxury Goods) | (a) | 47,631 | 2,108,148 | |||||||
|
| |||||||||
| 25,552,128 | ||||||||||
|
| |||||||||
CONSUMER STAPLES – 1.7% | ||||||||||
J&J Snack Foods Corp. (Food Products) | 23,654 | 2,759,712 | ||||||||
|
| |||||||||
ENERGY – 1.1% | ||||||||||
GasLog Ltd. (Oil, Gas & Consumable Fuels) | 58,500 | 485,550 | ||||||||
Parsley Energy, Inc. Class A (Oil, Gas & Consumable Fuels) | (a) | 69,947 | 1,290,522 | |||||||
|
| |||||||||
| 1,776,072 | ||||||||||
|
| |||||||||
FINANCIALS – 3.7% | ||||||||||
Bank of the Ozarks, Inc. (Banks) | 53,621 | 2,652,095 | ||||||||
Eagle Bancorp, Inc. (Banks) | (a) | 37,787 | 1,907,110 | |||||||
Renasant Corp. (Banks) | 41,238 | 1,419,000 | ||||||||
|
| |||||||||
| 5,978,205 | ||||||||||
|
| |||||||||
HEALTH CARE – 28.6% | ||||||||||
Anacor Pharmaceuticals, Inc. (Biotechnology) | (a) | 13,532 | 1,528,710 | |||||||
Arbutus Biopharma Corp. (Biotechnology) | (a) | 361,897 | 1,610,442 | |||||||
Celldex Therapeutics, Inc. (Biotechnology) | (a) | 167,215 | 2,621,931 | |||||||
Cepheid (Biotechnology) | (a) | 82,955 | 3,030,346 | |||||||
Ligand Pharmaceuticals, Inc. (Biotechnology) | (a) | 21,558 | 2,337,318 | |||||||
MacroGenics, Inc. (Biotechnology) | (a) | 91,634 | 2,837,905 | |||||||
Sangamo BioSciences, Inc. (Biotechnology) | (a) | 268,404 | 2,450,529 | |||||||
TESARO, Inc. (Biotechnology) | (a) | 45,308 | 2,370,515 | |||||||
Alliqua BioMedical, Inc. (Health Care Equip. & Supplies) | (a) | 870,996 | 1,863,931 | |||||||
LDR Holding Corp. (Health Care Equip. & Supplies) | (a) | 111,002 | 2,787,260 | |||||||
Wright Medical Group NV (Health Care Equip. & Supplies) | (a) | 113,639 | 2,747,791 | |||||||
Zeltiq Aesthetics, Inc. (Health Care Equip. & Supplies) | (a) | 70,045 | 1,998,384 | |||||||
Team Health Holdings, Inc. (Health Care Providers & Svs.) | (a) | 53,010 | 2,326,609 | |||||||
Cambrex Corp. (Life Sciences Tools & Svs.) | (a) | 44,546 | 2,097,671 | |||||||
BioDelivery Sciences International, Inc. (Pharmaceuticals) | (a) | 366,594 | 1,755,985 | |||||||
Intra-Cellular Therapies, Inc. (Pharmaceuticals) | (a) | 30,505 | 1,640,864 | |||||||
Phibro Animal Health Corp. Class A (Pharmaceuticals) | 95,226 | 2,869,159 | ||||||||
Prestige Brands Holdings, Inc. (Pharmaceuticals) | (a) | 57,236 | 2,946,509 | |||||||
Revance Therapeutics, Inc. (Pharmaceuticals) | (a) | 47,958 | 1,638,245 | |||||||
Teligent, Inc. (Pharmaceuticals) | (a) | 334,791 | 2,979,640 | |||||||
|
| |||||||||
| 46,439,744 | ||||||||||
|
| |||||||||
| Common Stocks (Continued) | Shares | Value | ||||||||
INDUSTRIALS – 10.5% | ||||||||||
Aerojet Rocketdyne Holdings, Inc. (Aerospace & Defense) | (a) | 155,469 | $ | 2,434,645 | ||||||
Astronics Corp. (Aerospace & Defense) | (a) | 70,601 | 2,874,167 | |||||||
XPO Logistics, Inc. (Air Freight & Logistics) | (a) | 60,378 | 1,645,301 | |||||||
Healthcare Services Group, Inc. (Commercial Svs. & Supplies) | 79,687 | 2,778,686 | ||||||||
Power Solutions International, Inc. (Electrical Equip.) | (a) | 92,541 | 1,688,873 | |||||||
PowerSecure International, Inc. (Electrical Equip.) | (a) | 194,574 | 2,928,339 | |||||||
Mueller Water Products, Inc. Class A (Machinery) | 302,342 | 2,600,141 | ||||||||
|
| |||||||||
| 16,950,152 | ||||||||||
|
| |||||||||
INFORMATION TECHNOLOGY – 35.0% | ||||||||||
Infinera Corp. (Communications Equip.) | (a) | 132,452 | 2,400,030 | |||||||
Radware Ltd. (Communications Equip.) | (a) | 196,420 | 3,013,083 | |||||||
Fabrinet (Electronic Equip., Instr. & Comp.) | (a) | 75,278 | 1,793,122 | |||||||
Perceptron, Inc. (Electronic Equip., Instr. & Comp.) | (a) | 274,101 | 2,135,247 | |||||||
Cornerstone OnDemand, Inc. (Internet Software & Svs.) | (a) | 68,641 | 2,370,174 | |||||||
Cvent, Inc. (Internet Software & Svs.) | (a) | 83,304 | 2,908,143 | |||||||
Demandware, Inc. (Internet Software & Svs.) | (a) | 48,427 | 2,613,605 | |||||||
Textura Corp. (Internet Software & Svs.) | (a) | 107,956 | 2,329,690 | |||||||
Euronet Worldwide, Inc. (IT Svs.) | (a) | 31,317 | 2,268,290 | |||||||
Applied Micro Circuits Corp. (Semiconductors & Equip.) | (a) | 355,539 | 2,264,783 | |||||||
Cavium, Inc. (Semiconductors & Equip.) | (a) | 41,474 | 2,725,257 | |||||||
Inphi Corp. (Semiconductors & Equip.) | (a) | 86,176 | 2,328,476 | |||||||
Integrated Device Technology, Inc. (Semiconductors & Equip.) | (a) | 64,211 | 1,691,960 | |||||||
Microsemi Corp. (Semiconductors & Equip.) | (a) | 86,973 | 2,834,450 | |||||||
Power Integrations, Inc. (Semiconductors & Equip.) | 51,046 | 2,482,367 | ||||||||
CommVault Systems, Inc. (Software) | (a) | 68,646 | 2,701,220 | |||||||
Guidewire Software, Inc. (Software) | (a) | 40,650 | 2,445,504 | |||||||
Imperva, Inc. (Software) | (a) | 37,407 | 2,368,237 | |||||||
Qlik Technologies, Inc. (Software) | (a) | 84,611 | 2,678,784 | |||||||
Telenav, Inc. (Software) | (a) | 397,972 | 2,264,461 | |||||||
Electronics For Imaging, Inc. (Tech. Hardware, Storage & Periph.) | (a) | 59,735 | 2,792,014 | |||||||
Immersion Corp. (Tech. Hardware, Storage & Periph.) | (a) | 245,888 | 2,867,054 | |||||||
Quantum Corp. (Tech. Hardware, Storage & Periph.) | (a) | 2,756,544 | 2,563,586 | |||||||
|
| |||||||||
| 56,839,537 | ||||||||||
|
| |||||||||
MATERIALS – 1.8% | ||||||||||
PolyOne Corp. (Chemicals) | 94,107 | 2,988,838 | ||||||||
|
| |||||||||
Total Common Stocks (Cost $173,228,348) | $ | 159,284,388 | ||||||||
|
| |||||||||
| Money Market Funds – 2.4% | Shares | Value | ||||||||
Fidelity Institutional Money Market Funds | ||||||||||
Money Market Portfolio – Class I | 3,894,000 | $ | 3,894,000 | |||||||
|
| |||||||||
Total Money Market Funds (Cost $3,894,000) | $ | 3,894,000 | ||||||||
|
| |||||||||
Total Investments – 100.6% (Cost $177,122,348) | (b) | $ | 163,178,388 | |||||||
Liabilities in Excess of Other Assets – (0.6)% | (1,009,793) | |||||||||
|
| |||||||||
Net Assets – 100.0% | $ | 162,168,595 | ||||||||
|
| |||||||||
Percentages are stated as a percent of net assets.
Footnotes:
| (a) | Non-income producing security. |
| (b) | Represents cost for financial reporting purposes, which may differ from cost basis for federal income tax purposes. See also Note 7 of the Notes to Financial Statements. |
The accompanying notes are an integral part of these financial statements.
| 82 |
| Ohio National Fund, Inc. | Balanced Portfolio |
Objective/Strategy
The Balanced Portfolio seeks capital appreciation and income by investing normally up to 75% of its total assets in equity securities of domestic and foreign companies of any market capitalization while maintaining a minimum of 25% of its total assets in fixed income securities.
Performance as of December 31, 2015
Average Annual returns | ||||
One year | 1.47% | |||
Five years | 7.52% | |||
Ten years | 6.03% |
Past performance does not guarantee future results. The performance data quoted represents past performance and current returns may be lower or higher. Total return figures include change in share price and reinvestment of dividends and capital gains. The investment return and principal value will fluctuate so that an investor’s shares, when redeemed, may be worth more or less than the original cost. To obtain performance information up to the most recent month end, call toll-free 1-877-781-6392.
The Portfolio is not open to direct retail investment. Beneficial interest in shares is obtained solely by purchase of variable life insurance policies and variable annuity contracts. Actual performance results for variable annuity and variable universal life contracts will be lower due to contract charges. Consult your contract for applicable charges.
Comments
For the year ended December 31, 2015, the Balanced Portfolio returned 1.47% versus 0.99% for its benchmark, which is comprised of 60% S&P Composite 1500 Index and 40% Barclays Capital U.S. Universal Index.
Calendar year 2015 was an interesting year, as both equity and fixed income returns were relatively muted. However, that is not to say there was a lack of market action during the time period. In fact, 2015 saw several significant events that included a virtual repricing of nearly all types of commodity assets and times of significant market volatility in both equity and fixed income securities.
Entering 2015, our equity valuation model viewed the overall broad domestic market as approximately 5% below our estimate of fair value. While our return expectations were relatively flat for the overall market, our system identified opportunities in specific sectors and industries. In an attempt to take advantage of those opportunities, the Portfolio was slightly overweight in equities relative to the blended benchmark, with a specific focus on the Consumer Discretionary, Financials, and Information Technology sectors. Additionally, given the lower overall market value readings, the Portfolio bought out-of-the-money S&P 500 put options and wrote out-of-the-money S&P 500 call options in an attempt to reduce the effects of market based volatility on the Portfolio. Relative to the fixed income portion of the benchmark, the fixed income portion of the Portfolio began the year with an overweight position in the corporate debt segment of the market. Because value was tough to find due to tight corporate bond spreads, the Portfolio had a specific focus on rating crossover bonds and high yield yield-to-call paper. Overall, this strategy proved advantageous during the first month of the year as the equity market fell by about 2.87%, due in large part to a combination of macro-economic concerns and a U.S. gross domestic product (“GDP”) slowdown.
The decline in equities had many investors fleeing to the safety of U.S. Treasuries as yields on the U.S. 10-year Treasury fell from 2.17% on January 1, 2015 to 1.64% by January 31, 2015. While the
underlying holdings in the Portfolio were generally in line with the benchmark during this sell-off, the Portfolio’s hedging profile helped it outperform the blended benchmark during this move. This bout of equity volatility provided some attractive entry points within certain sectors, according to our system, and we began to increase the Portfolio’s equity exposure throughout the remainder of the first quarter. In addition, we loosened the hedge on the equity portion of the Portfolio to put it in position to participate in the anticipated upside move. Increasing the equity exposure and loosening the hedge turned out to be a positive contribution to returns, as the equity market reversed course and rallied through the end of the first quarter. Further, positive selection effect in both the equity and fixed income portion of the Portfolio contributed to returns during this move.
The second quarter of 2015 was relatively uneventful from a price movement standpoint, although volatility returned to the marketplace near the end of June as concerns over Greece reemerged. Over the course of the second quarter, our methodology indicated decreasing value and fewer attractive opportunities in the equity market, leading us to reduce our equity exposure and increase our fixed income exposure in both corporate bonds and U.S. Treasuries. Additionally, the hedge was slowly increased throughout the second quarter, as stretched valuations made us wary of increased market volatility ahead. Again, positive selection effect in both the equity and fixed income portions of the Portfolio outperformed the benchmark for the second quarter of 2015.
The third quarter of 2015 brought about the largest equity downturn during the year, as concerns regarding emerging market growth and continued declines in commodity prices resulted in a rather aggressive sell-off during the last half of the quarter. Fortunately, due to low equity valuations, based on our methodology, the Portfolio began the quarter with a more defensive allocation at approximately 56% equities / 44% fixed income. Additionally, the Portfolio’s hedge profile was increased in an attempt to mitigate the effects of market volatility on the Portfolio. Specifically, deep out-of-the money puts were purchased in an attempt to protect the Portfolio should a strong sell-off take place. Both moves were advantageous as the Portfolio only captured 52% of the downside move in August 2015.
The last quarter of the year turned out to be a virtual mirror image of what took place during the third quarter, as equities produced their strongest returns of 2015. From a portfolio construction standpoint, we began to increase equity exposure to a more neutral balanced portfolio stance (60% equities / 40% fixed income) throughout the month of September as the August sell-off created attractive buying opportunities. The August volatility created additional buying opportunities in some closed-end fund arbitrage plays that we had been focusing on. While our increased allocation to these segments of the market was generally beneficial, the Portfolio underperformed the blended benchmark during the quarter in large part due to the emergence of new leadership in the market. This end of year rally was driven by the most beaten-down segments of the Energy and Materials sectors, which we still saw as too risky for purchase. While we underperformed during this final move of 2015, over the course of the entire calendar year, the Portfolio had both higher returns and reduced volatility relative to both the broad equity index and blended benchmark.
Focusing on the equity portion of the Portfolio, the largest sector contributor to performance over the course of 2015 was the Information Technology sector. While the Portfolio was underweight the sector as a whole due to stretched valuations, we saw industry-specific opportunities that performed extremely well, producing
| 83 | (continued) |
| Ohio National Fund, Inc. | Balanced Portfolio (Continued) |
positive benchmark-relative selection effect. Other sectors that contributed positively to Portfolio performance included the Consumer Discretionary, Consumer Staples, Utilities, and Telecommunication Services sectors. Positions in both the Industrials and Financials sectors detracted from Portfolio performance, as the combination of an overweight position and underperforming stock selections resulted in negative relative total effect.(1)
With regard to individual stock performance within the Portfolio, the five best benchmark-relative contributors were Alphabet, Inc., Facebook, Inc., Signature Bank, Advance Auto Parts, Inc., and Chipotle Mexican Grill. The five equities that had the most negative benchmark-relative contribution were Union Pacific Corp., Encore Capital Group, Inc., Eagle Materials, Inc., HCA Holdings, Inc., and Discover Financial Services.(1)
In the fixed income portion of the Portfolio, 2015 proved to be a challenging year in both the rate and credit markets. While the Portfolio maintained a heavy corporate bond focus, it was largely able to avoid the downturn in both investment grade and high yield corporate bonds through a combination of bottom-up bond selections and avoiding segments of the market we felt were either too risky or too tight from a credit spread standpoint. Selections in the Health Care, Insurance, and Financials segments of the market provided the highest relative total effect and resulted in strong relative selection effect compared to the broad fixed income benchmark. During the year, the Portfolio also focused on preferred issues and closed-end fund arbitrage opportunities. Both areas proved to be beneficial for the Portfolio over the course of the year. The Portfolio’s positions in the closed-end fund space provided both positive returns for our investors and a less risky place to allocate money relative to the volatility seen in the corporate bond segment of the market. These positions resulted in strong performance relative to the benchmark over the course of the year.(1)
Our equity valuations concluded 2015 with an overall average V/P (“Value/Price”) ratio of 1.05, giving us confidence there is room for the market to rise in the coming year. Currently, our system indicates attractive opportunities within the Financials, Utilities, and Materials sectors. The Portfolio continues to maintain a more normal balanced allocation stance with approximately 60% allocated to equities and 40% to fixed income (which includes preferred stocks & closed-end funds). The equity hedge has recently been reduced, targeting an equity beta at the upper end of our historical range. We will continue to adjust the positioning based on our value readings. In the fixed income portion of the Portfolio, we continue to be very selective in our individual bond holdings, as recent spread widening has reintroduced risk into a bond market that had been relatively quiet over the last few years. The recent volatility seen in the high yield segment of the market is presenting us with opportunities in the Energy sector, although we continue to remain cautious with our individual bond selections. Additionally, we continue to see opportunity in unique structured bonds like yield-to-call extension plays, preferred securities with attractive upside profiles, and closed-end funds. As always, we look to value as our primary guide and will adjust our positioning as market conditions dictate.(1)
| (1) | The Portfolio’s composition is subject to change. Holdings and weightings are as of December 31, 2015. |
Change in Value of $10,000 Investment
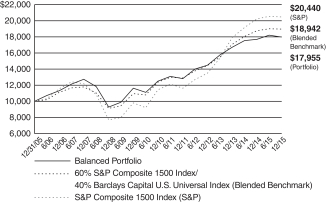
Hypothetical illustration based on past performance. Future performance will vary. The Portfolio’s returns reflect reinvested dividends. The Portfolio’s holdings may differ significantly from the securities in the index. The index is unmanaged and therefore does not reflect the cost of portfolio management and accounting.
The S&P Composite 1500 Index is a broad-based capitalization-weighted index of 1500 U.S. companies and is comprised of the S&P MidCap 400, S&P 500, and the S&P SmallCap 600. It is designed for investors seeking to replicate to the performance of the U.S. equity market or benchmark against a representative universe of tradable stocks. The index presented herein includes the effects of reinvested dividends.
The Barclays Capital U.S. Universal Index represents the union of the U.S. Aggregate Index, U.S. Corporate High Yield Index. Investment Grade 144A Index, Eurodollar Index, U.S. Emerging Markets Index, and the non-ERISA portion of the Commercial Mortgage-Backed Securities (CMBS) Index. The index covers USD-denominated, taxable bonds that are rated either investment grade or high-yield.
| 84 | (continued) |
| Ohio National Fund, Inc. | Balanced Portfolio (Continued) |
Portfolio Composition as of December 31, 2015 (1)
| % of Net Assets |
Common Stocks (4) | 55.3 | |||
Corporate Bonds (4) | 18.7 | |||
Preferred Stocks (4) | 3.1 | |||
Trust Preferred Securities (4) | 4.2 | |||
Master Limited Partnerships (4) | 0.2 | |||
Asset-Backed / Mortgage-Backed Securities (4) | 2.4 | |||
U.S. Treasury Obligations | 4.6 | |||
Closed-End Mutual Funds | 6.3 | |||
Exchange Traded Funds | 2.8 | |||
Purchased Options | 0.2 | |||
Money Market Funds and | 2.2 | |||
|
| |||
| 100.0 | ||||
|
|
Top 10 Portfolio Holdings as of December 31, 2015 (1) (2) (3)
| % of Net Assets |
1. U.S. Treasury Note 1.000%, 09/15/2017 | 2.3 | |||
2. AllianceBernstein Income Fund, Inc. | 1.6 | |||
3. Discover Financial Services | 1.5 | |||
4. CBRE Group, Inc. | 1.4 | |||
5. iShares Currency Hedged MSCI Eurozone ETF | 1.4 | |||
6. iShares Europe ETF | 1.4 | |||
7. CVS Health Corp. | 1.3 | |||
8. Union Pacific Corp. | 1.2 | |||
9. Kraft Heinz Foods Co. | 1.2 | |||
10. Ashland, Inc. | 1.2 |
| (1) | Composition of Portfolio subject to change. |
| (2) | Short-term investments have been excluded from the list of Top 10 Portfolio Holdings. |
| (3) | Top 10 Portfolio Holdings is presented at an individual security level. Total investment exposure by issuer may be higher. |
| (4) | Sectors (Common Stocks, Corporate Bonds, Preferred Stocks, Trust Preferred Securities, Master Limited Partnerships, Asset-Backed / Mortgage-Backed Securities): |
| % of Net Assets | ||||
Financials | 25.8 | |||
Health Care | 11.3 | |||
Information Technology | 11.0 | |||
Consumer Discretionary | 9.0 | |||
Industrials | 8.4 | |||
Consumer Staples | 5.0 | |||
Utilities | 5.0 | |||
Materials | 3.2 | |||
Energy | 2.9 | |||
Telecommunication Services | 2.3 | |||
|
| |||
| 83.9 | ||||
|
|
| 85 |
| Ohio National Fund, Inc. | Balanced Portfolio |
Schedule of Investments | December 31, 2015 |
| Common Stocks – 55.3% | Shares | Value | ||||||||
CONSUMER DISCRETIONARY – 7.3% | ||||||||||
BorgWarner, Inc. (Auto Components) | 112,146 | $ | 4,848,071 | |||||||
Delphi Automotive PLC (Auto Components) | 58,524 | 5,017,262 | ||||||||
Gentherm, Inc. (Auto Components) | (a) | 50,000 | 2,370,000 | |||||||
Royal Caribbean Cruises Ltd. (Hotels, Restaurants & Leisure) | 60,000 | 6,072,600 | ||||||||
Wyndham Worldwide Corp. (Hotels, Restaurants & Leisure) | 90,000 | 6,538,500 | ||||||||
Jarden Corp. (Household Durables) | (a) | 87,197 | 4,980,693 | |||||||
Mohawk Industries, Inc. (Household Durables) | (a) | 22,500 | 4,261,275 | |||||||
Whirlpool Corp. (Household Durables) | 10,000 | 1,468,700 | ||||||||
CBS Corp. Class B (Media) | 149,704 | 7,055,549 | ||||||||
Comcast Corp. Class A (Media) | (d) | 34,044 | 1,921,103 | |||||||
Advance Auto Parts, Inc. (Specialty Retail) | 20,000 | 3,010,200 | ||||||||
Home Depot, Inc. / The (Specialty Retail) | (d) | 40,000 | 5,290,000 | |||||||
Lowe’s Cos., Inc. (Specialty Retail) | 85,000 | 6,463,400 | ||||||||
Signet Jewelers Ltd. (Specialty Retail) | 30,000 | 3,710,700 | ||||||||
|
| |||||||||
| 63,008,053 | ||||||||||
|
| |||||||||
CONSUMER STAPLES – 1.4% | ||||||||||
CVS Health Corp. (Food & Staples Retailing) | (d) | 80,000 | 7,821,600 | |||||||
Tyson Foods, Inc. Class A (Food Products) | 75,000 | 3,999,750 | ||||||||
|
| |||||||||
| 11,821,350 | ||||||||||
|
| |||||||||
ENERGY – 1.0% | ||||||||||
Schlumberger Ltd. (Energy Equip. & Svs.) | 45,000 | 3,138,750 | ||||||||
Marathon Petroleum Corp. (Oil, Gas & Consumable Fuels) | 40,000 | 2,073,600 | ||||||||
Spectra Energy Corp. (Oil, Gas & Consumable Fuels) | 155,000 | 3,710,700 | ||||||||
|
| |||||||||
| 8,923,050 | ||||||||||
|
| |||||||||
FINANCIALS – 13.7% | ||||||||||
Bank of America Corp. (Banks) | 540,000 | 9,088,200 | ||||||||
Fifth Third Bancorp (Banks) | 150,000 | 3,015,000 | ||||||||
JPMorgan Chase & Co. (Banks) | 70,000 | 4,622,100 | ||||||||
Signature Bank (Banks) | (a)(d) | 63,270 | 9,703,720 | |||||||
SVB Financial Group (Banks) | (a) | 55,000 | 6,539,500 | |||||||
U.S. Bancorp (Banks) | 50,000 | 2,133,500 | ||||||||
Wells Fargo & Co. (Banks) | (d) | 79,000 | 4,294,440 | |||||||
Invesco Ltd. (Capital Markets) | 252,900 | 8,467,092 | ||||||||
Janus Capital Group, Inc. (Capital Markets) | 250,000 | 3,522,500 | ||||||||
Ally Financial, Inc. (Consumer Finance) | (a) | 300,000 | 5,592,000 | |||||||
Discover Financial Services (Consumer Finance) | 237,080 | 12,712,229 | ||||||||
Encore Capital Group, Inc. (Consumer Finance) | (a)(d) | 235,370 | 6,844,560 | |||||||
American International Group, Inc. (Insurance) | 70,000 | 4,337,900 | ||||||||
Arthur J. Gallagher & Co. (Insurance) | 85,670 | 3,507,330 | ||||||||
Lincoln National Corp. (Insurance) | 75,000 | 3,769,500 | ||||||||
Sun Life Financial, Inc. (Insurance) | 122,725 | 3,829,020 | ||||||||
XL Group PLC (Insurance) | 200,000 | 7,836,000 | ||||||||
Winthrop Realty Trust (Real Estate Investment Trusts) | 245,410 | 3,182,968 | ||||||||
CBRE Group, Inc. (Real Estate Mgmt. & Development) | (a) | 355,000 | 12,275,900 | |||||||
Jones Lang LaSalle, Inc. (Real Estate Mgmt. & Development) | 19,029 | 3,041,976 | ||||||||
|
| |||||||||
| 118,315,435 | ||||||||||
|
| |||||||||
HEALTH CARE – 7.7% | ||||||||||
AbbVie, Inc. (Biotechnology) | (d) | 100,000 | 5,924,000 | |||||||
Biogen, Inc. (Biotechnology) | (a) | 23,000 | 7,046,050 | |||||||
Gilead Sciences, Inc. (Biotechnology) | 55,530 | 5,619,081 | ||||||||
Aetna, Inc. (Health Care Providers & Svs.) | 20,000 | 2,162,400 | ||||||||
Cardinal Health, Inc. (Health Care Providers & Svs.) | 25,000 | 2,231,750 | ||||||||
Cigna Corp. (Health Care Providers & Svs.) | (d) | 20,000 | 2,926,600 | |||||||
HCA Holdings, Inc. (Health Care Providers & Svs.) | (a) | 110,000 | 7,439,300 | |||||||
McKesson Corp. (Health Care Providers & Svs.) | 45,000 | 8,875,350 | ||||||||
Allergan PLC (Pharmaceuticals) | (a) | 28,700 | 8,968,750 | |||||||
Jazz Pharmaceuticals PLC (Pharmaceuticals) | (a) | 45,000 | 6,325,200 | |||||||
Johnson & Johnson (Pharmaceuticals) | (d) | 85,000 | 8,731,200 | |||||||
|
| |||||||||
| 66,249,681 | ||||||||||
|
| |||||||||
INDUSTRIALS – 6.5% | ||||||||||
Curtiss-Wright Corp. (Aerospace & Defense) | 89,563 | 6,135,065 | ||||||||
General Dynamics Corp. (Aerospace & Defense) | (d) | 50,000 | 6,868,000 | |||||||
Honeywell International, Inc. (Aerospace & Defense) | 60,000 | 6,214,200 | ||||||||
FedEx Corp. (Air Freight & Logistics) | (d) | 25,000 | 3,724,750 | |||||||
Delta Air Lines, Inc. (Airlines) | (d) | 170,000 | 8,617,300 | |||||||
Southwest Airlines Co. (Airlines) | 60,000 | 2,583,600 | ||||||||
United Continental Holdings, Inc. (Airlines) | (a) | 40,000 | 2,292,000 | |||||||
Masco Corp. (Building Products) | 150,000 | 4,245,000 | ||||||||
Old Dominion Freight Line, Inc. (Road & Rail) | (a) | 40,000 | 2,362,800 | |||||||
| 86 | (continued) |
| Ohio National Fund, Inc. | Balanced Portfolio (Continued) |
Schedule of Investments | December 31, 2015 |
| Common Stocks (Continued) | Shares | Value | ||||||||
INDUSTRIALS (continued) | ||||||||||
Ryder System, Inc. (Road & Rail) | 45,000 | $ | 2,557,350 | |||||||
Union Pacific Corp. (Road & Rail) | 138,160 | 10,804,112 | ||||||||
|
| |||||||||
| 56,404,177 | ||||||||||
|
| |||||||||
INFORMATION TECHNOLOGY – 9.0% | ||||||||||
IPG Photonics Corp. (Electronic Equip., Instr. & Comp.) | (a) | 77,172 | 6,880,655 | |||||||
TE Connectivity Ltd. (Electronic Equip., Instr. & Comp.) | 100,000 | 6,461,000 | ||||||||
Alphabet, Inc. Class C (Internet Software & Svs.) | (a) | 12,776 | 9,695,451 | |||||||
Facebook, Inc. Class A (Internet Software & Svs.) | (a) | 85,000 | 8,896,100 | |||||||
Accenture PLC Class A (IT Svs.) | 20,786 | 2,172,137 | ||||||||
DST Systems, Inc. (IT Svs.) | 30,000 | 3,421,800 | ||||||||
MasterCard, Inc. Class A (IT Svs.) | 96,600 | 9,404,976 | ||||||||
Visa, Inc. (IT Svs.) | 131,400 | 10,190,070 | ||||||||
Applied Materials, Inc. (Semiconductors & Equip.) | 120,000 | 2,240,400 | ||||||||
Avago Technologies Ltd. (Semiconductors & Equip.) | 25,000 | 3,628,750 | ||||||||
Synaptics, Inc. (Semiconductors & Equip.) | (a) | 27,000 | 2,169,180 | |||||||
Synchronoss Technologies, Inc. (Software) | (a) | 118,821 | 4,186,064 | |||||||
Apple, Inc. (Tech. Hardware, Storage & Periph.) | (d) | 78,910 | 8,306,067 | |||||||
|
| |||||||||
| 77,652,650 | ||||||||||
|
| |||||||||
MATERIALS – 2.8% | ||||||||||
Ashland, Inc. (Chemicals) | (d) | 100,000 | 10,270,000 | |||||||
Methanex Corp. (Chemicals) | (d) | 65,183 | 2,151,691 | |||||||
Monsanto Co. (Chemicals) | 20,000 | 1,970,400 | ||||||||
Eagle Materials, Inc. (Construction Materials) | (d) | 105,000 | 6,345,150 | |||||||
Martin Marietta Materials, Inc. (Construction Materials) | 25,000 | 3,414,500 | ||||||||
|
| |||||||||
| 24,151,741 | ||||||||||
|
| |||||||||
TELECOMMUNICATION SERVICES – 1.6% | ||||||||||
AT&T, Inc. (Diversified Telecom. Svs.) | 130,000 | 4,473,300 | ||||||||
BCE, Inc. (Diversified Telecom. Svs.) | 70,000 | 2,703,400 | ||||||||
T-Mobile U.S., Inc. (Wireless Telecom. Svs.) | (a) | 170,000 | 6,650,400 | |||||||
|
| |||||||||
| 13,827,100 | ||||||||||
|
| |||||||||
UTILITIES – 4.3% | ||||||||||
ALLETE, Inc. (Electric Utilities) | 90,000 | 4,574,700 | ||||||||
ITC Holdings Corp. (Electric Utilities) | (d) | 130,164 | 5,108,937 | |||||||
OGE Energy Corp. (Electric Utilities) | 125,190 | 3,291,245 | ||||||||
Atmos Energy Corp. (Gas Utilities) | 54,495 | 3,435,365 | ||||||||
AES Corp. (Ind. Power & Renewable Elec.) | 300,000 | 2,871,000 | ||||||||
Ameren Corp. (Multi-Utilities) | 100,000 | 4,323,000 | ||||||||
CMS Energy Corp. (Multi-Utilities) | 256,300 | 9,247,304 | ||||||||
Sempra Energy (Multi-Utilities) | 50,000 | 4,700,500 | ||||||||
|
| |||||||||
| 37,552,051 | ||||||||||
|
| |||||||||
Total Common Stocks (Cost $470,557,855) | $ | 477,905,288 | ||||||||
|
| |||||||||
| Corporate Bonds – 18.7% | Rate | Maturity | Face Amount | Value | ||||||||||||
CONSUMER DISCRETIONARY – 1.7% | ||||||||||||||||
Darden Restaurants, Inc. (Hotels, Restaurants & Leisure) | (h) | 7.050% | 10/15/2037 | $ | 3,500,000 | $ | 3,672,407 | |||||||||
International Game Technology (Hotels, Restaurants & Leisure) | 5.350% | 10/15/2023 | 2,000,000 | 1,680,000 | ||||||||||||
Pinnacle Entertainment, Inc. (Hotels, Restaurants & Leisure) | 7.500% | 04/15/2021 | 3,110,000 | 3,242,175 | ||||||||||||
Pinnacle Entertainment, Inc. (Hotels, Restaurants & Leisure) | 6.375% | 08/01/2021 | 909,000 | 955,586 | ||||||||||||
TCI Communications, Inc. (Media) | 7.125% | 02/15/2028 | 4,000,000 | 5,173,196 | ||||||||||||
|
| |||||||||||||||
| 14,723,364 | ||||||||||||||||
|
| |||||||||||||||
CONSUMER STAPLES – 3.6% | ||||||||||||||||
CVS Health Corp. (Food & Staples Retailing) | (b) | 4.750% | 12/01/2022 | 10,726,000 | 11,494,325 | |||||||||||
Kraft Heinz Foods Co. (Food Products) | (b) | 4.875% | 02/15/2025 | 9,714,000 | 10,326,205 | |||||||||||
Altria Group, Inc. (Tobacco) | (h) | 9.250% | 08/06/2019 | 7,967,000 | 9,754,492 | |||||||||||
|
| |||||||||||||||
| 31,575,022 | ||||||||||||||||
|
| |||||||||||||||
ENERGY – 1.7% | ||||||||||||||||
Alliance Pipeline LP / United States (Oil, Gas & Consumable Fuels) | (b) | 7.877% | 12/31/2025 | 2,000,000 | 2,382,258 | |||||||||||
BG Energy Capital PLC (Oil, Gas & Consumable Fuels) | (b) | 4.000% | 10/15/2021 | 3,090,000 | 3,206,675 | |||||||||||
Bill Barrett Corp. (Oil, Gas & Consumable Fuels) | 7.000% | 10/15/2022 | 1,400,000 | 938,000 | ||||||||||||
Encana Corp. (Oil, Gas & Consumable Fuels) | 6.500% | 02/01/2038 | 1,000,000 | 799,388 | ||||||||||||
Noble Energy, Inc. (Oil, Gas & Consumable Fuels) | 5.875% | 06/01/2022 | 4,000,000 | 3,805,200 | ||||||||||||
Noble Energy, Inc. (Oil, Gas & Consumable Fuels) | 5.875% | 06/01/2024 | 1,350,000 | 1,291,795 | ||||||||||||
Range Resources Corp. (Oil, Gas & Consumable Fuels) | 5.000% | 08/15/2022 | 2,525,000 | 1,887,438 | ||||||||||||
|
| |||||||||||||||
| 14,310,754 | ||||||||||||||||
|
| |||||||||||||||
| 87 | (continued) |
| Ohio National Fund, Inc. | Balanced Portfolio (Continued) |
Schedule of Investments | December 31, 2015 |
| Corporate Bonds (Continued) | Rate | Maturity | Face Amount | Value | ||||||||||||
FINANCIALS – 3.8% | ||||||||||||||||
City National Corp. (Banks) | 5.250% | 09/15/2020 | $ | 1,500,000 | $ | 1,666,296 | ||||||||||
E*TRADE Financial Corp. (Capital Markets) | 5.375% | 11/15/2022 | 3,040,000 | 3,184,400 | ||||||||||||
Neuberger Berman Group LLC / Neuberger Berman Finance Corp. (Capital Markets) | (b) | 5.875% | 03/15/2022 | 5,800,000 | 6,032,000 | |||||||||||
Ally Financial, Inc. (Consumer Finance) | 8.000% | 03/15/2020 | 4,400,000 | 5,016,000 | ||||||||||||
Alleghany Corp. (Insurance) | 5.625% | 09/15/2020 | 1,000,000 | 1,086,336 | ||||||||||||
MBIA, Inc. (Insurance) | 6.625% | 10/01/2028 | 2,810,000 | 2,669,500 | ||||||||||||
Old Republic International Corp. (Insurance) | 4.875% | 10/01/2024 | 5,000,000 | 5,124,420 | ||||||||||||
ProAssurance Corp. (Insurance) | 5.300% | 11/15/2023 | 5,063,000 | 5,363,621 | ||||||||||||
Prudential Financial, Inc. (Insurance) | (e) | 8.875% | 06/15/2038 | 2,610,000 | 2,936,250 | |||||||||||
|
| |||||||||||||||
| 33,078,823 | ||||||||||||||||
|
| |||||||||||||||
HEALTH CARE – 3.6% | ||||||||||||||||
CHS / Community Health Systems, Inc. (Health Care Providers & Svs.) | 8.000% | 11/15/2019 | 1,750,000 | 1,763,125 | ||||||||||||
HCA, Inc. (Health Care Providers & Svs.) | 5.250% | 04/15/2025 | 5,200,000 | 5,239,000 | ||||||||||||
Highmark, Inc. (Health Care Providers & Svs.) | (b) | 4.750% | 05/15/2021 | 3,500,000 | 3,556,452 | |||||||||||
Highmark, Inc. (Health Care Providers & Svs.) | (b) | 6.125% | 05/15/2041 | 2,100,000 | 2,082,608 | |||||||||||
inVentiv Health, Inc. (Health Care Providers & Svs.) | (b) | 9.000% | 01/15/2018 | 4,120,000 | 4,223,000 | |||||||||||
Prospect Medical Holdings, Inc. (Health Care Providers & Svs.) | (b) | 8.375% | 05/01/2019 | 5,035,000 | 5,236,400 | |||||||||||
Pfizer, Inc. (Pharmaceuticals) | 5.800% | 08/12/2023 | 7,490,000 | 8,763,083 | ||||||||||||
|
| |||||||||||||||
| 30,863,668 | ||||||||||||||||
|
| |||||||||||||||
INDUSTRIALS – 1.0% | ||||||||||||||||
Air Canada (Airlines) | (b) | 8.750% | 04/01/2020 | 3,460,000 | 3,702,200 | |||||||||||
Ingersoll-Rand Co. (Machinery) | 6.391% | 11/15/2027 | 2,215,000 | 2,531,856 | ||||||||||||
Ingersoll-Rand Co. (Machinery) | 6.443% | 11/15/2027 | 1,800,000 | 2,149,238 | ||||||||||||
|
| |||||||||||||||
| 8,383,294 | ||||||||||||||||
|
| |||||||||||||||
INFORMATION TECHNOLOGY – 2.0% | ||||||||||||||||
Denali Borrower LLC / Denali Finance Corp. (Computers & Peripherals) | (b) | 5.625% | 10/15/2020 | 2,750,000 | 2,880,625 | |||||||||||
Corning, Inc. (Electronic Equip., Instr. & Comp.) | 7.250% | 08/15/2036 | 2,180,000 | 2,516,976 | ||||||||||||
EarthLink Holdings Corp. (Internet Software & Svs.) | 7.375% | 06/01/2020 | 2,400,000 | 2,442,000 | ||||||||||||
Lender Processing Services, Inc. / Black Knight Lending Solutions, Inc. (IT Svs.) | 5.750% | 04/15/2023 | 9,188,000 | 9,463,640 | ||||||||||||
|
| |||||||||||||||
| 17,303,241 | ||||||||||||||||
|
| |||||||||||||||
MATERIALS – 0.4% | ||||||||||||||||
Vulcan Materials Co. (Construction Materials) | 4.500% | 04/01/2025 | 1,250,000 | 1,237,500 | ||||||||||||
Alcoa, Inc. (Metals & Mining) | 5.125% | 10/01/2024 | 2,800,000 | 2,548,000 | ||||||||||||
|
| |||||||||||||||
| 3,785,500 | ||||||||||||||||
|
| |||||||||||||||
TELECOMMUNICATION SERVICES – 0.7% | ||||||||||||||||
Cincinnati Bell, Inc. (Diversified Telecom. Svs.) | 8.375% | 10/15/2020 | 3,950,000 | 4,038,875 | ||||||||||||
Level 3 Financing, Inc. (Diversified Telecom. Svs.) | 7.000% | 06/01/2020 | 2,000,000 | 2,090,000 | ||||||||||||
|
| |||||||||||||||
| 6,128,875 | ||||||||||||||||
|
| |||||||||||||||
UTILITIES – 0.2% | ||||||||||||||||
Tenaska Georgia Partners LP (Electric Utilities) | 9.500% | 02/01/2030 | 1,297,462 | 1,605,862 | ||||||||||||
|
| |||||||||||||||
Total Corporate Bonds (Cost $167,075,361) | $ | 161,758,403 | ||||||||||||||
|
| |||||||||||||||
| Preferred Stocks – 3.1% | Rate | Quantity | Value | |||||||||||||
FINANCIALS – 2.2% | ||||||||||||||||
Charles Schwab Corp. Series A / The (Capital Markets) | (f) | 7.000% | 4,000,000 | $ | 4,540,000 | |||||||||||
Digital Realty Trust, Inc. (Real Estate Investment Trusts) | 7.000% | 159,628 | 4,123,191 | |||||||||||||
Equity Commonwealth (Real Estate Investment Trusts) | 7.250% | 264,369 | 6,765,203 | |||||||||||||
Gramercy Property Trust (Acquired 08/26/2014 through 10/14/2015, Cost $3,928,553)(Real Estate Investment Trusts) | (i) | 7.125% | 153,634 | 3,840,850 | ||||||||||||
|
| |||||||||||||||
| 19,269,244 | ||||||||||||||||
|
| |||||||||||||||
INDUSTRIALS – 0.9% | ||||||||||||||||
General Electric Co. (Industrial Conglomerates) | (f) | 4.000% | 7,407,000 | 7,407,000 | ||||||||||||
|
| |||||||||||||||
Total Preferred Stocks (Cost $26,362,284) | $ | 26,676,244 | ||||||||||||||
|
| |||||||||||||||
| Trust Preferred Securities – 4.2% | Rate | Quantity | Value | |||||||||||||
FINANCIALS – 3.7% | ||||||||||||||||
PNC Preferred Funding Trust II (Banks) | (b)(f) | QL + 122 | 4,000,000 | $ | 3,580,000 | |||||||||||
RBS Capital Funding Trust V (Banks) | 5.900% | 184,122 | 4,518,354 | |||||||||||||
USB Capital IX (Banks) | (f) | QL + 102 | 1,500,000 | 1,155,000 | ||||||||||||
USB Realty Corp. (Banks) | (b)(f) | QL + 115 | 5,000,000 | 4,500,000 | ||||||||||||
NTC Capital I (Capital Markets) | (f) | QL + 52 | 3,300,000 | 2,833,875 | ||||||||||||
| 88 | (continued) |
| Ohio National Fund, Inc. | Balanced Portfolio (Continued) |
Schedule of Investments | December 31, 2015 |
| Trust Preferred Securities (Continued) | Rate | Quantity | Value | |||||||||||||
FINANCIALS (continued) | ||||||||||||||||
State Street Capital Trust I (Capital Markets) | (f) | QL + 56 | 5,123,000 | $ | 4,399,376 | |||||||||||
GMAC Capital Trust I (Consumer Finance) | (f) | 8.125% | 325,000 | 8,242,000 | ||||||||||||
ILFC E-Capital Trust II (Diversified Financial Svs.) | (b)(g) | QL/10T/30T + 180 | 2,900,000 | 2,668,000 | ||||||||||||
|
| |||||||||||||||
| 31,896,605 | ||||||||||||||||
|
| |||||||||||||||
UTILITIES – 0.5% | ||||||||||||||||
PECO Energy Capital Trust IV (Electric Utilities) | 5.750% | 5,000,000 | 4,759,955 | |||||||||||||
|
| |||||||||||||||
Total Trust Preferred Securities (Cost $37,812,312) | $ | 36,656,560 | ||||||||||||||
|
| |||||||||||||||
| Master Limited Partnerships – 0.2% | Shares | Value | ||||||||||||||
ENERGY – 0.2% | ||||||||||||||||
Plains All American Pipeline LP (Oil, Gas & Consumable Fuels) | 70,000 | $ | 1,617,000 | |||||||||||||
|
| |||||||||||||||
Total Master Limited Partnerships (Cost $2,223,298) | $ | 1,617,000 | ||||||||||||||
|
| |||||||||||||||
| Asset-Backed / Mortgage-Backed Securities – 2.4% | Rate | Maturity | Face Amount | Value | ||||||||||||
FINANCIALS – 2.4% | ||||||||||||||||
Citigroup Mortgage Loan Trust 2013-J1 Class B2 (Acquired 05/21/2015, Cost $1,964,905) | (b)(i) | 3.559% | 10/25/2043 | $ | 1,969,829 | $ | 1,963,511 | |||||||||
Fannie Mae Trust 2003-W2 Class 1A4 | 3.083% | 07/25/2042 | 1,579,875 | 1,603,667 | ||||||||||||
MASTR Seasoned Securitization Trust 2005-1 Class 1A1 | 6.571% | 09/25/2032 | 1,971,786 | 2,144,347 | ||||||||||||
Sequoia Mortgage Trust 2013-1 Class B2 (Acquired 04/15/2015, Cost $4,822,353) | (i) | 3.636% | 02/25/2043 | 4,781,935 | 4,604,103 | |||||||||||
Sequoia Mortgage Trust 2013-10 Class B2 (Acquired 02/17/2015, Cost $4,254,025) | (b)(i) | 3.583% | 08/25/2043 | 4,363,103 | 4,110,478 | |||||||||||
Sequoia Mortgage Trust 2013-12 Class B3 (Acquired 10/07/2015, Cost $2,310,257) | (b)(i) | 4.275% | 12/25/2043 | 2,268,748 | 2,309,627 | |||||||||||
Towd Point Mortgage Trust 2015-4 Class M2 | (b) | 3.750% | 04/25/2055 | 4,000,000 | 3,805,387 | |||||||||||
|
| |||||||||||||||
Total Asset-Backed / Mortgage-Backed Securities (Cost $21,061,780) | $ | 20,541,120 | ||||||||||||||
|
| |||||||||||||||
| U.S. Treasury Obligations – 4.6% | Rate | Maturity | Face Amount | Value | ||||||||||||
U.S. Treasury Inflation Indexed Bonds | 0.125% | 04/15/2019 | $ | 10,150,200 | $ | 10,084,031 | ||||||||||
U.S. Treasury Note | 1.000% | 09/15/2017 | 20,000,000 | 19,989,880 | ||||||||||||
U.S. Treasury Note | 1.875% | 05/31/2022 | 10,000,000 | 9,904,180 | ||||||||||||
|
| |||||||||||||||
Total U.S. Treasury Obligations (Cost $40,014,244) | $ | 39,978,091 | ||||||||||||||
|
| |||||||||||||||
| Closed-End Mutual Funds – 6.3% | Shares | Value | ||||||||||||||
Advent/Claymore Enhanced Growth & Income Fund | 183,120 | $ | 1,514,402 | |||||||||||||
AllianceBernstein Income Fund, Inc. | 1,802,644 | 13,826,280 | ||||||||||||||
Delaware Investments Dividend & Income Fund, Inc. | 180,766 | 1,594,356 | ||||||||||||||
Deutsche Global High Income Fund, Inc. | 189,106 | 1,427,750 | ||||||||||||||
Deutsche High Income Opportunities Fund, Inc. | 163,308 | 2,132,802 | ||||||||||||||
Diversified Real Asset Income Fund | 162,933 | 2,527,091 | ||||||||||||||
First Trust Dividend and Income Fund | 128,707 | 1,088,861 | ||||||||||||||
First Trust Mortgage Income Fund | 123,249 | 1,792,040 | ||||||||||||||
Firsthand Technology Value Fund, Inc. | (a) | 70,965 | 579,784 | |||||||||||||
Fort Dearborn Income Securities, Inc. | 253,937 | 3,684,626 | ||||||||||||||
Global High Income Fund, Inc. | 528,581 | 4,492,939 | ||||||||||||||
LMP Real Estate Income Fund, Inc. | 233,763 | 3,048,270 | ||||||||||||||
Managed High Yield Plus Fund, Inc. | 1,432,448 | 2,521,108 | ||||||||||||||
Neuberger Berman Real Estate Securities Income Fund, Inc. | 300,423 | 1,505,119 | ||||||||||||||
Nuveen Mortgage Opportunity Term Fund | 90,876 | 2,063,794 | ||||||||||||||
Strategic Global Income Fund, Inc. | 432,576 | 3,789,366 | ||||||||||||||
Western Asset/Claymore Inflation-Linked Opportunities & Income Fund | 108,660 | 1,118,111 | ||||||||||||||
Western Asset/Claymore Inflation-Linked Securities & Income Fund | 215,384 | 2,276,609 | ||||||||||||||
Zweig Fund, Inc. | 58,667 | 770,884 | ||||||||||||||
Zweig Total Return Fund, Inc. / The | 221,135 | 2,693,424 | ||||||||||||||
|
| |||||||||||||||
Total Closed-End Mutual Funds (Cost $56,779,327) | $ | 54,447,616 | ||||||||||||||
|
| |||||||||||||||
| Exchange Traded Funds – 2.8% | Shares | Value | ||||||||||||||
iShares Currency Hedged MSCI Eurozone ETF | 465,000 | $ | 12,006,300 | |||||||||||||
iShares Europe ETF | 295,000 | 11,832,450 | ||||||||||||||
|
| |||||||||||||||
Total Exchange Traded Funds (Cost $25,136,273) | $ | 23,838,750 | ||||||||||||||
|
| |||||||||||||||
| 89 | (continued) |
| Ohio National Fund, Inc. | Balanced Portfolio (Continued) |
Schedule of Investments | December 31, 2015 |
| Purchased Options – 0.2% | Expiration | Exercise Price | Contracts (c) | Value | ||||||||||||
S&P 500 Index Put Option | January 2016 | $1,850.00 | 700 | $ | 91,000 | |||||||||||
S&P 500 Index Put Option | January 2016 | $1,900.00 | 700 | 175,000 | ||||||||||||
S&P 500 Index Put Option | February 2016 | $1,925.00 | 100 | 194,000 | ||||||||||||
S&P 500 Index Put Option | February 2016 | $1,950.00 | 700 | 1,652,000 | ||||||||||||
|
| |||||||||||||||
Total Purchased Options (Cost $3,008,898) | $ | 2,112,000 | ||||||||||||||
|
| |||||||||||||||
| Money Market Funds – 0.9% | Shares | Value | ||||||||||||||
Fidelity Institutional Money Market Funds | 8,140,000 | $ | 8,140,000 | |||||||||||||
|
| |||||||||||||||
Total Money Market Funds (Cost $8,140,000) | $ | 8,140,000 | ||||||||||||||
|
| |||||||||||||||
Total Investments – 98.7% (Cost $858,171,632) | (j) | $ | 853,671,072 | |||||||||||||
Total Written Options Outstanding – (0.0)% (see following schedule) | (372,000) | |||||||||||||||
Other Assets in Excess of Liabilities – 1.3% | 11,622,965 | |||||||||||||||
|
| |||||||||||||||
Net Assets – 100.0% | $ | 864,922,037 | ||||||||||||||
|
| |||||||||||||||
Percentages are stated as a percent of net assets.
Abbreviations:
| QL: | Quarterly U.S. LIBOR Rate, 0.613% on 12/31/2015 |
| 10T: | 10 Year Constant Maturity Treasury Rate, 2.277% on 12/31/2015 |
| 30T: | 30 Year Constant Maturity Treasury Rate, 3.016% on 12/31/2015 |
Footnotes:
| (a) | Non-income producing security. |
| (b) | Security exempt from registration under Regulation D of the Securities Act of 1933. These securities may be resold in transactions exempt from registration, normally to qualified buyers under Rule 144A. At December 31, 2015, the value of these securities totaled $78,059,751, or 9.0% of the Portfolio’s net assets. These securities were deemed liquid pursuant to procedures approved by the Board of Directors. |
| (c) | 100 shares per contract. |
| (d) | Security is fully or partially pledged as collateral for written call options outstanding. Outstanding written call options are presented in the following schedule. |
| (e) | Security is a variable rate instrument in which the coupon rate is fixed until a later specified date, then is adjusted quarterly in concert with U.S. LIBOR. Interest rates stated are those in effect at December 31, 2015. |
| (f) | Security is a variable rate preferred stock or trust preferred security in which the dividend rate is fixed until a later specified date, then is adjusted quarterly in concert with U.S. LIBOR. Dividend rates stated are those in effect at December 31, 2015. |
| (g) | Security is a variable rate trust preferred security in which the dividend rate is fixed until a later specified date, then is adjusted quarterly in concert with U.S. LIBOR, 10 Year Constant Maturity Treasury Rate, or 30 Year Constant Maturity Treasury Rate up to a maximum of 14.5%. Dividend rates stated are those in effect at December 31, 2015. |
| (h) | Represents bonds that are credit sensitive. The coupon rates for these bonds are subject to adjustment based on changes in national credit rating agency ratings. |
| (i) | Represents a security deemed to be illiquid. At December 31, 2015, the value of illiquid securities in the Portfolio totaled $16,828,569, or 1.9% of the Portfolio’s net assets. |
| (j) | Represents cost for financial reporting purposes, which may differ from cost basis for federal income tax purposes. See also Note 7 of the Notes to Financial Statements. |
The accompanying notes are an integral part of these financial statements.
Schedule of Written Options Outstanding | December 31, 2015 |
| Expiration | Exercise Price | Contracts* | Value | |||||||||||
S&P 500 Index Call Option | February 2016 | $ | 2,125 | 400 | $ | 372,000 | ||||||||
|
|
|
| |||||||||||
Total Written Options Outstanding (Premiums received $544,685) | 400 | $ | 372,000 | |||||||||||
|
|
|
| |||||||||||
| * | 100 shares per contract. |
The accompanying notes are an integral part of these financial statements.
| 90 |
| Ohio National Fund, Inc. | Target VIP Portfolio |
Objective/Strategy
The Target VIP Portfolio seeks an above average total return by investing in the common stocks of companies which are identified by a model that applies separate uniquely specialized strategies.
Performance as of December 31, 2015
Average Annual returns | ||||
One year | -3.24% | |||
Five years | 10.06% | |||
Ten years | 4.31% |
Past performance does not guarantee future results. The performance data quoted represents past performance and current returns may be lower or higher. Total return figures include change in share price and reinvestment of dividends and capital gains. The investment return and principal value will fluctuate so that an investor’s shares, when redeemed, may be worth more or less than the original cost. To obtain performance information up to the most recent month end, call toll-free 1-877-781-6392.
The Portfolio is not open to direct retail investment. Beneficial interest in shares is obtained solely by purchase of variable life insurance policies and variable annuity contracts. Actual performance results for variable annuity and variable universal life contracts will be lower due to contract charges. Consult your contract for applicable charges.
Comments
For the year ended December 31, 2015, the Target VIP Portfolio returned -3.24% versus 0.48% for its benchmark, the Russell 3000 Index.
U.S. equities posted modest gains in 2015, though the markets were much more eventful than the final tally would indicate. The first half of the year saw stocks trade in a narrow range, as slow but steady economic growth was offset by headwinds in the Energy sector. In the second half, attention turned to China as a surprise currency devaluation and evidence of slowing growth sent global equities tumbling. In the fourth quarter, U.S. stocks recovered to finish modestly higher, while the Federal Reserve began the much anticipated process of normalizing interest rates with its first rate increase since 2006. While the broad U.S. stock market averages rose in 2015, the gains were largely driven by a small group of large stocks that were able to grow well above the overall market. This caused small caps to significantly lag large caps, as the Russell 2000 Index trailed the Russell 1000 Index by over 530 basis points. Similarly, sector returns showed a wide range in 2015, as the spread between the top and bottom sectors in the S&P 500 was over 30%. Energy was by far the worst performing sector, while the Consumer Discretionary sector was the best, as that sector benefitted from lower gas prices and improving employment conditions. Expectations for continued improvement on the jobs front and steady economic growth should remain supportive for equities as we start the new year.
The Portfolio had its annual rebalance in early January 2015. Though the selection process for the underlying strategies did not change, there were changes in the sector exposure of the Portfolio as a result of the rebalance. The rebalance resulted in additional exposure to the Industrials, Consumer Discretionary and Consumer Staples sectors. Industrials were overweight, while the additional Consumer Discretionary exposure increased its overweight. Consumer Staples remained underweight. The sectors losing notable weight as a result of the rebalance were Financials and Energy. Financials were underweight the benchmark, while Energy was in-line.(1)
The Energy sector was the biggest contributor to relative performance, as both stock selection and allocation contributed to relative results. Stock selection provided a majority of the relative performance, led by Tesoro Corp., an independent refiner. Refiners had a good year despite the plunge in oil prices, as their businesses are not as sensitive to oil prices as other names in the sector. The underweight mentioned previously also helped, as the Energy sector was the worst performing sector in the benchmark. Stock selection was also positive in the Consumer Staples and Health Care sectors led by The Kroger Co. and Eli Lilly & Co., respectively. A large underweight in the Financials sector also contributed to relative performance as the sector underperformed the broader market for the period.(1)
Stock selection in Information Technology stocks resulted in the sector being the biggest detractor from relative performance, leading the underperformance of the Portfolio. Micron Technology, Inc. and Yahoo!, Inc. were among the bottom five contributors in the Portfolio over the period. Stock selection in the Financials and Materials sectors also weighed on relative performance. Two British holdings, banking concern Standard Chartered PLC and gold miner Anglo American PLC, were also among the biggest detractors from performance over the period.(1)
The Portfolio’s best performers were AMN Healthcare Services, Inc., Cablevision Systems Corp., Ellie Mae, Inc., Tesoro Corp. and Repligen Corp. The worst performers were Anglo American PLC, Zumiez, Inc., Saia, Inc., Micron Technology, Inc. and South32 Ltd. The Portfolio’s top contributors to performance were The Home Depot, Inc., Boeing Co., The Kroger Co., The Walt Disney Co. and Eli Lilly & Co. The top detractors from performance were Micron Technology, Inc., Anglo American PLC, Standard Chartered PLC, Yahoo!, Inc. and Electricite de France SA.(1)
As we look to 2016, equities continue to look attractive relative to other asset classes, though short term risks have risen along with the recent Federal Reserve rate hike and China’s weakening economy. Taking a longer term view though, we view steady economic growth, improving employment data and low interest rates as reasons to remain positive on equities. As always, we remain consistent in the application of the six strategies underlying the Portfolio. The result is a Portfolio with broad exposures across the size and sector spectrum, which we believe provides diversification along with upside potential.
| (1) | The Portfolio’s composition is subject to change. Holdings and weightings are as of December 31, 2015. |
| 91 | (continued) |
| Ohio National Fund, Inc. | Target VIP Portfolio (Continued) |
Change in Value of $10,000 Investment
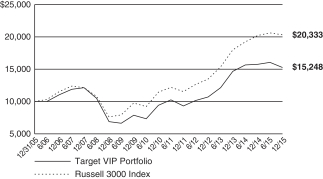
Hypothetical illustration based on past performance. Future performance will vary. The Portfolio’s returns reflect reinvested dividends. The Portfolio’s holdings may differ significantly from the securities in the index. The index is unmanaged and therefore does not reflect the cost of portfolio management and accounting.
The Russell 3000 Index measures the performance of the largest 3000 U.S. companies representing approximately 98% of the investable U.S. equity market. The Russell 3000 Index is constructed to provide a comprehensive, unbiased, and stable barometer of the broad market and is completely reconstituted annually to ensure new and growing equities are reflected. The index presented includes the effects of reinvested dividends.
Portfolio Composition as of December 31, 2015 (1)
| % of Net Assets | ||||
Common Stocks (4) | 98.9 | |||
Money Market Funds | 1.1 | |||
|
| |||
| 100.0 | ||||
|
|
Top 10 Portfolio Holdings as of December 31, 2015 (1) (2) (3)
| % of Net Assets | ||||
1. Apple, Inc. | 7.1 | |||
2. Home Depot, Inc. / The | 6.6 | |||
3. 3M Co. | 4.4 | |||
4. Taiwan Semiconductor Manufacturing Co. Ltd. – ADR | 4.4 | |||
5. Walt Disney Co. / The | 3.9 | |||
6. Boeing Co. / The | 3.8 | |||
7. AT&T, Inc. | 3.5 | |||
8. Intel Corp. | 3.2 | |||
9. Gilead Sciences, Inc. | 2.9 | |||
10. Amgen, Inc. | 2.5 |
| (1) | Composition of Portfolio subject to change. |
| (2) | Short-term investments have been excluded from the list of Top 10 Portfolio Holdings. |
| (3) | Top 10 Portfolio Holdings is presented at an individual security level. Total investment exposure by issuer may be higher. |
| (4) | Sectors (Common Stocks): |
| % of Net Assets | ||||
Information Technology | 19.7 | |||
Consumer Discretionary | 19.1 | |||
Health Care | 15.0 | |||
Industrials | 12.9 | |||
Consumer Staples | 6.7 | |||
Telecommunication Services | 6.4 | |||
Financials | 6.0 | |||
Energy | 5.8 | |||
Utilities | 4.4 | |||
Materials | 2.9 | |||
|
| |||
| 98.9 | ||||
|
|
| 92 |
| Ohio National Fund, Inc. | Target VIP Portfolio |
Schedule of Investments | December 31, 2015 |
| Common Stocks – 98.9% | Shares | Value | ||||||||
CONSUMER DISCRETIONARY – 19.1% | ||||||||||
American Axle & Manufacturing Holdings, Inc. (Auto Components) | (a) | 3,541 | $ | 67,067 | ||||||
Delphi Automotive PLC (Auto Components) | 6,136 | 526,039 | ||||||||
Gentherm, Inc. (Auto Components) | (a) | 6,682 | 316,727 | |||||||
Magna International, Inc. (Auto Components) | 8,567 | 347,478 | ||||||||
Tata Motors Ltd. – ADR (Automobiles) | (a) | 11,136 | 328,178 | |||||||
Core-Mark Holding Co., Inc. (Distributors) | 4,319 | 353,899 | ||||||||
BJ’s Restaurants, Inc. (Hotels, Restaurants & Leisure) | (a) | 4,823 | 209,656 | |||||||
Brinker International, Inc. (Hotels, Restaurants & Leisure) | 1,366 | 65,500 | ||||||||
Marriott International, Inc. Class A (Hotels, Restaurants & Leisure) | 1,677 | 112,426 | ||||||||
Popeyes Louisiana Kitchen, Inc. (Hotels, Restaurants & Leisure) | (a) | 4,368 | 255,528 | |||||||
Universal Electronics, Inc. (Household Durables) | (a) | 2,932 | 150,558 | |||||||
Cablevision Systems Corp. Class A (Media) | 4,474 | 142,721 | ||||||||
Walt Disney Co. / The (Media) | 16,978 | 1,784,048 | ||||||||
Dillard’s, Inc. Class A (Multiline Retail) | 775 | 50,925 | ||||||||
Dollar Tree, Inc. (Multiline Retail) | (a) | 1,785 | 137,838 | |||||||
Bed Bath & Beyond, Inc. (Specialty Retail) | (a) | 2,733 | 131,867 | |||||||
Caleres, Inc. (Specialty Retail) | 2,494 | 66,889 | ||||||||
Cato Corp. / The Class A (Specialty Retail) | 4,865 | 179,129 | ||||||||
Home Depot, Inc. / The (Specialty Retail) | 23,163 | 3,063,307 | ||||||||
O’Reilly Automotive, Inc. (Specialty Retail) | (a) | 889 | 225,290 | |||||||
Outerwall, Inc. (Specialty Retail) | 1,076 | 39,317 | ||||||||
Ross Stores, Inc. (Specialty Retail) | 3,635 | 195,599 | ||||||||
Zumiez, Inc. (Specialty Retail) | (a) | 5,428 | 82,071 | |||||||
|
| |||||||||
| 8,832,057 | ||||||||||
|
| |||||||||
CONSUMER STAPLES – 6.7% | ||||||||||
Brown-Forman Corp. Class B (Beverages) | 936 | 92,926 | ||||||||
Dr Pepper Snapple Group, Inc. (Beverages) | 1,422 | 132,530 | ||||||||
Monster Beverage Corp. (Beverages) | (a) | 1,481 | 220,610 | |||||||
Kroger Co. / The (Food & Staples Retailing) | 20,194 | 844,715 | ||||||||
Keurig Green Mountain, Inc. (Food Products) | 1,443 | 129,841 | ||||||||
Sanderson Farms, Inc. (Food Products) | 925 | 71,706 | ||||||||
USANA Health Sciences, Inc. (Personal Products) | (a) | 2,304 | 294,336 | |||||||
Altria Group, Inc. (Tobacco) | 14,527 | 845,617 | ||||||||
Imperial Tobacco Group PLC – ADR (Tobacco) | 4,569 | 483,172 | ||||||||
|
| |||||||||
| 3,115,453 | ||||||||||
|
| |||||||||
ENERGY – 5.8% | ||||||||||
FMC Technologies, Inc. (Energy Equip. & Svs.) | (a) | 401 | 11,633 | |||||||
BP PLC – ADR (Oil, Gas & Consumable Fuels) | 10,477 | 327,511 | ||||||||
Eni SpA – ADR (Oil, Gas & Consumable Fuels) | 11,452 | 341,270 | ||||||||
Exxon Mobil Corp. (Oil, Gas & Consumable Fuels) | 7,109 | 554,147 | ||||||||
Hess Corp. (Oil, Gas & Consumable Fuels) | 505 | 24,482 | ||||||||
REX American Resources Corp. (Oil, Gas & Consumable Fuels) | (a) | 1,502 | 81,213 | |||||||
Royal Dutch Shell PLC Class B – ADR (Oil, Gas & Consumable Fuels) | 5,747 | 264,592 | ||||||||
Statoil ASA – ADR (Oil, Gas & Consumable Fuels) | 22,622 | 315,803 | ||||||||
Synergy Resources Corp. (Oil, Gas & Consumable Fuels) | (a) | 16,353 | 139,328 | |||||||
Tesoro Corp. (Oil, Gas & Consumable Fuels) | 2,606 | 274,594 | ||||||||
TOTAL SA – ADR (Oil, Gas & Consumable Fuels) | 7,802 | 350,700 | ||||||||
|
| |||||||||
| 2,685,273 | ||||||||||
|
| |||||||||
FINANCIALS – 6.0% | ||||||||||
HSBC Holdings PLC – ADR (Banks) | 8,480 | 334,706 | ||||||||
Standard Chartered PLC (Banks) | 30,122 | 247,904 | ||||||||
Swedbank AB – ADR (Banks) | 15,895 | 349,611 | ||||||||
HFF, Inc. Class A (Capital Markets) | 7,042 | 218,795 | ||||||||
Legg Mason, Inc. (Capital Markets) | 2,861 | 112,237 | ||||||||
Piper Jaffray Cos. (Capital Markets) | (a) | 3,009 | 121,564 | |||||||
Moody’s Corp. (Diversified Financial Svs.) | 5,213 | 523,072 | ||||||||
Allstate Corp. / The (Insurance) | 10,397 | 645,550 | ||||||||
United Insurance Holdings Corp. (Insurance) | 3,884 | 66,416 | ||||||||
Universal Insurance Holdings, Inc. (Insurance) | 6,328 | 146,683 | ||||||||
|
| |||||||||
| 2,766,538 | ||||||||||
|
| |||||||||
| Common Stocks (Continued) | Shares | Value | ||||||||
HEALTH CARE – 15.0% | ||||||||||
Amgen, Inc. (Biotechnology) | 7,080 | $ | 1,149,296 | |||||||
Gilead Sciences, Inc. (Biotechnology) | 13,406 | 1,356,553 | ||||||||
Insys Therapeutics, Inc. (Biotechnology) | (a) | 13,070 | 374,194 | |||||||
MiMedx Group, Inc. (Biotechnology) | (a) | 20,207 | 189,340 | |||||||
Repligen Corp. (Biotechnology) | (a) | 6,066 | 171,607 | |||||||
Abaxis, Inc. (Health Care Equip. & Supplies) | 4,181 | 232,798 | ||||||||
Edwards Lifesciences Corp. (Health Care Equip. & Supplies) | (a) | 2,302 | 181,812 | |||||||
Intuitive Surgical, Inc. (Health Care Equip. & Supplies) | (a) | 393 | 214,641 | |||||||
Natus Medical, Inc. (Health Care Equip. & Supplies) | (a) | 6,064 | 291,375 | |||||||
OraSure Technologies, Inc. (Health Care Equip. & Supplies) | (a) | 10,510 | 67,684 | |||||||
AMN Healthcare Services, Inc. (Health Care Providers & Svs.) | (a) | 8,683 | 269,607 | |||||||
HCA Holdings, Inc. (Health Care Providers & Svs.) | (a) | 8,964 | 606,235 | |||||||
Providence Service Corp. / The (Health Care Providers & Svs.) | (a) | 3,005 | 140,995 | |||||||
Albany Molecular Research, Inc. (Life Sciences Tools & Svs.) | (a) | 5,988 | 118,862 | |||||||
Depomed, Inc. (Pharmaceuticals) | (a) | 10,869 | 197,055 | |||||||
Eli Lilly & Co. (Pharmaceuticals) | 12,043 | 1,014,743 | ||||||||
GlaxoSmithKline PLC – ADR (Pharmaceuticals) | 9,393 | 379,008 | ||||||||
|
| |||||||||
| 6,955,805 | ||||||||||
|
| |||||||||
INDUSTRIALS – 12.9% | ||||||||||
Boeing Co. / The (Aerospace & Defense) | 12,196 | 1,763,420 | ||||||||
Huntington Ingalls Industries, Inc. (Aerospace & Defense) | 999 | 126,723 | ||||||||
Northrop Grumman Corp. (Aerospace & Defense) | 1,218 | 229,971 | ||||||||
TASER International, Inc. (Aerospace & Defense) | (a) | 9,710 | 167,886 | |||||||
C.H. Robinson Worldwide, Inc. (Air Freight & Logistics) | 1,950 | 120,939 | ||||||||
Echo Global Logistics, Inc. (Air Freight & Logistics) | (a) | 4,452 | 90,776 | |||||||
Alaska Air Group, Inc. (Airlines) | 2,730 | 219,792 | ||||||||
United Continental Holdings, Inc. (Airlines) | (a) | 7,504 | 429,979 | |||||||
ACCO Brands Corp. (Commercial Svs. & Supplies) | (a) | 21,021 | 149,880 | |||||||
3M Co. (Industrial Conglomerates) | 13,544 | 2,040,268 | ||||||||
Greenbrier Cos., Inc. / The (Machinery) | 6,663 | 217,347 | ||||||||
Avis Budget Group, Inc. (Road & Rail) | (a) | 2,165 | 78,568 | |||||||
Ryder System, Inc. (Road & Rail) | 1,093 | 62,115 | ||||||||
Saia, Inc. (Road & Rail) | (a) | 4,544 | 101,104 | |||||||
United Rentals, Inc. (Trading Companies & Distributors) | (a) | 2,086 | 151,318 | |||||||
|
| |||||||||
| 5,950,086 | ||||||||||
|
| |||||||||
INFORMATION TECHNOLOGY – 19.7% | ||||||||||
F5 Networks, Inc. (Communications Equip.) | (a) | 167 | 16,192 | |||||||
OSI Systems, Inc. (Electronic Equip., Instr. & Comp.) | (a) | 3,709 | 328,840 | |||||||
Sanmina Corp. (Electronic Equip., Instr. & Comp.) | (a) | 3,381 | 69,581 | |||||||
DHI Group, Inc. (Internet Software & Svs.) | (a) | 9,876 | 90,563 | |||||||
LogMeIn, Inc. (Internet Software & Svs.) | (a) | 4,521 | 303,359 | |||||||
Yahoo!, Inc. (Internet Software & Svs.) | (a) | 10,237 | 340,483 | |||||||
Intel Corp. (Semiconductors & Equip.) | 42,554 | 1,465,985 | ||||||||
Lam Research Corp. (Semiconductors & Equip.) | 1,006 | 79,897 | ||||||||
Micron Technology, Inc. (Semiconductors & Equip.) | (a) | 31,580 | 447,173 | |||||||
Taiwan Semiconductor Manufacturing Co. Ltd. – ADR (Semiconductors & Equip.) | 89,527 | 2,036,739 | ||||||||
Ellie Mae, Inc. (Software) | (a) | 5,402 | 325,362 | |||||||
Qualys, Inc. (Software) | (a) | 6,383 | 211,214 | |||||||
Apple, Inc. (Tech. Hardware, Storage & Periph.) | 31,225 | 3,286,744 | ||||||||
Seagate Technology PLC (Tech. Hardware, Storage & Periph.) | 2,887 | 105,837 | ||||||||
|
| |||||||||
| 9,107,969 | ||||||||||
|
| |||||||||
MATERIALS – 2.9% | ||||||||||
Celanese Corp. (Chemicals) | 3,172 | 213,571 | ||||||||
Headwaters, Inc. (Construction Materials) | (a) | 13,428 | 226,530 | |||||||
Packaging Corp. of America (Containers & Packaging) | 2,030 | 127,992 | ||||||||
| 93 | (continued) |
| Ohio National Fund, Inc. | Target VIP Portfolio (Continued) |
Schedule of Investments | December 31, 2015 |
| Common Stocks (Continued) | Shares | Value | ||||||||
MATERIALS (continued) | ||||||||||
Anglo American PLC – ADR (Metals & Mining) | (a) | 43,595 | $ | 95,255 | ||||||
BHP Billiton Ltd. – ADR (Metals & Mining) | 8,450 | 217,672 | ||||||||
Rio Tinto PLC – ADR (Metals & Mining) | 8,631 | 251,335 | ||||||||
South32 Ltd. – ADR (Metals & Mining) | (a) | 2,829 | 10,793 | |||||||
Neenah Paper, Inc. (Paper & Forest Products) | 3,102 | 193,658 | ||||||||
|
| |||||||||
| 1,336,806 | ||||||||||
|
| |||||||||
TELECOMMUNICATION SERVICES – 6.4% | ||||||||||
AT&T, Inc. (Diversified Telecom. Svs.) | 47,178 | 1,623,395 | ||||||||
Consolidated Communications Holdings, Inc. (Diversified Telecom. Svs.) | 9,380 | 196,511 | ||||||||
Iridium Communications, Inc. (Diversified Telecom. Svs.) | (a) | 17,734 | 149,143 | |||||||
Telenor ASA – ADR (Diversified Telecom. Svs.) | 6,582 | 327,619 | ||||||||
TeliaSonera AB – ADR (Diversified Telecom. Svs.) | 30,927 | 303,703 | ||||||||
Vodafone Group PLC – ADR (Wireless Telecom. Svs.) | 11,690 | 377,119 | ||||||||
|
| |||||||||
| 2,977,490 | ||||||||||
|
| |||||||||
UTILITIES – 4.4% | ||||||||||
Electricite de France SA – ADR (Electric Utilities) | 73,215 | 215,252 | ||||||||
Empire District Electric Co. / The (Electric Utilities) | 8,276 | 232,307 | ||||||||
| Common Stocks (Continued) | Shares | Value | ||||||||
UTILITIES (continued) | ||||||||||
Southern Co. / The (Electric Utilities) | 3,052 | $ | 142,803 | |||||||
SSE PLC – ADR (Electric Utilities) | 15,856 | 354,619 | ||||||||
Engie SA – ADR (Multi-Utilities) | 17,082 | 300,643 | ||||||||
National Grid PLC – ADR (Multi-Utilities) | 5,667 | 394,083 | ||||||||
SCANA Corp. (Multi-Utilities) | 485 | 29,338 | ||||||||
Sempra Energy (Multi-Utilities) | 835 | 78,498 | ||||||||
American States Water Co. (Water Utilities) | 7,267 | 304,851 | ||||||||
|
| |||||||||
| 2,052,394 | ||||||||||
|
| |||||||||
Total Common Stocks (Cost $46,144,813) | $ | 45,779,871 | ||||||||
|
| |||||||||
| Money Market Funds – 1.1% | Shares | Value | ||||||||
Fidelity Institutional Money Market Funds | 511,000 | $ | 511,000 | |||||||
|
| |||||||||
Total Money Market Funds (Cost $511,000) | $ | 511,000 | ||||||||
|
| |||||||||
Total Investments – 100.0% (Cost $46,655,813) | (b) | $ | 46,290,871 | |||||||
Liabilities in Excess of Other Assets – (0.0)% | (18,615) | |||||||||
|
| |||||||||
Net Assets – 100.0% | $ | 46,272,256 | ||||||||
|
| |||||||||
Percentages are stated as a percent of net assets.
Abbreviations:
ADR: American Depositary Receipts
Footnotes:
| (a) | Non-income producing security. |
| (b) | Represents cost for financial reporting purposes, which may differ from cost basis for federal income tax purposes. See also Note 7 of the Notes to Financial Statements. |
The accompanying notes are an integral part of these financial statements.
| 94 |
| Ohio National Fund, Inc. | Bristol Growth Portfolio |
Objective/Strategy
The Bristol Growth Portfolio seeks long-term growth of capital by investing primarily in common stocks of the 1,000 largest publicly traded U.S. companies in terms of market capitalization.
Performance as of December 31, 2015
Average Annual returns | ||||
One year | 5.72% | |||
Five years | 12.39% | |||
Since inception (5/1/07) | 6.79% |
Past performance does not guarantee future results. The performance data quoted represents past performance and current returns may be lower or higher. Total return figures include change in share price and reinvestment of dividends and capital gains. The investment return and principal value will fluctuate so that an investor’s shares, when redeemed, may be worth more or less than the original cost. To obtain performance information up to the most recent month end, call toll-free 1-877-781-6392.
The Portfolio is not open to direct retail investment. Beneficial interest in shares is obtained solely by purchase of variable life insurance policies and variable annuity contracts. Actual performance results for variable annuity and variable universal life contracts will be lower due to contract charges. Consult your contract for applicable charges.
��
Comments
For the year ended December 31, 2015, the Bristol Growth Portfolio returned 5.72% versus 5.67% for its benchmark, the Russell 1000 Growth Index.
The Portfolio’s slight outperformance relative to the benchmark resulted primarily from strong stock selection. Stock selection in the Health Care sector contributed 467 basis points to relative performance, although stock selection in the largest sector detractor, Consumer Discretionary, detracted 344 basis points. Sector allocation as a whole detracted from relative performance, led by a slight overweight in Energy.(1)
The Portfolio’s best performers for the reporting period were Amazon.com, Inc., Intercept Pharmaceuticals, Inc., Pharmacyclics, Inc., Receptos, Inc. and Humana, Inc. The Portfolio’s worst performers were PVH Corp., Anadarko Petroleum Corp., Devon Energy Corp., Huntsman Corp. and Chipotle Mexican Grill. The top contributors to performance were Amazon.com, Inc., Clovis Oncology, Inc., Pharmacyclics, Inc., Intercept Pharmaceuticals, Inc. and Alphabet, Inc. The top detractors from performance were PVH Corp., Anadarko Petroleum Corp., Devon Energy Corp., Huntsman Corp. and Time Warner, Inc.(1)
The top contributor to the Portfolio’s performance was Amazon.com, Inc., which generated 176 basis points due to strong earnings reports and strong sales growth. Other top contributors to performance were mainly due to stocks in the Health Care sector such as Clovis Oncology, Inc., which added 124 basis points thanks to optimism around its lung cancer therapies, and Pharmacyclics, Inc., which was acquired by Abbvie, and contributed 115 basis points due to positive data on its cancer drug. Intercept Pharmaceuticals, Inc. added 104 basis points with positive data on its drug for NASH liver disease. Alphabet, Inc. added 86 basis points, as the stock benefitted from strong secular drivers, ramp up of innovative ad products, and management’s initiatives to unlock hidden value in business segments with a longer-term investment horizon.(1)
Detractors from performance during the reporting period included PVH Corp., which detracted 121 basis points due to weak earnings
reports and weakness in retail. Energy stocks such as Anadarko Petroleum Corp. and Devon Energy Corp. detracted 130 basis points as oil prices continued to plummet. Huntsman Corp. detracted 56 basis points due to bad earnings reports driven by weak pricing in titanium dioxide. We held on to Huntsman Corp. after the underperformance in the June quarter, as there were some signs its titanium-dioxide business would improve. Huntsman Corp. and its peers reduced supply, however, and its core polyurethane business was impacted by weaker growth in China and Europe. We sold it in August, which was beneficial for us, as the stock declined sharply after the company preannounced weaker earnings in late September due to a negative earnings report. Time Warner, Inc. also saw sharp drops, due to concerns about cord cutting, weak ratings and an overall weak advertising environment, and detracted 54 basis points.(1)
The year was volatile, as continued debate regarding the impact of the imminent rate increase played out. Weak consumer spending despite low oil prices weighed on the market, as did the terrorist attacks in Paris. The economy continued to slowly improve as China continued to move forward and employment in the U.S. remained solid. We continue to believe that the Federal Reserve will be measured in its increases (only if the economic data is strong) and, therefore, maintain a positive bias towards the market, as the Central Banks of all the major economies will likely continue to be supportive of growth. Our continued focus on companies with strong competitive positions and ability to gain market share will hopefully continue to benefit performance going forward.
| (1) | The Portfolio’s composition is subject to change. Holdings and weightings are as of December 31, 2015. |
Change in Value of $10,000 Investment
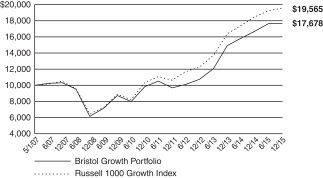
Hypothetical illustration based on past performance. Future performance will vary. The Portfolio’s returns reflect reinvested dividends. The Portfolio’s holdings may differ significantly from the securities in the index. The index is unmanaged and therefore does not reflect the cost of portfolio management and accounting.
The Russell 1000 Growth Index is a market-capitalization weighted index of those firms in the Russell 1000 Index with higher price-to-book ratios and higher forecasted growth values. The Russell 1000 Index measures the performance of the large-cap segment of the U.S. equity universe. The index presented herein includes the effects of requested dividends.
| 95 | (continued) |
| Ohio National Fund, Inc. | Bristol Growth Portfolio (Continued) |
Portfolio Composition as of December 31, 2015 (1)
| % of Net Assets | ||||
Common Stocks (4) | 99.4 | |||
Money Market Funds | 0.6 | |||
|
| |||
| 100.0 | ||||
|
|
Top 10 Portfolio Holdings as of December 31, 2015 (1) (2) (3)
| % of Net Assets | ||||
1. Microsoft Corp. | 4.7 | |||
2. Apple, Inc. | 3.8 | |||
3. Amazon.com, Inc | 3.4 | |||
4. Alphabet, Inc. Class C | 3.1 | |||
5. Thermo Fisher Scientific, Inc. | 2.8 | |||
6. Mylan NV | 2.6 | |||
7. Avago Technologies Ltd. | 2.6 | |||
8. Newell Rubbermaid, Inc. | 2.5 | |||
9. Visa, Inc. | 2.4 | |||
10. Hewlett Packard Enterprise Co. | 2.3 |
| (1) | Composition of Portfolio subject to change. |
| (2) | Short-term investments have been excluded from the list of Top 10 Portfolio Holdings. |
| (3) | Top 10 Portfolio Holdings is presented at an individual security level. Total investment exposure by issuer may be higher. |
| (4) | Sectors (Common Stocks): |
| % of Net Assets | ||||
Information Technology | 37.4 | |||
Health Care | 19.4 | |||
Consumer Discretionary | 15.2 | |||
Industrials | 13.0 | |||
Consumer Staples | 5.0 | |||
Financials | 3.6 | |||
Telecommunication Services | 3.2 | |||
Energy | 2.6 | |||
|
| |||
| 99.4 | ||||
|
|
| 96 |
| Ohio National Fund, Inc. | Bristol Growth Portfolio |
Schedule of Investments | December 31, 2015 |
| Common Stocks – 99.4% | Shares | Value | ||||||||
CONSUMER DISCRETIONARY – 15.2% | ||||||||||
Delphi Automotive PLC (Auto Components) | 27,917 | $ | 2,393,324 | |||||||
Chipotle Mexican Grill, Inc. (Hotels, Restaurants & Leisure) | (a) | 2,245 | 1,077,263 | |||||||
Newell Rubbermaid, Inc. (Household Durables) | 66,667 | 2,938,681 | ||||||||
Amazon.com, Inc. (Internet & Catalog Retail) | (a) | 5,827 | 3,938,411 | |||||||
CBS Corp. Class B (Media) | 35,984 | 1,695,926 | ||||||||
Time Warner, Inc. (Media) | 37,360 | 2,416,071 | ||||||||
Hanesbrands, Inc. (Textiles, Apparel & Luxury Goods) | 58,987 | 1,735,987 | ||||||||
PVH Corp. (Textiles, Apparel & Luxury Goods) | 20,620 | 1,518,663 | ||||||||
|
| |||||||||
| 17,714,326 | ||||||||||
|
| |||||||||
CONSUMER STAPLES – 5.0% | ||||||||||
Coca-Cola Co. / The (Beverages) | 50,492 | 2,169,136 | ||||||||
Molson Coors Brewing Co. Class B (Beverages) | 11,889 | 1,116,615 | ||||||||
Colgate-Palmolive Co. (Household Products) | 37,602 | 2,505,045 | ||||||||
|
| |||||||||
| 5,790,796 | ||||||||||
|
| |||||||||
ENERGY – 2.6% | ||||||||||
Schlumberger Ltd. (Energy Equip. & Svs.) | 16,783 | 1,170,614 | ||||||||
Anadarko Petroleum Corp. (Oil, Gas & Consumable Fuels) | 23,644 | 1,148,626 | ||||||||
Newfield Exploration Co. (Oil, Gas & Consumable Fuels) | (a) | 22,924 | 746,405 | |||||||
|
| |||||||||
| 3,065,645 | ||||||||||
|
| |||||||||
FINANCIALS – 3.6% | ||||||||||
Bank of America Corp. (Banks) | 5,607 | 94,366 | ||||||||
Hartford Financial Services Group, Inc. / The (Insurance) | 43,497 | 1,890,380 | ||||||||
Prudential Financial, Inc. (Insurance) | 26,843 | 2,185,289 | ||||||||
|
| |||||||||
| 4,170,035 | ||||||||||
|
| |||||||||
HEALTH CARE – 19.4% | ||||||||||
Biogen, Inc. (Biotechnology) | (a) | 4,977 | 1,524,704 | |||||||
Celgene Corp. (Biotechnology) | (a) | 19,408 | 2,324,302 | |||||||
Juno Therapeutics, Inc. (Biotechnology) | (a) | 25,148 | 1,105,758 | |||||||
Zimmer Biomet Holdings, Inc. (Health Care Equip. & Supplies) | 11,181 | 1,147,059 | ||||||||
Aetna, Inc. (Health Care Providers & Svs.) | 14,974 | 1,618,989 | ||||||||
Cigna Corp. (Health Care Providers & Svs.) | 9,572 | 1,400,671 | ||||||||
HCA Holdings, Inc. (Health Care Providers & Svs.) | (a) | 36,160 | 2,445,501 | |||||||
Thermo Fisher Scientific, Inc. (Life Sciences Tools & Svs.) | 23,341 | 3,310,921 | ||||||||
Allergan PLC (Pharmaceuticals) | (a) | 7,768 | 2,427,500 | |||||||
Mylan NV (Pharmaceuticals) | (a) | 55,642 | 3,008,563 | |||||||
Pfizer, Inc. (Pharmaceuticals) | 71,400 | 2,304,792 | ||||||||
|
| |||||||||
| 22,618,760 | ||||||||||
|
| |||||||||
INDUSTRIALS – 13.0% | ||||||||||
Hexcel Corp. (Aerospace & Defense) | 51,293 | 2,382,560 | ||||||||
Honeywell International, Inc. (Aerospace & Defense) | 21,202 | 2,195,891 | ||||||||
| Common Stocks (Continued) | Shares | Value | ||||||||
INDUSTRIALS (continued) | ||||||||||
United Technologies Corp. (Aerospace & Defense) | 10,578 | $ | 1,016,228 | |||||||
FedEx Corp. (Air Freight & Logistics) | 15,556 | 2,317,688 | ||||||||
Danaher Corp. (Industrial Conglomerates) | 26,713 | 2,481,103 | ||||||||
Stanley Black & Decker, Inc. (Machinery) | 19,500 | 2,081,235 | ||||||||
Xylem, Inc. (Machinery) | 71,389 | 2,605,699 | ||||||||
|
| |||||||||
| 15,080,404 | ||||||||||
|
| |||||||||
INFORMATION TECHNOLOGY – 37.4% | ||||||||||
Harris Corp. (Communications Equip.) | 31,291 | 2,719,188 | ||||||||
Alibaba Group Holding Ltd. – ADR (Internet Software & Svs.) | (a) | 22,939 | 1,864,253 | |||||||
Alphabet, Inc. Class A (Internet Software & Svs.) | (a) | 3,332 | 2,592,329 | |||||||
Alphabet, Inc. Class C (Internet Software & Svs.) | (a) | 4,694 | 3,562,183 | |||||||
Facebook, Inc. Class A (Internet Software & Svs.) | (a) | 24,672 | 2,582,172 | |||||||
MasterCard, Inc. Class A (IT Svs.) | 22,071 | 2,148,833 | ||||||||
Visa, Inc. (IT Svs.) | 36,660 | 2,842,983 | ||||||||
Avago Technologies Ltd. (Semiconductors & Equip.) | 20,449 | 2,968,172 | ||||||||
Intel Corp. (Semiconductors & Equip.) | 59,278 | 2,042,127 | ||||||||
NXP Semiconductors NV (Semiconductors & Equip.) | (a) | 31,988 | 2,694,989 | |||||||
Adobe Systems, Inc. (Software) | (a) | 26,195 | 2,460,758 | |||||||
Microsoft Corp. (Software) | 99,377 | 5,513,436 | ||||||||
Oracle Corp. (Software) | 63,739 | 2,328,386 | ||||||||
Apple, Inc. (Tech. Hardware, Storage & Periph.) | 41,655 | 4,384,605 | ||||||||
Hewlett Packard Enterprise Co. (Tech. Hardware, Storage & Periph.) | 178,949 | 2,720,025 | ||||||||
|
| |||||||||
| 43,424,439 | ||||||||||
|
| |||||||||
TELECOMMUNICATION SERVICES – 3.2% | ||||||||||
AT&T, Inc. (Diversified Telecom. Svs.) | 68,094 | 2,343,115 | ||||||||
Verizon Communications, Inc. (Diversified Telecom. Svs.) | 29,643 | 1,370,099 | ||||||||
|
| |||||||||
| 3,713,214 | ||||||||||
|
| |||||||||
Total Common Stocks (Cost $106,090,299) | $ | 115,577,619 | ||||||||
|
| |||||||||
| Money Market Funds – 0.7% | Shares | Value | ||||||||
Fidelity Institutional Money Market Funds | 820,000 | $ | 820,000 | |||||||
|
| |||||||||
Total Money Market Funds (Cost $820,000) | $ | 820,000 | ||||||||
|
| |||||||||
Total Investments – 100.1% (Cost $106,910,299) | (b) | $ | 116,397,619 | |||||||
Liabilities in Excess of Other Assets – (0.1)% | (172,478 | ) | ||||||||
|
| |||||||||
Net Assets – 100.0% | $ | 116,225,141 | ||||||||
|
| |||||||||
Percentages are stated as a percent of net assets.
Abbreviations:
ADR: American Depositary Receipts
Footnotes:
| (a) | Non-income producing security. |
| (b) | Represents cost for financial reporting purposes, which may differ from cost basis for federal income tax purposes. See also Note 7 of the Notes to Financial Statements. |
The accompanying notes are an integral part of these financial statements.
| 97 |
| Ohio National Fund, Inc. | Risk Managed Balanced Portfolio |
Objective/Strategy
The Risk Managed Balanced Portfolio seeks long-term capital growth, consistent with preservation of capital and balanced by current income. The Portfolio invests in a balanced portfolio of equity and fixed-income securities (the “Balanced Component”) and a risk management portfolio intended to enhance the risk adjusted return of the Portfolio (the “Risk Management Component”).
Performance as of December 31, 2015
Average Annual Returns | ||||
One year | -1.32% | |||
Since Inception (5/1/14) | 4.06% |
Comments
For the year ended December 31, 2015, the Risk Managed Balanced Portfolio returned -1.32% versus 1.25% for its benchmark, which is comprised of 55% S&P 500 Index and 45% Barclays Capital U.S. Aggregate Bond Index.
The Balanced Component, sub-advised by Janus Capital Management LLC, seeks to provide consistent returns over time by allocating across the spectrum of fixed income and equity securities. The Balanced Component underperformed by 125 basis points.
The Balanced Component’s equity sleeve underperformed its benchmark, the S&P 500 Index. Holdings within the Industrials and Consumer Staples sectors weighed most on relative performance. Stock selection in Consumer Discretionary and our underweight in Energy contributed to relative results. Union Pacific Corp. was our largest equity detractor. Similar to all rail companies, weaker oil volumes have been a headwind. The weaker volumes and operating margins have been disappointing and we are currently reviewing the position.(1)
The stock of Valeant Pharmaceuticals sold off after politicians criticized the company for high drug prices for some of its products that treat cardiac conditions. A short seller also questioned the company’s relationship with a specialty pharmacy that distributed some of its drugs. We have exited our position.(1)
Seagate Technology PLC was another detractor. The data storage company has lost market share to a competitor and grown at a slower pace than we expected, so we sold the position to pursue better growth opportunities.(1)
Microsoft Corp. was a top contributor to performance during the year. The stock has benefited from a re-valuation, as investors begin to give the company credit for the growth of its cloud business, that is second only to Amazon, and the potential for Microsoft Office 365. We believe these businesses will go a long way to offset the decline of some of Microsoft Corp.’s legacy businesses, such as its traditional desktop software. Progress on expense control and cost reduction have also been favorable for the stock. We continue to believe Microsoft Corp.’s cloud business and some of its other services are underappreciated by the market. We also appreciate the company’s efforts to reduce its share count and return more capital to shareholders.(1)
Alphabet, Inc. (formerly Google) was another top contributor. Alphabet benefited from better than expected earnings results late in the year, driven by improvements in its mobile search revenue, as well as strong results for YouTube. The firm also announced a significant stock buyback program, providing additional support to its shares.
The company’s restructuring, which was initiated in the third quarter, has also been well received by investors because it provides greater transparency around the company’s different business lines. In addition, we have been encouraged by the focus of Alphabet, Inc.’s new CFO on reining in unnecessary spending.(1)
Nike, Inc. was another contributor. The company continues to benefit from growth of its athletic apparel and footwear across the globe. Going forward, we believe innovation for both its products and manufacturing processes are long-term tailwinds for Nike, Inc. We also believe that investments to create a better omni-channel sales experience position Nike, Inc. well, as more sales migrate online.(1)
The fixed income sleeve of the Balanced Component outperformed its benchmark, the Barclays Capital U.S. Aggregate Bond Index. Overall, the largest contributor to relative performance was spread carry, which is a measure of the excess income generated by holding specific securities compared to those of the benchmark. On an asset class basis, our out-of-benchmark allocation to preferred equity was the leading contributor. This was followed by our positioning in out-of-benchmark high-yield credit, which was driven by spread carry.(1)
The main asset classes that detracted from relative performance were U.S. Treasuries and mortgage-backed securities, both due to yield curve positioning. During the period, the yield curve steepened as the market coalesced around the view that the Federal Reserve would finally raise interest rates after seven years of zero-interest-rate policy.(1)
On a credit sector basis, banking was the leading contributor due to security selection and spread carry. Spread carry within brokerage, asset managers and exchanges also aided results. Given the weakness experienced throughout the year in the energy sector, midstream and independent energy companies were among the largest credit sector detractors.(1)
Two companies in particular that contributed to relative performance were Fidelity National Information Services, Inc. and Ally Financial, Inc. Banking and payment technology company Fidelity National Information Services, Inc. has a solid business model, which can remain stable in a tepid economic environment. We believe that its management has the opportunity to better penetrate its customer base and can use free-cash-flow to pay down debt.(1)
Ally Financial, Inc. has many attributes that we find attractive. The company has streamlined itself into a pure play on auto financing, a sector that, we believe, has tailwinds as U.S. employment and consumption improves. The company has an asset-light business model, reliant upon its online banking channel to grow its substantial deposit base. We find that Ally Financial, Inc. has been able to retain these deposits at a greater rate than many expected possible with online accounts. Ally Financial, Inc.’s management is moving to pay down its highest-cost debt.(1)
Hard disk manufacturer Seagate Technology PLC was the largest individual detractor from relative performance. We invested in Seagate Technology PLC in 2014 due to its leading position in an industry that had undergone consolidation. We also liked its conservative balance sheet and potential for a ratings upgrade, which ultimately occurred. Recently, hard disk demand has softened due to weak personal computer growth in emerging markets and a strong U.S. dollar. The company also released a disappointing earnings report. Still, Seagate Technology PLC maintains a conservative balance sheet and management aims to reduce leverage further. The company continues to generate solid free-cash-flow, and, in our view, has a sufficient equity cushion to protect bondholders.(1)
| 98 | (continued) |
| Ohio National Fund, Inc. | Risk Managed Balanced Portfolio (Continued) |
Within the challenged Energy sector, Chesapeake Energy Corp. weighed on performance. We exited our positions in the company.(1)
The Portfolio’s Risk Management Component, a sleeve of derivatives and cash equivalents, sub-advised by AnchorPath Financial LLC, seeks to enhance the risk-adjusted return of the Portfolio, attempting to enhance returns in rising markets and reduce risk in downturns. Under normal circumstances, the Risk Management Component will represent approximately 20% of the Portfolio. The allocation over this period ranged between 18.7% and 22.4%, and ended the period representing approximately 19.0% of the Portfolio.(1)
The Portfolio’s performance is enhanced on a risk-adjusted basis when the aggregate Portfolio achieves lower volatility with similar returns, or higher returns at similar volatility compared to a benchmark. Over the period, compared to the Balanced Component, the Risk Managed Balanced Portfolio’s risk adjusted returns were not enhanced. While the aggregate Portfolio achieved volatility similar to the Balanced Component, its annual return for the year was 1.32% lower. The under-performance of the Risk Management Component was primarily attributable to losses on index-based options due to time decay of premium value and to declines in market implied volatility over the period.(1)
| (1) | The Portfolio’s composition is subject to change. Holdings and weightings are as of December 31, 2015. |
Change in Value of $10,000 Investment
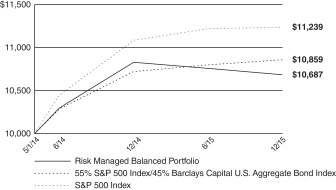
The S&P 500 index is a capitalization-weighted index designed to measure performance of the broad domestic economy through changes in the aggregate market value of 500 stocks representing all major industries. The index includes the effects of reinvested dividends.
The Barclays Capital U.S. Aggregate Bond Index measures returns of U.S. investment grade bonds market, which includes investment grade U.S. Government bonds, high quality corporate bonds, mortgage pass-through securities, and asset-backed securities publicly offered for sale in the U.S. The index’s securities must have at least one year remaining to maturity; they must also be denominated in U.S. dollars and must be fixed rate, nonconvertible, and taxable.
| 99 | (continued) |
| Ohio National Fund, Inc. | Risk Managed Balanced Portfolio (Continued) |
Portfolio Composition as of December 31, 2015 (1)
| % of Net Assets | ||||
Common Stocks (4) | 47.4 | |||
Corporate Bonds (4) | 12.3 | |||
Preferred Stocks (4) | 0.3 | |||
Trust Preferred Securities (4) | 0.4 | |||
Preferred Stock Depository Receipts (4) | 0.5 | |||
Master Limited Partnerships (4) | 1.4 | |||
Asset-Backed / Mortgage-Backed Securities (4) | 1.8 | |||
U.S. Treasury Obligations | 7.9 | |||
U.S. Government Agency Mortgage-Backed Securities | 7.0 | |||
Purchased Options | 6.6 | |||
Money Market Funds and | 14.4 | |||
|
| |||
| 100.0 | ||||
|
|
Top 10 Portfolio Holdings as of December 31, 2015 (1) (2) (3)
| % of Net Assets | ||||
1. MasterCard, Inc. Class A | 2.5 | |||
2. Microsoft Corp. | 2.4 | |||
3. Amgen, Inc. | 2.3 | |||
4. Allergan PLC | 2.0 | |||
5. NIKE, Inc. Class B | 1.9 | |||
6. Alphabet, Inc. Class C | 1.9 | |||
7. Apple, Inc. | 1.8 | |||
8. AbbVie, Inc. | 1.8 | |||
9. Home Depot, Inc. / The | 1.7 | |||
10. Dollar Tree, Inc. | 1.7 |
| (1) | Composition of Portfolio subject to change. |
| (2) | Short-term investments have been excluded from the list of Top 10 Portfolio Holdings. |
| (3) | Top 10 Portfolio Holdings is presented at an individual security level. Total investment exposure by issuer may be higher. |
| (4) | Sectors (Common Stocks, Corporate Bonds, Preferred Stocks, Trust Preferred Securities, Preferred Stock Depository Receipts, Master Limited Partnerships, Asset-Backed / Mortgage-Backed Securities): |
| % of Net Assets | ||||
Financials | 15.0 | |||
Information Technology | 11.8 | |||
Consumer Discretionary | 11.7 | |||
Health Care | 11.7 | |||
Industrials | 5.9 | |||
Materials | 3.5 | |||
Consumer Staples | 3.0 | |||
Energy | 1.2 | |||
Telecommunication Services | 0.2 | |||
Utilities | 0.1 | |||
|
| |||
| 64.1 | ||||
|
|
| 100 |
| Ohio National Fund, Inc. | Risk Managed Balanced Portfolio |
Schedule of Investments | December 31, 2015 |
| Common Stocks – 47.4% | Shares | Value | ||||||||
CONSUMER DISCRETIONARY – 9.6% | ||||||||||
General Motors Co. (Automobiles) | 41,554 | $ | 1,413,252 | |||||||
Norwegian Cruise Line Holdings Ltd. (Hotels, Restaurants & Leisure) | (a) | 18,817 | 1,102,676 | |||||||
Six Flags Entertainment Corp. (Hotels, Restaurants & Leisure) | 10,098 | 554,784 | ||||||||
Starbucks Corp. (Hotels, Restaurants & Leisure) | 12,019 | 721,501 | ||||||||
Ctrip.com International Ltd. – ADR (Internet & Catalog Retail) | (a) | 9,144 | 423,641 | |||||||
Priceline Group, Inc. / The (Internet & Catalog Retail) | (a) | 1,438 | 1,833,378 | |||||||
Mattel, Inc. (Leisure Products) | 22,700 | 616,759 | ||||||||
Dollar Tree, Inc. (Multiline Retail) | (a) | 33,018 | 2,549,650 | |||||||
Home Depot, Inc. / The (Specialty Retail) | 19,638 | 2,597,125 | ||||||||
NIKE, Inc. Class B (Textiles, Apparel & Luxury Goods) | 48,056 | 3,003,500 | ||||||||
|
| |||||||||
| 14,816,266 | ||||||||||
|
| |||||||||
CONSUMER STAPLES – 2.3% | ||||||||||
Diageo PLC (Beverages) | (c) | 13,752 | 375,539 | |||||||
Hershey Co. / The (Food Products) | 11,476 | 1,024,463 | ||||||||
Altria Group, Inc. (Tobacco) | 25,335 | 1,474,750 | ||||||||
Philip Morris International, Inc. (Tobacco) | 8,069 | 709,346 | ||||||||
|
| |||||||||
| 3,584,098 | ||||||||||
|
| |||||||||
FINANCIALS – 6.6% | ||||||||||
JPMorgan Chase & Co. (Banks) | 17,920 | 1,183,258 | ||||||||
U.S. Bancorp (Banks) | 45,172 | 1,927,489 | ||||||||
TD Ameritrade Holding Corp. (Capital Markets) | 29,543 | 1,025,438 | ||||||||
American Express Co. (Consumer Finance) | 15,280 | 1,062,724 | ||||||||
Synchrony Financial (Consumer Finance) | (a) | 33,815 | 1,028,314 | |||||||
CME Group, Inc. (Diversified Financial Svs.) | 15,065 | 1,364,889 | ||||||||
Prudential PLC (Insurance) | (c) | 49,789 | 1,121,727 | |||||||
Outfront Media, Inc. (Real Estate Investment Trusts) | 13,360 | 291,649 | ||||||||
CBRE Group, Inc. (Real Estate Mgmt. & Development) | (a) | 35,215 | 1,217,735 | |||||||
|
| |||||||||
| 10,223,223 | ||||||||||
|
| |||||||||
HEALTH CARE – 10.9% | ||||||||||
AbbVie, Inc. (Biotechnology) | 45,845 | 2,715,858 | ||||||||
Amgen, Inc. (Biotechnology) | 22,260 | 3,613,466 | ||||||||
Regeneron Pharmaceuticals, Inc. (Biotechnology) | (a) | 2,312 | 1,255,115 | |||||||
Aetna, Inc. (Health Care Providers & Svs.) | 11,313 | 1,223,162 | ||||||||
Allergan PLC (Pharmaceuticals) | (a) | 10,025 | 3,132,812 | |||||||
Bristol-Myers Squibb Co. (Pharmaceuticals) | 31,219 | 2,147,555 | ||||||||
Eli Lilly & Co. (Pharmaceuticals) | 18,247 | 1,537,492 | ||||||||
Merck & Co., Inc. (Pharmaceuticals) | 23,118 | 1,221,093 | ||||||||
|
| |||||||||
| 16,846,553 | ||||||||||
|
| |||||||||
INDUSTRIALS – 4.8% | ||||||||||
Boeing Co. / The (Aerospace & Defense) | 15,616 | 2,257,917 | ||||||||
Honeywell International, Inc. (Aerospace & Defense) | 16,144 | 1,672,034 | ||||||||
3M Co. (Industrial Conglomerates) | 3,932 | 592,316 | ||||||||
General Electric Co. (Industrial Conglomerates) | 28,412 | 885,034 | ||||||||
Dover Corp. (Machinery) | 9,439 | 578,705 | ||||||||
Union Pacific Corp. (Road & Rail) | 18,781 | 1,468,674 | ||||||||
|
| |||||||||
| 7,454,680 | ||||||||||
|
| |||||||||
INFORMATION TECHNOLOGY – 10.4% | ||||||||||
Alphabet, Inc. Class C (Internet Software & Svs.) | (a) | 3,933 | 2,984,675 | |||||||
Yahoo!, Inc. (Internet Software & Svs.) | (a) | 28,395 | 944,418 | |||||||
Automatic Data Processing, Inc. (IT Svs.) | �� | 7,169 | 607,358 | |||||||
MasterCard, Inc. Class A (IT Svs.) | 38,887 | 3,786,038 | ||||||||
Adobe Systems, Inc. (Software) | (a) | 12,684 | 1,191,535 | |||||||
Microsoft Corp. (Software) | 65,567 | 3,637,657 | ||||||||
Apple, Inc. (Tech. Hardware, Storage & Periph.) | 26,560 | 2,795,706 | ||||||||
|
| |||||||||
| 15,947,387 | ||||||||||
|
| |||||||||
MATERIALS – 2.6% | ||||||||||
E.I. du Pont de Nemours & Co. (Chemicals) | 26,150 | 1,741,590 | ||||||||
LyondellBasell Industries NV Class A (Chemicals) | 25,867 | 2,247,842 | ||||||||
|
| |||||||||
| 3,989,432 | ||||||||||
|
| |||||||||
TELECOMMUNICATION SERVICES – 0.2% | ||||||||||
Verizon Communications, Inc. (Diversified Telecom. Svs.) | 5,086 | 235,075 | ||||||||
|
| |||||||||
Total Common Stocks (Cost $69,811,633) | $ | 73,096,714 | ||||||||
|
| |||||||||
| 101 | (continued) |
| Ohio National Fund, Inc. | Risk Managed Balanced Portfolio (Continued) |
Schedule of Investments | December 31, 2015 |
| Corporate Bonds – 12.3% | Rate | Maturity | Face Amount | Value | ||||||||||||
CONSUMER DISCRETIONARY – 1.4% | ||||||||||||||||
ZF North America Capital, Inc. (Auto Components) | (b) | 4.000% | 04/29/2020 | $ | 150,000 | $ | 151,238 | |||||||||
ZF North America Capital, Inc. (Auto Components) | (b) | 4.750% | 04/29/2025 | 288,000 | 274,320 | |||||||||||
General Motors Co. (Automobiles) | 4.875% | 10/02/2023 | 428,000 | 437,695 | ||||||||||||
General Motors Co. (Automobiles) | 3.500% | 10/02/2018 | 98,000 | 98,984 | ||||||||||||
General Motors Co. (Automobiles) | 4.000% | 04/01/2025 | 9,000 | 8,526 | ||||||||||||
General Motors Financial Co., Inc. (Automobiles) | 3.100% | 01/15/2019 | 91,000 | 90,887 | ||||||||||||
1011778 B.C. ULC / New Red Finance, Inc. (Hotels, Restaurants & Leisure) | (b) | 4.625% | 01/15/2022 | 129,000 | 129,323 | |||||||||||
Brinker International, Inc. (Hotels, Restaurants & Leisure) | 3.875% | 05/15/2023 | 124,000 | 119,638 | ||||||||||||
PPL WEM Holdings Ltd. (Hotels, Restaurants & Leisure) | (b) | 5.375% | 05/01/2021 | 121,000 | 132,030 | |||||||||||
PPL WEM Holdings Ltd. (Hotels, Restaurants & Leisure) | (b) | 3.900% | 05/01/2016 | 36,000 | 36,144 | |||||||||||
Wynn Las Vegas LLC / Wynn Las Vegas Capital Corp. (Hotels, Restaurants & Leisure) | (b) | 4.250% | 05/30/2023 | 18,000 | 15,401 | |||||||||||
D.R. Horton, Inc. (Household Durables) | 4.750% | 05/15/2017 | 48,000 | 49,380 | ||||||||||||
D.R. Horton, Inc. (Household Durables) | 3.750% | 03/01/2019 | 81,000 | 81,000 | ||||||||||||
MDC Holdings, Inc. (Household Durables) | 5.500% | 01/15/2024 | 42,000 | 42,420 | ||||||||||||
Toll Brothers Finance Corp. (Household Durables) | 5.875% | 02/15/2022 | 55,000 | 57,750 | ||||||||||||
Toll Brothers Finance Corp. (Household Durables) | 4.375% | 04/15/2023 | 28,000 | 27,160 | ||||||||||||
CCO Safari II, LLC (Media) | (b) | 4.464% | 07/23/2022 | 81,000 | 80,718 | |||||||||||
CCO Safari II, LLC (Media) | (b) | 4.908% | 07/23/2025 | 282,000 | 281,723 | |||||||||||
Nielsen Finance LLC / Nielsen Finance Co. (Media) | 4.500% | 10/01/2020 | 58,000 | 58,870 | ||||||||||||
UBM PLC (Media) | (b)(g) | 5.750% | 11/03/2020 | 50,000 | 53,442 | |||||||||||
|
| |||||||||||||||
| 2,226,649 | ||||||||||||||||
|
| |||||||||||||||
CONSUMER STAPLES – 0.7% | ||||||||||||||||
CVS Health Corp. (Food & Staples Retailing) | 2.800% | 07/20/2020 | 198,000 | 198,972 | ||||||||||||
CVS Health Corp. (Food & Staples Retailing) | 3.500% | 07/20/2022 | 112,000 | 114,023 | ||||||||||||
CVS Health Corp. (Food & Staples Retailing) | 3.875% | 07/20/2025 | 166,000 | 169,444 | ||||||||||||
CVS Health Corp. (Food & Staples Retailing) | (b) | 4.750% | 12/01/2022 | 34,000 | 36,435 | |||||||||||
CVS Health Corp. (Food & Staples Retailing) | (b) | 5.000% | 12/01/2024 | 30,000 | 32,473 | |||||||||||
Kraft Heinz Foods Co. (Food Products) | (b) | 2.800% | 07/02/2020 | 84,000 | 83,803 | |||||||||||
Kraft Heinz Foods Co. (Food Products) | (b) | 3.500% | 07/15/2022 | 59,000 | 59,414 | |||||||||||
Smithfield Foods, Inc. (Food Products) | (b) | 5.250% | 08/01/2018 | 27,000 | 27,338 | |||||||||||
Tyson Foods, Inc. (Food Products) | 6.600% | 04/01/2016 | 86,000 | 87,138 | ||||||||||||
Wm. Wrigley Jr. Co. (Food Products) | (b) | 2.400% | 10/21/2018 | 271,000 | 271,747 | |||||||||||
|
| |||||||||||||||
| 1,080,787 | ||||||||||||||||
|
| |||||||||||||||
ENERGY – 1.2% | ||||||||||||||||
Helmerich & Payne International Drilling Co. (Energy Equip. & Svs.) | 4.650% | 03/15/2025 | 91,000 | 91,091 | ||||||||||||
Oceaneering International, Inc. (Energy Equip. & Svs.) | 4.650% | 11/15/2024 | 83,000 | 69,701 | ||||||||||||
Chevron Corp. (Oil, Gas & Consumable Fuels) | 1.345% | 11/15/2017 | 59,000 | 58,813 | ||||||||||||
Cimarex Energy Co. (Oil, Gas & Consumable Fuels) | 5.875% | 05/01/2022 | 246,000 | 235,679 | ||||||||||||
Cimarex Energy Co. (Oil, Gas & Consumable Fuels) | 4.375% | 06/01/2024 | 189,000 | 167,741 | ||||||||||||
DCP Midstream Operating LP (Oil, Gas & Consumable Fuels) | 4.950% | 04/01/2022 | 42,000 | 34,373 | ||||||||||||
DCP Midstream Operating LP (Oil, Gas & Consumable Fuels) | 5.600% | 04/01/2044 | 9,000 | 5,460 | ||||||||||||
Devon Energy Corp. (Oil, Gas & Consumable Fuels) | 2.250% | 12/15/2018 | 97,000 | 88,550 | ||||||||||||
Energy Transfer Partners LP (Oil, Gas & Consumable Fuels) | 4.150% | 10/01/2020 | 65,000 | 59,987 | ||||||||||||
EnLink Midstream Partners LP (Oil, Gas & Consumable Fuels) | 4.400% | 04/01/2024 | 93,000 | 73,673 | ||||||||||||
EnLink Midstream Partners LP (Oil, Gas & Consumable Fuels) | 5.600% | 04/01/2044 | 46,000 | 32,042 | ||||||||||||
Kinder Morgan Energy Partners LP (Oil, Gas & Consumable Fuels) | 5.000% | 10/01/2021 | 124,000 | 117,075 | ||||||||||||
Kinder Morgan Energy Partners LP (Oil, Gas & Consumable Fuels) | 4.300% | 05/01/2024 | 77,000 | 66,211 | ||||||||||||
Kinder Morgan, Inc. (Oil, Gas & Consumable Fuels) | 7.750% | 01/15/2032 | 59,000 | 55,988 | ||||||||||||
Motiva Enterprises LLC (Oil, Gas & Consumable Fuels) | (b) | 5.750% | 01/15/2020 | 29,000 | 31,226 | |||||||||||
NGL Energy Partners LP / NGL Energy Finance Corp. (Oil, Gas & Consumable Fuels) | 5.125% | 07/15/2019 | 73,000 | 57,670 | ||||||||||||
Phillips 66 Partners LP (Oil, Gas & Consumable Fuels) | 3.605% | 02/15/2025 | 35,000 | 30,734 | ||||||||||||
Shell International Finance BV (Oil, Gas & Consumable Fuels) | 2.250% | 11/10/2020 | 185,000 | 182,225 | ||||||||||||
Spectra Energy Partners LP (Oil, Gas & Consumable Fuels) | 4.750% | 03/15/2024 | 112,000 | 108,543 | ||||||||||||
Targa Resources Partners LP / Targa Resources Partners Finance Corp. (Oil, Gas & Consumable Fuels) | 4.125% | 11/15/2019 | 56,000 | 46,620 | ||||||||||||
Western Gas Partners LP (Oil, Gas & Consumable Fuels) | 5.375% | 06/01/2021 | 179,000 | 181,241 | ||||||||||||
|
| |||||||||||||||
| 1,794,643 | ||||||||||||||||
|
| |||||||||||||||
FINANCIALS – 4.9% | ||||||||||||||||
Bank of America Corp. (Banks) | 5.750% | 08/15/2016 | 40,000 | 40,979 | ||||||||||||
CIT Group, Inc. (Banks) | (b) | 5.500% | 02/15/2019 | 232,000 | 242,440 | |||||||||||
CIT Group, Inc. (Banks) | 4.250% | 08/15/2017 | 216,000 | 220,860 | ||||||||||||
Citigroup, Inc. (Banks) | 4.450% | 09/29/2027 | 201,000 | 199,804 | ||||||||||||
Citizens Financial Group, Inc. (Banks) | 4.300% | 12/03/2025 | 132,000 | 132,801 | ||||||||||||
Intesa Sanpaolo SpA (Banks) | (b) | 5.017% | 06/26/2024 | 200,000 | 196,869 | |||||||||||
Royal Bank of Scotland Group PLC (Banks) | 6.100% | 06/10/2023 | 174,000 | 187,037 | ||||||||||||
Royal Bank of Scotland Group PLC (Banks) | 6.000% | 12/19/2023 | 156,000 | 168,013 | ||||||||||||
Royal Bank of Scotland Group PLC (Banks) | 5.125% | 05/28/2024 | 281,000 | 284,806 | ||||||||||||
| 102 | (continued) |
| Ohio National Fund, Inc. | Risk Managed Balanced Portfolio (Continued) |
Schedule of Investments | December 31, 2015 |
| Corporate Bonds (Continued) | Rate | Maturity | Face Amount | Value | ||||||||||||
FINANCIALS (continued) | ||||||||||||||||
Santander UK PLC (Banks) | (b) | 5.000% | 11/07/2023 | $ | 542,000 | $ | 564,195 | |||||||||
SVB Financial Group (Banks) | 5.375% | 09/15/2020 | 67,000 | 73,329 | ||||||||||||
Ameriprise Financial, Inc. (Capital Markets) | (d) | 7.518% | 06/01/2066 | 265,000 | 259,038 | |||||||||||
Carlyle Holdings Finance LLC (Capital Markets) | (b) | 3.875% | 02/01/2023 | 20,000 | 20,267 | |||||||||||
Charles Schwab Corp. / The (Capital Markets) | 3.000% | 03/10/2025 | 67,000 | 65,902 | ||||||||||||
E*TRADE Financial Corp. (Capital Markets) | 5.375% | 11/15/2022 | 126,000 | 131,985 | ||||||||||||
E*TRADE Financial Corp. (Capital Markets) | 4.625% | 09/15/2023 | 191,000 | 194,104 | ||||||||||||
Goldman Sachs Group, Inc. / The (Capital Markets) | 5.625% | 01/15/2017 | 74,000 | 76,861 | ||||||||||||
Goldman Sachs Group, Inc. / The (Capital Markets) | 4.250% | 10/21/2025 | 108,000 | 107,242 | ||||||||||||
Lazard Group LLC (Capital Markets) | 6.850% | 06/15/2017 | 26,000 | 27,682 | ||||||||||||
Lazard Group LLC (Capital Markets) | 4.250% | 11/14/2020 | 153,000 | 158,537 | ||||||||||||
Morgan Stanley (Capital Markets) | 4.350% | 09/08/2026 | 41,000 | 41,158 | ||||||||||||
Morgan Stanley (Capital Markets) | 4.875% | 11/01/2022 | 44,000 | 46,724 | ||||||||||||
Neuberger Berman Group LLC / Neuberger Berman Finance Corp. (Capital Markets) | (b) | 4.875% | 04/15/2045 | 123,000 | 103,650 | |||||||||||
Neuberger Berman Group LLC / Neuberger Berman Finance Corp. (Capital Markets) | (b) | 5.875% | 03/15/2022 | 264,000 | 274,560 | |||||||||||
Raymond James Financial, Inc. (Capital Markets) | 4.250% | 04/15/2016 | 153,000 | 154,162 | ||||||||||||
Raymond James Financial, Inc. (Capital Markets) | 5.625% | 04/01/2024 | 268,000 | 296,818 | ||||||||||||
Stifel Financial Corp. (Capital Markets) | 4.250% | 07/18/2024 | 48,000 | 47,700 | ||||||||||||
TD Ameritrade Holding Corp. (Capital Markets) | 2.950% | 04/01/2022 | 72,000 | 71,367 | ||||||||||||
TD Ameritrade Holding Corp. (Capital Markets) | 3.625% | 04/01/2025 | 271,000 | 274,463 | ||||||||||||
Ally Financial, Inc. (Consumer Finance) | 4.125% | 03/30/2020 | 119,000 | 118,405 | ||||||||||||
Ally Financial, Inc. (Consumer Finance) | 5.750% | 11/20/2025 | 32,000 | 32,400 | ||||||||||||
Ally Financial, Inc. (Consumer Finance) | 8.000% | 12/31/2018 | 30,000 | 32,850 | ||||||||||||
American Express Co. (Consumer Finance) | (d) | 6.800% | 09/01/2066 | 153,000 | 154,148 | |||||||||||
Discover Financial Services (Consumer Finance) | 3.950% | 11/06/2024 | 29,000 | 28,599 | ||||||||||||
Discover Financial Services (Consumer Finance) | 3.750% | 03/04/2025 | 116,000 | 111,455 | ||||||||||||
Ford Motor Credit Co. LLC (Consumer Finance) | 3.984% | 06/15/2016 | 152,000 | 153,685 | ||||||||||||
Synchrony Financial (Consumer Finance) | 3.000% | 08/15/2019 | 82,000 | 81,902 | ||||||||||||
General Electric Capital Corp. (Diversified Financial Svs.) | (d) | 6.375% | 11/15/2067 | 123,000 | 128,449 | |||||||||||
Intercontinental Exchange, Inc. (Diversified Financial Svs.) | 3.750% | 12/01/2025 | 104,000 | 104,352 | ||||||||||||
International Lease Finance Corp. (Diversified Financial Svs.) | (b) | 6.750% | 09/01/2016 | 106,000 | 108,915 | |||||||||||
International Lease Finance Corp. (Diversified Financial Svs.) | 8.750% | 03/15/2017 | 45,000 | 47,925 | ||||||||||||
LeasePlan Corp. NV (Diversified Financial Svs.) | (b) | 2.500% | 05/16/2018 | 293,000 | 288,572 | |||||||||||
Voya Financial, Inc. (Diversified Financial Svs.) | (d) | 5.650% | 05/15/2053 | 59,000 | 58,115 | |||||||||||
ACE INA Holdings, Inc. (Insurance) | 3.350% | 05/03/2026 | 123,000 | 122,645 | ||||||||||||
CNO Financial Group, Inc. (Insurance) | 4.500% | 05/30/2020 | 32,000 | 32,640 | ||||||||||||
CNO Financial Group, Inc. (Insurance) | 5.250% | 05/30/2025 | 91,000 | 92,593 | ||||||||||||
Primerica, Inc. (Insurance) | 4.750% | 07/15/2022 | 198,000 | 209,335 | ||||||||||||
Alexandria Real Estate Equities, Inc. (Real Estate Investment Trusts) | 4.600% | 04/01/2022 | 120,000 | 124,562 | ||||||||||||
Alexandria Real Estate Equities, Inc. (Real Estate Investment Trusts) | 2.750% | 01/15/2020 | 108,000 | 106,204 | ||||||||||||
Alexandria Real Estate Equities, Inc. (Real Estate Investment Trusts) | 4.500% | 07/30/2029 | 94,000 | 91,945 | ||||||||||||
Post Apartment Homes LP (Real Estate Investment Trusts) | 4.750% | 10/15/2017 | 46,000 | 47,836 | ||||||||||||
Retail Opportunity Investments Partnership LP (Real Estate Investment Trusts) | 5.000% | 12/15/2023 | 47,000 | 48,008 | ||||||||||||
Retail Opportunity Investments Partnership LP (Real Estate Investment Trusts) | 4.000% | 12/15/2024 | 14,000 | 13,227 | ||||||||||||
Senior Housing Properties Trust (Real Estate Investment Trusts) | 6.750% | 12/15/2021 | 55,000 | 61,933 | ||||||||||||
SL Green Realty Corp. (Real Estate Investment Trusts) | 7.750% | 03/15/2020 | 111,000 | 129,596 | ||||||||||||
SL Green Realty Corp. (Real Estate Investment Trusts) | 5.000% | 08/15/2018 | 67,000 | 70,311 | ||||||||||||
Jones Lang LaSalle, Inc. (Real Estate Mgmt. & Development) | 4.400% | 11/15/2022 | 72,000 | 73,825 | ||||||||||||
Kennedy-Wilson, Inc. (Real Estate Mgmt. & Development) | 5.875% | 04/01/2024 | 141,000 | 136,065 | ||||||||||||
|
| |||||||||||||||
| 7,473,850 | ||||||||||||||||
|
| |||||||||||||||
HEALTH CARE – 0.8% | ||||||||||||||||
Becton Dickinson and Co. (Health Care Equip. & Supplies) | 1.800% | 12/15/2017 | 74,000 | 73,896 | ||||||||||||
Zimmer Biomet Holdings, Inc. (Health Care Equip. & Supplies) | 3.550% | 04/01/2025 | 157,000 | 152,643 | ||||||||||||
Zimmer Biomet Holdings, Inc. (Health Care Equip. & Supplies) | 2.700% | 04/01/2020 | 113,000 | 111,620 | ||||||||||||
Zimmer Biomet Holdings, Inc. (Health Care Equip. & Supplies) | 3.150% | 04/01/2022 | 105,000 | 103,228 | ||||||||||||
Fresenius Medical Care U.S. Finance II, Inc. (Health Care Providers & Svs.) | (b) | 5.875% | 01/31/2022 | 116,000 | 124,120 | |||||||||||
HCA, Inc. (Health Care Providers & Svs.) | 3.750% | 03/15/2019 | 61,000 | 61,458 | ||||||||||||
Laboratory Corp. of America Holdings (Health Care Providers & Svs.) | 3.200% | 02/01/2022 | 100,000 | 98,180 | ||||||||||||
Life Technologies Corp. (Life Sciences Tools & Svs.) | 6.000% | 03/01/2020 | 72,000 | 79,848 | ||||||||||||
Thermo Fisher Scientific, Inc. (Life Sciences Tools & Svs.) | 3.300% | 02/15/2022 | 48,000 | 47,910 | ||||||||||||
Actavis Funding SCS (Pharmaceuticals) | 3.000% | 03/12/2020 | 198,000 | 197,842 | ||||||||||||
Actavis Funding SCS (Pharmaceuticals) | 3.800% | 03/15/2025 | 143,000 | 142,283 | ||||||||||||
Actavis Funding SCS (Pharmaceuticals) | 4.550% | 03/15/2035 | 89,000 | 86,504 | ||||||||||||
|
| |||||||||||||||
| 1,279,532 | ||||||||||||||||
|
| |||||||||||||||
INDUSTRIALS – 0.9% | ||||||||||||||||
Exelis, Inc. (Aerospace & Defense) | 5.550% | 10/01/2021 | 45,000 | 49,349 | ||||||||||||
Exelis, Inc. (Aerospace & Defense) | 4.250% | 10/01/2016 | 82,000 | 83,473 | ||||||||||||
Southwest Airlines Co. (Airlines) | 5.125% | 03/01/2017 | 79,000 | 82,107 | ||||||||||||
| 103 | (continued) |
| Ohio National Fund, Inc. | Risk Managed Balanced Portfolio (Continued) |
Schedule of Investments | December 31, 2015 |
| Corporate Bonds (Continued) | Rate | Maturity | Face Amount | Value | ||||||||||||
INDUSTRIALS (continued) | ||||||||||||||||
Owens Corning (Building Products) | 4.200% | 12/01/2024 | $ | 48,000 | $ | 46,720 | ||||||||||
Cintas Corp No. 2 (Commercial Svs. & Supplies) | 2.850% | 06/01/2016 | 48,000 | 48,190 | ||||||||||||
CNH Industrial Capital LLC (Machinery) | 3.625% | 04/15/2018 | 55,000 | 54,147 | ||||||||||||
Verisk Analytics, Inc. (Professional Svs.) | 5.500% | 06/15/2045 | 136,000 | 129,837 | ||||||||||||
Verisk Analytics, Inc. (Professional Svs.) | 5.800% | 05/01/2021 | 186,000 | 206,164 | ||||||||||||
Verisk Analytics, Inc. (Professional Svs.) | 4.875% | 01/15/2019 | 48,000 | 50,222 | ||||||||||||
Verisk Analytics, Inc. (Professional Svs.) | 4.125% | 09/12/2022 | 48,000 | 48,389 | ||||||||||||
Verisk Analytics, Inc. (Professional Svs.) | 4.000% | 06/15/2025 | 200,000 | 194,292 | ||||||||||||
Penske Truck Leasing Co. LP / PTL Finance Corp. (Road & Rail) | (b) | 3.375% | 03/15/2018 | 76,000 | 77,208 | |||||||||||
Penske Truck Leasing Co. LP / PTL Finance Corp. (Road & Rail) | (b) | 4.250% | 01/17/2023 | 133,000 | 133,876 | |||||||||||
Penske Truck Leasing Co. LP / PTL Finance Corp. (Road & Rail) | (b) | 2.500% | 06/15/2019 | 53,000 | 52,142 | |||||||||||
AerCap Ireland Capital Ltd. / AerCap Global Aviation Trust (Trading Companies & Distributors) | 4.625% | 10/30/2020 | 181,000 | 185,299 | ||||||||||||
|
| |||||||||||||||
| 1,441,415 | ||||||||||||||||
|
| |||||||||||||||
INFORMATION TECHNOLOGY – 1.4% | ||||||||||||||||
Harris Corp. (Communications Equip.) | 3.832% | 04/27/2025 | 44,000 | 43,341 | ||||||||||||
Harris Corp. (Communications Equip.) | 5.054% | 04/27/2045 | 62,000 | 60,705 | ||||||||||||
FLIR Systems, Inc. (Electronic Equip., Instr. & Comp.) | 3.750% | 09/01/2016 | 88,000 | 89,272 | ||||||||||||
Molex Electronic Technologies, LLC (Electronic Equip., Instr. & Comp.) | (b) | 2.878% | 04/15/2020 | 24,000 | 23,384 | |||||||||||
Trimble Navigation Ltd. (Electronic Equip., Instr. & Comp.) | 4.750% | 12/01/2024 | 195,000 | 193,859 | ||||||||||||
Fidelity National Information Services, Inc. (IT Svs.) | 5.000% | 03/15/2022 | 12,000 | 12,472 | ||||||||||||
Fidelity National Information Services, Inc. (IT Svs.) | 3.625% | 10/15/2020 | 253,000 | 256,406 | ||||||||||||
Fidelity National Information Services, Inc. (IT Svs.) | 4.500% | 10/15/2022 | 116,000 | 118,125 | ||||||||||||
Fidelity National Information Services, Inc. (IT Svs.) | 5.000% | 10/15/2025 | 434,000 | 447,976 | ||||||||||||
TSMC Global Ltd. (Semiconductors & Equip.) | (b) | 1.625% | 04/03/2018 | 318,000 | 311,712 | |||||||||||
Autodesk, Inc. (Software) | 3.600% | 12/15/2022 | 40,000 | 38,873 | ||||||||||||
Cadence Design Systems, Inc. (Software) | 4.375% | 10/15/2024 | 160,000 | 158,869 | ||||||||||||
Seagate HDD Cayman (Tech. Hardware, Storage & Periph.) | 4.750% | 06/01/2023 | 33,000 | 28,887 | ||||||||||||
Seagate HDD Cayman (Tech. Hardware, Storage & Periph.) | 4.750% | 01/01/2025 | 362,000 | 301,604 | ||||||||||||
Seagate HDD Cayman (Tech. Hardware, Storage & Periph.) | (b) | 5.750% | 12/01/2034 | 96,000 | 67,177 | |||||||||||
Seagate HDD Cayman (Tech. Hardware, Storage & Periph.) | (b) | 4.875% | 06/01/2027 | 89,000 | 68,336 | |||||||||||
|
| |||||||||||||||
| 2,220,998 | ||||||||||||||||
|
| |||||||||||||||
MATERIALS – 0.9% | ||||||||||||||||
Albemarle Corp. (Chemicals) | 4.150% | 12/01/2024 | 135,000 | 129,027 | ||||||||||||
Albemarle Corp. (Chemicals) | 5.450% | 12/01/2044 | 49,000 | 47,389 | ||||||||||||
Ashland, Inc. (Chemicals) | 3.875% | 04/15/2018 | 67,000 | 68,340 | ||||||||||||
Ashland, Inc. (Chemicals) | 6.875% | 05/15/2043 | 88,000 | 83,600 | ||||||||||||
LyondellBasell Industries NV (Chemicals) | 4.625% | 02/26/2055 | 183,000 | 148,405 | ||||||||||||
Hanson Ltd. (Construction Materials) | 6.125% | 08/15/2016 | 66,000 | 67,732 | ||||||||||||
Martin Marietta Materials, Inc. (Construction Materials) | 4.250% | 07/02/2024 | 65,000 | 63,825 | ||||||||||||
Vulcan Materials Co. (Construction Materials) | 7.000% | 06/15/2018 | 64,000 | 71,040 | ||||||||||||
Vulcan Materials Co. (Construction Materials) | 7.500% | 06/15/2021 | 35,000 | 40,775 | ||||||||||||
Vulcan Materials Co. (Construction Materials) | 4.500% | 04/01/2025 | 189,000 | 187,110 | ||||||||||||
Ball Corp. (Containers & Packaging) | 4.375% | 12/15/2020 | 58,000 | 58,906 | ||||||||||||
Alcoa, Inc. (Metals & Mining) | 5.125% | 10/01/2024 | 133,000 | 121,030 | ||||||||||||
Reliance Steel & Aluminum Co. (Metals & Mining) | 4.500% | 04/15/2023 | 105,000 | 97,782 | ||||||||||||
Georgia-Pacific LLC (Paper & Forest Products) | (b) | 3.163% | 11/15/2021 | 74,000 | 73,890 | |||||||||||
Georgia-Pacific LLC (Paper & Forest Products) | (b) | 3.600% | 03/01/2025 | 176,000 | 174,048 | |||||||||||
|
| |||||||||||||||
| 1,432,899 | ||||||||||||||||
|
| |||||||||||||||
UTILITIES – 0.1% | ||||||||||||||||
IPALCO Enterprises, Inc. (Electric Utilities) | 5.000% | 05/01/2018 | 66,000 | 69,135 | ||||||||||||
|
| |||||||||||||||
Total Corporate Bonds (Cost $19,545,145) | $ | 19,019,908 | ||||||||||||||
|
| |||||||||||||||
| Preferred Stocks – 0.3% | Rate | Quantity | Value | |||||||||||||
FINANCIALS – 0.1% |
| |||||||||||||||
Zions Bancorporation (Banks) | (e) | 5.800% | 28,000 | $ | 26,810 | |||||||||||
Charles Schwab Corp. Series A / The (Capital Markets) | (e) | 7.000% | 139,000 | 157,765 | ||||||||||||
General Electric Capital Corp. (Diversified Financial Svs.) | 4.700% | 295 | 7,514 | |||||||||||||
|
| |||||||||||||||
| 192,089 | ||||||||||||||||
|
| |||||||||||||||
INDUSTRIALS – 0.2% | ||||||||||||||||
General Electric Co. (Industrial Conglomerates) | (e) | 4.000% | 123,450 | 123,450 | ||||||||||||
General Electric Co. (Industrial Conglomerates) | (e) | 4.100% | 118,430 | 118,134 | ||||||||||||
|
| |||||||||||||||
| 241,584 | ||||||||||||||||
|
| |||||||||||||||
Total Preferred Stocks (Cost $420,471) | $ | 433,673 | ||||||||||||||
|
| |||||||||||||||
| 104 | (continued) |
| Ohio National Fund, Inc. | Risk Managed Balanced Portfolio (Continued) |
Schedule of Investments | December 31, 2015 |
| Trust Preferred Securities – 0.4% | Rate | Quantity | Value | |||||||||||||
FINANCIALS – 0.4% |
| |||||||||||||||
Citigroup Capital XIII (Banks) | (e) | QL + 637 | 3,000 | $ | 77,970 | |||||||||||
Goldman Sachs Capital I (Capital Markets) | 6.345% | 191,000 | 223,319 | |||||||||||||
Morgan Stanley Capital Trust III (Capital Markets) | 6.250% | 581 | 14,804 | |||||||||||||
Morgan Stanley Capital Trust IV (Capital Markets) | 6.250% | 82 | 2,080 | |||||||||||||
Morgan Stanley Capital Trust V (Capital Markets) | 5.750% | 26 | 655 | |||||||||||||
Morgan Stanley Capital Trust VIII (Capital Markets) | 6.450% | 150 | 3,796 | |||||||||||||
GE Capital Trust I (Diversified Financial Svs.) | (e) | 6.375% | 325,000 | 337,797 | ||||||||||||
|
| |||||||||||||||
Total Trust Preferred Securities (Cost $672,880) | $ | 660,421 | ||||||||||||||
|
| |||||||||||||||
| Preferred Stock Depository Receipts – 0.5% | Rate | Quantity | Value | |||||||||||||
FINANCIALS – 0.5% |
| |||||||||||||||
Bank of America Corp. (Banks) | (f) | 8.000% | 139,000 | $ | 141,433 | |||||||||||
Wells Fargo & Co. (Banks) | (f) | 5.875% | 31,000 | 32,628 | ||||||||||||
Wells Fargo & Co. (Banks) | (f) | 6.625% | 3,225 | 92,654 | ||||||||||||
Morgan Stanley (Capital Markets) | (f) | 5.550% | 104,000 | 104,000 | ||||||||||||
Morgan Stanley (Capital Markets) | (f) | 6.875% | 4,400 | 122,100 | ||||||||||||
Morgan Stanley (Capital Markets) | (f) | 7.125% | 4,425 | 126,555 | ||||||||||||
Discover Financial Services (Consumer Finance) | 6.500% | 6,175 | 163,452 | |||||||||||||
|
| |||||||||||||||
Total Preferred Stock Depository Receipts (Cost $774,732) | $ | 782,822 | ||||||||||||||
|
| |||||||||||||||
| Master Limited Partnerships – 1.4% | Shares | Value | ||||||||||||||
FINANCIALS – 1.4% |
| |||||||||||||||
Blackstone Group LP / The (Capital Markets) | 73,905 | $ | 2,160,982 | |||||||||||||
|
| |||||||||||||||
Total Master Limited Partnerships (Cost $2,402,690) | $ | 2,160,982 | ||||||||||||||
|
| |||||||||||||||
| Asset-Backed / Mortgage-Backed Securities – 1.8% | Rate | Maturity | Face Amount | Value | ||||||||||||
CONSUMER DISCRETIONARY – 0.7% |
| |||||||||||||||
Applebee’s Funding LLC / IHOP Funding LLC 2014-1 A2 | (b) | 4.277% | 09/05/2044 | $ | 7,000 | $ | 7,089 | |||||||||
CKE Restaurant Holdings, Inc. 2013-1A A2 | (b) | 4.474% | 03/20/2043 | 431,438 | 429,043 | |||||||||||
DB Master Finance LLC 2015-1A A2I | (b) | 3.262% | 02/20/2045 | 49,625 | 49,104 | |||||||||||
Domino’s Pizza Master Issuer LLC 2012-1A A2 | (b) | 5.216% | 01/25/2042 | 174,206 | 179,218 | |||||||||||
Domino’s Pizza Master Issuer LLC 2015-1A A2I | (b) | 3.484% | 10/25/2045 | 124,000 | 121,520 | |||||||||||
Hilton U.S.A. Trust 2013-HLT DFX | (b) | 4.407% | 11/05/2030 | 125,000 | 125,108 | |||||||||||
Hilton U.S.A. Trust 2013-HLT EFX | (b) | 4.453% | 11/05/2030 | 150,000 | 149,960 | |||||||||||
Wendys Funding LLC 2015-1A A2I | (b) | 3.371% | 06/15/2045 | 84,788 | 82,726 | |||||||||||
|
| |||||||||||||||
| 1,143,768 | ||||||||||||||||
|
| |||||||||||||||
FINANCIALS – 1.1% | ||||||||||||||||
American Tower Trust I 13 1A | (b) | 1.551% | 03/15/2043 | 60,000 | 58,599 | |||||||||||
AmeriCredit Automobile Receivables Trust 2012-4 E | (b) | 3.820% | 02/10/2020 | 145,000 | 146,758 | |||||||||||
AmeriCredit Automobile Receivables Trust 2015-2 D | 3.000% | 06/08/2021 | 20,000 | 19,738 | ||||||||||||
Banc of America Commercial Mortgage Trust 2006-6 AJ | 5.421% | 10/10/2045 | 320,000 | 324,470 | ||||||||||||
COMM 2007-C9 Mortgage Trust AJ | 5.650% | 12/10/2049 | 10,000 | 10,129 | ||||||||||||
GCCFC Commercial Mortgage Trust 2007-GG11 AM | 5.867% | 12/10/2049 | 25,000 | 25,969 | ||||||||||||
GAHR Commericial Mortgage Trust 2015-NRF DFX | (b) | 3.382% | 12/15/2019 | 10,000 | 9,621 | |||||||||||
JP Morgan Chase Commercial Mortgage Securities Trust 2015-COSMO D | (b) | 3.631% | 01/15/2032 | 287,000 | 284,952 | |||||||||||
Santander Drive Auto Receivables Trust 2015-1 D | 3.240% | 04/15/2021 | 341,000 | 340,389 | ||||||||||||
Santander Drive Auto Receivables Trust 2015-4 D | 3.530% | 08/16/2021 | 53,000 | 52,526 | ||||||||||||
Wachovia Bank Commercial Mortgage Trust Series 2007-C30 AM | 5.383% | 12/15/2043 | 46,628 | 48,179 | ||||||||||||
Wachovia Bank Commercial Mortgage Trust Series 2007-C31 AJ | 5.660% | 04/15/2047 | 40,000 | 39,961 | ||||||||||||
Wachovia Bank Commercial Mortgage Trust Series 2007-C33 AJ | 5.952% | 02/15/2051 | 25,621 | 26,111 | ||||||||||||
JP Morgan Chase Commercial Mortgage Securities Trust 2015-SGP B | (b) | 3.081% | 07/15/2036 | 150,000 | 149,747 | |||||||||||
JP Morgan Chase Commercial Mortgage Securities Trust 2015-SGP D | (b) | 4.831% | 07/15/2036 | 100,000 | 99,986 | |||||||||||
JP Morgan Chase Commercial Mortgage Securities Trust 2015-UES E | (b) | 3.621% | 09/05/2032 | 44,000 | 41,169 | |||||||||||
|
| |||||||||||||||
| 1,678,304 | ||||||||||||||||
|
| |||||||||||||||
Total Asset-Backed / Mortgage-Backed Securities (Cost $2,864,710) | $ | 2,822,072 | ||||||||||||||
|
| |||||||||||||||
| U.S. Treasury Obligations – 7.9% | Rate | Maturity | Face Amount | Value | ||||||||||||
U.S. Treasury Note | 1.000% | 09/15/2018 | $ | 443,000 | $ | 439,899 | ||||||||||
U.S. Treasury Note | 1.375% | 09/30/2018 | 1,206,000 | 1,209,952 | ||||||||||||
U.S. Treasury Note | 1.250% | 10/31/2018 | 453,000 | 452,424 | ||||||||||||
U.S. Treasury Note | 1.625% | 07/31/2019 | 389,000 | 390,427 | ||||||||||||
U.S. Treasury Note | 1.750% | 09/30/2019 | 347,000 | 349,419 | ||||||||||||
U.S. Treasury Note | 1.500% | 10/31/2019 | 520,000 | 518,474 | ||||||||||||
U.S. Treasury Note | 1.625% | 12/31/2019 | 534,000 | 534,134 | ||||||||||||
U.S. Treasury Note | 1.375% | 09/30/2020 | 543,000 | 533,749 | ||||||||||||
| 105 | (continued) |
| Ohio National Fund, Inc. | Risk Managed Balanced Portfolio (Continued) |
Schedule of Investments | December 31, 2015 |
| U.S. Treasury Obligations (Continued) | Rate | Maturity | Face Amount | Value | ||||||||||||
U.S. Treasury Note | 2.125% | 09/30/2021 | $ | 279,000 | $ | 282,011 | ||||||||||
U.S. Treasury Note | 2.125% | 12/31/2021 | 392,000 | 395,544 | ||||||||||||
U.S. Treasury Note | 1.750% | 05/15/2023 | 120,000 | 116,903 | ||||||||||||
U.S. Treasury Note | 2.500% | 08/15/2023 | 442,000 | 453,470 | ||||||||||||
U.S. Treasury Note | 2.750% | 11/15/2023 | 621,000 | 648,078 | ||||||||||||
U.S. Treasury Note | 2.500% | 05/15/2024 | 322,000 | 329,010 | ||||||||||||
U.S. Treasury Note | (i) | 2.250% | 11/15/2024 | 1,865,000 | 1,863,907 | |||||||||||
U.S. Treasury Note | 2.000% | 02/15/2025 | 56,000 | 54,737 | ||||||||||||
U.S. Treasury Note | 2.000% | 08/15/2025 | 441,000 | 429,968 | ||||||||||||
U.S. Treasury Note | 2.250% | 11/15/2025 | 952,000 | 949,869 | ||||||||||||
U.S. Treasury Note | 3.750% | 11/15/2043 | 330,000 | 379,368 | ||||||||||||
U.S. Treasury Note | 3.625% | 02/15/2044 | 92,000 | 103,295 | ||||||||||||
U.S. Treasury Note | 3.375% | 05/15/2044 | 79,000 | 84,619 | ||||||||||||
U.S. Treasury Note | 2.500% | 02/15/2045 | 61,000 | 54,619 | ||||||||||||
U.S. Treasury Note | 3.000% | 05/15/2045 | 333,000 | 330,840 | ||||||||||||
U.S. Treasury Note | 3.000% | 11/15/2045 | 1,288,000 | 1,281,704 | ||||||||||||
|
| |||||||||||||||
Total U.S. Treasury Obligations (Cost $12,321,589) | $ | 12,186,420 | ||||||||||||||
|
| |||||||||||||||
| U.S. Government Agency Mortgage-Backed Securities – 7.0% | Rate | Maturity | Face Amount | Value | ||||||||||||
Fannie Mae Pool | 4.000% | 06/01/2029 | $ | 6,721 | $ | 7,186 | ||||||||||
Fannie Mae Pool | 4.000% | 09/01/2029 | 241,633 | 258,335 | ||||||||||||
Fannie Mae Pool | 3.500% | 10/01/2029 | 27,527 | 28,868 | ||||||||||||
Fannie Mae Pool | 3.500% | 05/01/2033 | 404,745 | 423,935 | ||||||||||||
Fannie Mae Pool | 4.000% | 04/01/2034 | 22,642 | 24,392 | ||||||||||||
Fannie Mae Pool | 5.500% | 04/01/2040 | 288,820 | 322,193 | ||||||||||||
Fannie Mae Pool | 4.500% | 01/01/2041 | 107,253 | 117,995 | ||||||||||||
Fannie Mae Pool | 5.500% | 05/01/2041 | 7,255 | 8,082 | ||||||||||||
Fannie Mae Pool | 5.500% | 06/01/2041 | 38,092 | 43,125 | ||||||||||||
Fannie Mae Pool | 5.500% | 07/01/2041 | 39,809 | 44,353 | ||||||||||||
Fannie Mae Pool | 4.500% | 11/01/2041 | 310,505 | 341,310 | ||||||||||||
Fannie Mae Pool | 5.500% | 02/01/2042 | 166,303 | 185,345 | ||||||||||||
Fannie Mae Pool | 4.000% | 06/01/2042 | 15,759 | 16,773 | ||||||||||||
Fannie Mae Pool | 3.500% | 07/01/2042 | 36,976 | 38,286 | ||||||||||||
Fannie Mae Pool | 4.000% | 07/01/2042 | 120,816 | 128,584 | ||||||||||||
Fannie Mae Pool | 4.000% | 08/01/2042 | 7,224 | 7,689 | ||||||||||||
Fannie Mae Pool | 4.000% | 09/01/2042 | 9,252 | 9,851 | ||||||||||||
Fannie Mae Pool | 4.000% | 12/01/2042 | 6,066 | 6,483 | ||||||||||||
Fannie Mae Pool | 3.500% | 01/01/2043 | 41,639 | 43,012 | ||||||||||||
Fannie Mae Pool | 3.500% | 02/01/2043 | 64,007 | 66,109 | ||||||||||||
Fannie Mae Pool | 3.500% | 02/01/2043 | 41,931 | 43,315 | ||||||||||||
Fannie Mae Pool | 4.500% | 03/01/2043 | 204,715 | 224,606 | ||||||||||||
Fannie Mae Pool | 4.000% | 07/01/2043 | 738,973 | 786,692 | ||||||||||||
Fannie Mae Pool | 4.000% | 08/01/2043 | 22,609 | 24,071 | ||||||||||||
Fannie Mae Pool | 3.500% | 04/01/2044 | 6,900 | 7,149 | ||||||||||||
Fannie Mae Pool | 3.500% | 05/01/2044 | 49,699 | 51,657 | ||||||||||||
Fannie Mae Pool | 4.500% | 05/01/2044 | 311,793 | 343,782 | ||||||||||||
Fannie Mae Pool | 5.500% | 05/01/2044 | 111,797 | 124,716 | ||||||||||||
Fannie Mae Pool | 4.000% | 06/01/2044 | 172,266 | 183,352 | ||||||||||||
Fannie Mae Pool | 4.000% | 07/01/2044 | 50,666 | 54,243 | ||||||||||||
Fannie Mae Pool | 5.000% | 07/01/2044 | 250,107 | 281,150 | ||||||||||||
Fannie Mae Pool | 4.000% | 08/01/2044 | 32,084 | 34,349 | ||||||||||||
Fannie Mae Pool | 4.500% | 08/01/2044 | 73,995 | 81,587 | ||||||||||||
Fannie Mae Pool | 4.500% | 10/01/2044 | 47,326 | 52,035 | ||||||||||||
Fannie Mae Pool | 4.500% | 10/01/2044 | 56,748 | 62,579 | ||||||||||||
Fannie Mae Pool | 3.500% | 02/01/2045 | 52,390 | 54,116 | ||||||||||||
Fannie Mae Pool | 4.500% | 03/01/2045 | 87,144 | 95,831 | ||||||||||||
Fannie Mae Pool | 4.500% | 05/01/2045 | 164,653 | 181,573 | ||||||||||||
Fannie Mae Pool | 4.500% | 06/01/2045 | 175,235 | 192,719 | ||||||||||||
Fannie Mae Pool | 4.000% | 09/01/2045 | 202,812 | 215,957 | ||||||||||||
Fannie Mae Pool | 4.500% | 10/01/2045 | 338,300 | 371,182 | ||||||||||||
Freddie Mac Gold Pool | 3.500% | 07/01/2029 | 86,097 | 90,118 | ||||||||||||
Freddie Mac Gold Pool | 3.500% | 09/01/2029 | 371,277 | 388,660 | ||||||||||||
Freddie Mac Gold Pool | 5.500% | 08/01/2041 | 139,588 | 159,149 | ||||||||||||
Freddie Mac Gold Pool | 5.500% | 08/01/2041 | 390,104 | 440,220 | ||||||||||||
Freddie Mac Gold Pool | 3.500% | 02/01/2044 | 19,188 | 19,818 | ||||||||||||
Freddie Mac Gold Pool | 4.500% | 05/01/2044 | 196,750 | 216,361 | ||||||||||||
Freddie Mac Gold Pool | 4.000% | 08/01/2044 | 87,052 | 92,897 | ||||||||||||
Freddie Mac Gold Pool | 4.500% | 06/01/2045 | 117,204 | 129,018 | ||||||||||||
Ginnie Mae I Pool | 5.000% | 01/15/2040 | 258,560 | 285,949 | ||||||||||||
Ginnie Mae I Pool | 5.000% | 05/15/2040 | 126,940 | 141,655 | ||||||||||||
| 106 | (continued) |
| Ohio National Fund, Inc. | Risk Managed Balanced Portfolio (Continued) |
Schedule of Investments | December 31, 2015 |
| U.S. Government Agency Mortgage-Backed Securities (Continued) | Rate | Maturity | Face Amount | Value | ||||||||||||
Ginnie Mae I Pool | 4.500% | 05/15/2044 | $ | 26,972 | $ | 29,425 | ||||||||||
Ginnie Mae I Pool | 5.000% | 06/15/2044 | 82,374 | 92,181 | ||||||||||||
Ginnie Mae I Pool | 5.000% | 06/15/2044 | 42,043 | 47,138 | ||||||||||||
Ginnie Mae I Pool | 4.000% | 01/15/2045 | 447,881 | 478,242 | ||||||||||||
Ginnie Mae I Pool | 4.000% | 03/15/2045 | 1,054,206 | 1,127,360 | ||||||||||||
Ginnie Mae I Pool | 4.000% | 04/15/2045 | 160,973 | 173,292 | ||||||||||||
Ginnie Mae II Pool | 5.500% | 11/20/2037 | 5,904 | 6,537 | ||||||||||||
Ginnie Mae II Pool | 5.500% | 05/20/2042 | 8,516 | 9,491 | ||||||||||||
Ginnie Mae II Pool | 5.000% | 12/20/2044 | 407,927 | 456,806 | ||||||||||||
Ginnie Mae II Pool | 5.000% | 09/20/2045 | 100,655 | 110,766 | ||||||||||||
Ginnie Mae II Pool | 4.000% | 11/20/2045 | 653,274 | 706,277 | ||||||||||||
|
| |||||||||||||||
Total U.S. Government Agency Mortgage-Backed Securities (Cost $10,827,344) | $ | 10,789,927 | ||||||||||||||
|
| |||||||||||||||
| Purchased Options – 6.6% | Expiration | Exercise Price | Contracts (h) | Value | ||||||||||||
S&P 500 Index Call Option | December 2017 | $1,900.00 | 12 | $ | 326,940 | |||||||||||
S&P 500 Index Call Option | December 2017 | $1,950.00 | 19 | 460,655 | ||||||||||||
S&P 500 Index Call Option | December 2017 | $2,000.00 | 2 | 42,690 | ||||||||||||
S&P 500 Index Call Option | December 2017 | $2,050.00 | 4 | 74,520 | ||||||||||||
S&P 500 Index Call Option | December 2017 | $2,100.00 | 9 | 144,000 | ||||||||||||
S&P 500 Index Put Option | December 2017 | $1,900.00 | 12 | 202,920 | ||||||||||||
S&P 500 Index Put Option | December 2017 | $1,950.00 | 19 | 354,635 | ||||||||||||
S&P 500 Index Put Option | December 2017 | $2,000.00 | 2 | 41,120 | ||||||||||||
S&P 500 Index Put Option | December 2017 | $2,050.00 | 4 | 90,660 | ||||||||||||
S&P 500 Index Put Option | December 2017 | $2,100.00 | 9 | 223,785 | ||||||||||||
SPDR S&P 500 ETF Trust Call Option | December 2017 | $185.00 | 50 | 154,500 | ||||||||||||
SPDR S&P 500 ETF Trust Call Option | December 2017 | $190.00 | 206 | 570,414 | ||||||||||||
SPDR S&P 500 ETF Trust Call Option | December 2017 | $195.00 | 226 | 559,915 | ||||||||||||
SPDR S&P 500 ETF Trust Call Option | December 2017 | $200.00 | 400 | 870,000 | ||||||||||||
SPDR S&P 500 ETF Trust Call Option | December 2017 | $205.00 | 420 | 783,720 | ||||||||||||
SPDR S&P 500 ETF Trust Call Option | December 2017 | $210.00 | 425 | 685,525 | ||||||||||||
SPDR S&P 500 ETF Trust Call Option | December 2017 | $215.00 | 137 | 191,800 | ||||||||||||
SPDR S&P 500 ETF Trust Call Option | December 2017 | $220.00 | 99 | 115,335 | ||||||||||||
SPDR S&P 500 ETF Trust Put Option | December 2017 | $185.00 | 50 | 77,000 | ||||||||||||
SPDR S&P 500 ETF Trust Put Option | December 2017 | $190.00 | 206 | 351,333 | ||||||||||||
SPDR S&P 500 ETF Trust Put Option | December 2017 | $195.00 | 226 | 426,575 | ||||||||||||
SPDR S&P 500 ETF Trust Put Option | December 2017 | $200.00 | 400 | 820,800 | ||||||||||||
SPDR S&P 500 ETF Trust Put Option | December 2017 | $205.00 | 420 | 947,100 | ||||||||||||
SPDR S&P 500 ETF Trust Put Option | December 2017 | $210.00 | 425 | 1,066,750 | ||||||||||||
SPDR S&P 500 ETF Trust Put Option | December 2017 | $215.00 | 137 | 380,586 | ||||||||||||
SPDR S&P 500 ETF Trust Put Option | December 2017 | $220.00 | 99 | 299,475 | ||||||||||||
|
| |||||||||||||||
Total Purchased Options (Cost $10,926,474) | $ | 10,262,753 | ||||||||||||||
|
| |||||||||||||||
| Money Market Funds – 14.2% | Shares | Value | ||||||||||||||
| Fidelity Institutional Money Market Funds Money Market Portfolio – Class I | 15,000,000 | $ | 15,000,000 | |||||||||||||
| Short-Term Investments Trust – STIC Prime Portfolio | 6,874,000 | 6,874,000 | ||||||||||||||
|
| |||||||||||||||
Total Money Market Funds (Cost $21,874,000) | $ | 21,874,000 | ||||||||||||||
|
| |||||||||||||||
Total Investments – 99.8% (Cost $152,441,668) | (j) | $ | 154,089,692 | |||||||||||||
Other Assets in Excess of Liabilities – 0.2% | (k) | 234,328 | ||||||||||||||
|
| |||||||||||||||
Net Assets – 100.0% | $ | 154,324,020 | ||||||||||||||
|
| |||||||||||||||
Percentages are stated as a percent of net assets.
Abbreviations:
QL: Quarterly U.S. LIBOR Rate, 0.613% on 12/31/2015
Footnotes:
| (a) | Non-income producing security. |
| (b) | Security exempt from registration under Regulation D of the Securities Act of 1933. These securities may be resold in transactions exempt from registration, normally to qualified buyers under Rule 144A. At December 31, 2015, the value of these securities totaled $6,536,736, or 4.2% of the Portfolio’s net assets. These securities were deemed liquid pursuant to procedures approved by the Board of Directors. |
| (c) | Security traded on a foreign exchange has been valued at an estimate of fair value that is different than the local market close price. These fair value estimates are determined by an independent fair valuation service that has been approved by the Board. These securities represent $1,497,266, or 1.0% of the Portfolio’s net assets. Other Portfolio securities are not subjected to fair value procedures because they are traded on domestic or foreign exchanges that have close times that are consistent with the U.S. market close, normally 4:00 pm Eastern Time. |
| (d) | Security is a variable rate instrument in which the coupon rate is fixed until a later specified date, then is adjusted quarterly in concert with U.S. LIBOR. Interest rates stated are those in effect at December 31, 2015. |
| 107 | (continued) |
| Ohio National Fund, Inc. | Risk Managed Balanced Portfolio (Continued) |
Schedule of Investments | December 31, 2015 |
| (e) | Security is a variable rate preferred stock or trust preferred security in which the dividend rate is fixed until a later specified date, then is adjusted quarterly in concert with U.S. LIBOR. Dividend rates stated are those in effect at December 31, 2015. |
| (f) | Security is a variable rate preferred stock depository receipt in which the dividend rate is fixed until a later specified date, then is adjusted quarterly in concert with U.S. LIBOR. Dividend rates stated are those in effect at December 31, 2015. |
| (g) | Represents bonds that are credit sensitive. The coupon rates for these bonds are subject to adjustment based on changes in national credit rating agency ratings. |
| (h) | 100 shares per contract. |
| (i) | Security is fully or partially pledged as collateral for futures contracts outstanding at December 31, 2015. |
| (j) | Represents cost for financial reporting purposes, which may differ from cost basis for federal income tax purposes. See also Note 7 of the Notes to Financial Statements. |
| (k) | Includes $230,460 of cash pledged as collateral for the following futures contracts outstanding at December 31, 2015: |
Type | Description | Expiration | Number of Contracts | Contract | Initial Contract Amount | Unrealized Appreciation (Depreciation) | Variation Margin Receivable (Payable) | |||||||||||||||
Long | S&P 500 E-mini | March 18, 2016 | 198 | $20,150,460 | $ | 19,835,303 | $ | 315,157 | $ | – | ||||||||||||
Long | 10-Year U.S. Treasury Note | March 21, 2016 | 668 | $84,105,375 | $ | 84,329,105 | $ | (223,730 | ) | $ | – | |||||||||||
|
|
|
| |||||||||||||||||||
| $ | 91,427 | $ | – | |||||||||||||||||||
|
|
|
| |||||||||||||||||||
The accompanying notes are an integral part of these financial statements.
| 108 |
| Ohio National Fund, Inc. |
| December 31, 2015 |
| Equity Portfolio | Money Market Portfolio | Bond Portfolio | Omni Portfolio | International Portfolio | Capital Appreciation Portfolio | International Small-Mid Company Portfolio | Aggressive Growth Portfolio | |||||||||||||||||||||||||
Assets: | ||||||||||||||||||||||||||||||||
Investments in securities, at value* | $ | 553,060,204 | $ | 157,491,579 | $ | 151,109,848 | $ | 48,745,204 | $ | 159,875,926 | $ | 438,798,870 | $ | 78,056,219 | $ | 51,594,899 | ||||||||||||||||
Cash | 561 | 66,778,531 | 440 | 356 | 24,146 | 106 | 95 | 623 | ||||||||||||||||||||||||
Cash subject to usage restrictions | — | — | — | — | 211,708 | — | 28,437 | — | ||||||||||||||||||||||||
Foreign currencies, at value** | — | — | — | — | 554 | — | — | — | ||||||||||||||||||||||||
Receivable for securities sold | — | — | — | 371,990 | — | — | 17,816 | — | ||||||||||||||||||||||||
Due from adviser | — | 42,319 | — | — | — | — | — | — | ||||||||||||||||||||||||
Receivable for fund shares sold | 97,654 | 2,072,378 | 1,682,060 | 48,434 | 59,781 | 81,651 | 63,083 | 12,371 | ||||||||||||||||||||||||
Dividends and accrued interest receivable | 689,670 | 4,021 | 1,524,160 | 149,352 | 181,762 | 317,033 | 59,260 | 17,311 | ||||||||||||||||||||||||
Foreign tax reclaim receivable | — | — | — | 680 | 152,000 | 26,908 | 24,410 | 2,736 | ||||||||||||||||||||||||
Prepaid expenses and other assets | 3,894 | 837 | 674 | 355 | 1,262 | 3,295 | 584 | 350 | ||||||||||||||||||||||||
Unrealized apppreciation on foreign currency contracts | — | — | — | — | 300,669 | — | 463,110 | — | ||||||||||||||||||||||||
|
|
|
|
|
|
|
|
|
|
|
|
|
|
|
| |||||||||||||||||
Total assets | 553,851,983 | 226,389,665 | 154,317,182 | 49,316,371 | 160,807,808 | 439,227,863 | 78,713,014 | 51,628,290 | ||||||||||||||||||||||||
|
|
|
|
|
|
|
|
|
|
|
|
|
|
|
| |||||||||||||||||
Liabilities: | ||||||||||||||||||||||||||||||||
Payable for securities purchased | — | — | — | 437,811 | — | — | — | — | ||||||||||||||||||||||||
Payable for fund shares redeemed | 18,168,488 | 1,529,335 | 180,634 | 136,289 | 1,194,480 | 8,484,187 | 265,536 | 224,275 | ||||||||||||||||||||||||
Payable for investment management services | 356,108 | 48,231 | 73,794 | 25,080 | 113,640 | 281,265 | 66,492 | 35,274 | ||||||||||||||||||||||||
Accrued custody expense | 1,707 | 849 | 576 | 647 | 10,888 | 1,904 | 6,507 | 465 | ||||||||||||||||||||||||
Accrued professional fees | 14,435 | 13,653 | 13,478 | 13,217 | 13,489 | 14,182 | 13,287 | 13,220 | ||||||||||||||||||||||||
Accrued accounting fees | 8,658 | 4,161 | 4,557 | 2,987 | 5,150 | 7,291 | 2,893 | 1,657 | ||||||||||||||||||||||||
Accrued printing and filing fees | 13,627 | 5,510 | 3,732 | 1,208 | 3,973 | 10,875 | 2,049 | 1,264 | ||||||||||||||||||||||||
Withholding tax payable | — | — | — | — | 16,788 | — | 29,270 | 338 | ||||||||||||||||||||||||
Variation margin payable on futures contracts | — | — | — | — | 24,645 | — | 57 | — | ||||||||||||||||||||||||
Unrealized depreciation on foreign currency contracts | — | — | — | — | 447,196 | — | — | — | ||||||||||||||||||||||||
|
|
|
|
|
|
|
|
|
|
|
|
|
|
|
| |||||||||||||||||
Total liabilities | 18,563,023 | 1,601,739 | 276,771 | 617,239 | 1,830,249 | 8,799,704 | 386,091 | 276,493 | ||||||||||||||||||||||||
|
|
|
|
|
|
|
|
|
|
|
|
|
|
|
| |||||||||||||||||
Net assets | $ | 535,288,960 | $ | 224,787,926 | $ | 154,040,411 | $ | 48,699,132 | $ | 158,977,559 | $ | 430,428,159 | $ | 78,326,923 | $ | 51,351,797 | ||||||||||||||||
|
|
|
|
|
|
|
|
|
|
|
|
|
|
|
| |||||||||||||||||
Net assets consist of: | ||||||||||||||||||||||||||||||||
Par value, $1 per share | $ | 16,717,342 | $ | 22,478,805 | $ | 10,050,496 | $ | 1,993,056 | $ | 12,716,405 | $ | 13,092,688 | $ | 2,612,495 | $ | 3,402,950 | ||||||||||||||||
Paid-in capital in excess of par value | 517,027,671 | 202,309,121 | 150,174,610 | 43,881,550 | 208,431,303 | 391,027,342 | 58,095,578 | 36,598,945 | ||||||||||||||||||||||||
Accumulated net realized gain (loss) on investments | (2,269,841 | ) | — | (7,870,085 | ) | 2,026,826 | (76,274,768 | ) | 35,350,953 | 6,048,478 | 3,932,832 | |||||||||||||||||||||
Net unrealized appreciation (depreciation) on: | ||||||||||||||||||||||||||||||||
Investments | 3,551,681 | — | (3,926,010 | ) | 707,314 | 10,282,340 | (9,598,156 | ) | 11,103,378 | 7,417,265 | ||||||||||||||||||||||
Foreign currency contracts | — | — | — | — | (146,527 | ) | — | 463,110 | — | |||||||||||||||||||||||
Futures contracts | — | — | — | — | (124,315 | ) | — | (20,803 | ) | — | ||||||||||||||||||||||
Other foreign currency related transactions | — | — | — | — | (10,440 | ) | (2,783 | ) | (27,848 | ) | (195 | ) | ||||||||||||||||||||
Undistributed net investment income (loss) | 262,107 | — | 5,611,400 | 90,386 | 4,103,561 | 558,115 | 52,535 | — | ||||||||||||||||||||||||
|
|
|
|
|
|
|
|
|
|
|
|
|
|
|
| |||||||||||||||||
Net assets | $ | 535,288,960 | $ | 224,787,926 | $ | 154,040,411 | $ | 48,699,132 | $ | 158,977,559 | $ | 430,428,159 | $ | 78,326,923 | $ | 51,351,797 | ||||||||||||||||
|
|
|
|
|
|
|
|
|
|
|
|
|
|
|
| |||||||||||||||||
* Investments in securities, at cost | $ | 549,508,523 | $ | 157,491,579 | $ | 155,035,858 | $ | 48,037,890 | $ | 149,593,586 | $ | 448,397,026 | $ | 66,952,841 | $ | 44,177,634 | ||||||||||||||||
|
|
|
|
|
|
|
|
|
|
|
|
|
|
|
| |||||||||||||||||
** Foreign currencies, at cost | $ | — | $ | — | $ | — | $ | — | $ | 117 | $ | — | $ | — | $ | — | ||||||||||||||||
|
|
|
|
|
|
|
|
|
|
|
|
|
|
|
| |||||||||||||||||
Shares outstanding | 16,717,342 | 22,478,805 | 10,050,496 | 1,993,056 | 12,716,405 | 13,092,688 | 2,612,495 | 3,402,950 | ||||||||||||||||||||||||
|
|
|
|
|
|
|
|
|
|
|
|
|
|
|
| |||||||||||||||||
Authorized Fund shares allocated to Portfolio | 25,000,000 | 55,000,000 | 30,000,000 | 10,000,000 | 30,000,000 | 25,000,000 | 7,000,000 | 7,000,000 | ||||||||||||||||||||||||
|
|
|
|
|
|
|
|
|
|
|
|
|
|
|
| |||||||||||||||||
Net asset value per share | $ | 32.02 | $ | 10.00 | $ | 15.33 | $ | 24.43 | $ | 12.50 | $ | 32.88 | $ | 29.98 | $ | 15.09 | ||||||||||||||||
|
|
|
|
|
|
|
|
|
|
|
|
|
|
|
| |||||||||||||||||
The accompanying notes are an integral part of these financial statements.
| 109 |
| Ohio National Fund, Inc. |
Statements of Assets and Liabilities | December 31, 2015 |
| Small Cap Growth Portfolio | Mid Cap Opportunity Portfolio | S&P 500® Index Portfolio | Strategic Value Portfolio | High Income Bond Portfolio | ClearBridge Small Cap Portfolio | Nasdaq-100® Index Portfolio | Bristol Portfolio | |||||||||||||||||||||||||
Assets: | ||||||||||||||||||||||||||||||||
Investments in securities, at value* | $ | 240,757,433 | $ | 78,870,840 | $ | 409,933,727 | $ | 315,282,603 | $ | 186,973,268 | $ | 93,428,765 | $ | 138,859,859 | $ | 218,525,388 | ||||||||||||||||
Cash | 652 | 318 | 1,146,494 | 827 | 725 | 217 | 333,173 | 665 | ||||||||||||||||||||||||
Receivable for securities sold | 155,567 | — | — | — | — | 130,843 | — | 10,533,519 | ||||||||||||||||||||||||
Receivable for fund shares sold | 127,291 | 44,317 | 215,820 | 112,249 | 4,239,484 | 556,971 | 129,968 | 209,665 | ||||||||||||||||||||||||
Dividends and accrued interest receivable | 63,688 | 26,410 | 622,000 | 1,533,892 | 3,371,180 | 116,123 | 56,147 | 146,059 | ||||||||||||||||||||||||
Foreign tax reclaim receivable | 1,867 | — | 3,899 | 80,499 | — | — | — | 3,798 | ||||||||||||||||||||||||
Prepaid expenses and other assets | 1,703 | 639 | 2,983 | 2,433 | 913 | 626 | 960 | 1,710 | ||||||||||||||||||||||||
|
|
|
|
|
|
|
|
|
|
|
|
|
|
|
| |||||||||||||||||
Total assets | 241,108,201 | 78,942,524 | 411,924,923 | 317,012,503 | 194,585,570 | 94,233,545 | 139,380,107 | 229,420,804 | ||||||||||||||||||||||||
|
|
|
|
|
|
|
|
|
|
|
|
|
|
|
| |||||||||||||||||
Liabilities: | ||||||||||||||||||||||||||||||||
Payable for securities purchased | 570,050 | — | 371,772 | — | — | — | — | 2,637,557 | ||||||||||||||||||||||||
Payable for fund shares redeemed | 2,115,341 | 163,976 | 670,687 | 6,926,047 | 219,186 | 143,359 | 747,150 | 7,931,593 | ||||||||||||||||||||||||
Payable for investment management services | 161,909 | 57,240 | 124,017 | 191,025 | 115,470 | 68,369 | 45,694 | 144,371 | ||||||||||||||||||||||||
Accrued custody expense | 1,495 | 539 | 1,204 | 1,641 | 713 | 334 | 418 | 1,155 | ||||||||||||||||||||||||
Accrued professional fees | 13,681 | 13,293 | 14,090 | 13,951 | 13,584 | 13,325 | 13,426 | 13,647 | ||||||||||||||||||||||||
Accrued accounting fees | 4,773 | 2,145 | 8,619 | 5,379 | 10,922 | 2,391 | 3,097 | 4,139 | ||||||||||||||||||||||||
Accrued printing and filing fees | 5,946 | 1,960 | 10,179 | 7,848 | 4,682 | 2,300 | 3,417 | 5,625 | ||||||||||||||||||||||||
Withholding tax payable | — | — | 714 | 57,846 | — | — | — | — | ||||||||||||||||||||||||
|
|
|
|
|
|
|
|
|
|
|
|
|
|
|
| |||||||||||||||||
Total liabilities | 2,873,195 | 239,153 | 1,201,282 | 7,203,737 | 364,557 | 230,078 | 813,202 | 10,738,087 | ||||||||||||||||||||||||
|
|
|
|
|
|
|
|
|
|
|
|
|
|
|
| |||||||||||||||||
Net assets | $ | 238,235,006 | $ | 78,703,371 | $ | 410,723,641 | $ | 309,808,766 | $ | 194,221,013 | $ | 94,003,467 | $ | 138,566,905 | $ | 218,682,717 | ||||||||||||||||
|
|
|
|
|
|
|
|
|
|
|
|
|
|
|
| |||||||||||||||||
Net assets consist of: | ||||||||||||||||||||||||||||||||
Par value, $1 per share | $ | 9,525,145 | $ | 2,632,143 | $ | 18,820,444 | $ | 22,012,469 | $ | 12,279,549 | $ | 2,349,989 | $ | 11,742,603 | $ | 10,176,589 | ||||||||||||||||
Paid-in capital in excess of par value | 205,582,454 | 64,961,340 | 254,587,264 | 255,021,362 | 190,114,075 | 77,697,458 | 68,750,367 | 179,591,148 | ||||||||||||||||||||||||
Accumulated net realized gain (loss) on investments | 6,492,841 | 5,121,887 | 4,811,305 | 7,057,251 | (975,549 | ) | 13,209,381 | 3,455,737 | 21,034,274 | |||||||||||||||||||||||
Net unrealized appreciation (depreciation) on: | ||||||||||||||||||||||||||||||||
Investments | 16,814,197 | 5,988,001 | 131,426,408 | 24,219,143 | (19,614,737 | ) | 746,639 | 54,472,473 | 7,738,164 | |||||||||||||||||||||||
Foreign currency related transactions | (191 | ) | — | — | (18,358 | ) | — | — | — | — | ||||||||||||||||||||||
Undistributed net investment income (loss) | (179,440 | ) | — | 1,078,220 | 1,516,899 | 12,417,675 | — | 145,725 | 142,542 | |||||||||||||||||||||||
|
|
|
|
|
|
|
|
|
|
|
|
|
|
|
| |||||||||||||||||
Net assets | $ | 238,235,006 | $ | 78,703,371 | $ | 410,723,641 | $ | 309,808,766 | $ | 194,221,013 | $ | 94,003,467 | $ | 138,566,905 | $ | 218,682,717 | ||||||||||||||||
|
|
|
|
|
|
|
|
|
|
|
|
|
|
|
| |||||||||||||||||
* Investments in securities, at cost | $ | 223,943,236 | $ | 72,882,839 | $ | 278,507,319 | $ | 291,063,460 | $ | 206,588,005 | $ | 92,682,126 | $ | 84,387,386 | $ | 210,787,224 | ||||||||||||||||
|
|
|
|
|
|
|
|
|
|
|
|
|
|
|
| |||||||||||||||||
Shares outstanding | 9,525,145 | 2,632,143 | 18,820,444 | 22,012,469 | 12,279,549 | 2,349,989 | 11,742,603 | 10,176,589 | ||||||||||||||||||||||||
|
|
|
|
|
|
|
|
|
|
|
|
|
|
|
| |||||||||||||||||
Authorized Fund shares allocated to Portfolio | 15,000,000 | 6,000,000 | 35,000,000 | 65,000,000 | 35,000,000 | 5,000,000 | 25,000,000 | 40,000,000 | ||||||||||||||||||||||||
|
|
|
|
|
|
|
|
|
|
|
|
|
|
|
| |||||||||||||||||
Net asset value per share | $ | 25.01 | $ | 29.90 | $ | 21.82 | $ | 14.07 | $ | 15.82 | $ | 40.00 | $ | 11.80 | $ | 21.49 | ||||||||||||||||
|
|
|
|
|
|
|
|
|
|
|
|
|
|
|
| |||||||||||||||||
The accompanying notes are an integral part of these financial statements.
| 110 |
| Ohio National Fund, Inc. |
Statements of Assets and Liabilities | December 31, 2015 |
| Bryton Growth Portfolio | Balanced Portfolio | Target VIP | Bristol Growth Portfolio | Risk Managed Balanced Portfolio | ||||||||||||||||
Assets: | ||||||||||||||||||||
Investments in securities, at value* | $ | 163,178,388 | $ | 853,671,072 | $ | 46,290,871 | $ | 116,397,619 | $ | 154,089,692 | ||||||||||
Cash | 240 | 5,405,437 | 711 | 252 | 1,665 | |||||||||||||||
Cash subject to usage restrictions | — | — | — | — | 230,460 | |||||||||||||||
Receivable for securities sold | 1,507,285 | 5,044,193 | — | 6,329,914 | — | |||||||||||||||
Receivable for fund shares sold | 100,017 | 2,864,967 | 2,147 | 30,270 | 375,402 | |||||||||||||||
Dividends and accrued interest receivable | 43,187 | 3,142,570 | 66,041 | 59,749 | 434,527 | |||||||||||||||
Foreign tax reclaim receivable | — | 16,717 | 5,198 | — | — | |||||||||||||||
Prepaid expenses and other assets | 1,294 | 6,496 | 375 | 907 | 724 | |||||||||||||||
|
|
|
|
|
|
|
|
|
| |||||||||||
Total assets | 164,830,411 | 870,151,452 | 46,365,343 | 122,818,711 | 155,132,470 | |||||||||||||||
|
|
|
|
|
|
|
|
|
| |||||||||||
Liabilities: | ||||||||||||||||||||
Options written, at value** | — | 372,000 | — | — | — | |||||||||||||||
Payable for securities purchased | 1,451,654 | 2,926,203 | — | 2,165,131 | 105,155 | |||||||||||||||
Payable for fund shares redeemed | 1,073,004 | 1,440,335 | 50,235 | 4,328,393 | 559,495 | |||||||||||||||
Payable for investment management services | 114,894 | 432,379 | 23,960 | 80,425 | 115,341 | |||||||||||||||
Accrued custody expense | 1,313 | 3,108 | 214 | 625 | 2,811 | |||||||||||||||
Accrued professional fees | 13,502 | 15,136 | 13,440 | 13,387 | 13,428 | |||||||||||||||
Accrued accounting fees | 3,391 | 13,972 | 1,940 | 2,630 | 8,530 | |||||||||||||||
Accrued printing and filing fees | 4,058 | 21,276 | 1,160 | 2,979 | 3,690 | |||||||||||||||
Withholding tax payable | — | 5,006 | 2,138 | — | — | |||||||||||||||
|
|
|
|
|
|
|
|
|
| |||||||||||
Total liabilities | 2,661,816 | 5,229,415 | 93,087 | 6,593,570 | 808,450 | |||||||||||||||
|
|
|
|
|
|
|
|
|
| |||||||||||
Net assets | $ | 162,168,595 | $ | 864,922,037 | $ | 46,272,256 | $ | 116,225,141 | $ | 154,324,020 | ||||||||||
|
|
|
|
|
|
|
|
|
| |||||||||||
Net assets consist of: | ||||||||||||||||||||
Par value, $1 per share | $ | 8,275,790 | $ | 45,538,142 | $ | 3,351,089 | $ | 6,712,745 | $ | 14,473,682 | ||||||||||
Paid-in capital in excess of par value | 149,065,562 | 792,411,461 | 46,830,954 | 90,497,287 | 140,368,908 | |||||||||||||||
Accumulated net realized gain (loss) on investments | 18,771,203 | 28,849,357 | (3,636,049 | ) | 9,487,227 | (2,522,952 | ) | |||||||||||||
Net unrealized appreciation (depreciation) on: | ||||||||||||||||||||
Investments | (13,943,960 | ) | (4,500,560 | ) | (364,942 | ) | 9,487,320 | 1,648,024 | ||||||||||||
Futures contracts | — | — | — | — | 91,427 | |||||||||||||||
Other foreign currency related transactions | — | (815 | ) | — | — | — | ||||||||||||||
Written options | — | 172,685 | — | — | — | |||||||||||||||
Undistributed net investment income (loss) | — | 2,451,767 | 91,204 | 40,562 | 264,931 | |||||||||||||||
|
|
|
|
|
|
|
|
|
| |||||||||||
Net assets | $ | 162,168,595 | $ | 864,922,037 | $ | 46,272,256 | $ | 116,225,141 | $ | 154,324,020 | ||||||||||
|
|
|
|
|
|
|
|
|
| |||||||||||
* Investments in securities, at cost | $ | 177,122,348 | $ | 858,171,632 | $ | 46,655,813 | $ | 106,910,299 | $ | 152,441,668 | ||||||||||
|
|
|
|
|
|
|
|
|
| |||||||||||
** Premiums received on options written | $ | — | $ | 544,685 | $ | — | $ | — | $ | — | ||||||||||
|
|
|
|
|
|
|
|
|
| |||||||||||
Shares outstanding | 8,275,790 | 45,538,142 | 3,351,089 | 6,712,745 | 14,473,682 | |||||||||||||||
|
|
|
|
|
|
|
|
|
| |||||||||||
Authorized Fund shares allocated to Portfolio | 30,000,000 | 55,000,000 | 10,000,000 | 25,000,000 | 15,000,000 | |||||||||||||||
|
|
|
|
|
|
|
|
|
| |||||||||||
Net asset value per share | $ | 19.60 | $ | 18.99 | $ | 13.81 | $ | 17.31 | $ | 10.66 | ||||||||||
|
|
|
|
|
|
|
|
|
| |||||||||||
The accompanying notes are an integral part of these financial statements.
| 111 |
| Ohio National Fund, Inc. |
| For the Year Ended December 31, 2015 |
| Equity Portfolio | Money Market Portfolio | Bond Portfolio | Omni Portfolio | International Portfolio | Capital Appreciation Portfolio | International Small-Mid Company Portfolio | Aggressive Growth Portfolio | |||||||||||||||||||||||||
Investment income: | ||||||||||||||||||||||||||||||||
Interest | $ | — | $ | 119,670 | $ | 6,644,396 | $ | 435,863 | $ | 36 | $ | — | $ | 4 | $ | 323 | ||||||||||||||||
Dividends, net of taxes withheld* | 7,840,138 | 21,727 | 2,057 | 491,025 | 3,816,936 | 7,401,684 | 1,060,224 | 384,599 | ||||||||||||||||||||||||
|
|
|
|
|
|
|
|
|
|
|
|
|
|
|
| |||||||||||||||||
Total investment income | 7,840,138 | 141,397 | 6,646,453 | 926,888 | 3,816,972 | 7,401,684 | 1,060,228 | 384,922 | ||||||||||||||||||||||||
|
|
|
|
|
|
|
|
|
|
|
|
|
|
|
| |||||||||||||||||
Expenses: | ||||||||||||||||||||||||||||||||
Management fees | 3,966,899 | 576,908 | 911,009 | 278,587 | 1,430,001 | 3,339,447 | 788,699 | 367,454 | ||||||||||||||||||||||||
Custodian fees | 19,511 | 10,512 | 6,755 | 7,880 | 151,422 | 21,229 | 93,013 | 6,377 | ||||||||||||||||||||||||
Directors’ fees | 55,847 | 22,258 | 17,138 | 5,142 | 18,645 | 47,701 | 8,574 | 5,005 | ||||||||||||||||||||||||
Professional fees | 34,761 | 24,868 | 23,101 | 19,356 | 23,394 | 32,171 | 20,393 | 19,337 | ||||||||||||||||||||||||
Accounting fees | 93,249 | 47,735 | 56,024 | 32,398 | 67,393 | 81,835 | 36,798 | 16,672 | ||||||||||||||||||||||||
Printing and filing fees | 34,453 | 15,695 | 10,406 | 3,931 | 11,098 | 28,578 | 6,160 | 3,603 | ||||||||||||||||||||||||
Compliance expense | 9,381 | 9,381 | 9,381 | 9,381 | 9,381 | 9,381 | 9,381 | 9,381 | ||||||||||||||||||||||||
Other | 8,781 | 2,965 | 2,239 | 956 | 9,813 | 7,017 | 3,677 | 955 | ||||||||||||||||||||||||
|
|
|
|
|
|
|
|
|
|
|
|
|
|
|
| |||||||||||||||||
Total expenses | 4,222,882 | 710,322 | 1,036,053 | 357,631 | 1,721,147 | 3,567,359 | 966,695 | 428,784 | ||||||||||||||||||||||||
|
|
|
|
|
|
|
|
|
|
|
|
|
|
|
| |||||||||||||||||
Less expenses reduced or reimbursed by adviser | — | (568,925 | ) | — | — | — | — | — | — | |||||||||||||||||||||||
|
|
|
|
|
|
|
|
|
|
|
|
|
|
|
| |||||||||||||||||
Net expenses | 4,222,882 | 141,397 | 1,036,053 | 357,631 | 1,721,147 | 3,567,359 | 966,695 | 428,784 | ||||||||||||||||||||||||
|
|
|
|
|
|
|
|
|
|
|
|
|
|
|
| |||||||||||||||||
Net investment income (loss) | 3,617,256 | — | 5,610,400 | 569,257 | 2,095,825 | 3,834,325 | 93,533 | (43,862 | ) | |||||||||||||||||||||||
|
|
|
|
|
|
|
|
|
|
|
|
|
|
|
| |||||||||||||||||
Realized/unrealized gain (loss) on investments, futures contracts, foreign currency contracts, and other foreign currency related transactions: | ||||||||||||||||||||||||||||||||
Net realized gain (loss) on: | ||||||||||||||||||||||||||||||||
Investments | 45,846,599 | — | 2,188,579 | 2,180,458 | (7,764,751 | ) | 36,861,690 | 6,062,714 | 4,256,616 | |||||||||||||||||||||||
Futures contracts | — | — | — | — | (2,254,839 | ) | — | (8,737 | ) | — | ||||||||||||||||||||||
Foreign currency contracts | — | — | — | — | 3,349,877 | — | (12,870 | ) | — | |||||||||||||||||||||||
Other foreign currency related transactions | — | — | — | — | 54,800 | (14,365 | ) | (28,128 | ) | (200 | ) | |||||||||||||||||||||
Change in unrealized appreciation/depreciation on: | ||||||||||||||||||||||||||||||||
Investments | (62,046,849 | ) | — | (11,088,723 | ) | (2,270,120 | ) | 5,863,257 | (46,510,705 | ) | (464,380 | ) | (157,386 | ) | ||||||||||||||||||
Futures contracts | — | — | — | — | (79,013 | ) | — | (20,803 | ) | — | ||||||||||||||||||||||
Foreign currency contracts | — | — | — | — | (1,371,025 | ) | — | 462,965 | — | |||||||||||||||||||||||
Other foreign currency related transactions | — | — | — | — | 36,747 | (1,646 | ) | (24,076 | ) | 37 | ||||||||||||||||||||||
|
|
|
|
|
|
|
|
|
|
|
|
|
|
|
| |||||||||||||||||
Net realized/unrealized gain (loss) on investments, futures contracts, foreign currency contracts, and other foreign currency related transactions | (16,200,250 | ) | — | (8,900,144 | ) | (89,662 | ) | (2,164,947 | ) | (9,665,026 | ) | 5,966,685 | 4,099,067 | |||||||||||||||||||
|
|
|
|
|
|
|
|
|
|
|
|
|
|
|
| |||||||||||||||||
Change in net assets from operations | $ | (12,582,994 | ) | $ | — | $ | (3,289,744 | ) | $ | 479,595 | $ | (69,122 | ) | $ | (5,830,701 | ) | $ | 6,060,218 | $ | 4,055,205 | ||||||||||||
|
|
|
|
|
|
|
|
|
|
|
|
|
|
|
| |||||||||||||||||
* Taxes withheld | $ | — | $ | — | $ | — | $ | — | $ | 649,949 | $ | 185,138 | $ | 84,985 | $ | 4,882 | ||||||||||||||||
|
|
|
|
|
|
|
|
|
|
|
|
|
|
|
| |||||||||||||||||
The accompanying notes are an integral part of these financial statements.
| 112 |
| Ohio National Fund, Inc. |
Statements of Operations | For the Year Ended December 31, 2015 |
| Small Cap Growth Portfolio | Mid Cap Opportunity Portfolio | S&P 500® Index Portfolio | Strategic Value Portfolio | High Income Bond Portfolio | ClearBridge Small Cap Portfolio | Nasdaq-100® Index Portfolio | Bristol Portfolio | |||||||||||||||||||||||||
Investment income: | ||||||||||||||||||||||||||||||||
Interest | $ | 1,104 | $ | — | $ | — | $ | — | $ | 14,141,323 | $ | — | $ | — | $ | — | ||||||||||||||||
Dividends, net of taxes withheld* | 1,629,675 | 631,164 | 8,651,378 | 14,022,733 | 5,236 | 574,036 | 1,642,031 | 3,160,810 | ||||||||||||||||||||||||
|
|
|
|
|
|
|
|
|
|
|
|
|
|
|
| |||||||||||||||||
Total investment income | 1,630,779 | 631,164 | 8,651,378 | 14,022,733 | 14,146,559 | 574,036 | 1,642,031 | 3,160,810 | ||||||||||||||||||||||||
|
|
|
|
|
|
|
|
|
|
|
|
|
|
|
| |||||||||||||||||
Expenses: | ||||||||||||||||||||||||||||||||
Management fees | 1,756,593 | 731,480 | 1,439,882 | 2,363,112 | 1,536,816 | 706,249 | 506,610 | 1,728,774 | ||||||||||||||||||||||||
Custodian fees | 20,477 | 8,664 | 22,420 | 32,055 | 10,522 | 6,054 | 8,493 | 14,029 | ||||||||||||||||||||||||
Directors’ fees | 24,129 | 9,209 | 43,489 | 35,024 | 23,254 | 8,548 | 14,068 | 25,081 | ||||||||||||||||||||||||
Professional fees | 25,137 | 20,589 | 30,962 | 27,798 | 24,919 | 38,397 | 22,081 | 25,370 | ||||||||||||||||||||||||
Accounting fees | 50,701 | 24,959 | 102,717 | 68,845 | 139,619 | 25,463 | 34,206 | 49,346 | ||||||||||||||||||||||||
Printing and filing fees | 15,845 | 6,027 | 24,477 | 21,449 | 14,277 | 12,498 | 8,678 | 16,970 | ||||||||||||||||||||||||
Compliance expense | 9,381 | 9,381 | 9,381 | 9,381 | 9,381 | 9,381 | 9,381 | 9,381 | ||||||||||||||||||||||||
Other | 3,848 | 2,049 | 8,615 | 8,488 | 3,614 | 1,822 | 2,711 | 5,412 | ||||||||||||||||||||||||
|
|
|
|
|
|
|
|
|
|
|
|
|
|
|
| |||||||||||||||||
Total expenses | 1,906,111 | 812,358 | 1,681,943 | 2,566,152 | 1,762,402 | 808,412 | 606,228 | 1,874,363 | ||||||||||||||||||||||||
|
|
|
|
|
|
|
|
|
|
|
|
|
|
|
| |||||||||||||||||
Net investment income (loss) | (275,332 | ) | (181,194 | ) | 6,969,435 | 11,456,581 | 12,384,157 | (234,376 | ) | 1,035,803 | 1,286,447 | |||||||||||||||||||||
|
|
|
|
|
|
|
|
|
|
|
|
|
|
|
| |||||||||||||||||
Realized/unrealized gain (loss) on investments and foreign currency related transactions: | ||||||||||||||||||||||||||||||||
Net realized gain (loss) on: | ||||||||||||||||||||||||||||||||
Investments | 6,834,827 | 6,123,950 | 7,650,057 | 6,995,988 | (949,435 | ) | 13,222,203 | 3,980,078 | 22,223,785 | |||||||||||||||||||||||
Foreign currency related transactions | (348 | ) | — | — | (130,694 | ) | — | — | — | — | ||||||||||||||||||||||
Change in unrealized appreciation/depreciation on: | ||||||||||||||||||||||||||||||||
Investments | (5,327,106 | ) | (10,394,162 | ) | (9,995,310 | ) | (5,116,834 | ) | (17,429,312 | ) | (14,029,088 | ) | 6,340,633 | (13,681,233 | ) | |||||||||||||||||
Foreign currency related transactions | (191 | ) | — | — | (4,006 | ) | — | — | — | — | ||||||||||||||||||||||
|
|
|
|
|
|
|
|
|
|
|
|
|
|
|
| |||||||||||||||||
Net realized/unrealized gain (loss) on investments and foreign currency related transactions | 1,507,182 | (4,270,212 | ) | (2,345,253 | ) | 1,744,454 | (18,378,747 | ) | (806,885 | ) | 10,320,711 | 8,542,552 | ||||||||||||||||||||
|
|
|
|
|
|
|
|
|
|
|
|
|
|
|
| |||||||||||||||||
Change in net assets from operations | $ | 1,231,850 | $ | (4,451,406 | ) | $ | 4,624,182 | $ | 13,201,035 | $ | (5,994,590 | ) | $ | (1,041,261 | ) | $ | 11,356,514 | $ | 9,828,999 | |||||||||||||
|
|
|
|
|
|
|
|
|
|
|
|
|
|
|
| |||||||||||||||||
* Taxes withheld | $ | 12,720 | $ | — | $ | 49 | $ | 426,633 | $ | — | $ | 1,775 | $ | 231 | $ | — | ||||||||||||||||
|
|
|
|
|
|
|
|
|
|
|
|
|
|
|
| |||||||||||||||||
The accompanying notes are an integral part of these financial statements.
| 113 |
| Ohio National Fund, Inc. |
Statements of Operations | For the Year Ended December 31, 2015 |
| Bryton Growth Portfolio | Balanced Portfolio | Target VIP | Bristol Growth Portfolio | Risk Managed Balanced Portfolio | ||||||||||||||||
Investment income: | ||||||||||||||||||||
Interest | $ | — | $ | 9,987,557 | $ | — | $ | — | $ | 763,993 | ||||||||||
Dividends, net of taxes withheld** | 622,831 | 9,218,359 | 1,203,638 | 1,601,723 | 830,423 | |||||||||||||||
|
|
|
|
|
|
|
|
|
| |||||||||||
Total investment income | 622,831 | 19,205,916 | 1,203,638 | 1,601,723 | 1,594,416 | |||||||||||||||
|
|
|
|
|
|
|
|
|
| |||||||||||
Expenses: | ||||||||||||||||||||
Management fees | 1,424,898 | 5,120,772 | 312,614 | 969,158 | 747,996 | |||||||||||||||
Custodian fees | 16,915 | 35,965 | 21,393 | 8,311 | 41,843 | |||||||||||||||
Directors’ fees | 18,977 | 92,799 | 5,550 | 13,374 | 9,057 | |||||||||||||||
Professional fees | 23,547 | 47,608 | 25,013 | 21,845 | 20,793 | |||||||||||||||
Accounting fees | 40,232 | 162,910 | 22,051 | 30,392 | 87,236 | |||||||||||||||
Printing and filing fees | 13,312 | 53,616 | 3,599 | 10,041 | 7,449 | |||||||||||||||
Compliance expense | 9,381 | 9,381 | 9,381 | 9,381 | 9,380 | |||||||||||||||
Other | 3,963 | 13,826 | 1,238 | 2,883 | 1,237 | |||||||||||||||
|
|
|
|
|
|
|
|
|
| |||||||||||
Total expenses | 1,551,225 | 5,536,877 | 400,839 | 1,065,385 | 924,991 | |||||||||||||||
|
|
|
|
|
|
|
|
|
| |||||||||||
Net investment income (loss) | (928,394 | ) | 13,669,039 | 802,799 | 536,338 | 669,425 | ||||||||||||||
|
|
|
|
|
|
|
|
|
| |||||||||||
Realized/unrealized gain (loss) on investments, foreign currency related transactions, and written options: | ||||||||||||||||||||
Net realized gain (loss) on: | ||||||||||||||||||||
Investments | 20,443,670 | 24,615,481 | 2,814,877 | 10,012,228 | (2,133,997 | ) | ||||||||||||||
Futures contracts | — | — | — | — | (83,930 | ) | ||||||||||||||
Foreign currency related transactions | — | (1,493 | ) | — | — | (94 | ) | |||||||||||||
Written options | — | 4,648,375 | — | — | — | |||||||||||||||
Change in unrealized appreciation/depreciation on: | ||||||||||||||||||||
Investments | (24,955,849 | ) | (32,147,673 | ) | (5,122,274 | ) | (3,703,251 | ) | 851,385 | |||||||||||
Futures contracts | — | — | — | — | (51,559 | ) | ||||||||||||||
Foreign currency related transactions | — | (815 | ) | — | — | — | ||||||||||||||
Written options | — | (236,603 | ) | — | — | — | ||||||||||||||
|
|
|
|
|
|
|
|
|
| |||||||||||
Net realized/unrealized gain (loss) on investments, foreign currency related transactions, and written options | (4,512,179 | ) | (3,122,728 | ) | (2,307,397 | ) | 6,308,977 | (1,418,195 | ) | |||||||||||
|
|
|
|
|
|
|
|
|
| |||||||||||
Change in net assets from operations | $ | (5,440,573 | ) | $ | 10,546,311 | $ | (1,504,598 | ) | $ | 6,845,315 | $ | (748,770 | ) | |||||||
|
|
|
|
|
|
|
|
|
| |||||||||||
* Taxes withheld | $ | — | $ | 33,979 | $ | 48,755 | $ | — | $ | 1,802 | ||||||||||
|
|
|
|
|
|
|
|
|
| |||||||||||
The accompanying notes are an integral part of these financial statements.
| 114 |
| Ohio National Fund, Inc. |
| Equity Portfolio | Money Market Portfolio | Bond Portfolio | Omni Portfolio | |||||||||||||||||||||||||||||
| Year Ended December 31, 2015 | Year Ended December 31, 2014 | Year Ended December 31, 2015 | Year Ended December 31, 2014 | Year Ended December 31, 2015 | Year Ended December 31, 2014 | Year Ended December 31, 2015 | Year Ended December 31, 2014 | |||||||||||||||||||||||||
Increase (Decrease) in net assets: | ||||||||||||||||||||||||||||||||
Operations: | ||||||||||||||||||||||||||||||||
Net investment income | $ | 3,617,256 | $ | 2,046,357 | $ | — | $ | — | $ | 5,610,400 | $ | 5,057,141 | $ | 569,257 | $ | 395,534 | ||||||||||||||||
Net realized gain on investments and foreign currency related transactions | 45,846,599 | 33,346,801 | — | — | 2,188,579 | 1,319,586 | 2,180,458 | 6,306,647 | ||||||||||||||||||||||||
Change in unrealized appreciation/depreciation on investments | (62,046,849 | ) | 6,063,115 | — | — | (11,088,723 | ) | 2,254,423 | (2,270,120 | ) | (2,442,237 | ) | ||||||||||||||||||||
|
|
|
|
|
|
|
|
|
|
|
|
|
|
|
| |||||||||||||||||
Change in net assets from operations | (12,582,994 | ) | 41,456,273 | — | — | (3,289,744 | ) | 8,631,150 | 479,595 | 4,259,944 | ||||||||||||||||||||||
|
|
|
|
|
|
|
|
|
|
|
|
|
|
|
| |||||||||||||||||
Distributions to shareholders: | ||||||||||||||||||||||||||||||||
Distributions from net investment income | (3,223,171 | ) | (1,660,324 | ) | — | — | — | — | (478,871 | ) | (341,371 | ) | ||||||||||||||||||||
|
|
|
|
|
|
|
|
|
|
|
|
|
|
|
| |||||||||||||||||
Capital transactions: | ||||||||||||||||||||||||||||||||
Received from shares sold | 130,000,804 | 315,246,386 | 176,016,856 | 192,184,015 | 45,521,831 | 46,735,844 | 22,103,189 | 2,915,916 | ||||||||||||||||||||||||
Received from dividends reinvested | 3,223,171 | 1,660,324 | — | — | — | — | 478,871 | 341,371 | ||||||||||||||||||||||||
Paid for shares redeemed | (100,864,266 | ) | (59,401,285 | ) | (153,241,617 | ) | (251,269,999 | ) | (46,855,502 | ) | (48,280,931 | ) | (11,080,234 | ) | (7,867,809 | ) | ||||||||||||||||
|
|
|
|
|
|
|
|
|
|
|
|
|
|
|
| |||||||||||||||||
Change in net assets from capital transactions | 32,359,709 | 257,505,425 | 22,775,239 | (59,085,984 | ) | (1,333,671 | ) | (1,545,087 | ) | 11,501,826 | (4,610,522 | ) | ||||||||||||||||||||
|
|
|
|
|
|
|
|
|
|
|
|
|
|
|
| |||||||||||||||||
Change in net assets | 16,553,544 | 297,301,374 | 22,775,239 | (59,085,984 | ) | (4,623,415 | ) | 7,086,063 | 11,502,550 | (691,949 | ) | |||||||||||||||||||||
Net assets: | ||||||||||||||||||||||||||||||||
Beginning of year | 518,735,416 | 221,434,042 | 202,012,687 | 261,098,671 | 158,663,826 | 151,577,763 | 37,196,582 | 37,888,531 | ||||||||||||||||||||||||
|
|
|
|
|
|
|
|
|
|
|
|
|
|
|
| |||||||||||||||||
End of year | $ | 535,288,960 | $ | 518,735,416 | $ | 224,787,926 | $ | 202,012,687 | $ | 154,040,411 | $ | 158,663,826 | $ | 48,699,132 | $ | 37,196,582 | ||||||||||||||||
|
|
|
|
|
|
|
|
|
|
|
|
|
|
|
| |||||||||||||||||
Undistributed net investment income | $ | 262,107 | $ | 386,033 | $ | — | $ | — | $ | 5,611,400 | $ | 5,057,141 | $ | 90,386 | $ | 54,163 | ||||||||||||||||
|
|
|
|
|
|
|
|
|
|
|
|
|
|
|
| |||||||||||||||||
The accompanying notes are an integral part of these financial statements.
| 115 |
| Ohio National Fund, Inc. |
Statements of Changes in Net Assets |
| International Portfolio | Capital Appreciation Portfolio | International Small-Mid Company Portfolio | Aggressive Growth Portfolio | |||||||||||||||||||||||||||||
| Year Ended December 31, 2015 | Year Ended December 31, 2014 | Year Ended December 31, 2015 | Year Ended December 31, 2014 | Year Ended December 31, 2015 | Year Ended December 31, 2014 | Year Ended December 31, 2015 | Year Ended December 31, 2014 | |||||||||||||||||||||||||
Increase (Decrease) in net assets: | ||||||||||||||||||||||||||||||||
Operations: | ||||||||||||||||||||||||||||||||
Net investment income (loss) | $ | 2,095,825 | $ | 2,572,757 | $ | 3,834,325 | $ | 1,213,441 | $ | 93,533 | $ | 277,179 | $ | (43,862 | ) | $ | (87,987 | ) | ||||||||||||||
Net realized gain (loss) on investments, futures contracts, foreign currency contracts, and other foreign currency related transactions | (6,614,913 | ) | 19,582,968 | 36,847,325 | 20,173,243 | 6,012,979 | 5,598,075 | 4,256,416 | 8,194,676 | |||||||||||||||||||||||
Change in unrealized appreciation/depreciation on investments, futures contracts, foreign currency contracts, and other foreign currency related transactions | 4,449,966 | (39,577,450 | ) | (46,512,351 | ) | (1,239,649 | ) | (46,294 | ) | (12,565,288 | ) | (157,349 | ) | (4,579,372 | ) | |||||||||||||||||
|
|
|
|
|
|
|
|
|
|
|
|
|
|
|
| |||||||||||||||||
Change in net assets from operations | (69,122 | ) | (17,421,725 | ) | (5,830,701 | ) | 20,147,035 | 6,060,218 | (6,690,034 | ) | 4,055,205 | 3,527,317 | ||||||||||||||||||||
|
|
|
|
|
|
|
|
|
|
|
|
|
|
|
| |||||||||||||||||
Distributions to shareholders: | ||||||||||||||||||||||||||||||||
Distributions from net investment income | — | — | (3,261,845 | ) | (1,165,844 | ) | — | — | — | — | ||||||||||||||||||||||
|
|
|
|
|
|
|
|
|
|
|
|
|
|
|
| |||||||||||||||||
Capital transactions: | ||||||||||||||||||||||||||||||||
Received from shares sold | 18,999,736 | 30,187,407 | 63,158,311 | 331,391,049 | 27,350,020 | 13,115,148 | 19,273,663 | 7,560,703 | ||||||||||||||||||||||||
Received from dividends reinvested | — | — | 3,261,845 | 1,165,844 | — | — | — | — | ||||||||||||||||||||||||
Paid for shares redeemed | (34,323,447 | ) | (27,822,330 | ) | (76,313,498 | ) | (40,131,679 | ) | (22,637,681 | ) | (15,853,656 | ) | (11,902,340 | ) | (10,565,748 | ) | ||||||||||||||||
|
|
|
|
|
|
|
|
|
|
|
|
|
|
|
| |||||||||||||||||
Change in net assets from capital transactions | (15,323,711 | ) | 2,365,077 | (9,893,342 | ) | 292,425,214 | 4,712,339 | (2,738,508 | ) | 7,371,323 | (3,005,045 | ) | ||||||||||||||||||||
|
|
|
|
|
|
|
|
|
|
|
|
|
|
|
| |||||||||||||||||
Change in net assets | (15,392,833 | ) | (15,056,648 | ) | (18,985,888 | ) | 311,406,405 | 10,772,557 | (9,428,542 | ) | 11,426,528 | 522,272 | ||||||||||||||||||||
Net assets: | ||||||||||||||||||||||||||||||||
Beginning of year | 174,370,392 | 189,427,040 | 449,414,047 | 138,007,642 | 67,554,366 | 76,982,908 | 39,925,269 | 39,402,997 | ||||||||||||||||||||||||
|
|
|
|
|
|
|
|
|
|
|
|
|
|
|
| |||||||||||||||||
End of year | $ | 158,977,559 | $ | 174,370,392 | $ | 430,428,159 | $ | 449,414,047 | $ | 78,326,923 | $ | 67,554,366 | $ | 51,351,797 | $ | 39,925,269 | ||||||||||||||||
|
|
|
|
|
|
|
|
|
|
|
|
|
|
|
| |||||||||||||||||
Undistributed net investment income (loss) | $ | 4,103,561 | $ | 4,254,016 | $ | 558,115 | $ | 37,465 | $ | 52,535 | $ | 196,497 | $ | — | $ | — | ||||||||||||||||
|
|
|
|
|
|
|
|
|
|
|
|
|
|
|
| |||||||||||||||||
The accompanying notes are an integral part of these financial statements.
| 116 |
| Ohio National Fund, Inc. |
Statements of Changes in Net Assets |
| Small Cap Growth Portfolio | Mid Cap Opportunity Portfolio | S&P 500® Index Portfolio | Strategic Value Portfolio | |||||||||||||||||||||||||||||
| Year Ended December 31, 2015 | Year Ended December 31, 2014 | Year Ended December 31, 2015 | Year Ended December 31, 2014 | Year Ended December 31, 2015 | Year Ended December 31, 2014 | Year Ended December 31, 2015 | Year Ended December 31, 2014 | |||||||||||||||||||||||||
Increase (Decrease) in net assets: | ||||||||||||||||||||||||||||||||
Operations: | ||||||||||||||||||||||||||||||||
Net investment income (loss) | $ | (275,332 | ) | $ | (394,361 | ) | $ | (181,194 | ) | $ | (151,221 | ) | $ | 6,969,435 | $ | 5,637,059 | $ | 11,456,581 | $ | 20,943,847 | ||||||||||||
Net realized gain on investments and foreign currency related transactions | 6,834,479 | 15,523,432 | 6,123,950 | 15,149,638 | 7,650,057 | 3,675,264 | 6,865,294 | 36,941,062 | ||||||||||||||||||||||||
Change in unrealized appreciation/depreciation on investments and foreign currency related transactions | (5,327,297 | ) | 7,521,125 | (10,394,162 | ) | (5,886,389 | ) | (9,995,310 | ) | 33,949,693 | (5,120,840 | ) | (11,438,100 | ) | ||||||||||||||||||
|
|
|
|
|
|
|
|
|
|
|
|
|
|
|
| |||||||||||||||||
Change in net assets from operations | 1,231,850 | 22,650,196 | (4,451,406 | ) | 9,112,028 | 4,624,182 | 43,262,016 | 13,201,035 | 46,446,809 | |||||||||||||||||||||||
|
|
|
|
|
|
|
|
|
|
|
|
|
|
|
| |||||||||||||||||
Distributions to shareholders: | ||||||||||||||||||||||||||||||||
Distributions from net investment income | — | — | — | — | (5,803,104 | ) | (4,671,250 | ) | (9,545,259 | ) | (17,815,244 | ) | ||||||||||||||||||||
|
|
|
|
|
|
|
|
|
|
|
|
|
|
|
| |||||||||||||||||
Capital transactions: | ||||||||||||||||||||||||||||||||
Received from shares sold | 80,445,971 | 130,344,816 | 15,062,479 | 14,483,197 | 121,420,565 | 111,526,771 | 40,593,584 | 42,389,840 | ||||||||||||||||||||||||
Received from dividends reinvested | — | — | — | — | 5,803,104 | 4,671,250 | 9,545,259 | 17,815,244 | ||||||||||||||||||||||||
Paid for shares redeemed | (55,586,735 | ) | (50,387,901 | ) | (18,579,706 | ) | (19,935,180 | ) | (103,525,243 | ) | (81,517,679 | ) | (76,596,758 | ) | (153,890,559 | ) | ||||||||||||||||
|
|
|
|
|
|
|
|
|
|
|
|
|
|
|
| |||||||||||||||||
Change in net assets from capital transactions | 24,859,236 | 79,956,915 | (3,517,227 | ) | (5,451,983 | ) | 23,698,426 | 34,680,342 | (26,457,915 | ) | (93,685,475 | ) | ||||||||||||||||||||
|
|
|
|
|
|
|
|
|
|
|
|
|
|
|
| |||||||||||||||||
Change in net assets | 26,091,086 | 102,607,111 | (7,968,633 | ) | 3,660,045 | 22,519,504 | 73,271,108 | (22,802,139 | ) | (65,053,910 | ) | |||||||||||||||||||||
Net assets: | ||||||||||||||||||||||||||||||||
Beginning of year | 212,143,920 | 109,536,809 | 86,672,004 | 83,011,959 | 388,204,137 | 314,933,029 | 332,610,905 | 397,664,815 | ||||||||||||||||||||||||
|
|
|
|
|
|
|
|
|
|
|
|
|
|
|
| |||||||||||||||||
End of year | $ | 238,235,006 | $ | 212,143,920 | $ | 78,703,371 | $ | 86,672,004 | $ | 410,723,641 | $ | 388,204,137 | $ | 309,808,766 | $ | 332,610,905 | ||||||||||||||||
|
|
|
|
|
|
|
|
|
|
|
|
|
|
|
| |||||||||||||||||
Undistributed net investment income (loss) | $ | (179,440 | ) | $ | (35,820 | ) | $ | — | $ | — | $ | 1,078,220 | $ | 885,679 | $ | 1,516,899 | $ | 2,817,246 | ||||||||||||||
|
|
|
|
|
|
|
|
|
|
|
|
|
|
|
| |||||||||||||||||
The accompanying notes are an integral part of these financial statements.
| 117 |
| Ohio National Fund, Inc. |
Statements of Changes in Net Assets |
| High Income Bond Portfolio | ClearBridge Small Cap Portfolio | Nasdaq-100® Index Portfolio | Bristol Portfolio | |||||||||||||||||||||||||||||
| Year Ended December 31, 2015 | Year Ended December 31, 2014 | Year Ended December 31, 2015 | Year Ended December 31, 2014 | Year Ended December 31, 2015 | Year Ended December 31, 2014 | Year Ended December 31, 2015 | Year Ended December 31, 2014 | |||||||||||||||||||||||||
Increase (Decrease) in net assets: | ||||||||||||||||||||||||||||||||
Operations: | ||||||||||||||||||||||||||||||||
Net investment income (loss) | $ | 12,384,157 | $ | 16,751,342 | $ | (234,376 | ) | $ | (349,357 | ) | $ | 1,035,803 | $ | 1,307,307 | $ | 1,286,447 | $ | 994,675 | ||||||||||||||
Net realized gain (loss) on investments and foreign currency related transactions | (949,435 | ) | 8,225,039 | 13,222,203 | 8,907,401 | 3,980,078 | 4,311,375 | 22,223,785 | 45,974,586 | |||||||||||||||||||||||
Change in unrealized appreciation/depreciation on investments and foreign currency related transactions | (17,429,312 | ) | (16,353,341 | ) | (14,029,088 | ) | (6,915,894 | ) | 6,340,633 | 12,616,165 | (13,681,233 | ) | (16,492,459 | ) | ||||||||||||||||||
|
|
|
|
|
|
|
|
|
|
|
|
|
|
|
| |||||||||||||||||
Change in net assets from operations | (5,994,590 | ) | 8,623,040 | (1,041,261 | ) | 1,642,150 | 11,356,514 | 18,234,847 | 9,828,999 | 30,476,802 | ||||||||||||||||||||||
|
|
|
|
|
|
|
|
|
|
|
|
|
|
|
| |||||||||||||||||
Distributions to shareholders: | ||||||||||||||||||||||||||||||||
Distributions from net investment income | — | — | — | — | (890,078 | ) | (1,151,494 | ) | (1,143,905 | ) | (895,082 | ) | ||||||||||||||||||||
|
|
|
|
|
|
|
|
|
|
|
|
|
|
|
| |||||||||||||||||
Capital transactions: | ||||||||||||||||||||||||||||||||
Received from shares sold | 30,680,501 | 45,515,603 | 40,142,976 | 16,459,619 | 45,816,486 | 43,549,332 | 24,394,898 | 17,018,019 | ||||||||||||||||||||||||
Received from dividends reinvested | — | — | — | — | 890,078 | 1,151,494 | 1,143,905 | 895,082 | ||||||||||||||||||||||||
Paid for shares redeemed | (60,565,349 | ) | (131,923,035 | ) | (20,589,393 | ) | (23,042,984 | ) | (40,292,164 | ) | (35,945,696 | ) | (47,557,762 | ) | (47,019,709 | ) | ||||||||||||||||
|
|
|
|
|
|
|
|
|
|
|
|
|
|
|
| |||||||||||||||||
Change in net assets from capital transactions | (29,884,848 | ) | (86,407,432 | ) | 19,553,583 | (6,583,365 | ) | 6,414,400 | 8,755,130 | (22,018,959 | ) | (29,106,608 | ) | |||||||||||||||||||
|
|
|
|
|
|
|
|
|
|
|
|
|
|
|
| |||||||||||||||||
Change in net assets | (35,879,438 | ) | (77,784,392 | ) | 18,512,322 | (4,941,215 | ) | 16,880,836 | 25,838,483 | (13,333,865 | ) | 475,112 | ||||||||||||||||||||
Net assets: | ||||||||||||||||||||||||||||||||
Beginning of year | 230,100,451 | 307,884,843 | 75,491,145 | 80,432,360 | 121,686,069 | 95,847,586 | 232,016,582 | 231,541,470 | ||||||||||||||||||||||||
|
|
|
|
|
|
|
|
|
|
|
|
|
|
|
| |||||||||||||||||
End of year | $ | 194,221,013 | $ | 230,100,451 | $ | 94,003,467 | $ | 75,491,145 | $ | 138,566,905 | $ | 121,686,069 | $ | 218,682,717 | $ | 232,016,582 | ||||||||||||||||
|
|
|
|
|
|
|
|
|
|
|
|
|
|
|
| |||||||||||||||||
Undistributed net investment income (loss) | $ | 12,417,675 | $ | 16,758,701 | $ | — | $ | 5,390 | $ | 145,725 | $ | 155,813 | $ | 142,542 | $ | 99,593 | ||||||||||||||||
|
|
|
|
|
|
|
|
|
|
|
|
|
|
|
| |||||||||||||||||
The accompanying notes are an integral part of these financial statements.
| 118 |
| Ohio National Fund, Inc. |
Statements of Changes in Net Assets |
| Bryton Growth Portfolio | Balanced Portfolio | Target VIP Portfolio | Bristol Growth Portfolio | |||||||||||||||||||||||||||||
| Year Ended December 31, 2015 | Year Ended December 31, 2014 | Year Ended December 31, 2015 | Year Ended December 31, 2014 | Year Ended December 31, 2015 | Year Ended December 31, 2014 | Year Ended December 31, 2015 | Year Ended December 31, 2014 | |||||||||||||||||||||||||
Increase (Decrease) in net assets: | ||||||||||||||||||||||||||||||||
Operations: | ||||||||||||||||||||||||||||||||
Net investment income (loss) | $ | (928,394 | ) | $ | (818,246 | ) | $ | 13,669,039 | $ | 7,584,554 | $ | 802,799 | $ | 954,277 | $ | 536,338 | $ | 425,637 | ||||||||||||||
Net realized gain on investments, foreign currency related transactions, and written options | 20,443,670 | 22,063,567 | 29,262,363 | 15,476,691 | 2,814,877 | 6,802,148 | 10,012,228 | 20,039,564 | ||||||||||||||||||||||||
Change in unrealized appreciation/depreciation on investments, foreign currency related transactions, and written options | (24,955,849 | ) | (9,867,313 | ) | (32,385,091 | ) | 8,993,866 | (5,122,274 | ) | (3,839,788 | ) | (3,703,251 | ) | (6,250,848 | ) | |||||||||||||||||
|
|
|
|
|
|
|
|
|
|
|
|
|
|
|
| |||||||||||||||||
Change in net assets from operations | (5,440,573 | ) | 11,378,008 | 10,546,311 | 32,055,111 | (1,504,598 | ) | 3,916,637 | 6,845,315 | 14,214,353 | ||||||||||||||||||||||
|
|
|
|
|
|
|
|
|
|
|
|
|
|
|
| |||||||||||||||||
Distributions to shareholders: | ||||||||||||||||||||||||||||||||
Distributions from net investment income | — | — | (11,143,284 | ) | (6,075,617 | ) | (711,595 | ) | (854,149 | ) | (495,776 | ) | (370,603 | ) | ||||||||||||||||||
|
|
|
|
|
|
|
|
|
|
|
|
|
|
|
| |||||||||||||||||
Capital transactions: | ||||||||||||||||||||||||||||||||
Received from shares sold | 33,757,924 | 30,786,203 | 192,294,038 | 624,661,369 | 3,534,416 | 6,144,750 | 40,862,885 | 10,802,580 | ||||||||||||||||||||||||
Received from dividends reinvested | — | — | 11,143,284 | 6,075,617 | 711,595 | 854,149 | 495,776 | 370,603 | ||||||||||||||||||||||||
Paid for shares redeemed | (45,234,692 | ) | (43,857,130 | ) | (171,051,951 | ) | (72,643,183 | ) | (10,899,471 | ) | (8,637,548 | ) | (55,536,366 | ) | (23,225,588 | ) | ||||||||||||||||
|
|
|
|
|
|
|
|
|
|
|
|
|
|
|
| |||||||||||||||||
Change in net assets from capital transactions | (11,476,768 | ) | (13,070,927 | ) | 32,385,371 | 558,093,803 | (6,653,460 | ) | (1,638,649 | ) | (14,177,705 | ) | (12,052,405 | ) | ||||||||||||||||||
|
|
|
|
|
|
|
|
|
|
|
|
|
|
|
| |||||||||||||||||
Change in net assets | (16,917,341 | ) | (1,692,919 | ) | 31,788,398 | 584,073,297 | (8,869,653 | ) | 1,423,839 | (7,828,166 | ) | 1,791,345 | ||||||||||||||||||||
Net assets: | ||||||||||||||||||||||||||||||||
Beginning of year | 179,085,936 | 180,778,855 | 833,133,639 | 249,060,342 | 55,141,909 | 53,718,070 | 124,053,307 | 122,261,962 | ||||||||||||||||||||||||
|
|
|
|
|
|
|
|
|
|
|
|
|
|
|
| |||||||||||||||||
End of year | $ | 162,168,595 | $ | 179,085,936 | $ | 864,922,037 | $ | 833,133,639 | $ | 46,272,256 | $ | 55,141,909 | $ | 116,225,141 | $ | 124,053,307 | ||||||||||||||||
|
|
|
|
|
|
|
|
|
|
|
|
|
|
|
| |||||||||||||||||
Undistributed net investment income (loss) | $ | — | $ | — | $ | 2,451,767 | $ | 1,410,355 | $ | 91,204 | $ | 100,128 | $ | 40,562 | $ | 55,034 | ||||||||||||||||
|
|
|
|
|
|
|
|
|
|
|
|
|
|
|
| |||||||||||||||||
The accompanying notes are an integral part of these financial statements.
| 119 |
| Ohio National Fund, Inc. |
Statements of Changes in Net Assets |
| Risk Managed Balanced Portfolio | ||||||||
| Year Ended December 31, 2015 | Period from May 1, 2014* to December 31, 2014 | |||||||
Increase (Decrease) in net assets: | ||||||||
Operations: | ||||||||
Net investment income | $ | 669,425 | $ | 81,427 | ||||
Net realized gain (loss) on investments, futures contracts, and foreign currency related transactions | (2,218,021 | ) | 1,167,312 | |||||
Change in unrealized appreciation/depreciation on investments, futures contracts, and foreign currency related transactions | 799,826 | 939,625 | ||||||
|
|
|
| |||||
Change in net assets from operations | (748,770 | ) | 2,188,364 | |||||
|
|
|
| |||||
Distributions to shareholders: | ||||||||
Distributions from net investment income | (376,684 | ) | — | |||||
|
|
|
| |||||
Capital transactions: | ||||||||
Received from shares sold | 140,396,888 | 54,419,880 | ||||||
Received from dividends reinvested | 376,684 | — | ||||||
Paid for shares redeemed | (19,130,791 | ) | (22,801,551 | ) | ||||
|
|
|
| |||||
Change in net assets from capital transactions | 121,642,781 | 31,618,329 | ||||||
|
|
|
| |||||
Change in net assets | 120,517,327 | 33,806,693 | ||||||
Net assets: | ||||||||
Beginning of year | 33,806,693 | — | ||||||
|
|
|
| |||||
End of year | $ | 154,324,020 | $ | 33,806,693 | ||||
|
|
|
| |||||
Undistributed net investment income | $ | 264,931 | $ | 81,420 | ||||
|
|
|
| |||||
| * | Represents date of inception and commencement of operations. |
The accompanying notes are an integral part of these financial statements.
| 120 |
| Ohio National Fund, Inc. |
| Equity Portfolio | Money Market Portfolio | |||||||||||||||||||||||||||||||||||||||
| Years Ended December 31, | Years Ended December 31, | |||||||||||||||||||||||||||||||||||||||
| 2015 | 2014 | 2013 | 2012 | 2011 | 2015 | 2014 | 2013 | 2012 | 2011 | |||||||||||||||||||||||||||||||
Selected per-share data: | ||||||||||||||||||||||||||||||||||||||||
Net asset value, beginning of year | $ | 33.44 | $ | 29.41 | $ | 21.54 | $ | 18.88 | $ | 19.72 | $ | 10.00 | $ | 10.00 | $ | 10.00 | $ | 10.00 | $ | 10.00 | ||||||||||||||||||||
Operations: | ||||||||||||||||||||||||||||||||||||||||
Net investment income | 0.21 | 0.12 | 0.27 | 0.35 | 0.21 | — | — | — | — | — | ||||||||||||||||||||||||||||||
Net realized and unrealized gain (loss) on investments and foreign currency related transactions | (1.44 | ) | 4.02 | 7.84 | 2.61 | (0.88 | ) | — | — | — | — | — | ||||||||||||||||||||||||||||
|
|
|
|
|
|
|
|
|
|
|
|
|
|
|
|
|
|
|
| |||||||||||||||||||||
Total from operations | (1.23 | ) | 4.14 | 8.11 | 2.96 | (0.67 | ) | — | — | — | — | — | ||||||||||||||||||||||||||||
|
|
|
|
|
|
|
|
|
|
|
|
|
|
|
|
|
|
|
| |||||||||||||||||||||
Distributions: | ||||||||||||||||||||||||||||||||||||||||
Distributions from net investment income | (0.19 | ) | (0.11 | ) | (0.24 | ) | (0.30 | ) | (0.17 | ) | — | — | — | — | — | |||||||||||||||||||||||||
|
|
|
|
|
|
|
|
|
|
|
|
|
|
|
|
|
|
|
| |||||||||||||||||||||
Net asset value, end of year | $ | 32.02 | $ | 33.44 | $ | 29.41 | $ | 21.54 | $ | 18.88 | $ | 10.00 | $ | 10.00 | $ | 10.00 | $ | 10.00 | $ | 10.00 | ||||||||||||||||||||
|
|
|
|
|
|
|
|
|
|
|
|
|
|
|
|
|
|
|
| |||||||||||||||||||||
Total return | –3.69 | % | 14.07 | % | 37.69 | % | 15.69 | % | –3.38 | % | 0.00 | % | 0.00 | % | 0.00 | % | 0.00 | % | 0.00 | % | ||||||||||||||||||||
Ratios and supplemental data: | ||||||||||||||||||||||||||||||||||||||||
Net assets at end of year (in millions) | $ | 535.3 | $ | 518.7 | $ | 221.4 | $ | 186.5 | $ | 187.9 | $ | 224.8 | $ | 202.0 | $ | 261.1 | $ | 258.6 | $ | 286.2 | ||||||||||||||||||||
Ratios to average net assets: | ||||||||||||||||||||||||||||||||||||||||
Ratios net of expenses reduced or reimbursed by adviser: | ||||||||||||||||||||||||||||||||||||||||
Expenses | 0.81 | % | 0.83 | % | 0.87 | % | 0.89 | % | 0.87 | % | 0.07 | % | 0.04 | % | 0.06 | % | 0.09 | % | 0.11 | % | ||||||||||||||||||||
Net investment income | 0.69 | % | 0.69 | % | 0.98 | % | 1.55 | % | 1.00 | % | 0.00 | % | 0.00 | % | 0.00 | % | 0.00 | % | 0.00 | % | ||||||||||||||||||||
Ratios assuming no expenses reduced or reimbursed by adviser: | ||||||||||||||||||||||||||||||||||||||||
Expenses | 0.81 | % | 0.83 | % | 0.87 | % | 0.89 | % | 0.87 | % | 0.34 | % | 0.33 | % | 0.34 | % | 0.35 | % | 0.34 | % | ||||||||||||||||||||
Portfolio turnover rate | 47 | % | 46 | % | 43 | % | 48 | % | 54 | % | 0 | % | 0 | % | 0 | % | 0 | % | 0 | % | ||||||||||||||||||||
The accompanying notes are an integral part of these financial statements.
| 121 |
| Ohio National Fund, Inc. |
Financial Highlights |
| Bond Portfolio | Omni Portfolio | |||||||||||||||||||||||||||||||||||||||
| Years Ended December 31, | Years Ended December 31, | |||||||||||||||||||||||||||||||||||||||
| 2015 | 2014 | 2013 | 2012 | 2011 | 2015 | 2014 | 2013 | 2012 | 2011 | |||||||||||||||||||||||||||||||
Selected per-share data: | ||||||||||||||||||||||||||||||||||||||||
Net asset value, beginning of year | $ | 15.65 | $ | 14.78 | $ | 15.07 | $ | 14.05 | $ | 13.21 | $ | 24.15 | $ | 21.74 | $ | 16.82 | $ | 15.21 | $ | 16.08 | ||||||||||||||||||||
Operations: | ||||||||||||||||||||||||||||||||||||||||
Net investment income | 0.56 | 0.50 | 0.56 | 0.51 | 0.48 | 0.28 | 0.26 | 0.24 | 0.26 | 0.25 | ||||||||||||||||||||||||||||||
Net realized and unrealized gain (loss) on investments and foreign currency related transactions | (0.88 | ) | 0.37 | (0.85 | ) | 0.51 | 0.36 | 0.24 | 2.37 | 4.89 | 1.57 | (0.91 | ) | |||||||||||||||||||||||||||
|
|
|
|
|
|
|
|
|
|
|
|
|
|
|
|
|
|
|
| |||||||||||||||||||||
Total from operations | (0.32 | ) | 0.87 | (0.29 | ) | 1.02 | 0.84 | 0.52 | 2.63 | 5.13 | 1.83 | (0.66 | ) | |||||||||||||||||||||||||||
|
|
|
|
|
|
|
|
|
|
|
|
|
|
|
|
|
|
|
| |||||||||||||||||||||
Distributions: | ||||||||||||||||||||||||||||||||||||||||
Distributions from net investment income | — | — | — | — | — | (0.24 | ) | (0.22 | ) | (0.21 | ) | (0.22 | ) | (0.21 | ) | |||||||||||||||||||||||||
|
|
|
|
|
|
|
|
|
|
|
|
|
|
|
|
|
|
|
| |||||||||||||||||||||
Net asset value, end of year | $ | 15.33 | $ | 15.65 | $ | 14.78 | $ | 15.07 | $ | 14.05 | $ | 24.43 | $ | 24.15 | $ | 21.74 | $ | 16.82 | $ | 15.21 | ||||||||||||||||||||
|
|
|
|
|
|
|
|
|
|
|
|
|
|
|
|
|
|
|
| |||||||||||||||||||||
Total return | –2.04 | % | 5.89 | % | –1.92 | % | 7.26 | % | 6.36 | % | 2.15 | % | 12.12 | % | 30.53 | % | 12.04 | % | -4.12 | % | ||||||||||||||||||||
Ratios and supplemental data: | ||||||||||||||||||||||||||||||||||||||||
Net assets at end of year (in millions) | $ | 154.0 | $ | 158.7 | $ | 151.6 | $ | 172.2 | $ | 162.0 | $ | 48.7 | $ | 37.2 | $ | 37.9 | $ | 33.2 | $ | 34.7 | ||||||||||||||||||||
Ratios to average net assets: | ||||||||||||||||||||||||||||||||||||||||
Expenses | 0.64 | % | 0.64 | % | 0.66 | % | 0.66 | % | 0.66 | % | 0.77 | % | 0.77 | % | 0.79 | % | 0.81 | % | 0.77 | % | ||||||||||||||||||||
Net investment income | 3.46 | % | 3.34 | % | 3.34 | % | 3.41 | % | 3.70 | % | 1.23 | % | 1.06 | % | 1.17 | % | 1.49 | % | 1.40 | % | ||||||||||||||||||||
Portfolio turnover rate | 93 | % | 35 | % | 15 | % | 18 | % | 15 | % | 186 | % | 198 | % | 210 | % | 179 | % | 147 | % | ||||||||||||||||||||
The accompanying notes are an integral part of these financial statements.
| 122 |
| Ohio National Fund, Inc. |
Financial Highlights |
| International Portfolio | Capital Appreciation Portfolio | |||||||||||||||||||||||||||||||||||||||
| Years Ended December 31, | Years Ended December 31, | |||||||||||||||||||||||||||||||||||||||
| 2015 | 2014 | 2013 | 2012 | 2011 | 2015 | 2014 | 2013 | 2012 | 2011 | |||||||||||||||||||||||||||||||
Selected per-share data: | ||||||||||||||||||||||||||||||||||||||||
Net asset value, beginning of year | $ | 12.55 | $ | 13.85 | $ | 12.41 | $ | 10.32 | $ | 12.20 | $ | 33.82 | $ | 31.24 | $ | 23.32 | $ | 19.95 | $ | 20.37 | ||||||||||||||||||||
Operations: | ||||||||||||||||||||||||||||||||||||||||
Net investment income | 0.19 | 0.18 | 0.23 | 0.20 | 0.17 | 0.29 | 0.08 | 0.13 | 0.15 | 0.09 | ||||||||||||||||||||||||||||||
Net realized and unrealized gain (loss) on investments, futures contracts, foreign currency contracts, and other foreign currency related transactions | (0.24 | ) | (1.48 | ) | 1.21 | 1.89 | (2.05 | ) | (0.98 | ) | 2.59 | 7.91 | 3.36 | (0.43 | ) | |||||||||||||||||||||||||
|
|
|
|
|
|
|
|
|
|
|
|
|
|
|
|
|
|
|
| |||||||||||||||||||||
Total from operations | (0.05 | ) | (1.30 | ) | 1.44 | 2.09 | (1.88 | ) | (0.69 | ) | 2.67 | 8.04 | 3.51 | (0.34 | ) | |||||||||||||||||||||||||
|
|
|
|
|
|
|
|
|
|
|
|
|
|
|
|
|
|
|
| |||||||||||||||||||||
Distributions: | ||||||||||||||||||||||||||||||||||||||||
Distributions from net investment income | — | — | — | — | — | (0.25 | ) | (0.09 | ) | (0.12 | ) | (0.14 | ) | (0.08 | ) | |||||||||||||||||||||||||
|
|
|
|
|
|
|
|
|
|
|
|
|
|
|
|
|
|
|
| |||||||||||||||||||||
Net asset value, end of year | $ | 12.50 | $ | 12.55 | $ | 13.85 | $ | 12.41 | $ | 10.32 | $ | 32.88 | $ | 33.82 | $ | 31.24 | $ | 23.32 | $ | 19.95 | ||||||||||||||||||||
|
|
|
|
|
|
|
|
|
|
|
|
|
|
|
|
|
|
|
| |||||||||||||||||||||
Total return | –0.40 | % (a) | –9.39 | % | 11.60 | % | 20.25 | % | –15.41 | % | –2.05 | % | 8.54 | % | 34.51 | % | 17.59 | % | –1.65 | % | ||||||||||||||||||||
Ratios and supplemental data: | ||||||||||||||||||||||||||||||||||||||||
Net assets at end of year (in millions) | $ | 159.0 | $ | 174.4 | $ | 189.4 | $ | 180.3 | $ | 172.8 | $ | 430.4 | $ | 449.4 | $ | 138.0 | $ | 115.7 | $ | 114.7 | ||||||||||||||||||||
Ratios to average net assets: | ||||||||||||||||||||||||||||||||||||||||
Ratios net of expenses reduced or reimbursed by adviser: | ||||||||||||||||||||||||||||||||||||||||
Expenses | 1.00 | % | 0.84 | % | 0.75 | % | 1.02 | % | 1.02 | % | 0.80 | % | 0.83 | % | 0.88 | % | 0.90 | % | 0.88 | % | ||||||||||||||||||||
Net investment income | 1.21 | % | 1.43 | % | 1.52 | % | 1.65 | % | 1.41 | % | 0.86 | % | 0.56 | % | 0.45 | % | 0.66 | % | 0.41 | % | ||||||||||||||||||||
Ratios assuming no expenses reduced or reimbursed by adviser: | ||||||||||||||||||||||||||||||||||||||||
Expenses | 1.00 | % | 1.00 | % | 1.01 | % | 1.02 | % | 1.02 | % | 0.80 | % | 0.83 | % | 0.88 | % | 0.90 | % | 0.88 | % | ||||||||||||||||||||
Portfolio turnover rate | 72 | % | 95 | % | 53 | % | 61 | % | 58 | % | 69 | % | 67 | % | 49 | % | 39 | % | 61 | % | ||||||||||||||||||||
| (a) | Initial Public Offering (IPO) investments had a significant impact on the total return in the current year and such performance may be difficult to repeat. |
The accompanying notes are an integral part of these financial statements.
| 123 |
| Ohio National Fund, Inc. |
Financial Highlights |
| International Small-Mid Company Portfolio | Aggressive Growth Portfolio | |||||||||||||||||||||||||||||||||||||||
| Years Ended December 31, | Years Ended December 31, | |||||||||||||||||||||||||||||||||||||||
| 2015 | 2014 | 2013 | 2012 | 2011 | 2015 | 2014 | 2013 | 2012 | 2011 | |||||||||||||||||||||||||||||||
Selected per-share data: | ||||||||||||||||||||||||||||||||||||||||
Net asset value, beginning of year | $ | 27.39 | $ | 30.03 | $ | 23.52 | $ | 19.17 | $ | 23.24 | $ | 13.70 | $ | 12.50 | $ | 9.51 | $ | 7.74 | $ | 8.17 | ||||||||||||||||||||
Operations: | ||||||||||||||||||||||||||||||||||||||||
Net investment income (loss) | 0.03 | 0.12 | 0.12 | 0.17 | 0.26 | (0.01 | ) | (0.03 | ) | (0.02 | ) | 0.03 | — | |||||||||||||||||||||||||||
Net realized and unrealized gain (loss) on investments, futures contracts, foreign currency contracts, and other foreign currency related transactions | 2.56 | (2.76 | ) | 6.39 | 4.18 | (4.33 | ) | 1.40 | 1.23 | 3.01 | 1.74 | (0.43 | ) | |||||||||||||||||||||||||||
|
|
|
|
|
|
|
|
|
|
|
|
|
|
|
|
|
|
|
| |||||||||||||||||||||
Total from operations | 2.59 | (2.64 | ) | 6.51 | 4.35 | (4.07 | ) | 1.39 | 1.20 | 2.99 | 1.77 | (0.43 | ) | |||||||||||||||||||||||||||
|
|
|
|
|
|
|
|
|
|
|
|
|
|
|
|
|
|
|
| |||||||||||||||||||||
Net asset value, end of year | $ | 29.98 | $ | 27.39 | $ | 30.03 | $ | 23.52 | $ | 19.17 | $ | 15.09 | $ | 13.70 | $ | 12.50 | $ | 9.51 | $ | 7.74 | ||||||||||||||||||||
|
|
|
|
|
|
|
|
|
|
|
|
|
|
|
|
|
|
|
| |||||||||||||||||||||
Total return | 9.46 | % (a) | –8.79 | % | 27.68 | % | 22.69 | % | –17.51 | % | 10.15 | % | 9.60 | % | 31.44 | % | 22.87 | % | –5.26 | % | ||||||||||||||||||||
Ratios and supplemental data: | ||||||||||||||||||||||||||||||||||||||||
Net assets at end of year (in millions) | $ | 78.3 | $ | 67.6 | $ | 77.0 | $ | 64.5 | $ | 57.5 | $ | 51.4 | $ | 39.9 | $ | 39.4 | $ | 33.1 | $ | 25.8 | ||||||||||||||||||||
Ratios to average net assets: | ||||||||||||||||||||||||||||||||||||||||
Expenses | 1.23 | % | 1.18 | % | 1.19 | % | 1.21 | % | 1.20 | % | 0.93 | % | 0.94 | % | 0.97 | % | 0.99 | % | 1.04 | % | ||||||||||||||||||||
Net investment income (loss) | 0.12 | % | 0.38 | % | 0.40 | % | 0.64 | % | 1.07 | % | –0.10 | % | –0.23 | % | –0.25 | % | 0.34 | % | 0.02 | % | ||||||||||||||||||||
Portfolio turnover rate | 58 | % | 65 | % | 51 | % | 55 | % | 67 | % | 60 | % | 55 | % | 60 | % | 17 | % | 47 | % | ||||||||||||||||||||
| (a) | Initial Public Offering (IPO) investments had a significant impact on the total return in the current year and such performance may be difficult to repeat. |
The accompanying notes are an integral part of these financial statements.
| 124 |
| Ohio National Fund, Inc. |
Financial Highlights |
| Small Cap Growth Portfolio | Mid Cap Opportunity Portfolio | |||||||||||||||||||||||||||||||||||||||
| Years Ended December 31, | Years Ended December 31, | |||||||||||||||||||||||||||||||||||||||
| 2015 | 2014 | 2013 | 2012 | 2011 | 2015 | 2014 | 2013 | 2012 | 2011 | |||||||||||||||||||||||||||||||
Selected per-share data: | ||||||||||||||||||||||||||||||||||||||||
Net asset value, beginning of year | $ | 25.07 | $ | 22.65 | $ | 15.59 | $ | 13.21 | $ | 12.86 | $ | 31.49 | $ | 28.24 | $ | 21.32 | $ | 17.81 | $ | 18.43 | ||||||||||||||||||||
Operations: | ||||||||||||||||||||||||||||||||||||||||
Net investment income (loss) | (0.03 | ) | (0.05 | ) | (0.03 | ) | (0.03 | ) | (0.08 | ) | (0.07 | ) | (0.05 | ) | (0.07 | ) | (0.02 | ) | (0.06 | ) | ||||||||||||||||||||
Net realized and unrealized gain (loss) on investments and foreign currency related transactions | (0.03 | ) | 2.47 | 7.09 | 2.41 | 0.43 | (1.52 | ) | 3.30 | 6.99 | 3.53 | (0.56 | ) | |||||||||||||||||||||||||||
|
|
|
|
|
|
|
|
|
|
|
|
|
|
|
|
|
|
|
| |||||||||||||||||||||
Total from operations | (0.06 | ) | 2.42 | 7.06 | 2.38 | 0.35 | (1.59 | ) | 3.25 | 6.92 | 3.51 | (0.62 | ) | |||||||||||||||||||||||||||
|
|
|
|
|
|
|
|
|
|
|
|
|
|
|
|
|
|
|
| |||||||||||||||||||||
Net asset value, end of year | $ | 25.01 | $ | 25.07 | $ | 22.65 | $ | 15.59 | $ | 13.21 | $ | 29.90 | $ | 31.49 | $ | 28.24 | $ | 21.32 | $ | 17.81 | ||||||||||||||||||||
|
|
|
|
|
|
|
|
|
|
|
|
|
|
|
|
|
|
|
| |||||||||||||||||||||
Total return | –0.24 | % (a) | 10.64 | % | 45.29 | % | 18.02 | % | 2.72 | % | –5.05 | % (a) | 11.51 | % | 32.46 | % | 19.71 | % | –3.36 | % | ||||||||||||||||||||
Ratios and supplemental data: | ||||||||||||||||||||||||||||||||||||||||
Net assets at end of year (in millions) | $ | 238.2 | $ | 212.1 | $ | 109.5 | $ | 35.0 | $ | 31.5 | $ | 78.7 | $ | 86.7 | $ | 83.0 | $ | 67.1 | $ | 61.1 | ||||||||||||||||||||
Ratios to average net assets: | ||||||||||||||||||||||||||||||||||||||||
Expenses | 0.85 | % | 0.89 | % | 1.04 | % | 1.10 | % | 1.08 | % | 0.94 | % | 0.94 | % | 0.96 | % | 0.98 | % | 0.96 | % | ||||||||||||||||||||
Net investment income (loss) | –0.12 | % | –0.31 | % | –0.29 | % | –0.20 | % | –0.60 | % | –0.21 | % | –0.18 | % | –0.28 | % | –0.09 | % | –0.29 | % | ||||||||||||||||||||
Portfolio turnover rate | 37 | % | 58 | % | 69 | % (b) | 65 | % | 58 | % | 59 | % | 61 | % | 44 | % | 45 | % | 51 | % | ||||||||||||||||||||
| (a) | Initial Public Offering (IPO) investments had a significant impact on the total return in the current year and such performance may be difficult to repeat. |
| (b) | The cost of purchases and proceeds from sales of securities that were incurred to realign the Portfolio’s holdings subsequent to the December 20, 2013 reorganization are excluded from the 2013 portfolio turnover rate calculation. If such amounts had not been excluded, the portfolio turnover rate would have been 146%. |
The accompanying notes are an integral part of these financial statements.
| 125 |
| Ohio National Fund, Inc. |
Financial Highlights |
| S&P 500® Index Portfolio | Strategic Value Portfolio | |||||||||||||||||||||||||||||||||||||||
| Years Ended December 31, | Years Ended December 31, | |||||||||||||||||||||||||||||||||||||||
| 2015 | 2014 | 2013 | 2012 | 2011 | 2015 | 2014 | 2013 | 2012 | 2011 | |||||||||||||||||||||||||||||||
Selected per-share data: | ||||||||||||||||||||||||||||||||||||||||
Net asset value, beginning of year | $ | 21.93 | $ | 19.63 | $ | 15.08 | $ | 13.25 | $ | 13.21 | $ | 13.92 | $ | 13.09 | $ | 11.09 | $ | 10.50 | $ | 9.36 | ||||||||||||||||||||
Operations: | ||||||||||||||||||||||||||||||||||||||||
Net investment income | 0.37 | 0.32 | 0.26 | 0.26 | 0.22 | 0.53 | 0.93 | 0.35 | 0.13 | 0.33 | ||||||||||||||||||||||||||||||
Net realized and unrealized gain on investments and foreign currency related transactions | (0.17 | ) | 2.25 | 4.52 | 1.78 | 0.01 | 0.06 | 0.68 | 1.97 | 0.63 | 0.98 | |||||||||||||||||||||||||||||
|
|
|
|
|
|
|
|
|
|
|
|
|
|
|
|
|
|
|
| |||||||||||||||||||||
Total from operations | 0.20 | 2.57 | 4.78 | 2.04 | 0.23 | 0.59 | 1.61 | 2.32 | 0.76 | 1.31 | ||||||||||||||||||||||||||||||
|
|
|
|
|
|
|
|
|
|
|
|
|
|
|
|
|
|
|
| |||||||||||||||||||||
Distributions: | ||||||||||||||||||||||||||||||||||||||||
Distributions from net investment income | (0.31 | ) | (0.27 | ) | (0.23 | ) | (0.21 | ) | (0.19 | ) | (0.44 | ) | (0.78 | ) | (0.32 | ) | (0.17 | ) | (0.17 | ) | ||||||||||||||||||||
|
|
|
|
|
|
|
|
|
|
|
|
|
|
|
|
|
|
|
| |||||||||||||||||||||
Net asset value, end of year | $ | 21.82 | $ | 21.93 | $ | 19.63 | $ | 15.08 | $ | 13.25 | $ | 14.07 | $ | 13.92 | $ | 13.09 | $ | 11.09 | $ | 10.50 | ||||||||||||||||||||
|
|
|
|
|
|
|
|
|
|
|
|
|
|
|
|
|
|
|
| |||||||||||||||||||||
Total return | 0.91 | % | 13.11 | % | 31.74 | % | 15.40 | % | 1.77 | % | 4.26 | % | 12.41 | % | 21.00 | % | 7.21 | % | 14.03 | % | ||||||||||||||||||||
Ratios and supplemental data: | ||||||||||||||||||||||||||||||||||||||||
Net assets at end of year (in millions) | $ | 410.7 | $ | 388.2 | $ | 314.9 | $ | 207.8 | $ | 170.7 | $ | 309.8 | $ | 332.6 | $ | 397.7 | $ | 268.2 | $ | 42.0 | ||||||||||||||||||||
Ratios to average net assets: | ||||||||||||||||||||||||||||||||||||||||
Expenses | 0.41 | % | 0.43 | % | 0.45 | % | 0.48 | % | 0.47 | % | 0.78 | % | 0.78 | % | 0.79 | % | 0.82 | % | 0.96 | % | ||||||||||||||||||||
Net investment income | 1.72 | % | 1.64 | % | 1.68 | % | 1.87 | % | 1.62 | % | 3.47 | % | 5.37 | % | 3.58 | % | 3.84 | % | 4.07 | % | ||||||||||||||||||||
Portfolio turnover rate | 14 | % | 11 | % | 15 | % | 7 | % | 9 | % | 13 | % | 22 | % | 22 | % | 30 | % | 19 | % | ||||||||||||||||||||
The accompanying notes are an integral part of these financial statements.
| 126 |
| Ohio National Fund, Inc. |
Financial Highlights |
| High Income Bond Portfolio | ClearBridge Small Cap Portfolio | |||||||||||||||||||||||||||||||||||||||
| Years Ended December 31, | Years Ended December 31, | |||||||||||||||||||||||||||||||||||||||
| 2015 | 2014 | 2013 | 2012 | 2011 | 2015 | 2014 | 2013 | 2012 | 2011 | |||||||||||||||||||||||||||||||
Selected per-share data: | ||||||||||||||||||||||||||||||||||||||||
Net asset value, beginning of year | $ | 16.32 | $ | 15.88 | $ | 14.83 | $ | 12.97 | $ | 12.31 | $ | 41.01 | $ | 40.03 | $ | 30.73 | $ | 27.00 | $ | 27.68 | ||||||||||||||||||||
Operations: | ||||||||||||||||||||||||||||||||||||||||
Net investment income (loss) | 1.18 | 1.57 | 1.10 | 0.99 | 1.08 | (0.10 | ) | (0.19 | ) | (0.15 | ) | (0.03 | ) | (0.19 | ) | |||||||||||||||||||||||||
Net realized and unrealized gain (loss) on investments and foreign currency related transactions | (1.68 | ) | (1.13 | ) | (0.05 | ) | 0.87 | (0.42 | ) | (0.91 | ) | 1.17 | 9.45 | 3.76 | (0.49 | ) | ||||||||||||||||||||||||
|
|
|
|
|
|
|
|
|
|
|
|
|
|
|
|
|
|
|
| |||||||||||||||||||||
Total from operations | (0.50 | ) | 0.44 | 1.05 | 1.86 | 0.66 | (1.01 | ) | 0.98 | 9.30 | 3.73 | (0.68 | ) | |||||||||||||||||||||||||||
|
|
|
|
|
|
|
|
|
|
|
|
|
|
|
|
|
|
|
| |||||||||||||||||||||
Net asset value, end of year | $ | 15.82 | $ | 16.32 | $ | 15.88 | $ | 14.83 | $ | 12.97 | $ | 40.00 | $ | 41.01 | $ | 40.03 | $ | 30.73 | $ | 27.00 | ||||||||||||||||||||
|
|
|
|
|
|
|
|
|
|
|
|
|
|
|
|
|
|
|
| |||||||||||||||||||||
Total return | –3.06 | % | 2.77 | % | 7.08 | % | 14.34 | % | 5.36 | % | –2.46 | % | 2.45 | % | 30.26 | % | 13.81 | % | –2.46 | % | ||||||||||||||||||||
Ratios and supplemental data: | ||||||||||||||||||||||||||||||||||||||||
Net assets at end of year (in millions) | $ | 194.2 | $ | 230.1 | $ | 307.9 | $ | 311.9 | $ | 267.5 | $ | 94.0 | $ | 75.5 | $ | 80.4 | $ | 55.1 | $ | 51.1 | ||||||||||||||||||||
Ratios to average net assets: | ||||||||||||||||||||||||||||||||||||||||
Expenses | 0.80 | % | 0.77 | % | 0.77 | % | 0.79 | % | 0.78 | % | 1.01 | % | 1.00 | % | 1.01 | % | 1.04 | % | 1.02 | % | ||||||||||||||||||||
Net investment income (loss) | 5.65 | % | 5.73 | % | 6.36 | % | 7.17 | % | 7.69 | % | -0.29 | % | -0.45 | % | -0.44 | % | -0.10 | % | -0.64 | % | ||||||||||||||||||||
Portfolio turnover rate | 29 | % | 33 | % | 29 | % | 35 | % | 35 | % | 126 | % (a) | 44 | % | 42 | % | 42 | % | 44 | % | ||||||||||||||||||||
| (a) | Effective September 25, 2015, the sub-adviser changed from Eagle Asset Management, Inc. to ClearBridge, LLC. Costs of purchases and proceeds from sales of portfolio securities associated with the change in the sub-adviser contributed to a higher portfolio turnover rate for the year ended December 31, 2015 as compared to prior years. |
The accompanying notes are an integral part of these financial statements.
| 127 |
| Ohio National Fund, Inc. |
Financial Highlights |
| Nasdaq-100® Index Portfolio | Bristol Portfolio | |||||||||||||||||||||||||||||||||||||||
| Years Ended December 31, | Years Ended December 31, | |||||||||||||||||||||||||||||||||||||||
| 2015 | 2014 | 2013 | 2012 | 2011 | 2015 | 2014 | 2013 | 2012 | 2011 | |||||||||||||||||||||||||||||||
Selected per-share data: | ||||||||||||||||||||||||||||||||||||||||
Net asset value, beginning of year | $ | 10.88 | $ | 9.25 | $ | 6.85 | $ | 5.85 | $ | 5.69 | $ | 20.75 | $ | 18.29 | $ | 13.01 | $ | 11.56 | $ | 12.51 | ||||||||||||||||||||
Operations: | ||||||||||||||||||||||||||||||||||||||||
Net investment income | 0.09 | 0.12 | 0.07 | 0.06 | 0.02 | 0.12 | 0.09 | 0.09 | 0.09 | 0.06 | ||||||||||||||||||||||||||||||
Net realized and unrealized gain (loss) on investments | 0.91 | 1.62 | 2.39 | 0.99 | 0.16 | 0.73 | 2.45 | 5.27 | 1.43 | (0.95 | ) | |||||||||||||||||||||||||||||
|
|
|
|
|
|
|
|
|
|
|
|
|
|
|
|
|
|
|
| |||||||||||||||||||||
Total from operations | 1.00 | 1.74 | 2.46 | 1.05 | 0.18 | 0.85 | 2.54 | 5.36 | 1.52 | (0.89 | ) | |||||||||||||||||||||||||||||
|
|
|
|
|
|
|
|
|
|
|
|
|
|
|
|
|
|
|
| |||||||||||||||||||||
Distributions: | ||||||||||||||||||||||||||||||||||||||||
Distributions from net investment income | (0.08 | ) | (0.11 | ) | (0.06 | ) | (0.05 | ) | (0.02 | ) | (0.11 | ) | (0.08 | ) | (0.08 | ) | (0.07 | ) | (0.06 | ) | ||||||||||||||||||||
|
|
|
|
|
|
|
|
|
|
|
|
|
|
|
|
|
|
|
| |||||||||||||||||||||
Net asset value, end of year | $ | 11.80 | $ | 10.88 | $ | 9.25 | $ | 6.85 | $ | 5.85 | $ | 21.49 | $ | 20.75 | $ | 18.29 | $ | 13.01 | $ | 11.56 | ||||||||||||||||||||
|
|
|
|
|
|
|
|
|
|
|
|
|
|
|
|
|
|
|
| |||||||||||||||||||||
Total return | 9.14 | % | 18.77 | % | 35.98 | % | 17.88 | % | 3.19 | % | 4.08 | % | 13.88 | % | 41.21 | % | 13.19 | % | -7.16 | % | ||||||||||||||||||||
Ratios and supplemental data: | ||||||||||||||||||||||||||||||||||||||||
Net assets at end of year (in millions) | $ | 138.6 | $ | 121.7 | $ | 95.8 | $ | 68.5 | $ | 55.5 | $ | 218.7 | $ | 232.0 | $ | 231.5 | $ | 204.9 | $ | 192.7 | ||||||||||||||||||||
Ratios to average net assets: | ||||||||||||||||||||||||||||||||||||||||
Expenses | 0.46 | % | 0.48 | % | 0.51 | % | 0.53 | % | 0.52 | % | 0.81 | % | 0.81 | % | 0.82 | % | 0.85 | % | 0.84 | % | ||||||||||||||||||||
Net investment income | 0.79 | % | 1.23 | % | 0.94 | % | 0.98 | % | 0.41 | % | 0.55 | % | 0.42 | % | 0.51 | % | 0.68 | % | 0.52 | % | ||||||||||||||||||||
Portfolio turnover rate | 19 | % | 23 | % | 43 | % | 25 | % | 44 | % | 228 | % | 239 | % | 269 | % | 244 | % | 198 | % | ||||||||||||||||||||
The accompanying notes are an integral part of these financial statements.
| 128 |
| Ohio National Fund, Inc. |
Financial Highlights |
| Bryton Growth Portfolio | Balanced Portfolio | |||||||||||||||||||||||||||||||||||||||
| Years Ended December 31, | Years Ended December 31, | |||||||||||||||||||||||||||||||||||||||
| 2015 | 2014 | 2013 | 2012 | 2011 | 2015 | 2014 | 2013 | 2012 | 2011 | |||||||||||||||||||||||||||||||
Selected per-share data: | ||||||||||||||||||||||||||||||||||||||||
Net asset value, beginning of year | $ | 20.47 | $ | 19.28 | $ | 13.70 | $ | 12.31 | $ | 13.57 | $ | 18.96 | $ | 18.02 | $ | 15.76 | $ | 13.91 | $ | 13.87 | ||||||||||||||||||||
Operations: | ||||||||||||||||||||||||||||||||||||||||
Net investment income (loss) | (0.11 | ) | (0.09 | ) | (0.11 | ) | (0.07 | ) | (0.08 | ) | 0.30 | 0.16 | 0.08 | 0.10 | 0.31 | |||||||||||||||||||||||||
Net realized and unrealized gain (loss) on investments, foreign currency related transactions, and written options | (0.76 | ) | 1.28 | 5.69 | 1.46 | (1.18 | ) | (0.02 | ) | 0.92 | 2.32 | 1.75 | (0.00 | ) | ||||||||||||||||||||||||||
|
|
|
|
|
|
|
|
|
|
|
|
|
|
|
|
|
|
|
| |||||||||||||||||||||
Total from operations | (0.87 | ) | 1.19 | 5.58 | 1.39 | (1.26 | ) | 0.28 | 1.08 | 2.40 | 1.85 | 0.31 | ||||||||||||||||||||||||||||
|
|
|
|
|
|
|
|
|
|
|
|
|
|
|
|
|
|
|
| |||||||||||||||||||||
Distributions: | ||||||||||||||||||||||||||||||||||||||||
Distributions from net investment income | — | — | — | — | — | (0.25 | ) | (0.14 | ) | (0.14 | ) | — | (0.27 | ) | ||||||||||||||||||||||||||
|
|
|
|
|
|
|
|
|
|
|
|
|
|
|
|
|
|
|
| |||||||||||||||||||||
Net asset value, end of year | $ | 19.60 | $ | 20.47 | $ | 19.28 | $ | 13.70 | $ | 12.31 | $ | 18.99 | $ | 18.96 | $ | 18.02 | $ | 15.76 | $ | 13.91 | ||||||||||||||||||||
|
|
|
|
|
|
|
|
|
|
|
|
|
|
|
|
|
|
|
| |||||||||||||||||||||
Total return | –4.25 | % | 6.17 | % | 40.73 | % | 11.29 | % | –9.29 | % | 1.47 | % | 5.99 | % | 15.26 | % | 13.30 | % | 2.29 | % | ||||||||||||||||||||
Ratios and supplemental data: | ||||||||||||||||||||||||||||||||||||||||
Net assets at end of year (in millions) | $ | 162.2 | $ | 179.1 | $ | 180.8 | $ | 157.7 | $ | 155.4 | $ | 864.9 | $ | 833.1 | $ | 249.1 | $ | 77.1 | $ | 17.1 | ||||||||||||||||||||
Ratios to average net assets: | ||||||||||||||||||||||||||||||||||||||||
Ratios net of expenses reduced or reimbursed by adviser: | ||||||||||||||||||||||||||||||||||||||||
Expenses | 0.88 | % | 0.88 | % | 0.89 | % | 0.93 | % | 0.91 | % | 0.64 | % | 0.64 | % | 0.75 | % | 0.86 | % | 0.94 | % | ||||||||||||||||||||
Net investment income | –0.53 | % | –0.45 | % | –0.59 | % | –0.57 | % | –0.67 | % | 1.58 | % | 1.80 | % | 1.45 | % | 1.90 | % | 2.33 | % | ||||||||||||||||||||
Ratios assuming no expenses reduced or reimbursed by adviser: | ||||||||||||||||||||||||||||||||||||||||
Expenses | 0.88 | % | 0.88 | % | 0.89 | % | 0.93 | % | 0.91 | % | 0.64 | % | 0.68 | % | 0.75 | % | 0.86 | % | 0.94 | % | ||||||||||||||||||||
Portfolio turnover rate | 169 | % | 178 | % | 185 | % | 152 | % | 156 | % | 92 | % | 94 | % | 82 | % (a) | 60 | % | 47 | % | ||||||||||||||||||||
| (a) | The cost of purchases and proceeds from sales of securities that were incurred to realign the Portfolio’s holdings subsequent to the December 20, 2013 reorganization are excluded from the 2013 portfolio turnover rate calculation. If such amounts had not been excluded, the portfolio turnover rate would have been 89%. |
The accompanying notes are an integral part of these financial statements.
| 129 |
| Ohio National Fund, Inc. |
Financial Highlights |
| Target VIP Portfolio | Bristol Growth Portfolio | |||||||||||||||||||||||||||||||||||||||
| Years Ended December 31, | Years Ended December 31, | |||||||||||||||||||||||||||||||||||||||
| 2015 | 2014 | 2013 | 2012 | 2011 | 2015 | 2014 | 2013 | 2012 | 2011 | |||||||||||||||||||||||||||||||
Selected per-share data: | ||||||||||||||||||||||||||||||||||||||||
Net asset value, beginning of year | $ | 14.49 | $ | 13.70 | $ | 10.10 | $ | 8.89 | $ | 9.11 | $ | 16.44 | $ | 14.72 | $ | 10.66 | $ | 9.63 | $ | 9.84 | ||||||||||||||||||||
Operations: | ||||||||||||||||||||||||||||||||||||||||
Net investment income | 0.25 | 0.25 | 0.09 | 0.18 | 0.10 | 0.08 | 0.06 | 0.06 | 0.06 | 0.04 | ||||||||||||||||||||||||||||||
Net realized and unrealized gain (loss) on investments and foreign currency related transactions | (0.72 | ) | 0.77 | 3.61 | 1.17 | (0.23 | ) | 0.86 | 1.71 | 4.05 | 1.02 | (0.21 | ) | |||||||||||||||||||||||||||
|
|
|
|
|
|
|
|
|
|
|
|
|
|
|
|
|
|
|
| |||||||||||||||||||||
Total from operations | (0.47 | ) | 1.02 | 3.70 | 1.35 | (0.13 | ) | 0.94 | 1.77 | 4.11 | 1.08 | (0.17 | ) | |||||||||||||||||||||||||||
|
|
|
|
|
|
|
|
|
|
|
|
|
|
|
|
|
|
|
| |||||||||||||||||||||
Distributions: | ||||||||||||||||||||||||||||||||||||||||
Distributions from net investment income | (0.21 | ) | (0.23 | ) | (0.10 | ) | (0.14 | ) | (0.09 | ) | (0.07 | ) | (0.05 | ) | (0.05 | ) | (0.05 | ) | (0.04 | ) | ||||||||||||||||||||
|
|
|
|
|
|
|
|
|
|
|
|
|
|
|
|
|
|
|
| |||||||||||||||||||||
Net asset value, end of year | $ | 13.81 | $ | 14.49 | $ | 13.70 | $ | 10.10 | $ | 8.89 | $ | 17.31 | $ | 16.44 | $ | 14.72 | $ | 10.66 | $ | 9.63 | ||||||||||||||||||||
|
|
|
|
|
|
|
|
|
|
|
|
|
|
|
|
|
|
|
| |||||||||||||||||||||
Total return | –3.24 | % | 7.44 | % | 36.71 | % | 15.24 | % | –1.41 | % | 5.72 | % | 12.01 | % | 38.62 | % | 11.20 | % | –1.77 | % | ||||||||||||||||||||
Ratios and supplemental data: | ||||||||||||||||||||||||||||||||||||||||
Net assets at end of year (in millions) | $ | 46.3 | $ | 55.1 | $ | 53.7 | $ | 21.2 | $ | 20.5 | $ | 116.2 | $ | 124.1 | $ | 122.3 | $ | 108.0 | $ | 99.9 | ||||||||||||||||||||
Ratios to average net assets: | ||||||||||||||||||||||||||||||||||||||||
Expenses | 0.77 | % | 0.77 | % | 0.82 | % | 0.87 | % | 0.84 | % | 0.86 | % | 0.86 | % | 0.88 | % | 0.92 | % | 0.90 | % | ||||||||||||||||||||
Net investment income | 1.54 | % | 1.77 | % | 0.92 | % | 1.73 | % | 1.07 | % | 0.43 | % | 0.34 | % | 0.42 | % | 0.57 | % | 0.41 | % | ||||||||||||||||||||
Portfolio turnover rate | 72 | % | 79 | % | 57 | % (a) | 70 | % | 79 | % | 168 | % | 192 | % | 237 | % | 229 | % | 187 | % | ||||||||||||||||||||
| (a) | The cost of purchases and proceeds from sales of securities that were incurred to realign the Portfolio’s holdings subsequent to the December 20, 2013 reorganization are excluded from the 2013 portfolio turnover rate calculation. If such amounts had not been excluded, the portfolio turnover rate would have been 138%. |
The accompanying notes are an integral part of these financial statements.
| 130 |
| Ohio National Fund, Inc. |
Financial Highlights |
| Risk Managed Balanced Portfolio | ||||||||
| Year Ended December 31, 2015 | Period from May 1, 2014* to December 31, 2014 | |||||||
Selected per-share data: | ||||||||
Net asset value, beginning of year | $ | 10.83 | $ | 10.00 | ||||
Operations: | ||||||||
Net investment income | 0.03 | 0.03 | ||||||
Net realized and unrealized gain (loss) on investments, futures contracts, and foreign currency related transactions | (0.17 | ) | 0.80 | |||||
|
|
|
| |||||
Total from operations | (0.14 | ) | 0.83 | |||||
|
|
|
| |||||
Distributions: | ||||||||
Distributions from net investment income | (0.03 | ) | — | |||||
|
|
|
| |||||
Net asset value, end of year | $ | 10.66 | $ | 10.83 | ||||
|
|
|
| |||||
Total return | –1.32 | % | 8.30 | %** | ||||
Ratios and supplemental data: | ||||||||
Net assets at end of year (in millions) | $ | 154.3 | $ | 33.8 | ||||
Ratios to average net assets: | ||||||||
Expenses | 1.11 | % | 1.43 | %*** | ||||
Net investment income | 0.81 | % | 0.43 | %*** | ||||
Portfolio turnover rate | 71 | % | 94 | %** | ||||
| * | Represents date of inception and commencement of operations. |
| ** | Not annualized |
| *** | Annualized |
The accompanying notes are an integral part of these financial statements.
| 131 |
| Ohio National Fund, Inc. |
| December 31, 2015 |
| (1) | Organization |
Ohio National Fund, Inc. (the “Fund”) is a Maryland corporation registered under the Investment Company Act of 1940, as amended (the “40 Act”). The Fund is an open-end investment company and follows accounting and reporting guidance under Financial Accounting Standards Board (“FASB”) Accounting Standards Codification (“ASC”) Topic 946, “Financial Services-Investment Companies”. The Fund consists of twenty-one separate investment portfolios (the “Portfolios”) that seek the following objectives and strategies:
| ¢ | Equity Portfolio — Long-term growth of capital by investing at least 80% of its assets in equity securities. |
| ¢ | Money Market Portfolio — Maximum current income consistent with preservation of principal and liquidity by investing in high quality money market instruments. |
| ¢ | Bond Portfolio — High level of income and opportunity for capital appreciation consistent with preservation of capital by investing primarily in intermediate-term and long-term fixed income securities. |
| ¢ | Omni Portfolio — High level of long-term total return consistent with preservation of capital by investing in stocks, bonds, and money market instruments. |
| ¢ | International Portfolio — Long term growth of capital by investing at least 80% of its assets in securities of foreign companies. |
| ¢ | Capital Appreciation Portfolio — Long-term capital growth by investing primarily in equity and equity related securities of established companies with either current or emerging earnings growth not fully appreciated or recognized by the market. |
| ¢ | International Small-Mid Company Portfolio — Long-term growth of capital by investing at least 80% of its assets in equity securities of non-U.S. small and mid-cap companies. |
| ¢ | Aggressive Growth Portfolio — Long-term capital growth by investing primarily in domestic and foreign equity securities selected for growth potential. |
| ¢ | Small Cap Growth Portfolio — Long-term capital appreciation by investing at least 80% of its net assets in stocks of small capitalization companies. |
| ¢ | Mid Cap Opportunity Portfolio — Long-term total return by investing at least 80% of its net assets in equity securities of mid-cap companies, primarily those that are strategically positioned for long-term growth. |
| ¢ | S&P 500® Index Portfolio — Total return that approximates the total return of the Standard & Poor’s 500® Index, at a risk level consistent with that of the Standard & Poor’s 500® Index. |
| ¢ | Strategic Value Portfolio — Growth of capital and income by investing primarily in high dividend yielding common stocks with dividend growth potential. |
| ¢ | High Income Bond Portfolio — High current income by investing at least 80% of its net assets in lower rated corporate debt obligations commonly referred to as “junk bonds”. The Portfolio’s investments are generally rated Ba or lower by Moody’s, or BB or lower by Standard & Poor’s or Fitch. |
| ¢ | ClearBridge Small Cap Portfolio (prior to September 25, 2015, the name of the Portfolio was the Capital Growth Portfolio) — Long-term capital appreciation by investing at least 80% of its net assets in common stocks and other equity securities of small capitalization companies or in other investments that the portfolio managers believe have similar economic characteristics. |
| ¢ | Nasdaq-100® Index Portfolio — Long-term growth of capital by investing primarily in stocks that are included in the Nasdaq-100® Index. Unlike the other Portfolios of the Fund, the Nasdaq-100® Index Portfolio is a non-diversified portfolio for purposes of Section 5(b) of the 40 Act. |
| ¢ | Bristol Portfolio — Long-term growth of capital by investing primarily in common stocks of the 1,000 largest publicly traded U.S. companies in terms of market capitalization. |
| ¢ | Bryton Growth Portfolio — Long-term growth of capital by investing primarily in common stocks of growth-oriented U.S. companies smaller than the 500 largest publicly traded U.S. companies in terms of market capitalization. |
| 132 | (continued) |
| Ohio National Fund, Inc. |
Notes to Financial Statements (Continued) | December 31, 2015 |
| ¢ | Balanced Portfolio — Capital appreciation and income by investing normally up to 75% of its total assets in equity securities of domestic and foreign companies of any market capitalization while maintaining a minimum of 25% of its total assets in fixed income securities. |
| ¢ | Target VIP Portfolio — Above average total return by investing in the common stocks of companies which are identified by a model that applies separate uniquely specialized strategies. |
| ¢ | Bristol Growth Portfolio — Long-term growth of capital by investing primarily in common stocks of the 1,000 largest publicly traded U.S. companies in terms of market capitalization. |
| ¢ | Risk Managed Balanced Portfolio — Long-term capital growth, consistent with preservation of capital and balanced by current income. The Portfolio invests in a balanced portfolio of equity and fixed-income securities and a risk management portfolio intended to enhance the risk adjusted return of the Portfolio. |
Additional detail regarding portfolio-specific objectives, policies, and investment strategies is provided in the prospectus and Statement of Additional Information of Ohio National Fund, Inc. There are no assurances that these objectives will be met. Each Portfolio, except the Nasdaq-100® Index Portfolio, is classified as diversified for purposes of Section 5(b) of the 40 Act.
At present, the Fund sells its shares only to separate accounts of The Ohio National Life Insurance Company (“ONLIC”), Ohio National Life Assurance Corporation (“ONLAC”), and National Security Life and Annuity Company (“NSLA”) to support certain benefits under variable contracts issued by those entities. In the future, Fund shares may be used for other purposes but, unless there is a change in applicable law, they will not be sold directly to the public.
Interest in each Portfolio is represented by a separate class of the Fund’s capital stock, par value $1. Each share of a Portfolio participates equally in the Portfolio’s dividends, distributions, net assets, and voting matters.
The Fund is authorized to issue 550 million of its capital shares. These authorized shares have been allocated to specific Portfolios of the Fund as follows:
Portfolio | Authorized Shares | |||
Equity | 25,000,000 | |||
Money Market | 55,000,000 | |||
Bond | 30,000,000 | |||
Omni | 10,000,000 | |||
International | 30,000,000 | |||
Capital Appreciation | 25,000,000 | |||
International Small-Mid Company | 7,000,000 | |||
Aggressive Growth | 7,000,000 | |||
Small Cap Growth | 15,000,000 | |||
Mid Cap Opportunity | 6,000,000 | |||
S&P 500® Index | 35,000,000 | |||
Portfolio | Authorized Shares | |||
Strategic Value | 65,000,000 | |||
High Income Bond | 35,000,000 | |||
ClearBridge Small Cap | 5,000,000 | |||
Nasdaq-100® Index | 25,000,000 | |||
Bristol | 40,000,000 | |||
Bryton Growth | 30,000,000 | |||
Balanced | 55,000,000 | |||
Target VIP | 10,000,000 | |||
Bristol Growth | 25,000,000 | |||
Risk Managed Balanced | 15,000,000 | |||
The Fund’s Board of Directors (the “Board”) periodically reallocates authorized shares among the Portfolios of the Fund and may authorize additional shares as deemed necessary.
Under the Fund’s organizational documents, its Officers and Directors are indemnified against certain liabilities arising out of the performance of their duties to the Fund. In addition, in the normal course of business, the Fund enters into contracts with its vendors and others that provide for general indemnifications. The Fund’s maximum exposure under these arrangements is unknown as this would involve future claims that may be made against the Fund. However, based on experience, the risk of loss to the Fund is expected to be remote.
| (2) | Significant Accounting Policies |
The following is a summary of significant accounting policies followed by the Fund in preparation of its Schedules of Investments:
Use of Estimates
The preparation of Schedules of Investments in conformity with U.S. generally accepted accounting principles (“U.S. GAAP”) requires management to make estimates and assumptions that affect the reported amounts of assets and liabilities and
| 133 | (continued) |
| Ohio National Fund, Inc. |
Notes to Financial Statements (Continued) | December 31, 2015 |
disclosure of contingent assets and liabilities at the date of the financial statements and the reported amounts of increases and decreases in net assets from operations during the reporting period. Actual results could differ from those estimates.
Security Valuation
Investments are valued using pricing procedures approved by the Board.
Various investments in the Money Market Portfolio are valued at amortized cost in accordance with Rule 2a-7 of the 40 Act. In all Portfolios of the Fund, fixed income instruments that mature in sixty days or less, and of sufficient credit quality, are valued at amortized cost. Amortized cost valuation involves valuing a security at its cost initially and thereafter amortizing to maturity any discounts or premiums on the level-yield method, regardless of the impact of fluctuating market interest rates on the value of the security. In these instances, amortized cost approximates fair value.
Investments, other than those securities aforementioned, are valued as follows:
Domestic equity securities that are traded on U.S. exchanges, other than Nasdaq Stock Market, are valued at the last trade price reported by the primary exchange of each security (4:00 pm Eastern Time for normal trading sessions). Domestic equity securities that are listed on the Nasdaq Stock Market are valued at the Nasdaq Official Closing Price (“NOCP”). Over-the-counter domestic equity securities are valued at the last trade price reported daily as of 4:00 pm Eastern Time (normal trading sessions). Over-the-counter traded ADRs may also be valued at an evaluated price based on the value of the underlying securities. If a domestic equity security is not traded on a particular day, the mean between the bid and ask prices reported at 4:00 pm Eastern Time (normal trading sessions) by the primary exchange will generally be used for valuation purposes. The principal sources for market quotations are independent pricing services that have been approved by the Board.
Fixed income securities that have a remaining maturity exceeding sixty days are generally valued at the bid price reported at 4:00 pm Eastern Time (normal trading sessions), as provided by independent pricing services approved by the Board.
Shares of open-end mutual funds are valued at each fund’s last calculated net asset value per share.
Restricted securities, illiquid securities, or other investments for which market quotations or other observable market inputs are not readily available are valued at an estimate of value using methods determined in good faith by the Fund’s Pricing Committee under the supervision of the Board.
Foreign equity securities are initially priced at the reported close price of the exchange on which a security is primarily traded. Securities not traded on a particular day are valued at the mean between the last reported bid and ask quotes at daily close, or the last sale price when appropriate. The principal sources for market quotations are independent pricing services that have been approved by the Board.
Equity securities that are primarily traded on foreign exchanges, other than those with close times that are consistent with the normal 4:00 pm Eastern Time close of U.S. equity markets, are further subjected to fair valuation pricing procedures provided by an independent fair valuation service. The service provides data that can be used to estimate the price of a foreign issue that would prevail in a liquid market given market information available daily at 4:00 pm Eastern Time (normal trading sessions). Multiple factors may be considered in performing this valuation, including an issue’s local close price, relevant general and sector indices, currency fluctuations, and pricing of related depository receipts, exchange traded funds, and futures. The pricing procedures are performed for each individual security for which there is a fairly large degree of certainty that the local close price is not the liquid market price at the time of U.S. market close. The procedures are performed each day there is a change in a consistently used market index from the time of local close to the U.S. market close. Backtesting analysis is performed on a quarterly basis to monitor the effectiveness of these procedures. The testing is reviewed by management of the Fund as well as the Fund’s Board. Prior results have indicated that these procedures have been effective in reaching valuation objectives.
The differences between the aggregate cost and values of investments are reflected as unrealized appreciation or unrealized depreciation.
Pricing inputs used in the Fund’s determination of its investment values are categorized according to a three-tier hierarchy framework. The hierarchy is summarized in three broad levels:
| Level 1: | Quoted prices in active markets for identical securities. |
| 134 | (continued) |
| Ohio National Fund, Inc. |
Notes to Financial Statements (Continued) | December 31, 2015 |
| Level 2: | Other significant observable inputs, including quoted prices for similar securities, interest rates, prepayment speeds, credit risk, etc. |
| Level 3: | Significant unobservable inputs, including the Fund’s own assumptions used to determine the value of securities. |
The following is a summary of the inputs used in valuing each of the Portfolio’s assets (liabilities) at value as of December 31, 2015:
| Portfolio | Financial Instrument Type | Level 1 | Level 2 | Level 3 | ||||||||||
Equity | Common Stocks** | $ | 528,143,954 | $ | — | $ | — | |||||||
| Master Limited Partnerships** | 6,027,250 | — | — | |||||||||||
| Money Market Funds | 18,889,000 | — | — | |||||||||||
|
|
|
|
|
| |||||||||
| $ | 553,060,204 | $ | — | $ | — | |||||||||
|
|
|
|
|
| |||||||||
Money Market* | Commercial Paper** | $ | — | �� | $ | 110,492,478 | $ | — | ||||||
| U.S. Treasury Obligations | — | 9,999,898 | — | |||||||||||
| U.S. Government Agency Issues | — | 9,999,203 | — | |||||||||||
| Money Market Funds | 27,000,000 | — | — | |||||||||||
|
|
|
|
|
| |||||||||
| $ | 27,000,000 | $ | 130,491,579 | $ | — | |||||||||
|
|
|
|
|
| |||||||||
Bond | Corporate Bonds** | $ | — | $ | 148,852,860 | $ | — | |||||||
| Asset-Backed Securities** | — | 843,748 | — | |||||||||||
| U.S. Treasury Obligations | — | 972,240 | — | |||||||||||
| Money Market Funds | 441,000 | — | — | |||||||||||
|
|
|
|
|
| |||||||||
| $ | 441,000 | $ | 150,668,848 | $ | — | |||||||||
|
|
|
|
|
| |||||||||
Omni | Common Stocks** | $ | 36,823,175 | $ | — | $ | — | |||||||
| Corporate Bonds** | — | 11,378,659 | — | |||||||||||
| Asset-Backed Securities** | — | 93,750 | — | |||||||||||
| U.S. Treasury Obligations | — | 347,620 | — | |||||||||||
| Money Market Funds | 102,000 | — | — | |||||||||||
|
|
|
|
|
| |||||||||
| $ | 36,925,175 | $ | 11,820,029 | $ | — | |||||||||
|
|
|
|
|
| |||||||||
International | Common Stocks** | $ | 25,404,295 | $ | 127,637,598 | $ | — | |||||||
| Preferred Stocks** | — | 837,014 | — | |||||||||||
| Money Market Funds | 5,997,019 | — | — | |||||||||||
|
|
|
|
|
| |||||||||
| $ | 31,401,314 | $ | 128,474,612 | $ | — | |||||||||
|
|
|
|
|
| |||||||||
| Futures contracts | $ | (124,315 | ) | $ | — | $ | — | |||||||
|
|
|
|
|
| |||||||||
| Foreign currency contracts | $ | — | $ | (146,527 | ) | $ | — | |||||||
|
|
|
|
|
| |||||||||
Capital Appreciation | Common Stocks** | $ | 406,657,253 | $ | 5,481,617 | $ | — | |||||||
| Money Market Funds | 26,660,000 | — | — | |||||||||||
|
|
|
|
|
| |||||||||
| $ | 433,317,253 | $ | 5,481,617 | $ | — | |||||||||
|
|
|
|
|
| |||||||||
International Small-Mid Company | Common Stocks** | $ | 14,799,653 | $ | 59,342,972 | $ | — | |||||||
| Money Market Funds | 3,913,594 | — | — | |||||||||||
|
|
|
|
|
| |||||||||
| $ | 18,713,247 | $ | 59,342,972 | $ | — | |||||||||
|
|
|
|
|
| |||||||||
| Foreign currency contracts | $ | — | $ | 463,110 | $ | — | ||||||||
|
|
|
|
|
| |||||||||
| Futures contracts | $ | (20,803 | ) | $ | — | $ | — | |||||||
|
|
|
|
|
| |||||||||
Aggressive Growth | Common Stocks** | $ | 50,207,899 | $ | — | $ | — | |||||||
| Money Market Funds | 1,387,000 | — | — | |||||||||||
|
|
|
|
|
| |||||||||
| $ | 51,594,899 | $ | — | $ | — | |||||||||
|
|
|
|
|
| |||||||||
Small Cap Growth | Common Stocks** | $ | 221,197,528 | $ | 6,020,589 | $ | — | |||||||
| Master Limited Partnerships** | 4,465,316 | — | — | |||||||||||
| Money Market Funds | 9,074,000 | — | — | |||||||||||
|
|
|
|
|
| |||||||||
| $ | 234,736,844 | $ | 6,020,589 | $ | — | |||||||||
|
|
|
|
|
|
| 135 | (continued) |
| Ohio National Fund, Inc. |
Notes to Financial Statements (Continued) | December 31, 2015 |
Portfolio | Financial Instrument Type | Level 1 | Level 2 | Level 3 | ||||||||||
Mid Cap Opportunity | Common Stocks** | $ | 77,023,840 | $ | — | $ | — | |||||||
| Money Market Funds | 1,847,000 | — | — | |||||||||||
|
|
|
|
|
| |||||||||
| $ | 78,870,840 | $ | — | $ | — | |||||||||
|
|
|
|
|
| |||||||||
S&P 500® Index | Common Stocks** | $ | 392,659,147 | $ | — | $ | — | |||||||
| Exchange Traded Funds | 17,274,580 | — | — | |||||||||||
|
|
|
|
|
| |||||||||
| $ | 409,933,727 | $ | — | $ | — | |||||||||
|
|
|
|
|
| |||||||||
Strategic Value | Common Stocks** | $ | 250,764,672 | $ | 54,231,931 | $ | — | |||||||
| Money Market Funds | 10,286,000 | — | — | |||||||||||
|
|
|
|
|
| |||||||||
| $ | 261,050,672 | $ | 54,231,931 | $ | — | |||||||||
|
|
|
|
|
| |||||||||
High Income Bond | Corporate Bonds** | $ | — | $ | 184,671,849 | $ | — | |||||||
| Common Stocks** | — | — | 8,419 | |||||||||||
| Money Market Funds | 2,293,000 | — | — | |||||||||||
|
|
|
|
|
| |||||||||
| $ | 2,293,000 | $ | 184,671,849 | $ | 8,419 | |||||||||
|
|
|
|
|
| |||||||||
ClearBridge Small Cap | Common Stocks** | $ | 90,910,765 | $ | — | $ | — | |||||||
| Money Market Funds | 2,518,000 | — | — | |||||||||||
|
|
|
|
|
| |||||||||
| $ | 93,428,765 | $ | — | $ | — | |||||||||
|
|
|
|
|
| |||||||||
Nasdaq-100® Index | Common Stocks** | $ | 133,191,353 | $ | — | $ | — | |||||||
| Exchange Traded Funds | 5,668,506 | — | — | |||||||||||
|
|
|
|
|
| |||||||||
| $ | 138,859,859 | $ | — | $ | — | |||||||||
|
|
|
|
|
| |||||||||
Bristol | Common Stocks** | $ | 217,767,388 | $ | — | $ | — | |||||||
| Money Market Funds | 758,000 | — | — | |||||||||||
|
|
|
|
|
| |||||||||
| $ | 218,525,388 | $ | — | $ | — | |||||||||
|
|
|
|
|
| |||||||||
Bryton Growth | Common Stocks** | $ | 159,284,388 | $ | — | $ | — | |||||||
| Money Market Funds | 3,894,000 | — | — | |||||||||||
|
|
|
|
|
| |||||||||
| $ | 163,178,388 | $ | — | $ | — | |||||||||
|
|
|
|
|
| |||||||||
Balanced | Common Stocks** | $ | 477,905,288 | $ | — | $ | — | |||||||
| Corporate Bonds** | — | 161,758,403 | — | |||||||||||
| Preferred Stocks** | 14,729,244 | 11,947,000 | — | |||||||||||
| Trust Preferred Securities** | 12,760,354 | 23,896,206 | — | |||||||||||
| Master Limited Partnerships** | 1,617,000 | — | — | |||||||||||
| Asset-Backed / Mortgage-Backed Securities** | — | 20,541,120 | — | |||||||||||
| U.S. Treasury Obligations | — | 39,978,091 | — | |||||||||||
| Closed-End Mutual Funds | 54,447,616 | — | — | |||||||||||
| Exchange Traded Funds | 23,838,750 | — | — | |||||||||||
| Purchased Options | 2,112,000 | — | — | |||||||||||
| Money Market Funds | 8,140,000 | — | — | |||||||||||
|
|
|
|
|
| |||||||||
| $ | 595,550,252 | $ | 258,120,820 | $ | — | |||||||||
|
|
|
|
|
| |||||||||
| Written Options Outstanding | $ | (372,000 | ) | $ | — | $ | — | |||||||
|
|
|
|
|
| |||||||||
Target VIP | Common Stocks** | $ | 45,779,871 | $ | — | $ | — | |||||||
| Money Market Funds | 511,000 | — | — | |||||||||||
|
|
|
|
|
| |||||||||
| $ | 46,290,871 | $ | — | $ | — | |||||||||
|
|
|
|
|
| |||||||||
Bristol Growth | Common Stocks** | $ | 115,577,619 | $ | — | $ | — | |||||||
| Money Market Funds | 820,000 | — | — | |||||||||||
|
|
|
|
|
| |||||||||
| $ | 116,397,619 | $ | — | $ | — | |||||||||
|
|
|
|
|
| |||||||||
| 136 | (continued) |
| Ohio National Fund, Inc. |
Notes to Financial Statements (Continued) | December 31, 2015 |
Portfolio | Financial Instrument Type | Level 1 | Level 2 | Level 3 | ||||||||||
Risk Managed Balanced | Common Stocks** | $ | 71,599,448 | $ | 1,497,266 | $ | — | |||||||
| Corporate Bonds** | — | 19,019,908 | — | |||||||||||
| Preferred Stocks** | 7,514 | 426,159 | — | |||||||||||
| Trust Preferred Securities** | 99,305 | 561,116 | — | |||||||||||
| Preferred Stock Depository Receipts** | 504,761 | 278,061 | — | |||||||||||
| Master Limited Partnerships** | 2,160,982 | — | — | |||||||||||
| Asset-Backed / Mortgage-Backed Securities** | — | 2,822,072 | — | |||||||||||
| U.S. Treasury Obligations | — | 12,186,420 | — | |||||||||||
| U.S. Government Agency Mortgage-Backed Securities | — | 10,789,927 | — | |||||||||||
| Purchased Options | 4,455,260 | 5,807,493 | — | |||||||||||
| Money Market Funds | 21,874,000 | — | — | |||||||||||
|
|
|
|
|
| |||||||||
| $ | 100,701,270 | $ | 53,388,422 | $ | — | |||||||||
|
|
|
|
|
| |||||||||
| Futures contracts | $ | 91,427 | $ | — | $ | — | ||||||||
|
|
|
|
|
| |||||||||
| * | At December 31, 2015, the Money Market Portfolio’s commercial paper investments were valued using amortized cost, in accordance with rules under the 40 Act. Amortized cost approximates the current fair value of a security, but since the value is not obtained from a quoted price in an active market, such securities are considered to be valued using Level 2 inputs. |
| ** | For detailed industry descriptions, see the accompanying Schedules of Investments. |
As stated above, the value assigned to the Fund’s foreign securities will, in most cases, not be the quoted or published prices of the investments on their respective primary markets or exchanges. Securities that are priced using fair value estimates are categorized as Level 2 in the fair value hierarchy, whereas securities that do not meet the established criteria are categorized as Level 1. The valuation of a foreign security from one valuation period to the next may result in a transfer between Levels 1 and 2 if the degree of certainty that the local close price is not the liquid market price at the time of U.S. market close is not similar for both periods. The Fund’s policy is to recognize transfers between fair value hierarchy levels at the reporting period end.
For the International Small-Mid Company Portfolio, there was a transfer of a security from Level 2 pricing at December 31, 2014, to Level 1 at December 31, 2015. This security was that Portfolio’s holding of Vectura Group PLC common stock. The fair valuation service provider reported that this security did not meet the minimum predictability threshold to be fair valued at December 31, 2015 and was not fair valued in the current period, whereas in the prior period, the security met the threshold to be fair valued. The value of this holding was $323,891 and $304,122 at December 31, 2015 and December 31, 2014, respectively.
Below is a reconciliation that details the activity of securities in Level 3 during the year ended December 31, 2015:
| High Income Bond | ||||
Beginning Balance – January 1, 2015 | $ | 5,799 | ||
Total gains or losses (realized/unrealized): | ||||
Included in earnings (or changes in net assets) | 2,620 | |||
Issuances | — | |||
Settlements | — | |||
Transfers out of Level 3 (due to availability of active market quotations or significant observable market inputs) | — | |||
Transfers into Level 3 (due to lack of active market quotations or significant observable inputs) | — | |||
|
| |||
Ending Balance – December 31, 2015 | $ | 8,419 | ||
|
| |||
The amount of total gains or losses for the period included in earnings (or changes in net assets) attributable to the change in unrealized gains or losses relating to assets still held at the reporting date | $ | 2,620 | ||
|
| |||
| 137 | (continued) |
| Ohio National Fund, Inc. |
Notes to Financial Statements (Continued) | December 31, 2015 |
The following table presents additional information about valuation techniques and inputs used for investments that are measured at fair value and categorized within Level 3 at December 31, 2015:
Instrument | Valuation Technique Used | Unobservable inputs | Input Values | |||||
Lone Pine Common Stock | Value of claim on the enterprise | Net enterprise value (in thousands) | $ | 135,030 | ||||
| value of underlying company | Share class claim on value | 25 | % | |||||
| # of share class total shares (in thousands) | 24,990 | |||||||
Foreign Securities and Currency
The books and records of all the Portfolios are maintained in U.S. dollars. All investments and cash quoted in foreign currencies are valued daily in U.S. dollars on the basis of the foreign currency exchange rates provided by an independent source. These exchange rates are currently determined daily, at 4:00 pm Eastern Time for normal trading sessions. Purchases and sales of foreign-denominated investments are recorded at rates of exchange prevailing on the respective dates of such transactions.
The Fund may not fully isolate that portion of the results of operations resulting from changes in foreign exchange rates from fluctuations arising from changes in market prices on foreign currency-denominated investments. For the portion that is isolated, amounts are reflected in the Statements of Operations as other foreign currency related transactions. However, for tax purposes, the Fund does fully isolate the effect of fluctuations in foreign exchange rates when determining the gain or loss upon sale or maturity of such investments to the extent required by federal income tax regulations.
All Portfolios of the Fund may invest in securities of foreign issuers. Securities of foreign issuers that are purchased by the Money Market Portfolio are limited to 50% of that Portfolio’s assets and must be denominated in U.S. dollars and held in custody in the United States of America. The International and International Small-Mid Company Portfolios may be invested entirely in foreign securities. Investments in securities of foreign issuers, including investments in foreign companies through the use of depositary receipts, carry certain risks not ordinarily associated with investments in securities of domestic issuers. Such risks include future political and economic developments, and the possible imposition of exchange controls or other foreign governmental laws and restrictions. In addition, with respect to certain countries, there is the possibility of expropriation of assets, confiscatory taxation, political or social instability, or diplomatic developments that could adversely affect capital investment within those countries.
Restricted and Illiquid Securities
Restricted securities are those securities purchased through a private offering and cannot be resold to the general public without prior registration under the Securities Act of 1933 (“the 1933 Act”) or pursuant to the resale limitations provided by Rule 144A under the 1933 Act, or an exemption from the registration requirements of the 1933 Act. 144A securities are issued by corporations without registration in reliance on 1933 Act provisions allowing for the private resale of unregistered securities to qualified institutional buyers. Section 4(a)(2) commercial paper is issued pursuant to Section 4(a)(2) of the 1933 Act which exempts an issue from registration. This paper may be used to finance non-current transactions, such as acquisitions, stock repurchase programs, and other long-term assets. Investments by a portfolio in Rule 144A and Section 4(a)(2) securities could have the effect of decreasing the liquidity of a Portfolio during any period in which qualified institutional investors were no longer interested in purchasing these securities.
Typically, the restricted securities noted above are not considered illiquid. The criteria used to determine if a restricted security is illiquid includes frequency of trades and quotes, available dealers willing to make transactions, availability of market makers in the security, and the nature of the security and its trades. The Money Market, Bond, and Omni Portfolios may invest up to 10% of their respective assets in illiquid securities. Each of the other Portfolios of the Fund may invest up to 15% of its net assets in illiquid securities.
Investment Transactions and Related Income
For financial reporting purposes, investment transactions are accounted for on a trade date basis. For purposes of executing separate account shareholder transactions in the normal course of business, however, the Fund’s investment transactions are recorded no later than the first calculation on the first business day following the trade date in accordance with Rule 2a-4 of the 40 Act. Accordingly, differences between the net asset values for financial reporting and for executing separate account shareholder transactions may arise.
| 138 | (continued) |
| Ohio National Fund, Inc. |
Notes to Financial Statements (Continued) | December 31, 2015 |
Dividend income is recognized on the ex-dividend date, except in the case of those Portfolios holding foreign securities, in which dividends are recorded as soon after the ex-dividend date as the Fund’s information agents become aware of such dividends. Interest income is accrued daily as earned and includes the amortization of premium and accretion of discount. Net realized gain or loss on investments and foreign exchange transactions are determined using the specific identification method.
Distributions to Shareholders and Federal Taxes
Net investment income of the Money Market Portfolio is declared and paid daily as a dividend to shareholders immediately before the computation of the net asset value of Money Market Portfolio shares. Dividends are automatically reinvested in additional Money Market Portfolio shares at the net asset value immediately following such computation. Distributions arising from net investment income and net capital gains from the remaining Portfolios are declared and paid to shareholders periodically as required for each of the Portfolios to continue to qualify as a regulated investment company pursuant to Subchapter M of the Internal Revenue Code. The Fund, excluding the Money Market Portfolio, may also fully or partially satisfy its distribution requirements by using consent dividends rather than cash dividends if consent dividends are authorized, these amounts will become taxable to the shareholders as if they were paid in cash. The Fund has the intent to continue to comply with tax provisions pertaining to regulated investment companies and make distributions of taxable income, whether by cash or consent dividends, sufficient to relieve it from substantially all federal income and excise taxes. As such, no provisions for federal income or excise taxes have been recorded.
The character of income and realized capital gains distributions are determined in accordance with federal income tax regulations and may differ from net investment income and realized gains for financial reporting purposes. These “book/tax” differences are either considered temporary or permanent in nature. To the extent these differences are permanent in nature they are reclassified within the composition of net assets; temporary differences do not require such reclassification. Distributions to shareholders that exceed taxable income and net taxable realized gains are reported as return of capital distributions.
The Fund’s management and its tax agent, U.S. Bancorp Fund Services, LLC, perform an affirmative evaluation of tax positions taken or expected to be taken in the course of preparing the Fund’s tax returns to determine whether it is more-likely-than-not (i.e. greater than 50-percent) that each tax position will be sustained upon examination by a taxing authority based on the technical merits of the position. A tax position that meets the more-likely-than-not recognition threshold is measured to determine the amount of benefit to recognize in the Schedules of Investments. Differences between tax positions taken in a tax return and amounts recognized in the Schedules of Investments will generally result in an increase in a liability for taxes payable (or a reduction of a tax refund receivable), including the recognition of any related interest and penalties as an operating expense. Implementation of the evaluation included a review of tax positions taken in tax years that remain subject to examination by all major tax jurisdictions, including federal tax and the state of Maryland (i.e., the last four tax year ends and the interim tax period since then). The determination has been made that there are no uncertain tax positions that would require the Portfolios to record a tax liability and, therefore, there is no impact to the Portfolios’ Schedules of Investments.
Expense Allocation
Expenses directly attributable to a Portfolio are charged to that Portfolio. Expenses that cannot be directly attributed to a Portfolio are allocated among all the benefited Portfolios on a basis of relative net assets or other appropriate method.
Foreign Withholding Taxes
Certain Portfolios in the Fund may be subject to taxes imposed by countries in which they invest with respect to their investments in issuers existing or operating in such countries. Such taxes are generally withheld based on income earned. These Portfolios accrue such taxes as the related income is earned.
Subsequent Events
On November 19, 2015, the Board of Directors of the Ohio National Fund, Inc. (the “Fund”) considered and approved the liquidation and termination of the Money Market Portfolio subject to the approval by the Portfolio’s shareholders of a plan of liquidation (the “Plan of Liquidation”). If the proposed Plan of Liquidation is approved by the Portfolio’s shareholders, the Money Market Portfolio will, by the Liquidation Date (as defined below), in accordance with the Plan of Liquidation: (1) sell its portfolio
| 139 | (continued) |
| Ohio National Fund, Inc. |
Notes to Financial Statements (Continued) | December 31, 2015 |
securities for cash or permit them to mature and reduce any other assets to cash or cash equivalents; (2) pay any liabilities; (3) make a liquidating distribution equal to the shareholders’ interest in the remaining assets of the Portfolio without the deduction of any fees or imposition of any charges; and (4) wind up its operations and terminate its existence. If the proposed Plan of Liquidation is approved, the Portfolio is expected to be liquidated on or about February 26, 2016 (the “Liquidation Date”).
Management has evaluated events and transactions through the date the financial statements were issued, for purposes of recognition or disclosure in these financial statements, and there are no other subsequent events to report.
| (3) | Related Party and Other Transactions |
The Fund has an Investment Advisory Agreement with Ohio National Investments, Inc. (“ONI”), a wholly-owned subsidiary of ONLIC. Under the terms of this agreement, ONI provides portfolio management and investment advice to the Fund and administers its operations, subject to the supervision of the Fund’s Board. This agreement is renewed annually upon the approval by the Board. As compensation for its services, ONI receives advisory fees from the Fund calculated on the basis of each Portfolio’s average daily net assets and the following current schedule of Board-approved annualized fee breakpoints.
Equity |
0.79% of first $200 million 0.74% of next $800 million 0.70% over $1 billion |
Bond |
0.60% of first $100 million 0.50% of next $150 million 0.45% of next $250 million 0.40% of next $500 million 0.30% of next $1 billion 0.25% over $2 billion |
International |
0.85% of first $100 million 0.80% of next $100 million 0.70% over $200 million |
International Small-Mid Company |
1.00% of first $100 million 0.90% of next $100 million 0.85% over $200 million |
Small Cap Growth |
0.80% of first $150 million 0.75% of next $150 million 0.70% of next $300 million 0.65% over $600 million |
S&P 500® Index |
0.40% of first $100 million 0.35% of next $150 million 0.33% over $250 million |
High Income Bond |
0.75% of first $75 million 0.70% of next $75 million 0.65% of next $75 million 0.60% over $225 million |
Nasdaq-100® Index |
0.40% of first $100 million 0.35% of next $150 million 0.33% over $250 million |
Money Market |
0.30% of first $100 million1 0.25% of next $150 million 0.23% of next $250 million 0.20% of next $500 million 0.15% over $1 billion |
Omni |
0.60% of first $100 million 0.50% of next $150 million 0.45% of next $250 million 0.40% of next $500 million 0.30% of next $1 billion 0.25% over $2 billion |
Capital Appreciation |
0.80% of first $100 million 0.75% of next $300 million 0.65% of next $600 million 0.60% over $1 billion |
Aggressive Growth |
0.80% of first $100 million 0.75% of next $400 million 0.70% over $500 million |
Mid Cap Opportunity |
0.85% of first $100 million 0.80% of next $100 million 0.75% of next $300 million 0.70% over $500 million |
Strategic Value |
0.75% of first $100 million 0.70% of next $400 million 0.65% over $500 million |
ClearBridge Small Cap2 |
0.85% of first $200 million 0.80% of next $300 million 0.75% over $500 million |
| 140 | (continued) |
| Ohio National Fund, Inc. |
Notes to Financial Statements (Continued) | December 31, 2015 |
Bryton Growth |
0.85% of first $100 million 0.75% of next $400 million 0.70% over $500 million |
Target VIP |
0.60% of first $100 million 0.55% of next $400 million 0.50% over $500 million |
Risk Managed Balanced |
0.90% of first $500 million 0.75% over $500 million |
Bristol |
0.80% of first $100 million 0.70% of next $400 million 0.65% over $500 million |
Balanced |
0.65% of first $200 million 0.60% of next $300 million 0.55% over $500 million |
Bristol Growth |
0.80% of first $100 million 0.70% of next $400 million 0.65% over $500 million |
| 1 | For the year ended December 31, 2015, ONI waived advisory fees in excess of an annualized rate of 0.25% of the first $100 million of average daily net assets in the Money Market Portfolio. Waivers related to the Money Market Portfolio are voluntary and are not subject to recoupment in subsequent periods. The amount of the waiver for the year ended December 31, 2015 was $50,000. If ONI did not agree to waive these fees, the total expenses incurred by the Money Market Portfolio for the year ended December 31, 2015 would have been higher than the net expenses reflected in the Statements of Operations. |
| 2 | At a meeting held on August 13, 2015, the Board approved the replacement of the sub-adviser to the Capital Growth Portfolio. ClearBridge,LLC replaced the Portfolio’s previous sub-adviser, Eagle Asset Management, Inc., on September 25, 2015. In conjunction with the change in sub-adviser and investment strategy, the name of the Portfolio was changed from Capital Growth Portfolio to ClearBridge Small Cap Portfolio. Also, the Board approved a revision to the Portfolio’s advisory fee schedule. Prior to September 25, 2015, the advisory fee breakpoints, based on daily net assets of the Portfolio, were: |
0.90% of first $100 million 0.85% of next $100 million 0.80% of next $300 million 0.75% over $500 million. |
Under the Investment Advisory Agreement, the Fund authorizes ONI to retain sub-advisers (“the Sub-Advisers”) for the Equity, Omni, International, Capital Appreciation, International Small-Mid Company, Aggressive Growth, Small Cap Growth, Mid Cap Opportunity, Strategic Value, High Income Bond, ClearBridge Small Cap, Bristol, Bryton Growth, Balanced, Target VIP, Bristol Growth, and Risk Managed Balanced Portfolios subject to the approval of the Board. ONI has entered into sub-advisory agreements with ClearBridge, LLC (“ClearBridge”), Suffolk Capital Management, LLC (“Suffolk”), Federated Global Investment Management Corp. (“Federated Global”), Jennison Associates LLC (“Jennison”), Janus Capital Management LLC (“Janus”), Goldman Sachs Asset Management, L.P. (“Goldman Sachs”), Federated Equity Management Company of Pennsylvania (“Federated Equity”), Federated Investment Management Company (“Federated Investment”), ICON Advisers, Inc. (“ICON”), First Trust Advisors L.P. (“First Trust”), and AnchorPath Financial, LLC (“AnchorPath”), to manage the investment of those Portfolios’ assets, subject to the supervision of ONI. As compensation for their services, the Sub-Advisers receive from ONI a sub-advisory fee calculated on the basis of each of the aforementioned Portfolio’s average daily net assets and the following current Board-approved schedule of annualized fee breakpoints.
Equity (ClearBridge) |
0.40% of first $200 million 0.38% over $200 million |
International (Federated Global) |
0.40% of first $200 million 0.35% over $200 million |
Capital Appreciation (Jennison) |
0.75% of first $10 million 0.50% of next $30 million 0.35% of next $25 million 0.25% of next $335 million 0.22% of next $600 million 0.20% over $1 billion |
Omni (Suffolk) |
0.30% of first $100 million 0.25% of next $150 million 0.225% of next $250 million 0.20% of next $500 million 0.15% of next $1 billion 0.125% over $2 billion |
International Small-Mid Company (Federated Global) |
0.75% of first $100 million 0.65% over $100 million |
Aggressive Growth (Janus) |
0.55% of first $100 million 0.50% of next $400 million 0.45% over $500 million |
| 141 | (continued) |
| Ohio National Fund, Inc. |
Notes to Financial Statements (Continued) | December 31, 2015 |
Small Cap Growth (Janus) |
0.55% of first $150 million 0.45% over $150 million |
Strategic Value (Federated Equity) |
0.50% of first $35 million 0.35% of next $65 million 0.25% over $100 million |
ClearBridge Small Cap (ClearBridge) 3 |
0.55% of first $200 million 0.50% over $200 million |
Bristol (Suffolk) |
0.45% of first $100 million 0.40% of next $400 million 0.35% over $500 million |
Balanced (ICON) |
0.40% of first $200 million 0.35% of next $300 million 0.30% over $500 million |
Bristol Growth (Suffolk) |
| 0.45% of first $100 million |
| 0.40% of next $400 million |
| 0.35% over $500 million |
Mid Cap Opportunity (Goldman Sachs) |
0.60% of first $100 million 0.55% of next $100 million 0.50% over $200 million |
High Income Bond (Federated Investment) |
0.50% of first $30 million 0.40% of next $20 million 0.30% of next $25 million 0.25% over $75 million |
Bryton Growth (Suffolk) |
0.50% of first $100 million 0.45% of next $400 million 0.40% over $500 million |
Target VIP (First Trust) |
0.35% of first $500 million 0.25% over $500 million |
Risk Managed Balanced (Janus) |
0.35% of first $500 million 0.25% over $500 million |
Risk Managed Balanced (AnchorPath) |
0.20% of first $500 million 0.15% over $500 million |
| 3 | At a meeting held on August 13, 2015, the Board approved the replacement of the sub-adviser to the Capital Growth Portfolio. ClearBridge, LLC replaced the Portfolio’s previous sub-adviser, Eagle Asset Management, Inc., on September 25, 2015. In conjunction with the change in sub-adviser and investment strategy, the name of the Portfolio was changed from Capital Growth Portfolio to ClearBridge Small Cap Portfolio. Also, the Board approved a revision to the Portfolio’s sub-advisory fee schedule. Prior to September 25, 2015, the sub-advisory fee breakpoints, based on daily net assets of the Portfolio, were: |
0.59% of first $100 million 0.55% of next $100 million 0.50% over $200 million |
Suffolk, the sub-adviser for the Omni, Bristol, Bryton Growth, and Bristol Growth Portfolios has an affiliation with ONI. Ohio National Financial Services, Inc. (ONFS) owns 100% of ONLIC, the parent company of ONI, and also owns 84.7% of the voting securities of Suffolk. There were no Fund liabilities payable to Suffolk at December 31, 2015 and fees paid to Suffolk are an expense of ONI, not of the Fund.
Pursuant to a service agreement among ONI, ONLIC, and the Fund, ONLIC has agreed to provide personnel and facilities to ONI on a cost-reimbursement basis. These personnel members include officers of the Fund. ONLIC also provides clerical and administrative services and such supplies and equipment as may be reasonably required in order for ONI to properly perform its advisory function pursuant to the Investment Advisory Agreement. ONLIC further performs duties to fulfill the transfer agent function on behalf of the Fund. Performance of these duties by ONLIC and availability of facilities, personnel, supplies, and equipment does not represent an expense to the Fund in excess of the advisory fees paid to ONI.
Pursuant to the Investment Advisory Agreement between ONI and the Fund, if the total expenses applicable to any Portfolio during any calendar quarter (excluding taxes, brokerage commissions, interest expense and management fees) exceed 1%, on an annualized basis, evaluated quarterly, of such Portfolio’s average daily net asset value, ONI will reimburse the Portfolio for such excess expenses. There were no expense reimbursements associated with this agreement during the year ended December 31, 2015.
During the year ended December 31, 2015, ONI voluntarily reimbursed the amount of daily gross expenses of the Money Market Portfolio in excess of daily income earned by the Portfolio. The amount reimbursed to the Portfolio for the year ended December 31, 2015 was $518,925, of which $42,319 was receivable from ONI at December 31, 2015. This reimbursement is not subject to recoupment in subsequent periods. The total amount noted as “Less expenses reduced or reimbursed by adviser” for this Portfolio on the Statements of Operations also includes a waiver of advisory fees. For the year ended December 31, 2015, ONI waived advisory fees in excess of an annualized rate of 0.25% of the first $100 million of average daily net assets in the Money
| 142 | (continued) |
| Ohio National Fund, Inc. |
Notes to Financial Statements (Continued) | December 31, 2015 |
Market Portfolio. Waivers related to the Money Market Portfolio are voluntary and are not subject to recoupment in subsequent periods. The amount of the waiver for the year ended December 31, 2015 was $50,000. If ONI did not agree to waive these fees, the total expenses incurred by the Money Market Portfolio for the year ended December 31, 2015 would have been higher than the net expenses reflected in the Statements of Operations.
The Investment Advisory Agreement allows for a portion of the expenses related to the Fund’s Chief Compliance Officer and staff to be incurred by the Fund and paid from the Fund to the Fund’s adviser, ONI. Pursuant to the service agreement among ONI, ONLIC, and the Fund, ONLIC has provided the personnel, services, and equipment necessary for the execution of the Fund’s regulation-mandated compliance function and ONI has reimbursed ONLIC for costs allocated to the Fund. For the year ended December 31, 2015, the Fund incurred compliance expenses totaling $197,000, which is allocated to the Portfolios by equal dollar amounts. Expenses incurred by the Portfolios are reflected on the Statements of Operations as “Compliance expense”.
Each director of the Board is compensated based on an annual retainer fee of $90,000, paid quarterly. The Board chair receives an additional quarterly retainer fee of $3,750, the lead independent director of the Board receives an additional quarterly retainer fee of $3,125, and the Audit Committee chair receives an additional quarterly retainer fee of $1,250; each paid quarterly. For the year ended December 31, 2015, directors’ compensation and reimbursement of director expenses by the Portfolios of the Fund totaled $502,869.
U.S. Bancorp Fund Services, LLC, 615 East Michigan Street, Milwaukee, Wisconsin, serves as the accounting agent for all but the International and International Small-Mid Company Portfolios. U.S. Bank Institutional Trust & Custody, 425 Walnut Street, Cincinnati, Ohio serves as the custodian for all but the International and International Small-Mid Company Portfolios. The accounting agent and custodian for the International and International Small-Mid Company Portfolios is State Street Bank-Kansas City, 801 Pennsylvania Ave., Kansas City, Missouri. For assets held outside the United States, U.S. Bank and State Street Bank-Kansas City enter into sub-custodial agreements, subject to approval by the Board.
| (4) | Capital Share Transactions |
Capital share transactions for the year ended December 31, 2015, and the year ended December 31, 2014, respectively, were as follows:
| Equity | Money Market | Bond | ||||||||||||||||||||||
| Year Ended 12/31/2015 | Year Ended 12/31/2014 | Year Ended 12/31/2015 | Year Ended 12/31/2014 | Year Ended 12/31/2015 | Year Ended 12/31/2014 | |||||||||||||||||||
Capital shares issued on sales | 4,185,136 | 9,807,995 | 17,601,686 | 19,218,401 | 2,899,766 | 3,030,585 | ||||||||||||||||||
Capital shares issued on reinvested dividends | 100,661 | 50,620 | — | — | — | — | ||||||||||||||||||
Capital shares redeemed | (3,082,399 | ) | (1,872,987 | ) | (15,324,162 | ) | (25,127,000 | ) | (2,989,043 | ) | (3,149,736 | ) | ||||||||||||
|
|
|
|
|
|
|
|
|
|
|
| |||||||||||||
Net increase/(decrease) | 1,203,398 | 7,985,628 | 2,277,524 | (5,908,599 | ) | (89,277 | ) | (119,151 | ) | |||||||||||||||
|
|
|
|
|
|
|
|
|
|
|
| |||||||||||||
| Omni | International | Capital Appreciation | ||||||||||||||||||||||
| Year Ended 12/31/2015 | Year Ended 12/31/2014 | Year Ended 12/31/2015 | Year Ended 12/31/2014 | Year Ended 12/31/2015 | Year Ended 12/31/2014 | |||||||||||||||||||
Capital shares issued on sales | 881,341 | 127,023 | 1,470,570 | 2,302,342 | 1,931,947 | 10,054,175 | ||||||||||||||||||
Capital shares issued on reinvested dividends | 19,348 | 14,307 | — | — | 99,144 | 35,371 | ||||||||||||||||||
Capital shares redeemed | (447,556 | ) | (344,229 | ) | (2,644,069 | ) | (2,089,021 | ) | (2,228,176 | ) | (1,217,063 | ) | ||||||||||||
|
|
|
|
|
|
|
|
|
|
|
| |||||||||||||
Net increase/(decrease) | 453,133 | (202,899 | ) | (1,173,499 | ) | 213,321 | (197,085 | ) | 8,872,483 | |||||||||||||||
|
|
|
|
|
|
|
|
|
|
|
| |||||||||||||
| International Small-Mid Company | Aggressive Growth | Small Cap Growth | ||||||||||||||||||||||
| Year Ended 12/31/2015 | Year Ended 12/31/2014 | Year Ended 12/31/2015 | Year Ended 12/31/2014 | Year Ended 12/31/2015 | Year Ended 12/31/2014 | |||||||||||||||||||
Capital shares issued on sales | 902,741 | 451,579 | 1,299,408 | 596,695 | 3,225,048 | 5,798,430 | ||||||||||||||||||
Capital shares issued on reinvested dividends | — | — | — | — | — | — | ||||||||||||||||||
Capital shares redeemed | (756,199 | ) | (549,074 | ) | (810,197 | ) | (835,040 | ) | (2,161,674 | ) | (2,173,789 | ) | ||||||||||||
|
|
|
|
|
|
|
|
|
|
|
| |||||||||||||
Net increase/(decrease) | 146,542 | (97,495 | ) | 489,211 | (238,345 | ) | 1,063,374 | 3,624,641 | ||||||||||||||||
|
|
|
|
|
|
|
|
|
|
|
| |||||||||||||
| 143 | (continued) |
| Ohio National Fund, Inc. |
Notes to Financial Statements (Continued) | December 31, 2015 |
| Mid Cap Opportunity | S&P 500® Index | Strategic Value | ||||||||||||||||||||||
| Year Ended 12/31/2015 | Year Ended 12/31/2014 | Year Ended 12/31/2015 | Year Ended 12/31/2014 | Year Ended 12/31/2015 | Year Ended 12/31/2014 | |||||||||||||||||||
Capital shares issued on sales | 476,708 | 492,242 | 5,538,430 | 5,393,429 | 2,875,366 | 2,994,850 | ||||||||||||||||||
Capital shares issued on reinvested dividends | — | — | 263,658 | 216,562 | 689,188 | 1,295,654 | ||||||||||||||||||
Capital shares redeemed | (597,287 | ) | (679,451 | ) | (4,681,641 | ) | (3,957,420 | ) | (5,446,104 | ) | (10,775,289 | ) | ||||||||||||
|
|
|
|
|
|
|
|
|
|
|
| |||||||||||||
Net increase/(decrease) | (120,579 | ) | (187,209 | ) | 1,120,447 | 1,652,571 | (1,881,550 | ) | (6,484,785 | ) | ||||||||||||||
|
|
|
|
|
|
|
|
|
|
|
| |||||||||||||
Capital shares issued on sales | 1,866,173 | 2,776,857 | 999,894 | 416,020 | 4,028,917 | 4,349,282 | ||||||||||||||||||
Capital shares issued on reinvested dividends | — | — | — | — | 73,804 | 106,128 | ||||||||||||||||||
Capital shares redeemed | (3,682,767 | ) | (8,064,822 | ) | (490,656 | ) | (584,328 | ) | (3,548,870 | ) | (3,627,481 | ) | ||||||||||||
|
|
|
|
|
|
|
|
|
|
|
| |||||||||||||
Net increase/(decrease) | (1,816,594 | ) | (5,287,965 | ) | 509,238 | (168,308 | ) | 553,851 | 827,929 | |||||||||||||||
|
|
|
|
|
|
|
|
|
|
|
| |||||||||||||
| Bristol | Bryton Growth | Balanced | ||||||||||||||||||||||
| Year Ended 12/31/2015 | Year Ended 12/31/2014 | Year Ended 12/31/2015 | Year Ended 12/31/2014 | Year Ended 12/31/2015 | Year Ended 12/31/2014 | |||||||||||||||||||
Capital shares issued on sales | 1,140,805 | 885,795 | 1,667,540 | 1,556,041 | 9,929,846 | 33,697,189 | ||||||||||||||||||
Capital shares issued on reinvested dividends | 52,545 | 43,834 | — | — | 583,724 | 325,770 | ||||||||||||||||||
Capital shares redeemed | (2,197,197 | ) | (2,406,623 | ) | (2,139,839 | ) | (2,185,467 | ) | (8,911,105 | ) | (3,910,873 | ) | ||||||||||||
|
|
|
|
|
|
|
|
|
|
|
| |||||||||||||
Net increase/(decrease) | (1,003,847 | ) | (1,476,994 | ) | (472,299 | ) | (629,426 | ) | 1,602,465 | 30,112,086 | ||||||||||||||
|
|
|
|
|
|
|
|
|
|
|
| |||||||||||||
Capital shares issued on sales | 241,439 | 435,011 | 2,488,528 | 703,568 | 13,089,618 | 5,294,469 | ||||||||||||||||||
Capital shares issued on reinvested dividends | 50,539 | 59,398 | 28,330 | 22,849 | 34,878 | — | ||||||||||||||||||
Capital shares redeemed | (747,298 | ) | (609,589 | ) | (3,350,039 | ) | (1,488,214 | ) | (1,771,547 | ) | (2,173,736 | ) | ||||||||||||
|
|
|
|
|
|
|
|
|
|
|
| |||||||||||||
Net increase/(decrease) | (455,320 | ) | (115,180 | ) | (833,181 | ) | (761,797 | ) | 11,352,949 | 3,120,733 | ||||||||||||||
|
|
|
|
|
|
|
|
|
|
|
| |||||||||||||
| * | Commencement of operations. |
| (5) | Investment Transactions |
Cost of purchases and proceeds from sales of investments (excluding short-term and government securities) for the year ended December 31, 2015 were as follows:
| Equity | Bond | Omni | International | Capital Appreciation | ||||||||||||||||
Cost of purchases | $ | 278,066,687 | $ | 116,331,461 | $ | 93,314,225 | $ | 113,431,906 | $ | 294,532,025 | ||||||||||
Proceeds from sales | $ | 238,610,653 | $ | 110,473,137 | $ | 81,106,221 | $ | 112,181,803 | $ | 311,432,897 | ||||||||||
| International Small-Mid Company | Aggressive Growth | Small Cap Growth | Mid Cap Opportunity | S&P 500® Index | ||||||||||||||||
Cost of purchases | $ | 48,621,959 | $ | 33,902,214 | $ | 100,036,088 | $ | 49,833,342 | $ | 82,325,662 | ||||||||||
Proceeds from sales | $ | 43,310,469 | $ | 26,462,389 | $ | 79,510,499 | $ | 53,666,842 | $ | 56,748,419 | ||||||||||
| Strategic Value | High Income Bond | ClearBridge Small Cap | Nasdaq-100® Index | Bristol | ||||||||||||||||
Cost of purchases | $ | 41,664,328 | $ | 61,287,954 | $ | 114,679,718 | $ | 31,826,847 | $ | 523,647,839 | ||||||||||
Proceeds from sales | $ | 62,696,005 | $ | 80,556,174 | $ | 98,093,201 | $ | 25,028,653 | $ | 544,222,024 | ||||||||||
| Bryton Growth | Balanced | Target VIP | Bristol Growth | Risk Managed Balanced | ||||||||||||||||
Cost of purchases | $ | 288,284,238 | $ | 759,261,037 | $ | 36,501,013 | $ | 204,348,840 | $ | 116,290,207 | ||||||||||
Proceeds from sales | $ | 301,930,852 | $ | 696,397,693 | $ | 42,653,400 | $ | 217,525,164 | $ | 23,434,637 | ||||||||||
| 144 | (continued) |
| Ohio National Fund, Inc. |
Notes to Financial Statements (Continued) | December 31, 2015 |
Cost of purchases and proceeds from sales of government securities for the year ended December 31, 2015 were as follows:
| Bond | Omni | Balanced | Risk Managed Balanced | |||||||||||||
Cost of purchases | $ | 39,143,042 | $ | 3,279,758 | $ | 51,776,610 | $ | 37,865,521 | ||||||||
Proceeds from sales | $ | 38,121,755 | $ | 3,331,164 | $ | 75,896,757 | $ | 26,117,230 | ||||||||
| (6) | Financial Instruments |
The Fund’s Portfolios, other than the Money Market Portfolio, may trade in financial instruments with off-balance sheet risk for hedging purposes or, otherwise, in accordance with stated investing objectives. These financial instruments may include options, futures, and foreign currency contracts that may involve, to a varying degree, elements of risk in excess of the amounts recognized on financial statements.
Options
A Portfolio may buy and write (i.e., sell) call and put options. In writing call options, the Portfolio gives the purchaser of the call option the right to purchase the underlying securities from the Portfolio at a specified “exercise” price at any time prior to the expiration of the option, normally within nine months. A Portfolio writes a covered call option when it owns the underlying securities and an uncovered call option when it does not. In purchasing put options, a Portfolio pays the seller of the put option a premium for the right of the Portfolio to sell the underlying securities to the seller at a specified exercise price prior to the expiration of the option. When a Portfolio sells a put option, it has the obligation to buy, and the purchaser of the put the right to sell, the underlying security at the exercise price during the option period. Whenever a Portfolio has a written covered call option outstanding, the underlying securities will be segregated by the Custodian and held in an escrow account to assure that such securities will be delivered to the option holder if the option is exercised. While the underlying securities are subject to the option, the Portfolio remains the record owner of the securities, entitling it to receive dividends and to exercise any voting rights. Whenever a Portfolio has a written uncovered call option outstanding, it will segregate with the Custodian cash or liquid assets that, when added to the amounts deposited with the broker as margin, equal to the market value of the securities underlying the call option (but not less than the exercise price of the call option). To cover a written put option, the Portfolio writing the option deposits cash or liquid securities in a segregated account at the Custodian. In order to terminate its position as the writer or the purchaser of an option, the Portfolio may enter into a “closing” transaction, which is the purchase (if the Portfolio has written the option) or sale (if the Portfolio is the purchaser of the option) of an option on the same underlying securities and having the same exercise price and expiration date as the option previously written or purchased by the Portfolio.
When a Portfolio writes a put or call option, an amount equal to the premium received is included on the Statement of Assets and Liabilities as a liability. The amount of the liability is subsequently marked-to-market to reflect the current market value of the option. Such liability is subject to off balance sheet risks to the extent of any future increases in market value of the written options. If an option expires on its stipulated expiration date or if the Portfolio enters into a closing purchase transaction, a gain or loss is realized. If a written call option on an individual security is exercised, a gain or loss is realized for the sale of the underlying security, and the proceeds from the sale are increased by the premium originally received. If a written call option on a securities index is exercised, a gain or loss is realized as determined by the premium originally received, the exercise price and the market value of the index. If a written put option on an individual security is exercised, the cost of the security acquired is decreased by the premium originally received. When a Portfolio purchases a put or call option, an amount equal to the premium paid is included on the Portfolio’s Statement of Assets and Liabilities as an investment, and is subsequently marked-to-market to reflect the current market value of the option. If an option expires on the stipulated expiration date or if the Portfolio enters into a closing sale transaction, a gain or loss is realized. If a Portfolio exercises a call option on an individual security, the cost of the security acquired is increased by the premium paid for the call. If the Portfolio exercises a put option on an individual security, a gain or loss is realized from the sale of the underlying security, and the proceeds from such a sale are decreased by the premium originally paid. If the Portfolio exercises a put option on a security index, a gain or loss is realized as determined by the premium originally paid, the exercise price and the market value of the index.
The Balanced Portfolio wrote call options and purchased put options associated with the S&P 500 Index during the year ended December 31, 2015 . These instruments were used by the Portfolio to provide a hedge against equity price risk. During a period in which the prices of the Portfolio’s common stocks may decline, these instruments are designed to increase in value, thus providing price accumulation gains that partially offset the price accumulation losses of the common stocks in the Portfolio.
| 145 | (continued) |
| Ohio National Fund, Inc. |
Notes to Financial Statements (Continued) | December 31, 2015 |
The Balanced Portfolio’s written call options are collateralized by cash and/or securities held by the Portfolio’s custodian under an Escrow Deposit Agreement between the custodian and the Options Clearing Corporation (“OCC”). Such collateral holdings are restricted from trading. The cash collateral or borrowings, if necessary, are included on the Statement of Assets and Liabilities. The securities pledged as collateral under the Escrow Deposit Agreement are noted as such on the Portfolio’s Schedules of Investments. Written and purchased options are non-income producing securities.
The number of option contracts written and the premiums received by the Balanced Portfolio for the year ended December 31, 2015 as follows:
| Number of Contracts | Premiums Received | |||||||
Options outstanding, beginning of period | 800 | $ | 1,432,788 | |||||
Options written | 7,600 | 8,582,544 | ||||||
Options exercised | — | — | ||||||
Options expired | — | — | ||||||
Options closed | (8,000 | ) | (9,470,647 | ) | ||||
|
|
|
| |||||
Options outstanding, end of period | 400 | $ | 544,685 | |||||
|
|
|
| |||||
Transactions involving purchased options by the Balanced Portfolio for the year ended December 31, 2015 were: Cost of purchases: $22.1 million, Proceeds from sales: $14.8 million.
The Risk Managed Balanced Portfolio also purchased call and put options associated with the S&P 500 Index during the year ended December 31, 2015. These instruments were used by the Risk Management Component of the Portfolio to provide for the Portfolio’s stated risk management strategy. Transactions involving purchased options by the Risk Managed Balanced Portfolio for the year ended December 31, 2015 were: Cost of purchases: $11.9 million, Proceeds from sales: $2.9 million.
Futures Contracts
A Portfolio may buy or sell two kinds of financial futures contracts: stock index futures contracts and interest rate futures contracts. Stock index futures contracts are contracts developed by and traded on national commodity exchanges whereby the buyer will, on a specified future date, pay or receive a final cash payment equal to the difference between the actual value of the stock index on the last day of the contract and the value of the stock index established by the contract multiplied by the specific dollar amount set by the exchange. Futures contracts may be based on broad-based stock indexes such as the S&P 500 Index or on narrow-based stock indexes. A particular index will be selected according to the Adviser’s investment strategy for the particular Portfolio. An interest rate futures contract is an agreement whereby one party agrees to sell and another party agrees to purchase a specified amount of a specified financial instrument (debt security) at a specified price at a specified date, time and place. Although interest rate futures contracts typically require actual future delivery of and payment for financial instruments, the contracts are usually closed out before the delivery date. A public market exists in interest rate futures contracts covering primarily the following financial instruments: U.S. Treasury bonds; U.S. Treasury notes; Government National Mortgage Association (GNMA) modified pass-through mortgage-backed securities; three-month U.S. Treasury bills; 90-day commercial paper; bank certificates of deposit; and Eurodollar certificates of deposit. U.S. futures contracts are traded on exchanges which have been designated “contract markets” by the Commodities Futures Trading Commission (“CFTC”) and must be executed through a futures commission merchant (“FCM”), or brokerage firm, which is a member of the relevant contract market. It is expected that futures contracts trading in additional financial instruments will be authorized.
The Fund, on behalf of each Portfolio, has filed with the National Futures Association, a notice claiming an exclusion from the definition of the term “commodity pool operator” under the Commodity Exchange Act, as amended, and the rules of the CFTC promulgated thereunder, with respect to each Portfolio’s operation. Accordingly, the Portfolios are not subject to registration or regulation as a commodity pool operator.
The buyer or seller of a futures contract is not required to deliver or pay for the underlying instrument unless the contract is held until the delivery date. However, both the buyer and seller are required to deposit “initial margin” for the benefit of the broker when the contract is entered into. Initial margin deposits are equal to a percentage of the contract’s value, as set by the exchange on which the contract is traded, and are similar to good faith deposits or performance bonds.
Unlike margin extended by a securities broker, initial margin payments do not constitute purchasing securities on margin for purposes of a Portfolio’s investment limitations. A Portfolio, its futures commission merchant and the Custodian retain control of
| 146 | (continued) |
| Ohio National Fund, Inc. |
Notes to Financial Statements (Continued) | December 31, 2015 |
the initial margin until the contract is liquidated. If the value of either party’s position declines, that party will be required to make additional “variation margin” payments to settle the change in value on a daily basis. The party that has a gain may be entitled to receive all or a portion of this amount. In the event of the bankruptcy of the FCM that holds margin on behalf of a Portfolio, the Portfolio may be entitled to return of margin owed to the Portfolio only in proportion to the amount received by the FCM’s other customers. ONI and the Sub-Advisers will attempt to minimize this risk by carefully monitoring the creditworthiness of the FCMs with which the Portfolios do business. In addition to the margin restrictions discussed above, transactions in futures contracts and options on futures contracts may involve the segregation of funds pursuant to requirements imposed by the SEC. Under those requirements, where a Portfolio has a long position in a futures contract or sells a put option, it will be required to establish a segregated account (not with an FCM or broker) containing cash or certain liquid assets equal to the purchase price of the contract or the exercise price of the option (less any margin on deposit). For a short position in futures contacts held by a Portfolio or call options sold by a Portfolio, those requirements mandate the establishment of a segregated account (not with a futures commission merchant or broker) containing cash or certain liquid assets that, when added to the amounts deposited as margin, equal the market value of the instruments underlying the futures contracts or call options. However, segregation of assets is not required if a Portfolio “covers” its position.
At December 31, 2015, there were outstanding futures contracts in the International Portfolio. Details of these contracts are as follows:
Type | Description | Expiration | Number of Contracts | Contract at Value | Initial Contract Amount | Unrealized Appreciation (Depreciation) | Variation Margin Receivable (Payable) | |||||||||||||||
Long | JPX-Nikkei Index 400 Future | March 10, 2016 | 211 | $2,448,896 | $ | 2,513,447 | $ | (64,551 | ) | $ | (177 | ) | ||||||||||
Long | Borsa Istanbul (BIST) 30 Future | February 29, 2016 | 483 | 1,475,217 | 1,534,981 | (59,764 | ) | (24,468 | ) | |||||||||||||
|
|
|
|
|
|
|
| |||||||||||||||
| $ | 3,924,113 | $ | 4,048,428 | $ | (124,315 | ) | $ | (24,645 | ) | |||||||||||||
|
|
|
|
|
|
|
| |||||||||||||||
A portion of the International Portfolio’s cash holdings totalling $211,708, as noted on the Portfolio’s Schedule of Investments, was pledged at December 31, 2015 as collateral for these contracts.
These futures contracts were executed for the purpose of increasing exposure to an attractive equities market, beyond that evidenced by the Portfolio’s investment in common stocks, while maintaining a significant cash balance that could be used for potentially higher-than-average shareholder transactions. There were other index futures contracts that were executed and closed in the International Portfolio during the year ended December 31, 2015. Those contracts were executed for similar purposes as the contracts outstanding at December 31, 2015. For the year ended December 31, 2015, the notional values of futures contracts opened and closed prior to contract settlement date by the International Portfolio were $81.3 million and $85.5 million, respectively.
At December 31, 2015, there were outstanding futures contracts in the International Small-Mid Company Portfolio. Details of these contracts are as follows:
Type | Description | Expiration | Number of Contracts | Contract at | Initial Contract Amount | Unrealized Appreciation (Depreciation) | Variation Margin Receivable (Payable) | |||||||||||||
Long | JPX-Nikkei Index 400 Future | March 10, 2016 | 68 | $789,218 | $ | 810,021 | $ | (20,803 | ) | $ | (57 | ) | ||||||||
A portion of the International Small-Mid Company Portfolio’s cash holdings totalling $28,437, as noted on the Portfolio’s Schedule of Investments, was pledged at December 31, 2015 as collateral for these contracts.
These futures contracts were executed for the purpose of increasing exposure to an attractive equities market, beyond that evidenced by the Portfolio’s investment in common stocks, while maintaining a significant cash balance that could be used for potentially higher-than-average shareholder transactions. There were other index futures contracts that were executed and closed in the International Small-Mid Company Portfolio during the year ended December 31, 2015. Those contracts were executed for similar purposes as the contracts outstanding at December 31, 2015. For the year ended December 31, 2015, the notional values of futures contracts opened and closed prior to contract settlement date by the International Small-Mid Company Portfolio were $1.6 million and $0.8 million, respectively.
| 147 | (continued) |
| Ohio National Fund, Inc. |
Notes to Financial Statements (Continued) | December 31, 2015 |
At December 31, 2015, there were also outstanding futures contracts in the Risk Managed Balanced Portfolio. Details of these contracts are as follows:
Type | Description | Expiration | Number of Contracts | Contract at Value | Initial Contract Amount | Unrealized Appreciation (Depreciation) | Variation Margin Receivable (Payable) | |||||||||||||||
Long | S&P 500 E-mini Future | March 18, 2016 | 198 | $20,150,460 | $ | 19,835,303 | $ | 315,157 | $ | — | ||||||||||||
Long | 10-Year U.S. Treasury Note Future | March 21, 2016 | 668 | $84,105,375 | $ | 84,329,105 | $ | (223,730 | ) | $ | — | |||||||||||
|
|
|
|
|
|
|
| |||||||||||||||
| $ | 104,255,835 | $ | 104,164,408 | $ | 91,427 | $ | — | |||||||||||||||
|
|
|
|
|
|
|
| |||||||||||||||
Portions of the Risk Managed Balanced Portfolio’s securities and cash holdings, as noted on the Portfolio’s Schedule of Investments, were pledged at December 31, 2015 as collateral for these contracts. These futures contracts were used by the Portfolio to provide for the Portfolio’s stated risk management strategy. There were other index futures contracts that were executed and closed in the Risk Managed Balanced Portfolio during the year ended December 31, 2015. Those contracts were executed for similar purposes as the contracts outstanding at December 31, 2015. For the year ended December 31, 2015, the notional values of futures contracts opened and closed prior to contract settlement date by the Risk Managed Balanced Portfolio were $341.7 million and $260.2 million, respectively.
Foreign Currency Contracts
In order to hedge against changes in the exchange rates of foreign currencies in relation to the U.S. dollar, each Portfolio, other than the Money Market Portfolio, may engage in forward foreign currency contracts, foreign currency options and foreign currency futures contracts in connection with the purchase, sale or ownership of a specific security. The International Portfolio, International Small-Mid Company Portfolio, Strategic Value Portfolio and High Income Bond Portfolio may engage in non-hedging related transactions to implement their investment strategies.
The Portfolios generally conduct their foreign currency exchange transactions on a spot (i.e., cash) basis at the spot rate prevailing in the foreign exchange currency market. When a Portfolio purchases or sells a security denominated in or exposed to a foreign currency, it may enter into a forward foreign currency contract (“forward contract”) for the purchase or sale, for a fixed amount of dollars, of the amount of currency involved in the underlying security transaction. A forward contract involves an obligation to purchase or sell a specific currency at a future date, which may be any fixed number of days from the date of the contract agreed upon by the parties, at a price set at the time of the contract. In this manner, a Portfolio may obtain protection against a possible loss resulting from an adverse change in the relationship between the U.S. dollar and the foreign currency during the period between the date the security is purchased or sold and the date upon which payment is made or received. Although such contracts tend to minimize the risk of loss due to the decline in the value of the hedged currency, at the same time they tend to limit any potential gain which might result should the value of such currency increase.
Forward contracts are traded in the interbank market conducted directly between currency traders (usually large commercial banks) and their customers. Generally a forward contract has no deposit requirement, and no commissions are charged. Although foreign exchange dealers do not charge a fee for conversion, they do realize a profit based on the difference between the prices at which they buy and sell various currencies. When the Portfolio manager believes that the currency of a particular foreign country may suffer a substantial decline against the U.S. dollar, a Portfolio may enter into a forward contract to sell, for a fixed amount of dollars, the amount of foreign currency approximating the value of some or all of that Portfolio’s securities denominated in or exposed to such foreign currency. No Portfolio will enter into such forward contracts or maintain a net exposure to such contracts where the consummation of the contracts would obligate the Portfolio to deliver an amount of foreign currency in excess of the value of its assets denominated in or exposed to that currency. At the consummation of a forward contract for delivery by a Portfolio of a foreign currency, the Portfolio may either make delivery of the foreign currency or terminate its contractual obligation to deliver the foreign currency by purchasing an offsetting contract obligating it to purchase, at the same maturity date, the same amount of the foreign currency. If the Portfolio chooses to make delivery of the foreign currency, it may be required to obtain such currency through the sale of its securities denominated in such currency or through conversion of other Portfolio assets into such currency. It is impossible to forecast the market value of Portfolio securities at the expiration of the forward contract. Accordingly, it may be necessary for the Portfolio to purchase additional foreign currency on
| 148 | (continued) |
| Ohio National Fund, Inc. |
Notes to Financial Statements (Continued) | December 31, 2015 |
the spot market (and bear the expense of such purchase) if the market value of the security is less than the amount of foreign currency the Portfolio is obligated to deliver, and if a decision is made to sell the security and make delivery of the foreign currency. Conversely, it may be necessary for the Portfolio to sell on the spot market some of the foreign currency received on the sale of its hedged security if the security’s market value exceeds the amount of foreign currency the Portfolio is obligated to deliver.
If the Portfolio retains the hedged security and engages in an offsetting transaction, it will incur a gain or loss to the extent that there has been movement in spot or forward contract prices. If a Portfolio engages in an offsetting transaction, it may subsequently enter into a new forward contract to sell the foreign currency. Should forward prices decline during the period between the Portfolio’s entering into a forward contract for the sale of a foreign currency and the date it enters into an offsetting contract for the purchase of the foreign currency, the Portfolio will realize a gain to the extent the price of the currency it has agreed to sell exceeds the price of the currency it has agreed to purchase. Should forward prices increase, the Portfolio will suffer a loss to the extent the price of the currency it has agreed to purchase exceeds the price of the currency it has agreed to sell.
Buyers and sellers of foreign currency options and futures contracts are subject to the same risks previously described with respect to options and futures generally. In addition, settlement of currency options and futures contracts with respect to most currencies must occur at a bank located in the issuing nation. The ability to establish and close out positions on such options is subject to the maintenance of a liquid market that may not always be available. Currency rates may fluctuate based on political considerations and governmental actions as opposed to purely economic factors.
Predicting the movements of foreign currency in relation to the U.S. dollar is difficult and requires different skills than those necessary to predict movements in the securities market. There is no assurance that the use of foreign currency hedging transactions can successfully protect a Portfolio against loss resulting from the movements of foreign currency in relation to the U.S. dollar. In addition, it must be remembered that these methods of protecting the value of a Portfolio’s securities against a decline in the value of a currency does not eliminate fluctuations in the underlying prices of the securities. It simply establishes a rate of exchange which can be achieved at some future point in time. Additionally, although such contracts tend to minimize the risk of loss due to the decline in the value of the hedged currency, at the same time they tend to limit any potential gain which might result should the value of such currency increase.
Foreign currency contracts were executed in the International and International Small-Mid Company Portfolios in order to mitigate the effect that exchange rate volatility had on the valuation of the Portfolios’ investments that were either significantly under-weighted or over-weighted in relation to the Portfolios’ respective benchmark indices. The International Portfolio was under-weighted in equity investments within Switzerland and, therefore, executed contracts to buy the Swiss Franc in order to mitigate the effect that volatility in that exchange rate (in relation to the U.S. dollar) might otherwise have on relative performance. Likewise, the International Portfolio was over-weighted in equity investments within Japan and member states of the European Union and, therefore, executed contracts to sell the Japanese Yen and the Euro in order to mitigate the effect that volatility in those exchange rates might otherwise have on relative performance. The International Small-Mid Company Portfolio was also over-weighted in equity investments within the member states of the European Union and, therefore, executed contracts to sell the Euro in order to mitigate the effect that volatility in that exchange rate might otherwise have on relative performance. The International Small-Mid Company Portfolio later entered into contracts to buy the Euro to effectively exit the original contract prior to its state delivery date. These contracts were executed to lock in the unrealized gain that resulted from the original transaction.
The Portfolios entered into other foreign currency contracts during the period for similar benchmark performance hedging purposes. The Portfolios also entered into contracts that were the inverse of previously executed contracts to effectively exit prior contracts earlier than stated contract delivery dates, as investment over-weights or under-weights were reduced, or as previously executed contracts resulted in an attractive return to the Portfolios. For the year ended December 31, 2015, the notional value of foreign currency contracts executed by the International Portfolio were approximately $233.1 million for currencies bought and approximately $274.4 million for currencies sold. For the year ended December 31, 2015, the notional value of foreign currency contracts executed by the International Small-Mid Company Portfolio were approximately $39.0 million for currencies bought and approximately $39.5 million for currencies sold.
| 149 | (continued) |
| Ohio National Fund, Inc. |
Notes to Financial Statements (Continued) | December 31, 2015 |
The values and financial statement effects of derivative instruments that were not accounted for as hedging instruments as of, and for the year ended December 31, 2015, were as follows:
Portfolio | Instrument | Primary Risk Type | Value- Asset Derivatives | Value- Liability Derivatives | Location on Statements of Assets and Liabilities | |||||||||||
International | Contracts to buy foreign currencies | Currency exchange rate | $ | 10,742,405 | $ | (11,100,000 | ) | (1 | ) | |||||||
|
|
|
| |||||||||||||
Contracts to sell foreign currencies | Currency exchange rate | $ | 48,253,054 | $ | (48,041,986 | ) | (1 | ) | ||||||||
|
|
|
| |||||||||||||
Futures contracts | Equity price | $ | 3,924,113 | $ | (4,048,428 | ) | (2 | ) | ||||||||
|
|
|
| |||||||||||||
International Small-Mid Company | Contracts to buy foreign currencies | Currency exchange rate | $ | 10,329,763 | $ | (10,338,295 | ) | (1 | ) | |||||||
|
|
|
| |||||||||||||
Contracts to sell foreign currencies | Currency exchange rate | $ | 10,801,405 | $ | (10,329,763 | ) | (1 | ) | ||||||||
|
|
|
| |||||||||||||
Futures contracts | Equity price | $ | 789,218 | $ | (810,021 | ) | (2 | ) | ||||||||
|
|
|
| |||||||||||||
Balanced | Purchased options | Equity price | $ | 2,112,000 | $ | — | (3 | ) | ||||||||
|
|
|
| |||||||||||||
Written options | Equity price | $ | — | $ | (372,000 | ) | (4 | ) | ||||||||
|
|
|
| |||||||||||||
Risk Managed Balanced | Purchased options | Equity price | $ | 10,262,753 | $ | — | (3 | ) | ||||||||
|
|
|
| |||||||||||||
Futures contracts | Equity price | $ | 104,255,835 | $ | (104,164,408 | ) | (2 | ) | ||||||||
|
|
|
| |||||||||||||
| (1) | Net unrealized appreciation/(depreciation) on foreign currency contacts. |
| (2) | Net unrealized appreciation/(depreciation) on futures contracts. The amounts represent the cumulative appreciation/(depreciation) of these futures contracts as reported in the Schedules of Investments. Only the current day’s variation margin is reported within the Statements of Assets and Liabilities as Variation margin payable on futures contracts. |
| (3) | Investments in securities, at value. |
| (4) | Options written, at value. |
Portfolio | Instrument | Risk Type | Realized Gain (Loss) on Derivatives Recognized in Income | Change in Unrealized Appreciation/ Depreciation on Derivatives Recognized in Income | Location on Statements of Operations | |||||||||||
International | Foreign currency contracts | Currency exchange rate | $ | 3,349,877 | $ | (1,371,025 | ) | (1 | ), (2) | |||||||
|
|
|
| |||||||||||||
Futures contracts | Equity price | $ | (2,254,839 | ) | $ | (79,013 | ) | (3 | ), (4) | |||||||
|
|
|
| |||||||||||||
International Small-Mid Company | Foreign currency contracts | Currency exchange rate | $ | (12,870 | ) | $ | 462,965 | (1 | ), (2) | |||||||
|
|
|
| |||||||||||||
Futures contracts | Equity price | $ | (8,737 | ) | $ | (20,803 | ) | (3 | ), (4) | |||||||
|
|
|
| |||||||||||||
Balanced | Purchased options | Equity price | $ | (6,619,394 | ) | $ | (847,847 | ) | (5 | ), (6) | ||||||
|
|
|
| |||||||||||||
Written options | Equity price | $ | 4,648,375 | $ | (236,603 | ) | (7 | ), (8) | ||||||||
|
|
|
| |||||||||||||
Risk Managed Balanced | Futures contracts | Equity price | $ | (83,930 | ) | $ | (51,559 | ) | (3 | ), (4) | ||||||
|
|
|
| |||||||||||||
Purchased options | Equity price | $ | (350,038 | ) | $ | (857,697 | ) | (5 | ), (6) | |||||||
|
|
|
| |||||||||||||
| (1) | Net realized gain (loss) on foreign currency contracts. |
| (2) | Change in unrealized appreciation/(depreciation) on foreign currency contracts. |
| (3) | Net realized gain (loss) on futures contracts. |
| (4) | Change in unrealized appreciation/(depreciation) on futures contracts. |
| (5) | Net realized gain (loss) on investments. |
| (6) | Change in unrealized appreciation/(depreciation) on investments. |
| (7) | Net realized gain (loss) on written options. |
| (8) | Change in unrealized appreciation/(depreciation) on written options. |
| 150 | (continued) |
| Ohio National Fund, Inc. |
Notes to Financial Statements (Continued) | December 31, 2015 |
The Portfolios may enter into International Swaps and Derivatives Association, Inc. Master Agreements (“ISDA Master Agreement”) or similar agreements with their derivative contract counterparties whereby the Portfolios may, under certain circumstances, offset with the counterparty certain derivative financial instruments’ payables and/or receivables and create one single net payment. Under certain of the ISDA Master Agreements in place at December 31, 2015, the Portfolios are subject to master netting agreements (“MNA”) that allows for amounts owed between each Portfolio and the counterparty to their transactions to be netted. The party that has the larger payable pays the excess of the larger amount over the smaller amount to the other party. The MNAs do not apply to amounts owed to or from different counterparties; further, certain of the MNAs limit offsetting for forward foreign currency contracts to amounts owed in the same currency and on the same exchange date.
For financial reporting purposes, the Portfolios offset derivative assets and liabilities that are subject to netting arrangements in the Statement of Assets and Liabilities.
Contracts Subject to Master Netting Agreements:
International Small-Mid Company | ||||||||||||||||
Counterparty | Currency | Exchange Date | Derivative Asset Subject to a MNA by Counterparty | Derivative Liability Available for Offset | Net Asset presented in the Statement of Assets and Liabilities | |||||||||||
JP Morgan Chase Bank NA | Euro | January 27, 2016 | $ | 217 | $ | (217 | ) | $ | — | |||||||
JP Morgan Chase Bank NA | Euro | January 27, 2016 | 33,920 | (33,920 | ) | — | ||||||||||
JP Morgan Chase Bank NA | Euro | January 27, 2016 | 471,642 | (8,532 | ) | 463,110 | ||||||||||
Counterparty | Currency | Exchange Date | Derivative Liability Subject to a MNA by Counterparty | Derivative Asset Available for Offset | Net Liability presented in the Statement of Assets and Liabilities | |||||||||||
JP Morgan Chase Bank NA | Euro | January 27, 2016 | $ | (12,551 | ) | $ | 12,551 | $ | — | |||||||
JP Morgan Chase Bank NA | Euro | January 27, 2016 | (30,118 | ) | 30,118 | — | ||||||||||
| (7) | Federal Income Tax Information |
At December 31, 2015, the components of accumulated earnings (deficit) on a tax basis were as follows:
Portfolio | Undistributed Ordinary Income | Undistributed Long-Term Capital Gains (Losses) | Accumulated Earnings | Accumulated Capital and Other Losses | Unrealized Appreciation (Depreciation) (1) | Unrealized Appreciation (Depreciation) on Foreign Currency, Futures, and Written Options | Total Accumulated Earnings (Deficit) | |||||||||||||||||||||
Equity | $ | 262,107 | $ | — | $ | 262,107 | $ | (1,568,071 | ) | $ | 2,849,911 | $ | — | $ | 1,543,947 | |||||||||||||
Money Market | — | — | — | — | — | — | — | |||||||||||||||||||||
Bond | 5,611,400 | — | 5,611,400 | (7,870,085 | ) | (3,926,010 | ) | — | (6,184,695 | ) | ||||||||||||||||||
Omni | 1,381,526 | 1,354,862 | 2,736,388 | — | 88,138 | — | 2,824,526 | |||||||||||||||||||||
International | 4,377,935 | — | 4,377,935 | (76,093,820 | ) | 9,680,491 | (134,755 | ) | (62,170,149 | ) | ||||||||||||||||||
Capital | 15,482,548 | 21,926,582 | 37,409,130 | — | (11,098,218 | ) | (2,783 | ) | 26,308,129 | |||||||||||||||||||
International Small-Mid Company | 1,698,014 | 5,054,277 | 6,752,291 | — | 10,915,210 | (48,651 | ) | 17,618,850 | ||||||||||||||||||||
Aggressive Growth | 205,653 | 3,727,179 | 3,932,832 | — | 7,417,265 | (195 | ) | 11,349,902 | ||||||||||||||||||||
Small Cap Growth | 3,446,384 | 3,250,368 | 6,696,752 | — | 16,430,846 | (191 | ) | 23,127,407 | ||||||||||||||||||||
Mid Cap Opportunity | — | 5,314,560 | 5,314,560 | — | 5,795,328 | — | 11,109,888 | |||||||||||||||||||||
S&P 500® Index | 2,075,519 | 7,315,899 | 9,391,418 | — | 127,924,515 | — | 137,315,933 | |||||||||||||||||||||
Strategic Value | 1,516,933 | 7,153,712 | 8,670,645 | — | 24,122,648 | (18,358 | ) | 32,774,935 | ||||||||||||||||||||
High Income Bond | 12,410,271 | — | 12,410,271 | (975,549 | ) | (19,607,333 | ) | — | (8,172,611 | ) | ||||||||||||||||||
ClearBridge Small Cap | — | 13,212,026 | 13,212,026 | — | 743,994 | — | 13,956,020 | |||||||||||||||||||||
Nasdaq-100® Index | 476,885 | 3,643,768 | 4,120,653 | — | 53,953,282 | — | 58,073,935 | |||||||||||||||||||||
Bristol | 13,979,979 | 11,245,180 | 25,225,159 | — | 3,689,821 | — | 28,914,980 | |||||||||||||||||||||
| 151 | (continued) |
| Ohio National Fund, Inc. |
Notes to Financial Statements (Continued) | December 31, 2015 |
Portfolio | Undistributed Ordinary Income | Undistributed Long-Term Capital Gains (Losses) | Accumulated Earnings | Accumulated Capital and Other Losses | Unrealized Appreciation (Depreciation) (1) | Unrealized Appreciation (Depreciation) on Foreign Currency, Futures, and Written Options | Total Accumulated Earnings (Deficit) | |||||||||||||||||||||
Bryton Growth | $ | 10,734,231 | $ | 10,192,779 | $ | 20,927,010 | $ | — | $ | (16,099,767 | ) | $ | — | $ | 4,827,243 | |||||||||||||
Balanced | 15,705,771 | 15,011,456 | 30,717,227 | — | (3,916,663 | ) | 171,870 | 26,972,434 | ||||||||||||||||||||
Target VIP | 91,204 | — | 91,204 | (3,578,862 | ) | (422,129 | ) | — | (3,909,787 | ) | ||||||||||||||||||
Bristol Growth | 5,265,240 | 5,668,603 | 10,933,843 | — | 8,081,266 | — | 19,015,109 | |||||||||||||||||||||
Risk Managed Balanced | 264,930 | — | 264,930 | (2,112,457 | ) | 1,237,530 | 91,427 | (518,570 | ) | |||||||||||||||||||
| (1) | The differences between book-basis and tax-basis unrealized appreciation/(depreciation) are attributed primarily to tax deferral of losses on wash sales and the realization for tax purposes of unrealized gains/(losses) on certain instruments. |
For Federal income tax purposes, the following Portfolios had capital loss carryforwards as of December 31, 2015 that are available to offset future realized gains, if any:
| Total Loss Carryforward | Expiration | |||||||||||||||||||||||
Portfolio | 2016 | 2017 | 2018 | No Expiration Short Term | No Expiration Long Term | |||||||||||||||||||
Equity | $ | 1,568,071 | $ | — | $ | — | $ | 1,568,071 | $ | — | $ | — | ||||||||||||
Bond | 7,870,085 | — | 7,870,085 | — | — | — | ||||||||||||||||||
International | 76,093,820 | 271,315 | 65,792,130 | — | 9,777,925 | 252,450 | ||||||||||||||||||
High Income Bond | 975,549 | — | — | — | 191,310 | 784,239 | ||||||||||||||||||
Target VIP | 3,578,862 | 3,578,862 | — | — | — | — | ||||||||||||||||||
Risk Managed Balanced | 2,112,457 | — | — | — | 1,789,397 | 323,060 | ||||||||||||||||||
The tax characteristics of distributions paid to shareholders for the year ended December 31, 2015 were as follows:
Portfolio | Ordinary Income | Net Long-Term Capital Gains | Total Distribution Paid | |||||||||
Equity | $ | 3,223,171 | $ | — | $ | 3,223,171 | ||||||
Omni | 478,871 | — | 478,871 | |||||||||
Capital Appreciation | 3,261,845 | — | 3,261,845 | |||||||||
S&P 500® Index | 5,803,104 | — | 5,803,104 | |||||||||
Strategic Value | 9,545,259 | — | 9,545,259 | |||||||||
Nasdaq-100® Index | 890,078 | — | 890,078 | |||||||||
Bristol | 1,143,905 | — | 1,143,905 | |||||||||
Balanced | 11,143,284 | — | 11,143,284 | |||||||||
Target VIP | 711,595 | — | 711,595 | |||||||||
Bristol Growth | 495,776 | — | 495,776 | |||||||||
Risk Managed Balanced | 376,684 | — | 376,684 | |||||||||
The tax characteristics of distributions paid to shareholders for the year ended December 31, 2014 were as follows:
Portfolio | Ordinary Income | Net Long-Term Capital Gains | Total Distribution Paid | |||||||||
Equity | $ | 1,660,324 | $ | — | $ | 1,660,324 | ||||||
Omni | 341,371 | — | 341,371 | |||||||||
Capital Appreciation | 1,165,844 | — | 1,165,844 | |||||||||
S&P 500® Index | 4,671,250 | — | 4,671,250 | |||||||||
Strategic Value | 17,815,244 | — | 17,815,244 | |||||||||
Nasdaq-100® Index | 1,151,494 | — | 1,151,494 | |||||||||
Bristol | 895,082 | — | 895,082 | |||||||||
Balanced | 6,075,617 | — | 6,075,617 | |||||||||
Target VIP | 854,149 | — | 854,149 | |||||||||
Bristol Growth | 370,603 | — | 370,603 | |||||||||
| 152 | (continued) |
Ohio National Fund, Inc.
Notes to Financial Statements (Continued) | December 31, 2015 |
During the year ended December 31, 2015, the Fund recorded classifications within the composition of net assets for permanent book/tax differences. These classifications were as follows:
| Equity | Money Market | Bond | Omni | International | Capital Appreciation | International Small-Mid Company | Aggressive Growth | Small Cap Growth | Mid Cap Opportunity | |||||||||||||||||||||||||||||||
Consent distributions | ||||||||||||||||||||||||||||||||||||||||
Paid in capital in excess of par value | $ | 488,548 | $ | — | $ | 5,057,141 | $ | 6,250,772 | $ | 5,661,713 | $ | 21,414,702 | $ | 859,889 | $ | 8,382,717 | $ | 15,069,642 | $ | — | ||||||||||||||||||||
Undistributed net investment income | (488,548 | ) | — | (5,057,141 | ) | (54,162 | ) | (5,661,713 | ) | (37,464 | ) | (196,497 | ) | (1 | ) | 2 | — | |||||||||||||||||||||||
Accumulated net realized gain (loss) on investments | — | — | — | (6,196,610 | ) | — | (21,377,238 | ) | (663,392 | ) | (8,382,716 | ) | (15,069,644 | ) | — | |||||||||||||||||||||||||
Undistributed net investment losses | ||||||||||||||||||||||||||||||||||||||||
Paid in capital in excess of par value | — | — | — | — | — | — | — | — | — | (181,194 | ) | |||||||||||||||||||||||||||||
Undistributed net investment income | — | — | — | — | — | — | — | 44,062 | 219,326 | 181,194 | ||||||||||||||||||||||||||||||
Accumulated net realized gain (loss) on investments | — | — | — | — | — | — | — | (44,062 | ) | (219,326 | ) | — | ||||||||||||||||||||||||||||
Foreign currency related reclassifications | ||||||||||||||||||||||||||||||||||||||||
Undistributed net investment income | — | — | — | — | 3,404,677 | (14,365 | ) | (40,998 | ) | (200 | ) | — | — | |||||||||||||||||||||||||||
Accumulated net realized gain (loss) on investments | — | — | — | — | (3,404,677 | ) | 14,365 | 40,998 | 200 | — | — | |||||||||||||||||||||||||||||
Real Estate Investment Trust (REIT) reclassifications | ||||||||||||||||||||||||||||||||||||||||
Paid in capital in excess of par value | — | — | — | — | — | — | — | — | — | — | ||||||||||||||||||||||||||||||
Undistributed net investment income | (181,838 | ) | — | — | — | 10,756 | — | — | — | — | — | |||||||||||||||||||||||||||||
Accumulated net realized gain (loss) on investments | 181,838 | — | — | — | (10,756 | ) | — | — | — | — | — | |||||||||||||||||||||||||||||
Reclassifications for partnership sales/basis | ||||||||||||||||||||||||||||||||||||||||
Paid in capital in excess of par value | — | — | — | — | — | — | — | — | (182 | ) | — | |||||||||||||||||||||||||||||
Undistributed net investment income | 152,375 | — | — | — | — | — | — | — | (87,268 | ) | — | |||||||||||||||||||||||||||||
Accumulated net realized gain (loss) on investments | (152,375 | ) | — | — | — | — | — | — | — | 87,450 | — | |||||||||||||||||||||||||||||
Other permanent differences | ||||||||||||||||||||||||||||||||||||||||
Paid in capital in excess of par value | — | — | — | — | — | 1 | — | 1 | — | (35 | ) | |||||||||||||||||||||||||||||
Undistributed net investment income | — | — | 1,000 | (1 | ) | — | (1 | ) | — | 1 | (348 | ) | — | |||||||||||||||||||||||||||
Accumulated net realized gain (loss) on investments | — | — | (1,000 | ) | 1 | — | — | — | (2 | ) | 348 | 35 | ||||||||||||||||||||||||||||
| 153 | (continued) |
Ohio National Fund, Inc.
Notes to Financial Statements (Continued) | December 31, 2015 |
| S&P 500® Index | Strategic Value | High Income Bond | ClearBridge Small Cap | Nasdaq-100® Index | Bristol | Bryton Growth | Balanced | Target VIP | Bristol Growth | Risk Managed Balanced | ||||||||||||||||||||||||||||||||||
Consent distributions | ||||||||||||||||||||||||||||||||||||||||||||
Paid in capital in excess of par value | $ | 5,422,617 | $ | 40,289,888 | $ | 24,976,336 | $ | 8,562,909 | $ | 4,361,575 | $ | 44,884,130 | $ | 20,850,934 | $ | 14,666,478 | $ | 100,128 | $ | 20,313,869 | $ | 1,386,280 | ||||||||||||||||||||||
Undistributed net investment income | (888,145 | ) | (2,649,665 | ) | (16,751,297 | ) | (7,715 | ) | (155,810 | ) | (99,592 | ) | — | (1,346,548 | ) | (100,128 | ) | (55,036 | ) | 97,603 | ||||||||||||||||||||||||
Accumulated net realized gain (loss) on investments | (4,534,472 | ) | (37,640,223 | ) | (8,225,039 | ) | (8,555,194 | ) | (4,205,765 | ) | (44,784,538 | ) | (20,850,934 | ) | (13,319,930 | ) | — | (20,258,833 | ) | (1,483,883 | ) | |||||||||||||||||||||||
Undistributed net investment losses | ||||||||||||||||||||||||||||||||||||||||||||
Paid in capital in excess of par value | — | — | — | (293,559 | ) | — | — | — | — | — | — | — | ||||||||||||||||||||||||||||||||
Undistributed net investment income | — | — | — | 285,842 | — | — | 928,394 | — | — | — | — | |||||||||||||||||||||||||||||||||
Accumulated net realized gain (loss) on investments | — | — | — | 7,717 | — | — | (928,394 | ) | — | — | — | — | ||||||||||||||||||||||||||||||||
Foreign currency related reclassifications | ||||||||||||||||||||||||||||||||||||||||||||
Undistributed net investment income | — | (130,694 | ) | — | — | — | — | — | (1,493 | ) | — | — | (94 | ) | ||||||||||||||||||||||||||||||
Accumulated net realized gain (loss) on investments | — | 130,694 | — | — | — | — | — | 1,493 | — | — | 94 | |||||||||||||||||||||||||||||||||
Real Estate Investment Trust (REIT) reclassifications | ||||||||||||||||||||||||||||||||||||||||||||
Paid in capital in excess of par value | — | — | — | — | — | — | — | — | — | — | 377 | |||||||||||||||||||||||||||||||||
Undistributed net investment income | (82,875 | ) | (450,983 | ) | — | (61,210 | ) | — | — | — | (191,247 | ) | — | — | (377 | ) | ||||||||||||||||||||||||||||
Accumulated net realized gain (loss) on investments | 82,875 | 450,983 | — | 61,210 | — | — | — | 191,247 | — | — | — | |||||||||||||||||||||||||||||||||
Reclassifications for partnership sales/basis | ||||||||||||||||||||||||||||||||||||||||||||
Paid in capital in excess of par value | — | — | — | — | — | — | — | — | — | — | (6 | ) | ||||||||||||||||||||||||||||||||
Undistributed net investment income | — | — | — | 7,717 | — | — | — | — | — | — | (11,156 | ) | ||||||||||||||||||||||||||||||||
Accumulated net realized gain (loss) on investments | — | — | — | (7,717 | ) | — | — | — | — | — | — | 11,162 | ||||||||||||||||||||||||||||||||
Other permanent differences | ||||||||||||||||||||||||||||||||||||||||||||
Paid in capital in excess of par value | — | 1 | — | — | 3 | 1 | — | 3 | — | — | — | |||||||||||||||||||||||||||||||||
Undistributed net investment income | (2,770 | ) | (2 | ) | 26,114 | 4,352 | (3 | ) | (1 | ) | — | 2,528 | — | 2 | — | |||||||||||||||||||||||||||||
Accumulated net realized gain (loss) on investments | 2,770 | 1 | (26,114 | ) | (4,352 | ) | — | — | — | (2,531 | ) | — | (2 | ) | — | |||||||||||||||||||||||||||||
| 154 | (continued) |
| Ohio National Fund, Inc. |
Notes to Financial Statements (Continued) | December 31, 2015 |
The cost basis for Federal income tax purposes may differ from the cost basis for financial reporting purposes. The table below details the unrealized appreciation (depreciation) and aggregate cost of securities at December 31, 2015 for Federal income tax purposes.
| Equity | Bond | Omni | International | Capital Appreciation | International Small-Mid Company | |||||||||||||||||||
Gross unrealized: | ||||||||||||||||||||||||
Appreciation | $ | 58,161,708 | $ | 3,033,232 | $ | 2,632,707 | $ | 19,317,998 | $ | 28,030,347 | $ | 15,642,696 | ||||||||||||
Depreciation | (55,311,797 | ) | (6,959,242 | ) | (2,544,569 | ) | (9,637,507 | ) | (39,128,565 | ) | (4,727,486 | ) | ||||||||||||
|
|
|
|
|
|
|
|
|
|
|
| |||||||||||||
Net unrealized appreciation (depreciation) | $ | 2,849,911 | $ | (3,926,010 | ) | $ | 88,138 | $ | 9,680,491 | $ | (11,098,218 | ) | $ | 10,915,210 | ||||||||||
|
|
|
|
|
|
|
|
|
|
|
| |||||||||||||
Aggregate cost of securities: | $ | 550,210,293 | $ | 155,035,858 | $ | 48,657,066 | $ | 150,195,435 | $ | 449,897,088 | $ | 67,141,009 | ||||||||||||
|
|
|
|
|
|
|
|
|
|
|
| |||||||||||||
| Aggressive Growth | Small Cap Growth | Mid Cap Opportunity | S&P 500® Index | Strategic Value | High Income Bond | |||||||||||||||||||
Gross unrealized: | ||||||||||||||||||||||||
Appreciation | $ | 8,749,296 | $ | 36,682,675 | $ | 11,499,086 | $ | 151,159,396 | $ | 41,622,264 | $ | 1,522,889 | ||||||||||||
Depreciation | (1,332,031 | ) | (20,251,829 | ) | (5,703,758 | ) | (23,234,881 | ) | (17,499,616 | ) | (21,130,222 | ) | ||||||||||||
|
|
|
|
|
|
|
|
|
|
|
| |||||||||||||
Net unrealized appreciation (depreciation) | $ | 7,417,265 | $ | 16,430,846 | $ | 5,795,328 | $ | 127,924,515 | $ | 24,122,648 | $ | (19,607,333 | ) | |||||||||||
|
|
|
|
|
|
|
|
|
|
|
| |||||||||||||
Aggregate cost of securities: | $ | 44,177,634 | $ | 224,326,587 | $ | 73,075,512 | $ | 282,009,212 | $ | 291,159,955 | $ | 206,580,601 | ||||||||||||
|
|
|
|
|
|
|
|
|
|
|
| |||||||||||||
| ClearBridge Small Cap | Nasdaq-100® Index | Bristol | Bryton Growth | Balanced | Target VIP | |||||||||||||||||||
Gross unrealized: | ||||||||||||||||||||||||
Appreciation | $ | 5,466,969 | $ | 57,052,644 | $ | 15,674,086 | $ | 10,500,809 | $ | 41,059,179 | $ | 5,345,578 | ||||||||||||
Depreciation | (4,722,975 | ) | (3,099,362 | ) | (11,984,265 | ) | (26,600,576 | ) | (44,975,842 | ) | (5,767,707 | ) | ||||||||||||
|
|
|
|
|
|
|
|
|
|
|
| |||||||||||||
Net unrealized appreciation (depreciation) | $ | 743,994 | $ | 53,953,282 | $ | 3,689,821 | $ | (16,099,767 | ) | $ | (3,916,663 | ) | $ | (422,129 | ) | |||||||||
|
|
|
|
|
|
|
|
|
|
|
| |||||||||||||
Aggregate cost of securities: | $ | 92,684,771 | $ | 84,906,577 | $ | 214,835,567 | $ | 179,278,155 | $ | 857,415,050 | $ | 46,713,000 | ||||||||||||
|
|
|
|
|
|
|
|
|
|
|
| |||||||||||||
| Bristol Growth | Risk Managed Balanced | |||||||||||||||||||||||
Gross unrealized: | ||||||||||||||||||||||||
Appreciation | $ | 13,581,304 | $ | 6,004,910 | ||||||||||||||||||||
Depreciation | (5,500,038 | ) | (4,767,380 | ) | ||||||||||||||||||||
|
|
|
| |||||||||||||||||||||
Net unrealized appreciation (depreciation) | $ | 8,081,266 | $ | 1,237,530 | ||||||||||||||||||||
|
|
|
| |||||||||||||||||||||
Aggregate cost of securities: | $ | 108,316,353 | $ | 152,760,735 | ||||||||||||||||||||
|
|
|
| |||||||||||||||||||||
| (8) | Legal Matters |
Effective December 20, 2013, the assets and liabilities of the Target Equity/Income Portfolio were acquired and assumed by the Target VIP Portfolio in exchange for shares of the Target VIP Portfolio (“the reorganization”).
In December 2007, prior to the reorganization, the Target Equity/Income Portfolio, as a shareholder of Lyondell Chemical Company (“Lyondell”), participated in a cash out merger of Lyondell in which it received $48 per share of consideration (the “Merger”). Lyondell later filed for bankruptcy and two entities created by the Lyondell bankruptcy plan of reorganization have initiated lawsuits seeking to recover, or clawback, proceeds received by shareholders in the December 2007 merger based on fraudulent transfer claims.
The first action, Edward S. Weisfelner, as Trustee of the LB Creditor Trust v. Morgan Stanley & Co., Inc., et. al., was initiated on October 22, 2010 (the “Creditor Trust Action”), in the Supreme Court of the State of New York in the County of New York but has
| 155 | (continued) |
| Ohio National Fund, Inc. |
Notes to Financial Statements (Continued) | December 31, 2015 |
subsequently been removed to the U.S. Bankruptcy Court for the Southern District of New York. The second action, Edward S. Weisfelner, as Trustee of the LB Litigation Trust v. Holmes TTEE, et. al., was initiated on December 23, 2010 (the “Litigation Trust Action”), in the U.S. Bankruptcy Court for the Southern District of New York. Both actions attempt to recover the proceeds paid out to the holders of Lyondell shares at the time of the 2007 merger. The value of the proceeds to the fund totaled $1,772,400.
On January 4, 2012, the Fund was named in a second amended complaint in the Creditor Trust Action. On April 9, 2014, plaintiffs filed a third amended complaint. In response, on July 30, 2014, the defendant group, including the Fund, filed an omnibus motion to dismiss. The outcome of these proceedings on the Portfolio cannot be predicted.
As a result of the aforementioned reorganization involving the Target Equity/Income Portfolio, any future claims that may result from these complaints will be assumed by the Target VIP Portfolio as the Survivor Portfolio. Management of the Fund continues to assess the cases and has not yet determined the potential effect, if any, on the net asset value of the Target VIP Portfolio.
Also, in December 2007, the S&P 500® Index and Strategic Value Portfolios, shareholders of the Tribune Company, participated in a similar cash out merger in which shareholders received $34 per share of consideration. The value of the proceeds received by the S&P 500® Index and Strategic Value Portfolios, was $37,910 and $384,200, respectively. The company subsequently filed for bankruptcy and several legal complaints have been initiated by groups of Tribune Company creditors seeking to recover, or clawback, proceeds received by shareholders based on fraudulent transfer claims (the “Tribune Bankruptcy”).
The first action, Official Committee of Unsecured Creditors of Tribune Company v. FitzSimons, et. al. (“FitzSimons”) was initiated on November 1, 2010 in the U.S. Bankruptcy Court for the District of Delaware. As a result of these proceedings, the Court agreed to allow individual creditors to file similar complaints in U.S. state courts. The Fund is specifically named in a complaint in the U.S. District Court, Southern District of Ohio, Western Division, Deutsche Bank Trust Company Americas, et. al. v. American Electric Power, et. al., that was initiated in June of 2011. The Fund, along with the Strategic Value Portfolio, is also named in a similar complaint in the U.S. District Court, Eastern District of Pennsylvania, Deutsche Bank Trust Company Americas, et. al. v. Ametek Inc. Employees Master Retirement Trust, et. al. These Tribune litigation actions have been consolidated into a single Multidistrict Litigation (“MDL”) in the U.S. District Court, Southern District of New York. Pursuant to a Court order dated September 7, 2012, certain defendants in the MDL, including the Fund, filed a motion to dismiss on November 6, 2012. The Court granted the motion to dismiss on September 23, 2013. Pending an appeal, only the actual fraudulent transfer claims as alleged in FitzSimons remain. The outcome of these proceedings on the two Portfolios of the Fund cannot be predicted. Management of the Fund continues to assess litigation matters and any offers of settlement.
| 156 |
| Ohio National Fund, Inc. |
The Board of Directors and Shareholders of Ohio National Fund, Inc.
We have audited the accompanying statements of assets and liabilities of the Equity Portfolio, Money Market Portfolio, Bond Portfolio, Omni Portfolio, International Portfolio, Capital Appreciation Portfolio, International Small-Mid Company Portfolio, Aggressive Growth Portfolio, Small Cap Growth Portfolio, Mid Cap Opportunity Portfolio, S&P 500 Index Portfolio, Strategic Value Portfolio, High Income Bond Portfolio, ClearBridge Small Cap Portfolio (formerly, Capital Growth Portfolio), Nasdaq-100 Index Portfolio, Bristol Portfolio, Bryton Growth Portfolio, Balanced Portfolio, Target VIP Portfolio, Bristol Growth Portfolio and Risk Managed Balanced Portfolio (each a Portfolio and collectively, the Portfolios of Ohio National Fund, Inc.), including the schedules of investments, as of December 31, 2015, and the related statements of operations for the year then ended, the statements of changes in net assets for each of the years or periods in the two-year period then ended and the financial highlights for each of the years or periods in the five-year period then ended. These financial statements and financial highlights are the responsibility of the Portfolios’ management. Our responsibility is to express an opinion on these financial statements and financial highlights based on our audits.
We conducted our audits in accordance with the standards of the Public Company Accounting Oversight Board (United States). Those standards require that we plan and perform the audits to obtain reasonable assurance about whether the financial statements and financial highlights are free of material misstatement. An audit includes examining, on a test basis, evidence supporting the amounts and disclosures in the financial statements and financial highlights. Our procedures included confirmation of securities owned as of December 31, 2015, by correspondence with custodians and brokers or by other appropriate auditing procedures. An audit also includes assessing the accounting principles used and significant estimates made by management, as well as evaluating the overall financial statement presentation. We believe that our audits provide a reasonable basis for our opinion.
In our opinion, the financial statements and financial highlights referred to above present fairly, in all material respects, the financial position of the Portfolios as of December 31, 2015, the results of their operations for the year then ended, the changes in their net assets for each of the years or periods in the two-year period then ended and the financial highlights for each of the years or periods in the five-year period then ended, in conformity with U.S. generally accepted accounting principles.
/s/ KPMG LLP
Columbus, Ohio
February 19, 2016
| 157 |
| Ohio National Fund, Inc. |
| December 31, 2015 |
| (1) | Review and Approval of Advisory and Sub-advisory Agreements |
At a meeting held on August 13, 2015, the Fund’s Board of Directors, including all Independent Directors, (collectively, the “Directors”) met for the specific purpose of considering the approval of a sub-advisory agreement for the Capital Growth Portfolio (currently named the ClearBridge Small Cap Portfolio) with a new sub-adviser. A representative of the Adviser reminded the Directors that at the May 21, 2015 meeting they had met with representatives of two potential sub-advisers that the Adviser had invited to the meeting to discuss their proposed strategies for the Portfolio, and that based on their consideration of the two potential sub-advisers and the Adviser’s recommendation, the Directors had determined that ClearBridge should be the proposed replacement.
The representative then reminded the Directors that at the May 21, 2015 meeting they had reviewed materials provided by ClearBridge with a Managing Director and Portfolio Manager of ClearBridge, who had discussed background information regarding the firm and its investment team for its small cap strategy, as well as the firm’s investment philosophy, portfolio construction process and approach to risk management.
The representative of the Adviser then pointed out that a copy of the proposed sub-advisory agreement was included in the Board materials, noting that it was in substantially the same form as recently used by the Fund for a different sub-adviser and that it included a reduction in the sub-advisory fee from 59 basis points to 55 basis points for the first $100 million in assets for the Portfolio. He also pointed out that the Adviser had agreed to reduce its advisory fee for the first $100 million in assets from 90 basis points to 85 basis points. It was the consensus of the Directors to agree to these fee reductions.
The representative of the Adviser then reviewed with the Directors the materials provided for purposes of their consideration of the sub-advisory agreement. He reviewed the performance for various periods ended June 30, 2015 of ClearBridge’s Small Cap composite (the “ClearBridge Composite”), which he pointed out was calculated without deduction for fees (i.e. “gross of fees”), in comparison with a peer group of funds in the U.S. Insurance Fund Small Cap Blend Morningstar category (the “Morningstar Peer Group”) and the Russell 2000 Index (the “Benchmark Index”). The Directors noted that, after deducting the anticipated net expense ratio for the Portfolio (the current actual net expense ratio, less the 5 basis point reduction of the advisory fee), the ClearBridge Composite outperformed the Morningstar Peer Group for the 1-, 3- and 5- year periods and outperformed the Benchmark Index for the 3- year period, while it underperformed the Morningstar Peer Group for the year-to-date period and underperformed the Benchmark Index for the year-to-date, 1- and 5- year periods.
The Directors also noted that the Portfolio’s anticipated net expense ratio was less than the average expense ratio for the Morningstar Peer Group, and that the sub-advisory fee was within the range of sub-advisory fees for the Morningstar Peer Group and less than the fees charged by ClearBridge to its proprietary fund and separately managed accounts with similar objectives and strategies, Overall, the Directors concluded that the proposed sub-advisory fee was reasonable. The Directors also reviewed ClearBridge’s estimated profit margin and determined that it was not excessive.
As part of the approval process, the Directors considered that, since ClearBridge is already a sub-adviser to another portfolio of the Fund, the Board had previously reviewed and approved ClearBridge’s code of ethics and compliance policies and procedures, including any changes thereto. The Directors also noted their satisfaction with the nature and quality of the services ClearBridge provides to the other portfolio.
After discussion, the Directors indicated that they were very impressed by the performance and presentation of ClearBridge, noting in particular the performance of the ClearBridge Composite (after deducting the anticipated net expense ratio for the Portfolio) relative to its Morningstar Peer Group. In unanimously determining to approve the proposed new sub-advisory agreement, the Directors concluded that the terms of the agreement were fair and reasonable and that approval was in the best interests of the Portfolio and its shareholders.
At a meeting held on November 19, 2015, the Board of Directors, including a majority of the Directors who are not “interested persons” of the Fund (the “Independent Directors”), approved the continuation of the Investment Advisory Agreement (the “Advisory Agreement”) with ONI (the “Adviser”) and, as applicable, the sub-advisory agreement with the Sub-Adviser (each a “Sub-Adviser,” and together the “Sub-Advisers”) for each of the Portfolios identified below. The Independent Directors were separately represented by independent legal counsel in connection with their consideration of the approval of the continuation of these agreements.
The Directors noted that the Adviser is responsible for monitoring the investment performance and other responsibilities of the various Sub-Advisers that have day-to-day responsibility for the decisions made for certain of the Fund’s investment portfolios (each, a “Portfolio”). They also noted that the Adviser reports to the Fund’s Board on its analysis of each Sub-Adviser’s performance at the regular meetings of the Board, which are held at least quarterly. Where warranted, the Adviser will add or remove a particular Portfolio from a watchlist that it maintains. Watchlist criteria include, for example: (a) Portfolio performance over various time periods; (b) Portfolio risk issues, such as changes in key personnel involved with Portfolio management or changes in investment philosophy or process; and (c) organizational risk issues, such as regulatory, compliance or legal concerns, or changes in the ownership of the Sub-Adviser.
In considering the Advisory Agreement and sub-advisory agreements, the Board requested and reviewed a significant amount of information relating to each Portfolio, the Adviser and the Sub-Advisers, including the following: (1) performance data for each Portfolio for various time periods, including year-to-date through October 31, 2015, (2) comparative performance, advisory fee and expense ratio information for a peer group of funds in the respective Portfolio’s Morningstar category (a “Morningstar Peer Group” or “peer group”), as well as management fee
| 158 | (continued) |
| Ohio National Fund, Inc. |
Additional Information (Unaudited) (Continued) | December 31, 2015 |
peer comparison charts showing where each Portfolio’s advisory fee was located in the dispersion of its peer funds’ advisory fees; (3) comparable performance information for each Portfolio’s relevant benchmark index or indices; (4) comparative data regarding advisory fees, including data regarding the fees charged by the Adviser and Sub-Advisers for managing other institutional funds and institutional accounts using investment strategies and techniques similar to those used in managing the Portfolios; (5) comparative data regarding the expense ratio of each Portfolio, as compared to its Morningstar Peer Group; (6) profitability analyses for the Adviser with respect to each Portfolio; and (7) other information regarding the nature, extent and quality of services provided by the Adviser and the Sub-Advisers, as applicable. The Directors also took into account information on the services provided by the Adviser and each Sub-Adviser and performance, fee and expense ratio information regarding each Portfolio provided to them periodically throughout the year. They also met with representatives of the Adviser to review the relative performance of each Portfolio, as compared with its benchmark(s) and peers, and in particular discussed those Portfolios that were on the watchlist.
The Directors, including all of the Independent Directors, were assisted by experienced independent legal counsel throughout the contract review process. The Independent Directors discussed the proposed continuations in private session with such counsel at which no representatives of management, the Adviser or any Sub-Adviser were present. The Directors, including all of the Independent Directors, relied upon the advice of independent legal counsel and their own business judgment in determining the material factors to be considered in evaluating the Advisory Agreement and each sub-advisory agreement and the weight to be given to each such factor. The conclusions reached by the Directors were based on a comprehensive evaluation of all of the information provided and were not the result of any one factor. Moreover, each Director may have afforded different weight to the various factors in reaching his or her conclusions with respect to the Advisory Agreement and each sub-advisory agreement.
Nature, Extent and Quality of Services
The Board evaluated the nature, extent and quality of the advisory services provided to the Portfolios by the Adviser. As part of its review, the Board reviewed information regarding the Adviser’s operations, procedures and personnel. The Directors took into account information they received during the previous year at Board meetings and other discussions and through periodic reports regarding the Adviser’s performance of its duties. The Directors considered the capabilities and resources that the Adviser has dedicated to performing services on behalf of the Fund and its Portfolios. The quality of administrative and other services, including the Adviser’s role in monitoring the performance and quality of compliance of the Sub-Advisers, also was considered. The Directors also considered the quality of the compliance programs of the Adviser and its responsiveness to inquiries and requests from the Board.
For each Portfolio subject to a sub-advisory agreement (all Portfolios other than the Money Market Portfolio, Bond Portfolio, S&P 500 Index Portfolio, Nasdaq-100 Index Portfolio and the fixed income portion of the Omni Portfolio), the Board considered similar criteria as applied to each Sub-Adviser, including the nature, extent and quality of the sub-advisory services provided by each Sub-Adviser. In addition to the criteria used to review the Adviser, the Directors reviewed information on each Sub-Adviser’s portfolio management and brokerage practices, including any soft dollar benefits received. The Directors also reviewed the performance record of each Portfolio managed by the applicable Sub-Adviser. It was the Directors’ conclusion that overall, they were satisfied with the nature, extent and quality of services provided to the Fund and each of the Portfolios. The Directors did not consider the sub-advisory agreement with ClearBridge, LLC with respect to the ClearBridge Small Cap Portfolio, as that sub-advisory agreement recently had been approved by the Board in conjunction with the substitution of ClearBridge, LLC as the Sub-Adviser to the Portfolio.
Investment Performance
Representatives of the Adviser reviewed with the Directors each Portfolio’s performance year-to-date and for the 1-, 3- and 5-year periods ended October 31, 2015, as compared to the Portfolio’s Morningstar Peer Group and benchmark(s). The Board also considered the Adviser’s effectiveness in monitoring the performance of each Sub-Adviser and the Adviser’s timeliness in responding to performance issues. A Portfolio-by-Portfolio discussion of each Portfolio’s performance and the Board’s conclusions regarding that performance is set forth below.
Fees and Expenses
The Board considered the advisory fee for each Portfolio, as well as the difference of each Portfolio’s fee from the average advisory fee for the Portfolio’s Morningstar Peer Group and the fee’s percentile ranking within the peer group. The Board also considered charts showing, for each Portfolio, how the Portfolio’s advisory fees compared to the advisory fees of the funds in its peer group. The charts showed the number of funds in the peer group within each defined range of advisory fees, and the range that included the Portfolio. The Board also reviewed the difference between each Portfolio’s overall expense ratio and that of its Morningstar Peer Group, as well as the expense ratio’s percentile ranking within the peer group. For these purposes, the Morningstar Peer Groups excluded funds with net assets over $1 billion and all funds identified as being funds of funds. The Morningstar Peer Groups also excluded non-index funds for the S&P 500 Index Portfolio and the Nasdaq-100 Index Portfolio and excluded index funds for all other Portfolios.
In addition, the Board looked at the average net assets for each fund in the respective Morningstar Peer Group, and then compared the advisory fee that would have been paid by the Portfolio if the Portfolio had had net assets equal to the Morningstar Peer Group’s average net assets. The Board considered that comparison on an absolute and percentile ranking basis.
| 159 | (continued) |
| Ohio National Fund, Inc. |
Additional Information (Unaudited) (Continued) | December 31, 2015 |
For all Portfolios other than those sub-advised by Suffolk, an affiliate of the Adviser, the Board also considered the amount of net advisory fee retained by the Adviser, after payment of the sub-advisory fee, as well as the proportion the net fee represented of the total advisory fee, in light of the services provided by the Adviser to the Portfolio. In this regard, in those cases where the Sub-Adviser provides sub-advisory services to a similar fund with an unaffiliated investment adviser, the Board reviewed a comparison of the advisory and sub-advisory fees paid by the similar fund to the fees for the Portfolio.
The Board also considered the fees paid to Sub-Advisers. With respect to the Portfolios sub-advised by Suffolk (including the equity portion of the Omni Portfolio), the Board evaluated the reasonableness of the total fees received by the Adviser. With respect to those Portfolios sub-advised by a Sub-Adviser that is not affiliated with the Adviser, the Board relied to a degree on the Adviser’s negotiation of each sub-advisory agreement on an arm’s-length basis, noting that in the past the Adviser has negotiated decreases in the sub-advisory fee for certain Portfolios and that the Adviser had always passed on the decrease by reducing its advisory fee by the same amount. Additionally, the Board considered the fees charged by the Adviser and Sub-Advisers to their separately managed institutional accounts and other accounts, and had no concerns with those rates relative to the fees charged to the Portfolios. The Directors also recognized that it is difficult to make comparisons of advisory fees because there are variations in the services that are included in the fees paid by other funds and separately managed accounts.
Profitability
The Board reviewed the advisory fee paid to the Adviser for each Portfolio and noted the pre-tax profit margins reported by the Adviser for each Portfolio. Counsel then reviewed with the Directors a Management Practice, Inc. report on “Mutual Fund Profitability in 2013,” which showed the range of pre-tax profit margins of 16 public company investment advisers in 2013 for their respective fund complexes, as well as the average pre-tax profit margin by type of fund (equity, alternative, fixed income or money market). The Directors noted that the profit margins, with respect to the Portfolios that were profitable to the Adviser, were all within or slightly less than the range of profit margins for the 16 fund complexes (with the exception of the profit margin with respect to Omni Portfolio, which was significantly less than that range). The Directors reasoned that the Adviser’s profitability with respect to Omni Portfolio was likely attributable to the relatively smaller size of the Portfolio. The Directors also noted that the Adviser, and not the Portfolios, is responsible for paying sub-advisory fees to the Sub-Advisers. The Board also evaluated whether the net advisory fee received by the Adviser for each Portfolio, after paying sub-advisory fees to the Sub-Adviser, was reasonable, given the level of the Adviser’s services to the Portfolio. The Directors took into account the fact that the Adviser is contractually obligated to reimburse each Portfolio for certain of its expenses should they exceed a specified amount. Additionally, the Directors acknowledged that calculating the Adviser’s profitability related to a specific Portfolio can be challenging and imprecise because of the difficulties in appropriately allocating the Adviser’s expenses across the Portfolios.
The Board also noted that the Adviser has been subsidizing the Money Market Portfolio (and as a result has a loss with respect to the Portfolio) to assure that it continues to be available to all of Ohio National Fund, Inc.’s shareholders (i.e., the shareholders of every Portfolio), so that shareholders in other Portfolios can elect to invest in the Money Market Portfolio to the extent they want to take a more defensive posture. Consequently, because the Adviser’s subsidization of the Money Market Portfolio benefits the shareholders of every Portfolio, the Board acknowledged that a portion of the costs incurred by the Adviser in subsidizing the Money Market Portfolio should be considered with respect to the Adviser’s profitability from managing each of the other Portfolios.
The Board also considered the reasonableness of the sub-advisory fees paid by the Adviser to each Sub-Adviser. The Directors relied on the ability of the Adviser to negotiate the terms of each sub-advisory agreement, including the sub-advisory fee, at arm’s-length, noting that the Adviser is not affiliated with any Sub-Adviser other than Suffolk. Accordingly, the cost of services provided by each unaffiliated Sub-Adviser and the profitability to the Sub-Adviser of its relationship with the applicable Portfolio were not material factors in the Board’s deliberations. For similar reasons, the Board concluded that the potential realization of economies of scale by the Portfolios from the sub-advisory arrangements with the unaffiliated Sub-Advisers should not be a material factor in the Board’s deliberations.
In considering the reasonableness of the sub-advisory fees payable by the Adviser to Suffolk, the Directors noted that the Adviser, not the Portfolios, is responsible for paying sub-advisory fees to Suffolk and concluded, because of the affiliate relationship, that the allocation of the advisory fee between the Adviser and Suffolk was not relevant. Accordingly, the cost of services provided by Suffolk and the profitability to Suffolk of its relationship with the applicable Portfolios were not material factors in the Board’s deliberations. For similar reasons, the Board concluded that the potential realization of economies of scale by the applicable Portfolios from the sub-advisory arrangements with Suffolk should not be a material factor in the Board’s deliberations.
After considering all of the above, the Board concluded that the profitability of the Adviser with respect to each Portfolio was reasonable.
Economies of Scale
The Directors noted that all of the advisory and sub-advisory fee schedules contain breakpoints that would reduce the applicable advisory or sub-advisory fees on assets above a specified level as the applicable Portfolio’s assets increase. The Directors also noted that a Portfolio would realize additional economies of scale if the Portfolio’s net assets increase over time proportionately more than certain other expenses. The Directors took into account that many of the Portfolios had a small amount of net assets relative to peer funds. After considering each Portfolio’s current size and potential for growth, the Board concluded that each Portfolio is likely to benefit from economies of scale as the Portfolio’s net assets increase.
| 160 | (continued) |
| Ohio National Fund, Inc. |
Additional Information (Unaudited) (Continued) | December 31, 2015 |
Portfolio-by-Portfolio Analysis
In addition to the foregoing, the Directors considered the specific factors and related conclusions set forth below with respect to each Portfolio’s performance and fees and expenses. Except as otherwise indicated, the performance data described below for each Portfolio is for periods ended October 31, 2015 and the advisory fee and expense data described below is as of September 30, 2015 for a Portfolio’s Morningstar Peer Group.
Equity Portfolio (Adviser – ONI, Sub-Adviser – Clearbridge). The Portfolio underperformed its benchmark index and peer group for the year-to-date, 1- and 5-year periods, but outperformed the benchmark and peer group for the 3-year period. Representatives of the Adviser highlighted that for the 3-year period, the Portfolio’s performance ranked in the 16th percentile of its peer group. The Directors noted that the Portfolio’s advisory fee was higher than the peer group average, but still within the range of its peers, and recognized that the Portfolio’s expense ratio was slightly below the peer group average. Overall, the Board concluded that the Portfolio’s performance was acceptable and that the advisory and sub-advisory fees were reasonable.
Money Market Portfolio (Adviser – ONI). The Portfolio very slightly underperformed its peer group average for the year-to-date, 1-, 3- and 5-year periods. The Directors noted that the Portfolio’s advisory fee and expense ratio were below average relative to its peer group and that the Adviser has a negative profit margin for the Portfolio. Overall, the Board concluded that the Portfolio’s performance was satisfactory and that the advisory fee was reasonable.
Bond Portfolio (Adviser – ONI). The Portfolio underperformed its benchmark index and its peer group average for the year-to-date, 1-, 3- and 5-year periods. Representatives of the Adviser discussed the conservative nature of the portfolio (indicating that it generally would be expected to slightly underperform) and how an unusual level of interest rate volatility that occurred in October 2015 affected overall returns for the Portfolio. The Directors noted that, although the Portfolio’s advisory fee was slightly above the peer group average, the Portfolio’s expense ratio was below the peer group average. Overall, the Board concluded that the Portfolio’s performance was acceptable and that the advisory fee was reasonable.
Omni Portfolio (Adviser – ONI, Sub-Adviser – Suffolk). The Omni Portfolio outperformed its benchmark index for the year-to-date, 1- and 3-year periods and its peer group average for the year-to-date, 1-, 3- and 5-year periods, while slightly underperforming the benchmark index for the 5-year period. Representatives of the Adviser pointed out that the Portfolio had performed in the top 1 percent of its peer group for the year-to-date, 1- and 3-year periods. The Board noted that the Portfolio’s advisory fee and expense ratio were below the Portfolio’s peer group average. Overall, the Board concluded that the Portfolio’s performance was satisfactory and that the advisory and sub-advisory fees were reasonable.
International Portfolio (Adviser – ONI, Sub-Adviser – Federated Global). The Portfolio outperformed its benchmark index for the year-to-date and 1-year periods, while underperforming the benchmark for the 3- and 5-year periods. The Portfolio outperformed its peer group for the 1-year period, but it underperformed its peer group for the year-to-date, 3- and 5-year periods. Representatives of the Adviser noted that the Portfolio’s performance had turned around over the last year and that as a result the Adviser had taken it off the watchlist. The Board noted that while the Portfolio’s advisory fee was slightly above the peer group average, its expense ratio was below the peer group average. Overall, the Board concluded that the Portfolio’s performance was satisfactory and that the advisory and sub-advisory fees were reasonable.
Capital Appreciation Portfolio (Adviser – ONI, Sub-Adviser – Jennison). The Portfolio underperformed its benchmark index for the year-to-date, 1-, 3- and 5-year periods, underperformed its peer group average for the year-to-date and 1-year periods, and outperformed its peer group average for the 3- and 5-year periods. Representatives of the Adviser noted that, while recent performance had been inconsistent, the Portfolio had outperformed its peer group over the longer term. The Board noted that, although the Portfolio’s advisory fee was higher than the peer group average, the expense ratio was below the peer group average. Overall, the Board concluded that the Portfolio’s performance was acceptable, especially in light of the Portfolio’s longer-term performance, and that the advisory and sub-advisory fees were reasonable.
International Small-Mid Company Portfolio (Adviser – ONI, Sub-Adviser – Federated Global). The Portfolio outperformed its benchmark index and peer group for year-to-date, 1-, 3- and 5-year periods, substantially outperforming both comparison groups for the year-to-date and 1-year periods. Representatives of the Adviser pointed out that the Portfolio’s performance had turned around significantly over the last year and that as a result the Adviser had taken it off the watchlist. The Board noted that the Portfolio’s advisory fee was slightly below the peer group average and the expense ratio was well below average relative to the peer group. Overall, the Board concluded that the Portfolio’s performance was satisfactory and that the advisory and sub-advisory fees were reasonable.
Aggressive Growth Portfolio (Adviser – ONI, Sub-Adviser – Janus). The Portfolio outperformed its peer group average for the year-to-date, 1-, 3- and 5-year periods, outperformed its benchmark index over the year-to-date, 1- and 3-year periods, and underperformed its benchmark over the 5-year period. Representatives of the Adviser highlighted that the Portfolio significantly outperformed its benchmark index and peer group average over the 1-year period. The Board noted that the Portfolio’s advisory fee was above average compared to its peer group, but within the range of the Portfolio’s peers. The Board also noted that the Portfolio’s net expense ratio was below the average of the Portfolio’s peer group. Overall, the Board concluded that the Portfolio’s performance was satisfactory and that the advisory and sub-advisory fees were reasonable.
Small Cap Growth Portfolio (Adviser – ONI, Sub-Adviser – Janus). The Portfolio outperformed its benchmark index and peer group average for the year-to-date, 1-, 3- and 5-year periods. Representatives of the Adviser pointed out that the Portfolio had performed in the top 1 percent of its
| 161 | (continued) |
| Ohio National Fund, Inc. |
Additional Information (Unaudited) (Continued) | December 31, 2015 |
peer group for the 5-year period. The Board noted that the Portfolio’s advisory fee and expense ratio were below the peer group average. Overall, the Board concluded that the Portfolio’s performance was satisfactory and that the advisory and sub-advisory fees were reasonable.
Mid Cap Opportunity Portfolio (Adviser – ONI, Sub-Adviser – Goldman Sachs). The Portfolio underperformed its benchmark index for the year-to-date, 1-, 3- and 5-year periods, underperformed its peer group average for the year-to-date, 1-year and 3-year periods, and outperformed its peer group average for the 5-year period. Representatives of the Adviser noted that the Portfolio’s underperformance was relatively recent, and that the Portfolio had been added to the watchlist, indicating that they would monitor performance closely, going forward. They also noted that the Portfolio’s 3-year and 5-year performance was fairly close to the peer group median, ranking in the 55th and 53rd percentile compared to the peer group. The Board noted that the Portfolio’s advisory fee was above the peer group average, although the Portfolio’s expense ratio was below the peer group average. Overall, the Board concluded that the Portfolio’s performance was acceptable, especially in light of the Portfolio’s longer-term performance, and that the advisory and sub-advisory fees were reasonable.
S&P 500® Index Portfolio (Adviser – ONI). While the Portfolio underperformed its benchmark index for the year-to-date, 1-, 3- and 5-year periods, the Board noted that its performance generally was in line with the S&P 500® Index when expenses were excluded. The Board did not rely on peer group comparison performance figures for the Portfolio because the Board considers peer group performance data for index funds to be generally irrelevant. The Board noted that, while the advisory fee was above the peer group average, the overall expense ratio is the statistic most important to index fund shareholders, and the Portfolio’s expense ratio was lower than the average for the peer group. Overall, the Board concluded that the Portfolio’s performance was satisfactory and that the advisory fees were reasonable.
Strategic Value Portfolio (Adviser – ONI, Sub-Adviser – Federated Equity). The Portfolio outperformed its benchmark index and peer group average for the year-to-date and 1-year periods, underperformed its benchmark index for the 3- and 5-year periods, underperformed its peer group average over the 3-year period, and outperformed its peer group average for the 5-year period. Representatives of the Adviser discussed a summary of dividend yield and dividend growth for the Portfolio, noting that the Portfolio was meeting its objective of obtaining dividend yield. The Directors noted that the Portfolio’s advisory fee was above average for the peer group, while the expense ratio was below the peer group average. Overall, the Board concluded that the Portfolio’s performance was satisfactory and that the advisory and sub-advisory fees were reasonable.
High Income Bond Portfolio (Adviser – ONI, Sub-Adviser – Federated Investment). The Portfolio outperformed its benchmark index and peer group average for the year-to-date, 1-, 3- and 5-year periods. The Directors noted that the advisory fee was above the peer group average, while the expense ratio was below the peer group average. Overall, the Board concluded that the Portfolio’s performance was satisfactory and that the advisory and sub-advisory fees were reasonable.
ClearBridge Small Cap Portfolio (Adviser – ONI; sub-advisory agreement with new Sub-Adviser – ClearBridge not considered). The Directors reviewed the comparative performance information for the Portfolio, but noted that, at the recommendation of the Adviser, they had replaced the Sub-Adviser for the Portfolio, effective September 24, 2015, due to the poor performance of the Portfolio. They therefore determined that, in their consideration of the renewal of the advisory Agreement, they should focus on the factors other than performance, as they believed that the Adviser had demonstrated the appropriate oversight of the former Sub-Adviser in determining to substitute ClearBridge, LLC as the new Sub-Adviser. The Board reviewed supplemental performance information for the Portfolio that covered the period running from the effective date of the change in sub-adviser until November 2, 2015, but reasoned that such a short history of performance did not provide a sufficient track record to evaluate. The Directors noted that although the Portfolio’s advisory fee was slightly above the peer group average, the expense ratio was below the peer group average. Overall, the Board concluded that the advisory fee was reasonable.
Nasdaq-100® Index Portfolio (Adviser – ONI). While the Portfolio underperformed its benchmark index for the year-to-date, 1-, 3- and 5-year periods, the Board noted that its performance generally was in line with the Nasdaq-100® Index when expenses were excluded. The Board did not rely on peer group comparison performance figures for the Portfolio because the Board considers peer group performance data for index funds to be generally irrelevant. The Board noted that the Portfolio’s advisory fee and net expense ratio were below the peer group averages. Overall, the Board concluded that the Portfolio’s performance was satisfactory and that the advisory fees were reasonable.
Bristol Portfolio (Adviser – ONI, Sub-Adviser – Suffolk). The Portfolio outperformed its peer group average for the year-to-date, 1-, 3- and 5-year periods, outperformed its benchmark index for the year-to-date, 1- and 3- year periods, and underperformed its benchmark index for the 5-year period. The Directors noted that, although the Portfolio’s advisory fee was above the peer group average, the Portfolio’s expense ratio was below the peer group average. Overall, the Board concluded that the Portfolio’s performance was satisfactory and that the advisory and sub-advisory fees were reasonable.
Bryton Growth Portfolio (Adviser – ONI, Sub-Adviser – Suffolk). The Portfolio underperformed its benchmark index and peer group average for the year-to-date, 1-, 3- and 5-year periods. The Directors noted that the Portfolio only slightly underperformed the peer group average for the 1- and 3-year periods. Representatives of the Adviser noted that the Portfolio’s three year performance was equal to the median for its peer group. The Directors noted that the Portfolio’s advisory fee was equal to the peer group average and the expense ratio was below the peer group average. Overall, the Board concluded that the Portfolio’s performance was satisfactory and that the advisory and sub-advisory fees were reasonable.
| 162 | (continued) |
| Ohio National Fund, Inc. |
Additional Information (Unaudited) (Continued) | December 31, 2015 |
Balanced Portfolio (Adviser – ONI, Sub-Adviser – ICON). The Portfolio outperformed its benchmark index for the year-to-date period, underperformed its benchmark index for the 1-, 3- and 5-year periods, outperformed its peer group average for the year-to-date, 1- and 5-year periods, and underperformed its peer group average for the 3-year period. The Directors noted the Portfolio’s good performance relative to its peer group, particularly over the last year. The Directors further considered supplemental information regarding the Portfolio’s historical standard deviation versus several indexes and noted that, based on that data, the Portfolio seemed to be achieving a reasonable return for the risk it was taking on. The Directors noted that the Portfolio’s advisory fee and expense ratio were below the peer group averages. Overall, the Board concluded that the Portfolio’s performance was satisfactory and that the advisory and sub-advisory fees were reasonable.
Target VIP Portfolio (Adviser – ONI, Sub-Adviser – First Trust). The Portfolio underperformed its benchmark index and peer group average for the year-to-date, 1-, 3- and 5- year periods. The Board noted that, because the Portfolio is not actively managed, its performance does not reflect on the Sub-Adviser, but is a function of the effectiveness of the model. Representatives of the Adviser indicated that the Portfolio has been added to the watchlist, indicating that they would monitor performance closely, going forward. The Board noted the Portfolio’s advisory fee and expense ratio were below its peer group averages. Overall, the Board concluded that the performance of the Portfolio was acceptable, particularly in light of the fact that the Portfolio is not actively managed, and that the advisory and sub-advisory fees were reasonable.
Bristol Growth Portfolio (Adviser – ONI, Sub-Adviser – Suffolk). The Portfolio underperformed its benchmark index over the year-to-date, 1- and 5-year periods, outperformed its benchmark index for the 3-year period, and outperformed its peer group average over the year-to-date, 1-, 3- and 5-year periods. The Directors noted that although the Portfolio’s advisory fee was slightly above its peer group average, the expense ratio was below the peer group average. Overall, the Board concluded that the Portfolio’s performance was satisfactory and that the advisory and sub-advisory fees were reasonable.
Risk Managed Balanced Portfolio (Adviser – ONI, Sub-Advisers – Janus and AnchorPath). The Portfolio underperformed its benchmark index for the year-to-date and 1-year periods, but outperformed its peer group average over the same periods. The Board also considered supplemental performance data that showed that the Portfolio was performing favorably with relatively low volatility when returns were evaluated since inception, and noted that AnchorPath appeared to be substantially contributing to the Portfolio’s total performance. The Directors also noted that the Portfolio’s advisory fee and expense ratio were substantially higher than the peer group average. Representatives of the Adviser explained that the Portfolio’s higher advisory fee was due, in part, to the engagement of two sub-advisers for the Portfolio. They noted that the Portfolio’s higher net expense ratio was expected due to the Portfolio’s relatively shorter operating history, and was expected to decline as the Portfolio’s assets grow. They also pointed out that there was no appropriate peer group for comparison purposes among insurances funds. The peer group used is a balanced fund peer group, but the Portfolio executes a strategy that is more comparable to that of alternative funds, which generally have much higher fees. Overall, the Board concluded that the Portfolio’s performance was satisfactory and that the advisory and sub-advisory fees were reasonable.
After consideration of the foregoing, the Board reached the following conclusions regarding the Investment Advisory Agreement and, as applicable, the sub-advisory agreement(s) with respect to each Portfolio, in addition to the conclusions set forth above: (a) ONI and the Sub-Adviser(s) had demonstrated that they possessed the capability and resources to perform the duties required of them under the Investment Advisory Agreement and applicable sub-advisory agreement(s), respectively; (b) the investment philosophy, strategies and techniques of ONI (with respect to the Portfolios without a Sub-Adviser) and the Sub-Adviser(s) were appropriate for pursuing the applicable Portfolio’s investment objective; (c) ONI (with respect to the Portfolios without a Sub-Adviser) and the Sub-Adviser(s) were likely to execute their investment philosophy, strategies and techniques consistently over time; and (d) ONI and the Sub-Adviser(s) maintained appropriate compliance programs. Based on all of the above-mentioned factors and their related conclusions, with no single factor or conclusion being determinative and with each Director not necessarily attributing the same weight to each factor, the Directors unanimously concluded that approval of the continuation of the Investment Advisory Agreement and, as applicable, the sub-advisory agreement was in the best interests of each Portfolio and its shareholders. Accordingly, the Board, including all of the Independent Directors, voted unanimously to approve the continuation of the Investment Advisory Agreement and, as applicable, the sub-advisory agreement(s) for each Portfolio.
| (2) | Expense Disclosure |
An individual may not buy or own membership interests of the Fund directly. An individual acquires an indirect interest in the Fund by purchasing a variable annuity contract or variable insurance policy and allocating premiums or purchase payments to Fund Portfolios available through the separate accounts of ONLIC, ONLAC, and NSLA. Separate accounts of these entities are the shareholders of the Fund.
As a shareholder of the Fund, a separate account incurs ongoing costs, including management fees and other Fund expenses. This example is intended to help a policy/contract owner understand ongoing costs (in dollars) associated with the underlying investment in the Fund’s Portfolios by the separate account shareholder and to compare these costs with the ongoing costs associated with investing in other mutual funds.
The example is based on an investment of $1,000 invested at July 1, 2015 and held through December 31, 2015.
| 163 | (continued) |
| Ohio National Fund, Inc. |
Additional Information (Unaudited) (Continued) | December 31, 2015 |
Actual Expenses
The table below provides information about investment values and actual expenses associated with each Portfolio of the Fund. The information below, together with the amount of an underlying investment, can be used to estimate expenses paid over the period. An estimate can be obtained by simply dividing an underlying investment value by $1,000 (for example, an $8,600 investment value divided by $1,000 = 8.6), then multiplying the result by the number in the table under the heading entitled “Expenses Paid During Period”.
Portfolio | Beginning Investment Value 7/1/2015 | Ending Investment Value 12/31/2015 | Expense Paid During Period* 7/1/2015 – 12/31/2015 | Expense Ratio During Period 7/1/2015 – 12/31/2015 (Annualized) | ||||||||||||
Equity | $ | 1,000.00 | $ | 956.00 | $ | 3.99 | 0.81 | % | ||||||||
Money Market | 1,000.00 | 1,000.00 | 0.40 | 0.08 | % | |||||||||||
Bond | 1,000.00 | 985.20 | 3.20 | 0.64 | % | |||||||||||
Omni | 1,000.00 | 977.00 | 3.89 | 0.78 | % | |||||||||||
International | 1,000.00 | 942.00 | 4.89 | 1.00 | % | |||||||||||
Capital Appreciation | 1,000.00 | 941.30 | 3.96 | 0.81 | % | |||||||||||
International Small-Mid Company | 1,000.00 | 959.40 | 6.07 | 1.23 | % | |||||||||||
Aggressive Growth | 1,000.00 | 1,026.50 | 4.80 | 0.94 | % | |||||||||||
Small Cap Growth | 1,000.00 | 924.60 | 4.12 | 0.85 | % | |||||||||||
Mid Cap Opportunity | 1,000.00 | 931.50 | 4.63 | 0.95 | % | |||||||||||
S&P 500® Index | 1,000.00 | 999.10 | 2.07 | 0.41 | % | |||||||||||
Strategic Value | 1,000.00 | 1,046.40 | 4.02 | 0.78 | % | |||||||||||
High Income Bond | 1,000.00 | 947.30 | 3.98 | 0.81 | % | |||||||||||
ClearBridge Small Cap | 1,000.00 | 909.10 | 4.91 | 1.02 | % | |||||||||||
Nasdaq-100® Index | 1,000.00 | 1,048.10 | 2.43 | 0.47 | % | |||||||||||
Bristol | 1,000.00 | 976.40 | 4.04 | 0.81 | % | |||||||||||
Bryton Growth | 1,000.00 | 864.60 | 4.14 | 0.88 | % | |||||||||||
Balanced | 1,000.00 | 986.10 | 3.20 | 0.64 | % | |||||||||||
Target VIP | 1,000.00 | 947.90 | 3.73 | 0.76 | % | |||||||||||
Bristol Growth | 1,000.00 | 1,000.00 | 4.39 | 0.87 | % | |||||||||||
Risk Managed Balanced | 1,000.00 | 993.20 | 5.33 | 1.06 | % | |||||||||||
| 164 | (continued) |
| Ohio National Fund, Inc. |
Additional Information (Unaudited) (Continued) | December 31, 2015 |
Hypothetical Example for Comparison Purposes
The table below provides information about hypothetical investment values and hypothetical expenses based on each respective Portfolio’s actual expense ratio and an assumed rate of return of 5% per year before expenses, which is not an actual return. The hypothetical investment values and expenses may not be used to estimate the actual ending investment balance or expenses actually paid for the period by the shareholders. A policy/contract holder may use this information to compare this 5% hypothetical example with the 5% hypothetical examples that appear in the shareholder reports of other funds.
Portfolio | Beginning Investment Value 7/1/2015 | Ending Investment Value 12/31/2015 | Expense Paid During Period* 7/1/2015 – 12/31/2015 | Expense Ratio During Period 7/1/2015 – 12/31/2015 (Annualized) | ||||||||||||
Equity | $ | 1,000.00 | $ | 1,021.12 | $ | 4.13 | 0.81 | % | ||||||||
Money Market | 1,000.00 | 1,024.80 | 0.41 | 0.08 | % | |||||||||||
Bond | 1,000.00 | 1,021.98 | 3.26 | 0.64 | % | |||||||||||
Omni | 1,000.00 | 1,021.27 | 3.97 | 0.78 | % | |||||||||||
International | 1,000.00 | 1,020.16 | 5.09 | 1.00 | % | |||||||||||
Capital Appreciation | 1,000.00 | 1,021.12 | 4.13 | 0.81 | % | |||||||||||
International Small-Mid Company | 1,000.00 | 1,019.00 | 6.26 | 1.23 | % | |||||||||||
Aggressive Growth | 1,000.00 | 1,020.47 | 4.79 | 0.94 | % | |||||||||||
Small Cap Growth | 1,000.00 | 1,020.92 | 4.33 | 0.85 | % | |||||||||||
Mid Cap Opportunity | 1,000.00 | 1,020.42 | 4.84 | 0.95 | % | |||||||||||
S&P 500® Index | 1,000.00 | 1,023.14 | 2.09 | 0.41 | % | |||||||||||
Strategic Value | 1,000.00 | 1,021.27 | 3.97 | 0.78 | % | |||||||||||
High Income Bond | 1,000.00 | 1,021.12 | 4.13 | 0.81 | % | |||||||||||
ClearBridge Small Cap | 1,000.00 | 1,020.06 | 5.19 | 1.02 | % | |||||||||||
Nasdaq-100® Index | 1,000.00 | 1,022.84 | 2.40 | 0.47 | % | |||||||||||
Bristol | 1,000.00 | 1,021.12 | 4.13 | 0.81 | % | |||||||||||
Bryton Growth | 1,000.00 | 1,020.77 | 4.48 | 0.88 | % | |||||||||||
Balanced | 1,000.00 | 1,021.98 | 3.26 | 0.64 | % | |||||||||||
Target VIP | 1,000.00 | 1,021.37 | 3.87 | 0.76 | % | |||||||||||
Bristol Growth | 1,000.00 | 1,020.82 | 4.43 | 0.87 | % | |||||||||||
Risk Managed Balanced | 1,000.00 | 1,019.86 | 5.40 | 1.06 | % | |||||||||||
| * | Expenses are equal to the average account value times the Fund’s annualized expense ratio multiplied by the number of days in the most recent fiscal half-year (184 days) divided by the number of days in the fiscal year (365 days). Please note that the expenses shown in these tables are meant to highlight ongoing Fund costs only and do not reflect any contract-level expenses or Fund transactional costs, such as sales charges (loads) or exchange fees (if any). Therefore, these tables are useful in comparing ongoing fund costs only, and will not fully assist a policy/contract owner in determining the relative total expenses of different funds. In addition, if transactional costs were included, costs may have been higher for these Portfolios as well as for a fund being compared. |
| (3) | Other Federal Tax Information |
For corporate shareholders, the percentages of the total ordinary income dividends paid in 2015, and ordinary income consent dividends that were incurred for the 2015 tax year, that qualify for the corporate dividends received deduction are as follows:
Equity | 100.00 | % | ||
Money Market | 0.00 | % | ||
Bond | 0.00 | % | ||
Omni | 24.46 | % | ||
International | 0.00 | % | ||
Capital Appreciation | 32.67 | % | ||
International Small-Mid Company | 0.00 | % | ||
Aggressive Growth | 100.00 | % | ||
Small Cap Growth | 44.38 | % | ||
Mid Cap Opportunity | 0.00 | % | ||
S&P 500® Index | 97.60 | % |
Strategic Value | 77.32 | % | ||
High Income Bond | 0.00 | % | ||
ClearBridge Small Cap | 0.00 | % | ||
Nasdaq-100® Index | 100.00 | % | ||
Bristol | 19.33 | % | ||
Bryton Growth | 4.30 | % | ||
Balanced | 22.46 | % | ||
Target VIP | 84.29 | % | ||
Bristol Growth | 25.67 | % | ||
Risk Managed Balanced | 100.00 | % |
| 165 | (continued) |
| Ohio National Fund, Inc. |
Additional Information (Unaudited) (Continued) | December 31, 2015 |
Pursuant to Section 853 of the Internal Revenue Code, the Fund designates the following amounts as foreign taxes paid for the year ended December 31, 2015:
| Creditable Foreign Taxes Paid | Per Share Amount | Portion of Ordinary Income Distribution Derived from Foreign Sourced Income | ||||||||||
International | $ | 641,652 | $ | 0.0505 | 100.00 | % | ||||||
International Small-Mid Company | $ | 83,106 | $ | 0.0318 | 100.00 | % | ||||||
Foreign taxes paid for purposes of Section 853 may be less than actual foreign taxes paid for financial statement purposes. None of the Portfolios listed above derived any income from ineligible foreign sources, as defined under Section 901(j) of the Internal Revenue Code.
| 166 |
| Ohio National Fund, Inc. |
| December 31, 2015 |
Name and Address | Age | Position(s) with the Fund | Term of Office | Number of Portfolios | Principal Occupation(s) During Past Five Years | |||||||
Independent Directors | ||||||||||||
| George M. Vredeveld One Financial Way Cincinnati, Ohio | 73 | Lead Independent Director, Member of Audit and Independent Directors Committees | Indefinite; Since March 1996 | 21 | Professor Emeritus, Finance: University of Cincinnati (January 2014-present); Research Fellow and Member of Academic Council: Varna Free University, Varna, Bulgaria (2012-present); Alpaugh Professor of Economics: Lindner College of Business, University of Cincinnati (2004-2013); Founder/President: Economics Center at the University of Cincinnati (1977-2012). | |||||||
| John I. Von Lehman One Financial Way Cincinnati, Ohio | 63 | Director, Chairman of Audit Committee and Member of Independent Directors Committee | Indefinite; Since August 2007 | 21 | Executive Vice President, CFO, Secretary, and Director: The Midland Company (1988-2007); Director, Audit Committee and Corporate Governance Committee Member: American Financial Group, Inc.; Finance Committee and Investment Committee member: Life Enriching Communities; Investment Committee: Xavier University Foundation. | |||||||
| Madeleine W. Ludlow One Financial Way Cincinnati, Ohio | 61 | Director, Member of Audit and Independent Directors Committees | Indefinite; Since April 2012 | 21 | Founder/Managing Director: West Capital Partners LLC (2010-present), Ludlow Ward Capital Advisors LLC (2005-2009); Director, ALLETE, Inc. | |||||||
| Geoffrey Keenan One Financial Way Cincinnati, Ohio | 57 | Director, Member of Audit and Independent Directors Committees | Indefinite; Since January 2015 | 21 | Executive Vice President and Chief Operating Officer of Gateway Investments Advisers, LLC (1995-2013) | |||||||
Interested Director | ||||||||||||
| John J. Palmer One Financial Way Cincinnati, Ohio | 76 | Chairman and Director | Indefinite; Since July 1997 | 21 | Insurance industry consultant (April 2010 to present), President: Ohio National Fund, Inc. (1997-2010); Director and Vice Chairman: ONLIC (1997-2010); President and CEO: NSLA (2002-2010); Director: NSLA, Tucson Symphony Orchestra, and Pima Canyon Estates Homeowners’ Association. | |||||||
Officers | ||||||||||||
| Christopher A. Carlson One Financial Way Cincinnati, Ohio | 56 | President | Indefinite; Since March 2000 | Vice Chairman and Chief Investment Officer: ONLIC (January 2014-present); Executive Vice President and Chief Investment Officer: ONLIC (August 2010-January 2014); President and Director: ONI; Chief Investment Officer: NSLA; Officer and Director of other Ohio National-affiliated companies. | ||||||||
| Thomas A. Barefield One Financial Way Cincinnati, Ohio | 62 | Vice President | Indefinite; Since February 1998 | Vice Chairman and Chief Distribution Officer: ONLIC (January 2014-present); Executive Vice President and Chief Marketing Officer — Institutional: ONLIC (January 2008-January 2014); Director and Vice President — Marketing: NSLA; Director: ONI; Senior Vice President: Ohio National Equities, Inc. | ||||||||
| R. Todd Brockman One Financial Way Cincinnati, Ohio | 47 | Treasurer | Indefinite; Since August 2004 | Vice President, Mutual Funds: ONLIC and NSLA (February 2014-present); Second Vice President, Mutual Fund Operations: ONLIC and NSLA (January 2007-February 2014); Treasurer: ONI. | ||||||||
| Kimberly A. Plante One Financial Way Cincinnati, Ohio | 41 | Secretary | Indefinite; Since March 2005 | Second Vice President and Counsel: ONLIC (January 2016-present); Senior Associate Counsel: ONLIC (January 2011-January 2016); Associate Counsel: ONLIC (July 2007-January 2011); Secretary: ONI; Officer of various other Ohio National-affiliated companies. | ||||||||
| 167 | (continued) |
| Ohio National Fund, Inc. |
Information about Directors and Officers (Unaudited) (Continued) | December 31, 2015 |
Name and Address | Age | Position(s) with the Fund | Term of Office | Number of Portfolios | Principal Occupation(s) and Other | |||||||
| Keith Dwyer One Financial Way Cincinnati, Ohio | 43 | Interim Chief Compliance Officer | Indefinite; Since November 2015 | Director, Fund Compliance: ONLIC (January 2015-present); Administrator, Fund Compliance: ONLIC (January 2014-January 2015); Compliance Analyst (September 2009-September 2011 and April 2013-January 2014); Interim Chief Compliance Officer: ONI, Suffolk, and other Ohio National-affiliated companies (November 2015 to present). | ||||||||
| Catherine E. Gehr One Financial Way Cincinnati, Ohio | 43 | Assistant Treasurer | Indefinite; Since March 2005 | Manager, Mutual Fund Operations: ONLIC; Assistant Treasurer: ONI. | ||||||||
| Emily Bae One Financial Way Cincinnati, Ohio | 30 | Assistant Secretary | Indefinite; Since May 2013 | Assistant Counsel: ONLIC (April 2013-present); Assistant Secretary: ONI (April 2013-present); Counsel: Goodyear Tire & Rubber Company (January 2012-April 2013). | ||||||||
| 168 |
Ohio National Fund, Inc.
Post Office Box 371
Cincinnati, Ohio 45201
Form 1320 Rev. 2-16
| Item 2. | Code Of Ethics. |
| As of the end of the period covered by this report, Ohio National Fund, Inc. (the “Fund”) has adopted a code of ethics that applies to the Fund’s principal executive officer and principal financial officer. There were no substantive amendments or waivers to the Code of Ethics during the period covered by this report. |
| A copy of this Code of Ethics is filed as Exhibit EX-99.CODE to this Form N-CSR and is also available, without charge, upon request, by calling 877-781-6392 toll free. |
| Item 3. | Audit Committee Financial Expert. |
| The Fund’s Board of Directors has determined that the Fund has an audit committee financial expert serving on its Audit Committee. The Audit Committee financial expert is Mr. John I. VonLehman. Mr. VonLehman is independent for purposes of Item 3 of Form N-CSR. |
| Item 4. | Principal Accountant Fees And Services. |
| The aggregate fees for each of the last two fiscal years for professional services rendered by the principal accountant for the audit of the Fund’s annual financial statements or services that are normally provided by the accountant in connection with statutory and regulatory filings or engagements for those fiscal years are listed below. |
| (a) | Audit Fees. |
| Audits of the Portfolios: |
| Fiscal year ended December 31, 2015: | $ | 275,500 | ||
| Fiscal year ended December 31, 2014: | $ | 267,750 |
| (b) | Audit-Related Fees. |
| Consent(s) on N-1A Annual Registration Statement filed with the SEC: |
| Fiscal year ended December 31, 2015: | $ | 10,000 | ||
| Fiscal year ended December 31, 2014: | $ | 5,000 |
| (c) | Tax Fees. |
| Fiscal year ended December 31, 2015: | $ | 81,480 | ||
| Fiscal year ended December 31, 2014: | $ | 0 |
| (d) | All Other Fees. None. |
| (e)(1) | Audit Committee Pre-Approval Policies and Procedures: |
| The Fund’s Audit Committee has adopted an Audit Committee Charter that requires that the Audit Committee oversee the quality and appropriateness of the accounting methods used in the preparation of the Fund’s financial statements, and the independent audit thereof; approve the selection and compensation of the independent auditors; and pre-approve the performance, by the independent auditors, of non-audit services for the Fund, its investment adviser, or any affiliated entity controlling, controlled by or under common control with the investment adviser that provides ongoing services to the Fund. |
| (e)(2) | Services Approved Pursuant to Paragraph (c)(7)(i)(C) of Rule 2-01 of Regulation S-X: |
| During the fiscal year ended December 31, 2015, there were tax services provided by the Fund’s principal accountant that were pre-approved by the Fund’s Audit Committee. During the fiscal year ended December 31, 2014, there were no non-audit services provided by the Fund’s principal accountant that would have required pre-approval by the Fund’s Audit Committee. The audit related fees aforementioned in item 4(b) were pre-approved by the Fund’s Audit Committee, although not required by paragraph (c) (7) (ii) of Regulation S-X as the audit-related fees were less than five percent of the total amount of revenues paid to the Fund’s principal accountant. |
| (f) Not applicable. |
| (g) There were no non-audit services provided by the Fund’s principal accountant, other than items disclosed in items (b) and (c) above, in which a fee was billed to the Fund, the Fund’s adviser, and any entity controlling, controlled by, or under common control with the adviser that provides ongoing services to the registrant for the last two fiscal years. |
| (h) Not applicable, as there were no non-audit services performed by the Fund’s principal accountant that were rendered to the Fund, the Fund’s adviser, or any entity controlling, controlled by, or under common control with the adviser that provided ongoing services to the registrant that were not pre-approved for the last two fiscal years. |
| Item 5. | Audit Committee Of Listed Registrants. |
| Not applicable. |
| Item 6. | Schedule of Investments. |
| Not applicable. |
| Item 7. | Disclosure Of Proxy Voting Policies And Procedures For Closed-End Management Investment Companies. |
| Not Applicable. |
| Item 8. | Portfolio Managers of Closed-End Management Investment Companies. |
| Not Applicable. |
| Item 9. | Purchases of Equity Securities by Closed-End Management Investment Company and Affiliated Purchasers. |
| Not Applicable. |
| Item 10. | Submission of Matters to a Vote of Security Holders. |
| There were no material changes to the procedures by which shareholders may recommend nominees to the Fund’s Board of Directors. |
| Item 11. | Controls and Procedures. |
| (a) | The Fund’s principal executive officer and principal financial officer have concluded, based on their evaluation conducted as of a date within 90 days of the filing of this report, that the Fund’s disclosure controls and procedures are adequately designed and are operating effectively to ensure (i) that material information relating to the Fund, including its consolidated subsidiaries, is made known to them by others within those entities, particularly during the period in which this report is being prepared; and (ii) that information required to be disclosed by the Fund on Form N-CSR is recorded, processed, summarized and reported within the time periods specified in the Securities and Exchange Commission’s rules and forms. |
| (b) | There were no changes in the Fund’s internal control over financial reporting that occurred during the second fiscal quarter of the period covered by this report that have materially affected, or are reasonably likely to materially affect, the Fund’s internal control over financial reporting. |
| Item 12. | Exhibits. |
| (a)(1) | The Fund’s Code of Ethics pursuant to Item 2 of Form N-CSR is filed and attached hereto as EX-99.CODE. |
| (a)(2) | A separate certification for each principal executive officer and principal financial officer of the Fund as required by Rule 30a-2(a) under the Investment Company Act of 1940 (17 CFR 270.30a-2(a)) is attached hereto as EX-99.CERT. |
| The certifications required by Section 906 of the Sarbanes-Oxley Act of 2002 are attached hereto as EX-99.906CERT. |
SIGNATURES
Pursuant to the requirements of the Securities Exchange Act of 1934 and the Investment Company Act of 1940, the registrant has duly caused this report to be signed on its behalf by the undersigned, thereunto duly authorized.
Ohio National Fund, Inc.
By: | /s/ Christopher A. Carlson | |
| Christopher A. Carlson | ||
| President | ||
| (Principal Executive Officer) | ||
| March 4, 2016 | ||
Pursuant to the requirements of the Securities Exchange Act of 1934 and the Investment Company Act of 1940, this report has been signed below by the following persons on behalf of the registrant and in the capacities and on the dates indicated.
Ohio National Fund, Inc.
By: | /s/ Christopher A. Carlson | |
| Christopher A. Carlson | ||
| President | ||
| (Principal Executive Officer) | ||
| March 4, 2016 | ||
| By: | /s/ R. Todd Brockman | |
| R. Todd Brockman | ||
| Treasurer | ||
| (Principal Financial Officer) | ||
| March 4, 2016 |