As filed with the Securities and Exchange Commission on August 25, 2011
UNITED STATES
SECURITIES AND EXCHANGE COMMISSION
WASHINGTON, D.C. 20549
FORM N-CSR
CERTIFIED SHAREHOLDER REPORT OF REGISTERED MANAGEMENT
INVESTMENT COMPANIES
Investment Company Act file number 811-03023
FORUM FUNDS
Three Canal Plaza, Suite 600
Portland, Maine 04101
Stacey E. Hong, Principal Executive Officer
Three Canal Plaza, Suite 600
Portland, Maine 04101
207-347-2000
Date of fiscal year end: June 30
Date of reporting period: July 1, 2010 – June 30, 2011
ITEM 1. REPORT TO STOCKHOLDERS.
Annual Report
June 30, 2011
Fund Adviser:
Auxier Asset Management LLC
5285 Meadows Road
Suite 333
Lake Oswego, Oregon 97035
Toll Free: (877) 3AUXIER or (877) 328-9437
| |
AUXIER FOCUS FUND A MESSAGE TO OUR SHAREHOLDERS JUNE 30, 2011 |
| |
AUXIER FOCUS FUND
PERFORMANCE UPDATE
June 30, 2011
AUXFX (AUXIER FOCUS FUND INVESTOR SHARES) RETURNS VS. S&P 500® INDEX (“S&P 500”)
| Auxier Focus Fund (the “Fund) | S&P 500 | Difference* |
| 03/31/11 – 06/30/11 | 1.79% | 0.10% | 1.69 |
| 12/31/10 – 06/30/11 | 8.44% | 6.02% | 2.42 |
| 12/31/09 – 12/31/10 | 10.10% | 15.06% | -4.96 |
| 12/31/08 – 12/31/09 | 24.76% | 26.46% | -1.70 |
| 12/31/07 – 12/31/08 | -24.52% | -37.00% | 12.48 |
| 12/31/06 – 12/31/07 | 5.71% | 5.49% | 0.22 |
| 12/31/05 – 12/31/06 | 11.75% | 15.79% | -4.04 |
| 12/31/04 – 12/31/05 | 4.58% | 4.91% | -0.33 |
| 12/31/03 – 12/31/04 | 10.73% | 10.87% | -0.14 |
| 12/31/02 – 12/31/03 | 26.75% | 28.69% | -1.94 |
| 12/31/01 – 12/31/02 | -6.79% | -22.10% | 15.31 |
| 12/31/00 – 12/31/01 | 12.67% | -11.88% | 24.55 |
| 12/31/99 – 12/31/00 | 4.05% | -9.10% | 13.15 |
| Since Inception 07/09/99 | 119.42% | 16.79% | 102.50 |
*In Percentage Points
| |
AUXIER FOCUS FUND A MESSAGE TO OUR SHAREHOLDERS JUNE 30, 2011 |
| |
Market Commentary
Auxier Focus Fund returned 1.79% in the second quarter 2011, while Standard & Poor’s 500 stock Index (S&P) gained 0.10%. For the first six months the Fund was up 8.44%, briskly outpacing the S&P’s 6.02%. The Fund also has outperformed the market by 102 percentage points cumulatively since inception in July 1999. We strive to match good markets and to excel materially in challenging, declining periods.
Negative macroeconomic headlines continue to overshadow positive underlying corporate performance. The financial media’s and public’s obsession with the “unknowable” has created opportunities to buy high-quality international franchises at attractive prices.
Many contributors to the Fund’s second quarter performance were businesses that improved from the “hopelessly out of favor” to merely unpopular. The Fund benefited from gains in downtrodden health insurers like WellPoint and UnitedHealth; education companies Apollo and ITT Educational; medical device companies Johnson & Johnson, Medtronic, and Zimmer, plus credit card processors Visa and MasterCard. These were a few industries in which proposed excessive regulation drove down price points to compelling levels a year ago. As the worst case failed to materialize and political compromise was reached, these stocks were revalued meaningfully higher. Others showing strong operational performance include Precision Castparts, McDonald’s, Weight Watchers, Nike and Phillip Morris. It is so important in today’s environment of austerity to search harder for exceptional buys. Going forward, an investor can’t depend on government stimulus or rising markets to bail out poor investment selections. We are putting added emphasis on businesses with high free cash flow and low or no mandatory capital spending.
Balance Sheet versus Inventory Slowdowns
Downturns resulting from extreme levels of borrowed money can be classified as “balance sheet” recessions, as contrasted with those driven by inventory adjustments. Recoveries following a balance sheet crisis like the one starting in 2008 tend to be choppy and shorter in duration (2-3 years) versus 5-7 years with an inventory recession. Easy money policies have stalled the traditional engines of recovery—housing and autos. As a result, the Fund has been more heavily weighted in companies that sell lower ticket necessity items and are thus less vulnerable to a slowdown. Advancing global austerity increases the appeal of powerful branded franchises that can self-finance expansion in new emerging markets. Greg Page, the CEO of Cargill, recently commented, “No matter where we do business in 66 countries we see per capita incomes rising and consumers electing to spend more on meat, milk, eggs and confection.”
“Facts are facts even in the height of emotion” -- Bernard Baruch
Gloom, fear and uncertainty are friends of fundamental, long-term investors. Remember, Carlos Slim, arguably the most successful investor on the planet today, made his mark buying good businesses in Mexico AFTER Mexico’s debt default in 1982. Recent negative news and partisan debate are obscuring some positives. Among them: growth in free markets, transparency and the peace dividend from winding down the Iraq and Afghanistan conflicts. In monitoring hundreds of stocks, we are amazed how customer-focused companies like McDonald’s deftly adapt to face challenges, innovate and continue to build value for shareholders, employees and communities. Many investors think a government bond issued at rock-bottom interest rates is safer than an exceptionally well-run business with a rock solid balance sheet. But that perception may prove to be very expensive in terms of lower purchasing power over the next several years...
Beware of Commodities’ Long Bull Run
The commodity boom now exceeds both the housing and tech bubbles in duration (114 and 113 months) and looks vulnerable as China and other emerging markets raise interest rates to combat inflation. The rapid build-up of credit in China between 2009 and 2010 exceeded the credit expansions that preceded the most recent housing bubble in the United States and the Japanese property bubble in the late 1980’s. Historically, quality stocks have bottomed as commodities speculation has reached fever levels. Another trend that looks very toppy is so-called high frequency exchange trading tied to mathematical formulas. Over the long run, when markets are free to function, they tend to be virtuous and eventually punish bad behavior. You can violate the laws of economics for only so long before paying the price of permanent capital loss.
| |
AUXIER FOCUS FUND A MESSAGE TO OUR SHAREHOLDERS JUNE 30, 2011 |
| |
Why Risk Management Matters
I was saddened when Borders recently declared bankruptcy. Talk about ironic: our knowledge-based economy is liquidating the second largest bookstore chain. Who would have thought traditional newspapers would be risky. Or Eastman Kodak? Such are the casualties of the Digital Age. This underscores the need for meticulous research and capital allocation rooted in fact-finding, fundamentals, price and value. In today’s competitive global economy, appraising and pricing risk correctly has never been more important. We saw the devastating results in the misperceptions of “safe” housing investments. Government bonds and commodities may not be as safe as portrayed. The lesson: any class of investment, when flooded with supply, can become risky. To enjoy the long-term fruits of compounding, the importance of a diligent chief risk officer can’t be underestimated. As Warren Buffett commented at his annual meeting, “My role as chief risk officer is too important to be left to a committee.”
Your trust and support is appreciated.
Jeff Auxier
As of 06/30/2011, the Fund held those securities mentioned in the letter as follows: WellPoint, Inc., 1.3%; UnitedHealth Group, Inc.,1.0%; Apollo Group, 1.4%; ITT Educational Services, 0.7%; Johnson & Johnson, 1.7%; Medtronic, Inc., 1.9%; Zimmer Holdings, 1.2%; Visa, 0.5%; MasterCard, Inc., 1.4%; Precision Castparts Corp., 0.6%; McDonald’s Corp, 0.8%; Weight Watchers Int’l Inc., 1.0%; Nike Inc. Class B, 0.3%; Phillip Morris International, 2.4%; Borders, 0%; Eastman Kodak, 0%, Cargill, 0%.
There can be no guarantee of success with any technique, strategy, or investment. All investing involves risk, including the loss of principal. The S&P 500 Index is a broad-based, unmanaged measurement of changes in stock market conditions based on 500 widely held common stocks. One cannot invest directly in an index.
The views in this shareholder letter were those of the Fund Manager as of the letter’s publication date and may not reflect his views on the date this letter is first distributed or anytime thereafter. These views are intended to assist readers in understanding the Fund’s investment methodology and do not constitute investment advice.
| |
AUXIER FOCUS FUND PERFORMANCE CHART AND ANALYSIS JUNE 30, 2011 |
| |
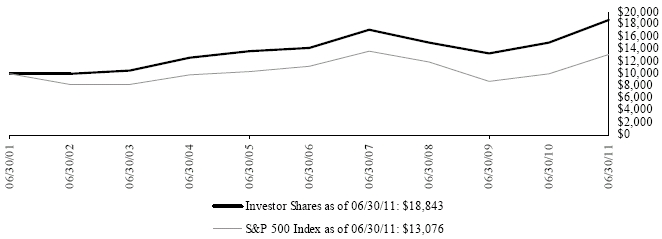
The following chart reflects the change in the value of a hypothetical $10,000 investment in Investor Shares, including reinvested dividends and distributions, in the Fund compared with the performance of the benchmark, S&P 500, over the past ten fiscal years. The S&P 500 is a broad-based, unmanaged measurement of changes in stock market conditions based on the average of 500 widely held common stocks. The total return of the Fund's classes includes the maximum sales charge of 5.75% (A Shares only) and operating expenses that reduce returns, while the total return of the S&P 500 does not include the effect of sales charges and expenses. A Shares are subject to a 1.00% contingent deferred sales charge on shares purchased without an initial sales charge and redeemed less than one year after purchase. The total return of the S&P 500 includes reinvestment of dividends and income. The total return of the Fund includes operating expenses that reduce returns, while the total return of the S&P 500 does not include expenses. The Fund is professionally managed while the S&P 500 is unmanaged and is not available for investment.
Performance data quoted represents past performance and is no guarantee of future results. Current performance may be lower or higher than the performance data quoted. Investment return and principal value will fluctuate so that shares, when redeemed, may be worth more or less than original cost. For the most recent month-end performance, please visit the website of the Fund's investment adviser at www.auxierasset.com. As stated in the Fund's prospectus, the annual operating expense ratios (gross) for Investor Shares and A Shares are 1.25% and 1.50%, respectively. However, the Fund's adviser has agreed to contractually waive a portion of its fees and to reimburse expenses such that total operating expenses do not exceed 1.25% for Investor Shares and A Shares, until October 31, 2011. Shares redeemed or exchanged within 180 days of purchase will be charged a 2.00% redemption fee. The performance table and graph do not reflect the deduction of taxes that a shareholder would pay on Fund distributions or the redemption of Fund shares. Returns greater than one year are annualized.
Performance for Investor Shares for periods prior to December 10, 2004, reflects performance and expenses of Auxier Focus Fund, a series of Unified Series Trust (the “Predecessor Fund”). Prior to January 3, 2003, the Predecessor Fund was a series of Ameriprime Funds.
| Average Annual Total Return as of 06/30/11: | | 1 Year | | 5 Years | | 10 Years | | Since Inception(1) |
| Investor Shares | | 24.35% | | 5.80% | | 6.54% | | 6.78% |
| S&P 500 Index (Since 07/09/99) | | 30.69% | | 2.94% | | 2.72% | | 1.30% |
A Shares (with sales charge)(2)(3) | | 17.20% | | 4.54% | | 5.91% | | 6.25% |
| (1) | Investor Shares and A Shares commenced operations on July 9, 1999, and July 8, 2005, respectively. |
| (2) | Due to shareholder redemptions on August 21, 2005, net assets of the class were zero from the close of business on that date until September 22, 2005. Financial information presented for the period August 21, 2005 to September 22, 2005 reflects performance of Investor Shares of the Fund. |
| (3) | For A Shares, performance for the 5-year, 10-year and since inception periods are blended average annual returns which include the returns of the Investor Shares prior to commencement of operations of the A Shares. |
| |
AUXIER FOCUS FUND SCHEDULE OF INVESTMENTS JUNE 30, 2011 |
| |
| | Shares | | Security Description | | Value | |
| Common Stock - 73.5% |
| Communications - 0.8% |
| | 1,000 | | America Movil SAB de CV, Series L, ADR | $ | 53,880 | |
| | 12,150 | | Motorola Solutions, Inc. (a) | | 559,386 | |
| | 10,000 | | News Corp., Class A | | 177,000 | |
| | 19,950 | | Telefonica SA, ADR | | 488,576 | |
| | | 1,278,842 | |
| Consumer Discretionary - 15.0% |
| | 52,863 | | Apollo Group, Inc., Class A (a) | | 2,309,056 | |
| | 1,000 | | Arcos Dorados Holdings, Inc., Class A | | 21,090 | |
| | 48,727 | | Bridgepoint Education, Inc. (a) | | 1,218,175 | |
| | 42,134 | | Career Education Corp. (a) | | 891,134 | |
| | 500 | | Coach, Inc. | | 31,965 | |
| | 57,100 | | Comcast Corp., Class A | | 1,446,914 | |
| | 3,000 | | Cooper-Standard Holding, Inc. (a) | | 138,000 | |
| | 2,000 | | Costco Wholesale Corp. | | 162,480 | |
| | 54,950 | | CVS Caremark Corp. | | 2,065,021 | |
| | 2,297 | | Discovery Communications, Inc., Class A (a) | | 94,085 | |
| | 2,297 | | Discovery Communications, Inc., Class C (a) | | 83,955 | |
| | 14,800 | | DR Horton, Inc. | | 170,496 | |
| | 37,987 | | Gruma S.A.B. de C.V., ADR (a) | | 313,013 | |
| | 131,400 | | H&R Block, Inc. | | 2,107,656 | |
| | 18,250 | | Home Depot, Inc. | | 661,015 | |
| | 14,850 | | ITT Educational Services, Inc. (a) | | 1,161,864 | |
| | 28,197 | | Lincoln Educational Services Corp. | | 483,579 | |
| | 28,000 | | Lowe's Cos., Inc. | | 652,680 | |
| | 15,800 | | McDonald's Corp. | | 1,332,256 | |
| | 4,900 | | NIKE, Inc., Class B | | 440,902 | |
| | 15,850 | | Sally Beauty Holdings, Inc. (a) | | 271,035 | |
| | 1,738 | | Strayer Education, Inc. | | 219,666 | |
| | 20,578 | | The Andersons, Inc. | | 869,420 | |
| | 33,870 | | The Interpublic Group of Cos., Inc. | | 423,375 | |
| | 3,890 | | Time Warner Cable, Inc. | | 303,576 | |
| | 15,500 | | Time Warner, Inc. | | 563,735 | |
| | 500 | | Toyota Motor Corp., ADR | | 41,210 | |
| | 13,808 | | Universal Technical Institute, Inc. | | 272,984 | |
| | 25,834 | | Value Line, Inc. | | 346,434 | |
| | 63,700 | | Wal-Mart Stores, Inc. | | 3,385,018 | |
| | 22,002 | | Weight Watchers International, Inc. | | 1,660,491 | |
| | 8,600 | | Yum! Brands, Inc. | | 475,064 | |
| | | 24,617,344 | |
| Consumer Staples - 15.8% |
| | 400,600 | | Alliance One International, Inc. (a) | | 1,293,938 | |
| | 35,150 | | Altria Group, Inc. | | 928,312 | |
| | 15,100 | | British American Tobacco PLC, ADR | | 1,328,800 | |
| | 3,404 | | Columbia Sportswear Co. | | 215,814 | |
| | 12,725 | | Diageo PLC, ADR | | 1,041,796 | |
| | 48,050 | | Dr. Pepper Snapple Group, Inc. | | 2,014,736 | |
| | 300 | | Fortune Brands, Inc. | | 19,131 | |
| | 16,862 | | Kraft Foods, Inc., Class A | | 594,048 | |
| | 9,250 | | Manpower, Inc. | | 496,263 | |
| | 5,760 | | National Beverage Corp. | | 84,384 | |
| | 3,000 | | Nestle SA, ADR | | 187,140 | |
| | 46,172 | | Paychex, Inc. | | 1,418,404 | |
| | 35,150 | | PepsiCo, Inc. | | 2,475,614 | |
| | 58,900 | | Philip Morris International, Inc. | | 3,932,753 | |
| | 89,229 | | PRGX Global, Inc. (a) | | 637,987 | |
| | 1,721 | | Ralcorp Holdings, Inc. (a) | | 149,004 | |
| | 11,450 | | Safeway, Inc. | | 267,587 | |
| | 4,000 | | SAIC, Inc. (a) | | 67,280 | |
| | 500 | | Sara Lee Corp. | | 9,495 | |
| | 67,885 | | Tesco PLC, ADR | | 1,330,546 | |
| | 37,250 | | The Coca-Cola Co. | | 2,506,552 | |
| | 500 | | The J.M. Smucker Co. | | 38,220 | |
| | 84,950 | | The Kroger Co. | | 2,106,760 | |
| | 7,750 | | The Procter & Gamble Co. | | 492,668 | |
| | 41,380 | | The Western Union Co. | | 828,841 | |
| | 45,300 | | Unilever NV, ADR | | 1,488,105 | |
| | | 25,954,178 | |
| Energy - 4.8% |
| | 44,600 | | BP PLC, ADR | | 1,975,334 | |
| | 16,750 | | Chevron Corp. | | 1,722,570 | |
| | 15,600 | | ConocoPhillips | | 1,172,964 | |
| | 11,200 | | Exxon Mobil Corp. | | 911,456 | |
| | 1,200 | | Gazprom Neft JSC, ADR | | 28,032 | |
| | 800 | | Lukoil OAO, ADR | | 51,000 | |
| | 2,500 | | PetroChina Co., Ltd., ADR | | 365,075 | |
| | 11,700 | | Petroleo Brasileiro SA, ADR | | 396,162 | |
| | 2,750 | | Surgutneftegas OJSC, ADR | | 26,950 | |
| | 9,250 | | Transocean, Ltd. | | 597,180 | |
| | 19,100 | | Valero Energy Corp. | | 488,387 | |
| | 13,800 | | Willbros Group, Inc. (a) | | 117,852 | |
| | | 7,852,962 | |
| Financials - 10.8% |
| | 25,700 | | Aflac, Inc. | | 1,199,676 | |
| | 13,500 | | American International Group, Inc. (a) | | 395,820 | |
| | 1,280 | | Ameriprise Financial, Inc. | | 73,830 | |
| | 1,000 | | Ashford Hospitality Trust, Inc. REIT | | 12,450 | |
| | 151,733 | | Bank of America Corp. | | 1,662,994 | |
| | 16,000 | | Berkshire Hathaway, Inc., Class B (a) | | 1,238,240 | |
| | 7,000 | | Central Pacific Financial Corp. (a) | | 98,000 | |
| | 9,090 | | Citigroup, Inc. | | 378,508 | |
| | 67,250 | | Marsh & McLennan Cos., Inc. | | 2,097,527 | |
| | 7,350 | | Mastercard, Inc., Class A | | 2,214,849 | |
| | 10,300 | | Mercury General Corp. | | 406,747 | |
| | 2,650 | | StanCorp Financial Group, Inc. | | 111,803 | |
| | 93,850 | | The Bank of New York Mellon Corp. | | 2,404,437 | |
| | 38,418 | | The Travelers Cos., Inc. | | 2,242,843 | |
| | 52,597 | | TNS, Inc. (a) | | 873,110 | |
| | 10,324 | | Unum Group | | 263,056 | |
| | 6,000 | | US Bancorp | | 153,060 | |
| | 9,500 | | Visa, Inc., Class A | | 800,470 | |
| | 24,950 | | Waddell & Reed Financial, Inc., Class A | | 906,932 | |
| | 7,646 | | Washington Federal, Inc. | | 125,624 | |
| | 4,380 | | West Coast Bancorp (a) | | 73,409 | |
| | | 17,733,385 | |
| Health Care - 14.5% |
| | 42,600 | | Abbott Laboratories | | 2,241,612 | |
| | 20,050 | | Alkermes, Inc. (a) | | 372,930 | |
| | 8,450 | | Amgen, Inc. (a) | | 493,058 | |
| | 81,376 | | BioScrip, Inc. (a) | | 528,130 | |
| | 500 | | CareFusion Corp. (a) | | 13,585 | |
| | 13,449 | | Coventry Health Care, Inc. (a) | | 490,485 | |
| | 5,820 | | Express Scripts, Inc. (a) | | 314,164 | |
| | 31,300 | | GlaxoSmithKline PLC, ADR | | 1,342,770 | |
| | 42,050 | | Johnson & Johnson | | 2,797,166 | |
| | 29,850 | | Medco Health Solutions, Inc. (a) | | 1,687,122 | |
| | 80,053 | | Medtronic, Inc. | | 3,084,442 | |
| | 72,660 | | Merck & Co., Inc. | | 2,564,171 | |
| | 87,782 | | Pfizer, Inc. | | 1,808,309 | |
| | 6,842 | | Quest Diagnostics, Inc. | | 404,362 | |
| | 31,129 | | UnitedHealth Group, Inc. | | 1,605,634 | |
| | 27,221 | | WellPoint, Inc. | | 2,144,198 | |
| | 30,600 | | Zimmer Holdings, Inc. (a) | | 1,933,920 | |
| | | 23,826,058 | |
| See Notes to Financial Statements. | 5 | |
| |
AUXIER FOCUS FUND SCHEDULE OF INVESTMENTS JUNE 30, 2011 |
| |
| | Shares | | Security Description | | Value | |
| Industrials - 2.6% |
| | 21,550 | | AGCO Corp. (a) | $ | 1,063,708 | |
| | 25,000 | | General Electric Co. | | 471,500 | |
| | 11,150 | | Granite Construction, Inc. | | 273,510 | |
| | 4,850 | | Illinois Tool Works, Inc. | | 273,976 | |
| | 300 | | ITT Corp. | | 17,679 | |
| | 1,000 | | POSCO, ADR | | 108,620 | |
| | 300 | | Potash Corp. of Saskatchewan, Inc. | | 17,097 | |
| | 12,500 | | Raytheon Co. | | 623,125 | |
| | 3,500 | | Textainer Group Holdings, Ltd. | | 107,590 | |
| | 3,550 | | The Boeing Co. | | 262,452 | |
| | 14,450 | | United Parcel Service, Inc., Class B | | 1,053,838 | |
| | | 4,273,095 | |
| Information Technology - 3.0% |
| | 16,650 | | Automatic Data Processing, Inc. | | 877,122 | |
| | 23,350 | | Dell, Inc. (a) | | 389,244 | |
| | 46,500 | | Intel Corp. | | 1,030,440 | |
| | 97,364 | | Microsoft Corp. | | 2,531,464 | |
| | 5,000 | | MoneyGram International, Inc. (a) | | 16,625 | |
| | 1,500 | | Verisk Analytics, Inc., Class A (a) | | 51,930 | |
| | | 4,896,825 | |
| Materials - 3.1% |
| | 28,700 | | E.I. du Pont de Nemours & Co. | | 1,551,235 | |
| | 7,000 | | LyondellBasell Industries NV, Class A | | 269,640 | |
| | 6,400 | | Precision Castparts Corp. | | 1,053,760 | |
| | 47,350 | | The Dow Chemical Co. | | 1,704,600 | |
| | 14,000 | | Vale SA, ADR | | 447,300 | |
| | | 5,026,535 | |
| Telecommunications - 3.0% |
| | 27,300 | | AT&T, Inc. | | 857,493 | |
| | 49,150 | | SK Telecom Co., Ltd., ADR | | 919,105 | |
| | 110,624 | | Tele Norte Leste Participacoes SA, ADR | | 1,719,097 | |
| | 30,300 | | Telefonos de Mexico SAB de CV, ADR, Class L | | 499,950 | |
| | 27,015 | | Verizon Communications, Inc. | | 1,005,768 | |
| | | 5,001,413 | |
| Utilities - 0.1% |
| | 6,616 | | FirstService Corp. (a) | | 228,517 | |
| | | | |
Total Common Stock (Cost $100,374,337) | | 120,689,154 | |
| | Principal | | Security Description | | Rate | | Maturity | | Value | |
| Corporate Bonds - 6.8% |
| Consumer Staples - 1.5% |
| $ | 1,180,000 | | American Stores Co. | | 7.90 | % | 05/01/17 | $ | 1,181,475 | |
| | 50,000 | | Constellation Brands, Inc. | | 7.25 | | 05/15/17 | | 54,625 | |
| | 654,000 | | Smithfield Foods, Inc., Series B | | 7.75 | | 05/15/13 | | 712,860 | |
| | 115,000 | | SUPERVALU, Inc. | | 7.50 | | 11/15/14 | | 115,575 | |
| | 375,000 | | SUPERVALU, Inc. | | 8.00 | | 05/01/16 | | 384,375 | |
| | | 2,448,910 | |
| Energy - 0.1% |
| | 190,000 | | El Paso Corp. | | 6.70 | | 02/15/27 | | 189,205 | |
| | | | |
| Financials - 2.6% |
| | 75,000 | | American Express Credit Corp., Series C | | 7.30 | | 08/20/13 | | 83,516 | |
| | 455,000 | | Hartford Financial Services Group, Inc. | | 5.25 | | 10/15/11 | | 460,543 | |
| | 2,370,000 | | Hartford Financial Services Group, Inc. | | 5.50 | | 10/15/16 | | 2,532,523 | |
| | 182,000 | | Hartford Financial Services Group, Inc. | | 6.30 | | 03/15/18 | | 198,179 | |
| | 260,000 | | Janus Capital Group, Inc. | | 6.70 | | 06/15/17 | | 285,378 | |
| | 620,000 | | Zions Bancorporation | | 5.50 | | 11/16/15 | | 639,020 | |
| | | 4,199,159 | |
| Health Care - 1.1% |
| | 540,000 | | Health Management Associates, Inc. | | 6.13 | | 04/15/16 | | 562,950 | |
| | 515,000 | | UnitedHealth Group, Inc. | | 4.88 | | 03/15/15 | | 563,328 | |
| | 430,000 | | WellPoint, Inc. | | 5.00 | | 12/15/14 | | 474,126 | |
| | 130,000 | | WellPoint, Inc. | | 5.25 | | 01/15/16 | | 145,128 | |
| | | 1,745,532 | |
| Materials – 1.1% |
| | 895,000 | | The Dow Chemical Co. | | 5.70 | | 05/15/18 | | 993,183 | |
| | 203,000 | | Weyerhaeuser Co. | | 9.00 | | 10/01/21 | | 246,711 | |
| | 505,000 | | Weyerhaeuser Co. | | 7.95 | | 03/15/25 | | 585,606 | |
| | | 1,825,500 | |
| Utilities - 0.4% |
| | 100,000 | | Constellation Energy Group, Inc. | | 4.55 | | 06/15/15 | | 106,517 | |
| | 255,000 | | Energy Future Holdings Corp. | | 9.75 | | 10/15/19 | | 259,071 | |
| | 312,000 | | Energy Future Intermediate Holding Co., LLC | | 9.75 | | 10/15/19 | | 316,980 | |
| | 27,000 | | Nevada Power Co., Series L | | 5.88 | | 01/15/15 | | 30,268 | |
| | | 712,836 | |
Total Corporate Bonds (Cost $9,306,459) | | 11,121,142 | |
| Foreign Municipal Bonds - 0.8% |
| | 750,000 | | Ontario Hydro Residual Strip (Canada), Series OC20 (b) | | 5.51 | | 10/01/20 | | 530,152 | |
| | 356,000 | | Ontario Hydro Residual Strip (Canada) (b) | | 5.47-5.65 | | 11/27/20 | | 251,265 | |
| See Notes to Financial Statements. | 6 | |
| |
AUXIER FOCUS FUND SCHEDULE OF INVESTMENTS JUNE 30, 2011 |
| |
| | Principal | | Security Description | | Rate | | Maturity | | Value | |
| $ | 605,000 | | Ontario Hydro Residual Strip (Canada) (b) | | 5.61 | % | 10/15/21 | $ | 405,663 | |
| | 235,000 | | Ontario Hydro Residual Strip (Canada) (b) | | 5.75 | | 08/18/22 | | 151,165 | |
| | | | |
Total Foreign Municipal Bonds (Cost $842,851) | | 1,338,245 | |
| Municipal Bonds - 0.2% |
| Ohio - 0.2% |
| | 550,000 | | Buckeye Tobacco Settlement Financing Authority | | 5.88 | | 06/01/47 | | 401,748 | |
| | | | |
Total Municipal Bonds (Cost $374,358) | | 401,748 | |
| Money Market Funds - 0.0% |
| | 31 | | Schwab Government Money Fund, 0.01% (c) (Cost $31) | | 31 | |
| | | | |
Total Investments - 81.3% (Cost $110,898,036)* | $ | 133,550,320 | |
| Other Assets & Liabilities, Net – 18.7% | | 30,808,707 | |
| Net Assets – 100.0% | $ | 164,359,027 | |
| ADR | American Depository Receipt |
| LLC | Limited Liability Company |
| PLC | Public Limited Company |
| REIT | Real Estate Investment Trust |
| (a) | Non-income producing security. |
| (b) | Zero coupon bond. Interest rate presented is yield to maturity. |
| (c) | Variable rate security. Rate presented is as of June 30, 2011. |
| | * Cost of investments for federal income tax purposes is $110,917,144 and net unrealized appreciation on investments consists of: |
| Gross Unrealized Appreciation | | $ | 28,068,394 | |
| Gross Unrealized Depreciation | | | (5,435,218 | ) |
| Net Unrealized Appreciation | | $ | 22,633,176 | |
The following is a summary of the inputs used to value the Fund’s investments as of June 30, 2011.
The inputs or methodology used for valuing securities are not necessarily an indication of the risks associated with investing in those securities. For more information on valuation inputs, and their aggregation into the levels used in the tables below, please refer to Note 2 - Security Valuation section in the accompanying Notes to Financial Statements.
| | Level 1 | | Level 2 | | Level 3 | | Total |
| Investments At Value |
| Common Stock | | | | | | | | | | | | | | | | |
| Communications | | $ | 1,278,842 | | | $ | - | | | $ | - | | | $ | 1,278,842 | |
| Consumer Discretionary | | | 24,617,344 | | | | - | | | | - | | | | 24,617,344 | |
| Consumer Staples | | | 25,954,178 | | | | - | | | | - | | | | 25,954,178 | |
| Energy | | | 7,852,962 | | | | - | | | | - | | | | 7,852,962 | |
| Financials | | | 17,733,385 | | | | - | | | | - | | | | 17,733,385 | |
| Health Care | | | 23,826,058 | | | | - | | | | - | | | | 23,826,058 | |
| Industrials | | | 4,273,095 | | | | - | | | | - | | | | 4,273,095 | |
| Information Technology | | | 4,896,825 | | | | - | | | | - | | | | 4,896,825 | |
| Materials | | | 5,026,535 | | | | - | | | | - | | | | 5,026,535 | |
| Telecommunications | | | 5,001,413 | | | | - | | | | - | | | | 5,001,413 | |
| Utilities | | | 228,517 | | | | - | | | | - | | | | 228,517 | |
| Corporate Bonds | | | - | | | | 11,121,142 | | | | - | | | | 11,121,142 | |
| Foreign Municipal Bonds | | | - | | | | 1,338,245 | | | | - | | | | 1,338,245 | |
| Municipal Bonds | | | - | | | | 401,748 | | | | - | | | | 401,748 | |
| Money Market Funds | | | - | | | | 31 | | | | - | | | | 31 | |
| Total Investments At Value | | $ | 120,689,154 | | | $ | 12,861,166 | | | $ | - | | | $ | 133,550,320 | |
The following is a reconciliation of Level 3 assets (at either the beginning or ending of the period) for which significant unobservable inputs were used to determine fair value.
| | | Corporate Bonds |
| Balance as of 06/30/10 | | $ | 167,200 | |
| Accretion | | | 703 | |
| Realized Gain (Loss) | | | - | |
| Change in Unrealized Appreciation (Depreciation) | | | 21,302 | |
| Purchase | | | - | |
| Sale | | | - | |
| Transfers Out | | | (189,205 | ) |
| Balance as of 06/30/11 | | $ | 0 | |
| Net change in unrealized appreciation from investments held as of 06/30/11** | | $ | 21,302 | |
| | | | | |
| | | | | |
| | ** The unrealized appreciation is included in net change in unrealized appreciation (depreciation) on investments in the accompanying Statement of Operations. |
| PORTFOLIO HOLDINGS | | |
| % of Net Assets | | |
| Common Stock | 73.5 | % |
| Corporate Bonds | 6.8 | % |
| Foreign Municipal Bonds | 0.8 | % |
| Municipal Bonds | 0.2 | % |
| Money Market Funds | 0.0 | % |
| Cash and Other Net Assets | 18.7 | % |
| | 100.0 | % |
| See Notes to Financial Statements. | 7 | |
| |
AUXIER FOCUS FUND STATEMENT OF ASSETS AND LIABILITIES JUNE 30, 2011 |
| |
| | | | | | | |
| ASSETS | | | | |
| | Total investments, at value (Cost $110,898,036) | | $ | 133,550,320 | |
| | Cash | | | 33,467,355 | |
| | Receivables: | | | | |
| | | Fund shares sold | | | 427,695 | |
| | | Dividends and interest | | | 348,424 | |
| Total Assets | | | 167,793,794 | |
| | | | | | | |
| LIABILITIES | | | | |
| | Payables: | | | | |
| | | Investment securities purchased | | | 3,259,179 | |
| | | Fund shares redeemed | | | 25,622 | |
| | Accrued Liabilities: | | | | |
| | Investment adviser fees | | | 149,768 | |
| | | Trustees’ fees and expenses | | | 64 | |
| | | Other expenses | | | 134 | |
| Total Liabilities | | | 3,434,767 | |
| | | | | | | |
| NET ASSETS | | $ | 164,359,027 | |
| | | | | | | |
| COMPONENTS OF NET ASSETS | | | | |
| | Paid-in capital | | $ | 138,316,692 | |
| | Undistributed net investment income | | | 1,068,800 | |
| | Accumulated net realized gain | | | 2,321,251 | |
| | Net unrealized appreciation | | | 22,652,284 | |
| NET ASSETS | | $ | 164,359,027 | |
| | | | | | | |
| SHARES OF BENEFICIAL INTEREST AT NO PAR VALUE (UNLIMITED SHARES AUTHORIZED) | | | | |
| | Investor Shares | | | 9,950,599 | |
| | A Shares | | | 40,140 | |
| | | | | | | |
NET ASSET VALUE, OFFERING AND REDEMPTION* PRICE PER SHARE | | | | |
| | Investor Shares (based on net assets of $163,698,725) | | $ | 16.45 | |
| | A Shares (based on net assets of $660,302) | | $ | 16.45 | |
| | A Shares Maximum Public Offering Price Per Share (net asset value per share/(100%-5.75%)) | | $ | 17.45 | |
| * | Shares redeemed or exchanged within 180 days of purchase are charged a 2.00% redemption fee. |
| See Notes to Financial Statements. | 8 | |
| |
AUXIER FOCUS FUND STATEMENT OF OPERATIONS YEAR ENDED JUNE 30, 2011 |
| |
| | | | | | | | |
| INVESTMENT INCOME | | | | | |
| | Dividend income (Net of foreign withholding taxes of $25,346) | | $ | 2,336,781 | | |
| | Interest income | | | 1,403,344 | | |
| Total Investment Income | | | 3,740,125 | | |
| | | | | | |
| EXPENSES | | | | | |
| | Investment adviser fees | | | 1,598,181 | | |
| | Distribution fees: | | | | | |
| | A Shares | | | 825 | | |
| | Trustees' fees and expenses | | | 3,973 | | |
| Total Expenses | | | 1,602,979 | | |
| | Fees waived and expenses reimbursed | | | (4,798 | ) | |
| Net Expenses | | | 1,598,181 | | |
| | | | | | | | |
| NET INVESTMENT INCOME | | | 2,141,944 | | |
| | | | | | | | |
| NET REALIZED AND UNREALIZED GAIN (LOSS) | | | | | |
| | Net realized gain on investments | | | 2,423,959 | | |
| | Net change in unrealized appreciation (depreciation) on: | | | | | |
| | Investments | | | 22,101,085 | | |
| | Foreign currency translations | | | 13,809 | | |
| NET REALIZED AND UNREALIZED GAIN | | | 24,538,853 | | |
| INCREASE IN NET ASSETS FROM OPERATIONS | | $ | 26,680,797 | | |
| | | | | | | | |
| See Notes to Financial Statements. | 9 | |
| |
AUXIER FOCUS FUND STATEMENTS OF CHANGES IN NET ASSETS |
| |
| | | | | | | | | | | | |
| | | | | For The Years Ended June 30, |
| | | | | 2011 | | | 2010 |
| OPERATIONS | | | | | | | | | |
| | Net investment income | | $ | 2,141,944 | | | | $ | 2,292,882 | |
| | Net realized gain | | | 2,423,959 | | | | | 696,183 | |
| | Net change in unrealized appreciation | | | 22,114,894 | | | | | 7,745,953 | |
| Increase in Net Assets Resulting from Operations | | | 26,680,797 | | | | | 10,735,018 | |
| | | | | | | | | | | | |
| DISTRIBUTIONS TO SHAREHOLDERS FROM | | | | | | | | | |
| | Net investment income: | | | | | | | | | |
| | | Investor Shares | | | (2,383,997 | ) | | | | (1,836,778 | ) |
| | | A Shares | | | (2,623 | ) | | | | (3,091 | ) |
| | Net realized gain: | | | | | | | | | |
| | | Investor Shares | | | (77,655 | ) | | | | - | |
| | | A Shares | | | (87 | ) | | | | - | |
| Total Distributions to Shareholders | | | (2,464,362 | ) | | | | (1,839,869 | ) |
| | | | | | | | | | | | |
| CAPITAL SHARE TRANSACTIONS | | | | | | | | | |
| | Sale of shares: | | | | | | | | | |
| | | Investor Shares | | | 52,157,159 | | | | | 19,500,648 | |
| | | A Shares | | | 495,798 | | | | | 17,906 | |
| | Reinvestment of distributions: | | | | | | | | | |
| | | Investor Shares | | | 2,420,510 | | | | | 1,798,747 | |
| | | A Shares | | | 2,710 | | | | | 3,091 | |
| | Redemption of shares: | | | | | | | | | |
| | | Investor Shares | | | (15,775,082 | ) | | | | (14,133,080 | ) |
| | | A Shares | | | (37,201 | ) | | | | (27,077 | ) |
| | Redemption fees | | | 10,155 | | | | | 5,388 | |
| Increase in Net Assets from Capital Share Transactions | | | 39,274,049 | | | | | 7,165,623 | |
| Increase in Net Assets | | | 63,490,484 | | | | | 16,060,772 | |
| | | | | | | | | | | | |
| NET ASSETS | | | | | | | | | |
| | Beginning of Year | | | 100,868,543 | | | | | 84,807,771 | |
| | End of Year (Including line (a)) | | $ | 164,359,027 | | | | $ | 100,868,543 | |
| | | | | | | | | | | | |
| SHARE TRANSACTIONS | | | | | | | | | |
| | Sale of shares: | | | | | | | | | |
| | | Investor Shares | | | 3,353,252 | | | | | 1,392,563 | |
| | | A Shares | | | 30,902 | | | | | 1,257 | |
| | Reinvestment of distributions: | | | | | | | | | |
| | | Investor Shares | | | 159,532 | | | | | 128,025 | |
| | | A Shares | | | 179 | | | | | 220 | |
| | Redemption of shares: | | | | | | | | | |
| | | Investor Shares | | | (1,029,404 | ) | | | | (1,013,829 | ) |
| | | A Shares | | | (2,579 | ) | | | | (1,988 | ) |
| Increase in Shares | | | 2,511,882 | | | | | 506,248 | |
| | | | | | | | | | | | |
| (a) | Undistributed net investment income. | | $ | 1,068,800 | | | | $ | 1,314,468 | |
| See Notes to Financial Statements. | 10 | |
| |
AUXIER FOCUS FUND FINANCIAL HIGHLIGHTS |
| |
These financial highlights reflect selected data for a share outstanding throughout each year. | | | | | | |
| | | For the Years Ended June 30, | |
| | | 2011 | | | | 2010 | | | | 2009(a) | | | | 2008 | | | | 2007 | | |
| INVESTOR SHARES | | | | | | | | | | | | | | | | | | | | |
| NET ASSET VALUE, Beginning of Year | $ | 13.49 | | | $ | 12.16 | | | $ | 14.22 | | | $ | 17.06 | | | $ | 14.76 | | |
| INVESTMENT OPERATIONS | | | | | | | | | | | | | | | | | | | | |
| Net investment income (b) | | 0.26 | | | | 0.32 | | | | 0.19 | | | | 0.18 | | | | 0.38 | | |
| Net realized and unrealized gain (loss) | | 3.00 | | | | 1.27 | | | | (1.77 | ) | | | (2.24 | ) | | | 2.66 | | |
| Total from Investment Operations | | 3.26 | | | | 1.59 | | | | (1.58 | ) | | | (2.06 | ) | | | 3.04 | | |
| DISTRIBUTIONS TO | | | | | | | | | | | | | | | | | | | | |
| SHAREHOLDERS FROM | | | | | | | | | | | | | | | | | | | | |
| Net investment income | | (0.29 | ) | | | (0.26 | ) | | | (0.16 | ) | | | (0.31 | ) | | | (0.27 | ) | |
| Net realized gains | | (0.01 | ) | | | — | | | | (0.32 | ) | | | (0.47 | ) | | | (0.47 | ) | |
| Total Distributions to Shareholders | | (0.30 | ) | | | (0.26 | ) | | | (0.48 | ) | | | (0.78 | ) | | | (0.74 | ) | |
REDEMPTION FEES (b) | | — | (c) | | | — | (c) | | — | (c) | | — | (c) | | — | (c) |
| NET ASSET VALUE, End of Year | $ | 16.45 | | | $ | 13.49 | | | $ | 12.16 | | | $ | 14.22 | | | $ | 17.06 | | |
| TOTAL RETURN | | 24.35 | % | | 12.99 | % | | (10.92 | )% | | (12.56 | )% | | 21.11 | % |
| RATIOS/SUPPLEMENTARY DATA | | | | | | | | | | | | | | | | | | | | |
| Net Assets at End of Year (000's omitted) | $163,699 | | | $100,712 | | | $84,660 | | | $103,664 | | | $116,774 | | |
| Ratios to Average Net Assets: | | | | | | | | | | | | | | | | | | | | |
| Net investment income | | 1.68 | % | | 2.29 | % | | 1.53 | % | | 1.10 | % | | 2.40 | % |
| Net expense | | 1.25 | % | | 1.30 | % | | 1.35 | % | | 1.35 | % | | 1.35 | % |
| Gross expense (d) | | 1.25 | % | | 1.30 | % | | 1.35 | % | | 1.36 | % | | 1.36 | % |
| PORTFOLIO TURNOVER RATE | | 20 | % | | 15 | % | | 24 | % | | 19 | % | | 16 | % |
| | | | | | | | | | | | | | | | | | | | | | |
| (a) | Effective November 1, 2008, C Shares were reclassified as Investor Shares. For the Period July 1, 2008, through November 1, 2008, total return for C Shares was (12.68)%. For the aforementioned period, the annualized gross expense and net expense ratios were 2.35% and 2.10%, respectively. |
| (b) | Calculated based on average shares outstanding during the year. |
| (c) | Less than $0.01 per share. |
| (d) | Reflects the expense ratio excluding any waivers and/or reimbursements. |
| See Notes to Financial Statements. | 11 | |
| |
AUXIER FOCUS FUND FINANCIAL HIGHLIGHTS |
| |
These financial highlights reflect selected data for a share outstanding throughout each year. | | | | | | |
| | | For the Years Ended June 30, | |
| | | 2011 | | | | 2010 | | | | 2009 | | | | 2008 | | | | 2007 | | |
| A SHARES | | | | | | | | | | | | | | | | | | | | |
| NET ASSET VALUE, Beginning of Year | $ | 13.49 | | | $ | 12.17 | | | $ | 14.22 | | | $ | 17.07 | | | $ | 14.77 | | |
| INVESTMENT OPERATIONS | | | | | | | | | | | | | | | | | | | | |
| Net investment income (a) | | 0.25 | | | | 0.32 | | | | 0.18 | | | | 0.17 | | | | 0.41 | | |
| Net realized and unrealized gain (loss) | | 3.01 | | | | 1.26 | | | | (1.75 | ) | | | (2.24 | ) | | | 2.63 | | |
| Total from Investment Operations | | 3.26 | | | | 1.58 | | | | (1.57 | ) | | | (2.07 | ) | | | 3.04 | | |
| DISTRIBUTIONS TO | | | | | | | | | | | | | | | | | | | | |
| SHAREHOLDERS FROM | | | | | | | | | | | | | | | | | | | | |
| Net investment income | | (0.29 | ) | | | (0.26 | ) | | | (0.16 | ) | | | (0.31 | ) | | | (0.27 | ) | |
| Net realized gains | | (0.01 | ) | | | — | | | | (0.32 | ) | | | (0.47 | ) | | | (0.47 | ) | |
| Total Distributions to Shareholders | | (0.30 | ) | | | (0.26 | ) | | | (0.48 | ) | | | (0.78 | ) | | | (0.74 | ) | |
REDEMPTION FEES (a) | | — | (b) | | | — | (b) | | — | (b) | | — | (b) | | — | (b) | |
| NET ASSET VALUE, End of Year | $ | 16.45 | | | $ | 13.49 | | | $ | 12.17 | | | $ | 14.22 | | | $ | 17.07 | | |
TOTAL RETURN (c) | | 24.35 | % | | 12.90 | % | | (10.85 | )% | | (12.61 | )% | | 21.10 | % |
| RATIOS/SUPPLEMENTARY DATA | | | | | | | | | | | | | | | | | | | | |
| Net Assets at End of Year (000's omitted) | $660 | | | $157 | | | $148 | | | $208 | | | $399 | | |
| Ratios to Average Net Assets: | | | | | | | | | | | | | | | | | | | | |
| Net investment income | | 1.61 | % | | 2.29 | % | | 1.49 | % | | 1.08 | % | | 2.59 | % |
| Net expense | | 1.25 | % | | 1.30 | % | | 1.35 | % | | 1.35 | % | | 1.35 | % |
| Gross expense (d) | | 1.50 | % | | 1.55 | % | | 1.60 | % | | 1.60 | % | | 1.60 | % |
| PORTFOLIO TURNOVER RATE | | 20 | % | | 15 | % | | 24 | % | | 19 | % | | 16 | % |
| | | | | | | | | | | | | | | | | | | | | | |
| (a) | Calculated based on average shares outstanding during the year. |
| (b) | Less than $0.01 per share. |
| (c) | Total return does not include the effect of front-end sales charges or contingent deferred sales charges. |
| (d) | Reflects the expense ratio excluding any waivers and/or reimbursements. |
| See Notes to Financial Statements. | 12 | |
| |
AUXIER FOCUS FUND NOTES TO FINANCIAL STATEMENTS JUNE 30, 2011 |
| |
Note 1. Organization
The Auxier Focus Fund (the “Fund”) is a diversified portfolio of Forum Funds (the “Trust”). The Trust is a Delaware statutory trust that is registered as an open-end, management investment company under the Investment Company Act of 1940 (the “Act”), as amended. Under its Trust Instrument, the Trust is authorized to issue an unlimited number of the Fund’s shares of beneficial interest without par value. The Fund currently offers two classes of shares: Investor Shares and A Shares. A Shares are offered at net asset value plus a maximum sales charge of 5.75%. A Shares are also subject to contingent deferred sales charge (“CDSC”) of 1.00% on purchases without an initial sales charge and redeemed less than one year after they are purchased. Investor Shares are not subject to a sales charge. Investor Shares and A Shares commenced operations on July 9, 1999 and July 8, 2005, respectively. The Fund’s investment objective is to provide long-term capital appreciation.
On August 27, 2008, the Board of Trustees of the Trust approved the conversion of the Fund’s C Shares into Investor Shares. On November 1, 2008, each shareholder of C Shares received Investor Shares in a dollar amount equal to their investment in C Shares as of that date.
Note 2. Summary of Significant Accounting Policies
These financial statements are prepared in accordance with generally accepted accounting principles in the United States of America (“GAAP”), which require management to make estimates and assumptions that affect the reported amounts of assets and liabilities, the disclosure of contingent liabilities at the date of the financial statements, and the reported amounts of increase and decrease in net assets from operations during the fiscal year. Actual amounts could differ from those estimates. The following summarizes the significant accounting policies of the Fund:
Security Valuation – Exchange-traded securities and over-the-counter securities are valued using the last quoted sale or official closing price, provided by independent pricing services as of the close of trading on the market or exchange for which they are primarily traded, on each Fund business day. In the absence of a sale, such securities are valued at the mean of the last bid and ask price provided by independent pricing services. Non-exchange traded securities for which quotations are available are valued using the last quoted sales price, or in the absence of a sale at the mean of the last bid and ask prices provided by independent pricing services. Debt securities may be valued at prices supplied by a fund’s pricing agent based on broker or dealer supplied valuations or matrix pricing, a method of valuing securities by reference to the value of other securities with similar characteristics such as rating, interest rate and maturity. Shares of open-end mutual funds are valued at net asset value (“NAV”). Short-term investments that mature in sixty days or less may be valued at amortized cost.
The Fund values its investments at fair value pursuant to procedures adopted by the Trust's Board of Trustees (the "Board") if (1) market quotations are insufficient or not readily available or (2) the adviser believes that the values available are unreliable. Fair valuation is based on subjective factors and, as a result, the fair value price of an investment may differ from the security’s market price and may not be the price at which the asset may be sold. Fair valuation could result in a different NAV than a NAV determined by using market quotes.
The Fund has a three-tier fair value hierarchy. The basis of the tiers is dependent upon the various “inputs” used to determine the value of the Fund’s investments. These inputs are summarized in the three broad levels listed below:
Level 1 — quoted prices in active markets for identical assets
Level 2 — other significant observable inputs (including quoted prices of similar securities, interest rates, prepayment speeds, credit risk, etc.)
Level 3 — significant unobservable inputs (including the Fund’s own assumptions in determining the fair value of investments)
The aggregate value by input level, as of June 30, 2011, for the Fund’s investments is included at the end of the Fund’s Schedule of Investments.
| |
AUXIER FOCUS FUND NOTES TO FINANCIAL STATEMENTS JUNE 30, 2011 |
| |
Security Transactions, Investment Income and Realized Gain and Loss – Investment transactions are accounted for on the trade date. Dividend income is recorded on the ex-dividend date. Foreign dividend income is recorded on the ex-dividend date or as soon as possible after the Fund determines the existence of a dividend declaration after exercising reasonable due diligence. Income and capital gains on some foreign securities may be subject to foreign withholding taxes, which are accrued as applicable. Interest income is recorded on an accrual basis. Premium is amortized and discount is accreted in accordance with GAAP. Identified cost of investments sold is used to determine the gain and loss for both financial statement and federal income tax purposes.
Foreign Currency Translations – Foreign currency amounts are translated into U.S. dollars as follows: (i) assets and liabilities at the rate of exchange at the end of the respective period; and (ii) purchases and sales of securities and income and expenses at the rate of exchange prevailing on the dates of such transactions. The portion of the results of operations arising from changes in the exchange rates and the portion due to fluctuations arising from changes in the market prices of securities are not isolated. Such fluctuations are included with the net realized and unrealized gain or loss on investments.
The Fund may enter into transactions to purchase or sell foreign currencies to protect the U.S. dollar value of its underlying portfolio securities against the effect of possible adverse movements in foreign exchange rates. Principal risks associated with such transactions include the movement in value of the foreign currency relative to the U.S. dollar and the ability of the counterparty to perform. Fluctuations in the value of such forward currency transactions are recorded daily as unrealized gain or loss; realized gain or loss includes net gain or loss on transactions that have terminated by settlement or by a fund entering into offsetting commitments. These instruments involve market risk, credit risk, or both kinds of risks, in excess of the amount recognized in the Statement of Assets and Liabilities. Risks arise from the possible inability of counterparties to meet the terms of their contracts and from movement in currency and securities values and interest rates.
Distributions to Shareholders – Distributions to shareholders of net investment income and net capital gains, if any, are declared and paid at least annually. Distributions are based on amounts calculated in accordance with applicable federal income tax regulations, which may differ from GAAP. These differences are due primarily to differing treatments of income and gain on various investment securities held by the Fund, timing differences and differing characterizations of distributions made by the Fund.
Federal Taxes – The Fund intends to qualify each year as a regulated investment company under Subchapter M of the Internal Revenue Code and distribute all of its taxable income to shareholders. In addition, by distributing in each calendar year substantially all its net investment income and capital gains, if any, the Fund will not be subject to a federal excise tax. Therefore, no federal income or excise tax provision is required.
As of June 30, 2011, there are no uncertain tax positions that would require financial statement recognition, de-recognition, or disclosure. The Fund’s federal tax returns filed in the three-year period ended June 30, 2011, remain subject to examination by the Internal Revenue Service.
Income and Expense Allocation – The Trust accounts separately for the assets, liabilities and operations of each of its investment portfolios. Expenses that are directly attributable to more than one investment portfolio are allocated among the respective investment portfolios in an equitable manner.
The Fund’s class specific expenses are charged to the operations of that class of shares. Income and expenses (other than expenses attributable to a specific class) and realized and unrealized gains or losses on investments are allocated to each class of shares based on the class’ respective net assets to the total net assets of the Fund.
Redemption Fees – A shareholder who redeems or exchanges shares within 180 days of purchase will incur a redemption fee of 2.00% of the current net asset value of shares redeemed or exchanged, subject to certain limitations. The fee is charged for the benefit of the remaining shareholders and will be paid to the Fund to help offset transaction costs. The fee is accounted for as an addition to paid-in capital. The Fund reserves the right to modify the terms of or terminate the fee at any time. There are limited exceptions to the imposition of the redemption fee.
Commitments and Contingencies – In the normal course of business, the Fund enters into contracts that provide general
| |
AUXIER FOCUS FUND NOTES TO FINANCIAL STATEMENTS JUNE 30, 2011 |
| |
indemnifications by the Fund to the counterparty to the contract. The Fund’s maximum exposure under these arrangements is dependent on future claims that may be made against the Fund and, therefore, cannot be estimated; however, based on experience, the risk of loss from such claims is considered remote.
Note 3. Advisory Fees, Servicing Fees and Other Transactions
Investment Adviser – Auxier Asset Management LLC (the “Adviser”), is the investment adviser to the Fund. Pursuant to an investment advisory agreement, the Adviser receives an advisory fee from the Fund at an annual rate of 1.25% of the Fund’s average daily assets.
Under the terms of the Investment Advisory Agreement, the Adviser provides investment advisory services to the Fund and is obligated to pay all expenses of the Fund except any expenses they are authorized to pay under Rule 12b-1, brokerage fees and commissions, borrowing costs, taxes, certain compensation expenses of the Trustees, and extraordinary and non-recurring expenses.
Distribution – Foreside Fund Services, LLC serves as the Fund’s distributor (the “Distributor”). The Distributor is not affiliated with the Adviser or Atlantic Fund Administration, LLC (d/b/a Atlantic Fund Services) (“Atlantic”) or their affiliates. The Fund has adopted a Distribution Plan (the “Plan”) for A Shares of the Fund in accordance with Rule 12b-1 of the Act. Under the Plan, the Fund pays the Distributor and/or any other entity as authorized by the Board a fee of up to 0.25% of the average daily net assets of A Shares. The Distributor had no role in determining the investment policies or which securities are to be purchased or sold by the Trust or its Funds.
For the year ended June 30, 2011, there were $14,202 in front-end sales charges assessed on the sale of A Shares and no contingent deferred sales charges were assessed on the sale of A Shares. The Distributor received $3,702 of the total front-end sales charges.
Other Service Providers – Atlantic provides fund accounting, fund administration, and transfer agency services to the Fund. Atlantic also provides certain shareholder report production, and EDGAR conversion and filing services. Atlantic provides a Principal Executive Officer, a Principal Financial Officer, a Chief Compliance Officer, and an Anti-Money Laundering Officer to the Fund, as well as certain additional compliance support functions.
Trustees and Officers – The Trust pays each independent Trustee an annual retainer fee of $45,000 for service to the Trust ($66,000 for the Chairman). In addition, the Chairman receives a monthly stipend of $500 to cover certain expenses incurred in connection with his duties to the Trust. The Trustees and Chairman may receive additional fees for special Board meetings. Each Trustee is also reimbursed for all reasonable out-of-pocket expenses incurred in connection with his duties as a Trustee, including travel and related expenses incurred in attending Board meetings. The amount of Trustees’ fees attributable to the Fund is disclosed in the Statement of Operations. Certain officers of the Trust are also officers or employees of the above named service providers, and during their terms of office received no compensation from the Fund.
Note 4. Expense Reimbursements and Fees Waived
The Adviser has contractually agreed to waive a portion of its fees and reimburse expenses through October 31, 2011, to the extent necessary to maintain the total operating expenses at 1.25% of average daily net assets of the Investor Shares and A Shares. These contractual waivers may be changed or eliminated at any time with consent of the Board. For the year ended June 30, 2011, expenses waived were $4,798.
Note 5. Security Transactions
The cost of purchases and proceeds from sales of investment securities (including maturities), other than short-term investments for the year ended June 30, 2011, were $38,271,339 and $23,195,285, respectively.
| |
AUXIER FOCUS FUND NOTES TO FINANCIAL STATEMENTS JUNE 30, 2011 |
| |
Note 6. Federal Income Tax and Investment Transactions
Distributions during the fiscal year ended were characterized for tax purposes as follows:
| Ordinary Income | | $ | 2,464,362 | | $ | 1,839,869 |
As of June 30, 2011, distributable earnings on a tax basis were as follows:
| Undistributed Ordinary Income | | $ | 1,225,893 | |
| Undistributed Long-Term Gain | | | 2,183,266 | |
| Unrealized Appreciation | | | 22,633,176 | |
| Total | | $ | 26,042,335 | |
The difference between components of distributable earnings on a tax basis and the amounts reflected in the Statement of Assets and Liabilities are primarily due to wash sales and passive foreign investment companies.
On the Statement of Assets and Liabilities, as a result of permanent book to tax differences, certain amounts have been reclassified for the year ended June 30, 2011. The following reclassification was the result of real estate investment trusts and partnership adjustments and has no impact on the net assets of the Fund.
| Accumulated Net Investment Income (Loss) | | $ | (992 | ) |
| Undistributed Net Realized Gain (Loss) | | | 992 | |
Note 7. Recent Accounting Pronouncements
In January 2010, the Financial Accounting Standards Board (“FASB”) issued Accounting Standards Update (“ASU”) No. 2010-06 “Improving Disclosures about Fair Value Measurements.” ASU No. 2010-06 clarifies existing disclosure and requires additional disclosures regarding fair value measurements. Effective for fiscal years beginning after December 15, 2010, and for interim periods within those fiscal years, entities will need to disclose information about purchases, sales, issuances and settlements of Level 3 securities on a gross basis, rather than as a net number as currently required. Management is currently evaluating the impact ASU No. 2010-06 will have on financial statement disclosures.
In May 2011, FASB issued ASU No. 2011-04 “Amendments to Achieve Common Fair Value Measurement and Disclosure Requirements in U.S. GAAP and IFRSs.” ASU No. 2011-04 establishes common requirements for measuring fair value and for disclosing information about fair value measurements in accordance with U.S. GAAP and International Financial Reporting Standards (“IFRSs”). ASU No. 2011-04 is effective for interim and annual periods beginning after December 15, 2011. Management is currently evaluating the impact ASU No. 2011-04 may have on financial statement disclosures.
Note 8. Subsequent Events
Subsequent events occurring after the date of this report through the date these financial statements were issued have been evaluated for potential impact and the Fund has had no such events.
| |
REPORT OF INDEPENDENT REGISTERED PUBLIC ACCOUNTING FIRM |
| |
To the Board of Trustees of Forum Funds
and the Shareholders of Auxier Focus Fund
We have audited the accompanying statement of assets and liabilities of the Auxier Focus Fund, a series of shares of beneficial interest in the Forum Funds, including the schedule of investments, as of June 30, 2011, and the related statement of operations for the year then ended, the statements of changes in net assets for each of the years in the two year period then ended and the financial highlights for each of the years in the three year period then ended. These financial statements and financial highlights are the responsibility of the Fund's management. Our responsibility is to express an opinion on these financial statements and financial highlights based on our audits. The financial highlights for each of the years in the two year period ended June 30, 2008 were audited by other auditors whose report dated August 25, 2008, expressed an unqualified opinion on such financial highlights.
We conducted our audits in accordance with the standards of the Public Company Accounting Oversight Board (United States). Those standards require that we plan and perform the audits to obtain reasonable assurance about whether the financial statements and financial highlights are free of material misstatement. An audit includes examining, on a test basis, evidence supporting the amounts and disclosures in the financial statements. Our procedures included confirmation of securities owned as of June 30, 2011 by correspondence with the custodian and brokers. An audit also includes assessing the accounting principles used and significant estimates made by management, as well as evaluating the overall financial statement presentation. We believe that our audits provide a reasonable basis for our opinion.
In our opinion, the financial statements and financial highlights referred to above present fairly, in all material respects, the financial position of the Auxier Focus Fund as of June 30, 2011, the results of its operations for the year then ended, the changes in its net assets for each of the years in the two year period then ended and its financial highlights for each of the years in the three year period then ended, in conformity with accounting principles generally accepted in the United States of America.
BBD, LLP
Philadelphia, Pennsylvania
August 22, 2011
| |
AUXIER FOCUS FUND ADDITIONAL INFORMATION (Unaudited) JUNE 30, 2011 |
| |
Proxy Voting Information
A description of the policies and procedures that the Fund uses to determine how to vote proxies relating to securities held in the Fund’s portfolio is available, without charge and upon request, by calling (877) 328-9437, on the Fund's website at www.auxierasset.com and on the SEC’s website at www.sec.gov. The Fund’s proxy voting record for the most recent twelve-month period ended June 30 is available, without charge and upon request, by calling (877) 328-9437 and on the SEC’s website at www.sec.gov.
Availability of Quarterly Portfolio Schedules
The Fund files its complete schedule of portfolio holdings with the SEC for the first and third quarters of each fiscal year on Form N-Q. The Fund’s Forms N-Q are available, without charge and upon request on the SEC’s website at www.sec.gov or may be reviewed and copied at the SEC’s Public Reference Room in Washington, DC. Information on the operation of the Public Reference Room may be obtained by calling (800) SEC-0330.
Shareholder Expense Example
As a shareholder of the Fund, you incur two types of costs: (1) transaction costs, including sales charges (loads) on purchase payments on certain classes, redemption fees, exchange fees, and CDSC fees, and (2) ongoing costs, including management fees, 12b-1 fees, and other Fund expenses. This example is intended to help you understand your ongoing costs (in dollars) of investing in the Fund, and to compare these costs with the ongoing costs of investing in other mutual funds.
The example is based on an investment of $1,000 invested at the beginning of the period and held for the entire period from January 1, 2011, through June 30, 2011.
Actual Expenses – The first line under each share class in the table below provides information about actual account values and actual expenses. You may use the information in this line, together with the amount you invested, to estimate the expenses that you paid over the period. Simply divide your account value by $1,000 (for example, an $8,600 account value divided by $1,000 = 8.6), then multiply the result by the number in the first line under the heading entitled “Expenses Paid During Period” to estimate the expenses you paid on your account during the period.
Hypothetical Example for Comparison Purposes – The second line under each share class of the table below provides information about hypothetical account values and hypothetical expenses based on the Fund’s actual expense ratio and an assumed rate of return of 5% per year before expenses, which is not the Fund’s actual return. The hypothetical account values and expenses may not be used to estimate the actual ending balance or expenses you paid for the period. You may use this information to compare the ongoing cost of investing in the Fund and other funds. To do so, compare this 5% hypothetical example with the 5% hypothetical examples that appear in the shareholder reports of other funds.
Please note that expenses shown in the table are meant to highlight your ongoing costs only and do not reflect any transactional costs, such as sales charges (loads) on purchase payments on certain classes, redemption fees, exchange fees, and CDSC fees. Therefore, the second line of the table is useful in comparing ongoing costs only, and will not help you determine the relative total costs of owning different funds. In addition, if these transactional costs had been included, your costs would have been higher.
| |
AUXIER FOCUS FUND ADDITIONAL INFORMATION (Unaudited) JUNE 30, 2011 |
| |
| | Beginning | | Ending | | Expenses | | Annualized |
| | Account Value | | Account Value | | Paid During | | Expense |
| | January 1, 2011 | | June 30, 2011 | | Period* | | Ratio* |
| Investor Shares | | | | | | | | | | | |
| Actual | $ | 1,000.00 | | $ | 1,084.38 | | $ | 6.46 | | 1.25 | % |
| Hypothetical (5% return before taxes) | $ | 1,000.00 | | $ | 1,018.60 | | $ | 6.26 | | 1.25 | % |
| A Shares | | | | | | | | | | | |
| Actual | $ | 1,000.00 | | $ | 1,084.38 | | $ | 6.46 | | 1.25 | % |
| Hypothetical (5% return before taxes) | $ | 1,000.00 | | $ | 1,018.60 | | $ | 6.26 | | 1.25 | % |
| | | | | | | | | | | | |
| | *Expenses are equal to the Fund’s annualized expense ratio as indicated above multiplied by the average account value over the period, multiplied by the number of days in the most recent fiscal half-year divided by 365 to reflect the half-year period. |
Federal Tax Status of Dividends Declared during the Tax Year
For federal income tax purposes, dividends from short-term capital gains are classified as ordinary income. The Fund designates 69.86% of its income dividend distributed as qualifying for the corporate dividends-received deduction (DRD) and 89.45% for the qualified dividend rate (QDI) as defined in Section 1(h)(11) of the Internal Revenue Code. The Fund also designates 41.48% of its income dividends as qualified interest income exempt from U.S. tax for foreign shareholders (QII) and 100% of its short-term capital gain dividends as exempt from U.S. tax for foreign shareholders (QSD).
Trustees and Officers of the Trust
The Board is responsible for oversight of the management of the Trust’s business affairs and of the exercise of all the Trust’s powers except those reserved for the shareholders. The following table provides information about each Trustee and certain officers of the Trust. Each Trustee and officer holds office until the person resigns, is removed, or is replaced. Unless otherwise noted, the persons have held their principal occupations for more than five years. The address for all Trustees and officers is Three Canal Plaza, Suite 600, Portland, Maine 04101, unless otherwise indicated. Each Trustee oversees twenty portfolios in the Trust. Mr. Keffer is considered an Interested Trustee due to his affiliation with Atlantic. The Fund’s Statement of Additional Information includes additional information about the Trustees and is available, without charge and upon request, by calling (877) 328-9437.
| Name and Year of Birth | Position with the Trust | Length of Time Served | Principal Occupation(s) During Past Five Years |
| Independent Trustees | | | |
J. Michael Parish Born: 1943 | Chairman of the Board; Trustee; Chairman, Nominating Committee and Qualified Legal Compliance Committee | Since 1989 (Chairman since 2004) | Retired since 2003. |
Costas Azariadis Born: 1943 | Trustee; Chairman, Valuation Committee | Since 1989 | Professor of Economics, Washington University since 2006; Professor of Economics, University of California-Los Angeles 1992-2006. |
James C. Cheng Born: 1942 | Trustee; Chairman, Audit Committee | Since 1989 | President, Technology Marketing Associates (marketing company for small- and medium-sized businesses in New England) since 1991. |
| |
AUXIER FOCUS FUND ADDITIONAL INFORMATION (Unaudited) JUNE 30, 2011 |
| |
| Name and Year of Birth | Position with the Trust | Length of Time Served | Principal Occupation(s) During Past Five Years |
| Interested Trustee | | | |
John Y. Keffer1 Born: 1942 | Trustee; Vice Chairman | Since 1989 | Chairman, Atlantic since 2008; President, Forum Foundation (a charitable organization) since 2005; President, Forum Trust, LLC (a non-depository trust company chartered in the State of Maine) since 1997. |
| Officers | | | |
Stacey E. Hong Born: 1966 | President; Principal Executive Officer | Since 2008 | President, Atlantic since 2008; Director, Consulting Services, Foreside Fund Services 2007. |
Karen Shaw Born: 1972 | Treasurer; Principal Financial Officer | Since 2008 | Senior Manager, Atlantic since 2008; Section Manager/Vice President, Enterprise Support Services, Citigroup 2003-2008. |
David Faherty Born: 1970 | Vice President | Since 2009 | Senior Counsel, Atlantic since 2009; Vice President, Citi Fund Services Ohio, Inc. 2007-2009; Associate Counsel, Investors Bank & Trust Co. 2006-2007. |
Michael J. McKeen Born: 1971 | Vice President | Since 2009 | Senior Manager, Atlantic since 2008; Vice President, Citigroup 2003-2008. |
Joshua LaPan Born: 1973 | Vice President | Since 2009 | Manager, Atlantic since 2008; Vice President, Citigroup 2003-2008. |
Timothy Bowden Born: 1969 | Vice President | Since 2009 | Manager, Atlantic since 2008; Vice President, Citigroup 2005-2008. |
Lina Bhatnagar Born: 1971 | Secretary | Since 2008 | Senior Administration Specialist, Atlantic since 2008; Regulatory Administration Specialist, Citigroup 2006-2008. |
1 Atlantic is a subsidiary of Forum Holdings Corp. I, a Delaware corporation that is wholly owned by Mr. Keffer.
FOR MORE INFORMATION
P.O. Box 588
Portland, Maine 04112
(877) 3AUXIER
(877) 328-9437
INVESTMENT ADVISER
Auxier Asset Management LLC
5285 Meadows Road
Suite 333
Lake Oswego, Oregon 97035
TRANSFER AGENT
Atlantic Fund Services
P.O. Box 588
Portland, Maine 04112
DISTRIBUTOR
Foreside Fund Services, LLC
Three Canal Plaza, Suite 100
Portland, Maine 04101
www.foreside.com
This report is submitted for the general information of the shareholders of the Fund. It is not authorized for
distribution to prospective investors unless preceded or accompanied by an effective prospectus, which includes
information regarding the Fund’s risks, objectives, fees and expenses, experience of its management, and other
information.
204-ANR-0611

| |
DF DENT PREMIER GROWTH FUND A MESSAGE TO OUR SHAREHOLDERS JUNE 30, 2011 |
| |
Dear Fellow Shareholder,
Performance
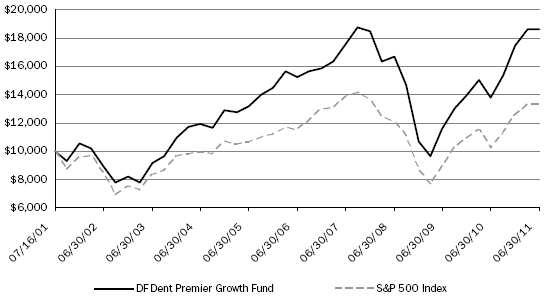
For the fiscal year ended June 30, 2011, the DF Dent Premier Growth Fund (the “Fund”) experienced a total return of +34.87% outperforming the total return of +30.69% for the S&P 500®Index (the “Index”), which is the Fund’s benchmark used for performance comparisons, by 4.18%. Your Fund has outperformed the Index in 8 of the 10 fiscal years since the Fund’s inception in July 2001 with a cumulative total return of +86.38% versus +33.05% for the Index. On a quarterly basis since the Fund’s inception, it has outperformed the Index in 28 of the 40 calendar quarters.
For a longer-term perspective, the Fund’s one-year, five-year and since inception average annual total return for the period ended June 30, 2011, were 34.87%, 4.15% and 6.45%, respectively. Performance data quoted represents past performance and is no guarantee of future results. Current performance may be lower or higher than the performance data quoted. Investment return and principal value will fluctuate so that an investor’s shares, when redeemed, may be worth more or less than original cost. For the most recent month-end performance, please call (866) 233-3368. As stated in the current prospectus, the Fund’s annual operating expense ratio (gross) is 1.27%. However, the Fund’s Adviser has contractually agreed to waive a portion of its fees and/or reimburse certain expenses to limit total operating expense to 1.10% on the first $150 million in Fund net assets and to 0.90% on net assets exceeding $150 million; otherwise, returns would have been lower. This agreement is in effect through October 31, 2012, per Board approval (prospectus to be updated fall, 2011). The contractual waivers may be changed or eliminated with the consent of the Board of Trustees at any time.
Expense Ratio Management
Your Fund’s Adviser, D.F. Dent & Company, Inc. (the “Adviser”), has again agreed to maintain your Fund’s expense ratio at a net 1.10% on the first $150 million of net assets and 0.90% on net assets exceeding $150 million through October 31, 2012, by reimbursing expenses and waiving management fees. The record of expense reimbursement and management fee waivers for the first ten years of your Fund is as follows:
| Year Ending | | Expense Reimbursement | | Management Fee Waived |
| 06/30/02 | | $ | 60,201 | | $ | 60,019 |
| 06/30/03 | | | 38,066 | | | 90,163 |
| 06/30/04 | | | 0 | | | 129,060 |
| 06/30/05 | | | 0 | | | 141,907 |
| 06/30/06 | | | 0 | | | 142,664 |
| 06/30/07 | | | 0 | | | 161,128 |
| 06/30/08 | | | 0 | | | 95,665 |
| 06/30/09 | | | 0 | | | 234,053 |
| 06/30/10 | | | 0 | | | 204,148 |
| 06/30/11 | | | 0 | | | 211,784 |
| Total | | $ | 98,267 | | $ | 1,470,591 |
| | 1 | DF DENT PREMIER GROWTH FUND |
| |
DF DENT PREMIER GROWTH FUND A MESSAGE TO OUR SHAREHOLDERS JUNE 30, 2011 |
| |
Portfolio Turnover
Portfolio turnover for the year increased versus the prior two years. Involuntary turnover from sales pursuant to tender offers was 0.8% in 2008, 3.2% in 2009, 5.4% in 2010, and 4.5% in 2011. Therefore, excluding tender offers, voluntary portfolio turnover was still under 20% in the fiscal year 2011. Annual portfolio turnover since inception has been as follows:
| | | 2002* | | 2003 | | 2004 | | 2005 | | 2006 | | 2007 | | 2008 | | 2009 | | 2010 | | 2011 | | Average |
| Portfolio Turnover** | | 0% | | 14% | | 20% | | 7% | | 25% | | 17% | | 21% | | 16% | | 8% | | 21% | | 15% |
We believe these low portfolio turnover rates are consistent with our investment strategy of holding positions for long periods and minimizing transaction expenses for shareholders. Brokerage expenses for the entire fiscal year’s trading amounted to less than $0.01 per share of your Fund. Thus, trading expense remained very low because of low portfolio turnover.
* The Fund commenced operations on July 16, 2001.
** Percentage calculated based on total value of investments.
Asset Allocation
Year-end asset allocation by market capitalization for the past five years was:
| | | 06/30/07 | | 06/30/08 | | 06/30/09 | | 06/30/10 | | 06/30/11 |
| Large Capitalization | | 36.1 | % | | 50.2 | % | | 36.8 | % | | 43.0 | % | | 50.2 | % |
| Mid Capitalization | | 43.5 | % | | 40.2 | % | | 52.9 | % | | 50.2 | % | | 40.6 | % |
| Small Capitalization | | 9.3 | % | | 9.4 | % | | 10.2 | % | | 6.3 | % | | 9.2 | % |
| Reserve Funds | | 11.1 | % | | 0.2 | % | | 0.1 | % | | 0.5 | % | | 0.0 | % |
| Total Fund | | 100.0 | % | | 100.0 | % | | 100.0 | % | | 100.0 | % | | 100.0 | % |
The Fund’s Prospectus has defined Mid Capitalization companies as those in the $1.5 billion to $7.0 billion market capitalization range, Large Capitalization companies as those with market capitalizations greater than $7.0 billion and Small Capitalization companies as those with market capitalizations under $1.5 billion.
Attribution
We have once again included in the Management Discussion of Fund Performance section later in this report, a bar graph of your Fund’s sector allocation versus the Index and a discussion of that allocation accompanied with commentary on stock selection within sectors of the Index.
Concentration
We have made an effort during the past four years to increase the position size in our favorite “core” holdings.
| | 2 | DF DENT PREMIER GROWTH FUND |
| |
DF DENT PREMIER GROWTH FUND A MESSAGE TO OUR SHAREHOLDERS JUNE 30, 2011 |
| |
We do not consider this strategy to be “over concentrated”. In the past five years, our concentration in the top 10 holdings has been as follows:
| Top 10 Holdings | | 06/30/07 | | 06/30/08 | | 06/30/09 | | 06/30/10 | | 06/30/11 |
| % of Fund | | 25.5 | % | | 36.7 | % | | 55.82 | % | | 54.97 | % | | 52.46 | % |
| Average Position Size of Top 10 | | 2.6 | % | | 3.7 | % | | 5.6 | % | | 5.5 | % | | 5.2 | % |
We wrote in each of the past two years that we had reached the desired level of concentration and did not intend to increase concentration beyond the 06/30/09 level shown above. In each of these past two years your Fund has outperformed the Index by over 4% total return. We continue to believe that the current concentration in the top 10 positions is appropriate, at the desired level, and has enhanced performance.
Management Ownership of Fund
Employees, their families, and the Adviser’s retirement plan increased their ownership from 8.4% of the Fund two years ago to 10.0% one year ago and 11.0% of the Fund on 06/30/11. There were only management purchases and no redemptions during these periods.
A Domestic Fund?
Our Prospectus has always stated that the Fund invests primarily in domestic companies. Thus, it is a “domestic” fund. However, in recent years companies domiciled in the U.S. have invested overseas recognizing the growth opportunities in targeted emerging, developing and developed markets outside the U.S. (“OUS”). Consequently, the revenues of these domestic companies derived from OUS have increased as a result of these overseas investments, the growth of overseas markets, and the prolonged weakness in the U.S. dollar. In tracking the OUS revenues of the companies within the Fund based upon Bloomberg and Factset data we estimate that 37% of the Fund’s companies’ revenues are derived from OUS, while 63% come from domestic markets.
Today’s global economy is characterized by hundreds of trade lanes stretching in all directions around the world (an important reason for your Fund’s 7th largest holding and 3rd best 2011 fiscal year performance contributor- Expeditors International of Washington, Inc.): U.S. companies shipping to OUS, foreign companies shipping into the U.S., foreign companies shipping to foreign countries, U.S. companies with foreign plants shipping to foreign countries and back into the U.S., foreign companies shipping from their U.S. plants to U.S. and OUS, etc. It’s enough to give the poor mutual fund manager a migraine headache! Add to this the reporting, regulatory, ethical, and recently revealed accounting irregularities of foreign companies, and investing becomes even more challenging.
So, what does a “domestic” fund do? At your Fund we have always hitched our investment wagon to talented management teams with a track record of consistently executing high quality business models in these markets. We simply believe that these “best-in-class***” management teams, who understand their markets and trends far better than Wall Street analysts and portfolio managers, can continue to determine which markets to invest in and how to seek strong returns on invested capital.
| | 3 | DF DENT PREMIER GROWTH FUND |
| |
DF DENT PREMIER GROWTH FUND A MESSAGE TO OUR SHAREHOLDERS JUNE 30, 2011 |
| |
For the past five years we have rarely had a client meeting where the first question asked was not, “Should we be investing more in international companies?” And, most clients have invested increased amounts in international markets, while industry mutual fund flows have seen a strong movement into foreign funds.
So, how has your Fund performed versus foreign investing? The table below compares your Fund’s annualized performance for various periods ending 06/30/11 versus the Morgan Stanley Capital International EAFE (Europe, Australasia and Far East) Index (the“MSCI EAFE Index”), a broad benchmark used to represent international markets.
| | | 1 year | | 3 years | | 5 years | | Since Inception* |
| DF Dent Premier Growth Fund | | 34.87 | % | | 3.72 | % | | 4.15 | % | | 6.45 | % |
| MSCI EAFE Index | | 30.36 | % | | 1.77 | % | | 1.48 | % | | 5.66 | % |
*The above +6.45% is the annual total return of the Fund since inception (07/16/01) through 06/30/11, 15 days shy of 10 years. The +5.66% is the annual total return of the MSCI EAFE index since 06/30/01.
A Few Anecdotes
We thought our shareholders might be interested in a few anecdotes from our conversations with the management teams of companies in your Fund to give you some flavor of the character and culture of the companies you own.
| · | Fastenal Co., a top five performer in each of the last two years, has rolled out a major vending machine initiative whereby the company sells products through vending machines that it places at customer sites. This reduces Fastenal Co.’s distribution costs while also helping customers reduce costs and improve accountability. The effort is exceeding expectations. Fastenal Co. now sees a potential market opportunity of 280,000 machines, up from an initial estimate of 50,000. Of the over 3,000 machines that have been installed so far, only 10 have been returned. |
| · | The CEO of ResMed, Inc., a leading developer of sleep disorder devices, reiterated that it is just a matter of time before long-haul trucking companies routinely test all of their drivers for sleep apnea. One large trucking company has already mandated this testing after its CEO was diagnosed with sleep apnea, started treatment and saw the health benefits first hand. |
| · | II-VI, Inc., a leading Pennsylvania developer and manufacturer of infrared laser materials, recently acquired Photop, a leading Chinese photonics designer and manufacturer of optical products. When we asked the CFO what gave management confidence that the acquisition would be successful over the long term, he said that beyond the financial and market due diligence the company had performed on the acquisition target, he and the other executives really liked and trusted the people at the acquired company and admired its company culture. II-VI, Inc. also recently completed an earnings accretive acquisition of Aegis Lightwave, a small company which makes optical devices for high speed networks. Borrowing cost on the loan for the acquisition was 0.815%. The financial numbers may be good, but without management compatibility and chemistry acquisitions often fail. |
| | 4 | DF DENT PREMIER GROWTH FUND |
| |
DF DENT PREMIER GROWTH FUND A MESSAGE TO OUR SHAREHOLDERS JUNE 30, 2011 |
| |
Commentary
An abundance of international and domestic concerns have weighed upon the equity markets in recent months. At the risk of oversimplification, I’d like to reduce the U.S. market’s and economy’s outlook to three major problems: jobs, housing, and lending. Surely there are other issues such as taxes, federal debt, state and local finances, along with overseas conflicts and foreign debt worries. However, jobs, housing, and lending are three lines which are inextricably entangled in a knot with no perceptible escape plan. Housing cannot get moving because of the huge overhang of unoccupied houses and mortgage debt. Banks are unwilling to lend because of poor asset quality, weak employment, and regulatory uncertainty (Dodd-Frank). Job growth is anemic as employers have benefitted from productivity improvements and are fearful of future healthcare costs. Consequently, all three are tangled in this knot. If one of the three were untangled, the other two would most likely loosen up. A better housing market would provide jobs and that would then beget lending. A better job market would encourage lending and home buying. More lending would allow small businesses to expand and hire more workers, who in turn would buy houses. But none of these are happening. Eventually the knot will loosen and these problems will dissipate. It just will take longer than we like.
Your Fund does not own any banks. Your Fund does not own housing or home furnishing companies. We have avoided discretionary consumer spending companies which depend upon employment levels even though these companies’ stocks have recently been good performers. Thus, we have intentionally avoided the three sectors entangled in the “knot” described in the above paragraph. As you will read later in the Attribution Analysis part of the Management Discussion and Financial Performance section of this report, we have emphasized Energy, Healthcare, Industrials, and Information Technology which we believe are well positioned sectors of the economy to provide growth. While not immune to the overall economy, we believe these sectors are favorably positioned in what most would agree will continue to be a slow and sluggish recovery.
As always, we acknowledge the responsibility you have conveyed by entrusting your funds to the DF Dent Premier Growth Fund and will work diligently on your behalf.
Respectively Submitted,
Daniel F. Dent
*** The determination of “best-in-class” is solely the opinion of the Fund’s Adviser, and such opinion is subject to change. Those companies that hold leading market share positions, strong growth potential, historically good profitability, and management teams known for integrity and good corporate governance are generally considered to be “best in class.”
| | 5 | DF DENT PREMIER GROWTH FUND |
| |
DF DENT PREMIER GROWTH FUND A MESSAGE TO OUR SHAREHOLDERS JUNE 30, 2011 |
| |
IMPORTANT INFORMATION:
The recent growth rate in the global equity markets has helped to produce short-term returns for some sectors/asset classes that are not typical and may not continue in the future. Because of ongoing market volatility, Fund performance may be subject to substantial short-term changes.
Investing involves risks, including the possible loss of principal. The Fund invests in small and medium size companies. Investments in these companies, especially smaller companies, carry greater risk than is customarily associated with larger companies for various reasons such as increased volatility of earnings and prospects, narrower markets, limited financial resources and less liquid stock. The Fund will typically invest in the securities of fewer issuers. If the Fund’s portfolio is over weighted in a sector, any negative development affecting that sector will have a greater impact on the Fund than a fund that is not over weighted in that sector.
The S&P 500 Index is a broad-based, unmanaged measurement of changes in stock market conditions based on the average of 500 widely held stocks. The MSCI EAFE (Europe, Australasia, Far East) Index is an unmanaged free float-adjusted market capitalization index that is designed to measure the equity market performance of developed markets, excluding the U.S. & Canada. One cannot invest directly in an index.
| | 6 | DF DENT PREMIER GROWTH FUND |
| |
DF DENT PREMIER GROWTH FUND MANAGEMENT DISCUSSION OF FUND PERFORMANCE JUNE 30, 2011 |
| |
Performance
For the fiscal year ended June 30, 2011, the Fund experienced a total return of +34.87 % versus a total return of +30.69 % for the Index, the benchmark we use for performance reporting. Performance versus the Index for various periods ending June 30, 2011 was as follows:
| Period Ending 06/30/11 | | DF Dent Premier Growth Fund | | S&P 500 Index | | Outperformance (Underperformance) |
| Six Months | | + | 6.73 | % | | + | 6.02 | % | | + | 0.71 | % |
| Twelve Months | | + | 34.87 | % | | + | 30.69 | % | | + | 4.18 | % |
| Five Years (annualized) | | + | 4.15 | % | | + | 2.94 | % | | + | 1.21 | % |
| Five Years (cumulative) | | + | 22.52 | % | | + | 15.61 | % | | + | 6.91 | % |
| Since Inception (07/16/01) (annualized) | | + | 6.45 | % | | + | 2.91 | % | | + | 3.54 | % |
| Since Inception (07/16/01) (cumulative) | | + | 86.38 | % | | + | 33.05 | % | | + | 53.33 | % |
| | | | | | | | | | | | | |
Past performance is not indicative of future performance.
As can be seen above, your Fund outperformed the Index for both the calendar year to date (Six Months) and its 06/30/11 Twelve Month Fiscal Year by 0.71% and 4.18%, respectively.
Your Fund outperformed the Index by +4.86% for fiscal year 2010 versus annualized outperformance since inception of +3.54% representing improvement in its relative performance during the past two years.
Sixteen days shy of its 10th anniversary; your Fund’s cumulative total return has exceeded the Index by 53.33%. Your Fund’s cumulative total return outperformance since inception (07/16/01) over the Index for the past three years has progressed as follows:
| 06/30/09 | | 06/30/10 | | 06/30/11 |
| + | 26.88 | % | | + | 36.39 | % | | + | 53.33 | % |
The most significant market factors affecting your Fund in the past year have been a powerful corporate earnings recovery coupled with abundant liquidity provided by the Federal Reserve, a very potent combination. We have noted before that “a rising tide lifts all ships”. Yes, that applies to both pretty and ugly boats alike. While worries over the possible contagion of Greece’s financial woes and the U.S. Federal debt restrained markets in the first six months of 2011, robust earnings growth and market liquidity sustained the equity market recovery.
Capital Gains Distribution Policy
It is the Fund’s policy to distribute all net realized capital gains to shareholders in December following the end of each fiscal year (06/30). Capital gains distributions were made in December of 2005, 2006, 2007, and 2008, but not 2009 or 2010. Shareholder redemptions during the sharp market decline of 2008-2009 forced
| | 7 | DF DENT PREMIER GROWTH FUND |
| |
DF DENT PREMIER GROWTH FUND MANAGEMENT DISCUSSION OF FUND PERFORMANCE JUNE 30, 2011 |
| |
the Fund to realize significant capital losses at that time which may be carried forward for eight years. Your Fund realized capital gains of $6,821,267, or $0.76 per share, which is completely offset by this loss carry forward in the 06/30/11 fiscal year. While there was an unrealized gain on a tax basis of $39,022,237 in the Fund as of 06/30/11, the unused loss carry forward amounted to $47,097,229 or $5.26 per share as of that date. This loss carry forward can offset capital gains up to $17,619,123 realized until 06/30/17 and $29,478,106 realized until 06/30/18. As such, we view the loss carry forward as a “hidden asset” which can shelter future capital gains, if realized, against future capital gains distributions and taxes.
Attribution Analysis
The following bar chart presents the Sector weightings of your Fund versus the Sector weightings of the Index as of June 30, 2011:
Source: FactSet
Because of the poor outlook for employment, a negative “wealth effect” upon households from declining residential housing prices, and the increased savings rate (more savings means less spending per household) over the last year we avoided the Consumer Discretionary Sector.
| | 8 | DF DENT PREMIER GROWTH FUND |
| |
DF DENT PREMIER GROWTH FUND MANAGEMENT DISCUSSION OF FUND PERFORMANCE JUNE 30, 2011 |
| |
The companies within the Financial Sector of your Fund generated a +30.84% return in the fiscal year versus a +13.00% return for this Sector within the Index. Banks represent about a 40% weighting of the Financial Sector and were not held in your Fund. Avoidance of banks with their asset quality problems contributed to your Fund’s performance within this Sector.
The overweight in the Energy Sector had a positive impact on performance lead by strong results from Core Laboratories NV, Chicago Bridge & Iron Co. NV, and Schlumberger, Ltd. The companies in the Energy Sector of the Fund had a combined total return of +47.92% following a total return of +30.45% in the prior fiscal year.
The overweighting in Health Care had a negative impact on total performance. The portfolio Health Care companies as a group provided “only” a +18.47% return versus a +28.22% return for the Index.
Again this year your Fund was significantly overweighted in the Industrial Sector at 30.60% versus 11.22% for the Index. Many of these companies benefited from the operating leverage resulting from cost reduction programs of recent years combined with the recovering economy. The stock selection also benefited your Fund with a +42.13% return versus +38.22% for the Industrial Sector of the Index.
| · | Slightly overweighted in Information Technology |
In this report last year I commented that this Sector in the Fund underperformed due mainly to our large holding in QUALCOMM, Inc., the Fund’s worst performer in fiscal 2010. This year QUALCOMM, Inc. made the greatest contribution to your Fund’s return and represented the second largest holding as of June 30, 2011. With a 6.28% weighting in your Fund versus only 0.71% in the Index, QUALCOMM Inc.’s +75.72% total return in the past year contributed significantly to the +40.68% return of the Information Technology Sector within your Fund versus a +25.73% return for the Sector in the Index. It paid to hold on to last year’s underperformer!
DealerTrack Holdings, Inc. and Ansys, Inc., which are not in the Index, had +39.51% and +34.85% returns, respectively, within the Fund.
These three companies contributed to the stock selection performance within the Fund.
Strategy and Trends
Our strategy is unchanged from what we stated last year, which is:
In managing your Fund we will invest in companies with historically profitable businesses managed by proven leaders with track records of good execution; avoid leverage; avoid the consumer; avoid financial engineering
| | 9 | DF DENT PREMIER GROWTH FUND |
| |
DF DENT PREMIER GROWTH FUND MANAGEMENT DISCUSSION OF FUND PERFORMANCE JUNE 30, 2011 |
| |
“shell games,” maintain positions in U.S. companies with exposure to high growth foreign markets; emphasize companies with cyclical growth opportunities to participate in the economic recovery; and constantly evaluate management teams of both new and older investments. We always remind ourselves that bad management can mess up an otherwise good company. So, avoid it!
The key trends observed over the past fiscal year in industries where your Fund was invested were:
| · | Strong spending patterns in niche health care markets such as life sciences, sleep-disordered breathing, and veterinary medicine, |
| · | Strengthening industrial markets from the economic recovery, |
| · | Improving demand for energy services, |
| · | Reluctance of companies to hire, consumers to borrow, and banks to lend (favoring self -financing companies with strong cash flow), |
| · | Continued investment in technology to improve efficiency and productivity. |
In my Commentary on page four of last year’s Annual Report I wrote that we expected more government regulation. Both the credit card companies and the post-secondary for profit education companies were subjected to U.S. Senate hearings and well publicized proposals to regulate their activities during the past year. While the Fund’s investment in Visa has been worthwhile, the stock was “whipsawed” over the year by the Durbin Amendment to limit debit card interchange fees to 12 cents. In June the Federal Reserve proposed a less onerous ceiling of 23 cents.
In the education sector, the Department of Education and the U.S. Senate were both on the attack. Surely, there have been many abuses by the for profit education companies, and many of the “bad actors” within this group need to be reined in from their unscrupulous behavior. However, the controversy swirling around this sector presented us with opportunities to build positions in some high quality companies of integrity within the group. On June 30, 2011, your Fund had a $1.5 million profit on its $5 million investment in K12, Inc., American Public Education, Inc., and National American University Holdings, Inc. That’s a 30% profit in three companies in a sector which was subjected to a steady flow of negative publicity, short selling, and regulatory uncertainty over the past year. Of course, it was the negative headlines which gave us the buying opportunities in these well managed companies.
During the past year your Fund did not invest in any derivatives or “structured products”.
| | 10 | DF DENT PREMIER GROWTH FUND |
| |
DF DENT PREMIER GROWTH FUND MANAGEMENT DISCUSSION OF FUND PERFORMANCE JUNE 30, 2011 |
| |
Best and Worst Performers
Those securities which contributed the most and declined the most during the past fiscal year were:
Five Best Contributors (Unaudited)
| Investments | | Realized and Unrealized Appreciation and Income in Fiscal Year 2011 | | Per Share As of 06/30/11 | |
| QUALCOMM, Inc. | | $ | 4,709,546 | | $ | 0.53 | |
| Fastenal Co. | | | 4,409,512 | | | 0.49 | |
| Expeditors International of Washington, Inc. | | | 3,180,708 | | | 0.36 | |
| Roper Industries, Inc. | | | 2,812,883 | | | 0.31 | |
| IDEXX Laboratories, Inc. | | | 2,629,559 | | | 0.29 | |
| | | $ | 17,742,208 | | $ | 1.98 | |
Five Poorest Contributors (Unaudited)
| Investments | | Realized and Unrealized Loss and Income in Fiscal Year 2011 | | Per Share As of 06/30/11 | |
| Cisco Systems, Inc. | | $ | (377,572) | | $ | (0.04) | |
| Quanta Services, Inc. | | | (266,801) | | | (0.03) | |
| 3-D Systems Corp. | | | (139,943) | | | (0.02) | |
| Teva Pharmaceutical Industries, Ltd., ADR | | | (133,638) | | | (0.01) | |
| Stryker Corp. | | | (97,019) | | | (0.01) | |
| | | $ | (1,014,973) | | $ | (0.11) | |
The views in this report contained herein were those of the Fund’s Adviser as of June 30, 2011, and may not reflect the Adviser’s views on the date this report is first published or anytime thereafter. This report may contain discussions about certain investments both held and not held in the portfolio as of the report date. All current and future holdings are subject to risk and are subject to change. While these views are intended to assist shareholders in understanding their investment in the Fund, they do not constitute investment or tax advice, are not a guarantee of future performance and are not intended as an offer or solicitation with respect to the purchase or sale of any security.
| | 11 | DF DENT PREMIER GROWTH FUND |
| |
DF DENT PREMIER GROWTH FUND PERFORMANCE CHART AND ANALYSIS (Unaudited) JUNE 30, 2011 |
| |
The following chart reflects the change in the value of a hypothetical $10,000 investment, including reinvested dividends and distributions, in the DF Dent Premier Growth Fund (the “Fund”) compared with the performance of the benchmark, S&P 500 Index ("S&P 500"), since inception. The S&P 500 is a broad-based, unmanaged measurement of changes in stock market conditions based on the average of 500 widely held common stocks. The total return of the S&P 500 includes reinvestment of dividends and income. The total return of the Fund includes operating expenses that reduce returns, while the total return of the S&P 500 does not include expenses. The Fund is professionally managed while the S&P 500 is unmanaged and is not available for investment.
Performance data quoted represents past performance and is no guarantee of future results. Current performance may be lower or higher than the performance data quoted. Investment return and principal value will fluctuate so that shares, when redeemed, may be worth more or less than original cost. For the most recent month-end performance, please call (866) 233-3368. As stated in the Fund’s prospectus, the annual operating expense ratio (gross) is 1.27%. However, the Fund’s adviser has agreed to contractually waive a portion of its fees and to reimburse expenses such that total operating expenses do not exceed 1.10% on the first $150 million in Fund net assets and to 0.90% on net assets exceeding the $150 million, until October 31, 2012, per Board approval (prospectus to be updated fall, 2011). During the period, certain fees were waived and/or expenses reimbursed; otherwise, returns would have been lower. The performance table and graph do not reflect the deduction of taxes that a shareholder would pay on Fund distributions or the redemption of Fund shares. Returns greater than one year are annualized.
| Average Annual Total Return | | | | | | | | Since Inception |
| Return as of 06/30/11 | | | | One Year | | Five Year | | 07/16/01 |
| DF Dent Premier Growth Fund | | | | | 34.87 | % | | 4.15 | % | | 6.45 | % |
| S&P 500 Index | | | | | 30.69 | % | | 2.94 | % | | 2.91 | % |
| | | | | | | | | | | | | |
| Investment Value on 06/30/11 | | | | | | | | | | | | |
| DF Dent Premier Growth Fund | | | | | $18,638 | | | | | | | |
| S&P 500 Index | | | | | $13,305 | | | | | | | |
| | 12 | DF DENT PREMIER GROWTH FUND |
| |
DF DENT PREMIER GROWTH FUND SCHEDULE OF INVESTMENTS JUNE 30, 2011 |
| |
| Shares | | Security Description | | Value | |
| Common Stock - 100.2% |
| Agriculture - 1.9% |
| | 53,000 | | Potash Corp. of Saskatchewan, Inc. | | $ | 3,020,470 | |
| | | | |
| Biotechnology - 1.5% |
| | 40,000 | | Celgene Corp. (a) | | 2,412,800 | |
| | | | |
| Business Services - 10.6% |
| | 38,000 | | Ecolab, Inc. | | 2,142,440 | |
| | 149,000 | | Expeditors International of Washington, Inc. | | 7,627,310 | |
| | 150,000 | | Healthcare Services Group, Inc. | | 2,437,500 | |
| | 51,000 | | Stericycle, Inc. (a) | | 4,545,120 | |
| | | 16,752,370 | |
| Communications Equipment - 1.3% |
| | 52,000 | | ADTRAN, Inc. | | 2,012,920 | |
| | | | |
| Computer Software - 6.2% |
| | 140,000 | | ANSYS, Inc. (a) | | 7,653,800 | |
| | 90,000 | | DealerTrack Holdings, Inc. (a) | | 2,065,500 | |
| | | 9,719,300 | |
| Distribution and Industrial Supplies - 9.4% |
| | 74,000 | | Beacon Roofing Supply, Inc. (a) | | 1,688,680 | |
| | 364,000 | | Fastenal Co. | | 13,100,360 | |
| | | 14,789,040 | |
| Distributors - 1.7% |
| | 100,000 | | LKQ Corp. (a) | | 2,609,000 | |
| | | | |
| Educational Services - 4.1% |
| | 51,000 | | American Public Education, Inc. (a) | | 2,270,010 | |
| | 60,000 | | K12, Inc. (a) | | 1,988,400 | |
| | 240,000 | | National American University Holdings, Inc. | | 2,258,400 | |
| | | 6,516,810 | |
| Electrical Equipment - 1.1% |
| | 83,000 | | Quanta Services, Inc. (a) | | 1,676,600 | |
| | | | |
| Electronics - 3.2% |
| | 64,000 | | Intel Corp. | | 1,418,240 | |
| | 92,000 | | Trimble Navigation, Ltd. (a) | | 3,646,880 | |
| | | 5,065,120 | |
| Energy Equipment and Services - 9.0% |
| | 53,000 | | Core Laboratories NV | | 5,911,620 | |
| | 75,000 | | Schlumberger, Ltd. | | 6,480,000 | |
| | 30,000 | | Unit Corp. (a) | | 1,827,900 | |
| | | 14,219,520 | |
| Energy Sources - 5.7% |
| | 28,000 | | Apache Corp. | | | 3,454,920 | |
| | 120,000 | | Ultra Petroleum Corp. (a) | | 5,496,000 | |
| | | 8,950,920 | |
| Financial Services - 7.9% |
| | 136,000 | | T. Rowe Price Group, Inc. | | 8,206,240 | |
| | 50,000 | | Visa, Inc., Class A | | 4,213,000 | |
| | | 12,419,240 | |
| Industrial Applications - 7.2% |
| | 138,000 | | II-VI, Inc. (a) | | 3,532,800 | |
| | 94,000 | | Roper Industries, Inc. | | 7,830,200 | |
| | | 11,363,000 | |
| Infrastructure - 3.6% |
| | 130,000 | | Jacobs Engineering Group, Inc. (a) | | 5,622,500 | |
| | | | |
| Insurance - 3.0% |
| | 9,000 | | Markel Corp. (a) | | 3,571,290 | |
| | 16,600 | | RenaissanceRe Holdings, Ltd. | | 1,161,170 | |
| | | 4,732,460 | |
| Life Sciences - 8.0% |
| | 128,000 | | IDEXX Laboratories, Inc. (a) | | 9,927,680 | |
| | 33,000 | | Techne Corp. | | 2,751,210 | |
| | | 12,678,890 | |
| Machinery - 1.1% |
| | 90,000 | | 3D Systems Corp. (a) | | 1,773,900 | |
| | | | |
| Medical Products - 3.1% |
| | 160,000 | | ResMed, Inc. (a) | | 4,952,000 | |
| | | | |
| Pharmaceuticals - 1.1% |
| | 35,000 | | Teva Pharmaceutical Industries, Ltd., ADR | | 1,687,700 | |
| | | | |
| Road and Rail - 1.2% |
| | 40,000 | | Landstar System, Inc. | | 1,859,200 | |
| | | | |
| Wireless Telecommunication Services - 8.3% |
| | 50,000 | | American Tower Corp., Class A (a) | | 2,615,000 | |
| | 185,000 | | QUALCOMM, Inc. | | 10,506,150 | |
| | | 13,121,150 | |
Total Common Stock (Cost $118,875,909) | | 157,954,910 | |
Total Investments - 100.2% (Cost $118,875,909)* | | $ | 157,954,910 | |
| Other Assets & Liabilities, Net – (0.2)% | | (300,328 | ) |
| Net Assets – 100.0% | | $ | 157,654,582 | |
| See Notes to Financial Statements. | 13 | DF DENT PREMIER GROWTH FUND |
| |
DF DENT PREMIER GROWTH FUND SCHEDULE OF INVESTMENTS JUNE 30, 2011 |
| |
| ADR | American Depository Receipt |
| (a) | Non-income producing security. |
* Cost for federal income tax purposes is $118,932,673 and net unrealized appreciation consists of:
| Gross Unrealized Appreciation | | $ | 41,602,520 | |
| Gross Unrealized Depreciation | | | (2,580,283 | ) |
| Net Unrealized Appreciation | | $ | 39,022,237 | |
The following is a summary of the inputs used to value the Fund’s investments as of June 30, 2011.
The inputs or methodology used for valuing securities are not necessarily an indication of the risks associated with investing in those securities. For more information on valuation inputs, and their aggregation into the levels used in the tables below, please refer to Note 2 - Security Valuation section in the accompanying Notes to Financial Statements.
| Valuation Inputs | | Investments in Securities |
| Level 1 - Quoted Prices | | $ | 157,954,910 | |
| Level 2 - Other Significant Observable Inputs | | | - | |
| Level 3 - Significant Unobservable Inputs | | | - | |
| Total | | $ | 157,954,910 | |
The Level 1 inputs displayed in this table are Common Stock. Refer to the Schedule of Investments for a further breakout of each security by type.
| PORTFOLIO HOLDINGS | | |
| % of Net Assets | | |
| Agriculture | 1.9 | % |
| Biotechnology | 1.5 | % |
| Business Services | 10.6 | % |
| Communications Equipment | 1.3 | % |
| Computer Software | 6.2 | % |
| Distribution and Industrial Supplies | 9.4 | % |
| Distributors | 1.7 | % |
| Educational Services | 4.1 | % |
| Electrical Equipment | 1.1 | % |
| Electronics | 3.2 | % |
| Energy Equipment and Services | 9.0 | % |
| Energy Sources | 5.7 | % |
| Financial Services | 7.9 | % |
| Industrial Applications | 7.2 | % |
| Infrastructure | 3.6 | % |
| Insurance | 3.0 | % |
| Life Sciences | 8.0 | % |
| Machinery | 1.1 | % |
| Medical Products | 3.1 | % |
| Pharmaceuticals | 1.1 | % |
| Road and Rail | 1.2 | % |
| Wireless Telecommunication Services | 8.3 | % |
| Other Assets & Liabilities, Net | (0.2 | )% |
| | 100.0 | % |
| See Notes to Financial Statements. | 14 | DF DENT PREMIER GROWTH FUND |
| |
DF DENT PREMIER GROWTH FUND STATEMENT OF ASSETS AND LIABILTIES JUNE 30, 2011 |
| |
| ASSETS | | | | |
| | Total investments, at value (Cost $118,875,909) | | $ | 157,954,910 | |
| | Cash | | | 39,945 | |
| | Receivables: | | | | |
| | | Dividends and interest | | | 33,641 | |
| | Prepaid expenses | | | 16,051 | |
| Total Assets | | | 158,044,547 | |
| | | | | | | |
| LIABILITIES | | | | |
| | Payables: | | | | |
| | | Fund shares redeemed | | | 495 | |
| | Accrued Liabilities: | | | | |
| | Investment adviser fees | | | 340,495 | |
| | | Trustees’ fees and expenses | | | 64 | |
| | | Fund service fees | | | 16,707 | |
| | | Compliance services fees | | | 2,083 | |
| | | Professional fees | | | 21,838 | |
| | | Other expenses | | | 8,283 | |
| Total Liabilities | | | 389,965 | |
| | | | | | | |
| NET ASSETS | | $ | 157,654,582 | |
| | | | | | | |
| COMPONENTS OF NET ASSETS | | | | |
| | Paid-in capital | | $ | 165,729,574 | |
| | Accumulated net realized loss | | | (47,153,993 | ) |
| | Net unrealized appreciation | | | 39,079,001 | |
| NET ASSETS | | $ | 157,654,582 | |
| SHARES OF BENEFICIAL INTEREST AT NO PAR VALUE (UNLIMITED SHARES AUTHORIZED) | | | 8,959,368 | |
| NET ASSET VALUE, OFFERING AND REDEMPTION PRICE PER SHARE | | $ | 17.60 | |
| | | | | | | |
| See Notes to Financial Statements. | 15 | DF DENT PREMIER GROWTH FUND |
| |
DF DENT PREMIER GROWTH FUND STATEMENT OF OPERATIONS YEAR ENDED JUNE 30, 2011 |
| |
| INVESTMENT INCOME | | | | |
| | Dividend income (Net of foreign withholding taxes of $12,722) | | $ | 1,186,371 | |
| | Interest income | | | 1,781 | |
| Total Investment Income | | | 1,188,152 | |
| | | | | |
| EXPENSES | | | | |
| | Investment adviser fees | | | 1,445,609 | |
| | Fund service fees | | | 196,699 | |
| | Custodian fees | | | 14,819 | |
| | Registration fees | | | 19,864 | |
| | Professional fees | | | 55,537 | |
| | Trustees' fees and expenses | | | 4,638 | |
| | Compliance services fees | | | 29,019 | |
| | Miscellaneous expenses | | | 33,871 | |
| Total Expenses | | | 1,800,056 | |
| | Fees waived and expenses reimbursed | | | (215,685 | ) |
| Net Expenses | | | 1,584,371 | |
| | | | | | | |
| NET INVESTMENT LOSS | | | (396,219 | ) |
| | | | | | | |
| NET REALIZED AND UNREALIZED GAIN (LOSS) | | | | |
| | Net realized gain on investments | | | 6,821,267 | |
| | Net change in unrealized appreciation (depreciation) on investments | | | 35,251,826 | |
| NET REALIZED AND UNREALIZED GAIN | | | 42,073,093 | |
| INCREASE IN NET ASSETS FROM OPERATIONS | | $ | 41,676,874 | |
| | | | | | | |
| See Notes to Financial Statements. | 16 | DF DENT PREMIER GROWTH FUND |
| |
DF DENT PREMIER GROWTH FUND STATEMENTS OF CHANGES IN NET ASSETS |
| |
| | | | | For the Years Ended June 30, |
| | | | | 2011 | | | 2010 |
| OPERATIONS | | | | | | | | | |
| | Net investment loss | | $ | (396,219 | ) | | | $ | (382,531 | ) |
| | Net realized gain (loss) | | | 6,821,267 | | | | | (2,113,144 | ) |
| | Net change in unrealized appreciation (depreciation) | | | 35,251,826 | | | | | 24,741,061 | |
| Increase in Net Assets Resulting from Operations | | | 41,676,874 | | | | | 22,245,386 | |
| | | | | | | | | | | | |
| CAPITAL SHARE TRANSACTIONS | | | | | | | | | |
| | Sale of shares | | | 23,320,760 | | | | | 17,578,723 | |
| | Redemption of shares | | | (30,947,880 | ) | | | | (33,610,580 | ) |
| Decrease in Net Assets from Capital Share Transactions | | | (7,627,120 | ) | | | | (16,031,857 | ) |
| Increase in Net Assets | | | 34,049,754 | | | | | 6,213,529 | |
| | | | | | | | | | | | |
| NET ASSETS | | | | | | | | | |
| | Beginning of Year | | | 123,604,828 | | | | | 117,391,299 | |
| | End of Year | | $ | 157,654,582 | | | | $ | 123,604,828 | |
| | | | | | | | | | | | |
| SHARE TRANSACTIONS | | | | | | | | | |
| | Sale of shares | | | 1,523,122 | | | | | 1,341,457 | |
| | Redemption of shares | | | (2,036,042 | ) | | | | (2,603,088 | ) |
| Decrease in Shares | | | (512,920 | ) | | | | (1,261,631 | ) |
| | | | | | | | | | | | |
| See Notes to Financial Statements. | 17 | DF DENT PREMIER GROWTH FUND |
| |
DF DENT PREMIER GROWTH FUND FINANCIAL HIGHLIGHTS |
| |
These financial highlights reflect selected data for a share outstanding throughout each year. | | | | | |
| | | For the Years Ended June 30, |
| | | 2011 | | 2010 | | 2009 | | 2008 | | 2007 |
| NET ASSET VALUE, Beginning | | | | | | | | | | | | | | | | | | | |
| of Year | $ | 13.05 | | | $ | 10.94 | | | $ | 16.20 | | | $ | 17.25 | | | $ | 15.11 | |
| INVESTMENT OPERATIONS | | | | | | | | | | | | | | | | | | | |
| Net investment loss (a) | | (0.04 | ) | | | (0.04 | ) | | | (0.03 | ) | | | (0.05 | ) | | | (0.04 | ) |
| Net realized and unrealized | | | | | | | | | | | | | | | | | | | |
| | gain (loss) | | 4.59 | | | | 2.15 | | | | (4.96 | ) | | | (0.76 | ) | | | 2.35 | |
| Total from Investment | | | | | | | | | | | | | | | | | | | |
| | Operations | | 4.55 | | | | 2.11 | | | | (4.99 | ) | | | (0.81 | ) | | | 2.31 | |
| DISTRIBUTIONS TO | | | | | | | | | | | | | | | | | | | |
| SHAREHOLDERS FROM | | | | | | | | | | | | | | | | | | | |
| Net realized gain | | — | | | | — | | | | (0.27 | ) | | | (0.24 | ) | | | (0.17 | ) |
| NET ASSET VALUE, End | | | | | | | | | | | | | | | | | | | |
| of Year | $ | 17.60 | | | $ | 13.05 | | | $ | 10.94 | | | $ | 16.20 | | | $ | 17.25 | |
| TOTAL RETURN | | 34.87 | % | | 19.29 | % | | (30.64 | )% | | (4.88 | )% | | 15.42 | % |
| | | | | | | | | | | | | | | | | | | | |
| RATIOS/SUPPLEMENTARY DATA | | | | | | | | | | | | | | | | | | |
| Net Assets at End of | | | | | | | | | | | | | | | | | | | |
| | Year (000's omitted) | $157,655 | | | $123,605 | | | $117,391 | | | $243,183 | | | $142,896 | |
| Ratios to Average Net Assets: | | | | | | | | | | | | | | | | | | | |
| Net investment loss | | (0.27 | )% | | (0.29 | )% | | (0.25 | )% | | (0.31 | )% | | (0.23 | )% |
| Net expense | | 1.10 | % | | 1.10 | % | | 1.10 | % | | 1.15 | % | | 1.20 | % |
| Gross expense (b) | | 1.25 | % | | 1.27 | % | | 1.26 | % | | 1.19 | % | | 1.36 | % |
| PORTFOLIO TURNOVER RATE | | 21 | % | | 8 | % | | 16 | % | | 21 | % | | 17 | % |
| | | | | | | | | | | | | | | | | | | | | |
| (a) | Calculated based on average shares outstanding during the year. |
| (b) | Reflects the expense ratio excluding any waivers and/or reimbursements. |
| See Notes to Financial Statements. | 18 | DF DENT PREMIER GROWTH FUND |
| |
DF DENT PREMIER GROWTH FUND NOTES TO FINANCIAL STATEMENTS JUNE 30, 2011 |
| |
Note 1. Organization
The DF Dent Premier Growth Fund (the “Fund”) is a diversified portfolio of Forum Funds (the “Trust”). The Trust is a Delaware statutory trust that is registered as an open-end, management investment company under the Investment Company Act of 1940 (the “Act”), as amended. Under its Trust Instrument, the Trust is authorized to issue an unlimited number of the Fund’s shares of beneficial interest without par value. The Fund commenced operations on July 16, 2001. The Fund seeks long-term capital appreciation.
Note 2. Summary of Significant Accounting Policies
These financial statements are prepared in accordance with generally accepted accounting principles in the United States of America (“GAAP”), which require management to make estimates and assumptions that affect the reported amounts of assets and liabilities, the disclosure of contingent liabilities at the date of the financial statements, and the reported amounts of increase and decrease in net assets from operations during the fiscal year. Actual amounts could differ from those estimates. The following summarizes the significant accounting policies of the Fund:
Security Valuation – Exchange-traded securities and over-the-counter securities are valued using the last quoted sale or official closing price, provided by independent pricing services as of the close of trading on the market or exchange for which they are primarily traded, on each Fund business day. In the absence of a sale, such securities are valued at the mean of the last bid and ask price provided by independent pricing services. Non-exchange traded securities for which quotations are available are valued using the last quoted sales price, or in the absence of a sale at the mean of the last bid and ask prices provided by independent pricing services. Shares of open-end mutual funds are valued at net asset value (“NAV”). Short-term investments that mature in sixty days or less may be valued at amortized cost.
The Fund values its investments at fair value pursuant to procedures adopted by the Trust's Board of Trustees (the "Board") if (1) market quotations are insufficient or not readily available or (2) the adviser believes that the values available are unreliable. Fair valuation is based on subjective factors and, as a result, the fair value price of an investment may differ from the security’s market price and may not be the price at which the asset may be sold. Fair valuation could result in a different NAV than a NAV determined by using market quotes.
The Fund has a three-tier fair value hierarchy. The basis of the tiers is dependent upon the various “inputs” used to determine the value of the Fund’s investments. These inputs are summarized in the three broad levels listed below:
Level 1 — quoted prices in active markets for identical assets
Level 2 — other significant observable inputs (including quoted prices of similar securities, interest rates, prepayment speeds, credit risk, etc.)
Level 3 — significant unobservable inputs (including the Fund’s own assumptions in determining the fair value of investments)
| | 19 | DF DENT PREMIER GROWTH FUND |
| |
DF DENT PREMIER GROWTH FUND NOTES TO FINANCIAL STATEMENTS JUNE 30, 2011 |
| |
The aggregate value by input level, as of June 30, 2011, for the Fund’s investments is included at the end of the Fund’s Schedule of Investments.
Security Transactions, Investment Income and Realized Gain and Loss – Investment transactions are accounted for on the trade date. Dividend income is recorded on the ex-dividend date. Foreign dividend income is recorded on the ex-dividend date or as soon as possible after the Fund determines the existence of a dividend declaration after exercising reasonable due diligence. Income and capital gains on some foreign securities may be subject to foreign withholding taxes, which are accrued as applicable. Interest income is recorded on an accrual basis. Premium is amortized and discount is accreted in accordance with GAAP. Identified cost of investments sold is used to determine the gain and loss for both financial statement and federal income tax purposes.
Distributions to Shareholders – Distributions to shareholders of net investment income and net capital gains, if any, are declared and paid at least annually. Distributions are based on amounts calculated in accordance with applicable federal income tax regulations, which may differ from GAAP. These differences are due primarily to differing treatments of income and gain on various investment securities held by the Fund, timing differences and differing characterizations of distributions made by the Fund.
Federal Taxes – The Fund intends to qualify each year as a regulated investment company under Subchapter M of the Internal Revenue Code and distribute all of its taxable income to shareholders. In addition, by distributing in each calendar year substantially all its net investment income and capital gains, if any, the Fund will not be subject to a federal excise tax. Therefore, no federal income or excise tax provision is required.
As of June 30, 2011, there are no uncertain tax positions that would require financial statement recognition, de-recognition, or disclosure. The Fund’s federal tax returns filed in the three-year period ended June 30, 2011, remain subject to examination by the Internal Revenue Service.
Income and Expense Allocation – The Trust accounts separately for the assets, liabilities and operations of each of its investment portfolios. Expenses that are directly attributable to more than one investment portfolio are allocated among the respective investment portfolios in an equitable manner.
Commitments and Contingencies – In the normal course of business, the Fund enters into contracts that provide general indemnifications by the Fund to the counterparty to the contract. The Fund’s maximum exposure under these arrangements is dependent on future claims that may be made against the Fund and, therefore, cannot be estimated; however, based on experience, the risk of loss from such claims is considered remote.
Note 3. Advisory Fees, Servicing Fees and Other Transactions
Investment Adviser – D.F. Dent and Company, Inc. (the “Adviser”) is the investment adviser to the Fund. Pursuant to an investment advisory agreement, the Adviser receives an advisory fee from the Fund at an annual rate of 1.00% of the Fund’s average daily net assets.
| | 20 | DF DENT PREMIER GROWTH FUND |
| |
DF DENT PREMIER GROWTH FUND NOTES TO FINANCIAL STATEMENTS JUNE 30, 2011 |
| |
Distribution – Foreside Fund Services, LLC serves as the Fund’s distributor (the “Distributor”). The Distributor receives no compensation from the Fund for its distribution services. The Distributor is not affiliated with the Adviser or Atlantic Fund Administration, LLC (d/b/a Atlantic Fund Services) (“Atlantic”) or their affiliates.
Other Service Providers – Atlantic provides fund accounting, fund administration, and transfer agency services to the Fund. Atlantic also provides certain shareholder report production, and EDGAR conversion and filing services. Pursuant to an Atlantic services agreement, the Fund pays Atlantic customary fees for its services. Atlantic provides a Principal Executive Officer, a Principal Financial Officer, a Chief Compliance Officer, and an Anti-Money Laundering Officer to the Fund, as well as certain additional compliance support functions.
Trustees and Officers – The Trust pays each independent Trustee an annual retainer fee of $45,000 for service to the Trust ($66,000 for the Chairman). In addition, the Chairman receives a monthly stipend of $500 to cover certain expenses incurred in connection with his duties to the Trust. The Trustees and Chairman may receive additional fees for special Board meetings. Each Trustee is also reimbursed for all reasonable out-of-pocket expenses incurred in connection with his duties as a Trustee, including travel and related expenses incurred in attending Board meetings. The amount of Trustees’ fees attributable to the Fund is disclosed in the Statement of Operations. Certain officers of the Trust are also officers or employees of the above named service providers, and during their terms of office received no compensation from the Fund.
Note 4. Fees Waived
The Adviser has contractually agreed to waive a portion of its fee and reimburse certain expenses through October 31, 2011, to the extent that annual operating expenses exceed 1.10% on the first $150 million of net assets and to the extent that annual operating expenses exceed 0.90% on net assets exceeding $150 million. Other fund service providers have voluntarily agreed to waive and reimburse a portion of their fees. These voluntary fee waivers and reimbursements may be reduced or eliminated at any time. For the year ended June 30, 2011, fees waived were as follows:
Investment Adviser Fees Waived | | Other Waivers | | Total Fees Waived |
| $211,784 | | $3,901 | | $215,685 |
Note 5. Security Transactions
The cost of purchases and proceeds from sales of investment securities (including maturities), other than short-term investments for the year ended June 30, 2011, were $30,823,325 and $38,226,704, respectively.
| | 21 | DF DENT PREMIER GROWTH FUND |
| |
DF DENT PREMIER GROWTH FUND NOTES TO FINANCIAL STATEMENTS JUNE 30, 2011 |
| |
Note 6. Federal Income Tax and Investment Transactions
As of June 30, 2011, distributable earnings (accumulated loss) on a tax basis were as follows:
| Capital and Other Losses | | $ | (47,097,229 | ) |
| Unrealized Appreciation | | | 39,022,237 | |
| Total | | $ | (8,074,992 | ) |
The difference between components of distributable earnings on a tax basis and the amounts reflected in the Statement of Assets and Liabilities are primarily due to wash sales.
As of June 30, 2011, the Fund had capital loss carryforwards to offset future capital gains of $17,619,123 and $29,478,106, expiring in 2017 and 2018, respectively.
On the Statement of Assets and Liabilities, as a result of permanent book to tax differences, certain amounts have been reclassified for the year ended June 30, 2011. The following reclassification was the result of net operating losses and has no impact on the net assets of the Fund.
| Accumulated Net Investment Income (Loss) | | $ | 396,219 | |
| Paid-in-Capital | | | (396,219 | ) |
Note 7. Recent Accounting Pronouncements
In January 2010, the Financial Accounting Standards Board (“FASB”) issued Accounting Standards Update (“ASU”) No. 2010-06 “Improving Disclosures about Fair Value Measurements.” ASU No. 2010-06 clarifies existing disclosure and requires additional disclosures regarding fair value measurements. Effective for fiscal years beginning after December 15, 2010, and for interim periods within those fiscal years, entities will need to disclose information about purchases, sales, issuances and settlements of Level 3 securities on a gross basis, rather than as a net number as currently required. Management is currently evaluating the impact ASU No. 2010-06 will have on financial statement disclosures.
In May 2011, FASB issued ASU No. 2011-04 “Amendments to Achieve Common Fair Value Measurement and Disclosure Requirements in U.S. GAAP and IFRSs.” ASU No. 2011-04 establishes common requirements for measuring fair value and for disclosing information about fair value measurements in accordance with U.S. GAAP and International Financial Reporting Standards (“IFRSs”). ASU No. 2011-04 is effective for interim and annual periods beginning after December 15, 2011. Management is currently evaluating the impact ASU No. 2011-04 may have on financial statement disclosures.
Note 8. Subsequent Events
Subsequent events occurring after the date of this report through the date these financial statements were issued have been evaluated for potential impact and the Fund has had no such events.
| | 22 | DF DENT PREMIER GROWTH FUND |
| |
REPORT OF INDEPENDENT REGISTERED PUBLIC ACCOUNTING FIRM |
| |
To the Board of Trustees of Forum Funds and the Shareholders of DF Dent Premier Growth Fund
We have audited the accompanying statement of assets and liabilities of the DF Dent Premier Growth Fund, a series of shares of beneficial interest in the Forum Funds, including the schedule of investments, as of June 30, 2011, and the related statement of operations for the year then ended, the statements of changes in net assets for each of the years in the two year period then ended and the financial highlights for each of the years in the three year period then ended. These financial statements and financial highlights are the responsibility of the Fund's management. Our responsibility is to express an opinion on these financial statements and financial highlights based on our audits. The financial highlights for each of the years in the two year period ended June 30, 2008 were audited by other auditors whose report dated August 25, 2008, expressed an unqualified opinion on such financial highlights.
We conducted our audits in accordance with the standards of the Public Company Accounting Oversight Board (United States). Those standards require that we plan and perform the audits to obtain reasonable assurance about whether the financial statements and financial highlights are free of material misstatement. An audit includes examining, on a test basis, evidence supporting the amounts and disclosures in the financial statements. Our procedures included confirmation of securities owned as of June 30, 2011 by correspondence with the custodian. An audit also includes assessing the accounting principles used and significant estimates made by management, as well as evaluating the overall financial statement presentation. We believe that our audits provide a reasonable basis for our opinion.
In our opinion, the financial statements and financial highlights referred to above present fairly, in all material respects, the financial position of the DF Dent Premier Growth Fund as of June 30, 2011, the results of its operations for the year then ended, the changes in its net assets for each of the years in the two year period then ended and its financial highlights for each of the years in the three year period then ended, in conformity with accounting principles generally accepted in the United States of America.
BBD, LLP
Philadelphia, Pennsylvania
August 22, 2011
| | 23 | DF DENT PREMIER GROWTH FUND |
| |
DF DENT PREMIER GROWTH FUND ADDITIONAL INFORMATION (Unaudited) JUNE 30, 2011 |
| |
Investment Advisory Agreement Approval
At the June 24, 2011 Board meeting, the Board, including the Independent Trustees, considered the approval of the investment advisory agreement pertaining to the Fund (the “Advisory Agreement”). In evaluating the Advisory Agreement for the Fund, the Board reviewed materials furnished by the Adviser and Atlantic, including information regarding the Adviser, its personnel, operations and financial condition. Specifically, the Board considered, among other matters: (1) the nature, extent and quality of the services to be provided to the Fund by the Adviser, including information on the investment performance of the Adviser; (2) the costs of the services to be provided and profitability to the Adviser with respect to its relationship with the Fund; (3) the advisory fee and the total expense ratio of the Fund compare to relevant peer groups of funds; (4) the extent to which economies of scale would be realized as the Fund grows and whether the advisory fee would enable the Fund’s investors to share in the benefits of economies of scale; and (5) other benefits received by the Adviser from its relationship with the Fund. In their deliberations, the Board did not identify any particular information that was all-important or controlling and attributed different weights to the various factors. In particular, the Board focused on the factors discussed below.
Nature, Extent and Quality of Services
Based on a presentation from senior representatives of the Adviser and a discussion of the Adviser’s personnel, operations and financial condition, the Board considered the quality of services provided by the Adviser and to be provided under the Advisory Agreement. In this regard, the Board considered information regarding the experience, qualifications and professional background of the portfolio managers and other personnel at the Adviser with principal investment responsibility for the Fund’s investments as well as the investment philosophy and decision-making processes of those professionals and the capability and integrity of the Adviser’s senior management and staff. The Board considered the adequacy of the Adviser’s resources and quality of services provided by the Adviser under the Advisory Agreement between the Trust and the Adviser.
The Board also considered the quality of the Adviser’s services with respect to regulatory compliance and compliance with client investment policies and restrictions as well as the financial condition and operational stability of the Adviser. The Board noted the Adviser’s representation that the firm is financially stable and able to provide investment advisory services to the Fund.
Based on the foregoing, the Board concluded that the nature, extent and quality of services provided to the Fund under the Advisory Agreement were appropriate in light of its investment objective and, thus, supported a decision to approve the Advisory Agreement.
Costs of Services and Profitability
The Board considered information provided by the Adviser regarding its costs of services and its profitability with respect to the Fund. In this regard, the Board considered the Adviser’s resources devoted to the Fund as well as the Adviser’s discussion of costs and profitability. Based on these and other applicable considerations, the Board concluded that the Adviser’s profits attributable to management of the Fund was not a material factor in approving the Agreement.
| | 24 | DF DENT PREMIER GROWTH FUND |
| |
DF DENT PREMIER GROWTH FUND ADDITIONAL INFORMATION (Unaudited) JUNE 30, 2011 |
| |
Performance
The Board reviewed performance of the Fund and the Adviser’s discussion of its investment philosophy. The Board noted that the Fund outperformed its benchmark for the 1-year, 5-year and since inception periods. The Board concluded that the Fund’s performance was reasonable relative to its benchmark and that the Fund and its shareholders could benefit from the Adviser’s management of the Fund.
Compensation
The Board considered the Adviser’s compensation for providing advisory services to the Fund and analyzed comparative information on fee rates and total expenses of similar mutual funds. The Board noted that the Adviser’s actual advisory fee rate for the Fund was above the median fee of that Fund’s Lipper Inc. peer group. The Board also noted that Fund’s actual total expense ratio was lower than the median of its Lipper Inc. peer group. Based on the foregoing, the Board concluded that the Adviser’s advisory fee rate charged to the Fund appeared to be within a reasonable range in light of the services it provides to the Fund.
Economies of Scale
The Board considered whether the Fund would benefit from any economies of scale. In this respect, the Board noted the Adviser’s representation that the Fund could benefit from economies of scale as assets grow, and that the Adviser has contractually agreed to reduce its advisory fee through October 31, 2012 to 0.90% for the Fund on assets exceeding $150 million.
Other Benefits
The Board noted the Adviser’s representation that, aside from its contractual advisory fees, it does not benefit in a material way from its relationship with the Fund other than soft-dollar research benefits. Based on the foregoing representation, the Board concluded that other benefits received by the Adviser from its relationship with the Fund were not a material factor to consider in approving the continuation of the Advisory Agreement.
Conclusion
The Board did not identify any single factor as being of paramount importance, and different Trustees may have given different weight to different factors. The Board reviewed a memorandum from Trust counsel discussing the legal standards applicable to its consideration of the Advisory Agreement. Based on its review, including consideration of each of the factors referenced above, the Board determined, in the exercise of its business judgment, that the advisory arrangement, as outlined in the Advisory Agreement, was fair and reasonable in light of the services performed, expenses incurred and such other matters as the Board considered relevant in the exercise of its reasonable business judgment.
| | 25 | DF DENT PREMIER GROWTH FUND |
| |
DF DENT PREMIER GROWTH FUND ADDITIONAL INFORMATION (Unaudited) JUNE 30, 2011 |
| |
Proxy Voting Information
A description of the policies and procedures that the Fund uses to determine how to vote proxies relating to securities held in the Fund’s portfolio is available, without charge and upon request, by calling (866) 233-3368 and on the SEC’s website at www.sec.gov. The Fund’s proxy voting record for the most recent twelve-month period ended June 30 is available, without charge and upon request, by calling (866) 233-3368 and on the SEC’s website at www.sec.gov.
Availability of Quarterly Portfolio Schedules
The Fund files its complete schedule of portfolio holdings with the SEC for the first and third quarters of each fiscal year on Form N-Q. The Fund’s Forms N-Q are available, without charge and upon request on the SEC’s website at www.sec.gov or may be reviewed and copied at the SEC’s Public Reference Room in Washington, DC. Information on the operation of the Public Reference Room may be obtained by calling (800) SEC-0330.
Shareholder Expense Example
As a shareholder of the Fund, you incur ongoing costs, including management fees and other Fund expenses. This example is intended to help you understand your ongoing costs (in dollars) of investing in the Fund and to compare these costs with the ongoing costs of investing in other mutual funds.
The example is based on an investment of $1,000 invested at the beginning of the period and held for the entire period from January 1, 2011, through June 30, 2011.
Actual Expenses – The first line in the table below provides information about actual account values and actual expenses. You may use the information in this line, together with the amount you invested, to estimate the expenses that you paid over the period. Simply divide your account value by $1,000 (for example, an $8,600 account value divided by $1,000 = 8.6), then multiply the result by the number in the first line under the heading entitled “Expenses Paid During Period” to estimate the expenses you paid on your account during the period.
Hypothetical Example for Comparison Purposes – The second line in the table below provides information about hypothetical account values and hypothetical expenses based on the Fund’s actual expense ratio and an assumed rate of return of 5% per year before expenses, which is not the Fund’s actual return. The hypothetical account values and expenses may not be used to estimate the actual ending account balance or expenses you paid for the period. You may use this information to compare the ongoing cost of investing in the Fund and other funds. To do so, compare this 5% hypothetical example with the 5% hypothetical examples that appear in the shareholder reports of other funds.
Please note that expenses shown in the table are meant to highlight your ongoing costs only. Therefore, the second line of the table is useful in comparing ongoing costs only and will not help you determine the relative total costs of owning different funds.
| | 26 | DF DENT PREMIER GROWTH FUND |
| |
DF DENT PREMIER GROWTH FUND ADDITIONAL INFORMATION (Unaudited) JUNE 30, 2011 |
| |
| | Beginning | | Ending | | Expenses | | Annualized |
| | Account Value | | Account Value | | Paid During | | Expense |
| | January 1, 2011 | | June 30, 2011 | | Period* | | Ratio* |
| Actual | $ | 1,000.00 | | $ | 1,067.32 | | $ | 5.59 | | 1.09 | % |
| Hypothetical (5% return before taxes) | $ | 1,000.00 | | $ | 1,019.39 | | $ | 5.46 | | 1.09 | % |
| | | | | | | | | | | | |
| | *Expenses are equal to the Fund’s annualized expense ratio as indicated above multiplied by the average account value over the period, multiplied by the number of days in the most recent fiscal half-year divided by 365 to reflect the half-year period. |
Trustees and Officers of the Trust
The Board is responsible for oversight of the management of the Trust’s business affairs and of the exercise of all the Trust’s powers except those reserved for the shareholders. The following table provides information about each Trustee and certain officers of the Trust. Each Trustee and officer holds office until the person resigns, is removed, or is replaced. Unless otherwise noted, the persons have held their principal occupations for more than five years. The address for all Trustees and officers is Three Canal Plaza, Suite 600, Portland, Maine 04101, unless otherwise indicated. Each Trustee oversees twenty portfolios in the Trust. Mr. Keffer is considered an Interested Trustee due to his affiliation with Atlantic. The Fund’s Statement of Additional Information includes additional information about the Trustees and is available, without charge and upon request, by calling (866) 233-3368.
| Name and Year of Birth | Position with the Trust | Length of Time Served | Principal Occupation(s) During Past Five Years |
| Independent Trustees | | | |
J. Michael Parish Born: 1943 | Chairman of the Board; Trustee; Chairman, Nominating Committee and Qualified Legal Compliance Committee | Since 1989 (Chairman since 2004) | Retired since 2003. |
Costas Azariadis Born: 1943 | Trustee; Chairman, Valuation Committee | Since 1989 | Professor of Economics, Washington University since 2006; Professor of Economics, University of California-Los Angeles 1992-2006. |
James C. Cheng Born: 1942 | Trustee; Chairman, Audit Committee | Since 1989 | President, Technology Marketing Associates (marketing company for small- and medium-sized businesses in New England) since 1991. |
| Interested Trustee | | | |
John Y. Keffer1 Born: 1942 | Trustee; Vice Chairman | Since 1989 | Chairman, Atlantic since 2008; President, Forum Foundation (a charitable organization) since 2005; President, Forum Trust, LLC (a non-depository trust company chartered in the State of Maine) since 1997. |
| | 27 | DF DENT PREMIER GROWTH FUND |
| |
DF DENT PREMIER GROWTH FUND ADDITIONAL INFORMATION (Unaudited) JUNE 30, 2011 |
| |
| Name and Year of Birth | Position with the Trust | Length of Time Served | Principal Occupation(s) During Past Five Years |
| Officers | | | |
Stacey E. Hong Born: 1966 | President; Principal Executive Officer | Since 2008 | President, Atlantic since 2008; Director, Consulting Services, Foreside Fund Services 2007. |
Karen Shaw Born: 1972 | Treasurer; Principal Financial Officer | Since 2008 | Senior Manager, Atlantic since 2008; Section Manager/Vice President, Enterprise Support Services, Citigroup 2003-2008. |
David Faherty Born: 1970 | Vice President | Since 2009 | Senior Counsel, Atlantic since 2009; Vice President, Citi Fund Services Ohio, Inc. 2007-2009; Associate Counsel, Investors Bank & Trust Co. 2006-2007. |
Michael J. McKeen Born: 1971 | Vice President | Since 2009 | Senior Manager, Atlantic since 2008; Vice President, Citigroup 2003-2008. |
Joshua LaPan Born: 1973 | Vice President | Since 2009 | Manager, Atlantic since 2008; Vice President, Citigroup 2003-2008. |
Timothy Bowden Born: 1969 | Vice President | Since 2009 | Manager, Atlantic since 2008; Vice President, Citigroup 2005-2008. |
Lina Bhatnagar Born: 1971 | Secretary | Since 2008 | Senior Administration Specialist, Atlantic since 2008; Regulatory Administration Specialist, Citigroup 2006-2008. |
1Atlantic is a subsidiary of Forum Holdings Corp. I, a Delaware corporation that is wholly owned by Mr. Keffer. |
| | 28 | DF DENT PREMIER GROWTH FUND |

| A Message to Our Shareholders | 1 |
| Performance Charts and Analysis (Unaudited) | 6 |
| Schedules of Investments | 7 |
| Statements of Assets and Liabilities | 11 |
| Statements of Operations | 12 |
| Statements of Changes in Net Assets | 13 |
| Financial Highlights | 14 |
| Notes to Financial Statements | 15 |
| Report of Independent Registered Public Accounting Firn | 20 |
| Additional Information (Unaudited) | 21 |
| |
GOLDEN FUNDS A MESSAGE TO OUR SHAREHOLDERS JUNE 30, 2011 |
| |
Dear Shareholder,
We are pleased to present the annual report for the Golden Large Cap Core Fund and the Golden Small Cap Core Fund (individually, a “Fund” and, collectively, the “Funds”) for the period of July 1, 2010 through June 30, 2011.
Market Review
The U.S. equity markets rebounded nicely in the third quarter of 2010 and erased most of the losses experienced in the second quarter. As the third quarter began, there was a lot of nervousness and fear about the potential for the economy to fall into a “double-dip” recession. However, the markets climbed in July as jobs data and manufacturing data indicated slow, steady growth in the economy. This changed in August as July housing market data showed a significant slowdown in the number of sales and weakness in home prices upon the expiration of the housing tax credit. At the August meeting of the Federal Open Market Committee (“FOMC”), the Federal Reserve (“Fed”) committed to reinvest principal payments from its portfolio of mortgage-backed securities into longer-term Treasury securities. Throughout the month of August, we continued to get mixed signals on the economy, and investors began worrying about deflation. As a result, the stock market swooned and the government bond market rallied. By the end of August, market participants had become convinced that the Fed would be forced to undertake a significant additional round of quantitative easing to provide greater stimulus to the economy and fight off deflation. This hope for “QE2” drove investors into risk assets, including equities, and the U.S. stock market indices had one of the best September’s in about 70 years.
The U.S. equity markets continued their march forward in the fourth quarter. In October, economic data painted a mixed picture. The reports included weak data on September payrolls and consumer confidence and more favorable data on September retail sales and manufacturing. Despite these uncertain conditions, it had become a foregone conclusion by this point that the Fed would provide additional monetary stimulus, and the markets moved higher in anticipation. There were several significant events early in November. On November 2nd, the Republican Party was voted into control of the U.S. House of Representatives. The electorate expressed a general dissatisfaction with the state of the economy and seemed to rally around the Republican Party promises to extend the “Bush tax cuts” and reign in government spending. Then, on November 3rd, the Fed announced that it was undertaking an additional round of quantitative easing (QE2). Its commitment to purchase $600 billion dollars worth of medium to long term U.S. Treasury debt by June 2011 was another example of the Fed’s effort to keep long term interest rates low. Throughout the remainder of November and December, the reported economic data, though not exceedingly strong, consistently came in above expectations. A notable event in December was the agreement reached between the Obama Administration and Congress that extended the current tax rates for two more years while also extending emergency jobless benefits and cutting payroll taxes by two percent through the end of 2011. The combination of better economic reports, additional monetary stimulus, and additional fiscal stimulus that we saw during the quarter was enough to stoke investors’ risk appetites. As a result, investors began to move out of bonds, sending yields higher, and moved into equities, especially smaller and more volatile stocks.
| |
GOLDEN FUNDS A MESSAGE TO OUR SHAREHOLDERS JUNE 30, 2011 |
| |
The U.S. equity markets moved significantly higher in the first quarter of 2011 to post the third straight quarter of gains. Over the course of the quarter, most economic reports positively surprised investors. Indicators of manufacturing activity showed expansion; small business sentiment showed improvement; consumer spending and core retail sales continued to show growth; and notably, payroll employment figures showed job growth. The Fed made no changes to monetary policy during the quarter, and its statements and meeting minutes indicated that the Fed remained comfortable with the strength and durability of the economic recovery. Despite significant rises in the prices of raw commodities, measures of core inflation continued to remain subdued. The market showed considerable resiliency in the face of significant challenges in the quarter. Geopolitical tensions in the Middle East and North Africa coupled with a falling U.S. dollar contributed to higher oil prices. A horrific earthquake and tsunami in Japan and the ensuing nuclear disaster at a nuclear power complex injected enough fear and uncertainty into the markets to cause a modest correction of approximately 7%, but the markets bounced back quickly to end the quarter on a high note. As of the end of the first quarter, indices of small and mid cap stocks had erased all of the losses from the bear market and reached all-time high levels. Large cap indices still had not fully recovered from their bear market declines.
The U.S. equity markets took a roller-coaster ride over the course of the second quarter of 2011 and ended roughly where they began. Most of the economic reports during the quarter were disappointing. Indicators of manufacturing activity showed a slowdown in the rate of expansion; small business sentiment weakened; durable goods orders dropped as a result of the supply-chain disruptions in Japan; retail sales were weak; measures of inflation rose; and payroll employment figures disappointed. The Fed made no changes to monetary policy during the quarter. However, in statements, meeting minutes, and in the press conferences led by Chairman Bernanke, the Fed acknowledged the slowdown in economic growth and the increase in inflation. Comments from Fed officials indicated a belief that these are transitory effects and that the economy can resume moderate growth with low inflation in the medium term. As a result, the Fed allowed its program of quantitative easing through the purchase of long-term U.S. Treasury securities (QE2) to end as scheduled on June 30. During the quarter, sovereign debt issues in Europe resurfaced as a front-page issue and contributed to a souring of investor sentiment. The combination of the fear of slowing growth and the potential for sovereign debt defaults sent the markets on a slide of approximately -7% for large cap stocks and -10% for small cap stocks. Around the middle of June when sentiment was at its lowest, the Greek government survived a confidence vote and passed new austerity measures at the same time that economic reports began to stabilize. This was enough fuel for the markets to sharply rally and erase virtually all of the losses for the quarter.
Golden Large Cap Core Fund
The Fund seeks to achieve long-term capital appreciation by investing in large capitalization domestic equities. The goal of the Fund is to construct an actively managed portfolio of fundamentally sound large-cap companies that we believe exhibit the likelihood of meeting or exceeding analysts’ earnings expectations.
For the one-year period ending June 30, 2011, the Fund delivered a total return of 28.85%. The Fund’s return trailed the 30.69% total return of the S&P 500® Index (“S&P 500”), the Fund’s benchmark index, for the same period. In general, the S&P 500’s strong advance was highly influenced by the strength of smaller
| |
GOLDEN FUNDS A MESSAGE TO OUR SHAREHOLDERS JUNE 30, 2011 |
| |
capitalization and higher beta companies. The Fund began the twelve month period with a somewhat defensive posture and was modestly under-represented in the better performing smaller capitalization and higher beta companies.
Two of the Fund’s best sources of advantage relative to the S&P 500 were the Financials and Materials sectors. Within Financials, the Fund benefited from stocks that it owned, as well as some timely sell decisions. The Fund’s best performer in the sector was Ameriprise Financial (AMP). Ameriprise purchased Columbia Asset Management from Bank of America and showed some success integrating it into its own operations. Investment performance and fund flows within the Columbia unit were nice contributors to Ameriprise’s financial results. Positions in Goldman Sachs (GS) and Citigroup (C) were sold at gains before the stocks subsequently declined on mortgage problems and balance sheet risk. The Materials sector was one of the top performing sectors in the S&P 500 for the period, and though it is one of the smaller sectors, a modest overweight exposure and strong stock selection were beneficial for the Fund. During the period, the Fund held positions in Sealed Air (SEE) and International Flavors and Fragrances (IFF), which it sold at gains. At the end of the period, the Fund continued to hold a position in Rockwood Holdings (ROC), which has appreciated significantly since its purchase in April 2011.
The Health Care and Consumer Discretionary sectors were the primary sources of relative underperformance during the period. Within Health Care, an underweight exposure to the managed care industry was the main reason the Fund’s results in the sector lagged those of the S&P 500. Several of the largest companies within the industry rebounded with strong profits and adjustments to their business models that account for the recent health care legislation. In addition, Fund holding Medco Health Solutions (MHS) suffered the loss of two high profile (though not necessarily highly profitable) clients in its pharmacy benefit management business, leading to weakness in the stock. The shortfall in the Consumer Discretionary sector was primarily attributable to the decline in Gap, Inc. (GPS), a stock that had been one of our best performers in prior years. Gap appeared to be negatively impacted by poor fashion, and cost increases (e.g., cotton prices and Chinese labor) negatively impacted margins.
Golden Small Cap Core Fund
The Fund seeks to achieve maximum long-term total return by investing in small capitalization domestic equities. The goal of the Fund is to construct an actively managed portfolio of fundamentally sound small-cap companies that we believe exhibit the likelihood of meeting or exceeding analysts’ earnings expectations.
For the one-year period ending June 30, 2011, the Fund generated a total return of 40.51%. This return exceeded the 37.41% total return of the Russell 2000 Index (“Russell 2000”), the Fund’s benchmark index, for the same period.
Looking back over the year, investors in the small cap segment of the market appear to have taken a greater interest in company fundamentals. Since our stock selection process is based on identifying fundamentally sound companies, we experienced greater success in picking stocks that outperformed the benchmark. Overall, with respect to the Fund, stock selection added value in six out of ten economic sectors. The best
| |
GOLDEN FUNDS A MESSAGE TO OUR SHAREHOLDERS JUNE 30, 2011 |
| |
results came from the Energy, Health Care, Financials and Industrials sectors. The weakest stock selection results came from the Information Technology and Materials sectors.
The Energy sector was the top performer within the Russell 2000 during the period, and the Fund moved to an overweight position in the sector in early 2011. Two of the portfolio’s best performers were Complete Production Services (CPX) and Oil States International (OIS). Both of these companies saw their stock prices more than double on solid earnings growth and investors’ apparent growing interest in energy companies.
HealthSpring (HS), a Health Care sector holding, was one of the Fund’s best stocks. The stock rose strongly after some weakness around the time of the healthcare legislation debate. The company surged nearly 200% for the year.
We maintained an underweight position in the Financials sector during the period, which ended up being a good decision due to the variety of ongoing issues affecting companies in that sector. The Fund did not have any exposure to the Banks industry, which underperformed over the period. However, it continued to benefit from its Diversified Financials industry holdings, notably World Acceptance Corp. (WRLD) and EZCORP, Inc. (EZPW). Several Insurance industry holdings, including CNA Surety (CNA) and American Financial Group (AFG), also added value.
The best performer in the portfolio, Chart Industries (GTLS), came from the Industrials sector. Chart Industries is a global manufacturer of equipment used in the production, storage, and end-use of hydrocarbon and industrial gases. The company continued a record of beating analysts’ expectations that reaches back quarterly to early 2008. The company’s shares rose nearly 250% for the year. The two worst performers in the portfolio, Genco Shipping & Trading (GNK) and The Dolan Company (DM), also came from the Industrials sector. Genco Shipping was weighed down by an oversupply of vessels in the market, weakening balance sheet health, and lower lease rates. We sold the company during the period. Management at The Dolan Company commented on a “temporary slowdown” in its foreclosure business due to mortgage servicing companies’ reaction to increased regulatory scrutiny.
The Fund’s overweight position in Information Technology was a positive, as the sector was one of the top performers in the Russell 2000. However, the Fund trailed the Russell 2000 in the sector due to weak stock selection. In particular, stock selection within the Technology Hardware & Equipment industry was a significant detractor. Four of the Fund’s ten weakest performers, Power-One, Inc. (PWER), S1 Corp. (SONE), Cirrus Logic, Inc. (CRUS) and Tekelec (TKLC), were from the sector.
Within Materials, stock selection and the timing of certain decisions was off and led to underperformance during the period. While there were some good returns from some of the Fund’s holdings in the sector, we were ultimately late in adding Buckeye Technologies (BKI) and Materion Corp. (MTRN), and we were early in our decision to sell Koppers Holdings (KOP).
| |
GOLDEN FUNDS A MESSAGE TO OUR SHAREHOLDERS JUNE 30, 2011 |
| |
Market Outlook
Over the next few months, investors will likely have a number of issues that cause anxiety and concern. The highest profile concerns are likely to be U.S. and European sovereign debt issues and the fiscal and monetary policy measures required to address and resolve them. We will be watching the negotiations in both areas closely to determine what impact the final results are likely to have on the equity markets as a result of their effects on the outlook for global growth and corporate earnings, investor sentiment, and risk appetite. The other major issue will be whether corporate earnings can continue the growth they have experienced since the depths of the financial crisis. We believe that, in general, companies will have survived the recent “growth scare” and will continue to report good earnings. However, the tone of corporate managers and the forward-looking guidance that they issue will be critical to investor sentiment. We believe that most companies will strike a cautious tone. This may contribute to volatility and market weakness in the short-run. However, reasonable equity valuations, improved clarity on the fiscal environment, continued monetary stimulus through the Fed’s zero interest rate policy, and a reset of corporate earnings expectations to a level that would be more sustainable over the long-run may set the table for an improved equity market environment for the later part of 2011.
We value and appreciate our relationship with the Funds and thank you for your support.
Sincerely,
Greg W. Golden, CFA Jeff C. Moser, CFA
The views expressed in this report are those of the Funds’ managers as of June 30, 2011, and may not reflect their views on the date this report is first published or anytime thereafter. These views are intended to assist shareholders of the Funds in understanding their investments in the Funds and do not constitute investment advice. Investing in the securities of small capitalization companies involves greater risk and the possibility of greater price volatility than investing in larger capitalization and more established companies.
| |
GOLDEN FUNDS PERFORMANCE CHARTS AND ANALYSIS (Unaudited) JUNE 30, 2011 |
| |
The following charts reflect the change in the value of a hypothetical $10,000 investment in Institutional Shares, including reinvested dividends and distributions, in the Golden Large Cap Core Fund and the Golden Small Cap Core Fund (each a “Fund” and, collectively, the “Funds”) compared with broad-based securities market indices. The Golden Large Cap Core Fund is compared to its benchmark, the S&P 500 Index (“S&P 500”). The Golden Small Cap Core Fund is compared to its primary benchmark, the Russell 2000 Index (“Russell 2000”), and the S&P SmallCap 600 Index (“S&P SmallCap 600”), its secondary benchmark. The S&P 500 is a broad-based, unmanaged measurement of changes in stock market conditions based on the average of 500 widely held common stock. The Russell 2000, is an unmanaged, market value weighted index, which measures performance of the 2,000 companies that are between the 1,000th and 3,000th largest in the market. The S&P SmallCap 600 is designed to be an accurate measure of the performance of small companies, reflecting the risk and return characteristics of the broader smallcap universe. The total return of the indices include reinvestment of dividends and income. The total return of each Fund includes operating expenses that reduce returns, while the total return of the indices do not include expenses. Indices are not available for investment.
Performance data quoted represents past performance and is no guarantee of future results. Current performance may be lower or higher than the performance data quoted. Investment return and principal value will fluctuate so that shares, when redeemed, may be worth more or less than original cost. For the most recent month-end performance please call (800) 206-8610. As stated in the Funds’ prospectus, the annual operating expense ratios (gross) are 0.70% and 0.95% for Institutional and Investor Shares, respectively, of the Golden Large Cap Core Fund, and 1.10% and 1.35% for Institutional and Investor Shares, respectively, of the Golden Small Cap Core Fund. The Funds' adviser has agreed to contractually waive a portion of its fees and to reimburse expenses through October 31, 2011, such that total operating expenses do not exceed 0.70% and 0.95% for Institutional and Investor Shares, respectively, of the Golden Large Cap Core Fund, and 1.10% and 1.35% for Institutional and Investor Shares, respectively, of the Golden Small Cap Core Fund. The performance table and graph do not reflect the deduction of taxes that a shareholder would pay on Fund distributions or the redemption of Fund shares. Returns greater than one year are annualized.

| |
GOLDEN LARGE CAP CORE FUND SCHEDULE OF INVESTMENTS JUNE 30, 2011 |
| |
| Shares | | Security Description | | Value | |
| Common Stock - 99.0% |
| Consumer Discretionary - 14.4% |
| | 115,470 | | CBS Corp., Class B | | $ | 3,289,741 | |
| | 119,180 | | Comcast Corp., Class A | | 3,020,021 | |
| | 174,170 | | Ford Motor Co. (a) | | 2,401,804 | |
| | 79,660 | | Home Depot, Inc. | | 2,885,285 | |
| | 49,105 | | Ross Stores, Inc. | | 3,934,293 | |
| | 109,070 | | The Gap, Inc. | | 1,974,167 | |
| | 44,100 | | WABCO Holdings, Inc. (a) | | 3,045,546 | |
| | | 20,550,857 | |
| Consumer Staples - 5.5% |
| | 77,545 | | CVS Caremark Corp. | | 2,914,141 | |
| | 129,730 | | Tyson Foods, Inc., Class A | | 2,519,357 | |
| | 46,290 | | Wal-Mart Stores, Inc. | | 2,459,851 | |
| | | 7,893,349 | |
| Energy - 13.1% |
| | 30,410 | | Chevron Corp. | | 3,127,364 | |
| | 38,585 | | ConocoPhillips | | 2,901,206 | |
| | 31,380 | | Exxon Mobil Corp. | | 2,553,704 | |
| | 78,970 | | Halliburton Co. | | 4,027,470 | |
| | 34,890 | | National Oilwell Varco, Inc. | | 2,728,747 | |
| | 32,385 | | Occidental Petroleum Corp. | | 3,369,336 | |
| | | 18,707,827 | |
| Financials - 11.0% |
| | 44,015 | | ACE, Ltd. | | 2,897,067 | |
| | 51,620 | | Ameriprise Financial, Inc. | | 2,977,442 | |
| | 54,005 | | JPMorgan Chase & Co. | | 2,210,965 | |
| | 64,530 | | MetLife, Inc. | | 2,830,931 | |
| | 71,115 | | Raymond James Financial, Inc. | | 2,286,347 | |
| | 41,030 | | T. Rowe Price Group, Inc. | | 2,475,750 | |
| | | 15,678,502 | |
| Health Care - 13.0% |
| | 40,050 | | Amgen, Inc. (a) | | 2,336,918 | |
| | 89,010 | | Bristol-Myers Squibb Co. | | 2,577,730 | |
| | 69,055 | | Cardinal Health, Inc. | | 3,136,478 | |
| | 73,710 | | Forest Laboratories, Inc. (a) | | 2,899,751 | |
| | 32,395 | | Johnson & Johnson | | 2,154,915 | |
| | 38,280 | | McKesson Corp. | | 3,202,122 | |
| | 39,975 | | Medco Health Solutions, Inc. (a) | | 2,259,387 | |
| | | 18,567,301 | |
| Industrials - 12.8% |
| | 30,430 | | 3M Co. | | 2,886,285 | |
| | 56,775 | | Danaher Corp. | | 3,008,507 | |
| | 146,050 | | General Electric Co. | | 2,754,503 | |
| | 67,185 | | Tyco International, Ltd. | | 3,320,955 | |
| | 27,675 | | Union Pacific Corp. | | 2,889,270 | |
| | 37,535 | | United Technologies Corp. | | 3,322,223 | |
| | | 18,181,743 | |
| Materials - 2.3% |
| | 59,990 | | Rockwood Holdings, Inc. (a) | | 3,316,847 | |
| | | | |
| Technology - 24.9% |
| | 57,135 | | Agilent Technologies, Inc. (a) | | 2,920,170 | |
| | 9,160 | | Apple, Inc. (a) | | 3,074,737 | |
| | 193,815 | | Atmel Corp. (a) | | 2,726,977 | |
| | 104,680 | | Cisco Systems, Inc. | | 1,634,055 | |
| | 130,980 | | Corning, Inc. | | 2,377,287 | |
| | 49,360 | | Hewlett-Packard Co. | | 1,796,704 | |
| | 90,400 | | IAC/InterActiveCorp. (a) | | 3,450,568 | |
| | 19,715 | | IBM Corp. | | 3,382,108 | |
| | 117,890 | | Intel Corp. | | 2,612,442 | |
| | 90,595 | | Microsoft Corp. | | 2,355,470 | |
| | 96,865 | | Oracle Corp. | | 3,187,827 | |
| | 147,950 | | Symantec Corp. (a) | | 2,917,574 | |
| | 95,820 | | Texas Instruments, Inc. | | 3,145,771 | |
| | | 35,581,690 | |
| Telecommunications - 2.0% |
| | 75,610 | | Verizon Communications, Inc. | | 2,814,960 | |
| | | | |
Total Common Stock (Cost $114,024,530) | | 141,293,076 | |
Total Investments - 99.0% (Cost $114,024,530)* | | $ | 141,293,076 | |
| Other Assets & Liabilities, Net – 1.0% | | 1,463,213 | |
| Net Assets – 100.0% | | $ | 142,756,289 | |
| | (a) | Non-income producing security. |
| | *Cost for federal income tax purposes is $114,149,243 and net unrealized appreciation consists of: |
Gross Unrealized Appreciation | | $ | 28,775,666 | |
| Gross Unrealized Depreciation | | | (1,631,833 | ) |
| Net Unrealized Appreciation | | $ | 27,143,833 | |
| See Notes to Financial Statements. | 7 | |
| |
GOLDEN LARGE CAP CORE FUND SCHEDULE OF INVESTMENTS JUNE 30, 2011 |
| |
The following is a summary of the inputs used to value the Fund’s investments as of June 30, 2011.
The inputs or methodology used for valuing securities are not necessarily an indication of the risks associated with investing in those securities. For more information on valuation inputs, and their aggregation into the levels used in the tables below, please refer to Note 2 - Security Valuation section in the accompanying Notes to Financial Statements.
| Valuation Inputs | | Investments in Securities |
| Level 1 - Quoted Prices | | $ | 141,293,076 | |
| Level 2 - Other Significant Observable Inputs | | | - | |
| Level 3 - Significant Unobservable Inputs | | | - | |
| Total | | $ | 141,293,076 | |
The Level 1 inputs displayed in this table are Common Stock. Refer to the Schedule of Investments for a further breakout of each security by type.
| PORTFOLIO HOLDINGS | | |
| % of Net Assets | | |
| Consumer Discretionary | 14.4 | % |
| Consumer Staples | 5.5 | % |
| Energy | 13.1 | % |
| Financials | 11.0 | % |
| Health Care | 13.0 | % |
| Industrials | 12.8 | % |
| Materials | 2.3 | % |
| Technology | 24.9 | % |
| Telecommunications | 2.0 | % |
| Other Assets & Liabilities, Net | 1.0 | % |
| | 100.0 | % |
| See Notes to Financial Statements. | 8 | |
| |
GOLDEN SMALL CAP CORE FUND SCHEDULE OF INVESTMENTS JUNE 30, 2011 |
| |
| Shares | | Security Description | | Value | |
| Common Stock - 99.0% |
| Consumer Discretionary - 14.1% |
| | 28,657 | | Aeropostale, Inc. (a) | | $ | 501,498 | |
| | 21,255 | | Big Lots, Inc. (a) | | 704,603 | |
| | 39,865 | | Bridgepoint Education, Inc. (a) | | 996,625 | |
| | 14,145 | | Cracker Barrel Old Country Store, Inc. | | 697,490 | |
| | 62,955 | | Ruby Tuesday, Inc. (a) | | 678,655 | |
| | 64,075 | | Sally Beauty Holdings, Inc. (a) | | 1,095,682 | |
| | 16,235 | | The Warnaco Group, Inc. (a) | | 848,279 | |
| | 16,070 | | Tupperware Brands Corp. | | 1,083,922 | |
| | 22,175 | | Wolverine World Wide, Inc. | | 925,806 | |
| | | 7,532,560 | |
| Energy - 11.0% |
| | 38,545 | | Cloud Peak Energy, Inc. (a) | | 821,008 | |
| | 31,070 | | Complete Production Services, Inc. (a) | | 1,036,495 | |
| | 44,960 | | CVR Energy, Inc. (a) | | 1,106,915 | |
| | 41,965 | | Goodrich Petroleum Corp. (a) | | 772,576 | |
| | 14,735 | | Oil States International, Inc. (a) | | 1,177,474 | |
| | 52,530 | | Western Refining, Inc. (a) | | 949,217 | |
| | | 5,863,685 | |
| Financials - 16.7% |
| | 27,080 | | American Financial Group, Inc. | | 966,485 | |
| | 64,520 | | Ashford Hospitality Trust, Inc. REIT | | 803,274 | |
| | 27,150 | | DuPont Fabros Technology, Inc. REIT | | 684,180 | |
| | 35,350 | | EZCORP, Inc., Class A (a) | | 1,257,576 | |
| | 28,265 | | FBL Financial Group, Inc., Class A | | 908,720 | |
| | 56,175 | | Interactive Brokers Group, Inc., Class A | | 879,139 | |
| | 79,275 | | Meadowbrook Insurance Group, Inc. | | 785,615 | |
| | 12,475 | | ProAssurance Corp. (a) | | 873,250 | |
| | 16,435 | | StanCorp Financial Group, Inc. | | 693,393 | |
| | 15,930 | | World Acceptance Corp. (a) | | 1,044,530 | |
| | | 8,896,162 | |
| Health Care - 11.4% |
| | 12,570 | | Chemed Corp. | | 823,587 | |
| | 24,910 | | HealthSpring, Inc. (a) | | 1,149,098 | |
| | 32,075 | | Impax Laboratories, Inc. (a) | | 698,914 | |
| | 41,805 | | Kindred Healthcare, Inc. (a) | | 897,553 | |
| | 11,080 | | Mednax, Inc. (a) | | 799,865 | |
| | 25,310 | | Par Pharmaceutical Cos., Inc. (a) | | 834,724 | |
| | 48,710 | | Viropharma, Inc. (a) | | 901,135 | |
| | | 6,104,876 | |
| Industrials - 14.6% |
| | 8,400 | | Amerco, Inc. (a) | | 807,660 | |
| | 25,210 | | Applied Industrial Technologies, Inc. | | 897,728 | |
| | 20,610 | | Crane Co. | | 1,018,340 | |
| | 22,070 | | Chart Industries, Inc. (a) | | | 1,191,339 | |
| | 36,990 | | Deluxe Corp. | | | 914,023 | |
| | 26,870 | | EMCOR Group, Inc. (a) | | 787,560 | |
| | 41,430 | | MasTec, Inc. (a) | | 816,999 | |
| | 24,250 | | Old Dominion Freight Line, Inc. (a) | | 904,525 | |
| | 54,300 | | The Dolan Co. (a) | | 459,921 | |
| | | 7,798,095 | |
| Materials - 6.8% |
| | 40,360 | | Buckeye Technologies, Inc. | | 1,088,913 | |
| | 23,735 | | Materion Corp. (a) | | 877,483 | |
| | 13,220 | | Rock-Tenn Co., Class A | | 877,015 | |
| | 13,425 | | Schnitzer Steel Industries, Inc., Class A | | 773,280 | |
| | | 3,616,691 | |
| Technology - 22.5% |
| | 59,775 | | Advanced Energy Industries, Inc. (a) | | 884,072 | |
| | 15,415 | | Anixter International, Inc. | | 1,007,216 | |
| | 74,230 | | Brooks Automation, Inc. (a) | | 806,138 | |
| | 13,245 | | CACI International, Inc., Class A (a) | | 835,495 | |
| | 48,675 | | Cirrus Logic, Inc. (a) | | 773,932 | |
| | 25,375 | | InterDigital, Inc. | | 1,036,569 | |
| | 25,800 | | j2 Global Communications, Inc. (a) | | 728,334 | |
| | 170,025 | | Magma Design Automation, Inc. (a) | | 1,358,500 | |
| | 57,325 | | Power-One, Inc. (a) | | 464,333 | |
| | 40,095 | | QLogic Corp. (a) | | 638,312 | |
| | 63,685 | | Sanmina-SCI Corp. (a) | | 657,866 | |
| | 81,075 | | Seachange International, Inc. (a) | | 873,988 | |
| | 35,670 | | TIBCO Software, Inc. (a) | | 1,035,143 | |
| | 17,955 | | Veeco Instruments, Inc. (a) | | 869,202 | |
| | | 11,969,100 | |
| Utilities - 1.9% |
| | 59,615 | | PNM Resources, Inc. | | 997,955 | |
| | | | |
Total Common Stock (Cost $40,073,440) | | 52,779,124 | |
Total Investments - 99.0% (Cost $40,073,440)* | | $ | 52,779,124 | |
| Other Assets & Liabilities, Net – 1.0% | | 521,038 | |
| Net Assets – 100.0% | | $ | 53,300,162 | |
| | REIT | Real Estate Investment Trust |
| | (a) | Non-income producing security. |
| | *Cost for federal income tax purposes is $41,102,672 and net unrealized appreciation consists of: |
| Gross Unrealized Appreciation | | $ | 12,973,363 | |
| Gross Unrealized Depreciation | | | (1,296,911 | ) |
| Net Unrealized Appreciation | | $ | 11,676,452 | |
| See Notes to Financial Statements. | 9 | |
| |
GOLDEN SMALL CAP CORE FUND SCHEDULE OF INVESTMENTS JUNE 30, 2011 |
| |
The following is a summary of the inputs used to value the Fund’s investments as of June 30, 2011.
The inputs or methodology used for valuing securities are not necessarily an indication of the risks associated with investing in those securities. For more information on valuation inputs, and their aggregation into the levels used in the tables below, please refer to Note 2 - Security Valuation section in the accompanying Notes to Financial Statements.
| Valuation Inputs | | Investments in Securities |
| Level 1 - Quoted Prices | | $ | 52,779,124 | |
| Level 2 - Other Significant Observable Inputs | | | - | |
| Level 3 - Significant Unobservable Inputs | | | - | |
| Total | | $ | 52,779,124 | |
The Level 1 inputs displayed in this table are Common Stock. Refer to the Schedule of Investments for a further breakout of each security by type.
| PORTFOLIO HOLDINGS | | |
| % of Net Assets | | |
| Consumer Discretionary | 14.1 | % |
| Energy | 11.0 | % |
| Financials | 16.7 | % |
| Health Care | 11.4 | % |
| Industrials | 14.6 | % |
| Materials | 6.8 | % |
| Technology | 22.5 | % |
| Utilities | 1.9 | % |
| Other Assets & Liabilities, Net | 1.0 | % |
| | 100.0 | % |
| See Notes to Financial Statements. | 10 | |
| |
GOLDEN FUNDS STATEMENTS OF ASSETS AND LIABILITIES JUNE 30, 2011 |
| |
| | | | | | GOLDEN LARGE CAP CORE FUND | | | | GOLDEN SMALL CAP CORE FUND | |
| ASSETS | | | | | | | | |
| | Total investments, at value (Cost $114,024,530 and $40,073,440, respectively) | $ | 141,293,076 | | | $ | 52,779,124 | |
| | Cash | | | 1,503,519 | | | | 601,982 | |
| | Receivables: | | | | | | | | |
| | | Fund shares sold | | | - | | | | 9,200 | |
| | | Dividends and interest | | | 146,311 | | | | 17,383 | |
| Total Assets | | | 142,942,906 | | | | 53,407,689 | |
| | | | | | | | | | | |
| LIABILITIES | | | | | | | | |
| | Payables: | | | | | | | | |
| | | Fund shares redeemed | | | 119,971 | | | | 73,526 | |
| | Accrued Liabilities: | | | | | | | | |
| | Investment adviser fees | | | 66,587 | | | | 33,979 | |
| | | Trustees’ fees and expenses | | | 59 | | | | 22 | |
| Total Liabilities | | | 186,617 | | | | 107,527 | |
| | | | | | | | | | | |
| NET ASSETS | | $ | 142,756,289 | | | $ | 53,300,162 | |
| | | | | | | | | | | |
| COMPONENTS OF NET ASSETS | | | | | | | | |
| | Paid-in capital | | $ | 125,586,927 | | | $ | 106,776,665 | |
| | Undistributed net investment income | | | 843,841 | | | | - | |
| | Accumulated net realized loss | | | (10,943,025 | ) | | | (66,182,187 | ) |
| | Net unrealized appreciation | | | 27,268,546 | | | | 12,705,684 | |
| NET ASSETS | | $ | 142,756,289 | | | $ | 53,300,162 | |
| SHARES OF BENEFICIAL INTEREST AT NO PAR VALUE (UNLIMITED SHARES AUTHORIZED) | | | 12,856,238 | | | | 4,802,955 | |
| NET ASSET VALUE, OFFERING AND REDEMPTION PRICE PER SHARE | | $ | 11.10 | | | $ | 11.10 | |
| | | | | | | | | | | |
| See Notes to Financial Statements. | 11 | |
| |
GOLDEN FUNDS STATEMENTS OF OPERATIONS YEAR ENDED JUNE 30, 2011 |
| |
| | | | | | GOLDEN LARGE CAP CORE FUND | | | | GOLDEN SMALL CAP CORE FUND | |
| INVESTMENT INCOME | | | | | | | | |
| | Dividend income | | $ | 2,883,999 | | | $ | 760,012 | |
| | Interest income | | | 3,124 | | | | 2,354 | |
| Total Investment Income | | | 2,887,123 | | | | 762,366 | |
| | | | | | | | | |
| EXPENSES | | | | | | | | |
| | Investment adviser fees | | | 1,158,440 | | | | 933,706 | |
| | Trustees' fees and expenses | | | 5,501 | | | | 3,083 | |
| Total Expenses | | | 1,163,941 | | | | 936,789 | |
| | Fees waived and expenses reimbursed | | | (5,501 | ) | | | (3,083 | ) |
| Net Expenses | | | 1,158,440 | | | | 933,706 | |
| | | | | | | | | | | |
| NET INVESTMENT INCOME (LOSS) | | | 1,728,683 | | | | (171,340 | ) |
| | | | | | | | | | | |
| NET REALIZED AND UNREALIZED GAIN (LOSS) | | | | | | | | |
| | Net realized gain on investments | | | 16,455,416 | | | | 28,445,392 | |
| | Net change in unrealized appreciation (depreciation) on investments | | | 24,229,126 | | | | 5,589,644 | |
| NET REALIZED AND UNREALIZED GAIN | | | 40,684,542 | | | | 34,035,036 | |
| INCREASE IN NET ASSETS FROM OPERATIONS | | $ | 42,413,225 | | | $ | 33,863,696 | |
| | | | | | | | | | | |
| See Notes to Financial Statements. | 12 | |
| |
GOLDEN FUNDS STATEMENTS OF CHANGES IN NET ASSETS |
| |
| | | | | GOLDEN LARGE CAP CORE FUND | | GOLDEN SMALL CAP CORE FUND |
| | | | | | | | | | Shares | | | | | | | | Shares | |
| NET ASSETS JUNE 30, 2009 | | $ | 160,219,326 | | | | $ 160,219,326 | | | $ | 131,370,220 | | | | $ 131,370,220 | |
| OPERATIONS | | | | | | | | | | | | | | | | |
| | Net investment income (loss) | | | 2,345,907 | | | | | | | | (491,417 | ) | | | | |
| | Net realized gain (loss) | | | 2,578,522 | | | | | | | | (5,756,756 | ) | | | | |
| | Net change in unrealized appreciation (depreciation) | | | 12,112,622 | | | | | | | | 24,576,062 | | | | | |
| Increase in Net Assets Resulting from Operations | | | 17,037,051 | | | | | | | | 18,327,889 | | | | | |
| | | | | | | | | | | | | | | | | | | |
| DISTRIBUTIONS TO SHAREHOLDERS FROM | | | | | | | | | | | | | | | | |
| | Net investment income | | | (2,369,453 | ) | | | | | | | - | | | | | |
| | | | | | | | | | | | | | | | | | | |
| CAPITAL SHARE TRANSACTIONS | | | | | | | | | | | | | | | | |
| | Sale of shares | | | 18,952,857 | | | | 2,076,332 | | | | 6,729,637 | | | | 849,798 | |
| | Reinvestment of distributions | | | 56,677 | | | | 6,036 | | | | - | | | | - | |
| | Redemption of shares | | | (37,184,262 | ) | | | (4,027,815 | ) | | | (52,192,891 | ) | | | (6,485,348 | ) |
| Decrease in Net Assets from Capital Share Transactions | | | (18,174,728 | ) | | | (1,945,447 | ) | | | (45,463,254 | ) | | | (5,635,550 | ) |
| Decrease in Net Assets | | | (3,507,130 | ) | | | | | | | (27,135,365 | ) | | | | |
| | | | | | | | | | | | | | | | | | | |
| NET ASSETS JUNE 30, 2010 (Including line (a)) | | $ | 156,712,196 | | | | | | | $ | 104,234,855 | | | | | |
| OPERATIONS | | | | | | | | | | | | | | | | |
| | Net investment income (loss) | | | 1,728,683 | | | | | | | | (171,340 | ) | | | | |
| | Net realized gain | | | 16,455,416 | | | | | | | | 28,445,392 | | | | | |
| | Net change in unrealized appreciation (depreciation) | | | 24,229,126 | | | | | | | | 5,589,644 | | | | | |
| Increase in Net Assets Resulting from Operations | | | 42,413,225 | | | | | | | | 33,863,696 | | | | | |
| | | | | | | | | | | | | | | | | | | |
| DISTRIBUTIONS TO SHAREHOLDERS FROM | | | | | | | | | | | | | | | | |
| | Net investment income | | | (2,092,596 | ) | | | | | | | - | | | | | |
| | | | | | | | | | | | | | | | | | | |
| CAPITAL SHARE TRANSACTIONS | | | | | | | | | | | | | | | | |
| | Sale of shares | | | 10,968,235 | | | | 1,071,646 | | | | 2,997,512 | | | | 310,411 | |
| | Reinvestment of distributions | | | 43,587 | | | | 4,195 | | | | - | | | | - | |
| | Redemption of shares | | | (65,288,358 | ) | | | (6,189,916 | ) | | | (87,795,901 | ) | | | (8,703,772 | ) |
| Decrease in Net Assets from Capital Share Transactions | | | (54,276,536 | ) | | | (5,114,075 | ) | | | (84,798,389 | ) | | | (8,393,361 | ) |
| Decrease in Net Assets | | | (13,955,907 | ) | | | | | | | (50,934,693 | ) | | | | |
| NET ASSETS JUNE 30, 2011 (Including line (b)) | | $ | 142,756,289 | | | | | | | $ | 53,300,162 | | | | | |
| (a) | Undistributed net investment income June 30, 2010 | | $ | 1,207,754 | | | | | | | $ | - | | | | | |
| (b) | Undistributed net investment income June 30, 2011 | | $ | 843,841 | | | | | | | $ | - | | | | | |
| See Notes to Financial Statements. | 13 | |
| |
GOLDEN FUNDS FINANCIAL HIGHLIGHTS |
| |
| These financial highlights reflect selected data for a share outstanding throughout each year. | | | | | | |
| | | For the Years Ended June 30, |
| | | 2011 | | 2010 | | 2009 | | 2008 | | 2007 | |
| GOLDEN LARGE CAP CORE FUND |
| NET ASSET VALUE, Beginning of Year | $ | 8.72 | | | $ | 8.04 | | | $ | 10.82 | | | $ | 12.24 | | | $ | 10.31 | |
| INVESTMENT OPERATIONS | | | | | | | | | | | | | | | | | | | |
| Net investment income (a) | | 0.11 | | | | 0.12 | | | | 0.14 | | | | 0.12 | | | | 0.10 | |
| Net realized and unrealized gain (loss) | | 2.40 | | | | 0.69 | | | | (2.81 | ) | | | (1.45 | ) | | | 1.88 | |
| Total from Investment Operations | | 2.51 | | | | 0.81 | | | | (2.67 | ) | | | (1.33 | ) | | | 1.98 | |
| DISTRIBUTIONS TO | | | | | | | | | | | | | | | | | | | |
| SHAREHOLDERS FROM | | | | | | | | | | | | | | | | | | | |
| Net investment income | | (0.13 | ) | | | (0.13 | ) | | | (0.11 | ) | | | (0.09 | ) | | | — | |
| Net realized gain | | — | | | | — | | | | — | | | | — | (b) | | (0.05 | ) |
| Total Distributions to Shareholders | | (0.13 | ) | | | (0.13 | ) | | | (0.11 | ) | | | (0.09 | ) | | | (0.05 | ) |
| NET ASSET VALUE, End of Year | $ | 11.10 | | | $ | 8.72 | | | $ | 8.04 | | | $ | 10.82 | | | $ | 12.24 | |
| TOTAL RETURN | | 28.85 | % | | 9.90 | % | | (24.65 | )% | | (10.90 | )% | | 19.20 | % |
| RATIOS/SUPPLEMENTARY DATA | | | | | | | | | | | | | | | | | | | |
| Net Assets at End of Year (000's omitted) | $142,756 | | | $156,712 | | | $160,219 | | | $133,917 | | | $129,124 | |
| Ratios to Average Net Assets: | | | | | | | | | | | | | | | | | | | |
| Net investment income | | 1.04 | % | | 1.33 | % | | 1.66 | % | | 1.06 | % | | 0.89 | % |
| Net expense | | 0.70 | % | | 0.70 | % | | 0.70 | % | | 0.70 | % | | 0.70 | % |
| Gross expense (c) | | 0.70 | % | | 0.70 | % | | 0.70 | % | | 0.70 | % | | 0.71 | % |
| PORTFOLIO TURNOVER RATE | | 57 | % | | 49 | % | | 40 | % | | 46 | % | | 56 | % |
GOLDEN SMALL CAP CORE FUND |
| NET ASSET VALUE, Beginning of Year | $ | 7.90 | | | $ | 6.98 | | | $ | 11.09 | | | $ | 13.60 | | | $ | 11.40 | |
| INVESTMENT OPERATIONS | | | | | | | | | | | | | | | | | | | |
| Net investment loss (a) | | (0.02 | ) | | | (0.03 | ) | | | (0.02 | ) | | | (0.04 | ) | | | (0.04 | ) |
| Net realized and unrealized gain (loss) | | 3.22 | | | | 0.95 | | | | (4.09 | ) | | | (2.36 | ) | | | 2.24 | |
| Total from Investment Operations | | 3.20 | | | | 0.92 | | | | (4.11 | ) | | | (2.40 | ) | | | 2.20 | |
| DISTRIBUTIONS TO | | | | | | | | | | | | | | | | | | | |
| SHAREHOLDERS FROM | | | | | | | | | | | | | | | | | | | |
| Net realized gain | | — | | | | — | | | | — | | | | (0.11 | ) | | | — | |
| NET ASSET VALUE, End of Year | $ | 11.10 | | | $ | 7.90 | | | $ | 6.98 | | | $ | 11.09 | | | $ | 13.60 | |
| TOTAL RETURN | | 40.51 | % | | 13.18 | % | | (37.06 | )% | | (17.66 | )% | | 19.30 | % |
| RATIOS/SUPPLEMENTARY DATA | | | | | | | | | | | | | | | | | | | |
| Net Assets at End of Year (000's omitted) | $53,300 | | | $104,235 | | | $131,370 | | | $209,709 | | | $197,131 | |
| Ratios to Average Net Assets: | | | | | | | | | | | | | | | | | | | |
| Net investment loss | | (0.20 | )% | | (0.39 | )% | | (0.28 | )% | | (0.38 | )% | | (0.30 | )% |
| Net expense | | 1.10 | % | | 1.10 | % | | 1.10 | % | | 1.10 | % | | 1.10 | % |
| Gross expense (c) | | 1.10 | % | | 1.10 | % | | 1.10 | % | | 1.11 | % | | 1.11 | % |
| PORTFOLIO TURNOVER RATE | | 55 | % | | 55 | % | | 95 | % | | 72 | % | | 55 | % |
| (a) | Calculated based on average shares outstanding during the year. |
| (b) | Less than $0.01 per share. |
| (c) | Reflects the expense ratio excluding any waivers and/or reimbursements. |
| See Notes to Financial Statements. | 14 | |
| |
GOLDEN FUNDS NOTES TO FINANCIAL STATEMENTS JUNE 30, 2011 |
| |
Note 1. Organization
The Golden Large Cap Core Fund and Golden Small Cap Core Fund (individually, a “Fund” and, collectively the “Funds”) are diversified portfolios of Forum Funds (the “Trust”). The Trust is a Delaware statutory trust that is registered as an open-end, management investment company under the Investment Company Act of 1940 (the “Act”), as amended. Under its Trust Instrument, the Trust is authorized to issue an unlimited number of each Fund’s shares of beneficial interest without par value. Each Fund currently offers two classes of shares: Institutional Shares and Investor Shares. As of June 30, 2011, Investor Shares had not commenced operations. Golden Large Cap Core Fund seeks to achieve long-term capital appreciation. Golden Small Cap Core Fund seeks to achieve maximum long-term total return. Each Fund commenced operations on September 13, 2005.
Note 2. Summary of Significant Accounting Policies
These financial statements are prepared in accordance with generally accepted accounting principles in the United States of America (“GAAP”), which require management to make estimates and assumptions that affect the reported amounts of assets and liabilities, the disclosure of contingent liabilities at the date of the financial statements, and the reported amounts of increase and decrease in net assets from operations during the fiscal year. Actual amounts could differ from those estimates. The following summarizes the significant accounting policies of each Fund:
Security Valuation – Exchange-traded securities and over-the-counter securities are valued using the last quoted sale or official closing price, provided by independent pricing services as of the close of trading on the market or exchange for which they are primarily traded, on each Fund business day. In the absence of a sale, such securities are valued at the mean of the last bid and ask price provided by independent pricing services. Non-exchange traded securities for which quotations are available are valued using the last quoted sales price, or in the absence of a sale at the mean of the last bid and ask prices provided by independent pricing services. Shares of open-end mutual funds are valued at net asset value (“NAV”). Short-term investments that mature in sixty days or less may be valued at amortized cost.
Each Fund values its investments at fair value pursuant to procedures adopted by the Trust's Board of Trustees (the "Board") if (1) market quotations are insufficient or not readily available or (2) the adviser believes that the values available are unreliable. Fair valuation is based on subjective factors and, as a result, the fair value price of an investment may differ from the security’s market price and may not be the price at which the asset may be sold. Fair valuation could result in a different NAV than a NAV determined by using market quotes.
Each Fund has a three-tier fair value hierarchy. The basis of the tiers is dependent upon the various “inputs” used to determine the value of each Fund’s investments. These inputs are summarized in the three broad levels listed below:
Level 1 — quoted prices in active markets for identical assets
| |
GOLDEN FUNDS NOTES TO FINANCIAL STATEMENTS JUNE 30, 2011 |
| |
Level 2 — other significant observable inputs (including quoted prices of similar securities, interest rates, prepayment speeds, credit risk, etc.)
Level 3 — significant unobservable inputs (including each Fund’s own assumptions in determining the fair value of investments)
The aggregate value by input level, as of June 30, 2011, for each Fund’s investments is included at the end of each Fund’s Schedule of Investments.
Security Transactions, Investment Income and Realized Gain and Loss – Investment transactions are accounted for on the trade date. Dividend income is recorded on the ex-dividend date. Foreign dividend income is recorded on the ex-dividend date or as soon as possible after each Fund determines the existence of a dividend declaration after exercising reasonable due diligence. Income and capital gains on some foreign securities may be subject to foreign withholding taxes, which are accrued as applicable. Interest income is recorded on an accrual basis. Premium is amortized and discount is accreted in accordance with GAAP. Identified cost of investments sold is used to determine the gain and loss for both financial statement and federal income tax purposes.
Distributions to Shareholders – Distributions to shareholders of net investment income and net capital gains, if any, are declared and paid at least annually. Distributions are based on amounts calculated in accordance with applicable federal income tax regulations, which may differ from GAAP. These differences are due primarily to differing treatments of income and gain on various investment securities held by each Fund, timing differences and differing characterizations of distributions made by each Fund.
Federal Taxes – Each Fund intends to qualify each year as a regulated investment company under Subchapter M of the Internal Revenue Code and distribute all of their taxable income to shareholders. In addition, by distributing in each calendar year substantially all their net investment income and capital gains, if any, the Funds will not be subject to a federal excise tax. Therefore, no federal income or excise tax provision is required.
As of June 30, 2011, there are no uncertain tax positions that would require financial statement recognition, de-recognition, or disclosure. Each Fund’s federal tax returns filed in the three-year period ended June 30, 2011, remain subject to examination by the Internal Revenue Service.
Income and Expense Allocation – The Trust accounts separately for the assets, liabilities and operations of each of its investment portfolios. Expenses that are directly attributable to more than one investment portfolio are allocated among the respective investment portfolios in an equitable manner.
Commitments and Contingencies – In the normal course of business, each Fund enters into contracts that provide general indemnifications by each Fund to the counterparty to the contract. Each Fund’s maximum exposure under these arrangements is dependent on future claims that may be made against each Fund and, therefore, cannot be estimated; however, based on experience, the risk of loss from such claims is considered remote.
| |
GOLDEN FUNDS NOTES TO FINANCIAL STATEMENTS JUNE 30, 2011 |
| |
Note 3. Advisory Fees, Servicing Fees and Other Transactions
Investment Adviser – Golden Capital Management, LLC (the “Adviser”) is the investment adviser to the Funds. Pursuant to an Investment Advisory Agreement, the Adviser receives an advisory fee at an annual rate of 0.70% and 1.10% of the average daily net assets of Golden Large Cap Core Fund and Golden Small Cap Core Fund, respectively. Under the terms of the Investment Advisory Agreement, the Adviser provides investment advisory services to each Fund and is obligated to pay all expenses to each Fund except any expenses they are authorized to pay under Rule 12b-1, brokerage costs, commissions, borrowing costs, taxes, extraordinary and non-recurring expenses and certain compensation expenses of the Trustees.
Distribution – Foreside Fund Services, LLC serves as each Fund’s distributor (the “Distributor”). The Distributor receives no compensation from the Funds for its distribution services. The Distributor is not affiliated with the Adviser or Atlantic Fund Administration, LLC (d/b/a Atlantic Fund Services) (“Atlantic”) or their affiliates.
Other Service Providers – Atlantic provides fund accounting, fund administration, and transfer agency services to each Fund. Atlantic also provides certain shareholder report production, and EDGAR conversion and filing services. Atlantic provides a Principal Executive Officer, a Principal Financial Officer, a Chief Compliance Officer, and an Anti-Money Laundering Officer to each Fund, as well as certain additional compliance support functions.
Trustees and Officers – The Trust pays each independent Trustee an annual retainer fee of $45,000 for service to the Trust ($66,000 for the Chairman). In addition, the Chairman receives a monthly stipend of $500 to cover certain expenses incurred in connection with his duties to the Trust. The Trustees and Chairman may receive additional fees for special Board meetings. Each Trustee is also reimbursed for all reasonable out-of-pocket expenses incurred in connection with his duties as a Trustee, including travel and related expenses incurred in attending Board meetings. The amount of Trustees’ fees attributable to each Fund is disclosed in the Statement of Operations. Certain officers of the Trust are also officers or employees of the above named service providers, and during their terms of office received no compensation from each Fund.
Note 4. Expense Reimbursements and Fees Waived
The Adviser has contractually agreed to waive a portion of its fees and reimburse certain expenses through October 31, 2011, to limit total annual operating expenses to 0.70% for Institutional Shares and 0.95% for Investor Shares, of the average daily net assets of each respective class of the Golden Large Cap Core Fund. The Adviser also contractually agreed to waive a portion of its fees and reimburse certain expenses through October 31, 2011, to limit total annual operating expenses to 1.10% for Institutional Shares and 1.35% for Investor Shares of average daily net assets of each respective class of the Golden Small Cap Core Fund. For the year ended June 30, 2011, fees waived and reimbursed were as follows:
| |
GOLDEN FUNDS NOTES TO FINANCIAL STATEMENTS JUNE 30, 2011 |
| |
| | | | Investment Adviser Reimbursement | |
| | Golden Large Cap Core Fund | | $ | 5,501 | |
| | Golden Small Cap Core Fund | | | 3,083 | |
Note 5. Security Transactions
The cost of purchases and proceeds from sales of investment securities (including maturities), other than short-term investments for the year ended June 30, 2011, were as follows:
| | | | | Purchases | | Sales |
| Golden Large Cap Core Fund | | $ | 91,368,035 | | $ | 145,755,196 |
| Golden Small Cap Core Fund | | $ | 44,986,175 | | $ | 128,980,827 |
Note 6. Federal Income Tax and Investment Transactions
Distributions during the fiscal years ended as noted were characterized for tax purposes as follows:
| Golden Large Cap Core Fund |
| 2011 | | $ | 2,092,596 |
| 2010 | | | 2,369,453 |
As of June 30, 2011, distributable earnings (accumulated loss) on a tax basis were as follows:
| | | Undistributed Ordinary Income | | | Capital and Other Losses | | Unrealized Appreciation | | Total |
| Golden Large Cap Core Fund | | $ | 843,841 | | $ | (10,818,312 | ) | | $ | 27,143,833 | | | $ | 17,169,362 | |
| Golden Small Cap Core Fund | | | — | | | (65,152,955 | ) | | | 11,676,452 | | | | (53,476,503 | ) |
The difference between components of distributable earnings on a tax basis and the amounts reflected in the Statements of Assets and Liabilities are primarily due to wash sales.
As of June 30, 2011, capital loss carryforwards to offset future capital gains were as follows with the respective expiration dates:
| | | 2017 | | 2018 | |
| Golden Large Cap Core Fund | | $ | — | | $ | 10,818,312 | |
| Golden Small Cap Core Fund | | | 7,582,636 | | | 57,570,319 | |
| |
GOLDEN FUNDS NOTES TO FINANCIAL STATEMENTS JUNE 30, 2011 |
| |
On the Statement of Assets and Liabilities, as a result of permanent book to tax differences, certain amounts have been reclassified for the year ended June 30, 2011. The following reclassification was the result of real estate investment trust adjustments and net operating losses and has no impact on the net assets of the Fund.
| | | Accumulated Net Investment Income | | Undistributed Net Realized Gain | | Paid-in-Capital |
| Golden Small Cap Core Fund | | $ | 171,340 | | | $ | 1,023 | | | $ | (172,363) | |
Note 7. Recent Accounting Pronouncements
In January 2010, the Financial Accounting Standards Board (“FASB”) issued Accounting Standards Update (“ASU”) No. 2010-06 “Improving Disclosures about Fair Value Measurements.” ASU No. 2010-06 clarifies existing disclosure and requires additional disclosures regarding fair value measurements. Effective for fiscal years beginning after December 15, 2010, and for interim periods within those fiscal years, entities will need to disclose information about purchases, sales, issuances and settlements of Level 3 securities on a gross basis, rather than as a net number as currently required. Management is currently evaluating the impact ASU No. 2010-06 will have on financial statement disclosures.
In May 2011, FASB issued ASU No. 2011-04 “Amendments to Achieve Common Fair Value Measurement and Disclosure Requirements in U.S. GAAP and IFRSs.” ASU No. 2011-04 establishes common requirements for measuring fair value and for disclosing information about fair value measurements in accordance with U.S. GAAP and International Financial Reporting Standards (“IFRSs”). ASU No. 2011-04 is effective for interim and annual periods beginning after December 15, 2011. Management is currently evaluating the impact ASU No. 2011-04 may have on financial statement disclosures.
Note 8. Subsequent Events
Subsequent events occurring after the date of this report through the date these financial statements were issued have been evaluated for potential impact and each Fund has had no such events.
| |
REPORT OF INDEPENDENT PUBLIC ACCOUNTING FIRM |
| |
To the Board of Trustees of Forum Funds and the Shareholders of
Golden Large Cap Core Fund and Golden Small Cap Core Fund
We have audited the accompanying statements of assets and liabilities of Golden Large Cap Core Fund and Golden Small Cap Core Fund, each a series of shares of beneficial interest in the Forum Funds, including the schedules of investments, as of June 30, 2011, and the related statements of operations for the year then ended, the statements of changes in net assets for each of the years in the two year period then ended and the financial highlights for each of the years in the three year period then ended. These financial statements and financial highlights are the responsibility of the Funds’ management. Our responsibility is to express an opinion on these financial statements and financial highlights based on our audits. The financial highlights for each of the years in the two-year period ended June 30, 2008 were audited by other auditors whose report dated August 25, 2008, expressed an unqualified opinion on such financial highlights.
We conducted our audits in accordance with the standards of the Public Company Accounting Oversight Board (United States). Those standards require that we plan and perform the audits to obtain reasonable assurance about whether the financial statements and financial highlights are free of material misstatement. An audit includes examining, on a test basis, evidence supporting the amounts and disclosures in the financial statements. Our procedures included confirmation of securities owned as of June 30, 2011 by correspondence with the custodian. An audit also includes assessing the accounting principles used and significant estimates made by management, as well as evaluating the overall financial statement presentation. We believe that our audits provide a reasonable basis for our opinion.
In our opinion, the financial statements and financial highlights referred to above present fairly, in all material respects, the financial position of Golden Large Cap Core Fund and Golden Small Cap Core Fund as of June 30, 2011, the results of their operations for the year then ended, the changes in their net assets for each of the years in the two year period then ended and their financial highlights for each of the years in the three year period then ended, in conformity with accounting principles generally accepted in the United States of America.

BBD, LLP
Philadelphia, Pennsylvania
August 22, 2011
| |
GOLDEN FUNDS ADDITIONAL INFORMATION (Unaudited) JUNE 30, 2011 |
| |
Investment Advisory Agreement Approval
At the March 25, 2011 Board meeting, the Board, including the Independent Trustees, considered the approval of the continuance of the investment advisory agreement pertaining to the Funds (the “Advisory Agreement”). In evaluating the Advisory Agreement for the Funds, the Board reviewed materials furnished by the Adviser and the administrator, including information regarding the Adviser, its personnel, operations and financial condition. Specifically, the Board considered, among other matters: (1) the nature, extent and quality of the services to be provided to the Funds by the Adviser, including information on the investment performance of the Adviser; (2) the costs of the services to be provided and profitability to the Adviser with respect to its relationship with the Funds; (3) the advisory fee and total expense ratio of the Funds compared to relevant peer groups of funds; (4) the extent to which economies of scale would be realized as the Funds grow and whether the advisory fee would enable the Funds’ investors to share in the benefits of economies of scale; and (5) other benefits received by the Adviser from its relationship with the Funds. In their deliberations, the Board did not identify any particular information that was all-important or controlling and attributed different weights to the various factors. In particular, the Board focused on the factors discussed below.
Nature, Extent and Quality of Services
Based on a presentation from senior representatives of the Adviser and a discussion of the Adviser’s personnel, operations and financial condition, the Board considered the quality of services provided by the Adviser under the Advisory Agreement. In this regard, the Board considered information regarding the experience, qualifications and professional background of the portfolio managers and other personnel at the Adviser with principal investment responsibility for the Funds’ investments as well as the investment philosophy and decision-making processes of those professionals and the capability and integrity of the Adviser’s senior management and staff. The Board considered the adequacy of the Adviser’s resources and quality of services provided by the Adviser under the Advisory Agreement between the Trust and the Adviser. The Board also considered the quality of the Adviser’s services with respect to regulatory compliance and compliance with client investment policies and restrictions as well as the financial condition and operational stability of the Adviser. The Board noted the Adviser’s representation that the firm is financially stable and able to provide investment advisory services to the Funds. Based on the foregoing, the Board concluded that the nature, extent and quality of services provided to the Funds under the Advisory Agreement were appropriate in light of their investment objectives and, thus, supported a decision to approve the Advisory Agreement.
Costs of Services and Profitability
The Board considered information provided by the Adviser regarding its costs of services and its profitability with respect to the Funds. In this regard, the Board considered the Adviser’s resources devoted to each of the Funds as well as the Adviser’s discussion of costs and profitability. Based on these and other applicable considerations, the Board concluded that the Adviser’s profits attributable to management of the Funds were not a material factor in approving the Agreement.
| |
GOLDEN FUNDS ADDITIONAL INFORMATION (Unaudited) JUNE 30, 2011 |
| |
Performance
The Board reviewed performance of the Funds and the Adviser’s discussion of its investment philosophy. The Board noted that the Golden Large Cap Core Fund underperformed its benchmark for the 1-year and since inception periods ended December 31, 2010, but outperformed its benchmark for the 3-year period ended December 31, 2010. The Board also noted that the Golden Small Cap Core Fund had underperformed its benchmark for the 1-year period ended December 31, 2010, but posted good absolute returns in what was described by the Adviser as an unpredictable market. Noting the stability in the Funds’ assets and the possible benefits from a potential transaction described during Golden’s presentation, the Board concluded that each Fund’s performance was reasonable relative to its benchmark and that each Fund and their shareholders could benefit from the Adviser’s management of each Fund.
Compensation
The Board considered the Adviser’s compensation for providing advisory services to each Fund and analyzed comparative information on fee rates and total expenses of similar mutual funds. The Board noted that the Adviser’s actual advisory fee rate for the Golden Large Cap Core Fund was above the median fee of that Fund’s Lipper Inc. peer group and that the Adviser’s actual advisory fee rate for the Golden Small Cap Core Fund was above the median fee of that Fund’s Lipper Inc. peer group. The Board also noted that the Golden Large Cap Core Fund’s actual total expense ratio was the lowest of its Lipper Inc. peer group and that the Golden Small Cap Core Fund’s actual total expense ratio was higher than the median of its Lipper Inc. peer group. Based on the foregoing, the Board concluded that the Adviser’s advisory fee rate charged to the Funds appeared to be within a reasonable range in light of the services the Adviser provides to each Fund.
Economies of Scale
The Board considered whether the Funds would benefit from any economies of scale. In this respect, the Board noted the Adviser’s representation that the Funds could benefit from economies of scale as assets grow, but the Adviser currently is not proposing breakpoints or changes in fees at this time. Based on the foregoing information, the Board concluded that economies of scale were not a material factor in approving the Advisory Agreement.
Other Benefits
The Board noted the Adviser’s representation that, aside from its contractual advisory fees, it does not benefit in a material way from its relationship with the Funds other than soft-dollar research benefits. Based on the foregoing representation, the Board concluded that other benefits received by the Adviser from its relationship with the Funds were not a material factor to consider in approving the continuation of the Advisory Agreement.
Conclusion
The Board did not identify any single factor as being of paramount importance, and different Trustees may
| |
GOLDEN FUNDS ADDITIONAL INFORMATION (Unaudited) JUNE 30, 2011 |
| |
have given different weight to different factors. The Board reviewed a memorandum from Trust counsel discussing the legal standards applicable to its consideration of the Advisory Agreement. Based on its review, including consideration of each of the factors referenced above, the Board determined, in the exercise of its business judgment, that the advisory arrangement, as outlined in the Advisory Agreement, was fair and reasonable in light of the services performed, expenses incurred and such other matters as the Board considered relevant in the exercise of its reasonable business judgment.
Proxy Voting Information
A description of the policies and procedures that each Fund uses to determine how to vote proxies relating to securities held in each Fund’s portfolio is available, without charge and upon request, by calling (800) 206-8610 and on the SEC’s website at www.sec.gov. Each Fund’s proxy voting record for the most recent twelve-month period ended June 30 is available, without charge and upon request, by calling (800) 206-8610 and on the SEC’s website at www.sec.gov.
Availability of Quarterly Portfolio Schedules
Each Fund files its complete schedule of portfolio holdings with the SEC for the first and third quarters of each fiscal year on Form N-Q. Each Fund’s Forms N-Q are available, without charge and upon request on the SEC’s website at www.sec.gov or may be reviewed and copied at the SEC’s Public Reference Room in Washington, DC. Information on the operation of the Public Reference Room may be obtained by calling (800) SEC-0330.
Shareholder Expense Example
As a shareholder of the Funds, you incur ongoing costs, including management fees, distribution (12b-1) fees and other Fund expenses. This example is intended to help you understand your ongoing costs (in dollars) of investing in the Funds and to compare these costs with the ongoing costs of investing in other mutual funds.
The example is based on an investment of $1,000 invested at the beginning of the period and held for the entire period from January 1, 2011, through June 30, 2011.
Actual Expenses – The first line in the table below provides information about actual account values and actual expenses. You may use the information in this line, together with the amount you invested, to estimate the expenses that you paid over the period. Simply divide your account value by $1,000 (for example, an $8,600 account value divided by $1,000 = 8.6), then multiply the result by the number in the first line under the heading entitled “Expenses Paid During Period” to estimate the expenses you paid on your account during the period.
Hypothetical Example for Comparison Purposes – The second line in the table below provides information about hypothetical account values and hypothetical expenses based on each Fund’s actual expense ratio and an assumed rate of return of 5% per year before expenses, which is not each Fund’s actual return. The
| |
GOLDEN FUNDS ADDITIONAL INFORMATION (Unaudited) JUNE 30, 2011 |
| |
hypothetical account values and expenses may not be used to estimate the actual ending account balance or expenses you paid for the period. You may use this information to compare the ongoing cost of investing in each Fund and other funds. To do so, compare this 5% hypothetical example with the 5% hypothetical examples that appear in the shareholder reports of other funds.
Please note that expenses shown in the table are meant to highlight your ongoing costs only. Therefore, the second line of the table is useful in comparing ongoing costs only and will not help you determine the relative total costs of owning different funds.
| | Beginning | | Ending | | Expenses | | Annualized |
| | Account Value | | Account Value | | Paid During | | Expense |
| | January 1, 2011 | | June 30, 2011 | | Period* | | Ratio* |
| Golden Large Cap Core Fund | | | | | | | | | | | |
| Actual | $ | 1,000.00 | | $ | 1,068.33 | | $ | 3.59 | | 0.70 | % |
| Hypothetical (5% return before taxes) | $ | 1,000.00 | | $ | 1,021.32 | | $ | 3.51 | | 0.70 | % |
| Golden Small Cap Core Fund | | | | | | | | | | | |
| Actual | $ | 1,000.00 | | $ | 1,099.01 | | $ | 5.72 | | 1.10 | % |
| Hypothetical (5% return before taxes) | $ | 1,000.00 | | $ | 1,019.34 | | $ | 5.51 | | 1.10 | % |
| | | | | | | | | | | | |
| * | Expenses are equal to the Fund’s annualized expense ratio as indicated above multiplied by the average account value over the period, multiplied by the number of days in the most recent fiscal half-year divided by 365 to reflect the half-year period. |
Federal Tax Status of Dividends Declared during the Tax Year
For federal income tax purposes, dividends from short-term capital gains are classified as ordinary income. The Golden Large Cap Core Fund designates 100.00% of its income dividend distributed as qualifying for the corporate dividends-received deduction (DRD) and 100.00% for the qualified dividend rate (QDI) as defined in Section 1(h)(11) of the Internal Revenue Code. The Golden Large Cap Core Fund also designates 0.13% of its income dividends as qualified interest income exempt from U.S. tax for foreign shareholders (QII).
Trustees and Officers of the Trust
The Board is responsible for oversight of the management of the Trust’s business affairs and of the exercise of all the Trust’s powers except those reserved for the shareholders. The following table provides information about each Trustee and certain officers of the Trust. Each Trustee and officer holds office until the person resigns, is removed, or is replaced. Unless otherwise noted, the persons have held their principal occupations for more than five years. The address for all Trustees and officers is Three Canal Plaza, Suite 600, Portland, Maine 04101, unless otherwise indicated. Each Trustee oversees twenty portfolios in the Trust. Mr. Keffer is considered an Interested Trustee due to his affiliation with Atlantic. Each Fund’s Statement of Additional Information includes additional information about the Trustees and is available, without charge and upon request, by calling (800) 206-8610.
| |
GOLDEN FUNDS ADDITIONAL INFORMATION (Unaudited) JUNE 30, 2011 |
| |
| Name and Year of Birth | Position with the Trust | Length of Time Served | Principal Occupation(s) During Past Five Years |
| Independent Trustees | | | |
J. Michael Parish Born: 1943 | Chairman of the Board; Trustee; Chairman, Nominating Committee and Qualified Legal Compliance Committee | Since 1989 (Chairman since 2004) | Retired since 2003. |
Costas Azariadis Born: 1943 | Trustee; Chairman, Valuation Committee | Since 1989 | Professor of Economics, Washington University since 2006; Professor of Economics, University of California-Los Angeles 1992-2006. |
James C. Cheng Born: 1942 | Trustee; Chairman, Audit Committee | Since 1989 | President, Technology Marketing Associates (marketing company for small- and medium-sized businesses in New England) since 1991. |
| Interested Trustee | | | |
John Y. Keffer1 Born: 1942 | Trustee; Vice Chairman | Since 1989 | Chairman, Atlantic since 2008; President, Forum Foundation (a charitable organization) since 2005; President, Forum Trust, LLC (a non-depository trust company chartered in the State of Maine) since 1997. |
| Officers | | | |
Stacey E. Hong Born: 1966 | President; Principal Executive Officer | Since 2008 | President, Atlantic since 2008; Director, Consulting Services, Foreside Fund Services 2007. |
Karen Shaw Born: 1972 | Treasurer; Principal Financial Officer | Since 2008 | Senior Manager, Atlantic since 2008; Section Manager/Vice President, Enterprise Support Services, Citigroup 2003-2008. |
David Faherty Born: 1970 | Vice President | Since 2009 | Senior Counsel, Atlantic since 2009; Vice President, Citi Fund Services Ohio, Inc. 2007-2009; Associate Counsel, Investors Bank & Trust Co. 2006-2007. |
Michael J. McKeen Born: 1971 | Vice President | Since 2009 | Senior Manager, Atlantic since 2008; Vice President, Citigroup 2003-2008. |
Joshua LaPan Born: 1973 | Vice President | Since 2009 | Manager, Atlantic since 2008; Vice President, Citigroup 2003-2008. |
Timothy Bowden Born: 1969 | Vice President | Since 2009 | Manager, Atlantic since 2008; Vice President, Citigroup 2005-2008. |
Lina Bhatnagar Born: 1971 | Secretary | Since 2008 | Senior Administration Specialist, Atlantic since 2008; Regulatory Administration Specialist, Citigroup 2006-2008. |
1Atlantic is a subsidiary of Forum Holdings Corp. I, a Delaware corporation that is wholly owned by Mr. Keffer. |
ITEM 2. CODE OF ETHICS.
| (a) | As of the end of the period covered by this report, Forum Funds (the “Registrant”) has adopted a code of ethics, which applies to its Principal Executive Officer and Principal Financial Officer. |
| (b) | There have been no amendments to the Registrant’s code of ethics that apply to its Principal Executive Officer and Principal Financial Officer. |
| (c) | There have been no waivers to the Registrant’s code of ethics that apply to its Principal Executive Officer and Principal Financial Officer. |
(e) (1) A copy of the Code of Ethics is being filed under Item 12(a) hereto.
ITEM 3. AUDIT COMMITTEE FINANCIAL EXPERT.
The Board of Trustees has determined that no member of the Audit Committee is an "audit committee financial expert" as that term is defined under applicable regulatory guidelines.
ITEM 4. PRINCIPAL ACCOUNTANT FEES AND SERVICES.
(a) Audit Fees - The aggregate fees billed for each of the last two fiscal years (the “Reporting Periods”) for professional services rendered by the Registrant’s principal accountant for the audit of the Registrant’s annual financial statements, or services that are normally provided by the principal accountant in connection with the statutory and regulatory filings or engagements for the Reporting Periods, were $56,000 in 2010 and $56,000 in 2011.
(b) Audit-Related Fees – The aggregate fees billed in the Reporting Periods for assurance and related services rendered by the principal accountant that were reasonably related to the performance of the audit of the Registrant’s financial statements and are not reported under paragraph (a) of this Item 4 were $0 in 2010 and $0 in 2011.
(c) Tax Fees - The aggregate fees billed in the Reporting Periods for professional services rendered by the principal accountant to the Registrant for tax compliance, tax advice and tax planning were $12,000 in 2010 and $12,000 in 2011. These services consisted of review or preparation of U.S. federal, state, local and excise tax returns.
(d) All Other Fees - The aggregate fees billed in the Reporting Periods for products and services provided by the principal accountant to the Registrant, other than the services reported in paragraphs (a) through (c) of this Item, were $0 in 2010 and $0 in 2011.
(e) (1) The Audit Committee reviews and approves in advance all audit and “permissible non-audit services” (as that term is defined by the rules and regulations of the Securities and Exchange Commission) to be rendered to a series of the Registrant (each, a “Series”). In addition, the Audit Committee reviews and approves in advance all “permissible non-audit services” to be provided to an investment adviser (not including any sub-adviser) of a Series, or an affiliate of such investment adviser, that is controlling, controlled by or under common control with the investment adviser and provides on-going services to the Registrant (“Affiliate”), by the Series’ principal accountant if the engagement relates directly to the operations and financial reporting of the Series. The Audit Committee considers whether fees paid by a Series’ investment adviser or an Affiliate to the Series’ principal accountant for audit and permissible non-audit services are consistent with the principal accountant’s independence.
(e) (2) No services included in (b) - (d) above were approved pursuant to paragraph (c)(7)(i)(C) of Rule 2-01 of Regulation S-X.
(f) Not applicable
(g) The aggregate non-audit fees billed by the principal accountant for services rendered to the Registrant for the Reporting Periods were $0 in 2010 and $0 in 2011. There were no fees billed in either of the Reporting Periods for non-audit services rendered by the principal accountant to the Registrant’s investment adviser or any Affiliate.
(h) During the Reporting Period, the Registrant's principal accountant provided no non-audit services to the investment advisers or any entity controlling, controlled by or under common control with the investment advisers to the series of the Registrant to which this report relates.
ITEM 5. AUDIT COMMITTEE OF LISTED REGISTRANTS.
Not applicable.
ITEM 6. SCHEDULE OF INVESTMENTS.
| (a) | Included as part of report to shareholders under Item 1. |
ITEM 7. DISCLOSURE OF PROXY VOTING POLICIES AND PROCEDURES FOR CLOSED-END
MANAGEMENT INVESTMENT COMPANIES.
Not applicable.
ITEM 8. PORTFOLIO MANAGERS OF CLOSED-END MANAGEMENT INVESTMENT COMPANIES.
Not applicable.
ITEM 9. PURCHASES OF EQUITY SECURITIES BY CLOSED-END MANAGEMENT INVESTMENT COMPANY AND AFFILIATED PURCHASERS.
Not applicable.
ITEM 10. SUBMISSION OF MATTERS TO A VOTE OF SECURITY HOLDERS
The Registrant does not accept nominees to the board of trustees from shareholders.
ITEM 11. CONTROLS AND PROCEDURES
(a) The Registrant’s Principal Executive Officer and Principal Financial Officer have concluded that the Registrant’s disclosure controls and procedures (as defined in Rule 30a-3(c) under the Investment Company Act of 1940 (the “Act”)) are effective, based on their evaluation of the controls and procedures required by Rule 30a-3(b) under the Act and Rules 13a-15(b) or 15d-15(b) under the Securities Exchange Act of 1934, as of a date within 90 days of the filing date of this report.
(b) There were no changes in the Registrant’s internal control over financial reporting (as defined in
Rule 30a-3(d) under the Act) that occurred during the second fiscal quarter of the period covered by this report that have materially affected, or are reasonably likely to materially affect, the Registrant’s internal control over financial reporting.
ITEM 12. EXHIBITS.
(a)(1) Code of Ethics (Exhibit filed herewith).
(a)(2) Certifications pursuant to Rule 30a-2(a) of the Act, and Section 302 of the Sarbanes-Oxley Act of 2002. (Exhibits filed herewith)
(a)(3) Not applicable.
(b) Certifications pursuant to Rule 30a-2(b) of the Act, and Section 906 of the Sarbanes-Oxley Act of 2002. (Exhibit filed herewith)
SIGNATURES
Pursuant to the requirements of the Securities Exchange Act of 1934 and the Investment Company Act of 1940, the Registrant has duly caused this report to be signed on its behalf by the undersigned, thereunto duly authorized.
Registrant Forum Funds
| By | /s/ Stacey E. Hong | |
| | Stacey E. Hong, Principal Executive Officer | |
| | | |
| Date | August 19, 2011 | |
| | | |
Pursuant to the requirements of the Securities Exchange Act of 1934 and the Investment Company Act of 1940, this report has been signed below by the following persons on behalf of the Registrant and in the capacities and on the dates indicated.
| By | /s/ Stacey E. Hong | |
| | Stacey E. Hong, Principal Executive Officer | |
| | | |
| Date | August 19, 2011 | |
| | | |
| By | /s/ Karen Shaw | |
| | Karen Shaw, Principal Financial Officer | |
| | | |
| Date | August 19, 2011 | |
| | | |