As filed with the Securities and Exchange Commission on March 2, 2011
UNITED STATES
SECURITIES AND EXCHANGE COMMISSION
WASHINGTON, D.C. 20549
FORM N-CSR
CERTIFIED SHAREHOLDER REPORT OF REGISTERED MANAGEMENT
INVESTMENT COMPANIES
Investment Company Act file number 811-03023
FORUM FUNDS
Three Canal Plaza, Suite 600
Portland, Maine 04101
Stacey E. Hong, Principal Executive Officer
Three Canal Plaza, Suite 600
Portland, Maine 04101
207-347-2000
Date of fiscal year end: December 31
Date of reporting period: January 1, 2010 – December 31, 2010
ITEM 1. REPORT TO STOCKHOLDERS.
| |
ADAMS HARKNESS SMALL CAP GROWTH FUND DECEMBER 31, 2010 |
| |
Dear Shareholder,
A strong start to performance for the financial markets in the first quarter of 2010 gave way to a myriad of worries in the spring, as markets wrestled with European financial issues, China’s slowdown, and the Gulf Coast oil spill. The summer months of July and August were fairly volatile which gave way to a September that was one for the record books. The market exploded to the upside during September as investors began to respond to the potential positives of the economy getting better, a second go-around of quantitative easing by the Fed, and the possibility of having a more balanced Congress after the mid-term elections. The implementation of the second round of quantitative easing from the Fed coupled with the November elections that balanced the power between The Presid ent and Republicans ignited a rally in the markets in the fourth quarter that was, in our opinion, extremely robust in nature.
Due primarily to strong stockpicking, Adams Harkness Small Cap Growth Fund (the”Fund”) outperformed its benchmark, the Russell 2000 Growth Index. The Fund benefited from being overweight technology and consumer stocks. We were overweight these sectors because we believed that they would respond most favorably as the economy started to improve. We were also modestly underweight health-care stocks for most of 2010, which was also of benefit, although stockpicking in that sector contributed positively to performance. Among our best performers in 2010 were Riverbed Technology, whose products we believe significantly improve transmission speeds of data across wide area networks; Polypore International, which makes specialized membranes used in separation and filtration processes f or lithium batteries and electric drive vehicles; and Lululemon Athletica, a designer and retailer of technical athletic apparel primarily in North America. The Fund also benefitted from having a number of companies in which it had positions being taken over at premiums, such as EV 3 Corporation, Micrus Endovascular, and Netezza. While we did have stocks that did not live up to our expectations,--such as HH Gregg, DG FastChannel, Inc., a provider of digital technology services, and Intermune, a biotechnology company which had a negative decision from the FDA on a new product—these positions were not large positions in the Fund.
The portfolio was “procyclical”—which means it was positioned in sectors that could benefit from a recovering economy—for most of the year. We were overweight technology, consumer and energy sectors and increased our weighting in industrials as we moved through the year. We were underweight health-care and underweight financials. While we were “procyclical” with regard to sector weights, our discipline is to focus on companies that have, in our opinion, the strongest earnings prospects, driven in part by secular trends (which we call themes) and also in part by internal events such as strong new product cycles. Companies of this type, we believe, should be able to drive earnings growth despite economic headwinds or mounting concerns over the direction of policy, particularly when these concerns are more global than domestic in nature.
As you know, a thematic overlay is an integral part of our investment approach; we focus on those themes that we believe are secular as opposed to cyclical. While the broad themes we utilize do not change very often, the sub-themes within those broader themes can change more frequently. Within the technology sector, we have focused on several sub-themes of “virtualization—the move to the cloud”; “the second wave of networking”, and “smart phones and tablets take over the world”. While topical, it is important to note that all of these sub-themes, in our opinion, have at their heart a strong positive economic proposition that drives them
| |
ADAMS HARKNESS SMALL CAP GROWTH FUND DECEMBER 31, 2010 |
| |
forward. For cloud computing, which is a general term for anything that involves delivering hosted services over the Internet, it is estimated that the move to the cloud can cut a corporation’s information technology costs in half; for networking—which in the information age is our new infrastructure—demand is driven by the growth of corporations’ businesses; and it is our belief that smart phones and tablets represent another evolution in making technology an integral part of our daily intellectual, emotional, and economic experience—an extension of ourselves, in essence. Within the consumer sector we are focused on a strong value proposition (which does not necessarily mean the cheapest) and the ability to connect with the consumer on an emotional level and provide a differentiated experience. We have similar themes across the industrial, energy and health-care sectors.
It is our belief that this will remain a stockpicker’s market for some time to come. It is our view that overall growth stocks are currently cheap on a price/earnings basis, as investor confidence in that earnings growth is extremely low. Our strategy therefore is to purchase those companies that we believe to be “the best of the best”, given the information we have in hand today. In our experience, while periods such as this one can be frustrating, over time the market tends to be reasonably efficient. We believe as we move through the next 12 months the market will once again begin paying for earnings growth by awarding premium multiples to those companies that can deliver earnings growth at above average rates.
The main risk to our investment strategy would be another significant global recession; while that is always a possibility, we think that possibility is diminished by the fact that all the government banks around the world seem to be dedicated to providing significant liquidity and preventing, to the extent possible, another economic recession. Normally, we would cite an increase in bond yields as presenting a risk. However, given the market’s strong fear of deflation, it does not appear certain to us that a slight rise in interest rates, were it driven by an increase in inflation, would be viewed by the market as a negative event. In regards to specific sectors, we are underweight financials, due to the poor outlook for earnings. We are watching the sector closely and will increas e our weighting if we see the outlook improving. Finally, the risk that is always present is that we pick the wrong stocks. Consqeuently, we remain focused on diligently employing our investment process to mitigate this risk.
Sincerely,
Mary Lisanti, CFA
President & Portfolio Manager
An investment in the Fund is subject to risk, including the possible loss of principal amount invested. Investments in small-sized companies pose greater risks than those typically associated with larger, more established companies such as increased volatility of earnings and prospects, higher failure rates, and limited markets, product lines or financial resources.
The Russell 2000 Growth Index measures the performance of the small-cap growth segment of the U.S. equity universe. It includes those Russell 2000 companies with higher price-to-book ratios and higher forecasted growth values. One cannot invest directly in an index. Price-to-book ratio is used to compare a stock’s market
| |
ADAMS HARKNESS SMALL CAP GROWTH FUND DECEMBER 31, 2010 |
| |
value to its book value. Book Value is the total asset of a company minus total liability. Price to earnings ratio is the valuation of a company’s current share price compared to its per-share earnings.
The views in this report were those of the Fund manager as of December 31, 2010, and may not necessarily reflect her views on the date this report is first published or anytime thereafter. These views are intended to assist shareholders in understanding the Fund’s investment methodology and do not constitute investment advice.
| |
ADAMS HARKNESS SMALL CAP GROWTH FUND DECEMBER 31, 2010 |
| |
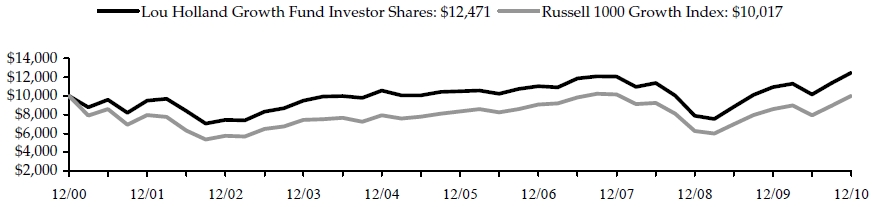
The following chart reflects the change in the value of a hypothetical $10,000 investment, including reinvested dividends and distributions, in the Adams Harkness Small Cap Growth Fund (the “Fund”) compared with the performance of the benchmark Russell 2000 Growth Index ("Russell 2000 Growth"), since inception. The Russell 2000 Growth, the Fund‘s primary performance benchmark, measures the performance of those Russell 2000 Index companies with higher price-to-book ratios and higher forecasted growth values. The total return of the Russell 2000 Growth includes reinvestment of dividends and income. The total return of the Fund includes operating expenses that reduce returns, while the total return of the Russell 2000 Growth does not include expenses. The Fund is professionally managed while the Russell 2 000 Growth is unmanaged and is not available for investment.
Performance data quoted represents past performance and is no guarantee of future results. Current performance may be lower or higher than the performance data quoted. Investment return and principal value will fluctuate so that shares, when redeemed, may be worth more or less than original cost. For the most recent month-end performance please call (800) 441-7031, on the Fund's website at www.ahsmallcap.com. For the most recent month-end performance, please visit the website of the Fund's investment adviser at www.ahsmallcap.com. As stated in the Fund's prospectus, the annual operating expense ratio (gross) is 4.01%. Shares re deemed or exchanged within 30 days of purchase will be charged a 1.00% redemption fee. The performance table and graph do not reflect the deduction of taxes that a shareholder would pay on Fund distributions or the redemption of Fund shares. Returns greater than one year are annualized.
| Average Annual Total Return as of 12/31/10 | One Year | Five Year | Since Inception 2/27/04 |
| Adams Harkness Small Cap Growth Fund | 34.80% | 2.34% | 4.65% |
| Russell 2000 Growth Index | 29.09% | 5.30% | 5.75% |
Investment Value as of 12/31/10
| Adams Harkness Small Cap Growth Fund | $13,651 |
| Russell 2000 Growth Index | $14,664 |
| |
ADAMS HARKNESS SMALL CAP GROWTH FUND SCHEDULE OF INVESTMENTS DECEMBER 31, 2010 |
| |
| Shares | | Security Description | | Value | |
| Common Stock - 94.2% |
| Biotechnology - 3.8% |
| | 3,429 | | Alimera Sciences, Inc. (a) | $ | 35,593 | |
| | 2,997 | | Imris, Inc. (a) | | 17,113 | |
| | 3,350 | | InterMune, Inc. (a) | | 121,940 | |
| | 9,425 | | NPS Pharmaceuticals, Inc. (a) | | 74,457 | |
| | 1,700 | | Onyx Pharmaceuticals, Inc. (a) | | 62,679 | |
| | 3,080 | | Orexigen Therapeutics, Inc. (a) | | 24,886 | |
| | 1,660 | | Pharmasset, Inc. (a) | | 72,061 | |
| | 3,670 | | Theravance, Inc. (a) | | 92,007 | |
| | | 500,736 | |
| Business Services - 4.6% |
| | 835 | | American Public Education, Inc. (a) | | 31,095 | |
| | 3,030 | | Dice Holdings, Inc. (a) | | 43,480 | |
| | 457 | | Heidrick & Struggles International, Inc. | | 13,093 | |
| | 5,885 | | Kenexa Corp. (a) | | 128,234 | |
| | 3,560 | | Kforce, Inc. (a) | | 57,601 | |
| | 2,475 | | Korn/Ferry International (a) | | 57,197 | |
| | 1,570 | | Rackspace Hosting, Inc. (a) | | 49,314 | |
| | 3,985 | | SuccessFactors, Inc. (a) | | 115,406 | |
| | 2,155 | | The Advisory Board Co. (a) | | 102,643 | |
| | | 598,063 | |
| Chemicals - 2.1% |
| | 6,630 | | Polypore International, Inc. (a) | | 270,040 | |
| | | | | | | |
| Communications Equipment - 5.0% |
| | 5,680 | | Acme Packet, Inc. (a) | | 301,949 | |
| | 4,900 | | Aruba Networks, Inc. (a) | | 102,312 | |
| | 9,100 | | Ixia (a) | | 152,698 | |
| | 2,755 | | Riverbed Technology, Inc. (a) | | 96,893 | |
| | | 653,852 | |
| Consumer Discretionary - 10.4% |
| | 3,225 | | BJ's Restaurants, Inc. (a) | | 114,262 | |
| | 8,135 | | Bravo Brio Restaurant Group, Inc. (a) | | 155,948 | |
| | 5,210 | | CROCS, Inc. (a) | | 89,195 | |
| | 1,070 | | Deckers Outdoor Corp. (a) | | 85,322 | |
| | 1,405 | | Hibbett Sports, Inc. (a) | | 51,844 | |
| | 16,725 | | Krispy Kreme Doughnuts, Inc. (a) | | 116,740 | |
| | 1,340 | | Lululemon Athletica, Inc. (a) | | 91,683 | |
| | 895 | | OpenTable, Inc. (a) | | 63,079 | |
| | 5,830 | | Pinnacle Entertainment, Inc. (a) | | 81,737 | |
| | 4,690 | | Saks, Inc. (a) | | 50,183 | |
| | 2,554 | | Shutterfly, Inc. (a) | | 89,467 | |
| | 1,265 | | Steven Madden, Ltd. (a) | | 52,776 | |
| | 3,420 | | Texas Roadhouse, Inc. (a) | | 58,721 | |
| | 1,535 | | The Buckle, Inc. | | 57,977 | |
| | 8,060 | | THQ, Inc. (a) | | 48,844 | |
| | 4,615 | | Vera Bradley, Inc. (a) | | 152,295 | |
| | | 1,360,073 | |
| Consumer Retail - 4.8% |
| | 6,135 | | AnnTaylor Stores Corp. (a) | | 168,038 | |
| | 4,565 | | Chico's FAS, Inc. | | 54,917 | |
| | 3,325 | | Ulta Salon Cosmetics & Fragrance, Inc. (a) | | 113,050 | |
| | 3,835 | | Vitamin Shoppe, Inc. (a) | | 129,009 | |
| | 5,990 | | Zumiez, Inc. (a) | | 160,951 | |
| | | 625,965 | |
| Consumer Services - 1.4% |
| | 3,220 | | Ancestry.com, Inc. (a) | | 91,190 | |
| | 1,450 | | MWI Veterinary Supply, Inc. (a) | | 91,568 | |
| | | 182,758 | |
| Consumer Staples - 0.8% |
| | 8,025 | | SunOpta, Inc. (a) | | 62,756 | |
| | 880 | | The Fresh Market, Inc. (a) | | 36,256 | |
| | | 99,012 | |
| Energy - 10.3% |
| | 5,895 | | Approach Resources, Inc. (a) | | 136,174 | |
| | 5,790 | | Basic Energy Services, Inc. (a) | | 95,419 | |
| | 9,290 | | Brigham Exploration Co. (a) | | 253,060 | |
| | 4,130 | | Carrizo Oil & Gas, Inc. (a) | | 142,444 | |
| | 7,200 | | Complete Production Services, Inc. (a) | | 212,760 | |
| | 2,380 | | Lufkin Industries, Inc. | | 148,488 | |
| | 3,895 | | Northern Oil and Gas, Inc. (a) | | 105,983 | |
| | 4,930 | | Oasis Petroleum, Inc. (a) | | 133,702 | |
| | 2,880 | | Rosetta Resources, Inc. (a) | | 108,403 | |
| | | 1,336,433 | |
| Financial Services - 3.1% |
| | 4,695 | | Cardtronics, Inc. (a) | | 83,102 | |
| | 4,515 | | Dollar Financial Corp. (a) | | 129,264 | |
| | 6,941 | | Envestnet, Inc. (a) | | 118,413 | |
| | 1,300 | | Green Dot Corp., Class A (a) | | 73,762 | |
| | | 404,541 | |
| Health-Care - 5.7% |
| | 4,450 | | Cepheid, Inc. (a) | | 101,237 | |
| | 2,225 | | Cyberonics, Inc. (a) | | 69,020 | |
| | 4,930 | | DexCom, Inc. (a) | | 67,295 | |
| | 1,720 | | HeartWare International, Inc. (a) | | 150,620 | |
| | 4,180 | | MAKO Surgical Corp. (a) | | 63,620 | |
| | 4,420 | | Volcano Corp. (a) | | 120,710 | |
| | 4,486 | | Zoll Medical Corp. (a) | | 167,014 | |
| | | 739,516 | |
| Health-Care Services - 6.6% |
| | 1,355 | | athenahealth, Inc. (a) | | 55,528 | |
| | 2,685 | | Catalyst Health Solutions, Inc. (a) | | 124,826 | |
| | 1,020 | | Healthspring, Inc. (a) | | 27,061 | |
| | 1,830 | | HMS Holdings Corp. (a) | | 118,529 | |
| See Notes to Financial Statements. | 5 | |
| |
ADAMS HARKNESS SMALL CAP GROWTH FUND SCHEDULE OF INVESTMENTS DECEMBER 31, 2010 |
| |
| Shares | | Security Description | | Value | |
| | 5,194 | | Medidata Solutions, Inc. (a) | $ | 124,033 | |
| | 3,750 | | Nektar Therapeutics (a) | | 48,187 | |
| | 9,380 | | NxStage Medical, Inc. (a) | | 233,374 | |
| | 2,615 | | Salix Pharmaceuticals, Ltd. (a) | | 122,800 | |
| | | 854,338 | |
| Industrials - 9.3% |
| | 2,605 | | Ameresco, Inc., Class A (a) | | 37,408 | |
| | 4,425 | | American Axle & Manufacturing Holdings, Inc. (a) | | 56,906 | |
| | 2,825 | | ArvinMeritor, Inc. (a) | | 57,969 | |
| | 11,100 | | Commercial Vehicle Group, Inc. (a) | | 180,375 | |
| | 6,315 | | Daktronics, Inc. | | 100,535 | |
| | 4,050 | | FleetCor Technologies, Inc. (a) | | 125,226 | |
| | 7,055 | | Globe Specialty Metals, Inc. | | 120,570 | |
| | 2,815 | | GrafTech International, Ltd. (a) | | 55,850 | |
| | 1,421 | | Haynes International, Inc. | | 59,440 | |
| | 1,075 | | HEICO Corp. | | 54,857 | |
| | 3,510 | | Maxwell Technologies, Inc. (a) | | 66,304 | |
| | 1,340 | | Portfolio Recovery Associates, Inc. (a) | | 100,768 | |
| | 2,350 | | Rush Enterprises, Inc. (a) | | 48,034 | |
| | 799 | | Stoneridge, Inc. (a) | | 12,616 | |
| | 3,925 | | Titan International, Inc. | | 76,694 | |
| | 5,140 | | Wabash National Corp. (a) | | 60,909 | |
| | | 1,214,461 | |
| Materials - 2.4% |
| | 11,910 | | Horsehead Holding Corp. (a) | | 155,306 | |
| | 2,800 | | Kronos Worldwide, Inc. | | 118,972 | |
| | 915 | | Rockwood Holdings, Inc. (a) | | 35,795 | |
| | | 310,073 | |
| Semiconductors and Semiconductor Equipment - 1.4% |
| | 4,715 | | Cavium Networks, Inc. (a) | | 177,661 | |
| Software - 5.0% |
| | 5,940 | | Ariba, Inc. (a) | | 139,531 | |
| | 5,655 | | BroadSoft, Inc. (a) | | 135,041 | |
| | 3,770 | | LogMeIn, Inc. (a) | | 167,162 | |
| | 2,535 | | TIBCO Software, Inc. (a) | | 49,965 | |
| | 3,335 | | Ultimate Software Group, Inc. (a) | | 162,181 | |
| | | 653,880 | |
| Technology - 17.5% |
| | 17,320 | | Anadigics, Inc. (a) | | 120,028 | |
| | 4,620 | | Aspen Technology, Inc. (a) | | 58,697 | |
| | 3,540 | | Atheros Communications, Inc. (a) | | 127,157 | |
| | 3,820 | | Calix, Inc. (a) | | 64,558 | |
| | 1,840 | | CommVault Systems, Inc. (a) | | 52,661 | |
| | 2,235 | | comScore, Inc. (a) | | 49,863 | |
| | 5,795 | | Cypress Semiconductor Corp. (a) | | 107,671 | |
| | 10,655 | | Entropic Communications, Inc. (a) | | 128,712 | |
| | 5,554 | | Finisar Corp. (a) | | 164,898 | |
| | 5,010 | | Fortinet, Inc. (a) | | 162,073 | |
| | 6,175 | | IntraLinks Holdings, Inc. (a) | | 115,534 | |
| | 2,565 | | Microsemi Corp. (a) | | 58,739 | |
| | 4,124 | | Motricity, Inc. (a) | | 76,583 | |
| | 3,525 | | Netlogic Microsystems, Inc. (a) | | 110,720 | |
| | 4,675 | | NetSuite, Inc. (a) | | 116,875 | |
| | 3,385 | | Newport Corp. (a) | | 58,797 | |
| | 3,895 | | Omnivision Technologies, Inc. (a) | | 115,331 | |
| | 1,850 | | Opnet Technologies, Inc. | | 49,525 | |
| | 2,285 | | QLIK Technologies, Inc. (a) | | 58,976 | |
| | 3,270 | | RealD, Inc. (a) | | 84,758 | |
| | 8,080 | | RF Micro Devices, Inc. (a) | | 59,388 | |
| | 2,135 | | SAVVIS, Inc. (a) | | 54,485 | |
| | 2,680 | | SemiLEDs Corp. (a) | | 77,854 | |
| | 6,275 | | Sierra Wireless, Inc. (a) | | 93,623 | |
| | 4,495 | | TriQuint Semiconductor, Inc. (a) | | 52,547 | |
| | 3,550 | | ValueClick, Inc. (a) | | 56,907 | |
| | | 2,276,960 | |
Total Common Stock (Cost $10,128,967) | | 12,258,362 | |
Total Investments - 94.2% (Cost $10,128,967)* | $ | 12,258,362 | |
| Other Assets & Liabilities, Net – 5.8% | | 748,937 | |
| Net Assets – 100.0% | $ | 13,007,299 | |
| (a) | Non-income producing security. |
| | *Cost of investments for federal income tax purposes is $10,186,752 and net unrealized appreciation on investments consists of: |
| Gross Unrealized Appreciation | | $ | 2,165,818 | |
| Gross Unrealized Depreciation | | | (94,208 | ) |
| Net Unrealized Appreciation | | $ | 2,071,610 | |
| See Notes to Financial Statements. | 6 | |
| |
ADAMS HARKNESS SMALL CAP GROWTH FUND SCHEDULE OF INVESTMENTS DECEMBER 31, 2010 |
| |
The following is a summary of the inputs used to value the Fund’s investments as of December 31, 2010.
The inputs or methodology used for valuing securities are not necessarily an indication of the risk associated with investing in those securities. For more information on valuation inputs, and their aggregation into the levels used in the tables below, please refer to Note 2 - Security Valuation section in the accompanying Notes to Financial Statements.
| Valuation Inputs | | Investments in Securities |
| Level 1 – Quoted Prices | | $ | 12,258,362 |
| Level 2 – Other Significant Observable Inputs | | | – |
| Level 3 – Significant Unobservable Inputs | | | – |
| Total Investments | | $ | 12,258,362 |
The Level 1 inputs displayed in this table are Common Stock. Refer to the Schedule of Investments for a further breakout of each security by type.
| PORTFOLIO HOLDINGS | | |
| % of Total Investments | | |
| | | |
| Biotechnology | 4.1 | % |
| Business Services | 4.9 | % |
| Chemicals | 2.2 | % |
| Communications Equipment | 5.3 | % |
| Consumer Discretionary | 11.1 | % |
| Consumer Retail | 5.1 | % |
| Consumer Services | 1.5 | % |
| Consumer Staples | 0.8 | % |
| Energy | 10.9 | % |
| Financial Services | 3.3 | % |
| Health-Care | 6.0 | % |
| Health-Care Services | 7.0 | % |
| Industrials | 9.9 | % |
| Materials | 2.5 | % |
| Semiconductors and Semiconductor Equipment | 1.5 | % |
| Software | 5.3 | % |
| Technology | 18.6 | % |
| | 100.0 | % |
| See Notes to Financial Statements. | 7 | |
|
ADAMS HARKNESS SMALL CAP GROWTH FUND STATEMENT OF ASSETS AND LIABILITIES DECEMBER 31, 2010 |
| |
| | | | | | | |
| ASSETS | | | | |
| | Total investments, at value (Cost $10,128,967) | | $ | 12,258,362 | |
| | Cash | | | 378,348 | |
| | Receivables: | | | | |
| | | Fund shares sold | | | 396,698 | |
| | | Dividends and interest | | | 68 | |
| | Prepaid expenses | | | 12,030 | |
| Total Assets | | | 13,045,506 | |
| | | | | | | |
| LIABILITIES | | | | |
| | Accrued Liabilities: | | | | |
| | Investment adviser fees | | | 2,564 | |
| | | Trustees’ fees and expenses | | | 7 | |
| | | Fund service fees | | | 3,314 | |
| | | Compliance services fees | | | 2,083 | |
| | | Other expenses | | | 30,239 | |
| Total Liabilities | | | 38,207 | |
| | | | | | | |
| NET ASSETS | | $ | 13,007,299 | |
| | | | | | | |
| COMPONENTS OF NET ASSETS | | | | |
| | Paid-in capital | | $ | 14,464,318 | |
| | Accumulated net realized loss | | | (3,586,414 | ) |
| | Net unrealized appreciation | | | 2,129,395 | |
| NET ASSETS | | $ | 13,007,299 | |
| SHARES OF BENEFICIAL INTEREST AT NO PAR VALUE (UNLIMITED SHARES AUTHORIZED) | | | 1,032,881 | |
| NET ASSET VALUE, OFFERING AND REDEMPTION PRICE* PER SHARE | | $ | 12.59 | |
| * | Shares redeemed or exchanged within 30 days of purchase are charged a 1.00% redemption fee. | | | | |
| See Notes to Financial Statements. | 8 | |
| |
ADAMS HARKNESS SMALL CAP GROWTH FUND STATEMENT OF OPERATIONS YEAR ENDED DECEMBER 31, 2010 |
| |
| | | | | | | | |
| INVESTMENT INCOME | | | | | |
| | Dividend income | | $ | 10,428 | | |
| | Interest income | | | 554 | | |
| Total Investment Income | | | 10,982 | | |
| EXPENSES | | | | | |
| | Investment adviser fees | | | 118,784 | | |
| | Fund service fees | | | 148,797 | | |
| | Shareholder service fees | | | 29,696 | | |
| | Custodian fees | | | 4,682 | | |
| | Registration fees | | | 17,552 | | |
| | Professional fees | | | 55,722 | | |
| | Trustees’ fees and expenses | | | 404 | | |
| | Compliance services fees | | | 28,001 | | |
| | Miscellaneous expenses | | | 27,038 | | |
| Total Expenses | | | 430,676 | | |
| | Fees waived | | | (152,329 | ) | |
| Net Expenses | | | 278,347 | | |
| | | | | | | | |
| NET INVESTMENT LOSS | | | (267,365 | ) | |
| | | | | | | | |
| NET REALIZED AND UNREALIZED GAIN | | | | | |
| | Net realized gain on investments | | | 3,437,945 | | |
| | Net change in unrealized appreciation (depreciation) on investments | | | 92,228 | | |
| NET REALIZED AND UNREALIZED GAIN | | | 3,530,173 | | |
| INCREASE IN NET ASSETS FROM OPERATIONS | | $ | 3,262,808 | | |
| | | | | | | | |
| See Notes to Financial Statements. | 9 | |
| |
ADAMS HARKNESS SMALL CAP GROWTH FUND STATEMENT OF CHANGES IN NET ASSETS |
| |
| | | | | For the Year Ended December 31, 2010 | | | For the Year Ended December 31, 2009 | |
| OPERATIONS | | | | | | | | | | |
| | Net investment loss | | $ | (267,365 | ) | | | $ | (353,995 | ) | |
| | Net realized gain | | | 3,437,945 | | | | | 1,230,533 | | |
| | Net change in unrealized appreciation (depreciation) | | | 92,228 | | | | | 1,170,832 | | |
| Increase in Net Assets Resulting from Operations | | | 3,262,808 | | | | | 2,047,370 | | |
| | | | | | | | | | | | | |
| CAPITAL SHARE TRANSACTIONS | | | | | | | | | | |
| | Sale of shares | | | 3,348,366 | | | | | 1,667,229 | | |
| | Redemption of shares | | | (6,007,810 | ) | | | | (5,288,742 | ) | |
| | Redemption fees | | | 387 | | | | | 40 | | |
| Decrease in Net Assets from Capital Share Transactions | | | (2,659,057 | ) | | | | (3,621,473 | ) | |
| Increase (Decrease) in Net Assets | | | 603,751 | | | | | (1,574,103 | ) | |
| | | | | | | | | | | | | |
| NET ASSETS | | | | | | | | | | |
| | Beginning of Year | | | 12,403,548 | | | | | 13,977,651 | | |
| | End of Year | | $ | 13,007,299 | | | | $ | 12,403,548 | | |
| | | | | | | | | | | | | |
| SHARE TRANSACTIONS | | | | | | | | | | |
| | Sale of shares | | | 305,740 | | | | | 223,978 | | |
| | Redemption of shares | | | (600,337 | ) | | | | (714,991 | ) | |
| Decrease in Shares | | | (294,597 | ) | | | | (491,013 | ) | |
| | | | | | | | | | | | | |
| See Notes to Financial Statements. | 10 | |
| |
ADAMS HARKNESS SMALL CAP GROWTH FUND FINANCIAL HIGHLIGHTS |
| |
These financial highlights reflect selected data for a share outstanding throughout each year.
| | | | | | | |
| | | For the Years Ended December 31, | |
| | | 2010 | | 2009 | | 2008 | | 2007 | | 2006 | |
| | | | | | | | | | | | | | | | | | | | | |
| NET ASSET VALUE, Beginning of Year | $ | 9.34 | | | $ | 7.69 | | | $ | 14.38 | | | $ | 12.36 | | | $ | 12.03 | | |
| INVESTMENT OPERATIONS | | | | | | | | | | | | | | | | | | | | |
| Net investment loss (a) | | (0.23 | ) | | | (0.23 | ) | | | (0.19 | ) | | | (0.23 | ) | | | (0.18 | ) | |
| Net realized and unrealized gain (loss) | | 3.48 | | | | 1.88 | | | | (6.23 | ) | | | 2.77 | | | | 0.51 | (d) |
| Total from Investment Operations | | 3.25 | | | | 1.65 | | | | (6.42 | ) | | | 2.54 | | | | 0.33 | | |
| DISTRIBUTIONS TO | | | | | | | | | | | | | | | | | | | | |
| SHAREHOLDERS FROM | | | | | | | | | | | | | | | | | | | | |
| Net realized gain | | — | | | | — | | | | (0.27 | ) | | | (0.52 | ) | | | — | | |
| REDEMPTION FEES (a) | | — | (b) | — | (b) | — | (b) | — | (b) | | — | (b) |
| NET ASSET VALUE, End of Year | $ | 12.59 | | | $ | 9.34 | | | $ | 7.69 | | | $ | 14.38 | | | $ | 12.36 | | |
| TOTAL RETURN | | 34.80 | % | | 21.46 | % | | (44.63 | )% | | 20.54 | % | | 2.74 | % |
| RATIOS/SUPPLEMENTARY DATA | | | | | | | | | | | | | | | | | | | | |
| Net Assets at End of Year (000's omitted) | $13,007 | | | $12,404 | | | $13,978 | | | $28,505 | | | $27,212 | | |
| Ratios to Average Net Assets: | | | | | | | | | | | | | | | | | | | | |
| Net investment loss | | (2.25 | )% | | (2.97 | )% | | (1.68 | )% | | (1.70 | )% | | (1.41 | )% |
| Net expense | | 2.34 | % | | 3.08 | % | | 1.90 | % | | 1.82 | % | | 1.65 | % |
| Gross expense (c) | | 3.63 | % | | 4.01 | % | | 2.78 | % | | 2.36 | % | | 2.65 | % |
| PORTFOLIO TURNOVER RATE | | 319 | % | | 381 | % | | 521 | % | | 380 | % | | 497 | % |
| | | | | | | | | | | | | | | | | | | | | | |
| (a) | Calculated based on average shares outstanding during the year. |
| (b) | Less than $0.01 per share. |
| (c) | Reflects the expense ratio excluding any waivers or reimbursements. |
| (d) | Per share amount does not reflect the actual net realized and unrealized gain/loss for the period because of the timing of sales of the Fund shares and the amount of per share realized and unrealized gains and losses at such time. |
| See Notes to Financial Statements. | 11 | |
|
ADAMS HARKNESS SMALL CAP GROWTH FUND NOTES TO FINANCIAL STATEMENTS DECEMBER 31, 2010 |
| |
Note 1. Organization
The Adams Harkness Small Cap Growth Fund (the “Fund”) is a diversified portfolio of Forum Funds (the “Trust”). The Trust is a Delaware statutory trust that is registered as an open-end, management investment company under the Investment Company Act of 1940 (the “Act”), as amended. Under its Trust Instrument, the Trust is authorized to issue an unlimited number of the Fund’s shares of beneficial interest without par value. The Fund commenced operations on February 27, 2004. The Fund seeks to maximize capital appreciation.
Note 2. Summary of Significant Accounting Policies
These financial statements are prepared in accordance with generally accepted accounting principles in the United States of America (“GAAP”), which require management to make estimates and assumptions that affect the reported amounts of assets and liabilities, the disclosure of contingent liabilities at the date of the financial statements, and the reported amounts of increase and decrease in net assets from operations during the fiscal year. Actual amounts could differ from those estimates. The following summarizes the significant accounting policies of the Fund:
Security Valuation – Exchange-traded securities and over-the-counter securities are valued using the last quoted sale or official closing price, provided by independent pricing services as of the close of trading on the market or exchange for which they are primarily traded, on each Fund business day. In the absence of a sale, such securities are valued at the mean of the last bid and ask price provided by independent pricing services. Non-exchange traded securities for which quotations are available are valued using the last quoted sales price, or in the absence of a sale at the mean of the last bid and ask prices provided by independent pricing servi ces. Shares of open-end mutual funds are valued at net asset value (“NAV”). Short-term investments that mature in sixty days or less may be valued at amortized cost.
The Fund values its investments at fair value pursuant to procedures adopted by the Trust's Board of Trustees (the "Board") if (1) market quotations are insufficient or not readily available or (2) the adviser believes that the values available are unreliable. Fair valuation is based on subjective factors and as a result, the fair value price of an investment may differ from the security’s market price and may not be the price at which the asset may be sold. Fair valuation could result in a different NAV than a NAV determined by using market quotes.
The Fund has a three-tier fair value hierarchy. The basis of the tiers is dependent upon the various “inputs” used to determine the value of the Fund’s investments. These inputs are summarized in the three broad levels listed below:
Level 1 — quoted prices in active markets for identical assets
Level 2 — other significant observable inputs (including quoted prices of similar securities, interest rates, prepayment speeds, credit risk, etc.)
Level 3 — significant unobservable inputs (including the Fund’s own assumptions in determining the fair value
|
ADAMS HARKNESS SMALL CAP GROWTH FUND NOTES TO FINANCIAL STATEMENTS DECEMBER 31, 2010 |
| |
of investments)
The aggregate value by input level, as of December 31, 2010, for the Fund’s investments is included at the end of the Fund’s Schedule of Investments.
Security Transactions, Investment Income and Realized Gain and Loss – Investment transactions are accounted for on the trade date. Dividend income is recorded on the ex-dividend date. Foreign dividend income is recorded on the ex-dividend date or as soon as possible after the Fund determines the existence of a dividend declaration after exercising reasonable due diligence. Income and capital gains on some foreign securities may be subject to foreign withholding taxes, which are accrued as applicable. Interest income is recorded on an accrual basis. Premium and discount is amortized and accreted in accordance with GAAP. Identified cost of investments so ld is used to determine the gain and loss for both financial statement and federal income tax purposes.
Distributions to Shareholders – Distributions to shareholders of net investment income, if any, are declared and paid at least quarterly. Distributions to shareholders of net capital gains, if any, are declared and paid annually. Distributions are based on amounts calculated in accordance with applicable federal income tax regulations, which may differ from GAAP. These differences are due primarily to differing treatments of income and gain on various investment securities held by the Fund, timing differences and differing characterizations of distributions made by the Fund.
Federal Taxes – The Fund intends to qualify each year as a regulated investment company under Subchapter M of the Internal Revenue Code and distribute all of its taxable income to shareholders. In addition, by distributing in each calendar year substantially all its net investment income and capital gains, if any, the Fund will not be subject to a federal excise tax. Therefore, no federal income or excise tax provision is required.
As of December 31, 2010, there are no uncertain tax positions that would require financial statement recognition, de-recognition, or disclosure. The Fund’s federal tax returns filed in the three-year period ended December 31, 2010, remain subject to examination by the Internal Revenue Service.
Income and Expense Allocation – The Trust accounts separately for the assets, liabilities and operations of each of its investment portfolios. Expenses that are directly attributable to more than one investment portfolio are allocated among the respective investment portfolios in an equitable manner.
Commitments and Contingencies – In the normal course of business, the Fund enters into contracts that provide general indemnifications by the Fund to the counterparty to the contract. The Fund’s maximum exposure under these arrangements is dependent on future claims that may be made against the Fund and, therefore, cannot be estimated; however, based on experience, the risk of loss from such claims is considered remote.
Redemption Fees – A shareholder who redeems or exchanges shares within 30 days of purchase will incur a redemption fee of 1.00% of the current net asset value of shares redeemed or exchanged, subject to certain
|
ADAMS HARKNESS SMALL CAP GROWTH FUND NOTES TO FINANCIAL STATEMENTS DECEMBER 31, 2010 |
| |
limitations. The fee is charged for the benefit of the remaining shareholders and will be paid to the Fund to help offset transaction costs. The fee is accounted for as an addition to paid-in capital. The Fund reserves the right to modify the terms of or terminate the fee at any time. There are limited exceptions to the imposition of the redemption fee.
Note 3. Advisory Fees, Servicing Fees and Other Transactions
Investment Adviser – AH Lisanti Capital Growth, LLC (the “Adviser”) is the investment adviser to the Fund. Pursuant to an investment advisory agreement, the Adviser receives an advisory fee from the Fund at an annual rate of 1.00% of the Fund’s average daily net assets.
Shareholder Service Plan – The Trust has adopted a shareholder service plan for the Fund under which the Fund may reimburse the Fund’s administrator for amounts paid by the administrator for providing shareholder service activities that are not otherwise provided by the Transfer Agent. The Fund’s administrator may make such payments to various financial institutions, including the Adviser, that provide shareholder servicing to their customers invested in the Fund in amounts of up to 0.25% annually of the average daily net assets of the shares held by such customers.
Distribution – Foreside Fund Services, LLC serves as the Fund’s distributor (the “Distributor”). The Distributor receives no compensation from the Fund for its distribution services. The Distributor is not affiliated with the Adviser or Atlantic Fund Administration, LLC (d/b/a Atlantic Fund Services) (“Atlantic”) or their affiliates.
Other Service Providers – Atlantic provides fund accounting, fund administration, and transfer agency services to the Fund. Atlantic also provides certain shareholder report production, and EDGAR conversion and filing services. Pursuant to an Atlantic services agreement, the Fund pays Atlantic customary fees for its services. Atlantic provides a Principal Executive Officer, a Principal Financial Officer, a Chief Compliance Officer, and an Anti-Money Laundering Officer to the Fund, as well as certain additional compliance support functions.
Trustees and Officers – The Trust pays each independent Trustee an annual retainer fee of $40,000 for service to the Trust ($60,000 for the Chairman). In addition, the Chairman receives a monthly stipend of $500 to cover certain expenses incurred in connection with his duties to the Trust. The Trustees and Chairman may receive additional fees for special Board meetings. Each Trustee is also reimbursed for all reasonable out-of-pocket expenses incurred in connection with his duties as a Trustee, including travel and related expenses incurred in attending Board meetings. The amount of Trustees’ fees attri butable to the Fund is disclosed in the Statement of Operations. Certain officers of the Trust are also officers or employees of the above named service providers, and during their terms of office received no compensation from the Fund.
|
ADAMS HARKNESS SMALL CAP GROWTH FUND NOTES TO FINANCIAL STATEMENTS DECEMBER 31, 2010 |
| |
Note 4. Fees Waived
During the period, certain Fund service providers have voluntarily agreed to waive a portion of their fees. Effective July 1, 2010, the Fund’s Adviser has voluntarily agreed to waive a portion of its fees and/or reimburse expenses so to cap the expense ratio at 1.80%. These voluntary waivers may be reduced or eliminated at any time. For the fiscal year ended December 31, 2010, fees waived were as follows:
| Adviser Fees Waived | | Fund Service Fees Waived | | Compliance Service Fees Waived | | Total Fees Waived |
| $43,114 | | $106,436 | | $2,779 | | $152,329 |
Note 5. Security Transactions
The cost of purchases and proceeds from sales of investment securities (including maturities), other than short-term investments for the fiscal year ended December 31, 2010, were $37,364,205 and $40,943,637, respectively.
Note 6. Federal Income Tax and Investment Transactions
As of December 31, 2010, distributable earnings (accumulated losses) on a tax basis were as follows:
| Unrealized Appreciation | | $ | 2,071,610 | |
| Capital Losses | | | (3,528,629 | ) |
| Total | | $ | (1,457,019 | ) |
The difference between components of distributable earnings on a tax basis and the amounts reflected in the Statement of Assets and Liabilities are primarily due to wash sales.
As of December 31, 2010, the Fund had capital loss carryforwards to offset future capital gains of $712,424 and $2,816,205, expiring in 2016 and 2017, respectively.
On the Statement of Assets and Liabilities, as a result of permanent book to tax differences, certain amounts have been reclassified for the year ended December 31, 2010. The following reclassification was the result of net operating losses and has no impact on the net assets of the Fund.
| Accumulated Net Investment Income (Loss) | | $ | 267,365 |
| Paid-in-Capital | | | (267,365) |
|
ADAMS HARKNESS SMALL CAP GROWTH FUND NOTES TO FINANCIAL STATEMENTS DECEMBER 31, 2010 |
| |
Note 7. Recent Accounting Pronouncements
In January 2010, the Financial Accounting Standards Board issued Accounting Standards Update (“ASU”) No. 2010-06 “Improving Disclosures about Fair Value Measurements.” ASU No. 2010-06 clarifies existing disclosure and requires additional disclosures regarding fair value measurements. Effective for fiscal years beginning after December 15, 2010, and for interim periods within those fiscal years, entities will need to disclose information about purchases, sales, issuances and settlements of Level 3 securities on a gross basis, rather than as a net number as currently required. Management is currently evaluating the impact ASU No. 2010-06 will have on financial statement disclosures.
Note 8. Subsequent Events
Subsequent events occurring after the date of this report through the date these financial statements were issued have been evaluated for potential impact and the Fund has had no such events.
|
REPORT OF INDEPENDENT PUBLIC ACCOUNTING FIRM |
| |
To the Board of Trustees of Forum Funds
and the Shareholders of Adams Harkness Small Cap Growth Fund
We have audited the accompanying statement of assets and liabilities of Adams Harkness Small Cap Growth Fund (the “Fund”), a series of shares of beneficial interest in the Forum Funds, including the schedule of investments, as of December 31, 2010, and the related statement of operations for the year then ended, the statements of changes in net assets for each of the years in the two year period then ended, and the financial highlights for each of the years in the three year period then ended. These financial statements and financial highlights are the responsibility of the Fund's management. Our responsibility is to express an opinion on these financial statements and financial highlights based on our audits. The financial highlights for each of the years in the two-year period ended December 31, 2007 were audited by other auditors whose report dated February 26, 2008, expressed an unqualified opinion on such financial highlights.
We conducted our audits in accordance with the standards of the Public Company Accounting Oversight Board (United States). Those standards require that we plan and perform the audits to obtain reasonable assurance about whether the financial statements and financial highlights are free of material misstatement. An audit includes examining, on a test basis, evidence supporting the amounts and disclosures in the financial statements. Our procedures included confirmation of securities owned as of December 31, 2010 by correspondence with the custodian. An audit also includes assessing the accounting principles used and significant estimates made by management, as well as evaluating the overall financial statement presentation. We believe that our audits provide a reason able basis for our opinion.
In our opinion, the financial statements and financial highlights referred to above present fairly, in all material respects, the financial position of Adams Harkness Small Cap Growth Fund as of December 31, 2010, the results of its operations for the year then ended, the changes in its net assets for each of the years in the two year period then ended and its financial highlights for each of the years in the three year period then ended, in conformity with accounting principles generally accepted in the United States of America.
&# 160; 
BBD, LLP
Philadelphia, Pennsylvania
February 18, 2011
|
ADAMS HARKNESS SMALL CAP GROWTH FUND ADDITIONAL INFORMATION (Unaudited) DECEMBER 31, 2010 |
| |
Investment Advisory Agreement Approval
At the September 10, 2010 Board meeting, the Board, including the Independent Trustees, considered the approval of the continuance of the investment advisory agreement pertaining to the Fund (the “Advisory Agreement”). In evaluating the Advisory Agreement, the Board reviewed materials furnished by the Adviser and the administrator, including information regarding the Adviser, its personnel, operations and financial condition. Specifically, the Board considered, among other matters: (1) the nature, extent and quality of the services to be provided to the Fund by the Adviser, including information on the investment performance of the Adviser; (2) the costs of the services to be provided and profitability to the Adviser with respect to its relationship with the Fund; (3) the advisory fee a nd total expense ratio of the Fund compared to relevant peer groups of funds; (4) the extent to which economies of scale would be realized as the Fund grows and whether the advisory fee would enable the Fund’s investors to share in the benefits of economies of scale; and (5) other benefits received by the Adviser from its relationship with the Fund. In their deliberations, the Board did not identify any particular information that was all-important or controlling and attributed different weights to the various factors. In particular, the Board focused on the factors discussed below.
Nature, Extent and Quality of Services
Based on a presentation from senior representatives of the Adviser and a discussion of the Adviser’s personnel, operations and financial condition, the Board considered the quality of services to be provided by the Adviser under the Advisory Agreement. In this regard, the Board considered information regarding the experience, qualifications and professional background of the portfolio managers and other personnel at the Adviser with principal investment responsibility for the Fund’s investments as well as the investment philosophy and decision-making processes of those professionals and the capability and integrity of the Adviser’s senior management and staff. The Board considered the adequacy of the Adviser’s resources and quality of services provided by the Adviser under t he Advisory Agreement between the Trust and the Adviser. The Board also considered the quality of the Adviser’s services with respect to regulatory compliance and compliance with client investment policies and restrictions as well as the financial condition and operational stability of the Adviser. The Board noted the Adviser’s representation that the firm is financially stable and able to provide investment advisory services to the Fund. The Board concluded that, overall, it was satisfied with the nature, extent and quality of services to be provided to the Fund under the Advisory Agreement.
Costs of Services and Profitability
The Board considered information provided by the Adviser regarding its costs of services and its profitability with respect to the Fund. The Board also considered the Adviser’s resources devoted to the Fund as well as the Adviser’s discussion of costs and profitability. Based on the foregoing and all other relevant facts, the Board concluded that the Adviser’s profits attributable to management of the Fund were not excessive in light of the services provided by the Adviser on behalf of the Fund.
Performance
The Board reviewed performance of the Fund and the Adviser’s discussion of its investment philosophy. The
|
ADAMS HARKNESS SMALL CAP GROWTH FUND ADDITIONAL INFORMATION (Unaudited) DECEMBER 31, 2010 |
| |
Board noted that the Fund underperformed its benchmark for the 1-year period but outperformed its benchmark for the quarter ended June 30, 2010. The Board concluded that the Fund’s performance was reasonable relative to its peers and benchmark and that the Fund and its shareholders could benefit from the Adviser’s management of the Fund.
Compensation
The Board considered the Adviser’s compensation for providing advisory services to the Fund and analyzed comparative information on fee rates, expenses and performance of similar mutual funds. The Board noted that the Adviser’s actual total expenses were the lowest of its Lipper Inc. peer group. The Board noted that the Adviser’s actual advisory fee rate was higher than the median advisory fee rate of its Lipper Inc. peer group. The Board also noted that the Fund’s actual total expense ratio was 1.23% above the median of its Lipper Inc. peer groups. The Board noted that the median actual total expense ratio of the Fund’s Lipper Inc. peer group was 1.85% and considered the Adviser’s representation that it plans to continue to limit, on a volu ntary basis, expenses of the Fund to 1.80%. The Board recognized that it was difficult to compare expense ratios because of variations between the services to be provided by the Adviser and by advisers within the Fund’s Lipper Inc. peer group funds. Based on the foregoing and on all of the information presented, the Board concluded that the Adviser’s advisory fee charged to the Fund was reasonable.
Economies of Scale
The Board considered whether the Fund would benefit from any economies of scale. The Board noted the Adviser’s representation that in the future it may experience economies of scale in connection with the provision of services to the Fund, but is not proposing breakpoints or changes in fees based on economies of scale at this time. Based on, among other things, the size of the Fund, the Board concluded that it would not be necessary to consider the implementation of fee breakpoints at this time.
Other Benefits
The Board noted the Adviser’s representation that the Adviser does not expect to receive any kind of benefit or compensation from its relationship with the Fund, other than its contractual advisory fees. Based on the foregoing representation, the Board concluded that other benefits received by the Adviser from its relationship with the Fund were not a material factor to consider in approving the continuation of the Advisory Agreement.
Conclusion
The Board reviewed a memorandum from Trust Counsel discussing the legal standards applicable to its consideration of the Advisory Agreement. Based on its review, including consideration of each of the factors referenced above, the Board determined, in the exercise of its business judgment, that the advisory arrangement, as outlined in the Advisory Agreement, was fair and reasonable in light of the services performed, expenses incurred and such other matters as the Board considered relevant in the exercise of its reasonable business judgment.
|
ADAMS HARKNESS SMALL CAP GROWTH FUND ADDITIONAL INFORMATION (Unaudited) DECEMBER 31, 2010 |
| |
Proxy Voting Information
A description of the policies and procedures that the Fund uses to determine how to vote proxies relating to securities held in the Fund’s portfolio is available, without charge and upon request, by calling (800) 441-7031, on the Fund's website at www.ahsmallcap.com and on the SEC’s website at www.sec.gov. The Fund’s proxy voting record for the most recent twelve-month period ended June 30 is available, without charge and upon request, by calling (800) 441-7031, on the Fund's website at www.ahsmallcap.com and on the SEC’s website at www.sec.gov.
Availability of Quarterly Portfolio Schedules
The Fund files its complete schedule of portfolio holdings with the SEC for the first and third quarters of each fiscal year on Form N-Q. The Fund’s Forms N-Q are available, without charge and upon request on the SEC’s website at www.sec.gov or may be reviewed and copied at the SEC’s Public Reference Room in Washington, DC. Information on the operation of the Public Reference Room may be obtained by calling (800)-SEC-0330.
Shareholder Expense Example
As a shareholder of the Fund, you incur two types of costs: (1) transaction costs, including redemption fees and exchange fees, and (2) ongoing costs, including management fees and other Fund expenses. This example is intended to help you understand your ongoing costs (in dollars) of investing in the Fund, and to compare these costs with the ongoing costs of investing in other mutual funds.
The example is based on an investment of $1,000 invested at the beginning of the period and held for the entire period from July 1, 2010, through December 31, 2010.
Actual Expenses – The first line in the table below provides information about actual account values and actual expenses. You may use the information in this line, together with the amount you invested, to estimate the expenses that you paid over the period. Simply divide your account value by $1,000 (for example, an $8,600 account value divided by $1,000 = 8.6), then multiply the result by the number in the first line under the heading entitled “Expenses Paid During Period” to estimate the expenses you paid on your account during the period.
Hypothetical Example for Comparison Purposes – The second line in the table below provides information about hypothetical account values and hypothetical expenses based on the Fund’s actual expense ratio and an assumed rate of return of 5% per year before expenses, which is not the Fund’s actual return. The hypothetical account values and expenses may not be used to estimate the actual ending account balance or expenses you paid for the period. You may use this information to compare the ongoing cost of investing in the Fund and other funds. To do so, compare this 5% hypothetical example with the 5% hypothetical examples that appear in the shareholder reports of other funds.
Please note that expenses shown in the table are meant to highlight your ongoing costs only and do not reflect
|
ADAMS HARKNESS SMALL CAP GROWTH FUND ADDITIONAL INFORMATION (Unaudited) DECEMBER 31, 2010 |
| |
any transactional costs, such as redemption fees and exchange fees. Therefore, the second line of the table is useful in comparing ongoing costs only, and will not help you determine the relative total costs of owning different funds. In addition, if these transactional costs had been included, your costs would have been higher.
| | Beginning Account Value July 1, 2010 | | Ending Account Value December 31, 2010 | | Expenses Paid During Period * | | Annualized Expense Ratio * |
| Actual | $ | 1,000.00 | | $ | 1,350.86 | | $ | 10.67 | | | 1.80% |
Hypothetical (5% return before expenses) | $ | 1,000.00 | | $ | 1,016.13 | | $ | 9.15 | | | 1.80% |
| | | | | | | | | | | | |
* Expenses are equal to the Fund’s annualized expense ratio as indicated above multiplied by the average account value over the period, multiplied by the number of days in the most recent fiscal half-year divided by 365 to reflect the half-year period.
Trustees and Officers of the Trust
The Board is responsible for oversight of the management of the Trust’s business affairs and of the exercise of all the Trust’s powers except those reserved for the shareholders. The following table provides information about each Trustee and certain officers of the Trust. Each Trustee and officer holds office until the person resigns, is removed, or is replaced. Unless otherwise noted, the persons have held their principal occupations for more than five years. The address for all Trustees and officers is Three Canal Plaza, Suite 600, Portland, Maine 04101, unless otherwise indicated. Each Trustee oversees twenty-three portfolios in the Trust. Mr. Keffer is considered an Interested Trustee due to his affiliation with Atlantic. Mr. K effer is also an Interested Director of Wintergreen Fund, Inc. The Fund’s Statement of Additional Information includes additional information about the Trustees and is available, without charge and upon request, by calling (800) 441-7031, on the Fund's website at www.ahsmallcap.com.
| Name and Year of Birth | Position with the Trust | Length of Time Served | Principal Occupation(s) During Past Five Years |
| Independent Trustees | | | |
J. Michael Parish Born: 1943 | Chairman of the Board; Trustee; Chairman, Nominating Committee and Qualified Legal Compliance Committee | Since 1989 (Chairman since 2004) | Retired since 2003. |
Costas Azariadis Born: 1943 | Trustee; Chairman, Valuation Committee | Since 1989 | Professor of Economics, Washington University since 2006; Professor of Economics, University of California-Los Angeles 1992-2006. |
James C. Cheng Born: 1942 | Trustee; Chairman, Audit Committee | Since 1989 | President, Technology Marketing Associates (marketing company for small- and medium-sized businesses in New England) since 1991. |
|
ADAMS HARKNESS SMALL CAP GROWTH FUND ADDITIONAL INFORMATION (Unaudited) DECEMBER 31, 2010 |
| |
| Name and Year of Birth | Position with the Trust | Length of Time Served | Principal Occupation(s) During Past Five Years |
| Interested Trustee | | | |
John Y. Keffer1 Born: 1942 | Trustee; Vice Chairman | Since 1989 | Chairman, Atlantic since 2008; President, Forum Foundation (a charitable organization) since 2005; President, Forum Trust, LLC (a non-depository trust company chartered in the State of Maine) since 1997. |
| Officers | | | |
Stacey E. Hong Born: 1966 | President; Principal Executive Officer | Since 2008 | President, Atlantic since 2008; Director, Consulting Services, Foreside Fund Services 2007; Elder Care, 2005-2006. |
Karen Shaw Born: 1972 | Treasurer; Principal Financial Officer | Since 2008 | Senior Manager, Atlantic since 2008; Section Manager/Vice President, Enterprise Support Services, Citigroup 2003-2008. |
David Faherty Born: 1970 | Vice President | Since 2009 | Senior Counsel, Atlantic since 2009; Vice President, Citi Fund Services Ohio, Inc. 2007-2009; Associate Counsel, Investors Bank & Trust Co. 2006-2007. |
Michael J. McKeen Born: 1971 | Vice President | Since 2009 | Senior Manager, Atlantic since 2008; Vice President, Citigroup 2003-2008. |
Joshua LaPan Born: 1973 | Vice President | Since 2009 | Manager, Atlantic since 2008; Vice President, Citigroup 2003-2008. |
Timothy Bowden Born: 1969 | Vice President | Since 2009 | Manager, Atlantic since 2008; Vice President, Citigroup 2005-2008. |
Lina Bhatnagar Born: 1971 | Secretary | Since 2008 | Senior Administration Specialist, Atlantic since 2008; Regulatory Administration Specialist, Citigroup 2006-2008. |
| | 1 Since 1997, John Y. Keffer has been president and owner of Forum Trust, LLC. Prior to January 1, 2010, Atlantic was a wholly owned subsidiary of Forum Trust, LLC. Effective January 1, 2010, Atlantic became a wholly owned subsidiary of Forum Holdings Corp., a Delaware corporation that is wholly owned by Mr. Keffer. |

A Message to Our Shareholders............................................................................................1
Performance Chart and Analysis............................................................................................6
Schedule of Investments.........................................................................................................7
Statement of Assets and Liabilities.......................................................................................9
Statement of Operations........................................................................................................10
Statements of Changes in Net Assets................................................................................11
Financial Highlights...............................................................................................................12
Notes to Financial Statements..............................................................................................13
Report of Independent Registered Public Accounting Firm...........................................16
Additional Information (Unaudited)...................................................................................17
The views expressed in this report are those of the investment advisor of The BeeHive Fund (the “Fund”) as of December 31, 2010, and may not reflect their views on the date this report is first published or any time thereafter. These views are intended to assist shareholders of the Fund in understanding their investments in the Fund and do not constitute investment advice. The Fund is subject to various forms of risk including the possible loss of principal. Investing in foreign securities entails risks not associated with domestic equities including economic and political instability and currency fluctuations. Investing in fixed income securities includes the risk that rising interest rates will cause a decline in values. Focused investments in particular industries or market sectors can entail increased volatility and gre ater market risk than is the case with more broadly diversified investments. Investments in securities of small and mid-capitalization companies involve the possibility of greater volatility than investments in larger capitalization companies. Investments in American Depository Receipts involve many of the same risks as investing in foreign securities.
| |
THE BEEHIVE FUND A MESSAGE TO OUR SHAREHOLDERS DECEMBER 31, 2010 |
| |
“One expects many things to happen that somehow never do.”
- James Grant
Dear Shareholder,
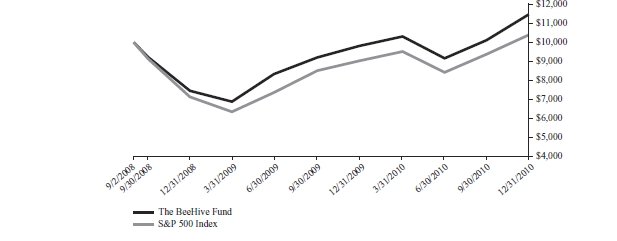
Once again, we find the end of the calendar year to be a convenient time for discussion and review, even if your capital does not care much about artificial time periods. We, as a firm, may be pleased with our 2010 performance, but that means nothing if losses loom on the horizon. The future is, and always has been, our focus – but historical reflection does fulfill a beneficial purpose.
The BeeHive Fund (the “Fund”), once again outperformed the S&P 500 in 2010 and, more satisfying to us, had a strong absolute gain of almost 17%. Individual standouts included Check Point Software Technologies, FMC Corp., Kinder Morgan and Oracle; laggards were Baxter, Microsoft, Unilever and Western Union. The Fund, after an untimely start date just before the September 2008 Lehman collapse, now has a sizeable gain since inception.
Our quarterly missives over the last year hold the keys to our positive performance. We remain conservative in our investing – but we do not invest to advance an inflexible ideological position; we invest to preserve purchasing power and to earn real returns.
All through this recovery, media face-time has been given chiefly to those who were correct in being negative prior to the crisis, but have also remained so throughout. Their incentives were clear; they achieved fame and fortune through doom saying, which was correct and prescient – but it has not been in their interest to turn moderate or sanguine. Instead, they have generally attempted to make the next great call for disaster. This left them fighting yesterday’s war, and not participating in the peace.
We, on the other hand, being free of a self-proscribed tilt or taint, were able to identify one important fact: that direction matters. No matter how tepid a recovery may be, a recovery – or even an abatement of decline – is positive for stock prices. We continue to believe that the recovery is building steam, albeit slowly. There is no need to look past the General Motors IPO and TARP repayments to understand that we are well beyond the crisis state that prevailed in 2008 and early 2009. Employment and housing continue to be a drag, and government spending restraints will be a headwind – but, as we consistently stated in 2010, recovery will likely continue. Our belief in this recovery is not only from macroeconomic analysis, but from our focus on the fundamentals of the businesses we analyze. Corporations are generally prospering.
Now turning to the question of whether stocks are valued appropriately. Ultimately the reason to own equities is that the future profits and/or cash flows provide an adequate return on today’s investment. The holdings in the Fund today, in our opinion, will provide such a return.
This does not fully answer the question of valuation for “the market,” but we feel no compunction to analyze a 500 stock portfolio subjectively selected by the good people at Standard and Poor’s1; we have no need to model our portfolio on theirs. If pressed, we would say that market overvaluation is hard to see when the recovery cycle remains in place, broad retail participation in stocks is still lacking, and valuations, again in our opinion, are compelling, even if not overwhelmingly so.
________________________
1 Despite conventional wisdom, the S&P 500 is not a purely passive index. Its constituents and criteria for inclusion are subjectively constructed by S&P. We quote from their published policies:
Standard & Poor’s U.S. indices are maintained by the U.S. Index Committee. All committee members are full-time professional members of Standard & Poor’s staff. The committee meets monthly. At each meeting, the Index Committee reviews pending corporate actions that may affect index constituents, statistics comparing the composition of the indices to the market, companies that are being considered as candidates for addition to an index, and any significant market events. In addition, the Index Committee may revise index policy covering rules for selecting companies, treatment of dividends, share counts or other matters.
Standard & Poor’s considers information about changes to its U.S. indices and related matters to be potentially market moving and material. Therefore, all Index Committee discussions are confidential.
| |
THE BEEHIVE FUND A MESSAGE TO OUR SHAREHOLDERS DECEMBER 31, 2010 |
| |
Notwithstanding our belief in economic recovery, the increased stock valuations will necessitate more than GDP growth to earn significant returns. In early 2009, stocks as an asset class were unusually cheap. We took the position that the prudent way to benefit from a recovery and minimize risk was to hold the best franchises available in necessary and important industries. While these firms still present attractive investments, we are beginning to find better opportunities in firms that have significant secular growth due to 1) disruptive business models or technologies, 2) competitive advantages that allow them to take market share, 3) unique or niche businesses that allow pricing ability, 4) businesses that are underpenetrated and therefore can grow faster than the global economy or 5) some combination of the above.
As a recent example, we sold our position in Johnson & Johnson. Similarly, and just subsequent to year-end, we took some of our gains in Nestlé. In both cases we sold high quality stocks with quality management. Despite these attributes, they were not cheap and have such a large presence in their respective industries that it will be hard for them to grow faster than general global economic activity, and due to strong operational management, hard to find additional operating leverage. New purchases in the quarter included IMAX Corp. (IMAX) and, following year-end, DG FastChannel (DGIT).
IMAX has a unique and niche technology and brand, as well as a new disruptive business model. At the same time, the company is underpenetrated in its potential markets – especially internationally. DGIT, likewise, has a dominant position in a niche industry that is undergoing a format shift that should provide strong profit growth. We hope you find our further discussion in the Appendix of interest. In addition to the recent purchases, we discuss our current holding in Thermo Fisher as their recent acquisition of Dionex Corp. was an important event for shareholders.
Recent Sale
In our quarterly letters we have tended to discuss our new purchases in detail, while dedicating just a line or two to our sales. In our practice of investment management, things are much more balanced and we spend as much time debating current holdings as we do new opportunities. Within our process, a sell discussion is typically initiated for one of three reasons: the investment thesis has changed or played out; market valuation more than compensates for our assessment of the future opportunity; or better investments exist. While this makes it sound like a science, selecting the right time to sell is rarely simple. It is difficult to know when to take the loss on a thesis that is not playing out the way it was initially anticipated, and equally difficult to recognize the right time to sell a good business that is performing well, but ha s become fairly (or over) valued. To illuminate the process, we provide a brief summary of our initial investment in Nestlé, along with our recent partial sale.
When we invested in Nestlé, market sentiment was tepid. After delivering organic revenue growth and operating margin expansion through good times and bad for over a decade, investors believed that there was no catalyst or potential for upside surprise – in other words Nestlé was too consistent and, frankly, too boring. We, on the other hand, were happy to have the opportunity to purchase shares in a great franchise at a valuation that was a discount to all of its peers. While timing was uncertain, we also believed that Nestlé had the potential to unlock hidden value through the sale of its stakes in Alcon, L’Oréal, or both.
Since our purchase, shares of Nestlé have performed well. But even great franchises can reach valuations that imply a muted future investment opportunity. Such is the case with Nestlé. We continue to view Nestlé as the operational gold standard in the packaged food industry and are confident that management will continue to invest the proceeds from the sale of the Alcon stake productively. However investor sentiment has shifted 180 degrees: the consistency of execution that resulted in a valuation discount at the time of purchase now earns a premium and the ambivalence concerning capital structure has shifted to enthusiasm – particularly in anticipation of share buy-backs. We fully agree that the market is accurately valuing the Nestlé franchise; unfortunately that means the upside opportunity is limited and we n ow need to look for other undervalued franchises.
Firm Update
Once again, we are pleased to announce the expansion of our partnership at Spears Abacus Advisors. John Raggio joined our fixed income team in 2008, and has been the lead analyst and portfolio manager for our fixed income securities since mid-2009. John has proven to be an invaluable asset during a volatile period in the credit markets. In addition to his bond responsibilities, his ability to analyze balance sheets and corporate liquidity has enhanced our work in convertible debt issues and preferred securities and even our common stock research effort. John is an integral part of our investment team, and effective January 1, 2011 we are proud to call him our partner.
| |
THE BEEHIVE FUND A MESSAGE TO OUR SHAREHOLDERS DECEMBER 31, 2010 |
| |
Concluding Thoughts
William Shakespeare once said, through the lips of Hamlet, “There is nothing either good or bad, but thinking makes it so.” We quote this not to delve into a debate about moral relativism. Rather as a succinct summary of the mistake our peers and, hopefully less so, we sometimes make. To begin the investment process with a bias, generally leads you to where you started. We respect those who continue to caution that dangers possibly lurk, even if they are not probable scenarios. We certainly build these views into our research, but ultimately follow where our own independent analysis leads.
If you want to be bearish, there is no lack of macroeconomic reasons to be so – municipalities may be set to collapse, Europe might implode, deficits appear unsustainable, the Fed will possibly debauch the currency, and the cost of capital is unnaturally low. But as the eminent Mr. Grant points out, you can work yourself up to heights of lather for things that remain unlikely. This DOES NOT mean we are complacent, only that we believe managing risk means not just protecting against high risk, but also low probability scenarios. Proper risk management means benefitting from the white swans, as well as protecting against the black.
We remain encouraged by developments within the Fund portfolio and throughout the economy, although there certainly are many conditions we would prefer did not exist. Given the rapidity of events and the interconnectedness of the global economy, we remain flexible in our beliefs and liquid in the portfolio. We have been pleased to serve you as The BeeHive Fund’s investment advisors over these last two years, and we continue to honor your trust.
Have a very healthy, happy and prosperous New Year.
Sincerely,
| |
THE BEEHIVE FUND A MESSAGE TO OUR SHAREHOLDERS DECEMBER 31, 2010 |
| |
Appendix
IMAX Corp.
Founded in 1967, IMAX opened its first large format screen in 1970. Until only recently, the company has catered primarily to the institutional market and, what the CEO affectionately calls whale, bear and seal movies. Recent success is due to a three-pronged strategy wholly different than the IMAX of old and aimed at replacing the high-cost, low-margin business model of the past, which depended on lumpy sales cycles of theater systems to museums, amusement parks, and a few specialty movie exhibitors.
The three important developments include:
1) Fast and economical digital re-mastering of 35mm into IMAX format to allow for theatrical release of Hollywood movies simultaneously with regular format theaters,
2) New technologies that allow less costly system installation (smaller screens for multiplexes) and more efficient film distribution (digital instead of film prints), and
3) A shift to joint ventures whereby IMAX contributes the system and then shares in box office receipts with the exhibitor, instead of one-time sales of systems.
The new business model creates a recurring revenue stream and a greater lifetime revenue per screen. Simply, IMAX can attract the best films due to the immersive experience and premium pricing, convert them at a low fixed cost, distribute them cheaply through a rapidly growing international network of theaters and collect a percentage of gross receipts from both the studio and the exhibitor.
IMAX is a small company and its share price has risen sharply since last summer. Nonetheless, our models indicate that significant upside remains as the network of theatres grows (currently at 375 globally compared to 1,300 identified addressable locations). This combination of household name recognition and untapped potential is rare; however, the large run-up in the stock has given us some pause, so we have only taken a partial position until the stock price – or the facts – become more compelling.
DG FastChannel, Inc.
Early in the first quarter of 2011, we added DG Fastchannel (DGIT) to the portfolio. DGIT provides content delivery and management services to the advertising industry using a proprietary network to electronically distribute content to media outlets. While DGIT provides solutions targeting multiple media formats, including television, radio, print or online, the distribution of television spots remains DG’s core business and accounts for the majority of revenue and profitability. DG’s growth over the past few years has been driven by the conversion of the “dub and ship” method of content distribution to digital.
While opportunity still remains from the shift from tape to electronic, a new more powerful transition is beginning in the shift from standard definition spots to high definition spots.
DGIT receives premium pricing on the delivery of an HD spot, and though HD deliveries comprised less than 10% of the spots delivered in 2010 they generated about 40% of total company revenue. While this price premium will certainly decline as penetration grows, the largely fixed cost nature of DGIT’s business means that incremental gross margins will continue to be very attractive.
We see additional opportunities for upside from the digitization of direct response distribution, expansion of DGIT’s network into international markets and growth of the online distribution channel. Though this opportunity does not come without risk, we think that the valuation at our purchase price provides a very favorable return asymmetry.
| |
THE BEEHIVE FUND A MESSAGE TO OUR SHAREHOLDERS DECEMBER 31, 2010 |
| |
Thermo Fisher Scientific Inc.
In the life science tools industry, Thermo Fisher is the largest market participant and its scale and breadth of product offering provide a competitive advantage. While internal development of new products is important (and is receiving renewed attention), we believe that a key component of Thermo Fisher’s business model is the ability to use excess free cash generation to acquire products and technologies that are complementary to their existing portfolio and to leverage their distribution infrastructure.
In aggregate these “bolt-on acquisitions” can add a couple of points to revenue growth each year but individually are generally too small to warrant comment. However, this quarter we want to highlight the recently announced acquisition of Dionex because of its size ($2.1 billion) as well as its strategic fit.
Dionex is the leading participant in ion chromatography and also a major participant in liquid chromatography. Both types of chromatography are frequently used in advance of mass spectrometry (mass spec) to separate the components of a mixture before identification and measurement. Instruments are often sold together and bringing these two strong franchises under the same roof should have a synergistic effect on both chromatography and mass spec sales. Although the purchase price was at a premium, the fact that Thermo Fisher shares traded up on the deal announcement tells us that we are not alone in our positive view of the transaction.
| |
THE BEEHIVE FUND PERFORMANCE CHART AND ANALYSIS DECEMBER 31, 2010 |
| |
The following chart reflects the change in the value of a hypothetical $10,000 investment, including reinvested dividends and distributions, in The BeeHive Fund compared with the performance of the benchmark S&P 500 Index (the "S&P 500"), since inception. The S&P 500 is a market-value weighted index representing the performance of 500 widely held, publicly traded stocks. The total return of the S&P 500 includes reinvestment of dividends and income. The total return of the Fund includes operating expenses that reduce returns, while the total return of the S&P 500 does not include expenses. The S&P 500 is not available for investment.
Performance data quoted represents past performance and is no guarantee of future results. Current performance may be lower or higher than the performance data quoted. Investment return and principal value will fluctuate so that shares, when redeemed, may be worth more or less than original cost. For the most recent month-end performance please call (866) 684-4915. As stated in the Fund’s prospectus, the annual operating expense ratio (gross) is 1.64%. However, the Fund’s adviser has agreed to contractually waive a portion of its fees and to reimburse expenses such that total operating expenses do not exceed 0.99%, which is in effect until April 30, 2011. During the period, certain fees were waived and/or expenses reimbursed; otherwise, retu rns would have been lower. The performance table and graph do not reflect the deduction of taxes that a shareholder would pay on Fund distributions or the redemption of Fund shares. Returns greater than one year are annualized.
| Total Return as of 12/31/10 | One Year | Since Inception 9/2/08 |
| The BeeHive Fund | 16.90% | 6.06% |
| S&P 500 Index | 15.06% | 1.65% |
Investment Value on 12/31/10
The BeeHive Fund $11,467
S&P 500 Index $10,388
| |
THE BEEHIVE FUND SCHEDULE OF INVESTMENTS DECEMBER 31, 2010 |
| |
| Shares | | Security Description | | Value | |
| Common Stock – 99.0% |
| Basic Materials – 2.3% |
| | 22,020 | | FMC Corp. | $ | 1,759,178 | |
| Consumer Discretionary – 10.7% |
| | 150,660 | | Comcast Corp., Class A | | 3,310,000 | |
| | 26,130 | | IMAX Corp. (a) | | 732,946 | |
| | 56,260 | | The Walt Disney Co. | | 2,110,313 | |
| | 61,465 | | Time Warner, Inc. | | 1,977,329 | |
| | | 8,130,588 | |
| Consumer Staples – 11.9% |
| | 90,580 | | CVS Caremark Corp. | | 3,149,466 | |
| | 50,585 | | Nestlé SA, ADR | | 2,975,410 | |
| | 94,670 | | Unilever PLC, ADR | | 2,923,410 | |
| | | 9,048,286 | |
| Energy – 13.2% |
| | 30,360 | | Apache Corp. | | 3,619,823 | |
| | 42,235 | | Devon Energy Corp. | | 3,315,870 | |
| | 46,213 | | Kinder Morgan Management, LLC (a) | | 3,090,725 | |
| | | 10,026,418 | |
| Financials – 15.5% |
| | 61,150 | | ACE, Ltd. | | 3,806,587 | |
| | 63,735 | | AON Corp. | | 2,932,447 | |
| | 75,870 | | Axis Capital Holdings, Ltd. | | 2,722,216 | |
| | 49,300 | | State Street Corp. | | 2,284,562 | |
| | | 11,745,812 | |
| Health Care Equipment and Services – 11.0% |
| | 54,555 | | Baxter International, Inc. | | 2,761,574 | |
| | 129,480 | | Hologic, Inc. (a) | | 2,436,814 | |
| | 73,415 | | St. Jude Medical, Inc. (a) | | 3,138,491 | |
| | | 8,336,879 | |
| Industrials – 2.6% |
| | 33,500 | | Cooper Industries PLC | | 1,952,715 | |
| |
| Information Technology – 3.3% |
| | 134,591 | | The Western Union Co. | | 2,499,355 | |
| Pharmaceuticals, Biotechnology and Life Sciences – 9.0% |
| | 69,070 | | Life Technologies Corp. (a) | | 3,833,385 | |
| | 53,680 | | Thermo Fisher Scientific Inc. (a) | | 2,971,725 | |
| | | 6,805,110 | |
| Technology – 19.5% |
| | 94,420 | | Broadridge Financial Solutions, Inc. | | 2,070,631 | |
| | 78,585 | | Check Point Software Technologies, Ltd. (a) | | 3,635,342 | |
| | 4,961 | | Google, Inc., Class A (a) | | 2,946,685 | |
| | 102,345 | | Microsoft Corp. | | 2,857,472 | |
| | 104,720 | | Oracle Corp. | | 3,277,736 | |
| | | 14,787,866 | |
Total Common Stock (Cost $59,871,796) | | 75,092,207 | |
| | | | |
| Short–Term Investments – 1.0% |
| Money Market Funds – 1.0% |
| | 720,252 | | Fidelity Institutional Cash Money Market Fund, 0.22% (b) (Cost $720,252) | $ | 720,252 | |
| | | | |
Total Investments – 100.0% (Cost $60,592,048)* | $ | 75,812,459 | |
| Other Assets & Liabilities, Net – 0.0% | | 35,781 | |
| Net Assets – 100.0% | $ | 75,848,240 | |
| ADR | American Depository Receipt |
| LLC | Limited Liability Company |
| PLC | Public Limited Company |
| (a) | Non-income producing security. |
| (b) | Variable rate security. Rate presented is as of December 31, 2010. |
| | * Cost of investments for federal income tax purposes is $60,684,173 and net unrealized appreciation on investments consists of: |
| Gross Unrealized Appreciation | | $ | 15,248,906 | |
| Gross Unrealized Depreciation | | | (120,620) | |
| Net Unrealized Appreciation | | $ | 15,128,286 | |
| See Notes to Financial Statements | 7 | |
| |
| |
THE BEEHIVE FUND SCHEDULE OF INVESTMENTS DECEMBER 31, 2010 |
| |
The following is a summary of the inputs used to value the Fund’s investments as of December 31, 2010.
The inputs or methodology used for valuing securities are not necessarily an indication of the risk associated with investing in those securities. For more information on valuation inputs, and their aggregation into the levels used in the tables below, please refer to Note 2- Security Valuation section in the accompanying Notes to Financial Statements.
| | | Level 1 | | | | Level 2 | | | | Level 3 | | | | Total | |
| Common Stock | | | | | | | | | | | | | | | |
| Basic Materials | $ | 1,759,178 | | | $ | – | | | $ | – | | | $ | 1,759,178 | |
| Consumer Discretionary | | 8,130,588 | | | | – | | | | – | | | | 8,130,588 | |
| Consumer Staples | | 9,048,286 | | | | – | | | | – | | | | 9,048,286 | |
| Energy | | 10,026,418 | | | | – | | | | – | | | | 10,026,418 | |
| Financials | | 11,745,812 | | | | – | | | | – | | | | 11,745,812 | |
| Health Care Equipment and Services | | 8,336,879 | | | | – | | | | – | | | | 8,336,879 | |
| Industrials | | 1,952,715 | | | | – | | | | – | | | | 1,952,715 | |
| Information Technology | | 2,499,355 | | | | – | | | | – | | | | 2,499,355 | |
| Pharmaceuticals, Biotechnology and Life Sciences | | 6,805,110 | | | | – | | | | – | | | | 6,805,110 | |
| Technology | | 14,787,866 | | | | – | | | | – | | | | 14,787,866 | |
| Money Market Funds | | – | | | | 720,252 | | | | – | | | | 720,252 | |
| TOTAL | $ | 75,092,207 | | | $ | 720,252 | | | $ | – | | | $ | 75,812,459 | |
| | | | | | | | | | | | | | | | |
| PORTFOLIO HOLDINGS | | |
| % of Total Investments | | |
| Basic Materials | 2.3 | % |
| Consumer Discretionary | 10.7 | % |
| Consumer Staples | 11.9 | % |
| Energy | 13.2 | % |
| Financials | 15.5 | % |
| Health Care Equipment and Services | 11.0 | % |
| Industrials | 2.6 | % |
| Information Technology | 3.3 | % |
| Pharmaceuticals, Biotechnology and Life Sciences | 9.0 | % |
| Technology | 19.5 | % |
| Money Market Funds | 1.0 | % |
| | 100.0 | % |
| See Notes to Financial Statements | 8 | |
| |
| |
THE BEEHIVE FUND STATEMENT OF ASSETS AND LIABILITIES DECEMBER 31, 2010 |
| |
| | | | | | | |
| ASSETS | | | | |
| | Total investments, at value (Cost $60,592,048) | | $ | 75,812,459 | |
| | Receivables: | | | | |
| | | Dividends | | | 115,605 | |
| | Prepaid expenses | | | 3,713 | |
| Total Assets | | | 75,931,777 | |
| | | | | | | |
| LIABILITIES | | | | |
| | Accrued Liabilities: | | | | |
| | Investment advisor fees | | | 42,696 | |
| | | Trustees’ fees and expenses | | | 45 | |
| | | Fund service fees | | | 11,971 | |
| | | Compliance services fees | | | 2,083 | |
| | | Other expenses | | | 26,742 | |
| Total Liabilities | | | 83,537 | |
| | | | | | | |
| NET ASSETS | | $ | 75,848,240 | |
| | | | | | | |
| COMPONENTS OF NET ASSETS | | | | |
| | Paid-in capital | | $ | 60,599,634 | |
| | Accumulated net realized gain | | | 28,195 | |
| | Net unrealized appreciation | | | 15,220,411 | |
| NET ASSETS | | $ | 75,848,240 | |
| SHARES OF BENEFICIAL INTEREST AT NO PAR VALUE (UNLIMITED SHARES AUTHORIZED) | | | 6,808,813 | |
| NET ASSET VALUE, OFFERING AND REDEMPTION PRICE PER SHARE | | $ | 11.14 | |
| | | | | | | |
| See Notes to Financial Statements | 9 | |
| |
| |
THE BEEHIVE FUND STATEMENT OF OPERATIONS YEAR ENDED DECEMBER 31, 2010 |
| |
| | | | | | | | |
| INVESTMENT INCOME | | | | | |
| | Dividend income (Net foreign withholding taxes of $7,158) | | $ | 841,951 | | |
| Total Investment Income | | | 841,951 | | |
| | | | | | |
| EXPENSES | | | | | |
| | Investment advisor fees | | | 435,484 | | |
| | Fund service fees | | | 145,809 | | |
| | Distribution fees | | | 145,161 | | |
| | Custodian fees | | | 6,073 | | |
| | Registration fees | | | 3,758 | | |
| | Professional fees | | | 65,599 | | |
| | Trustees’ fees and expenses | | | 1,875 | | |
| | Compliance services fees | | | 30,905 | | |
| | Miscellaneous expenses | | | 20,094 | | |
| Total Expenses | | | 854,758 | | |
| | Fees waived and expenses reimbursed | | | (278,337 | ) | |
| Net Expenses | | | 576,421 | | |
| | | | | | | | |
| NET INVESTMENT INCOME | | | 265,530 | | |
| | | | | | | | |
| NET REALIZED AND UNREALIZED GAIN (LOSS) | | | | | |
| | Net realized gain on investments | | | 1,759,590 | | |
| | Net change in unrealized appreciation (depreciation) on investments | | | 8,587,089 | | |
| NET REALIZED AND UNREALIZED GAIN | | | 10,346,679 | | |
| INCREASE IN NET ASSETS FROM OPERATIONS | | $ | 10,612,209 | | |
| | | | | | | | |
| See Notes to Financial Statements | 10 | |
| |
| |
THE BEEHIVE FUND STATEMENTS OF CHANGES IN NET ASSETS |
| |
| | | | | For the Year Ended December 31, 2010 | | | For the Year Ended December 31, 2009 | |
| OPERATIONS | | | | | | | | | | |
| | Net investment income | | $ | 265,530 | | | | $ | 173,045 | | |
| | Net realized gain | | | 1,759,590 | | | | | 33,593 | | |
| | Net change in unrealized appreciation (depreciation) | | | 8,587,089 | | | | | 8,941,844 | | |
| Increase in Net Assets Resulting from Operations | | | 10,612,209 | | | | | 9,148,482 | | |
| | | | | | | | | | | | | |
| DISTRIBUTIONS TO SHAREHOLDERS FROM | | | | | | | | | | |
| | Net investment income | | | (265,564 | ) | | | | (173,030 | ) | |
| | Net realized gain | | | (1,398,504 | ) | | | | - | | |
| Total Distributions to Shareholders | | | (1,664,068 | ) | | | | (173,030 | ) | |
| | | | | | | | | | | | | |
| CAPITAL SHARE TRANSACTIONS | | | | | | | | | | |
| | Sale of shares | | | 23,648,988 | | | | | 10,861,047 | | |
| | Reinvestment of distributions | | | 1,664,068 | | | | | 173,030 | | |
| | Redemption of shares | | | (607,741 | ) | | | | (1,483,225 | ) | |
| Increase in Net Assets from Capital Share Transactions | | | 24,705,315 | | | | | 9,550,852 | | |
| Increase in Net Assets | | | 33,653,456 | | | | | 18,526,304 | | |
| | | | | | | | | | | | | |
| NET ASSETS | | | | | | | | | | |
| | Beginning of Year | | | 42,194,784 | | | | | 23,668,480 | | |
| | End of Year (Including line (a)) | | $ | 75,848,240 | | | | $ | 42,194,784 | | |
| | | | | | | | | | | | | |
| SHARE TRANSACTIONS | | | | | | | | | | |
| | Sale of shares | | | 2,389,040 | | | | | 1,284,804 | | |
| | Reinvestment of distributions | | | 153,450 | | | | | 17,747 | | |
| | Redemption of shares | | | (60,985 | ) | | | | (155,778 | ) | |
| Increase in Shares | | | 2,481,505 | | | | | 1,146,773 | | |
| | | | | | | | | | | | | |
| (a) | Undistributed net investment income | | $ | - | | | | $ | 15 | | |
| See Notes to Financial Statements | 11 | |
| |
| |
THE BEEHIVE FUND FINANCIAL HIGHLIGHTS |
| |
| These financial highlights reflect selected data for a share outstanding throughout each period. | | |
| | | For the Years Ended December 31, | | September 2, 2008 (a) through | |
| | | 2010 | | 2009 | | December 31, 2008 | |
| | | | | | | | | | | | | | | |
| NET ASSET VALUE, Beginning of Period | $ | 9.75 | | | $ | 7.44 | | | $ | 10.00 | | | | |
| INVESTMENT OPERATIONS | | | | | | | | | | | | | | |
| Net investment income (b) | | 0.05 | | | | 0.05 | | | | 0.02 | | | | |
| Net realized and unrealized gain (loss) | | 1.59 | | | | 2.30 | | | | (2.56 | ) | | | |
| Total from Investment Operations | | 1.64 | | | | 2.35 | | | | (2.54 | ) | | | |
| DISTRIBUTIONS TO SHAREHOLDERS FROM | | | | | | | | | | | | | | |
| Net investment income | | (0.04 | ) | | | (0.04 | ) | | | (0.02 | ) | | | |
| Net realized gain | | (0.21 | ) | | | — | | | | — | | | | |
| Total Distributions to Shareholders | | (0.25 | ) | | | (0.04 | ) | | | (0.02 | ) | | | |
| | | | | | | | | | | | | | | |
| NET ASSET VALUE, End of Period | $ | 11.14 | | | $ | 9.75 | | | $ | 7.44 | | | | |
| TOTAL RETURN | | 16.90 | % | | 31.59 | % | | (25.45 | )%(c) | | |
| | | | | | | | | | | | | | |
| RATIOS/SUPPLEMENTARY DATA | | | | | | | | | | | | | |
| | | | | | | | | | | | | | |
| Net Assets at End of Period (000’s omitted) | | $75,848 | | | $42,195 | | | $23,668 | | | |
| Ratios to Average Net Assets: | | | | | | | | | | | | | |
| Net investment income | | 0.46 | % | | 0.55 | % | | 0.79 | %(d) | | |
| Net expense | | 0.99 | % | | 1.00 | % | | 1.00 | %(d) | | |
| Gross expense (e) | | 1.47 | % | | 1.88 | % | | 3.79 | %(d) | | |
| PORTFOLIO TURNOVER RATE | | 43 | % | | 33 | % | | 7 | %(c) | | |
| | | | | | | | | | | | | | | |
| | | | | | | | | | | | | | | |
| (a) Commencement of operations. | | |
| (b) Calculated based on average shares outstanding during each period. | | |
| (c) Not annualized. | | |
| (d) Annualized. | | |
| (e) Reflects the expense ratio excluding any waivers or reimbursements. | | |
See Notes to Financial Statements | 12 | |
| |
| |
THE BEEHIVE FUND NOTES TO FINANCIAL STATEMENTS DECEMBER 31, 2010 |
| |
Note 1. Organization
The BeeHive Fund (the “Fund”) is a diversified portfolio of Forum Funds (the “Trust”). The Trust is a Delaware statutory trust that is registered as an open-end, management investment company under the Investment Company Act of 1940 (the “Act”), as amended. Under its Trust Instrument, the Trust is authorized to issue an unlimited number of the Fund’s shares of beneficial interest without par value. The Fund commenced operations on September 2, 2008. The Fund seeks capital appreciation.
Note 2. Summary of Significant Accounting Policies
These financial statements are prepared in accordance with generally accepted accounting principles in the United States of America (“GAAP”), which require management to make estimates and assumptions that affect the reported amounts of assets and liabilities, the disclosure of contingent liabilities at the date of the financial statements, and the reported amounts of increase and decrease in net assets from operations during the fiscal year. Actual amounts could differ from those estimates. The following summarizes the significant accounting policies of the Fund:
Security Valuation – Exchange-traded securities and over-the-counter securities are valued using the last quoted sale or official closing price, provided by independent pricing services as of the close of trading on the market or exchange for which they are primarily traded, on each Fund business day. In the absence of a sale, such securities are valued at the mean of the last bid and ask price provided by independent pricing services. Non-exchange traded securities for which quotations are available are valued using the last quoted sales price, or in the absence of a sale at the mean of the last bid and ask prices provided by independent pricing services. Shares of open-end mutual funds are valued at net asset value (“NAV”). Short-term investments that mature in si xty days or less may be valued at amortized cost.
The Fund values its investments at fair value pursuant to procedures adopted by the Trust’s Board of Trustees (the “Board”) if (1) market quotations are insufficient or not readily available or (2) the advisor believes that the values available are unreliable. Fair valuation is based on subjective factors and as a result, the fair value price of an investment may differ from the security’s market price and may not be the price at which the asset may be sold. Fair valuation could result in a different NAV than a NAV determined by using market quotes.
The Fund has a three-tier fair value hierarchy. The basis of the tiers is dependent upon the various “inputs” used to determine the value of the Fund’s investments. These inputs are summarized in the three broad levels listed below:
Level 1 — quoted prices in active markets for identical assets
Level 2 — other significant observable inputs (including quoted prices of similar securities, interest rates, prepayment speeds, credit risk, etc.)
Level 3 — significant unobservable inputs (including the Fund’s own assumptions in determining the fair value of investments)
The aggregate value by input level, as of December 31, 2010, for the Fund’s investments is included at the end of the Fund’s Schedule of Investments.
Security Transactions, Investment Income and Realized Gain and Loss – Investment transactions are accounted for on the trade date. Dividend income is recorded on the ex-dividend date. Foreign dividend income is recorded on the ex-dividend date or as soon as possible after the Fund determines the existence of a dividend declaration after exercising reasonable due diligence. Income and capital gains on some foreign securities may be subject to foreign withholding taxes, which are accrued as applicable. Interest income is recorded on an accrual basis. Premium and discount is amortized and accreted in accordance with GAAP. Identified cost of investments sold is used to determine the gain and loss for both financial statement and federal income tax purposes.
Distributions to Shareholders – Distributions to shareholders of net investment income and net capital gains, if any, are declared and paid at least annually. Distributions are based on amounts calculated in accordance with applicable federal income tax regulations, which may differ from GAAP. These differences are due primarily to differing treatments of income and gain on various investment securities held by the Fund, timing differences and differing characterizations of distributions made by the Fund.
Federal Taxes – The Fund intends to qualify each year as a regulated investment company under Subchapter M of the Internal Revenue Code and to distribute all of its taxable income to shareholders. In addition, by distributing in each calendar year substantially all its net
| |
THE BEEHIVE FUND NOTES TO FINANCIAL STATEMENTS DECEMBER 31, 2010 |
| |
investment income and capital gains, if any, the Fund will not be subject to a federal excise tax. Therefore, no federal income or excise tax provision is required.
As of December 31, 2010, there are no uncertain tax positions that would require financial statement recognition, de-recognition, or disclosure. The Fund’s federal tax returns filed in the three-year period ended December 31, 2010, remain subject to examination by the Internal Revenue Service.
Income and Expense Allocation – The Trust accounts separately for the assets, liabilities and operations of each of its investment portfolios. Expenses that are directly attributable to more than one investment portfolio are allocated among the respective investment portfolios in an equitable manner.
Commitments and Contingencies – In the normal course of business, the Fund enters into contracts that provide general indemnifications by the Fund to the counterparty to the contract. The Fund’s maximum exposure under these arrangements is dependent on future claims that may be made against the Fund and, therefore, cannot be estimated; however, based on experience, the risk of loss from such claims is considered remote.
Note 3. Advisory Fees, Servicing Fees and Other Transactions
Investment Advisor – Spears Abacus Advisors LLC (the “Advisor”) is the investment advisor to the Fund. Pursuant to an investment advisory agreement, the Advisor receives an advisory fee from the Fund at an annual rate of 0.75% of the Fund’s average daily net assets.
Distribution – Foreside Fund Services, LLC serves as the Fund’s distributor (the “Distributor”). The Distributor is not affiliated with the Advisor or Atlantic Fund Administration, LLC (d/b/a Atlantic Fund Services) (“Atlantic”) or their affiliates. The Fund has adopted a distribution plan in accordance with Rule 12b-1 of the Act. The Fund may pay the Distributor and/or any other entity as authorized by the Board a fee of 0.25% of the Fund’s average daily net assets.
Other Service Providers – Atlantic provides fund accounting, fund administration, and transfer agency services to the Fund. Atlantic also provides certain shareholder report production, and EDGAR conversion and filing services. Pursuant to an Atlantic services agreement, the Fund pays Atlantic customary fees for its services. Atlantic provides a Principal Executive Officer, a Principal Financial Officer, a Chief Compliance Officer, and an Anti-Money Laundering Officer to the Fund, as well as certain additional compliance support functions.
Trustees and Officers – The Trust pays each independent Trustee an annual retainer fee of $40,000 for service to the Trust ($60,000 for the Chairman). In addition, the Chairman receives a monthly stipend of $500 to cover certain expenses incurred in connection with his duties to the Trust. The Trustees and Chairman may receive additional fees for special Board meetings. Each Trustee is also reimbursed for all reasonable out-of-pocket expenses incurred in connection with his duties as a Trustee, including travel and related expenses incurred in attending Board meetings. The amount of Trustees’ fees attributable to the Fund is disclosed in the Statement of Operations. Certain officers of the Trust are also officers or e mployees of the above named service providers, and during their terms of office received no compensation from the Fund.
Note 4. Expense Reimbursements and Fees Waived
The Advisor has contractually agreed to waive and reimburse a portion of its fees through April 30, 2011, to limit annual operating expenses to 0.99%. Other fund service providers have voluntarily agreed to waive a portion of their fees. These voluntary fee waivers may be reduced or eliminated at any time. For the fiscal year ended December 31, 2010, fees waived were as follows:
| | Investment Advisor Waived | | Distribution Fees Waived | | Service Provider Fees Waived | | Total Fees Waived | |
| | $127,277 | | $145,161 | | $5,899 | | $278,337 | |
The Fund may repay the Advisor for fees waived and expenses reimbursed pursuant to the expense cap if (1) such payment is made within three years of the fees waived or expense reimbursement, (2) such payment is approved by the Board and (3) and the resulting expenses do not exceed 0.99%. As of December 31, 2010, the following amounts are subject to recapture by the Advisor:
| |
THE BEEHIVE FUND NOTES TO FINANCIAL STATEMENTS DECEMBER 31, 2010 |
| |
| | | | Amount of Fees Waived and/or Expenses Reimbursed | | Expiration Date to Recoup Fees Waived and/or Expenses Reimbursed | | Fees Recouped | |
| | December 31, 2008 | | $ | 126,276 | | 12/31/2011 | | $ | - | |
| | December 31, 2009 | | | 178,966 | | 12/31/2012 | | | - | |
| | December 31, 2010 | | | 127,277 | | 12/31/2013 | | | - | |
Note 5. Security Transactions
The cost of purchases and proceeds from sales of investment securities (including maturities), other than short-term investments for the fiscal year ended December 31, 2010, were $47,954,449 and $24,091,127, respectively.
Note 6. Federal Income Tax and Investment Transactions
Distributions during the fiscal years ended as noted were characterized for tax purposes as follows:
| | | 2010 | | 2009 |
| Ordinary Income | | $ | 265,545 | | $ | 173,030 |
| Long-Term Gain | | | 1,398,523 | | | - |
As of December 31, 2010, distributable earnings (accumulated losses) on a tax basis were as follows:
| Undistributed Long-Term Gain | | $ | 120,320 | |
| Unrealized Appreciation | | | 15,128,286 | |
| Total | | $ | 15,248,606 | |
The difference between components of distributable earnings on a tax basis and the amounts reflected in the Statement of Assets and Liabilities are primarily due to wash sales.
On the Statement of Assets and Liabilities, as a result of permanent book to tax differences, certain amounts have been reclassified for the year ended December 31, 2010. The following reclassification was the result of redesignation of distributions and has no impact on the net assets of the Fund.
| Accumulated Net Investment Income (Loss) | | $ | 19 | |
| Undistributed Net Realized Gain (Loss) | | | (19) | |
Note 7. Recent Accounting Pronouncements
In January 2010, the Financial Accounting Standards Board issued Accounting Standards Update (“ASU”) No. 2010-06 “Improving Disclosures about Fair Value Measurements.” ASU No. 2010-06 clarifies existing disclosure and requires additional disclosures regarding fair value measurements. Effective for fiscal years beginning after December 15, 2010, and for interim periods within those fiscal years, entities will need to disclose information about purchases, sales, issuances and settlements of Level 3 securities on a gross basis, rather than as a net number as currently required. Management is currently evaluating the impact ASU No. 2010-06 will have on financial statement disclosures.
Note 8. Subsequent Events
Subsequent events occurring after the date of this report through the date these financial statements were issued have been evaluated for potential impact and the Fund has had no such events.
| |
REPORT OF INDEPENDENT REGISTERED PUBLIC ACCOUNTING FIRM |
| |
To the Board of Trustees of Forum Funds
and the Shareholders of The BeeHive Fund
We have audited the accompanying statement of assets and liabilities of The BeeHive Fund (the “Fund”), a series of shares of beneficial interest in the Forum Funds, including the schedule of investments, as of December 31, 2010, and the related statement of operations for the year then ended, the statements of changes in net assets for each of the years in the two year period then ended, and the financial highlights for each of the years in the two year period then ended, and the period September 2, 2008 (commencement of operations) through December 31, 2008. These financial statements and financial highlights are the responsibility of the Fund’s management. Our responsibility is to express an opinion on these financial statements and financia l highlights based on our audits.
We conducted our audits in accordance with the standards of the Public Company Accounting Oversight Board (United States). Those standards require that we plan and perform the audits to obtain reasonable assurance about whether the financial statements and financial highlights are free of material misstatement. An audit includes examining, on a test basis, evidence supporting the amounts and disclosures in the financial statements. Our procedures included confirmation of securities owned as of December 31, 2010 by correspondence with the custodian. An audit also includes assessing the accounting principles used and significant estimates made by management, as well as evaluating the overall financial statement presentation. We believe that our audits provide a reasonable basis for our opinion.
In our opinion, the financial statements and financial highlights referred to above present fairly, in all material respects, the financial position of The BeeHive Fund as of December 31, 2010, and the results of its operations for the year then ended, the changes in its net assets for each of the years in the two year period then ended, and its financial highlights for each of the years in the two year period then ended, and the period September 2, 2008 through December 31, 2008, in conformity with accounting principles generally accepted in the United States of America.
BBD, LLP
Philadelphia, Pennsylvania
February 18, 2011
| |
THE BEEHIVE FUND ADDITIONAL INFORMATION (Unaudited) DECEMBER 31, 2010 |
| |
Investment Advisory Agreement Approval
At the September 9, 2010 Board meeting, the Board, including the Independent Trustees, considered the approval of the continuance of the investment advisory agreement pertaining to the Fund (the “Advisory Agreement”). In evaluating the Advisory Agreement, the Board reviewed materials furnished by the Advisor and the administrator, including information regarding the Advisor, its personnel, operations and financial condition. Specifically, the Board considered, among other matters: (1) the nature, extent and quality of the services to be provided to the Fund by the Advisor, including information on the investment performance of the Advisor; (2) the costs of the services to be provided and profitability to the Advisor with respect to its relationship with the Fund; (3) the advisory fee and total expense rat io of the Fund compared to relevant peer groups of funds; (4) the extent to which economies of scale would be realized as the Fund grows and whether the advisory fee would enable the Fund’s investors to share in the benefits of economies of scale; and (5) other benefits received by the Advisor from its relationship with the Fund. In their deliberations, the Board did not identify any particular information that was all-important or controlling and attributed different weights to the various factors.
Nature, Extent and Quality of the Services
In connection with a presentation from senior representatives of the Advisor and a discussion of the Advisor’s personnel, operations and financial condition, the Board considered the quality of services to be provided by the Advisor under the Advisory Agreement between the Trust and the Advisor. In this regard, the Board considered information regarding the experience, qualifications and professional background of the portfolio managers and other personnel at the Advisor with principal investment responsibility for the Fund’s investments, the investment philosophy and decision-making processes of those professionals and the capability and integrity of the Advisor’s senior management and staff. In this regard, the Board considered, among other things, the adequacy of the Advisor’s resources and quality of services provided by the Advisor under the Advisory Agreement. The Board also considered the quality of the Advisor’s services to be provided with respect to regulatory compliance and compliance with client investment policies and restrictions and the financial condition and operational stability of the Advisor. The Board noted the Advisor’s representation that the firm is financially stable and able to provide investment advisory services to the Fund. The Board concluded that, overall, it was satisfied with the nature, extent and quality of services to be provided to the Fund under the Advisory Agreement.
Costs of Services and Profitability
The Board then considered information provided by the Advisor regarding its estimated costs of services and estimated profitability with respect to the Fund. In this regard, the Board considered the resources that the Advisor will devote to the Fund. The Board reviewed the Advisor’s representations regarding the profitability of the Fund compared to the Advisor’s overall business. Based on the foregoing and all other relevant factors, the Board concluded that the level of the Advisor’s estimated profits attributable to management of the Fund would not be excessive in light of the services to be provided by the Advisor on behalf of the Fund.
Performance
The Advisor discussed its proposed approach to managing the Fund, and the Board considered the Fund’s investment objectives and strategy as well as the Advisor’s ability to execute the strategy and achieve the investment objective of the Fund. Based on the foregoing, the Board determined that the Advisor’s management of the Fund could benefit the Fund and its shareholders.
Compensation
The Board considered the Advisor’s proposed compensation for providing advisory services to the Fund and analyzed comparative information on fee rates and total expenses. In this regard, the Board noted that the Advisor’s actual advisory fee rate was lower than the median advisory fee rate of the Fund’s Lipper Inc. peer group. The Board also noted that the actual total expenses were lower than the median total expense ratio of the Fund’s Lipper Inc. peer group. The Board recognized that it was difficult to compare expense ratios because of variations between the services to be provided by the Advisor and by advisers within the Fund’s Lipper Inc. peer group funds. Based on the foregoing and all of the information presented, the Board concluded that the Advisor’s advisory fee to be charged to the Fund was reasonable.
| |
THE BEEHIVE FUND ADDITIONAL INFORMATION (Unaudited) DECEMBER 31, 2010 |
| |
Economies of Scale
The Board considered whether the Fund would benefit from any economies of scale. In this respect, the Board noted the Advisor’s representation that the Fund could benefit from economies of scale as assets grow, but the Advisor currently is not proposing breakpoints or changes in fees at this time.
Other Benefits
The Board noted the Advisor’s representation that, aside from its contractual advisory fees, it does not expect to benefit in a material way from its relationship with the Fund. Based on the foregoing representation, the Board concluded that other benefits received by the Advisor from its relationship with the Fund were not a material factor to consider in approving the Advisory Agreement.
Conclusion
The Board reviewed a memorandum from Trust counsel discussing the legal standards applicable to its consideration of the Advisory Agreement. The Board also discussed the proposed approval of the Advisory Agreement. Based upon its review, including consideration of each of the factors referenced above, the Board determined, in the exercise of its business judgment, that the advisory arrangement, as outlined in the proposed Advisory Agreement, was fair and reasonable in light of the services to be performed, expenses to be incurred and other such matters as the Board considered relevant in the exercise of its reasonable business judgment.
Proxy Voting Information
A description of the policies and procedures that the Fund uses to determine how to vote proxies relating to securities held in the Fund’s portfolio is available, without charge and upon request, by calling (866) 684-4915 and on the SEC’s website at www.sec.gov. The Fund’s proxy voting record for the most recent twelve-month period ended June 30 is available, without charge and upon request, by calling (866) 684-4915 and on the SEC’s website at www.sec.gov.
Availability of Quarterly Portfolio Schedules
The Fund files its complete schedule of portfolio holdings with the SEC for the first and third quarters of each fiscal year on Form N-Q. The Fund’s Forms N-Q are available, without charge and upon request on the SEC’s website at www.sec.gov or may be reviewed and copied at the SEC’s Public Reference Room in Washington, DC. Information on the operation of the Public Reference Room may be obtained by calling (800) SEC-0330.
Shareholder Expense Example
As a shareholder of the Fund, you incur ongoing costs, including management fees, distribution (Rule 12b-1) fees and other Fund expenses. This example is intended to help you understand your ongoing costs (in dollars) of investing in the Fund, and to compare these costs with the ongoing costs of investing in other mutual funds.
The example is based on an investment of $1,000 invested at the beginning of the period and held for the entire period from July 1, 2010, through December 31, 2010.
Actual Expenses – The first line in the table below provides information about actual account values and actual expenses. You may use the information in this line, together with the amount you invested, to estimate the expenses that you paid over the period. Simply divide your account value by $1,000 (for example, an $8,600 account value divided by $1,000 = 8.6), then multiply the result by the number in the first line under the heading entitled “Expenses Paid During Period” to estimate the expenses you paid on your account during the period.
Hypothetical Example for Comparison Purposes – The second line in the table below provides information about hypothetical account values and hypothetical expenses based on the Fund’s actual expense ratio and an assumed rate of return of 5% per year before expenses, which is not the Fund’s actual return. The hypothetical account values and expenses may not be used to estimate the actual ending account balance or expenses you paid for the period. You may use this information to compare the ongoing cost of investing in the Fund and other funds. To do so, compare this 5% hypothetical example with the 5% hypothetical examples that appear in the shareholder reports of other funds.
| |
THE BEEHIVE FUND ADDITIONAL INFORMATION (Unaudited) DECEMBER 31, 2010 |
| |
Please note that expenses shown in the table are meant to highlight your ongoing costs only. Therefore, the second line of the table is useful in comparing ongoing costs only, and will not help you determine the relative total costs of owning different funds.
| | Beginning Account Value July 1, 2010 | | Ending Account Value December 31, 2010 | | Expenses Paid During Period * | | Annualized Expense Ratio * |
| Actual | $ | 1,000.00 | | $ | 1,251.12 | | $ | 5.62 | | | 0.99% |
Hypothetical (5% return before expenses) | $ | 1,000.00 | | $ | 1,020.21 | | $ | 5.04 | | | 0.99% |
| | | | | | | | | | | | |
* Expenses are equal to the Fund’s annualized expense ratio as indicated above multiplied by the average account value over the period, multiplied by the number of days in the most recent fiscal half-year divided by 365 to reflect the half-year period.
Federal Tax Status of Dividends Declared during the Tax Year
For federal income tax purposes, dividends from short-term capital gains are classified as ordinary income. The Fund designates 100% of its income dividend distributed as qualifying for the corporate dividends-received deduction (DRD) and 100% for the qualified dividend rate (QDI) as defined in Section 1(h)(11) of the Internal Revenue Code.
Trustees and Officers of the Trust
The Board is responsible for oversight of the management of the Trust’s business affairs and of the exercise of all the Trust’s powers except those reserved for the shareholders. The following table provides information about each Trustee and certain officers of the Trust. Each Trustee and officer holds office until the person resigns, is removed, or is replaced. Unless otherwise noted, the persons have held their principal occupations for more than five years. The address for all Trustees and officers is Three Canal Plaza, Suite 600, Portland, Maine 04101, unless otherwise indicated. Each Trustee oversees twenty-three portfolios in the Trust. Mr. Keffer is considered an Interested Trustee due to his affiliation with Atlantic. Mr. Keffer is also an In terested Director of Wintergreen Fund, Inc. The Fund’s Statement of Additional Information includes additional information about the Trustees and is available, without charge and upon request, by calling (866) 684-4915.
| Name and Year of Birth | Position with the Trust | Length of Time Served | Principal Occupation(s) During Past Five Years |
| Independent Trustees | | | |
J. Michael Parish Born: 1943 | Chairman of the Board; Trustee; Chairman, Nominating Committee and Qualified Legal Compliance Committee | Since 1989 (Chairman since 2004) | Retired since 2003. |
Costas Azariadis Born: 1943 | Trustee; Chairman, Valuation Committee | Since 1989 | Professor of Economics, Washington University since 2006; Professor of Economics, University of California-Los Angeles 1992-2006. |
James C. Cheng Born: 1942 | Trustee; Chairman, Audit Committee | Since 1989 | President, Technology Marketing Associates (marketing company for small- and medium-sized businesses in New England) since 1991. |
| Interested Trustee | | | |
John Y. Keffer1 Born: 1942 | Trustee; Vice Chairman | Since 1989 | Chairman, Atlantic since 2008; President, Forum Foundation (a charitable organization) since 2005; President, Forum Trust, LLC (a non-depository trust company chartered in the State of Maine) since 1997. |
| | 1 Since 1997, John Y. Keffer has been president and owner of Forum Trust, LLC. Prior to January 1, 2010, Atlantic was a wholly owned subsidiary of Forum Trust, LLC. Effective January 1, 2010, Atlantic became a wholly owned subsidiary of Forum Holdings Corp., a Delaware corporation that is wholly owned by Mr. Keffer. |
| |
THE BEEHIVE FUND ADDITIONAL INFORMATION (Unaudited) DECEMBER 31, 2010 |
| |
| Name and Year of Birth | Position with the Trust | Length of Time Served | Principal Occupation(s) During Past Five Years |
Officers | | | |
Stacey E. Hong Born: 1966 | President; Principal Executive Officer | Since 2008 | President, Atlantic since 2008; Director, Consulting Services, Foreside Fund Services 2007; Elder Care, 2005-2006. |
Karen Shaw Born: 1972 | Treasurer; Principal Financial Officer | Since 2008 | Senior Manager, Atlantic since 2008; Section Manager/Vice President, Enterprise Support Services, Citigroup 2003-2008. |
David Faherty Born: 1970 | Vice President | Since 2009 | Senior Counsel, Atlantic since 2009; Vice President, Citi Fund Services Ohio, Inc. 2007-2009; Associate Counsel, Investors Bank & Trust Co. 2006-2007. |
Michael J. McKeen Born: 1971 | Vice President | Since 2009 | Senior Manager, Atlantic since 2008; Vice President, Citigroup 2003-2008. |
Joshua LaPan Born: 1973 | Vice President | Since 2009 | Manager, Atlantic since 2008; Vice President, Citigroup 2003-2008. |
Timothy Bowden Born: 1969 | Vice President | Since 2009 | Manager, Atlantic since 2008; Vice President, Citigroup 2005-2008. |
Lina Bhatnagar Born: 1971 | Secretary | Since 2008 | Senior Administration Specialist, Atlantic since 2008; Regulatory Administration Specialist, Citigroup 2006-2008. |
| LOU HOLLAND |
| GROWTH FUND |
| |
| Letter to Shareholders |
| December, 2010 |
Dear Fellow Shareholder:
Thank you for your investment in the Lou Holland Growth Fund.
Fund Results
After a tremendous rise in 2009, the domestic equity market continued to climb higher in 2010, with the major stock indexes experiencing a second consecutive year of double-digit returns. As expected, the Fund again participated in this strong uptrend, generating a return of +14.03%. However, the Fund’s conservative high quality strategy was unable to keep pace with the +16.71% return of its style benchmark, the Russell 1000 Growth Index, and it also trailed the +15.06% return of its secondary benchmark, the S&P 500 Index.
Fund Performance
Stock selection decisions were additive to Fund performance overall during the year, with good performance in technology, health care, and producer durables more than offsetting weakness in energy and financial services. However, sector allocation decisions were unfavorable. An underweight in the strong performing consumer discretionary and materials & processing sectors hurt relative performance.
In addition, the Fund was particularly impacted by the combined effect of an overweight in energy and the weak performance of energy holdings, which acted as a major drag. Halliburton Company and Occidental Petroleum were among the top contributors to the Fund’s overall performance. However, Range Resources and Southwestern Energy, high quality natural gas focused exploration and production companies, were the main detractors. Both have been negatively impacted by low natural gas prices and overall natural gas supplies that remain high relative to current demand. Given the uncertain global economic environment, we continue to diligently assess our holdings and the near-term dynamics and longer-term outlook for the sector. However, we believe that Range and Southwestern are best posit ioned because of their deep inventory of high quality low cost reserves and that industry fundamentals will eventually shift in favor of these companies.
Financial services was another area of weakness for the Fund. IHS, which was initiated as a new position earlier in the year, has posted very strong performance as the company’s organic growth continues to trend higher. However, Visa and BlackRock have disappointed. Regulatory concerns about interchange fees and the competitive landscape for mobile payments have caused a contraction in Visa’s multiple and BlackRock has been negatively impacted by concern about outflows due to the Barclays integration and due to the negative market sentiment toward money funds and quantitative strategies. Despite these issues, we continue to believe in their longer-term drivers.
Technology holdings provided a source of positive relative performance. Citrix had another stellar year due to a well-executed business model, movement toward cloud computing and penetration into new vertical markets with existing offerings. QUALCOMM and Apple were also top contributors. QUALCOMM is a major beneficiary of global smartphone share gains, with an enviable market share. Apple continued to gain market- and mind-share through new applications and hardware. We believe that the company’s pace of innovation remains robust, as does its underlying growth rate.
In health care, Genzyme Corporation rose sharply on news of Sanofi-Aventis’ offer to acquire the company and Laboratory Corporation of America recently closed the acquisition of Genzyme’s lab testing business, making them in our
| LOU HOLLAND |
| GROWTH FUND |
| |
| Letter to Shareholders |
| December, 2010 |
view the premier player in the genomic/esoteric testing segment, the fastest growing and most profitable area of lab testing.
A number of producer durables holdings contributed nicely to Fund performance. Waters Corp. continues to deliver strong results, generate impressive cash flow, and gain market share with one of its products. In addition, Expeditors International benefited from the uptick in global trade.
Fund Changes
We rely on our fundamental, bottom-up research to identify stocks that meet our long-term, fundamental, conservative investment criteria of double-digit earnings growth rates and reasonable valuations. We focus on a three-to-five year investment horizon which generally results in low average turnover over long periods of time. However, turnover can be higher or lower than average in any given year. 2010 was a year of below average turnover for the Fund, as was 2009 because we continue to allow the thesis behind our investments to play out, including the purchases during the last market downturn that positioned the Fund to benefit from a future return of domestic and global economic growth.
Additions during the year include Mead Johnson, IHS, and Waters Corporation. Mead Johnson exhibits one of the best top line growth outlooks in the staples sector, with strong exposure to emerging markets and a reasonable number of competitors in the space. IHS, principally a subscription based data provider serving energy, infrastructure, environmental and security markets, has grown organically over time and was purchased due to its strong position in its core end markets and management’s history of effectively redeploying excess cash flow toward accretive merger & acquisition transactions. Waters, a manufacturer and designer of capital equipment for health care and industrial research has fundamentals that continue to improve, a balance sheet that remains rock solid, and shares that have become relatively cheap. Berkshire Hathaway entered the portfolio when it replaced Burlington Northern due to its acquisition of the company.
Stocks are generally sold when they no longer meet our investment criteria or when we identify a better idea. Suntech Power was exited because of concerns that the European debt crisis could impact credit for solar projects and cause some countries to discontinue or reduce solar subsidies. AFLAC was sold because of concerns about its exposure to European hybrid securities. Two holdings were take-over targets: Xerox acquired ACS and XTO Energy was taken over by Exxon Mobil. Symantec Corporation was liquidated to create cash for various buys and McKesson Corporation was sold because of concerns about management’s capital allocation and other decisions. After Questar’s spin-off of QEP, the QEP position was retained since it fit our criteria of a low cost producer (of na tural gas) with a deep inventory for projects, but the remaining Questar position was sold.
Outlook
Despite the headwinds that continue to face the economy, the S&P 500 Index experienced its second consecutive positive year, returning +15.06%. This came on the heels of the stellar +26.46% return it produced in 2009. And while the stock market performed better than generally anticipated in 2010, the path to this end was anything but smooth. The main focus of the financial markets since the recession began three years ago has been the economy and, throughout the past year, investors reacted strongly to economic and other news and events on a real-time basis. However, during the last half of the year, additional monetary and fiscal stimulus, strong corporate earnings, and better economic data resulted in a shift from the earlier fear of a double-dip recession to optimism that the e conomy is or will be improving. The economy
| LOU HOLLAND |
| GROWTH FUND |
| |
| Letter to Shareholders |
| December, 2010 |
now appears to be on more durable ground than it was this time last year. Yet, some risks linger, particularly high unemployment, slow job creation, and continued weak housing. Earnings have been better than anticipated, but corporations remain cautious about future demand as evidenced by their preference to use cash strategically in ways that generally benefit shareholders, as contrasted to putting people back to work. Indeed, the economy faces many challenges as it continues to unwind the excesses of the past several decades. Thus, while things are improving, stock market action may likely remain choppy until data signals an economy that is able to grow on a self-sustaining basis.
We do not attempt to predict the direction of the stock market, the economy, or interest rates. However, we understand that corporate profitability and earnings are affected by the pace of economic growth. Thus, we remain committed to using our thorough, high quality, bottom-up research to identify companies that best meet our long-term fundamental investment criteria. In addition, we currently like companies with exposure to faster-growing products or markets, companies that are market share gainers, and companies whose bottom lines are leveraged to increased demand as the economy recovers. We continue to focus on high quality companies, with solid balance sheets and strong free cash flow and also favorably regard those using this time to take advantage of opportunities that strengthen th eir competitive positions and that create shareholder value longer-term, including returning capital to shareholders by instituting or increasing dividends and/or buying back shares.
In general, we believe that as the economy further recovers and corporate earnings growth normalizes, investors will become cautious of lower quality stocks with lower quality or unsustainable earnings. We expect investors to shift their focus toward stocks of high quality companies with strong balance sheets and good managements, with the ability to generate high quality, sustainable earnings with achievable estimates, metrics consistent with our bottom-up fundamental investment criteria.
We believe that our extensive investment experience and our conservative growth strategy will produce superior results for long-term investors.
Sincerely,
Monica L. Walker Carl R. Bhathena
CEO & Chief Investment Officer – Equity Co-Portfolio Manager - Equity
| LOU HOLLAND |
| GROWTH FUND |
| |
| Performance Chart and Analysis |
| December 31, 2010 |
The following chart reflects the change in the value of a hypothetical $10,000 investment in Investor Shares, including reinvested dividends and distributions, in the Lou Holland Growth Fund (the “Fund”) compared with the performance of the benchmark Russell 1000 Growth Index, over the past ten fiscal years. The Russell 1000 Growth Index, is an unmanaged index which measures the performance of a subset of approximately 622 of those Russell 1000 companies (that is, the 1,000 largest U.S. companies in terms of market capitalization) with higher price-to-book ratios and higher forecasted growth values. The total return of the Fund's classes includes the maximum sales charge of 5.75% (A Shares only) and operating expenses that reduce returns, while the total return of the Russell 1000 Growth Index does not include the effect of sales charges and expenses. A Shares are subject to a 1.00% contingent deferred sales charge on shares purchased without an initial sales charge and redeemed less than one year after purchase. The total return of the Russell 1000 Growth Index includes reinvestment of dividends and income. The total return of the Fund includes operating expenses that reduce returns, while the total return of the Russell 1000 Growth Index does not include expenses. The Fund is professionally managed while the Russell 1000 Growth Index is unmanaged and is not available for investment.
Performance data quoted represents past performance and is no guarantee of future results. Current performance may be lower or higher than the performance data quoted. Investment return and principal value will fluctuate so that shares, when redeemed, may be worth more or less than original cost. For the most recent month-end performance, please visit the website of the Fund's investment adviser at www.hollandcap.com. As stated in the Fund's prospectus, the annual operating expense ratios (gross) for Investor Shares, Institutional Shares and A Shares, respectively are 1.79%, 1.81% and 36.77%, respectively. However, the Fund's adviser has agreed to contractually waive a portion of its fees and to reimb urse expenses such that total operating expenses do not exceed 1.35% for Investor Shares through May 1, 2013, and 1.20% and 1.40% for Institutional Shares and A Shares, respectively, which is in effect until May 1, 2011. The performance table and graph do not reflect the deduction of taxes that a shareholder would pay on Fund distributions or the redemption of Fund shares. Returns greater than one year are annualized.
Average Annual Rate of Return for the Year Ended December 31, 2010
| Lou Holland Growth Fund | 1 Year | 5 Years | 10 Years |
| Investor Shares | 14.03% | 3.54% | 2.24% |
| Institutional Shares* | 14.20% | 3.57% | 2.25% |
| A Shares (with sales charge)* | 7.42% | 2.31% | 1.63% |
| Russell 1000 Growth Index | 16.71% | 3.75% | 0.02% |
*For the Institutional Shares and the A Shares, performance for the above periods are blended average annual returns which include the returns of the Investor Shares prior to February 1, 2010, the commencement of operations of the Institutional Shares and A Shares.
| LOU HOLLAND |
| GROWTH FUND |
| |
| Schedule of Investments |
| December 31, 2010 |
| Shares | | Security Description | | Value | |
| Common Stock - 98.5% |
| Consumer Discretionary - 12.1% |
| | 7,350 | | Amazon.com, Inc. (a) | $ | 1,323,000 | |
| | 9,500 | | Costco Wholesale Corp. | | 685,995 | |
| | 5,950 | | Kohl's Corp. (a) | | 323,323 | |
| | 13,700 | | NIKE, Inc., Class B | | 1,170,254 | |
| | 17,350 | | The Walt Disney Co. | | 650,799 | |
| | 12,650 | | Wal-Mart Stores, Inc. | | 682,214 | |
| | 37,700 | | Yum! Brands, Inc. | | 1,849,185 | |
| | | 6,684,770 | |
| Consumer Staples - 6.1% |
| | 7,050 | | Diageo PLC, ADR | | 524,027 | |
| | 11,500 | | H.J. Heinz Co. | | 568,790 | |
| | 13,100 | | Mead Johnson Nutrition Co. | | 815,475 | |
| | 14,550 | | PepsiCo, Inc. | | 950,551 | |
| | 7,850 | | The Procter & Gamble Co. | | 504,991 | |
| | | 3,363,834 | |
| Energy - 18.0% |
| | 27,309 | | Exxon Mobil Corp. | | 1,996,834 | |
| | 37,250 | | Halliburton Co. | | 1,520,917 | |
| | 14,250 | | Noble Corp. | | 509,723 | |
| | 19,850 | | Occidental Petroleum Corp. | | 1,947,285 | |
| | 19,700 | | QEP Resources, Inc. | | 715,307 | |
| | 46,700 | | Range Resources Corp. | | 2,100,566 | |
| | 31,050 | | Southwestern Energy Co. (a) | | 1,162,202 | |
| | | 9,952,834 | |
| Financial Services - 8.7% |
| | 17,490 | | Berkshire Hathaway, Inc., Class B (a) | | 1,401,124 | |
| | 3,800 | | BlackRock, Inc. | | 724,204 | |
| | 8,900 | | IHS, Inc., Class A (a) | | 715,471 | |
| | 46,950 | | TD Ameritrade Holding Corp. | | 891,580 | |
| | 15,650 | | Visa, Inc., Class A | | 1,101,447 | |
| | | 4,833,826 | |
| Health Care - 9.8% |
| | 45,350 | | Covidien PLC | | 2,070,681 | |
| | 12,250 | | Genzyme Corp. (a) | | 872,200 | |
| | 18,550 | | Hospira, Inc. (a) | | 1,033,049 | |
| | 16,650 | | Laboratory Corp. of America Holdings (a) | | 1,463,868 | |
| | | 5,439,798 | |
| Materials & Processing - 2.1% |
| | 12,050 | | Praxair, Inc. | | 1,150,414 | |
| | | | |
| Producer Durables - 11.1% |
| | 9,450 | | Automatic Data Processing, Inc. | | 437,346 | |
| | 12,100 | | Expeditors International of Washington, Inc. | | 660,660 | |
| | 22,700 | | Honeywell International, Inc. (a) | | 1,206,732 | |
| | 7,400 | | MSC Industrial Direct Co. | | 478,706 | |
| | 10,300 | | Roper Industries, Inc. | | 787,229 | |
| | 7,450 | | United Parcel Service, Inc., Class B | | 540,721 | |
| | 9,550 | | United Technologies Corp. | | 751,776 | |
| | 16,350 | | Waters Corp. (a) | | 1,270,558 | |
| | | 6,133,728 | |
| Technology - 30.6% |
| | 43,650 | | Adobe Systems, Inc. (a) | | 1,343,547 | |
| | 25,450 | | American Tower Corp., Class A(a) | | 1,314,238 | |
| | 7,850 | | Apple, Inc. (a) | | 2,532,096 | |
| | 98,250 | | Cisco Systems, Inc. (a) | | 1,987,598 | |
| | 34,150 | | Citrix Systems, Inc. (a) | | 2,336,201 | |
| | 2,700 | | Google, Inc., Class A (a) | | 1,603,719 | |
| | 31,700 | | Intel Corp. | | 666,651 | |
| | 9,700 | | International Business Machines Corp. | | 1,423,572 | |
| | 59,950 | | Microsoft Corp. | | 1,673,804 | |
| | 40,550 | | QUALCOMM, Inc. | | 2,006,819 | |
| | | 16,888,245 | |
Total Common Stock (Cost $40,746,902) | | 54,447,449 | |
Total Investments - 98.5% (Cost $40,746,902)* | $ | 54,447,449 | |
| Other Assets & Liabilities, Net – 1.5% | | 818,417 | |
| Net Assets – 100.0% | $ | 55,265,866 | |
| | See Notes to Financial Statements | |
| | 5 | |
| LOU HOLLAND |
| GROWTH FUND |
| |
| Schedule of Investments |
| December 31, 2010 |
| ADR | American Depository Receipt |
| PLC | Public Limited Company |
(a) Non-income producing security.
*Cost of investments for federal income tax purposes is $40,951,430 and net unrealized appreciation on investments consists of:
| Gross Unrealized Appreciation | | $ | 14,924,157 | |
| Gross Unrealized Depreciation | | | (1,428,138 | ) |
| Net Unrealized Appreciation | | $ | 13,496,019 | |
The following is a summary of the inputs used to value the Fund’s investments as of December 31, 2010.
The inputs or methodology used for valuing securities are not necessarily an indication of the risk associated with investing in those securities. For more information on valuation inputs, and their aggregation into the levels used in the tables below, please refer to Note 2- Security Valuation section in the accompanying Notes to Financial Statements.
| Valuation Inputs | | Investments in Securities |
| Level 1 – Quoted Prices | | $ | 54,447,449 |
| Level 2 – Other Significant Observable Inputs | | | – |
| Level 3 – Significant Unobservable Inputs | | | – |
| Total Investments | | $ | 54,447,449 |
The Level 1 inputs displayed in this table are Common Stock. Refer to the Schedule of Investments for a further breakout of each security by type.
| PORTFOLIO HOLDINGS | | |
| % of Total Investments | | |
| Consumer Discretionary | 12.3 | % |
| Consumer Staples | 6.2 | % |
| Energy | 18.3 | % |
| Financial Services | 8.9 | % |
| Health Care | 10.0 | % |
| Materials & Processing | 2.1 | % |
| Producer Durables | 11.2 | % |
| Technology | 31.0 | % |
| | 100.0 | % |
| | See Notes to Financial Statements | |
| | 6 | |
| LOU HOLLAND |
| GROWTH FUND |
| |
| Statement of Assets and Liabilities |
| December 31, 2010 |
| ASSETS | | | | |
| | Total investments, at value (Cost $40,746,902) | | $ | 54,447,449 | |
| | Cash | | | 1,019,331 | |
| | Receivables: | | | | |
| | | Fund shares sold | | | 11,945 | |
| | | Dividends and interest | | | 37,002 | |
| | Prepaid expenses | | | 12,054 | |
| Total Assets | | | 55,527,781 | |
| LIABILITIES | | | | |
| | Payables: | | | | |
| | | Investment securities purchased | | | 147,789 | |
| | | Fund shares redeemed | | | 30,024 | |
| | Accrued Liabilities: | | | | |
| | Investment adviser fees | | | 27,204 | |
| | | Trustees’ fees and expenses | | | 34 | |
| | | Fund service fees | | | 8,422 | |
| | | Compliance services fees | | | 1,250 | |
| | | Other expenses | | | 47,192 | |
| Total Liabilities | | | 261,915 | |
| NET ASSETS | | $ | 55,265,866 | |
| | | | | | | |
| COMPONENTS OF NET ASSETS | | | | |
| | Paid-in capital | | $ | 41,769,847 | |
| | Accumulated net realized loss | | | (204,528 | ) |
| | Net unrealized appreciation | | | 13,700,547 | |
| NET ASSETS | | $ | 55,265,866 | |
| | | | | | | |
| SHARES OF BENEFICIAL INTEREST AT NO PAR VALUE (UNLIMITED SHARES AUTHORIZED) | | | | |
| | Investor Shares | | | 2,710,957 | |
| | Institutional Shares | | | 56,304 | |
| | A Shares | | | 618 | |
| NET ASSET VALUE, OFFERING AND REDEMPTION PRICE PER SHARE | | | | |
| | Investor Shares (based on net assets of $54,127,702) | | $ | 19.97 | |
| | Institutional Shares (based on net assets of $1,125,826) | | $ | 20.00 | |
| | A Shares (based on net assets of $12,338) | | $ | 19.96 | |
| | A Shares Maximum Public Offering Price Per Share (net asset value per share/(100%-5.75%)) | | $ | 21.18 | |
| | See Notes to Financial Statements | |
| | 7 | |
| LOU HOLLAND |
| GROWTH FUND |
| |
| Statement of Operations |
| For the Year Ended December 31, 2010 |
| INVESTMENT INCOME | | | | |
| | Dividend income (Net foreign withholding taxes of $113) | | $ | 567,745 | |
| | Interest income | | | 2,410 | |
| Total Investment Income | | | 570,155 | |
| | | | | |
| EXPENSES | | | | |
| | Investment adviser fees | | | 429,008 | |
| | Fund service fees | | | 173,890 | |
| | Transfer Agent fees: | | | | |
| | Investor Shares | | | 15,912 | |
| | Institutional Shares | | | 759 | |
| | A Shares | | | 279 | |
| | Distribution fees: | | | | |
| | Investor Shares | | | 112,809 | |
| | A Shares | | | 25 | |
| | Custodian fees | | | 5,590 | |
| | Registration fees: | | | | |
| | Investor Shares | | | 18,357 | |
| | Institutional Shares | | | 230 | |
| | A Shares | | | 31 | |
| | Professional fees | | | 50,268 | |
| | Trustees’ fees and expenses | | | 7,447 | |
| | Compliance services fees | | | 28,245 | |
| | Miscellaneous expenses | | | 56,942 | |
| Total Expenses | | | 899,792 | |
| | Fees waived and expenses reimbursed | | | (220,008 | ) |
| Net Expenses | | | 679,784 | |
| | | | | | | |
| NET INVESTMENT LOSS | | | (109,629 | ) |
| | | | | | | |
| NET REALIZED AND UNREALIZED GAIN (LOSS) | | | | |
| | Net realized gain on investments | | | 1,268,179 | |
| | Net change in unrealized appreciation (depreciation) on investments | | | 5,678,823 | |
| NET REALIZED AND UNREALIZED GAIN | | | 6,947,002 | |
| INCREASE IN NET ASSETS FROM OPERATIONS | | $ | 6,837,373 | |
| | | | | | | |
| | See Notes to Financial Statements | |
| | 8 | |
| LOU HOLLAND |
| GROWTH FUND |
| |
| Statements of Changes in Net Assets |
| |
| | | | | For the Year Ended December 31, 2010 | | | | For the Year Ended December 31, 2009 |
| OPERATIONS | | | | | | | | | | |
| | Net investment loss | | $ | (109,629 | ) | | | | $ | (41,938 | ) |
| | Net realized gain | | | 1,268,179 | | | | | | 806,897 | |
| | Net change in unrealized appreciation (depreciation) | | | 5,678,823 | | | | | | 12,795,123 | |
| Increase in Net Assets Resulting from Operations | | | 6,837,373 | | | | | | 13,560,082 | |
| DISTRIBUTIONS TO SHAREHOLDERS FROM | | | | | | | | | | |
| | Net realized gain: | | | | | | | | | | |
| | | Investor Shares | | | (1,269,349 | ) | | | | | - | |
| | | Institutional Shares | | | (32,086 | ) | | | | | - | |
| | | A Shares | | | (290 | ) | | | | | - | |
| Total Distributions to Shareholders | | | (1,301,725 | ) | | | | | - | |
| CAPITAL SHARE TRANSACTIONS | | | | | | | | | | |
| | Sale of shares: | | | | | | | | | | |
| | | Investor Shares | | | 4,822,845 | | | | | | 6,969,667 | |
| | | Institutional Shares | | | 1,294,688 | | | | | | - | |
| | | A Shares | | | 10,500 | | | | | | - | |
| | Reinvestment of distributions: | | | | | | | | | | |
| | | Investor Shares | | | 1,268,874 | | | | | | - | |
| | | Institutional Shares | | | 32,086 | | | | | | - | |
| | | A Shares | | | 290 | | | | | | - | |
| | Redemption of shares: | | | | | | | | | | |
| | 1 | Investor Shares | | | (7,699,480 | ) | | | | | (3,954,743 | ) |
| | 2 | Institutional Shares | | | (340,732 | ) | | | | | - | |
| Increase (Decrease) in Net Assets from Capital Share Transactions | | (610,929 | ) | | | | | 3,014,924 | |
| Increase in Net Assets | | | 4,924,719 | | | | | | 16,575,006 | |
| NET ASSETS | | | | | | | | | | |
| | Beginning of Year | | | 50,341,147 | | | | | | 33,766,141 | |
| | End of Year | | $ | 55,265,866 | | | | | $ | 50,341,147 | |
| SHARE TRANSACTIONS | | | | | | | | | | |
| | Sale of shares: | | | | | | | | | | |
| | | Investor Shares | | | 261,853 | | | | | | 464,205 | |
| | | Institutional Shares | | | 72,145 | | | | | | - | |
| | | A Shares | | | 603 | | | | | | - | |
| | Reinvestment of distributions: | | | | | | | | | | |
| | | Investor Shares | | | 64,344 | | | | | | - | |
| | | Institutional Shares | | | 1,625 | | | | | | - | |
| | | A Shares | | | 15 | | | | | | - | |
| | Redemption of shares: | | | | | | | | | | |
| | | Investor Shares | | | (422,104 | ) | | | | | (274,993 | ) |
| | | Institutional Shares | | | (17,466 | ) | | | | | - | |
| Increase (Decrease) in Shares | | | (38,985 | ) | | | | | 189,212 | |
| | See Notes to Financial Statements | |
| | 9 | |
| LOU HOLLAND |
| GROWTH FUND |
| |
| Financial Highlights |
| |
These financial highlights reflect selected data for a share outstanding throughout each year.
| | | Years Ended December 31, | | | | |
| | | 2010 | | | | 2009 | | | | 2008 | | | | 2007 | | | | 2006 | | | | | |
| INVESTOR SHARES | | | | | | | | | | | | | | | | | | | | | | | |
| NET ASSET VALUE, Beginning of Year | $ | 17.94 | | | $ | 12.90 | | | $ | 19.81 | | | $ | 18.65 | | | $ | 17.99 | | | | | |
| INVESTMENT OPERATIONS | | | | | | | | | | | | | | | | | | | | | | | |
| Net investment income (loss) (a) | | (0.04 | ) | | | (0.02 | ) | | | (0.04 | ) | | | (0.04 | ) | | | 0.02 | | | | | |
| Net realized and unrealized gain (loss) | | 2.55 | | | | 5.06 | | | | (6.86 | ) | | | 1.79 | | | | 0.92 | | | | | |
| Total from Investment Operations | | 2.51 | | | | 5.04 | | | | (6.90 | ) | | | 1.75 | | | | 0.94 | | | | | |
| DISTRIBUTIONS TO | | | | | | | | | | | | | | | | | | | | | | | |
| SHAREHOLDERS FROM | | | | | | | | | | | | | | | | | | | | | | | |
| Net investment income | | — | | | | — | | | | — | | | | (0.01 | ) | | | (0.01 | ) | | | | |
| Net realized gain | | (0.48 | ) | | | — | | | | (0.01 | ) | | | (0.58 | ) | | | (0.27 | ) | | | | |
| Total Distributions to Shareholders | | (0.48 | ) | | | — | | | | (0.01 | ) | | | (0.59 | ) | | | (0.28 | ) | | | | |
| NET ASSET VALUE, End of Year | $ | 19.97 | | | $ | 17.94 | | | $ | 12.90 | | | $ | 19.81 | | | $ | 18.65 | | | | | |
| TOTAL RETURN | | 14.03 | % | | 39.07 | % | | (34.83 | )% | | 9.40 | % | | 5.23 | % | | | | |
| RATIOS/SUPPLEMENTARY DATA | | | | | | | | | | | | | | | | | | | | |
| Net Assets at End of | | | | | | | | | | | | | | | | | | | | |
| | Year (000's omitted) | $54,128 | | | $50,341 | | | $33,766 | | | $55,703 | | | $58,993 | | | | | |
| Ratios to Average Net Assets: | | | | | | | | | | | | | | | | | | | | |
| Net investment income (loss) | | (0.22 | )% | | (0.11 | )% | | (0.25 | )% | | (0.19 | )% | | 0.10 | % | |
| Net expense | | 1.35 | % | | 1.35 | % | | 1.35 | % | | 1.35 | % | | 1.35 | % | |
| Gross expense (b) | | 1.77 | % | | 1.69 | % | | 1.71 | % | | 1.41 | % | | 1.47 | % | |
| PORTFOLIO TURNOVER RATE | | 18 | % | | 11 | % | | 35 | % | | 26 | % | | 32 | % | |
| | | | | | | | | | | | | | | | | | | | | | |
| (a) | Calculated based on average shares outstanding during the year. | | | | | | | |
| (b) | Reflects the expense ratio excluding any waivers or reimbursements. | | | | | | | |
| | See Notes to Financial Statements | |
| | 10 | |
| LOU HOLLAND |
| GROWTH FUND |
| |
| Financial Highlights |
| |
| These financial highlights reflect selected data for a share outstanding throughout the period. |
| | | March 1, 2010 (a) through December 31, 2010 |
| INSTITUTIONAL SHARES | | | |
| NET ASSET VALUE, Beginning of Period | $ | 17.88 | |
| INVESTMENT OPERATIONS | | | |
| Net investment loss (b) | | (0.01 | ) |
| Net realized and unrealized gain (loss) | | 2.61 | |
| Total from Investment Operations | | 2.60 | |
| DISTRIBUTIONS TO SHAREHOLDERS FROM | | | |
| Net realized gain | | (0.48 | ) |
| NET ASSET VALUE, End of Period | $ | 20.00 | |
| TOTAL RETURN | | 14.58 | %(c) |
| RATIOS/SUPPLEMENTARY DATA | | | |
| Net Assets at End of Period (000's omitted) | | $1,126 | |
| Ratios to Average Net Assets: | | | |
| Net investment loss | | (0.06 | )%(d) |
| Net expense | | 1.20 | %(d) |
| Gross expense (e) | | 1.91 | %(d) |
| PORTFOLIO TURNOVER RATE | | 18 | %(c) |
| | | | | |
| (a) | Commencement of operations. |
| (b) | Calculated based on average shares outstanding during the period. |
| (c) | Not annualized. |
| (d) | Annualized. |
| (e) | Reflects the expense ratio excluding any waivers or reimbursements. |
| | See Notes to Financial Statements | |
| | 11 | |
| LOU HOLLAND |
| GROWTH FUND |
| |
| Financial Highlights |
| |
| These financial highlights reflect selected data for a share outstanding throughout the period. | | |
| | | February 1, 2010 (a) through December 31, 2010 | | |
| A SHARES | | | | | | |
| NET ASSET VALUE, Beginning of Period | $ | 17.40 | | | | |
| INVESTMENT OPERATIONS | | | | | | |
| Net investment loss (b) | | (0.04 | ) | | | |
| Net realized and unrealized gain (loss) | | 3.08 | | | | |
| Total from Investment Operations | | 3.04 | | | | |
| DISTRIBUTIONS TO SHAREHOLDERS FROM | | | | | | |
| Net realized gain | | (0.48 | ) | | | |
| NET ASSET VALUE, End of Period | $ | 19.96 | | | | |
| TOTAL RETURN | | 17.51 | %(c)(d) | | |
| RATIOS/SUPPLEMENTARY DATA | | | | | |
| Net Assets at End of Period (000's omitted) | $ | 12 | | |
| Ratios to Average Net Assets: | | | | |
| Net investment loss | | (0.22 | )%(e) | | |
| Net expense | | 1.40 | %(e) | | |
| Gross expense (f) | | 42.81 | %(e) | | |
| PORTFOLIO TURNOVER RATE | | 18 | %(c) | | |
| | | | | | |
| (a) | Commencement of operations. | | | |
| (b) | Calculated based on average shares outstanding during the period. | | | |
| (c) | Not annualized. | | | |
| (d) | Total Return does not include the effect of front end sales charge or contingent deferred sales charge. | | | |
| (e) | Annualized. | | | |
| (f) | Reflects the expense ratio excluding any waivers and/or reimbursements. | | | |
| | See Notes to Financial Statements | |
| | 12 | |
| LOU HOLLAND |
| GROWTH FUND |
| |
| Notes to Financial Statements |
| December 31, 2010 |
Note 1. Organization
The Lou Holland Growth Fund (the “Fund”) is a diversified portfolio of Forum Funds (the “Trust”). The Trust is a Delaware statutory trust that is registered as an open-end, management investment company under the Investment Company Act of 1940 (the “Act”), as amended. Under its Trust Instrument, the Trust is authorized to issue an unlimited number of the Fund’s shares of beneficial interest without par value. The Fund currently offers three classes of shares: Investor Shares, Institutional Shares and A Shares. A Shares are offered at net asset value plus a maximum sales charge of 5.75%. A Shares are also subject to contingent deferred sales charge (“CDSC”) of 1.00% on purchases without an initial sales charge and redeemed less than one year after they are purchased. Investor Shares and Institutional Shares are not subject to a sales charge. Investor Shares commenced operations on April 29, 1996, Institutional Shares commenced operations on March 1, 2010, and A Shares commenced operations on February 1, 2010. The Fund’s investment objective is to seek long-term growth of capital, with the receipt of dividend income as a secondary consideration.
On January 22, 2010, at a Special Meeting of Shareholders of the Fund, formerly a series of the Lou Holland Trust, (the “Former Fund”), the shareholders approved a proposal to reorganize the Former Fund into the Lou Holland Growth Fund, a newly created series of the Forum Funds. The Fund is designed to be substantially similar from an investment perspective to the Former Fund. The primary purpose of the reorganization was to move the Former Fund to a newly created series of the Trust. As a result of the reorganization, the Fund is now operating under the supervision of a different board of trustees and the Lou Holland Trust has been terminated. On February 1, 2010, the shares of the Former Fund were, in effect, exchanged on a tax-free basis for Investor Shares of the Fund with the same aggregate value. No sales load, commission or other transactional fees were imposed on shareholders in connection with the tax-free exchange of their shares.
Note 2. Summary of Significant Accounting Policies
These financial statements are prepared in accordance with generally accepted accounting principles in the United States of America (“GAAP”), which require management to make estimates and assumptions that affect the reported amounts of assets and liabilities, the disclosure of contingent liabilities at the date of the financial statements, and the reported amounts of increase and decrease in net assets from operations during the fiscal year. Actual amounts could differ from those estimates. The following summarizes the significant accounting policies of the Fund:
Security Valuation – Exchange-traded securities and over-the-counter securities are valued using the last quoted sale or official closing price, provided by independent pricing services as of the close of trading on the market or exchange for which they are primarily traded, on each Fund business day. In the absence of a sale, such securities are valued at the mean of the last bid and ask price provided by independent pricing services. Non-exchange traded securities for which quotations are available are valued using the last quoted sales price, or in the absence of a sale at the mean of the last bid and ask prices provided by independent pricing services. Shares of open-end mutual funds are valued at net asset value (“NAV”). Short-term investments tha t mature in sixty days or less may be valued at amortized cost.
The Fund values its investments at fair value pursuant to procedures adopted by the Trust's Board of Trustees (the "Board") if (1) market quotations are insufficient or not readily available or (2) the adviser believes that the values available are unreliable. Fair valuation is based on subjective factors and as a result, the fair value price of an investment may differ from the security’s market price and may not be the price at which the asset may be sold. Fair valuation could result in a different NAV than a NAV determined by using market quotes.
| LOU HOLLAND |
| GROWTH FUND |
| |
| Notes to Financial Statements |
| December 31, 2010 |
The Fund has a three-tier fair value hierarchy. The basis of the tiers is dependent upon the various “inputs” used to determine the value of the Fund’s investments. These inputs are summarized in the three broad levels listed below:
Level 1 — quoted prices in active markets for identical assets
Level 2 — other significant observable inputs (including quoted prices of similar securities, interest rates, prepayment speeds, credit risk, etc.)
Level 3 — significant unobservable inputs (including the Fund’s own assumptions in determining the fair value of investments)
The aggregate value by input level, as of December 31, 2010, for the Fund’s investments is included at the end of the Fund’s Schedule of Investments.
Security Transactions, Investment Income and Realized Gain and Loss – Investment transactions are accounted for on the trade date. Dividend income is recorded on the ex-dividend date. Foreign dividend income is recorded on the ex-dividend date or as soon as possible after the Fund determines the existence of a dividend declaration after exercising reasonable due diligence. Income and capital gains on some foreign securities may be subject to foreign withholding taxes, which are accrued as applicable. Interest income is recorded on an accrual basis. Premium and discount is amortized and accreted in accordance with GAAP. Identified cost of investments sold is used to determine the gain and loss for both financial statement and federal income tax purposes.
Distributions to Shareholders – Distributions to shareholders of net investment income and net capital gains, if any, are declared and paid at least annually. Distributions are based on amounts calculated in accordance with applicable federal income tax regulations, which may differ from GAAP. These differences are due primarily to differing treatments of income and gain on various investment securities held by the Fund, timing differences and differing characterizations of distributions made by the Fund.
Federal Taxes – The Fund intends to qualify each year as a regulated investment company under Subchapter M of the Internal Revenue Code and distribute all of its taxable income to shareholders. In addition, by distributing in each calendar year substantially all its net investment income and capital gains, if any, the Fund will not be subject to a federal excise tax. Therefore, no federal income or excise tax provision is required.
As of December 31, 2010, there are no uncertain tax positions that would require financial statement recognition, de-recognition, or disclosure. The Fund’s federal tax returns filed in the three-year period ended December 31, 2010, remain subject to examination by the Internal Revenue Service.
Income and Expense Allocation – The Trust accounts separately for the assets, liabilities and operations of each of its investment portfolios. Expenses that are directly attributable to more than one investment portfolio are allocated among the respective investment portfolios in an equitable manner.
The Fund’s class specific expenses are charged to the operations of that class of shares. Income and expenses (other than expenses attributable to a specific class) and realized and unrealized gains or losses on investments are allocated to each
| LOU HOLLAND |
| GROWTH FUND |
| |
| Notes to Financial Statements |
| December 31, 2010 |
class of shares based on the class’ respective net assets to the total net assets of the Fund.
Commitments and Contingencies – In the normal course of business, the Fund enters into contracts that provide general indemnifications by the Fund to the counterparty to the contract. The Fund’s maximum exposure under these arrangements is dependent on future claims that may be made against the Fund and, therefore, cannot be estimated; however, based on experience, the risk of loss from such claims is considered remote.
Note 3. Advisory Fees, Servicing Fees and Other Transactions
Investment Adviser – Holland Capital Management LLC (the “Adviser”) is the investment adviser to the Fund. Pursuant to an investment advisory agreement, the Adviser receives an advisory fee monthly from the Fund at annualized rates of 0.85% of the Fund’s average daily net assets up to $500 million, 0.75% of the Fund’s average daily net assets up to the next $500 million and 0.65% of the Fund’s average daily net assets in excess of $1 billion.
Distribution – Foreside Fund Services, LLC serves as the Fund’s distributor (the “Distributor”). The Distributor is not affiliated with the Adviser or Atlantic Fund Administration, LLC (d/b/a Atlantic Fund Services) (“Atlantic”) or their affiliates. The Fund has adopted a Distribution Plan (the “Plan”) for Investor Shares and A Shares of the Fund in accordance with Rule 12b-1 of the Act. Under the Plan, the Fund pays the Distributor and/or any other entity as authorized by the Board a fee of up to 0.25% of the average daily net assets of Investor Shares and A Shares. The Distributor had no role in determining the investment policies or which securities are to be purchased or sold by the Trust or its Funds.
For the period ended December 31, 2010, there were no front-end or CDSC sales charges assessed on the sale of A Shares.
Other Service Providers – Atlantic provides fund accounting, fund administration, and transfer agency services to the Fund. Atlantic also provides certain shareholder report production, and EDGAR conversion and filing services. Atlantic provides a Principal Executive Officer, a Principal Financial Officer, a Chief Compliance Officer, and an Anti-Money Laundering Officer to the Fund, as well as certain additional compliance support functions.
Trustees and Officers – The Trust pays each independent Trustee an annual retainer fee of $40,000 for service to the Trust ($60,000 for the Chairman). In addition, the Chairman receives a monthly stipend of $500 to cover certain expenses incurred in connection with his duties to the Trust. The Trustees and Chairman may receive additional fees for special Board meetings. Each Trustee is also reimbursed for all reasonable out-of-pocket expenses incurred in connection with his duties as a Trustee, including travel and related expenses incurred in attending Board meetings. The amount of Trustees’ fees attributable to the Fund is disclosed in the Statement of Operations. Certain officers of the Trust are also officers o r employees of the above named service providers, and during their terms of office received no compensation from the Fund.
Note 4. Expense Reimbursements and Fees Waived
The Adviser has contractually agreed to waive a portion of its fees and reimburse expenses through May 1, 2013, to the extent necessary to maintain the total operating expenses at 1.35% of average daily net assets of the Investor Shares. The Adviser has contractually agreed to waive a portion of its fees and reimburse expenses through May 1, 2011 to the extent
| LOU HOLLAND |
| GROWTH FUND |
| |
| Notes to Financial Statements |
| December 31, 2010 |
necessary to maintain the total operating expenses at 1.20% and 1.40% of the Institutional Shares and A Shares, respectively. Other fund service providers have voluntarily agreed to waive a portion of their fees. These contractual waivers may be changed or eliminated at any time with consent of the Board and voluntary fee waivers and expense reimbursements may be reduced or eliminated at any time. For the period ended December 31, 2010, fees waived and reimbursed were as follows:
| | Investment Adviser Waived | | Investment Adviser Reimbursed | | Other Waivers | | Total Fees Waived | |
| | $53,457 | | $67,192 | | $99,359 | | $220,008 | |
Note 5. Security Transactions
The cost of purchases and proceeds from sales of investment securities (including maturities), other than short-term investments for the year ended December 31, 2010, were $8,825,873 and $10,633,760, respectively.
Note 6. Federal Income Tax and Investment Transactions
Distributions during the fiscal year ended December 31, 2010, were characterized for tax purposes as follows:
| | | 2010 | |
| Ordinary Income | | $ | 99,530 | |
| Long-Term Capital Gain | | | 1,202,195 | |
| Total | | $ | $1,301,725 | |
As of December 31, 2010, distributable earnings (accumulated losses) on a tax basis were as follows:
| Unrealized Appreciation | | $ | 13,496,019 | |
The difference between components of distributable earnings on a tax basis and the amounts reflected in the Statement of Assets and Liabilities are primarily due to wash sales.
On the Statement of Assets and Liabilities, as a result of permanent book to tax differences, certain amounts have been reclassified for the year ended December 31, 2010. The following reclassification was the result of net operating losses and distributions in excess of net investment income necessary to satisfy excise tax distribution requirements and has no impact on the net assets of the Fund.
| Accumulated Net Investment Income (Loss) | $ | 109,629 | |
| Undistributed Net Realized Gain (Loss) | | (35,971 | ) |
| Paid-in-Capital | | (73,658 | ) |
| LOU HOLLAND |
| GROWTH FUND |
| |
| Notes to Financial Statements |
| December 31, 2010 |
Note 7. Recent Accounting Pronouncements
In January 2010, the Financial Accounting Standards Board issued Accounting Standards Update (“ASU”) No. 2010-06 “Improving Disclosures about Fair Value Measurements.” ASU No. 2010-06 clarifies existing disclosure and requires additional disclosures regarding fair value measurements. Effective for fiscal years beginning after December 15, 2010, and for interim periods within those fiscal years, entities will need to disclose information about purchases, sales, issuances and settlements of Level 3 securities on a gross basis, rather than as a net number as currently required. Management is currently evaluating the impact ASU No. 2010-06 will have on financial statement disclosures.
Note 8. Change in Independent Registered Public Accounting Firm
The Board, with the approval and recommendation of the Audit Committee, selected BBD, LLP (“BBD”) to replace Deloitte & Touche, LLP (“D&T”), as the Fund’s independent registered public accounting firm for the Fund’s fiscal year ending December 31, 2010. D&T resigned subsequent to the Board’s approval of BBD. Throughout D&T’s tenure, including the Fund's two most recent fiscal periods, the Fund had no disagreements with D&T on any matter of accounting principles or practices, financial statement disclosure or auditing scope or procedures, and there were no reportable events of the kind described in Item 304(a)(1)(v) of Regulation S-K under the Securities Exchange Act of 1934. With respect to the Fund, D&T’s audit opinions, including the past two fiscal periods, have not contained either an adverse opinion or disclaimer of opinion, nor were they qualified or modified as to uncertainty, audit scope or accounting principles. Further, there were no disagreements between the Fund and D&T on accounting principles, financial statement disclosure or audit scope, which, if not resolved to the satisfaction of D&T would have caused D&T to make reference to the disagreement in a D&T report.
During the last two fiscal years of the Fund, neither the Fund nor anyone on its behalf has consulted BBD on items concerning the application of accounting principles to a specified transaction (either completed or proposed) or the type of audit opinion that might be rendered on the Fund's financial statements, or concerning the subject of a disagreement of the kind described in Item 304(a)(1)(iv) of Regulation S-K or reportable events of the kind described in Item 304(a)(1)(v) of Regulation S-K.
Note 9. Subsequent Events
Subsequent events occurring after the date of this report through the date these financial statements were issued have been evaluated for potential impact and the Fund has had no such events.
| LOU HOLLAND |
| GROWTH FUND |
| |
| REPORT OF INDEPENDENT REGISTERED PUBLIC ACCOUNTING FIRM |
| |
To the Board of Trustees of Forum Funds
and the Shareholders of Lou Holland Growth Fund
We have audited the accompanying statement of assets and liabilities of the Lou Holland Growth Fund (the “Fund”), a series of shares of beneficial interest in the Forum Funds, including the schedule of investments, as of December 31, 2010, and the related statement of operations, the statement of changes in net assets and the financial highlights for the year then ended. These financial statements and financial highlights are the responsibility of the Fund's management. Our responsibility is to express an opinion on these financial statements and financial highlights based on our audit. The statement of changes in net assets for the year ended December 31, 2009 and the financial highlights for each of the years in the four year period ended December 31, 2009 were audited by other auditors whose report dated February 25, 2010, expressed an unqualified opinion on such financial statement and financial highlights.
We conducted our audit in accordance with the standards of the Public Company Accounting Oversight Board (United States). Those standards require that we plan and perform the audit to obtain reasonable assurance about whether the financial statements and financial highlights are free of material misstatement. An audit includes examining, on a test basis, evidence supporting the amounts and disclosures in the financial statements. Our procedures included confirmation of securities owned as of December 31, 2010 by correspondence with the custodian and brokers or by other appropriate auditing procedures where replies from brokers were not received. An audit also includes assessing the accounting principles used and significant estimates made by management, as well as evaluating the overall financial statement presentation. We believe that our audit provides a reasonable basis for our opinion.
In our opinion, the financial statements and financial highlights referred to above present fairly, in all material respects, the financial position of the Lou Holland Growth Fund as of December 31, 2010, and the results of its operations, the changes in its net assets and its financial highlights for the year then ended, in conformity with accounting principles generally accepted in the United States of America.
BBD, LLP
Philadelphia, Pennsylvania
February 18, 2011
| LOU HOLLAND |
| GROWTH FUND |
| |
| Additional Information (Unaudited) |
| December 31, 2010 |
Shareholder Proxy Vote
At a special meeting of shareholders, held on January 22, 2010, shares were voted as follows on the proposal presented to shareholders:
To approve an Agreement and Plan of Reorganization under which the Lou Holland Growth Fund, a series of The Lou Holland Trust, would assign all of its assets and liabilities to the Lou Holland Growth Fund (“FF Lou Holland Fund”), a series of Forum Funds, in exchange for shares of the FF Lou Holland Fund in a tax-free reorganization.
| For | Against | Abstain |
| 2,412,593 | 83,688 | 80,865 |
Proxy Voting Information
A description of the policies and procedures that the Fund uses to determine how to vote proxies relating to securities held in the Fund’s portfolio is available, without charge and upon request, by calling (800) 295-9779 and on the SEC’s website at www.sec.gov. The Fund’s proxy voting record for the most recent twelve-month period ended June 30 is available, without charge and upon request, by calling (800) 295-9779, on the Fund’s website at www.hollandcap.com/lhgf_perf.html and on the SEC’s website at www.sec.gov.
Availability of Quarterly Portfolio Schedules
The Fund files its complete schedule of portfolio holdings with the SEC for the first and third quarters of each fiscal year on Form N-Q. The Fund’s Forms N-Q are available, without charge and upon request on the SEC’s website at www.sec.gov or may be reviewed and copied at the SEC’s Public Reference Room in Washington, DC. Information on the operation of the Public Reference Room may be obtained by calling (800)-SEC-0330.
Shareholder Expense Example
As a shareholder of the Fund, you incur two types of costs: (1) transaction costs, including sales charges (loads) on purchase payments on certain classes, and (2) ongoing costs, including management fees, Rule 12b-1 fees, and other Fund expenses. This example is intended to help you understand your ongoing costs (in dollars) of investing in the Fund, and to compare these costs with the ongoing costs of investing in other mutual funds.
The example is based on an investment of $1,000 invested at the beginning of the period and held for the entire period from July 1, 2010, through December 31, 2010.
Actual Expenses – The first line under each share class in the table below provides information about actual account values and actual expenses. You may use the information in this line, together with the amount you invested, to estimate the expenses that you paid over the period. Simply divide your account value by $1,000 (for example, an $8,600 account value divided by $1,000 = 8.6), then multiply the result by the number in the first line under the heading entitled “Expenses Paid During Period” to estimate the expenses you paid on your account during the period.
| LOU HOLLAND |
| GROWTH FUND |
| |
| Additional Information (Unaudited) |
| December 31, 2010 |
Hypothetical Example for Comparison Purposes – The second line under each share class of the table below provides information about hypothetical account values and hypothetical expenses based on the Fund’s actual expense ratio and an assumed rate of return of 5% per year before expenses, which is not the Fund’s actual return. The hypothetical account values and expenses may not be used to estimate the actual ending balance or expenses you paid for the period. You may use this information to compare the ongoing cost of investing in the Fund and other funds. To do so, compare this 5% hypothetical example with the 5% hypothetical examples that appear in the shareholder reports of other funds.
Please note that expenses shown in the table are meant to highlight your ongoing costs only and do not reflect any transactional costs, such as sales charges (loads) on purchase payments on certain classes. Therefore, the second line of the table is useful in comparing ongoing costs only, and will not help you determine the relative total costs of owning different funds. In addition, if these transactional costs had been included, your costs would have been higher.
| | Beginning Account Value July 1, 2010 | | Ending Account Value December 31, 2010 | | Expenses Paid During Period * | | Annualized Expense Ratio * |
| Investor Shares | | | | | | | | | | | |
| Actual | $ | 1,000.00 | | $ | 1,228.65 | | $ | 7.58 | | | 1.35% |
Hypothetical (5% return before expenses) | $ | 1,000.00 | | $ | 1,018.40 | | $ | 6.87 | | | 1.35% |
| Institutional Shares | | | | | | | | | | | |
| Actual | $ | 1,000.00 | | $ | 1,229.74 | | $ | 6.74 | | | 1.20% |
Hypothetical (5% return before expenses) | $ | 1,000.00 | | $ | 1,019.16 | | $ | 6.11 | | | 1.20% |
| A Shares | | | | | | | | | | | |
| Actual | $ | 1,000.00 | | $ | 1,228.06 | | $ | 7.86 | | | 1.40% |
Hypothetical (5% return before expenses) | $ | 1,000.00 | | $ | 1,018.15 | | $ | 7.12 | | | 1.40% |
* Expenses are equal to the Fund’s annualized expense ratio as indicated above multiplied by the average account value over the period, multiplied by the number of days in the most recent fiscal half-year divided by 365 to reflect the half-year period.
Federal Tax Status of Dividends Declared During the Year
For federal income tax purposes, dividends from short-term capital gains are classified as ordinary income. The Fund designates 100% of its income dividend distributed as qualifying for the corporate dividends-received deduction (DRD) and 100% for the qualified dividend rate (QDI) as defined in Section 1(h)(11) of the Internal Revenue Code. The Fund also designates 100% as short-term capital gain dividends exempt from US tax for foreign shareholders (QSD).
| LOU HOLLAND |
| GROWTH FUND |
| |
| Additional Information (Unaudited) |
| December 31, 2010 |
Trustees and Officers of the Trust
The Board is responsible for oversight of the management of the Trust’s business affairs and of the exercise of all the Trust’s powers except those reserved for the shareholders. The following table provides information about each Trustee and certain officers of the Trust. Each Trustee and officer holds office until the person resigns, is removed, or is replaced. Unless otherwise noted, the persons have held their principal occupations for more than five years. The address for all Trustees and officers is Three Canal Plaza, Suite 600, Portland, Maine 04101, unless otherwise indicated. Each Trustee oversees twenty-three portfolios in the Trust. Mr. Keffer is considered an Interested Trustee due to his affiliation with Atlantic. Mr. Keffer is also an Interested Director of Wintergreen Fund, Inc. The Fund’s Statement of Additional Information includes additional information about the Trustees and is available, without charge and upon request, by calling (800) 295-9779.
| Name and Year of Birth | Position with the Trust | Length of Time Served | Principal Occupation(s) During Past Five Years |
| Independent Trustees | | | |
J. Michael Parish Born: 1943 | Chairman of the Board; Trustee; Chairman, Nominating Committee and Qualified Legal Compliance Committee | Since 1989 (Chairman since 2004) | Retired since 2003. |
Costas Azariadis Born: 1943 | Trustee; Chairman, Valuation Committee | Since 1989 | Professor of Economics, Washington University since 2006; Professor of Economics, University of California-Los Angeles 1992-2006. |
James C. Cheng Born: 1942 | Trustee; Chairman, Audit Committee | Since 1989 | President, Technology Marketing Associates (marketing company for small- and medium-sized businesses in New England) since 1991. |
| Interested Trustee | | | |
John Y. Keffer1 Born: 1942 | Trustee; Vice Chairman | Since 1989 | Chairman, Atlantic since 2008; President, Forum Foundation (a charitable organization) since 2005; President, Forum Trust, LLC (a non-depository trust company chartered in the State of Maine) since 1997. |
| | 1 Since 1997, John Y. Keffer has been president and owner of Forum Trust, LLC. Prior to January 1, 2010, Atlantic was a wholly owned subsidiary of Forum Trust, LLC. Effective January 1, 2010, Atlantic became a wholly owned subsidiary of Forum Holdings Corp., a Delaware corporation that is wholly owned by Mr. Keffer. |
| LOU HOLLAND |
| GROWTH FUND |
| |
| Additional Information (Unaudited) |
| December 31, 2010 |
| Name and Year of Birth | Position with the Trust | Length of Time Served | Principal Occupation(s) During Past Five Years |
| Officers | | | |
Stacey E. Hong Born: 1966 | President; Principal Executive Officer | Since 2008 | President, Atlantic since 2008; Director, Consulting Services, Foreside Fund Services 2007; Elder Care, 2005-2006. |
Karen Shaw Born: 1972 | Treasurer; Principal Financial Officer | Since 2008 | Senior Manager, Atlantic since 2008; Section Manager/Vice President, Enterprise Support Services, Citigroup 2003-2008. |
David Faherty Born: 1970 | Vice President | Since 2009 | Senior Counsel, Atlantic since 2009; Vice President, Citi Fund Services Ohio, Inc. 2007-2009; Associate Counsel, Investors Bank & Trust Co. 2006-2007. |
Michael J. McKeen Born: 1971 | Vice President | Since 2009 | Senior Manager, Atlantic since 2008; Vice President, Citigroup 2003-2008. |
Joshua LaPan Born: 1973 | Vice President | Since 2009 | Manager, Atlantic since 2008; Vice President, Citigroup 2003-2008. |
Timothy Bowden Born: 1969 | Vice President | Since 2009 | Manager, Atlantic since 2008; Vice President, Citigroup 2005-2008. |
Lina Bhatnagar Born: 1971 | Secretary | Since 2008 | Senior Administration Specialist, Atlantic since 2008; Regulatory Administration Specialist, Citigroup 2006-2008. |
TABLE OF CONTENTS
A Message to Our Shareholders............................................................................................1
Performance Chart and Analysis............................................................................................6
Schedule of Investments.........................................................................................................7
Statement of Assets and Liabilities.....................................................................................10
Statement of Operations........................................................................................................11
Statements of Changes in Net Assets................................................................................12
Financial Highlights...............................................................................................................13
Notes to Financial Statements..............................................................................................14
Report of Independent Registered Public Accounting Firm...........................................20
Additional Information (Unaudited)...................................................................................21
| |
POLARIS GLOBAL VALUE FUND DECEMBER 31, 2010 |
| |
Dear Fellow Shareholder,
For the year ended December 31, 2010, the Polaris Global Value Fund (the “Fund”) returned a very satisfactory 20.64%, outperforming the MSCI World Index, net, which returned 11.76%. The Fund’s annual results, which exceeded the benchmark by 8.88%, can be credited to strategic bottom-up stock picking, as our research identified what we believe are fundamentally-sound companies that not only survived the recession but also emerged stronger in the early recovery phase of the world economy. Many of the portfolio companies underwent restructuring during the recession, streamlining business units and creating efficiencies. As a result, companies posting even slow sales growth generated higher percen tage increases in cash flows. Further bolstering the Fund’s results, we purchased 11 new companies during the year, nine of which posted double digit returns by year end.
The following table summarizes total returns through December 31, 2010.
| | 2010 | Annualized As of December 31, 2010 |
| | YTD | QIV | QIII | QII | QI | 1 Yr | 3 Yrs | 5 Yrs | 10 Yrs | 15 Yrs | 20 Yrs | ITD |
| Polaris Global Value Fund | 20.64% | 10.38% | 14.26% | -9.98% | 6.14% | 20.64% | -4.20% | 1.02% | 8.41% | 9.16% | 10.76% | 9.31% |
| MSCI World Index, | 11.76% | 8.95% | 13.78% | -12.67% | 3.24% | 11.76% | -4.85% | 2.43% | 2.31% | 5.48% | 7.01% | 5.80% |
*Inception-to-date (Inception 7/31/1989)
Performance data quoted represents past performance and is no guarantee of future results. Current performance may be lower or higher than the performance data quoted. Returns for more than one year are annualized. Investment return and principal value will fluctuate so that an investor's shares, when redeemed, may be worth more or less than original cost. For the most recent month end performance, please call (888) 263-5594 or visit the Fund’s website at www.polarisfunds.com. As stated in the current prospectus, the Fund’s annual operating expense ratio (gross) is 1.46%. Shares redeemed or exchanged within 180 days of purchase will be charged a 1.00% fee. Fund performance returns shown do not reflect this fee; if reflected, the returns would have been lower. See page 4 for additional disclosure.
The recent growth rate in the stock market has helped to produce short-term returns that are not typical and may not continue in the future. Because of ongoing market volatility, fund performance may be subject to substantial short-term changes.
The table above shows that the Fund’s long-term performance has exceeded benchmark returns with lower market risk, as measured by the beta statistic of 0.92 since the Fund’s inception (volatility measurement relative to the MSCI World Index).
2010 PERFORMANCE ANALYSIS:
It is noteworthy that our most important contributions stemmed from the developed world (United States, continental Europe and Scandinavian countries). This fact seems incongruous with the tide of investor money flowing into emerging markets; however, we achieved strong returns without the level of volatility often associated with emerging markets.
| |
POLARIS GLOBAL VALUE FUND DECEMBER 31, 2010 |
| |
Contributing more than half of the positive results for the year, U.S. holdings performed strongly, with banks, industrials and consumer staples leading the pack. Six out of seven German holdings in the portfolio posted returns in excess of 18% during the year, while all of the portfolio’s Swedish and Finnish stocks achieved double digit returns.
Turning to our more traditional sector analysis, the Fund saw some of its strongest gains from industrials, materials and energy stocks, many of which have substantial exposure to emerging markets. Finland's industrials such as Konecranes, YIT Oyj and Kone Oyj posted returns in excess of 20%, as their order books and revenue streams were stronger than we expected. The top-performing Scandinavian companies were all export-oriented, with competitive global business models that were able to capitalize on growth in emerging markets.
The Fund’s energy stocks posted strong returns, backed by stabilized Asian refining companies and higher global oil prices, which boosted Thai Oil, Sasol and Marathon Oil. One of the Fund’s newer positions, ProSafe SE also performed well after announcing record third quarter 2010 results.
Materials companies, whose products are in strong demand due to the growth of developed economies compounded by growth in emerging countries, also contributed strongly to results. We have positioned the portfolio toward those materials companies, which cannot supply enough to keep up with increased demand despite sluggish worldwide growth. Nine out of eleven portfolio companies in the materials sector posted double digit returns. Symrise AG, a German maker of ingredients in the beverage, food and fragrance industry, benefited from consumer demand for healthier foods and reduction in salt and high fructose corn syrup. Companies such as Smurfit Kappa (resilient demand for boxes for food and other products in Europe and Latin America) and Methanex (strong demand for methanol from Ch ina) continued to report strong earnings and cash flows. CRH, the Irish building materials group, detracted from better performance in this sector. The company’s European business remained strong, but performance has been impinged by weak U.S. business.
The Fund’s financial holdings significantly outperformed the sector benchmark due to the strength of small- and mid-cap U.S. banks. Southwest Bancorp performed well, partially attributable to a capital raise that strengthened the balance sheet, while Ameris Bancorp, Webster Financial and Astoria Financial posted double digit returns. While many U.S. community banks/thrifts suffered in 2007-08, this year signaled a return to better valuations.
Defensive sectors within the portfolio (telecom, consumer staples, healthcare and utilities) contributed positively, but less so than the cyclical counterparts. Interestingly, some of the strongest contributors were new purchases during the year, such as telecom company, Frontier Communications and healthcare sector stock, Questcor Pharmaceuticals.
While the Fund has positive absolute performance in all 10 sectors for the year, consumer discretionary stocks (namely British homebuilders) contributed the least to performance. After strong returns in the first half of the year, homebuilders stagnated in the fourth quarter when the British government announced large budget cuts. In early 2011, many of these homebuilders have posted positive earnings reports, demonstrating their ability to grow even in a slow housing market.
| |
POLARIS GLOBAL VALUE FUND DECEMBER 31, 2010 |
| |
FULL YEAR 2010 ASSET ALLOCATION:
During the year, the Fund sold holdings in companies that had reached valuation limits we set or where our analysis revealed deterioration in individual company fundamentals. Culture Convenience, the Japanese provider of music and film CDs and video games, had been facing increased competition from others who have more effectively embraced internet channels of distribution. Based on projected weaker sales, the Fund decided to realize a marginal loss and sell this position in the third quarter of 2010.
Rich valuations were evident in Cargotec, where weak sales forecasts (due to lower sales levels in shipbuilding, container handling and port facilities) were not reflected in the current stock price. Similarly, Tokyo Electric Power became fairly valued, once we factored in the cost of higher priced non-nuclear energy generation due to higher oil prices and higher capital expenditures. In both instances, the Fund realized losses when the stocks were sold and cash was allocated to new investments and increased weightings in portfolio areas with strong growth potential.
Our analyst team conducted extensive on-the-ground research, triangulation and financial modeling before new investments were added to the Fund’s “watch list” of stocks. This list was narrowed to 11 stocks (across sectors including financials, IT, health care, industrials, telecom, consumer discretionary and energy) that were purchased during 2010, 10 of which posted positive absolute returns, while only one was in negative territory.
The following table shows the Fund’s asset allocation at December 31, 2010.
Polaris Global Value Fund Asset Allocation
| | Portfolio Weighting | Energy | Utilities | Materials | Industrials | Consumer Discretionary | Consumer Staples | Health Care | Financials | Info. Tech. | Telecom Services | Cash |
| N. America | 37.33% | 1.33% | 2.22% | 3.24% | 6.55% | 1.53% | 2.65% | 4.59% | 11.08% | 1.47% | 2.68% | 0.00% |
| Japan | 7.12% | 0.00% | 0.98% | 0.77% | 1.82% | 0.00% | 2.47% | 0.00% | 0.00% | 0.00% | 1.09% | 0.00% |
| Other Asia | 8.00% | 2.14% | 0.00% | 1.58% | 0.00% | 0.00% | 0.00% | 0.00% | 1.09% | 2.18% | 1.01% | 0.00% |
| Europe | 32.75% | 2.66% | 0.00% | 8.21% | 6.14% | 6.70% | 1.62% | 1.95% | 3.80% | 1.67% | 0.00% | 0.00% |
| Scandinavia | 12.50% | 0.00% | 0.00% | 0.00% | 4.70% | 3.54% | 0.00% | 0.00% | 4.26% | 0.00% | 0.00% | 0.00% |
| Africa & S. America | 2.22% | 1.39% | 0.00% | 0.83% | 0.00% | 0.00% | 0.00% | 0.00% | 0.00% | 0.00% | 0.00% | 0.00% |
| Cash | 0.08% | 0.00% | 0.00% | 0.00% | 0.00% | 0.00% | 0.00% | 0.00% | 0.00% | 0.00% | 0.00% | 0.08% |
| Industry Totals | 100.00% | 7.52% | 3.20% | 14.64% | 19.20% | 11.77% | 6.73% | 6.54% | 20.23% | 5.32% | 4.78% | 0.08% |
Table may not cross foot due to rounding.
INVESTMENT ENVIRONMENT AND STRATEGY:
While economic conditions improve in the private sector, questions remain about the fiscal health of governments worldwide. Countries are expected to implement budget cuts, higher taxes and similar measures to mitigate rising debt levels. Such fiscal policies may negatively impact economies worldwide. Additionally, we remain concerned about the possible implosion of the Chinese real estate market, which continues to experience a boom because currency controls trap liquidity in the country and investors have nowhere to invest except stocks and real estate, thus creating unsustainable valuations. We are hard pressed to
| |
POLARIS GLOBAL VALUE FUND DECEMBER 31, 2010 |
| |
find a real estate bubble in the history of the world that has not ended badly and, despite the Chinese efforts to engineer a soft landing, we remain skeptical this bubble will escape the inevitable.
Our outlook remains consistent: we expect economic activity to be slow, steady and mixed. We are guardedly optimistic about future growth prospects, as we identify fundamentally-strong companies reporting good earnings across a myriad of sectors and countries. We believe sales growth reported among many late-cycle companies may also portend early stages of macro-economic recovery. We are taking advantage of this environment to analyze current holdings and new opportunities in an effort to mitigate potential loss of principal if the above negative developments evolve, as we continually seek to grow the value of our investments in the years to come.
As always, we welcome your questions and comments.
Sincerely,
Bernard R. Horn, Jr.
Portfolio Manager
The Fund invests in securities of foreign issuers, including issuers located in countries with emerging capital markets. Investments in such securities entail certain risks not associated with investments in domestic securities, such as volatility of currency exchange rates, and in some cases, political and economic instability and relatively illiquid markets. Fund performance includes reinvestment of dividends and capital gains. During the period, some of the Fund’s fees were waived or expenses reimbursed. In the absence of these waivers and reimbursements, performance figures would be lower.
On June 1, 1998, a limited partnership managed by the adviser reorganized into the Fund. The predecessor limited partnership maintained an investment objective and investment policies that were, in all material respects, equivalent to those of the Fund. The Fund’s performance for the periods before June 1, 1998 is that of the limited partnership and includes the expenses of the limited partnership. If the limited partnership’s performance had been readjusted to reflect the second year expenses of the Fund, the Fund’s performance for all the periods would have been lower. The limited partnership was not registered under the Investment Company Act of 1940 (“1940 Act”) and was not subject to certain investment limitations, diversification requirements, and other restrictions imposed by the 1940 Act and the Internal Revenue Code, which, if applicable, may have adversely affected its performance.
| |
POLARIS GLOBAL VALUE FUND DECEMBER 31, 2010 |
| |
As of December 31, 2010, the Fund’s largest equity holdings and the percentages they represent in the Fund’s portfolio market value are as follows:
| Issuer | | | | Percentage of Total Net Assets | | Issuer | | | | Percentage of Total Net Assets | |
| Kone Oyj, Class B | | | 2.41% | | | | Greencore Group PLC | | | | 1.61% | | |
| Mac-Gray Corp. | | | | 2.17% | | | | AMETEK, Inc. | | | | 1.60% | | |
| Thai Oil PCL | | | | 2.14% | | | | Symrise AG | | 1.60% | | |
| Duni AB, Class A | | 1.90% | | | | Praxair, Inc. | | | | 1.59% | | |
| BASF SE | | | 1.85% | | | | Frontier Communications Corp. | | | | 1.59% | | |
| Andritz AG | | | 1.70% | | | | BHP Billiton, Ltd., ADR | | | | 1.58% | | |
| Wincor Nixdorf AG | | | 1.66% | | | | Trevi Finanziaria SpA | | | | 1.58% | | |
| Methanex Corp. | | | | 1.66% | | | | DnB NOR ASA | | | | 1.56% | | |
| Autoliv, Inc. | | | | 1.64% | | | | Tognum AG | | | | 1.54% | | |
| Christian Dior SA | | | 1.62% | | | | Carter’s, Inc. | | | | | 1.54% | | |
The MSCI World, EAFE, and USA Indexes, net dividends reinvested measure the performance of a diverse range of global stock markets in the United States, Canada, Europe, Australia, New Zealand and the Far East. The MSCI World Index is unmanaged and includes the reinvestment of dividends, net of withholding taxes. One cannot invest directly in an index or an average.
The views in this letter were those of the Fund manager as of December 31, 2010 and may not reflect the views of the manager on the date this letter is second published or anytime thereafter. These views are intended to assist shareholders of the Fund in understanding their investment and do not constitute investment advice.
The Fund’s annual performance as compared to the benchmark is as follows:
| Historical Calendar Year Annual Returns (years ended December 31) |
| | Polaris Global Value Fund | MSCI World Index | | Polaris Global Value Fund | MSCI World Index |
| 2010 | 20.64% | 11.76% | 1999 | 16.50% | 24.93% |
| 2009 | 35.46% | 29.99% | 1998 | -8.85% | 24.34% |
| 2008 | -46.19% | -40.71% | 1997 | 34.55% | 15.76% |
| 2007 | -3.97% | 9.04% | 1996 | 23.34% | 13.48% |
| 2006 | 24.57% | 20.07% | 1995 | 31.82% | 20.72% |
| 2005 | 10.52% | 9.49% | 1994 | -2.78% | 5.08% |
| 2004 | 23.63% | 14.72% | 1993 | 25.70% | 22.50% |
| 2003 | 47.06% | 33.11% | 1992 | 9.78% | -5.23% |
| 2002 | 3.82% | -19.89% | 1991 | 17.18% | 18.28% |
| 2001 | 2.21% | -16.82% | 1990 | -11.74% | -17.02% |
| 2000 | -5.82% | -13.18% | | | |
| |
POLARIS GLOBAL VALUE FUND DECEMBER 31, 2010 |
| |
The following chart reflects the change in the value of a hypothetical $10,000 investment, including reinvested dividends and distributions, in the Polaris Global Value Fund (the “Fund”) compared with the performance of the benchmark Morgan Stanley Capital International World Index ("MSCI World Index"), over the past ten fiscal years. The MSCI World Index measures the performance of a diverse range of global stock markets in the United States, Canada, Europe, Australia, New Zealand and the Far East. The total return of the MSCI World Index includes reinvestment of dividends and income. The total return of the Fund includes operating expenses that reduce returns, while the total return of the MSCI World Index does not include expenses. The Fund is professionally managed while the MSCI World Index is unmanaged an d is not available for investment.
Performance data quoted represents past performance and is no guarantee of future results. Current performance may be lower or higher than the performance data quoted. Investment return and principal value will fluctuate so that shares, when redeemed, may be worth more or less than original cost. For the most recent month-end performance please call (888) 263-5594 or visit the Fund’s website at www.polarisfunds.com. Shares redeemed or exchanged within 180 days of purchase will be charged a 1.00% redemption fee. As stated in the Fund's prospectus, the annual operating expense ratio (gross) is 1.46%. The performance table and graph do not reflect the deduc tion of taxes that a shareholder would pay on Fund distributions or the redemption of Fund shares. Returns greater than one year are annualized.
| Annual Total Return as of 12/31/10 | One Year | Five Year | Ten Year |
| Polaris Global Value Fund | 20.64% | 1.02% | 8.41% |
| MSCI World Index | 11.76% | 2.43% | 2.31% |
Investment Value as of 12/31/10
| Polaris Global Value Fund | $22,430 |
| MSCI World Index | $12,562 |
| |
POLARIS GLOBAL VALUE FUND DECEMBER 31, 2010 |
| |
| | Shares | | Security Description | | Value | |
| Common Stock - 99.9% |
| Australia - 1.6% |
| | 32,100 | | BHP Billiton, Ltd., ADR | $ | 2,982,732 | |
| | | | |
| Austria - 1.7% |
| | 34,932 | | Andritz AG | | 3,211,092 | |
| | | | |
| Belgium - 1.7% |
| | 20,044 | | KBC Groep NV (a) | | 683,013 | |
| | 23,116 | | Solvay SA, Class A | | 2,463,470 | |
| | | 3,146,483 | |
| Canada - 1.7% |
| | 102,537 | | Methanex Corp. | | 3,119,526 | |
| | | | |
| Cyprus - 1.3% |
| | 296,620 | | ProSafe SE | | 2,358,706 | |
| | | | |
| Finland - 4.5% |
| | 81,818 | | Kone Oyj, Class B | | 4,548,269 | |
| | 38,520 | | Konecranes Oyj | | 1,590,040 | |
| | 95,793 | | YIT Oyj | | 2,387,353 | |
| | | 8,525,662 | |
| France - 4.4% |
| | 21,365 | | Christian Dior SA | | 3,052,000 | |
| | 22,254 | | Imerys SA | | 1,483,481 | |
| | 28,650 | | Technip SA | | 2,645,493 | |
| | 62,939 | | Transgene SA (a) | | 1,177,475 | |
| | | 8,358,449 | |
| Germany - 10.2% |
| | 43,500 | | BASF SE | | 3,488,324 | |
| | 36,300 | | Demag Cranes AG (a) | | 1,752,340 | |
| | 48,400 | | Hannover Rueckversicherung AG | | 2,582,873 | |
| | 15,900 | | Muenchener Rueckversicherungs AG, Class R | | 2,409,216 | |
| | 110,000 | | Symrise AG | | 3,009,682 | |
| | 111,400 | | Tognum AG | | 2,911,776 | |
| | 38,450 | | Wincor Nixdorf AG | | 3,119,838 | |
| | | 19,274,049 | |
| India - 1.8% |
| | 16,500 | | Infosys Technologies, Ltd., ADR | | 1,255,320 | |
| | 16,400 | | State Bank of India, GDR | | 2,062,626 | |
| | | 3,317,946 | |
| Ireland - 4.3% |
| | 100,708 | | CRH PLC | | 2,106,116 | |
| | 1,790,278 | | Greencore Group PLC | | 3,038,282 | |
| | 296,693 | | Smurfit Kappa Group PLC (a) | | 2,894,237 | |
| | | 8,038,635 | |
| | 206,850 | | Trevi Finanziaria SpA | | 2,979,739 | |
| | | | |
| Japan - 7.1% |
| | 117,900 | | Asahi Breweries, Ltd. | | 2,284,231 | |
| | 347,320 | | Iino Kaiun Kaisha, Ltd. | | 1,569,977 | |
| | 356 | | KDDI Corp. | | 2,056,460 | |
| | 52,416 | | MEIJI Holdings Co., Ltd. | | 2,369,340 | |
| | 418,000 | | Nippon Yusen KK | | 1,853,430 | |
| | 643,000 | | Showa Denko KK | | 1,449,304 | |
| | 74,900 | | The Kansai Electric Power Co., Inc. | | 1,848,745 | |
| | | 13,431,487 | |
| Norway - 1.7% |
| | 160,227 | | Camillo Eitzen & Co. ASA (a) | | 310,291 | |
| | 209,496 | | DnB NOR ASA | | 2,940,459 | |
| | | 3,250,750 | |
| South Africa - 2.2% |
| | 1,978,605 | | Metorex, Ltd. (a) | | 1,573,873 | |
| | 50,270 | | Sasol, Ltd. | | 2,642,504 | |
| | | 4,216,377 | |
| South Korea – 2.5% |
| | 3,427 | | Samsung Electronics Co., Ltd. | | 2,865,647 | |
| | 12,468 | | SK Telecom Co., Ltd. | | 1,906,069 | |
| | | 4,771,716 | |
| Sweden - 6.2% |
| | 39,271 | | Autoliv, Inc. | | 3,100,053 | |
| | 329,200 | | Duni AB, Class A | | 3,573,127 | |
| | 121,102 | | Investor AB, Class B | | 2,591,062 | |
| | 78,200 | | Svenska Handelsbanken AB, Class A | | 2,498,670 | |
| | | 11,762,912 | |
| See Notes to Financial Statements. | 7 | |
| |
POLARIS GLOBAL VALUE FUND DECEMBER 31, 2010 |
| |
| Shares | | Security Description | | Value | |
| Switzerland - 1.3% |
| | 42,300 | | Novartis AG | $ | 2,485,973 | |
| | | | |
| Thailand - 2.2% |
| | 1,555,650 | | Thai Oil PCL | | 4,038,136 | |
| | | | |
| United Kingdom - 6.2% |
| | 1,409,202 | | Barratt Developments PLC (a) | | 1,947,716 | |
| | 195,123 | | BBA Aviation PLC | | 674,143 | |
| | 262,648 | | Bellway PLC | | 2,743,612 | |
| | 1,436,273 | | Lloyds Banking Group PLC (a) | | 1,471,215 | |
| | 361,695 | | Persimmon PLC | | 2,350,412 | |
| | 5,090,040 | | Taylor Wimpey PLC (a) | | 2,500,595 | |
| | | 11,687,693 | |
| United States - 35.7% |
| | 61,600 | | Allete, Inc. | | 2,295,216 | |
| | 262,650 | | Ameris Bancorp (a) | | 2,768,331 | |
| | 76,809 | | AMETEK, Inc. | | 3,014,753 | |
| | 152,404 | | Astoria Financial Corp. | | 2,119,940 | |
| | 306,153 | | Brooks Automation, Inc. (a) | | 2,776,808 | |
| | 2,190 | | Capitol Federal Financial, Inc. | | 26,083 | |
| | 98,100 | | Carter's, Inc. (a) | | 2,894,931 | |
| | 169,774 | | Colony Bankcorp, Inc. (a) | | 687,585 | |
| | 308,214 | | Frontier Communications Corp. | | 2,998,922 | |
| | 33,317 | | General Dynamics Corp. | | 2,364,174 | |
| | 49,800 | | H.J. Heinz Co. | | 2,463,108 | |
| | 90,924 | | Independent Bank Corp. | | 2,459,494 | |
| | 112,063 | | International Bancshares Corp. | | 2,244,622 | |
| | 273,360 | | Mac-Gray Corp. | | 4,086,732 | |
| | 67,582 | | Marathon Oil Corp. | | 2,502,561 | |
| | 36,344 | | NextEra Energy, Inc. | | 1,889,525 | |
| | 52,400 | | Peoples Bancorp, Inc. | | 820,060 | |
| | 31,449 | | Praxair, Inc. | | 3,002,436 | |
| | 45,600 | | Quest Diagnostics, Inc. | | 2,461,032 | |
| | 90,257 | | Questcor Pharmaceuticals, Inc. (a) | | 1,329,486 | |
| | 177,097 | | Southwest Bancorp, Inc. (a) | | 2,196,003 | |
| | 40,000 | | The Chubb Corp. | | 2,385,600 | |
| | 38,600 | | The J.M. Smucker Co. | | 2,534,090 | |
| | 39,982 | | The Toro Co. | | 2,464,490 | |
| | 71,184 | | UnitedHealth Group, Inc. | | 2,570,454 | |
| | 129,700 | | Univest Corp. of Pennsylvania | | 2,486,349 | |
| | 57,551 | | Verizon Communications, Inc. | | 2,059,175 | |
| | 138,138 | | Webster Financial Corp. | | 2,721,319 | |
| | 40,500 | | WellPoint, Inc. (a) | | 2,302,830 | |
| | 8,074 | | WESCO International, Inc. (a) | $ | 426,307 | |
| | | 67,352,416 | |
Total Common Stock (Cost $194,830,703) | | 188,310,479 | |
| | Principal | | Security Description | | Rate | | Maturity | | Value | |
| Short-Term Investments - 0.0% |
| Certificates of Deposit - 0.0% |
| $ | 31,265 | | Middlesex Federal Savings Bank | | 2.00 | % | 11/26/11 | | 31,265 | |
| | 31,523 | | Stoneham Savings Bank | | 1.50 | | 11/24/11 | | 31,523 | |
| | | | |
Total Certificates of Deposit (Cost $62,788) | | 62,788 | |
Total Short-Term Investments (Cost $62,788) | | 62,788 | |
Total Investments - 99.9% (Cost $194,893,491)* | | 188,373,267 | |
| Other Assets & Liabilities, Net – 0.1% | | 99,935 | |
| Net Assets – 100.0% | $ | 188,473,202 | |
| ADR | American Depository Receipt |
| GDR | Global Depository Receipt |
| PCL | Public Company Limited |
| PLC | Public Limited Company |
| (a) | Non-income producing security. |
| | * Cost of investments for federal income tax purposes is $197,478,962 and net unrealized depreciation on investments consists of: |
| Gross Unrealized Appreciation | | $ | 38,037,503 | |
| Gross Unrealized Depreciation | | | (47,143,198 | ) |
| Net Unrealized Depreciation | | $ | (9,105,695 | ) |
| See Notes to Financial Statements. | 8 | |
| |
POLARIS GLOBAL VALUE FUND DECEMBER 31, 2010 |
| |
The following is a summary of the inputs used to value the Fund’s investments as of December 31, 2010.
The inputs or methodology used for valuing securities are not necessarily an indication of the risk associated with investing in those securities. For more information on valuation inputs, and their aggregation into the levels used in the tables below, please refer to Note 2- Security Valuation section in the accompanying Notes to Financial Statements.
| | Level 1 | | Level 2 | | Level 3 | | Total |
| Investments at Value: | | | | | | | | | | | | | | | |
| Common Stock | | | | | | | | | | | | | | | |
| Australia | $ | 2,982,732 | | | $ | - | | | $ | - | | | $ | 2,982,732 | |
| Austria | | 3,211,092 | | | | - | | | | - | | | | 3,211,092 | |
| Belgium | | 3,146,483 | | | | - | | | | - | | | | 3,146,483 | |
| Canada | | 3,119,526 | | | | - | | | | - | | | | 3,119,526 | |
| Cyprus | | 2,358,706 | | | | | | | | | | | | 2,358,706 | |
| Finland | | 8,525,662 | | | | - | | | | - | | | | 8,525,662 | |
| France | | 8,358,449 | | | | - | | | | - | | | | 8,358,449 | |
| Germany | | 19,274,049 | | | | - | | | | - | | | | 19,274,049 | |
| India | | 3,317,946 | | | | - | | | | - | | | | 3,317,946 | |
| Ireland | | 8,038,635 | | | | - | | | | - | | | | 8,038,635 | |
| Italy | | 2,979,739 | | | | - | | | | - | | | | 2,979,739 | |
| Japan | | 13,431,487 | | | | - | | | | - | | | | 13,431,487 | |
| Norway | | 3,250,750 | | | | - | | | | - | | | | 3,250,750 | |
| South Africa | | 4,216,377 | | | | - | | | | - | | | | 4,216,377 | |
| South Korea | | 4,771,716 | | | | - | | | | - | | | | 4,771,716 | |
| Sweden | | 11,762,912 | | | | - | | | | - | | | | 11,762,912 | |
| Switzerland | | 2,485,973 | | | | - | | | | - | | | | 2,485,973 | |
| Thailand | | - | | | | 4,038,136 | | | | - | | | | 4,038,136 | |
| United Kingdom | | 11,687,693 | | | | - | | | | - | | | | 11,687,693 | |
| United States | | 67,352,416 | | | | - | | | | - | | | | 67,352,416 | |
| Certificates of Deposit | | - | | | | 62,788 | | | | - | | | | 62,788 | |
| Total Investments at Value | $ | 184,272,343 | | | $ | 4,100,924 | | | $ | - | | | $ | 188,373,267 | |
| PORTFOLIO HOLDINGS | | |
| % of Total Investments | | |
| | | |
| Consumer Discretionary | 11.8 | % |
| Consumer Staples | 6.7 | % |
| Energy | 7.5 | % |
| Financials | 20.3 | % |
| Health Care | 6.6 | % |
| Industrials | 19.2 | % |
| Information Technology | 5.3 | % |
| Materials | 14.6 | % |
| Telecommunication Services | 4.8 | % |
| Utilities | 3.2 | % |
| Short-Term Investments | 0.0 | % |
| | 100.0 | % |
| See Notes to Financial Statements. | 9 | |
| |
POLARIS GLOBAL VALUE FUND DECEMBER 31, 2010 |
| |
| | | | | | | |
| ASSETS | | | | |
| | Total investments, at value (Cost $194,893,491) | | $ | 188,373,267 | |
| | Cash | | | 51,509 | |
| | Foreign currency (Cost $33,427) | | | 33,427 | |
| | Receivables: | | | | |
| | | Fund shares sold | | | 138,027 | |
| | | Dividends and interest | | | 420,945 | |
| | Prepaid expenses | | | 11,795 | |
| Total Assets | | | 189,028,970 | |
| | | | | | | |
| LIABILITIES | | | | |
| | Payables: | | | | |
| | | Fund shares redeemed | | | 229,833 | |
| | | Distributions payable | | | 80,991 | |
| | Accrued Liabilities: | | | | |
| | Investment adviser fees | | | 158,273 | |
| | | Trustees’ fees and expenses | | | 114 | |
| | | Fund service fees | | | 47,789 | |
| | | Compliance services fees | | | 2,083 | |
| | | Other expenses | | | 36,685 | |
| Total Liabilities | | | 555,768 | |
| | | | | | | |
| NET ASSETS | | $ | 188,473,202 | |
| | | | | | | |
| COMPONENTS OF NET ASSETS | | | | |
| | Paid-in capital | | $ | 311,222,117 | |
| | Undistributed net investment income | | | 1,584,508 | |
| | Accumulated net realized loss | | | (117,819,543 | ) |
| | Net unrealized depreciation | | | (6,513,880 | ) |
| NET ASSETS | | $ | 188,473,202 | |
| SHARES OF BENEFICIAL INTEREST AT NO PAR VALUE (UNLIMITED SHARES AUTHORIZED) | | | 13,462,560 | |
| NET ASSET VALUE, OFFERING AND REDEMPTION PRICE* PER SHARE | | $ | 14.00 | |
| | | | | | | |
| * | Shares redeemed or exchanged within 180 days of purchase are charged a 1.00% redemption fee. | | | | |
| See Notes to Financial Statements. | 10 | |
| |
POLARIS GLOBAL VALUE FUND YEAR ENDED DECEMBER 31, 2010 |
| |
| | | | | | | |
| INVESTMENT INCOME | | | | |
| | Dividend income (Net foreign withholding taxes of $363,407) | | $ | 4,130,751 | |
| | Interest income | | | 18,340 | |
| Total Investment Income | | | 4,149,091 | |
| | | | | |
| EXPENSES | | | | |
| | Investment adviser fees | | | 1,829,788 | |
| | Fund service fees | | | 482,852 | |
| | Custodian fees | | | 51,443 | |
| | Registration fees | | | 16,054 | |
| | Professional fees | | | 57,217 | |
| | Trustees’ fees and expenses | | | 6,245 | |
| | Compliance services fees | | | 40,610 | |
| | Miscellaneous expenses | | | 52,089 | |
| Total Expenses | | | 2,536,298 | |
| | Fees waived | | | (15,561 | ) |
| Net Expenses | | �� | 2,520,737 | |
| | | | | | | |
| NET INVESTMENT INCOME | | | 1,628,354 | |
| | | | | | | |
| NET REALIZED AND UNREALIZED GAIN (LOSS) | | | | |
| | Net realized gain (loss) on: | | | | |
| | Investments | | | (9,517,988 | ) |
| | Foreign currency transactions | | | (36,057 | ) |
| | Written options | | | 61,979 | |
| | Net realized loss | | | (9,492,066 | ) |
| | Net change in unrealized appreciation (depreciation) on: | | | | |
| | Investments | | | 42,250,248 | |
| | Foreign currency translations | | | 6,410 | |
| | Net change in unrealized appreciation (depreciation) | | | 42,256,658 | |
| NET REALIZED AND UNREALIZED GAIN | | | 32,764,592 | |
| INCREASE IN NET ASSETS FROM OPERATIONS | | $ | 34,392,946 | |
| | | | | | | |
| See Notes to Financial Statements. | 11 | |
| |
POLARIS GLOBAL VALUE FUND |
| |
| | | | | For the Year Ended December 31, 2010 | | | For the Year Ended December 31, 2009 |
| OPERATIONS | | | | | | | | | |
| | Net investment income | | $ | 1,628,354 | | | | $ | 1,530,893 | |
| | Net realized loss | | | (9,492,066 | ) | | | | (61,717,796 | ) |
| | Net change in unrealized appreciation (depreciation) | | | 42,256,658 | | | | | 107,975,488 | |
| Increase in Net Assets Resulting from Operations | | | 34,392,946 | | | | | 47,788,585 | |
| | | | | | | | | | | | |
| DISTRIBUTIONS TO SHAREHOLDERS FROM | | | | | | | | | |
| | Net investment income | | | (2,012,912 | ) | | | | (20,598 | ) |
| | | | | | | | | | | | |
| CAPITAL SHARE TRANSACTIONS | | | | | | | | | |
| | Sale of shares | | | 11,634,190 | | | | | 17,990,755 | |
| | Reinvestment of distributions | | | 1,931,922 | | | | | 20,598 | |
| | Redemption of shares | | | (48,899,792 | ) | | | | (50,652,983 | ) |
| | Redemption fees | | | 29,239 | | | | | 8,622 | |
| Decrease in Net Assets from Capital Share Transactions | | | (35,304,441 | ) | | | | (32,633,008 | ) |
| Increase (Decrease) in Net Assets | | | (2,924,407 | ) | | | | 15,134,979 | |
| | | | | | | | | | | | |
| NET ASSETS | | | | | | | | | |
| | Beginning of Year | | | 191,397,609 | | | | | 176,262,630 | |
| | End of Year (Including line (a)) | | $ | 188,473,202 | | | | $ | 191,397,609 | |
| | | | | | | | | | | | |
| SHARE TRANSACTIONS | | | | | | | | | |
| | Sale of shares | | | 929,098 | | | | | 1,750,618 | |
| | Reinvestment of distributions | | | 137,994 | | | | | 2,742 | |
| | Redemption of shares | | | (3,916,671 | ) | | | | (5,790,642 | ) |
| Decrease in Shares | | | (2,849,579 | ) | | | | (4,037,282 | ) |
| | | | | | | | | | | | |
| (a) | Undistributed net investment income. | | $ | 1,584,508 | | | | $ | 2,002,230 | |
| See Note to Financial Statements. | 12 | |
| |
POLARIS GLOBAL VALUE FUND |
| |
These financial highlights reflect selected data for a share outstanding throughout each year.
| | | | | | |
| | | For the Years Ended December 31, |
| | | 2010 | | 2009 | | 2008 | | 2007 | | 2006 |
| NET ASSET VALUE, Beginning of Year | $ | 11.73 | | | $ | 8.66 | | | $ | 17.51 | | | $ | 19.98 | | | $ | 16.20 | |
| INVESTMENT OPERATIONS | | | | | | | | | | | | | | | | | | | |
| Net investment income (a) | | 0.11 | | | | 0.09 | | | | 0.25 | | | | 0.20 | | | | 0.17 | |
| Net realized and unrealized gain (loss) | | 2.31 | | | | 2.98 | | | | (8.41 | ) | | | (0.94 | ) | | | 3.80 | |
| Total from Investment Operations | | 2.42 | | | | 3.07 | | | | (8.16 | ) | | | (0.74 | ) | | | 3.97 | |
| DISTRIBUTIONS TO | | | | | | | | | | | | | | | | | | | |
| SHAREHOLDERS FROM | | | | | | | | | | | | | | | | | | | |
| Net investment income | | (0.15 | ) | | | — | (b) | | (0.31 | ) | | | (0.26 | ) | | | (0.16 | ) |
| Net realized gain | | — | | | | — | | | | (0.38 | ) | | | (1.49 | ) | | | (0.04 | ) |
| Total Distributions to Shareholders | | (0.15 | ) | | | — | | | | (0.69 | ) | | | (1.75 | ) | | | (0.20 | ) |
| REDEMPTION FEES (a) | | — | (b) | | — | (b) | | — | (b) | | 0.02 | | | | 0.01 | |
| NET ASSET VALUE, End of Year | $ | 14.00 | | | $ | 11.73 | | | $ | 8.66 | | | $ | 17.51 | | | $ | 19.98 | |
| TOTAL RETURN | | 20.64 | % | | 35.46 | % | | (46.19 | )% | | (3.97 | )% | | 24.57 | % |
| RATIOS/SUPPLEMENTARY DATA | | | | | | | | | | | | | | | | | | | |
| Net Assets at End of Year (000’s omitted) | $ | 188,473 | | | $ | 191,398 | | | $ | 176,263 | | | $ | 602,703 | | | $ | 608,053 | |
| Ratios to Average Net Assets: | | | | | | | | | | | | | | | | | | | |
| Net investment income | | 0.89 | % | | 0.91 | % | | 1.74 | % | | 0.99 | % | | 0.93 | % |
| Net expense | | 1.38 | % | | 1.45 | % | | 1.43 | % | | 1.19 | % | | 1.23 | % |
| Gross Expense (c) | | 1.39 | % | | 1.46 | % | | 1.43 | % | | 1.19 | % | | 1.23 | % |
| PORTFOLIO TURNOVER RATE | | 10 | % | | 22 | % | | 16 | % | | 46 | % | | 5 | % |
| | | | | | | | | | | | | | | | | | | | | |
| (a) | Calculated based on average shares outstanding during the year. |
| (b) | Less than $0.01 per share. |
| (c) | Reflects the expense ratio excluding any waivers and/or reimbursements. |
| See Note to Financial Statements. | 13 | |
| |
POLARIS GLOBAL VALUE FUND DECEMBER 31, 2010 |
| |
Note 1. Organization
The Polaris Global Value Fund (the “Fund”) is a diversified portfolio of Forum Funds (the “Trust”). The Trust is a Delaware statutory trust that is registered as an open-end, management investment company under the Investment Company Act of 1940 (the “Act”), as amended. Under its Trust Instrument, the Trust is authorized to issue an unlimited number of the Fund’s shares of beneficial interest without par value. The Fund commenced operations June 1, 1998 after it acquired the net assets of Global Value Limited Partnership (the “Partnership”), in exchange for Fund shares. The Partnership commenced operations on July 31, 1989. The Fund seeks capital appreciation.
Note 2. Summary of Significant Accounting Policies
These financial statements are prepared in accordance with generally accepted accounting principles in the United States of America (“GAAP”), which require management to make estimates and assumptions that affect the reported amounts of assets and liabilities, the disclosure of contingent liabilities at the date of the financial statements, and the reported amounts of increase and decrease in net assets from operations during the fiscal year. Actual amounts could differ from those estimates. The following summarizes the significant accounting policies of the Fund:
Security Valuation – Exchange-traded securities and over-the-counter securities are valued using the last quoted sale or official closing price, provided by independent pricing services as of the close of trading on the market or exchange for which they are primarily traded, on each Fund business day. In the absence of a sale, such securities are valued at the mean of the last bid and ask price provided by independent pricing services. Non-exchange traded securities for which quotations are available are valued using the last quoted sales price, or in the absence of a sale at the mean of the last bid and ask prices provided by independent pricing services. Debt securities may be value d at prices supplied by a fund’s pricing agent based on broker or dealer supplied valuations or matrix pricing, a method of valuing securities by reference to the value of other securities with similar characteristics such as rating, interest rate and maturity. Forward currency contracts are generally valued at the mean of bid and ask prices for the time period interpolated from rates reported by an independent pricing service for proximate time periods. Exchange-traded options for which there were no sales reported that day are generally valued at the mean of the last bid and ask prices. Options not traded on an exchange are generally valued at broker-dealer bid quotation. Shares of open-end mutual funds are valued at net asset value (“NAV”). Short-term investments that mature in sixty days or less may be valued at amortized cost.
The Fund values its investments at fair value pursuant to procedures adopted by the Trust's Board of Trustees (the "Board") if (1) market quotations are insufficient or not readily available or (2) the adviser believes that the values available are unreliable. Fair valuation is based on subjective factors and as a result, the fair value price of an investment may differ from the security’s market price and may not be the price at which the asset may be sold. Fair valuation could result in a different NAV than a NAV determined by using market quotes.
The Fund has a three-tier fair value hierarchy. The basis of the tiers is dependent upon the various “inputs” used to determine the value of the Fund’s investments. These inputs are summarized in the three broad levels listed below:
Level 1 — quoted prices in active markets for identical assets
Level 2 — other significant observable inputs (including quoted prices of similar securities, interest rates, prepayment speeds, credit risk, etc.)
| |
POLARIS GLOBAL VALUE FUND NOTES TO FINANCIAL STATEMENTS DECEMBER 31, 2010 |
| |
Level 3 — significant unobservable inputs (including the Fund’s own assumptions in determining the fair value of investments)
The aggregate value by input level, as of December 31, 2010, for the Fund’s investments is included at the end of the Fund’s Schedule of Investments.
Security Transactions, Investment Income and Realized Gain and Loss – Investment transactions are accounted for on the trade date. Dividend income is recorded on the ex-dividend date. Foreign dividend income is recorded on the ex-dividend date or as soon as possible after the Fund determines the existence of a dividend declaration after exercising reasonable due diligence. Income and capital gains on some foreign securities may be subject to foreign withholding taxes, which are accrued as applicable. Interest income is recorded on an accrual basis. Premium and discount is amortized and accreted in accordance with GAAP. Identified cost of investments sold is used to determine the gain and loss for both financial statement and federal income tax purposes.
Foreign Currency Translations – Foreign currency amounts are translated into U.S. dollars as follows: (i) assets and liabilities at the rate of exchange at the end of the respective period; and (ii) purchases and sales of securities and income and expenses at the rate of exchange prevailing on the dates of such transactions. The portion of the results of operations arising from changes in the exchange rates and the portion due to fluctuations arising from changes in the market prices of securities are not isolated. Such fluctuations are included with the net realized and unrealized gain or loss on investments.
The Fund may enter into transactions to purchase or sell foreign currencies to protect the U.S. dollar value of its underlying portfolio securities against the effect of possible adverse movements in foreign exchange rates. Principal risks associated with such transactions include the movement in value of the foreign currency relative to the U.S. dollar and the ability of the counterparty to perform. Fluctuations in the value of such forward currency transactions are recorded daily as unrealized gain or loss; realized gain or loss includes net gain or loss on transactions that have terminated by settlement or by a fund entering into offsetting commitments. These instruments involve market risk, credit risk, or both kinds of risks, in excess of the amount recognized in the Statement of Assets and Liabilities. Risks arise fr om the possible inability of counterparties to meet the terms of their contracts and from movement in currency and securities values and interest rates.
Foreign Currency Transactions – The Fund may enter into transactions to purchase or sell foreign currency contracts and options on foreign currency. Forward currency contracts are agreements to exchange one currency for another at a future date and at a specified price. A fund may use forward currency contracts to facilitate transactions in foreign securities and to manage a fund’s foreign currency exposure. These contracts are intrinsically valued daily based on forward rates, and a fund’s net equity therein, representing unrealized gain or loss on the contracts as measured by the difference between the forward foreign exchange rates at the dates of entry into the contrac ts and the forward rates at the reporting date, is recorded as a component of net asset value. Due to the risk associated with these transactions, a fund could incur losses up to the entire contract amount, which may exceed the net unrealized value included in its net asset value.
The volume of open currency positions may vary on a daily basis as the Fund transacts currency contracts in order to achieve the exposure desired by the Adviser. During the year ended December 31, 2010, the Fund entered into an aggregated total notional value of $32,196,463 of forward currency contracts. Additionally, the Fund entered into a total value of $10,334,486 of spot currency contracts for the year ended December 31, 2010. There were no currency contracts outstanding as of December 31, 2010.
| |
POLARIS GLOBAL VALUE FUND NOTES TO FINANCIAL STATEMENTS DECEMBER 31, 2010 |
| |
Written Options – When a fund writes an option, an amount equal to the premium received by the fund is recorded as a liability and is subsequently adjusted to the current value of the option written. Premiums received from writing options that expire unexercised are treated by the fund on the expiration date as realized gain from written options. The difference between the premium and the amount paid on effecting a closing purchase transaction, including brokerage commissions, is also treated as a realized gain, or if the premium is less than the amount paid for the closing purchase transaction, as a realized loss. If a call option is exercised, the premium is added to the proceeds fr om the sale of the underlying security or currency in determining whether the fund has realized a gain or loss. If a put option is exercised, the premium reduces the cost basis of the securities purchased by the fund. The fund, as writer of an option, bears the market risk of an unfavorable change in the price of the security underlying the written option. Written options are non-income producing securities.
The volume of open positions may vary on a daily basis as the Fund transacts written options in order to achieve the exposure desired by the adviser. The Fund entered into a total value of $101,787 of written options for the year ended December 31, 2010. Transactions in options written during the year ended December 31, 2010, were as follows:
| | | Calls | |
| | | Number of Contracts | | Premiums | |
| Options Outstanding, December 31, 2009 | | - | | $ | - | |
| Options written | | 1,119 | | | 101,787 | |
| Options terminated in closing transactions | | (275 | ) | | (24,791 | ) |
| Options exercised | | (211 | ) | | (39,808 | ) |
| Options expired | | (633 | ) | | (37,188 | ) |
| Options Outstanding, December 31, 2010 | | - | | $ | - | |
Derivatives Transactions - The Fund’s use of derivatives during the year ended December 31, 2010, was limited to forward currency contracts and written options. Following is a summary of how the derivatives are treated in the financial statements and their impact on the Fund.
There were no open derivatives on December 31, 2010, and thus there was no disclosure on the Statement of Assets and Liabilities.
Realized and unrealized gains and losses on derivatives contracts entered into during the year ended December 31, 2010, by the Fund are recorded in the following locations in the Statement of Operations:
| Contract Type/Primary Risk Exposure | | Location of Gain or (Loss) on Derivatives | | Realized Gain (Loss) on Derivatives | | Change in Unrealized Appreciation (Depreciation) on Derivatives | |
| | | | | | | | | | |
| Equity Contracts | | Realized Gain (Loss) – Written options | | $ | 61,979 | | $ | - | |
| | | | | | | | | | |
| Forward Currency Contracts | | Realized Gain (Loss) – Foreign currency transactions | | | 93,633 | | | - | |
| |
POLARIS GLOBAL VALUE FUND NOTES TO FINANCIAL STATEMENTS DECEMBER 31, 2010 |
| |
Distributions to Shareholders – Distributions to shareholders of net investment income and net capital gains, if any, are declared and paid at least annually. Distributions are based on amounts calculated in accordance with applicable federal income tax regulations, which may differ from GAAP. These differences are due primarily to differing treatments of income and gain on various investment securities held by the Fund, timing differences and differing characterizations of distributions made by the Fund.
Federal Taxes – The Fund intends to qualify each year as a regulated investment company under Subchapter M of the Internal Revenue Code and distribute all of its taxable income to shareholders. In addition, by distributing in each calendar year substantially all its net investment income and capital gains, if any, the Fund will not be subject to a federal excise tax. Therefore, no federal income or excise tax provision is required.
As of December 31, 2010, there are no uncertain tax positions that would require financial statement recognition, de-recognition, or disclosure. The Fund’s federal tax returns filed in the three-year period ended December 31, 2010, remain subject to examination by the Internal Revenue Service.
Income and Expense Allocation – The Trust accounts separately for the assets, liabilities and operations of each of its investment portfolios. Expenses that are directly attributable to more than one investment portfolio are allocated among the respective investment portfolios in an equitable manner.
Redemption Fees – A shareholder who redeems or exchanges shares within 180 days of purchase will incur a redemption fee of 1.00% of the current net asset value of shares redeemed or exchanged, subject to certain limitations. The fee is charged for the benefit of the remaining shareholders and will be paid to the Fund to help offset transaction costs. The fee is accounted for as an addition to paid-in capital. The Fund reserves the right to modify the terms of or terminate the fee at any time. There are limited exceptions to the imposition of the redemption fee.
Commitments and Contingencies – In the normal course of business, the Fund enters into contracts that provide general indemnifications by the Fund to the counterparty to the contract. The Fund’s maximum exposure under these arrangements is dependent on future claims that may be made against the Fund and, therefore, cannot be estimated; however, based on experience, the risk of loss from such claims is considered remote.
Note 3. Advisory Fees, Servicing Fees and Other Transactions
Investment Adviser – Polaris Capital Management, LLC (the “Adviser”) is the investment adviser to the Fund. Pursuant to an investment advisory agreement, the Adviser receives an advisory fee from the Fund at an annual rate of 1.00% of the Fund’s average daily net assets.
Shareholder Service Plan – The Trust has adopted a shareholder service plan for the Fund under which the Fund may reimburse the Fund’s administrator for amounts paid by the administrator for providing shareholder service activities that are not otherwise provided by the Transfer Agent. The Fund’s administrator may make such payments to various financial institutions, including the Adviser, that provide shareholder servicing to their customers invested in the Fund in amounts of up to 0.25% annually of the average daily net assets of the shares held by such customers. During the year ended December 31, 2010, the Fund did not make any payments under the Shareholder Service Pl an.
| |
POLARIS GLOBAL VALUE FUND NOTES TO FINANCIAL STATEMENTS DECEMBER 31, 2010 |
| |
Distribution – Foreside Fund Services, LLC serves as the Fund’s distributor (the “Distributor”). The Distributor receives no compensation from the Fund for its distribution services. The Distributor is not affiliated with the Adviser or Atlantic Fund Administration, LLC (d/b/a Atlantic Fund Services) (“Atlantic”) or their affiliates.
Other Service Providers – Atlantic provides fund accounting, fund administration, and transfer agency services to the Fund. Atlantic also provides certain shareholder report production, and EDGAR conversion and filing services. Pursuant to an Atlantic services agreement, the Fund pays Atlantic customary fees for its services. Atlantic provides a Principal Executive Officer, a Principal Financial Officer, a Chief Compliance Officer, and an Anti-Money Laundering Officer to the Fund, as well as certain additional compliance support functions.
Trustees and Officers – The Trust pays each independent Trustee an annual retainer fee of $40,000 for service to the Trust ($60,000 for the Chairman). In addition, the Chairman receives a monthly stipend of $500 to cover certain expenses incurred in connection with his duties to the Trust. The Trustees and Chairman may receive additional fees for special Board meetings. Each Trustee is also reimbursed for all reasonable out-of-pocket expenses incurred in connection with his duties as a Trustee, including travel and related expenses incurred in attending Board meetings. The amount of Trustees’ fees attributable to the Fund is disclosed in the Statement of Operations. Certain officers of the Trust are also officers or employees of the above named service providers, and during their terms of office received no compensation from the Fund.
Note 4. Fees Waived
During the period, certain fund service providers have voluntarily agreed to waive a portion of their fees. These voluntary waivers may be reduced or eliminated at any time. For the year ended December 31, 2010, fees waived were $15,561.
Note 5. Security Transactions
The cost of purchases and proceeds from sales of investment securities (including maturities), other than short-term investments for the year ended December 31, 2010, were $18,610,266 and $54,601,101, respectively.
Note 6. Federal Income Tax and Investment Transactions
Distributions during the fiscal years as noted were characterized for tax purposes as follows:
| | | 2010 | | 2009 |
| Ordinary Income | | $ | 2,012,912 | | $ | 20,598 |
As of December 31, 2010, distributable earnings (accumulated losses) on a tax basis were as follows:
| Undistributed Ordinary Income | | $ | 2,381,071 | |
| Unrealized Appreciation (Depreciation) | | | (9,099,351 | ) |
| Capital and Other Losses | | | (116,030,635 | ) |
| Total | | $ | (122,748,915 | ) |
| |
POLARIS GLOBAL VALUE FUND NOTES TO FINANCIAL STATEMENTS DECEMBER 31, 2010 |
| |
The difference between components of distributable earnings on a tax basis and the amounts reflected in the Statement of Assets and Liabilities are primarily due to wash sales and investments in passive foreign investment companies.
For tax purposes, the current year post-October loss was $2,893 (realized during the period November 1, 2010, through December 31, 2010). This loss will be recognized for tax purposes on the first business day of the Fund’s next fiscal year, January 1, 2011.
As of December 31, 2010, capital loss carryforwards to offset future capital gains were as follows with the respective expiration dates:
| 2016 | | 2017 | | 2018 | |
| $ | 41,240,428 | | $ | 59,164,411 | | $ | 15,622,903 | |
On the Statement of Assets and Liabilities, as a result of permanent book to tax differences, certain amounts have been reclassified for the year ended December 31, 2010. The following reclassification was the result of currency gain/loss and has no impact on the net assets of the Fund.
| Accumulated Net Investment Income (Loss) | | $ | (33,164 | ) |
| Undistributed Net Realized Gain (Loss) | | | 33,164 | |
Note 7. Recent Accounting Pronouncements
In January 2010, the Financial Accounting Standards Board issued Accounting Standards Update (“ASU”) No. 2010-06 “Improving Disclosures about Fair Value Measurements.” ASU No. 2010-06 clarifies existing disclosure and requires additional disclosures regarding fair value measurements. Effective for fiscal years beginning after December 15, 2010, and for interim periods within those fiscal years, entities will need to disclose information about purchases, sales, issuances and settlements of Level 3 securities on a gross basis, rather than as a net number as currently required. Management is currently evaluating the impact ASU No. 2010-06 will have on financial statement disclosures.
Note 8. Subsequent Events
Subsequent events occurring after the date of this report through the date these financial statements were issued have been evaluated for potential impact and the Fund has had no such events.
To the Board of Trustees of Forum Funds and the Shareholders of Polaris Global Value Fund
We have audited the accompanying statement of assets and liabilities of Polaris Global Value Fund (the “Fund”), a series of shares of beneficial interest in the Forum Funds, including the schedule of investments, as of December 31, 2010, and the related statement of operations for the year then ended, the statements of changes in net assets for each of the years in the two year period then ended, and the financial highlights for each of the years in the three year period then ended. These financial statements and financial highlights are the responsibility of the Fund's management. Our responsibility is to express an opinion on these financial statements and financial highlights based on our audits.&# 160; The financial highlights for each of the years in the two year period ended December 31, 2007 were audited by other auditors whose report dated February 26, 2008, expressed an unqualified opinion on such financial highlights.
We conducted our audits in accordance with the standards of the Public Company Accounting Oversight Board (United States). Those standards require that we plan and perform the audits to obtain reasonable assurance about whether the financial statements and financial highlights are free of material misstatement. An audit includes examining, on a test basis, evidence supporting the amounts and disclosures in the financial statements. Our procedures included confirmation of securities owned as of December 31, 2010 by correspondence with the custodian. An audit also includes assessing the accounting principles used and significant estimates made by management, as well as evaluating the overall financial statement presentation. We believe that our audits provide a reasonabl e basis for our opinion.
In our opinion, the financial statements and financial highlights referred to above present fairly, in all material respects, the financial position of Polaris Global Value Fund as of December 31, 2010, and the results of its operations for the year then ended, the changes in its net assets for each of the years in the two year period then ended and its financial highlights for each of the years in the three year period then ended, in conformity with accounting principles generally accepted in the United States of America.
BBD, LLP
Philadelphia, Pennsylvania
February 18, 2011
| |
POLARIS GLOBAL VALUE FUND DECEMBER 31, 2010 |
| |
Proxy Voting Information
A description of the policies and procedures that the Fund uses to determine how to vote proxies relating to securities held in the Fund’s portfolio is available, without charge and upon request, by calling (888) 263-5594 and on the SEC’s website at www.sec.gov. The Fund’s proxy voting record for the most recent twelve-month period ended June 30 is available, without charge and upon request, by calling (888) 263-5594 and on the SEC’s website at www.sec.gov.
Availability of Quarterly Portfolio Schedules
The Fund files its complete schedule of portfolio holdings with the SEC for the first and third quarters of each fiscal year on Form N-Q. The Fund’s Forms N-Q are available, without charge and upon request on the SEC’s website at www.sec.gov or may be reviewed and copied at the SEC’s Public Reference Room in Washington, DC. Information on the operation of the Public Reference Room may be obtained by calling (800) SEC-0330.
Shareholder Expense Example
As a shareholder of the Fund, you incur two types of costs: (1) transaction costs, including redemption fees and exchange fees, and (2) ongoing costs, including management fees and other Fund expenses. This example is intended to help you understand your ongoing costs (in dollars) of investing in the Fund, and to compare these costs with the ongoing costs of investing in other mutual funds.
The example is based on an investment of $1,000 invested at the beginning of the period and held for the entire period from July 1, 2010, through December 31, 2010.
Actual Expenses – The first line in the table below provides information about actual account values and actual expenses. You may use the information in this line, together with the amount you invested, to estimate the expenses that you paid over the period. Simply divide your account value by $1,000 (for example, an $8,600 account value divided by $1,000 = 8.6), then multiply the result by the number in the first line under the heading entitled “Expenses Paid During Period” to estimate the expenses you paid on your account during the period.
Hypothetical Example for Comparison Purposes – The second line of the table below provides information about hypothetical account values and hypothetical expenses based on the Fund’s actual expense ratio and an assumed rate of return of 5% per year before expenses, which is not the Fund’s actual return. The hypothetical account values and expenses may not be used to estimate the actual ending balance or expenses you paid for the period. You may use this information to compare the ongoing cost of investing in the Fund and other funds. To do so, compare this 5% hypothetical example with the 5% hypothetical examples that appear in the sharehol der reports of other funds.
Please note that expenses shown in the table are meant to highlight your ongoing costs only and do not reflect any transactional costs, such as redemption fees and exchange fees. Therefore, the second line of the table is useful in comparing ongoing costs only and will not help you determine the relative total costs of owning different funds. In addition, if these transactional costs had been included, your costs would have been higher.
| |
POLARIS GLOBAL VALUE FUND ADDITIONAL INFORMATION (Unaudited) DECEMBER 31, 2010 |
| |
| | Beginning Account Value July 1, 2010 | | Ending Account Value December 31, 2010 | | Expenses Paid During Period * | | Annualized Expense Ratio * |
| Actual | $ | 1,000.00 | | $ | 1,261.23 | | $ | 7.87 | | | 1.38% |
Hypothetical (5% return before expenses) | $ | 1,000.00 | | $ | 1,018.25 | | $ | 7.02 | | | 1.38% |
| | | | | | | | | | | | |
* Expenses are equal to the Fund’s annualized expense ratio as indicated above multiplied by the average account value over the period, multiplied by the number of days in the most recent fiscal half-year divided by 365 to reflect the half-year period.
Federal Tax Status of Dividends Declared during the Tax Year
The Fund designates 45.95% of its income dividend distributed as qualifying for the corporate dividends-received deduction (DRD) and 100.00% for the qualified dividend rate (QDI) as defined in Section 1(h)(11) of the Internal Revenue Code. The Fund also designates 0.08% as qualified interest income exempt from US tax for foreign shareholders (QII).
Trustees and Officers of the Trust
The Board is responsible for oversight of the management of the Trust’s business affairs and of the exercise of all the Trust’s powers except those reserved for the shareholders. The following table provides information about each Trustee and certain officers of the Trust. Each Trustee and officer holds office until the person resigns, is removed, or is replaced. Unless otherwise noted, the persons have held their principal occupations for more than five years. The address for all Trustees and officers is Three Canal Plaza, Suite 600, Portland, Maine 04101, unless otherwise indicated. Each Trustee oversees twenty-three portfolios in the Trust. Mr. Keffer is considered an Interested Trustee due to his affiliation with Atlantic. Mr. Keff er is also an Interested Director of Wintergreen Fund, Inc. The Fund’s Statement of Additional Information includes additional information about the Trustees and is available, without charge and upon request, by calling (888) 263-5594.
| Name and Year of Birth | Position with the Trust | Length of Time Served | Principal Occupation(s) During Past Five Years |
Independent Trustees J. Michael Parish Born: 1943 | Chairman of the Board; Trustee; Chairman, Nominating Committee and Qualified Legal Compliance Committee | Since 1989 (Chairman since 2004) | Retired since 2003. |
Costas Azariadis Born: 1943 | Trustee; Chairman, Valuation Committee | Since 1989 | Professor of Economics, Washington University since 2006; Professor of Economics, University of California-Los Angeles 1992-2006. |
| |
POLARIS GLOBAL VALUE FUND ADDITIONAL INFORMATION (Unaudited) DECEMBER 31, 2010 |
| |
| Name and Year of Birth | Position with the Trust | Length of Time Served | Principal Occupation(s) During Past Five Years |
James C. Cheng Born: 1942 | Trustee; Chairman, Audit Committee | Since 1989 | President, Technology Marketing Associates (marketing company for small- and medium-sized businesses in New England) since 1991. |
Interested Trustee John Y. Keffer1 Born: 1942 | Trustee; Vice Chairman | Since 1989 | Chairman, Atlantic since 2008; President, Forum Foundation (a charitable organization) since 2005; President, Forum Trust, LLC (a non-depository trust company chartered in the State of Maine) since 1997. |
Officers Stacey E. Hong Born: 1966 | President; Principal Executive Officer | Since 2008 | President, Atlantic since 2008; Director, Consulting Services, Foreside Fund Services 2007; Elder Care, 2005-2006. |
Karen Shaw Born: 1972 | Treasurer; Principal Financial Officer | Since 2008 | Senior Manager, Atlantic since 2008; Section Manager/Vice President, Enterprise Support Services, Citigroup 2003-2008. |
David Faherty Born: 1970 | Vice President | Since 2009 | Senior Counsel, Atlantic since 2009; Vice President, Citi Fund Services Ohio, Inc. 2007-2009; Associate Counsel, Investors Bank & Trust Co. 2006-2007. |
Michael J. McKeen Born: 1971 | Vice President | Since 2009 | Senior Manager, Atlantic since 2008; Vice President, Citigroup 2003-2008. |
Joshua LaPan Born: 1973 | Vice President | Since 2009 | Manager, Atlantic since 2008; Vice President, Citigroup 2003-2008. |
Timothy Bowden Born: 1969 | Vice President | Since 2009 | Manager, Atlantic since 2008; Vice President, Citigroup 2005-2008. |
Lina Bhatnagar Born: 1971 | Secretary | Since 2008 | Senior Administration Specialist, Atlantic since 2008; Regulatory Administration Specialist, Citigroup 2006-2008. |
| | 1 Since 1997, John Y. Keffer has been president and owner of Forum Trust, LLC. Prior to January 1, 2010, Atlantic was a wholly owned subsidiary of Forum Trust, LLC. Effective January 1, 2010, Atlantic became a wholly owned subsidiary of Forum Holdings Corp., a Delaware corporation that is wholly owned by Mr. Keffer. |
[THIS PAGE INTENTIONALLY LEFT BLANK]
ITEM 2. CODE OF ETHICS.
(a) As of the end of the period covered by this report, Forum Funds (the “Registrant”) has adopted a code of ethics, which applies to its Principal Executive Officer and Principal Financial Officer.
(c) There have been no amendments to the Registrant’s code of ethics that apply to its Principal Executive Officer and Principal Financial Officer.
(d) There have been no waivers to the Registrant’s code of ethics that apply to its Principal Executive Officer and Principal Financial Officer.
(e) Not applicable.
(f) (1) A copy of the Code of Ethics is being filed under Item 12(a) hereto.
ITEM 3. AUDIT COMMITTEE FINANCIAL EXPERT.
The Board of Trustees has determined that no member of the Audit Committee is an "audit committee financial expert" as that term is defined under applicable regulatory guidelines.
ITEM 4. PRINCIPAL ACCOUNTANT FEES AND SERVICES.
(a) Audit Fees - The aggregate fees billed for each of the last two fiscal years (the “Reporting Periods”) for professional services rendered by the Registrant’s principal accountant for the audit of the Registrant’s annual financial statements, or services that are normally provided by the principal accountant in connection with the statutory and regulatory filings or engagements for the Reporting Periods, were $70,300 in 2009 and $59,000 in 2010.
(b) Audit-Related Fees – The aggregate fees billed in the Reporting Periods for assurance and related services rendered by the principal accountant that were reasonably related to the performance of the audit of the Registrant’s financial statements and are not reported under paragraph (a) of this Item 4 were $0 in 2009 and $0 in 2010.
(c) Tax Fees - The aggregate fees billed in the Reporting Periods for professional services rendered by the principal accountant to the Registrant for tax compliance, tax advice and tax planning were $13,000 in 2009 and $12,000 in 2010. These services consisted of review or preparation of U.S. federal, state, local and excise tax returns.
(d) All Other Fees - The aggregate fees billed in the Reporting Periods for products and services provided by the principal accountant to the Registrant, other than the services reported in paragraphs (a) through (c) of this Item, were $0 in 2009 and $0 in 2010.
(e) (1) The Audit Committee reviews and approves in advance all audit and “permissible non-audit services” (as that term is defined by the rules and regulations of the Securities and Exchange Commission) to be rendered to a series of the Registrant (each, a “Series”). In addition, the Audit Committee reviews and approves in advance all “permissible non-audit services” to be provided to an investment adviser (not including any sub-adviser) of a Series, or an affiliate of such investment adviser, that is controlling, controlled by or under common control with the investment adviser and provides on-going services to the Registrant (“Affiliate”), by the Series’ principal accountant if the engagement relates directly to the operations and financial reporting of the Series. The Audit Committee considers whether fees paid by a Series’ investment adviser or an Affiliate to the Series’ principal accountant for audit and permissible non-audit services are consistent with the principal accountant’s independence.
(e) (2) 0%
(f) Not applicable
(g) The aggregate non-audit fees billed by the principal accountant for services rendered to the Registrant for the Reporting Periods were $0 in 2009 and $0 in 2010. There were no fees billed in either of the Reporting Periods for non-audit services rendered by the principal accountant to the Registrant’s investment adviser or any Affiliate.
(h) During the Reporting Period, the Registrant's principal accountant provided no non-audit services to the investment advisers or any entity controlling, controlled by or under common control with the investment advisers to the series of the Registrant to which this report relates.
ITEM 5. AUDIT COMMITTEE OF LISTED REGISTRANTS.
Not applicable
ITEM 6. INVESTMENTS.
| (a) | Included as part of report to shareholders under Item 1. |
ITEM 7. DISCLOSURE OF PROXY VOTING POLICIES AND PROCEDURES FOR CLOSED-END
MANAGEMENT INVESTMENT COMPANIES.
Not applicable.
ITEM 8. PORTFOLIO MANAGERS OF CLOSED-END MANAGEMENT INVESTMENT COMPANIES.
Not applicable.
ITEM 9. PURCHASES OF EQUITY SECURITIES BY CLOSED-END MANAGEMENT INVESTMENT COMPANY AND AFFILIATED PURCHASERS.
Not applicable.
ITEM 10. SUBMISSION OF MATTERS TO A VOTE OF SECURITY HOLDERS
The Registrant does not accept nominees to the board of trustees from shareholders.
ITEM 11. CONTROLS AND PROCEDURES
(a) The Registrant’s Principal Executive Officer and Principal Financial Officer have concluded that the Registrant’s disclosure controls and procedures (as defined in Rule 30a-3(c) under the Investment Company Act of 1940 (the “Act”)) are effective, based on their evaluation of the controls and procedures required by Rule 30a-3(b) under the Act and Rules 13a-15(b) or 15d-15(b) under the Securities Exchange Act of 1934, as of a date within 90 days of the filing date of this report.
(b) There were no changes in the Registrant’s internal control over financial reporting (as defined in
Rule 30a-3(d) under the Act) that occurred during the second fiscal quarter of the period covered by this report that have materially affected, or are reasonably likely to materially affect, the Registrant’s internal control over financial reporting.
ITEM 12. EXHIBITS.
(a)(1) Code of Ethics (Exhibit filed herewith).
(a)(2) Certifications pursuant to Rule 30a-2(a) of the Act, and Section 302 of the Sarbanes-Oxley Act of 2002. (Exhibits filed herewith)
(a)(3) Not applicable.
(b) Certifications pursuant to Rule 30a-2(b) of the Act, and Section 906 of the Sarbanes-Oxley Act of 2002. (Exhibit filed herewith)
SIGNATURES
Pursuant to the requirements of the Securities Exchange Act of 1934 and the Investment Company Act of 1940, the Registrant has duly caused this report to be signed on its behalf by the undersigned, thereunto duly authorized.
Registrant Forum Funds
| | | | |
| | By | /s/ Stacey E. Hong | |
| | | Stacey E. Hong, Principal Executive Officer | |
| | Date | 2/25/11 | |
| | | | |
Pursuant to the requirements of the Securities Exchange Act of 1934 and the Investment Company Act of 1940, this report has been signed below by the following persons on behalf of the Registrant and in the capacities and on the dates indicated.
| | | | |
| | By | /s/ Stacey E. Hong | |
| | | Stacey E. Hong, Principal Executive Officer | |
| | Date | 2/25/11 | |
| | | |
| | By | /s/ Karen Shaw | |
| | | Karen Shaw, Principal Financial Officer | |
| | Date | 2/25/11 | |
| | | |