As filed with the Securities and Exchange Commission on June 2, 2010
UNITED STATES
SECURITIES AND EXCHANGE COMMISSION
WASHINGTON, D.C. 20549
FORM N-CSR
CERTIFIED SHAREHOLDER REPORT OF REGISTERED MANAGEMENT
INVESTMENT COMPANIES
Investment Company Act file number 811-03023
FORUM FUNDS
Three Canal Plaza, Suite 600
Portland, Maine 04101
Stacey E. Hong, Principal Executive Officer
Three Canal Plaza, Suite 600
Portland, Maine 04101
207-347-2000
Date of fiscal year end: March 31
Date of reporting period: April 1, 2009 – March 31, 2010
| ITEM 1. | REPORT TO STOCKHOLDERS. |

ANNUAL REPORT
MARCH 31, 2010

Absolute Opportunities Fund, Absolute Strategies Fund, Absolute Funds and logo are registered service marks of Absolute Investment Advisers LLC; Absolute Investment Advisers (“AIA” and “Absolute”) and logo are registered service marks of AIA; and other marks referred to herein are the trademarks, service marks, registered trademarks or registered service marks of the respective owners thereof.
ABSOLUTE STRATEGIES FUND
A MESSAGE TO OUR SHAREHOLDERS
MARCH 31, 2010
Dear Shareholder,
We are pleased to present the annual report for the Absolute Strategies Fund (the “Fund”) for the 12 months ended March 31, 2010. Before discussing the performance of our Fund, it is important to state that the past two years have been an extraordinary period of time for global capital markets. There have been large distortions of investment cycles with significant mis-pricings of assets and risk both to the upside and the downside. As such, the performance of the Absolute Strategies Fund over these periods (2008 & 2009) will likely be viewed as outliers.
The Fund (Institutional Shares) returned 22.95% for the twelve months ended March 31, 2010, versus 49.77% for the S&P 500 Index (“S&P 500”) and 14.46% for the HFRX Global Hedge Fund Index. More importantly, the Fund’s performance was achieved without taking meaningful risks and the Fund’s overall net exposure was held to modest levels throughout the past year. From inception through March 31, the Fund’s beta was 0.27, (beta measures the Fund’s sensitivity to the S&P 500) demonstrating that Fund returns were largely independent of this market index. The annualized standard deviation of the Fund’s returns, a measure of portfolio volatility, has been 6.5% vs. 21.7% for the S&P 500 and 6.3% for the HFRX Global Hedge Fund Index.
The Fund’s allocations and performance can be viewed across multiple dimensions. Overall holdings of the Fund, aggregated across sub-adviser strategies, are diversified across a wide range of industries and asset classes. As such, it is difficult to attribute performance to any small group of securities. The Fund held over 1,200 securities, including both long and short equity, fixed income, ETFs, options, cash and financial futures hedges. As stated in the schedule of investments, the Fund’s long and short securities, excluding short term investments, were approximately $1,852 million and $690 million, respectively. Long and short equity securities totaled approximately 39% and 26% of net assets, respectively. Our largest single long stock position was in PepsiCo, Inc., which represented 1% of net assets. Convertible bonds and asset backed obligations totaled approximately 19% and 7% of net assets, respectively; these securities are utilized primarily in convertible arbitrage and distressed debt strategies. Other fixed income securities, including corporate bonds, totaled approximately 10% of net assets. Cash held by our sub-advisers was approximately 7% of net assets; additional deposits with the custodian were held primarily as collateral for options, futures, and short positions.
We currently allocate assets to twelve sub-advisers. As of March 31, 2010, we allocated approximately 95% of the Fund’s assets; the remaining 5% was held in cash for future allocations and rebalancing. Of the sub-advisers who received assets, the largest allocation to a single manager strategy was approximately 15%; the smallest was roughly 1%. While we view each manager strategy as an independent risk/return profile, the
ABSOLUTE STRATEGIES FUND
A MESSAGE TO OUR SHAREHOLDERS
MARCH 31, 2010
following chart illustrates a summary breakdown of our sub-adviser allocations by style, (each category may represent strategies used by multiple sub-advisers) for fiscal year end 2009 and 2010 respectively:
| | | | | | |
Sub-Adviser Strategy | | Allocations as of
March 31, 2009 | | | Allocations as of
March 31, 2010: | |
Distressed Debt | | 14 | % | | 14 | % |
Global Macro | | 10 | % | | 15 | % |
Discretionary Fixed Income | | 3 | % | | 2 | % |
Opportunistic Equity | | 14 | % | | 13 | % |
Long/Short Equity | | 18 | % | | 13 | % |
Market-Neutral Equity | | 16 | % | | 17 | % |
Convertible Arbitrage | | 23 | % | | 21 | % |
Unallocated | | 2 | % | | 5 | % |
For us, the only benchmark of significance is the amount of risk being taken to generate a return or expected return. As stated in prior commentaries, the Fund’s performance will vary based on risk/reward trade-offs and opportunities to exploit mis-pricings in an asymmetric manner. The portfolio is built from the bottom-up, but we think about systemic risks in the context of aggregated exposures as a result of manager allocations and positioning. This means that the Fund’s overall capital at risk will vary relative to potential expected payoffs vs. the potential for meaningful losses. In 2009, the Fund was able to generate strong risk-adjusted returns by adding exposures to our convertible arbitrage, opportunistic equity, distressed debt and global macro managers in early 2009, while reducing allocations to market neutral managers during that time. As preferred, the managers who we added were strong performance leaders over the past 12 months while laggard returns were attributable to the market neutral strategies.
Much of the re-pricing of risk has broadly occurred and opportunities have become more limited. As a result, we are now quite cautious. The Fund’s capital at risk has recently been dramatically reduced or hedged and our allocations are currently focused largely on our global macro, market neutral (including value-arbitrage), and convertible arbitrage managers. These managers may perform well in a more volatile environment. We have also recently increased our overlay hedge to mitigate the potential impact of large systemic risks while maintaining manager allocations. Currently, our net exposures are as low as they have been since inception; however, this could change if we see a re-pricing of risk in certain markets.
Why are we hedged? Simple. In our opinion, the potential for systemic risks continue to be very high, and we do not believe markets are currently pricing in the bad outcomes, only the optimistic ones; this is the opposite of a year ago when most investors were predicting Great Depression II. The past few market cycles have been highly compressed as investors appear to recognize risks only after they occur (For example: leverage and sub-prime problems were clear red flags in 2006, but investors did not react to them until the 2nd half of 2008). As such, the discounting mechanism of the markets has also become compressed as all assets go through stages of an escalator up and then an elevator back down (there are very few floors where you can get off).
ABSOLUTE STRATEGIES FUND
A MESSAGE TO OUR SHAREHOLDERS
MARCH 31, 2010
The easiest way to understand how investors have mis-priced risk is to think back over the past few years. In 2006-2007, investors were moderately rewarded (in the short-term) for taking large risks when everyone else was also eagerly accepting risk. This turned out to be a huge error in judgment and resulted in enormous losses. Compare this to a year ago (1st quarter 2009) when investors were highly rewarded for taking risk when nobody was accepting risk. The environment today resembles the 2007 period as it relates to momentum-fueled investing and elevated expectations. Investors now feel comfortable taking risk again because it feels safe and they likely underperformed last year. For the Fund, early 2009 felt like a great time to increase capital at risk when assets were cheap and expectations were low, not after markets rally 80% and things sound safe.
As discussed in our 4th quarter commentary (visit www.absoluteadvisers.com for past commentaries), there are many risks that we believe are not adequately priced into the current equity and credit markets. Yes, earnings have improved and the economy has stabilized, but isn’t that what an 80% re-pricing of equities takes into account? (We also wonder, if pundits believe the economy is so strong, why are rates still at 0%, and what does the economy and fiscal debt look like at rates of 5%+?) The reality is that the core global problem (too much debt), has not been addressed and may have become worse as fiscal deficits have grown. Beyond the many other secular headwinds, deleveraging continues to be the key theme and it began to make headlines in the 1st quarter starting with Greece, and could stretch throughout much of Europe and beyond. It’s important to realize that we are not dealing with problems concerning liquidity this time around. We are dealing with global problems concerning debt servicing and solvency among numerous large public and private institutions that have highly similar issues, including the UK, Japan, and the US. Unfortunately, many world leaders and bullish investors somehow believe that the correct course of action for solving a serious debt burden is to add more debt. If smart people think this is a good idea, they are likely either in denial or they are fearful of making correct choices.
It is amazing how few people believe sovereign debt is a systemic risk and completely dismiss the possibility of contagion, similar to the reaction to Bear Stearns. Historically, sovereign and domestic debt crises are quite common following a financial crisis, (Reinhart & Rogoff, “This Time is Different,” 2009). While everything may turn out ok, we speculate about what happens if it doesn’t. Can you envision Greece getting bailed out (a la Bear Stearns), soothing the markets only to delay the credit crunch until the next country comes along (a la Lehman Brothers) that cannot be bailed out? Is this not the same recipe and process that the Federal Reserve has been experimenting with over the past 12 years since the Long Term Capital Management bailout in 1998? When/how does it end and what do we do when we cannot do any more bailouts? Aren’t we already there given 0% interest rates and the government’s potential lack of meaningful political and fiscal capital? At the very least, shouldn’t equity and credit risk premiums rise?
Throwing new money at bad investments is a highly unproductive use of capital that simply dilutes future growth and curbs long-term investment. We are essentially giving more money to the worst stewards of capital at the expense of other investors and savers who could invest in productive opportunities. From the perspective of an asset allocator, or for that matter Adam Smith, this is a recipe for disaster. Eventually the providers of capital will retaliate and withdraw (historically referred to as bond market vigilantes), leading to much higher costs of capital and potential defaults. If the process to inflate and monetize debt fails, the
ABSOLUTE STRATEGIES FUND
A MESSAGE TO OUR SHAREHOLDERS
MARCH 31, 2010
deflationary forces become compounded and much more dangerous than before. Additionally, we believe that continuing to delay pain and forcing excessive risk taking may potentially create a pinnacle of moral hazard that could result in far more, or extended, pain in the future than was experienced in 2008. We also recognize this process could take years, and actually the US may benefit from a flight to ��relative safety” in the short term.
On the other hand, even if the economy begins to truly strengthen and labor markets improve in the short term, what will happen to asset prices in both equities and credit if the Fed simply hints at raising rates? We would argue that many investors who find equities attractive are rationalizing their decisions through the use of exceptionally low cost of equity capital being used to discount stock prices. If equity prices are highly levered to interest rates, then investors would need to adjust their “models” should risk-free rates move up. Bond prices may fare even worse in a rising interest rate environment. Additionally, could the US economy handle a 2-3% Fed Funds rate, or for that matter even a lack of stimulus? What would happen to the housing market? If one believes the economy cannot handle an increase in rates, then by definition it is not sustainable. (We are assuming the Fed doesn’t leave rates at 0% on the back of a strong economy. But, who knows, they’ve enabled bubbles before.)
Investor sentiment continues to swing vastly from fear and panic to risk-taking and euphoria. This herd-like behavior, combined with unnatural government and central bank interference in markets and economies, will likely lead to continued volatility, distortion and unusual short-term market effects. Given the many unknowns above, we are very comfortable with our current exposures and cautious positioning to protect capital, and we will not be disappointed or surprised to miss out on momentum and central bank-fueled risk-taking. In fact, that has been the trend for our Fund in the past when markets have ignored risk with short-term rallies that lacked sustainability. We will continue to be disciplined and exercise patience for accepting risk until times when others aren’t so eagerly willing to accept it and will vary our capital at risk accordingly. Given the potential for highly volatile market conditions, our exposures may change as opportunities to accept risk appear. These opportunities will be defined by the mis-pricing of risk, not by a flurry of great news headlines.
As a reminder, investors who measure performance quarter to quarter may have misaligned expectations as the Fund seeks performance over a full market cycle and is intended for long-term risk-conscious investors. Thank you for your investment in the Absolute Strategies Fund.
Sincerely,

Jay Compson
Portfolio Manager
Absolute Investment Advisers LLC
ABSOLUTE OPPORTUNITIES FUND
A MESSAGE TO OUR SHAREHOLDERS
MARCH 31, 2010
Dear Shareholder,
We are pleased to present the annual report for the Absolute Opportunities Fund (the “Fund”) for the period ended March 31, 2010. The Fund was launched on October 21, 2008, as a compliment to the Absolute Strategies Fund. The Fund was created to capture a variety of investment opportunities and market inefficiencies. The Fund utilizes relatively few managers with highly flexible investment strategies and thus, is intended to have a more concentrated, idiosyncratic risk profile compared to the Strategies Fund. As such, the Fund may expose investors to greater risks and should be utilized by patient, long-term investors seeking diversification away from traditional investments.
The Fund returned 19.00% for the twelve months ended March 31, 2010, versus 49.77% for the S&P 500 Index (“S&P 500”) and 14.46% for the HFRX Global Hedge Fund Index. Since inception (October 21, 2008), the Fund has returned 17.45% vs. 17.97% for the S&P 500 and 5.01% for the HFRX Global Hedge Fund Index. The Fund’s exposures have been well diversified and performance has been consistent through both up and down markets. From inception through March 31, 2010, the Fund’s beta was 0.19, (beta measures the Fund’s sensitivity to the S&P 500) demonstrating that Fund returns were largely independent of this market index.
As of March 31, 2010, 1-year and since inception annualized performance for the Fund was 19.00% and 17.45%, respectively. Performance data quoted represents past performance and is no guarantee of future results. Current performance may be lower or higher than the performance data quoted. Investment return and principal value will fluctuate so that an investor’s shares, when redeemed, may be worth more or less than the original cost. The recent opportunities in the capital markets have helped produce short-term returns that are not typical and may not continue in the future. For performance current to the most recent month-end, call the Fund at 888-99-ABSOLUTE. As stated in the current prospectus, the Fund’s annual operating expense ratio (gross) for Institutional Shares is 3.82%. Excluding the effect of expenses attributable to dividends on short sales, the Fund’s total annual operating expense ratio is 3.77%. Returns include the reinvestment of dividends and capital gains. Some of the Fund’s fees were waived or expenses reimbursed; otherwise, returns would have been lower.
Much of the Fund’s gains for the past year occurred early on in the equity and credit rally from mis-pricings in previously distressed securities. Performance has been driven by special situations and key events at specific companies that were largely unrelated to market momentum. Currently, the overall portfolio is positioned with a much more conservative or hedged stance seeking to exploit future volatility in both the equity and credit markets. There are few compelling risk/reward opportunities in distressed assets and managers are careful not to stretch for yield in the credit markets. However, opportunities will likely be more plentiful over the next few years as there is an enormous amount of maturing debt that may imply increased restructuring activity and defaults.
Some managers, whose strategies utilize short selling and were not designed for the enormous market rally over past 12 months, are now quite optimistic and feel well-positioned for their specific investment discipline. These managers, who consistently utilize short positions largely waited out the move in the markets, but are
ABSOLUTE OPPORTUNITIES FUND
A MESSAGE TO OUR SHAREHOLDERS
MARCH 31, 2010
now looking to take advantage of elevated investor expectations. Their investment strategies are designed to be unique and in many cases may seek to add short exposure to specific companies that are poised for financial deterioration due to balance sheet and cash flow challenges. Specific to credit markets, the Fund has short positions targeting the compressed spreads of specific investment grade issuers that may be mis-priced fundamentally or are threatened by rising costs of capital. As such, these positions may not be specific to broad asset classes or markets. Given our comments in the Strategies Fund commentary, we are very comfortable with these positions and believe the Fund will be well positioned to capitalize on the continued uncertainty in the economy and the global capital markets.
As with the Strategies Fund, the Absolute Opportunities Fund seeks performance over a full market cycle and is intended for long-term risk-conscious investors. Thank you for your investment in our Fund.
Sincerely,
Jay Compson
Portfolio Manager
Absolute Investment Advisers LLC
ABSOLUTE STRATEGIES FUND
PERFORMANCE CHART AND ANALYSIS
MARCH 31, 2010
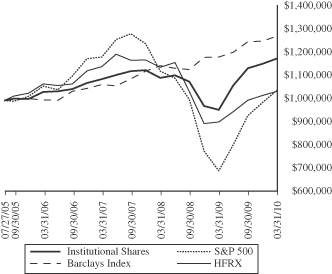
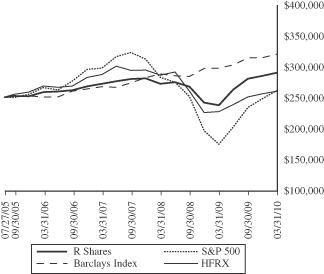
The following charts reflect the change in the value of a hypothetical $1,000,000 investment in Institutional Shares and a $250,000 investment in R Shares, including reinvested dividends and distributions, in the Absolute Strategies Fund (the “Fund”) compared with the performance of the Standard and Poor’s 500 Index (“S&P 500”), Barclays Capital U.S. Aggregate Bond Index (“Barclays Index”) and the HFRX Global Hedge Fund Index (“HFRX”), since inception. The S&P 500 is a market-value weighted index representing the performance of 500 widely held, publicly traded stocks. The Barclays Index covers the U.S. dollar-denominated, investment-grade, fixed-rate, taxable bond market of SEC-registered securities. HFRX is designed to be representative of the overall composition of the hedge fund universe; it is comprised of eight strategies – convertible arbitrage, distressed securities, equity hedge, equity market neutral, event driven, macro, merger arbitrage, and relative value arbitrage. The strategies are asset-weighted based on the distribution of assets in the hedge fund industry. The total return of the indices includes reinvestment of dividends and income. The total return of the Fund includes operating expenses that reduce returns, while the total return of the indices do not include expenses. The Fund is professionally managed while the indices are unmanaged and are not available for investment.
ABSOLUTE STRATEGIES FUND
PERFORMANCE CHART AND ANALYSIS
MARCH 31, 2010
Institutional and R Shares vs. S&P 500 Index and Barclays Capital U.S. Aggregate Bond Index and HFRX Global Hedge Fund Index
| | | | | | |
Average Annual Total Return as of 03/31/10 | | One Year | | | Commencement of Investment
Operations 07/27/05 | |
Absolute Strategies Fund — Institutional Shares | | 22.95 | % | | 3.61 | % |
Absolute Strategies Fund — R Shares | | 22.28 | % | | 3.19 | % |
S&P 500 Index | | 49.77 | % | | 0.93 | % |
Barclays Capital U.S. Aggregate Bond Index | | 7.69 | % | | 5.36 | % |
HFRX Global Hedge Fund Index | | 14.46 | % | | 0.81 | % |
| | | |
Investment Value as of 03/31/10 | | |
Absolute Strategies Fund — Institutional Shares | | $ | 1,180,589 |
S&P 500 Index | | $ | 1,044,081 |
Barclays Capital U.S. Aggregate Bond Index | | $ | 1,276,538 |
HFRX Global Hedge Fund Index | | $ | 1,038,536 |
ABSOLUTE STRATEGIES FUND
PERFORMANCE CHART AND ANALYSIS
MARCH 31, 2010
| | | |
Investment Value as of 03/31/10 | | |
Absolute Strategies Fund — R Shares | | $ | 289,588 |
S&P 500 Index | | $ | 261,020 |
Barclays Capital U.S. Aggregate Bond Index | | $ | 319,134 |
HFRX Global Hedge Fund Index | | $ | 259,634 |
Performance data quoted represents past performance and is no guarantee of future results. Current performance may be lower or higher than the performance data quoted. Investment return and principal value will fluctuate so that shares, when redeemed, may be worth more or less than original cost. For the most recent month-end performance please call (888) 992-2765. As stated in the Fund’s prospectus, the annual operating expense ratios (gross) for Institutional Shares and R Shares are 2.32% and 2.73%, respectively. Excluding the effect of expenses attributable to dividends on short sales, the Fund’s total annual operating expense ratios would be 1.82% and 2.23% for Institutional Shares and R Shares, respectively. The performance table and graph do not reflect the deduction of taxes that a shareholder would pay on Fund distributions or the redemption of Fund shares. Returns greater than one year are annualized.
ABSOLUTE OPPORTUNITIES FUND
PERFORMANCE CHART AND ANALYSIS
MARCH 31, 2010
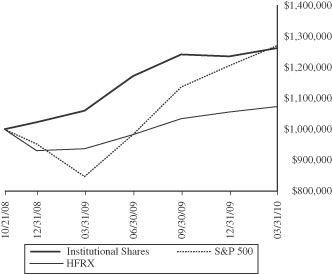
The following chart reflects the change in the value of a hypothetical $1,000,000 investment in Institutional Shares, including reinvested dividends and distributions, in the Absolute Opportunities Fund (the “Fund”) compared with the performance of the Standard and Poor’s 500 Index (“S&P 500”) and the HFRX Global Hedge Fund Index (“HFRX”), since inception. The S&P 500 is a market-value weighted index representing the performance of 500 widely held, publicly traded stocks. HFRX is designed to be representative of the overall composition of the hedge fund universe; it is comprised of eight strategies – convertible arbitrage, distressed securities, equity hedge, equity market neutral, event driven, macro, merger arbitrage, and relative value arbitrage. The strategies are asset-weighted based on the distribution of assets in the hedge fund industry. The total return of the indices includes reinvestment of dividends and income. The total return of the Fund includes operating expenses that reduce returns, while the total return of the indices do not include expenses. The Fund is professionally managed while the indices are unmanaged and are not available for investment.
ABSOLUTE OPPORTUNITIES FUND
PERFORMANCE CHART AND ANALYSIS
MARCH 31, 2010
Absolute Opportunities Fund vs. S&P 500 Index and HFRX Global Hedge Fund Index
| | | | | | |
Average Annual Total Return as of 03/31/10 | | One Year | | | Commencement of Investment
Operations 10/21/08 | |
Absolute Opportunities Fund — Institutional Shares | | 19.00 | % | | 17.45 | % |
S&P 500 Index | | 49.77 | % | | 17.97 | % |
HFRX Global Hedge Fund Index | | 14.46 | % | | 5.01 | % |
| | | |
Investment Value as of 03/31/10 | | |
Absolute Opportunities Fund — Institutional Shares | | $ | 1,260,795 |
S&P 500 Index | | $ | 1,268,973 |
HFRX Global Hedge Fund Index | | $ | 1,072,938 |
Performance data quoted represents past performance and is no guarantee of future results. Current performance may be lower or higher than the performance data quoted. Investment return and principal value will fluctuate so that shares, when redeemed, may be worth more or less than original cost. For the most recent month-end performance please call (888) 992-2765. As stated in the Fund’s prospectus, the annual operating expense ratio (gross) is 3.82%. Excluding the effect of expenses attributable to dividends on short sales, the Fund’s total annual operating expense ratio would be 3.77%. However, the Fund’s adviser has agreed to contractually waive a portion of its fees and to reimburse expenses such that total operating expenses do not exceed 2.95% (excluding all interest, taxes, portfolio transaction expenses, dividend on short sales and extraordinary expenses), which is in effect until July 31, 2010. The performance table and graph do not reflect the deduction of taxes that a shareholder would pay on Fund distributions or the redemption of Fund shares. Returns greater than one year are annualized.
ABSOLUTE STRATEGIES FUND
SCHEDULE OF INVESTMENTS
MARCH 31, 2010
| | | | | |
| Shares | | Security Description | | Value |
| Long Positions - 84.4% | | | |
| Equity Securities - 39.0% | | | |
| Common Stock - 36.9% | | | |
| Consumer Discretionary - 8.6% | | | |
| 32,000 | | Abercrombie & Fitch Co. | | $ | 1,460,480 |
| 38,800 | | Aeropostale, Inc. (a)(b) | | | 1,118,604 |
| 378,000 | | Anhui Expressway Co., Class H (b) | | | 258,029 |
| 28,300 | | AnnTaylor Stores Corp. (a)(b) | | | 585,810 |
| 23,900 | | ATC Technology Corp. (a)(b) | | | 410,124 |
| 6,400 | | AutoZone, Inc. (a)(b) | | | 1,107,776 |
| 162,000 | | Bed Bath & Beyond, Inc. (a)(b)(c) | | | 7,089,120 |
| 45,400 | | Brinker International, Inc. (a) | | | 875,312 |
| 29,400 | | Career Education Corp. (a)(b) | | | 930,216 |
| 235,480 | | Carmax, Inc. (a)(b)(d) | | | 5,915,258 |
| 36,800 | | Choice Hotels International, Inc. (a) | | | 1,281,008 |
| 25,000 | | Church & Dwight Co., Inc. | | | 1,673,750 |
| 100,000 | | Cintas Corp. | | | 2,809,000 |
| 43,000 | | Coach, Inc. (a) | | | 1,699,360 |
| 75,000 | | Coinstar, Inc. (b) | | | 2,437,500 |
| 500,000 | | Comcast Corp., Special Class A (c) | | | 8,985,000 |
| 180,636 | | CVS Caremark Corp. (a)(c) | | | 6,604,052 |
| 7,300 | | Deckers Outdoor Corp. (a)(b) | | | 1,007,400 |
| 78,100 | | DIRECTV, Class A (a)(b) | | | 2,640,561 |
| 35,400 | | Domino’s Pizza, Inc. (a)(b) | | | 482,856 |
| 230,000 | | eBay, Inc. (b) | | | 6,198,500 |
| 33,300 | | Ennis, Inc. (a) | | | 541,791 |
| 109,600 | | Equifax, Inc. (a) | | | 3,923,680 |
| 14,300 | | Equinix, Inc. (a)(b) | | | 1,391,962 |
| 56,700 | | Expedia, Inc. (a) | | | 1,415,232 |
| 38,800 | | Ezcorp, Inc., Class A (a)(b) | | | 799,280 |
| 18,100 | | Factset Research Systems, Inc. (a) | | | 1,327,997 |
| 75,900 | | Ford Motor Co. (a)(b) | | | 954,063 |
| 29,100 | | Fossil, Inc. (a)(b) | | | 1,098,234 |
| 67,800 | | Genpact, Ltd. (a)(b) | | | 1,136,328 |
| 370 | | Google, Inc., Class A (b) | | | 209,794 |
| 250,000 | | H&R Block, Inc. | | | 4,450,000 |
| 13,000 | | Hewitt Associates, Inc., Class A (a)(b) | | | 517,140 |
| 50,000 | | Hillenbrand, Inc. | | | 1,099,500 |
| 34,900 | | HNI Corp. (a) | | | 929,387 |
| 13,200 | | Hospira, Inc. (a)(b) | | | 747,780 |
| 45,400 | | IAC/InterActiveCorp. (a)(b) | | | 1,032,396 |
| 50,000 | | International Game Technology | | | 922,500 |
| 25,200 | | International Speedway Corp., Class A (a) | | | 649,404 |
| 52,900 | | inVentiv Health, Inc. (a)(b) | | | 1,188,134 |
| 12,000 | | ITT Educational Services, Inc. (a)(b) | | | 1,349,760 |
| 190,000 | | Jiangsu Expressway Co., Ltd., Class H (b) | | | 179,373 |
| 12,673 | | Lear Corp. (b) | | | 1,005,602 |
| 27,700 | | Liberty Global, Inc., Class A (a)(b) | | | 807,732 |
| 520,000 | | Liberty Media Corp. — Interactive, Class A (b) | | | 7,961,200 |
| 50,000 | | Liberty Media Corp. — Starz, Class A (b) | | | 2,734,000 |
| 334,600 | | Lowe’s Cos., Inc. (a)(c) | | | 8,110,704 |
| 66,000 | | Ltd Brands, Inc. (a) | | | 1,624,920 |
| | | | | |
| Shares | | Security Description | | Value |
| 25,300 | | Lululemon Athletica, Inc. (a)(b) | | $ | 1,049,950 |
| 60,400 | | Macy’s, Inc. (a) | | | 1,314,908 |
| 18,600 | | MAXIMUS, Inc. (a) | | | 1,133,298 |
| 17,000 | | McDonald’s Corp. (a)(c) | | | 1,134,240 |
| 43,900 | | Meredith Corp. (a) | | | 1,510,599 |
| 150,000 | | Mobile Mini, Inc. (b) | | | 2,323,500 |
| 19,800 | | MWI Veterinary Supply, Inc. (a)(b) | | | 799,920 |
| 24,300 | | Navistar International Corp. (a)(b) | | | 1,087,668 |
| 11,200 | | Netflix, Inc. (a)(b) | | | 825,888 |
| 24,500 | | Netgear, Inc. (a)(b) | | | 639,450 |
| 160,000 | | Newell Rubbermaid, Inc. | | | 2,432,000 |
| 4,800 | | Nike, Inc., Class B | | | 352,800 |
| 65,700 | | PetSmart, Inc. (a) | | | 2,099,772 |
| 11,000 | | Polaris Industries, Inc. (a) | | | 562,760 |
| 34,500 | | Rent-A-Center, Inc. (a)(b) | | | 815,925 |
| 195,080 | | Robert Half International, Inc. (a) | | | 5,936,284 |
| 88,300 | | Rollins, Inc. (a) | | | 1,914,344 |
| 99,705 | | Royal Caribbean Cruises, Ltd. (a)(b)(d) | | | 3,289,268 |
| 27,100 | | RR Donnelley & Sons Co. (a) | | | 578,585 |
| 28,000 | | Scholastic Corp. (a) | | | 784,000 |
| 13,800 | | Scripps Networks Interactive, Inc., Class A (a) | | | 612,030 |
| 16,748 | | Sears Holdings Corp. (b) | | | 1,815,986 |
| 384,000 | | Shenzhen Expressway Co., Ltd., Class H | | | 201,786 |
| 810,000 | | Sichuan Expressway Co., Ltd., Class H | | | 479,892 |
| 49,800 | | Stage Stores, Inc. (a) | | | 766,422 |
| 55,200 | | Staples, Inc. (a) | | | 1,291,128 |
| 53,300 | | Starbucks Corp. (a) | | | 1,293,591 |
| 6,000 | | Starwood Hotels & Resorts Worldwide, Inc. | | | 279,840 |
| 2,900 | | Strayer Education, Inc. (a) | | | 706,208 |
| 36,700 | | The Cheesecake Factory, Inc. (a)(b) | | | 993,102 |
| 19,300 | | The Corporate Executive Board Co. (a) | | | 513,187 |
| 54,400 | | The Finish Line, Inc., Class A (a) | | | 887,808 |
| 36,200 | | The Gap, Inc. (a) | | | 836,582 |
| 2,692 | | The Steak N Shake Co. (a)(b) | | | 1,026,379 |
| 25,300 | | The Timberland Co., Class A (a)(b) | | | 539,902 |
| 100,950 | | The Walt Disney Co. (a)(c) | | | 3,524,164 |
| 72,200 | | TIBCO Software, Inc. (a)(b) | | | 779,038 |
| 16,400 | | Tim Hortons, Inc. (a) | | | 534,476 |
| 10,800 | | TJX Cos., Inc. (a)(b) | | | 459,216 |
| 38,200 | | Toro Co. (a) | | | 1,878,294 |
| 250,000 | | Total System Services, Inc. | | | 3,915,000 |
| 42,000 | | Universal Technical Institute, Inc. (a)(b) | | | 958,440 |
| 94,600 | | Valueclick, Inc. (a)(b) | | | 959,244 |
| 393,000 | | Viacom, Inc., Class B (b) | | | 13,511,340 |
| 36,300 | | WABCO Holdings, Inc. (a)(b) | | | 1,086,096 |
| 217,385 | | Walgreen Co. (a)(c) | | | 8,062,810 |
| 41,000 | | Wal-Mart Stores, Inc. (a)(c) | | | 2,279,600 |
| 54,642 | | Warner Music Group Corp. (b) | | | 378,123 |
| 37,600 | | Websense, Inc. (a)(b) | | | 856,152 |
| 21,900 | | Weight Watchers International, Inc. (a) | | | 559,107 |
| 17,900 | | WESCO International, Inc. (a)(b) | | | 621,309 |
| 11,300 | | Williams-Sonoma, Inc. | | | 297,077 |
| | | | |
| See Notes to Financial Statements. | | 12 | | ABSOLUTE FUNDS |
ABSOLUTE STRATEGIES FUND
SCHEDULE OF INVESTMENTS
MARCH 31, 2010
| | | | | |
| Shares | | Security Description | | Value |
| 23,900 | | WMS Industries, Inc. (a)(b) | | $ | 1,002,366 |
| 17,500 | | WW Grainger, Inc. (a) | | | 1,892,100 |
| 34,800 | | Wyndham Worldwide Corp. (a) | | | 895,404 |
| 236,000 | | Zhejiang Expressway Co., Ltd., Class H | | | 213,074 |
| | | | | |
| | | | | 191,169,041 |
| | | | | |
| Consumer Staples - 4.8% | | | |
| 31,800 | | Brown-Forman Corp., Class B (a) | | | 1,890,510 |
| 30,600 | | Campbell Soup Co. (a) | | | 1,081,710 |
| 160,000 | | Clorox Co. | | | 10,262,400 |
| 55,800 | | ConAgra Foods, Inc. (a) | | | 1,398,906 |
| 29,425 | | CSS Industries, Inc. | | | 591,443 |
| 117,600 | | Cypress Bioscience, Inc. (a)(b) | | | 576,240 |
| 47,000 | | Deluxe Corp. (a) | | | 912,740 |
| 83,900 | | Diageo PLC, ADR (a) | | | 5,659,055 |
| 43,200 | | Elizabeth Arden, Inc. (a)(b) | | | 777,600 |
| 19,700 | | Hansen Natural Corp. (a)(b) | | | 854,586 |
| 45,600 | | Herbalife, Ltd. (a) | | | 2,103,072 |
| 27,000 | | HJ Heinz Co. (a) | | | 1,231,470 |
| 9,400 | | J&J Snack Foods Corp. (a) | | | 408,618 |
| 120,500 | | Johnson & Johnson (a)(c) | | | 7,856,600 |
| 7,000 | | Kellogg Co. (a) | | | 374,010 |
| 200 | | Kraft Foods, Inc., Class A (a) | | | 6,048 |
| 84,300 | | Lancaster Colony Corp. (a) | | | 4,970,328 |
| 80,000 | | McCormick & Co., Inc. (Non-voting shares) | | | 3,068,800 |
| 340,000 | | PepsiCo, Inc. (c) | | | 22,494,400 |
| 100,700 | | Philip Morris International, Inc. (a) | | | 5,252,512 |
| 61,100 | | Prestige Brands Holdings, Inc. (a)(b) | | | 549,900 |
| 12,500 | | Ralcorp Holdings, Inc. (a)(b) | | | 847,250 |
| 150,000 | | SYSCO Corp. | | | 4,425,000 |
| 281,800 | | The Coca-Cola Co. (c) | | | 15,499,000 |
| 126,200 | | The Procter & Gamble Co. (a)(c) | | | 7,984,674 |
| 160,000 | | Toyota Industries Corp., ADR (Unsponsored) | | | 4,571,920 |
| 70,050 | | Viterra, Inc. (b) | | | 661,428 |
| | | | | |
| | | | | 106,310,220 |
| | | | | |
| Energy - 2.3% | | | |
| 7,900 | | Apache Corp. (a) | | | 801,850 |
| 5,000 | | Cabot Oil & Gas Corp. (a) | | | 184,000 |
| 23,204 | | Canadian Natural Resources, Ltd. | | | 1,718,024 |
| 27,128 | | Canadian Oil Sands Trust | | | 813,319 |
| 26,810 | | Canadian Oil Sands Trust | | | 804,657 |
| 18,627 | | Cenovus Energy, Inc. | | | 488,214 |
| 66,100 | | Chevron Corp. (a) | | | 5,012,363 |
| 2,945 | | China Petroleum & Chemical Corp., ADR | | | 242,197 |
| 3,172 | | CNOOC, Ltd., ADR | | | 523,634 |
| 33,400 | | Complete Production Services, Inc. (a)(b) | | | 385,770 |
| 283,900 | | ConocoPhillips (a) | | | 14,527,163 |
| 12,400 | | Contango Oil & Gas Co. (a)(b) | | | 634,260 |
| 25,900 | | Dawson Geophysical Co. (a)(b) | | | 757,316 |
| 75,600 | | El Paso Corp. (a) | | | 819,504 |
| 18,627 | | EnCana Corp. | | | 577,996 |
| | | | | |
| Shares | | Security Description | | Value |
| 26,000 | | EQT Corp. (a) | | $ | 1,066,000 |
| 39,400 | | Exterran Holdings, Inc. (a)(b) | | | 952,298 |
| 21,000 | | Exxon Mobil Corp. (a)(c) | | | 1,406,580 |
| 21,800 | | FMC Technologies, Inc. (a)(b) | | | 1,408,934 |
| 35,000 | | Forest Oil Corp. (a)(b) | | | 903,700 |
| 19,400 | | Hess Corp. | | | 1,213,470 |
| 7,600 | | Holly Corp. | | | 212,116 |
| 51,400 | | Imperial Oil, Ltd. (a) | | | 1,997,918 |
| 68,300 | | Key Energy Services, Inc. (a)(b) | | | 652,265 |
| 12,100 | | Lufkin Industries, Inc. (a) | | | 957,715 |
| 74,800 | | Marathon Oil Corp. (a) | | | 2,366,672 |
| 27,200 | | Murphy Oil Corp. (a) | | | 1,528,368 |
| 4,600 | | Occidental Petroleum Corp. (a) | | | 388,884 |
| 19,100 | | Oceaneering International, Inc. (a)(b) | | | 1,212,659 |
| 16,500 | | Oil States International, Inc. (a)(b) | | | 748,110 |
| 96,700 | | Patterson-UTI Energy, Inc. (a) | | | 1,350,899 |
| 3,683 | | PetroChina Co., Ltd., ADR | | | 431,721 |
| 53,000 | | Pioneer Drilling Co. (a)(b) | | | 373,120 |
| 22,400 | | Southwestern Energy Co. (a)(b) | | | 912,128 |
| 42,617 | | Suncor Energy, Inc. | | | 1,386,757 |
| 20,200 | | Ultra Petroleum Corp. (a)(b) | | | 941,926 |
| 62,900 | | W&T Offshore, Inc. (a) | | | 528,360 |
| | | | | |
| | | | | 51,230,867 |
| | | | | |
| Financial - 6.9% | | | |
| 9,540 | | ADFITECH, Inc. (b) | | | 20,988 |
| 3,900 | | Affiliated Managers Group, Inc. (a)(b) | | | 308,100 |
| 18,200 | | Aflac, Inc. (a) | | | 988,078 |
| 57,000 | | American Express Co. (c) | | | 2,351,820 |
| 260,000 | | AmeriCredit Corp. (b) | | | 6,177,600 |
| 8,800 | | Ameriprise Financial, Inc. (a) | | | 399,168 |
| 49,300 | | Apartment Investment & Management Co. REIT, Class A (a) | | | 907,613 |
| 120,000 | | Arthur J Gallagher & Co. | | | 2,946,000 |
| 22,300 | | Bancfirst Corp. (a) | | | 934,593 |
| 86,900 | | Banco Latinoamericano de Comerico Exterior, Class E (a) | | | 1,247,884 |
| 74,500 | | Bank of America Corp. | | | 1,329,825 |
| 47,400 | | Bank of Hawaii Corp. (a) | | | 2,130,630 |
| 32,700 | | Bank of the Ozarks, Inc. (a) | | | 1,150,713 |
| 126 | | Berkshire Hathaway, Inc., Class A (a)(b) | | | 15,346,837 |
| 49,790 | | Berkshire Hathaway, Inc., Class B (b) | | | 4,046,433 |
| 14,300 | | Brookfield Asset Management, Inc., Class A (a) | | | 363,506 |
| 17,000 | | Brookfield Properties Corp. | | | 261,120 |
| 18,400 | | CB Richard Ellis Group, Inc., Class A (b) | | | 291,640 |
| 34,300 | | Chubb Corp. (a)(c) | | | 1,778,455 |
| 37,700 | | City Holding Co. (a) | | | 1,292,733 |
| 8,652 | | CME Group, Inc. (a) | | | 2,734,984 |
| 32,025 | | Commerce Bancshares, Inc. (a) | | | 1,317,508 |
| 6,600 | | Credicorp, Ltd. (a) | | | 581,988 |
| 23,400 | | Cullen/Frost Bankers, Inc. (a) | | | 1,305,720 |
| 61,000 | | Dime Community Bancshares (a) | | | 770,430 |
| 29,900 | | Eaton Vance Corp. (a) | | | 1,002,846 |
| | | | |
| See Notes to Financial Statements. | | 13 | | ABSOLUTE FUNDS |
ABSOLUTE STRATEGIES FUND
SCHEDULE OF INVESTMENTS
MARCH 31, 2010
| | | | | |
| Shares | | Security Description | | Value |
| 33,300 | | Erie Indemnity Co., Class A | | $ | 1,436,229 |
| 470 | | Fairfax Financial Holdings, Ltd. | | | 176,269 |
| 19,300 | | Federated Investors, Inc., Class B (a) | | | 509,134 |
| 28,100 | | Forestar Group, Inc. (a)(b) | | | 530,528 |
| 54,930 | | Franklin Resources, Inc. (a) | | | 6,091,737 |
| 101,500 | | Fulton Financial Corp. (a) | | | 1,034,285 |
| 21,900 | | Global Payments, Inc. (a) | | | 997,545 |
| 2,615 | | HDFC Bank, Ltd., ADR | | | 364,505 |
| 49,100 | | Hong Kong Exchanges and Clearing, Ltd. | | | 819,572 |
| 163,300 | | Hudson City Bancorp, Inc. (a) | | | 2,312,328 |
| 35,943 | | Icahn Enterprises LP | | | 1,707,293 |
| 7,140 | | ICICI Bank, Ltd., ADR | | | 304,878 |
| 24,600 | | Infinity Property & Casualty Corp. (a) | | | 1,117,824 |
| 20,285 | | IntercontinentalExchange, Inc. (a)(b) | | | 2,275,571 |
| 75,400 | | International Bancshares Corp. (a) | | | 1,733,446 |
| 50,800 | | Janus Capital Group, Inc. (a) | | | 725,932 |
| 10,000 | | Jones Lang LaSalle, Inc. (a) | | | 728,900 |
| 96,000 | | Lender Processing Services, Inc. (a) | | | 3,624,000 |
| 30,500 | | Life Partners Holdings, Inc. (a) | | | 676,185 |
| 40,200 | | LTC Properties, Inc. REIT (a) | | | 1,087,812 |
| 6,005 | | Mastercard, Inc., Class A | | | 1,525,270 |
| 28,300 | | Montpelier Re Holdings, Ltd. (a) | | | 475,723 |
| 13,500 | | Moody’s Corp. (a) | | | 401,625 |
| 64,300 | | National Financial Partners Corp. (a)(b) | | | 906,630 |
| 49,900 | | National Health Investors, Inc. REIT (a) | | | 1,934,124 |
| 10,275 | | Nationwide Health Properties, Inc. REIT (a) | | | 361,166 |
| 36,900 | | NBT Bancorp, Inc. (a) | | | 843,165 |
| 102,300 | | Net 1 UEPS Technologies, Inc. (a)(b) | | | 1,881,297 |
| 35,900 | | NewAlliance Bancshares, Inc. (a) | | | 453,058 |
| 7,280 | | Northern Trust Corp. | | | 402,293 |
| 79,307 | | NYSE Euronext (a) | | | 2,348,280 |
| 26,400 | | optionsXpress Holdings, Inc. (a)(b) | | | 430,056 |
| 537,070 | | PrivateBancorp, Inc. (a) | | | 7,357,859 |
| 33,400 | | ProAssurance Corp. (a)(b) | | | 1,955,236 |
| 18,300 | | Prosperity Bancshares, Inc. (a) | | | 750,300 |
| 7,500 | | PS Business Parks, Inc. REIT (a) | | | 400,500 |
| 30,200 | | Realty Income Corp. REIT | | | 926,838 |
| 200,000 | | Resource America, Inc., Class A | | | 960,000 |
| 13,200 | | RLI Corp. (a) | | | 752,664 |
| 70,100 | | S&T Bancorp, Inc. (a) | | | 1,465,090 |
| 23,500 | | Safety Insurance Group, Inc. (a) | | | 885,245 |
| 18,400 | | Saul Centers, Inc. REIT (a) | | | 761,760 |
| 35,300 | | Selective Insurance Group (a) | | | 585,980 |
| 131,900 | | Singapore Exchange, Ltd. | | | 721,280 |
| 23,250 | | State Street Corp. (c) | | | 1,049,505 |
| 50,600 | | T Rowe Price Group, Inc. (a) | | | 2,779,458 |
| 47,100 | | Taubman Centers, Inc. REIT (a) | | | 1,880,232 |
| 301,160 | | The Bancorp, Inc. (b) | | | 2,680,324 |
| 253,777 | | The Bank of New York Mellon Corp. (a)(c) | | | 7,836,634 |
| 1,170 | | The Goldman Sachs Group, Inc. | | | 199,637 |
| 35,545 | | The NASDAQ OMX Group, Inc. (b) | | | 750,710 |
| 22,450 | | The Progressive Corp. | | | 428,570 |
| 160,400 | | Trustco Bank Corp. NY (a) | | | 989,668 |
| 15,300 | | Trustmark Corp. (a) | | | 373,779 |
| | | | | |
| Shares | | Security Description | | Value |
| 35,600 | | UMB Financial Corp. (a) | | $ | 1,445,360 |
| 19,700 | | United Bankshares, Inc. (a) | | | 516,534 |
| 44,600 | | Unitrin, Inc. (a) | | | 1,251,030 |
| 57,100 | | Universal American Corp. (a)(b) | | | 880,482 |
| 223,083 | | Urbana Corp., Non Voting Class A (b) | | | 344,844 |
| 60,070 | | US Global Investors, Inc., Class A | | | 594,092 |
| 246,000 | | Value Partners Group, Ltd. | | | 190,102 |
| 24,700 | | Ventas, Inc. REIT (a) | | | 1,172,756 |
| 23,950 | | Verisk Analytics, Inc., Class A (b) | | | 675,390 |
| 31,586 | | Visa, Inc., Class A (a) | | | 2,875,274 |
| 12,100 | | Waddell & Reed Financial, Inc., Class A (a) | | | 436,084 |
| 327,500 | | Wells Fargo & Co. (a)(c)(d) | | | 10,191,800 |
| 83,100 | | WesBanco, Inc. (a) | | | 1,351,206 |
| 15,900 | | Westamerica Bancorporation (a) | | | 916,635 |
| 15,500 | | Wright Express Corp. (a)(b) | | | 466,860 |
| | | | | |
| | | | | 152,003,590 |
| | | | | |
| Healthcare - 3.9% | | | |
| 76,600 | | Alkermes, Inc. (a)(b) | | | 993,502 |
| 51,300 | | Allscripts-Misys Healthcare Solutions, Inc. (a)(b) | | | 1,003,428 |
| 35,300 | | AMERIGROUP Corp. (a)(b) | | | 1,173,372 |
| 39,100 | | AmerisourceBergen Corp. (a) | | | 1,130,772 |
| 17,700 | | Amgen, Inc. (a)(b) | | | 1,057,752 |
| 74,800 | | Amsurg Corp. (a)(b) | | | 1,614,932 |
| 24,450 | | Baxter International, Inc. (c) | | | 1,422,990 |
| 60,800 | | Beckman Coulter, Inc. (a) | | | 3,818,240 |
| 43,600 | | Becton Dickinson and Co. | | | 3,432,628 |
| 11,500 | | Biogen Idec, Inc. (a)(b) | | | 659,640 |
| 9,200 | | Bio-Rad Laboratories, Inc., Class A (a)(b) | | | 952,384 |
| 425,000 | | Boston Scientific Corp. (b) | | | 3,068,500 |
| 15,000 | | Cerner Corp. (a)(b) | | | 1,275,900 |
| 16,800 | | Charles River Laboratories International, Inc. (a)(b) | | | 660,408 |
| 20,000 | | Covance, Inc. (b) | | | 1,227,800 |
| 30,000 | | Covidien PLC | | | 1,508,400 |
| 51,000 | | CR Bard, Inc. | | | 4,417,620 |
| 29,000 | | Dendreon Corp. (a)(b) | | | 1,057,630 |
| 241,000 | | Exelixis, Inc. (a)(b) | | | 1,462,870 |
| 12,700 | | Express Scripts, Inc. (a)(b) | | | 1,292,352 |
| 15,700 | | Forest Laboratories, Inc. (a)(b) | | | 492,352 |
| 32,000 | | Gentiva Health Services, Inc. (a)(b) | | | 904,960 |
| 35,575 | | Gilead Sciences, Inc. (a)(b) | | | 1,617,951 |
| 44,400 | | Healthspring, Inc. (a)(b) | | | 781,440 |
| 21,589 | | Henry Schein, Inc. (a)(b) | | | 1,271,592 |
| 67,100 | | Hill-Rom Holdings, Inc. (a) | | | 1,825,791 |
| 39,200 | | Hologic, Inc. (a)(b) | | | 726,768 |
| 43,000 | | IDEXX Laboratories, Inc. (a)(b) | | | 2,474,650 |
| 21,800 | | Invacare Corp. | | | 578,572 |
| 24,000 | | Kinetic Concepts, Inc. (a)(b) | | | 1,147,440 |
| 20,300 | | Life Technologies Corp. (a)(b) | | | 1,061,081 |
| 12,300 | | Lincare Holdings, Inc. (a)(b) | | | 552,024 |
| 20,800 | | Magellan Health Services, Inc. (a)(b) | | | 904,384 |
| | | | |
| See Notes to Financial Statements. | | 14 | | ABSOLUTE FUNDS |
ABSOLUTE STRATEGIES FUND
SCHEDULE OF INVESTMENTS
MARCH 31, 2010
| | | | | |
| Shares | | Security Description | | Value |
| 9,825 | | Medco Health Solutions, Inc. (a)(b) | | $ | 634,302 |
| 10,000 | | Medtronic, Inc. (a)(c) | | | 450,300 |
| 12,940 | | Mindray Medical International, Ltd., ADR | | | 471,275 |
| 12,600 | | Orthofix International NV (a)(b) | | | 458,388 |
| 35,000 | | Perrigo Co. | | | 2,055,200 |
| 560,000 | | Pfizer, Inc. (c) | | | 9,604,000 |
| 89,965 | | Quest Diagnostics, Inc. (a)(c) | | | 5,244,060 |
| 77,100 | | Quidel Corp. (a)(b) | | | 1,121,034 |
| 143,250 | | Shandong Weigao Group Medical Polymer Co., Ltd., Class H | | | 597,778 |
| 137,000 | | St Jude Medical, Inc. (a)(b)(c) | | | 5,623,850 |
| 16,800 | | Stryker Corp. (a) | | | 961,296 |
| 13,700 | | Techne Corp. (a) | | | 872,553 |
| 14,400 | | Teleflex, Inc. | | | 922,608 |
| 102,700 | | The Medicines Co. (a)(b) | | | 805,168 |
| 115,950 | | UnitedHealth Group, Inc. (a) | | | 3,788,086 |
| 51,700 | | Valeant Pharmaceuticals International (a)(b) | | | 2,218,447 |
| 36,800 | | WellPoint, Inc. (a)(b) | | | 2,369,184 |
| 15,300 | | Zimmer Holdings, Inc. (a)(b) | | | 905,760 |
| | | | | |
| | | | | 86,673,414 |
| | | | | |
| Industrial - 3.8% | | | |
| 32,600 | | 3M Co. (a) | | | 2,724,382 |
| 14,500 | | Actuant Corp., Class A | | | 283,475 |
| 46,600 | | Aptargroup, Inc. (a) | | | 1,833,710 |
| 17,400 | | Avnet, Inc. (a)(b) | | | 522,000 |
| 8,700 | | BE Aerospace, Inc. (a)(b) | | | 264,915 |
| 1,356,000 | | Beijing Capital International Airport Co., Ltd., Class H | | | 810,360 |
| 11,200 | | Canadian National Railway Co. (a) | | | 678,608 |
| 23,700 | | Carlisle Cos., Inc. (a) | | | 902,970 |
| 273,682 | | Cemex SAB de CV, ADR (a)(b) | | | 2,794,293 |
| 11,400 | | CH Robinson Worldwide, Inc. (a) | | | 636,690 |
| 10,000 | | CNH Global NV (a)(b) | | | 307,500 |
| 44,800 | | Continental Airlines, Inc., Class B (a)(b) | | | 984,256 |
| 21,545 | | CSX Corp. | | | 1,096,640 |
| 15,300 | | Deere & Co. (a) | | | 909,738 |
| 18,700 | | Dolby Laboratories, Inc., Class A (a)(b) | | | 1,097,129 |
| 25,500 | | Drew Industries, Inc. (a)(b) | | | 561,510 |
| 2,400 | | Flowserve Corp. | | | 264,648 |
| 23,400 | | Frontline, Ltd. (a) | | | 716,742 |
| 12,600 | | Gardner Denver, Inc. (a) | | | 554,904 |
| 12,900 | | Garmin, Ltd. (a) | | | 496,392 |
| 44,900 | | Gentex Corp. (a) | | | 871,958 |
| 13,400 | | Goodrich Corp. (a) | | | 944,968 |
| 81,800 | | Graco, Inc. (a) | | | 2,617,600 |
| 27,500 | | Graham Corp. (a) | | | 494,725 |
| 20,100 | | Greif, Inc., Class A (a) | | | 1,103,892 |
| 8,549 | | Guangshen Railway Co., Ltd., ADR | | | 171,322 |
| 15,600 | | Harsco Corp. (a) | | | 498,264 |
| 19,500 | | Illinois Tool Works, Inc. (a) | | | 923,520 |
| | | | | |
| Shares | | Security Description | | Value |
| 36,000 | | JB Hunt Transport Services, Inc. (a) | | $ | 1,291,680 |
| 347 | | Kansas City Southern (a)(b) | | | 12,551 |
| 55,600 | | Knightsbridge Tankers, Ltd. | | | 941,864 |
| 16,700 | | L-3 Communications Holdings, Inc. (a) | | | 1,530,221 |
| 47,700 | | Landstar System, Inc. (a) | | | 2,002,446 |
| 22,800 | | Layne Christensen Co. (a)(b) | | | 608,988 |
| 11,600 | | Lennox International, Inc. (a) | | | 514,112 |
| 11,300 | | Lincoln Electric Holdings, Inc. (a) | | | 613,929 |
| 107,800 | | Lockheed Martin Corp. (a) | | | 8,971,116 |
| 64,000 | | Methode Electronics, Inc. (a) | | | 633,600 |
| 48,500 | | Nalco Holding Co. (a) | | | 1,180,005 |
| 45,600 | | Nordson Corp. (a) | | | 3,097,152 |
| 15,240 | | Norfolk Southern Corp. | | | 851,764 |
| 29,200 | | Northrop Grumman Corp. (a) | | | 1,914,644 |
| 1,900 | | Precision Castparts Corp. | | | 240,749 |
| 38,900 | | Quanex Building Products Corp. (a) | | | 643,017 |
| 18,651 | | Quanta Services, Inc. (b) | | | 357,353 |
| 31,200 | | Raytheon Co. (a) | | | 1,782,144 |
| 15,800 | | Rockwell Collins, Inc. (a) | | | 988,922 |
| 32,200 | | Rogers Corp. (b) | | | 934,122 |
| 29,800 | | Sonoco Products Co. (a) | | | 917,542 |
| 14,300 | | SPX Corp. (a) | | | 948,376 |
| 10,700 | | Terex Corp. (a)(b) | | | 242,997 |
| 104,950 | | The Boeing Co. (a)(c)(d) | | | 7,620,420 |
| 110,000 | | The Brink’s Co. | | | 3,105,300 |
| 12,000 | | Thomas & Betts Corp. (a)(b) | | | 470,880 |
| 617,000 | | Tianjin Port Development Holdings, Ltd. (b) | | | 185,158 |
| 25,000 | | Towers Watson & Co., Class A | | | 1,187,500 |
| 12,000 | | TYCO International, Ltd. (a) | | | 459,000 |
| 14,521 | | Union Pacific Corp. | | | 1,064,389 |
| 74,850 | | United Parcel Service, Inc., Class B (a) | | | 4,821,089 |
| 8,300 | | United Technologies Corp. (a) | | | 610,963 |
| 165,540 | | USG Corp. (a)(b) | | | 2,840,666 |
| 14,200 | | Valmont Industries, Inc. (a) | | | 1,176,186 |
| 37,900 | | Waste Connections, Inc. (a)(b) | | | 1,287,084 |
| 71,900 | | Zebra Technologies Corp., Class A (a)(b) | | | 2,128,240 |
| | | | | |
| | | | | 84,243,280 |
| | | | | |
| Information Technology - 3.2% | | | |
| 120,500 | | Accenture PLC, Class A (a) | | | 5,054,975 |
| 38,900 | | ACI Worldwide, Inc. (a)(b) | | | 801,729 |
| 32,800 | | Adobe Systems, Inc. (a)(b) | | | 1,160,136 |
| 21,800 | | Advent Software, Inc. (a)(b) | | | 975,550 |
| 18,300 | | Alliance Data Systems Corp. (a)(b) | | | 1,171,017 |
| 41,600 | | Altera Corp. (a) | | | 1,011,296 |
| 13,500 | | ANSYS, Inc. (a)(b) | | | 582,390 |
| 228,420 | | Automatic Data Processing, Inc. (a) | | | 10,157,837 |
| 69,270 | | Broadridge Financial Solutions, Inc. (a) | | | 1,480,992 |
| 53,300 | | CGI Group, Inc., Class A (a)(b) | | | 794,703 |
| 26,900 | | Check Point Software Technologies (b) | | | 943,114 |
| 6,000 | | Citrix Systems, Inc. (b) | | | 284,820 |
| 96,750 | | Computershare, Ltd. | | | 1,111,559 |
| 15,400 | | Cree, Inc. (a)(b) | | | 1,081,388 |
| | | | |
| See Notes to Financial Statements. | | 15 | | ABSOLUTE FUNDS |
ABSOLUTE STRATEGIES FUND
SCHEDULE OF INVESTMENTS
MARCH 31, 2010
| | | | | |
| Shares | | Security Description | | Value |
| 120,000 | | Dell, Inc. (b) | | $ | 1,801,200 |
| 10,640 | | DST Systems, Inc. | | | 441,028 |
| 11,700 | | Dun & Bradstreet Corp. (a) | | | 870,714 |
| 65,100 | | Earthlink, Inc. (a) | | | 555,954 |
| 103,600 | | Epicor Software Corp. (a)(b) | | | 990,416 |
| 48,100 | | Fiserv, Inc. (a)(b) | | | 2,441,556 |
| 8,058 | | Hewlett-Packard Co. (a) | | | 428,282 |
| 185,400 | | Integrated Device Technology, Inc. (a)(b) | | | 1,136,502 |
| 31,500 | | Intel Corp. (a) | | | 701,190 |
| 3,391 | | International Business Machines Corp. (a)(c) | | | 434,896 |
| 62,100 | | Intersil Corp., Class A (a) | | | 916,596 |
| 60,000 | | Jack Henry & Associates, Inc. | | | 1,443,600 |
| 36,800 | | Logitech International SA (a)(b) | | | 601,312 |
| 16,000 | | Manhattan Associates, Inc. (a)(b) | | | 407,680 |
| 82,400 | | Micrel, Inc. (a) | | | 878,384 |
| 31,800 | | MICROS Systems, Inc. (a)(b) | | | 1,045,584 |
| 349,825 | | Microsoft Corp. (a) | | | 10,239,378 |
| 51,400 | | MKS Instruments, Inc. (a)(b) | | | 1,006,926 |
| 23,547 | | MSCI, Inc., Class A (b) | | | 850,047 |
| 83,800 | | NVIDIA Corp. (a)(b) | | | 1,456,444 |
| 21,675 | | Oracle Corp. (a) | | | 556,831 |
| 14,500 | | Progress Software Corp. (a)(b) | | | 455,735 |
| 39,700 | | Red Hat, Inc. (a)(b) | | | 1,162,019 |
| 10,400 | | Research In Motion, Ltd. (a)(b) | | | 769,080 |
| 7,800 | | Riverbed Technology, Inc. (a)(b) | | | 221,520 |
| 5,600 | | Salesforce.com, Inc. (a)(b) | | | 416,920 |
| 41,460 | | Scientific Learning Corp. (a)(b) | | | 199,008 |
| 51,000 | | Seagate Technology (a)(b) | | | 931,260 |
| 120,100 | | SEI Investments Co. (a) | | | 2,638,597 |
| 6,900 | | Solera Holdings, Inc. | | | 266,685 |
| 34,400 | | SRA International, Inc., Class A (a)(b) | | | 715,176 |
| 72,500 | | Symantec Corp. (a)(b) | | | 1,226,700 |
| 23,400 | | Teradata Corp. (a)(b) | | | 676,026 |
| 39,900 | | Texas Instruments, Inc. (a) | | | 976,353 |
| 5,400 | | Varian Semiconductor Equipment Associates, Inc. (b) | | | 178,848 |
| 25,300 | | VMWare, Inc., Class A (a)(b) | | | 1,348,490 |
| 24,900 | | Western Digital Corp. (a)(b) | | | 970,851 |
| 46,700 | | Xilinx, Inc. (a) | | | 1,190,850 |
| | | | | |
| | | | | 70,160,144 |
| | | | | |
| Materials - 1.2% | | | |
| 32,800 | | A Schulman, Inc. (a) | | | 802,616 |
| 49,262 | | Anglo American PLC, ADR (Unsponsored) (b) | | | 1,066,030 |
| 14,285 | | BHP Billiton, Ltd., ADR | | | 1,147,371 |
| 11,100 | | Carpenter Technology Corp. (a) | | | 406,260 |
| 35,000 | | Compass Minerals International, Inc. | | | 2,808,050 |
| 29,285 | | Franco-Nevada Corp. | | | 785,720 |
| 10,734 | | Freeport-McMoRan Copper & Gold, Inc. | | | 896,718 |
| 42,000 | | H.B. Fuller Co. (a) | | | 974,820 |
| 85,500 | | International Flavors & Fragrances, Inc. (a) | | | 4,075,785 |
| | | | | |
| Shares | | Security Description | | Value |
| 13,300 | | Kaiser Aluminum Corp. (a) | | $ | 512,981 |
| 33,400 | | Minerals Technologies, Inc. (a) | | | 1,731,456 |
| 17,300 | | Nucor Corp. (a) | | | 785,074 |
| 7,260 | | Potash Corp. of Saskatchewan, Inc. | | | 866,481 |
| 25,700 | | Potlatch Corp. (a) | | | 900,528 |
| 15,300 | | PPG Industries, Inc. (a) | | | 1,000,620 |
| 4,001 | | Rio Tinto PLC, ADR | | | 947,157 |
| 15,500 | | Schnitzer Steel Industries, Inc., Class A (a) | | | 814,215 |
| 17,900 | | Sigma-Aldrich Corp. (a) | | | 960,514 |
| 67,300 | | Southern Copper Corp. (a) | | | 2,131,391 |
| 4,600 | | The Mosaic Co. | | | 279,542 |
| 19,000 | | The Sherwin-Williams Co. (a) | | | 1,285,920 |
| 29,700 | | Valspar Corp. (a) | | | 875,556 |
| | | | | |
| | | | | 26,054,805 |
| | | | | |
| Telecommunication Services - 1.5% | | | |
| 20,400 | | Amdocs, Ltd. (a)(b) | | | 614,244 |
| 27,700 | | American Tower Corp., Class A (a)(b) | | | 1,180,297 |
| 21,800 | | BCE, Inc. (a) | | | 639,830 |
| 13,900 | | Harris Corp. (a) | | | 660,111 |
| 21,100 | | NeuStar, Inc., Class A (a)(b) | | | 531,720 |
| 1,430,000 | | News Corp., Class A | | | 20,606,300 |
| 14,000 | | Plantronics, Inc. (a) | | | 437,920 |
| 22,300 | | United States Cellular Corp. (a)(b) | | | 922,774 |
| 258,000 | | Vodafone Group PLC, ADR (a) | | | 6,008,820 |
| | | | | |
| | | | | 31,602,016 |
| | | | | |
| Utilities - 0.7% | | | |
| 19,100 | | Alliant Energy Corp. (a) | | | 635,266 |
| 70,380 | | Calpine Corp. (b) | | | 836,818 |
| 27,400 | | DPL, Inc. (a) | | | 745,006 |
| 121,250 | | Dynegy, Inc., Class A (b) | | | 152,775 |
| 39,500 | | Edison International (a) | | | 1,349,715 |
| 70,600 | | El Paso Electric Co. (a)(b) | | | 1,454,360 |
| 41,100 | | Energen Corp. (a) | | | 1,912,383 |
| 19,100 | | Entergy Corp. (a) | | | 1,553,785 |
| 10,000 | | Exelon Corp. | | | 438,100 |
| 35,900 | | IDACORP, Inc. | | | 1,242,858 |
| 21,700 | | ITC Holdings Corp. (a) | | | 1,193,500 |
| 55,095 | | Mirant Corp. (a)(b) | | | 598,332 |
| 8,245 | | NRG Energy, Inc. (b) | | | 172,320 |
| 40,000 | | PPL Corp. (a) | | | 1,108,400 |
| 60,000 | | Public Service Enterprise Group, Inc. (a) | | | 1,771,200 |
| 26,839 | | RRI Energy, Inc. (b) | | | 99,036 |
| | | | | |
| | | | | 15,263,854 |
| | | | | |
| Total Common Stock (Cost $686,314,034) | | | 814,711,231 |
| | | | | |
| | | | |
| See Notes to Financial Statements. | | 16 | | ABSOLUTE FUNDS |
ABSOLUTE STRATEGIES FUND
SCHEDULE OF INVESTMENTS
MARCH 31, 2010
| | | | | | | | | | |
| Shares | | Security
Description | | Rate | | | | | Value |
| Preferred Stock - 2.1% | | | | | | | | |
| Consumer Discretionary - 0.8% | | | | | | | | |
| 7,819 | | Callaway Golf Co., Series B (a)(e) | | 7.50 | % | | | | $ | 1,086,841 |
| 1,564 | | Callaway Golf Co., Series B (a) | | 7.50 | | | | | | 217,396 |
| 62,787 | | Ford Motor Co. Capital Trust II (a) | | 6.50 | | | | | | 2,931,368 |
| 323 | | Interpublic Group of Cos., Inc. (a)(e) | | 5.25 | | | | | | 263,326 |
| 11,377 | | Interpublic Group of Cos., Inc., Series B (a) | | 5.25 | | | | | | 10,125,530 |
| 62,259 | | Retail Ventures, Inc. (a) | | 6.63 | | | | | | 2,732,547 |
| | | | | | | | | | |
| | | | | | | | | | 17,357,008 |
| | | | | | | | | | |
| Consumer Staples - 0.0% | | | | | | | | |
| 2,514 | | Bunge, Ltd. (a) | | 5.13 | | | | | | 1,561,194 |
| | | | | | | | | | |
| Energy - 0.3% | | | | | | | | |
| 14,345 | | ATP Oil & Gas Corp. (a)(e) | | 8.00 | | | | | | 1,576,157 |
| 34,618 | | Goodrich Petroleum Corp., Series B (a) | | 5.38 | | | | | | 1,152,779 |
| 2,754 | | SandRidge Energy, Inc. (a) | | 8.50 | | | | | | 326,983 |
| 15,709 | | Whiting Petroleum Corp. (a) | | 6.25 | | | | | | 3,109,125 |
| | | | | | | | | | |
| | | | | | | | | | 6,165,044 |
| | | | | | | | | | |
| Financial - 0.7% | | | | | | | | |
| 87,199 | | 2009 Dole Food Automatic Common Exchange Security Trust (a)(e) | | 7.00 | | | | | | 1,073,638 |
| 118,122 | | Alexandria Real Estate Equities, Inc. REIT, Series D (a) | | 7.00 | | | | | | 2,702,041 |
| 65,428 | | AMG Capital Trust II (a) | | 5.15 | | | | | | 2,314,515 |
| 1,745 | | Bank of America Corp. (a) | | 7.25 | | | | | | 1,706,174 |
| 29,070 | | Hartford Financial Services Group, Inc. (a) | | 7.25 | | | | | | 769,192 |
| 49,398 | | SLM Corp., Series A | | 6.97 | | | | | | 1,894,907 |
| 5,485 | | SLM Corp., Series B (a) | | 7.25 | | | | | | 3,668,423 |
| 1,375 | | Wells Fargo & Co., Series L | | 7.50 | | | | | | 1,343,375 |
| | | | | | | | | | |
| | | | | | | | | | 15,472,265 |
| | | | | | | | | | |
| Healthcare - 0.2% | | | | | | | | |
| 70 | | Healthsouth Corp. (a)(e) | | 6.50 | | | | | | 60,480 |
| 2,528 | | Healthsouth Corp., Series A | | 6.50 | | | | | | 2,184,192 |
| 6,475 | | Inverness Medical Innovations, Inc., Series B (a) | | 3.00 | | | | | | 1,712,638 |
| 29,522 | | Omnicare Capital Trust II, Series B (a) | | 4.00 | | | | | | 1,225,163 |
| | | | | | | | | | |
| | | | | | | | | | 5,182,473 |
| | | | | | | | | | |
| Industrial - 0.1% | | | | | | | | |
| 1,607 | | Kansas City Southern (a) | | 5.13 | | | | | | 2,062,413 |
| | | | | | | | | | |
| Total Preferred Stock (Cost $37,102,587) | | | 47,800,397 |
| | | | | | | | | | |
| Total Equity Securities (Cost $723,416,621) | | | 862,511,628 |
| | | | | | | | | | |
| | | | | | | | | | | |
| Principal | | Security
Description | | Rate | | | Maturity | | Value |
| | Fixed Income Securities - 35.7% | | | | | | |
| | Asset Backed Obligations - 7.2% | | | | | | |
| $ | 4,095,000 | | ACE Securities Corp., Series 2006-HE1 A2D (f) | | 0.55 | % | | 02/25/36 | | $ | 1,688,036 |
| | 148,522 | | Adjustable Rate Mortgage Trust, Series 2005-12 2A1 (a)(f) | | 5.58 | | | 03/25/36 | | | 99,016 |
| | 126,572 | | Adjustable Rate Mortgage Trust, Series 2006-1 3A3 (a)(f) | | 5.79 | | | 03/25/36 | | | 89,041 |
| | 1,392,660 | | Aerco, Ltd., Series 2A A3 (e)(f) | | 0.69 | | | 07/15/25 | | | 821,669 |
| | 228,465 | | Alliance Bancorp Trust, Series 2007-OA1 A1 (f) | | 0.49 | | | 07/25/37 | | | 110,922 |
| | 1,015,000 | | American Airlines Pass Through Trust, Series 2001-02 (a) | | 7.86 | | | 10/01/11 | | | 1,027,688 |
| | 620,695 | | American Airlines Pass Through Trust, Series 2009-1A | | 10.38 | | | 07/02/19 | | | 716,903 |
| | 990,000 | | American Home Mortgage Assets, Series 2007-4 A2 (f) | | 0.44 | | | 08/25/37 | | | 635,240 |
| | 1,055,000 | | Argent Securities, Inc., Series 2005-W5 A2D (f) | | 0.57 | | | 01/25/36 | | | 465,396 |
| | 390,000 | | Asset Backed Funding Certificates, Series 2006-HE1 M2 (f) | | 0.53 | | | 01/25/37 | | | 467 |
| | 1,875,000 | | Asset Backed Funding Certificates, Series 2007-NC1 M2 (e)(f) | | 1.50 | | | 05/25/37 | | | 69,512 |
| | 1,500,000 | | Asset Backed Funding Certificates, Series 2007-WMC1 A2B (f) | | 1.25 | | | 06/25/37 | | | 651,258 |
| | 1,200,000 | | Astoria Depositor Corp. (e) | | 8.14 | | | 05/01/21 | | | 1,170,750 |
| | | | |
| See Notes to Financial Statements. | | 17 | | ABSOLUTE FUNDS |
ABSOLUTE STRATEGIES FUND
SCHEDULE OF INVESTMENTS
MARCH 31, 2010
| | | | | | | | | | | |
| Principal | | Security
Description | | Rate | | | Maturity | | Value |
| $ | 382,282 | | Banc of America Alternative Loan Trust, Series 2005-8 2CB1 (a) | | 6.00 | % | | 09/25/35 | | $ | 284,542 |
| | 114,542 | | Banc of America Funding Corp., Series 2006-E 2A1 (a)(f) | | 5.76 | | | 06/20/36 | | | 74,760 |
| | 423,067 | | Banc of America Funding Corp., Series 2006-F 1A1 (a)(f) | | 5.13 | | | 07/20/36 | | | 361,445 |
| | 295,380 | | Banc of America Funding Corp., Series 2006-H 6A1 (f) | | 0.43 | | | 10/20/36 | | | 155,346 |
| | 620,024 | | Banc of America Funding Corp., Series 2007-8 2A1 | | 7.00 | | | 10/25/37 | | | 421,841 |
| | 225,757 | | Banc of America Funding Corp., Series 2007-E 4A1 (f) | | 5.71 | | | 07/20/47 | | | 146,757 |
| | 110,000 | | Bayview Financial Acquisition Trust, Series 2005-D AF3 (a)(f) | | 5.50 | | | 12/28/35 | | | 92,106 |
| | 357,624 | | Bear Stearns Adjustable Rate Mortgage Trust, Series 2007-5 1A1 (a)(f) | | 5.80 | | | 08/25/47 | | | 223,265 |
| | 1,297,432 | | Bear Stearns Alt-A Trust, Series 2005-4 21A1 (f) | | 3.21 | | | 05/25/35 | | | 871,539 |
| | 285,987 | | Bear Stearns Alt-A Trust, Series 2005-8 11A1 (a)(f) | | 0.52 | | | 10/25/35 | | | 162,817 |
| | 198,160 | | Bear Stearns Alt-A Trust, Series 2006-1 22A1 (f) | | 5.13 | | | 02/25/36 | | | 113,685 |
| | 282,460 | | Bear Stearns Alt-A Trust, Series 2006-2 23A1 (a)(f) | | 5.63 | | | 03/25/36 | | | 129,833 |
| | 2,850,013 | | Bear Stearns Asset Backed Securities Trust, Series 2006-SD4 3A1 (f) | | 1.44 | | | 10/25/36 | | | 1,156,184 |
| | 1,500,000 | | BNC Mortgage Loan Trust, Series 2007-3 A3 (f) | | 0.38 | | | 07/25/37 | | | 793,003 |
| | 528,999 | | BNC Mortgage Loan Trust, Series 2007-4 A3A (f) | | 0.50 | | | 11/25/37 | | | 484,891 |
| | | | | | | | | | | |
| Principal | | Security
Description | | Rate | | | Maturity | | Value |
| $ | 1,300,000 | | Centex Home Equity Loan Trust, Series 2006-A AV4 (f) | | 0.50 | % | | 06/25/36 | | $ | 673,405 |
| | 806,009 | | Centex Home Equity, Series 2005-C AF6 (g) | | 4.64 | | | 06/25/35 | | | 777,823 |
| | 125,000 | | Chase Mortgage Finance Corp., Series 2005-A1 2A3 (a)(f) | | 5.23 | | | 12/25/35 | | | 98,676 |
| | 633,550 | | Chaseflex Trust, Series 2007-1 2A9 (a) | | 6.00 | | | 02/25/37 | | | 422,918 |
| | 1,200,000 | | Citicorp Residential Mortgage Securities, Inc., Series 2006-2 A5 (g) | | 6.04 | | | 09/25/36 | | | 985,171 |
| | 1,400,000 | | Citicorp Residential Mortgage Securities, Inc., Series 2007-1 A5 (g) | | 6.05 | | | 03/25/37 | | | 1,242,294 |
| | 75,000 | | Citigroup Commerical Mortgage Trust, Series 2007-C6 A4 (a)(f) | | 5.70 | | | 12/10/49 | | | 74,824 |
| | 1,462 | | Citigroup Mortgage Loan Trust, Inc., Series 2005-WF1 A2 (a)(f) | | 4.49 | | | 11/25/34 | | | 1,394 |
| | 1,300,000 | | Citigroup Mortgage Loan Trust, Inc., Series 2007-AHL3 A3B (f) | | 0.42 | | | 07/25/45 | | | 529,647 |
| | 415,000 | | Citigroup Mortgage Loan Trust, Inc., Series 2007-AMC2 M1 (f) | | 0.52 | | | 01/25/37 | | | 2,771 |
| | 195,000 | | Citigroup Mortgage Loan Trust, Inc., Series 2007-AMC2 M2 (f) | | 0.54 | | | 01/25/37 | | | 816 |
| | 65,464 | | Citigroup Mortgage Loan Trust, Inc., Series 2007-AMC4 A2A (a)(f) | | 0.31 | | | 05/25/37 | | | 57,670 |
| | 1,010,296 | | Citigroup Mortgage Loan Trust, Inc., Series 2007-AR8 2A1A (f) | | 5.85 | | | 07/25/37 | | | 744,279 |
| | | | |
| See Notes to Financial Statements. | | 18 | | ABSOLUTE FUNDS |
ABSOLUTE STRATEGIES FUND
SCHEDULE OF INVESTMENTS
MARCH 31, 2010
| | | | | | | | | | | |
| Principal | | Security
Description | | Rate | | | Maturity | | Value |
| $ | 3,110,000 | | Citigroup Mortgage Loan Trust, Inc., Series 2007-WFH1 A4 (f) | | 0.45 | % | | 01/25/37 | | $ | 1,299,376 |
| | 1,397,000 | | Citigroup Mortgage Loan Trust, Inc., Series 2007-WFH2 A3 (f) | | 0.43 | | | 03/25/37 | | | 608,576 |
| | 1,250,000 | | Citigroup Mortgage Loan Trust, Inc., Series 2007-WFH2 M1 (f) | | 0.65 | | | 03/25/37 | | | 73,375 |
| | 925,000 | | Citigroup Mortgage Loan Trust, Inc., Series 2007-WFH3 A2 (f) | | 0.41 | | | 06/25/37 | | | 578,194 |
| | 1,000,000 | | Citigroup Mortgage Loan Trust, Inc., Series 2007-WFH3 M2 (f) | | 0.52 | | | 06/25/37 | | | 17,676 |
| | 1,000,000 | | Citigroup Mortgage Loan Trust, Inc., Series 2007-WFH4 A2B (f) | | 1.30 | | | 07/25/37 | | | 488,525 |
| | 285,000 | | Citigroup Mortgage Loan Trust, Inc., Series 2007-WFH4 A2C (a)(f) | | 1.55 | | | 07/25/37 | | | 116,470 |
| | 1,205,000 | | Citigroup/Deutsche Bank Commercial Mortgage Trust, Series 2007-CD4 A4 (a) | | 5.32 | | | 12/11/49 | | | 1,168,599 |
| | 160,000 | | Citigroup/Deutsche Bank Commercial Mortgage Trust, Series 2007-CD5 A4 (a)(f) | | 5.89 | | | 11/15/44 | | | 160,281 |
| | 227,576 | | Citimortgage Alternative Loan Trust, Series 2006-A7 1A12 | | 6.00 | | | 12/25/36 | | | 163,578 |
| | 88,303 | | Citimortgage Alternative Loan Trust, Series 2007-A4 1A6 (a) | | 5.75 | | | 04/25/37 | | | 66,174 |
| | 1,250,000 | | Conseco Finance, Series 2002-C BF1 (f) | | 8.00 | | | 06/15/32 | | | 1,066,980 |
| | 100,000 | | Continental Airlines, Inc., Series 2007-1 A | | 5.98 | | | 04/19/22 | | | 98,250 |
| | | | | | | | | | | |
| Principal | | Security
Description | | Rate | | | Maturity | | Value |
| $ | 832,818 | | Continental Airlines, Inc., Series 2009-1 | | 9.00 | % | | 07/08/16 | | $ | 907,772 |
| | 1,072,424 | | Coso Geothermal Power Holdings (e) | | 7.00 | | | 07/15/26 | | | 1,017,383 |
| | 84,564 | | Countrywide Alternative Loan Trust, Series 2004-J10 4CB1 | | 6.50 | | | 10/25/34 | | | 72,403 |
| | 285,227 | | Countrywide Alternative Loan Trust, Series 2005-43 4A1 (f) | | 5.60 | | | 10/25/35 | | | 202,726 |
| | 108,068 | | Countrywide Alternative Loan Trust, Series 2005-50CB 1A1 (a) | | 5.50 | | | 11/25/35 | | | 78,004 |
| | 434,767 | | Countrywide Alternative Loan Trust, Series 2006-36T2 1A1 (a)(f) | | 0.57 | | | 12/25/36 | | | 210,352 |
| | 78,077 | | Countrywide Alternative Loan Trust, Series 2006-7CB 3A1 (a) | | 5.25 | | | 05/25/21 | | | 54,189 |
| | 2,240,083 | | Countrywide Alternative Loan Trust, Series 2006-OA10 1A1 (f) | | 1.36 | | | 08/25/46 | | | 1,176,219 |
| | 4,810,711 | | Countrywide Alternative Loan Trust, Series 2006-OA22 A1 (f) | | 0.41 | | | 02/25/47 | | | 2,579,167 |
| | 520,748 | | Countrywide Alternative Loan Trust, Series 2007-16CB 4A7 | | 6.00 | | | 08/25/37 | | | 358,239 |
| | 416,344 | | Countrywide Alternative Loan Trust, Series 2007-19 1A34 | | 6.00 | | | 08/25/37 | | | 283,129 |
| | 762,235 | | Countrywide Alternative Loan Trust, Series 2007-OH1 A1A (f) | | 0.34 | | | 04/25/47 | | | 648,990 |
| | 1,740,000 | | Countrywide Asset-Backed Certificates, Series 2007-10 2A2 (f) | | 0.37 | | | 06/25/47 | | | 1,220,483 |
| | 674,061 | | Countrywide Asset-Backed Certificates, Series 2007-13 2A1 (f) | | 1.15 | | | 10/25/47 | | | 451,860 |
| | | | |
| See Notes to Financial Statements. | | 19 | | ABSOLUTE FUNDS |
ABSOLUTE STRATEGIES FUND
SCHEDULE OF INVESTMENTS
MARCH 31, 2010
| | | | | | | | | | | |
| Principal | | Security
Description | | Rate | | | Maturity | | Value |
| $ | 1,027,000 | | Countrywide Asset-Backed Certificates, Series 2007-7 2A2 (f) | | 0.41 | % | | 10/25/47 | | $ | 827,174 |
| | 101,130 | | Countrywide Asset-Backed Certificates, Series 2007-9 2A1 (a)(f) | | 0.31 | | | 06/25/47 | | | 92,275 |
| | 1,835,183 | | Countrywide Home Loan Mortgage Pass Through Trust, Series 2004-HYB5 3A1 (f) | | 3.48 | | | 04/20/35 | | | 1,296,572 |
| | 1,067,499 | | Countrywide Home Loan Mortgage Pass Through Trust, Series 2007-HY3 2A1 (a)(f) | | 5.49 | | | 06/25/47 | | | 760,797 |
| | 534,427 | | Countrywide Home Loan Mortgage Pass Through Trust, Series 2007-HY3 4A1 (a)(f) | | 5.93 | | | 06/25/47 | | | 437,382 |
| | 145,802 | | Countrywide Home Loan Mortgage Pass Through Trust, Series 2007-HY5 1A1 (a)(f) | | 5.85 | | | 09/25/47 | | | 107,450 |
| | 661,559 | | Countrywide Home Loan Mortgage Pass Through Trust, Series 2007-HYB2 3A1 (a)(f) | | 5.27 | | | 02/25/47 | | | 392,612 |
| | 1,455,000 | | Credit - Based Asset Servicing and Securitization, LLC, Series 2006-CB4 AV3 (f) | | 0.40 | | | 05/25/36 | | | 782,009 |
| | 1,600,000 | | Credit - Based Asset Servicing and Securitization, LLC, Series 2006-CB8 A2B (f) | | 0.36 | | | 10/25/36 | | | 1,311,696 |
| | 1,600,000 | | Credit - Based Asset Servicing and Securitization, LLC, Series 2006-CB8 M2 (f) | | 0.55 | | | 10/25/36 | | | 10,683 |
| | 564,000 | | Credit - Based Asset Servicing and Securitization, LLC, Series 2006-CB9 A2 (f) | | 0.36 | | | 11/25/36 | | | 220,305 |
| | | | | | | | | | | |
| Principal | | Security
Description | | Rate | | | Maturity | | Value |
| $ | 845,000 | | Credit - Based Asset Servicing and Securitization, LLC, Series 2006-CB9 A4 (f) | | 0.48 | % | | 11/25/36 | | $ | 297,846 |
| | 1,563,000 | | Credit - Based Asset Servicing and Securitization, LLC, Series 2007-CB4 M1 (f) | | 0.57 | | | 04/25/37 | | | 16,574 |
| | 1,500,000 | | Credit - Based Asset Servicing and Securitization, LLC, Series 2007-CB5 A3 (f) | | 0.50 | | | 04/25/37 | | | 592,721 |
| | 31,276 | | Credit Suisse First Boston Mortgage Securities Corp., Series 2003-AR24 2A4 (f) | | 3.05 | | | 10/25/33 | | | 26,127 |
| | 1,312,183 | | Credit Suisse Mortgage Capital Certificates, Series 2006-6 2A1 (a)(f) | | 0.85 | | | 07/25/36 | | | 566,541 |
| | 324,030 | | Credit Suisse Mortgage Capital Certificates, Series 2006-8 3A1 (a) | | 6.00 | | | 10/25/21 | | | 240,812 |
| | 1,930,000 | | Credit Suisse Mortgage Capital Certificates, Series 2006-C5 A3 (a) | | 5.31 | | | 12/15/39 | | | 1,825,259 |
| | 200,000 | | CS First Boston Mortgage Securities Corp., Series 2005-C5 A3 (a)(f) | | 5.10 | | | 08/15/38 | | | 208,499 |
| | 1,300,000 | | CW Capital Cobalt, Ltd., Series 2006-C1 A4 | | 5.22 | | | 08/15/48 | | | 1,243,426 |
| | 550,000 | | Delta Air Lines, Inc., Series 2000-A2 | | 7.57 | | | 11/18/10 | | | 566,500 |
| | 359,571 | | Deutsche ALT-A Securities Inc Alternate Loan Trust, Series 2006-AB2 A5B (g) | | 6.09 | | | 06/25/36 | | | 199,557 |
| | 1,447,199 | | Deutsche ALT-A Securities, Inc. Alternate Loan Trust, Series 2007-AR1 A4 (f) | | 0.41 | | | 01/25/47 | | | 480,354 |
| | | | |
| See Notes to Financial Statements. | | 20 | | ABSOLUTE FUNDS |
ABSOLUTE STRATEGIES FUND
SCHEDULE OF INVESTMENTS
MARCH 31, 2010
| | | | | | | | | | | |
| Principal | | Security
Description | | Rate | | | Maturity | | Value |
| $ | 2,174,555 | | Deutsche ALT-A Securities, Inc. Alternate Loan Trust, Series 2007-OA2 A1 (f) | | 1.02 | % | | 04/25/47 | | $ | 1,221,992 |
| | 325,968 | | Dynegy Roseton/Danskammer Pass Through Trust, Series A (a) | | 7.27 | | | 11/08/10 | | | 327,190 |
| | 995,000 | | Dynegy Roseton/Danskammer Pass Through Trust, Series B (a) | | 7.67 | | | 11/08/16 | | | 967,021 |
| | 4,500,000 | | Ellington Loan Acquisition Trust, Series 2007-2 A2C (e)(f) | | 1.35 | | | 05/25/37 | | | 2,229,663 |
| | 1,200,000 | | Equifirst Loan Securitization Trust, Series 2007-1 A2B (f) | | 0.44 | | | 04/25/37 | | | 611,883 |
| | 77,935 | | Equity One ABS, Inc., Series 2002-4 M1 (a)(f) | | 5.22 | | | 02/25/33 | | | 56,967 |
| | 2,800,000 | | First Franklin Mortgage Loan Asset Backed Certificates, Series 2006-FF11 2A3 (f) | | 0.40 | | | 08/25/36 | | | 1,239,349 |
| | 2,500,000 | | First Franklin Mortgage Loan Asset Backed Certificates, Series 2006-FF18 M1 (a)(f) | | 0.48 | | | 12/25/37 | | | 8,756 |
| | 930,000 | | First Franklin Mortgage Loan Asset Backed Certificates, Series 2007-FF1 A2C (f) | | 0.39 | | | 01/25/38 | | | 414,406 |
| | 1,326,451 | | First Horizon Alternative Mortgage Securities, Series 2005-AA3 2A1 (f) | | 2.64 | | | 05/25/35 | | | 923,567 |
| | 804,689 | | First Horizon Alternative Mortgage Securities, Series 2006-AA2 2A1 (a)(f) | | 6.08 | | | 05/25/36 | | | 411,223 |
| | | | | | | | | | | |
| Principal | | Security
Description | | Rate | | | Maturity | | Value |
| $ | 721,222 | | First Horizon Alternative Mortgage Securities, Series 2006-FA8 1A1 | | 6.25 | % | | 02/25/37 | | $ | 510,465 |
| | 217,922 | | First Horizon Alternative Mortgage Securities, Series 2006-FA8 1A8 (a)(f) | | 0.62 | | | 02/25/37 | | | 107,564 |
| | 1,130,000 | | First Horizon Mortgage Pass-Through Trust, Series 2005-AR6 2A1B (a)(f) | | 5.53 | | | 01/25/36 | | | 766,483 |
| | 351,204 | | FPL Energy National Wind Portfolio, LLC (a)(e) | | 6.13 | | | 03/25/19 | | | 338,479 |
| | 272,435 | | FPL Energy Wind Funding, LLC (a)(e) | | 6.88 | | | 06/27/17 | | | 266,305 |
| | 200,000 | | GE Capital Commercial Mortgage Corp., Series 2006-C1 A3 (a)(f) | | 5.33 | | | 03/10/44 | | | 209,724 |
| | 370,989 | | Green Tree Home Improvement Loan Trust, Series 1997-D HEB1 | | 7.41 | | | 09/15/28 | | | 365,581 |
| | 1,305,000 | | Greenwich Capital Commercial Funding Corp., Series 2006-GG7 A4 (f) | | 5.89 | | | 07/10/38 | | | 1,332,525 |
| | 180,000 | | Greenwich Capital Commercial Funding Corp., Series 2007-GG9 A4 (a) | | 5.44 | | | 03/10/39 | | | 175,375 |
| | 1,015,346 | | GSAA Home Equity Trust, Series 2005-12 AF3 (f) | | 5.07 | | | 09/25/35 | | | 827,151 |
| | 1,630,000 | | GSAA Home Equity Trust, Series 2005-7 AF3 (f) | | 4.75 | | | 05/25/35 | | | 1,291,228 |
| | 1,500,000 | | GSAA Home Equity Trust, Series 2006-9 A4A (f) | | 0.49 | | | 06/25/36 | | | 660,250 |
| | 2,503,163 | | GSAA Home Equity Trust, Series 2007-3 1A1B (f) | | 0.35 | | | 03/25/47 | | | 199,278 |
| | 1,650,000 | | GSAA Home Equity Trust, Series 2007-5 2A3A (f) | | 0.57 | | | 04/25/47 | | | 837,870 |
| | | | |
| See Notes to Financial Statements. | | 21 | | ABSOLUTE FUNDS |
ABSOLUTE STRATEGIES FUND
SCHEDULE OF INVESTMENTS
MARCH 31, 2010
| | | | | | | | | | | |
| Principal | | Security
Description | | Rate | | | Maturity | | Value |
| $ | 568,346 | | GSR Mortgage Loan Trust, Series 2004-14 3A2 (f) | | 3.51 | % | | 12/25/34 | | $ | 379,131 |
| | 1,525,000 | | GSR Mortgage Loan Trust, Series 2004-9 5A7 (a)(f) | | 3.89 | | | 08/25/34 | | | 1,279,746 |
| | 389,047 | | GSR Mortgage Loan Trust, Series 2005-AR5 1A1 (f) | | 3.55 | | | 10/25/35 | | | 262,848 |
| | 22,244 | | Harborview Mortgage Loan Trust, Series 2004-8 2A4A (a)(f) | | 0.64 | | | 11/19/34 | | | 13,659 |
| | 230,843 | | Harborview Mortgage Loan Trust, Series 2006-3 2A1A (a)(f) | | 6.34 | | | 06/19/36 | | | 143,553 |
| | 2,082,845 | | Harborview Mortgage Loan Trust, Series 2007-5 A1A (f) | | 0.43 | | | 09/19/37 | | | 1,089,750 |
| | 313,255 | | Homebanc Mortgage Trust, Series 2004-1 2A (f) | | 1.11 | | | 08/25/29 | | | 195,700 |
| | 364,960 | | HSBC Asset Loan Obligation, Series 2007-AR2 2A1 (a)(f) | | 5.84 | | | 09/25/37 | | | 255,546 |
| | 900,000 | | HSBC Home Equity Loan Asset Backed Certificates, Series 2006-3 A4 (f) | | 0.48 | | | 03/20/36 | | | 693,802 |
| | 79,899 | | HSBC Home Equity Loan Asset Backed Certificates, Series 2006-4 A2F (a)(g) | | 5.32 | | | 03/20/36 | | | 79,742 |
| | 800,000 | | HSBC Home Equity Loan Asset Backed Certificates, Series 2006-4 A3V (f) | | 0.39 | | | 03/20/36 | | | 736,553 |
| | 625,000 | | HSBC Home Equity Loan Asset Backed Certificates, Series 2007-1 M1 (f) | | 0.62 | | | 03/20/36 | | | 264,488 |
| | 2,200,000 | | HSBC Home Equity Loan Asset Backed Certificates, Series 2007-1 M2 (f) | | 0.72 | | | 03/20/36 | | | 507,782 |
| | 1,300,000 | | HSBC Home Equity Loan Asset Backed Certificates, Series 2007-2 M1 (a)(f) | | 0.55 | | | 07/20/36 | | | 505,868 |
| | | | | | | | | | | |
| Principal | | Security
Description | | Rate | | | Maturity | | Value |
| $ | 1,000,000 | | HSBC Home Equity Loan Asset Backed Certificates, Series 2007-2 M2 (f) | | 0.61 | % | | 07/20/36 | | $ | 231,182 |
| | 731,731 | | HSBC Home Equity Loan Asset Backed Certificates, Series 2007-3 APT (a)(f) | | 1.44 | | | 11/20/36 | | | 663,883 |
| | 1,390,000 | | HSBC Home Equity Loan Asset Backed Certificates, Series 2007-3 M1 (f) | | 2.49 | | | 11/20/36 | | | 716,464 |
| | 1,540,000 | | Indiantown Cogeneration LP, Series A-10 (a) | | 9.77 | | | 12/15/20 | | | 1,662,330 |
| | 122,364 | | Indymac INDA Mortgage Loan Trust, Series 2006-AR1 A1 (a)(f) | | 5.85 | | | 08/25/36 | | | 119,362 |
| | 370,025 | | Indymac INDA Mortgage Loan Trust, Series 2007-AR7 1A1 (a)(f) | | 6.14 | | | 11/25/37 | | | 271,983 |
| | 877,231 | | Indymac Index Mortgage Loan Trust, Series 2004-AR7 A2 (f) | | 1.11 | | | 09/25/34 | | | 506,681 |
| | 506,342 | | Indymac Index Mortgage Loan Trust, Series 2005-AR5 1A1 (a)(f) | | 3.19 | | | 05/25/35 | | | 271,853 |
| | 1,526,701 | | Indymac Index Mortgage Loan Trust, Series 2006-AR19 1A2 (a)(f) | | 5.85 | | | 08/25/36 | | | 761,864 |
| | 129,835 | | Indymac Index Mortgage Loan Trust, Series 2006-AR25 3A1 (a)(f) | | 5.81 | | | 09/25/36 | | | 75,468 |
| | 269,886 | | Indymac Index Mortgage Loan Trust, Series 2006-AR29 A1 (a)(f) | | 0.42 | | | 11/25/36 | | | 142,829 |
| | 609,352 | | Indymac Index Mortgage Loan Trust, Series 2006-AR3 2A1A (a)(f) | | 5.88 | | | 03/25/36 | | | 353,768 |
| | 1,069,010 | | Indymac Index Mortgage Loan Trust, Series 2006-AR7 1A1 (f) | | 3.62 | | | 05/25/36 | | | 506,205 |
| | | | |
| See Notes to Financial Statements. | | 22 | | ABSOLUTE FUNDS |
ABSOLUTE STRATEGIES FUND
SCHEDULE OF INVESTMENTS
MARCH 31, 2010
| | | | | | | | | | | |
| Principal | | Security
Description | | Rate | | | Maturity | | Value |
| $ | 628,550 | | Indymac Index Mortgage Loan Trust, Series 2006-AR7 4A1 (a)(f) | | 5.84 | % | | 05/25/36 | | $ | 347,821 |
| | 450,000 | | Indymac Index Mortgage Loan Trust, Series 2006-R1 A3 (a)(f) | | 5.46 | | | 12/25/35 | | | 169,480 |
| | 1,126,672 | | Indymac Index Mortgage Loan Trust, Series 2007-AR5 1A1 (f) | | 5.55 | | | 05/25/37 | | | 617,573 |
| | 1,350,000 | | Indymac Residential Asset Backed Trust, Series 2007-A 2A4A (f) | | 0.57 | | | 04/25/47 | | | 541,937 |
| | 1,551,968 | | JetBlue Airways Pass Through Trust, Series 2004-2 G1 (f) | | 0.63 | | | 08/15/16 | | | 1,288,133 |
| | 1,835,000 | | JP Morgan Alternative Loan Trust, Series 2006-A4 A7 (f) | | 6.30 | | | 09/25/36 | | | 913,409 |
| | 1,240,000 | | JP Morgan Alternative Loan Trust, Series 2006-A6 2A5 (f) | | 6.05 | | | 11/25/36 | | | 800,754 |
| | 417,299 | | JP Morgan Alternative Loan Trust, Series 2007-A2 12A2 (f) | | 0.35 | | | 06/25/37 | | | 372,443 |
| | 165,000 | | JP Morgan Chase Commercial Mortgage Securities Corp., Series 2006-LDP7 A4 (a)(f) | | 5.87 | | | 04/15/45 | | | 170,605 |
| | 1,870,000 | | JP Morgan Chase Commercial Mortgage Securities Corp., Series 2007-CB18 A4 | | 5.44 | | | 06/12/47 | | | 1,831,050 |
| | 1,175,000 | | JP Morgan Chase Commercial Mortgage Securities Corp., Series 2007-CB19 A4 (a)(f) | | 5.75 | | | 02/12/49 | | | 1,169,954 |
| | 2,615,000 | | JP Morgan Chase Commercial Mortgage Securities Corp., Series 2007-LD12 A4 (a)(f) | | 5.88 | | | 02/15/51 | | | 2,561,746 |
| | | | | | | | | | | |
| Principal | | Security
Description | | Rate | | | Maturity | | Value |
| $ | 2,005,000 | | JP Morgan Chase Commercial Mortgage Securities Corp., Series 2007-LDPX A3 (a) | | 5.42 | % | | 01/15/49 | | $ | 1,935,229 |
| | 1,380,000 | | JP Morgan Mortgage Acquisition Corp., Series 2006-CH1 A4 (f) | | 0.39 | | | 07/25/36 | | | 969,968 |
| | 3,450,135 | | JP Morgan Mortgage Acquisition Corp., Series 2006-HE1 A4 (a)(f) | | 0.52 | | | 01/25/36 | | | 1,353,091 |
| | 4,065,000 | | JP Morgan Mortgage Acquisition Corp., Series 2007-CH3 A4 (a)(f) | | 0.46 | | | 03/25/37 | | | 1,619,850 |
| | 1,200,000 | | JP Morgan Mortgage Acquisition Corp., Series 2007-CH4 A3 (f) | | 0.36 | | | 05/25/37 | | | 704,087 |
| | 1,610,000 | | JP Morgan Mortgage Acquisition Corp., Series 2007-CH5 A3 (a)(f) | | 0.36 | | | 05/25/37 | | | 853,653 |
| | 2,813,000 | | JP Morgan Mortgage Acquisition Corp., Series 2007-HE1 AV4 (f) | | 0.53 | | | 03/25/47 | | | 1,105,935 |
| | 120,000 | | JP Morgan Mortgage Trust, Series 2005-A3 11A2 (f) | | 4.50 | | | 06/25/35 | | | 89,782 |
| | 1,032,686 | | JP Morgan Mortgage Trust, Series 2005-A5 TA1 (f) | | 5.43 | | | 08/25/35 | | | 968,317 |
| | 200,000 | | JP Morgan Mortgage Trust, Series 2006-A2 2A2 (f) | | 5.76 | | | 04/25/36 | | | 159,733 |
| | 2,500,000 | | JP Morgan Mortgage Trust, Series 2006-A2 2A4 (a)(f) | | 5.76 | | | 04/25/36 | | | 2,038,037 |
| | | | |
| See Notes to Financial Statements. | | 23 | | ABSOLUTE FUNDS |
ABSOLUTE STRATEGIES FUND
SCHEDULE OF INVESTMENTS
MARCH 31, 2010
| | | | | | | | | | | |
| Principal | | Security
Description | | Rate | | | Maturity | | Value |
| $ | 245,427 | | JP Morgan Mortgage Trust, Series 2007-A2 4A1M (a)(f) | | 5.74 | % | | 04/25/37 | | $ | 203,105 |
| | 330,000 | | LB-UBS Commercial Mortgage Trust, Series 2003-C8 A4 (a)(f) | | 5.12 | | | 11/15/32 | | | 347,636 |
| | 296,765 | | Lehman XS Trust, Series 2005-6 1A1 (f) | | 0.51 | | | 11/25/35 | | | 154,168 |
| | 1,853,769 | | Lehman XS Trust, Series 2006-14N 3A2 (a)(f) | | 0.37 | | | 08/25/36 | | | 826,491 |
| | 2,250,000 | | Lehman XS Trust, Series 2007-12N 1A3A (f) | | 0.45 | | | 07/25/47 | | | 493,904 |
| | 1,108,409 | | Lehman XS Trust, Series 2007-16N 2A2 (a)(f) | | 1.10 | | | 09/25/47 | | | 602,053 |
| | 1,700,000 | | Master Adjustable Rate Mortgage Trust, Series 2004-13 3A7 (f) | | 3.10 | | | 11/21/34 | | | 1,500,434 |
| | 395,307 | | Master Adjustable Rate Mortgage Trust, Series 2007-R5 A1 (e)(f) | | 5.59 | | | 11/25/35 | | | 221,924 |
| | 1,250,000 | | Master Asset Backed Securities Trust, Series 2006-AM3 A4 (f) | | 0.49 | | | 10/25/36 | | | 444,948 |
| | 885,000 | | Master Asset Backed Securities Trust, Series 2007-HE1 A3 (f) | | 0.46 | | | 05/25/37 | | | 399,953 |
| | 26,458 | | Master Seasoned Securities Trust, Series 2004-1 4A1 (a)(f) | | 3.51 | | | 10/25/32 | | | 19,811 |
| | 1,300,000 | | Merrill Lynch First Franklin Mortgage Loan Trust, Series 2007-1 A2C (f) | | 0.50 | | | 04/25/37 | | | 557,866 |
| | 1,688,600 | | Merrill Lynch First Franklin Mortgage Loan Trust, Series 2007-3 A2C (a)(f) | | 0.43 | | | 06/25/37 | | | 659,873 |
| | 2,000,000 | | Merrill Lynch First Franklin Mortgage Loan Trust, Series 2007-3 A2D (f) | | 0.50 | | | 06/25/37 | | | 789,417 |
| | | | | | | | | | | |
| Principal | | Security
Description | | Rate | | | Maturity | | Value |
| $ | 3,131,000 | | Merrill Lynch First Franklin Mortgage Loan Trust, Series 2007-4 2A4 (f) | | 0.50 | % | | 07/25/37 | | $ | 1,262,879 |
| | 1,150,000 | | Merrill Lynch/Countrywide Commercial Mortgage Trust, Series 2006-4 A3 (f) | | 5.17 | | | 12/12/49 | | | 1,114,667 |
| | 2,560,000 | | Merrill Lynch/Countrywide Commercial Mortgage Trust, Series 2007-7 A4 (f) | | 5.75 | | | 06/12/50 | | | 2,351,942 |
| | 702,182 | | Mid-State Trust, Series 2006-1A (e) | | 5.79 | | | 10/15/40 | | | 699,451 |
| | 913,918 | | Midwest Generation, LLC, Series B | | 8.56 | | | 01/02/16 | | | 935,669 |
| | 4,135,000 | | Morgan Stanley ABS Capital Inc., Series 2006-HE3 A2D (f) | | 0.50 | | | 04/25/36 | | | 1,492,165 |
| | 4,000,000 | | Morgan Stanley ABS Capital Inc., Series 2006-NC2 A2D (f) | | 0.54 | | | 02/25/36 | | | 1,510,502 |
| | 890,000 | | Morgan Stanley Capital Inc., Series 2006-T21 A4 (a)(f) | | 5.16 | | | 10/12/52 | | | 912,173 |
| | 1,365,000 | | Morgan Stanley Capital Inc., Series 2007-IQ16 A4 | | 5.81 | | | 12/12/49 | | | 1,345,108 |
| | 2,025,577 | | Morgan Stanley Mortgage Loan Trust, Series 2006-11 1A3 (g) | | 6.42 | | | 08/25/36 | | | 1,176,642 |
| | 700,000 | | Morgan Stanley Mortgage Loan Trust, Series 2006-7 5A2 (f) | | 5.96 | | | 06/25/36 | | | 412,015 |
| | 349,294 | | Morgan Stanley Mortgage Loan Trust, Series 2007-13 6A1 (a) | | 6.00 | | | 10/25/37 | | | 249,460 |
| | 165,000 | | Nationstar Home Equity Loan Trust, Series 2006-B AV3 (a)(f) | | 0.42 | | | 09/25/36 | | | 119,862 |
| | 2,700,000 | | Nationstar Home Equity Loan Trust, Series 2006-B AV4 (f) | | 0.53 | | | 09/25/36 | | | 1,268,620 |
| | | | |
| See Notes to Financial Statements. | | 24 | | ABSOLUTE FUNDS |
ABSOLUTE STRATEGIES FUND
SCHEDULE OF INVESTMENTS
MARCH 31, 2010
| | | | | | | | | | | |
| Principal | | Security
Description | | Rate | | | Maturity | | Value |
| $ | 2,300,000 | | Nationstar Home Equity Loan Trust, Series 2007-A AV3 (f) | | 0.40 | % | | 03/25/37 | | $ | 957,674 |
| | 1,130,000 | | Nationstar Home Equity Loan Trust, Series 2007-C 2AV2 (a)(f) | | 0.38 | | | 06/25/37 | | | 810,922 |
| | 1,100,000 | | Newcastle Mortgage Securities Trust, Series 2007-1 2A4 (f) | | 0.59 | | | 04/25/37 | | | 361,825 |
| | 641,389 | | Nomura Asset Acceptance Corp., Series 2007-1 1A1A (g) | | 6.00 | | | 03/25/47 | | | 385,291 |
| | 100,000 | | Northwest Airlines, Inc., Series 1A-2 | | 6.84 | | | 04/01/11 | | | 100,750 |
| | 638,196 | | Opteum Mortgage Acceptance Corp., Series 2005-5 2A1B (f) | | 5.64 | | | 12/25/35 | | | 525,508 |
| | 1,217,699 | | Opteum Mortgage Acceptance Corp., Series 2006-2 A1C (f) | | 0.52 | | | 07/25/36 | | | 530,606 |
| | 1,355,713 | | Option One Mortgage Loan Trust, Series 2006-3 2A2 (f) | | 0.35 | | | 02/25/37 | | | 873,671 |
| | 1,620,000 | | Option One Mortgage Loan Trust, Series 2007-4 2A3 (f) | | 0.49 | | | 04/25/37 | | | 588,408 |
| | 2,750,000 | | Option One Mortgage Loan Trust, Series 2007-5 2A4 (f) | | 0.55 | | | 05/25/37 | | | 911,161 |
| | 1,335,000 | | Option One Mortgage Loan Trust, Series 2007-6 2A3 (f) | | 0.43 | | | 07/25/37 | | | 549,078 |
| | 750,000 | | Option One Mortgage Loan Trust, Series 2007-6 2A4 (f) | | 0.50 | | | 07/25/37 | | | 308,127 |
| | 1,020,000 | | Popular ABS Mortgage Pass-Through Trust, Series 2005-6 A5 (g) | | 6.09 | | | 01/25/36 | | | 569,005 |
| | 1,745,000 | | Popular ABS Mortgage Pass-Through Trust, Series 2007-A A3 (a)(f) | | 0.56 | | | 06/25/47 | | | 726,373 |
| | 1,030,000 | | Prudential Holdings, LLC (a)(e) | | 8.70 | | | 12/18/23 | | | 1,189,065 |
| | | | | | | | | | | |
| Principal | | Security
Description | | Rate | | | Maturity | | Value |
| $ | 1,164,019 | | Reliant Energy Mid-Atlantic Power Holdings, LLC, Series B (a) | | 9.24 | % | | 07/02/17 | | $ | 1,245,500 |
| | 642,898 | | Residential Accredit Loans, Inc., Series 2005-QA12 NB4 (a)(f) | | 5.75 | | | 12/25/35 | | | 374,800 |
| | 936,488 | | Residential Accredit Loans, Inc., Series 2005-QO3 A1 (f) | | 0.65 | | | 10/25/45 | | | 506,319 |
| | 914,981 | | Residential Accredit Loans, Inc., Series 2005-QO5 A1 (a)(f) | | 1.46 | | | 01/25/46 | | | 511,730 |
| | 577,148 | | Residential Accredit Loans, Inc., Series 2006-QS12 2A18 (a) | | 5.75 | | | 09/25/36 | | | 403,676 |
| | 429,880 | | Residential Accredit Loans, Inc., Series 2006-QS17 A4 | | 6.00 | | | 12/25/36 | | | 263,058 |
| | 659,302 | | Residential Accredit Loans, Inc., Series 2006-QS7 A1 (a) | | 6.00 | | | 06/25/36 | | | 357,224 |
| | 281,814 | | Residential Accredit Loans, Inc., Series 2007-QS5- A1 | | 5.50 | | | 03/25/37 | | | 170,638 |
| | 595,253 | | Residential Accredit Loans, Inc., Series 2007-QS8 A10 | | 6.00 | | | 06/25/37 | | | 387,513 |
| | 570,856 | | Residential Asset Mortgage Products, Inc., Series 2004-SL3 A4 | | 8.50 | | | 12/25/31 | | | 567,255 |
| | 676,337 | | Residential Asset Securitization Trust, Series 2006-A10 A5 | | 6.50 | | | 09/25/36 | | | 363,257 |
| | 1,615,000 | | Saxon Asset Securities Trust, Series 2006-3 A3 (f) | | 0.42 | | | 10/25/46 | | | 701,306 |
| | 1,365,000 | | Saxon Asset Securities Trust, Series 2007-1 A2C (f) | | 0.40 | | | 01/25/47 | | | 736,124 |
| | 250,000 | | Securitized Asset Backed Receivables, LLC Trust, Series 2007-NC1 A2B (a)(f) | | 0.40 | | | 12/25/36 | | | 95,844 |
| | | | |
| See Notes to Financial Statements. | | 25 | | ABSOLUTE FUNDS |
ABSOLUTE STRATEGIES FUND
SCHEDULE OF INVESTMENTS
MARCH 31, 2010
| | | | | | | | | | | |
| Principal | | Security
Description | | Rate | | | Maturity | | Value |
| $ | 2,260,000 | | Securitized Asset Backed Receivables, LLC Trust, Series 2007-NC2 A2B (f) | | 0.39 | % | | 01/25/37 | | $ | 924,362 |
| | 349,879 | | Soundview Home Equity Loan Trust, Series 2006-EQ1 A2 (f) | | 0.36 | | | 10/25/36 | | | 341,709 |
| | 1,930,000 | | Soundview Home Equity Loan Trust, Series 2006-EQ1 A3 (f) | | 0.41 | | | 10/25/36 | | | 1,000,350 |
| | 1,200,000 | | Soundview Home Equity Loan Trust, Series 2006-OPT1 2A4 (f) | | 0.52 | | | 03/25/36 | | | 624,819 |
| | 1,350,000 | | Soundview Home Equity Loan Trust, Series 2006-OPT5 2A4 (f) | | 0.49 | | | 07/25/36 | | | 514,412 |
| | 1,200,000 | | Soundview Home Equity Loan Trust, Series 2007-NS1 A4 (f) | | 0.55 | | | 01/25/37 | | | 479,271 |
| | 2,254,000 | | Soundview Home Equity Loan Trust, Series 2007-OPT1 2A2 (f) | | 0.40 | | | 06/25/37 | | | 967,760 |
| | 3,349,000 | | Soundview Home Equity Loan Trust, Series 2007-OPT2 2A4 (f) | | 0.50 | | | 07/25/37 | | | 1,254,325 |
| | 120,000 | | Soundview Home Equity Loan Trust, Series 2007-OPT2 M2 (f) | | 0.52 | | | 07/25/37 | | | 2,788 |
| | 500,000 | | Soundview Home Equity Loan Trust, Series 2007-OPT5 M2 (e)(f) | | 2.40 | | | 10/25/37 | | | 53,321 |
| | 646,193 | | Structured Adjustable Rate Mortgage Loan Trust, Series 2006-1 7A3 (a)(f) | | 5.62 | | | 02/25/36 | | | 456,392 |
| | 775,000 | | Structured Adjustable Rate Mortgage Loan Trust, Series 2006-1 7A4 (f) | | 5.62 | | | 02/25/36 | | | 453,716 |
| | | | | | | | | | | |
| Principal | | Security
Description | | Rate | | | Maturity | | Value |
| $ | 116,470 | | Structured Adjustable Rate Mortgage Loan Trust, Series 2007-3 3A1 (a)(f) | | 5.67 | % | | 04/25/47 | | $ | 75,762 |
| | 2,389,628 | | Structured Asset Mortgage Investments, Inc., Series 2006-AR8 A1A (f) | | 0.45 | | | 10/25/36 | | | 1,334,718 |
| | 2,048,638 | | Structured Asset Mortgage Investments, Inc., Series 2007-AR3 2A1 (f) | | 0.44 | | | 09/25/47 | | | 1,176,676 |
| | 4,300,750 | | Structured Asset Mortgage Investments, Inc., Series 2007-AR6 A1 (f) | | 1.96 | | | 08/25/47 | | | 2,436,680 |
| | 1,850,000 | | Structured Asset Securities Corp., Series 2007-BC3 2A2 (a)(f) | | 0.39 | | | 05/25/47 | | | 1,156,722 |
| | 14,252,872 | | The FINOVA Group, Inc. (h) | | 7.50 | | | 11/15/09 | | | 61,287 |
| | 1,108,724 | | Thornburg Mortgage Securities Trust, Series 2007-3 3A1 (f) | | 0.47 | | | 06/25/47 | | | 920,783 |
| | 900,000 | | UAL Pass Through Trust, Series 2009-1 | | 10.40 | | | 11/01/16 | | | 974,250 |
| | 330,000 | | Wachovia Bank Commercial Mortgage Trust, Series 2003-C6 A4 (a)(f) | | 5.13 | | | 08/15/35 | | | 347,998 |
| | 85,000 | | Wachovia Bank Commercial Mortgage Trust, Series 2006-C28 A4 (a) | | 5.57 | | | 10/15/48 | | | 83,738 |
| | 19,522 | | WaMu Mortgage Pass Through Certificates, Series 2002-AR18 A (a)(f) | | 2.77 | | | 01/25/33 | | | 18,016 |
| | 242,164 | | WaMu Mortgage Pass Through Certificates, Series 2005-AR14 1A1 (a)(f) | | 5.05 | | | 12/25/35 | | | 230,279 |
| | | | |
| See Notes to Financial Statements. | | 26 | | ABSOLUTE FUNDS |
ABSOLUTE STRATEGIES FUND
SCHEDULE OF INVESTMENTS
MARCH 31, 2010
| | | | | | | | | | | |
| Principal | | Security
Description | | Rate | | | Maturity | | Value |
| $ | 115,000 | | WaMu Mortgage Pass Through Certificates, Series 2005-AR16 1A4A (a)(f) | | 5.08 | % | | 12/25/35 | | $ | 91,341 |
| | 466,988 | | WaMu Mortgage Pass Through Certificates, Series 2006-AR12 2A3 (a)(f) | | 5.73 | | | 10/25/36 | | | 358,883 |
| | 284,484 | | WaMu Mortgage Pass Through Certificates, Series 2006-AR16 1A1 (a)(f) | | 5.57 | | | 12/25/36 | | | 205,387 |
| | 563,842 | | WaMu Mortgage Pass Through Certificates, Series 2007-HY3 4A1 (a)(f) | | 5.31 | | | 03/25/37 | | | 483,755 |
| | 826,475 | | WaMu Mortgage Pass Through Certificates, Series 2007-HY4 1A1 (f) | | 5.45 | | | 04/25/37 | | | 590,875 |
| | 1,882,206 | | WaMu Mortgage Pass Through Certificates, Series 2007-OA1 A1A (a)(f) | | 1.17 | | | 02/25/47 | | | 957,046 |
| | 983,553 | | WaMu Mortgage Pass Through Certificates, Series 2007-OA4 1A (a)(f) | | 1.23 | | | 05/25/47 | | | 553,569 |
| | 1,945,393 | | WaMu Mortgage Pass Through Certificates, Series 2007-OA6 1A (f) | | 1.27 | | | 07/25/47 | | | 1,150,646 |
| | 870,957 | | Washington Mutual Alternative Mortgage Pass-Through Certificates, Series 2005-3 2A3 (f) | | 0.80 | | | 05/25/35 | | | 591,466 |
| | 626,222 | | Washington Mutual Alternative Mortgage Pass-Through Certificates, Series 2005-4 CB13 (f) | | 0.75 | | | 06/25/35 | | | 423,175 |
| | 1,674,849 | | Washington Mutual Alternative Mortgage Pass-Through Certificates, Series 2006-1 4CB | | 6.50 | | | 02/25/36 | | | 1,058,787 |
| | | | | | | | | | | |
| Principal | | Security
Description | | Rate | | | Maturity | | Value |
| $ | 1,350,900 | | Washington Mutual Alternative Mortgage Pass-Through Certificates, Series 2007-OC1 A4 (f) | | 0.57 | % | | 01/25/47 | | $ | 453,265 |
| | 440,453 | | Wells Fargo Home Equity Trust, Series 2006-3 A2 (f) | | 0.40 | | | 01/25/37 | | | 270,435 |
| | 2,694,000 | | Wells Fargo Home Equity Trust, Series 2006-3 A3 (a)(f) | | 0.46 | | | 01/25/37 | | | 923,154 |
| | | | | | | | | | | |
| Total Asset Backed Obligations
(Cost $157,851,942) | | | 160,021,027 |
| | | | | | | | | | | |
| | Corporate Convertible Bonds - 18.7% | | | | | | |
| | Consumer Discretionary - 3.9% | | | | | | |
| | 1,479,000 | | Charming Shoppes, Inc. (a) | | 1.13 | | | 05/01/14 | | | 1,161,015 |
| | 4,564,000 | | Chemed Corp. (a) | | 1.88 | | | 05/15/14 | | | 4,193,175 |
| | 2,300,000 | | Coinstar, Inc. (a) | | 4.00 | | | 09/01/14 | | | 2,478,250 |
| | 1,000,000 | | Empire Resorts, Inc. (a) | | 8.00 | | | 07/31/14 | | | 342,500 |
| | 1,561,000 | | Equinix, Inc. (a) | | 3.00 | | | 10/15/14 | | | 1,648,806 |
| | 4,500,000 | | Equinix, Inc. (a) | | 4.75 | | | 06/15/16 | | | 6,142,500 |
| | 1,157,000 | | Euronet Worldwide, Inc. (a) | | 3.50 | | | 10/15/25 | | | 1,093,365 |
| | 5,000,000 | | Finisar Corp. (a)(e) | | 5.00 | | | 10/15/29 | | | 8,250,000 |
| | 4,640,000 | | Ford Motor Co. (a) | | 4.25 | | | 11/15/16 | | | 6,965,800 |
| | 4,766,000 | | Gaylord Entertainment Co. (a)(e) | | 3.75 | | | 10/01/14 | | | 5,969,415 |
| | 4,000,000 | | Group 1 Automotive, Inc. (a)(e)(i) | | 3.00 | | | 03/15/20 | | | 3,927,200 |
| | 330,000 | | Group 1 Automotive, Inc. (a)(g) | | 2.25 | | | 06/15/36 | | | 274,312 |
| | 515,000 | | Hertz Global Holdings, Inc. (a) | | 5.25 | | | 06/01/14 | | | 730,012 |
| | 389,000 | | Iconix Brand Group, Inc. (a) | | 1.88 | | | 06/30/12 | | | 364,201 |
| | 353,000 | | Interpublic Group of Cos., Inc. | | 4.25 | | | 03/15/23 | | | 369,326 |
| | 4,500,000 | | Jakks Pacific, Inc. (a)(e) | | 4.50 | | | 11/01/14 | | | 4,860,000 |
| | | | |
| See Notes to Financial Statements. | | 27 | | ABSOLUTE FUNDS |
ABSOLUTE STRATEGIES FUND
SCHEDULE OF INVESTMENTS
MARCH 31, 2010
| | | | | | | | | | | |
| Principal | | Security
Description | | Rate | | | Maturity | | Value |
| $ | 835,000 | | Liberty Media, LLC | | 3.13 | % | | 03/30/23 | | $ | 890,319 |
| | 2,008,000 | | Live Nation, Inc. (a) | | 2.88 | | | 07/15/27 | | | 1,772,060 |
| | 1,000,000 | | Live Nation, Inc. (a)(e) | | 2.88 | | | 07/15/27 | | | 882,500 |
| | 1,750,000 | | Navistar International Corp. (a) | | 3.00 | | | 10/15/14 | | | 1,960,000 |
| | 394,000 | | Penske Auto Group, Inc. | | 3.50 | | | 04/01/26 | | | 394,985 |
| | 2,860,000 | | priceline.com, Inc. (a)(e) | | 1.25 | | | 03/15/15 | | | 3,006,575 |
| | 5,173,000 | | Regis Corp. (a) | | 5.00 | | | 07/15/14 | | | 7,099,943 |
| | 1,875,000 | | Saks, Inc. (a) | | 2.00 | | | 03/15/24 | | | 1,785,938 |
| | 3,308,000 | | Sonic Automotive, Inc. (a) | | 5.00 | | | 10/01/29 | | | 3,692,555 |
| | 6,576,000 | | Titan International, Inc. (a)(e) | | 5.63 | | | 01/15/17 | | | 7,233,600 |
| | 3,000,000 | | TRW Automotive, Inc. (a)(e) | | 3.50 | | | 12/01/15 | | | 3,588,750 |
| | 3,000,000 | | WebMD Health Corp. (a)(e) | | 3.13 | | | 09/01/25 | | | 3,971,250 |
| | 1,334,000 | | XM Satellite Radio, Inc. (a)(e) | | 7.00 | | | 12/01/14 | | | 1,303,985 |
| | | | | | | | | | | |
| | | | | | | | | | | 86,352,337 |
| | | | | | | | | | | |
| | Consumer Staples - 1.0% | | | | | | |
| | 1,525,000 | | Central European Distribution Corp. (a) | | 3.00 | | | 03/15/13 | | | 1,370,594 |
| | 1,212,000 | | Chiquita Brands International, Inc. (a) | | 4.25 | | | 08/15/16 | | | 1,208,970 |
| | 7,000,000 | | Ingersoll-Rand Global Holding Co., Ltd. (a) | | 4.50 | | | 04/15/12 | | | 14,000,000 |
| | 1,037,000 | | Smithfield Foods, Inc. (a) | | 4.00 | | | 06/30/13 | | | 1,192,550 |
| | 2,366,000 | | Sotheby’s | | 3.13 | | | 06/15/13 | | | 2,679,495 |
| | 420,000 | | Spartan Stores, Inc. (a) | | 3.38 | | | 05/15/27 | | | 365,925 |
| | 665,000 | | Spartan Stores, Inc. (a)(e) | | 3.38 | | | 05/15/27 | | | 579,381 |
| | | | | | | | | | | |
| | | | | | | | | | | 21,396,915 |
| | | | | | | | | | | |
| | Energy - 0.8% | | | | | | |
| | 535,000 | | BPZ Resources, Inc. (a)(e) | | 6.50 | | | 03/01/15 | | | 668,750 |
| | 420,000 | | Chesapeake Energy Corp. | | 2.50 | | | 05/15/37 | | | 346,500 |
| | 3,000,000 | | Covanta Holding Corp. (a)(e) | | 3.25 | | | 06/01/14 | | | 3,258,750 |
| | | | | | | | | | | |
| Principal | | Security
Description | | Rate | | | Maturity | | Value |
| $ | 1,204,000 | | Exterran Holdings, Inc. (a) | | 4.25 | % | | 06/15/14 | | $ | 1,497,475 |
| | 1,672,000 | | Global Industries, Ltd. (a) | | 2.75 | | | 08/01/27 | | | 1,090,980 |
| | 778,000 | | GMX Resources, Inc. (a) | | 5.00 | | | 02/01/13 | | | 635,042 |
| | 1,690,000 | | International Coal Group, Inc. (a) | | 9.00 | | | 08/01/12 | | | 1,945,613 |
| | 3,776,000 | | International Coal Group, Inc. (a) | | 4.00 | | | 04/01/17 | | | 3,950,640 |
| | 519,000 | | James River Coal Co. (a)(e) | | 4.50 | | | 12/01/15 | | | 479,426 |
| | 1,116,000 | | Peabody Energy Corp. (a) | | 4.75 | | | 12/15/41 | | | 1,213,650 |
| | 930,000 | | Penn Virginia Corp. (a) | | 4.50 | | | 11/15/12 | | | 878,850 |
| | 1,288,000 | | Pioneer Natural Resources Co. (a) | | 2.88 | | | 01/15/38 | | | 1,486,030 |
| | 587,000 | | St Mary Land & Exploration Co. | | 3.50 | | | 04/01/27 | | | 589,935 |
| | 900,000 | | Western Refining, Inc. (a) | | 5.75 | | | 06/15/14 | | | 730,125 |
| | | | | | | | | | | |
| | | | | | | | | | | 18,771,766 |
| | | | | | | | | | | |
| | Financial - 1.2% | | | | | | |
| | 757,000 | | Affiliated Managers Group, Inc. | | 3.95 | | | 08/15/38 | | | 751,322 |
| | 1,015,000 | | AmeriCredit Corp. (a) | | 2.13 | | | 09/15/13 | | | 988,356 |
| | 925,000 | | Annaly Capital Management, Inc. REIT (a) | | 4.00 | | | 02/15/15 | | | 942,344 |
| | 400,000 | | Boston Properties LP REIT | | 2.88 | | | 02/15/37 | | | 400,500 |
| | 5,000,000 | | CBIZ, Inc. (a) | | 3.13 | | | 06/01/26 | | | 4,825,000 |
| | 1,830,000 | | Forest City Enterprises, Inc. | | 3.63 | | | 10/15/14 | | | 2,066,756 |
| | 1,811,000 | | Forest City Enterprises, Inc. (a)(e) | | 5.00 | | | 10/15/16 | | | 2,275,069 |
| | 3,080,000 | | Icahn Enterprises LP (e)(f) | | 4.00 | | | 08/15/13 | | | 2,725,800 |
| | 1,304,000 | | KKR Financial Holdings, LLC (a) | | 7.50 | | | 01/15/17 | | | 1,599,030 |
| | 1,807,000 | | Leucadia National Corp. | | 3.75 | | | 04/15/14 | | | 2,254,233 |
| | 734,000 | | MF Global, Ltd. (e) | | 9.00 | | | 06/20/38 | | | 850,522 |
| | 2,258,000 | | MF Global, Ltd. (a) | | 9.00 | | | 06/20/38 | | | 2,616,458 |
| | 1,000,000 | | Penson Worldwide, Inc. (a)(e) | | 8.00 | | | 06/01/14 | | | 1,318,750 |
| | | | |
| See Notes to Financial Statements. | | 28 | | ABSOLUTE FUNDS |
ABSOLUTE STRATEGIES FUND
SCHEDULE OF INVESTMENTS
MARCH 31, 2010
| | | | | | | | | | | |
| Principal | | Security
Description | | Rate | | | Maturity | | Value |
| $ | 1,200,000 | | The NASDAQ OMX Group, Inc. | | 2.50 | % | | 08/15/13 | | $ | 1,161,000 |
| | 755,000 | | Washington Real Estate Investment Trust REIT | | 3.88 | | | 09/15/26 | | | 752,169 |
| | | | | | | | | | | |
| | | | | | | | | | | 25,527,309 |
| | | | | | | | | | | |
| | Healthcare - 4.8% | | | | | | | | |
| | 3,993,000 | | American Medical Systems Holdings, Inc. (a) | | 3.25 | | | 07/01/36 | | | 4,377,326 |
| | 5,591,000 | | American Medical Systems Holdings, Inc. (a) | | 4.00 | | | 09/15/41 | | | 6,583,403 |
| | 560,000 | | Amylin Pharmaceuticals, Inc. (a) | | 3.00 | | | 06/15/14 | | | 501,900 |
| | 1,100,000 | | ATS Medical, Inc. (a) | | 6.00 | | | 10/15/25 | | | 1,072,500 |
| | 400,000 | | ATS Medical, Inc. (a)(e) | | 6.00 | | | 10/15/25 | | | 390,000 |
| | 3,000,000 | | BioMarin Pharmaceuticals, Inc. (a) | | 2.50 | | | 03/29/13 | | | 4,530,000 |
| | 3,000,000 | | Biovail Corp. (a)(e) | | 5.38 | | | 08/01/14 | | | 3,885,000 |
| | 6,780,000 | | Cubist Pharmaceuticals, Inc. (a) | | 2.25 | | | 06/15/13 | | | 6,754,575 |
| | 5,500,000 | | Endo Pharmaceuticals Holdings, Inc. (a)(e) | | 1.75 | | | 04/15/15 | | | 5,513,750 |
| | 2,600,000 | | Hologic, Inc. (a)(g) | | 2.00 | | | 12/15/37 | | | 2,340,000 |
| | 3,000,000 | | Incyte Corp., Ltd. (a)(e) | | 4.75 | | | 10/01/15 | | | 5,362,500 |
| | 4,750,000 | | Insulet Corp. (a) | | 5.38 | | | 06/15/13 | | | 4,744,063 |
| | 1,078,000 | | Invacare Corp. (a) | | 4.13 | | | 02/01/27 | | | 1,307,075 |
| | 5,984,000 | | Kinetic Concepts, Inc. (a)(e) | | 3.25 | | | 04/15/15 | | | 6,761,920 |
| | 540,000 | | King Pharmaceuticals, Inc. (a) | | 1.25 | | | 04/01/26 | | | 498,825 |
| | 2,778,000 | | LifePoint Hospitals, Inc. (a) | | 3.50 | | | 05/15/14 | | | 2,784,945 |
| | 2,334,000 | | Molina Healthcare, Inc. (a) | | 3.75 | | | 10/01/14 | | | 2,170,620 |
| | 6,000,000 | | Mylan, Inc. (a)(e) | | 3.75 | | | 09/15/15 | | | 10,912,500 |
| | 1,442,000 | | Nektar Therapeutics (a) | | 3.25 | | | 09/28/12 | | | 1,440,197 |
| | 1,950,000 | | NovaMed, Inc. (a) | | 1.00 | | | 06/15/12 | | | 1,638,000 |
| | 6,000,000 | | PDL BioPharma, Inc. (a) | | 2.00 | | | 02/15/12 | | | 5,820,000 |
| | | | | | | | | | | |
| Principal | | Security
Description | | Rate | | | Maturity | | Value |
| $ | 4,000,000 | | PSS World Medical, Inc. (a)(e) | | 3.13 | % | | 08/01/14 | | $ | 5,025,000 |
| | 1,352,000 | | SonoSite, Inc. (a) | | 3.75 | | | 07/15/14 | | | 1,434,810 |
| | 1,937,000 | | Theravance, Inc. (a) | | 3.00 | | | 01/15/15 | | | 1,675,505 |
| | 6,789,000 | | Viropharma, Inc. (a) | | 2.00 | | | 03/15/17 | | | 6,508,954 |
| | 1,283,000 | | West Pharmaceutical Services, Inc. (a) | | 4.00 | | | 03/15/47 | | | 1,148,285 |
| | 3,500,000 | | Wilson Greatbatch, Inc. (a) | | 2.25 | | | 06/15/13 | | | 3,171,875 |
| | 7,700,000 | | Wright Medical Group, Inc. (a) | | 2.63 | | | 12/01/14 | | | 6,843,375 |
| | | | | | | | | | | |
| | | | | | | | | | | 105,196,903 |
| | | | | | | | | | | |
| | Industrial - 1.1% | | | | | | | | |
| | 1,800,000 | | AAR Corp. (a) | | 1.75 | | | 02/01/26 | | | 1,874,250 |
| | 5,656,000 | | AirTran Holdings, Inc. (a) | | 5.25 | | | 11/01/16 | | | 6,087,270 |
| | 693,000 | | AMR Corp. (a) | | 6.25 | | | 10/15/14 | | | 804,746 |
| | 1,500,000 | | C&D Technologies, Inc. (a) | | 5.25 | | | 11/01/25 | | | 980,625 |
| | 3,729,000 | | Cemex SAB de CV (a)(e) | | 4.88 | | | 03/15/15 | | | 3,864,176 |
| | 1,000,000 | | EnerSys (a)(g) | | 3.38 | | | 06/01/38 | | | 938,750 |
| | 1,500,000 | | FEI Co. (a) | | 2.88 | | | 06/01/13 | | | 1,546,875 |
| | 736,000 | | GenCorp, Inc. (a)(e) | | 4.06 | | | 12/31/39 | | | 704,720 |
| | 670,000 | | PHH Corp. (a)(e) | | 4.00 | | | 09/01/14 | | | 756,263 |
| | 1,000,000 | | SunPower Corp. (e)(i) | | 4.50 | | | 03/15/15 | | | 1,009,420 |
| | 1,500,000 | | Terex Corp. (a) | | 4.00 | | | 06/01/15 | | | 2,340,000 |
| | 1,000,000 | | Textron, Inc. (a) | | 4.50 | | | 05/01/13 | | | 1,740,000 |
| | 3,113,000 | | Trinity Industries, Inc. (a) | | 3.88 | | | 06/01/36 | | | 2,455,379 |
| | | | | | | | | | | |
| | | | | | | | | | | 25,102,474 |
| | | | | | | | | | | |
| | Information Technology - 3.3% | | | | | | | | |
| | 1,950,000 | | Advanced Micro Devices, Inc. (a) | | 6.00 | | | 05/01/15 | | | 1,879,313 |
| | 6,301,000 | | CACI International, Inc. (a) | | 2.13 | | | 05/01/14 | | | 6,694,813 |
| | 625,000 | | CACI International, Inc. (a)(e) | | 2.13 | | | 05/01/14 | | | 664,062 |
| | 709,000 | | Cogent Communications Group, Inc. (a) | | 1.00 | | | 06/15/27 | | | 502,504 |
| | | | |
| See Notes to Financial Statements. | | 29 | | ABSOLUTE FUNDS |
ABSOLUTE STRATEGIES FUND
SCHEDULE OF INVESTMENTS
MARCH 31, 2010
| | | | | | | | | | | |
| Principal | | Security
Description | | Rate | | | Maturity | | Value |
| $ | 2,325,000 | | Concur Technologies, Inc. (e) | | 2.50 | % | | 04/15/15 | | $ | 2,320,652 |
| | 217,000 | | CSG Systems International, Inc. (a)(e) | | 3.00 | | | 03/01/17 | | | 228,935 |
| | 4,500,000 | | Earthlink, Inc. (a)(g) | | 3.25 | | | 11/15/26 | | | 4,978,125 |
| | 4,000,000 | | Epicor Software Corp. (a) | | 2.38 | | | 05/15/27 | | | 3,590,000 |
| | 1,400,000 | | Informatica Corp. | | 3.00 | | | 03/15/26 | | | 1,946,000 |
| | 4,000,000 | | Maxtor Corp. (a) | | 2.38 | | | 08/15/12 | | | 4,685,000 |
| | 4,293,000 | | Mentor Graphics Corp. (a) | | 6.25 | | | 03/01/26 | | | 4,185,675 |
| | 2,615,000 | | Micron Technology, Inc. (a) | | 1.88 | | | 06/01/14 | | | 2,513,669 |
| | 2,800,000 | | Nuance Communications, Inc. (a) | | 2.75 | | | 08/15/27 | | | 3,041,500 |
| | 5,750,000 | | ON Semiconductor Corp. (a) | | 1.88 | | | 12/15/25 | | | 7,374,375 |
| | 2,000,000 | | Radisys Corp. (a) | | 2.75 | | | 02/15/13 | | | 1,912,500 |
| | 3,511,000 | | Rambus, Inc. (a) | | 5.00 | | | 06/15/14 | | | 4,858,346 |
| | 302,000 | | Rovi Corp. (a)(e) | | 2.63 | | | 02/15/40 | | | 303,132 |
| | 778,000 | | SanDisk Corp. (a) | | 1.00 | | | 05/15/13 | | | 675,887 |
| | 3,500,000 | | SYNNEX Corp. (a)(e) | | 4.00 | | | 05/15/18 | | | 4,217,500 |
| | 2,700,000 | | Take-Two Interactive Software, Inc. (a) | | 4.38 | | | 06/01/14 | | | 3,145,500 |
| | 3,843,000 | | TeleCommunication Systems, Inc. (a)(e) | | 4.50 | | | 11/01/14 | | | 3,977,505 |
| | 917,000 | | Teradyne, Inc. (a) | | 4.50 | | | 03/15/14 | | | 1,992,183 |
| | 1,908,000 | | THQ, Inc. (a)(e) | | 5.00 | | | 08/15/14 | | | 2,072,565 |
| | 2,800,000 | | Veeco Instruments, Inc. (a)(i) | | 4.13 | | | 04/15/12 | | | 4,613,112 |
| | 1,330,000 | | Verigy, Ltd. (a)(e) | | 5.25 | | | 07/15/14 | | | 1,482,950 |
| | | | | | | | | | | |
| | | | | | | | | | | 73,855,803 |
| | | | | | | | | | | |
| | Materials - 0.8% | | | | | | | | |
| | 700,000 | | Anglo American PLC (e) | | 4.00 | | | 05/07/14 | | | 1,197,168 |
| | 5,000,000 | | Goldcorp, Inc. (a)(e) | | 2.00 | | | 08/01/14 | | | 5,587,500 |
| | 5,936,000 | | Jaguar Mining, Inc. (a)(e) | | 4.50 | | | 11/01/14 | | | 5,913,740 |
| | 2,825,000 | | Kaiser Aluminum Corp. (a)(e) | | 4.50 | | | 04/01/15 | | | 2,908,903 |
| | 455,000 | | Steel Dynamics, Inc. (a) | | 5.13 | | | 06/15/14 | | | 561,925 |
| | | | | | | | | | | |
| Principal | | Security
Description | | Rate | | | Maturity | | Value |
| $ | 307,000 | | Sterlite Industries India, Ltd. (a) | | 4.00 | % | | 10/30/14 | | $ | 326,187 |
| | 768,000 | | United States Steel Corp. (a) | | 4.00 | | | 05/15/14 | | | 1,617,600 |
| | | | | | | | | | | |
| | | | | | | | | | | 18,113,023 |
| | | | | | | | | | | |
| | Telecommunication Services - 1.8% | | | |
| | 2,326,000 | | ADC Telecommunications, Inc. (a) | | 3.50 | | | 07/15/17 | | | 1,750,315 |
| | 6,250,000 | | Alaska Communications Systems Group, Inc. (a) | | 5.75 | | | 03/01/13 | | | 5,906,250 |
| | 2,000,000 | | Ciena Corp. (a) | | 0.25 | | | 05/01/13 | | | 1,670,000 |
| | 4,715,000 | | Ciena Corp. (a)(e) | | 4.00 | | | 03/15/15 | | | 4,903,600 |
| | 2,342,000 | | Ciena Corp. (a) | | 0.88 | | | 06/15/17 | | | 1,592,560 |
| | 4,300,000 | | CommScope, Inc. (a) | | 3.25 | | | 07/01/15 | | | 5,229,875 |
| | 5,000,000 | | Comtech Telecommunications Corp. (a)(e) | | 3.00 | | | 05/01/29 | | | 5,443,750 |
| | 343,000 | | Leap Wireless International, Inc. (a) | | 4.50 | | | 07/15/14 | | | 300,125 |
| | 1,107,000 | | Leap Wireless International, Inc. (e) | | 4.50 | | | 07/15/14 | | | 968,625 |
| | 450,000 | | SBA Communications Corp. | | 1.88 | | | 05/01/13 | | | 478,125 |
| | 1,506,000 | | Time Warner Telecom, Inc. (a) | | 2.38 | | | 04/01/26 | | | 1,722,487 |
| | 7,812,000 | | Virgin Media, Inc. (a) | | 6.50 | | | 11/15/16 | | | 9,618,525 |
| | | | | | | | | | | |
| | | | | | | | | | | 39,584,237 |
| | | | | | | | | | | |
| Total Corporate Convertible Bonds
(Cost $356,487,397) | | | 413,900,767 |
| | | | | | | | | | | |
| | Corporate Non-Convertible Bonds - 3.4% | | | |
| | Consumer Discretionary - 0.4% | | | | | | |
| | 300,000 | | Delphi Corp. (h) | | 6.50 | | | 08/15/13 | | | 11,250 |
| | 1,416,000 | | Jarden Corp. | | 7.50 | | | 05/01/17 | | | 1,442,550 |
| | 1,200,000 | | Lear Corp. (h) | | 0.00 | | | 12/01/13 | | | 24,000 |
| | 1,500,000 | | Limited Brands, Inc. | | 7.60 | | | 07/15/37 | | | 1,421,250 |
| | 365,000 | | Royal Caribbean Cruises, Ltd. | | 8.00 | | | 05/15/10 | | | 367,693 |
| | 2,138,000 | | Saks, Inc. | | 9.88 | | | 10/01/11 | | | 2,260,935 |
| | 430,000 | | Time Warner Cable, Inc. | | 8.25 | | | 04/01/19 | | | 521,197 |
| | 2,028,000 | | WMG Holdings Corp. (g) | | 9.50 | | | 12/15/14 | | | 2,053,350 |
| | | | | | | | | | | |
| | | | | | | | | | | 8,102,225 |
| | | | | | | | | | | |
| | | | |
| See Notes to Financial Statements. | | 30 | | ABSOLUTE FUNDS |
ABSOLUTE STRATEGIES FUND
SCHEDULE OF INVESTMENTS
MARCH 31, 2010
| | | | | | | | | | | |
| Principal | | Security
Description | | Rate | | | Maturity | | Value |
| | Energy - 0.2% | | | | | | | | |
| $ | 770,000 | | Atlas Energy Operating Co., LLC/Atlas Energy Finance Corp. (a) | | 12.13 | % | | 08/01/17 | | $ | 885,500 |
| | 470,000 | | CenterPoint Energy Resources Corp. | | 6.15 | | | 05/01/16 | | | 509,863 |
| | 500,000 | | CenterPoint Energy Resources Corp., MTN | | 6.00 | | | 05/15/18 | | | 529,276 |
| | 910,000 | | Chesapeake Energy Corp. (a) | | 7.00 | | | 08/15/14 | | | 927,062 |
| | 582,000 | | Chesapeake Energy Corp. | | 7.25 | | | 12/15/18 | | | 584,910 |
| | 337,000 | | The Williams Cos., Inc. (a) | | 7.88 | | | 09/01/21 | | | 397,567 |
| | 300,000 | | Valero Energy Corp. | | 9.38 | | | 03/15/19 | | | 357,723 |
| | 550,000 | | Valero Energy Corp. | | 7.50 | | | 04/15/32 | | | 568,383 |
| | 275,000 | | Valero Energy Corp. | | 10.50 | | | 03/15/39 | | | 354,132 |
| | | | | | | | | | | |
| | | | | | | | | | | 5,114,416 |
| | | | | | | | | | | |
| | Financial - 1.9% | | | | | | | | |
| | 37,334 | | ADFITECH, Inc. (i) | | 8.00 | | | 03/15/20 | | | 27,814 |
| | 155,000 | | Allied World Assurance | | 7.50 | | | 08/01/16 | | | 168,018 |
| | 615,000 | | BAC Capital Trust XV (a)(f) | | 1.05 | | | 06/01/56 | | | 419,240 |
| | 20,000 | | Bank of America Corp., MTN (a) | | 5.65 | | | 05/01/18 | | | 20,266 |
| | 890,000 | | BankAmerica Capital III (a)(f) | | 0.82 | | | 01/15/27 | | | 614,392 |
| | 420,000 | | Capital One Capital V (a) | | 10.25 | | | 08/15/39 | | | 498,872 |
| | 195,000 | | Capital One Financial Corp., MTN | | 5.70 | | | 09/15/11 | | | 203,875 |
| | 60,000 | | Centro NP, LLC REIT | | 5.13 | | | 09/15/12 | | | 54,150 |
| | 975,000 | | Chase Capital II, Series B (f) | | 0.75 | | | 02/01/27 | | | 763,698 |
| | 1,355,000 | | Chase Capital III, Series C (a)(f) | | 0.80 | | | 03/01/27 | | | 1,019,411 |
| | 1,200,000 | | Citigroup Funding, Inc., Series 2 (f) | | 0.58 | | | 04/30/12 | | | 1,209,077 |
| | 135,000 | | Citigroup, Inc. | | 6.50 | | | 08/19/13 | | | 145,642 |
| | 400,000 | | Citigroup, Inc. (f) | | 0.53 | | | 11/05/14 | | | 371,122 |
| | 150,000 | | Citigroup, Inc. (a) | | 5.85 | | | 08/02/16 | | | 154,035 |
| | 90,000 | | Citigroup, Inc. (a) | | 6.13 | | | 05/15/18 | | | 92,107 |
| | 700,000 | | Citigroup, Inc. (f) | | 1.95 | | | 05/15/18 | | | 660,077 |
| | 300,000 | | Citigroup, Inc. | | 8.50 | | | 05/22/19 | | | 350,730 |
| | | | | | | | | | | |
| Principal | | Security
Description | | Rate | | | Maturity | | Value |
| $ | 1,550,000 | | Citigroup, Inc. (f) | | 0.80 | % | | 08/25/36 | | $ | 974,817 |
| | 94,000 | | Citigroup, Inc. (a) | | 6.88 | | | 03/05/38 | | | 95,282 |
| | 1,050,000 | | City National Capital Trust I | | 9.63 | | | 02/01/40 | | | 1,169,663 |
| | 340,000 | | Countrywide Financial Corp., MTN | | 5.80 | | | 06/07/12 | | | 361,606 |
| | 75,000 | | Countrywide Financial Corp., MTN, Series A | | 4.50 | | | 06/15/10 | | | 75,580 |
| | 70,000 | | Countrywide Home Loans, Inc.,
MTN | | 4.00 | | | 03/22/11 | | | 71,982 |
| | 845,000 | | Credit Suisse Guernsey, Ltd., Series 1 (a)(f) | | 0.94 | | | 05/29/49 | | | 664,381 |
| | 100,000 | | Credit Suisse/NewYork (a) | | 5.50 | | | 05/01/14 | | | 108,943 |
| | 660,000 | | Credit Suisse/NewYork | | 6.00 | | | 02/15/18 | | | 699,892 |
| | 965,000 | | Discover Bank | | 8.70 | | | 11/18/19 | | | 1,058,686 |
| | 925,000 | | Duke Realty LP REIT (a) | | 7.38 | | | 02/15/15 | | | 999,939 |
| | 500,000 | | ERP Operating LP REIT (a) | | 5.20 | | | 04/01/13 | | | 519,326 |
| | 100,000 | | Fairfax Financial Holdings, Ltd. | | 7.75 | | | 04/26/12 | | | 105,500 |
| | 800,000 | | Farmers Exchange Capital (a)(e) | | 7.05 | | | 07/15/28 | | | 738,550 |
| | 207,000 | | General Electric Capital Corp. | | 5.63 | | | 05/01/18 | | | 216,668 |
| | 115,000 | | General Electric Capital Corp., MTN (a)(f) | | 1.15 | | | 05/22/13 | | | 114,733 |
| | 100,000 | | General Electric Capital Corp., MTN (a)(f) | | 0.45 | | | 05/11/16 | | | 90,930 |
| | 675,000 | | General Electric Capital Corp.,
MTN | | 6.88 | | | 01/10/39 | | | 730,438 |
| | 400,000 | | General Electric Capital Corp., MTN, Series 2004-A (f) | | 0.52 | | | 09/15/14 | | | 380,602 |
| | 190,000 | | GMAC, LLC | | 7.25 | | | 03/02/11 | | | 194,275 |
| | 858,000 | | GMAC, LLC (a)(f) | | 2.45 | | | 12/01/14 | | | 756,473 |
| | 150,000 | | HBOS PLC (e) | | 6.75 | | | 05/21/18 | | | 138,029 |
| | 232,000 | | HCP, Inc. REIT | | 5.63 | | | 05/01/17 | | | 226,573 |
| | 450,000 | | JP Morgan Chase Capital XXIII (f) | | 1.25 | | | 05/15/47 | | | 340,582 |
| | 725,000 | | JPMorgan Chase Capital XIII, Series M (f) | | 1.24 | | | 09/30/34 | | | 569,039 |
| | | | |
| See Notes to Financial Statements. | | 31 | | ABSOLUTE FUNDS |
ABSOLUTE STRATEGIES FUND
SCHEDULE OF INVESTMENTS
MARCH 31, 2010
| | | | | | | | | | | |
| Principal | | Security
Description | | Rate | | | Maturity | | Value |
| $ | 1,950,000 | | JPMorgan Chase Capital XXI, Series U (a)(f) | | 1.20 | % | | 02/02/37 | | $ | 1,499,780 |
| | 680,000 | | LBG Capital No.1 PLC (f) | | 8.00 | | | 06/15/49 | | | 595,000 |
| | 3,535,000 | | MBNA Capital, Series B (f) | | 1.05 | | | 02/01/27 | | | 2,439,390 |
| | 80,000 | | Merrill Lynch & Co., Inc., MTN (f) | | 8.68 | | | 05/02/17 | | | 82,952 |
| | 80,000 | | Merrill Lynch & Co., Inc., MTN (f) | | 8.95 | | | 05/18/17 | | | 86,352 |
| | 80,000 | | Merrill Lynch & Co., Inc., MTN (f) | | 9.57 | | | 06/06/17 | | | 87,552 |
| | 201,000 | | MetLife, Inc. | | 6.50 | | | 12/15/32 | | | 210,880 |
| | 200,000 | | Morgan Stanley (f) | | 0.50 | | | 01/18/11 | | | 200,055 |
| | 110,000 | | Morgan Stanley | | 5.05 | | | 01/21/11 | | | 113,580 |
| | 155,000 | | Morgan Stanley | | 6.75 | | | 04/15/11 | | | 163,666 |
| | 40,000 | | Morgan Stanley (a) | | 6.60 | | | 04/01/12 | | | 43,419 |
| | 1,380,000 | | Morgan Stanley (f) | | 0.62 | | | 06/20/12 | | | 1,391,665 |
| | 1,645,000 | | Morgan Stanley (a) | | 6.00 | | | 05/13/14 | | | 1,778,446 |
| | 90,000 | | Morgan Stanley | | 4.20 | | | 11/20/14 | | | 90,292 |
| | 125,000 | | Morgan Stanley, MTN (f) | | 0.70 | | | 10/18/16 | | | 114,471 |
| | 125,000 | | Morgan Stanley, MTN, Series G (a)(f) | | 0.55 | | | 01/09/14 | | | 119,622 |
| | 115,000 | | Nationsbank Capital Trust III (a)(f) | | 0.80 | | | 01/15/27 | | | 80,921 |
| | 2,400,000 | | Nationwide Mutual Insurance Co. (a)(e)(f) | | 5.81 | | | 12/15/24 | | | 2,058,490 |
| | 415,000 | | NB Capital Trust IV (a) | | 8.25 | | | 04/15/27 | | | 422,263 |
| | 2,282,000 | | Nuveen Investments, Inc. | | 5.50 | | | 09/15/15 | | | 1,765,698 |
| | 770,000 | | Raymond James Financial, Inc. | | 8.60 | | | 08/15/19 | | | 881,480 |
| | 100,000 | | Shurgard Storage Centers, LLC REIT | | 7.75 | | | 02/22/11 | | | 103,804 |
| | 49,000 | | Shurgard Storage Centers, LLC REIT | | 5.88 | | | 03/15/13 | | | 51,607 |
| | 250,000 | | The Bear Stearns Cos., LLC | | 5.70 | | | 11/15/14 | | | 272,529 |
| | 75,000 | | The Bear Stearns Cos., LLC | | 7.25 | | | 02/01/18 | | | 86,809 |
| | 1,935,000 | | The Goldman Sachs Group, Inc. (f) | | 1.05 | | | 12/05/11 | | | 1,963,013 |
| | 200,000 | | The Goldman Sachs Group, Inc. (f) | | 0.43 | | | 02/06/12 | | | 199,028 |
| | 250,000 | | The Goldman Sachs Group, Inc. | | 5.13 | | | 01/15/15 | | | 263,984 |
| | 405,000 | | The Goldman Sachs Group, Inc. | | 6.15 | | | 04/01/18 | | | 429,200 |
| | | | | | | | | | | |
| Principal | | Security
Description | | Rate | | | Maturity | | Value |
| $ | 555,000 | | The Goldman Sachs Group, Inc. | | 7.50 | % | | 02/15/19 | | $ | 635,304 |
| | 100,000 | | The Goldman Sachs Group, Inc., MTN, Series B (f) | | 0.65 | | | 07/22/15 | | | 96,817 |
| | 477,000 | | Thornburg Mortgage, Inc. (h) | | 8.00 | | | 05/15/13 | | | 14,548 |
| | 1,100,000 | | Wachovia Corp. (f) | | 0.59 | | | 10/28/15 | | | 1,021,819 |
| | 175,000 | | Washington Real Estate Investment Trust REIT | | 5.95 | | | 06/15/11 | | | 179,330 |
| | 635,000 | | WEA Finance, LLC (e) | | 4.38 | | | 11/15/10 | | | 644,978 |
| | 1,155,000 | | WEA Finance, LLC (a)(e) | | 7.50 | | | 06/02/14 | | | 1,293,955 |
| | 15,000 | | WEA Finance, LLC (a)(e) | | 6.75 | | | 09/02/19 | | | 16,034 |
| | 170,000 | | Weingarten Realty Investors REIT, MTN | | 4.99 | | | 09/03/13 | | | 172,469 |
| | 800,000 | | ZFS Finance USA Trust IV (e)(f) | | 5.88 | | | 05/09/32 | | | 754,328 |
| | 1,375,000 | | ZFS Finance USA Trust I (a)(e)(f) | | 6.15 | | | 12/15/65 | | | 1,354,375 |
| | | | | | | | | | | |
| | | | | | | | | | | 41,954,920 |
| | | | | | | | | | | |
| | Healthcare - 0.1% |
| | 1,270,000 | | CHS/Community Health Systems, Inc. (a) | | 8.88 | | | 07/15/15 | | | 1,317,625 |
| | | | | | | | | | | |
| | Industrial - 0.1% |
| | 500,000 | | Continental Airlines, Inc., Series 2007-1 B (a) | | 6.90 | | | 04/19/22 | | | 455,000 |
| | 1,040,000 | | Delta Air Lines, Inc. (a)(e) | | 9.50 | | | 09/15/14 | | | 1,098,500 |
| | 870,000 | | Delta Air Lines, Inc., Series 2001-A2 (a) | | 7.11 | | | 09/18/11 | | | 909,150 |
| | | | | | | | | | | |
| | | | | | | | | | | 2,462,650 |
| | | | | | | | | | | |
| | Information Technology - 0.1% |
| | 1,029,000 | | First Data Corp. | | 9.88 | | | 09/24/15 | | | 892,657 |
| | 1,480,000 | | Sungard Data Systems, Inc. | | 9.13 | | | 08/15/13 | | | 1,524,400 |
| | | | | | | | | | | |
| | | | | | | | | | | 2,417,057 |
| | | | | | | | | | | |
| | | | |
| See Notes to Financial Statements. | | 32 | | ABSOLUTE FUNDS |
ABSOLUTE STRATEGIES FUND
SCHEDULE OF INVESTMENTS
MARCH 31, 2010
| | | | | | | | | | | |
| Principal | | Security
Description | | Rate | | | Maturity | | Value |
| | Materials - 0.0% |
| $ | 110,000 | | Barrick Gold Finance Co. | | 5.80 | % | | 11/15/34 | | $ | 105,125 |
| | | | | | | | | | | |
| | Telecommunication Services - 0.1% |
| | 145,000 | | Cellco Partnership/Verizon Wireless Capital, LLC | | 8.50 | | | 11/15/18 | | | 181,200 |
| | 665,000 | | Qwest Corp. (a) | | 7.88 | | | 09/01/11 | | | 708,225 |
| | 515,000 | | Sprint Nextel Corp. (f) | | 0.69 | | | 06/28/10 | | | 513,203 |
| | | | | | | | | | | |
| | | | | | | | | | | 1,402,628 |
| | | | | | | | | | | |
| | Utilities - 0.5% |
| | 1,460,000 | | Edison Mission Energy (a) | | 7.00 | | | 05/15/17 | | | 1,025,650 |
| | 1,520,000 | | KCP&L Greater Missouri Operations Co. (a) | | 11.88 | | | 07/01/12 | | | 1,769,879 |
| | 950,000 | | Mirant Americas Generation, LLC | | 9.13 | | | 05/01/31 | | | 857,375 |
| | 415,000 | | Nisource Finance Corp. (a) | | 10.75 | | | 03/15/16 | | | 528,131 |
| | 845,000 | | NRG Energy, Inc. (a) | | 7.25 | | | 02/01/14 | | | 853,450 |
| | 145,000 | | Oncor Electric Delivery Co. (a)(e) | | 6.80 | | | 09/01/18 | | | 163,165 |
| | 1,040,000 | | PNM Resources, Inc. (a) | | 9.25 | | | 05/15/15 | | | 1,111,500 |
| | 80,000 | | Public Service Co. of New Mexico | | 7.95 | | | 05/15/18 | | | 83,588 |
| | 1,385,000 | | Sabine Pass LNG LP (a) | | 7.25 | | | 11/30/13 | | | 1,308,825 |
| | 2,410,000 | | Southern Union Co. (a)(f) | | 7.20 | | | 11/01/66 | | | 2,247,325 |
| | 400,000 | | Texas-New Mexico Power Co. (e) | | 9.50 | | | 04/01/19 | | | 488,103 |
| | 1,150,000 | | The AES Corp. (a)(e) | | 8.75 | | | 05/15/13 | | | 1,173,000 |
| | | | | | | | | | | |
| | | | | | | | | | | 11,609,991 |
| | | | | | | | | | | |
| Total Corporate Non-Convertible Bonds
(Cost $64,280,925) | | | 74,486,637 |
| | | | | | | | | | | |
| | | | | | | | | | | |
| Principal | | Security
Description | | Rate | | | Maturity | | Value |
| | Foreign Government Bonds - 0.0% |
| $ | 10,100,000 | | Argentina Government International Bond, Series GDP (f) (Cost $428,132) | | 3.26 | % | | 12/15/35 | | $ | 808,000 |
| | | | | | | | | | | |
| | Interest Only Bonds - 0.0% |
| | 37,763,831 | | Lehman ABS Manufactured Housing Contract, Series 2001-B AIOC (f) (Cost $426,536) | | 0.55 | | | 05/15/41 | | | 479,148 |
| | | | | | | | | | | |
| | Municipal Bonds - 0.1% |
| | California - 0.0% |
| | 25,000 | | State of California (a) | | 7.55 | | | 04/01/39 | | | 25,872 |
| | 150,000 | | State of California (a) | | 7.30 | | | 10/01/39 | | | 150,681 |
| | | | | | | | | | | |
| | | | | | | | | | | 176,553 |
| | | | | | | | | | | |
| | Georgia - 0.1% |
| | 175,000 | | Atlanta Airport Revenue Bond, Class F | | 5.25 | | | 01/01/15 | | | 190,480 |
| | | | | | | | | | | |
| | Indiana - 0.0% |
| | 100,000 | | Indianapolis Local Public Improvement Bond Bank, Class F | | 5.00 | | | 01/01/15 | | | 107,302 |
| | | | | | | | | | | |
| | Total Municipal Bonds (Cost $462,247) | | | | | | 474,335 |
| | | | | | | | | | | |
| | Syndicated Loans - 0.1% |
| | 500,000 | | HCA, Inc. | | 1.79 | | | 11/18/12 | | | 485,715 |
| | 1,384,268 | | HCA, Inc. | | 1.79 | | | 11/18/12 | | | 1,344,719 |
| | 743,103 | | Tribune, Inc. (h) | | 6.50 | | | 05/24/14 | | | 476,864 |
| | | | | | | | | | | |
| | Total Syndicated Loans (Cost $2,440,582) | | | 2,307,298 |
| | | | | | | | | | | |
| | U.S. Government & Agency Obligations - 6.2% |
| | Agency - 3.0% |
| | 2,800,000 | | FHLB (g) | | 0.75 | | | 10/05/11 | | | 2,805,804 |
| | 31,000,000 | | FHLMC | | 1.63 | | | 04/26/11 | | | 31,343,356 |
| | 31,000,000 | | FNMA (a) | | 1.88 | | | 04/20/12 | | | 31,418,190 |
| | | | | | | | | | | |
| | | | | | | | | | | 65,567,350 |
| | | | | | | | | | | |
| | Discount Note - 0.2% |
| | 4,295,000 | | FHLB (a)(j) | | 0.12 | | | 04/23/10 | | | 4,294,671 |
| | 1,015,000 | | FHLMC, Series RB (j) | | 0.11 | | | 05/04/10 | | | 1,014,915 |
| | | | | | | | | | | |
| | | | | | | | | | | 5,309,586 |
| | | | | | | | | | | |
| | | | |
| See Notes to Financial Statements. | | 33 | | ABSOLUTE FUNDS |
ABSOLUTE STRATEGIES FUND
SCHEDULE OF INVESTMENTS
MARCH 31, 2010
| | | | | | | | | | | |
| Principal | | Security
Description | | Rate | | | Maturity | | Value |
| | Interest Only Bonds - 0.1% |
| $ | 9,636,105 | | FNMA, Series 2005-92 US (f) | | 5.85 | % | | 10/25/25 | | $ | 950,430 |
| | 8,902,769 | | GNMA, Series 2007-78 SG (f) | | 6.30 | | | 12/20/37 | | | 763,112 |
| | | | | | | | | | | |
| | | | | | | | | | | 1,713,542 |
| | | | | | | | | | | |
| | Mortgage Securities - 0.4% |
| | 179,987 | | FHLMC Pool #1B3413 (f) | | 5.87 | | | 05/01/37 | | | 190,920 |
| | 18,349 | | FHLMC Pool #1L0113 (f) | | 3.61 | | | 05/01/35 | | | 19,123 |
| | 259,886 | | FHLMC Pool #A72860 (a) | | 6.00 | | | 02/01/38 | | | 279,204 |
| | 245,476 | | FHLMC Pool #G01864 (a) | | 5.00 | | | 01/01/34 | | | 255,200 |
| | 168,788 | | FHLMC Pool #G02366 | | 6.50 | | | 10/01/36 | | | 184,827 |
| | 331,600 | | FHLMC Pool #G03436 (a) | | 6.00 | | | 11/01/37 | | | 356,423 |
| | 213,543 | | FHLMC Pool #G03640 (a) | | 5.50 | | | 12/01/37 | | | 225,780 |
| | 238,992 | | FHLMC Pool #G05119 (a) | | 6.50 | | | 09/01/38 | | | 260,118 |
| | 213,659 | | FHLMC Pool #G13475 (a) | | 6.00 | | | 01/01/24 | | | 231,046 |
| | 132,246 | | FHLMC Pool #H03161 (a) | | 6.50 | | | 08/01/37 | | | 143,448 |
| | 34,348 | | FHLMC, Series 2433 SA (a)(f) | | 20.33 | | | 02/15/32 | | | 41,646 |
| | 205,000 | | FHLMC, Series 2929 PE (a) | | 5.00 | | | 05/15/33 | | | 216,100 |
| | 276,222 | | FNMA Pool #254868 (a) | | 5.00 | | | 09/01/33 | | | 286,646 |
| | 157,851 | | FNMA Pool #545639 (a) | | 6.50 | | | 04/01/32 | | | 174,094 |
| | 22,632 | | FNMA Pool #555177 (f) | | 2.55 | | | 01/01/33 | | | 23,319 |
| | 3,170 | | FNMA Pool #673743 (a)(f) | | 4.26 | | | 11/01/32 | | | 3,273 |
| | 268,765 | | FNMA Pool #725027 (a) | | 5.00 | | | 11/01/33 | | | 278,907 |
| | 335,654 | | FNMA Pool #734922 | | 4.50 | | | 09/01/33 | | | 340,049 |
| | 241,382 | | FNMA Pool #735646 | | 4.50 | | | 07/01/20 | | | 253,830 |
| | 85,961 | | FNMA Pool #735861 (a) | | 6.50 | | | 09/01/33 | | | 94,988 |
| | 82,837 | | FNMA Pool #735881 (a) | | 6.00 | | | 11/01/34 | | | 89,905 |
| | 149,597 | | FNMA Pool #764388 (a)(f) | | 4.94 | | | 03/01/34 | | | 157,028 |
| | | | | | | | | | | |
| Principal | | Security
Description | | Rate | | | Maturity | | Value |
| $ | 208,477 | | FNMA Pool #776708 (a) | | 5.00 | % | | 05/01/34 | | $ | 216,019 |
| | 68,995 | | FNMA Pool #841741 (a)(f) | | 5.05 | | | 09/01/35 | | | 72,879 |
| | 569,428 | | FNMA Pool #888219 | | 5.50 | | | 03/01/37 | | | 601,200 |
| | 257,124 | | FNMA Pool #888430 | | 5.00 | | | 11/01/33 | | | 266,827 |
| | 138,672 | | FNMA Pool #895606 (a)(f) | | 5.78 | | | 06/01/36 | | | 146,422 |
| | 433,305 | | FNMA Pool #897164 (a) | | 6.50 | | | 08/01/36 | | | 470,955 |
| | 467,605 | | FNMA Pool #962723 (a) | | 5.50 | | | 04/01/38 | | | 493,450 |
| | 509,404 | | FNMA Pool #963997 (a) | | 5.50 | | | 06/01/38 | | | 537,559 |
| | 405,018 | | FNMA Pool #974148 (a) | | 5.50 | | | 02/01/38 | | | 427,404 |
| | 113,441 | | FNMA, Series 2001-52 YZ (a) | | 6.50 | | | 10/25/31 | | | 124,391 |
| | 55,355 | | FNMA, Series 2001-81 QG (a) | | 6.50 | | | 01/25/32 | | | 60,652 |
| | 225,000 | | FNMA, Series 2006-4 WE (a) | | 4.50 | | | 02/25/36 | | | 214,555 |
| | 11,510 | | GNMA II Pool #80610 (a)(f) | | 4.38 | | | 06/20/32 | | | 11,907 |
| | 31,692 | | GNMA II Pool #81136 (a)(f) | | 3.25 | | | 11/20/34 | | | 32,636 |
| | 37,701 | | GNMA II Pool #81432 (a)(f) | | 3.63 | | | 08/20/35 | | | 38,491 |
| | 37,750 | | GNMA II Pool #81435 (a)(f) | | 3.63 | | | 08/20/35 | | | 38,540 |
| | 250,000 | | GNSF45 - GNMA TBA | | 4.50 | | | 04/15/40 | | | 253,008 |
| | 295,000 | | GNSF45 - GNMA TBA | | 4.50 | | | 04/15/40 | | | 298,549 |
| | 530,000 | | GNSF45 - GNMA TBA | | 4.50 | | | 04/15/40 | | | 536,376 |
| | | | | | | | | | | |
| | | | | | | | | | | 8,947,694 |
| | | | | | | | | | | |
| | U.S. Treasury Securities - 2.5% |
| | 31,000,000 | | U.S. Treasury Bill (k) | | 0.15-
0.48 |
| | 04/08/10 | | | 30,999,520 |
| | 19,035,000 | | U.S. Treasury Bill (a)(k) | | 0.13 | | | 04/15/10 | | | 19,033,973 |
| | 145,000 | | U.S. Treasury Bill (k) | | 0.09 | | | 05/13/10 | | | 144,978 |
| | 455,000 | | U.S. Treasury Bond (a) | | 8.00 | | | 11/15/21 | | | 620,080 |
| | 65,000 | | U.S. Treasury Bond (a) | | 4.25 | | | 05/15/39 | | | 60,247 |
| | | | |
| See Notes to Financial Statements. | | 34 | | ABSOLUTE FUNDS |
ABSOLUTE STRATEGIES FUND
SCHEDULE OF INVESTMENTS
MARCH 31, 2010
| | | | | | | | | | | |
| Principal | | Security
Description | | Rate | | | Maturity | | Value |
| $ | 280,000 | | U.S. Treasury Inflation Indexed Bond (a) | | 2.00 | % | | 01/15/16 | | $ | 324,652 |
| | 187,000 | | U.S. Treasury Inflation Indexed Bond (a) | | 2.38 | | | 01/15/27 | | | 209,783 |
| | 556,000 | | U.S. Treasury Inflation Indexed Bond (a) | | 1.75 | | | 01/15/28 | | | 530,025 |
| | 1,360,000 | | U.S. Treasury Note (a) | | 2.38 | | | 02/28/15 | | | 1,351,083 |
| | 5,000 | | U.S. Treasury Note | | 2.50 | | | 03/31/15 | | | 4,988 |
| | 1,375,000 | | U.S. Treasury Note (a) | | 3.38 | | | 11/15/19 | | | 1,327,198 |
| | | | | | | | | | | |
| | | | | | | | | | | 54,606,527 |
| | | | | | | | | | | |
| Total U.S. Government & Agency Obligations
(Cost $134,101,326) | | | 136,144,699 |
| | | | | | | | | | | |
| Total Fixed Income Securities
(Cost $716,479,087) | | | 788,621,911 |
| | | | | | | | | | | |
| | | | |
| Shares | | Security
Description | | | | | | | Value |
| | Rights - 0.0% |
| | 150,000 | | Comdisco Holding Co., Inc. (b)(l) | | | 18,375 |
| | 53,784 | | PIMCO Income Strategy Fund II (b) | | | 16,673 |
| | | | | | | | | | | |
| | Total Rights (Cost $51,260) | | | 35,048 |
| | | | | | | | | | | |
| | Warrant - 0.0% |
| | 4,696 | | Lear Corp. (b) (Cost $308,259) | | | 373,076 |
| | | | | | | | | | | |
| | Investment Companies - 7.6% |
| | 50,529 | | BlackRock Credit Allocation Income Trust I, Inc. | | | 456,277 |
| | 61,990 | | BlackRock Floating Rate Income Fund | | | 954,026 |
| | 69,698 | | Eaton Vance Limited Duration Income Fund | | | 1,108,895 |
| | 91,820 | | Energy Select Sector SPDR Fund | | | 5,281,486 |
| | 24,322 | | First Trust/Four Corners Senior Floating Rate Income Fund | | | 313,754 |
| | 84,330 | | iPath MSCI India Index ETN (b) | | | 5,637,461 |
| | 21,000 | | iShares Barclays TIPS Bond Fund | | | 2,182,110 |
| | 13,500 | | iShares iBoxx $ High Yield Corporate Bond Fund | | | 1,192,995 |
| | 127,500 | | iShares MSCI Brazil Index Fund | | | 9,391,650 |
| | 335,480 | | iShares MSCI Canada Index Fund | | | 9,356,537 |
| | 98,160 | | iShares MSCI EAFE Index Fund | | | 5,496,960 |
| | 1,034,400 | | iShares MSCI Emerging Markets Index Fund (d) | | | 43,568,928 |
| | 332,690 | | iShares MSCI Hong Kong Index Fund | | | 5,419,520 |
| | | | | | | | | | | | |
| Shares | | Security
Description | | | | | | | Value |
| | 105,990 | | iShares MSCI Mexico Investable Market Index Fund | | $ | 5,656,686 |
| | 127,710 | | iShares MSCI Pacific ex-Japan Index Fund | | | 5,490,253 |
| | 112,135 | | iShares MSCI South Korea Index Fund | | | 5,606,750 |
| | 434,960 | | iShares MSCI Taiwan Index Fund | | | 5,458,748 |
| | 81,005 | | iShares Russell 2000 Index Fund | | | 5,492,949 |
| | 44,990 | | iShares S&P 500 Index Fund | | | 5,279,127 |
| | 32,000 | | PCM Fund, Inc. | | | 305,600 |
| | 12,400 | | PIMCO Income Opportunity Fund | | | 297,352 |
| | 53,784 | | PIMCO Income Strategy Fund II | | | 517,940 |
| | 221,920 | | PowerShares DB Commodity Index Tracking Fund (b) | | | 5,219,558 |
| | 25,000 | | ProShares UltraShort 20+ Year Treasury (a)(b) | | | 1,217,250 |
| | 166,720 | | SPDR Barclays Capital High Yield Bond ETF | | | 6,633,789 |
| | 18,500 | | Utilities Select Sector SPDR Fund | | | 548,155 |
| | 125,350 | | Van Kampen Senior Income Trust | | | 639,285 |
| | 674,025 | | Vanguard Emerging Markets ETF | | | 28,430,375 |
| | 7,400 | | WisdomTree Japan SmallCap Dividend Fund | | | 307,470 |
| | | | | | | | | | | | |
| | Total Investment Companies (Cost $160,570,561) | | | 167,461,886 |
| | | | | | | | | | | | |
| | | | |
| Principal | | Security
Description | | Rate | | | Maturity | | Value |
| | Short-Term Investments - 0.6% |
| | Commercial Paper - 0.6% |
| $ | 4,090,000 | | BNP Paribas Finance, Inc. | | | 0.19 | % | | 04/27/10 | | | 4,089,439 |
| | 4,090,000 | | Credit Agricole North America | | | 0.20 | | | 05/03/10 | | | 4,089,291 |
| | 4,100,000 | | Lloyds TSB Bank PLC (a) | | | 0.21 | | | 04/26/10 | | | 4,099,402 |
| | | | | | | | | | | | |
| | Total Commercial Paper (Cost $12,278,132) | | | 12,278,132 |
| | | | | | | | | | | | |
| Total Short-Term Investments
(Cost $12,278,132) | | | 12,278,132 |
| | | | | | | | | | | | |
| | | | |
| Contracts | | Security
Description | | Strike
Price | | | Expiration
Date | | Value |
| | Purchased Options - 1.5% |
| | Call Options Purchased - 1.3% |
| | 50 | | 3M Co. | | $ | 40.00 | | | 01/11 | | | 219,625 |
| | 135 | | Accenture PLC | | | 30.00 | | | 01/12 | | | 173,475 |
| | 150 | | Automatic Data Processing, Inc. | | | 20.00 | | | 01/11 | | | 367,500 |
| | | | |
| See Notes to Financial Statements. | | 35 | | ABSOLUTE FUNDS |
ABSOLUTE STRATEGIES FUND
SCHEDULE OF INVESTMENTS
MARCH 31, 2010
| | | | | | | | | | |
| Contracts | | Security
Description | | Strike
Price | | Expiration
Date | | Value |
| 385 | | Bed Bath & Beyond, Inc. | | $ | 25.00 | | 01/12 | | $ | 781,550 |
| 100 | | ConocoPhillips | | | 45.00 | | 01/11 | | | 77,250 |
| 830 | | CVS Caremark Corp. | | | 36.00 | | 05/10 | | | 136,950 |
| 990 | | CVS Caremark Corp. | | | 36.00 | | 08/10 | | | 248,985 |
| 100 | | CVS Caremark Corp. | | | 25.00 | | 01/11 | | | 120,000 |
| 200 | | CVS Caremark Corp. | | | 15.00 | | 01/11 | | | 435,000 |
| 160 | | CVS Caremark Corp. | | | 20.00 | | 01/12 | | | 272,000 |
| 810 | | International Business Machines Corp. | | | 135.00 | | 07/10 | | | 151,470 |
| 205 | | International Business Machines Corp. | | | 140.00 | | 10/10 | | | 46,125 |
| 1,000 | | Johnson & Johnson | | | 65.00 | | 07/10 | | | 180,000 |
| 170 | | Johnson & Johnson | | | 50.00 | | 01/11 | | | 257,975 |
| 398 | | Johnson & Johnson | | | 40.00 | | 01/11 | | | 997,985 |
| 270 | | Johnson & Johnson | | | 50.00 | | 01/12 | | | 421,200 |
| 470 | | Lowe’s Cos., Inc. | | | 12.50 | | 01/11 | | | 556,950 |
| 550 | | Lowe’s Cos., Inc. | | | 10.00 | | 01/11 | | | 787,875 |
| 950 | | Lowe’s Cos., Inc. | | | 15.00 | | 01/12 | | | 921,500 |
| 1,400 | | Medtronic, Inc. | | | 48.00 | | 08/10 | | | 203,000 |
| 280 | | Medtronic, Inc. | | | 45.00 | | 08/10 | | | 74,200 |
| 1,500 | | Merck & Co., Inc. | | | 40.00 | | 01/12 | | | 510,000 |
| 6,400 | | Pfizer, Inc. | | | 22.50 | | 06/10 | | | 9,600 |
| 3,200 | | Pfizer, Inc. | | | 21.00 | | 06/10 | | | 6,400 |
| 295 | | Quest Diagnostics, Inc. | | | 45.00 | | 01/11 | | | 411,525 |
| 830 | | State Street Corp. | | | 50.00 | | 01/12 | | | 531,200 |
| 540 | | The Bank of New York Mellon Corp. | | | 20.00 | | 01/12 | | | 648,000 |
| 248 | | The Boeing Co. | | | 40.00 | | 01/12 | | | 816,540 |
| 650 | | The Coca-Cola Co. | | | 30.00 | | 01/11 | | | 1,625,000 |
| 100 | | The Coca-Cola Co. | | | 25.00 | | 01/11 | | | 300,000 |
| 105 | | The Coca-Cola Co. | | | 40.00 | | 01/12 | | | 162,645 |
| 447 | | The Procter & Gamble Co. | | | 40.00 | | 01/11 | | | 1,050,450 |
| 50 | | The Procter & Gamble Co. | | | 35.00 | | 01/11 | | | 144,250 |
| 340 | | The Procter & Gamble Co. | | | 30.00 | | 01/11 | | | 1,118,600 |
| 176 | | The Procter & Gamble Co. | | | 40.00 | | 01/12 | | | 410,960 |
| 327 | | The Walt Disney Co. | | | 22.50 | | 01/11 | | | 416,925 |
| | | | | | | | | | | |
| Contracts | | Security
Description | | Strike
Price | | Expiration
Date | | Value | |
| 277 | | United Parcel Service, Inc. | | $ | 40.00 | | 01/12 | | $ | 674,495 | |
| 1,050 | | UnitedHealth Group, Inc. | | | 25.00 | | 01/11 | | | 937,125 | |
| 250 | | Walgreen Co. | | | 22.50 | | 01/11 | | | 366,250 | |
| 1,230 | | Walgreen Co. | | | 10.00 | | 01/11 | | | 3,327,150 | |
| 535 | | Walgreen Co. | | | 25.00 | | 01/12 | | | 690,150 | |
| 1,053 | | Wal-Mart Stores, Inc. | | | 30.00 | | 01/11 | | | 2,703,577 | |
| 730 | | Wal-Mart Stores, Inc. | | | 45.00 | | 01/12 | | | 868,700 | |
| 455 | | Wal-Mart Stores, Inc. | | | 40.00 | | 01/12 | | | 732,550 | |
| 475 | | Wal-Mart Stores, Inc. | | | 35.00 | | 01/12 | | | 983,250 | |
| 4,800 | | Wells Fargo & Co. | | | 30.00 | | 07/10 | | | 1,200,000 | |
| | | | | | | | | | | |
Total Call Options Purchased
(Premiums Paid $22,725,684) | | | 28,075,957 | |
| | | | | | | | | | | |
| Put Options Purchased - 0.2% | |
| 3,290 | | Boston Scientific Corp. | | | 5.00 | | 01/11 | | | 98,700 | |
| 75 | | International Business Machines Corp. | | | 115.00 | | 04/10 | | | 375 | |
| 450 | | iShares MSCI Emerging Markets | | | 40.00 | | 06/10 | | | 52,200 | |
| 1,000 | | SPDR S&P 500 ETF Trust | | | 110.00 | | 12/10 | | | 553,000 | |
| 500 | | SPDR S&P 500 ETF Trust | | | 50.00 | | 12/10 | | | 4,500 | |
| 17,400 | | SPDR S&P 500 ETF Trust | | | 90.00 | | 03/11 | | | 4,210,800 | |
| | | | | | | | | | | |
Total Put Options Purchased
(Premiums Paid $5,929,193) | | | 4,919,575 | |
| | | | | | | | | | | |
Total Purchased Options
(Premiums Paid $28,654,877) | | | 32,995,532 | |
| | | | | | | | | | | |
Total Long Positions - 84.4%
(Cost $1,641,758,797) | | $ | 1,864,277,213 | |
Total Short Positions - (31.2)%
(Cost $(625,458,042)) | | | (689,626,133 | ) |
Total Written Options - (0.4)%
(Premiums Received $(9,749,976)) | | | (7,780,843 | ) |
| Other Assets & Liabilities, Net - 47.2% | | | 1,043,238,528 | |
| | | | | | | | | | | |
| Net Assets - 100.0% | | $ | 2,210,108,765 | |
| | | | | | | | | | | |
| | | | |
| See Notes to Financial Statements. | | 36 | | ABSOLUTE FUNDS |
ABSOLUTE STRATEGIES FUND
SCHEDULE OF SECURITIES SOLD SHORT
MARCH 31, 2010
| | | | | | | |
| Shares | | | Security Description | | Value | |
| Short Positions - (31.2)% | | | | |
| Equity Securities - (25.7)% | | | | |
| Common Stock - (25.7)% | | | | |
| Consumer Discretionary - (5.0)% | | | | |
| (6,600 | ) | | Amazon.com, Inc. | | $ | (895,818 | ) |
| (33,300 | ) | | BJ’s Wholesale Club, Inc. | | | (1,231,767 | ) |
| (34,700 | ) | | Brookdale Senior Living, Inc. | | | (722,801 | ) |
| (44,300 | ) | | Burger King Holdings, Inc. | | | (941,818 | ) |
| (235,186 | ) | | Callaway Golf Co. | | | (2,074,341 | ) |
| (40,876 | ) | | Charming Shoppes, Inc. | | | (223,183 | ) |
| (28,907 | ) | | Chemed Corp. | | | (1,571,963 | ) |
| (8,500 | ) | | Chipotle Mexican Grill, Inc. | | | (957,695 | ) |
| (6,600 | ) | | Church & Dwight Co., Inc. | | | (441,870 | ) |
| (36,340 | ) | | Coinstar, Inc. | | | (1,181,050 | ) |
| (12,100 | ) | | CoStar Group, Inc. | | | (502,392 | ) |
| (38,600 | ) | | Costco Wholesale Corp. | | | (2,304,806 | ) |
| (53,800 | ) | | CTC Media, Inc. | | | (926,436 | ) |
| (71,599 | ) | | DSW, Inc., Class A | | | (1,827,922 | ) |
| (29,100 | ) | | Emeritus Corp. | | | (592,185 | ) |
| (56,887 | ) | | Empire Resorts, Inc. | | | (103,534 | ) |
| (65,269 | ) | | Equinix, Inc. | | | (6,353,284 | ) |
| (21,100 | ) | | Ethan Allen Interiors, Inc. | | | (435,293 | ) |
| (7,146 | ) | | Euronet Worldwide, Inc. | | | (131,701 | ) |
| (398,200 | ) | | Finisar Corp. | | | (6,255,722 | ) |
| (580,064 | ) | | Ford Motor Co. | | | (7,291,404 | ) |
| (30,800 | ) | | GameStop Corp., Class A | | | (674,828 | ) |
| (185,175 | ) | | Gaylord Entertainment Co. | | | (5,423,776 | ) |
| (29,300 | ) | | Genuine Parts Co. | | | (1,237,925 | ) |
| (91,167 | ) | | Group 1 Automotive, Inc. | | | (2,904,581 | ) |
| (47,100 | ) | | H&R Block, Inc. | | | (838,380 | ) |
| (15,500 | ) | | Hanesbrands, Inc. | | | (431,210 | ) |
| (29,200 | ) | | Harley-Davidson, Inc. | | | (819,644 | ) |
| (31,700 | ) | | Hasbro, Inc. | | | (1,213,476 | ) |
| (50,536 | ) | | Hertz Global Holdings, Inc. | | | (504,855 | ) |
| (25,000 | ) | | Hewitt Associates, Inc., Class A | | | (994,500 | ) |
| (31,400 | ) | | hhgregg, Inc. | | | (792,536 | ) |
| (28,900 | ) | | HNI Corp. | | | (769,607 | ) |
| (67,257 | ) | | Iconix Brand Group, Inc. | | | (1,033,068 | ) |
| (364,866 | ) | | Interpublic Group of Cos., Inc. | | | (3,035,685 | ) |
| (207,577 | ) | | Jakks Pacific, Inc. | | | (2,708,880 | ) |
| (19,100 | ) | | JC Penney Co., Inc. | | | (614,447 | ) |
| (20,400 | ) | | K12, Inc. | | | (453,084 | ) |
| (9,800 | ) | | Kohl’s Corp. | | | (536,844 | ) |
| (20,500 | ) | | Lamar Advertising Co., Class A | | | (704,175 | ) |
| (26,000 | ) | | Landauer, Inc. | | | (1,695,720 | ) |
| (19,100 | ) | | Las Vegas Sands Corp. | | | (403,965 | ) |
| (30,000 | ) | | Live Nation Entertainment, Inc. | | | (435,000 | ) |
| (38,200 | ) | | Marriott International, Inc., Class A | | | (1,204,064 | ) |
| (3,200 | ) | | McDonald’s Corp. | | | (213,504 | ) |
| (72,000 | ) | | MGM Mirage | | | (864,000 | ) |
| (66,500 | ) | | Mobile Mini, Inc. | | | (1,030,085 | ) |
| (15,700 | ) | | Monro Muffler Brake, Inc. | | | (561,432 | ) |
| (25,750 | ) | | Navistar International Corp. | | | (1,152,570 | ) |
| | | | | | | |
| Shares | | | Security Description | | Value | |
| (5,800 | ) | | Nike, Inc., Class B | | $ | (426,300 | ) |
| (42,700 | ) | | O’Reilly Automotive, Inc. | | | (1,781,017 | ) |
| (100,400 | ) | | Orient-Express Hotels, Ltd., Class A | | | (1,423,672 | ) |
| (13,100 | ) | | Owens & Minor, Inc. | | | (607,709 | ) |
| (58,600 | ) | | PACCAR, Inc. | | | (2,539,724 | ) |
| (18,500 | ) | | Pool Corp. | | | (418,840 | ) |
| (6,065 | ) | | priceline.com, Inc. | | | (1,546,575 | ) |
| (20,600 | ) | | Rackspace Hosting, Inc. | | | (385,838 | ) |
| (260,682 | ) | | Regis Corp. | | | (4,869,540 | ) |
| (96,612 | ) | | Saks, Inc. | | | (830,863 | ) |
| (186,397 | ) | | Sonic Automotive, Inc., Class A | | | (2,050,367 | ) |
| (37,900 | ) | | Staples, Inc. | | | (886,481 | ) |
| (36,400 | ) | | Starbucks Corp. | | | (883,428 | ) |
| (17,100 | ) | | Starwood Hotels & Resorts Worldwide, Inc. | | | (797,544 | ) |
| (52,400 | ) | | The Goodyear Tire & Rubber Co. | | | (662,336 | ) |
| (24,600 | ) | | The McGraw-Hill Cos., Inc. | | | (876,990 | ) |
| (26,500 | ) | | The Walt Disney Co. | | | (925,115 | ) |
| (14,300 | ) | | Time Warner Cable, Inc. | | | (762,333 | ) |
| (571,691 | ) | | Titan International, Inc. | | | (4,990,862 | ) |
| (66,900 | ) | | TiVo, Inc. | | | (1,145,328 | ) |
| (107,900 | ) | | Total System Services, Inc. | | | (1,689,714 | ) |
| (79,404 | ) | | TRW Automotive Holdings Corp. | | | (2,269,366 | ) |
| (46,400 | ) | | Vail Resorts, Inc. | | | (1,860,176 | ) |
| (6,300 | ) | | VF Corp. | | | (504,945 | ) |
| (21,500 | ) | | Viad Corp. | | | (441,825 | ) |
| (12,800 | ) | | Walgreen Co. | | | (474,752 | ) |
| (3,700 | ) | | Wal-Mart Stores, Inc. | | | (205,720 | ) |
| (37,900 | ) | | Weight Watchers International, Inc. | | | (967,587 | ) |
| (12,200 | ) | | Wynn Resorts, Ltd. | | | (925,126 | ) |
| (23,700 | ) | | Yum! Brands, Inc. | | | (908,421 | ) |
| | | | | | | |
| | | | | | (109,277,320 | ) |
| | | | | | | |
| Consumer Staples - (0.7)% | | | | |
| (25,500 | ) | | Avon Products, Inc. | | | (863,685 | ) |
| (28,958 | ) | | Bunge, Ltd. | | | (1,784,681 | ) |
| (95,600 | ) | | CardioNet, Inc. | | | (731,340 | ) |
| (30,417 | ) | | Central European Distribution Corp. | | | (1,064,899 | ) |
| (36,667 | ) | | Chiquita Brands International, Inc. | | | (576,772 | ) |
| (73,900 | ) | | Dean Foods Co. | | | (1,159,491 | ) |
| (54,494 | ) | | Dole Food Co., Inc. | | | (645,754 | ) |
| (35,100 | ) | | Flowers Foods, Inc. | | | (868,374 | ) |
| (53,400 | ) | | Great Atlantic & Pacific Tea Co. | | | (409,578 | ) |
| (6,900 | ) | | Green Mountain Coffee Roasters, Inc. | | | (668,058 | ) |
| (22,700 | ) | | Hansen Natural Corp. | | | (984,726 | ) |
| (90,736 | ) | | Smithfield Foods, Inc. | | | (1,881,865 | ) |
| (11,934 | ) | | Spartan Stores, Inc. | | | (172,088 | ) |
| (25,700 | ) | | The Estee Lauder Cos., Inc., Class A | | | (1,667,159 | ) |
| (46,500 | ) | | The Hain Celestial Group, Inc. | | | (806,775 | ) |
| (9,500 | ) | | The Kroger Co. | | | (205,770 | ) |
| (38,800 | ) | | Whole Foods Market, Inc. | | | (1,402,620 | ) |
| | | | | | | |
| | | | | | (15,893,635 | ) |
| | | | | | | |
| | | | |
| See Notes to Financial Statements. | | 37 | | ABSOLUTE FUNDS |
ABSOLUTE STRATEGIES FUND
SCHEDULE OF SECURITIES SOLD SHORT
MARCH 31, 2010
| | | | | | | |
| Shares | | | Security Description | | Value | |
| Energy - (1.8)% | | | | |
| (29,800 | ) | | Andarko Petroleum Corp. | | $ | (2,170,334 | ) |
| (58,185 | ) | | ATP Oil & Gas Corp. | | | (1,094,460 | ) |
| (167,238 | ) | | BPZ Resources, Inc. | | | (1,229,199 | ) |
| (45,800 | ) | | Brigham Exploration Co. | | | (730,510 | ) |
| (36,500 | ) | | Cameron International Corp. | | | (1,564,390 | ) |
| (18,100 | ) | | Clean Energy Fuels Corp. | | | (412,318 | ) |
| (31,200 | ) | | CNX Gas Corp. | | | (1,187,160 | ) |
| (161,500 | ) | | Covanta Holding Corp. | | | (2,690,590 | ) |
| (33,200 | ) | | Dresser-Rand Group, Inc. | | | (1,043,144 | ) |
| (20,400 | ) | | EOG Resources, Inc. | | | (1,895,976 | ) |
| (39,566 | ) | | Exterran Holdings, Inc. | | | (956,310 | ) |
| (3,000 | ) | | First Solar, Inc. | | | (367,950 | ) |
| (52,400 | ) | | Forest Oil Corp. | | | (1,352,968 | ) |
| (18,843 | ) | | Global Industries, Ltd. | | | (120,972 | ) |
| (10,796 | ) | | GMX Resources, Inc. | | | (88,743 | ) |
| (50,640 | ) | | Goodrich Petroleum Corp. | | | (792,009 | ) |
| (520,419 | ) | | International Coal Group, Inc. | | | (2,378,315 | ) |
| (15,103 | ) | | James River Coal Co. | | | (240,138 | ) |
| (6,200 | ) | | Noble Energy, Inc. | | | (452,600 | ) |
| (47,300 | ) | | Patriot Coal Corp. | | | (967,758 | ) |
| (8,188 | ) | | Peabody Energy Corp. | | | (374,192 | ) |
| (22,562 | ) | | Penn Virginia Corp. | | | (552,769 | ) |
| (82,100 | ) | | Petrohawk Energy Corp. | | | (1,664,988 | ) |
| (13,318 | ) | | Pioneer Natural Resources Co. | | | (750,070 | ) |
| (47,300 | ) | | Plains Exploration & Production Co. | | | (1,418,527 | ) |
| (35,900 | ) | | Pride International, Inc. | | | (1,080,949 | ) |
| (49,400 | ) | | Range Resources Corp. | | | (2,315,378 | ) |
| (32,644 | ) | | SandRidge Energy, Inc. | | | (251,359 | ) |
| (41,400 | ) | | Seahawk Drilling, Inc. | | | (780,390 | ) |
| (89,900 | ) | | Spectra Energy Corp. | | | (2,025,447 | ) |
| (39,300 | ) | | TransCanada Corp. | | | (1,444,668 | ) |
| (5,800 | ) | | Transocean, Ltd. | | | (501,004 | ) |
| (99,600 | ) | | Weatherford International, Ltd. | | | (1,579,656 | ) |
| (58,342 | ) | | Western Refining, Inc. | | | (320,881 | ) |
| (36,045 | ) | | Whiting Petroleum Corp. | | | (2,913,878 | ) |
| | | | | | | |
| | | | | | (39,710,000 | ) |
| | | | | | | |
| Financial - (3.6)% | | | | |
| (12,150 | ) | | Affiliated Managers Group, Inc. | | | (959,850 | ) |
| (30,829 | ) | | Alexandria Real Estate Equities, Inc. REIT | | | (2,084,040 | ) |
| (16,300 | ) | | AMB Property Corp. REIT | | | (444,012 | ) |
| (17,460 | ) | | AmeriCredit Corp. | | | (414,850 | ) |
| (25,873 | ) | | Annaly Capital Management, Inc. REIT | | | (444,498 | ) |
| (26,400 | ) | | AON Corp. | | | (1,127,544 | ) |
| (31,500 | ) | | Arthur J Gallagher & Co. | | | (773,325 | ) |
| (61,400 | ) | | Aspen Insurance Holdings, Ltd. | | | (1,770,776 | ) |
| (105,200 | ) | | Associated Banc-Corp. | | | (1,451,760 | ) |
| (61,227 | ) | | Bank of America Corp. | | | (1,092,902 | ) |
| (18,300 | ) | | Capitol Federal Financial | | | (685,518 | ) |
| (139,400 | ) | | Cathay General Bancorp | | | (1,624,010 | ) |
| (141,303 | ) | | CBIZ, Inc. | | | (928,361 | ) |
| (11,700 | ) | | City National Corp. | | | (631,449 | ) |
| | | | | | | |
| Shares | | | Security Description | | Value | |
| (140,557 | ) | | Cousins Properties, Inc. REIT | | $ | (1,168,029 | ) |
| (43,400 | ) | | Developers Diversified Realty Corp. REIT | | | (528,178 | ) |
| (15,500 | ) | | Entertainment Properties Trust REIT | | | (637,515 | ) |
| (34,300 | ) | | Federated Investors, Inc., Class B | | | (904,834 | ) |
| (67,500 | ) | | Fifth Third Bancorp | | | (917,325 | ) |
| (99,832 | ) | | First Horizon National Corp. | | | (1,402,640 | ) |
| (48,600 | ) | | First Niagara Financial Group, Inc. | | | (691,092 | ) |
| (60,300 | ) | | FirstMerit Corp. | | | (1,300,671 | ) |
| (105,261 | ) | | Forest City Enterprises, Inc., Class A | | | (1,516,811 | ) |
| (59,700 | ) | | Glacier Bancorp, Inc. | | | (909,231 | ) |
| (366,100 | ) | | GLG Partners, Inc. | | | (1,123,927 | ) |
| (29,200 | ) | | Global Payments, Inc. | | | (1,330,060 | ) |
| (13,372 | ) | | Hartford Financial Services Group, Inc. | | | (380,032 | ) |
| (97,500 | ) | | Hilltop Holdings, Inc. | | | (1,145,625 | ) |
| (26,600 | ) | | Hospitality Properties Trust REIT | | | (637,070 | ) |
| (21,000 | ) | | Iberiabank Corp. | | | (1,260,210 | ) |
| (97,700 | ) | | Inland Real Estate Corp. REIT | | | (893,955 | ) |
| (43,100 | ) | | Interactive Brokers Group, Inc., Class A | | | (696,065 | ) |
| (60,900 | ) | | Interactive Data Corp. | | | (1,948,800 | ) |
| (181,200 | ) | | Investors Real Estate Trust REIT | | | (1,634,424 | ) |
| (66,800 | ) | | KeyCorp | | | (517,700 | ) |
| (46,100 | ) | | Kimco Realty Corp. REIT | | | (721,004 | ) |
| (119,078 | ) | | KKR Financial Holdings, LLC | | | (977,630 | ) |
| (23,300 | ) | | Lazard, Ltd., Class A | | | (831,810 | ) |
| (36,400 | ) | | Leucadia National Corp. | | | (903,084 | ) |
| (104,085 | ) | | Lexington Realty Trust REIT | | | (677,593 | ) |
| (35,000 | ) | | Lincoln National Corp. | | | (1,074,500 | ) |
| (40,900 | ) | | Marsh & McLennan Cos., Inc. | | | (998,778 | ) |
| (46,700 | ) | | Marshall & Ilsley Corp. | | | (375,935 | ) |
| (65,700 | ) | | MB Financial, Inc. | | | (1,480,221 | ) |
| (10,900 | ) | | MetLife, Inc. | | | (472,406 | ) |
| (230,561 | ) | | MF Global Holdings, Ltd. | | | (1,860,627 | ) |
| (33,600 | ) | | Moody’s Corp. | | | (999,600 | ) |
| (29,900 | ) | | Morgan Stanley | | | (875,771 | ) |
| (17,000 | ) | | Morningstar, Inc. | | | (817,530 | ) |
| (214,500 | ) | | National Penn Bancshares, Inc. | | | (1,480,050 | ) |
| (18,900 | ) | | Northern Trust Corp. | | | (1,044,414 | ) |
| (93,300 | ) | | Old National Bancorp | | | (1,114,935 | ) |
| (112,100 | ) | | Old Republic International Corp. | | | (1,421,428 | ) |
| (34,900 | ) | | Paychex, Inc. | | | (1,071,430 | ) |
| (80,639 | ) | | Penson Worldwide, Inc. | | | (812,035 | ) |
| (100,300 | ) | | Pinnacle Financial Partners, Inc. | | | (1,515,533 | ) |
| (33,800 | ) | | Principal Financial Group, Inc. | | | (987,298 | ) |
| (76,000 | ) | | PrivateBancorp, Inc. | | | (1,041,200 | ) |
| (25,900 | ) | | Protective Life Corp. | | | (569,541 | ) |
| (106,300 | ) | | Ramco-Gershenson Properties Trust REIT | | | (1,196,938 | ) |
| (23,400 | ) | | Regency Centers Corp. REIT | | | (876,798 | ) |
| (124,200 | ) | | Regions Financial Corp. | | | (974,970 | ) |
| (13,700 | ) | | SL Green Realty Corp. REIT | | | (784,599 | ) |
| (260,955 | ) | | SLM Corp. | | | (3,267,157 | ) |
| (267,800 | ) | | Sterling Bancshares, Inc. | | | (1,494,324 | ) |
| (38,200 | ) | | SunTrust Banks, Inc. | | | (1,023,378 | ) |
| (49,400 | ) | | TD Ameritrade Holding Corp. | | | (941,564 | ) |
| (98,100 | ) | | Umpqua Holdings Corp. | | | (1,300,806 | ) |
| | | | |
| See Notes to Financial Statements. | | 38 | | ABSOLUTE FUNDS |
ABSOLUTE STRATEGIES FUND
SCHEDULE OF SECURITIES SOLD SHORT
MARCH 31, 2010
| | | | | | | |
| Shares | | | Security Description | | Value | |
| (178,400 | ) | | United Community Banks, Inc. | | $ | (786,744 | ) |
| (31,815 | ) | | Valley National Bancorp | | | (488,996 | ) |
| (74,500 | ) | | Washington Federal, Inc. | | | (1,513,840 | ) |
| (101,900 | ) | | Western Alliance Bancorp | | | (579,811 | ) |
| (96,900 | ) | | Whitney Holding Corp. | | | (1,336,251 | ) |
| (30,800 | ) | | Willis Group Holdings PLC | | | (963,732 | ) |
| (67,600 | ) | | Wilmington Trust Corp. | | | (1,120,132 | ) |
| (23,400 | ) | | Zions Bancorp. | | | (510,588 | ) |
| | | | | | | |
| | | | | | (79,262,070 | ) |
| | | | | | | |
| Healthcare - (4.2)% | | | | |
| (21,000 | ) | | Allscripts-Misys Healthcare Solutions, Inc. | | | (410,760 | ) |
| (366,282 | ) | | American Medical Systems Holdings, Inc. | | | (6,805,520 | ) |
| (48,968 | ) | | Amylin Pharmaceuticals, Inc. | | | (1,101,290 | ) |
| (25,100 | ) | | athenahealth, Inc. | | | (917,656 | ) |
| (21,285 | ) | | ATS Medical, Inc. | | | (55,341 | ) |
| (8,800 | ) | | Baxter International, Inc. | | | (512,160 | ) |
| (16,500 | ) | | Becton Dickinson and Co. | | | (1,299,045 | ) |
| (205,755 | ) | | BioMarin Pharmaceuticals, Inc. | | | (4,808,494 | ) |
| (130,500 | ) | | Biovail Corp. | | | (2,188,485 | ) |
| (14,300 | ) | | Cerner Corp. | | | (1,216,358 | ) |
| (37,600 | ) | | Covance, Inc. | | | (2,308,264 | ) |
| (118,392 | ) | | Cubist Pharmaceuticals, Inc. | | | (2,668,556 | ) |
| (29,100 | ) | | Dendreon Corp. | | | (1,061,277 | ) |
| (21,400 | ) | | Edwards Lifesciences Corp. | | | (2,116,032 | ) |
| (126,500 | ) | | Endo Pharmaceuticals Holdings, Inc. | | | (2,996,785 | ) |
| (23,900 | ) | | Gen-Probe, Inc. | | | (1,195,000 | ) |
| (3,200 | ) | | Gilead Sciences, Inc. | | | (145,536 | ) |
| (50,441 | ) | | Greatbatch, Inc. | | | (1,068,845 | ) |
| (68,139 | ) | | Healthsouth Corp. | | | (1,274,199 | ) |
| (19,400 | ) | | HMS Holdings Corp. | | | (989,206 | ) |
| (23,634 | ) | | Hologic, Inc. | | | (438,174 | ) |
| (33,700 | ) | | Illumina, Inc. | | | (1,310,930 | ) |
| (95,900 | ) | | Immunogen, Inc. | | | (775,831 | ) |
| (306,600 | ) | | Incyte Corp., Ltd. | | | (4,280,136 | ) |
| (137,006 | ) | | Insulet Corp. | | | (2,067,420 | ) |
| (34,324 | ) | | Invacare Corp. | | | (910,959 | ) |
| (30,267 | ) | | Inverness Medical Innovations, Inc. | | | (1,181,321 | ) |
| (61,400 | ) | | Isis Pharmaceuticals, Inc. | | | (670,488 | ) |
| (84,827 | ) | | Kinetic Concepts, Inc. | | | (4,055,579 | ) |
| (9,071 | ) | | King Pharmaceuticals, Inc. | | | (106,675 | ) |
| (27,165 | ) | | LifePoint Hospitals, Inc. | | | (999,129 | ) |
| (19,200 | ) | | Luminex Corp. | | | (323,136 | ) |
| (17,800 | ) | | McKesson Corp. | | | (1,169,816 | ) |
| (24,876 | ) | | Molina Healthcare, Inc. | | | (626,129 | ) |
| (405,414 | ) | | Mylan, Inc. | | | (9,206,952 | ) |
| (32,900 | ) | | Myriad Genetics, Inc. | | | (791,245 | ) |
| (18,083 | ) | | Nektar Therapeutics | | | (275,042 | ) |
| (107,487 | ) | | NovaMed, Inc. | | | (365,456 | ) |
| (35,100 | ) | | NuVasive, Inc. | | | (1,586,520 | ) |
| (27,127 | ) | | Omnicare, Inc. | | | (767,423 | ) |
| (38,500 | ) | | Patterson Cos., Inc. | | | (1,195,425 | ) |
| | | | | | | |
| Shares | | | Security Description | | Value | |
| (223,008 | ) | | PDL BioPharma, Inc. | | $ | (1,384,880 | ) |
| (29,900 | ) | | Pharmaceutical Product Development, Inc. | | | (710,125 | ) |
| (151,400 | ) | | PSS World Medical, Inc. | | | (3,559,414 | ) |
| (73,400 | ) | | Qiagen NV | | | (1,687,466 | ) |
| (20,294 | ) | | SonoSite, Inc. | | | (651,640 | ) |
| (11,200 | ) | | St Jude Medical, Inc. | | | (459,760 | ) |
| (27,100 | ) | | STERIS Corp. | | | (912,186 | ) |
| (34,500 | ) | | SurModics, Inc. | | | (722,430 | ) |
| (10,400 | ) | | The Cooper Cos., Inc. | | | (404,352 | ) |
| (44,940 | ) | | Theravance, Inc. | | | (598,601 | ) |
| (55,700 | ) | | VCA Antech, Inc. | | | (1,561,271 | ) |
| (24,200 | ) | | Vertex Pharmaceuticals, Inc. | | | (989,054 | ) |
| (242,149 | ) | | Viropharma, Inc. | | | (3,300,491 | ) |
| (89,000 | ) | | Vivus, Inc. | | | (776,080 | ) |
| (16,300 | ) | | Volcano Corp. | | | (393,808 | ) |
| (32,052 | ) | | West Pharmaceutical Services, Inc. | | | (1,344,581 | ) |
| (110,031 | ) | | Wright Medical Group, Inc. | | | (1,955,251 | ) |
| (93,400 | ) | | XenoPort, Inc. | | | (864,884 | ) |
| | | | | | | |
| | | | | | (90,518,869 | ) |
| | | | | | | |
| Industrial - (3.7)% | | | | |
| (34,380 | ) | | AAR Corp. | | | (853,312 | ) |
| (47,200 | ) | | Aecom Technology Corp. | | | (1,339,064 | ) |
| (43,500 | ) | | Aerovironment, Inc. | | | (1,135,785 | ) |
| (775,723 | ) | | AirTran Holdings, Inc. | | | (3,940,673 | ) |
| (13,100 | ) | | American Science & Engineering, Inc. | | | (981,452 | ) |
| (131,929 | ) | | AMR Corp. | | | (1,201,873 | ) |
| (22,100 | ) | | Bristow Group, Inc. | | | (833,833 | ) |
| (97,365 | ) | | C&D Technologies, Inc. | | | (155,784 | ) |
| (31,500 | ) | | Caterpillar, Inc. | | | (1,979,775 | ) |
| (185,080 | ) | | Cemex SAB de CV, ADR | | | (1,889,667 | ) |
| (15,000 | ) | | CH Robinson Worldwide, Inc. | | | (837,750 | ) |
| (30,800 | ) | | Clean Harbors, Inc. | | | (1,711,248 | ) |
| (37,300 | ) | | Commercial Metals Co. | | | (561,738 | ) |
| (35,700 | ) | | Con-way, Inc. | | | (1,253,784 | ) |
| (25,000 | ) | | Danaher Corp. | | | (1,997,750 | ) |
| (12,600 | ) | | Deere & Co. | | | (749,196 | ) |
| (31,400 | ) | | Eagle Materials, Inc. | | | (833,356 | ) |
| (14,100 | ) | | Energizer Holdings, Inc. | | | (884,916 | ) |
| (146,700 | ) | | Energy Recovery, Inc. | | | (924,210 | ) |
| (12,613 | ) | | EnerSys | | | (311,037 | ) |
| (67,166 | ) | | FEI Co. | | | (1,538,773 | ) |
| (19,300 | ) | | Fluor Corp. | | | (897,643 | ) |
| (13,000 | ) | | GATX Corp. | | | (372,450 | ) |
| (54,909 | ) | | GenCorp, Inc. | | | (316,276 | ) |
| (118,400 | ) | | General Electric Co. | | | (2,154,880 | ) |
| (11,800 | ) | | Genesee & Wyoming, Inc. | | | (402,616 | ) |
| (14,700 | ) | | Goodrich Corp. | | | (1,036,644 | ) |
| (27,300 | ) | | Gulfmark Offshore, Inc. | | | (724,815 | ) |
| (20,400 | ) | | Honeywell International, Inc. | | | (923,508 | ) |
| (367,500 | ) | | Ingersoll-Rand PLC | | | (12,814,725 | ) |
| (18,300 | ) | | Jacobs Engineering Group, Inc. | | | (826,977 | ) |
| (60,454 | ) | | Kansas City Southern | | | (2,186,621 | ) |
| | | | |
| See Notes to Financial Statements. | | 39 | | ABSOLUTE FUNDS |
ABSOLUTE STRATEGIES FUND
SCHEDULE OF SECURITIES SOLD SHORT
MARCH 31, 2010
| | | | | | | |
| Shares | | | Security Description | | Value | |
| (107,100 | ) | | Kelly Services, Inc., Class A | | $ | (1,784,286 | ) |
| (22,300 | ) | | Kennametal, Inc. | | | (627,076 | ) |
| (27,600 | ) | | Lennox International, Inc. | | | (1,223,232 | ) |
| (21,600 | ) | | ManPower, Inc. | | | (1,233,792 | ) |
| (17,500 | ) | | Martin Marietta Materials, Inc. | | | (1,462,125 | ) |
| (24,800 | ) | | Matthews International Corp., Class A | | | (880,400 | ) |
| (20,000 | ) | | Moog, Inc., Class A | | | (708,400 | ) |
| (36,800 | ) | | National Instruments Corp. | | | (1,227,280 | ) |
| (24,500 | ) | | OSI Systems, Inc. | | | (687,225 | ) |
| (24,900 | ) | | Owens-Illinois, Inc. | | | (884,946 | ) |
| (24,600 | ) | | Pall Corp. | | | (996,054 | ) |
| (16,113 | ) | | PHH Corp. | | | (379,783 | ) |
| (7,400 | ) | | Regal-Beloit Corp. | | | (439,634 | ) |
| (21,500 | ) | | Resources Connection, Inc. | | | (412,155 | ) |
| (51,800 | ) | | Roper Industries, Inc. | | | (2,996,112 | ) |
| (31,300 | ) | | RTI International Metals, Inc. | | | (949,329 | ) |
| (52,200 | ) | | SAIC, Inc. | | | (923,940 | ) |
| (101,400 | ) | | SuccessFactors, Inc. | | | (1,930,656 | ) |
| (26,155 | ) | | SunPower Corp., Class A | | | (494,330 | ) |
| (99,700 | ) | | Terex Corp. | | | (2,264,187 | ) |
| (67,084 | ) | | Textron, Inc. | | | (1,424,193 | ) |
| (43,400 | ) | | The Brink’s Co. | | | (1,225,182 | ) |
| (19,600 | ) | | Tidewater, Inc. | | | (926,492 | ) |
| (20,800 | ) | | Towers Watson & Co., Class A | | | (988,000 | ) |
| (11,000 | ) | | TransDigm Group, Inc. | | | (583,440 | ) |
| (37,500 | ) | | Trimble Navigation, Ltd. | | | (1,077,000 | ) |
| (31,315 | ) | | Trinity Industries, Inc. | | | (625,047 | ) |
| (24,000 | ) | | Wabtec Corp. | | | (1,010,880 | ) |
| (46,000 | ) | | Waste Management, Inc. | | | (1,583,780 | ) |
| (18,200 | ) | | Waters Corp. | | | (1,229,228 | ) |
| (32,800 | ) | | Zebra Technologies Corp., Class A | | | (970,880 | ) |
| | | | | | | |
| | | | | | (82,721,195 | ) |
| | | | | | | |
| Information Technology - (3.4)% | | | | |
| (36,400 | ) | | 3PAR, Inc. | | | (364,000 | ) |
| (15,552 | ) | | Advanced Micro Devices, Inc. | | | (144,167 | ) |
| (38,600 | ) | | Akamai Technologies, Inc. | | | (1,212,426 | ) |
| (29,400 | ) | | Analog Devices, Inc. | | | (847,308 | ) |
| (1,200 | ) | | Apple, Inc. | | | (281,916 | ) |
| (37,800 | ) | | ArcSight, Inc. | | | (1,064,070 | ) |
| (36,500 | ) | | Automatic Data Processing, Inc. | | | (1,623,155 | ) |
| (28,900 | ) | | Broadcom Corp., Class A | | | (958,902 | ) |
| (48,300 | ) | | CA, Inc. | | | (1,133,601 | ) |
| (71,790 | ) | | CACI International, Inc., Class A | | | (3,506,941 | ) |
| (5,766 | ) | | Cogent Communications Group, Inc. | | | (60,024 | ) |
| (58,800 | ) | | Compellent Technologies, Inc. | | | (1,031,940 | ) |
| (21,200 | ) | | Computer Programs and Systems, Inc. | | | (828,496 | ) |
| (24,350 | ) | | Concur Technologies, Inc. | | | (998,593 | ) |
| (60,500 | ) | | Constant Contact, Inc. | | | (1,404,810 | ) |
| (11,200 | ) | | Cree, Inc. | | | (786,464 | ) |
| (4,051 | ) | | CSG Systems International, Inc. | | | (84,909 | ) |
| (60,800 | ) | | Dell, Inc. | | | (912,608 | ) |
| (35,200 | ) | | Digital River, Inc. | | | (1,066,560 | ) |
| (304,355 | ) | | Earthlink, Inc. | | | (2,599,192 | ) |
| | | | | | | |
| Shares | | | Security Description | | Value | |
| (97,000 | ) | | Electronic Arts, Inc. | | $ | (1,810,020 | ) |
| (90,001 | ) | | Epicor Software Corp. | | | (860,410 | ) |
| (29,200 | ) | | EPIQ Systems, Inc. | | | (362,956 | ) |
| (20,000 | ) | | IHS, Inc., Class A | | | (1,069,400 | ) |
| (87,000 | ) | | Informatica Corp. | | | (2,336,820 | ) |
| (35,100 | ) | | Linear Technology Corp. | | | (992,628 | ) |
| (32,500 | ) | | Maxwell Technologies, Inc. | | | (402,675 | ) |
| (52,600 | ) | | MedAssets, Inc. | | | (1,104,600 | ) |
| (43,100 | ) | | MEMC Electronic Materials, Inc. | | | (660,723 | ) |
| (48,970 | ) | | Mentor Graphics Corp. | | | (392,739 | ) |
| (58,100 | ) | | Microchip Technology, Inc. | | | (1,636,096 | ) |
| (163,175 | ) | | Micron Technology, Inc. | | | (1,695,388 | ) |
| (40,200 | ) | | National Semiconductor Corp. | | | (580,890 | ) |
| (22,900 | ) | | NetApp, Inc. | | | (745,624 | ) |
| (5,400 | ) | | Netease.com, ADR | | | (191,538 | ) |
| (97,500 | ) | | Netezza Corp. | | | (1,247,025 | ) |
| (15,500 | ) | | NetSuite, Inc. | | | (225,370 | ) |
| (90,300 | ) | | Nuance Communications, Inc. | | | (1,502,592 | ) |
| (617,150 | ) | | ON Semiconductor Corp. | | | (4,937,200 | ) |
| (61,700 | ) | | Palm, Inc. | | | (231,992 | ) |
| (21,600 | ) | | Pegasystems, Inc. | | | (799,200 | ) |
| (5,800 | ) | | Quality Systems, Inc. | | | (356,352 | ) |
| (79,818 | ) | | Radisys Corp. | | | (715,169 | ) |
| (131,028 | ) | | Rambus, Inc. | | | (2,862,962 | ) |
| (2,600 | ) | | Research In Motion, Ltd. | | | (192,270 | ) |
| (3,443 | ) | | Rovi Corp. | | | (127,839 | ) |
| (5,400 | ) | | Salesforce.com, Inc. | | | (402,030 | ) |
| (2,835 | ) | | SanDisk Corp. | | | (98,176 | ) |
| (199,076 | ) | | Seagate Technology | | | (3,635,128 | ) |
| (40,300 | ) | | SEI Investments Co. | | | (885,391 | ) |
| (24,600 | ) | | Sybase, Inc. | | | (1,146,852 | ) |
| (59,600 | ) | | Symantec Corp. | | | (1,008,432 | ) |
| (89,752 | ) | | SYNNEX Corp. | | | (2,653,069 | ) |
| (294,324 | ) | | Take-Two Interactive Software, Inc. | | | (2,899,091 | ) |
| (320,388 | ) | | TeleCommunication Systems, Inc., Class A | | | (2,348,444 | ) |
| (157,557 | ) | | Teradyne, Inc. | | | (1,759,912 | ) |
| (155,074 | ) | | THQ, Inc. | | | (1,087,069 | ) |
| (51,900 | ) | | Ultimate Software Group, Inc. | | | (1,710,105 | ) |
| (29,800 | ) | | Varian Semiconductor Equipment Associates, Inc. | | | (986,976 | ) |
| (116,820 | ) | | Veeco Instruments, Inc. | | | (5,081,670 | ) |
| (74,915 | ) | | Verigy, Ltd. | | | (837,550 | ) |
| (11,200 | ) | | VMWare, Inc., Class A | | | (596,960 | ) |
| | | | | | | |
| | | | | | (76,087,415 | ) |
| | | | | | | |
| Materials - (1.3)% | | | | |
| (13,000 | ) | | Albemarle Corp. | | | (554,190 | ) |
| (86,100 | ) | | Alcoa, Inc. | | | (1,226,064 | ) |
| (68,100 | ) | | Avery Dennison Corp. | | | (2,479,521 | ) |
| (14,200 | ) | | Compass Minerals International, Inc. | | | (1,139,266 | ) |
| (13,600 | ) | | Deltic Timber Corp. | | | (599,080 | ) |
| (18,100 | ) | | Ecolab, Inc. | | | (795,495 | ) |
| (62,610 | ) | | Goldcorp, Inc. | | | (2,330,344 | ) |
| | | | |
| See Notes to Financial Statements. | | 40 | | ABSOLUTE FUNDS |
ABSOLUTE STRATEGIES FUND
SCHEDULE OF SECURITIES SOLD SHORT
MARCH 31, 2010
| | | | | | | |
| Shares | | | Security Description | | Value | |
| (18,400 | ) | | Intrepid Potash, Inc. | | $ | (558,072 | ) |
| (329,636 | ) | | Jaguar Mining, Inc. | | | (3,035,948 | ) |
| (38,520 | ) | | Kaiser Aluminum Corp. | | | (1,485,716 | ) |
| (2,800 | ) | | Monsanto Co. | | | (199,976 | ) |
| (20,400 | ) | | Nucor Corp. | | | (925,752 | ) |
| (9,900 | ) | | Potash Corp. of Saskatchewan, Inc. | | | (1,181,565 | ) |
| (10,500 | ) | | PPG Industries, Inc. | | | (686,700 | ) |
| (20,800 | ) | | Rayonier, Inc. | | | (944,944 | ) |
| (19,000 | ) | | Royal Gold, Inc. | | | (877,990 | ) |
| (16,700 | ) | | Schweitzer-Mauduit International, Inc. | | | (794,252 | ) |
| (32,300 | ) | | Sensient Technologies Corp. | | | (938,638 | ) |
| (18,142 | ) | | Steel Dynamics, Inc. | | | (316,941 | ) |
| (9,210 | ) | | Sterlite Industries India, Ltd., ADR | | | (171,398 | ) |
| (15,000 | ) | | The Mosaic Co. | | | (911,550 | ) |
| (18,300 | ) | | The Sherwin-Williams Co. | | | (1,238,544 | ) |
| (50,500 | ) | | Thompson Creek Metals Co., Inc. | | | (683,265 | ) |
| (32,802 | ) | | United States Steel Corp. | | | (2,083,583 | ) |
| (41,000 | ) | | Vulcan Materials Co. | | | (1,936,840 | ) |
| (24,500 | ) | | Weyerhaeuser Co. | | | (1,109,115 | ) |
| | | | | | | |
| | | | | | (29,204,749 | ) |
| | | | | | | |
| Telecommunication Services - (1.2)% | | | | |
| (65,247 | ) | | ADC Telecommunications, Inc. | | | (476,956 | ) |
| (35,000 | ) | | Adtran, Inc. | | | (922,250 | ) |
| (150,154 | ) | | Alaska Communications Systems Group, Inc. | | | (1,219,251 | ) |
| (202,617 | ) | | Ciena Corp. | | | (3,087,883 | ) |
| (121,727 | ) | | CommScope, Inc. | | | (3,410,791 | ) |
| (101,360 | ) | | Comtech Telecommunications Corp. | | | (3,242,506 | ) |
| (3,457 | ) | | Leap Wireless International, Inc. | | | (56,557 | ) |
| (42,300 | ) | | Neutral Tandem, Inc. | | | (675,954 | ) |
| (52,200 | ) | | SAVVIS, Inc. | | | (861,300 | ) |
| (398,455 | ) | | Sirius XM Radio, Inc. | | | (346,855 | ) |
| (34,600 | ) | | Sycamore Networks, Inc. | | | (695,806 | ) |
| (12,000 | ) | | Telefonos de Mexico SAB de CV, ADR, Class L | | | (187,200 | ) |
| (51,300 | ) | | Thomson Reuters Corp. | | | (1,862,190 | ) |
| (51,082 | ) | | TW Telecom, Inc. | | | (927,138 | ) |
| (310,936 | ) | | Virgin Media, Inc. | | | (5,366,755 | ) |
| (79,938 | ) | | WebMD Health Corp. | | | (3,707,524 | ) |
| | | | | | | |
| | | | | | (27,046,916 | ) |
| | | | | | | |
| Utilities - (0.8)% | | | | |
| (8,000 | ) | | Allegheny Energy, Inc. | | | (184,000 | ) |
| (19,600 | ) | | American Electric Power Co., Inc. | | | (669,928 | ) |
| (92,000 | ) | | American Water Works Co., Inc. | | | (2,001,920 | ) |
| (19,300 | ) | | Atmos Energy Corp. | | | (551,401 | ) |
| (40,900 | ) | | Calpine Corp. | | | (486,301 | ) |
| (28,800 | ) | | CenterPoint Energy, Inc. | | | (413,568 | ) |
| (40,000 | ) | | Hawaiian Electric Industries, Inc. | | | (898,000 | ) |
| (46,300 | ) | | NiSource, Inc. | | | (731,540 | ) |
| (27,200 | ) | | Northeast Utilities | | | (751,808 | ) |
| (69,500 | ) | | Otter Tail Corp. | | | (1,526,220 | ) |
| | | | | | | | | | | | |
| Shares | | | Security
Description | | Value | |
| | (42,500 | ) | | Pepco Holdings, Inc. | | $ | (728,875 | ) |
| | (26,300 | ) | | Pico Holdings, Inc. | | | (978,097 | ) |
| | (35,000 | ) | | PPL Corp. | | | | | | | (969,850 | ) |
| | (52,700 | ) | | Progress Energy, Inc. | | | (2,074,272 | ) |
| | (28,600 | ) | | Public Service Enterprise Group, Inc. | | | (844,272 | ) |
| | (68,200 | ) | | Southern Co. | | | (2,261,512 | ) |
| | (56,100 | ) | | The Empire District Electric Co. | | | (1,010,922 | ) |
| | (23,700 | ) | | Xcel Energy, Inc. | | | (502,440 | ) |
| | | | | | | | | | | | |
| | | | | | | | | | | (17,584,926 | ) |
| | | | | | | | | | | | |
| | Total Common Stock (Cost $(510,151,945)) | | | (567,307,095 | ) |
| | | | | | | | | | | | |
| | Total Equity Securities (Cost $(510,151,945)) | | | (567,307,095 | ) |
| | | | | | | | | | | | |
| | Fixed Income Securities - 0.0% | | | | |
| | U.S. Government & Agency Obligations - 0.0% | | | | |
| | U.S. Treasury Securities - 0.0% | | | | |
| | | | |
| Principal | | | Security
Description | | Rate | | Maturity | | Value | |
| $ | (300,000 | ) | | U.S. Treasury Note
(Cost $(306,968)) | | 3.63% | | 8/15/19 | | | (296,438 | ) |
| | | | | | | | | | | | |
| Total Fixed Income Securities
(Cost $(306,968)) | | | | | | | (296,438 | ) |
| | | | | | | | | | | | |
| | Investment Companies - (5.5)% | | | | |
| | (346,920 | ) | | iShares Russell 2000 Index Fund | | | (23,524,645 | ) |
| | (303,915 | ) | | Powershares QQQ | | | (14,642,625 | ) |
| | (518,070 | ) | | SPDR S&P 500 ETF Trust | | | (60,609,009 | ) |
| | (162,380 | ) | | SPDR S&P MidCap 400 ETF Trust | | | (23,246,321 | ) |
| | | | | | | | | | | | |
| Total Investment Companies
(Cost $(114,999,129)) | | | | | | | (122,022,600 | ) |
| | | | | | | | | | | | |
| | Total Short Positions (Cost $(625,458,042)) | | | $(689,626,133) | |
| | | | | | | | | | | | |
| | | | |
| See Notes to Financial Statements. | | 41 | | ABSOLUTE FUNDS |
ABSOLUTE STRATEGIES FUND
SCHEDULE OF CALL AND PUT OPTIONS WRITTEN
MARCH 31, 2010
| | | | | | | | | | | | |
| Contracts | | | Security
Description | | Strike
Price | | Expiration
Date | | Value | |
| Written Options - (0.4)% | | | | |
| Call Options Written - (0.1)% | | | | |
| (300 | ) | | Carmax, Inc. | | $ | 25.00 | | 04/10 | | $ | (34,500 | ) |
| (900 | ) | | iShares MSCI Emerging Markets | | | 50.00 | | 01/11 | | | (87,300 | ) |
| (250 | ) | | Royal Caribbean Cruises, Ltd. | | | 30.00 | | 06/10 | | | (107,500 | ) |
| (250 | ) | | Royal Caribbean Cruises, Ltd. | | | 28.00 | | 06/10 | | | (145,000 | ) |
| (247 | ) | | Royal Caribbean Cruises, Ltd. | | | 35.00 | | 09/10 | | | (69,901 | ) |
| (250 | ) | | Royal Caribbean Cruises, Ltd. | | | 30.00 | | 09/10 | | | (135,000 | ) |
| (1,699 | ) | | S&P 500 Index | | | 1275.00 | | 04/10 | | | (8,495 | ) |
| (564 | ) | | S&P 500 Index | | | 1270.00 | | 04/10 | | | (2,820 | ) |
| (579 | ) | | S&P 500 Index | | | 1260.00 | | 04/10 | | | (2,895 | ) |
| (619 | ) | | S&P 500 Index | | | 1250.00 | | 04/10 | | | (6,190 | ) |
| (1,900 | ) | | SPDR S&P 500 ETF Trust | | | 130.00 | | 12/10 | | | (361,000 | ) |
| (250 | ) | | The Boeing Co. | | | 80.00 | | 01/11 | | | (97,500 | ) |
| (4,800 | ) | | Wells Fargo & Co. | | | 35.00 | | 07/10 | | | (230,400 | ) |
| | | | | | | | | | | | |
Total Call Options Written
(Premiums Received $(1,259,220)) | | | (1,288,501 | ) |
| | | | | | | | | | | | |
| Put Options Written - (0.3)% | | | | |
| (125 | ) | | American Express Co. | | | 35.00 | | 01/11 | | | (28,125 | ) |
| (17 | ) | | Apple, Inc. | | | 180.00 | | 01/11 | | | (13,005 | ) |
| (65 | ) | | Baxter International, Inc. | | | 57.50 | | 08/10 | | | (17,387 | ) |
| (225 | ) | | Bed Bath & Beyond, Inc. | | | 37.00 | | 08/10 | | | (18,000 | ) |
| (100 | ) | | Best Buy Co., Inc. | | | 35.00 | | 01/11 | | | (17,250 | ) |
| (130 | ) | | Chubb Corp. | | | 50.00 | | 01/11 | | | (46,800 | ) |
| (1,150 | ) | | Citigroup, Inc. | | | 4.00 | | 01/11 | | | (64,400 | ) |
| (1,150 | ) | | Citigroup, Inc. | | | 2.50 | | 01/11 | | | (12,650 | ) |
| (190 | ) | | Comcast Corp. | | | 14.00 | | 07/10 | | | (2,375 | ) |
| (200 | ) | | Comcast Corp. | | | 12.50 | | 01/11 | | | (7,000 | ) |
| (75 | ) | | Costco Wholesale Corp. | | | 57.50 | | 07/10 | | | (11,325 | ) |
| (75 | ) | | Costco Wholesale Corp. | | | 55.00 | | 07/10 | | | (6,300 | ) |
| (245 | ) | | CVS Caremark Corp. | | | 35.00 | | 01/11 | | | (67,375 | ) |
| (450 | ) | | CVS Caremark Corp. | | | 35.00 | | 01/12 | | | (201,375 | ) |
| | | | | | | | | | | | |
| Contracts | | | Security
Description | | Strike
Price | | Expiration
Date | | Value | |
| (70 | ) | | DeVry, Inc. | | $ | 50.00 | | 08/10 | | $ | (7,000 | ) |
| (60 | ) | | Dollar Tree, Inc. | | | 45.00 | | 08/10 | | | (2,400 | ) |
| (100 | ) | | Exxon Mobil Corp. | | | 70.00 | | 07/10 | | | (47,800 | ) |
| (100 | ) | | Exxon Mobil Corp. | | | 65.00 | | 01/11 | | | (45,000 | ) |
| (100 | ) | | Family Dollar Stores, Inc. | | | 30.00 | | 07/10 | | | (4,500 | ) |
| (160 | ) | | Fluor Corp. | | | 40.00 | | 07/10 | | | (12,800 | ) |
| (75 | ) | | International Business Machines Corp. | | | 115.00 | | 04/10 | | | (375 | ) |
| (35 | ) | | International Business Machines Corp. | | | 130.00 | | 01/11 | | | (37,275 | ) |
| (34 | ) | | International Business Machines Corp. | | | 130.00 | | 01/12 | | | (54,400 | ) |
| (135 | ) | | International Business Machines Corp. | | | 120.00 | | 01/12 | | | (156,262 | ) |
| (150 | ) | | Johnson & Johnson | | | 60.00 | | 01/11 | | | (33,150 | ) |
| (250 | ) | | Johnson & Johnson | | | 60.00 | | 01/12 | | | (116,250 | ) |
| (110 | ) | | Joy Global, Inc. | | | 40.00 | | 01/11 | | | (30,030 | ) |
| (100 | ) | | JPMorgan Chase & Co. | | | 40.00 | | 06/10 | | | (8,600 | ) |
| (400 | ) | | Lowe’s Cos., Inc. | | | 22.50 | | 01/11 | | | (64,800 | ) |
| (230 | ) | | McDonald’s Corp. | | | 65.00 | | 01/11 | | | (96,600 | ) |
| (250 | ) | | Medtronic, Inc. | | | 35.00 | | 01/11 | | | (32,500 | ) |
| (280 | ) | | Medtronic, Inc. | | | 45.00 | | 01/12 | | | (186,200 | ) |
| (170 | ) | | Merck & Co., Inc. | | | 40.00 | | 01/11 | | | (93,500 | ) |
| (725 | ) | | Merck & Co., Inc. | | | 30.00 | | 01/12 | | | (203,725 | ) |
| (1,450 | ) | | Merck & Co., Inc. | | | 25.00 | | 01/12 | | | (222,575 | ) |
| (71 | ) | | Mohawk Industries | | | 40.00 | | 01/11 | | | (11,715 | ) |
| (80 | ) | | PepsiCo, Inc. | | | 57.50 | | 04/10 | | | (400 | ) |
| (175 | ) | | PepsiCo, Inc. | | | 60.00 | | 07/10 | | | (12,250 | ) |
| (800 | ) | | Pfizer, Inc. | | | 20.00 | | 01/11 | | | (294,000 | ) |
| (500 | ) | | Pfizer, Inc. | | | 17.50 | | 01/11 | | | (93,500 | ) |
| (100 | ) | | QUALCOMM, Inc. | | | 40.00 | | 01/11 | | | (34,900 | ) |
| (90 | ) | | Quest Diagnostics, Inc. | | | 60.00 | | 08/10 | | | (35,550 | ) |
| (100 | ) | | Ross Stores, Inc. | | | 40.00 | | 01/11 | | | (9,500 | ) |
| (312 | ) | | S&P 500 Index | | | 1075.00 | | 04/10 | | | (34,320 | ) |
| (1,163 | ) | | S&P 500 Index | | | 1070.00 | | 04/10 | | | (133,745 | ) |
| (564 | ) | | S&P 500 Index | | | 1055.00 | | 04/10 | | | (47,940 | ) |
| (938 | ) | | S&P 500 Index | | | 1050.00 | | 04/10 | | | (79,730 | ) |
| (195 | ) | | S&P 500 Index | | | 1045.00 | | 04/10 | | | (12,675 | ) |
| (70 | ) | | Schlumberger, Ltd. | | | 55.00 | | 01/11 | | | (27,300 | ) |
| | | | |
| See Notes to Financial Statements. | | 42 | | ABSOLUTE FUNDS |
ABSOLUTE STRATEGIES FUND
SCHEDULE OF CALL AND PUT OPTIONS WRITTEN
MARCH 31, 2010
| | | | | | | | | | | | |
| Contracts | | | Security
Description | | Strike
Price | | Expiration
Date | | Value | |
| (2,475 | ) | | SPDR S&P 500 ETF Trust | | $ | 105.00 | | 03/11 | | $ | (1,336,500 | ) |
| (17,400 | ) | | SPDR S&P 500 ETF Trust | | | 70.00 | | 03/11 | | | (1,209,300 | ) |
| (100 | ) | | St Jude Medical, Inc. | | | 35.00 | | 07/10 | | | (5,500 | ) |
| (1,600 | ) | | State Street Corp. | | | 30.00 | | 01/12 | | | (348,000 | ) |
| (325 | ) | | The Bank of New York Mellon Corp. | | | 30.00 | | 01/11 | | | (91,813 | ) |
| (250 | ) | | The Boeing Co. | | | 65.00 | | 01/11 | | | (118,750 | ) |
| (100 | ) | | The Boeing Co. | | | 55.00 | | 01/11 | | | (22,400 | ) |
| (115 | ) | | The Coca-Cola Co. | | | 50.00 | | 01/11 | | | (26,220 | ) |
| (300 | ) | | The Procter & Gamble Co. | | | 50.00 | | 01/11 | | | (29,100 | ) |
| (100 | ) | | The St. Joe Co. | | | 30.00 | | 01/11 | | | (23,000 | ) |
| (100 | ) | | The St. Joe Co. | | | 25.00 | | 01/11 | | | (10,250 | ) |
| (430 | ) | | The Walt Disney Co. | | | 30.00 | | 07/10 | | | (16,555 | ) |
| (180 | ) | | Walgreen Co. | | | 35.00 | | 01/11 | | | (44,100 | ) |
| (965 | ) | | Wal-Mart Stores, Inc. | | | 50.00 | | 01/11 | | | (181,420 | ) |
| (160 | ) | | Waste Management, Inc. | | | 32.50 | | 07/10 | | | (14,400 | ) |
| (800 | ) | | Wells Fargo & Co. | | | 25.00 | | 01/12 | | | (218,400 | ) |
| | | | | | | | | | | | |
Total Put Options Written
(Premiums Received $(8,490,756)) | | | (6,492,342 | ) |
| | | | | | | | | | | | |
Total Written Options
(Premiums Received $(9,749,976)) | | $ | (7,780,843 | ) |
| | | | | | | | | | | | |
| | | | |
| See Notes to Financial Statements. | | 43 | | ABSOLUTE FUNDS |
ABSOLUTE STRATEGIES FUND
NOTES TO SCHEDULE OF INVESTMENTS
MARCH 31, 2010
ADR American Depositary Receipt
ETF Exchange Traded Fund
ETN Exchange Traded Note
FHLB Federal Home Loan Bank
FHLMC Federal Home Loan Mortgage Corporation
FNMA Federal National Mortgage Association
GNMA Government National Mortgage Association
LLC Limited Liability Company
LP Limited Partnership
MTN Medium Term Note
PLC Public Limited Company
REIT Real Estate Investment Trust
| (a) | All or a portion of this security is held as collateral for securities sold short. |
| (b) | Non-income producing security. |
| (c) | Subject to put option written by the Fund. |
| (d) | Subject to call option written by the Fund. |
| (e) | Security exempt from registration under Rule 144A under the Securities Act of 1933. At year end, the value of these securities amounted to $163,585,030 or 7.4% of net assets. |
| (f) | Variable rate security. Rate presented is as of March 31, 2010. |
| (g) | Debt obligation initially issued at one coupon rate which converts to higher coupon rate at a specified date. Rate presented is as of March 31, 2010. |
| (h) | Security is in default on scheduled interest or principal payments. |
| (i) | Security fair valued in accordance with procedures adopted by the Board of Trustees. At year end, the value of these securities amounted to $9,577,546 or 0.4% of net assets. |
| (j) | Zero coupon bond. Interest rate presented is yield to maturity. |
| (k) | Rate presented is yield to maturity. |
| (l) | Holders of Comdisco Holding Co., Inc. were issued contingent equity distribution rights pursuant to the Comdisco, Inc. First Amended Joint Plan of Reorganization. Accordingly, there is no associated strike price or expiration date. |
A summary of outstanding credit default swap agreements held by the Fund at March 31, 2010, is as follows:
| | | | | | | | | | | | | | | | |
| Counterparty | | Reference Entity/Obligation | | Buy/Sell
Protection | | Receive
Rate | | | Termination
Date | | Notional
Amount | | | Net
Unrealized
Appreciation |
| Barclays | | Index ABS CDS | | Sell | | 0.09 | % | | 08/25/37 | | $ | (2,400,000 | ) | | $ | 140,984 |
| Barclays | | Index ABS CDS | | Sell | | 0.76 | % | | 01/25/38 | | | (2,400,000 | ) | | | 187,516 |
| | | | | | | | | | | | | | | | |
| | | | | | | | | | | | | | | $ | 328,500 |
| | | | | | | | | | | | | | | | |
The aggregate cash/securities held as collateral for the above counterparty was $3,221,814 as of March 31, 2010. The notional amounts are equal to the potential payment that the Fund could be required to make as a seller of credit protection or receive as a buyer of credit protection.
The Fund enters contracts to sell protection to create a long credit position. Credit events that could require payment are bankruptcy, failure to pay, restructuring, obligation acceleration, obligation default, or repudiation/moratorium.
At March 31, 2010, the Fund held the following futures contracts:
| | | | | | | | | | | | | |
| Contracts | | | Type | | Expiration
Date | | Notional
Contract Value | | | Net
Unrealized
Appreciation/
(Depreciation) | |
| 9 | | | U.S. 5-year Note (CBT) Future | | 06/30/10 | | $ | 1,036,218 | | | $ | (2,625 | ) |
| 23 | | | U.S. 10-year Note (CBT) Future | | 06/30/10 | | | 2,672,998 | | | | 752 | |
| (2 | ) | | 3-Month Euro$ Future | | 09/13/10 | | | (491,097 | ) | | | (6,227 | ) |
| (2 | ) | | 3-Month Euro$ Future | | 12/13/10 | | | (489,097 | ) | | | (6,752 | ) |
| (2 | ) | | 3-Month Euro$ Future | | 03/14/11 | | | (487,247 | ) | | | (6,852 | ) |
| (2 | ) | | 3-Month Euro$ Future | | 06/13/11 | | | (485,398 | ) | | | (6,827 | ) |
| (2 | ) | | 3-Month Euro$ Future | | 09/19/11 | | | (483,747 | ) | | | (6,652 | ) |
| (2 | ) | | 3-Month Euro$ Future | | 12/19/11 | | | (482,147 | ) | | | (6,478 | ) |
| (2 | ) | | 3-Month Euro$ Future | | 03/19/12 | | | (480,998 | ) | | | (6,078 | ) |
| (2 | ) | | 3-Month Euro$ Future | | 06/18/12 | | | (479,948 | ) | | | (5,653 | ) |
| (4,700 | ) | | S&P 500 Emini Future | | 06/18/10 | | | (267,816,500 | ) | | | (6,017,250 | ) |
| (20 | ) | | U.S. 2-year Note (CBT) Future | | 06/30/10 | | | (4,337,188 | ) | | | (1,875 | ) |
| (50 | ) | | U.S. 5-year Note (CBT) Future | | 06/30/10 | | | (5,759,049 | ) | | | 16,861 | |
| (140 | ) | | U.S. 10-year Note (CBT) Future | | 06/30/10 | | | (16,367,692 | ) | | | 92,692 | |
| (20 | ) | | U.S. Long Bond (CBT) Future | | 06/30/10 | | | (2,332,500 | ) | | | 10,000 | |
| | | | | | | | | | | | | |
| | | | | | | $ | (296,783,392 | ) | | $ | (5,952,964 | ) |
| | | | | | | | | | | | | |
| | | | |
| See Notes to Financial Statements. | | 44 | | ABSOLUTE FUNDS |
ABSOLUTE STRATEGIES FUND
NOTES TO SCHEDULE OF INVESTMENTS
MARCH 31, 2010
| * | Cost for Federal income tax purposes is $1,048,488,048 and net unrealized appreciation (depreciation) consists of: |
| | | | |
Gross Unrealized Appreciation | | $ | 258,431,445 | |
Gross Unrealized Depreciation | | | (140,049,256 | ) |
| | | | |
Net Unrealized Appreciation | | $ | 118,382,189 | |
| | | | |
The following is a summary of the inputs used to value the Fund’s investments as of March 31, 2010:
The inputs or methodology for valuing securities are not necessarily an indication of the risk associated with investing in those securities. For more information on valuation inputs, and their aggregation into the levels used in the table below, refer to Note 2—Security Valuation section in the accompanying Notes to Financial Statements.
| | | | | | | | | | | | |
| | | Level 1 | | Level 2 | | Level 3 | | Total |
Assets | | | | | | | | | | | | |
Investments at Value: | | | | | | | | | | | | |
Common Stock | | | | | | | | | | | | |
Consumer Discretionary | | $ | 191,169,041 | | $ | - | | $ | - | | $ | 191,169,041 |
Consumer Staples | | | 106,310,220 | | | - | | | - | | | 106,310,220 |
Energy | | | 51,230,867 | | | - | | | - | | | 51,230,867 |
Financial | | | 152,003,590 | | | - | | | - | | | 152,003,590 |
Healthcare | | | 86,673,414 | | | - | | | - | | | 86,673,414 |
Industrial | | | 84,243,280 | | | - | | | - | | | 84,243,280 |
Information Technology | | | 70,160,144 | | | - | | | - | | | 70,160,144 |
Materials | | | 26,054,805 | | | - | | | - | | | 26,054,805 |
Telecommunication Services | | | 31,602,016 | | | - | | | - | | | 31,602,016 |
Utilities | | | 15,263,854 | | | - | | | - | | | 15,263,854 |
Preferred Stock | | | | | | | | | | | | |
Consumer Discretionary | | | 17,357,008 | | | - | | | - | | | 17,357,008 |
Consumer Staples | | | 1,561,194 | | | - | | | - | | | 1,561,194 |
Energy | | | 6,165,044 | | | - | | | - | | | 6,165,044 |
Financial | | | 15,472,265 | | | - | | | - | | | 15,472,265 |
Healthcare | | | 5,182,473 | | | - | | | - | | | 5,182,473 |
Industrial | | | 2,062,413 | | | - | | | - | | | 2,062,413 |
Asset Backed Obligations | | | | | | 160,021,027 | | | - | | | 160,021,027 |
Corporate Convertible Bonds | | | - | | | 404,351,035 | | | 9,549,732 | | | 413,900,767 |
Corporate Non-Convertible Bonds | | | - | | | 74,458,823 | | | 27,814 | | | 74,486,637 |
Foreign Government Bonds | | | - | | | 808,000 | | | - | | | 808,000 |
Interest-Only Bond | | | - | | | 479,148 | | | - | | | 479,148 |
Municipal Bonds | | | - | | | 474,335 | | | - | | | 474,335 |
Syndicated Loans | | | - | | | 2,307,298 | | | - | | | 2,307,298 |
U.S. Government and Agency Obligations | | | - | | | 136,144,699 | | | - | | | 136,144,699 |
Rights | | | 35,048 | | | - | | | - | | | 35,048 |
Warrant | | | 373,076 | | | - | | | - | | | 373,076 |
Investment Companies | | | 167,461,886 | | | - | | | - | | | 167,461,886 |
Commercial Paper | | | - | | | 12,278,132 | | | - | | | 12,278,132 |
Purchased Options | | | 32,995,532 | | | - | | | - | | | 32,995,532 |
| | | | | | | | | | | | |
Total Investments at Value | | | 1,063,377,170 | | | 791,322,497 | | | 9,577,546 | | | 1,864,277,213 |
Other Financial Instruments**: | | | | | | | | | | | | |
Credit Default Swaps | | | - | | | 328,500 | | | - | | | 328,500 |
Futures | | | 120,305 | | | - | | | - | | | 120,305 |
| | | | | | | | | | | | |
Total Assets | | $ | 1,063,497,475 | | $ | 791,650,997 | | $ | 9,577,546 | | $ | 1,864,726,018 |
| | | | | | | | | | | | |
| | | | |
| See Notes to Financial Statements. | | 45 | | ABSOLUTE FUNDS |
ABSOLUTE STRATEGIES FUND
NOTES TO SCHEDULE OF INVESTMENTS
MARCH 31, 2010
| | | | | | | | | | | | | | | |
| | | Level 1 | | | Level 2 | | | Level 3 | | Total | |
Liabilities | | | | | | | | | | | | | | | |
Securities Sold Short | | | | | | | | | | | | | | | |
Common Stock | | $ | (567,307,095 | ) | | $ | - | | | $ | - | | $ | (567,307,095 | ) |
U.S. Treasury Securities | | | - | | | | (296,438 | ) | | | - | | | (296,438 | ) |
Investment Companies | | | (122,022,600 | ) | | | - | | | | - | | | (122,022,600 | ) |
| | | | | | | | | | | | | | | |
Total Securities Sold Short | | | (689,329,695 | ) | | | (296,438 | ) | | | - | | | (689,626,133 | ) |
Other Financial Instruments **: | | | | | | | | | | | | | | | |
Written Options | | | (7,780,843 | ) | | | - | | | | - | | | (7,780,843 | ) |
Futures | | | (6,073,269 | ) | | | - | | | | - | | | (6,073,269 | ) |
| | | | | | | | | | | | | | | |
Total Liabilities | | $ | (703,183,807 | ) | | $ | (296,438 | ) | | $ | - | | $ | (703,480,245 | ) |
| | | | | | | | | | | | | | | |
| ** | Other Financial Instruments are derivative instruments not reflected in the Schedule of Investments, such as futures and credit default swaps, which are valued at the unrealized appreciation (depreciation) of the instrument. Written options are reported at their market value at year end. |
The following is a reconciliation of Level 3 assets (at either the beginning or ending of the year) for which significant unobservable inputs were used to determine fair value.
| | | | | | | | | | | | | | | | |
| | | Asset Backed
Obligations | | | Corporate
Convertible Bonds | | | Corporate
Non-Convertible
Bonds | | | Total | |
Balance as of 03/31/09 | | $ | 222,914 | | | $ | 4,754,510 | | | $ | - | | | $ | 4,977,424 | |
Accrued Accretion/(Amortization) | | | 21,428 | | | | 234,595 | | | | (58 | ) | | | 255,965 | |
Realized Gain/(Loss) | | | (4,764 | ) | | | 677,604 | | | | - | | | | 672,840 | |
Change in Unrealized Appreciation/(Depreciation) | | | 141,682 | | | | 2,551,543 | | | | (139,974 | ) | | | 2,553,251 | |
Purchases | | | - | | | | 13,865,192 | | | | 167,846 | | | | 14,033,038 | |
Sales | | | (282,243 | ) | | | (9,807,912 | ) | | | - | | | | (10,090,155 | ) |
Transfers In/(Out) | | | (99,017 | ) | | | (2,725,800 | ) | | | - | | | | (2,824,817 | ) |
| | | | | | | | | | | | | | | | |
Balance as of 03/31/10 | | $ | - | | | $ | 9,549,732 | | | $ | 27,814 | | | $ | 9,577,546 | |
| | | | | | | | | | | | | | | | |
Net change in unrealized appreciation/(depreciation) from investments held as of 03/31/10 *** | | $ | - | | | $ | 1,570,176 | | | $ | (139,974 | ) | | $ | 1,430,202 | |
| | | | | | | | | | | | | | | | |
| *** | The unrealized appreciation (depreciation) is included in net change in unrealized appreciation (depreciation) of investments in the accompanying Statement of Operations. |
| | | | |
| See Notes to Financial Statements. | | 46 | | ABSOLUTE FUNDS |
ABSOLUTE OPPORTUNITIES FUND
SCHEDULE OF INVESTMENTS
MARCH 31, 2010
| | | | | |
| Shares | | Security Description | | Value |
| Long Positions - 85.3% |
| Equity Securities - 31.4% |
| Common Stock - 29.8% |
| Consumer Discretionary - 8.8% |
| 44,523 | | Accuride Corp. (a) | | $ | 58,548 |
| 16,951 | | Amazon.com, Inc. (a)(b) | | | 2,300,759 |
| 4,067 | | Chipotle Mexican Grill, Inc. (a) | | | 458,229 |
| 20,840 | | Comcast Corp., Special Class A | | | 374,495 |
| 133,867 | | Denny’s Corp. (a) | | | 514,049 |
| 23,878 | | DeVry, Inc. | | | 1,556,846 |
| 33,992 | | DIRECTV, Class A (a)(b) | | | 1,149,269 |
| 29,936 | | EchoStar Corp., Class A (a) | | | 607,102 |
| 90,167 | | Ford Motor Co. (a) | | | 1,133,399 |
| 1,701 | | Google, Inc., Class A (a) | | | 964,484 |
| 13,718 | | Ingles Market, Inc., Class A | | | 206,182 |
| 29,092 | | J Crew Group, Inc. (a) | | | 1,335,323 |
| 55,994 | | Las Vegas Sands Corp. (a) | | | 1,184,273 |
| 52,500 | | Liberty Media Corp. - Starz, Series A (a) | | | 2,870,700 |
| 6,808 | | Lululemon Athletica, Inc. (a) | | | 282,532 |
| 34,023 | | McDonald’s Corp. (b) | | | 2,270,014 |
| 23,869 | | Nu Skin Enterprises, Inc., Class A | | | 694,588 |
| 3,403 | | priceline.com, Inc. (a) | | | 867,765 |
| 16,972 | | Rue21, Inc. (a) | | | 588,419 |
| 164,967 | | Sky City Entertainment Group, Ltd. | | | 377,333 |
| 27,362 | | Starbucks Corp. | | | 664,076 |
| 91,062 | | Stewart Enterprises, Inc., Class A | | | 569,137 |
| 32,992 | | Susser Holdings Corp. (a) | | | 278,782 |
| 23,389 | | The Geo Group, Inc. (a) | | | 463,570 |
| 317,500 | | Tigrent, Inc. (a) | | | 174,625 |
| 134,831 | | Titan International, Inc. (b) | | | 1,177,075 |
| 20,419 | | Ulta Salon Cosmetics & Fragrance, Inc. (a) | | | 461,878 |
| 51,561 | | Under Armour, Inc., Class A (a) | | | 1,516,409 |
| | | | | |
| | | | | 25,099,861 |
| | | | | |
| Consumer Staples - 1.6% |
| 13,606 | | Green Mountain Coffee Roasters, Inc. (a)(b) | | | 1,317,333 |
| 614,046 | | QLT, Inc. (a) | | | 3,131,634 |
| | | | | |
| | | | | 4,448,967 |
| | | | | |
| Energy - 6.2% |
| 22,285 | | Canadian Oil Sands Trust | | | 668,122 |
| 27,742 | | Clean Energy Fuels Corp. (a) | | | 631,963 |
| 192,384 | | Energy Partners, Ltd. (a) | | | 2,343,237 |
| 67,294 | | Exterran Holdings, Inc. (a)(b) | | | 1,626,496 |
| 18,000 | | Exterran Partners LP | | | 395,100 |
| 3,400 | | Mitcham Industries, Inc. (a) | | | 24,582 |
| 3,583 | | Petroleo Brasileiro SA, ADR | | | 141,851 |
| 5,230,572 | | Primary Energy Recycling, Inc. (c) | | | 4,892,476 |
| 85,000 | | SEACOR Holdings, Inc. (a)(b) | | | 6,856,100 |
| | | | | |
| | | | | 17,579,927 |
| | | | | |
| | | | | |
| Shares | | Security Description | | Value |
| Financial - 6.5% |
| 11,324 | | Asset Managers Holdings Co., Ltd. (a) | | $ | 1,180,971 |
| 474,000 | | CapitalSource, Inc. (b)(d) | | | 2,649,660 |
| 313,445 | | Coventree, Inc. (a) | | | 1,149,591 |
| 17,276 | | Global Cash Access Holdings, Inc. (a) | | | 141,145 |
| 27,633 | | Hilltop Holdings, Inc. (a) | | | 324,688 |
| 34,023 | | JPMorgan Chase & Co. (b) | | | 1,522,529 |
| 165,463 | | MI Developments, Inc., Class A | | | 2,157,638 |
| 6,750,000 | | Pacific Century Premium Developments, Ltd. | | | 2,521,171 |
| 868,600 | | Urbana Corp., Non Voting Class A (a) | | | 1,342,689 |
| 20,428 | | Visa, Inc., Class A (b) | | | 1,859,561 |
| 169,850 | | Walter Investment Management Corp. REIT | | | 2,717,600 |
| 34,016 | | Wells Fargo & Co. | | | 1,058,578 |
| | | | | |
| | | | | 18,625,821 |
| | | | | |
| Healthcare - 0.4% |
| 70,000 | | Triple-S Management Corp., Class B (a) | | | 1,243,200 |
| | | | | |
| Industrial - 0.4% |
| 95,000 | | Aircastle, Ltd. | | | 899,650 |
| 10,900 | | Canfor Corp. (a) | | | 101,418 |
| 47,500 | | Timberwest Forest Corp. (a) | | | 210,456 |
| | | | | |
| | | | | 1,211,524 |
| | | | | |
| Information Technology - 3.0% |
| 27,631 | | AOL, Inc. (a) | | | 698,512 |
| 6,804 | | Apple, Inc. (a)(b) | | | 1,598,464 |
| 68,060 | | Aruba Networks, Inc. (a) | | | 929,700 |
| 16,947 | | Hewlett-Packard Co. | | | 900,733 |
| 13,482 | | International Business Machines Corp. (b) | | | 1,729,066 |
| 34,029 | | Marvell Technology Group, Ltd. (a) | | | 693,511 |
| 18,733 | | Rovi Corp. (a) | | | 695,556 |
| 10,216 | | Salesforce.com, Inc. (a) | | | 760,581 |
| 32,414 | | SolarWinds, Inc. (a) | | | 702,087 |
| | | | | |
| | | | | 8,708,210 |
| | | | | |
| Materials - 1.8% |
| 25,000 | | Acadian Timber Corp. | | | 183,873 |
| 8,839 | | Agnico-Eagle Mines, Ltd. | | | 492,067 |
| 36,700 | | Andean Resources, Ltd. (a) | | | 92,504 |
| 17,500 | | AuEx Ventures, Inc. (a) | | | 52,208 |
| 16,486 | | Cameco Corp. | | | 451,881 |
| 2,112 | | Clearwater Paper Corp. (a) | | | 104,016 |
| 18,152 | | Domtar Corp. (a) | | | 1,169,170 |
| 44,300 | | KapStone Paper and Packaging Corp. (a) | | | 525,841 |
| 2,480 | | Kirkland Lake Gold, Inc. (a) | | | 18,533 |
| 39,843 | | Lake Shore Gold Corp. (a) | | | 98,857 |
| 12,780 | | Monsanto Co. | | | 912,748 |
| 13,577 | | Newmont Mining Corp. | | | 691,477 |
| 3,200 | | Schweitzer-Mauduit International, Inc. | | | 152,192 |
| | | | |
| See Notes to Financial Statements. | | 47 | | ABSOLUTE FUNDS |
ABSOLUTE OPPORTUNITIES FUND
SCHEDULE OF INVESTMENTS
MARCH 31, 2010
| | | | | | | | | | | |
| Shares | | Security
Description | | | | | | | Value |
| | 15,000 | | Sprott Resource Corp. (a) | | $ | 69,414 |
| | 2,969 | | The Mosaic Co. | | | 180,426 |
| | | | | | | | | | | |
| | | | | | | | | | | 5,195,207 |
| | | | | | | | | | | |
| | Telecommunication Services - 1.1% |
| | 17,011 | | Atheros Communications, Inc. (a) | | | 658,496 |
| | 105,000 | | Vodafone Group PLC, ADR | | | 2,445,450 |
| | | | | | | | | | | |
| | | | | | | | | | | 3,103,946 |
| | | | | | | | | | | |
| | Total Common Stock (Cost $72,939,775) | | | 85,216,663 |
| | | | | | | | | | | |
| | Preferred Stock - 1.6% | | | | | | | | |
| | Energy - 0.1% | | | | | | | | |
| | | |
| | | Rate | | | | | |
| | 3,498 | | McMoRan Exploration Co. | | 6.75 | % | | | | | 374,566 |
| | | | | | | | | | | |
| | Financial - 1.5% | | | | | | | | |
| | 207,687 | | Fremont General Financing I | | 9.00 | | | | | | 4,257,584 |
| | | | | | | | | | | |
| | Total Preferred Stock (Cost $4,307,528) | | | 4,632,150 |
| | | | | | | | | | | |
| | Total Equity Securities (Cost $77,247,303) | | | 89,848,813 |
| | | | | | | | | | | |
| | | | |
| Principal | | Security Description | | | | | Maturity | | Value |
| | Fixed Income Securities - 25.5% |
| | Asset Backed Obligations - 4.5% |
| $ | 400,000 | | ACE Securities Corp., Series 2006-HE1 A2D (e) | | 0.55 | | | 02/25/36 | | | 164,888 |
| | 126,605 | | Aerco, Ltd., Series 2A A3 (e)(f) | | 0.69 | | | 07/15/25 | | | 74,697 |
| | 20,000 | | American Airlines Pass Through Trust, Series 2001-02 | | 7.86 | | | 10/01/11 | | | 20,250 |
| | 46,742 | | American Airlines Pass Through Trust, Series 2003-01 (b) | | 3.86 | | | 07/09/10 | | | 46,538 |
| | 49,656 | | American Airlines Pass Through Trust, Series 2009-1A | | 10.38 | | | 07/02/19 | | | 57,352 |
| | 89,000 | | Argent Securities, Inc., Series 2005-W5 A2D (e) | | 0.57 | | | 01/25/36 | | | 39,261 |
| | 115,000 | | Astoria Depositor Corp. (f) | | 8.14 | | | 05/01/21 | | | 112,197 |
| | 155,006 | | Banc of America Funding Corp., Series 2007-8 2A1 | | 7.00 | | | 10/25/37 | | | 105,460 |
| | | | | | | | | | | |
| Principal | | Security Description | | Rate | | | Maturity | | Value |
| $ | 129,743 | | Bear Stearns Alt-A Trust, Series 2005-4 21A (e) | | 3.21 | % | | 05/25/35 | | $ | 87,154 |
| | 125,000 | | Carrington Mortgage Loan Trust, Series 2007-FRE1 A3 (e) | | 0.51 | | | 02/25/37 | | | 44,771 |
| | 400,000 | | Centex Home Equity Loan Trust, Series 2006-A AV4 (e) | | 0.50 | | | 06/25/36 | | | 207,202 |
| | 87,094 | | Citigroup Mortgage Loan Trust, Inc., Series 2007-AR8 2A1A (e) | | 5.85 | | | 07/25/37 | | | 64,162 |
| | 500,000 | | Citigroup Mortgage Loan Trust, Inc., Series 2007-WFH1 A4 (e) | | 0.45 | | | 01/25/37 | | | 208,903 |
| | 457,000 | | Citigroup Mortgage Loan Trust, Inc., Series 2007-WFH2 A3 (e) | | 0.43 | | | 03/25/37 | | | 199,083 |
| | 495,000 | | Citigroup Mortgage Loan Trust, Inc., Series 2007-WFH4 A2C (e) | | 1.55 | | | 07/25/37 | | | 202,289 |
| | 105,000 | | Citigroup/Deutsche Bank Commercial Mortgage Trust, Series 2007-CD4 A4 | | 5.32 | | | 12/11/49 | | | 101,828 |
| | 84,751 | | Citimortgage Alternative Loan Trust, Series 2007-A1 1A7 | | 6.00 | | | 01/25/37 | | | 58,172 |
| | 76,364 | | Conseco Finance, Series 2001-D A5 (e) | | 6.69 | | | 11/15/32 | | | 76,976 |
| | 70,000 | | Continental Airlines, Inc., Series 2007-1 | | 5.98 | | | 04/19/22 | | | 68,775 |
| | 48,989 | | Continental Airlines, Inc., Series 2009-1 | | 9.00 | | | 07/08/16 | | | 53,398 |
| | 93,254 | | Coso Geothermal Power Holdings (f) | | 7.00 | | | 07/15/26 | | | 88,468 |
| | 346,107 | | Countrywide Alternative Loan Trust, Series 2005-27 2A1 (e) | | 1.81 | | | 08/25/35 | | | 182,249 |
| | 190,407 | | Countrywide Alternative Loan Trust, Series 2006-OA10 1A1 (e) | | 1.36 | | | 08/25/46 | | | 99,979 |
| | 345,191 | | Countrywide Alternative Loan Trust, Series 2006-OA22 A1 (e) | | 0.41 | | | 02/25/47 | | | 185,067 |
| | 71,604 | | Countrywide Alternative Loan Trust, Series 2007-OH1 A1A (e) | | 0.34 | | | 04/25/47 | | | 60,966 |
| | 300,000 | | Countrywide Asset-Backed Certificates, Series 2007-10 2A2 (e) | | 0.37 | | | 06/25/47 | | | 210,428 |
| | | | |
| See Notes to Financial Statements. | | 48 | | ABSOLUTE FUNDS |
ABSOLUTE OPPORTUNITIES FUND
SCHEDULE OF INVESTMENTS
MARCH 31, 2010
| | | | | | | | | | | |
| Principal | | Security Description | | Rate | | | Maturity | | Value |
| $ | 237,904 | | Countrywide Asset-Backed Certificates, Series 2007-13 2A2 (e) | | 1.05 | % | | 10/25/47 | | $ | 168,228 |
| | 300,000 | | Countrywide Asset-Backed Certificates, Series 2007-4 A2 | | 5.53 | | | 09/25/37 | | | 267,717 |
| | 80,000 | | Countrywide Asset-Backed Certificates, Series 2007-5 2A2 (e) | | 0.42 | | | 09/25/47 | | | 61,099 |
| | 75,000 | | Countrywide Asset-Backed Certificates, Series 2007-7 2A2 (e) | | 0.41 | | | 10/25/47 | | | 60,407 |
| | 171,360 | | Countrywide Home Loan Mortgage Pass Through Trust, Series 2004-HYB5 3A1 (e) | | 3.48 | | | 04/20/35 | | | 121,067 |
| | 77,636 | | Countrywide Home Loan Mortgage Pass Through Trust, Series 2007-HY3 2A1 (e) | | 5.49 | | | 06/25/47 | | | 55,331 |
| | 350,000 | | Credit - Based Asset Servicing and Securitization, LLC, Series 2006-CB4 AV3 (e) | | 0.40 | | | 05/25/36 | | | 188,112 |
| | 250,000 | | Credit - Based Asset Servicing and Securitization, LLC, Series 2006-CB8 A2B (e) | | 0.36 | | | 10/25/36 | | | 204,953 |
| | 160,000 | | Credit Suisse Mortgage Capital Certificates, Series 2006-C5 A3 | | 5.31 | | | 12/15/39 | | | 151,317 |
| | 120,000 | | CW Capital Cobalt, Ltd., Series 2006-C1 A4 | | 5.22 | | | 08/15/48 | | | 114,778 |
| | 50,000 | | Delta Air Lines, Inc., Series 2000-A2 | | 7.57 | | | 11/18/10 | | | 51,500 |
| | 50,000 | | Delta Air Lines, Inc., Series 2002-G2 | | 6.42 | | | 07/02/12 | | | 50,125 |
| | 185,455 | | Deutsche ALT-A Securities, Inc. Alternate Loan Trust, Series 2007-OA2 A1 (e) | | 1.02 | | | 04/25/47 | | | 104,217 |
| | 31,746 | | Dynegy Roseton/Danskammer Pass Through Trust, Series A | | 7.27 | | | 11/08/10 | | | 31,865 |
| | 65,000 | | Dynegy Roseton/Danskammer Pass Through Trust, Series B | | 7.67 | | | 11/08/16 | | | 63,172 |
| | 300,000 | | Ellington Loan Acquisition Trust, Series 2007-1 A2C (e)(f) | | 1.50 | | | 05/29/37 | | | 133,810 |
| | | | | | | | | | | |
| Principal | | Security Description | | Rate | | | Maturity | | Value |
| $ | 394,000 | | Ellington Loan Acquisition Trust, Series 2007-2 A2C (e)(f) | | 1.35 | % | | 05/25/37 | | $ | 195,219 |
| | 300,000 | | Equifirst Loan Securitization Trust, Series 2007-1 A2B (e) | | 0.44 | | | 04/25/37 | | | 152,971 |
| | 450,000 | | First Franklin Mortgage Loan Asset Backed Certificates, Series 2006-FF11 2A3 (e) | | 0.40 | | | 08/25/36 | | | 199,181 |
| | 21,950 | | FPL Energy National Wind Portfolio, LLC (f) | | 6.13 | | | 03/25/19 | | | 21,155 |
| | 15,870 | | FPL Energy Wind Funding, LLC (f) | | 6.88 | | | 06/27/17 | | | 15,513 |
| | 52,567 | | Green Tree Home Improvement Loan Trust, Series 1997-E HEB1 | | 7.53 | | | 01/15/29 | | | 50,087 |
| | 110,000 | | Greenwich Capital Commercial Funding Corp., Series 2006-GG7 A4 (e) | | 5.89 | | | 07/10/38 | | | 112,320 |
| | 180,000 | | GSAA Home Equity Trust, Series 2005-7 AF3 (e) | | 4.75 | | | 05/25/35 | | | 142,590 |
| | 400,000 | | GSAMP Trust, Series 2007-FM2 A2B (e) | | 0.34 | | | 01/25/37 | | | 165,183 |
| | 203,420 | | Harborview Mortgage Loan Trust, Series 2007-5 A1A (e) | | 0.43 | | | 09/19/37 | | | 106,430 |
| | 42,029 | | HSBC Home Equity Loan Asset Backed Certificates, Series 2006-1 A1 (e) | | 0.40 | | | 01/20/36 | | | 36,709 |
| | 300,000 | | HSBC Home Equity Loan Asset Backed Certificates, Series 2007-1 M2 (e) | | 0.72 | | | 03/20/36 | | | 69,243 |
| | 72,514 | | HSBC Home Equity Loan Asset Backed Certificates, Series 2007-3 APT (e) | | 1.44 | | | 11/20/36 | | | 65,790 |
| | 110,000 | | HSBC Home Equity Loan Asset Backed Certificates, Series 2007-3 M1 (e) | | 2.49 | | | 11/20/36 | | | 56,699 |
| | 120,000 | | Indiantown Cogeneration LP, Series A-10 | | 9.77 | | | 12/15/20 | | | 129,532 |
| | 122,136 | | Indymac Index Mortgage Loan Trust, Series 2006-AR19 1A2 (e) | | 5.85 | | | 08/25/36 | | | 60,949 |
| | | | |
| See Notes to Financial Statements. | | 49 | | ABSOLUTE FUNDS |
ABSOLUTE OPPORTUNITIES FUND
SCHEDULE OF INVESTMENTS
MARCH 31, 2010
| | | | | | | | | | | |
| Principal | | Security Description | | Rate | | | Maturity | | Value |
| $ | 400,000 | | Indymac Residential Asset Backed Trust, Series 2007-A 2A4A (e) | | 0.57 | % | | 04/25/47 | | $ | 160,574 |
| | 120,709 | | JetBlue Airways Pass Through Trust, Series 2004-2 G1 (e) | | 0.63 | | | 08/15/16 | | | 100,188 |
| | 165,000 | | JP Morgan Alternative Loan Trust, Series 2006-A4 A7 (e) | | 6.30 | | | 09/25/36 | | | 82,132 |
| | 120,000 | | JP Morgan Alternative Loan Trust, Series 2006-A6 2A5 (e) | | 6.05 | | | 11/25/36 | | | 77,492 |
| | 160,000 | | JP Morgan Chase Commercial Mortgage Securities Corp., Series 2007-CB18 A4 | | 5.44 | | | 06/12/47 | | | 156,667 |
| | 105,000 | | JP Morgan Chase Commercial Mortgage Securities Corp., Series 2007-CB19 A4 (e) | | 5.75 | | | 02/12/49 | | | 104,549 |
| | 210,000 | | JP Morgan Chase Commercial Mortgage Securities Corp., Series 2007-LD12 A4 (e) | | 5.88 | | | 02/15/51 | | | 205,723 |
| | 110,000 | | JP Morgan Chase Commercial Mortgage Securities Corp., Series 2007-LDPX A3 | | 5.42 | | | 01/15/49 | | | 106,172 |
| | 265,000 | | JP Morgan Mortgage Acquisition Corp., Series 2006-CH1 A4 (e) | | 0.39 | | | 07/25/36 | | | 186,262 |
| | 350,000 | | JP Morgan Mortgage Acquisition Corp., Series 2006-HE1 A4 (e) | | 0.52 | | | 01/25/36 | | | 137,265 |
| | 300,000 | | JP Morgan Mortgage Acquisition Corp., Series 2007-CH1 AV4 (e) | | 0.38 | | | 10/25/36 | | | 244,407 |
| | 185,000 | | JP Morgan Mortgage Acquisition Corp., Series 2007-CH2 AF2 (g) | | 5.48 | | | 01/25/37 | | | 136,006 |
| | 360,000 | | JP Morgan Mortgage Acquisition Corp., Series 2007-CH3 A4 (e) | | 0.46 | | | 03/25/37 | | | 143,455 |
| | 200,000 | | JP Morgan Mortgage Acquisition Corp., Series 2007-CH4 A3 (e) | | 0.36 | | | 05/25/37 | | | 117,348 |
| | 135,642 | | Lehman XS Trust, Series 2006-14N 3A2 (e) | | 0.37 | | | 08/25/36 | | | 60,475 |
| | | | | | | | | | | |
| Principal | | Security Description | | Rate | | | Maturity | | Value |
| $ | 140,683 | | Lehman XS Trust, Series 2007-16N 2A2 (e) | | 1.10 | % | | 09/25/47 | | $ | 76,415 |
| | 500,000 | | Master Asset Backed Securities Trust, Series 2006-AM3 A4 (e) | | 0.49 | | | 10/25/36 | | | 177,979 |
| | 350,000 | | Merrill Lynch First Franklin Mortgage Loan Trust, Series 2007-3 A2C (e) | | 0.43 | | | 06/25/37 | | | 136,774 |
| | 115,000 | | Merrill Lynch/Countrywide Commercial Mortgage Trust, Series 2006-4 A3 (e) | | 5.17 | | | 12/12/49 | | | 111,467 |
| | 230,000 | | Merrill Lynch/Countrywide Commercial Mortgage Trust, Series 2007-7 A4 (e) | | 5.75 | | | 06/12/50 | | | 211,307 |
| | 171,264 | | Mid-State Trust, Series 2006-1A (f) | | 5.79 | | | 10/15/40 | | | 170,598 |
| | 76,160 | | Midwest Generation, LLC, Series B | | 8.56 | | | 01/02/16 | | | 77,972 |
| | 655,000 | | Morgan Stanley ABS Capital Inc., Series 2006-HE1 A4 (e) | | 0.54 | | | 01/25/36 | | | 302,053 |
| | 365,000 | | Morgan Stanley ABS Capital Inc., Series 2006-HE3 A2D (e) | | 0.50 | | | 04/25/36 | | | 131,715 |
| | 400,000 | | Morgan Stanley ABS Capital Inc., Series 2006-NC2 A2D (e) | | 0.54 | | | 02/25/36 | | | 151,050 |
| | 200,000 | | Morgan Stanley ABS Capital Inc., Series 2007-HE2 A2B (e) | | 0.34 | | | 01/25/37 | | | 92,213 |
| | 110,000 | | Morgan Stanley Capital Inc., Series 2007-IQ16 A4 | | 5.81 | | | 12/12/49 | | | 108,397 |
| | 195,708 | | Morgan Stanley Mortgage Loan Trust, Series 2006-11 1A3 (g) | | 6.42 | | | 08/25/36 | | | 113,685 |
| | 80,000 | | Nationstar Home Equity Loan Trust, Series 2006-B AV3 (e) | | 0.42 | | | 09/25/36 | | | 58,115 |
| | 220,000 | | Nationstar Home Equity Loan Trust, Series 2006-B AV4 (e) | | 0.53 | | | 09/25/36 | | | 103,369 |
| | 125,000 | | Nationstar Home Equity Loan Trust, Series 2007-A AV4 (e) | | 0.48 | | | 03/25/37 | | | 58,475 |
| | 197,600 | | Newcastle Mortgage Securities Trust, Series 2007-1 2A4 (e) | | 0.59 | | | 04/25/37 | | | 64,997 |
| | | | |
| See Notes to Financial Statements. | | 50 | | ABSOLUTE FUNDS |
ABSOLUTE OPPORTUNITIES FUND
SCHEDULE OF INVESTMENTS
MARCH 31, 2010
| | | | | | | | | | | |
| Principal | | Security Description | | Rate | | | Maturity | | Value |
| $ | 230,060 | | Option One Mortgage Loan Trust, Series 2006-3 2A2 (e) | | 0.35 | % | | 02/25/37 | | $ | 148,259 |
| | 380,000 | | Option One Mortgage Loan Trust, Series 2007-4 2A3 (e) | | 0.49 | | | 04/25/37 | | | 138,022 |
| | 375,000 | | Option One Mortgage Loan Trust, Series 2007-6 2A3 (e) | | 0.43 | | | 07/25/37 | | | 154,235 |
| | 82,000 | | Prudential Holdings, LLC (f) | | 8.70 | | | 12/18/23 | | | 94,663 |
| | 84,349 | | Reliant Energy Mid-Atlantic Power Holdings, LLC, Series B | | 9.24 | | | 07/02/17 | | | 90,254 |
| | 100,000 | | Saxon Asset Securities Trust, Series 2005-2 M1 (e) | | 0.67 | | | 10/25/35 | | | 82,537 |
| | 320,000 | | Saxon Asset Securities Trust, Series 2006-3 A3 (e) | | 0.42 | | | 10/25/46 | | | 138,959 |
| | 217,745 | | Securitized Asset Backed Receivables, LLC Trust, Series 2007-BR2 A2 (e) | | 0.48 | | | 02/25/37 | | | 96,118 |
| | 500,000 | | Securitized Asset Backed Receivables, LLC Trust, Series 2007-NC1 A2B (e) | | 0.40 | | | 12/25/36 | | | 191,687 |
| | 250,000 | | Soundview Home Equity Loan Trust, Series 2006-WF2 A2C (e) | | 0.39 | | | 12/25/36 | | | 193,253 |
| | 216,874 | | Structured Asset Mortgage Investments, Inc., Series 2006-AR8 A1A (e) | | 0.45 | | | 10/25/36 | | | 121,134 |
| | 171,674 | | Structured Asset Mortgage Investments, Inc., Series 2007-AR3 2A1 (e) | | 0.44 | | | 09/25/47 | | | 98,604 |
| | 348,361 | | Structured Asset Mortgage Investments, Inc., Series 2007-AR6 A1 (e) | | 1.96 | | | 08/25/47 | | | 197,371 |
| | 120,000 | | Structured Asset Securities Corp., Series 2007-BC3 2A2 (e) | | 0.39 | | | 05/25/47 | | | 75,031 |
| | 97,013 | | Thornburg Mortgage Securities Trust, Series 2007-3 3A1 (e) | | 0.47 | | | 06/25/47 | | | 80,569 |
| | | | | | | | | | | |
| Principal | | Security Description | | Rate | | | Maturity | | Value |
| $ | 90,000 | | UAL Pass Through Trust, Series 2009-1 | | 10.40 | % | | 11/01/16 | | $ | 97,425 |
| | 152,510 | | WaMu Mortgage Pass Through Certificates, Series 2004-AR6 A (e) | | 0.67 | | | 05/25/44 | | | 90,471 |
| | 99,177 | | WaMu Mortgage Pass Through Certificates, Series 2007-HY4 1A1 (e) | | 5.45 | | | 04/25/37 | | | 70,905 |
| | 189,126 | | WaMu Mortgage Pass Through Certificates, Series 2007-OA6 1A (e) | | 1.27 | | | 07/25/47 | | | 111,863 |
| | 87,096 | | Washington Mutual Alternative Mortgage Pass-Through Certificates, Series 2005-3 2A3 (e) | | 0.80 | | | 05/25/35 | | | 59,147 |
| | 121,765 | | Washington Mutual Alternative Mortgage Pass-Through Certificates, Series 2005-4 CB13 (e) | | 0.75 | | | 06/25/35 | | | 82,284 |
| | 138,698 | | Washington Mutual Alternative Mortgage Pass-Through Certificates, Series 2006-1 4CB | | 6.50 | | | 02/25/36 | | | 87,681 |
| | 176,181 | | Wells Fargo Home Equity Trust, Series 2006-3 A2 (e) | | 0.40 | | | 01/25/37 | | | 108,174 |
| | | | | | | | | | | |
| | Total Asset Backed Obligations (Cost $10,556,071) | | | 13,001,724 |
| | | | | | | | | | | |
| | Corporate Convertible Bonds - 6.1% |
| | Consumer Discretionary - 1.0% |
| | 1,700,000 | | Stewart Enterprises, Inc. (b) | | 3.38 | | | 07/15/16 | | | 1,462,000 |
| | | | |
| See Notes to Financial Statements. | | 51 | | ABSOLUTE FUNDS |
ABSOLUTE OPPORTUNITIES FUND
SCHEDULE OF INVESTMENTS
MARCH 31, 2010
| | | | | | | | | | | |
| Principal | | Security Description | | Rate | | | Maturity | | Value |
| $ | 1,375,000 | | Titan International, Inc. (f) | | 5.63 | % | | 01/15/17 | | $ | 1,512,500 |
| | | | | | | | | | | |
| | | | | | | | | | | 2,974,500 |
| | | | | | | | | | | |
| | Financial - 2.2% |
| | 1,500,000 | | AngloGold Ashanti Holdings Finance PLC (b)(f) | | 3.50 | | | 05/22/14 | | | 1,668,750 |
| | 3,700,000 | | CompuCredit Holdings Corp. | | 3.63 | | | 05/30/25 | | | 2,238,500 |
| | 1,000,000 | | CompuCredit Holdings Corp. (f) | | 5.88 | | | 11/30/35 | | | 475,000 |
| | 550,000 | | Hilltop Holdings, Inc. | | 7.50 | | | 08/15/25 | | | 589,875 |
| | 1,650,000 | | iStar Financial, Inc. REIT (e) | | 0.79 | | | 10/01/12 | | | 1,254,825 |
| | | | | | | | | | | |
| | | | | | | | | | | 6,226,950 |
| | | | | | | | | | | |
| | Industrial - 0.8% |
| | 500,000 | | AGCO Corp. (b) | | 1.25 | | | 12/15/36 | | | 554,375 |
| | 2,700,000 | | Ambassadors International, Inc. | | 3.75 | | | 04/15/27 | | | 1,896,750 |
| | | | | | | | | | | |
| | | | | | | | | | | 2,451,125 |
| | | | | | | | | | | |
| | Materials - 2.1% | | | |
| | 2,050,000 | | Goldcorp, Inc. (b)(f) | | 2.00 | | | 08/01/14 | | | 2,290,875 |
| | 3,675,000 | | Kinross Gold Corp. (b) | | 1.75 | | | 03/15/28 | | | 3,707,156 |
| | | | | | | | | | | |
| | | | | | | | | | | 5,998,031 |
| | | | | | | | | | | |
| Total Corporate Convertible Bonds
(Cost $13,830,211) | | | 17,650,606 |
| | | | | | | | | | | |
| | Corporate Non-Convertible Bonds - 7.6% |
| | Consumer Discretionary - 3.5% |
| | 225,000 | | Dillard’s, Inc. | | 7.88 | | | 01/01/23 | | | 200,812 |
| | 225,000 | | Dillard’s, Inc. | | 7.75 | | | 05/15/27 | | | 191,250 |
| | 385,000 | | Invista (f) | | 9.25 | | | 05/01/12 | | | 391,737 |
| | 130,000 | | New Albertsons, Inc. | | 7.75 | | | 06/15/26 | | | 111,150 |
| | 1,760,000 | | New Albertsons, Inc., MTN, Series 1998-C (b) | | 6.63 | | | 06/01/28 | | | 1,342,000 |
| | 35,000 | | PHI, Inc. | | 7.13 | | | 04/15/13 | | | 34,169 |
| | 1,650,000 | | Phillips-Van Heusen Corp. (b) | | 8.13 | | | 05/01/13 | | | 1,685,063 |
| | 10,000 | | Service Corp. International | | 7.88 | | | 02/01/13 | | | 10,100 |
| | 1,000,000 | | Tenneco, Inc., Series B (b) | | 10.25 | | | 07/15/13 | | | 1,041,250 |
| | | | | | | | | | | |
| Principal | | Security Description | | Rate | | | Maturity | | Value |
| $ | 2,000,000 | | The Hertz Corp. (b) | | 8.88 | % | | 01/01/14 | | $ | 2,065,000 |
| | 50,000 | | Time Warner Cable, Inc. | | 8.25 | | | 04/01/19 | | | 60,604 |
| | 780,000 | | Titan International, Inc. (b) | | 8.00 | | | 01/15/12 | | | 783,900 |
| | 1,000,000 | | Vector Group, Ltd. (b) | | 11.00 | | | 08/15/15 | | | 1,055,000 |
| | 1,015,000 | | Warnaco, Inc. (b) | | 8.88 | | | 06/15/13 | | | 1,042,913 |
| | | | | | | | | | | |
| | | | | | | | | | | 10,014,948 |
| | | | | | | | | | | |
| | Consumer Staples - 0.1% |
| | 208,000 | | NBTY, Inc. | | 7.13 | | | 10/01/15 | | | 210,600 |
| | | | | | | | | | | |
| | Energy - 0.6% |
| | 60,000 | | Atlas Energy Operating Co., LLC / Atlas Energy Finance Corp. | | 12.13 | | | 08/01/17 | | | 69,000 |
| | 50,000 | | CenterPoint Energy Resources Corp. | | 6.15 | | | 05/01/16 | | | 54,241 |
| | 50,000 | | CenterPoint Energy Resources Corp., MTN | | 6.00 | | | 05/15/18 | | | 52,928 |
| | 60,000 | | Chesapeake Energy Corp. | | 7.00 | | | 08/15/14 | | | 61,125 |
| | 100,000 | | Continental Resources, Inc. | | 8.25 | | | 10/01/19 | | | 106,500 |
| | 700,000 | | SEACOR Holdings, Inc. (b) | | 7.38 | | | 10/01/19 | | | 721,772 |
| | 100,000 | | Tesoro Corp. | | 6.50 | | | 06/01/17 | | | 92,500 |
| | 19,000 | | The Williams Cos., Inc. | | 7.88 | | | 09/01/21 | | | 22,415 |
| | 30,000 | | Valero Energy Corp. | | 9.38 | | | 03/15/19 | | | 35,772 |
| | 50,000 | | Valero Energy Corp. | | 7.50 | | | 04/15/32 | | | 51,671 |
| | 15,000 | | Valero Energy Corp. | | 10.50 | | | 03/15/39 | | | 19,316 |
| | 500,000 | | Woodside Finance, Ltd. (b)(f) | | 5.00 | | | 11/15/13 | | | 526,864 |
| | | | | | | | | | | |
| | | | | | | | | | | 1,814,104 |
| | | | | | | | | | | |
| | Financial - 1.3% |
| | 30,000 | | Capital One Capital V | | 10.25 | | | 08/15/39 | | | 35,634 |
| | 200,000 | | Chase Capital II, Series B (e) | | 0.75 | | | 02/01/27 | | | 156,656 |
| | | | |
| See Notes to Financial Statements. | | 52 | | ABSOLUTE FUNDS |
ABSOLUTE OPPORTUNITIES FUND
SCHEDULE OF INVESTMENTS
MARCH 31, 2010
| | | | | | | | | | | |
| Principal | | Security Description | | Rate | | | Maturity | | Value |
| $ | 185,000 | | Chase Capital III, Series C (e) | | 0.80 | % | | 03/01/27 | | $ | 139,182 |
| | 140,000 | | Citigroup, Inc. (e) | | 1.03 | | | 12/09/11 | | | 142,064 |
| | 75,000 | | Citigroup, Inc. (b)(e) | | 0.53 | | | 11/05/14 | | | 69,585 |
| | 80,000 | | Citigroup, Inc. | | 8.50 | | | 05/22/19 | | | 93,528 |
| | 100,000 | | Citigroup, Inc. (e) | | 0.80 | | | 08/25/36 | | | 62,891 |
| | 90,000 | | City National Capital Trust I | | 9.63 | | | 02/01/40 | | | 100,257 |
| | 155,000 | | Credit Suisse Guernsey, Ltd., Series 1 (e) | | 0.94 | | | 05/29/49 | | | 121,869 |
| | 55,000 | | Discover Financial Services | | 10.25 | | | 07/15/19 | | | 65,539 |
| | 60,000 | | Duke Realty LP REIT | | 7.38 | | | 02/15/15 | | | 64,861 |
| | 50,000 | | ERP Operating LP REIT | | 5.20 | | | 04/01/13 | | | 51,933 |
| | 80,000 | | General Electric Capital Corp., MTN, Series 2004-A (e) | | 0.52 | | | 09/15/14 | | | 76,120 |
| | 16,000 | | General Electric Capital Corp. | | 5.63 | | | 05/01/18 | | | 16,747 |
| | 100,000 | | General Electric Capital Corp., MTN (e) | | 0.63 | | | 05/05/26 | | | 82,318 |
| | 80,000 | | General Electric Capital Corp., MTN | | 6.88 | | | 01/10/39 | | | 86,570 |
| | 60,000 | | GMAC, LLC | | 7.25 | | | 03/02/11 | | | 61,350 |
| | 650,000 | | iStar Financial, Inc. REIT | | 5.15 | | | 03/01/12 | | | 575,250 |
| | 140,000 | | JPMorgan Chase Capital XXI,
Series U (e) | | 1.20 | | | 02/02/37 | | | 107,677 |
| | 440,000 | | MBNA Capital,
Series B (e) | | 1.05 | | | 02/01/27 | | | 303,630 |
| | 50,000 | | Morgan Stanley | | 6.60 | | | 04/01/12 | | | 54,274 |
| | 175,000 | | Morgan Stanley (e) | | 0.62 | | | 06/20/12 | | | 176,479 |
| | 125,000 | | Morgan Stanley (e) | | 0.73 | | | 10/15/15 | | | 115,946 |
| | 110,000 | | Nationsbank Capital Trust III (e) | | 0.80 | | | 01/15/27 | | | 77,403 |
| | 175,000 | | Nationwide Mutual Insurance Co. (e)(f) | | 5.81 | | | 12/15/24 | | | 150,098 |
| | 62,000 | | Raymond James Financial, Inc. | | 8.60 | | | 08/15/19 | | | 70,976 |
| | 165,000 | | The Goldman Sachs Group, Inc. (e) | | 1.05 | | | 12/05/11 | | | 167,389 |
| | 20,000 | | The Goldman Sachs Group, Inc., MTN, Series B (e) | | 0.65 | | | 07/22/15 | | | 19,363 |
| | 30,000 | | The Goldman Sachs Group, Inc. | | 6.15 | | | 04/01/18 | | | 31,793 |
| | 58,000 | | The Goldman Sachs Group, Inc. | | 7.50 | | | 02/15/19 | | | 66,392 |
| | 100,000 | | Wachovia Corp. (e) | | 0.59 | | | 10/28/15 | | | 92,893 |
| | | | | | | | | | | |
| Principal | | Security Description | | Rate | | | Maturity | | Value |
| $ | 55,000 | | WEA Finance, LLC (f) | | 4.38 | % | | 11/15/10 | | $ | 55,864 |
| | 100,000 | | WEA Finance, LLC (f) | | 7.50 | | | 06/02/14 | | | 112,031 |
| | 175,000 | | ZFS Finance USA Trust I (e)(f) | | 6.15 | | | 12/15/65 | | | 172,375 |
| | | | | | | | | | | |
| | | | | | | | | | | 3,776,937 |
| | | | | | | | | | | |
| | Healthcare - 0.0% |
| | 95,000 | | CHS/Community Health Systems, Inc. | | 8.88 | | | 07/15/15 | | | 98,562 |
| | 65,000 | | HCA, Inc. (f) | | 8.50 | | | 04/15/19 | | | 70,241 |
| | | | | | | | | | | |
| | | | | | | | | | | 168,803 |
| | | | | | | | | | | |
| | Industrial - 0.3% |
| | 265,000 | | Bristow Group, Inc. | | 6.13 | | | 06/15/13 | | | 265,663 |
| | 85,000 | | Bristow Group, Inc. | | 7.50 | | | 09/15/17 | | | 86,275 |
| | 90,000 | | Delta Air Lines, Inc. (f) | | 9.50 | | | 09/15/14 | | | 95,062 |
| | 148,000 | | Mueller Industries, Inc. | | 6.00 | | | 11/01/14 | | | 148,000 |
| | 155,000 | | Silgan Holdings, Inc. | | 7.25 | | | 08/15/16 | | | 161,587 |
| | | | | | | | | | | |
| | | | | | | | | | | 756,587 |
| | | | | | | | | | | |
| | Materials - 1.1% |
| | 1,000,000 | | Allegheny Ludlum Corp. (b) | | 6.95 | | | 12/15/25 | | | 965,466 |
| | 695,000 | | Freeport-McMoRan Corp. (b) | | 9.50 | | | 06/01/31 | | | 876,825 |
| | 1,000,000 | | Freeport-McMoRan Corp. (b) | | 6.13 | | | 03/15/34 | | | 899,871 |
| | 338,000 | | Westlake Chemical Corp. (b) | | 6.63 | | | 01/15/16 | | | 331,240 |
| | | | | | | | | | | |
| | | | | | | | | | | 3,073,402 |
| | | | | | | | | | | |
| | Telecommunication Services - 0.3% |
| | 25,000 | | Cellco Partnership/ Verizon Wireless Capital, LLC | | 8.50 | | | 11/15/18 | | | 31,241 |
| | 500,000 | | MasTec, Inc. (b) | | 7.63 | | | 02/01/17 | | | 488,125 |
| | 96,000 | | Millicom International Cellular SA | | 10.00 | | | 12/01/13 | | | 100,080 |
| | 60,000 | | Qwest Corp. | | 7.88 | | | 09/01/11 | | | 63,900 |
| | 50,000 | | Sprint Nextel Corp. (e) | | 0.69 | | | 06/28/10 | | | 49,826 |
| | | | | | | | | | | |
| | | | | | | | | | | 733,172 |
| | | | | | | | | | | |
| | | | |
| See Notes to Financial Statements. | | 53 | | ABSOLUTE FUNDS |
ABSOLUTE OPPORTUNITIES FUND
SCHEDULE OF INVESTMENTS
MARCH 31, 2010
| | | | | | | | | | | |
| Principal | | Security Description | | Rate | | | Maturity | | Value |
| | Utilities - 0.4% |
| $ | 110,000 | | Edison Mission Energy | | 7.00 | % | | 05/15/17 | | $ | 77,275 |
| | 170,000 | | KCP&L Greater Missouri Operations Co. (b) | | 11.88 | | | 07/01/12 | | | 197,947 |
| | 25,000 | | KCP&L Greater Missouri Operations Co. | | 8.27 | | | 11/15/21 | | | 26,062 |
| | 100,000 | | Mirant Americas Generation, LLC | | 9.13 | | | 05/01/31 | | | 90,250 |
| | 85,000 | | Nisource Finance Corp. | | 10.75 | | | 03/15/16 | | | 108,172 |
| | 55,000 | | NRG Energy, Inc. | | 7.25 | | | 02/01/14 | | | 55,550 |
| | 90,000 | | PNM Resources, Inc. | | 9.25 | | | 05/15/15 | | | 96,187 |
| | 100,000 | | Sabine Pass LNG LP | | 7.25 | | | 11/30/13 | | | 94,500 |
| | 160,000 | | Southern Union Co. (e) | | 7.20 | | | 11/01/66 | | | 149,200 |
| | 40,000 | | Texas-New Mexico Power Co. (f) | | 9.50 | | | 04/01/19 | | | 48,810 |
| | 89,000 | | The AES Corp. (f) | | 8.75 | | | 05/15/13 | | | 90,780 |
| | | | | | | | | | | |
| | | | | | | | | | | 1,034,733 |
| | | | | | | | | | | |
| Total Corporate Non-Convertible Bonds
(Cost $19,619,076) | | | 21,583,286 |
| | | | | | | | | | | |
| | U.S. Government & Agency Obligations - 7.3% |
| | Agency - 2.8% |
| | 265,000 | | FHLB (g) | | 0.75 | | | 10/05/11 | | | 265,549 |
| | 3,750,000 | | FHLMC (b) | | 1.63 | | | 04/26/11 | | | 3,791,535 |
| | 3,750,000 | | FNMA (b) | | 1.88 | | | 04/20/12 | | | 3,800,588 |
| | | | | | | | | | | |
| | | | | | | | | | | 7,857,672 |
| | | | | | | | | | | |
| | Interest Only Bonds - 0.0% |
| | 338,860 | | GNMA, Series 2007-78 SG (e) | | 6.30 | | | 12/20/37 | | | 29,046 |
| | | | | | | | | | | |
| | U.S. Treasury Securities - 4.5% |
| | 3,750,000 | | U.S. Treasury Bill (h) | | 0.15-
0.25 |
| | 04/08/10 | | | 3,749,942 |
| | 410,000 | | U.S. Treasury Bill (h) | | 0.13 | | | 04/15/10 | | | 409,978 |
| | 300,000 | | U.S. Treasury Bill (b)(h) | | 0.14 | | | 04/22/10 | | | 299,988 |
| | 5,300,000 | | U.S. Treasury Bill (b)(h) | | 0.08-
0.16 |
| | 04/29/10 | | | 5,299,619 |
| | 70,000 | | U.S. Treasury Bill (h) | | 0.11 | | | 05/06/10 | | | 69,992 |
| | 2,500,000 | | U.S. Treasury Bill (b)(h) | | 0.09 | | | 05/13/10 | | | 2,499,625 |
| | | | | | | | | | | |
| Principal | | Security Description | | Rate | | | Maturity | | Value |
| $ | 500,000 | | U.S. Treasury Bill (b)(h) | | 0.14 | % | | 07/08/10 | | $ | 499,823 |
| | | | | | | | | | | |
| | | | | | | | | | | 12,828,967 |
| | | | | | | | | | | |
| Total U.S. Government & Agency Obligations
(Cost $20,647,088) | | | 20,715,685 |
| | | | | | | | | | | |
| | Total Fixed Income Securities (Cost $64,652,446) | | | 72,951,301 |
| | | | | | | | | | | |
| | | | |
| Shares | | Security
Description | | | | | | | Value |
| | Investment Companies - 10.2% |
| | 14,525 | | Energy Select Sector SPDR Fund | | | 835,478 |
| | 13,345 | | iPath MSCI India Index ETN (a) | | | 892,113 |
| | 20,520 | | iShares MSCI Brazil Index Fund | | | 1,511,503 |
| | 53,990 | | iShares MSCI Canada Index Fund | | | 1,505,781 |
| | 15,535 | | iShares MSCI EAFE Index Fund | | | 869,960 |
| | 167,970 | | iShares MSCI Emerging Markets Index Fund | | | 7,074,896 |
| | 52,605 | | iShares MSCI Hong Kong Index Fund | | | 856,936 |
| | 16,760 | | iShares MSCI Mexico Investable Market Index Fund | | | 894,481 |
| | 20,195 | | iShares MSCI Pacific ex-Japan Index Fund | | | 868,183 |
| | 17,745 | | iShares MSCI South Korea Index Fund | | | 887,250 |
| | 68,780 | | iShares MSCI Taiwan Index Fund | | | 863,189 |
| | 12,815 | | iShares Russell 2000 Index Fund | | | 868,985 |
| | 7,150 | | iShares S&P 500 Index Fund | | | 838,981 |
| | 32,027 | | Market Vectors - Gold Miners ETF | | | 1,422,319 |
| | 35,090 | | PowerShares DB Commodity Index Tracking Fund (a) | | | 825,317 |
| | 21,450 | | SPDR Barclays Capital High Yield Bond ETF | | | 853,496 |
| | 23,034 | | SPDR Gold Trust (a)(b) | | | 2,509,554 |
| | 109,750 | | Vanguard Emerging Markets ETF | | | 4,629,255 |
| | | | | | | | | | | |
| | Total Investment Companies (Cost $27,773,682) | | | 29,007,677 |
| | | | | | | | | | | |
| | | | |
| Principal | | Security
Description | | Rate | | | Maturity | | Value |
| | Short-Term Investments - 17.4% |
| | Certificate of Deposits - 0.1% |
| $ | 245,000 | | Citibank, N.A. | | 0.69 | | | 09/03/10 | | | 245,391 |
| | | | | | | | | | | |
| | Commercial Paper - 17.3% |
| | 2,000,000 | | Aetna, Inc. | | 0.27 | | | 04/15/10 | | | 1,999,790 |
| | 1,500,000 | | American Electric Power Co., Inc. (b) | | 0.30 | | | 04/13/10 | | | 1,499,850 |
| | 2,325,000 | | AutoZone, Inc. | | 0.27 | | | 04/07/10 | | | 2,324,895 |
| | 1,000,000 | | BMW US Capital, LLC | | 0.30 | | | 04/07/10 | | | 999,950 |
| | | | |
| See Notes to Financial Statements. | | 54 | | ABSOLUTE FUNDS |
ABSOLUTE OPPORTUNITIES FUND
SCHEDULE OF INVESTMENTS
MARCH 31, 2010
| | | | | | | | | | | |
| Principal | | Security
Description | | Rate | | | Maturity | | Value |
| $ | 1,500,000 | | BMW US Capital, LLC | | 0.32 | % | | 04/13/10 | | $ | 1,499,840 |
| | 1,500,000 | | BMW US Capital, LLC (b) | | 0.32 | | | 04/19/10 | | | 1,499,760 |
| | 3,500,000 | | Carnival Corp. | | 0.32-0.33 | | | 04/07/10 | | | 3,499,812 |
| | 4,000,000 | | Carnival Corp. | | 0.34 | | | 04/09/10 | | | 3,999,698 |
| | 1,000,000 | | Clorox Co. | | 0.25 | | | 04/13/10 | | | 999,917 |
| | 1,000,000 | | Clorox Co. | | 0.28 | | | 05/07/10 | | | 999,725 |
| | 2,000,000 | | Consolidated Edison Co. of New York, Inc. | | 0.30 | | | 04/06/10 | | | 1,999,917 |
| | 790,000 | | Duke Energy Corp. | | 0.27 | | | 04/06/10 | | | 789,970 |
| | 500,000 | | Duke Energy Corp. | | 0.26 | | | 04/12/10 | | | 499,960 |
| | 1,500,000 | | Elsevier Finance SA | | 0.32 | | | 04/01/10 | | | 1,500,000 |
| | 1,000,000 | | Elsevier Finance SA | | 0.32 | | | 04/08/10 | | | 999,938 |
| | 3,489,000 | | Florida Power & Light Co. (b) | | 0.25-0.32 | | | 04/09/10 | | | 3,488,783 |
| | 2,373,000 | | FMC Technologies, Inc. | | 0.30 | | | 04/07/10 | | | 2,372,881 |
| | 1,000,000 | | HJ Heinz Co. | | 0.25 | | | 04/12/10 | | | 999,923 |
| | 1,000,000 | | HJ Heinz Co. | | 0.25 | | | 04/16/10 | | | 999,896 |
| | 2,200,000 | | HJ Heinz Co. (b) | | 0.27 | | | 04/27/10 | | | 2,199,571 |
| | 1,800,000 | | Interstate Power & Light | | 0.30 | | | 04/08/10 | | | 1,799,895 |
| | 335,000 | | Lloyds TSB Bank PLC | | 0.21 | | | 04/26/10 | | | 334,951 |
| | 1,300,000 | | Public Service Co. of North Carolina, Inc. | | 0.26 | | | 04/07/10 | | | 1,299,944 |
| | 1,000,000 | | Safeway, Inc. | | 0.28 | | | 04/26/10 | | | 999,805 |
| | 2,000,000 | | Stanley Works | | 0.28 | | | 04/05/10 | | | 1,999,938 |
| | 500,000 | | The Dow Chemical Co. | | 0.95 | | | 04/01/10 | | | 500,000 |
| | 500,000 | | The Dow Chemical Co. | | 0.95 | | | 04/05/10 | | | 499,947 |
| | 500,000 | | The Dow Chemical Co. | | 0.95 | | | 04/07/10 | | | 499,921 |
| | 1,300,000 | | The Dow Chemical Co. | | 0.95 | | | 04/12/10 | | | 1,299,623 |
| | 995,000 | | Volkswagen of America, Inc. | | 0.26 | | | 04/07/10 | | | 994,957 |
| | | | | | | | | | | | |
| Principal | | Security
Description | | Rate | | | Maturity | | Value |
| $ | 2,000,000 | | Xcel Energy, Inc. | | | 0.25 | % | | 04/01/10 | | $ | 2,000,000 |
| | 2,000,000 | | XTO Energy, Inc. | | | 0.27 | | | 04/27/10 | | | 1,999,610 |
| | | | | | | | | | | | |
| | | | | | | | | | | | 49,402,667 |
| | | | | | | | | | | | |
| | Total Short-Term Investments (Cost $49,647,760) | | | 49,648,058 |
| | | | | | | | | | | | |
| | | | |
| Contracts | | Security
Description | | Strike
Price | | | Expiration
Date | | Value |
| | Purchased Options - 0.8% |
| | Call Options Purchased - 0.1% |
| | 126 | | Cameco Corp. | | $ | 30.00 | | | 01/11 | | | 28,350 |
| | 242 | | Market Vectors - Gold Miners ETF | | | 55.00 | | | 01/11 | | | 53,966 |
| | 123 | | Market Vectors - Gold Miners ETF | | | 45.00 | | | 01/11 | | | 68,265 |
| | 122 | | Monsanto Co. | | | 80.00 | | | 10/10 | | | 31,110 |
| | 229 | | SPDR Gold Trust | | | 150.00 | | | 01/11 | | | 25,877 |
| | 253 | | SPDR Gold Trust | | | 125.00 | | | 01/11 | | | 91,586 |
| | | | | | | | | | | | |
| Total Call Options Purchased
(Premiums Paid $374,391) | | | 299,154 |
| | | | | | | | | | | | |
| | Put Options Purchased - 0.7% |
| | 511 | | American International Group, Inc. | | | 20.00 | | | 01/11 | | | 112,931 |
| | 523 | | Career Education Corp. | | | 27.00 | | | 10/10 | | | 103,293 |
| | 173 | | Caterpillar, Inc. | | | 50.00 | | | 11/10 | | | 38,925 |
| | 68 | | Chipotle Mexican Grill, Inc. | | | 105.00 | | | 09/10 | | | 41,820 |
| | 193 | | Collective Brands, Inc. | | | 22.50 | | | 09/10 | | | 42,460 |
| | 391 | | Cracker Barrel Old Country Store, Inc. | | | 45.00 | | | 09/10 | | | 121,210 |
| | 203 | | Dillard’s, Inc. | | | 22.50 | | | 11/10 | | | 54,810 |
| | 72 | | DineEquity, Inc. | | | 30.00 | | | 06/10 | | | 5,760 |
| | 63 | | DineEquity, Inc. | | | 35.00 | | | 09/10 | | | 20,632 |
| | | | |
| See Notes to Financial Statements. | | 55 | | ABSOLUTE FUNDS |
ABSOLUTE OPPORTUNITIES FUND
SCHEDULE OF INVESTMENTS
MARCH 31, 2010
| | | | | | | | | | |
| Contracts | | Security
Description | | Strike
Price | | Expiration
Date | | Value |
| 194 | | Freeport-McMoRan Copper & Gold, Inc. | | $ | 75.00 | | 11/10 | | $ | 129,010 |
| 485 | | Freeport-McMoRan Copper & Gold, Inc. | | | 60.00 | | 11/10 | | | 119,310 |
| 1,387 | | iShares MSCI Emerging Markets Index Fund | | | 41.00 | | 04/10 | | | 56,867 |
| 1,040 | | iShares MSCI Emerging Markets Index Fund | | | 35.00 | | 09/10 | | | 100,880 |
| 452 | | iShares Russell 2000 Index Fund | | | 65.00 | | 08/10 | | | 122,040 |
| 60 | | Jo-Ann Stores, Inc. | | | 30.00 | | 04/10 | | | 600 |
| 610 | | Johnson Controls, Inc. | | | 30.00 | | 10/10 | | | 100,650 |
| 567 | | Limited Brands, Inc. | | | 21.50 | | 01/11 | | | 99,225 |
| 953 | | Materials Select Sector SPDR | | | 31.00 | | 09/10 | | | 117,696 |
| 118 | | Oil Services Holders Trust | | | 120.00 | | 10/10 | | | 112,395 |
| 232 | | Retail Holders Trust | | | 95.00 | | 10/10 | | | 78,880 |
| 388 | | Royal Caribbean Cruises, Ltd. | | | 31.00 | | 09/10 | | | 109,610 |
| 107 | | Southern Copper Corp. | | | 30.00 | | 09/10 | | | 29,425 |
| 350 | | SPDR KBW Regional Banking ETF | | | 20.00 | | 06/10 | | | 3,500 |
| | | | | | | | | | | |
| Contracts | | Security
Description | | Strike
Price | | Expiration
Date | | Value | |
| 147 | | SPDR KBW Regional Banking ETF | | $ | 25.00 | | 09/10 | | $ | 21,315 | |
| 457 | | SPDR S&P Retail ETF | | | 40.00 | | 09/10 | | | 97,798 | |
| 324 | | Teck Resources, Ltd. | | | 32.00 | | 08/10 | | | 30,780 | |
| 267 | | The Cheesecake Factory, Inc. | | | 25.00 | | 10/10 | | | 45,390 | |
| 112 | | The Dow Chemical Co. | | | 28.00 | | 09/10 | | | 23,072 | |
| 305 | | Wells Fargo & Co. | | | 26.00 | | 10/10 | | | 35,075 | |
| | | | | | | | | | | |
Total Put Options Purchased
(Premiums Paid $2,309,382) | | | 1,975,359 | |
| | | | | | | | | | | |
Total Purchased Options
(Premiums Paid $2,683,773) | | | 2,274,513 | |
Total Long Positions - 85.3%
(Cost $222,004,964) | | $ | 243,730,362 | |
Total Short Positions - (16.2)%
(Cost $(43,369,593)) | | | (46,165,947 | ) |
Total Written Options - (0.1)%
(Premiums Received $(392,188)) | | | (378,048 | ) |
| Other Assets & Liabiities, Net - 31.0% | | | 88,452,375 | |
| | | | | | | | | | | |
| Net Assets - 100.0% | | $ | 285,638,742 | |
| | | | | | | | | | | |
| | | | |
| See Notes to Financial Statements. | | 56 | | ABSOLUTE FUNDS |
ABSOLUTE OPPORTUNITIES FUND
SCHEDULE OF SECURITIES SOLD SHORT
MARCH 31, 2010
| | | | | | | |
| Shares | | | Security Description | | Value | |
| Short Positions - (16.2)% | | | | |
| Equity Securities - (4.7)% | | | | |
| Common Stock - (4.7)% | | | | |
| Consumer Discretionary - (3.3)% | | | | |
| (32,100 | ) | | American Axle & Manufacturing Holdings, Inc. | | $ | (320,357 | ) |
| (8,500 | ) | | American Greetings Corp., Class A | | | (177,140 | ) |
| (32,600 | ) | | ArvinMeritor, Inc. | | | (435,210 | ) |
| (26,442 | ) | | Asbury Automotive Group, Inc. | | | (351,679 | ) |
| (15,000 | ) | | Career Education Corp. | | | (474,600 | ) |
| (46,066 | ) | | Dillard’s, Inc., Class A | | | (1,087,158 | ) |
| (19,592 | ) | | DineEquity, Inc. | | | (775,059 | ) |
| (24,480 | ) | | Dollar Thrifty Automotive Group, Inc. | | | (786,542 | ) |
| (65,000 | ) | | Ford Motor Co. | | | (817,050 | ) |
| (10,281 | ) | | FTI Consulting, Inc. | | | (404,249 | ) |
| (10,000 | ) | | Grand Canyon Education, Inc. | | | (261,400 | ) |
| (11,400 | ) | | Jo-Ann Stores, Inc. | | | (478,572 | ) |
| (13,500 | ) | | Korn/Ferry International | | | (238,275 | ) |
| (4,700 | ) | | Landry’s Restaurants, Inc. | | | (84,224 | ) |
| (9,318 | ) | | Liz Claiborne, Inc. | | | (69,233 | ) |
| (1,500 | ) | | priceline.com, Inc. | | | (382,500 | ) |
| (315,000 | ) | | RITE AID Corp. | | | (472,500 | ) |
| (15,031 | ) | | Royal Caribbean Cruises, Ltd. | | | (495,873 | ) |
| (25,000 | ) | | Sonic Automotive, Inc., Class A | | | (275,000 | ) |
| (22,796 | ) | | Tenneco, Inc. | | | (539,125 | ) |
| (27,042 | ) | | The McClatchy Co., Class A | | | (132,776 | ) |
| (18,000 | ) | | TRW Automotive Holdings Corp. | | | (514,440 | ) |
| | | | | | | |
| | | | | | (9,572,962 | ) |
| | | | | | | |
| Consumer Staples - (0.3)% | | | | |
| (19,100 | ) | | Corinthian Colleges, Inc. | | | (335,969 | ) |
| (3,932 | ) | | Green Mountain Coffee Roasters, Inc. | | | (380,696 | ) |
| | | | | | | |
| | | | | | (716,665 | ) |
| | | | | | | |
| Energy - (0.1)% | | | | |
| (3,480 | ) | | InterOil Corp. | | | (225,504 | ) |
| | | | | | | |
| Financial - (0.6)% | | | | |
| (8,503 | ) | | SL Green Realty Corp. REIT | | | (486,967 | ) |
| (12,333 | ) | | The Macerich Co. REIT | | | (472,477 | ) |
| (30,000 | ) | | Wells Fargo & Co. | | | (933,600 | ) |
| | | | | | | |
| | | | | | (1,893,044 | ) |
| | | | | | | |
| Industrial - (0.2)% | | | | |
| (20,099 | ) | | Werner Enterprises, Inc. | | | (465,694 | ) |
| | | | | | | |
| Materials - (0.2)% | | | | |
| (6,191 | ) | | Freeport-McMoRan Copper & Gold, Inc. | | | (517,196 | ) |
| | | | | | | |
Total Common Stock (Cost $(10,932,741))
| | | (13,391,065 | ) |
| | | | | | | |
Total Equity Securities (Cost $(10,932,741))
| | | (13,391,065 | ) |
| | | | | | | |
| | | | | | | | | | | | | |
| Principal | | | Security
Description | | Rate | | | Maturity | | Value | |
| | Fixed Income Securities - (4.7)% | | | | | | | |
| | Corporate Non-Convertible Bonds - (2.5)% | | | | |
| | Consumer Discretionary - (2.1)% | | | | | | | |
| $ | (1,100,000 | ) | | Boyd Gaming Corp. | | 7.75 | % | | 12/15/12 | | $ | (1,102,750 | ) |
| | (500,000 | ) | | Isle of Capri Casinos, Inc. | | 7.00 | | | 03/01/14 | | | (430,000 | ) |
| | (500,000 | ) | | MGM Mirage | | 7.63 | | | 01/15/17 | | | (418,750 | ) |
| | (1,000,000 | ) | | Pinnacle Entertainment, Inc. | | 7.50 | | | 06/15/15 | | | (870,000 | ) |
| | (1,000,000 | ) | | Tenneco, Inc. | | 8.63 | | | 11/15/14 | | | (1,020,000 | ) |
| | (2,000,000 | ) | | The Hertz Corp. | | 10.50 | | | 01/01/16 | | | (2,157,500 | ) |
| | | | | | | | | | | | | |
| | | | | | | | | | | | (5,999,000 | ) |
| | | | | | | | | | | | | |
| | Materials - (0.4)% | | | | | | | |
| | (1,000,000 | ) | | The Dow Chemical Co. | | 7.38 | | | 11/01/29 | | | (1,121,090 | ) |
| | | | | | | | | | | | | |
| Total Corporate Non-Convertible Bonds
(Cost $(6,802,246))
| | | (7,120,090 | ) |
| | | | | | | | | | | | | |
| | U.S. Government & Agency Obligations - (2.2)% | | | | |
| | U.S. Treasury Securities - (2.2)% | | | | | | | |
| | (2,500,000 | ) | | U.S. Treasury Bond | | 4.25 | | | 5/15/39 | | | (2,317,190 | ) |
| | (4,000,000 | ) | | U.S. Treasury Note | | 0.75 | | | 11/30/11 | | | (3,995,784 | ) |
| | | | | | | | | | | | | |
| Total U.S. Government & Agency Obligations
(Cost $(6,593,055))
| | | (6,312,974 | ) |
| | | | | | | | | | | | | |
| Total Fixed Income Securities
(Cost $(13,395,301))
|
| | | | | (13,433,064 | ) |
| | | | | | | | | | | | | |
| | | | |
| Shares | | | Security
Description | | | | | | | Value | |
| | Investment Companies - (6.8)% | | | | | | | |
| | (104,026 | ) | | Consumer Discretionary Select Sector SPDR Fund | | | (3,416,214 | ) |
| | (104,026 | ) | | Powershares QQQ | | | (5,011,973 | ) |
| | (40,678 | ) | | SPDR KBW Regional Banking ETF | | | (1,066,577 | ) |
| | (74,435 | ) | | SPDR S&P 500 ETF Trust | | | (8,708,151 | ) |
| | (27,563 | ) | | SPDR S&P Retail ETF | | | (1,138,903 | ) |
| | | | | | | | | | | | | |
| Total Investment Companies (Cost $(19,041,551))
| | | (19,341,818 | ) |
| | | | | | | | | | | | | |
| Total Short Positions (Cost $(43,369,593))
| | $ | (46,165,947 | ) |
| | | | | | | | | | | | | |
| | | | |
| See Notes to Financial Statements. | | 57 | | ABSOLUTE FUNDS |
ABSOLUTE OPPORTUNITIES FUND
SCHEDULE OF CALL AND PUT OPTIONS WRITTEN
MARCH 31, 2010
| | | | | | | | | | | | |
| Contracts | | | Security
Description | | Strike
Price | | Expiration
Date | | Value | |
| Written Options - (0.1)% | | | | | | |
| Call Options Written - (0.1)% | | | | | | |
| (4,000 | ) | | CapitalSource, Inc. | | $ | 5.00 | | 07/10 | | $ | (340,000 | ) |
| (155 | ) | | S&P 500 Index | | | 1275.00 | | 04/10 | | | (775 | ) |
| (53 | ) | | S&P 500 Index | | | 1270.00 | | 04/10 | | | (265 | ) |
| (52 | ) | | S&P 500 Index | | | 1260.00 | | 04/10 | | | (260 | ) |
| (51 | ) | | S&P 500 Index | | | 1250.00 | | 04/10 | | | (510 | ) |
| | | | | | | | | | | | |
Total Call Options Written
(Premiums Received $(278,960)) | | | | | (341,810 | ) |
| | | | | | | | | | | | |
| Put Options Written - 0.0% | | | | | | | | | |
| (50 | ) | | Dillard’s, Inc. | | | 7.50 | | 05/10 | | | (1,125 | ) |
| (63 | ) | | DineEquity, Inc. | | | 22.50 | | 09/10 | | | (3,308 | ) |
| (50 | ) | | Freeport-McMoRan Copper & Gold, Inc. | | | 60.00 | | 05/10 | | | (1,350 | ) |
| (200 | ) | | Freeport-McMoRan Copper & Gold, Inc. | | | 50.00 | | 05/10 | | | (2,200 | ) |
| (60 | ) | | Jo-Ann Stores, Inc. | | | 25.00 | | 04/10 | | | (390 | ) |
| (28 | ) | | S&P 500 Index | | | 1075.00 | | 04/10 | | | (3,080 | ) |
| (101 | ) | | S&P 500 Index | | | 1070.00 | | 04/10 | | | (11,615 | ) |
| (53 | ) | | S&P 500 Index | | | 1055.00 | | 04/10 | | | (4,505 | ) |
| (86 | ) | | S&P 500 Index | | | 1050.00 | | 04/10 | | | (7,310 | ) |
| (17 | ) | | S&P 500 Index | | | 1045.00 | | 04/10 | | | (1,105 | ) |
| (100 | ) | | Teck Resources, Ltd. | | | 20.00 | | 05/10 | | | (250 | ) |
| | | | | | | | | | | | |
Total Put Options Written
(Premiums Received $(113,228)) | | | | | (36,238 | ) |
| | | | | | | | | | | | |
Total Written Options
(Premiums Received $(392,188)) | | | | $ | (378,048 | ) |
| | | | | | | | | | | | |
| | | | |
| See Notes to Financial Statements. | | 58 | | ABSOLUTE FUNDS |
ABSOLUTE OPPORTUNITIES FUND
NOTES TO SCHEDULE OF INVESTMENTS
MARCH 31, 2010
ADR American Depositary Receipt
ETF Exchange Traded Fund
ETN Exchange Traded Note
FHLB Federal Home Loan Bank
FHLMC Federal Home Loan Mortgage Corporation
FNMA Federal National Mortgage Association
GNMA Government National Mortgage Association
LLC Limited Liability Company
LP Limited Partnership
MTN Medium Term Note
PLC Public Limited Company
REIT Real Estate Investment Trust
| (a) | Non-income producing security. |
| (b) | All or a portion of this security is held as collateral for securities sold short. |
| (c) | Affiliated Company. As of March 31, 2010, the Fund no longer owns 5% of the outstanding stock of the company and is no longer an affiliate. |
| (d) | Subject to call option written by the Fund. |
| (e) | Variable rate security. Rate presented is as of March 31, 2010. |
| (f) | Security exempt from registration under Rule 144A under the Securities Act of 1933. At year end, the value of these securities amounted to $8,567,307 or 3.0% of net assets. |
| (g) | Debt obligation initially issued at one coupon rate which converts to higher coupon rate at a specified date. Rate presented is as of March 31, 2010. |
| (h) | Rate presented is yield to maturity. |
An affiliated company is a company in which the Fund has ownership of at least 5% of the voting securities.
Transactions during the year with companies which were affiliates are as follows:
| | | | | | | | | | | | | | | | | | | | | |
Name of Issuer | | Shares held at
beginning of year | | Gross
Additions | | Gross
Reductions | | | Realized
Loss | | | Shares held at
end of year | | Value March 31,
2010 | | Investment
Income |
Primary Energy Recycling, Inc. | | 1,583,200 | | $ | 2,810,681 | | $ | (1,183,060 | ) | | $ | (1,670,559 | ) | | 5,230,572 | | $ | 4,892,476 | | $ | 319,419 |
A summary of outstanding credit default swap agreements held by the Fund at March 31, 2010, is as follows:
| | | | | | | | | | | | | | | | |
Counterparty | | Reference Entity/Obligation | | Buy/Sell
Protection | | Pay
Rate | | | Termination
Date | | Notional
Amount | | Net
Unrealized
Appreciation
(Depreciation) | |
Royal Bank of Scotland | | Arrow Electronics, 6.875%, 6/1/18 | | Buy | | (1.00 | )% | | 12/20/14 | | $ | 5,000,000 | | $ | 59,971 | |
Barclays | | Black and Decker Corp, 5.75%, 11/15/16 | | Buy | | (1.00 | ) | | 09/20/14 | | | 10,000,000 | | | (544,744 | ) |
Royal Bank of Scotland | | Belgium Government Bonds, 5.75%, 9/28/10 | | Buy | | (1.00 | ) | | 03/20/15 | | | 5,000,000 | | | (47,927 | ) |
Barclays | | Belgium Government Bonds, 5.75%, 9/28/10 | | Buy | | (0.71 | ) | | 09/20/14 | | | 5,000,000 | | | (42,981 | ) |
Barclays | | Carnival Corp, 6.65%, 1/25/28 | | Buy | | (1.00 | ) | | 03/20/15 | | | 5,000,000 | | | (24,125 | ) |
Barclays | | Con-Way Inc,
8.875%, 5/1/10 | | Buy | | (1.00 | ) | | 03/20/15 | | | 5,000,000 | | | 51,897 | |
Barclays | | Con-Way Inc,
8.875%, 5/1/10 | | Buy | | (1.00 | ) | | 12/20/14 | | | 10,000,000 | | | 185,220 | |
Royal Bank of Scotland | | Eastman Chemical Company, 7.60%, 2/1/2027 | | Buy | | (1.00 | ) | | 12/20/14 | | | 5,000,000 | | | (47,327 | ) |
Barclays | | Fortune Brands Inc, 5.375%, 1/15/16 | | Buy | | (1.00 | ) | | 06/20/15 | | | 5,000,000 | | | 19,915 | |
Royal Bank of Scotland | | Fortune Brands Inc,
5.375%, 1/15/16 | | Buy | | (1.00 | ) | | 03/20/16 | | | 5,000,000 | | | (6,992 | ) |
| | | | |
| See Notes to Financial Statements. | | 59 | | ABSOLUTE FUNDS |
ABSOLUTE OPPORTUNITIES FUND
NOTES TO SCHEDULE OF INVESTMENTS
MARCH 31, 2010
| | | | | | | | | | | | | | | | |
Counterparty | | Reference Entity/Obligation | | Buy/Sell
Protection | | Pay Rate | | | Termination
Date | | Notional
Amount | | Net
Unrealized
Appreciation
(Depreciation) | |
Royal Bank of Scotland | | Fortune Brands Inc,
5.375%, 1/15/16 | | Buy | | (1.00 | )% | | 12/20/14 | | $ | 5,000,000 | | $ | (85,497 | ) |
Barclays | | Gatx Corporation,
6%, 2/15/18 | | Buy | | (1.00 | ) | | 03/20/16 | | | 10,000,000 | | | 46,953 | |
Barclays | | The Hershey Company, 6.95%, 8/15/12 | | Buy | | (1.00 | ) | | 03/20/15 | | | 5,000,000 | | | 5,283 | |
Barclays | | The Hershey Company, 6.95%, 8/15/12 | | Buy | | (1.00 | ) | | 03/20/16 | | | 5,000,000 | | | (1,577 | ) |
Barclays | | Southwest Airlines Company, 5.25%, 10/1/14 | | Buy | | (1.00 | ) | | 03/20/16 | | | 5,000,000 | | | 6,469 | |
Royal Bank of Scotland | | Marriott International Inc, 5.81%, 11/10/15 | | Buy | | (1.00 | ) | | 12/20/14 | | | 5,000,000 | | | (43,680 | ) |
Barclays | | Metro AG,
4.75%, 5/29/12 | | Buy | | (1.00 | ) | | 06/20/15 | | | 5,000,000 | | | (58,702 | ) |
Barclays | | Omnicom Group Inc,
5.90%, 4/15/16 | | Buy | | (1.00 | ) | | 12/20/14 | | | 5,000,000 | | | 17,083 | |
Barclays | | Ryder System Inc,
6.95%, 12/1/25 | | Buy | | (1.00 | ) | | 06/20/15 | | | 5,000,000 | | | 22,641 | |
Barclays | | Sara Lee Corporation, 6.125%, 11/1/32 | | Buy | | (1.00 | ) | | 03/20/17 | | | 10,000,000 | | | 21,251 | |
| | | | | | | | | | | | | | | | |
| | | | | | | | | | | | | | $ | (466,869 | ) |
| | | | | | | | | | | | | | | | |
At March 31, 2010, the Fund held the following futures contracts:
| | | | | | | | | | | | | |
| Contracts | | | Type | | Expiration
Date | | Notional
Contract Value | | | Net
Depreciation | |
| (150 | ) | | S&P 500 Emini | | 06/18/10 | | $ | (8,518,500 | ) | | $ | (220,875 | ) |
| * | Cost for Federal income tax purposes is $182,265,240 and net unrealized appreciation (depreciation) consists of: |
| | | | |
Gross Unrealized Appreciation | | $ | 19,910,360 | |
Gross Unrealized Depreciation | | | (4,989,233 | ) |
| | | | |
Net Unrealized Appreciation | | $ | 14,921,127 | |
| | | | |
| | | | |
| See Notes to Financial Statements. | | 60 | | ABSOLUTE FUNDS |
ABSOLUTE OPPORTUNITIES FUND
NOTES TO SCHEDULE OF INVESTMENTS
MARCH 31, 2010
The following is a summary of the inputs used to value the Fund’s investments as of March 31, 2010:
The inputs or methodology for valuing securities are not necessarily an indication of the risk associated with investing in those securities. For more information on valuation inputs, and their aggregation into the levels used in the table below, refer to Note 2—Security Valuation section in the accompanying Notes to Financial Statements.
| | | | | | | | | | | | | | | |
| | | Level 1 | | | Level 2 | | | Level 3 | | Total | |
Assets | | | | | | | | | | | | | | | |
Investments at Value: | | | | | | | | | | | | | | | |
Common Stock | | | | | | | | | | | | | | | |
Consumer Discretionary | | $ | 25,099,861 | | | $ | - | | | $ | - | | $ | 25,099,861 | |
Consumer Staples | | | 4,448,967 | | | | - | | | | - | | | 4,448,967 | |
Energy | | | 17,579,927 | | | | - | | | | - | | | 17,579,927 | |
Financial | | | 18,625,821 | | | | - | | | | - | | | 18,625,821 | |
Healthcare | | | 1,243,200 | | | | - | | | | - | | | 1,243,200 | |
Industrial | | | 1,211,524 | | | | - | | | | - | | | 1,211,524 | |
Information Technology | | | 8,708,210 | | | | - | | | | - | | | 8,708,210 | |
Materials | | | 5,195,207 | | | | - | | | | - | | | 5,195,207 | |
Telecommunication Services | | | 3,103,946 | | | | - | | | | - | | | 3,103,946 | |
Preferred Stock | | | | | | | | | | | | | | | |
Energy | | | 374,566 | | | | - | | | | - | | | 374,566 | |
Financial | | | 4,257,584 | | | | - | | | | - | | | 4,257,584 | |
Asset Backed Obligations | | | - | | | | 13,001,724 | | | | - | | | 13,001,724 | |
Corporate Convertible Bonds | | | - | | | | 17,650,606 | | | | - | | | 17,650,606 | |
Corporate Non-Convertible Bonds | | | - | | | | 21,583,286 | | | | - | | | 21,583,286 | |
U.S. Government & Agency Obligations | | | - | | | | 20,715,685 | | | | - | | | 20,715,685 | |
Investment Companies | | | 29,007,677 | | | | - | | | | - | | | 29,007,677 | |
Certificate of Deposits | | | - | | | | 245,391 | | | | - | | | 245,391 | |
Commercial Paper | | | - | | | | 49,402,667 | | | | - | | | 49,402,667 | |
Purchased Options | | | 2,274,513 | | | | - | | | | - | | | 2,274,513 | |
| | | | | | | | | | | | | | | |
Total Investments at Value | | | 121,131,003 | | | | 122,599,359 | | | | - | | | 243,730,362 | |
Other Financial Instruments**: | | | | | | | | | | | | | | | |
Credit Default Swaps | | | - | | | | 436,683 | | | | - | | | 436,683 | |
| | | | | | | | | | | | | | | |
Total Assets | | $ | 121,131,003 | | | $ | 123,036,042 | | | $ | - | | $ | 244,167,045 | |
| | | | | | | | | | | | | | | |
Liabilities | | | | | | | | | | | | | | | |
Securities Sold Short | | | | | | | | | | | | | | | |
Common Stock | | $ | (13,391,065 | ) | | $ | - | | | $ | - | | $ | (13,391,065 | ) |
Corporate Non-Convertible Bonds | | | - | | | | (7,120,090 | ) | | | - | | | (7,120,090 | ) |
U.S. Government & Agency Obligations | | | - | | | | (6,312,974 | ) | | | - | | | (6,312,974 | ) |
Investment Companies | | | (19,341,818 | ) | | | - | | | | - | | | (19,341,818 | ) |
| | | | | | | | | | | | | | | |
Total Securities Sold Short | | | (32,732,883 | ) | | | (13,433,064 | ) | | | - | | | (46,165,947 | ) |
Other Financial Instruments**: | | | | | | | | | | | | | | | |
Credit Default Swaps | | | - | | | | (903,552 | ) | | | - | | | (903,552 | ) |
Futures | | | (220,875 | ) | | | - | | | | - | | | (220,875 | ) |
Written Options | | | (378,048 | ) | | | - | | | | - | | | (378,048 | ) |
| | | | | | | | | | | | | | | |
Total Other Financial Instruments | | | (598,923 | ) | | | (903,552 | ) | | | - | | | (1,502,475 | )�� |
| | | | | | | | | | | | | | | |
Total Liabilities | | $ | (33,331,806 | ) | | $ | (14,336,616 | ) | | $ | - | | $ | (47,668,422 | ) |
| | | | | | | | | | | | | | | |
| ** | Other Financial Instruments are derivative instruments not reflected in the Schedule of Investments, such as futures and credit default swaps, which are valued at the unrealized appreciation (depreciation) of the instrument. Written options are reported at their market value at year end. |
| | | | |
| See Notes to Financial Statements. | | 61 | | ABSOLUTE FUNDS |
ABSOLUTE OPPORTUNITIES FUND
NOTES TO SCHEDULE OF INVESTMENTS
MARCH 31, 2010
The following is a reconciliation of Level 3 assets (at either the beginning or ending of the period) for which significant unobservable inputs were used to determine fair value.
| | | | | | | | | | | | |
| | | Corporate
Convertible Bonds | | | Corporate
Non-Convertible
Bonds | | | Total | |
Balance as of 03/31/09 | | $ | 3,171,026 | | | $ | 271,400 | | | $ | 3,442,426 | |
Accrued Accretion/(Amortization) | | | 108,342 | | | | 866 | | | | 109,208 | |
Realized Gain/ (Loss) | | | (50,573 | ) | | | 157,452 | | | | 106,879 | |
Change in Unrealized Appreciation/(Depreciation) | | | (168,685 | ) | | | - | | | | (168,685 | ) |
Purchases | | | 3,169,141 | | | | - | | | | 3,169,141 | |
Sales | | | (2,522,095 | ) | | | (429,718 | ) | | | (2,951,813 | ) |
Transfers In/(Out) | | | (3,707,156 | ) | | | - | | | | (3,707,156 | ) |
| | | | | | | | | | | | |
Balance as of 03/31/10 | | $ | - | | | $ | - | | | $ | - | |
| | | | | | | | | | | | |
Net change in unrealized appreciation (depreciation) from investments held as of 03/31/10 *** | | $ | - | | | $ | - | | | $ | - | |
| | | | | | | | | | | | |
| *** | The unrealized appreciation (depreciation) is included in net change in unrealized appreciation (depreciation) of investments in the accompanying Statement of Operations. |
| | | | |
| See Notes to Financial Statements. | | 62 | | ABSOLUTE FUNDS |
ABSOLUTE STRATEGIES FUND
PORTFOLIO HOLDINGS SUMMARY (Unaudited)
MARCH 31, 2010
| | | |
| Portfolio Breakdown (% of Net Assets) | |
Long Positions | | | |
Equity Securities | | 39.0% | |
Asset Backed Obligations | | 7.2% | |
Corporate Convertible Bonds | | 18.7% | |
Corporate Non-Convertible Bonds | | 3.4% | |
Foreign Government Bonds | | 0.0% | |
Interest Only Bonds | | 0.0% | |
Municipal Bonds | | 0.1% | |
Syndicated Loans | | 0.1% | |
U.S. Government and Agency Obligations | | 6.2% | |
Rights | | 0.0% | |
Warrant | | 0.0% | |
Investment Companies | | 7.6% | |
Short-Term Investments | | 0.6% | |
Options | | 1.5% | |
Short Positions | | | |
Equity Securities | | –25.7% | |
U.S. Government and Agency Obligations | | 0.0% | |
Investment Companies | | –5.5% | |
Options | | –0.4% | |
Other Assets less Liabilities* | | 47.2% | * |
| | | 100.0% | |
| * | Consists of deposits with the custodian and/or brokers for securities sold short, cash, foreign currency, prepaid expenses, receivables, payables, and accrued liabilities. Deposits with the custodian and/or brokers for securities sold short represents 34.6% of net assets. See Note 2. |
| | | | |
| See Notes to Financial Statements. | | 63 | | ABSOLUTE FUNDS |
ABSOLUTE STRATEGIES FUND
PORTFOLIO HOLDINGS SUMMARY (Unaudited)
MARCH 31, 2010
| | | | |
| | | (% of Equity Holdings) |
| Sector Breakdown | | Long | | Short |
Consumer Discretionary | | 24.2% | | 19.3% |
Consumer Staples | | 12.5% | | 2.8% |
Energy | | 6.7% | | 7.0% |
Financial | | 19.4% | | 14.0% |
Healthcare | | 10.6% | | 15.9% |
Industrial | | 10.0% | | 14.6% |
Information Technology | | 8.1% | | 13.4% |
Materials | | 3.0% | | 5.1% |
Telecommunication Services | | 3.7% | | 4.8% |
Utilities | | 1.8% | | 3.1% |
| | | 100.0% | | 100.0% |
| | | | |
| See Notes to Financial Statements. | | 64 | | ABSOLUTE FUNDS |
ABSOLUTE OPPORTUNITIES FUND
PORTFOLIO HOLDINGS SUMMARY (Unaudited)
MARCH 31, 2010
| | | |
| Portfolio Breakdown (% of Net Assets) | |
Long Positions | | | |
Equity Securities | | 31.4% | |
Asset Backed Obligations | | 4.5% | |
Corporate Convertible Bonds | | 6.1% | |
Corporate Non-Convertible Bonds | | 7.6% | |
U.S. Government and Agency Obligations | | 7.3% | |
Investment Companies | | 10.2% | |
Short-Term Investments | | 17.4% | |
Options | | 0.8% | |
Short Positions | | | |
Equity Securities | | –4.7% | |
Corporate Non-Convertible Bonds | | –2.5% | |
U.S. Government and Agency Obligations | | –2.2% | |
Investment Companies | | –6.8% | |
Options | | –0.1% | |
Other Assets less Liabilities* | | 31.0% | * |
| | | 100.0% | |
| * | Consists of deposits with the custodian and/or brokers for securities sold short, cash, foreign currency, prepaid expenses, receivables, payables, and accrued liabilities. Deposits with the custodian and/or brokers for securities sold short represents 16.5% of net assets. See Note 2. |
| | | | |
| See Notes to Financial Statements. | | 65 | | ABSOLUTE FUNDS |
ABSOLUTE OPPORTUNITIES FUND
PORTFOLIO HOLDINGS SUMMARY (Unaudited)
MARCH 31, 2010
| | | | |
| | | (% of Equity Holdings) |
| Sector Breakdown | | Long | | Short |
Consumer Discretionary | | 27.9% | | 71.5% |
Consumer Staples | | 4.9% | | 5.3% |
Energy | | 20.0% | | 1.7% |
Financial | | 25.5% | | 14.1% |
Healthcare | | 1.4% | | 0.0% |
Industrial | | 1.3% | | 3.5% |
Information Technology | | 9.7% | | 0.0% |
Materials | | 5.8% | | 3.9% |
Telecommunication Services | | 3.5% | | 0.0% |
| | | 100.0% | | 100.0% |
| | | | |
| See Notes to Financial Statements. | | 66 | | ABSOLUTE FUNDS |
ABSOLUTE FUNDS
STATEMENTS OF ASSETS AND LIABILITIES
MARCH 31, 2010
| | | | | | |
| | | ABSOLUTE
STRATEGIES
FUND | | ABSOLUTE
OPPORTUNITIES
FUND |
| ASSETS | | | | | | |
Total investments, at value (Cost $1,641,758,797 and $222,004,964, respectively) | | $ | 1,864,277,213 | | $ | 243,730,362 |
Deposits with brokers | | | 765,122,885 | | | 47,151,506 |
Cash | | | 269,257,863 | | | 48,089,212 |
Receivables: | | | | | | |
Fund shares sold | | | 17,758,629 | | | 1,308,602 |
Investment securities sold | | | 29,818,562 | | | 20,359,486 |
Interest and dividends | | | 7,812,472 | | | 741,795 |
Variation margin | | | 1,007,977 | | | 31,875 |
Other | | | 90,930 | | | - |
Swap premiums paid | | | - | | | 1,351,481 |
Unrealized gain on swap agreements | | | 328,500 | | | 436,683 |
Prepaid expenses | | | 27,039 | | | 14,075 |
| | | | | | |
| | |
Total Assets | | | 2,955,502,070 | | | 363,215,077 |
| | | | | | |
| | |
| LIABILITIES | | | | | | |
Swap premiums received | | | 3,265,600 | | | 649,910 |
Unrealized loss on swap agreements | | | - | | | 903,552 |
Payables: | | | | | | |
Securities sold short, at value (Cost $625,458,042 and $43,369,593, respectively) | | | 689,626,133 | | | 46,165,947 |
Call options written, at value (Premiums received $1,259,220 and $278,960, respectively) | | | 1,288,501 | | | 341,810 |
Put options written, at value (Premiums received $8,490,756 and $113,228, respectively) | | | 6,492,342 | | | 36,238 |
Investment securities purchased | | | 38,806,382 | | | 28,106,789 |
Fund shares redeemed | | | 1,830,242 | | | 402,828 |
Dividends on securities sold short | | | 541,836 | | | 214,157 |
Variation margin | | | 84,012 | | | - |
Other | | | 55,436 | | | 21,377 |
Accrued liabilities: | | | | | | |
Investment adviser fees | | | 2,868,058 | | | 595,075 |
Trustees’ fees and expenses | | | 1,525 | | | 217 |
Fund service fees | | | 278,098 | | | 43,522 |
Compliance services fees | | | 6,502 | | | - |
Other expenses | | | 248,638 | | | 94,913 |
| | | | | | |
| | |
Total Liabilities | | | 745,393,305 | | | 77,576,335 |
| | | | | | |
| | |
| NET ASSETS | | $ | 2,210,108,765 | | $ | 285,638,742 |
| | | | | | |
| | | | |
| See Notes to Financial Statements. | | 67 | | ABSOLUTE FUNDS |
ABSOLUTE FUNDS
STATEMENTS OF ASSETS AND LIABILITIES (Continued)
MARCH 31, 2010
| | | | | | | | |
| | | ABSOLUTE
STRATEGIES
FUND | | | ABSOLUTE
OPPORTUNITIES
FUND | |
| COMPONENTS OF NET ASSETS | | | | | | | | |
Paid-in capital | | $ | 2,172,016,200 | | | $ | 273,838,121 | |
Accumulated undistributed (distributions in excess of) net investment income | | | 2,498,245 | | | | (2,162,883 | ) |
Accumulated net realized loss | | | (119,100,964 | ) | | | (4,292,016 | ) |
Net unrealized appreciation | | | 154,695,284 | | | | 18,255,520 | |
| | | | | | | | |
| | |
| NET ASSETS | | $ | 2,210,108,765 | | | $ | 285,638,742 | |
| | | | | | | | |
| | |
| SHARES OF BENEFICIAL INTEREST AT $0.000 PAR VALUE (UNLIMITED SHARES AUTHORIZED) | | | | | | | | |
Institutional Shares | | | 198,621,091 | | | | 24,262,741 | |
R Shares | | | 8,778,647 | | | | - | |
| | |
| NET ASSET VALUE, OFFERING AND REDEMPTION PRICE PER SHARE | | | | | | | | |
Institutional Shares (based on net assets of $2,116,412,474 and $285,638,742, respectively) | | $ | 10.66 | | | $ | 11.77 | |
| | | | | | | | |
R Shares (based on net assets of $93,696,291 and $0, respectively) | | $ | 10.67 | | | $ | - | |
| | | | | | | | |
| | | | |
| See Notes to Financial Statements. | | 68 | | ABSOLUTE FUNDS |
ABSOLUTE FUNDS
STATEMENTS OF OPERATIONS
YEAR ENDED MARCH 31, 2010
| | | | | | | | |
| | | ABSOLUTE
STRATEGIES
FUND | | | ABSOLUTE
OPPORTUNITIES
FUND | |
| INVESTMENT INCOME | | | | | | | | |
Interest income | | $ | 30,181,681 | | | $ | 3,590,151 | |
Dividend income (net foreign withholding taxes of $51,198 and $31,788, respectively) | | | 12,182,073 | | | | 593,553 | |
Dividend income from affiliated investment | | | - | | | | 319,419 | |
| | | | | | | | |
Total Investment Income | | | 42,363,754 | | | | 4,503,123 | |
| | | | | | | | |
| | |
| EXPENSES | | | | | | | | |
Investment adviser fees | | | 21,873,044 | | | | 4,935,219 | |
Investment adviser expense reimbursements recouped | | | 44,643 | | | | - | |
Fund service fees | | | 1,541,269 | | | | 289,917 | |
Distribution fees: | | | | | | | | |
R Shares | | | 143,880 | | | | - | |
C Shares | | | 39,468 | | | | - | |
Custodian fees | | | 190,963 | | | | 176,458 | |
Registration fees | | | 230,205 | | | | 84,428 | |
Professional fees | | | 78,409 | | | | 98,904 | |
Trustees’ fees and expenses | | | 46,422 | | | | 5,121 | |
Compliance services fees | | | 104,292 | | | | 44,553 | |
Offering costs | | | - | | | | 36,545 | |
Dividend expenses on securities sold short | | | 4,593,032 | | | | 665,742 | |
Interest expense | | | 116,738 | | | | 166,734 | |
Miscellaneous expenses | | | 295,099 | | | | 71,135 | |
| | | | | | | | |
Total Expenses | | | 29,297,464 | | | | 6,574,756 | |
Fees waived and expenses reimbursed | | | (27,336 | ) | | | (448,437 | ) |
| | | | | | | | |
Net Expenses | | | 29,270,128 | | | | 6,126,319 | |
| | | | | | | | |
| | |
| NET INVESTMENT INCOME (LOSS) | | | 13,093,626 | | | | (1,623,196 | ) |
| | | | | | | | |
| | |
| NET REALIZED AND UNREALIZED GAIN (LOSS) | | | | | | | | |
Net realized gain (loss) on: | | | | | | | | |
Investments in unaffiliated issuers | | | 25,849,147 | | | | 14,879,961 | |
Investments in affiliated issuers | | | - | | | | (1,670,559 | ) |
Foreign currency transactions | | | (21,411 | ) | | | (301,436 | ) |
Futures | | | (36,009,947 | ) | | | (1,550,250 | ) |
Securities sold short | | | (26,569,352 | ) | | | (3,810,093 | ) |
Written options | | | 7,795,104 | | | | 634,497 | |
Swaps | | | 116,310 | | | | (970,249 | ) |
| | | | | | | | |
Net realized gain (loss) on investments and foreign currency | | | (28,840,149 | ) | | | 7,211,871 | |
| | | | | | | | |
Net unrealized gain (loss) on: | | | | | | | | |
Investments in unaffiliated issuers | | | 388,941,735 | | | | 19,172,892 | |
Investments in affiliated issuers | | | - | | | | 250,454 | |
Foreign currency translations | | | (3,740 | ) | | | 1,157 | |
Futures | | | (4,990,003 | ) | | | (220,875 | ) |
Securities sold short | | | (141,642,105 | ) | | | (2,742,748 | ) |
Written options | | | 1,862,007 | | | | 14,485 | |
Swaps | | | 328,500 | | | | (466,869 | ) |
| | | | | | | | |
Net change in unrealized appreciation on investments and translation of assets and liabilities in foreign currencies | | | 244,496,394 | | | | 16,008,496 | |
| | | | | | | | |
| | |
| NET REALIZED AND UNREALIZED GAIN | | | 215,656,245 | | | | 23,220,367 | |
| | | | | | | | |
| | |
| INCREASE IN NET ASSETS FROM OPERATIONS | | $ | 228,749,871 | | | $ | 21,597,171 | |
| | | | | | | | |
| | | | |
| See Notes to Financial Statements. | | 69 | | ABSOLUTE FUNDS |
ABSOLUTE FUNDS
STATEMENTS OF CHANGES IN NET ASSETS
| | | | | | | | | | | | | | |
| | | ABSOLUTE
STRATEGIES
FUND | | | ABSOLUTE
OPPORTUNITIES
FUND* | |
| | | | | | Shares | | | | | | Shares | |
| NET ASSETS MARCH 31, 2008 | | $ | 906,920,281 | | | | | | $ | - | | | | |
| | | | |
| OPERATIONS | | | | | | | | | | | | | | |
Net investment income | | | 6,758,808 | | | | | | | 186,205 | | | | |
Net realized gain (loss) on investments and foreign currency | | | (35,999,035 | ) | | | | | | 1,196,185 | | | | |
Net change in unrealized appreciation (depreciation) on investments and translation of assets and liabilities in foreign currencies | | | (93,050,780 | ) | | | | | | 2,247,024 | | | | |
| | | | | | | | | | | | | | |
Increase (Decrease) in Net Assets Resulting from Operations | | | (122,291,007 | ) | | | | | | 3,629,414 | | | | |
| | | | | | | | | | | | | | |
| | | | |
| DISTRIBUTIONS TO SHAREHOLDERS FROM | | | | | | | | | | | | | | |
Net investment income: | | | | | | | | | | | |
Institutional Shares | | | (6,732,508 | ) | | | | | | (98,321 | ) | | | |
R Shares | | | (115,063 | ) | | | | | | - | | | | |
C Shares | | | - | | | | | | | - | | | | |
Net realized gain on investments sold: | | | | | | | | | | | |
Institutional Shares | | | (29,397,640 | ) | | | | | | (20,274 | ) | | | |
R Shares | | | (1,115,291 | ) | | | | | | - | | | | |
C Shares | | | (512,716 | ) | | | | | | - | | | | |
| | | | | | | | | | | | | | |
Total Distributions to Shareholders | | | (37,873,218 | ) | | | | | | (118,595 | ) | | | |
| | | | | | | | | | | | | | |
| | | | |
| CAPITAL SHARE TRANSACTIONS | | | | | | | | | | | | | | |
Sale of shares: | | | | | | | | | | | | | | |
Institutional Shares | | | 589,125,377 | | | 60,762,277 | | | | 79,687,409 | | | 7,890,506 | |
R Shares | | | 16,473,925 | | | 1,688,059 | | | | - | | | - | |
C Shares | | | 6,206,368 | | | 612,812 | | | | - | | | - | |
Reinvestment of distributions: | | | | | | | | | | | | | | |
Institutional Shares | | | 28,504,546 | | | 3,180,666 | | | | 114,961 | | | 11,317 | |
R Shares | | | 1,066,505 | | | 119,584 | | | | - | | | - | |
C Shares | | | 465,989 | | | 53,014 | | | | - | | | - | |
Redemption of shares: | | | | | | | | | | | | | | |
Institutional Shares | | | (535,714,373 | ) | | (55,850,406 | ) | | | (6,068,596 | ) | | (592,227 | ) |
R Shares | | | (16,502,712 | ) | | (1,720,267 | ) | | | - | | | - | |
C Shares | | | (11,161,364 | ) | | (1,175,039 | ) | | | - | | | - | |
| | | | | | | | | | | | | | |
Increase from Capital Share Transactions | | | 78,464,261 | | | 7,670,700 | | | | 73,733,774 | | | 7,309,596 | |
| | | | | | | | | | | | | | |
Increase (Decrease) in Net Assets | | | (81,699,964 | ) | | | | | | 77,244,593 | | | | |
| | | | | | | | | | | | | | |
| | | | |
| NET ASSETS MARCH 31, 2009 (Including line (a)) | | $ | 825,220,317 | | | | | | $ | 77,244,593 | | | | |
| | | | | | | | | | | | | | |
| * | | Absolute Opportunities Fund commenced operations on October 21, 2008. |
| | | | |
| See Notes to Financial Statements. | | 70 | | ABSOLUTE FUNDS |
ABSOLUTE FUNDS
STATEMENTS OF CHANGES IN NET ASSETS (Continued)
| | | | | | | | | | | | | | |
| | | ABSOLUTE
STRATEGIES
FUND | | | ABSOLUTE
OPPORTUNITIES
FUND | |
| | | | | | Shares | | | | | | Shares | |
| NET ASSETS MARCH 31, 2009 (Including line (a)) | | $ | 825,220,317 | | | | | | $ | 77,244,593 | | | | |
| | | | |
| OPERATIONS | | | | | | | | | | | | | | |
Net investment income (loss) | | | 13,093,626 | | | | | | | (1,623,196 | ) | | | |
Net realized gain (loss) on investments and foreign currency | | | (28,840,149 | ) | | | | | | 7,211,871 | | | | |
Net change in unrealized appreciation on investments and translation of assets and liabilities in foreign currencies | | | 244,494,394 | | | | | | | 16,008,496 | | | | |
| | | | | | | | | | | | | | |
Increase in Net Assets Resulting from Operations | | | 228,749,871 | | | | | | | 21,597,171 | | | | |
| | | | | | | | | | | | | | |
| | | | |
| DISTRIBUTIONS TO SHAREHOLDERS FROM | | | | | | | | | | | | | | |
Net investment income: | | | | | | | | | | | |
Institutional Shares | | | (17,418,188 | ) | | | | | | (137,914 | ) | | | |
R Shares | | | (595,594 | ) | | | | | | - | | | | |
C Shares | | | (3,051 | ) | | | | | | - | | | | |
Net realized gain on investments sold: | | | | | | | | | | | |
Institutional Shares | | | (523,480 | ) | | | | | | (13,192,459 | ) | | | |
R Shares | | | (25,550 | ) | | | | | | - | | | | |
Return of capital | | | - | | | | (561,655 | ) | | | |
| | | | | | | | | | | | | | |
Total Distributions to Shareholders | | | (18,565,863 | ) | | | | | | (13,892,028 | ) | | | |
| | | | | | | | | | | | | | |
| | | | |
| CAPITAL SHARE TRANSACTIONS | | | | | | | | | | | | | | |
Sale of shares: | | | | | | | | | | | | | | |
Institutional Shares | | | 1,406,849,302 | | | 136,541,144 | | | | 224,899,495 | | | 18,978,657 | |
R Shares | | | 64,326,097 | | | 6,223,141 | | | | - | | | - | |
C Shares | | | 1,766,676 | | | 189,776 | | | | - | | | - | |
Contributions from share reclassification: | | | | | | | | | | | | | | |
R Shares (Note 1) | | | 11,850,969 | | | 1,181,552 | | | | - | | | - | |
Reinvestment of distributions: | | | | | | | | | | | | | | |
Institutional Shares | | | 14,230,604 | | | 1,398,424 | | | | 13,524,960 | | | 1,164,863 | |
R Shares | | | 541,269 | | | 52,658 | | | | - | | | - | |
C Shares | | | 2,713 | | | 282 | | | | - | | | - | |
Redemption of shares: | | | | | | | | | | | | | | |
Institutional Shares | | | (292,167,533 | ) | | (28,850,151 | ) | | | (37,735,449 | ) | | (3,190,375 | ) |
R Shares | | | (18,564,577 | ) | | (1,809,266 | ) | | | - | | | - | |
C Shares | | | (2,280,111 | ) | | (241,645 | ) | | | - | | | - | |
Redemptions from share reclassification: | | | | | | | | | | | | | | |
C Shares (Note 1) | | | (11,850,969 | ) | | (1,192,466 | ) | | | - | | | - | |
| | | | | | | | | | | | | | |
Increase from Capital Share Transactions | | | 1,174,704,440 | | | 113,493,449 | | | | 200,689,006 | | | 16,953,145 | |
| | | | | | | | | | | | | | |
Increase in Net Assets | | | 1,384,888,448 | | | | | | | 208,394,149 | | | | |
| | | | | | | | | | | | | | |
| | | | |
| NET ASSETS MARCH 31, 2010 (Including line (b)) | | $ | 2,210,108,765 | | | | | | $ | 285,638,742 | | | | |
| | | | | | | | | | | | | | |
(a) Undistributed (distributions in excess of) net investment income March 31, 2009 | | $ | 2,830,641 | | | | | | $ | (16,847 | ) | | | |
| | | | | | | | | | | | | | |
(b) Undistributed (distributions in excess of) net investment income March 31, 2010 | | $ | 2,498,245 | | | | | | $ | (2,162,883 | ) | | | |
| | | | | | | | | | | | | | |
| | | | |
| See Notes to Financial Statements. | | 71 | | ABSOLUTE FUNDS |
ABSOLUTE STRATEGIES FUND
FINANCIAL HIGHLIGHTS
These financial highlights reflect selected data for a share outstanding throughout each period.
| | | | | | | | | | | | | | | | | | | | |
| | | For the Year
Ended
March 31, 2010 | | | For the Year
Ended
March 31, 2009 | | | For the Year
Ended
March 31, 2008 | | | For the Year
Ended
March 31, 2007 | | | July 11, 2005 (a)
through
March 31, 2006 | |
| INSTITUTIONAL SHARES | | | | | | | | | | | | | | | | | | | | |
| NET ASSET VALUE, Beginning of Period | | $ | 8.79 | | | $ | 10.52 | | | $ | 10.62 | | | $ | 10.29 | | | $ | 10.00 | |
| | | | | | | | | | | | | | | | | | | | |
| | | | | |
| INVESTMENT OPERATIONS | | | | | | | | | | | | | | | | | | | | |
Net investment income (b) | | | 0.10 | | | | 0.08 | | | | 0.16 | | | | 0.26 | | | | 0.14 | |
Net realized and unrealized gain (loss) | | | 1.91 | | | | (1.38 | ) | | | (0.11 | ) | | | 0.29 | | | | 0.22 | |
| | | | | | | | | | | | | | | | | | | | |
Total from Investment Operations | | | 2.01 | | | | (1.30 | ) | | | 0.05 | | | | 0.55 | | | | 0.36 | |
| | | | | | | | | | | | | | | | | | | | |
| | | | | |
| DISTRIBUTIONS TO SHAREHOLDERS FROM | | | | | | | | | | | | | | | | | | | | |
Net investment income | | | (0.14 | ) | | | (0.08 | ) | | | (0.15 | ) | | | (0.22 | ) | | | (0.07 | ) |
Net realized investment gains | | | - | (c) | | | (0.35 | ) | | | - | | | | - | (c) | | | - | (c) |
| | | | | | | | | | | | | | | | | | | | |
Total Distributions to Shareholders | | | (0.14 | ) | | | (0.43 | ) | | | (0.15 | ) | | | (0.22 | ) | | | (0.07 | ) |
| | | | | | | | | | | | | | | | | | | | |
| | | | | |
| REDEMPTION FEES (b) | | | - | | | | - | | | | - | | | | - | (c) | | | - | (c) |
| | | | | | | | | | | | | | | | | | | | |
| | | | | |
| NET ASSET VALUE, End of Period | | $ | 10.66 | | | $ | 8.79 | | | $ | 10.52 | | | $ | 10.62 | | | $ | 10.29 | |
| | | | | | | | | | | | | | | | | | | | |
| | | | | |
| TOTAL RETURN | | | 22.95 | % | | | (12.41 | )% | | | 0.41 | % | | | 5.38 | % | | | 3.60 | %(d) |
| | | | | |
| RATIOS/SUPPLEMENTARY DATA | | | | | | | | | | | | | | | | | | | | |
Net Assets at End of Period (000’s omitted) | | $ | 2,116,412 | | | $ | 786,766 | | | $ | 856,441 | | | $ | 196,602 | | | $ | 66,888 | |
Ratios to Average Net Assets: | | | | | | | | | | | | | | | | | | | | |
Net investment income | | | 0.98 | % | | | 0.78 | % | | | 1.50 | % | | | 2.46 | % | | | 1.91 | %(f) |
| | | | | |
Net expense (g) | | | 1.78 | % | | | 1.81 | % | | | 1.88 | % | | | 1.95 | % | | | 1.95 | %(f) |
| | | | | |
Dividend and interest expense | | | 0.34 | % | | | 0.50 | % | | | 0.50 | % | | | 0.43 | % | | | 0.38 | %(f) |
Gross Expense (h) | | | 2.12 | % | | | 2.31 | % | | | 2.38 | % | | | 2.44 | % | | | 2.59 | %(f) |
| | | | | |
| PORTFOLIO TURNOVER RATE | | | 114 | % | | | 133 | % | | | 553 | % | | | 424 | % | | | 405 | %(d)(i) |
| | | | |
| See Notes to Financial Statements. | | 72 | | ABSOLUTE FUNDS |
ABSOLUTE STRATEGIES FUND
FINANCIAL HIGHLIGHTS
| | | | | | | | | | | | | | | | | | | | |
| | | For the Year
Ended
March 31, 2010 | | | For the Year
Ended
March 31, 2009 | | | For the Year
Ended
March 31, 2008 | | | For the Year
Ended
March 31, 2007 | | | July 11, 2005 (a)
through
March 31, 2006 | |
| R SHARES (j) | | | | | | | | | | | | | | | | | | | | |
| NET ASSET VALUE, Beginning of Period | | $ | 8.82 | | | $ | 10.55 | | | $ | 10.63 | | | $ | 10.28 | | | $ | 10.00 | |
| | | | | | | | | | | | | | | | | | | | |
| | | | | |
| INVESTMENT OPERATIONS | | | | | | | | | | | | | | | | | | | | |
Net investment income (b) | | | 0.05 | | | | 0.04 | | | | 0.13 | | | | 0.22 | | | | 0.10 | |
Net realized and unrealized gain (loss) | | | 1.91 | | | | (1.39 | ) | | | (0.13 | ) | | | 0.30 | | | | 0.22 | |
| | | | | | | | | | | | | | | | | | | | |
Total from Investment Operations | | | 1.96 | | | | (1.35 | ) | | | 0.00 | | | | 0.52 | | | | 0.32 | |
| | | | | | | | | | | | | | | | | | | | |
| | | | | |
| DISTRIBUTIONS TO SHAREHOLDERS FROM | | | | | | | | | | | | | | | | | | | | |
Net investment income | | | (0.11 | ) | | | (0.03 | ) | | | (0.08 | ) | | | (0.17 | ) | | | (0.04 | ) |
Net realized investment gains | | | - | (c) | | | (0.35 | ) | | | - | | | | - | (c) | | | - | (c) |
| | | | | | | | | | | | | | | | | | | | |
Total Distributions to Shareholders | | | (0.11 | ) | | | (0.38 | ) | | | (0.08 | ) | | | (0.17 | ) | | | (0.04 | ) |
| | | | | | | | | | | | | | | | | | | | |
| | | | | |
| REDEMPTION FEES (b) | | | - | | | | - | | | | - | | | | - | (c) | | | - | (c) |
| | | | | | | | | | | | | | | | | | | | |
| | | | | |
| NET ASSET VALUE, End of Period | | $ | 10.67 | | | $ | 8.82 | | | $ | 10.55 | | | $ | 10.63 | | | $ | 10.28 | |
| | | | | | | | | | | | | | | | | | | | |
| | | | | |
| TOTAL RETURN | | | 22.28 | % | | | (12.73 | )% | | | 0.01 | %(e) | | | 5.12 | %(e) | | | 3.24 | %(d)(e) |
| | | | | |
| RATIOS/SUPPLEMENTARY DATA | | | | | | | | | | | | | | | | | | | | |
Net Assets at End of Period (000’s omitted) | | $ | 93,696 | | | $ | 27,600 | | | $ | 32,106 | | | $ | 36,613 | | | $ | 42,755 | |
Ratios to Average Net Assets: | | | | | | | | | | | | | | | | | | | | |
Net investment income | | | 0.52 | % | | | 0.37 | % | | | 1.17 | % | | | 2.07 | % | | | 1.42 | %(f) |
Net expense (g) | | | 2.22 | % | | | 2.23 | % | | | 2.25 | % | | | 2.25 | % | | | 2.24 | %(f) |
Dividend and interest expense | | | 0.34 | % | | | 0.50 | % | | | 0.48 | % | | | 0.41 | % | | | 0.35 | %(f) |
Gross Expense (h) | | | 2.56 | % | | | 2.73 | % | | | 2.76 | % | | | 2.78 | % | | | 3.07 | %(f) |
| | | | | |
| PORTFOLIO TURNOVER RATE | | | 114 | % | | | 133 | % | | | 553 | % | | | 424 | % | | | 405 | %(d)(i) |
| (a) | | Commencement of operations. |
| (b) | | Calculated based on average shares outstanding during the period. |
| (c) | | Less than $0.01 per share. |
| (e) | | Total return excludes the effect of the applicable sales load. |
| (g) | | Excludes dividend and interest expense. |
| (h) | | Reflects the expense ratio excluding any waivers and/or reimbursements. |
| (i) | | As revised, to reflect a computational error. Such amount was previously reported as 95%. |
| (j) | | Effective July 31, 2009, C shares were reclassified as R Shares. For the period April 1, 2009 through July 31, 2009, total return for the C Shares was 14.02%. For the aforementioned period, the annualized gross expense and net expense ratios were 3.56% and 3.30%, respectively. |
| | | | |
| See Notes to Financial Statements. | | 73 | | ABSOLUTE FUNDS |
ABSOLUTE OPPORTUNITIES FUND
FINANCIAL HIGHLIGHTS
These financial highlights reflect selected data for a share outstanding throughout each period.
| | | | | | | | |
| | | For the Year
Ended
March 31, 2010 | | | October 21, 2008 (a)
through
March 31, 2009 | |
| INSTITUTIONAL SHARES | | | | | | | | |
| NET ASSET VALUE, Beginning of Period | | $ | 10.57 | | | $ | 10.00 | |
| | | | | | | | |
| | |
| INVESTMENT OPERATIONS | | | | | | | | |
Net investment income (loss) (b) | | | (0.11 | ) | | | 0.04 | |
Net realized and unrealized gain | | | 2.11 | | | | 0.55 | |
| | | | | | | | |
Total from Investment Operations | | | 2.00 | | | | 0.59 | |
| | | | | | | | |
| | |
| DISTRIBUTIONS TO SHAREHOLDERS FROM | | | | | | | | |
Net investment income | | | (0.01 | ) | | | (0.02 | ) |
Net realized investment gains | | | (0.75 | ) | | | - | (c) |
Return of capital | | | (0.04 | ) | | | - | |
| | | | | | | | |
Total Distributions to Shareholders | | | (0.80 | ) | | | (0.02 | ) |
| | | | | | | | |
| | |
| NET ASSET VALUE, End of Period | | $ | 11.77 | | | $ | 10.57 | |
| | | | | | | | |
| | |
| TOTAL RETURN | | | 19.00 | % | | | 5.95 | %(d) |
| | |
| RATIOS/SUPPLEMENTARY DATA | | | | | | | | |
Net Assets at End of Period (000’s omitted) | | $ | 285,639 | | | $ | 77,245 | |
Ratios to Average Net Assets: | | | | | | | | |
Net investment income (loss) | | | (0.90 | )% | | | 0.84 | %(e) |
Net expense (f) | | | 2.95 | % | | | 2.95 | %(e) |
Dividend and interest expense | | | 0.46 | % | | | 0.05 | %(e) |
Gross Expense (g) | | | 3.66 | % | | | 3.82 | %(e) |
| | |
| PORTFOLIO TURNOVER RATE | | | 597 | % | | | 281 | %(d) |
| (a) | | Commencement of operations. |
| (b) | | Calculated based on average shares outstanding during the period. |
| (c) | | Less than $0.01 per share. |
| (f) | | Excludes dividend and interest expense. |
| (g) | | Reflects the expense ratio excluding any waivers and/or reimbursements. |
| | | | |
| See Notes to Financial Statements. | | 74 | | ABSOLUTE FUNDS |
ABSOLUTE FUNDS
NOTES TO FINANCIAL STATEMENTS
MARCH 31, 2010
Note 1. Organization
The Absolute Strategies Fund and Absolute Opportunities Fund (individually, a “Fund” and, collectively the “Funds”) are non-diversified portfolios of Forum Funds (the “Trust”). The Trust is a Delaware statutory trust that is registered as an open-end, management investment company under the Investment Company Act of 1940 (the “Act”), as amended. As of March 31, 2010, the Trust had thirty-two investment portfolios. Under its Trust Instrument, the Trust is authorized to issue an unlimited number of each Fund’s shares of beneficial interest without par value. The Absolute Strategies Fund currently offers two classes of shares: Institutional Shares and R Shares. Institutional and R Shares commenced operations on July 11, 2005. The Absolute Strategies Fund seeks to achieve long-term capital appreciation with an emphasis on absolute (positive) returns and low correlation to traditional financial market indices. The Absolute Opportunities Fund currently offers Institutional Shares. The Absolute Opportunities Fund commenced operations on October 21, 2008. The Absolute Opportunities Fund seeks to achieve long-term capital appreciation with an emphasis on risk-adjusted returns and lower volatility than traditional equity market indices.
With respect to the Absolute Strategies Fund, on June 24, 2009, the Trust’s Board of Trustees (the “Board”) approved the conversion of the outstanding shares of the Absolute Strategies Fund’s C Shares, in a tax-free exchange into shares of the Fund’s R Shares and the closure of the C Shares to new investments. On July 31, 2009, each shareholder of the C Shares received R Shares in a dollar amount equal to their investment in the C Shares as of that date.
Note 2. Summary of Significant Accounting Policies
These financial statements are prepared in accordance with generally accepted accounting principles in the United States of America (“GAAP”), which require management to make estimates and assumptions that affect the reported amounts of assets and liabilities, the disclosure of contingent liabilities at the date of the financial statements, and the reported amounts of increase and decrease in net assets from operations during the fiscal period. Actual amounts could differ from those estimates. The following summarizes the significant accounting policies of each Fund:
Security Valuation – Exchange-traded securities and over-the-counter securities are valued using the last quoted sale or official closing price, provided by independent pricing services as of the close of trading on the market or exchange for which they are primarily traded, on each Fund business day. In the absence of a sale, such securities are valued at the mean of the last bid and asked price provided by independent pricing services. Non-exchange traded securities for which quotations are available are valued using the last quoted sales price, or in the absence of a sale at the mean of the last bid and asked prices provided by independent pricing services. Debt securities may be valued at prices supplied by a Fund’s pricing agent based on broker or dealer supplied valuations or matrix pricing, a method of valuing securities by reference to the value of other securities with similar characteristics such as rating, interest rate and maturity. Exchange-traded options for which there were no sales reported that day are generally valued at the mean of the last bid and asked prices. Options not traded on an exchange are generally valued at broker-dealer bid quotation. Shares of open-end mutual funds are valued at net asset value (“NAV”). Futures contracts listed for trading on a securities
ABSOLUTE FUNDS
NOTES TO FINANCIAL STATEMENTS
MARCH 31, 2010
exchange or board of trade shall be valued at the last quoted sales price or in the absence of a sale at the mean of the last bid and asked prices. Short-term investments that mature in sixty days or less may be valued at amortized cost.
Each Fund values its investments at fair value pursuant to procedures adopted by the Board if (1) market quotations are insufficient or not readily available or (2) the adviser believes that the values available are unreliable. Fair valuation is based on subjective factors and as a result, the fair value price of an investment may differ from the security’s market price and may not be the price at which the asset may be sold. Fair valuation could result in a different NAV than a NAV determined by using market quotes.
Each Fund has a three-tier fair value hierarchy. The basis of the tiers is dependent upon the various “inputs” used to determine the value of each Fund’s investments. These inputs are summarized in the three broad levels listed below:
Level 1—quoted prices in active markets for identical assets
Level 2—other significant observable inputs (including quoted prices of similar securities, interest rates, prepayment speeds, credit risk, etc.)
Level 3—significant unobservable inputs (including each Fund’s own assumptions in determining the fair value of investments)
The aggregate value by input level, as of March 31, 2010, for each Fund’s investments is included at the end of each Fund’s Schedule of Investments.
Security Transactions, Investment Income and Realized Gain and Loss – Investment transactions are accounted for on trade date. Dividend income is recorded on the ex-dividend date. Foreign dividend income is recorded on the ex-dividend date or as soon as possible after each Fund determines the existence of a dividend declaration after exercising reasonable due diligence. Income and capital gains on some foreign securities may be subject to foreign withholding taxes, which are accrued as applicable. Interest income is recorded on an accrual basis. Premium and discount is amortized and accreted in accordance with GAAP. Identified cost of investments sold is used to determine the gain and loss for both financial statement and Federal income tax purposes. Each Fund estimates components of distribution from real estate investment trusts (“REITs”). Distributions received in excess of income are recorded as a reduction of the cost of the related investments.
Foreign Currency Translations – Foreign currency amounts are translated into U.S. dollars as follows: (i) assets and liabilities at the rate of exchange at the end of the respective period; and (ii) purchases and sales of securities and income and expenses at the rate of exchange prevailing on the dates of such transactions. The portion of the results of operations arising from changes in the exchange rates and the portion due to fluctuations arising from changes in the market prices of securities are not isolated. Such fluctuations are included with the net realized and unrealized gain or loss on investments.
ABSOLUTE FUNDS
NOTES TO FINANCIAL STATEMENTS
MARCH 31, 2010
Each Fund may enter into transactions to purchase or sell foreign currencies to protect the U.S. dollar value of its underlying portfolio securities against the effect of possible adverse movements in foreign exchange rates. Principal risks associated with such transactions include the movement in value of the foreign currency relative to the U.S. dollar and the ability of the counterparty to perform. Fluctuations in the value of such forward currency transactions are recorded daily as unrealized gain or loss; realized gain or loss includes net gain or loss on transactions that have terminated by settlement or by each Fund entering into offsetting commitments. These instruments involve market risk, credit risk, or both kinds of risks, in excess of the amount recognized in the Statement of Assets and Liabilities. Risks arise from the possible inability of counterparties to meet the terms of their contracts and from movement in currency and securities values and interest rates.
Futures Contracts – Each Fund may purchase future contracts to gain exposure to market changes, which may be more efficient or cost effective than actually buying the securities. A futures contract is an agreement between parties to buy or sell a security at a set price on a future date. Upon entering into such a contract, each Fund is required to pledge to the broker an amount of cash, U.S. Government obligations or other high-quality debt securities equal to the minimum “initial margin” requirements of the exchange on which the futures contract is traded. Pursuant to the contract, each Fund agrees to receive from or pay to the broker an amount of cash equal to the daily fluctuation in the value of the contract. Such receipts or payments are known as “variation margin” and are recorded by each Fund as unrealized gains or losses. When the contract is closed, each Fund records a realized gain or loss equal to the difference between the value of the contract at the time it was opened and value at the time it was closed. Risks of entering into futures contracts include the possibility that there may be an illiquid market and that a change in the value of the contract may not correlate with changes in the value of the underlying securities.
Notional amounts of each individual futures contract outstanding as of March 31, 2010, are disclosed in the notes to each Fund’s Schedule of Investments. The volume of open positions may vary on a daily basis as each Fund transacts futures contracts in order to achieve the exposure desired by the adviser. Each Fund entered into a total notional amount of $(989,432,393) and $(31,477,500) for Absolute Strategies Fund and Absolute Opportunities Fund, respectively, on futures contracts for the year ended March 31, 2010.
Securities Sold Short – Each Fund may sell a security short to increase investment returns. Each Fund may also sell a security short in anticipation of a decline in the market value of a security. A short sale is a transaction in which each Fund sells a security that it does not own. To complete the transaction, each Fund must borrow the security in order to deliver it to the buyer. Each Fund must replace the borrowed security by purchasing it at market price at the time of replacement; the price may be higher or lower than the price at which each Fund sold the security. Each Fund incurs a loss from a short sale if the price of the security increases between the date of the short sale and the date on which each Fund replaces the borrowed security. Each Fund realizes a profit if the price of the security declines between those dates.
Until each Fund replaces the borrowed security, each Fund will maintain on its books and records cash and long securities to sufficiently cover its short position on a daily basis. The collateral for the securities sold short includes the deposits with custodian for securities sold short as shown on the Statement of Assets and
ABSOLUTE FUNDS
NOTES TO FINANCIAL STATEMENTS
MARCH 31, 2010
Liabilities and the securities held long as shown on the Schedule of Investments. Dividends paid on securities sold short are recorded as an expense on each Fund’s Statement of Operations.
Options – When each Fund writes an option, an amount equal to the premium received by each Fund is recorded as a liability and is subsequently adjusted to the current value of the option written. Premiums received from writing options that expire unexercised are treated by each Fund on the expiration date as realized gain from investments. The difference between the premium and the amount paid on effecting a closing purchase transaction, including brokerage commissions, is also treated as a realized gain, or if the premium is less than the amount paid for the closing purchase transaction, as a realized loss. If a call option is exercised, the premium is added to the proceeds from the sale of the underlying security or currency in determining whether each Fund has realized a gain or loss. If a put option is exercised, the premium reduces the cost basis of the securities purchased by each Fund. Each Fund, as writer of an option, bears the market risk of an unfavorable change in the price of the security underlying the written option.
When each Fund purchases an option, an amount equal to the premium paid by each Fund is recorded as an investment and is subsequently adjusted to the current value of the option purchased. If an option expires on the stipulated expiration date or if each Fund enters into a closing sale transaction, a gain or loss is realized. If a call option is exercised, the cost of the security acquired is increased by the premium paid for the call. If a put option is exercised, a gain or loss is realized from the sale of the underlying security, and the proceeds from such sale are decreased by the premium originally paid. Written and purchased options are non-income producing securities.
The values of each individual purchased option outstanding as of March 31, 2010, are disclosed in each Fund’s Schedule of Investments. The volume of open purchased option positions may vary on a daily basis as each Fund transacts purchased options in order to achieve the exposure desired by the adviser. Each Fund entered into a total value of $26,324,880 and $22,391,184 for Absolute Strategies Fund and Absolute Opportunities Fund, respectively, on purchased options for the year ended March 31, 2010.
The values of each individual written option outstanding as of March 31, 2010, are disclosed in each Fund’s Schedule of Call and Put Options Written. The volume of open positions may vary on a daily basis as each Fund transacts written options in order to achieve the exposure desired by the adviser. Each Fund entered into a total value of $(18,558,553) and $(1,120,135) for Absolute Strategies Fund and Absolute Opportunities Fund, respectively, on written options for the year ended March 31, 2010.
Credit Default Swaps – Each Fund may invest in credit default swaps. A credit default swap gives one party (the buyer) the right to recoup the economic value of a decline in the value of debt securities of the reference issuer (including sovereign debt obligations) if a credit event (a downgrade or default) occurs. This value is obtained by delivering a debt security of the reference issuer to the party in return for a previously agreed payment from the other party (frequently, the par value of the debt security). Credit default swaps may require initial premium (discount) payments as well as periodic payments (receipts) related to the interest leg of the swap or to the default of a reference obligation.
ABSOLUTE FUNDS
NOTES TO FINANCIAL STATEMENTS
MARCH 31, 2010
If each Fund is a seller of a credit default swap contract, each Fund would be required to pay the par (or other agreed upon) value of a referenced debt obligation to the counterparty in the event of a default or other credit event by the reference issuer, such as a U.S. or foreign corporate issuer, with respect to such debt obligations. In return, each Fund would receive from the counterparty a periodic stream of payments over the term of the contract provided that no event of default has occurred. If no default occurs, each Fund would keep the stream of payments and would have no payment obligations. As the seller, each Fund would be subject to investment exposure on the notional amount of the swap.
If each Fund is the buyer of a credit default swap contract, each Fund would have the right to deliver a referenced debt obligation and receive the par (or other agreed-upon) value of such debt obligation from the counterparty in the event of a default or other credit event (such as a credit downgrade) by the reference issuer, such as a U.S. or foreign corporation, with respect to its debt obligations. In return, each Fund would pay the counterparty a periodic stream of payments over the term of the contract provided that no event of default has occurred. If no default occurs, the counterparty would keep the stream of payments and would have no further obligations to each Fund.
Notional amounts of each individual credit default swap agreement outstanding as of March 31, 2010, are disclosed in the notes to each Fund’s Schedule of Investments. The volume of open positions may vary on a daily basis as each Fund transacts credit default swaps in order to achieve the exposure desired by the adviser. Each Fund entered into a total net notional amount of $(3,366,000) and $1,167,773 for Absolute Strategies Fund and Absolute Opportunities Fund, respectively, on credit default swap agreements for the year ended March 31, 2010.
Derivatives Transactions – Each Fund’s use of derivatives during the period ended March 31, 2010, was limited to credit default swaps, options and futures contracts. Following is a summary of how the derivatives are treated in the financial statements and their impact on each Fund.
ABSOLUTE FUNDS
NOTES TO FINANCIAL STATEMENTS
MARCH 31, 2010
The location on the Statement of Assets and Liabilities of each Fund’s derivative positions by type of exposure, all of which are not accounted for as hedging instruments as required by the Derivatives and Hedging Topic of the FASB Accounting Standards Codification, is as follows:
| | | | | | | | | | | |
Fund Contract Type/
Primary Risk Exposure | | Location on Statement of
Assets and Liabilities | | Asset
Derivatives | | Location on Statement of
Assets and Liabilities | | Liability
Derivatives | |
| Absolute Strategies Fund | | | | | | | | | | | |
Credit contracts | | Unrealized gain on swap agreements | | $ | 328,500 | | Unrealized loss on swap agreements | | $ | - | |
| | Swap premiums paid | | | - | | Swap premiums received | | | (3,265,600 | ) |
| | | | |
Equity contracts | | Receivable-Variation margin | | | 1,007,977 | | Payable-Variation margin | | | (84,012 | ) |
| | Total investments, at value | | | 32,995,532 | | | | | | |
| | | | | | | Call options written, at value | | | (1,288,501 | ) |
| | | | | | | Put options written, at value | | | (6,492,342 | ) |
| | | | |
| Absolute Opportunities Fund | | | | | | | | | | | |
Credit contracts | | Unrealized gain on swap agreements | | $ | 436,683 | | Unrealized loss on swap agreements | | $ | (903,552 | ) |
| | Swap premiums paid | | | 1,351,481 | | Swap premiums received | | | (649,910 | ) |
| | | | |
Equity contracts | | Receivable-Variation margin | | | 31,875 | | Payable-Variation margin | | | - | |
| | Total investments, at value | | | 2,274,513 | | | | | | |
| | | | | | | Call options written, at value | | | (341,810 | ) |
| | | | | | | Put options written, at value | | | (36,238 | ) |
ABSOLUTE FUNDS
NOTES TO FINANCIAL STATEMENTS
MARCH 31, 2010
Realized and unrealized gains and losses on derivatives contracts entered into during the year ended March 31, 2010, by each Fund are recorded in the following locations in the Statement of Operations:
| | | | | | | | | | |
Fund Contract Type/Primary
Risk Exposure | | Location of Gain or (Loss)
on Derivatives | | Realized Gain
(Loss) on
Derivatives | | | Change in Unrealized
Appreciation
(Depreciation) on
Derivatives | |
| Absolute Strategies Fund | | | | | | | | | | |
Credit contracts | | Realized gain (loss)-Swaps and Change in unrealized gain (loss)-Swaps | | $ | 118,010 | | | $ | 328,500 | |
Commodity contracts | | Change in unrealized gain (loss)-Futures | | | — | | | | (5,952,965 | ) |
Equity contracts | | Realized gain (loss)-Futures and Change in unrealized gain (loss)-Futures | | | (36,009,947 | ) | | | 962,962 | |
| | Realized gain (loss)-Investments and Change in unrealized gain (loss)-Investments | | | (3,120,333 | ) | | | 9,923,381 | |
| | Realized gain (loss)-Written options and Change in unrealized gain (loss)-Written options | | | 7,795,104 | | | | 1,862,007 | |
| | |
| Absolute Opportunities Fund | | | | | | | | |
Credit contracts | | Realized gain (loss)-Swaps and Change in unrealized gain (loss)-Swaps | | $ | (799,277 | ) | | $ | (466,869 | ) |
Equity contracts | | Realized gain (loss)-Futures and Change in unrealized gain (loss)-Futures | | | (1,550,250 | ) | | | (220,875 | ) |
| | Realized gain (loss)-Investments and Change in unrealized gain (loss)-Investments | | | (4,702,848 | ) | | | (424,630 | ) |
| | Realized gain (loss)-Written options and Change in unrealized gain (loss)-Written options | | | 634,497 | | | | 14,485 | |
Restricted Securities – Each Fund may invest in securities that are subject to legal or contractual restrictions on resale (“restricted securities”). Restricted securities may be resold in transactions that are exempt from registration under the Federal securities laws or if the securities are registered to the public. The sale or other disposition of these securities may involve additional expenses and the prompt sale of these securities at an acceptable price may be difficult. Information regarding restricted securities held by each Fund is included in their Schedule of Investments, if applicable.
When-Issued Transactions – Each Fund may purchase securities on a forward commitment or ‘when-issued’ basis. Each Fund records a when-issued transaction on the trade date and will segregate with the custodian qualifying assets that have a value sufficient to make payment for the securities purchased. Securities purchased on a when-issued basis are marked-to-market daily and each Fund begins earning interest on the settlement date. Losses may arise due to changes in the market value of the underlying securities or if the counterparty does not perform under the contract.
ABSOLUTE FUNDS
NOTES TO FINANCIAL STATEMENTS
MARCH 31, 2010
Distributions to Shareholders – Distributions to shareholders of net investment income, if any, are declared and paid at least semi-annually. Distributions to shareholders of net capital gains, if any, are declared and paid at least annually. Distributions are based on amounts calculated in accordance with applicable Federal income tax regulations, which may differ from GAAP. These differences are due primarily to differing treatments of income and gain on various investment securities held by each Fund, timing differences and differing characterizations of distributions made by each Fund.
Federal Taxes – Each Fund intends to qualify each year as a regulated investment company under Subchapter M of the Internal Revenue Code and distribute all of their taxable income to shareholders. In addition, by distributing in each calendar year substantially all their net investment income and capital gains, if any, the Funds will not be subject to a Federal excise tax. Therefore, no Federal income or excise tax provision is required.
As of March 31, 2010, there are no uncertain tax positions that would require financial statement recognition, de-recognition, or disclosure. The Absolute Strategies Fund’s Federal tax returns filed in the three-year period ended March 31, 2010, remain subject to examination by the Internal Revenue Service. The Absolute Opportunities Fund’s Federal tax return filed in the two-year period ended March 31, 2010, will be subject to examination by the Internal Revenue Service.
Income and Expense Allocation – The Trust accounts separately for the assets, liabilities and operations of each of its investment portfolios. Expenses that are directly attributable to more than one investment portfolio are allocated among the respective investment portfolios in an equitable manner.
The Absolute Strategies Fund’s class specific expenses are charged to the operations of that class of shares. Income and expenses (other than expenses attributable to a specific class) and realized and unrealized gains or losses on investments are allocated to each class of shares based on the class’ respective net assets to the total net assets of the Fund.
Commitments and Contingencies – In the normal course of business, each Fund enters into contracts that provide general indemnifications by each Fund to the counterparty to the contract. Each Fund’s maximum exposure under these arrangements is dependent on future claims that may be made against each Fund and, therefore, cannot be estimated; however, based on experience, the risk of loss from such claims is considered remote.
Offering Costs – Offering costs for the Absolute Opportunities Fund of $64,218 consist of fees related to the mailing and printing of the initial prospectus, certain startup legal costs, and initial registration filings. Such costs were amortized over a twelve-month period beginning with the commencement of operations of the Absolute Opportunities Fund.
ABSOLUTE FUNDS
NOTES TO FINANCIAL STATEMENTS
MARCH 31, 2010
Note 3. Advisory Fees, Servicing Fees and Other Transactions
Investment Adviser – Absolute Investment Advisers LLC (the “Adviser”) is the investment adviser to the Funds. Pursuant to an Investment Advisory Agreement, the Adviser receives an advisory fee at an annual rate of 1.60% and 2.75% of the average daily net assets of Absolute Strategies Fund and Absolute Opportunities Fund, respectively.
Each sub-advisory fee, calculated as a percentage of each Fund’s average daily net assets, is paid by the Adviser.
Distribution – Foreside Fund Services, LLC serves as each Fund’s distributor (the “Distributor”). The Distributor is not affiliated with the Adviser or with Atlantic Fund Administration, LLC (“Atlantic”) or their affiliates. The Absolute Strategies Fund has adopted a Distribution Plan (the “Plan”) for R Shares of the Fund in accordance with Rule 12b-1 of the Act. Under the Plan, the Fund pays the Distributor and/or any other entity as authorized by the Board a fee of up to 0.25% of the average daily net assets of R Shares.
Other Service Providers – Atlantic provides fund accounting, fund administration, and transfer agency services to each Fund. Pursuant to an Atlantic services agreement, each Fund pays Atlantic customary fees for its services. Atlantic provides a Principal Executive Officer, a Principal Financial Officer, a Chief Compliance Officer, and an Anti-Money Laundering Officer to each Fund, as well as certain additional compliance support functions.
Trustees and Officers – The Trust pays each independent Trustee an annual retainer fee of $40,000 for service to the Trust ($60,000 for the Chairman). In addition, the Chairman receives a monthly stipend of $500 to cover certain expenses incurred in connection with his duties to the Trust. The Trustees and Chairman may receive additional fees for special Board meetings. Each Trustee is also reimbursed for all reasonable out-of-pocket expenses incurred in connection with his duties as a Trustee, including travel and related expenses incurred in attending Board meetings. The amount of Trustees’ fees attributable to each Fund is disclosed in the Statement of Operations. Certain officers of the Trust are also officers or employees of the above named service providers, and during their terms of office received no compensation from each Fund.
Note 4. Expense Reimbursements and Fees Waived
Certain fund service providers have voluntarily agreed to waive a portion of their fees for Absolute Strategies Fund. These voluntary waivers may be reduced or eliminated at any time. For the year ended March 31, 2010, there were $27,336 of fund service fees waived.
The Absolute Strategies Fund may repay the Adviser for fees waived and expenses reimbursed under an expense cap that is no longer in place because the terms of the cap permitted the reimbursements provided that (1) they took place within three years of the fees waived or expense reimbursement and (2) the payment is approved by the Board of Trustees. For the year ended March 31, 2010, the Adviser recouped $44,643 in expense reimbursements.
ABSOLUTE FUNDS
NOTES TO FINANCIAL STATEMENTS
MARCH 31, 2010
The Adviser contractually agreed to waive its fees and/or reimburse expenses to limit total annual operating expenses (excluding all interest, taxes, portfolio transaction expenses, dividends on short sales and extraordinary expenses) of Institutional Shares of Absolute Opportunities Fund to 2.95% through at least July 31, 2010. Other fund service providers have voluntarily agreed to waive a portion of their fees. The fees waived were as follows:
| | | | | | | |
Investment Adviser
Waived | | Fund Service
Fees Waived | | Total |
| $ | 327,552 | | $ | 120,885 | | $ | 448,437 |
The Absolute Opportunities Fund may repay the Adviser fees waived and expenses reimbursed pursuant to the expense cap if (1) such payment is made within three years of the fees waived or expense reimbursement; and (2) such payment is approved by the Board, and the resulting class expenses do not exceed 2.95% for Institutional Shares. For the period October 21, 2008 (commencement of operations) through March 31, 2010, the Adviser waived fees and/or reimbursed expenses as follows:
| | | | | | | | |
| | | Amount of Fees Waived
and/or Expenses
Reimbursed | | Expiration Date to Recoup
Fees Waived and/or
Expenses Reimbursed | | Fees Recouped |
March 31, 2009 | | $ | 181,968 | | March 31, 2012 | | $ | 0 |
March 31, 2010 | | $ | 327,552 | | March 31, 2013 | | $ | 0 |
Note 5. Security Transactions
The cost of purchases and proceeds from sales of investment securities (including maturities), other than short-term investments for the year ended March 31, 2010, were as follows:
Absolute Strategies Fund
| | | | | | | | | |
Non-U.S. Government Obligations | | U.S. Government
Obligations |
Purchases | | Sales | | Purchases | | Sales |
| $1,865,783,667 | | $ | 1,240,785,077 | | $ | 88,902,587 | | $ | 26,113,861 |
The Absolute Strategies Fund placed a portion of it’s portfolio transactions with a brokerage firm affiliated with a sub-adviser. The commissions paid to this affiliated firm were $19,306 for the period.
Absolute Opportunities Fund
| | | | | | | | | |
Non-U.S. Government Obligations | | U.S. Government
Obligations |
Purchases | | Sales | | Purchases | | Sales |
| $653,233,487 | | $ | 564,033,116 | | $ | 13,004,800 | | $ | 5,203,282 |
ABSOLUTE FUNDS
NOTES TO FINANCIAL STATEMENTS
MARCH 31, 2010
Note 6. Federal Income Tax and Investment Transactions
Distributions during the fiscal years ended as noted were characterized for tax purposes as follows:
| | | | | | | | |
| | | Ordinary
Income | | Long-Term Capital Gain | | Return of
Capital | | Total |
Absolute Strategies Fund | | | | | | | | |
2010 | | $18,565,863 | | $ - | | $ - | | $18,565,863 |
2009 | | 33,886,819 | | 3,986,399 | | - | | 37,873,218 |
Absolute Opportunities Fund | | | | | | | | |
2010 | | 13,220,730 | | 109,643 | | 561,655 | | 13,892,028 |
2009 | | 107,287 | | 11,308 | | - | | 118,595 |
As of March 31, 2010, distributable earnings (accumulated loss) on a tax basis were as follows:
| | | | | | | | | | | | | |
| | | Undistributed
Ordinary Income | | Capital and
Other Losses | | | Unrealized
Appreciation/
Depreciation | | Total |
Absolute Strategies Fund | | $ | 3,404,940 | | $ | (83,975,468 | ) | | $ | 118,663,093 | | $ | 38,092,565 |
Absolute Opportunities Fund | | | - | | | (2,678,630 | ) | | | 14,479,251 | | | 11,800,621 |
The difference between components of distributable earnings on a tax basis and the amounts reflected in the Statement of Assets and Liabilities are primarily due to wash sales, post October losses, passive foreign investment company holdings, real estate investment trusts, partnerships, credit default swaps, grantor trusts, constructive sales, straddles, short dividend adjustments, inflation indexed securities, loss deferral on covers, convertible bond premium adjustments and non-deductible offering costs.
For tax purposes, the current year post-October loss was $12,018,680 and $2,678,630 for Absolute Strategies Fund and Absolute Opportunities Fund, respectively. These losses will be recognized for tax purposes on the first business day of each Fund’s next fiscal year, April 1, 2010.
As of March 31, 2010, the Absolute Strategies Fund had capital loss carryforwards to offset future capital gains of $71,956,788, expiring in 2018.
On the Statement of Assets and Liabilities, as a result of permanent book to tax differences, certain amounts have been reclassified for the year ended March 31, 2010. The following reclassifications were the result of book to tax differences resulting from real estate investment trusts, partnerships, passive foreign investment holdings, grantor trusts, straddles, constructive sales, convertible bond premium, short dividend
ABSOLUTE FUNDS
NOTES TO FINANCIAL STATEMENTS
MARCH 31, 2010
reclassifications, contingent payment debt instruments, credit default swap income, organization cost amortization, paydown reclassifications, and redesignation of distributions. The reclassifications have no impact on the net assets of each Fund.
| | | | | | | | | | | |
| | | Accumulated Net
Investment
Income (Loss) | | | Undistributed
Net Realized
Gain (Loss) | | | Paid-in-Capital |
Absolute Strategies Fund | | $ | 4,590,811 | | | $ | (4,591,375 | ) | | $ | 564 |
Absolute Opportunities Fund | | | (384,926 | ) | | | 384,926 | | | | - |
Note 7. Written Option Transactions
Transactions in options written during the year ended March 31, 2010, for Absolute Strategies Fund were as follows:
| | | | | | | |
| | | Calls | |
| | | Number of
Contracts | | | Premiums | |
Options Outstanding, March 31, 2009 | | 2,764 | | | $ | 258,652 | |
Options written | | 50,487 | | | | 2,229,200 | |
Options terminated in closing transactions | | (39,389 | ) | | | (882,756 | ) |
Options exercised | | (965 | ) | | | (314,913 | ) |
Options expired | | (289 | ) | | | (30,963 | ) |
| | | | | | | |
Options Outstanding, March 31, 2010 | | 12,608 | | | $ | 1,259,220 | |
| | | | | | | |
| |
| | | Puts | |
| | | Number of
Contracts | | | Premiums | |
Options Outstanding, March 31, 2009 | | 1,692 | | | $ | 317,674 | |
Options written | | 86,195 | | | | 16,329,353 | |
Options terminated in closing transactions | | (48,148 | ) | | | (8,156,271 | ) |
Options exercised | | - | | | | - | |
Options expired | | - | | | | - | |
| | | | | | | |
Options Outstanding, March 31, 2010 | | 39,739 | | | $ | 8,490,756 | |
| | | | | | | |
ABSOLUTE FUNDS
NOTES TO FINANCIAL STATEMENTS
MARCH 31, 2010
Transactions in options written during the year ended March 31, 2010, for Absolute Opportunities Fund were as follows:
| | | | | | | |
| | | Calls | |
| | | Number of
Contracts | | | Premiums | |
Options Outstanding, March 31, 2009 | | 319 | | | $ | 3,866 | |
Options written | | 8,291 | | | | 328,755 | |
Options terminated in closing transactions | | (4,241 | ) | | | (42,926 | ) |
Options exercised | | (25 | ) | | | (10,600 | ) |
Options expired | | (33 | ) | | | (135 | ) |
| | | | | | | |
Options Outstanding, March 31, 2010 | | 4,311 | | | $ | 278,960 | |
| | | | | | | |
| |
| | | Puts | |
| | | Number of
Contracts | | | Premiums | |
Options Outstanding, March 31, 2009 | | 246 | | | $ | 46,315 | |
Options written | | 6,648 | | | | 791,378 | |
Options terminated in closing transactions | | (6,036 | ) | | | (721,772 | ) |
Options exercised | | - | | | | - | |
Options expired | | (50 | ) | | | (2,693 | ) |
| | | | | | | |
Options Outstanding, March 31, 2010 | | 808 | | | $ | 113,228 | |
| | | | | | | |
Note 8. Recent Accounting Pronouncements
In January 2010, the Financial Accounting Standards Board issued Accounting Standards Update (“ASU”) No. 2010-06 “Improving Disclosures about Fair Value Measurements.” ASU No. 2010-06 clarifies existing disclosure and requires additional disclosures regarding fair value measurements. Effective for interim and annual reporting periods beginning after December 15, 2009, entities are required to disclose significant transfers into and out of Level 1 and 2 measurements in the fair value hierarchy and the reasons for those transfers. Effective for fiscal years beginning after December 15, 2010, and for interim periods within those fiscal years, entities will need to disclose information about purchases, sales, issuances and settlements of Level 3 securities on a gross basis, rather than as a net number as currently required. Management is currently evaluating the impact ASU No. 2010-06 will have on its financial statement disclosures.
ABSOLUTE FUNDS
NOTES TO FINANCIAL STATEMENTS
MARCH 31, 2010
Note 9. Subsequent Events
Effective April 15, 2010 (the “Closing Date”), the Absolute Strategies Fund is closed to new investments, except as provided below.
After the Closing Date, existing shareholders of the Absolute Strategies Fund will be permitted to add to their accounts through the purchase of additional shares and through the reinvestment of dividends and capital gain distributions.
In addition, Trustees and officers of the Trust and employees and managers of the Adviser and its affiliates, or the spouse, sibling, direct ancestor, or direct descendent of any such person, may establish new accounts and continue to add to existing accounts in the Fund. Trust officers may permit the establishment of new accounts or permit additional sales to existing accounts under circumstances not identified above if the Adviser, as investment manager of the Fund, deems it to be in the best interest of the Fund and its shareholders. The Board of Trustees reserves the right to re-open the Fund to new investors at any time or to modify the extent to which future sales of shares are limited.
Subsequent events occurring after the date of this report have been evaluated for potential impact and Management has determined that, except as set forth above, there are no material subsequent events requiring financial statement disclosure.
REPORT OF INDEPENDENT REGISTERED PUBLIC ACCOUNTING FIRM
To the Board of Trustees of Forum Funds and the Shareholders of Absolute Strategies Fund and Absolute Opportunities Fund
We have audited the accompanying statements of assets and liabilities of Absolute Strategies Fund and Absolute Opportunities Fund, each a series of shares of beneficial interest in the Forum Funds, including the schedules of investments, as of March 31, 2010, and the related statements of operations for the year then ended, and the statements of changes in net assets and the financial highlights for each of the years or periods (Absolute Opportunities Fund commenced operations on October 21, 2008) in the two year period then ended. These financial statements and financial highlights are the responsibility of the Funds’ management. Our responsibility is to express an opinion on these financial statements and financial highlights based on our audits. The financial highlights for Absolute Strategies Fund for each of the years in the two-year period ended March 31, 2008 and for the period from July 11, 2005 (commencement of operations) through March 31, 2006 were audited by other auditors whose report dated May 28, 2008, expressed an unqualified opinion on such financial highlights.
We conducted our audits in accordance with the standards of the Public Company Accounting Oversight Board (United States). Those standards require that we plan and perform the audits to obtain reasonable assurance about whether the financial statements and financial highlights are free of material misstatement. An audit includes examining, on a test basis, evidence supporting the amounts and disclosures in the financial statements. Our procedures included confirmation of securities owned as of March 31, 2010 by correspondence with the custodian and brokers and by other appropriate auditing procedures where responses from brokers were not received. An audit also includes assessing the accounting principles used and significant estimates made by management, as well as evaluating the overall financial statement presentation. We believe that our audits provide a reasonable basis for our opinion.
In our opinion, the financial statements and financial highlights referred to above present fairly, in all material respects, the financial position of Absolute Strategies Fund and Absolute Opportunities Fund as of March 31, 2010, the results of their operations for the year then ended, and the changes in their net assets and their financial highlights for each of the years or periods in the two year period then ended, in conformity with accounting principles generally accepted in the United States of America.

BBD, LLP
Philadelphia, Pennsylvania
May 27, 2010
ABSOLUTE FUNDS
ADDITIONAL INFORMATION (Unaudited)
MARCH 31, 2010
Investment Advisory Agreement Approval
At the March 19, 2010 Board meeting, the Board, including the Independent Trustees, considered the continuance of the investment advisory agreement between Absolute Investment Advisors, LLC (“Absolute” or “Adviser”) and Forum Funds (“Trust”) pertaining to the Funds; the continuance of certain sub-advisory agreements for the Funds with Aronson+Johnson+Ortiz, LP; Bernzott Capital Advisors; Contravisory Research & Management Corp.; GMB Capital Management; LLC; Green Eagle Capital, LLC; Horizon Asset Management, Inc.; Kinetics Asset Management, Inc.; Kingstown Capital Management, LP; Kovitz Investment Group, LLC; Madden Asset Management, LLC; Mohican Financial Management, LLC; SSI Investment Management, Inc.; Semaphore Management LLC; TWIN Capital Management, Inc.; and Yacktman Asset Management Co. (the “Sub-advisers”); and the approval of a sub-advisory agreement for the Funds with MetWest Asset Management Corp. (included in the term “Sub-advisers”). In evaluating the Advisory and Sub-Advisory Agreements for the Funds, the Board reviewed materials furnished by Absolute, the Sub-Advisors (collectively, the “Advisers”) and the administrator, including information regarding the Advisers’ personnel, operations and financial condition.
Specifically, the Board considered, among other matters: (1) the nature, extent and quality of the services to be provided to the Fund by the Advisers, including information on the investment performance of the Advisers; (2) the costs of the services to be provided and profitability to the Advisers with respect to its relationship with the Fund; (3) the advisory fee and total expense ratio of the Fund compared to relevant peer group of funds; (4) the extent to which economies of scale would be realized as the Fund grows and whether the advisory fee would enable the Fund’s investors to share in the benefits of economies of scale; and (5) other benefits received by the Advisers from their relationship with the Fund. In their deliberations, the Board did not identify any particular information that was all-important or controlling and attributed different weights to the various factors. In particular, the Board focused on the factors discussed below.
Nature, Extent and Quality of Services
The Board received a presentation from senior representatives of the Adviser and Sub-advisers. The Board undertook these considerations in connection with the proposed renewal of the Advisory Agreement between each Absolute Fund and Absolute and the renewal of each Sub-advisory Agreement between Absolute and each of the Sub-advisers, except MetWest. The Board undertook these considerations with respect to MetWest in connection with the proposal approval of a new Sub-advisory Agreement between MetWest and Absolute following a change of control of MetWest.
The Board considered the quality of services to be provided by Absolute and the Sub-advisers under the Advisory and Sub-advisory Agreements with the Trust and Absolute, respectively. In this regard, the Board considered information regarding the experience, qualifications and professional background of the portfolio managers and other personnel at the Adviser and the Sub-advisers with principal investment responsibility for the Absolute Funds’ investments as well as the investment philosophy and decision-making processes of those professionals and the capability and integrity of the Adviser’s and the Sub-advisers’ senior management and staff. The Board also considered the adequacy of the Adviser’s and Sub-advisers’ resources and quality of services to be provided by the under the Advisory Agreement and the Sub-advisory Agreement.
ABSOLUTE FUNDS
ADDITIONAL INFORMATION (Unaudited)
MARCH 31, 2010
The Board, in addition, considered the quality of the Adviser’s and the Sub-advisers’ services with respect to regulatory compliance and compliance with client investment policies and restrictions as well as the financial condition and operational stability of the Adviser and Sub-advisers’. The Board noted the Adviser’s and the Sub-advisers’ representations that their firms are financially stable and able to provide investment advisory and sub-advisory services to the Funds. With respect to MetWest, in particular, the Board considered the representations of Absolute’s senior management team, including in its written response to the Board’s due diligence letter, that the change in control of MetWest was not expected to have any impact on the portfolio management, compliance or administrative services provided to the Absolute Funds by MetWest and that, to date, the change in control of MetWest had not resulted in adverse consequences for the Absolute Funds.
The Board concluded that, overall, it was satisfied with the nature, extent and quality of services to be provided to the Funds under the Advisory Agreement and Sub-advisory Agreements.
Costs of Services and Profitability
The Board considered information provided by Absolute and its Sub-advisers regarding the costs incurred in connection with providing services to each Absolute Fund and its profitability with respect to each Absolute Fund. The Board considered that Absolute continues to contractually waive certain advisory fees and, as necessary, reimburse certain expenses of the Absolute Opportunities Fund. In the totality of the circumstances, the Board concluded that the level of the Adviser’s estimated profits projected in connection with its management of the Fund was not excessive in light of the proposed services to be provided.
Performance
In connection with a presentation by Absolute regarding its approach to managing the Absolute Funds, the Board considered each Fund’s performance and each Sub-adviser’s performance, including, as applicable, over the 1-year, 3-year and since inception periods ended March 31, 2010. The Board noted that the Absolute Opportunities Fund outperformed its benchmark index, the S&P 500, since its inception on October 21, 2008 and had a positive return during the difficult first quarter of 2009. The Board also noted that the Absolute Strategies Fund underperformed its benchmark index, also the S&P 500 [over the same periods]. The Board noted that the Absolute Strategies Fund had maintained a relatively low beta, indicating that the Fund has a relatively low sensitivity to the movements of the S&P 500, as it is its objective to do.
The Board also considered the performance of each Sub-adviser, as presented to the Board by Absolute. With respect to those Sub-advisers’ whose performance lagged the relevant Fund’s benchmark, the Board noted Absolute’s representation that Absolute maintained confidence in each Sub-adviser and that each Sub-adviser could be expected to achieve dramatically different performance results in light of the particular strategy it had been engaged by Absolute to execute. The Board further noted Absolute’s explanation that, standing alone, no Sub-adviser would necessarily be expected to outperform either Fund’s benchmark index, but rather that only the performance of each Fund as a whole may appropriately be compared to the benchmark index; in this regard, the Board noted that Absolute emphasized its responsibility for allocating each Fund’s assets among
ABSOLUTE FUNDS
ADDITIONAL INFORMATION (Unaudited)
MARCH 31, 2010
Sub-advisers in order to achieve the Fund’s investment objective. In light of Absolute’s presentation, the unpredictability of the market over the last year and the continued growth of the each Absolute Fund’s assets, the Board concluded that the Absolute Funds and their shareholders could benefit from the renewal of Absolute’s Advisory Agreement with the Funds and of each of the applicable Sub-advisory Agreements between Absolute and each Sub-adviser, except with respect to MetWest, with respect to which the Board concluded that each Absolute Fund could benefit from the approval of the new Final Sub-Advisory Agreement between MetWest and Absolute.
Compensation
The Board considered the compensation paid to Absolute and each Sub-adviser for providing advisory services to the applicable Absolute Fund. The Board also considered comparative information regarding fees and total expenses of similar mutual funds, noting Absolute’s representation that it believes that hedge funds provide a fairer comparison to each Absolute Fund in terms of strategy and complexity and, as such, the Lipper Inc. peer group is not a complete reflection of the each Absolute Fund’s peers. The Board noted that Absolute’s advisory fee rate and total expense ratio were higher than the median advisory fee rate and median total expense ratio for funds in its Lipper Inc. peer group. The Board specifically considered that the Absolute Funds’ fees were among the highest charged by the funds in their Lipper Inc. peer group. In this regard, the Board considered Absolute’s representation that hedge funds are more similar to each of the Absolute Funds than the mutual funds in their Lipper Inc. peer group, and that such hedge funds’ fees typically consist of a 2% advisory fee and 20% performance fee. The Board also recognized that Absolute pays all of the Sub-advisers out of its advisory fee. Under the circumstances, the Board concluded that it is difficult to make an apples-to-apples comparison of the Absolute Funds’ expense ratios and those of their Lipper Inc. peer group Funds, including due to variations between the services provided by the Adviser to the Absolute Funds and those included in the fees paid by other funds. Based on the foregoing and other relevant facts, the Board concluded that the advisory fees charged to each Absolute Fund were reasonable.
Economies of Scale
In connection with its review of the advisory fee, the Board considered whether either of the Absolute Funds would benefit from any economies of scale and noted that the advisory fees for each of the Absolute Fund do not contain breakpoints. The Board noted Absolute’s representation that neither Absolute Fund could achieve large economies of scale because the investment strategies of the Sub-advisers were not high-capacity strategies – meaning the Sub-advisers could not successfully manage larger and larger amounts of assets and, as a result, did not generally offer fee schedules with breakpoints. The Board also noted Absolute’s representation that, to the extent it was able to obtain fee breaks with certain sub-advisers, fee breakpoints may not be incorporated into the Absolute Funds’ fee structures given the given the capacity constraints of the funds as a whole. In light of the circumstances, including the Adviser’s representations regarding the fees imposed by comparable hedge funds, the Board concluded that it was not necessary to impose fee breakpoints at this time.
ABSOLUTE FUNDS
ADDITIONAL INFORMATION (Unaudited)
MARCH 31, 2010
Other Benefits
The Board noted the Adviser’s and Sub-advisers’ representations that, except for their ability to associate themselves with the Absolute Funds and grow their assets under management, including their contractual advisory and sub-advisory fees, Absolute and the Sub-advisers do not realize any other benefits from their relationships with the Absolute Funds. Under the circumstances, including the foregoing representations, the Board concluded that other benefits received by Absolute and the Sub-advisers from their relationships with the Absolute Funds were not a material factor to consider in approving the continuation of the Advisory and Sub-advisory Agreements.
The Board reviewed a memorandum from Trust counsel discussing the legal standards applicable to its consideration the Advisory and Sub-advisory Agreements. Based on its review, including consideration of each of the factors referenced above, the Board determined, in the exercise of its business judgment, that the advisory arrangements, as outlined in the Advisory and Sub-advisory Agreements, were fair and reasonable in light of the services performed, expenses incurred and such other matters as the Board considered relevant in the exercise of its reasonable business judgment.
Proxy Voting Information
A description of the policies and procedures that each Fund uses to determine how to vote proxies relating to securities held in each Fund’s portfolio is available, without charge and upon request, by calling (888) 992-2765 and on the SEC’s website at www.sec.gov. Each Fund’s proxy voting record for the most recent twelve-month period ended June 30 is available, without charge and upon request, by calling (888) 992-2765 and on the SEC’s website at www.sec.gov.
Availability of Quarterly Portfolio Schedules
Each Fund files its complete schedule of portfolio holdings with the SEC for the first and third quarters of each fiscal year on Form N-Q. Each Fund’s Forms N-Q are available, without charge and upon request on the SEC’s website at www.sec.gov or may be reviewed and copied at the SEC’s Public Reference Room in Washington DC. Information on the operation of the Public Reference Room may be obtained by calling 1-800-SEC-0330.
Shareholder Expense Example
As a shareholder of the Funds, you incur ongoing costs, including management fees, distribution (12b-1) fees and other Fund expenses. This example is intended to help you understand your ongoing costs (in dollars) of investing in the Funds, and to compare these costs with the ongoing costs of investing in other mutual funds.
The example is based on an investment of $1,000 invested at the beginning of the period and held for the entire period from October 1, 2009, through March 31, 2010.
ABSOLUTE FUNDS
ADDITIONAL INFORMATION (Unaudited)
MARCH 31, 2010
Actual Expenses – The first line under each share class in the table below provides information about actual account values and actual expenses. You may use the information in this line, together with the amount you invested, to estimate the expenses that you paid over the period. Simply divide your account value by $1,000 (for example, an $8,600 account value divided by $1,000 = 8.6), then multiply the result by the number in the first line under the heading entitled “Expenses Paid During Period” to estimate the expenses you paid on your account during the period.
Hypothetical Example for Comparison Purposes – The second line under each share class in the table below provides information about hypothetical account values and hypothetical expenses based on each Fund’s actual expense ratio and an assumed rate of return of 5% per year before expenses, which is not each Fund’s actual return. The hypothetical account values and expenses may not be used to estimate the actual ending account balance or expenses you paid for the period. You may use this information to compare the ongoing cost of investing in each Fund and other funds. To do so, compare this 5% hypothetical example with the 5% hypothetical examples that appear in the shareholder reports of other funds.
Please note that expenses shown in the table are meant to highlight your ongoing costs only. Therefore, the second line of the table is useful in comparing ongoing costs only, and will not help you determine the relative total costs of owning different funds.
Absolute Strategies Fund
| | | | | | | | | | | | |
| | | Beginning Account
Value
October 1, 2009 | | Ending Account
Value
March 31, 2010 | | Expenses Paid
During Period * | | Annualized
Expense Ratio * | |
| Institutional Shares | | | | | | | | | | | | |
Actual | | $ | 1,000.00 | | $ | 1,037.57 | | $ | 10.82 | | 2.13 | % |
Hypothetical (5% return before expenses) | | $ | 1,000.00 | | $ | 1,014.31 | | $ | 10.70 | | 2.13 | % |
| R Shares | | | | | | | | | | | | |
Actual | | $ | 1,000.00 | | $ | 1,035.13 | | $ | 12.84 | | 2.53 | % |
Hypothetical (5% return before expenses) | | $ | 1,000.00 | | $ | 1,012.32 | | $ | 12.69 | | 2.53 | % |
* Expenses are equal to the Fund’s annualized expense ratio as indicated above multiplied by the average account value over the period, multiplied by the number of days in the most recent fiscal half-year divided by 365 to reflect the half-year period.
ABSOLUTE FUNDS
ADDITIONAL INFORMATION (Unaudited)
MARCH 31, 2010
Absolute Opportunities Fund
| | | | | | | | | | | | |
| | | Beginning Account
Value
October 1, 2009 | | Ending Account
Value
March 31, 2010 | | Expenses Paid
During Period * | | Annualized
Expense Ratio * | |
Actual | | $ | 1,000.00 | | $ | 1,016.68 | | $ | 17.85 | | 3.55 | % |
Hypothetical (5% return before expenses) | | $ | 1,000.00 | | $ | 1,007.23 | | $ | 17.77 | | 3.55 | % |
* Expenses are equal to the Fund’s annualized expense ratio as indicated above multiplied by the average account value over the period, multiplied by the number of days in the most recent fiscal half-year divided by 365 to reflect the half-year period.
Federal Tax Status of Dividends Declared during the Tax Year
For Federal income tax purposes, dividends from short-term capital gains are classified as ordinary income. The Absolute Strategies Fund designates 45.81% of its income dividend distributed as qualifying for the corporate dividends-received deduction (DRD) and 46.69% for the qualified dividend rate (QDI) as defined in Section 1(h)(11) of the Internal Revenue Code. The Absolute Strategies Fund also designates 93.10% as qualified interest income exempt from US tax for foreign shareholders (QII) and 100.00% as short-term capital gain dividends exempt from U.S. tax for foreign shareholders (QSD). The Absolute Opportunities Fund designates 2.92% of its income dividend distributed as DRD and 7.76% for QDI. The Absolute Opportunities Fund also designates 100.00% as QII and 87.23% for QSD.
ABSOLUTE FUNDS
ADDITIONAL INFORMATION (Unaudited)
MARCH 31, 2010
Trustees and Officers of the Trust
The Board is responsible for oversight of the management of the Trust’s business affairs and of the exercise of all the Trust’s powers except those reserved for the shareholders. The following table provides information about each Board member and certain officers of the Trust. Each Trustee and officer holds office until the person resigns, is removed, or is replaced. Unless otherwise noted, the persons have held their principal occupations for more than five years. The address for all Trustees and officers is Three Canal Plaza, Suite 600, Portland, Maine 04101, unless otherwise indicated. Each Trustee oversees thirty-two portfolios in the Trust. Mr. Keffer is considered an Interested Trustee due to his affiliation with Atlantic. Mr. Keffer is also an Interested Director of Wintergreen Fund, Inc. Each Fund’s Statement of Additional Information includes additional information about the Trustees and is available, without charge and upon request, by calling (888) 992-2765.
| | | | | | |
| Name and Year of Birth | | Position
with the
Trust | | Length
of Time
Served | | Principal
Occupation(s)
During Past 5 Years |
| Independent Trustees | | | | | | |
J. Michael Parish Born: 1943 | | Chairman of the Board; Trustee; Chairman, Nominating Committee and Qualified Legal Compliance Committee | | Since 1989 (Chairman since 2004) | | Retired since 2003. |
Costas Azariadis Born: 1943 | | Trustee; Chairman, Valuation Committee | | Since 1989 | | Professor of Economics, Washington University since 2006; Professor of Economics, University of California-Los Angeles 1992-2006. |
James C. Cheng Born: 1942 | | Trustee; Chairman, Audit Committee | | Since 1989 | | President, Technology Marketing Associates (marketing company for small- and medium-sized businesses in New England) since 1991. |
| Interested Trustee | | | | | | |
John Y. Keffer1 Born: 1942 | | Trustee; Vice Chairman | | Since 1989 | | Chairman, Atlantic since 2008; President, Forum Foundation (a charitable organization) since 2005; President, Forum Trust, LLC (a non-depository trust company chartered in the State of Maine) since 1997. |
1 Since 1997, John Y. Keffer has been president and owner of Forum Trust, LLC. Prior to January 1, 2010, Atlantic was a wholly owned subsidiary of Forum Trust, LLC. Effective January 1, 2010, Atlantic became a wholly owned subsidiary of Forum Holdings Corp., a Delaware corporation that is wholly owned by Mr. Keffer.
ABSOLUTE FUNDS
ADDITIONAL INFORMATION (Unaudited)
MARCH 31, 2010
| | | | | | |
| Name and Year of Birth | | Position
with the
Trust | | Length
of Time
Served | | Principal
Occupation(s)
During Past 5 Years |
| Officers | | | | | | |
Stacey E. Hong Born: 1966 | | President; Principal Executive Officer | | Since 2008 | | President, Atlantic since 2008; Director, Consulting Services, Foreside Fund Services 2007; Elder Care, 2005-2006. |
Karen Shaw Born: 1972 | | Treasurer; Principal Financial Officer | | Since 2008 | | Senior Manager, Atlantic since 2008; Section Manager/Vice President, Enterprise Support Services, Citigroup 2003-2008. |
David Faherty Born: 1970 | | Vice President | | Since 2009 | | Senior Counsel, Atlantic since 2009; Vice President, Citi Fund Services Ohio, Inc. 2007-2009.; Associate Counsel, Investors Bank & Trust Co. 2006-2007; FDIC 2005. |
Michael J. McKeen Born: 1971 | | Vice President | | Since 2009 | | Senior Manager, Atlantic since 2008; Vice President, Citigroup 2003-2008. |
Joshua LaPan Born: 1973 | | Vice President | | Since 2009 | | Manager, Atlantic since 2008; Vice President, Citigroup 2003-2008. |
Timothy Bowden Born: 1969 | | Vice President | | Since 2009 | | Manager, Atlantic since 2008; Vice President, Citigroup 2005-2008. |
Lina Bhatnagar Born: 1971 | | Secretary | | Since 2008 | | Senior Administration Specialist, Atlantic since 2008; Regulatory Administration Specialist, Citigroup 2006-2008. |
P.O. BOX 588
PORTLAND, MAINE 04112
(888) 992-2765 (TOLL FREE)
(888) 99-ABSOLUTE (TOLL FREE)
INVESTMENT ADVISER
Absolute Investment Advisers LLC
350 Lincoln Street, Suite 216
Hingham, Massachusetts 02043
www.absoluteadvisers.com
TRANSFER AGENT
Atlantic Fund Administration, LLC
P.O. Box 588
Portland, Maine 04112
(888) 992-2765 (Toll Free)
(888) 99-ABSOLUTE (Toll Free)
DISTRIBUTOR
Foreside Fund Services, LLC
Three Canal Plaza, Suite 100
Portland, Maine 04101
www.foreside.com
This report is submitted for the general information of the shareholders of the Funds. It is not authorized for distribution to prospective investors unless preceded or accompanied by an effective prospectus, which includes information regarding the Funds’ risks, objectives, fees and expenses, experience of its managements and other information.
212-ANR-0310

BECK, MACK & OLIVER
GLOBAL EQUITY FUND
PARTNERS FUND
ANNUAL REPORT
March 31, 2010
BECK, MACK & OLIVER LLC
TABLE OF CONTENTS
BECK, MACK & OLIVER GLOBAL EQUITY FUND
A MESSAGE TO OUR SHAREHOLDERS
MARCH 31, 2010
Dear Fellow Shareholder:
The Beck, Mack & Oliver Global Equity Fund (the “Fund”) ended its fiscal year on March 31, 2010 with a net asset value of $17.96 per share, realizing a return of 50.16% for the twelve-month period and representing an increase from its March 31, 2009 net asset value of $11.99 per share. The Fund’s fiscal return compares with a return of 52.37% for the Fund’s benchmark, the MSCI World Index (“MSCI”)1, and a 49.77% return for the S&P 500 Index (“S&P 500”)2. For a longer term perspective, the Fund’s 3-, 5-, and 10-year average annual total returns for the period ended March 31st were as follows:
| | | | | | | | | | | | |
Average Annual Total Return as of 03/31/2010
| | One Year
| | | Three Years
| | | Five Years
| | | Ten Years
| |
Beck, Mack & Oliver Global Equity Fund | | 50.16 | % | | -4.23 | % | | 4.12 | % | | -0.59 | % |
MSCI World Index | | 52.37 | % | | -5.41 | % | | 2.89 | % | | -0.03 | % |
S&P 500 Index | | 49.77 | % | | -4.17 | % | | 1.92 | % | | -0.65 | % |
Performance data quoted represents past performance and is no guarantee of future results. Current performance may be lower or higher than the performance data quoted. Investment return and principal value will fluctuate so that an investor’s shares, when redeemed, may be worth more or less than original cost. For the most recent month-end performance, please call (800) 754-8759. Shares redeemed or exchanged within 60 days of purchase will be charged a 2.00% redemption fee. As stated in the current prospectus, the Fund’s annual operating expense ratio (gross) is 2.28%. However, the Fund’s adviser has agreed to contractually waive a portion of its fees and/or reimburse expenses such that total operating expenses do not exceed 1.25%, which is in effect until July 31, 2010. During the period certain fees were waived and/or expenses reimbursed; otherwise returns would have been lower. Returns greater than one year are annualized. The recent growth rate in the stock market has helped to produce short-term returns that are not typical and may not continue in the future.
Fiscal Year in Review
The Fund’s performance during the fiscal year ended March 31, 2010 lagged its benchmark MSCI World Index by 2.21% in a sharply rising market environment that rebounded over 50%. 2010 proved to be the first calendar year in which the Fund underperformed relative to the MSCI World index and the S&P 500 after seven consecutive years of outperformance.
| 1 | The MSCI measures the performance of a diverse range of global stock markets in the United States, Canada, Europe, Australia, New Zealand and the Far East. The total return of the MSCI includes reinvestment of dividends and income. The total return of the Fund includes operating expenses that reduce returns, while the total return of the MSCI does not include expenses. The Fund is professionally managed while the MSCI is unmanaged and is not available for investment. |
| 2 | The S&P 500 is a market-value weighted index representing the performance of 500 widely held, publicly traded stocks. The total return of the S&P 500 includes reinvestment of dividends and income. The total return of the Fund includes operating expenses that reduce returns, while the total return of the S&P 500 does not include expenses. The Fund is professionally managed while the S&P 500 is unmanaged and is not available for investment. |
1
BECK, MACK & OLIVER GLOBAL EQUITY FUND
A MESSAGE TO OUR SHAREHOLDERS
MARCH 31, 2010
While the Fund participated in the broad market rally of 2009 and the fiscal year ended March 31, 2010, the performance was shaved by a cautious outlook and a large allocation toward consumer staples, which participated but lagged the sharp reflation rally. The rally was dominated by resource related companies (where the Fund has exposure through Anglo American PLC and EnCana Corp., among others) and technology (where the Fund’s exposure was limited to its position in QUALCOMM, Inc.). In addition, cash inflows into the Fund in the midst of the rally were put to work slowly and methodically; to participate fully would have required us to be more aggressive. We are comfortable with our decision-making and prefer to stick with our disciplined process, which has kept us in good stead over the long term. We invest in what we believe are asymmetrically favorable situations with a preference for long-term investment, and in securities with attributes that point to a high probability for successful outcome.
Securities that contributed to the Fund’s performance included diversified and real estate focused Asian companies such as Jardine Matheson Holdings, Ltd. and Hang Lung Properties, Ltd. which rebounded sharply from their lows. Some of these Asia-based equities were significantly mispriced at the market lows (with some trading at fractions of book value) especially when considering their financial strength and lack of need to access capital markets for day-to-day operations. Additionally, it appears business could be vibrant in the region for years to come — notwithstanding some potential hiccups along the way — to the benefit of companies whose assets posses natural barriers to entry and competitive advantages. Other sectors that contributed to Fund performance included our investments in metals and mining companies like Anglo American. Anglo common stock appeared to be priced for implosion during the depths of March 2009, trading into single digits from the mid $30’s. We purchased additional shares of this common stock at fire sale prices due to what we believe were significant though transitory issues. Anglo has a unique resource base in industrial metals and precious minerals, and a good management team capable of unlocking shareholder value. It is apparent that only a handful of companies worldwide have a comparable depth of resources — the result of consolidation in prior years. We regard these companies as strategic assets — they possess basic building blocks used to further develop emerging and growing economies worldwide. Consolidation also appears to have produced a generally rational competitive environment for metals and mining companies.
Our high relative exposure to consumer staples proved the primary drag on the Fund’s relative performance over the period. We remain constructive on our holdings in this area and have been adding to existing and establishing new positions in common stocks that have not participated in the rally to the same degree as those in other market sectors. Examples include Japan Tobacco, Inc. where concerns about a potential excise tax increase in its home market weighed on the stock. We increased our position based on our thesis that this uncertainty would likely be resolved positively and that the stock was unduly cheap on an absolute basis and versus its peer group.
Outlook and Areas of Opportunity
Within the consumer staples sector, one industry we like in particular is the global beer business, which is relatively protected from economic volatility but attractive at present for a few reasons. The industry is undergoing rapid consolidation — especially after the creation of market leader AB-Inbev. In response to AB-Inbev’s enhanced competitive position and market power, others have followed suit including Fund holdings Heineken Holdings NV and FEMSA (which has a beer component to its net asset value). The beer industry’s competitive landscape is rapidly becoming dominated by a few competitors that are well-positioned to extract efficiencies from redundant operations, and will likely follow other industries that have consolidated down to a few players that act as rational competitors and have the potential
2
BECK, MACK & OLIVER GLOBAL EQUITY FUND
A MESSAGE TO OUR SHAREHOLDERS
MARCH 31, 2010
for pricing to remain steady while marketing costs are reigned in. The few remaining sizable but non-dominant global beer companies appear to be ripe for further consolidation and in our opinion represent an area of opportunity for the Fund.
The Fund has been active in acquiring property casualty insurance and related companies and has now allocated over 10 % of Fund NAV to select securities. New and existing common stock positions include Enstar Group, Munich Re, Axis Capital, Renaissance Re, Fairfax Financial and Tokio Marine. All were acquired, to one degree or another, at discounts to our appraisal of long-term business value and some at significant discounts to book value. In our opinion the collective group has multiple attributes that make them compelling investments including:
| | • | | Disciplined and skillful underwriting or appraisal abilities that are above that of the competition |
| | • | | Astute investment capabilities |
| | • | | Historical financial strength |
| | • | | Operating leverage to higher global interest rates, a potential long term consequence of the credit crises |
In particular, Enstar is a unique business since the company does not write insurance policies; rather, it acquires books of insurance in run-off from other companies looking to shed certain businesses to enhance overall profitability. Its appraisal abilities are thus a key to Enstar’s success as is its ability to consummate acquisitions. The company has proven these capabilities over its history and has achieved double digit returns on capital and above average book value compounding versus the universe of public insurance companies. The market for Enstar’s services is large, providing growth potential for years to come. The business is generally counter-cyclical to the insurance industry as companies are more active in looking to shed books of business in softer pricing environments. From a valuation perspective, Enstar trades at a very low multiple to future earnings — an anomaly and unwarranted in our opinion given its track record of success and the growth potential ahead of it.
We believe the Fund is well-positioned for different market scenarios. It should participate in the growth of emerging markets through its holdings of consumer-oriented companies exporting into fast growing regions of the world with a growing middle class. Infrastructure and energy holdings should benefit from long-term growth in domestic economies while having revenue streams based in local currencies, providing a ballast against currency swings that affect exporters. Such holdings are also geared toward stronger local currencies (generally in Asia) versus the U.S. dollar. The hard asset component (buildings, resources, basic infrastructure) should also provide an inflation hedge to the portfolio. Financial holdings in property/casualty and reinsurance are capital providers in a scenario where capital becomes more expensive and financial regulations globally become more stringent, requiring higher levels of capital from financial services companies (with the potential for firm pricing for a longer period of time). Finally, companies in this arena with operating leverage to higher short term interest rates position the Fund toward that scenario.
3
BECK, MACK & OLIVER GLOBAL EQUITY FUND
A MESSAGE TO OUR SHAREHOLDERS
MARCH 31, 2010
Thank you for your continued investment in the Fund.
| | |
 | |  |
| |
| David E. Rappa | | Peter A. Vlachos |

Robert C. Beck
Investing overseas involves special risks, including the volatility of currency exchange rates and, in some cases, limited geographic focus, political and economic instability, and relatively illiquid markets. The Fund may invest in small- and mid-cap companies which carry greater risk than is customarily associated with larger companies for various reasons such as narrower markets, limited financial resources and less liquid stock.
This letter may contain discussions about certain investments both held and not held in the portfolio. All current and future holdings are subject to risk.
The views in this report were those of the Fund managers as of March 31, 2010, and may not reflect their views on the date this report is first published or any time thereafter. These views are intended to assist shareholders in understanding their investment in the Fund and do not constitute investment advice.
4
BECK, MACK & OLIVER GLOBAL EQUITY FUND
PERFORMANCE CHART AND ANALYSIS
MARCH 31, 2010
The following chart reflects the change in the value of a hypothetical $10,000 investment, including reinvested dividends and distributions, in the Beck, Mack & Oliver Global Equity Fund (the “Fund”) compared with the performance of the Morgan Stanley Capital International World Index (“MSCI”), over the past ten fiscal years. The MSCI measures the performance of a diverse range of global stock markets in the United States, Canada, Europe, Australia, New Zealand and the Far East. The total return of the MSCI includes reinvestment of dividends and income. The total return of the Fund includes operating expenses that reduce returns, while the total return of the MSCI does not include expenses. The Fund is professionally managed while the MSCI is unmanaged and is not available for investment. Performance data quoted represents past performance and is no guarantee of future results. Current performance may be lower or higher than the performance data quoted. Investment return and principal value will fluctuate so that shares, when redeemed, may be worth more or less than original cost. For the most recent month-end performance please call (800) 943-6786. Shares redeemed or exchanged within 60 days of purchase will be charged a 2.00% redemption fee. As stated in the Fund’s prospectus, the annual operating expense ratio (gross) is 2.28%. However, the Fund’s adviser has agreed to contractually waive a portion of its fees and to reimburse expenses such that total operating expenses do not exceed 1.25%, which is in effect until July 31, 2010. During the period, certain fees were waived and/or expenses reimbursed; otherwise, returns would have been lower. The performance table and graph do not reflect the deduction of taxes that a shareholder would pay on Fund distributions or the redemption of Fund shares. Returns greater than one year are annualized.
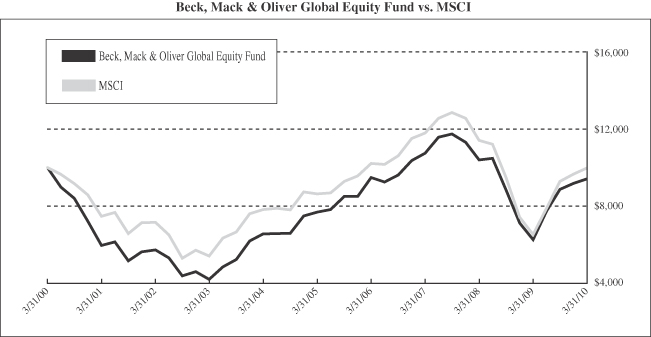
| | | |
Investment Value on 03/31/10:
| | |
Beck, Mack & Oliver Global Equity Fund | | $ | 9,425 |
MSCI | | | 9,972 |
| | | | | | | | | |
Average Annual Total Return as of 03/31/10:
| | One Year
| | | Five Years
| | | Ten Years
| |
Beck, Mack & Oliver Global Equity Fund | | 50.16 | % | | 4.12 | % | | (0.59 | )% |
MSCI | | 52.37 | % | | 2.89 | % | | (0.03 | )% |
5
BECK, MACK & OLIVER GLOBAL EQUITY FUND
PORTFOLIO PROFILE
MARCH 31, 2010
% of Total Investments
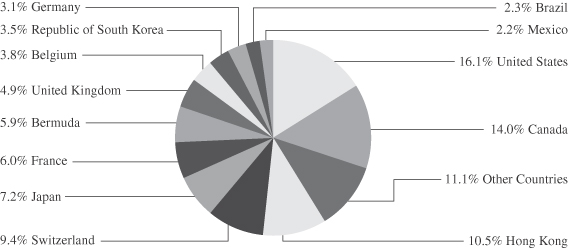
| | | |
% of Total Investments | | | |
Financials | | 35.9 | % |
Consumer Staples | | 18.7 | % |
Healthcare | | 11.1 | % |
Energy | | 7.8 | % |
Consumer Discretionary | | 6.5 | % |
Industrials | | 4.1 | % |
Materials | | 3.9 | % |
Telecommunication Services | | 3.7 | % |
Information Technology | | 2.7 | % |
U.S. Treasury | | 2.5 | % |
Foreign Treasury | | 1.8 | % |
Utilities | | 1.3 | % |
| | |
|
|
| | | 100.0 | % |
| | |
|
|
See Notes to Financial Statements.
6
BECK, MACK & OLIVER GLOBAL EQUITY FUND
SCHEDULE OF INVESTMENTS
MARCH 31, 2010
| | | | | |
Shares
| | Security Description
| | Value
|
| |
Common Stock — 89.9% | | | |
| | |
| | | Australia — 0.5% | | | |
| 25,000 | | Santos, Ltd. | | $ | 336,319 |
| | | | |
|
|
| | |
| | | Belgium — 3.6% | | | |
| 2,700 | | Ackermans & van Haaren NV | | | 197,508 |
| 41,300 | | Compagnie Nationale a Portefeuille | | | 2,164,336 |
| | | | |
|
|
| | | | | | 2,361,844 |
| | | | |
|
|
| | |
| | | Bermuda — 5.5% | | | |
| 33,500 | | Axis Capital Holdings, Ltd. | | | 1,047,210 |
| 28,000 | | Enstar Group, Ltd.(a) | | | 1,936,480 |
| 11,550 | | RenaissanceRe Holdings, Ltd. | | | 655,578 |
| | | | |
|
|
| | | | | | 3,639,268 |
| | | | |
|
|
| | |
| | | Brazil — 2.2% | | | |
| 98,645 | | BM&FBOVESPA SA | | | 662,311 |
| 41,800 | | Redecard SA | | | 773,312 |
| | | | |
|
|
| | | | | | 1,435,623 |
| | | | |
|
|
| | |
| | | Canada — 13.1% | | | |
| 16,100 | | Brookfield Asset Management, Inc., Class A | | | 409,772 |
| 5,600 | | Canadian Natural Resources, Ltd. | | | 414,466 |
| 25,400 | | Cenovus Energy, Inc. | | | 665,734 |
| 52,000 | | EnCana Corp. | | | 1,613,560 |
| 1,560 | | Fairfax Financial Holdings, Ltd. | | | 585,062 |
| 418,772 | | Huntingdon Real Estate Investment Trust(a) | | | 2,473,915 |
| 11 | | Imperial Oil, Ltd. | | | 422 |
| 470,000 | | Petroamerica Oil Corp.(a) | | | 222,124 |
| 5,500 | | Potash Corp. of Saskatchewan, Inc. | | | 656,425 |
| 21,400 | | Suncor Energy, Inc. | | | 696,356 |
| 98,000 | | Viterra, Inc.(a) | | | 925,338 |
| | | | |
|
|
| | | | | | 8,663,174 |
| | | | |
|
|
| | |
| | | China — 0.9% | | | |
| 1,038,000 | | Huaneng Power International, Inc., Class H | | | 602,940 |
| | | | |
|
|
| | | | | |
Shares
| | Security Description
| | Value
|
| | |
| | | France — 5.6% | | | |
| 12,300 | | Accor SA | | $ | 680,469 |
| 5,250 | | Eurazeo | | | 364,686 |
| 53,900 | | Sanofi-Aventis SA, ADR | | | 2,013,704 |
| 8,000 | | Suez Environnement Co. | | | 184,121 |
| 33,900 | | UbiSoft Entertainment SA(a) | | | 466,112 |
| | | | |
|
|
| | | | | | 3,709,092 |
| | | | |
|
|
| | |
| | | Germany — 2.6% | | | |
| 10,675 | | Muenchener Rueckversicherungs AG | | | 1,734,509 |
| | | | |
|
|
| | |
| | | Hong Kong — 9.9% | | | |
| 204,300 | | Cheung Kong Holdings, Ltd. | | | 2,631,291 |
| 250,000 | | Hang Lung Properties, Ltd. | | | 1,007,824 |
| 148,000 | | Henderson Land Development Co., Ltd. | | | 1,042,676 |
| 33,600 | | Jardine Matheson Holdings, Ltd. | | | 1,118,880 |
| 255,000 | | Wheelock & Co., Ltd. | | | 752,101 |
| | | | |
|
|
| | | | | | 6,552,772 |
| | | | |
|
|
| | |
| | | Japan — 6.8% | | | |
| 710 | | Japan Tobacco, Inc. | | | 2,642,850 |
| 23,800 | | Tokio Marine Holdings, Inc. | | | 670,290 |
| 12,000 | | Toyota Industries Corp. | | | 342,710 |
| 57,100 | | Universal Entertainment Corp. | | | 830,634 |
| | | | |
|
|
| | | | | | 4,486,484 |
| | | | |
|
|
| | |
| | | Jordan — 1.0% | | | |
| 44,520 | | Arab Bank PLC | | | 678,250 |
| | | | |
|
|
| | |
| | | Luxembourg — 2.0% | | | |
| 1,800 | | Millicom International Cellular SA | | | 160,470 |
| 45,600 | | SES SA, FDR | | | 1,151,419 |
| | | | |
|
|
| | | | | | 1,311,889 |
| | | | |
|
|
| | |
| | | Malaysia — 1.1% | | | |
| 352,000 | | Genting Bhd | | | 712,201 |
| | | | |
|
|
| | |
| | | Mexico — 2.1% | | | |
| 29,100 | | Fomento Economico Mexicano SAB de CV, ADR | | | 1,383,123 |
| | | | |
|
|
| | |
| | | Netherlands — 1.2% | | | |
| 17,400 | | Heineken Holding NV | | | 774,016 |
| | | | |
|
|
See Notes to Financial Statements.
7
BECK, MACK & OLIVER GLOBAL EQUITY FUND
SCHEDULE OF INVESTMENTS
MARCH 31, 2010
| | | | | |
Shares
| | Security Description
| | Value
|
| | |
| | | Republic of South Korea — 3.3% | | | |
| 800 | | LG Corp. | | $ | 50,201 |
| 675 | | Lotte Confectionery Co., Ltd. | | | 786,889 |
| 8,630 | | SK Telecom Co., Ltd. | | | 1,323,351 |
| | | | |
|
|
| | | | | | 2,160,441 |
| | | | |
|
|
| | |
| | | Sweden — 1.1% | | | |
| 41,400 | | Investor AB, Class A | | | 758,555 |
| | | | |
|
|
| | |
| | | Switzerland — 8.8% | | | |
| 23,869 | | ABB, Ltd. | | | 521,342 |
| 8,500 | | Compagnie Financiere Richemont SA, Class A | | | 329,149 |
| 3,800 | | Kuehne + Nagel International AG | | | 384,541 |
| 50,620 | | Nestle SA | | | 2,592,451 |
| 23,100 | | Novartis AG | | | 1,247,672 |
| 9,160 | | Pargesa Holding SA | | | 777,523 |
| | | | |
|
|
| | | | | | 5,852,678 |
| | | | |
|
|
| | |
| | | Taiwan — 1.2% | | | |
| 42,000 | | Chunghwa Telecom Co., Ltd., ADR | | | 816,060 |
| | | | |
|
|
| | |
| | | United Kingdom — 4.6% | | | |
| 45,600 | | Anglo American PLC, ADR(a) | | | 986,784 |
| 16,900 | | British American Tobacco PLC | | | 582,543 |
| 8,970 | | Diageo PLC, ADR | | | 605,026 |
| 34,576 | | GlaxoSmithKline PLC | | | 663,996 |
| 3,500 | | HSBC Holdings PLC, ADR | | | 177,415 |
| | | | |
|
|
| | | | | | 3,015,764 |
| | | | |
|
|
| | |
| | | United States — 12.8% | | | |
| 23,500 | | Baxter International, Inc. | | | 1,367,700 |
| 5,600 | | Fluor Corp. | | | 260,456 |
| 12,300 | | Genzyme Corp.(a) | | | 637,509 |
| 395 | | JG Boswell Co. | | | 247,270 |
| 4,900 | | Johnson & Johnson | | | 319,480 |
| 29,600 | | Leucadia National Corp.(a) | | | 734,376 |
| 37,700 | | Metabolix, Inc.(a) | | | 459,186 |
| 15,600 | | Newmont Mining Corp. | | | 794,508 |
| 25,600 | | Philip Morris International, Inc. | | | 1,335,296 |
| 10,000 | | QUALCOMM, Inc. | | | 419,900 |
| 40,000 | | Spectra Energy Corp. | | | 901,200 |
| | | | | |
Shares
| | Security Description
| | Value
|
| 12,200 | | Tejon Ranch Co.(a) | | $ | 372,344 |
| 22,000 | | The NASDAQ OMX Group, Inc.(a) | | | 464,640 |
| 2,500 | | Waters Corp.(a) | | | 168,850 |
| | | | |
|
|
| | | | | | 8,482,715 |
| | | | |
|
|
| |
Total Common Stock
(Cost $50,580,022) | | | 59,467,717 |
| | | | |
|
|
| | | | | | | | | | |
Principal
| | | | Rate
| | | Maturity
| | |
| | | |
Corporate Bond — 0.1% | | | | | | | | |
| | | | |
| | | Canada — 0.1% | | | | | | | | |
| $75,000 | | Huntingdon Real Estate Investment Trust, Series C (b) (Cost $66,361) | | 7.50 | % | | 03/31/12 | | | 71,356 |
| | | | | | | | | |
|
|
| | | |
Foreign Government Bonds — 1.7% | | | | | | | | |
| | | | |
| | | Australia — 1.2% | | | | | | | | |
| 850,000 | | Australian Government | | 5.75 | % | | 06/15/11 | | | 790,834 |
| | | | | | | | | |
|
|
| | | | |
| | | Germany — 0.3% | | | | | | | | |
| 150,000 | | Bundesschatzanweisungen | | 1.25 | % | | 03/11/11 | | | 204,013 |
| | | | | | | | | |
|
|
| | | | |
| | | New Zealand — 0.2% | | | | | | | | |
| 200,000 | | New Zealand Government, Series 1111 | | 6.00 | % | | 11/15/11 | | | 147,032 |
| | | | | | | | | |
|
|
| | | |
Total Foreign Government Bonds
(Cost $1,080,375) | | | | | | | | 1,141,879 |
| | | | | | | | | |
|
|
| | | |
U.S. Treasury Securities — 2.3% | | | | | | | | |
| 500,000 | | U.S. Treasury Inflation Index | | 1.88 | % | | 07/15/13 | | | 624,603 |
| 400,000 | | U.S. Treasury Note | | 2.00 | % | | 09/30/10 | | | 403,578 |
| 500,000 | | U.S. Treasury Note | | 1.13 | % | | 01/15/12 | | | 501,993 |
| | | | | | | | | |
|
|
| | | |
Total U.S. Treasury Securities
(Cost $1,487,450) | | | | | | | | 1,530,174 |
| | | | | | | | | |
|
|
| | |
Total Investments — 94.0%
(Cost $53,214,208)* | | | | | $ | 62,211,126 |
| | |
Other Asset and Liabilities, Net — 6.0% | | | | | | 3,958,018 |
| | | | | | | | | |
|
|
| | |
NET ASSETS — 100.0% | | | | | $ | 66,169,144 |
| | | | | | | | | |
|
|
See Notes to Financial Statements.
8
BECK, MACK & OLIVER GLOBAL EQUITY FUND
SCHEDULE OF INVESTMENTS
MARCH 31, 2010
ADR American Depositary Receipt
FDR Fiduciary Depositary Receipt
PLC Public Limited Company
| (a) | Non-income producing security. |
| (b) | Security exempt from registration under Rule 144A under the Securities Act of 1933. At the period end, the value of these securities amounted to $71,356 or 0.1% of net assets. |
| * | Cost for Federal income tax purposes is $54,539,664 and net unrealized appreciation consists of: |
| | | | |
Gross Unrealized Appreciation | | $ | 9,630,984 | |
Gross Unrealized Depreciation | | | (1,959,522 | ) |
| | |
|
|
|
Net Unrealized Appreciation | | $ | 7,671,462 | |
| | |
|
|
|
The following is a summary of the inputs used to value the Fund’s investments as of March 31, 2010:
The inputs or methodology used for valuing securities are not necessarily an indication of the risk associated with investing in those securities. For more information on valuation inputs, and their aggregation into the levels used in the table below, refer to Note 2 —Security Valuation in the accompanying Notes to Financial Statements.
| | | | | | | | | | | | |
| | | Level 1
| | Level 2
| | Level 3
| | Total
|
Investments at Value: | | | | | | | | | |
Common Stocks | | | | | | | | | | | | |
Australia | | $ | 336,319 | | $ | — | | $ | — | | $ | 336,319 |
Belgium | | | 2,361,844 | | | — | | | — | | | 2,361,844 |
Bermuda | | | 3,639,268 | | | — | | | — | | | 3,639,268 |
Brazil | | | 1,435,623 | | | — | | | — | | | 1,435,623 |
Canada | | | 8,663,174 | | | — | | | — | | | 8,663,174 |
China | | | 602,940 | | | — | | | — | | | 602,940 |
France | | | 3,709,092 | | | — | | | — | | | 3,709,092 |
Germany | | | 1,734,509 | | | — | | | — | | | 1,734,509 |
Hong Kong | | | 6,552,772 | | | — | | | — | | | 6,552,772 |
Japan | | | 4,486,484 | | | — | | | — | | | 4,486,484 |
Jordan | | | 678,250 | | | — | | | — | | | 678,250 |
Luxembourg | | | 1,311,889 | | | — | | | — | | | 1,311,889 |
Malaysia | | | 712,201 | | | — | | | — | | | 712,201 |
Mexico | | | 1,383,123 | | | — | | | — | | | 1,383,123 |
Netherlands | | | 774,016 | | | — | | | — | | | 774,016 |
South Korea | | | 2,160,441 | | | — | | | — | | | 2,160,441 |
Sweden | | | 758,555 | | | — | | | — | | | 758,555 |
Switzerland | | | 5,852,678 | | | — | | | — | | | 5,852,678 |
| | | | | | | | | | | | |
| | | Level 1
| | Level 2
| | Level 3
| | Total
|
Taiwan | | $ | 816,060 | | $ | — | | $ | — | | $ | 816,060 |
United Kingdom | | | 3,015,764 | | | — | | | — | | | 3,015,764 |
United States | | | 8,482,715 | | | — | | | — | | | 8,482,715 |
Corporate Bond | | | — | | | 71,356 | | | — | | | 71,356 |
Foreign Bonds | | | — | | | 1,141,879 | | | — | | | 1,141,879 |
U.S. Treasury Securities | | | — | | | 1,530,174 | | | — | | | 1,530,174 |
| | |
|
| |
|
| |
|
| |
|
|
Total Investments at Value | | | 59,467,717 | | | 2,743,409 | | | — | | | 62,211,126 |
| | |
|
| |
|
| |
|
| |
|
|
Other Financial Instruments**: | | | | | | | | | | | | |
Forward Currency Contracts | | | — | | | 69,344 | | | — | | | 69,344 |
| | |
|
| |
|
| |
|
| |
|
|
Total | | $ | 59,467,717 | | $ | 2,812,753 | | $ | — | | $ | 62,280,470 |
| | |
|
| |
|
| |
|
| |
|
|
| ** | Other Financial Instruments are derivative instruments not reflected in the Schedule of Investments, such as forward foreign currency contracts, which are valued at the unrealized appreciation (depreciation) of the instrument. |
See Notes to Financial Statements.
9
BECK, MACK & OLIVER GLOBAL EQUITY FUND
STATEMENT OF ASSETS AND LIABILITIES
MARCH 31, 2010
| | | | |
ASSETS | | | | |
Total investments, at value (Cost $53,214,208) | | $ | 62,211,126 | |
Foreign currency (Cost $2,771) | | | 2,771 | |
Unrealized gain on forward currency contracts | | | 104,143 | |
Cash | | | 4,699,026 | |
Receivables: | | | | |
Fund shares sold | | | 54,500 | |
Interest and dividends | | | 224,183 | |
Prepaid expenses | | | 10,251 | |
| | |
|
|
|
Total Assets | | | 67,306,000 | |
| | |
|
|
|
LIABILITIES | | | | |
Unrealized loss on forward currency contracts | | | 34,799 | |
Payables: | | | | |
Investment securities purchased | | | 1,018,838 | |
Accrued liabilities: | | | | |
Investment adviser fees | | | 30,111 | |
Compliance services fees | | | 1,784 | |
Fund service fees | | | 15,998 | |
Other expenses | | | 35,326 | |
| | |
|
|
|
Total Liabilities | | | 1,136,856 | |
| | |
|
|
|
NET ASSETS | | $ | 66,169,144 | |
| | |
|
|
|
COMPONENTS OF NET ASSETS | | | | |
Paid-in capital | | $ | 61,719,527 | |
Distributions in excess of net investment income | | | (170,054 | ) |
Net realized loss | | | (4,449,154 | ) |
Unrealized appreciation | | | 9,068,825 | |
| | |
|
|
|
NET ASSETS | | $ | 66,169,144 | |
| | |
|
|
|
NET ASSET VALUE, OFFERING PRICE AND REDEMPTION PRICE PER SHARE | | | | |
Based on net assets of $66,169,144 and 3,683,400 shares outstanding at $0.00 par value
(unlimited shares authorized) | | $ | 17.96 | |
| | |
|
|
|
See Notes to Financial Statements.
10
BECK, MACK & OLIVER GLOBAL EQUITY FUND
STATEMENT OF OPERATIONS
YEAR ENDED MARCH 31, 2010
| | | | |
INVESTMENT INCOME | | | | |
Dividend income (net of foreign withholding taxes of $91,267) | | $ | 939,384 | |
Interest income (net of foreign withholding taxes of $1,271) | | | 150,994 | |
| | |
|
|
|
Total Investment Income | | | 1,090,378 | |
| | |
|
|
|
EXPENSES | | | | |
Investment adviser fees | | | 804,179 | |
Fund service fees (Note 3) | | | 173,986 | |
Custodian fees | | | 37,395 | |
Registration fees | | | 17,674 | |
Professional fees | | | 75,451 | |
Trustees’ fees and expenses | | | 1,581 | |
Compliance services fees | | | 31,410 | |
Miscellaneous expenses | | | 37,616 | |
| | |
|
|
|
Total Expenses | | | 1,179,292 | |
Fees waived and/or reimbursed | | | (459,798 | ) |
| | |
|
|
|
Net Expenses | | | 719,494 | |
| | |
|
|
|
NET INVESTMENT INCOME | | | 370,884 | |
| | |
|
|
|
NET REALIZED AND UNREALIZED GAIN (LOSS) | | | | |
Net realized loss on: | | | | |
Investments | | | (1,454,033 | ) |
Foreign currency transactions | | | (183,561 | ) |
| | |
|
|
|
Net Realized Loss | | | (1,637,594 | ) |
| | |
|
|
|
Net change in unrealized appreciation (depreciation) on: | | | | |
Investments | | | 20,457,356 | |
Foreign currency translations | | | (43,178 | ) |
| | |
|
|
|
Net Change in Unrealized Appreciation | | | 20,414,178 | |
| | |
|
|
|
NET REALIZED AND UNREALIZED GAIN | | | 18,776,584 | |
| | |
|
|
|
INCREASE IN NET ASSETS FROM OPERATIONS | | $ | 19,147,468 | |
| | |
|
|
|
See Notes to Financial Statements.
11
BECK, MACK & OLIVER GLOBAL EQUITY FUND
STATEMENTS OF CHANGES IN NET ASSETS
| | | | | | | | |
| | | Year Ended
March 31, 2010
| | | Year Ended
March 31, 2009
| |
OPERATIONS | | | | | | | | |
Net investment income | | $ | 370,884 | | | $ | 347,410 | |
Net realized loss | | | (1,637,594 | ) | | | (2,702,711 | ) |
Net change in unrealized appreciation (depreciation) | | | 20,414,178 | | | | (20,473,493 | ) |
| | |
|
|
| |
|
|
|
Increase (Decrease) in Net Assets from Operations | | | 19,147,468 | | | | (22,828,794 | ) |
| | |
|
|
| |
|
|
|
DISTRIBUTIONS TO SHAREHOLDERS FROM | | | | | | | | |
Net investment income | | | (152,280 | ) | | | — | |
Net realized gain on investments sold | | | — | | | | (1,034,286 | ) |
| | |
|
|
| |
|
|
|
Total Distributions to Shareholders | | | (152,280 | ) | | | (1,034,286 | ) |
| | |
|
|
| |
|
|
|
CAPITAL SHARE TRANSACTIONS | | | | | | | | |
Sale of shares | | | 15,519,757 | | | | 5,922,399 | |
Reinvestment of distributions | | | 141,354 | | | | 1,034,231 | |
Redemption of shares | | | (4,746,432 | ) | | | (2,270,858 | ) |
| | |
|
|
| |
|
|
|
Increase from Capital Share Transactions | | | 10,914,679 | | | | 4,685,772 | |
| | |
|
|
| |
|
|
|
Increase (Decrease) in Net Assets | | | 29,909,867 | | | | (19,177,308 | ) |
NET ASSETS | | | | | | | | |
Beginning of year | | | 36,259,277 | | | | 55,436,585 | |
| | |
|
|
| |
|
|
|
End of year(a) | | $ | 66,169,144 | | | $ | 36,259,277 | |
| | |
|
|
| |
|
|
|
SHARE TRANSACTIONS | | | | | | | | |
Sale of shares | | | 953,756 | | | | 384,438 | |
Reinvestment of distributions | | | 8,082 | | | | 78,232 | |
Redemption of shares | | | (302,306 | ) | | | (164,671 | ) |
| | |
|
|
| |
|
|
|
Increase from Capital Share Transactions | | | 659,532 | | | | 297,999 | |
| | |
|
|
| |
|
|
|
(a) Amount includes distributions in excess of net investment income | | $ | (170,054 | ) | | $ | (374,941 | ) |
| | |
|
|
| |
|
|
|
See Notes to Financial Statements.
12
BECK, MACK & OLIVER GLOBAL EQUITY FUND
FINANCIAL HIGHLIGHTS
These financial highlights reflect selected per share data and ratios for a share outstanding throughout each year.
| | | | | | | | | | | | | | | | | | | | |
| | | Years Ended March 31,
| |
| | | 2010
| | | 2009
| | | 2008
| | | 2007
| | | 2006
| |
NET ASSET VALUE, Beginning of Year | | $ | 11.99 | | | $ | 20.34 | | | $ | 22.78 | | | $ | 21.97 | | | $ | 19.15 | |
| | |
|
|
| |
|
|
| |
|
|
| |
|
|
| |
|
|
|
INVESTMENT OPERATIONS | | | | | | | | | | | | | | | | | | | | |
Net investment income(a) | | | 0.11 | | | | 0.12 | | | | 0.07 | | | | 0.11 | | | | 0.10 | |
Net realized and unrealized gain (loss) | | | 5.90 | | | | (8.12 | ) | | | (0.64 | ) | | | 2.69 | | | | 4.17 | |
| | |
|
|
| |
|
|
| |
|
|
| |
|
|
| |
|
|
|
Total from Investment Operations | | | 6.01 | | | | (8.00 | ) | | | (0.57 | ) | | | 2.80 | | | | 4.27 | |
| | |
|
|
| |
|
|
| |
|
|
| |
|
|
| |
|
|
|
DISTRIBUTIONS TO SHAREHOLDERS FROM | | | | | | | | | | | | | | | | | | | | |
Net investment income | | | (0.04 | ) | | | — | | | | (0.53 | ) | | | (0.46 | ) | | | (0.49 | ) |
Net realized gain | | | — | | | | (0.35 | ) | | | (1.34 | ) | | | (1.53 | ) | | | (0.96 | ) |
| | |
|
|
| |
|
|
| |
|
|
| |
|
|
| |
|
|
|
Total Distributions to Shareholders | | | (0.04 | ) | | | (0.35 | ) | | | (1.87 | ) | | | (1.99 | ) | | | (1.45 | ) |
| | |
|
|
| |
|
|
| |
|
|
| |
|
|
| |
|
|
|
Redemption fee(a) | | | — | | | | — | | | | — | (b) | | | — | (b) | | | — | (b) |
| | |
|
|
| |
|
|
| |
|
|
| |
|
|
| |
|
|
|
NET ASSET VALUE, End of Year | | $ | 17.96 | | | $ | 11.99 | | | $ | 20.34 | | | $ | 22.78 | | | $ | 21.97 | |
| | |
|
|
| |
|
|
| |
|
|
| |
|
|
| |
|
|
|
TOTAL RETURN | | | 50.16 | % | | | (39.51 | )% | | | (3.32 | )% | | | 13.22 | % | | | 23.10 | % |
| | | | | |
RATIOS/SUPPLEMENTARY DATA | | | | | | | | | | | | | | | | | | | | |
Net Assets at End of Year (000’s omitted) | | $ | 66,169 | | | $ | 36,259 | | | $ | 55,437 | | | $ | 54,280 | | | $ | 40,215 | |
Ratios to Average Net Assets: | | | | | | | | | | | | | | | | | | | | |
Net investment income | | | 0.69 | % | | | 0.73 | % | | | 0.29 | % | | | 0.49 | % | | | 0.47 | % |
Net expenses | | | 1.34 | % | | | 1.75 | % | | | 1.75 | % | | | 1.90 | % | | | 2.41 | % |
Gross expenses(c) | | | 2.20 | % | | | 2.28 | % | | | 2.07 | % | | | 2.28 | % | | | 2.43 | % |
PORTFOLIO TURNOVER RATE | | | 54 | % | | | 56 | % | | | 51 | % | | | 26 | % | | | 56 | % |
| (a) | Calculated based on average shares outstanding during the year. |
| (b) | Less than $0.01 per share. |
| (c) | Reflects the expense ratio excluding any waivers and/or reimbursements. |
See Notes to Financial Statements.
13
BECK, MACK & OLIVER PARTNERS FUND
A MESSAGE TO OUR SHAREHOLDERS
MARCH 31, 2010
Dear Fellow Shareholder:
The Beck, Mack & Oliver Partners Fund (the “Partners Fund”) ended its fiscal year on March 31, 2010 with a net asset value of $10.66 per share, realizing a return of 46.38% for the twelve-month period and representing an increase from its December 31, 2009 net asset value of $10.28 per share. The Partners Fund’s fiscal return compares with a return of 49.77% for the Partners Fund’s benchmark, the S&P 500 Index (“S&P 500”)1. For a longer term perspective, the Partners Fund’s 3-, 5-, and 10-year average annual total returns for the period ended March 31st were as follows:
| | | | | | | | | | | | |
Average Annual Total Return as of 03/31/2010
| | One Year2
| | | Three Years
| | | Five Years
| | | Ten Years
| |
Beck, Mack & Oliver Partners Fund | | 46.38 | % | | -7.04 | % | | 1.20 | % | | 1.92 | % |
S&P 500 Index | | 49.77 | % | | -4.17 | % | | 1.92 | % | | -0.65 | % |
Performance data quoted represents past performance and is no guarantee of future results. Current performance may be lower or higher than the performance data quoted. Investment return and principal value will fluctuate so that an investor’s shares, when redeemed, may be worth more or less than original cost. Shares redeemed or exchanged within 60 days of purchase will be charged a 2.00% redemption fee. As stated in the current prospectus, the Fund’s annual operating expense ratio (gross) is 1.79%. However, the Fund’s adviser has agreed to contractually waive a portion of its fees and/or reimburse expenses such that total operating expenses do not exceed 1.00%, which is in effect until July 31, 2011; otherwise performance shown would have been lower. For the most recent month-end performance, please call (800) 754-8759. Returns greater than one year are annualized. See page 15 for additional disclosure.
During the sharp market rebound environment of 2009, the market’s best performing stocks were generally small capitalization, lower credit quality companies. Within the context of the Federal Reserve’s “cheap money” policies, this outperformance is explainable as larger, higher-quality balance sheets prove less of a competitive advantage. However, as interest rates rise and the cost of money increases, the attractiveness of lower quality companies typically begins to wane. Since the market reached its nadir last March, stock prices of lower-quality companies (defined as rated B or lower in The Bank of America Merrill Lynch universe of 1,600 stocks) have outperformed higher-quality companies by 35% while stock prices of smaller market capitalization companies outperformed larger market capitalization companies by 40%. (Source: Bank of America Merrill Lynch)
The U.S. equity markets see-sawed sharply during the first quarter of 2010. In mid-January stocks began a decline on concerns over financial industry regulatory reform, Chinese economic policy, and sovereign credit woes in Greece. In early March a particularly accommodative stance by the Federal Reserve and the prospect of improving corporate profitability helped lift stock prices sharply higher.
| 1 | The S&P 500 is a market-value weighted index representing the performance of 500 widely held, publicly traded stocks. The total return of the S&P 500 includes reinvestment of dividends and income. The total return of the Fund includes operating expenses that reduce returns, while the total return of the S&P 500 does not include expenses. The Fund is professionally managed while the S&P 500 is unmanaged and is not available for investment. |
| 2 | The recent growth rate in the stock market has helped to produce short-term returns that are not typical and may not continue in the future. |
14
BECK, MACK & OLIVER PARTNERS FUND
A MESSAGE TO OUR SHAREHOLDERS
MARCH 31, 2010
With an eye on managing downside risk, the Partners Fund continues to own mid to large capitalization companies with strong balance sheets, positions which have hampered its relative performance. We believe that over the next market cycle, which may likely include the raising of interest rates by the Federal Reserve, our higher-quality portfolio should be well-positioned.
The healthcare companies in our portfolio have large market capitalizations, strong balance sheets and high cash generation capabilities. The financial strength of these companies, along with concerns over newly enacted legislation, continues to cast a shadow over this sector, which underperformed the S&P by 18% during the past 12 months. However, their relatively strong balance sheets combined with favorable demographic trends cause us to be optimistic about their future return potential. We remain overweight in this sector and own large positions in Abbot Laboratories, Baxter International, Johnson & Johnson and Merck & Co.
Another area of focus is the energy sector. The strength of oil (up 68.7% during the past 12 months) and improving prospects for world economies has not led to outperformance for many companies in this sector; energy stocks in the S&P 500 were up only 26.7% from March 31, 2009. At current prices we would expect companies that produce oil to generate significant amounts of cash flow while demand for exploration and extraction companies should increase, allowing them greater visibility into the future. As people become more comfortable with the stability of the global economic recovery and begin focusing on the long term earnings power of these companies, we believe their relative performance will turn positive.
With the seeds of an economic recovery having been sown and much of the systemic risk in the financial system seemingly having been brought into the light of day, the probability of double dipping to the trough of last March appears low. That being said, the high demand for riskier assets is a trend worth watching closely. Junk bonds (those of lower credit quality issuers) set a quarterly record with $67.1 billion of issuance in the U.S. during the first quarter, up from $11 billion in the first quarter of 2009. Source: Dealogic (Holdings) PLC. Our concern remains that this increased ownership of riskier assets will augment the amount of indigestion normally felt during a Federal Reserve interest rate tightening cycle.
With stocks approaching more normalized valuations we remain selective in our approach to allocating capital to the equity markets. We maintain our fundamental, bottom up approach to security analysis and continue to build our bullpen of ideas that can be used to populate the portfolio when stock prices become untethered from our estimates of the intrinsic value.
Thank you for your continued support.
| | |
| |
 | | |
| |
| Zachary A. Wydra | | |
(In November 2009, a limited partnership managed by the Adviser reorganized into the Fund. This limited partnership maintained an investment objective and investment policies that were, in all material respects, substantially similar to those of the Fund. The Fund will adopt the performance history and financial statements of the limited partnership. The Fund’s performance for periods prior to December 1, 2009 is that of the limited partnership and reflects the expenses of the limited partnership, which were lower than the Fund’s current net expenses, except for 2008 where the expenses of the
15
BECK, MACK & OLIVER PARTNERS FUND
A MESSAGE TO OUR SHAREHOLDERS
MARCH 31, 2010
limited partnership were higher. The performance prior to December 1, 2009 is based on calculations that are different than the standardized method of calculations accepted by the SEC. If the limited partnership’s performance had been readjusted to reflect the estimated expenses of the Fund for its first fiscal year, the performance would have been lower. The limited partnership was not registered under the Investment Company Act of 1940 (“1940 Act”) and was not subject to certain investment limitations, diversification requirements, and other restrictions imposed by the 1940 Act and the Internal Revenue Code of 1986, which, if applicable, may have adversely affected its performance.)
There is no assurance that the fund will achieve its investment objective. The risks associated with the fund include: equity and convertible securities risk, foreign securities risk, management risk, debt securities risk, no-investment grade securities risk, liquidity risk and non-diversification risk. Total return figures include the reinvestment of dividends and capital gains. During the periods shown, some of the Fund’s fees were waived or expenses reimbursed. In the absence of these waivers and reimbursements, performance figures would be lower.
This letter may contain discussions about certain investments both held and not held in the portfolio. All current and future holdings are subject to risk.
The views in this report were those of the Fund managers as of March 31, 2010, and may not reflect their views on the date this report is first published or any time thereafter. These views are intended to assist shareholders in understanding their investment in the Fund and do not constitute investment advice.
16
BECK, MACK & OLIVER PARTNERS FUND
PERFORMANCE CHART AND ANALYSIS
MARCH 31, 2010
The following chart reflects the change in the value of a hypothetical $10,000 investment, including reinvested dividends and distributions, in the Beck, Mack & Oliver Partners Fund (the “Fund”) compared with the performance of the Standard & Poor’s 500 Index (“S&P 500”), over the past ten fiscal years. The S&P 500 is a market-value weighted index representing the performance of 500 widely held, publicly traded stocks. The total return of the S&P 500 includes reinvestment of dividends and income. The total return of the Fund includes operating expenses that reduce returns, while the total return of the S&P 500 does not include expenses. The Fund is professionally managed while the S&P 500 is unmanaged and is not available for investment. Performance data quoted represents past performance and is no guarantee of future results. Current performance may be lower or higher than the performance data quoted. Investment return and principal value will fluctuate so that shares, when redeemed, may be worth more or less than original cost. For the most recent month-end performance please call (800) 943-6786. Shares redeemed or exchanged within 60 days of purchase will be charged a 2.00% redemption fee. As stated in the Fund’s prospectus, the annual operating expense ratio (gross) is 1.79%. However, the Fund’s adviser has agreed to contractually waive a portion of its fees and to reimburse expenses such that total operating expenses do not exceed 1.00%, which is in effect until July 31, 2011. During the period, certain fees were waived and/or expenses reimbursed; otherwise, returns would have been lower. The performance table and graph do not reflect the deduction of taxes that a shareholder would pay on Fund distributions or the redemption of Fund shares. Returns greater than one year are annualized.
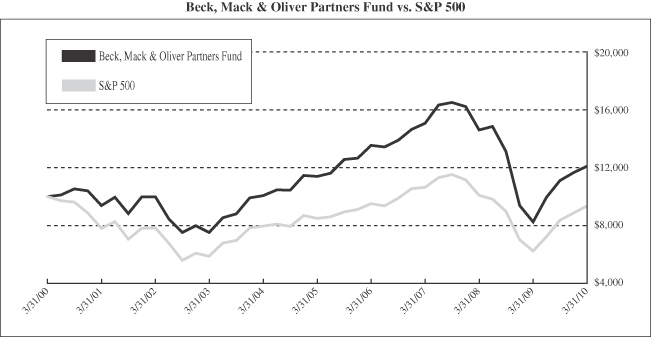
| | | |
Investment Value on 03/31/10:
| | |
Beck, Mack & Oliver Partners Fund | | $ | 12,093 |
S&P 500 | | | 9,365 |
| | | | | | | | | |
Average Annual Total Return as of 03/31/10:
| | One Year
| | | Five Years
| | | Ten Years
| |
Beck, Mack & Oliver Partners Fund | | 46.38 | % | | 1.20 | % | | 1.92 | % |
S&P 500 | | 49.77 | % | | 1.92 | % | | (0.65 | )% |
17
BECK, MACK & OLIVER PARTNERS FUND
PORTFOLIO PROFILE
MARCH 31, 2010
% of Total Investments
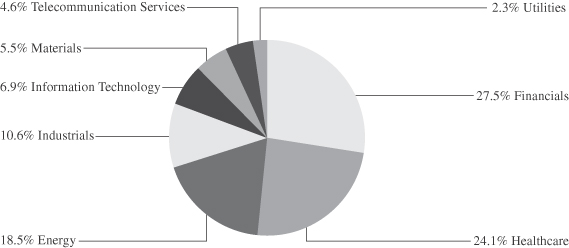
See Notes to Financial Statements.
18
BECK, MACK & OLIVER PARTNERS FUND
SCHEDULE OF INVESTMENTS
MARCH 31, 2010
| | | | | |
Shares
| | Security Description
| | Value
|
| |
Common Stock — 86.9% | | | |
| | |
| | | Energy — 16.8% | | | |
| 15,328 | | ConocoPhillips | | $ | 784,334 |
| 16,963 | | EnCana Corp. | | | 526,362 |
| 3,800 | | Exxon Mobil Corp. | | | 254,524 |
| 16,936 | | Noble Corp. | | | 708,264 |
| 6,889 | | Schlumberger Ltd. | | | 437,176 |
| 22,790 | | The Williams Cos., Inc. | | | 526,449 |
| | | | |
|
|
| | | | | | 3,237,109 |
| | | | |
|
|
| | |
| | | Financials — 23.6% | | | |
| 16,689 | | Axis Capital Holdings, Ltd. | | | 521,698 |
| 5,300 | | Berkshire Hathaway, Inc., Class B(a) | | | 430,731 |
| 20,579 | | Brookfield Asset Management, Inc., Class A | | | 523,118 |
| 10,582 | | Enstar Group, Ltd.(a) | | | 731,851 |
| 12,419 | | HCC Insurance Holdings, Inc. | | | 342,764 |
| 7,547 | | Homefed Corp.(a) | | | 177,166 |
| 28,963 | | Leucadia National Corp.(a) | | | 718,572 |
| 14,284 | | PICO Holdings, Inc.(a) | | | 531,222 |
| 6,200 | | RenaissanceRe Holdings, Ltd. | | | 351,912 |
| 24,692 | | RHJ International(a) | | | 214,498 |
| | | | |
|
|
| | | | | | 4,543,532 |
| | | | |
|
|
| | |
| | | Healthcare — 21.9% | | | |
| 11,827 | | Abbott Laboratories | | | 623,046 |
| 11,296 | | Baxter International, Inc. | | | 657,427 |
| 5,150 | | Genzyme Corp.(a) | | | 266,925 |
| 8,886 | | Johnson & Johnson | | | 579,367 |
| 7,119 | | Laboratory Corp. of America Holdings(a) | | | 538,979 |
| 16,102 | | Merck & Co., Inc. | | | 601,410 |
| 50,745 | | Metabolix, Inc.(a) | | | 618,074 |
| 4,924 | | Waters Corp.(a) | | | 332,567 |
| | | | |
|
|
| | | | | | 4,217,795 |
| | | | |
|
|
| | |
| | | Industrials — 9.7% | | | |
| 27,185 | | Ceres Power Holdings PLC(a) | | | 52,783 |
| 11,579 | | Dover Corp. | | | 541,318 |
| 12,206 | | Fluor Corp. | | | 567,701 |
| 12,046 | | Roper Industries, Inc. | | | 696,741 |
| | | | |
|
|
| | | | | | 1,858,543 |
| | | | |
|
|
| | | | | |
Shares
| | Security Description
| | Value
|
| | |
| | | Information Technology — 6.3% | | | |
| 3,724 | | Fidelity National Information Services, Inc. | | $ | 87,291 |
| 23,458 | | Molex, Inc., Class A | | | 414,034 |
| 16,963 | | QUALCOMM, Inc. | | | 712,276 |
| | | | |
|
|
| | | | | | 1,213,601 |
| | | | |
|
|
| | |
| | | Materials — 5.0% | | | |
| 29,549 | | Nalco Holding Co. | | | 718,927 |
| 2,000 | | Potash Corp. of Saskatchewan, Inc. | | | 238,700 |
| | | | |
|
|
| | | | | | 957,627 |
| | | | |
|
|
| | |
| | | Telecommunication Services — 1.5% | | | |
| 174,849 | | Level 3 Communications, Inc.(a) | | | 283,255 |
| | | | |
|
|
| | |
| | | Utilities — 2.1% | | | |
| 15,500 | | Brookfield Infrastructure Partners LP | | | 272,645 |
| 11,202 | | Mirant Corp.(a) | | | 121,654 |
| | | | |
|
|
| | | | | | 394,299 |
| | | | |
|
|
| |
Total Common Stock
(Cost $12,778,754) | | | 16,705,761 |
| | | | |
|
|
See Notes to Financial Statements.
19
BECK, MACK & OLIVER PARTNERS FUND
SCHEDULE OF INVESTMENTS
MARCH 31, 2010
| | | | | | | | | | |
Principal
| | | | Rate
| | | Maturity
| | Value
|
| | |
Corporate Convertible Bond — 1.2% | | | | | | |
| $232,000 | | Level 3 Communications, Inc.
(Cost $212,231) | | 5.25 | % | | 12/15/11 | | $ | 227,070 |
| | | | | | | | | |
|
|
| |
Corporate Non-Convertible Bonds — 2.9% | | | |
| 250,000 | | HSBC Finance Corp. | | 6.75 | % | | 05/15/11 | | | 262,848 |
| 300,000 | | Level 3 Financing, Inc. | | 9.25 | % | | 11/01/14 | | | 294,000 |
| | | | | | | | | |
|
|
| | | |
Total Corporate Non-Convertible Bonds
(Cost $554,567) | | | | | | | | 556,848 |
| | | | | | | | | |
|
|
| | | |
Total Investments — 91.0%
(Cost $13,545,552)* | | | | | | | $ | 17,489,679 |
| | | |
Other Assets and Liabilities, Net — 9.0% | | | | | | | | 1,728,622 |
| | | | | | | | | |
|
|
| | | |
NET ASSETS — 100.0% | | | | | | | $ | 19,218,301 |
| | | | | | | | | |
|
|
LP Limited Partnership
PLC Public Limited Company
| (a) | Non-income producing security. |
| * | Cost for Federal income tax purposes is $13,553,181 and net unrealized appreciation consists of: |
| | | | |
Gross Unrealized Appreciation | | $ | 4,768,605 | |
Gross Unrealized Depreciation | | | (832,107 | ) |
| | |
|
|
|
Net Unrealized Appreciation | | $ | 3,936,498 | |
| | |
|
|
|
The following is a summary of the inputs used to value the Fund’s investments as of March 31, 2010:
The inputs or methodology used for valuing securities are not necessarily an indication of the risk associated with investing in those securities. For more information on valuation inputs, and their aggregation into the levels used in the table below, refer to Note 2 —Security Valuation in the accompanying Notes to Financial Statements.
| | | | | | | | | | | | |
| | | Level 1
| | Level 2
| | Level 3
| | Total
|
Investments at Value: | | | | | | | | | | | | |
Common Stock | | | | | | | | | | | | |
Energy | | $ | 3,237,109 | | $ | — | | $ | — | | $ | 3,237,109 |
Financials | | | 4,329,034 | | | 214,498 | | | — | | | 4,543,532 |
Healthcare | | | 4,217,795 | | | — | | | — | | | 4,217,795 |
Industrials | | | 1,858,543 | | | — | | | — | | | 1,858,543 |
Information Technology | | | 1,213,601 | | | — | | | — | | | 1,213,601 |
Materials | | | 957,627 | | | — | | | — | | | 957,627 |
Telecommunication Services | | | 283,255 | | | | | | | | | 283,255 |
Utilities | | | 394,299 | | | — | | | — | | | 394,299 |
Corporate Convertible Bond | | | — | | | 227,070 | | | — | | | 227,070 |
Corporate Non-Convertible Bonds | | | — | | | 556,848 | | | — | | | 556,848 |
| | |
|
| |
|
| |
|
| |
|
|
Total Investments at Value | | $ | 16,491,263 | | $ | 998,416 | | $ | — | | $ | 17,489,679 |
| | |
|
| |
|
| |
|
| |
|
|
See Notes to Financial Statements.
20
BECK, MACK & OLIVER PARTNERS FUND
STATEMENT OF ASSETS AND LIABILITIES
MARCH 31, 2010
| | | |
ASSETS | | | |
Total investments, at value (Cost $13,545,552) | | $ | 17,489,679 |
Cash | | | 1,633,213 |
Receivables: | | | |
Fund shares sold | | | 80,500 |
Interest and dividends | | | 45,169 |
Prepaid expenses | | | 1,948 |
| | |
|
|
Total Assets | | | 19,250,509 |
| | |
|
|
LIABILITIES | | | |
Payables: | | | |
Fund shares redeemed | | | 1,066 |
Accrued liabilities: | | | |
Investment adviser fees | | | 4,761 |
Compliance services fees | | | 833 |
Fund service fees | | | 2,625 |
Other expenses | | | 22,923 |
| | |
|
|
Total Liabilities | | | 32,208 |
| | |
|
|
NET ASSETS | | $ | 19,218,301 |
| | |
|
|
COMPONENTS OF NET ASSETS | | | |
Paid-in capital | | $ | 14,893,691 |
Undistributed net investment income | | | 35,936 |
Accumulated net realized gain on investments | | | 344,547 |
Unrealized appreciation on investments | | | 3,944,127 |
| | |
|
|
NET ASSETS | | $ | 19,218,301 |
| | |
|
|
NET ASSET VALUE, OFFERING PRICE AND REDEMPTION PRICE PER SHARE | | | |
Based on net assets of $19,218,301 and 1,803,465 shares outstanding at $0.00 par value (unlimited shares authorized) | | $ | 10.66 |
| | |
|
|
See Notes to Financial Statements.
21
BECK, MACK & OLIVER PARTNERS FUND
STATEMENT OF OPERATIONS
PERIOD ENDED MARCH 31, 2010*
| | | | |
INVESTMENT INCOME | | | | |
Dividend income (net of foreign withholding taxes of $1,999) | | $ | 87,033 | |
Interest income | | | 20,990 | |
| | |
|
|
|
Total Investment Income | | | 108,023 | |
| | |
|
|
|
EXPENSES | | | | |
Investment adviser fees | | | 58,218 | |
Fund service fees (Note 3) | | | 52,265 | |
Custodian fees | | | 3,420 | |
Registration fees | | | 3,341 | |
Professional fees | | | 21,048 | |
Trustees’ fees and expenses | | | 110 | |
Compliance services fees | | | 3,946 | |
Miscellaneous expenses | | | 6,441 | |
| | |
|
|
|
Total Expenses | | | 148,789 | |
Fees waived and/or reimbursed | | | (90,571 | ) |
| | |
|
|
|
Net Expenses | | | 58,218 | |
| | |
|
|
|
NET INVESTMENT INCOME | | | 49,805 | |
| | |
|
|
|
NET REALIZED AND UNREALIZED GAIN | | | | |
Net realized gain on investments | | | 342,210 | |
Net change in unrealized appreciation on investments | | | 696,065 | |
| | |
|
|
|
NET REALIZED AND UNREALIZED GAIN | | | 1,038,275 | |
| | |
|
|
|
INCREASE IN NET ASSETS FROM OPERATIONS | | $ | 1,088,080 | |
| | |
|
|
|
| * | Beck, Mack & Oliver Partners Fund commenced operations on December 1, 2009. |
See Notes to Financial Statements.
22
BECK, MACK & OLIVER PARTNERS FUND
STATEMENT OF CHANGES IN NET ASSETS
| | | | |
| | | December 1, 2009*
through
March 31, 2010
| |
OPERATIONS | | | | |
Net investment income | | $ | 49,805 | |
Net realized gain on investments | | | 342,210 | |
Net change in unrealized appreciation on investments | | | 696,065 | |
| | |
|
|
|
Increase in Net Assets from Operations | | | 1,088,080 | |
| | |
|
|
|
DISTRIBUTIONS TO SHAREHOLDERS FROM | | | | |
Net investment income | | | (15,673 | ) |
| | |
|
|
|
Total Distributions to Shareholders | | | (15,673 | ) |
| | |
|
|
|
CAPITAL SHARE TRANSACTIONS | | | | |
Sale of shares | | | 5,029,969 | |
Shares issued from reorganization (Note 1) | | | 13,513,594 | |
Reinvestment of distributions | | | 15,651 | |
Redemption of shares | | | (413,320 | ) |
| | |
|
|
|
Increase from Capital Share Transactions | | | 18,145,894 | |
| | |
|
|
|
Increase in Net Assets | | | 19,218,301 | |
NET ASSETS | | | | |
Beginning of period | | | — | |
| | |
|
|
|
End of period(a) | | $ | 19,218,301 | |
| | |
|
|
|
SHARE TRANSACTIONS | | | | |
Sale of shares | | | 490,164 | |
Shares issued from reorganization (Note 1) | | | 1,351,359 | |
Reinvestment of distributions | | | 1,522 | |
Redemption of shares | | | (39,580 | ) |
| | |
|
|
|
Increase from Capital Share Transactions | | | 1,803,465 | |
| | |
|
|
|
(a) Amount includes undistributed net investment income | | $ | 35,936 | |
| | |
|
|
|
| * | Commencement of operations. |
See Notes to Financial Statements.
23
BECK, MACK & OLIVER PARTNERS FUND
FINANCIAL HIGHLIGHTS
These financial highlights reflect selected per share data and ratios for a share outstanding throughout the period.
| | | | |
| | | December 1, 2009(a)
through
March 31, 2010
| |
NET ASSET VALUE, Beginning of Period | | $ | 10.00 | |
| | |
|
|
|
INVESTMENT OPERATIONS | | | | |
Net investment income(b) | | | 0.03 | |
Net realized and unrealized gain | | | 0.64 | |
| | |
|
|
|
Total from Investment Operations | | | 0.67 | |
| | |
|
|
|
DISTRIBUTIONS TO SHAREHOLDERS FROM | | | | |
Net investment income | | | (0.01 | ) |
| | |
|
|
|
Total Distributions to Shareholders | | | (0.01 | ) |
| | |
|
|
|
NET ASSET VALUE, End of Period | | $ | 10.66 | |
| | |
|
|
|
TOTAL RETURN(c) | | | 6.70 | % |
| |
RATIOS/SUPPLEMENTARY DATA | | | | |
Net Assets at End of Period
(000’s omitted) | | $ | 19,218 | |
Ratios to Average Net Assets:(d) | | | | |
Net investment income | | | 0.86 | % |
Net expenses | | | 1.00 | % |
Gross expenses(e) | | | 2.56 | % |
PORTFOLIO TURNOVER RATE | | | 17 | % |
| (a) | Commencement of operations. |
| (b) | Calculated based on average shares outstanding during the period. |
| (e) | Reflects the expense ratio excluding any waivers and/or reimbursements. |
See Notes to Financial Statements.
24
BECK, MACK & OLIVER FUNDS
NOTES TO FINANCIAL STATEMENTS
MARCH 31, 2010
Note 1. Organization
The Beck, Mack & Oliver Global Equity Fund and Beck, Mack & Oliver Partners Fund (individually, a “Fund” and, collectively the “Funds”) are diversified portfolios of Forum Funds (the “Trust”). The Trust is a Delaware statutory trust that is registered as an open-end, management investment company under the Investment Company Act of 1940 (the “Act”), as amended. As of March 31, 2010, the Trust had thirty-two investment portfolios. Under its Trust Instrument, the Trust is authorized to issue an unlimited number of each Fund’s shares of beneficial interest without par value. The Beck, Mack & Oliver Global Equity Fund commenced operations on December 8, 1993. The Beck, Mack & Oliver Global Equity Fund seeks capital appreciation by investing primarily in common stock and securities convertible into common stock. Effective June 24, 2009, the name of the Austin Global Equity Fund was changed to the Beck, Mack & Oliver Global Equity Fund. The Beck, Mack & Oliver Partners Fund commenced operations on December 1, 2009, after it acquired the net assets of the BMO Partners Fund, L.P. (the “Partnership”), in exchange for Fund shares. The Partnership commenced operations in 1991. The Beck, Mack & Oliver Partners Fund seeks long-term capital appreciation consistent with the preservation of capital.
On December 1, 2009, the Partnership reorganized into the Beck, Mack & Oliver Partners Fund. The reorganization of net assets and unrealized gain from this tax-free transaction was as follows:
| | | | | | | | |
Date of
Contribution
| | Net Assets
| | Shares Issued
| | Unrealized Gain on
Investments
Received from
Reorganization
|
| December 1, 2009 | | $ | 13,513,594 | | 1,351,359 | | $ | 3,248,062 |
Note 2. Summary of Significant Accounting Policies
These financial statements are prepared in accordance with generally accepted accounting principles in the United States of America (“GAAP”), which require management to make estimates and assumptions that affect the reported amounts of assets and liabilities, the disclosure of contingent liabilities at the date of the financial statements, and the reported amounts of increase and decrease in net assets from operations during the fiscal period. Actual amounts could differ from those estimates. The following summarizes the significant accounting policies of each Fund:
Security Valuation — Exchange-traded securities and over-the-counter securities are valued using the last quoted sale or official closing price, provided by independent pricing services as of the close of trading on the market or exchange for which they are primarily traded, on each Fund business day. In the absence of a sale, such securities are valued at the mean of the last bid and asked price provided by independent pricing services. Non-exchange traded securities for which quotations are available are valued using the last quoted sales price, or in the absence of a sale at the mean of the last bid and asked prices provided by independent pricing services. Debt securities may be valued at prices supplied by a Fund’s pricing agent based on broker or dealer supplied valuations or matrix pricing, a method of valuing securities by reference to the value of other securities with similar characteristics such as rating, interest rate and maturity. Forward currency contracts are generally valued at the mean of bid and asked prices for the time period interpolated from rates reported by an independent pricing service for proximate time periods. Exchange-traded options for which there were no sales reported that day are generally valued at the last sale or official closing price as reported by an independent pricing service
25
BECK, MACK & OLIVER FUNDS
NOTES TO FINANCIAL STATEMENTS
MARCH 31, 2010
on the exchange on which they are primarily traded. Options not traded on an exchange are generally valued at broker-dealer bid quotation. Shares of open-end mutual funds are valued at net asset value (“NAV”). Short-term investments that mature in sixty days or less may be valued at amortized cost.
Each Fund values its investments at fair value pursuant to procedures adopted by the Trust’s Board of Trustees (the “Board”) if (1) market quotations are insufficient or not readily available or (2) the adviser believes that the values available are unreliable. Fair valuation is based on subjective factors and as a result, the fair value price of an investment may differ from the security’s market price and may not be the price at which the asset may be sold. Fair valuation could result in a different NAV than a NAV determined by using market quotes.
Each Fund has a three-tier fair value hierarchy. The basis of the tiers is dependent upon the various “inputs” used to determine the value of each Fund’s investments. These inputs are summarized in the three broad levels listed below:
Level 1 — quoted prices in active markets for identical assets
Level 2 — other significant observable inputs (including quoted prices of similar securities, interest rates, prepayment speeds, credit risk, etc.)
Level 3 — significant unobservable inputs (including each Fund’s own assumptions in determining the fair value of investments)
The aggregate value by input level, as of March 31, 2010, for each Fund’s investments is included at the end of each Fund’s Schedule of Investments.
Security Transactions, Investment Income and Realized Gain and Loss — Investment transactions are accounted for on trade date. Dividend income is recorded on the ex-dividend date. Foreign dividend income is recorded on the ex-dividend date or as soon as possible after each Fund determines the existence of a dividend declaration after exercising reasonable due diligence. Income and capital gains on some foreign securities may be subject to foreign withholding taxes, which are accrued as applicable. Interest income is recorded on an accrual basis. Premium and discount is amortized and accreted in accordance with GAAP. Identified cost of investments sold is used to determine the gain and loss for both financial statement and Federal income tax purposes.
Foreign Currency Translations — Foreign currency amounts are translated into U.S. dollars as follows: (i) assets and liabilities at the rate of exchange at the end of the respective period; and (ii) purchases and sales of securities and income and expenses at the rate of exchange prevailing on the dates of such transactions. The portion of the results of operations arising from changes in the exchange rates and the portion due to fluctuations arising from changes in the market prices of securities are not isolated. Such fluctuations are included with the net realized and unrealized gain or loss on investments.
Each Fund may enter into transactions to purchase or sell foreign currencies to protect the U.S. dollar value of its underlying portfolio securities against the effect of possible adverse movements in foreign exchange rates. Principal risks associated with such transactions include the movement in value of the foreign currency relative to the U.S. dollar and the ability of the counterparty to perform. Fluctuations in the value of such forward currency transactions are recorded daily as unrealized gain or loss; realized gain or loss includes net gain or loss on transactions that have terminated by settlement or by each Fund entering into offsetting commitments. These instruments involve market risk, credit risk, or both kinds of risks, in excess of the amount recognized in the Statement of Assets and Liabilities. Risks arise from the possible inability of counterparties to meet the terms of their contracts and from movement in currency and securities values and interest rates.
26
BECK, MACK & OLIVER FUNDS
NOTES TO FINANCIAL STATEMENTS
MARCH 31, 2010
Foreign Currency Transactions — Each Fund may enter into transactions to purchase or sell foreign currency contracts and options on foreign currency. Forward currency contracts are agreements to exchange one currency for another at a future date and at a specified price. Each Fund may use forward currency contracts to facilitate transactions in foreign securities and to manage each Fund’s foreign currency exposure. These contracts are intrinsically valued daily based on forward rates, and each Fund’s net equity therein, representing unrealized gain or loss on the contracts as measured by the difference between the forward foreign exchange rates at the dates of entry into the contracts and the forward rates at the reporting date, is recorded as a component of net asset value. Due to the risk associated with these transactions, each Fund could incur losses up to the entire contract amount, which may exceed the net unrealized value included in its net asset value.
The volume of open currency positions may vary on a daily basis as the Beck, Mack and Oliver Global Equity Fund transacts currency contracts in order to achieve the exposure desired by the adviser. During the fiscal year ended March 31, 2010, the Beck, Mack & Oliver Global Equity Fund entered into an aggregate total notional value of total value of $13,337,813 on forward currency contracts. Additionally, the Beck, Mack & Oliver Global Equity Fund entered into a total value of $29,004,470 on spot currency contracts for the fiscal year ended March 31, 2010.
The values of each individual forward currency contract outstanding in the Beck, Mack & Oliver Global Equity Fund as of March 31, 2010, are disclosed in the table below.
| | | | | | | | | |
Contracts to
Sell
| | Settlement
Date
| | Settlement
Value
| | Net Unrealized
Appreciation
(Depreciation)
| |
| (213,240) CAD | | 12/09/10 | | $ | 200,000 | | $ | (9,419 | ) |
| (416,920) CAD | | 01/13/11 | | | 400,000 | | | (9,119 | ) |
| (212,080) CAD | | 02/28/11 | | | 200,000 | | | (7,863 | ) |
| (606,300) CHF | | 12/08/10 | | | 600,000 | | | 23,569 | |
| (362,950) CHF | | 01/27/11 | | | 350,000 | | | 4,687 | |
| (1,002,915) CHF | | 02/07/11 | | | 950,000 | | | (4,342 | ) |
| (254,638) EUR | | 02/08/11 | | | 350,000 | | | 6,081 | |
| (515,160) EUR | | 02/09/11 | | | 700,000 | | | 4,214 | |
| (235,727) EUR | | 02/22/11 | | | 320,000 | | | 1,611 | |
| (147,005) EUR | | 03/09/11 | | | 200,000 | | | 1,438 | |
| (372,162) GBP | | 01/28/11 | | | 600,000 | | | 36,114 | |
| (126,772) GBP | | 02/23/11 | | | 195,000 | | | 2,931 | |
| (44,800,000) JPY | | 12/08/10 | | | 500,000 | | | 19,627 | |
| (46,345,000) JPY | | 01/12/11 | | | 500,000 | | | 2,743 | |
| (287,875,000) KRW | | 03/11/11 | | | 250,000 | | | (1,199 | ) |
| (507,750) MYR | | 03/11/11 | | | 150,000 | | | (2,857 | ) |
| (714,370) SEK | | 12/10/10 | | | 100,000 | | | 1,128 | |
| | | | |
|
| |
|
|
|
| | | | | $ | 6,565,000 | | $ | 69,344 | |
| | | | |
|
| |
|
|
|
27
BECK, MACK & OLIVER FUNDS
NOTES TO FINANCIAL STATEMENTS
MARCH 31, 2010
CAD Canadian Dollar
CHF Swiss Franc
EUR Euro
GBP British Pound Sterling
JPY Japanese Yen
KRW Korean Won
MYR Malaysian Ringgit
SEK Swedish Krona
Derivatives Transactions — The Beck, Mack and Oliver Global Equity Fund’s use of derivatives during the period ended March 31, 2010, was limited to forward currency contracts and purchased put options. The volume of open positions may vary on a daily basis as Beck, Mack and Oliver Global Equity Fund transacts derivative transactions in order to achieve the exposure desired by the adviser. Following is a summary of how the derivatives are treated in the financial statements and their impact on the Beck, Mack and Oliver Global Equity Fund.
The location on the Statement of Assets and Liabilities of the Beck, Mack & Oliver Global Equity Fund’s derivative positions by type of exposure, all of which are not accounted for as hedging instruments as required by the Derivatives and Hedging Topic of the FASB Accounting Standards Codification, is as follows:
| | | | | | | | | | |
Fund
Contract Type/
Primary Risk Exposure
| | Location on Statement of
Assets and Liabilities
| | Asset
Derivatives
| | Location on Statement of
Assets and Liabilities
| | Liability
Derivatives
|
Beck, Mack & Oliver Global Equity Fund | | | | | | | | | | |
Forward Currency Contracts | | Unrealized gain on forward currency contracts | | $ | 104,143 | | Unrealized loss on forward currency contracts | | $ | 34,799 |
Realized and unrealized gains and losses on derivatives contracts entered into during the period ended March 31, 2010, by the Beck, Mack & Oliver Global Equity Fund are recorded in the following locations in the Statement of Operations:
| | | | | | | | | | |
Fund
Contract Type/
Primary Risk Exposure
| | Location of Gain or
(Loss) on Derivatives
| | Realized Loss
on Derivatives
| | | Change in
Unrealized
Depreciation on
Derivatives
| |
Beck, Mack & Oliver Global Equity Fund | | | | | | | | | | |
Purchased Put Options | | Net Realized loss — Investments and Net Change in Unrealized Appreciation (Depreciation) on — Investments | | $ | (179,830 | ) | | $ | (12,255 | ) |
28
BECK, MACK & OLIVER FUNDS
NOTES TO FINANCIAL STATEMENTS
MARCH 31, 2010
| | | | | | | | |
Fund
Contract Type/
Primary Risk Exposure
| | Location of Gain or
(Loss) on Derivatives
| | Realized Loss
on Derivatives
| | | Change in
Unrealized
Depreciation on
Derivatives
| |
Forward Currency Contracts | | Net Realized loss — Foreign currency transactions and Net Change in Unrealized Appreciation (Depreciation) on — Foreign currency translations | | (67,726 | ) | | (47,942 | ) |
Distributions to Shareholders — Distributions to shareholders of net investment income and net capital gains, if any, are declared and paid at least annually. Distributions are based on amounts calculated in accordance with applicable Federal income tax regulations, which may differ from GAAP. These differences are due primarily to differing treatments of income and gain on various investment securities held by each Fund, timing differences and differing characterizations of distributions made by each Fund.
Federal Taxes — Each Fund intends to qualify each year as a regulated investment company under Subchapter M of the Internal Revenue Code and distribute all of their taxable income to shareholders. In addition, by distributing in each calendar year substantially all their net investment income and capital gains, if any, the Funds will not be subject to a Federal excise tax. Therefore, no Federal income or excise tax provision is required.
As of March 31, 2010, there are no uncertain tax positions that would require financial statement recognition, de-recognition, or disclosure. The Beck, Mack & Oliver Global Equity Fund’s Federal tax returns filed in the three-year period ended March 31, 2010, remain subject to examination by the Internal Revenue Service. The Beck, Mack & Oliver Partners Fund’s Federal tax return filed in the period ended March 31, 2010, will be subject to examination by the Internal Revenue Service.
Income and Expense Allocation — The Trust accounts separately for the assets, liabilities and operations of each of its investment portfolios. Expenses that are directly attributable to more than one investment portfolio are allocated among the respective investment portfolios in an equitable manner.
Redemption Fees — A shareholder who redeems or exchanges shares within 60 days of purchase will incur a redemption fee of 2.00% of the current net asset value of shares redeemed or exchanged, subject to certain limitations. The fee is charged for the benefit of the remaining shareholders and will be paid to each Fund to help offset transaction costs. The fee is accounted for as an addition to paid-in capital. Each Fund reserves the right to modify the terms of or terminate the fee at any time. There are limited exceptions to the imposition of the redemption fee.
Commitments and Contingencies — In the normal course of business, each Fund enters into contracts that provide general indemnifications by each Fund to the counterparty to the contract. Each Fund’s maximum exposure under these arrangements is dependent on future claims that may be made against each Fund and, therefore, cannot be estimated; however, based on experience, the risk of loss from such claims is considered remote.
29
BECK, MACK & OLIVER FUNDS
NOTES TO FINANCIAL STATEMENTS
MARCH 31, 2010
Note 3. Advisory Fees, Servicing Fees and Other Transactions
Investment Adviser — Beck, Mack & Oliver, LLC (the “Adviser”) is the investment adviser to the Funds. Pursuant to an Investment Advisory Agreement, the Adviser receives an advisory fee at an annual rate of 1.50% and 1.00% of the average daily net assets of Beck, Mack & Oliver Global Equity Fund and Beck, Mack & Oliver Partners Fund, respectively.
Distribution — Foreside Fund Services, LLC serves as each Fund’s distributor (the “Distributor”). The Distributor receives no compensation from the Funds for its distribution services. The Distributor is not affiliated with the Adviser or with Atlantic Fund Administration, LLC (“Atlantic”) or their affiliates.
Other Service Providers — Atlantic provides fund accounting, fund administration, and transfer agency services to each Fund. Pursuant to an Atlantic services agreement, each Fund pays Atlantic customary fees for its services. Atlantic provides a Principal Executive Officer, a Principal Financial Officer, a Chief Compliance Officer, and an Anti-Money Laundering Officer to each Fund, as well as certain additional compliance support functions.
Trustees and Officers — The Trust pays each independent Trustee an annual retainer fee of $40,000 for service to the Trust ($60,000 for the Chairman). In addition, the Chairman receives a monthly stipend of $500 to cover certain expenses incurred in connection with his duties to the Trust. The Trustees and Chairman may receive additional fees for special Board meetings. Each Trustee is also reimbursed for all reasonable out-of-pocket expenses incurred in connection with his duties as a Trustee, including travel and related expenses incurred in attending Board meetings. The amount of Trustees’ fees attributable to each Fund is disclosed in the Statement of Operations. Certain officers of the Trust are also officers or employees of the above named service providers, and during their terms of office received no compensation from each Fund.
Note 4. Expense Reimbursement and Fees Waived
Prior to June 24, 2009, the Adviser had contractually agreed to waive its fees and reimburse Fund expenses to the extent that total annual fund operating expenses exceeded 1.75% of the average daily net assets of the Beck, Mack & Oliver Global Equity Fund. Effective June 24, 2009, the Adviser has contractually agreed to waive a portion of its fee and reimburse certain expenses to limit total annual operating expenses to 1.25% of average daily net assets of the Beck, Mack & Oliver Global Equity Fund through July 31, 2010.
The Adviser has contractually agreed to waive a portion of its fee and reimburse certain expenses to limit total annual operating expenses to 1.00% of average daily net assets of the Beck, Mack & Oliver Partners Fund through July 31, 2011.
Other fund service providers have voluntarily agreed to waive a portion of their fees. Voluntary fee waivers may be reduced or eliminated at any time. For the fiscal year ended March 31, 2010, fees waived were as follows:
| | | | | | | | | |
| | | Investment Adviser Fees Waived
| | Fund Service Fees Waived
| | Total Fees Waived
|
Beck, Mack & Oliver Global Equity Fund | | $ | 452,114 | | $ | 7,684 | | $ | 459,798 |
Beck, Mack & Oliver Partners Fund | | | 45,731 | | | 44,840 | | | 90,571 |
30
BECK, MACK & OLIVER FUNDS
NOTES TO FINANCIAL STATEMENTS
MARCH 31, 2010
Note 5. Security Transactions
The cost of purchases and proceeds from sales of investment securities (including maturities), other than short-term investments for the fiscal year ended March 31, 2010, were as follows:
Beck, Mack & Oliver Global Equity Fund
| | | | | | | | | | |
Non-U.S. Government Obligations
| | U.S. Government Obligations
|
Purchases
| | Sales
| | Purchases
| | Sales
|
| $ | 33,562,177 | | $ | 26,210,954 | | $ | 494,883 | | $ | — |
Beck, Mack & Oliver Partners Fund
| | | | | | | | | | |
Non-U.S. Government Obligations
| | U.S. Government Obligations
|
Purchases
| | Sales
| | Purchases
| | Sales
|
| $ | 6,526,334 | | $ | 2,766,096 | | $ | — | | $ | — |
Note 6. Federal Income Tax and Investment Transactions
Distributions during the fiscal years ended as noted were characterized for tax purposes as follows:
| | | | | | | | | |
| | | Ordinary Income
| | Long-Term Capital Gain
| | Total
|
Beck, Mack & Oliver Global Equity Fund | | | | | | | | | |
2010 | | $ | 152,280 | | $ | — | | $ | 152,280 |
2009 | | | — | | | 1,034,286 | | | 1,034,286 |
Beck, Mack & Oliver Partners Fund | | | | | | | | | |
2010 | | | 15,673 | | | — | | | 15,673 |
As of March 31, 2010, distributable earnings (accumulated loss) on a tax basis were as follows:
| | | | | | | | | | | | | | | | |
| | | Undistributed
Ordinary Income
| | Undistributed
Long-Term Gain
| | Capital and
Other Losses
| | | Unrealized
Appreciation
| | Total
|
Beck, Mack & Oliver Global Equity Fund | | $ | 1,183,643 | | $ | — | | $ | (4,405,192 | ) | | $ | 7,671,166 | | $ | 4,449,617 |
Beck, Mack & Oliver Partners Fund | | | 91,079 | | | 297,033 | | | — | | | | 3,936,498 | | | 4,324,610 |
The difference between components of distributable earnings on a tax basis and the amounts reflected in the Statement of Assets and Liabilities are primarily due to wash sales, passive foreign investment company and currency and inflation-indexed securities in the Beck, Mack & Oliver Global Equity Fund and wash sales, partnerships and non-deductible offering costs in the Beck, Mack & Oliver Partners Fund.
31
BECK, MACK & OLIVER FUNDS
NOTES TO FINANCIAL STATEMENTS
MARCH 31, 2010
For tax purposes, the current year post-October loss was $126,899 (realized during the period November 1, 2009 through March 31, 2010) for Beck, Mack & Oliver Global Equity Fund. This loss was recognized for tax purposes on the first business day of the Fund’s next fiscal year, April 1, 2010.
As of March 31, 2010, the Beck, Mack & Oliver Global Equity Fund had capital loss carryforwards to offset future capital gains of $243,552 and $4,034,741, expiring in 2017 and 2018, respectively.
On the Statement of Assets and Liabilities, as a result of permanent book to tax differences, certain amounts have been reclassified for the year ended March 31, 2010. The following reclassifications were the result of currency gain/loss reclassifications and passive foreign investment company transactions in the Beck, Mack & Oliver Global Equity Fund and non-deductible offering costs and partnerships in the Beck, Mack & Oliver Partners Fund and have no impact on the net assets of each Fund.
| | | | | | | | | | | |
| | | Accumulated
Undistributed
(Distributions in Excess of)
Net Investment Income
| | | Net Realized Gain (Loss)
| | Paid-in-Capital
| |
Beck, Mack & Oliver Global Equity Fund | | $ | (13,717 | ) | | $ | 13,717 | | $ | — | |
Beck, Mack & Oliver Partners Fund | |
| 1,804
|
| | | 2,337 | |
| (4,141
| )
|
Note 7. Recent Accounting Pronouncements
In January 2010, the Financial Accounting Standards Board issued Accounting Standards Update (“ASU”) No. 2010-06 “Improving Disclosures about Fair Value Measurements.” ASU No. 2010-06 clarifies existing disclosure and requires additional disclosures regarding fair value measurements. Effective for interim and annual reporting periods beginning after December 15, 2009, entities are required to disclose significant transfers into and out of Level 1 and 2 measurements in the fair value hierarchy and the reasons for those transfers. Effective for fiscal years beginning after December 15, 2010, and for interim periods within those fiscal years, entities will need to disclose information about purchases, sales, issuances and settlements of Level 3 securities on a gross basis, rather than as a net number as currently required. Management is currently evaluating the impact ASU No. 2010-06 will have on its financial statement disclosures.
Note 8. Subsequent Events
Subsequent events occurring after the date of this report have been evaluated for potential impact and each Fund has had no such events.
32
REPORT OF INDEPENDENT REGISTERED PUBLIC ACCOUNTING FIRM
To the Board of Trustees of Forum Funds
and the Shareholders of Beck, Mack & Oliver Global Equity Fund
and Beck, Mack & Oliver Partners Fund
We have audited the accompanying statements of assets and liabilities of Beck, Mack & Oliver Global Equity Fund (formerly the Austin Global Equity Fund) and Beck, Mack & Oliver Partners Fund, each a series of shares of beneficial interest in the Forum Funds, including the schedules of investments, as of March 31, 2010, and the related statements of operations for the year then ended and for the period December 1, 2009 (Commencement of Operations for Beck, Mack and Oliver Partners Fund) through March 31, 2010, and the statements of changes in net assets and the financial highlights for each of the years or period in the two year period then ended. These financial statements and financial highlights are the responsibility of the Funds’ management. Our responsibility is to express an opinion on these financial statements and financial highlights based on our audits. The financial highlights for Beck, Mack & Oliver Global Equity Fund for each of the years in the three year period ended March 31, 2008 were audited by other auditors whose report dated May 28, 2008, expressed an unqualified opinion on such financial highlights.
We conducted our audits in accordance with the standards of the Public Company Accounting Oversight Board (United States). Those standards require that we plan and perform the audits to obtain reasonable assurance about whether the financial statements and financial highlights are free of material misstatement. An audit includes examining, on a test basis, evidence supporting the amounts and disclosures in the financial statements. Our procedures included confirmation of securities owned as of March 31, 2010 by correspondence with the custodian and brokers and by other appropriate auditing procedures where responses from brokers were not received. An audit also includes assessing the accounting principles used and significant estimates made by management, as well as evaluating the overall financial statement presentation. We believe that our audits provide a reasonable basis for our opinion.
In our opinion, the financial statements and financial highlights referred to above present fairly, in all material respects, the financial position of Beck, Mack & Oliver Global Equity Fund and Beck, Mack & Oliver Partners Fund as of March 31, 2010, the results of their operations for the year or period then ended, and the changes in their net assets and their financial highlights for each of the years or period in the two year period then ended, in conformity with accounting principles generally accepted in the United States of America.

BBD, LLP
Philadelphia, Pennsylvania
May 25, 2010
33
BECK, MACK & OLIVER FUNDS
ADDITIONAL INFORMATION (Unaudited)
MARCH 31, 2010
Investment Advisory Agreement Approval
At the October 8, 2009, Board meeting, the Board, including the Independent Trustees, considered the initial approval of the investment advisory agreement pertaining to the Beck, Mack & Oliver Partners Fund (the “Advisory Agreement”). In evaluating the Advisory Agreement for the Fund, the Board reviewed materials furnished by the Adviser and Atlantic, including information regarding the Adviser, its personnel, operations and financial condition. Specifically, the Board considered, among other matters: (1) the nature, extent and quality of the services to be provided to the Fund by the Adviser, including information on the investment performance of the Adviser; (2) the costs of the services to be provided and profitability to the Adviser with respect to its relationship with the Fund; (3) the advisory fee and the total expense ratio of the Fund compared to relevant peer groups of funds; (4) the extent to which economies of scale would be realized as the Fund grows and whether the advisory fee would enable the Fund’s investors to share in the benefits of economies of scale; and (5) other benefits received by the Adviser from its relationship with the Fund. In their deliberations, the Board did not identify any particular information that was all-important or controlling and attributed different weights to the various factors. In particular, the Board focused on the factors discussed below.
Nature, Extent and Quality of Services
The Board received a presentation from senior representatives of the Adviser and discussed the Adviser’s personnel, operations and financial condition. The Board considered the quality of services provided by the Adviser under the Advisory Agreement, as well as the Adviser’s track record in managing another series of Forum Funds. In this regard, the Board considered information regarding the experience, qualifications and professional background of the portfolio managers and other personnel at the Adviser with principal investment responsibility for the Fund’s investments; the investment philosophy and decision-making processes of those professionals; the capability and integrity of the Adviser’s senior management and staff; the quality of the Adviser’s services with respect to regulatory compliance and compliance with client investment policies and restrictions; and the financial condition and operational stability of the Adviser.
The Board considered the adequacy of the Adviser’s resources and quality of services to be provided by the Adviser under the Advisory Agreement. The Board noted the Adviser’s representation that the firm is financially stable and able to provide investment advisory services to the Fund. The Board concluded that, overall, it was satisfied with the nature, extent and quality of services to be provided to the Fund under the Advisory Agreement.
Costs of Services and Profitability
The Board then considered information provided by the Adviser regarding its projected costs of services and profitability with respect to the Fund. The Board reviewed the Adviser’s estimated profit and loss analysis. The Board also considered that the Adviser continues to contractually waive certain advisory fees and, as necessary, reimburse Fund expenses. The Board concluded that the level of the Adviser’s estimated profits projected in connection with its management of the Fund was not excessive in light of the proposed services to be provided.
Compensation
The Board considered the Adviser’s proposed compensation for providing advisory services to the Fund and analyzed comparative information on advisory fees and total expenses. The Board noted that the Adviser’s proposed contractual advisory fee was lower than the median contractual advisory fees for its Lipper Inc. peer group. The Board also
34
BECK, MACK & OLIVER FUNDS
ADDITIONAL INFORMATION (Unaudited)
MARCH 31, 2010
considered the Fund’s total expense ratio, noting that the Adviser’s proposed total expense ratio was lower than the median of its Lipper Inc. peer group. Based on the foregoing, the Board concluded that the Adviser’s advisory fee to be charged to the Fund was reasonable.
Performance
The Adviser discussed its proposed approach to managing the Fund. The Board considered that the Fund was new, but considered the performance history of the BMO Partners Fund, L.P., which would be converting into the Fund and the Adviser’s capability and performance of managing the Beck, Mack & Oliver Global Equity Fund. Based on the foregoing, the Board determined that the Adviser’s management of the Fund could benefit the Fund and its shareholders.
Economies of Scale
The Board considered whether the Fund would benefit from any economies of scale. The Board noted the Adviser’s representation that in the future it is likely to experience economies of scale in connection to provision of services to the Fund, but the Adviser currently is not contemplating breakpoints or changes in fees at this time. The Board considered the size of the Fund and concluded that it would not be necessary to consider the implementation of fee breakpoints until the time that assets under management were larger.
Other Benefits
The Board noted the Adviser’s representation that it anticipates using a portion of the brokerage commissions generated by the Fund to generate soft-dollars for use towards brokerage services. Based on the foregoing representation, the Board concluded that other benefits received by the Adviser from its relationship with the Fund were not a material factor to consider in approving the Advisory Agreement.
The Board reviewed a memorandum from Trust Counsel discussing the legal standards applicable to its consideration of the advisory agreement. Based on its review, including consideration of each of the factors referenced above, the Board determined, in the exercise of its business judgment, that the advisory arrangement, as outlined in the Advisory Agreement, was fair and reasonable in light of the services performed, expenses incurred and such other matters as the Board considered relevant in the exercise of its reasonable business judgment.
Proxy Voting Information
A description of the policies and procedures that each Fund uses to determine how to vote proxies relating to securities held in each Fund’s portfolio is available, without charge and upon request, by calling (800) 943-6786 and on the SEC’s website at www.sec.gov. Each Fund’s proxy voting record for the most recent twelve-month period ended June 30 is available, without charge and upon request, by calling (800) 943-6786 and on the SEC’s website at www.sec.gov.
Availability of Quarterly Portfolio Schedules
Each Fund files its complete schedule of portfolio holdings with the SEC for the first and third quarters of each fiscal year on Form N-Q. Each Fund’s Forms N-Q are available, without charge and upon request on the SEC’s website at www.sec.gov or may be reviewed and copied at the SEC’s Public Reference Room in Washington DC. Information on the operation of the Public Reference Room may be obtained by calling 1-800-SEC-0330.
35
BECK, MACK & OLIVER FUNDS
ADDITIONAL INFORMATION (Unaudited)
MARCH 31, 2010
Shareholder Expense Example
As a shareholder of the Funds, you incur two types of costs: (1) transaction costs, including redemption fees and exchange fees, and (2) ongoing costs, including management fees and other Fund expenses. This example is intended to help you understand your ongoing costs (in dollars) of investing in the Funds, and to compare these costs with the ongoing costs of investing in other mutual funds.
The example is based on an investment of $1,000 invested at the beginning of the period and held for the entire period from October 1, 2009, through March 31, 2010.
Actual Expenses — The first line in the table below provides information about actual account values and actual expenses. You may use the information in this line, together with the amount you invested, to estimate the expenses that you paid over the period. Simply divide your account value by $1,000 (for example, an $8,600 account value divided by $1,000 = 8.6), then multiply the result by the number in the first line under the heading entitled “Expenses Paid During Period” to estimate the expenses you paid on your account during the period.
Hypothetical Example for Comparison Purposes — The second line of the table below provides information about hypothetical account values and hypothetical expenses based on each Fund’s actual expense ratio and an assumed rate of return of 5% per year before expenses, which is not each Fund’s actual return. The hypothetical account values and expenses may not be used to estimate the actual ending account balance or expenses you paid for the period. You may use this information to compare the ongoing cost of investing in each Fund and other funds. To do so, compare this 5% hypothetical example with the 5% hypothetical examples that appear in the shareholder reports of other funds.
Please note that expenses shown in the table are meant to highlight your ongoing costs only. Therefore, the second line of the table is useful in comparing ongoing costs only, and will not help you determine the relative total costs of owning different funds.
| | | | | | | | | | | | |
| | | Beginning
Account Value
October 1, 2009*
| | Ending
Account Value
March 31, 2010
| | Expenses
Paid During
Period**
| | Annualized
Expense Ratio**
| |
Beck, Mack & Oliver Global Equity Fund | | | | | | | | | | | | |
Actual | | $ | 1,000.00 | | $ | 1,062.84 | | $ | 6.43 | | 1.25 | % |
Hypothetical (5% return before expenses) | | $ | 1,000.00 | | $ | 1,018.25 | | $ | 6.29 | | 1.25 | % |
Beck, Mack & Oliver Partners Fund | | | | | | | | | | | | |
Actual | | $ | 1,000.00 | | $ | 1,054.30 | | $ | 3.41 | | 1.00 | % |
Hypothetical (5% return before expenses) | | $ | 1,000.00 | | $ | 1,005.01 | | $ | 3.33 | | 1.00 | % |
| * | December 1, 2009 for the Beck, Mack & Oliver Partners Fund. |
36
BECK, MACK & OLIVER FUNDS
ADDITIONAL INFORMATION (Unaudited)
MARCH 31, 2010
| ** | Expenses are equal to each Fund’s annualized expense ratio as indicated above multiplied by the average account value over the period, multiplied by the number of days in the most recent fiscal half-year divided by 365 to reflect the half-year period. |
Federal Tax Status of Dividends Declared during the Tax Year
For Federal income tax purposes, dividends from short-term capital gains are classified as ordinary income. The Beck, Mack & Oliver Global Equity Fund designates 10.47% of its income dividend distributed as qualifying for the corporate dividends-received deduction (DRD) and 50.73% for the qualified dividend rate (QDI) as defined in Section 1(h)(11) of the Internal Revenue Code. The Beck, Mack & Oliver Global Equity Fund also designates 53.82% as qualified interest income exempt from U.S. tax for foreign shareholders (QII). The Beck, Mack & Oliver Partners Fund designates 53.37% of its income dividend distributed as DRD and 75.86% for QDI. The Beck, Mack & Oliver Partners Fund also designates 83.62% as QII.
37
BECK, MACK & OLIVER FUNDS
ADDITIONAL INFORMATION (Unaudited)
MARCH 31, 2010
Trustees and Officers of the Trust
The Board is responsible for oversight of the management of the Trust’s business affairs and of the exercise of all the Trust’s powers except those reserved for the shareholders. The following table provides information about each Board member and certain officers of the Trust. Each Trustee and officer holds office until the person resigns, is removed, or is replaced. Unless otherwise noted, the persons have held their principal occupations for more than five years. The address for all Trustees and officers is Three Canal Plaza, Suite 600, Portland, Maine 04101, unless otherwise indicated. Each Trustee oversees thirty-two portfolios in the Trust. Mr. Keffer is considered an Interested Trustee due to his affiliation with Atlantic. Mr. Keffer is also an Interested Director of Wintergreen Fund, Inc. Each Fund’s Statement of Additional Information includes additional information about the Trustees and is available, without charge and upon request, by calling (800) 943-6786.
| | | | | | |
| Name and Year of Birth | | Position
with the
Trust | | Length
of Time
Served | | Principal Occupation(s)
During Past 5 Years |
| Independent Trustees | | | | | | |
J. Michael Parish Born: 1943 | | Chairman of the Board; Trustee; Chairman, Nominating Committee and Qualified Legal Compliance Committee | | Since 1989 (Chairman since 2004) | | Retired since 2003. |
Costas Azariadis Born: 1943 | | Trustee; Chairman, Valuation Committee | | Since 1989 | | Professor of Economics, Washington University since 2006; Professor of Economics, University of California-Los Angeles 1992-2006. |
James C. Cheng Born: 1942 | | Trustee; Chairman, Audit Committee | | Since 1989 | | President, Technology Marketing Associates (marketing company for small- and medium-sized businesses in New England) since 1991. |
| Interested Trustee | | | | | | |
John Y. Keffer1 Born: 1942 | | Trustee; Vice Chairman | | Since 1989 | | Chairman, Atlantic since 2008; President, Forum Foundation (a charitable organization) since 2005; President, Forum Trust, LLC (a non-depository trust company chartered in the State of Maine) since 1997. |
| 1 | Since 1997, John Y. Keffer has been president and owner of Forum Trust, LLC. Prior to January 1, 2010, Atlantic was a wholly owned subsidiary of Forum Trust, LLC. Effective January 1, 2010, Atlantic became a wholly owned subsidiary of Forum Holdings Corp., a Delaware corporation that is wholly owned by Mr. Keffer. |
38
BECK, MACK & OLIVER FUNDS
ADDITIONAL INFORMATION (Unaudited)
MARCH 31, 2010
| | | | | | |
| Name and Year of Birth | | Position
with the
Trust | | Length
of Time
Served | | Principal Occupation(s)
During Past 5 Years |
| Officers | | | | | | |
Stacey E. Hong Born: 1966 | | President; Principal Executive Officer | | Since 2008 | | President, Atlantic since 2008; Director, Consulting Services, Foreside Fund Services 2007; Elder Care, 2005-2006. |
Karen Shaw Born: 1972 | | Treasurer; Principal Financial Officer | | Since 2008 | | Senior Manager, Atlantic since 2008; Section Manager/Vice President, Enterprise Support Services, Citigroup 2003-2008. |
David Faherty Born: 1970 | | Vice President | | Since 2009 | | Senior Counsel, Atlantic since 2009; Vice President, Citi Fund Services Ohio, Inc. 2007-2009.; Associate Counsel, Investors Bank & Trust Co. 2006-2007; FDIC 2005. |
Michael J. McKeen Born: 1971 | | Vice President | | Since 2009 | | Senior Manager, Atlantic since 2008; Vice President, Citigroup 2003-2008. |
Joshua LaPan Born: 1973 | | Vice President | | Since 2009 | | Manager, Atlantic since 2008; Vice President, Citigroup 2003-2008. |
Timothy Bowden Born: 1969 | | Vice President | | Since 2009 | | Manager, Atlantic since 2008; Vice President, Citigroup 2005-2008. |
Lina Bhatnagar Born: 1971 | | Secretary | | Since 2008 | | Senior Administration Specialist, Atlantic since 2008; Regulatory Administration Specialist, Citigroup 2006-2008. |
39
FOR MORE INFORMATION
Investment Adviser
Beck, Mack & Oliver LLC
360 Madison Ave, 18th Floor
New York, NY 10017
www.beckmack.com
Transfer Agent
Atlantic Fund Administration, LLC
P.O. Box 588
Portland, ME 04112
Distributor
Foreside Fund Services, LLC
Three Canal Plaza, Suite 100
Portland, Maine 04101
www.foreside.com
Beck, Mack & Oliver Global Equity Fund
Beck, Mack & Oliver Partners Fund
P.O. Box 588
Portland, ME 04112
(800) 754-8759
www.beckmack.com
This report is submitted for the general information of the shareholders of the Funds. It is not authorized for distribution to prospective investors unless preceded or accompanied by an effective prospectus, which includes information regarding the Funds’ risks, objectives, fees and expenses, experience of its management, and other information.
229-ANR-0310

HARD CURRENCY FUND
ASIAN CURRENCY FUND
ABSOLUTE RETURN CURRENCY FUND

| | |
ANNUAL REPORT | | MARCH 31, 2010 |
TABLEOF CONTENTS
| | | | |
| | |
| | | 1 | |  |
A MESSAGETOOUR SHAREHOLDERS
MARCH 31, 2010
Dear Shareholder,
We present the annual report for the Merk Hard Currency Fund (MERKX), Merk Asian Currency Fund (MEAFX) and Merk Absolute Return Currency Fund (MABFX) (individually, a “Fund” and, collectively the “Funds”) with respect to the period April 1, 2009 (September 9, 2009 for MABFX) through March 31, 2010 (the “Period”).
| | • | | The Merk Hard Currency Fund seeks to profit from a decline in the U.S. dollar relative to a basket of hard currencies. |
| | • | | The Merk Asian Currency Fund seeks to profit from a decline in the U.S. dollar relative to Asian currencies. |
| | • | | The Merk Absolute Return Currency Fund seeks to generate positive absolute returns by investing in currencies. |

Merk Hard Currency Fund Investor Shares posted a return of 14.70% for the Period ended March 31, 2010. In comparison, the J.P. Morgan 3-Month Global Cash Index (“reference basket”) increased 8.60% during the Period. As of March 31, 2010, the Fund had an annualized return of 6.17% since inception on May 10, 2005; this compares to an annualized return of 4.45% since May 10, 2005 for the reference basket. The Fund’s performance data represents past performance and is no guarantee of future results. Current performance may be lower or higher than the performance data quoted. Investment return and principal value will fluctuate so that an investor’s shares, when redeemed, may be worth more or less than original cost. Please visit www.merkfunds.com for most recent month end performance. As stated in the current prospectus, the Fund’s expense ratio is 1.32%.
The Fund’s performance is foremost influenced by changes in exchange rates of currencies to which the Fund has exposure. All the currencies the Fund had exposure to appreciated over the reference period. Notable performers were the Australian dollar, which rose by 32.68%, the Canadian dollar, which rose by 24.12%, and the Norwegian krone, which rose by 13.38%.(* ) We adapt the currency allocations as our analysis of monetary policies and economic environments evolve. We chose to remove the Japanese yen (JPY) from the Fund during the Period. This decision was made in light of initiatives and heightened concerns surrounding the soundness of monetary policy being pursued by the Bank of Japan, along with long-term concerns over the economy, all of which led us to no longer consider the JPY a hard currency.

Merk Asian Currency Fund Investor Shares posted a return of 1.51% for the Period. In comparison, the Citigroup 3-Month U.S. Treasury-Bill Index (“reference basket”) increased 0.13% during the Period. As of March 31, 2010, the Fund had an annualized return of - -1.64% since inception on April 1, 2008; this compares to an annualized return of 0.63% since March 31, 2008, for the reference basket.1 The Fund’s performance data represents past performance and is no guarantee of future results. Current performance may be lower or higher than the performance data quoted. Investment return and principal value will fluctuate so that an investor’s shares, when redeemed, may be worth more or less than original cost. Please visit www.merkfunds.com for most recent month end performance. As stated in the current prospectus, the Fund’s expense ratio is 1.30%.
The Fund’s performance is foremost influenced by changes in exchange rates of currencies to which the Fund has exposure. The majority of currencies the Fund had exposure to appreciated over the reference period. Notable currency returns were the South Korean won (KRW), which returned 22.26%, the Indian rupee (INR), which returned 12.94%, and the Singapore dollar (SGD),
| 1 | Note that the inception date of the Merk Asian Currency Fund is April 1, 2008 and, therefore, that the annualized return for the Fund is from April 1, 2008, through March 31, 2010, whereas the annualized return for the reference basket is calculated for the time period March 31, 2008, through March 31, 2010. |
| | | | |
| | |
| | | 2 | | |
A MESSAGETOOUR SHAREHOLDERS
MARCH 31, 2010
which returned 8.86%. The Fund’s largest exposure, the Chinese renminbi (CNY), was essentially flat through the Period, returning 0.12%.(* ) We adapt the currency allocations as our analysis of monetary policies and economic environments evolve.
We progressively reduced the Fund’s exposure to the CNY in the aftermath of the financial crisis. On March 31, 2009, the Fund’s exposure to the CNY stood at 72.3% of net assets; as of March 31, 2010, the Fund’s CNY exposure was 48.3% of net assets. The large exposure to CNY at the height of the credit crisis reflected our view that China was best positioned within Asia to deal with a global downturn, and would come out relatively unscathed, likely finding itself in a much stronger position relative to the rest of Asia and much of the world. We continue to view the CNY favorably, believing domestic inflationary pressures may convince the Chinese authorities to allow the currency to appreciate. In our view, present initiatives to tame inflation are highly ineffective relative to currency appreciation; we firmly believe there is upside potential for the currency.
We continue to believe that Asian countries that produce goods and services at the mid to high end of the value chain are better positioned than those countries producing low-end goods and services. Higher-end producers have greater pricing power, whereas low-end producers compete predominantly on price; in our assessment, low-end producers are more likely to instigate competitive devaluations of their currencies. China, in our analysis, has long allowed its low-end industries to fail and migrate to other lower-cost producers within Asia. As a result, we believe Chinese exporters may have pricing power should their currency appreciate.
Conversely, we monitor how important exports to China are to the respective economies within Asia. A stronger Chinese currency increases the country’s purchasing power and may provide a boost to currencies of countries exporting to China, such as Malaysia, South Korea and Taiwan.

Merk Absolute Return Currency Fund Investor Shares posted a return of -2.30% for the period from its inception date on September 9, 2009, through March 31, 2010. In comparison, the Citigroup 3-Month U.S. Treasury-Bill Index (“reference basket”) increased 0.06% for the period August 31, 2009, through March 31, 2010.2
The Fund’s performance is foremost influenced by changes in exchange rates of currencies to which the Fund has exposure. The Merk Absolute Return Currency Fund employs a tactical, periodic currency allocation process; currency exposures are typically rebalanced on a monthly basis. As such, certain currency exposures can change significantly from one month to the next. Moreover, the Fund aims to take advantage of potential shorter-term opportunities within the currency market. At any time, the Fund may have a net long or net short U.S. dollar currency exposure.
The Fund can, at times, take positions on a short-term view that may differ from our long-term macro-economic view on any one currency. For instance, the Fund has held a net short position in the euro during the first quarter of calendar year 2010. While the Merk Hard Currency Fund gradually expanded its position because of the perceived long-term value of the euro, the Absolute Return Currency Fund has aimed to capitalize on short-term dynamics and benefited from a decline in the currency during the quarter (the euro declined 5.66% during the quarter).
The Fund benefited from a net positive exposure to the Canadian dollar (CAD) for much of the Period since inception, as the CAD returned 6.22% through this timeframe. On the other hand, the Fund has held a positive net exposure to the Swedish krona (SEK) for much of the Period since inception, which has detracted from overall performance, as the SEK declined 2.96% since inception of the Fund through to the end of the Period.(* )
| 2 | Note that data is not available for the reference basket on the inception date of the Merk Absolute Return Currency Fund (September 9, 2009). As such, performance for the reference basket is calculated for the time period August 31, 2009, through March 31, 2010, whereas performance for the Fund is calculated for the period since inception through March 31, 2010. |
| | | | |
| | |
| | | 3 | | |
A MESSAGETOOUR SHAREHOLDERS
MARCH 31, 2010
Market Analysis and Insights
We continue to see risks ahead for the U.S. economy, and in particular, the U.S. dollar. Significant global imbalances remain – indeed; the recent global financial crisis has served to exaggerate many of these imbalances. Of grave concern is the unsustainable Federal budget deficit, which may have morphed out of control, with no signs of government restraint over the near-term. The U.S. current account deficit remains at a high level, and will likely weigh on the dollar for years to come. Add to this the inflationary pressures brought about by the Federal Reserve Bank’s (Fed) substantial balance sheet expansion – the balance sheet has grown nearly threefold since the beginning of the crisis – which may cause a further devaluation of the U.S. dollar. Despite political rhetoric to the contrary, in our assessment, policies are clearly working against a strong U.S. dollar. Moreover, we are yet to see evidence of a strong, sustainable economic turnaround in the U.S.
We were never in the “V” shaped recovery camp, and our analysis of the data thus far doesn’t support such a thesis. Businesses appear unwilling to hire, with the unemployment rate remaining at historically high levels. House prices have yet to revert to long-run affordability measures, despite historically low interest rates. Banks are not lending despite a plethora of available funds – whether this is predominantly driven by continued bank risk aversion, a lack of demand for loans, or a combination thereof does not portend a strong economic rebound. Debt levels remain high and what debt is not being driven by private sector demand is more than made up for through insatiable government debt growth. Alcoholics do not drink themselves sober; likewise piling more and more debt onto the system does not rectify a country’s debt-fueled problems. Until we see fiscal and monetary restraint in action rather than words, we consider the medium and long-term risks remain to the downside for the U.S. dollar.
Given current dynamics, we consider there to be many attractive currency investment opportunities. Of particular interest is the Asian region and those countries well placed to benefit from ongoing Asian demand. Despite a global economic downturn, Asian behemoths China and India continued to post healthy economic growth, albeit down from their lofty highs. Both countries realize they can no longer rely on exports to the West, and the U.S. in particular, to drive economic growth given the weak consumer spending outlook here. Rather, China and India have increasingly focused on developing their own domestic economies and respective middle classes. Such focus will require substantial ongoing spending on infrastructure, which is reliant on hard commodities and natural resources. As such, we favor the currencies of countries that are rich in such resources and have central banks that have followed more prudent monetary policies, like Australia, Canada and Norway.
In our opinion, negative real interest rates in conjunction with rapid Asian domestic economic growth, will create increasing inflationary pressures. Indeed, China has recently clamped down on bank lending and India has raised interest rates in response to such pressures. We believe the Chinese approach to containing inflation is ineffective, and currency appreciation may be necessary to tame domestic inflationary pressures. China presently focuses on curtailing bank lending via required reserve rules and direct government mandates. In our opinion, a more effective, less costly response would be to allow the currency to appreciate. While this is unlikely to happen overnight, we have seen China move in this direction, allowing numerous bi-lateral swap agreements across a range of currencies, increasing the number of currencies with which the Chinese renminbi can be readily converted, and carrying out stress tests on the business implications of a stronger renminbi.
An Asian currency we are not currently in favor of, however, is the Japanese yen (JPY). We harbor concerns over the long-term viability of the country’s ability to service its enormous levels of debt in light of unfavorable demographics – specifically, an aging, shrinking population. Moreover, recent initiatives have us concerned that the Bank of Japan (BoJ) may now reignite its quantitative easing policies, which had lain dormant throughout much of the credit crisis (ostensibly through weak leadership). Such policies may significantly devalue the currency. In our view, the recently elected Democratic Party of Japan has compromised the independence of the BoJ, telling the Bank in not-so-subtle ways that it needs to do everything in its power to stave off deflation (read: print money). Indeed, the BoJ has succumbed to this pressure, recently announcing an expanded quantitative easing program. We believe these steps may undermine the value of the JPY going forward.
Lastly, there has been a lot of concern surrounding Greece’s woes and the spillover effects on the rest of Europe and the euro (EUR). Unlike many other market participants, we see considerable value in the EUR on a long-term view. It is welcome relief to see that market dynamics are bringing Greece to account, penalizing the country for its lack of fiscal discipline. We believe that Greece will ultimately be seen for what it is: a low single digit percentage of eurozone GDP. In our eyes, the EUR will not only survive, but may offer significant upside potential. Structurally, in our analysis, the eurozone is simply not as effective at printing and spending money as the U.S. is. Given the spluttering economic recovery outlined above, we consider the Fed may expand its balance sheet once more in the next economic downturn, devaluing the U.S. dollar, while the European Central Bank (ECB) is likely to continue to follow much more prudent monetary policies. Therefore, while the eurozone may experience weaker economic growth, it may be on the backdrop of a stronger currency. It is important to note that when a country doesn’t have a large current account deficit, as the eurozone does not, it doesn’t necessarily need strong economic growth to have a strong currency – one only needs to look to the Japanese yen over recent years as an example. Relative to the U.S. dollar, the EUR may retain significant value.
| | | | |
| | |
| | | 4 | | |
A MESSAGETOOUR SHAREHOLDERS
MARCH 31, 2010
With so many global dynamics playing out, we believe there may be many attractive currency investment opportunities. We believe the currency asset class may continue to provide valuable portfolio diversification benefits and upside potential.
We invite you to read more about our Funds and sign up for our periodic newsletter at www.merkfunds.com.
Sincerely,
| | |

| | 
|
| |
Axel G. Merk | | Kieran Osborne |
President & Chief Investment Officer | | Co-Portfolio Manager |
The views in this Report were those of the Funds’ Managers as of March 31, 2010, and may not reflect the views of the Managers on the date this Report is first published or anytime thereafter. These views are intended to assist shareholders of each Fund in understanding their investments in each Fund and do not constitute investment advice.
Since the Funds primarily invest in foreign currencies, changes in currency exchange rates will affect the value of what the respective Fund owns and the price of the Fund’s shares. Investing in foreign instruments bears a greater risk than investing in domestic instruments for reasons such as volatility of currency exchange rates and, in some cases, limited geographic focus, political and economic instability, and relatively illiquid markets. The Funds are subject to interest rate risk, which is the risk that debt securities in the Fund’s portfolio will decline in value because of increases in market interest rates. As a non-diversified fund, the Merk Hard Currency Fund will be subject to more investment risk and potential for volatility than a diversified fund because its portfolio may, at times, focus on a limited number of issuers. The Funds may also invest in derivative securities, which can be volatile and involve various types and degrees of risk.
The J.P. Morgan 3-Month Global Cash Index tracks total returns of three-month constant maturity euro-currency deposits. The euro-currency deposits are the only short-term securities consistent across all markets in terms of liquidity, maturity and credit quality. The index is unmanaged and includes reinvested distributions. One cannot invest directly in an index, nor is an index representative of the Fund’s portfolio.
JPMorgan does not sponsor, endorse or promote the Merk Hard Currency Fund in connection with any reference to the J.P. Morgan 3-Month Global Cash Index. JPMorgan makes no representation or warranty, express or implied regarding the advisability of investing in securities generally or in any product particularly or the ability of the JPMorgan Index to track general bond market performance.
The Citigroup 3-Month Treasury Bill Index is an unmanaged index representing monthly return equivalents of yield averages of the last 3 month Treasury Bill issues. It is not possible to invest directly in an unmanaged index.
* All returns are relative to the U.S. dollar. Source for exchange rates listed in this letter: Bloomberg
| | | | |
| | |
| | | 5 | | |
PERFORMANCE CHARTAND ANALYSIS
MARCH 31, 2010
The following chart reflects the change in the value of a hypothetical $10,000 investment in Investor Shares, including reinvested dividends and distributions, in the Merk Hard Currency Fund (the “Fund”) compared with the performance of the J.P. Morgan 3-Month Global Cash Index, since inception. The J.P. Morgan 3-Month Global Cash Index tracks total returns of three-month constant maturity euro-currency deposits. The euro-currency deposits are the only short-term securities consistent across all markets in terms of liquidity, maturity and credit quality. The total return of the J.P. Morgan 3-Month Global Cash Index includes reinvestment of dividends and income. The total return of the Fund includes operating expenses that reduce returns, while the total return of the J.P. Morgan 3-Month Global Cash Index does not include expenses. The Fund is professionally managed while the J.P. Morgan 3-Month Global Cash Index is unmanaged and is not available for investment, nor is the index representative of the Fund’s portfolio.
Performance data quoted represents past performance and is no guarantee of future results. Current performance may be lower or higher than the performance data quoted. Investment return and principal value will fluctuate so that shares, when redeemed, may be worth more or less than original cost. The performance table and graph do not reflect the deduction of taxes that a shareholder would pay on Fund distributions or the redemption of Fund shares. Returns greater than one year are annualized. For the most recent month-end performance please call (866) 637-5386 or visit www.merkfunds.com.
Merk Hard Currency Fund vs. J.P. Morgan 3-Month Global Cash Index
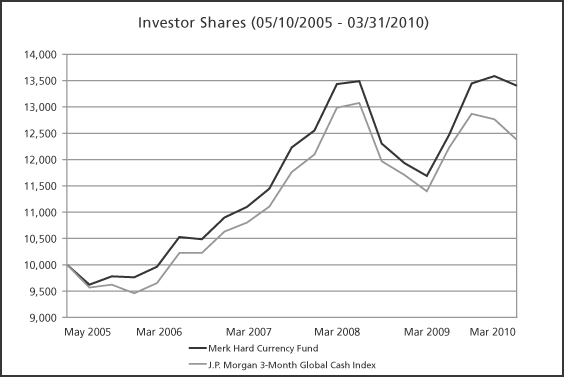
| | | |
Investment Value on 03/31/10:
| | |
Merk Hard Currency Fund | | $ | 13,404 |
J.P. Morgan 3-Month Global Cash Index | | $ | 12,377 |
| | | | |
Average Annual Total Return as of 03/31/10:
| | One Year
| | Since Inception
(05/10/05)
|
Merk Hard Currency Fund | | 14.70% | | 6.17% |
J.P. Morgan 3-Month Global Cash Index | | 8.60% | | 4.45% |
| | | | |
| | |
| | | 6 | | |
PERFORMANCE CHARTAND ANALYSIS
MARCH 31, 2010
The following chart reflects the change in the value of a hypothetical $10,000 investment in Investor Shares, including reinvested dividends and distributions, in the Merk Asian Currency Fund (the “Fund”) compared with the performance of the Citigroup 3-Month U.S. Treasury Bill Index, since inception. The Citigroup 3-Month U.S. Treasury Bill Index measures return equivalents of yield averages that are not marked to market and consists of the last three three-month Treasury bill month-end rates. The total return of the Citigroup 3-Month U.S. Treasury Bill Index includes reinvestment of dividends and income. The total return of the Fund includes operating expenses that reduce returns, while the total return of the Citigroup 3-Month U.S. Treasury Bill Index does not include expenses. The Fund is professionally managed while the Citigroup 3-Month U.S. Treasury Bill Index is unmanaged and is not available for investment, nor is the index representative of the Fund’s portfolio.
Performance data quoted represents past performance and is no guarantee of future results. Current performance may be lower or higher than the performance data quoted. Investment return and principal value will fluctuate so that shares, when redeemed, may be worth more or less than original cost. The performance table and graph do not reflect the deduction of taxes that a shareholder would pay on Fund distributions or the redemption of Fund shares. Returns greater than one year are annualized. For the most recent month-end performance please call (866) 637-5386 or visit www.merkfunds.com.
Merk Asian Currency Fund vs. Citigroup 3-Month U.S. Treasury Bill Index
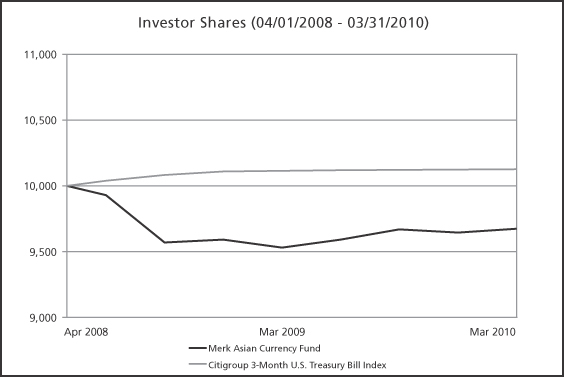
| | | |
Investment Value on 03/31/10:
| | |
Merk Asian Currency Fund | | $ | 9,674 |
Citigroup 3-Month U.S. Treasury Bill Index | | $ | 10,126 |
| | | | |
Average Annual Total Return as of 03/31/10:
| | One Year
| | Since Inception
(04/01/08)*
|
Merk Asian Currency Fund | | 1.51% | | (1.64)% |
Citigroup 3-Month U.S. Treasury Bill Index | | 0.13% | | 0.63% |
| * | Return for the Citigroup 3-Month U.S. Treasury Bill Index is for the period beginning March 31, 2008. |
| | | | |
| | |
| | | 7 | | |
PERFORMANCE CHARTAND ANALYSIS
MARCH 31, 2010
The following chart reflects the change in the value of a hypothetical $10,000 investment in Investor Shares, including reinvested dividends and distributions, in the Merk Absolute Return Currency Fund (the “Fund”) compared with the performance of the Citigroup 3-Month U.S. Treasury Bill Index, since inception. The Citigroup 3-Month U.S. Treasury Bill Index measures return equivalents of yield averages that are not marked to market and consists of the last three three-month Treasury bill month-end rates. The total return of the Citigroup 3-Month U.S. Treasury Bill Index includes reinvestment of dividends and income. The total return of the Fund includes operating expenses that reduce returns, while the total return of the Citigroup 3-Month U.S. Treasury Bill Index does not include expenses. The Fund is professionally managed while the Citigroup 3-Month U.S. Treasury Bill Index is unmanaged and is not available for investment, nor is the index representative of the Fund’s portfolio.
Performance data quoted represents past performance and is no guarantee of future results. Current performance may be lower or higher than the performance data quoted. Investment return and principal value will fluctuate so that shares, when redeemed, may be worth more or less than original cost. The performance table and graph do not reflect the deduction of taxes that a shareholder would pay on Fund distributions or the redemption of Fund shares. Returns greater than one year are annualized. For the most recent month-end performance please call (866) 637-5386 or visit www.merkfunds.com.
Merk Absolute Return Currency Fund vs. Citigroup 3-Month U.S. Treasury Bill Index
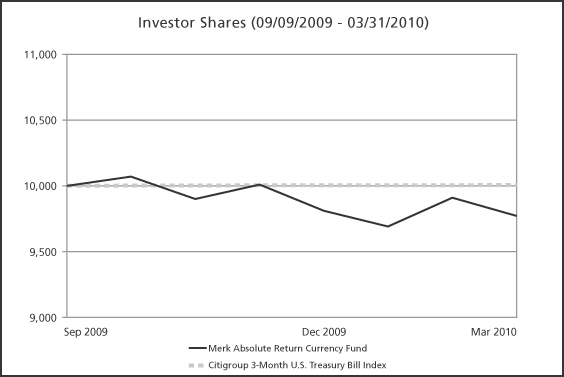
| | | |
Investment Value on 03/31/10:
| | |
Merk Absolute Return Currency Fund | | $ | 9,770 |
Citigroup 3-Month U.S. Treasury Bill Index | | $ | 10,006 |
| | | | |
Average Annual Total Return as of 03/31/10:
| | Six Months
| | Since Inception
(09/09/09)*
|
Merk Absolute Return Currency Fund | | (2.98)% | | (2.30)% |
Citigroup 3-Month U.S. Treasury Bill Index | | 0.04% | | 0.06% |
| * | Return for the Citigroup 3-Month U.S. Treasury Bill Index is for the period beginning August 31, 2009. |
| | | | |
| | |
| | | 8 | | |
MERK HARD CURRENCY FUND
SCHEDULEOF INVESTMENTS
MARCH 31, 2010
| | | | | | | | | | | |
Principal
| | Security Description
| | Currency
| | Rate
| | Maturity
| | Value in USD
|
| | | | |
Foreign Bonds - 44.1% | | | | | | | | | |
| | | | |
Municipal County - Germany - 3.7% | | | | | | | | | |
| 11,750,000 | | State of North Rhine-Westphalia, Series 5 | | EUR | | 3.25% | | 06/30/10 | | $ | 15,972,791 |
| | | | | | | | | | |
|
|
| | | | |
Non-U.S. Government - Australia - 4.8% | | | | | | | | | |
| 23,000,000 | | Australian Government Bond, Series 121 | | AUD | | 5.25 | | 08/15/10 | | | 21,173,406 |
| | | | | | | | | | |
|
|
| | | | |
Non-U.S. Government - Finland - 4.7% | | | | | | | | | |
| 15,100,000 | | Finland Government Bond, Series 1 | | EUR | | 2.75 | | 09/15/10 | | | 20,596,180 |
| | | | | | | | | | |
|
|
| | | | |
Non-U.S. Government - New Zealand - 5.6% | | | | | | | | | |
| 33,000,000 | | New Zealand Government Bond, Series 1111 | | NZD | | 6.00 | | 11/15/11 | | | 24,260,335 |
| | | | | | | | | | |
|
|
| | | | |
Non-U.S. Government - Switzerland - 4.7% | | | | | | | | | |
| 21,500,000 | | Switzerland Government Bond | | CHF | | 3.50 | | 08/07/10 | | | 20,616,591 |
| | | | | | | | | | |
|
|
| | | | |
Regional Agency - Australia - 5.2% | | | | | | | | | |
| 24,800,000 | | Queensland Treasury Corp., Series 10 | | AUD | | 5.50 | | 05/14/10 | | | 22,807,462 |
| | | | | | | | | | |
|
|
| | | | |
Regional Authority - Canada - 15.4% | | | | | | | | | |
| 11,000,000 | | Alberta Capital Finance Authority MTN (a) | | CAD | | 0.51 | | 02/05/13 | | | 10,827,741 |
| 7,000,000 | | Alberta Capital Finance Authority (a) | | CAD | | 0.83 | | 07/02/14 | | | 6,951,204 |
| 10,000,000 | | Alberta Treasury Branch | | CAD | | 4.10 | | 06/01/11 | | | 10,173,288 |
| 15,000,000 | | Province of Ontario MTN (a) | | CAD | | 1.04 | | 07/15/11 | | | 14,778,172 |
| 15,000,000 | | Province of Manitoba MTN (a) | | CAD | | 0.85 | | 09/04/12 | | | 14,858,810 |
| 10,000,000 | | Province of Saskatchewan | | CAD | | 6.15 | | 09/01/10 | | | 10,067,838 |
| | | | | | | | | | |
|
|
| | | | | | | | | | | | 67,657,053 |
| | | | | | | | | | |
|
|
| | | |
Total Foreign Bonds (Cost $181,812,096) | | | | | | | 193,083,818 |
| | | | | | | | | | |
|
|
| | | | |
Foreign Treasury Securities - 42.2% | | | | | | | | | |
| | | | |
Non-U.S. Government - Belgium - 4.8% | | | | | | | | | |
| 15,500,000 | | Belgium Treasury Bill (b) | | EUR | | 0.31 | | 04/15/10 | | | 20,932,647 |
| | | | | | | | | | |
|
|
| | | | |
Non-U.S. Government - Canada - 4.8% | | | | | | | | | |
| 21,500,000 | | Canadian Treasury Bill, Series 182 (b) | | CAD | | 0.13 | | 04/01/10 | | | 21,168,638 |
| | | | | | | | | | |
|
|
| | | | |
Non-U.S. Government - France - 4.8% | | | | | | | | | |
| 15,500,000 | | French Treasury Bill (b) | | EUR | | 0.28 | | 04/29/10 | | | 20,930,503 |
| | | | | | | | | | |
|
|
| | | | |
Non-U.S. Government - Germany - 4.8% | | | | | | | | | |
| 15,500,000 | | German Treasury Bill, Series 32 (b) | | EUR | | 0.25 | | 04/14/10 | | | 20,933,064 |
| | | | | | | | | | |
|
|
| | | | |
Non-U.S. Government - Netherlands - 4.6% | | | | | | | | | |
| 15,000,000 | | Dutch Treasury Certificate (b) | | EUR | | 0.26 | | 04/30/10 | | | 20,255,305 |
| | | | | | | | | | |
|
|
| | | | |
Non-U.S. Government - Norway - 18.4% | | | | | | | | | |
| 480,000,000 | | Norwegian Treasury Bill (b) | | NOK | | 1.95 | | 06/16/10 | | | 80,473,819 |
| | | | | | | | | | |
|
|
Total Foreign Treasury Securities (Cost $189,370,131) | | | | | | | | | 184,693,976 |
| | | | | | | | | | |
|
|
| | | | |
U.S. Treasury Bills - 1.2% | | | | | | | | | |
| 5,000,000 | | U.S. Treasury Bill (b) (Cost $4,999,679) | | USD | | 0.11 | | 04/22/10 | | | 4,999,664 |
| | | | | | | | | | |
|
|
| | | | |
| | |
See Notes to Financial Statements | | 9 | | |
MERK HARD CURRENCY FUND
SCHEDULEOF INVESTMENTS
MARCH 31, 2010
| | | | | | | | | | | | |
Shares
| | Security Description
| | | | | | | | Value in USD
| |
| | | | |
Exchange Traded Fund - 9.0% | | | | | | | | | | |
| 362,000 | | SPDR Gold Trust (Cost $35,261,460) | | | | | | | | $ | 39,439,900 | |
| | | | | | | | | | |
|
|
|
| | | | |
Total Investments - 96.5% (Cost $411,443,366)* | | | | | | | | $ | 422,217,358 | |
| | | | | | | | | | |
|
|
|
| | | | |
Foreign Currencies - 2.6%: | | | | | | | | | | |
Australian Dollar - 1.0% | | | | | | | | | 4,277,826 | |
British Sterling Pound - 0.0% | | | | | | | | | 586 | |
Canadian Dollar - 0.3% | | | | | | | | | 1,135,985 | |
Euro - 0.1% | | | | | | | | | 682,338 | |
Japanese Yen - 0.0% | | | | | | | | | 6,626 | |
New Zealand Dollar - 0.2% | | | | | | | | | 734,409 | |
Norwegian Krone - 0.0% | | | | | | | | | 2,396 | |
Swedish Krona - 0.0% | | | | | | | | | 6,207 | |
Swiss Franc - 1.0% | | | | | | | | | 4,391,248 | |
| | | | | | | | | | |
|
|
|
| | | | |
Total Foreign Currencies (Cost $11,157,500) | | | | | | | | | 11,237,621 | |
| | | | | | | | | | |
|
|
|
| | | | |
Net Unrealized Loss on Forward Currency Contracts - 0.0% | | | | | | | | | (893 | ) |
| | | | | | | | | | |
|
|
|
| | | | |
Other Assets and Liabilities, Net - 0.9% | | | | | | | | | 3,932,513 | |
| | | | | | | | | | |
|
|
|
| | | | |
NET ASSETS - 100.0% | | | | | | | | $ | 437,386,599 | |
| | | | | | | | | | |
|
|
|
| (a) | Variable rate security. Rate presented is as of March 31, 2010. |
| (b) | Rates shown are annualized yields at time of purchase. |
| * | Cost for Federal income tax purposes is $411,359,299 and net unrealized appreciation (depreciation) consists of: |
| | | | |
Gross Unrealized Appreciation | | $ | 18,199,555 | |
Gross Unrealized Depreciation | | | (7,341,496 | ) |
| | |
|
|
|
Net Unrealized Appreciation | | $ | 10,858,059 | |
| | |
|
|
|
As of March 31, 2010, the Merk Hard Currency Fund had the following currency exposures (unaudited):
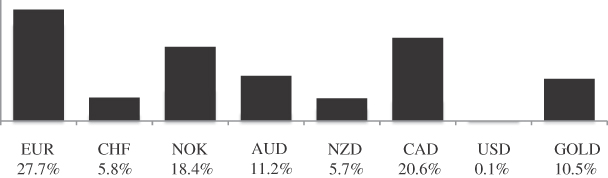
| | |
AUD | | Australian Dollar |
CAD | | Canadian Dollar |
CHF | | Swiss Franc |
EUR | | Euro |
NOK | | Norwegian Krone |
NZD | | New Zealand Dollar |
USD | | United States Dollar |
MTN | | Medium Term Note |
| | | | |
| | |
See Notes to Financial Statements | | 10 | | |
MERK HARD CURRENCY FUND
SCHEDULEOF INVESTMENTS
MARCH 31, 2010
As of March 31, 2010, the Fund held the following futures contracts:
| | | | | | | | | | |
Contracts
| | Type
| | Expiration Date
| | Notional
Contract Value
| | Net Unrealized
Appreciation
|
59 | | Gold 100 Oz. Future | | 06/30/10 | | $ | 6,501,760 | | $ | 73,790 |
As of March 31, 2010, the Merk Hard Currency Fund had the following currency contract outstanding:
| | | | | | | | | | |
Contracts to Sell
| | Contract
Value
| | | Settlement
Date
| | Unrealized
Loss
| |
(705,418) New Zealand Dollar | | $ | (500,000 | ) | | 04/06/10 | | $ | (893 | ) |
The following is a summary of the inputs used to value the Fund’s net assets as of March 31, 2010:
The inputs or methodology used for valuing securities are not necessarily an indication of the risk associated with investing in those securities. For more information on valuation inputs, and their aggregation into the levels used in the table below, refer to Note 2 – Security Valuation section in the accompanying Notes to Financial Statements.
| | | | | | | | | | | | | | |
| | | Level 1
| | Level 2
| | | Level 3
| | Total
| |
Assets | | | | | | | | | | | | | | |
Investments at Value: | | | | | | | | | | | | | | |
Foreign Bonds | | $ | - | | $ | 193,083,818 | | | $ | - | | $ | 193,083,818 | |
Foreign Treasury Securities | | | - | | | 184,693,976 | | | | - | | | 184,693,976 | |
U.S. Treasury Bill | | | - | | | 4,999,664 | | | | - | | | 4,999,664 | |
Exchange Traded Fund | | | 39,439,900 | | | - | | | | - | | | 39,439,900 | |
| | |
|
| |
|
|
| |
|
| |
|
|
|
Total Investments at Value | | | 39,439,900 | | | 382,777,458 | | | | - | | | 422,217,358 | |
Other Financial Instruments**: | | | | | | | | | | | | | | |
Futures | | | 73,790 | | | - | | | | - | | | 73,790 | |
| | |
|
| |
|
|
| |
|
| |
|
|
|
Total Assets | | $ | 39,513,690 | | $ | 382,777,458 | | | $ | - | | $ | 422,291,148 | |
| | |
|
| |
|
|
| |
|
| |
|
|
|
Liabilities | | | | | | | | | | | | | | |
Other Financial Instruments**: | | | | | | | | | | | | | | |
Forward Currency Contracts | | | - | | | (893 | ) | | | - | | | (893 | ) |
| | |
|
| |
|
|
| |
|
| |
|
|
|
Total Liabilities | | $ | - | | $ | (893 | ) | | $ | - | | $ | (893 | ) |
| | |
|
| |
|
|
| |
|
| |
|
|
|
| ** | Other Financial Instruments are derivative instruments not reflected in the Schedule of Investments, such as futures and forward currency contracts, which are valued at the unrealized appreciation (depreciation) of the instrument. |
PORTFOLIO HOLDINGS
% of Net Assets
| | |
Foreign Bonds | | 44.1% |
Foreign Treasury Securities | | 42.2% |
U.S. Treasury Bill | | 1.2% |
Exchange Traded Fund | | 9.0% |
Foreign Currencies | | 2.6% |
Forward Currency Contracts | | 0.0% |
Other Assets and Liabilities, Net | | 0.9% |
| | |
|
Total | | 100.0% |
| | |
|
| | | | |
| | |
See Notes to Financial Statements | | 11 | | |
MERK ASIAN CURRENCY FUND
SCHEDULEOF INVESTMENTS
MARCH 31, 2010
| | | | | | | | | | | | |
Principal
| | Security Description
| | | | Rate
| | Maturity
| | Value in USD
|
| | | | |
| U.S. Treasury Bills (a) (b) - 98.6% | | | | | | | | | |
| $ | 8,000,000 | | U.S. Treasury Bill | | | | 0.19% | | 04/29/10 | | $ | 7,999,426 |
| | 12,000,000 | | U.S. Treasury Bill | | | | 0.13-0.17 | | 05/20/10 | | | 11,997,826 |
| | 11,500,000 | | U.S. Treasury Bill | | | | 0.16-0.20 | | 06/17/10 | | | 11,496,676 |
| | 9,000,000 | | U.S. Treasury Bill | | | | 0.13 | | 07/15/10 | | | 8,996,193 |
| | 12,000,000 | | U.S. Treasury Bill | | | | 0.14 | | 07/29/10 | | | 11,994,252 |
| | 13,000,000 | | U.S. Treasury Bill | | | | 0.19 | | 08/26/10 | | | 12,989,912 |
| | 8,000,000 | | U.S. Treasury Bill | | | | 0.24 | | 09/23/10 | | | 7,991,560 |
| | | | | | | | | | | |
|
|
| | | | |
| Total U.S. Treasury Bills (Cost $73,463,913) | | | | | | | | | 73,465,845 |
| | | | | | | | | | | |
|
|
| | | | |
| Total Investments - 98.6% Cost ($73,463,913)* | | | | | | | | $ | 73,465,845 |
| | | | | | | | | | | |
|
|
| | | | |
| Net Unrealized Gain on Forward Currency Contracts - 0.3% | | | | | | | | $ | 197,759 |
| | | | |
| Other Assets and Liabilities, Net - 1.1% | | | | | | | | | 809,145 |
| | | | | | | | | | | |
|
|
| | | | |
| NET ASSETS - 100.0% | | | | | | | | $ | 74,472,749 |
| | | | | | | | | | | |
|
|
| (a) | Rates shown are annualized yields at time of purchase. |
| (b) | All or a portion of these securities are being held as collateral for forward currency contracts. |
| * | Cost for Federal income tax purposes is $73,463,913 and net unrealized appreciation (depreciation) consists of: |
| | | | |
Gross Unrealized Appreciation | | $ | 2,722 | |
Gross Unrealized Depreciation | | | (790 | ) |
| | |
|
|
|
Net Unrealized Appreciation | | $ | 1,932 | |
| | |
|
|
|
As of March 31, 2010, the Merk Asian Currency Fund had the following currency exposures (unaudited):
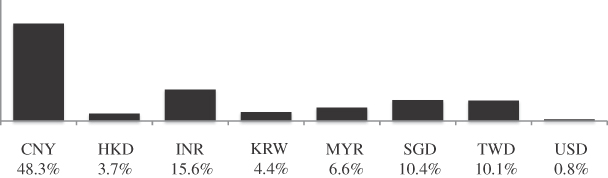
| | |
CNY | | Chinese Renminbi |
HKD | | Hong Kong Dollar |
INR | | Indian Rupee |
KRW | | South Korean Won |
MYR | | Malaysian Ringgit |
SGD | | Singapore Dollar |
TWD | | New Taiwan Dollar |
USD | | United States Dollar |
| | | | |
| | |
See Notes to Financial Statements | | 12 | | |
MERK ASIAN CURRENCY FUND
SCHEDULEOF INVESTMENTS
MARCH 31, 2010
As of March 31, 2010, the Fund had the following forward currency contracts outstanding:
| | | | | | | | | | | | | | |
Contracts to Purchase
| | Contract
Value
| | Settlement
Date
| | Unrealized
Gain
| | Unrealized
Loss
| |
| 79,000,000 | | Chinese Renminbi | | $ | 11,636,471 | | 04/16/10 | | $ | - | | $ | (63,267 | ) |
| 35,000,000 | | Chinese Renminbi | | | 5,156,918 | | 04/16/10 | | | - | | | (29,549 | ) |
| 15,000,000 | | Hong Kong Dollar | | | 1,935,509 | | 04/16/10 | | | - | | | (3,342 | ) |
| 105,000,000 | | Indian Rupee | | | 2,295,609 | | 04/16/10 | | | 39,960 | | | - | |
| 72,000,000 | | New Taiwan Dollar | | | 2,287,166 | | 04/16/10 | | | - | | | (15,818 | ) |
| 36,000,000 | | New Taiwan Dollar | | | 1,143,402 | | 04/16/10 | | | - | | | (7,728 | ) |
| 48,000,000 | | New Taiwan Dollar | | | 1,525,747 | | 04/16/10 | | | - | | | (11,515 | ) |
| 2,000,000 | | Singapore Dollar | | | 1,438,642 | | 04/16/10 | | | - | | | (9,113 | ) |
| 27,700,000 | | Chinese Renminbi | | | 4,079,529 | | 05/20/10 | | | - | | | (21,357 | ) |
| 23,400,000 | | Chinese Renminbi | | | 3,446,498 | | 05/20/10 | | | - | | | (18,295 | ) |
| 45,000,000 | | Indian Rupee | | | 957,243 | | 05/20/10 | | | 40,496 | | | - | |
| 127,000,000 | | Indian Rupee | | | 2,709,044 | | 05/20/10 | | | 106,796 | | | - | |
| 10,000,000 | | Malaysian Ringgit | | | 2,902,758 | | 05/20/10 | | | 154,460 | | | - | |
| 33,000,000 | | New Taiwan Dollar | | | 1,036,432 | | 05/20/10 | | | 8,491 | | | - | |
| 3,100,000 | | Singapore Dollar | | | 2,181,102 | | 05/20/10 | | | 34,323 | | | - | |
| 1,500,000,000 | | South Korean Won | | | 1,275,402 | | 05/20/10 | | | 47,700 | | | - | |
| 23,100,000 | | Chinese Renminbi | | | 3,418,677 | | 06/18/10 | | | - | | | (33,468 | ) |
| 57,500,000 | | Chinese Renminbi | | | 8,507,176 | | 06/18/10 | | | - | | | (80,789 | ) |
| 6,600,000 | | Hong Kong Dollar | | | 851,020 | | 06/18/10 | | | - | | | (469 | ) |
| 115,000,000 | | Indian Rupee | | | 2,523,590 | | 06/18/10 | | | 19,429 | | | - | |
| 132,500,000 | | Indian Rupee | | | 2,907,615 | | 06/18/10 | | | 22,385 | | | - | |
| 6,000,000 | | Malaysian Ringgit | | | 1,805,597 | | 06/18/10 | | | 25,687 | | | - | |
| 49,600,000 | | New Taiwan Dollar | | | 1,577,608 | | 06/18/10 | | | - | | | (2,393 | ) |
| 1,850,000 | | Singapore Dollar | | | 1,322,846 | | 06/18/10 | | | - | | | (950 | ) |
| 3,900,000 | | Singapore Dollar | | | 2,789,061 | | 06/18/10 | | | - | | | (2,361 | ) |
| 2,200,000,000 | | South Korean Won | | | 1,940,035 | | 06/18/10 | | | - | | | (1,554 | ) |
| | | | | | | | | |
|
| |
|
|
|
Unrealized gain (loss) on forward currency contracts | | | | | | | $ | 499,727 | | $ | (301,968 | ) |
| | | | | | | | | |
|
| |
|
|
|
The following is a summary of the inputs used to value the Fund’s investments as of March 31, 2010:
The inputs or methodology used for valuing securities are not necessarily an indication of the risk associated with investing in those securities. For more information on valuation inputs, and their aggregation into the levels used in the table below, refer to Note 2 – Security Valuation section in the accompanying Notes to Financial Statements.
| | | | | | |
Valuation Inputs
| | Investments in
Securities
| | Other
Financial
Instruments**
|
Level 1 – Quoted Prices | | $ | - | | $ | - |
Level 2 – Other Significant Observable Inputs | | | 73,465,845 | | | 197,759 |
Level 3 – Significant Unobservable Inputs | | | - | | | - |
| | |
|
| |
|
|
Total Investments | | $ | 73,465,845 | | $ | 197,759 |
| | |
|
| |
|
|
| ** | Other Financial Instruments include forward currency contracts, which are valued at the unrealized appreciation (depreciation) on the instrument. |
The Level 2 inputs in the Investments in Securities column displayed in this table are U.S. Treasury Bills.
PORTFOLIO HOLDINGS
% of Net Assets
| | |
U.S. Treasury Bills | | 98.6% |
Forward Currency Contracts | | 0.3% |
Other Assets and Liabilities, Net | | 1.1% |
| | |
|
Total | | 100.0% |
| | |
|
| | | | |
| | |
See Notes to Financial Statements | | 13 | | |
MERK ABSOLUTE RETURN CURRENCY FUND
SCHEDULEOF INVESTMENTS
MARCH 31, 2010
| | | | | | | | | | | | | |
Principal
| | Security Description
| | | | Rate
| | Maturity
| | Value in USD
| |
| | U.S. Treasury Bills (a) (b) – 97.5% | | | | | | | | | | |
| $ | 10,500,000 | | U.S. Treasury Bill | | | | 0.16% | | 04/29/10 | | $ | 10,499,246 | |
| | 3,500,000 | | U.S. Treasury Bill | | | | 0.16 | | 07/22/10 | | | 3,498,366 | |
| | 8,000,000 | | U.S. Treasury Bill | | | | 0.24 | | 09/23/10 | | | 7,991,560 | |
| | | | | | | | | | | |
|
|
|
| | Total U.S. Treasury Bills (Cost $21,987,713) | | | | | | | 21,989,172 | |
| | | | | | | | | | | |
|
|
|
| | Total Investments – 97.5% (Cost $21,987,713)* | | | | | | $ | 21,989,172 | |
| | | | | | | | | | | |
|
|
|
| | Net Unrealized Loss on Forward Currency Contracts – (2.1)% | | | | | | $ | (480,715 | ) |
| | | | | | | | | | | |
|
|
|
| | Other Assets and Liabilities, Net – 4.6% | | | | | | | 1,034,655 | |
| | | | | | | | | | | |
|
|
|
| | NET ASSETS – 100.0% | | | | | | $ | 22,543,112 | |
| | | | | | | | | | | |
|
|
|
| (a) | Rates shown are annualized yields at time of purchase. |
| (b) | All or a portion of these securities are being held as collateral for forward currency contracts. |
| * | Cost for Federal income tax purposes is $21,987,713 and net unrealized appreciation consists of: |
| | | |
Gross Unrealized Appreciation | | $ | 1,459 |
Gross Unrealized Depreciation | | | - |
| | |
|
|
Net Unrealized Appreciation | | $ | 1,459 |
| | |
|
|
As of March 31, 2010, the Merk Absolute Return Currency Fund had the following currency exposures (unaudited):
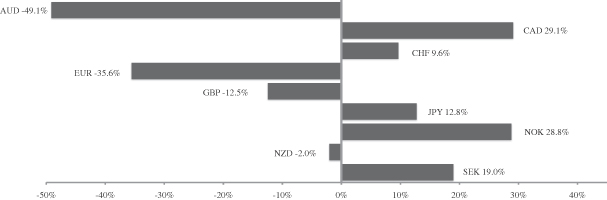
| | |
AUD | | Australian Dollar |
CAD | | Canadian Dollar |
CHF | | Swiss Franc |
EUR | | Euro |
GBP | | Pound Sterling |
JPY | | Japanese Yen |
NOK | | Norwegian Krone |
NZD | | New Zealand Dollar |
SEK | | Swedish Krona |
| | | | |
| | |
See Notes to Financial Statements | | 14 | | |
MERK ABSOLUTE RETURN CURRENCY FUND
SCHEDULEOF INVESTMENTS
MARCH 31, 2010
As of March 31, 2010, the Merk Absolute Return Currency Fund had the following forward currency contracts outstanding:
| | | | | | | | | | | | | | | |
Contracts to Purchase (Sell)
| | Contract
Value
| | | Settlement
Date
| | Unrealized
Gain
| | Unrealized
Loss
| |
| 200,000 | | Australian Dollar | | $ | 182,024 | | | 04/16/10 | | $ | 1,188 | | $ | - | |
| 340,000 | | Australian Dollar | | | 309,245 | | | 04/16/10 | | | 2,216 | | | - | |
| 450,000 | | Australian Dollar | | | 409,374 | | | 04/16/10 | | | 2,853 | | | - | |
| 2,000,000 | | Australian Dollar | | | 1,819,634 | | | 04/16/10 | | | 12,488 | | | - | |
| 9,820,000 | | Australian Dollar | | | 8,934,393 | | | 04/16/10 | | | 61,325 | | | - | |
| 3,700,000 | | Australian Dollar | | | 3,356,921 | | | 04/16/10 | | | 32,504 | | | - | |
| 300,000 | | Australian Dollar | | | 272,245 | | | 04/16/10 | | | 2,573 | | | - | |
| 200,000 | | Australian Dollar | | | 183,187 | | | 04/16/10 | | | 25 | | | - | |
| (10,000,000) | | Australian Dollar | | | (8,917,930 | ) | | 04/16/10 | | | - | | | (242,679 | ) |
| (10,000,000) | | Australian Dollar | | | (8,918,820 | ) | | 04/16/10 | | | - | | | (241,789 | ) |
| (8,100,000) | | Australian Dollar | | | (7,224,244 | ) | | 04/16/10 | | | - | | | (195,849 | ) |
| (1,000,000) | | Australian Dollar | | | (894,974 | ) | | 04/16/10 | | | - | | | (21,087 | ) |
| 9,000,000 | | Canadian Dollar | | | 8,611,905 | | | 04/16/10 | | | 249,369 | | | - | |
| 6,410,000 | | Canadian Dollar | | | 6,226,251 | | | 04/16/10 | | | 84,945 | | | - | |
| 200,000 | | Canadian Dollar | | | 195,085 | | | 04/16/10 | | | 1,832 | | | - | |
| 100,000 | | Canadian Dollar | | | 98,464 | | | 04/16/10 | | | - | | | (6 | ) |
| (1,540,000) | | Canadian Dollar | | | (1,463,754 | ) | | 04/16/10 | | | - | | | (52,508 | ) |
| (4,815,000) | | Canadian Dollar | | | (4,680,064 | ) | | 04/16/10 | | | - | | | (60,717 | ) |
| (240,000) | | Canadian Dollar | | | (232,862 | ) | | 04/16/10 | | | - | | | (3,438 | ) |
| (55,000) | | Canadian Dollar | | | (53,437 | ) | | 04/16/10 | | | - | | | (715 | ) |
| (2,200,000) | | Canadian Dollar | | | (2,151,560 | ) | | 04/16/10 | | | - | | | (14,529 | ) |
| (200,000) | | Canadian Dollar | | | (196,790 | ) | | 04/16/10 | | | - | | | (127 | ) |
| 8,300,000 | | Swiss Franc | | | 7,727,580 | | | 04/16/10 | | | 145,192 | | | - | |
| 60,000 | | Swiss Franc | | | 55,924 | | | 04/16/10 | | | 988 | | | - | |
| (4,000,000) | | Swiss Franc | | | (3,693,096 | ) | | 04/16/10 | | | - | | | (101,010 | ) |
| (810,000) | | Swiss Franc | | | (756,683 | ) | | 04/16/10 | | | - | | | (11,624 | ) |
| (390,000) | | Swiss Franc | | | (364,258 | ) | | 04/16/10 | | | - | | | (5,668 | ) |
| (80,000) | | Swiss Franc | | | (74,657 | ) | | 04/16/10 | | | - | | | (1,225 | ) |
| (700,000) | | Swiss Franc | | | (652,056 | ) | | 04/16/10 | | | - | | | (11,913 | ) |
| (90,000) | | Swiss Franc | | | (85,501 | ) | | 04/16/10 | | | 134 | | | - | |
| 850,000 | | Euro | | | 1,148,195 | | | 04/16/10 | | | - | | | (124 | ) |
| 200,000 | | Euro | | | 272,834 | | | 04/16/10 | | | - | | | (2,700 | ) |
| 1,900,000 | | Euro | | | 2,526,099 | | | 04/16/10 | | | 40,177 | | | - | |
| 150,000 | | Euro | | | 201,649 | | | 04/16/10 | | | 952 | | | - | |
| (1,600,000) | | Euro | | | (2,178,414 | ) | | 04/16/10 | | | 17,339 | | | - | |
| (4,380,000) | | Euro | | | (5,982,861 | ) | | 04/16/10 | | | 66,918 | | | - | |
| (2,895,000) | | Euro | | | (3,955,317 | ) | | 04/16/10 | | | 45,122 | | | - | |
| (100,000) | | Euro | | | (134,914 | ) | | 04/16/10 | | | - | | | (153 | ) |
| (60,000) | | Euro | | | (81,151 | ) | | 04/16/10 | | | 110 | | | - | |
| 100,000 | | Pound Sterling | | | 149,623 | | | 04/16/10 | | | 2,113 | | | - | |
| 100,000 | | Pound Sterling | | | 149,977 | | | 04/16/10 | | | 1,759 | | | - | |
| 190,000 | | Pound Sterling | | | 285,395 | | | 04/16/10 | | | 2,902 | | | - | |
| 2,460,000 | | Pound Sterling | | | 3,693,383 | | | 04/16/10 | | | 39,312 | | | - | |
| 600,000 | | Pound Sterling | | | 889,049 | | | 04/16/10 | | | 21,364 | | | - | |
| (4,300,000) | | Pound Sterling | | | (6,552,009 | ) | | 04/16/10 | | | 27,381 | | | - | |
| (1,000,000) | | Pound Sterling | | | (1,501,359 | ) | | 04/16/10 | | | - | | | (15,996 | ) |
| 97,000,000 | | Japanese Yen | | | 1,091,605 | | | 04/16/10 | | | - | | | (53,969 | ) |
| 361,000,000 | | Japanese Yen | | | 3,991,438 | | | 04/16/10 | | | - | | | (129,720 | ) |
| (59,700,000) | | Japanese Yen | | | (659,854 | ) | | 04/16/10 | | | 21,226 | | | - | |
| (41,300,000) | | Japanese Yen | | | (457,086 | ) | | 04/16/10 | | | 15,288 | | | - | |
| (8,000,000) | | Japanese Yen | | | (88,481 | ) | | 04/16/10 | | | 2,903 | | | - | |
| (80,000,000) | | Japanese Yen | | | (861,508 | ) | | 04/16/10 | | | 5,726 | | | - | |
| 40,000,000 | | Norwegian Krone | | | 6,757,710 | | | 04/16/10 | | | - | | | (32,251 | ) |
| | | | |
| | |
See Notes to Financial Statements | | 15 | | |
MERK ABSOLUTE RETURN CURRENCY FUND
SCHEDULEOF INVESTMENTS
MARCH 31, 2010
| | | | | | | | | | | | | | |
Contracts to Purchase (Sell)
| | Contract
Value
| | | Settlement
Date
| | Unrealized
Gain
| | Unrealized
Loss
| |
| 48,400,000 | | Norwegian Krone | | 8,179,316 | | | 04/16/10 | | | - | | | (41,511 | ) |
| 100,000 | | Norwegian Krone | | 16,986 | | | 04/16/10 | | | - | | | (173 | ) |
| 900,000 | | Norwegian Krone | | 150,707 | | | 04/16/10 | | | 616 | | | - | |
| (18,000,000) | | Norwegian Krone | | (3,014,635 | ) | | 04/16/10 | | | - | | | (11,822 | ) |
| (9,000,000) | | Norwegian Krone | | (1,530,559 | ) | | 04/16/10 | | | 17,331 | | | - | |
| (8,700,000) | | Norwegian Krone | | (1,478,875 | ) | | 04/16/10 | | | 16,087 | | | - | |
| (1,500,000) | | Norwegian Krone | | (254,706 | ) | | 04/16/10 | | | 2,501 | | | - | |
| (12,500,000) | | Norwegian Krone | | (2,053,326 | ) | | 04/16/10 | | | - | | | (48,380 | ) |
| (700,000) | | Norwegian Krone | | (117,242 | ) | | 04/16/10 | | | - | | | (454 | ) |
| (400,000) | | Norwegian Krone | | (67,309 | ) | | 04/16/10 | | | 55 | | | - | |
| 6,330,000 | | New Zealand Dollar | | 4,412,149 | | | 04/16/10 | | | 79,571 | | | - | |
| 3,400,000 | | New Zealand Dollar | | 2,364,003 | | | 04/16/10 | | | 48,611 | | | - | |
| (650,000) | | New Zealand Dollar | | (452,720 | ) | | 04/16/10 | | | - | | | (8,515 | ) |
| (9,380,000) | | New Zealand Dollar | | (6,527,542 | ) | | 04/16/10 | | | - | | | (128,435 | ) |
| (350,000) | | New Zealand Dollar | | (243,761 | ) | | 04/16/10 | | | - | | | (4,596 | ) |
| 3,650,000 | | Swedish Krona | | 512,216 | | | 04/16/10 | | | - | | | (6,701 | ) |
| 30,000,000 | | Swedish Krona | | 4,211,958 | | | 04/16/10 | | | - | | | (57,041 | ) |
| 52,800,000 | | Swedish Krona | | 7,414,191 | | | 04/16/10 | | | - | | | (101,536 | ) |
| 600,000 | | Swedish Krona | | 83,008 | | | 04/16/10 | | | 90 | | | - | |
| (32,300,000) | | Swedish Krona | | (4,531,076 | ) | | 04/16/10 | | | 57,615 | | | - | |
| (12,500,000) | | Swedish Krona | | (1,733,548 | ) | | 04/16/10 | | | 2,332 | | | - | |
| (1,000,000) | | Swedish Krona | | (140,120 | ) | | 04/16/10 | | | 1,622 | | | - | |
| (10,000,000) | | Swedish Krona | | (1,378,404 | ) | | 04/16/10 | | | - | | | (6,569 | ) |
| (400,000) | | Swedish Krona | | (55,558 | ) | | 04/16/10 | | | 160 | | | - | |
| | | | | | | | | |
|
| |
|
|
|
Unrealized gain (loss) on forward currency contracts | | | | | | | $ | 1,134,815 | | $ | (1,615,530 | ) |
| | | | | | | | | |
|
| |
|
|
|
The following is a summary of the inputs used to value the Fund’s investments as of March 31, 2010:
The inputs or methodology used for valuing securities are not necessarily an indication of the risk associated with investing in those securities. For more information on valuation inputs, and their aggregation into the levels used in the table below, refer to Note 2 – Security Valuation section in the accompanying Notes to Financial Statements.
| | | | | | | |
Valuation Inputs
| | Investments in
Securities
| | Other
Financial
Instruments**
| |
Level 1 – Quoted Prices | | $ | - | | $ | - | |
Level 2 – Other Significant Observable Inputs | | | 21,989,172 | | | (480,715 | ) |
Level 3 – Significant Unobservable Inputs | | | - | | | - | |
| | |
|
| |
|
|
|
Total Investments | | $ | 21,989,172 | | $ | (480,715 | ) |
| | |
|
| |
|
|
|
** Other Financial Instruments include forward currency contracts, which are valued at the unrealized appreciation (depreciation) on the instrument.
The Level 2 inputs in the Investments in Securities column displayed in this table are U.S. Treasury Bills.
PORTFOLIO HOLDINGS
% of Net Assets
| | |
U.S. Treasury Bills | | 97.5% |
Forward Currency Contracts | | (2.1)% |
Other Assets and Liabilities, Net | | 4.6% |
| | |
|
Total | | 100.0% |
| | |
|
| | | | |
| | |
See Notes to Financial Statements | | 16 | | |
STATEMENTSOF ASSETS AND LIABILITIES
MARCH 31, 2010
| | | | | | | | | | | |
| | | Merk Hard
Currency
Fund
| | | Merk Asian
Currency
Fund
| | Merk Absolute
Return
Currency
Fund
| |
ASSETS | | | | | | | | | | | |
Investments: | | | | | | | | | | | |
Total investments, at cost | | $ | 411,443,366 | | | $ | 73,463,913 | | $ | 21,987,713 | |
Net unrealized appreciation | | | 10,773,992 | | | | 1,932 | | | 1,459 | |
| | |
|
|
| |
|
| |
|
|
|
Total investments, at value | | | 422,217,358 | | | | 73,465,845 | | | 21,989,172 | |
Foreign currency (Cost $11,157,500, $0, and $0, respectively) | | | 11,237,621 | | | | - | | | - | |
Cash | | | 3,578,238 | | | | 565,449 | | | 1,012,599 | |
Unrealized gain on forward currency contracts | | | - | | | | 499,727 | | | 1,134,815 | |
Deposits with brokers for margin on futures contracts | | | 432,253 | | | | - | | | - | |
Receivables: | | | | | | | | | | | |
Fund shares sold | | | 905,599 | | | | 330,695 | | | 41,937 | |
Interest and dividends | | | 2,982,176 | | | | 51 | | | 110 | |
Variation margin | | | 52,670 | | | | - | | | - | |
| | |
|
|
| |
|
| |
|
|
|
Total Assets | | | 441,405,915 | | | | 74,861,767 | | | 24,178,633 | |
| | |
|
|
| |
|
| |
|
|
|
| | | |
LIABILITIES | | | | | | | | | | | |
Unrealized loss on forward currency contracts | | | 893 | | | | 301,968 | | | 1,615,530 | |
Payables: | | | | | | | | | | | |
Investment securities purchased | | | 2,936,998 | | | | - | | | - | |
Fund shares redeemed | | | 630,700 | | | | 28,827 | | | 9,588 | |
Accrued liabilities: | | | | | | | | | | | |
Investment adviser fees | | | 339,188 | | | | 39,490 | | | 3,024 | |
Distribution fees | | | 93,605 | | | | 15,609 | | | 6,149 | |
Other expenses | | | 17,932 | | | | 3,124 | | | 1,230 | |
| | |
|
|
| |
|
| |
|
|
|
Total Liabilities | | | 4,019,316 | | | | 389,018 | | | 1,635,521 | |
| | |
|
|
| |
|
| |
|
|
|
| | | |
NET ASSETS | | $ | 437,386,599 | | | $ | 74,472,749 | | $ | 22,543,112 | |
| | |
|
|
| |
|
| |
|
|
|
| | | |
COMPONENTS OF NET ASSETS | | | | | | | | | | | |
Paid-in capital | | $ | 422,666,856 | | | $ | 73,964,269 | | $ | 22,965,242 | |
Accumulated net investment income (loss) | | | (583,819 | ) | | | 308,789 | | | 57,126 | |
Accumulated net realized gain (loss) | | | 4,388,278 | | | | - | | | - | |
Unrealized appreciation (depreciation) | | | 10,915,284 | | | | 199,691 | | | (479,256 | ) |
| | |
|
|
| |
|
| |
|
|
|
| | | |
NET ASSETS | | $ | 437,386,599 | | | $ | 74,472,749 | | $ | 22,543,112 | |
| | |
|
|
| |
|
| |
|
|
|
| | | |
SHARES OF BENEFICIAL INTEREST at $0.000 PAR VALUE (unlimited shares authorized) | | | 37,232,162 | | | | 7,733,858 | | | 2,307,668 | |
| | |
|
|
| |
|
| |
|
|
|
| | | |
NET ASSET VALUE, OFFERING AND REDEMPTION PRICE PER SHARE | | $ | 11.75 | | | $ | 9.63 | | $ | 9.77 | |
| | |
|
|
| |
|
| |
|
|
|
| | | | |
| | |
See Notes to Financial Statements | | 17 | | |
STATEMENTSOF OPERATIONS
YEAR ENDED MARCH 31, 2010
| | | | | | | | | | | | |
| | | Merk Hard
Currency
Fund
| | | Merk Asian
Currency
Fund
| | | Merk Absolute
Return Currency
Fund*
| |
INVESTMENT INCOME | | | | | | | | | | | | |
Interest income | | $ | 4,792,961 | | | $ | 175,614 | | | $ | 18,462 | |
Less: foreign taxes withheld | | | (252,670 | ) | | | - | | | | - | |
| | |
|
|
| |
|
|
| |
|
|
|
Total Investment Income | | | 4,540,291 | | | | 175,614 | | | | 18,462 | |
| | |
|
|
| |
|
|
| |
|
|
|
| | | |
EXPENSES | | | | | | | | | | | | |
Investment adviser fees | | | 3,859,784 | | | | 650,417 | | | | 133,032 | |
Interest expense | | | 3,428 | | | | 31 | | | | - | |
Distribution fees | | | 964,943 | | | | 162,604 | | | | 33,258 | |
Transfer agency fees | | | 192,994 | | | | 32,522 | | | | 6,652 | |
| | |
|
|
| |
|
|
| |
|
|
|
Total Expenses | | | 5,021,149 | | | | 845,574 | | | | 172,942 | |
| | |
|
|
| |
|
|
| |
|
|
|
| | | |
NET INVESTMENT LOSS | | | (480,858 | ) | | | (669,960 | ) | | | (154,480 | ) |
| | |
|
|
| |
|
|
| |
|
|
|
| | | |
NET REALIZED AND UNREALIZED GAIN (LOSS) | | | | | | | | | | | | |
Net realized gain (loss) on: | | | | | | | | | | | | |
Investments | | | 26,592,432 | | | | 623 | | | | - | |
Futures | | | 1,037,122 | | | | - | | | | - | |
Foreign currency transactions | | | (1,791,023 | ) | | | 1,525,260 | | | | (282,968 | ) |
| | |
|
|
| |
|
|
| |
|
|
|
Net Realized Gain (Loss) | | | 25,838,531 | | | | 1,525,883 | | | | (282,968 | ) |
| | |
|
|
| |
|
|
| |
|
|
|
Net change in unrealized appreciation (depreciation) on: | | | | | | | | | | | | |
Investments | | | 14,119,950 | | | | (25,796 | ) | | | 1,459 | |
Futures | | | 126,530 | | | | - | | | | - | |
Foreign currency translations | | | 171,483 | | | | (10,653 | ) | | | (480,715 | ) |
| | |
|
|
| |
|
|
| |
|
|
|
Net Change in Unrealized Appreciation (Depreciation) | | | 14,417,963 | | | | (36,449 | ) | | | (479,256 | ) |
| | |
|
|
| |
|
|
| |
|
|
|
| | | |
NET REALIZED AND UNREALIZED GAIN (LOSS) | | | 40,256,494 | | | | 1,489,434 | | | | (762,224 | ) |
| | |
|
|
| |
|
|
| |
|
|
|
| | | |
INCREASE (DECREASE) IN NET ASSETS FROM OPERATIONS | | $ | 39,775,636 | | | $ | 819,474 | | | $ | (916,704 | ) |
| | |
|
|
| |
|
|
| |
|
|
|
| * | Merk Absolute Return Currency Fund commenced operations on September 9, 2009. |
| | | | |
| | |
See Notes to Financial Statements | | 18 | | |
STATEMENTSOF CHANGES IN NET ASSETS
| | | | | | | | | | | | | | | | | | | | |
| | | Merk Hard
Currency Fund
| | | Merk Asian
Currency Fund
| | | Merk Absolute
Return
Currency Fund
| |
| | | Year Ended
March 31,
2010
| | | Year Ended
March 31,
2009
| | | Year Ended
March 31,
2010
| | | Year Ended
March 31,
2009
| | | Period Ended
March 31,
2010*
| |
OPERATIONS | | | | | | | | | | | | | | | | | | | | |
Net investment income (loss) | | $ | (480,858 | ) | | $ | 4,271,365 | | | $ | (669,960 | ) | | $ | 61,735 | | | $ | (154,480 | ) |
Net realized gain (loss) | | | 25,838,531 | | | | (40,687,181 | ) | | | 1,525,883 | | | | (2,554,075 | ) | | | (282,968 | ) |
Net change in unrealized appreciation (depreciation) on investments | | | 14,417,963 | | | | (19,191,842 | ) | | | (36,449 | ) | | | 236,140 | | | | (479,256 | ) |
| | |
|
|
| |
|
|
| |
|
|
| |
|
|
| |
|
|
|
Increase (Decrease) in Net Assets Resulting from Operations | | | 39,775,636 | | | | (55,607,658 | ) | | | 819,474 | | | | (2,256,200 | ) | | | (916,704 | ) |
| | |
|
|
| |
|
|
| |
|
|
| |
|
|
| |
|
|
|
| | | | | |
DISTRIBUTIONS TO SHAREHOLDERS FROM | | | | | | | | | | | | | | | | | | | | |
Net investment income | | | (5,203,694 | ) | | | (3,114,602 | ) | | | (326,098 | ) | | | - | | | | - | |
Net realized gain on investments | | | (2,592,556 | ) | | | (2,061,302 | ) | | | (2,183 | ) | | | - | | | | - | |
| | |
|
|
| |
|
|
| |
|
|
| |
|
|
| |
|
|
|
Total Distributions to Shareholders | | | (7,796,250 | ) | | | (5,175,904 | ) | | | (328,281 | ) | | | - | | | | - | |
| | |
|
|
| |
|
|
| |
|
|
| |
|
|
| |
|
|
|
| | | | | |
CAPITAL SHARE TRANSACTIONS | | | | | | | | | | | | | | | | | | | | |
Sale of shares | | | 359,628,295 | | | | 338,428,219 | | | | 64,007,147 | | | | 88,431,529 | | | | 39,686,180 | |
Reinvestment of distributions | | | 7,392,466 | | | | 4,929,480 | | | | 316,832 | | | | - | | | | - | |
Redemption of shares | | | (229,710,349 | ) | | | (417,293,267 | ) | | | (38,152,856 | ) | | | (38,364,896 | ) | | | (16,226,364 | ) |
| | |
|
|
| |
|
|
| |
|
|
| |
|
|
| |
|
|
|
Increase (Decrease) from Capital Share Transactions | | | 137,310,412 | | | | (73,935,568 | ) | | | 26,171,123 | | | | 50,066,633 | | | | 23,459,816 | |
| | |
|
|
| |
|
|
| |
|
|
| |
|
|
| |
|
|
|
Increase (Decrease) in Net Assets | | | 169,289,798 | | | | (134,719,130 | ) | | | 26,662,316 | | | | 47,810,433 | | | | 22,543,112 | |
| | | | | |
NET ASSETS | | | | | | | | | | | | | | | | | | | | |
Beginning of Period | | | 268,096,801 | | | | 402,815,931 | | | | 47,810,433 | | | | - | | | | - | |
| | |
|
|
| |
|
|
| |
|
|
| |
|
|
| |
|
|
|
End of Period (a) | | $ | 437,386,599 | | | $ | 268,096,801 | | | $ | 74,472,749 | | | $ | 47,810,433 | | | $ | 22,543,112 | |
| | |
|
|
| |
|
|
| |
|
|
| |
|
|
| |
|
|
|
| | | | | |
SHARE TRANSACTIONS | | | | | | | | | | | | | | | | | | | | |
Sale of shares | | | 30,478,240 | | | | 29,690,090 | | | | 6,643,825 | | | | 8,993,964 | | | | 3,960,845 | |
Reinvestment of distributions | | | 618,547 | | | | 418,117 | | | | 32,986 | | | | - | | | | - | |
Redemption of shares | | | (19,586,832 | ) | | | (37,500,503 | ) | | | (3,960,871 | ) | | | (3,976,046 | ) | | | (1,653,177 | ) |
| | |
|
|
| |
|
|
| |
|
|
| |
|
|
| |
|
|
|
Increase (Decrease) from Capital Share Transactions | | | 11,509,955 | | | | (7,392,296 | ) | | | 2,715,940 | | | | 5,017,918 | | | | 2,307,668 | |
| | |
|
|
| |
|
|
| |
|
|
| |
|
|
| |
|
|
|
(a) Accumulated net investment income (loss) | | $ | (583,819 | ) | | $ | (16,326,387 | ) | | $ | 308,789 | | | $ | (218,853 | ) | | $ | 57,126 | |
| | |
|
|
| |
|
|
| |
|
|
| |
|
|
| |
|
|
|
| * | Merk Absolute Return Currency Fund commenced operations on September 9, 2009. |
| | | | |
| | |
See Notes to Financial Statements | | 19 | | |
FINANCIAL HIGHLIGHTS
These financial highlights reflect selected data for a share outstanding throughout each period.
| | | | | | | | | | | | | | | | | | | | |
| | | Year Ended
March 31, 2010
| | | Year Ended
March 31, 2009
| | | Year Ended
March 31, 2008
| | | Year Ended
March 31, 2007
| | | May 10, 2005 (a)
through
March 31, 2006
| |
MERK HARD CURRENCY FUND | | | | | | | | | | | | | | | | | | | | |
| | | | | |
NET ASSET VALUE, Beginning of Period | | $ | 10.42 | | | $ | 12.16 | | | $ | 10.72 | | | $ | 9.95 | | | $ | 10.00 | |
| | |
|
|
| |
|
|
| |
|
|
| |
|
|
| |
|
|
|
| | | | | |
INVESTMENT OPERATIONS | | | | | | | | | | | | | | | | | | | | |
Net investment income (loss) (b) | | | (0.01 | ) | | | 0.15 | | | | 0.28 | | | | 0.20 | | | | 0.09 | |
Net realized and unrealized gain (loss) | | | 1.55 | | | | (1.71 | ) | | | 1.92 | | | | 0.93 | | | | (0.13 | ) (c) |
| | |
|
|
| |
|
|
| |
|
|
| |
|
|
| |
|
|
|
Total from Investment Operations | | | 1.54 | | | | (1.56 | ) | | | 2.20 | | | | 1.13 | | | | (0.04 | ) |
| | |
|
|
| |
|
|
| |
|
|
| |
|
|
| |
|
|
|
| | | | | |
DISTRIBUTIONS TO SHAREHOLDERS FROM | | | | | | | | | | | | | | | | | | | | |
Net investment income | | | (0.14 | ) | | | (0.10 | ) | | | (0.73 | ) | | | (0.36 | ) | | | - | |
Net realized gain | | | (0.07 | ) | | | (0.08 | ) | | | (0.03 | ) | | | - | (d) | | | (0.01 | ) |
| | |
|
|
| |
|
|
| |
|
|
| |
|
|
| |
|
|
|
Total Distributions | | | (0.21 | ) | | | (0.18 | ) | | | (0.76 | ) | | | (0.36 | ) | | | (0.01 | ) |
| | |
|
|
| |
|
|
| |
|
|
| |
|
|
| |
|
|
|
| | | | | |
NET ASSET VALUE, End of Period | | $ | 11.75 | | | $ | 10.42 | | | $ | 12.16 | | | $ | 10.72 | | | $ | 9.95 | |
| | |
|
|
| |
|
|
| |
|
|
| |
|
|
| |
|
|
|
| | | | | |
TOTAL RETURN | | | 14.70% | | | | (13.01)% | | | | 21.02% | | | | 11.45% | | | | (0.40)% | (e) |
| | | | | |
RATIO/SUPPLEMENTARY DATA | | | | | | | | | | | | | | | | | | | | |
Net Assets at End of Period (000’s omitted) | | $ | 437,387 | | | $ | 268,097 | | | $ | 402,816 | | | $ | 75,449 | | | $ | 10,643 | |
Ratios to Average Net Assets: | | | | | | | | | | | | | | | | | | | | |
Net expenses | | | 1.30% | | | | 1.31% | | | | 1.30% | | | | 1.30% | | | | 1.30% | (f) |
Gross expenses (g) | | | 1.30% | | | | 1.32% | | | | 1.31% | | | | 1.31% | | | | 1.31% | (f) |
Net investment income (loss) | | | (0.12)% | | | | 1.36% | | | | 2.40% | | | | 1.93% | | | | 1.04% | (f) |
| | | | | |
PORTFOLIO TURNOVER RATE | | | 15% | | | | 27% | | | | 51% | | | | 29% | | | | 0% | (e) |
| (a) | Commencement of operations. |
| (b) | Calculated based on average shares outstanding during the period. |
| (c) | Per share amount does not reflect the actual net realized and unrealized gain/loss for the period due to the timing of Fund share sales and the amount of per share realized and unrealized gains and losses at such time. |
| (d) | Less than $0.01 per share. |
| (g) | Reflects the expense ratio excluding any waivers and/or reimbursements. |
| | | | |
| | |
See Notes to Financial Statements | | 20 | | |
FINANCIAL HIGHLIGHTS
These financial highlights reflect selected data for a share outstanding throughout each period.
| | | | | | | | |
| | | Year Ended
March 31, 2010
| | | April 1, 2008 (a)
through
March 31, 2009
| |
MERK ASIAN CURRENCY FUND | | | | | | | | |
| | |
NET ASSET VALUE, Beginning of Period | | $ | 9.53 | | | $ | 10.00 | |
| | |
|
|
| |
|
|
|
| | |
INVESTMENT OPERATIONS | | | | | | | | |
Net investment income (loss) (b) | | | (0.10 | ) | | | 0.01 | |
Net realized and unrealized gain (loss) | | | 0.24 | | | | (0.48 | ) |
| | |
|
|
| |
|
|
|
Total from Investment Operations | | | 0.14 | | | | (0.47 | ) |
| | |
|
|
| |
|
|
|
| | |
DISTRIBUTIONS TO SHAREHOLDERS FROM | | | | | | | | |
Net investment income | | | (0.04 | ) | | | - | |
Net realized gain | | | - | (c) | | | - | |
| | |
|
|
| |
|
|
|
Decrease in Net Assets from Distributions | | | (0.04 | ) | | | - | |
| | |
|
|
| |
|
|
|
| | |
NET ASSET VALUE, End of Period | | $ | 9.63 | | | $ | 9.53 | |
| | |
|
|
| |
|
|
|
| | |
TOTAL RETURN | | | 1.51% | | | | (4.70)% | (d) |
| | |
RATIO/SUPPLEMENTARY DATA | | | | | | | | |
Net Assets at End of Period (000’s omitted) | | $ | 74,473 | | | $ | 47,810 | |
Ratios to Average Net Assets: | | | | | | | | |
Net expenses | | | 1.30% | | | | 1.30% | (e) |
Gross expenses | | | 1.30% | | | | 1.30% | (e) |
Net investment income (loss) | | | (1.03)% | | | | 0.16% | (e) |
| | |
PORTFOLIO TURNOVER RATE | | | 0% | | | | 0% | (d) |
| (a) | Commencement of operations. |
| (b) | Calculated based on average shares outstanding during the period. |
| (c) | Less than $0.01 per share. |
| | | | |
| | |
See Notes to Financial Statements | | 21 | | |
FINANCIAL HIGHLIGHTS
These financial highlights reflect selected data for a share outstanding throughout the period.
| | | | |
| | | September 9, 2009 (a)
through
March 31, 2010
| |
MERK ABSOLUTE RETURN CURRENCY FUND | | | | |
| |
NET ASSET VALUE, Beginning of Period | | $ | 10.00 | |
| | |
|
|
|
| |
INVESTMENT OPERATIONS | | | | |
Net investment loss (b) | | | (0.06 | ) |
Net realized and unrealized loss | | | (0.17 | ) |
| | |
|
|
|
Total from Investment Operations | | | (0.23 | ) |
| | |
|
|
|
| |
NET ASSET VALUE, End of Period | | $ | 9.77 | |
| | |
|
|
|
| |
TOTAL RETURN | | | (2.30)% | (c) |
| |
RATIO/SUPPLEMENTARY DATA | | | | |
Net Assets at End of Period (000’s omitted) | | $ | 22,543 | |
Ratios to Average Net Assets: | | | | |
Net expenses | | | 1.30% | (d) |
Gross expenses | | | 1.30% | (d) |
Net investment loss | | | (1.16)% | (d) |
| |
PORTFOLIO TURNOVER RATE | | | 0% | (c) |
| (a) | Commencement of operations. |
| (b) | Calculated based on average shares outstanding during the period. |
| | | | |
| | |
See Notes to Financial Statements | | 22 | | |
NOTESTO FINANCIAL STATEMENTS
MARCH 31, 2010
NOTE 1. Organization
The Merk Asian Currency Fund and Merk Absolute Return Currency Fund (individually, a “Fund” and, collectively the “Funds”) are diversified portfolios of Forum Funds (the “Trust”). The Merk Hard Currency Fund (individually included in the defined term, “Fund” and, collectively included in the defined term, “Funds”) is a non-diversified portfolio of the Trust. The Trust is a Delaware statutory trust that is registered as an open-end, management investment company under the Investment Company Act of 1940 (the “Act”), as amended. As of March 31, 2010, the Trust had thirty-two investment portfolios. Under its Trust Instrument, the Trust is authorized to issue an unlimited number of each Fund’s shares of beneficial interest without par value. Each Fund offers Investor Shares. Merk Hard Currency Fund seeks to protect against the depreciation of the U.S. dollar relative to other currencies. Merk Asian Currency seeks to protect against the depreciation of the U.S. dollar relative to Asian currencies. Merk Absolute Return Currency Fund seeks to generate positive absolute returns by investing in securities and instruments that create exposure to currencies. Merk Hard Currency Fund commenced operations on May 10, 2005. Merk Asian Currency Fund commenced operations on April 1, 2008. Merk Absolute Return Currency Fund commenced operations on September 9, 2009.
NOTE 2. Summary of Significant Accounting Policies
These financial statements are prepared in accordance with generally accepted accounting principles in the United States of America (“GAAP”), which require management to make estimates and assumptions that affect the reported amounts of assets and liabilities, the disclosure of contingent liabilities at the date of the financial statements, and the reported amounts of increase and decrease in net assets from operations during the fiscal period. Actual amounts could differ from those estimates. The following summarizes the significant accounting policies of each Fund:
Security Valuation – Exchange-traded securities and over-the-counter securities are valued using the last quoted sale or official closing price, provided by independent pricing services as of the close of trading on the market or exchange for which they are primarily traded, on each Fund business day. In the absence of a sale, such securities are valued at the mean of the last bid and asked price provided by independent pricing services. Non-exchange traded securities for which quotations are available are valued using the last quoted sales price, or in the absence of a sale at the mean of the last bid and asked prices provided by independent pricing services. Debt securities may be valued at prices supplied by a Fund’s pricing agent based on broker or dealer supplied valuations or matrix pricing, a method of valuing securities by reference to the value of other securities with similar characteristics such as rating, interest rate and maturity. Shares of open-end mutual funds are valued at net asset value (“NAV”). Futures contracts listed for trading on a securities exchange or board of trade shall be valued at the last quoted sales price or in the absence of a sale at the mean of the last bid and asked prices. Forward currency contracts are generally valued at the mean of bid and asked prices for the time period interpolated from rates reported by an independent pricing service for proximate time periods. Short-term investments that mature in sixty days or less may be valued at amortized cost.
Each Fund values its investments at fair value pursuant to procedures adopted by the Trust’s Board of Trustees (the “Board”) if (1) market quotations are insufficient or not readily available or (2) the adviser believes that the values available are unreliable. Fair valuation is based on subjective factors and as a result, the fair value price of an investment may differ from the security’s market price and may not be the price at which the asset may be sold. Fair valuation could result in a different NAV than a NAV determined by using market quotes.
Each Fund has a three-tier fair value hierarchy. The basis of the tiers is dependent upon the various “inputs” used to determine the value of each Fund’s investments. These inputs are summarized in the three broad levels listed below:
Level 1 – quoted prices in active markets for identical assets
Level 2 – other significant observable inputs (including quoted prices of similar securities, interest rates, prepayment speeds, credit risk, etc.)
Level 3 – significant unobservable inputs (including each Fund’s own assumptions in determining the fair value of investments)
The aggregate value by input level, as of March 31, 2010, for each Fund’s investments is included at the end of each Fund’s Schedule of Investments.
Security Transactions, Investment Income and Realized Gain and Loss – Investment transactions are accounted for on trade date. Income and capital gains on some foreign securities may be subject to foreign withholding taxes, which are accrued as applicable. Interest income is recorded on an accrual basis. Premium and discount is amortized and accreted in accordance with GAAP. Identified cost of investments sold is used to determine the gain and loss for both financial statement and Federal income tax purposes.
Foreign Currency Translations – Foreign currency amounts are translated into U.S. dollars as follows: (i) assets and liabilities at the rate of exchange at the end of the respective period; and (ii) purchases and sales of securities and income and expenses at the rate of exchange prevailing on the dates of such transactions. The portion of the results of operations arising from changes in the
| | | | |
| | |
| | | 23 | | |
NOTESTO FINANCIAL STATEMENTS
MARCH 31, 2010
exchange rates and the portion due to fluctuations arising from changes in the market prices of securities are not isolated. Such fluctuations are included with the net realized and unrealized gain or loss on investments.
Each Fund may enter into transactions to purchase or sell foreign currencies to protect the U.S. dollar value of its underlying portfolio securities against the effect of possible adverse movements in foreign exchange rates. Principal risks associated with such transactions include the movement in value of the foreign currency relative to the U.S. dollar and the ability of the counterparty to perform. Fluctuations in the value of such forward currency transactions are recorded daily as unrealized gain or loss; realized gain or loss includes net gain or loss on transactions that have terminated by settlement or by each Fund entering into offsetting commitments. These instruments involve market risk, credit risk, or both kinds of risks, in excess of the amount recognized in the Statement of Assets and Liabilities. Risks arise from the possible inability of counterparties to meet the terms of their contracts and from movement in currency and securities values and interest rates.
Foreign Currency Transactions – Each Fund may enter into transactions to purchase or sell foreign currency contracts and options on foreign currency. Forward currency contracts are agreements to exchange one currency for another at a future date and at a specified price. Each Fund may use forward currency contracts to facilitate transactions in foreign securities and to manage each Fund’s foreign currency exposure. These contracts are intrinsically valued daily based on forward rates, and each Fund’s net equity therein, representing unrealized gain or loss on the contracts as measured by the difference between the forward foreign exchange rates at the dates of entry into the contracts and the forward rates at the reporting date, is recorded as a component of net asset value. Due to the risk associated with these transactions, each Fund could incur losses up to the entire contract amount, which may exceed the net unrealized value included in its net asset value.
The values of each individual forward currency contract outstanding as of March 31, 2010, are disclosed in each Fund’s notes to the Schedule of Investments.
The volume of open currency positions may vary on a daily basis as each Fund transacts currency contracts in order to achieve the exposure desired by the adviser. During the period ended March 31, 2010, the Merk Hard Currency Fund, Merk Asian Currency Fund and Merk Absolute Return Currency Fund entered into an aggregated total notional value of $156,971,920, $540,323,640 and $919,592,417, respectively, on forward currency contracts. Additionally, the Merk Hard Currency Fund entered into a total value of $181,601,371 on spot currency contracts for the year ended March 31, 2010.
Futures Contracts – Each Fund may purchase futures contracts to gain exposure to market changes, which may be more efficient or cost effective than actually buying the securities. A futures contract is an agreement between parties to buy or sell a security at a set price on a future date. Upon entering into such a contract, each Fund is required to pledge to the broker an amount of cash, U.S. Government obligations or other high-quality debt securities equal to the minimum “initial margin” requirements of the exchange on which the futures contract is traded. Pursuant to the contract, each Fund agrees to receive from or pay to the broker an amount of cash equal to the daily fluctuation in the value of the contract. Such receipts or payments are known as “variation margin” and are recorded by each Fund as unrealized gains or losses. When the contract is closed, each Fund records a realized gain or loss equal to the difference between the value of the contract at the time it was opened and value at the time it was closed. Risks of entering into futures contracts include the possibility that there may be an illiquid market and that a change in the value of the contract may not correlate with changes in the value of the underlying securities.
Notional amounts of each individual futures contract outstanding as of March 31, 2010, are disclosed in the notes to the Merk Hard Currency Fund’s Schedule of Investments. The volume of open positions may vary on a daily basis as the Fund transacts futures contracts in order to achieve the exposure desired by the adviser. The Fund entered into a total notional amount of $34,131,880 on futures contracts for the year ended March 31, 2010.
Derivatives Transactions – Each Fund’s use of derivatives during the period ended March 31, 2010, was limited to forward currency contracts and futures. Following is a summary of how the derivatives are treated in the financial statements and their impact on each Fund.
| | | | |
| | |
| | | 24 | | |
NOTESTO FINANCIAL STATEMENTS
MARCH 31, 2010
The location on the Statements of Assets and Liabilities of each Fund’s derivative positions by type of exposure, all of which are not accounted for as hedging instruments as required by the Derivatives and Hedging Topic of the FASB Accounting Standards Codification, is as follows:
| | | | | | | | | | | |
Fund Contract Type/
Primary Risk Exposure
| | Location on
Statement of Assets and
Liabilities
| | Asset
Derivatives
| | Location on
Statement of Assets and
Liabilities
| | Liability
Derivatives
| |
Merk Hard Currency Fund | | | | | | | | | | | |
| | | | |
Commodity Contracts | | Receivable-Variation
Margin | | $ | 52,670 | | Payable-Variation
Margin | | $ | - | |
| | | | |
Forward Currency Contracts | | Unrealized gain on
forward currency
contracts | | $ | - | | Unrealized loss on
forward currency
contracts | | $ | (893 | ) |
Merk Asian Currency Fund | | | | | | | | | | | |
| | | | |
Forward Currency Contracts | | Unrealized gain on
forward currency
contracts | | $ | 499,727 | | Unrealized loss on
forward currency
contracts | | $ | (301,968 | ) |
Merk Absolute Return Currency Fund | | | | | | | | | | | |
| | | | |
Forward Currency Contracts | | Unrealized gain on
forward currency
contracts | | $ | 1,134,815 | | Unrealized loss on
forward currency
contracts | | $ | (1,615,530 | ) |
Realized and unrealized gains and losses on derivatives contracts entered into during the period ended March 31, 2010, by each Fund are recorded in the following locations in the Statement of Operations:
| | | | | | | | | | |
Fund Contract Type/
Primary Risk Exposure
| | Location of Gain or (Loss) on Derivatives
| | Realized Gain
(Loss) on
Derivatives
| | | Change in
Unrealized
Appreciation
(Depreciation) on
Derivatives
| |
Merk Hard Currency Fund | | | | | | | | | | |
| | | |
Commodity Contracts | | Net realized gain (loss) – Futures and Net change in unrealized appreciation (depreciation) – Futures | | $ | 1,037,122 | | | $ | 126,530 | |
| | | |
Forward Currency Contracts | | Net realized gain (loss) – foreign currency transactions and Net change in unrealized appreciation (depreciation) – foreign currency translations | | $ | (457,149 | ) | | $ | (893 | ) |
Merk Asian Currency Fund | | | | | | | | | | |
| | | |
Forward Currency Contracts | | Net realized gain (loss) – foreign currency transactions and Net change in unrealized appreciation (depreciation) – foreign currency translations | | $ | 1,525,260 | | | $ | (10,653 | ) |
Merk Absolute Return Currency Fund | | | | | | | | | | |
| | | |
Forward Currency Contracts | | Net realized gain (loss) – foreign currency transactions and Net change in unrealized appreciation (depreciation) – foreign currency translations | | $ | (225,232 | ) | | $ | (480,715 | ) |
Restricted Securities – Each Fund may invest in securities that are subject to legal or contractual restrictions on resale (“restricted securities”). Restricted securities may be resold in transactions that are exempt from registration under the Federal securities laws or if the securities are registered to the public. The sale or other disposition of these securities may involve additional expenses and
| | | | |
| | |
| | | 25 | | |
NOTESTO FINANCIAL STATEMENTS
MARCH 31, 2010
the prompt sale of these securities at an acceptable price may be difficult. Information regarding restricted securities held by each Fund is included in their respective Schedule of Investments, if applicable.
Distributions to Shareholders – Distributions to shareholders of net investment income, if any, are declared and paid at least quarterly. Distributions to shareholders of net capital gains, if any, are declared and paid annually. Distributions are based on amounts calculated in accordance with applicable Federal income tax regulations, which may differ from GAAP. These differences are due primarily to differing treatments of income and gain on various investment securities held by each Fund, timing differences and differing characterizations of distributions made by each Fund.
Federal Taxes – Each Fund intends to qualify each year as a regulated investment company under Subchapter M of the Internal Revenue Code and distribute all of their taxable income to shareholders. In addition, by distributing in each calendar year substantially all their net investment income and capital gains, if any, the Funds will not be subject to a Federal excise tax. Therefore, no Federal income or excise tax provision is required.
As of March 31, 2010, there are no uncertain tax positions that would require financial statement recognition, de-recognition, or disclosure. The Merk Hard Currency Fund’s Federal tax returns filed in the three-year period ended March 31, 2010, remain subject to examination by the Internal Revenue Service. The Merk Asian Currency Fund’s Federal tax return filed in the two-year period ended March 31, 2010, will be subject to examination by the Internal Revenue Service. The Merk Absolute Return Currency Fund’s Federal tax return filed for the period ended March 31, 2010, will be subject to examination by the Internal Revenue Service.
Income and Expense Allocation – The Trust accounts separately for the assets, liabilities and operations of each of its investment portfolios. Expenses that are directly attributable to more than one investment portfolio are allocated among the respective investment portfolios in an equitable manner.
Commitments and Contingencies – In the normal course of business, each Fund enters into contracts that provide general indemnifications by each Fund to the counterparty to the contract. Each Fund’s maximum exposure under these arrangements is dependent on future claims that may be made against each Fund and, therefore, cannot be estimated; however, based on experience, the risk of loss from such claims is considered remote.
NOTE 3. Advisory Fees, Servicing Fees and Other Transactions
Investment Adviser – Merk Investments, LLC, (the “Adviser”) is the investment adviser to each Fund. Pursuant to an Investment Advisory Agreement, the Adviser receives an advisory fee from each Fund at an annual rate of 1.00% of each Fund’s average daily net assets.
Under the terms of the Investment Advisory Agreement, the Adviser provides investment advisory services to each Fund and is obligated to pay all expenses of each Fund except any expenses it is authorized to pay under Rule 12b-1, brokerage costs, commissions, borrowing costs, taxes, the transfer agent’s basis point fees, and extraordinary and non-recurring expenses.
Distribution – Foreside Fund Services, LLC serves as each Fund’s distributor (the “Distributor”). The Distributor is not affiliated with the Adviser or with Atlantic Fund Administration, LLC (“Atlantic”) or their affiliates. The Funds have adopted a Distribution Plan (the “Plan”) in accordance with Rule 12b-1 of the Act. Under the Plan, the Funds pay the Distributor and/or any other entity as authorized by the Board a fee of up to 0.25% of the average daily net assets of each Fund for the marketing of fund shares and for services provided to shareholders.
Other Service Providers – Atlantic provides fund accounting, fund administration, and transfer agency services to each Fund. Atlantic provides a Principal Executive Officer, a Principal Financial Officer, a Chief Compliance Officer, and an Anti-Money Laundering Officer to each Fund, as well as certain additional compliance support functions.
For the period ended March 31, 2010, the Adviser paid compliance service fees of $21,662 for the Merk Hard Currency Fund, $7,851 for the Merk Asian Currency Fund, and $3,293 for the Merk Absolute Return Currency Fund, from fees collected under the Investment Advisory Agreement.
NOTE 4. Security Transactions
The cost of purchases and proceeds from sales of investment securities (including maturities), other than short-term investments for the year ended March 31, 2010, were $87,211,940 and $19,809,467, respectively for the Merk Hard Currency Fund.
The Merk Asian Currency Fund and Merk Absolute Return Currency Fund did not purchase or sell any investment securities (including maturities), other than short-term investments for the year ended March 31, 2010.
| | | | |
| | |
| | | 26 | | |
NOTESTO FINANCIAL STATEMENTS
MARCH 31, 2010
NOTE 5. Federal Income Tax and Investment Transactions
Distributions during the fiscal years ended as noted were characterized for tax purposes as follows:
| | | | | | | | | |
| | | Ordinary Income
| | Long-Term
Capital Gain
| | Total
|
Merk Hard Currency Fund | | | | | | | | | |
2010 | | $ | 5,203,694 | | $ | 2,592,556 | | $ | 7,796,250 |
2009 | | | 3,114,602 | | | 2,061,302 | | | 5,175,904 |
Merk Asian Currency Fund | | | | | | | | | |
2010 | | | 328,281 | | | - | | | 328,281 |
As of March 31, 2010, distributable earnings (accumulated loss) on a tax basis were as follows:
| | | | | | | | | | | | | | | | | |
| | | Undistributed
Ordinary Income
| | Undistributed
Long-Term Gain
| | Capital and
Other Losses
| | | Unrealized
Appreciation
on Investments
and Foreign
Currency
Translations
| | Total
| |
Merk Hard Currency Fund | | $ | 2,919,222 | | $ | 3,994,195 | | $ | (3,120,129 | ) | | $ | 10,926,455 | | $ | 14,719,743 | |
Merk Asian Currency Fund | | | 108,210 | | | - | | | - | | | | 400,270 | | | 508,480 | |
Merk Absolute Return Currency Fund | | | - | | | - | | | (423,589 | ) | | | 1,459 | | | (422,130 | ) |
The difference between components of distributable earnings on a tax basis and the amounts reflected in the Statement of Assets and Liabilities are primarily due to deferral of post October losses, forward currency contracts, grantor trust adjustments, bond bifurcation and non-deductible offering costs.
For tax purposes, the current year post-October loss was $3,120,129 and $423,589 (realized during the period November 1, 2009, through March 31, 2010) for Merk Hard Currency Fund and Merk Absolute Return Currency Fund, respectively. These losses will be recognized for tax purposes on the first business day of each Fund’s next fiscal year, April 1, 2010.
On the Statement of Assets and Liabilities, as a result of permanent book to tax differences, certain amounts have been reclassified for the year ended March 31, 2010. The following reclassifications were the result of currency gain/loss reclassifications, grantor trust adjustments, redesignation of distributions, non-deductible offering costs and net operating losses and have no impact on the net assets of each Fund.
| | | | | | | | | | | |
| | | Accumulated Net
Investment
Income
| | Undistributed
Net Realized
Gain (Loss)
| | | Paid-in-Capital
| |
Merk Hard Currency Fund | | $ | 21,427,120 | | $ | (21,427,120 | ) | | $ | - | |
Merk Asian Currency Fund | | | 1,523,700 | | | (1,523,700 | ) | | | - | |
Merk Absolute Return Currency Fund | | | 211,606 | | | 282,968 | | | | (494,574 | ) |
NOTE 6. Recent Accounting Pronouncements
In January 2010, the Financial Accounting Standards Board issued Accounting Standards Update (“ASU”) No. 2010-06 “Improving Disclosures about Fair Value Measurements.” ASU No. 2010-06 clarifies existing disclosure and requires additional disclosures regarding fair value measurements. Effective for interim and annual reporting periods beginning after December 15, 2009, entities are required to disclose significant transfers into and out of Level 1 and 2 measurements in the fair value hierarchy and the reasons for those transfers. Effective for fiscal years beginning after December 15, 2010, and for interim periods within those fiscal years, entities will need to disclose information about purchases, sales, issuances and settlements of Level 3 securities on a gross basis, rather than as a net number as currently required. Management is currently evaluating the impact ASU No. 2010-06 will have on its financial statement disclosures.
NOTE 7. Subsequent Events
Effective April 1, 2010, Institutional Shares of each Fund are available for investment.
Subsequent events occurring after the date of this report have been evaluated for potential impact and Management has determined that, except as set forth above, there are no material subsequent events requiring financial statement disclosure.
| | | | |
| | |
| | | 27 | | |
REPORTOF INDEPENDENT REGISTERED PUBLICACCOUNTING FIRM
To the Board of Trustees of Forum Funds and the Shareholders of Merk Hard Currency Fund, Merk Asian Currency Fund and Merk Absolute Return Currency Fund
We have audited the accompanying statements of assets and liabilities of Merk Hard Currency Fund, Merk Asian Currency Fund and Merk Absolute Return Currency Fund, each a series of shares of beneficial interest in the Forum Funds, including the schedules of investments, as of March 31, 2010, and the related statements of operations for the year then ended and for the period September 9, 2009 through March 31, 2010 (Commencement of Operations for Merk Absolute Return Currency Fund), and changes in net assets and the financial highlights for each of the years or period in the two year period then ended. These financial statements and financial highlights are the responsibility of the Funds’ management. Our responsibility is to express an opinion on these financial statements and financial highlights based on our audits. The financial highlights for Merk Hard Currency Fund for each of the years in the two-year period ended March 31, 2008, and for the period from May 10, 2005 (commencement of operations) through March 31, 2006 were audited by other auditors whose report dated May 28, 2008, expressed an unqualified opinion on such financial highlights.
We conducted our audits in accordance with the standards of the Public Company Accounting Oversight Board (United States). Those standards require that we plan and perform the audits to obtain reasonable assurance about whether the financial statements and financial highlights are free of material misstatement. An audit includes examining, on a test basis, evidence supporting the amounts and disclosures in the financial statements. Our procedures included confirmation of securities owned as of March 31, 2010 by correspondence with the custodian and brokers. An audit also includes assessing the accounting principles used and significant estimates made by management, as well as evaluating the overall financial statement presentation. We believe that our audits provide a reasonable basis for our opinion.
In our opinion, the financial statements and financial highlights referred to above present fairly, in all material respects, the financial position of Merk Hard Currency Fund, Merk Asian Currency Fund and Merk Absolute Return Currency Fund as of March 31, 2010, and the results of their operations for the year or period then ended, and the changes in their net assets and their financial highlights for each of the years or period in the two year period then ended, in conformity with accounting principles generally accepted in the United States of America.

BBD, LLP
Philadelphia, Pennsylvania
May 25, 2010
| | | | |
| | |
| | | 28 | | |
ADDITIONAL INFORMATION (UNAUDITED)
MARCH 31, 2010
Proxy Voting Information
A description of the policies and procedures that each Fund uses to determine how to vote proxies relating to securities held in each Fund’s portfolio is available, without charge and upon request, by calling (866) 637-5386 and on the SEC’s website at www.sec.gov. Each Fund’s proxy voting record for the most recent twelve-month period ended June 30 is available, without charge and upon request, by calling (866) 637-5386 and on the SEC’s website at www.sec.gov. For the year ended March 31, 2010, the Funds did not own any securities for which a shareholder meeting was called and voted on.
Availability of Quarterly Portfolio Schedules
Each Fund files its complete schedule of portfolio holdings with the SEC for the first and third quarters of each fiscal year on Form N-Q. Each Fund’s Forms N-Q are available, without charge and upon request on the SEC’s website at www.sec.gov or may be reviewed and copied at the SEC’s Public Reference Room in Washington DC. Information on the operation of the Public Reference Room may be obtained by calling 1-800-SEC-0330.
Shareholder Expense Example
As a shareholder of the Funds, you incur ongoing costs, including management fees, distribution (12b-1) fees and other Fund expenses. This example is intended to help you understand your ongoing costs (in dollars) of investing in the Funds, and to compare these costs with the ongoing costs of investing in other mutual funds.
The example is based on an investment of $1,000 invested at the beginning of the period and held for the entire period from October 1, 2009, through March 31, 2010.
Actual Expenses – The first line under each Fund in the table below provides information about actual account values and actual expenses. You may use the information in this line, together with the amount you invested, to estimate the expenses that you paid over the period. Simply divide your account value by $1,000 (for example, an $8,600 account value divided by $1,000 = 8.6), then multiply the result by the number in the first line under the heading entitled “Expenses Paid During Period” to estimate the expenses you paid on your account during the period.
Hypothetical Example for Comparison Purposes – The second line under each Fund of the table below provides information about hypothetical account values and hypothetical expenses based on each Fund’s actual expense ratio and an assumed rate of return of 5% per year before expenses, which is not each Fund’s actual return. The hypothetical account values and expenses may not be used to estimate the actual ending account balance or expenses you paid for the period. You may use this information to compare the ongoing cost of investing in each Fund and other funds. To do so, compare this 5% hypothetical example with the 5% hypothetical examples that appear in the shareholder reports of other funds.
Please note that expenses shown in the table are meant to highlight your ongoing costs only. Therefore, the second line of the table is useful in comparing ongoing costs only, and will not help you determine the relative total costs of owning different funds.
| | | | | | | | | | | |
| | | Beginning
Account Value
October 1, 2009 | | Ending
Account Value
March 31, 2010 | | Expenses Paid
During Period* | | Annualized
Expense Ratio* |
Merk Hard Currency Fund | | | | | | | | | | | |
Actual | | $ | 1,000.00 | | $ | 996.81 | | $ | 6.47 | | 1.30% |
Hypothetical
(5% return before expenses) | | $ | 1,000.00 | | $ | 1,018.45 | | $ | 6.54 | | 1.30% |
Merk Asian Currency Fund | | | | | | | | | | | |
Actual | | $ | 1,000.00 | | $ | 1,000.43 | | $ | 6.48 | | 1.30% |
Hypothetical
(5% return before expenses) | | $ | 1,000.00 | | $ | 1,018.45 | | $ | 6.54 | | 1.30% |
Merk Absolute Return Currency Fund | | | | | | | | | | | |
Actual | | $ | 1,000.00 | | $ | 970.21 | | $ | 6.39 | | 1.30% |
Hypothetical
(5% return before expenses) | | $ | 1,000.00 | | $ | 1,018.45 | | $ | 6.54 | | 1.30% |
| * | Expenses are equal to each Fund’s annualized expense ratio as indicated above multiplied by the average account value over the period, multiplied by the number of days in the most recent fiscal half-year divided by 365 to reflect the half-year period. |
| | | | |
| | |
| | | 29 | | |
ADDITIONAL INFORMATION (UNAUDITED)
MARCH 31, 2010
Federal Tax Status of Dividends Declared during the Tax Year
For Federal income tax purposes, dividends from short-term capital gains are classified as ordinary income. The Merk Hard Currency Fund designates 0.06% as qualified interest income exempt from U.S. tax for foreign shareholders (QII). The Merk Asian Currency Fund designates 18.25% as QII and 100.00% as short-term capital gain dividends exempt from U.S. tax for foreign shareholders (QSD).
Trustees and Officers of the Trust
The Board is responsible for oversight of the management of the Trust’s business affairs and of the exercise of all the Trust’s powers except those reserved for the shareholders. The following table provides information about each Board member and certain officers of the Trust. Each Trustee and officer holds office until the person resigns, is removed, or is replaced. Unless otherwise noted, the persons have held their principal occupations for more than five years. The address for all Trustees and officers is Three Canal Plaza, Suite 600, Portland, Maine 04101, unless otherwise indicated. Each Trustee oversees thirty-two portfolios in the Trust. Mr. Keffer is considered an Interested Trustee due to his affiliation with Atlantic. Mr. Keffer is also an Interested Director of Wintergreen Fund, Inc. Each Fund’s Statement of Additional Information includes additional information about the Trustees and is available, without charge and upon request, by calling (866) 637-5386.
| | | | | | |
Name
and Year of Birth | | Position with
the Trust | | Length of Time Served | | Principal Occupation(s) During Past 5 Years |
| Independent Trustees | | | | | | |
J. Michael Parish Born: 1943 | | Chairman of the Board; Trustee; Chairman, Nominating Committee and Qualified Legal Compliance Committee | | Since 1989 (Chairman since 2004) | | Retired since 2003. |
Costas Azariadis Born: 1943 | | Trustee; Chairman, Valuation Committee | | Since 1989 | | Professor of Economics, Washington University since 2006; Professor of Economics, University of California-Los Angeles 1992 – 2006. |
James C. Cheng Born: 1942 | | Trustee; Chairman, Audit Committee | | Since 1989 | | President, Technology Marketing Associates (marketing company for small- and medium-sized businesses in New England) since 1991. |
| Interested Trustee | | | | | | |
John Y. Keffer1 Born: 1942 | | Trustee; Vice Chairman | | Since 1989 | | Chairman, Atlantic since 2008; President, Forum Foundation (a charitable organization) since 2005; President, Forum Trust, LLC (a non-depository trust company chartered in the State of Maine) since 1997. |
| 1 | Since 1997, John Y. Keffer has been president and owner of Forum Trust, LLC. Prior to January 1, 2010, Atlantic was a wholly owned subsidiary of Forum Trust, LLC. Effective January 1, 2010, Atlantic became a wholly owned subsidiary of Forum Holdings Corp., a Delaware corporation that is wholly owned by Mr. Keffer. |
| | | | |
| | |
| | | 30 | | |
ADDITIONAL INFORMATION (UNAUDITED)
MARCH 31, 2010
| | | | | | |
Name
and Year of Birth | | Position with
the Trust | | Length of
Time Served | | Principal Occupation(s) During Past 5 Years |
| Officers | | | | | | |
Stacey E. Hong Born: 1966 | | President; Principal Executive Officer | | Since 2008 | | President, Atlantic since 2008; Director, Consulting Services, Foreside Fund Services 2007; Elder Care, 2005 – 2006. |
Karen Shaw Born: 1972 | | Treasurer; Principal Financial Officer | | Since 2008 | | Senior Manager, Atlantic since 2008; Section Manager/Vice President, Enterprise Support Services, Citigroup 2003 – 2008. |
David Faherty Born: 1970 | | Vice President | | Since 2009 | | Senior Counsel, Atlantic since 2009; Vice President, Citi Fund Services Ohio, Inc. 2007 – 2009.; Associate Counsel, Investors Bank & Trust Co. 2006 – 2007; FDIC 2005. |
Michael J. McKeen Born: 1971 | | Vice President | | Since 2009 | | Senior Manager, Atlantic since 2008; Vice President, Citigroup 2003 – 2008. |
Joshua LaPan Born: 1973 | | Vice President | | Since 2009 | | Manager, Atlantic since 2008; Vice President, Citigroup 2003 – 2008. |
Timothy Bowden Born: 1969 | | Vice President | | Since 2009 | | Manager, Atlantic since 2008; Vice President, Citigroup 2005 – 2008. |
Lina Bhatnagar Born: 1971 | | Secretary | | Since 2008 | | Senior Administration Specialist, Atlantic since 2008; Regulatory Administration Specialist, Citigroup 2006 – 2008. |
| | | | |
| | |
| | | 31 | | |

HARD CURRENCY FUND
ASIAN CURRENCY FUND
ABSOLUTE RETURN CURRENCY FUND
P.O. BOX 588
PORTLAND, ME 04112
208-ANR-0310
FOR MORE INFORMATION
INVESTMENT ADVISER
Merk Investments, LLC
555 Bryant Street #455
Palo Alto, CA 94301
www.merkfunds.com
TRANSFER AGENT
Atlantic Fund Administration, LLC
P.O. Box 588
Portland, ME 04112
DISTRIBUTOR
Foreside Fund Services, LLC
Three Canal Plaza, Suite 100
Portland, ME 04101
www.foreside.com
This report is submitted for the general information of the shareholders of each Fund. It is not authorized for distribution to prospective investors unless preceded or accompanied by an effective prospectus, which includes information regarding each Fund’s risks, objectives, fees and expenses, experience of its management and other information.

ANNUAL REPORT
MARCH 31, 2010
PAYSONTOTAL RETURN FUND

TABLE OF CONTENTS
MARCH 31, 2010
IMPORTANT INFORMATION
The recent growth rate in the global equity markets has helped to produce short-term returns for some sectors/asset classes that are not typical and may not continue in the future. Because of ongoing market volatility, Payson Total Return Fund (the “Fund”) performance may be subject to substantial short-term changes.
The views in this report are those of the Fund’s investment adviser, H.M. Payson & Co. as of March 31, 2010, and may not reflect their views on the date this report is first published or anytime thereafter. This report may contain discussions about investments that may or may not be held by the Fund as of the date of this report. Holdings and allocations are subject to risks and to change. These views are intended to assist shareholders in understanding their investment in the Fund and do not constitute investment advice.
An investment in the Fund is subject to risk, including the possible loss of principal. Other Fund risks include interest rate risk, credit risks and liquidity risk. In addition, the Fund invests in midcap companies which pose greater risks than those associated with larger, more established companies. There is no assurance that the Fund will achieve its investment objective.
The S&P 500 Index is a broad-based, unmanaged measurement of changes in stock market conditions based on the average of 500 widely held common stocks. One cannot invest directly in an index.
A MESSAGE TO OUR SHAREHOLDERS
March 31, 2010
Dear Payson Total Return Fund Shareholder:
The year ending March 31, 2010 saw one of the largest rallies ever in U.S. equity markets, as the S&P 500 Index produced a total return of 49.77%. The rally in equities extended to the mid and small capitalized companies in the U.S., and to the equity markets of most countries across the globe. The spreads between riskier fixed income instruments and U.S. treasuries collapsed, prompting a strong rally in the prices of most fixed income asset classes except U.S. treasuries, which had modest declines in value for the fiscal year.
For the fiscal year, we are pleased to report that the Payson Total Return Fund produced a total return of 65.44%, outperfoming the S&P 500 Index by 15.67%. While the absolute returns from equities during the first decade of the 21st century were modest, we are also pleased to report that the Fund has outperformed the S&P 500 Index for the trailing one, three, five, and ten year periods ending March 31, 2010. One dollar invested in the Fund on March 31, 2000 would have been worth $1.34 on March 31, 2010, while the same investment for the same time frame in the S&P 500 Index would have been worth $0.94.
For a longer-term perspective, the Fund’s one-year, five-year and ten-year average annual total returns for the period ended March 31, 2010, were 65.44%, 2.47% and 2.96%, respectively. Performance data quoted represents past performance and is no guarantee of future results. Current performance may be lower or higher than the performance data quoted. Investment return and principal value will fluctuate so that an investor’s shares, when redeemed, may be worth more or less than original cost. As stated in the current prospectus, the Fund’s annual gross operating expense ratio is 1.78%. For the most recent month end performance, please call (800)805-8258. Total returns include reinvestment of dividends and capital gains. For the period reported, some of the Fund’s fees were waived or expenses reimbursed, otherwise total return would have been lower.
A year ago in the 2009 Annual Report of the Payson Total Return Fund, we cautioned clients against shifting away from risky assets and that “while fear is great and the current situation is indeed serious, comparisons to the Great Depression were grossly premature if not absurd”. While fear was rampant following the two year collapse in equity prices that culminated in March of 2009, we positioned the Fund more aggressively. Positions in high yield bonds and in emerging market equity were established. We reduced our exposure to health care and consumer staples, and increased exposure to more economically sensitive sectors including consumer discretionary, basic materials, and industrials. Our more aggressive stance led to the Fund’s outperformance during the recently completed fiscal year.
The dramatic appreciation in the stock and bond markets reduces our expectations for future returns, and indeed, leaves them both overvalued in our opinion — especially the bond market. Today, stock and bond prices are discounting a strong and sustained earnings recovery against a backdrop of recovering but still very shaky economic conditions, we think it is time to err on the side of caution in the Fund’s portfolio.
Last year the stocks of companies that were more exposed to the economic cycle did far better than their stronger brethren since they were rebounding off lower lows. We believe these stocks for the most part have come too far too fast, and have shifted the Fund portfolio away from such stocks to those of companies
1
that historically generate high levels of free cash flow and compelling balance sheet strength. Such companies appear poised to weather even the toughest economic environment. Now is not the time to reach for return and definitely not the time to chase yields. It is a time to reduce risk and be prepared to accept much lower returns until opportunities improve. If the markets perform better than we now expect and our defensive portfolio stance turns out to be too conservative, we are confident the returns we might miss will cost our shareholders less sleep than the losses we may otherwise avoid if our outlook turns out to be correct.
As always, we thank you for your continued confidence in H.M. Payson & Co.
2
PAYSON TOTAL RETURN FUND
PERFORMANCE CHART AND ANALYSIS
MARCH 31, 2010
The following chart reflects the change in the value of a hypothetical $10,000 investment, including reinvested dividends and distributions, in the Payson Total Return Fund (the “Fund”) compared with the performance of the Standard and Poor’s 500 Index (“S&P 500”), over the past 10 fiscal years. The S&P 500 is a market-value weighted index representing the performance of 500 widely held, publicly traded stocks. The total return of the S&P 500 includes reinvestment of dividends and income. The total return of the Fund includes operating expenses that reduce returns, while the total return of the S&P 500 does not include expenses. The Fund is professionally managed while the S&P 500 is unmanaged and is not available for investment.
Performance data quoted represents past performance and is no guarantee of future results. Current performance may be lower or higher than the performance data quoted. Investment return and principal value will fluctuate so that shares, when redeemed, may be worth more or less than original cost. For the most recent month-end performance please call (800) 805-8258. As stated in the Fund’s prospectus, the annual operating expense ratio (gross) is 1.78%. The performance table and graph do not reflect the deduction of taxes that a shareholder would pay on Fund distributions or the redemption of Fund shares. Returns greater than one year are annualized.
Comparison of Change in Value of a $10,000 Investment
PAYSON TOTAL RETURN FUND
vs. S&P 500 INDEX
| | | | |
| | |
Average Annual Total Return on 03/31/10
| | Fund
| | S&P 500
|
One Year: | | 65.44% | | 49.77% |
Five Year: | | 2.47% | | 1.92% |
Ten Year: | | 2.96% | | (0.65)% |
| | |
Investment Value on 03/31/10
| | | | |
Payson Total Return Fund: | | $13,387 | | |
S&P 500 Index: | | $9,365 | | |
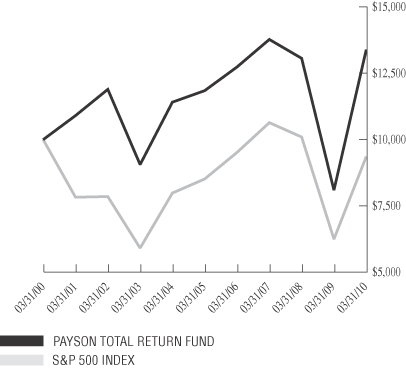
3
PAYSON TOTAL RETURN FUND
SCHEDULE OF INVESTMENTS
MARCH 31, 2010
| | | | | |
Shares
| | Security Description
| | Value
|
| | | | | | |
Common Stock — 96.5% | | | |
Consumer Discretionary — 11.0% | | | |
| 10,500 | | Aeropostale, Inc.(a) | | $ | 302,715 |
| 18,044 | | Best Buy Co., Inc. | | | 767,592 |
| 28,925 | | Hasbro, Inc. | | | 1,107,249 |
| 19,500 | | Polaris Industries, Inc. | | | 997,620 |
| 22,300 | | TJX Cos., Inc. | | | 948,196 |
| | | | |
|
|
| | | | | | 4,123,372 |
| | | | |
|
|
| |
Consumer Staples — 13.4% | | | |
| 12,500 | | Diageo PLC, ADR | | | 843,125 |
| 37,150 | | Kraft Foods, Inc. | | | 1,123,416 |
| 14,850 | | The Procter & Gamble Co. | | | 939,559 |
| 31,780 | | Walgreen Co. | | | 1,178,720 |
| 17,245 | | Wal-Mart Stores, Inc. | | | 958,822 |
| | | | |
|
|
| | | | | | 5,043,642 |
| | | | |
|
|
| |
Energy — 15.0% | | | |
| 16,000 | | BP PLC, ADR | | | 913,120 |
| 18,896 | | ConocoPhillips | | | 966,908 |
| 27,000 | | Exxon Mobil Corp. | | | 1,808,460 |
| 23,370 | | Noble Corp. | | | 977,333 |
| 22,480 | | Unit Corp.(a) | | | 950,454 |
| | | | |
|
|
| | | | | | 5,616,275 |
| | | | |
|
|
| |
Financial — 13.1% | | | |
| 21,050 | | Aflac, Inc. | | | 1,142,805 |
| 67,386 | | Annaly Capital Management, Inc., REIT | | | 1,157,691 |
| 53,000 | | Bank of America Corp. | | | 946,050 |
| 26,300 | | HCC Insurance Holdings, Inc. | | | 725,880 |
| 12,100 | | JPMorgan Chase & Co. | | | 541,475 |
| 9,300 | | State Street Corp. | | | 419,802 |
| | | | |
|
|
| | | | | | 4,933,703 |
| | | | |
|
|
| |
Health Care — 14.4% | | | |
| 12,580 | | Becton Dickinson and Co. | | | 990,423 |
| 16,855 | | Johnson & Johnson | | | 1,098,946 |
| | | | | |
Shares
| | Security Description
| | Value
|
| | | | | | |
Health Care — (Continued) | | | |
| 9,500 | | Laboratory Corp. of America Holdings(a) | | $ | 719,245 |
| 18,585 | | Medtronic, Inc. | | | 836,883 |
| 53,500 | | Pfizer, Inc. | | | 917,525 |
| 36,300 | | Pharmaceutical Product Development, Inc. | | | 862,125 |
| | | | |
|
|
| | | | | | 5,425,147 |
| | | | |
|
|
| |
Industrials — 12.0% | | | |
| 33,000 | | ABB, Ltd., ADR | | | 720,720 |
| 23,800 | | FLIR Systems, Inc.(a) | | | 671,160 |
| 15,545 | | General Dynamics Corp. | | | 1,200,074 |
| 18,700 | | ITT Corp. | | | 1,002,507 |
| 12,500 | | United Technologies Corp. | | | 920,125 |
| | | | |
|
|
| | | | | | 4,514,586 |
| | | | |
|
|
| |
Materials — 3.2% | | | |
| 14,472 | | Freeport-McMoRan Copper & Gold, Inc. | | | 1,208,991 |
| | | | |
|
|
| |
Technology — 14.4% | | | |
| 1,100 | | Google, Inc., Class A(a) | | | 623,711 |
| 23,930 | | Harris Corp. | | | 1,136,436 |
| 17,900 | | Hewlett-Packard Co. | | | 951,385 |
| 6,100 | | IBM | | | 782,325 |
| 27,265 | | Microsoft Corp. | | | 798,047 |
| 59,800 | | Tyler Technologies, Inc.(a) | | | 1,121,848 |
| | | | |
|
|
| | | | | | 5,413,752 |
| | | | |
|
|
Total Common Stock
(cost $29,430,758) | | | 36,279,468 |
| | | | |
|
|
| | | | | | | | | | |
| | | | |
Principal
| | | | Rate
| | | Maturity
| | |
| Mortgage-Backed Securities — 0.0% | | |
| $ | 443 | | GNMA Pool #394795 (cost $444) | | 7.50 | % | | 10/15/10 | | 453 |
| | | | | | | | | | |
|
See Notes to Financial Statements.
4
PAYSON TOTAL RETURN FUND
SCHEDULE OF INVESTMENTS
MARCH 31, 2010
| | | | | |
Shares
| | Security Description
| | Value
|
| | | | | | |
Investment Companies — 3.2% | | | |
| 20,000 | | iShares S&P 500 Growth Index Fund
(cost $1,190,808) | | $ | 1,198,400 |
| | | | |
|
|
Total Investments — 99.7%
(cost $30,622,010)* | | $ | 37,478,321 |
Other Assets and Liabilities, Net — 0.3% | | | 129,615 |
| | | | |
|
|
NET ASSETS — 100.0% | | $ | 37,607,936 |
| | | | |
|
|
| ADR | American Depositary Receipt |
| PLC | Public Limited Company |
| REIT | Real Estate Investment Trust |
| (a) | Non-income producing security. |
| * | Cost for Federal income tax purposes is $30,622,010, and net unrealized appreciation consists of: |
| | | | |
Gross Unrealized Appreciation | | $ | 6,961,615 | |
Gross Unrealized Depreciation | | | (105,304 | ) |
| | |
|
|
|
Net Unrealized Appreciation | | $ | 6,856,311 | |
| | |
|
|
|
The following is a summary of the inputs used to value the Fund’s investments as of March 31, 2010:
The inputs or methodology used for valuing securities are not necessarily an indication of the risk associated with investing in those securities. For more information on valuation inputs, and their aggregation into the levels used in the table below, refer to Note 2 — Security Valuation section in the accompanying Notes to Financial Statements.
| | | | | | | | | | | | |
| | | | |
| | | Level 1
| | Level 2
| | Level 3
| | Total
|
Common Stocks | | | | | | | | | | | | |
Consumer Discretionary | | $ | 4,123,372 | | $ | — | | $ | — | | $ | 4,123,372 |
Consumer Staples | | | 5,043,642 | | | — | | | — | | | 5,043,642 |
Energy | | | 5,616,275 | | | — | | | — | | | 5,616,275 |
Financial | | | 4,933,703 | | | — | | | — | | | 4,933,703 |
Health Care | | | 5,425,147 | | | — | | | — | | | 5,425,147 |
Industrials | | | 4,514,586 | | | — | | | — | | | 4,514,586 |
Materials | | | 1,208,991 | | | — | | | — | | | 1,208,991 |
Technology | | | 5,413,752 | | | — | | | — | | | 5,413,752 |
Mortgage-Backed Securities | | | — | | | 453 | | | — | | | 453 |
Investment Companies | | | 1,198,400 | | | — | | | — | | | 1,198,400 |
| | |
|
| |
|
| |
|
| |
|
|
TOTAL | | $ | 37,477,868 | | $ | 453 | | $ | — | | $ | 37,478,321 |
| | |
|
| |
|
| |
|
| |
|
|
| | |
| PORTFOLIO HOLDINGS | | |
| % of Total Investments | | |
| |
Consumer Discretionary | | 11.0% |
Consumer Staples | | 13.5% |
Energy | | 15.0% |
Financial | | 13.2% |
Health Care | | 14.5% |
Industrials | | 12.0% |
Materials | | 3.2% |
Technology | | 14.4% |
Mortgage-Backed Securities | | 0.0% |
Investment Companies | | 3.2% |
| | |
|
| | | 100.0% |
| | |
|
See Notes to Financial Statements.
5
PAYSON TOTAL RETURN FUND
STATEMENT OF ASSETS AND LIABILITIES
MARCH 31, 2010
| | | | |
ASSETS | | | | |
Total investments, at value
(Cost $30,622,010) | | $ | 37,478,321 | |
Cash | | | 509,483 | |
Receivables: | | | | |
Interest and dividends | | | 81,226 | |
Prepaid expenses | | | 4,633 | |
| | |
|
|
|
Total Assets | | | 38,073,663 | |
| | |
|
|
|
LIABILITIES | | | | |
Payables: | | | | |
Distributions | | | 106,675 | |
Portfolio securities purchased | | | 296,204 | |
Accrued Liabilities: | | | | |
Investment adviser fees | | | 18,715 | |
Compliance services fees | | | 2,216 | |
Fund service fees | | | 13,470 | |
Trustees’ fees and expenses | | | 22 | |
Other expenses | | | 28,425 | |
| | |
|
|
|
Total Liabilities | | | 465,727 | |
| | |
|
|
|
NET ASSETS | | $ | 37,607,936 | |
| | |
|
|
|
COMPONENTS OF NET ASSETS | | | | |
Paid-in capital | | $ | 32,959,220 | |
Accumulated distributions in excess of net investment income | | | (32 | ) |
Accumulated net realized loss on investments | | | (2,207,563 | ) |
Unrealized appreciation on investments | | | 6,856,311 | |
| | |
|
|
|
NET ASSETS | | $ | 37,607,936 | |
| | |
|
|
|
SHARES OF BENEFICAL INTEREST AT $0.00 PAR VALUE (unlimited shares authorized) | | | 3,014,472 | |
| | |
|
|
|
NET ASSET VALUE, OFFERING PRICE AND REDEMPTION PRICE PER SHARE | | $ | 12.48 | |
| | |
|
|
|
See Notes to Financial Statements.
6
PAYSON TOTAL RETURN FUND
STATEMENT OF OPERATIONS
YEAR ENDED MARCH 31, 2010
| | | | |
INVESTMENT INCOME | | | | |
Dividend income (Net of foreign withholding taxes of $2,245) | | $ | 676,704 | |
Interest income | | | 893 | |
| | |
|
|
|
Total Investment Income | | | 677,597 | |
| | |
|
|
|
EXPENSES | | | | |
Investment advisory fees | | | 168,167 | |
Fund service fees | | | 156,522 | |
Custody fees | | | 8,011 | |
Registration fees | | | 10,110 | |
Professional fees | | | 50,734 | |
Trustees’ fees and expenses | | | 865 | |
Compliance services fees | | | 30,815 | |
Reporting fees | | | 16,595 | |
Miscellaneous expenses | | | 9,582 | |
| | |
|
|
|
Total Expenses | | | 451,401 | |
Less fees waived | | | (5,356 | ) |
| | |
|
|
|
Net Expenses | | | 446,045 | |
| | |
|
|
|
NET INVESTMENT INCOME | | | 231,552 | |
| | |
|
|
|
NET REALIZED AND UNREALIZED GAIN ON INVESTMENTS | | | | |
Net realized gain on investments | | | 4,150,660 | |
Net change in unrealized appreciation on investments | | | 7,937,846 | |
| | |
|
|
|
NET REALIZED AND UNREALIZED GAIN ON INVESTMENTS | | | 12,088,506 | |
| | |
|
|
|
INCREASE IN NET ASSETS RESULTING FROM OPERATIONS | | $ | 12,320,058 | |
| | |
|
|
|
See Notes to Financial Statements.
7
PAYSON TOTAL RETURN FUND
STATEMENTS OF CHANGES IN NET ASSETS
| | | | | | | | |
| | | Year Ended
March 31,
2010
| | | Year Ended
March 31,
2009
| |
OPERATIONS: | | | | | | | | |
Net investment income | | $ | 231,552 | | | $ | 211,563 | |
Net realized gain (loss) on investments | | | 4,150,660 | | | | (4,928,874 | ) |
Net change in unrealized appreciation (depreciation) on investments | | | 7,937,846 | | | | (5,424,017 | ) |
| | |
|
|
| |
|
|
|
Increase (Decrease) in Net Assets Resulting from Operations | | | 12,320,058 | | | | (10,141,328 | ) |
| | |
|
|
| |
|
|
|
DISTRIBUTIONS TO SHAREHOLDERS FROM | | | | | | | | |
Net investment income | | | (217,865 | ) | | | (204,369 | ) |
Net realized gain on investments | | | — | | | | (157,685 | ) |
| | |
|
|
| |
|
|
|
Total Distributions to Shareholders | | | (217,865 | ) | | | (362,054 | ) |
| | |
|
|
| |
|
|
|
CAPITAL SHARE TRANSACTIONS | | | | | | | | |
Sale of shares | | | 12,021,589 | | | | 1,136,706 | |
Reinvestment of distributions | | | 85,298 | | | | 195,883 | |
Redemption of shares | | | (2,612,598 | ) | | | (2,394,465 | ) |
| | |
|
|
| |
|
|
|
Increase (Decrease) from Capital Share Transactions | | | 9,494,289 | | | | (1,061,876 | ) |
| | |
|
|
| |
|
|
|
Increase (Decrease) in Net Assets | | | 21,596,482 | | | | (11,565,258 | ) |
NET ASSETS: | | | | | | | | |
Beginning of year | | | 16,011,454 | | | | 27,576,712 | |
| | |
|
|
| |
|
|
|
End of year(a) | | $ | 37,607,936 | | | $ | 16,011,454 | |
| | |
|
|
| |
|
|
|
SHARE TRANSACTIONS | | | | | | | | |
Sale of shares | | | 1,140,764 | | | | 107,509 | |
Reinvestment of distributions | | | 7,056 | | | | 21,484 | |
Redemption of shares | | | (243,050 | ) | | | (229,808 | ) |
| | |
|
|
| |
|
|
|
| | | | 904,770 | | | | (100,815 | ) |
| | |
|
|
| |
|
|
|
(a) Amount includes accumulated distributions in excess of net investment income | | $ | (32 | ) | | $ | (13,719 | ) |
| | |
|
|
| |
|
|
|
See Notes to Financial Statements.
8
PAYSON TOTAL RETURN FUND
FINANCIAL HIGHLIGHTS
These financial highlights reflect selected per share data and ratios for a share outstanding throughout each year.
| | | | | | | | | | | | | | | | | | | | |
| | | Years Ended March 31,
| |
| | | 2010
| | | 2009
| | | 2008
| | | 2007
| | | 2006
| |
NET ASSET VALUE, Beginning of Year | | $ | 7.59 | | | $ | 12.48 | | | $ | 13.57 | | | $ | 12.88 | | | $ | 12.04 | |
| | |
|
|
| |
|
|
| |
|
|
| |
|
|
| |
|
|
|
INVESTMENT OPERATIONS | | | | | | | | | | | | | | | | | | | | |
Net investment income(a) | | | 0.09 | | | | 0.10 | | | | 0.11 | | | | 0.07 | | | | 0.08 | |
Net realized and unrealized gain (loss) on investments | | | 4.87 | | | | (4.82 | ) | | | (0.76 | ) | | | 0.96 | | | | 0.82 | |
| | |
|
|
| |
|
|
| |
|
|
| |
|
|
| |
|
|
|
Total from Investment Operations | | | 4.96 | | | | (4.72 | ) | | | (0.65 | ) | | | 1.03 | | | | 0.90 | |
| | |
|
|
| |
|
|
| |
|
|
| |
|
|
| |
|
|
|
DISTRIBUTIONS TO SHAREHOLDERS FROM | | | | | | | | | | | | | | | | | | | | |
Net investment income | | | (0.07 | ) | | | (0.10 | ) | | | (0.12 | ) | | | (0.06 | ) | | | (0.06 | ) |
Net realized investment gains | | | — | | | | (0.07 | ) | | | (0.32 | ) | | | (0.28 | ) | | | — | |
| | |
|
|
| |
|
|
| |
|
|
| |
|
|
| |
|
|
|
Total Distributions to Shareholders | | | (0.07 | ) | | | (0.17 | ) | | | (0.44 | ) | | | (0.34 | ) | | | (0.06 | ) |
| | |
|
|
| |
|
|
| |
|
|
| |
|
|
| |
|
|
|
NET ASSET VALUE, End of Year | | $ | 12.48 | | | $ | 7.59 | | | $ | 12.48 | | | $ | 13.57 | | | $ | 12.88 | |
| | |
|
|
| |
|
|
| |
|
|
| |
|
|
| |
|
|
|
TOTAL RETURN | | | 65.44 | % | | | (38.05 | )% | | | (5.06 | )% | | | 7.98 | % | | | 7.51 | % |
RATIOS/SUPPLEMENTARY DATA | | | | | | | | | | | | | | | | | | | | |
Net Assets at End of Year (000’s omitted) | | $ | 37,608 | | | $ | 16,011 | | | $ | 27,577 | | | $ | 30,376 | | | $ | 18,800 | |
Ratios to Average Net Assets: | | | | | | | | | | | | | | | | | | | | |
Net investment income | | | 0.83 | % | | | 0.94 | % | | | 0.80 | % | | | 0.54 | % | | | 0.66 | % |
Net expenses | | | 1.59 | % | | | 1.77 | % | | | 1.46 | % | | | 1.36 | % | | | 1.37 | % |
Gross expenses(b) | | | 1.61 | % | | | 1.78 | % | | | 1.46 | % | | | 1.85 | % | | | 1.89 | % |
PORTFOLIO TURNOVER RATE | | | 79 | % | | | 109 | % | | | 57 | % | | | 46 | % | | | 85 | % |
| (a) | Calculated based upon average shares outstanding during the year. |
| (b) | Reflects the expense ratio excluding any waivers and/or reimbursements. |
See Notes to Financial Statements.
9
PAYSON TOTAL RETURN FUND
NOTES TO FINANCIAL STATEMENTS
MARCH 31, 2010
Note 1. Organization
The Payson Total Return Fund (the “Fund”) is a diversified portfolio of Forum Funds (the “Trust”). The Trust is a Delaware statutory trust that is registered as an open-end, management investment company under the Investment Company Act of 1940 (the “Act”), as amended. As of March 31, 2010, the Trust had thirty-two investment portfolios. Under its Trust Instrument, the Trust is authorized to issue an unlimited number of each Fund’s shares of beneficial interest without par value. The Fund commenced operations on November 25, 1991. The Fund seeks a combination of high current income and capital appreciation.
Note 2. Summary of Significant Accounting Policies
These financial statements are prepared in accordance with generally accepted accounting principles in the United States of America (“GAAP”), which require management to make estimates and assumptions that affect the reported amounts of assets and liabilities, the disclosure of contingent liabilities at the date of the financial statements, and the reported amounts of increase and decrease in net assets from operations during the fiscal period. Actual amounts could differ from those estimates. The following summarizes the significant accounting policies of the Fund:
Security Valuation–Exchange-traded securities and over-the-counter securities are valued using the last quoted sale or official closing price, provided by independent pricing services as of the close of trading on the market or exchange for which they are primarily traded, on each Fund business day. In the absence of a sale, such securities are valued at the mean of the last bid and asked price provided by independent pricing services. Non-exchange traded securities for which quotations are available are valued using the last quoted sales price, or in the absence of a sale at the mean of the last bid and asked prices provided by independent pricing services. Shares of open-end mutual funds are valued at net asset value (“NAV”). Short-term investments that mature in sixty days or less may be valued at amortized cost.
The Fund values its investments at fair value pursuant to procedures adopted by the Trust’s Board of Trustees (the “Board”) if (1) market quotations are insufficient or not readily available or (2) the adviser believes that the values available are unreliable. Fair valuation is based on subjective factors and as a result, the fair value price of an investment may differ from the security’s market price and may not be the price at which the asset may be sold. Fair valuation could result in a different NAV than a NAV determined by using market quotes.
The Fund has a three-tier fair value hierarchy. The basis of the tiers is dependent upon the various “inputs” used to determine the value of the Fund’s investments. These inputs are summarized in the three broad levels listed below:
Level 1–quoted prices in active markets for identical assets
Level 2–other significant observable inputs (including quoted prices of similar securities, interest rates, prepayment speeds, credit risk, etc.)
Level 3–significant unobservable inputs (including the Fund’s own assumptions in determining the fair value of investments)
The aggregate value by input level, as of March 31, 2010, for the Fund’s investments is included at the end of the Fund’s Schedule of Investments.
10
PAYSON TOTAL RETURN FUND
NOTES TO FINANCIAL STATEMENTS
MARCH 31, 2010
Security Transactions, Investment Income and Realized Gain and Loss–Investment transactions are accounted for on trade date. Dividend income is recorded on the ex-dividend date. Foreign dividend income is recorded on the ex-dividend date or as soon as possible after the Fund determines the existence of a dividend declaration after exercising reasonable due diligence. Income and capital gains on some foreign securities may be subject to foreign withholding taxes, which are accrued as applicable. Interest income is recorded on an accrual basis. Premium and discount is amortized and accreted in accordance with GAAP. Identified cost of investments sold is used to determine the gain and loss for both financial statement and Federal income tax purposes.
Distributions to Shareholders–Distributions to shareholders of net investment income, if any, are declared and paid at least quarterly. Distributions to shareholders of net capital gains, if any, are declared and paid annually. Distributions are based on amounts calculated in accordance with applicable Federal income tax regulations, which may differ from GAAP. These differences are due primarily to differing treatments of income and gain on various investment securities held by the Fund, timing differences and differing characterizations of distributions made by the Fund.
Federal Taxes–The Fund intends to qualify each year as a regulated investment company under Subchapter M of the Internal Revenue Code and distribute all of its taxable income to shareholders. In addition, by distributing in each calendar year substantially all its net investment income and capital gains, if any, the Fund will not be subject to a Federal excise tax. Therefore, no Federal income or excise tax provision is required.
As of March 31, 2010, there are no uncertain tax positions that would require financial statement recognition, de-recognition, or disclosure. The Fund’s Federal tax returns filed in the three-year period ended March 31, 2010, remain subject to examination by the Internal Revenue Service.
Income and Expense Allocation–The Trust accounts separately for the assets, liabilities and operations of each of its investment portfolios. Expenses that are directly attributable to more than one investment portfolio are allocated among the respective investment portfolios in an equitable manner.
Commitments and Contingencies–In the normal course of business, the Fund enters into contracts that provide general indemnifications by the Fund to the counterparty to the contract. The Fund’s maximum exposure under these arrangements is dependent on future claims that may be made against the Fund and, therefore, cannot be estimated; however, based on experience, the risk of loss from such claims is considered remote.
Note 3. Advisory Fees, Servicing Fees and Other Transactions
Investment Adviser–H.M. Payson & Co., (the “Adviser”) is the investment adviser to the Fund. Pursuant to an investment advisory agreement, the Adviser receives an advisory fee from the Fund at an annual rate of 0.60% of the Fund’s average daily net assets.
Distribution–Foreside Fund Services, LLC serves as the Fund’s distributor (the “Distributor”). The Distributor receives no compensation from the Fund for its distribution services. The Distributor is not affiliated with the Adviser or with Atlantic Fund Administration, LLC (“Atlantic”) or their affiliates.
11
PAYSON TOTAL RETURN FUND
NOTES TO FINANCIAL STATEMENTS
MARCH 31, 2010
Other Service Providers–Atlantic provides fund accounting, fund administration, and transfer agency services to the Fund. Pursuant to an Atlantic services agreement, the Fund pays Atlantic customary fees for its services. Atlantic provides a Principal Executive Officer, a Principal Financial Officer, a Chief Compliance Officer, and an Anti-Money Laundering Officer to the Fund, as well as certain additional compliance support functions.
Trustees and Officers–The Trust pays each independent Trustee an annual retainer fee of $40,000 for service to the Trust ($60,000 for the Chairman). In addition, the Chairman receives a monthly stipend of $500 to cover certain expenses incurred in connection with his duties to the Trust. The Trustees and Chairman may receive additional fees for special Board meetings. Each Trustee is also reimbursed for all reasonable out-of-pocket expenses incurred in connection with his duties as a Trustee, including travel and related expenses incurred in attending Board meetings. The amount of Trustees’ fees attributable to the Fund is disclosed in the Statement of Operations. Certain officers of the Trust are also officers or employees of the above named service providers, and during their terms of office received no compensation from the Fund.
Note 4. Fees Waived
During the year, certain fund service providers have voluntarily agreed to waive a portion of their fees. These voluntary waivers may be reduced or eliminated at any time. For the year ended March 31, 2010, fees waived were $5,356.
Note 5. Security Transactions
The cost of purchases and proceeds from sales of investment securities (including maturities), other than short-term investments for the year ended March 31, 2010, were $31,024,628 and $21,521,036, respectively.
Note 6. Federal Income Tax and Investment Transactions
Distributions during the fiscal years ended as noted were characterized for tax purposes as follows:
| | | | | | |
| | | 2010
| | 2009
|
Ordinary Income | | $ | 131,653 | | $ | 183,915 |
Long-Term Capital Gain | | | — | | | 157,676 |
| | |
|
| |
|
|
Total | | $ | 131,653 | | $ | 341,591 |
| | |
|
| |
|
|
12
PAYSON TOTAL RETURN FUND
NOTES TO FINANCIAL STATEMENTS
MARCH 31, 2010
As of March 31, 2010, distributable earnings (accumulated loss) on a tax basis were as follows:
| | | | |
Undistributed Ordinary Income | | $ | 106,643 | |
Capital and Other Losses | | | (2,207,563 | ) |
Unrealized Appreciation | | | 6,856,311 | |
Other Temporary Differences | | | (106,675 | ) |
| | |
|
|
|
Total | | $ | 4,648,716 | |
| | |
|
|
|
The difference between components of distributable earnings on a tax basis and the amounts reflected in the Statement of Assets and Liabilities are primarily due to distributions payable that are deductible when paid for tax purposes.
As of March 31, 2010, the Fund had capital loss carryforwards to offset future capital gains of $2,207,563, expiring in 2017.
Note 7. Recent Accounting Pronouncements
In January 2010, the Financial Accounting Standards Board issued Accounting Standards Update (“ASU”) No. 2010-06 “Improving Disclosures about Fair Value Measurements.” ASU No. 2010-06 clarifies existing disclosure and requires additional disclosures regarding fair value measurements. Effective for interim and annual reporting periods beginning after December 15, 2009, entities are required to disclose significant transfers into and out of Level 1 and 2 measurements in the fair value hierarchy and the reasons for those transfers. Effective for fiscal years beginning after December 15, 2010, and for interim periods within those fiscal years, entities will need to disclose information about purchases, sales, issuances and settlements of Level 3 securities on a gross basis, rather than as a net number as currently required. Management is currently evaluating the impact ASU No. 2010-06 will have on its financial statement disclosures.
Note 8. Subsequent Events
Subsequent events occurring after the date of this report have been evaluated for potential impact and the Fund has had no such events.
13
REPORT OF INDEPENDENT REGISTERED PUBLIC ACCOUNTING FIRM
To the Board of Trustees of Forum Funds
and the Shareholders of Payson Total Return Fund
We have audited the accompanying statement of assets and liabilities of Payson Total Return Fund, a series of shares of beneficial interest in the Forum Funds, including the schedule of investments, as of March 31, 2010, and the related statement of operations for the year then ended, and the statements of changes in net assets and the financial highlights for each of the years in the two year period then ended. These financial statements and financial highlights are the responsibility of the Fund’s management. Our responsibility is to express an opinion on these financial statements and financial highlights based on our audits. The financial highlights for each of the years in the three year period ended March 31, 2008 were audited by other auditors whose report dated May 28, 2008, expressed an unqualified opinion on such financial highlights.
We conducted our audits in accordance with the standards of the Public Company Accounting Oversight Board (United States). Those standards require that we plan and perform the audits to obtain reasonable assurance about whether the financial statements and financial highlights are free of material misstatement. An audit includes examining, on a test basis, evidence supporting the amounts and disclosures in the financial statements. Our procedures included confirmation of securities owned as of March 31, 2010 by correspondence with the custodian and brokers. An audit also includes assessing the accounting principles used and significant estimates made by management, as well as evaluating the overall financial statement presentation. We believe that our audits provide a reasonable basis for our opinion.
In our opinion, the financial statements and financial highlights referred to above present fairly, in all material respects, the financial position of Payson Total Return Fund as of March 31, 2010, the results of its operations for the year then ended, and the changes in its net assets and its financial highlights for each of the years in the two year period then ended, in conformity with accounting principles generally accepted in the United States of America.

BBD, LLP
Philadelphia, Pennsylvania
May 25, 2010
14
PAYSON TOTAL RETURN FUND
ADDITIONAL INFORMATION (unaudited)
MARCH 31, 2010
Proxy Voting Information
A description of the policies and procedures that the Fund uses to determine how to vote proxies relating to securities held in the Fund’s portfolio is available, without charge and upon request, by calling (800) 805-8258 and on the SEC’s website at www.sec.gov. The Fund’s proxy voting record for the most recent twelve-month period ended June 30 is available, without charge and upon request, by calling (800) 805-8258 and on the SEC’s website at www.sec.gov.
Availability of Quarterly Portfolio Schedules
The Fund files its complete schedule of portfolio holdings with the SEC for the first and third quarters of each fiscal year on Form N-Q. The Fund’s Forms N-Q are available, without charge and upon request on the SEC’s website at www.sec.gov or may be reviewed and copied at the SEC’s Public Reference Room in Washington DC. Information on the operation of the Public Reference Room may be obtained by calling 1-800-SEC-0330.
Shareholder Expense Example
As a shareholder of the Fund, you incur ongoing costs, including management fees and other Fund expenses. This example is intended to help you understand your ongoing costs (in dollars) of investing in the Fund, and to compare these costs with the ongoing costs of investing in other mutual funds.
The example is based on an investment of $1,000 invested at the beginning of the period and held for the entire period from October 1, 2009, through March 31, 2010.
Actual Expenses–The first line in the table below provides information about actual account values and actual expenses. You may use the information in this line, together with the amount you invested, to estimate the expenses that you paid over the period. Simply divide your account value by $1,000 (for example, an $8,600 account value divided by $1,000 = 8.6), then multiply the result by the number in the first line under the heading entitled “Expenses Paid During Period” to estimate the expenses you paid on your account during the period.
Hypothetical Example for Comparison Purposes–The second line of the table below provides information about hypothetical account values and hypothetical expenses based on the Fund’s actual expense ratio and an assumed rate of return of 5% per year before expenses, which is not the Fund’s actual return. The hypothetical account values and expenses may not be used to estimate the actual ending account balance or expenses you paid for the period. You may use this information to compare the ongoing cost of investing in the Fund and other funds. To do so, compare this 5% hypothetical example with the 5% hypothetical examples that appear in the shareholder reports of other funds.
15
PAYSON TOTAL RETURN FUND
ADDITIONAL INFORMATION (unaudited)
MARCH 31, 2010
Please note that expenses shown in the table are meant to highlight your ongoing costs only. Therefore, the second line of the table is useful in comparing ongoing costs only, and will not help you determine the relative total costs of owning different funds.
| | | | | | | | | | | | |
| | | Beginning Account
Value
October 1, 2009
| | Ending Account
Value
March 31, 2010
| | Expenses
Paid During
Period*
| | Annualized
Expense
Ratio*
| |
Actual | | $ | 1,000.00 | | $ | 1,146.01 | | $ | 7.49 | | 1.40 | % |
Hypothetical (5% return before expenses) | | $ | 1,000.00 | | $ | 1,017.95 | | $ | 7.04 | | 1.40 | % |
| | * | Expenses are equal to the Fund’s annualized expense ratio as indicated above multiplied by the average account value over the period, multiplied by the number of days in the most recent fiscal year divided by 365 to reflect the half-year period. |
Federal Tax Status of Dividends Declared during the Tax Year
For Federal income tax purposes, dividends from short-term capital gains are classified as ordinary income. The Fund designates 100.00% of its income dividend distributed as qualifying for the corporate dividends-received deduction (DRD) and 100.00% for the qualified dividend rate (QDI) as defined in Section 1(h)(11) of the Internal Revenue Code. The Fund also designates 0.46% as qualified interest income exempt from U.S. tax for foreign shareholders (QII).
Trustees and Officers of the Trust
The Board is responsible for oversight of the management of the Trust’s business affairs and of the exercise of all the Trust’s powers except those reserved for the shareholders. The following table provides information about each Board member and certain officers of the Trust. Each Trustee and officer holds office until the person resigns, is removed, or is replaced. Unless otherwise noted, the persons have held their principal occupations for more than five years. The address for all Trustees and officers is Three Canal Plaza, Suite 600, Portland, Maine 04101, unless otherwise indicated. Each Trustee oversees thirty-two portfolios in the Trust. Mr. Keffer is considered an Interested Trustee due to his affiliation with Atlantic. Mr. Keffer is also an Interested Director of Wintergreen Fund, Inc. The Fund’s Statement of Additional Information includes additional information about the Trustees and is available, without charge and upon request, by calling (800) 805-8258.
| | | | | | |
| Name and Year of Birth | | Position with
the Trust | | Length of
Time Served | | Principal Occupation(s)
During Past 5 Years |
| Independent Trustees | | | | | | |
J. Michael Parish Born: 1943 | | Chairman of the Board; Trustee; Chairman, Nominating Committee and Qualified Legal Compliance Committee | | Since 1989 (Chairman since 2004) | | Retired since 2003. |
16
PAYSON TOTAL RETURN FUND
ADDITIONAL INFORMATION (unaudited)
MARCH 31, 2010
| | | | | | |
| Name and Year of Birth | | Position with
the Trust | | Length of
Time Served | | Principal Occupation(s)
During Past 5 Years |
Costas Azariadis Born: 1943 | | Trustee; Chairman, Valuation Committee | | Since 1989 | | Professor of Economics, Washington University since 2006; Professor of Economics, University of California-Los Angeles 1992–2006. |
James C. Cheng Born: 1942 | | Trustee; Chairman, Audit Committee | | Since 1989 | | President, Technology Marketing Associates (marketing company for small- and medium-sized businesses in New England) since 1991. |
| Interested Trustee | | | | | | |
John Y. Keffer1 Born: 1942 | | Trustee; Vice Chairman | | Since 1989 | | Chairman, Atlantic since 2008; President, Forum Foundation (a charitable organization) since 2005; President, Forum Trust, LLC (a non-depository trust company chartered in the State of Maine) since 1997. |
| 1 | Since 1997, John Y. Keffer has been president and owner of Forum Trust, LLC. Prior to January 1, 2010, Atlantic was a wholly owned subsidiary of Forum Trust, LLC. Effective January 1, 2010, Atlantic became a wholly owned subsidiary of Forum Holdings Corp., a Delaware corporation that is wholly owned by Mr. Keffer. |
| | | | | | |
| Name and Year of Birth | | Position with
the Trust | | Length of
Time Served | | Principal Occupation(s)
During Past 5 Years |
| Officers | | | | | | |
Stacey E. Hong Born: 1966 | | President; Principal Executive Officer | | Since 2008 | | President, Atlantic since 2008; Director, Consulting Services, Foreside Fund Services 2007; Elder Care, 2005–2006. |
Karen Shaw Born: 1972 | | Treasurer; Principal Financial Officer | | Since 2008 | | Senior Manager, Atlantic since 2008; Section Manager/Vice President, Enterprise Support Services, Citigroup 2003–2008. |
David Faherty Born: 1970 | | Vice President | | Since 2009 | | Senior Counsel, Atlantic since 2009; Vice President, Citi Fund Services Ohio, Inc. 2007–2009.; Associate Counsel, Investors Bank & Trust Co. 2006–2007; FDIC 2005. |
Michael J. McKeen Born: 1971 | | Vice President | | Since 2009 | | Senior Manager, Atlantic since 2008; Vice President, Citigroup 2003–2008. |
Joshua LaPan Born: 1973 | | Vice President | | Since 2009 | | Manager, Atlantic since 2008; Vice President, Citigroup 2003–2008. |
Timothy Bowden Born: 1969 | | Vice President | | Since 2009 | | Manager, Atlantic since 2008; Vice President, Citigroup 2005–2008. |
Lina Bhatnagar Born: 1971 | | Secretary | | Since 2008 | | Senior Administration Specialist, Atlantic since 2008; Regulatory Administration Specialist, Citigroup 2006–2008. |
17
FOR MORE INFORMATION
TRANSFER AGENT
Atlantic Fund Administration, LLC
P.O. Box 588
Portland, ME 04112
DISTRIBUTOR
Foreside Fund Services, LLC
Three Canal Plaza, Suite 100
Portland, ME 04101
www.foreside.com
This report is submitted for the general information of the shareholders of the Fund. It is not authorized for distribution to prospective investors unless preceded or accompanied by an effective prospectus, which includes information regarding the Fund’s risks, objectives, fees and expenses, experience of its management, and other information.
230-ANR-0310
PAYSON TOTAL RETURN FUND
P.O. BOX 588
PORTLAND, ME 04112
800-805-8258
www.hmpayson.com

| | |
| (a) | | As of the end of the period covered by this report, Forum Funds (the “Registrant”) has adopted a code of ethics, which applies to its Principal Executive Officer and Principal Financial Officer. |
| |
| (c) | | There have been no amendments to the Registrant’s code of ethics that apply to its Principal Executive Officer and Principal Financial Officer. |
| |
| (d) | | There have been no waivers to the Registrant’s code of ethics that apply to its Principal Executive Officer and Principal Financial Officer. |
| |
| (e) | | Not applicable. |
| |
| (f) (1) | | A copy of the Code of Ethics is being filed under Item 12(a) hereto. |
| ITEM 3. | AUDIT COMMITTEE FINANCIAL EXPERT. |
The Board of Trustees has determined that no member of the Audit Committee is an “audit committee financial expert” as that term is defined under applicable regulatory guidelines.
| ITEM 4. | PRINCIPAL ACCOUNTANT FEES AND SERVICES. |
(a) Audit Fees - The aggregate fees billed for each of the last two fiscal years (the “Reporting Periods”) for professional services rendered by the Registrant’s principal accountant for the audit of the Registrant’s annual financial statements, or services that are normally provided by the principal accountant in connection with the statutory and regulatory filings or engagements for the Reporting Periods, were $140,000 in 2009 and $168,000 in 2010.
(b) Audit-Related Fees - The aggregate fees billed in the Reporting Periods for assurance and related services rendered by the principal accountant that were reasonably related to the performance of the audit of the Registrant’s financial statements and are not reported under paragraph (a) of this Item 4 were $0 in 2009 and $0 in 2010.
(c) Tax Fees - The aggregate fees billed in the Reporting Periods for professional services rendered by the principal accountant to the Registrant for tax compliance, tax advice and tax planning were $22,000 in 2009 and $28,000 in 2010. These services consisted of review or preparation of U.S. federal, state, local and excise tax returns.
(d) All Other Fees - The aggregate fees billed in the Reporting Periods for products and services provided by the principal accountant to the Registrant, other than the services reported in paragraphs (a) through (c) of this Item, were $0 in 2009 and $0 in 2010.
(e) (1) The Audit Committee reviews and approves in advance all audit and “permissible non-audit services” (as that term is defined by the rules and regulations of the Securities and Exchange Commission) to be rendered to a series of the Registrant (each, a “Series”). In addition, the Audit Committee reviews and approves in advance all “permissible non-audit services” to be provided to an investment adviser (not including any sub-adviser) of a Series, or an affiliate of such investment adviser, that is controlling, controlled by or under common control with the investment adviser and provides on-going services to the Registrant (“Affiliate”), by the Series’ principal accountant if the engagement relates directly to the operations and financial reporting of the Series. The Audit Committee considers whether fees paid by a Series’ investment adviser or an Affiliate to the Series’ principal accountant for audit and permissible non-audit services are consistent with the principal accountant’s independence.
(e) (2) 0%
(f) Not applicable
(g) The aggregate non-audit fees billed by the principal accountant for services rendered to the Registrant for the Reporting Periods were $0 in 2009 and $0 in 2010. There were no fees billed in either of the Reporting Periods for non-audit services rendered by the principal accountant to the Registrant’s investment adviser or any Affiliate.
(h) If the Registrant’s principal accountant provided non-audit services to the Registrant’s adviser or any Affiliate, and the services were not pre-approved as described in paragraph (e)(1) of this Item, the Audit Committee would consider whether the provision of such services was compatible with maintaining the independence of the Registrant’s principal accountant.
| ITEM 5. | AUDIT COMMITTEE OF LISTED REGISTRANTS. |
Not applicable.
| ITEM 6. | SCHEDULE OF INVESTMENTS. |
| (a) | Included as part of report to shareholders under Item 1. |
| ITEM 7. | DISCLOSURE OF PROXY VOTING POLICIES AND PROCEDURES FOR CLOSED-END MANAGEMENT INVESTMENT COMPANIES. |
Not applicable.
| ITEM 8. | PORTFOLIO MANAGERS OF CLOSED-END MANAGEMENT INVESTMENT COMPANIES. |
Not applicable.
| ITEM 9. | PURCHASES OF EQUITY SECURITIES BY CLOSED-END MANAGEMENT INVESTMENT COMPANY AND AFFILIATED PURCHASERS. |
Not applicable.
| ITEM 10. | SUBMISSION OF MATTERS TO A VOTE OF SECURITY HOLDERS |
The Registrant does not accept nominees to the board of trustees from shareholders.
| ITEM 11. | CONTROLS AND PROCEDURES |
(a) The Registrant’s Principal Executive Officer and Principal Financial Officer have concluded that the Registrant’s disclosure controls and procedures (as defined in Rule 30a-3(c) under the Investment Company Act of 1940 (the “Act”)) are effective, based on their evaluation of the controls and procedures required by Rule 30a-3(b) under the Act and Rules 13a-15(b) or 15d-15(b) under the Securities Exchange Act of 1934, as of a date within 90 days of the filing date of this report.
(b) There were no changes in the Registrant’s internal control over financial reporting (as defined in Rule 30a-3(d) under the Act) that occurred during the second fiscal quarter of the period covered by this report that have materially affected, or are reasonably likely to materially affect, the Registrant’s internal control over financial reporting.
(a)(1) Code of Ethics (Exhibit filed herewith).
(a)(2) Certifications pursuant to Rule 30a-2(a) of the Act, and Section 302 of the Sarbanes-Oxley Act of 2002. (Exhibits filed herewith)
(a)(3) Not applicable.
(b) Certifications pursuant to Rule 30a-2(b) of the Act, and Section 906 of the Sarbanes-Oxley Act of 2002. (Exhibit filed herewith)
SIGNATURES
Pursuant to the requirements of the Securities Exchange Act of 1934 and the Investment Company Act of 1940, the Registrant has duly caused this report to be signed on its behalf by the undersigned, thereunto duly authorized.
| | |
Registrant Forum Funds |
| |
| By | | /S/ STACEY E. HONG |
| | Stacey E. Hong, Principal Executive Officer |
| |
Date | | 5/28/10 |
Pursuant to the requirements of the Securities Exchange Act of 1934 and the Investment Company Act of 1940, this report has been signed below by the following persons on behalf of the Registrant and in the capacities and on the dates indicated.
| | |
| |
| By | | /S/ STACEY E. HONG |
| | Stacey E. Hong, Principal Executive Officer |
| |
Date | | 5/28/10 |
| |
| By | | /S/ KAREN SHAW |
| | Karen Shaw, Principal Financial Officer |
| |
Date | | 5/28/10 |