As filed with the Securities and Exchange Commission on August 24, 2010
UNITED STATES
SECURITIES AND EXCHANGE COMMISSION
WASHINGTON, D.C. 20549
FORM N-CSR
CERTIFIED SHAREHOLDER REPORT OF REGISTERED
MANAGEMENT INVESTMENT COMPANIES
Investment Company Act file number 811-03023
FORUM FUNDS
Three Canal Plaza, Suite 600
Portland, Maine 04101
Stacey E. Hong, Principal Executive Officer
Three Canal Plaza, Suite 600
Portland, Maine 04101
207-347-2000
Date of fiscal year end: June 30
Date of reporting period: July 1, 2009 – June 30, 2010
| ITEM 1. | REPORT TO STOCKHOLDERS. |
Annual Report
June 30, 2010
Fund Adviser:
Auxier Asset Management LLC
5285 Meadows Road
Suite 333
Lake Oswego, Oregon 97035
Toll Free: (877) 3AUXIER or (877) 328-9437
| |
| AUXIER FOCUS FUND A MESSAGE TO OUR SHAREHOLDERS JUNE 30, 2010 |
AUXIER FOCUS FUND
PERFORMANCE UPDATE
June 30, 2010
AUXFX RETURNS VS. S&P 500 INDEX
| | Auxier Focus Fund | S&P 500 Index | Difference* |
| 03/31/10 – 06/30/10 | -9.04% | -11.43% | 2.39 |
| 12/31/09 – 06/30/10 | -3.99% | -6.65% | 2.66 |
| 12/31/08 – 12/31/09 | 24.76% | 26.46% | -1.70 |
| 12/31/07 – 12/31/08 | -24.52% | -37.00% | 12.48 |
| 12/31/06 – 12/31/07 | 5.71% | 5.49% | 0.22 |
| 12/31/05 – 12/31/06 | 11.75% | 15.79% | -4.04 |
| 12/31/04 – 12/31/05 | 4.58% | 4.91% | -0.33 |
| 12/31/03 – 12/31/04 | 10.73% | 10.87% | -0.14 |
| 12/31/02 – 12/31/03 | 26.75% | 28.69% | -1.94 |
| 12/31/01 – 12/31/02 | -6.79% | -22.10% | 15.31 |
| 12/31/00 – 12/31/01 | 12.67% | -11.88% | 24.55 |
| 12/31/99 – 12/31/00 | 4.05% | -9.10% | 13.15 |
| Since Inception 7/9/99 | 76.35% | -10.64% | 86.99 |
| | | * in percentage points |
Average Annual Returns for the period ended 06/30/2010 | 1 Year | 3 Year | 5 Year | 10 Year | Since Inception |
| Auxier Focus Fund | 12.99% | -4.16% | 1.97% | 5.79% | 5.30% |
| (Investor Shares) | | | | | (7/9/99) |
| S&P 500 Index | 14.43% | -9.81% | -0.79% | -1.59% | -1.02% |
Performance data quoted represents past performance and is no guarantee of future results. Current performance may be lower or higher than the performance data quoted. Investment return and principal value will fluctuate so that an investor's shares, when redeemed, may be worth more or less than original cost. As stated in the current prospectus, the Fund’s annual operating expense ratio (gross) is 1.25%. The Fund’s adviser has contractually agreed to maintain annual operating expenses at 1.25%, which is in effect until October 31, 2010. The Fund charges a 2.00% redemption fee on shares redeemed within six months of purchase. For the most recent month-end performance, please call (877)328-9437 or visit the Fund’s website at www.auxierasset.com.
The recent growth rate in the stock market has helped to produce short-term returns that are not typical and may not continue in the future. Because of ongoing market volatility, fund performance may be subject to substantial short-term changes.
Before investing you should carefully consider the Fund’s investment objectives, risks, charges and expenses. This and other information is in the prospectus, a copy of which may be obtained by calling (877) 328-9437 or visiting the Fund’s website. Please read the prospectus carefully before you invest.
Fund returns (i) assume the reinvestment of all dividends and capital gain distributions and (ii) would have been lower during the period if certain fees and expenses had not been waived. Performance shown is for the Fund’s Investor Class shares; returns for other share classes will vary. Performance for Investor Class shares for periods prior to December 10, 2004 reflects performance of the applicable share class of Auxier Focus Fund, a series of Unified Series Trust (the “Predecessor Fund”). Prior to January 3, 2003, the Predecessor Fund was a series of Ameriprime Funds. The performance of the Fund’s Investor Class shares for the period prior to December 10, 2004, reflects the expenses of the Predecessor Fund.
The Fund may invest in value and/or growth stocks. Investments in value stocks are subject to risk that their intrinsic value may never be realized and investments in growth stocks may be susceptible to rapid price swings, especially during periods of economic uncertainty. In addition, the Fund may invest in smaller companies which generally carry greater risk than is customarily associated with larger companies for various reasons such as narrower markets, limited financial resources and less liquid stock. Moreover, if the Fund's portfolio is overweighted in a sector, any negative development affecting that sector will have a greater impact on the Fund than a fund that is not overweighted in that sector. Foreside Fund Services, LLC, distributor.
| |
| AUXIER FOCUS FUND A MESSAGE TO OUR SHAREHOLDERS JUNE 30, 2010 |
Summer 2010
Market Commentary
Auxier Focus Fund ended second quarter 2010 with a -9.04% return, outperforming the -11.43% return for Standard & Poor’s 500 Index (S&P) by 2.39 percentage points. Year-to-date the Fund is down -3.99% versus a -6.65% decline for the S&P. The Fund has outperformed the market (S&P) by 86.99 percentage points cumulatively since inception in 1999.
A Formula for Going Nowhere Fast
Velocity trading has followed in the footsteps of velocity banking1 as the latest easy shortcut to the arduous fundamentals of capital allocation. Like the parabolic rise of derivatives that enhance returns through leverage, commodity Exchange Traded Funds (ETFs) have grown fifty fold from $50 billion ten years ago to $277 billion (Bloomberg). These vehicles generate no cash flow and therefore are speculations. Many buyers apparently overlooked the unanticipated “contango” effect2 (the inability to deliver on the futures contract) and experienced losses when there should have been gains.
In addition, two-thirds of stock exchange volume has recently been tied to so-called algorithmic trading formulas. Computer models abound that can fail to factor in periodic bouts of emotional folly. This means a greater likelihood of material misappraisals and plum pickings for flexible bargain shoppers. There are no shortcuts to investing. The economy is too dynamic and competitive. It is time to get back to the basics of investing—the craft of the specific. That’s knowing more about what you own than the market; showing conviction to buy more at compelling price points; quantifying true risk to invest when odds are highly favorable. Just as velocity banking failed, speculation that is not grounded in cash flow and fundamental analysis could in time fail as well.
Beware of Politicians Bearing Bonds
Two great Warren Buffett sayings apply today. “If money is easy, grab your wallet and run the other way” and “most men would rather die than think; many do.” Like the heady, high-tech bubble that peaked in 2000, followed by comparable manias for real estate and private equity, the investing herd is stampeding into bond funds like never before. In the past 18 months, some $580 billion has been channeled into US taxable bond funds and $500 billion into municipal bonds at the highest prices in history (Dow Jones News). Never mind that estimates of off- balance sheet liabilities at the federal level run seven times our gross domestic product (GDP). Governments at all levels have made entitlement promises that are unsustainable and, if unchecked, would lead to bankruptcy. Good money continues to be allocated to Fannie Mae and Freddie Mac, a disreputable duo that has already cost taxpayers $300-$500 billion. Illinois and California face a solvency crisis. Worse, the failed leadership and policies of both states have now been transferred to Washington DC. Once deficits reach a certain point, the risk of a failed bond auction becomes closer to reality. Remember, in eight centuries only a handful of countries have honored their debts. James Grant (Grant’s Interest Rate Observer) recently noted
1 A term used to describe the rate at which money is exchanged from one transaction to another.
2 When the futures price is above the expected future spot price. Consequently, the price will decline to the spot price before the delivery date.
| |
| AUXIER FOCUS FUND A MESSAGE TO OUR SHAREHOLDERS JUNE 30, 2010 |
how Illinois, back in the railroad boom of 1842, was forced to pay 42.75% interest on its municipal bonds. More recently, yields on two-year notes in Greece climbed from less than 4% to over 20% in a very short period. If policymakers don’t make adjustments the market will. Unfortunately, unlike Japan, the US does not have the savings to absorb the shortfall. I would bet that we could see a similar panic in government bonds, especially if current spending policies are not corrected. In the early 1980s, the biggest municipal bond default in history occurred when Washington Public Power Supply System (WPPSS), aptly nicknamed “whoops”, failed to pay on a number of partially constructed nuclear plants. We were able to profit from the gloom by buying senior secured notes yielding 16% tax free. The bonds had originally been rated AAA3 and paid puny interest. Examining the entire capital structure is so important when investing in stocks and bonds. It is difficult to survive over the long term with a weak balance sheet. As Jim Grant says, there is no such thing as a bad bond, just a bad price.
New Zealand’s Lesson for US Housing Subsidies
Back in 1985, New Zealand abolished all farm subsidies. Farmers’ income initially plunged as land and stock prices slumped. However, productivity soon recovered dramatically, boosting farming’s share of GDP from 14% to 16.6%. Farm products now comprise over 50% of all exports, and the rural population has grown. The move created a much more vibrant industry commanding a greater share of the overall economy. American policymakers should study this model to help reform Fannie Mae, Freddie Mac and our failed approach to housing subsidies.
Gateways to Emerging Market Middle Class
The US consumer and government face painful restructuring periods ahead. But many emerging economies learned their lessons the hard way back in 1998, and today have much better balance sheets. Global population is expected to grow from 6.8 billion to 9.2 billion by 2050. Chinese consumption of skin-care products, cosmetics and fragrances has quadrupled to $13 billion the last decade (Business Week). We like low-ticket necessity products that have a steady demand. Global austerity tends to favor our high-quality, self-funding businesses. Prime examples are multinational corporations, with powerful global distributions. Many of these stocks have sold off to price points where there is very little premium for the emerging market gateway these companies provide. Their high free-cash flow provides the needed flexibility to profit in times of distress.
Election Day 1994 Revisited?
The current US stock market feels like the early 1990s. Hillary Clinton was trying to socialize medicine. The country had endured one of the worst banking crises since the Great Depression. The 1994 midterm elections led to the biggest Republican sweep in fifty years, overtaking both the House and Senate. This catalyst helped fan favorable tailwinds in the market. Over the following six years, surviving small and midsized banks appreciated 400-800%. Healthcare stocks in general enjoyed meaningful upward valuations in price/earnings ratios4. Large blue chips had three consecutive years of above-average returns. It is rare to have the chance to buy high-quality businesses at ten times earnings. Currently, 13 of the top 25 S&P 500 stocks sell for 10-11 times estimated 2011 earnings. Neon Liberty Capital recently (July 2010) analyzed market performances after a decade in which the economy was in recession 25% or more of the time, as has our past decade. Guess
3 The highest rating given on bonds by bond rating agencies.
4 Price/earnings ratio is the value of a company’s stock price relative to company earnings.
| |
| AUXIER FOCUS FUND A MESSAGE TO OUR SHAREHOLDERS JUNE 30, 2010 |
what? Returns in comparable decades ending in 1955, 1958, 1975 and 1982 were well above average. The subsequent average gains over three, five and ten years were all above 14% annually.
Why Our Approach Can Win Over Time
We will always have to face crisis situations. Our approach is to work hard to anticipate potential areas of harm and irrational behavior. Then take advantage of the resulting bargains. Our edge? Managing through challenging environments demands rational, tenacious daily research effort that focuses on minimizing the downside. Seeking to identify durable investments is critical to outpace devaluations that result from the “easy path” politicians consistently follow. We are in times when you can’t depend on a rising market for returns.
We rely instead on our dedication to spot exceptional individual opportunities and moving when we believe the price is right.
Your trust and support is appreciated.
Jeff Auxier
As of June 30, 2010, the Fund held those securities mentioned in the letter as follows: Washington Public Power Supply System (WPPSS) 0%; The Federal National Mortgage Association 0%; Federal Home Loan Mortgage Corp 0%.
There can be no guarantee of success with any technique, strategy, or investment. All investing involves risk, including the loss of principal. The S&P 500 Index is a broad-based, unmanaged measurement of changes in stock market conditions based on 500 widely held common stocks. One cannot invest directly in an index.
The views in this shareholder letter were those of the Fund Manager as of the letter’s publication date and may not reflect his views on the date this letter is first distributed or anytime thereafter. These views are intended to assist readers in understanding the Fund’s investment methodology and do not constitute investment advice.
| |
AUXIER FOCUS FUNDPERFORMANCE CHART AND ANALYSIS JUNE 30, 2010 |
| | | | | | |
| COMPARISON OF CHANGE IN VALUE OF A $10,000 INVESTMENT |
| | | | | | |
| The following chart reflects the change in the value of a hypothetical $10,000 investment in Investor Shares, including reinvested dividends and distributions, in the Auxier Focus Fund (the “Fund”) compared with the performance of the Standard & Poor's 500 Index ("S&P 500"), over the past ten fiscal years. The S&P 500 is a market-value weighted index representing the performance of 500 widely held, publicly traded stocks. The total return of the Fund's classes includes the maximum sales charge of 5.75% (A Shares only) and operating expenses that reduce returns, while the total return of the S&P 500 does not include the effect of sales charges and expenses. A Shares are subject to a 1.00% contingent deferred sales charge on shares purchased without an initial sales charge and redeemed less than one year after purchase. The total return of the S&P 500 includes reinvestment of dividends and income. The total return of the Fund includes operating expenses that reduce returns, while the total return of the S&P 500 does not include expenses. The Fund is professionally managed while the S&P 500 is unmanaged and is not available for investment. |
| |
Performance data quoted represents past performance and is no guarantee of future results. Current performance may be lower or higher than the performance data quoted. Investment return and principal value will fluctuate so that shares, when redeemed, may be worth more or less than original cost. For the most recent month-end performance, please visit the website of the Fund's investment adviser at www.auxierasset.com. As stated in the Fund's prospectus, the annual operating expense ratios (gross) for Investor Shares and A Shares are 1.25% and 1.50%, respectively. However, the Fund's adviser has agreed to contractually waive a portion of its fees and to reimburse expenses such that total operating expenses do not exceed 1.25% for Investor Shares and A Shares, which is in effect until October 31, 2010. Shares redeemed or exchanged within 180 days days of purchase will be charged a 2.00% redemption fee. The performance table and graph do not reflect the deduction of taxes that a shareholder would pay on Fund distributions or the redemption of Fund shares. Returns greater than one year are annualized. |
| |
| Performance for Investor Shares for periods prior to December 10, 2004, reflects performance for and expenses of Auxier Focus Fund, a series of Unified Series Trust (the “Predecessor Fund”). Prior to January 3, 2003, the Predecessor Fund was a series of Ameriprime Funds. |
| | | | | | |
| Average Annual Total Return as of 06/30/10 | 1 Year | 5 Years | 10 Years | Since Inception (1) | |
| | | | | | |
| Investor Shares | 12.99% | 1.97% | 5.79% | 5.30% | |
| S&P 500 Index (since 07/09/99) | 14.43% | (0.79)% | (1.59)% | (1.02)% | |
A Shares (with sales charge) (2)(3) | 6.41% | 0.77% | 5.17% | 4.74% | |
| | | | | | |

| | | | | | |
| (1) Investor and A Shares commenced operations on July 9, 1999, and July 8, 2005, respectively. | | |
| | | | | | |
| (2) Due to shareholder redemptions on August 21, 2005, net assets of the class were zero from the close of business | |
| on that date until September 22, 2005. Financial information presented for the period August 21, 2005, to September 22, 2005 | |
| reflects perfomance of Investor Shares of the Fund. | | | | | |
| | | | | | |
| (3) For A Shares, performance for the 5-year, 10-year and the since inception periods are blended average annual returns | |
| which include the returns of the Investor Shares prior to the commencement of operations of the A Shares. | | |
| | | | | | |
| |
| AUXIER FOCUS FUND SCHEDULE OF INVESTMENTS JUNE 30, 2010 |
| Shares | | Security Description | | | | Value | |
| Common Stock - 69.2% | | | | | |
| Communications - 0.1% | | | | | |
| 6,000 | | News Corp., Class A | | | | $ 71,760 | |
| | | | | | | | |
| Consumer Discretionary - 19.0% | | | | | |
| 9,713 | | Apollo Group, Inc., Class A (a) | | | | 412,511 | |
| 26,250 | | Bridgepoint Education, Inc. (a) | | | | 415,013 | |
| 13,300 | | Career Education Corp. (a) | | | | 306,166 | |
| 57,100 | | Comcast Corp., Class A | | | | 991,827 | |
| 3,000 | | Costco Wholesale Corp. | | | | 164,490 | |
| 41,050 | | CVS Caremark Corp. | | | | 1,203,586 | |
| 2,297 | | Discovery Communications, Inc., Class A (a) | | | | 82,026 | |
| 2,297 | | Discovery Communications, Inc., Class C (a) | | | | 71,046 | |
| 14,800 | | D.R. Horton, Inc. | | | | 145,484 | |
| 100 | | Ecolab, Inc. | | | | 4,491 | |
| 3,000 | | Education Management Corp. (a) | | | | 45,750 | |
| 37,987 | | Gruma S.A.B. de C.V., ADR (a) | | | | 228,302 | |
| 18,250 | | Home Depot, Inc. | | | | 512,278 | |
| 82,150 | | H&R Block, Inc. | | | | 1,288,934 | |
| 8,700 | | ITT Educational Services, Inc. (a) | | | | 722,274 | |
| 20,197 | | Lincoln Educational Services Corp. (a) | | | | 415,856 | |
| 28,000 | | Lowe's Cos., Inc. | | | | 571,760 | |
| 12,800 | | McDonald's Corp. | | | | 843,136 | |
| 13,250 | | NIKE, Inc., Class B | | | | 895,037 | |
| 16,215 | | Palm Harbor Homes, Inc. (a) | | | | 28,863 | |
| 15,250 | | Sally Beauty Holdings, Inc. (a) | | | | 125,050 | |
| 67,885 | | Tesco PLC, ADR | | | | 1,149,293 | |
| 27,895 | | The Andersons, Inc. | | | | 909,098 | |
| 40,870 | | The Interpublic Group of Cos., Inc. (a) | | | | 291,403 | |
| 3,890 | | Time Warner Cable, Inc. | | | | 202,591 | |
| 15,500 | | Time Warner, Inc. | | | | 448,105 | |
| 44,700 | | Unilever NV, ADR | | | | 1,221,204 | |
| 17,058 | | Universal Technical Institute, Inc. (a) | | | | 403,251 | |
| 25,634 | | Value Line, Inc. | | | | 465,001 | |
| 49,550 | | Wal-Mart Stores, Inc. | | | | 2,381,868 | |
| 74,777 | | Weight Watchers International, Inc. | | | | 1,921,021 | |
| 8,600 | | Yum! Brands, Inc. | | | | 335,744 | |
| | | | | | | 19,202,459 | |
| Consumer Staples - 16.5% | | | | | |
| 376,600 | | Alliance One International, Inc. (a) | | | | 1,340,696 | |
| 35,150 | | Altria Group, Inc. | | | | 704,406 | |
| 15,100 | | British American Tobacco PLC, ADR | | | | 955,830 | |
| 19,532 | | Columbia Sportswear Co. | | | | 911,558 | |
| 16,800 | | Diageo PLC, ADR | | | | 1,054,032 | |
| | | | | | | | |
| | | | | | | | |
| | | | | | | | |
| See Notes to Financial Statements. | 6 | | | | | |
| | | | | | |
| AUXIER FOCUS FUND | | | | | |
| SCHEDULE OF INVESTMENTS | | | | | |
| JUNE 30, 2010 | | | | | | | |
| | | | | | | | |
| Shares | | Security Description | | | | Value | |
| 55,800 | | Dr. Pepper Snapple Group, Inc. | | | | $ 2,086,362 | |
| 2,000 | | Helen of Troy, Ltd. (a) | | | | 44,120 | |
| 16,862 | | Kraft Foods, Inc., Class A | | | | 472,136 | |
| 12,700 | | Manpower, Inc. | | | | 548,386 | |
| 1,000 | | Molson Coors Brewing Co., Class B | | | | 42,360 | |
| 8,760 | | National Beverage Corp. (a) | | | | 107,573 | |
| 3,000 | | Nestle SA, ADR | | | | 144,720 | |
| 44,372 | | Paychex, Inc. | | | | 1,152,341 | |
| 58,900 | | Philip Morris International, Inc. | | | | 2,699,976 | |
| 1,721 | | Ralcorp Holdings, Inc. (a) | | | | 94,311 | |
| 11,450 | | Safeway, Inc. | | | | 225,107 | |
| 37,250 | | The Coca-Cola Co. | | | | 1,866,970 | |
| 77,850 | | The Kroger Co. | | | | 1,532,867 | |
| 41,380 | | The Western Union Co. | | | | 616,976 | |
| | | | | | | 16,600,727 | |
| Energy - 4.5% | | | | | | | |
| 26,850 | | BP PLC, ADR | | | | 775,428 | |
| 16,750 | | Chevron Corp. | | | | 1,136,655 | |
| 15,600 | | ConocoPhillips | | | | 765,804 | |
| 11,200 | | Exxon Mobil Corp. | | | | 639,184 | |
| 1,200 | | Gazprom Neft JSC, ADR | | | | 22,500 | |
| 800 | | Lukoil OAO, ADR | | | | 41,200 | |
| 2,500 | | PetroChina Co., Ltd., ADR | | | | 274,325 | |
| 7,800 | | Petroleo Brasileiro SA, ADR | | | | 267,696 | |
| 2,750 | | Surgutneftegaz, ADR | | | | 24,062 | |
| 1,000 | | Transocean Ltd. (a) | | | | 46,330 | |
| 24,100 | | Valero Energy Corp. | | | | 433,318 | |
| 8,800 | | Willbros Group, Inc. (a) | | | | 65,120 | |
| | | | | | | 4,491,622 | |
| Financials - 7.2% | | | | | | | |
| 3,200 | | American Express Co. | | | | 127,040 | |
| 1,280 | | Ameriprise Financial, Inc. | | | | 46,246 | |
| 33,233 | | Bank of America Corp. | | | | 477,558 | |
| 16,000 | | Berkshire Hathaway, Inc., Class B (a) | | | | 1,275,040 | |
| 24,193 | | Citigroup, Inc. (a) | | | | 90,966 | |
| 77,850 | | Marsh & McLennan Cos., Inc. | | | | 1,755,518 | |
| 28,100 | | The Bank of New York Mellon Corp. | | | | 693,789 | |
| 38,418 | | The Travelers Cos., Inc. | | | | 1,892,086 | |
| 3,000 | | TNS, Inc. (a) | | | | 52,320 | |
| 10,324 | | Unum Group | | | | 224,031 | |
| 24,950 | | Waddell & Reed Financial, Inc., Class A | | | | 545,906 | |
| 7,646 | | Washington Federal, Inc. | | | | 123,712 | |
| 4,000 | | West Coast Bancorp | | | | 10,200 | |
| | | | | | | 7,314,412 | |
| Health Care - 9.9% | | | | | |
| 37,450 | | Alkermes, Inc. (a) | | | | 466,253 | |
| 5,750 | | Amgen, Inc. (a) | | | | 302,450 | |
| 85,226 | | BioScrip, Inc. (a) | | | | 446,584 | |
| | | | | | | | |
| | | | | | | | |
| See Notes to Financial Statements. | 7 | | | | | |
| | | | | | |
| AUXIER FOCUS FUND | | | | | |
| SCHEDULE OF INVESTMENTS | | | | | |
| JUNE 30, 2010 | | | | | | | |
| | | | | | | | |
| Shares | | Security Description | | | | Value | |
| 13,449 | | Coventry Health Care, Inc. (a) | | | | $ 237,778 | |
| 5,820 | | Express Scripts, Inc. (a) | | | | 273,656 | |
| 31,300 | | GlaxoSmithKline PLC, ADR | | | | 1,064,513 | |
| 13,850 | | Johnson & Johnson | | | | 817,981 | |
| 7,070 | | LifePoint Hospitals, Inc. (a) | | | | 221,998 | |
| 17,150 | | Merck & Co., Inc. | | | | 599,736 | |
| 83,282 | | Pfizer, Inc. | | | | 1,187,601 | |
| 6,842 | | Quest Diagnostics, Inc. | | | | 340,526 | |
| 36,200 | | UnitedHealth Group, Inc. | | | | 1,028,080 | |
| 28,221 | | WellPoint, Inc. (a) | | | | 1,380,854 | |
| 30,600 | | Zimmer Holdings, Inc. (a) | | | | 1,653,930 | |
| | | | | | | 10,021,940 | |
| Industrials - 2.8% | | | | | |
| 21,550 | | AGCO Corp. (a) | | | | 581,204 | |
| 11,127 | | Blount International, Inc. (a) | | | | 114,274 | |
| 100 | | CF Industries Holdings, Inc. | | | | 6,345 | |
| 28,000 | | General Electric Co. | | | | 403,760 | |
| 11,150 | | Granite Construction, Inc. | | | | 262,917 | |
| 4,850 | | Illinois Tool Works, Inc. | | | | 200,208 | |
| 1,000 | | POSCO, ADR (a) | | | | 94,320 | |
| 100 | | Potash Corp. of Saskatchewan, Inc. | | | | 8,624 | |
| 3,500 | | Textainer Group Holdings, Ltd. | | | | 84,490 | |
| 3,550 | | The Boeing Co. | | | | 222,763 | |
| 100 | | The Mosaic Co. | | | | 3,898 | |
| 14,450 | | United Parcel Service, Inc., Class B | | | | 822,060 | |
| | | | | | | 2,804,863 | |
| Information Technology - 2.3% | | | | | |
| 28,750 | | Automatic Data Processing, Inc. | | | | 1,157,475 | |
| 37,350 | | Dell, Inc. (a) | | | | 450,441 | |
| 30,150 | | Microsoft Corp. | | | | 693,752 | |
| 5,000 | | MoneyGram International, Inc. (a) | | | | 12,275 | |
| 1,500 | | Verisk Analytics, Inc., Class A (a) | | | | 44,850 | |
| | | | | | | 2,358,793 | |
| Materials - 3.3% | | | | | | | |
| 11,200 | | Alcoa, Inc. | | | | 112,672 | |
| 28,700 | | E.I. du Pont de Nemours & Co. | | | | 992,733 | |
| 550 | | Plum Creek Timber Co., Inc., REIT | | | | 18,991 | |
| 7,100 | | Precision Castparts Corp. | | | | 730,732 | |
| 47,350 | | The Dow Chemical Co. | | | | 1,123,142 | |
| 14,000 | | Vale SA, ADR | | | | 340,900 | |
| | | | | | | 3,319,170 | |
| Telecommunications - 3.3% | | | | | |
| 27,300 | | AT&T, Inc. | | | | 660,387 | |
| 49,150 | | SK Telecom Co., Ltd., ADR | | | | 723,979 | |
| 60,750 | | Tele Norte Leste Participacoes SA, ADR | | | | 908,820 | |
| 30,300 | | Telefonos de Mexico SAB de CV, ADR | | | | 427,533 | |
| 21,650 | | Verizon Communications, Inc. | | | | 606,633 | |
| | | | | | | 3,327,352 | |
| Utilities - 0.3% | | | | | | | |
| 13,000 | | FirstService Corp. (a) | | | | 270,010 | |
| | | | | | | | |
| Total Common Stock (Cost $71,975,174) | | | | 69,783,108 | |
| | | | | | |
| | | | | | |
| See Notes to Financial Statements. | 8 | | | | | |
| | | | | | | | |
| AUXIER FOCUS FUND | | | | | |
| SCHEDULE OF INVESTMENTS | | | | | |
| JUNE 30, 2010 | | | | | | | |
| | | | | | | | |
| Shares | | Security Description | | Rate | | | Value | |
| Preferred Stock - 0.5% | | | | | |
| Utilities - 0.5% | | | | | | | |
| 305 | | AEP Texas Central Co. | 4.00 | % | | $ 21,979 | |
| 1,600 | | FirstService Corp. | 7.00 | | | 37,680 | |
| 1,210 | | Great Plains Energy, Inc. | 4.50 | | | 98,161 | |
| 4,000 | | Hawaiian Electric Co., Inc., Series C | 4.25 | | | 66,625 | |
| 300 | | Indianapolis Power & Light Co. | 4.00 | | | 25,022 | |
| 78 | | MidAmerican Energy Co. | 3.30 | | | 4,792 | |
| 80 | | MidAmerican Energy Co. | 3.90 | | | 6,000 | |
| 200 | | NSTAR Electric Co. | 4.25 | | | 17,488 | |
| 1,000 | | Pacific Enterprises | 4.50 | | | 81,975 | |
| 400 | | Peco Energy Co., Series A | 3.80 | | | 30,040 | |
| 1,500 | | The Connecticut Light & Power Co., Series 1947 | 1.90 | | | 53,344 | |
| 1,000 | | The Connecticut Light & Power Co., Series 1947 | 2.00 | | | 37,438 | |
| 1,500 | | The Connecticut Light & Power Co., Series 1949 | 3.90 | | | 51,656 | |
| 300 | | Westar Energy, Inc. | 4.25 | | | 23,259 | |
| Total Preferred Stock (Cost $421,559) | | | | 555,459 | |
| | | | | | | | |
| Principal | | | | | | Maturity | | | |
| Asset Backed Obligations - 0.0% | | | | | |
| $ 2,154 | | Scotia Pacific Co., LLC, Series B (b) (c) (Cost $1,944) | 6.55 | | 07/20/28 | 0 | |
| | | | | | | | |
| Corporate Bonds - 22.1% | | | | | |
| Consumer Discretionary - 0.3% | | | | | |
| 315,000 | | Time Warner, Inc. | 6.88 | | 05/01/12 | 343,323 | |
| | | | | | | | |
| Consumer Staples - 6.1% | | | | | |
| 1,180,000 | | American Stores Co. | 7.90 | | 05/01/17 | 1,121,000 | |
| 50,000 | | Constellation Brands, Inc. | 7.25 | | 05/15/17 | 50,938 | |
| 1,110,000 | | Dr. Pepper Snapple Group, Inc. | 6.12 | | 05/01/13 | 1,235,911 | |
| 350,000 | | General Mills, Inc. | 5.70 | | 02/15/17 | 407,068 | |
| 535,000 | | Kraft Foods, Inc. | 5.63 | | 11/01/11 | 563,153 | |
| 1,225,000 | | Smithfield Foods, Inc., Series B | 7.75 | | 05/15/13 | 1,219,641 | |
| 115,000 | | SUPERVALU, Inc. | 7.50 | | 11/15/14 | 115,575 | |
| 375,000 | | SUPERVALU, Inc. | 8.00 | | 05/01/16 | 373,125 | |
| 985,000 | | Tyson Foods, Inc. | 8.25 | | 10/01/11 | 1,068,725 | |
| | | | | | | 6,155,136 | |
| | | | | | | | |
| Energy - 2.8% | | | | | | | |
| 1,170,000 | | Chesapeake Energy Corp. | 6.63 | | 01/15/16 | 1,194,862 | |
| 100,000 | | Constellation Energy Group, Inc. | 4.55 | | 06/15/15 | 105,328 | |
| 190,000 | | El Paso Corp. (c) | 6.70 | | 02/15/27 | 167,200 | |
| 1,270,000 | | El Paso Performance-Linked Trust (d) | 7.75 | | 07/15/11 | 1,315,444 | |
| | | | | | | 2,782,834 | |
| Financials - 3.5% | | | | | | | |
| 75,000 | | American Express Credit Corp., Series C | 7.30 | | 08/20/13 | 84,975 | |
| 455,000 | | Hartford Financial Services Group, Inc. | 5.25 | | 10/15/11 | 471,114 | |
| 2,370,000 | | Hartford Financial Services Group, Inc. | 5.50 | | 10/15/16 | 2,466,241 | |
| | | | | | | | |
| | | | | | | | |
| See Notes to Financial Statements. | 9 | | | | | |
| | | | | | |
| | | | | | |
| AUXIER FOCUS FUND | | | | | |
| SCHEDULE OF INVESTMENTS | | | | | |
| JUNE 30, 2010 | | | | | | | |
| | | | | | | | |
| Principal | | Security Description | | Rate | | | Maturity | | Value | |
| 182,000 | | Hartford Financial Services Group, Inc. | 6.30 | | 03/15/18 | $ 188,855 | |
| 345,000 | | Janus Capital Group, Inc. | 6.95 | | 06/15/17 | 346,806 | |
| 156,396 | | The FINOVA Group, Inc. (b) | 7.50 | | 11/15/09 | 657 | |
| | | | | | | 3,558,648 | |
| Health Care - 1.7% | | | | | |
| 540,000 | | Health Management Associates, Inc. | 6.13 | | 04/15/16 | 514,350 | |
| 515,000 | | UnitedHealth Group, Inc. | 4.88 | | 03/15/15 | 548,466 | |
| 430,000 | | WellPoint, Inc. | 5.00 | | 12/15/14 | 467,652 | |
| 130,000 | | WellPoint, Inc. | 5.25 | | 01/15/16 | 142,500 | |
| | | | | | | 1,672,968 | |
| Industrials - 5.4% | | | | | |
| 2,832,000 | | Church & Dwight Co., Inc. | 6.00 | | 12/15/12 | 2,860,320 | |
| 740,000 | | General Electric Capital Corp., MTN | 5.63 | | 09/15/17 | 792,112 | |
| 180,000 | | Johnson Controls, Inc. | 5.25 | | 01/15/11 | 182,875 | |
| 495,000 | | Johnson Controls, Inc. | 4.88 | | 09/15/13 | 533,596 | |
| 94,000 | | Waste Management, Inc. | 7.38 | | 08/01/10 | 94,493 | |
| 71,000 | | Waste Management, Inc. | 7.65 | | 03/15/11 | 73,881 | |
| 835,000 | | Waste Management, Inc. | 6.38 | | 11/15/12 | 915,405 | |
| | | | | | | 5,452,682 | |
| | | | | | | | |
| Materials - 1.7% | | | | | |
| 895,000 | | The Dow Chemical Co. | 5.70 | | 05/15/18 | 945,008 | |
| 203,000 | | Weyerhaeuser Co. | 9.00 | | 10/01/21 | 233,760 | |
| 505,000 | | Weyerhaeuser Co. | 7.95 | | 03/15/25 | 532,641 | |
| | | | | | | 1,711,409 | |
| | | | | | | | |
| Utilities - 0.6% | | | | | | | |
| 255,000 | | Energy Future Holdings Corp. | 9.75 | | 10/15/19 | 240,706 | |
| 312,000 | | Energy Future Intermediate Holding Co., LLC | 9.75 | | 10/15/19 | 294,511 | |
| 27,000 | | Nevada Power Co., Series L | 5.88 | | 01/15/15 | 30,116 | |
| | | | | | | 565,333 | |
| | | | | | | | |
| Total Corporate Bonds (Cost $20,005,383) | | | | 22,242,333 | |
| | | | | | | | |
Foreign Municipal Bonds - 1.1% (e) | | | | | |
| 750,000 | | Ontario Hydro Generic Residual Strip (Canada), Series OC20 | 5.51 | | 10/01/20 | 455,087 | |
| 356,000 | | Ontario Hydro Generic Residual Strip (Canada) | 5.47-5.65 | | 11/27/20 | 214,058 | |
| 605,000 | | Ontario Hydro Generic Residual Strip (Canada) | 5.61 | | 10/15/21 | 345,826 | |
| 235,000 | | Ontario Hydro Generic Residual Strip (Canada) | 5.75 | | 08/18/22 | 127,717 | |
| Total Foreign Municipal Bonds (Cost $782,138) | | | | 1,142,688 | |
| Shares | | | | | | | |
| Money Market Fund - 0.0% | | | | | |
| 31 | | Schwab Government Money Fund 0.01% (f) (Cost $31) | | | | 31 | |
| | | | | | | | |
| Total Investments - 92.9% (Cost $93,186,229)* | | | | $ 93,723,619 | |
| Cash - 6.0% | | | | | | 6,075,058 | |
| Other Assets & Liabilities, Net - 1.1% | | | | 1,069,866 | |
| NET ASSETS - 100.0% | | | | $ 100,868,543 | |
| | | | | | | | |
| | | | | | | | |
| See Notes to Financial Statements. | 10 | | | | | |
| | | | | | | | |
| AUXIER FOCUS FUND | | | | | |
| SCHEDULE OF INVESTMENTS | | | | | |
| JUNE 30, 2010 | | | | | | | |
| | | | | | | | |
| ADR American Depository Receipt. | | | | | |
| MTN Medium Term Note. | | | | | |
| PLC Public Limited Company. | | | | | |
| | | | | | | | |
| | | | | | | | |
| (a) Non-income producing security. | | | | | |
| (b) Security is currently in default on scheduled principal or interest payments. | | | | |
| (c) Security fair valued in accordance with procedures adopted by the Board of Trustees. | | | | |
| At the period end, the value of these securities amounted to $167,200 or 0.2% of net assets. | | | |
| (d) Security exempt from registration under Rule 144A under the Securities Act of 1933. | | | | |
| At the period end, the value of these securities amounted to $1,315,444 or 1.3% of net assets. | | | |
| (e) Zero coupon bonds. Interest rate presented is yield to maturity. | | | | | |
| (f) Represents 7-day effective yield as of June 30, 2010. | | | | | |
| | | | | | | | |
| | | | | | | | |
| * Cost for federal income tax purposes is $93,198,399 and net unrealized appreciation consists of: | | | |
| | | | | | | | |
| | Gross Unrealized Appreciation | $ 12,759,653 | | | | |
| | Gross Unrealized Depreciation | (12,234,433) | | | | |
| | Net Unrealized Appreciation | $ 525,220 | | | | |
| | | | | | | | |
| | | | | | | | |
| | | | | | | | |
| The following is a summary of the inputs used to value the Fund's investments as of June 30, 2010. | | |
| The inputs or methodology used for valuing securities are not necessarily an indication of the risk associated with investing in those |
| securities. For more information on valuation inputs, and their aggregation into the levels used in the table below, refer to Note 2 - |
| Security Valuation section in the accompanying Notes to Financial Statements. | | | | |
| | | | | | | | |
| | | | Level 1 | Level 2 | Level 3 | Total | |
| | | Common Stock | | | | | |
| | | Communications | $ 71,760 | $ - | $ - | $ 71,760 | |
| | | Consumer Discretionary | 19,202,459 | - | - | 19,202,459 | |
| | | Consumer Staples | 16,600,727 | - | - | 16,600,727 | |
| | | Energy | 4,491,622 | - | - | �� 4,491,622 | |
| | | Financials | 7,314,412 | - | - | 7,314,412 | |
| | | Health Care | 10,021,940 | - | - | 10,021,940 | |
| | | Industrials | 2,804,863 | - | - | 2,804,863 | |
| | | Information Technology | 2,358,793 | - | - | 2,358,793 | |
| | | Materials | 3,319,170 | - | - | 3,319,170 | |
| | | Telecommunications | 3,327,352 | - | - | 3,327,352 | |
| | | Utilities | 270,010 | - | - | 270,010 | |
| | | Preferred Stock - Utilities | 37,680 | 517,779 | - | 555,459 | |
| | | Asset Backed Obligations | - | - | 0 | 0 | |
| | | Corporate Bonds | - | 22,075,133 | 167,200 | 22,242,333 | |
| | | Foreign Municpal Bonds | - | 1,142,688 | - | 1,142,688 | |
| | | Money Market Fund | - | 31 | - | 31 | |
| | | TOTAL | $ 69,820,788 | $23,735,631 | $ 167,200 | $ 93,723,619 | |
| | | | | | |
| | | | | | |
| See Notes to Financial Statements. | 11 | | | | | |
| | | | | | |
| AUXIER FOCUS FUND | | | | | |
| SCHEDULE OF INVESTMENTS | | | | | |
| JUNE 30, 2010 | | | | | | | |
| | | | | | | | |
| The following is a reconciliation of Level 3 assets (at either the beginning or ending of the year) for which significant unobservable inputs | |
| were used to determine fair value. | | | | | |
| | | | Preferred Stock | Asset Backed Obligations | Corporate Bonds | Total | |
| | | | | | | | |
| | | Balance as of 06/30/09 | $ 18,681 | $ 1,982 | $ - | $ 20,663 | |
| | | Accrued Accretion / (Amortization) | - | - | - | - | |
| | | Realized Gain / (Loss) | - | - | - | - | |
| | | Change in Unrealized Appreciation / (Depreciation) | 3,298 | (1,982) | - | 1,316 | |
| | | Net Purchase / (Sales) | - | - | - | - | |
| | | Transfers In / (Out) | (21,979) | - | 167,200 | $ 145,221 | |
| | | Balance as of 06/30/10 | $ - | $ - | $ 167,200 | $ 167,200 | |
| | | Net Change in Unrealized Appreciation / (Depreciation) from Investments held as of 06/30/10** | $ - | $ (1,982) | $ - | $ (1,982) | |
| | | | | | | | |
| ** The unrealized appreciation / (depreciation) is included in net change in unrealized appreciation / (depreciation) of investments in the accompanying Statement of Operations. |
| | | | | | | | |
| | | PORTFOLIO HOLDINGS | | | | | |
| | | % of Net Assets | | | | | |
| | | Common Stock | | 69.2% | | | |
| | | Preferred Stock | | 0.5% | | | |
| | | Asset Backed Obligations | | 0.0% | | | |
| | | Corporate Bonds | | 22.1% | | | |
| | | Foreign Municipal Bonds | | 1.1% | | | |
| | | Money Market Fund | | 0.0% | | | |
| | | Cash and Other Net Assets | | 7.1% | | | |
| | | | | 100.0% | | | |
| | | | | | | | |
| See Notes to Financial Statements. | | 12 | | | | | |
| | | | | | |
| AUXIER FOCUS FUND | | |
| STATEMENT OF ASSETS AND LIABILITIES | | |
| JUNE 30, 2010 | | |
| | | | | | |
| | | | | | |
| | | | | | |
| | | | | | |
| ASSETS | | |
| | Investments, at value (Cost $93,186,229) | $ 93,723,619 | |
| | Cash | 6,075,058 | |
| | Receivables: | | |
| | | Fund shares sold | 29,880 | |
| | | Investment securities sold | 642,638 | |
| | | Dividends and interest | 498,859 | |
| Total Assets | 100,970,054 | |
| | | | | | |
| LIABILITIES | | |
| | Payables: | | |
| | | Fund shares redeemed | 911 | |
| | Accrued Liabilities: | | |
| | | Investment adviser fees | 100,495 | |
| | | Trustees' fees and expenses | 72 | |
| | | Distribution fees | 33 | |
| Total Liabilities | 101,511 | |
| | | | | | |
| NET ASSETS | $ 100,868,543 | |
| | | | | | |
| COMPONENTS OF NET ASSETS | | |
| | Paid-in capital | $ 99,042,643 | |
| | Undistributed net investment income | 1,314,468 | |
| | Accumulated net realized loss | (25,958) | |
| | Net unrealized appreciation | 537,390 | |
| | | | | | |
| NET ASSETS | $ 100,868,543 | |
| | | | | | |
| SHARES OF BENEFICIAL INTEREST AT $0.000 PAR VALUE (UNLIMITED SHARES AUTHORIZED) | | |
| | Investor Shares | 7,467,219 | |
| | A Shares | 11,638 | |
| | | | | | |
| NET ASSET VALUE, OFFERING AND REDEMPTION PRICE PER SHARE | | |
| | Investor Shares (based on net assets of $100,711,603) | $ 13.49 | |
| | A Shares (based on net assets of $156,940) | $ 13.49 | |
| | A Shares Maximum Public Offering Price Per Share (net asset value per share/94.25%) | $ 14.31 | |
| | | | | | |
| | | | | | |
| See Notes to Financial Statements. | 13 | | |
| | | | |
| AUXIER FOCUS FUND | | |
| STATEMENT OF OPERATIONS | | |
| YEAR ENDED JUNE 30, 2010 | | |
| | | | |
| | | | |
| INVESTMENT INCOME | | |
| | Dividend income (net of foreign taxes withheld of $22,657) | $ 1,900,908 | |
| | Interest income | 1,692,886 | |
| Total Investment Income | 3,593,794 | |
| | | | |
| EXPENSES | | |
| | Investment adviser fees | 1,300,953 | |
| | Distribution fees: | | |
| | A Shares | 401 | |
| | Trustees' fees and expenses | 3,231 | |
| Total Expenses | 1,304,585 | |
| | Expenses waived | (3,673) | |
| Net Expenses | 1,300,912 | |
| | | | |
| NET INVESTMENT INCOME | 2,292,882 | |
| | | | |
| NET REALIZED AND UNREALIZED GAIN ON INVESTMENTS | | |
| | AND FOREIGN CURRENCY TRANSACTIONS | | |
| | Net realized gain on investments and foreign currency transactions | 696,183 | |
| | Net change in unrealized appreciation (depreciation) on investments | 7,745,953 | |
| | | | |
| NET REALIZED AND UNREALIZED GAIN ON INVESTMENTS | | |
| | AND FOREIGN CURRENCY TRANSACTIONS | 8,442,136 | |
| | | | |
| INCREASE IN NET ASSETS FROM OPERATIONS | $ 10,735,018 | |
| | | | |
| | | | |
| See Notes to Financial Statements. | 14 | | |
| | | | | | | |
| AUXIER FOCUS FUND | | | | |
| STATEMENTS OF CHANGES IN NET ASSETS | | | |
| | | | | | | |
| | | | | | | |
| | | | Year Ended | | Year Ended | |
| | | | June 30, 2010 | | June 30, 2009 | |
| | | | | | | |
| OPERATIONS | | | | | |
| | Net investment income | | $ 2,292,882 | | $ 1,324,441 | |
| | Net realized gain (loss) | | 696,183 | | (628,109) | |
| | Net change in unrealized appreciation (depreciation) | 7,745,953 | | (12,207,055) | |
| Increase (Decrease) in Net Assets from Operations | 10,735,018 | | (11,510,723) | |
| | | | | | | |
| DISTRIBUTIONS TO SHAREHOLDERS FROM | | | | |
| | Net investment income: | | | | | |
| | Investor Shares | | (1,836,778) | | (1,100,100) | |
| | A Shares | | (3,091) | | (2,270) | |
| | Net realized gains: | | | | | |
| | Investor Shares | | - | | (2,232,463) | |
| | A Shares | | - | | (4,702) | |
| Total Distributions to Shareholders | | (1,839,869) | | (3,339,535) | |
| | | | | | | |
| CAPITAL SHARE TRANSACTIONS | | | | |
| | Sale of shares: | | | | | |
| | Investor Shares | | 19,500,648 | | 12,832,552 | |
| | A Shares | | 17,906 | | - | |
| | Contributions from share reclassification: | | | | |
| | Investor Shares (Note 1) | | - | | 38,065 | |
| | Reinvestment of distributions: | | | | | |
| | Investor Shares | | 1,798,747 | | 3,261,809 | |
| | A Shares | | 3,091 | | 6,972 | |
| | Redemption of shares: | | | | | |
| | Investor Shares | | (14,133,080) | | (20,340,642) | |
| | A Shares | | (27,077) | | (32,769) | |
| | C Shares | | - | | (59,684) | |
| | Redemptions from share reclassification: | | | | |
| | C Shares (Note 1) | | - | | (38,065) | |
| | Redemption fees | | 5,388 | | 13,358 | |
| Increase (Decrease) in Net Assets From Capital Transactions | 7,165,623 | | (4,318,404) | |
| Increase (Decrease) in Net Assets | | 16,060,772 | | (19,168,662) | |
| | | | | | | |
| NET ASSETS | | | | | |
| | Beginning of Year | | 84,807,771 | | 103,976,433 | |
| | End of Year (a) | | $ 100,868,543 | | $ 84,807,771 | |
| | | | | | | |
| | | | | | | |
| | (a) Amount includes undistributed net investment income | $ 1,314,468 | | $ 777,620 | |
| | | | | | | |
| | | | | | | |
| See Notes to Financial Statements. | 15 | | | | |
| | | | | | | | | | | | | | | | | | | | |
| AUXIER FOCUS FUND | | | | | | | | | | | | | | | | | | |
| FINANCIAL HIGHLIGHTS | | | | | | | | | | | | | | | | | | |
| | | | | | | | | | | | | | | | | | | | |
| | | | | | | | | | | | | | | | | | | | |
| These financial highlights reflect selected per share data and ratios for a share outstanding throughout each period. | | | |
| | | | | | | | | | | | | | | | | | | | |
| | | | | | | | | | | | | | | | | | | | |
| | | Beginning | | | | Net Realized | Total | | Distributions | | | | Ending | |
| | | Net Asset | | Net | | and | | from | | From Net | | From Net | | Total | | | | Net Asset | |
| | | Value Per | | Investment | | Unrealized | | Investment | Investment | Realized | | Distributions to | Redemption | | Value Per | |
| | | Share | | Income (b) | | Gain (Loss) | | Operations | | Income | | Gains | | Shareholders | | Fees (b) | | Share | |
| | | | | | | | | | | | | | | | | | | | |
| Investor Shares | | | | | | | | | | | | | | | | | | |
| | | | | | | | | | | | | | | | | | | | |
| Year Ended June 30, 2010 | $ 12.16 | | $ 0.32 | | $ 1.27 | | $ 1.59 | | $ (0.26) | | $ - | | $ (0.26) | | $ - | (f) | $ 13.49 | |
| Year Ended June 30, 2009 (i) | 14.22 | | 0.19 | | (1.77) | | (1.58) | | (0.16) | | (0.32) | | (0.48) | | - | (f) | 12.16 | |
| Year Ended June 30, 2008 | 17.06 | | 0.18 | | (2.24) | | (2.06) | | (0.31) | | (0.47) | | (0.78) | | - | (f) | 14.22 | |
| Year Ended June 30, 2007 | 14.76 | | 0.38 | | 2.66 | | 3.04 | | (0.27) | | (0.47) | | (0.74) | | - | (f) | 17.06 | |
| Year Ended June 30, 2006 | 14.64 | | 0.21 | | 0.30 | | 0.51 | | (0.18) | | (0.21) | | (0.39) | | - | (f) | 14.76 | |
| | | | | | | | | | | | | | | | | | | | |
| A Shares | | | | | | | | | | | | | | | | | | |
| | | | | | | | | | | | | | | | | | | | |
| Year Ended June 30, 2010 | 12.17 | | 0.32 | | 1.26 | | 1.58 | | (0.26) | | - - | | (0.26) | | - | (f) | 13.49 | |
| Year Ended June 30, 2009 | 14.22 | | 0.18 | | (1.75) | | (1.57) | | (0.16) | | (0.32) | | (0.48) | | - | (f) | 12.17 | |
| Year Ended June 30, 2008 | 17.07 | | 0.17 | | (2.24) | | (2.07) | | (0.31) | | (0.47) | | (0.78) | | - | (f) | 14.22 | |
| Year Ended June 30, 2007 | 14.77 | | 0.41 | | 2.63 | | 3.04 | | (0.27) | | (0.47) | | (0.74) | | - | | 17.07 | |
| July 8, 2005 through June 30, 2006 (g) (h) | 14.81 | | 0.21 | | 0.14 | | 0.35 | | (0.18) | | (0.21) | | (0.39) | | - | | 14.77 | |
| | | | | | | | | | | | | | | | | | | | |
| (a) | Annualized for periods less than one year. | | | | | | | | | | | | | | | | | |
| (b) | Calculated based on average shares outstanding for the period. | | | | | | | | | | | | | | | |
| (c) | Not annualized for periods less than one year. | | | | | | | | | | | | | | | | | |
| (d) | Total return does not include the effect of front-end sales charges or contingent deferred sales charges. | | | | | |
| (e) | Reflects the expense ratio excluding any waivers and/or reimbursements. | | | | | | | | | | | | | |
| (f) | Less than $0.01 per share. | | | | | | | | | | | | | | | | | | |
| (g) | Due to shareholder redemptions, on August 21, 2005, net assets of the class were zero from the close of business on | | | |
| | that date until September 22, 2005. Financial information presented is for the period July 8, 2005, through June 30, 2006. | | |
| (h) | A shares commenced operations on July 8, 2005. | | | | | | | | | | | | | | | | | |
| (i) | Effective November 1, 2008, C Shares were reclassified as Investor Shares. For the Period July 1, 2008, through November 1, 2008, | |
| | total return for C Shares was (12.68)%. For the aforementioned period, the annualized gross expenses and net expenses ratios | |
| | were 2.35% and 2.10%, respectively. | | | | | | | | | | | | | | | | | | |
| | | | | | | | | | | | | | | | | | | | |
| | | | | | | | | | | | | | | | | | | | |
| See Notes to Financial Statements. | | | | | 16 | | | | | | | | | | | | | |
| | | | | | | | | | | | |
| AUXIER FOCUS FUND | | | | | | | | | | | |
| FINANCIAL HIGHLIGHTS (continued) | | | | | | | | | | | |
| | | | | | | | | | | | |
| | | | | | | | | | | | |
| | | | | | | | | | | | |
| | | | | | | | Ratios to Average | | | | |
| | | | | | | Net Assets (a) | | | |
| | | | Net Assets at | | Net | | | | | | Portfolio |
| | Total | | End of Period | | Investment | | Net | | Gross | | Turnover |
| | Return (c) (d) | | (000's Omitted) | | Income | | Expenses | | Expenses (e) | | Rate (c) |
| | | | | | | | | | | | |
| | | | | | | | | | | | |
| Investor Shares | | | | | | | | | | | |
| | | | | | | | | | | | |
| Year Ended June 30, 2010 | 12.99% | | $ 100,712 | | 2.29% | | 1.30% | | 1.30% | | 15% |
| Year Ended June 30, 2009 (i) | (10.92)% | | 84,660 | | 1.53% | | 1.35% | | 1.35% | | 24% |
| Year Ended June 30, 2008 | (12.56)% | | 103,664 | | 1.10% | | 1.35% | | 1.36% | | 19% |
| Year Ended June 30, 2007 | 21.11% | | 116,774 | | 2.40% | | 1.35% | | 1.36% | | 16% |
| Year Ended June 30, 2006 | 3.44% | | 103,642 | | 1.44% | | 1.35% | | 1.36% | | 28% |
| | | | | | | | | | | | |
| A Shares | | | | | | | | | | | |
| | | | | | | | | | | | |
| Year Ended June 30, 2010 | 12.90% | | 157 | | 2.29% | | 1.30% | | 1.55% | | 15% |
| Year Ended June 30, 2009 | (10.85)% | | 148 | | 1.49% | | 1.35% | | 1.60% | | 24% |
| Year Ended June 30, 2008 | (12.61)% | | 208 | | 1.08% | | 1.35% | | 1.60% | | 19% |
| Year Ended June 30, 2007 | 21.10% | | 399 | | 2.59% | | 1.35% | | 1.60% | | 16% |
| July 8, 2005 through June 30, 2006 (g) (h) | 2.32% | | 392 | | 1.56% | | 1.35% | | 1.61% | | 28% |
| | | | | | | | | | | | |
| | | | | | | | | | | | |
| See Notes to Financial Statements. | | | 17 | | | | | | | | |
| |
| AUXIER FOCUS FUND NOTES TO FINANCIAL STATEMENTS JUNE 30, 2010 |
Note 1. Organization
The Auxier Focus Fund (the “Fund”) is a diversified portfolio of Forum Funds (the “Trust”). The Trust is a Delaware statutory trust that is registered as an open-end, management investment company under the Investment Company Act of 1940 (the “Act”), as amended. As of June 30, 2010, the Trust had twenty-two investment portfolios. Under its Trust Instrument, the Trust is authorized to issue an unlimited number of each Fund’s shares of beneficial interest without par value. The Fund currently offers two classes of shares: Investor Shares and A Shares. A Shares are offered at net asset value plus a maximum sales charge of 5.75%. A Shares are also subject to contingent deferred sales charge (“CDSC”) of 1.00% on purchases without an initial sales charge and redeemed less than one year after they are purchased. Investor Shares are not subject to a sales charge. Investor Shares and A Shares commenced operations on July 9, 1999 and July 8, 2005, respectively. The Fund’s investment objective is to achieve long-term capital appreciation.
On August 27, 2008, the Board of Trustees of the Trust approved the conversion of the Fund’s C Shares into Investor Shares. On November 1, 2008, each shareholder of C Shares received Investor Shares in a dollar amount equal to their investment in C Shares as of that date.
Note 2. Summary of Significant Accounting Policies
These financial statements are prepared in accordance with generally accepted accounting principles in the United States of America (“GAAP”), which require management to make estimates and assumptions that affect the reported amounts of assets and liabilities, the disclosure of contingent liabilities at the date of the financial statements, and the reported amounts of increase and decrease in net assets from operations during the fiscal period. Actual amounts could differ from those estimates. The following summarizes the significant accounting policies of the Fund:
Security Valuation – Exchange-traded securities and over-the-counter securities are valued using the last quoted sale or official closing price, provided by independent pricing services as of the close of trading on the market or exchange for which they are primarily traded, on each Fund business day. In the absence of a sale, such securities are valued at the mean of the last bid and asked price provided by independent pricing services. Non-exchange traded securities for which quotations are available are valued using the last quoted sales price, or in the absence of a sale at the mean of the last bid and asked prices provided by independent pricing services. Debt securities may be valued at prices supplied by a Fund’s pricing agent based on broker or dealer supplied valuations or matrix pricing, a method of valuing securities by reference to the value of other securities with similar characteristics such as rating, interest rate and maturity. Shares of open-end mutual funds are valued at net asset value (“NAV”). Short-term investments that mature in sixty days or less may be valued at amortized cost.
The Fund values its investments at fair value pursuant to procedures adopted by the Trust's Board of Trustees (the "Board") if (1) market quotations are insufficient or not readily available or (2) the adviser believes that the values available are unreliable. Fair valuation is based on subjective factors and as a result, the fair value price of an investment may differ from the security’s market price and may not be the price at which the asset may be sold. Fair valuation could result in a different NAV than a NAV determined by using market quotes.
The Fund has a three-tier fair value hierarchy. The basis of the tiers is dependent upon the various “inputs” used to determine the value of the Fund’s investments. These inputs are summarized in the three broad levels listed below:
Level 1 — quoted prices in active markets for identical assets
Level 2 — other significant observable inputs (including quoted prices of similar securities, interest rates, prepayment speeds, credit risk, etc.)
Level 3 — significant unobservable inputs (including the Fund’s own assumptions in determining the fair value of investments)
The aggregate value by input level, as of June 30, 2010, for the Fund’s investments is included at the end of the
18
| |
| AUXIER FOCUS FUND NOTES TO FINANCIAL STATEMENTS JUNE 30, 2010 |
Fund’s Schedule of Investments.
Security Transactions, Investment Income and Realized Gain and Loss – Investment transactions are accounted for on trade date. Dividend income is recorded on the ex-dividend date. Foreign dividend income is recorded on the ex-dividend date or as soon as possible after the Fund determines the existence of a dividend declaration after exercising reasonable due diligence. Income and capital gains on some foreign securities may be subject to foreign withholding taxes, which are accrued as applicable. Interest income is recorded on an accrual basis. Premium and discount is amortized and accreted in accordance with GAAP. Identified cost of investments sold is used to determine the gain and loss for both financial statement and federal income tax purposes.
Foreign Currency Translations – Foreign currency amounts are translated into U.S. dollars as follows: (i) assets and liabilities at the rate of exchange at the end of the respective period; and (ii) purchases and sales of securities and income and expenses at the rate of exchange prevailing on the dates of such transactions. The portion of the results of operations arising from changes in the exchange rates and the portion due to fluctuations arising from changes in the market prices of securities are not isolated. Such fluctuations are included with the net realized and unrealized gain or loss on investments.
The Fund may enter into transactions to purchase or sell foreign currencies to protect the U.S. dollar value of its underlying portfolio securities against the effect of possible adverse movements in foreign exchange rates. Principal risks associated with such transactions include the movement in value of the foreign currency relative to the U.S. dollar and the ability of the counterparty to perform. Fluctuations in the value of such forward currency transactions are recorded daily as unrealized gain or loss; realized gain or loss includes net gain or loss on transactions that have terminated by settlement or by the Fund entering into offsetting commitments. These instruments involve market risk, credit risk, or both kinds of risks, in excess of the amount recognized in the Statement of Assets and Liabilities. Risks arise from the possible inability of counterparties to meet the terms of their contracts and from movement in currency and securities values and interest rates.
Distributions to Shareholders – Distributions to shareholders of net investment income and net capital gains, if any, are declared and paid at least annually. Distributions are based on amounts calculated in accordance with applicable federal income tax regulations, which may differ from GAAP. These differences are due primarily to differing treatments of income and gain on various investment securities held by the Fund, timing differences and differing characterizations of distributions made by the Fund.
Federal Taxes – The Fund intends to qualify each year as a regulated investment company under Subchapter M of the Internal Revenue Code and distribute all of its taxable income to shareholders. In addition, by distributing in each calendar year substantially all its net investment income and capital gains, if any, the Fund will not be subject to a federal excise tax. Therefore, no federal income or excise tax provision is required.
As of June 30, 2010, there are no uncertain tax positions that would require financial statement recognition, de-recognition, or disclosure. The Fund’s federal tax returns filed in the three-year period ended June 30, 2010, remain subject to examination by the Internal Revenue Service.
Income and Expense Allocation – The Trust accounts separately for the assets, liabilities and operations of each of its investment portfolios. Expenses that are directly attributable to more than one investment portfolio are allocated among the respective investment portfolios in an equitable manner.
The Fund’s class specific expenses are charged to the operations of that class of shares. Income and expenses (other than expenses attributable to a specific class) and realized and unrealized gains or losses on investments are allocated to each class of shares based on the class’ respective net assets to the total net assets of the Fund.
Redemption Fees – A shareholder who redeems or exchanges shares within 180 days of purchase will incur a redemption fee of 2.00% of the current net asset value of shares redeemed or exchanged, subject to certain limitations. The fee is charged for the benefit of the remaining shareholders and will be paid to the Fund to help offset transaction costs. The fee is accounted for as an addition to paid-in capital. The Fund reserves the right to
19
| |
AUXIER FOCUS FUND NOTES TO FINANCIAL STATEMENTS JUNE 30, 2010 |
modify the terms of or terminate the fee at any time. There are limited exceptions to the imposition of the redemption fee.
Commitments and Contingencies – In the normal course of business, the Fund enters into contracts that provide general indemnifications by the Fund to the counterparty to the contract. The Fund’s maximum exposure under these arrangements is dependent on future claims that may be made against the Fund and, therefore, cannot be estimated; however, based on experience, the risk of loss from such claims is considered remote.
Note 3. Advisory Fees, Servicing Fees and Other Transactions
Investment Adviser – Auxier Asset Management LLC (the “Adviser”), is the investment adviser to the Fund. Effective January 1, 2010, the advisory fee received by the Adviser from the fund is at an annual rate of 1.25% of the Fund’s average daily assets. Prior to January 1, 2010, the Adviser received an advisory fee from the Fund at an annual rate of 1.35% of the Fund’s average daily assets.
Under the terms of the Investment Advisory Agreement, the Adviser provides investment advisory services to the Fund and is obligated to pay all expenses of the Fund except any expenses it is authorized to pay under Rule 12b-1, brokerage fees and commissions, borrowing costs, taxes, certain compensation expenses of the Trustees, and extraordinary and non-recurring expenses.
Distribution – Foreside Fund Services, LLC serves as the Fund’s distributor (the “Distributor”). The Distributor is not affiliated with the Adviser or with Atlantic Fund Administration, LLC (“Atlantic”) or their affiliates. The Fund has adopted a Distribution Plan (the “Plan”) for A Shares of the Fund in accordance with Rule 12b-1 of the Act. Under the Plan, the Fund pays the Distributor and/or any other entity as authorized by the Board a fee of up to 0.25% of the average daily net assets of A Shares. The Distributor had no role in determining the investment policies or which securities are to be purchased or sold by the Trust or its Funds.
For the year ended June 30, 2010, there were $1,094 in front-end sales charges assessed on the sale of A Shares, no contingent deferred sales charges were assessed on the sale of A Shares. The distributor received $144 of the total front-end sales charges.
Other Service Providers – Atlantic provides fund accounting, fund administration, and transfer agency services to the Fund. Atlantic also provides certain shareholder report production and EDGAR conversion and filing services. Atlantic provides a Principal Executive Officer, a Principal Financial Officer, a Chief Compliance Officer, and an Anti-Money Laundering Officer to the Fund, as well as certain additional compliance support functions.
Trustees and Officers – The Trust pays each independent Trustee an annual retainer fee of $40,000 for service to the Trust ($60,000 for the Chairman). In addition, the Chairman receives a monthly stipend of $500 to cover certain expenses incurred in connection with his duties to the Trust. The Trustees and Chairman may receive additional fees for special Board meetings. Each Trustee is also reimbursed for all reasonable out-of-pocket expenses incurred in connection with his duties as a Trustee, including travel and related expenses incurred in attending Board meetings. The amount of Trustees’ fees attributable to the Fund is disclosed in the Statement of Operations. Certain officers of the Trust are also officers or employees of the above named service providers, and during their terms of office received no compensation from the Fund.
Note 4. Expense Reimbursements and Fees Waived
Effective January 1, 2010, the Adviser has contractually agreed to waive a portion of its fees and reimburse expenses through October 31, 2010, to the extent necessary to maintain the total operating expenses at 1.25% of average daily net assets of the Investor Shares and A Shares. Prior to January 1, 2010, the Adviser had contractually agreed to waive a portion of its fees and reimburse expenses to maintain the total operating expenses at 1.35% of average daily net assets of the Investor Shares and A Shares. These contractual waivers may be changed or eliminated at any time with consent of the Board. For the year ended June 30, 2010, expenses waived were $3,673.
20
| |
| AUXIER FOCUS FUND NOTES TO FINANCIAL STATEMENTS JUNE 30, 2010 |
Note 5. Security Transactions
The cost of purchases and proceeds from sales of investment securities (including maturities), other than short-term investments for the year ended June 30, 2010, were $19,806,070 and $14,789,751, respectively.
Note 6. Federal Income Tax and Investment Transactions
Distributions during the fiscal years ended as noted were characterized for tax purposes as follows:
| | | 2010 | | 2009 |
| Ordinary Income | | $ | 1,839,869 | | $ | 1,275,234 |
| Long-Term Capital Gain | | | - | | | 2,064,301 |
| Total | | $ | 1,839,869 | | $ 3,339,535 |
As of June 30, 2010, distributable earnings (accumulated losses) on a tax basis were as follows:
| Undistributed Ordinary Income | | $ | 1,314,360 | |
| Capital and Other Losses | | | (13,680) | |
| Unrealized Appreciation | | | 525,220 | |
| Total | | $ | 1,825,900 | |
The difference between components of distributable earnings on a tax basis and the amounts reflected in the Statement of Assets and Liabilities are primarily due to wash sales.
As of June 30, 2010, the Fund had capital loss carryforwards to offset future capital gains of $13,680, expiring in 2017.
On the Statement of Assets and Liabilities, as a result of permanent book to tax differences, certain amounts have been reclassified for the year ended June 30, 2010. The following reclassification was the result of currency gain (loss) and real estate investment trust and partnership adjustments and has no impact on the net assets of the Fund.
| Undistributed Net Investment Income (Loss) | | $ | 83,835 |
| Accumulated Net Realized Loss | | | (83,727) |
| Paid-in-Capital | | | (108) |
Note 7. Share Transactions
Share transactions for the Fund were as follows:
| | | Year Ended June 30, 2010 | | Year Ended June 30, 2009 | |
| Sale of shares: | | | | | |
| Investor Shares | | 1,392,563 | | 1,070,517 | |
| A Shares | | 1,257 | | - | |
| Reinvestment of distributions: | | | | | |
| Investor Shares | | 128,025 | | 283,722 | |
| A Shares | | 220 | | 605 | |
21
| |
| AUXIER FOCUS FUND NOTES TO FINANCIAL STATEMENTS JUNE 30, 2010 |
| Contributions from share reclassification: | | | | |
| Investor Shares | | - | | 3,090 |
| Redemption of shares: | | | | |
| Investor Shares | | (1,013,829) | | (1,689,078) |
| A Shares | | (1,988) | | (3,064) |
| C Shares | | - | | (4,267) |
| Redemption from share reclassification: | | | | |
| C Shares | | - | | (3,051) |
| Increase (decrease) from share transactions | | 506,248 | | (341,526) |
Note 8. Recent Accounting Pronouncements
In January 2010, the Financial Accounting Standards Board issued Accounting Standards Update (“ASU”) No. 2010-06 “Improving Disclosures about Fair Value Measurements.” ASU No. 2010-06 clarifies existing disclosure and requires additional disclosures regarding fair value measurements. Effective for interim and annual reporting periods beginning after December 15, 2009, entities are required to disclose significant transfers into and out of Level 1 and 2 measurements in the fair value hierarchy and the reasons for those transfers. Effective for fiscal years beginning after December 15, 2010, and for interim periods within those fiscal years, entities will need to disclose information about purchases, sales, issuances and settlements of Level 3 securities on a gross basis, rather than as a net number as currently required. Management is currently evaluating the impact ASU No. 2010-06 will have on financial statement disclosures.
Note 9. Subsequent Events
Subsequent events occurring after the date of this report have been evaluated for potential impact and the Fund has had no such events.
22
| |
| REPORT OF INDEPENDENT REGISTERED PUBLIC ACCOUNTING FIRM |
To the Board of Trustees of Forum Funds
and the Shareholders of Auxier Focus Fund
We have audited the accompanying statement of assets and liabilities of the Auxier Focus Fund, a series of shares of beneficial interest in the Forum Funds, including the schedule of investments, as of June 30, 2010, and the related statement of operations for the year then ended, and the statements of changes in net assets and the financial highlights for each of the years in the two year period then ended. These financial statements and financial highlights are the responsibility of the Fund's management. Our responsibility is to express an opinion on these financial statements and financial highlights based on our audits. The financial highlights for each of the years or period in the three-year period ended June 30, 2008, were audited by other auditors whose report dated August 25, 2008, expressed an unqualified opinion on such financial highlights.
We conducted our audits in accordance with the standards of the Public Company Accounting Oversight Board (United States). Those standards require that we plan and perform the audits to obtain reasonable assurance about whether the financial statements and financial highlights are free of material misstatement. An audit includes examining, on a test basis, evidence supporting the amounts and disclosures in the financial statements. Our procedures included confirmation of securities owned as of June 30, 2010, by correspondence with the custodian. An audit also includes assessing the accounting principles used and significant estimates made by management, as well as evaluating the overall financial statement presentation. We believe that our audits provide a reasonable basis for our opinion.
In our opinion, the financial statements and financial highlights referred to above present fairly, in all material respects, the financial position of the Auxier Focus Fund as of June 30, 2010, the results of its operations for the year then ended, and the changes in its net assets and its financial highlights for each of the years in the two year period then ended, in conformity with accounting principles generally accepted in the United States of America.
BBD, LLP
Philadelphia, Pennsylvania
August 18, 2010
23
| |
| AUXIER FOCUS FUND ADDITIONAL INFORMATION (Unaudited) JUNE 30, 2010 |
Proxy Voting Information
A description of the policies and procedures that the Fund uses to determine how to vote proxies relating to securities held in the Fund’s portfolio is available, without charge and upon request, by calling (877) 328-9437, on the Fund's website at www.auxierasset.com and on the SEC’s website at www.sec.gov. The Fund’s proxy voting record for the most recent twelve-month period ended June 30 is available, without charge and upon request, by calling (877) 328-9437 and on the SEC’s website at www.sec.gov.
Availability of Quarterly Portfolio Schedules
The Fund files its complete schedule of portfolio holdings with the SEC for the first and third quarters of each fiscal year on Form N-Q. The Fund’s Forms N-Q are available, without charge and upon request on the SEC’s website at www.sec.gov or may be reviewed and copied at the SEC’s Public Reference Room in Washington, DC. Information on the operation of the Public Reference Room may be obtained by calling 1-800-SEC-0330.
Shareholder Expense Example
As a shareholder of the Fund, you incur two types of costs: (1) transaction costs, including sales charges (loads) on purchase payments on certain classes, redemption fees, exchange fees and CDSC fees, and (2) ongoing costs, including management fees, 12b-1 fees, and other Fund expenses. This example is intended to help you understand your ongoing costs (in dollars) of investing in the Fund, and to compare these costs with the ongoing costs of investing in other mutual funds.
The example is based on an investment of $1,000 invested at the beginning of the period and held for the entire period from January 1, 2010, through June 30, 2010.
Actual Expenses – The first line under each share class in the table below provides information about actual account values and actual expenses. You may use the information in this line, together with the amount you invested, to estimate the expenses that you paid over the period. Simply divide your account value by $1,000 (for example, an $8,600 account value divided by $1,000 = 8.6), then multiply the result by the number in the first line under the heading entitled “Expenses Paid During Period” to estimate the expenses you paid on your account during the period.
Hypothetical Example for Comparison Purposes – The second line under each share class of the table below provides information about hypothetical account values and hypothetical expenses based on the Fund’s actual expense ratio and an assumed rate of return of 5% per year before expenses, which is not the Fund’s actual return. The hypothetical account values and expenses may not be used to estimate the actual ending balance or expenses you paid for the period. You may use this information to compare the ongoing cost of investing in the Fund and other funds. To do so, compare this 5% hypothetical example with the 5% hypothetical examples that appear in the shareholder reports of other funds.
Please note that expenses shown in the table are meant to highlight your ongoing costs only and do not reflect any transactional costs, such as sales charges (loads) on purchase payments on certain classes, redemption fees, exchange fees and CDSC fees. Therefore, the second line of the table is useful in comparing ongoing costs only, and will not help you determine the relative total costs of owning different funds. In addition, if these transactional costs had been included, your costs would have been higher.
| | Beginning Account Value January 1, 2010 | | Ending Account Value June 30, 2010 | | Expenses Paid During Period * | | Annualized Expense Ratio * |
| Investor Shares | | | | | | | | | | | |
| Actual | $ | 1,000.00 | | $ | 960.14 | | $ | 6.08 | | | 1.25% |
Hypothetical (5% return before expenses) | $ | 1,000.00 | | $ | 1,018.60 | | $ | 6.26 | | | 1.25% |
| A Shares | | | | | | | | | | | |
| Actual | $ | 1,000.00 | | $ | 960.14 | | $ | 6.08 | | | 1.25% |
Hypothetical (5% return before expenses) | $ | 1,000.00 | | $ | 1,018.60 | | $ | 6.26 | | | 1.25% |
| | | | | | | | | | | | |
| | | | | | | | | | | | |
* Expenses are equal to the Fund’s annualized expense ratio as indicated above multiplied by the average account value over the
24
| |
| AUXIER FOCUS FUND ADDITIONAL INFORMATION (Unaudited) JUNE 30, 2010 |
period, multiplied by the number of days in the most recent fiscal half-year divided by 365 to reflect the half-year period.
Federal Tax Status of Dividends Declared during the Tax Year
For federal income tax purposes, dividends from short-term capital gains are classified as ordinary income. The Fund designates 72.78% of its income dividend distributed as qualifying for the corporate dividends-received deduction (DRD) and 88.95% for the qualified dividend rate (QDI) as defined in Section 1(h)(11) of the Internal Revenue Code. The Fund also designates 40.02% as qualified interest income exempt from U.S. tax for foreign shareholders (QII).
Trustees and Officers of the Trust
The Board is responsible for oversight of the management of the Trust’s business affairs and of the exercise of all the Trust’s powers except those reserved for the shareholders. The following table provides information about each Board member and certain officers of the Trust. Each Trustee and officer holds office until the person resigns, is removed, or is replaced. Unless otherwise noted, the persons have held their principal occupations for more than five years. The address for all Trustees and officers is Three Canal Plaza, Suite 600, Portland, Maine 04101, unless otherwise indicated. Each Trustee oversees twenty-two portfolios in the Trust. Mr. Keffer is considered an Interested Trustee due to his affiliation with Atlantic. Mr. Keffer is also an Interested Director of Wintergreen Fund, Inc. The Fund’s Statement of Additional Information includes additional information about the Trustees and is available, without charge and upon request, by calling (877) 328-9437.
| Name and Year of Birth | Position with the Trust | Length of Time Served | Principal Occupation(s) During Past 5 Years |
| Independent Trustees | | | |
J. Michael Parish Born: 1943 | Chairman of the Board; Trustee; Chairman, Nominating Committee and Qualified Legal Compliance Committee | Since 1989 (Chairman since 2004) | Retired since 2003. |
Costas Azariadis Born: 1943 | Trustee; Chairman, Valuation Committee | Since 1989 | Professor of Economics, Washington University since 2006; Professor of Economics, University of California-Los Angeles 1992-2006. |
James C. Cheng Born: 1942 | Trustee; Chairman, Audit Committee | Since 1989 | President, Technology Marketing Associates (marketing company for small- and medium-sized businesses in New England) since 1991. |
John Y. Keffer1 Born: 1942 | Trustee; Vice Chairman | Since 1989 | Chairman, Atlantic since 2008; President, Forum Foundation (a charitable organization) since 2005; President, Forum Trust, LLC (a non-depository trust company chartered in the State of Maine) since 1997. |
| | 1 Since 1997, John Y. Keffer has been president and owner of Forum Trust, LLC. Prior to January 1, 2010, Atlantic was a wholly owned subsidiary of Forum Trust, LLC. Effective January 1, 2010, Atlantic became a wholly owned subsidiary of Forum Holdings Corp., a Delaware corporation that is wholly owned by Mr. Keffer. |
25
| |
| AUXIER FOCUS FUND ADDITIONAL INFORMATION (Unaudited) JUNE 30, 2010 |
| Name and Year of Birth | Position with the Trust | Length of Time Served | Principal Occupation(s) During Past 5 Years |
| Officers | | | |
Stacey E. Hong Born: 1966 | President; Principal Executive Officer | Since 2008 | President, Atlantic since 2008; Director, Consulting Services, Foreside Fund Services 2007; Elder Care, 2005-2006; Director, Fund Accounting, Citigroup 2003-2005. |
Karen Shaw Born: 1972 | Treasurer; Principal Financial Officer | Since 2008 | Senior Manager, Atlantic since 2008; Section Manager/Vice President, Enterprise Support Services, Citigroup 2003-2008. |
David Faherty Born: 1970 | Vice President | Since 2009 | Senior Counsel, Atlantic since 2009; Vice President, Citi Fund Services Ohio, Inc. 2007-2009.; Associate Counsel, Investors Bank & Trust Co. 2006-2007; FDIC 2005. |
Michael J. McKeen Born: 1971 | Vice President | Since 2009 | Senior Manager, Atlantic since 2008; Vice President, Citigroup 2003-2008. |
Joshua LaPan Born: 1973 | Vice President | Since 2009 | Manager, Atlantic since 2008; Vice President, Citigroup 2003-2008. |
Timothy Bowden Born: 1969 | Vice President | Since 2009 | Manager, Atlantic since 2008; Vice President, Citigroup 2005-2008. |
Lina Bhatnagar Born: 1971 | Secretary | Since 2008 | Senior Administration Specialist, Atlantic since 2008; Regulatory Administration Specialist, Citigroup 2006-2008. |
26
(THIS PAGE INTENTIONALLY LEFT BLANK.)
(THIS PAGE INTENTIONALLY LEFT BLANK.)
FOR MORE INFORMATION
P.O. Box 588
Portland, ME 04112
(877) 3AUXIER
(877) 328-9437
INVESTMENT ADVISER
Auxier Asset Management LLC
5285 Meadows Road
Suite 333
Lake Oswego, Oregon 97035
www.auxierasset.com
TRANSFER AGENT
Atlantic Fund Administration, LLC
P.O. Box 588
Portland, ME 04112
DISTRIBUTOR
Foreside Fund Services, LLC
Three Canal Plaza, Suite 100
Portland, Maine 04101
www.foreside.com
This report is submitted for the general information of the shareholders of the Fund. It is not authorized for
distribution to prospective investors unless preceded or accompanied by an effective prospectus, which includes
information regarding the Fund’s risks, objectives, fees and expenses, experience of its management, and other
information.
204-ANR-0610

PREMIER
GROWTH FUND
ANNUAL REPORT
JUNE 30, 2010
AND COMPANY, INC.
INVESTMENT COUNSEL
P.O. BOX 588
PORTLAND, ME 04112
(866) 2DF-DENT (TOLL FREE)
DF DENT PREMIER GROWTH FUND
A MESSAGE TO OUR SHAREHOLDERS
JUNE 30, 2010
Dear Fellow Shareholders:
Performance
For the fiscal year ended June 30, 2010, the DF Dent Premier Growth Fund (the “Fund”) experienced a total return of +19.29% outperforming the total return of +14.43% for the S&P 500 Index (the “Index”), which is the Fund’s benchmark, by 4.86%. Your Fund has outperformed the Index in seven of the nine fiscal years since the Fund’s inception on July 16, 2001, with a cumulative total return of +38.20% versus +1.81% for the Index.
For a longer-term perspective, the Fund’s one-year, five-year and since inception average annual total return for the period ended June 30, 2010 were 19.29%, 1.01% and 3.68%, respectively. Performance data quoted represents past performance and is no guarantee of future results. Current performance may be lower or higher than the performance data quoted. Investment return and principal value will fluctuate so that an investor’s shares, when redeemed, may be worth more or less than original cost. For the most recent month-end performance please call (866)2DF-DENT. As stated in the current prospectus, the Fund’s annual operating expense ratio (gross) is 1.26%. However, the Fund’s adviser has contractually agreed to waive a portion of its fees and/or reimburse certain expenses to limit total operating expense to 1.10%. This agreement is in effect through October 31, 2011, per Board approval (prospectus to be updated fall, 2010). Otherwise, returns would have been lower. The contractual waivers may be changed or eliminated with the consent of the Board of Trustees at any time.
Expense Ratio Management
Your Fund’s adviser, D.F. Dent and Company, Inc. (the “Adviser”), has again agreed to maintain your Fund’s net expense ratio at 1.10% through October 31, 2011, by reimbursing certain expenses and waiving a portion of its management fees. Otherwise, returns would be lower since the Fund’s prospectus lists the total annual operating expense ratio (gross) as 1.26%. The record of expense reimbursement and management fee waivers for the first nine years of your Fund is as follows:
| | | | | | |
Year Ending
| | Expense
Reimbursement
| | Management
Fee Waived
|
6/30/02 | | $ | 60,201 | | $ | 60,019 |
6/30/03 | | | 38,066 | | | 90,163 |
6/30/04 | | | 0 | | | 129,060 |
6/30/05 | | | 0 | | | 141,907 |
6/30/06 | | | 0 | | | 142,664 |
6/30/07 | | | 0 | | | 161,128 |
6/30/08 | | | 0 | | | 95,665 |
6/30/09 | | | 0 | | | 234,053 |
6/30/10 | | | 0 | | | 204,148 |
| | |
|
| |
|
|
| | | $ | 98,267 | | $ | 1,258,807 |
DF DENT PREMIER GROWTH FUND
1
DF DENT PREMIER GROWTH FUND
A MESSAGE TO OUR SHAREHOLDERS
JUNE 30, 2010
Portfolio Turnover
Portfolio turnover for the year decreased versus the prior 4 years. Involuntary turnover from sales pursuant to tender offers increased from 0.8% in 2008 to 3.2% in 2009 to 5.4% in 2010. Annual portfolio turnover since inception has been as follows:
| | | | | | | | | | | | | | | | | | | | | | | | | | | | | | |
| | | 2002*
| | | 2003
| | | 2004
| | | 2005
| | | 2006
| | | 2007
| | | 2008
| | | 2009
| | | 2010
| | | Average
| |
Portfolio Turnover** | | 0 | % | | 14 | % | | 20 | % | | 7 | % | | 25 | % | | 17 | % | | 21 | % | | 16 | % | | 8 | % | | 14 | % |
We believe these low portfolio turnover rates are consistent with our investment strategy of holding positions for long periods and minimizing transaction expenses for shareholders.
| * | | The Fund commenced operations on July 16, 2001. |
| ** | | Percentage calculated based on total value of investments. |
Asset Allocation
| | | | | | | | | | |
| | | 06/30/06
| | 06/30/07
| | 06/30/08
| | 06/30/09
| | 06/30/10
|
Large-Capitalization | | 36.9% | | 36.1% | | 50.2% | | 36.8% | | 43.0% |
Mid-Capitalization | | 45.1% | | 43.5% | | 40.2% | | 52.9% | | 50.2% |
Small-Capitalization | | 10.3% | | 9.3% | | 9.4% | | 10.2% | | 6.3% |
Reserve Funds | | 7.7% | | 11.1% | | 0.2% | | 0.1% | | 0.5% |
| | |
| |
| |
| |
| |
|
Total Fund | | 100% | | 100% | | 100% | | 100% | | 100% |
| | |
| |
| |
| |
| |
|
The Fund’s Prospectus has defined Mid-Capitalization companies as those in the $1.5 billion to $7.0 billion market capitalization range.
Attribution
We have added a new section to this year’s Annual Report. Page 7 and 8 of the Management Discussion of Fund Performance contains an analysis of performance attribution. The Adviser has invested in and implemented an upgraded software operating system which performs a number of portfolio analytics. The Attribution Section of the software compares the Fund’s sector weightings versus the benchmark’s weightings. Commentary is offered on whether the Fund overweighted or underweighted the various sectors within the benchmark (sector selection) and then whether the stocks selected outperformed or underperformed within each sector discussed (stock selection). We believe this more detailed analysis will assist shareholders in reviewing the strategy employed within their Fund and evaluating historical performance attribution.
DF DENT PREMIER GROWTH FUND
2
DF DENT PREMIER GROWTH FUND
A MESSAGE TO OUR SHAREHOLDERS
JUNE 30, 2010
Concentration
We have made an effort during the past three years to increase the position size in our favorite “core” holdings. We do not consider this strategy to be “over concentrated.” In the past three years, we have increased concentration in the top 10 holdings as follows:
| | | | | | | | | | | | |
Top 10 Holdings
| | 06/30/07
| | | 06/30/08
| | | 06/30/09
| | | 06/30/10
| |
% of the Fund | | 25.5 | % | | 36.7 | % | | 55.82 | % | | 54.97 | % |
Average Position Size of Top 10 | | 2.6 | % | | 3.7 | % | | 5.6 | % | | 5.5 | % |
We wrote one year ago that we had reached the desired level of concentration and did not intend to increase concentration beyond the 06/30/09 level shown above. We continue to believe that the current concentration in the top 10 positions is appropriate and at a desired level.
Management Ownership of Fund
Employees, their families, and the Adviser’s retirement plan increased their investments from 8.4% of the Fund a year ago to 10.0% of the Fund on 06/30/10. There were only management purchases and no redemptions during this period.
Bubbles
With the advantage of hindsight, we can observe two clear bubbles which resulted from an abundance of easy inexpensive money. The late 1990s bubble in IPOs, dotcom/internet, and technology stocks resulted from excessive speculation fueled by very easy monetary policy. Between 2006 and 2008, low-interest-rate, high-loan-to-appraisal-value sub-prime mortgages offered to low- and middle-income homeowners were rapidly aggregated and packaged as higher grade, asset-backed securities. Abundant credit conditions then allowed banks to unload these mortgage-backed securities, reinvesting the proceeds in more sub-prime mortgages and, perpetuating a continuous cycle of toxic asset creation. Two bubbles and two ugly endings in the past decade.
A third bubble? In the past year the Federal Reserve’s near zero interest rate policy has driven many investors to seek income in the bond markets. Nowhere is this phenomenon clearer than in the mutual fund industry’s monthly flows of capital. Investors have poured money into fixed-income mutual funds while redeeming U.S. equity funds. Your Fund was not spared by this industry trend, and it experienced net redemptions during the fiscal year. Asset reallocation and portfolio rebalancing are appropriate strategies, but beating down the doors to invest in bonds with interest rates at 50-year lows at the end of a decade when bonds have outperformed stocks by over 6% per year makes the bond market appear a bit “bubblish.” We mention this to our growth shareholders because we believe that the possibility of higher interest rates in future years could burst the bond market’s bubble. A possible associated outcome would be a return by investors to real equity growth as the cycle reverses and bonds underperform stocks.
DF DENT PREMIER GROWTH FUND
3
DF DENT PREMIER GROWTH FUND
A MESSAGE TO OUR SHAREHOLDERS
JUNE 30, 2010
Commentary
The U.S. economy is currently at a crossroads. The Administration and the Federal Reserve believe that accommodative policies are in order to stimulate demand and avoid slipping back into recession. They believe that the fragility of the recovery and the need to create jobs justify huge federal deficits in the short term despite the resulting long-term debt burdens. In stark contrast, at its meeting in Canada last June, the G-20 concluded that the time has come to reduce government spending and improve the debt laden balance sheets of member nations despite the likely short-term negative impact on their economies. It recommended specifically that member nations cut their fiscal deficits in half by 2013. The Greek financial crisis earlier this year has weighed heavily on the minds of OECD (Organization for Economic Cooperation and Development) central bankers and the IMF (International Monetary Fund) economists, who are fearful that sustained deficits will throw more countries into similar predicaments requiring financial rescue packages from the stronger nations. In other words, U.S. authorities desire continued stimulus to sustain the recovery and create jobs while our major trading partners are in favor of restraint and deficit reduction. The resolution to a large degree hinges upon the outcome of this November’s mid-term elections, which will determine the composition of Congress. While that outcome is difficult to predict, much of the current uncertainty will be resolved as to which crossroad the U.S. will select.
In abbreviated form, we believe that the foreseeable investment horizon over the next year will be characterized by the following features: (1) sustained but modest economic growth; (2) low inflation and low interest rates with gradual increases beginning in late 2010 or 2011 as part of the Federal Reserve’s “Exit Policy; (3)” sticky high unemployment; (4) a shift from private to public debt as households continue to de-leverage while the government runs massive deficits; (5) higher taxes, more government regulation and a sustained squeeze on state and local budgets; (6) high oil prices with perhaps an upward spike resulting from unforeseen supply disruptions; (7) the dollar and gold holding their values; and (8) reduced federal stimulus.
How can an investor ferret through these complexities to reach a rational investment strategy? Many listen to the daily noise emanating from CNBC or other market commentaries—a certain path to confusion, inertia, and likely depression. Your Fund will hitch its wagon to great companies led by experienced management teams with proven records of execution and integrity. These management teams know how to navigate their enterprises through these challenging times. They are more talented at operating their companies in these environments than we are at guessing what the next shifts in the stock market might be. They operate real businesses seeking continued growth in real profits in real time.
As always, we acknowledge the responsibility you have conveyed by entrusting your investment to the D. F. Dent Premier Growth Fund and will work diligently on your behalf.
Respectfully submitted,

Daniel F. Dent
DF DENT PREMIER GROWTH FUND
4
DF DENT PREMIER GROWTH FUND
A MESSAGE TO OUR SHAREHOLDERS
JUNE 30, 2010
IMPORTANT INFORMATION:
The recent growth rate in the global equity markets has helped to produce short-term returns for some sectors/asset classes that are not typical and may not continue in the future. Because of ongoing market volatility, Fund performance may be subject to substantial short-term changes.
Investing involves risks, including the possible loss of principal. The Fund invests in small and medium size companies. Investments in these companies, especially smaller companies, carry greater risk than is customarily associated with larger companies for various reason such as increased volatility of earnings and prospects, narrower markets, limited financial resources and less liquid stock. The Fund will typically invest in the securities of fewer issuers. If the Fund’s portfolio is over weighted in a sector, any negative development affecting that sector will have a greater impact on the Fund than a fund that is not over weighted in that sector.
The S&P 500 Index is a broad-based, unmanaged measurement of changes in stock market conditions based on the average of 500 widely held stocks. One cannot invest directly in an index. Tender offers are offers to purchase some or all of a shareholder’s shares in a corporation, usually at a premium to the market price. G-20 is the group of 20 Finance Ministers and Central Bank Governors from 20 economies. It is a forum for cooperation and consultation on matters pertaining to the international financial system.
DF DENT PREMIER GROWTH FUND
5
DF DENT PREMIER GROWTH FUND
MANAGEMENT DISCUSSION OF FUND PERFORMANCE
JUNE 30, 2010
Performance
For the fiscal year ended June 30, 2010, the Fund experienced a total return of +19.29 % versus a total return of +14.43 % for the S&P 500 Index, the Fund’s benchmark. Performance versus the S&P 500 Index for various periods ending June 30, 2010 was as follows:
| | | | | | |
Period Ending 06/30/10
| | DF Dent Premier
Growth Fund
| | S&P 500 Index
| | Outperformance
(Underperformance)
|
Six Months | | - 0.84 % | | - 6.65% | | 5.81% |
Twelve Months | | +19.29% | | +14.43% | | 4.86% |
Five Years (annualized) | | + 1.01% | | - 0.79% | | 1.80% |
Five Years (cumulative) | | + 5.17% | | - 3.91% | | 9.08% |
Since Inception (07/16/01) (annualized) | | + 3.68% | | + 0.20% | | 3.48% |
Since Inception (cumulative) | | +38.20% | | + 1.81% | | 36.39% |
Past performance is not indicative of future performance.
As can be seen above, your Fund outperformed the S&P 500 Index for both the calendar year to date and its 06/30/10 fiscal year by 5.81% and 4.86%, respectively. Although in positive performance territory for most of 2010, market weakness in late June dragged the 2010 total return to a slightly negative year-to-date result.
How did your Fund perform in the past year versus its benchmark, and how did this compare to its prior performance? We are encouraged by the above fact that outperformance over the past 12 months of +4.86% was significantly better than it has been for the past 5 years (annualized) at +1.80% and since the Fund’s inception on July 16, 2001 (annualized) at +3.48%. In other words, the Fund’s latest fiscal year’s outperformance of +4.86% versus the S&P 500 Index compares with +3.48% annualized outperformance of the Fund over the approximate 9-year life of the Fund. While it may or may not be realized, our goal is to seek to increase the margin of outperformance in future years. One year ago (06/30/09), we reported that your Fund’s cumulative outperformance since inception was +26.88%. This year it was even higher at +36.39%.
We have commented previously that the stock market recovery from the March 2009 lows seemed to have two phases: the first a liquidity-driven phase and the second an earnings-driven phase. The liquidity-driven phase affected most stocks much like “a rising tide lifts all boats.” The earnings-driven phase seemed to take hold in 2010, where strong earnings reports of your portfolio companies have driven performance. Of the Fund’s 10 largest positions, which represented 55% of the portfolio on 06/30/10, nine companies beat analysts’ consensus earnings estimates in the 2nd quarter, and one company missed the consensus by a small amount. We seek companies that have the potential to underpromise and overdeliver. Your Fund also benefited from 2 tender offers for portfolio companies: the $150 per share cash tender offer for K-Tron and Schlumberger’s stock tender offer for Smith International resulted in strong performance of the stocks for both of these companies. A third tender offer, that of Novartis for Alcon, which is a significant Fund holding, has not yet been resolved.
DF DENT PREMIER GROWTH FUND
6
DF DENT PREMIER GROWTH FUND
MANAGEMENT DISCUSSION OF FUND PERFORMANCE
JUNE 30, 2010
However, we believe Alcon has the potential to receive an improved offer from Novartis before the end of 2010.
Capital Gains Distribution policy
It is the Fund’s policy to distribute all net realized capital gains to shareholders in December following the end of each fiscal year (06/30). Capital gains distributions were made in December of 2005, 2006, 2007, and 2008, but not 2009. Shareholder redemptions during the sharp market decline of 2008-2009 forced the Fund to realize significant capital losses at that time, which may be carried forward for 8 years. While there was an unrealized gain of $3,827,175 in the Fund as of 06/30/10, the loss carry forward amounted to $52,801,104 or $5.57 per share as of that date. This loss carry forward can offset capital gains up to $23,322,998 realized until 06/30/17 and $29,478,106 realized until 06/30/18. As such, we view the loss carry forward as a “hidden asset” which may shelter future capital gains, if realized, against future capital gains distributions and taxes.
Attribution analysis
The following bar chart presents the sector weightings of your Fund versus the sector weightings of the S&P 500 Index as of June 30, 2010:

Source: FactSet
DF DENT PREMIER GROWTH FUND
7
DF DENT PREMIER GROWTH FUND
MANAGEMENT DISCUSSION OF FUND PERFORMANCE
JUNE 30, 2010
The following themes of your Fund are apparent in the bar chart on page 7:
Because of the poor outlook for employment and the increased savings rate (more savings means less spending per household) over the last year we avoided both the Consumer Discretionary and the Consumer Staples Sectors.
Overweighting the Energy Sector had a positive impact on performance lead by strong results from Core Laboratories, Chicago Bridge & Iron, and Smith International. The companies in the Energy Sector of the Fund had a combined total return of +30.45% versus the benchmark’s Energy Sector total return of only +2.08 for the fiscal year.
Overweighting Health Care benefited performance as that Sector’s holdings within the Fund accomplished a +27.16% total return versus +8.86% for the benchmark.
As you can observe in the above chart, the Fund’s largest overweight was in Industrials at 32.77% versus the benchmark at 10.35%. Overweighting Industrials benefited overall Fund performance accomplishing a +24.29% total return. However, our stock selection was not as good as in the Energy and Health Care Sectors as the benchmark’s Industrial Sector reported a +27.40% total return. Therefore, our Industrial Sector allocation was good, but our stock selection within the Sector lagged the benchmark by -3.11%. Combining the positive Sector allocation and the negative stock selection resulted in an overall positive impact on the Fund’s performance versus the benchmark.
| | • | | Slightly Underweighted in Information Technology, |
This Sector in the Fund underperformed with a +3.00% total return versus a +16.05% total return for the benchmark. QUALCOMM, held in both the Fund and the benchmark, performed very poorly with a -26.08% total return for the fiscal year. The Fund’s underperformance in this Sector was largely explained by its average portfolio weight in QUALCOMM of 6.35% versus only 0.74% in the benchmark.
Strategy and Trends
Our strategy in managing your Fund during the past year has been very direct and clearly defined: invest in companies with historically profitable businesses managed by proven leaders with track records of good execution; avoid leverage; avoid the consumer sectors; avoid financial engineering “shell games”; maintain positions in U.S. companies with exposure to high growth foreign markets; emphasize companies with cyclical growth opportunities to participate in the economic recovery; and constantly evaluate management of both new and older investments. We always remind ourselves that bad management can mess up an otherwise good company. So, avoid it!
DF DENT PREMIER GROWTH FUND
8
DF DENT PREMIER GROWTH FUND
MANAGEMENT DISCUSSION OF FUND PERFORMANCE
JUNE 30, 2010
The key trends observed over the past fiscal year in industries where your Fund was invested were:
| | • | | Strong spending patterns in niche health care markets such as ophthalmology, sleep-disordered breathing, and veterinary medicine, |
| | • | | Strengthening industrial markets from the economic recovery, |
| | • | | Improving demand for energy services, |
| | • | | Reluctance of companies to hire and banks to lend (favoring self -financing companies with strong cash flow), |
| | • | | Continued investment in technology to improve efficiency and productivity. |
Best and Worst Performers
Those securities which contributed the most and declined the most during the past fiscal year were:
| | | | |
5 Best Contributors (Unaudited)
| | | | |
Investments
| | Realized and Unrealized
Appreciation and Income in
Fiscal Year 2010
| | Per Share
As of 6/30/10
|
Fastenal Co. | | $ 3,824,850 | | $0.40 |
K-Tron International, Inc. | | 3,261,970 | | 0.34 |
IDEXX Laboratories, Inc. | | 2,758,222 | | 0.29 |
Core Laboratories NV | | 1,837,371 | | 0.19 |
ResMed, Inc. | | 1,755,579 | | 0.19 |
| | |
| |
|
| | | $13,437,992 | | $1.41 |
| | |
| |
|
| | | | |
5 Poorest Contributors (Unaudited)
| | | | |
Investments
| | Realized and Unrealized
Losses and Income in
Fiscal Year 2010
| | Per Share
As of 6/30/10
|
QUALCOMM, Inc. | | $2,273,700 | | $(0.24) |
Iron Mountain, Inc. | | 941,339 | | (0.10) |
Jacobs Engineering Group, Inc. | | 760,843 | | (0.08) |
Monsanto Co. | | 423,670 | | (0.04) |
Techne Corp. | | 405,306 | | (0.04) |
| | |
| |
|
| | | $4,804,858 | | $(0.50) |
| | |
| |
|
DF DENT PREMIER GROWTH FUND
9
DF DENT PREMIER GROWTH FUND
MANAGEMENT DISCUSSION OF FUND PERFORMANCE
JUNE 30, 2010
The views in this report contained herein were those of the Fund’s Adviser as of June 30, 2010, and may not reflect the Adviser’s views on the date this report is first published or anytime thereafter. This report may contain discussions about certain investments both held and not held in the portfolio as of the report date. All current and future holdings are subject to risk and are subject to change. While these views are intended to assist shareholders in understanding their investment in the Fund, they do not constitute investment or tax advice, are not a guarantee of future performance and are not intended as an offer or solicitation with respect to the purchase or sale of any security.
DF DENT PREMIER GROWTH FUND
10
DF DENT PREMIER GROWTH FUND
PERFORMANCE CHART AND ANALYSIS
JUNE 30, 2010
The following chart reflects the change in the value of a hypothetical $100,000 investment, including reinvested dividends and distributions, in the DF Dent Premier Growth Fund (the “Fund”) compared with the performance of the Standard and Poor’s 500 Index (“S&P 500”), since inception. The S&P 500 is a market-value weighted index representing the performance of 500 widely held, publicly-traded stocks. The total return of the S&P 500 includes reinvestment of dividends and income. The total return of the Fund includes operating expenses that reduce returns, while the total return of the S&P 500 does not include expenses. The Fund is professionally managed while the S&P 500 is unmanaged and is not available for investment.
Performance data quoted represents past performance and is no guarantee of future results. Current performance may be lower or higher than the performance data quoted. Investment return and principal value will fluctuate so that shares, when redeemed, may be worth more or less than original cost. For the most recent month-end performance please call 866-233-3368. As stated in the Fund’s prospectus, the annual operating expense ratio (gross) is 1.26%. However, the Fund’s adviser has agreed to contractually waive a portion of its fees and to reimburse expenses such that total operating expenses do not exceed 1.10%. This agreement is in effect until October 31, 2011, per Board approval (prospectus to be updated fall, 2010). During the period, certain fees were waived and/or expenses reimbursed; otherwise, returns would have been lower. The performance table and graph do not reflect the deduction of taxes that a shareholder would pay on Fund distributions or the redemption of Fund shares. Returns greater than one year are annualized.
| | | | | | | | |
Average Annual Total Return Return as of 06/30/10
| | One Year
| | Five Year
| | | Since Inception
07/16/01
|
DF Dent Premier Growth Fund | | | 19.29% | | 1.01 | % | | 3.68% |
S&P 500 Index | | | 14.43% | | (0.79 | )% | | 0.20% |
Investment Value on 06/30/10
| | | | | | | |
DF Dent Premier Growth Fund | | $ | 138,195 | | | | | |
S&P 500 Index | | $ | 101,808 | | | | | |
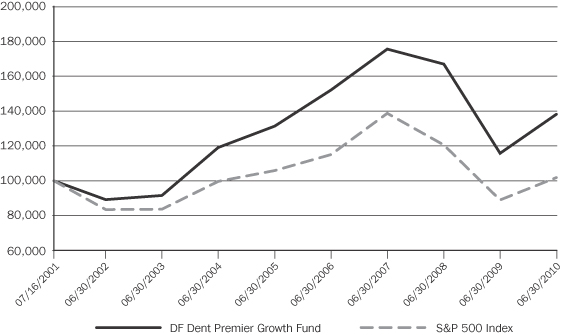
DF DENT PREMIER GROWTH FUND
11
DF DENT PREMIER GROWTH FUND
SCHEDULE OF INVESTMENTS
JUNE 30, 2010
| | | | | |
Shares
| | Security Description
| | Value
|
| Common Stock - 99.7% |
| Business Services - 9.2% |
| 200,000 | | Expeditors International of Washington, Inc. | | $ | 6,902,000 |
| 67,100 | | Healthcare Services Group, Inc. | | | 1,271,545 |
| 143,000 | | Iron Mountain, Inc. | | | 3,211,780 |
| | | | |
|
|
| | | | | | 11,385,325 |
| | | | |
|
|
| Computer Software - 5.5% |
| 147,000 | | ANSYS, Inc.(a) | | | 5,963,790 |
| 55,000 | | DealerTrack Holdings, Inc.(a) | | | 904,750 |
| | | | |
|
|
| | | | | | 6,868,540 |
| | | | |
|
|
| Data Networking - 1.7% | | | |
| 100,000 | | Cisco Systems, Inc.(a) | | | 2,131,000 |
| | | | |
|
|
| Distribution and Industrial Supplies - 8.7% |
| 215,000 | | Fastenal Co. | | | 10,790,850 |
| | | | |
|
|
| Educational Services - 1.3% |
| 20,000 | | American Public Education, Inc.(a) | | | 874,000 |
| 81,000 | | National American University Holdings, Inc. | | | 705,510 |
| | | | |
|
|
| | | | | | 1,579,510 |
| | | | |
|
|
| Electronics - 3.3% | | | |
| 90,000 | | Intel Corp. | | | 1,750,500 |
| 85,000 | | Trimble Navigation, Ltd.(a) | | | 2,380,000 |
| | | | |
|
|
| | | | | | 4,130,500 |
| | | | |
|
|
| Energy Services - 7.2% |
| 28,700 | | Core Laboratories NV | | | 4,236,407 |
| 50,000 | | Schlumberger, Ltd. | | | 2,767,000 |
| 50,000 | | Smith International, Inc. | | | 1,882,500 |
| | | | |
|
|
| | | | | | 8,885,907 |
| | | | |
|
|
| Energy Sources - 6.3% |
| 31,000 | | Apache Corp. | | | 2,609,890 |
| 117,000 | | Ultra Petroleum Corp.(a) | | | 5,177,250 |
| | | | |
|
|
| | | | | | 7,787,140 |
| | | | |
|
|
| Financial Services - 6.5% |
| 130,000 | | T. Rowe Price Group, Inc. | | | 5,770,700 |
| 32,000 | | Visa, Inc., Class A | | | 2,264,000 |
| | | | |
|
|
| | | | | | 8,034,700 |
| | | | |
|
|
| Health Care Services - 2.7% |
| 50,000 | | Stericycle, Inc.(a) | | | 3,279,000 |
| | | | |
|
|
| Industrial Applications - 8.3% |
| 121,000 | | Actuant Corp., Class A | | | 2,278,430 |
| 60,000 | | II-VI, Inc.(a) | | | 1,777,800 |
| 110,000 | | Roper Industries, Inc. | | | 6,155,600 |
| | | | |
|
|
| | | | | | 10,211,830 |
| | | | |
|
|
| | | | | |
Shares
| | Security Description
| | Value
|
| Infrastructure - 7.4% |
| 223,000 | | Chicago Bridge & Iron Co. NV(a) | | $ | 4,194,630 |
| 135,000 | | Jacobs Engineering Group, Inc.(a) | | | 4,919,400 |
| | | | |
|
|
| | | | | | 9,114,030 |
| | | | |
|
|
| Insurance - 2.4% |
| 9,000 | | Markel Corp.(a) | | | 3,060,000 |
| | | | |
|
|
| Life Sciences - 12.0% |
| 173,000 | | IDEXX Laboratories, Inc.(a) | | | 10,535,700 |
| 74,000 | | Techne Corp. | | | 4,251,300 |
| | | | |
|
|
| | | | | | 14,787,000 |
| | | | |
|
|
| Medical Products - 6.2% |
| 80,000 | | ResMed, Inc.(a) | | | 4,864,800 |
| 55,000 | | Stryker Corp. | | | 2,753,300 |
| | | | |
|
|
| | | | | | 7,618,100 |
| | | | |
|
|
| Pharmaceuticals - 4.4% |
| 37,000 | | Alcon, Inc. | | | 5,483,030 |
| | | | |
|
|
| Wireless Telecommunication Services - 6.6% |
| 39,000 | | American Tower Corp., Class A(a) | | | 1,735,500 |
| 195,000 | | QUALCOMM, Inc. | | | 6,403,800 |
| | | | |
|
|
| | | | | | 8,139,300 |
| | | | |
|
|
| Total Common Stock (Cost $119,458,587) | | | 123,285,762 |
| | | | |
|
|
| Total Investments - 99.7% | | | |
| | | (Cost $119,458,587)* | | $ | 123,285,762 |
| Other Assets and Liabilities, Net - 0.3% | | | 319,066 |
| | | | |
|
|
| TOTAL NET ASSETS - 100.0% | | $ | 123,604,828 |
| | | | |
|
|
| (a) | Non-income producing security. |
| * | Cost for federal income tax purposes is $119,532,717 and net unrealized appreciation consists of: |
| | | | |
Gross Unrealized Appreciation | | $ | 16,486,202 | |
Gross Unrealized Depreciation | | | (12,733,157 | ) |
| | |
|
|
|
Net Unrealized Appreciation | | $ | 3,753,045 | |
| | |
|
|
|
See Notes to Financial Statements.
DF DENT PREMIER GROWTH FUND
12
DF DENT PREMIER GROWTH FUND
SCHEDULE OF INVESTMENTS
JUNE 30, 2010
The following is a summary of the inputs used to value the Fund’s investments as of June 30, 2010.
The inputs or methodology used for valuing securities are not necessarily an indication of the risk associated with investing in those securities. For more information on valuation inputs, and their aggregation into the levels used in the table below, please refer to Note 2—Security Valuation section in the accompanying Notes to Financial Statements.
| | | |
Valuation Inputs
| | Investments
in Securities
|
Level 1—Quoted Prices | | $ | 123,285,762 |
Level 2—Other Significant Observable Inputs | | | - |
Level 3—Significant Unobservable Inputs | | | - |
| | |
|
|
Total Investments | | $ | 123,285,762 |
| | |
|
|
The Level 1 inputs in this table are Common Stock. Refer to the Schedule of Investments for a further breakout of each security by type.
| | |
PORTFOLIO HOLDINGS | | |
% of Net Assets | | |
Business Services | | 9.2% |
Computer Software | | 5.5% |
Data Networking | | 1.7% |
Distribution and Industrial Supplies | | 8.7% |
Educational Services | | 1.3% |
Electronics | | 3.3% |
Energy Services | | 7.2% |
Energy Sources | | 6.3% |
Financial Services | | 6.5% |
Health Care Services | | 2.7% |
Industrial Applications | | 8.3% |
Infrastructure | | 7.4% |
Insurance | | 2.4% |
Life Sciences | | 12.0% |
Medical Products | | 6.2% |
Pharmaceuticals | | 4.4% |
Wireless Telecommunications Services | | 6.6% |
Other Assets and Liabilities, Net | | 0.3% |
| | |
|
| | | 100.0% |
| | |
|
See Notes to Financial Statements.
DF DENT PREMIER GROWTH FUND
13
DF DENT PREMIER GROWTH FUND
STATEMENT OF ASSETS AND LIABILITIES
JUNE 30, 2010
| | | | |
| ASSETS | | | | |
Investments, at value (Cost $119,458,587) | | $ | 123,285,762 | |
Cash | | | 664,283 | |
Receivables: | | | | |
Fund shares sold | | | 150 | |
Dividends and interest | | | 33,725 | |
Prepaid expenses | | | 16,449 | |
| | |
|
|
|
| |
Total Assets | | | 124,000,369 | |
| | |
|
|
|
| |
| LIABILITIES | | | | |
Payables: | | | | |
Fund shares redeemed | | | 60,174 | |
Accrued Liabilities: | | | | |
Investment adviser fees | | | 288,472 | |
Trustees’ fees and expenses | | | 70 | |
Compliance services fees | | | 2,083 | |
Fund service fees | | | 15,311 | |
Professional fees | | | 21,417 | |
Other expenses | | | 8,014 | |
| | |
|
|
|
| |
Total Liabilities | | | 395,541 | |
| | |
|
|
|
| |
| NET ASSETS | | $ | 123,604,828 | |
| | |
|
|
|
| |
| COMPONENTS OF NET ASSETS | | | | |
Paid-in capital | | $ | 173,752,913 | |
Accumulated net realized loss on investments | | | (53,975,260 | ) |
Unrealized appreciation on investments | | | 3,827,175 | |
| | |
|
|
|
| |
| NET ASSETS | | $ | 123,604,828 | |
| | |
|
|
|
| |
| NET ASSET VALUE, OFFERING AND REDEMPTION PRICE PER SHARE | | | | |
Based on net assets of $123,604,828 and 9,472,288 shares outstanding at $0.00 par value (unlimited shares authorized) | | $ | 13.05 | |
| | |
|
|
|
See Notes to Financial Statements.
DF DENT PREMIER GROWTH FUND
14
DF DENT PREMIER GROWTH FUND
STATEMENT OF OPERATIONS
YEAR ENDED JUNE 30, 2010
| | | | |
| INVESTMENT INCOME | | | | |
Dividend income (net of foreign withholding taxes of $15,095) | | $ | 1,051,024 | |
Interest income | | | 1,058 | |
| | |
|
|
|
Total Investment Income | | | 1,052,082 | |
| | |
|
|
|
| |
| EXPENSES | | | | |
Investment adviser fees | | | 1,304,196 | |
Fund service fees | | | 187,225 | |
Custodian fees | | | 15,961 | |
Professional fees | | | 50,673 | |
Trustees’ fees and expenses | | | 4,241 | |
Compliance services fees | | | 40,832 | |
Registration fees | | | 16,524 | |
Miscellaneous expenses | | | 34,650 | |
| | |
|
|
|
Total Expenses | | | 1,654,302 | |
Fees waived | | | (219,689 | ) |
| | |
|
|
|
Net Expenses | | | 1,434,613 | |
| | |
|
|
|
| |
| NET INVESTMENT LOSS | | | (382,531 | ) |
| | |
|
|
|
| |
| NET REALIZED AND UNREALIZED GAIN (LOSS) ON INVESTMENTS | | | | |
Net realized loss on investments | | | (2,113,144 | ) |
Net change in unrealized appreciation (depreciation) on investments | | | 24,741,061 | |
| | |
|
|
|
| |
| NET REALIZED AND UNREALIZED GAIN ON INVESTMENTS | | | 22,627,917 | |
| | |
|
|
|
| |
| INCREASE IN NET ASSETS FROM OPERATIONS | | $ | 22,245,386 | |
| | |
|
|
|
See Notes to Financial Statements.
DF DENT PREMIER GROWTH FUND
15
DF DENT PREMIER GROWTH FUND
STATEMENTS OF CHANGES IN NET ASSETS
| | | | | | | | |
| | | Year Ended
June 30, 2010
| | | Year Ended
June 30, 2009
| |
| OPERATIONS | | | | | | | | |
Net investment loss | | $ | (382,531 | ) | | $ | (383,852 | ) |
Net realized loss on investments | | | (2,113,144 | ) | | | (51,865,842 | ) |
Net change in unrealized appreciation (depreciation) on investments | | | 24,741,061 | | | | (27,667,251 | ) |
| | |
|
|
| |
|
|
|
Increase (Decrease) in Net Assets from Operations | | | 22,245,386 | | | | (79,916,945 | ) |
| | |
|
|
| |
|
|
|
| | |
| DISTRIBUTIONS TO SHAREHOLDERS FROM | | | | | | | | |
Net realized gain on investments | | | - | | | | (3,102,053 | ) |
| | |
|
|
| |
|
|
|
| | |
| CAPITAL SHARE TRANSACTIONS | | | | | | | | |
Sale of shares | | | 17,578,723 | | | | 34,837,524 | |
Reinvestment of distributions | | | - | | | | 2,396,238 | |
Redemption of shares | | | (33,610,580 | ) | | | (80,005,986 | ) |
| | |
|
|
| |
|
|
|
Decrease in Net Assets from Capital Share Transactions | | | (16,031,857 | ) | | | (42,772,224 | ) |
| | |
|
|
| |
|
|
|
| | |
Increase (Decrease) in Net Assets | | | 6,213,529 | | | | (125,791,222 | ) |
| | |
| NET ASSETS | | | | | | | | |
Beginning of Year | | | 117,391,299 | | | | 243,182,521 | |
| | |
|
|
| |
|
|
|
End of Year | | $ | 123,604,828 | | | $ | 117,391,299 | |
| | |
|
|
| |
|
|
|
| | |
| SHARE TRANSACTIONS | | | | | | | | |
Sale of shares | | | 1,341,457 | | | | 3,306,362 | |
Reinvestment of distributions | | | - | | | | 243,273 | |
Redemption of shares | | | (2,603,088 | ) | | | (7,823,523 | ) |
| | |
|
|
| |
|
|
|
Decrease in Shares | | | (1,261,631 | ) | | | (4,273,888 | ) |
| | |
|
|
| |
|
|
|
See Notes to Financial Statements.
DF DENT PREMIER GROWTH FUND
16
DF DENT PREMIER GROWTH FUND
FINANCIAL HIGHLIGHTS
These financial highlights reflect selected data for a share outstanding of the Fund throughout each year.
| | | | | | | | | | | | | | | | | | | | |
| | | Year Ended
| |
| | | June 30,
2010
| | | June 30,
2009
| | | June 30,
2008
| | | June 30,
2007
| | | June 30,
2006
| |
| NET ASSET VALUE, Beginning of Year | | $ | 10.94 | | | $ | 16.20 | | | $ | 17.25 | | | $ | 15.11 | | | $ | 13.14 | |
| | |
|
|
| |
|
|
| |
|
|
| |
|
|
| |
|
|
|
| | | | | |
| INVESTMENT OPERATIONS | | | | | | | | | | | | | | | | | | | | |
Net investment loss (a) | | | (0.04 | ) | | | (0.03 | ) | | | (0.05 | ) | | | (0.04 | ) | | | (0.03 | ) |
Net realized and unrealized gain (loss) | | | 2.15 | | | | (4.96 | ) | | | (0.76 | ) | | | 2.35 | | | | 2.10 | |
| | |
|
|
| |
|
|
| |
|
|
| |
|
|
| |
|
|
|
Total from Investment Operations | | | 2.11 | | | | (4.99 | ) | | | (0.81 | ) | | | 2.31 | | | | 2.07 | |
| | |
|
|
| |
|
|
| |
|
|
| |
|
|
| |
|
|
|
| | | | | |
| DISTRIBUTIONS TO SHAREHOLDERS FROM | | | | | | | | | | | | | | | | | | | | |
Net realized gain | | | - | | | | (0.27 | ) | | | (0.24 | ) | | | (0.17 | ) | | | (0.10 | ) |
| | |
|
|
| |
|
|
| |
|
|
| |
|
|
| |
|
|
|
| | | | | |
| NET ASSET VALUE, End of Year | | $ | 13.05 | | | $ | 10.94 | | | $ | 16.20 | | | $ | 17.25 | | | $ | 15.11 | |
| | |
|
|
| |
|
|
| |
|
|
| |
|
|
| |
|
|
|
| | | | | |
| TOTAL RETURN | | | 19.29 | % | | | (30.64 | )% | | | (4.88 | )% | | | 15.42 | % | | | 15.77 | % |
| | | | | |
| RATIOS/SUPPLEMENTARY DATA: | | | | | | | | | | | | | | | | | | | | |
Net Assets at End of Year
(000’s omitted) | | $ | 123,605 | | | $ | 117,391 | | | $ | 243,183 | | | $ | 142,896 | | | $ | 77,994 | |
Ratios to average net assets: | | | | | | | | | | | | | | | | | | | | |
Net expenses | | | 1.10 | % | | | 1.10 | % | | | 1.15 | % | | | 1.20 | % | | | 1.25 | % |
Gross expenses (b) | | | 1.27 | % | | | 1.26 | % | | | 1.19 | % | | | 1.36 | % | | | 1.51 | % |
Net investment loss | | | (0.29 | )% | | | (0.25 | )% | | | (0.31 | )% | | | (0.23 | )% | | | (0.18 | )% |
| | | | | |
| PORTFOLIO TURNOVER RATE | | | 8 | % | | | 16 | % | | | 21 | % | | | 17 | % | | | 25 | % |
| (a) | | Calculated based on average shares outstanding during the year. |
| (b) | | Reflects the expense ratio excluding any waivers and/or reimbursements. |
See Notes to Financial Statements.
DF DENT PREMIER GROWTH FUND
17
DF DENT PREMIER GROWTH FUND
NOTES TO FINANCIAL STATEMENTS
JUNE 30, 2010
Note 1. Organization
The DF Dent Premier Growth Fund (the “Fund”) is a diversified portfolio of Forum Funds (the “Trust”). The Trust is a Delaware statutory trust that is registered as an open-end, management investment company under the Investment Company Act of 1940 (the “Act”), as amended. As of June 30, 2010, the Trust had twenty-two investment portfolios. Under its Trust Instrument, the Trust is authorized to issue an unlimited number of each Fund’s shares of beneficial interest without par value. The Fund commenced operations on July 16, 2001. The Fund seeks long-term capital appreciation.
Note 2. Summary of Significant Accounting Policies
These financial statements are prepared in accordance with generally accepted accounting principles in the United States of America (“GAAP”), which require management to make estimates and assumptions that affect the reported amounts of assets and liabilities, the disclosure of contingent liabilities at the date of the financial statements, and the reported amounts of increase and decrease in net assets from operations during the fiscal period. Actual amounts could differ from those estimates. The following summarizes the significant accounting policies of the Fund:
Security Valuation – Exchange-traded securities and over-the-counter securities are valued using the last quoted sale or official closing price, provided by independent pricing services as of the close of trading on the market or exchange for which they are primarily traded, on each Fund business day. In the absence of a sale, such securities are valued at the mean of the last bid and asked price provided by independent pricing services. Non-exchange traded securities for which quotations are available are valued using the last quoted sales price, or in the absence of a sale at the mean of the last bid and asked prices provided by independent pricing services. Shares of open-end mutual funds are valued at net asset value (“NAV”). Short-term investments that mature in sixty days or less may be valued at amortized cost.
The Fund values its investments at fair value pursuant to procedures adopted by the Trust’s Board of Trustees (the “Board”) if (1) market quotations are insufficient or not readily available or (2) the adviser believes that the values available are unreliable. Fair valuation is based on subjective factors and as a result, the fair value price of an investment may differ from the security’s market price and may not be the price at which the asset may be sold. Fair valuation could result in a different NAV than a NAV determined by using market quotes.
The Fund has a three-tier fair value hierarchy. The basis of the tiers is dependent upon the various “inputs” used to determine the value of the Fund’s investments. These inputs are summarized in the three broad levels listed below:
Level 1 – quoted prices in active markets for identical assets
Level 2 – other significant observable inputs (including quoted prices of similar securities, interest rates, prepayment speeds, credit risk, etc.)
DF DENT PREMIER GROWTH FUND
18
DF DENT PREMIER GROWTH FUND
NOTES TO FINANCIAL STATEMENTS
JUNE 30, 2010
Level 3 – significant unobservable inputs (including the Fund’s own assumptions in determining the fair value of investments)
The aggregate value by input level, as of June 30, 2010, for the Fund’s investments is included at the end of the Fund’s Schedule of Investments.
Security Transactions, Investment Income and Realized Gain and Loss – Investment transactions are accounted for on trade date. Dividend income is recorded on the ex-dividend date. Foreign dividend income is recorded on the ex-dividend date or as soon as possible after the Fund determines the existence of a dividend declaration after exercising reasonable due diligence. Income and capital gains on some foreign securities may be subject to foreign withholding taxes, which are accrued as applicable. Interest income is recorded on an accrual basis. Premium and discount is amortized and accreted in accordance with GAAP. Identified cost of investments sold is used to determine the gain and loss for both financial statement and federal income tax purposes.
Distributions to Shareholders – Distributions to shareholders of net investment income and net capital gains, if any, are declared and paid at least annually. Distributions are based on amounts calculated in accordance with applicable federal income tax regulations, which may differ from GAAP. These differences are due primarily to differing treatments of income and gain on various investment securities held by the Fund, timing differences and differing characterizations of distributions made by the Fund.
Federal Taxes – The Fund intends to qualify each year as a regulated investment company under Subchapter M of the Internal Revenue Code and distribute all of its taxable income to shareholders. In addition, by distributing in each calendar year substantially all its net investment income and capital gains, if any, the Fund will not be subject to a federal excise tax. Therefore, no federal income or excise tax provision is required.
As of June 30, 2010, there are no uncertain tax positions that would require financial statement recognition, de-recognition, or disclosure. The Fund’s federal tax returns filed in the three-year period ended June 30, 2010, remain subject to examination by the Internal Revenue Service.
Income and Expense Allocation – The Trust accounts separately for the assets, liabilities and operations of each of its investment portfolios. Expenses that are directly attributable to more than one investment portfolio are allocated among the respective investment portfolios in an equitable manner.
Commitments and Contingencies – In the normal course of business, the Fund enters into contracts that provide general indemnifications by the Fund to the counterparty to the contract. The Fund’s maximum exposure under these arrangements is dependent on future claims that may be made against the Fund and, therefore, cannot be estimated; however, based on experience, the risk of loss from such claims is considered remote.
DF DENT PREMIER GROWTH FUND
19
DF DENT PREMIER GROWTH FUND
NOTES TO FINANCIAL STATEMENTS
JUNE 30, 2010
Note 3. Advisory Fees, Servicing Fees and Other Transactions
Investment Adviser – D.F. Dent and Company, Inc. (the “Adviser”), is the investment adviser to the Fund. Pursuant to an investment advisory agreement, the Adviser receives an advisory fee from the Fund at an annual rate of 1.00% of the Fund’s average daily net assets.
Distribution – Foreside Fund Services, LLC serves as the Fund’s distributor (the “Distributor”). The Distributor receives no compensation from the Fund for its distribution services. The Distributor is not affiliated with the Adviser or with Atlantic Fund Administration, LLC (“Atlantic”) or their affiliates.
Other Service Providers – Atlantic provides fund accounting, fund administration, and transfer agency services to the Fund. Atlantic also provides certain shareholder report production, and EDGAR conversion and filing services. Pursuant to an Atlantic services agreement, the Fund pays Atlantic customary fees for its services. Atlantic provides a Principal Executive Officer, a Principal Financial Officer, a Chief Compliance Officer, and an Anti-Money Laundering Officer to the Fund, as well as certain additional compliance support functions.
Trustees and Officers – The Trust pays each independent Trustee an annual retainer fee of $40,000 for service to the Trust ($60,000 for the Chairman). In addition, the Chairman receives a monthly stipend of $500 to cover certain expenses incurred in connection with his duties to the Trust. The Trustees and Chairman may receive additional fees for special Board meetings. Each Trustee is also reimbursed for all reasonable out-of-pocket expenses incurred in connection with his duties as a Trustee, including travel and related expenses incurred in attending Board meetings. The amount of Trustees’ fees attributable to the Fund is disclosed in the Statement of Operations. Certain officers of the Trust are also officers or employees of the above named service providers, and during their terms of office received no compensation from the Fund.
Note 4. Fees Waived
The Adviser has contractually agreed to waive a portion of its fee and reimburse certain expenses through October 31, 2010, to the extent that annual operating expenses exceed 1.10%. Other fund service providers have voluntarily agreed to waive and reimburse a portion of their fees. These voluntary fee waivers and reimbursements may be reduced or eliminated at any time. For the year ended June 30, 2010, fees waived were as follows:
| | | | | | | |
Investment Adviser
Fees Waived
| | Other
Waivers
| | Total Fees
Waived
|
| $ | 204,148 | | $ | 15,541 | | $ | 219,689 |
Note 5. Security Transactions
The cost of purchases and proceeds from sales of investment securities (including maturities), other than short-term investments for the year ended June 30, 2010, were $9,882,082 and $26,852,857, respectively.
DF DENT PREMIER GROWTH FUND
20
DF DENT PREMIER GROWTH FUND
NOTES TO FINANCIAL STATEMENTS
JUNE 30, 2010
Note 6. Federal Income Tax and Investment Transactions
Distributions during the fiscal years ended as noted were characterized for tax purposes as follows:
| | | | | | |
| | | 2010
| | 2009
|
Long-Term Capital Gain | | $ | - | | $ | 3,102,053 |
As of June 30, 2010, distributable earnings (accumulated losses) on a tax basis were as follows:
| | | | |
Capital and Other Losses | | $ | (53,901,130 | ) |
Unrealized Appreciation | | | 3,753,045 | |
| | |
|
|
|
Total | | $ | (50,148,085 | ) |
| | |
|
|
|
The difference between components of distributable earnings on a tax basis and the amounts reflected in the Statement of Assets and Liabilities are primarily due to wash sales and post-October losses.
For tax purposes, the current year post-October loss was $1,100,026. This loss will be recognized for tax purposes on the first business day of the Fund’s next fiscal year, July 1, 2010.
As of June 30, 2010, the Fund had capital loss carryforwards to offset future capital gains of $23,322,998 and $29,478,106, expiring in 2017 and 2018, respectively.
On the Statement of Assets and Liabilities, as a result of permanent book to tax differences, certain amounts have been reclassified for the year ended June 30, 2010. The following reclassification was the result of net operating losses and has no impact on the net assets of the Fund.
| | | | |
Accumulated Net Investment Income (Loss) | | $ | 382,531 | |
Paid-in-Capital | | | (382,531 | ) |
Note 7. Recent Accounting Pronouncements
In January 2010, the Financial Accounting Standards Board issued Accounting Standards Update (“ASU”) No. 2010-06 “Improving Disclosures about Fair Value Measurements.” ASU No. 2010-06 clarifies existing disclosure and requires additional disclosures regarding fair value measurements. Effective for interim and annual reporting periods beginning after December 15, 2009, entities are required to disclose significant transfers into and out of Level 1 and 2 measurements in the fair value hierarchy and the reasons for those transfers. Effective for fiscal years beginning after December 15, 2010, and for interim periods within those fiscal years, entities will need to disclose information about purchases, sales, issuances and settlements of Level 3 securities on a gross basis, rather than as a net number as currently required. Management is currently evaluating the impact ASU No. 2010-06 will have on financial statement disclosures.
DF DENT PREMIER GROWTH FUND
21
DF DENT PREMIER GROWTH FUND
NOTES TO FINANCIAL STATEMENTS
JUNE 30, 2010
Note 8. Subsequent Events
Subsequent events occurring after the date of this report have been evaluated for potential impact and the Fund has had no such events.
DF DENT PREMIER GROWTH FUND
22
REPORT OF INDEPENDENT REGISTERED PUBLIC ACCOUNTING FIRM
To the Board of Trustees of Forum Funds and the Shareholders of DF Dent Premier Growth Fund
We have audited the accompanying statement of assets and liabilities of the DF Dent Premier Growth Fund, a series of shares of beneficial interest in the Forum Funds, including the schedule of investments, as of June 30, 2010, and the related statement of operations for the year then ended, and the statements of changes in net assets and the financial highlights for each of the years in the two year period then ended. These financial statements and financial highlights are the responsibility of the Fund’s management. Our responsibility is to express an opinion on these financial statements and financial highlights based on our audits. The financial highlights for each of the years in the three-year period ended June 30, 2008, were audited by other auditors whose report dated August 25, 2008, expressed an unqualified opinion on such financial highlights.
We conducted our audits in accordance with the standards of the Public Company Accounting Oversight Board (United States). Those standards require that we plan and perform the audits to obtain reasonable assurance about whether the financial statements and financial highlights are free of material misstatement. An audit includes examining, on a test basis, evidence supporting the amounts and disclosures in the financial statements. Our procedures included confirmation of securities owned as of June 30, 2010, by correspondence with the custodian. An audit also includes assessing the accounting principles used and significant estimates made by management, as well as evaluating the overall financial statement presentation. We believe that our audits provide a reasonable basis for our opinion.
In our opinion, the financial statements and financial highlights referred to above present fairly, in all material respects, the financial position of the DF Dent Premier Growth Fund as of June 30, 2010, the results of its operations for the year then ended, and the changes in its net assets and its financial highlights for each of the years in the two year period then ended, in conformity with accounting principles generally accepted in the United States of America.

BBD, LLP
Philadelphia, Pennsylvania
August 18, 2010
DF DENT PREMIER GROWTH FUND
23
DF DENT PREMIER GROWTH FUND
ADDITIONAL INFORMATION (Unaudited)
JUNE 30, 2010
Proxy Voting Information
A description of the policies and procedures that the Fund uses to determine how to vote proxies relating to securities held in the Fund’s portfolio is available, without charge and upon request, by calling 866-233-3368 and on the SEC’s website at www.sec.gov. The Fund’s proxy voting record for the most recent twelve-month period ended June 30 is available, without charge and upon request, by calling 866-233-3368 and on the SEC’s website at www.sec.gov.
Availability of Quarterly Portfolio Schedules
The Fund files its complete schedule of portfolio holdings with the SEC for the first and third quarters of each fiscal year on Form N-Q. The Fund’s Forms N-Q are available, without charge and upon request on the SEC’s website at www.sec.gov or may be reviewed and copied at the SEC’s Public Reference Room in Washington, DC. Information on the operation of the Public Reference Room may be obtained by calling 1-800-SEC-0330.
Shareholder Expense Example
As a shareholder of the Fund, you incur ongoing costs, including management fees and other Fund expenses. This example is intended to help you understand your ongoing costs (in dollars) of investing in the Fund, and to compare these costs with the ongoing costs of investing in other mutual funds.
The example is based on an investment of $1,000 invested at the beginning of the period and held for the entire period from January 1, 2010, through June 30, 2010.
Actual Expenses – The first line in the table below provides information about actual account values and actual expenses. You may use the information in this line, together with the amount you invested, to estimate the expenses that you paid over the period. Simply divide your account value by $1,000 (for example, an $8,600 account value divided by $1,000 = 8.6), then multiply the result by the number in the first line under the heading entitled “Expenses Paid During Period” to estimate the expenses you paid on your account during the period.
Hypothetical Example for Comparison Purposes – The second line in the table below provides information about hypothetical account values and hypothetical expenses based on the Fund’s actual expense ratio and an assumed rate of return of 5% per year before expenses, which is not the Fund’s actual return. The hypothetical account values and expenses may not be used to estimate the actual ending account balance or expenses you paid for the period. You may use this information to compare the ongoing cost of investing in the Fund and other funds. To do so, compare this 5% hypothetical example with the 5% hypothetical examples that appear in the shareholder reports of other funds.
DF DENT PREMIER GROWTH FUND
24
DF DENT PREMIER GROWTH FUND
ADDITIONAL INFORMATION (Unaudited)
JUNE 30, 2010
Please note that expenses shown in the table are meant to highlight your ongoing costs only. Therefore, the second line of the table is useful in comparing ongoing costs only, and will not help you determine the relative total costs of owning different funds.
| | | | | | | | | | | | |
| | | Beginning
Account Value
January 1, 2010
| | Ending
Account Value
June 30, 2010
| | Expenses Paid
During Period*
| | Annualized
Expense Ratio*
| |
Actual | | $ | 1,000.00 | | $ | 991.64 | | $ | 5.43 | | 1.10 | % |
Hypothetical (5% return before expenses) | | $ | 1,000.00 | | $ | 1,019.34 | | $ | 5.51 | | 1.10 | % |
| * | | Expenses are equal to the Fund’s annualized expense ratio as indicated above multiplied by the average account value over the period, multiplied by the number of days in the most recent fiscal year divided by 365 to reflect the half-year period. |
DF DENT PREMIER GROWTH FUND
25
DF DENT PREMIER GROWTH FUND
ADDITIONAL INFORMATION (Unaudited)
JUNE 30, 2010
Trustees and Officers of the Trust
The Board is responsible for oversight of the management of the Trust’s business affairs and of the exercise of all the Trust’s powers except those reserved for the shareholders. The following table provides information about each Board member and certain officers of the Trust. Each Trustee and officer holds office until the person resigns, is removed, or is replaced. Unless otherwise noted, the persons have held their principal occupations for more than five years. The address for all Trustees and officers is Three Canal Plaza, Suite 600, Portland, Maine 04101, unless otherwise indicated. Each Trustee oversees twenty-two portfolios in the Trust. Mr. Keffer is considered an Interested Trustee due to his affiliation with Atlantic. Mr. Keffer is also an Interested Director of Wintergreen Fund, Inc. The Fund’s Statement of Additional Information includes additional information about the Trustees and is available, without charge and upon request, by calling 866-233-3368.
| | | | | | |
| Name and Year of Birth | | Position
with the
Trust | | Length
of Time
Served | | Principal
Occupation(s)
During Past 5 Years |
| Independent Trustees | | | | | | |
J. Michael Parish Born: 1943 | | Chairman of the Board; Trustee; Chairman, Nominating Committee and Qualified Legal Compliance Committee | | Since 1989 (Chairman since 2004) | | Retired since 2003. |
Costas Azariadis Born: 1943 | | Trustee; Chairman, Valuation Committee | | Since 1989 | | Professor of Economics, Washington University since 2006; Professor of Economics, University of California-Los Angeles 1992-2006. |
James C. Cheng Born: 1942 | | Trustee; Chairman, Audit Committee | | Since 1989 | | President, Technology Marketing Associates (marketing company for small- and medium-sized businesses in New England) since 1991. |
| Interested Trustee | | | | | | |
John Y. Keffer1 Born: 1942 | | Trustee; Vice Chairman | | Since 1989 | | Chairman, Atlantic since 2008; President, Forum Foundation (a charitable organization) since 2005; President, Forum Trust, LLC (a non-depository trust company chartered in the State of Maine) since 1997. |
| 1 | | Since 1997, John Y. Keffer has been president and owner of Forum Trust, LLC. Prior to January 1, 2010, Atlantic was a wholly owned subsidiary of Forum Trust, LLC. Effective January 1, 2010, Atlantic became a wholly owned subsidiary of Forum Holdings Corp., a Delaware corporation that is wholly owned by Mr. Keffer. |
DF DENT PREMIER GROWTH FUND
26
DF DENT PREMIER GROWTH FUND
ADDITIONAL INFORMATION (Unaudited)
JUNE 30, 2010
| | | | | | |
| Name and Year of Birth | | Position
with the
Trust | | Length
of Time
Served | | Principal
Occupation(s)
During Past 5 Years |
| Officers | | | | | | |
Stacey E. Hong Born: 1966 | | President; Principal Executive Officer | | Since 2008 | | President, Atlantic since 2008; Director, Consulting Services, Foreside Fund Services 2007; Elder Care, 2005-2006; Director, Fund Accounting, Citigroup 2003-2005. |
Karen Shaw Born: 1972 | | Treasurer; Principal Financial Officer | | Since 2008 | | Senior Manager, Atlantic since 2008; Section Manager/Vice President, Enterprise Support Services, Citigroup 2003-2008. |
David Faherty Born: 1970 | | Vice President | | Since 2009 | | Senior Counsel, Atlantic since 2009; Vice President, Citi Fund Services Ohio, Inc. 2007-2009.; Associate Counsel, Investors Bank & Trust Co. 2006-2007; FDIC 2005. |
Michael J. McKeen Born: 1971 | | Vice President | | Since 2009 | | Senior Manager, Atlantic since 2008; Vice President, Citigroup 2003-2008. |
Joshua LaPan Born: 1973 | | Vice President | | Since 2009 | | Manager, Atlantic since 2008; Vice President, Citigroup 2003-2008. |
Timothy Bowden Born: 1969 | | Vice President | | Since 2009 | | Manager, Atlantic since 2008; Vice President, Citigroup 2005-2008. |
Lina Bhatnagar Born: 1971 | | Secretary | | Since 2008 | | Senior Administration Specialist, Atlantic since 2008; Regulatory Administration Specialist, Citigroup 2006-2008. |
DF DENT PREMIER GROWTH FUND
27
PREMIER
GROWTH FUND
NASDAQ TICKER SYMBOL
DFDPX
INVESTMENT ADVISER
D.F. Dent and Company, Inc.
Two East Read Street
Baltimore, MD 21202
www.dfdent.com
TRANSFER AGENT
Atlantic Fund Administration, LLC
P.O. Box 588
Portland, ME 04112
(866) 2DF-DENT
DISTRIBUTOR
Foreside Fund Services, LLC
Three Canal Plaza, Suite 100
Portland, ME 04101
www.foreside.com
221-ANR-0610
This report is submitted for the general information of the shareholders of the Fund. It is not authorized for distribution to prospective investors unless preceded or accompanied by an effective prospectus, which includes information regarding the Fund’s risks, objectives, fees and expenses, experience of its management, and other information.

ANNUAL REPORT
Golden Large Cap Core Fund
Golden Small Cap Core Fund
June 30, 2010
TABLE OF CONTENTS
A MESSAGE TO OUR SHAREHOLDERS
JUNE 30, 2010
Dear Shareholder,
We are pleased to present the annual report for the Golden Large Cap Core Fund and the Golden Small Cap Core Fund (the “Funds”) for the period of July 1, 2009, through June 30, 2010.
General Market Overview
The dramatic stock market rally that began in March 2009 continued through the first quarter of 2010 when the major indices ended the quarter at levels not seen since the fall of 2008. During the beginning stages of the rally (second quarter of 2009), improvements in economic data meant that the data was merely “less bad;” however, in the third quarter, we began to receive some economic data that showed the environment getting “better.” During the third quarter, we saw evidence of an increase in manufacturing activity that was induced by inventory restocking; measures of consumer sentiment began to show modest improvement from very low levels; and there were even some month-over-month improvements in residential real estate prices as indicated by the S&P/Case-Shiller Home Price Index. During the fourth quarter, we continued to see improvements in the economic data. Various measures of manufacturing and services activity stabilized; residential real estate prices stabilized; job losses slowed; consumer sentiment and consumer spending improved slightly; and inflation data remained tame. The first quarter of 2010 saw a late-January and early February sell-off, which was sparked by fiscal and monetary tightening measures in China coupled with sovereign debt fears in Europe that were related to widening budget deficits. Rather than succumbing to the fear, the market staged an impressive recovery in the latter half of the quarter and climbed the proverbial “wall-of-worry” with very little daily volatility.
Over these three quarters, the overall theme was investors’ appetite for risk. The modestly better economic data combined with fiscal stimulus measures targeted at the automotive and housing markets and ample liquidity provided by the Federal Reserve (it held short-term interest rates at 0-0.25% and intervened in the long-term U.S. Treasury bond market and the mortgage-backed securities market to hold long-term interest rates low) were enough to keep investors in a risk-taking mode. As a result, we saw higher beta (i.e., historical volatility relative to the overall market) stocks outperform lower beta stocks and stocks considered to be of lower quality (e.g., stocks with lower returns on equity) outperform higher quality stocks.
The second quarter of 2010 stood in stark contrast to the previous three quarters. The U.S. equity markets experienced a sharp decline as the major equity benchmarks fell approximately 15% from their late-April highs and ended the quarter down approximately 10%. The combination of sovereign debt fears in Europe, slightly weaker economic data, and a “flash crash” on May 6th caused investors to seriously contemplate the possibility of a double-dip recession and another potential credit crunch. Despite an aid package for Greece from the European Union and the International Monetary Fund, sovereign debt purchases by the European Central Bank, and announced austerity measures by several countries, investors continued to lose confidence in the outlook for the overall economy and the financial institutions exposed to European sovereign debt.
As for economic reports that came out during the quarter, most of them pointed to a weakening of the economic recovery. Manufacturing was still expanding, but at a slower pace. The job market, which had shown signs of improvement, stalled out. The housing market also dropped after the expiration of a federal
1
A MESSAGE TO OUR SHAREHOLDERS
JUNE 30, 2010
tax credit. Regarding the “flash crash,” the dramatic intraday drop in the stock market exposed serious flaws in the microstructure of the markets. We see reason for concern given the high percentage of market trading volume that seems to be coming from high-frequency traders, traders paying a stock exchange for the ability to locate their computers in the same data center as the exchange in order to gain timing advantages, and traders using client information for the benefit of their own proprietary trading. Given all this uncertainty, it is not surprising that investors flocked to the safety of cash, gold, and U.S. Treasury securities.
Golden Large Cap Core Fund
The Fund seeks to achieve long-term capital appreciation by investing in large capitalization domestic equities. The goal of the Fund is to construct an actively managed portfolio of fundamentally sound large-cap companies that we believe exhibit the likelihood of meeting or exceeding analysts’ earnings expectations.
For the one-year period ending June 30, 2010, the Fund delivered a total return of 9.90%. The Fund’s return trailed the 14.43% total return of the S&P 500 Index (the Fund’s benchmark index) for the same period. In general, the Fund’s exposure to defensive stocks was relatively greater than that of the Index over the course of the year. Our emphasis on lower beta and higher quality stocks made it difficult for the Fund to keep up, as the aggressive upturn in the broad equity market generally favored higher beta and lower quality stocks.
Versus the S&P 500 Index, two of the Fund’s best sources of relative advantage came from the Consumer Discretionary and Energy sectors. Within Consumer Discretionary, Ross Stores (ROST) was the best performing stock in the sector. During the uncertain economic times, consumers have continued to favor off-price retailers, and ROST is a leader in that group with competitively-priced, branded merchandise. We were underweight the Energy sector throughout the course of the year. That positioning was beneficial to the Fund’s relative return, because the Energy sector’s 2.1% return was the weakest in the Index.
The sources of underperformance relative to the benchmark primarily came from the Financials and Health Care sectors. Financial stocks stormed back from their crisis lows. The best performing industry groups within the sector were Consumer Finance and Real Estate Investment Trusts, which were areas that suffered tremendously during the downturn. Our Fund was underweight these industry groups within Financials, and that positioning hurt performance relative to the Index. It remains unclear whether fundamentals will catch up with the rebound that has been seen in these stocks. In Health Care, two investments in the Medical Equipment industry (Baxter International (BAX) and St. Jude Medical (STJ)) suffered and accounted for most of the shortfall in relative performance within the sector. The problem was the same for both companies; results fell short of historical and management-guided expectations due to loss of market share and price competition.
Golden Small Cap Core Fund
The Fund seeks to achieve maximum long-term total return by investing in small capitalization domestic equities. The goal of the Fund is to construct an actively managed portfolio of fundamentally sound small-cap companies that we believe exhibit the likelihood of meeting or exceeding analysts’ earnings expectations.
2
A MESSAGE TO OUR SHAREHOLDERS
JUNE 30, 2010
For the one-year period ending June 30, 2010, the Fund delivered a total return of 13.18%. This return lagged the 21.48% total return of the Russell 2000 Index (the Fund’s benchmark index) for the same period. The market’s rally began from an extreme oversold position earlier in 2009 and was led by higher beta, poorer quality companies. These particular characteristics of the rally are important in explaining the weaker relative performance of the Fund.
In general, investors were relieved as the market rebounded sharply from the lows of 2009 and were hopeful that the unprecedented stimulus measures taken by the U.S. government would stave off a second Great Depression. This dramatic shift in investor psychology led to an aggressive increase in risk appetite, which boosted the price action for the riskier assets (i.e., higher beta companies).
In terms of relative performance, the Fund’s best results came from the Health Care sector, while the Information Technology and Consumer Staples sectors also delivered positive results. Within Health Care, the best performance came from the Pharmaceutical industry, where shares of generic drug maker Par Pharmaceutical (PRX) delivered strong returns as it experienced stronger-than-expected demand. Within the Health Care Services industry, shares of HealthSpring (HS) and Chemed Corp. (CHE) were also strong performers. Overall, the Fund’s Health Care sector returned approximately 27.5% versus the benchmark sector return of 13.2%.
Relative weakness was most pronounced within the Industrials, Financials, and Materials sectors. Within the benchmark, Industrials was an underperforming sector for the period, and the Fund’s sector weighting was in line with that of the benchmark. The Fund was able to deliver good relative performance within the Commercial Services industry with companies like Deluxe Corp. (DLX) and Sykes Enterprises (SYKE); however, it lost ground due to stock selection in the Transportation and Capital Goods industries, which hampered overall sector results. Weak performers among the Fund’s Industrials holdings included Genco Shipping & Trading (GNK); Great Lakes Dredge & Dock (GLDD), which was sold during the period; and Chart Industries (GTLS). The Fund maintained an underweight position in the Financials sector throughout the year based on weak fundamentals and an uncertain economic outlook. An overweight stance within the Insurance industry was helpful in offsetting a lack of exposure to the Banks industry. However, weak relative results in the Diversified Financials and Real Estate industries contributed to the bulk of the shortfall within the sector.
Looking Forward
As the third quarter of 2010 begins, investors are very nervous and seem to be predisposed to interpret mixed news on the economy in a negative light. As a result, it is difficult to imagine a positive catalyst significant enough to spark a pronounced rally in the market. However, there are ample conditions present to begin to build a floor under the market. Currently, the forward price/earnings multiple on the market has moved back toward the low levels reached in 2008. The earnings yield and dividend yield are attractive relative to the very low levels of U.S. Treasury bond yields. Corporate balance sheets are generally in good shape, and companies are holding historically high levels of cash.
One consequence of the reasonable valuations and strong balance sheets will likely be an increase in stock buybacks and a pickup in merger and acquisition activity. Additionally, inflation is currently very low
3
A MESSAGE TO OUR SHAREHOLDERS
JUNE 30, 2010
with the Consumer Price Index growing at an annual rate that is at its lowest level since the 1960’s. Low inflation combined with the continued weakness in the overall economy and the job market are likely to keep monetary conditions accommodative with the Federal Funds Rate remaining near zero for many months to come. While we are still conscious of the many structural challenges the economy faces (e.g., consumer over-indebtedness, impending higher taxes, increased government deficits and debt, and greater government intrusion in the economy), the conditions may be in place for the overall market to stabilize, and we believe stock-specific opportunities will present themselves.
We value and appreciate our relationship with the Funds and thank you for your support.
Sincerely,
| | |
 | |  |
| Greg W. Golden, CFA | | Jeff C. Moser, CFA |
The views expressed in this report are those of the Funds’ managers as of June 30, 2010, and may not reflect their views on the date this report is first published or anytime thereafter. These views are intended to assist shareholders of the Funds in understanding their investments in the Funds and do not constitute investment advice. Investing in the securities of small capitalization companies involves greater risk and the possibility of greater price volatility than investing in larger capitalization and more established companies.
4
PERFORMANCE CHARTS AND ANALYSIS
JUNE 30, 2010
The following charts reflect the change in the value of a hypothetical $10,000 investment, including reinvested dividends and distributions, in the Golden Large Cap Core Fund and Golden Small Cap Core Fund (each a “Fund” and, collectively, the “Funds”) compared with broad-based securities market indices. The Golden Large Cap Core Fund is compared to its benchmark, the Standard and Poor’s 500 Index (“S&P 500”). The Golden Small Cap Core Fund is compared to its primary benchmark, the Russell 2000 Index (“Russell 2000”), and the S&P SmallCap 600 Index (“S&P SmallCap 600”), its secondary benchmark. The S&P 500 is a market-value weighted index representing the performance of 500 widely held, publicly traded stocks. The Russell 2000, is an unmanaged, market value weighted index, which measures performance of the 2,000 companies that are between the 1,000th and 3,000th largest in the market. The S&P SmallCap 600 is designed to be an accurate measure of the performance of small companies, reflecting the risk and return characteristics of the broader smallcap universe. The total return of the indices include reinvestment of dividends and income. The total return of each Fund includes operating expenses that reduce returns, while the total return of the indices do not include expenses. Each Fund is professionally managed while the indices are unmanaged and are not available for investment.
Performance data quoted represents past performance and is no guarantee of future results. Current performance may be lower or higher than the performance data quoted. Investment return and principal value will fluctuate so that shares, when redeemed, may be worth more or less than original cost. For the most recent month-end performance please call (800) 206-8610. As stated in the Funds’ prospectus, the annual operating expense ratios (gross) are 0.70% and 0.95% for Institutional and Investor Shares, respectively, of the Golden Large Cap Core Fund, and 1.10% and 1.35% for Institutional and Investor Shares, respectively, of the Golden Small Cap Core Fund. The Fund’s adviser has agreed to contractually waive a portion of its fees and to reimburse expenses through October 31, 2010, such that total operating expenses do not exceed 0.70% and 0.95% for Institutional and Investor Shares, respectively, of the Golden Large Cap Core Fund, and 1.10% and 1.35% for Institutional and Investor Shares, respectively, of the Golden Small Cap Core Fund. The performance table and graph do not reflect the deduction of taxes that a shareholder would pay on Fund distributions or the redemption of Fund shares. Returns greater than one year are annualized.
GOLDEN LARGE CAP CORE FUND
vs. S&P 500 INDEX
| | | | | | |
| | |
Average Annual Total Return on 06/30/10 | | 1 Year | | Since Inception
(09/13/05) | |
Golden Large Cap Core Fund: | | | 9.90% | | (1.96 | )% |
S&P 500 Index: | | | 14.43% | | (1.59 | )% |
| | |
Investment Value on 06/30/10 | | | | | |
Golden Large Cap Core Fund: | | $ | 9,094 | | | |
S&P 500 Index: | | $ | 9,262 | | | |
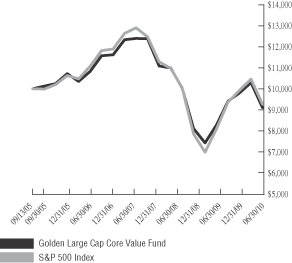
GOLDEN SMALL CAP CORE FUND
vs. RUSSELL 2000 INDEX AND
S&P 600 SMALLCAP INDEX
| | | | | | |
| | |
Average Annual Total Return on 06/30/10 | | 1 Year | | Since Inception
(09/13/05) | |
Golden Small Cap Core Fund: | | | 13.18% | | (4.60 | )% |
Russell 2000 Index: | | | 21.48% | | (0.72 | )% |
S&P SmallCap 600 Index: | | | 23.63% | | (0.25 | )% |
| | |
Investment Value on 06/30/10 | | | | | |
Golden Small Cap Core Fund: | | $ | 7,977 | | | |
Russell 2000 Index: | | $ | 9,659 | | | |
S&P SmallCap 600 Index: | | $ | 9,879 | | | |
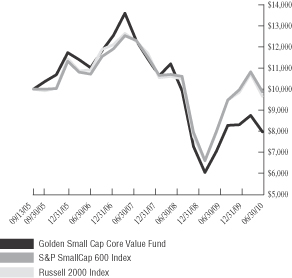
5
GOLDEN LARGE CAP CORE FUND
SCHEDULE OF INVESTMENTS
JUNE 30, 2010
| | | | | |
| Shares | | Security Description | | Value |
Common Stock — 98.9% |
Consumer Discretionary — 13.0% |
| 112,705 | | Home Depot, Inc. | | $ | 3,163,629 |
| 55,335 | | McDonald's Corp. | | | 3,644,916 |
| 50,325 | | NIKE, Inc., Class B | | | 3,399,454 |
| 69,485 | | Ross Stores, Inc. | | | 3,702,856 |
| 154,330 | | The Gap, Inc. | | | 3,003,262 |
| 110,640 | | Viacom, Inc., Class B | | | 3,470,777 |
| | | | | |
| | | | | 20,384,894 |
| | | | | |
|
Consumer Staples — 8.3% |
| 101,895 | | General Mills, Inc. | | | 3,619,310 |
| 107,210 | | Kraft Foods, Inc., Class A | | | 3,001,880 |
| 53,235 | | The Procter & Gamble Co. | | | 3,193,035 |
| 65,495 | | Wal-Mart Stores, Inc. | | | 3,148,345 |
| | | | | |
| | | | | 12,962,570 |
| | | | | |
|
Energy — 8.8% |
| 43,010 | | Chevron Corp. | | | 2,918,659 |
| 54,605 | | ConocoPhillips | | | 2,680,559 |
| 44,400 | | Exxon Mobil Corp. | | | 2,533,908 |
| 70,940 | | Noble Corp. | | | 2,192,755 |
| 45,825 | | Occidental Petroleum Corp. | | | 3,535,399 |
| | | | | |
| | | | | 13,861,280 |
| | | | | |
|
Financials — 15.5% |
| 62,275 | | ACE, Ltd. | | | 3,205,917 |
| 85,370 | | Ameriprise Financial, Inc. | | | 3,084,418 |
| 815,135 | | Citigroup, Inc.(a) | | | 3,064,908 |
| 76,405 | | JPMorgan Chase & Co. | | | 2,797,187 |
| 46,220 | | PartnerRe, Ltd. | | | 3,241,871 |
| 54,715 | | PNC Financial Services Group, Inc. | | | 3,091,397 |
| 19,495 | | The Goldman Sachs Group, Inc. | | | 2,559,109 |
| 147,720 | | Unum Group | | | 3,205,524 |
| | | | | |
| | | | | 24,250,331 |
| | | | | |
|
Health Care — 12.9% |
| 46,515 | | Amgen, Inc.(a) | | | 2,446,689 |
| | | | | |
| Shares | | Security Description | | Value |
Health Care, continued |
| 56,710 | | Baxter International, Inc. | | $ | 2,304,695 |
| 125,945 | | Bristol-Myers Squibb Co. | | | 3,141,068 |
| 97,735 | | Cardinal Health, Inc. | | | 3,284,873 |
| 68,855 | | Covidien PLC | | | 2,766,594 |
| 45,850 | | Johnson & Johnson | | | 2,707,901 |
| 54,155 | | McKesson Corp. | | | 3,637,050 |
| | | | | |
| | | | | 20,288,870 |
| | | | | |
|
Industrials — 10.3% |
| 43,040 | | 3M Co. | | | 3,399,730 |
| 35,010 | | Flowserve Corp. | | | 2,968,848 |
| 206,675 | | General Electric Co. | | | 2,980,253 |
| 95,080 | | Tyco International, Ltd. | | | 3,349,668 |
| 53,100 | | United Technologies Corp. | | | 3,446,721 |
| | | | | |
| | | | | 16,145,220 |
| | | | | |
|
Materials — 3.6% |
| 71,140 | | International Flavors & Fragrances, Inc. | | | 3,017,759 |
| 133,135 | | Sealed Air Corp. | | | 2,625,422 |
| | | | | |
| | | | | 5,643,181 |
| | | | | |
|
Technology — 22.2% |
| 113,990 | | Agilent Technologies, Inc.(a) | | | 3,240,736 |
| 254,850 | | AVX Corp. | | | 3,267,177 |
| 89,495 | | BMC Software, Inc.(a) | | | 3,099,212 |
| 157,195 | | CA, Inc. | | | 2,892,388 |
| 148,460 | | Cisco Systems, Inc.(a) | | | 3,163,682 |
| 69,765 | | Hewlett-Packard Co. | | | 3,019,429 |
| 27,900 | | IBM Corp. | | | 3,445,092 |
| 166,845 | | Intel Corp. | | | 3,245,135 |
| 128,215 | | Microsoft Corp. | | | 2,950,227 |
| 135,595 | | Texas Instruments, Inc. | | | 3,156,652 |
| 129,510 | | Tyco Electronics, Ltd. | | | 3,286,964 |
| | | | | |
| | | | | 34,766,694 |
| | | | | |
|
Telecommunications — 2.2% |
| 103,357 | | CenturyLink, Inc. | | | 3,442,822 |
| | | | | |
See Notes to Financial Statements.
6
GOLDEN LARGE CAP CORE FUND
SCHEDULE OF INVESTMENTS
JUNE 30, 2010
| | | | | |
| Shares | | Security Description | | Value |
Utilities — 2.1% |
| 100,770 | | Constellation Energy Group, Inc. | | $ | 3,249,833 |
| | | | | |
Total Common Stock
(Cost $151,956,275) | | | 154,995,695 |
| | | | | |
Total Investments — 98.9%
(Cost $151,956,275)* | | $ | 154,995,695 |
Other Assets & Liabilities, Net — 1.1% | | | 1,716,501 |
| | | | | |
NET ASSETS — 100.0% | | $ | 156,712,196 |
| | | | | |
| PLC Public | Limited Company |
| (a) | Non-income producing security. |
| * | Cost for investments for federal income tax purposes is $152,115,142 and net unrealized appreciation on investments consists of: |
| | | | |
Gross Unrealized Appreciation | | $ | 13,215,394 | |
Gross Unrealized Depreciation | | | (10,334,841 | ) |
| | | | |
Net Unrealized Appreciation | | $ | 2,880,553 | |
| | | | |
The following is a summary of the inputs used to value the Fund’s investments as of June 30, 2010.
The inputs or methodology used for valuing securities are not necessarily an indication of the risk associated with investing in those securities. For more information on valuation inputs, and their aggregation into the levels used in the tables below, please refer to Note 2 — Security Valuation section in the accompanying Notes to Financial Statements.
| | | |
| Valuation Inputs | | Investments in Securities |
Level 1 — Quoted Prices | | $ | 154,995,695 |
Level 2 — Other Significant Observable Inputs | | | — |
Level 3 — Significant Unobservable Inputs | | | — |
| | | |
Total Investments | | $ | 154,995,695 |
| | | |
The Level 1 inputs displayed in this table are Common Stock. Refer to the Schedule of Investments for a further breakout of each security by type.
| | |
PORTFOLIO HOLDINGS % of Net Assets | | |
Consumer Discretionary | | 13.0% |
Consumer Staples | | 8.3% |
Energy | | 8.8% |
Financials | | 15.5% |
Health Care | | 12.9% |
Industrials | | 10.3% |
Materials | | 3.6% |
Technology | | 22.2% |
Telecommunications | | 2.2% |
Utilities | | 2.1% |
Other Assets & Liabilities, Net | | 1.1% |
| | |
| | 100.0% |
| | |
See Notes to Financial Statements.
7
GOLDEN SMALL CAP CORE FUND
SCHEDULE OF INVESTMENTS
JUNE 30, 2010
| | | | | |
| Shares | | Security Description | | Value |
Common Stock — 98.6% | | | |
Consumer Discretionary — 18.7% | | | |
| 77,722 | | Aeropostale, Inc.(a) | | $ | 2,225,958 |
| 57,645 | | Big Lots, Inc.(a) | | | 1,849,828 |
| 73,465 | | Carter's, Inc.(a) | | | 1,928,456 |
| 38,400 | | Cracker Barrel Old Country Store, Inc. | | | 1,787,904 |
| 41,425 | | Gymboree Corp.(a) | | | 1,769,262 |
| 170,820 | | Ruby Tuesday, Inc.(a) | | | 1,451,970 |
| 243,635 | | Sally Beauty Holdings, Inc.(a) | | | 1,997,807 |
| 212,410 | | Service Corp. International | | | 1,571,834 |
| 44,010 | | The Warnaco Group, Inc.(a) | | | 1,590,521 |
| 43,570 | | Tupperware Brands Corp. | | | 1,736,265 |
| 60,150 | | Wolverine World Wide, Inc. | | | 1,516,983 |
| | | | | |
| | | | | 19,426,788 |
| | | | | |
| |
Consumer Staples — 4.8% | | | |
| 130,525 | | Del Monte Foods Co. | | | 1,878,255 |
| 87,055 | | Impax Laboratories, Inc.(a) | | | 1,659,268 |
| 76,930 | | PHH Corp.(a) | | | 1,464,747 |
| | | | | |
| | | | | 5,002,270 |
| | | | | |
|
Energy — 3.7% |
| 129,300 | | Complete Production Services, Inc.(a) | | | 1,848,990 |
| 51,055 | | Oil States International, Inc.(a) | | | 2,020,757 |
| | | | | |
| | | | | 3,869,747 |
| | | | | |
|
Financials — 17.7% |
| 73,490 | | American Financial Group, Inc. | | | 2,007,747 |
| 63,920 | | Aspen Insurance Holdings, Ltd. | | | 1,581,381 |
| 118,390 | | CNA Surety Corp.(a) | | | 1,902,527 |
| 73,655 | | DuPont Fabros Technology, Inc. REIT | | | 1,808,967 |
| 53,465 | | Harleysville Group, Inc. | | | 1,659,019 |
| 250,095 | | Meadowbrook Insurance Group, Inc. | | | 2,158,320 |
| 48,970 | | National Health Investors, Inc. REIT | | | 1,888,283 |
| 33,810 | | ProAssurance Corp.(a) | | | 1,919,056 |
| 44,625 | | StanCorp Financial Group, Inc. | | | 1,809,097 |
| 43,215 | | World Acceptance Corp.(a) | | | 1,655,567 |
| | | | | |
| | | | | 18,389,964 |
| | | | | |
| | | | | |
| Shares | | Security Description | | Value |
Health Care — 14.8% |
| 86,505 | | American Medical Systems Holdings, Inc.(a) | | $ | 1,913,491 |
| 34,105 | | Chemed Corp. | | | 1,863,497 |
| 38,265 | | Emergency Medical Services Corp.(a) | | | 1,876,133 |
| 72,650 | | Endo Pharmaceuticals Holdings, Inc.(a) | | | 1,585,223 |
| 80,255 | | Healthspring, Inc.(a) | | | 1,244,755 |
| 113,430 | | Kindred Healthcare, Inc.(a) | | | 1,456,441 |
| 30,080 | | Mednax, Inc.(a) | | | 1,672,749 |
| 61,582 | | Owens & Minor, Inc. | | | 1,747,697 |
| 80,660 | | Par Pharmaceutical Cos., Inc.(a) | | | 2,093,934 |
| | | | | |
| | | | | 15,453,920 |
| | | | | |
|
Industrials — 13.8% |
| 74,605 | | Chart Industries, Inc.(a) | | | 1,162,346 |
| 39,480 | | Consolidated Graphics, Inc.(a) | | | 1,707,115 |
| 55,940 | | Crane Co. | | | 1,689,947 |
| 100,345 | | Deluxe Corp. | | | 1,881,469 |
| 72,870 | | EMCOR Group, Inc.(a) | | | 1,688,398 |
| 80,865 | | EnerSys(a) | | | 1,728,085 |
| 81,420 | | Genco Shipping & Trading, Ltd.(a) | | | 1,220,486 |
| 123,645 | | GrafTech International, Ltd.(a) | | | 1,807,690 |
| 21,090 | | Valmont Industries, Inc. | | | 1,532,399 |
| | | | | |
| | | | | 14,417,935 |
| | | | | |
|
Materials — 4.3% |
| 42,470 | | Cytec Industries, Inc. | | | 1,698,375 |
| 45,225 | | Koppers Holdings, Inc. | | | 1,016,658 |
| 35,895 | | Rock-Tenn Co., Class A | | | 1,782,905 |
| | | | | |
| | | | | 4,497,938 |
| | | | | |
|
Technology — 19.2% |
| 125,595 | | Acacia Reseach Corp.(a) | | | 1,787,217 |
| 120,860 | | Acxiom Corp.(a) | | | 1,775,433 |
| 129,120 | | Arris Group, Inc.(a) | | | 1,315,733 |
| 35,965 | | CACI International, Inc., Class A(a) | | | 1,527,793 |
| 70,000 | | j2 Global Communications, Inc.(a) | | | 1,528,800 |
See Notes to Financial Statements.
8
GOLDEN SMALL CAP CORE FUND
SCHEDULE OF INVESTMENTS
JUNE 30, 2010
| | | | | |
| Shares | | Security Description | | Value |
Technology, continued |
| 108,810 | | QLogic Corp.(a) | | $ | 1,808,422 |
| 234,240 | | S1 Corp.(a) | | | 1,407,782 |
| 41,560 | | Silicon Laboratories, Inc.(a) | | | 1,685,674 |
| 120,875 | | Skyworks Solutions, Inc.(a) | | | 2,029,491 |
| 45,535 | | Tech Data Corp.(a) | | | 1,621,957 |
| 104,130 | | Tekelec(a) | | | 1,378,681 |
| 175,180 | | TIBCO Software, Inc.(a) | | | 2,112,671 |
| | | | | |
| | | | | 19,979,654 |
| | | | | |
|
Telecommunications — 1.6% |
| 68,875 | | InterDigital, Inc.(a) | | | 1,700,524 |
| | | | | |
Total Common Stock
(Cost $95,622,700) | | | 102,738,740 |
| | | | | |
Total Investments — 98.6%
(Cost $95,622,700)* | | $ | 102,738,740 |
Other Assets & Liabilities, Net — 1.4% | | | 1,496,115 |
| | | | | |
NET ASSETS — 100.0% | | $ | 104,234,855 |
| | | | | |
| REIT Real | Estate Investment Trust |
| (a) | Non-income producing security. |
| * | Cost for investments for federal income tax purposes is $98,035,243 and net unrealized appreciation on investments consists of: |
| | | | |
Gross Unrealized Appreciation | | $ | 12,751,126 | |
Gross Unrealized Depreciation | | | (8,047,629 | ) |
| | | | |
Net Unrealized Appreciation | | $ | 4,703,497 | |
| | | | |
The following is a summary of the inputs used to value the Fund’s investments as of June 30, 2010.
The inputs or methodology used for valuing securities are not necessarily an indication of the risk associated with investing in those securities. For more information on valuation inputs, and their aggregation into the levels used in the tables below, please refer to Note 2 — Security Valuation section in the accompanying Notes to Financial Statements.
| | | |
Valuation Inputs | | Investments
in Securities |
Level 1 — Quoted Prices | | $ | 102,738,740 |
Level 2 — Other Significant Observable Inputs | | | — |
Level 3 — Significant Unobservable Inputs | | | — |
| | | |
Total Investments | | $ | 102,738,740 |
| | | |
The Level 1 inputs displayed in this table are Common Stock. Refer to the Schedule of Investments for a further breakout of each security by type.
| | |
PORTFOLIO HOLDINGS
% of Net Assets | | |
Consumer Discretionary | | 18.7% |
Consumer Staples | | 4.8% |
Energy | | 3.7% |
Financials | | 17.7% |
Health Care | | 14.8% |
Industrials | | 13.8% |
Materials | | 4.3% |
Technology | | 19.2% |
Telecommunications | | 1.6% |
Other Assets & Liabilities, Net | | 1.4% |
| | |
| | 100.0% |
| | |
See Notes to Financial Statements.
9
STATEMENTS OF ASSETS AND LIABILITIES
JUNE 30, 2010
| | | | | | | | |
| | | GOLDEN
LARGE CAP
CORE FUND | | | GOLDEN
SMALL CAP
CORE FUND | |
ASSETS | | | | | | | | |
Total investments, at value
(Cost $151,956,275 and $95,622,700, respectively) | | $ | 154,995,695 | | | $ | 102,738,740 | |
Cash | | | 1,848,539 | | | | 1,660,171 | |
Receivables: | | | | | | | | |
Fund shares sold | | | 49,387 | | | | 198 | |
Dividends and interest | | | 244,463 | | | | 68,749 | |
| | | | | | | | |
Total Assets | | | 157,138,084 | | | | 104,467,858 | |
| | | | | | | | |
LIABILITIES | | | | | | | | |
Payables: | | | | | | | | |
Fund shares redeemed | | | 342,787 | | | | 145,120 | |
Accrued liabilities: | | | | | | | | |
Investment adviser fee | | | 83,001 | | | | 87,815 | |
Trustees’ fees and expenses | | | 100 | | | | 68 | |
| | | | | | | | |
Total Liabilities | | | 425,888 | | | | 233,003 | |
| | | | | | | | |
NET ASSETS | | $ | 156,712,196 | | | $ | 104,234,855 | |
| | | | | | | | |
COMPONENTS OF NET ASSETS | | | | | | | | |
Paid-in capital | | $ | 179,863,463 | | | $ | 191,747,417 | |
Undistributed net investment income | | | 1,207,754 | | | | — | |
Accumulated net realized loss | | | (27,398,441 | ) | | | (94,628,602 | ) |
Net unrealized appreciation | | | 3,039,420 | | | | 7,116,040 | |
| | | | | | | | |
NET ASSETS | | $ | 156,712,196 | | | $ | 104,234,855 | |
| | | | | | | | |
SHARES OF BENEFICIAL INTEREST AT $0.000 PAR VALUE (unlimited shares authorized) | | | 17,970,313 | | | | 13,196,316 | |
| | | | | | | | |
NET ASSET VALUE, OFFERING AND REDEMPTION PRICE PER SHARE | | $ | 8.72 | | | $ | 7.90 | |
| | | | | | | | |
See Notes to Financial Statements.
10
STATEMENTS OF OPERATIONS
YEAR ENDED JUNE 30, 2010
| | | | | | | | |
| | | GOLDEN
LARGE CAP
CORE FUND | | | GOLDEN
SMALL CAP
CORE FUND | |
INVESTMENT INCOME | | | | | | | | |
Dividend income (net foreign withholding taxes of $556 and $875, respectively) | | $ | 3,572,175 | | | $ | 881,278 | |
Interest income | | | 4,165 | | | | 3,339 | |
| | | | | | | | |
Total Investment Income | | | 3,576,340 | | | | 884,617 | |
| | | | | | | | |
EXPENSES | | | | | | | | |
Investment adviser fee | | | 1,230,433 | | | | 1,376,034 | |
Trustees’ fees and expenses | | | 5,725 | | | | 4,157 | |
| | | | | | | | |
Total Expenses | | | 1,236,158 | | | | 1,380,191 | |
Fees waived and expenses reimbursed | | | (5,725 | ) | | | (4,157 | ) |
| | | | | | | | |
Net Expenses | | | 1,230,433 | | | | 1,376,034 | |
| | | | | | | | |
NET INVESTMENT INCOME (LOSS) | | | 2,345,907 | | | | (491,417 | ) |
| | | | | | | | |
NET REALIZED AND UNREALIZED GAIN (LOSS) | | | | | | | | |
Net realized gain (loss) on investments | | | 2,578,522 | | | | (5,756,756 | ) |
Net change in unrealized appreciation (depreciation) on investments | | | 12,112,622 | | | | 24,576,062 | |
| | | | | | | | |
NET REALIZED AND UNREALIZED GAIN ON INVESTMENTS | | | 14,691,144 | | | | 18,819,306 | |
| | | | | | | | |
INCREASE IN NET ASSETS FROM OPERATIONS | | $ | 17,037,051 | | | $ | 18,327,889 | |
| | | | | | | | |
See Notes to Financial Statements.
11
STATEMENTS OF CHANGES IN NET ASSETS
| | | | | | | | | | | | | | |
| | | GOLDEN
LARGE CAP
CORE FUND | | | GOLDEN
SMALL CAP
CORE FUND | |
| | | | | | SHARES | | | | | | SHARES | |
NET ASSETS JUNE 30, 2008 | | $ | 133,916,734 | | | | | | $ | 209,709,149 | | | | |
| | | | | | | | | | | | | | | |
OPERATIONS | | | | | | | | | | | | | | |
Net investment income (loss) | | | 2,237,485 | | | | | | | (440,106 | ) | | | |
Net realized loss | | | (23,169,364 | ) | | | | | | (68,731,131 | ) | | | |
Net change in unrealized appreciation (depreciation) | | | (12,542,234 | ) | | | | | | (20,883,766 | ) | | | |
| | | | | | | | | | | | | | |
Decrease in Net Assets Resulting from Operations | | | (33,474,113 | ) | | | | | | (90,055,003 | ) | | | |
| | | | | | | | | | | | | | |
DISTRIBUTIONS TO SHAREHOLDERS FROM | | | | | | | | | | | | | | |
Net investment income | | | (1,801,342 | ) | | | | | | — | | | | |
| | | | | | | | | | | | | | |
CAPITAL SHARE TRANSACTIONS | | | | | | | | | | | | | | |
Sale of shares | | | 98,310,920 | | | 11,977,189 | | | | 98,873,776 | | | 11,599,277 | |
Reinvestment of distributions | | | 83,158 | | | 10,553 | | | | — | | | — | |
Redemption of shares | | | (36,816,031 | ) | | (4,444,165 | ) | | | (87,157,702 | ) | | (11,682,703 | ) |
| | | | | | | | | | | | | | |
Increase (Decrease) in Net Assets from Capital Share Transactions | | | 61,578,047 | | | 7,543,577 | | | | 11,716,074 | | | (83,426 | ) |
| | | | | | | | | | | | | | |
Increase (Decrease) in Net Assets | | | 26,302,592 | | | | | | | (78,338,929 | ) | | | |
| | | | |
NET ASSETS JUNE 30, 2009 (Including line (a)) | | $ | 160,219,326 | | | | | | $ | 131,370,220 | | | | |
| | | | | | | | | | | | | | | |
OPERATIONS | | | | | | | | | | | | | | |
Net investment income (loss) | | | 2,345,907 | | | | | | | (491,417 | ) | | | |
Net realized gain (loss) | | | 2,578,522 | | | | | | | (5,756,756 | ) | | | |
Net change in unrealized appreciation (depreciation) | | | 12,112,622 | | | | | | | 24,576,062 | | | | |
| | | | | | | | | | | | | | |
Increase in Net Assets Resulting from Operations | | | 17,037,051 | | | | | | | 18,327,889 | | | | |
| | | | | | | | | | | | | | |
DISTRIBUTIONS TO SHAREHOLDERS FROM | | | | | | | | | | | | | | |
Net investment income | | | (2,369,453 | ) | | | | | | — | | | | |
| | | | | | | | | | | | | | |
CAPITAL SHARE TRANSACTIONS | | | | | | | | | | | | | | |
Sale of shares | | | 18,952,857 | | | 2,076,332 | | | | 6,729,637 | | | 849,798 | |
Reinvestment of distributions | | | 56,677 | | | 6,036 | | | | — | | | — | |
Redemption of shares | | | (37,184,262 | ) | | (4,027,815 | ) | | | (52,192,891 | ) | | (6,485,348 | ) |
| | | | | | | | | | | | | | |
Decrease in Net Assets from Capital Share Transactions | | | (18,174,728 | ) | | (1,945,447 | ) | | | (45,463,254 | ) | | (5,635,550 | ) |
| | | | | | | | | | | | | | |
Decrease in Net Assets | | | (3,507,130 | ) | | | | | | (27,135,365 | ) | | | |
| | | | |
NET ASSETS JUNE 30, 2010 (Including line (b)) | | $ | 156,712,196 | | | | | | $ | 104,234,855 | | | | |
| | | | | | | | | | | | | | | |
(a) Undistributed net investment income June 30, 2009 | | $ | 1,231,300 | | | | | | $ | — | | | | |
| | | | | | | | | | | | | | |
(b) Undistributed net investment income June 30, 2010 | | $ | 1,207,754 | | | | | | $ | — | | | | |
| | | | | | | | | | | | | | |
See Notes to Financial Statements.
12
FINANCIAL HIGHLIGHTS
These financial highlights reflect selected per share data and ratios for a share outstanding throughout each period.
| | | | | | | | | | | | | | | | | | | | |
| | | Year Ended
June 30,
2010 | | | Year Ended
June 30,
2009 | | | Year Ended
June 30,
2008 | | | Year Ended
June 30,
2007 | | | September 13, 2005 (a)
through
June 30, 2006 | |
GOLDEN LARGE CAP CORE FUND | | | | | | | | | | | | | | | | | | | | |
NET ASSET VALUE, Beginning of Period | | $ | 8.04 | | | $ | 10.82 | | | $ | 12.24 | | | $ | 10.31 | | | $ | 10.00 | |
| | | | | | | | | | | | | | | | | | | | |
INVESTMENT OPERATIONS | | | | | | | | | | | | | | | | | | | | |
Net investment income (b) | | | 0.12 | | | | 0.14 | | | | 0.12 | | | | 0.10 | | | | 0.11 | |
Net realized and unrealized gain (loss) | | | 0.69 | | | | (2.81 | ) | | | (1.45 | ) | | | 1.88 | | | | 0.23 | (c) |
| | | | | | | | | | | | | | | | | | | | |
Total from Investment Operations | | | 0.81 | | | | (2.67 | ) | | | (1.33 | ) | | | 1.98 | | | | 0.34 | |
| | | | | | | | | | | | | | | | | | | | |
DISTRIBUTIONS TO SHAREHOLDERS FROM | | | | | | | | | | | | | | | | | |
Net investment income | | | (0.13 | ) | | | (0.11 | ) | | | (0.09 | ) | | | — | | | | — | |
Net realized gains | | | — | | | | — | | | | — | (d) | | | (0.05 | ) | | | (0.03 | ) |
| | | | | | | | | | | | | | | | | | | | |
Total Distributions to Shareholders | | | (0.13 | ) | | | (0.11 | ) | | | (0.09 | ) | | | (0.05 | ) | | | (0.03 | ) |
| | | | | | | | | | | | | | | | | | | | |
NET ASSET VALUE, End of Period | | $ | 8.72 | | | $ | 8.04 | | | $ | 10.82 | | | $ | 12.24 | | | $ | 10.31 | |
| | | | | | | | | | | | | | | | | | | | |
TOTAL RETURN (e) | | | 9.90 | % | | | (24.65 | )% | | | (10.90 | )% | | | 19.20 | % | | | 3.39 | % |
RATIOS/SUPPLEMENTARY DATA | | | | | | | | | | | | | | | | | | | | |
Net Assets at End of Period (000’s omitted) | | $ | 156,712 | | | $ | 160,219 | | | $ | 133,917 | | | $ | 129,124 | | | $ | 21,563 | |
Ratios to Average Net Assets (f): | | | | | | | | | | | | | | | | | | | | |
Net expenses | �� | | 0.70 | % | | | 0.70 | % | | | 0.70 | % | | | 0.70 | % | | | 0.70 | % |
Gross expenses (g) | | | 0.70 | % | | | 0.70 | % | | | 0.70 | % | | | 0.71 | % | | | 0.72 | % |
Net investment income | | | 1.33 | % | | | 1.66 | % | | | 1.06 | % | | | 0.89 | % | | | 1.36 | % |
PORTFOLIO TURNOVER RATE (e) | | | 49 | % | | | 40 | % | | | 46 | % | | | 56 | % | | | 120 | % |
GOLDEN SMALL CAP CORE FUND | | | | | | | | | | | | | | | | | | | | |
NET ASSET VALUE, Beginning of Period | | $ | 6.98 | | | $ | 11.09 | | | $ | 13.60 | | | $ | 11.40 | | | $ | 10.00 | |
| | | | | | | | | | | | | | | | | | | | |
INVESTMENT OPERATIONS | | | | | | | | | | | | | | | | | | | | |
Net investment loss (b) | | | (0.03 | ) | | | (0.02 | ) | | | (0.04 | ) | | | (0.04 | ) | | | (0.01 | ) |
Net realized and unrealized gain (loss) | | | 0.95 | | | | (4.09 | ) | | | (2.36 | ) | | | 2.24 | | | | 1.41 | (c) |
| | | | | | | | | | | | | | | | | | | | |
Total from Investment Operations | | | 0.92 | | | | (4.11 | ) | | | (2.40 | ) | | | 2.20 | | | | 1.40 | |
| | | | | | | | | | | | | | | | | | | | |
DISTRIBUTIONS TO SHAREHOLDERS FROM | | | | | | | | | | | | | | | | | |
Net investment income | | | — | | | | — | | | | — | | | | — | | | | — | |
Net realized investment gains | | | — | | | | — | | | | (0.11 | ) | | | — | | | | — | |
| | | | | | | | | | | | | | | | | | | | |
Total Distributions to Shareholders | | | — | | | | — | | | | (0.11 | ) | | | — | | | | — | |
| | | | | | | | | | | | | | | | | | | | |
NET ASSET VALUE, End of Period | | $ | 7.90 | | | $ | 6.98 | | | $ | 11.09 | | | $ | 13.60 | | | $ | 11.40 | |
| | | | | | | | | | | | | | | | | | | | |
TOTAL RETURN (e) | | | 13.18 | % | | | (37.06 | )% | | | (17.66 | )% | | | 19.30 | % | | | 14.00 | % |
RATIOS/SUPPLEMENTARY DATA | | | | | | | | | | | | | | | | | | | | |
Net Assets at End of Period (000’s omitted) | | $ | 104,235 | | | $ | 131,370 | | | $ | 209,709 | | | $ | 197,131 | | | $ | 24,837 | |
Ratios to Average Net Assets (f): | | | | | | | | | | | | | | | | | | | | |
Net expenses | | | 1.10 | % | | | 1.10 | % | | | 1.10 | % | | | 1.10 | % | | | 1.10 | % |
Gross expenses (g) | | | 1.10 | % | | | 1.10 | % | | | 1.11 | % | | | 1.11 | % | | | 1.11 | % |
Net investment loss | | | (0.39 | )% | | | (0.28 | )% | | | (0.38 | )% | | | (0.30 | )% | | | (0.11 | )% |
PORTFOLIO TURNOVER RATE (e) | | | 55 | % | | | 95 | % | | | 72 | % | | | 55 | % | | | 41 | % |
| (a) | Commencement of operations. |
| (b) | Calculated based on average shares outstanding during the period. |
| (c) | Per share amount does not reflect the actual net realized and unrealized gain/loss for the period because of the timing of sales of the fund shares and the amount of per share realized and unrealized gains and losses at that time. |
| (d) | Less than $0.01 per share. |
| (e) | Not annualized for periods less than one year. |
| (f) | Annualized for periods less than one year. |
| (g) | Reflects the expense ratio excluding any waivers and/or reimbursements. |
See Notes to Financial Statements.
13
NOTES TO FINANCIAL STATEMENTS
JUNE 30, 2010
Note 1. Organization
Golden Large Cap Core Fund and Golden Small Cap Core Fund (individually, a “Fund” and, collectively the “Funds”) are diversified portfolios of Forum Funds (the “Trust”). The Trust is a Delaware statutory trust that is registered as an open-end, management investment company under the Investment Company Act of 1940 (the “Act”), as amended. As of June 30, 2010, the Trust had twenty-two investment portfolios. Under its Trust Instrument, the Trust is authorized to issue an unlimited number of each Fund’s shares of beneficial interest without par value. Each Fund currently offers two classes of shares: Institutional Shares and Investor Shares. As of June 30, 2010, Investor Shares had not commenced operations. Golden Large Cap Core Fund seeks to achieve long-term capital appreciation. Golden Small Cap Core Fund seeks to achieve maximum long-term total return. Each Fund commenced operations on September 13, 2005.
Note 2. Summary of Significant Accounting Policies
These financial statements are prepared in accordance with generally accepted accounting principles in the United States of America (“GAAP”), which require management to make estimates and assumptions that affect the reported amounts of assets and liabilities, the disclosure of contingent liabilities at the date of the financial statements, and the reported amounts of increase and decrease in net assets from operations during the fiscal period. Actual amounts could differ from those estimates. The following summarizes the significant accounting policies of each Fund:
Security Valuation–Exchange-traded securities and over-the-counter securities are valued using the last quoted sale or official closing price, provided by independent pricing services as of the close of trading on the market or exchange for which they are primarily traded, on each Fund business day. In the absence of a sale, such securities are valued at the mean of the last bid and asked price provided by independent pricing services. Non-exchange traded securities for which quotations are available are valued using the last quoted sales price, or in the absence of a sale at the mean of the last bid and asked prices provided by independent pricing services. Shares of open-end mutual funds are valued at net asset value (“NAV”). Short-term investments that mature in sixty days or less may be valued at amortized cost.
Each Fund values its investments at fair value pursuant to procedures adopted by the Trust’s Board of Trustees (the “Board”) if (1) market quotations are insufficient or not readily available or (2) the adviser believes that the values available are unreliable. Fair valuation is based on subjective factors and as a result, the fair value price of an investment may differ from the security’s market price and may not be the price at which the asset may be sold. Fair valuation could result in a different NAV than a NAV determined by using market quotes.
Each Fund has a three-tier fair value hierarchy. The basis of the tiers is dependent upon the various “inputs” used to determine the value of each Fund’s investments. These inputs are summarized in the three broad levels listed below:
Level 1–quoted prices in active markets for identical assets
Level 2–other significant observable inputs (including quoted prices of similar securities, interest rates, prepayment speeds, credit risk, etc.)
14
NOTES TO FINANCIAL STATEMENTS
JUNE 30, 2010
Level 3–significant unobservable inputs (including each Fund’s own assumptions in determining the fair value of investments)
The aggregate value by input level, as of June 30, 2010, for each Fund’s investments is included at the end of each Fund’s Schedule of Investments.
Security Transactions, Investment Income and Realized Gain and Loss–Investment transactions are accounted for on trade date. Dividend income is recorded on the ex-dividend date. Foreign dividend income is recorded on the ex-dividend date or as soon as possible after each Fund determines the existence of a dividend declaration after exercising reasonable due diligence. Income and capital gains on some foreign securities may be subject to foreign withholding taxes, which are accrued as applicable. Interest income is recorded on an accrual basis. Premium and discount is amortized and accreted in accordance with GAAP. Identified cost of investments sold is used to determine the gain and loss for both financial statement and federal income tax purposes.
Distributions to Shareholders–Distributions to shareholders of net investment income and net capital gains, if any, are declared and paid at least annually. Distributions are based on amounts calculated in accordance with applicable federal income tax regulations, which may differ from GAAP. These differences are due primarily to differing treatments of income and gain on various investment securities held by each Fund, timing differences and differing characterizations of distributions made by each Fund.
Federal Taxes–Each Fund intends to qualify each year as a regulated investment company under Subchapter M of the Internal Revenue Code and distribute all of their taxable income to shareholders. In addition, by distributing in each calendar year substantially all their net investment income and capital gains, if any, the Funds will not be subject to a federal excise tax. Therefore, no federal income or excise tax provision is required.
As of June 30, 2010, there are no uncertain tax positions that would require financial statement recognition, de-recognition, or disclosure. Each Fund’s federal tax returns filed in the three-year period ended June 30, 2010, remain subject to examination by the Internal Revenue Service.
Income and Expense Allocation–The Trust accounts separately for the assets, liabilities and operations of each of its investment portfolios. Expenses that are directly attributable to more than one investment portfolio are allocated among the respective investment portfolios in an equitable manner.
Commitments and Contingencies–In the normal course of business, each Fund enters into contracts that provide general indemnifications by each Fund to the counterparty to the contract. Each Fund’s maximum exposure under these arrangements is dependent on future claims that may be made against each Fund and, therefore, cannot be estimated; however, based on experience, the risk of loss from such claims is considered remote.
Note 3. Advisory Fees, Servicing Fees and Other Transactions
Investment Adviser–Golden Capital Management, LLC (the “Adviser”) is the investment adviser to the Funds. Pursuant to an Investment Advisory Agreement, the Adviser receives an advisory fee at an annual
15
NOTES TO FINANCIAL STATEMENTS
JUNE 30, 2010
rate of 0.70% and 1.10% of the average daily net assets of Golden Large Cap Core Fund and Golden Small Cap Core Fund, respectively. Under the terms of the Investment Advisory Agreement, the Adviser provides investment advisory services to each Fund and is obligated to pay all expenses of each Fund except any expenses it is authorized to pay under Rule 12b-1, brokerage costs, commissions, borrowing costs, taxes, extraordinary and non-recurring expenses and certain compensation expenses of the Trustees.
Distribution–Foreside Fund Services, LLC serves as each Fund’s distributor (the “Distributor”). The Distributor receives no compensation from the Funds for its distribution services. The Distributor is not affiliated with the Adviser or with Atlantic Fund Administration, LLC (“Atlantic”) or their affiliates.
Other Service Providers–Atlantic provides fund accounting, fund administration, and transfer agency services to each Fund. Atlantic also provides certain shareholder report production, and Edgar conversion and filing services. Atlantic provides a Principal Executive Officer, a Principal Financial Officer, a Chief Compliance Officer, and an Anti-Money Laundering Officer to each Fund, as well as certain additional compliance support functions.
Trustees and Officers–The Trust pays each independent Trustee an annual retainer fee of $40,000 for service to the Trust ($60,000 for the Chairman). In addition, the Chairman receives a monthly stipend of $500 to cover certain expenses incurred in connection with his duties to the Trust. The Trustees and Chairman may receive additional fees for special Board meetings. Each Trustee is also reimbursed for all reasonable out-of-pocket expenses incurred in connection with his duties as a Trustee, including travel and related expenses incurred in attending Board meetings. The amount of Trustees’ fees attributable to each Fund is disclosed in the Statement of Operations. Certain officers of the Trust are also officers or employees of the above named service providers, and during their terms of office received no compensation from each Fund.
Note 4. Expense Reimbursements and Fees Waived
The Adviser has contractually agreed to waive a portion of its fees and reimburse certain expenses through October 31, 2010, to limit total annual operating expenses to 0.70% for Institutional Shares and 0.95% for Investor Shares, of the average daily net assets of each respective class of the Golden Large Cap Core Fund. The Adviser also contractually agreed to waive a portion of its fees and reimburse certain expenses through October 31, 2010, to limit total annual operating expenses to 1.10% for Institutional Shares and 1.35% for Investor Shares of average daily net assets of each respective class of the Golden Small Cap Core Fund. For the year ended June 30, 2010, fees waived and reimbursed were as follows:
| | | |
| | | Investment Adviser
Reimbursement |
Golden Large Cap Core Fund | | $ | 5,725 |
Golden Small Cap Core Fund | | | 4,157 |
16
NOTES TO FINANCIAL STATEMENTS
JUNE 30, 2010
Note 5. Security Transactions
The cost of purchases and proceeds from sales of investment securities (including maturities), other than short-term investments for the year ended June 30, 2010, were as follows:
| | | | | | |
| | | Purchases | | Sales |
Golden Large Cap Core Fund | | $ | 84,791,968 | | $ | 103,001,477 |
Golden Small Cap Core Fund | | | 67,321,440 | | | 113,578,451 |
Note 6. Federal Income Tax and Investment Transactions
Distributions during the fiscal years ended as noted were characterized for tax purposes as follows:
| | | |
| | | Ordinary
Income |
Golden Large Cap Core Fund | | | |
2010 | | $ | 2,369,453 |
2009 | | | 1,801,342 |
As of June 30, 2010, distributable earnings (accumulated losses) on a tax basis were as follows:
| | | | | | | | | | | | | | |
| | | Undistributed
Ordinary
Income | | Capital
and Other
Losses | | | Unrealized
Appreciation | | Total | |
Golden Large Cap Core Fund | | $ | 1,207,754 | | $ | (27,239,574 | ) | | $ | 2,880,553 | | $ | (23,151,267 | ) |
Golden Small Cap Core Fund | | | — | | | (92,216,059 | ) | | | 4,703,497 | | | (87,512,562 | ) |
The difference between components of distributable earnings on a tax basis and the amounts reflected in the Statement of Assets and Liabilities are primarily due to wash sales.
As of June 30, 2010, capital loss carryforwards to offset future capital gains were as follows with the respective expiration dates:
| | | | | | | | | |
| | | 2016 | | 2017 | | 2018 |
Golden Large Cap Core Fund | | $ | 1,112,578 | | $ | 11,054,975 | | $ | 15,072,021 |
Golden Small Cap Core Fund | | | 2,562,878 | | | 32,082,637 | | | 57,570,544 |
On the Statement of Assets and Liabilities, as a result of permanent book to tax differences, certain amounts have been reclassified for the year ended June 30, 2010. The following reclassification was the result of net operating losses and has no impact on the net assets of the Fund.
| | | | | | | |
| | | Accumulated Net
Investment
Income (Loss) | | Paid-in-Capital | |
Golden Small Cap Core Fund | | $ | 491,417 | | $ | (491,417 | ) |
17
NOTES TO FINANCIAL STATEMENTS
JUNE 30, 2010
Note 7. Recent Accounting Pronouncements
In January 2010, the Financial Accounting Standards Board issued Accounting Standards Update (“ASU”) No. 2010-06 “Improving Disclosures about Fair Value Measurements.” ASU No. 2010-06 clarifies existing disclosure and requires additional disclosures regarding fair value measurements. Effective for interim and annual reporting periods beginning after December 15, 2009, entities are required to disclose significant transfers into and out of Level 1 and 2 measurements in the fair value hierarchy and the reasons for those transfers. Effective for fiscal years beginning after December 15, 2010, and for interim periods within those fiscal years, entities will need to disclose information about purchases, sales, issuances and settlements of Level 3 securities on a gross basis, rather than as a net number as currently required. Management is currently evaluating the impact ASU No. 2010-06 will have on financial statement disclosures.
Note 8. Subsequent Events
Subsequent events occurring after the date of this report have been evaluated for potential impact and each Fund has had no such events.
18
REPORT OF INDEPENDENT REGISTERED PUBLIC ACCOUNTING FIRM
To the Board of Trustees of Forum Funds and the Shareholders of Golden Large Cap Core Fund and Golden Small Cap Core Fund
We have audited the accompanying statements of assets and liabilities of Golden Large Cap Core Fund and Golden Small Cap Core Fund, each a series of shares of beneficial interest in the Forum Funds, including the schedules of investments, as of June 30, 2010, and the related statements of operations for the year then ended, and the statements of changes in net assets and the financial highlights for each of the years in the two year period then ended. These financial statements and financial highlights are the responsibility of the Funds’ management. Our responsibility is to express an opinion on these financial statements and financial highlights based on our audits. The financial highlights for each of the years or period in the three-year period ended June 30, 2008, were audited by other auditors whose report dated August 25, 2008, expressed an unqualified opinion on such financial highlights.
We conducted our audits in accordance with the standards of the Public Company Accounting Oversight Board (United States). Those standards require that we plan and perform the audits to obtain reasonable assurance about whether the financial statements and financial highlights are free of material misstatement. An audit includes examining, on a test basis, evidence supporting the amounts and disclosures in the financial statements. Our procedures included confirmation of securities owned as of June 30, 2010, by correspondence with the custodian. An audit also includes assessing the accounting principles used and significant estimates made by management, as well as evaluating the overall financial statement presentation. We believe that our audits provide a reasonable basis for our opinion.
In our opinion, the financial statements and financial highlights referred to above present fairly, in all material respects, the financial position of Golden Large Cap Core Fund and Golden Small Cap Core Fund as of June 30, 2010, the results of their operations for the year then ended, and the changes in their net assets and their financial highlights for each of the years in the two year period then ended, in conformity with accounting principles generally accepted in the United States of America.

BBD, LLP
Philadelphia, Pennsylvania
August 18, 2010
19
ADDITIONAL INFORMATION (Unaudited)
JUNE 30, 2010
Investment Advisory Agreement Approval
At the March 19, 2010 Board meeting, the Board, including the Independent Trustees, considered the approval of the continuance of the investment advisory agreement pertaining to the Funds (the “Advisory Agreement”). In evaluating the Advisory Agreement for the Funds, the Board reviewed materials furnished by the Adviser and the administrator, including information regarding the Adviser, its personnel, operations and financial condition. Specifically, the Board considered, among other matters: (1) the nature, extent and quality of the services to be provided to the Funds by the Adviser, including information on the investment performance of the Adviser; (2) the costs of the services to be provided and profitability to the Adviser with respect to its relationship with the Funds; (3) the advisory fee and total expense ratio of the Funds compared to relevant peer groups of funds; (4) the extent to which economies of scale would be realized as the Funds grow and whether the advisory fee would enable the Funds’ investors to share in the benefits of economies of scale; and (5) other benefits received by the Adviser from its relationship with the Funds. In their deliberations, the Board did not identify any particular information that was all-important or controlling and attributed different weights to the various factors. In particular, the Board focused on the factors discussed below.
Nature, Extent and Quality of Services
Based on a presentation from senior representatives of the Adviser and a discussion of the Adviser’s personnel, operations and financial condition, the Board considered the quality of services provided by the Adviser under the Advisory Agreement. In this regard, the Board considered information regarding the experience, qualifications and professional background of the portfolio managers and other personnel at the Adviser with principal investment responsibility for the Funds’ investments as well as the investment philosophy and decision-making processes of those professionals and the capability and integrity of the Adviser’s senior management and staff. The Board considered the adequacy of the Adviser’s resources and quality of services provided by the Adviser under the Advisory Agreement between the Trust and the Adviser. The Board also considered the quality of the Adviser’s services with respect to regulatory compliance and compliance with client investment policies and restrictions as well as the financial condition and operational stability of the Adviser. The Board noted the Adviser’s representation that the firm is financially stable and able to provide investment advisory services to the Funds. The Board concluded that, overall, it was satisfied with the nature, extent and quality of services to be provided to the Funds under the Advisory Agreement.
Costs of Services and Profitability
The Board considered information provided by the Adviser regarding its costs of services and its profitability with respect to the Funds. In this regard, the Board considered the Adviser’s resources devoted to the each of the Funds as well as the Adviser’s assessment of costs and profitability. Based on these and other applicable considerations, the Board concluded that the Adviser’s profits attributable to management of the Funds were not excessive in light of the services provided by the Adviser on behalf of the Funds.
Performance
The Board reviewed performance of the Funds and the Adviser’s discussion of its investment philosophy. The Board noted that the Golden Large Cap Core Fund underperformed its benchmark for the 1-year and
20
ADDITIONAL INFORMATION (Unaudited)
JUNE 30, 2010
since inception periods but outperformed its benchmark for the 3-year period. The Board also noted that the Golden Small Cap Core Fund had underperformed its benchmark for the 1-year, 3-year and since inception periods. Noting the growth in the Funds’ assets and the relatively volatile market during the prior year as well as the Adviser’s representation that each Fund’s performance during that period reflected a defensive position adopted by the Adviser for the portfolios in light of market conditions, the Board concluded that the each Fund’s performance was reasonable relative to its peers and benchmark and that each Fund and their shareholders could benefit from the Adviser’s management of each Fund.
Compensation
The Board considered the Adviser’s compensation for providing advisory services to each Fund and analyzed comparative information on fee rates, expenses and performance of similar mutual funds. The Board noted that the Adviser’s actual advisory fee rate for the Golden Large Cap Core Fund was below the median fee of that Fund’s Lipper Inc. peer group and that the Adviser’s actual advisory fee rate for the Golden Small Cap Core Fund was the highest of that Fund’s Lipper Inc. peer group. The Board also noted that the Golden Large Cap Core Fund’s actual total expense ratio was the lowest of its Lipper Inc. peer group and that the Golden Small Cap Core Fund’s actual total expense ratio was higher than the median of its Lipper Inc. peer group. The Board recognized, however, that it is difficult to compare advisory fees and expense ratios because of variations between the services provided by the Adviser and those provided for in the advisory fees paid by other funds. Based on the foregoing and on all of the information presented, the Board concluded that the Adviser’s advisory fee charged to each Fund was reasonable.
Economies of Scale
The Board considered whether the Funds would benefit from any economies of scale. In this respect, the Board noted the Adviser’s representation that fee breakpoints would be appropriate if there were significant growth in the assets of either Fund. The Board considered the size of each Fund and concluded that it would not be necessary to consider the implementation of fee breakpoints at this time.
Other Benefits
The Board noted the Adviser’s representation that, aside from its contractual advisory fees, it does not benefit in a material way from its relationship with the Funds other than soft-dollar research benefits. Based on the foregoing representation, the Board concluded that other benefits received by the Adviser from its relationship with the Funds were not a material factor to consider in approving the continuation of the Advisory Agreement.
Conclusion
The Board reviewed a memorandum from Trust counsel discussing the legal standards applicable to its consideration of the Advisory Agreement. Based on its review, including consideration of each of the factors referenced above, the Board determined, in the exercise of its business judgment, that the advisory arrangement, as outlined in the Advisory Agreement, was fair and reasonable in light of the services performed, expenses incurred and such other matters as the Board considered relevant in the exercise of its reasonable business judgment.
21
ADDITIONAL INFORMATION (Unaudited)
JUNE 30, 2010
Proxy Voting Information
A description of the policies and procedures that each Fund uses to determine how to vote proxies relating to securities held in each Fund’s portfolio is available, without charge and upon request, by calling (800) 206-8610 and on the SEC’s website at www.sec.gov. Each Fund’s proxy voting record for the most recent twelve-month period ended June 30 is available, without charge and upon request, by calling (800) 206-8610 and on the SEC’s website at www.sec.gov.
Availability of Quarterly Portfolio Schedules
Each Fund files its complete schedule of portfolio holdings with the SEC for the first and third quarters of each fiscal year on Form N-Q. Each Fund’s Forms N-Q are available, without charge and upon request on the SEC’s website at www.sec.gov or may be reviewed and copied at the SEC’s Public Reference Room in Washington DC. Information on the operation of the Public Reference Room may be obtained by calling 1-800-SEC-0330.
Shareholder Expense Example
As a shareholder of the Funds, you incur ongoing costs, including management fees, distribution (12b-1) fees and other Fund expenses. This example is intended to help you understand your ongoing costs (in dollars) of investing in the Funds, and to compare these costs with the ongoing costs of investing in other mutual funds. The example is based on an investment of $1,000 invested at the beginning of the period and held for the entire period from January 1, 2010, through June 30, 2010.
Actual Expenses–The first line in the table below provides information about actual account values and actual expenses. You may use the information in this line, together with the amount you invested, to estimate the expenses that you paid over the period. Simply divide your account value by $1,000 (for example, an $8,600 account value divided by $1,000 = 8.6), then multiply the result by the number in the first line under the heading entitled “Expenses Paid During Period” to estimate the expenses you paid on your account during the period.
Hypothetical Example for Comparison Purposes–The second line in the table below provides information about hypothetical account values and hypothetical expenses based on each Fund’s actual expense ratio and an assumed rate of return of 5% per year before expenses, which is not each Fund’s actual return. The hypothetical account values and expenses may not be used to estimate the actual ending account balance or expenses you paid for the period. You may use this information to compare the ongoing cost of investing in each Fund and other funds. To do so, compare this 5% hypothetical example with the 5% hypothetical examples that appear in the shareholder reports of other funds.
22
ADDITIONAL INFORMATION (Unaudited)
JUNE 30, 2010
Please note that expenses shown in the table are meant to highlight your ongoing costs only. Therefore, the second line of the table is useful in comparing ongoing costs only, and will not help you determine the relative total costs of owning different funds.
| | | | | | | | | | | | |
| | | Beginning
Account Value
January 1, 2010 | | Ending
Account Value
June 30, 2010 | | Expenses
Paid During
Period* | | Annualized
Expense
Ratio* | |
Golden Large Cap Core Fund | | | | | | | | | | | | |
Actual | | $ | 1,000.00 | | $ | 928.65 | | $ | 3.35 | | 0.70 | % |
Hypothetical (5% return before expenses) | | $ | 1,000.00 | | $ | 1,021.32 | | $ | 3.51 | | 0.70 | % |
Golden Small Cap Core Fund | | | | | | | | | | | | |
Actual | | $ | 1,000.00 | | $ | 959.91 | | $ | 5.35 | | 1.10 | % |
Hypothetical (5% return before expenses) | | $ | 1,000.00 | | $ | 1,019.34 | | $ | 5.51 | | 1.10 | % |
| * | Expenses are equal to each Fund’s annualized expense ratio as indicated above multiplied by the average account value over the period, multiplied by the number of days in the most recent fiscal half-year divided by 365 to reflect the half-year period. |
Federal Tax Status of Dividends Declared during the Tax Year
For federal income tax purposes, dividends from short-term capital gains are classified as ordinary income. The Golden Large Cap Core Fund designates 100.00% of its income dividend distributed as qualifying for the corporate dividends-received deduction (DRD) and 100.00% for the qualified dividend rate (QDI) as defined in Section 1(h)(11) of the Internal Revenue Code. The Golden Large Cap Core Fund also designates 0.06% as qualified interest income exempt from US tax for foreign shareholders (QII).
Trustees and Officers of the Trust
The Board is responsible for oversight of the management of the Trust’s business affairs and of the exercise of all the Trust’s powers except those reserved for the shareholders. The following table provides information about each Board member and certain officers of the Trust. Each Trustee and officer holds office until the person resigns, is removed, or is replaced. Unless otherwise noted, the persons have held their principal occupations for more than five years. The address for all Trustees and officers is Three Canal Plaza, Suite 600, Portland, Maine 04101, unless otherwise indicated. Each Trustee oversees twenty-two portfolios in the Trust. Mr. Keffer is considered an Interested Trustee due to his affiliation with Atlantic. Mr. Keffer is also an Interested Director of Wintergreen Fund, Inc. Each Fund’s Statement of Additional Information includes additional information about the Trustees and is available, without charge and upon request, by calling (800) 206-8610.
| | | | | | |
| Name and Year of Birth | | Position with the Trust | | Length of Time Served | | Principal Occupation(s) During Past 5 Years |
| Independent Trustees | | | | | | |
J. Michael Parish Born: 1943 | | Chairman of the Board; Trustee; Chairman, Nominating Committee and Qualified Legal Compliance Committee | | Since 1989 (Chairman since 2004) | | Retired since 2003. |
23
ADDITIONAL INFORMATION (Unaudited)
JUNE 30, 2010
| | | | | | |
| Name and Year of Birth | | Position with the Trust | | Length of Time Served | | Principal Occupation(s) During Past 5 Years |
Costas Azariadis Born: 1943 | | Trustee; Chairman, Valuation Committee | | Since 1989 | | Professor of Economics, Washington University since 2006; Professor of Economics, University of California-Los Angeles 1992–2006. |
James C. Cheng Born: 1942 | | Trustee; Chairman, Audit Committee | | Since 1989 | | President, Technology Marketing Associates (marketing company for small- and medium-sized businesses in New England) since 1991. |
| Interested Trustee | | | | | | |
John Y. Keffer1 Born: 1942 | | Trustee; Vice Chairman | | Since 1989 | | Chairman, Atlantic since 2008; President, Forum Foundation (a charitable organization) since 2005; President, Forum Trust, LLC (a non-depository trust company chartered in the State of Maine) since 1997. |
| 1 | Since 1997, John Y. Keffer has been president and owner of Forum Trust, LLC. Prior to January 1, 2010, Atlantic was a wholly owned subsidiary of Forum Trust, LLC. Effective January 1, 2010, Atlantic became a wholly owned subsidiary of Forum Holdings Corp., a Delaware corporation that is wholly owned by Mr. Keffer. |
| | | | | | |
| Name and Year of Birth | | Position with the Trust | | Length of Time Served | | Principal Occupation(s) During Past 5 Years |
| Officers | | | | | | |
Stacey E. Hong Born: 1966 | | President; Principal Executive Officer | | Since 2008 | | President, Atlantic since 2008; Director, Consulting Services, Foreside Fund Services 2007; Elder Care, 2005–2006; Director, Fund Accounting, Citigroup 2003–2005. |
Karen Shaw Born: 1972 | | Treasurer; Principal Financial Officer | | Since 2008 | | Senior Manager, Atlantic since 2008; Section Manager/Vice President, Enterprise Support Services, Citigroup 2003–2008. |
David Faherty Born: 1970 | | Vice President | | Since 2009 | | Senior Counsel, Atlantic since 2009; Vice President, Citi Fund Services Ohio, Inc. 2007–2009.; Associate Counsel, Investors Bank & Trust Co. 2006–2007; FDIC 2005. |
Michael J. McKeen Born: 1971 | | Vice President | | Since 2009 | | Senior Manager, Atlantic since 2008; Vice President, Citigroup 2003–2008. |
Joshua LaPan Born: 1973 | | Vice President | | Since 2009 | | Manager, Atlantic since 2008; Vice President, Citigroup 2003–2008. |
Timothy Bowden Born: 1969 | | Vice President | | Since 2009 | | Manager, Atlantic since 2008; Vice President, Citigroup 2005–2008. |
Lina Bhatnagar Born: 1971 | | Secretary | | Since 2008 | | Senior Administration Specialist, Atlantic since 2008; Regulatory Administration Specialist, Citigroup 2006–2008. |
24
TRANSFER AGENT
Atlantic Fund Administration, LLC
P.O. Box 588
Portland, ME 04112
DISTRIBUTOR
Foreside Fund Services, LLC
Three Canal Plaza, Suite 100
Portland, Maine 04101
www.foreside.com
This report is submitted for the general information of the shareholders of the Funds. It is not authorized for distribution to prospective investors unless preceded or accompanied by an effective prospectus, which includes information regarding the Funds’ risks, objectives, fees and expenses, experience of its management, and other information.
FOR MORE INFORMATION
Golden Large Cap Core Fund
Golden Small Cap Core Fund
Golden Funds
P.O. Box 588
Portland, ME 04112
(800) 206-8610
213-ANR-0610
| (a) | As of the end of the period covered by this report, Forum Funds (the “Registrant”) has adopted a code of ethics, which applies to its Principal Executive Officer and Principal Financial Officer. |
| (b) | There have been no amendments to the Registrant’s code of ethics that apply to its Principal Executive Officer and Principal Financial Officer. |
| (c) | There have been no waivers to the Registrant’s code of ethics that apply to its Principal Executive Officer and Principal Financial Officer. |
| (e) (1) | A copy of the Code of Ethics is being filed under Item 12(a) hereto. |
| ITEM 3. | AUDIT COMMITTEE FINANCIAL EXPERT. |
The Board of Trustees has determined that no member of the Audit Committee is an “audit committee financial expert” as that term is defined under applicable regulatory guidelines.
| ITEM 4. | PRINCIPAL ACCOUNTANT FEES AND SERVICES. |
(a) Audit Fees - The aggregate fees billed for each of the last two fiscal years (the “Reporting Periods”) for professional services rendered by the Registrant’s principal accountant for the audit of the Registrant’s annual financial statements, or services that are normally provided by the principal accountant in connection with the statutory and regulatory filings or engagements for the Reporting Periods, were $56,000 in 2009 and $56,000 in 2010.
(b) Audit-Related Fees - The aggregate fees billed in the Reporting Periods for assurance and related services rendered by the principal accountant that were reasonably related to the performance of the audit of the Registrant’s financial statements and are not reported under paragraph (a) of this Item 4 were $0 in 2009 and $0 in 2010.
(c) Tax Fees - The aggregate fees billed in the Reporting Periods for professional services rendered by the principal accountant to the Registrant for tax compliance, tax advice and tax planning were $12,000 in 2009 and $12,000 in 2010. These services consisted of review or preparation of U.S. federal, state, local and excise tax returns.
(d) All Other Fees - The aggregate fees billed in the Reporting Periods for products and services provided by the principal accountant to the Registrant, other than the services reported in paragraphs (a) through (c) of this Item, were $0 in 2009 and $0 in 2010.
(e) (1) The Audit Committee reviews and approves in advance all audit and “permissible non-audit services” (as that term is defined by the rules and regulations of the Securities and Exchange Commission) to be rendered to a series of the Registrant (each, a “Series”). In addition, the Audit Committee reviews and approves in advance all “permissible non-audit services” to be provided to an investment adviser (not including any sub-adviser) of a Series, or an affiliate of such investment adviser, that is controlling, controlled by or under common control with the investment adviser and provides on-going services to the Registrant (“Affiliate”), by the Series’ principal accountant if the engagement relates directly to the operations and financial reporting of the Series. The Audit Committee considers whether fees paid by a Series’ investment adviser or an Affiliate to the Series’ principal accountant for audit and permissible non-audit services are consistent with the principal accountant’s independence.
(e) (2) 0%
(f) Not applicable
(g) The aggregate non-audit fees billed by the principal accountant for services rendered to the Registrant for the Reporting Periods were $0 in 2009 and $0 in 2010. There were no fees billed in either of the Reporting Periods for non-audit services rendered by the principal accountant to the Registrant’s investment adviser or any Affiliate.
(h) If the Registrant’s principal accountant provided non-audit services to the Registrant’s adviser or any Affiliate, and the services were not pre-approved as described in paragraph (e)(1) of this Item, the Audit Committee would consider whether the provision of such services was compatible with maintaining the independence of the Registrant’s principal accountant.
| ITEM 5. | AUDIT COMMITTEE OF LISTED REGISTRANTS. |
Not applicable
| ITEM 6. | SCHEDULE OF INVESTMENTS. |
(a) Included as part of report to shareholders under Item 1.
(b) Not applicable.
| ITEM 7. | DISCLOSURE OF PROXY VOTING POLICIES AND PROCEDURES FOR CLOSED-END MANAGEMENT INVESTMENT COMPANIES. |
Not applicable.
| ITEM 8. | PORTFOLIO MANAGERS OF CLOSED-END MANAGEMENT INVESTMENT COMPANIES. |
Not applicable.
| ITEM 9. | PURCHASES OF EQUITY SECURITIES BY CLOSED-END MANAGEMENT INVESTMENT COMPANY AND AFFILIATED PURCHASERS. |
Not applicable.
| ITEM 10. | SUBMISSION OF MATTERS TO A VOTE OF SECURITY HOLDERS |
The Registrant does not accept nominees to the board of trustees from shareholders.
| ITEM 11. | CONTROLS AND PROCEDURES |
(a) The Registrant’s Principal Executive Officer and Principal Financial Officer have concluded that the Registrant’s disclosure controls and procedures (as defined in Rule 30a-3(c) under the Investment Company Act of 1940 (the “Act”)) are effective, based on their evaluation of the controls and procedures required by Rule 30a-3(b) under the Act and Rules 13a-15(b) or 15d-15(b) under the Securities Exchange Act of 1934, as of a date within 90 days of the filing date of this report.
(b) There were no changes in the Registrant’s internal control over financial reporting (as defined in Rule 30a-3(d) under the Act) that occurred during the second fiscal quarter of the period covered by this report that have materially affected, or are reasonably likely to materially affect, the Registrant’s internal control over financial reporting.
| | |
| |
| (a)(1) | | Code of Ethics (Exhibit filed herewith). |
| |
| (a)(2) | | Certifications pursuant to Rule 30a-2(a) of the Act, and Section 302 of the Sarbanes-Oxley Act of 2002. (Exhibits filed herewith) |
| |
| (a)(3) | | Not applicable. |
| |
| (b) | | Certifications pursuant to Rule 30a-2(b) of the Act, and Section 906 of the Sarbanes-Oxley Act of 2002. (Exhibit filed herewith) |
SIGNATURES
Pursuant to the requirements of the Securities Exchange Act of 1934 and the Investment Company Act of 1940, the Registrant has duly caused this report to be signed on its behalf by the undersigned, thereunto duly authorized.
| | |
| Registrant Forum Funds |
| |
| By | | /s/ Stacey E. Hong |
| | Stacey E. Hong, Principal Executive Officer |
Date 8/19/10
Pursuant to the requirements of the Securities Exchange Act of 1934 and the Investment Company Act of 1940, this report has been signed below by the following persons on behalf of the Registrant and in the capacities and on the dates indicated.
| | |
| |
| By | | /s/ Stacey E. Hong |
| | Stacey E. Hong, Principal Executive Officer |
Date 8/19/10
| | |
|
| |
| By | | /s/ Karen Shaw |
| | Karen Shaw, Principal Financial Officer |
Date 8/19/10