As filed with the Securities and Exchange Commission on February 26, 2010
UNITED STATES
SECURITIES AND EXCHANGE COMMISSION
WASHINGTON, D.C. 20549
FORM N-CSR
CERTIFIED SHAREHOLDER REPORT OF REGISTERED MANAGEMENT
INVESTMENT COMPANIES
Investment Company Act file number 811-03023
FORUM FUNDS
Three Canal Plaza, Suite 600
Portland, Maine 04101
Stacey E. Hong, Principal Executive Officer
Three Canal Plaza, Suite 600
Portland, Maine 04101
207-347-2000
Date of fiscal year end: December 31
Date of reporting period: January 1, 2009 – December 31, 2009
| ITEM 1. | REPORT TO STOCKHOLDERS. |

ADAMS HARKNESS
SMALL CAP GROWTH FUND
ANNUAL REPORT
DECEMBER 31, 2009
ADAMS HARKNESS SMALL CAP GROWTH FUND
SHAREHOLDER LETTER
DECEMBER 31, 2009
Dear Shareholder,
2009 was a tale of two markets. For most of the first quarter, the stock market continued the decline precipitously. The Russell 2000 Growth Index (Russell 2000) bottomed on March 6th at a low of $190.78 and then rose 45% in the next eight weeks to close at $277. For the entire second quarter, the Russell 2000 rose 23.38%, closing June 30th at $285.18. Unfortunately our fund did not keep up with the Russell 2000 Growth Index in 2009. The fund was positioned in a fairly defensive manner as we went into the year: we had a significant weighting in healthcare and we were focused on companies that had very predictable earnings growth. As the market turned in mid-March our fund was still fairly defensively positioned and as such lost substantial ground as the market roared back in the April-May time frame. While we had begun to move to a more “procyclical” tilt as we began to see “green shoots” emerging from the 18 month recession that gripped the world and the fundamentals of many industries looked like they could start to improve, quite frankly we did not do it quickly enough and therefore missed most of the six to eight week rally. That rally was quick enough and powerful enough that missing most of it was of great detriment to the fund for the entire year. Why did we miss it? While our process is anticipatory, it is at its heart fundamentally based. While we do not need to see evidence of improvement, we do need to see signs that things can begin to improve before we are comfortable changing our investment tilt. In this case, the stocks seemed to move before it was apparent that things could be getting better, which was a bit problematic for our investment style. Additionally, the greatest move occurred in what we term the liquidity or solvency trade: those companies most close to bankruptcy or whose balance sheets were most impaired, rebounded the most. There were numerous small cap companies with severe fundamental business risks that became extremely depressed during the downturn, as many investors questioned whether they would survive. These low quality companies rebounded sharply as the ensuing economic recovery took hold, essentially saving these companies. Those kinds of companies are not names in which we would invest in given our investment discipline. During that initial rally we lost substantial performance in the industrials, healthcare, materials, and financials sectors that we simply couldn’t make up the rest of the year. From June on, when the fund was positioned offensively, and the solvency trade ran its course, the market started paying attention to fundamentals more than anything else, our fund started to outperform the benchmark. While the second half of the year showed much improved performance relative to the benchmark, we entered that period with enough of a deficit that we were not able to make up all of the difference between ourselves and the benchmark. We positioned the fund to take advantage of early cyclical market forces, and as such we started to gain back performance by being overweight in the technology, consumer discretionary, and energy sectors for the majority of that time frame, a position we still employ today.
While 2009 proved to be a frustrating year for us, we did have some things that went right. Among our stronger contributors to returns during the year were SXC Health Solutions Corp., which saw strong returns due to a transformational acquisition it made early in 2009; Green Mountain Coffee Roasters, Inc., which benefitted from strong adoption of its K-Cup single use coffee systems, Brigham Exploration Co., a smaller exploration and production company which is transitioning from a gas-focused company to an oil-focused company, and LuluLemon Athletica, Inc., which experienced a strong rebound in demand for its yoga and sports clothing as consumer spending began to pick up.
1
ADAMS HARKNESS SMALL CAP GROWTH FUND
SHAREHOLDER LETTER
DECEMBER 31, 2009
Among the top ten losers for 2009 we number four healthcare names: LHC Group, Inc., Biomarin Pharmaceutical, Inc., Thoratec Corp., and athenahealth, Inc. All of these companies suffered more from a general selloff in the group in the wake of Obama’s election and strong focus on healthcare reform, as opposed to any specific fundamental issues.
Our overall outlook for the market for 2010 is mildly positive. We believe we will continue to see positive Gross Domestic Product (GDP) growth which will be somewhat offset by high unemployment, slower state and local government spending, and federal policies that could have a slightly dampening affect on growth (such as raising taxes). Thus, we believe that although nominal GDP will look strong, the recovery will feel a bit like the one in the early 1990s — very slow and somewhat tentative. We have focused on particular companies and themes that we believe will do well even if the economic recovery is anemic. We remain slightly overweight in the consumer sector, focused on companies that have true growth prospects because of their small size and unique product offerings, such as J Crew, Inc. and LuluLemon Athletica, Inc.; companies that are transforming themselves due to new management, such as Chicos FAS, Inc. and companies, such as restaurants and sporting goods companies, which should benefit as employment stabilizes. We are not factoring into our analysis a pickup in consumer spending, as we believe that will remain muted for at least the next several years as the consumers repair their balance sheets. We have increased our weighting in healthcare slightly, and will look to continue to do so opportunistically, as we believe that as more clarity emerges with regards to healthcare reform sentiment will become less negative and investors will focus on identifying winners and losers in reform as opposed to avoiding the group entirely.
Our biggest over weights are in energy and information technology sectors and our biggest under weights are in consumer staples, financials and industrials sectors. We view energy, material and industrial sectors as a group and if treated as a group we are equal weight those sectors. Our underweight in industrials/overweight in energy and materials stems from the fact that many of the companies in the industrial space are tied to housing and construction in some way, shape or form and we are not positive on that sector at this time. Within those three sectors (energy/industrials/materials) we have a strong focus on rebuilding the energy infrastructure through developing the smart grid and furthering clean energy, as well as a focus on global growth. In the technology sector we are focused on several major themes: high value added semiconductors, as we believe semiconductor usage is at the beginning of a secular uptrend, given the smart phones, Windows 7, pc upgrade cycle, increasing use in autos and clean energy, and servers/storage/telecommunications as we move to cloud computing. Cloud computing is another very strong theme that we believe will be a major focus of corporate spending, as it has the potential to significantly lower IT costs. While we are currently underweight in financials, we expect to increase our weighting in that sector as we move through the year. The first phase of the Great Bank Bailout, we believe, was saving the mega banks, which according to analysts’ estimates account for as much as 50% of the lending in this country. We believe the second phase will be the focus of regulators in 2010, and we call it “Rebuilding the Core” (or the middle). This will be very similar to what occurred after the Savings & Loan collapse in 1990-1991: the FDIC will force consolidation of the banking system by closing “bad banks” and merging them into stronger banks, creating larger and stronger entities — in effect, rebuilding the major regional sector of the banking system, which had all but disappeared in the last few years. We view rebuilding this sector as key to the stability of the economic recovery — as that sector gets rebuilt, they will be in a position to lend, particularly to smaller and mid sized businesses, which
2
ADAMS HARKNESS SMALL CAP GROWTH FUND
SHAREHOLDER LETTER
DECEMBER 31, 2009
will eventually lift employment prospects. More importantly for your portfolio, we believe that out of this will come some financial companies that will have very strong prospects for renewed growth. We will be closely monitoring this sector for opportunities as we move through the year.
We are growth investors; the major risk to the portfolio in 2010 that we see at this point would be that the economy slips back into recession. If our view is accurate, that will not happen. While the recovery will be enough to sustain the market, corporate profit growth, while good, will not be strong enough to lift all stocks equally. That implies that 2010 could be a stockpicker’s market, which should be a better backdrop for our investment style than the 2008-2009 environments.
Sincerely,

Mary Lisanti, CFA
President & Portfolio Manager
The Adams Harkness Small Cap Growth Fund invests in smaller companies which generally carry greater risk than is customarily associated with larger companies for various reasons such as narrower markets, limited financial resources, and less liquid stock. Growth stocks emphasize companies that are believed to offer above-average prospects for capital growth due to their strong earnings and revenue potential. Growth stocks tend to offer relatively low dividend yields.
The recent growth in the stock market has helped to produce short-term returns that are not typical and may not continue in the future. Because of ongoing market volatility, fund performance may be subject to substantial short-term changes.
The views in this report were those of the Fund manager as of December 31, 2009, and may not reflect her views on the date this report is first published or anytime thereafter. These views are intended to assist shareholders in understanding their investments in the Fund and do not constitute investment advice.
3
ADAMS HARKNESS SMALL CAP GROWTH FUND
PERFORMANCE CHART AND ANALYSIS
DECEMBER 31, 2009
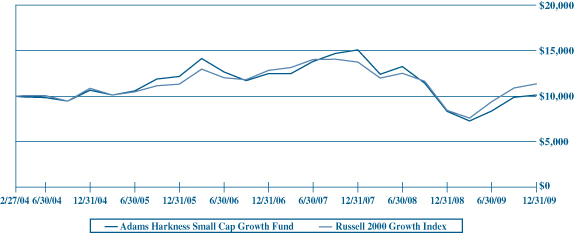
The following chart reflects the change in value of a hypothetical $10,000 investment in the Adams Harkness Small Cap Growth Fund (the “Fund”) since inception, including reinvested dividends and distributions. The result is compared with a broad-based securities market index. The Russell 2000 Growth Index (the “Index”), the Fund‘s primary performance benchmark, measures the performance of those Russell 2000 Index companies with higher price-to-book ratios and higher forecasted growth values. The Index is unmanaged and does not reflect the expenses of the Fund. One cannot invest directly in an index.
Performance data quoted represents past performance and is no guarantee of future results. Current performance may be lower or higher than the performance data quoted. Investment return and principal value of an investment in the Fund will fluctuate so that shares, when redeemed, may be worth more or less than their original cost. The Fund’s annual operating expense ratio (gross) is 2.78%. Shares redeemed or exchanged within 30 days of purchase will be charged a 1.00% redemption fee. Returns greater than one year are annualized. During the period certain fees were waived and/or expenses reimbursed; otherwise, returns would have been lower. For the most recent month-end performance, please call (800) 441-7031 or visit the Fund’s website at www.ahsmallcap.com. The performance table and graph do not reflect the deduction of taxes that a shareholder would pay on Fund distributions or the redemption of Fund shares.
| | | | | | | |
Average Annual Total Return as of 12/31/09
| | 1 Year
| | 5 Year
| | Since
Inception
2/27/04
|
Adams Harkness Small Cap Growth Fund | | | 21.46% | | (1.00)% | | 0.22% |
Russell 2000 Growth Index | | | 34.47% | | 0.87 % | | 2.21% |
| | | |
Investment Value on 12/31/09
| | | | | | |
Adams Harkness Small Cap Growth Fund | | $ | 10,127 | | | | |
Russell 2000 Growth Index | | $ | 11,360 | | | | |
4
ADAMS HARKNESS SMALL CAP GROWTH FUND
SCHEDULE OF INVESTMENTS
DECEMBER 31, 2009
| | | | | |
Shares
| | Security Description
| | Value
|
| Common Stock - 99.2% |
| Communications Equipment - 5.9% |
| 5,030 | | Acme Packet, Inc.(a) | | $ | 55,330 |
| 16,155 | | Aruba Networks, Inc.(a) | | | 172,212 |
| 5,165 | | Blue Coat Systems, Inc.(a) | | | 147,409 |
| 6,480 | | DragonWave, Inc.(a) | | | 74,261 |
| 2,340 | | F5 Networks, Inc.(a) | | | 123,973 |
| 2,035 | | Fortinet, Inc.(a) | | | 35,755 |
| 5,390 | | Riverbed Technology, Inc.(a) | | | 123,808 |
| | | | |
|
|
| | | | | | 732,748 |
| | | | |
|
|
| Computers and Peripherals - 4.2% |
| 12,272 | | Compellent Technologies, Inc.(a) | | | 278,329 |
| 11,575 | | Rackspace Hosting, Inc.(a) | | | 241,339 |
| | | | |
|
|
| | | | | | 519,668 |
| | | | |
|
|
| Consumer Discretionary - 7.2% |
| 1,235 | | Archipelago Learning, Inc.(a) | | | 25,565 |
| 2,930 | | Buffalo Wild Wings, Inc.(a) | | | 117,991 |
| 1,280 | | Deckers Outdoor Corp.(a) | | | 130,202 |
| 3,325 | | FGX International Holdings, Ltd.(a) | | | 65,137 |
| 8,575 | | LuluLemon Athletica, Inc.(a) | | | 258,107 |
| 2,425 | | PF Chang’s China Bistro, Inc.(a) | | | 91,932 |
| 4,429 | | Shutterfly, Inc.(a) | | | 78,880 |
| 5,170 | | Tempur-Pedic International, Inc.(a) | | | 122,167 |
| | | | |
|
|
| | | | | | 889,981 |
| | | | |
|
|
| Consumer Retail - 12.6% |
| 7,850 | | AnnTaylor Stores Corp.(a) | | | 107,074 |
| 11,630 | | Chico’s FAS, Inc.(a) | | | 163,402 |
| 4,170 | | Dress Barn, Inc.(a) | | | 96,327 |
| 2,715 | | Fossil, Inc.(a) | | | 91,115 |
| 5,605 | | hhgregg, Inc.(a) | | | 123,478 |
| 2,715 | | J. Crew Group, Inc.(a) | | | 121,469 |
| 4,140 | | Kirkland’s, Inc.(a) | | | 71,912 |
| 7,240 | | Lumber Liquidators, Inc.(a) | | | 194,032 |
| 2,370 | | Rue21, Inc.(a) | | | 66,573 |
| 2,265 | | Steven Madden, Ltd.(a) | | | 93,409 |
| 8,030 | | Ulta Salon Cosmetics & Fragrance, Inc.(a) | | | 145,825 |
| 1,315 | | Under Armour, Inc., Class A(a) | | | 35,860 |
| 5,664 | | Vitamin Shoppe, Inc.(a) | | | 125,967 |
| 4,340 | | Williams-Sonoma, Inc. | | | 90,185 |
| 3,015 | | Zumiez, Inc.(a) | | | 38,351 |
| | | | |
|
|
| | | | | | 1,564,979 |
| | | | |
|
|
| Energy - 7.7% |
| 1,315 | | Arena Resources, Inc.(a) | | | 56,716 |
| 21,925 | | Brigham Exploration Co.(a) | | | 297,084 |
| 3,045 | | Carrizo Oil & Gas, Inc.(a) | | | 80,662 |
| 7,650 | | Complete Production Services, Inc.(a) | | | 99,450 |
| 6,184 | | GMX Resources, Inc.(a) | | | 84,968 |
| 9,205 | | Patriot Coal Corp.(a) | | | 142,309 |
| 9,910 | | Rosetta Resources, Inc.(a) | | | 197,506 |
| | | | |
|
|
| | | | | | 958,695 |
| | | | |
|
|
| | | | | |
Shares
| | Security Description
| | Value
|
| Financials - 0.6% |
| 3,320 | | Dollar Financial Corp.(a) | | $ | 78,551 |
| | | | |
|
|
| Health-Care - 8.2% |
| 6,474 | | Align Technology, Inc.(a) | | | 115,367 |
| 1,570 | | BioMarin Pharmaceutical, Inc.(a) | | | 29,532 |
| 14,150 | | DexCom, Inc.(a) | | | 114,332 |
| 9,045 | | GLG Life Tech Corp.(a) | | | 69,194 |
| 3,400 | | Orthofix International N.V.(a) | | | 105,298 |
| 5,385 | | Par Pharmaceutical Cos., Inc.(a) | | | 145,718 |
| 6,670 | | Thoratec Corp.(a) | | | 179,556 |
| 6,140 | | Wright Medical Group, Inc.(a) | | | 116,353 |
| 5,365 | | Zoll Medical Corp.(a) | | | 143,353 |
| | | | |
|
|
| | | | | | 1,018,703 |
| | | | |
|
|
| Health-Care Services -10.8% |
| 3,225 | | Air Methods Corp.(a) | | | 108,425 |
| 2,180 | | Almost Family, Inc.(a) | | | 86,175 |
| 2,030 | | athenahealth, Inc.(a) | | | 91,837 |
| 1,845 | | Emergency Medical Services Corp.(a) | | | 99,907 |
| 3,960 | | ev3, Inc.(a) | | | 52,826 |
| 635 | | HMS Holdings Corp.(a) | | | 30,918 |
| 4,405 | | IPC The Hospitalist Co., Inc.(a) | | | 146,466 |
| 4,400 | | LHC Group, Inc.(a) | | | 147,884 |
| 3,545 | | Natus Medical, Inc.(a) | | | 52,431 |
| 7,845 | | Nektar Therapeutics(a) | | | 73,115 |
| 9,710 | | Salix Pharmaceuticals, Ltd.(a) | | | 246,634 |
| 3,650 | | SXC Health Solutions Corp.(a) | | | 196,917 |
| | | | |
|
|
| | | | | | 1,333,535 |
| | | | |
|
|
| Industrials - 16.5% |
| 8,540 | | Aegean Marine Petroleum Network, Inc. | | | 234,679 |
| 3,030 | | American Superconductor Corp.(a) | | | 123,927 |
| 6,515 | | ArcSight, Inc.(a) | | | 166,654 |
| 1,675 | | Atlas Air Worldwide Holdings, Inc.(a) | | | 62,394 |
| 9,210 | | BE Aerospace, Inc.(a) | | | 216,435 |
| 2,430 | | Canadian Solar, Inc.(a) | | | 70,033 |
| 2,430 | | Echo Global Logistics, Inc.(a) | | | 30,837 |
| 4,700 | | EnerNOC, Inc.(a) | | | 142,833 |
| 6,270 | | Globe Specialty Metals, Inc.(a) | | | 58,938 |
| 7,330 | | GrafTech International, Ltd.(a) | | | 113,982 |
| 15,430 | | Horsehead Holding Corp.(a) | | | 196,733 |
| 1,715 | | Huron Consulting Group, Inc.(a) | | | 39,514 |
| 1,764 | | Itron, Inc.(a) | | | 119,193 |
| 3,365 | | Korn/Ferry International(a) | | | 55,522 |
| 2,505 | | MSC Industrial Direct Co. | | | 117,735 |
| 1,125 | | Portfolio Recovery Associates, Inc.(a) | | | 50,490 |
| 1,560 | | SYKES Enterprises, Inc.(a) | | | 39,733 |
| 5,305 | | Taleo Corp., Class A(a) | | | 124,774 |
| 6,475 | | UAL Corp.(a) | | | 83,592 |
| | | | |
|
|
| | | | | | 2,047,998 |
| | | | |
|
|
| Semiconductors and Semiconductor Equipment - 16.1% |
| 5,165 | | Atheros Communications, Inc.(a) | | | 176,850 |
| 7,980 | | Cavium Networks, Inc.(a) | | | 190,163 |
| 12,395 | | Cirrus Logic, Inc.(a) | | | 84,534 |
See Notes to Financial Statements. 5 |
ADAMS HARKNESS SMALL CAP GROWTH FUND
SCHEDULE OF INVESTMENTS
DECEMBER 31, 2009
| | | | | |
Shares
| | Security Description
| | Value
|
| Semiconductors and Semiconductor Equipment - (Continued) |
| 8,315 | | Cypress Semiconductor Corp.(a) | | $ | 87,806 |
| 9,055 | | Mellanox Technologies, Ltd.(a) | | | 170,777 |
| 4,030 | | Netlogic Microsystems, Inc.(a) | | | 186,428 |
| 4,010 | | Power Integrations, Inc. | | | 145,804 |
| 14,655 | | RF Micro Devices, Inc.(a) | | | 69,904 |
| 4,535 | | Rubicon Technology, Inc.(a) | | | 92,106 |
| 3,230 | | Silicon Laboratories, Inc.(a) | | | 156,138 |
| 13,610 | | Skyworks Solutions, Inc.(a) | | | 193,126 |
| 15,110 | | Teradyne, Inc.(a) | | | 162,130 |
| 5,765 | | Veeco Instruments, Inc.(a) | | | 190,476 |
| 4,740 | | Volterra Semiconductor Corp.(a) | | | 90,629 |
| | | | |
|
|
| | | | | | 1,996,871 |
| | | | |
|
|
| Software - 5.6% |
| 3,915 | | CommVault Systems, Inc.(a) | | | 92,746 |
| 3,745 | | Concur Technologies, Inc.(a) | | | 160,099 |
| 4,755 | | Informatica Corp.(a) | | | 122,964 |
| 6,560 | | Rightnow Technologies, Inc.(a) | | | 113,947 |
| 2,265 | | SolarWinds, Inc.(a) | | | 52,118 |
| 1,860 | | Solera Holdings, Inc. | | | 66,979 |
| 2,215 | | Telvent GIT SA | | | 86,341 |
| | | | |
|
|
| | | | | | 695,194 |
| | | | |
|
|
| Technology - 3.8% |
| 3,336 | | Bottomline Technologies, Inc.(a) | | | 58,614 |
| 2,160 | | comScore, Inc.(a) | | | 37,908 |
| 3,365 | | GSI Commerce, Inc.(a) | | | 85,437 |
| 4,105 | | Plexus Corp.(a) | | | 116,992 |
| 6,140 | | Sapient Corp.(a) | | | 50,778 |
| 2,135 | | VistaPrint N.V.(a) | | | 120,969 |
| | | | |
|
|
| | | | | | 470,698 |
| | | | |
|
|
| Total Common Stock (Cost $10,270,454) | | | 12,307,621 |
| | | | |
|
|
| Total Investments - 99.2% | | | |
| | | (Cost $10,270,454)* | | $ | 12,307,621 |
| Other Assets and Liabilities, Net - 0.8% | | | 95,927 |
| | | | |
|
|
| Total Net Assets - 100.0% | | $ | 12,403,548 |
| | | | |
|
|
| (a) | | Non-income producing security. |
| * | | Cost of investments for Federal income tax purposes is $10,348,830, and net unrealized appreciation on investments consists of: |
| | | | |
Gross Unrealized Appreciation | | $ | 2,081,120 | |
Gross Unrealized Depreciation | | | (122,329 | ) |
| | |
|
|
|
Net Unrealized Appreciation | | $ | 1,958,791 | |
| | |
|
|
|
The following is a summary of the inputs used to value the Fund’s investments as of December 31, 2009:
The inputs or methodology used for valuing securities are not necessarily an indication of the risk associated with investing in those securities. For more information on valuation inputs, and their aggregation into the levels used in the table below, refer to Note 2 — Security Valuation section in the accompanying Notes to Financial Statements.
| | | |
| Valuation Inputs | | Investments
in Securities |
Level 1 — Quoted Prices | | $ | 12,307,621 |
Level 2 — Other Significant Observable Inputs | | | – |
Level 3 — Significant Unobservable Inputs | | | – |
| | |
|
|
Total Investments | | $ | 12,307,621 |
| | |
|
|
The Level 1 inputs displayed in this table are Common Stock.
Refer to the Schedule of Investments for a further breakout of each security by type.
| | |
PORTFOLIO HOLDINGS | | |
% of Total Investments | | |
Communications Equipment | | 6.0% |
Computers and Peripherals | | 4.2% |
Consumer Discretionary | | 7.2% |
Consumer Retail | | 12.7% |
Energy | | 7.8% |
Financials | | 0.7% |
Health-Care | | 8.3% |
Health-Care Services | | 10.8% |
Industrials | | 16.6% |
Semiconductors and Semiconductor Equipment | | 16.2% |
Software | | 5.7% |
Technology | | 3.8% |
| | |
|
| | | 100.0% |
| | |
|
See Notes to Financial Statements. 6 |
ADAMS HARKNESS SMALL CAP GROWTH FUND
STATEMENT OF ASSETS AND LIABILITIES
DECEMBER 31, 2009
| | | | |
ASSETS | | | | |
Total investments, at value (Cost $10,270,454) | | $ | 12,307,621 | |
Cash | | | 116,136 | |
Receivables: | | | | |
Fund shares sold | | | 16,751 | |
Dividends and interest | | | 38 | |
Prepaid Expenses | | | 12,824 | |
| | |
|
|
|
| |
Total Assets | | | 12,453,370 | |
| | |
|
|
|
| |
LIABILITIES | | | | |
Payables: | | | | |
Fund shares redeemed | | | 2,598 | |
Accrued Liabilities: | | | | |
Investment adviser fees | | | 10,396 | |
Compliance services fees | | | 1,999 | |
Fund service fees | | | 3,623 | |
Trustees’ fees and expenses | | | 14 | |
Other expenses | | | 31,192 | |
| | |
|
|
|
| |
Total Liabilities | | | 49,822 | |
| | |
|
|
|
| |
NET ASSETS | | $ | 12,403,548 | |
| | |
|
|
|
| |
COMPONENTS OF NET ASSETS | | | | |
Paid-in capital | | $ | 17,390,740 | |
Accumulated net realized loss from investments | | | (7,024,359 | ) |
Unrealized appreciation on investments | | | 2,037,167 | |
| | |
|
|
|
| |
NET ASSETS | | $ | 12,403,548 | |
| | |
|
|
|
| |
NET ASSET VALUE, OFFERING PRICE PER SHARE | | | | |
Based on net assets of $12,403,548 and 1,327,478 shares outstanding at $0.000 par value (unlimited shares authorized) | | $ | 9.34 | |
| | |
|
|
|
See Notes to Financial Statements. 7 |
ADAMS HARKNESS SMALL CAP GROWTH FUND
STATEMENT OF OPERATIONS
YEAR ENDED DECEMBER 31, 2009
| | | | |
INVESTMENT INCOME | | | | |
Dividend income | | $ | 13,589 | |
Interest income | | | 51 | |
| | |
|
|
|
Total Investment Income | | | 13,640 | |
| | |
|
|
|
| |
EXPENSES | | | | |
Investment adviser fees | | | 119,228 | |
Fund service fees | | | 151,650 | |
Shareholder services fees | | | 29,807 | |
Custodian fees | | | 28,870 | |
Professional fees | | | 73,700 | |
Trustees’ fees and expenses | | | 458 | |
Compliance services fees | | | 28,722 | |
Registration fees | | | 15,585 | |
Reports to shareholders | | | 17,850 | |
Miscellaneous expenses | | | 12,723 | |
| | |
|
|
|
Total Expenses | | | 478,593 | |
Fees waived and expenses reimbursed | | | (110,958 | ) |
| | |
|
|
|
Net Expenses | | | 367,635 | |
| | |
|
|
|
| |
NET INVESTMENT LOSS | | | (353,995 | ) |
| | |
|
|
|
| |
NET REALIZED AND UNREALIZED GAIN ON INVESTMENTS | | | | |
Net realized gain on investments | | | 1,230,533 | |
Net change in unrealized appreciation on investments | | | 1,170,832 | |
| | |
|
|
|
| |
NET REALIZED AND UNREALIZED GAIN ON INVESTMENTS | | | 2,401,365 | |
| | |
|
|
|
| |
INCREASE IN NET ASSETS FROM OPERATIONS | | $ | 2,047,370 | |
| | |
|
|
|
See Notes to Financial Statements. 8 |
ADAMS HARKNESS SMALL CAP GROWTH FUND
STATEMENTS OF CHANGES IN NET ASSETS
| | | | | | | | |
| | | Year Ended
December 31, 2009
| | | Year Ended
December 31, 2008
| |
OPERATIONS | | | | | | | | |
Net investment loss | | $ | (353,995 | ) | | $ | (351,551 | ) |
Net realized gain (loss) on investments | | | 1,230,533 | | | | (8,175,439 | ) |
Net change in unrealized appreciation (depreciation)
on investments | | | 1,170,832 | | | | (3,687,980 | ) |
| | |
|
|
| |
|
|
|
Increase (Decrease) in Net Assets from Operations | | | 2,047,370 | | | | (12,214,970 | ) |
| | |
|
|
| |
|
|
|
| | |
DISTRIBUTIONS TO SHAREHOLDERS FROM | | | | | | | | |
Net realized gain on investments | | | – | | | | (478,127 | ) |
| | |
|
|
| |
|
|
|
| | |
CAPITAL SHARE TRANSACTIONS | | | | | | | | |
Sale of shares | | | 1,667,229 | | | | 5,587,220 | |
Reinvestment of distributions | | | – | | | | 474,064 | |
Redemption of shares | | | (5,288,742 | ) | | | (7,896,942 | ) |
Redemption fees | | | 40 | | | | 1,467 | |
| | |
|
|
| |
|
|
|
Decrease in Net Assets from Capital Share Transactions | | | (3,621,473 | ) | | | (1,834,191 | ) |
| | |
|
|
| |
|
|
|
| | |
Decrease in Net Assets | | | (1,574,103 | ) | | | (14,527,288 | ) |
| | |
NET ASSETS | | | | | | | | |
Beginning of year | | | 13,977,651 | | | | 28,504,939 | |
| | |
|
|
| |
|
|
|
End of year (a) | | $ | 12,403,548 | | | $ | 13,977,651 | |
| | |
|
|
| |
|
|
|
| | |
SHARE TRANSACTIONS | | | | | | | | |
Sale of shares | | | 223,978 | | | | 486,173 | |
Reinvestment of distributions | | | – | | | | 62,957 | |
Redemption of shares | | | (714,991 | ) | | | (713,128 | ) |
| | |
|
|
| |
|
|
|
Decrease in Shares | | | (491,013 | ) | | | (163,998 | ) |
| | |
|
|
| |
|
|
|
| (a) | Amount includes undistributed net investment income of $0 and $0, respectively. |
See Notes to Financial Statements. 9 |
ADAMS HARKNESS SMALL CAP GROWTH FUND
FINANCIAL HIGHLIGHTS
These financial highlights reflect selected data for a share outstanding of the Fund throughout each year.
| | | | | | | | | | | | | | | | | | | | |
| | | For the Years Ended December 31,
| |
| | | 2009
| | | 2008
| | | 2007
| | | 2006
| | | 2005
| |
NET ASSET VALUE, Beginning of Year | | $ | 7.69 | | | $ | 14.38 | | | $ | 12.36 | | | $ | 12.03 | | | $ | 10.65 | |
| | |
|
|
| |
|
|
| |
|
|
| |
|
|
| |
|
|
|
| | | | | |
INVESTMENT OPERATIONS | | | | | | | | | | | | | | | | | | | | |
Net investment loss (a) | | | (0.23 | ) | | | (0.19 | ) | | | (0.23 | ) | | | (0.18 | ) | | | (0.16 | ) |
Net realized and unrealized gain/(loss) on investments | | | 1.88 | | | | (6.23 | ) | | | 2.77 | | | | 0.51 | (b) | | | 1.67 | |
| | |
|
|
| |
|
|
| |
|
|
| |
|
|
| |
|
|
|
Total from Investment Operations | | | 1.65 | | | | (6.42 | ) | | | 2.54 | | | | 0.33 | | | | 1.51 | |
| | |
|
|
| |
|
|
| |
|
|
| |
|
|
| |
|
|
|
Redemption Fees (a) | | | – | (c) | | | – | (c) | | | – | (c) | | | – | (c) | | | – | (c) |
| | | | |
DISTRIBUTIONS TO SHAREHOLDERS FROM | | | | | | | | | | | | | | | | | |
Net realized gain on investments | | | – | | | | (0.27 | ) | | | (0.52 | ) | | | – | | | | (0.13 | ) |
| | |
|
|
| |
|
|
| |
|
|
| |
|
|
| |
|
|
|
| | | | | |
NET ASSET VALUE, End of Year | | $ | 9.34 | | | $ | 7.69 | | | $ | 14.38 | | | $ | 12.36 | | | $ | 12.03 | |
| | |
|
|
| |
|
|
| |
|
|
| |
|
|
| |
|
|
|
| | | | | |
TOTAL RETURN | | | 21.46 | % | | | (44.63 | %) | | | 20.54 | % | | | 2.74 | % | | | 14.18 | % |
| | | | | |
RATIO/SUPPLEMENTARY DATA: | | | | | | | | | | | | | | | | | | | | |
Net Assets at End of Year (000’s omitted) | | $ | 12,404 | | | $ | 13,978 | | | $ | 28,505 | | | $ | 27,212 | | | $ | 9,381 | |
Ratios to Average Net Assets : | | | | | | | | | | | | | | | | | | | | |
Net expenses | | | 3.08 | % | | | 1.90 | % | | | 1.82 | % | | | 1.65 | % | | | 1.65 | % |
Gross expenses (d) | | | 4.01 | % | | | 2.78 | % | | | 2.36 | % | | | 2.65 | % | | | 5.17 | % |
Net investment loss | | | (2.97 | )% | | | (1.68 | )% | | | (1.70 | )% | | | (1.41 | )% | | | (1.44 | )% |
| | | | | |
PORTFOLIO TURNOVER RATE | | | 381 | % | | | 521 | % | | | 380 | % | | | 497 | % | | | 307 | % |
| (a) | Calculated based on average shares outstanding during the period. |
| (b) | Per share amount does not reflect the actual net realized and unrealized gain/loss for the period because of the timing of sales of the fund shares and the amount of per share realized and unrealized gains and losses at such time |
| (c) | Less than $0.01 per share. |
| (d) | Reflects the expense ratio excluding any waivers. |
See Notes to Financial Statements. 10 |
ADAMS HARKNESS SMALL CAP GROWTH FUND
NOTES TO FINANCIAL STATEMENTS
DECEMBER 31, 2009
Note 1. Organization
The Adams Harkness Small Cap Growth Fund (the “Fund”) is a diversified portfolio of Forum Funds (the “Trust”). The Trust is a Delaware statutory trust that is registered as an open-end, management investment company under the Investment Company Act of 1940, as amended. As of December 31, 2009, the Trust had twenty-nine investment portfolios. Under its Trust Instrument, the Trust is authorized to issue an unlimited number of the Fund’s shares of beneficial interest without par value. The Fund commenced operations on February 27, 2004. The Fund seeks maximum capital appreciation.
Note 2. Summary of Significant Accounting Policies
These financial statements are prepared in accordance with generally accepted accounting principles in the United States of America (“GAAP”), which require management to make estimates and assumptions that affect the reported amounts of assets and liabilities, the disclosure of contingent liabilities at the date of the financial statements, and the reported amounts of increase and decrease in net assets from operations during the fiscal period. Actual amounts could differ from those estimates. The following summarizes the significant accounting policies of the Fund:
Security Valuation – Exchange traded securities and over-the-counter securities are valued using the last quoted sale or official closing price, provided by independent pricing services as of the close of trading on the market or exchange for which they are primarily traded, on each Fund business day. In the absence of a sale, such securities are valued at the mean of the last bid and asked prices provided by independent pricing services. Non-exchange traded securities for which quotations are available are valued using the last quoted sales price, or in the absence of a sale at the mean of the last bid and asked prices provided by independent pricing services. Shares of open-end mutual funds are valued at net asset value (“NAV”). Short-term investments that mature in sixty days or less may be valued at amortized cost.
The Fund values its investments at fair value pursuant to procedures adopted by the Trust’s Board of Trustees (the “Board”) if (1) market quotations are insufficient or not readily available or (2) the adviser believes that the values available are unreliable. Fair valuation is based on subjective factors and as a result, the fair value price of an investment may differ from the security’s market price and may not be the price at which the asset may be sold. Fair valuation could result in a different NAV than a NAV determined by using market quotes.
The Fund has a three-tier fair value hierarchy. The basis of the tiers is dependent upon the various “inputs” used to determine the value of the Fund’s investments. These inputs are summarized in the three broad levels listed below:
Level 1 — quoted prices in active markets for identical assets
Level 2 — other significant observable inputs (including quoted prices of similar securities, interest rates, prepayment speeds, credit risk, etc.)
11
ADAMS HARKNESS SMALL CAP GROWTH FUND
NOTES TO FINANCIAL STATEMENTS
DECEMBER 31, 2009
Level 3 — significant unobservable inputs (including the Fund’s own assumptions in determining the fair value of investments)
The aggregate value by input level, as of December 31, 2009, for the Fund’s investments is included at the end of the Fund’s Schedule of Investments.
Securities Transactions, Investment Income and Realized Gain and Loss – Investment transactions are accounted for on trade date. Dividend income is recorded on the ex-dividend date. Foreign dividend income is recorded on the ex-dividend date or as soon as practical after the Fund determines the existence of a dividend declaration after exercising reasonable due diligence. Income and capital gains on some foreign securities may be subject to foreign withholding taxes, which are accrued as applicable. Interest income is recorded on an accrual basis. Premium and discount is amortized and accreted in accordance with GAAP. Identified cost of investments sold is used to determine the gain and loss for both financial statement and Federal income tax purposes.
Distributions to Shareholders – Distributions to shareholders of net investment income, if any, are declared and paid at least quarterly. Distributions to shareholders of capital gains, if any, are declared and paid at least annually. Distributions are based on amounts calculated in accordance with applicable Federal income tax regulations, which may differ from GAAP. These differences are due primarily to differing treatments of income and gain on various investment securities held by the Fund, timing differences and differing characterizations of distributions made by the Fund.
Federal Taxes – The Fund intends to qualify each year as a regulated investment company under Subchapter M of the Internal Revenue Code and distribute all its taxable income. In addition, by distributing in each calendar year substantially all its net investment income and capital gains, if any, the Fund will not be subject to a Federal excise tax. Therefore, no Federal income or excise tax provision is required.
As of December 31, 2009, there are no uncertain tax positions that would require financial statement recognition, de-recognition, or disclosure. The Fund’s Federal tax returns filed in the three-year period ended December 31, 2009, remain subject to examination by the Internal Revenue Service.
Commitments and Contingencies – In the normal course of business, the Fund enters into contracts that provide general indemnifications by the Fund to the counterparty to the contract. The Fund’s maximum exposure under these arrangements is dependent on future claims that may be made against the Fund and, therefore, cannot be estimated; however, based on experience, the risk of loss from such claims is considered remote.
Income and Expense Allocation – The Trust accounts separately for the assets, liabilities and operations of each of its investment portfolios. Expenses that are directly attributable to more than one investment portfolio are allocated among the respective investment portfolios in an equitable manner.
12
ADAMS HARKNESS SMALL CAP GROWTH FUND
NOTES TO FINANCIAL STATEMENTS
DECEMBER 31, 2009
Redemption Fees – A shareholder who redeems or exchanges shares within 30 days of purchase will incur a redemption fee of 1.00% of the current net asset value of shares redeemed or exchanged, subject to certain limitations. The fee is charged for the benefit of the remaining shareholders and will be paid to the Fund to help offset transaction costs. The fee is accounted for as an addition to paid-in capital. The Fund reserves the right to modify the terms of or terminate the fee at any time. There are limited exceptions to the imposition of the redemption fee.
Note 3. Advisory Fees, Servicing Fees and Other Transactions
Investment Adviser – AH Lisanti Capital Growth Fund, LLC (the “Adviser”) is the investment adviser of the Fund. Pursuant to an investment advisory agreement, the Adviser receives an advisory fee from the Fund at an annual rate of 1.00% of the Fund’s average daily net assets.
Shareholder Service Plan – The Trust has adopted a shareholder service plan for the Fund under which the Fund may reimburse the Fund’s administrator for amounts paid by the administrator for providing shareholder service activities that are not otherwise provided by the Transfer Agent. The Fund’s administrator may make such payments to various financial institutions, including the Adviser, that provide shareholder servicing to their customers invested in the Fund in amounts up to 0.25% annually of the average daily net assets of the shares held by such customers.
Distribution – Foreside Fund Services, LLC serves as the Fund’s distributor (the “Distributor”). The Distributor receives no compensation from the Fund for its distribution services. The Distributor is not affiliated with the Adviser or with Atlantic Fund Administration, LLC (“Atlantic”) or their affiliates.
Other Service Providers – Atlantic provides fund accounting, fund administration and transfer agency services to the Fund. Pursuant to an Atlantic services agreement, the Fund pays Atlantic customary fees for its services.
Atlantic provides a Principal Executive Officer, Principal Financial Officer, Chief Compliance Officer, and an Anti-Money Laundering Officer to the Fund, as well as certain additional compliance support functions.
Trustees and Officers – The Trust pays each independent Trustee an annual retainer fee of $40,000 for service to the Trust ($60,000 for the Chairman). In addition, the Chairman receives a monthly stipend of $500 to cover certain expenses incurred in connection with his duties to the Trust. The Trustees and Chairman may receive additional fees for special Board meetings. Each Trustee is also reimbursed for all reasonable out-of-pocket expenses incurred in connection with his duties as a Trustee, including travel and related expenses incurred in attending Board meetings. The amount of Trustees’ fees attributable to the Fund is disclosed in the Statement of Operations. Certain officers of the Trust are also officers or employees of the above named service providers, and during their terms of office received no compensation from the Fund.
13
ADAMS HARKNESS SMALL CAP GROWTH FUND
NOTES TO FINANCIAL STATEMENTS
DECEMBER 31, 2009
Note 4. Fees Waived
During the year, certain Fund service providers have voluntarily agreed to waive a portion of their fees. These voluntary waivers may be reduced or eliminated at any time. For the year ended December 31, 2009, fees waived were as follows:
| | | | | | | |
Fund Service Fees
Waived
| | Other
Waivers
| | Total Fees
Waived
|
| $ | 107,473 | | $ | 3,485 | | $ | 110,958 |
Note 5. Security Transactions
The cost of purchases and proceeds from sales of investment securities (including maturities), other than short-term investments for the year ended December 31, 2009, were $44,694,089 and $48,652,611, respectively.
Note 6. Federal Tax Information and Investment Transactions
Distributions during the fiscal years ended as noted were characterized for tax purposes as follows:
| | | | | | |
| | | 2009
| | 2008
|
Ordinary Income | | $ | — | | $ | 401,233 |
Long-Term Capital Gain | | | — | | | 76,894 |
| | |
|
| |
|
|
| | | $ | — | | $ | 478,127 |
| | |
|
| |
|
|
As of December 31, 2009, accumulated loss on a tax basis were as follow:
| | | | |
Unrealized Appreciation (Depreciation) | | $ | 1,958,791 | |
Capital and Other Losses | | | (6,945,983 | ) |
| | |
|
|
|
Total | | $ | (4,987,192 | ) |
| | |
|
|
|
The difference between components of distributable earnings on a tax basis and the amounts reflected in the Statement of Assets and Liabilities are primarily due to wash sales.
For tax purposes, the current year post-October loss was $29,165 (realized during the period November 1, 2009, through December 31, 2009). This loss will be recognized for tax purposes on the first business day of the Fund’s fiscal year, January 1, 2010.
As of December 31, 2009, the Fund had capital loss carryforwards to offset future capital gains of $4,100,613 expiring in 2016 and $2,816,205 expiring in 2017.
14
ADAMS HARKNESS SMALL CAP GROWTH FUND
NOTES TO FINANCIAL STATEMENTS
DECEMBER 31, 2009
On the Statement of Assets and Liabilities, as a result of permanent book to tax differences, certain amounts have been reclassified for the year ended December 31, 2009. The following reclassification was the result of net operating losses, and has no impact on the net assets of the Fund.
| | | | |
Accumulated Net Investment Loss | | $ | 353,995 | |
Paid-in-Capital | | | (353,995 | ) |
Note 7. Recent Accounting Pronouncement
In June 2009, the Financial Accounting Standards Board (“FASB”) issued the “FASB Accounting Standard Codification TM and the Hierarchy of Generally Accepted Accounting Principles” (“Codification”). The FASB approved the Codification as the single source of authoritative U.S. accounting and reporting standards for nongovernmental entities, in addition to guidance issued by the Securities and Exchange Commission (the “SEC”). All guidance contained in the Codification carries an equal level of authority. The Codification supersedes all then-existing non-SEC accounting and reporting standards. All other non-grandfathered non-SEC accounting literature not included in the Codification has become nonauthoritative. The Codification is effective for financial statements issued for interim and annual periods ending after September 15, 2009. Management has evaluated the Codification and has determined that it did not have a significant impact on the reporting of the Fund’s financial statements.
In January 2010, the Financial Accounting Standards Board issued Accounting Standards Update (“ASU”) No. 2010-06 “Improving Disclosures about Fair Value Measurements.” ASU No. 2010-06 clarifies existing disclosure and requires additional disclosures regarding fair value measurements. Effective for interim and annual reporting periods beginning after December 15, 2009, entities will be required to disclose significant transfers into and out of Level 1 and 2 measurements in the fair value hierarchy and the reasons for those transfers. Effective for fiscal years beginning after December 15, 2010, and for interim periods within those fiscal years, entities will need to disclose information about purchases, sales, issuances and settlements of Level 3 securities on a gross basis, rather than as a net number as currently required. Management is currently evaluating the impact ASU No. 2010-06 will have on its financial statement disclosures.
Note 8. Subsequent Events
Subsequent events occurring after the date of this report have been evaluated for potential impact to this report through February 24, 2010, and the Fund has noted no such events.
15
REPORT OF INDEPENDENT REGISTERED PUBLIC ACCOUNTING FIRM
To the Board of Trustees of Forum Funds
and the Shareholders of Adams Harkness Small Cap Growth Fund
We have audited the accompanying statement of assets and liabilities of Adams Harkness Small Cap Growth Fund, a series of shares of beneficial interest in the Forum Funds, including the schedule of investments, as of December 31, 2009, and the related statement of operations for the year then ended, and the statements of changes in net assets and the financial highlights for each of the years in the two year period then ended. These financial statements and financial highlights are the responsibility of the Fund’s management. Our responsibility is to express an opinion on these financial statements and financial highlights based on our audits. The financial highlights for each of the years in the three year period ended December 31, 2007 were audited by other auditors whose report dated February 26, 2008, expressed an unqualified opinion on such financial highlights.
We conducted our audits in accordance with the standards of the Public Company Accounting Oversight Board (United States). Those standards require that we plan and perform the audits to obtain reasonable assurance about whether the financial statements and financial highlights are free of material misstatement. An audit includes examining, on a test basis, evidence supporting the amounts and disclosures in the financial statements. Our procedures included confirmation of securities owned as of December 31, 2009 by correspondence with the custodian. An audit also includes assessing the accounting principles used and significant estimates made by management, as well as evaluating the overall financial statement presentation. We believe that our audits provide a reasonable basis for our opinion.
In our opinion, the financial statements and financial highlights referred to above present fairly, in all material respects, the financial position of Adams Harkness Small Cap Growth Fund as of December 31, 2009, the results of its operations for the year then ended, and the changes in its net assets and its financial highlights for each of the years in the two year period then ended, in conformity with accounting principles generally accepted in the United States of America.

BBD, LLP
Philadelphia, Pennsylvania
February 24, 2010
16
ADAMS HARKNESS SMALL CAP GROWTH FUND
ADDITIONAL INFORMATION (Unaudited)
DECEMBER 31, 2009
Investment Advisory Approval
At the October 8, 2009, Board meeting, the Board, including the Independent Trustees, considered the approval of the continuance of the investment advisory agreement pertaining to the Fund (the “Advisory Agreement”). In evaluating the Advisory Agreement for the Fund, the Board reviewed materials furnished by the Adviser and Atlantic, including information regarding the Adviser, its personnel, operations and financial condition. Specifically, the Board considered, among other matters: (1) the nature, extent and quality of the services to be provided to the Fund by the Adviser, including information on the investment performance of the Adviser; (2) the costs of the services to be provided and profitability to the Adviser with respect to its relationship with the Fund; (3) the advisory fee and total expense ratio of the Fund compared to relevant peer groups of funds; (4) the extent to which economies of scale would be realized as the Fund grows and whether the advisory fee would enable the Fund’s investors to share in the benefits of economies of scale; and (5) other benefits received by the Adviser from its relationship with the Fund. In their deliberations, the Board did not identify any particular information that was all-important or controlling and attributed different weights to the various factors. In particular, the Board focused on the factors discussed below.
Nature, Extent and Quality of Services
In connection with a presentation from senior representatives of the Adviser, the Board considered the quality of services provided by the Adviser under the Advisory Agreement. In this regard, the Board considered information regarding the experience, qualifications and professional background of the portfolio managers and other personnel at the Adviser with principal investment responsibility for the Fund’s investments; the investment philosophy and decision-making processes of those professionals; the capability and integrity of the Adviser’s senior management and staff; the quality of the Adviser’s services with respect to regulatory compliance and compliance with client investment policies and restrictions; and the financial condition and operational stability of the Adviser. The Board also considered the adequacy of the Adviser’s resources and quality of services currently provided by the Adviser under the Advisory Agreement. The Board noted the Adviser’s representation that the firm is financially stable and able to provide investment advisory services to the Fund. The Board concluded that, overall, it was satisfied with the nature, extent and quality of services to be provided to the Fund under the Advisory Agreement.
Costs of Services and Profitability
The Board considered information provided by the Adviser regarding its costs of services and its profitability with respect to the Fund. The Board also considered the Adviser’s resources devoted to the Fund as well as an assessment of costs and profitability. Under those circumstances, the Board concluded that the Adviser’s profits attributable to management of the Fund were not excessive in light of the services provided by the Adviser on behalf of the Fund.
Performance
The Board reviewed performance of the Fund and the Adviser’s discussion of its investment philosophy. The Board noted that the Fund underperformed its benchmark for the 1-year period. The Board noted the Adviser’s
17
ADAMS HARKNESS SMALL CAP GROWTH FUND
ADDITIONAL INFORMATION (Unaudited)
DECEMBER 31, 2009
representation that it had outperformed its peers. The Board also noted the relatively difficult market faced by the Fund over the last year and the Fund’s performance during that period. Based on this review and all of the relevant facts and circumstances, the Board concluded that the Fund’s performance was reasonable relative to its peers and benchmark and that the Fund and its shareholders could benefit from the Adviser’s management of the Fund.
Compensation
The Board considered the compensation paid to the Adviser for providing advisory services to the Fund. The Board also analyzed comparative information regarding advisory fees and total expenses of mutual funds within its Lipper Inc. peer group. The Board noted that the Adviser’s actual advisory fee rate was the lowest of its Lipper Inc. peer group. The Board also noted that the Fund’s actual total expense ratio was above the median of its Lipper Inc. peer groups. The Board recognized, however, that it is difficult to compare advisory fees and expense ratios because of variations between the services provided by the Adviser and those provided for in the advisory fees paid by other funds. Based on the foregoing and on all of the information presented, the Board concluded that the Adviser’s advisory fee charged to the Funds was reasonable.
Economies of Scale
The Board considered whether the Fund would benefit from any economies of scale. In this respect, the Board noted the Adviser’s representation that fee breakpoints would be appropriate if there were significant growth in the assets of the Fund. Based on all of these considerations and other relevant factors, the Board concluded that it would not be necessary to consider the implementation of fee breakpoints until the time that assets under management were larger.
Other Benefits
The Board noted the Adviser’s representation that it does not benefit in a material way from its relationship with the Fund other than soft-dollar research benefits. The Board accordingly concluded that other benefits received by the Adviser from its relationship with the Fund were not a material factor to consider in approving the continuation of the Advisory Agreement.
Conclusion
The Board reviewed a memorandum from Trust Counsel discussing the legal standards applicable to its consideration of the Advisory Agreement. Based on its review, including consideration of each of the factors referenced above, the Board determined, in the exercise of its business judgment, that the advisory arrangement, as outlined in the Advisory Agreement, was fair and reasonable in light of the services performed, expenses incurred and such other matters as the Board considered relevant in the exercise of its reasonable business judgment.
18
ADAMS HARKNESS SMALL CAP GROWTH FUND
ADDITIONAL INFORMATION (Unaudited)
DECEMBER 31, 2009
Proxy Voting Information
A description of the policies and procedures that the Fund uses to determine how to vote proxies relating to securities held in the Fund’s portfolio is available, without charge and upon request, by calling (800) 441-7031 and on the SEC’s website at www.sec.gov. The Fund’s proxy voting records for the twelve-month period ended June 30, is available, without charge and upon request, by calling (800) 441-7031, on the Fund’s website at www.ahsmallcap.com and on the SEC’s website at www.sec.gov.
Availability of Quarterly Portfolio Schedules
The Fund files its complete schedule of portfolio holdings with the SEC for the first and third quarters of each fiscal year on Form N-Q. The Fund’s Forms N-Q are available, without charge and upon request on the SEC’s website at www.sec.gov or may be reviewed and copied at the SEC’s Public Reference Room in Washington, DC. Information on the operation of the Public Reference Room may be obtained by calling (800) SEC-0330.
Shareholder Expense Example
As a shareholder of the Fund, you incur two types of costs: (1) transaction costs, including redemption fees and exchange fees; (2) ongoing costs, including management fees and other Fund expenses. This example is intended to help you understand your ongoing costs (in dollars) of investing in the Fund and to compare these costs with the ongoing costs of investing in other mutual funds.
The example is based on an investment of $1,000 invested at the beginning of the period and held for the entire period from July 1, 2009, through December 31, 2009.
Actual Expenses – The first line of the following table provides information about actual account values and actual expenses. You may use the information in this line, together with the amount you invested, to estimate the expenses that you paid over the period. Simply divide your account value by $1,000 (for example, an $8,600 account value divided by $1,000 = 8.6), then multiply the result by the number in the first line under the heading entitled “Expenses Paid During Period” to estimate the expenses you paid on your account during the period.
Hypothetical Example for Comparison Purposes – The second line of the following table provides information about hypothetical account values and hypothetical expenses based on the Fund’s actual expense ratio and an assumed rate of return of 5% per year before expenses, which is not the Fund’s actual return. The hypothetical account values and expenses may not be used to estimate the actual ending account balance or expenses you paid for the period. You may use this information to compare the ongoing cost of investing in the Fund and other funds. To do so, compare this 5% hypothetical example with the 5% hypothetical examples that appear in the shareholder reports of other funds.
19
ADAMS HARKNESS SMALL CAP GROWTH FUND
ADDITIONAL INFORMATION (Unaudited)
DECEMBER 31, 2009
Please note that expenses shown in the table are meant to highlight your ongoing costs only and do not reflect any transactional costs, such as sales charges (loads) for certain share classes, redemption fees or exchange fees. Therefore, the second line of the table is useful in comparing ongoing costs only, and will not help you determine the relative total costs of owning different funds. In addition, if these transactional costs had been included, your costs would have been higher.
| | | | | | | | | | | | |
| | | Beginning
Account Value
July 1, 2009
| | Ending
Account Value
December 31, 2009
| | Expenses
Paid
During Period*
| | Annualized
Expense Ratio*
| |
Actual | | $ | 1,000.00 | | $ | 1,209.80 | | $ | 18.08 | | 3.25 | % |
Hypothetical
(5% return before expenses) | | $ | 1,000.00 | | $ | 1,008.80 | | $ | 16.43 | | 3.25 | % |
| * | Expenses are equal to the Fund’s annualized expense ratio as indicated above multiplied by the average account value over the period, multiplied by the number of days in most recent fiscal half-year divided by 365 to reflect the half-year period. |
Trustees and Officers of the Trust
The Board is responsible for oversight of the management of the Trust’s business affairs and of the exercise of all the Trust’s powers except those reserved for shareholders. The following table provides information about each Board member and certain officers of the Trust. Each Trustee and officer holds office until the person resigns, is removed, or is replaced. Unless otherwise noted, the persons have held their principal occupations for more than five years. The address for all Trustees and officers is Three Canal Plaza, Suite 600, Portland, Maine, 04101, unless otherwise indicated. Each Trustee oversees twenty-nine portfolios in the Trust. Mr. Keffer is considered an Interested Trustee due to his affiliation with Atlantic. Mr. Keffer is also an Interested Director of Wintergreen Fund, Inc. The Fund’s Statement of Additional Information includes additional information about the Trustees and is available, without charge and upon request, by calling (800) 441-7031.
20
ADAMS HARKNESS SMALL CAP GROWTH FUND
ADDITIONAL INFORMATION (Unaudited)
DECEMBER 31, 2009
| | | | | | |
Name and Year of Birth | | Position with the Trust | | Length of
Time Served | | Principal Occupation(s) During Past 5 Years |
| Independent Trustees | | | | | | |
J. Michael Parish Born: 1943 | | Chairman of the Board; Trustee; Chairman, Nominating Committee and Qualified Legal Compliance Committee | | Since 1989 (Chairman since 2004) | | Retired; Partner, Wolf, Block, Schorr and Solis-Cohen, LLP (law firm) 2002 – 2003. |
Costas Azariadis Born: 1943 | | Trustee; Chairman, Valuation Committee | | Since 1989 | | Professor of Economics, Washington University since 2006; Professor of Economics, University of California-Los Angeles 1992 – 2006. |
James C. Cheng Born: 1942 | | Trustee; Chairman, Audit Committee | | Since 1989 | | President, Technology Marketing Associates (marketing company for small- and medium-sized businesses in New England) since 1991. |
| Interested Trustee | | | | | | |
John Y. Keffer1 Born: 1942 | | Trustee | | Since 1989 | | Chairman, Atlantic since 2008; President, Forum Foundation (a charitable organization) since 2005; President, Forum Trust, LLC (a non-depository trust company) since 1997; President, Citigroup Fund Services, LLC (“Citigroup”) 2003 – 2005. |
| 1 | Since 1997, John Y. Keffer has been president and owner of Forum Trust, LLC. Atlantic is a subsidiary of Forum Trust, LLC. |
21
ADAMS HARKNESS SMALL CAP GROWTH FUND
ADDITIONAL INFORMATION (Unaudited)
DECEMBER 31, 2009
| | | | | | |
Name and Year of Birth | | Position with the Trust | | Length of
Time Served | | Principal Occupation(s) During Past 5 Years |
| Officers | | | | | | |
Stacey E. Hong Born: 1966 | | President; Principal Executive Officer | | Since 2008 | | President, Atlantic since 2008; Director, Consulting Services, Foreside Fund Services, 2007; Elder Care, 2005 – 2006; Director, Fund Accounting, Citigroup 2003 – 2005. |
Karen Shaw Born: 1972 | | Treasurer; Principal Financial Officer | | Since 2008 | | Senior Manager, Atlantic since 2008; Section Manager/Vice President, Enterprise Support Services, Citigroup 2003 – 2008. |
David Faherty Born: 1970 | | Vice President | | Since April 2009 | | Senior Counsel, Atlantic since 2009; Vice President, Citi Fund Services Ohio, Inc. 2007 – 2009; Associate Counsel, Investors Bank & Trust Company 2006 – 2007; employee of FDIC 2005. |
Michael J. McKeen Born: 1971 | | Vice President | | Since September 2009 | | Senior Manager, Atlantic since 2008; Vice President, Citigroup 2003 – 2008. |
Joshua LaPan Born: 1973 | | Vice President | | Since September 2009 | | Manager, Atlantic since 2008; Vice President, Citigroup 2003 – 2008. |
Timothy Bowden Born: 1969 | | Vice President | | Since September 2009 | | Manager, Atlantic since 2008; Vice President, Citigroup 2005 – 2008. |
Lina Bhatnagar Born: 1971 | | Secretary | | Since 2008 | | Senior Administration Specialist, Atlantic since 2008; Regulatory Administration Specialist, Citigroup, 2006 – 2008; Money Market/Short Term Trader, Wellington Management, 1996 – 2002. |
22

ADAMS HARKNESS SMALL CAP GROWTH FUND
P.O. BOX 588
PORTLAND, ME 04112
(800) 441-7031
WWW.AHSMALLCAP.COM
INVESTMENT ADVISER
AH LISANTI CAPITAL GROWTH, LLC
608 FIFTH AVENUE
SUITE 301
NEW YORK, NY 10020
DISTRIBUTOR
FORESIDE FUND SERVICES, LLC
THREE CANAL PLAZA
SUITE 100
PORTLAND, ME 04101
WWW.FORESIDE.COM
THISREPORTISSUBMITTEDFORTHEGENERALINFORMATIONOFTHESHAREHOLDERSOFTHE FUND. ITISNOTAUTHORIZEDFORDISTRIBUTIONTOPROSPECTIVEINVESTORSUNLESSPRECEDEDORACCOMPANIEDBYANEFFECTIVEPROSPECTUS,WHICHINCLUDESINFORMATIONREGARDINGTHE FUND’SRISKS,OBJECTIVES,FEESANDEXPENSES,EXPERIENCEOFITSMANAGEMENTANDOTHERINFORMATION.
228 - ANR - 1209

ANNUAL REPORT
December 31, 2009

http://www.polarisfunds.com
(888) 263-5594
TABLE OF CONTENTS
POLARIS GLOBAL VALUE FUND
A MESSAGE TO OUR SHAREHOLDERS
DECEMBER 31, 2009
Dear Fellow Shareholder,
For the year ended December 31, 2009, the Polaris Global Value Fund (“the Fund”) returned 35.46%, outperforming the MSCI World Index, which returned 29.99%. Strong results can be attributed to pre-crisis stock picking and the decision to hold and add to investments in 2009, many of which had declined substantially in 2008. We maintained a calm, disciplined approach during the downturn, recognizing that declines in fundamentally strong portfolio companies with good cash flows and positive business conditions would not persist. During 2009, the majority of Fund holdings rebounded dramatically, with 21% of portfolio companies’ stock prices doubling in value.
The following table summarizes total returns through December 31, 2009.
| | | | | | | | | | | | | | | | | | | | | | |
| | | | | | | | | | | | | As of December 31, 2009 |
| | | YTD | | QIV | | QIII | | QII | | QI | | 1 Yr | | 3 Yrs | | 5 Yrs | | 10 Yrs | | 15 Yrs | | ITD* |
Polaris Global Value Fund | | 35.46% | | 1.13% | | 21.98% | | 31.35% | | -16.40% | | 35.46% | | -11.21% | | -0.74% | | 5.76% | | 9.81% | | 8.78% |
MSCI World Index, net dividends reinvested | | 29.99% | | 4.07% | | 17.45% | | 20.75% | | -11.92% | | 29.99% | | -5.63% | | 2.01% | | -0.24% | | 6.02% | | 5.52% |
Performance data quoted represents past performance and is no guarantee of future results. Current performance may be lower or higher than the performance data quoted. Returns for more than one year are annualized. Investment return and principal value will fluctuate so that an investor’s shares, when redeemed, may be worth more or less than original cost. For the most recent month end performance, please call (888) 263-5594 or visit the Fund’s website at www.polarisfunds.com. As stated in the current prospectus dated May 1, 2009, the Fund’s annual operating expense ratio (gross) is 1.43%. Shares redeemed or exchanged within 180 days of purchase will be charged a 1.00% fee. Fund performance returns shown do not reflect this fee; if reflected, the returns would have been lower. See page 6 for additional disclosure.
The recent growth rate in the stock market has helped to produce short-term returns that are not typical and may not continue in the future. Because of ongoing market volatility, fund performance may be subject to substantial short-term changes.
The table above shows that the Fund’s long-term performance has exceeded benchmark returns with lower market risk, as measured by the beta statistic of 0.91 since the Fund’s inception (volatility measurement relative to the MSCI World Index). It is worth noting that the Fund’s beta increased during 2007 and 2008 as the beta of many holdings increased substantially along with overall market volatility.
The year 2009 marked the end of the first decade of the new millennium. It was an inauspicious start as 2000-2009 was the worst decade since 1900 (110 years) for U.S. equities and the second worst for global equities. With annualized returns of 5.76% during the decade, the Fund outperformed the -0.24% return for the MSCI World Index. More indications of the Fund’s long-term outperformance versus various benchmarks are evident in the chart below. The Fund’s success may be credited to strong bottom-up stock picking, as our research identified fundamentally-strong industrials, materials, energy and other companies that not only weathered difficult operating conditions, but thrived by addressing demands from emerging markets.
1
POLARIS GLOBAL VALUE FUND
A MESSAGE TO OUR SHAREHOLDERS
DECEMBER 31, 2009
| | | | | | | | | | | | | | |
| | | US-CPI | | US-TBills | | US-Bonds | | US-Equity | | World-Equity | | EAFE-Equity | | Polaris Global
Value Fund |
| 1990 –1999 | | 2.9% | | 4.6% | | 8.1% | | 19.0% | | 12.0% | | 7.3% | | 12.4% |
| 2000 – 2009 | | 2.5% | | 2.7% | | 6.0% | | -1.5% | | -0.2% | | 1.4% | | 5.8% |
All returns are in nominal terms.
Source: US CPI: The Wall Street Journal; US TBills: The Wall Street Journal; US Bonds: Barclays Capital US Aggregate Bond Index; US Equity: MSCI USA Index; World Equity: MSCI World Index (gross dividends reinvested); EAFE Equity: MSCI EAFE Index
The BRIC countries (Brazil, Russia, India, China) played a larger role in the global markets. Many of these countries first entered the market economy at the end of the 1990s, starting from a low base and undervalued assets not priced by investors. The past 10 years saw these countries’ markets revalued upwards substantially from their debut, with China, India, Russia and most Latin American countries tipping into double-digit annualized returns.
2009 PERFORMANCE ANALYSIS:
Avoiding the pitfalls of investor panic and the drive to conservative investments, we carefully analyzed our portfolio by selling challenged companies in favor of long-standing fundamentally strong holdings. Maintaining our strict value strategy allowed us to execute purchases in a volatile first quarter 2009, many of which thrived by year-end.
Two examples of this purchase strategy were Novartis and Infosys Technologies. Novartis is a successful Swiss pharmaceutical and healthcare products company with a franchise in cardiovascular and oncology drugs. A high percentage of recent sales are from drugs developed in the past two years, and the influence of the faster growing emerging markets is having a favorable influence on results. Selling at an unusually low price to maintenance cash flow, the addition of Novartis added substantially to the diversification of the portfolio. Since purchasing the stock in the second quarter 2009, the stock has risen more than 30%.
Infosys is an Indian company that is a well known leader in global information technology solutions. Essentially a provider of outsourced IT services to hundreds of companies both large and small throughout the world, its IT services deal with the entire range of issues that confront large companies: conception, design, development, engineering, maintenance, integration, and operation. The company has enjoyed a fast rate of earnings and cash flow growth, but the worldwide economic crisis temporarily depressed revenue and earnings. An accompanying stock price decline provided an excellent opportunity to invest in a company likely to benefit from the resumption of growth expected in 2010 and beyond. Since purchasing the stock in the second quarter 2009, this holding has risen over 95%.
We continue to cultivate a diversified portfolio that may withstand volatility. For the year ended December 31, 2009, positive returns were broad-based, with sector benchmark outperformance in industrials, materials, consumer discretionary, consumer staples, energy, healthcare and IT.
In the materials sector, the Fund profited from its investment in commodities (copper, coal, iron ore), which have experienced a tighter supply/demand balance, partially due to increased demand from emerging markets.
2
POLARIS GLOBAL VALUE FUND
A MESSAGE TO OUR SHAREHOLDERS
DECEMBER 31, 2009
Stimulus packages in Asia and the U.S. fueled infrastructure activity in both regions, clearly benefitting the Fund’s holdings in CRH and other building supplies. Chemical companies, such as BASF, proved to be strong performers as demand renewed somewhat unexpectedly due to large scale production cutbacks in the industry.
Stimulus packages also proved a boon for industrials involved in infrastructure, such as CRH, YIT OYJ, Kone OYJ and Trevi Finanziaria, which won large dam repair contracts in the U.S. In addition, service-based industrial businesses proved resilient, retaining stable margins and sustainable free cash flows. U.S.-based Mac-Gray Corporation saw its stock price appreciate during the year, rebounding after the company’s annual meeting and conclusion of a proxy contest. Overall, industrials were the largest contributor to outperformance for the year, with the portfolio’s holdings contributing more than 11% to the Fund’s return.
Within consumer discretionary, U.K. homebuilders proved nimble in production schedules and reduced supply, which resulted in firmer U.K. housing prices. Additionally, many of these companies reinforced their financial strength to prepare for the resumption of the growth expected in the U.K. housing sector. Interestingly, the U.S. is in a multi-year correction process, but it has taken less than one year for the U.K. housing market to correct. Three of four U.K. homebuilders in the portfolio more than doubled in value during the year, rebounding from large declines in 2008.
When investors ignored consumer staples stocks in favor of cyclical companies in 2009, we saw the opportunity to buy good brand names with stable cash flows at exceptionally good values. Top names on our “watch list”, such as The J.M. Smucker Company and Heinz, were purchased in early 2009 and subsequently produced strong returns.
Financials detracted from even better performance, as smaller U.S. banks, not plagued by the mortgage crisis, have fallen in sympathy with the larger industry trends. We expect U.S. banks to be a source of outperformance based on bank valuations, after adjustment for normalized insurance premiums, repayment of high-cost TARP (Troubled Asset Relief Program) funding and post-peak loan losses. As the Fund’s holdings in industrials and materials companies have outperformed anticipating economic recovery, it is our belief that bank shares will experience normalized fundamentals long before they appear in reported results.
Defensive holdings, including telecommunications and utilities, proved to be low risk stocks that buffered market volatility in 2008. In 2009, however, investors began selling these off to take more risk in other sectors. Consequently, the Fund’s holdings in these sectors were negatively impacted. We will continue to opportunistically identify undervalued defensive names that offer diversification, reduced cyclical exposure and potentially strong returns over the long-term.
3
POLARIS GLOBAL VALUE FUND
A MESSAGE TO OUR SHAREHOLDERS
DECEMBER 31, 2009
The following table illustrates the Fund’s summary performance attribution by country and sector:
| | | | | | | | |
| Country | | Full Year 2009% | | | Sector | | Full Year 2009% | |
Finland | | 6.6 | | | Industrials | | 11.7 | |
United Kingdom | | 6.0 | | | Materials | | 10.0 | |
Ireland | | 5.0 | | | Consumer Discretionary | | 8.5 | |
France | | 3.8 | | | Energy | | 4.0 | |
United States | | 2.8 | | | Health Care | | 2.6 | |
Sweden | | 2.7 | | | Consumer Staples | | 2.2 | |
Germany | | 1.8 | | | Information Technology | | 1.3 | |
Canada | | 1.5 | | | Utilities | | (0.4 | ) |
Austria | | 1.4 | | | Telecommunications | | (0.4 | ) |
Australia | | 1.3 | | | Financials | | (4.0 | ) |
Italy | | 1.2 | | | | | | |
Thailand | | 1.1 | | | | | | |
South Africa | | 1.1 | | | | | | |
Belgium | | 1.0 | | | | | | |
India | | 0.8 | | | | | | |
South Korea | | 0.8 | | | | | | |
Norway | | 0.8 | | | | | | |
Switzerland | | 0.5 | | | | | | |
Spain | | (2.0 | ) | | | | | |
Japan | | (2.6 | ) | | | | | |
Cash & Equivalents | | 0.1 | | | Cash & Equivalents | | 0.1 | |
| | |
|
| | | |
|
|
| | | 35.5 | % | | | | 35.5 | % |
| | |
|
| | | |
|
|
Table may not foot due to rounding.
2009 ASSET ALLOCATION:
During the calendar year 2009, we trimmed holdings in financials, materials and industrials, where analysis revealed deterioration in fundamentals in relation to evolving market dynamics. The shares of geographically diverse banks in Spain and Ireland were liquidated as we remained concerned about worsening economic conditions in both regions. Additional sell decisions were executed throughout the year, as we identified companies expected to be challenged going forward, while retaining companies that suffered short-term cash flow reductions, but which have strong long-term fundamentals. Cash was allocated to new investment ideas and increased weightings in portfolio areas with strong growth potential.
We invested in three new financials, including an Indian bank, a Swedish bank and one eastern U.S. institution. In the materials sector, we added a German flavor and fragrance producer, which sells product to food processors, cosmetics and other consumer staples companies. Within industrials, a fourth quarter investment was made in the third largest chemical transportation company in the world based on number of vessels. The company was previously affected by reduced chemical demand and a new-build commitment that had to be renegotiated. The company sought new funds to bolster its cash reserves and the Fund bought shares at an opportune price. The shares advanced 47% since its discounted offering price on November 27th.
We also made initial investments in an Indian information technology company and two consumer staples companies. We continue to see better values overseas; consequently, the Fund remained underweight in North America relative to the World Index. The Fund’s Scandinavian and European holdings were weighted greater than the benchmark.
4
POLARIS GLOBAL VALUE FUND
A MESSAGE TO OUR SHAREHOLDERS
DECEMBER 31, 2009
The following table shows the Fund’s asset allocation at December 31, 2009.
| | | | | | | | | | | | | | | | | | | | | | | | | | | | |
| | | Polaris Global Value Fund Asset Allocation |
| | | World
Market
Weighting | | Portfolio
Weighting | | Energy | | Utilities | | Materials | | Industrials | | Consumer
Discretionary | | Consumer
Staples | | Health
Care | | Financials | | Info.
Tech. | | Telecom
Services | | Other | | Cash |
N. America | | 53.04% | | 32.52% | | 1.26% | | 2.18% | | 3.37% | | 6.72% | | 0.00% | | 3.07% | | 5.31% | | 9.61% | | 0.00% | | 0.99% | | 0.00% | | 0.00% |
Japan | | 9.71% | | 7.36% | | 0.00% | | 1.57% | | 0.67% | | 1.43% | | 0.30% | | 2.40% | | 0.00% | | 0.00% | | 0.00% | | 0.98% | | 0.00% | | 0.00% |
Other Asia | | 5.80% | | 8.59% | | 1.73% | | 0.00% | | 2.19% | | 0.00% | | 0.00% | | 0.00% | | 0.00% | | 1.62% | | 2.10% | | 0.95% | | 0.00% | | 0.00% |
Europe | | 28.95% | | 35.45% | | 2.36% | | 0.00% | | 9.57% | | 5.58% | | 10.51% | | 2.14% | | 1.41% | | 3.87% | | 0.00% | | 0.00% | | 0.00% | | 0.00% |
Scandinavia | | 2.50% | | 13.76% | | 0.00% | | 0.00% | | 0.00% | | 6.88% | | 2.66% | | 0.00% | | 0.00% | | 4.22% | | 0.00% | | 0.00% | | 0.00% | | 0.00% |
Africa & S. America | | 0.00% | | 2.32% | | 1.66% | | 0.00% | | 0.66% | | 0.00% | | 0.00% | | 0.00% | | 0.00% | | 0.00% | | 0.00% | | 0.00% | | 0.00% | | 0.00% |
Cash | | 0.00% | | -0.01% | | 0.00% | | 0.00% | | 0.00% | | 0.00% | | 0.00% | | 0.00% | | 0.00% | | 0.00% | | 0.00% | | 0.00% | | 0.00% | | -0.01% |
| | | | |
|
Industry Totals | | | | 100.00% | | 7.01% | | 3.75% | | 16.46% | | 20.62% | | 13.48% | | 7.61% | | 6.73% | | 19.33% | | 2.10% | | 2.93% | | 0.00% | | -0.01% |
| | | | |
|
Market Weighting | | 100.00% | | | | 10.93% | | 4.61% | | 7.52% | | 10.43% | | 9.34% | | 10.16% | | 10.07% | | 20.59% | | 11.96% | | 4.41% | | 0.00% | | 0.00% |
| | |
| | | |
|
Table may not cross foot due to rounding.
INVESTMENT ENVIRONMENT AND STRATEGY:
Recent discussions with portfolio companies indicate that the economic recovery is mixed, with industrials and materials experiencing slow growth in North America and Europe and moderate growth in Asia and Latin America. Late-stage companies still expect to see growth for several years. Until the recovery extends to more industries and markets and unemployment is reduced, we expect historically aggressive monetary and fiscal stimulus by central banks and governments around the world to continue. If massive government borrowing creates future inflation, the Fund’s holdings in real assets (such as materials and industrials) should provide a hedge. However, we do not claim an ability to accurately forecast macro-economic trends, preferring our long-standing commitment to bottom-up stock picking.
Current bottom-up analysis indicates that many companies are returning to more normalized valuation levels. In fact, there is no better indication of the returning fair valuations than a review of our own Fund. The Fund was at a yearly low on March 9, 2009, subsequently returning 91.06% (cumulative) by year-end (compared to a cumulative 75.22% return for the MSCI World Index). Past performance is not indicative of future results.
As fair valuations return, our research team will dig deep to unearth undervalued companies across sectors and countries. We continue to identify a mix of companies poised to benefit from the general market recovery. We see a number of these smaller banking institutions ripe for a rebound in 2010 and beyond. Other undervalued opportunities are pinpointed on a case-by-case basis.
As uncertainty and volatility remain in the global market, we have worked diligently to design a portfolio diversified across sectors and countries, with companies that can continue to generate strong cash flows in various macro-economic environments.
5
POLARIS GLOBAL VALUE FUND
A MESSAGE TO OUR SHAREHOLDERS
DECEMBER 31, 2009
As always, we welcome your questions and comments.
Sincerely,

Bernard R. Horn, Jr.
Portfolio Manager
The Fund invests in securities of foreign issuers, including issuers located in countries with emerging capital markets. Investments in such securities entail certain risks not associated with investments in domestic securities, such as volatility of currency exchange rates, and in some cases, political and economic instability and relatively illiquid markets. Fund performance includes reinvestment of dividends and capital gains. During the period, some of the Fund’s fees were waived or expenses reimbursed. In the absence of these waivers and reimbursements, performance figures would be lower.
On June 1, 1998, a limited partnership managed by the adviser reorganized into the Fund. The predecessor limited partnership maintained an investment objective and investment policies that were, in all material respects, equivalent to those of the Fund. The Fund’s performance for the periods before June 1, 1998 is that of the limited partnership and includes the expenses of the limited partnership. If the limited partnership’s performance had been readjusted to reflect the second year expenses of the Fund, the Fund’s performance for all the periods would have been lower. The limited partnership was not registered under the Investment Company Act of 1940 (“1940 Act”) and was not subject to certain investment limitations, diversification requirements, and other restrictions imposed by the 1940 Act and the Internal Revenue Code, which, if applicable, may have adversely affected its performance.
As of December 31, 2009, the Fund’s largest equity holdings and the percentages they represent in the Fund’s portfolio market value are as follows:
| | | | | | | | |
| Issuer | | Percentage
of Total
Net Assets | | | Issuer | | Percentage
of Total
Net Assets | |
Barratt Developments PLC | | 2.80 | % | | Christian Dior SA | | 1.88 | % |
Technip SA | | 2.36 | % | | CRH PLC | | 1.85 | % |
Kone Oyj, Class B | | 2.34 | % | | Smurfit Kappa Group PLC | | 1.84 | % |
BHP Billiton, Ltd., ADR | | 2.19 | % | | Bellway PLC | | 1.81 | % |
Greencore Group PLC | | 2.13 | % | | The Chubb Corp. | | 1.75 | % |
Persimmon PLC | | 2.10 | % | | Symrise AG | | 1.74 | % |
Trevi Finanziaria SpA | | 1.99 | % | | Solvay SA | | 1.74 | % |
Mac-Gray Corp. | | 1.95 | % | | Thai Oil PCL | | 1.73 | % |
Methanex Corp. | | 1.95 | % | | WellPoint, Inc. | | 1.71 | % |
Taylor Wimpey PLC | | 1.93 | % | | BASF SE | | 1.71 | % |
The MSCI World, EAFE, and USA Indexes, net dividends reinvested measures the performance of a diverse range of global stock markets in the United States, Canada, Europe, Australia, New Zealand and the Far East. The MSCI World Index is unmanaged and does include the reinvestment of dividends, net of withholding taxes. One cannot invest directly in an index or an average.
6
POLARIS GLOBAL VALUE FUND
A MESSAGE TO OUR SHAREHOLDERS
DECEMBER 31, 2009
The views in this letter were those of the Fund manager as of December 31, 2009, and may not reflect the views of the manager on the date this letter is second published or anytime thereafter. These views are intended to assist shareholders of the Fund in understanding their investment and do not constitute investment advice.
Before investing, you should carefully consider the Fund’s investment objectives, risks, charges and expenses. This and other information is in the prospectus, a copy of which may be obtained by calling (888) 263-5594 or visit the Fund’s website at www.polarisfunds.com. Please read the prospectus carefully before you invest.
Foreside Fund Services, LLC, is the Fund’s Distributor.
The Fund’s annual performance as compared to the benchmark is as follows:
Historical Calendar Year Annual Returns (years ended December 31)
| | | | | | | | | | | | | | |
| | | Polaris Global
Value Fund
| | | MSCI World Index
| | | | | Polaris Global
Value Fund
| | | MSCI World Index
| |
| 2009 | | 35.46 | % | | 29.99 | % | | 1999 | | 16.50 | % | | 24.93 | % |
| 2008 | | -46.19 | % | | -40.71 | % | | 1998 | | -8.85 | % | | 24.34 | % |
| 2007 | | -3.97 | % | | 9.04 | % | | 1997 | | 34.55 | % | | 15.76 | % |
| 2006 | | 24.57 | % | | 20.07 | % | | 1996 | | 23.34 | % | | 13.48 | % |
| 2005 | | 10.52 | % | | 9.49 | % | | 1995 | | 31.82 | % | | 20.72 | % |
| 2004 | | 23.63 | % | | 14.72 | % | | 1994 | | -2.78 | % | | 5.08 | % |
| 2003 | | 47.06 | % | | 33.11 | % | | 1993 | | 25.70 | % | | 22.50 | % |
| 2002 | | 3.82 | % | | -19.89 | % | | 1992 | | 9.78 | % | | -5.23 | % |
| 2001 | | 2.21 | % | | -16.82 | % | | 1991 | | 17.18 | % | | 18.28 | % |
| 2000 | | -5.82 | % | | -13.18 | % | | 1990 | | -11.74 | % | | -17.02 | % |
7
POLARIS GLOBAL VALUE FUND
PERFORMANCE CHART AND ANALYSIS
DECEMBER 31, 2009
The following chart reflects the change in the value of a hypothetical $10,000 investment, including reinvested dividends and distributions, in the Polaris Global Value Fund (the “Fund”) compared with the Morgan Stanley Capital International (“MSCI”) World Index (“Index”), net dividends reinvested, over the past ten fiscal years. The Index measures the performance of a diverse range of global stock markets in the United States, Canada, Europe, Australia, New Zealand and the Far East. The total return of the Fund includes operating expenses that reduce returns, while the total return of the Index does not include expenses. The Fund is professionally managed while the Index is unmanaged and is not available for investment. Past performance is not predictive of, nor a guarantee of future results. Market volatility can significantly impact short-term performance. The performance table and graph do not reflect the deduction of taxes that a shareholder would pay on Fund distributions or the redemption of Fund shares.
| | | | | | |
Annual Total Return as of 12/31/09
| | One Year
| | Five Year
| | Ten Year
|
Polaris Global Value Fund | | 35.46% | | (0.74)% | | 5.76% |
MSCI World Index | | 29.99% | | 2.01% | | (0.24)% |
| | | |
Investment Value on 12/31/09
| | | | | | |
Polaris Global Value Fund | | $17,511 | | | | |
MSCI World Index | | $ 9,759 | | | | |

8
POLARIS GLOBAL VALUE FUND
SCHEDULE OF INVESTMENTS
DECEMBER 31, 2009
| | | | | |
Shares
| | Security Description
| | Value
|
| Common Stock – 100.1% |
| Australia – 2.2% |
| 54,852 | | BHP Billiton, Ltd., ADR | | $ | 4,200,566 |
| | | | |
|
|
| Austria – 1.6% |
| 51,132 | | Andritz AG | | | 2,970,127 |
| | | | |
|
|
| Belgium – 2.2% |
| 20,044 | | KBC Groep NV(a) | | | 872,798 |
| 30,716 | | Solvay SA | | | 3,326,687 |
| | | | |
|
|
| | | | | | 4,199,485 |
| | | | |
|
|
| Canada – 1.9% |
| 190,137 | | Methanex Corp. | | | 3,732,383 |
| | | | |
|
|
| Finland – 6.5% |
| 114,063 | | Cargotec Corp., Class B | | | 3,157,475 |
| 101,020 | | Konecranes Oyj | | | 2,763,112 |
| 104,318 | | Kone Oyj, Class B | | | 4,480,370 |
| 95,793 | | YIT Oyj | | | 1,984,333 |
| | | | |
|
|
| | | | | | 12,385,290 |
| | | | |
|
|
| France – 4.9% |
| 34,965 | | Christian Dior SA | | | 3,596,904 |
| 22,254 | | Imerys SA | | | 1,340,372 |
| 63,900 | | Technip SA | | | 4,525,230 |
| | | | |
|
|
| | | | | | 9,462,506 |
| | | | |
|
|
| Germany – 8.3% |
| 52,100 | | BASF SE | | | 3,266,851 |
| 36,300 | | Demag Cranes AG | | | 1,229,655 |
| 51,400 | | Hannover Rueckversicherung AG(a) | | | 2,419,061 |
| 18,900 | | Muenchener Rueckversicherungs AG | | | 2,949,734 |
| 154,900 | | Symrise AG | | | 3,330,853 |
| 161,700 | | Tognum AG | | | 2,686,620 |
| | | | |
|
|
| | | | | | 15,882,774 |
| | | | |
|
|
| India – 2.1% |
| 16,500 | | Infosys Technologies, Ltd., ADR | | | 911,955 |
| 31,900 | | State Bank of India, Ltd., GDR | | | 3,110,824 |
| | | | |
|
|
| | | | | | 4,022,779 |
| | | | |
|
|
| Ireland – 5.8% |
| 7,885 | | Anglo Irish Bank Corp., Ltd.(a)(b) | | | 0 |
| 129,109 | | CRH PLC | | | 3,535,108 |
| 2,054,454 | | Greencore Group PLC | | | 4,079,050 |
| 397,293 | | Smurfit Kappa Group PLC(a) | | | 3,531,144 |
| | | | |
|
|
| | | | | | 11,145,302 |
| | | | |
|
|
| | | | | |
Shares
| | Security Description
| | Value
|
| Italy – 2.0% |
| 240,350 | | Trevi Finanziaria SpA | | $ | 3,800,428 |
| | | | |
|
|
| Japan – 7.4% |
| 142,500 | | Asahi Breweries, Ltd. | | | 2,619,423 |
| 121,200 | | Culture Convenience Club Co., Ltd. | | | 580,396 |
| 347,320 | | Iino Kaiun Kaisha, Ltd. | | | 1,469,309 |
| 74,900 | | Kansai Electric Power Co., Inc. | | | 1,688,839 |
| 356 | | KDDI Corp. | | | 1,884,447 |
| 52,416 | | MEIJI Holdings Co., Ltd. | | | 1,975,414 |
| 418,000 | | Nippon Yusen KK | | | 1,279,111 |
| 643,000 | | Showa Denko KK | | | 1,277,232 |
| 52,800 | | Tokyo Electric Power Co., Inc. | | | 1,323,756 |
| | | | |
|
|
| | | | | | 14,097,927 |
| | | | |
|
|
| Norway – 1.6% |
| 160,227 | | Camillo Eitzen & Co. ASA(a) | | | 356,994 |
| 209,496 | | DnB NOR ASA(a) | | | 2,270,523 |
| 1,344,000 | | Eitzen Chemical ASA(a) | | | 427,124 |
| | | | |
|
|
| | | | | | 3,054,641 |
| | | | |
|
|
| South Africa – 2.3% |
| 1,938,619 | | Metorex, Ltd.(a) | | | 1,263,517 |
| 78,770 | | Sasol, Ltd. | | | 3,180,686 |
| | | | |
|
|
| | | | | | 4,444,203 |
| | | | |
|
|
| South Korea – 2.6% |
| 4,527 | | Samsung Electronics Co., Ltd. | | | 3,106,183 |
| 12,468 | | SK Telecom Co., Ltd. | | | 1,814,832 |
| | | | |
|
|
| | | | | | 4,921,015 |
| | | | |
|
|
| Sweden – 5.7% |
| 43,871 | | Autoliv, Inc. | | | 1,902,246 |
| 391,200 | | Duni AB | | | 3,198,647 |
| 159,802 | | Investor AB, Class B | | | 2,968,375 |
| 99,400 | | Svenska Handelsbanken AB | | | 2,836,963 |
| | | | |
|
|
| | | | | | 10,906,231 |
| | | | |
|
|
| Switzerland – 1.4% |
| 49,600 | | Novartis AG | | | 2,709,072 |
| | | | |
|
|
| Thailand – 1.7% |
| 2,585,650 | | Thai Oil PCL | | | 3,315,433 |
| | | | |
|
|
| United Kingdom – 9.3% |
| 2,675,602 | | Barratt Developments PLC(a) | | | 5,358,827 |
| 262,648 | | Bellway PLC | | | 3,470,196 |
| 1,436,273 | | Lloyds Banking Group PLC(a) | | | 1,175,942 |
| 531,146 | | Persimmon PLC(a) | | | 4,027,876 |
| 5,874,040 | | Taylor Wimpey PLC(a) | | | 3,690,737 |
| | | | |
|
|
| | | | | | 17,723,578 |
| | | | |
|
|
See Notes to Financial Statements.
9
POLARIS GLOBAL VALUE FUND
SCHEDULE OF INVESTMENTS
DECEMBER 31, 2009
| | | | | |
Shares
| | Security Description
| | Value
|
| United States – 30.6% |
| 69,100 | | Allete, Inc. | | $ | 2,258,188 |
| 404,495 | | Ameris Bancorp | | | 2,896,184 |
| 74,906 | | AMETEK, Inc. | | | 2,864,405 |
| 249,204 | | Astoria Financial Corp. | | | 3,097,606 |
| 169,774 | | Colony Bankcorp, Inc. | | | 786,054 |
| 36,344 | | FPL Group, Inc. | | | 1,919,690 |
| 39,317 | | General Dynamics Corp. | | | 2,680,240 |
| 110,200 | | Health Net, Inc.(a) | | | 2,566,558 |
| 64,400 | | H.J. Heinz Co. | | | 2,753,744 |
| 131,263 | | International Bancshares Corp. | | | 2,484,809 |
| 50,800 | | J.M. Smucker Co. | | | 3,136,900 |
| 363,060 | | Mac-Gray Corp.(a) | | | 3,739,518 |
| 77,082 | | Marathon Oil Corp. | | | 2,406,500 |
| 34,049 | | Praxair, Inc. | | | 2,734,475 |
| 34,400 | | Quest Diagnostics, Inc. | | | 2,077,072 |
| 335,997 | | Southwest Bancorp, Inc. | | | 2,331,819 |
| 68,100 | | The Chubb Corp. | | | 3,349,158 |
| 67,382 | | Toro Co. | | | 2,817,241 |
| 74,184 | | UnitedHealth Group, Inc. | | | 2,261,128 |
| 122,900 | | Univest Corp. of Pennsylvania | | | 2,154,437 |
| 57,551 | | Verizon Communications, Inc. | | | 1,906,665 |
| 111,738 | | Webster Financial Corp. | | | 1,326,330 |
| 56,300 | | WellPoint, Inc.(a) | | | 3,281,727 |
| 29,174 | | WESCO International, Inc.(a) | | | 787,990 |
| | | | |
|
|
| | | | | | 58,618,438 |
| | | | |
|
|
| Total Common Stock (Cost $240,362,649) | | | 191,592,178 |
| | | | |
|
|
| | | | | | |
Principal
Amount
| | Security Description
| | Value
| |
| Short-Term Investments – 0.0% | |
| Certificates of Deposit – 0.0% | |
| $31,265 | | Middlesex Savings Bank, 2.00%, 11/26/11 | | $ | 31,265 | |
| 31,523 | | Stoneham Savings Bank, 1.50%, 11/24/11 | | | 31,523 | |
| | | | |
|
|
|
| Total Certificates of Deposit (Cost $62,788) | | | 62,788 | |
| | | | |
|
|
|
| Total Short-Term Investments | | | | |
| | | (Cost $62,788) | | | 62,788 | |
| | | | |
|
|
|
| Total Investments – 100.1% | | | | |
| | | (Cost $240,425,437) | | $ | 191,654,966 | |
| Other Assets and Liabilities, Net – (0.1)% | | | (257,357 | ) |
| | | | |
|
|
|
| Net Assets – 100.0% | | $ | 191,397,609 | |
| | | | |
|
|
|
| ADR | American Depositary Receipt |
| GDR | Global Depositary Receipt |
| PCL | Public Company Limited |
| PLC | Public Limited Company |
| (a) | Non–income producing security. |
| (b) | Security fair valued in accordance with procedures adopted by the Board of Trustees. |
| | At the period end, the value of these securities amounted to $0 or 0.00% of net assets. |
See Notes to Financial Statements.
10
POLARIS GLOBAL VALUE FUND
SCHEDULE OF INVESTMENTS
DECEMBER 31, 2009
| * | Cost for Federal income tax purposes is $242,219,343 and net unrealized depreciation consists of: |
| | | | |
Gross Unrealized Appreciation | | $ | 25,267,709 | |
Gross Unrealized Depreciation | | | (75,832,086 | ) |
| | |
|
|
|
Net Unrealized Depreciation on Investments | | $ | (50,564,377 | ) |
| | |
|
|
|
The following is a summary of the inputs used to value the Fund’s investments as of December 31, 2009:
The inputs or methodology used for valuing securities are not necessarily an indication of the risk associated with investing in those securities. For more information on valuation inputs, and their aggregation into the levels used in the table below, refer to Note 2 – Security Valuation section in the accompanying Notes to Financial Statements.
| | | | | | | | | | | | |
Valuation Inputs
| | Level 1
| | Level 2
| | Level 3
| | Total
|
Investments At Value: | | | | | | | | | | | | |
Common Stocks | | | | | | | | | | | | |
Australia | | $ | 4,200,566 | | $ | – | | $ | – | | $ | 4,200,566 |
Austria | | | 2,970,127 | | | – | | | – | | | 2,970,127 |
Belgium | | | 4,199,485 | | | – | | | – | | | 4,199,485 |
Canada | | | 3,732,383 | | | – | | | – | | | 3,732,383 |
Finland | | | 12,385,290 | | | – | | | – | | | 12,385,290 |
France | | | 9,462,506 | | | – | | | – | | | 9,462,506 |
Germany | | | 15,882,774 | | | – | | | – | | | 15,882,774 |
India | | | 4,022,779 | | | – | | | – | | | 4,022,779 |
Ireland | | | 11,145,302 | | | – | | | – | | | 11,145,302 |
Italy | | | 3,800,428 | | | – | | | – | | | 3,800,428 |
Japan | | | 14,097,927 | | | – | | | – | | | 14,097,927 |
Norway | | | 3,054,641 | | | – | | | – | | | 3,054,641 |
South Africa | | | 4,444,203 | | | – | | | – | | | 4,444,203 |
South Korea | | | 4,921,015 | | | – | | | – | | | 4,921,015 |
Sweden | | | 10,906,231 | | | – | | | – | | | 10,906,231 |
Switzerland | | | 2,709,072 | | | – | | | – | | | 2,709,072 |
Thailand | | | – | | | 3,315,433 | | | – | | | 3,315,433 |
United Kingdom | | | 17,723,578 | | | – | | | – | | | 17,723,578 |
United States | | | 58,618,438 | | | – | | | – | | | 58,618,438 |
Certificates of Deposit | | | – | | | 62,788 | | | – | | | 62,788 |
| | |
|
| |
|
| |
|
| |
|
|
Total Investments at Value: | | $ | 188,276,745 | | $ | 3,378,221 | | $ | – | | $ | 191,654,966 |
| | |
|
| |
|
| |
|
| |
|
|
Portfolio Holdings
% of Total Investments
| | |
Industrials | | 20.6% |
Financials | | 19.3% |
Materials | | 16.5% |
Consumer Discretionary | | 13.5% |
Consumer Staples | | 7.6% |
Energy | | 7.0% |
Health Care | | 6.7% |
Utilities | | 3.8% |
Telecommunication Services | | 2.9% |
Information Technology | | 2.1% |
Short-Term Investments | | 0.0% |
| | |
|
Total | | 100.0% |
| | |
|
See Notes to Financial Statements.
11
POLARIS GLOBAL VALUE FUND
STATEMENT OF ASSETS AND LIABILITIES
DECEMBER 31, 2009
| | | | |
ASSETS | | | | |
Total investments, at value (Cost $240,425,437) | | $ | 191,654,966 | |
Receivables: | | | | |
Fund shares sold | | | 110,165 | |
Interest and dividends | | | 405,990 | |
Prepaid expenses | | | 8,002 | |
| | |
|
|
|
Total Assets | | | 192,179,123 | |
| | |
|
|
|
| |
LIABILITIES | | | | |
Payables: | | | | |
Dividends | | | 1,103 | |
Fund shares redeemed | | | 448,574 | |
Due to custodian | | | 74,405 | |
Accrued Liabilities: | | | | |
Investment adviser fees | | | 162,088 | |
Fund service fees | | | 62,809 | |
Compliance services fees | | | 2,062 | |
Trustees’ fees and expenses | | | 216 | |
Other expenses | | | 30,257 | |
| | |
|
|
|
Total Liabilities | | | 781,514 | |
| | |
|
|
|
| |
NET ASSETS | | $ | 191,397,609 | |
| | |
|
|
|
| |
COMPONENTS OF NET ASSETS | | | | |
Paid-in capital | | $ | 346,526,558 | |
Accumulated net investment income | | | 2,002,230 | |
Accumulated net realized loss on investments and foreign currency transactions | | | (108,360,641 | ) |
Net unrealized depreciation on investments and foreign currency translations | | | (48,770,538 | ) |
| | |
|
|
|
| |
NET ASSETS | | $ | 191,397,609 | |
| | |
|
|
|
| |
NET ASSET VALUE AND OFFERING PRICE PER SHARE
Based on net assets of $191,397,609 and 16,312,139 shares outstanding at $0.000 par value (unlimited shares authorized) | | $ | 11.73 | |
| | |
|
|
|
See Notes to Financial Statements.
12
POLARIS GLOBAL VALUE FUND
STATEMENT OF OPERATIONS
YEAR ENDED DECEMBER 31, 2009
| | | | |
INVESTMENT INCOME | | | | |
Dividend income (net of foreign withholding taxes $451,335) | | $ | 3,967,091 | |
Interest income | | | 4,064 | |
| | |
|
|
|
Total Investment Income | | | 3,971,155 | |
| | |
|
|
|
| |
EXPENSES | | | | |
Investment adviser fees | | | 1,684,092 | |
Fund service fees | | | 521,869 | |
Custodian fees | | | 59,487 | |
Professional fees | | | 61,033 | |
Registration fees | | | 18,946 | |
Trustees’ fees and expenses | | | 6,146 | |
Compliance services fees | | | 43,902 | |
Miscellaneous expenses | | | 61,577 | |
| | |
|
|
|
Total Expenses | | | 2,457,052 | |
Fees waived | | | (16,790 | ) |
| | |
|
|
|
Net Expenses | | | 2,440,262 | |
| | |
|
|
|
| |
NET INVESTMENT INCOME | | | 1,530,893 | |
| | |
|
|
|
| |
NET REALIZED AND UNREALIZED GAIN (LOSS) ON INVESTMENTS
AND FOREIGN CURRENCY TRANSACTIONS | | | | |
| |
Realized Gain (Loss) on: | | | | |
Investments | | | (62,295,438 | ) |
Foreign currency transactions | | | 552,483 | |
Written options | | | 25,159 | |
| | |
|
|
|
Net Realized Loss on Investments and Foreign Currency Transactions | | | (61,717,796 | ) |
| | |
|
|
|
| |
Change in Unrealized Appreciation (Depreciation) on: | | | | |
Investments | | | 107,975,873 | |
Foreign Currency Translations | | | (385 | ) |
| | |
|
|
|
Net Change in Unrealized Appreciation on Investments
and Foreign Currency Translations | | | 107,975,488 | |
| | |
|
|
|
| |
NET REALIZED AND UNREALIZED GAIN (LOSS) ON INVESTMENTS
AND FOREIGN CURRENCY TRANSACTIONS | | | 46,257,692 | |
| | |
|
|
|
| |
INCREASE IN NET ASSETS RESULTING FROM OPERATIONS | | $ | 47,788,585 | |
| | |
|
|
|
See Notes to Financial Statements.
13
POLARIS GLOBAL VALUE FUND
STATEMENTS OF CHANGES IN NET ASSETS
| | | | | | | | |
| | | Year Ended
December 31, 2009
| | | Year Ended
December 31, 2008
| |
OPERATIONS | | | | | | | | |
Net investment income | | $ | 1,530,893 | | | $ | 6,576,581 | |
Net realized loss on investments and
foreign currency transactions | | | (61,717,796 | ) | | | (45,571,300 | ) |
Net change in unrealized appreciation (depreciation) on
investments and foreign currency translations | | | 107,975,488 | | | | (169,906,296 | ) |
| | |
|
|
| |
|
|
|
Increase (Decrease) in Net Assets Resulting
from Operations | | | 47,788,585 | | | | (208,901,015 | ) |
| | |
|
|
| |
|
|
|
| | |
DISTRIBUTIONS TO SHAREHOLDERS FROM | | | | | | | | |
Net investment income | | | (20,598 | ) | | | (6,185,088 | ) |
Net realized gain on investments | | | – | | | | (7,917,460 | ) |
| | |
|
|
| |
|
|
|
Total Distributions to Shareholders | | | (20,598 | ) | | | (14,102,548 | ) |
| | |
|
|
| |
|
|
|
| | |
CAPITAL SHARE TRANSACTIONS | | | | | | | | |
Sale of shares | | | 17,990,755 | | | | 41,080,925 | |
Reinvestment of distributions | | | 20,598 | | | | 13,259,942 | |
Redemption of shares | | | (50,652,983 | ) | | | (257,888,101 | ) |
Redemption fees | | | 8,622 | | | | 110,167 | |
| | |
|
|
| |
|
|
|
Decrease in Net Assets from Capital Share Transactions | | | (32,633,008 | ) | | | (203,437,067 | ) |
| | |
|
|
| |
|
|
|
Increase (Decrease) in Net Assets | | | 15,134,979 | | | | (426,440,630 | ) |
| | |
NET ASSETS | | | | | | | | |
Beginning of Year | | | 176,262,630 | | | | 602,703,260 | |
| | |
|
|
| |
|
|
|
End of Year(a) | | $ | 191,397,609 | | | $ | 176,262,630 | |
| | |
|
|
| |
|
|
|
| | |
SHARE TRANSACTIONS | | | | | | | | |
Sale of shares | | | 1,750,618 | | | | 2,725,384 | |
Reinvestment of distributions | | | 2,742 | | | | 1,656,696 | |
Redemption of shares | | | (5,790,642 | ) | | | (18,462,084 | ) |
| | |
|
|
| |
|
|
|
Decrease in Shares | | | (4,037,282 | ) | | | (14,080,004 | ) |
| | |
|
|
| |
|
|
|
| | |
(a) Amount includes undistributed (distributions in excess of)
net investment income | | $ | 2,002,230 | | | $ | (60,548 | ) |
| | |
|
|
| |
|
|
|
See Notes to Financial Statements.
14
POLARIS GLOBAL VALUE FUND
FINANCIAL HIGHLIGHTS
These financial highlights reflect selected data for a share outstanding throughout each year:
| | | | | | | | | | | | | | | | | | | | |
| | | Year Ended
| |
| | | December 31,
2009
| | | December 31,
2008
| | | December 31,
2007
| | | December 31,
2006
| | | December 31,
2005
| |
NET ASSET VALUE, Beginning of Year | | $ | 8.66 | | | $ | 17.51 | | | $ | 19.98 | | | $ | 16.20 | | | $ | 14.80 | |
| | |
|
|
| |
|
|
| |
|
|
| |
|
|
| |
|
|
|
INVESTMENT OPERATIONS | | | | | | | | | | | | | | | | | | | | |
Net investment income(a) | | | 0.09 | | | | 0.25 | | | | 0.20 | | | | 0.17 | | | | 0.19 | |
Net realized and unrealized gain (loss) on investments, options and foreign currency transactions | | | 2.98 | | | | (8.41 | ) | | | (0.94 | ) | | | 3.80 | | | | 1.36 | |
| | |
|
|
| |
|
|
| |
|
|
| |
|
|
| |
|
|
|
Total from Investment Operations | | | 3.07 | | | | (8.16 | ) | | | (0.74 | ) | | | 3.97 | | | | 1.55 | |
| | |
|
|
| |
|
|
| |
|
|
| |
|
|
| |
|
|
|
DISTRIBUTIONS TO SHAREHOLDERS FROM | | | | | | | | | | | | | | | | | | | | |
Net investment income | | | – | (b) | | | (0.31 | ) | | | (0.26 | ) | | | (0.16 | ) | | | (0.16 | ) |
Net realized gain on investments, options and foreign currency transactions | | | – | | | | (0.38 | ) | | | (1.49 | ) | | | (0.04 | ) | | | – | |
| | |
|
|
| |
|
|
| |
|
|
| |
|
|
| |
|
|
|
Total Distributions to Shareholders | | | – | | | | (0.69 | ) | | | (1.75 | ) | | | (0.20 | ) | | | (0.16 | ) |
| | |
|
|
| |
|
|
| |
|
|
| |
|
|
| |
|
|
|
REDEMPTION FEE(a) | | | – | (b) | | | – | (b) | | | 0.02 | | | | 0.01 | | | | 0.01 | |
| | |
|
|
| |
|
|
| |
|
|
| |
|
|
| |
|
|
|
NET ASSET VALUE, End of Year | | $ | 11.73 | | | $ | 8.66 | | | $ | 17.51 | | | $ | 19.98 | | | $ | 16.20 | |
| | |
|
|
| |
|
|
| |
|
|
| |
|
|
| |
|
|
|
TOTAL RETURN | | | 35.46 | % | | | (46.19 | )% | | | (3.97 | )% | | | 24.57 | % | | | 10.52 | % |
RATIO/SUPPLEMENTARY DATA | | | | | | | | | | | | | | | | | | | | |
Net Assets at End of Year (000’s omitted) | | $ | 191,398 | | | $ | 176,263 | | | $ | 602,703 | | | $ | 608,053 | | | $ | 280,580 | |
Ratios to Average Net Assets: | | | | | | | | | | | | | | | | | | | | |
Net investment income | | | 0.91 | % | | | 1.74 | % | | | 0.99 | % | | | 0.93 | % | | | 1.23 | % |
Net expenses | | | 1.45 | % | | | 1.43 | % | | | 1.19 | % | | | 1.23 | % | | | 1.29 | % |
Gross expenses(c) | | | 1.46 | % | | | 1.43 | % | | | 1.19 | % | | | 1.23 | % | | | 1.30 | % |
PORTFOLIO TURNOVER RATE | | | 22 | % | | | 16 | % | | | 46 | % | | | 5 | % | | | 10 | % |
| (a) | Calculated based on average shares outstanding during the period. |
| (b) | Amount rounds to less than $0.01 per share. |
| (c) | Reflects the expense ratio excluding any waivers and/or reimbursements. |
See Notes to Financial Statements.
15
POLARIS GLOBAL VALUE FUND
NOTES TO FINANCIAL STATEMENTS
DECEMBER 31, 2009
Note 1. Organization
The Polaris Global Value Fund (the “Fund”), is a diversified portfolio of Forum Funds (the “Trust”). The Trust is a Delaware statutory trust that is registered as an open-end, management investment company under the Investment Company Act of 1940, as amended. As of December 31, 2009, the Trust had twenty-nine investment portfolios. Under its Trust Instrument, the Trust is authorized to issue an unlimited number of the Fund’s shares of beneficial interest without par value. The Fund commenced operations on June 1, 1998, after it acquired the net assets of Global Value Limited Partnership (the “Partnership”), in exchange for Fund shares. The Partnership commenced operations on July 31, 1989. The Fund seeks capital appreciation by investing primarily in common stocks (including ADRs) of companies located worldwide (including emerging market countries).
Note 2. Summary of Significant Accounting Policies
These financial statements are prepared in accordance with generally accepted accounting principles in the United States of America (“GAAP”), which require management to make estimates and assumptions that affect the reported amounts of assets and liabilities, the disclosure of contingent liabilities at the date of the financial statements and the reported amounts of increase and decrease in net assets from operations during the fiscal period. Actual amounts could differ from those estimates. The following summarizes the significant accounting policies of the Fund:
Security Valuation – Exchange traded securities and over-the-counter securities are valued using the last sale or official closing price, provided by independent pricing services as of the close of trading on the market or exchange for which they are primarily traded, on each Fund business day. In the absence of a sale, such securities are valued at the mean of the last bid and asked prices provided by independent pricing services. Non-exchange traded securities for which quotations are available are generally valued at the mean of the current bid and asked prices provided by independent pricing services. Debt securities may be valued at prices supplied by a Fund’s pricing agent based on broker or dealer supplied valuations or matrix pricing, a method of valuing securities by reference to the value of other securities with similar characteristics such as rating, interest rate and maturity. Shares of open-end mutual funds are valued at net asset value (“NAV”). Short-term investments that mature in sixty days or less may be valued at amortized cost.
The Fund values its investments at fair value pursuant to procedures adopted by the Trust’s Board of Trustees (the “Board”) if (1) market quotations are insufficient or not readily available or (2) the adviser believes that the values available are unreliable. Fair valuation is based on subjective factors and as a result, the fair value price of an investment may differ from the security’s market price and may not be the price at which the asset may be sold. Fair valuation could result in a different NAV than a NAV determined by using market quotes.
The Fund has a three-tier fair value hierarchy. The basis of the tiers is dependent upon the various “inputs” used to determine the value of the Fund’s investments. These inputs are summarized in the three broad levels listed below:
Level 1 – quoted prices in active markets for identical assets
Level 2 – other significant observable inputs (including quoted prices of similar securities, interest rates, prepayment speeds, credit risk, etc.)
16
POLARIS GLOBAL VALUE FUND
NOTES TO FINANCIAL STATEMENTS
DECEMBER 31, 2009
Level 3 – significant unobservable inputs (including the Fund’s own assumptions in determining the fair value of investments)
The aggregate value by input level, as of December 31, 2009, for the Fund’s investments is included at the end of the Fund’s schedule of investments.
Security Transactions, Investment Income and Realized Gain and Loss – Investment transactions are accounted for on trade date. Dividend income is recorded on the ex-dividend date. Foreign dividend income is recorded on the ex-dividend date or as soon as practical after the Fund determines the existence of a dividend declaration after exercising reasonable due diligence. Income and capital gains on some foreign securities may be subject to foreign withholding taxes, which are accrued as applicable. Interest income is recorded on an accrual basis. Premium and discount is amortized and accreted in accordance with GAAP. Identified cost of investments sold is used to determine the gain and loss for both financial statement and federal income tax purposes.
Foreign Currency Translations – Foreign currency amounts are translated into US dollars as follows: (i) assets and liabilities at the rate of exchange at the end of the respective period; and (ii) purchases and sales of securities and income and expenses at the rate of exchange prevailing on the dates of such transactions. The portion of the results of operations arising from changes in the exchange rates and the portion due to fluctuations arising from changes in the market prices of securities are not isolated. Such fluctuations are included with the net realized and unrealized gain or loss on investments.
The Fund may enter into transactions to purchase or sell foreign currencies to protect the U.S. dollar value of its underlying portfolio securities against the effect of possible adverse movements in foreign exchange rates. Principal risks associated with such transactions include the movement in value of the foreign currency relative to the U.S. dollar and the ability of the counterparty to perform. Fluctuations in the value of such forward currency transactions are recorded daily as unrealized gain or loss; realized gain or loss includes net gain or loss on transactions that have terminated by settlement or by the Fund entering into offsetting commitments. These instruments involve market risk, credit risk, or both kinds of risks, in excess of the amount recognized in the statement of assets and liabilities. Risks arise from the possible inability of counterparties to meet the terms of their contracts and from movement in currency and securities values and interest rates.
Foreign Currency Transactions – The Fund may enter into transactions to purchase or sell foreign currency contracts and options on foreign currency. Forward foreign currency contracts are agreements to exchange one currency for another at a future date and at a specified price. The Fund may use forward foreign currency contracts to facilitate transactions in foreign securities and to manage the Fund’s foreign currency exposure. These contracts are intrinsically valued daily based on forward rates, and the Fund’s net equity therein, representing unrealized gain or loss on the contracts as measured by the difference between the forward foreign exchange rates at the dates of entry into the contracts and the forward rates at the reporting date, is recorded as a component of net asset value. Due to the risks associated with these transactions, the Fund could incur losses up to the entire contract amount, which may exceed the net unrealized value included in its net asset value.
Options – When the Fund writes an option, an amount equal to the premium received by the Fund is recorded
as a liability and is subsequently adjusted to the current value of the option written. Premiums received from
writing options that expire unexercised are treated by the Fund on the expiration date as realized gain from investments. The difference between the premium and the amount paid on effecting a closing purchase
17
POLARIS GLOBAL VALUE FUND
NOTES TO FINANCIAL STATEMENTS
DECEMBER 31, 2009
transaction, including brokerage commissions, is also treated as a realized gain, or if the premium is less than the amount paid for the closing purchase transaction, as a realized loss. If a call option is exercised, the premium is added to the proceeds from the sale of the underlying security or currency in determining whether the Fund has realized a gain or loss. If a put option is exercised, the premium reduces the cost basis of the securities purchased by the Fund. The Fund, as writer of an option, bear the market risk of an unfavorable change in the price of the security underlying the written option. When the Fund purchases an option, an amount equal to the premium paid by the Fund is recorded as an investment and is subsequently adjusted to the current value of the option purchased. If an option expires on the stipulated expiration date or if the Fund enters into a closing sale transaction, a gain or loss is realized. If a call option is exercised, the cost of the security acquired is increased by the premium paid for the call. If a put option is exercised, a gain or loss is realized from the sale of the underlying security, and the proceeds from such sale are decreased by the premium originally paid. Written and purchased options are non-income producing securities.
Transactions in options written during the year ended December 31, 2009, were as follows:
| | | | | | | |
| | | Calls
| |
| | | Number of
Contracts
| | | Premiums
| |
Options Outstanding, December 31, 2008 | | – | | | $ | – | |
Options written | | 2,896 | | | | 331,570 | |
Options terminated in closing transactions | | (187 | ) | | | (48,460 | ) |
Options exercised | | (2,309 | ) | | | (257,951 | ) |
Options expired | | (400 | ) | | | (25,159 | ) |
| | |
|
| |
|
|
|
Options Outstanding, December 31, 2009 | | – | | | $ | – | |
| | |
|
| |
|
|
|
Derivatives Transactions – In March 2008, the Financial Accounting Standards Board (“FASB”) issued the “Disclosures about Derivative Instruments and Hedging Activities Topic”. This is effective for annual and interim periods beginning after November 15, 2008, and requires enhanced disclosures about the Fund’s derivative and hedging activities, including how such activities are accounted for and their effect on the Fund’s financial position, performance and cash flows. The Fund adopted this disclosure in the prior reporting period.
The Fund’s use of derivatives during the year ended December 31, 2009, was limited to forward currency contracts and written options. The volume of open positions may vary on a daily basis as the Fund transacts derivative contracts in order to achieve the exposure desired by the Adviser. The total number of foreign exchange contracts entered into during the year was $47,133,276. Following is a summary of how the derivatives are treated in the financial statements and their impact on the Fund.
There were no open derivatives as of December 31, 2009, and thus there was no disclosure on the Statements of Assets & Liabilities.
18
POLARIS GLOBAL VALUE FUND
NOTES TO FINANCIAL STATEMENTS
DECEMBER 31, 2009
Realized and unrealized gains and losses on derivatives contracts entered into during the year ended December 31, 2009, by the Fund are recorded in the following locations in the Statement of Operations:
| | | | | | | | |
Contract Type/Primary Risk Exposure
| | Location of Gain or
(Loss) on Derivatives
| | Realized
Gain (Loss)
| | Change in
Unrealized
Appreciation
(Depreciation)
on Derivatives
| |
Equity contracts | | Realized gain (loss) on Written options | | $25,159 | | | – | |
Foreign exchange contracts | | Realized gain (loss) on Foreign currency transactions and change in unrealized appreciation (depreciation) on Foreign currency translations | | $(7,077) | | $ | (97 | ) |
Distributions to Shareholders – Distributions to shareholders of net investment income and net capital gains if any are declared and paid at least annually. Distributions are based on amounts calculated in accordance with applicable Federal income tax regulations, which may differ from GAAP. These differences are due primarily to differing treatments of income and gain on various investment securities held by the Fund, timing differences and differing characterizations of distributions made by the Fund.
Federal Taxes – The Fund intends to qualify each year as a regulated investment company under Subchapter M of the Internal Revenue Code and distribute all its taxable income. In addition, by distributing in each calendar year substantially all its net investment income and capital gains, if any, the Fund will not be subject to a Federal excise tax. Therefore, no Federal income or excise tax provision is required
The Fund concluded that as of December 31, 2009, there are no uncertain tax positions that would require financial statement recognition, de-recognition, or disclosure. The Fund’s Federal tax returns filed in the three-year period ended December 31, 2009, remain subject to examination by the Internal Revenue Service.
Income and Expense Allocation – The Trust accounts separately for the assets, liabilities and operations of each of its investment portfolios. Expenses that are directly attributable to more than one investment portfolio are allocated among the respective investment portfolios in an equitable manner.
Redemption Fee – A shareholder who redeems or exchanges shares within 180 days of purchase will incur a redemption fee of 1.00% of the current net asset value of shares redeemed or exchanged, subject to certain limitations. The fee is charged for the benefit of the remaining shareholders and will be paid to the Fund to help offset transaction costs. The fee is accounted for as an addition to paid-in capital. The Fund reserves the right to modify the terms of or terminate the fee at any time. There are limited exceptions to the imposition of the redemption fee.
Commitments and Contingencies – In the normal course of business, the Fund enters into contracts that provide general indemnifications by the Fund to the counterparty to the contract. The Fund’s maximum exposure under these arrangements is dependent on future claims that may be made against the Fund and, therefore, cannot be estimated; however, based on experience, the risk of loss from such claims is considered remote.
19
POLARIS GLOBAL VALUE FUND
NOTES TO FINANCIAL STATEMENTS
DECEMBER 31, 2009
Note 3. Advisory Fees, Servicing Fees and Other Transactions with Related Parties
Investment Adviser – Polaris Capital Management, LLC (the “Adviser”) is the investment adviser to the Fund. Pursuant to an Investment Advisory Agreement, the Adviser receives an advisory fee from the Fund at an annual rate of 1.00% of the Fund’s average daily net assets.
Shareholder Service Agent – The Trust has adopted a shareholder servicing plan for the Fund under which the Fund may reimburse the Fund’s administrator for amounts paid by the administrator for providing shareholder service activities that are not otherwise provided by the Transfer Agent. The Fund’s administrator may make such payments to various financial institutions, including the Adviser, that provide shareholder servicing to their customers invested in the Fund, in amounts up to 0.25% annually of average daily net assets of the shares held by such customers. During the year ended December 31, 2009, the Fund did not make any payments under the Shareholder Service Plan.
Distribution – Foreside Fund Services, LLC serves as the Fund’s distributor (the “Distributor”). The Distributor receives no compensation from the Fund for its distribution services. The Distributor is not affiliated with the Adviser or with Atlantic Fund Administration, LLC (“Atlantic”) or their affiliates.
Other Service Providers – Atlantic provides fund accounting, fund administration and transfer agency services to the Fund. Pursuant to an Atlantic services agreement, the Fund pays Atlantic customary fees for its services.
Atlantic provides a Principal Executive Officer, Principal Financial Officer, Chief Compliance Officer, and an Anti-Money Laundering Officer to the Fund, as well as certain additional compliance support functions.
Trustees and Officers – The Trust pays each independent Trustee an annual retainer fee of $40,000 for service to the Trust ($60,000 for the Chairman). In addition, the Chairman receives a monthly stipend of $500 to cover certain expenses incurred in connection with his duties to the Trust. The Trustees and Chairman may receive additional fees for special Board meetings. Each Trustee is also reimbursed for all reasonable out-of-pocket expenses incurred in connection with his duties as a Trustee, including travel and related expenses incurred in attending Board meetings. The amount of Trustees’ fees attributable to the Fund is disclosed in the Statement of Operations. Certain officers of the Trust are also officers or employees of the above named service providers, and during their terms of office received no compensation from the Fund.
Note 4. Expense Reimbursements and Fees Waived
Certain fund service providers have voluntarily agreed to waive and reimburse a portion of their fees. These voluntary waivers and reimbursements may be reduced or eliminated at any time. For the year ended December 31, 2009, fees waived were $16,790.
Note 5. Security Transactions
The cost of purchases and proceeds from sales of investment securities (including maturities), other than short-term investments for the year ended December 31, 2009, were $37,182,649 and $61,340,469, respectively.
20
POLARIS GLOBAL VALUE FUND
NOTES TO FINANCIAL STATEMENTS
DECEMBER 31, 2009
Note 6. Federal Tax Information and Investment Transactions
Distributions during the fiscal years ended as noted were characterized for tax purposes as follows:
| | | | | | |
| | | 2009
| | 2008
|
Ordinary Income | | $ | 20,598 | | $ | 6,185,143 |
Long-Term Capital Gain | | | – | | | 7,917,405 |
| | |
|
| |
|
|
Total | | $ | 20,598 | | $ | 14,102,548 |
| | |
|
| |
|
|
As of December 31, 2009, distributable earnings (accumulated loss) on a tax basis were as follows:
| | | | |
Undistributed Ordinary Income | | $ | 2,012,834 | |
Unrealized Appreciation (Depreciation) on Investments and Foreign Currency | | | (50,564,444 | ) |
Capital and Other Losses | | | (106,577,339 | ) |
| | |
|
|
|
Total | | $ | (155,128,949 | ) |
| | |
|
|
|
The difference between components of distributable earnings on a tax basis and the amounts reflected in the Statement of Assets and Liabilities are primarily due to wash sales and investments in passive foreign investment companies.
For tax purposes, the current year post-October loss was $6,172,500 (realized during the period November 1, 2009, through December 31, 2009). This loss will be recognized for tax purposes on the first business day of the Fund’s next fiscal year, January 1, 2010.
As of December 31, 2009, the Fund had capital loss carryforwards to offset future capital gains of $41,240,428 and $59,164,411, expiring in 2016 and 2017, respectively.
On the Statement of Assets and Liabilities, as a result of permanent book to tax differences, certain amounts have been reclassified for the year ended December 31, 2009. The following reclassification was the result of currency gain, and has no impact on the net assets of the Fund.
| | | | |
Accumulated Net Investment Income | | $ | 552,483 | |
Accumulated Net Realized Gain (Loss) | | | (552,483 | ) |
Note 7. Recent Accounting Pronouncement
In June 2009, the Financial Accounting Standards Board (“FASB”) issued the “FASB Accounting Standard CodificationTM and the Hierarchy of Generally Accepted Accounting Principles” (“Codification”). The FASB approved the Codification as the single source of authoritative U.S. accounting and reporting standards for non-governmental entities, in addition to guidance issued by the Securities and Exchange Commission (“SEC”). All guidance contained in the Codification carries an equal level of authority. The Codification supersedes all then-existing non-SEC accounting and reporting standards. All other non-grandfathered non-SEC accounting literature not included in the Codification has become nonauthoritative. The Codification is effective for financial
21
POLARIS GLOBAL VALUE FUND
NOTES TO FINANCIAL STATEMENTS
DECEMBER 31, 2009
statements issued for interim and annual periods ending after September 15, 2009. Management has evaluated the Codification and has determined that it did not have a significant impact on the reporting of the Fund’s financial statements.
In January 2010, the Financial Accounting Standards Board issued Accounting Standards Update (“ASU”) No. 2010-06 “Improving Disclosures about Fair Value Measurements.” ASU No. 2010-06 clarifies existing disclosure and requires additional disclosures regarding fair value measurements. Effective for interim and annual reporting periods beginning after December 15, 2009, entities will be required to disclose significant transfers into and out of Level 1 and 2 measurements in the fair value hierarchy and the reasons for those transfers. Effective for fiscal years beginning after December 15, 2010, and for interim periods within those fiscal years, entities will need to disclose information about purchases, sales, issuances and settlements of Level 3 securities on a gross basis, rather than as a net number as currently required. Management is currently evaluating the impact ASU No. 2010-06 will have on its financial statement disclosures.
Note 8. Subsequent Events
Subsequent events occurring after the date of this report have been evaluated for potential impact to this report through February 24, 2010, and the Fund has noted no such events.
22
POLARIS GLOBAL VALUE FUND
REPORT OF INDEPENDENT REGISTERED PUBLIC ACCOUNTING FIRM
To the Board of Trustees of Forum Funds
and the Shareholders of Polaris Global Value Fund
We have audited the accompanying statement of assets and liabilities of Polaris Global Value Fund, a series of shares of beneficial interest in the Forum Funds, including the schedule of investments, as of December 31, 2009, and the related statement of operations for the year then ended, and the statements of changes in net assets and the financial highlights for each of the years in the two year period then ended. These financial statements and financial highlights are the responsibility of the Fund’s management. Our responsibility is to express an opinion on these financial statements and financial highlights based on our audits. The financial highlights for each of the years in the three year period ended December 31, 2007 were audited by other auditors whose report dated February 26, 2008, expressed an unqualified opinion on such financial highlights.
We conducted our audits in accordance with the standards of the Public Company Accounting Oversight Board (United States). Those standards require that we plan and perform the audits to obtain reasonable assurance about whether the financial statements and financial highlights are free of material misstatement. An audit includes examining, on a test basis, evidence supporting the amounts and disclosures in the financial statements. Our procedures included confirmation of securities owned as of December 31, 2009 by correspondence with the custodian. An audit also includes assessing the accounting principles used and significant estimates made by management, as well as evaluating the overall financial statement presentation. We believe that our audits provide a reasonable basis for our opinion.
In our opinion, the financial statements and financial highlights referred to above present fairly, in all material respects, the financial position of Polaris Global Value Fund as of December 31, 2009, the results of its operations for the year then ended, and the changes in its net assets and its financial highlights for each of the years in the two year period then ended, in conformity with accounting principles generally accepted in the United States of America.

BBD, LLP
Philadelphia, Pennsylvania
February 24, 2010
23
POLARIS GLOBAL VALUE FUND
ADDITIONAL INFORMATION
DECEMBER 31, 2009 (Unaudited)
Proxy Voting Information
A description of the policies and procedures that the Fund uses to determine how to vote proxies relating to securities held in the Fund’s portfolio is available, without charge and upon request, by calling (888) 263-5594 and on the SEC’s website at www.sec.gov. The Fund’s proxy voting records for the twelve-month period ended June 30, is available, without charge and upon request, by calling (888) 263-5594 and on the SEC’s website at www.sec.gov.
Availability of Quarterly Portfolio Schedules
The Fund files its complete schedule of portfolio holdings with the SEC for the first and third quarters of each fiscal year on Form N-Q. The Fund’s Forms N-Q are available, without charge and upon request on the SEC’s website at www.sec.gov or may be reviewed and copied at the SEC’s Public Reference Room in Washington, DC. Information on the operation of the Public Reference Room may be obtained by calling 1-800-SEC-0330.
Shareholder Expenses Example
As a shareholder of the Fund, you incur two types of costs: (1) transaction costs, including redemption fees; and exchange fees and (2) ongoing costs, including management fees, and other Fund expenses. This example is intended to help you understand your ongoing costs (in dollars) of investing in the Fund and to compare these costs with the ongoing costs of investing in other mutual funds.
The following example is based on $1,000 invested at the beginning of the period and held for the entire period from July 1, 2009, through December 31, 2009.
Actual Expenses – The first line of the table below provides information about actual account values and actual expenses. You may use the information in this line, together with the amount you invested, to estimate the expenses that you paid over the period. Simply divide your account value by $1,000 (for example, an $8,600 account value divided by $1,000 = 8.6), then multiply the result by the number in the first line under the heading entitled “Expenses Paid During Period” to estimate the expenses you paid on your account during the period.
Hypothetical Example for Comparison Purposes – The second line of the table below provides information about hypothetical account values and hypothetical expenses based on the Fund’s actual expense ratio and an assumed rate of return of 5% per year before expenses, which is not the Fund’s actual return. The hypothetical account values and expenses may not be used to estimate the actual ending account balance or expenses you paid for the period. You may use this information to compare the ongoing cost of investing in the Fund and other funds. To do so, compare this 5% hypothetical example with the 5% hypothetical examples that appear in the shareholder reports of other funds.
Please note that expenses shown in the table are meant to highlight your ongoing costs only and do not reflect any transactional costs, such as redemption fees or exchange fees. Therefore, the second line of the table is useful in comparing ongoing costs only, and will not help you determine the relative total costs of owning different funds. In addition, is these transactional costs had been included, your costs would have been higher.
24
POLARIS GLOBAL VALUE FUND
ADDITIONAL INFORMATION
DECEMBER 31, 2009 (Unaudited)
| | | | | | | | | | | | |
| | | Beginning
Account Value
July 1, 2009
| | Ending
Account Value
December 31, 2009
| | Expenses Paid
During Period*
| | Annualized
Expense Ratio*
| |
Actual | | $ | 1,000.00 | | $ | 1,233.60 | | $ | 7.66 | | 1.36 | % |
Hypothetical (5% return before expenses) | | $ | 1,000.00 | | $ | 1,018.30 | | $ | 6.92 | | 1.36 | % |
| * | Expenses are equal to the Fund’s annualized expense ratio as indicated above multiplied by the average account value over the period, multiplied by the number of days in most recent fiscal half-year divided by 365 to reflect the half-year period. |
Federal Tax Status of Dividends Declared during the Tax Year
Income Dividends – For Federal income tax purposes, dividends from short-term capital gains are classified as ordinary income. The Fund designates 44.76% of its income dividend distributed as qualifying for the corporate dividends-received deduction (DRD) and 100.00% for the qualified dividend rate (QDI) as defined in Section 1(h)(11) of the Internal Revenue Code. The Fund also designates 0.79% of its income dividends as qualified interest income (QII.)
Trustees and Officers of the Trust
The Board is responsible for oversight of the management of the Trust’s business affairs and of the exercise of all the Trust’s powers except those reserved for shareholders. The following table provides information about each Board member and certain officers of the Trust. Each Trustee and officer holds office until the person resigns, is removed, or is replaced. Unless otherwise noted, the persons have held their principal occupations for more than five years. The address for all Trustees and officers is Three Canal Plaza, Suite 600, Portland, Maine, 04101, unless otherwise indicated. Each Trustee oversees twenty-nine portfolios in the Trust. Mr. Keffer is considered an Interested Trustee due to his affiliation with Atlantic. Mr. Keffer is also an Interested Director of Wintergreen Fund, Inc. The Fund’s Statement of Additional Information includes additional information about the Trustees and is available, without charge and upon request, by calling (888) 263-5594.
| | | | | | |
Name
and Year of Birth | | Position with
the Trust | | Length of
Time Served | | Principal Occupation(s) During Past 5 Years |
INDEPENDENT TRUSTEES | | | | | | |
J. Michael Parish Born: 1943 | | Chairman of the Board; Trustee; Chairman, Nominating Committee and Qualified Legal Compliance Committee | | Since 1989 (Chairman since 2004) | | Retired; Partner, Wolf, Block, Schorr and Solis-Cohen, LLP (law firm) 2002 – 2003. |
25
POLARIS GLOBAL VALUE FUND
ADDITIONAL INFORMATION
DECEMBER 31, 2009 (Unaudited)
| | | | | | |
Name
and Year of Birth | | Position with
the Trust | | Length of
Time Served | | Principal Occupation(s) During Past 5 Years |
INDEPENDENT TRUSTEES (continued) | | | | | | |
Costas Azariadis Born: 1943 | | Trustee; Chairman, Valuation Committee | | Since 1989 | | Professor of Economics, Washington University since 2006; Professor of Economics, University of California-Los Angeles 1992 – 2006. |
James C. Cheng Born: 1942 | | Trustee; Chairman, Audit Committee | | Since 1989 | | President, Technology Marketing Associates (marketing company for small- and medium-sized businesses in New England) since 1991. |
INTERESTED TRUSTEE | | | | | | |
John Y. Keffer1 Born: 1942 | | Trustee | | Since 1989 | | Chairman, Atlantic since 2008; President, Forum Foundation (a charitable organization) since 2005; President, Forum Trust, LLC (a non-depository trust company) since 1997; President, Citigroup Fund Services, LLC (“Citigroup”) 2003 – 2005. |
OFFICERS | | | | | | |
Stacey E. Hong Born: 1966 | | President; Principal Executive Officer | | Since 2008 | | President, Atlantic since 2008; Director, Consulting Services, Foreside Fund Services, 2007; Elder Care 2005 – 2006; Director, Fund Accounting, Citigroup 2003 – 2005; Director/Senior Manager/Manager, Accounting, Forum, 1992 – 2003. |
Karen Shaw Born: 1972 | | Treasurer; Principal Financial Officer | | Since 2008 | | Senior Manager, Atlantic since 2008; Section Manager/Vice President, Enterprise Support Services, Citigroup 2003 – 2008. |
David Faherty Born: 1970 | | Vice President | | Since April 2009 | | Senior Counsel, Atlantic since February 2009; Vice President, Citi Fund Services Ohio, Inc. 2007 – 2009; Associate Counsel, Investors Bank & Trust Company 2006 – 2007; employee of FDIC 2005. |
26
POLARIS GLOBAL VALUE FUND
ADDITIONAL INFORMATION
DECEMBER 31, 2009 (Unaudited)
| | | | | | |
Name
and Year of Birth | | Position with
the Trust | | Length of
Time Served | | Principal Occupation(s) During Past 5 Years |
OFFICERS (continued) | | | | | | |
Michael J. McKeen Born: 1971 | | Vice President | | Since September 2009 | | Senior Manager, Atlantic since 2008; Vice President, Citigroup 2003 – 2008. |
Joshua LaPan Born: 1973 | | Vice President | | Since September 2009 | | Manager, Atlantic since 2008; Vice President, Citigroup 2003 – 2008. |
Timothy Bowden Born: 1969 | | Vice President | | Since September 2009 | | Manager, Atlantic since 2008; Vice President, Citigroup 2005 – 2008; Manager, PNC, 1997 – 2005. |
Lina Bhatnagar Born: 1971 | | Secretary | | Since 2008 | | Senior Administration Specialist, Atlantic since 2008; Regulatory Administration Specialist, Citigroup, 2006 – 2008; Money Market/Short Term Trader, Wellington Management, 1996 – 2002. |
| 1 | Since 1997, John Y. Keffer has been president and owner of Forum Trust, LLC. Atlantic is a subsidiary of Forum Trust, LLC. |
27

ANNUAL REPORT
December 31, 2009
http://www.polarisfunds.com
(888) 263-5594
INVESTMENT ADVISER
Polaris Capital Management, LLC
125 Summer Street
Boston, MA 02110
DISTRIBUTOR
Foreside Fund Services, LLC
Three Canal Plaza, Suite 100
Portland, ME 04101
www.foreside.com
TRANSFER AGENT
Atlantic Fund Administration, LLC
P.O. Box 588
Portland, ME 04112
This report is submitted for the general information of the shareholders of the Fund. It is not authorized for distribution to prospective investors unless preceded or accompanied by an effective prospectus, which includes information regarding the Fund’s risks, objectives, fees and expenses, experience of its management and other information.
225-ANR-1209

Annual Report
December 31, 2009
TABLE OF CONTENTS
The views expressed in this report are those of the investment advisor of The BeeHive Fund (the “Fund”) as of December 31, 2009, and may not reflect its views on the date this report is first published or any time thereafter. These views are intended to assist shareholders of the Fund in understanding their investments in the Fund and do not constitute investment advice. The Fund is subject to various forms of risk, including the possible loss of principal. Investing in foreign securities entails risks not associated with domestic equities, including economic and political instability and currency fluctuations. Investing in fixed income securities includes the risk that rising interest rates will cause a decline in values. Focused investments in particular industries or market sectors can entail increased volatility and greater market risk than is the case with more broadly diversified investments. Investments in securities of small and mid-capitalization companies involve the possibility of greater volatility than investments in larger capitalization companies. Investments in American Depositary Receipts involve many of the same risks as investing in foreign securities.
THE BEEHIVE FUND
A MESSAGE TO OUR SHAREHOLDERS
DECEMBER 31, 2009
Although another trip around the sun has little meaning to an investment portfolio (except for tax reasons), it does provide a nice opportunity to look back over the year, and to think about what lies ahead.
From an investment and economic perspective, cycles are more relevant than the lapse of a calendar year. In 2009, for example, the early months were actually extensions of the 2008 bear cycle (which really began in 2007) and March 10th began a steep recovery period. Combining the 57% peak-to-trough decline with the 65% advance from the bottom has produced a 29% decline in the S&P 500 from the peak in 2007 to the end of 2009 (all figures excluding dividends).
The end of 2009 also marked the end of another important decade for investors. It is ten years after the last great bull year of 1999—and it has been, to say the least, a very mixed ten year period. The S&P 500 Index and Dow Jones Industrial Average produced poor returns over the period (a decline of 24% and 9% respectively). And while the actual results experienced by many investors were better due to dividend reinvestment, diversification, dollar cost averaging, or effective asset allocation and stock picking by their advisor, the pain was very real.
But, let’s return to the task at hand; how do we view the period ahead and how does one best invest a portfolio for protection and growth? A quick non-scientific review of macro data tells us short-term economic growth, at least in the U.S., appears challenged. We also admit that the geopolitical environment is daunting and will not likely improve meaningfully in the near term. However, investors have always worked with exogenous risks that need to be divorced from the goal of investing to preserve capital. We invest with the understanding that the world is uncertain, but that economic life manages to persist.
In short, we do not think shares are irrationally priced. Today, investment decisions can be based on basic, ascertainable, and—most importantly—current facts and metrics without assuming a particularly rosy view of gross domestic product growth. Our portfolio trades at an average of 14.5 times our 2009 earnings estimates (we won’t know for a few weeks what actual results were). We believe that these same companies will experience average earnings growth of 9.5% during 2010, and they presently trade at 13.5 times our 2010 earnings per share estimates. This means, on average, the reported earnings of our shares represent a 7% yield on today’s price. Many of our companies have free cash flow in excess of reported earnings (as earnings include non-cash charges like depreciation) and therefore an even more attractive free cash flow yield. While this is not all returned to shareholders, it is left to us as investors to invest with managements that use this cash flow productively to pay dividends, pay down debt, buy in shares, or make profitable investments in acquisitions, building projects, or hiring people. A 13.5 price-to-earnings ratio (7% earnings yield) company that reinvests its earnings in projects meeting a similar implied rate of return can double earnings per share in less than ten years, even without debt financing. Despite all of the present challenges, the power of compounding remains a potent force.
This return seems particularly attractive to us for a few reasons. First, earnings already reflect a tough environment. Can it get tougher? Sure. But we believe opportunities for growth exist. Secondly, our companies tend to be less sensitive to economic swings and have recurring revenue models. And lastly, this return is very compelling when compared to other investment opportunities that are perceived to be “safer.”
We created the table below to illustrate the change in relative valuation over the last decade. We focused our attention on three assets, each presenting a different level of risk and return: the one year Treasury, the one year BBB corporate bond and the S&P 500 earnings yield based on one year forward estimated earnings. In theory, investors should require a greater return for assuming additional risk in their investments. As such, one would generally expect that the yield on the one year Treasury would be lower than the yield on the one year BBB corporate, which would in turn be lower than the earnings yield offered by the constituents of the S&P 500. As seen below, this relationship did not hold a decade ago when the bubble era earnings yield fell significantly below the yield available on short-term fixed income instruments. Today, the S&P 500 earnings yield is significantly higher than the yields of both government and corporate bonds. Admittedly, today’s bond yields may be too low and the trajectory of earnings can be debated, but stocks do not appear irrationally priced.
| | | | | | | | | |
| | | 1 Year
Treasury Yield
| | | 1 Year
BBB Yield
| | | S&P 500
Earnings Yield
| |
December 31, 1999 | | 6.0 | % | | 7.4 | % | | 3.8 | % |
December 31, 2009 | | 0.4 | % | | 2.4 | % | | 7.1 | % |
THE BEEHIVE FUND
A MESSAGE TO OUR SHAREHOLDERS
DECEMBER 31, 2009
A final, and critical, reason to believe in a positive long-term future relates to our specific holdings. We believe that we hold a portfolio of companies with defensible competitive positions, solid balance sheets and global growth prospects, all at reasonable valuations.
This past quarter, we acquired shares of two new companies that have compelling stories and are examples of attractively priced investments available in the stock market today. One is a leading technology company with a huge moat around its business model and numerous growth opportunities. The other is a 100 year old company whose recent restructuring and niche markets provide an investment levered to a recovery, but with significant downside protection.
Oracle Corporation
Oracle was founded as a database software provider and has not only maintained its industry leading position in database management, but also has leveraged this position to become a major participant in the middleware and enterprise application software markets. Oracle’s installed base, combined with its license and support business model, produces a durable stream of update and support revenue that currently accounts for roughly 80% of firm profitability. Oracle has used this cash flow to fund internal development and to acquire complementary technologies, driving compound annual earnings growth over the past five years toward 25%.
Despite this history of success, at the time of our purchase Oracle carried an 8% free cash flow yield and the share price implied flat new license sales over the next few years. Of course this potential exists; however, we believe that the continued improvement in the global economy, near term product launches and continued productive use of excess cash flow will prove the consensus outlook to be overly conservative. Additional upside should also result from Oracle’s pending acquisition of Sun Microsystems. At a minimum, this acquisition will be immediately accretive to Oracle’s earnings and we believe it will accelerate earnings growth meaningfully into the future.
FMC Corporation
Our second purchase in the quarter was specialty chemical company FMC Corporation. FMC is unusual within the chemical industry as it possesses structural advantages in each of its four main product categories. For instance, FMC’s lithium division, which provides material for uses that include batteries and pharmaceutical manufacturing, is one of three companies that produce two-thirds of the world’s lithium (FMC produces roughly 15%) and enjoy a significant cost advantage. Additionally, FMC is one of only two major downstream producers of lithium specialty products, providing better margins and insulation from fluctuations in commodity prices. As another example, FMC’s agricultural division focuses on niche products and geographies that are too small for larger agricultural chemical competitors. With a low cost of production, FMC should generate healthy margins and protect market share in all of its primary businesses.
At purchase, FMC traded at 12 times our estimate of 2010 earnings, which assumes only modest economic growth. For FMC to exceed our expectations and be a great investment, we do need a sustained economic recovery. But a solid balance sheet, experienced management team and a collection of businesses advantaged by low cost positions, differentiated products or a combination thereof, makes us confident that the upside potential outweighs the downside risk.
Our Portfolio
Despite our cautious stance, the portfolio performed well during the most recent quarter and for the year overall. We held no leveraged financial lenders and were willing to miss their sharp rebound, assuming the other potential outcome was bankruptcy or nationalization. We remained steadfast in our health care holdings, despite the regulatory environment and market concerns.
In fact, as the health care debate has begun to subside, the value that we believe exists within the sector is beginning to attract investor attention. These stocks were outperformers during the fourth quarter. Our portfolio also benefited from merger and acquisition activity as XTO Energy Inc., which was added to the portfolio in the second quarter of 2009, is being acquired by Exxon Mobil Corporation at a 25% premium to our purchase price.
Even with the advance of the broad index, not all stocks in our portfolio have yet participated and we continue to identify additional new opportunities. For example, we are currently doing research on the insurance brokerage industry. On average, its value declined 11.5% during 2009 despite possessing strong franchises and generating 5% earnings growth.
2
THE BEEHIVE FUND
A MESSAGE TO OUR SHAREHOLDERS
DECEMBER 31, 2009
Concluding Thoughts
Ten years ago we were approaching the end of a 17 year long bull market in stocks, and the end of at least five years in bubble territory. The future looked bright to most. Some saw the technology crash arriving, a few perhaps saw the beginning of a housing bubble, and hardly anyone saw the possibility of a September 11, 2001 event and all its aftermath. In the last ten years we have learned many lessons, but few of them new. The law of unintended consequences persists, fear and greed drive an economy, criminals sometimes wear suits, more credit is not more wealth, and one should never assume that those in control know more than those who are not.
As we write today, we recognize the precarious position of our economy, and by association, that of the global economy. We are in a grand experiment of government intervention that has unknowable outcomes. The consumer debt bubble hid our issues for far too long and the de-leveraging has yet to run its full course. We now understand that the technology boom and productivity miracle that drove our economy for the last two decades has a very real dark-side and therefore job growth will be muted. The near term picture is cloudy.
Yet, we know what current income is earned by a stock or bond investment today. We can reasonably extrapolate this return and change our assumptions as factors present themselves. We will remain fully alert in our process, flexible in our beliefs, and liquid in our portfolio holdings. Overall, we believe that a well balanced, patient portfolio will continue to perform well in the years ahead.
Have a happy, healthy, and prosperous New Year.
Sincerely,
| | |
 | |  |
| William G. Spears | | Robert M. Raich |
3
THE BEEHIVE FUND
PERFORMANCE CHART AND ANALYSIS
DECEMBER 31, 2009
The following chart reflects the change in value of a hypothetical $10,000 investment in The BeeHive Fund since inception, including reinvested dividends and distributions. The result is compared to the S&P 500 Index (the “Index”), which is a market-value weighted index representing the performance of 500 widely held, publicly traded large capitalization stocks. The total return of the Fund includes operating expenses that reduce returns, while the total return of the Index does not include expenses. The Fund is professionally managed, while the Index is unmanaged and is not available for direct investment.
Performance data quoted represents past performance and is no guarantee of future results. Current performance may be lower or higher than the performance data quoted. Investment return and principal value of an investment in the Fund will fluctuate so that shares, when redeemed, may be worth more or less than their original cost. For the most recent month-end performance, please call (866) 684-4915. The performance table and graph do not reflect the deduction of taxes that a shareholder would pay on Fund distributions or the redemption of Fund shares. The Fund’s annual operating expense ratio (gross) per the prospectus is 3.76%. However, Spears Abacus Advisors LLC, the investment advisor to the Fund (the “Advisor”), has contractually agreed to waive a portion of its fees and/or to reimburse certain expenses through April 30, 2010, to limit Total Annual Fund Operating Expenses to 1.00%. During the period, certain fees were waived and/or expenses reimbursed; otherwise, returns would have been lower.
| | | | | | |
Total Return as of 12/31/09
| | One Year
| | | Since
Inception
9/2/08
| |
The BeeHive Fund | | 31.59 | % | | (1.44 | )% |
S&P 500 Index | | 26.46 | % | | (7.40 | )% |
| | | |
Investment Value on 12/31/09
| | |
The BeeHive Fund | | $ | 9,809 |
S&P 500 Index | | $ | 9,028 |
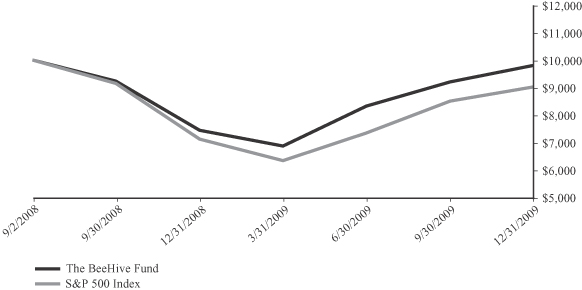
4
THE BEEHIVE FUND
SCHEDULE OF INVESTMENTS
DECEMBER 31, 2009
| | | | | |
Shares
| | Security Description
| | Value
|
Common Stock—96.8% |
Basic Materials—2.0% | | | |
| 15,035 | | FMC Corp. | | $ | 838,352 |
| | | | |
|
|
Consumer Discretionary—12.7% | | | |
| 103,120 | | Comcast Corp., Class A | | | 1,738,603 |
| 26,195 | | Hasbro, Inc. | | | 839,812 |
| 43,010 | | The Walt Disney Co. | | | 1,387,073 |
| 47,225 | | Time Warner, Inc. | | | 1,376,136 |
| | | | |
|
|
| | | | | | 5,341,624 |
| | | | |
|
|
Consumer Staples—12.4% | | | |
| 55,780 | | CVS Caremark Corp. | | | 1,796,674 |
| 34,245 | | Nestle SA, ADR | | | 1,655,746 |
| 55,265 | | Unilever PLC, ADR | | | 1,762,953 |
| | | | |
|
|
| | | | | | 5,215,373 |
| | | | |
|
|
Energy—8.0% | | | |
| 23,725 | | Devon Energy Corp. | | | 1,743,788 |
| 35,195 | | XTO Energy, Inc. | | | 1,637,623 |
| | | | |
|
|
| | | | | | 3,381,411 |
| | | | |
|
|
Financials—8.4% | | | |
| 41,165 | | ACE, Ltd. | | | 2,074,716 |
| 52,695 | | Axis Capital Holdings, Ltd. | | | 1,497,065 |
| | | | |
|
|
| | | | | | 3,571,781 |
| | | | |
|
|
Health Care Equipment and Services—19.7% | | | |
| 28,390 | | Baxter International, Inc. | | | 1,665,925 |
| 94,230 | | Hologic, Inc. (a) | | | 1,366,335 |
| 8,955 | | Laboratory Corp. of America Holdings (a) | | | 670,192 |
| 20,155 | | Quest Diagnostics, Inc. | | | 1,216,959 |
| 46,130 | | St. Jude Medical, Inc. (a) | | | 1,696,661 |
| 55,635 | | UnitedHealth Group, Inc. | | | 1,695,755 |
| | | | |
|
|
| | | | | | 8,311,827 |
| | | | |
|
|
Industrials—7.3% | | | |
| 38,335 | | Cooper Industries, PLC | | | 1,634,604 |
| 36,630 | | Honeywell International, Inc. | | | 1,435,896 |
| | | | |
|
|
| | | | | | 3,070,500 |
| | | | |
|
|
Information Technology—1.8% | | | |
| 40,700 | | The Western Union Co. | | | 767,195 |
| | | | |
|
|
Pharmaceuticals, Biotechnology and Life Sciences—11.3% | | | |
| 28,805 | | Johnson & Johnson | | | 1,855,330 |
| 20,880 | | Life Technologies Corp. (a) | | | 1,090,562 |
| 38,285 | | Thermo Fisher Scientific, Inc. (a) | | | 1,825,812 |
| | | | |
|
|
| | | | | | 4,771,704 |
| | | | |
|
|
Technology—9.3% | | | |
| 1,496 | | Google, Inc., Class A (a) | | | 927,490 |
| 56,045 | | Microsoft Corp. | | | 1,708,812 |
| 52,490 | | Oracle Corp. | | | 1,288,105 |
| | | | |
|
|
| | | | | | 3,924,407 |
| | | | |
|
|
Utilities—3.9% | | | |
| 31,515 | | FPL Group, Inc. | | | 1,664,622 |
| | | | |
|
|
Total Common Stock (Cost $34,225,474) | | | 40,858,796 |
| | | | |
|
|
| | | | | |
Shares
| | Security Description
| | Value
|
Short-Term Investments—3.1% | | | |
Money Market Fund—3.1% | | | |
| 1,278,688 | | Fidelity Institutional Cash Money Market Fund, 0.26% (b) (Cost $1,278,688) | | $ | 1,278,688 |
| | | | |
|
|
Total Investments—99.9% (Cost $35,504,162)* | | $ | 42,137,484 |
Other Assets and Liabilities, Net—0.1% | | | 57,300 |
| | | | |
|
|
NET ASSETS—100.0% | | $ | 42,194,784 |
| | | | |
|
|
| ADR | | American Depositary Receipt |
| PLC | | Public Limited Company |
| (a) | | Non-income producing security. |
| (b) | | Represents 7-day effective yield as of December 31, 2009. |
| * | | Cost for Federal income tax purposes is $35,632,133, and net unrealized appreciation consists of: |
| | | | |
Gross Unrealized Appreciation | | $ | 7,011,264 | |
Gross Unrealized Depreciation | | | (494,051 | ) |
| | |
|
|
|
Net Unrealized Appreciation | | $ | 6,517,213 | |
| | |
|
|
|
The following is a summary of the inputs used to value the Fund’s investments as of December 31, 2009:
The inputs or methodology used for valuing securities are not necessarily an indication of the risk associated with investing in those securities. For more information on valuation inputs, and their aggregation into the levels used in the table below, refer to Note 2—Security Valuation section in the accompanying Notes to Financial Statements.
| | | | | | | | | | | | |
| | | Level 1
| | Level 2
| | Level 3
| | Total
|
Common Stocks | | | | | | | | | | | | |
Basic Materials | | $ | 838,352 | | $ | — | | $ | — | | $ | 838,352 |
Consumer Discretionary | | | 5,341,624 | | | — | | | — | | | 5,341,624 |
Consumer Staples | | | 5,215,373 | | | — | | | — | | | 5,215,373 |
Energy | | | 3,381,411 | | | — | | | — | | | 3,381,411 |
Financials | | | 3,571,781 | | | — | | | — | | | 3,571,781 |
Health Care Equipment and Services | | | 8,311,827 | | | — | | | — | | | 8,311,827 |
Industrials | | | 3,070,500 | | | — | | | — | | | 3,070,500 |
Information Technology | | | 767,195 | | | — | | | — | | | 767,195 |
Pharmaceuticals, Biotechnology and Life Sciences | | | 4,771,704 | | | — | | | — | | | 4,771,704 |
Technology | | | 3,924,407 | | | — | | | — | | | 3,924,407 |
Utilities | | | 1,664,622 | | | — | | | — | | | 1,664,622 |
Money Market Fund | | | — | | | 1,278,688 | | | — | | | 1,278,688 |
| | |
|
| |
|
| |
|
| |
|
|
TOTAL | | $ | 40,858,796 | | $ | 1,278,688 | | $ | — | | $ | 42,137,484 |
| | |
|
| |
|
| |
|
| |
|
|
| | | |
PORTFOLIO HOLDINGS | | | |
% of Total Investments | | | |
Basic Materials | | 2.0 | % |
Consumer Discretionary | | 12.7 | % |
Consumer Staples | | 12.4 | % |
Energy | | 8.0 | % |
Financials | | 8.5 | % |
Health Care Equipment and Services | | 19.7 | % |
Industrials | | 7.3 | % |
Information Technology | | 1.8 | % |
Pharmaceuticals, Biotechnology and Life Sciences | | 11.3 | % |
Technology | | 9.3 | % |
Utilities | | 3.9 | % |
Money Market Fund | | 3.1 | % |
| | |
|
|
| | | 100.0 | % |
| | |
|
|
| | | | |
| See Notes to Financial Statements. | | 5 | | |
THE BEEHIVE FUND
STATEMENT OF ASSETS AND LIABILITIES
DECEMBER 31, 2009
| | | | |
ASSETS | | | | |
Total investments, at value (Cost $35,504,162) | | $ | 42,137,484 | |
Receivables: | | | | |
Fund shares sold | | | 52,000 | |
Dividends and interest | | | 59,803 | |
Prepaid Expenses | | | 2,522 | |
| | |
|
|
|
Total Assets | | | 42,251,809 | |
| | |
|
|
|
| |
LIABILITIES | | | | |
Accrued Liabilities: | | | | |
Investment advisory fees | | | 16,639 | |
Professional fees | | | 20,969 | |
Fund service fees | | | 12,237 | |
Compliance services fees | | | 2,083 | |
Trustees’ fees and expenses | | | 25 | |
Other expenses | | | 5,072 | |
| | |
|
|
|
Total Liabilities | | | 57,025 | |
| | |
|
|
|
| |
NET ASSETS | | $ | 42,194,784 | |
| | |
|
|
|
| |
COMPONENTS OF NET ASSETS | | | | |
Paid-in capital | | $ | 35,894,319 | |
Undistributed net investment income | | | 15 | |
Accumulated net realized loss from investments | | | (332,872 | ) |
Unrealized appreciation on investments | | | 6,633,322 | |
| | |
|
|
|
| |
NET ASSETS | | $ | 42,194,784 | |
| | |
|
|
|
| |
NET ASSET VALUE, OFFERING AND REDEMPTION PRICE PER SHARE | | | | |
Based on net assets of $42,194,784 and 4,327,308 shares outstanding at $0.000 par value
(unlimited shares authorized) | | $ | 9.75 | |
| | |
|
|
|
| | | | |
| See Notes to Financial Statements. | | 6 | | |
THE BEEHIVE FUND
STATEMENT OF OPERATIONS
YEAR ENDED DECEMBER 31, 2009
| | | | |
INVESTMENT INCOME | | | | |
Dividend income (net of foreign withholding taxes of $7,258) | | $ | 488,813 | |
Interest income | | | 203 | |
| | |
|
|
|
Total Investment Income | | | 489,016 | |
| | |
|
|
|
| |
EXPENSES | | | | |
Investment advisory fees | | | 236,977 | |
Fund service fees | | | 146,442 | |
Distribution | | | 78,992 | |
Custodian fees | | | 8,085 | |
Professional fees | | | 49,473 | |
Compliance services fees | | | 30,657 | |
Trustees’ fees and expenses | | | 1,043 | |
Registration fees | | | 5,136 | |
Offering costs | | | 21,160 | |
Miscellaneous expenses | | | 17,223 | |
| | |
|
|
|
Total Expenses | | | 595,188 | |
Fees waived and expenses reimbursed | | | (279,217 | ) |
| | |
|
|
|
Net Expenses | | | 315,971 | |
| | |
|
|
|
| |
NET INVESTMENT INCOME | | | 173,045 | |
| | |
|
|
|
| |
NET REALIZED AND UNREALIZED GAIN ON INVESTMENTS | | | | |
Net realized gain on investments | | | 33,593 | |
Net change in unrealized appreciation on investments | | | 8,941,844 | |
| | |
|
|
|
| |
NET REALIZED AND UNREALIZED GAIN ON INVESTMENTS | | | 8,975,437 | |
| | |
|
|
|
| |
INCREASE IN NET ASSETS FROM OPERATIONS | | $ | 9,148,482 | |
| | |
|
|
|
| | | | |
| See Notes to Financial Statements. | | 7 | | |
THE BEEHIVE FUND
STATEMENTS OF CHANGES IN NET ASSETS
| | | | | | | | |
| | | Year Ended
December 31, 2009
| | | September 2, 2008 (a)
through
December 31, 2008
| |
OPERATIONS | | | | | | | | |
Net investment income | | $ | 173,045 | | | $ | 39,341 | |
Net realized gain (loss) on investments | | | 33,593 | | | | (366,465 | ) |
Net change in unrealized appreciation (depreciation) on investments | | | 8,941,844 | | | | (2,308,522 | ) |
| | |
|
|
| |
|
|
|
Increase (Decrease) in Net Assets from Operations | | | 9,148,482 | | | | (2,635,646 | ) |
| | |
|
|
| |
|
|
|
| | |
DISTRIBUTIONS TO SHAREHOLDERS FROM | | | | | | | | |
Net investment income | | | (173,030 | ) | | | (46,339 | ) |
| | |
|
|
| |
|
|
|
| | |
CAPITAL SHARE TRANSACTIONS | | | | | | | | |
Sale of shares | | | 10,861,047 | | | | 26,309,216 | |
Reinvestment of distributions | | | 173,030 | | | | 46,339 | |
Redemption of shares | | | (1,483,225 | ) | | | (5,090 | ) |
| | |
|
|
| |
|
|
|
Increase in Net Assets from Capital Share Transactions | | | 9,550,852 | | | | 26,350,465 | |
| | |
|
|
| |
|
|
|
Increase in Net Assets | | | 18,526,304 | | | | 23,668,480 | |
| | |
NET ASSETS | | | | | | | | |
Beginning of period | | | 23,668,480 | | | | — | |
| | |
|
|
| |
|
|
|
End of period (b) | | $ | 42,194,784 | | | $ | 23,668,480 | |
| | |
|
|
| |
|
|
|
| | |
SHARE TRANSACTIONS | | | | | | | | |
Sale of shares | | | 1,284,804 | | | | 3,174,999 | |
Reinvestment of distributions | | | 17,747 | | | | 6,228 | |
Redemption of shares | | | (155,778 | ) | | | (692 | ) |
| | |
|
|
| |
|
|
|
Increase in Shares | | | 1,146,773 | | | | 3,180,535 | |
| | |
|
|
| |
|
|
|
| (a) | | Commencement of operations. |
| (b) | | Amount includes undistributed net investment income of $15 and $0, respectively. |
| | | | |
| See Notes to Financial Statements. | | 8 | | |
THE BEEHIVE FUND
FINANCIAL HIGHLIGHTS
These financial highlights reflect selected data for a share outstanding of the Fund throughout each period.
| | | | | | | | |
| | | Year Ended
December 31, 2009
| | | September 2, 2008 (a)
through
December 31, 2008
| |
NET ASSET VALUE, Beginning of Period | | $ | 7.44 | | | $ | 10.00 | |
| | |
|
|
| |
|
|
|
| | |
INVESTMENT OPERATIONS | | | | | | | | |
Net investment income (b) | | | 0.05 | | | | 0.02 | |
Net realized and unrealized gain (loss) on investments | | | 2.30 | | | | (2.56 | ) |
| | |
|
|
| |
|
|
|
Total from Investment Operations | | | 2.35 | | | | (2.54 | ) |
| | |
|
|
| |
|
|
|
| | |
DISTRIBUTIONS TO SHAREHOLDERS FROM | | | | | | | | |
Net investment income | | | (0.04 | ) | | | (0.02 | ) |
| | |
|
|
| |
|
|
|
| | |
NET ASSET VALUE, End of Period | | $ | 9.75 | | | $ | 7.44 | |
| | |
|
|
| |
|
|
|
| | |
TOTAL RETURN (c) | | | 31.59 | % | | | (25.45 | )% |
| | |
RATIO/SUPPLEMENTARY DATA: | | | | | | | | |
Net Assets at End of Period (000’s omitted) | | $ | 42,195 | | | $ | 23,668 | |
Ratios to Average Net Assets (d): | | | | | | | | |
Net expenses | | | 1.00 | % | | | 1.00 | % |
Gross expenses (e) | | | 1.88 | % | | | 3.79 | % |
Net investment income | | | 0.55 | % | | | 0.79 | % |
| | |
PORTFOLIO TURNOVER RATE (c) | | | 33 | % | | | 7 | % |
| (a) | | Commencement of operations. |
| (b) | | Calculated based on average shares outstanding during the period. |
| (c) | | Not annualized for periods less than one year. |
| (d) | | Annualized for periods less than one year. |
| (e) | | Reflects the expense ratio excluding any waivers or reimbursements. |
| | | | |
| See Notes to Financial Statements. | | 9 | | |
THE BEEHIVE FUND
NOTES TO FINANCIAL STATEMENTS
DECEMBER 31, 2009
Note 1. Organization
The BeeHive Fund (the “Fund”) is a diversified portfolio of Forum Funds (the “Trust”). The Trust is a Delaware statutory trust that is registered as an open-end, management investment company under the Investment Company Act of 1940 (the “1940 Act”), as amended. As of December 31, 2009, the Trust had twenty-nine investment portfolios. Under its Trust Instrument, the Trust is authorized to issue an unlimited number of the Fund’s shares of beneficial interest without par value. The Fund commenced operations on September 2, 2008. The Fund seeks capital appreciation.
Note 2. Summary of Significant Accounting Policies
These financial statements are prepared in accordance with generally accepted accounting principles in the United States of America (“GAAP”), which require management to make estimates and assumptions that affect the reported amounts of assets and liabilities, the disclosure of contingent liabilities at the date of the financial statements and the reported amounts of increase and decrease in net assets from operations during the fiscal period. Actual amounts could differ from those estimates. The following summarizes the significant accounting policies of the Fund:
Security Valuation—Exchange traded securities and over-the-counter securities are valued using the last quoted sale or official closing price, provided by independent pricing services as of the close of trading on the market or exchange for which they are primarily traded, on each Fund business day. In the absence of a sale, such securities are valued at the mean of the last bid and asked prices provided by independent pricing services. Non-exchange traded securities for which quotations are available are valued using the last quoted sales price, or in the absence of a sale at the mean of the last bid and asked prices provided by independent pricing services. Shares of open-end mutual funds are valued at net asset value (“NAV”). Short-term investments that mature in sixty days or less may be valued at amortized cost.
The Fund values its investments at fair value pursuant to procedures adopted by the Trust’s Board of Trustees (the “Board”) if (1) market quotations are insufficient or not readily available or (2) the advisor believes that the values available are unreliable. Fair valuation is based on subjective factors and as a result, the fair value price of an investment may differ from the security’s market price and may not be the price at which the asset may be sold. Fair valuation could result in a different NAV than an NAV determined by using market quotes.
The Fund has a three-tier fair value hierarchy. The basis of the tiers is dependent upon the various “inputs” used to determine the value of the Fund’s investments. These inputs are summarized in the three broad levels listed below:
Level 1 – quoted prices in active markets for identical assets
Level 2 – other significant observable inputs (including quoted prices of similar securities, interest rates, prepayment speeds, credit risk, etc.)
Level 3 – significant unobservable inputs (including the Fund’s own assumptions in determining the fair value of investments)
The aggregate value by input level, as of December 31, 2009, for the Fund’s investments is included at the end of the Fund’s schedule of investments.
Securities Transactions, Investment Income and Realized Gain and Loss—Investment transactions are accounted for on trade date. Dividend income is recorded on the ex-dividend date. Foreign dividend income is recorded on the ex-dividend date or as soon as practical after the Fund determines the existence of a dividend declaration after exercising reasonable due diligence. Income and capital gains on some foreign securities may be subject to foreign withholding taxes, which are accrued as applicable. Interest income is recorded on an accrual basis. Premium and discount is amortized and accreted in accordance with GAAP. Identified cost of investments sold is used to determine the gain and loss for both financial statement and Federal income tax purposes.
Distributions to Shareholders—Distributions to shareholders of net investment income and net capital gains, if any, are declared and paid at least annually. Distributions are based on amounts calculated in accordance with applicable Federal income tax regulations, which may differ from GAAP. These differences are due primarily to differing treatments of income and gain on various investment securities held by the Fund, timing differences and differing characterizations of distributions made by the Fund.
10
THE BEEHIVE FUND
NOTES TO FINANCIAL STATEMENTS
DECEMBER 31, 2009
Federal Taxes—The Fund intends to qualify each year as a regulated investment company under Subchapter M of the Internal Revenue Code and distribute all its taxable income. In addition, by distributing in each calendar year substantially all its net investment income and capital gains, if any, the Fund will not be subject to a Federal excise tax. Therefore, no Federal income or excise tax provision is required.
As of December 31, 2009, there are no uncertain tax positions that would require financial statement recognition, de-recognition, or disclosure. The Fund’s Federal tax returns filed in the two-year period ended December 31, 2009, remain subject to examination by the Internal Revenue Service.
Income and Expense Allocation—The Trust accounts separately for the assets, liabilities and operations of each of its investment portfolios. Expenses that are directly attributable to more than one investment portfolio are allocated among the respective investment portfolios in an equitable manner.
Commitments and Contingencies—In the normal course of business, the Fund enters into contracts that provide general indemnifications by the Fund to the counterparty to the contract. The Fund’s maximum exposure under these arrangements is dependent on future claims that may be made against the Fund and, therefore, cannot be estimated; however, based on experience, the risk of loss from such claims is considered remote.
Note 3. Advisory Fees, Servicing Fees and Other Transactions
Investment Advisor—Spears Abacus Advisors LLC (the “Advisor”) is the investment advisor of the Fund. Pursuant to an investment advisory agreement, the Advisor receives an advisory fee from the Fund at an annual rate of 0.75% of the Fund’s average daily net assets.
Distribution—Foreside Fund Services, LLC serves as the Fund’s distributor (the “Distributor”). The Distributor is not affiliated with the Advisor or with Atlantic Fund Administration, LLC (“Atlantic”) or their affiliates. The Fund has adopted a distribution plan in accordance with Rule 12b-1 of the 1940 Act. The Fund may pay the Distributor or any other entity as authorized by the Board a fee of 0.25% of the Fund’s average daily net assets.
Other Service Providers—Atlantic provides fund accounting, fund administration and transfer agency services to the Fund. Pursuant to an Atlantic services agreement, the Fund pays Atlantic customary fees for its services. Atlantic provides a Principal Executive Officer, a Principal Financial Officer, a Chief Compliance Officer, and an Anti-Money Laundering Officer to the Fund, as well as certain additional compliance support functions.
Trustees and Officers—The Trust pays each independent Trustee an annual retainer fee of $40,000 for service to the Trust ($60,000 for the Chairman). In addition, the Chairman receives a monthly stipend of $500 to cover certain expenses incurred in connection with his duties to the Trust. The Trustees and Chairman may receive additional fees for special Board meetings. Each Trustee is also reimbursed for all reasonable out-of-pocket expenses incurred in connection with his duties as a Trustee, including travel and related expenses incurred in attending Board meetings. The amount of Trustees’ fees attributable to the Fund is disclosed in the Statement of Operations. Certain officers of the Trust are also officers or employees of the above named service providers, and during their terms of office received no compensation from the Fund.
Note 4. Expenses Reimbursed and Fees Waived
The Advisor has contractually agreed to waive a portion of its fees and/or to reimburse certain expenses through April 30, 2010, to limit total annual operating expenses to 1.00%. Other fund service providers have voluntarily agreed to waive a portion of their fees. These voluntary waivers may be reduced or eliminated at any time. For the year ended December 31, 2009, fees waived and reimbursed were as follows:
| | | | | | | | | | | | | |
Investment
Advisor Waived
| | Investment
Advisor
Reimbursed
| | Distribution Fees
Waived
| | Service
Provider
Waivers
| | Total Fees
Waived and
Reimbursed
|
| $ | 171,086 | | $ | 7,880 | | $ | 78,992 | | $ | 21,259 | | $ | 279,217 |
11
THE BEEHIVE FUND
NOTES TO FINANCIAL STATEMENTS
DECEMBER 31, 2009
The Fund may repay the Advisor for fees waived and expenses reimbursed pursuant to the expense cap if (1) such payment is made within three years of the fees waived or expense reimbursement, (2) such payment is approved by the Board and (3) and the resulting expenses do not exceed 1.00%. For the period September 2, 2008 (commencement of operations) through December 31, 2009, the Advisor waived and/or reimbursed fees as follows:
| | | | | | | | |
| | | Amount of Fees Waived
and/or
Expenses Reimbursed
| | Expiration Date to
Recoup Fees Waived
and/or Expenses
Reimbursed
| | Fees Recouped
|
December 31, 2008 | | $ | 126,276 | | 12/31/2011 | | $ | 0 |
December 31, 2009 | | | 178,966 | | 12/31/2012 | | | 0 |
Note 5. Security Transactions
The cost of purchases and proceeds from sales of investment securities (including maturities), other than short-term investments for the year ended December 31, 2009, were $20,128,250 and $9,799,174, respectively.
Note 6. Federal Tax Information and Investment Transactions
Distributions during the fiscal years ended as noted were characterized for tax purposes as follows:
| | | | | | |
| | | 2009
| | 2008
|
Ordinary Income | | $ | 173,030 | | $ | 46,339 |
As of December 31, 2009, distributable earnings (accumulated loss) on a tax basis were as follows:
| | | | |
Unrealized Appreciation | | $ | 6,517,213 | |
Capital and Other Losses | | | (216,763 | ) |
Undistributed Ordinary Income | | | 15 | |
| | |
|
|
|
Total | | $ | 6,300,465 | |
| | |
|
|
|
As of December 31, 2009, the Fund had capital loss carryforwards to offset future capital gains of $216,763, expiring in 2016.
Note 7. Recent Accounting Pronouncement
In June 2009, the Financial Accounting Standards Board (“FASB”) issued the “FASB Accounting Standard CodificationTM and the Hierarchy of Generally Accepted Accounting Principles” (the “Codification”). The FASB approved the Codification as the single source of authoritative U.S. accounting and reporting standards for nongovernmental entities, in addition to guidance issued by the Securities and Exchange Commission (the “SEC”). All guidance contained in the Codification carries an equal level of authority. The Codification supersedes all then-existing non-SEC accounting and reporting standards. All other non-grandfathered non-SEC accounting literature not included in the Codification has become nonauthoritative. The Codification is effective for financial statements issued for interim and annual periods ending after September 15, 2009. Management has evaluated the Codification and has determined that it did not have a significant impact on the reporting of the Fund’s financial statements.
In January 2010, the Financial Accounting Standards Board issued Accounting Standards Update (“ASU”) No. 2010-06 “Improving Disclosures about Fair Value Measurements.” ASU No. 2010-06 clarifies existing disclosure and requires additional disclosures regarding fair value measurements. Effective for interim and annual reporting periods beginning after December 15, 2009, entities will be required to disclose significant transfers into and out of Level 1 and 2 measurements in the fair value hierarchy and the reasons for those transfers. Effective for fiscal years beginning after December 15, 2010, and for interim periods within those fiscal years, entities will need to disclose information about purchases, sales, issuances and settlements of Level 3 securities on a gross basis, rather than as a net number as currently required. Management is currently evaluating the impact ASU No. 2010-06 will have on its financial statement disclosures.
Note 8. Subsequent Events
Subsequent events occurring after the date of this report have been evaluated for potential impact to this report through February 24, 2010, and the Fund has noted no such events.
12
REPORT OF INDEPENDENT REGISTERED PUBLIC ACCOUNTING FIRM
To the Board of Trustees of Forum Funds
and the Shareholders of The BeeHive Fund
We have audited the accompanying statement of assets and liabilities of The BeeHive Fund, a series of shares of beneficial interest in the Forum Funds, including the schedule of investments, as of December 31, 2009, and the related statement of operations for the year then ended, and the statements of changes in net assets and the financial highlights for the year then ended, and the period September 2, 2008 (commencement of operations) through December 31, 2008. These financial statements and financial highlights are the responsibility of the Fund’s management. Our responsibility is to express an opinion on these financial statements and financial highlights based on our audits.
We conducted our audits in accordance with the standards of the Public Company Accounting Oversight Board (United States). Those standards require that we plan and perform the audits to obtain reasonable assurance about whether the financial statements and financial highlights are free of material misstatement. An audit includes examining, on a test basis, evidence supporting the amounts and disclosures in the financial statements. Our procedures included confirmation of securities owned as of December 31, 2009 by correspondence with the custodian. An audit also includes assessing the accounting principles used and significant estimates made by management, as well as evaluating the overall financial statement presentation. We believe that our audits provide a reasonable basis for our opinion.
In our opinion, the financial statements and financial highlights referred to above present fairly, in all material respects, the financial position of The BeeHive Fund as of December 31, 2009, the results of its operations for the year then ended, and the changes in net assets and the financial highlights for the year then ended and the period September 2, 2008 through December 31, 2008, in conformity with accounting principles generally accepted in the United States of America.

BBD, LLP
Philadelphia, Pennsylvania
February 24, 2010
13
THE BEEHIVE FUND
ADDITIONAL INFORMATION (Unaudited)
DECEMBER 31, 2009
Proxy Voting Information
A description of the policies and procedures that the Fund uses to determine how to vote proxies relating to securities held in the Fund’s portfolio is available, without charge and upon request, by calling (866) 684-4915 and on the SEC’s website at www.sec.gov. The Fund’s proxy voting records for the period of September 2, 2008 (the Fund’s commencement of operations) through June 30, 2009, is available, without charge and upon request, by calling (866) 684-4915 and on the SEC’s website at www.sec.gov.
Availability of Quarterly Portfolio Schedules
The Fund files its complete schedule of portfolio holdings with the SEC for the first and third quarters of each fiscal year on Form N-Q. The Fund’s Forms N-Q are available, without charge and upon request on the SEC’s website at www.sec.gov or may be reviewed and copied at the SEC’s Public Reference Room in Washington, DC. Information on the operation of the Public Reference Room may be obtained by calling (800) SEC-0330.
Shareholder Expense Example
As a shareholder of the Fund, you incur ongoing costs, including management fees, distribution (12b-1) fees and other Fund expenses. This example is intended to help you understand your ongoing costs (in dollars) of investing in the Fund and to compare these costs with the ongoing costs of investing in other mutual funds.
The example is based on an investment of $1,000 invested at the beginning of the period and held for the entire period from July 1, 2009, through December 31, 2009.
Actual Expenses—The first line of the table below provides information about actual account values and actual expenses. You may use the information in this line, together with the amount you invested, to estimate the expenses that you paid over the period. Simply divide your account value by $1,000 (for example, an $8,600 account value divided by $1,000 &$061; 8.6), then multiply the result by the number in the first line under the heading entitled “Expenses Paid During Period” to estimate the expenses you paid on your account during the period.
Hypothetical Example for Comparison Purposes—The second line of the table below provides information about hypothetical account values and hypothetical expenses based on the Fund’s actual expense ratio and an assumed rate of return of 5% per year before expenses, which is not the Fund’s actual return. The hypothetical account values and expenses may not be used to estimate the actual ending account balance or expenses you paid for the period. You may use this information to compare the ongoing cost of investing in the Fund and other funds. To do so, compare this 5% hypothetical example with the 5% hypothetical examples that appear in the shareholder reports of other funds.
Please note that expenses shown in the table are meant to highlight your ongoing costs only. Therefore, the second line of the table is useful in comparing ongoing costs only, and will not help you determine the relative total costs of owning different funds.
| | | | | | | | | | | | |
| | | Beginning
Account Value
July 1, 2009
| | Ending
Account Value
December 31, 2009
| | Expenses Paid
During Period*
| | Annualized
Expense Ratio*
| |
Actual | | $ | 1,000.00 | | $ | 1,176.71 | | $ | 5.49 | | 1.00 | % |
Hypothetical (5% return before expenses) | | $ | 1,000.00 | | $ | 1,020.16 | | $ | 5.09 | | 1.00 | % |
| * | | Expenses are equal to the Fund’s annualized expense ratio as indicated above multiplied by the average account value over the period, multiplied by the number of days in most recent fiscal half-year divided by 365 to reflect the half-year period. |
Income Dividends—The Fund designates 100.00% of its income dividend distributed as qualifying for the corporate dividends-received deduction (DRD) and 100.00% for the qualified dividend rate (QDI) as defined in Section 1(h)(11) of the Internal Revenue Code. The Fund also designates 0.04% of its income dividends as qualified interest income (QII.)
14
THE BEEHIVE FUND
ADDITIONAL INFORMATION (Unaudited)
DECEMBER 31, 2009
Trustees and Officers of the Trust
The Board is responsible for oversight of the management of the Trust’s business affairs and of the exercise of all the Trust’s powers except those reserved for shareholders. The following table provides information about each Board member and certain officers of the Trust. Each Trustee and officer holds office until the person resigns, is removed, or is replaced. Unless otherwise noted, the persons have held their principal occupations for more than five years. The address for all Trustees and officers is Three Canal Plaza, Suite 600, Portland, Maine, 04101, unless otherwise indicated. Each Trustee oversees twenty-nine portfolios in the Trust. Mr. Keffer is considered an Interested Trustee due to his affiliation with Atlantic. Mr. Keffer is also an Interested Director of Wintergreen Fund, Inc. The Fund’s Statement of Additional Information includes additional information about the Trustees and is available, without charge and upon request, by calling (866) 684-4915.
| | | | | | |
| Name and Year of Birth | | Position with
the Trust | | Length of
Time Served | | Principal Occupation(s)
During Past 5 Years |
| | | |
| Independent Trustees | | | | | | |
J. Michael Parish Born: 1943 | | Chairman of the Board; Trustee; Chairman, Nominating Committee and Qualified Legal Compliance Committee | | Since 1989 (Chairman since 2004) | | Retired; Partner, Wolf, Block, Schorr and Solis-Cohen, LLP (law firm) 2002-2003. |
Costas Azariadis Born: 1943 | | Trustee; Chairman, Valuation Committee | | Since 1989 | | Professor of Economics, Washington University since 2006; Professor of Economics, University of California-Los Angeles 1992-2006. |
James C. Cheng Born: 1942 | | Trustee; Chairman, Audit Committee | | Since 1989 | | President, Technology Marketing Associates (marketing company for small- and medium-sized businesses in New England) since 1991. |
| | | |
| Interested Trustee | | | | | | |
John Y. Keffer1 Born: 1942 | | Trustee | | Since 1989 | | Chairman, Atlantic since 2008; President, Forum Foundation (a charitable organization) since 2005; President, Forum Trust, LLC (a non-depository trust company) since 1997; President, Citigroup Fund Services, LLC (“Citigroup”) 2003-2005. |
| 1 | | Since 1997, John Y. Keffer has been president and owner of Forum Trust, LLC. Atlantic is a subsidiary of Forum Trust, LLC. |
15
THE BEEHIVE FUND
ADDITIONAL INFORMATION (Unaudited)
DECEMBER 31, 2009
| | | | | | |
| Name and Year of Birth | | Position with
the Trust | | Length of
Time Served | | Principal Occupation(s)
During Past 5 Years |
| | | |
| Officers | | | | | | |
Stacey E. Hong Born: 1966 | | President; Principal Executive Officer | | Since 2008 | | President, Atlantic since 2008; Director, Consulting Services, Foreside Fund Services; Elder Care, 2005-2006; Director, Fund Accounting, Citigroup 2003-2005. |
Karen Shaw Born: 1972 | | Treasurer; Principal Financial Officer | | Since 2008 | | Senior Manager, Atlantic since 2008; Section Manager/Vice President, Enterprise Support Services, Citigroup 2003-2008. |
David Faherty Born: 1970 | | Vice President | | Since April 2009 | | Senior Counsel, Atlantic since 2009; Vice President, Citi Fund Services Ohio, Inc. 2007-2009; Associate Counsel, Investors Bank & Trust Company 2006-2007; employee of FDIC 2005. |
Michael J. McKeen Born: 1971 | | Vice President | | Since September 2009 | | Senior Manager, Atlantic since 2008; Vice President, Citigroup 2003-2008. |
Joshua LaPan Born: 1973 | | Vice President | | Since September 2009 | | Manager, Atlantic since 2008; Vice President, Citigroup 2003-2008. |
Timothy Bowden Born: 1969 | | Vice President | | Since September 2009 | | Manager, Atlantic since 2008; Vice President, Citigroup 2005-2008. |
Lina Bhatnagar Born: 1971 | | Secretary | | Since 2008 | | Senior Administration Specialist, Atlantic since 2008; Regulatory Administration Specialist, Citigroup, 2006-2008; Money Market/Short Term Trader, Wellington Management, 1996-2002. |
16
This report is submitted for the general information of the shareholders of the Fund. It is not authorized for distribution to prospective investors unless preceded or accompanied by an effective prospectus, which includes information regarding the Fund’s risks, objectives, fees and expenses, experience of its management and other information.
Distributor
Foreside Fund Services, LLC
Three Canal Plaza
Suite 100
Portland, ME 04101
www.foreside.com
THE BEEHIVE FUND
P.O. Box 588
Portland, Maine 04112
(866) 684-4915 (toll free)
237-ANR-1209
| (a) | As of the end of the period covered by this report, Forum Funds (the “Registrant”) has adopted a code of ethics, which applies to its Principal Executive Officer and Principal Financial Officer. |
| (c) | There have been no amendments to the Registrant’s code of ethics that apply to its Principal Executive Officer and Principal Financial Officer. |
| (d) | There have been no waivers to the Registrant’s code of ethics that apply to its Principal Executive Officer and Principal Financial Officer. |
| (f)(1) | A copy of the Code of Ethics is being filed under Item 12(a) hereto. |
| ITEM 3. | AUDIT COMMITTEE FINANCIAL EXPERT. |
The Board of Trustees has determined that no member of the Audit Committee is an “audit committee financial expert” as that term is defined under applicable regulatory guidelines.
| ITEM 4. | PRINCIPAL ACCOUNTANT FEES AND SERVICES. |
(a) Audit Fees – The aggregate fees billed for each of the last two fiscal years (the “Reporting Periods”) for professional services rendered by the Registrant’s principal accountant for the audit of the Registrant’s annual financial statements, or services that are normally provided by the principal accountant in connection with the statutory and regulatory filings or engagements for the Reporting Periods, were $45,000 in 2008 and $45,000 in 2009.
(b) Audit-Related Fees – The aggregate fees billed in the Reporting Periods for assurance and related services rendered by the principal accountant that were reasonably related to the performance of the audit of the Registrant’s financial statements and are not reported under paragraph (a) of this Item 4 were $0 in 2008 and $0 in 2009.
(c) Tax Fees – The aggregate fees billed in the Reporting Periods for professional services rendered by the principal accountant to the Registrant for tax compliance, tax advice and tax planning were $9,000 in 2008 and $9,000 in 2009. These services consisted of review or preparation of U.S. federal, state, local and excise tax returns.
(d) All Other Fees – The aggregate fees billed in the Reporting Periods for products and services provided by the principal accountant to the Registrant, other than the services reported in paragraphs (a) through (c) of this Item, were $0 in 2008 and $0 in 2009.
(e) (1) The Audit Committee reviews and approves in advance all audit and “permissible non-audit services” (as that term is defined by the rules and regulations of the Securities and Exchange Commission) to be rendered to a series of the Registrant (each, a “Series”). In addition, the Audit Committee reviews and approves in advance all “permissible non-audit services” to be provided to an investment adviser (not including any sub-adviser) of a Series, or an affiliate of such investment adviser, that is controlling, controlled by or under common control with the investment adviser and provides on-going services to the Registrant (“Affiliate”), by the Series’ principal accountant if the engagement relates directly to the operations and financial reporting of the Series. The Audit Committee considers whether fees paid by a Series’ investment adviser or an Affiliate to the Series’ principal accountant for audit and permissible non-audit services are consistent with the principal accountant’s independence.
(e) (2) 0%
(f) Not applicable
(g) The aggregate non-audit fees billed by the principal accountant for services rendered to the Registrant for the Reporting Periods were $9,000 in 2008 and $9,000 in 2009. There were no fees billed in either of the Reporting Periods for non-audit services rendered by the principal accountant to the Registrant’s investment adviser or any Affiliate.
(h) If the Registrant’s principal accountant provided non-audit services to the Registrant’s adviser or any Affiliate, and the services were not pre-approved as described in paragraph (e)(1) of this Item, the Audit Committee would consider whether the provision of such services was compatible with maintaining the independence of the Registrant’s principal accountant.
| ITEM 5. | AUDIT COMMITTEE OF LISTED REGISTRANTS. |
Not applicable.
| ITEM 6. | SCHEDULE OF INVESTMENTS. |
| (a) | Included as part of report to shareholders under Item 1. |
| ITEM 7. | DISCLOSURE OF PROXY VOTING POLICIES AND PROCEDURES FOR CLOSED-END MANAGEMENT INVESTMENT COMPANIES. |
Not applicable.
| ITEM 8. | PORTFOLIO MANAGERS OF CLOSED-END MANAGEMENT INVESTMENT COMPANIES. |
Not applicable.
| ITEM 9. | PURCHASES OF EQUITY SECURITIES BY CLOSED-END MANAGEMENT INVESTMENT COMPANY AND AFFILIATED PURCHASERS. |
Not applicable.
| ITEM 10. | SUBMISSION OF MATTERS TO A VOTE OF SECURITY HOLDERS |
The Registrant does not accept nominees to the board of trustees from shareholders.
| ITEM 11. | CONTROLS AND PROCEDURES |
(a) The Registrant’s Principal Executive Officer and Principal Financial Officer have concluded that the Registrant’s disclosure controls and procedures (as defined in Rule 30a-3(c) under the Investment Company Act of 1940 (the “Act”)) are effective, based on their evaluation of the controls and procedures required by Rule 30a-3(b) under the Act and Rules 13a-15(b) or 15d-15(b) under the Securities Exchange Act of 1934, as of a date within 90 days of the filing date of this report.
(b) There were no changes in the Registrant’s internal control over financial reporting (as defined in Rule 30a-3(d) under the Act) that occurred during the second fiscal quarter of the period covered by this report that have materially affected, or are reasonably likely to materially affect, the Registrant’s internal control over financial reporting.
(a)(1) Code of Ethics (Exhibit filed herewith).
(a)(2) Certifications pursuant to Rule 30a-2(a) of the Act, and Section 302 of the Sarbanes-Oxley Act of 2002. (Exhibits filed herewith)
(a)(3) Not applicable.
(b) Certifications pursuant to Rule 30a-2(b) of the Act, and Section 906 of the Sarbanes-Oxley Act of 2002. (Exhibit filed herewith)
SIGNATURES
Pursuant to the requirements of the Securities Exchange Act of 1934 and the Investment Company Act of 1940, the Registrant has duly caused this report to be signed on its behalf by the undersigned, thereunto duly authorized.
| | | | |
| | |
| Registrant | | | | Forum Funds |
| | |
| By | | | | /S/ STACEY E. HONG |
| | | | Stacey E. Hong, Principal Executive Officer |
| | |
| Date | | | | 02/26/10 |
Pursuant to the requirements of the Securities Exchange Act of 1934 and the Investment Company Act of 1940, this report has been signed below by the following persons on behalf of the Registrant and in the capacities and on the dates indicated.
| | | | |
| | |
| By | | | | /S/ STACEY E. HONG |
| | | | Stacey E. Hong, Principal Executive Officer |
| | |
| Date | | | | 02/26/10 |
| | |
| By | | | | /S/ KAREN SHAW |
| | | | Karen Shaw, Principal Financial Officer |
| | |
| Date | | | | 02/26/10 |