As filed with the Securities and Exchange Commission on December 21, 2011
UNITED STATES
SECURITIES AND EXCHANGE COMMISSION
WASHINGTON, D.C. 20549
FORM N-CSR
CERTIFIED SHAREHOLDER REPORT OF REGISTERED MANAGEMENT
INVESTMENT COMPANIES
Investment Company Act file number 811-03023
FORUM FUNDS
Three Canal Plaza, Suite 600
Portland, Maine 04101
Stacey E. Hong, Principal Executive Officer
Three Canal Plaza, Suite 600
Portland, Maine 04101
207-347-2000
Date of fiscal year end: October 31
Date of reporting period: November 1, 2010 – October 31, 2011
ITEM 1. REPORT TO STOCKHOLDERS.
| A Message to Our Shareholders | 1 |
| Performance Chart and Analysis (Unaudited) | 4 |
| Schedule of Investments | 5 |
| Statement of Assets and Liabilities | 7 |
| Statement of Operations | 8 |
| Statements of Changes in Net Assets | 9 |
| Financial Highlights | 10 |
| Notes to Financial Statements | 11 |
| Report of Independent Registered Public Accounting Firm | 16 |
| Additional Information (Unaudited) | 17 |
FOUNTAINHEAD SPECIAL VALUE FUND
A MESSAGE TO OUR SHAREHOLDERS
Dear Shareholder,
For the fiscal year ended 10/31/2011, the Fountainhead Special Value Fund (the “Fund”) (KINGX) rose 6.83%. Performance was solid, but the Fund did underperform its benchmark index, the Russell 2500TM Index, which rose 7.97%. The last fiscal year was a volatile one, characterized by strength in the market through late July, followed by a severe downdraft in August and September as fears of the U.S. debt downgrade and Europe’s problems came into focus. A strong recovery in October brought equity markets back in the black as the fiscal year came to a close. For the period ended 10/31/2011, the Fund’s 1-year, 5-year, 10-year, and since inception (12/31/96) average annual returns were 6.83%, -3.03%, 1.44, and 6.24%, respectively. (Performance data quoted represents past performance and is no guarantee of future results. Current performance may be lower or higher than the performance data quoted. Investment return and principal value will fluctuate so that an investor’s shares, when redeemed, may be worth more or less than original cost. For the most recent month-end performance, please call (800) 868-9535. As stated in the current prospectus, the Fund’s annual operating expense ratio (gross) is 4.04%. However, the Adviser has contractually agreed to waive a portion of its fees and reimburse certain expenses through March 1, 2012, to limit Total Annual Fund Operating Expenses to 1.75%. Shares held less than 180 days will be subject to a 1.00% redemption fee.)
Despite the volatility, the Fund performed well over the past twelve months with significant strength coming from the healthcare sector. The Fund’s top performer, STAAR Surgical Company, rose 80.4%. Other healthcare names that made positive contributions to the Fund’s performance included Intuitive Surgical, Inc. (ISRG) +44.2%; Medidata Solutions, Inc. (MDSO) +38.8%; Thoratec Corporation (THOR) +38.7%; Wright Medical Group, Inc. (WMGI) +28.8%; and Omnicare, Inc. (OCR) +23.6%. Beckman Coulter, Inc. (BEC), agreed to be acquired by Danaher Corporation (DHR), and the stock was sold to net a 54.9% gain. Besides the healthcare-related names, other stocks that performed well were Nuance Communications, Inc. (NUAN) +68.6%; Newpark Resources, Inc. (NR) +51.9%; and Asbury Automotive Group, Inc. (ABG) +23.3%. Textron Inc. (TXT), which was owned for two different periods during the fiscal year, rose a cumulative +34.5%.
On the downside, performance was hindered over the twelve-month period by a few of the Fund’s energy names which have natural gas exposure. Comstock Resources, Inc. (CNK), Ultra Petroleum Corp. (UPL), and Penn Virginia Corporation (PVA) all declined by 20% or more during the fiscal year. A couple of Telecom names, Leap Wireless International, Inc. (LEAP) and NII Holdings, Inc. (NIHD) were also weak performers, declining by greater than 40%. Pacific Sunwear of California, Inc. (PSUN) was the worst performer, declining by more than 60%.
Over the past twelve months, the global economy continued to recover from the 2008 recession. European sovereign debt concerns, government monetary intervention, and the U.S. deficit/debt debate were all drivers of the equity markets. While equity indices have demonstrated gains during the period, investors would be excused if they felt a little less than fulfilled. A broad sell-off late in the period, led by the most leveraged and volatile issues, put a severe dent in gains made over the beginning of the year. The final month’s rebound returned equities to positive territory, and there are many reasons for equity investors to be confident about the future. Many businesses across the U.S. are improving productivity and cash flow generation and now have healthier balance sheets. Fundamental health at the microeconomic level could help overcome macroeconomic negatives and return the economy to a stable growth trajectory.
1
FOUNTAINHEAD SPECIAL VALUE FUND
A MESSAGE TO OUR SHAREHOLDERS
International markets have faced a challenging environment during the past twelve months. Many European sovereign entities have accumulated more debt than they can feasibly pay back, and their solvency has been questioned. Greece, in particular, has been in the headlines, and global markets have reacted dramatically as each successive report or rumor has emerged from the region. However, European leaders have worked tirelessly to forge a compromise with the goal of stabilizing the region’s financial system and allowing the European Union to continue in its current form. These plans have encouraged investors, yet European markets remain volatile. Confidence is fragile, but even the most symbolic compromise should benefit the fundamental economy.
In other parts of the world, emerging markets continue to post impressive growth figures. China’s growth has proved to be incredibly resilient, and the country continues to import a significant amount of goods and services. As emerging markets develop further, an expanded consumer base should be a key driver of growth for international operations of businesses in developed countries. India also displays growth promise and could eventually become a major consumer in the future. In an effort to diversify as well as participate in current and future trends, we have strategically positioned the Fund to have a greater international bias.
On the domestic front, with Election Day 2012 only one year away, the markets will be paying attention to the drivers of the national debate. A prominent issue will be the high unemployment rate. One could expect many speeches and papers issued by candidates addressing this stubborn figure. The oft cited rate has been hovering around 9% for an extended period of time. Encouragingly, continuing unemployment claims have been on the decline, but the headline number appears stuck. Productivity has increased at the corporate level as businesses have learned to produce at high levels with fewer employees. Some of this is a function of technology, especially information technology, but there may be a confidence issue at the corporate level similar to the confidence issue at the consumer level. Leaders of these businesses see an environment filled with regulatory risk, and some are foregoing further investment in operations until the future regulatory environment has crystallized. Countless U.S. corporations are not only improving productivity, but cash flow generation and cost management efficiency have led to improved cash balances as well as healthier balance sheets. Businesses have become more efficient out of necessity and have retained leaner workforces even as the economy recovered. Now, corporations are finding other uses for their cash, including share repurchases and strategic acquisitions as opposed to investing in a larger workforce. In short, businesses have found that they can get the job done with fewer people. Politicians are frustrated that these businesses will not devote resources to improving the job picture and are calling on corporations to make more aggressive investments in their operations.
We would be remiss if we did not address the issue of interest rates and expected interest rates. A reasonable observer would note that rates are hovering at historical lows and have been for some time. A key difference between today’s investment environment and the environment three years ago is the state of credit in the marketplace. Credit markets froze three years ago, which put a tremendous amount of stress on the financial markets. Today, credit liquidity appears ample. Investors are closely watching LIBOR for signs of weakness in the banking system, but rates remain lower than they were in 2008 and are near the lowest levels in the past ten years. Central Bank intervention as well as a preference for lower risk assets have planted rates at current levels. Central Banks around the world have employed accommodative monetary policies that would suggest inflation and higher interest rates in the future.
2
FOUNTAINHEAD SPECIAL VALUE FUND
A MESSAGE TO OUR SHAREHOLDERS
The Federal Reserve’s “Operation Twist” could allow corporations to continue to borrow for the long-term at historically low levels. This should benefit shareholders of public companies as the available capital could be used for dividends, share repurchases, investment in operations, and/or mergers and acquisitions. This government intervention, however, could also lead to higher rates and inflation down the road but the timing of such an environment is difficult to discern and likely depends on confidence levels around the world. Small-cap stocks and commodity-related stocks tend to perform well during periods of inflation. We currently have exposure to both and plan to be well positioned as we approach this period of higher rates. Companies that are well situated on the strategic front with competitive advantages over peers and new entrants are likely to perform relatively well. These factors suggest positive days ahead for Fountainhead Special Value Fund shareholders.
Best regards,
Sincerely,
Roger E. King, CFA Leah R. Bennett, CFA
Chairman and President Managing Director
King Investment Advisors, Inc. King Investment Advisors, Inc.
IMPORTANT RISKS & DISCLOSURES:
The views in this report were those of the Fund managers as of October 31, 2011, and may not reflect their views on the date this report is first published or anytime thereafter. These views are intended to assist the shareholders of the Fund in understanding their investments in the Fund and do not constitute investment advice. This letter may contain discussions about certain investments held and not held in the portfolio. All current and future portfolio holdings are subject to risk. There can be no guarantee of success with any technique, strategy or investment.
The Fund’s investments in small- and medium-sized companies involve greater risk than investing in larger, more established companies such as increased volatility of earnings and prospects, higher failure rates, and limited markets, product lines or financial resources. The Fund’s portfolio may be overweight in an industry sector in which any negative development affecting that sector will have a greater impact on the Fund’s performance. In addition, the Fund may incur American Depositary Receipts (ADRs) risks that are not associated with domestic investments such as increased volatility including political and financial instability, lack of timely or reliable regulatory standards, and price volatility.
The Russell 2500 Index measures the performance of the small- to mid-cap segment of the U.S. equity universe. It includes approximately 2,500 of the smallest securities in the Russell 3000®Index based on a combination of their market cap and current index membership. One cannot invest directly in an index.
3
FOUNTAINHEAD SPECIAL VALUE FUND
PERFORMANCE CHART AND ANALYSIS (Unaudited)
The following chart reflects the change in the value of a hypothetical $10,000 investment, including reinvested dividends and distributions, in the Fountainhead Special Value Fund (the “Fund”) compared with the performance of the benchmark, Russell 2500 Index, over the past ten fiscal years. The Russell 2500 Index measures the performance of the small- to mid-cap segment of the U.S. equity universe. It includes approximately 2,500 of the smallest securities in the Russell 3000® Index based on a combination of their market cap and current index membership. The total return of the Russell 2500 Index includes the reinvestment of dividends and income. The total return of the Fund includes operating expenses that reduce returns, while the total return of the Russell 2500 Index does not include expenses. The Fund is professionally managed while the Russell 2500 Index is unmanaged and is not available for investment.
| | | Average Annual Total Return |
| | | One Year | | Five Years | | Ten Years |
| Fountainhead Special Value Fund | | 6.83 | % | | -3.03 | % | | 1.44 | % |
| Russell 2500 Index | | 7.97 | % | | 2.01 | % | | 8.01 | % |
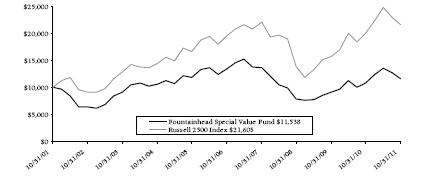
Performance data quoted represents past performance and is no guarantee of future results. Current performance may be lower or higher than the performance data quoted. Investment return and principal value will fluctuate so that shares, when redeemed, may be worth more or less than original cost. For the most recent month-end performance, please call (800) 868-9535. As stated in the Fund's prospectus, the annual operating expense ratio (gross) is 4.04%. However, the Fund's adviser has agreed to contractually waive a portion of its fees and to reimburse certain expenses to limit total operating expenses to 1.75%, which is in effect until March 1, 2012. During the period, certain fees were waived and/or expenses reimbursed; otherwise, returns would have been lower. Shares redeemed or exchanged within 180 days of purchase will be charged a 1.00% redemption fee. The performance table and graph do not reflect the deduction of taxes that a shareholder would pay on Fund distributions or the redemption of Fund shares. Returns greater than one year are annualized.
4
FOUNTAINHEAD SPECIAL VALUE FUND
SCHEDULE OF INVESTMENTS
AFA
| | Shares | | Security Description | | Value | |
| Common Stock - 100.5% |
| Basic Materials - 2.8% |
| | 9,000 | | Intrepid Potash, Inc. (a) | $ | 250,470 | |
| | | | |
| Consumer Discretionary - 20.0% |
| | 78,500 | | Callaway Golf Company | | 456,085 | |
| | 6,800 | | Coinstar, Inc. (a) | | 324,632 | |
| | 12,600 | | Expedia, Inc. | | 330,876 | |
| | 28,000 | | La-Z-Boy, Inc. (a) | | 284,480 | |
| | 92,000 | | Pacific Sunwear of California, Inc. (a) | | 115,000 | |
| | 8,300 | | Sotheby's | | 292,326 | |
| | | 1,803,399 | |
| Drugs/Pharmaceutical Preparations - 8.7% |
| | 9,000 | | Auxilium Pharmaceuticals, Inc. (a) | | 140,040 | |
| | 10,100 | | Emergent BioSolutions Inc. (a) | | 190,486 | |
| | 6,900 | | Forest Laboratories, Inc. (a) | | 215,970 | |
| | 12,300 | | Mylan Inc. (a) | | 240,711 | |
| | | 787,207 | |
| Energy - 14.9% |
| | 15,400 | | Comstock Resources, Inc. (a) | | 280,896 | |
| | 7,200 | | CONSOL Energy Inc. | | 307,872 | |
| | 37,500 | | Newpark Resources, Inc. (a) | | 334,875 | |
| | 19,500 | | Penn Virginia Corp. | | 118,755 | |
| | 10,700 | | Superior Energy Services, Inc. (a) | | 300,884 | |
| | | 1,343,282 | |
| Financials - 9.0% |
| | 49,500 | | GFI Group Inc. | | 213,840 | |
| | 13,000 | | The NASDAQ OMX Group, Inc. (a) | | 325,650 | |
| | 15,000 | | Weyerhaeuser Company (REIT) | | 269,700 | |
| | | 809,190 | |
| Health Care Services - 8.3% |
| | 11,600 | | Omnicare, Inc. | | 345,912 | |
| | 18,200 | | PAREXEL International Corp. (a) | | 400,946 | |
| | | 746,858 | |
| Industrials - 3.4% |
| | 15,600 | | Textron Inc. | | 302,952 | |
| | | | |
| Medical Products - 21.9% |
| | 45,000 | | Boston Scientific Corp. (a) | | 265,050 | |
| | 20,000 | | Hologic, Inc. (a) | | 322,400 | |
| | 14,800 | | Illumina, Inc. (a) | | 453,176 | |
| | 525 | | Intuitive Surgical, Inc. (a) | | 227,777 | |
FA
| | Shares | | Security Description | | Value | |
| | 9,500 | | Thoratec Corporation (a) | $ | 346,845 | |
| | 21,000 | | Wright Medical Group, Inc. (a) | | 360,990 | |
| | | 1,976,238 | |
| Technology - 6.3% |
| | 21,300 | | Nuance Communications, Inc. (a) | | 564,024 | |
| | | | |
| Telecommunications - 5.2% |
| | 19,000 | | Leap Wireless International, Inc. (a) | | 132,050 | |
| | 14,400 | | NII Holdings, Inc. (a) | | 338,832 | |
| | | 470,882 | |
Total Common Stock (Cost $9,049,281) | | 9,054,502 | |
Total Investments - 100.5% (Cost $9,049,281)* | $ | 9,054,502 | |
| Other Assets & Liabilities, Net - (0.5)% | | (44,608 | ) |
| Net Assets - 100.0% | $ | 9,009,894 | |
REIT | Real Estate Investment Trust |
| (a) | Non-income producing security. |
| * | Cost for federal income tax purposes is $9,049,281 and net unrealized appreciation consists of: |
| Gross Unrealized Appreciation | | $ | 1,003,029 | |
| Gross Unrealized Depreciation | | | (997,808 | ) |
| Net Unrealized Appreciation | | $ | 5,221 | |
See Notes to Financial Statements.
5
FOUNTAINHEAD SPECIAL VALUE FUND
SCHEDULE OF INVESTMENTS
The following is a summary of the inputs used to value the Fund’s investments as of October 31, 2011.
The inputs or methodology used for valuing securities are not necessarily an indication of the risks associated with investing in those securities. For more information on valuation inputs, and their aggregation into the levels used in the tables below, please refer to Note 2 - Security Valuation section in the accompanying Notes to Financial Statements.
| Valuation Inputs | | Investments in Securities |
| Level 1 - Quoted Prices | | $ | 9,054,502 | |
| Level 2 - Other Significant Observable Inputs | | | - | |
| Level 3 - Significant Unobservable Inputs | | | - | |
| Total | | $ | 9,054,502 | |
The Level 1 inputs displayed in this table are Common Stock. Refer to the Schedule of Investments for a further breakout of each security by type.
AFA
| PORTFOLIO HOLDINGS | | |
| % of Total Investments | | |
| Basic Materials | 2.8 | % |
| Consumer Discretionary | 19.9 | % |
| Drugs/Pharmaceutical Preparations | 8.7 | % |
| Energy | 14.8 | % |
| Financials | 8.9 | % |
| Health Care Services | 8.3 | % |
| Industrials | 3.4 | % |
| Medical Products | 21.8 | % |
| Technology | 6.2 | % |
| Telecommunications | 5.2 | % |
| | 100.0 | % |
See Notes to Financial Statements. 6
FOUNTAINHEAD SPECIAL VALUE FUND
STATEMENT OF ASSETS AND LIABILITIES
| | | | | | | |
| ASSETS | | | | |
| | Total investments, at value (Cost $9,049,281) | | $ | 9,054,502 | |
| | Cash | | | 1,669 | |
| | Receivables: | | | | |
| | | Investment securities sold | | | 211,679 | |
| | | Interest | | | 16 | |
| | Prepaid expenses | | | 11,091 | |
| Total Assets | | | 9,278,957 | |
| | | | | | | |
| LIABILITIES | | | | |
| | Payables: | | | | |
| | | Investment securities purchased | | | 192,965 | |
| | | Fund shares redeemed | | | 46,986 | |
| | Accrued Liabilities: | | | | |
| | | Fund services fees | | | 2,316 | |
| | | Compliance services fees | | | 2,083 | |
| | | Other expenses | | | 24,713 | |
| Total Liabilities | | | 269,063 | |
| | | | | | | |
| NET ASSETS | | $ | 9,009,894 | |
| | | | | | | |
| COMPONENTS OF NET ASSETS | | | | |
| | Paid-in capital | | $ | 9,566,861 | |
| | Accumulated net realized loss | | | (562,188 | ) |
| | Net unrealized appreciation | | | 5,221 | |
| NET ASSETS | | $ | 9,009,894 | |
| SHARES OF BENEFICIAL INTEREST AT NO PAR VALUE (UNLIMITED SHARES AUTHORIZED) | | | 479,678 | |
NET ASSET VALUE, OFFERING AND REDEMPTION PRICE PER SHARE* | | $ | 18.78 | |
| * | Shares redeemed or exchanged within 180 days of purchase are charged a 1.00% redemption fee. |
See Notes to Financial Statements.
7
FOUNTAINHEAD SPECIAL VALUE FUND
STATEMENT OF OPERATIONS
| | | | | | | | |
| INVESTMENT INCOME | | | | | |
| | Dividend income | | $ | 54,779 | | |
| | Interest income | | | 185 | | |
| Total Investment Income | | | 54,964 | | |
| | | | | | |
| EXPENSES | | | | | |
| | Investment adviser fees | | | 85,694 | | |
| | Fund services fees | | | 139,844 | | |
| | Custodian fees | | | 5,000 | | |
| | Registration fees | | | 16,878 | | |
| | Professional fees | | | 46,777 | | |
| | Trustees' fees and expenses | | | 303 | | |
| | Compliance services fees | | | 25,000 | | |
| | Miscellaneous expenses | | | 19,920 | | |
| Total Expenses | | | 339,416 | | |
| | Fees waived and expenses reimbursed | | | (172,789 | ) | |
| Net Expenses | | | 166,627 | | |
| | | | | | | | |
| NET INVESTMENT LOSS | | | (111,663 | ) | |
| | | | | | | | |
| NET REALIZED AND UNREALIZED GAIN (LOSS) | | | | | |
| | Net realized gain on investments | | | 1,471,922 | | |
| | Net change in unrealized appreciation (depreciation) on investments | | | (774,161 | ) | |
| NET REALIZED AND UNREALIZED GAIN | | | 697,761 | | |
| INCREASE IN NET ASSETS FROM OPERATIONS | | $ | 586,098 | | |
| | | | | | | | |
See Notes to Financial Statements.
8
FOUNTAINHEAD SPECIAL VALUE FUND
STATEMENTS OF CHANGES
| | | | | Year Ended October 31, 2011 | | | Year Ended October 31, 2010 |
| OPERATIONS | | | | | | | | | |
| | Net investment loss | | $ | (111,663 | ) | | | $ | (113,863 | ) |
| | Net realized gain | | | 1,471,922 | | | | | 712,190 | |
| | Net change in unrealized appreciation (depreciation) | | | (774,161 | ) | | | | 777,263 | |
| Increase in Net Assets Resulting from Operations | | | 586,098 | | | | | 1,375,590 | |
| | | | | | | | | | | | |
| CAPITAL SHARE TRANSACTIONS | | | | | | | | | |
| | Sale of shares | | | 408,024 | | | | | 600,763 | |
| | Redemption of shares | | | (424,264 | ) | | | | (1,358,469 | ) |
| | Redemption fees | | | - | | | | | 44 | |
| Decrease in Net Assets from Capital Share Transactions | | | (16,240 | ) | | | | (757,662 | ) |
| Increase in Net Assets | | | 569,858 | | | | | 617,928 | |
| | | | | | | | | | | | |
| NET ASSETS | | | | | | | | | |
| | Beginning of Year | | | 8,440,036 | | | | | 7,822,108 | |
| | End of Year | | $ | 9,009,894 | | | | $ | 8,440,036 | |
| | | | | | | | | | | | |
| SHARE TRANSACTIONS | | | | | | | | | |
| | Sale of shares | | | 21,115 | | | | | 34,829 | |
| | Redemption of shares | | | (21,543 | ) | | | | (81,698 | ) |
| Decrease in Shares | | | (428 | ) | | | | (46,869 | ) |
| | | | | | | | | | | | |
See Notes to Financial Statements.
9
FOUNTAINHEAD SPECIAL VALUE FUND
FINANCIAL HIGHLIGHTS
These financial highlights reflect selected data for a share outstanding throughout each year.
| | | | | | | |
| | | For the Years Ended October 31, | |
| | | 2011 | | 2010 | | 2009 | | 2008 | | 2007 | |
| NET ASSET VALUE, Beginning of Year | $ | 17.58 | | | $ | 14.84 | | | $ | 12.73 | | | $ | 22.57 | | | $ | 22.35 | | |
| INVESTMENT OPERATIONS | | | | | | | | | | | | | | | | | | | | |
| Net investment loss (a) | | (0.23 | ) | | | (0.22 | ) | | | (0.15 | ) | | | (0.16 | ) | | | (0.21 | ) | |
| Net realized and unrealized gain (loss) | | 1.43 | | | | 2.96 | | | | 2.26 | | | | (9.27 | ) | | | 0.43 | | |
| Total from Investment Operations | | 1.20 | | | | 2.74 | | | | 2.11 | | | | (9.43 | ) | | | 0.22 | | |
| DISTRIBUTIONS TO | | | | | | | | | | | | | | | | | | | | |
| SHAREHOLDERS FROM | | | | | | | | | | | | | | | | | | | | |
| Net realized gain | | — | | | | — | | | | — | | | | (0.41 | ) | | | — | | |
| REDEMPTION FEES (a) | | — | | | | — | (b) | | — | (b) | | — | (b) | | — | (b) |
| NET ASSET VALUE, End of Year | $ | 18.78 | | | $ | 17.58 | | | $ | 14.84 | | | $ | 12.73 | | | $ | 22.57 | | |
| TOTAL RETURN | | 6.83 | % | | 18.46 | % | | 16.58 | % | | (42.45 | )% | | 0.98 | % |
| RATIOS/SUPPLEMENTARY DATA | | | | | | | | | | | | | | | | | | | | |
| Net Assets at End of | | | | | | | | | | | | | | | | | | | | |
| | Year (000's omitted) | $9,010 | | | $8,440 | | | $7,822 | | | $7,728 | | | $16,482 | | |
| Ratios to Average Net Assets: | | | | | | | | | | | | | | | | | | | | |
| Net investment loss | | (1.17 | )% | | (1.35 | )% | | (1.17 | )% | | (0.88 | )% | | (0.92 | )% |
| Net expense | | 1.75 | % | | 1.75 | % | | 1.67 | % | | 1.50 | % | | 1.50 | % |
| Gross expense (c) | | 3.56 | % | | 4.04 | % | | 4.50 | % | | 3.18 | % | | 2.27 | % |
| PORTFOLIO TURNOVER RATE | | 78 | % | | 117 | % | | 103 | % | | 139 | % | | 133 | % |
| | | | | | | | | | | | | | | | | | | | | | |
| (a) | Calculated based on average shares outstanding during the year. |
| (b) | Less than $0.01 per share. |
| (c) | Reflects the expense ratio excluding any waivers and/or reimbursements. |
See Notes to Financial Statements.
10
FOUNTAINHEAD SPECIAL VALUE FUND
NOTES TO FINANCIAL STATEMENTS
Note 1. Organization
The Fountainhead Special Value Fund (the “Fund”) is a diversified portfolio of Forum Funds (the “Trust”). The Trust is a Delaware statutory trust that is registered as an open-end, management investment company under the Investment Company Act of 1940 (the “Act”), as amended. Under its Trust Instrument, the Trust is authorized to issue an unlimited number of the Fund’s shares of beneficial interest without par value. The Fund commenced operations on December 31, 1996. The Fund seeks long-term capital growth.
Note 2. Summary of Significant Accounting Policies
These financial statements are prepared in accordance with generally accepted accounting principles in the United States of America (“GAAP”), which require management to make estimates and assumptions that affect the reported amounts of assets and liabilities, the disclosure of contingent liabilities at the date of the financial statements, and the reported amounts of increase and decrease in net assets from operations during the fiscal year. Actual amounts could differ from those estimates. The following summarizes the significant accounting policies of the Fund:
Security Valuation – Exchange-traded securities and over-the-counter securities are valued using the last quoted sale or official closing price, provided by independent pricing services as of the close of trading on the market or exchange for which they are primarily traded, on each Fund business day. In the absence of a sale, such securities are valued at the mean of the last bid and ask price provided by independent pricing services. Non-exchange traded securities for which quotations are available are valued using the last quoted sales price, or in the absence of a sale at the mean of the last bid and ask prices provided by independent pricing services. Short-term investments that mature in 60 days or less may be valued at amortized cost.
The Fund values its investments at fair value pursuant to procedures adopted by the Trust’s Board of Trustees (the “Board”) if (1) market quotations are insufficient or not readily available or (2) the adviser believes that the values available are unreliable. Fair valuation is based on subjective factors and as a result, the fair value price of an investment may differ from the security’s market price and may not be the price at which the asset may be sold. Fair valuation could result in a different net asset value (“NAV”) than a NAV determined by using market quotes.
The Fund has a three-tier fair value hierarchy. The basis of the tiers is dependent upon the various “inputs” used to determine the value of the Fund’s investments. These inputs are summarized in the three broad levels listed below:
Level 1 — quoted prices in active markets for identical assets
Level 2 — other significant observable inputs (including quoted prices of similar securities, interest rates, prepayment speeds, credit risk, etc.)
Level 3 — significant unobservable inputs (including the Fund’s own assumptions in determining the fair value of investments)
11
FOUNTAINHEAD SPECIAL VALUE FUND
NOTES TO FINANCIAL STATEMENTS
AFA
The aggregate value by input level, as of October 31, 2011, for the Fund’s investments is included at the end of the Fund’s Schedule of Investments.
Security Transactions, Investment Income and Realized Gain and Loss – Investment transactions are accounted for on the trade date. Dividend income is recorded on the ex-dividend date. Foreign dividend income is recorded on the ex-dividend date or as soon as possible after the Fund determines the existence of a dividend declaration after exercising reasonable due diligence. Income and capital gains on some foreign securities may be subject to foreign withholding taxes, which are accrued as applicable. Interest income is recorded on an accrual basis. Premium is amortized and discount is accreted using the effective interest method. Identified cost of investments sold is used to determine the gain and loss for both financial statement and federal income tax purposes.
Distributions to Shareholders – Distributions to shareholders of net investment income and net capital gains, if any, are declared and paid at least annually. Distributions are based on amounts calculated in accordance with applicable federal income tax regulations, which may differ from GAAP. These differences are due primarily to differing treatments of income and gain on various investment securities held by the Fund, timing differences and differing characterizations of distributions made by the Fund.
Federal Taxes – The Fund intends to qualify each year as a regulated investment company under Subchapter M of the Internal Revenue Code and distribute all of its taxable income to shareholders. In addition, by distributing in each calendar year substantially all its net investment income and capital gains, if any, the Fund will not be subject to a federal excise tax. Therefore, no federal income or excise tax provision is required.
As of October 31, 2011, there are no uncertain tax positions that would require financial statement recognition, de-recognition, or disclosure. The Fund’s federal tax returns filed in the three-year period ended October 31, 2011, remain subject to examination by the Internal Revenue Service.
Income and Expense Allocation – The Trust accounts separately for the assets, liabilities and operations of each of its investment portfolios. Expenses that are directly attributable to more than one investment portfolio are allocated among the respective investment portfolios in an equitable manner.
Redemption Fees – A shareholder who redeems or exchanges shares within 180 days of purchase will incur a redemption fee of 1.00% of the current net asset value of shares redeemed or exchanged, subject to certain limitations. The fee is charged for the benefit of the remaining shareholders and will be paid to the Fund to help offset transaction costs. The fee is accounted for as an addition to paid-in capital. The Fund reserves the right to modify the terms of or terminate the fee at any time. There are limited exceptions to the imposition of the redemption fee.
Commitments and Contingencies – In the normal course of business, the Fund enters into contracts that provide general indemnifications by the Fund to the counterparty to the contract. The Fund’s maximum exposure under these arrangements is dependent on future claims that may be made against the Fund and, therefore, cannot be estimated; however, based on experience, the risk of loss from such claims is considered remote.
12
FOUNTAINHEAD SPECIAL VALUE FUND
NOTES TO FINANCIAL STATEMENTS
Note 3. Fees and Expenses
Investment Adviser – King Investment Advisors, Inc. (the “Adviser”) is the investment adviser to the Fund. Pursuant to an investment advisory agreement, the Adviser receives an advisory fee from the Fund at an annual rate of 0.90% of the Fund’s average daily net assets.
Distribution – Foreside Fund Services, LLC serves as the Fund’s distributor (the “Distributor”). The Distributor is not affiliated with the Adviser or Atlantic Fund Administration, LLC (d/b/a Atlantic Fund Services) (“Atlantic”) or their affiliates. The Distributor receives no compensation from the Fund for its distribution services.
Other Service Providers – Atlantic provides fund accounting, fund administration, and transfer agency services to the Fund. Atlantic also provides certain shareholder report production, and EDGAR conversion and filing services. Pursuant to an Atlantic services agreement, the Fund pays Atlantic customary fees for its services. Atlantic provides a Principal Executive Officer, a Principal Financial Officer, a Chief Compliance Officer, and an Anti-Money Laundering Officer to the Fund, as well as certain additional compliance support functions.
Trustees and Officers – The Trust pays each independent Trustee an annual retainer fee of $45,000 for service to the Trust ($66,000 for the Chairman). In addition, the Chairman receives a monthly stipend of $500 to cover certain expenses incurred in connection with his duties to the Trust. The Trustees and Chairman may receive additional fees for special Board meetings. Each Trustee is also reimbursed for all reasonable out-of-pocket expenses incurred in connection with his duties as a Trustee, including travel and related expenses incurred in attending Board meetings. The amount of Trustees’ fees attributable to the Fund is disclosed in the Statement of Operations. Certain officers of the Trust are also officers or employees of the above named service providers, and during their terms of office received no compensation from the Fund.
Note 4. Expense Reimbursements and Fees Waived
The Adviser has contractually agreed to waive a portion of its fee and reimburse certain expenses through March 1, 2012, to limit annual operating expenses to 1.75%. Other fund service providers have voluntarily agreed to waive and reimburse a portion of their fees. These voluntary waivers and reimbursements may be reduced or eliminated at any time. For the year ended October 31, 2011, fees waived and reimbursed were as follows:
| Investment Adviser Fees Waived | | Other Waivers | | Total Fees Waived |
| $85,694 | | $87,095 | | $172,789 |
Note 5. Security Transactions
The cost of purchases and proceeds from sales of investment securities (including maturities), other than short-term investments during the year ended October 31, 2011, were $7,370,620 and $7,409,493, respectively.
13
FOUNTAINHEAD SPECIAL VALUE FUND
NOTES TO FINANCIAL STATEMENTS
Note 6. Federal Income Tax and Investment Transactions
As of October 31, 2011, distributable earnings (accumulated loss) on a tax basis were as follows:
| Capital and Other Losses | | $ | (562,188 | ) |
| Unrealized Appreciation | | $ | 5,221 | |
| Total | | $ | (556,967 | ) |
As of October 31, 2011, the Fund had capital loss carryforwards to offset future capital gains of $562,188, expiring in 2017.
On the Statement of Assets and Liabilities, as a result of permanent book to tax differences, certain amounts have been reclassified for the year ended October 31, 2011. The following reclassification was the result of net operating losses and has no impact on the net assets of the Fund.
| Accumulated Net Investment Income (Loss) | | $ | 111,663 | |
| Paid-in-Capital | | | (111,663 | ) |
Note 7. Recent Accounting Pronouncements
In January 2010, the Financial Accounting Standards Board (“FASB”) issued Accounting Standards Update (“ASU”) No. 2010-06 “Improving Disclosures about Fair Value Measurements.” ASU No. 2010-06 clarifies existing disclosure and requires additional disclosures regarding fair value measurements. Effective for fiscal years beginning after December 15, 2010, and for interim periods within those fiscal years, entities will need to disclose information about purchases, sales, issuances and settlements of Level 3 securities on a gross basis, rather than as a net number as currently required. Management is currently evaluating the impact ASU No. 2010-06 will have on financial statement disclosures.
In May 2011, FASB issued ASU No. 2011-04 “Amendments to Achieve Common Fair Value Measurement and Disclosure Requirements in U.S. GAAP and IFRSs.” ASU No. 2011-04 establishes common requirements for measuring fair value and for disclosing information about fair value measurements in accordance with U.S. GAAP and International Financial Reporting Standards (“IFRSs”). ASU No. 2011-04 is effective for interim and annual periods beginning after December 15, 2011. Management is currently evaluating the impact ASU No. 2011-04 may have on financial statement disclosures.
Note 8. Regulated Investment Company Modernization Act
The Regulated Investment Company Modernization Act of 2010 (the “Modernization Act”) was enacted on December 22, 2010. The Modernization Act makes changes to several of the federal income and excise tax provisions impacting the Fund. In general, the provisions of the Modernization Act will be effective for the Fund's fiscal year ending October 31, 2012. The Modernization Act provides several benefits, including unlimited carryover on future capital losses, simplification provisions on asset diversification and/or qualifying income tests, and several provisions aimed at preserving the character of distributions made by a fiscal year regulated investment company. Relevant information regarding the impact of the Modernization
14
FOUNTAINHEAD SPECIAL VALUE FUND
NOTES TO FINANCIAL STATEMENTS
Act on the Fund, if any, will be included in the October 31, 2012, annual report.
Note 9. Subsequent Events
Subsequent events occurring after the date of this report through the date these financial statements were issued have been evaluated for potential impact and the Fund has had no such events.
15
REPORT OF INDEPENDENT REGISTERED PUBLIC ACCOUNTING FIRM
To the Board of Trustees of Forum Funds and the Shareholders of Fountainhead Special Value Fund:
We have audited the accompanying statement of assets and liabilities of the Fountainhead Special Value Fund, a series of shares of beneficial interest in the Forum Funds, including the schedule of investments, as of October 31, 2011, and the related statement of operations for the year then ended, the statements of changes in net assets for each of the years in the two year period then ended, and the financial highlights for each of the years in the three year period then ended. These financial statements and financial highlights are the responsibility of the Fund's management. Our responsibility is to express an opinion on these financial statements and financial highlights based on our audits. The financial highlights for each of the years in the two-year period ended October 31, 2008 were audited by other auditors whose report dated December 22, 2008, expressed an unqualified opinion on such financial highlights.
We conducted our audits in accordance with the standards of the Public Company Accounting Oversight Board (United States). Those standards require that we plan and perform the audits to obtain reasonable assurance about whether the financial statements and financial highlights are free of material misstatement. An audit includes examining, on a test basis, evidence supporting the amounts and disclosures in the financial statements. Our procedures included confirmation of securities owned as of October 31, 2011 by correspondence with the custodian and broker. An audit also includes assessing the accounting principles used and significant estimates made by management, as well as evaluating the overall financial statement presentation. We believe that our audits provide a reasonable basis for our opinion.
In our opinion, the financial statements and financial highlights referred to above present fairly, in all material respects, the financial position of the Fountainhead Special Value Fund as of October 31, 2011, the results of its operations for the year then ended, the changes in its net assets for each of the years in the two year period then ended, and the financial highlights for each of the years in the three year period then ended, in conformity with accounting principles generally accepted in the United States of America.
BBD, LLP
Philadelphia, Pennsylvania
December 16, 2011
16
FOUNTAINHEAD SPECIAL VALUE FUND
ADDITIONAL INFORMATION (Unaudited)
Proxy Voting Information
A description of the policies and procedures that the Fund uses to determine how to vote proxies relating to securities held in the Fund’s portfolio is available, without charge and upon request, by calling (800) 868-9535 and on the U.S. Securities and Exchange Commission’s (the “SEC”) website at www.sec.gov. The Fund’s proxy voting record for the most recent twelve-month period ended June 30 is available, without charge and upon request, by calling (800) 868-9535 and on the SEC’s website at www.sec.gov.
Availability of Quarterly Portfolio Schedules
The Fund files its complete schedule of portfolio holdings with the SEC for the first and third quarters of each fiscal year on Form N-Q. The Fund’s Forms N-Q are available, without charge and upon request on the SEC’s website at www.sec.gov or may be reviewed and copied at the SEC’s Public Reference Room in Washington, DC. Information on the operation of the Public Reference Room may be obtained by calling (800) SEC-0330.
Shareholder Expense Example
As a shareholder of the Fund, you incur two types of costs: (1) transaction costs, including redemption fees, and (2) ongoing costs, including management fees and other Fund expenses. This example is intended to help you understand your ongoing costs (in dollars) of investing in the Fund, and to compare these costs with the ongoing costs of investing in other mutual funds.
The example is based on an investment of $1,000 invested at the beginning of the period and held for the entire period from May 1, 2011, through October 31, 2011.
Actual Expenses – The first line of the table below provides information about actual account values and actual expenses. You may use the information in this line, together with the amount you invested, to estimate the expenses that you paid over the period. Simply divide your account value by $1,000 (for example, an $8,600 account value divided by $1,000 = 8.6), then multiply the result by the number in the first line under the heading entitled “Expenses Paid During Period” to estimate the expenses you paid on your account during the period.
Hypothetical Example for Comparison Purposes – The second line of the table below provides information about hypothetical account values and hypothetical expenses based on the Fund’s actual expense ratio and an assumed rate of return of 5% per year before expenses, which is not the Fund’s actual return. The hypothetical account values and expenses may not be used to estimate the actual ending account balance or expenses you paid for the period. You may use this information to compare the ongoing costs of investing in the Fund and other funds. To do so, compare this 5% hypothetical example with the 5% hypothetical examples that appear in the shareholder reports of other funds.
Please note that the expenses shown in the table are meant to highlight your ongoing costs only and do not reflect any transactional costs, such as redemption fees. Therefore, the second line of the table is useful in comparing ongoing costs only, and will not help you determine the relative total costs of owning different funds. In addition, if these transactional costs were included, your costs would have been higher.
17
FOUNTAINHEAD SPECIAL VALUE FUND
ADDITIONAL INFORMATION (Unaudited)
| | Beginning | | Ending | | Expenses | | Annualized |
| | Account Value | | Account Value | | Paid During | | Expense |
| | May 1, 2011 | | October 31, 2011 | | Period* | | Ratio* |
| Actual | $ | 1,000.00 | | $ | 850.55 | | $ | 8.16 | | 1.75 | % |
| Hypothetical (5% return before taxes) | $ | 1,000.00 | | $ | 1,016.38 | | $ | 8.89 | | 1.75 | % |
| * | Expenses are equal to the Fund’s annualized expense ratio multiplied by the average account value over the period, multiplied by the number of days in the most recent fiscal half-year divided by 365 to reflect the half-year period. |
Trustees and Officers of the Trust
The Board is responsible for oversight of the management of the Trust’s business affairs and of the exercise of all the Trust’s powers except those reserved for the shareholders. The following table provides information about each Trustee and certain officers of the Trust. Each Trustee and officer holds office until the person resigns, is removed, or is replaced. Unless otherwise noted, the persons have held their principal occupations for more than five years. The address for all Trustees and officers is Three Canal Plaza, Suite 600, Portland, Maine 04101, unless otherwise indicated. Mr. Keffer is considered an Interested Trustee due to his affiliation with Atlantic. The Fund’s Statement of Additional Information includes additional information about the Trustees and is available, without charge and upon request, by calling (800) 868-9535.
| Name and Year of Birth | Position with the Trust | Length of Time Served | Principal Occupation(s) During Past Five Years | Number of Series of Trust Overseen by Trustee | Other Directorships Held by Trustee |
| Independent Trustees | | | | | |
J. Michael Parish Born: 1943 | Chairman of the Board; Trustee; Chairman, Nominating Committee and Qualified Legal Compliance Committee | Since 1989 (Chairman since 2004) | Retired since 2003. | 23 | 0 |
Costas Azariadis Born: 1943 | Trustee; Chairman, Valuation Committee | Since 1989 | Professor of Economics, Washington University since 2006; Professor of Economics, University of California-Los Angeles 1992-2006. | 23 | 0 |
James C. Cheng Born: 1942 | Trustee; Chairman, Audit Committee | Since 1989 | President, Technology Marketing Associates (marketing company for small- and medium-sized businesses in New England) since 1991. | 23 | 0 |
18
FOUNTAINHEAD SPECIAL VALUE FUND
ADDITIONAL INFORMATION (Unaudited)
| Name and Year of Birth | Position with the Trust | Length of Time Served | Principal Occupation(s) During Past Five Years | Number of Series of Trust Overseen by Trustee | Other Directorships Held by Trustee |
| Independent Trustees | | | | | |
David Tucker Born: 1958 | Trustee | Since 2011 | Director, Blue Sky Experience, Kansas City Mo. since 2008, Senior Vice President & General Counsel, American Century Companies 1998-2008. | 23 | 0 |
| Interested Trustee | | | | | |
John Y. Keffer1 Born: 1942 | Trustee; Vice Chairman | Since 1989 | Chairman, Atlantic since 2008; President, Forum Foundation (a charitable organization) since 2005; President, Forum Trust, LLC (a non-depository trust company chartered in the State of Maine) since 1997. | 23 | Director, Wintergreen Fund, Inc. |
| Officers | | | | | |
Stacey E. Hong Born: 1966 | President; Principal Executive Officer | Since 2008 | President, Atlantic since 2008; Director, Consulting Services, Foreside Fund Services 2007. | N/A | N/A |
Karen Shaw Born: 1972 | Treasurer; Principal Financial Officer | Since 2008 | Senior Vice President, Atlantic since 2008; Vice President, Citigroup 2003-2008. | N/A | N/A |
David Faherty Born: 1970 | Vice President | Since 2009 | Senior Counsel, Atlantic since 2009; Vice President, Citi Fund Services Ohio, Inc. 2007-2009; Associate Counsel, Investors Bank & Trust Co. 2006-2007. | N/A | N/A |
Michael J. McKeen Born: 1971 | Vice President | Since 2009 | Senior Manager, Atlantic since 2008; Vice President, Citigroup 2003-2008. | N/A | N/A |
Joshua LaPan Born: 1973 | Vice President | Since 2009 | Manager, Atlantic since 2008; Vice President, Citigroup 2003-2008. | N/A | N/A |
1Atlantic is a subsidiary of Forum Holdings Corp. I, a Delaware corporation that is wholly owned by Mr. Keffer. |
19
FOUNTAINHEAD SPECIAL VALUE FUND
ADDITIONAL INFORMATION (Unaudited)
| Name and Year of Birth | Position with the Trust | Length of Time Served | Principal Occupation(s) During Past Five Years | Number of Series of Trust Overseen by Trustee | Other Directorships Held by Trustee |
| Officers | | | | | |
Timothy Bowden Born: 1969 | Vice President | Since 2009 | Manager, Atlantic since 2008; Vice President, Citigroup 2005-2008. | N/A | N/A |
Lina Bhatnagar Born: 1971 | Secretary | Since 2008 | Senior Administration Specialist, Atlantic since 2008; Regulatory Administration Specialist, Citigroup 2006-2008. | N/A | N/A |
20
Annual Report
October 31, 2011
Fund Adviser:
Waterville Capital, LLC
Radnor Court, Suite 210
259 Radnor-Chester Road
Radnor, PA 19087
Toll Free: (877) 356-9055
WATERVILLE LARGE CAP VALUE FUND
A MESSAGE TO OUR SHAREHOLDERS
Dear Shareholder,
Waterville Capital is pleased to report that the Investor Shares (WVLVX) and Institutional Shares (WVLIX) of the Waterville Large Cap Value Fund (the “Fund”), for the year ended October 31, 2011, returned 14.05% and 14.40%, respectively. This compares to a 8.09% return for the S&P 500 Index (“Benchmark”) and a 9.90% return for the BXY Index (CBOE S&P 500 2% out-of-the-money BuyWrite Index) (“Secondary Benchmark”). The Waterville Large Cap Value Fund delivered significant, positive, actively managed returns with a lower volatility than the Benchmark. The traits that generated these returns were hard work, patience, and discipline. These traits are not always rewarded and indeed some of this fiscal year’s return was due to work done in the previous year. This fiscal year, however, the Fund’s management and process combined for a year that has met the Fund’s investment goals.
It is also satisfying to report these returns given the past year’s negative global macro focus. Early in 2011 we had a tragic natural and environmental event in Japan that was not manufactured by the financial system or overreaching governments. However, the global macro picture was weak enough that this event preyed on the weaknesses of the world’s current financial state. Aside from the horrific events in Japan, this past year’s issues can be summed up in one word: Debt. In the U.S. we have seen a cycle of extreme amounts of personal financial debt rippling to the corporate sector while also being absorbed by the federal government. Holders of U.S. debt have been rewarded for putting their full faith and credit in the U.S. government in the face of a credit downgrade, the same cannot be said for investors holding European sovereign debt. The clock is ticking on the European debt issue, and U.S. equity investors must continue to keep an eye on events across the ocean while looking for investments at home.
As said earlier, process-driven, active management (including managing portfolio return volatility); discipline; and patience were the key drivers to the significant outperformance of the Fund. The continued gyrations of global debt markets impacted the U.S. equity market and made the domestic large cap space a good hunting ground for active managers with discipline. The last few months of the Fund’s fiscal year proved to be the most challenging for U.S. equities. However, while some viewed active management during the dramatic equity market lows of August and September as simply “rearranging deck chairs on the Titanic,” the Fund was able to take advantage of these extremes to put its active process to work and generate alpha for the shareholders. It was a challenging time but the Fund’s strategy of managing volatility, mostly by selling short dated out-of-the-money S&P 500 calls, gave the Fund enough confidence to put cash to work in our current investments and even add equities that had become extremely cheap by the Fund’s metrics because of overall market conditions.
When others around you are losing their heads and their shirts, it is important to have conviction in your investment thesis and to be able to implement that process when the equity market is in distress. Blindly buying dips or panic selling are not objective processes, but objectivity is the first commodity to go when markets move with extreme volatility. It is imperative to have as part of an investment thesis the realization that the market will at times behave in such a manner and to have processes in place to try to manage that volatility.
A conviction in an investing thesis and keeping an eye on ways to mitigate the large moves of markets allow for an investor to do two powerful things: actively seek to add to portfolio returns and take advantage of increased option prices to help manage portfolio volatility. It is easy to understand that if two portfolios are similar but one has a higher average return than the other, then the portfolio with the higher return will lead to greater wealth in the long term. Not as obvious is that for two portfolios generating similar average returns, the one that is more volatile than the other will have sharply divergent internal rates-of-returns, with the less volatile portfolio compounding at a higher rate.
Let’s take a look at some obvious numbers in a simplistic manner. A 20% decline requires a 25% gain over the same duration to be even, a 50% decline requires a 100% gain to be even, an 80% decline requires a 400% gain to be even and a 100% decline means you should run for Congress. A 10% decline, however, requires only an 11% return to be even.
So, an investor can see that much better-than-average returns are good and that much lower volatilities are also good but when these beneficial portfolio effects are combined incrementally, you are likely to have a dramatic positive wealth effect over the longer term. With the extreme increase in realized volatility in all capital markets in the summer and early fall of this year, U.S. equity and index implied volatilities had a parametric increase accordingly. This gave the Fund the opportunity to sell higher implied volatilities in the S&P 500 Index which in practical terms meant that the Fund was able
1
WATERVILLE LARGE CAP VALUE FUND
A MESSAGE TO OUR SHAREHOLDERS
to sell larger call option premiums on the Index. This provided a much welcomed increased cushion against downside equity moves. Adding to the Fund’s holdings near market lows and selling increased implied volatility allowed the Fund to combine these effects for a significant outperformance over the last 12 months.
The Fund’s investment process brought it to an overweighting in the Healthcare, Consumer Discretionary, and Information Technology sectors. Healthcare and the Consumer Discretionary sector holdings have had a significant positive contribution to the Fund’s return this year. In both of these sectors a combination of sector overweighting and an efficient selection of investments were major factors in the Fund’s outperformance. The takeover of Cephalon Inc. and solid gains in Biogen Idec Inc. were large factors in the positive return of the Healthcare sector. The Fund’s continued investment in the Managed Healthcare space has also been a large contributor to meeting the Fund’s investment goals this fiscal year. This space continues to be filled with cash flow rich companies trading at attractive price-to-earnings and price-to-book ratios.
In the Consumer Discretionary sector; solid returns were in part achieved through the active due diligence, risk mitigation, and research that are part of the Fund’s process. This was most visible in the For-Profit Education sub sector. Apollo Group (APOL) had been a challenging investment but the active work put in to this investment in 2010 has been rewarded in 2011. In 2010 the Fund recognized through active research that APOL was in front of the Department of Education’s concerns, APOL had a sound business model and Fund management believed that APOL was a best in breed in a group that was under severe scrutiny. Just as this active due diligence process let the Fund add to its APOL holdings at attractive prices, it also steered the Fund away from other names in this sub sector. Other companies in the space such as Devry Inc. and Washington Post did meet the Fund’s definition of cheap; but when placed under further due diligence, they failed to satisfy the Fund’s concerns and, therefore, the Fund did not make an investment in these names.
Investments in Best Buy and Janus Capital Group continued to prove onerous. Even though revenues and cash flows for Best Buy have been adequate, the rebound in retail consumer spending remained subdued and, as such, the Fund’s investment in Best Buy was a disappointment. Given that the equity environment had a number of stocks that the Fund considered to be better values, the Fund sold all of its Best Buy position this fall and made investments in those other names. Another cash flow rich investment that continued to disappoint was Janus Capital Group. Janus’s fee for its financial service business model has suffered with the volatility of the equity market and its share price has suffered in kind. The Fund will keep a close eye on the risk of continuing to invest in Janus.
Just as various overweighting helped performance, so did underweighting. The Fund’s process, which in part looks at variations on a Return on Assets, mostly keeps the Fund underinvested in large commercial banks. This systemic metric-driven underweighting also helped the Fund’s returns relative to its benchmarks during this latest round of financial stress. The large hybrid commercial-investment banking model is in need of a makeover. Whether this transformation comes from a government mandate or is solved by the free market is still uncertain but change is coming and it remains difficult to guess what the outcome will be.
The Fund manager believes a consistent program of managing volatility coupled with a disciplined value investing approach will be the best strategy to achieve above-average long-term returns. Equities with reliable earnings, minimal leverage, and attractive valuations continue to be the drivers for our future investments, as they have been during the past year. As always, Waterville Capital is committed to excellence in value investing and managing the volatility of your investment.
Sincerely,
Sean Bonner
Chief Investment Officer
Waterville Capital, LLC
2
WATERVILLE LARGE CAP VALUE FUND
A MESSAGE TO OUR SHAREHOLDERS
IMPORTANT INFORMATION
There is no assurance that the Fund will achieve its investment objective. The Fund is subject to risks of broad market decline or decline in particular holdings, Index Call Option Risk, management risk, focused holdings risk, counterparty risk, sector risk and value stock risk in which stocks may remain undervalued for extended periods of time. Details are located within the Fund’s prospectus.
Volatility is a statistical measure of the dispersion of returns for a given security or market index. Volatility can either be measured by using the standard deviation or variance between returns from that same security or market index. Commonly, the higher the volatility, the riskier the security. An index option is an option providing exposure to the movement of a broad based stock market index. By selling an index call option, the Fund is selling the right to an option buyer to purchase the Index at a particular (strike) price. Alpha is the difference between a fund’s actual returns and its expected performance, given its level of risk as measured by Beta. Beta is a measure of a fund’s sensitivity to market movements. A call option is out-of-the-money if the stock price is below its strike price. Strike Price is the price at which a specific options contract can be exercised.
The S&P 500 Index is a broad-based, unmanaged measurement of changes in stock market conditions based on the average of 500 widely held common stocks. The CBOE S&P 500 2% OTM BuyWrite Index (“BXY Index”) is a benchmark index designed to track the performance of a hypothetical buy-write strategy that consists of using out of the money S&P 500 Index call options on an underlying position to generate income from option premiums. One cannot invest directly in an index.
The views in this report were those of the Fund manager as of October 31, 2011, and may not reflect their views on the date this report is first published or anytime thereafter. These views are intended to assist the shareholders of the Fund in understanding their investments in the Fund and do not constitute investment advice. This letter contains discussions about certain investments both held and not held in the portfolio. All current and future holdings are subject to risk and to change.
3
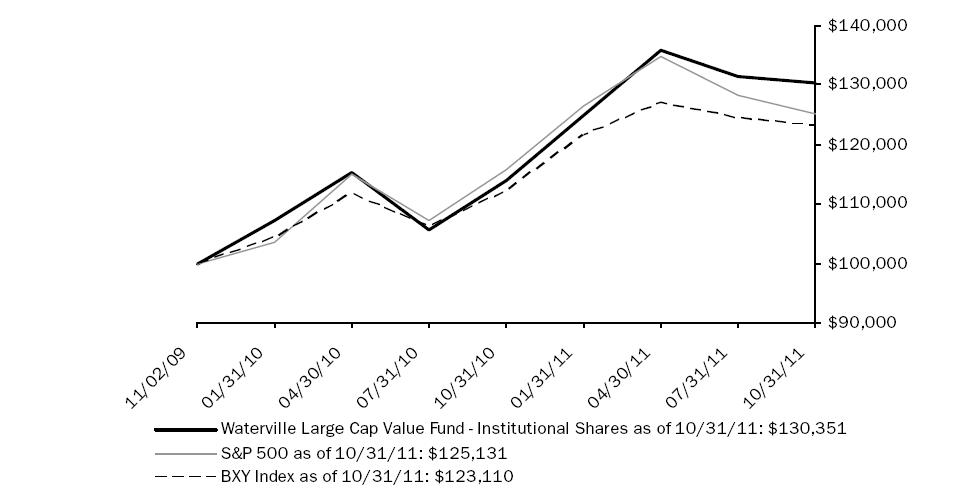
WATERVILLE LARGE CAP VALUE FUNDPERFORMANCE CHART AND ANALYSIS (Unaudited)
The following chart reflects the change in the value of a hypothetical $100,000 investment in Institutional Shares, including reinvested dividends and distributions, in the Waterville Large Cap Value Fund (the “Fund”) compared with the performance of the primary benchmark, the S&P 500 Index ("S&P 500"), and the secondary benchmark, the CBOE S&P 500 2% Out-of-the-Money BuyWrite Index ("BXY Index"), since inception. The S&P 500 is a broad-based, unmanaged measurement of changes in stock market conditions based on the average of 500 widely held common stocks. The BXY Index is a benchmark index designed to track the performance of a hypothetical buy-write strategy that consists of using out of the money S&P 500 Index call options on an underlying position to generate income from option premiums. The total return of the indices includes reinvestment of dividends and income. The total return of the Fund includes operating expenses that reduce returns, while the total returns of the indices do not include expenses. The Fund is professionally managed while the indices are unmanaged and are not available for investment.
Performance data quoted represents past performance and is no guarantee of future results. Current performance may be lower or higher than the performance data quoted. Investment return and principal value will fluctuate so that shares, when redeemed, may be worth more or less than original cost. For the most recent month-end performance, please call (877) 356-9055. As stated in the Fund's prospectus, the annual operating expense ratios (gross) for Investor Shares and Institutional Shares are 28.33% and 2.48%, respectively. However, the Fund's adviser has agreed to contractually reduce a portion of its fees and to reimburse expenses such that total operating expenses do not exceed 2.00% for Investor Shares and Institutional Shares, through at least March 1, 2012. During the period, certain fees were waived and/or expenses reimbursed, otherwise returns would have been lower. The performance table and graph do not reflect the deduction of taxes that a shareholder would pay on Fund distributions or the redemption of Fund shares. Returns greater than one year are annualized.
| Total Return as of 10/31/11 | | One Year | | Since Inception 11/02/09 |
| Waterville Large Cap Value Fund — Investor Shares | | 14.05% | | 13.97% |
| Waterville Large Cap Value Fund — Institutional Shares | | 14.40% | | 14.21% |
| S&P 500 | | 8.09% | | 11.90% |
| BXY Index | | 9.90% | | 10.99% |
4
WATERVILLE LARGE CAP VALUE FUNDSCHEDULE OF INVESTMENTS
| Shares | | Security Description | | Value | |
| Common Stock - 99.3% |
| Consumer Discretionary - 21.5% |
| | 19,845 | | Apollo Group, Inc., Class A (a) | | $ | 939,661 | |
| | 30,891 | | Expedia, Inc. | | | 811,198 | |
| | 34,409 | | GameStop Corp., Class A (a) | | | 879,838 | |
| | 84,367 | | Gannett Co., Inc. | | | 986,250 | |
| | 59,900 | | H&R Block, Inc. | | | 915,871 | |
| | 68,731 | | Newell Rubbermaid, Inc. | | | 1,017,219 | |
| | 10,418 | | Ross Stores, Inc. | | | 913,971 | |
| | 48,547 | | The Gap, Inc. | | | 917,538 | |
| | 111,758 | | The Interpublic Group of Cos., Inc. | | | 1,059,466 | |
| | 20,104 | | Viacom, Inc., Class B | | | 881,560 | |
| | | | 9,322,572 | |
| Consumer Staples - 5.6% |
| | 21,246 | | Dr. Pepper Snapple Group, Inc. | | | 795,663 | |
| | 7,314 | | Lorillard, Inc. | | | 809,367 | |
| | 21,623 | | Reynolds American, Inc. | | | 836,378 | |
| | | | 2,441,408 | |
| Financial - 8.2% |
| | 45,199 | | Federated Investors, Inc., Class B | | | 883,188 | |
| | 133,710 | | Janus Capital Group, Inc. | | | 877,138 | |
| | 34,984 | | Leucadia National Corp. | | | 938,621 | |
| | 34,835 | | The NASDAQ OMX Group, Inc. (a) | | | 872,617 | |
| | | | 3,571,564 | |
| Healthcare - 22.3% |
| | 21,520 | | AmerisourceBergen Corp. | | | 878,016 | |
| | 8,653 | | Biogen Idec, Inc. (a) | | | 1,006,863 | |
| | 25,999 | | Bristol-Myers Squibb Co. | | | 821,308 | |
| | 28,132 | | Coventry Health Care, Inc. (a) | | | 894,879 | |
| | 22,005 | | Eli Lilly & Co. | | | 817,706 | |
| | 25,955 | | Forest Laboratories, Inc. (a) | | | 812,392 | |
| | 21,032 | | Gilead Sciences, Inc. (a) | | | 876,193 | |
| | 11,077 | | Humana, Inc. | | | 940,327 | |
| | 17,147 | | Medco Health Solutions, Inc. (a) | | | 940,684 | |
| | 23,904 | | Medtronic, Inc. | | | 830,425 | |
| | 12,475 | | WellPoint, Inc. | | | 859,527 | |
| | | | 9,678,320 | |
| Industrials - 10.3% |
| | 14,025 | | General Dynamics Corp. | | | 900,265 | |
| | 19,013 | | Illinois Tool Works, Inc. | | | 924,602 | |
| | 13,012 | | L-3 Communications Holdings, Inc. | | | 881,953 | |
| | 15,335 | | Northrop Grumman Corp. | | | 885,596 | |
| | 19,797 | | Raytheon Co. | | | 874,830 | |
| | | | 4,467,246 | |
| Information Technology - 26.7% |
| | 14,200 | | Analog Devices, Inc. | | | 519,294 | |
| | 76,820 | | Applied Materials, Inc. | | | 946,422 | |
| | 40,976 | | CA, Inc. | | | 887,540 | |
| | 23,350 | | Harris Corp. | | | 881,462 | |
| | 35,067 | | Hewlett-Packard Co. | | | 933,133 | |
| | 37,159 | | Intel Corp. | | | 911,882 | |
| | 20,897 | | KLA-Tencor Corp. | | | 984,040 | |
| | 32,094 | | Microsoft Corp. | | | 854,663 | |
| | 67,480 | | SAIC, Inc. (a) | | | 838,776 | |
| | 19,480 | | SanDisk Corp. (a) | | | 987,052 | |
| | 71,690 | | Teradyne, Inc. (a) | | | 1,026,601 | |
| | 30,038 | | Texas Instruments, Inc. | | | 923,068 | |
| | 9,404 | | Visa, Inc., Class A | | | 877,017 | |
| | | | 11,570,950 | |
| Materials - 4.7% |
| | 6,123 | | CF Industries Holdings, Inc. | | | 993,579 | |
| | 26,216 | | Freeport-McMoRan Copper & Gold, Inc. | | | 1,055,456 | |
| | | | 2,049,035 | |
| | | Value | |
Total Common Stock (b) (Cost $41,161,712) | | $ | 43,101,095 | |
Total Investments in Securities - 99.3% (Cost $41,161,712)* | | $ | 43,101,095 | |
| | Contracts | | Security Description | | | Strike Price | | Exp. Date | | Value | |
| Call Options Written - (0.6)% |
| (70) | | S&P 500 Index | | $ | 1,325 | | 11/11 | | | (17,500) |
| (75) | | S&P 500 Index | | | 1,310 | | 11/11 | | | (42,750) |
| (30) | | S&P 500 Index | | | 1,300 | | 11/11 | | | (21,900) |
| (75) | | S&P 500 Index | | | 1,290 | | 11/11 | | | (82,500) |
| (75) | | S&P 500 Index | | | 1,275 | | 11/11 | | | (115,500) |
Total Written Options - (0.6)% (Premiums Received $(207,618))* | | | | | | | | | $ | (280,150) |
| Other Assets & Liabilities, Net – 1.3% | | | 566,031 | |
| Net Assets – 100.0% | | $ | 43,386,976 | |
| | (a) Non-income producing security. |
| | (b) All or a portion of these securities are pledged as collateral for |
| | * Cost for federal income tax purposes is $41,358,021 and net unrealized appreciation consists of: |
| Gross Unrealized Appreciation | | $ | 4,423,796 | |
| Gross Unrealized Depreciation | | | (2,680,722 | ) |
| Net Unrealized Appreciation | | $ | 1,743,074 | |
The following is a summary of the inputs used to value the Fund’s investments and other financial instruments and liabilities as of October 31, 2011.
The inputs or methodology used for valuing securities are not necessarily an indication of the risks associated with investing in those securities. For more information on valuation inputs, and their aggregation into the levels used in the tables below, please refer to Note 2 - Security Valuation section in the accompanying Notes to Financial Statements.
| Valuation Inputs | | Investments in Securities | | Other Financial Instruments** |
| Level 1 - Quoted Prices | | $ | 43,101,095 | | | $ | (280,150 | ) |
| Level 2 - Other Significant Observable Inputs | | | - | | | | - | |
| Level 3 - Significant Unobservable Inputs | | | - | | | | - | |
| Total | | $ | 43,101,095 | | | $ | (280,150 | ) |
The Level 1 inputs displayed in the Investments in Securities column of this table are Common Stock. Refer to the Schedule of Investments for a further breakout of each security by type.
| | **Other Financial Instruments are derivative instruments not reflected in the Total Investments in Securities, such as written call options, which are valued at their market value at year end. |
AFA
| PORTFOLIO HOLDINGS | | |
| % of Total Investments | | |
| Consumer Discretionary | 21.6 | % |
| Consumer Staples | 5.7 | % |
| Financial | 8.3 | % |
| Healthcare | 22.4 | % |
| Industrials | 10.4 | % |
| Information Technology | 26.8 | % |
| Materials | 4.8 | % |
| | 100.0 | % |
See Notes to Financial Statements. 5
WATERVILLE LARGE CAP VALUE FUNDSTATEMENT OF ASSETS AND LIABILITIES
| | | | | | | |
| ASSETS | | | | |
| | Total investments, at value (Cost $41,161,712) | | $ | 43,101,095 | |
| | Cash | | | 535,027 | |
| | Receivables: | | | | |
| | | Investment securities sold | | | 63,954 | |
| | | Dividends and interest | | | 42,075 | |
| | Prepaid expenses | | | 4,982 | |
| Total Assets | | | 43,747,133 | |
| | | | | | | |
| LIABILITIES | | | | |
| | Payables: | | | | |
| | | Call options written, at value (Premiums received $207,618) | | | 280,150 | |
| | Accrued Liabilities: | | | | |
| | Investment adviser fees | | | 35,615 | |
| | | Fund services fees | | | 13,409 | |
| | | Compliance services fees | | | 1,667 | |
| | | Other expenses | | | 29,316 | |
| Total Liabilities | | | 360,157 | |
| | | | | | | |
| NET ASSETS | | $ | 43,386,976 | |
| | | | | | | |
| COMPONENTS OF NET ASSETS | | | | |
| | Paid-in capital | | $ | 38,697,189 | |
| | Accumulated net realized gain | | | 2,822,936 | |
| | Net unrealized appreciation | | | 1,866,851 | |
| NET ASSETS | | $ | 43,386,976 | |
| | | | | | | |
| SHARES OF BENEFICIAL INTEREST AT NO PAR VALUE (UNLIMITED SHARES AUTHORIZED) | | | | |
| | Investor Shares | | | 282,786 | |
| | Institutional Shares | | | 3,138,111 | |
| | | | | | | |
| NET ASSET VALUE, OFFERING AND REDEMPTION PRICE PER SHARE | | | | |
| | Investor Shares (based on net assets of $3,581,560) | | $ | 12.67 | |
| | Institutional Shares (based on net assets of $39,805,416) | | $ | 12.68 | |
See Notes to Financial Statements. 6
WATERVILLE LARGE CAP VALUE FUNDSTATEMENT OF OPERATIONS
| | | | | | | | |
| INVESTMENT INCOME | | | | | |
| | Dividend income | | $ | 782,541 | | |
| | Interest income | | | 578 | | |
| Total Investment Income | | | 783,119 | | |
| | | | | | |
| EXPENSES | | | | | |
| | Investment adviser fees | | | 400,658 | | |
| | Investment adviser expense reimbursements recouped | | | 28,349 | | |
| | Fund services fees | | | 158,995 | | |
| | Transfer agent fees: | | | | | |
| | Investor Shares | | | 1,540 | | |
| | Institutional Shares | | | 12,502 | | |
| | Distribution fees: | | | | | |
| | Investor Shares | | | 7,099 | | |
| | Custodian fees | | | 9,999 | | |
| | Registration fees: | | | | | |
| | Investor Shares | | | 1,208 | | |
| | Institutional Shares | | | 15,679 | | |
| | Professional fees | | | 42,103 | | |
| | Trustees' fees and expenses | | | 1,228 | | |
| | Compliance services fees | | | 25,221 | | |
| | Miscellaneous expenses | | | 20,688 | | |
| Total Expenses | | | 725,269 | | |
| | Fees waived and expenses reimbursed | | | (57,200 | ) | |
| Net Expenses | | | 668,069 | | |
| | | | | | | | |
| NET INVESTMENT INCOME | | | 115,050 | | |
| | | | | | | | |
| NET REALIZED AND UNREALIZED GAIN (LOSS) | | | | | |
| | Net realized gain (loss) on: | | | | | |
| | Investments | | | 1,924,391 | | |
| | Written options | | | 937,165 | | |
| | Net realized gain | | | 2,861,556 | | |
| | Net change in unrealized appreciation (depreciation) on: | | | | | |
| | Investments | | | 1,821,275 | | |
| | Written options | | | (92,533 | ) | |
| | Net change in unrealized appreciation (depreciation) | | | 1,728,742 | | |
| NET REALIZED AND UNREALIZED GAIN | | | 4,590,298 | | |
| INCREASE IN NET ASSETS FROM OPERATIONS | | $ | 4,705,348 | | |
| | | | | | | | |
See Notes to Financial Statements. 7
WATERVILLE LARGE CAP VALUE FUNDSTATEMENTS OF CHANGES
| | | | | For the Year Ended October 31, 2011 | | | November 2, 2009* through October 31, 2010 |
| OPERATIONS | | | | | | | | | |
| | Net investment income (loss) | | $ | 115,050 | | | | $ | (30,079 | ) |
| | Net realized gain | | | 2,861,556 | | | | | 750,660 | |
| | Net change in unrealized appreciation (depreciation) | | | 1,728,742 | | | | | 138,109 | |
| Increase in Net Assets Resulting from Operations | | | 4,705,348 | | | | | 858,690 | |
| | | | | | | | | | | | |
| DISTRIBUTIONS TO SHAREHOLDERS FROM | | | | | | | | | |
| | Net investment income: | | | | | | | | | |
| | | Investor Shares | | | (3,970 | ) | | | | - | |
| | | Institutional Shares | | | (132,247 | ) | | | | (17,434 | ) |
| | Net realized gain: | | | | | | | | | |
| | | Investor Shares | | | (36,407 | ) | | | | - | |
| | | Institutional Shares | | | (746,992 | ) | | | | - | |
| Total Distributions to Shareholders | | | (919,616 | ) | | | | (17,434 | ) |
| | | | | | | | | | | | |
| CAPITAL SHARE TRANSACTIONS | | | | | | | | | |
| | Sale of shares: | | | | | | | | | |
| | | Investor Shares | | | 3,088,976 | | | | | 503,966 | |
| | | Institutional Shares | | | 4,030,292 | | | | | 30,748,750 | |
| | Reinvestment of distributions: | | | | | | | | | |
| | | Investor Shares | | | 39,734 | | | | | - | |
| | | Institutional Shares | | | 874,621 | | | | | 17,401 | |
| | Redemption of shares: | | | | | | | | | |
| | | Investor Shares | | | (161,029 | ) | | | | (60,821 | ) |
| | | Institutional Shares | | | (321,902 | ) | | | | - | |
| Increase in Net Assets from Capital Share Transactions | | | 7,550,692 | | | | | 31,209,296 | |
| Increase in Net Assets | | | 11,336,424 | | | | | 32,050,552 | |
| | | | | | | | | | | | |
| NET ASSETS | | | | | | | | | |
| | Beginning of Period | | | 32,050,552 | | | | | - | |
| | End of Period (Including line (a)) | | $ | 43,386,976 | | | | $ | 32,050,552 | |
| | | | | | | | | | | | |
| SHARE TRANSACTIONS | | | | | | | | | |
| | Sale of shares: | | | | | | | | | |
| | | Investor Shares | | | 252,909 | | | | | 45,376 | |
| | | Institutional Shares | | | 313,656 | | | | | 2,774,878 | |
| | Reinvestment of distributions: | | | | | | | | | |
| | | Investor Shares | | | 3,375 | | | | | - | |
| | | Institutional Shares | | | 74,271 | | | | | 1,596 | |
| | Redemption of shares: | | | | | | | | | |
| | | Investor Shares | | | (12,985 | ) | | | | (5,889 | ) |
| | | Institutional Shares | | | (26,290 | ) | | | | - | |
| Increase in Shares | | | 604,936 | | | | | 2,815,961 | |
| | | | | | | | | | | | |
| (a) | Undistributed net investment income. | | $ | - | | | | $ | 15,286 | |
| * | Commencement of operations. | | | | | | | | | |
See Notes to Financial Statements. 8
WATERVILLE LARGE CAP VALUE FUNDFINANCIAL HIGHLIGHTS
| These financial highlights reflect selected data for a share outstanding throughout each period. |
| | | For the Year Ended October 31, 2011 | | November 2, 2009 (a) through October 31, 2010 | |
| INVESTOR SHARES | | | | | | | | |
| NET ASSET VALUE, Beginning of Period | $ | 11.38 | | | $ | 10.00 | | |
| INVESTMENT OPERATIONS | | | | | | | | |
| Net investment loss (b) | | (0.01 | )(c) | | | (0.02 | ) | |
| Net realized and unrealized gain | | 1.59 | | | | 1.40 | | |
| Total from Investment Operations | | 1.58 | | | | 1.38 | | |
| DISTRIBUTIONS TO SHAREHOLDERS FROM | | | | | | | | |
| Net investment income | | (0.02 | ) | | | — | | |
| Net realized gain | | (0.27 | ) | | | — | | |
| Total Distributions to Shareholders | | (0.29 | ) | | | — | | |
| NET ASSET VALUE, End of Period | $ | 12.67 | | | $ | 11.38 | | |
| TOTAL RETURN | | 14.05 | % | | 13.80 | %(d) |
| RATIOS/SUPPLEMENTARY DATA | | | | | | | | |
| Net Assets at End of Period (000's omitted) | $3,582 | | | $449 | | |
| Ratios to Average Net Assets: | | | | | | | | |
| Net investment loss | | (0.07 | )% | | (0.19 | )%(e) |
| Net expense | | 2.00 | % | | 1.97 | %(e) |
| Gross expense (f) | | 2.15 | % | | 28.33 | %(e) |
| PORTFOLIO TURNOVER RATE | | 72 | % | | 95 | %(d) |
| INSTITUTIONAL SHARES | | | | | | | | |
| NET ASSET VALUE, Beginning of Period | $ | 11.38 | | | $ | 10.00 | | |
| INVESTMENT OPERATIONS | | | | | | | | |
| Net investment income (loss) (b) | | 0.04 | | | | (0.02 | ) | |
| Net realized and unrealized gain | | 1.57 | | | | 1.41 | | |
| Total from Investment Operations | | 1.61 | | | | 1.39 | | |
| DISTRIBUTIONS TO SHAREHOLDERS FROM | | | | | | | | |
| Net investment income | | (0.04 | ) | | | (0.01 | ) | |
| Net realized gain | | (0.27 | ) | | | — | | |
| Total Distributions to Shareholders | | (0.31 | ) | | | (0.01 | ) | |
| NET ASSET VALUE, End of Period | $ | 12.68 | | | $ | 11.38 | | |
| TOTAL RETURN | | 14.40 | % | | 13.94 | %(d) |
| RATIOS/SUPPLEMENTARY DATA | | | | | | | | |
| Net Assets at End of Period (000's omitted) | $39,805 | | | $31,601 | | |
| Ratios to Average Net Assets: | | | | | | | | |
| Net investment income (loss) | | 0.31 | % | | (0.15 | )%(e) |
| Net expense | | 1.64 | % | | 1.95 | %(e) |
| Gross expense (f) | | 1.78 | % | | 2.48 | %(e) |
| PORTFOLIO TURNOVER RATE | | 72 | % | | 95 | %(d) |
| | | | | | | | | | |
| (a) | Commencement of operations. |
| (b) | Calculated based on average shares outstanding during the period. |
| (c) | Per share amount does not reflect the actual net investment income (loss) for the period because of the timing of purchases and redemptions of Investor Class shares in relation to the timing of dividends earned by the Fund. |
| (d) | Not annualized. |
| (e) | Annualized. |
| (f) | Reflects the expense ratio excluding any waivers and/or reimbursements. |
See Notes to Financial Statements. 9
WATERVILLE LARGE CAP VALUE FUNDNOTES TO FINANCIAL STATEMENTS
Note 1. Organization
The Waterville Large Cap Value Fund (the “Fund”) is a diversified portfolio of Forum Funds (the “Trust”). The Trust is a Delaware statutory trust that is registered as an open-end, management investment company under the Investment Company Act of 1940 (the “Act”), as amended. Under its Trust Instrument, the Trust is authorized to issue an unlimited number of the Fund’s shares of beneficial interest without par value. The Fund currently offers two classes of shares: Investor Shares and Institutional Shares. The Fund commenced operations on November 2, 2009. The Fund’s investment objective is to achieve long-term capital appreciation.
Note 2. Summary of Significant Accounting Policies
These financial statements are prepared in accordance with generally accepted accounting principles in the United States of America (“GAAP”), which require management to make estimates and assumptions that affect the reported amounts of assets and liabilities, the disclosure of contingent liabilities at the date of the financial statements, and the reported amounts of increase and decrease in net assets from operations during the fiscal year. Actual amounts could differ from those estimates. The following summarizes the significant accounting policies of the Fund:
Security Valuation – Exchange-traded securities and over-the-counter securities are valued using the last quoted sale or official closing price, provided by independent pricing services as of the close of trading on the market or exchange for which they are primarily traded, on each Fund business day. In the absence of a sale, such securities are valued at the mean of the last bid and ask price provided by independent pricing services. Non-exchange traded securities for which quotations are available are valued using the last quoted sales price, or in the absence of a sale at the mean of the last bid and ask prices provided by independent pricing services. Short-term investments that mature in 60 days or less may be valued at amortized cost. Exchange-traded options for which there were no sales reported that day are generally valued at the mean of the last bid and ask prices. Options not traded on an exchange are generally valued at broker-dealer bid quotation.
The Fund values its investments at fair value pursuant to procedures adopted by the Trust's Board of Trustees (the "Board") if (1) market quotations are insufficient or not readily available or (2) the adviser believes that the values available are unreliable. Fair valuation is based on subjective factors and, as a result, the fair value price of an investment may differ from the security’s market price and may not be the price at which the asset may be sold. Fair valuation could result in a different NAV than a NAV determined by using market quotes.
The Fund has a three-tier fair value hierarchy. The basis of the tiers is dependent upon the various “inputs” used to determine the value of the Fund’s investments. These inputs are summarized in the three broad levels listed below:
Level 1 — quoted prices in active markets for identical assets
Level 2 — other significant observable inputs (including quoted prices of similar securities, interest rates, prepayment speeds, credit risk, etc.)
Level 3 — significant unobservable inputs (including the Fund’s own assumptions in determining the fair value of investments)
The aggregate value by input level, as of October 31, 2011, for the Fund’s investments is included at the end of the Fund’s Schedule of Investments.
Security Transactions, Investment Income and Realized Gain and Loss – Investment transactions are accounted for on the trade date. Dividend income is recorded on the ex-dividend date. Foreign dividend income is recorded on the ex-dividend date or as soon as possible after the Fund determines the existence of a dividend declaration after exercising reasonable due diligence. Income and capital gains on some foreign securities may be subject to foreign withholding taxes, which are accrued as applicable. Interest income is recorded on an accrual basis. Premium is amortized and discount is accreted using the effective interest method. Identified cost of investments sold is used to determine the gain and loss for both financial statement and federal income tax purposes.
10
WATERVILLE LARGE CAP VALUE FUNDNOTES TO FINANCIAL STATEMENTS
Written Options – When a fund writes an option, an amount equal to the premium received by the fund is recorded as a liability and is subsequently adjusted to the current value of the option written. Premiums received from writing options that expire unexercised are treated by the fund on the expiration date as realized gain from written options. The difference between the premium and the amount paid on effecting a closing purchase transaction, including brokerage commissions, is also treated as a realized gain, or if the premium is less than the amount paid for the closing purchase transaction, as a realized loss. If a call option is exercised, the premium is added to the proceeds from the sale of the underlying security in determining whether the fund has realized a gain or loss. If a put option is exercised, the premium reduces the cost basis of the securities purchased by the fund. The fund, as writer of an option, bears the market risk of an unfavorable change in the price of the security underlying the written option. Written options are non-income producing securities.
The values of each individual written option outstanding as of October 31, 2011, are disclosed in the Fund’s Schedule of Investments. The volume of open positions may vary on a daily basis as the Fund transacts written options in order to achieve the exposure desired by the adviser. The Fund entered into a total value of $1,953,282 on written options for the year ended October 31, 2011.
Transactions in written options during the year ended October 31, 2011, were as follows:
| | | Calls | |
| | | Number of | | | | | |
| | | Contracts | | | Premiums | |
| Options Outstanding, October 31, 2010 | | (252 | ) | $ | (107,991 | ) |
| Options written | | (3,324 | ) | | | (1,953,282 | ) | |
| Options terminated in closing transactions | | 1,457 | | | 1,254,518 | |
| Options exercised | | - | | | | - | | |
| Options expired | | 1,794 | | | | 599,137 | | |
| Options Outstanding, October 31, 2011 | | (325 | ) | | $ | (207,618 | ) | |
Derivatives Transactions - The Fund’s use of derivatives during the year ended October 31, 2011, was limited to written options. The Fund uses derivative instruments as part of its principal investment strategy to achieve its investment objective. Following is a summary of how the derivatives are treated in the financial statements and their impact on the Fund.
The location on the Statement of Assets and Liabilities of the Fund’s derivative positions by type of exposure, all of which are not accounted for as hedging instruments, is as follows:
Contract Type/ Primary Risk Exposure | | Location on Statement of Assets and Liabilities | | Asset Derivatives | | Location on Statement of Assets and Liabilities | | Liability Derivatives | |
| | | | | | | | | | | | |
| Equity Contracts | | | | | | | | | | | |
| | | - | | | $ - | | Call options written, at value | | | $(280,150) | |
11
WATERVILLE LARGE CAP VALUE FUNDNOTES TO FINANCIAL STATEMENTS
Realized and unrealized gains and losses on derivatives contracts entered into during the year ended October 31, 2011, by the Fund are recorded in the following locations on the Statement of Operations:
| Contract Type/Primary Risk Exposure | | Location of Gain or (Loss) on Derivatives | | Realized Gain (Loss) on Derivatives | | Change in Unrealized Appreciation (Depreciation) on Derivatives |
| | | | | | | | | |
| Equity Contracts | | | | | | | | |
| | | Realized gain (loss) – Written Options and Change in unrealized appreciation (depreciation) – Written Options | | | $937,165 | | | $(92,533) |
Distributions to Shareholders – Distributions to shareholders of net investment income, if any, are declared and paid at least quarterly. Distributions to shareholders of net capital gains, if any, are declared and paid annually. Distributions are based on amounts calculated in accordance with applicable federal income tax regulations, which may differ from GAAP. These differences are due primarily to differing treatments of income and gain on various investment securities held by the Fund, timing differences and differing characterizations of distributions made by the Fund. On December 14, 2011, the Fund paid a distribution of $0.5019 and $0.4314 per share in short term capital gains and long term capital gains, respectively, related to the period ended October 31, 2011.
Federal Taxes – The Fund intends to qualify each year as a regulated investment company under Subchapter M of the Internal Revenue Code and distribute all of its taxable income to shareholders. In addition, by distributing in each calendar year substantially all its net investment income and capital gains, if any, the Fund will not be subject to a federal excise tax. Therefore, no federal income or excise tax provision is required.
As of October 31, 2011, there are no uncertain tax positions that would require financial statement recognition, de-recognition, or disclosure. The Fund’s federal tax return filed in the one-year period ended October 31, 2011, remains subject to examination by the Internal Revenue Service.
Income and Expense Allocation – The Trust accounts separately for the assets, liabilities and operations of each of its investment portfolios. Expenses that are directly attributable to more than one investment portfolio are allocated among the respective investment portfolios in an equitable manner. The Fund’s class specific expenses are charged to the operations of that class of shares. Income and expenses (other than expenses attributable to a specific class) and realized and unrealized gains or losses on investments are allocated to each class of shares based on the class’ respective net assets to the total net assets of the Fund.
Commitments and Contingencies – In the normal course of business, the Fund enters into contracts that provide general indemnifications by the Fund to the counterparty to the contract. The Fund’s maximum exposure under these arrangements is dependent on future claims that may be made against the Fund and, therefore, cannot be estimated; however, based on experience, the risk of loss from such claims is considered remote.
Note 3. Fees and Expenses
Investment Adviser – Waterville Capital, LLC (the “Adviser”) is the investment adviser to the Fund. Pursuant to an investment advisory agreement, the Adviser receives an advisory fee from the Fund at an annual rate of 1.00% of the Fund’s average daily net assets.
Distribution – Foreside Fund Services, LLC serves as the Fund’s distributor (the “Distributor”). The Distributor is not affiliated with the Adviser or Atlantic Fund Administration, LLC (d/b/a Atlantic Fund Services) (“Atlantic”) or their affiliates. The Fund has adopted a Distribution Plan (the “Plan”) for Investor Shares in accordance with Rule 12b-1 of the Act. Under the Plan, the Fund pays the Distributor and/or any other entity as authorized by the Board a fee of up to 0.25% of the average daily net assets of Investor Shares.
12
WATERVILLE LARGE CAP VALUE FUNDNOTES TO FINANCIAL STATEMENTS
Other Service Providers – Atlantic provides fund accounting, fund administration, and transfer agency services to the Fund. Atlantic also provides certain shareholder report production, and EDGAR conversion and filing services. Pursuant to an Atlantic services agreement, the Fund pays Atlantic customary fees for its services. Atlantic provides a Principal Executive Officer, a Principal Financial Officer, a Chief Compliance Officer, and an Anti-Money Laundering Officer to the Fund, as well as certain additional compliance support functions.
Trustees and Officers – The Trust pays each independent Trustee an annual retainer fee of $45,000 for service to the Trust ($66,000 for the Chairman). In addition, the Chairman receives a monthly stipend of $500 to cover certain expenses incurred in connection with his duties to the Trust. The Trustees and Chairman may receive additional fees for special Board meetings. Each Trustee is also reimbursed for all reasonable out-of-pocket expenses incurred in connection with his duties as a Trustee, including travel and related expenses incurred in attending Board meetings. The amount of Trustees’ fees attributable to the Fund is disclosed in the Statement of Operations. Certain officers of the Trust are also officers or employees of the above named service providers, and during their terms of office received no compensation from the Fund.
Note 4. Expense Cap Agreement
The Adviser has contractually agreed to reduce a portion of its fees and reimburse expenses to limit total annual fund operating expenses (excluding all taxes, interest, portfolio transaction expenses, dividend on short sales, acquired fund fees and expenses, and extraordinary expenses) of Institutional and Investor Shares to 2.00%, through at least March 1, 2012. For the year ended October 31, 2011, the adviser did not waive fees or reimburse expenses. Other fund service providers have voluntarily agreed to waive a portion of their fees. Voluntary fee waivers and expense reimbursements may be reduced or eliminated at any time. For the year ended October 31, 2011, other waivers were $57,200.
The Fund may pay the Adviser for fees waived and expenses reimbursed pursuant to the expense cap if (1) such payment is made within three years of the fees waived or expense reimbursement, (2) such payment is approved by the Board and (3) and the resulting expenses do not exceed 2.00%. For the period November 2, 2009 (commencement of operations) through October 31, 2011, the Adviser waived and/or reimbursed fees as follows:
| | | Amount of Fees Waived and/or Expenses Reimbursed | | Expiration Date to Recoup Fees Waived and/or Expenses Reimbursed | | Fees Recouped |
| October 31, 2010 | | $48,422 | | October 31, 2013 | | $28,349 |
Note 5. Security Transactions
The cost of purchases and proceeds from sales of investment securities (including maturities), other than short-term investments during the year ended October 31, 2011, were $35,898,954 and $28,499,824, respectively.
Note 6. Federal Income Tax and Investment Transactions
Distributions during the fiscal year ended were characterized for tax purposes as follows:
| Ordinary Income | | $ | 869,482 | | $ | 17,434 |
| Long-Term Capital Gain | | | 50,134 | | | - |
| Total | | $ | 919,616 | | $ | 17,434 |
13
WATERVILLE LARGE CAP VALUE FUNDNOTES TO FINANCIAL STATEMENTS
As of October 31,2011, distributable earnings (accumulated loss) on a tax basis were as follows:
| Undistributed Ordinary Income | | $ | 1,584,614 | |
| Undistributed Long-Term Gain | | | 1,362,099 | |
| Unrealized Appreciation | | | 1,743,074 | |
| Total | | $ | 4,689,787 | |
The difference between components of distributable earnings on a tax basis and the amounts reflected in the Statement of Assets and Liabilities are primarily due to mark-to-market on section 1256 contracts and the tax deferral of losses on wash sales.
On the Statement of Assets and Liabilities, as a result of permanent book to tax differences, certain amounts have been reclassified for the year ended October 31, 2011. The following reclassification was the result of re-designation of distributions and has no impact on the net assets of the Fund.
| Accumulated Net Investment Income (Loss) | | $ | 5,881 | |
| Undistributed Net Realized Gain (Loss) | | | (5,881 | ) |
The Fund invests in broad based options which qualify under section 1256 of the Internal Revenue Code. Each section 1256 contract is treated as sold for its fair market value on the last business day of its taxable year and any gain or loss realized upon sale or mark-to-market is treated as 60% long term and 40% short term.
Note 7. Recent Accounting Pronouncements
In January 2010, the Financial Accounting Standards Board (“FASB”) issued Accounting Standards Update (“ASU”) No. 2010-06 “Improving Disclosures about Fair Value Measurements.” ASU No. 2010-06 clarifies existing disclosure and requires additional disclosures regarding fair value measurements. Effective for fiscal years beginning after December 15, 2010, and for interim periods within those fiscal years, entities will need to disclose information about purchases, sales, issuances and settlements of Level 3 securities on a gross basis, rather than as a net number as currently required. Management is currently evaluating the impact ASU No. 2010-06 will have on financial statement disclosures.
In May 2011, FASB issued ASU No. 2011-04 “Amendments to Achieve Common Fair Value Measurement and Disclosure Requirements in U.S. GAAP and IFRSs.” ASU No. 2011-04 establishes common requirements for measuring fair value and for disclosing information about fair value measurements in accordance with U.S. GAAP and International Financial Reporting Standards (“IFRSs”). ASU No. 2011-04 is effective for interim and annual periods beginning after December 15, 2011. Management is currently evaluating the impact ASU No. 2011-04 may have on financial statement disclosures.
Note 8. Regulated Investment Company Modernization Act
The Regulated Investment Company Modernization Act of 2010 (the “Modernization Act”) was enacted on December 22, 2010. The Modernization Act makes changes to several of the federal income and excise tax provisions impacting the Fund. In general, the provisions of the Modernization Act will be effective for the Fund's fiscal year ending October 31, 2012. The Modernization Act provides several benefits, including unlimited carryover on future capital losses, simplification provisions on asset diversification and/or qualifying income tests, and several provisions aimed at preserving the character of distributions made by a fiscal year regulated investment company. Relevant information regarding the impact of the Modernization Act on the Fund, if any, will be included in the October 31, 2012, annual report.
14
WATERVILLE LARGE CAP VALUE FUNDNOTES TO FINANCIAL STATEMENTS
Note 9. Subsequent Events
Subsequent events occurring after the date of this report through the date these financial statements were issued have been evaluated for potential impact and the Fund has had no such events.
15
REPORT OF INDEPENDENT REGISTERED PUBLIC ACCOUNTING FIRM
To the Board of Trustees of Forum Funds
and the Shareholders of Waterville Large Cap Value Fund
We have audited the accompanying statement of assets and liabilities of the Waterville Large Cap Value Fund, a series of shares of beneficial interest in the Forum Funds, including the schedule of investments, as of October 31, 2011, and the related statement of operations for the year then ended, and the statement of changes in net assets and the financial highlights for the year then ended and the period November 2, 2009 (commencement of operations) through October 31, 2010. These financial statements and financial highlights are the responsibility of the Fund's management. Our responsibility is to express an opinion on these financial statements and financial highlights based on our audits.
We conducted our audits in accordance with the standards of the Public Company Accounting Oversight Board (United States). Those standards require that we plan and perform the audits to obtain reasonable assurance about whether the financial statements and financial highlights are free of material misstatement. An audit includes examining, on a test basis, evidence supporting the amounts and disclosures in the financial statements. Our procedures included confirmation of securities owned as of October 31, 2011 by correspondence with the custodian and brokers. An audit also includes assessing the accounting principles used and significant estimates made by management, as well as evaluating the overall financial statement presentation. We believe that our audits provide a reasonable basis for our opinion.
In our opinion, the financial statements and financial highlights referred to above present fairly, in all material respects, the financial position of the Waterville Large Cap Value Fund as of October 31, 2011, and the results of its operations for the year then ended, and the changes in its net assets and its financial highlights for year then ended and the period November 2, 2009 through October 31, 2010, in conformity with accounting principles generally accepted in the United States of America.
BBD, LLP
Philadelphia, Pennsylvania
December 16, 2011
16
WATERVILLE LARGE CAP VALUE FUNDADDITIONAL INFORMATION (Unaudited)
Investment Advisory Agreement Approval
At the September 16, 2011 Board meeting, the Board, including the Independent Trustees, considered the approval of the continuance of the investment advisory agreement pertaining to the Fund (the “Advisory Agreement”). In evaluating the Advisory Agreement for the Fund, the Board reviewed materials furnished by the Adviser and Atlantic, including information regarding the Adviser, its personnel, operations and financial condition. Specifically, the Board considered, among other matters: (1) the nature, extent and quality of the services to be provided to the Fund by the Adviser, including information on the investment performance of the Adviser; (2) the costs of the services to be provided and profitability to the Adviser with respect to its relationship with the Fund; (3) the advisory fee and the total expense ratio of the Fund compare to relevant peer groups of funds; (4) the extent to which economies of scale would be realized as the Fund grows and whether the advisory fee would enable the Fund’s investors to share in the benefits of economies of scale; and (5) other benefits received by the Adviser from its relationship with the Fund. In their deliberations, the Board did not identify any particular information that was all-important or controlling and attributed different weights to the various factors. In particular, the Board focused on the factors discussed below.
Nature, Extent and Quality of Services
Based on a presentation from senior representatives of the Adviser and a discussion of the Adviser’s personnel, operations and financial condition, the Board considered the quality of services to be provided by the Adviser under the Advisory Agreement. In this regard, the Board considered information regarding the experience, qualifications and professional background of the portfolio managers and other personnel at the Adviser with principal investment responsibility for the Fund’s investments as well as the investment philosophy and decision-making processes of those professionals and the capability and integrity of the Adviser’s senior management and staff. The Board considered the adequacy of the Adviser’s resources and quality of services provided by the Adviser under the Advisory Agreement between the Trust and the Adviser.
Costs of Services and Profitability
The Board considered information provided by the Adviser regarding its costs of services and its profitability with respect to the Fund. In this regard, the Board considered the Adviser’s resources devoted to the Fund as well as the Adviser’s discussion of costs and profitability. Based on these and other applicable considerations, the Board concluded that the Adviser’s profits attributable to management of the Fund were not a material factor in approving the Agreement.
Performance
The Board reviewed the performance of the Fund and the Adviser’s discussion of its investment philosophy. The Board considered the Fund’s performance over the one-year and since inception (annualized) periods ended August 31, 2011. The Board noted that the Fund outperformed its benchmark, the S&P 500 Index, for both the one-year period and since inception. Given, among other things, the Fund’s performance during those periods, the Board concluded that the Fund’s performance was reasonable relative to its benchmark and that the Fund and its shareholders could benefit from the Adviser’s management of the Fund.
Compensation
The Board considered the Adviser’s compensation for providing advisory services to the Fund and analyzed comparative information on fee rates and total expenses of similar mutual funds. The Board noted that the Adviser’s actual advisory fee rate and actual total expenses of the Fund were above the median of the Fund’s Lipper Inc. peer group. The Board considered the Fund’s use out-of-the-money S&P 500 Index which is unique among its Lipper Inc. peer group. Based on the foregoing, the Board concluded that the Adviser’s advisory fee rate charged to the Fund appeared to be within a reasonable range in light of the services it provides to the Fund.
17
WATERVILLE LARGE CAP VALUE FUNDADDITIONAL INFORMATION (Unaudited)
Economies of Scale
The Board considered whether the Fund would benefit from any economies of scale. In this respect, the Board noted the Adviser’s representation that the Fund potentially could benefit from economies of scale as assets grow, but the Adviser currently is not proposing breakpoints or changes in fees at this time. Based on the foregoing information, the Board concluded that economies of scale were not a material factor in approving the Advisory Agreement.
Other Benefits
The Board noted the Adviser’s representation that the Adviser does not expect to receive any kind of benefit or compensation from its relationship with the Fund, other than its contractual advisory fees. Based on the foregoing representation, the Board concluded that other benefits received by the Adviser from its relationship with the Fund were not a material factor to consider in approving the continuation of the Advisory Agreement.
Conclusion
The Board did not identify any single factor as being of paramount importance, and different Trustees may have given different weight to different factors. The Board reviewed a memorandum from Trust counsel discussing the legal standards applicable to its consideration of the Advisory Agreement. Based on its review, including consideration of each of the factors referenced above, the Board determined, in the exercise of its business judgment, that the advisory arrangement, as outlined in the Advisory Agreement, was fair and reasonable in light of the services performed, expenses incurred and such other matters as the Board considered relevant in the exercise of its reasonable business judgment.
Proxy Voting Information
A description of the policies and procedures that the Fund uses to determine how to vote proxies relating to securities held in the Fund’s portfolio is available, without charge and upon request, by calling (877) 356-9055 and on the U.S. Securities and Exchange Commission’s (the “SEC”) website at www.sec.gov. The Fund’s proxy voting record for the most recent twelve-month period ended June 30 is available, without charge and upon request, by calling (877) 356-9055 and on the SEC’s website at www.sec.gov.
Availability of Quarterly Portfolio Schedules
The Fund files its complete schedule of portfolio holdings with the SEC for the first and third quarters of each fiscal year on Form N-Q. The Fund’s Forms N-Q are available, without charge and upon request on the SEC’s website at www.sec.gov or may be reviewed and copied at the SEC’s Public Reference Room in Washington, DC. Information on the operation of the Public Reference Room may be obtained by calling (800) SEC-0330.
Shareholder Expense Example
As a shareholder of the Fund, you incur ongoing costs, including management fees, distribution (12b-1) fees and other Fund expenses. This example is intended to help you understand your ongoing costs (in dollars) of investing in the Fund and to compare these costs with the ongoing costs of investing in other mutual funds.
The example is based on an investment of $1,000 invested at the beginning of the period and held for the entire period from May 1, 2011, through October 31, 2011.
Actual Expenses – The first line under each share class of the table below provides information about actual account values and actual expenses. You may use the information in this line, together with the amount you invested, to estimate the expenses that you paid over the period. Simply divide your account value by $1,000 (for example, an $8,600 account value divided by $1,000 = 8.6), then multiply the result by the number in the first line under the heading entitled “Expenses Paid During Period” to estimate the expenses you paid on your account during the period.
Hypothetical Example for Comparison Purposes – The second line under each share class of the table below provides
18
WATERVILLE LARGE CAP VALUE FUNDADDITIONAL INFORMATION (Unaudited)
information about hypothetical account values and hypothetical expenses based on the Fund’s actual expense ratio and an assumed rate of return of 5% per year before expenses, which is not the Fund’s actual return. The hypothetical account values and expenses may not be used to estimate the actual ending account balance or expenses you paid for the period. You may use this information to compare the ongoing costs of investing in the Fund and other funds. To do so, compare this 5% hypothetical example with the 5% hypothetical examples that appear in the shareholder reports of other funds.
Please note that the expenses shown in the table are meant to highlight your ongoing costs only. Therefore, the second line of the table is useful in comparing ongoing costs only and will not help you determine the relative total costs of owning different funds.
| | Beginning | | Ending | | Expenses | | Annualized |
| | Account Value | | Account Value | | Paid During | | Expense |
| | May 1, 2011 | | October 31, 2011 | | Period* | | Ratio* |
| Investor Shares | | | | | | | | | | | |
| Actual | $ | 1,000.00 | | $ | 959.27 | | $ | 9.88 | | 2.00 | % |
| Hypothetical (5% return before taxes) | $ | 1,000.00 | | $ | 1,015.12 | | $ | 10.16 | | 2.00 | % |
| Institutional Shares | | | | | | | | | | | |
| Actual | $ | 1,000.00 | | $ | 960.55 | | $ | 7.66 | | 1.55 | % |
| Hypothetical (5% return before taxes) | $ | 1,000.00 | | $ | 1,017.39 | | $ | 7.88 | | 1.55 | % |
| | *Expenses are equal to the Fund’s annualized expense ratio multiplied by the average account value over the period, multiplied by the number of days in the most recent fiscal half-year divided by 365 to reflect the half-year period. |
Federal Tax Status of Dividends Declared during the Tax Year
For federal income tax purposes, dividends from short-term capital gains are classified as ordinary income.
The Fund designates 44.61% of its income dividend distributed as qualifying for the corporate dividends-received deduction (DRD) and 44.18% for the qualified dividend rate (QDI) as defined in Section 1(h)(11) of the Internal Revenue Code. The Fund also designates 0.05% as qualified interest income exempt from US tax for foreign shareholders (QII) and 85.01% as short-term capital gain dividends exempt from U.S. tax for foreign shareholders (QSD).
Trustees and Officers of the Trust
The Board is responsible for oversight of the management of the Trust’s business affairs and of the exercise of all the Trust’s powers except those reserved for the shareholders. The following table provides information about each Trustee and certain officers of the Trust. Each Trustee and officer holds office until the person resigns, is removed, or is replaced. Unless otherwise noted, the persons have held their principal occupations for more than five years. The address for all Trustees and officers is Three Canal Plaza, Suite 600, Portland, Maine 04101, unless otherwise indicated. Mr. Keffer is considered an Interested Trustee due to his affiliation with Atlantic. The Fund’s Statement of Additional Information includes additional information about the Trustees and is available, without charge and upon request, by calling (877) 356-9055.
19
WATERVILLE LARGE CAP VALUE FUNDADDITIONAL INFORMATION (Unaudited)
| Name and Year of Birth | Position with the Trust | Length of Time Served | Principal Occupation(s) During Past Five Years | Number of Series of Trust Overseen by Trustee | Other Directorships Held by Trustee |
| Independent Trustees | | | | | |
J. Michael Parish Born: 1943 | Chairman of the Board; Trustee; Chairman, Nominating Committee and Qualified Legal Compliance Committee | Since 1989 (Chairman since 2004) | Retired since 2003. | 23 | 0 |
Costas Azariadis Born: 1943 | Trustee; Chairman, Valuation Committee | Since 1989 | Professor of Economics, Washington University since 2006; Professor of Economics, University of California-Los Angeles 1992-2006. | 23 | 0 |
James C. Cheng Born: 1942 | Trustee; Chairman, Audit Committee | Since 1989 | President, Technology Marketing Associates (marketing company for small- and medium-sized businesses in New England) since 1991. | 23 | 0 |
David Tucker Born: 1958 | Trustee | Since 2011 | Director, Blue Sky Experience, Kansas City Mo. since 2008, Senior Vice President & General Counsel, American Century Companies 1998-2008 | 23 | 0 |
| Interested Trustee | | | | | |
John Y. Keffer1 Born: 1942 | Trustee; Vice Chairman | Since 1989 | Chairman, Atlantic since 2008; President, Forum Foundation (a charitable organization) since 2005; President, Forum Trust, LLC (a non-depository trust company chartered in the State of Maine) since 1997. | 23 | Director, Wintergreen Fund, Inc. |
| Officers | | | | | |
Stacey E. Hong Born: 1966 | President; Principal Executive Officer | Since 2008 | President, Atlantic since 2008; Director, Consulting Services, Foreside Fund Services 2007. | N/A | N/A |
Karen Shaw Born: 1972 | Treasurer; Principal Financial Officer | Since 2008 | Senior Vice President, Atlantic since 2008; Vice President, Citigroup 2003-2008. | N/A | N/A |
David Faherty Born: 1970 | Vice President | Since 2009 | Senior Counsel, Atlantic since 2009; Vice President, Citi Fund Services Ohio, Inc. 2007-2009; Associate Counsel, Investors Bank & Trust Co. 2006-2007. | N/A | N/A |
Michael J. McKeen Born: 1971 | Vice President | Since 2009 | Senior Vice President, Atlantic since 2008; Vice President, Citigroup 2003-2008. | N/A | N/A |
Joshua LaPan Born: 1973 | Vice President | Since 2009 | Manager, Atlantic since 2008; Vice President, Citigroup 2003-2008. | N/A | N/A |
Timothy Bowden Born: 1969 | Vice President | Since 2009 | Manager, Atlantic since 2008; Vice President, Citigroup 2005-2008. | N/A | N/A |
Lina Bhatnagar Born: 1971 | Secretary | Since 2008 | Senior Administration Specialist, Atlantic since 2008; Regulatory Administration Specialist, Citigroup 2006-2008. | N/A | N/A |
1Atlantic is a subsidiary of Forum Holdings Corp. I, a Delaware corporation that is wholly owned by Mr. Keffer. |
20
FOR MORE INFORMATION:
P.O. Box 588
Portland, ME 04112
(877) 356-9055
INVESTMENT ADVISER
Waterville Capital, LLC
Radnor Court, Suite 210
259 Radnor-Chester Road
Radnor, PA 19087
TRANSFER AGENT
Atlantic Fund Services
P.O. Box 588
Portland, ME 04112
DISTRIBUTOR
Foreside Fund Services, LLC
Three Canal Plaza, Suite 100
Portland, Maine 04101
www.foreside.com
This report is submitted for the general information of the shareholders of the Fund. It is not authorized for distribution to prospective investors unless preceded or accompanied by an effective prospectus, which includes information regarding the Fund’s risks, objectives, fees and expenses, experience of its management, and other information.
239-ANR-1011
ITEM 2. CODE OF ETHICS.
| (a) | As of the end of the period covered by this report, Forum Funds (the “Registrant”) has adopted a code of ethics, which applies to its Principal Executive Officer and Principal Financial Officer. |
| (c) | There have been no amendments to the Registrant’s code of ethics that apply to its Principal Executive Officer and Principal Financial Officer. |
| (d) | There have been no waivers to the Registrant’s code of ethics that apply to its Principal Executive Officer and Principal Financial Officer. |
(f) (1) A copy of the Code of Ethics is being filed under Item 12(a) hereto.
ITEM 3. AUDIT COMMITTEE FINANCIAL EXPERT.
The Board of Trustees has determined that no member of the Audit Committee is an "audit committee financial expert" as that term is defined under applicable regulatory guidelines.
ITEM 4. PRINCIPAL ACCOUNTANT FEES AND SERVICES.
(a) Audit Fees - The aggregate fees billed for each of the last two fiscal years (the “Reporting Periods”) for professional services rendered by the Registrant’s principal accountant for the audit of the Registrant’s annual financial statements, or services that are normally provided by the principal accountant in connection with the statutory and regulatory filings or engagements for the Reporting Periods, were $25,000 in 2010 and $28,000 in 2011.
(b) Audit-Related Fees – The aggregate fees billed in the Reporting Periods for assurance and related services rendered by the principal accountant that were reasonably related to the performance of the audit of the Registrant’s financial statements and are not reported under paragraph (a) of this Item 4 were $0 in 2010 and $0 in 2011.
(c) Tax Fees - The aggregate fees billed in the Reporting Periods for professional services rendered by the principal accountant to the Registrant for tax compliance, tax advice and tax planning were $6,000 in 2010 and $6,000 in 2011. These services consisted of review or preparation of U.S. federal, state, local and excise tax returns.
(d) All Other Fees - The aggregate fees billed in the Reporting Periods for products and services provided by the principal accountant to the Registrant, other than the services reported in paragraphs (a) through (c) of this Item, were $0 in 2010 and $0 in 2011.
(e) (1) The Audit Committee reviews and approves in advance all audit and “permissible non-audit services” (as that term is defined by the rules and regulations of the Securities and Exchange Commission) to be rendered to a series of the Registrant (each, a “Series”). In addition, the Audit Committee reviews and approves in advance all “permissible non-audit services” to be provided to an investment adviser (not including any sub-adviser) of a Series, or an affiliate of such investment adviser, that is controlling, controlled by or under common control with the investment adviser and provides on-going services to the Registrant (“Affiliate”), by the Series’ principal accountant if the engagement relates directly to the operations and financial reporting of the Series. The Audit Committee considers whether fees paid by a Series’ investment adviser or an Affiliate to the Series’ principal accountant for audit and permissible non-audit services are consistent with the principal accountant’s independence.
(e) (2) No services included in (b) - (d) above were approved pursuant to paragraph (c)(7)(i)(C) of Rule 2-01 of Regulation S-X.
(f) Not applicable
(g) The aggregate non-audit fees billed by the principal accountant for services rendered to the Registrant for the Reporting Periods were $0 in 2010 and $0 in 2011. There were no fees billed in either of the Reporting Periods for non-audit services rendered by the principal accountant to the Registrant’s investment adviser or any Affiliate.
(h) During the Reporting Period, the Registrant's principal accountant provided no non-audit services to the investment advisers or any entity controlling, controlled by or under common control with the investment advisers to the series of the Registrant to which this report relates.
ITEM 5. AUDIT COMMITTEE OF LISTED REGISTRANTS.
Not applicable.
ITEM 6. SCHEDULE OF INVESTMENTS.
| (a) | Included as part of report to shareholders under Item 1. |
ITEM 7. DISCLOSURE OF PROXY VOTING POLICIES AND PROCEDURES FOR CLOSED-END
MANAGEMENT INVESTMENT COMPANIES.
Not applicable.
ITEM 8. PORTFOLIO MANAGERS OF CLOSED-END MANAGEMENT INVESTMENT COMPANIES.
Not applicable.
ITEM 9. PURCHASES OF EQUITY SECURITIES BY CLOSED-END MANAGEMENT INVESTMENT COMPANY AND AFFILIATED PURCHASERS.
Not applicable.
ITEM 10. SUBMISSION OF MATTERS TO A VOTE OF SECURITY HOLDERS
The Registrant does not accept nominees to the board of trustees from shareholders.
ITEM 11. CONTROLS AND PROCEDURES
(a) The Registrant’s Principal Executive Officer and Principal Financial Officer have concluded that the Registrant’s disclosure controls and procedures (as defined in Rule 30a-3(c) under the Investment Company Act of 1940 (the “Act”)) are effective, based on their evaluation of the controls and procedures required by Rule 30a-3(b) under the Act and Rules 13a-15(b) or 15d-15(b) under the Securities Exchange Act of 1934, as of a date within 90 days of the filing date of this report.
(b) There were no changes in the Registrant’s internal control over financial reporting (as defined in
Rule 30a-3(d) under the Act) that occurred during the second fiscal quarter of the period covered by this report that have materially affected, or are reasonably likely to materially affect, the Registrant’s internal control over financial reporting.
ITEM 12. EXHIBITS.
(a)(1) Code of Ethics (Exhibit filed herewith).
(a)(2) Certifications pursuant to Rule 30a-2(a) of the Act, and Section 302 of the Sarbanes-Oxley Act of 2002. (Exhibits filed herewith)
(a)(3) Not applicable.
(b) Certifications pursuant to Rule 30a-2(b) of the Act, and Section 906 of the Sarbanes-Oxley Act of 2002. (Exhibit filed herewith)
SIGNATURES
Pursuant to the requirements of the Securities Exchange Act of 1934 and the Investment Company Act of 1940, the Registrant has duly caused this report to be signed on its behalf by the undersigned, thereunto duly authorized.
Registrant Forum Funds
By /s/ Stacey E. Hong
Stacey E. Hong, Principal Executive Officer
Date 12/13/11
Pursuant to the requirements of the Securities Exchange Act of 1934 and the Investment Company Act of 1940, this report has been signed below by the following persons on behalf of the Registrant and in the capacities and on the dates indicated.
By /s/ Stacey E. Hong
Stacey E. Hong, Principal Executive Officer
By /s/ Karen Shaw
Karen Shaw, Principal Financial Officer