As filed with the Securities and Exchange Commission on June 6, 2012
UNITED STATES
SECURITIES AND EXCHANGE COMMISSION
WASHINGTON, D.C. 20549
FORM N-CSR
CERTIFIED SHAREHOLDER REPORT OF REGISTERED MANAGEMENT
INVESTMENT COMPANIES
Investment Company Act file number 811-03023
FORUM FUNDS
Three Canal Plaza, Suite 600
Portland, Maine 04101
Stacey E. Hong, Principal Executive Officer
Three Canal Plaza, Suite 600
Portland, Maine 04101
207-347-2000
Date of fiscal year end: March 31
Date of reporting period: April 1, 2011 – March 31, 2012
ITEM 1. REPORT TO STOCKHOLDERS.
The views in this report were those of the Absolute Strategies Fund and Absolute Opportunities Fund’s (each a “Fund” and collectively the “Funds”) adviser as of March 31, 2012, and may not reflect their views on the date this report is first published or any time thereafter. These views are intended to assist shareholders in understanding their investment in the Funds and do not constitute investment advice. None of the information presented should be construed as an offer to sell or recommendation of any security mentioned herein.
Since the Funds utilize multi-manager strategies with multiple sub-advisers, they may be exposed to varying forms of risk. These risks include, but are not limited to, general market risk, multi-manager risk, non-diversification risk, small company risk, foreign risk, interest rate risk, credit risk, prepayment risk, IPO risk, liquidity risk, high turnover risk, leverage risk, pooled investment vehicle risk and derivatives risk. For a complete description of the Funds’ principal investment risks, please refer to each Fund’s prospectus.
Beta is a measure of an asset’s sensitivity to broad market moves, as measured for instance by the S&P 500® Index. A fund with a realized beta of 0.5 with respect to the S&P 500®Index infers that about 50% of the fund’s returns were explained by the performance of the index (the rest of the performance was independent of the index). Standard deviation indicates the volatility of a fund’s total returns and is useful because it identifies the spread of a fund’s short-term fluctuations. The HFR Indices are equally weighted performance indexes, utilized by numerous hedge fund managers as a benchmark for their own hedge funds. One cannot invest directly in an index or average.
Absolute Opportunities Fund, Absolute Strategies Fund, Absolute Funds, and Absolute Investment Advisers are registered service marks of Absolute Investment Advisers LLC (“AIA” and “Absolute”) and the respective logos are service marks of AIA; and other marks referred to herein are the trademarks, service marks or registered trademarks of the respective owners thereof.
A MESSAGE TO OUR SHAREHOLDERS
Dear Shareholder,
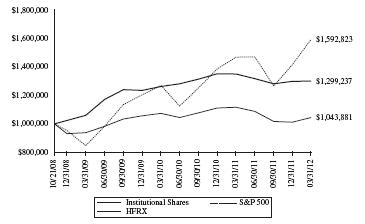
We are pleased to present the annual report for the Absolute Strategies Fund (the “Fund”) for the 12 months ended March 31, 2012. The Fund (Institutional Shares) returned 3.36% for the twelve months ended March 31, 2012, versus 8.54% for the S&P 500 Index (“S&P 500”) and -6.38% for the HFRX Global Hedge Fund Index. More importantly, the Fund’s performance was achieved without taking meaningful risks and the Fund’s overall net exposure was held to modest levels throughout the past year. From inception through March 31, the Fund’s beta was 0.21, (beta measures the Fund’s sensitivity to the S&P 500) demonstrating that Fund returns were largely independent of this market index.
As of March 31, 2012, 1-year, 5-year and since inception (July 27, 2005) annualized performance for the Fund (Institutional Shares) was 3.36%, 2.60% and 3.29%, respectively. Performance data quoted represents past performance and is no guarantee of future results. Current performance may be lower or higher than the performance data quoted. Investment return and principal value will fluctuate so that an investor’s shares, when redeemed, may be worth more or less than their original cost. For performance current to the most recent month-end, call the Fund at (888) 992-2765. As stated in the current prospectus, the Fund’s total annual operating expense ratio (gross) is 2.28% for Institutional Shares. Excluding the effect of expenses attributable to dividends and interest on short sales and acquired fund fees and expenses, the Fund’s total annual operating expense ratio (net) would be 1.73% for Institutional Shares. Returns include the reinvestments of dividends and capital gains.
The Fund’s allocations and performance can be viewed across multiple dimensions. Overall holdings of the Fund, aggregated across sub-adviser strategies, are diversified across a wide range of industries and asset classes. As such, it is difficult to attribute performance to any small group of securities. The Fund held over 1,200 securities, including both long and short equity, fixed income, ETFs, options, cash and financial futures hedges. Detailed positioning can be found in the schedule of investments section of the annual report.
We currently allocate assets to ten sub-advisers (managers) that utilize eleven strategies. As of March 31, 2012, we allocated approximately 93% of the Fund’s assets; the remaining 7% was held in cash for future allocations and rebalancing. Of the sub-advisers who received assets, the largest allocation to a single manager strategy was approximately 15%; the smallest was roughly 1%. We view each manager strategy as an independent risk/return profile as opposed to designating categories, benchmarks or buckets. The following list provides insight into the more concentrated nature of our allocations where we currently have our largest single strategy allocations. The strategies below (listed alphabetically by manager) each had an allocation between 8%-15% as of March 31:
Aronson Johnson Ortiz – Equity Market Neutral
Kovitz Investment Group – Long/Short Equity
Longhorn Capital Partners – Global Long/Short Equity
Metropolitan West Asset Management – Distressed Debt
Mohican Financial Management – Convertible Arbitrage
St. James Investment Management – Concentrated Equity
Yacktman Asset Management – Concentrated Equity
The Fund’s beta (sensitivity) to the S&P 500 has been trending lower during the run-up in asset prices and has been averaging near zero over the past two years. Our performance can be explained by the Fund’s manager changes and overall positioning, which has become much more strategic and conservative as markets have appeared more speculative and momentum driven. As such, our beta and volatility have been lower than normal. This is to be expected given the Fund’s desire to preserve capital and our managers’ willingness to change their exposures from “aggressive” to “conservative” as the price of risk changes.
We remain pleased with the Fund’s performance in what continues to be a very volatile and emotional environment for many investors. While the performance for any one month or even a few quarters may appear “disappointing,” investors with reasonable and rational time horizons will understand the Fund’s ability to provide a unique risk/return profile that does not rely on beta-driven, correlated asset allocation strategies. In order to provide diversification to an overall portfolio in today’s momentum-fueled markets, one cannot be investing in the same
1 ABSOLUTE FUNDS
A MESSAGE TO OUR SHAREHOLDERS
things as everyone else. You have to be doing something different. As a result, overall returns and performance are likely to come at different times and intervals than other parts of a portfolio. This is the definition of diversification. It may come as a surprise to many investors that even with the significant gains in global equities over the past 6 months, our Fund has actually outperformed the MSCI World Equity Index over the past 12 months, as well as the past 5 years through March 31. Additionally, the Fund produced a positive return during last year’s volatile global equity sell-off. This is why we stress patience and discipline. The Fund’s overall positioning is relatively unchanged and remains well hedged and defensive. A recap of our positioning is discussed in more detail toward the end of this letter.
It is no secret the structural problems and crises throughout the global economy stem from excess debt. This letter attempts to explain why we think the global economy is in this situation, why the process for creating the problems continues to this day, why financial markets are not out of the woods, and how we plan to manage your money within this environment. We are extremely optimistic about the future investing climate, but only after we get through the final stage of the credit bubble. In our view, the root of the problem stems from the willingness of a broad swath of investors and money managers to bid up asset prices to extreme levels. The price increases are based on short term fundamentals, powerful momentum, and easy money from central banks. This creates a speculative environment that along with easy money, allows borrowers to take on excessive levels of debt based on short term, unsustainable asset prices. Money managers and investors are also providing the supply of credit in addition to the high asset prices that serve as collateral. This again is based on short term, unsustainable fundamentals. Asset prices eventually drop once long-term fundamentals trump the short-term; however the debt remains fixed. This creates an immediate collateral problem for both the borrower AND lender. Again, we blame the allocators of capital (largely using other peoples’ money) for this misallocation of capital. The allocators will make large sums of money until investors finally lose faith in the process.
The reason the above process continues today is many investors have learned very little from the credit crisis and multiple investing bubbles over the past decade-plus. They are reverting back to bad investing habits and are chasing short-term performance because markets are going up. You do not need a global survey to realize that investors are now expecting returns monthly and they possess an obsession for relative returns. This is forcing money managers, who fear losing clients to someone else who promises performance, to once again buy what is “working” and sell what is “not working” regardless of valuation or fundamentals. As a result, critical thinking and independent judgments are displaced for fear of being different from the herd or benchmark. The herd grows larger and larger until momentum carries every asset class to a level where investors are “locked-in” to an incredibly low expected return across their entire portfolio. This further stresses the need for short-term performance and puts more pressure on the herd to chase performance. Eventually, momentum dies off and there are no more buyers. A large supply/demand imbalance results and markets fall off of a cliff.
Money managers who brought us the tech bubble, the housing bubble, the bond bubble, and various swings in herding investor psychology have not altered their incentive structures. The incentive structure is not based on whether managers make money or lose money for their clients; that appears to be irrelevant. The focus is on keeping the asset base and waiting for the Federal Reserve to bail them out. If you are skeptical, explain how an entire industry missed the multitude of risks and overvalued markets over the past decade that resulted in multiple bouts of large investor losses? The signs were there and were glaringly obvious in hindsight. And, if the past decade wasn’t an appropriate time to think about systemic risks, when would be? Our guess…probably never. The markets, benchmarks and peer groups continue to serve as cover for reason and judgment regardless of potential investor losses. There is no critical thinking. Most of the money management industry simply desires to keep investors invested. Period.
The discussion of the money management industry’s inability to manage risk is not about throwing stones. We certainly do not have all of the answers and we will inevitably make plenty of mistakes. However, understanding the financial industry’s repetitive conditioning is essential for understanding the ongoing problems affecting banks, the financial system, and the economy as a whole. Blindly allocating capital to both winners and losers not only stresses misallocation of capital, but creates discrepancies between assets and liabilities. “Catch us if we fall” attitudes further erode true price discovery. The warning signals that market prices and interest rates normally provide are being suppressed. As the process builds, it becomes insurmountable. Hugh Hendry, a European
2 ABSOLUTE FUNDS
A MESSAGE TO OUR SHAREHOLDERS
money manager, recently commented at the Milken Conference about the current credit crisis in Europe, “You can’t make up how bad it is.” Commenting further he stated, “We have reached a profound point in economic history where the truth is unpalatable to the political class, and that truth is that the scale and magnitude of the problem is larger than their ability to respond, and it terrifies them.” We agree. In our view, the financial and political elite are being intellectually dishonest with understanding, managing, and communicating systemic risks and they are attempting to control markets, prices and interest rates. The risks are not complicated and do not require a brilliant mind or a Ph.D. in economics to understand. It is simple exponential math and the ability and willingness to think for yourself.
Why do we believe we are not out of the woods? The seriousness of this process is creating the current, global structural problems because it impacts the most vital element: collateral. Collateral is what serves as the foundation for the current leveraged financial economy globally as it provides the means (the asset-side of a balance sheet) for lending and borrowing. When asset prices rise, additional debt can be created. When asset prices rise artificially, thanks to the effort of central banks over the past decade-plus through artificially low interest rates, it provides an unsustainable foundation for new debt. A simple example of this is the artificial increase in house prices (collateral) that allowed homeowners to take on additional debt and use their home values as an ATM. When prices of homes dropped back to supply/demand equilibrium, the higher levels of debt that were based on artificially high home prices caused a massive collateral problem. The asset/home dropped in value while the liability remained the same, thus wiping out all of the homeowner’s equity. This process continues to this day. The Federal Reserve and other central banks try to inflate asset prices through money creation to entice the creation of new credit. This creates more debt on asset prices that are artificially elevated in hopes of kick-starting the economy. Unfortunately, newly created debt today has diminishing marginal productivity and is contributing very little to GDP growth. GDP is simply a measure of spending, not a measure of prosperity or wealth. One-time measures that create spending levels that again are artificial through deficit spending or credit are simply unsustainable (borrow and spend has limits).
Additionally, with interest rates at historic lows, investment models have low hurdle rates for success, which leads to low return-on-investment projects or crowded speculative bets on financial products. Banks have controlled much of the new liquidity and are using additional leverage on low returning bets on real estate, financial instruments and derivatives. These financial bets tend to be short lived and traders withdraw when momentum wanes or they experience losses. Asset prices then drop (think housing) and you have new collateral problems, which now include both borrower and lender, all over again. These experiments to jump start the economy create further credit and solvency problems once supply and demand revert back to natural equilibrium. Credit problems create a further drop in asset prices as banks must sell assets, and collateral problems worsen to the point where there is no fix and it spirals out of control. Collateral is about money and when money is lost, banks run into severe funding problems due to highly leveraged positions on little equity. Enter the financial elite to provide taxpayer funded bailouts. This ongoing financial repression, where failure and speculation are rewarded and savers are punished, is controlled by a small, non-elected group of economists with no market experience and a poor history of understanding anything that isn’t constant and linear. These economists fail to understand that the reason capital markets aren’t working is because the mechanism for pricing risk (interest rates) is broken. Amazingly, there has never been more blind faith in this group by the “catch us if we fall” investment industry.
Regardless of how much faith investors currently have in central banks, there are limits to creating money out of thin air and faith can disappear quickly. Nothing stresses the gaping income and wealth disparity more than central bank money printing and inflation. It doesn’t take long for young, educationally-indebted and highly unemployed generations to resort to severe social unrest and political pressures. The 99% represents a majority last we checked, but even large voter turnouts by small factions can dramatically upend the status quo. Smaller factions have indeed defined democracy and upheaval since the beginning of time. The only thing holding up the current system is propaganda and the ability of the financial and political elite to stay in power. Many things can change the status quo, but the most powerful multiples are the bond markets (rising sovereign yields) and the political process (elections or scandal). This is where the Euro-zone is right now. National elections are pushing back against the bail-out and financial regimes and against German political will to control Euro-zone economic policy. If the status quo is upended and nationalism and self-protection re-roots itself in Europe, there will likely
3 ABSOLUTE FUNDS
A MESSAGE TO OUR SHAREHOLDERS
be a reassessment of basic math showing that debts cannot be supported or paid back. Political instability is the last thing Europe can afford right now and it could potentially upset the entire global financial system.
According to the World Bank, almost half of all global trade involves Europe, which also serves as China’s largest customer. As Euro-zone economic and credit conditions worsen, we expect global trade dislocations to reverberate; this will likely impact China and the rest of Asia on a large scale. Problems in the Euro-zone could take place simultaneously with China’s need to address their own credit bubble and economic imbalances. As we’ve been discussing for almost a year, China has been the main driver of global growth through a massive stimulus phase that fostered unsustainably high fixed investment levels. This has created a severe imbalance between fixed investment and consumption in China that will likely require much slower GDP growth to rebalance. According to analysis by Michael Pettis, even if consumption growth averages 7-8%, a rebalancing of investment vs. consumption implies overall real GDP growth for China averaging not much more than 3% annually over the rest of the decade. A slowing of the investment boom in China, while difficult to time, is mathematically inevitable. Many emerging market countries and even US based companies have enjoyed huge profit growth that was directly tied to the China story. This means that the countries and companies who benefited greatly from China’s investment and infrastructure boom, notably those that are capital intensive or tied to industrial commodities, are at risk of a severe downturn. This assumes that China is able to handle its own credit and housing bubble, which could also be called into question once the slowdown begins. We view a hard landing in China as defined not by negative growth, but by subpar real growth. We believe this scenario is very likely, especially given credit strains and elevated inflation levels throughout Asia.
When considering the problems facing the Euro-zone, China, and the potential impact on emerging markets, we have become increasingly optimistic about the future for the United States within the global economy. Europe is a collection of insolvent nations that must come together to avert disaster. However, the opposite is occurring. China has severe imbalances that are the responsibility of a small political committee censoring a nation of very low per capita wealth. Emerging markets live largely off of the successes of Europe and China. While the U.S. has the tools to fix our own problems, Americans must be willing to accept some pain. We are optimistic the U.S. will eventually come out of this better than we went into it and the U.S. economy will greatly outperform on a relative basis in the long run. However, this is not necessarily a positive for broad U.S. markets due to global market correlation and the initial pain needed to tackle our own debt problems. U.S. equity markets have also become heavily dependent on current record profit margins, a declining U.S. dollar, and foreign sources of earnings growth. The positive impact of direct government subsidies on economic growth, corporate margins, and cost of capital will prove to be transitory, unsustainable, and likely costly for many investors. U.S. companies that were leveraged to the China miracle could be exposed to significant downturns. Broadly speaking, U.S. equities are not cheap based on normalized fundamentals and most U.S. bonds are completely unattractive long-term. Most alarming is the massive capital flows into bond funds and bond ETFs. This is coming at a time when Wall Street dealer balance sheets have been shrinking significantly, which should be a red flag for significant liquidity concerns when selling becomes necessary. When viewing the overall environment for asset allocation and highly correlated price movements, the task of a financial advisor could not be more challenging.
We firmly believe managing money in this environment needs to take into account the idea that the risk of loss has been conditioned out of most investors’ thought and risk management processes. The overall positioning of both of our Funds is driven largely by the bottoms-up analysis and security selection of our managers, but it also contemplates the environment outlined above. There is an obsession with short-term relative returns and it is resulting in passive asset allocation strategies that are fully invested and very crowded; investors are all competing for the same ideas. This can create significant opportunities for managers like ours, who focus on individual security selection and the mis-pricing of assets. But time and patience are required. Short-term, emotion-driven markets can create a gap between price and value that can remain wide for frustratingly long periods of time; however, price and value eventually converge. We remain committed to our longer-term theses, despite short-term volatility and we are enthusiastic about the potential for a vast re-pricing of risk.
Currently, the Strategies Fund’s positioning continues to seek opportunity and discrepancy in the pricing of high quality vs. high risk companies (measured by price/cash generation and balance sheet strength). The long equity portfolio is skewed largely toward select domestic companies that have stable economic profiles, attractive
4 ABSOLUTE FUNDS
A MESSAGE TO OUR SHAREHOLDERS
valuations, and low sensitivity to cyclical margin pressure. The short equity portfolio leans toward companies where earnings power and valuations are stretched or face significant economic headwinds. These short positions include European financials, China-related growth stories, and select low quality industrial, consumer, and financial stocks in the U.S. Fundamental data and recent earnings reports point out underlying weaknesses and fragile foundations for growth in these businesses. Overlay futures hedges include certain equity indices, Euro currency, and to a lesser extent long-term U.S. Government debt. The Fund also continues to have a large allocation to convertible arbitrage which we believe provides an attractive balance of risk and reward that can also benefit from equity volatility. In other credit, certain tranches of sub-prime mortgage and asset backed debt remain reasonably priced with attractive yields.
As a reminder, the Fund is designed for patient, disciplined investors who are looking for something to preserve capital and provide a diversifying element to a mix of directional asset classes. Given the high sensitivities and correlations across most global asset classes, diversification can be incredibly difficult; we cannot think of a better time to be using our Fund.
Thank you for your investment in our Fund.
Sincerely,
Jay Compson
Portfolio Manager
Absolute Investment Advisers LLC
5 ABSOLUTE FUNDS
ABSOLUTE OPPORTUNITIES FUNDA MESSAGE TO OUR SHAREHOLDERS
Dear Shareholder,
We are pleased to present the annual report for the Absolute Opportunities Fund (the “Fund”) for the period ended March 31, 2012. For new readers, the Fund was created as a compliment to the Absolute Strategies Fund to capture a variety of investment opportunities and market inefficiencies. The Fund currently utilizes five managers with highly flexible investment strategies and thus, is intended to have a more concentrated, idiosyncratic risk profile compared to the Strategies Fund. Many of the investment positions are catalyst or event driven and the Fund’s performance has the potential to be a bit lumpier than the Strategies Fund. However, much of the discussion and analysis of the macro-economic and investing climate found in the Strategies Fund letter applies to both Funds. To reiterate our view, we firmly believe managing money in this environment needs to take into account the idea that the risk of loss has been conditioned out of most investors’ thought and risk management processes.
The Fund returned -3.68% for the twelve months ended March 31, 2012, versus 8.54% for the S&P 500 Index and -6.38% for the HFRX Global Hedge Fund Index. Since inception through March 31, the Fund returned 29.92% versus 59.28% for the S&P 500 and 4.39% for the HFRX Index. Additionally the Fund has achieved this performance without taking on significant market risks while having low net exposure to broader equity and credit markets. The Fund’s volatility has been roughly one-fourth that of the S&P 500 and the Fund’s beta has been 0.14, (beta measures the Fund’s sensitivity to the S&P 500). We do anticipate Fund volatility to pick up a bit once new opportunities arise from a re-pricing of risk. Outside of a handful of event-driven and special situation securities, the equity and credit markets currently are not offering a plethora of dramatically cheap, high conviction long prospects. In fact, while much of the Fund’s gains in 2009-2010 resulted from being long distressed, idiosyncratic credit positions, many of the Fund’s more asymmetric opportunities are now actually on the short side in corporate credit.
As of March 31, 2012, 1-year and since inception annualized performance for the Fund was -3.68% and 7.90%, respectively. Performance data quoted represents past performance and is no guarantee of future results. Current performance may be lower or higher than the performance data quoted. Investment return and principal value will fluctuate so that an investor’s shares, when redeemed, may be worth more or less than their original cost. For performance current to the most recent month-end, call the Fund at (888) 992-2765. As stated in the current prospectus, the Fund’s total annual operating expense ratio (gross) is 3.43%. Excluding the effect of expenses attributable to dividends and interest on short sales and acquired fund fees and expenses, the Fund’s total annual operating expense ratio (net) would be 3.00%. However, the Fund’s adviser has agreed to contractually waive a portion of its fees and to reimburse expenses such that total operating expenses do not exceed 2.95% (excluding all interest, taxes, portfolio transaction expenses, dividends and interest on short sales, acquired fund fees and expenses, proxy expenses, and extraordinary expenses), which is in effect until July 31, 2012. Returns include the reinvestments of dividends and capital gains.
The past 12 months was a challenging period for the Absolute Opportunities Fund to deliver a meaningful return. The Fund focuses on security selection, real mis-pricings, and the key attribute that has served the test of time, patience. As such, the Fund may develop high conviction contrarian views from the bottom up. This style of investing has become something of a dinosaur and has been completely out of favor by the crowded, short-term mentality of today’s investors and asset allocators. Risk-on/risk-off investing seems to be driving the thought processes of most money managers over the past couple of years. As discussed in the Absolute Strategies Fund letter, many asset allocators are desperate to create short term performance to appease relative-return focused investors. Neither of our Funds follows such a philosophy and the Opportunities Fund should be viewed as a polar opposite to industry herding. While inactivity during momentum-fueled markets can seem frustrating, these environments are usually short-lived. We are very comfortable with our Fund managers’ exposures and are optimistic about the Fund’s longer-term positioning in an incredibly complex environment.
The Fund’s performance has largely been agnostic to recent market movements and may seem to ignore investor preference for short-term, risk-on rallies. This is exactly what the Fund was designed for. Much of the Fund’s larger long equity positions are in companies that were previously aggressively levered, but have shown meaningful balance sheet improvements and have broken free from restrictive bond or bank covenants. By and large, these
6 ABSOLUTE FUNDS
ABSOLUTE OPPORTUNITIES FUNDA MESSAGE TO OUR SHAREHOLDERS
companies are very cheap and continue to both generate substantial free cash and de-lever as fundamentals improve. However, this bias worked against many of the Fund’s positions during the latest market rally as cash generation, balance sheet quality, and valuation all seemed to take a back seat to momentum. During periods of market momentum, outperforming stocks continued higher and underperformers grinded lower. One of the more enduring features of the markets of late has been that lower-valuation stocks have lagged while high-valuation stocks continue to outperform. As our managers’ preference is to generally seek out “unloved” companies to buy (buying low) and “over-loved” companies to sell or short (selling high), short-term pricing and investor attitudes were simply not in our favor. These periods do not last forever, tend to end unexpectedly, and usually serve as a precursor for eventual mis-pricings. In the meantime, we will heed the words of Oaktree’s Howard Marks: “you simply cannot create investment opportunities when they’re not there…when prices are high, it’s inescapable that prospective returns are low.”
The Fund has a large allocation to specific short positions in investment grade corporate debt, many of which have very low yields and extremely expensive valuations. The manager of this strategy has identified appealing short opportunities in several issuers with cyclical sensitivity to their cash flows, largely in retailing, transportation, leisure and lodging industries. Several of the issuers face meaningful margin pressures with the cost of food, fuel and other commodities becoming increasingly difficult to pass along to cash strapped consumers. Many of these forces are also compounded in certain high yield credits where companies have re-levered their balance sheets at a time when margins have peaked, cash generation has slowed, and costs are rising. Companies whose earnings growth had already benefited from significant cost cutting programs are particularly at risk as fundamentals start to decline. These companies may face substantial headwinds at a time when their low-cost debt needs to be refinanced. The Fund maintains several short credit and short equity positions in these more leveraged companies as well. Shorting credit is highly contrarian and can cause a bit of a performance drag in the short term; however, we believe the longer term risk/reward opportunity is one of the best available in any asset class today.
We believe that bottom-up analysis and focused, idiosyncratic positioning has the potential for superior long-term performance versus crowded, directional asset class investing that appears priced for perfection. As a reminder, the Fund may expose investors to different risks, including highly contrarian views, and should be utilized by patient, long-term investors seeking diversification away from traditional investments.
We have a tremendous amount of conviction in the Absolute Opportunities Fund; however we only market the Fund selectively to patient, disciplined financial advisors and investors. We very much appreciate the advisors who continue to understand how the Fund is different and the contrarian role it can play within an overall portfolio.
Thank you for your investment in our Fund.
Sincerely,
Jay Compson
Portfolio Manager
Absolute Investment Advisers LLC
7 ABSOLUTE FUNDS
PERFORMANCE CHART AND ANALYSIS
MARCH 31, 2012 (Unaudited)
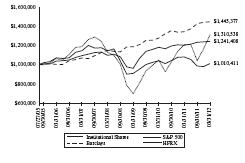
The following charts reflect the change in the value of a hypothetical $1,000,000 investment in Institutional Shares and a $250,000 investment in R Shares, including reinvested dividends and distributions, in the Absolute Strategies Fund (the “Fund”) compared with the performance of the benchmark, S&P 500 Index ("S&P 500"), Barclays Capital U.S. Aggregate Bond Index ("Barclays Index") and the HFRX Global Hedge Fund Index ("HFRX"), since inception. The S&P 500 is a broad-based, unmanaged measurement of changes in stock market conditions based on the average of 500 widely held common stocks. The Barclays Index covers the U.S. dollar-denominated, investment-grade, fixed-rate, taxable bond market of SEC-registered securities. HFRX is designed to be representative of the overall composition of the hedge fund universe; it is comprised of eight strategies - convertible arbitrage, distressed securities, equity hedge, equity market neutral, event driven, macro, merger arbitrage, and relative value arbitrage. The strategies are asset-weighted based on the distribution of assets in the hedge fund industry. The total return of the indices include the reinvestment of dividends and income. The total return of the Fund includes operating expenses that reduce returns, while the total return of the indices do not include expenses. The Fund is professionally managed while the indices are unmanaged and are not available for investment.
Comparison of Changes in Value of a $1,000,000 Investment
Institutinal Shares vs. S&P 500 Index, Barclays Capital U.S. Aggregate Bond Index
and HFRX Global Hedge Fund Index
| Average Annual Total Return as of 03/31/12 | | One Year | | | Five Years | | | Commencement of Investment Operations 07/27/05 | |
| Absolute Strategies Fund - Institutional Shares | | | 3.36 | % | | | 2.60 | % | | | 3.29 | % |
| S&P 500 Index | | | 8.54 | % | | | 2.01 | % | | | 4.13 | % |
| Barclays Capital U.S. Aggregate Bond Index | | | 7.71 | % | | | 6.25 | % | | | 5.67 | % |
| HFRX Global Hedge Fund Index | | | -6.38 | % | | | -2.46 | % | | | 0.16 | % |
8 ABSOLUTE FUNDS
PERFORMANCE CHART AND ANALYSIS
MARCH 31, 2012 (Unaudited)
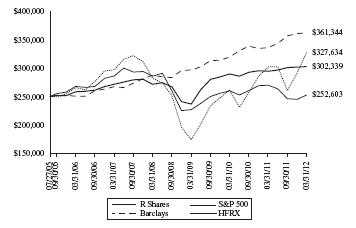
Comparison of Changes in Value of a $250,000 Investment
R Shares vs. S&P 500 Index, Barclays Capital U.S. Aggregate Bond Index
and HFRX Global Hedge Fund Index
| Average Annual Total Return as of 03/31/12 | | One Year | | | Five Years | | | Commencement of Investment Operations 07/27/05 | |
| Absolute Strategies Fund - R Shares | | | 2.87 | % | | | 2.19 | % | | | 2.89 | % |
| S&P 500 Index | | | 8.54 | % | | | 2.01 | % | | | 4.13 | % |
| Barclays Capital U.S. Aggregate Bond Index | | | 7.71 | % | | | 6.25 | % | | | 5.67 | % |
| HFRX Global Hedge Fund Index | | | -6.38 | % | | | -2.46 | % | | | 0.16 | % |
Performance data quoted represents past performance and is no guarantee of future results. Current performance may be lower or higher than the performance data quoted. Investment return and principal value will fluctuate so that shares, when redeemed, may be worth more or less than original cost. For the most recent month-end performance, please call (888) 992-2765. As stated in the Fund's prospectus, the annual operating expense ratios (gross) for Institutional Shares and R Shares are 2.28% and 2.66%, respectively. Excluding the effect of expenses attributable to dividends and interest on short sales and acquired fund fees and expenses, the Fund’s total annual operating expense ratios would be 1.73% and 2.11% for Institutional Shares and R Shares, respectively. The performance table and graph do not reflect the deduction of taxes that a shareholder would pay on Fund distributions or the redemption of Fund shares. Returns greater than one year are annualized.
9 ABSOLUTE FUNDS
ABSOLUTE OPPORTUNITIES FUND
PERFORMANCE CHART AND ANALYSIS
MARCH 31, 2012 (Unaudited)
The following chart reflects the change in the value of a hypothetical $1,000,000 investment in Institutional Shares, including reinvested dividends and distributions, in the Absolute Opportunities Fund (the “Fund”) compared with the performance of the benchmark, the S&P 500 Index ("S&P 500") and the HFRX Global Hedge Fund Index ("HFRX"), since inception. The S&P 500 is a broad-based, unmanaged measurement of changes in stock market conditions based on the average of 500 widely held common stocks. HFRX is designed to be representative of the overall composition of the hedge fund universe; it is comprised of eight strategies - convertible arbitrage, distressed securities, equity hedge, equity market neutral, event driven, macro, merger arbitrage, and relative value arbitrage. The strategies are asset-weighted based on the distribution of assets in the hedge fund industry. The total return of the indices include the reinvestment of dividends and income. The total return of the Fund includes operating expenses that reduce returns, while the total return of the indices do not include expenses. The Fund is professionally managed while the indices are unmanaged and are not available for investment.
Comparison of Changes in Value of a $1,000,000 Investment
Absolute Opportunities Fund vs. S&P 500 Index and HFRX Global Hedge Fund Index
| Average Annual Total Return as of 03/31/12 | | One Year | | | Commencement of Investment Operations 10/21/08 | |
| Absolute Opportunities Fund - Institutional Shares | | | -3.68 | % | | | 7.90 | % |
| S&P 500 Index | | | 8.54 | % | | | 14.49 | % |
| HFRX Global Hedge Fund Index | | | -6.38 | % | | | 1.26 | % |
Performance data quoted represents past performance and is no guarantee of future results. Current performance may be lower or higher than the performance data quoted. Investment return and principal value will fluctuate so that shares, when redeemed, may be worth more or less than original cost. For the most recent month-end performance, please call (888) 992-2765. As stated in the Fund's prospectus, the annual operating expense ratio (gross) is 3.43%. Excluding the effect of expenses attributable to dividends and interest on short sales and acquired fund fees and expenses, the Fund’s total annual operating expense ratio would be 3.00%. However, the Fund's adviser has agreed to contractually waive a portion of its fees and to reimburse expenses such that total operating expenses do not exceed 2.95% (excluding all interest, taxes, portfolio transaction expenses, dividends and interest on short sales, acquired fund fees and expenses, proxy expenses, and extraordinary expenses), which is in effect until July 31, 2012. The performance table and graph do not reflect the deduction of taxes that a shareholder would pay on Fund distributions or the redemption of Fund shares. Returns greater than one year are annualized.
10 ABSOLUTE FUNDS
ABSOLUTE STRATEGIES FUND
PORTFOLIO HOLDINGS SUMMARY (Unaudited)
MARCH 31, 2012
| Portfolio Breakdown (% of Net Assets) |
| Long Positions |
| Equity Securities | | | 41.7 | % |
| Asset Backed Obligations | | | 7.0 | % |
| Corporate Convertible Bonds | | | 18.1 | % |
| Corporate Non-Convertible Bonds | | | 2.2 | % |
| Exchange Traded Notes | | | 0.0 | % |
| Foreign Government Bonds | | | 0.0 | % |
| Interest Only Bonds | | | 0.1 | % |
| Municipal Bonds | | | 0.1 | % |
| Syndicated Loans | | | 0.1 | % |
| U.S. Government & Agency Obligations | | | 2.1 | % |
| Rights | | | 0.0 | % |
| Investment Companies | | | 8.9 | % |
| Short-Term Investments | | | 0.1 | % |
| Purchased Options | | | 1.2 | % |
| Short Positions |
| Equity Securities | | | -37.2 | % |
| Investment Companies | | | -0.8 | % |
| Written Options | | | -0.5 | % |
| Other Assets and Liabilities, Net* | | | 56.9 | % |
| | | | 100.0 | % |
* Consists of deposits with the custodian and/or brokers for securities sold short, cash, foreign currency, prepaid expenses, receivables, payables, and accrued liabilities. Deposits with the custodian and/or brokers for securities sold short represents 38.6% of net assets. See Note 2.
| | (% of Equity Holdings) |
| Sector Breakdown | Long | Short |
| Consumer Discretionary | 24.4% | 20.1% | |
| Consumer Staples | 13.6% | 5.1% | |
| Energy | 6.3% | 4.6% | |
| Financial | 18.1% | 21.7% | |
| Healthcare | 11.6% | 8.3% | |
| Industrial | 5.1% | 18.8% | |
| Information Technology | 11.6% | 11.2% | |
| Materials | 1.6% | 5.1% | |
| Telecommunication Services | 5.8% | 4.3% | |
| Utilities | 1.9% | 0.8% | |
| | 100.0% | 100.0% | |
A
11 ABSOLUTE FUNDS
ABSOLUTE STRATEGIES FUND
SCHEDULE OF INVESTMENTS
MARCH 31, 2012
| | | Security | | | | | | | | |
| | Shares | | Description | | | | | | | | Value |
| Long Positions - 81.6% | | | | | | | | | | | |
| Equity Securities - 41.7% | | | | | | | | | | | |
| Common Stock - 39.6% | | | | | | | | | | | |
| Consumer Discretionary - 9.9% | | | | | | | | | | | |
| | 69,600 | | Aaron's, Inc. (a) | | | | | | | $ | 1,802,640 |
| | 103,700 | | Aeropostale, Inc. (a)(b) | | | | | | | | 2,241,994 |
| | 22,600 | | Airgas, Inc. (a) | | | | | | | | 2,010,722 |
| | 106,950 | | ANN, Inc. (a)(b) | | | | | | | | 3,063,048 |
| | 203,750 | | Apollo Group, Inc., Class A (a)(b) | | | | | | | | 7,872,900 |
| | 45,900 | | Arctic Cat, Inc. (a)(b) | | | | | | | | 1,965,897 |
| | 6,200 | | AutoZone, Inc. (a)(b) | | | | | | | | 2,305,160 |
| | 32,100 | | Bally Technologies, Inc. (a)(b) | | | | | | | | 1,500,675 |
| | 155,100 | | Bebe Stores, Inc. (a) | | | | | | | | 1,431,573 |
| | 278,400 | | Bed Bath & Beyond, Inc. (a)(b)(c) | | | | | | | | 18,310,368 |
| | 44,092 | | Biglari Holdings, Inc. (a)(b) | | | | | | | | 17,762,462 |
| | 52,000 | | Brinker International, Inc. (a) | | | | | | | | 1,432,600 |
| | 75,600 | | Capella Education Co. (a)(b) | | | | | | | | 2,717,820 |
| | 543,700 | | CarMax, Inc. (a)(b)(c) | | | | | | | | 18,839,205 |
| | 33,900 | | Casey's General Stores, Inc. (a) | | | | | | | | 1,880,094 |
| | 93,700 | | Cash America International, Inc. (a) | | | | | | | | 4,491,041 |
| | 3,500 | | Chipotle Mexican Grill, Inc., Class A (a)(b) | | | | | | | | 1,463,000 |
| | 59,600 | | Coach, Inc. (a) | | | | | | | | 4,605,888 |
| | 24,400 | | Coinstar, Inc. (a)(b) | | | | | | | | 1,550,620 |
| | 300,000 | | Comcast Corp., Special Class A | | | | | | | | 8,853,000 |
| | 141,400 | | Copart, Inc. (a)(b) | | | | | | | | 3,686,298 |
| | 54,300 | | Costco Wholesale Corp. (a)(c) | | | | | | | | 4,930,440 |
| | 638,936 | | CVS Caremark Corp. (a) | | | | | | | | 28,624,333 |
| | 85,100 | | DIRECTV, Class A (a)(b) | | | | | | | | 4,198,834 |
| | 32,000 | | Dollar Tree, Inc. (a)(b) | | | | | | | | 3,023,680 |
| | 37,300 | | Equifax, Inc. (a) | | | | | | | | 1,650,898 |
| | 13,500 | | Fossil, Inc. (a)(b) | | | | | | | | 1,781,730 |
| | 41,800 | | FTI Consulting, Inc. (a)(b) | | | | | | | | 1,568,336 |
| | 39,250 | | Gartner, Inc. (a)(b) | | | | | | | | 1,673,620 |
| | 24,000 | | Google, Inc., Class A (a)(b) | | | | | | | | 15,389,760 |
| | 101,900 | | Grand Canyon Education, Inc. (a)(b) | | | | | | | | 1,809,744 |
| | 350,000 | | H&R Block, Inc. | | | | | | | | 5,764,500 |
| | 68,450 | | IAC/InterActiveCorp. (a) | | | | | | | | 3,360,211 |
| | 175,500 | | Interval Leisure Group, Inc. (a) | | | | | | | | 3,053,700 |
| | 19,000 | | ITT Educational Services, Inc. (a)(b) | | | | | | | | 1,256,660 |
| | 139,700 | | Kirkland's, Inc. (a)(b) | | | | | | | | 2,260,346 |
| | 222,000 | | Kohl's Corp. (a)(c) | | | | | | | | 11,106,660 |
| | 300,000 | | Liberty Media Corp. - Interactive, Class A (b) | | | | | | | | 5,727,000 |
| | 36,000 | | LKQ Corp. (a)(b) | | | | | | | | 1,122,120 |
| | 728,900 | | Lowe's Cos., Inc. (a)(c) | | | | | | | | 22,872,882 |
| | 33,550 | | Ltd. Brands, Inc. (a) | | | | | | | | 1,610,400 |
| | 42,400 | | Mattel, Inc. (a) | | | | | | | | 1,427,184 |
| | 162,000 | | Meritor, Inc. (a)(b) | | | | | | | | 1,307,340 |
| | 118,400 | | Newell Rubbermaid, Inc. (a) | | | | | | | | 2,108,704 |
| | 83,300 | | Papa John's International, Inc. (a)(b) | | | | | | | | 3,137,078 |
| | 362,700 | | PetMed Express, Inc. (a) | | | | | | | | 4,490,226 |
| | 25,000 | | PetSmart, Inc. (a) | | | | | | | | 1,430,500 |
| | | Security | | | | | | | | |
| | Shares | | Description | | | | | | | | Value |
| | 21,100 | | Polaris Industries, Inc. (a) | | | | | | | $ | 1,522,365 |
| | 14,400 | | Ralph Lauren Corp. (a) | | | | | | | | 2,510,352 |
| | 364,400 | | Robert Half International, Inc. (a) | | | | | | | | 11,041,320 |
| | 72,150 | | Rollins, Inc. (a) | | | | | | | | 1,535,352 |
| | 44,700 | | Royal Caribbean Cruises, Ltd. | | | | | | | | 1,315,521 |
| | 42,600 | | Scholastic Corp. (a) | | | | | | | | 1,502,928 |
| | 30,000 | | Starbucks Corp. (a) | | | | | | | | 1,676,700 |
| | 31,100 | | Strayer Education, Inc. (a) | | | | | | | | 2,932,108 |
| | 342,650 | | Target Corp. (a)(c) | | | | | | | | 19,966,215 |
| | 45,000 | | The Cheesecake Factory, Inc. (a)(b) | | | | | | | | 1,322,550 |
| | 106,600 | | The Corporate Executive Board Co. (a) | | | | | | | | 4,584,866 |
| | 227,000 | | The Geo Group, Inc. (a)(b) | | | | | | | | 4,315,270 |
| | 138,400 | | The Goodyear Tire & Rubber Co. (a)(b) | | | | | | | | 1,552,848 |
| | 60,800 | | The Toro Co. (a) | | | | | | | | 4,323,488 |
| | 179,100 | | The Walt Disney Co. (a)(c) | | | | | | | | 7,840,998 |
| | 136,500 | | Total System Services, Inc. (a) | | | | | | | | 3,149,055 |
| | 160,000 | | Toyota Industries Corp., ADR | | | | | | | | 4,852,784 |
| | 413,000 | | Viacom, Inc., Class B | | | | | | | | 19,600,980 |
| | 373,200 | | Walgreen Co. (a)(c) | | | | | | | | 12,498,468 |
| | 501,000 | | Wal-Mart Stores, Inc. (a)(c) | | | | | | | | 30,661,200 |
| | 203,200 | | Websense, Inc. (a)(b) | | | | | | | | 4,285,488 |
| | 7,500 | | WW Grainger, Inc. (a) | | | | | | | | 1,611,075 |
| | 98,500 | | Wyndham Worldwide Corp. (a) | | | | | | | | 4,581,235 |
| | | | | | | | | | | | 395,657,057 |
| | | | | | | | | | | | |
| Consumer Staples - 5.6% | | | | | | | | | | | |
| | 1,337,300 | | Allos Therapeutics, Inc. (a)(b) | | | | | | | | 1,979,204 |
| | 110,800 | | Amedisys, Inc. (a)(b) | | | | | | | | 1,602,168 |
| | 41,300 | | Arbitron, Inc. (a) | | | | | | | | 1,527,274 |
| | 400,000 | | Avon Products, Inc. | | | | | | | | 7,744,000 |
| | 33,200 | | Cal-Maine Foods, Inc. (a) | | | | | | | | 1,270,232 |
| | 454,000 | | Campbell Soup Co. (a) | | | | | | | | 15,367,900 |
| | 108,500 | | Clorox Co. (a) | | | | | | | | 7,459,375 |
| | 31,900 | | Cyberonics, Inc. (a)(b) | | | | | | | | 1,216,347 |
| | 56,200 | | Deluxe Corp. (a) | | | | | | | | 1,316,204 |
| | 37,600 | | DENTSPLY International, Inc. (a) | | | | | | | | 1,508,888 |
| | 39,050 | | Dr. Pepper Snapple Group, Inc. (a) | | | | | | | | 1,570,201 |
| | 26,650 | | Herbalife, Ltd. (a) | | | | | | | | 1,834,053 |
| | 36,450 | | Hormel Foods Corp. (a) | | | | | | | | 1,076,004 |
| | 41,800 | | Iron Mountain, Inc. (a) | | | | | | | | 1,203,840 |
| | 12,400 | | Kimberly-Clark Corp. (a) | | | | | | | | 916,236 |
| | 125,000 | | Kraft Foods, Inc., Class A | | | | | | | | 4,751,250 |
| | 25,050 | | Lorillard, Inc. (a) | | | | | | | | 3,243,474 |
| | 275,000 | | Molson Coors Brewing Co., Class B | | | | | | | | 12,443,750 |
| | 596,000 | | PepsiCo, Inc. (a) | | | | | | | | 39,544,600 |
| | 177,000 | | QLT, Inc. (a)(b) | | | | | | | | 1,239,000 |
| | 81,150 | | Sara Lee Corp. (a) | | | | | | | | 1,747,159 |
| | 835,000 | | Sysco Corp. | | | | | | | | 24,933,100 |
| | 200,000 | | The Coca-Cola Co. (c) | | | | | | | | 14,802,000 |
| | 15,600 | | The Hershey Co. (a) | | | | | | | | 956,748 |
| | 885,000 | | The Procter & Gamble Co. (a) | | | | | | | | 59,480,850 |
| | 600,000 | | The Western Union Co. | | | | | | | | 10,560,000 |
| | 18,150 | | Tupperware Brands Corp. (a) | | | | | | | | 1,152,525 |
| | | | | | | | | | | | 222,446,382 |
See Notes to Financial Statements. 12 ABSOLUTE FUNDS
ABSOLUTE STRATEGIES FUND
SCHEDULE OF INVESTMENTS
MARCH 31, 2012
| | Shares | | Security Description | | | | | | | | Value |
Energy - 2.3% | | | | | | | | | | | |
| | 28,600 | | Cabot Oil & Gas Corp. (a) | | | | | | | $ | 891,462 |
| | 216,200 | | ConocoPhillips (a) | | | | | | | | 16,433,362 |
| | 19,550 | | EQT Corp. (a) | | | | | | | | 942,506 |
| | 152,800 | | Exxon Mobil Corp. (a) | | | | | | | | 13,252,344 |
| | 229,500 | | Gran Tierra Energy, Inc. (a)(b) | | | | | | | | 1,443,555 |
| | 67,800 | | Gulf Island Fabrication, Inc. (a) | | | | | | | | 1,984,506 |
| | 30,800 | | Hess Corp. (a) | | | | | | | | 1,815,660 |
| | 39,550 | | HollyFrontier Corp. (a) | | | | | | | | 1,271,533 |
| | 73,600 | | Marathon Oil Corp. (a) | | | | | | | | 2,333,120 |
| | 36,800 | | Marathon Petroleum Corp. (a) | | | | | | | | 1,595,648 |
| | 142,100 | | Matrix Service Co. (a)(b) | | | | | | | | 1,990,821 |
| | 72,500 | | Murphy Oil Corp. (a) | | | | | | | | 4,079,575 |
| | 51,100 | | Oceaneering International, Inc. (a) | | | | | | | | 2,753,779 |
| | 225,700 | | Patterson-UTI Energy, Inc. (a) | | | | | | | | 3,902,353 |
| | 11,300 | | Pioneer Natural Resources Co. (a) | | | | | | | | 1,260,967 |
| | 18,250 | | SM Energy Co. (a) | | | | | | | | 1,291,552 |
| | 275,000 | | Spectra Energy Corp. | | | | | | | | 8,676,250 |
| | 113,500 | | Sunoco, Inc. (a) | | | | | | | | 4,330,025 |
| | 55,800 | | Tesoro Corp. (a)(b) | | | | | | | | 1,497,672 |
| | 154,900 | | Tetra Technologies, Inc. (a)(b) | | | | | | | | 1,459,158 |
| | 175,000 | | Total SA, ADR | | | | | | | | 8,946,000 |
| | 53,100 | | Unit Corp. (a)(b) | | | | | | | | 2,270,556 |
| | 294,300 | | Vaalco Energy, Inc. (a)(b) | | | | | | | | 2,781,135 |
| | 159,500 | | Valero Energy Corp. (a) | | | | | | | | 4,110,315 |
| | | | | | | | | | | | 91,313,854 |
| Financial - 6.6% | | | | | | | | | | | |
| | 284,500 | | American Express Co. (a) | | | | | | | | 16,461,170 |
| | 26,200 | | American Tower Corp. REIT (a) | | | | | | | | 1,651,124 |
| | 63,100 | | Aon PLC (a) | | | | | | | | 3,095,686 |
| | 57,250 | | Apartment Investment & Management Co., Class A REIT (a) | | | | | | | | 1,511,972 |
| | 180,500 | | Artio Global Investors, Inc. (a) | | | | | | | | 860,985 |
| | 165,900 | | Banco Latinoamericano de Comerico Exterior SA, Class E (a) | | | | | | | | 3,502,149 |
| | 447,000 | | Bancorp, Inc. (b) | | | | | | | | 4,487,880 |
| | 144 | | Berkshire Hathaway, Inc., Class A (a)(b) | | | | | | | | 17,553,600 |
| | 262,600 | | Berkshire Hathaway, Inc., Class B (a)(b)(c) | | | | | | | | 21,309,990 |
| | 134,600 | | Boston Private Financial Holdings, Inc. (a) | | | | | | | | 1,333,886 |
| | 166,400 | | Capitol Federal Financial, Inc. (a) | | | | | | | | 1,973,504 |
| | 36,700 | | Cardinal Health, Inc. (a) | | | | | | | | 1,582,137 |
| | 79,300 | | Chemical Financial Corp. (a) | | | | | | | | 1,858,792 |
| | 39,300 | | City Holding Co. (a) | | | | | | | | 1,364,496 |
| | 11,000 | | CME Group, Inc. (a) | | | | | | | | 3,182,630 |
| | 93,800 | | Columbia Banking System, Inc. (a) | | | | | | | | 2,136,764 |
| | 31,200 | | Coventry Health Care, Inc. (a) | | | | | | | | 1,109,784 |
| | 34,800 | | Erie Indemnity Co., Class A (a) | | | | | | | | 2,712,312 |
| | 470 | | Fairfax Financial Holdings, Ltd. | | | | | | | | 189,217 |
| | 113,400 | | Fifth Third Bancorp (a) | | | | | | | | 1,593,270 |
| | 7,500 | | First Citizens BancShares, Inc., Class A (a) | | | | | | | | 1,370,175 |
| | | | | | | | | | | |
| | | | Security | | | | | | | | |
| | Shares | | Description | | | | | | | | Value |
| | 108,330 | | Franklin Resources, Inc. (a) | | | | | | | $ | 13,436,170 |
| | 22,300 | | Global Payments, Inc. (a)(d) | | | | | | | | 1,058,581 |
| | 31,100 | | Greenhill & Co., Inc. (a) | | | | | | | | 1,357,204 |
| | 152,700 | | Health Net, Inc. (a)(b) | | | | | | | | 6,065,244 |
| | 398,600 | | Huntington Bancshares, Inc. (a) | | | | | | | | 2,570,970 |
| | 106,200 | | Interactive Brokers Group, Inc., Class A (a) | | | | | | | | 1,805,400 |
| | 190,650 | | International Bancshares Corp. (a) | | | | | | | | 4,032,247 |
| | 179,300 | | Janus Capital Group, Inc. (a) | | | | | | | | 1,597,563 |
| | 335,300 | | KeyCorp (a) | | | | | | | | 2,850,050 |
| | 66,300 | | Lincoln National Corp. (a) | | | | | | | | 1,747,668 |
| | 21,400 | | Markel Corp. (b) | | | | | | | | 9,607,316 |
| | 75,300 | | Moody's Corp. (a) | | | | | | | | 3,170,130 |
| | 101,600 | | National Financial Partners Corp. (a)(b) | | | | | | | | 1,538,224 |
| | 52,600 | | National Health Investors, Inc. REIT (a) | | | | | | | | 2,565,828 |
| | 262,100 | | Net 1 UEPS Technologies, Inc. (a)(b) | | | | | | | | 2,369,384 |
| | 162,100 | | Oritani Financial Corp. (a) | | | | | | | | 2,379,628 |
| | 325,000 | | Paychex, Inc. | | | | | | | | 10,071,750 |
| | 414,170 | | PrivateBancorp, Inc. (a) | | | | | | | | 6,282,959 |
| | 20,400 | | PS Business Parks, Inc. REIT (a) | | | | | | | | 1,337,016 |
| | 11,800 | | Public Storage REIT (a) | | | | | | | | 1,630,406 |
| | 200,000 | | Resource America, Inc., Class A | | | | | | | | 1,262,000 |
| | 39,000 | | SunTrust Banks, Inc. (a) | | | | | | | | 942,630 |
| | 42,000 | | T. Rowe Price Group, Inc. (a) | | | | | | | | 2,742,600 |
| | 587,600 | | The Bank of New York Mellon Corp. (a)(c) | | | | | | | | 14,178,788 |
| | 111,800 | | The Goldman Sachs Group, Inc. (a) | | | | | | | | 13,904,566 |
| | 38,200 | | The Hanover Insurance Group, Inc. (a) | | | | | | | | 1,570,784 |
| | 30,350 | | The Macerich Co. REIT (a) | | | | | | | | 1,752,712 |
| | 71,250 | | The Progressive Corp. (a) | | | | | | | | 1,651,575 |
| | 72,500 | | The Travelers Cos., Inc. (a) | | | | | | | | 4,292,000 |
| | 51,450 | | UDR, Inc. REIT (a) | | | | | | | | 1,374,230 |
| | 28,350 | | Ventas, Inc. REIT (a) | | | | | | | | 1,618,785 |
| | 13,000 | | Visa, Inc., Class A (a) | | | | | | | | 1,534,000 |
| | 196,700 | | Washington Federal, Inc. (a) | | | | | | | | 3,308,494 |
| | 865,650 | | Wells Fargo & Co. (a) | | | | | | | | 29,553,291 |
| | 200,000 | | Weyerhaeuser Co. REIT | | | | | | | | 4,384,000 |
| | 275,000 | | WR Berkley Corp. | | | | | | | | 9,933,000 |
| | | | | | | | | | | | 262,318,716 |
| Healthcare - 4.6% | | | | | | | | | | | |
| | 42,000 | | Abbott Laboratories (a) | | | | | | | | 2,574,180 |
| | 123,950 | | Aetna, Inc. (a) | | | | | | | | 6,217,332 |
| | 17,200 | | Alexion Pharmaceuticals, Inc. (a)(b) | | | | | | | | 1,597,192 |
| | 119,900 | | AMAG Pharmaceuticals, Inc. (a)(b) | | | | | | | | 1,910,007 |
| | 95,350 | | AmerisourceBergen Corp. (a) | | | | | | | | 3,783,488 |
| | 363,150 | | Becton Dickinson and Co. (a) | | | | | | | | 28,198,597 |
| | 23,400 | | Cerner Corp. (a)(b) | | | | | | | | 1,782,144 |
| | 97,100 | | Charles River Laboratories International, Inc. (a)(b) | | | | | | | | 3,504,339 |
| | 141,300 | | Community Health Systems, Inc. (a)(b) | | | | | | | | 3,142,512 |
| | 26,750 | | Covidien PLC (a) | | | | | | | | 1,462,690 |
| | 110,000 | | CR Bard, Inc. | | | | | | | | 10,859,200 |
See Notes to Financial Statements. 13 ABSOLUTE FUNDS
ABSOLUTE STRATEGIES FUND
SCHEDULE OF INVESTMENTS
MARCH 31, 2012
| | | | | | | | | | | |
| | | | Security | | | | | | | | |
| | Shares | | Description | | | | | | | | Value |
| | 16,000 | | Henry Schein, Inc. (a)(b) | | | | | | | $ | 1,210,880 |
| | 78,400 | | Hill-Rom Holdings, Inc. (a) | | | | | | | | 2,619,344 |
| | 2,900 | | Intuitive Surgical, Inc. (a)(b) | | | | | | | | 1,571,075 |
| | 438,600 | | Johnson & Johnson (a) | | | | | | | | 28,930,056 |
| | 19,700 | | Kensey Nash Corp. (a) | | | | | | | | 576,422 |
| | 75,600 | | Magellan Health Services, Inc. (a)(b) | | | | | | | | 3,690,036 |
| | 300,000 | | Medtronic, Inc. | | | | | | | | 11,757,000 |
| | 117,400 | | Myriad Genetics, Inc. (a)(b) | | | | | | | | 2,777,684 |
| | 205,800 | | Nordion, Inc. (a) | | | | | | | | 2,000,376 |
| | 230,000 | | Novartis AG, ADR | | | | | | | | 12,744,300 |
| | 500,000 | | Pfizer, Inc. | | | | | | | | 11,330,000 |
| | 76,000 | | Quest Diagnostics, Inc. (a) | | | | | | | | 4,647,400 |
| | 159,300 | | St. Jude Medical, Inc. (a)(c) | | | | | | | | 7,058,583 |
| | 145,000 | | Stryker Corp. | | | | | | | | 8,044,600 |
| | 242,400 | | Tenet Healthcare Corp. (a)(b) | | | | | | | | 1,287,144 |
| | 117,350 | | Thoratec Corp. (a)(b) | | | | | | | | 3,955,869 |
| | 73,500 | | Triple-S Management Corp., Class B (a)(b) | | | | | | | | 1,697,850 |
| | 87,500 | | UnitedHealth Group, Inc. | | | | | | | | 5,157,250 |
| | 116,700 | | Warner Chilcott PLC, Class A (a)(b) | | | | | | | | 1,961,727 |
| | 58,050 | | WellPoint, Inc. (a) | | | | | | | | 4,284,090 |
| | 181,000 | | XenoPort, Inc. (a)(b) | | | | | | | | 814,500 |
| | | | | | | | | | | | 183,147,867 |
| Industrial - 2.1% | | | | | | | | | | | |
| | 24,200 | | Acuity Brands, Inc. (a) | | | | | | | | 1,520,486 |
| | 28,500 | | Agilent Technologies, Inc. (a) | | | | | | | | 1,268,535 |
| | 37,900 | | Alliant Techsystems, Inc. (a) | | | | | | | | 1,899,548 |
| | 11,600 | | Amerco, Inc. (a) | | | | | | | | 1,223,916 |
| | 32,700 | | Analogic Corp. (a) | | | | | | | | 2,208,558 |
| | 217,300 | | Apogee Enterprises, Inc. (a) | | | | | | | | 2,814,035 |
| | 30,300 | | Applied Industrial Technologies, Inc. (a) | | | | | | | | 1,246,239 |
| | 18,000 | | BE Aerospace, Inc. (a)(b) | | | | | | | | 836,460 |
| | 307,852 | | Cemex SAB de CV, ADR (a)(b) | | | | | | | | 2,388,935 |
| | 35,500 | | Chicago Bridge & Iron Co. NV (a) | | | | | | | | 1,533,245 |
| | 25,500 | | Crane Co. (a) | | | | | | | | 1,236,750 |
| | 11,500 | | Cummins, Inc. (a) | | | | | | | | 1,380,460 |
| | 149,800 | | Delta Air Lines, Inc. (a)(b) | | | | | | | | 1,484,518 |
| | 20,000 | | Dover Corp. (a) | | | | | | | | 1,258,800 |
| | 28,600 | | Fluor Corp. (a) | | | | | | | | 1,717,144 |
| | 82,800 | | Foster Wheeler AG (a)(b) | | | | | | | | 1,884,528 |
| | 27,450 | | Graco, Inc. (a) | | | | | | | | 1,456,497 |
| | 19,750 | | Hubbell, Inc., Class B (a) | | | | | | | | 1,551,955 |
| | 61,000 | | Jabil Circuit, Inc. (a) | | | | | | | | 1,532,320 |
| | 48,700 | | JB Hunt Transport Services, Inc. (a) | | | | | | | | 2,647,819 |
| | 347 | | Kansas City Southern (a)(b) | | | | | | | | 24,876 |
| | 15,000 | | Lockheed Martin Corp. (a) | | | | | | | | 1,347,900 |
| | 5,800 | | Mettler-Toledo International, Inc. (a)(b) | | | | | | | | 1,071,550 |
| | 38,700 | | Mine Safety Appliances Co. (a) | | | | | | | | 1,589,796 |
| | 178,200 | | Myers Industries, Inc. (a) | | | | | | | | 2,628,450 |
| | 48,800 | | Northrop Grumman Corp. (a) | | | | | | | | 2,980,704 |
| | 56,300 | | Packaging Corp. of America (a) | | | | | | | | 1,665,917 |
| | 59,350 | | Raytheon Co. (a) | | | | | | | | 3,132,493 |
| | 35,768 | | Rock-Tenn Co., Class A (a) | | | | | | | | 2,416,486 |
| | | | | | | | | | | |
| | | | Security | | | | | | | | |
| | Shares | | Description | | | | | | | | Value |
| | 232,400 | | SAIC, Inc. (a) | | | | | | | $ | 3,067,680 |
| | 34,200 | | Sturm Ruger & Co., Inc. (a) | | | | | | | | 1,679,220 |
| | 164,800 | | The Boeing Co. (a)(c) | | | | | | | | 12,256,176 |
| | 98,050 | | United Parcel Service, Inc., Class B (a) | | | | | | | | 7,914,596 |
| | 44,600 | | URS Corp. (a) | | | | | | | | 1,896,392 |
| | 540 | | USG Corp. (a)(b)(c) | | | | | | | | 9,288 |
| | 37,250 | | Waste Connections, Inc. (a) | | | | | | | | 1,211,743 |
| | 47,000 | | Werner Enterprises, Inc. (a) | | | | | | | | 1,168,420 |
| | 125,000 | | Xylem, Inc. | | | | | | | | 3,468,750 |
| | | | | | | | | | | | 82,621,185 |
| Information Technology - 4.8% | | | | | | | | | | | |
| | 210,600 | | Accenture PLC, Class A (a)(c) | | | | | | | | 13,583,700 |
| | 327,200 | | Activision Blizzard, Inc. (a) | | | | | | | | 4,194,704 |
| | 244,100 | | Actuate Corp. (a)(b) | | | | | | | | 1,532,948 |
| | 63,700 | | Adobe Systems, Inc. (a)(b) | | | | | | | | 2,185,547 |
| | 164,800 | | Amtech Systems, Inc. (a)(b) | | | | | | | | 1,372,784 |
| | 43,400 | | Apple, Inc. (a)(b)(e) | | | | | | | | 26,016,998 |
| | 233,400 | | Automatic Data Processing, Inc. (a) | | | | | | | | 12,881,346 |
| | 34,100 | | Avago Technologies, Ltd. (a) | | | | | | | | 1,328,877 |
| | 101,300 | | BMC Software, Inc. (a)(b) | | | | | | | | 4,068,208 |
| | 163,700 | | CA, Inc. (a) | | | | | | | | 4,511,572 |
| | 70,700 | | CACI International, Inc., Class A (a)(b) | | | | | | | | 4,403,903 |
| | 45,500 | | Computer Sciences Corp. (a) | | | | | | | | 1,362,270 |
| | 340,000 | | Corning, Inc. | | | | | | | | 4,787,200 |
| | 29,150 | | DST Systems, Inc. (a) | | | | | | | | 1,580,805 |
| | 154,050 | | Electronic Arts, Inc. (a)(b) | | | | | | | | 2,538,744 |
| | 134,300 | | EPIQ Systems, Inc. (a) | | | | | | | | 1,625,030 |
| | 40,100 | | Fair Isaac Corp. (a) | | | | | | | | 1,760,390 |
| | 310,000 | | Hewlett-Packard Co. | | | | | | | | 7,387,300 |
| | 29,000 | | Intuit, Inc. (a) | | | | | | | | 1,743,770 |
| | 25,700 | | KLA-Tencor Corp. (a) | | | | | | | | 1,398,594 |
| | 526,700 | | LSI Corp. (a)(b) | | | | | | | | 4,571,756 |
| | 31,850 | | MICROS Systems, Inc. (a)(b) | | | | | | | | 1,760,986 |
| | 1,475,000 | | Microsoft Corp. | | | | | | | | 47,568,750 |
| | 123,300 | | Monolithic Power Systems, Inc. (a)(b) | | | | | | | | 2,425,311 |
| | 41,600 | | Nuance Communications, Inc. (a)(b) | | | | | | | | 1,064,128 |
| | 47,000 | | Parametric Technology Corp. (a)(b) | | | | | | | | 1,313,180 |
| | 40,000 | | QUALCOMM, Inc. (a) | | | | | | | | 2,720,800 |
| | 185,300 | | Quest Software, Inc. (a)(b) | | | | | | | | 4,311,931 |
| | 30,700 | | Red Hat, Inc. (a)(b) | | | | | | | | 1,838,623 |
| | 280,000 | | Research In Motion, Ltd. (b) | | | | | | | | 4,118,800 |
| | 46,000 | | Silicon Laboratories, Inc. (a)(b) | | | | | | | | 1,978,000 |
| | 254,500 | | Symantec Corp. (a)(b) | | | | | | | | 4,759,150 |
| | 32,600 | | Tyler Technologies, Inc. (a)(b) | | | | | | | | 1,252,166 |
| | 128,400 | | Unisys Corp. (a)(b) | | | | | | | | 2,532,048 |
| | 798,000 | | United Online, Inc. (a) | | | | | | | | 3,902,220 |
| | 53,500 | | VeriSign, Inc. (a) | | | | | | | | 2,051,190 |
| | 80,650 | | Xerox Corp. (a) | | | | | | | | 651,652 |
| | 207,600 | | Xyratex, Ltd. (a) | | | | | | | | 3,302,916 |
| | | | | | | | | | | | 192,388,297 |
| | | | | | | | | | | |
See Notes to Financial Statements. 14 ABSOLUTE FUNDS
ABSOLUTE STRATEGIES FUND
SCHEDULE OF INVESTMENTS
MARCH 31, 2012
| | | | Security | | | | | | | | |
| | Shares | | Description | | | | | | | | Value |
| Materials - 0.6% | | | | | | | | | | | |
| | 74,400 | | A Schulman, Inc. (a) | | | | | | | $ | 2,010,288 |
| | 34,900 | | Cytec Industries, Inc. (a) | | | | | | | | 2,121,571 |
| | 33,400 | | Eastman Chemical Co. (a) | | | | | | | | 1,726,446 |
| | 56,800 | | Freeport-McMoRan Copper & Gold, Inc. (a) | | | | | | | | 2,160,672 |
| | 53,000 | | H.B. Fuller Co. (a) | | | | | | | | 1,739,990 |
| | 25,600 | | International Flavors & Fragrances, Inc. (a) | | | | | | | | 1,500,160 |
| | 33,100 | | Minerals Technologies, Inc. (a) | | | | | | | | 2,165,071 |
| | 17,700 | | PPG Industries, Inc. (a) | | | | | | | | 1,695,660 |
| | 52,300 | | RPM International, Inc. (a) | | | | | | | | 1,369,737 |
| | 39,600 | | Schweitzer-Mauduit International, Inc. (a) | | | | | | | | 2,734,776 |
| | 21,300 | | Sigma-Aldrich Corp. (a) | | | | | | | | 1,556,178 |
| | 34,450 | | United States Steel Corp. (a) | | | | | | | | 1,011,797 |
| | 65,100 | | Valspar Corp. (a) | | | | | | | | 3,143,679 |
| | | | | | | | | | | | 24,936,025 |
| Telecommunication Services - 2.4% | | | | | | | | | | | |
| | 27,000 | | AMC Networks, Inc., Class A (a)(b) | | | | | | | | 1,205,010 |
| | 136,300 | | Amdocs, Ltd. (a)(b) | | | | | | | | 4,304,354 |
| | 159,200 | | Cbeyond, Inc. (a)(b) | | | | | | | | 1,273,600 |
| | 15,700 | | Charter Communications, Inc., Class A (a)(b) | | | | | | | | 996,165 |
| | 1,000,000 | | Cisco Systems, Inc. | | | | | | | | 21,150,000 |
| | 48,600 | | Comtech Telecommunications Corp. (a) | | | | | | | | 1,583,388 |
| | 22,300 | | Crown Castle International Corp. (a)(b) | | | | | | | | 1,189,482 |
| | 30,300 | | Discovery Communications, Inc., Class A (a)(b) | | | | | | | | 1,533,180 |
| | 14,900 | | F5 Networks, Inc. (a)(b) | | | | | | | | 2,010,904 |
| | 29,400 | | Motorola Solutions, Inc. (a) | | | | | | | | 1,494,402 |
| | 97,100 | | NeuStar, Inc., Class A (a)(b) | | | | | | | | 3,616,975 |
| | 141,700 | | Neutral Tandem, Inc. (a)(b) | | | | | | | | 1,727,323 |
| | 2,400,000 | | News Corp., Class A | | | | | | | | 47,256,000 |
| | 75,600 | | Plantronics, Inc. (a) | | | | | | | | 3,043,656 |
| | 64,200 | | Sycamore Networks, Inc. (a)(b) | | | | | | | | 1,138,908 |
| | 37,600 | | Verizon Communications, Inc. (a) | | | | | | | | 1,437,448 |
| | 161,300 | | XO Group, Inc. (a)(b) | | | | | | | | 1,514,607 |
| | | | | | | | | | | | 96,475,402 |
| Utilities - 0.7% | | | | | | | | | | | |
| | 28,500 | | Alliant Energy Corp. (a) | | | | | | | | 1,234,620 |
| | 63,000 | | Edison International (a) | | | | | | | | 2,678,130 |
| | 68,250 | | Entergy Corp. (a) | | | | | | | | 4,586,400 |
| | 400,000 | | Exelon Corp. | | | | | | | | 15,684,000 |
| | 16,650 | | ITC Holdings Corp. (a) | | | | | | | | 1,281,051 |
| | 78,050 | | Questar Corp. (a) | | | | | | | | 1,503,243 |
| | | | | | | | | | | | 26,967,444 |
| | | | | | | | | | | | |
| Total Common Stock | | | | | | | | | | | |
| (Cost $1,282,122,949) | | | | | | | | | | | 1,578,272,229 |
| | | | | | | | | | | | |
| | | | Security | | | | | | | | |
| | Shares | | Description | | Rate | | | | | | Value |
| Preferred Stock - 2.1% | | | | | | | | | | | |
| | | | | | | | | | | | |
| Consumer Discretionary - 0.2% | | | | | | | | | | | |
| | 20,641 | | Callaway Golf Co., Series B (a) | | 7.50 | % | | | | $ | 2,126,023 |
| | 29,029 | | Newell Financial Trust I (a) | | 5.25 | | | | | | 1,378,878 |
| | 43,669 | | The Goodyear Tire & Rubber Co. (a) | | 5.88 | | | | | | 1,809,207 |
| | 3,622 | | The Interpublic Group of Cos., Inc., Series B (a) | | 5.25 | | | | | | 3,758,730 |
| | | | | | | | | | | | 9,072,838 |
| Consumer Staples - 0.1% | | | | | | | | | | | |
| | 35,751 | | Bunge, Ltd. (a) | | 4.88 | | | | | | 3,592,975 |
| Energy - 0.3% | | | | | | | | | | | |
| | 2,483 | | Chesapeake Energy Corp. (a)(f) | | 5.75 | | | | | | 2,532,660 |
| | 9,496 | | Energy XXI Bermuda, Ltd. (a) | | 5.63 | | | | | | 3,590,675 |
| | 62,936 | | Goodrich Petroleum Corp., Series B (a) | | 5.38 | | | | | | 2,366,394 |
| | 26,079 | | Petroquest Energy, Inc., Series B (a) | | 6.88 | | | | | | 904,615 |
| | 32,696 | | SandRidge Energy, Inc. (a) | | 8.50 | | | | | | 4,016,703 |
| | | | | | | | | | | | 13,411,047 |
| | | | | | | | | | | | |
| | | | | | | | | | | | |
| Financial - 1.0% | | | | | | | | | | | |
| | 205,298 | | 2009 Dole Food Automatic Common Exchange Security Trust (a)(f) | | 7.00 | | | | | | 2,062,608 |
| | 62,932 | | 2010 Swift Mandatory Common Exchange Security Trust (a)(f) | | 6.00 | | | | | | 700,194 |
| | 173,460 | | Alexandria Real Estate Equities, Inc. REIT, Series D (a) | | 7.00 | | | | | | 4,610,567 |
| | 89,153 | | AMG Capital Trust II (a) | | 5.15 | | | | | | 3,828,007 |
| | 51,762 | | Aspen Insurance Holdings, Ltd. (a) | | 5.63 | | | | | | 2,782,725 |
| | 1,507 | | Bank of America Corp., Series L (a) | | 7.25 | | | | | | 1,475,353 |
| | 35,212 | | Forest City Enterprises, Inc., Series A (a) | | 7.00 | | | | | | 1,910,357 |
| | 65,734 | | Health Care REIT, Inc., Series I (a) | | 6.50 | | | | | | 3,436,574 |
| | 35,643 | | KeyCorp, Series A (a) | | 7.75 | | | | | | 4,015,362 |
| | 15,413 | | Lexington Realty Trust, Series C | | 6.50 | | | | | | 673,355 |
| | 51,413 | | MetLife, Inc. (a) | | 5.00 | | | | | | 3,635,927 |
| | 101,296 | | Synovus Financial Corp. (a) | | 8.25 | | | | | | 1,939,818 |
| | 138,235 | | UBS AG (a) | | 9.38 | | | | | | 2,291,936 |
| | 1,375 | | Wells Fargo & Co., Series L | | 7.50 | | | | | | 1,535,463 |
| | 69,709 | | Wintrust Financial Corp. (a) | | 7.50 | | | | | | 3,842,709 |
| | 474 | | Wintrust Financial Corp., Series C (d) | | 5.00 | | | | | | 488,813 |
| | | | | | | | | | | | 39,229,768 |
| Healthcare - 0.2% | | | | | | | | | | | |
| | 7,166 | | Alere, Inc., Series B (a) | | 3.00 | | | | | | 1,727,006 |
| | 70 | | HealthSouth Corp. (a)(f) | | 6.50 | | | | | | 68,968 |
| | 4,324 | | HealthSouth Corp., Series A (a) | | 6.50 | | | | | | 4,260,221 |
| | | | | | | | | | | | |
See Notes to Financial Statements. 15 ABSOLUTE FUNDS
ABSOLUTE STRATEGIES FUND
SCHEDULE OF INVESTMENTS
MARCH 31, 2012
| | | | Security | | | | | | | | |
| | Shares | | Description | | Rate | | | | | | Value |
| | 59,028 | | Omnicare Capital Trust II, Series B (a) | | 4.00 | % | | | | $ | 2,837,033 |
| | | | | | | | | | | | 8,893,228 |
| | | | | | | | | | | | |
| | | | | | | | | | | | |
| Industrial - 0.1% | | | | | | | | | | | |
| | 67,813 | | Continental Airlines Finance Trust II (a) | | 6.00 | | | | | | 2,335,310 |
| Materials - 0.1% | | | | | | | | | | | |
| | 58,847 | | AngloGold Ashanti Holdings Finance PLC (a) | | 6.00 | | | | | | 2,533,952 |
| Utilities - 0.1% | | | | | | | | | | | |
| | 62,828 | | CenterPoint Energy, Inc. (a)(g) | | 0.47 | | | | | | 2,359,977 |
| | 38,200 | | PPL Corp. (a) | | 9.50 | | | | | | 2,075,788 |
| | | | | | | | | | | | 4,435,765 |
| Total Preferred Stock | | | | | | | | | | | |
| (Cost $78,690,080) | | | | | | | | | | | 83,504,883 |
| | | | | | | | | | | | |
| Total Equity Securities | | | | | | | | | | | |
| (Cost $1,360,813,029) | | | | | | | | | | | 1,661,777,112 |
| | | | | | | | | | | | |
| | | | | | | | | | | | |
| | | | Security | | | | | | | | |
| | Principal | | Description | | Rate | | Maturity | | | | Value |
| | | | | | | | | | | | |
| Fixed Income Securities - 29.7% | | | | | | | | | | | |
| Asset Backed Obligations - 7.0% | | | | | | | | | | | |
| $ | 3,337,000 | | ACE Securities Corp., Series 2006-ASP3 A2C (g) | | 0.39 | % | 06/25/36 | | | $ | 1,447,858 |
| | 1,775,000 | | ACE Securities Corp., Series 2006-HE1 A2D (g) | | 0.54 | | 02/25/36 | | | | 593,327 |
| | 561,852 | | ACE Securities Corp., Series 2007-HE1 A2A (g) | | 0.33 | | 01/25/37 | | | | 160,001 |
| | 125,127 | | Adjustable Rate Mortgage Trust, Series 2005-12 2A1 (a)(g) | | 2.95 | | 03/25/36 | | | | 76,206 |
| | 193,848 | | Adjustable Rate Mortgage Trust, Series 2005-3 8A32 (a)(g) | | 0.56 | | 07/25/35 | | | | 167,292 |
| | 2,154,211 | | Adjustable Rate Mortgage Trust, Series 2006-1 2A1 (g) | | 3.23 | | 03/25/36 | | | | 1,267,918 |
| | 96,695 | | Adjustable Rate Mortgage Trust, Series 2006-1 3A3 (a)(g) | | 5.50 | | 03/25/36 | | | | 62,660 |
| | 3,135,490 | | Adjustable Rate Mortgage Trust, Series 2007-1 5A1 (g) | | 0.39 | | 03/25/37 | | | | 1,503,502 |
| | 1,349,999 | | Aircastle Aircraft Lease Backed Trust, Series 2007-1A G1 (a)(f)(g) | | 0.50 | | 06/14/37 | | | | 1,169,859 |
| | 944,532 | | Alta Wind Holdings, LLC (f) | | 7.00 | | 06/30/35 | | | | 1,020,257 |
| | | | | | | | | | | | |
| | | | Security | | | | | | | | |
| | Principal | | Description | | Rate | | Maturity | | | | Value |
| $ | 590,727 | | American Home Mortgage Assets, LLC, Series 2007-4 A2 (g) | | 0.43 | % | 08/25/37 | | | $ | 445,620 |
| | 1,144,000 | | Argent Securities, Inc., Series 2005-W5 A2D (g) | | 0.56 | | 01/25/36 | | | | 425,909 |
| | 1,000,000 | | Asset Backed Funding Certificates, Series 2006-HE1 A2C (g) | | 0.40 | | 01/25/37 | | | | 314,958 |
| | 1,875,000 | | Asset Backed Funding Certificates, Series 2007-NC1 M2 (f)(g) | | 1.49 | | 05/25/37 | | | | 73,952 |
| | 1,500,000 | | Asset Backed Funding Certificates, Series 2007-WMC1 A2B (g) | | 1.24 | | 06/25/37 | | | | 603,817 |
| | 1,315,000 | | Astoria Depositor Corp. (f) | | 8.14 | | 05/01/21 | | | | 1,117,750 |
| | 1,140,000 | | Avalon IV Capital, Ltd., Series 2012-1A C (a)(d)(f)(g) | | 4.39 | | 04/17/23 | | | | 1,093,260 |
| | 953,720 | | AWAS Aviation Capital, Ltd. (f) | | 7.00 | | 10/17/16 | | | | 994,253 |
| | 500,000 | | Axis Equipment Finance Receivables, LLC, Series 2012-1I D (a)(d) | | 5.50 | | 11/20/15 | | | | 427,843 |
| | 500,000 | | Axis Equipment Finance Receivables, LLC, Series 2012-1I E1 (a)(d) | | 6.25 | | 04/20/16 | | | | 411,253 |
| | 550,000 | | Axis Equipment Finance Receivables, LLC, Series 2012-1I E2 (a)(d) | | 7.00 | | 03/20/17 | | | | 414,714 |
| | 1,154,479 | | Babcock & Brown Air Funding I, Ltd., Series 2007-1A G1 (a)(f)(g) | | 0.54 | | 11/14/33 | | | | 969,762 |
| | 333,107 | | Banc of America Alternative Loan Trust, Series 2005-8 2CB1 (a) | | 6.00 | | 09/25/35 | | | | 272,333 |
| | 205,825 | | Banc of America Funding Corp., Series 2005-B 3A1B (a)(g) | | 0.55 | | 04/20/35 | | | | 156,279 |
| | 7,580,000 | | Banc of America Funding Corp., Series 2006-D 1A2 (g) | | 0.52 | | 05/20/36 | | | | 1,731,806 |
| | | | | | | | | | | | |
See Notes to Financial Statements. 16 ABSOLUTE FUNDS
ABSOLUTE STRATEGIES FUND
SCHEDULE OF INVESTMENTS
MARCH 31, 2012
| | | | Security | | | | | | | | |
| | Principal | | Description | | Rate | | Maturity | | | | Value |
| $ | 80,117 | | Banc of America Funding Corp., Series 2006-E 2A1 (a)(g) | | 2.83 | % | 06/20/36 | | | $ | 53,373 |
| | 339,770 | | Banc of America Funding Corp., Series 2006-F 1A1 (a)(g) | | 2.67 | | 07/20/36 | | | | 273,824 |
| | 150,446 | | Banc of America Funding Corp., Series 2006-G 2A3 (a)(g) | | 0.41 | | 07/20/36 | | | | 146,761 |
| | 225,059 | | Banc of America Funding Corp., Series 2006-H 6A1 (g) | | 0.43 | | 10/20/36 | | | | 119,119 |
| | 655,284 | | Banc of America Funding Corp., Series 2007-8 2A1 | | 7.00 | | 10/25/37 | | | | 471,675 |
| | 159,415 | | Banc of America Funding Corp., Series 2007-E 4A1 (g) | | 5.40 | | 07/20/47 | | | | 110,168 |
| | 1,485,000 | | Banc of America Merrill Lynch Commercial Mortgage, Inc., Series 2004-4 A6 (g) | | 4.88 | | 07/10/42 | | | | 1,588,977 |
| | 175,000 | | Banc of America Merrill Lynch Commercial Mortgage, Inc., Series 2005-2 A5 (a)(g) | | 4.86 | | 07/10/43 | | | | 191,589 |
| | 2,320,521 | | Bayview Commercial Asset Trust, Series 2004-3 A1 (a)(f)(g) | | 0.61 | | 01/25/35 | | | | 1,886,427 |
| | 1,225,000 | | Bayview Commercial Asset Trust, Series 2006-SP1 M1 (a)(f)(g) | | 0.69 | | 04/25/36 | | | | 836,287 |
| | 94,138 | | Bayview Financial Acquisition Trust, Series 2005-D AF3 (a)(g) | | 5.50 | | 12/28/35 | | | | 88,710 |
| | 266,764 | | Bear Stearns Adjustable Rate Mortgage Trust, Series 2007-5 1A1 (a)(g) | | 5.20 | | 08/25/47 | | | | 155,417 |
| | 1,254,849 | | Bear Stearns Alt-A Trust, Series 2005-4 21A1 (g) | | 2.85 | | 05/25/35 | | | | 814,600 |
| | 228,467 | | Bear Stearns Alt-A Trust, Series 2005-8 11A1 (a)(g) | | 0.51 | | 10/25/35 | | | | 137,266 |
| | | | | | | | | | | | |
| | | | Security | | | | | | | | |
| | Principal | | Description | | Rate | | Maturity | | | | Value |
| $ | 471,136 | | Bear Stearns Alt-A Trust, Series 2006-1 22A1 (g) | | 2.58 | % | 02/25/36 | | | $ | 291,263 |
| | 2,498,027 | | Bear Stearns Alt-A Trust, Series 2006-2 21A1 (g) | | 3.12 | | 03/25/36 | | | | 1,300,769 |
| | 234,523 | | Bear Stearns Alt-A Trust, Series 2006-2 23A1 (a)(g) | | 2.94 | | 03/25/36 | | | | 130,661 |
| | 1,590,314 | | Bear Stearns Alt-A Trust, Series 2006-3 1A1 (g) | | 0.43 | | 05/25/36 | | | | 770,318 |
| | 1,569,848 | | Bear Stearns Alt-A Trust, Series 2006-4 11A1 (g) | | 0.40 | | 08/25/36 | | | | 931,304 |
| | 200,000 | | Bear Stearns Asset Backed Securities Trust, Series 2005-TC2 A3 (a)(g) | | 0.61 | | 08/25/35 | | | | 183,662 |
| | 74,370 | | Bear Stearns Commercial Mortgage Securities, Series 2002-PBW1 A2 (a)(g) | | 4.72 | | 11/11/35 | | | | 74,888 |
| | 1,680,000 | | Bear Stearns Commercial Mortgage Securities, Series 2004-PWR6 A6 | | 4.83 | | 11/11/41 | | | | 1,817,256 |
| | 1,815,000 | | Bear Stearns Commercial Mortgage Securities, Series 2005-T20 A4A (a)(g) | | 5.15 | | 10/12/42 | | | | 2,025,458 |
| | 1,500,000 | | BNC Mortgage Loan Trust, Series 2007-3 A3 (g) | | 0.37 | | 07/25/37 | | | | 784,346 |
| | 214,915 | | BNC Mortgage Loan Trust, Series 2007-4 A3A (g) | | 0.49 | | 11/25/37 | | | | 212,006 |
| | 3,400,000 | | Brazos Higher Education Authority, Series 2010-1 A2 (a)(g) | | 1.69 | | 02/25/35 | | | | 3,187,548 |
| | 795,246 | | Centex Home Equity, Series 2005-C AF6 (h) | | 4.64 | | 06/25/35 | | | | 773,366 |
| | 1,700,000 | | Centex Home Equity, Series 2006-A AV4 (g) | | 0.49 | | 06/25/36 | | | | 980,619 |
| | | | | | | | | | | | |
See Notes to Financial Statements. 17 ABSOLUTE FUNDS
ABSOLUTE STRATEGIES FUND
SCHEDULE OF INVESTMENTS
MARCH 31, 2012
| | | | Security | | | | | | | | |
| | Principal | | Description | | Rate | | Maturity | | | | Value |
| $ | 125,000 | | Chase Mortgage Finance Corp., Series 2005-A1 2A3 (a)(g) | | 2.80 | % | 12/25/35 | | | $ | 101,535 |
| | 410,162 | | Chaseflex Trust, Series 2007-1 2A9 (a) | | 6.00 | | 02/25/37 | | | | 291,175 |
| | 2,292,047 | | Chaseflex Trust, Series 2007-M1 1A2 (g) | | 0.47 | | 08/25/37 | | | | 1,111,287 |
| | 3,286,580 | | CIT Education Loan Trust, Series 2007-1 A (a)(f)(g) | | 0.56 | | 03/25/42 | | | | 2,962,309 |
| | 1,200,000 | | Citicorp Residential Mortgage Securities, Inc., Series 2006-2 A5 (h) | | 6.04 | | 09/25/36 | | | | 1,010,160 |
| | 1,400,000 | | Citicorp Residential Mortgage Securities, Inc., Series 2007-1 A5 (h) | | 6.05 | | 03/25/37 | | | | 956,363 |
| | 145,000 | | Citigroup Commerical Mortgage Trust, Series 2007-C6 A4 (a)(g) | | 5.70 | | 12/10/49 | | | | 166,302 |
| | 380,000 | | Citigroup Mortgage Loan Trust, Inc., Series 2006-WF1 A2D (h) | | 5.92 | | 03/25/36 | | | | 218,845 |
| | 2,850,000 | | Citigroup Mortgage Loan Trust, Inc., Series 2007-AHL3 A3B (g) | | 0.41 | | 07/25/45 | | | | 1,043,978 |
| | 111,564 | | Citigroup Mortgage Loan Trust, Inc., Series 2007-AMC2 M1 (g) | | 0.51 | | 01/25/37 | | | | 129 |
| | 754,572 | | Citigroup Mortgage Loan Trust, Inc., Series 2007-AR8 2A1A (g) | | 5.14 | | 07/25/37 | | | | 493,379 |
| | 3,610,000 | | Citigroup Mortgage Loan Trust, Inc., Series 2007-WFH1 A4 (g) | | 0.44 | | 01/25/37 | | | | 1,706,505 |
| | 1,250,000 | | Citigroup Mortgage Loan Trust, Inc., Series 2007-WFH2 M1 (g) | | 0.64 | | 03/25/37 | | | | 230,413 |
| | | | | | | | | | | | |
| | | | Security | | | | | | | | |
| | Principal | | Description | | Rate | | Maturity | | | | Value |
| $ | 760,640 | | Citigroup Mortgage Loan Trust, Inc., Series 2007-WFH3 A2 (g) | | 0.40 | % | 06/25/37 | | | $ | 560,908 |
| | 3,300,000 | | Citigroup Mortgage Loan Trust, Inc., Series 2007-WFH4 A2B (g) | | 1.29 | | 07/25/37 | | | | 1,851,239 |
| | 285,000 | | Citigroup Mortgage Loan Trust, Inc., Series 2007-WFH4 A2C (a)(g) | | 1.54 | | 07/25/37 | | | | 132,100 |
| | 1,600,000 | | Citigroup/Deutsche Bank Commercial Mortgage Trust, Series 2005-CD1 A4 (g) | | 5.23 | | 07/15/44 | | | | 1,786,916 |
| | 160,000 | | Citigroup/Deutsche Bank Commercial Mortgage Trust, Series 2007-CD5 A4 (a)(g) | | 5.89 | | 11/15/44 | | | | 184,732 |
| | 173,549 | | Citimortgage Alternative Loan Trust, Series 2006-A7 1A12 | | 6.00 | | 12/25/36 | | | | 117,956 |
| | 66,159 | | Citimortgage Alternative Loan Trust, Series 2007-A4 1A6 (a) | | 5.75 | | 04/25/37 | | | | 46,018 |
| | 35,000 | | Commercial Mortgage Pass Through Certificates, 2007-C9 A4 (a)(g) | | 5.81 | | 12/10/49 | | | | 40,396 |
| | 1,143,978 | | Conseco Finance Securitizations Corp., Series 2001-4 A4 (a) | | 7.36 | | 08/01/32 | | | | 1,212,670 |
| | 1,180,029 | | Conseco Finance, Series 2002-C BF1 (g) | | 8.00 | | 06/15/32 | | | | 1,177,991 |
| | 481,795 | | Continental Airlines Pass Through Trust, Series 2007-1 B (a) | | 6.90 | | 04/19/22 | | | | 489,504 |
| | 752,038 | | Continental Airlines Pass Through Trust, Series 2009-1 (a) | | 9.00 | | 07/08/16 | | | | 857,323 |
| | 1,038,795 | | Coso Geothermal Power Holdings (f) | | 7.00 | | 07/15/26 | | | | 638,161 |
| | | | | | | | | | | | |
See Notes to Financial Statements. 18 ABSOLUTE FUNDS
ABSOLUTE STRATEGIES FUND
SCHEDULE OF INVESTMENTS
MARCH 31, 2012
| | | | Security | | | | | | | | |
| | Principal | | Description | | Rate | | Maturity | | | | Value |
| | | | | | | | | | | | |
| $ | 76,465 | | Countrywide Alternative Loan Trust, Series 2004-J10 4CB1 | | 6.50 | % | 10/25/34 | | | $ | 75,639 |
| | 583,744 | | Countrywide Alternative Loan Trust, Series 2005-36 2A1A (g) | | 0.55 | | 08/25/35 | | | | 282,827 |
| | 240,803 | | Countrywide Alternative Loan Trust, Series 2005-43 4A1 (g) | | 5.30 | | 10/25/35 | | | | 185,638 |
| | 88,229 | | Countrywide Alternative Loan Trust, Series 2005-50CB 1A1 (a) | | 5.50 | | 11/25/35 | | | | 67,393 |
| | 332,414 | | Countrywide Alternative Loan Trust, Series 2005-73CB 1A8 | | 5.50 | | 01/25/36 | | | | 257,897 |
| | 850,000 | | Countrywide Alternative Loan Trust, Series 2005-J10 1A16 | | 5.50 | | 10/25/35 | | | | 661,993 |
| | 569,477 | | Countrywide Alternative Loan Trust, Series 2005-J12 2A1 (g) | | 0.51 | | 08/25/35 | | | | 243,442 |
| | 352,946 | | Countrywide Alternative Loan Trust, Series 2006-36T2 1A1 (a)(g) | | 0.56 | | 12/25/36 | | | | 187,205 |
| | 50,706 | | Countrywide Alternative Loan Trust, Series 2006-7CB 3A1 (a) | | 5.25 | | 05/25/21 | | | | 39,053 |
| | 2,144,041 | | Countrywide Alternative Loan Trust, Series 2006-OA10 1A1 (g) | | 1.12 | | 08/25/46 | | | | 1,152,419 |
| | 4,001,685 | | Countrywide Alternative Loan Trust, Series 2006-OA22 A1 (g) | | 0.40 | | 02/25/47 | | | | 2,494,198 |
| | 418,378 | | Countrywide Alternative Loan Trust, Series 2007-16CB 4A7 | | 6.00 | | 08/25/37 | | | | 312,768 |
| | 331,900 | | Countrywide Alternative Loan Trust, Series 2007-19 1A34 | | 6.00 | | 08/25/37 | | | | 238,901 |
| | | | | | | | | | | | |
| | | | Security | | | | | | | | |
| | Principal | | Description | | Rate | | Maturity | | | | Value |
| $ | 183,107 | | Countrywide Alternative Loan Trust, Series 2007-OH1 A1A (g) | | 0.33 | % | 04/25/47 | | | $ | 180,389 |
| | 2,040,000 | | Countrywide Asset-Backed Certificates, Series 2007-10 2A2 (g) | | 0.36 | | 06/25/47 | | | | 1,664,220 |
| | 582,075 | | Countrywide Asset-Backed Certificates, Series 2007-13 2A1 (g) | | 1.14 | | 10/25/47 | | | | 398,510 |
| | 8,540 | | Countrywide Asset-Backed Certificates, Series 2007-9 2A1 (a)(g) | | 0.30 | | 06/25/47 | | | | 8,496 |
| | 1,602,625 | | Countrywide Home Loan Mortgage Pass Through Trust, Series 2004-HYB5 3A1 (g) | | 2.95 | | 04/20/35 | | | | 1,146,051 |
| | 239,116 | | Countrywide Home Loan Mortgage Pass Through Trust, Series 2005-9 1A1 (a)(g) | | 0.54 | | 05/25/35 | | | | 163,892 |
| | 907,230 | | Countrywide Home Loan Mortgage Pass Through Trust, Series 2007-HY3 2A1 (a)(g) | | 5.10 | | 06/25/47 | | | | 601,262 |
| | 410,433 | | Countrywide Home Loan Mortgage Pass Through Trust, Series 2007-HY3 4A1 (a)(g) | | 5.66 | | 06/25/47 | | | | 358,079 |
| | 107,594 | | Countrywide Home Loan Mortgage Pass Through Trust, Series 2007-HY5 1A1 (a)(g) | | 5.55 | | 09/25/47 | | | | 71,914 |
| | 5,696 | | Credit Suisse First Boston Mortgage Securities Corp., Series 2002-CP3 A3 (a) | | 5.60 | | 07/15/35 | | | | 5,700 |
| | 24,846 | | Credit Suisse First Boston Mortgage Securities Corp., Series 2003-AR24 2A4 (g) | | 2.72 | | 10/25/33 | | | | 22,988 |
| | | | | | | | | | | | |
See Notes to Financial Statements. 19 ABSOLUTE FUNDS
ABSOLUTE STRATEGIES FUND
SCHEDULE OF INVESTMENTS
MARCH 31, 2012
| | | | Security | | | | | | | | |
| | Principal | | Description | | Rate | | Maturity | | | | Value |
| $ | 144,319 | | Credit Suisse First Boston Mortgage Securities Corp., Series 2005-6 8A1 (a) | | 4.50 | % | 07/25/20 | | | $ | 141,911 |
| | 1,000,497 | | Credit Suisse Mortgage Capital Certificates, Series 2006-6 2A1 (a)(g) | | 0.84 | | 07/25/36 | | | | 439,747 |
| | 177,121 | | Credit Suisse Mortgage Capital Certificates, Series 2006-8 3A1 (a) | | 6.00 | | 10/25/21 | | | | 153,584 |
| | 1,588,000 | | Credit Suisse Mortgage Capital Certificates, Series 2006-C3 A3 (g) | | 5.81 | | 06/15/38 | | | | 1,801,156 |
| | 565,000 | | Credit Suisse Mortgage Capital Certificates, Series 2006-C5 A3 | | 5.31 | | 12/15/39 | | | | 625,348 |
| | 537,826 | | Credit-Based Asset Servicing and Securitization, LLC, Series 2006-CB4 AV3 (g) | | 0.39 | | 05/25/36 | | | | 213,114 |
| | 1,500,000 | | Credit-Based Asset Servicing and Securitization, LLC, Series 2006-CB6 A24 (g) | | 0.49 | | 07/25/36 | | | | 552,598 |
| | 1,500,000 | | Credit-Based Asset Servicing and Securitization, LLC, Series 2006-CB7 A5 (g) | | 0.48 | | 10/25/36 | | | | 607,775 |
| | 1,850,000 | | Credit-Based Asset Servicing and Securitization, LLC, Series 2006-CB8 A2B (g) | | 0.35 | | 10/25/36 | | | | 1,516,730 |
| | 558,387 | | Credit-Based Asset Servicing and Securitization, LLC, Series 2006-CB9 A2 (g) | | 0.35 | | 11/25/36 | | | | 215,601 |
| | | | | | | | | | | | |
| | | | Security | | | | | | | | |
| | Principal | | Description | | Rate | | Maturity | | | | Value |
| $ | 3,316,658 | | Credit-Based Asset Servicing and Securitization, LLC, Series 2006-CB9 A3 (g) | | 0.39 | % | 11/25/36 | | | $ | 1,289,429 |
| | 3,484,966 | | Credit-Based Asset Servicing and Securitization, LLC, Series 2006-CB9 A4 (g) | | 0.47 | | 11/25/36 | | | | 1,373,315 |
| | 1,600,000 | | Credit-Based Asset Servicing and Securitization, LLC, Series 2007-CB2 A2B (h) | | 5.51 | | 02/25/37 | | | | 980,927 |
| | 3,017,693 | | Credit-Based Asset Servicing and Securitization, LLC, Series 2007-CB2 A2E (a)(h) | | 5.68 | | 02/25/37 | | | | 1,685,353 |
| | 1,500,000 | | Credit-Based Asset Servicing and Securitization, LLC, Series 2007-CB5 A3 (g) | | 0.49 | | 04/25/37 | | | | 633,515 |
| | 1,078,732 | | CSAB Mortgage Backed Trust, Series 2007-1 1A1A (g) | | 5.90 | | 05/25/37 | | | | 585,907 |
| | 75,000 | | DBRR Trust, Series 2011-LC2 A4A (a)(f)(g) | | 4.54 | | 07/12/44 | | | | 83,443 |
| | 1,018,040 | | Delta Air Lines Pass Through Trust, Series 2002-1 G-1 | | 6.72 | | 01/02/23 | | | | 1,075,305 |
| | 320,804 | | Deutsche ALT-A Securities, Inc. Alternate Loan Trust, Series 2006-AB2 A5B (h) | | 6.09 | | 06/25/36 | | | | 190,142 |
| | 1,007,956 | | Deutsche ALT-A Securities, Inc. Alternate Loan Trust, Series 2007-AR1 A4 (g) | | 0.40 | | 01/25/47 | | | | 563,563 |
| | 5,957,346 | | Deutsche ALT-A Securities, Inc. Alternate Loan Trust, Series 2007-AR3 2A4 (g) | | 0.59 | | 06/25/37 | | | | 1,420,988 |
| | | | | | | | | | | | |
See Notes to Financial Statements. 20 ABSOLUTE FUNDS
ABSOLUTE STRATEGIES FUND
SCHEDULE OF INVESTMENTS
MARCH 31, 2012
| | | | Security | | | | | | | | |
| | Principal | | Description | | Rate | | Maturity | | | | Value |
| $ | 1,955,574 | | Deutsche ALT-A Securities, Inc. Alternate Loan Trust, Series 2007-OA2 A1 (g) | | 0.93 | % | 04/25/47 | | | $ | 1,274,739 |
| | 3,400,204 | | Downey Savings & Loan Association Mortgage Loan Trust, Series 2007-AR1 2A1A (g) | | 0.38 | | 04/19/47 | | | | 2,197,129 |
| | 2,155,000 | | Dynegy Roseton, LLC/Dynegy Danskammer, LLC Pass Through Trust, Series B (a)(i) | | 7.67 | | 11/08/16 | | | | 1,330,712 |
| | 2,920,000 | | Equifirst Loan Securitization Trust, Series 2007-1 A2B (g) | | 0.43 | | 04/25/37 | | | | 1,145,858 |
| | 77,935 | | Equity One ABS, Inc., Series 2002-4 M1 (a)(g) | | 5.22 | | 02/25/33 | | | | 64,493 |
| | 3,661,000 | | First Franklin Mortgage Loan Asset Backed Certificates, Series 2006-FF13 A2D (g) | | 0.48 | | 10/25/36 | | | | 1,555,121 |
| | 1,066,588 | | First Franklin Mortgage Loan Asset Backed Certificates, Series 2006-FF18 M1 (a)(g) | | 0.47 | | 12/25/37 | | | | 3,635 |
| | 930,000 | | First Franklin Mortgage Loan Asset Backed Certificates, Series 2007-FF1 A2C (g) | | 0.38 | | 01/25/38 | | | | 407,251 |
| | 1,245,816 | | First Horizon Alternative Mortgage Securities, Series 2005-AA3 2A1 (g) | | 2.33 | | 05/25/35 | | | | 907,843 |
| | 546,152 | | First Horizon Alternative Mortgage Securities, Series 2006-FA8 1A1 | | 6.25 | | 02/25/37 | | | | 409,215 |
| | 643,563 | | First Horizon Alternative Mortgage Securities, Series 2006-FA8 1A8 (a)(g) | | 0.61 | | 02/25/37 | | | | 344,518 |
| | | | | | | | | | | | |
| | | | Security | | | | | | | | |
| | Principal | | Description | | Rate | | Maturity | | | | Value |
| $ | 1,108,678 | | First Horizon Asset Securities, Inc., Series 2005-AR6 2A1B (a)(g) | | 2.59 | % | 01/25/36 | | | $ | 786,010 |
| | 4,610,000 | | First NLC Trust, Series 2005-4 A4 (g) | | 0.63 | | 02/25/36 | | | | 1,707,085 |
| | 261,336 | | FPL Energy National Wind Portfolio, LLC (a)(f) | | 6.13 | | 03/25/19 | | | | 256,255 |
| | 1,081,048 | | GE Business Loan Trust, Series 2003-2A A (f)(g) | | 0.61 | | 11/15/31 | | | | 994,759 |
| | 1,522,960 | | GE Business Loan Trust, Series 2004-1 A (a)(f)(g) | | 0.53 | | 05/15/32 | | | | 1,381,125 |
| | 1,218,298 | | GE Business Loan Trust, Series 2005-1A A3 (a)(f)(g) | | 0.49 | | 06/15/33 | | | | 1,038,949 |
| | 1,629,508 | | GE Business Loan Trust, Series 2005-2A A (a)(f)(g) | | 0.48 | | 11/15/33 | | | | 1,420,995 |
| | 208,333 | | GE Seaco Finance SRL, Series 2004-1A A (f)(g) | | 0.54 | | 04/17/19 | | | | 203,836 |
| | 1,320,000 | | GE Seaco Finance SRL, Series 2005-1A A (a)(f)(g) | | 0.49 | | 11/17/20 | | | | 1,261,365 |
| | 1,209,842 | | Genesis Funding, Ltd., Series 2006-1A G1 (a)(f)(g) | | 0.48 | | 12/19/32 | | | | 1,061,564 |
| | 223,839 | | GenOn REMA LLC, Series B (a) | | 9.24 | | 07/02/17 | | | | 223,839 |
| | 810,000 | | GenOn REMA, LLC, Series C (a) | | 9.68 | | 07/02/26 | | | | 769,500 |
| | 1,376,000 | | Green Tree Financial Corp., Series 1996-10 M1 (g) | | 7.24 | | 11/15/28 | | | | 1,492,558 |
| | 936,902 | | Green Tree Financial Corp., Series 1997-1 A6 (a) | | 7.29 | | 03/15/28 | | | | 991,352 |
| | 59,589 | | Green Tree Home Improvement Loan Trust, Series 1997-D HEB1 | | 7.41 | | 09/15/28 | | | | 59,430 |
| | 1,250,000 | | Green Tree, Series 2008-MH1 A2 (a)(f)(g) | | 8.97 | | 04/25/38 | | | | 1,379,338 |
| | | | | | | | | | | | |
See Notes to Financial Statements. 21 ABSOLUTE FUNDS
ABSOLUTE STRATEGIES FUND
SCHEDULE OF INVESTMENTS
MARCH 31, 2012
| | | | Security | | | | | | | | |
| | Principal | | Description | | Rate | | Maturity | | | | Value |
| $ | 1,342,438 | | Green Tree, Series 2008-MH1 A3 (a)(f)(g) | | 8.97 | % | 04/25/38 | | | $ | 1,492,245 |
| | 1,830,000 | | Greenwich Capital Commercial Funding Corp., Series 2004-GG1 A7 (a)(g) | | 5.32 | | 06/10/36 | | | | 1,953,231 |
| | 1,485,000 | | Greenwich Capital Commercial Funding Corp., Series 2006-GG7 A4 (a)(g) | | 5.88 | | 07/10/38 | | | | 1,689,706 |
| | 180,000 | | Greenwich Capital Commercial Funding Corp., Series 2007-GG9 A4 (a) | | 5.44 | | 03/10/39 | | | | 198,839 |
| | 250,000 | | GS Mortgage Securities Corp II, Series 2011-GC5 A4 (a) | | 3.71 | | 08/10/44 | | | | 261,960 |
| | 543,445 | | GSAA Trust, Series 2005-12 AF3 (g) | | 5.07 | | 09/25/35 | | | | 508,085 |
| | 1,671,939 | | GSAA Trust, Series 2006-16 A1 (g) | | 0.30 | | 10/25/36 | | | | 721,515 |
| | 1,666,122 | | GSAA Trust, Series 2006-19 A1 (g) | | 0.33 | | 12/25/36 | | | | 728,727 |
| | 1,599,798 | | GSAA Trust, Series 2006-20 1A1 (g) | | 0.31 | | 12/25/46 | | | | 732,746 |
| | 1,221,429 | | GSAA Trust, Series 2006-9 A4A (g) | | 0.48 | | 06/25/36 | | | | 553,448 |
| | 2,503,163 | | GSAA Trust, Series 2007-3 1A1B (g) | | 0.34 | | 03/25/47 | | | | 108,765 |
| | 1,721,713 | | GSAA Trust, Series 2007-4 A1 (g) | | 0.34 | | 03/25/37 | | | | 751,202 |
| | 1,457,782 | | GSAA Trust, Series 2007-5 2A3A (g) | | 0.56 | | 04/25/47 | | | | 714,586 |
| | 6,017,277 | | GSAMP Trust, Series 2007-FM2 A2B (g) | | 0.33 | | 01/25/37 | | | | 2,192,366 |
| | 437,281 | | GSR Mortgage Loan Trust, Series 2004-14 3A2 (g) | | 2.89 | | 12/25/34 | | | | 326,789 |
| | 1,525,000 | | GSR Mortgage Loan Trust, Series 2004-9 5A7 (a)(g) | | 2.25 | | 08/25/34 | | | | 1,331,016 |
| | | | | | | | | | | | |
| | | | Security | | | | | | | | |
| | Principal | | Description | | Rate | | Maturity | | | | Value |
| $ | 285,076 | | GSR Mortgage Loan Trust, Series 2005-AR5 1A1 (g) | | 2.94 | % | 10/25/35 | | | $ | 202,840 |
| | 1,391,101 | | GSR Mortgage Loan Trust, Series 2007-AR2 2A1 (g) | | 2.73 | | 05/25/47 | | | | 991,434 |
| | 18,080 | | Harborview Mortgage Loan Trust, Series 2004-8 2A4A (a)(g) | | 0.64 | | 11/19/34 | | | | 12,009 |
| | 180,101 | | Harborview Mortgage Loan Trust, Series 2006-3 2A1A (a)(g) | | 5.47 | | 06/19/36 | | | | 96,641 |
| | 1,922,966 | | Harborview Mortgage Loan Trust, Series 2007-5 A1A (g) | | 0.43 | | 09/19/37 | | | | 1,211,156 |
| | 4,536,000 | | Home Equity Loan Trust, Series 2007-FRE1 2AV4 (g) | | 0.58 | | 04/25/37 | | | | 1,711,968 |
| | 282,114 | | Homebanc Mortgage Trust, Series 2004-1 2A (g) | | 1.10 | | 08/25/29 | | | | 207,212 |
| | 279,386 | | HSBC Asset Loan Obligation, Series 2007-AR2 2A1 (a)(g) | | 5.28 | | 09/25/37 | | | | 170,259 |
| | 900,000 | | HSBC Home Equity Loan Trust, Series 2006-3 A4 (g) | | 0.48 | | 03/20/36 | | | | 770,347 |
| | 657,504 | | HSBC Home Equity Loan Trust, Series 2006-4 A3V (g) | | 0.39 | | 03/20/36 | | | | 634,364 |
| | 2,400,000 | | HSBC Home Equity Loan Trust, Series 2007-2 M1 (a)(g) | | 0.55 | | 07/20/36 | | | | 1,661,399 |
| | 556,905 | | HSBC Home Equity Loan Trust, Series 2007-3 APT (a)(g) | | 1.44 | | 11/20/36 | | | | 502,189 |
| | 1,500,000 | | HSBC Home Equity Loan Trust, Series 2007-3 M1 (g) | | 2.49 | | 11/20/36 | | | | 984,372 |
| | 216,192 | | Impac CMB Trust, Series 2005-1 1A1 (a)(g) | | 0.76 | | 04/25/35 | | | | 170,717 |
| | | | | | | | | | | | |
See Notes to Financial Statements. 22 ABSOLUTE FUNDS
ABSOLUTE STRATEGIES FUND
SCHEDULE OF INVESTMENTS
MARCH 31, 2012
| | | | Security | | | | | | | | |
| | Principal | | Description | | Rate | | Maturity | | | | Value |
| $ | 1,497,631 | | Indiantown Cogeneration LP, Series A-10 (a) | | 9.77 | % | 12/15/20 | | | $ | 1,555,615 |
| | 72,752 | | Indymac INDA Mortgage Loan Trust, Series 2006-AR1 A1 (a)(g) | | 5.52 | | 08/25/36 | | | | 71,281 |
| | 249,151 | | Indymac INDA Mortgage Loan Trust, Series 2007-AR7 1A1 (a)(g) | | 5.65 | | 11/25/37 | | | | 200,508 |
| | 1,363,867 | | Indymac Index Mortgage Loan Trust, Series 2004-AR12 A1 (g) | | 1.02 | | 12/25/34 | | | | 861,013 |
| | 685,060 | | Indymac Index Mortgage Loan Trust, Series 2004-AR7 A2 (g) | | 1.10 | | 09/25/34 | | | | 461,193 |
| | 414,915 | | Indymac Index Mortgage Loan Trust, Series 2005-AR5 1A1 (a)(g) | | 2.72 | | 05/25/35 | | | | 236,839 |
| | 1,174,827 | | Indymac Index Mortgage Loan Trust, Series 2006-AR19 1A2 (a)(g) | | 2.93 | | 08/25/36 | | | | 572,012 |
| | 92,370 | | Indymac Index Mortgage Loan Trust, Series 2006-AR25 3A1 (a)(g) | | 2.85 | | 09/25/36 | | | | 47,830 |
| | 189,624 | | Indymac Index Mortgage Loan Trust, Series 2006-AR29 A1 (a)(g) | | 0.41 | | 11/25/36 | | | | 92,583 |
| | 270,739 | | Indymac Index Mortgage Loan Trust, Series 2006-AR33 3A1 (g) | | 5.15 | | 01/25/37 | | | | 227,067 |
| | 3,205,308 | | Indymac Index Mortgage Loan Trust, Series 2006-AR41 A3 (g) | | 0.42 | | 02/25/37 | | | | 1,570,545 |
| | 839,614 | | Indymac Index Mortgage Loan Trust, Series 2006-AR7 1A1 (g) | | 3.07 | | 05/25/36 | | | | 451,448 |
| | 3,904,738 | | Indymac Index Mortgage Loan Trust, Series 2006-AR7 3A1 (g) | | 2.85 | | 05/25/36 | | | | 2,325,117 |
| | | | | | | | | | | | |
| | | | Security | | | | | | | | |
| | Principal | | Description | | Rate | | Maturity | | | | Value |
| $ | 483,715 | | Indymac Index Mortgage Loan Trust, Series 2006-AR7 4A1 (a)(g) | | 5.40 | % | 05/25/36 | | | $ | 242,530 |
| | 450,000 | | Indymac Index Mortgage Loan Trust, Series 2006-R1 A3 (a)(g) | | 5.07 | | 12/25/35 | | | | 258,943 |
| | 775,672 | | Indymac Index Mortgage Loan Trust, Series 2007-AR5 1A1 (g) | | 3.73 | | 05/25/37 | | | | 338,052 |
| | 2,972,169 | | Indymac Index Mortgage Loan Trust, Series 2007-AR5 3A1 (g) | | 4.92 | | 05/25/37 | | | | 1,629,780 |
| | 4,000,865 | | Indymac Index Mortgage Loan Trust, Series 2007-AR7 2A1 (g) | | 4.35 | | 06/25/37 | | | | 1,979,984 |
| | 55,260 | | Indymac Index Mortgage Loan Trust, Series 2007-FLX1 A1 (a)(g) | | 0.34 | | 02/25/37 | | | | 54,395 |
| | 366,990 | | Indymac Index Mortgage Loan Trust, Series 2007-FLX2 A1C (a)(g) | | 0.43 | | 04/25/37 | | | | 157,468 |
| | 1,270,883 | | Indymac Manufactured Housing Contract, Series 1998-2 A4 (a)(g) | | 6.64 | | 08/25/29 | | | | 1,269,035 |
| | 1,137,658 | | JetBlue Airways Pass Through Trust, Series 2004-2 G1 (g) | | 0.88 | | 08/15/16 | | | | 1,023,892 |
| | 3,483,252 | | JP Morgan Alternative Loan Trust, Series 2006-A2 3A1 (g) | | 2.69 | | 05/25/36 | | | | 2,076,335 |
| | 2,000,000 | | JP Morgan Alternative Loan Trust, Series 2006-A4 A7 (g) | | 6.30 | | 09/25/36 | | | | 680,540 |
| | 1,360,000 | | JP Morgan Alternative Loan Trust, Series 2006-A6 2A5 (g) | | 6.05 | | 11/25/36 | | | | 858,622 |
| | 147,016 | | JP Morgan Alternative Loan Trust, Series 2007-A2 12A2 (g) | | 0.34 | | 06/25/37 | | | | 142,526 |
| | | | | | | | | | | | |
See Notes to Financial Statements. 23 ABSOLUTE FUNDS
ABSOLUTE STRATEGIES FUND
SCHEDULE OF INVESTMENTS
MARCH 31, 2012
| | | | Security | | | | | | | | |
| | Principal | | Description | | Rate | | Maturity | | | | Value |
| $ | 165,000 | | JP Morgan Chase Commercial Mortgage Securities Corp., Series 2006-LDP7 A4 (a)(g) | | 5.87 | % | 04/15/45 | | | $ | 188,536 |
| | 1,870,000 | | JP Morgan Chase Commercial Mortgage Securities Corp., Series 2007-CB18 A4 | | 5.44 | | 06/12/47 | | | | 2,089,020 |
| | 450,000 | | JP Morgan Mortgage Acquisition Corp., Series 2006-HE1 A4 (a)(g) | | 0.53 | | 01/25/36 | | | | 171,672 |
| | 3,276,985 | | JP Morgan Mortgage Acquisition Corp., Series 2006-WMC3 A4 (g) | | 0.39 | | 08/25/36 | | | | 1,072,849 |
| | 4,756,818 | | JP Morgan Mortgage Acquisition Corp., Series 2007-CH3 A4 (a)(g) | | 0.45 | | 03/25/37 | | | | 1,975,019 |
| | 1,110,000 | | JP Morgan Mortgage Acquisition Corp., Series 2007-CH4 A5 (g) | | 0.48 | | 05/25/37 | | | | 460,183 |
| | 2,590,000 | | JP Morgan Mortgage Acquisition Corp., Series 2007-HE1 AF2 (h) | | 5.27 | | 03/25/47 | | | | 1,399,499 |
| | 3,885,774 | | JP Morgan Mortgage Acquisition Corp., Series 2007-HE1 AF6 (h) | | 5.27 | | 03/25/47 | | | | 2,351,717 |
| | 2,813,000 | | JP Morgan Mortgage Acquisition Corp., Series 2007-HE1 AV4 (g) | | 0.52 | | 03/25/47 | | | | 971,765 |
| | 446,899 | | JP Morgan Mortgage Trust, Series 2005-A5 TA1 (g) | | 5.42 | | 08/25/35 | | | | 444,747 |
| | 200,000 | | JP Morgan Mortgage Trust, Series 2006-A2 2A2 (g) | | 5.47 | | 04/25/36 | | | | 163,795 |
| | | | | | | | | | | | |
| | | | Security | | | | | | | | |
| | Principal | | Description | | Rate | | Maturity | | | | Value |
| $ | 2,500,000 | | JP Morgan Mortgage Trust, Series 2006-A2 2A4 (a)(g) | | 5.47 | % | 04/25/36 | | | $ | 2,040,778 |
| | 2,265,377 | | JP Morgan Mortgage Trust, Series 2006-A3 2A1 (g) | | 2.89 | | 05/25/36 | | | | 1,557,042 |
| | 1,470,048 | | JP Morgan Mortgage Trust, Series 2007-A1 5A2 (a)(g) | | 2.85 | | 07/25/35 | | | | 1,367,308 |
| | 62,260 | | JP Morgan Mortgage Trust, Series 2007-A2 4A1M (a)(g) | | 5.51 | | 04/25/37 | | | | 51,525 |
| | 538,103 | | Lease Investment Flight Trust, Series 1 A1 (g) | | 0.63 | | 07/15/31 | | | | 344,386 |
| | 1,614,309 | | Lease Investment Flight Trust, Series 1 A2 (g) | | 0.67 | | 07/15/31 | | | | 1,025,086 |
| | 1,420,906 | | Lehman ABS Manufactured Housing Contract Trust, Series 2001-B A6 (a)(g) | | 6.47 | | 04/15/40 | | | | 1,535,592 |
| | 462,154 | | Lehman Mortgage Trust, Series 2006-1 3A3 | | 5.50 | | 02/25/36 | | | | 466,813 |
| | 229,533 | | Lehman XS Trust, Series 2005-6 1A1 (g) | | 0.50 | | 11/25/35 | | | | 111,537 |
| | 2,500,000 | | Lehman XS Trust, Series 2005-6 3A3A (h) | | 5.76 | | 11/25/35 | | | | 1,053,605 |
| | 2,296,033 | | Lehman XS Trust, Series 2006-13 1A2 (g) | | 0.41 | | 09/25/36 | | | | 1,464,602 |
| | 5,380,278 | | Lehman XS Trust, Series 2006-13 1A3 (g) | | 0.53 | | 09/25/36 | | | | 1,110,871 |
| | 1,560,460 | | Lehman XS Trust, Series 2006-14N 3A2 (a)(g) | | 0.36 | | 08/25/36 | | | | 829,352 |
| | 2,353,942 | | Lehman XS Trust, Series 2006-19 A2 (g) | | 0.41 | | 12/25/36 | | | | 1,520,322 |
| | 2,510,867 | | Lehman XS Trust, Series 2006-9 A1B (g) | | 0.40 | | 05/25/46 | | | | 1,680,070 |
| | 2,212,898 | | Lehman XS Trust, Series 2007-12N 1A3A (g) | | 0.44 | | 07/25/47 | | | | 752,373 |
| | | | | | | | | | | | |
See Notes to Financial Statements. 24 ABSOLUTE FUNDS
ABSOLUTE STRATEGIES FUND
SCHEDULE OF INVESTMENTS
MARCH 31, 2012
| | | | Security | | | | | | | | |
| | Principal | | Description | | Rate | | Maturity | | | | Value |
| $ | 999,390 | | Lehman XS Trust, Series 2007-16N 2A2 (a)(g) | | 1.09 | % | 09/25/47 | | | $ | 660,615 |
| | 1,700,000 | | Mastr Adjustable Rate Mortgages Trust, Series 2004-13 3A7 (g) | | 2.72 | | 11/21/34 | | | | 1,673,892 |
| | 342,665 | | Mastr Adjustable Rate Mortgages Trust, Series 2007-R5 A1 (f)(g) | | 2.75 | | 11/25/35 | | | | 190,767 |
| | 3,806,000 | | Mastr Asset Backed Securities Trust, Series 2006-AM2 A4 (f)(g) | | 0.50 | | 06/25/36 | | | | 1,052,131 |
| | 3,100,000 | | Mastr Asset Backed Securities Trust, Series 2006-HE5 A3 (g) | | 0.40 | | 11/25/36 | | | | 1,028,706 |
| | 885,000 | | Mastr Asset Backed Securities Trust, Series 2007-HE1 A3 (g) | | 0.45 | | 05/25/37 | | | | 345,388 |
| | 20,295 | | Mastr Seasoned Securities Trust, Series 2004-1 4A1 (a)(g) | | 2.70 | | 10/25/32 | | | | 18,958 |
| | 1,300,000 | | Merrill Lynch First Franklin Mortgage Loan Trust, Series 2007-1 A2C (g) | | 0.49 | | 04/25/37 | | | | 538,306 |
| | 3,941,000 | | Merrill Lynch First Franklin Mortgage Loan Trust, Series 2007-3 A2C (a)(g) | | 0.42 | | 06/25/37 | | | | 1,480,876 |
| | 4,700,000 | | Merrill Lynch First Franklin Mortgage Loan Trust, Series 2007-3 A2D (g) | | 0.49 | | 06/25/37 | | | | 1,888,582 |
| | 3,131,000 | | Merrill Lynch First Franklin Mortgage Loan Trust, Series 2007-4 2A4 (g) | | 0.49 | | 07/25/37 | | | | 1,352,113 |
| | 3,899,258 | | Merrill Lynch Mortgage Investors, Inc., Series 2006-A1 1A1 (g) | | 2.84 | | 03/25/36 | | | | 2,159,910 |
| | | | | | | | | | | | |
| | | | Security | | | | | | | | |
| | Principal | | Description | | Rate | | Maturity | | | | Value |
| $ | 1,150,000 | | Merrill Lynch/Countrywide Commercial Mortgage Trust, Series 2006-4 A3 (g) | | 5.17 | % | 12/12/49 | | | $ | 1,274,385 |
| | 873,258 | | Mid-State Trust, Series 2006-1A (f) | | 5.79 | | 10/15/40 | | | | 892,514 |
| | 451,579 | | Mirant Mid- Atlantic Pass Through Trust, Series B | | 9.13 | | 06/30/17 | | | | 458,353 |
| | 662,520 | | Mirant Mid-Atlantic Pass Through Trust, Series C | | 10.06 | | 12/30/28 | | | | 679,083 |
| | 200,000 | | Morgan Stanley ABS Capital I, Series 2004-NC7 M2 (a)(g) | | 0.86 | | 07/25/34 | | | | 159,667 |
| | 2,975,000 | | Morgan Stanley ABS Capital I, Series 2006-HE1 A4 (g) | | 0.53 | | 01/25/36 | | | | 1,358,943 |
| | 2,234,217 | | Morgan Stanley ABS Capital I, Series 2006-HE5 A2C (g) | | 0.38 | | 08/25/36 | | | | 1,169,574 |
| | 4,400,000 | | Morgan Stanley ABS Capital I, Series 2006-NC2 A2D (g) | | 0.53 | | 02/25/36 | | | | 1,817,882 |
| | 1,935,000 | | Morgan Stanley ABS Capital I, Series 2007-HE1 A2C (g) | | 0.39 | | 11/25/36 | | | | 683,222 |
| | 1,835,000 | | Morgan Stanley Capital I, Series 2005-T19 A4A (a) | | 4.89 | | 06/12/47 | | | | 2,020,082 |
| | 120,000 | | Morgan Stanley Capital I, Series 2006-HQ9 A4 (a)(g) | | 5.73 | | 07/12/44 | | | | 136,688 |
| | 1,835,000 | | Morgan Stanley Capital I, Series 2006-T21 A4 (a)(g) | | 5.16 | | 10/12/52 | | | | 2,050,024 |
| | 105,000 | | Morgan Stanley Capital I, Series 2006-T23 A4 (a)(g) | | 5.81 | | 08/12/41 | | | | 120,680 |
| | 1,365,000 | | Morgan Stanley Capital I, Series 2007-IQ16 A4 | | 5.81 | | 12/12/49 | | | | 1,571,171 |
| | 165,000 | | Morgan Stanley Capital I, Series 2007-T27 A4 (a)(g) | | 5.64 | | 06/11/42 | | | | 190,914 |
| | 40,000 | | Morgan Stanley Capital I, Series 2011-C3 A2 (a) | | 3.22 | | 07/15/49 | | | | 42,224 |
| | | | | | | | | | | | |
See Notes to Financial Statements. 25 ABSOLUTE FUNDS
ABSOLUTE STRATEGIES FUND
SCHEDULE OF INVESTMENTS
MARCH 31, 2012
| | | | Security | | | | | | | | |
| | Principal | | Description | | Rate | | Maturity | | | | Value |
| $ | 25,000 | | Morgan Stanley Capital I, Series 2011-C3 A4 (a) | | 4.12 | % | 07/15/49 | | | $ | 27,141 |
| | 1,854,455 | | Morgan Stanley Mortgage Loan Trust, Series 2006-11 1A3 (h) | | 6.42 | | 08/25/36 | | | | 888,617 |
| | 2,549,231 | | Morgan Stanley Mortgage Loan Trust, Series 2006-7 5A2 (g) | | 5.96 | | 06/25/36 | | | | 1,202,889 |
| | 288,718 | | Morgan Stanley Mortgage Loan Trust, Series 2007-13 6A1 (a) | | 6.00 | | 10/25/37 | | | | 189,150 |
| | 1,755,851 | | Morgan Stanley Mortgage Loan Trust, Series 2007-2AX 2A1 (g) | | 0.33 | | 12/25/36 | | | | 692,456 |
| | 1,690,778 | | Morgan Stanley Mortgage Loan Trust, Series 2007-7AX 2A1 (g) | | 0.36 | | 04/25/37 | | | | 629,292 |
| | 2,920,000 | | Nationstar Home Equity Loan Trust, Series 2006-B AV4 (g) | | 0.52 | | 09/25/36 | | | | 1,603,474 |
| | 2,300,000 | | Nationstar Home Equity Loan Trust, Series 2007-A AV3 (g) | | 0.39 | | 03/25/37 | | | | 1,709,734 |
| | 281,715 | | NCUA Guaranteed Notes, Series 2010-R2 1A (a)(g) | | 0.61 | | 11/06/17 | | | | 281,715 |
| | 181,660 | | NCUA Guaranteed Notes, Series 2010-R2 2A (a)(g) | | 0.71 | | 11/05/20 | | | | 181,660 |
| | 162,909 | | NCUA Guaranteed Notes, Series 2010-R3 1A (a)(g) | | 0.80 | | 12/08/20 | | | | 163,520 |
| | 134,395 | | NCUA Guaranteed Notes, Series 2010-R3 2A (a)(g) | | 0.80 | | 12/08/20 | | | | 135,051 |
| | 1,297,600 | | Newcastle Mortgage Securities Trust, Series 2007-1 2A4 (g) | | 0.58 | | 04/25/37 | | | | 425,840 |
| | | | | | | | | | | | |
| | | | Security | | | | | | | | |
| | Principal | | Description | | Rate | | Maturity | | | | Value |
| $ | 1,483,990 | | Nomura Asset Acceptance Corp., Series 2006-AR4 A1A (g) | | 0.41 | % | 12/25/36 | | | $ | 674,365 |
| | 436,892 | | Nomura Asset Acceptance Corp., Series 2007-1 1A1A (h) | | 6.00 | | 03/25/47 | | | | 231,558 |
| | 160,000 | | Nomura Asset Securities Corp., Series 1998-D6 A3 (a)(g) | | 7.04 | | 03/15/30 | | | | 167,639 |
| | 1,470,873 | | Nomura Home Equity Loan, Inc., Series 2005-HE1 M3 (g) | | 0.72 | | 09/25/35 | | | | 958,041 |
| | 1,596,154 | | Novastar Home Equity Loan, Series 2006-2 A2C (g) | | 0.39 | | 06/25/36 | | | | 739,387 |
| | 1,220,262 | | Oakwood Mortgage Investors, Inc., Series 1999-B A4 | | 6.99 | | 12/15/26 | | | | 1,151,456 |
| | 288,318 | | Opteum Mortgage Acceptance Corp., Series 2005-5 2A1B (g) | | 5.64 | | 12/25/35 | | | | 283,017 |
| | 970,842 | | Opteum Mortgage Acceptance Corp., Series 2006-2 A1C (g) | | 0.51 | | 07/25/36 | | | | 473,460 |
| | 1,335,000 | | Option One Mortgage Loan Trust, Series 2007-6 2A3 (g) | | 0.42 | | 07/25/37 | | | | 498,791 |
| | 750,000 | | Option One Mortgage Loan Trust, Series 2007-6 2A4 (g) | | 0.49 | | 07/25/37 | | | | 283,780 |
| | 808,217 | | Origen Manufactured Housing, Series 2004-A M2 (a)(g) | | 6.64 | | 01/15/35 | | | | 819,369 |
| | 5,535,000 | | Ownit Mortgage Loan Asset Backed Certificates, Series 2006-6 A2C (a)(g) | | 0.40 | | 09/25/37 | | | | 1,812,131 |
| | 1,845,000 | | Popular ABS Mortgage Pass-Through Trust, Series 2007-A A3 (g) | | 0.55 | | 06/25/47 | | | | 730,746 |
| | | | | | | | | | | | |
See Notes to Financial Statements. 26 ABSOLUTE FUNDS
ABSOLUTE STRATEGIES FUND
SCHEDULE OF INVESTMENTS
MARCH 31, 2012
| | | | Security | | | | | | | | |
| | Principal | | Description | | Rate | | Maturity | | | | Value |
| $ | 1,030,000 | | Prudential Holdings, LLC (f) | | 8.70 | % | 12/18/23 | | | $ | 1,283,018 |
| | 577,238 | | Residential Accredit Loans, Inc., Series 2005-QA12 NB4 (a)(g) | | 4.05 | | 12/25/35 | | | | 400,497 |
| | 597,372 | | Residential Accredit Loans, Inc., Series 2005-QO3 A1 (g) | | 0.64 | | 10/25/45 | | | | 356,303 |
| | 749,079 | | Residential Accredit Loans, Inc., Series 2005-QO5 A1 (a)(g) | | 1.16 | | 01/25/46 | | | | 374,351 |
| | 585,383 | | Residential Accredit Loans, Inc., Series 2006-QS10 A1 | | 6.00 | | 08/25/36 | | | | 389,396 |
| | 315,143 | | Residential Accredit Loans, Inc., Series 2006-QS17 A4 | | 6.00 | | 12/25/36 | | | | 195,107 |
| | 459,601 | | Residential Accredit Loans, Inc., Series 2007-QS1 1A1 | | 6.00 | | 01/25/37 | | | | 321,834 |
| | 238,614 | | Residential Accredit Loans, Inc., Series 2007-QS5 A1 | | 5.50 | | 03/25/37 | | | | 144,127 |
| | 485,291 | | Residential Accredit Loans, Inc., Series 2007-QS8 A10 | | 6.00 | | 06/25/37 | | | | 335,223 |
| | 924,216 | | Residential Accredit Loans, Inc., Series 2007-QS8 A6 | | 6.00 | | 06/25/37 | | | | 596,558 |
| | 100,119 | | Residential Asset Mortgage Products, Inc., Series 2004-RZ1 AI7 (a)(g) | | 4.03 | | 01/25/33 | | | | 101,154 |
| | 473,759 | | Residential Asset Mortgage Products, Inc., Series 2004-SL3 A4 | | 8.50 | | 12/25/31 | | | | 491,443 |
| | 543,843 | | Residential Asset Securitization Trust, Series 2006-A10 A5 | | 6.50 | | 09/25/36 | | | | 358,938 |
| | 1,422,192 | | Residential Asset Securitization Trust, Series 2007-A5 1A2 (g) | | 0.64 | | 05/25/37 | | | | 344,444 |
| | 2,469,789 | | Saxon Asset Securities Trust, Series 2005-4 A1B (g) | | 0.62 | | 11/25/37 | | | | 1,925,446 |
| | | | | | | | | | | | |
| | | | Security | | | | | | | | |
| | Principal | | Description | | Rate | | Maturity | | | | Value |
| $ | 1,935,000 | | Saxon Asset Securities Trust, Series 2006-3 A3 (g) | | 0.41 | % | 10/25/46 | | | $ | 870,622 |
| | 1,365,000 | | Saxon Asset Securities Trust, Series 2007-1 A2C (g) | | 0.39 | | 01/25/47 | | | | 508,069 |
| | 3,722,635 | | Securitized Asset Backed Receivables, LLC Trust, Series 2006-HE2 A2D (g) | | 0.48 | | 07/25/36 | | | | 1,342,466 |
| | 2,500,000 | | Securitized Asset Backed Receivables, LLC Trust, Series 2007-BR5 A2C (g) | | 0.59 | | 05/25/37 | | | | 922,621 |
| | 250,000 | | Securitized Asset Backed Receivables, LLC Trust, Series 2007-NC1 A2B (a)(g) | | 0.39 | | 12/25/36 | | | | 89,767 |
| | 2,411,355 | | Securitized Asset Backed Receivables, LLC Trust, Series 2007-NC2 A2B (g) | | 0.38 | | 01/25/37 | | | | 857,926 |
| | 360,000 | | SG Mortgage Securities Trust, Series 2006-OPT2 A3C (a)(g) | | 0.39 | | 10/25/36 | | | | 114,388 |
| | 1,000,000 | | Soundview Home Equity Loan Trust, Series 2006-EQ2 A4 (g) | | 0.48 | | 01/25/37 | | | | 371,889 |
| | 3,250,000 | | Soundview Home Equity Loan Trust, Series 2006-OPT5 2A4 (g) | | 0.48 | | 07/25/36 | | | | 1,166,275 |
| | 1,200,000 | | Soundview Home Equity Loan Trust, Series 2007-NS1 A4 (g) | | 0.54 | | 01/25/37 | | | | 423,380 |
| | 3,349,000 | | Soundview Home Equity Loan Trust, Series 2007-OPT2 2A4 (g) | | 0.49 | | 07/25/37 | | | | 1,144,831 |
| | 120,000 | | Soundview Home Equity Loan Trust, Series 2007-OPT2 M2 (g) | | 0.51 | | 07/25/37 | | | | 2,134 |
| | | | | | | | | | | | |
See Notes to Financial Statements. 27 ABSOLUTE FUNDS
ABSOLUTE STRATEGIES FUND
SCHEDULE OF INVESTMENTS
MARCH 31, 2012
| | | | Security | | | | | | | | |
| | Principal | | Description | | Rate | | Maturity | | | | Value |
| $ | 1,021,010 | | Spirit Master Funding, LLC, Series 2005-1 A1 (a)(f) | | 5.05 | % | 07/20/23 | | | $ | 916,356 |
| | 331,153 | | Structured Adjustable Rate Mortgage Loan Trust, Series 2006-1 7A3 (a)(g) | | 5.44 | | 02/25/36 | | | | 300,927 |
| | 845,000 | | Structured Adjustable Rate Mortgage Loan Trust, Series 2006-1 7A4 (g) | | 5.44 | | 02/25/36 | | | | 492,919 |
| | 89,967 | | Structured Adjustable Rate Mortgage Loan Trust, Series 2007-3 3A1 (a)(g) | | 5.20 | | 04/25/47 | | | | 60,351 |
| | 2,155,474 | | Structured Asset Mortgage Investments, Inc., Series 2006-AR8 A1A (g) | | 0.44 | | 10/25/36 | | | | 1,249,230 |
| | 2,238,983 | | Structured Asset Mortgage Investments, Inc., Series 2007-AR3 2A1 (g) | | 0.43 | | 09/25/47 | | | | 1,138,522 |
| | 3,300,000 | | Structured Asset Mortgage Investments, Inc., Series 2007-AR4 A3 (g) | | 0.46 | | 09/25/47 | | | | 1,361,910 |
| | 4,051,569 | | Structured Asset Mortgage Investments, Inc., Series 2007-AR6 A1 (g) | | 1.66 | | 08/25/47 | | | | 2,356,453 |
| | 1,607,760 | | Structured Asset Securities Corp., Series 2003-26A 3A5 (a)(g) | | 2.78 | | 09/25/33 | | | | 1,464,128 |
| | 168,549 | | Structured Asset Securities Corp., Series 2003-34A 5A4 (a)(g) | | 2.52 | | 11/25/33 | | | | 166,308 |
| | 216,080 | | Structured Asset Securities Corp., Series 2005-4XS 2A1A (a)(g) | | 1.99 | | 03/25/35 | | | | 169,732 |
| | 367,500 | | TAL Advantage, LLC, Series 2006-1A (a)(f)(g) | | 0.43 | | 04/20/21 | | | | 348,921 |
| | | | | | | | | | | | |
| | | | Security | | | | | | | | |
| | Principal | | Description | | Rate | | Maturity | | | | Value |
| $ | 459,208 | | TAL Advantage, LLC, Series 2010-2A A (f) | | 4.30 | % | 10/20/25 | | | $ | 466,924 |
| | 220,833 | | TAL Advantage, LLC, Series 2011-1A A (f) | | 4.60 | | 01/20/26 | | | | 223,606 |
| | 664,583 | | TAL Advantage, LLC, Series 2011-2A A (f) | | 4.31 | | 05/20/26 | | | | 667,533 |
| | 425,641 | | Terwin Mortgage Trust, Series 2005-1SL M1 (f)(g) | | 1.11 | | 02/25/35 | | | | 391,584 |
| | 300,833 | | Textainer Marine Containers, Ltd., Series 2005-1A A (a)(f)(g) | | 0.49 | | 05/15/20 | | | | 289,580 |
| | 855,625 | | Textainer Marine Containers, Ltd., Series 2011-1A A (a)(f) | | 4.70 | | 06/15/26 | | | | 874,130 |
| | 591,990 | | Trinity Rail Leasing LP, Series 2006-1A A1 (a)(f) | | 5.90 | | 05/14/36 | | | | 642,350 |
| | 985,592 | | Trip Rail Master Funding, LLC, Series 2011-1A A1A (a)(f) | | 4.37 | | 07/15/41 | | | | 1,019,360 |
| | 715,867 | | Triton Container Finance, LLC, Series 2006-1A (a)(f)(g) | | 0.41 | | 11/26/21 | | | | 675,009 |
| | 492,188 | | Triton Container Finance, LLC, Series 2007-1A (a)(f)(g) | | 0.38 | | 02/26/19 | | | | 473,960 |
| | 691,071 | | UAL Pass Through Trust, Series 2009-1 | | 10.40 | | 11/01/16 | | | | 788,719 |
| | 3,600,000 | | US Education Loan Trust, LLC, Series 2006-2A A1 (a)(f)(g) | | 0.67 | | 03/01/31 | | | | 3,179,782 |
| | 330,000 | | Wachovia Bank Commercial Mortgage Trust, Series 2003-C6 A4 (a)(g) | | 5.13 | | 08/15/35 | | | | 342,983 |
| | 1,610,000 | | Wachovia Bank Commercial Mortgage Trust, Series 2004-C12 A4 (g) | | 5.32 | | 07/15/41 | | | | 1,730,759 |
| | 1,830,000 | | Wachovia Bank Commercial Mortgage Trust, Series 2005-C20 A7 (a)(g) | | 5.12 | | 07/15/42 | | | | 2,029,724 |
See Notes to Financial Statements. 28 ABSOLUTE FUNDS
ABSOLUTE STRATEGIES FUND
SCHEDULE OF INVESTMENTS
MARCH 31, 2012
| | Principal | | Security Description | | Rate | | Maturity | | | | Value |
| $ | 145,000 | | Wachovia Bank Commercial Mortgage Trust, Series 2005-C21 A4 (a)(g) | | 5.20 | % | 10/15/44 | | | $ | 160,400 |
| | 190,000 | | Wachovia Bank Commercial Mortgage Trust, Series 2006-C29 A4 (a) | | 5.31 | | 11/15/48 | | | | 213,229 |
| | 15,323 | | WaMu Mortgage Pass Through Certificates, Series 2002-AR18 A (a)(g) | | 2.49 | | 01/25/33 | | | | 14,878 |
| | 72,103 | | WaMu Mortgage Pass Through Certificates, Series 2005-AR14 1A1 (a)(g) | | 2.46 | | 12/25/35 | | | | 70,828 |
| | 115,000 | | WaMu Mortgage Pass Through Certificates, Series 2005-AR16 1A4A (a)(g) | | 2.46 | | 12/25/35 | | | | 98,838 |
| | 370,155 | | WaMu Mortgage Pass Through Certificates, Series 2006-AR12 2A3 (a)(g) | | 5.69 | | 10/25/36 | | | | 289,323 |
| | 216,969 | | WaMu Mortgage Pass Through Certificates, Series 2006-AR16 1A1 (a)(g) | | 2.37 | | 12/25/36 | | | | 151,887 |
| | 420,156 | | WaMu Mortgage Pass Through Certificates, Series 2007-HY3 4A1 (a)(g) | | 2.64 | | 03/25/37 | | | | 335,291 |
| | 697,747 | | WaMu Mortgage Pass Through Certificates, Series 2007-HY4 1A1 (g) | | 4.48 | | 04/25/37 | | | | 481,235 |
| | 1,571,448 | | WaMu Mortgage Pass Through Certificates, Series 2007-OA1 A1A (a)(g) | | 0.86 | | 02/25/47 | | | | 875,009 |
| | 830,338 | | WaMu Mortgage Pass Through Certificates, Series 2007-OA4 1A (a)(g) | | 0.93 | | 05/25/47 | | | | 498,359 |
| | 1,833,052 | | WaMu Mortgage Pass Through Certificates, Series 2007-OA6 1A (g) | | 0.97 | | 07/25/47 | | | | 1,146,652 |
| | | | | | | | | | | | |
| | | | Security | | | | | | | | |
| | Principal | | Description | | Rate | | Maturity | | | | Value |
| $ | 702,035 | | Washington Mutual Alternative Mortgage Pass-Through Certificates, Series 2005-3 2A3 (g) | | 0.79 | % | 05/25/35 | | | $ | 443,795 |
| | 453,770 | | Washington Mutual Alternative Mortgage Pass-Through Certificates, Series 2005-4 CB13 (g) | | 0.74 | | 06/25/35 | | | | 319,020 |
| | 1,556,860 | | Washington Mutual Alternative Mortgage Pass-Through Certificates, Series 2006-1 4CB | | 6.50 | | 02/25/36 | | | | 969,671 |
| | 537,540 | | Washington Mutual Alternative Mortgage Pass-Through Certificates, Series 2006-7 A1A (h) | | 6.09 | | 09/25/36 | | | | 310,180 |
| | 2,397,834 | | Washington Mutual Alternative Mortgage Pass-Through Certificates, Series 2006-AR2 A1A (g) | | 1.10 | | 04/25/46 | | | | 1,340,532 |
| | 2,969,101 | | Washington Mutual Alternative Mortgage Pass-Through Certificates, Series 2006-AR7 A1A (g) | | 1.08 | | 09/25/46 | | | | 1,186,420 |
| | 3,277,980 | | Washington Mutual Alternative Mortgage Pass-Through Certificates, Series 2007-OA2 2A (g) | | 0.86 | | 01/25/47 | | | | 1,372,764 |
| | 2,699,709 | | Washington Mutual Alternative Mortgage Pass-Through Certificates, Series 2007-OA3 2A (g) | | 0.91 | | 02/25/47 | | | | 1,089,683 |
| | | | | | | | | | | | |
See Notes to Financial Statements. 29 ABSOLUTE FUNDS
ABSOLUTE STRATEGIES FUND
SCHEDULE OF INVESTMENTS
MARCH 31, 2012
| | | | Security | | | | | | | | |
| | Principal | | Description | | Rate | | Maturity | | | | Value |
| $ | 4,064,163 | | Washington Mutual Alternative Mortgage Pass-Through Certificates, Series 2007-OA5 A1A (g) | | 1.00 | % | 05/25/47 | | | $ | 2,283,208 |
| | 1,036,098 | | Washington Mutual Alternative Mortgage Pass-Through Certificates, Series 2007-OC1 A4 (g) | | 0.56 | | 01/25/47 | | | | 502,377 |
| | 88,288 | | Wells Fargo Alternative Loan Trust, Series 2005-2 A4 (a)(g) | | 0.58 | | 10/25/35 | | | | 83,477 |
| | 318,503 | | Wells Fargo Home Equity Trust, Series 2006-3 A2 (g) | | 0.39 | | 01/25/37 | | | | 219,195 |
| | 2,694,000 | | Wells Fargo Home Equity Trust, Series 2006-3 A3 (a)(g) | | 0.45 | | 01/25/37 | | | | 1,019,000 |
| | 263,291 | | Wells Fargo Mortgage Backed Securities Trust, Series 2006-8 A14 | | 5.50 | | 07/25/36 | | | | 261,889 |
| | 115,000 | | WF-RBS Commercial Mortgage Trust, Series 2011-C5 A4 (a) | | 3.67 | | 11/15/44 | | | | 120,311 |
| Total Asset Backed Obligations | | | | | | | | | | | |
| (Cost $280,416,584) | | | | | | | | | | | 278,545,836 |
| | | | | | | | | | | | |
| Corporate Convertible Bonds - 18.1% | | | | | | | | | | | |
| Consumer Discretionary - 3.1% | | | | | | | | | | | |
| | 3,359,000 | | Brookdale Senior Living, Inc. (a) | | 2.75 | | 06/15/18 | | | | 3,153,261 |
| | 4,250,000 | | Chemed Corp. (a) | | 1.88 | | 05/15/14 | | | | 4,361,562 |
| | 1,000,000 | | Coinstar, Inc. | | 4.00 | | 09/01/14 | | | | 1,691,250 |
| | 721,000 | | DR Horton, Inc., Series DHI (a) | | 2.00 | | 05/15/14 | | | | 935,498 |
| | 7,250,000 | | Equinix, Inc. (a) | | 3.00 | | 10/15/14 | | | | 10,938,437 |
| | 2,913,000 | | Gaylord Entertainment Co. (a)(f) | | 3.75 | | 10/01/14 | | | | 3,750,487 |
| | 1,400,000 | | Hawaiian Holdings, Inc. (a) | | 5.00 | | 03/15/16 | | | | 1,372,000 |
| | 5,500,000 | | Hertz Global Holdings, Inc. (a) | | 5.25 | | 06/01/14 | | | | 10,621,875 |
| | | | | | | | | | | | |
| | | | Security | | | | | | | | |
| | Principal | | Description | | Rate | | Maturity | | | | Value |
| $ | 2,800,000 | | Home Inns & Hotels Management, Inc. (a) | | 2.00 | % | 12/15/15 | | | $ | 2,156,000 |
| | 4,500,000 | | Home Inns & Hotels Management, Inc. (a)(f) | | 2.00 | | 12/15/15 | | | | 3,465,000 |
| | 5,300,000 | | Jakks Pacific, Inc. (a)(f) | | 4.50 | | 11/01/14 | | | | 6,989,375 |
| | 862,000 | | JetBlue Airways Corp., Series A-C (a) | | 6.75 | | 10/15/39 | | | | 1,061,338 |
| | 2,209,000 | | Lennar Corp. (a)(f) | | 2.75 | | 12/15/20 | | | | 3,098,123 |
| | 835,000 | | Liberty Interactive, LLC | | 3.13 | | 03/30/23 | | | | 1,012,438 |
| | 3,719,000 | | Liberty Interactive, LLC (a)(d) | | 3.25 | | 03/15/31 | | | | 3,286,852 |
| | 3,798,000 | | Live Nation Entertainment, Inc. (a) | | 2.88 | | 07/15/27 | | | | 3,650,828 |
| | 2,250,000 | | Meritor, Inc. (a)(h) | | 4.63 | | 03/01/26 | | | | 2,064,375 |
| | 2,249,000 | | MGM Resorts International (a) | | 4.25 | | 04/15/15 | | | | 2,386,751 |
| | 5,463,000 | | Navistar International Corp. (a) | | 3.00 | | 10/15/14 | | | | 6,050,272 |
| | 994,000 | | Penske Automotive Group, Inc. | | 3.50 | | 04/01/26 | | | | 1,078,490 |
| | 3,200,000 | | priceline.com, Inc. (a)(f) | | 1.25 | | 03/15/15 | | | | 7,652,000 |
| | 2,000,000 | | priceline.com, Inc. (a)(f) | | 1.00 | | 03/15/18 | | | | 2,127,500 |
| | 819,000 | | RadioShack Corp. (a)(f) | | 2.50 | | 08/01/13 | | | | 784,193 |
| | 10,894,000 | | Regis Corp. (a) | | �� 5.00 | | 07/15/14 | | | | 14,597,960 |
| | 1,250,000 | | Saks, Inc. | | 2.00 | | 03/15/24 | | | | 1,332,813 |
| | 9,984,000 | | Sonic Automotive, Inc. (a) | | 5.00 | | 10/01/29 | | | | 15,225,600 |
| | 2,002,000 | | WESCO International, Inc. (a) | | 6.00 | | 09/15/29 | | | | 4,839,835 |
| | 2,790,000 | | XM Satellite Radio, Inc. (a)(f) | | 7.00 | | 12/01/14 | | | | 4,132,687 |
| | | | | | | | | | | | 123,816,800 |
| Consumer Staples - 1.2% | | | | | | | | | | | |
| | 2,006,000 | | Avis Budget Group, Inc. (a) | | 3.50 | | 10/01/14 | | | | 2,362,065 |
| | 187,000 | | Cenveo Corp. (a)(d)(f) | | 7.00 | | 05/15/17 | | | | 198,220 |
| | 1,114,000 | | Corsicanto, Ltd. (a)(f) | | 3.50 | | 01/15/32 | | | | 1,680,747 |
| | 7,400,000 | | Ingersoll-Rand Global Holding Co., Ltd. (a) | | 4.50 | | 04/15/12 | | | | 17,177,250 |
| | | | | | | | | | | | |
See Notes to Financial Statements. 30 ABSOLUTE FUNDS
ABSOLUTE STRATEGIES FUND
SCHEDULE OF INVESTMENTS
MARCH 31, 2012
| | | | Security | | | | | | | | |
| | Principal | | Description | | Rate | | Maturity | | | | Value |
| $ | 1,400,000 | | Olam International, Ltd. | | 6.00 | % | 10/15/16 | | | $ | 1,640,800 |
| | 978,000 | | Sunrise Senior Living, Inc. (a)(f) | | 5.00 | | 04/01/41 | | | | 772,620 |
| | 1,250,000 | | Tyson Foods, Inc. (a) | | 3.25 | | 10/15/13 | | | | 1,557,813 |
| | 6,000,000 | | United Rentals, Inc. (a) | | 4.00 | | 11/15/15 | | | | 23,400,000 |
| | | | | | | | | | | | 48,789,515 |
| | | | | | | | | | | | |
| | | | | | | | | | | | |
| Energy - 0.6% | | | | | | | | | | | |
| | 1,600,000 | | Alliance Oil Co., Ltd. | | 7.25 | | 07/16/14 | | | | 1,629,600 |
| | 1,027,000 | | Alpha Appalachia Holdings, Inc. (a) | | 3.25 | | 08/01/15 | | | | 926,868 |
| | 920,000 | | Chesapeake Energy Corp. | | 2.50 | | 05/15/37 | | | | 852,150 |
| | 5,750,000 | | Endeavour International Corp. (a)(f) | | 5.50 | | 07/15/16 | | | | 5,678,125 |
| | 3,600,000 | | Essar Energy Invest, Ltd. | | 4.25 | | 02/01/16 | | | | 2,412,000 |
| | 1,453,000 | | Exterran Holdings, Inc. (a) | | 4.25 | | 06/15/14 | | | | 1,456,632 |
| | 2,250,000 | | Helix Energy Solutions Group, Inc. (a) | | 3.25 | | 03/15/32 | | | | 2,385,000 |
| | 1,500,000 | | JinkoSolar Holding Co., Ltd. (a)(f) | | 4.00 | | 05/15/16 | | | | 856,875 |
| | 2,024,000 | | Newpark Resources, Inc. (a) | | 4.00 | | 10/01/17 | | | | 2,254,230 |
| | 720,000 | | Patriot Coal Corp. (a)(d) | | 3.25 | | 05/31/13 | | | | 693,000 |
| | 461,000 | | Peabody Energy Corp. | | 4.75 | | 12/15/41 | | | | 440,255 |
| | 933,000 | | Penn Virginia Corp. (d) | | 4.50 | | 11/15/12 | | | | 928,335 |
| | 587,000 | | SM Energy Co. | | 3.84 | | 04/01/27 | | | | 766,769 |
| | 190,000 | | Stone Energy Corp. (a)(f) | | 1.75 | | 03/01/17 | | | | 184,300 |
| | 1,590,000 | | Western Refining, Inc. (a) | | 5.75 | | 06/15/14 | | | | 3,011,062 |
| | | | | | | | | | | | 24,475,201 |
| Financial - 1.6% | | | | | | | | | | | |
| | 757,000 | | Affiliated Managers Group, Inc. | | 3.95 | | 08/15/38 | | | | 836,485 |
| | 4,584,000 | | Air Lease Corp. (a)(f) | | 3.88 | | 12/01/18 | | | | 5,025,210 |
| | 5,000,000 | | American Equity Investment Life Holding Co. (a)(f) | | 3.50 | | 09/15/15 | | | | 5,956,250 |
| | 2,283,000 | | Amtrust Financial Services, Inc. (a)(f) | | 5.50 | | 12/15/21 | | | | 2,511,300 |
| | | | | | | | | | | | |
| | | | Security | | | | | | | | |
| | Principal | | Description | | Rate | | Maturity | | | | Value |
| $ | 3,190,000 | | Annaly Capital Management, Inc. REIT (a) | | 4.00 | % | 02/15/15 | | | $ | 3,724,325 |
| | 1,000,000 | | Ares Capital Corp. (a)(f) | | 4.88 | | 03/15/17 | | | | 991,250 |
| | 2,500,000 | | BGC Partners, Inc. (a)(f) | | 4.50 | | 07/15/16 | | | | 2,521,875 |
| | 10,296,000 | | CBIZ, Inc. (a)(f) | | 4.88 | | 10/01/15 | | | | 11,235,510 |
| | 352,000 | | CNO Financial Group, Inc. (a) | | 7.00 | | 12/30/16 | | | | 551,760 |
| | 620,000 | | CNO Financial Group, Inc. (a) | | 7.00 | | 12/30/16 | | | | 971,850 |
| | 863,000 | | CNO Financial Group, Inc., Series 1 (a) | | 7.00 | | 12/30/16 | | | | 1,352,752 |
| | 1,830,000 | | Forest City Enterprises, Inc. | | 3.63 | | 10/15/14 | | | | 2,204,006 |
| | 1,034,000 | | Forest City Enterprises, Inc. (a)(f) | | 4.25 | | 08/15/18 | | | | 1,050,803 |
| | 3,080,000 | | Icahn Enterprises LP (f)(g) | | 4.00 | | 08/15/13 | | | | 3,067,680 |
| | 1,304,000 | | KKR Financial Holdings, LLC (a) | | 7.50 | | 01/15/17 | | | | 1,846,790 |
| | 1,024,000 | | Knight Capital Group, Inc. | | 3.50 | | 03/15/15 | | | | 1,005,793 |
| | 2,823,000 | | Knight Capital Group, Inc. (a) | | 3.50 | | 03/15/15 | | | | 2,713,609 |
| | 1,807,000 | | Leucadia National Corp. | | 3.75 | | 04/15/14 | | | | 2,285,855 |
| | 620,000 | | National Financial Partners Corp. | | 4.00 | | 06/15/17 | | | | 842,425 |
| | 8,208,000 | | National Financial Partners Corp. (a) | | 4.00 | | 06/15/17 | | | | 11,152,620 |
| | 1,900,000 | | The NASDAQ OMX Group, Inc. (d) | | 2.50 | | 08/15/13 | | | | 1,909,500 |
| | | | | | | | | | | | 63,757,648 |
| Healthcare - 3.2% | | | | | | | | | | | |
| | 7,800,000 | | Accuray, Inc. (a)(f) | | 3.75 | | 08/01/16 | | | | 7,887,750 |
| | 5,300,000 | | AMERIGROUP Corp. (a) | | 2.00 | | 05/15/12 | | | | 8,407,125 |
| | 689,000 | | BioMarin Pharmaceutical, Inc. (a) | | 1.88 | | 04/23/17 | | | | 1,231,588 |
| | 6,525,000 | | Charles River Laboratories International, Inc. (a) | | 2.25 | | 06/15/13 | | | | 6,606,562 |
| | 7,045,000 | | Cubist Pharmaceuticals, Inc. (a) | | 2.25 | | 06/15/13 | | | | 10,118,381 |
| | 4,700,000 | | Cubist Pharmaceuticals, Inc. (a) | | 2.50 | | 11/01/17 | | | | 7,525,875 |
| | | | | | | | | | | | |
See Notes to Financial Statements. 31 ABSOLUTE FUNDS
ABSOLUTE STRATEGIES FUND
SCHEDULE OF INVESTMENTS
MARCH 31, 2012
| | | | Security | | | | | | | | |
| | Principal | | Description | | Rate | | Maturity | | | | Value |
| $ | 6,800,000 | | Endo Pharmaceuticals Holdings, Inc. (a) | | 1.75 | % | 04/15/15 | | | $ | 9,698,500 |
| | 6,000,000 | | Illumina, Inc. (a)(f) | | 0.25 | | 03/15/16 | | | | 5,782,500 |
| | 2,700,000 | | Insulet Corp. (a) | | 3.75 | | 06/15/16 | | | | 2,835,000 |
| | 2,201,000 | | LifePoint Hospitals, Inc. (a) | | 3.50 | | 05/15/14 | | | | 2,311,050 |
| | 3,350,000 | | Medivation, Inc. (a) | | 2.63 | | 04/01/17 | | | | 3,555,188 |
| | 858,000 | | Molina Healthcare, Inc. (a) | | 3.75 | | 10/01/14 | | | | 1,096,095 |
| | 6,000,000 | | Mylan, Inc. (a) | | 3.75 | | 09/15/15 | | | | 11,265,000 |
| | 3,500,000 | | NuVasive, Inc. (a) | | 2.75 | | 07/01/17 | | | | 3,001,250 |
| | 2,000,000 | | Omnicare, Inc. | | 3.75 | | 04/01/42 | | | | 1,989,000 |
| | 7,000,000 | | PSS World Medical, Inc. (a)(f) | | 3.13 | | 08/01/14 | | | | 9,248,750 |
| | 2,000,000 | | Regeneron Pharmaceuticals, Inc. (a)(f) | | 1.88 | | 10/01/16 | | | | 3,080,000 |
| | 4,569,000 | | Salix Pharmaceuticals, Ltd. (a)(f) | | 1.50 | | 03/15/19 | | | | 4,797,450 |
| | 4,047,000 | | Teleflex, Inc. (a) | | 3.88 | | 08/01/17 | | | | 4,770,401 |
| | 7,800,000 | | Viropharma, Inc. (a) | | 2.00 | | 03/15/17 | | | | 13,406,250 |
| | 6,611,000 | | Volcano Corp. (a) | | 2.88 | | 09/01/15 | | | | 7,891,881 |
| | 2,513,000 | | West Pharmaceutical Services, Inc. (a) | | 4.00 | | 03/15/47 | | | | 2,349,655 |
| | | | | | | | | | | | 128,855,251 |
| Industrial - 2.6% | | | | | | | | | | | |
| | 7,000,000 | | AAR Corp. (a) | | 1.75 | | 02/01/26 | | | | 6,947,500 |
| | 6,515,000 | | AirTran Holdings, Inc. (a) | | 5.25 | | 11/01/16 | | | | 8,265,906 |
| | 7,500,000 | | Altra Holdings, Inc. (a)(f) | | 2.75 | | 03/01/31 | | | | 7,509,375 |
| | 4,000,000 | | AM Castle & Co. (a)(f) | | 7.00 | | 12/15/17 | | | | 5,795,000 |
| | 1,627,000 | | Cemex SAB de CV (a) | | 4.88 | | 03/15/15 | | | | 1,537,515 |
| | 1,312,000 | | Chart Industries, Inc. (a) | | 2.00 | | 08/01/18 | | | | 1,685,920 |
| | 11,241,000 | | Covanta Holding Corp. (a) | | 3.25 | | 06/01/14 | | | | 12,969,304 |
| | 3,110,000 | | DryShips, Inc. (a) | | 5.00 | | 12/01/14 | | | | 2,659,050 |
| | 5,500,000 | | FEI Co. (a) | | 2.88 | | 06/01/13 | | | | 9,432,500 |
| | 3,500,000 | | Genco Shipping & Trading, Ltd. (a) | | 5.00 | | 08/15/15 | | | | 2,275,000 |
| | 2,939,000 | | General Cable Corp. (a)(h) | | 4.50 | | 11/15/29 | | | | 3,111,666 |
| | 758,000 | | Greenbrier Cos., Inc. (a)(f) | | 3.50 | | 04/01/18 | | | | 730,523 |
| | 9,195,000 | | Griffon Corp. (a)(f) | | 4.00 | | 01/15/17 | | | | 9,378,900 |
| | 7,359,000 | | Kaman Corp. (a)(f) | | 3.25 | | 11/15/17 | | | | 8,913,589 |
| | | | | | | | | | | | |
| | | | Security | | | | | | | | |
| | Principal | | Description | | Rate | | Maturity | | | | Value |
| $ | 7,000,000 | | L-3 Communications Holdings, Inc. (a) | | 3.00 | % | 08/01/35 | | | $ | 6,851,250 |
| | 1,672,000 | | PHH Corp. (a) | | 4.00 | | 09/01/14 | | | | 1,613,480 |
| | 961,000 | | PHH Corp. (a) | | 6.00 | | 06/15/17 | | | | 1,417,475 |
| | 5,750,000 | | RTI International Metals, Inc. (a) | | 3.00 | | 12/01/15 | | | | 5,879,375 |
| | 5,600,000 | | TTM Technologies, Inc. (a) | | 3.25 | | 05/15/15 | | | | 6,027,000 |
| | | | | | | | | | | | 103,000,328 |
| Information Technology - 3.9% | | | | | | | | | | | |
| | 5,751,000 | | CACI International, Inc. (a) | | 2.13 | | 05/01/14 | | | | 7,159,995 |
| | 625,000 | | CACI International, Inc. (a)(f) | | 2.13 | | 05/01/14 | | | | 778,125 |
| | 4,500,000 | | Cadence Design Systems, Inc. (a) | | 2.63 | | 06/01/15 | | | | 7,498,125 |
| | 7,750,000 | | Ciena Corp. (a)(f) | | 4.00 | | 03/15/15 | | | | 8,786,563 |
| | 2,263,000 | | Ciena Corp. (a)(f) | | 3.75 | | 10/15/18 | | | | 2,565,676 |
| | 8,000,000 | | Digital River, Inc. | | 2.00 | | 11/01/30 | | | | 7,790,000 |
| | 819,000 | | Electronic Arts, Inc. (a)(f) | | 0.75 | | 07/15/16 | | | | 757,575 |
| | 3,000,000 | | Lam Research Corp. (a)(f) | | 0.50 | | 05/15/16 | | | | 3,101,250 |
| | 6,750,000 | | Mentor Graphics Corp. (a)(f) | | 4.00 | | 04/01/31 | | | | 7,306,875 |
| | 3,256,000 | | Microchip Technology, Inc. (a) | | 2.13 | | 12/15/37 | | | | 4,509,560 |
| | 2,750,000 | | Micron Technology, Inc. (a)(f) | | 1.50 | | 08/01/31 | | | | 2,915,000 |
| | 8,500,000 | | NetApp, Inc. (a) | | 1.75 | | 06/01/13 | | | | 12,356,875 |
| | 1,997,000 | | Novellus Systems, Inc. (a)(f) | | 2.63 | | 05/15/41 | | | | 2,785,815 |
| | 3,000,000 | | Nuance Communications, Inc. (a) | | 2.75 | | 08/15/27 | | | | 4,383,750 |
| | 1,889,000 | | Nuance Communications, Inc. (a)(f) | | 2.75 | | 11/01/31 | | | | 2,144,015 |
| | 9,950,000 | | ON Semiconductor Corp. (a) | | 1.88 | | 12/15/25 | | | | 13,345,437 |
| | 3,667,000 | | ON Semiconductor Corp. (a) | | 2.63 | | 12/15/26 | | | | 4,111,624 |
| | 2,300,000 | | Photronics, Inc. (a) | | 5.50 | | 10/01/14 | | | | 3,542,000 |
| | 9,708,000 | | Photronics, Inc. (a)(f) | | 3.25 | | 04/01/16 | | | | 9,865,755 |
| | 6,563,000 | | Radisys Corp. (a) | | 2.75 | | 02/15/13 | | | | 6,505,574 |
| | 6,525,000 | | Rambus, Inc. (a) | | 5.00 | | 06/15/14 | | | | 6,557,625 |
| | | | | | | | | | | | |
See Notes to Financial Statements. 32 ABSOLUTE FUNDS
ABSOLUTE STRATEGIES FUND
SCHEDULE OF INVESTMENTS
MARCH 31, 2012
| | | | Security | | | | | | | | |
| | Principal | | Description | | Rate | | Maturity | | | | Value |
| $ | 6,000,000 | | Rudolph Technologies, Inc. (a)(f) | | 3.75 | % | 07/15/16 | | | $ | 6,697,500 |
| | 3,500,000 | | Salesforce.com, Inc. (a) | | 0.75 | | 01/15/15 | | | | 6,562,500 |
| | 8,500,000 | | SYNNEX Corp. (a) | | 4.00 | | 05/15/18 | | | | 11,740,625 |
| | 6,500,000 | | Take-Two Interactive Software, Inc. (a) | | 4.38 | | 06/01/14 | | | | 10,075,000 |
| | 2,832,000 | | VeriSign, Inc. (a) | | 3.25 | | 08/15/37 | | | | 3,632,040 |
| | | | | | | | | | | | 157,474,879 |
| | | | | | | | | | | | |
| | | | | | | | | | | | |
| Materials - 0.5% | | | | | | | | | | | |
| | 700,000 | | Anglo American PLC | | 4.00 | | 05/07/14 | | | | 974,400 |
| | 1,350,000 | | Goldcorp, Inc. (a) | | 2.00 | | 08/01/14 | | | | 1,635,187 |
| | 7,103,000 | | Horsehead Holding Corp. (a)(f) | | 3.80 | | 07/01/17 | | | | 7,502,544 |
| | 1,950,000 | | Jaguar Mining, Inc. (a)(f) | | 4.50 | | 11/01/14 | | | | 1,681,875 |
| | 1,227,000 | | Kaiser Aluminum Corp. | | 4.50 | | 04/01/15 | | | | 1,470,805 |
| | 137,000 | | Kaiser Aluminum Corp. (a) | | 4.50 | | 04/01/15 | | | | 164,222 |
| | 3,059,000 | | Sterlite Industries India, Ltd. (a) | | 4.00 | | 10/30/14 | | | | 2,886,931 |
| | 484,000 | | United States Steel Corp. (a) | | 4.00 | | 05/15/14 | | | | 574,750 |
| | 1,500,000 | | Uranium One, Inc. (h) | | 5.00 | | 03/13/15 | | | | 1,713,620 |
| | | | | | | | | | | | 18,604,334 |
| Telecommunication Services - 1.4% | | | | | | | | | | | |
| | 9,000,000 | | Alaska Communications Systems Group, Inc. (a)(f) | | 6.25 | | 05/01/18 | | | | 6,975,000 |
| | 4,000,000 | | Clearwire Communications, LLC/Clearwire Finance, Inc. (a)(f) | | 8.25 | | 12/01/40 | | | | 3,135,000 |
| | 7,900,000 | | Comtech Telecommunic-ations Corp. (a) | | 3.00 | | 05/01/29 | | | | 8,956,625 |
| | 379,000 | | DealerTrack Holdings, Inc. (a)(f) | | 1.50 | | 03/15/17 | | | | 405,530 |
| | 5,246,000 | | InterDigital, Inc. (a)(f) | | 2.50 | | 03/15/16 | | | | 5,285,345 |
| | 750,000 | | Ixia | | 3.00 | | 12/15/15 | | | | 780,000 |
| | 2,783,000 | | Ixia (a) | | 3.00 | | 12/15/15 | | | | 2,894,320 |
| | 245,000 | | Level 3 Communications, Inc., Series B (a) | | 7.00 | | 03/15/15 | | | | 320,950 |
| | 450,000 | | SBA Communications Corp. | | 1.88 | | 05/01/13 | | | | 570,375 |
| | | | | | | | | | | | |
| | | | Security | | | | | | | | |
| | Principal | | Description | | Rate | | Maturity | | | | Value |
| $ | 1,801,000 | | SBA Communications Corp. (a) | | 4.00 | % | 10/01/14 | | | $ | 3,174,263 |
| | 8,975,000 | | Virgin Media, Inc. (a) | | 6.50 | | 11/15/16 | | | | 13,754,187 |
| | 3,793,000 | | WebMD Health Corp. | | 2.50 | | 01/31/18 | | | | 3,418,441 |
| | 4,500,000 | | WebMD Health Corp. (a) | | 2.25 | | 03/31/16 | | | | 4,301,865 |
| | | | | | | | | | | | 53,971,901 |
| Total Corporate Convertible Bonds | | | | | | | | | | | |
| (Cost $618,481,556) | | | | | | | | | | $ | 722,745,857 |
| | | | | | | | | | | | |
| Corporate Non-Convertible Bonds - 2.2% | | | | | | | | | | | |
| Consumer Discretionary - 0.1% | | | | | | | | | | | |
| | 1,416,000 | | Jarden Corp. | | 7.50 | | 05/01/17 | | | | 1,564,680 |
| | 430,000 | | Time Warner Cable, Inc. | | 8.25 | | 04/01/19 | | | | 550,692 |
| | | | | | | | | | | | 2,115,372 |
| Energy - 0.1% | | | | | | | | | | | |
| | 1,420,000 | | Arch Coal, Inc. (a)(f) | | 7.00 | | 06/15/19 | | | | 1,317,050 |
| | 470,000 | | CenterPoint Energy Resources Corp. | | 6.15 | | 05/01/16 | | | | 542,032 |
| | 155,000 | | El Paso Pipeline Partners Operating Co., LLC (a) | | 5.00 | | 10/01/21 | | | | 161,490 |
| | 1,200,000 | | Polarcus, Ltd. | | 2.88 | | 04/27/16 | | | | 1,096,800 |
| | 210,000 | | The Williams Cos., Inc. | | 7.88 | | 09/01/21 | | | | 262,160 |
| | | | | | | | | | | | 3,379,532 |
| Financial - 1.4% | | | | | | | | | | | |
| | 1,850,000 | | Abbey National Treasury Services PLC (a)(f) | | 3.88 | | 11/10/14 | | | | 1,863,246 |
| | 37,334 | | ADFITECH, Inc. (d) | | 8.00 | | 03/15/20 | | | | 20,907 |
| | 858,000 | | Ally Financial, Inc. (g) | | 2.69 | | 12/01/14 | | | | 814,290 |
| | 945,000 | | Bank of America Corp. (a) | | 5.63 | | 10/14/16 | | | | 1,005,716 |
| | 1,150,000 | | Bank of America Corp., MTN (a) | | 7.38 | | 05/15/14 | | | | 1,248,975 |
| | 20,000 | | Bank of America Corp., MTN, Series L (a) | | 5.65 | | 05/01/18 | | | | 21,378 |
| | 1,500,000 | | Bank of America NA BKNT | | 6.10 | | 06/15/17 | | | | 1,604,485 |
| | 625,000 | | Cantor Fitzgerald LP (f) | | 6.38 | | 06/26/15 | | | | 632,972 |
| | 420,000 | | Capital One Capital V (a) | | 10.25 | | 08/15/39 | | | | 433,650 |
| | 1,175,000 | | Chase Capital II, Series B (g) | | 1.05 | | 02/01/27 | | | | 900,670 |
| | 1,540,000 | | Chase Capital III, Series C (a)(g) | | 1.04 | | 03/01/27 | | | | 1,179,760 |
| | | | | | | | | | | | |
See Notes to Financial Statements. 33 ABSOLUTE FUNDS
ABSOLUTE STRATEGIES FUND
SCHEDULE OF INVESTMENTS
MARCH 31, 2012
| | | | Security | | | | | | | | |
| | Principal | | Description | | Rate | | Maturity | | | | Value |
| $ | 500,000 | | Chase Capital VI (g) | | 1.17 | % | 08/01/28 | | | $ | 380,440 |
| | 90,000 | | CIT Group, Inc. (a)(f) | | 7.00 | | 05/04/15 | | | | 90,221 |
| | 2,475,000 | | CIT Group, Inc. (a)(f) | | 6.63 | | 04/01/18 | | | | 2,673,000 |
| | 135,000 | | Citigroup, Inc. | | 6.50 | | 08/19/13 | | | | 142,867 |
| | 150,000 | | Citigroup, Inc. | | 5.85 | | 08/02/16 | | | | 163,864 |
| | 94,000 | | Citigroup, Inc. | | 6.88 | | 03/05/38 | | | | 108,885 |
| | 90,000 | | Citigroup, Inc. (a) | | 6.13 | | 05/15/18 | | | | 101,019 |
| | 400,000 | | Citigroup, Inc. (a)(g) | | 0.81 | | 11/05/14 | | | | 383,645 |
| | 3,250,000 | | Citigroup, Inc. (a)(g) | | 1.04 | | 08/25/36 | | | | 2,159,046 |
| | 2,200,000 | | Citigroup, Inc. (g) | | 2.20 | | 05/15/18 | | | | 2,093,491 |
| | 340,000 | | Countrywide Financial Corp., MTN | | 5.80 | | 06/07/12 | | | | 342,700 |
| | 100,000 | | Credit Suisse New York | | 5.50 | | 05/01/14 | | | | 107,283 |
| | 500,000 | | Credit Suisse New York | | 6.00 | | 02/15/18 | | | | 542,077 |
| | 965,000 | | Discover Bank BKNT | | 8.70 | | 11/18/19 | | | | 1,202,583 |
| | 925,000 | | Duke Realty LP REIT | | 7.38 | | 02/15/15 | | | | 1,039,798 |
| | 500,000 | | ERP Operating LP REIT (a) | | 5.20 | | 04/01/13 | | | | 516,869 |
| | 800,000 | | Farmers Exchange Capital (a)(f) | | 7.05 | | 07/15/28 | | | | 876,166 |
| | 207,000 | | General Electric Capital Corp. | | 5.63 | | 05/01/18 | | | | 240,245 |
| | 150,000 | | General Electric Capital Corp., MTN | | 5.38 | | 10/20/16 | | | | 171,556 |
| | 100,000 | | General Electric Capital Corp., MTN (g) | | 0.71 | | 05/11/16 | | | | 95,714 |
| | 130,000 | | General Electric Capital Corp., MTN (g) | | 0.80 | | 08/07/18 | | | | 119,932 |
| | 2,590,000 | | General Electric Capital Corp., MTN (g) | | 0.91 | | 05/05/26 | | | | 2,118,250 |
| | 1,880,000 | | General Electric Capital Corp., MTN (g) | | 0.98 | | 08/15/36 | | | | 1,385,334 |
| | 400,000 | | General Electric Capital Corp., MTN, Series A (g) | | 0.73 | | 09/15/14 | | | | 394,906 |
| | 150,000 | | HBOS PLC, MTN (f) | | 6.75 | | 05/21/18 | | | | 140,959 |
| | 232,000 | | HCP, Inc. REIT | | 5.63 | | 05/01/17 | | | | 255,335 |
| | 100,000 | | HCP, Inc., MTN (a) | | 6.70 | | 01/30/18 | | | | 115,651 |
| | 1,000,000 | | HCP, Inc., MTN REIT | | 6.30 | | 09/15/16 | | | | 1,123,256 |
| | | | | | | | | | | | |
| | | | Security | | | | | | | | |
| | Principal | | Description | | Rate | | Maturity | | | | Value |
| $ | 1,250,000 | | Health Care REIT, Inc. | | 4.70 | % | 09/15/17 | | | $ | 1,313,210 |
| | 125,000 | | Health Care REIT, Inc. | | 4.95 | | 01/15/21 | | | | 128,186 |
| | 60,000 | | Health Care REIT, Inc. (a) | | 5.25 | | 01/15/22 | | | | 62,881 |
| | 50,000 | | Health Care REIT, Inc. (a) | | 6.50 | | 03/15/41 | | | | 52,225 |
| | 750,000 | | Healthcare Realty Trust, Inc. REIT | | 6.50 | | 01/17/17 | | | | 823,110 |
| | 540,000 | | Healthcare Realty Trust, Inc. REIT | | 5.75 | | 01/15/21 | | | | 553,672 |
| | 1,475,000 | | International Lease Finance Corp. (f) | | 6.75 | | 09/01/16 | | | | 1,587,469 |
| | 725,000 | | JP Morgan Chase Capital XIII (g) | | 1.42 | | 09/30/34 | | | | 551,418 |
| | 450,000 | | JP Morgan Chase Capital XXIII (g) | | 1.50 | | 05/15/47 | | | | 336,524 |
| | 150,000 | | JPMorgan Chase & Co. (a) | | 4.50 | | 01/24/22 | | | | 156,360 |
| | 2,090,000 | | JPMorgan Chase Capital XXI, Series U (g) | | 1.49 | | 02/02/37 | | | | 1,531,895 |
| | 1,600,000 | | Lloyds TSB Bank PLC | | 4.88 | | 01/21/16 | | | | 1,660,371 |
| | 175,000 | | Lloyds TSB Bank PLC | | 6.38 | | 01/21/21 | | | | 188,163 |
| | 80,000 | | Merrill Lynch & Co., Inc., MTN (d)(g) | | 8.68 | | 05/02/17 | | | | 86,600 |
| | 80,000 | | Merrill Lynch & Co., Inc., MTN (d)(g) | | 8.95 | | 05/18/17 | | | | 87,200 |
| | 80,000 | | Merrill Lynch & Co., Inc., MTN (d)(g) | | 9.57 | | 06/06/17 | | | | 89,000 |
| | 1,645,000 | | Morgan Stanley | | 6.00 | | 05/13/14 | | | | 1,722,586 |
| | 90,000 | | Morgan Stanley | | 4.20 | | 11/20/14 | | | | 90,770 |
| | 250,000 | | Morgan Stanley, MTN (a)(g) | | 1.01 | | 10/18/16 | | | | 214,908 |
| | 1,250,000 | | Nationwide Health Properties, Inc. | | 6.00 | | 05/20/15 | | | | 1,352,130 |
| | 2,575,000 | | Nationwide Mutual Insurance Co. (f)(g) | | 5.81 | | 12/15/24 | | | | 2,361,602 |
| | 60,000 | | New Plan Excel Realty Trust | | 5.13 | | 09/15/12 | | | | 60,150 |
| | 2,282,000 | | Nuveen Investments, Inc. | | 5.50 | | 09/15/15 | | | | 2,099,440 |
| | | | | | | | | | | | |
See Notes to Financial Statements. 34 ABSOLUTE FUNDS
ABSOLUTE STRATEGIES FUND
SCHEDULE OF INVESTMENTS
MARCH 31, 2012
| | | | Security | | | | | | | | |
| | Principal | | Description | | Rate | | Maturity | | | | Value |
| $ | 770,000 | | Raymond James Financial, Inc. | | 8.60 | % | 08/15/19 | | | $ | 936,664 |
| | 49,000 | | Shurgard Storage Centers, LLC REIT | | 5.88 | | 03/15/13 | | | | 50,720 |
| | 250,000 | | The Bear Stearns Cos., LLC | | 5.70 | | 11/15/14 | | | | 276,415 |
| | 75,000 | | The Bear Stearns Cos., LLC | | 7.25 | | 02/01/18 | | | | 90,547 |
| | 250,000 | | The Goldman Sachs Group, Inc. | | 6.25 | | 09/01/17 | | | | 274,339 |
| | 405,000 | | The Goldman Sachs Group, Inc. | | 6.15 | | 04/01/18 | | | | 437,394 |
| | 555,000 | | The Goldman Sachs Group, Inc. | | 7.50 | | 02/15/19 | | | | 634,973 |
| | 1,500,000 | | The Goldman Sachs Group, Inc. | | 6.00 | | 06/15/20 | | | | 1,580,866 |
| | 100,000 | | The Goldman Sachs Group, Inc., MTN, Series B (g) | | 0.96 | | 07/22/15 | | | | 93,578 |
| | 1,430,000 | | The Royal Bank of Scotland PLC (a) | | 3.95 | | 09/21/15 | | | | 1,447,030 |
| | 477,000 | | Thornburg Mortgage, Inc. (d)(i) | | 8.00 | | 05/15/13 | | | | 42,930 |
| | 1,100,000 | | Wachovia Corp. (a)(g) | | 0.89 | | 10/28/15 | | | | 1,048,617 |
| | 15,000 | | WEA Finance, LLC / WT Finance Aust Pty, Ltd. (a)(f) | | 6.75 | | 09/02/19 | | | | 17,369 |
| | 1,155,000 | | WEA Finance, LLC / WT Finance Aust Pty, Ltd. (f) | | 7.50 | | 06/02/14 | | | | 1,276,139 |
| | 170,000 | | Weingarten Realty Investors, MTN REIT | | 4.99 | | 09/03/13 | | | | 173,929 |
| | 1,000,000 | | WT Finance Aust Pty, Ltd. / Westfield Capital / WEA Finance, LLC (f) | | 5.13 | | 11/15/14 | | | | 1,065,916 |
| | 800,000 | | ZFS Finance USA Trust IV (f)(g) | | 5.88 | | 05/09/32 | | | | 807,000 |
| | | | | | | | | | | | 56,175,437 |
| Healthcare - 0.1% | | | | | | | | | | | |
| | 700,000 | | Boston Scientific Corp. | | 5.45 | | 06/15/14 | | | | 757,260 |
| | | | | | | | | | | | |
| | | | Security | | | | | | | | |
| | Principal | | Description | | Rate | | Maturity | | | | Value |
| $ | 624,000 | | CHS/Community Health Systems, Inc. | | 8.88 | % | 07/15/15 | | | $ | 647,400 |
| | 685,000 | | CHS/Community Health Systems, Inc. (a)(f) | | 8.00 | | 11/15/19 | | | | 712,400 |
| | 300,000 | | HCA, Inc. | | 7.88 | | 02/15/20 | | | | 331,125 |
| | 1,300,000 | | HCA, Inc. (a) | | 7.25 | | 09/15/20 | | | | 1,421,875 |
| | 750,000 | | Tenet Healthcare Corp. | | 8.88 | | 07/01/19 | | | | 843,750 |
| | | | | | | | | | | | 4,713,810 |
| Industrial - 0.0% | | | | | | | | | | | |
| | 1,162,000 | | Neo Material Technologies, Inc. (f) | | 5.00 | | 12/31/17 | | | | 1,210,572 |
| Telecommunication Services - 0.2% | | | | | | | | | | | |
| | 630,000 | | CCH II, LLC / CCH II Capital Corp. | | 13.50 | | 11/30/16 | | | | 719,775 |
| | 2,530,000 | | CSC Holdings, LLC (a) | | 8.50 | | 04/15/14 | | | | 2,827,275 |
| | 350,000 | | Frontier Communications Corp. | | 7.88 | | 04/15/15 | | | | 378,000 |
| | 835,000 | | Frontier Communications Corp. | | 8.25 | | 05/01/14 | | | | 910,150 |
| | 1,100,000 | | Intelsat Jackson Holdings SA | | 9.50 | | 06/15/16 | | | | 1,152,250 |
| | 1,650,000 | | Nextel Communications, Inc., Series C (a) | | 5.95 | | 03/15/14 | | | | 1,658,250 |
| | 160,000 | | Nextel Communications, Inc., Series E | | 6.88 | | 10/31/13 | | | | 160,800 |
| | | | | | | | | | | | 7,806,500 |
| Utilities - 0.3% | | | | | | | | | | | |
| | 1,500,000 | | Calpine Construction Finance Co. LP/CCFC Finance Corp. (a)(f) | | 8.00 | | 06/01/16 | | | | 1,638,750 |
| | 1,570,000 | | Edison Mission Energy | | 7.00 | | 05/15/17 | | | | 996,950 |
| | 1,050,000 | | GenOn Americas Generation, LLC | | 9.13 | | 05/01/31 | | | | 908,250 |
| | 610,000 | | KCP&L Greater Missouri Operations Co. | | 11.88 | | 07/01/12 | | | | 625,825 |
| | 735,000 | | NRG Energy, Inc. | | 7.63 | | 05/15/19 | | | | 712,950 |
| | 1,065,000 | | NRG Energy, Inc. | | 7.88 | | 05/15/21 | | | | 1,027,725 |
| | 35,000 | | NRG Energy, Inc. (a) | | 8.50 | | 06/15/19 | | | | 35,438 |
| | 145,000 | | Oncor Electric Delivery Co., LLC | | 6.80 | | 09/01/18 | | | | 175,518 |
| | | | | | | | | | | | |
See Notes to Financial Statements. 35 ABSOLUTE FUNDS
ABSOLUTE STRATEGIES FUND
SCHEDULE OF INVESTMENTS
MARCH 31, 2012
| | | | Security | | | | | | | | |
| | Principal | | Description | | Rate | | Maturity | | | | Value |
| $ | 1,040,000 | | PNM Resources, Inc. | | 9.25 | % | 05/15/15 | | | $ | 1,205,100 |
| | 80,000 | | Public Service Co. of New Mexico | | 7.95 | | 05/15/18 | | | | 97,240 |
| | 550,000 | | Sabine Pass LNG LP | | 7.50 | | 11/30/16 | | | | 592,625 |
| | 1,485,000 | | Sabine Pass LNG LP (a) | | 7.25 | | 11/30/13 | | | | 1,574,100 |
| | 600,000 | | Sabine Pass LNG LP (f) | | 7.50 | | 11/30/16 | | | | 622,500 |
| | 2,830,000 | | Southern Union Co. (a)(g) | | 3.56 | | 11/01/66 | | | | 2,490,400 |
| | | | | | | | | | | | 12,703,371 |
| Total Corporate Non-Convertible Bonds | | | | | | | | | | | |
| (Cost $80,609,086) | | | | | | | | | | | 88,104,594 |
| | | | | | | | | | | | |
| Exchange Traded Notes - 0.0% | | | | | | | | | | | |
| | 14,223 | | iPATH S&P 500 VIX Mid-Term Futures ETN (a)(b) | | | | | | | | 657,529 |
| Total Exchange Traded Notes | | | | | | | | | | | |
| (Cost $746,454) | | | | | | | | | | | 657,529 |
| Foreign Government Bonds - 0.0% | | | | | | | | | | | |
| | 10,100,000 | | Argentine Republic Government International Bond, Series GDP (g) | | 4.38 | | 12/15/35 | | | | 1,338,250 |
| Total Foreign Government Bonds | | | | | | | | | | | |
| (Cost $547,620) | | | | | | | | | | | 1,338,250 |
| Interest Only Bonds - 0.1% | | | | | | | | | | | |
| | | | | | | | | | | | |
| | 29,941,904 | | Lehman ABS Manufactured Housing Contract Trust, Series 2001-B AIOC (g) | | 0.55 | | 04/15/40 | | | | 444,586 |
| | 70,401,949 | | Residential Accredit Loans, Inc., Series 2006-QS11 AV (g) | | 0.33 | | 08/25/36 | | | | 890,571 |
| | 34,527,008 | | Residential Accredit Loans, Inc., Series 2006-QS6 1AV (g) | | 0.73 | | 06/25/36 | | | | 1,077,957 |
| | 76,187,913 | | Residential Accredit Loans, Inc., Series 2007-QS2 AV (g) | | 0.32 | | 01/25/37 | | | | 1,032,483 |
| | 76,982,342 | | Residential Accredit Loans, Inc., Series 2007-QS3 AV (g) | | 0.32 | | 02/25/37 | | | | 935,128 |
| Total Interest Only Bonds | | | | | | | | | | | |
| (Cost $3,841,642) | | | | | | | | | | | 4,380,725 |
| | | | | | | | | | | | |
| | | | Security | | | | | | | | |
| | Principal | | Description | | Rate | | Maturity | | | | Value |
| Municipal Bonds - 0.1% | | | | | | | | | | | |
| | | | | | | | | | | | |
| California - 0.0% | | | | | | | | | | | |
| $ | 60,000 | | State of California (a) | | 7.55 | % | 04/01/39 | | | $ | 77,909 |
| | 105,000 | | State of California (a) | | 7.30 | | 10/01/39 | | | | 131,574 |
| | | | | | | | | | | | 209,483 |
| Illinois - 0.0% | | | | | | | | | | | |
| | 150,000 | | State of Illinois (a) | | 5.67 | | 03/01/18 | | | | 163,762 |
| | 95,000 | | State of Illinois (a) | | 5.10 | | 06/01/33 | | | | 89,648 |
| | | | | | | | | | | | 253,410 |
| North Carolina - 0.1% | | | | | | | | | | | |
| | 3,400,000 | | North Carolina State Education Assistance Authority, Series 2011-1 A3 (a)(g) | | 1.46 | | 10/25/41 | | | | 3,145,102 |
| Total Municipal Bonds | | | | | | | | | | | |
| (Cost $3,605,789) | | | | | | | | | | | 3,607,995 |
| | | | | | | | | | | | |
| Syndicated Loans - 0.1% | | | | | | | | | | | |
| | 997,494 | | Chrysler Group, LLC (g) | | 6.00 | | 05/24/17 | | | | 1,015,065 |
| | 500,000 | | HCA, Inc. | | 3.49 | | 11/18/12 | | | | 500,000 |
| | 1,384,268 | | HCA, Inc. | | 3.49 | | 11/18/12 | | | | 1,384,267 |
| Total Syndicated Loans | | | | | | | | | | | |
| (Cost $2,779,575) | | | | | | | | | | | 2,899,332 |
| U.S. Government & Agency Obligations - 2.1% | | | | | | | | | | | |
| Agency - 0.5% | | | | | | | | | | | |
| | 3,950,000 | | FHLB | | 0.60 | | 03/27/14 | | | | 3,951,059 |
| | 3,950,000 | | FHLB | | 0.50 | | 03/27/14 | | | | 3,951,031 |
| | 3,910,000 | | FHLB | | 0.50 | | 08/28/14 | | | | 3,907,325 |
| | 3,955,000 | | FHLB | | 0.88 | | 04/10/15 | | | | 3,957,242 |
| | 3,955,000 | | FHLB | | 1.00 | | 04/16/15 | | | | 3,957,662 |
| | | | | | | | | | | | 19,724,319 |
| Interest Only Bonds - 0.4% | | | | | | | | | | | |
| | 11,040,922 | | FHLMC, Series 3262, Class KS (g) | | 6.17 | | 01/15/37 | | | | 1,682,975 |
| | 15,633,583 | | FHLMC, Series 3271, Class SB (g) | | 5.81 | | 02/15/37 | | | | 2,096,141 |
| | 5,743,511 | | FNMA, Series 2005-92, Class US (g) | | 5.86 | | 10/25/25 | | | | 719,735 |
| | 9,599,634 | | FNMA, Series 2006-125, Class SM (a)(g) | | 6.96 | | 01/25/37 | | | | 1,542,067 |
| | 574,446 | | FNMA, Series 2006-27, Class SH (a)(g) | | 6.46 | | 04/25/36 | | | | 90,975 |
| | 12,665,563 | | FNMA, Series 2007-52, Class LS (g) | | 5.81 | | 06/25/37 | | | | 1,770,926 |
| | | | | | | | | | | | |
See Notes to Financial Statements. 36 ABSOLUTE FUNDS
ABSOLUTE STRATEGIES FUND
SCHEDULE OF INVESTMENTS
MARCH 31, 2012
| | | | Security | | | | | | | | |
| | Principal | | Description | | Rate | | Maturity | | | | Value |
| $ | 3,200,420 | | FNMA, Series 2007-68, Class SC (g) | | 6.46 | % | 07/25/37 | | | $ | 506,561 |
| | 1,044,496 | | FNMA, Series 2007-77, Class SK (a)(g) | | 5.63 | | 08/25/37 | | | | 132,357 |
| | 12,656,866 | | FNMA, Series 2009-115, Class SB (g) | | 6.01 | | 01/25/40 | | | | 1,866,279 |
| | 5,200,604 | | FNMA, Series 2010-112, Class PI | | 6.00 | | 10/25/40 | | | | 872,381 |
| | 5,563,725 | | FNMA, Series 2010-35, Class IA | | 5.00 | | 07/25/38 | | | | 373,003 |
| | 4,438,590 | | GNMA, Series 2007-78, Class SG (g) | | 6.30 | | 12/20/37 | | | | 667,620 |
| | 5,643,898 | | GNMA, Series 2008-51, Class GS (g) | | 5.99 | | 06/16/38 | | | | 900,433 |
| | 583,268 | | GNMA, Series 2009-106, Class KS (a)(g) | | 6.16 | | 11/20/39 | | | | 90,130 |
| | 1,105,750 | | GNMA, Series 2010-158, Class EI (a) | | 4.00 | | 12/16/25 | | | | 132,817 |
| | 385,951 | | GNMA, Series 2010-4, Class NS (g) | | 6.15 | | 01/16/40 | | | | 61,599 |
| | 4,606,515 | | GNMA, Series 2010-4, Class SL (g) | | 6.16 | | 01/16/40 | | | | 737,523 |
| | 10,426,109 | | GNMA, Series 2012-7, Class PI | | 3.50 | | 01/20/38 | | | | 1,563,479 |
| | | | | | | | | | | | 15,807,001 |
| Mortgage Securities - 0.4% | | | | | | | | | | | |
| | 375,000 | | FGLMC35 - FHLMC TBA | | 3.50 | | 04/15/42 | | | | 384,316 |
| | 657,997 | | FHLMC Gold Pool #A95820 (a) | | 4.00 | | 12/01/40 | | | | 699,251 |
| | 232,265 | | FHLMC Gold Pool #A96411 (a) | | 4.00 | | 01/01/41 | | | | 246,029 |
| | 131,872 | | FHLMC Gold Pool #G01864 (a) | | 5.00 | | 01/01/34 | | | | 142,387 |
| | 173,916 | | FHLMC Gold Pool #G05866 (a) | | 4.50 | | 02/01/40 | | | | 189,517 |
| | 532,404 | | FHLMC Gold Pool #G06242 (a) | | 4.50 | | 09/01/40 | | | | 580,165 |
| | 329,921 | | FHLMC Gold Pool #G06354 (a) | | 4.00 | | 04/01/41 | | | | 349,472 |
| | 195,758 | | FHLMC Gold Pool #G06361 (a) | | 4.00 | | 03/01/41 | | | | 208,031 |
| | 111,221 | | FHLMC Gold Pool #G13475 (a) | | 6.00 | | 01/01/24 | | | | 120,626 |
| | 36,021 | | FHLMC Gold Pool #H03161 (a) | | 6.50 | | 08/01/37 | | | | 40,112 |
| | 533,579 | | FHLMC Gold Pool #J13884 (a) | | 3.50 | | 12/01/25 | | | | 562,996 |
| | 118,049 | | FHLMC Gold Pool #Q04090 (a) | | 4.00 | | 10/01/41 | | | | 125,044 |
| | | | | | | | | | | | |
| | | | Security | | | | | | | | |
| | Principal | | Description | | Rate | | Maturity | | | | Value |
| $ | 471,164 | | FHLMC Gold Pool #Q04091 (a) | | 4.00 | % | 10/01/41 | | | $ | 497,318 |
| | 118,253 | | FHLMC Pool #1B3413 (g) | | 5.93 | | 05/01/37 | | | | 128,488 |
| | 11,168 | | FHLMC Pool #1L0113 (g) | | 3.12 | | 05/01/35 | | | | 11,828 |
| | 20,700 | | FHLMC, Series 2433, Class SA (a)(g) | | 20.30 | | 02/15/32 | | | | 32,497 |
| | 205,000 | | FHLMC, Series 2929, Class PE (a) | | 5.00 | | 05/15/33 | | | | 216,882 |
| | 868,076 | | FHLMC, Series 3442, Class MT (g) | | 0.24 | | 07/15/34 | | | | 846,768 |
| | 200,000 | | FNCI30 - FNMA TBA | | 3.00 | | 04/15/27 | | | | 207,094 |
| | 305,000 | | FNCI30 - FNMA TBA | | 3.00 | | 04/15/27 | | | | 315,818 |
| | 945,000 | | FNCI30 - FNMA TBA | | 3.00 | | 05/15/27 | | | | 976,008 |
| | 380,000 | | FNCL35 - FNMA TBA | | 3.50 | | 04/15/42 | | | | 390,331 |
| | 153,066 | | FNMA Pool #254868 (a) | | 5.00 | | 09/01/33 | | | | 165,755 |
| | 107,769 | | FNMA Pool #545639 (a) | | 6.50 | | 04/01/32 | | | | 123,905 |
| | 17,319 | | FNMA Pool #555177 (g) | | 2.27 | | 01/01/33 | | | | 18,216 |
| | 2,980 | | FNMA Pool #673743 (a)(g) | | 2.76 | | 11/01/32 | | | | 3,003 |
| | 142,785 | | FNMA Pool #725027 (a) | | 5.00 | | 11/01/33 | | | | 154,622 |
| | 222,760 | | FNMA Pool #734922 | | 4.50 | | 09/01/33 | | | | 240,342 |
| | 117,860 | | FNMA Pool #735646 | | 4.50 | | 07/01/20 | | | | 126,697 |
| | 61,448 | | FNMA Pool #735861 (a) | | 6.50 | | 09/01/33 | | | | 70,305 |
| | 59,832 | | FNMA Pool #735881 (a) | | 6.00 | | 11/01/34 | | | | 66,851 |
| | 69,378 | | FNMA Pool #764388 (a)(g) | | 5.00 | | 03/01/34 | | | | 74,523 |
| | 122,296 | | FNMA Pool #776708 (a) | | 5.00 | | 05/01/34 | | | | 135,243 |
| | 17,674 | | FNMA Pool #841741 (a)(g) | | 5.15 | | 09/01/35 | | | | 18,828 |
| | 270,456 | | FNMA Pool #888219 | | 5.50 | | 03/01/37 | | | | 295,400 |
| | 141,699 | | FNMA Pool #888430 | | 5.00 | | 11/01/33 | | | | 153,446 |
| | 64,011 | | FNMA Pool #895606 (a)(g) | | 5.71 | | 06/01/36 | | | | 69,208 |
| | 224,240 | | FNMA Pool #897164 (a) | | 6.50 | | 08/01/36 | | | | 253,126 |
| | 298,500 | | FNMA Pool #962723 (a) | | 5.50 | | 04/01/38 | | | | 330,414 |
| | 376,696 | | FNMA Pool #963997 | | 5.50 | | 06/01/38 | | | | 416,971 |
| | 143,623 | | FNMA Pool #974148 | | 5.50 | | 02/01/38 | | | | 156,645 |
| | | | | | | | | | | | |
See Notes to Financial Statements. 37 ABSOLUTE FUNDS
ABSOLUTE STRATEGIES FUND
SCHEDULE OF INVESTMENTS
MARCH 31, 2012
| | | | Security | | | | | | | | |
| | Principal | | Description | | Rate | | Maturity | | | | Value |
| $ | 214,878 | | FNMA Pool #AB1613 (a) | | 4.00 | % | 10/01/40 | | | $ | 228,091 |
| | 202,038 | | FNMA Pool #AB3864 (a) | | 3.50 | | 11/01/41 | | | | 208,450 |
| | 224,749 | | FNMA Pool #AD0249 (a) | | 5.50 | | 04/01/37 | | | | 247,022 |
| | 166,136 | | FNMA Pool #AD0791 (a) | | 4.76 | | 02/01/20 | | | | 187,054 |
| | 166,828 | | FNMA Pool #AE0600 (a) | | 3.98 | | 11/01/20 | | | | 181,926 |
| | 167,211 | | FNMA Pool #AE0605 (a) | | 4.67 | | 07/01/20 | | | | 187,901 |
| | 493,525 | | FNMA Pool #AH3428 (a) | | 3.50 | | 01/01/26 | | | | 525,361 |
| | 261,532 | | FNMA Pool #AJ0764 (a) | | 4.50 | | 09/01/41 | | | | 279,149 |
| | 303,685 | | FNMA Pool #AL0149 (a) | | 4.00 | | 02/01/41 | | | | 321,789 |
| | 69,423 | | FNMA, Series 2001-52, Class YZ (a) | | 6.50 | | 10/25/31 | | | | 81,064 |
| | 32,653 | | FNMA, Series 2001-81, Class QG (a) | | 6.50 | | 01/25/32 | | | | 37,108 |
| | 1,531,340 | | FNMA, Series 2003-64, Class KS (g) | | 9.33 | | 07/25/18 | | | | 1,700,066 |
| | 225,000 | | FNMA, Series 2006-4, Class WE (a) | | 4.50 | | 02/25/36 | | | | 247,991 |
| | 9,283 | | GNMA II Pool #080610 (a)(g) | | 2.38 | | 06/20/32 | | | | 9,617 |
| | 22,382 | | GNMA II Pool #081136 (a)(g) | | 2.13 | | 11/20/34 | | | | 23,212 |
| | 30,164 | | GNMA II Pool #081432 (a)(g) | | 1.63 | | 08/20/35 | | | | 31,187 |
| | 25,975 | | GNMA II Pool #081435 (a)(g) | | 1.63 | | 08/20/35 | | | | 26,855 |
| | | | | | | | | | | | 14,668,321 |
| | | | | | | | | | | | |
| Principal Only Bonds - 0.0% | | | | | | | | | | | |
| | 1,782,871 | | FHLMC, Series 3885, Class PO | | 0.00 | | 11/15/33 | | | | 1,602,241 |
| | 315,000 | | U.S. Treasury Strip Principal (a)(j) | | 0.00 | | 02/15/27 | | | | 199,924 |
| | | | | | | | | | | | 1,802,165 |
| | | | | | | | | | | | |
| U.S. Treasury Securities - 0.8% | | | | | | | | | | | |
| | 28,700,000 | | U.S. Treasury Bill (a)(j) | | 0.05 | | 04/05/12 | | | | 28,699,796 |
| | 120,000 | | U.S. Treasury Bill (j) | | 0.05 | | 04/26/12 | | | | 119,993 |
| | 225,000 | | U.S. Treasury Bond (a) | | 3.13 | | 02/15/42 | | | | 215,719 |
| | 140,000 | | U.S. Treasury Inflation Indexed Bonds (a) | | 2.13 | | 02/15/41 | | | | 191,490 |
| | 555,000 | | U.S. Treasury Note (a) | | 2.00 | | 11/15/21 | | | | 546,459 |
| | | | | | | | | | | | 29,773,457 |
| Total U.S. Government & Agency Obligations | | | | | | | | | | | |
| (Cost $76,420,349) | | | | | | | | | | | 81,775,263 |
| Total Fixed Income Securities | | | | | | | | | | | |
| (Cost $1,067,448,655) | | | | | | | | | | $ | 1,184,055,381 |
| | | | | | | | | | | | |
| | | | Security | | | | | | | | |
| | Shares | | Description | | | | | | | | Value |
| Rights - 0.0% | | | | | | | | | | | |
| | 150,000 | | Comdisco Holding Co., Inc. (k) | | | | | | | | 10,950 |
| Total Rights | | | | | | | | | | | |
| (Cost $43,783) | | | | | | | | | | | 10,950 |
| Investment Companies - 8.9% | | | | | | | | | | | |
| | 23,000 | | American Select Portfolio | | | | | | | | 239,430 |
| | 50,529 | | BlackRock Credit Allocation Income Trust I, Inc. | | | | | | | | 500,742 |
| | 61,990 | | BlackRock Floating Rate Income Fund | | | | | | | | 884,597 |
| | 1,593,000 | | Consumer Staples Select Sector SPDR Fund (a) | | | | | | | | 54,289,440 |
| | 69,698 | | Eaton Vance Limited Duration Income Fund | | | | | | | | 1,118,653 |
| | 125,350 | | Invesco Van Kampen Senior Income Trust | | | | | | | | 615,469 |
| | 21,000 | | iShares Barclays TIPS Bond Fund | | | | | | | | 2,470,650 |
| | 13,500 | | iShares iBoxx $ High Yield Corporate Bond Fund | | | | | | | | 1,226,340 |
| | 61,198 | | PCM Fund, Inc. | | | | | | | | 673,790 |
| | 30,000 | | PIMCO Income Opportunity Fund | | | | | | | | 790,500 |
| | 98,012 | | PIMCO Income Strategy Fund II | | | | | | | | 995,802 |
| | 35,000 | | ProShares UltraShort 20+ Year Treasury (a)(b) | | | | | | | | 715,750 |
| | 31,100 | | SPDR Barclays Capital High Yield Bond ETF | | | | | | | | 1,224,407 |
| | 70,000 | | SPDR Gold Trust (b) | | | | | | | | 11,349,800 |
| | 1,889,562 | | SPDR S&P 500 ETF Trust (a)(c)(e) | | | | | | | | 265,899,165 |
| | 700,000 | | Sprott Physical Gold Trust (b) | | | | | | | | 10,108,000 |
| | 7,400 | | WisdomTree Japan SmallCap Dividend Fund | | | | | | | | 337,292 |
| Total Investment Companies | | | | | | | | | | | |
| (Cost $306,378,084) | | | | | | | | | | | 353,439,827 |
| | | | | | | | | | | | |
| | | | Security | | | | | | | | |
| | Principal | | Description | | Rate | | Maturity | | | | Value |
| Short-Term Investments - 0.1% | | | | | | | | | | | |
| Commercial Paper - 0.1% | | | | | | | | | | | |
| $ | 3,755,000 | | Deutsche Bank Financial, LLC | | 0.22 | % | 4/10/2012 | | | | 3,754,793 |
| Total Commercial Paper | | | | | | | | | | | |
| (Cost $3,754,793) | | | | | | | | | | | 3,754,793 |
| | | | | | | | | | | | |
| Total Short-Term Investments | | | | | | | | | | | |
| (Cost $3,754,793) | | | | | | | | | | | 3,754,793 |
| | | | | | | | | | | | |
| | | | | | | | | | | | |
| | | | Security | | Strike | | Expiration | | | | |
| | Contracts | | Description | | Price | | Date | | | | Value |
| | | | | | | | | | | | |
| Purchased Options - 1.2% | | | | | | | | | | | |
| Call Options Purchased - 0.7% | | | | | | | | | | | |
| | 630 | | Abbott Laboratories | $ | 50.00 | | 1/13 | | | | 718,200 |
| | 1,600 | | Abbott Laboratories | | 45.00 | | 1/13 | | | | 2,576,000 |
| | 238 | | Accenture PLC | | 45.00 | | 1/13 | | | | 466,480 |
| | | | | | | | | | | | |
See Notes to Financial Statements. 38 ABSOLUTE FUNDS
ABSOLUTE STRATEGIES FUND
SCHEDULE OF INVESTMENTS
MARCH 31, 2012
| | | | Security | | Strike | | Expiration | | | | |
| | Contracts | | Description | | Price | | Date | | | | Value |
| | 225 | | Berkshire Hathaway, Inc., Class B | $ | 70.00 | | 1/13 | | | $ | 310,500 |
| | 2,340 | | Johnson & Johnson | | 65.00 | | 1/13 | | | | 758,160 |
| | 1,440 | | Johnson & Johnson | | 50.00 | | 1/13 | | | | 2,325,600 |
| | 1,700 | | Lowe's Cos., Inc. | | 15.00 | | 1/13 | | | | 2,754,000 |
| | 465 | | Target Corp. | | 40.00 | | 1/13 | | | | 860,250 |
| | 1,575 | | The Coca-Cola Co. | | 55.00 | | 1/13 | | | | 3,012,187 |
| | 1,426 | | The Procter & Gamble Co. | | 55.00 | | 1/13 | | | | 1,753,980 |
| | 840 | | The Walt Disney Co. | | 35.00 | | 1/13 | | | | 842,100 |
| | 327 | | The Walt Disney Co. | | 25.00 | | 1/13 | | | | 617,213 |
| | 277 | | United Parcel Service, Inc., Class B | | 60.00 | | 1/13 | | | | 576,160 |
| | 940 | | Walgreen Co. | | 38.00 | | 1/13 | | | | 113,740 |
| | 365 | | Walgreen Co. | | 30.00 | | 1/13 | | | | 175,200 |
| | 1,665 | | Walgreen Co. | | 25.00 | | 1/13 | | | | 1,461,037 |
| | 1,850 | | Wal-Mart Stores, Inc. | | 50.00 | | 1/13 | | | | 2,146,000 |
| | 443 | | Wal-Mart Stores, Inc. | | 42.50 | | 1/13 | | | | 832,840 |
| | 4,460 | | Wells Fargo & Co. | | 22.50 | | 1/13 | | | | 5,251,650 |
| Total Call Options Purchased | | | | | | | | | | | |
| (Premiums Paid $19,869,691) | | | | | | | | | | | 27,551,297 |
| | | | | | | | | | | | |
| Put Options Purchased - 0.5% | | | | | | | | | | | |
| | 135 | | Amazon.com, Inc. | | 175.00 | | 1/13 | | | | 182,925 |
| | 5,000 | | iShares Russell 2000 Index Fund | | 80.00 | | 11/12 | | | | 2,827,500 |
| | 3,660 | | SPDR S&P 500 ETF Trust | | 108.00 | | 6/12 | | | | 73,200 |
| | 21,035 | | SPDR S&P 500 ETF Trust | | 137.00 | | 1/13 | | | | 17,343,358 |
| Total Put Options Purchased | | | | | | | | | | | |
| (Premiums Paid $30,804,332) | | | | | | | | | | | 20,426,983 |
| | | | | | | | | | | | |
| Total Purchased Options | | | | | | | | | | | |
| (Premiums Paid $50,674,023) | | | | | | | | | | | 47,978,280 |
| | | | | | | | | | | | |
| Total Long Positions - 81.6% | | | | | | | | | | | |
| (Cost $2,789,112,367)* | | | | | | | | | | $ | 3,251,016,343 |
| | | | | | | | | | | | |
| Total Short Positions - (38.0)% | | | | | | | | | | | (1,512,492,121) |
| (Cost $(1,440,619,198))* | | | | | | | | | | | |
| | | | | | | | | | | | |
| | | | | | | | | | | | |
| Total Written Options - (0.5)% | | | | | | | | | | | (20,028,073) |
| (Premiums Received $(31,645,294))* | | | | | | | | | | | |
| | | | | | | | | | | | |
| Other Assets & Liabilities, Net – 56.9% | | | | | | | | | | | 2,264,936,281 |
| Net Assets – 100.0% | | | | | | | | | | $ | 3,983,432,430 |
See Notes to Financial Statements. 39 ABSOLUTE FUNDS
ABSOLUTE STRATEGIES FUND
SCHEDULE OF SECURITIES SOLD SHORT
MARCH 31, 2012
| Shares | | Security Description | | Value |
| Short Positions - (38.0)% |
| Common Stock - (37.2)% |
| Consumer Discretionary - (7.5)% |
| | (84,800) | | ABM Industries, Inc. | $ | (2,060,640) |
| | (9,000) | | Amazon.com, Inc. | | (1,822,590) |
| | (146,600) | | American Greetings Corp., Class A | | (2,248,844) |
| | (298,935) | | Brookdale Senior Living, Inc. | | (5,596,063) |
| | (228,100) | | Brown Shoe Co., Inc. | | (2,105,363) |
| | (430,183) | | Callaway Golf Co. | | (2,908,037) |
| | (95,500) | | Caribou Coffee Co., Inc. | | (1,780,120) |
| | (165,800) | | CarMax, Inc. | | (5,744,970) |
| | (122,300) | | Carnival Corp. | | (3,923,384) |
| | (17,000) | | Chemed Corp. | | (1,065,560) |
| | (130,700) | | Coach, Inc. | | (10,100,496) |
| | (19,900) | | Coinstar, Inc. | | (1,264,645) |
| | (30,400) | | Darden Restaurants, Inc. | | (1,555,264) |
| | (165,600) | | Dick's Sporting Goods, Inc. | | (7,962,048) |
| | (28,750) | | DIRECTV, Class A | | (1,418,525) |
| | (96,500) | | Dollar General Corp. | | (4,458,300) |
| | (36,448) | | DR Horton, Inc. | | (552,916) |
| | (130,250) | | DreamWorks Animation SKG, Inc., Class A | | (2,403,112) |
| | (65,400) | | EchoStar Corp., Class A | | (1,840,356) |
| | (161,000) | | Emeritus Corp. | | (2,843,260) |
| | (65,100) | | Equinix, Inc. | | (10,249,995) |
| | (175,500) | | Fastenal Co. | | (9,494,550) |
| | (55,500) | | Fossil, Inc. | | (7,324,890) |
| | (69,476) | | Gaylord Entertainment Co. | | (2,139,861) |
| | (154,500) | | Genuine Parts Co. | | (9,694,875) |
| | (43,100) | | G-III Apparel Group, Ltd. | | (1,224,902) |
| | (66,600) | | Gildan Activewear, Inc. | | (1,834,830) |
| | (76,200) | | H&R Block, Inc. | | (1,255,014) |
| | (126,500) | | Hanesbrands, Inc. | | (3,736,810) |
| | (125,424) | | Hawaiian Holdings, Inc. | | (655,968) |
| | (581,800) | | Hertz Global Holdings, Inc. | | (8,750,272) |
| | (85,100) | | Home Inns & Hotels Management, Inc., ADR | | (2,170,901) |
| | (40,200) | | Hyatt Hotels Corp. | | (1,717,344) |
| | (81,400) | | Iconix Brand Group, Inc. | | (1,414,732) |
| | (182,500) | | Interface, Inc., Class A | | (2,545,875) |
| | (219,209) | | Jakks Pacific, Inc. | | (3,825,197) |
| | (144,367) | | JetBlue Airways Corp. | | (705,955) |
| | (364,700) | | Johnson Controls, Inc. | | (11,845,456) |
| | (178,200) | | K12, Inc. | | (4,210,866) |
| | (47,600) | | Landauer, Inc. | | (2,523,752) |
| | (135,446) | | Lennar Corp., Class A | | (3,681,422) |
| | (31,050) | | Life Time Fitness, Inc. | | (1,570,199) |
| | (14,507) | | Live Nation Entertainment, Inc. | | (136,366) |
| | (83,500) | | Ltd. Brands, Inc. | | (4,008,000) |
| | (86,700) | | Meritage Homes Corp. | | (2,346,102) |
| | (47,502) | | Meritor, Inc. | | (383,341) |
| | (72,399) | | MGM Resorts International | | (986,074) |
| | (197,900) | | Mobile Mini, Inc. | | (4,179,648) |
| | (20,950) | | Mohawk Industries, Inc. | | (1,393,385) |
| | (57,419) | | Navistar International Corp. | | (2,322,599) |
| | (8,875) | | Netflix, Inc. | | (1,020,980) |
| | (3,464) | | Newell Rubbermaid, Inc. | | (61,694) |
| | (146,000) | | Nordstrom, Inc. | | (8,135,120) |
| | (104,400) | | Nu Skin Enterprises, Inc., Class A | | (6,045,804) |
| | (123,400) | | Perry Ellis International, Inc. | | (2,303,878) |
| | (26,400) | | priceline.com, Inc. | | (18,942,000) |
| | (142,450) | | Pricesmart, Inc. | | (10,371,784) |
| | (101,600) | | Rackspace Hosting, Inc. | | (5,871,464) |
| | (1,638) | | RadioShack Corp. | | (10,188) |
| Shares | | Security Description | | Value |
| | (486,976) | | Regis Corp. | $ | (8,974,968) |
| | (58,100) | | Robert Half International, Inc. | | (1,760,430) |
| | (46,000) | | Royal Caribbean Cruises, Ltd. | | (1,353,780) |
| | (292,100) | | Ruby Tuesday, Inc. | | (2,666,873) |
| | (28,000) | | Scripps Networks Interactive, Inc., Class A | | (1,363,320) |
| | (125,200) | | Skechers U.S.A., Inc., Class A | | (1,592,544) |
| | (100,900) | | SkyWest, Inc. | | (1,114,945) |
| | (550,630) | | Sonic Automotive, Inc., Class A | | (9,861,783) |
| | (247,100) | | Southwest Airlines Co. | | (2,036,104) |
| | (406,500) | | Standard Pacific Corp. | | (1,812,990) |
| | (162,000) | | Stein Mart, Inc. | | (1,069,200) |
| | (49,000) | | The Gap, Inc. | | (1,280,860) |
| | (110,500) | | The Geo Group, Inc. | | (2,100,605) |
| | (113,805) | | The Goodyear Tire & Rubber Co. | | (1,276,892) |
| | (107,206) | | The Interpublic Group of Cos., Inc. | | (1,223,220) |
| | (28,700) | | Tiffany & Co. | | (1,984,031) |
| | (4,517) | | Time Warner Cable, Inc. | | (368,136) |
| | (130,600) | | TiVo, Inc. | | (1,565,894) |
| | (40,900) | | Under Armour, Inc., Class A | | (3,844,600) |
| | (37,893) | | United Continental Holdings, Inc. | | (814,700) |
| | (97,800) | | Vail Resorts, Inc. | | (4,229,850) |
| | (12,500) | | VF Corp. | | (1,824,750) |
| | (19,577) | | Viacom, Inc., Class B | | (929,124) |
| | (3,142,000) | | Wal-Mart de Mexico SAB de CV | | (10,543,080) |
| | (64,097) | | WESCO International, Inc. | | (4,186,175) |
| | (54,100) | | Westport Innovations, Inc. | | (2,213,772) |
| | (29,200) | | Williams-Sonoma, Inc. | | (1,094,416) |
| | | | | | (297,833,628) |
| Consumer Staples - (1.9)% |
| | (68,006) | | Avis Budget Group, Inc. | | (962,285) |
| | (65,600) | | Avon Products, Inc. | | (1,270,016) |
| | (19,196) | | Bunge, Ltd. | | (1,313,774) |
| | (39,600) | | Campbell Soup Co. | | (1,340,460) |
| | (11,220) | | Cenveo, Inc. | | (37,924) |
| | (51,800) | | Coca-Cola Enterprises, Inc. | | (1,481,480) |
| | (109,200) | | DENTSPLY International, Inc. | | (4,382,196) |
| | (162,865) | | Dole Food Co., Inc. | | (1,625,393) |
| | (88,800) | | Flowers Foods, Inc. | | (1,808,856) |
| | (38,200) | | HeartWare International, Inc. | | (2,509,358) |
| | (231,300) | | Imperial Sugar Co. | | (1,084,797) |
| | (101,000) | | IPC The Hospitalist Co., Inc. | | (3,727,910) |
| | (24,300) | | Kellogg Co. | | (1,303,209) |
| | (45,400) | | Kenexa Corp. | | (1,418,296) |
| | (59,150) | | Masimo Corp. | | (1,382,927) |
| | (28,800) | | McCormick & Co., Inc., Non-Voting Shares | | (1,567,584) |
| | (18,400) | | Mead Johnson Nutrition Co. | | (1,517,632) |
| | (431,072) | | Olam International, Ltd. | | (809,299) |
| | (73,700) | | Ritchie Bros. Auctioneers, Inc. | | (1,751,112) |
| | (223,545) | | Sunrise Senior Living, Inc. | | (1,412,804) |
| | (39,000) | | Sysco Corp. | | (1,164,540) |
| | (25,800) | | The Advisory Board Co. | | (2,286,396) |
| | (41,000) | | The Brink's Co. | | (978,670) |
| | (155,200) | | The Estee Lauder Cos., Inc., Class A | | (9,613,088) |
| | (56,856) | | Tootsie Roll Industries, Inc. | | (1,302,571) |
| | (51,200) | | Tyson Foods, Inc., Class A | | (980,480) |
| | (32,600) | | United Natural Foods, Inc. | | (1,521,116) |
| | (526,200) | | United Rentals, Inc. | | (22,568,718) |
| | (23,000) | | Whole Foods Market, Inc. | | (1,913,600) |
| | | | | | (75,036,491) |
| Energy - (1.7)% |
| | (294,400) | | Abraxas Petroleum Corp. | | (918,528) |
| | (50,216) | | Alliance Oil Co., Ltd., SDR | | (554,093) |
See Notes to Financial Statements. 40 ABSOLUTE FUNDS
ABSOLUTE STRATEGIES FUND
SCHEDULE OF SECURITIES SOLD SHORT
MARCH 31, 2012
| Shares | | Security Description | | Value |
| | (1,197) | | Alpha Natural Resources, Inc. | $ | (18,206) |
| | (46,100) | | Cabot Oil & Gas Corp. | | (1,436,937) |
| | (100,700) | | Carrizo Oil & Gas, Inc. | | (2,845,782) |
| | (110,100) | | Cheniere Energy, Inc. | | (1,649,298) |
| | (75,556) | | Chesapeake Energy Corp. | | (1,750,633) |
| | (34,500) | | Cimarex Energy Co. | | (2,603,715) |
| | (14,900) | | Concho Resources, Inc. | | (1,520,992) |
| | (26,750) | | Consol Energy, Inc. | | (912,175) |
| | (17,900) | | Continental Resources, Inc. | | (1,536,178) |
| | (15,000) | | Diamond Offshore Drilling, Inc. | | (1,001,250) |
| | (19,050) | | Dril-Quip, Inc. | | (1,238,631) |
| | (114,200) | | Enbridge, Inc. | | (4,436,670) |
| | (62,600) | | Encana Corp. | | (1,230,090) |
| | (185,000) | | Endeavour International Corp. | | (2,192,250) |
| | (79,119) | | Energy XXI Bermuda, Ltd. | | (2,856,987) |
| | (81,100) | | Essar Energy PLC | | (201,234) |
| | (227,200) | | EXCO Resources, Inc. | | (1,506,336) |
| | (21,984) | | Exterran Holdings, Inc. | | (289,969) |
| | (162,300) | | Forest Oil Corp. | | (1,967,076) |
| | (71,305) | | Goodrich Petroleum Corp. | | (1,356,221) |
| | (39,800) | | Gulfport Energy Corp. | | (1,158,976) |
| | (56,600) | | Helix Energy Solutions Group, Inc. | | (1,007,480) |
| | (11,800) | | Kinder Morgan Energy Partners LP | | (976,450) |
| | (336,400) | | Magnum Hunter Resources Corp. | | (2,156,324) |
| | (137,970) | | Newpark Resources, Inc. | | (1,129,974) |
| | (93,900) | | Northern Oil and Gas, Inc. | | (1,947,486) |
| | (541) | | Patriot Coal Corp. | | (3,376) |
| | (12,600) | | PetroChina Co., Ltd., ADR | | (1,770,678) |
| | (57,699) | | Petroquest Energy, Inc. | | (354,272) |
| | (310,200) | | Polarcus, Ltd. | | (307,261) |
| | (374,900) | | Resolute Energy Corp. | | (4,266,362) |
| | (472,643) | | SandRidge Energy, Inc. | | (3,700,795) |
| | (112,900) | | Seadrill, Ltd. | | (4,234,879) |
| | (36,900) | | Southwestern Energy Co. | | (1,129,140) |
| | (66,300) | | Spectra Energy Corp. | | (2,091,765) |
| | (2,888) | | Stone Energy Corp. | | (82,568) |
| | (99,600) | | TransCanada Corp. | | (4,282,800) |
| | (33,550) | | Ultra Petroleum Corp. | | (759,236) |
| | (14,000) | | Walter Energy, Inc. | | (828,940) |
| | (133,877) | | Western Refining, Inc. | | (2,519,565) |
| | | | | | (68,731,578) |
| Financial - (8.1)% |
| | (13,096) | | Affiliated Managers Group, Inc. | | (1,464,264) |
| | (11,750,000) | | Agricultural Bank of China, Ltd., Class H | | (5,038,600) |
| | (101,650) | | Air Lease Corp. | | (2,446,715) |
| | (26,392) | | Alexandria Real Estate Equities, Inc. REIT | | (1,930,047) |
| | (267,300) | | American Equity Investment Life Holding Co. | | (3,413,421) |
| | (48,629) | | Amtrust Financial Services, Inc. | | (1,307,148) |
| | (125,773) | | Annaly Capital Management, Inc. REIT | | (1,989,729) |
| | (20,000) | | Ares Capital Corp. | | (327,000) |
| | (57,464) | | Aspen Insurance Holdings, Ltd. | | (1,605,544) |
| | (55,200) | | AvalonBay Communities, Inc. REIT | | (7,802,520) |
| | (1,264,414) | | Banco Santander SA, ADR | | (9,698,055) |
| | (1,498) | | Bank of America Corp. | | (14,336) |
| | (14,710,000) | | Bank of China, Ltd., Class H | | (5,929,046) |
| | (6,405,000) | | Bank of Communications Co., Ltd., Class H | | (4,841,557) |
| | (608,008) | | Barclays PLC, ADR | | (9,211,321) |
| | (264,000) | | BB&T Corp. | | (8,286,960) |
| | (106,200) | | BGC Partners, Inc., Class A | | (784,818) |
| | (90,100) | | Boston Properties, Inc. REIT | | (9,459,599) |
| | (57,250) | | Brown & Brown, Inc. | | (1,361,405) |
| Shares | | Security Description | | Value |
| | | | | | |
| | (35,000) | | Cardinal Health, Inc. | $ | (1,508,850) |
| | (921,065) | | CBIZ, Inc. | | (5,821,131) |
| | (8,420,000) | | China Citic Bank Corp, Ltd., Class H | | (5,063,569) |
| | (8,152,000) | | China Construction Bank Corp., Class H | | (6,298,588) |
| | (2,375,000) | | China Merchants Bank Co., Ltd., Class H | | (4,856,707) |
| | (107,000) | | Cincinnati Financial Corp. | | (3,692,570) |
| | (284,285) | | CNO Financial Group, Inc. | | (2,211,737) |
| | (63,000) | | Corporate Office Properties Trust REIT | | (1,462,230) |
| | (31,000) | | Cullen/Frost Bankers, Inc. | | (1,803,890) |
| | (147,573) | | Deutsche Bank AG | | (7,347,660) |
| | (50,600) | | Eaton Vance Corp. | | (1,446,148) |
| | (444,000) | | Erste Group Bank AG | | (10,238,492) |
| | (17,350) | | Federal Realty Investment Trust REIT | | (1,679,306) |
| | (145,400) | | First Potomac Realty Trust REIT | | (1,757,886) |
| | (262,100) | | Flagstone Reinsurance Holdings SA | | (2,062,727) |
| | (114,797) | | Forest City Enterprises, Inc., Class A | | (1,797,721) |
| | (2,871,835) | | Grupo Financiero Banorte SAB de CV | | (12,765,657) |
| | (216,500) | | HCP, Inc. REIT | | (8,543,090) |
| | (209,193) | | Health Care REIT, Inc. | | (11,497,247) |
| | (29,000) | | Highwoods Properties, Inc. REIT | | (966,280) |
| | (56,600) | | Iberiabank Corp. | | (3,026,402) |
| | (7,020,000) | | Industrial & Commercial Bank of China, Class H | | (4,529,003) |
| | (11,800) | | IntercontinentalExchange, Inc. | | (1,621,556) |
| | (80,500) | | Jefferies Group, Inc. | | (1,516,620) |
| | (137,800) | | KBW, Inc. | | (2,549,300) |
| | (108,266) | | KeyCorp | | (920,261) |
| | (119,078) | | KKR Financial Holdings, LLC | | (1,096,708) |
| | (74,267) | | Knight Capital Group, Inc., Class A | | (955,816) |
| | (50,000) | | Lazard, Ltd., Class A | | (1,428,000) |
| | (48,550) | | Lender Processing Services, Inc. | | (1,262,300) |
| | (2,900) | | Markel Corp. | | (1,301,926) |
| | (71,973) | | MetLife, Inc. | | (2,688,192) |
| | (21,100) | | Morningstar, Inc. | | (1,330,355) |
| | (557,455) | | National Financial Partners Corp. | | (8,439,869) |
| | (104,000) | | National Retail Properties, Inc. REIT | | (2,827,760) |
| | (158,600) | | NBT Bancorp, Inc. | | (3,501,888) |
| | (412,800) | | New York Community Bancorp, Inc. | | (5,742,048) |
| | (1,127,000) | | Nordea Bank AB | | (10,246,539) |
| | (208,600) | | Old Republic International Corp. | | (2,200,730) |
| | (639,500) | | OTP Bank PLC | | (11,090,103) |
| | (37,600) | | Paychex, Inc. | | (1,165,224) |
| | (88,400) | | Piper Jaffray Cos. | | (2,353,208) |
| | (335,550) | | Plum Creek Timber Co., Inc. REIT | | (13,945,458) |
| | (89,000) | | Potlatch Corp. REIT | | (2,789,260) |
| | (150,000) | | Royal Bank of Canada | | (8,707,500) |
| | (23,900) | | Signature Bank | | (1,506,656) |
| | (812,000) | | Swedbank AB, Class A | | (12,617,310) |
| | (767,163) | | Synovus Financial Corp. | | (1,572,684) |
| | (163,400) | | TCF Financial Corp. | | (1,942,826) |
| | (79,900) | | TD Ameritrade Holding Corp. | | (1,577,226) |
| | (147,100) | | United Bankshares, Inc. | | (4,245,306) |
| | (348,400) | | Valley National Bancorp | | (4,511,780) |
| | (296,500) | | Wells Fargo & Co. | | (10,122,510) |
| | (79,250) | | Westamerica Bancorp. | | (3,804,000) |
| | (389,700) | | Weyerhaeuser Co. REIT | | (8,542,224) |
| | (140,899) | | Wintrust Financial Corp. | | (5,042,775) |
| | | | | | (322,454,894) |
| Healthcare - (3.1)% |
| | (447,100) | | Accuray, Inc. | | (3,156,526) |
| | (133,900) | | Achillion Pharmaceuticals, Inc. | | (1,282,762) |
| | (116,700) | | Akorn, Inc. | | (1,365,390) |
| | (31,761) | | Alere, Inc. | | (826,104) |
See Notes to Financial Statements. 41 ABSOLUTE FUNDS
ABSOLUTE STRATEGIES FUND
SCHEDULE OF SECURITIES SOLD SHORT
MARCH 31, 2012
| Shares | | Security Description | | Value |
| | | | | | |
| | (16,200) | | Allergan, Inc. | $ | (1,545,966) |
| | (62,500) | | Allscripts Healthcare Solutions, Inc. | | (1,037,500) |
| | (101,563) | | Amarin Corp PLC, ADR | | (1,149,693) |
| | (122,800) | | AMERIGROUP Corp. | | (8,261,984) |
| | (32,700) | | Becton Dickinson and Co. | | (2,539,155) |
| | (29,765) | | BioMarin Pharmaceutical, Inc. | | (1,019,451) |
| | (53,400) | | Cerner Corp. | | (4,066,944) |
| | (21,800) | | Charles River Laboratories International, Inc. | | (786,762) |
| | (183,600) | | Conceptus, Inc. | | (2,640,168) |
| | (29,550) | | Covance, Inc. | | (1,407,466) |
| | (317,700) | | Cubist Pharmaceuticals, Inc. | | (13,740,525) |
| | (37,150) | | Edwards Lifesciences Corp. | | (2,701,919) |
| | (180,600) | | Endo Pharmaceuticals Holdings, Inc. | | (6,994,638) |
| | (26,050) | | Express Scripts, Inc. | | (1,411,389) |
| | (168,844) | | HealthSouth Corp. | | (3,457,925) |
| | (11,400) | | Illumina, Inc. | | (599,754) |
| | (57,700) | | Insulet Corp. | | (1,104,378) |
| | (62,700) | | Integra LifeSciences Holdings Corp. | | (2,175,063) |
| | (18,350) | | Laboratory Corp. of America Holdings | | (1,679,759) |
| | (16,390) | | LifePoint Hospitals, Inc. | | (646,422) |
| | (33,000) | | MAKO Surgical Corp. | | (1,390,950) |
| | (20,994) | | Medivation, Inc. | | (1,568,672) |
| | (19,189) | | Molina Healthcare, Inc. | | (645,326) |
| | (390,800) | | Mylan, Inc. | | (9,164,260) |
| | (115,400) | | NuVasive, Inc. | | (1,943,336) |
| | (82,959) | | Omnicare, Inc. | | (2,950,852) |
| | (46,050) | | Patterson Cos., Inc. | | (1,538,070) |
| | (247,800) | | PSS World Medical, Inc. | | (6,279,252) |
| | (19,537) | | Regeneron Pharmaceuticals, Inc. | | (2,278,405) |
| | (46,628) | | Salix Pharmaceuticals, Ltd. | | (2,447,970) |
| | (33,000) | | St. Jude Medical, Inc. | | (1,462,230) |
| | (21,600) | | Techne Corp. | | (1,514,160) |
| | (44,600) | | Teleflex, Inc. | | (2,727,290) |
| | (29,150) | | United Therapeutics Corp. | | (1,373,840) |
| | (62,500) | | VCA Antech, Inc. | | (1,450,625) |
| | (43,800) | | Vertex Pharmaceuticals, Inc. | | (1,796,238) |
| | (343,300) | | Viropharma, Inc. | | (10,323,031) |
| | (145,070) | | Volcano Corp. | | (4,112,734) |
| | (51,975) | | West Pharmaceutical Services, Inc. | | (2,210,497) |
| | | | | | (122,775,381) |
| Industrial - (7.0)% |
| | (38,300) | | AAR Corp. | | (698,975) |
| | (35,900) | | Alexander & Baldwin, Inc. | | (1,739,355) |
| | (175,539) | | Altra Holdings, Inc. | | (3,370,349) |
| | (326,411) | | AM Castle & Co. | | (4,129,099) |
| | (542,000) | | Atlas Copco AB, Class A | | (13,116,207) |
| | (38,700) | | Brady Corp., Class A | | (1,251,945) |
| | (26,700) | | Candian Pacific Railway, Ltd. | | (2,027,865) |
| | (120,000) | | Caterpillar, Inc. | | (12,782,400) |
| | (107,598) | | Cemex SAB de CV, ADR | | (834,964) |
| | (84,750) | | CH Robinson Worldwide, Inc. | | (5,550,278) |
| | (14,245) | | Chart Industries, Inc. | | (1,044,586) |
| | (48,900) | | CIRCOR International, Inc. | | (1,626,903) |
| | (178,000) | | Colfax Corp. | | (6,272,720) |
| | (39,400) | | Con-way, Inc. | | (1,284,834) |
| | (380,179) | | Covanta Holding Corp. | | (6,170,305) |
| | (31,800) | | Crown Holdings, Inc. | | (1,171,194) |
| | (273,800) | | Donaldson Co., Inc. | | (9,782,874) |
| | (225,211) | | DryShips, Inc. | | (783,734) |
| | (199,507) | | Eaton Corp. | | (9,941,434) |
| | (252,000) | | Emerson Electric Co. | | (13,149,360) |
| | (161,229) | | FEI Co. | | (7,917,956) |
| | (11,200) | | Flowserve Corp. | | (1,293,712) |
| | (155,038) | | FLSmidth & Co. | | (10,881,420) |
| | Shares | | Security Description | | Value |
| | | | | | |
| | (144,800) | | Fluor Corp. | $ | (8,693,792) |
| | (65,700) | | Genco Shipping & Trading, Ltd. | | (417,852) |
| | (69,980) | | General Cable Corp. | | (2,035,018) |
| | (728,700) | | General Electric Co. | | (14,625,009) |
| | (12,961) | | Greenbrier Cos., Inc. | | (256,498) |
| | (227,000) | | Greif, Inc., Class A | | (12,693,840) |
| | (308,260) | | Griffon Corp. | | (3,298,382) |
| | (115,500) | | HMS Holdings Corp. | | (3,604,755) |
| | (21,300) | | Illinois Tool Works, Inc. | | (1,216,656) |
| | (61,600) | | Imax Corp. | | (1,505,504) |
| | (416,300) | | Ingersoll-Rand PLC | | (17,214,005) |
| | (306,000) | | Jabil Circuit, Inc. | | (7,686,720) |
| | (161,200) | | Joy Global, Inc. | | (11,848,200) |
| | (145,053) | | Kaman Corp. | | (4,924,549) |
| | (347) | | Kansas City Southern | | (24,877) |
| | (32,100) | | KBR, Inc. | | (1,141,155) |
| | (8,766) | | L-3 Communications Holdings, Inc. | | (620,370) |
| | (33,750) | | Lennox International, Inc. | | (1,360,125) |
| | (30,500) | | Martin Marietta Materials, Inc. | | (2,611,715) |
| | (71,100) | | MasTec, Inc. | | (1,286,199) |
| | (25,700) | | Mueller Industries, Inc. | | (1,168,065) |
| | (98,300) | | National Instruments Corp. | | (2,803,516) |
| | (25,255) | | Neo Material Technologies, Inc. | | (284,876) |
| | (89,913) | | PHH Corp. | | (1,390,954) |
| | (32,200) | | Precision Castparts Corp. | | (5,567,380) |
| | (37,000) | | Rock-Tenn Co., Class A | | (2,499,720) |
| | (32,600) | | Roper Industries, Inc. | | (3,232,616) |
| | (89,120) | | RTI International Metals, Inc. | | (2,055,107) |
| | (215,000) | | Sandvik AB | | (3,103,555) |
| | (70,200) | | Siemens AG, ADR | | (7,078,968) |
| | (125,000) | | SKF AB, Class B | | (3,051,407) |
| | (57,450) | | Spirit Aerosystems Holdings, Inc., Class A | | (1,405,227) |
| | (18,350) | | Stericycle, Inc. | | (1,534,794) |
| | (48,459) | | Swift Transportation Co. | | (559,217) |
| | (34,300) | | Texas Industries, Inc. | | (1,200,843) |
| | (46,800) | | The Babcock & Wilcox Co. | | (1,205,100) |
| | (26,900) | | Trimble Navigation, Ltd. | | (1,463,898) |
| | (181,200) | | TTM Technologies, Inc. | | (2,081,988) |
| | (43,800) | | Universal Display Corp. | | (1,600,014) |
| | (100,800) | | UTi Worldwide, Inc. | �� | (1,736,784) |
| | (97,000) | | Valmont Industries, Inc. | | (11,388,770) |
| | (146,950) | | Waste Management, Inc. | | (5,137,372) |
| | (12,000) | | Waters Corp. | | (1,111,920) |
| | (105,600) | | Worthington Industries, Inc. | | (2,025,408) |
| | | | | | (278,575,189) |
| Information Technology - (4.1)% |
| | (76,100) | | 3D Systems Corp. | | (1,791,394) |
| | (124,400) | | Aspen Technology, Inc. | | (2,553,932) |
| | (36,350) | | Broadcom Corp., Class A | | (1,428,555) |
| | (45,000) | | Broadridge Financial Solutions, Inc. | | (1,075,950) |
| | (66,700) | | CACI International, Inc., Class A | | (4,154,743) |
| | (509,700) | | Cadence Design Systems, Inc. | | (6,034,848) |
| | (117,000) | | Cavium, Inc. | | (3,619,980) |
| | (342,098) | | Ciena Corp. | | (5,538,567) |
| | (15,650) | | Citrix Systems, Inc. | | (1,234,941) |
| | (18,900) | | Cognizant Technology Solutions Corp., Class A | | (1,454,355) |
| | (28,800) | | Computer Programs and Systems, Inc. | | (1,627,776) |
| | (197,300) | | Compuware Corp. | | (1,813,187) |
| | (30,200) | | Concur Technologies, Inc. | | (1,732,876) |
| | (48,100) | | Constant Contact, Inc. | | (1,432,899) |
| | (24,500) | | Cree, Inc. | | (774,935) |
| | (24,100) | | Digital River, Inc. | | (450,911) |
| | (200,943) | | Electronic Arts, Inc. | | (3,311,541) |
See Notes to Financial Statements. 42 ABSOLUTE FUNDS
ABSOLUTE STRATEGIES FUND
SCHEDULE OF SECURITIES SOLD SHORT
MARCH 31, 2012
| | Shares | | Security Description | | Value |
| | | | | | |
| | (48,700) | | Fortinet, Inc. | $ | (1,346,555) |
| | (26,500) | | IHS, Inc., Class A | | (2,481,725) |
| | (55,300) | | Informatica Corp. | | (2,925,370) |
| | (115,000) | | Intel Corp. | | (3,232,650) |
| | (22,650) | | Lam Research Corp. | | (1,010,643) |
| | (53,500) | | Linear Technology Corp. | | (1,802,950) |
| | (134,900) | | Medidata Solutions, Inc. | | (3,593,736) |
| | (173,700) | | Mentor Graphics Corp. | | (2,581,182) |
| | (227,185) | | Microchip Technology, Inc. | | (8,451,282) |
| | (188,177) | | Micron Technology, Inc. | | (1,524,234) |
| | (10,200) | | MicroStrategy, Inc., Class A | | (1,428,000) |
| | (216,600) | | NetApp, Inc. | | (9,697,182) |
| | (59,900) | | NetSuite, Inc. | | (3,012,371) |
| | (45,329) | | Novellus Systems, Inc. | | (2,262,370) |
| | (160,814) | | Nuance Communications, Inc. | | (4,113,622) |
| | (1,319,600) | | ON Semiconductor Corp. | | (11,889,596) |
| | (43,400) | | Opnet Technologies, Inc. | | (1,258,600) |
| | (73,300) | | Pegasystems, Inc. | | (2,797,128) |
| | (1,045,220) | | Photronics, Inc. | | (6,950,713) |
| | (64,700) | | Pitney Bowes, Inc. | | (1,137,426) |
| | (46,200) | | Quality Systems, Inc. | | (2,020,326) |
| | (38,900) | | Radisys Corp. | | (287,860) |
| | (18,100) | | Rambus, Inc. | | (116,745) |
| | (328,600) | | Rosetta Stone, Inc. | | (3,391,152) |
| | (314,253) | | Rudolph Technologies, Inc. | | (3,491,351) |
| | (71,400) | | Salesforce.com, Inc. | | (11,032,014) |
| | (49,700) | | Skyworks Solutions, Inc. | | (1,374,205) |
| | (57,500) | | Sourcefire, Inc. | | (2,767,475) |
| | (88,950) | | Symantec Corp. | | (1,663,365) |
| | (240,800) | | SYNNEX Corp. | | (9,184,112) |
| | (545,400) | | Take-Two Interactive Software, Inc. | | (8,390,979) |
| | (53,300) | | Ultimate Software Group, Inc. | | (3,905,824) |
| | (112,020) | | VeriSign, Inc. | | (4,294,847) |
| | | | | | (165,448,980) |
| Materials - (1.9)% |
| | (13,400) | | Air Products & Chemicals, Inc. | | (1,230,120) |
| | (46,600) | | Allied Nevada Gold Corp. | | (1,515,898) |
| | (47,410) | | AngloGold Ashanti, Ltd., ADR | | (1,750,377) |
| | (2,350) | | APERAM, NY Registry Shares | | (43,452) |
| | (23,000) | | ArcelorMittal | | (439,990) |
| | (192,650) | | Avery Dennison Corp. | | (5,804,545) |
| | (152,100) | | Balchem Corp. | | (4,601,025) |
| | (149,900) | | BHP Billiton, Ltd., ADR | | (10,852,760) |
| | (29,100) | | Ecolab, Inc. | | (1,796,052) |
| | (35,400) | | Freeport-McMoRan Copper & Gold, Inc. | | (1,346,616) |
| | (15,700) | | Goldcorp, Inc. | | (707,442) |
| | (321,709) | | Horsehead Holding Corp. | | (3,664,266) |
| | (76,500) | | International Flavors & Fragrances, Inc. | | (4,482,900) |
| | (37,724) | | Jaguar Mining, Inc. | | (176,171) |
| | (19,847) | | Kaiser Aluminum Corp. | | (937,969) |
| | (1,870,000) | | Mexichem SAB de CV | | (7,205,912) |
| | (15,000) | | POSCO, ADR | | (1,255,500) |
| | (13,800) | | Praxair, Inc. | | (1,582,032) |
| | (200,100) | | Rio Tinto PLC, ADR | | (11,123,559) |
| | (39,900) | | Sigma-Aldrich Corp. | | (2,915,094) |
| | (219,744) | | Southern Copper Corp. | | (6,968,082) |
| | (39,324) | | Sterlite Industries India, Ltd., ADR | | (335,827) |
| | (169,880) | | Stillwater Mining Co. | | (2,147,283) |
| | (8,809) | | United States Steel Corp. | | (258,720) |
| | (397,312) | | Uranium One, Inc. | | (1,103,368) |
| | (59,000) | | Vale SA, ADR | | (1,376,470) |
| | | | | | (75,621,430) |
| | Shares | | Security Description | | Value |
| Telecommunication Services - (1.6)% |
| | (132,415) | | Alaska Communications Systems Group, Inc. | $ | (407,838) |
| | (1,629) | | AOL, Inc. | | (30,902) |
| | (26,000) | | Baidu, Inc., ADR | | (3,790,020) |
| | (118,100) | | BroadSoft, Inc. | | (4,517,325) |
| | (57,400) | | Cablevision Systems Corp., Class A | | (842,632) |
| | (19,577) | | CBS Corp., Class B, Non-Voting Shares | | (663,856) |
| | (77,800) | | CenturyLink, Inc. | | (3,006,970) |
| | (249,000) | | Clearwire Corp., Class A | | (567,720) |
| | (100,500) | | comScore, Inc. | | (2,149,695) |
| | (120,000) | | Comtech Telecommunications Corp. | | (3,909,600) |
| | (6,329) | | DealerTrack Holdings, Inc. | | (191,516) |
| | (130,700) | | DigitalGlobe, Inc. | | (1,743,538) |
| | (35,550) | | Discovery Communications, Inc., Class A | | (1,798,830) |
| | (30,800) | | InterDigital, Inc. | | (1,073,688) |
| | (77,300) | | Ixia | | (965,477) |
| | (34,050) | | John Wiley & Sons, Inc., Class A | | (1,620,439) |
| | (45,300) | | Juniper Networks, Inc. | | (1,036,464) |
| | (5,456) | | Level 3 Communications, Inc. | | (140,383) |
| | (761,100) | | Limelight Networks, Inc. | | (2,504,019) |
| | (31,700) | | LogMeIn, Inc. | | (1,116,791) |
| | (38,800) | | NII Holdings, Inc. | | (710,428) |
| | (25,700) | | Omnicom Group, Inc. | | (1,301,705) |
| | (82,745) | | SBA Communications Corp., Class A | | (4,204,273) |
| | (196,200) | | Shaw Communications, Inc., Class B | | (4,149,630) |
| | (18,600) | | Sina Corp. | | (1,209,000) |
| | (1,086,734) | | Sirius XM Radio, Inc. | | (2,510,356) |
| | (17,897) | | Time Warner, Inc. | | (675,612) |
| | (78,200) | | Viasat, Inc. | | (3,770,022) |
| | (391,549) | | Virgin Media, Inc. | | (9,780,894) |
| | (157,902) | | WebMD Health Corp. | | (4,039,133) |
| | | (64,428,756) |
| Utilities - (0.3)% |
| | (67,050) | | Aqua America, Inc. | | (1,494,544) |
| | (312,500) | | Atlantic Power Corp. | | (4,325,000) |
| | (79,050) | | Calpine Corp. | | (1,360,451) |
| | (17,700) | | National Fuel Gas Co. | | (851,724) |
| | (94,400) | | UGI Corp. | | (2,572,400) |
| | (35,100) | | WGL Holdings, Inc. | | (1,428,570) |
| | | | | | (12,032,689) |
Total Common Stock (Cost $(1,406,610,732)) | | (1,482,939,016) |
| Investment Companies - (0.8)% |
| | (149,900) | | iShares FTSE/Xinhua China 25 Index Fund | | (5,490,837) |
| | (233,000) | | iShares MSCI Australia Index Fund | | (5,477,830) |
| | (69,700) | | iShares MSCI Brazil Index Fund | | (4,512,378) |
| | (67,000) | | iShares MSCI Canada Index Fund | | (1,898,780) |
| | (330,000) | | iShares MSCI Hong Kong Index Fund | | (5,755,200) |
| | (13,000) | | iShares MSCI South Korea Index Fund | | (774,020) |
| | (54,000) | | Market Vectors Russia ETF | | (1,668,060) |
| | (80,000) | | SPDR S&P Metals & Mining ETF | | (3,976,000) |
Total Investment Companies (Cost $(34,008,466)) | | (29,553,105) |
Total Short Positions - (38.0)% (Cost $(1,440,619,198)) | $ | (1,512,492,121) |
See Notes to Financial Statements. 43 ABSOLUTE FUNDS
ABSOLUTE STRATEGIES FUND
SCHEDULE OF CALL AND PUT OPTIONS WRITTEN
MARCH 31, 2012
| Contracts | | Security Description | | | Strike Price | | Exp. Date | | Value |
| Call Options Written - (0.1)% |
| (45) | | Amazon.com, Inc. | | $ | 175.00 | | 01/13 | $ | (186,750) |
| (65) | | Apple, Inc. | | | 500.00 | | 01/13 | | (832,000) |
| (2,500) | | iShares Russell 2000 Index Fund | | | 81.00 | | 11/12 | | (1,733,750) |
| (4,205) | | SPDR S&P 500 ETF Trust | | | 145.00 | | 01/13 | | (2,417,875) |
Total Call Options Written (Premiums Received $(4,249,484)) | | (5,170,375) |
| Put Options Written - (0.4)% |
| (500) | | Accenture PLC | | | 40.00 | | 01/13 | | (35,000) |
| (135) | | Amazon.com, Inc. | | | 155.00 | | 01/13 | | (113,400) |
| (675) | | Bed Bath & Beyond, Inc. | | | 60.00 | | 01/13 | | (248,063) |
| (1,700) | | Berkshire Hathaway, Inc., Class B | | | 90.00 | | 01/13 | | (1,772,250) |
| (1,275) | | CarMax, Inc. | | | 35.00 | | 10/12 | | (408,000) |
| (275) | | Costco Wholesale Corp. | | | 80.00 | | 07/12 | | (18,150) |
| (5,000) | | iShares Russell 2000 Index Fund | | | 70.00 | | 11/12 | | (1,387,500) |
| (425) | | Kohl's Corp. | | | 57.50 | | 01/13 | | (412,250) |
| (450) | | Kohl's Corp. | | | 50.00 | | 01/13 | | (218,250) |
| (1,400) | | Lowe's Cos., Inc. | | | 30.00 | | 01/13 | | (345,800) |
| (6,270) | | SPDR S&P 500 ETF Trust | | | 110.00 | | 12/12 | | (1,385,670) |
| (21,035) | | SPDR S&P 500 ETF Trust | | | 110.00 | | 01/13 | | (5,405,995) |
| (9,305) | | SPDR S&P 500 ETF Trust | | | 80.00 | | 01/13 | | (562,952) |
| (277) | | St. Jude Medical, Inc. | | | 45.00 | | 01/13 | | (138,500) |
| (1,050) | | Target Corp. | | | 40.00 | | 01/13 | | (65,100) |
| (185) | | The Bank of New York Mellon Corp. | | | 30.00 | | 01/13 | | (128,113) |
| (1,000) | | The Bank of New York Mellon Corp. | | | 25.00 | | 01/13 | | (315,000) |
| (460) | | The Bank of New York Mellon Corp. | | | 20.00 | | 01/13 | | (56,580) |
| (743) | | The Boeing Co. | | | 82.50 | | 01/13 | | (854,450) |
| (150) | | The Coca-Cola Co. | | | 77.50 | | 01/13 | | (100,500) |
| (775) | | The Walt Disney Co. | | | 45.00 | | 01/13 | | (360,375) |
| (725) | | USG Corp. | | | 15.00 | | 01/13 | | (163,125) |
| (580) | | USG Corp. | | | 12.50 | | 01/13 | | (78,300) |
| (1,400) | | Walgreen Co. | | | 30.00 | | 01/13 | | (245,000) |
| (1,050) | | Wal-Mart Stores, Inc. | | | 40.00 | | 01/13 | | (39,375) |
Total Put Options Written (Premiums Received $(27,395,810)) | | (14,857,698) |
Total Written Options - (0.5)% (Premiums Received $(31,645,294)) | $ | (20,028,073) |
See Notes to Financial Statements. 44 ABSOLUTE FUNDS
ABSOLUTE STRATEGIES FUND
NOTES TO SCHEDULE OF INVESTMENTS, SECURITIES SOLD SHORT AND CALL AND PUT OPTIONS WRITTEN
MARCH 31, 2012
| ADR | American Depositary Receipt |
| BKNT | Bank Note |
| ETF | Exchange Traded Fund |
| ETN | Exchange Traded Note |
| FHLB | Federal Home Loan Bank |
| FHLMC | Federal Home Loan Mortgage Corporation |
| FNMA | Federal National Mortgage Association |
| GNMA | Government National Mortgage Association |
| LLC | Limited Liability Company |
| LP | Limited Partnership |
| MTN | Medium Term Note |
| PLC | Public Limited Company |
| REIT | Real Estate Investment Trust |
| SDR | Swedish Depositary Receipt |
| (a) | All or a portion of this security is held as collateral for securities sold short. |
| (b) | Non-income producing security. |
| (c) | Subject to put option written by the Fund. |
(d) | Security fair valued in accordance with procedures adopted by the Board of Trustees. At the period end, the value of these securities amounted to $11,237,008 or 0.3% of net assets. |
| (e) | Subject to call option written by the Fund. |
| (f) | Security exempt from registration under Rule 144A under the Securities Act of 1933. At the period end, the value of these securities amounted to $270,724,847 or 6.8% of net assets. |
| (g) | Variable rate security. Rate presented is as of March 31, 2012. |
| (h) | Debt obligation initially issued at one coupon rate which converts to higher coupon rate at a specified date. Rate presented is as of March 31, 2012. |
| (i) | Security is currently in default and is on scheduled interest or principal payment. |
| (j) | Rate presented is yield to maturity. |
| (k) | Holders of Comdisco Holding Co., Inc. were issued contingent equity distribution rights pursuant to the Comdisco, Inc. First Amended Joint Plan of Reorganization. Accordingly, there is no associated strike price or expiration date. |
A summary of outstanding credit default swap agreements held by the Fund at March 31, 2012, is as follows:
Credit Default Swaps – Sell Protection
| Counterparty | | Reference Entity / Obligation | | Receive Rate | | Termination Date | | Credit Spread as of 03/31/12(1) | | | Notional Amount | | | Net Unrealized Depreciation |
| Barclays Capital, Inc. | | Markit ABX.HE Index | | 0.76 | % | | 01/25/38 | | 7.06 | % | | $ | (2,310,009 | ) | $ | (15,273 | ) |
| | (1) Credit spreads are an indication of the seller’s performance risk, related to the likelihood of a credit event occurring that would require a seller to make payment to a buyer. Credit spreads are used to determine the value of swap contracts and reflect the cost of buying/selling protection, which may include upfront payments made to enter into the contract. |
The aggregate cash/securities held as collateral for the above Barclays counterparty was $1,503,176 as of March 31, 2012. The notional amounts are equal to the potential payment that the Fund could be required to make as a seller of credit protection.
The Fund enters contracts to sell protection to create a long credit position. Credit events that could require payment are bankruptcy, failure to pay, restructuring, obligation acceleration, obligation default, or repudiation/moratorium.
A summary of outstanding interest rate swap agreements held by the Fund at March 31, 2012, is as follows:
| | | Rate Type | | | | | |
| Counterparty | | Payments Made by the Fund | | Payments Received by the Fund | | Termination Date | Notional Amount | | Net Unrealized Depreciation |
| Barclays | | 2.91% semi-annually | | 3 month USD LIBOR quarterly | | 02/16/27 | $ | 190,000 | | | $ | (4,304 | ) |
AFAt March 31, 2012, the Fund held the following futures contracts:
| Contracts | | Type | | Expiration Date | | Notional Contract Value | | Net Unrealized Appreciation (Depreciation) |
| 9 | | | U.S. 10-year Note Future | | 06/29/12 | | $ | 1,179,293 | | | $ | (13,934 | ) |
| 12 | | | U.S. Ultra Bond Future | | 06/29/12 | | | 1,874,572 | | | | (62,947 | ) |
| (600 | ) | | Euro FX Currency Future | | 06/20/12 | | | (98,086,350 | ) | | | (1,956,150 | ) |
| (5,100 | ) | | Russell 2000 Mini Future | | 06/15/12 | | | (406,862,810 | ) | | | (15,264,190 | ) |
| (3,600 | ) | | S&P 500 Emini Future | | 06/15/12 | | | (244,547,250 | ) | | | (8,037,750 | ) |
| (837 | ) | | U.S. 10-year Note Future | | 06/29/12 | | | (109,996,675 | ) | | | 1,618,253 | |
| (40 | ) | | U.S. 2-year Note Future | | 06/29/12 | | | (8,806,248 | ) | | | 623 | |
| (160 | ) | | U.S. 5-year Note Future | | 06/29/12 | | | (19,701,248 | ) | | | 94,998 | |
| (20 | ) | | U.S. Long Bond Future | | 06/29/12 | | | (2,802,500 | ) | | | 47,500 | |
| | | | | | | | $ | (887,749,216 | ) | | $ | (23,573,597 | ) |
AF
See Notes to Financial Statements. 45 ABSOLUTE FUNDS
ABSOLUTE STRATEGIES FUND
NOTES TO SCHEDULE OF INVESTMENTS, SECURITIES SOLD SHORT AND CALL AND PUT OPTIONS WRITTEN
MARCH 31, 2012
| | * Cost for federal income tax purposes is $1,469,497,179 and net unrealized appreciation consists of: |
| Gross Unrealized Appreciation | | $ | 526,350,232 | |
| Gross Unrealized Depreciation | | | (277,351,262 | ) |
| Net Unrealized Appreciation | | $ | 248,998,970 | |
The following is a summary of the inputs used to value the Fund’s investments and other financial instruments and liabilities as of March 31, 2012.
The inputs or methodology used for valuing securities are not necessarily an indication of the risks associated with investing in those securities. For more information on valuation inputs, and their aggregation into the levels used in the tables below, please refer to the Security Valuation section in Note 2 of the accompanying Notes to Financial Statements.
| | | | Level 1 | | | | Level 2 | | | | Level 3 | | | | Total | |
| Assets |
| Investments At Value |
| Common Stock | | | | | | | | | | | | | | | | |
| Consumer Discretionary | | $ | 395,657,057 | | | $ | - | | | $ | - | | | $ | 395,657,057 | |
| Consumer Staples | | | 222,446,382 | | | | - | | | | - | | | | 222,446,382 | |
| Energy | | | 91,313,854 | | | | - | | | | - | | | | 91,313,854 | |
| Financial | | | 261,260,135 | | | | - | | | | 1,058,581 | | | | 262,318,716 | |
| Healthcare | | | 183,147,867 | | | | - | | | | - | | | | 183,147,867 | |
| Industrial | | | 82,621,185 | | | | - | | | | - | | | | 82,621,185 | |
| Information Technology | | | 192,388,297 | | | | - | | | | - | | | | 192,388,297 | |
| Materials | | | 24,936,025 | | | | - | | | | - | | | | 24,936,025 | |
| Telecommunication Services | | | 96,475,402 | | | | - | | | | - | | | | 96,475,402 | |
| Utilities | | | 26,967,444 | | | | - | | | | - | | | | 26,967,444 | |
| Preferred Stock | | | | | | | | | | | | | | | | |
| Consumer Discretionary | | | 9,072,838 | | | | - | | | | - | | | | 9,072,838 | |
| Consumer Staples | | | - | | | | 3,592,975 | | | | - | | | | 3,592,975 | |
| Energy | | | 10,878,387 | | | | 2,532,660 | | | | - | | | | 13,411,047 | |
| Financial | | | 35,748,825 | | | | 2,992,130 | | | | 488,813 | | | | 39,229,768 | |
| Healthcare | | | 8,893,228 | | | | - | | | | - | | | | 8,893,228 | |
| Industrial | | | 2,335,310 | | | | - | | | | - | | | | 2,335,310 | |
| Materials | | | 2,533,952 | | | | - | | | | - | | | | 2,533,952 | |
| Utilities | | | 4,435,765 | | | | - | | | | - | | | | 4,435,765 | |
| Asset Backed Obligations | | | - | | | | 276,198,766 | | | | 2,347,070 | | | | 278,545,836 | |
| Corporate Convertible Bonds | | | - | | | | 715,729,950 | | | | 7,015,907 | | | | 722,745,857 | |
| Corporate Non-Convertible Bonds | | | - | | | | 87,777,957 | | | | 326,637 | | | | 88,104,594 | |
| Exchange Traded Notes | | | 657,529 | | | | - | | | | - | | | | 657,529 | |
| Foreign Government Bonds | | | - | | | | 1,338,250 | | | | - | | | | 1,338,250 | |
| Interest Only Bonds | | | - | | | | 4,380,725 | | | | - | | | | 4,380,725 | |
| Municipal Bonds | | | - | | | | 3,607,995 | | | | - | | | | 3,607,995 | |
| Syndicated Loans | | | - | | | | 2,899,332 | | | | - | | | | 2,899,332 | |
| U.S. Government & Agency Obligations | | | - | | | | 81,775,263 | | | | - | | | | 81,775,263 | |
| Rights | | | 10,950 | | | | - | | | | - | | | | 10,950 | |
| Investment Companies | | | 353,439,827 | | | | - | | | | - | | | | 353,439,827 | |
| Commercial Paper | | | - | | | | 3,754,793 | | | | - | | | | 3,754,793 | |
| Purchased Options | | | 47,978,280 | | | | - | | | | - | | | | 47,978,280 | |
| Total Investments At Value | | $ | 2,053,198,539 | | | $ | 1,186,580,796 | | | $ | 11,237,008 | | | $ | 3,251,016,343 | |
| Other Financial Instruments** | | | | | | | | | | | | | | | | |
| Futures | | | 1,761,374 | | | | - | | | | - | | | | 1,761,374 | |
| Total Assets | | $ | 2,054,959,913 | | | $ | 1,186,580,796 | | | $ | 11,237,008 | | | $ | 3,252,777,717 | |
See Notes to Financial Statements. 46 ABSOLUTE FUNDS
ABSOLUTE STRATEGIES FUND
NOTES TO SCHEDULE OF INVESTMENTS, SECURITIES SOLD SHORT AND CALL AND PUT OPTIONS WRITTEN
MARCH 31, 2012
| | | | Level 1 | | | | Level 2 | | | | Level 3 | | | | Total | |
| Common Stock | | $ | (1,482,384,923 | ) | | $ | (554,093 | ) | | $ | - | | | $ | (1,482,939,016 | ) |
| Investment Companies | | | (29,553,105 | ) | | | - | | | | - | | | | (29,553,105 | ) |
| Total Securities Sold Short | | $ | (1,511,938,028 | ) | | $ | (554,093 | ) | | $ | - | | | $ | (1,512,492,121 | ) |
| Other Financial Instruments** |
| Written Options | | | (20,028,073 | ) | | | - | | | | - | | | | (20,028,073 | ) |
| Credit Default Swaps | | | - | | | | (15,273 | ) | | | - | | | | (15,273 | ) |
| Interest Rate Swaps | | | - | | | | (4,304 | ) | | | - | | | | (4,304 | ) |
| Forward Currency Contracts | | | - | | | | (92,516 | ) | | | - | | | | (92,516 | ) |
| Futures | | | (25,334,971 | ) | | | - | | | | - | | | | (25,334,971 | ) |
| Total Other Financial Instruments | | $ | (45,363,044 | ) | | $ | (112,093 | ) | | $ | - | | | $ | (45,475,137 | ) |
| Total Liabilities | | $ | (1,557,301,072 | ) | | $ | (666,186 | ) | | $ | - | | | $ | (1,557,967,258 | ) |
| | **Other Financial Instruments are derivative instruments not refected in the Schedule of Investments and Schedule of Securities Sold Short, such as futures, credit default swaps, interest rate swaps and forward currency contracts, which are valued at the unrealized appreciation (depreciation) of the instrument. Written options are reported at their market value at period end. |
The following is a reconciliation of Level 3 investments for which significant unobservable inputs were used to determine fair value.
| | | Common Stock | | Preferred Stock | | Asset Backed Obligations | | Corporate Convertible Bonds | | Corporate Non-Convertible Bonds | | Written Options |
| | | | | | | | | | | | | | | | | | | | | | | | | |
| Balance as of 03/31/11 | | $ | - | | | $ | 2,704,826 | | | $ | 4,135,031 | | | $ | 16,000,106 | | | $ | 260,900 | | | $ | (215 | ) |
| Accrued Accretion /(Amortization) | | | - | | | | - | | | | 9,190 | | | | (17,312 | ) | | | - | | | | - | |
| Realized Gain / (Loss) | | | - | | | | - | | | | - | | | | 20,205 | | | | - | | | | - | |
| Change in Unrealized Appreciation / (Depreciation) | | | - | | | | (704,892 | ) | | | (198,457 | ) | | | 628,872 | | | | 1,900 | | | | (27,495 | ) |
| Purchases | | | - | | | | 4,134,711 | | | | 867,977 | | | | 19,895,611 | | | | - | | | | 27,710 | |
| Sales | | | - | | | | - | | | | - | | | | (13,338,984 | ) | | | - | | | | - | |
| Paydowns / Calls | | | - | | | | - | | | | (1,408,721 | ) | | | - | | | | - | | | | - | |
| Transfers In / (Out) | | | 1,058,581 | | | | (5,645,832 | ) | | | (1,057,950 | ) | | | (16,172,591 | ) | | | 63,837 | | | | - | |
| Balance as of 03/31/12 | | $ | 1,058,581 | | | $ | 488,813 | | | $ | 2,347,070 | | | $ | 7,015,907 | | | $ | 326,637 | | | $ | - | |
| Net change in unrealized appreciation / (depreciation) from investments held as of 03/31/12*** | | $ | (97,530 | ) | | $ | (694,817 | ) | | $ | (135,027 | ) | | $ | 760,359 | | | $ | 45,359 | | | $ | - | |
| | *** The change in unrealized appreciation/(depreciation) is included in net change in unrealized appreciation/(depreciation) of investments in the accompanying Statement of Operations. |
The Fund utilizes the end of period methodology when determining transfers in or out of the level 3 category.
See Notes to Financial Statements. 47 ABSOLUTE FUNDS
ABSOLUTE OPPORTUNITIES FUND
PORTFOLIO HOLDINGS SUMMARY (Unaudited)
MARCH 31, 2012
| Portfolio Breakdown (% of Net Assets) |
| Long Positions |
| Equity Securities | | | 38.7 | % |
| Asset Backed Obligations | | | 0.7 | % |
| Corporate Convertible Bonds | | | 4.6 | % |
| Corporate Non-Convertible Bonds | | | 6.5 | % |
| Syndicated Loans | | | 0.6 | % |
| U.S. Government & Agency Obligations | | | 1.9 | % |
| Rights | | | 0.1 | % |
| Warrants | | | 1.4 | % |
| Investment Companies | | | 1.4 | % |
| Short-Term Investments | | | 15.8 | % |
| Purchased Options | | | 0.7 | % |
| Short Positions |
| Equity Securities | | | -15.1 | % |
| Corporate Non-Convertible Bonds | | | -3.6 | % |
| U.S. Treasury Securities | | | -0.7 | % |
| Investment Companies | | | -2.7 | % |
| Written Options | | | 0.0 | % |
| Other Assets less Liabilities* | | | 49.7 | % |
| | | | 100.0 | % |
* Consists of deposits with the custodian and/or brokers for securities sold short, cash, foreign currency, prepaid expenses, receivables, payables, and accrued liabilities. Deposits with the custodian and/or brokers for securities sold short represents 23.1% of net assets. See Note 2.
| | (% of Equity Holdings) |
| Sector Breakdown | Long | Short |
| Consumer Discretionary | 16.2% | 45.4% | |
| Consumer Staples | 7.8% | 8.2% | |
| Energy | 30.3% | 1.7% | |
| Financial | 10.3% | 7.8% | |
| Healthcare | 0.4% | 0.0% | |
| Industrial | 8.9% | 23.2% | |
| Information Technology | 0.7% | 3.5% | |
| Materials | 12.8% | 8.2% | |
| Telecommunication Services | 12.6% | 2.0% | |
| | 100.0% | 100.0% | |
A
See Notes to Financial Statements. 48 ABSOLUTE FUNDS
ABSOLUTE OPPORTUNITIES FUND
SCHEDULE OF INVESTMENTS
MARCH 31, 2012
FA
| Shares | | Security Description | | Value | |
| Long Positions - 72.4% |
| Equity Securities - 38.7% |
| Common Stock - 37.8% |
| Consumer Discretionary - 5.4% |
| | 129,972 | | Barnes & Noble, Inc. (a) | $ | 1,722,129 |
| | 92,675 | | Cooper-Standard Holding, Inc. (a) | | 4,053,605 |
| | 12,261 | | Deckers Outdoor Corp. (a) | | 773,056 |
| | 163,479 | | Ford Motor Co. | | 2,041,853 |
| | 408 | | Google, Inc., Class A (a) | | 261,626 |
| | 4,087 | | JC Penney Co., Inc. | | 144,802 |
| | 81,753 | | Lakes Entertainment, Inc. (a) | | 147,155 |
| | 8,173 | | Las Vegas Sands Corp. | | 470,520 |
| | 12,325 | | MDC Holdings, Inc. | | 317,862 |
| | 202,531 | | Nevada Gold & Casinos, Inc. (a)(b) | | 289,619 |
| | 6,524 | | NVR, Inc. (a)(b) | | 4,738,577 |
| | 252,785 | | PHH Corp. (a) | | 3,910,584 |
| | 139,210 | | Regis Corp. | | 2,565,640 |
| | 12,265 | | Skullcandy, Inc. (a) | | 194,155 |
| | 234,921 | | Statoil Fuel & Retail ASA | | 1,497,455 |
| | 79,495 | | Susser Holdings Corp. (a)(b) | | 2,040,637 |
| | 2,052 | | The Home Depot, Inc. | | 103,236 |
| | 6,139 | | The Walt Disney Co. | | 268,765 |
| | 122,609 | | The Wendy's Co. | | 614,271 |
| | 317,500 | | Tigrent, Inc. (a) | | 79,375 |
| | 8,174 | | Under Armour, Inc., Class A (a) | | 768,356 |
| | 4,290 | | Wynn Resorts, Ltd. (b) | | 535,735 |
| | | 27,539,013 |
| Consumer Staples - 3.0% |
| | 25,297 | | Blyth, Inc. | | 1,892,974 |
| | 625,322 | | Grifols SA, ADR (a) | | 4,821,233 |
| | 132,680 | | Ingles Markets, Inc., Class A (b) | | 2,340,475 |
| | 77,654 | | Lender Processing Services, Inc. (a) | | 2,019,004 |
| | 32,994 | | MGP Ingredients, Inc. (b) | | 177,508 |
| | 81,925 | | Primo Water Corp. (a) | | 159,754 |
| | 539,858 | | QLT, Inc. (a)(b) | | 3,779,006 |
| | 4,090 | | Wal-Mart Stores, Inc. | | 250,308 |
| | | 15,440,262 |
| Energy - 11.7% |
| | 13,987 | | Cenovus Energy, Inc. (b) | | 502,693 |
| | 33,503 | | Compton Petroleum Corp. (a) | | 133,313 |
| | 1,982,479 | | Connacher Oil and Gas, Ltd. (a) | | 1,908,045 |
| | 100,377 | | CVR Energy, Inc. (a)(b) | | 2,685,085 |
| | 226,964 | | El Paso Corp. (b) | | 6,706,786 |
| | 62,376 | | Energy Partners, Ltd. (a)(b) | | 1,036,065 |
| | 144,369 | | Energy XXI Bermuda, Ltd. (a)(b) | | 5,213,165 |
| | 50,476 | | Helix Energy Solutions Group, Inc. (a)(b) | | 898,473 |
| | 86,487 | | Marathon Petroleum Corp. (b) | | 3,750,076 |
| | 92,474 | | McMoRan Exploration Co. (a) | | 989,472 |
| | 45,223 | | MEG Energy Corp. (a) | | 1,743,723 |
| | 25,208 | | Mitcham Industries, Inc. (a)(b) | | 566,172 |
| | 986,834 | | Primary Energy Recycling Corp. (a) | | 4,699,445 |
| | 28,740 | | QEP Resources, Inc. | | 876,570 |
| | 197,466 | | Quicksilver Resources, Inc. (a) | | 995,229 |
| | 74,517 | | Rose Rock Midstream LP | | 1,776,485 |
| | 34,866 | | SEACOR Holdings, Inc. (a)(b) | | 3,339,466 |
| | 186,958 | | SemGroup Corp., Class A (a)(b) | | 5,447,956 |
| | 414,451 | | SunCoke Energy, Inc. (a)(b) | | 5,889,349 |
| | 339,916 | | Tesoro Corp. (a)(b) | | 9,123,345 |
| | 161,779 | | Tetra Technologies, Inc. (a)(b) | | 1,523,958 |
| | 16,242 | | WPX Energy, Inc. (a) | | 292,518 |
| | | 60,097,389 |
FA
| Shares | | Security Description | | Value | |
| Financial - 4.0% |
| | 611,264 | | Alm Brand A/S (a) | $ | 1,259,886 |
| | 16,349 | | American International Group, Inc. (a) | | 504,040 |
| | 26,505 | | Annaly Mortgage Management, Inc. REIT (a) | | 419,309 |
| | 12,262 | | Bank of America Corp. (a) | | 117,347 |
| | 40,877 | | Berkshire Hathaway, Inc., Class B (a) | | 3,317,169 |
| | 163,445 | | Coventree, Inc. (a)(c) | | 696,417 |
| | 309,383 | | Forest City Enterprises, Inc., Class A (a) | | 4,844,938 |
| | 111,618 | | Hilltop Holdings, Inc. (a)(b) | | 936,475 |
| | 5,828 | | Ichigo Group Holdings Co., Ltd. (a) | | 633,004 |
| | 8,174 | | Leucadia National Corp. | | 213,342 |
| | 202,056 | | MGIC Investment Corp. (a)(b) | | 1,002,198 |
| | 61,765 | | MI Developments, Inc., Class A | | 2,136,451 |
| | 278,688 | | Old Republic International Corp. | | 2,940,158 |
| | 8,174 | | SunTrust Banks, Inc. | | 197,566 |
| | 12,260 | | The Blackstone Group LP | | 195,424 |
| | 585,576 | | Urbana Corp., Non Voting Class A (a) | | 639,910 |
| | 8,174 | | Wells Fargo & Co. | | 279,060 |
| | | 20,332,694 |
| Healthcare - 0.1% |
| | 16,349 | | Life Technologies Corp. (a) | | 798,158 |
| Industrial - 3.4% |
| | 468,081 | | Air Transport Services Group, Inc. (a)(b) | 2,710,189 |
| | 71,416 | | EnPro Industries, Inc. (a) | 2,935,198 |
| | 267,804 | | Exelis, Inc. | 3,352,906 |
| | 18,812 | | Genesee & Wyoming, Inc. (a) | 1,026,759 |
| | 323,271 | | Great Lakes Dredge & Dock Corp. (b) | 2,334,017 |
| | 1,725,979 | | Kvaerner ASA | 4,909,936 |
| | 134,975 | | Rentech, Inc. (a) | 280,748 |
| | 17,549,753 |
| Information Technology - 0.3% |
| | 769,279 | | CareView Communications, Inc. (a) | 1,192,382 |
| | 817 | | International Business Machines Corp. | 170,467 |
| | 1,362,849 |
| Materials - 5.0% |
| | 111,711 | | Alexco Resource Corp. (a)(b) | 779,743 |
| | 20,488 | | Clearwater Paper Corp. (a) | 680,407 |
| | 64,746 | | Coeur d'Alene Mines Corp. (a)(b) | 1,537,070 |
| | 29,936 | | Domtar Corp. (b) | 2,855,296 |
| | 80,140 | | First Majestic Silver Corp. (a)(b) | 1,328,721 |
| | 220,132 | | Fortuna Silver Mines, Inc. (a)(b) | 994,997 |
| | 162,130 | | Gabriel Resources, Ltd. (a) | 762,334 |
| | 105,703 | | Goldcorp, Inc. (b) | 4,762,977 |
| | 84,194 | | Kinross Gold Corp. (b) | 824,259 |
| | 221,234 | | Kirkland Lake Gold, Inc. (a) | 3,198,350 |
| | 211,183 | | Lake Shore Gold Corp. (a) | 218,075 |
| | 390,557 | | Novagold Resources, Inc. (a)(b) | 2,804,199 |
| | 13,612 | | Penford Corp. (a)(b) | 92,017 |
| | 557,479 | | San Gold Corp. (a) | 810,411 |
| | 18,472 | | Silver Wheaton Corp. (b) | 613,270 |
| | 559,378 | | Sprott Resource Corp. (a) | 2,248,840 |
| | 16,203 | | The Mosaic Co. | 895,864 |
| | 25,406,830 |
| Telecommunication Services - 4.9% |
| | 7,658 | | AboveNet, Inc. (a) | 634,082 |
| | 1,635 | | Amazon.com, Inc. (a) | 331,104 |
| | 3,761,912 | | Cable & Wireless Worldwide PLC | 2,045,842 |
| | 69,585 | | Charter Communications, Inc. (a) | 4,415,168 |
See Notes to Financial Statements. 49 ABSOLUTE FUNDS
ABSOLUTE OPPORTUNITIES FUND
SCHEDULE OF INVESTMENTS
MARCH 31, 2012
| Shares | | Security Description | | Value | |
| Telecommunication Services (continued) | | |
| | 666,521 | | Cincinnati Bell, Inc. (a) | $ | 2,679,414 |
| | 57,433 | | Dice Holdings, Inc. (a) | | 535,850 |
| | 60,888 | | Liberty Media Corp. - Liberty Capital, Class A (a) | | 5,367,277 |
| | 304,141 | | LIN TV Corp., Class A (a) | | 1,231,771 |
| | 4,087 | | LinkedIn Corp. (a) | | 416,833 |
| | 8,662 | | Promotora de Informaciones SA, Class B, ADR | | 37,680 |
| | 216,592 | | Vodafone Group PLC, ADR | | 5,993,101 |
| | 42,608 | | WebMD Health Corp. (a)(b) | | 1,089,913 |
| | 20,434 | | Zynga, Inc., Class A (a) | | 268,707 |
| | | 25,046,742 |
Total Common Stock (Cost $165,114,934) | | 193,573,690 |
| | Shares | | Security Description | | Rate | | | Value | |
| Preferred Stock - 0.9% |
| Consumer Discretionary - 0.9% |
| | 140,000 | | General Motors Co. (Escrow Shares) (a)(c) | 0.00 | % | 87,500 |
| | 104,760 | | General Motors Co., Series B | 4.75 | | 4,384,206 |
| | 4,471,706 |
Total Preferred Stock (Cost $4,471,847) | | 4,471,706 |
Total Equity Securities (Cost $169,586,781) | | 198,045,396 |
| | Principal | | Security Description | | Rate | | Maturity | | Value | |
| Fixed Income Securities - 14.3% |
| Asset Backed Obligations - 0.7% |
| $ | 1,384,231 | | Punch Taverns Finance B, Ltd. | 7.37 | % | 06/30/22 | 1,881,967 |
| | 770,000 | | Punch Taverns Finance B, Ltd. | 8.44 | | 06/30/25 | 757,443 |
| | 1,174,000 | | Punch Taverns Finance B, Ltd. | 6.96 | | 06/30/28 | 1,042,187 |
Total Asset Backed Obligations (Cost $3,573,976) | | 3,681,597 |
| Corporate Convertible Bonds - 4.6% |
| Consumer Discretionary - 1.2% |
| | 2,336,000 | | Titan International, Inc. (b)(d) | 5.63 | 01/15/17 | 5,991,840 |
| Consumer Staples - 0.3% |
| | 1,419,000 | | Archer-Daniels-Midland Co. (b) | 0.88 | 02/15/14 | 1,458,023 |
| Energy - 0.3% |
| | 1,375,000 | | Newpark Resources, Inc. (b) | 4.00 | 10/01/17 | 1,531,406 |
| Financial - 1.4% |
| | 3,207,000 | | CompuCredit Holdings Corp. | 3.63 | 05/30/25 | 3,190,965 |
| | 1,000,000 | | CompuCredit Holdings Corp. | 5.88 | 11/30/35 | 443,750 |
| | Principal | | Security Description | | Rate | | Maturity | | Value | |
| Financial (continued) | | | |
| $ | 1,816,000 | | Hilltop Holdings, Inc. (b) | 7.50 | % | 08/15/25 | $ | 1,927,230 |
| | 3,316,692 | | Orco Property Group, Series ORC (c) | 1.00 | | 04/30/20 | | 1,327,041 |
| | 280,615 | | Orco Property Group, MTN, Series WW (c) | 4.50 | | 04/30/20 | | 112,277 |
| | 1,080,358 | | Orco Property Group, Series WW (c) | 2.50 | | 04/30/20 | | 432,262 |
| | | 7,433,525 |
| Industrial - 0.6% |
| | 500,000 | | AGCO Corp. (b) | 1.25 | | 12/15/36 | | 641,875 |
| | 500,000 | | General Cable Corp. (b) | 0.88 | | 11/15/13 | | 490,000 |
| | 1,300,000 | | MasTec, Inc. (b) | 4.00 | | 06/15/14 | | 1,766,375 |
| | | 2,898,250 |
| Materials - 0.8% |
| | 1,533,000 | | AngloGold Ashanti Holdings Finance PLC (b)(d) | 3.50 | | 05/22/14 | | 1,690,132 |
| | 2,115,000 | | Goldcorp, Inc. (b) | 2.00 | | 08/01/14 | | 2,561,794 |
| | | 4,251,926 |
Total Corporate Convertible Bonds (Cost $17,018,825) | | 23,564,970 |
| Corporate Non-Convertible Bonds - 6.5% |
| Consumer Discretionary - 2.7% |
| | 225,000 | | Dillard's, Inc. (b) | 7.88 | 01/01/23 | 226,687 |
| | 225,000 | | Dillard's, Inc. (b) | 7.75 | 05/15/27 | 219,375 |
| | 13,100,000 | | DirectBuy Holdings, Inc. (d)(e) | 12.00 | 02/01/17 | 2,554,500 |
| | 2,250,000 | | Greektown Superholdings, Inc., Series A (b) | 13.00 | 07/01/15 | 2,480,625 |
| | 5,000,000 | | Kraft Foods, Inc. (f) | 1.46 | 07/10/13 | 5,033,770 |
| | 1,760,000 | | New Albertsons, Inc., MTN, Series C (b) | 6.63 | 06/01/28 | 1,249,600 |
| | 450,000 | | PHH Corp. | 9.25 | 03/01/16 | 459,562 |
| | 10,000 | | Service Corp. International (b) | 7.88 | 02/01/13 | 10,338 |
| | 1,417,000 | | Vector Group, Ltd. (b) | 11.00 | 08/15/15 | 1,493,164 |
| | 13,727,621 |
| Consumer Staples - 0.4% |
| | 1,442,000 | | Novasep Holding SAS (c) | 8.00 | 12/15/16 | 1,896,187 |
| | 267,000 | | Novasep Holding SAS (c) | 8.00 | 12/15/16 | 351,097 |
| | 2,247,284 |
| Energy - 0.9% |
| | 837,000 | | Copano Energy, LLC / Copano Energy Finance Corp. (b) | 7.75 | 06/01/18 | 880,942 |
See Notes to Financial Statements. 50 ABSOLUTE FUNDS
ABSOLUTE OPPORTUNITIES FUND
SCHEDULE OF INVESTMENTS
MARCH 31, 2012
| | Principal | | Security Description | | Rate | | Maturity | | Value | |
| Energy (continued) | | | | |
| $ | 75,000 | | Denbury Resources, Inc. (b) | 9.75 | % | 03/01/16 | $ | 82,688 |
| | 120,000 | | Encore Acquisition Co. (b) | 9.50 | | 05/01/16 | | 132,600 |
| | 1,500,000 | | Holly Energy Partners LP/Holly Energy Finance Corp. (b) | 8.25 | | 03/15/18 | | 1,597,500 |
| | 1,150,000 | | McMoRan Exploration Co. (b) | 11.88 | | 11/15/14 | | 1,219,000 |
| | 700,000 | | SEACOR Holdings, Inc. (b) | 7.38 | | 10/01/19 | | 740,412 |
| | | 4,653,142 |
| Financial - 1.0% |
| | 6,353,326 | | Orco Property Group (c) | 2.50 | | 04/30/20 | | 2,542,029 |
| | 2,696,433 | | Signature Group Holdings, Inc. | 9.00 | | 12/31/16 | | 2,082,994 |
| | 500,000 | | Woodside Finance, Ltd. (b)(d) | 5.00 | | 11/15/13 | | 525,304 |
| | | 5,150,327 |
| Industrial - 0.3% |
| | 704,000 | | Darling International, Inc. (b) | 8.50 | | 12/15/18 | | 788,480 |
| | 500,000 | | MasTec, Inc. (b) | 7.63 | | 02/01/17 | | 521,875 |
| | 187,000 | | Mueller Industries, Inc. (b) | 6.00 | | 11/01/14 | | 187,468 |
| | | 1,497,823 |
| Materials - 0.7% |
| | 1,000,000 | | Allegheny Ludlum Corp. (b) | 6.95 | | 12/15/25 | | 1,159,889 |
| | 165,000 | | Clearwater Paper Corp. | 7.13 | | 11/01/18 | | 175,725 |
| | 695,000 | | Freeport-McMoRan Corp. (b) | 9.50 | | 06/01/31 | | 988,141 |
| | 1,000,000 | | Freeport-McMoRan Corp. (b) | 6.13 | | 03/15/34 | | 1,063,456 |
| | | 3,387,211 |
| Telecommunication Services - 0.5% |
| | 2,166,000 | | Viasat, Inc. (b) | 8.88 | | 09/15/16 | | 2,350,110 |
Total Corporate Non-Convertible Bonds (Cost $34,436,300) | | 33,013,518 |
| Syndicated Loans - 0.6% |
| | 2,889,715 | | Cinram International, Inc. | 9.19 | 12/31/13 | 1,155,886 |
| | 1,720,800 | | Walter Investment Management | 12.50 | 12/31/16 | 1,766,401 |
Total Syndicated Loans (Cost $3,261,975) | | 2,922,287 |
| | Principal | | Security Description | | Rate | | Maturity | | Value | |
| U.S. Government & Agency Obligations - 1.9% |
| U.S. Treasury Securities (g) - 1.9% |
| $ | 5,000,000 | | U.S. Treasury Bill (g) | 0.05 | % | 05/03/12 | $ | 4,999,746 |
| | 5,000,000 | | U.S. Treasury Bill (g) | 0.05 | | 05/24/12 | | 4,999,613 |
| | | 9,999,359 |
Total U.S. Government & Agency Obligations (Cost $9,999,387) | | 9,999,359 |
Total Fixed Income Securities (Cost $68,290,463) | | 73,181,731 |
| | Shares | | Security Description | | Value |
| Rights - 0.1% |
| | 142,161 | | Sanofi (a) | 191,917 |
Total Rights (Cost $177,186) | | 191,917 |
| Warrants - 1.4% |
| | 175,929 | | Bank of America Corp. (a) | 818,070 |
| | 113,527 | | General Motors Co. (a) | 1,887,954 |
| | 1,858,235 | | Kinder Morgan, Inc. (a) | 4,496,929 |
| | 176,463 | | Kinross Gold Corp. (a) | 113,225 |
Total Warrants (Cost $5,955,086) | | 7,316,178 |
| Investment Companies - 1.4% |
| | 17,955 | | Central GoldTrust (a)(b) | 1,144,631 |
| | 32,413 | | iShares Silver Trust (a)(b) | 1,016,796 |
| | 47,230 | | Market Vectors - Gold Miners ETF | 2,341,191 |
| | 23,152 | | Market Vectors Junior Gold Miners ETF | 568,382 |
| | 152,584 | | Sprott Physical Gold Trust (a) | 2,203,313 |
Total Investment Companies (Cost $7,391,353) | | 7,274,313 |
| | Principal | | Security Description | | Rate | | Maturity | | Value | |
| Short-Term Investments - 15.8% |
| Commercial Paper (g) - 15.8% |
| $ | 5,000,000 | | Airgas, Inc. | 0.50 | 05/21/12 | 4,996,528 |
| | 2,500,000 | | Bacardi Corp. | 0.45 | 04/25/12 | 2,499,250 |
| | 5,000,000 | | Clorox Co. | 0.42 | 04/12/12 | 4,999,358 |
| | 3,500,000 | | Devon Energy Corp. | 0.42 | 04/17/12 | 3,499,347 |
| | 1,500,000 | | Devon Energy Corp. | 0.45 | 05/14/12 | 1,499,194 |
| | 5,000,000 | | Diageo Capital PLC (b) | 0.48 | 05/24/12 | 4,996,467 |
| | 4,000,000 | | Duke Energy Corp. | 0.40 | 04/23/12 | 3,999,022 |
| | 4,800,000 | | Florida Power Corp. | 0.46 | 05/03/12 | 4,798,037 |
| | 3,500,000 | | Harris Corp. | 0.42 | 04/04/12 | 3,499,878 |
| | 5,000,000 | | Hewlett-Packard Co. (b) | 0.50 | 04/03/12 | 4,999,861 |
| | 650,000 | | Hewlett-Packard Co. | 0.45 | 04/09/12 | 649,935 |
| | 2,538,000 | | Kansas City Power & Light | 0.45 | 04/18/12 | 2,537,461 |
| | 3,200,000 | | NBC Universal Media, LLC | 0.38 | 04/26/12 | 3,199,156 |
See Notes to Financial Statements. 51 ABSOLUTE FUNDS
ABSOLUTE OPPORTUNITIES FUND
SCHEDULE OF INVESTMENTS
MARCH 31, 2012
| | Principal | | Security Description | | Rate | | Maturity | | Value | |
| $ | 3,230,000 | | Newell Rubbermaid, Inc. | 1.00 | % | 05/08/12 | $ | 3,226,680 |
| | 5,000,000 | | Reed Elsevier, Inc. (b) | 0.45 | | 04/16/12 | | 4,999,062 |
| | 2,500,000 | | Safeway, Inc. | 0.82 | | 04/03/12 | | 2,499,886 |
| | 2,500,000 | | Safeway, Inc. | 0.90 | | 04/09/12 | | 2,499,500 |
| | 3,000,000 | | South Carolina Electric & Gas | 0.45 | | 04/03/12 | | 2,999,925 |
| | 5,000,000 | | Tyco Electronics Group SA | 0.45 | | 04/09/12 | | 4,999,500 |
| | 5,000,000 | | VF Corp. | 0.48 | | 04/23/12 | | 4,998,533 |
| | 3,500,000 | | Virginia Electric Power | 0.40 | | 04/16/12 | | 3,499,417 |
| | 2,500,000 | | Western Union Co. | 0.42 | | 04/03/12 | | 2,499,942 |
| | 2,500,000 | | Western Union Co. | 0.43 | | 04/11/12 | | 2,499,701 |
Total Commercial Paper (Cost $80,895,640) | | 80,895,640 |
Total Short-Term Investments (Cost $80,895,640) | | 80,895,640 |
| | Contracts | | Security Description | | | Strike Price | | Exp. Date | | Value | |
| Purchased Options - 0.7% |
| Call Options Purchased - 0.1% |
| | 871 | | Goldcorp, Inc. | $ | 50.00 | 07/12 | 95,810 |
| | 2,061 | | Kinross Gold Corp. | | 14.00 | 05/12 | 8,244 |
| | 160 | | Kinross Gold Corp. | | 17.50 | 01/13 | 1,920 |
| | 518 | | Market Vectors - Gold Miners ETF | | 60.00 | 09/12 | 47,656 |
| | 704 | | Market Vectors - Gold Miners ETF | | 57.00 | 09/12 | 104,192 |
| | 463 | | Market Vectors - Gold Miners ETF | | 55.00 | 09/12 | 92,600 |
| | 293 | | Primo Water Corp. | | 7.50 | 04/12 | 293 |
| | 222 | | SPDR Gold Trust | | 170.00 | 04/12 | 7,104 |
| | 222 | | SPDR Gold Trust | | 175.00 | 09/12 | 81,252 |
Total Call Options Purchased (Premiums Paid $911,721) | | 439,071 |
| Put Options Purchased - 0.6% |
| | 117 | | Amazon.com, Inc. | 160.00 | 07/12 | 35,217 |
| | 58 | | Amazon.com, Inc. | 185.00 | 10/12 | 74,530 |
| | 144 | | Darden Restaurants, Inc. | 45.00 | 10/12 | 28,440 |
| | 782 | | Dollar Tree, Inc. | 77.50 | 08/12 | 62,560 |
| | 449 | | Energy Sector SPDR Fund | 66.00 | 01/13 | 185,886 |
| | 585 | | Harley-Davidson, Inc. | 43.00 | 08/12 | 95,940 |
| | 1,107 | | iShares Dow Jones U.S. Real Estate Index Fund | 53.00 | 06/12 | 34,871 |
| | 492 | | iShares Dow Jones U.S. Real Estate Index Fund | 55.00 | 09/12 | 67,158 |
| | 409 | | iShares MSCI Emerging Markets Index Fund | 42.00 | 04/12 | 24,540 |
| | Contracts | | Security Description | | | Strike Price | | Exp. Date | | Value | |
| | 408 | | iShares MSCI Emerging Markets Index Fund | $ | 40.00 | 05/12 | $ | 24,888 |
| | 1,356 | | iShares Russell 2000 Index Fund | | 75.00 | 08/12 | | 320,016 |
| | 1,012 | | iShares Russell 2000 Index Fund | | 73.00 | 11/12 | | 350,658 |
| | 103 | | JC Penney Co., Inc. | | 37.00 | 08/12 | | 42,745 |
| | 917 | | Ltd. Brands, Inc. | | 37.00 | 05/12 | | 9,170 |
| | 423 | | Ltd. Brands, Inc. | | 41.00 | 08/12 | | 42,300 |
| | 263 | | Monster Beverage Corp. | | 50.00 | 06/12 | | 11,835 |
| | 1,635 | | Powershares QQQ | | 66.00 | 04/12 | | 78,480 |
| | 818 | | Powershares QQQ | | 60.00 | 06/12 | | 40,082 |
| | 682 | | Powershares QQQ | | 60.00 | 09/12 | | 98,890 |
| | 77 | | Ralph Lauren Corp. | | 140.00 | 04/12 | | 770 |
| | 107 | | Salesforce.com, Inc. | | 130.00 | 08/12 | | 66,073 |
| | 295 | | Simon Property Group, Inc. REIT | | 120.00 | 10/12 | | 86,582 |
| | 1,159 | | Southern Copper Corp. | | 29.00 | 09/12 | | 231,800 |
| | 318 | | SPDR S&P Retail ETF | | 55.00 | 09/12 | | 64,395 |
| | 1,154 | | SPDR S&P Retail ETF | | 50.00 | 09/12 | | 121,170 |
| | 383 | | Target Corp. | | 50.00 | 04/12 | | 1,915 |
| | 2,032 | | Target Corp. | | 52.50 | 10/12 | | 363,728 |
| | 318 | | VF Corp. | | 120.00 | 08/12 | | 63,600 |
| | 934 | | Wells Fargo & Co. | | 28.00 | 10/12 | | 95,268 |
| | 492 | | Whole Foods Market, Inc. | | 75.00 | 08/12 | | 150,060 |
| | 819 | | Whole Foods Market, Inc. | | 65.00 | 08/12 | | 96,232 |
Total Put Options Purchased (Premiums Paid $5,487,314) | | 2,969,799 |
Total Purchased Options (Premiums Paid $6,399,035) | | 3,408,870 |
Total Long Positions - 72.4% (Cost $338,695,544)* | $ | 370,314,045 |
Total Short Positions - (22.1)% (Cost $(103,357,865))* | | (113,135,429 | ) |
Total Written Options - (0.0)% (Premiums Received $(266,154))* | | (254,860 | ) |
| Other Assets & Liabilities, Net – 49.7% | | | 253,997,173 |
| Net Assets – 100.0% | | $ | 510,920,929 |
See Notes to Financial Statements. 52 ABSOLUTE FUNDS
ABSOLUTE OPPORTUNITIES FUND
SCHEDULE OF SECURITIES SOLD SHORT
MARCH 31, 2012
AFA
| Shares | | Security Description | | Value |
| Short Positions - (22.1)% |
| Common Stock - (15.1)% |
| Consumer Discretionary - (6.9)% |
| | (89,695) | | American Axle & Manufacturing Holdings, Inc. | $ | (1,050,328) |
| | (55,222) | | Asbury Automotive Group, Inc. | | (1,490,994) |
| | (26,102) | | Autoliv, Inc. | | (1,750,139) |
| | (9,120) | | AutoNation, Inc. | | (312,907) |
| | (56,087) | | BJ's Restaurants, Inc. | | (2,823,981) |
| | (27,686) | | Brinker International, Inc. | | (762,749) |
| | (16,891) | | Buffalo Wild Wings, Inc. | | (1,531,845) |
| | (14,525) | | Dillard's, Inc., Class A | | (915,366) |
| | (12,160) | | Dollar Tree, Inc. | | (1,148,998) |
| | (47,698) | | Group 1 Automotive, Inc. | | (2,679,197) |
| | (88,951) | | Hanesbrands, Inc. | | (2,627,613) |
| | (32,355) | | Harley-Davidson, Inc. | | (1,587,983) |
| | (13,723) | | JC Penney Co., Inc. | | (486,206) |
| | (26,750) | | Ltd. Brands, Inc. | | (1,284,000) |
| | (34,552) | | Lululemon Athletica, Inc. | | (2,580,343) |
| | (3,544) | | Maidenform Brands, Inc. | | (79,775) |
| | (59,848) | | Penske Auto Group, Inc. | | (1,474,056) |
| | (26,693) | | PVH Corp. | | (2,384,486) |
| | (11,500) | | Ralph Lauren Corp. | | (2,004,795) |
| | (30,603) | | Six Flags Entertainment Corp. | | (1,431,302) |
| | (20,125) | | Tenneco, Inc. | | (747,644) |
| | (31,681) | | The McClatchy Co., Class A | | (91,558) |
| | (90,007) | | Titan International, Inc. | | (2,128,666) |
| | (14,758) | | TRW Automotive Holdings Corp. | | (685,509) |
| | (11,274) | | Under Armour, Inc., Class A | | (1,059,756) |
| | | | | | (35,120,196) |
| Consumer Staples - (1.2)% |
| | (64,094) | | Avon Products, Inc. | | (1,240,860) |
| | (19,144) | | Diamond Foods, Inc. | | (436,866) |
| | (17,013) | | Green Mountain Coffee Roasters, Inc. | | (796,889) |
| | (23,782) | | Monster Beverage Corp. | | (1,476,624) |
| | (13,893) | | Ritchie Bros. Auctioneers, Inc. | | (330,098) |
| | (5,646) | | Sanderson Farms, Inc. | | (299,408) |
| | (88,693) | | Serco Group PLC | | (769,615) |
| | (12,225) | | Whole Foods Market, Inc. | | (1,017,120) |
| | | | | | (6,367,480) |
| Energy - (0.3)% |
| | (10,773) | | InterOil Corp. | | (553,840) |
| | (37,981) | | Northern Oil and Gas, Inc. | | (787,726) |
| | | | | | (1,341,566) |
| Financial - (1.2)% |
| | (15,547) | | Digital Realty Trust, Inc. REIT | | (1,150,011) |
| | (10,998) | | Simon Property Group, Inc. REIT | | (1,602,189) |
| | (56,300) | | The Macerich Co. REIT | | (3,251,325) |
| | | | | | (6,003,525) |
| Industrial - (3.5)% |
| | (7,005) | | BorgWarner, Inc. | (590,802) |
| | (78,737) | | Bristow Group, Inc. | (3,758,117) |
| | (2,044) | | Caterpillar, Inc. | (217,727) |
| | (8,362) | | CNH Global NV | (331,971) |
| | (73,352) | | General Electric Co. | (1,472,175) |
| | (65,597) | | IMI PLC | (1,020,371) |
| | (24,379) | | Legrand SA | (897,069) |
| | (13,761) | | Nexans SA | (928,847) |
| Shares | | Security Description | | Value |
| | | | | | |
| | (14,200) | | Nordson Corp. | $ | (774,042) |
| | (61,507) | | Old Dominion Freight Line, Inc. | | (2,932,039) |
| | (48,100) | | Rexel SA | | (1,060,094) |
| | (32,833) | | Sensata Technologies Holding NV | | (1,099,249) |
| | (42,865) | | SKF AB, Class B | | (1,046,389) |
| | (30,044) | | TAL International Group, Inc. | | (1,102,915) |
| | (2,730) | | Texas Industries, Inc. | | (95,577) |
| | (8,175) | | United Technologies Corp. | | (678,034) |
| | | | | | (18,005,418) |
| Information Technology - (0.5)% |
| | (17,609) | | Salesforce.com, Inc. | (2,720,767) |
| Materials - (1.2)% |
| | (8,828) | | Air Liquide SA | | (1,176,919) |
| | (2,911) | | Clearwater Paper Corp. | | (96,674) |
| | (22,828) | | Cliffs Natural Resources, Inc. | | (1,581,067) |
| | (289,338) | | Fortescue Metals Group, Ltd. | | (1,741,319) |
| | (55,012) | | Southern Copper Corp. | | (1,744,431) |
| | | | | | (6,340,410) |
| Telecommunication Services - (0.3)% |
| | (7,402) | | Amazon.com, Inc. | | (1,498,979) |
| | (57,245) | | Promotora de Informaciones SA, Class A | | (43,518) |
| | | | | | (1,542,497) |
Total Common Stock (Cost $(69,666,610)) | | (77,441,859) |
| | Principal | | Security Description | | Rate | | Maturity | | Value | |
| Fixed Income Securities - (4.3)% |
| Corporate Non-Convertible Bonds - (3.6)% |
| Consumer Discretionary - (2.6)% |
| $ | (578,000) | | Hanesbrands, Inc. | 6.38 | % | 12/15/20 | $ | (596,785) |
| | (500,000) | | Isle of Capri Casinos, Inc. | 7.00 | | 03/01/14 | | (500,000) |
| | (2,737,000) | | Levi Strauss & Co. | 7.63 | | 05/15/20 | | (2,908,062) |
| | (500,000) | | MGM Resorts International | 7.63 | | 01/15/17 | | (518,750) |
| | (1,851,000) | | Pinnacle Entertainment, Inc. | 8.75 | | 05/15/20 | | (2,031,473) |
| | (5,275,000) | | PVH Corp. | 7.38 | | 05/15/20 | | (5,842,062) |
| | (557,000) | | Quiksilver, Inc. | 6.88 | | 04/15/15 | | (562,570) |
| | | | | | | | | (12,959,702) |
| Consumer Staples - (0.3)% |
| | (1,548,000) | | SUPERVALU, Inc. | 8.00 | 05/01/16 | (1,629,270) |
| Materials - (0.5)% |
| | (2,000,000) | | The Dow Chemical Co. | 7.38 | 11/01/29 | (2,597,372) |
See Notes to Financial Statements. 53 ABSOLUTE FUNDS
ABSOLUTE OPPORTUNITIES FUND
SCHEDULE OF SECURITIES SOLD SHORT
MARCH 31, 2012
| | Principal | | Security Description | | Rate | | Maturity | | Value | |
| Telecommunication Services - (0.2)% |
| $ | (1,077,000) | | Univision Communications, Inc. | 8.50 | % | 05/15/21 | $ | (1,071,615) |
Total Corporate Non-Convertible Bonds (Cost $(17,076,884)) | | (18,257,959) |
| U.S. Treasury Securities - (0.7)% |
| | (3,000,000) | | U.S. Treasury Bond | 4.38 | 05/15/40 | (3,605,625) |
Total U.S. Treasury Securities (Cost $(3,176,124)) | | (3,605,625) |
Total Fixed Income Securities (Cost $(20,253,008)) | | (21,863,584) |
| Shares | | Security Description | | Value |
| Investment Companies - (2.7)% |
| | (37,228) | | Eaton Vance Senior Floating-Rate Trust | | (567,355) |
| | (20,830) | | iShares iBoxx $ High Yield Corporate Bond Fund | | (1,892,197) |
| | (21,471) | | iShares Russell 2000 Index Fund | | (1,778,872) |
| | (26,556) | | SPDR KBW Regional Banking ETF | | (756,049) |
| | (2,173) | | SPDR S&P 500 ETF Trust | | (305,785) |
| | (149,881) | | SPDR S&P Oil & Gas Exploration & Production ETF | | (8,529,728) |
| | | |
Total Investment Companies (Cost $(13,438,247)) | | (13,829,986) |
Total Short Positions - (22.1)% (Cost $(103,357,865)) | $ | (113,135,429) |
See Notes to Financial Statements. 54 ABSOLUTE FUNDS
ABSOLUTE OPPORTUNITIES FUND
SCHEDULE OF CALL AND PUT OPTIONS WRITTEN
MARCH 31, 2012
| Contracts | | Security Description | | | Strike Price | | Exp. Date | | Value |
| Call Options Written - (0.0)% |
| (2,330) | | Kinder Morgan, Inc. | | $ | 40.00 | | 06/12 | $ | (151,450) |
Total Call Options Written (Premiums Received $(150,248)) | (151,450) |
| Put Options Written - (0.0)% |
| (383) | | Kinder Morgan, Inc. | | | 35.00 | | 06/12 | | (103,410) |
Total Put Options Written (Premiums Received $(115,906)) | | (103,410) |
Total Written Options - (0.0)% (Premiums Received $(266,154)) | $ | (254,860) |
See Notes to Financial Statements. 55 ABSOLUTE FUNDS
ABSOLUTE OPPORTUNITIES FUND
NOTES TO SCHEDULE OF INVESTMENTS, SECURITIES SOLD SHORT AND CALL AND PUT OPTIONS WRITTEN
MARCH 31, 2012
| ADR | American Depositary Receipt |
| ETF | Exchange Traded Fund |
| LLC | Limited Liability Company |
| LP | Limited Partnership |
| MTN | Medium Term Note |
| PLC | Public Limited Company |
| REIT | Real Estate Investment Trust |
| (a) | Non-income producing security. |
| (b) | All or a portion of this security is held as collateral for securities sold short. |
| (c) | Security fair valued in accordance with procedures adopted by the Board of Trustees. At the period end, the value of these securities amounted to $7,444,810 or 1.5% of net assets. |
| (d) | Security exempt from registration under Rule 144A under the Securities Act of 1933. At the period end, the value of these securities amounted to $10,761,776 or 2.1% of net assets. |
| (e) | Security is currently in default and is on scheduled interest or principal payment. |
| (f) | Variable rate security. Rate presented is as of March 31, 2012. |
| (g) | Rate presented is yield to maturity. |
A summary of outstanding credit default swap agreements held by the Fund at March 31, 2012, is as follows:
Credit Default Swaps – Buy Protection
| Counterparty | | Reference Entity / Obligation | | Pay Rate | | Termination Date | | Credit Spread as of 03/31/12(1) | | | Notional Amount | | | Net Unrealized Appreciation (Depreciation) |
Barclays Capital, Inc. | | Beam, Inc., 5.38%, 01/15/16 | | (1.00 | )% | | 06/20/17 | | 0.48 | % | | $ | 10,000,000 | | $ | (50,350 | ) |
Barclays Capital, Inc. | | Capital One Financial Corp., 5.25%, 02/21/17 | | (1.00 | ) | | 06/20/17 | | 1.12 | | | | 10,000,000 | | | (59,374 | ) |
Deutsche Bank | | Capital One Financial Corp., 5.25%, 02/21/17 | | (1.00 | ) | | 06/20/17 | | 1.12 | | | | 10,000,000 | | | (64,371 | ) |
Deutsche Bank | | Carnival Corp., 6.65%, 01/15/28 | | (1.00 | ) | | 06/20/17 | | 1.48 | | | | 15,000,000 | | | (17,995 | ) |
| Citigroup Global Markets, Inc. | | Carnival Corp., 6.65%, 01/15/28 | | (1.00 | ) | | 12/20/17 | | 1.55 | | | | 5,000,000 | | | (53,621 | ) |
| Citigroup Global Markets, Inc. | | Carnival Corp., 6.65%, 02/25/28 | | (1.00 | ) | | 09/20/17 | | 1.52 | | | | 10,000,000 | | | (103,445 | ) |
Deutsche Bank | | ConAgra Foods, Inc., 7.00%, 10/01/28 | | (1.00 | ) | | 06/20/17 | | 0.55 | | | | 15,000,000 | | | (36,470 | ) |
Deutsche Bank | | Darden Restaurants, Inc., 6.00%, 08/15/35 | | (1.00 | ) | | 09/20/17 | | 1.00 | | | | 5,000,000 | | | (7,484 | ) |
| Citigroup Global Markets, Inc. | | Darden Restaurants, Inc., 6.00%, 08/15/35 | | (1.00 | ) | | 09/20/17 | | 1.00 | | | | 10,000,000 | | | (14,940 | ) |
Barclays Capital, Inc. | | Eastman Chemical Co., 7.60%, 02/01/27 | | (1.00 | ) | | 06/20/17 | | 0.81 | | | | 15,000,000 | | | (318,295 | ) |
Barclays Capital, Inc. | | Kimco Realty Corp., 5.98%, 07/30/12 | | (1.00 | ) | | 06/20/17 | | 1.36 | | | | 20,000,000 | | | (251,211 | ) |
| Citigroup Global Markets, Inc. | | Kimco Realty Corp., 5.98%, 07/30/12 | | (1.00 | ) | | 09/20/17 | | 1.39 | | | | 5,000,000 | | | (3,407 | ) |
| BNP Paribas Securities Corp. | | Kohl's Corp., 6.25%, 12/15/17 | | (1.00 | ) | | 06/20/17 | | 1.58 | | | | 10,000,000 | | | 318,931 | |
Deutsche Bank | | Koninklijke DSM, 4.00%, 11/10/15 | | (1.00 | ) | | 12/20/17 | | 0.53 | | | | 10,000,000 | | | (216,262 | ) |
Deutsche Bank | | Lowe's Cos., Inc., 5.40%, 10/15/16 | | (1.00 | ) | | 03/20/18 | | 0.67 | | | | 10,000,000 | | | (106,969 | ) |
Deutsche Bank | | Lowe's Cos., Inc., 5.40%, 10/15/16 | | (1.00 | ) | | 09/20/17 | | 0.62 | | | | 5,000,000 | | | (102,429 | ) |
Barclays Capital, Inc. | | Macy's Retail Holdings, Inc., 7.45%, 07/15/17 | | (1.00 | ) | | 12/20/17 | | 1.19 | | | | 10,000,000 | | | (23,410 | ) |
| BNP Paribas Securities Corp. | | Macy's Retail Holdings, Inc., 7.45%, 07/15/17 | | (1.00 | ) | | 09/20/17 | | 1.15 | | | | 5,000,000 | | | (24,263 | ) |
Barclays Capital, Inc. | | Marriott International, Inc., 5.81%, 11/10/15 | | (1.00 | ) | | 12/20/17 | | 0.93 | | | | 5,000,000 | | | (150,503 | ) |
| RBS Securities, Inc. | | Marriott International, Inc., 5.81%, 11/10/15 | | (1.00 | ) | | 06/20/17 | | 0.85 | | | | 5,000,000 | | | (166,692 | ) |
Barclays Capital, Inc. | | Marriott International, Inc., 5.81%, 11/10/15 | | (1.00 | ) | | 09/20/17 | | 0.89 | | | | 5,000,000 | | | (36,789 | ) |
See Notes to Financial Statements. 56 ABSOLUTE FUNDS
ABSOLUTE OPPORTUNITIES FUND
NOTES TO SCHEDULE OF INVESTMENTS, SECURITIES SOLD SHORT AND CALL AND PUT OPTIONS WRITTEN
MARCH 31, 2012
| Counterparty | | Reference Entity / Obligation | | Pay Rate | | Termination Date | | Credit Spread as of 03/31/12(1) | | | Notional Amount | | | Net Unrealized Appreciation (Depreciation) |
| Citigroup Global Markets, Inc. | | Marriott International, Inc., 5.81%, 11/10/15 | | (1.00 | )% | | 09/20/17 | | 0.89 | % | | $ | 5,000,000 | | $ | (21,298 | ) |
Deutsche Bank | | Nordstrom, Inc., 6.95%, 03/15/28 | | (1.00 | ) | | 06/20/17 | | 0.77 | | | | 10,000,000 | | | (66,979 | ) |
Barclays Capital, Inc. | | Nordstrom, Inc., 6.95%, 03/15/28 | | (1.00 | ) | | 03/02/18 | | 0.86 | | | | 5,000,000 | | | (55,427 | ) |
| BNP Paribas Securities Corp. | | Nordstrom, Inc., 6.95%, 03/15/28 | | (1.00 | ) | | 09/20/17 | | 0.80 | | | | 5,000,000 | | | (78,270 | ) |
| Citigroup Global Markets, Inc. | | Nordstrom, Inc., 6.95%, 03/15/28 | | (1.00 | ) | | 09/20/17 | | 0.80 | | | | 5,000,000 | | | (17,007 | ) |
| BNP Paribas Securities Corp. | | Southwest Airlines Co., 5.25%, 10/01/14 | | (1.00 | ) | | 06/20/17 | | 1.65 | | | | 5,000,000 | | | 47,089 | |
Barclays Capital, Inc. | | Southwest Airlines Co., 5.25%, 10/01/14 | | (1.00 | ) | | 06/20/17 | | 1.65 | | | | 5,000,000 | | | 60,026 | |
Deutsche Bank | | Southwest Airlines Co., 5.25%, 10/01/14 | | (1.00 | ) | | 06/20/17 | | 1.65 | | | | 15,000,000 | | | 18,040 | |
| Citigroup Global Markets, Inc. | | Starwood Hotels & Resorts Worldwide Inc., 6.75%, 05/15/18 | | (1.00 | ) | | 09/20/17 | | 1.18 | | | | 5,000,000 | | | (14,455 | ) |
Deutsche Bank | | Starwood Hotels & Resorts Worldwide Inc., 6.75%, 05/15/18 | | (1.00 | ) | | 06/20/12 | | 1.16 | | | | 10,000,000 | | | (38,548 | ) |
Barclays Capital, Inc. | | Starwood Hotels & Resorts Worldwide Inc., 6.75%, 05/15/18 | | (1.00 | ) | | 12/20/17 | | 1.22 | | | | 5,000,000 | | | (42,496 | ) |
| | | | | | | | | | | | | | | | $ | (1,698,674 | ) |
F
| | (1) Credit spreads are an indication of the seller’s performance risk, related to the likelihood of a credit event occurring that would require a seller to make payment to a buyer. Credit spreads are used to determine the value of swap contracts and reflect the cost of buying/selling protection, which may include upfront payments made to enter into the contract. |
AFA
| | At March 31, 2012, the Fund held the following futures contracts: |
| Contracts | | Type | | Expiration Date | | Notional Contract Value | | Net Unrealized Depreciation |
| (150 | ) | | Euro FX Currency Future | | 06/20/12 | | $ | (24,521,588 | ) | | $ | (489,038 | ) |
| (60110 | ) | | Russell 2000 Mini Future | | 06/15/12 | | | (47,866,950 | ) | | | (1,795,050 | ) |
| (250 | ) | | S&P 500 Emini Future | | 06/15/12 | | | (16,900,375 | ) | | | (640,250 | ) |
| | | | | | | | $ | (89,288,913 | ) | | $ | (2,924,338 | ) |
AFA
| | * Cost for federal income tax purposes is $241,853,608 and net unrealized appreciation consists of: |
| Gross Unrealized Appreciation | | $ | 45,351,318 | |
| Gross Unrealized Depreciation | | | (30,281,170 | ) |
| Net Unrealized Appreciation | | $ | 15,070,148 | |
See Notes to Financial Statements. 57 ABSOLUTE FUNDS
ABSOLUTE OPPORTUNITIES FUND
NOTES TO SCHEDULE OF INVESTMENTS, SECURITIES SOLD SHORT AND CALL AND PUT OPTIONS WRITTEN
MARCH 31, 2012
The following is a summary of the inputs used to value the Fund’s investments and other financial instruments and liabilities as of March 31, 2012.
The inputs or methodology used for valuing securities are not necessarily an indication of the risks associated with investing in those securities. For more information on valuation inputs, and their aggregation into the levels used in the tables below, please refer to the Security Valuation section in Note 2 of the accompanying Notes to Financial Statements.
| | Level 1 | | Level 2 | | Level 3 | | Total |
| Assets |
| Investments At Value |
| Common Stock | | | | | | | | | | | | | | | | |
| Consumer Discretionary | | $ | 27,539,013 | | | $ | - | | | $ | - | | | $ | 27,539,013 | |
| Consumer Staples | | | 15,440,262 | | | | - | | | | - | | | | 15,440,262 | |
| Energy | | | 60,097,389 | | | | - | | | | - | | | | 60,097,389 | |
| Financial | | | 19,636,277 | | | | - | | | | 696,417 | | | | 20,332,694 | |
| Healthcare | | | 798,158 | | | | - | | | | - | | | | 798,158 | |
| Industrial | | | 17,549,753 | | | | - | | | | - | | | | 17,549,753 | |
| Information Technology | | | 1,362,849 | | | | - | | | | - | | | | 1,362,849 | |
| Materials | | | 25,406,830 | | | | - | | | | - | | | | 25,406,830 | |
| Telecommunication Services | | | 25,046,742 | | | | - | | | | - | | | | 25,046,742 | |
| Preferred Stock | | | | | | | | | | | | | | | | |
| Consumer Discretionary | | | 4,384,206 | | | | - | | | | 87,500 | | | | 4,471,706 | |
| Asset Backed Obligations | | | - | | | | 3,681,597 | | | | - | | | | 3,681,597 | |
| Corporate Convertible Bonds | | | - | | | | 21,693,390 | | | | 1,871,580 | | | | 23,564,970 | |
| Corporate Non-Convertible Bonds | | | - | | | | 28,224,205 | | | | 4,789,313 | | | | 33,013,518 | |
| Syndicated Loans | | | - | | | | 2,922,287 | | | | - | | | | 2,922,287 | |
| U.S. Government & Agency Obligations | | | - | | | | 9,999,359 | | | | - | | | | 9,999,359 | |
| Rights | | | 191,917 | | | | - | | | | - | | | | 191,917 | |
| Warrants | | | 7,316,178 | | | | - | | | | - | | | | 7,316,178 | |
| Investment Companies | | | 7,274,313 | | | | - | | | | - | | | | 7,274,313 | |
| Commercial Paper | | | - | | | | 80,895,640 | | | | - | | | | 80,895,640 | |
| Purchased Options | | | 3,408,870 | | | | - | | | | - | | | | 3,408,870 | |
| Total Investments At Value | | $ | 215,452,757 | | | $ | 147,416,478 | | | $ | 7,444,810 | | | $ | 370,314,045 | |
| Other Financial Instruments** | | | | | | | | | | | | | | | | |
| Credit Default Swaps | | | - | | | | 444,086 | | | | - | | | | 444,086 | |
| Total Assets | | $ | 215,452,757 | | | $ | 147,860,564 | | | $ | 7,444,810 | | | $ | 370,758,131 | |
| Common Stock | | | (77,441,859 | ) | | | - | | | | - | | | | (77,441,859 | ) |
| Corporate Non-Convertible Bonds | | | - | | | | (18,257,959 | ) | | | - | | | | (18,257,959 | ) |
| U.S. Treasury Securities | | | - | | | | (3,605,625 | ) | | | - | | | | (3,605,625 | ) |
| Investment Companies | | | (13,829,986 | ) | | | - | | | | - | | | | (13,829,986 | ) |
| Total Securities Sold Short | | $ | (91,271,845 | ) | | $ | (21,863,584 | ) | | $ | - | | | $ | (113,135,429 | ) |
| Other Financial Instruments** |
| Written Options | | | (254,860 | ) | | | - | | | | - | | | | (254,860 | ) |
| Futures | | | (2,924,337 | ) | | | - | | | | - | | | | (2,924,337 | ) |
| Credit Default Swaps | | | - | | | | (2,142,760 | ) | | | - | | | | (2,142,760 | ) |
| Total Other Financial Instruments | | $ | (3,179,197 | ) | | $ | (2,142,760 | ) | | $ | - | | | $ | (5,321,957 | ) |
| Total Liabilities | | $ | (94,451,042 | ) | | $ | (24,006,344 | ) | | $ | - | | | $ | (118,457,386 | ) |
| | ** Other Financial Instruments are derivative instruments not reflected in the Schedule of Investments and Schedule of Securities Sold Short such as futures and credit default swaps, which are valued at the unrealized appreciation (depreciation) of the instrument. Written options are reported at their market value at year end. |
See Notes to Financial Statements. 58 ABSOLUTE FUNDS
ABSOLUTE OPPORTUNITIES FUND
NOTES TO SCHEDULE OF INVESTMENTS, SECURITIES SOLD SHORT AND CALL AND PUT OPTIONS WRITTEN
MARCH 31, 2012
The following is a reconciliation of Level 3 investments for which significant unobservable inputs were used to determine fair value.
| | | Common Stock | | Preferred Stock | | Asset Backed Obligations | | Corporate Convertible Bonds | | Corporate Non-Convertible Bonds |
| | | | | | | | | | | | | | | | | | | | | |
| Balance as of 03/31/11 | | $ | - | | | $ | - | | | $ | 264,546 | | | $ | - | | | $ | - | |
| Accrued Accretion / (Amortization) | | | - | | | | - | | | | (601 | ) | | | - | | | | - | |
| Realized Gain / (Loss) | | | - | | | | - | | | | 13,177 | | | | - | | | | - | |
| Change in Unrealized Appreciation / (Depreciation) | | | - | | | | - | | | | (17,183 | ) | | | - | | | | - | |
| Purchases | | | - | | | | - | | | | 53,308 | | | | - | | | | - | |
| Sales | | | - | | | | - | | | | (313,247 | ) | | | - | | | | - | |
| Transfers In / (Out) | | | 696,417 | | | | 87,500 | | | | - | | | | 1,871,580 | | | | 4,789,313 | |
| Balance as of 03/31/12 | | $ | 696,417 | | | $ | 87,500 | | | $ | - | | | $ | 1,871,580 | | | $ | 4,789,313 | |
| Net change in unrealized appreciation / (depreciation) from investments held as of 03/31/12*** | | $ | 192,342 | | | $ | 87,500 | | | $ | - | | | $ | (526,412 | ) | | $ | (1,214,760 | ) |
| | *** The change in unrealized appreciation/(depreciation) is included in net change in unrealized appreciation/(depreciation) of investments in the accompanying Statement of Operations. |
The Fund utilizes the end of period methodology when determining transfers in or out of the level 3 category.
See Notes to Financial Statements. 59 ABSOLUTE FUNDS
ABSOLUTE FUNDS
STATEMENTS OF ASSETS AND LIABILITIES
MARCH 31, 2012
| | | | | | ABSOLUTE STRATEGIES FUND | | | | ABSOLUTE OPPORTUNITIES FUND | |
| ASSETS | | | | | | | | |
| | Total investments, at value (Cost $2,789,112,367 and $338,695,544, respectively) | $ | 3,251,016,343 | | | $ | 370,314,045 | |
| | Deposits with brokers | | | 1,536,678,055 | | | | 117,951,422 | |
| | Cash | | | 769,522,332 | | | | 143,545,806 | |
| | Foreign currency (Cost $0 and $3,720,321, respectively) | | | - | | | | 3,742,905 | |
| | Receivables: | | | | | | | | |
| | | Fund shares sold | | | 13,038,237 | | | | 2,111,565 | |
| | | Investment securities sold | | | 24,039,553 | | | | 10,602,040 | |
| | | Dividends and interest | | | 12,912,140 | | | | 818,098 | |
| | | Variation margin | | | 1,875,859 | | | | 174,000 | |
| | Swap premiums paid | | | - | | | | 3,405,234 | |
| | Unrealized gain on swap agreements | | | - | | | | 444,086 | |
| | Prepaid expenses | | | 56,931 | | | | 19,744 | |
| Total Assets | | | 5,609,139,450 | | | | 653,128,945 | |
| | | | | | | | | | | |
| LIABILITIES | | | | | | | | |
| | Swap premiums received | | | 1,440,645 | | | | 754,926 | |
| | Unrealized loss on swap agreements | | | 19,577 | | | | 2,142,760 | |
| | Unrealized loss on forward currency contracts | | | 92,516 | | | | - | |
| | Payables: | | | | | | | | |
| | | Securities sold short, at value (Cost $1,440,619,198 and $103,357,865, respectively) | | | 1,512,492,121 | | | | 113,135,429 | |
| | | Call options written, at value (Premiums received $4,249,484 and $150,248, respectively) | | | 5,170,375 | | | | 151,450 | |
| | | Put options written, at value (Premiums received $27,395,810 and $115,906, respectively) | | | 14,857,698 | | | | 103,410 | |
| | | Investment securities purchased | | | 36,678,113 | | | | 23,351,532 | |
| | | Fund shares redeemed | | | 2,890,050 | | | | 475,916 | |
| | | Dividends and interest on securities sold short | | | 1,992,998 | | | | 551,930 | |
| | | Variation margin | | | 1,290,611 | | | | 150,625 | |
| | | Due to broker | | | 42,824,464 | | | | - | |
| | | Other | | | 31,645 | | | | 62,379 | |
| | Accrued Liabilities: | | | | | | | | |
| | | Investment adviser fees | | | 5,338,317 | | | | 1,161,353 | |
| | | Fund services fees | | | 301,771 | | | | 63,902 | |
| | | Compliance services fees | | | 5,640 | | | | 2,277 | |
| | | Other expenses | | | 280,479 | | | | 100,127 | |
| Total Liabilities | | | 1,625,707,020 | | | | 142,208,016 | |
| | | | | | | | | | | |
| NET ASSETS | | $ | 3,983,432,430 | | | $ | 510,920,929 | |
| | | | | | | | | | | |
See Notes to Financial Statements. 60 ABSOLUTE FUNDS
ABSOLUTE FUNDS
STATEMENTS OF ASSETS AND LIABILITIES
MARCH 31, 2012
| | | | ABSOLUTE STRATEGIES FUND | | | | ABSOLUTE OPPORTUNITIES FUND | |
| COMPONENTS OF NET ASSETS | | | | | | | | |
| | Paid-in capital | | $ | 3,816,231,181 | | | $ | 516,299,427 | |
| | Distributions in excess of net investment income | | | (2,264,949 | ) | | | (5,754,823 | ) |
| | Accumulated net realized loss | | | (208,530,617 | ) | | | (16,874,588 | ) |
| | Net unrealized appreciation | | | 377,996,815 | | | | 17,250,913 | |
| NET ASSETS | | $ | 3,983,432,430 | | | $ | 510,920,929 | |
| | | | | | | | | | | |
| SHARES OF BENEFICIAL INTEREST AT NO PAR VALUE (UNLIMITED SHARES AUTHORIZED) | | | | | | | | |
| | Institutional Shares | | | 350,699,420 | | | | 44,092,875 | |
| | R Shares | | | 8,495,290 | | | | - | |
| | | | | | | | | | | |
| NET ASSET VALUE, OFFERING AND REDEMPTION PRICE PER SHARE | | | | | | | | |
| | Institutional Shares (based on net assets of $3,889,319,030 and $510,920,929, respectively) | | $ | 11.09 | | | $ | 11.59 | |
| | R Shares (based on net assets of $94,113,400 and $0, respectively) | | $ | 11.08 | | | $ | - | |
See Notes to Financial Statements. 61 ABSOLUTE FUNDS
ABSOLUTE FUNDS
STATEMENTS OF OPERATIONS
YEAR ENDED MARCH 31, 2012
| | | | | | ABSOLUTE STRATEGIES FUND | | | | ABSOLUTE OPPORTUNITIES FUND | | |
| INVESTMENT INCOME | | | | | | | | | |
| | Dividend income (Net of foreign withholding taxes of $184,524 and $84,915, respectively) | | $ | 38,229,994 | | | $ | 2,789,713 | | |
| | Interest income | | | 24,948,947 | | | | 5,206,489 | | |
| Total Investment Income | | | 63,178,941 | | | | 7,996,202 | | |
| | | | | | | | | | |
| EXPENSES | | | | | | | | | |
| | Investment adviser fees | | | 57,404,685 | | | | 15,294,379 | | |
| | Fund services fees | | | 1,158,074 | | | | 227,715 | | |
| | Transfer agent fees: | | | | | | | | | |
| | Institutional Shares | | | 1,706,268 | | | | 360,859 | | |
| | R Shares | | | 195,374 | | | | - | | |
| | Distribution fees: | | | | | | | | | |
| | R Shares | | | 245,742 | | | | - | | |
| | Custodian fees | | | 511,247 | | | | 306,007 | | |
| | Registration fees: | | | | | | | | | |
| | Institutional Shares | | | 143,339 | | | | 47,259 | | |
| | R Shares | | | 21,909 | | | | - | | |
| | Professional fees | | | 171,715 | | | | 106,719 | | |
| | Trustees' fees and expenses | | | 120,333 | | | | 19,127 | | |
| | Compliance services fees | | | 68,732 | | | | 27,006 | | |
| | Dividend and interest expense on securities sold short | | | 22,647,452 | | | | 2,376,647 | | |
| | Interest expense | | | 7,610,998 | | | | 998,020 | | |
| | Miscellaneous expenses | | | 431,791 | | | | 105,003 | | |
| Total Expenses | | | 92,437,659 | | | | 19,868,741 | | |
| | Fees waived and expenses reimbursed | | | - | | | | (87,404 | ) | |
| Net Expenses | | | 92,437,659 | | | | 19,781,337 | | |
| | | | | | | | | | | | |
| NET INVESTMENT LOSS | | | (29,258,718 | ) | | | (11,785,135 | ) | |
| | | | | | | | | | | | |
| NET REALIZED AND UNREALIZED GAIN (LOSS) | | | | | | | | | |
| | Net realized gain (loss) on: | | | | | | | | | |
| | Investments | | | 59,166,585 | | | | 10,600,702 | | |
| | Foreign currency transactions | | | 12,266 | | | | (220,871 | ) | |
| | Futures | | | 11,067,813 | | | | 2,120,199 | | |
| | Securities sold short | | | (100,834,561 | ) | | | (7,106,343 | ) | |
| | Written options | | | 28,613,330 | | | | (2,043,110 | ) | |
| | Swaps | | | 129,732 | | | | (890,252 | ) | |
| | Net realized gain (loss) | | | (1,844,835 | ) | | | 2,460,325 | | |
See Notes to Financial Statements. 62 ABSOLUTE FUNDS
ABSOLUTE FUNDS
STATEMENTS OF OPERATIONS
YEAR ENDED MARCH 31, 2012
| | | | | ABSOLUTE STRATEGIES FUND | | | | ABSOLUTE OPPORTUNITIES FUND | | |
| | Net change in unrealized appreciation (depreciation) on: | | | | | | | | | |
| | Investments | | $ | 84,275,704 | | | $ | (9,371,152 | ) | |
| | Foreign currency translations | | | (82,560 | ) | | | (11,010 | ) | |
| | Futures | | | (8,433,005 | ) | | | (1,065,838 | ) | |
| | Securities sold short | | | 67,261,969 | | | | (1,778,990 | ) | |
| | Written options | | | 3,926,103 | | | | (372,640 | ) | |
| | Swaps | | | (313,754 | ) | | | (904,879 | ) | |
| | Net change in unrealized appreciation (depreciation) | | | 146,634,457 | | | | (13,504,509 | ) | |
| NET REALIZED AND UNREALIZED GAIN (LOSS) | | | 144,789,622 | | | | (11,044,184 | ) | |
| INCREASE (DECREASE) IN NET ASSETS FROM OPERATIONS | | $ | 115,530,904 | | | $ | (22,829,319 | ) | |
| | | | | | | | | | | | |
See Notes to Financial Statements. 63 ABSOLUTE FUNDS
ABSOLUTE FUNDS
STATEMENTS OF CHANGES IN NET ASSETS
| | | ABSOLUTE STRATEGIES FUND | | ABSOLUTE OPPORTUNITIES FUND |
| | | | | | | | | | | | | |
| | | | | | Shares | | | | | | Shares | |
| NET ASSETS MARCH 31, 2010 | | $ | 2,210,108,765 | | | | | $ | 285,638,742 | | | |
| | | | | | | | | | | | | |
| OPERATIONS | | | | | | | | | | | | |
| Net investment loss | | | (6,412,112 | ) | | | | | (4,337,257 | ) | | |
| Net realized gain (loss) | | | (21,221,572 | ) | | | | | 16,631,169 | | | |
| Net change in unrealized appreciation (depreciation) | | | 76,667,074 | | | | | | 12,499,902 | | | |
| Increase in Net Assets Resulting from Operations | | | 49,033,390 | | | | | | 24,793,814 | | | |
| | | | | | | | | | | | | |
| DISTRIBUTIONS TO SHAREHOLDERS FROM | | | | | | | | | | | | |
| Net investment income: | | | | | | | | | | | | |
| Institutional Shares | | | (11,911,986 | ) | | | | | - | | | |
| R Shares | | | (90,854 | ) | | | | | - | | | |
| Net realized gain | | | - | | | | | | (6,614,816 | ) | | |
| Total Distributions to Shareholders | | | (12,002,840 | ) | | | | | (6,614,816 | ) | | |
| | | | | | | | | | | | | |
| CAPITAL SHARE TRANSACTIONS | | | | | | | | | | | | |
| Sale of shares: | | | | | | | | | | | | |
| Institutional Shares | | | 1,857,639,669 | | 172,773,736 | | | | 388,035,006 | | 31,630,757 | |
| R Shares | | | 41,103,425 | | 3,817,934 | | | | - | | - | |
| Reinvestment of distributions: | | | | | | | | | | | | |
| Institutional Shares | | | 8,840,490 | | 823,347 | | | | 6,287,899 | | 513,717 | |
| R Shares | | | 83,186 | | 7,660 | | | | - | | - | |
| Redemption of shares: | | | | | | | | | | | | |
| Institutional Shares | | | (718,415,256 | ) | (66,762,107 | ) | | | (105,013,438 | ) | (8,620,001 | ) |
| R Shares | | | (34,402,834 | ) | (3,186,259 | ) | | | - | | - | |
| Increase in Net Assets from Capital Share Transactions | | | 1,154,848,680 | | 107,474,311 | | | | 289,309,467 | | 23,524,473 | |
| Increase in Net Assets | | | 1,191,879,230 | | | | | | 307,488,465 | | | |
| | | | | | | | | | | | | |
| NET ASSETS MARCH 31, 2011 (Including line (a)) | | $ | 3,401,987,995 | | | | | $ | 593,127,207 | | | |
| | | | | | | | | | | | | |
See Notes to Financial Statements. 64 ABSOLUTE FUNDS
ABSOLUTE FUNDS
STATEMENTS OF CHANGES IN NET ASSETS
| | | | ABSOLUTE STRATEGIES FUND | | | | ABSOLUTE OPPORTUNITIES FUND | |
| | | | | | | | | | | | | |
| | | | | | Shares | | | | | | Shares | |
| | | | | | | | | | | | | |
| NET ASSETS MARCH 31, 2011 (Including line (a)) | | $ | 3,401,987,995 | | | | | $ | 593,127,207 | | | |
| | | | | | | | | | | | | |
| OPERATIONS | | | | | | | | | | | | |
| | Net investment loss | | | (29,258,718 | ) | | | | | (11,785,135 | ) | | |
| | Net realized gain (loss) | | | (1,844,835 | ) | | | | | 2,460,325 | | | |
| | Net change in unrealized appreciation (depreciation) | | | 146,634,457 | | | | | | (13,504,509 | ) | | |
| Increase (Decrease) in Net Assets Resulting from Operations | | | 115,530,904 | | | | | | (22,829,319 | ) | | |
| | | | | | | | | | | | | | |
| DISTRIBUTIONS TO SHAREHOLDERS FROM | | | | | | | | | | | | |
| | Net investment income: | | | | | | | | | | | | |
| | Institutional Shares | | | (6,689,291 | ) | | | | | - | | | |
| | Net realized gain: | | | | | | | | | | | | |
| | Institutional Shares | | | (16,344,134 | ) | | | | | (16,872,174 | ) | | |
| | R Shares | | | (439,299 | ) | | | | | - | | | |
| Total Distributions to Shareholders | | | (23,472,724 | ) | | | | | (16,872,174 | ) | | |
| | | | | | | | | | | | | | |
| CAPITAL SHARE TRANSACTIONS | | | | | | | | | | | | |
| | Sale of shares: | | | | | | | | | | | | |
| | Institutional Shares | | | 1,600,750,824 | | 145,911,735 | | | | 246,299,421 | | 20,519,202 | |
| | R Shares | | | 33,674,499 | | 3,066,276 | | | | - | | - | |
| | Reinvestment of distributions: | | | | | | | | | | | | |
| | Institutional Shares | | | 18,063,489 | | 1,641,104 | | | | 16,150,949 | | 1,392,323 | |
| | R Shares | | | 411,621 | | 37,285 | | | | - | | - | |
| | Redemption of shares: | | | | | | | | | | | | |
| | Institutional Shares | | | (1,119,308,289 | ) | (102,309,486 | ) | | | (304,955,155 | ) | (25,605,864 | ) |
| | R Shares | | | (44,205,889 | ) | (4,026,253 | ) | | | - | | - | |
| Increase (Decrease) in Net Assets from Capital Share Transactions | | 489,386,255 | | 44,320,661 | | | | (42,504,785 | ) | (3,694,339 | ) |
| Increase (Decrease) in Net Assets | | | 581,444,435 | | | | | | (82,206,278 | ) | | |
| | | | | | | | | | | | | | |
| NET ASSETS MARCH 31, 2012 (Including line (b)) | | $ | 3,983,432,430 | | | | | $ | 510,920,929 | | | |
| | | | | | | | | | | | | | |
| (a) | Undistributed (distributions in excess of) net investment income March 31, 2011 | | $ | 4,703,624 | | | | | $ | (1,368,328 | ) | | |
| | | | | | | | | | | | | | |
| (b) | Distributions in excess of net investment income March 31, 2012 | | $ | (2,264,949 | ) | | | | $ | (5,754,823 | ) | | |
See Notes to Financial Statements. 65 ABSOLUTE FUNDS
ABSOLUTE STRATEGIES FUND
FINANCIAL HIGHLIGHTS
| These financial highlights reflect selected data for a share outstanding throughout each year. | | | | | | |
| | For the Years Ended March 31, |
| | | 2012 | | 2011 | | 2010 | | 2009 | | 2008 | |
| INSTITUTIONAL SHARES | | | | | | | | | | | | | | | | | | | | |
| NET ASSET VALUE, Beginning | | | | | | | | | | | | | | | | | | | | |
| of Year | $ | 10.80 | | | $ | 10.66 | | | $ | 8.79 | | | $ | 10.52 | | | $ | 10.62 | | |
| INVESTMENT OPERATIONS | | | | | | | | | | | | | | | | | | | | |
| Net investment income (loss) (a) | | (0.09 | ) | | | (0.02 | ) | | | 0.10 | | | | 0.08 | | | | 0.16 | | |
| Net realized and unrealized | | | | | | | | | | | | | | | | | | | | |
| | gain (loss) | | 0.45 | | | | 0.20 | | | | 1.91 | | | | (1.38 | ) | | | (0.11 | ) | |
| Total from Investment | | | | | | | | | | | | | | | | | | | | |
| | Operations | | 0.36 | | | | 0.18 | | | | 2.01 | | | | (1.30 | ) | | | 0.05 | | |
| DISTRIBUTIONS TO | | | | | | | | | | | | | | | | | | | | |
| SHAREHOLDERS FROM | | | | | | | | | | | | | | | | | | | | |
| Net investment income | | (0.02 | ) | | | (0.04 | ) | | | (0.14 | ) | | | (0.08 | ) | | | (0.15 | ) | |
| Net realized gain | | (0.05 | ) | | | — | | | | — | (b) | | (0.35 | ) | | | — | | |
| Total Distributions to | | | | | | | | | | | | | | | | | | | | |
| | Shareholders | | (0.07 | ) | | | (0.04 | ) | | | (0.14 | ) | | | (0.43 | ) | | | (0.15 | ) | |
| NET ASSET VALUE, End | | | | | | | | | | | | | | | | | | | | |
| of Year | $ | 11.09 | | | $ | 10.80 | | | $ | 10.66 | | | $ | 8.79 | | | $ | 10.52 | | |
| TOTAL RETURN | | 3.36 | % | | 1.73 | % | | 22.95 | % | | (12.41 | )% | | 0.41 | % |
| RATIOS/SUPPLEMENTARY | | | | | | | | | | | | | | | | | | | | |
| DATA | | | | | | | | | | | | | | | | | | | | |
| Net Assets at End of | | | | | | | | | | | | | | | | | | | | |
| | Year (000's omitted) | $3,889,319 | | | $3,300,120 | | | $2,116,412 | | | $786,766 | | | $856,441 | | |
| Ratios to Average Net Assets: | | | | | | | | | | | | | | | | | | | | |
| Net investment income (loss) | | (0.80 | )% | | (0.20 | )% | | 0.98 | % | | 0.78 | % | | 1.50 | % |
| Net expense (c) | | 1.73 | % | | 1.73 | % | | 1.78 | % | | 1.81 | % | | 1.88 | % |
| Dividend and interest expense | | 0.85 | % | | 0.53 | % | | 0.34 | % | | 0.50 | % | | 0.50 | % |
| Gross expense | | 2.58 | % | | 2.26 | % (d) | | 2.12 | % (d) | | 2.31 | % (d) | | 2.38 | % (d) |
| PORTFOLIO TURNOVER RATE | | 112 | % | | 192 | % | | 114 | % | | 133 | % | | 553 | % |
| | | | | | | | | | | | | | | | | | | | | | |
| (a) | Calculated based on average shares outstanding during each year. |
| (b) | Less than $0.01 per share. |
| (c) | Excludes dividend and interest expense. |
| (d) | Reflects the expense ratio excluding any waivers and/or reimbursements. |
See Notes to Financial Statements. 66 ABSOLUTE FUNDS
ABSOLUTE STRATEGIES FUND
FINANCIAL HIGHLIGHTS
| These financial highlights reflect selected data for a share outstanding throughout each year. | | | | | | |
| | | For the Years Ended March 31, | |
| | | 2012 | | 2011 | | 2010 | | 2009 | | 2008 | |
| R SHARES (a) | | | | | | | | | | | | | | | | | | | | |
| NET ASSET VALUE, Beginning | | | | | | | | | | | | | | | | | | | | |
| of Year | $ | 10.82 | | | $ | 10.67 | | | $ | 8.82 | | | $ | 10.55 | | | $ | 10.63 | | |
| INVESTMENT OPERATIONS | | | | | | | | | | | | | | | | | | | | |
| Net investment income (loss) (b) | | (0.16 | ) | | | (0.10 | ) | | | 0.05 | | | | 0.04 | | | | 0.13 | | |
| Net realized and unrealized | | | | | | | | | | | | | | | | | | | | |
| | gain (loss) | | 0.47 | | | | 0.26 | | | | 1.91 | | | | (1.39 | ) | | | (0.13 | ) | |
| Total from Investment | | | | | | | | | | | | | | | | | | | | |
| | Operations | | 0.31 | | | | 0.16 | | | | 1.96 | | | | (1.35 | ) | | | — | | |
| DISTRIBUTIONS TO | | | | | | | | | | | | | | | | | | | | |
| SHAREHOLDERS FROM | | | | | | | | | | | | | | | | | | | | |
| Net investment income | | — | | | | (0.01 | ) | | | (0.11 | ) | | | (0.03 | ) | | | (0.08 | ) | |
| Net realized gain | | (0.05 | ) | | | — | | | | — | (c) | | (0.35 | ) | | | — | | |
| Total Distributions to | | | | | | | | | | | | | | | | | | | | |
| | Shareholders | | (0.05 | ) | | | (0.01 | ) | | | (0.11 | ) | | | (0.38 | ) | | | (0.08 | ) | |
| NET ASSET VALUE, End | | | | | | | | | | | | | | | | | | | | |
| of Year | $ | 11.08 | | | $ | 10.82 | | | $ | 10.67 | | | $ | 8.82 | | | $ | 10.55 | | |
| TOTAL RETURN | | 2.87 | % | | 1.49 | % | | 22.28 | % | | (12.73 | )% | | 0.01 | % (d) |
| RATIOS/SUPPLEMENTARY | | | | | | | | | | | | | | | | | | | | |
| DATA | | | | | | | | | | | | | | | | | | | | |
| Net Assets at End of | | | | | | | | | | | | | | | | | | | | |
| | Year (000’s omitted) | $94,113 | | | $101,868 | | | $93,696 | | | $27,600 | | | $32,106 | | |
| Ratios to Average Net Assets: | | | | | | | | | | | | | | | | | | | | |
| Net investment income (loss) | | (1.43 | )% | | (0.95 | )% | | 0.52 | % | | 0.37 | % | | 1.17 | % |
| Net expense (e) | | 2.14 | % | | 2.11 | % | | 2.22 | % | | 2.23 | % | | 2.25 | % |
| Dividend and interest expense | | 0.81 | % | | 0.53 | % | | 0.34 | % | | 0.50 | % | | 0.48 | % |
| Gross expense | | 2.95 | % | | 2.64 | % (f) | | 2.56 | % (f) | | 2.73 | % (f) | | 2.76 | % (f) |
| PORTFOLIO TURNOVER RATE | | 112 | % | | 192 | % | | 114 | % | | 133 | % | | 553 | % |
| | | | | | | | | | | | | | | | | | | | | | |
| (a) | Effective July 31, 2009, C Shares were reclassified as R Shares. For the period April 1, 2009 through July 31, 2009, total return for the C Shares was 14.02%. For the aforementioned period, the annualized gross expense and net expense ratios were 3.56% and 3.30%, respectively. |
| (b) | Calculated based on average shares outstanding during each year. |
| (c) | Less than $0.01 per share. |
| (d) | Total return excludes the effect of the applicable sales load. |
| (e) | Excludes dividend and interest expense. |
| (f) | Reflects the expense ratio excluding any waivers and/or reimbursements. |
See Notes to Financial Statements. 67 ABSOLUTE FUNDS
ABSOLUTE OPPORTUNITIES FUND
FINANCIAL HIGHLIGHTS
| These financial highlights reflect selected data for a share outstanding throughout each period. | | |
| | | For the Years Ended March 31, | | | |
| | | 2012 | | 2011 | | 2010 | | October 21, 2008 (a) through March 31, 2009 | |
| INSTITUTIONAL SHARES | | | | | | | | | | | | | | | | |
| NET ASSET VALUE, Beginning | | | | | | | | | | | | | | | | |
| of Period | $ | 12.41 | | | $ | 11.77 | | | $ | 10.57 | | | $ | 10.00 | | |
| INVESTMENT OPERATIONS | | | | | | | | | | | | | | | | |
| Net investment income (loss) (b) | | (0.25 | ) | | | (0.13 | ) | | | (0.11 | ) | | | 0.04 | | |
| Net realized and unrealized | | | | | | | | | | | | | | | | |
| | gain (loss) | | (0.21 | ) | | | 0.95 | | | | 2.11 | | | | 0.55 | | |
| Total from Investment | | | | | | | | | | | | | | | | |
| | Operations | | (0.46 | ) | | | 0.82 | | | | 2.00 | | | | 0.59 | | |
| DISTRIBUTIONS TO | | | | | | | | | | | | | | | | |
| SHAREHOLDERS FROM | | | | | | | | | | | | | | | | |
| Net investment income | | — | | | | — | | | | (0.01 | ) | | | (0.02 | ) | |
| Net realized gain | | (0.36 | ) | | | (0.18 | ) | | | (0.75 | ) | | | — | (c) |
| Return of capital | | — | | | | — | | | | (0.04 | ) | | | — | | |
| Total Distributions to | | | | | | | | | | | | | | | | |
| | Shareholders | | (0.36 | ) | | | (0.18 | ) | | | (0.80 | ) | | | (0.02 | ) | |
| NET ASSET VALUE, End | | | | | | | | | | | | | | | | |
| of Period | $ | 11.59 | | | $ | 12.41 | | | $ | 11.77 | | | $ | 10.57 | | |
| TOTAL RETURN | | (3.68 | )% | | 6.98 | % | | 19.00 | % | | 5.95 | %(d) |
| RATIOS/SUPPLEMENTARY | | | | | | | | | | | | | | | | |
| DATA | | | | | | | | | | | | | | | | |
| Net Assets at End of | | | | | | | | | | | | | | | | |
| | Period (000's omitted) | $510,921 | | | $593,127 | | | $285,639 | | | $77,245 | | |
| Ratios to Average Net Assets: | | | | | | | | | | | | | | | | |
| Net investment income (loss) | | (2.12 | )% | | (1.05 | )% | | (0.90 | )% | | 0.84 | %(e) |
| Net expense (f) | | 2.95 | % | | 2.95 | % | | 2.95 | % | | 2.95 | %(e) |
| Dividend and interest expense | | 0.61 | % | | 0.42 | % | | 0.46 | % | | 0.05 | %(e) |
| Gross expense (g) | | 3.58 | % | | 3.42 | % | | 3.66 | % | | 3.82 | %(e) |
| PORTFOLIO TURNOVER RATE | | 430 | % | | 630 | % | | 597 | % | | 281 | %(d) |
| | | | | | | | | | | | | | | | | | |
| (a) | Commencement of operations. |
| (b) | Calculated based on average shares outstanding during each period. |
| (c) | Less than $0.01 per share. |
| (d) | Not annualized. |
| (e) | Annualized. |
| (f) | Excludes dividend and interest expense. |
| (g) | Reflects the expense ratio excluding any waivers and/or reimbursements. |
See Notes to Financial Statements. 68 ABSOLUTE FUNDS
ABSOLUTE FUNDS
NOTES TO FINANCIAL STATEMENTS
MARCH 31, 2012
Note 1. Organization
The Absolute Strategies Fund and Absolute Opportunities Fund (individually, a “Fund” and, collectively the “Funds”) are non-diversified portfolios of Forum Funds (the “Trust”). The Trust is a Delaware statutory trust that is registered as an open-end, management investment company under the Investment Company Act of 1940 (the “Act”), as amended. Under its Trust Instrument, the Trust is authorized to issue an unlimited number of each Fund’s shares of beneficial interest without par value. The Absolute Strategies Fund currently offers two classes of shares: Institutional Shares and R Shares. Institutional and R Shares commenced operations on July 11, 2005. The Absolute Strategies Fund seeks to achieve long-term capital appreciation with an emphasis on absolute (positive) returns and low sensitivity to traditional financial market indices, such as the S&P 500 Index. The Absolute Opportunities Fund currently offers Institutional Shares. The Absolute Opportunities Fund commenced operations on October 21, 2008. The Absolute Opportunities Fund seeks to achieve long-term capital appreciation with an emphasis on risk-adjusted returns and lower volatility than traditional equity market indices, such as the S&P 500 Index.
Note 2. Summary of Significant Accounting Policies
These financial statements are prepared in accordance with accounting principles generally accepted in the United States of America (“GAAP”), which require management to make estimates and assumptions that affect the reported amounts of assets and liabilities, the disclosure of contingent liabilities at the date of the financial statements, and the reported amounts of increase and decrease in net assets from operations during the fiscal year. Actual amounts could differ from those estimates. The following summarizes the significant accounting policies of each Fund:
Security Valuation – Exchange-traded securities and over-the-counter securities are valued using the last quoted sale or official closing price, provided by independent pricing services as of the close of trading on the market or exchange for which they are primarily traded, on each Fund business day. In the absence of a sale, such securities are valued at the mean of the last bid and ask price provided by independent pricing services. Non-exchange traded securities for which quotations are available are valued using the last quoted sales price, or in the absence of a sale at the mean of the last bid and ask prices provided by independent pricing services. Debt securities may be valued at prices supplied by a fund’s pricing agent based on broker or dealer supplied valuations or matrix pricing, a method of valuing securities by reference to the value of other securities with similar characteristics such as rating, interest rate and maturity. Exchange-traded options for which there were no sales reported that day are generally valued at the mean of the last bid and ask prices. Options not traded on an exchange are generally valued at broker-dealer bid quotations. Shares of open-end mutual funds are valued at net asset value (“NAV”). Futures contracts listed for trading on a securities exchange or board of trade shall be valued at the last quoted sales price or in the absence of a sale at the mean of the last bid and asked prices. Short-term investments that mature in 60 days or less may be valued at amortized cost.
Each Fund values its investments at fair value pursuant to procedures adopted by the Board if (1) market quotations are insufficient or not readily available or (2) the adviser believes that the values available are unreliable. Fair valuation is based on subjective factors and, as a result, the fair value price of an investment may differ from the security’s market price and may not be the price at which the asset may be sold. Fair valuation could result in a different NAV than a NAV determined by using market quotes.
Each Fund has a three-tier fair value hierarchy. The basis of the tiers is dependent upon the various “inputs” used to determine the value of each Fund’s investments. These inputs are summarized in the three broad levels listed below:
Level 1 — quoted prices in active markets for identical assets
Level 2 — other significant observable inputs (including quoted prices of similar securities, interest rates, prepayment speeds, credit risk, etc.)
69 ABSOLUTE FUNDS
ABSOLUTE FUNDS
NOTES TO FINANCIAL STATEMENTS
MARCH 31, 2012
Level 3 — significant unobservable inputs (including each Fund’s own assumptions in determining the fair value of investments)
The aggregate value by input level, as of March 31, 2012, for each Fund’s investments is included in the Notes to Schedules of Investments, Securities Sold Short and Call and Put Options Written.
Security Transactions, Investment Income and Realized Gain and Loss – Investment transactions are accounted for on the trade date. Dividend income is recorded on the ex-dividend date. Foreign dividend income is recorded on the ex-dividend date or as soon as possible after each Fund determines the existence of a dividend declaration after exercising reasonable due diligence. Income and capital gains on some foreign securities may be subject to foreign withholding taxes, which are accrued as applicable. Interest income is recorded on an accrual basis. Premium is amortized and discount is accreted using the effective interest method. Identified cost of investments sold is used to determine the gain and loss for both financial statement and federal income tax purposes. Each Fund estimates components of distributions from real estate investment trusts (“REITs”). Distributions received in excess of income are recorded as a reduction of the cost of the related investments.
Foreign Currency Translations – Foreign currency amounts are translated into U.S. dollars as follows: (1) assets and liabilities at the rate of exchange at the end of the respective period; and (2) purchases and sales of securities and income and expenses at the rate of exchange prevailing on the dates of such transactions. The portion of the results of operations arising from changes in the exchange rates and the portion due to fluctuations arising from changes in the market prices of securities are not isolated. Such fluctuations are included with the net realized and unrealized gain or loss on investments.
The volume of open currency positions may vary on a daily basis as the Absolute Strategies Fund transacts forward currency contracts in order to achieve the exposure desired by the adviser. The Absolute Strategies Fund and Absolute Opportunities Fund entered into an aggregated total notional value of $178,581,118 and $4,428,801, respectively, of forward currency contracts for the year ended March 31, 2012.
The values of each individual forward currency contract outstanding in the Absolute Strategies Fund as of March 31, 2012, are disclosed in the table below.
| Contracts to Sell | | Settlement Date | | Settlement Value | | Net Unrealized Depreciation |
| (267,390,883 | ) | | Hungarian Forint | | 04/02/12 | | $ | 1,210,776 | | | $ | (258 | ) |
| (7,852,156 | ) | | Swedish Krona | | 04/02/12 | | | 1,174,001 | | | | (12,878 | ) |
| (7,843,524 | ) | | Swedish Krona | | 04/02/12 | | | 1,172,710 | | | | (12,864 | ) |
| (19,619,703 | ) | | Swedish Krona | | 04/03/12 | | | 2,932,072 | | | | (33,146 | ) |
| (19,805,135 | ) | | Swedish Krona | | 04/03/12 | | | 2,959,872 | | | | (33,370 | ) |
| | | | | | | | | | | | $ | (92,516 | ) |
Futures Contracts – Each Fund may purchase futures contracts to gain exposure to market changes, which may be more efficient or cost effective than actually buying the securities. A futures contract is an agreement between parties to buy or sell a security at a set price on a future date. Upon entering into such a contract, a fund is required to pledge to the broker an amount of cash, U.S. Government obligations or other high-quality debt securities equal to the minimum “initial margin” requirements of the exchange on which the futures contract is traded. Pursuant to the contract, the fund agrees to receive from or pay to the broker an amount of cash equal to the daily fluctuation in the value of the contract. Such receipts or payments are known as “variation margin” and are recorded by the fund as unrealized gains or losses. When the contract is closed, the fund records a realized gain or loss equal to the difference between the value of the contract at the time it was opened and value at the time it was closed. Risks of entering into futures contracts include the possibility that there may be an illiquid market and that a change in the value of the contract may not correlate with changes in the value of the underlying securities.
70 ABSOLUTE FUNDS
ABSOLUTE FUNDS
NOTES TO FINANCIAL STATEMENTS
MARCH 31, 2012
Notional amounts of each individual futures contract outstanding as of March 31, 2012 for each Fund, are disclosed in the Notes to Schedule of Investments, Securities Sold Short and Call and Put Options Written. The volume of open positions may vary on a daily basis as each Fund transacts futures contracts in order to achieve the exposure desired by the adviser. Each Fund entered into a total notional amount of $3,171,976,418 and $327,832,677 for Absolute Strategies Fund and Absolute Opportunities Fund, respectively, on futures contracts for the year ended March 31, 2012.
Securities Sold Short – Each Fund may sell a security short to increase investment returns. Each Fund may also sell a security short in anticipation of a decline in the market value of a security. A short sale is a transaction in which a fund sells a security that it does not own. To complete the transaction, the fund must borrow the security in order to deliver it to the buyer. The fund must replace the borrowed security by purchasing it at market price at the time of replacement; the price may be higher or lower than the price at which the fund sold the security. The fund incurs a loss from a short sale if the price of the security increases between the date of the short sale and the date on which the fund replaces the borrowed security. The fund realizes a profit if the price of the security declines between those dates.
Until the fund replaces the borrowed security, the fund will maintain on its books and records cash and long securities to sufficiently cover its short position on a daily basis. The collateral for the securities sold short includes the deposits with broker for securities sold short as shown on the Statement of Assets and Liabilities and the securities held long as shown on the Schedule of Investments. Dividends and interest paid on securities sold short are recorded as an expense on each Fund’s Statement of Operations.
Purchased Options – When a fund purchases an option, an amount equal to the premium paid by the fund is recorded as an investment and is subsequently adjusted to the current value of the option purchased. If an option expires on the stipulated expiration date or if the fund enters into a closing sale transaction, a gain or loss is realized. If a call option is exercised, the cost of the security acquired is increased by the premium paid for the call. If a put option is exercised, a gain or loss is realized from the sale of the underlying security, and the proceeds from such sale are decreased by the premium originally paid. Purchased options are non-income producing securities.
The values of each individual purchased option outstanding as of March 31, 2012, are disclosed in each Fund’s Schedule of Investments. The volume of open purchased option positions may vary on a daily basis as each Fund transacts purchased options in order to achieve the exposure desired by the adviser. Each Fund entered into a total value of $105,968,606 and $78,884,906 for Absolute Strategies Fund and Absolute Opportunities Fund, respectively, on purchased options during the year ended March 31, 2012.
Written Options – When a fund writes an option, an amount equal to the premium received by the fund is recorded as a liability and is subsequently adjusted to the current value of the option written. Premiums received from writing options that expire unexercised are treated by the fund on the expiration date as realized gain from written options. The difference between the premium and the amount paid on effecting a closing purchase transaction, including brokerage commissions, is also treated as a realized gain, or if the premium is less than the amount paid for the closing purchase transaction, as a realized loss. If a call option is exercised, the premium is added to the proceeds from the sale of the underlying security in determining whether the fund has realized a gain or loss. If a put option is exercised, the premium reduces the cost basis of the securities purchased by the fund. The fund, as writer of an option, bears the market risk of an unfavorable change in the price of the security underlying the written option. Written options are non-income producing securities.
The values of each individual written option outstanding as of March 31, 2012, are disclosed in each Fund’s Schedule of Call and Put Options Written. The volume of open positions may vary on a daily basis as each Fund transacts written options in order to achieve the exposure desired by the adviser. Each Fund entered into written options with a total value of $(80,103,063) and $(9,370,448) for Absolute Strategies Fund and Absolute Opportunities Fund, respectively, during the year ended March 31, 2012.
71 ABSOLUTE FUNDS
ABSOLUTE FUNDS
NOTES TO FINANCIAL STATEMENTS
MARCH 31, 2012
Transactions in written options during the year ended March 31, 2012, were as follows:
| | | | | | | | | | | | | | | |
| Absolute Strategies Fund | | | | | | | | | | | | | | |
| | | Calls | | Puts |
| | | Number of | | | | | | Number of | | | | |
| | | Contracts | | | Premiums | | Contracts | | Premiums |
| Options Outstanding, March 31, 2011 | | (12,867 | ) | | $ | (4,963,339 | ) | | (70,097 | ) | | $ | (24,636,005 | ) |
| Options written | | (17,562 | ) | | | (8,856,091 | ) | | (109,282 | ) | | | (71,246,972 | ) |
| Options terminated in closing transactions | | 22,582 | | | 9,226,156 | | 86,663 | | | 60,824,089 | |
| Options exercised | | - | | | | - | | | 5,645 | | | 2,145,938 | |
| Options expired | | 1,032 | | | 343,790 | | 30,231 | | | 5,517,140 | |
| Options Outstanding, March 31, 2012 | | (6,815 | ) | | $ | (4,249,484 | ) | | (56,840 | ) | | $ | (27,395,810 | ) |
| | | | | | | | | | | | | | | |
| | | | | | | | | | | | | | | |
| Absolute Opportunities Fund | | | | | | | | | | | | | | |
| | | Calls | | Puts |
| | | Number of | | | | | | Number of | | | | |
| | | Contracts | | | Premiums | | Contracts | | Premiums |
| Options Outstanding, March 31, 2011 | | (4,312 | ) | | $ | (339,502 | ) | | (12,453 | ) | | $ | (728,938) | |
| Options written | | (60,284 | ) | | | (1,918,913 | ) | | (132,610 | ) | | | (7,451,536 | ) |
| Options terminated in closing transactions | | 53,263 | | | 1,947,996 | | 113,540 | | | 7,486,834 | |
| Options exercised | | - | | | | - | | | - | | | | - | |
| Options expired | | 9,003 | | | 160,171 | | 31,140 | | | 577,734 | |
| Options Outstanding, March 31, 2012 | | (2,330 | ) | | $ | (150,248 | ) | | (383 | ) | | $ | (115,906 | ) |
| | | | | | | | | | | | | | | |
Credit Default Swaps – Each Fund may invest in credit default swaps. A credit default swap gives one party (the buyer) the right to recoup the economic value of a decline in the value of debt securities of the reference issuer (including sovereign debt obligations) if a credit event (a downgrade or default) occurs. This value is obtained by delivering a debt security of the reference issuer to the party in return for a previously agreed payment from the other party (frequently, the par value of the debt security). Credit default swaps may require initial premium (discount) payments as well as periodic payments (receipts) related to the interest leg of the swap or to the default of a reference obligation.
If a fund is a seller of a credit default swap contract, the fund would be required to pay the par (or other agreed upon) value of a referenced debt obligation to the counterparty in the event of a default or other credit event by the reference issuer, such as a U.S. or foreign corporate issuer, with respect to such debt obligations. In return, the fund would receive from the counterparty a periodic stream of payments over the term of the contract provided that no event of default has occurred. If no default occurs, the fund would keep the stream of payments and would have no payment obligations. As the seller, the fund would be subject to investment exposure on the notional amount of the swap.
If a fund is the buyer of a credit default swap contract, the fund would have the right to deliver a referenced debt obligation and receive the par (or other agreed-upon) value of such debt obligation from the counterparty in the event of a default or other credit event (such as a credit downgrade) by the reference issuer, such as a U.S. or foreign corporation, with respect to its debt obligations. In return, the fund would pay the counterparty a periodic stream of payments over the term of the contract provided that no event of default has occurred. If no default occurs, the counterparty would keep the stream of payments and would have no further obligations to the fund.
72 ABSOLUTE FUNDS
ABSOLUTE FUNDS
NOTES TO FINANCIAL STATEMENTS
MARCH 31, 2012
Notional amounts of each individual credit default swap agreement outstanding as of March 31, 2012 for each Fund, are disclosed in the Notes to Schedule of Investments, Securities Sold Short and Call and Put Options Written. The volume of open positions may vary on a daily basis as each Fund transacts credit default swaps in order to achieve the exposure desired by the adviser. The Absolute Opportunities Fund entered into a total notional amount of $680,000,000 on credit default swap agreements during the year ended March 31, 2012. The Absolute Strategies Fund did not enter into any credit default swaps for the year ended March 31, 2012.
Interest Rate Swaps – Each Fund may enter into interest rate swaps for investment purposes to manage exposure to fluctuations in interest rates or to add leverage.
Interest rate swaps represent an agreement between two counterparties to exchange cash flows based on the difference in two interest rates, applied to the notional principal amount for a specified period. The payment flows are usually netted against each other, with the difference being paid by one party to the other. The Fund settles accrued net receivables or payables under the swap contracts on a periodic basis.
The primary risk associated with interest rate swaps is that unfavorable changes in interest rates could adversely impact the Funds.
Notional amounts of each individual interest rate swap agreement outstanding as of March 31, 2012 for each Fund, are disclosed in the Notes to Schedule of Investments, Securities Sold Short and Call and Put Options Written. The volume of open positions may vary on a daily basis as each Fund transacts interest rate swaps in order to achieve the exposure desired by the adviser. The Absolute Opportunities Fund did not enter into any interest rate swaps for the year ended March 31, 2012. The Absolute Strategies Fund entered into a total notional amount of $190,000 on interest rate swap agreements during the year ended March 31, 2012.
Derivatives Transactions - Each Fund’s use of derivatives during the year ended March 31, 2012, was limited to credit default swaps, interest rate swaps, options, forward currency contracts and futures contracts. Following is a summary of how the derivatives are treated in the financial statements and their impact on each Fund.
The location on the Statement of Assets and Liabilities of each Fund’s derivative positions by type of exposure, all of which are not accounted for as hedging instruments, is as follows:
| | | Location on Statement of Assets and Liabilities | | Asset Derivatives | | Location on Statement of Assets and Liabilities | | Liability Derivatives | |
Fund Contract Type/ Primary Risk Exposure |
| | | | | | | | | | | | |
| Absolute Strategies Fund | | | | | | | | | | | |
| | | | | | | | | | | | |
| Credit contracts | | | | | | | | | | | |
| | | Unrealized gain on swap agreements | | $ | - | | Unrealized loss on swap agreements | | $ | (15,273 | ) |
| | | | | | | | | | | | |
| | | Swap premiums paid | | | - | | Swap premiums received | | | (1,440,645 | ) |
| | | | | | | | | | | | |
| Currency contracts | | | | | | | | | | | |
| | | Receivable-Variation margin | | | - | | Payable-Variation margin | | | (352,500 | ) |
| | | | | | | | | | | | |
| Equity contracts | | | | | | | | | | | |
| | | Receivable-Variation margin | | | 1,479,000 | | Payable-Variation margin | | | (900,000 | ) |
73 ABSOLUTE FUNDS
ABSOLUTE FUNDS
NOTES TO FINANCIAL STATEMENTS
MARCH 31, 2012
Fund Contract Type/ Primary Risk Exposure | | Location on Statement of Assets and Liabilities | | Asset Derivatives | | Location on Statement of Assets and Liabilities | | Liability Derivatives | |
| | | | | | | | | | | | |
| Absolute Strategies Fund - | | | | | | | | | | | |
| continued | | | | | | | | | | | |
| | | | | | | | | | | | |
| | | Total investments, at value | | $ | 47,978,280 | | | | | | |
| | | | | | | | | | | | |
| | | | | | | | Call options written, at value | | $ | (5,170,375 | ) |
| | | | | | | | | | | | |
| | | | | | | | Put options written, at value | | | (14,857,698 | ) |
| | | | | | | | | | | | |
| Forward Currency contracts | | | | | | | | | | | |
| | | Unrealized gain on forward currency contracts | | | - | | Unrealized loss on forward currency contracts | | | (92,516 | ) |
| | | | | | | | | | | | |
| Interest contracts | | | | | | | | | | | |
| | | Unrealized gain on swap agreements | | | - | | Unrealized loss on swap agreements | | | (4,304 | ) |
| | | | | | | | | | | | |
| | | Receivable-Variation margin | | | 396,859 | | Payable-Variation margin | | | (38,111 | ) |
| | | | | | | | | | | | |
| Absolute Opportunities Fund | | | | | | | | | | | |
| | | | | | | | | | | | |
| Credit contracts | | | | | | | | | | | |
| | | Unrealized gain on swap agreements | | | 444,086 | | Unrealized loss on swap agreements | | | (2,142,760 | ) |
| | | | | | | | | | | | |
| | | Swap premiums paid | | | 3,405,234 | | Swap premiums received | | | (754,926 | ) |
| | | | | | | | | | | | |
| Currency contracts | | | | | | | | | | | |
| | | Receivable-Variation margin | | | - | | Payable-Variation margin | | | (88,125 | ) |
| | | | | | | | | | | | |
| Equity contracts | | | | | | | | | | | |
| | | Receivable-Variation margin | | | 174,000 | | Payable-Variation margin | | | (62,500 | ) |
| | | | | | | | | | | | |
| | | Total investments, at value | | | 3,408,870 | | | | | | |
| | | | | | | | | | | | |
| | | | | | | | Call options written, at value | | | (151,450 | ) |
74 ABSOLUTE FUNDS
ABSOLUTE FUNDS
NOTES TO FINANCIAL STATEMENTS
MARCH 31, 2012
Fund Contract Type/ Primary Risk Exposure | | Location on Statement of Assets and Liabilities | | Asset Derivatives | | Location on Statement of Assets and Liabilities | | Liability Derivatives | |
| | | | | | | | | | | | |
| Absolute Opportunities Fund - continued | | | | | | | | | | | |
| | | | | | | | | | | | |
| | | | | | | | Put options written, at value | | $ | (103,410 | ) |
| | | | | | | | | | | | |
Realized and unrealized gains and losses on derivatives contracts entered into during the year ended March 31, 2012, by each Fund are recorded in the following locations on the Statement of Operations:
| | | Location of Gain or (Loss) on Derivatives | | Realized Gain (Loss) on Derivatives | | Change in Unrealized Appreciation (Depreciation) on Derivatives | |
Fund Contract Type/Primary Risk Exposure | |
| | | | | | | | | | |
| Absolute Strategies Fund | | | | | | | | | |
| | | | | | | | | | |
| Credit contracts | | | | | | | | | |
| | | Realized gain (loss) – Swaps and Change in unrealized gain (loss) - Swaps | | $ | 66,008 | | $ | (309,450 | ) |
| | | | | | | | | | |
| Currency contracts | | | | | | | | | |
| | | Realized gain (loss) – Futures and Change in unrealized gain (loss) – Futures | | | 7,532,550 | | | (1,885,812 | ) |
| | | | | | | | | | |
| Equity contracts | | | | | | | | | |
| | | Realized gain (loss) – Futures and Change in unrealized gain (loss) – Futures | | | 7,515,663 | | | (8,174,710 | ) |
| | | | | | | | | | |
| | | Realized gain (loss) – Investments and Change in unrealized gain (loss) - Investments | | | (34,721,936 | ) | | 2,192,039 | |
| | | | | | | | | | |
| | | Realized gain (loss) – Written options and Change in unrealized gain (loss) – Written options | | | 28,613,330 | | | 3,926,103 | |
| | | | | | | | | | |
| Forward Currency contracts | | | | | | | | | |
| | | Realized gain (loss) – Foreign currency transactions and Net Change in unrealized gain (loss) – Foreign currency translations | | | 40,667 | | | (92,516 | ) |
| | | | | | | | | | |
75 ABSOLUTE FUNDS
ABSOLUTE FUNDS
NOTES TO FINANCIAL STATEMENTS
MARCH 31, 2012
Fund Contract Type/Primary Risk Exposure | | Location of Gain or (Loss) on Derivatives | | Realized Gain (Loss) on Derivatives | | Change in Unrealized Appreciation (Depreciation) on Derivatives | |
| | | | | | | | | | |
| Absolute Strategies Fund - | | | | | | | | | |
| continued | | | | | | | | | |
| | | | | | | | | | |
| Interest contracts | | | | | | | | | |
| | | Realized gain (loss) – Futures and Change in unrealized gain (loss) – Futures | | $ | (3,979,920 | ) | $ | 1,627,517 | |
| | | | | | | | | | |
| | | Realized gain (loss) – Swaps and Change in unrealized gain (loss) – Swaps | | | 63,724 | | | (4,304 | ) |
| | | | | | | | | | |
| Absolute Opportunities Fund | | | | | | | | | |
| | | | | | | | | | |
| Credit contracts | | | | | | | | | |
| | | Realized gain (loss) – Swaps and Change in unrealized gain (loss) – Swaps | | | (890,252 | ) | | (904,879 | ) |
| | | | | | | | | | |
| Currency contracts | | | | | | | | | |
| | | Realized gain (loss) – Futures and Change in unrealized gain (loss) – Futures | | | 1,402,800 | | | (489,038 | ) |
| | | | | | | | | | |
| Equity contracts | | | | | | | | | |
| | | Realized gain (loss) – Futures and Change in unrealized gain (loss) – Futures | | | 717,399 | | | (576,800 | ) |
| | | | | | | | | | |
| | | Realized gain (loss) – Investments and Change in unrealized gain (loss) - Investments | | | 702,174 | | | (314,354 | ) |
| | | | | | | | | | |
| | | Realized gain (loss) – Written options and Change in unrealized gain (loss) – Written options | | | (2,043,110 | ) | | (372,640 | ) |
| | | | | | | | | | |
| Forward Currency contracts | | | | | | | | | |
| | | Realized gain (loss) – Foreign currency transactions and Net Change in unrealized gain (loss) – Foreign currency translations | | $ | (59,589 | ) | $ | - | |
76 ABSOLUTE FUNDS
ABSOLUTE FUNDS
NOTES TO FINANCIAL STATEMENTS
MARCH 31, 2012
Restricted Securities – Each Fund may invest in securities that are subject to legal or contractual restrictions on resale (“restricted securities”). Restricted securities may be resold in transactions that are exempt from registration under the Federal securities laws or if the securities are registered to the public. The sale or other disposition of these securities may involve additional expenses and the prompt sale of these securities at an acceptable price may be difficult. Information regarding restricted securities held by each Fund is included in their Schedule of Investments, if applicable.
When-Issued Transactions – Each Fund may purchase securities on a forward commitment or ‘when-issued’ basis. A fund records a when-issued transaction on the trade date and will segregate with the custodian qualifying assets that have a value sufficient to make payment for the securities purchased. Securities purchased on a when-issued basis are marked-to-market daily and the fund begins earning interest on the settlement date. Losses may arise due to changes in the market value of the underlying securities or if the counterparty does not perform under the contract.
Distributions to Shareholders – Distributions to shareholders of net investment income, if any, are declared and paid at least semi-annually. Distributions to shareholders of net capital gains, if any, are declared and paid annually. Distributions are based on amounts calculated in accordance with applicable federal income tax regulations, which may differ from GAAP. These differences are due primarily to differing treatments of income and gain on various investment securities held by each Fund, timing differences and differing characterizations of distributions made by each Fund.
Federal Taxes – Each Fund intends to continue to qualify each year as a regulated investment company under Subchapter M of the Internal Revenue Code and to distribute all of their taxable income to shareholders. In addition, by distributing in each calendar year substantially all of their net investment income and capital gains, if any, the Funds will not be subject to a federal excise tax. Therefore, no federal income or excise tax provision is required. Each Fund files a U.S. federal income and excise tax return as required. A fund’s federal income tax returns are subject to examination by the Internal Revenue Service for a period of three fiscal years after they are filed. As of March 31, 2012, there are no uncertain tax positions that would require financial statement recognition, de-recognition, or disclosure.
Income and Expense Allocation – The Trust accounts separately for the assets, liabilities and operations of each of its investment portfolios. Expenses that are directly attributable to more than one investment portfolio are allocated among the respective investment portfolios in an equitable manner.
The Absolute Strategies Fund’s class specific expenses are charged to the operations of that class of shares. Income and expenses (other than expenses attributable to a specific class) and realized and unrealized gains or losses on investments are allocated to each class of shares based on the class’ respective net assets to the total net assets of the Fund.
Commitments and Contingencies – In the normal course of business, each Fund enters into contracts that provide general indemnifications by each Fund to the counterparty to the contract. Each Fund’s maximum exposure under these arrangements is dependent on future claims that may be made against each Fund and, therefore, cannot be estimated; however, based on experience, the risk of loss from such claims is considered remote.
Note 3. Fees and Expenses
Investment Adviser – Absolute Investment Advisers LLC (the “Adviser”) is the investment adviser to the Funds. Pursuant to an Investment Advisory Agreement, the Adviser receives an advisory fee at an annual rate of 1.60% and 2.75% of the average daily net assets of Absolute Strategies Fund and Absolute Opportunities Fund, respectively.
Each sub-advisory fee, calculated as a percentage of each Fund’s average daily net assets, is paid by the Adviser.
77 ABSOLUTE FUNDS
ABSOLUTE FUNDS
NOTES TO FINANCIAL STATEMENTS
MARCH 31, 2012
Distribution – Foreside Fund Services, LLC serves as each Fund’s distributor (the “Distributor”). The Distributor is not affiliated with the Adviser or Atlantic Fund Administration, LLC (d/b/a Atlantic Fund Services) (“Atlantic”) or their affiliates. The Absolute Strategies Fund has adopted a Distribution Plan (the “Plan”) for R Shares of the Fund in accordance with Rule 12b-1 of the Act. Under the Plan, the Fund pays the Distributor and/or any other entity as authorized by the Board a fee of up to 0.25% of the average daily net assets of R Shares.
Other Service Providers – Atlantic provides fund accounting, fund administration, and transfer agency services to each Fund. Atlantic also provides certain shareholder report production, and EDGAR conversion and filing services. Pursuant to an Atlantic services agreement, each Fund pays Atlantic customary fees for its services. Atlantic provides a Principal Executive Officer, a Principal Financial Officer, a Chief Compliance Officer, and an Anti-Money Laundering Officer to each Fund, as well as certain additional compliance support functions.
Trustees and Officers – The Trust pays each independent Trustee an annual retainer fee of $45,000 for service to the Trust ($66,000 for the Chairman). In addition, for the year ended March 31, 2012, the Chairman received a monthly stipend of $500 to cover certain expenses incurred in connection with his duties to the Trust. The stipend was discontinued April 1, 2012. The Trustees and Chairman may receive additional fees for special Board meetings. Each Trustee is also reimbursed for all reasonable out-of-pocket expenses incurred in connection with his duties as a Trustee, including travel and related expenses incurred in attending Board meetings. The amount of Trustees’ fees attributable to each Fund is disclosed in the Statement of Operations. Certain officers of the Trust are also officers or employees of the above named service providers, and during their terms of office received no compensation from each Fund.
Note 4. Expense Reimbursements and Fees Waived
The Adviser has contractually agreed to waive its fees and/or reimburse expenses to limit total annual operating expenses (excluding all taxes, interest, portfolio transaction expenses, dividend and interest expenses on short sales, acquired fund fees, proxy expenses and extraordinary expenses) of Institutional Shares of Absolute Opportunities Fund to 2.95% through July 31, 2012. The adviser waived fees of $87,404 for the year ended March 31, 2012.
The Absolute Opportunities Fund may repay the Adviser fees waived and expenses reimbursed pursuant to the expense cap if (1) such payment is made within three years of the fees waived or expense reimbursement; and (2) such payment is approved by the Board, and (3) the resulting class expenses do not exceed 2.95% for Institutional Shares. For the period April 1, 2009 through March 31, 2012, the Adviser waived fees and/or reimbursed expenses as follows:
| Year Ended | | | Amount of Fees Waived and/or Expenses Reimbursed | | Expiration Date to Recoup Fees Waived and/or Expenses Reimbursed | | | Fees Recouped |
| March 31, 2010 | | $ | 327,552 | | March 31, 2013 | | $ | - |
| March 31, 2011 | | $ | 95,814 | | March 31, 2014 | | $ | - |
| March 31, 2012 | | $ | 87,404 | | March 31, 2015 | | $ | - |
| | | | | | | | | |
78 ABSOLUTE FUNDS
ABSOLUTE FUNDS
NOTES TO FINANCIAL STATEMENTS
MARCH 31, 2012
Note 5. Security Transactions
The cost of purchases and proceeds from sales of investment securities (including maturities), other than short-term investments during the year ended March 31, 2012, were as follows:
| Absolute Strategies Fund |
| |
| Non-U.S. Government Obligations | | U.S. Government Obligations |
| Purchases | | Sales | | Purchases | | Sales |
| $3,266,455,614 | | $3,054,130,927 | | $82,188,410 | | $104,166,707 |
The Absolute Strategies Fund placed a portion of it’s portfolio transactions with a brokerage firm affiliated with a sub-adviser. The commissions paid to this affiliated firm were $11,125 for the year.
| Absolute Opportunities Fund |
| |
| Non-U.S. Government Obligations | | U.S. Government Obligations |
| Purchases | | Sales | | Purchases | | Sales |
| $1,232,680,073 | | $1,288,946,134 | | $5,536,303 | | $9,910,780 |
Note 6. Federal Income Tax and Investment Transactions
Distributions during the fiscal years ended as noted were characterized for tax purposes as follows:
| | | Ordinary Income | | Long-Term Capital Gain | | Total |
| 2012 | | $ | 6,090,602 | | | $ | 17,382,122 | | | $ | 23,472,724 | |
| 2011 | | | 12,002,840 | | | | - | | | | 12,002,840 | |
| Absolute Opportunities Fund |
| 2012 | | | 368,743 | | | | 16,503,431 | | | | 16,872,174 | |
| 2011 | | | 4,900,930 | | | | 1,713,886 | | | | 6,614,816 | |
As of March 31, 2012, distributable earnings (accumulated loss) on a tax basis were as follows:
| | | Capital and Other Losses | | Unrealized Appreciation on Investments and Foreign Currency | | Total |
| Absolute Strategies Fund | | $ | (81,811,149 | ) | | $ | 249,012,398 | | | $ | 167,201,249 | |
| Absolute Opportunities Fund | | | (18,853,472 | ) | | | 13,474,974 | | | | (5,378,498 | ) |
The difference between components of distributable earnings on a tax basis and the amounts reflected in the Statement of Assets and Liabilities are primarily due to credit default swaps, wash sales, post October losses, passive foreign investment holdings, real estate investment trusts, partnerships, grantor trusts, constructive sales, straddles, short dividend adjustments, loss deferral on covers, convertible bond premium adjustments, contingent payment debt instruments, futures mark-to-market and registered investment companies.
For tax purposes, the current year post-October loss and late year ordinary loss was $81,811,149 and $18,853,472 (realized during the period November 1, 2011 through March 31, 2012) for Absolute Strategies Fund and Absolute Opportunities Fund, respectively. These losses will be recognized for tax purposes on the first business day of each Fund’s next fiscal year, April 1, 2012.
79 ABSOLUTE FUNDS
ABSOLUTE FUNDS
NOTES TO FINANCIAL STATEMENTS
MARCH 31, 2012
On the Statement of Assets and Liabilities, as a result of permanent book to tax differences, certain amounts have been reclassified for the year ended March 31, 2012. The following reclassifications were the result of book to tax differences resulting from real estate investment trusts, partnerships, passive foreign investment holdings, grantor trusts, registered investment companies, straddles, constructive sales, short dividend reclassifications, currency, paydowns, convertible bond premium adjustments, contingent payment debt instruments, credit default swap income, organization cost amortization, re-designation of distributions and net operating losses and has no impact on the net assets of each Fund.
| | Accumulated Net Investment Income (Loss) | | Undistributed Net Realized Gain (Loss) | | Paid-in-Capital |
| Absolute Strategies Fund | $ | 28,979,436 | | $ | (28,958,921) | | $ | (20,515) |
| Absolute Opportunities Fund | | 7,398,640 | | | (3,055,425) | | | (4,343,215) |
Note 7. Recent Accounting Pronouncements
In May 2011, FASB issued ASU No. 2011-04 “Amendments to Achieve Common Fair Value Measurement and Disclosure Requirements in U.S. GAAP and IFRSs.” ASU No. 2011-04 establishes common requirements for measuring fair value and for disclosing information about fair value measurements in accordance with U.S. GAAP and International Financial Reporting Standards (“IFRSs”). ASU No. 2011-04 is effective for interim and annual periods beginning after December 15, 2011. Management is evaluating the impact ASU No. 2011-04 may have on financial statement disclosures.
In December 2011, FASB issued ASU No. 2011-11 “Disclosures about Offsetting Assets and Liabilities” requiring disclosure of both gross and net information related to offsetting and related arrangements enabling users of its financial statements to understand the effect of those arrangements on the entity’s financial position. The objective of this disclosure is to facilitate comparison between those entities that prepare their financial statements on the basis of U.S. GAAP and those entities that prepare their financial statements on the basis of IFRSs. ASU No. 2011-11 is effective for interim and annual periods beginning on or after January 1, 2013. Management is evaluating any impact ASU No. 2011-11 may have on each Fund’s financial statements.
Note 8. Subsequent Events
Subsequent events occurring after the date of this report through the date these financial statements were issued have been evaluated for potential impact and each Fund has had no such events.
80 ABSOLUTE FUNDS
REPORT OF INDEPENDENT REGISTERED PUBLIC ACCOUNTING FIRM
To the Board of Trustees of Forum Funds and the Shareholders of Absolute Strategies Fund and Absolute Opportunities Fund
We have audited the accompanying statements of assets and liabilities of Absolute Strategies Fund and Absolute Opportunities Fund, each a series of shares of beneficial interest in the Forum Funds, including the schedules of investments, as of March 31, 2012, and the related statements of operations for the year then ended, the statements of changes in net assets for each of the years in the two year period then ended, and the financial highlights for the years or periods (Absolute Opportunities Fund commenced operations on October 21, 2009) in the four year period then ended. These financial statements and financial highlights are the responsibility of the Funds' management. Our responsibility is to express an opinion on these financial statements and financial highlights based on our audits. The financial highlights for Absolute Strategies Fund for the year ended March 31, 2008 were audited by other auditors whose report dated May 28, 2008, expressed an unqualified opinion on such financial highlights.
We conducted our audits in accordance with the standards of the Public Company Accounting Oversight Board (United States). Those standards require that we plan and perform the audits to obtain reasonable assurance about whether the financial statements and financial highlights are free of material misstatement. An audit includes examining, on a test basis, evidence supporting the amounts and disclosures in the financial statements. Our procedures included confirmation of securities owned as of March 31, 2012 by correspondence with the custodian and brokers and by other appropriate auditing procedures where responses from brokers were not received. An audit also includes assessing the accounting principles used and significant estimates made by management, as well as evaluating the overall financial statement presentation. We believe that our audits provide a reasonable basis for our opinion.
In our opinion, the financial statements and financial highlights referred to above present fairly, in all material respects, the financial position of Absolute Strategies Fund and Absolute Opportunities Fund as of March 31, 2012, the results of their operations for the year then ended, the changes in their net assets for each of the years in the two year period then ended, and their financial highlights for each of the years or periods in the four year period then ended, in conformity with accounting principles generally accepted in the United States of America.
BBD, LLP
Philadelphia, Pennsylvania
May 30, 2012
81 ABSOLUTE FUNDS
ABSOLUTE FUNDS
ADDITIONAL INFORMATION (Unaudited)
MARCH 31, 2012
Investment Advisory Agreement Approval
At the March 16, 2012 Board meeting, the Board, including the Independent Trustees, considered the approval of the continuance of the investment advisory agreement between Absolute Investment Advisors LLC (“Absolute”) and the Trust pertaining to the Funds (the “Advisory Agreement”) and the continurance of certain sub-advisory agreements (“Sub-Advisory Agreements”) for the Funds with Aronson+Johnson+Ortiz, LP; Green Eagle Capital, LLC; Horizon Asset Management, Inc.; Kingstown Capital Management, LP; Kovitz Investment Group, LLC; Longhorn Capital Partners, LLC; Madden Asset Management, LLC; Metropolitan West Asset Management, LLC; Mohican Financial Management, LLC; Pine Cobble Capital, LLC; SSI Investment Management, Inc.; Semaphore Management LLC; St. James Investment Company, LLC; TWIN Capital Management, Inc.; and Yacktman Asset Management Co. (the “Sub-advisers”). In evaluating the Advisory and Sub-Advisory Agreements for the Funds, the Board reviewed materials furnished by Absolute, the Sub-advisers (collectively, the “Advisers”) and the administrator, including information regarding the Advisers’ personnel, operations and financial condition.
Specifically, the Board considered, among other matters: (1) the nature, extent and quality of the services to be provided to the Funds by the Advisers, including information on the investment performance of the Advisers; (2) the costs of the services to be provided and profitability to the Advisers with respect to its relationship with the Funds; (3) the advisory fee and total expense ratio of the Funds compared to relevant peer groups of funds; (4) the extent to which economies of scale would be realized as the Funds grow and whether the advisory fee would enable the Funds’ investors to share in the benefits of economies of scale; and (5) other benefits received by the Advisers from its relationship with the Funds. In their deliberations, the Board did not identify any particular information that was all-important or controlling and attributed different weights to the various factors. In particular, the Board focused on the factors discussed below.
Nature, Extent and Quality of Services
Based on a presentation from senior representatives of Absolute and a discussion of the personnel, operations and financial condition of the Adviser regarding itself and the Sub-advisers, the Board considered the quality of services to be provided by Absolute under the Advisory Agreement between the Trust and Absolute and the quality of services to be provided by each Sub-adviser under under each Subadvisory Agreement between Absolute and each Sub-adviser. In this regard, the Board considered information regarding the experience, qualifications and professional background of the portfolio managers and other personnel at Absolute and each Sub-adviser with principal investment responsibility for the Funds’ investments as well as the investment philosophy and decision-making processes of those professionals and the capability and integrity of Absolute’s and each Sub-adviser’s senior management and staff. The Board considered the adequacy of Absolute’s and each Sub-adviser’s resources and quality of services provided by Absolute under the Advisory Agreement and each Sub-adviser under each Subadvisory Agreement.
Costs of Services and Profitability
The Board considered information provided by Absolute regarding its costs of services and its profitability with respect to the Funds. In this regard, the Board considered Absolute’s resources devoted to the Funds as well as Absolute’s discussion of costs and profitability. Based on these and other applicable considerations, the Board concluded that Absolute’s profits attributable to management of the Funds were not a material factor in approving the Advisory Agreement.
The Board did not consider information regarding the costs of services to be provided and profits to be realized by each Sub-adviser from its relationship with the Funds, noting instead the arm’s length nature of the relationship between Absolute and the Sub-advisers with respect to the negotiation of the advisory fee rate on behalf of each Fund. The Board concluded that each Sub-adviser’s projected profitability was not a material factor in determining whether or not to approve the Subadvisory Agreements because Absolute, and not the Funds, were responsible for paying the sub-advisory fees due under each Subadvisory Agreement.
82 ABSOLUTE FUNDS
ABSOLUTE FUNDS
ADDITIONAL INFORMATION (Unaudited)
MARCH 31, 2012
Performance
The Board reviewed performance of the Funds and Absolute’s discussion of its investment philosophy. The Board considered each Fund’s performance and each Sub-adviser’s performance over the 1 year, 3 year, 5 year and since inception periods ended February 29, 2012, as applicable. The Board noted that the Absolute Opportunities Fund underperformed the S&P 500, its benchmark index, during the 1 year, 3 year and since inception periods. The Board also noted that the Absolute Strategies Fund underperformed the S&P 500 Index, its benchmark index, for the 1 year, 3 year and since inception periods but outperformed it for 5 year period. The Board also noted the significant increase in assets of each of the Funds during the calendar year ended December 31, 2011.
With respect to Sub-adviser performance, Absolute explained that each Sub-adviser could be expected to achieve dramatically different performance results in light of each Sub-adviser’s particular strategy. The Board noted Absolute’s explanation that, standing alone, no Sub-adviser would necessarily be expected to perform in line with the market and that instead the performance of each Fund as a whole should be considered. In this regard, the Board noted that Absolute emphasized its responsibility for allocating each Fund’s assets among Sub-advisers in order to achieve the applicable Fund’s investment objective. In light of Absolute’s presentation and the continued growth of each Fund’s assets, the Board concluded that the Funds and their shareholders could benefit from the renewal of the Advisory Agreement and of each of the applicable Sub-Advisory Agreements between Absolute and each Sub-adviser.
Compensation
The Board considered the compensation paid to Absolute for providing advisory services to each Fund. The Board also considered comparative information regarding fees and total expenses of mutual funds identified by Lipper, Inc. as the Funds’ peer group, noting Absolute’s representation that it believes that hedge funds provide a fairer comparison to each Fund in terms of strategy and complexity and, as such, the Lipper Inc. peer group is not a complete reflection of each Fund’s peers. The Board noted that the Adviser’s advisory fee rate and total expense ratio were higher than the median advisory fee rate and median total expense ratio for funds in their Lipper Inc. peer groups. The Board specifically considered that the Funds’ fees were among the highest charged by the funds in their Lipper Inc. peer groups. In this regard, the Board considered the Adviser’s explanation that hedge funds are more similar to each of the Funds than the mutual funds in their Lipper Inc. peer groups, and that such hedge funds’ fees typically consist of a high advisory fee (some as high as 2%) and an additional performance fee (some as high as 20%). The Board also considered Absolute’s belief that the only comparable mutual fund peer is the Hatteras Alpha Hedged Strategies Fund which maintains an advisory fee of 3.99%. The Board recognized that Absolute’s fees do not include performance fees and that Absolute pays all of the Sub-advisers out of its advisory fee. Under these circumstances, the Board concluded that it is difficult to make a meaningful comparison of the Funds’ expense ratios to those of their Lipper Inc. peer groups, due to variations between the services provided by Absolute to the Funds and those included in the fees paid by other funds. Based on the foregoing, the Board concluded that the advisory fee rate charged to the Funds appeared to be within a reasonable range in light of the services that Absolute provides to each of the Funds.
Economies of Scale
The Board considered whether either of the Funds would benefit from any economies of scale. In this respect, the Board noted Absolute’s explanation that neither Fund could achieve large economies of scale because the investment strategies of the Sub-advisers were not high-capacity strategies – meaning the Sub-advisers could not successfully manage larger and larger amounts of assets. The Board also noted Absolute’s explanation that, to the extent it was able to obtain fee breaks with certain Sub-advisers, fee breakpoints may not be incorporated into the Funds’ fee structures given the capacity constraints of the Sub-Advisers and the need for Absolute to be able to hire additional Sub-Advisers at all times for the Funds as a whole. Based on the foregoing information, the Board concluded that capacity constraints preclude economies of scale from being a material factor in approving the Advisory Agreement or the Sub-advisory Agreements.
83 ABSOLUTE FUNDS
ABSOLUTE FUNDS
ADDITIONAL INFORMATION (Unaudited)
MARCH 31, 2012
The Board noted the Advisers’ representations that Absolute does not expect to receive any kind of benefit or compensation from its relationship with the Funds, other than its contractual advisory and sub-advisory fees. Based on the foregoing representations, the Board concluded that other benefits received by Absolute and the Sub-advisers from their relationships with the Funds were not a material factor to consider in approving the continuation of the Advisory and Sub-advisory Agreements.
Conclusion
The Board did not identify any single factor as being of paramount importance, and different Trustees may have given different weight to different factors. The Board reviewed a memorandum from Trust counsel discussing the legal standards applicable to its consideration of the Advisory Agreement and Sub-advisory Agreements. Based on its review, including consideration of each of the factors referenced above, the Board determined, in the exercise of its business judgment, that the advisory arrangements, as outlined in the Advisory Agreement and Sub-advisory Agreements, were fair and reasonable in light of the services performed, expenses incurred and such other matters as the Board considered relevant in the exercise of its reasonable business judgment.
Proxy Voting Information
A description of the policies and procedures that each Fund uses to determine how to vote proxies relating to securities held in each Fund’s portfolio is available, without charge and upon request, by calling (888) 992-2765 and on the U.S. Securities and Exchange Commission’s (the “SEC”) website at www.sec.gov. Each Fund’s proxy voting record for the most recent twelve-month period ended June 30 is available, without charge and upon request, by calling (888) 992-2765 and on the SEC’s website at www.sec.gov.
Availability of Quarterly Portfolio Schedules
Each Fund files its complete schedule of portfolio holdings with the SEC for the first and third quarters of each fiscal year on Form N-Q. These filings are available, without charge and upon request on the SEC’s website at www.sec.gov or may be reviewed and copied at the SEC’s Public Reference Room in Washington, DC. Information on the operation of the Public Reference Room may be obtained by calling (800) SEC-0330.
Shareholder Expense Example
As a shareholder of the Funds, you incur ongoing costs, including management fees, distribution (12b-1) fees and other Fund expenses. This example is intended to help you understand your ongoing costs (in dollars) of investing in the Funds and to compare these costs with the ongoing costs of investing in other mutual funds.
The example is based on an investment of $1,000 invested at the beginning of the period and held for the entire period from October 1, 2011, through March 31, 2012.
Actual Expenses – The first line under each share class of the table below provides information about actual account values and actual expenses. You may use the information in this line, together with the amount you invested, to estimate the expenses that you paid over the period. Simply divide your account value by $1,000 (for example, an $8,600 account value divided by $1,000 = 8.6), then multiply the result by the number in the first line under the heading entitled “Expenses Paid During Period” to estimate the expenses you paid on your account during the period.
84 ABSOLUTE FUNDS
ABSOLUTE FUNDS
ADDITIONAL INFORMATION (Unaudited)
MARCH 31, 2012
Hypothetical Example for Comparison Purposes – The second line under each share class of the table below provides information about hypothetical account values and hypothetical expenses based on each Fund’s actual expense ratio and an assumed rate of return of 5% per year before expenses, which is not each Fund’s actual return. The hypothetical account values and expenses may not be used to estimate the actual ending account balance or expenses you paid for the period. You may use this information to compare the ongoing costs of investing in each Fund and other funds. To do so, compare this 5% hypothetical example with the 5% hypothetical examples that appear in the shareholder reports of other funds.
Please note that the expenses shown in the table are meant to highlight your ongoing costs only. Therefore, the second line of the table is useful in comparing ongoing costs only and will not help you determine the relative total costs of owning different funds.
| | Beginning | | Ending | | Expenses | | Annualized |
| | Account Value | | Account Value | | Paid During | | Expense |
| | October 1, 2011 | | March 31, 2012 | | Period* | | Ratio* |
| Absolute Strategies Fund | | | | | | | | | | | |
| Institutional Shares | | | | | | | | | | | |
| Actual | $ | 1,000.00 | | $ | 1,007.57 | | $ | 12.30 | | 2.45 | % |
| Hypothetical (5% return before taxes) | $ | 1,000.00 | | $ | 1,012.75 | | $ | 12.33 | | 2.45 | % |
| R Shares | | | | | | | | | | | |
| Actual | $ | 1,000.00 | | $ | 1,005.47 | | $ | 14.39 | | 2.87 | % |
| Hypothetical (5% return before taxes) | $ | 1,000.00 | | $ | 1,010.65 | | $ | 14.43 | | 2.87 | % |
| | | | | | | | | | | | |
| Absolute Opportunities Fund | | | | | | | | | | | |
| Institutional Shares | | | | | | | | | | | |
| Actual | $ | 1,000.00 | | $ | 1,014.76 | | $ | 18.99 | | 3.77 | % |
| Hypothetical (5% return before taxes) | $ | 1,000.00 | | $ | 1,006.15 | | $ | 18.91 | | 3.77 | % |
| | | | | | | | | | | | |
| | *Expenses are equal to the Fund’s annualized expense ratio multiplied by the average account value over the period, multiplied by the number of days in the most recent fiscal half-year divided by 365 to reflect the half-year period. |
Federal Tax Status of Dividends Declared during the Tax Year
For federal income tax purposes, dividends from short-term capital gains are classified as ordinary income. The Absolute Strategies Fund designates 100.00% of its income dividend distributed as qualifying for the corporate dividends-received deduction (DRD) and 100.00% for the qualified dividend rate (QDI) as defined in Section 1(h)(11) of the Internal Revenue Code. The Absolute Strategies Fund also designates 41.11% as qualified interest income exempt from U.S. tax for foreign shareholders (QII).
The Absolute Opportunties Fund designates 40.03% of its income dividend distributed as DRD and 45.90% for QDI. The Absolute Opportunities Fund also designates 100.00% as short-term capital gain dividends exempt from U.S. tax for foreign shareholders (QSD).
Trustees and Officers of the Trust
The Board is responsible for oversight of the management of the Trust’s business affairs and of the exercise of all the Trust’s powers except those reserved for the shareholders. The following table provides information about each Trustee and certain officers of the Trust. Each Trustee and officer holds office until the person resigns, is removed, or is replaced. Unless otherwise noted, the persons have held their principal occupations for more than five years. The address for all Trustees and officers is Three Canal Plaza, Suite 600, Portland, Maine 04101. Mr. Keffer is considered an Interested Trustee due to his affiliation with Atlantic. Each Fund’s Statement of Additional
85 ABSOLUTE FUNDS
ABSOLUTE FUNDS
ADDITIONAL INFORMATION (Unaudited)
MARCH 31, 2012
Information includes additional information about the Trustees and is available, without charge and upon request, by calling (888) 992-2765.
| Name and Year of Birth | Position with the Trust | Length of Time Served | Principal Occupation(s) During Past Five Years | Number of Series of Trust Overseen by Trustee | Other Directorships Held by Trustee |
| Independent Trustees | | | | | |
J. Michael Parish Born: 1943 | Chairman of the Board; Trustee; Chairman, Nominating Committee and Qualified Legal Compliance Committee | Since 1989 (Chairman since 2004) | Retired since 2003. | 21 | 0 |
Costas Azariadis Born: 1943 | Trustee; Chairman, Valuation Committee | Since 1989 | Professor of Economics, Washington University since 2006. | 21 | 0 |
James C. Cheng Born: 1942 | Trustee; Chairman, Audit Committee | Since 1989 | President, Technology Marketing Associates (marketing company for small- and medium-sized businesses in New England) since 1991. | 21 | 0 |
David Tucker Born: 1958 | Trustee | Since 2011 | Director, Blue Sky Experience since 2008; Senior Vice President & General Counsel, American Century Companies 1998-2008. | 21 | 0 |
| Interested Trustee | | | | | |
John Y. Keffer1 Born: 1942 | Trustee; Vice Chairman | Since 1989 | Chairman, Atlantic since 2008; President, Forum Foundation (a charitable organization) since 2005; President, Forum Trust, LLC (a non-depository trust company chartered in the State of Maine) since 1997. | 21 | Director, Wintergreen Fund, Inc.; Director, Forum ETF Trust |
| Officers | | | | | |
Stacey E. Hong Born: 1966 | President; Principal Executive Officer | Since 2008 | President, Atlantic since 2008; Director, Consulting Services, Foreside Fund Services 2007. | N/A | N/A |
Karen Shaw Born: 1972 | Treasurer; Principal Financial Officer | Since 2008 | Senior Vice President, Atlantic since 2008; Vice President, Citigroup 2003-2008. | N/A | N/A |
David Faherty Born: 1970 | Vice President | Since 2009 | Senior Counsel, Atlantic since 2009; Vice President, Citi Fund Services Ohio, Inc. 2007-2009; Associate Counsel, Investors Bank & Trust Co. 2006-2007. | N/A | N/A |
Michael J. McKeen Born: 1971 | Vice President | Since 2009 | Senior Vice President, Atlantic since 2008; Vice President, Citigroup 2003-2008. | N/A | N/A |
Joshua LaPan Born: 1973 | Vice President | Since 2009 | Manager, Atlantic since 2008; Vice President, Citigroup 2003-2008. | N/A | N/A |
Timothy Bowden Born: 1969 | Vice President | Since 2009 | Manager, Atlantic since 2008; Vice President, Citigroup 2005-2008. | N/A | N/A |
Lina Bhatnagar Born: 1971 | Secretary | Since 2008 | Senior Administration Specialist, Atlantic since 2008; Regulatory Administration Specialist, Citigroup 2006-2008. | N/A | N/A |
1Atlantic is a subsidiary of Forum Holdings Corp. I, a Delaware corporation that is wholly owned by Mr. Keffer. |
[INTENTIONALLY LEFT BLANK]
87 ABSOLUTE FUNDS
[INTENTIONALLY LEFT BLANK]
TABLE OF CONTENTS
| Beck, Mack & Oliver Global Equity Fund | |
| A Message to Our Shareholders | 2 |
| Performance Chart and Analysis (Unaudited) | 6 |
| Portfolio Profile (Unaudited) | 7 |
| Schedule of Investments | 8 |
| Statement of Assets and Liabilities | 12 |
| Statement of Operations | 13 |
| Statement of Changes in Net Assets | 14 |
| Financial Highlights | 15 |
| Beck, Mack & Oliver Partners Fund | |
| A Message to Our Shareholders | 16 |
| Performance Chart and Analysis (Unaudited) | 21 |
| Portfolio Profile (Unaudited) | 22 |
| Schedule of Investments | 23 |
| Statement of Assets and Liabilities | 24 |
| Statement of Operations | 25 |
| Statement of Changes in Net Assets | 26 |
| Financial Highlights | 27 |
| | |
| Notes to Financial Statements | 28 |
| Report of Independent Registered Public Accounting Firm | 36 |
| Additional Information (Unaudited) | 37 |
BECK, MACK & OLIVER GLOBAL EQUITY FUND
A MESSAGE TO OUR SHAREHOLDERS
MARCH 31, 2012
Dear Shareholders:
The Beck, Mack & Oliver Global Equity Fund (the “Global Fund”) ended its fiscal year on March 31, 2012 with a net asset value of $18.88 per share, realizing a return of -3.20% for the twelve-month period. The Global Fund’s fiscal return compares with a return of 0.56% for the Global Fund’s benchmark, the MSCI World Index (“MSCI”)1, and an 8.54% return for the S&P 500 Index (“S&P 500”)2 . For a longer term perspective, the Global Fund’s 3-, 5-, and 10-year average annual total returns for the period ended March 31st were as follows:
| Average Annual Total Return as of 03/31/2012 | | One Year | | Three Years | | Five Years | | Ten Years |
| Beck, Mack & Oliver Global Equity Fund | | -3.20% | | 18.42% | | -0.58% | | 6.12% |
| MSCI World Index | | 0.56% | | 20.24% | | -0.70% | | 4.72% |
| S&P 500 Index | | 8.54% | | 23.42% | | 2.01% | | 4.12% |
(Performance data quoted represents past performance and is no guarantee of future results. Current performance may be lower or higher than the performance data quoted. Investment return and principal value will fluctuate so that an investor’s shares, when redeemed, may be worth more or less than original cost. For the most recent month-end performance, please call (800) 943-6786. Shares redeemed or exchanged within 60 days of purchase will be charged a 2.00% redemption fee. As stated in the current prospectus, the Global Fund’s annual operating expense ratio (gross) is 1.97%. However, the Global Fund’s adviser has agreed to contractually waive a portion of its fees and/or reimburse expenses such that total operating expenses do not exceed 1.25%, which is in effect until July 31, 2012. During the period certain fees were waived and/or expenses reimbursed; otherwise returns would have been lower. Returns greater than one year are annualized.)
Fiscal 2011 was a challenging period for the Global Fund. First and foremost we want to thank each of our shareholders for your ongoing support and investment alongside ours. Despite what appears to be a continued challenging environment for global equities, we are committed to pursuing performance consistent with our historic track-record and are confident in our ability to do so for shareholders.
The Global Fund underperformed its benchmark during the fiscal period ending March 31, 2012. Going into the fiscal year, the portfolio was populated with a large number of “discount to NAV” (net asset value) common stocks, family
| 1 | The MSCI measures the performance of a diverse range of global stock markets in the United States, Canada, Europe, Australia, New Zealand and the Far East. The total return of the MSCI includes reinvestment of dividends and income. The total return of the Global Fund includes operating expenses that reduce returns, while the total return of the MSCI does not include expenses. The Global Fund is professionally managed while the MSCI is unmanaged and is not available for investment. |
| 2 | The S&P 500 is a market-value weighted index representing the performance of 500 widely held, publicly traded stocks. The total return of the S&P 500 includes reinvestment of dividends and income. The total return of the Global Fund includes operating expenses that reduce returns, while the total return of the S&P 500 does not include expenses. The Global Fund is professionally managed while the S&P 500 is unmanaged and is not available for investment. One cannot invest directly in an index. |
2
BECK, MACK & OLIVER GLOBAL EQUITY FUND
A MESSAGE TO OUR SHAREHOLDERS
MARCH 31, 2012
controlled conglomerates, real estate investment companies, and passive foreign investment companies (PFIC’s), many domiciled in Asia. The portfolio has always had a sizable allocation to these “types” of common stock, but the weightings were higher than usual in fiscal 2011. We have observed in the recent past that many of the better quality companies with tangible income producing assets have been domiciled in the Asia-Pacific region whereas in prior years the portfolio had been populated with more global franchise-type companies such as Philip Morris International, Akzo Nobel, and Coca-Cola FEMSA – businesses with pricing power and yield. To a certain extent, the Global Fund had migrated away from these franchises as time progressed because of an unusual valuation disparity we identified in the former. Many appear to be Graham and Dodd type “net nets,” which as we have discussed in the past are companies with tangible assets that we have visited over the years where you can actually “see” the assets at work (class A buildings, malls, etc.).
As 2011 progressed we increased the weighting of these Asian-Pacific components of the portfolio as the price to value discrepancy appeared more extreme relative to other stocks in our opinion. These Asian-Pacific stocks have performed poorly in the recent market environment. We believe many of our stocks were depressed primarily due to liquidity issues (capital flight and forced selling) but we do not believe there has been any material degradation in the fundamentals of these companies. In the case of property-related companies in Asia, a more stringent regulatory environment implemented to depress transaction prices (to prevent a bubble) had remained for longer than we anticipated and took its toll over the course of 2011. We do not, however, believe that any rational analyst would conclude that these securities have been potentially permanently impaired, even if the environment for Hong Kong remains cloudy given its position as an international financial center. We have made the case for share buybacks to some company management teams and various analysts. Genting Bhd, an Asian conglomerate we own with interests in gaming, leisure and agriculture, is a good example of a family controlled conglomerate that has been a good capital allocator and buys back equity opportunistically.
In Europe, we were correctly underweight with no direct exposure to European financial institutions. Our discount to NAV strategy in general has not worked well in this current market environment. We believe, however, that it will work again in the future. One discount to NAV situation that did work well in fiscal 2011 was Baron Albert Frere’s holding company, CNP, which acquired shares Baron Frere did not already own, thereby eliminating the discount. Other bright spots in the portfolio included the pricing power/franchise companies the Global Fund owns such as FEMSA and Coca-Cola FEMSA as well as agriculture-related companies such as GrainCorp.
With cash held by the Global Fund going into the 4Q2011, correction in U.S. equities and continued caution on our part with regard to allocating significantly to Euro denominated securities, we aggressively and opportunistically deployed capital into U.S. domiciled names such as Berkshire Hathaway and select non-Euro denominated franchises such as Swatch Group. In a true study in absurdity, we started buying Swatch, which is in our opinion a wonderful, impossible to replicate franchise, at around 9x forward EPS (earnings per share3). Only a few months later Swatch’s common stock was trading around 14x EPS as of March 31, 2012. It’s a study in absurdity because the Swatch operating business did not by any means change as drastically as the market for its stock would suggest over this short period of time.
We continue to have a large allocation to Canada and anticipate this weighting to stay flat to down. Our largest holding
3
BECK, MACK & OLIVER GLOBAL EQUITY FUND
A MESSAGE TO OUR SHAREHOLDERS
MARCH 31, 2012
is Huntingdon Capital Corp. (HNT-UN.TO). Huntingdon was a severely discounted equity with an energetic management team in a relatively stable Canadian real estate market at purchase. Management has so far delivered on the turnaround it embarked on a few years ago, and hard work has paid off thus far. Management has made good progress in shoring up Huntingdon’s balance sheet through asset sales at favorable prices (cap rates) and on capital improvements to its properties. The company successfully refinanced its debt and underwent a change in structure from a REIT (real estate investment trust) to a corporation in order to maintain flexibility in capital allocation.
The Global Fund’s allocation to Hong Kong was near 14% percent of net assets as of March 31, 2012 and we anticipate this weighting will be flat to down in the near future. These stocks appear extremely cheap (Graham and Dodd net-net type cheap!). We believe the strict regulatory environment will ease in the not too distant future. In general these stocks are discounting a fairly draconian real estate scenario in China and Hong Kong. As an example, Wheelock (20 Hong Kong dollars) is trading well below its 03/31/12 liquidation value of its main equity interest, Wharf Holdings (retail malls, ports). Wharf is publicly traded so the value that Wheelock has in its participation is readily apparent every day. Wharf itself also trades at a discount to relative to its high quality NAV driven by its cash generative best-in-class4 mall properties. We owned Wheelock during the initial part of the credit crises in 2008 and saw the stock behave the same way (it got even cheaper but quickly rebounded and closed its discount). All the while its EBITDA5 and cash flows have expanded, driven by mainland Chinese visitors spending money in tax friendly Hong Kong.
As of 03/31/12 our Japanese allocation of 10% of net assets was in high quality industrials and franchises doing business worldwide. We have a good portion of the currency hedged by out-of-the-money puts6 on the ¥en. Japanese equities are cheap by many metrics, in some cases single digit multiples of the operating business adjusted for cash. Japanese stocks can likely do well in an environment of a weakening ¥en and an expanding U.S. economy given the importance of exports to the Japanese economy. Mexico represents an area of opportunity due to attractive demographics, its proximity to U.S. and South American markets, and a relatively sound fiscal position. Criminal violence is a detractor but has not materially affected businesses or Foreign Direct Investment.
During 1Q2012, we began to execute on a plan to increase our exposure to mid-size companies with economic moats that can expand over time. An example of a recent purchase during the reporting period was Dufry, one of the dominant Duty Free retail companies operating on a global basis. Dufry has been a consolidator of the fragmented Duty Free retail market and we expect will continue to do so. Given its geographic footprint, we anticipate it should benefit from the expanding wallet of the emerging market consumer. We entered at an attractive valuation during 2011’s market turbulence.
Finally, we are pleased to announce that during 1Q2012, our Global Fund invested in its first private company, Switch Communications of Nevada via a private fund established solely for this investment, Brightwood Switch SPV, LP. Switch is led by a visionary owner-operator management team that has built a unique, hard to replicate collection of data center assets. We were fortunate to be able to visit Switch during a due diligence trip and believe in the Switch thesis.
| 4 | The determination of “best-in-class” is solely the opinion of Wharf and is subject to change. |
| 5 | EBITDA is Earnings Before Interest, Taxes, Depreciation and Amortization used to analyze a company's operating profitability. |
| 6 | Out-of-the-money put options have a strike price below the price of the underlying asset. |
4
BECK, MACK & OLIVER GLOBAL EQUITY FUND
A MESSAGE TO OUR SHAREHOLDERS
MARCH 31, 2012
“The Cloud,” data storage, and unparalleled security and reliability surround the Switch investment thesis, and Switch has been experiencing rapid growth for its services.
We thank you for your loyalty and patience which we believe will be rewarded in the fullness of time. We look forward to updating you on our progress in the coming months.
David E. Rappa Peter A. Vlachos
Robert C. Beck
IMPORTANT RISKS AND DISCLOSURE:
There is no assurance that the Global Equity Fund will achieve its investment objective. Investing overseas involves special risks, including the volatility of currency exchange rates and, in some cases, political and economic instability, and relatively illiquid markets. The Global Equity Fund may invest in small and mid-sized capitalization companies meaning that these companies carry greater risk than is customarily associated with larger companies for various reasons such as narrower markets, limited financial resources and less liquid stock.
The views in this report were those of the Global Equity Fund managers as of March 31, 2012 and may not reflect their views on the date this report is first published or any time thereafter. These views are intended to assist shareholders in understanding their investment in the Global Equity Fund and do not constitute investment advice. This letter may contain discussions about certain investments both held and not held in the portfolio. All current and future holdings are subject to risk and to change.
5
BECK, MACK & OLIVER GLOBAL EQUITY FUNDPERFORMANCE CHART AND ANALYSIS (Unaudited)
The following chart reflects the change in the value of a hypothetical $10,000 investment, including reinvested dividends and distributions, in the Beck, Mack & Oliver Global Equity Fund (the “Fund”) compared with the performance of the benchmark, Morgan Stanley Capital International World Index ("MSCI"), over the past ten fiscal years. The MSCI measures the performance of a diverse range of 24 developed countries’ stock markets including the United States, Canada, Europe, the Middle East and the Pacific. The total return of the MSCI includes the reinvestment of dividends and income. The total return of the Fund includes operating expenses that reduce returns, while the total return of the MSCI does not include expenses. The Fund is professionally managed while the MSCI is unmanaged and is not available for investment.
Performance data quoted represents past performance and is no guarantee of future results. Current performance may be lower or higher than the performance data quoted. Investment return and principal value will fluctuate so that shares, when redeemed, may be worth more or less than original cost. For the most recent month-end performance, please call (800) 943-6786. Shares redeemed or exchanged within 60 days of purchase will be charged a 2.00% redemption fee. As stated in the Fund’s prospectus, the annual operating expense ratio (gross) is 1.97%. However, the Fund’s adviser has contractually agreed to reduce a portion of its fees and reimburse expenses to limit total operating expenses to 1.25%, through July 31, 2012. During the period, certain fees were waived and/or expenses reimbursed; otherwise, returns would have been lower. The performance table and graph do not reflect the deduction of taxes that a shareholder would pay on Fund distributions or the redemption of Fund shares. Returns greater than one year are annualized.
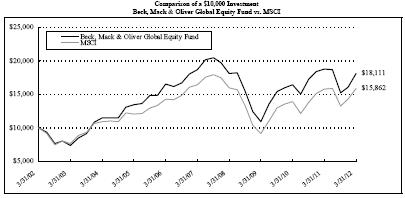
| Average Annual Total Returns for Periods Ended March 31, 2012: | | One Year | | Five Years | | Ten Years |
| Beck, Mack & Oliver Global Equity Fund | | -3.20 | % | | -0.58 | % | | 6.12 | % |
| MSCI | | 0.56 | % | | -0.70 | % | | 4.72 | % |
6
BECK, MACK & OLIVER GLOBAL EQUITY FUND
PORTFOLIO PROFILE (Unaudited)
MARCH 31, 2012
| % of Total Investments | | |
| Financials | 51.9 | % |
| Consumer Staples | 12.6 | % |
| Consumer Discretionary | 11.8 | % |
| Energy | 6.3 | % |
| Information Technology | 3.1 | % |
| Industrials | 3.1 | % |
| Materials | 3.1 | % |
| Healthcare | 3.0 | % |
| Investment Companies | 1.9 | % |
| Telecommunication Services | 1.6 | % |
| Foreign Government Bond | 1.5 | % |
| Warrants | 0.1 | % |
| | | |
| | 100.0 | % |
See Notes to Financial Statements.
7
BECK, MACK & OLIVER GLOBAL EQUITY FUNDSCHEDULE OF INVESTMENTS
| | Shares | | Security Description | | Value | |
| Common Stock – 81.9% |
| Australia - 2.0% |
| | 196,100 | | GrainCorp, Ltd. | $ | 1,838,328 |
| | | |
| Belgium - 2.0% |
| | 25,700 | | Anheuser-Busch InBev NV, ADR | | 1,868,904 |
| | | |
| Bermuda - 6.8% |
| | 372,700 | | Archer, Ltd. (a) | | 926,064 |
| | 32,000 | | Axis Capital Holdings, Ltd. | | 1,061,440 |
| | 29,000 | | Enstar Group, Ltd. (a) | | 2,870,710 |
| | 19,950 | | RenaissanceRe Holdings, Ltd. | | 1,510,814 |
| | | 6,369,028 |
| Brazil - 0.7% |
| | 37,945 | | BM&FBovespa SA | | 232,603 |
| | 51,000 | | Diagnosticos da America SA (a) | | 391,974 |
| | | 624,577 |
| Canada - 17.8% |
| | 114,900 | | Brookfield Asset Management, Inc., Class A | | 3,625,147 |
| | 68,140 | | Encana Corp. | | 1,338,951 |
| | 3,935 | | Fairfax Financial Holdings, Ltd. | | 1,584,187 |
| | 647,250 | | Huntingdon Capital Corp. (b) | | 7,137,952 |
| | 5,500 | | Imperial Oil, Ltd. | | 249,897 |
| | 173,000 | | Kinross Gold Corp. | | 1,691,062 |
| | 2,418,800 | | Petroamerica Oil Corp. (a) | | 387,997 |
| | 2,651,700 | | Petromanas Energy, Inc. (a) | | 611,450 |
| | 44 | | Suncor Energy, Inc. | | 1,450 |
| | | 16,628,093 |
| China - 0.3% |
| | 285,000 | | Minth Group, Ltd. | | 330,305 |
| | | |
| Hong Kong - 13.7% |
| | 64,600 | | Cheung Kong Holdings, Ltd. | | 834,375 |
| | 171,000 | | Guoco Group, Ltd. | | 1,492,979 |
| | 784,000 | | Hang Lung Properties, Ltd. | | 2,872,276 |
| | 161,449 | | Henderson Land Development Co., Ltd. | | 890,869 |
| | 490,500 | | Hopewell Holdings, Ltd. | | 1,345,384 |
| | 7,600 | | Jardine Matheson Holdings, Ltd. | | 380,000 |
| | 2,704,000 | | Value Partners Group, Ltd. | | 1,640,043 |
| | 955,000 | | Wheelock & Co., Ltd. | | 2,877,710 |
| | 152,000 | | Wynn Macau, Ltd. | | 444,321 |
| | | 12,777,957 |
| Indonesia - 1.7% |
| | 99,826,500 | | Panin Financial Tbk PT (a) | | 1,550,237 |
| | | |
| Japan - 10.0% |
| | 9,800 | | Fanuc, Ltd. | | 1,738,118 |
| | 140 | | Japan Tobacco, Inc. | | 788,208 |
| | 3,700 | | Keyence Corp. | | 869,905 |
| | 5,600 | | Kyocera Corp. | | 512,843 |
| | Shares | | Security Description | | Value | |
| | 24,400 | | Moshi Moshi Hotline, Inc. | $ | 243,794 |
| | 8,100 | | Shimano, Inc. | | 487,840 |
| | 38,900 | | Shiseido Co., Ltd. | | 671,127 |
| | 43,900 | | Softbank Corp. | | 1,297,853 |
| | 42,000 | | Toray Industries, Inc. | | 311,562 |
| | 56,800 | | Toyota Industries Corp. | | 1,712,852 |
| | 30,500 | | Universal Entertainment Corp. | | 683,919 |
| | | 9,318,021 |
| Jordan - 1.3% |
| | 102,570 | | Arab Bank PLC | | 1,177,886 |
| | | |
| Malaysia - 0.5% |
| | 135,900 | | Genting Bhd | | 480,873 |
| | | |
| Mexico - 4.3% |
| | 16,500 | | Coca-Cola Femsa S.A.B. de C.V., ADR | | 1,747,515 |
| | 6,000 | | Fomento Economico Mexicano S.A.B. de C.V., ADR | | 493,620 |
| | 83,900 | | Grupo Televisa SA, ADR | | 1,768,612 |
| | | 4,009,747 |
| Singapore - 0.6% |
| | 324,000 | | Global Logistic Properties, Ltd. (a) | | 567,042 |
| | | |
| Spain - 0.5% |
| | 100,500 | | Promotora de Informaciones SA, ADR | | 437,175 |
| | | |
| Sweden - 1.0% |
| | 41,750 | | Investor AB, Class A | | 904,947 |
| | | |
| Switzerland - 4.1% |
| | 14,599 | | Dufry AG (a) | | 1,908,366 |
| | 8,220 | | Nestle SA | | 517,222 |
| | 3,100 | | The Swatch Group AG | | 1,426,886 |
| | | 3,852,474 |
| United Kingdom - 3.8% |
| | 6,000 | | Anglo American PLC | | 224,282 |
| | 66,500 | | Justice Holdings, Ltd. (a) | | 925,391 |
| | 450,000 | | TESCO PLC | | 2,375,259 |
| | | 3,524,932 |
F
| United States - 10.8% |
| | 34,000 | | Baxter International, Inc. | 2,032,520 |
| | 39,400 | | Berkshire Hathaway, Inc., Class B (a) | 3,197,310 |
| | 11,200 | | Kraton Performance Polymers, Inc. (a) | 297,584 |
| | 140,198 | | Leucadia National Corp. | 3,659,168 |
| | 13,000 | | Schlumberger, Ltd. | 909,090 |
| | 10,095,672 |
Total Common Stock (Cost $66,225,382) | | 76,356,198 |
See Notes to Financial Statements.
8
BECK, MACK & OLIVER GLOBAL EQUITY FUNDSCHEDULE OF INVESTMENTS
| | Principal | | Security Description | | Value | |
| Private Equity Fund - 1.3% |
| United States - 1.3% |
| $ | 1,200,000 | | Brightwood Switch SPV, LP(a)(b)(c)(d)(Cost $1,200,000) | $ | 1,200,000 |
| | Principal | | Security Description | | Rate | | Maturity | | | |
| Corporate Non-Convertible Bonds - 1.6% |
| Canada - 0.6% |
| | 500,000 | | Huntingdon Real Estate | | 7.50 | % | 12/31/16 | | 532,608 |
| United States - 1.0% |
| | 200,000 | | Cemex Finance, LLC (e) | | 9.50 | | 12/14/16 | | 200,520 |
| | 400,000 | | United Refining Co. | | 10.50 | | 02/28/18 | | 415,000 |
| | 400,000 | | Xinergy Corp. (e) | | 9.25 | | 05/15/19 | | 310,000 |
| | | 925,520 |
Total Corporate Non-Convertible Bonds (Cost $1,421,326) | | 1,458,128 |
| Foreign Government Bonds - 1.3% |
| Hong Kong - 1.1% |
| | 8,000,000 | | Hong Kong Government Bond | | 0.26 | | 08/19/13 | | 1,031,509 |
| Singapore - 0.2% |
| | 250,000 | | Singapore Government Bond | | 1.63 | | 04/01/13 | | 201,763 |
Total Foreign Government Bonds (Cost $1,241,844) | | 1,233,272 |
| Warrants - 0.1% |
| | 14,000 | | Huntingdon Capital Corp. (a) | | 45,967 |
| | 14,048,000 | | Panin Financial Tbk PT (a) | | 56,844 |
Total Warrants (Cost $-) | | 102,811 |
| Investment Companies - 1.7% |
| | 136,626 | | DoubleLine Total Return Bond Fund, Class I | | 1,535,671 |
Total Investment Companies (Cost $1,513,853) | | 1,535,671 |
| | Contracts | | Security Description | | | Strike Price | | Exp. Date | | Value | |
| Call Options Purchased - 0.0% |
| | 600,000 | | Australian Currency | $ | 0.97 | 04/12 | $ | 78 |
| | 275,000 | | Australian Currency | | 0.98 | 08/12 | | 4,685 |
| | 250,000 | | Australian Currency | | 0.99 | 09/12 | | 6,117 |
| | 1,000,000 | | Japanese Currency | | 90.00 | 06/12 | | 1,543 |
| | 1,000,000 | | Japanese Currency | | 100.00 | 01/13 | | 3,545 |
Total Call Options Purchased (Premiums Paid $39,275) | | 15,968 |
Total Investments - 87.9% (Cost $71,641,680)* | $ | 81,902,048 |
| Other Assets & Liabilities, Net - 12.1% | | 11,285,674 |
| Net Assets - 100.0% | $ | 93,187,722 |
| ADR | American Depositary Receipt |
| LLC | Limited Liability Company |
| PLC | Public Limited Company |
| (a) | Non-income producing security. |
| (c) | Security fair valued in accordance with procedures adopted by the Board of Trustees. At the period end, the value of these securities amounted to $1,200,000 or 1.3% of net assets. |
| (d) | Private equity fund purchased on 02/21/12, that invests in Switch Communications Group, LLC. Illiquid investment in which redemptions are not accepted. |
| (e) | Security exempt from registration under Rule 144A under the Securities Act of 1933. At the period end, the value of these securities amounted to $510,520 or 0.5% of net assets. |
| | * Cost for federal income tax purposes is $73,758,380 and net unrealized appreciation consists of: |
| Gross Unrealized Appreciation | | $ | 13,187,141 | |
| Gross Unrealized Depreciation | | | (5,043,473 | ) |
| Net Unrealized Appreciation | | $ | 8,143,668 | |
See Notes to Financial Statements.
9
BECK, MACK & OLIVER GLOBAL EQUITY FUNDSCHEDULE OF INVESTMENTS
An affiliate is an entity in which the Fund has ownership of at least 5% of the voting securities. Transactions during the year with affiliates are as follows:
| Name of Issuer | | Shares held at beginning of year | | Gross Additions | | Gross Reductions | | Realized Gain | | Shares/ Principal held at end of year | | Value March 31, 2012 | | Investment Income |
| Huntingdon Capital Corp. | | 695,750 | $ | 80,381 | $ | (664,329) | $ | 252,626 | | 647,250 | $ | 7,137,952 | $ | 35,982 |
| Brightwood Switch SPV, LP | - | | 1,200,000 | | - | | - | | $1,200,000 | | 1,200,000 | | - |
The inputs or methodology used for valuing securities are not necessarily an indication of the risks associated with investing in those securities. For more information on valuation inputs, and their aggregation into the levels used in the tables below, please refer to the Security Valuation section in Note 2 of the accompanying Notes to Financial Statements.
The following is a summary of the inputs used to value the Fund’s investments and other financial instruments and liabilities as of March 31, 2012.
| | | | Level 1 | | | | Level 2 | | | | Level 3 | | | | Total | |
| Assets |
| Investments At Value |
| Common Stock | | | | | | | | | | | | | | | | |
| Australia | | $ | 1,838,328 | | | $ | - | | | $ | - | | | $ | 1,838,328 | |
| Belgium | | | 1,868,904 | | | | - | | | | - | | | | 1,868,904 | |
| Bermuda | | | 6,369,028 | | | | - | | | | - | | | | 6,369,028 | |
| Brazil | | | 624,577 | | | | - | | | | - | | | | 624,577 | |
| Canada | | | 16,628,093 | | | | - | | | | - | | | | 16,628,093 | |
| China | | | 330,305 | | | | - | | | | - | | | | 330,305 | |
| Hong Kong | | | 12,777,957 | | | | - | | | | - | | | | 12,777,957 | |
| Indonesia | | | 1,550,237 | | | | - | | | | - | | | | 1,550,237 | |
| Japan | | | 9,318,021 | | | | - | | | | - | | | | 9,318,021 | |
| Jordan | | | 1,177,886 | | | | - | | | | - | | | | 1,177,886 | |
| Malaysia | | | 480,873 | | | | - | | | | - | | | | 480,873 | |
| Mexico | | | 4,009,747 | | | | - | | | | - | | | | 4,009,747 | |
| Singapore | | | 567,042 | | | | - | | | | - | | | | 567,042 | |
| Spain | | | 437,175 | | | | - | | | | - | | | | 437,175 | |
| Sweden | | | 904,947 | | | | - | | | | - | | | | 904,947 | |
| Switzerland | | | 3,852,474 | | | | - | | | | - | | | | 3,852,474 | |
| United Kingdom | | | 3,524,932 | | | | - | | | | - | | | | 3,524,932 | |
| United States | | | 10,095,672 | | | | - | | | | - | | | | 10,095,672 | |
| Private Equity Fund | | | - | | | | - | | | | 1,200,000 | | | | 1,200,000 | |
| Corporate Non-Convertible Bonds | | | - | | | | 1,458,128 | | | | - | | | | 1,458,128 | |
| Foreign Government Bonds | | | - | | | | 1,233,272 | | | | - | | | | 1,233,272 | |
| Warrants | | | 102,811 | | | | - | | | | - | | | | 102,811 | |
| Investment Companies | | | 1,535,671 | | | | - | | | | - | | | | 1,535,671 | |
| Call Options Purchased | | | 15,968 | | | | - | | | | - | | | | 15,968 | |
| Total Investments At Value | | $ | 78,010,648 | | | $ | 2,691,400 | | | $ | 1,200,000 | | | $ | 81,902,048 | |
| Other Financial Instruments** | | | | | | | | | | | | | | | | |
| Forward Currency Contracts | | | - | | | | 11,668 | | | | - | | | | 11,668 | |
| Total Assets | | $ | 78,010,648 | | | $ | 2,703,068 | | | $ | 1,200,000 | | | $ | 81,913,716 | |
See Notes to Financial Statements.
10
BECK, MACK & OLIVER GLOBAL EQUITY FUNDSCHEDULE OF INVESTMENTS
| | | | Level 1 | | | | Level 2 | | | | Level 3 | | | | Total | |
| Liabilities |
| Other Financial Instruments** | | | | | | | | | | | | | | | | |
| Forward Currency Contracts | | $ | - | | | $ | (134,850 | ) | | $ | - | | | $ | (134,850 | ) |
| Total Liabilities | | $ | - | | | $ | (134,850 | ) | | $ | - | | | $ | (134,850 | ) |
| ** | Other Financial Instruments are derivatives not reflected in the Total Investments in Securities, such as forward currency contracts, which are valued at their market value at period end. |
There were no significant transfers between Level 1 and Level 2 for the year ended March 31, 2012.
The following is a reconciliation of Level 3 investments for which significant unobservable inputs were used to determine fair value.
| | | Call Options Purchased | | Private Equity Fund |
| | | | | | | | | |
| Balance as of 03/31/11 | | $ | 9,444 | | | $ | - | |
| Purchases | | | - | | | | 1,200,000 | |
| Transfers Out | | | (9,444 | ) | | | - | |
| Balance as of 03/31/12 | | $ | - | | | $ | 1,200,000 | |
The Fund utilizes the end of period methodology when determining transfers in or out of the level 3 category.
See Notes to Financial Statements.
11
BECK, MACK & OLIVER GLOBAL EQUITY FUNDSTATEMENT OF ASSETS AND LIABILITIES
| ASSETS | | | | |
| Investments, at value (Cost $67,360,618) | | $ | 73,564,096 | |
| Investments in affiliates, at value (Cost $4,281,062) | | | 8,337,952 | |
| Total Investments | | $ | 81,902,048 | |
| Cash | | | 9,733,425 | |
| Foreign currency (Cost $260,966) | | | 259,518 | |
| Receivables: | | | | |
| Fund shares sold | | | 3,197 | |
| Investment securities sold | | | 1,491,340 | |
| Dividends and interest | | | 302,515 | |
| Unrealized gain on forward currency contracts | | | 11,668 | |
| Prepaid expenses | | | 13,804 | |
| Total Assets | | | 93,717,515 | |
| | | | | | |
| LIABILITIES | | | | |
| Unrealized loss on forward currency contracts | | | 134,850 | |
| Payables: | | | | |
| Investment securities purchased | | | 231,052 | |
| Fund shares redeemed | | | 43,709 | |
| Accrued Liabilities: | | | | |
| Investment adviser fees | | | 66,647 | |
| Fund services fees | | | 15,710 | |
| Compliance services fees | | | 1,544 | |
| Other expenses | | | 36,281 | |
| Total Liabilities | | | 529,793 | |
| | | | | | |
| NET ASSETS | | $ | 93,187,722 | |
| | | | | | |
| COMPONENTS OF NET ASSETS | | | | |
| Paid-in capital | | $ | 82,000,740 | |
| Distributions in excess of net investment income | | | (1,656,144 | ) |
| Accumulated net realized gain | | | 2,700,804 | |
| Net unrealized appreciation | | | 10,142,322 | |
| NET ASSETS | | $ | 93,187,722 | |
| SHARES OF BENEFICIAL INTEREST AT NO PAR VALUE (UNLIMITED SHARES AUTHORIZED) | | | 4,936,169 | |
NET ASSET VALUE, OFFERING AND REDEMPTION PRICE PER SHARE* | | $ | 18.88 | |
| * | Shares redeemed or exchanged within 60 days of purchase are charged a 2.00% redemption fee. |
See Notes to Financial Statements. 12
BECK, MACK & OLIVER GLOBAL EQUITY FUNDSTATEMENT OF OPERATIONS
| | | | | |
| INVESTMENT INCOME | | | | |
| Dividend income (Net of foreign withholding taxes of $167,963) | | $ | 1,900,639 | |
| Dividend income from affiliated investment (Net of foreign withholding taxes of $6,350) | | | 35,982 | |
| Interest income (Net of foreign withholding taxes of $489) | | | 68,629 | |
| Total Investment Income | | | 2,005,250 | |
| Adviser | | | | |
| EXPENSES | | | | |
| Investment adviser fees | | | 1,419,527 | |
| Fund services fees | | | 186,997 | |
| Custodian fees | | | 63,832 | |
| Registration fees | | | 18,129 | |
| Professional fees | | | 52,442 | |
| Trustees' fees and expenses | | | 3,265 | |
| Compliance services fees | | | 20,050 | |
| Miscellaneous expenses | | | 29,840 | |
| Total Expenses | | | 1,794,082 | |
| Fees waived and expenses reimbursed | | | (611,143 | ) |
| Net Expenses | | | 1,182,939 | |
| | | | | |
| NET INVESTMENT INCOME | | | 822,311 | |
| | | | | |
| NET REALIZED AND UNREALIZED GAIN (LOSS) | | | | |
| Net realized gain (loss) on: | | | | |
| Investments in unaffiliated issuers | | | 3,403,838 | |
| Investments in affiliated issuers | | | 252,626 | |
| Capital gain distributions from underlying investment companies | | | 26,904 | |
| Foreign currency transactions | | | (2,008,965 | ) |
| Net realized gain | | | 1,674,403 | |
| Net change in unrealized appreciation (depreciation) on: | | | | |
| Investments in unaffiliated issuers | | | (10,218,832 | ) |
| Investments in affiliated issuers | | | 2,661,100 | |
| Foreign currency translations | | | 846,585 | |
| Net change in unrealized appreciation (depreciation) | | | (6,711,147 | ) |
| NET REALIZED AND UNREALIZED LOSS | | | (5,036,744 | ) |
| DECREASE IN NET ASSETS FROM OPERATIONS | | $ | (4,214,433 | ) |
| | | | | |
See Notes to Financial Statements. 13
BECK, MACK & OLIVER GLOBAL EQUITY FUNDSTATEMENTS OF CHANGES IN NET ASSETS
| | | | For the Years Ended March 31, |
| | | | 2012 | | 2011 |
| OPERATIONS | | | | | | | | |
| Net investment income | | $ | 822,311 | | | $ | 606,239 | |
| Net realized gain | | | 1,674,403 | | | | 4,138,210 | |
| Net change in unrealized appreciation (depreciation) | | | (6,711,147 | ) | | | 7,784,644 | |
| Increase (Decrease) in Net Assets Resulting from Operations | | | (4,214,433 | ) | | | 12,529,093 | |
| | | | | | | | | | |
| DISTRIBUTIONS TO SHAREHOLDERS FROM | | | | | | | | |
| Net investment income | | | (3,118,934 | ) | | | (1,183,670 | ) |
| Net realized gain | | | (130,315 | ) | | | - | |
| Total Distributions to Shareholders | | | (3,249,249 | ) | | | (1,183,670 | ) |
| | | | | | | | | | |
| CAPITAL SHARE TRANSACTIONS | | | | | | | | |
| Sale of shares | | | 3,069,287 | | | | 30,807,564 | |
| Reinvestment of distributions | | | 2,726,587 | | | | 1,066,235 | |
| Redemption of shares | | | (10,301,661 | ) | | | (4,240,785 | ) |
| Redemption fees | | | 89 | | | | 9,521 | |
| Increase (Decrease) in Net Assets from Capital Share Transactions | | (4,505,698 | ) | | | 27,642,535 | |
| Increase (Decrease) in Net Assets | | | (11,969,380 | ) | | | 38,987,958 | |
| | | | | | | | | | |
| NET ASSETS | | | | | | | | |
| Beginning of Year | | | 105,157,102 | | | | 66,169,144 | |
| End of Year (Including line (a)) | | $ | 93,187,722 | | | $ | 105,157,102 | |
| | | | | | | | | | |
| SHARE TRANSACTIONS | | | | | | | | |
| Sale of shares | | | 166,826 | | | | 1,670,605 | |
| Reinvestment of distributions | | | 163,059 | | | | 53,499 | |
| Redemption of shares | | | (578,235 | ) | | | (222,985 | ) |
| Increase (Decrease) in Shares | | | (248,350 | ) | | | 1,501,119 | |
| | | | | | | | | | |
| (a) | Undistributed (distributions in excess of) net investment income. | | $ | (1,656,144 | ) | | $ | 90,480 | |
See Notes to Financial Statements. 14
BECK, MACK & OLIVER GLOBAL EQUITY FUNDFINANCIAL HIGHLIGHTS
| These financial highlights reflect selected data for a share outstanding throughout each year. | | | | | |
| | | For the Years Ended March 31, |
| | | 2012 | | 2011 | | 2010 | | 2009 | | 2008 |
| NET ASSET VALUE, Beginning of Year | $ | 20.28 | | | $ | 17.96 | | | $ | 11.99 | | | $ | 20.34 | | | $ | 22.78 | |
| INVESTMENT OPERATIONS | | | | | | | | | | | | | | | | | | | |
| Net investment income (a) | | 0.16 | | | | 0.13 | | | | 0.11 | | | | 0.12 | | | | 0.07 | |
| Net realized and unrealized gain (loss) | | (0.89 | ) | | | 2.42 | | | | 5.90 | | | | (8.12 | ) | | | (0.64 | ) |
| Total from Investment Operations | | (0.73 | ) | | | 2.55 | | | | 6.01 | | | | (8.00 | ) | | | (0.57 | ) |
| DISTRIBUTIONS TO | | | | | | | | | | | | | | | | | | | |
| SHAREHOLDERS FROM | | | | | | | | | | | | | | | | | | | |
| Net investment income | | (0.64 | ) | | | (0.23 | ) | | | (0.04 | ) | | | — | | | | (0.53 | ) |
| Net realized gain | | (0.03 | ) | | | — | | | | — | | | | (0.35 | ) | | | (1.34 | ) |
| Total Distributions to Shareholders | | (0.67 | ) | | | (0.23 | ) | | | (0.04 | ) | | | (0.35 | ) | | | (1.87 | ) |
| REDEMPTION FEES (a) | | — | (b) | | | — | (b) | | — | | | | — | | | | — | (b) |
| NET ASSET VALUE, End of Year | $ | 18.88 | | | $ | 20.28 | | | $ | 17.96 | | | $ | 11.99 | | | $ | 20.34 | |
| TOTAL RETURN | | (3.20 | )% | | 14.24 | % | | 50.16 | % | | (39.51 | )% | | (3.32 | )% |
| RATIOS/SUPPLEMENTARY DATA | | | | | | | | | | | | | | | | | | | |
| Net Assets at End of Year (000's omitted) | $93,188 | | | $105,157 | | | $66,169 | | | $36,259 | | | $55,437 | |
| Ratios to Average Net Assets: | | | | | | | | | | | | | | | | | | | |
| Net investment income | | 0.87 | % | | 0.68 | % | | 0.69 | % | | 0.73 | % | | 0.29 | % |
| Net expense | | 1.25 | % | | 1.25 | % | | 1.34 | % | | 1.75 | % | | 1.75 | % |
| Gross expense (c) | | 1.90 | % | | 1.97 | % | | 2.20 | % | | 2.28 | % | | 2.07 | % |
| PORTFOLIO TURNOVER RATE | | 101 | % | | 122 | % | | 54 | % | | 56 | % | | 51 | % |
| | | | | | | | | | | | | | | | | | | | | |
| (a) | Calculated based on average shares outstanding during each year. |
| (b) | Less than $0.01 per share. |
| (c) | Reflects the expense ratio excluding any waivers and/or reimbursements. |
See Notes to Financial Statements. 15
BECK, MACK & OLIVER PARTNERS FUNDA MESSAGE TO OUR SHAREHOLDERS
Dear Fellow Shareholder:
The Beck, Mack & Oliver Partners Fund (the “Partners Fund”) returned 9.82% net of fees and expenses for the fiscal year ended March 31, 2012, resulting in a net asset value of $12.16 per share. By comparison, the S&P 500 Index ended the March 31, 2012 year with a return of 8.54%. Since its December 1, 2009 re-organization from a limited partnership, the Partners Fund has returned 16.24% annualized versus 13.11% annualized for the S&P 500 Index. For a longer-term perspective, the Partners Fund’s average annual total returns for the period ending March 31, 2012 were as follows:
| Average Annual Total Return as of 03/31/2012 | | One Year | | Since 12/01/09 Reorg* | | Three Years | | Five Years | | Ten Years |
| Beck, Mack & Oliver Partners Fund | | 9.82% | | 16.24% | | 25.38% | | 1.59% | | 5.01% |
| S&P 500 Index | | 8.54% | | 13.11% | | 23.42% | | 2.01% | | 4.12% |
(Performance data quoted represents past performance and is no guarantee of future results. Current performance may be lower or higher than the performance data quoted. Investment return and principal value will fluctuate so that an investor’s shares, when redeemed, may be worth more or less than original cost. Shares redeemed or exchanged within 60 days of purchase will be charged a 2.00% redemption fee. As stated in the current prospectus, the Partners Fund’s annual operating expense ratio (gross) is 2.13%. However, the Partners Fund’s adviser has agreed to contractually waive a portion of its fees and/or reimburse expenses such that total operating expenses do not exceed 1.00%, which is in effect until July 31, 2012; otherwise performance shown would have been lower. For the most recent month-end performance, please call (800) 943-6786. Returns greater than one year are annualized.)
*Excludes performance prior to the Partners Fund’s reorganization from a limited partnership. See important additional information regarding performance on the bottom of page 20.
Performance and Portfolio Update
We attribute the Partners Fund’s outperformance to stock selection and an intense focus on mitigating downside risk as evidenced by our decision to not always be 100% invested in equities. The Partners Fund did not invest in any derivative securities during the fiscal year, and at fiscal year-end, the Partners Fund had 28 equity holdings with the top ten (10) largest positions representing 38.3% of net assets. The Partners Fund’s weighted average market capitalization was $42.2 billion, yet the Partners Fund’s two (2) largest positions were both below $2 billion in market capitalization. The largest sector exposures remained Financials (25.7% of net assets), Energy (15.0%) and Healthcare (12.6%) with Cash representing 20.5%.
Stock selection for the Partners Fund was driven by fundamental analysis of specific companies and the industries in which they operate. Securities were purchased when the share price was substantially below our estimate of intrinsic value. During the past year of high stock price volatility, the Partners Fund was afforded the opportunity to actively reorient the holdings in the portfolio towards the most asymmetric risk / reward on a frequent basis.
Looking at the portfolio, the securities that contributed most positively to the Partners Fund’s fiscal year performance included:
16
BECK, MACK & OLIVER PARTNERS FUNDA MESSAGE TO OUR SHAREHOLDERS
Best Performing Equities Contribution to Performance 7
| Lowe’s Cos., Inc. | | | 1.97 | % |
| Molex, Inc. | | | 1.56 | % |
| Plains Exploration & Production Co. | | | 1.40 | % |
| Nalco Holding Co. | | | 1.29 | % |
| Merck & Co., Inc. | | | 1.29 | % |
Those that detracted the most from the Partners Fund’s fiscal year performance included:
Underperforming EquitiesContribution to Performance7
| Axis Capital Holdings, Ltd. | | | - 0.37 | % |
| Schlumberger, Ltd. | | | - 0.43 | % |
| PICO Holdings, Inc. | | | -0.46 | % |
| Noble Corp. | | | - 0.68 | % |
| Encana Corp. | | | - 3.11 | % |
Active, Focused and Nimble
Several weeks ago I visited the Statue of Liberty and Ellis Island with my wife and three children. My six year old daughter was particularly excited to research the names of our relatives who arrived at the turn of the century. As I explained to her why people would willingly leave their homes and often their families behind to seek opportunity that was not guaranteed, I asked myself, “would I have the courage to actively pursue better prospects as they had?” More important than pondering this hypothetical, the trip served as a good reminder that the greatness of our country in every aspect is the result of individuals who actively pursued alternatives in the face of the unknown….rarely, if ever, has this type of achievement been the result of being more passive. The same would hold true for organizations and companies that have succeeded and created value over time - “passive” is not a word that comes up too often. Steve Jobs was not renowned for his passivity and most of us would be either slightly or highly offended if someone used the dictionary definition of passive to describe us: (1) lacking in energy or will;(2) lethargic.
So why the recent and seemingly growing obsession with a passive approach to investing through the use of index funds and exchange-traded funds? Do people in their heart of hearts really believe that the market has become so efficient that identifying great companies run by exceptional management teams that trade at reasonable valuations is a thing of the past? Do they really think that when a thoughtful decision about capital allocation is made or when a competitive advantage is gained or when two people collaborate on what becomes a brilliant scientific breakthrough that this information is immediately disseminated to every person in the world that owns a stock and that each of these people evaluates that information and subsequently behaves in an entirely consistent manner? The answer I’ll give is similar to the answer my father would give me when I told him that I was going to play for the Knicks…”The probability is low.”
Many investors have defaulted to being passive as they view the supposed purveyors of active management as lacking appeal, an opinion that is not uninformed. Many asset managers at their core are asset aggregators, defining success by
| 7 | Contribution is the return of a security multiplied by the security’s weight in the portfolio. |
17
BECK, MACK & OLIVER PARTNERS FUNDA MESSAGE TO OUR SHAREHOLDERS
how much money they manage and their profit margins, not their cumulative outperformance net of fees. The goal for these “aggregators” is to be close to average and avoid criticism; while greatness may be an objective stated in their marketing materials, the preconditions for its achievement seem unlikely. At the portfolio level, as assets swell, managers are forced to either invest only in the largest companies or divide the portfolio into smaller increments (one of the largest U.S. equity mutual funds had over 320 positions as of 12/31/11 and had more than 100 positions which were under one tenth of one percent), which when charging fees close to 1% make it almost impossible to generate outperformance net of fees. We believe nothing says “I lack conviction” more than a 300 stock portfolio. Thus, compared to these types of options, low cost index funds are a better alternative.
However, for those willing to actively seek a better alternative, there is hope, and Beck, Mack & Oliver LLC has worked hard to remain a place where thoughtful investors can intelligently have assets managed. John Beck, our retired senior partner, taught me that if your efforts are singularly focused on generating superior performance and placing client objectives above all else, “the rest should take care of itself,” meaning that the firm will likely grow and prosper over time. We are in our 81st year as a private partnership and have created a culture and an environment where the preconditions for investment success exist. By our estimate, these preconditions are:
| 1) | We actively seek out opportunities that we believe will deliver an asymmetric pattern of returns over time (meaning we seek opportunities where a return above our estimated cost of capital appears high and the probability of permanent impairment seems low); |
| 2) | Organizationally we remain singular in our focus, only managing core portfolios for clients; |
| 3) | We have remained 100% independent and have been owner operated since 1931; and, |
| 4) | We have retained our ability to manage concentrated portfolios that can be populated with our highest conviction ideas, be they large companies or small companies. |
Our promise is that we will work with diligence and remain active, focused and nimble.
Market Perspective
A recent study suggested that U.S. companies have emerged from the deepest recession since World War II more efficient and with stronger balance sheets. The study points to the fact that in 2011 cumulative sales and profits among members of the Standard & Poor's 500 Index exceeded the totals of 2007. Deep cost cutting during the downturn and caution during the recovery has driven these improvements.
This is exciting, but does it imply that equities are attractively valued? Commonly used metrics such at P/E ratios (stock price per share / earnings per share) can be misleading when assessing the relative attractiveness of equities as profit margins fluctuate over time and often revert to longer-term averages. High profit margins, when faced with slower revenue growth and potentially rising costs, tend to decline and move back toward longer-term averages, which leads to slower earnings growth and implies that the market should trade at a lower multiple of earnings. Therefore, making unadjusted comparisons (assuming profit margins are static in their current state) can be misleading.
18
BECK, MACK & OLIVER PARTNERS FUNDA MESSAGE TO OUR SHAREHOLDERS
In mid-2009, the P/E ratio of the S&P 500 Index was above 20 (high relative to longer-term averages) but profit margins were near 10-year lows and aggressive cost cutting resulted in margin expansion and earnings growth. Today the market trades at about 14 times current year earnings (only 12 times forward estimates), but profit margins for S&P 500 companies hit a multi-year high in the third quarter of 2011 and sales growth, which is an important driver of margin expansion, slowed in the second half of 2011. This condition causes us to place particular emphasis on finding companies that will be able to both grow revenues and pass along rising costs to their customers, thus protecting profit margins. Strong cash flows also enable management teams to repurchase shares and help protect profitability on a per share basis.
Noble Drilling
During our quantitative assessment of intrinsic value, we strive to predict what a company’s cash flow generating capability will be over the next 5 years and the sustainability of those cash flows thereafter. Predicting the future is a difficult task as there are multiple variables and these variables fluctuate in relative importance. That is why we like to stack the odds in our favor as much as possible, and when we find a company 1) where the visibility into future cash flows is high, 2) that is exposed to positive industry trends, 3) that operates in an oligopoly (a market controlled by a small number of firms) where barriers to entry are high, and 4) that trades at a reasonable valuation, it becomes a candidate for the portfolio.
Noble Corporation (NE), founded in 1921, operates as an offshore drilling contractor for the oil and gas industry. Through its fleet of offshore drilling rigs, it serves clients around the globe (United States, Gulf of Mexico, Mexico, Brazil, the North Sea, the Mediterranean, West Africa, the Middle East, India, and the Asian Pacific). There is no debate that oil is getting more difficult and costly to find, pushing companies to explore beyond the traditional onshore reservoirs to geologies where the cost of extraction is greater. In most cases the ability to extract oil from these new reservoirs has been enabled by the development of new and innovative technology; no area of new discovery better represents this than the ultra-deepwater. As you might expect, the cost of extraction in the ultra-deepwater is higher (NE charges more per day to rent a drillship for the ultra-deepwater than a jack-up rig that works in more shallow water) and the list of available partners is smaller due to the complexity of the work and the capital required to purchase the assets (a drillship can cost $600 million).
This has created a dynamic where the large integrated oil companies (Exxon, Chevron, Royal Dutch Shell) are willing to sign contracts to secure drilling assets for future use. NE had revenue of roughly $2.6 billion in 2011 and has drilling contracts in place for over $17 billion of high margin, high return on invested capital future revenue. Additionally, because the number of ultra-deepwater drillships is limited and capacity expansion takes time, the contracts that are now being signed look a lot more like “take-or-pay” contracts versus the cancellable contracts that had been widespread in the past. This important evolution was emphasized to me during a recent dinner with a senior executive on the NE management team. He further explained that the centralization of the contract negotiation effort at NE is an important change that has improved the quality and certainty of these contracts. There can be no assurance that any investment strategy or product will be successful. In our effort to find large and growing cash flow streams that are highly predictable at a reasonable price (NE shares are trading at less than 9x 2013 estimated earnings), however, we believe NE represents one such excellent opportunity and hence is a growing position in the Partners Fund. As of March 31, 2012, NE represented 2.32% of the net assets of the Partners Fund.
19
BECK, MACK & OLIVER PARTNERS FUNDA MESSAGE TO OUR SHAREHOLDERS
As always, many thanks for your continued support.
Zachary A. Wydra
IMPORTANT RISKS AND DISCLOSURE:
There is no assurance that the Partners Fund will achieve its investment objective. An investment in the Partners Fund is subject to risk, including the possible loss of principal amount invested. The risks associated with the Partners Fund include: equity and convertible securities risk, foreign securities risk, management risk, debt securities risk, noninvestment grade securities risk, liquidity risk and non-diversification risk. The Partners Fund may invest in small and mid-sized capitalization companies meaning that these companies carry greater risk than is customarily associated with larger companies for various reasons such as narrower markets, limited financial resources and less liquid stock.
The price-to-earnings (P/E) ratio is a valuation ratio of a company’s current share price compared to its per-share earnings.
The views in this report were those of the Partners Fund managers as of March 31, 2012, and may not reflect their views on the date this report is first published or any time thereafter. These views are intended to assist shareholders in understanding their investment in the Partners Fund and do not constitute investment advice. This letter may contain discussions about certain investments both held and not held in the portfolio. All current and future holdings are subject to risk and to change.
On December 1, 2009, a limited partnership managed by the adviser reorganized into the Partners Fund. The predecessor limited partnership maintained an investment objective and investment policies that were, in all material respects, equivalent to those of the Partners Fund. The Partners Fund’s performance for the periods before December 1, 2009 is that of the limited partnership and includes the expenses of the limited partnership, which were lower than the Partners Fund’s current expenses, except for 2008 where the expenses of the limited partnership were higher. The performance prior to December 1, 2009, is based on calculations that are different from the standardized method of calculations by the SEC. If the limited partnership’s performance had been readjusted to reflect the estimated expenses of the Partners Fund for its first fiscal year, the performance would have been lower. The limited partnership was not registered under the Investment Company Act of 1940 (“1940 Act”) and was not subject to certain investment limitations, diversification requirements, and other restrictions imposed by the 1940 Act and the Internal Revenue Code of 1986, which, if applicable, may have adversely affected its performance.
20
BECK, MACK & OLIVER PARTNERS FUNDPERFORMANCE CHART AND ANALYSIS (Unaudited)
The following chart reflects the change in the value of a hypothetical $10,000 investment, including reinvested dividends and distributions, in the Beck, Mack & Oliver Partners Fund (the “Fund”) compared with the performance of the benchmark, the S&P 500 Index (the "S&P 500"), over the past ten fiscal years. The S&P 500 is a broad-based, unmanaged measurement of changes in stock market conditions based on the average of 500 widely held common stocks. The total return of the S&P 500 includes the reinvestment of dividends and income. The total return of the Fund includes operating expenses that reduce returns, while the total return of the S&P 500 does not include expenses. The Fund is professionally managed while the S&P 500 is unmanaged and is not available for investment.
Performance data quoted represents past performance and is no guarantee of future results. Current performance may be lower or higher than the performance data quoted. Investment return and principal value will fluctuate so that shares, when redeemed, may be worth more or less than original cost. For the most recent month-end performance, please call (800) 943-6786. Shares redeemed or exchanged within 60 days of purchase will be charged a 2.00% redemption fee. As stated in the Fund’s prospectus, the annual operating expense ratio (gross) is 2.13%. However, the Fund’s adviser has contractually agreed to reduce a portion of its fees and reimburse expenses to limit total operating expenses to 1.00%, through July 31, 2012. During the period, certain fees were waived and/or expenses reimbursed; otherwise, returns would have been lower. The performance table and graph do not reflect the deduction of taxes that a shareholder would pay on Fund distributions or the redemption of Fund shares. Returns greater than one year are annualized.
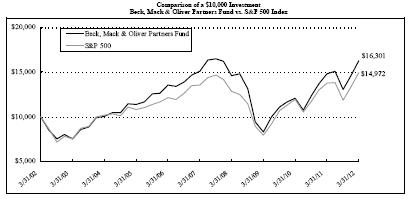
| Average Annual Total Returns for Periods Ended March 31, 2012: | | One Year | | Five Years | | Ten Years |
| Beck, Mack & Oliver Partners Fund | | 9.82 | % | | 1.59 | % | | 5.01 | % |
| S&P 500 Index | | 8.54 | % | | 2.01 | % | | 4.12 | % |
21
BECK, MACK & OLIVER PARTNERS FUNDPORTFOLIO PROFILE (Unaudited)
See Notes to Financial Statements. 22
BECK, MACK & OLIVER PARTNERS FUNDSCHEDULE OF INVESTMENTS
| Shares | | Security Description | | Value |
| Common Stock - 76.3% |
| Consumer Discretionary - 6.4% |
| | 50,600 | | Lowe's Cos., Inc. | $ | 1,587,828 |
| | 54,900 | | The Gap, Inc. | | 1,435,086 |
| | | 3,022,914 |
| Consumer Staples - 2.5% |
| | 15,800 | | Anheuser-Busch InBev NV, ADR | | 1,148,976 |
| | | |
| Energy - 15.0% |
| | 29,700 | | Bristow Group, Inc. | | 1,417,581 |
| | 77,600 | | Encana Corp. | | 1,524,840 |
| | 29,100 | | Noble Corp. (a) | | 1,090,377 |
| | 19,350 | | Plains Exploration & Production Co. (a) | | 825,278 |
| | 15,550 | | Schlumberger, Ltd. | | 1,087,411 |
| | 42,400 | | Subsea 7 SA, ADR (a) | | 1,118,936 |
| | | 7,064,423 |
| Financials - 25.7% |
| | 27,000 | | Axis Capital Holdings, Ltd. | | 895,590 |
| | 14,300 | | Berkshire Hathaway, Inc., Class B (a) | | 1,160,445 |
| | 58,550 | | Brookfield Asset Management, Inc., Class A | | 1,848,423 |
| | 19,700 | | Enstar Group, Ltd. (a) | | 1,950,103 |
| | 6,250 | | Homefed Corp. (a) | | 142,188 |
| | 62,500 | | Leucadia National Corp. | | 1,631,250 |
| | 89,300 | | PICO Holdings, Inc. (a) | | 2,094,085 |
| | 14,000 | | RenaissanceRe Holdings, Ltd. | | 1,060,220 |
| | 42,000 | | U.S. Bancorp | | 1,330,560 |
| | | 12,112,864 |
| Healthcare - 12.6% |
| | 29,450 | | Abbott Laboratories | | 1,804,990 |
| | 30,500 | | Baxter International, Inc. | | 1,823,290 |
| | 5,400 | | Johnson & Johnson | | 356,184 |
| | 50,300 | | Merck & Co., Inc. | | 1,931,520 |
| | | 5,915,984 |
| Industrials - 6.8% |
| | 28,800 | | Dover Corp. | | 1,812,672 |
| | 15,350 | | Fluor Corp. | | 921,614 |
| | 4,550 | | Roper Industries, Inc. | | 451,178 |
| | | 3,185,464 |
| Information Technology - 4.8% |
| | 4,050 | | International Business Machines Corp. | | 845,033 |
| | 60,850 | | Molex, Inc., Class A | | 1,426,932 |
| | | 2,271,965 |
| Shares | | Security Description | | Value |
| Telecommunication Services - 2.5% |
| | 45,750 | | Level 3 Communications, Inc. (a) | $ | 1,177,148 |
| | | |
Total Common Stock (Cost $27,516,105) | | 35,899,738 |
| | | |
Total Investments - 76.3% (Cost $27,516,105)* | $ | 35,899,738 |
| Other Assets & Liabilities, Net - 23.7% | | 11,157,238 |
| Net Assets - 100.0% | $ | 47,056,976 |
| ADR | American Depositary Receipt |
| (a) | Non-income producing security. |
| | * Cost for federal income tax purposes is $27,726,238 and net unrealized appreciation consists of: |
| Gross Unrealized Appreciation | | $ | 8,700,392 | |
| Gross Unrealized Depreciation | | | (526,892 | ) |
| Net Unrealized Appreciation | | $ | 8,173,500 | |
The inputs or methodology used for valuing securities are not necessarily an indication of the risks associated with investing in those securities. For more information on valuation inputs, and their aggregation into the levels used in the tables below, please refer to the Security Valuation section in Note 2 of the accompanying Notes to Financial Statements.
The following is a summary of the inputs used to value the Fund’s investments as of March 31, 2012.
| Valuation Inputs | | Investments in Securities |
| Level 1 - Quoted Prices | | $ | 35,899,738 | |
| Level 2 - Other Significant Observable Inputs | | | - | |
| Level 3 - Significant Unobservable Inputs | | | - | |
| Total | | $ | 35,899,738 | |
The Level 1 inputs displayed in this table are Common Stock. Refer to the Schedule of Investments for a further breakout of each security by type.
There were no significant transfers between Level 1 and Level 2 for the year ended March 31, 2012.
See Notes to Financial Statements. 23
BECK, MACK & OLIVER PARTNERS FUNDSTATEMENT OF ASSETS AND LIABILITIES
| | | | | | |
| ASSETS | | | | |
| Total investments, at value (Cost $27,516,105) | | $ | 35,899,738 | |
| Cash | | | 9,629,114 | |
| Receivables: | | | | |
| Fund shares sold | | | 1,743,291 | |
| Investment securities sold | | | 230,678 | |
| Dividends and interest | | | 62,665 | |
| Prepaid expenses | | | 9,020 | |
| Total Assets | | | 47,574,506 | |
| | | | | | |
| LIABILITIES | | | | |
| Payables: | | | | |
| Investment securities purchased | | | 450,709 | |
| Fund shares redeemed | | | 2,800 | |
| Accrued Liabilities: | | | | |
| Investment adviser fees | | | 23,900 | |
| Fund services fees | | | 13,755 | |
| Compliance services fees | | | 955 | |
| Other expenses | | | 25,411 | |
| Total Liabilities | | | 517,530 | |
| | | | | | |
| NET ASSETS | | $ | 47,056,976 | |
| | | | | | |
| COMPONENTS OF NET ASSETS | | | | |
| Paid-in capital | | $ | 38,278,656 | |
| Undistributed net investment income | | | 27,654 | |
| Accumulated net realized gain | | | 367,033 | |
| Net unrealized appreciation | | | 8,383,633 | |
| NET ASSETS | | $ | 47,056,976 | |
| SHARES OF BENEFICIAL INTEREST AT NO PAR VALUE (UNLIMITED SHARES AUTHORIZED) | | | 3,868,897 | |
NET ASSET VALUE, OFFERING AND REDEMPTION PRICE PER SHARE* | | $ | 12.16 | |
| * | Shares redeemed or exchanged within 60 days of purchase are charged a 2.00% redemption fee. |
See Notes to Financial Statements. 24
BECK, MACK & OLIVER PARTNERS FUNDSTATEMENT OF OPERATIONS
| | | | | |
| INVESTMENT INCOME | | | | |
| Dividend income (Net of foreign withholding taxes of $11,577) | | $ | 508,036 | |
| Interest income | | | 18,795 | |
| Total Investment Income | | | 526,831 | |
| Adviser | | | | |
| EXPENSES | | | | |
| Investment adviser fees | | | 313,912 | |
| Fund services fees | | | 159,452 | |
| Custodian fees | | | 10,000 | |
| Registration fees | | | 20,871 | |
| Professional fees | | | 33,192 | |
| Trustees' fees and expenses | | | 956 | |
| Compliance services fees | | | 9,977 | |
| Miscellaneous expenses | | | 16,415 | |
| Total Expenses | | | 564,775 | |
| Fees waived and expenses reimbursed | | | (250,863 | ) |
| Net Expenses | | | 313,912 | |
| | | | | |
| NET INVESTMENT INCOME | | | 212,919 | |
| | | | | |
| NET REALIZED AND UNREALIZED GAIN (LOSS) | | | | |
| Net realized gain on investments | | | 3,106,880 | |
| Net change in unrealized appreciation (depreciation) on investments | | | 1,082,709 | |
| NET REALIZED AND UNREALIZED GAIN | | | 4,189,589 | |
| INCREASE IN NET ASSETS FROM OPERATIONS | | $ | 4,402,508 | |
| | | | | |
See Notes to Financial Statements. �� 25
BECK, MACK & OLIVER PARTNERS FUNDSTATEMENTS OF CHANGES IN NET ASSETS
| | | | For the Years Ended March 31, |
| | | | 2012 | | 2011 |
| OPERATIONS | | | | | | | | |
| Net investment income | | $ | 212,919 | | | $ | 218,961 | |
| Net realized gain | | | 3,106,880 | | | | 1,121,783 | |
| Net change in unrealized appreciation (depreciation) | | | 1,082,709 | | | | 3,356,797 | |
| Increase in Net Assets Resulting from Operations | | | 4,402,508 | | | | 4,697,541 | |
| | | | | | | | | | |
| DISTRIBUTIONS TO SHAREHOLDERS FROM | | | | | | | | |
| Net investment income | | | (214,984 | ) | | | (203,007 | ) |
| Net realized gain | | | (3,472,200 | ) | | | (756,148 | ) |
| Total Distributions to Shareholders | | | (3,687,184 | ) | | | (959,155 | ) |
| | | | | | | | | | |
| CAPITAL SHARE TRANSACTIONS | | | | | | | | |
| Sale of shares | | | 18,699,380 | | | | 3,375,171 | |
| Reinvestment of distributions | | | 3,551,842 | | | | 946,674 | |
| Redemption of shares | | | (2,391,243 | ) | | | (797,600 | ) |
| Redemption fees | | | 714 | | | | 27 | |
| Increase in Net Assets from Capital Share Transactions | | | 19,860,693 | | | | 3,524,272 | |
| Increase in Net Assets | | | 20,576,017 | | | | 7,262,658 | |
| | | | | | | | | | |
| NET ASSETS | | | | | | | | |
| Beginning of Year | | | 26,480,959 | | | | 19,218,301 | |
| End of Year (Including line (a)) | | $ | 47,056,976 | | | $ | 26,480,959 | |
| | | | | | | | | | |
| SHARE TRANSACTIONS | | | | | | | | |
| Sale of shares | | | 1,627,778 | | | | 300,049 | |
| Reinvestment of distributions | | | 332,284 | | | | 82,614 | |
| Redemption of shares | | | (204,432 | ) | | | (72,861 | ) |
| Increase in Shares | | | 1,755,630 | | | | 309,802 | |
| | | | | | | | | | |
| (a) | Undistributed net investment income. | | $ | 27,654 | | | $ | 50,897 | |
See Notes to Financial Statements. 26
BECK, MACK & OLIVER PARTNERS FUNDFINANCIAL HIGHLIGHTS
| These financial highlights reflect selected data for a share outstanding throughout each period. |
| | | For the Year Ended March 31, 2012 | | For the Year Ended March 31, 2011 | | December 1, 2009 (a) through March 31, 2010 |
| NET ASSET VALUE, Beginning of Period | $ | 12.53 | | | $ | 10.66 | | | $ | 10.00 | |
| INVESTMENT OPERATIONS | | | | | | | | | | | |
| Net investment income (b) | | 0.08 | | | | 0.11 | | | | 0.03 | |
| Net realized and unrealized gain (loss) | | 0.95 | | | | 2.25 | | | | 0.64 | |
| Total from Investment Operations | | 1.03 | | | | 2.36 | | | | 0.67 | |
| DISTRIBUTIONS TO SHAREHOLDERS FROM | | | | | | | | | | | |
| Net investment income | | (0.06 | ) | | | (0.10 | ) | | | (0.01 | ) |
| Net realized gain | | (1.34 | ) | | | (0.39 | ) | | | — | |
| Total Distributions to Shareholders | | (1.40 | ) | | | (0.49 | ) | | | (0.01 | ) |
| REDEMPTION FEES (b) | | — | (c) | | | — | (c) | | | — | |
| NET ASSET VALUE, End of Period | $ | 12.16 | | | $ | 12.53 | | | $ | 10.66 | |
| TOTAL RETURN | | 9.82 | % | | 22.62 | % | | 6.70 | %(d) |
| RATIOS/SUPPLEMENTARY DATA | | | | | | | | | | | |
| Net Assets at End of Period (000's omitted) | $47,057 | | | $26,481 | | | $19,218 | |
| Ratios to Average Net Assets: | | | | | | | | | | | |
| Net investment income | | 0.68 | % | | 1.03 | % | | 0.86 | %(e) |
| Net expense | | 1.00 | % | | 1.00 | % | | 1.00 | %(e) |
| Gross expense (f) | | 1.80 | % | | 2.13 | % | | 2.56 | %(e) |
| PORTFOLIO TURNOVER RATE | | 67 | % | | 49 | % | | 17 | %(d) |
| | | | | | | | | | | | | |
| (a) | Commencement of operations. |
| (b) | Calculated based on average shares outstanding during each period. |
| (c) | Less than $0.01 per share. |
| (d) | Not annualized. |
| (e) | Annualized. |
| (f) | Reflects the expense ratio excluding any waivers and/or reimbursements. |
See Notes to Financial Statements. 27
BECK, MACK & OLIVER FUNDSNOTES TO FINANCIAL STATEMENTS
Note 1. Organization
The Beck, Mack & Oliver Global Equity Fund and Beck, Mack & Oliver Partners Fund (individually, a “Fund” and, collectively the “Funds”) are diversified and non-diversified portfolios of Forum Funds (the “Trust”), respectively. The Trust is a Delaware statutory trust that is registered as an open-end, management investment company under the Investment Company Act of 1940 (the “Act”), as amended. Under its Trust Instrument, the Trust is authorized to issue an unlimited number of each Fund’s shares of beneficial interest without par value. The Beck, Mack & Oliver Global Equity Fund commenced operations on December 8, 1993, and seeks capital appreciation by investing primarily in a portfolio of common stock and securities convertible into common stock. Prior to June 24, 2009, the Beck, Mack & Oliver Global Equity Fund was named the Austin Global Equity Fund. The Beck, Mack & Oliver Partners Fund commenced operations on December 1, 2009, after it acquired the net assets of the BMO Partners Fund, L.P. (the “Partnership”), in exchange for Fund shares. The Partnership commenced operations in 1991. The Beck, Mack & Oliver Partners Fund seeks long-term capital appreciation consistent with the preservation of capital.
Note 2. Summary of Significant Accounting Policies
These financial statements are prepared in accordance with accounting principles generally accepted in the United States of America (“GAAP”), which require management to make estimates and assumptions that affect the reported amounts of assets and liabilities, the disclosure of contingent liabilities at the date of the financial statements, and the reported amounts of increase and decrease in net assets from operations during the fiscal year. Actual amounts could differ from those estimates. The following summarizes the significant accounting policies of each Fund:
Security Valuation – Exchange-traded securities and over-the-counter securities are valued using the last quoted sale or official closing price, provided by independent pricing services as of the close of trading on the market or exchange for which they are primarily traded, on each Fund business day. In the absence of a sale, such securities are valued at the mean of the last bid and ask price provided by independent pricing services. Non-exchange traded securities for which quotations are available are valued using the last quoted sales price, or in the absence of a sale at the mean of the last bid and ask prices provided by independent pricing services. Debt securities may be valued at prices supplied by a fund’s pricing agent based on broker or dealer supplied valuations or matrix pricing, a method of valuing securities by reference to the value of other securities with similar characteristics such as rating, interest rate and maturity. Forward currency contracts are generally valued at the mean of bid and ask prices for the time period interpolated from rates reported by an independent pricing service for proximate time periods. Exchange-traded options for which there were no sales reported that day are generally valued at the mean of the last bid and ask prices. Options not traded on an exchange are generally valued at broker-dealer bid quotations. Shares of open-end mutual funds are valued at net asset value (“NAV”). Interests in private equity funds will generally be subject to fair valuation. Short-term investments that mature in 60 days or less may be valued at amortized cost.
Each Fund values its investments at fair value pursuant to procedures adopted by the Trust's Board of Trustees (the "Board") if (1) market quotations are insufficient or not readily available or (2) the adviser believes that the values available are unreliable. Fair valuation is based on subjective factors and, as a result, the fair value price of an investment may differ from the security’s market price and may not be the price at which the asset may be sold. Fair valuation could result in a different NAV than a NAV determined by using market quotes.
28
BECK, MACK & OLIVER FUNDSNOTES TO FINANCIAL STATEMENTS
Each Fund has a three-tier fair value hierarchy. The basis of the tiers is dependent upon the various “inputs” used to determine the value of each Fund’s investments. These inputs are summarized in the three broad levels listed below:
Level 1 — quoted prices in active markets for identical assets
Level 2 — other significant observable inputs (including quoted prices of similar securities, interest rates, prepayment speeds, credit risk, etc.)
Level 3 — significant unobservable inputs (including each Fund’s own assumptions in determining the fair value of investments)
The aggregate value by input level, as of March 31, 2012, for each Fund’s investments is included at the end of each Fund’s Schedule of Investments.
Security Transactions, Investment Income and Realized Gain and Loss – Investment transactions are accounted for on the trade date. Dividend income is recorded on the ex-dividend date. Foreign dividend income is recorded on the ex-dividend date or as soon as possible after each Fund determines the existence of a dividend declaration after exercising reasonable due diligence. Income and capital gains on some foreign securities may be subject to foreign withholding taxes, which are accrued as applicable. Interest income is recorded on an accrual basis. Premium is amortized and discount is accreted using the effective interest method. Identified cost of investments sold is used to determine the gain and loss for both financial statement and federal income tax purposes.
Foreign Currency Translations – Foreign currency amounts are translated into U.S. dollars as follows: (1) assets and liabilities at the rate of exchange at the end of the respective period; and (2) purchases and sales of securities and income and expenses at the rate of exchange prevailing on the dates of such transactions. The portion of the results of operations arising from changes in the exchange rates and the portion due to fluctuations arising from changes in the market prices of securities are not isolated. Such fluctuations are included with the net realized and unrealized gain or loss on investments.
Foreign Currency Transactions – Each Fund may enter into transactions to purchase or sell foreign currency contracts and options on foreign currency. Forward currency contracts are agreements to exchange one currency for another at a future date and at a specified price. A fund may use forward currency contracts to facilitate transactions in foreign securities, to manage a fund’s foreign currency exposure and to protect the U.S. dollar value of its underlying portfolio securities against the effect of possible adverse movements in foreign exchange rates. These contracts are intrinsically valued daily based on forward rates, and a fund’s net equity therein, representing unrealized gain or loss on the contracts as measured by the difference between the forward foreign exchange rates at the dates of entry into the contracts and the forward rates at the reporting date, is recorded as a component of net asset value. These instruments involve market risk, credit risk, or both kinds of risks, in excess of the amount recognized in the Statement of Assets and Liabilities. Risks arise from the possible inability of counterparties to meet the terms of their contracts and from movement in currency and securities values and interest rates. Due to the risks associated with these transactions, a fund could incur losses up to the entire contract amount, which may exceed the net unrealized value included in its net asset value.
The volume of open currency positions may vary on a daily basis as the Beck, Mack & Oliver Global Equity Fund
29
BECK, MACK & OLIVER FUNDSNOTES TO FINANCIAL STATEMENTS
transacts currency contracts in order to achieve the exposure desired by the adviser. During the year ended March 31, 2012, the Beck, Mack & Oliver Global Equity Fund entered into an aggregated total notional value of $26,289,081 of forward currency contracts.
The values of each individual forward currency contract outstanding in Beck, Mack & Oliver Global Equity Fund as of March 31, 2012, are disclosed in the table below.
| Contracts to Sell | | Settlement Date | | Settlement Value | | Net Unrealized Appreciation (Depreciation) |
| (600,320 | ) | | Brazilian Real | | 05/23/12 | | $ | 320,000 | | | $ | (5,093 | ) |
| (347,893 | ) | | Brazilian Real | | 07/10/12 | | | 185,000 | | | | (1,722 | ) |
| (1,247,280 | ) | | Canadian Dollars | | 06/15/12 | | | 1,200,000 | | | | (48,439 | ) |
| (3,092,498 | ) | | Canadian Dollars | | 09/21/12 | | | 3,100,000 | | | | 11,668 | |
| (699,525 | ) | | Swiss Franc | | 06/13/12 | | | 750,000 | | | | (25,650 | ) |
| (276,441 | ) | | Pounds Sterling | | 07/10/12 | | | 425,000 | | | | (16,863 | ) |
| (318,289 | ) | | Pounds Sterling | | 09/06/12 | | | 500,000 | | | | (8,555 | ) |
| (296,992 | ) | | Pounds Sterling | | 09/13/12 | | | 465,000 | | | | (9,504 | ) |
| (1,739,400 | ) | | Norwegian Krone | | 10/02/12 | | | 300,000 | | | | (3,234 | ) |
| (1,726,250 | ) | | Swedish Krona | | 07/03/12 | | | 250,000 | | | | (9,968 | ) |
| (675,000 | ) | | Swedish Krona | | 09/05/12 | | | 100,000 | | | | (1,413 | ) |
| (162,663 | ) | | Singapore Dollar | | 05/21/12 | | | 125,000 | | | | (4,409 | ) |
| | | | | | | | | | | | | | |
| | | | | | | | | | | | $ | (123,182 | ) |
Purchased Options – When a fund purchases an option, an amount equal to the premium paid by the fund is recorded as an investment and is subsequently adjusted to the current value of the option purchased. If an option expires on the stipulated expiration date or if the fund enters into a closing sale transaction, a gain or loss is realized. If a call option is exercised, the cost of the security acquired is increased by the premium paid for the call. If a put option is exercised, a gain or loss is realized from the sale of the underlying security, and the proceeds from such sale are decreased by the premium originally paid. Purchased options are non-income producing securities.
The values of each individual purchased option outstanding as of March 31, 2012, are disclosed in the Beck, Mack & Oliver Global Equity Fund’s Schedule of Investments. The volume of open purchased option positions may vary on a daily basis as the Beck, Mack & Oliver Global Equity Fund transacts purchased options in order to achieve the exposure desired by the adviser. The Beck, Mack & Oliver Global Equity Fund entered into a total value of $247,573 on purchased options during the year ended March 31, 2012.
Derivatives Transactions - The Beck, Mack & Oliver Global Equity Fund’s use of derivatives during the year ended March 31, 2012, was limited to purchased options and forward currency contracts. Following is a summary of how the derivatives are treated in the financial statements and their impact on the Beck, Mack & Oliver Global Equity Fund.
The location on the Statement of Assets and Liabilities of the Beck, Mack & Oliver Global Equity Fund’s derivative positions by type of exposure is as follows:
30
BECK, MACK & OLIVER FUNDSNOTES TO FINANCIAL STATEMENTS
| | | Location on Statement of Assets and Liabilities | | Asset Derivatives | | Location on Statement of Assets and Liabilities | | Liability Derivatives | |
Contract Type/ Primary Risk Exposure |
| | | | | | | | | | | | |
| | | | | | | | | | | | |
| Purchased Call Options | | Total investments, at value | | $ | 15,968 | | | | $ | - | |
| | | | | | | | | | | | |
| Forward Currency Contracts | | Unrealized gain on forward currency contracts | | | 11,668 | | Unrealized loss on forward currency contracts | | | 134,850 | |
Realized and unrealized gains and losses on derivatives contracts entered into during the year ended March 31, 2012, by the Beck, Mack & Oliver Global Equity Fund are recorded in the following locations on the Statement of Operations:
| | | Location of Gain or (Loss) on Derivatives | | Realized Gain (Loss) on Derivatives | | Change in Unrealized Appreciation (Depreciation) on Derivatives | |
| Contract Type/Primary Risk Exposure |
| | | | | | | | | | |
| | | | | | | | | | |
| Purchased Options | | Realized gain (loss) – Investments in unaffiliated issuers and Net Change in Unrealized Appreciation (Depreciation) on – Investments in unaffiliated issuers | | $ | (163,815 | ) | $ | 22,424 | |
| | | | | | | | | | |
| Forward Currency Contracts | | Realized gain (loss) – Foreign currency transactions and Net Change in Unrealized Appreciation (Depreciation) on – Foreign currency translations | | | (1,416,883 | ) | | (840,294 | ) |
Distributions to Shareholders – Distributions to shareholders of net investment income and net capital gains, if any, are declared and paid at least annually. Distributions are based on amounts calculated in accordance with applicable federal income tax regulations, which may differ from GAAP. These differences are due primarily to differing treatments of income and gain on various investment securities held by each Fund, timing differences and differing characterizations of distributions made by each Fund.
Federal Taxes – Each Fund intends to continue to qualify each year as a regulated investment company under Subchapter M of the Internal Revenue Code and to distribute all of their taxable income to shareholders. In addition, by distributing in each calendar year substantially all of their net investment income and capital gains, if any, the Funds will not be subject to a federal excise tax. Therefore, no federal income or excise tax provision is required. Each Fund files a
31
BECK, MACK & OLIVER FUNDSNOTES TO FINANCIAL STATEMENTS
U.S. federal income and excise tax return as required. A fund’s federal income tax returns are subject to examination by the Internal Revenue Service for a period of three fiscal years after they are filed. As of March 31, 2012, there are no uncertain tax positions that would require financial statement recognition, de-recognition, or disclosure.
Income and Expense Allocation – The Trust accounts separately for the assets, liabilities and operations of each of its investment portfolios. Expenses that are directly attributable to more than one investment portfolio are allocated among the respective investment portfolios in an equitable manner.
Redemption Fees – A shareholder who redeems or exchanges shares within 60 days of purchase will incur a redemption fee of 2.00% of the current net asset value of shares redeemed or exchanged, subject to certain limitations. The fee is charged for the benefit of the remaining shareholders and will be paid to each Fund to help offset transaction costs. The fee is accounted for as an addition to paid-in capital. Each Fund reserves the right to modify the terms of or terminate the fee at any time. There are limited exceptions to the imposition of the redemption fee.
Commitments and Contingencies – In the normal course of business, each Fund enters into contracts that provide general indemnifications by each Fund to the counterparty to the contract. Each Fund’s maximum exposure under these arrangements is dependent on future claims that may be made against each Fund and, therefore, cannot be estimated; however, based on experience, the risk of loss from such claims is considered remote.
Note 3. Fees and Expenses
Investment Adviser – Beck, Mack & Oliver LLC (the “Adviser”) is the investment adviser to the Funds. Pursuant to an Investment Advisory Agreement, the Adviser receives an advisory fee at an annual rate of 1.50% and 1.00% of the average daily net assets of Beck, Mack & Oliver Global Equity Fund and Beck, Mack & Oliver Partners Fund, respectively.
Distribution – Foreside Fund Services, LLC serves as each Fund’s distributor (the “Distributor”). The Distributor receives no compensation from the Funds for its distribution services. The Distributor is not affiliated with the Adviser or Atlantic Fund Administration, LLC (d/b/a Atlantic Fund Services) (“Atlantic”) or their affiliates.
Other Service Providers – Atlantic provides fund accounting, fund administration, and transfer agency services to each Fund. Atlantic also provides certain shareholder report production, and EDGAR conversion and filing services. Pursuant to an Atlantic services agreement, each Fund pays Atlantic customary fees for its services. Atlantic provides a Principal Executive Officer, a Principal Financial Officer, a Chief Compliance Officer, and an Anti-Money Laundering Officer to each Fund, as well as certain additional compliance support functions.
Trustees and Officers – The Trust pays each independent Trustee an annual retainer fee of $45,000 for service to the Trust ($66,000 for the Chairman). In addition, for the year ended March 31, 2012, the Chairman received a monthly stipend of $500 to cover certain expenses incurred in connection with his duties to the Trust. The stipend was discontinued April 1, 2012. The Trustees and Chairman may receive additional fees for special Board meetings. Each Trustee is also reimbursed for all reasonable out-of-pocket expenses incurred in connection with his duties as a Trustee, including travel and related expenses incurred in attending Board meetings. The amount of Trustees’ fees attributable to
32
BECK, MACK & OLIVER FUNDSNOTES TO FINANCIAL STATEMENTS
each Fund is disclosed in the Statement of Operations. Certain officers of the Trust are also officers or employees of the above named service providers, and during their terms of office received no compensation from each Fund.
Note 4. Expense Reimbursement and Fees Waived
The Adviser has contractually agreed to waive a portion of its fee and reimburse certain expenses to limit total annual operating expenses to 1.25% and 1.00% of average daily net assets through July 31, 2012 of the Beck, Mack & Oliver Global Equity Fund and the Beck, Mack & Oliver Partners Fund, respectively.
Other fund service providers have voluntarily agreed to waive a portion of their fees. Voluntary fee waivers may be reduced or eliminated at any time. For the year ended March 31, 2012, fees waived were as follows:
| | | Investment Adviser Fees Waived | | | Other Waivers | | | Total Fees Waived | |
| Beck, Mack & Oliver Global Equity Fund | | $ | 611,143 | | | $ | - | | | $ | 611,143 | |
| Beck, Mack & Oliver Partners Fund | | | 210,863 | | | | 40,000 | | | | 250,863 | |
Note 5. Security Transactions
The cost of purchases and proceeds from sales of investment securities (including maturities), other than short-term investments during the year ended March 31, 2012, were as follows:
| | | Purchases | | | Sales | |
| Beck, Mack & Oliver Global Equity Fund | | $ | 89,258,508 | | | $ | 105,913,273 | |
| Beck, Mack & Oliver Partners Fund | | | 24,151,471 | | | | 18,692,460 | |
Note 6. Federal Income Tax and Investment Transactions
Distributions during the fiscal years as noted were characterized for tax purposes as follows:
| | | Ordinary Income | | | Long Term Capital Gain | | | Total | |
| Beck, Mack & Oliver Global Equity Fund | | | | | | | | | |
| 2012 | | $ | 3,118,891 | | | $ | 130,358 | | | $ | 3,249,249 | |
| 2011 | | | 1,183,670 | | | | - | | | | 1,183,670 | |
| Beck, Mack & Oliver Partners Fund | | | | | | | | | | | | |
| 2012 | | | 929,383 | | | | 2,757,801 | | | | 3,687,184 | |
| 2011 | | | 361,813 | | | | 597,342 | | | | 959,155 | |
33
BECK, MACK & OLIVER FUNDSNOTES TO FINANCIAL STATEMENTS
The difference between components of distributable earnings on a tax basis and the amounts reflected in the Statements of Assets and Liabilities are primarily due to wash sales, currency contracts, real estate investment trusts and investments in passive foreign investment companies in the Beck, Mack & Oliver Global Equity Fund and wash sales in the Beck, Mack & Oliver Partners Fund.
As of March 31, 2012, distributable earnings (accumulated losses) on a tax basis were as follows:
| | | Undistributed Ordinary Income | | Undistributed Long-Term Gain | | Capital and Other Losses | | Unrealized Appreciation (Depreciation) | | Total |
| Beck, Mack & Oliver Global Equity Fund | | $ | - | | | $ | 3,042,590 | | | $ | - | | | $ | 8,144,392 | | | $ | 11,186,982 | |
| Beck, Mack & Oliver Partners Fund | | | 523,799 | | | | 81,021 | | | | - | | | | 8,173,500 | | | | 8,778,320 | |
On the Statements of Assets and Liabilities, as a result of permanent book to tax differences, certain amounts have been reclassified for the year ended March 31, 2012. The following reclassifications were the result of net operating loss, currency gain/loss reclassifications and investments in passive foreign investment companies in the Beck, Mack & Oliver Global Equity Fund and investments in partnerships in the Beck, Mack & Oliver Partners Fund and have no impact on the net assets of each Fund.
| | | Accumulated Net Investment Income (Loss) | | Undistributed Net Realized Gain (Loss) | | Paid-in-Capital |
| Beck, Mack & Oliver Global Equity Fund | | $ | 549,999 | | | $ | 2,305,625 | | | $ | (2,855,624 | ) |
| Beck, Mack & Oliver Partners Fund | | | (21,178 | ) | | | 21,178 | | | | - | |
Note 7. Recent Accounting Pronouncements
In May 2011, FASB issued ASU No. 2011-04 “Amendments to Achieve Common Fair Value Measurement and Disclosure Requirements in U.S. GAAP and IFRSs.” ASU No. 2011-04 establishes common requirements for measuring fair value and for disclosing information about fair value measurements in accordance with U.S. GAAP and International Financial Reporting Standards (“IFRSs”). ASU No. 2011-04 is effective for interim and annual periods beginning after December 15, 2011. Management is evaluating the impact ASU No. 2011-04 may have on financial statement disclosures.
In December 2011, FASB issued ASU No. 2011-11 “Disclosures about Offsetting Assets and Liabilities” requiring disclosure of both gross and net information related to offsetting and related arrangements enabling users of its financial statements to understand the effect of those arrangements on the entity’s financial position. The objective of this disclosure is to facilitate comparison between those entities that prepare their financial statements on the basis of U.S. GAAP and those entities that prepare their financial statements on the basis of IFRSs. ASU No. 2011-11 is effective for
34
BECK, MACK & OLIVER FUNDSNOTES TO FINANCIAL STATEMENTS
interim and annual periods beginning on or after January 1, 2013. Management is evaluating any impact ASU No. 2011-11 may have on each Fund’s financial statements.
Note 8. Subsequent Events
Subsequent events occurring after the date of this report through the date these financial statements were issued have been evaluated for potential impact and each Fund has had no such events.
35
REPORT OF INDEPENDENT REGISTERED PUBLIC ACCOUNTING FIRM
To the Board of Trustees of Forum Funds and the Shareholders of Beck, Mack & Oliver Global Equity Fund and Beck, Mack & Oliver Partners Fund
We have audited the accompanying statements of assets and liabilities of Beck, Mack & Oliver Global Equity Fund and Beck, Mack & Oliver Partners Fund, each a series of shares of beneficial interest in the Forum Funds, including the schedules of investments, as of March 31, 2012, and the related statements of operations for the year then ended, the statements of changes in net assets for each of the years in the two-year period then ended, and the financial highlights for each of the years in the four-year period then ended for Beck, Mack & Oliver Global Equity Fund and for each of the years in the two-year period then ended and for the period December 1, 2009 (commencement of operations) through March 31, 2010 for Beck, Mack & Oliver Partners Fund. These financial statements and financial highlights are the responsibility of the Funds' management. Our responsibility is to express an opinion on these financial statements and financial highlights based on our audits. The financial highlights for Beck, Mack & Oliver Global Equity Fund for the year ended March 31, 2008 were audited by other auditors whose report dated May 28, 2008, expressed an unqualified opinion on such financial highlights.
We conducted our audits in accordance with the standards of the Public Company Accounting Oversight Board (United States). Those standards require that we plan and perform the audits to obtain reasonable assurance about whether the financial statements and financial highlights are free of material misstatement. An audit includes examining, on a test basis, evidence supporting the amounts and disclosures in the financial statements. Our procedures included confirmation of securities owned as of March 31, 2012 by correspondence with the custodian and brokers and by other appropriate auditing procedures where responses from brokers were not received. An audit also includes assessing the accounting principles used and significant estimates made by management, as well as evaluating the overall financial statement presentation. We believe that our audits provide a reasonable basis for our opinion.
In our opinion, the financial statements and financial highlights referred to above present fairly, in all material respects, the financial position of Beck, Mack & Oliver Global Equity Fund and Beck, Mack & Oliver Partners Fund as of March 31, 2012, the results of their operations for the year then ended, the changes in their net assets for each of the years in the two-year period then ended, and their financial highlights for each of the years or periods in the four-year period then ended, in conformity with accounting principles generally accepted in the United States of America.
BBD, LLP
Philadelphia, Pennsylvania
May 29, 2012
36
BECK, MACK & OLIVER FUNDS
ADDITIONAL INFORMATION (Unaudited)
Investment Advisory Agreement Approval
At the March 16, 2012 Board meeting, the Board, including the Independent Trustees, considered the renewal of the investment advisory agreement pertaining to the Beck, Mack & Oliver Global Equity Fund and the Beck, Mack & Oliver Partners Fund (the “Advisory Agreement”). In evaluating the Advisory Agreement for the Funds, the Board reviewed materials furnished by the Adviser and Atlantic, including information regarding the Adviser, its personnel, operations and financial condition. Specifically, the Board considered, among other matters: (1) the nature, extent and quality of the services to be provided to the Funds by the Adviser, including information on the investment performance of the Adviser; (2) the costs of the services to be provided and profitability to the Adviser with respect to its relationship with the Funds; (3) the advisory fee and the total expense ratio of the Funds compare to relevant peer groups of funds; (4) the extent to which economies of scale would be realized as the Fund grows and whether the advisory fee would enable each Fund’s investors to share in the benefits of economies of scale; and (5) other benefits received by the Adviser from its relationship with the Funds. In their deliberations, the Board did not identify any particular information that was all-important or controlling and attributed different weights to the various factors. In particular, the Board focused on the factors discussed below.
Nature, Extent and Quality of Services
Based on a presentation from senior representatives of Beck, Mack & Oliver LLC (the “Adviser”) and a discussion of the Adviser’s personnel, operations and financial condition, the Board considered the quality of services to be provided by the Adviser under the Advisory Agreement between the Trust and the Adviser. In this regard, the Board considered information regarding the experience, qualifications and professional background of the portfolio managers and other personnel at the Adviser with principal investment responsibility for the Funds’ investments as well as the investment philosophy and decision-making processes of those professionals and the capability and integrity of the Adviser’s senior management and staff. The Board considered the adequacy of the Adviser’s resources and quality of services provided by the Adviser under the Advisory Agreement between the Trust and the Adviser.
Costs of Services and Profitability
The Board considered information provided by the Adviser regarding its costs of services and its profitability with respect to the Funds. In this regard, the Board considered the Adviser’s resources devoted to the each of the Funds as well as the Adviser’s discussion of costs and profitability. Based on these and other applicable considerations, the Board concluded that the Adviser’s profits attributable to management of the Funds were not a material factor in approving the Advisory Agreement.
Performance
The Board reviewed performance of the Funds and the Adviser’s discussion of its investment philosophy. The Board noted that the Beck, Mack & Oliver Global Equity Fund outperformed its benchmark for the 5- year, 10-year and since inception periods and underperformed its benchmark for the 1-year and 3-year periods. The Board also noted that the Beck, Mack & Oliver Partners Fund had outperformed its benchmark for the 1-year 3-year and 5-year year periods and since inception periods. Noting the Funds’ asset growth and performance, the Board concluded that the each Fund’s
37
BECK, MACK & OLIVER FUNDS
ADDITIONAL INFORMATION (Unaudited)
performance was reasonable relative to its benchmark and that each Fund and their shareholders could benefit from the Adviser’s management of each Fund.
Compensation
The Board considered the Adviser’s compensation for providing advisory services to each Fund and analyzed comparative information on fee rates and total expenses of similar mutual funds. The Board noted that the Adviser’s actual advisory fee rate for the Beck, Mack & Oliver Global Equity Fund was above the median fee of that Fund’s Lipper Inc. peer group and that the Adviser’s actual advisory fee rate for the Beck, Mack & Oliver Partners Fund was the lowest of that Fund’s Lipper Inc. peer group. The Board also noted that the Beck, Mack & Oliver Global Equity Fund’s actual total expense ratio was lower than the median of its Lipper Inc. peer group and that the Beck, Mack & Oliver Partners Fund’s actual total expense ratio was below the median of its Lipper Inc. peer group. Based on the foregoing, the Board concluded that the Adviser’s advisory fee rate charged to the Funds appeared to be within a reasonable range in light of the services it provides to each of the Funds.
Economies of Scale
The Board considered whether the Funds would benefit from any economies of scale. In this respect, the Board noted the Adviser’s representation that the Funds potentially could benefit from economies of scale as assets grow, but the Adviser currently is not proposing breakpoints or changes in fees at this time. Based on the foregoing information, the Board concluded that economies of scale were not a material factor in approving the Advisory Agreement.
Other Benefits
The Board noted the Adviser’s representation that, aside from its contractual advisory fees, it does not benefit in a material way from its relationship with the Funds other than soft-dollar research benefits. Based on the foregoing representation, the Board concluded that other benefits received by the Adviser from its relationship with the Funds were not a material factor to consider in approving the continuation of the Advisory Agreement.
Conclusion
The Board did not identify any single factor as being of paramount importance, and different Trustees may have given different weight to different factors. The Board reviewed a memorandum from Trust counsel discussing the legal standards applicable to its consideration of the Advisory Agreement. Based on its review, including consideration of each of the factors referenced above, the Board determined, in the exercise of its business judgment, that the advisory arrangement, as outlined in the Advisory Agreement, was fair and reasonable in light of the services performed, expenses incurred and such other matters as the Board considered relevant in the exercise of its reasonable business judgment.
Proxy Voting Information
A description of the policies and procedures that each Fund uses to determine how to vote proxies relating to securities
38
BECK, MACK & OLIVER FUNDS
ADDITIONAL INFORMATION (Unaudited)
held in each Fund’s portfolio is available, without charge and upon request, by calling (800) 943-6786 and on the U.S. Securities and Exchange Commission’s (the “SEC”) website at www.sec.gov. Each Fund’s proxy voting record for the most recent twelve-month period ended June 30 is available, without charge and upon request, by calling (800) 943-6786 and on the SEC’s website at www.sec.gov.
Availability of Quarterly Portfolio Schedules
Each Fund files its complete schedule of portfolio holdings with the SEC for the first and third quarters of each fiscal year on Form N-Q. These filings are available, without charge and upon request on the SEC’s website at www.sec.gov or may be reviewed and copied at the SEC’s Public Reference Room in Washington, DC. Information on the operation of the Public Reference Room may be obtained by calling (800) SEC-0330.
Shareholder Expense Example
As a shareholder of the Funds, you incur two types of costs: (1) transaction costs, including redemption fees and exchange fees, and (2) ongoing costs, including management fees and other Fund expenses. This example is intended to help you understand your ongoing costs (in dollars) of investing in the Funds, and to compare these costs with the ongoing costs of investing in other mutual funds.
The example is based on an investment of $1,000 invested at the beginning of the period and held for the entire period from October 1, 2011, through March 31, 2012.
Actual Expenses – The first line of the table below provides information about actual account values and actual expenses. You may use the information in this line, together with the amount you invested, to estimate the expenses that you paid over the period. Simply divide your account value by $1,000 (for example, an $8,600 account value divided by $1,000 = 8.6), then multiply the result by the number in the first line under the heading entitled “Expenses Paid During Period” to estimate the expenses you paid on your account during the period.
Hypothetical Example for Comparison Purposes – The second line of the table below provides information about hypothetical account values and hypothetical expenses based on each Fund’s actual expense ratio and an assumed rate of return of 5% per year before expenses, which is not each Fund’s actual return. The hypothetical account values and expenses may not be used to estimate the actual ending account balance or expenses you paid for the period. You may use this information to compare the ongoing costs of investing in each Fund and other funds. To do so, compare this 5% hypothetical example with the 5% hypothetical examples that appear in the shareholder reports of other funds.
Please note that the expenses shown in the table are meant to highlight your ongoing costs only. Therefore, the second line of the table is useful in comparing ongoing costs only and will not help you determine the relative total costs of owning different funds.
39
BECK, MACK & OLIVER FUNDS
ADDITIONAL INFORMATION (Unaudited)
| | Beginning Account Value October 1, 2011 | | Ending Account Value March 31, 2012 | | Expenses Paid During Period * | | Annualized Expense Ratio * |
| Beck, Mack & Oliver Global Equity Fund | | | | | | | | | | | | |
| Actual | $ | 1,000.00 | | | $ | 1,193.37 | | | $ | 6.85 | | | | 1.25% |
Hypothetical (5% return before expenses) | $ | 1,000.00 | | | $ | 1,018.75 | | | $ | 6.31 | | | | 1.25% |
| Beck, Mack & Oliver Partners Fund | | | | | | | | | | | | | | |
| Actual | $ | 1,000.00 | | | $ | 1,249.84 | | | $ | 5.62 | | | | 1.00% |
Hypothetical (5% return before expenses) | $ | 1,000.00 | | | $ | 1,020.00 | | | $ | 5.05 | | | | 1.00% |
| * | Expenses are equal to each Fund’s annualized expense ratio as indicated above multiplied by the average account value over the period, multiplied by the number of days in the most recent fiscal half-year divided by 366 to reflect the half-year period. |
Federal Tax Status of Dividends Declared during the Tax Year
For federal income tax purposes, dividends from short-term capital gains are classified as ordinary income. The Beck, Mack & Oliver Global Equity Fund designates 2.76% of its income dividend distributed as qualifying for the corporate dividends-received deduction (DRD) and 31.12% for the qualified dividend rate (QDI) as defined in Section 1(h)(11) of the Internal Revenue Code. The Beck, Mack & Oliver Global Equity Fund also designates 0.62% as qualified interest income exempt from U.S. tax for foreign shareholders (QII). The Beck, Mack & Oliver Partners Fund designates 36.36% of its income dividend distributed as DRD and 50.12% for QDI. The Beck, Mack & Oliver Partners Fund also designates 7.41% as QII and 80.54% as short-term capital gain dividends exempt from U.S. tax for foreign shareholders (QSD).
Capital Gain Dividends – The Beck, Mack & Oliver Global Equity Fund paid long-term capital gain dividends of $130,358 for the tax year ended March 31, 2012. The Beck, Mack & Oliver Partners Fund paid long-term capital gain dividends of $2,757,801 for the tax year ended March 31, 2012.
40
BECK, MACK & OLIVER FUNDS
ADDITIONAL INFORMATION (Unaudited)
Trustees and Officers of the Trust
The Board is responsible for oversight of the management of the Trust’s business affairs and of the exercise of all the Trust’s powers except those reserved for the shareholders. The following table provides information about each Trustee and certain officers of the Trust. Each Trustee and officer holds office until the person resigns, is removed, or is replaced. Unless otherwise noted, the persons have held their principal occupations for more than five years. The address for all Trustees and officers is Three Canal Plaza, Suite 600, Portland, Maine 04101. Mr. Keffer is considered an Interested Trustee due to his affiliation with Atlantic. Each Fund’s Statement of Additional Information includes additional information about the Trustees and is available, without charge and upon request, by calling (800) 943-6786.
| Name and Year of Birth | Position with the Trust | Length of Time Served | Principal Occupation(s) During Past Five Years | Number of Series of Trust Overseen by Trustee | Other Directorships Held by Trustee |
| Independent Trustees | | | | | |
J. Michael Parish Born: 1943 | Chairman of the Board; Trustee; Chairman, Nominating Committee and Qualified Legal Compliance Committee | Since 1989 (Chairman since 2004) | Retired since 2003. | 21 | 0 |
Costas Azariadis Born: 1943 | Trustee; Chairman, Valuation Committee | Since 1989 | Professor of Economics, Washington University since 2006. | 21 | 0 |
James C. Cheng Born: 1942 | Trustee; Chairman, Audit Committee | Since 1989 | President, Technology Marketing Associates (marketing company for small- and medium-sized businesses in New England) since 1991. | 21 | 0 |
David Tucker Born: 1958 | Trustee | Since 2011 | Director, Blue Sky Experience since 2008; Senior Vice President & General Counsel, American Century Companies 1998-2008. | 21 | 0 |
41
BECK, MACK & OLIVER FUNDS
ADDITIONAL INFORMATION (Unaudited)
| Name and Year of Birth | Position with the Trust | Length of Time Served | Principal Occupation(s) During Past Five Years | Number of Series of Trust Overseen by Trustee | Other Directorships Held by Trustee |
| Interested Trustee | | | | | |
John Y. Keffer1 Born: 1942 | Trustee; Vice Chairman | Since 1989 | Chairman, Atlantic since 2008; President, Forum Foundation (a charitable organization) since 2005; President, Forum Trust, LLC (a non-depository trust company chartered in the State of Maine) since 1997. | 21 | Director, Wintergreen Fund, Inc.; Director, Form ETF Trust |
| Officers | | | | | |
Stacey E. Hong Born: 1966 | President; Principal Executive Officer | Since 2008 | President, Atlantic since 2008; Director, Consulting Services, Foreside Fund Services 2007. | N/A | N/A |
Karen Shaw Born: 1972 | Treasurer; Principal Financial Officer | Since 2008 | Senior Vice President, Atlantic since 2008; Vice President, Citigroup 2003-2008. | N/A | N/A |
David Faherty Born: 1970 | Vice President | Since 2009 | Senior Counsel, Atlantic since 2009; Vice President, Citi Fund Services Ohio, Inc. 2007-2009; Associate Counsel, Investors Bank & Trust Co. 2006-2007. | N/A | N/A |
Michael J. McKeen Born: 1971 | Vice President | Since 2009 | Senior Vice President, Atlantic since 2008; Vice President, Citigroup 2003-2008. | N/A | N/A |
Joshua LaPan Born: 1973 | Vice President | Since 2009 | Manager, Atlantic since 2008; Vice President, Citigroup 2003-2008. | N/A | N/A |
Timothy Bowden Born: 1969 | Vice President | Since 2009 | Manager, Atlantic since 2008; Vice President, Citigroup 2005-2008. | N/A | N/A |
Lina Bhatnagar Born: 1971 | Secretary | Since 2008 | Senior Administration Specialist, Atlantic since 2008; Regulatory Administration Specialist, Citigroup 2006-2008. | N/A | N/A |
1Atlantic is a subsidiary of Forum Holdings Corp. I, a Delaware corporation that is wholly owned by Mr. Keffer. |
42

MERK HARD CURRENCY FUND®
Investor Shares (MERKX)
Institutional Shares (MHCIX)
MERK ASIAN CURRENCY FUND®
Investor Shares (MEAFX)
Institutional Shares (MASIX)
MERK ABSOLUTE RETURN CURRENCY FUND®
Investor Shares (MABFX)
Institutional Shares (MAAIX)
MERK CURRENCY ENHANCED U.S. EQUITY FUNDSM
Investor Shares (MUSFX)
Institutional Shares (MUSIX)

| | |
ANNUAL REPORT | | MARCH 31, 2012 |
TABLEOF CONTENTS
| | | | |
| | |
| | | 1 | |  |
A MESSAGETOOUR SHAREHOLDERS
MARCH 31, 2012
Dear Shareholder,
We present the Annual Report for the Merk Hard Currency Fund®, Merk Asian Currency Fund®, and Merk Absolute Return Currency Fund® (individually a “Fund” and collectively the “Funds”) with respect to the period April 1, 2011 through March 31, 2012 (the “Period”) as well as for the Merk Currency Enhanced U.S. Equity FundSM (individually included in the defined term “Fund,” and collectively included in the defined term, “Funds”) for the period since inception on September 12, 2011 through March 31, 2012.
| | • | | The Merk Hard Currency Fund seeks to profit from a rise in hard currencies relative to the U.S. dollar. |
| | • | | The Merk Asian Currency Fund seeks to profit from a rise in Asian currencies relative to the U.S. dollar. |
| | • | | The Merk Absolute Return Currency Fund seeks to generate positive absolute returns by investing in currencies. |
| | • | | The Merk Currency Enhanced U.S. Equity Fund seeks to generate total returns that exceed that of the S&P 500® Index (the “S&P 500”) by utilizing a currency overlay. |
On September 12, 2011, we launched the Merk Currency Enhanced U.S. Equity Fund, adding to our suite of transparent no-load currency mutual funds. The Merk Currency Enhanced U.S. Equity Fund seeks to outperform the S&P 500 by managing the currency exposure associated with investments in U.S. equities, specifically the S&P 500. This Fund may provide investors with a unique opportunity to be concurrently invested in U.S. equities, while pursuing a currency overlay strategy.

Merk Hard Currency Fund Investor Shares posted a return of -1.68% for the 12-month period ended March 31, 2012. In comparison, the JPMorgan 3-Month Global Cash Index (“reference basket”) posted a return of -2.19% during the Period. As of March 31, 2012, the Investor Shares of the Fund had a five-year return of 5.37% and an annualized return of 5.45% since inception on May 10, 2005; this compares to a five-year return of 3.83% and an annualized return of 3.92% since May 10, 2005 for the reference basket. The Fund’s performance data represents past performance and is no guarantee of future results. Current performance may be lower or higher than the performance data quoted. Investment return and principal value will fluctuate so that an investor’s shares, when redeemed, may be worth more or less than original cost. Please visit www.merkfunds.com for most recent month end performance. The Fund’s expense ratio for the Investor Shares is 1.30%.
The Fund’s performance is foremost influenced by changes in exchange rates of currencies to which the Fund has exposure. The performance of currencies to which the Fund had exposure was somewhat bifurcated through the Period, with European currencies tending to underperform, while Asia-Pacific currencies and gold outperformed. Notably, gold returned 16.47%, as measured by the spot price of gold per troy ounce, the New Zealand dollar returned 7.51% and the Japanese yen returned 0.31% during the reference period. On the other hand, the euro declined 5.76% and the Swedish krona declined 4.40%.(*)
We adapt the currency allocations as our analysis of monetary policies and economic environments evolve. During the Period, we decreased the Fund’s euro and Swiss franc positions, mostly in favor of increasing the Fund’s exposures to the New Zealand dollar and Singapore dollar. Indeed, we introduced the Singapore dollar to the Fund for the first time during the Period, ending the month of March 2012 with a 7.5% allocation to the currency. We also took positions in the Japanese yen during the Period, tactically taking advantage of periodic strength in the currency, particularly as global contagion concerns increased regarding the European situation.
While concern surrounding the deteriorating fiscal health of peripheral European nations drove global contagion concerns through most of the Period, policy makers in the region helped alleviate investor concern in the early months of 2012. Increased clarity was provided regarding the Greek debt situation, with bond holders agreeing to swap bonds for a substantial haircut. EU policy makers also made progress on the expansion of fiscal safety nets, increasing the overall size of bailout facilities through the extension of the European Financial Stability Facility (EFSF). Notwithstanding, concerns remain over the region, particularly the Spanish situation, which appears to have deteriorated. We decided to reduce the Fund’s position during the Period, largely driven by our assessment that there was an increased likelihood of the European Central Bank (ECB) pursuing more expansionary monetary policies. We subsequently decided to increase the position in the latter stages of the Period, given percieved improvements in risk outlook on the back of progress made, as alluded to above, but remain cautious.
| | | | |
| | |
| | | 2 | | |
A MESSAGETOOUR SHAREHOLDERS
MARCH 31, 2012
We also decided to reduce the Fund’s allocation to the Swiss franc during the Period based on valuation fundamentals and increased intervention risks. In our assessment, substantial amounts of speculative money had rushed into the currency in the summer of 2011, partially driven by growing concerns emenating from periphery European nations, and compounded by momentum investors. In our opinion, this ultimately resulted in an overvalued franc. At the same time, the Swiss National Bank (SNB) became evermore vocal regarding the possibility of currency intervention, in an attempt to talk down the currency. When the communication strategy failed to work, the SNB was forced to act, intervening to peg the franc to the euro in September 2011. The peg of 1.20 to the euro remained in place through the end of the Period.
We chose to increase the Fund’s position in the New Zealand dollar on the assessment that the U.S. Federal Reserve (the “Fed”) and other central banks – notably the Bank of England, Bank of Japan and ECB – would be pressured into more expansionary monetary policies, which in turn may be positive for those currencies highly correlated to commodity prices. Moreover, we consider New Zealand well placed to benefit from ongoing economic strength in Asia and the economy to bounce back strongly from the earthquake that struck Christchurch. Such conditions may release latent inflationary pressures and likely cause the Reserve Bank of New Zealand (RBNZ) to tighten monetary policy ahead of counterparts around the world. Indeed, the outlook for interest rate increases in New Zealand remained positive while expectations for many other currencies declined substantially throughout the Period.
We also chose to introduce the Singapore dollar to the Fund during the Period, elevating our assessment of the currency to “hard currency” status. We are particularly attracted to the region’s financial and high-tech capabilities and believe the nation stands to gain from continued Asian-region growth. Singapore is also likely to attract business away from the historic global financial hubs of London and New York, given the substantial regulatory burdens facing both those cities. The Monetary Authority of Singapore (MAS) has shown prudence and restraint in implementing monetary policy, specifically targeting the currency as a monetary policy tool; with inflation pressures rising, we believe they will utilize currency strength to help mitigate these risks.

Merk Asian Currency Fund Investor Shares posted a return of -1.28% for the 12-month period ending March 31, 2012. In comparison, the Citigroup 3-Month U.S. T-Bill Index (“reference basket”) increased 0.05% during the Period. As of March 31, 2012, the Investor Shares had an annualized return of -0.47% since inception on April 1, 2008; this compares to an annualized return of 0.36% since March 31, 2008 for the reference basket.1 The Fund’s Performance data represents past performance and is no guarantee of future results. Current performance may be lower or higher than the performance data quoted. Investment return and principal value will fluctuate so that an investor’s shares, when redeemed, may be worth more or less than original cost. Please visit www.merkfunds.com for most recent month end performance. The Fund’s expense ratio for the Investor Shares is 1.30%.
The Fund’s performance is foremost influenced by changes in exchange rates of currencies to which the Fund has exposure. The majority of currencies to which the Fund had exposure declined in value over the reference period. Notable exceptions were the Fund’s largest position, the Chinese renminbi, which appreciated 3.97%, and the Singapore dollar, which returned 0.22%. The Taiwanese dollar declined 0.34%, the Malaysian ringgit declined 1.29%, and the South Korean won declined 3.19% during the Period. We adapt the currency allocations as our analysis of monetary policies and economic environments evolve.
While still maintaining a significant position in the currency, we chose to reduce the Fund’s portfolio allocation to the Chinese renminbi during the Period, primarily opting to increase the Fund’s Singapore dollar exposure. We consider both these currencies as attractive investment opportunities; indeed, at the end of the Period they were the Fund’s top two currency exposures, in combination representing over 50% of the Fund’s total currency allocation. With heightened market volatility stemming from concerns surrounding the global economic outlook, the risk of Asian central bank intervention has once again become elevated; indeed, we have recently witnessed many Asian central banks actively selling currencies in an attempt to stimulate export growth.
| 1 | Note that the inception date of the Merk Asian Currency Fund is April 1, 2008 and, therefore, the annualized return for the Fund is from April 1, 2008 through March 31, 2012, whereas the annualized return for the reference basket is calculated for the time period March 31, 2008 through March 31, 2012. |
| | | | |
| | |
| | | 3 | | |
A MESSAGETOOUR SHAREHOLDERS
MARCH 31, 2012
We consider the Chinese and Singapore authorities less likely to follow similar practices. Indeed, we favor the currencies of Asian nations whom we deem to produce goods and services at the higher end of the value chain. These nations have less incentive to devalue their currencies, as they tend to have greater pricing power; a greater ability to pass on cost increases via a stronger currency. We consider both China and Singapore to produce more value-added goods relative to their Asian counterparts. Indeed, the Chinese continued to allow their currency to appreciate relative to the U.S. dollar through the Period, as evidenced by the relative strength in the currency; in contrast to the Chinese renminbi’s appreciation of 3.97%, the Indonesian rupiah declined 4.79% during the Period. We consider the Indonesian economy to produce lower-end goods and services relative to China, and as such is more likely to instigate currency devaluation in an attempt to spur export growth and thus stimulate the economy. (The Indonesian rupiah is a currency the Fund has not held since 2008). As part of the Fund’s overall Chinese remnimbi allocation, we added offshore Chinese renminbi time deposits to supplement the forward currency contracts historically employed.

Merk Absolute Return Currency Fund Investor Shares posted a return of -7.57% for the 12-month period ending March 31, 2012. In comparison, the Citigroup 3-Month U.S. T-Bill Index (“reference basket”) increased 0.05% during the Period. As of March 31, 2012, the Investor Shares had an annualized return of -1.51% since inception on September 9, 2009; this compares to an annualized return of 0.10% since August 31, 2009 for the reference basket.2 The Fund’s performance data represents past performance and is no guarantee of future results. Current performance may be lower or higher than the performance data quoted. Investment return and principal value will fluctuate so that an investor’s shares, when redeemed, may be worth more or less than original cost. Please visit www.merkfunds.com for most recent month end performance. The Fund’s expense ratio for the Investor Shares is 1.30%.
The Fund’s performance is foremost influenced by changes in exchange rates of currencies to which the Fund has exposure. The Fund employs a tactical, periodic currency allocation process; currency exposures have historically been rebalanced on a monthly or bi-weekly basis. As such, currency exposures can change significantly from one holding period to the next. Moreover, the Fund aims to take advantage of potential short-term profit opportunities within the currency market. As such, the Fund may have a net long or net short U.S. dollar currency exposure at any time.
The Fund can take offsetting positions in otherwise highly correlated currencies, on a short-term view that such currency positioning will yield profitable returns. Indeed, during the Period, the Fund held both long and short positions at various points in time in the majority of currencies the Fund invests in. As an example, the Fund held a long position in the New Zealand dollar during the month of August 2011, while simultaneously holding a short position in the Australian dollar; these two currencies have historically moved together in tandem. The Fund also took similar positions in these currencies in the month of November 2011. Likewise, the Fund has held long positions in the euro, with corresponding offsetting short positions in the Swiss franc, along with the opposite positioning, at various times during the Period. Such allocations may generate returns that are unlikely to be correlated to traditional asset classes. Holding offsetting positions in otherwise correlated currencies may also help contain the volatility of the Fund.
Through the last quarter of the Period, the Fund benefited from long positions in the Swedish krona, which returned 4.12% and the Australian dollar, which returned 1.34% through the quarter. The Fund also benefited from a short position in the Japanese yen over the same time period, as the currency declined 7.19%. On the other hand, the Fund’s short position to the British pound detracted from performance, as the currency returned 2.99% through the last quarter of the Period.(*)
| 2 | Note that data is not available for the reference basket on the inception date of the Merk Absolute Return Currency Fund (September 9, 2009). As such, performance for the reference basket is calculated for the time period August 31, 2009 through March 31, 2012, whereas performance for the Fund is calculated for the period since inception through March 31, 2012. |
| | | | |
| | |
| | | 4 | | |
A MESSAGETOOUR SHAREHOLDERS
MARCH 31, 2012

Merk Currency Enhanced U.S Equity Fund Investor Shares posted a return of 20.99% for the period since its inception date on September 12, 2011 through March 31, 2012. The Fund’s performance data represents past performance and is no guarantee of future results. Current performance may be lower or higher than the performance data quoted. Investment return and principal value will fluctuate so that an investor’s shares, when redeemed, may be worth more or less than original cost. Please visit www.merkfunds.com for most recent month end performance. The Fund’s expense ratio for the Investor Shares is 1.38%. The expense ratio may vary from the expense ratio presented in other sections of this report that are based on expenses incurred during the period covered by this report.
The Merk Currency Enhanced U.S. Equity Fund seeks to generate total returns that exceed that of the S&P 500. By employing a currency overlay, the Fund actively manages U.S. dollar and other currency risk while concurrently providing investment exposure to the S&P 500. Currency overlay allocations are periodically revised based on both quantitative and qualitative analyses in seeking to achieve positive absolute returns from the Fund’s exposure to currencies.
The Fund intends to obtain investment exposure to the S&P 500 equivalent to the value of its net assets by investing in exchange traded funds (“ETFs”), other investment companies, securities of companies included in the S&P 500 and S&P 500 derivatives. Because the Fund invests in currency derivatives, the Fund can invest in currencies, while concurrently obtaining investment exposure to the S&P 500 equivalent to the value of its net assets.
To gain exposure to the S&P 500, the Fund typically will invest principally in index-based ETFs and other investment companies that track the S&P 500. The Fund also may seek exposure to the S&P 500 by investing directly in the common stocks of companies listed on the S&P 500 or indirectly in options, futures, options on futures and swaps. The performance of these equities and financial instruments in which the Fund will invest is expected to correlate closely to the performance of the S&P 500.
To achieve returns that exceed the S&P 500, we will seek to actively manage the currency exposure associated with the broad U.S. equities markets by seeking exposure to the currencies of countries that, in our opinion, have liquid currency markets.
The Fund periodically revises its currency exposure based on an integration of quantitative and qualitative analyses. Currency allocations are determined based on quantitative factors; these are then rebalanced based on a “risk overlay”; finally, we apply a “macro overlay” to adjust currency allocations based on qualitative factors.
The Fund’s performance since inception was primarily driven by its exposure to the S&P 500 Index, which returned 22.68% during this timeframe. Through the last three months of 2011, the currency overlay detracted, on net, from overall Fund performance, whereas during the first three months of 2012, the currency overlay contributed positively to the overall performance of the Fund.
Please visit www.merkfunds.com where we publish and discuss the Fund’s currency allocations. None of the Funds engage in securities lending or repurchase agreements. Please also read the Fund’s prospectus.
Market Analysis and Insights
The 12-month period ended March 31, 2012 could be described as one of contrasting halves. The first half of the Period was marked by increased pessimism and concern regarding Europe, particularly the periphery nations. In contrast, market sentiment was more optimistic through the second six-month period, and markets exhibited significant strength; during the first six-month period ended September 30, 2011, the market – as measured by the S&P 500 Index – returned -13.78%, while the market returned 25.89% during the second six-month period ended March 31, 3012.
News emanating from Europe dominated market gyrations for the majority of the Period. Specifically, the periphery nation sovereign debt crisis and concerns surrounding its global contagion effects – particularly on countries previously considered immune to the fallout, like China – held the market’s attention. Concerns appeared more acute through the first half of the Period, where we witnessed heightened levels of market volatility and general selling of perceived risky assets. The VIX index – widely followed as a bellwether for market volatility – reached a high of 48 in August 2011, as concerns mounted regarding the Greek debt situation and focus shifted to the larger European countries, particularly Italy and Spain, where political upheaval only muddied the waters. Policy makers on this side of the Atlantic compounded the problem, with Washington leaving the decision to raise the U.S. Government’s debt ceiling to the last minute causing further market distress.
| | | | |
| | |
| | | 5 | | |
A MESSAGETOOUR SHAREHOLDERS
MARCH 31, 2012
During the second half of the Period, the market appeared to ascribe a more optimistic assessment to the European situation and the global economy. Particularly in the U.S., we saw the release of many economic data points that beat consensus expectations, including notable improvements to the unemployment rate. European policy makers also appeared to alleviate the market’s concerns regarding Italy and Spain, where austerity measures were finally agreed to and put in place, while much needed clarity was provided surrounding the Greek situation when bondholders agreed to participate in a debt swap. At the same time, we witnessed a number of central banks following much easier policies through the second half of the Period. The U.S. Federal Reserve (Fed) became evermore dovish in its rhetoric regarding easing measures and extended the calendar date that low rates are anticipated to be kept in effect, moving it out to the end of 2014 from mid-2013 previously. The Bank of England expanded its quantitative easing program by £50 billion and the Bank of Japan also increased its expansionary asset purchases by ¥10 trillion and concurrently set an inflation target. Additionally, the ECB expanded its balance sheet via two long-term refinancing operations (LTRO’s), together totaling over €1 trillion. All of which helped alleviate market concerns and underpinned significant strength in equity markets, as indicated above, and a substantial reduction in the VIX index, which fell to a low below 14 in March of 2012.
Going forward, we consider that central banks around the world are likely to err on the side of further monetary policy easing. Our analysis finds that the composition of voting members on the Fed’s Federal Open Market Committee (FOMC) is more dovish in 2012 compared to 2011 and is set to become even more dovish in 2013.3 We therefore consider it very likely that rates will be kept low for an extended period of time in the U.S. and, should economic fundamentals deteriorate, further easing policies may be put in place. Elsewhere, the Bank of Japan appears committed to generating inflation via easing policies, while the Bank of England appears to be more concerned about deflation despite the existence of what we deem to be elevated inflationary pressures (as measured by the consumer price index). We consider it likely that the Bank of England announces further stimulus measures should economic growth in the United Kingdom disappoint. At the same time, there is renewed pressure on the ECB to purchase periphery nation debt to stave off further fiscal deterioration in the region. While ECB President Draghi appears committed to provide the banking system with unlimited levels of liquidity (through the two three-year LTRO facilities), pressure is mounting to intervene directly through the Securities Market Program (SMP) and buy the likes of Spanish debt. Notwithstanding, the ECB is likely to do everything in its power to stop the financial industry from collapsing, which may mean further liquidity provisions, such as the LTRO’s already seen.
All of which should serve to underpin those currencies most correlated with the outlook for economic growth and of countries set to benefit from increases in the price of commodities and precious metals. We believe as central banks continue to follow expansionary, inflationary policies, that those assets exhibiting the greatest monetary sensitivity should benefit – such as commodities, natural resources and precious metals. As such, we favor the currencies of commodity producing nations, such as Australia, Canada and New Zealand. In particular, we do not consider that China will experience too severe a slowdown in economic growth – the recent announcement to expand the trading band of its currency should be seen as a signal that policy makers there believe the risks to the economy have satisfactorily abated. We think Australia and New Zealand are well situated to benefit from ongoing Asian economic strength, while both countries’ fiscal positions are in stark contrast to the U.S. and Europe, for all the right reasons. Canada, too, should benefit from ongoing commodity price appreciation, and is well placed should the U.S. economy continue to pick up steam ahead of consensus forecasts.
In Asia, we continue to favor the currencies of nations who are producing more value-added goods and services while concurrently focusing on the development of the domestic economy as a source of long-term sustainable economic growth. China in particular checks these boxes. We consider building inflationary pressures brought about by increases in global commodities and a tightly managed currency, may ultimately force the Chinese into allowing the currency to float more freely.4 While there have been recent hiccups regarding China’s upcoming leadership transition, the ultimate goal of the Communist Party remains intact: to maintain social stability, so as to remain in power. We believe there are several aspects to this notion, none the least being the support of strong, sustainable economic growth and the containment of inflationary pressures. Regarding the latter: should inflation get out of hand, the risk of social upheaval may become elevated. China’s close management of the dissemination of any news discussing the “Arab Spring” uprisings is indicative of the strength of its resolve in maintaining social stability. One of the contributing factors causing the “Arab Spring” was runaway inflation.
| 3 | Generally speaking, a central banker may be considered a dove if his or her monetary policy stance is perceived to focus more on stimulating employment and economic growth and less on inflation. |
| 4 | Indeed, in early April 2012, China announced it would allow the trading band to widen for the Chinese renminbi. |
| | | | |
| | |
| | | 6 | | |
A MESSAGETOOUR SHAREHOLDERS
MARCH 31, 2012
In China and other Asian nations, allowing the respective currencies to float more freely may act as a natural valve in alleviating the inflationary pressures being experienced. Moreover, we consider China and countries such as Malaysia, Singapore, South Korea and Taiwan to have the pricing power to allow their currencies to appreciate. These countries now produce relatively higher value-added goods and services compared to other Asian nations; therefore we believe they have the ability to pass on price pressures to the end consumer – Western consumers. With a concurrent focus on the development of their domestic economies, we believe Asian nations will eventually be less reliant on exports to the West, with a renewed focus on domestic demand, as well as demand within Asia, as a source of future growth. The result may be stronger Asian currencies over the medium to long-term, while western nations may experience increases in import prices going forward.
Regarding the U.S. dollar, we consider the more dovish FOMC voting member composition to be a negative for the currency, as it will likely lead to more expansionary policies relative to global central bank counterparts. In our view, the aforementioned debt ceiling debacle is just one increment in the ongoing marginal deterioration of the U.S.’s safe haven status; concurrent degradation to the long-term sustainability of the U.S.’s fiscal situation may ultimately erode confidence that the U.S. will honor its future obligations. Importantly, we do not doubt these obligations will be fulfilled, but the manner in which they are likely to be fulfilled gives us grave cause for concern. In our assessment, future obligations are unlikely to be met through much needed austerity measures, either from spending cuts or revenue increases, as neither side of the political aisle has shown a willingness to comprehensively and satisfactorily address the issues. Rather, future obligations are likely to be met through the path of least resistance: inflation. Said another way, devaluation of the currency.
We continue to believe the currency asset class may provide investors with the opportunity to access enhanced risk-adjusted returns and valuable diversification benefits. We are excited about the outlook for the asset class and believe many investment opportunities continue to exist in the space.
We invite you to read more about our Funds and sign up for our periodic newsletter at www.merkfunds.com.
Sincerely,
| | |
 | |  |
| |
Axel G. Merk | | Kieran Osborne, CFA |
President & Chief Investment Officer | | Co-Portfolio Manager |
Portfolio Manager | | Merk Absolute Return Currency Fund |
| | | Merk Currency Enhanced U.S. Equity Fund |
The views in this Report were those of the Fund Managers as of March 31, 2012, and may not reflect the views of the Managers on the date this Report is first published or anytime thereafter. These views are intended to assist shareholders of the Funds in understanding their investments in the Funds and do not constitute investment advice.
Since the Funds primarily invest in foreign currencies, changes in currency exchange rates will affect the value of what the respective Fund owns and the price of the Fund’s shares. Investing in foreign instruments bears a greater risk than investing in domestic instruments for reasons such as volatility of currency exchange rates and, in some cases, limited geographic focus, political and economic instability, and relatively illiquid markets. The Funds are subject to interest rate risk, which is the risk that debt securities in the respective Fund’s portfolio will decline in value because of increases in market interest rates. As a non-diversified fund, the Merk Hard Currency Fund will be subject to more investment risk and potential for volatility than a diversified fund because its portfolio may, at times, focus on a limited number of issuers. The Funds may also invest in derivative securities, which can be volatile and involve various types and degrees of risk.
The JPMorgan 3-Month Global Cash Index tracks total returns of three-month constant maturity euro-currency deposits. The euro-currency deposits are the only short-term securities consistent across all markets in terms of liquidity, maturity and credit quality. The index is unmanaged and includes reinvested distributions. One cannot invest directly in an index, nor is an index representative of the Fund’s portfolio.
JPMorgan does not sponsor, endorse or promote the Merk Hard Currency Fund in connection with any reference to the JPMorgan 3-Month Global Cash Index. JPMorgan makes no representation or warranty, express or implied regarding the advisability of investing in securities generally or in any product particularly or the ability of the JPMorgan 3-Month Global Cash Index to track general bond market performance.
| | | | |
| | |
| | | 7 | | |
A MESSAGETOOUR SHAREHOLDERS
MARCH 31, 2012
The Citigroup 3-Month U.S. T-Bill Index is an unmanaged index representing monthly return equivalents of yield averages of the last 3 month Treasury Bill issues. It is not possible to invest directly in an unmanaged index.
* All returns are relative to the U.S. dollar unless otherwise stated. Returns for the U.S. dollar are calculated using the Dollar Index (DXY). Source for exchange rates listed in this letter: Bloomberg.
| | | | |
| | |
| | | 8 | | |
MERK HARD CURRENCY FUND
PERFORMANCE CHARTAND ANALYSIS (UNAUDITED)
MARCH 31, 2012
The following chart reflects the change in the value of a hypothetical $10,000 investment in Investor Shares, including reinvested dividends and distributions, in the Merk Hard Currency Fund (the “Fund”) compared with the performance of the benchmark, JPMorgan 3-Month Global Cash Index, since inception. The JPMorgan 3-Month Global Cash Index tracks total returns of three-month constant maturity euro-currency deposits. The euro-currency deposits are the only short-term securities consistent across all markets in terms of liquidity, maturity and credit quality. The total return of the JPMorgan 3-Month Global Cash Index includes reinvestment of distributions. The total return of the Fund includes operating expenses that reduce returns, while the total return of the JPMorgan 3-Month Global Cash Index does not include expenses. The Fund is professionally managed while the JPMorgan 3-Month Global Cash Index is unmanaged and is not available for investment, nor is the index representative of the Fund’s portfolio.
Performance data quoted represents past performance and is no guarantee of future results. Current performance may be lower or higher than the performance data quoted. Investment return and principal value will fluctuate so that shares, when redeemed, may be worth more or less than original cost. The performance table and graph do not reflect the deduction of taxes that a shareholder would pay on Fund distributions or the redemption of Fund shares. Returns greater than one year are annualized. For the most recent month-end performance, please call (866) 637-5386 or visit www.merkfunds.com.
Comparison of Change in Value of $10,000 Investment
Merk Hard Currency Fund Investor Shares vs. JPMorgan 3-Month Global Cash Index
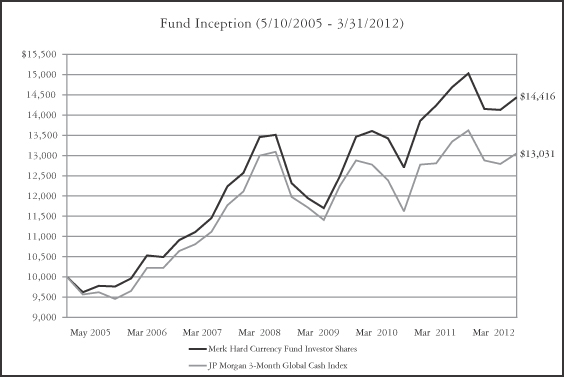
| | | | | | | | | | | | |
Average Annual Total Return as of 03/31/12:
| | One Year
| | | Five Year
| | | Since Inception
(05/10/05)
| |
Merk Hard Currency Fund Investor Shares | | – | 1.68% | | | | 5.37% | | | | 5.45% | |
Merk Hard Currency Fund Institutional Shares* | | – | 1.49% | | | | 5.48% | | | | 5.53% | |
JPMorgan 3-Month Global Cash Index | | – | 2.19% | | | | 3.83% | | | | 3.92% | |
| * | For the Institutional Shares, performance for the above periods are blended average annual returns which include the returns of the Investor Shares prior to April 1, 2010, the commencement of operations of the Institutional Shares. |
| | | | |
| | |
| | | 9 | | |
MERK ASIAN CURRENCY FUND
PERFORMANCE CHARTAND ANALYSIS (UNAUDITED)
MARCH 31, 2012
The following chart reflects the change in the value of a hypothetical $10,000 investment in Investor Shares, including reinvested dividends and distributions, in the Merk Asian Currency Fund (the “Fund”) compared with the performance of the benchmark, Citigroup 3-Month U.S. T-Bill Index, since inception. The Citigroup 3-Month U.S. T-Bill Index measures return equivalents of yield averages that are not marked to market and consists of the last three three-month Treasury bill month-end rates. The total return of the Citigroup 3-Month U.S. T-Bill Index includes reinvestment of distributions. The total return of the Fund includes operating expenses that reduce returns, while the total return of the Citigroup 3-Month U.S. T-Bill Index does not include expenses. The Fund is professionally managed while the Citigroup 3-Month U.S. T-Bill Index is unmanaged and is not available for investment, nor is the index representative of the Fund’s portfolio.
Performance data quoted represents past performance and is no guarantee of future results. Current performance may be lower or higher than the performance data quoted. Investment return and principal value will fluctuate so that shares, when redeemed, may be worth more or less than original cost. The performance table and graph do not reflect the deduction of taxes that a shareholder would pay on Fund distributions or the redemption of Fund shares. Returns greater than one year are annualized. For the most recent month-end performance, please call (866) 637-5386 or visit www.merkfunds.com.
Comparison of Change in Value of $10,000 Investment
Merk Asian Currency Fund Investor Shares vs. Citigroup 3-Month U.S. T-Bill Index
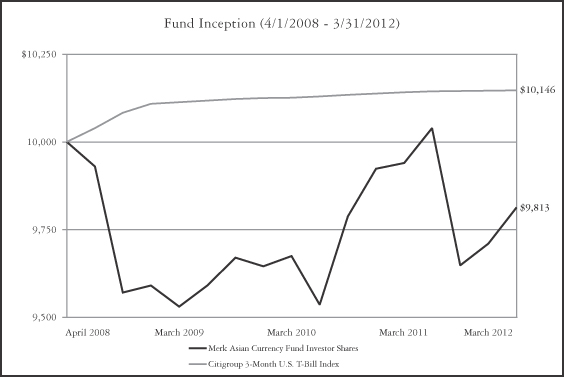
| | | | | | | | |
Average Annual Total Return as of 03/31/12:
| | One Year
| | | Since Inception
(04/01/08)
| |
Merk Asian Currency Fund Investor Shares | | – | 1.28% | | | – | 0.47% | |
Merk Asian Currency Fund Institutional Shares* | | – | 1.01% | | | – | 0.34% | |
Citigroup 3-Month U.S. T-Bill Index** | | | 0.05% | | | | 0.36% | |
| * | For the Institutional Shares, performance for the above periods are blended average annual returns which include the returns of the Investor Shares prior to April 1, 2010, the commencement of operations of the Institutional Shares. |
| ** | Return for the Citigroup 3-Month U.S. T-Bill Index is for the period beginning March 31, 2008. |
| | | | |
| | |
| | | 10 | | |
MERK ABSOLUTE RETURN CURRENCY FUND
PERFORMANCE CHARTAND ANALYSIS (UNAUDITED)
MARCH 31, 2012
The following chart reflects the change in the value of a hypothetical $10,000 investment in Investor Shares, including reinvested dividends and distributions, in the Merk Absolute Return Currency Fund (the “Fund”) compared with the performance of the benchmark, Citigroup 3-Month U.S. T-Bill Index, since inception. The Citigroup 3-Month U.S. T-Bill Index measures return equivalents of yield averages that are not marked to market and consists of the last three three-month Treasury bill month-end rates. The total return of the Citigroup 3-Month U.S. T-Bill Index include reinvestment of distributions. The total return of the Fund includes operating expenses that reduce returns, while the total return of the Citigroup 3-Month U.S. T-Bill Index does not include expenses. The Fund is professionally managed while the Citigroup 3-Month U.S. T-Bill Index is unmanaged and is not available for investment, nor is the index representative of the Fund’s portfolio.
Performance data quoted represents past performance and is no guarantee of future results. Current performance may be lower or higher than the performance data quoted. Investment return and principal value will fluctuate so that shares, when redeemed, may be worth more or less than original cost. The performance table and graph do not reflect the deduction of taxes that a shareholder would pay on Fund distributions or the redemption of Fund shares. Returns greater than one year are annualized. For the most recent month-end performance, please call (866) 637-5386 or visit www.merkfunds.com.
Comparison of Change in Value of $10,000 Investment
Merk Absolute Return Currency Fund Investor Shares vs. Citigroup 3-Month U.S. T-Bill Index
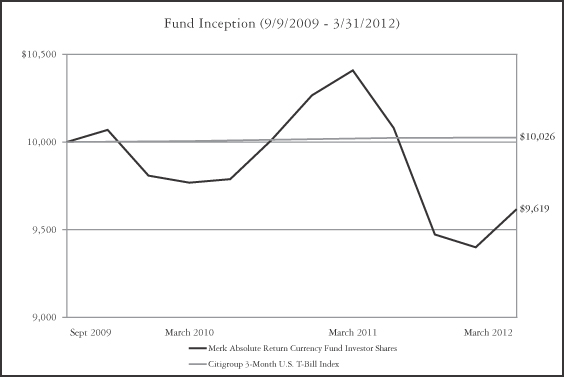
| | | | | | | | |
Average Annual Total Return as of 03/31/12:
| | One Year
| | | Since Inception
(09/09/09)
| |
Merk Absolute Return Currency Fund Investor Shares | | – | 7.57% | | | – | 1.51% | |
Merk Absolute Return Currency Fund Institutional Shares* | | – | 7.41% | | | – | 1.31% | |
Citigroup 3-Month U.S. T-Bill Index** | | | 0.05% | | | | 0.10% | |
| * | For the Institutional Shares, performance for the above periods are blended average annual returns which include the returns of the Investor Shares prior to April 1, 2010, the commencement of operations of the Institutional Shares. |
| ** | Return for the Citigroup 3-Month U.S. T-Bill Index is for the period beginning August 31, 2009. |
| | | | |
| | |
| | | 11 | | |
MERK CURRENCY ENHANCED U.S. EQUITY FUND
PERFORMANCE CHARTAND ANALYSIS (UNAUDITED)
MARCH 31, 2012
The following chart reflects the change in the value of a hypothetical $10,000 investment in Investor Shares, including reinvested dividends and distributions, in the Merk Currency Enhanced U.S. Equity Fund (the “Fund”) compared with the performance of the benchmark, S&P 500 Index (the “S&P 500”), since inception. The S&P 500 is a broad-based, unmanaged measurement of changes in stock market conditions based on the average of 500 widely held common stocks. The total return of the S&P 500 includes reinvestment of distributions. The total return of the Fund includes operating expenses that reduce returns, while the total return of the S&P 500 does not include expenses. The Fund is professionally managed while the S&P 500 is unmanaged and is not available for investment, nor is the index representative of the Fund’s portfolio.
Performance data quoted represents past performance and is no guarantee of future results. Current performance may be lower or higher than the performance data quoted. Investment return and principal value will fluctuate so that shares, when redeemed, may be worth more or less than original cost. The performance table and graph do not reflect the deduction of taxes that a shareholder would pay on Fund distributions or the redemption of Fund shares. Returns greater than one year are annualized. For the most recent month-end performance, please call (866) 637-5386 or visit www.merkfunds.com.
Comparison of Change in Value of $10,000 Investment
Merk Currency Enhanced U.S. Equity Fund Investor Shares vs. S&P 500 Index
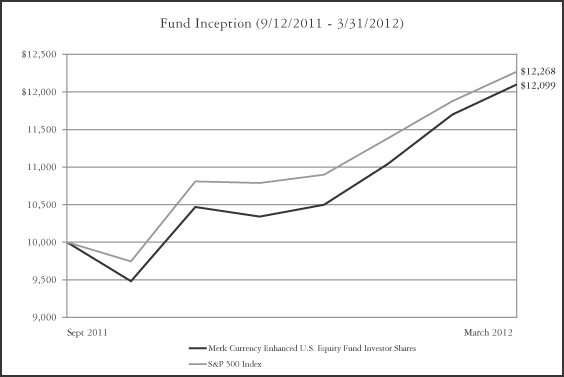
| | | | |
Average Annual Total Return as of 03/31/12:
| | Since Inception
(09/12/11)
| |
Merk Currency Enhanced U.S. Equity Fund Investor Shares | | | 20.99% | |
Merk Currency Enhanced U.S. Equity Fund Institutional Shares | | | 21.28% | |
S&P 500 Index | | | 22.68% | |
| | | | |
| | |
| | | 12 | | |
MERK HARD CURRENCY FUND
SCHEDULEOF INVESTMENTS
MARCH 31, 2012
| | | | | | | | | | | | | | | | |
Principal
| | | Security Description
| | Currency
| | Rate
| | Maturity
| | | Value in USD
| |
| | | | |
| Foreign Bonds (a) - 49.3% | | | | | | | | | | | | |
| | | | |
| Government Agency - Sweden - 2.8% | | | | | | | | | | | | |
| | 100,000,000 | | | Svensk Exportkredit AB (b) | | SEK | | 3.17% | | | 05/20/12 | | | $ | 15,133,914 | |
| | | | | | | | | | | | | | |
|
|
|
| | | | |
| Municipal City - Sweden - 0.5% | | | | | | | | | | | | |
| | 20,000,000 | | | City of Gothenburg EMTN | | SEK | | 3.08 | | | 04/14/12 | | | | 3,023,663 | |
| | | | | | | | | | | | | | |
|
|
|
| | | | |
| Non-U.S. Government - Australia - 3.9% | | | | | | | | | | | | |
| | 20,500,000 | | | Australia Government Bond, Series 123 | | AUD | | 5.75 | | | 04/15/12 | | | | 21,248,267 | |
| | | | | | | | | | | | | | |
|
|
|
| | | | |
| Non-U.S. Government - Denmark - 0.8% | | | | | | | | | | | | |
| | 25,000,000 | | | Denmark Government Bond | | DKK | | 4.00 | | | 11/15/12 | | | | 4,584,533 | |
| | | | | | | | | | | | | | |
|
|
|
| | | | |
| Non-U.S. Government - Finland - 4.9% | | | | | | | | | | | | |
| | 20,000,000 | | | Finland Government Bond | | EUR | | 4.25 | | | 09/15/12 | | | | 27,161,940 | |
| | | | | | | | | | | | | | |
|
|
|
| | | | |
| Non-U.S. Government - New Zealand - 15.0% | | | | | | | | | | | | |
| | 97,200,000 | | | New Zealand Government Bond, Series 413 | | NZD | | 6.50 | | | 04/15/13 | | | | 82,711,832 | |
| | | | | | | | | | | | | | |
|
|
|
| | | | |
| Non-U.S. Government - Singapore - 2.4% | | | | | | | | | | | | |
| | 15,550,000 | | | Singapore Government Bond | | SGD | | 3.63 | | | 07/01/14 | | | | 13,313,202 | |
| | | | | | | | | | | | | | |
|
|
|
| | | | |
| Non-U.S. Government - Sweden - 2.0% | | | | | | | | | | | | |
| | 71,000,000 | | | Sweden Government Bond, Series 1046 | | SEK | | 5.50 | | | 10/08/12 | | | | 10,952,628 | |
| | | | | | | | | | | | | | |
|
|
|
| | | | |
| Non-U.S. Government - Switzerland - 1.8% | | | | | | | | | | | | |
| | 9,000,000 | | | Switzerland Government Bond | | CHF | | 2.75 | | | 06/10/12 | | | | 10,020,688 | |
| | | | | | | | | | | | | | |
|
|
|
| | | | |
| Regional Agency - Australia - 7.9% | | | | | | | | | | | | |
| | 18,000,000 | | | New South Wales Treasury Corp., Series 12 | | AUD | | 6.00 | | | 05/01/12 | | | | 18,671,145 | |
| | 23,800,000 | | | Western Australia Treasury Corp., Series 12 | | AUD | | 5.50 | | | 07/17/12 | | | | 24,742,937 | |
| | | | | | | | | | | | | | |
|
|
|
| | | | | | | | | | | | | | | | 43,414,082 | |
| | | | | | | | | | | | | | |
|
|
|
| | | | |
| Regional Authority - Canada - 6.0% | | | | | | | | | | | | |
| | 11,000,000 | | | Alberta Capital Finance Authority MTN (b) | | CAD | | 1.35 | | | 02/05/13 | | | | 11,048,193 | |
| | 7,000,000 | | | Alberta Capital Finance Authority (b) | | CAD | | 1.67 | | | 07/02/14 | | | | 7,076,355 | |
| | 15,000,000 | | | Province of Manitoba MTN (b) | | CAD | | 1.68 | | | 09/04/12 | | | | 15,075,192 | |
| | | | | | | | | | | | | | |
|
|
|
| | | | | | | | | | | | | | | | 33,199,740 | |
| | | | | | | | | | | | | | |
|
|
|
| | | | |
| Sovereign Agency - Finland - 1.3% | | | | | | | | | | | | |
| | 39,900,000 | | | Municipality Finance PLC Kunta EMTN | | NOK | | 2.75 | | | 09/16/13 | | | | 7,058,294 | |
| | | | | | | | | | | | | | |
|
|
|
| | | | |
| Total Foreign Bonds (Cost $268,274,698) | | | | | | | | | | | 271,822,783 | |
| | | | | | | | | | | | | | |
|
|
|
| | | | |
| Foreign Treasury Securities (a)(c) - 33.7% | | | | | | | | | | | | |
| | | | |
| Central Bank - Singapore - 4.8% | | | | | | | | | | | | |
| | 24,000,000 | | | Monetary Authority of Singapore Bill, Series 31 | | SGD | | 0.28 | | | 04/09/12 | | | | 19,091,031 | |
| | 9,000,000 | | | Monetary Authority of Singapore Bill, Series 28 | | SGD | | 0.20 | | | 04/27/12 | | | | 7,158,620 | |
| | | | | | | | | | | | | | |
|
|
|
| | | | | | | | | | | | | | | | 26,249,651 | |
| | | | | | | | | | | | | | |
|
|
|
| | | | |
| Non-U.S. Government - Canada - 10.5% | | | | | | | | | | | | |
| | 58,000,000 | | | Canadian Treasury Bill | | CAD | | 0.83-0.88 | | | 04/12/12 | | | | 58,132,812 | |
| | | | | | | | | | | | | | |
|
|
|
| | | | |
| | |
See Notes to Financial Statements | | 13 | | |
MERK HARD CURRENCY FUND
SCHEDULEOF INVESTMENTS
MARCH 31, 2012
| | | | | | | | | | | | | | | | |
Principal
| | | Security Description
| | Currency
| | Rate
| | Maturity
| | | Value in USD
| |
| | | | |
| Non-U.S. Government - France - 4.8% | | | | | | | | | | | | |
| | 20,000,000 | | | French Treasury Bill | | EUR | | 0.05% | | | 06/21/12 | | | $ | 26,668,658 | |
| | | | | | | | | | | | | | |
|
|
|
| | | | |
| Non-U.S. Government - Germany - 2.1% | | | | | | | | | | | | |
| | 8,500,000 | | | German Treasury Bill | | EUR | | 0.01 | | | 07/25/12 | | | | 11,339,587 | |
| | | | | | | | | | | | | | |
|
|
|
| | | | |
| Non-U.S. Government - Netherlands - 4.6% | | | | | | | | | | | | |
| | 12,500,000 | | | Dutch Treasury Certificate | | EUR | | 0.06 | | | 05/31/12 | | | | 16,674,663 | |
| | 6,500,000 | | | Dutch Treasury Certificate | | EUR | | 0.02 | | | 06/29/12 | | | | 8,668,562 | |
| | | | | | | | | | | | | | |
|
|
|
| | | | | | | | | | | | | | | | 25,343,225 | |
| | | | | | | | | | | | | | |
|
|
|
| | | | |
| Non-U.S. Government - Norway - 6.9% | | | | | | | | | | | | |
| | 217,000,000 | | | Norwegian Treasury Bill | | NOK | | 1.40-1.63 | | | 06/20/12 | | | | 37,985,241 | |
| | | | | | | | | | | | | | |
|
|
|
| | | | |
| Total Foreign Treasury Securities (Cost $186,383,582) | | | | | | | | | | | 185,719,174 | |
| | | | | | | | | | | | | | |
|
|
|
| | | | |
| Banker’s Acceptance (c) - 4.9% | | | | | | | | | | | | |
| | 27,000,000 | | | Toronto Dominion Bank Ltd., B.A. (Cost $27,245,782) | | CAD | | 1.00 | | | 04/02/12 | | | | 27,068,282 | |
| | | | | | | | | | | | | | |
|
|
|
| | | | | |
Shares
| | | | | | | | | | | | | |
| | | | |
| Exchange Traded Product - 8.3% | | | | | | | | | | | | |
| | 284,000 | | | SPDR Gold Trust (Cost $37,519,058) | | | | | | | | | | | 46,047,760 | |
| | | | | | | | | | | | | | |
|
|
|
| | | | |
| Total Investments - 96.2% (Cost $519,423,120)* | | | | | | | | | | $ | 530,657,999 | |
| | | | | | | | | | | | | | |
|
|
|
| | | | |
| Foreign Currencies - 3.0%: | | | | | | | | | | | | |
| Australian Dollar - 0.0% | | | | | | | | | | | 101,468 | |
| Canadian Dollar - 0.7% | | | | | | | | | | | 3,684,511 | |
| Danish Krone - 0.0% | | | | | | | | | | | 7,534 | |
| Euro - 1.8% | | | | | | | | | | | 9,644,444 | |
| Japanese Yen - 0.0% | | | | | | | | | | | 13,156 | |
| New Zealand Dollar - 0.0% | | | | | | | | | | | 7,289 | |
| Norwegian Krone - 0.2% | | | | | | | | | | | 1,108,246 | |
| Singapore Dollar - 0.3% | | | | | | | | | | | 1,654,613 | |
| Swedish Krona - 0.0% | | | | | | | | | | | 5,303 | |
| Swiss Franc - 0.0% | | | | | | | | | | | 48,954 | |
| | | | | | | | | | | | | | |
|
|
|
| | | | |
| Total Foreign Currencies (Cost $16,252,409) | | | | | | | | | | | 16,275,518 | |
| | | | | | | | | | | | | | |
|
|
|
| | | | |
| Other Assets and Liabilities, Net - 0.8% | | | | | | | | | | | 4,251,428 | |
| | | | | | | | | | | | | | |
|
|
|
| | | | |
| NET ASSETS - 100.0% | | | | | | | | | | $ | 551,184,945 | |
| | | | | | | | | | | | | | |
|
|
|
| (a) | All or portion of these securities are segregated to cover outstanding forward currency contract and future contract exposures. |
| (b) | Variable rate security. Rate presented is as of March 31, 2012. |
| (c) | Rates shown are annualized yields at time of purchase. |
| | |
| EMTN | | European Medium Term Note |
| MTN | | Medium Term Note |
| PLC | | Public Limited Company |
| | | | |
| | |
See Notes to Financial Statements | | 14 | | |
MERK HARD CURRENCY FUND
SCHEDULEOF INVESTMENTS
MARCH 31, 2012
| * | Cost for Federal income tax purposes is $519,281,683 and net unrealized appreciation consists of: |
| | | | |
Gross Unrealized Appreciation | | $ | 15,719,978 | |
Gross Unrealized Depreciation | | | (4,343,662 | ) |
| | |
|
|
|
Net Unrealized Appreciation | | $ | 11,376,316 | |
| | |
|
|
|
As of March 31, 2012, the Merk Hard Currency Fund had the following currency exposures:
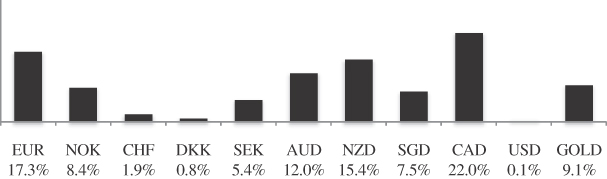
| | |
| AUD | | Australian Dollar |
| CAD | | Canadian Dollar |
| CHF | | Swiss Franc |
| DKK | | Danish Krone |
| EUR | | Euro |
| JPY | | Japanese Yen |
| NOK | | Norwegian Krone |
| NZD | | New Zealand Dollar |
| SEK | | Swedish Krona |
| SGD | | Singapore Dollare |
| USD | | United States Dollar |
As of March 31, 2012, the Merk Hard Currency Fund held the following futures contracts:
| | | | | | | | | | | | | | | | |
Contracts
| | Type
| | | Expiration Date
| | | Notional
Contract Value
| | | Net Unrealized
Depreciation
| |
25 | | | Gold 100 Oz. Future | | | | 06/27/2012 | | | $ | 4,179,750 | | | $ | (6,000 | ) |
| | | | |
| | |
See Notes to Financial Statements | | 15 | | |
MERK HARD CURRENCY FUND
SCHEDULEOF INVESTMENTS
MARCH 31, 2012
The following is a summary of the inputs used to value the Fund’s investments and other financial instruments as of March, 31, 2012:
The inputs or methodology used for valuing securities are not necessarily an indication of the risk associated with investing in those securities. For more information on valuation inputs, and their aggregation into the levels used in the tables below, please refer to the Security Valuation section in Note 2 of the accompanying Notes to Financial Statements.
| | | | | | | | | | | | | | | | |
| | | Level 1
| | | Level 2
| | | Level 3
| | | Total
| |
Assets | | | | | | | | | | | | | | | | |
Investments at Value: | | | | | | | | | | | | | | | | |
Foreign Bonds | | $ | - | | | $ | 271,822,783 | | | $ | - | | | $ | 271,822,783 | |
Foreign Treasury Securities | | | - | | | | 185,719,174 | | | | - | | | | 185,719,174 | |
Banker’s Acceptance | | | - | | | | 27,068,282 | | | | | | | | 27,068,282 | |
Exchange Traded Product | | | 46,047,760 | | | | - | | | | - | | | | 46,047,760 | |
| | |
|
|
| |
|
|
| |
|
|
| |
|
|
|
Total Investments at Value | | $ | 46,047,760 | | | $ | 484,610,239 | | | $ | - | | | $ | 530,657,999 | |
| | |
|
|
| |
|
|
| |
|
|
| |
|
|
|
Total Assets | | $ | 46,047,760 | | | $ | 484,610,239 | | | $ | - | | | $ | 530,657,999 | |
| | |
|
|
| |
|
|
| |
|
|
| |
|
|
|
Liabilities | | | | | | | | | | | | | | | | |
Other Financial Instruments**: | | | | | | | | | | | | | | | | |
Futures | | | (6,000 | ) | | | - | | | | - | | | | (6,000 | ) |
| | |
|
|
| |
|
|
| |
|
|
| |
|
|
|
Total Liabilities | | $ | (6,000 | ) | | $ | - | | | $ | - | | | $ | (6,000 | ) |
| | |
|
|
| |
|
|
| |
|
|
| |
|
|
|
| ** | Other Financial Instruments include derivative instruments not reflected in the Schedule of Investments, such as futures which are valued at the unrealized appreciation (depreciation) of the instrument. |
There were no significant transfers between Level 1 and Level 2 for the year ended March 31, 2012.
PORTFOLIO HOLDINGS
% of Net Assets
| | | | |
Foreign Bonds | | | 49.3% | |
Foreign Treasury Securities | | | 33.7% | |
Banker’s Acceptance | | | 4.9% | |
Exchange Traded Product | | | 8.3% | |
Foreign Currencies | | | 3.0% | |
Other Assets and Liabilities, Net | | | 0.8% | |
| | |
|
|
|
Total | | | 100.0% | |
| | |
|
|
|
| | | | |
| | |
See Notes to Financial Statements | | 16 | | |
MERK ASIAN CURRENCY FUND
SCHEDULEOF INVESTMENTS
MARCH 31, 2012
| | | | | | | | | | | | | | | | |
Principal
| | | Security Description
| | | | Rate
| | Maturity
| | | Value in USD
| |
| | | | |
| U.S. Treasury Bills (a)(b) - 93.8% | | | | | | | | | | | | |
| $ | 5,700,000 | | | U.S. Treasury Bill | | | | 0.07% | | | 07/26/12 | | | $ | 5,698,546 | |
| | 20,500,000 | | | U.S. Treasury Bill | | | | 0.10 | | | 08/23/12 | | | | 20,490,427 | |
| | 8,500,000 | | | U.S. Treasury Bill | | | | 0.08 | | | 09/20/12 | | | | 8,494,653 | |
| | 20,000,000 | | | U.S. Treasury Bill | | | | 0.11 | | | 10/18/12 | | | | 19,985,920 | |
| | 15,000,000 | | | U.S. Treasury Bill | | | | 0.10 | | | 11/15/12 | | | | 14,987,955 | |
| | 11,500,000 | | | U.S. Treasury Bill | | | | 0.11 | | | 12/13/12 | | | | 11,489,018 | |
| | 7,500,000 | | | U.S. Treasury Bill | | | | 0.11-0.15 | | | 01/10/13 | | | | 7,490,722 | |
| | | | | | | | | | | | | | |
|
|
|
| | | | |
| Total U.S. Treasury Bills (Cost $88,650,382) | | | | | | | | | | | 88,637,241 | |
| | | | | | | | | | | | | | |
|
|
|
| | | | |
| Time Deposits (a)(b) - 4.5% | | | | | | | | | | | | |
| | 27,016,875 | | | CNH Barclays Bank PLC (Cost $ 4,280,579) | | | | 0.90 | | | 04/23/12 | | | | 4,278,207 | |
| | | | | | | | | | | | | | |
|
|
|
| | | | |
| Total Investments - 98.3% Cost ($92,930,961)* | | | | | | | | | | $ | 92,915,448 | |
| | | | | | | | | | | | | | |
|
|
|
| | | | |
| Net Unrealized Gain on Forward Currency Contracts - 0.3% | | | | | | | | | | | 323,115 | |
| | | | |
| Other Assets and Liabilities, Net - 1.4% | | | | | | | | | | | 1,331,969 | |
| | | | | | | | | | | | | | |
|
|
|
| | | | |
| NET ASSETS - 100.0% | | | | | | | | | | $ | 94,570,532 | |
| | | | | | | | | | | | | | |
|
|
|
| (a) | All or a portion of these securities are segregated to cover outstanding forward currency contract exposure. |
| (b) | Rates shown are annualized yields at time of purchase. |
| | |
PLC | | Public Limited Company |
| * | Cost for Federal income tax purposes is $92,930,961 and net unrealized depreciation consists of: |
| | | | |
Gross Unrealized Appreciation | | $ | - | |
Gross Unrealized Depreciation | | | (15,513 | ) |
| | |
|
|
|
Net Unrealized Depreciation | | $ | (15,513 | ) |
| | |
|
|
|
As of March 31, 2012, the Merk Asian Currency Fund had the following currency exposures:
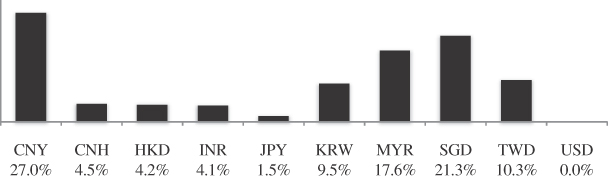
| | | | |
| | |
See Notes to Financial Statements | | 17 | | |
MERK ASIAN CURRENCY FUND
SCHEDULEOF INVESTMENTS
MARCH 31, 2012
| | |
| CNH | | Chinese Renminbi - Offshore |
| CNY | | Chinese Renminbi - Onshore |
| HKD | | Hong Kong Dollar |
| INR | | Indian Rupee |
| JPY | | Japanese Yen |
| KRW | | South Korean Won |
| MYR | | Malaysian Ringgit |
| SGD | | Singapore Dollar |
| TWD | | New Taiwan Dollar |
| USD | | United States Dollar |
As of March 31, 2012, the Merk Asian Currency Fund had the following forward currency contracts outstanding:
| | | | | | | | | | | | | | | | | | | | |
Contracts to Purchase (Sell)
| | Contract
Value
| | | Settlement
Date
| | | Unrealized
Gain
| | | Unrealized
(Loss)
| |
| | 21,800,000 | | | Chinese Renminbi | | $ | 3,454,834 | | | | 04/18/12 | | | $ | 5,594 | | | $ | - | |
| | 28,000,000 | | | Chinese Renminbi | | | 4,436,698 | | | | 04/18/12 | | | | 7,888 | | | | - | |
| | 35,000,000 | | | Chinese Renminbi | | | 5,552,911 | | | | 04/18/12 | | | | 2,821 | | | | - | |
| | 6,200,000 | | | Hong Kong Dollar | | | 798,434 | | | | 04/18/12 | | | | 23 | | | | - | |
| | 139,000,000 | | | Indian Rupee | | | 2,641,581 | | | | 04/18/12 | | | | 75,285 | | | | - | |
| | 4,650,000 | | | Malaysian Ringgit | | | 1,472,451 | | | | 04/18/12 | | | | 43,448 | | | | - | |
| | 55,000,000 | | | New Taiwan Dollar | | | 1,858,736 | | | | 04/18/12 | | | | 4,906 | | | | - | |
| | 5,740,000 | | | Singapore Dollar | | | 4,453,562 | | | | 04/18/12 | | | | 112,750 | | | | - | |
| | 2,000,000,000 | | | South Korean Won | | | 1,718,213 | | | | 04/18/12 | | | | 44,463 | | | | - | |
| | 7,000,000 | | | Chinese Renminbi | | | 1,113,001 | | | | 05/23/12 | | | | - | | | | (2,540 | ) |
| | 28,200,000 | | | Malaysian Ringgit | | | 9,261,692 | | | | 05/23/12 | | | | - | | | | (91,008 | ) |
| | 10,800,000 | | | Singapore Dollar | | | 8,559,425 | | | | 05/23/12 | | | | 32,743 | | | | - | |
| | 3,300,000,000 | | | South Korean Won | | | 2,919,631 | | | | 05/23/12 | | | | - | | | | (18,924 | ) |
| | 13,000,000 | | | Chinese Renminbi | | | 2,048,535 | | | | 06/20/12 | | | | 13,027 | | | | - | |
| | 23,200,000 | | | Chinese Renminbi | | | 3,661,212 | | | | 06/20/12 | | | | 17,883 | | | | - | |
| | 32,800,000 | | | Chinese Renminbi | | | 5,172,686 | | | | 06/20/12 | | | | 28,792 | | | | - | |
| | (4,300,000) | | | Hong Kong Dollar | | | (553,974 | ) | | | 06/20/12 | | | | 52 | | | | - | |
| | 29,300,000 | | | Hong Kong Dollar | | | 3,776,282 | | | | 06/20/12 | | | | - | | | | (1,885 | ) |
| | 59,000,000 | | | Indian Rupee | | | 1,152,794 | | | | 06/20/12 | | | | - | | | | (14,597 | ) |
| | (120,000,000) | | | Japanese Yen | | | (1,431,105 | ) | | | 06/20/12 | | | | - | | | | (19,780 | ) |
| | 239,000,000 | | | Japanese Yen | | | 2,854,549 | | | | 06/20/12 | | | | 35,129 | | | | - | |
| | 8,900,000 | | | Malaysian Ringgit | | | 2,892,146 | | | | 06/20/12 | | | | - | | | | (2,435 | ) |
| | 9,400,000 | | | Malaysian Ringgit | | | 3,055,321 | | | | 06/20/12 | | | | - | | | | (3,267 | ) |
| | 78,000,000 | | | New Taiwan Dollar | | | 2,643,620 | | | | 06/20/12 | | | | 1,008 | | | | - | |
| | 153,800,000 | | | New Taiwan Dollar | | | 5,210,027 | | | | 06/20/12 | | | | 4,637 | | | | - | |
| | 600,000 | | | Singapore Dollar | | | 477,761 | | | | 06/20/12 | | | | - | | | | (353 | ) |
| | 8,200,000 | | | Singapore Dollar | | | 6,465,985 | | | | 06/20/12 | | | | 58,595 | | | | - | |
| | 2,000,000,000 | | | South Korean Won | | | 1,760,749 | | | | 06/20/12 | | | | - | | | | (5,985 | ) |
| | 2,900,000,000 | | | South Korean Won | | | 2,549,563 | | | | 06/20/12 | | | | - | | | | (5,155 | ) |
| | | | | | | | | | | | | | |
|
|
| |
|
|
|
| Unrealized gain (loss) on forward currency
contracts | | | | | | | | | | $ | 489,044 | | | $ | (165,929 | ) |
| | | | | | | | | | | | | | |
|
|
| |
|
|
|
| | | | |
| | |
See Notes to Financial Statements | | 18 | | |
MERK ASIAN CURRENCY FUND
SCHEDULEOF INVESTMENTS
MARCH 31, 2012
The following is a summary of the inputs used to value the Fund’s investments and other financial instruments as of March, 31, 2012:
The inputs or methodology used for valuing securities are not necessarily an indication of the risk associated with investing in those securities. For more information on valuation inputs, and their aggregation into the levels used in the tables below, please refer to the Security Valuation section in Note 2 of the accompanying Notes to Financial Statements.
| | | | | | | | |
Valuation Inputs
| | Investments in
Securities
| | | Other
Financial
Instruments**
| |
Level 1 – Quoted Prices | | $ | - | | | $ | - | |
Level 2 – Other Significant Observable Inputs | | | 92,915,448 | | | | 323,115 | |
Level 3 – Significant Unobservable Inputs | | | - | | | | - | |
| | |
|
|
| |
|
|
|
Total Investments | | $ | 92,915,448 | | | $ | 323,115 | |
| | |
|
|
| |
|
|
|
| ** | Other Financial Instruments include derivatives not reflected in the Schedule of Investments, such as forward currency contracts, which are valued at the unrealized appreciation (depreciation) on the instrument. |
The Level 2 inputs in the Investments in Securities column displayed in this table are U.S. Treasury Bills and Time Deposits. Refer to the Schedule of Investments for a further breakout of each security by type.
There were no significant transfers between Level 1 and Level 2 for the year ended March 31, 2012.
PORTFOLIO HOLDINGS
% of Net Assets
| | | | |
U.S. Treasury Bills | | | 93.8% | |
Time Deposits | | | 4.5% | |
Net Unrealized Gain on Forward Currency Contracts | | | 0.3% | |
Other Assets and Liabilities, Net | | | 1.4% | |
| | |
|
|
|
Total | | | 100.0% | |
| | |
|
|
|
| | | | |
| | |
See Notes to Financial Statements | | 19 | | |
MERK ABSOLUTE RETURN CURRENCY FUND
SCHEDULEOF INVESTMENTS
MARCH 31, 2012
| | | | | | | | | | | | | | | | |
Principal
| | | Security Description
| | | | Rate
| | Maturity
| | | Value in USD
| |
| | | | |
| U.S. Treasury Bills (a) (b) - 99.0% | | | | | | | | | | | | |
| $ | 1,500,000 | | | U.S. Treasury Bill | | | | 0.07% | | | 7/26/2012 | | | $ | 1,499,617 | |
| | 2,500,000 | | | U.S. Treasury Bill | | | | 0.10 | | | 8/23/2012 | | | | 2,498,832 | |
| | 7,500,000 | | | U.S. Treasury Bill | | | | 0.08 | | | 9/20/2012 | | | | 7,495,283 | |
| | 5,500,000 | | | U.S. Treasury Bill | | | | 0.11 | | | 10/18/2012 | | | | 5,496,128 | |
| | 4,000,000 | | | U.S. Treasury Bill | | | | 0.11 | | | 11/15/2012 | | | | 3,996,788 | |
| | 4,000,000 | | | U.S. Treasury Bill | | | | 0.11 | | | 12/13/2012 | | | | 3,996,180 | |
| | | | | | | | | | | | | | |
|
|
|
| | | | |
| Total U.S. Treasury Bills (Cost $24,986,684) | | | | | | | | | | | 24,982,828 | |
| | | | | | | | | | | | | | |
|
|
|
| | | | |
| Total Investments - 99.0% Cost ($24,986,684)* | | | | | | | | | | $ | 24,982,828 | |
| | | | | | | | | | | | | | |
|
|
|
| | | | |
| Net Unrealized Gain on Forward Currency Contracts - 0.6% | | | | | | | | | | | 141,772 | |
| | | | |
| Other Assets and Liabilities, Net - 0.4% | | | | | | | | | | | 115,279 | |
| | | | | | | | | | | | | | |
|
|
|
| | | | |
| NET ASSETS - 100.0% | | | | | | | | | | $ | 25,239,879 | |
| | | | | | | | | | | | | | |
|
|
|
| (a) | All or a portion of these securities are segregated to cover outstanding forward currency contract exposure. |
| (b) | Rates shown are annualized yields at time of purchase. |
| * | Cost for Federal income tax purposes is $24,986,684 and net unrealized depreciation consists of: |
| | | | |
Gross Unrealized Appreciation | | $ | - | |
Gross Unrealized Depreciation | | | (3,856 | ) |
| | |
|
|
|
Net Unrealized Depreciation | | $ | (3,856 | ) |
| | |
|
|
|
As of March 31, 2012, the Merk Absolute Return Currency Fund had the following currency exposures:
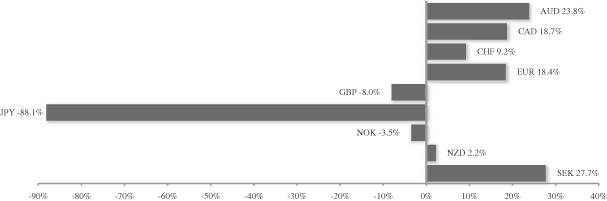
| | |
| AUD | | Australian Dollar |
| CAD | | Canadian Dollar |
| CHF | | Swiss Franc |
| EUR | | Euro |
| GBP | | Pound Sterling |
| JPY | | Japanese Yen |
| NOK | | Norwegian Krone |
| NZD | | New Zealand Dollar |
| SEK | | Swedish Krona |
| | | | |
| | |
See Notes to Financial Statements | | 20 | | |
MERK ABSOLUTE RETURN CURRENCY FUND
SCHEDULEOF INVESTMENTS
MARCH 31, 2012
As of March 31, 2012, the Merk Absolute Return Currency Fund had the following forward currency contracts outstanding:
| | | | | | | | | | | | | | | | | | | | |
Contracts to Purchase (Sell)
| | Contract
Value
| | | Settlement
Date
| | | Unrealized
Gain
| | | Unrealized
(Loss)
| |
| | 50,000 | | | Australian Dollar | | $ | 52,037 | | | | 04/18/12 | | | $ | - | | | $ | (350 | ) |
| | 720,000 | | | Australian Dollar | | | 752,886 | | | | 04/18/12 | | | | - | | | | (8,590 | ) |
| | 5,050,000 | | | Australian Dollar | | | 5,227,417 | | | | 04/18/12 | | | | - | | | | (7,009 | ) |
| | (1,175,000) | | | British Pound Sterling | | | (1,878,957 | ) | | | 04/18/12 | | | | - | | | | (237 | ) |
| | (80,000) | | | British Pound Sterling | | | (125,147 | ) | | | 04/18/12 | | | | - | | | | (2,798 | ) |
| | (3,960,000) | | | Canadian Dollar | | | (3,967,002 | ) | | | 04/18/12 | | | | - | | | | (1,714 | ) |
| | (60,000) | | | Canadian Dollar | | | (60,399 | ) | | | 04/18/12 | | | | 267 | | | | - | |
| | 60,000 | | | Canadian Dollar | | | 60,408 | | | | 04/18/12 | | | | - | | | | (276 | ) |
| | 90,000 | | | Canadian Dollar | | | 90,711 | | | | 04/18/12 | | | | - | | | | (512 | ) |
| | 8,590,000 | | | Canadian Dollar | | | 8,631,162 | | | | 04/18/12 | | | | - | | | | (22,256 | ) |
| | 40,000 | | | Euro | | | 52,120 | | | | 04/18/12 | | | | 1,232 | | | | - | |
| | 1,390,000 | | | Euro | | | 1,853,622 | | | | 04/18/12 | | | | 363 | | | | - | |
| | 2,060,000 | | | Euro | | | 2,687,960 | | | | 04/18/12 | | | | 59,672 | | | | - | |
| | (1,185,000,000) | | | Japanese Yen | | | (14,241,248 | ) | | | 04/18/12 | | | | - | | | | (77,937 | ) |
| | (644,000,000) | | | Japanese Yen | | | (7,817,270 | ) | | | 04/18/12 | | | | 35,367 | | | | - | |
| | (13,000,000) | | | Japanese Yen | | | (155,401 | ) | | | 04/18/12 | | | | - | | | | (1,688 | ) |
| | (6,000,000) | | | Japanese Yen | | | (73,028 | ) | | | 04/18/12 | | | | 526 | | | | - | |
| | 7,000,000 | | | Japanese Yen | | | 83,783 | | | | 04/18/12 | | | | 802 | | | | - | |
| | (1,750,000) | | | New Zealand Dollar | | | (1,434,948 | ) | | | 04/18/12 | | | | 3,780 | | | | - | |
| | 2,430,000 | | | New Zealand Dollar | | | 1,977,383 | | | | 04/18/12 | | | | 9,895 | | | | - | |
| | (45,250,000) | | | Norwegian Krone | | | (7,928,206 | ) | | | 04/18/12 | | | | - | | | | (12,231 | ) |
| | 200,000 | | | Norwegian Krone | | | 35,047 | | | | 04/18/12 | | | | 49 | | | | - | |
| | 400,000 | | | Norwegian Krone | | | 68,700 | | | | 04/18/12 | | | | 1,492 | | | | - | |
| | 39,600,000 | | | Norwegian Krone | | | 6,831,829 | | | | 04/18/12 | | | | 117,151 | | | | - | |
| | 450,000 | | | Swedish Krona | | | 65,673 | | | | 04/18/12 | | | | 2,295 | | | | - | |
| | 18,550,000 | | | Swedish Krona | | | 2,797,642 | | | | 04/18/12 | | | | 4,179 | | | | - | |
| | 27,300,000 | | | Swedish Krona | | | 3,993,305 | | | | 04/18/12 | | | | 130,130 | | | | - | |
| | (3,090,000) | | | Swiss Franc | | | (3,336,061 | ) | | | 04/18/12 | | | | - | | | | (87,731 | ) |
| | (60,000) | | | Swiss Franc | | | (64,440 | ) | | | 04/18/12 | | | | - | | | | (2,041 | ) |
| | 5,240,000 | | | Swiss Franc | | | 5,806,101 | | | | 04/18/12 | | | | - | | | | (58 | ) |
| | | | | | | | | | | | | | |
|
|
| |
|
|
|
| Unrealized gain (loss) on forward currency
contracts | | | | | | | | | | $ | 367,200 | | | $ | (225,428 | ) |
| | | | | | | | | | | | | | |
|
|
| |
|
|
|
The following is a summary of the inputs used to value the Fund’s investments and other financial instruments as of March, 31, 2012:
The inputs or methodology used for valuing securities are not necessarily an indication of the risk associated with investing in those securities. For more information on valuation inputs, and their aggregation into the levels used in the tables below, please refer to the Security Valuation section in Note 2 of the accompanying Notes to Financial Statements.
| | | | | | | | |
Valuation Inputs
| | Investments in
Securities
| | | Other
Financial
Instruments**
| |
Level 1 – Quoted Prices | | $ | - | | | $ | - | |
Level 2 – Other Significant Observable Inputs | | | 24,982,828 | | | | 141,772 | |
Level 3 – Significant Unobservable Inputs | | | - | | | | - | |
| | |
|
|
| |
|
|
|
Total Investments | | $ | 24,982,828 | | | $ | 141,772 | |
| | |
|
|
| |
|
|
|
| ** | Other Financial Instruments include derivative instruments not reflected in the Scheduled of Investments, such as forward currency contracts, which are valued at the unrealized appreciation (depreciation) on the instrument. |
| | | | |
| | |
See Notes to Financial Statements | | 21 | | |
MERK ABSOLUTE RETURN CURRENCY FUND
SCHEDULEOF INVESTMENTS
MARCH 31, 2012
The Level 2 inputs in the Investments in Securities column displayed in this table are U.S. Treasury Bills. Refer to the Schedule of Investments for a further breakout of each security by type.
There were no significant transfers between Level 1 and Level 2 for the year ended March 31, 2012.
PORTFOLIO HOLDINGS
% of Net Assets
| | | | |
U.S. Treasury Bills | | | 99.0% | |
Net Unrealized Gain on Forward Currency Contracts | | | 0.6% | |
Other Assets and Liabilities, Net | | | 0.4% | |
| | |
|
|
|
Total | | | 100.0% | |
| | |
|
|
|
| | | | |
| | |
See Notes to Financial Statements | | 22 | | |
MERK CURRENCY ENHANCED U.S. EQUITY FUND
SCHEDULEOF INVESTMENTS
MARCH 31, 2012
| | | | | | | | | | | | | | |
Shares
| | | Security Description
| | | | | | | | Value in USD
| |
| | | | |
| Exchange Traded Product (a) - 96.3% | | | | | | | | | | |
| | 15,550 | | | SPDR S&P 500 ETF Trust (Cost $1,922,370) | | | | | | | | $ | 2,188,197 | |
| | | | | | | | | | | | |
|
|
|
| | | | |
| Total Investments - 96.3% Cost ($1,922,370)* | | | | | | | | $ | 2,188,197 | |
| | | | | | | | | | | | |
|
|
|
| | | | |
| Net Unrealized Gain on Forward Currency Contracts - 0.6% | | | | | | | | $ | 12,622 | |
| | | | | | | | | | | | |
|
|
|
| | | | |
| Other Assets and Liabilities, Net - 3.1% | | | | | | | | | 70,949 | |
| | | | | | | | | | | | |
|
|
|
| | | | |
| NET ASSETS - 100.0% | | | | | | | | $ | 2,271,768 | |
| | | | | | | | | | | | |
|
|
|
| (a) | All or a portion of these securities are segregated to cover outstanding forward currency contract exposure. |
| * | Cost for Federal income tax purposes is $1,922,370 and net unrealized appreciation consists of: |
| | | | |
Gross Unrealized Appreciation | | $ | 265,853 | |
Gross Unrealized Depreciation | | | (26 | ) |
| | |
|
|
|
Net Unrealized Appreciation | | $ | 265,827 | |
| | |
|
|
|
As of March 31, 2012, the Merk Currency Enhanced U.S. Equity Fund held the following futures contracts:
| | | | | | | | | | | | | | | | |
Contracts
| | Type
| | | Expiration Date
| | | Notional
Contract Value
| | | Net Unrealized
Appreciation
| |
1 | | | E-mini S&P 500 Future | | | | 06/15/2012 | | | $ | 66,955 | | | $ | 3,208 | |
| | | | |
| | |
See Notes to Financial Statements | | 23 | | |
MERK CURRENCY ENHANCED U.S. EQUITY FUND
SCHEDULEOF INVESTMENTS
MARCH 31, 2012
As of March 31, 2012, the Merk Currency Enhanced U.S. Equity Fund had the following forward currency contracts outstanding:
| | | | | | | | | | | | | | | | | | | | |
Contracts to Purchase (Sell)
| | Contract
Value
| | | Settlement
Date
| | | Unrealized
Gain
| | | Unrealized
(Loss)
| |
| | 5,000 | | | Australian Dollar | | | 5,204 | | | | 04/18/12 | | | $ | - | | | $ | (35 | ) |
| | 60,000 | | | Australian Dollar | | | 62,741 | | | | 04/18/12 | | | | - | | | | (716 | ) |
| | 450,000 | | | Australian Dollar | | | 465,809 | | | | 04/18/12 | | | | - | | | | (625 | ) |
| | (320,000) | | | Canadian Dollar | | | (320,566 | ) | | | 04/18/12 | | | | - | | | | (138 | ) |
| | 30,000 | | | Canadian Dollar | | | 30,237 | | | | 04/18/12 | | | | - | | | | (171 | ) |
| | 40,000 | | | Canadian Dollar | | | 40,272 | | | | 04/18/12 | | | | - | | | | (184 | ) |
| | 670,000 | | | Canadian Dollar | | | 673,211 | | | | 04/18/12 | | | | - | | | | (1,736 | ) |
| | (240,000) | | | Swiss Franc | | | (259,112 | ) | | | 04/18/12 | | | | - | | | | (6,814 | ) |
| | (30,000) | | | Swiss Franc | | | (32,220 | ) | | | 04/18/12 | | | | - | | | | (1,020 | ) |
| | 460,000 | | | Swiss Franc | | | 509,696 | | | | 04/18/12 | | | | - | | | | (5 | ) |
| | 20,000 | | | Euro | | | 26,060 | | | | 04/18/12 | | | | 615 | | | | - | |
| | 130,000 | | | Euro | | | 173,360 | | | | 04/18/12 | | | | 34 | | | | - | |
| | 160,000 | | | Euro | | | 208,774 | | | | 04/18/12 | | | | 4,635 | | | | - | |
| | (105,000) | | | British Pound Sterling | | | (167,907 | ) | | | 04/18/12 | | | | - | | | | (21 | ) |
| | (5,000) | | | British Pound Sterling | | | (7,822 | ) | | | 04/18/12 | | | | - | | | | (175 | ) |
| | (92,000,000) | | | Japanese Yen | | | (1,105,650 | ) | | | 04/18/12 | | | | - | | | | (6,051 | ) |
| | (62,000,000) | | | Japanese Yen | | | (752,594 | ) | | | 04/18/12 | | | | 3,405 | | | | - | |
| | (5,000,000) | | | Japanese Yen | | | (59,769 | ) | | | 04/18/12 | | | | - | | | | (649 | ) |
| | (4,000,000) | | | Japanese Yen | | | (49,109 | ) | | | 04/18/12 | | | | 775 | | | | - | |
| | (1,000,000) | | | Japanese Yen | | | (12,171 | ) | | | 04/18/12 | | | | 88 | | | | - | |
| | (3,850,000) | | | Norwegian Krone | | | (674,555 | ) | | | 04/18/12 | | | | - | | | | (1,041 | ) |
| | 100,000 | | | Norwegian Krone | | | 17,175 | | | | 04/18/12 | | | | 373 | | | | - | |
| | 200,000 | | | Norwegian Krone | | | 35,047 | | | | 04/18/12 | | | | 49 | | | | - | |
| | 3,100,000 | | | Norwegian Krone | | | 534,815 | | | | 04/18/12 | | | | 9,171 | | | | - | |
| | (150,000) | | | New Zealand Dollar | | | (122,996 | ) | | | 04/18/12 | | | | 324 | | | | - | |
| | 210,000 | | | New Zealand Dollar | | | 170,885 | | | | 04/18/12 | | | | 855 | | | | - | |
| | 250,000 | | | Swedish Krona | | | 36,485 | | | | 04/18/12 | | | | 1,275 | | | | - | |
| | 1,750,000 | | | Swedish Krona | | | 263,928 | | | | 04/18/12 | | | | 394 | | | | - | |
| | 2,100,000 | | | Swedish Krona | | | 307,177 | | | | 04/18/12 | | | | 10,010 | | | | - | |
| | | | | | | | | | | | | | |
|
|
| |
|
|
|
| Unrealized gain (loss) on forward currency
contracts | | | | | | | | | | $ | 32,003 | | | $ | (19,381 | ) |
| | | | | | | | | | | | | | |
|
|
| |
|
|
|
The following is a summary of the inputs used to value the Fund’s investments and other financial instruments as of March, 31, 2012:
The inputs or methodology used for valuing securities are not necessarily an indication of the risk associated with investing in those securities. For more information on valuation inputs, and their aggregation into the levels used in the tables below, please refer to the Security Valuation section in Note 2 of the accompanying Notes to Financial Statements.
| | | | | | | | |
Valuation Inputs
| | Investments in
Securities
| | | Other
Financial
Instruments**
| |
Level 1 – Quoted Prices | | $ | 2,188,197 | | | $ | 3,208 | |
Level 2 – Other Significant Observable Inputs | | | - | | | | 12,622 | |
Level 3 – Significant Unobservable Inputs | | | - | | | | - | |
| | |
|
|
| |
|
|
|
Total Investments | | $ | 2,188,197 | | | $ | 15,830 | |
| | |
|
|
| |
|
|
|
| ** | Other Financial Instruments include derivative instruments not reflected in the Schedule of Investments, such as futures and forward currency contracts which are valued at the unrealized appreciation (depreciation) of the instrument. |
| | | | |
| | |
See Notes to Financial Statements | | 24 | | |
MERK CURRENCY ENHANCED U.S. EQUITY FUND
SCHEDULEOF INVESTMENTS
MARCH 31, 2012
The Level 1 inputs in the Investments in Securities column displayed in this table are Exchange Traded Products. Refer to the Schedule of Investments for a further breakout of each security by type.
There were no significant transfers between Level 1 and Level 2 for the year ended March 31, 2012.
PORTFOLIO HOLDINGS
% of Net Assets
| | | | |
Exchange Traded Product | | | 96.3% | |
Net Unrealized Gain on Forward Currency Contracts | | | 0.6% | |
Other Assets and Liabilities, Net | | | 3.1% | |
| | |
|
|
|
Total | | | 100.0% | |
| | |
|
|
|
| | | | |
| | |
See Notes to Financial Statements | | 25 | | |
STATEMENTSOF ASSETSAND LIABILITIES
MARCH 31, 2012
| | | | | | | | | | | | | | | | |
| | | Merk Hard
Currency
Fund
| | | Merk Asian
Currency
Fund
| | | Merk Absolute
Return
Currency
Fund
| | | Merk Currency
Enhanced U.S.
Equity
Fund
| |
ASSETS | | | | | | | | | | | | | | | | |
Investments: | | | | | | | | | | | | | | | | |
Total investments, at cost | | $ | 519,423,120 | | | $ | 92,930,961 | | | $ | 24,986,684 | | | $ | 1,922,370 | |
Net unrealized appreciation (depreciation) | | | 11,234,879 | | | | (15,513 | ) | | | (3,856 | ) | | | 265,827 | |
| | |
|
|
| |
|
|
| |
|
|
| |
|
|
|
Total investments, at value | | | 530,657,999 | | | | 92,915,448 | | | | 24,982,828 | | | | 2,188,197 | |
Foreign currency (Cost $16,252,409, $0, $0, and $0, respectively) | | | 16,275,518 | | | | - | | | | - | | | | - | |
Cash | | | 2,507,141 | | | | 915,638 | | | | 264,766 | | | | 158,368 | |
Unrealized gain on forward currency contracts | | | - | | | | 489,044 | | | | 367,200 | | | | 32,003 | |
Receivables: | | | | | | | | | | | | | | | | |
Fund shares sold | | | 785,139 | | | | 572,401 | | | | 2,127 | | | | 1,750 | |
Investment securities sold | | | 5,181,010 | | | | - | | | | - | | | | - | |
Interest and dividends | | | 5,596,554 | | | | 999 | | | | 4 | | | | 9,119 | |
Variation margin | | | 42,500 | | | | - | | | | - | | | | 250 | |
| | |
|
|
| |
|
|
| |
|
|
| |
|
|
|
Total Assets | | | 561,045,861 | | | | 94,893,530 | | | | 25,616,925 | | | | 2,389,687 | |
| | |
|
|
| |
|
|
| |
|
|
| |
|
|
|
| | | | |
LIABILITIES | | | | | | | | | | | | | | | | |
Unrealized loss on forward currency contracts | | | - | | | | 165,929 | | | | 225,428 | | | | 19,381 | |
Payables: | | | | | | | | | | | | | | | | |
Investment securities purchased | | | 8,668,701 | | | | - | | | | - | | | | 98,230 | |
Fund shares redeemed | | | 624,297 | | | | 75,938 | | | | 133,473 | | | | - | |
Accrued liabilities: | | | | | | | | | | | | | | | | |
Investment adviser fees | | | 442,924 | | | | 63,260 | | | | 12,894 | | | | - | |
Distribution fees | | | 101,109 | | | | 13,868 | | | | 4,181 | | | | 73 | |
Other expenses | | | 23,885 | | | | 4,003 | | | | 1,070 | | | | 235 | |
| | |
|
|
| |
|
|
| |
|
|
| |
|
|
|
Total Liabilities | | | 9,860,916 | | | | 322,998 | | | | 377,046 | | | | 117,919 | |
| | |
|
|
| |
|
|
| |
|
|
| |
|
|
|
| | | | |
NET ASSETS | | $ | 551,184,945 | | | $ | 94,570,532 | | | $ | 25,239,879 | | | $ | 2,271,768 | |
| | |
|
|
| |
|
|
| |
|
|
| |
|
|
|
| | | | |
COMPONENTS OF NET ASSETS | | | | | | | | | | | | | | | | |
Paid-in capital | | $ | 548,836,285 | | | $ | 95,613,237 | | | $ | 25,243,735 | | | $ | 1,965,922 | |
Undistributed (distributions in excess of) net investment income | | | (12,409,153 | ) | | | (1,349,918 | ) | | | (141,772 | ) | | | 3,841 | |
Accumulated net realized gain (loss) | | | 3,503,123 | | | | (389 | ) | | | - | | | | 20,348 | |
Net unrealized appreciation (depreciation) | | | 11,254,690 | | | | 307,602 | | | | 137,916 | | | | 281,657 | |
| | |
|
|
| |
|
|
| |
|
|
| |
|
|
|
| | | | |
NET ASSETS | | $ | 551,184,945 | | | $ | 94,570,532 | | | $ | 25,239,879 | | | $ | 2,271,768 | |
| | |
|
|
| |
|
|
| |
|
|
| |
|
|
|
| | | | |
SHARES OF BENEFICIAL INTEREST AT NO PAR VALUE
(unlimited shares authorized) | | | | | | | | | | | | | | | | |
Investor Shares | | | 38,883,465 | | | | 6,790,031 | | | | 2,098,583 | | | | 39,853 | |
Institutional Shares | | | 6,892,340 | | | | 3,135,280 | | | | 594,079 | | | | 150,899 | |
| | | | |
NET ASSET VALUE, OFFERING AND REDEMPTION PRICE PER SHARE | | | | | | | | | | | | | | | | |
Investor Shares (based on net assets of $468,130,321, $64,666,512, $19,661,924 and $473,828, respectively) | | $ | 12.04 | | | $ | 9.52 | | | $ | 9.37 | | | $ | 11.89 | |
Institutional Shares (based on net assets of $83,054,624, $29,904,020, $5,577,955 and $1,797,940, respectively) | | $ | 12.05 | | | $ | 9.54 | | | $ | 9.39 | | | $ | 11.91 | |
| | | | |
| | |
See Notes to Financial Statements | | 26 | | |
STATEMENTSOF OPERATIONS
FISCAL PERIODS ENDED MARCH 31, 2012
| | | | | | | | | | | | | | | | |
| | | Merk Hard
Currency
Fund
| | | Merk Asian
Currency
Fund
| | | Merk Absolute
Return Currency
Fund
| | | Merk Currency
Enhanced U.S.
Equity
Fund*
| |
INVESTMENT INCOME | | | | | | | | | | | | | | | | |
Dividend income | | $ | - | | | $ | - | | | $ | - | | | $ | 22,814 | |
Interest income | | | 8,457,647 | | | | 124,247 | | | | 36,132 | | | | 28 | |
Less: foreign taxes withheld | | | (756,272 | ) | | | - | | | | - | | | | - | |
| | |
|
|
| |
|
|
| |
|
|
| |
|
|
|
Total Investment Income | | | 7,701,375 | | | | 124,247 | | | | 36,132 | | | | 22,842 | |
| | |
|
|
| |
|
|
| |
|
|
| |
|
|
|
| | | | |
EXPENSES | | | | | | | | | | | | | | | | |
Investment adviser fees | | | 5,948,961 | | | | 1,050,870 | | | | 306,123 | | | | 6,269 | |
Interest expense | | | 694 | | | | 100 | | | | - | | | | - | |
Distribution fees | | | | | | | | | | | | | | | | |
Investor Shares | | | 1,215,530 | | | | 200,232 | | | | 61,461 | | | | 261 | |
Transfer agency fees | | | | | | | | | | | | | | | | |
Investor Shares | | | 243,111 | | | | 40,047 | | | | 12,293 | | | | - | |
Institutional Shares | | | 54,342 | | | | 12,497 | | | | 3,014 | | | | - | |
Operating expense | | | - | | | | - | | | | - | | | | 2,874 | |
| | |
|
|
| |
|
|
| |
|
|
| |
|
|
|
Total Expenses | | | 7,462,638 | | | | 1,303,746 | | | | 382,891 | | | | 9,404 | |
| | |
|
|
| |
|
|
| |
|
|
| |
|
|
|
| | | | |
NET INVESTMENT INCOME (LOSS) | | | 238,737 | | | | (1,179,499 | ) | | | (346,759 | ) | | | 13,438 | |
| | |
|
|
| |
|
|
| |
|
|
| |
|
|
|
| | | | |
NET REALIZED AND UNREALIZED GAIN (LOSS) | | | | | | | | | | | | | | | | |
Net realized gain (loss) on: | | | | | | | | | | | | | | | | |
Investments | | | (4,193,517 | ) | | | (9,092 | ) | | | 691 | | | | - | |
Futures | | | 512,054 | | | | - | | | | - | | | | 39,043 | |
Foreign currency transactions | | | 3,780,417 | | | | (681,131 | ) | | | (2,720,187 | ) | | | 3,909 | |
| | |
|
|
| |
|
|
| |
|
|
| |
|
|
|
Net Realized Gain (Loss) | | | 98,954 | | | | (690,223 | ) | | | (2,719,496 | ) | | | 42,952 | |
| | |
|
|
| |
|
|
| |
|
|
| |
|
|
|
Net change in unrealized appreciation (depreciation) on: | | | | | | | | | | | | | | | | |
Investments | | | (21,626,243 | ) | | | (30,417 | ) | | | (7,266 | ) | | | 265,827 | |
Futures | | | (6,000 | ) | | | - | | | | - | | | | 3,208 | |
Foreign currency translations | | | (101,264 | ) | | | 208,130 | | | | 335,918 | | | | 12,622 | |
| | |
|
|
| |
|
|
| |
|
|
| |
|
|
|
Net Change in Unrealized Appreciation (Depreciation) | | | (21,733,507 | ) | | | 177,713 | | | | 328,652 | | | | 281,657 | |
| | |
|
|
| |
|
|
| |
|
|
| |
|
|
|
| | | | |
NET REALIZED AND UNREALIZED GAIN (LOSS) | | | (21,634,553 | ) | | | (512,510 | ) | | | (2,390,844 | ) | | | 324,609 | |
| | |
|
|
| |
|
|
| |
|
|
| |
|
|
|
| | | | |
INCREASE (DECREASE) IN NET ASSETS FROM OPERATIONS | | $ | (21,395,816 | ) | | $ | (1,692,009 | ) | | $ | (2,737,603 | ) | | $ | 338,047 | |
| | |
|
|
| |
|
|
| |
|
|
| |
|
|
|
| * | Merk Currency Enhanced U.S. Equity Fund commenced operations on September 12, 2011. |
| | | | |
| | |
See Notes to Financial Statements | | 27 | | |
STATEMENTSOF CHANGES IN NET ASSETS
| | | | | | | | |
| | | Merk Hard
Currency Fund
| |
| | | For the
Year Ended
March 31, 2012
| | | For the
Year Ended
March 31, 2011
| |
OPERATIONS | | | | | | | | |
Net investment income (loss) | | $ | 238,737 | | | $ | 473,691 | |
Net realized gain (loss) | | | 98,954 | | | | 11,521,569 | |
Net change in unrealized appreciation (depreciation) on investments | | | (21,733,507 | ) | | | 22,072,913 | |
| | |
|
|
| |
|
|
|
Increase (Decrease) in Net Assets Resulting from Operations | | | (21,395,816 | ) | | | 34,068,173 | |
| | |
|
|
| |
|
|
|
| | |
DISTRIBUTIONS TO SHAREHOLDERS FROM | | | | | | | | |
Net investment income | | | | | | | | |
Investor Shares | | | (5,725,313 | ) | | | (3,535,041 | ) |
Institutional Shares | | | (1,577,232 | ) | | | (834,244 | ) |
Net realized gain on investments | | | | | | | | |
Investor Shares | | | (7,233,266 | ) | | | (3,937,681 | ) |
Institutional Shares | | | (1,675,716 | ) | | | (524,947 | ) |
| | |
|
|
| |
|
|
|
Total Distributions to Shareholders | | | (16,211,527 | ) | | | (8,831,913 | ) |
| | |
|
|
| |
|
|
|
| | |
CAPITAL SHARE TRANSACTIONS | | | | | | | | |
Sale of shares | | | | | | | | |
Investor Shares | | | 439,231,868 | | | | 173,788,333 | |
Institutional Shares | | | 90,170,772 | | | | 103,652,527 | |
Reinvestment of distributions | | | | | | | | |
Investor Shares | | | 12,088,848 | | | | 7,102,999 | |
Institutional Shares | | | 2,303,429 | | | | 901,939 | |
Redemption of shares | | | | | | | | |
Investor Shares | | | (330,818,037 | ) | | | (260,299,219 | ) |
Institutional Shares | | | (97,351,743 | ) | | | (14,602,287 | ) |
| | |
|
|
| |
|
|
|
Increase (Decrease) in Net Assets from Capital Share Transactions | | | 115,625,137 | | | | 10,544,292 | |
| | |
|
|
| |
|
|
|
Increase (Decrease) in Net Assets | | | 78,017,794 | | | | 35,780,552 | |
| | |
NET ASSETS | | | | | | | | |
Beginning of Period | | | 473,167,151 | | | | 437,386,599 | |
| | |
|
|
| |
|
|
|
End of Period (a) | | $ | 551,184,945 | | | $ | 473,167,151 | |
| | |
|
|
| |
|
|
|
| | |
SHARE TRANSACTIONS | | | | | | | | |
Sale of shares | | | | | | | | |
Investor Shares | | | 34,560,188 | | | | 14,540,682 | |
Institutional Shares | | | 7,165,154 | | | | 8,676,158 | |
Reinvestment of distributions | | | | | | | | |
Investor Shares | | | 1,015,036 | | | | 602,948 | |
Institutional Shares | | | 193,631 | | | | 75,873 | |
Redemption of shares | | | | | | | | |
Investor Shares | | | (26,755,965 | ) | | | (22,311,586 | ) |
Institutional Shares | | | (8,004,573 | ) | | | (1,213,903 | ) |
| | |
|
|
| |
|
|
|
Increase (Decrease) from Capital Share Transactions | | | 8,173,471 | | | | 370,172 | |
| | |
|
|
| |
|
|
|
(a) Amount includes undistributed (distributions in excess of) net investment income | | $ | (12,409,153 | ) | | $ | 2,103,876 | |
| | |
|
|
| |
|
|
|
| * | Merk Currency Enhanced U.S. Equity Fund commenced operations on September 12, 2011. |
| | | | |
| | |
See Notes to Financial Statements | | 28 | | |
| | | | | | | | | | | | | | | | | | | | |
| | | Merk Asian
Currency Fund
| | | Merk Absolute Return
Currency Fund
| | | Merk Currency
Enhanced
U.S. Equity Fund
| |
| | | For the
Year Ended
March 31, 2012
| | | For the
Year Ended
March 31, 2011
| | | For the
Year Ended
March 31, 2012
| | | For the
Year Ended
March 31, 2011
| | | For the
Period Ended
March 31, 2012*
| |
| | | | | | | | | | | | | | | | | | | | | |
| | | $ | (1,179,499 | ) | | $ | (893,364 | ) | | $ | (346,759 | ) | | $ | (230,799 | ) | | $ | 13,438 | |
| | | | (690,223 | ) | | | 3,145,488 | | | | (2,719,496 | ) | | | 1,205,901 | | | | 42,952 | |
| | | | 177,713 | | | | (69,802 | ) | | | 328,652 | | | | 288,520 | | | | 281,657 | |
| | |
|
|
| |
|
|
| |
|
|
| |
|
|
| |
|
|
|
| | | | (1,692,009 | ) | | | 2,182,322 | | | | (2,737,603 | ) | | | 1,263,622 | | | | 338,047 | |
| | |
|
|
| |
|
|
| |
|
|
| |
|
|
| |
|
|
|
| | | | | |
| | | | | | | | | | | | | | | | | | | | | |
| | | | | | | | | | | | | | | | | | | | | |
| | | | (894,324 | ) | | | (1,210,598 | ) | | | (362,095 | ) | | | (319,608 | ) | | | (2,764 | ) |
| | | | (228,002 | ) | | | (350,001 | ) | | | (85,428 | ) | | | (70,167 | ) | | | (10,811 | ) |
| | | | | | | | | | | | | | | | | | | | | |
| | | | - | | | | (561 | ) | | | - | | | | (696 | ) | | | (1,865 | ) |
| | | | - | | | | (137 | ) | | | - | | | | (106 | ) | | | (16,830 | ) |
| | |
|
|
| |
|
|
| |
|
|
| |
|
|
| |
|
|
|
| | | | (1,122,326 | ) | | | (1,561,297 | ) | | | (447,523 | ) | | | (390,577 | ) | | | (32,270 | ) |
| | |
|
|
| |
|
|
| |
|
|
| |
|
|
| |
|
|
|
| | | | | |
| | | | | | | | | | | | | | | | | | | | | |
| | | | | | | | | | | | | | | | | | | | | |
| | | | 26,643,648 | | | | 48,577,021 | | | | 12,793,009 | | | | 18,671,361 | | | | 444,054 | |
| | | | 18,405,436 | | | | 25,420,662 | | | | 3,597,299 | | | | 5,982,410 | | | | 1,500,000 | |
| | | | | | | | | | | | | | | | | | | | | |
| | | | 817,516 | | | | 1,133,691 | | | | 344,360 | | | | 306,871 | | | | 4,066 | |
| | | | 225,453 | | | | 346,826 | | | | 71,172 | | | | 52,975 | | | | 27,641 | |
| | | | | | | | | | | | | | | | | | | | | |
| | | | (43,228,365 | ) | | | (41,962,491 | ) | | | (15,471,498 | ) | | | (17,769,598 | ) | | | (9,770 | ) |
| | | | (11,024,436 | ) | | | (3,063,868 | ) | | | (2,291,063 | ) | | | (1,278,450 | ) | | | - | |
| | |
|
|
| |
|
|
| |
|
|
| |
|
|
| |
|
|
|
| | | | (8,160,748 | ) | | | 30,451,841 | | | | (956,721 | ) | | | 5,965,569 | | | | 1,965,991 | |
| | |
|
|
| |
|
|
| |
|
|
| |
|
|
| |
|
|
|
| | | | (10,975,083 | ) | | | 31,072,866 | | | | (4,141,847 | ) | | | 6,838,614 | | | | 2,271,768 | |
| | | | | |
| | | | | | | | | | | | | | | | | | | | | |
| | | | 105,545,615 | | | | 74,472,749 | | | | 29,381,726 | | | | 22,543,112 | | | | - | |
| | |
|
|
| |
|
|
| |
|
|
| |
|
|
| |
|
|
|
| | | $ | 94,570,532 | | | $ | 105,545,615 | | | $ | 25,239,879 | | | $ | 29,381,726 | | | $ | 2,271,768 | |
| | |
|
|
| |
|
|
| |
|
|
| |
|
|
| |
|
|
|
| | | | | |
| | | | | | | | | | | | | | | | | | | | | |
| | | | | | | | | | | | | | | | | | | | | |
| | | | 2,734,941 | | | | 5,001,552 | | | | 1,293,230 | | | | 1,848,264 | | | | 40,471 | |
| | | | 1,910,460 | | | | 2,625,028 | | | | 364,580 | | | | 591,098 | | | | 148,309 | |
| | | | | | | | | | | | | | | | | | | | | |
| | | | 84,141 | | | | 116,467 | | | | 34,960 | | | | 29,939 | | | | 373 | |
| | | | 23,243 | | | | 35,655 | | | | 7,226 | | | | 5,168 | | | | 2,590 | |
| | | | | | | | | | | | | | | | | | | | | |
| | | | (4,519,375 | ) | | | (4,361,553 | ) | | | (1,621,091 | ) | | | (1,794,387 | ) | | | (991 | ) |
| | | | (1,143,555 | ) | | | (315,551 | ) | | | (246,097 | ) | | | (127,896 | ) | | | - | |
| | |
|
|
| |
|
|
| |
|
|
| |
|
|
| |
|
|
|
| | | | (910,145 | ) | | | 3,101,598 | | | | (167,192 | ) | | | 552,186 | | | | 190,752 | |
| | |
|
|
| |
|
|
| |
|
|
| |
|
|
| |
|
|
|
| | | $ | (1,349,918 | ) | | $ | 999,616 | | | $ | (141,772 | ) | | $ | 641,651 | | | $ | 3,841 | |
| | |
|
|
| |
|
|
| |
|
|
| |
|
|
| |
|
|
|
| | | | |
| | |
See Notes to Financial Statements | | 29 | | |
FINANCIAL HIGHLIGHTS
These financial highlights reflect selected data for a share outstanding throughout each period.
| | | | | | | | | | | | | | | | | | | | |
| | | For the Years Ended March 31,
| |
| | | 2012
| | | 2011
| | | 2010
| | | 2009
| | | 2008
| |
MERK HARD CURRENCY FUND | | | | | | | | | | | | | | | | | | | | |
INVESTOR SHARES | | | | | | | | | | | | | | | | | | | | |
NET ASSET VALUE, Beginning of Year | | $ | 12.58 | | | $ | 11.75 | | | $ | 10.42 | | | $ | 12.16 | | | $ | 10.72 | |
| | |
|
|
| |
|
|
| |
|
|
| |
|
|
| |
|
|
|
INVESTMENT OPERATIONS | | | | | | | | | | | | | | | | | | | | |
Net investment income (loss) (a) | | | - | | | | 0.01 | | | | (0.01 | ) | | | 0.15 | | | | 0.28 | |
Net realized and unrealized gain (loss) | | | (0.22 | ) | | | 1.07 | | | | 1.55 | | | | (1.71 | ) | | | 1.92 | |
| | |
|
|
| |
|
|
| |
|
|
| |
|
|
| |
|
|
|
Total from Investment Operations | | | (0.22 | ) | | | 1.08 | | | | 1.54 | | | | (1.56 | ) | | | 2.20 | |
| | |
|
|
| |
|
|
| |
|
|
| |
|
|
| |
|
|
|
DISTRIBUTIONS TO SHAREHOLDERS FROM | | | | | | | | | | | | | | | | | | | | |
Net investment income | | | (0.15 | ) | | | (0.12 | ) | | | (0.14 | ) | | | (0.10 | ) | | | (0.73 | ) |
Net realized gain | | | (0.17 | ) | | | (0.13 | ) | | | (0.07 | ) | | | (0.08 | ) | | | (0.03 | ) |
| | |
|
|
| |
|
|
| |
|
|
| |
|
|
| |
|
|
|
Total Distributions | | | (0.32 | ) | | | (0.25 | ) | | | (0.21 | ) | | | (0.18 | ) | | | (0.76 | ) |
| | |
|
|
| |
|
|
| |
|
|
| |
|
|
| |
|
|
|
NET ASSET VALUE, End of Year | | $ | 12.04 | | | $ | 12.58 | | | $ | 11.75 | | | $ | 10.42 | | | $ | 12.16 | |
| | |
|
|
| |
|
|
| |
|
|
| |
|
|
| |
|
|
|
TOTAL RETURN | | | (1.68)% | | | | 9.39% | | | | 14.70% | | | | (13.01)% | | | | 21.02% | |
RATIO/SUPPLEMENTARY DATA | | | | | | | | | | | | | | | | | | | | |
Net Assets at End of Year (000’s omitted) | | $ | 468,130 | | | $ | 378,289 | | | $ | 437,387 | | | $ | 268,097 | | | $ | 402,816 | |
Ratios to Average Net Assets: | | | | | | | | | | | | | | | | | | | | |
Net expenses | | | 1.30% | | | | 1.30% | | | | 1.30% | | | | 1.31% | | | | 1.30% | |
Gross expenses | | | 1.30% | | | | 1.30% | | | | 1.30% | | | | 1.32% | (b) | | | 1.31% | (b) |
Net investment income (loss) | | | (0.01)% | | | | 0.09% | | | | (0.12)% | | | | 1.36% | | | | 2.40% | |
PORTFOLIO TURNOVER RATE (c) | | | 94% | | | | 49% | | | | 15% | | | | 27% | | | | 51% | |
| | | | | |
| | | For the Year
Ended
March 31, 2012
| | | April 1, 2010 (d)
through
March 31, 2011
| | | | | | | | | | |
INSTITUTIONAL SHARES | | | | | | | | | | | | | | | | | | | | |
NET ASSET VALUE, Beginning of Period | | $ | 12.59 | | | $ | 11.81 | | | | | | | | | | | | | |
| | |
|
|
| |
|
|
| | | | | | | | | | | | |
INVESTMENT OPERATIONS | | | | | | | | | | | | | | | | | | | | |
Net investment income (a) | | | 0.03 | | | | 0.05 | | | | | | | | | | | | | |
Net realized and unrealized gain (loss) | | | (0.23 | ) | | | 1.01 | | | | | | | | | | | | | |
| | |
|
|
| |
|
|
| | | | | | | | | | | | |
Total from Investment Operations | | | (0.20 | ) | | | 1.06 | | | | | | | | | | | | �� | |
| | |
|
|
| |
|
|
| | | | | | | | | | | | |
DISTRIBUTIONS TO SHAREHOLDERS FROM | | | | | | | | | | | | | | | | | | | | |
Net investment income | | | (0.17 | ) | | | (0.15 | ) | | | | | | | | | | | | |
Net realized gain | | | (0.17 | ) | | | (0.13 | ) | | | | | | | | | | | | |
| | |
|
|
| |
|
|
| | | | | | | | | | | | |
Total Distributions | | | (0.34 | ) | | | (0.28 | ) | | | | | | | | | | | | |
| | |
|
|
| |
|
|
| | | | | | | | | | | | |
NET ASSET VALUE, End of Period | | $ | 12.05 | | | $ | 12.59 | | | | | | | | | | | | | |
| | |
|
|
| |
|
|
| | | | | | | | | | | | |
TOTAL RETURN | | | (1.49)% | | | | 9.21% | (e) | | | | | | | | | | | | |
RATIO/SUPPLEMENTARY DATA | | | | | | | | | | | | | | | | | | | | |
Net Assets at End of Period (000’s omitted) | | $ | 83,055 | | | $ | 94,878 | | | | | | | | | | | | | |
Ratios to Average Net Assets: | | | | | | | | | | | | | | | | | | | | |
Net expenses | | | 1.05% | | | | 1.05% | (f) | | | | | | | | | | | | |
Gross expenses | | | 1.05% | | | | 1.05% | (f) | | | | | | | | | | | | |
Net investment income | | | 0.26% | | | | 0.35% | (f) | | | | | | | | | | | | |
PORTFOLIO TURNOVER RATE (c) | | | 94% | | | | 49% | | | | | | | | | | | | | |
| (a) | Calculated based on average shares outstanding during the period. |
| (b) | Reflects the expense ratio excluding any waivers and/or reimbursements. |
| (c) | The portfolio turnover rate is calculated without regard to any securities whose maturities or expiration dates at the time of acquisition were one year or less. |
| (d) | Commencement of operations. |
| | | | |
| | |
See Notes to Financial Statements | | 30 | | |
FINANCIAL HIGHLIGHTS
These financial highlights reflect selected data for a share outstanding throughout each period.
| | | | | | | | | | | | | | | | |
| | | For the Years Ended March 31,
| | | April 1, 2008 (a)
through
March 31, 2009
| |
| | | 2012
| | | 2011
| | | 2010
| | |
MERK ASIAN CURRENCY FUND | | | | | | | | | | | | | | | | |
INVESTOR SHARES | | | | | | | | | | | | | | | | |
NET ASSET VALUE, Beginning of Period | | $ | 9.74 | | | $ | 9.63 | | | $ | 9.53 | | | $ | 10.00 | |
| | |
|
|
| |
|
|
| |
|
|
| |
|
|
|
INVESTMENT OPERATIONS | | | | | | | | | | | | | | | | |
Net investment income (loss) (b) | | | (0.11 | ) | | | (0.11 | ) | | | (0.10 | ) | | | 0.01 | |
Net realized and unrealized gain (loss) | | | (0.01 | ) | | | 0.37 | | | | 0.24 | | | | (0.48 | ) |
| | |
|
|
| |
|
|
| |
|
|
| |
|
|
|
Total from Investment Operations | | | (0.12 | ) | | | 0.26 | | | | 0.14 | | | | (0.47 | ) |
| | |
|
|
| |
|
|
| |
|
|
| |
|
|
|
DISTRIBUTIONS TO SHAREHOLDERS FROM | | | | | | | | | | | | | | | | |
Net investment income | | | (0.10 | ) | | | (0.15 | ) | | | (0.04 | ) | | | - | |
Net realized gain | | | - | | | | - | (c) | | | - | (c) | | | - | |
| | |
|
|
| |
|
|
| |
|
|
| |
|
|
|
Total Distributions | | | (0.10 | ) | | | (0.15 | ) | | | (0.04 | ) | | | - | |
| | |
|
|
| |
|
|
| |
|
|
| |
|
|
|
NET ASSET VALUE, End of Period | | $ | 9.52 | | | $ | 9.74 | | | $ | 9.63 | | | $ | 9.53 | |
| | |
|
|
| |
|
|
| |
|
|
| |
|
|
|
TOTAL RETURN | | | (1.28)% | | | | 2.74% | | | | 1.51% | | | | (4.70)% | (d) |
RATIO/SUPPLEMENTARY DATA | | | | | | | | | | | | | | | | |
Net Assets at End of Period (000’s omitted) | | $ | 64,667 | | | $ | 82,711 | | | $ | 74,473 | | | $ | 47,810 | |
Ratios to Average Net Assets: | | | | | | | | | | | | | | | | |
Net expenses | | | 1.30% | | | | 1.30% | | | | 1.30% | | | | 1.30% | (e) |
Gross expenses | | | 1.30% | | | | 1.30% | | | | 1.30% | | | | 1.30% | (e)(f) |
Net investment income (loss) | | | (1.18)% | | | | (1.12)% | | | | (1.03)% | | | | 0.16% | (e) |
PORTFOLIO TURNOVER RATE (g) | | | 0% | | | | 0% | | | | 0% | | | | 0% | (d) |
| | | | |
| | | For the Year
Ended
March 31, 2012
| | | April 1, 2010 (a)
through
March 31, 2011
| | | | | | | |
INSTITUTIONAL SHARES | | | | | | | | | | | | | | | | |
NET ASSET VALUE, Beginning of Period | | $ | 9.74 | | | $ | 9.63 | | | | | | | | | |
| | |
|
|
| |
|
|
| | | | | | | | |
INVESTMENT OPERATIONS | | | | | | | | | | | | | | | | |
Net investment loss (b) | | | (0.09 | ) | | | (0.08 | ) | | | | | | | | |
Net realized and unrealized gain (loss) | | | (0.01 | ) | | | 0.37 | | | | | | | | | |
| | |
|
|
| |
|
|
| | | | | | | | |
Total from Investment Operations | | | (0.10 | ) | | | 0.29 | | | | | | | | | |
| | |
|
|
| |
|
|
| | | | | | | | |
DISTRIBUTIONS TO SHAREHOLDERS FROM | | | | | | | | | | | | | | | | |
Net investment income | | | (0.10 | ) | | | (0.18 | ) | | | | | | | | |
Net realized gain | | | - | | | | - | (c) | | | | | | | | |
| | |
|
|
| |
|
|
| | | | | | | | |
Total Distributions | | | (0.10 | ) | | | (0.18 | ) | | | | | | | | |
| | |
|
|
| |
|
|
| | | | | | | | |
NET ASSET VALUE, End of Period | | $ | 9.54 | | | $ | 9.74 | | | | | | | | | |
| | |
|
|
| |
|
|
| | | | | | | | |
TOTAL RETURN | | | (1.01)% | | | | 3.00% | (d) | | | | | | | | |
RATIO/SUPPLEMENTARY DATA | | | | | | | | | | | | | | | | |
Net Assets at End of Period (000’s omitted) | | $ | 29,904 | | | $ | 22,835 | | | | | | | | | |
Ratios to Average Net Assets: | | | | | | | | | | | | | | | | |
Net expenses | | | 1.05% | | | | 1.05% | (e) | | | | | | | | |
Gross expenses | | | 1.05% | | | | 1.05% | (e) | | | | | | | | |
Net investment loss | | | (0.94)% | | | | (0.86)% | (e) | | | | | | | | |
PORTFOLIO TURNOVER RATE (g) | | | 0% | | | | 0% | | | | | | | | | |
| (a) | Commencement of operations. |
| (b) | Calculated based on average shares outstanding during the period. |
| (c) | Less than $0.01 per share. |
| (f) | Reflects the expense ratio excluding any waivers and/or reimbursements. |
| (g) | The portfolio turnover rate is calculated without regard to any securities whose maturities or expiration dates at the time of acquisition were one year or less. |
| | | | |
| | |
See Notes to Financial Statements | | 31 | | |
FINANCIAL HIGHLIGHTS
These financial highlights reflect selected data for a share outstanding throughout each period.
| | | | | | | | | | | | |
| | | For the Years Ended March 31,
| | | September 9, 2009 (a)
through
March 31, 2010
| |
| | | 2012
| | | 2011
| | |
MERK ABSOLUTE RETURN CURRENCY FUND | | | | | | | | | | | | |
INVESTOR SHARES | | | | | | | | | | | | |
NET ASSET VALUE, Beginning of Period | | $ | 10.27 | | | $ | 9.77 | | | $ | 10.00 | |
| | |
|
|
| |
|
|
| |
|
|
|
INVESTMENT OPERATIONS | | | | | | | | | | | | |
Net investment loss (b) | | | (0.11 | ) | | | (0.11 | ) | | | (0.06 | ) |
Net realized and unrealized gain (loss) | | | (0.66 | ) | | | 0.75 | | | | (0.17 | ) |
| | |
|
|
| |
|
|
| |
|
|
|
Total from Investment Operations | | | (0.77 | ) | | | 0.64 | | | | (0.23 | ) |
| | |
|
|
| |
|
|
| |
|
|
|
DISTRIBUTIONS TO SHAREHOLDERS FROM | | | | | | | | | | | | |
Net investment income | | | (0.13 | ) | | | (0.14 | ) | | | - | |
Net realized gain | | | - | | | | - | (c) | | | - | |
| | |
|
|
| |
|
|
| |
|
|
|
Total Distributions | | | (0.13 | ) | | | (0.14 | ) | | | 0.00 | |
| | |
|
|
| |
|
|
| |
|
|
|
NET ASSET VALUE, End of Period | | $ | 9.37 | | | $ | 10.27 | | | $ | 9.77 | |
| | |
|
|
| |
|
|
| |
|
|
|
TOTAL RETURN | | | (7.57)% | | | | 6.52% | | | | (2.30)% | (d) |
RATIO/SUPPLEMENTARY DATA | | | | | | | | | | | | |
Net Assets at End of Period (000’s omitted) | | $ | 19,662 | | | $ | 24,568 | | | $ | 22,543 | |
Ratios to Average Net Assets: | | | | | | | | | | | | |
Net expenses | | | 1.30% | | | | 1.30% | | | | 1.30% | (e) |
Gross expenses | | | 1.30% | | | | 1.30% | | | | 1.30% | (e) |
Net investment loss | | | (1.18)% | | | | (1.11)% | | | | (1.16)% | (e) |
PORTFOLIO TURNOVER RATE (f) | | | 0% | | | | 0% | | | | 0% | (d) |
| | | |
| | | For the Year
Ended
March 31, 2012
| | | April 1, 2010 (a)
through
March 31, 2011
| | | | |
INSTITUTIONAL SHARES | | | | | | | | | | | | |
NET ASSET VALUE, Beginning of Period | | $ | 10.28 | | | $ | 9.82 | | | | | |
| | |
|
|
| |
|
|
| | | | |
INVESTMENT OPERATIONS | | | | | | | | | | | | |
Net investment loss (b) | | | (0.09 | ) | | | (0.09 | ) | | | | |
Net realized and unrealized gain (loss) | | | (0.67 | ) | | | 0.71 | | | | | |
| | |
|
|
| |
|
|
| | | | |
Total from Investment Operations | | | (0.76 | ) | | | 0.62 | | | | | |
| | |
|
|
| |
|
|
| | | | |
DISTRIBUTIONS TO SHAREHOLDERS FROM | | | | | | | | | | | | |
Net investment income | | | (0.13 | ) | | | (0.16 | ) | | | | |
Net realized gain | | | - | | | | - | (c) | | | | |
| | |
|
|
| |
|
|
| | | | |
Total Distributions | | | (0.13 | ) | | | (0.16 | ) | | | | |
| | |
|
|
| |
|
|
| | | | |
NET ASSET VALUE, End of Period | | $ | 9.39 | | | $ | 10.28 | | | | | |
| | |
|
|
| |
|
|
| | | | |
TOTAL RETURN | | | (7.41)% | | | | 6.33% | (d) | | | | |
RATIO/SUPPLEMENTARY DATA | | | | | | | | | | | | |
Net Assets at End of Period (000’s omitted) | | $ | 5,578 | | | $ | 4,813 | | | | | |
Ratios to Average Net Assets: | | | | | | | | | | | | |
Net expenses | | | 1.05% | | | | 1.05% | (e) | | | | |
Gross expenses | | | 1.05% | | | | 1.05% | (e) | | | | |
Net investment loss | | | (0.94)% | | | | (0.86)% | (e) | | | | |
PORTFOLIO TURNOVER RATE (f) | | | 0% | | | | 0% | (d) | | | | |
| (a) | Commencement of operations. |
| (b) | Calculated based on average shares outstanding during the period. |
| (c) | Less than $0.01 per share. |
| (f) | The portfolio turnover rate is calculated without regard to any securities whose maturities or expiration dates at the time of acquisition were one year or less. |
| | | | |
| | |
See Notes to Financial Statements | | 32 | | |
FINANCIAL HIGHLIGHTS
These financial highlights reflect selected data for a share outstanding throughout the period.
| | | | |
| | | September 12, 2011 (a)
through
March 31, 2012
| |
MERK CURRENCY ENHANCED U.S. EQUITY FUND | | | | |
INVESTOR SHARES | | | | |
NET ASSET VALUE, Beginning of Period | | $ | 10.00 | |
| | |
|
|
|
INVESTMENT OPERATIONS | | | | |
Net investment income (b) | | | 0.07 | |
Net realized and unrealized gain | | | 2.00 | |
| | |
|
|
|
Total from Investment Operations | | | 2.07 | |
| | |
|
|
|
DISTRIBUTIONS TO SHAREHOLDERS FROM | | | | |
Net investment income | | | (0.07 | ) |
Net realized gain | | | (0.11 | ) |
| | |
|
|
|
Total Distributions | | | (0.18 | ) |
| | |
|
|
|
NET ASSET VALUE, End of Period | | $ | 11.89 | |
| | |
|
|
|
TOTAL RETURN | | | 20.99% | (c) |
RATIO/SUPPLEMENTARY DATA | | | | |
Net Assets at End of Period (000’s omitted) | | $ | 474 | |
Ratios to Average Net Assets: | | | | |
Net expenses | | | 1.30% | (d)(e)(g) |
Gross expenses | | | 1.30% | (d)(e)(g) |
Net investment income | | | 1.26% | (d)(e)(g) |
PORTFOLIO TURNOVER RATE (f) | | | 0% | (c) |
| |
| | | September 12, 2011 (a)
through
March 31, 2012
| |
INSTITUTIONAL SHARES | | | | |
NET ASSET VALUE, Beginning of Period | | $ | 10.00 | |
| | |
|
|
|
INVESTMENT OPERATIONS | | | | |
Net investment income (b) | | | 0.09 | |
Net realized and unrealized gain | | | 2.00 | |
| | |
|
|
|
Total from Investment Operations | | | 2.09 | |
| | |
|
|
|
DISTRIBUTIONS TO SHAREHOLDERS FROM | | | | |
Net investment income | | | (0.07 | ) |
Net realized gain | | | (0.11 | ) |
| | |
|
|
|
Total Distributions | | | (0.18 | ) |
| | |
|
|
|
NET ASSET VALUE, End of Period | | $ | 11.91 | |
| | |
|
|
|
TOTAL RETURN | | | 21.28% | (c) |
RATIO/SUPPLEMENTARY DATA | | | | |
Net Assets at End of Period (000’s omitted) | | $ | 1,798 | |
Ratios to Average Net Assets: | | | | |
Net expenses | | | 1.05% | (d)(e)(g) |
Gross expenses | | | 1.05% | (d)(e)(g) |
Net investment income | | | 1.58% | (d)(e)(g) |
PORTFOLIO TURNOVER RATE (f) | | | 0% | (c) |
| (a) | Commencement of operations. |
| (b) | Calculated based on average shares outstanding during the period. |
| (d) | The ratios of expenses and net investment income to average net assets do not reflect the Fund’s proportionate share of income and expenses of underlying investment companies in which the Fund invests. |
| (f) | The portfolio turnover rate is calculated without regard to any securities whose maturities or expiration dates at the time of acquisition were one year or less. |
| (g) | Recognition of net investment income by the Fund is affected by the timing of the declaration of dividends by the underlying investments in which the Fund invests. |
| | | | |
| | |
See Notes to Financial Statements | | 33 | | |
MERK FUNDS
NOTESTO FINANCIAL STATEMENTS
MARCH 31, 2012
NOTE 1. Organization
The Merk Hard Currency Fund (individually included in the defined term, “Fund” and, collectively included in the defined term, “Funds”) is a non-diversified portfolio of the Trust. The Merk Asian Currency Fund, Merk Absolute Return Currency Fund and Merk Currency Enhanced U.S. Equity Fund (individually, a “Fund” and, collectively the “Funds”) are diversified portfolios of Forum Funds (the “Trust”). The Trust is a Delaware statutory trust that is registered as an open-end, management investment company under the Investment Company Act of 1940 (the “Act”), as amended. Under its Trust Instrument, the Trust is authorized to issue an unlimited number of each Fund’s shares of beneficial interest without par value. Each Fund currently offers two classes of shares: Investor Shares and Institutional Shares. The Merk Hard Currency Fund seeks to protect against the depreciation of the U.S. dollar relative to other currencies. The Merk Asian Currency Fund seeks to protect against the depreciation of the U.S. dollar relative to Asian currencies. The Merk Absolute Return Currency Fund seeks to generate positive absolute returns by investing in securities and instruments that create exposure to currencies. The Merk Currency Enhanced U.S. Equity Fund seeks to generate total return that exceeds that of the S&P 500 Index, by investing in securities and instruments that create exposure to U.S. equities and currencies. The Merk Hard Currency Fund Investor Shares and Institutional Shares commenced operations on May 10, 2005 and April 1, 2010, respectively. The Merk Asian Currency Fund Investor Shares and Institutional Shares commenced operations on April 1, 2008 and April 1, 2010, respectively. The Merk Absolute Return Currency Fund Investor Shares and Institutional Shares commenced operations on September 9, 2009 and April 1, 2010, respectively. The Merk Currency Enhanced U.S. Equity Fund Investor Shares and Institutional Shares commenced operations on September 12, 2011.
NOTE 2. Summary of Significant Accounting Policies
These financial statements are prepared in accordance with accounting principles generally accepted in the United States of America (“GAAP”), which require management to make estimates and assumptions that affect the reported amounts of assets and liabilities, the disclosure of contingent liabilities at the date of the financial statements, and the reported amounts of increase and decrease in net assets from operations during the fiscal period. Actual amounts could differ from those estimates. The following summarizes the significant accounting policies of each Fund:
Security Valuation – Exchange-traded securities and over-the-counter securities are valued using the last quoted sale or official closing price, provided by independent pricing services as of the close of trading on the market or exchange for which they are primarily traded, on each Fund business day. In the absence of a sale, such securities are valued at the mean of the last bid and ask price provided by independent pricing services. Non-exchange traded securities for which quotations are available are valued using the last quoted sales price, or in the absence of a sale at the mean of the last bid and ask prices provided by independent pricing services. Debt securities may be valued at prices supplied by a fund’s pricing agent based on broker or dealer supplied valuations or matrix pricing, a method of valuing securities by reference to the value of other securities with similar characteristics such as rating, interest rate and maturity. Shares of open-end mutual funds are valued at net asset value (“NAV”). Futures contracts listed for trading on a securities exchange or board of trade shall be valued at the last quoted sales price or in the absence of a sale at the mean of the last bid and asked prices. Forward currency contracts are generally valued at the mean of bid and ask prices for the time period interpolated from rates reported by an independent pricing service for proximate time periods. Short-term investments that mature in 60 days or less may be valued at amortized cost.
Each Fund values its investments at fair value pursuant to procedures adopted by the Trust’s Board of Trustees (the “Board”) if (1) market quotations are insufficient or not readily available or (2) the adviser believes that the values available are unreliable. Fair valuation is based on subjective factors and, as a result, the fair value price of an investment may differ from the security’s market price and may not be the price at which the asset may be sold. Fair valuation could result in a different NAV than a NAV determined by using market quotes.
Each Fund has a three-tier fair value hierarchy. The basis of the tiers is dependent upon the various “inputs” used to determine the value of each Fund’s investments. These inputs are summarized in the three broad levels listed below:
Level 1 – quoted prices in active markets for identical assets
Level 2 – other significant observable inputs (including quoted prices of similar securities, interest rates, prepayment speeds, credit risk, etc.)
Level 3 – significant unobservable inputs (including each Fund’s own assumptions in determining the fair value of investments)
The aggregate value by input level, as of March 31, 2012, for each Fund’s investments is included at the end of each Fund’s Schedule of Investments.
| | | | |
| | |
| | | 34 | | |
MERK FUNDS
NOTESTO FINANCIAL STATEMENTS
MARCH 31, 2012
Security Transactions, Investment Income and Realized Gain and Loss – Investment transactions are accounted for on the trade date. Income and capital gains on some foreign securities may be subject to foreign withholding taxes, which are accrued as applicable. Interest income is recorded on an accrual basis. Premium is amortized and discount is accreted using the effective interest method. Identified cost of investments sold is used to determine the gain and loss for both financial statement and federal income tax purposes.
Foreign Currency Translations – Foreign currency amounts are translated into U.S. dollars as follows: (1) assets and liabilities at the rate of exchange at the end of the respective period; and (2) purchases and sales of securities and income and expenses at the rate of exchange prevailing on the dates of such transactions. The portion of the results of operations arising from changes in the exchange rates and the portion due to fluctuations arising from changes in the market prices of securities are not isolated. Such fluctuations are included with the net realized and unrealized gain or loss on investments.
Foreign Currency Transactions – Each Fund may enter into transactions to purchase or sell foreign currency contracts and options on foreign currency. Forward currency contracts are agreements to exchange one currency for another at a future date and at a specified price. A fund may use forward currency contracts to facilitate transactions in foreign securities, to manage a fund’s foreign currency exposure and to protect the U.S. dollar value of its underlying portfolio securities against the effect of possible adverse movements in foreign exchange rates. These contracts are intrinsically valued daily based on forward rates, and a fund’s net equity therein, representing unrealized gain or loss on the contracts as measured by the difference between the forward foreign exchange rates at the dates of entry into the contracts and the forward rates at the reporting date, is recorded as a component of net asset value. These instruments involve market risk, credit risk, or both kinds of risks, in excess of the amount recognized in the Statement of Assets and Liabilities. Risks arise from the possible inability of counterparties to meet the terms of their contracts and from movement in currency and securities values and interest rates. Due to the risks associated with these transactions, a fund could incur losses up to the entire contract amount, which may exceed the net unrealized value included in its net asset value.
The values of each individual forward currency contract outstanding as of March 31, 2012, are disclosed in each Fund’s Schedule of Investments.
The volume of open currency positions may vary on a daily basis as each Fund transacts currency contracts in order to achieve the exposure desired by the adviser. During the period ended March 31, 2012, the Merk Hard Currency Fund, Merk Asian Currency Fund, Merk Absolute Return Currency and the Merk Currency Enhanced U.S. Equity Fund entered into an aggregated total notional value of $1,782,086,793, $897,228,012, $2,755,490,147 and $77,147,683, respectively, of forward currency contracts.
Futures Contracts – Each Fund may purchase futures contracts to gain exposure to market changes, which may be more efficient or cost effective than actually buying the securities. A futures contract is an agreement between parties to buy or sell a security at a set price on a future date. Upon entering into such a contract, a fund is required to pledge to the broker an amount of cash, U.S. Government obligations or other high-quality debt securities equal to the minimum “initial margin” requirements of the exchange on which the futures contract is traded. Pursuant to the contract, the fund agrees to receive from or pay to the broker an amount of cash equal to the daily fluctuation in the value of the contract. Such receipts or payments are known as “variation margin” and are recorded by the fund as unrealized gains or losses. When the contract is closed, the fund records a realized gain or loss equal to the difference between the value of the contract at the time it was opened and value at the time it was closed. Risks of entering into futures contracts include the possibility that there may be an illiquid market and that a change in the value of the contract may not correlate with changes in the value of the underlying securities.
The Merk Hard Currency Fund and the Merk Currency Enhanced U.S. Equity Fund entered into a total notional amount of $31,989,850 and $547,962, respectively, on futures contracts during the period ended March 31, 2012.
Derivatives Transactions – Each Fund’s use of derivatives during the period ended March 31, 2012, was limited to forward currency contracts and/or futures. Following is a summary of how the derivatives are treated in the financial statements and their impact on each Fund.
| | | | |
| | |
| | | 35 | | |
MERK FUNDS
NOTESTO FINANCIAL STATEMENTS
MARCH 31, 2012
The location on the Statement of Assets and Liabilities of each Fund’s derivative positions by type of exposure is as follows:
| | | | | | | | | | | | | | |
Fund Contract Type/
Primary Risk Exposure
| | Location on
Statement of Assets and
Liabilities
| | Asset
Derivatives
| | | Location on
Statement of Assets and
Liabilities
| | | Change in
Unrealized
Appreciation
(Depreciation) on
Derivatives
| |
| Merk Hard Currency Fund | | | | | | | | | | | | | | |
| | | | |
| Commodity Contracts | | Receivable-Variation
Margin | | $ | 42,500 | | |
| Payable-Variation
Margin |
| | $ | - | |
| Merk Asian Currency Fund | | | | | | | | | | | | | | |
| | | | |
| Forward Currency Contracts | | Unrealized gain on
forward currency
contracts | | $ | 489,044 | | |
| Unrealized loss on
forward currency
contracts |
| | $ | (165,929 | ) |
| Merk Absolute Return Currency Fund | | | | | | | | | | | | | | |
| | | | |
| Forward Currency Contracts | | Unrealized gain on
forward currency
contracts | | $ | 367,200 | | |
| Unrealized loss on
forward currency
contracts |
| | $ | (225,428 | ) |
| Merk Currency Enhanced U.S. Equity Fund | | | | | | | | | | | | | | |
| | | | |
| Commodity Contracts | | Receivable-Variation
Margin | | $ | 250 | | |
| Payable-Variation
Margin |
| | $ | - | |
| | | | |
| Forward Currency Contracts | | Unrealized gain on
forward currency
contracts | | $ | 32,003 | | |
| Unrealized loss on
forward currency
contracts |
| | $ | (19,381 | ) |
Realized and unrealized gains and losses on derivatives contracts entered into during the period ended March 31, 2012, by each Fund are recorded in the following locations on the Statement of Operations:
| | | | | | | | | | |
Fund Contract Type/
Primary Risk Exposure
| | Location of Gain or (Loss)
on Derivatives
| | Realized Gain
(Loss) on
Derivatives
| | | Change in
Unrealized
Appreciation
(Depreciation) on
Derivatives
| |
| Merk Hard Currency Fund | | | | | | | | | | |
| | | |
| Commodity Contracts | | Net realized gain (loss) – futures and Net change in unrealized appreciation (depreciation) – futures | | $ | 512,054 | | | $ | (6,000) | |
| | | |
| Forward Currency Contracts | | Net realized gain (loss) – foreign currency transactions and Net change in unrealized appreciation (depreciation) – foreign currency translations | | $ | (861,644) | | | $ | - | |
| Merk Asian Currency Fund | | | | | | | | | | |
| | | |
| Forward Currency Contracts | | Net realized gain (loss) – foreign currency transactions and Net change in unrealized appreciation (depreciation) – foreign currency translations | | $ | (681,131) | | | $ | 208,130 | |
| | | | |
| | |
| | | 36 | | |
MERK FUNDS
NOTESTO FINANCIAL STATEMENTS
MARCH 31, 2012
| | | | | | | | | | |
Fund Contract Type/
Primary Risk Exposure
| | Location of Gain or (Loss)
on Derivatives
| | Realized Gain
(Loss) on
Derivatives
| | | Change in
Unrealized
Appreciation
(Depreciation) on
Derivatives
| |
| Merk Absolute Return Currency Fund | | | | | | | | | | |
| | | |
| Forward Currency Contracts | | Net realized gain (loss) – foreign currency transactions and Net change in unrealized appreciation (depreciation) – foreign currency translations | | $ | (2,720,187) | | | $ | 335,918 | |
| Merk Currency Enhanced U.S. Equity Fund | | | | | | | | | | |
| | | |
| Commodity Contracts | | Net realized gain (loss) – futures and Net change in unrealized appreciation (depreciation) – futures | | $ | 39,043 | | | $ | 3,208 | |
| | | |
| Forward Currency Contracts | | Net realized gain (loss) – foreign currency transactions and Net change in unrealized appreciation (depreciation) – foreign currency translations | | $ | 3,909 | | | $ | 12,622 | |
Distributions to Shareholders – Distributions to shareholders of net investment income, if any, are declared and paid at least quarterly. Distributions to shareholders of net capital gains, if any, are declared and paid annually. Distributions are based on amounts calculated in accordance with applicable federal income tax regulations, which may differ from GAAP. These differences are due primarily to differing treatments of income and gain on various investment securities held by each Fund, timing differences and differing characterizations of distributions made by each Fund.
Federal Taxes – Each Fund intends to qualify each year as a regulated investment company under Subchapter M of the Internal Revenue Code and to distribute all of their taxable income to shareholders. In addition, by distributing in each calendar year substantially all their net investment income and capital gains, if any, the Funds will not be subject to a federal excise tax. Therefore, no federal income or excise tax provision is required. Each Fund files a U.S. federal income and excise tax return as required. A fund’s federal income tax returns are subject to examination by the Internal Revenue Service (IRS) for a period of three fiscal years after they are filed. As of March 31, 2012, there are no uncertain tax positions that would require financial statement recognition, de-recognition, or disclosure.
Income and Expense Allocation – The Trust accounts separately for the assets, liabilities and operations of each of its investment portfolios. Expenses that are directly attributable to more than one investment portfolio are allocated among the respective investment portfolios in an equitable manner.
Commitments and Contingencies – In the normal course of business, each Fund enters into contracts that provide general indemnifications by each Fund to the counterparty to the contract. Each Fund’s maximum exposure under these arrangements is dependent on future claims that may be made against each Fund and, therefore, cannot be estimated; however, based on experience, the risk of loss from such claims is considered remote.
NOTE 3. Fees and Expenses
Investment Adviser – Merk Investments, LLC (the “Adviser”) is the investment adviser to each Fund. Pursuant to an investment advisory agreement, the Adviser receives an advisory fee from the Merk Hard Currency Fund, Merk Asian Currency Fund and Merk Absolute Return Currency Fund at an annual rate of 1.00% of each Fund’s average daily net assets. Pursuant to an investment advisory agreement and an operating services agreement, the Adviser receives an advisory fee and an operational services fee, at annual rates of 0.72% and 0.33%, respectively, on the Merk Currency Enhanced U.S. Equity Fund’s average daily net assets.
Under the terms of the Investment Advisory Agreement for the Merk Hard Currency Fund, Merk Asian Currency Fund and Merk Absolute Return Currency Fund and the Operating Services Agreement for Merk Currency Enhanced U.S. Equity Fund, the Adviser is obligated to pay all expenses of each Fund except any expenses it is authorized to pay under Rule 12b-1, brokerage costs, commissions, borrowing costs, taxes, the transfer agent’s basis point fees, and extraordinary and non-recurring expenses.
| | | | |
| | |
| | | 37 | | |
MERK FUNDS
NOTESTO FINANCIAL STATEMENTS
MARCH 31, 2012
Distribution – Foreside Fund Services, LLC serves as each Fund’s distributor (the “Distributor”). The Distributor is not affiliated with the Adviser or Atlantic Fund Administration, LLC (d/b/a Atlantic Fund Services) (“Atlantic”) or their affiliates. The Funds have adopted a Distribution Plan (the “Plan”) for Investor Shares of the Funds in accordance with Rule 12b-1 of the Act. Under the Plan, the Funds pay the Distributor and/or any other entity as authorized by the Board a fee of up to 0.25% of the average daily net assets of each Fund for the marketing of fund shares and for services provided to shareholders.
Other Service Providers – Atlantic provides fund accounting, fund administration, and transfer agency services to each Fund. Atlantic also provides certain shareholder report production, and EDGAR conversion and filing services. Atlantic provides a Principal Executive Officer, a Principal Financial Officer, a Chief Compliance Officer, and an Anti-Money Laundering Officer to each Fund, as well as certain additional compliance support functions.
NOTE 4. Security Transactions
The cost of purchases and proceeds from sales of investment securities (including maturities), other than short-term investments during the period ended March 31, 2012, were as follows:
| | | | | | | | |
| | | Purchases
| | | Sales
| |
Merk Hard Currency Fund | | $ | 221,175,364 | | | $ | 206,250,315 | |
Merk Asian Currency Fund | | | 33,964,156 | | | | 5,995,497 | |
Merk Absolute Return Currency Fund | | | 7,492,012 | | | | 999,139 | |
Merk Currency Enhanced U.S. Equity Fund | | | 1,922,370 | | | | - | |
NOTE 5. Federal Income Tax and Investment Transactions
Distributions during the fiscal years as noted were characterized for tax purposes as follows:
| | | | | | | | | | | | |
| | | Ordinary Income
| | | Long-Term
Capital Gain
| | | Total
| |
Merk Hard Currency Fund | | | | | | | | | | | | |
2012 | | $ | 6,601,923 | | | $ | 9,609,604 | | | $ | 16,211,527 | |
2011 | | | 4,837,428 | | | | 3,994,485 | | | | 8,831,913 | |
Merk Asian Currency Fund | | | | | | | | | | | | |
2012 | | | 1,122,326 | | | | - | | | | 1,122,326 | |
2011 | | | 1,561,297 | | | | - | | | | 1,561,297 | |
Merk Absolute Return Currency Fund | | | | | | | | | | | | |
2012 | | | 447,523 | | | | - | | | | 447,523 | |
2011 | | | 390,577 | | | | - | | | | 390,577 | |
Merk Currency Enhanced U.S. Equity Fund | | | | | | | | | | | | |
2012 | | | 21,053 | | | | 11,217 | | | | 32,270 | |
As of March 31, 2012, distributable earnings (accumulated losses) on a tax basis were as follows:
| | | | | | | | | | | | | | | | | | | | |
| | | Deferred
Currency and
Other Losses
| | | Undistributed
Ordinary Income
| | | Accumulated
Long-Term Gain
| | | Unrealized
Appreciation
(Depreciation) on
Investments and
Foreign
Currency
Translations
| | | Total
| |
Merk Hard Currency Fund | | $ | (12,535,311 | ) | | $ | - | | | $ | 3,496,627 | | | $ | 11,387,344 | | | $ | 2,348,660 | |
Merk Asian Currency Fund | | | (1,247,094 | ) | | | - | | | | - | | | | 204,389 | | | | (1,042,705 | ) |
Merk Absolute Return Currency Fund | | | - | | | | - | | | | - | | | | (3,856 | ) | | | (3,856 | ) |
Merk Currency Enhanced U.S. Equity Fund | | | - | | | | 25,885 | | | | 14,134 | | | | 265,827 | | | | 305,846 | |
The difference between components of distributable earnings on a tax basis and the amounts reflected in the Statement of Assets and Liabilities are primarily due to grantor trust adjustments, futures contracts and forward contracts.
| | | | |
| | |
| | | 38 | | |
MERK FUNDS
NOTESTO FINANCIAL STATEMENTS
MARCH 31, 2012
For Tax purposes, the current year post-October loss and late year ordinary loss was $12,535,311 and $1,247,094, (realized during the period November 1, 2011 through March 31, 2012) for Merk Hard Currency Fund and Merk Asian Currency Fund, respectively. These losses were recognized for tax purposes on the first business day of each Fund’s next fiscal year, April 1, 2012.
On the Statements of Assets and Liabilities, as a result of permanent book to tax differences, certain amounts have been reclassified for the period ended March 31, 2012. The following reclassifications were the result of re-designation of distributions, net operating loss, non-deductible offering costs, currency gain/loss reclassification and grantor trust adjustments and has no impact on the net assets of each Fund.
| | | | | | | | | | | | |
| | | Paid in
Capital
| | | Undistributed Net
Investment
Income (Loss)
| | | Accumulated
Net Realized
Gain (Loss)
| |
Merk Hard Currency Fund | | $ | - | | | $ | (7,449,221 | ) | | $ | 7,449,221 | |
Merk Asian Currency Fund | | | (642,125 | ) | | | (47,709 | ) | | | 689,834 | |
Merk Absolute Return Currency Fund | | | (2,730,355 | ) | | | 10,859 | | | | 2,719,496 | |
Merk Currency Enhanced U.S. Equity Fund | | | (69 | ) | | | 3,978 | | | | (3,909 | ) |
NOTE 6. Underlying Investments in Other Investment Companies
The Merk Currency Enhanced U.S. Equity Fund currently invests a portion of its assets in SPDR S&P 500 ETF Trust. The Merk Currency Enhanced U.S. Equity Fund may eliminate its investments at any time if the Adviser determines that it is in the best interest of the Fund and its shareholders to do so.
The performance of the Merk Currency Enhanced U.S. Equity Fund may be directly affected by the performance of the SPDR S&P 500 ETF Trust. The financial statements of the SPDR S&P 500 ETF Trust, including the portfolio of investments, can be found at the SPDR S&P 500 ETF Trust’s website www.spdrs.com or the Securities and Exchange Commission’s website www.sec.gov and should be read in conjunction with the Merk Currency Enhanced U.S. Equity Fund’s financial statements. As of March 31, 2012, the percentage of the Merk Currency Enhanced U.S. Equity Fund’s net assets invested in the SPDR S&P 500 ETF Trust was 96.3%.
NOTE 7. Recent Accounting Pronouncements
In May 2011, FASB issued ASU No. 2011-04 “Amendments to Achieve Common Fair Value Measurement and Disclosure Requirements in U.S. GAAP and IFRSs.” ASU No. 2011-04 establishes common requirements for measuring fair value and for disclosing information about fair value measurements in accordance with U.S. GAAP and International Financial Reporting Standards (“IFRSs”). ASU No. 2011-04 is effective for interim and annual periods beginning after December 15, 2011. Management is currently evaluating the impact ASU No. 2011-04 may have on financial statement disclosures.
In December 2011, FASB issued ASU No. 2011-11 “Disclosures about Offsetting Assets and Liabilities” requiring disclosure of both gross and net information related to offsetting and related arrangements enabling users of its financial statements to understand the effect of those arrangements on the entity’s financial position. The objective of this disclosure is to facilitate comparison between those entities that prepare their financial statements on the basis of U.S. GAAP and those entities that prepare their financial statements on the basis of IFRS. ASU No. 2011-11 is effective for interim and annual periods beginning on or after January 1, 2013. Management is evaluating any impact ASU No. 2011-11 may have on each Fund’s financial statements.
NOTE 8. Subsequent Events
Subsequent events occurring after the date of this report through the date these financial statements were issued have been evaluated for potential impact and each Fund has had no such events.
| | | | |
| | |
| | | 39 | | |
REPORTOF INDEPENDENT REGISTERED PUBLICACCOUNTING FIRM
To the Board of Trustees of Forum Funds
and the Shareholders of Merk Hard Currency Fund, Merk Asian Currency Fund,
Merk Absolute Return Currency Fund and Merk Currency Enhanced U.S. Equity Fund
We have audited the accompanying statements of assets and liabilities of Merk Hard Currency Fund, Merk Asian Currency Fund, Merk Absolute Return Currency Fund and Merk Currency Enhanced U.S. Equity Fund, (The “Funds”) each a series of shares of beneficial interest in the Forum Funds, including the schedules of investments, as of March 31, 2012, and the related statements of operations for the year then ended and for the period September 12, 2011 through March 31, 2012 (Commencement of Operations for Merk Currency Enhanced U.S Equity Fund), the statements of changes in net assets for each of the years or period in the two year period then ended, and the financial highlights for each of the years or periods in the four year period then ended. These financial statements and financial highlights are the responsibility of the Funds’ management. Our responsibility is to express an opinion on these financial statements and financial highlights based on our audits. The financial highlights for Merk Hard Currency Fund for the year ended March 31, 2008 were audited by other auditors whose report dated May 28, 2008, expressed an unqualified opinion on such financial highlights.
We conducted our audits in accordance with the standards of the Public Company Accounting Oversight Board (United States). Those standards require that we plan and perform the audit to obtain reasonable assurance about whether the financial statements and financial highlights are free of material misstatement. An audit includes examining, on a test basis, evidence supporting the amounts and disclosures in the financial statements. Our procedures included confirmation of securities owned as of March 31, 2012 by correspondence with the custodian and brokers and by other appropriate auditing procedures where responses from brokers were not received. An audit also includes assessing the accounting principles used and significant estimates made by management, as well as evaluating the overall financial statement presentation. We believe that our audits provide a reasonable basis for our opinion.
In our opinion, the financial statements and financial highlights referred to above present fairly, in all material respects, the financial position of Merk Hard Currency Fund, Merk Asian Currency Fund, Merk Absolute Return Currency Fund and Merk Currency Enhanced U.S. Equity Fund as of March 31, 2012, and the results of their operations for the year or period then ended, the changes in their net assets for each of the years or period in the two year period then ended, and their financial highlights for each of the years or periods in the four year period then ended, in conformity with accounting principles generally accepted in the United States of America.

BBD, LLP
Philadelphia, Pennsylvania
May 30, 2012
| | | | |
| | |
| | | 40 | | |
MERK FUNDS
ADDITIONAL INFORMATION (UNAUDITED)
MARCH 31, 2012
Proxy Voting Information
A description of the policies and procedures that each Fund uses to determine how to vote proxies relating to securities held in each Fund’s portfolio is available, without charge and upon request, by calling (866) 637-5386 and on the U.S. Securities and Exchange Commission’s (the “SEC”) website at www.sec.gov. Each Fund’s proxy voting record for the most recent twelve-month period ended June 30 is available, without charge and upon request, by calling (866) 637-5386 and on the SEC’s website at www.sec.gov.
Availability of Quarterly Portfolio Schedules
Each Fund files its complete schedule of portfolio holdings with the SEC for the first and third quarters of each fiscal year on Form N-Q. These filings are available, without charge and upon request on the SEC’s website at www.sec.gov or may be reviewed and copied at the SEC’s Public Reference Room in Washington, DC. Information on the operation of the Public Reference Room may be obtained by calling (800) SEC-0330.
Shareholder Expense Example
As a shareholder of the Funds, you incur ongoing costs, including management fees, distribution and/or service (12b-1) fees and other Fund expenses. This example is intended to help you understand your ongoing costs (in dollars) of investing in the Funds and to compare these costs with the ongoing costs of investing in other mutual funds.
The example is based on an investment of $1,000 invested at the beginning of the period and held for the entire period from October 1, 2011, through March 31, 2012.
Actual Expenses – The first line under each Fund of the table below provides information about actual account values and actual expenses. You may use the information in this line, together with the amount you invested, to estimate the expenses that you paid over the period. Simply divide your account value by $1,000 (for example, an $8,600 account value divided by $1,000 = 8.6), then multiply the result by the number in the first line under the heading entitled “Expenses Paid During Period” to estimate the expenses you paid on your account during the period.
Hypothetical Example for Comparison Purposes – The second line under each Fund of the table below provides information about hypothetical account values and hypothetical expenses based on each Fund’s actual expense ratio and an assumed rate of return of 5% per year before expenses, which is not each Fund’s actual return. The hypothetical account values and expenses may not be used to estimate the actual ending account balance or expenses you paid for the period. You may use this information to compare the ongoing costs of investing in each Fund and other funds. To do so, compare this 5% hypothetical example with the 5% hypothetical examples that appear in the shareholder reports of other funds.
Please note that the expenses shown in the table are meant to highlight your ongoing costs only. Therefore, the second line of the table is useful in comparing ongoing costs only and will not help you determine the relative total costs of owning different funds.
| | | | | | | | | | | | | | | | |
| | | Beginning
Account Value
October 1, 2011* | | | Ending
Account Value March 31, 2012 | | | Expenses Paid
During Period | | | Annualized
Expense Ratio | |
Merk Hard Currency Fund | | | | | | | | | | | | | | | | |
Investor Shares Actual | | | $1,000.00 | | | | $1,020.51 | | | | $6.57 | | | | 1.30% | |
Hypothetical
(5% return before expenses) | | | $1,000.00 | | | | $1,018.50 | | | | $6.56 | | | | 1.30% | |
Institutional Shares Actual | | | $1,000.00 | | | | $1,021.88 | | | | $5.31 | | | | 1.05% | |
Hypothetical
(5% return before expenses) | | | $1,000.00 | | | | $1,019.75 | | | | $5.30 | | | | 1.05% | |
Merk Asian Currency Fund | | | | | | | | | | | | | | | | |
Investor Shares Actual | | | $1,000.00 | | | | $1,017.10 | | | | $6.56 | | | | 1.30% | |
Hypothetical
(5% return before expenses) | | | $1,000.00 | | | | $1,018.50 | | | | $6.56 | | | | 1.30% | |
Institutional Shares Actual | | | $1,000.00 | | | | $1,019.23 | | | | $5.30 | | | | 1.05% | |
Hypothetical
(5% return before expenses) | | | $1,000.00 | | | | $1,019.75 | | | | $5.30 | | | | 1.05% | |
| | | | |
| | |
| | | 41 | | |
MERK FUNDS
ADDITIONAL INFORMATION (UNAUDITED)
MARCH 31, 2012
| | | | | | | | | | | | | | | | |
| | | Beginning
Account Value
October 1, 2011* | | | Ending
Account Value March 31, 2012 | | | Expenses Paid
During Period | | | Annualized
Expense Ratio | |
Merk Absolute Return Currency Fund | | | | | | | | | | | | | | | | |
Investor Shares Actual | | | $1,000.00 | | | | $1,015.16 | | | | $6.55 | | | | 1.30% | |
Hypothetical
(5% return before expenses) | | | $1,000.00 | | | | $1,018.50 | | | | $6.56 | | | | 1.30% | |
Institutional Shares Actual | | | $1,000.00 | | | | $1,016.23 | | | | $5.29 | | | | 1.05% | |
Hypothetical
(5% return before expenses) | | | $1,000.00 | | | | $1,019.75 | | | | $5.30 | | | | 1.05% | |
Merk Currency Enhanced U.S. Equity Fund | | | | | | | | | | | | | | | | |
Investor Shares Actual | | | $1,000.00 | | | | $1,276.25 | | | | $7.40 | | | | 1.30% | |
Hypothetical
(5% return before expenses) | | | $1,000.00 | | | | $1,018.50 | | | | $6.56 | | | | 1.30% | |
Institutional Shares Actual | | | $1,000.00 | | | | $1,279.34 | | | | $5.98 | | | | 1.05% | |
Hypothetical
(5% return before expenses) | | | $1,000.00 | | | | $1,019.75 | | | | $5.30 | | | | 1.05% | |
| * | Expenses are equal to the Funds’ annualized expense ratio as indicated above multiplied by the average account value over the period, multiplied by the number of days in the most recent fiscal half-year divided by 365 to reflect the half-year period. |
Federal Tax Status of Dividends Declared during the Tax Year
For federal income tax purposes, dividends from short-term capital gains are classified as ordinary income. The Merk Hard Currency Fund designates 11.82% of its income distributions as short-term capital gain dividends exempt from U.S. tax for foreign shareholders (QSD). The Merk Asian Currency Fund designates 4.24% of its income distributions as qualified interest income exempt from U.S. tax for foreign shareholders (QII). The Merk Absolute Return Currency Fund designates 3.63% of its income distributions as QII. The Merk Currency Enhanced U.S. Equity Fund designates 0.05% of its income distributions as QII and 35.52% of its income distributions as QSD.
| | | | |
| | |
| | | 42 | | |
MERK FUNDS
ADDITIONAL INFORMATION (UNAUDITED)
MARCH 31, 2012
Trustees and Officers of the Trust
The Board is responsible for oversight of the management of the Trust’s business affairs and of the exercise of all the Trust’s powers except those reserved for the shareholders. The following table provides information about each Trustee and certain officers of the Trust. Each Trustee and officer holds office until the person resigns, is removed, or is replaced. Unless otherwise noted, the persons have held their principal occupations for more than five years. The address for all Trustees and officers is Three Canal Plaza, Suite 600, Portland, Maine 04101. Mr. Keffer is considered an Interested Trustee due to his affiliation with Atlantic. Each Fund’s Statement of Additional Information includes additional information about the Trustees and is available, without charge and upon request, by calling (866) 637-5386.
| | | | | | | | | | |
Name
and Year of Birth | | Position with
the Trust | | Length of
Time Served | | Principal
Occupation(s) During
Past Five Years | | Number of Series
of Trust Overseen
by Trustee | | Other
Directorships
Held by Trustee |
| Independent Trustees | | | | | | | | | | |
J. Michael Parish Born: 1943 | | Chairman of the Board; Trustee; Chairman, Nominating Committee and Qualified Legal Compliance Committee | | Since 1989 (Chairman since 2004) | | Retired since 2003. | | 21 | | 0 |
Costas Azariadis Born: 1943 | | Trustee; Chairman, Valuation Committee | | Since 1989 | | Professor of Economics, Washington University since 2006. | | 21 | | 0 |
James C. Cheng Born: 1942 | | Trustee; Chairman, Audit Committee | | Since 1989 | | President, Technology Marketing Associates (marketing company for small- and medium-sized businesses in New England) since 1991. | | 21 | | 0 |
David Tucker Born: 1958 | | Trustee | | Since 2011 | | Director, Blue Sky Experience, since 2008; Senior Vice President & General Counsel, American Century Companies 1998 – 2008. | | 21 | | 0 |
| Interested Trustee | | | | | | | | | | |
John Y. Keffer 1 Born: 1942 | | Trustee; Vice Chairman | | Since 1989 | | Chairman, Atlantic since 2008; President, Forum Foundation (a charitable organization) since 2005; President, Forum Trust, LLC (a non-depository trust company chartered in the State of Maine) since 1997. | | 21 | | Director, Wintergreen Fund, Inc.; Director, Forum ETF Trust |
| | | | |
| | |
| | | 43 | | |
MERK FUNDS
ADDITIONAL INFORMATION (UNAUDITED)
MARCH 31, 2012
| | | | | | | | | | |
Name
and Year of Birth | | Position with
the Trust | | Length of
Time Served | | Principal
Occupation(s) During
Past Five Years | | Number of Series
of Trust Overseen
by Trustee | | Other
Directorships
Held by Trustee |
| Officers | | | | | | | | | | |
Stacey E. Hong Born: 1966 | | President; Principal Executive Officer | | Since 2008 | | President, Atlantic since 2008; Director, Consulting Services, Foreside Fund Services 2007. | | N/A | | N/A |
Karen Shaw Born: 1972 | | Treasurer; Principal Financial Officer | | Since 2008 | | Senior Vice President, Atlantic since 2008; Vice President, Citigroup 2003 – 2008. | | N/A | | N/A |
David Faherty Born: 1970 | | Vice President | | Since 2009 | | Senior Counsel, Atlantic since 2009; Vice President, Citi Fund Services Ohio, Inc. 2007 – 2009; Associate Counsel, Investors Bank & Trust Co. 2006 – 2007. | | N/A | | N/A |
Michael J. McKeen Born: 1971 | | Vice President | | Since 2009 | | Senior Vice President, Atlantic since 2008; Vice President, Citigroup 2003 – 2008. | | N/A | | N/A |
Joshua LaPan Born: 1973 | | Vice President | | Since 2009 | | Manager, Atlantic since 2008; Vice President, Citigroup 2003 – 2008. | | N/A | | N/A |
Timothy Bowden Born: 1969 | | Vice President | | Since 2009 | | Manager, Atlantic since 2008; Vice President, Citigroup 2005 – 2008. | | N/A | | N/A |
Lina Bhatnagar Born: 1971 | | Secretary | | Since 2008 | | Senior Administration Specialist, Atlantic since 2008; Regulatory Administration Specialist, Citigroup 2006 – 2008. | | N/A | | N/A |
| 1 | Atlantic is a subsidiary of Forum Holdings Corp. I, a Delaware corporation that is wholly owned by Mr. Keffer. |
| | | | |
| | |
| | | 44 | | |

MERK HARD CURRENCY FUND®
MERK ASIAN CURRENCY FUND®
MERK ABSOLUTE RETURN
CURRENCY FUND®
MERK CURRENCY ENHANCEDU.S. EQUITY FUNDSM
P.O. BOX 588
PORTLAND, ME 04112
208-ANR-0312
FOR MORE INFORMATION
INVESTMENT ADVISER
Merk Investments, LLC
555 Bryant Street #455
Palo Alto, CA 94301
www.merkfunds.com
TRANSFER AGENT
Atlantic Fund Services
P.O. Box 588
Portland, ME 04112
DISTRIBUTOR
Foreside Fund Services, LLC
Three Canal Plaza, Suite 100
Portland, ME 04101
www.foreside.com
This report is submitted for the general information of the shareholders of each Fund. It is not authorized for distribution to prospective investors unless preceded or accompanied by an effective prospectus, which includes information regarding each Fund’s risks, objectives, fees and expenses, experience of its management and other information.
TABLE OF CONTENTS
MARCH 31, 2012
| A Message to Our Shareholders | 1 |
| Performance Chart and Analysis (Unaudited) | 3 |
| Schedule of Investments | 4 |
| Statement of Assets and Liabilities | 6 |
| Statement of Operations | 7 |
| Statements of Changes in Net Assets | 8 |
| Financial Highlights | 9 |
| Notes to Financial Statements | 10 |
| Report of Independent Public Accounting Firm | 14 |
| Additional Information (Unaudited) | 15 |
IMPORTANT INFORMATION
The views in this report were those of the Payson Total Return Fund’s (the “Fund”) adviser, H.M. Payson & Co. as of March 31, 2012, and may not reflect their views on the date this report is first published or anytime thereafter. This report may contain discussions about investments that may or may not be held by the Fund as of the date of this report. Holdings and allocations are subject to risks and to change. These views are intended to assist shareholders in understanding their investment in the Fund and do not constitute investment advice.
An investment in the Fund is subject to risk, including the possible loss of principal. Other Fund risks include debt securities risk, interest rate risk, credit risk, liquidity risk, inflation-indexed security risk and government securities risk. In addition, the Fund invests in midcap companies which pose greater risks than those associated with larger, more established companies. There is no assurance that the Fund will achieve its investment objective.
The Fund’s benchmark, the S&P 500® Index, is a broad-based, unmanaged measurement of changes in stock market conditions based on the average of 500 widely held common stocks. One cannot invest directly in an index.
A MESSAGE TO OUR SHAREHOLDERS
Dear Payson Total Return Fund Shareholder,
The Payson Total Return Fund (the “Fund”) provided a total return of 11.35% for the fiscal year ended March 31, 2012, outperforming by 2.81% the S&P 500 Index (the “Index”), which had a total return of 8.54%. The Fund also outperformed the Index over the trailing three and five year periods that ended March 31, 2012. The Fund’s annualized three and five year returns were 27.81% and 4.16%, as compared to the Index’s three and five year annualized returns of 23.42% and 2.01%.
For a longer-term perspective, the Fund’s one-year, five-year and ten-year average annual total returns for the period ended March 31, 2012, were 11.35%, 4.16% and 3.57%, respectively. Performance data quoted represents past performance and is no guarantee of future results. Current performance may be lower or higher than the performance data quoted. Investment return and principal value will fluctuate so that an investor’s shares, when redeemed, may be worth more or less than original cost. As stated in the current prospectus, the Fund's annual gross operating expense ratio is 1.31%. For the most recent month end performance, please call (800) 805-8258. Total returns include reinvestment of dividends and capital gains. For the period reported, some of the Fund’s fees were waived or expenses reimbursed, otherwise total return would have been lower.
The fiscal year began with stocks trading in a relatively narrow range. Beginning in July of 2011, concerns about the financial stability of the European Community and future economic growth in the U.S. and the rest of the world led to sharp declines in the general level of stock prices. From its peak reached on April 29, 2011, the Index declined more than 19%, reaching a bottom on October 3, 2011. The market seemed to be fixated on the daily news from Europe, with stocks gyrating up and down much in sync with good or bad news regarding possible bond defaults from Greece and other weaker members of the European Community. Fear of defaults led investors to seek the perceived safety of U.S. treasury bonds, driving already low interest rates to even lower levels. The yields on ten and thirty year bonds issued by the U.S. treasury dipped below 2% and 3%, respectively.
As often happens when fear and volatility are elevated and stock prices are in decline, any marginally good news can spur a recovery. Indeed, late in 2011, modestly improving economic reports from the U.S. and around the world as well as hope that Europe would avert a crisis, prompted a reversal. Stock prices began to rise in the fourth quarter of the calendar year and after a brief dip in November of 2011, regained momentum that carried the rally to the end of the Fund’s fiscal year on March 31, 2012. From the low reached on October 3, 2011, to the end of the Fund’s fiscal year, the Index gained over 28% in value. Interest rates rose although they remained very low by historical standards. For the fiscal year, ten and thirty year U.S. treasury bond yields declined from 3.5% to 2.2% and from 4.5% to 3.3%, respectively.
Volatility and fear in the markets present opportunity. Our research effort focuses on companies trading at reasonable valuations and possessed of strong balance sheets, positive economic margins, and growing streams of cash flow, earnings, and dividends. With in depth research, we believe buying good companies at reasonable valuations will likely lead to better than market performance. At the same time, by becoming modestly more aggressive with stock selection when fear is high and more defensive when fear is low, we believe we can further add to investment performance. The outperformance of the Fund as compared to the Index and most of its peer group of mutual funds is in large part due to our research effort and careful security
1
A MESSAGE TO OUR SHAREHOLDERS
selection, along with modest adjustments to the portfolio to take advantage of the opportunities presented by high levels of volatility.
During the past year and relative to the Index, we maintained the Fund with a modest over weighting in the technology sector and under weighting in the financial services, telecommunications, and utilities sectors. We generally increased the Fund’s weighting in the consumer discretionary, industrial and materials sectors during periods of higher volatility and declining market prices, while decreasing this sector exposure in favor of the more defensive consumer staples and health care sectors during periods of higher equity market prices and elevated optimism.
The best performing stocks for the fiscal year in the Fund portfolio included Apple (+72%), Pep Boys (+64%), Whirlpool (+63%), TJX Companies (+62%), Intel (+44%), Wells Fargo (+42%), Cummins (+34%) and Microsoft (+30%). The worst performing stocks for the fiscal year in the Fund portfolio include JPMorgan Chase (-24%), Flowserve (-17%), Freeport-McMoran Copper & Gold (-16%), Owens-Illinois (-15%), Oshkosh (-15%), Western Union (-15%), Berkshire Hathaway (-14%), and Walgreen (-14%). Returns shown are the full year total return if the stock was held for the full year in the Fund portfolio, or if the stock was held for less than the full year then the total return from the stock while held in the Fund’s portfolio is shown above.
The equity markets staged an impressive recovery following their selloff in the middle of 2011. Of course, it is still a very uncertain world, with a long list of issues to cause investors angst. The overhang from excessive debt levels is likely to inhibit economic growth for years to come. Record corporate profit margins have given investors reason to cheer, but these will be difficult to sustain. Then there is the ongoing unrest in the Middle East, high gasoline prices, and a U.S. presidential election.
With the market recovering so strongly since the financial crisis, returns going forward may be more difficult to generate. While we are modest with our expectations, we believe stock returns have the potential to exceed what we might reasonably expect from other asset classes (bonds and cash), so we continue to invest primarily in equities. Furthermore, we strive to position the Fund’s portfolio to achieve slightly higher returns by staying with our valuation discipline and focusing on dividends and dividend growth. To mitigate the risk of a decline in profit margins, we are emphasizing companies with strong competitive positions in industries where profitability tends to be more stable and predictable.
After such a strong recovery, it would stand to reason that stocks may be vulnerable to a correction of some magnitude; yet these are notoriously difficult to predict – as is good news which could propel the market higher. Therefore, the Fund’s portfolio remains more or less fully invested, with a somewhat defensive posture.
As always, we thank you for your continued investment in the Payson Total Return Fund and confidence in H.M. Payson & Co.
2
PERFORMANCE CHART AND ANALYSIS (Unaudited)
The following chart reflects the change in the value of a hypothetical $10,000 investment, including reinvested dividends and distributions, in the Payson Total Return Fund (the “Fund”) compared with the performance of the benchmark, S&P 500 Index ("S&P 500"), over the past ten fiscal years. The S&P 500 is a broad-based, unmanaged measurement of changes in stock market conditions based on the average of 500 widely held common stocks. The total return of the S&P 500 includes the reinvestment of dividends and income. The total return of the Fund includes operating expenses that reduce returns, while the total return of the S&P 500 does not include expenses. The Fund is professionally managed while the S&P 500 is unmanaged and is not available for investment.
Performance data quoted represents past performance and is no guarantee of future results. Current performance may be lower or higher than the performance data quoted. Investment return and principal value will fluctuate so that shares, when redeemed, may be worth more or less than original cost. For the most recent month-end performance, please call (800) 805-8258. As stated in the Fund's prospectus, the annual operating expense ratio (gross) is 1.31%. The performance table and graph do not reflect the deduction of taxes that a shareholder would pay on Fund distributions or the redemption of Fund shares. Returns greater than one year are annualized.
Comparison of Change in Value of a $10,000 Investment
Payson Total Return Fund vs. S&P 500 Index
Average Annual Total Returns Periods Ended March 31, 2012 | | One Year | | Five Years | | Ten Years |
| Payson Total Return Fund | | 11.35 | % | | 4.16 | % | | 3.57 | % |
| S&P 500 Index | | 8.54 | % | | 2.01 | % | | 4.12 | % |
3
| | Shares | | Security Description | | | Value | |
| Common Stock – 99.6% |
| Consumer Discretionary – 15.1% |
| | 17,945 | | Autoliv, Inc. | | $ | 1,203,212 | |
| | 84,380 | | H&R Block, Inc. | | 1,389,739 | |
| | 30,200 | | Hasbro, Inc. | | 1,108,944 | |
| | 87,600 | | PEP Boys-Manny Moe & Jack | | 1,306,992 | |
| | 24,788 | | TJX Cos., Inc. | | 984,331 | |
| | 29,500 | | Whirlpool Corp. | | 2,267,370 | |
| | | 8,260,588 | |
| Consumer Staples – 10.8% |
| | 85,600 | | Avon Products, Inc. | | 1,657,216 | |
| | 16,000 | | Diageo PLC, ADR | | 1,544,000 | |
| | 21,020 | | PepsiCo, Inc. | | 1,394,677 | |
| | 19,850 | | The Procter & Gamble Co. | | 1,334,119 | |
| | | 5,930,012 | |
| Energy – 13.8% |
| | 31,330 | | BP PLC, ADR | | 1,409,850 | |
| | 15,585 | | ConocoPhillips | | 1,184,616 | |
| | 11,710 | | Exxon Mobil Corp. | | 1,015,608 | |
| | 33,600 | | The Williams Cos., Inc. | | 1,035,216 | |
| | 21,000 | | Transocean, Ltd. | | 1,148,700 | |
| | 98,133 | | WPX Energy, Inc. (a) | | 1,767,375 | |
| | | 7,561,365 | |
| Financial – 10.3% |
| | 12,000 | | Aflac, Inc. | | 551,880 | |
| | 21,490 | | American Express Co. | | 1,243,411 | |
| | 18,300 | | Berkshire Hathaway, Inc., Class B (a) | | 1,485,045 | |
| | 12,957 | | JPMorgan Chase & Co. | | 595,763 | |
| | 15,438 | | The Travelers Cos., Inc. | | 913,930 | |
| | 24,800 | | Wells Fargo & Co. | | 846,672 | |
| | | 5,636,701 | |
| Health Care – 9.3% |
| | 27,284 | | Abbott Laboratories | | 1,672,237 | |
| | 13,918 | | Johnson & Johnson | | 918,031 | |
| | 9,500 | | Laboratory Corp. of America Holdings (a) | | 869,630 | |
| | 10,400 | | Life Technologies Corp. (a) | | 507,728 | |
| | 28,200 | | Sanofi-Aventis SA, ADR | | 1,092,750 | |
| | | 5,060,376 | |
| Industrials – 11.3% |
| | 48,325 | | CSX Corp. | | 1,039,954 | |
| | 12,725 | | Cummins, Inc. | | 1,527,509 | |
| | 3,615 | | General Dynamics Corp. | | 265,269 | |
| | 16,000 | | Parker Hannafin Corp. | | 1,352,800 | |
| | 55,000 | | The Geo Group, Inc. (a) | | 1,045,550 | |
| | 11,665 | | United Technologies Corp. | | 967,495 | |
| | | 6,198,577 | |
| Materials – 2.0% |
| | 50,100 | | Pan American Silver Corp. | | | 1,105,206 | |
| | | | |
| Technology – 27.0% |
| | 3,000 | | Apple, Inc. (a) | | 1,798,410 | |
| | 24,866 | | Comtech Telecommunications Corp. | | 810,134 | |
| | 55,000 | | CSG Systems International, Inc. (a) | | 832,700 | |
| | 1,975 | | Google, Inc., Class A (a) | | 1,266,449 | |
| | 32,887 | | Harris Corp. | | 1,482,546 | |
| | 56,775 | | Hewlett-Packard Co. | | 1,352,948 | |
| | 65,500 | | Intel Corp. | | 1,841,205 | |
| | 62,000 | | Microsoft Corp. | | 1,999,500 | |
| | 36,200 | | Oracle Corp. | | 1,055,592 | |
| | 57,330 | | The Western Union Co. | | 1,009,008 | |
| | 163,660 | | Xerox Corp. | | 1,322,373 | |
| | | 14,770,865 | |
Total Common Stock (Cost $44,706,354) | | 54,523,690 | |
Total Investments – 99.6% (Cost $44,706,354)* | | $ | 54,523,690 | |
| Other Assets & Liabilities, Net – 0.4% | | 219,148 | |
| Net Assets – 100.0% | | $ | 54,742,838 | |
| ADR | American Depositary Receipt |
| PLC | Public Limited Company |
| (a) | Non-income producing security. |
| | * Cost for federal income tax purposes is $44,706,354 and net unrealized appreciation consists of: |
| Gross Unrealized Appreciation | | $ | 9,937,147 | |
| Gross Unrealized Depreciation | | | (119,811 | ) |
| Net Unrealized Appreciation | | $ | 9,817,336 | |
See Notes to Financial Statements. 4
The following is a summary of the inputs used to value the Fund’s investments as of March 31, 2012.
The inputs or methodology used for valuing securities are not necessarily an indication of the risks associated with investing in those securities. For more information on valuation inputs, and their aggregation into the levels used in the tables below, please refer to the Security Valuation section in Note 2 of the accompanying Notes to Financial Statements.
| Valuation Inputs | | Investments in Securities |
| Level 1 - Quoted Prices | | $ | 54,523,690 | |
| Level 2 - Other Significant Observable Inputs | | | - | |
| Level 3 - Significant Unobservable Inputs | | | - | |
| Total | | $ | 54,523,690 | |
The Level 1 inputs displayed in this table are Common Stock. Refer to the Schedule of Investments for a further breakout of each security by type.
There were no significant transfers between Level 1 and Level 2 for the year ended March 31, 2012.
AFPORTFOLIO HOLDINGS | | | |
| % of Total Investments | | | |
| | | | |
| Consumer Discretionary | | | 15.1 | % |
| Consumer Staples | | | 10.9 | % |
| Energy | | | 13.9 | % |
| Financial | | | 10.3 | % |
| Health Care | | | 9.3 | % |
| Industrials | | | 11.4 | % |
| Materials | | | 2.0 | % |
| Technology | | | 27.1 | % |
| | | | 100.0 | % |
See Notes to Financial Statements. �� 5
STATEMENT OF ASSETS AND LIABILITIES
| ASSETS | | | | |
| Total investments, at value (Cost $44,706,354) | | $ | 54,523,690 | |
| Cash | | | 455,157 | |
| Receivables: | | | | |
| Fund shares sold | | | 29,743 | |
| Dividends and interest | | | 48,071 | |
| Prepaid expenses | | | 8,310 | |
| Total Assets | | | 55,064,971 | |
| | | | | | |
| LIABILITIES | | | | |
| Payables: | | | | |
| Fund shares redeemed | | | 70,988 | |
| Distributions payable | | | 183,355 | |
| Accrued Liabilities: | | | | |
| Investment adviser fees | | | 27,563 | |
| Fund services fees | | | 12,623 | |
| Compliance services fees | | | 2,083 | |
| Other expenses | | | 25,521 | |
| Total Liabilities | | | 322,133 | |
| | | | | | |
| NET ASSETS | | $ | 54,742,838 | |
| | | | | | |
| COMPONENTS OF NET ASSETS | | | | |
| Paid-in capital | | $ | 42,859,066 | |
| Undistributed net investment income | | | 1,707 | |
| Accumulated net realized gain | | | 2,064,729 | |
| Net unrealized appreciation | | | 9,817,336 | |
| NET ASSETS | | $ | 54,742,838 | |
| SHARES OF BENEFICIAL INTEREST AT NO PAR VALUE (UNLIMITED SHARES AUTHORIZED) | | | 3,782,556 | |
| NET ASSET VALUE, OFFERING AND REDEMPTION PRICE PER SHARE | | $ | 14.47 | |
| | | | | | |
See Notes to Financial Statements. 6
YEAR ENDED MARCH 31, 2012
| INVESTMENT INCOME | | | | |
| Dividend income (Net of foreign withholding taxes of $253) | | $ | 1,238,569 | |
| Interest income | | | 516 | |
| Total Investment Income | | | 1,239,085 | |
| | | | | |
| EXPENSES | | | | |
| Investment adviser fees | | | 286,174 | |
| Fund services fees | | | 154,089 | |
| Custodian fees | | | 5,125 | |
| Registration fees | | | 10,727 | |
| Professional fees | | | 41,700 | |
| Trustees' fees and expenses | | | 1,574 | |
| Compliance services fees | | | 25,010 | |
| Miscellaneous expenses | | | 22,460 | |
| Total Expenses | | | 546,859 | |
| | | | | |
| NET INVESTMENT INCOME | | | 692,226 | |
| | | | | |
| NET REALIZED AND UNREALIZED GAIN (LOSS) | | | | |
| Net realized gain on investments | | | 2,058,413 | |
| Net change in unrealized appreciation (depreciation) on investments | | | 2,766,131 | |
| NET REALIZED AND UNREALIZED GAIN | | | 4,824,544 | |
| INCREASE IN NET ASSETS FROM OPERATIONS | | $ | 5,516,770 | |
| | | | | |
See Notes to Financial Statements. 7
STATEMENTS OF CHANGES IN NET ASSETS
| | | | For the Years Ended March 31, |
| | | | 2012 | | 2011 |
| OPERATIONS | | | | | | | | |
| Net investment income | | $ | 692,226 | | | $ | 433,095 | |
| Net realized gain | | | 2,058,413 | | | | 4,886,053 | |
| Net change in unrealized appreciation (depreciation) | | | 2,766,131 | | | | 194,894 | |
| Increase in Net Assets Resulting from Operations | | | 5,516,770 | | | | 5,514,042 | |
| | | | | | | | | | |
| DISTRIBUTIONS TO SHAREHOLDERS FROM | | | | | | | | |
| Net investment income | | | (673,881 | ) | | | (433,068 | ) |
| Net realized gain | | | (2,688,807 | ) | | | - | |
| Total Distributions to Shareholders | | | (3,362,688 | ) | | | (433,068 | ) |
| | | | | | | | | | |
| CAPITAL SHARE TRANSACTIONS | | | | | | | | |
| Sale of shares | | | 8,734,645 | | | | 10,707,254 | |
| Reinvestment of distributions | | | 2,920,214 | | | | 162,833 | |
| Redemption of shares | | | (6,051,356 | ) | | | (6,573,744 | ) |
| Increase in Net Assets from Capital Share Transactions | | | 5,603,503 | | | | 4,296,343 | |
| Increase in Net Assets | | | 7,757,585 | | | | 9,377,317 | |
| | | | | | | | | | |
| NET ASSETS | | | | | | | | |
| Beginning of Year | | | 46,985,253 | | | | 37,607,936 | |
| End of Year (Including line (a)) | | $ | 54,742,838 | | | $ | 46,985,253 | |
| | | | | | | | | | |
| SHARE TRANSACTIONS | | | | | | | | |
| Sale of shares | | | 645,702 | | | | 852,430 | |
| Reinvestment of distributions | | | 230,729 | | | | 12,668 | |
| Redemption of shares | | | (449,955 | ) | | | (523,490 | ) |
| Increase in Shares | | | 426,476 | | | | 341,608 | |
| | | | | | | | | | |
| (a) | Undistributed (distributions in excess of) net investment income. | | $ | 1,707 | | | $ | (10,113 | ) |
See Notes to Financial Statements. 8
These financial highlights reflect selected data for a share outstanding throughout each year. | | | | | |
| | | For the Years Ended March 31, |
| | | 2012 | | 2011 | | 2010 | | 2009 | | 2008 |
| NET ASSET VALUE, Beginning of Year | $ | 14.00 | | | $ | 12.48 | | | $ | 7.59 | | | $ | 12.48 | | | $ | 13.57 | |
| INVESTMENT OPERATIONS | | | | | | | | | | | | | | | | | | | |
| Net investment income (a) | | 0.20 | | | | 0.13 | | | | 0.09 | | | | 0.10 | | | | 0.11 | |
| Net realized and unrealized gain (loss) | | 1.25 | | | | 1.52 | | | | 4.87 | | | | (4.82 | ) | | | (0.76 | ) |
| Total from Investment Operations | | 1.45 | | | | 1.65 | | | | 4.96 | | | | (4.72 | ) | | | (0.65 | ) |
| DISTRIBUTIONS TO | | | | | | | | | | | | | | | | | | | |
| SHAREHOLDERS FROM | | | | | | | | | | | | | | | | | | | |
| Net investment income | | (0.19 | ) | | | (0.13 | ) | | | (0.07 | ) | | | (0.10 | ) | | | (0.12 | ) |
| Net realized gain | | (0.79 | ) | | | — | | | | — | | | | (0.07 | ) | | | (0.32 | ) |
| Total Distributions to Shareholders | | (0.98 | ) | | | (0.13 | ) | | | (0.07 | ) | | | (0.17 | ) | | | (0.44 | ) |
| NET ASSET VALUE, End of Year | $ | 14.47 | | | $ | 14.00 | | | $ | 12.48 | | | $ | 7.59 | | | $ | 12.48 | |
| TOTAL RETURN | | 11.35 | % | | 13.33 | % | | 65.44 | % | | (38.05 | )% | | (5.06 | )% |
| | | | | | | | | | | | | | | | | | | | |
| RATIOS/SUPPLEMENTARY DATA | | | | | | | | | | | | | | | | | | | |
| Net Assets at End of | | | | | | | | | | | | | | | | | | | |
| Year (000's omitted) | $54,743 | | | $46,985 | | | $37,608 | | | $16,011 | | | $27,577 | |
| Ratios to Average Net Assets: | | | | | | | | | | | | | | | | | | | |
| Net investment income | | 1.45 | % | | 1.08 | % | | 0.83 | % | | 0.94 | % | | 0.80 | % |
| Net expense | | 1.15 | % | | 1.28 | % | | 1.59 | % | | 1.77 | % | | 1.46 | % |
| Gross expense | | 1.15 | % | | 1.29 | %(b) | 1.61 | %(b) | 1.78 | %(b) | 1.46 | % |
| PORTFOLIO TURNOVER RATE | | 101 | % | | 72 | % | | 79 | % | | 109 | % | | 57 | % |
| | | | | | | | | | | | | | | | | | | | | |
| (a) | Calculated based on average shares outstanding during each year. |
| (b) | Reflects the expense ratio excluding any waivers and/or reimbursements. |
See Notes to Financial Statements. 9
NOTES TO FINANCIAL STATEMENTS
Note 1. Organization
The Payson Total Return Fund (the “Fund”) is a diversified portfolio of Forum Funds (the “Trust”). The Trust is a Delaware statutory trust that is registered as an open-end, management investment company under the Investment Company Act of 1940 (the “Act”), as amended. Under its Trust Instrument, the Trust is authorized to issue an unlimited number of the Fund’s shares of beneficial interest without par value. The Fund commenced operations on November 25, 1991. The Fund seeks a combination of high current income and capital appreciation.
Note 2. Summary of Significant Accounting Policies
These financial statements are prepared in accordance with accounting principles generally accepted in the United States of America (“GAAP”), which require management to make estimates and assumptions that affect the reported amounts of assets and liabilities, the disclosure of contingent liabilities at the date of the financial statements, and the reported amounts of increase and decrease in net assets from operations during the fiscal year. Actual amounts could differ from those estimates. The following summarizes the significant accounting policies of the Fund:
Security Valuation – Exchange-traded securities and over-the-counter securities are valued using the last quoted sale or official closing price, provided by independent pricing services as of the close of trading on the market or exchange for which they are primarily traded, on each Fund business day. In the absence of a sale, such securities are valued at the mean of the last bid and ask price provided by independent pricing services. Non-exchange traded securities for which quotations are available are valued using the last quoted sales price, or in the absence of a sale at the mean of the last bid and ask prices provided by independent pricing services. Shares of open-end mutual funds are valued at net asset value (“NAV”). Short-term investments that mature in 60 days or less may be valued at amortized cost.
The Fund values its investments at fair value pursuant to procedures adopted by the Trust's Board of Trustees (the "Board") if (1) market quotations are insufficient or not readily available or (2) the adviser believes that the values available are unreliable. Fair valuation is based on subjective factors and, as a result, the fair value price of an investment may differ from the security’s market price and may not be the price at which the asset may be sold. Fair valuation could result in a different NAV than a NAV determined by using market quotes.
The Fund has a three-tier fair value hierarchy. The basis of the tiers is dependent upon the various “inputs” used to determine the value of the Fund’s investments. These inputs are summarized in the three broad levels listed below:
Level 1 — quoted prices in active markets for identical assets
Level 2 — other significant observable inputs (including quoted prices of similar securities, interest rates, prepayment speeds, credit risk, etc.)
10
NOTES TO FINANCIAL STATEMENTS
Level 3 — significant unobservable inputs (including the Fund’s own assumptions in determining the fair value of investments)
The aggregate value by input level, as of March 31, 2012, for the Fund’s investments is included at the end of the Fund’s Schedule of Investments.
Security Transactions, Investment Income and Realized Gain and Loss – Investment transactions are accounted for on the trade date. Dividend income is recorded on the ex-dividend date. Foreign dividend income is recorded on the ex-dividend date or as soon as possible after the Fund determines the existence of a dividend declaration after exercising reasonable due diligence. Income and capital gains on some foreign securities may be subject to foreign withholding taxes, which are accrued as applicable. Interest income is recorded on an accrual basis. Premium is amortized and discount is accreted using the effective interest method. Identified cost of investments sold is used to determine the gain and loss for both financial statement and federal income tax purposes.
Distributions to Shareholders – Distributions to shareholders of net investment income, if any, are declared and paid at least quarterly. Distributions to shareholders of net capital gains, if any, are declared and paid annually. Distributions are based on amounts calculated in accordance with applicable federal income tax regulations, which may differ from GAAP. These differences are due primarily to differing treatments of income and gain on various investment securities held by the Fund, timing differences and differing characterizations of distributions made by the Fund.
Federal Taxes – The Fund intends to continue to qualify each year as a regulated investment company under Subchapter M of the Internal Revenue Code and to distribute all of its taxable income to shareholders. In addition, by distributing in each calendar year substantially all of its net investment income and capital gains, if any, the Fund will not be subject to a federal excise tax. Therefore, no federal income or excise tax provision is required. The Fund files a U.S. federal income and excise tax return as required. A fund’s federal income tax returns are subject to examination by the Internal Revenue Service for a period of three fiscal years after they are filed. As of March 31, 2012, there are no uncertain tax positions that would require financial statement recognition, de-recognition, or disclosure.
Income and Expense Allocation – The Trust accounts separately for the assets, liabilities and operations of each of its investment portfolios. Expenses that are directly attributable to more than one investment portfolio are allocated among the respective investment portfolios in an equitable manner.
Commitments and Contingencies – In the normal course of business, the Fund enters into contracts that provide general indemnifications by the Fund to the counterparty to the contract. The Fund’s maximum exposure under these arrangements is dependent on future claims that may be made against the Fund and, therefore, cannot be estimated; however, based on experience, the risk of loss from such claims is considered remote.
Note 3. Fees and Expenses
Investment Adviser – H.M. Payson & Co. (the “Adviser”) is the investment adviser to the Fund. Pursuant to
11
NOTES TO FINANCIAL STATEMENTS
an investment advisory agreement, the Adviser receives an advisory fee from the Fund at an annual rate of 0.60% of the Fund’s average daily net assets.
Distribution – Foreside Fund Services, LLC serves as the Fund’s distributor (the “Distributor”). The Distributor receives no compensation from the Fund for its distribution services. The Distributor is not affiliated with the Adviser or Atlantic Fund Administration, LLC (d/b/a Atlantic Fund Services) (“Atlantic”) or their affiliates.
Other Service Providers – Atlantic provides fund accounting, fund administration, and transfer agency services to the Fund. Atlantic also provides certain shareholder report production, and EDGAR conversion and filing services. Pursuant to an Atlantic services agreement, the Fund pays Atlantic customary fees for its services. Atlantic provides a Principal Executive Officer, a Principal Financial Officer, a Chief Compliance Officer, and an Anti-Money Laundering Officer to the Fund, as well as certain additional compliance support functions.
Trustees and Officers – The Trust pays each independent Trustee an annual retainer fee of $45,000 for service to the Trust ($66,000 for the Chairman). In addition, for the year ended March 31, 2012, the Chairman received a monthly stipend of $500 to cover certain expenses incurred in connection with his duties to the Trust. The stipend was discontinued April 1, 2012. The Trustees and Chairman may receive additional fees for special Board meetings. Each Trustee is also reimbursed for all reasonable out-of-pocket expenses incurred in connection with his duties as a Trustee, including travel and related expenses incurred in attending Board meetings. The amount of Trustees’ fees attributable to the Fund is disclosed in the Statement of Operations. Certain officers of the Trust are also officers or employees of the above named service providers, and during their terms of office received no compensation from the Fund.
Note 4. Security Transactions
The cost of purchases and proceeds from sales of investment securities (including maturities), other than short-term investments during the period ended March 31, 2012, were $51,675,642 and $48,566,901, respectively.
Note 5. Federal Income Tax and Investment Transactions
Distributions during the fiscal years ended as noted were characterized for tax purposes as follows:
| Ordinary Income | | $ | 915,810 | | $ | 377,321 |
| Long-Term Capital Gain | | | 2,425,945 | | | - |
| | | $ | 3,341,755 | | $ | 377,321 |
12
NOTES TO FINANCIAL STATEMENTS
| Undistributed Ordinary Income | | $ | 185,062 | |
| Undistributed Long-Term Gain | | | 2,064,729 | |
| Unrealized Appreciation | | | 9,817,336 | |
| Other Temporary Differences | | | (183,355 | ) |
| Total | | $ | 11,883,772 | |
The difference between components of distributable earnings on a tax basis and the amounts reflected in the Statement of Assets and Liabilities are primarily due to distributions payable that are deductible when paid for tax purposes.
On the Statement of Assets and Liabilities, as a result of permanent book to tax differences, certain amounts have been reclassified for the year ended March 31, 2012. The following reclassification was the result of Real Estate Investment Trust distribution reclassifications and has no impact on the net assets of the Fund.
| Accumulated Net Investment Income (Loss) | | $ | (6,525 | ) |
| Undistributed Net Realized Gain (Loss) | | | 6,525 | |
Note 6. Recent Accounting Pronouncements
In May 2011, FASB issued ASU No. 2011-04 “Amendments to Achieve Common Fair Value Measurement and Disclosure Requirements in U.S. GAAP and IFRSs.” ASU No. 2011-04 establishes common requirements for measuring fair value and for disclosing information about fair value measurements in accordance with U.S. GAAP and International Financial Reporting Standards (“IFRSs”). ASU No. 2011-04 is effective for interim and annual periods beginning after December 15, 2011. Management is evaluating the impact ASU No. 2011-04 may have on financial statement disclosures.
In December 2011, FASB issued ASU No. 2011-11 “Disclosures about Offsetting Assets and Liabilities” requiring disclosure of both gross and net information related to offsetting and related arrangements enabling users of its financial statements to understand the effect of those arrangements on the entity’s financial position. The objective of this disclosure is to facilitate comparison between those entities that prepare their financial statements on the basis of U.S. GAAP and those entities that prepare their financial statements on the basis of IFRSs. ASU No. 2011-11 is effective for interim and annual periods beginning on or after January 1, 2013. Management is evaluating any impact ASU No. 2011-11 may have on the Fund’s financial statements.
Note 7. Subsequent Events
Subsequent events occurring after the date of this report through the date these financial statements were issued have been evaluated for potential impact and the Fund has had no such events.
13
REPORT OF INDEPENDENT REGISTERED PUBLIC ACCOUNTING FIRM
To the Board of Trustees of Forum Funds and the Shareholders of Payson Total Return Fund
We have audited the accompanying statement of assets and liabilities of Payson Total Return Fund, a series of shares of beneficial interest in the Forum Funds, including the schedule of investments, as of March 31, 2012, and the related statement of operations for the year then ended, the statements of changes in net assets for each of the years in the two year period then ended, and the financial highlights for each of the years in the four year period then ended. These financial statements and financial highlights are the responsibility of the Fund's management. Our responsibility is to express an opinion on these financial statements and financial highlights based on our audits. The financial highlights for the year ended March 31, 2008 were audited by other auditors whose report dated May 28, 2008, expressed an unqualified opinion on such financial highlights.
We conducted our audits in accordance with the standards of the Public Company Accounting Oversight Board (United States). Those standards require that we plan and perform the audits to obtain reasonable assurance about whether the financial statements and financial highlights are free of material misstatement. An audit includes examining, on a test basis, evidence supporting the amounts and disclosures in the financial statements. Our procedures included confirmation of securities owned as of March 31, 2012 by correspondence with the custodian. An audit also includes assessing the accounting principles used and significant estimates made by management, as well as evaluating the overall financial statement presentation. We believe that our audits provide a reasonable basis for our opinion.
In our opinion, the financial statements and financial highlights referred to above present fairly, in all material respects, the financial position of Payson Total Return Fund as of March 31, 2012, the results of its operations for the year then ended, the changes in its net assets for each of the years in the two year period then ended, and its financial highlights for each of the years in the four year period then ended, in conformity with accounting principles generally accepted in the United States of America.
BBD, LLP
Philadelphia, Pennsylvania
May 23, 2012
14
ADDITIONAL INFORMATION (Unaudited)
Proxy Voting Information
A description of the policies and procedures that the Fund uses to determine how to vote proxies relating to securities held in the Fund’s portfolio is available, without charge and upon request, by calling (800) 805-8258 and on the U.S. Securities and Exchange Commission’s (the “SEC”) website at www.sec.gov. The Fund’s proxy voting record for the most recent twelve-month period ended June 30 is available, without charge and upon request, by calling (800) 805-8258 and on the SEC’s website at www.sec.gov.
Availability of Quarterly Portfolio Schedules
The Fund files its complete schedule of portfolio holdings with the SEC for the first and third quarters of each fiscal year on Form N-Q. These filings are available, without charge and upon request on the SEC’s website at www.sec.gov or may be reviewed and copied at the SEC’s Public Reference Room in Washington, DC. Information on the operation of the Public Reference Room may be obtained by calling (800) SEC-0330.
Shareholder Expense Example
As a shareholder of the Fund, you incur ongoing costs, including management fees and other Fund expenses. This example is intended to help you understand your ongoing costs (in dollars) of investing in the Fund and to compare these costs with the ongoing costs of investing in other mutual funds.
The example is based on an investment of $1,000 invested at the beginning of the period and held for the entire period from October 1, 2011, through March 31, 2012.
Actual Expenses – The first line of the table below provides information about actual account values and actual expenses. You may use the information in this line, together with the amount you invested, to estimate the expenses that you paid over the period. Simply divide your account value by $1,000 (for example, an $8,600 account value divided by $1,000 = 8.6), then multiply the result by the number in the first line under the heading entitled “Expenses Paid During Period” to estimate the expenses you paid on your account during the period.
Hypothetical Example for Comparison Purposes – The second line of the table below provides information about hypothetical account values and hypothetical expenses based on the Fund’s actual expense ratio and an assumed rate of return of 5% per year before expenses, which is not the Fund’s actual return. The hypothetical account values and expenses may not be used to estimate the actual ending account balance or expenses you paid for the period. You may use this information to compare the ongoing costs of investing in the Fund and other funds. To do so, compare this 5% hypothetical example with the 5% hypothetical examples that appear in the shareholder reports of other funds.
Please note that the expenses shown in the table are meant to highlight your ongoing costs only. Therefore, the second line of the table is useful in comparing ongoing costs only and will not help you determine the relative total costs of owning different funds.
15
ADDITIONAL INFORMATION (Unaudited)
| | Beginning | | Ending | | Expenses | | | Annualized |
| | Account Value | | Account Value | | Paid During | | | Expense |
| | October 1, 2011 | | March 31, 2012 | | Period* | | | Ratio* |
| Actual | | $ | 1,000.00 | | | $ | 1,257.62 | | | $ | 6.38 | | | | 1.13 | % |
| Hypothetical (5% return before taxes) | | $ | 1,000.00 | | | $ | 1,019.35 | | | $ | 5.70 | | | | 1.13 | % |
| | | | | | | | | | | | | | | | | |
| * | Expenses are equal to the Fund’s annualized expense ratio multiplied by the average account value over the period, multiplied by the number of days in the most recent fiscal half-year divided by 365 to reflect the half-year period. |
Federal Tax Status of Dividends Declared during the Tax Year
For federal income tax purposes, dividends from short-term capital gains are classified as ordinary income. The Fund designates 97.78% of its income dividend distributed as qualifying for the corporate dividends-received deduction (DRD) and 100.00% for the qualified dividend rate (QDI) as defined in Section 1(h)(11) of the Internal Revenue Code. The Fund also designates 0.08% as qualified interest income exempt from U.S. tax for foreign shareholders (QII) and 28.70% as short-term capital gain dividends exempt from U.S. tax for foreign shareholders (QSD).
Trustees and Officers of the Trust
The Board is responsible for oversight of the management of the Trust’s business affairs and of the exercise of all the Trust’s powers except those reserved for the shareholders. The following table provides information about each Trustee and certain officers of the Trust. Each Trustee and officer holds office until the person resigns, is removed, or is replaced. Unless otherwise noted, the persons have held their principal occupations for more than five years. The address for all Trustees and officers is Three Canal Plaza, Suite 600, Portland, Maine 04101. Mr. Keffer is considered an Interested Trustee due to his affiliation with Atlantic. The Fund’s Statement of Additional Information includes additional information about the Trustees and is available, without charge and upon request, by calling (800) 805-8258.
Name and Year of Birth | Position with the Trust | Length of Time Served | Principal Occupation(s) During Past Five Years | Number of Series of Trust Overseen by Trustee | Other Directorships Held by Trustee |
| Independent Trustees | | | | | |
J. Michael Parish Born: 1943 | Chairman of the Board; Trustee; Chairman, Nominating Committee and Qualified Legal Compliance Committee | Since 1989 (Chairman since 2004) | Retired since 2003. | 21 | 0 |
Costas Azariadis Born: 1943 | Trustee; Chairman, Valuation Committee | Since 1989 | Professor of Economics, Washington University since 2006. | 21 | 0 |
16
ADDITIONAL INFORMATION (Unaudited)
Name and Year of Birth | Position with the Trust | Length of Time Served | Principal Occupation(s) During Past Five Years | Number of Series of Trust Overseen by Trustee | Other Directorships Held by Trustee |
| Independent Trustees - continued | | | | | |
James C. Cheng Born: 1942 | Trustee; Chairman, Audit Committee | Since 1989 | President, Technology Marketing Associates (marketing company for small- and medium-sized businesses in New England) since 1991. | 21 | 0 |
David Tucker Born: 1958 | Trustee | Since 2011 | Director, Blue Sky Experience since 2008, Senior Vice President & General Counsel, American Century Companies 1998-2008. | 21 | 0 |
| Interested Trustee | | | | | |
John Y. Keffer1 Born: 1942 | Trustee; Vice Chairman | Since 1989 | Chairman, Atlantic since 2008; President, Forum Foundation (a charitable organization) since 2005; President, Forum Trust, LLC (a non-depository trust company chartered in the State of Maine) since 1997. | 21 | Director, Wintergreen Fund, Inc.; Director, Forum ETF Trust |
| Officers | | | | | |
Stacey E. Hong Born: 1966 | President; Principal Executive Officer | Since 2008 | President, Atlantic since 2008; Director, Consulting Services, Foreside Fund Services 2007. | N/A | N/A |
Karen Shaw Born: 1972 | Treasurer; Principal Financial Officer | Since 2008 | Senior Vice President, Atlantic since 2008; Vice President, Citigroup 2003-2008. | N/A | N/A |
David Faherty Born: 1970 | Vice President | Since 2009 | Senior Counsel, Atlantic since 2009; Vice President, Citi Fund Services Ohio, Inc. 2007-2009; Associate Counsel, Investors Bank & Trust Co. 2006-2007. | N/A | N/A |
Michael J. McKeen Born: 1971 | Vice President | Since 2009 | Senior Vice President, Atlantic since 2008; Vice President, Citigroup 2003-2008. | N/A | N/A |
Joshua LaPan Born: 1973 | Vice President | Since 2009 | Manager, Atlantic since 2008; Vice President, Citigroup 2003-2008. | N/A | N/A |
Timothy Bowden Born: 1969 | Vice President | Since 2009 | Manager, Atlantic since 2008; Vice President, Citigroup 2005-2008. | N/A | N/A |
Lina Bhatnagar Born: 1971 | Secretary | Since 2008 | Senior Administration Specialist, Atlantic since 2008; Regulatory Administration Specialist, Citigroup 2006-2008. | N/A | N/A |
1Atlantic is a subsidiary of Forum Holdings Corp. I, a Delaware corporation that is wholly owned by Mr. Keffer. |
17
ITEM 2. CODE OF ETHICS.
| (a) | As of the end of the period covered by this report, Forum Funds (the “Registrant”) has adopted a code of ethics, which applies to its Principal Executive Officer and Principal Financial Officer (the “Code of Ethics”). |
| (c) | There have been no amendments to the Registrant’s Code of Ethics during the period covered by this report. |
| (d) | There have been no waivers to the Registrant’s Code of Ethics during the period covered by this report. |
(f) (1) A copy of the Code of Ethics is being filed under Item 12(a) hereto.
ITEM 3. AUDIT COMMITTEE FINANCIAL EXPERT.
The Board of Trustees has determined that no member of the Audit Committee is an "audit committee financial expert" as that term is defined under applicable regulatory guidelines.
ITEM 4. PRINCIPAL ACCOUNTANT FEES AND SERVICES.
(a) Audit Fees - The aggregate fees billed for each of the last two fiscal years (the “Reporting Periods”) for professional services rendered by the Registrant’s principal accountant for the audit of the Registrant’s annual financial statements, or services that are normally provided by the principal accountant in connection with the statutory and regulatory filings or engagements for the Reporting Periods, were $171,000 in 2011 and $191,500 in 2012.
(b) Audit-Related Fees – The aggregate fees billed in the Reporting Periods for assurance and related services rendered by the principal accountant that were reasonably related to the performance of the audit of the Registrant’s financial statements and are not reported under paragraph (a) of this Item 4 were $0 in 2011 and $0 in 2012.
(c) Tax Fees - The aggregate fees billed in the Reporting Periods for professional services rendered by the principal accountant to the Registrant for tax compliance, tax advice and tax planning were $28,000 in 2011 and $38,000 in 2012. These services consisted of review or preparation of U.S. federal, state, local and excise tax returns.
(d) All Other Fees - The aggregate fees billed in the Reporting Periods for products and services provided by the principal accountant to the Registrant, other than the services reported in paragraphs (a) through (c) of this Item, were $0 in 2011 and $0 in 2012.
(e) (1) The Audit Committee reviews and approves in advance all audit and “permissible non-audit services” (as that term is defined by the rules and regulations of the Securities and Exchange Commission) to be rendered to a series of the Registrant (each, a “Series”). In addition, the Audit Committee reviews and approves in advance all “permissible non-audit services” to be provided to an investment adviser (not including any sub-adviser) of a Series, or an affiliate of such investment adviser, that is controlling, controlled by or under common control with the investment adviser and provides on-going services to the Registrant (“Affiliate”), by the Series’ principal accountant if the engagement relates directly to the operations and financial reporting of the Series. The Audit Committee considers whether fees paid by a Series’ investment adviser or an Affiliate to the Series’ principal accountant for audit and permissible non-audit services are consistent with the principal accountant’s independence.
(e) (2) No services included in (b) - (d) above were approved pursuant to paragraph (c)(7)(i)(C) of Rule 2-01 of Regulation S-X.
(f) Not applicable
(g) The aggregate non-audit fees billed by the principal accountant for services rendered to the Registrant for the Reporting Periods were $0 in 2010 and $0 in 2011. There were no fees billed in either of the Reporting Periods for non-audit services rendered by the principal accountant to the Registrant’s investment adviser or any Affiliate.
(h) During the Reporting Period, the Registrant's principal accountant provided no non-audit services to the investment advisers or any entity controlling, controlled by or under common control with the investment advisers to the series of the Registrant to which this report relates.
ITEM 5. AUDIT COMMITTEE OF LISTED REGISTRANTS.
Not applicable.
ITEM 6. INVESTMENTS.
| (a) | Included as part of report to shareholders under Item 1. |
ITEM 7. DISCLOSURE OF PROXY VOTING POLICIES AND PROCEDURES FOR CLOSED-END
MANAGEMENT INVESTMENT COMPANIES.
Not applicable.
ITEM 8. PORTFOLIO MANAGERS OF CLOSED-END MANAGEMENT INVESTMENT COMPANIES.
Not applicable.
ITEM 9. PURCHASES OF EQUITY SECURITIES BY CLOSED-END MANAGEMENT INVESTMENT COMPANY AND AFFILIATED PURCHASERS.
Not applicable.
ITEM 10. SUBMISSION OF MATTERS TO A VOTE OF SECURITY HOLDERS
The Registrant does not accept nominees to the board of trustees from shareholders.
ITEM 11. CONTROLS AND PROCEDURES
(a) The Registrant’s Principal Executive Officer and Principal Financial Officer have concluded that the Registrant’s disclosure controls and procedures (as defined in Rule 30a-3(c) under the Investment Company Act of 1940 (the “Act”)) are effective, based on their evaluation of the controls and procedures required by Rule 30a-3(b) under the Act and Rules 13a-15(b) or 15d-15(b) under the Securities Exchange Act of 1934, as of a date within 90 days of the filing date of this report.
(b) There were no changes in the Registrant’s internal control over financial reporting (as defined in
Rule 30a-3(d) under the Act) that occurred during the second fiscal quarter of the period covered by this report that have materially affected, or are reasonably likely to materially affect, the Registrant’s internal control over financial reporting.
ITEM 12. EXHIBITS.
(a)(1) Code of Ethics (Exhibit filed herewith).
(a)(2) Certifications pursuant to Rule 30a-2(a) of the Act, and Section 302 of the Sarbanes-Oxley Act of 2002. (Exhibits filed herewith)
(a)(3) Not applicable.
(b) Certifications pursuant to Rule 30a-2(b) of the Act, and Section 906 of the Sarbanes-Oxley Act of 2002. (Exhibit filed herewith)
SIGNATURES
Pursuant to the requirements of the Securities Exchange Act of 1934 and the Investment Company Act of 1940, the Registrant has duly caused this report to be signed on its behalf by the undersigned, thereunto duly authorized.
Registrant Forum Funds
By /s/ Stacey E. Hong
Stacey E. Hong, Principal Executive Officer ��
Date May 29, 2012
Pursuant to the requirements of the Securities Exchange Act of 1934 and the Investment Company Act of 1940, this report has been signed below by the following persons on behalf of the Registrant and in the capacities and on the dates indicated.
By /s/ Stacey E. Hong
Stacey E. Hong, Principal Executive Officer
By /s/ Karen Shaw
Karen Shaw, Principal Financial Officer