As filed with the Securities and Exchange Commission on December 28, 2012
UNITED STATES
SECURITIES AND EXCHANGE COMMISSION
WASHINGTON, D.C. 20549
FORM N-CSR
CERTIFIED SHAREHOLDER REPORT OF REGISTERED MANAGEMENT
INVESTMENT COMPANIES
Investment Company Act file number 811-03023
FORUM FUNDS
Three Canal Plaza, Suite 600
Portland, Maine 04101
Stacey E. Hong, Principal Executive Officer
Three Canal Plaza, Suite 600
Portland, Maine 04101
207-347-2000
Date of fiscal year end: October 31
Date of reporting period: November 1, 2011 – October 31, 2012
ITEM 1. REPORT TO STOCKHOLDERS.
| A Message to Our Shareholders | | | 1 | |
| Performance Chart and Analysis (Unaudited) | | | 4 | |
| Schedule of Investments | | | 5 | |
| Statement of Assets and Liabilities | | | 7 | |
| Statement of Operations | | | 8 | |
| Statements of Changes in Net Assets | | | 9 | |
| Financial Highlights | | | 10 | |
| Notes to Financial Statements | | | 11 | |
| Report of Independent Registered Public Accounting Firm | | | 16 | |
| Additional Information (Unaudited) | | | 17 | |
| | | | | |
FOUNTAINHEAD SPECIAL VALUE FUNDA MESSAGE TO OUR SHAREHOLDERS
Dear Shareholder,
For the fiscal year ended October 31, 2012, the Fountainhead Special Value Fund (the “Fund”) (KINGX) returned 8.47%; its benchmark index, the Russell 2500TM Index, returned 13.00%. For the period ended October 31, 2012, the Fund’s 1-year, 5-year, 10-year, and since inception (12/31/96) average annual returns were 8.47%, -1.63%, 7.05%, and 6.38%, respectively. (Performance data quoted represents past performance and is no guarantee of future results. Current performance may be lower or higher than the performance data quoted. Investment return and principal value will fluctuate so that an investor’s shares, when redeemed, may be worth more or less than original cost. For the most recent month-end performance, please call 800-868-9535. As stated in the current prospectus, the Fund’s annual operating expense ratio (gross) is 3.56%. However, the Adviser has contractually agreed to waive a portion of its fees and reimburse certain expenses through March 1, 2013, to limit Total Annual Fund Operating Expenses to 1.75%. Shares held less than 180 days will be subject to a 1.00% redemption fee.)
The Fund’s top performer was regional bank, HomeStreet, Inc. (HMST), which rose 60.7%. Another one of the Fund’s best performers, eResearch Technology, Inc. (ERT), agreed to be acquired by affiliates of Genstar Capital, LLC. We sold the stock ahead of the deal closing to lock in a 57.2% gain. Illumina, Inc. (ILMN), another takeover candidate, increased 55.1% following news of a hostile takeover bid from Roche Holding A.G., which was later rejected by management. Forest and paper products company, Weyerhauser Company (WY), made a significant contribution as well, rising 54.0%. Several of the Fund’s Healthcare stocks continued to deliver excellent results for the one-year time period with particular strength in the Healthcare Services and Equipment sector: PAREXEL International Corp. (PRXL) +39.3%; BioScrip, Inc. (BIOS) +38.6%; Auxilium Pharmaceuticals, Inc. (AUXL) +31.6%; and Hologic, Inc. (HOLX) +27.9%. Other strong performers included cable operator, Cablevision Systems Corp. (CVC), +33.1%; Internet software and services company, Akamai Technologies, Inc. (AKAM) +31.0%; multi-industrial company specializing in aerospace and defense, Textron (TXT) +29.8%; on-line restaurant reservation company, OpenTable, Inc. (OPEN), +29.6%; furniture retailer, La-Z Boy, Inc. +24.9%; and regional bank, First Commonwealth Financial Corp. (FCF) +21.9%.
The Fund’s poorest performer was wireless telecom provider, NII Holdings, Inc. (NIHD), which declined 52.4% and was eliminated from the portfolio. Other stocks that negatively impacted performance and were eliminated from the Fund included Comstock Resources, Inc. (CRK) -34.6%; Leap Wireless International, Inc. (LEAP) -29.7%; Emergent BioSolutions Inc. (EBS) -29.5%; Intrepid Potash, Inc. (IPI) -23.0%; and Roundy’s, Inc. (RNDY) -22.1%. Also hindering performance were the holdings of Bravo Brio Restaurant Group, Inc. (BBRG); Superior Energy Services, Inc. (SPN); Take-Two Interactive Software, Inc. (TTWO); and Travelzoo, Inc. (TZOO), all declining by more than 20%. Despite their recent performance, we continue to hold these stocks because we believe they continue to offer significant upside growth potential and the long-term investment thesis is intact for each.
The U.S. Federal Reserve has a dual mandate that states it must keep unemployment low and prices stable. Capital markets and the central bank are keenly aware of this mandate. Earlier this year there was widespread speculation that because of high unemployment and the tepid pace of the recovery, the Fed would begin yet another round of quantitative easing. This speculation proved to be appropriate because the Fed announced a new easing plan on September 13. Popularly known as “QE3,” the central bankers committed to buying mortgage-backed securities for an undisclosed period of time. The open-ended nature
1
FOUNTAINHEAD SPECIAL VALUE FUNDA MESSAGE TO OUR SHAREHOLDERS
of this announcement implies that the Fed will keep buying these securities until employment rebounds. The U.S. housing market, arguably the primary culprit for the economic recession, has already been displaying real signs of life, but the Fed obviously feels that more intervention is needed in this arena. Purchasing the mortgage-related securities will keep mortgage rates low and potentially spur more activity in the housing market. The Fed sees the risk of creating another housing bubble via overleveraged homeowners as outweighed by the benefit of a livelier residential real estate market.
As the central bank buys these assets from current owners, the sellers will have to determine a place for the new capital. With rates stuck at microscopic levels, these investors will look at riskier investments that demand higher returns. This increased risk appetite may boost the amount of money in the system and could push prices higher. That was the intended goal of prior easing programs, and the S&P 500, a broad measure of the U.S. equity market, has increased by nearly 70% (14% per annum) since the first easing program. If equity investors had remained patient during this time, then they would have been handsomely rewarded. However, many investors felt the volatility in the equity market during this period was untenable. The gyrations of the market created a flight to perceived safety away from risky assets, including equities, into traditionally more stable assets, namely fixed income. This is curious because fixed income securities can only increase in price if interest rates decrease. Currently, interest rates are so low that they virtually have only one direction to move: up! Heavy buyers of bonds may not be purchasing as stable an asset as they think, especially if rates rise quickly.
Recent economic growth, both domestic and international, has left much to be desired, and the prospect for near-term future growth faces many challenges as well. Domestically, there is a conspicuous obstacle colloquially known as the fiscal cliff that will only occur if Congress and the President fail to address the situation. The fiscal cliff is a combination of tax increases, the expiration of tax cuts, and a sequestration of federal spending.
The Congressional Budget Office (CBO) estimates that all of these items, if they occur as scheduled, could cause a reduction in real GDP of 0.5% and an increase in unemployment to 9%. The CBO also indicated that the fiscal cliff could cut job growth by one million jobs next year. Some analysts think it will be much worse. It is important to note that this is the default scenario. In other words, if politicians fail to reach a compromise and do not act, the economy could fall off the fiscal cliff.
Granted, the current Congress and the President do not exactly have a track record of working together and a grand compromise seems unlikely. The fiscal cliff will materialize at the beginning of the year, so either the lame-duck Congress and the President will need to be diligent and devise some sort of compromise, or a solution will have to wait until the new Congress reports for duty. Given presidential veto power, it is important to note that in either scenario, the President will be deeply involved in the bargain. It is unlikely that any of the significant components of the fiscal cliff will be allowed to happen. If a compromise cannot be achieved during the lame-duck session, then it is likely that the fiscal cliff will be delayed, and a short extension will be passed.
The opportunities for equity investors have seldom been more alluring. Central bankers around the world are coaxing both institutions and individuals into riskier assets with accommodative measures that would have read like fiction before the recent financial crisis. Both the U.S. Federal Reserve and the European Central Bank have recently announced open-ended stimulus packages. The Fed has also assured the market
2
FOUNTAINHEAD SPECIAL VALUE FUNDA MESSAGE TO OUR SHAREHOLDERS
OCTOBER 31, 2012
that it will not raise the federal funds rate until mid-2015, which suggests that this widespread accommodative monetary policy is just starting to get comfortable. These factors suggest there will be good days ahead for Fountainhead Special Value Fund shareholders.
Best regards,
Sincerely,
Roger E. King, CFA Leah R. Bennett, CFA
Chairman and President Managing Director
King Investment Advisors, Inc. King Investment Advisors, Inc.
IMPORTANT RISKS & DISCLOSURES:
The views in this report were those of the Fund managers as of October 31, 2012 and may not reflect their views on the date this report is first published or anytime thereafter. These views are intended to assist the shareholders of the Fund in understanding their investments in the Fund and do not constitute investment advice. This letter may contain discussions about certain investments held and not held in the portfolio. All current and future portfolio holdings are subject to risk. There can be no guarantee of success with any technique, strategy or investment.
The Fund’s investments in small- and medium-sized companies involve greater risk than investing in larger, more established companies such as increased volatility of earnings and prospects, higher failure rates, and limited markets, product lines or financial resources. The Fund’s portfolio may be overweight in an industry sector in which any negative development affecting that sector will have a greater impact on the Fund’s performance. In addition, the Fund may incur American Depositary Receipts (ADRs) risks that are not associated with domestic investments such as increased volatility including political and financial instability, lack of timely or reliable regulatory standards, and price volatility.
The Russell 2500 Index measures the performance of the small- to mid-cap segment of the U.S. equity universe. It includes approximately 2,500 of the smallest securities in the Russell 3000®Index based on a combination of their market cap and current index membership. One cannot invest directly in an index.
3
FOUNTAINHEAD SPECIAL VALUE FUNDPERFORMANCE CHART AND ANALYSIS (Unaudited)
The following chart reflects the change in the value of a hypothetical $10,000 investment, including reinvested dividends and distributions, in Fountainhead Special Value Fund (the “Fund”) compared with the performance of the benchmark, Russell 2500 Index, over the past ten fiscal years. The Russell 2500 Index measures the performance of the small- to mid-cap segment of the U.S. equity universe. It includes approximately 2,500 of the smallest securities in the Russell 3000® Index based on a combination of their market cap and current index membership. The total return of the Russell 2500 Index includes the reinvestment of dividends and income. The total return of the Fund includes operating expenses that reduce returns, while the total return of the Russell 2500 Index does not include expenses. The Fund is professionally managed while the Russell 2500 Index is unmanaged and is not available for investment.
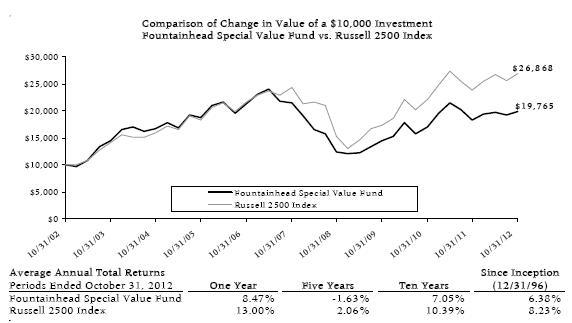
Performance data quoted represents past performance and is no guarantee of future results. Current performance may be lower or higher than the performance data quoted. Investment return and principal value will fluctuate so that shares, when redeemed, may be worth more or less than original cost. For the most recent month-end performance, please call (800) 868-9535. As stated in the Fund's prospectus, the annual operating expense ratio (gross) is 3.56%. However, the Fund's adviser has agreed to contractually waive a portion of its fees and to reimburse certain expenses to limit total operating expenses to 1.75%, which is in effect until March 1, 2013. During the period, certain fees were waived and/or expenses reimbursed; otherwise, returns would have been lower. Shares redeemed or exchanged within 180 days of purchase will be charged a 1.00% redemption fee. The performance table and graph do not reflect the deduction of taxes that a shareholder would pay on Fund distributions or the redemption of Fund shares. Returns greater than one year are annualized.
4
FOUNTAINHEAD SPECIAL VALUE FUNDSCHEDULE OF INVESTMENTS
| | Shares | | Security Description | | Value | |
| Common Stock - 99.9% |
| Consumer Discretionary - 18.9% |
| | 19,050 | | Bravo Brio Restaurant Group, Inc. (a) | $ | 251,460 | |
| | 19,000 | | Cablevision Systems Corp., Class A | | 330,980 | |
| | 78,500 | | Callaway Golf Company | | 428,610 | |
| | 7,150 | | Coinstar, Inc. (a) | | 335,621 | |
| | 8,500 | | Sotheby's | | 264,605 | |
| | 2,500 | | Titan International, Inc. | | 52,450 | |
| | | 1,663,726 | |
| Drugs/Pharmaceutical Preparations - 12.4% |
| | 15,000 | | Auxilium Pharmaceuticals, Inc. (a) | | 307,200 | |
| | 7,400 | | Cubist Pharmaceuticals, Inc. (a) | | 317,460 | |
| | 22,000 | | Emergent BioSolutions Inc. (a) | | 292,380 | |
| | 5,160 | | Forest Laboratories, Inc. (a) | | 173,944 | |
| | | 1,090,984 | |
| Energy - 6.6% |
| | 33,700 | | Halcón Resources Corporation (a) | | 218,039 | |
| | 3,100 | | Oasis Petroleum Inc. (a) | | 91,047 | |
| | 13,600 | | Superior Energy Services, Inc. (a) | | 276,488 | |
| | | 585,574 | |
| Financials - 15.6% |
| | 8,000 | | Flushing Financial Corporation | | 124,400 | |
| | 8,200 | | HomeStreet, Inc. (a) | | 367,196 | |
| | 23,300 | | KKR & Co. L.P. | | 350,665 | |
| | 28,000 | | MetroCorp Bancshares, Inc. (a) | | 283,920 | |
| | 9,200 | | Weyerhaeuser Company (REIT) | | 254,748 | |
| | | 1,380,929 | |
| Health Care Services - 8.2% |
| | 38,800 | | BioScrip, Inc. (a) | | 357,348 | |
| | 12,000 | | PAREXEL International Corp. (a) | | 368,280 | |
| | | 725,628 | |
| Industrials - 3.1% |
| | 11,000 | | Textron Inc. | | 277,310 | |
| | | | |
| Medical Products - 14.9% |
| | 25,400 | | Hologic, Inc. (a) | | 523,748 | |
| | 9,875 | | Illumina, Inc. (a) | | 469,161 | |
| | 9,000 | | Thoratec Corporation (a) | | 321,300 | |
| | | 1,314,209 | |
| | Shares | | Security Description | | Value | |
| Technology - 20.2% |
| | 7,200 | | Akamai Technologies, Inc. (a) | $ | 273,528 | |
| | 22,600 | | Omnicell, Inc. (a) | | 329,508 | |
| | 5,800 | | OpenTable, Inc. (a) | | 272,426 | |
| | 13,700 | | Shutterfly, Inc. (a) | | 414,562 | |
| | 21,800 | | Take-Two Interactive Software, Inc. (a) | | 243,070 | |
| | 13,800 | | Travelzoo Inc. (a) | | 246,330 | |
| | | 1,779,424 | |
Total Common Stock (Cost $8,370,483) | | 8,817,784 | |
Total Investments - 99.9% (Cost $8,370,483)* | $ | 8,817,784 | |
| Other Assets & Liabilities, Net – 0.1% | | 12,372 | |
| Net Assets – 100.0% | $ | 8,830,156 | |
| REIT | Real Estate Investment Trust |
| (a) | Non-income producing security. |
| | * Cost for federal income tax purposes is $8,365,204 and net unrealized appreciation consists of: |
| Gross Unrealized Appreciation | | $ | 1,128,407 | |
| Gross Unrealized Depreciation | | | (675,827 | ) |
| Net Unrealized Appreciation | | $ | 452,580 | |
See Notes to Financial Statements. 5
FOUNTAINHEAD SPECIAL VALUE FUNDSCHEDULE OF INVESTMENTS
OCTOBER 31, 2012
The following is a summary of the inputs used to value the Fund’s investments as of October 31, 2012.
The inputs or methodology used for valuing securities are not necessarily an indication of the risks associated with investing in those securities. For more information on valuation inputs, and their aggregation into the levels used in the tables below, please refer to the Security Valuation section in Note 2 of the accompanying Notes to Financial Statements.
| Valuation Inputs | | Investments in Securities |
| Level 1 - Quoted Prices | | $ | 8,817,784 | |
| Level 2 - Other Significant Observable Inputs | | | - | |
| Level 3 - Significant Unobservable Inputs | | | - | |
| Total | | $ | 8,817,784 | |
The Level 1 inputs displayed in this table are Common Stock. Refer to the Schedule of Investments for a further breakout of each security by type.
There were no transfers between Level 1 and Level 2 for the year ended October 31, 2012.
A
| PORTFOLIO HOLDINGS | | | |
| % of Total Investments | | | |
| Consumer Discretionary | | | 18.9 | % |
| Drugs/Pharmaceutical Preparations | | | 12.4 | % |
| Energy | | | 6.6 | % |
| Financials | | | 15.7 | % |
| Health Care Services | | | 8.2 | % |
| Industrials | | | 3.1 | % |
| Medical Products | | | 14.9 | % |
| Technology | | | 20.2 | % |
| | | | 100.0 | % |
See Notes to Financial Statements. 6
FOUNTAINHEAD SPECIAL VALUE FUNDSTATEMENT OF ASSETS AND LIABILITIES
| | | | | | |
| ASSETS | | | | |
| | Total investments, at value (Cost $8,370,483) | | $ | 8,817,784 | |
| | Cash | | | 10,496 | |
| | Receivables: | | | | |
| | Investment securities sold | | | 26,738 | |
| | Prepaid expenses | | | 10,263 | |
| Total Assets | | | 8,865,281 | |
| | | | | | |
| LIABILITIES | | | | |
| | Payables: | | | | |
| | Investment securities purchased | | | 4,595 | |
| | Accrued Liabilities: | | | | |
| | Fund services fees | | | 8,234 | |
| | Other expenses | | | 22,296 | |
| Total Liabilities | | | 35,125 | |
| | | | | | |
| NET ASSETS | | $ | 8,830,156 | |
| | | | | | |
| COMPONENTS OF NET ASSETS | | | | |
| | Paid-in capital | | $ | 8,619,108 | |
| | Accumulated net investment loss | | | (107,070 | ) |
| | Accumulated net realized loss | | | (129,183 | ) |
| | Net unrealized appreciation | | | 447,301 | |
| NET ASSETS | | $ | 8,830,156 | |
| SHARES OF BENEFICIAL INTEREST AT NO PAR VALUE (UNLIMITED SHARES AUTHORIZED) | | | 433,560 | |
NET ASSET VALUE, OFFERING AND REDEMPTION PRICE PER SHARE* | | $ | 20.37 | |
| * | Shares redeemed or exchanged within 180 days of purchase are charged a 1.00% redemption fee. |
See Notes to Financial Statements. 7
FOUNTAINHEAD SPECIAL VALUE FUNDSTATEMENT OF OPERATIONS
| | | | | |
| INVESTMENT INCOME | | | | |
| Dividend income | | $ | 44,817 | |
| Interest income | | | 123 | |
| Total Investment Income | | | 44,940 | |
| | | | | |
| EXPENSES | | | | |
| Investment adviser fees | | | 82,432 | |
| Fund services fees | | | 163,805 | |
| Custodian fees | | | 5,000 | |
| Registration fees | | | 17,935 | |
| Professional fees | | | 35,786 | |
| Trustees' fees and expenses | | | 337 | |
| Miscellaneous expenses | | | 17,050 | |
| Total Expenses | | | 322,345 | |
| Fees waived and expenses reimbursed | | | (162,060 | ) |
| Net Expenses | | | 160,285 | |
| | | | | |
| NET INVESTMENT LOSS | | | (115,345 | ) |
| | | | | |
| NET REALIZED AND UNREALIZED GAIN (LOSS) | | | | |
| Net realized gain on investments | | | 418,726 | |
| Net change in unrealized appreciation (depreciation) on investments | | | 442,080 | |
| NET REALIZED AND UNREALIZED GAIN | | | 860,806 | |
| INCREASE IN NET ASSETS FROM OPERATIONS | | $ | 745,461 | |
| | | | | |
See Notes to Financial Statements. 8
FOUNTAINHEAD SPECIAL VALUE FUNDSTATEMENTS OF CHANGES IN NET ASSETS
| | | | For the Year Ended October 31, 2012 | | For the Year Ended October 31, 2011 |
| OPERATIONS | | | | | | | | |
| | Net investment loss | | $ | (115,345 | ) | | $ | (111,663 | ) |
| | Net realized gain | | | 418,726 | | | | 1,471,922 | |
| | Net change in unrealized appreciation (depreciation) | | | 442,080 | | | | (774,161 | ) |
| Increase in Net Assets Resulting from Operations | | | 745,461 | | | | 586,098 | |
| | | | | | | | | | |
| CAPITAL SHARE TRANSACTIONS | | | | | | | | |
| | Sale of shares | | | 262,384 | | | | 408,024 | |
| | Redemption of shares | | | (1,187,583 | ) | | | (424,264 | ) |
| Decrease in Net Assets from Capital Share Transactions | | | (925,199 | ) | | | (16,240 | ) |
| Increase (Decrease) in Net Assets | | | (179,738 | ) | | | 569,858 | |
| | | | | | | | | | |
| NET ASSETS | | | | | | | | |
| | Beginning of Year | | | 9,009,894 | | | | 8,440,036 | |
| | End of Year (Including line (a)) | | $ | 8,830,156 | | | $ | 9,009,894 | |
| | | | | | | | | | |
| SHARE TRANSACTIONS | | | | | | | | |
| | Sale of shares | | | 12,830 | | | | 21,115 | |
| | Redemption of shares | | | (58,948 | ) | | | (21,543 | ) |
| Decrease in Shares | | | (46,118 | ) | | | (428 | ) |
| | | | | | | | | | |
| (a) | Accumulated net investment loss | | $ | (107,070 | ) | | $ | - | |
See Notes to Financial Statements. 9
FOUNTAINHEAD SPECIAL VALUE FUNDFINANCIAL HIGHLIGHTS
| These financial highlights reflect selected data for a share outstanding throughout each year. | | | | | | |
| | | For the Years Ended October 31, | |
| | | 2012 | | 2011 | | 2010 | | 2009 | | 2008 | |
| NET ASSET VALUE, Beginning of Year | $ | 18.78 | | | $ | 17.58 | | | $ | 14.84 | | | $ | 12.73 | | | $ | 22.57 | | |
| INVESTMENT OPERATIONS | | | | | | | | | | | | | | | | | | | | |
| Net investment loss (a) | | (0.25 | ) | | | (0.23 | ) | | | (0.22 | ) | | | (0.15 | ) | | | (0.16 | ) | |
| Net realized and unrealized gain (loss) | | 1.84 | | | | 1.43 | | | | 2.96 | | | | 2.26 | | | | (9.27 | ) | |
| Total from Investment Operations | | 1.59 | | | | 1.20 | | | | 2.74 | | | | 2.11 | | | | (9.43 | ) | |
| DISTRIBUTIONS TO | | | | | | | | | | | | | | | | | | | | |
| SHAREHOLDERS FROM | | | | | | | | | | | | | | | | | | | | |
| Net realized gain | | — | | | | — | | | | — | | | | — | | | | (0.41 | ) | |
| REDEMPTION FEES (a) | | — | | | | — | | | | — | (b) | | — | (b) | | — | (b) |
| NET ASSET VALUE, End of Year | $ | 20.37 | | | $ | 18.78 | | | $ | 17.58 | | | $ | 14.84 | | | $ | 12.73 | | |
| TOTAL RETURN | | 8.47 | % | | 6.83 | % | | 18.46 | % | | 16.58 | % | | (42.45 | )% |
| RATIOS/SUPPLEMENTARY DATA | | | | | | | | | | | | | | | | | | | | |
| Net Assets at End of Year (000's omitted) | $8,830 | | | $9,010 | | | $8,440 | | | $7,822 | | | $7,728 | | |
| Ratios to Average Net Assets: | | | | | | | | | | | | | | | | | | | | |
| Net investment loss | | (1.26 | )% | | (1.17 | )% | | (1.35 | )% | | (1.17 | )% | | (0.88 | )% |
| Net expense | | 1.75 | % | | 1.75 | % | | 1.75 | % | | 1.67 | % | | 1.50 | % |
| Gross expense (c) | | 3.52 | % | | 3.56 | % | | 4.04 | % | | 4.50 | % | | 3.18 | % |
| PORTFOLIO TURNOVER RATE | | 90 | % | | 78 | % | | 117 | % | | 103 | % | | 139 | % |
| | | | | | | | | | | | | | | | | | | | | | |
| (a) | Calculated based on average shares outstanding during each year. |
| (b) | Less than $0.01 per share. |
| (c) | Reflects the expense ratio excluding any waivers and/or reimbursements. |
See Notes to Financial Statements. 10
FOUNTAINHEAD SPECIAL VALUE FUNDNOTES TO FINANCIAL STATEMENTS
Note 1. Organization
The Fountainhead Special Value Fund (the “Fund”) is a diversified portfolio of Forum Funds (the “Trust”). The Trust is a Delaware statutory trust that is registered as an open-end, management investment company under the Investment Company Act of 1940 (the “Act”), as amended. Under its Trust Instrument, the Trust is authorized to issue an unlimited number of the Fund’s shares of beneficial interest without par value. The Fund commenced operations on December 31, 1996. The Fund seeks long-term capital growth.
Note 2. Summary of Significant Accounting Policies
These financial statements are prepared in accordance with accounting principles generally accepted in the United States of America (“GAAP”), which require management to make estimates and assumptions that affect the reported amounts of assets and liabilities, the disclosure of contingent liabilities at the date of the financial statements, and the reported amounts of increase and decrease in net assets from operations during the fiscal year. Actual amounts could differ from those estimates. The following summarizes the significant accounting policies of the Fund:
Security Valuation – Exchange-traded securities and over-the-counter securities are valued using the last quoted sale or official closing price, provided by independent pricing services as of the close of trading on the market or exchange for which they are primarily traded, on each Fund business day. In the absence of a sale, such securities are valued at the mean of the last bid and ask price provided by independent pricing services. Non-exchange traded securities for which quotations are available are valued using the last quoted sales price, or in the absence of a sale at the mean of the last bid and ask prices provided by independent pricing services. Short-term investments that mature in 60 days or less may be valued at amortized cost.
The Fund values its investments at fair value pursuant to procedures adopted by the Trust’s Board of Trustees (the “Board”) if (1) market quotations are insufficient or not readily available or (2) the adviser believes that the values available are unreliable. Fair valuation is based on subjective factors and as a result, the fair value price of an investment may differ from the security’s market price and may not be the price at which the asset may be sold. Fair valuation could result in a different net asset value (“NAV”) than a NAV determined by using market quotes.
The Fund has a three-tier fair value hierarchy. The basis of the tiers is dependent upon the various “inputs” used to determine the value of the Fund’s investments. These inputs are summarized in the three broad levels listed below:
Level 1 — quoted prices in active markets for identical assets
Level 2 — other significant observable inputs (including quoted prices of similar securities, interest rates, prepayment speeds, credit risk, etc.)
Level 3 — significant unobservable inputs (including the Fund’s own assumptions in determining the fair value of investments)
11
FOUNTAINHEAD SPECIAL VALUE FUNDNOTES TO FINANCIAL STATEMENTS
The aggregate value by input level, as of October 31, 2012, for the Fund’s investments is included at the end of the Fund’s Schedule of Investments.
Security Transactions, Investment Income and Realized Gain and Loss – Investment transactions are accounted for on the trade date. Dividend income is recorded on the ex-dividend date. Foreign dividend income is recorded on the ex-dividend date or as soon as possible after the Fund determines the existence of a dividend declaration after exercising reasonable due diligence. Income and capital gains on some foreign securities may be subject to foreign withholding taxes, which are accrued as applicable. Interest income is recorded on an accrual basis. Premium is amortized and discount is accreted using the effective interest method. Identified cost of investments sold is used to determine the gain and loss for both financial statement and federal income tax purposes.
Distributions to Shareholders – Distributions to shareholders of net investment income and net capital gains, if any, are declared and paid at least annually. Distributions are based on amounts calculated in accordance with applicable federal income tax regulations, which may differ from GAAP. These differences are due primarily to differing treatments of income and gain on various investment securities held by the Fund, timing differences and differing characterizations of distributions made by the Fund.
Federal Taxes – The Fund intends to continue to qualify each year as a regulated investment company under Subchapter M of the Internal Revenue Code and to distribute all of its taxable income to shareholders. In addition, by distributing in each calendar year substantially all of its net investment income and capital gains, if any, the Fund will not be subject to a federal excise tax. Therefore, no federal income or excise tax provision is required. The Fund files a U.S. federal income and excise tax return as required. A fund’s federal income tax returns are subject to examination by the Internal Revenue Service for a period of three fiscal years after they are filed. As of October 31, 2012, there are no uncertain tax positions that would require financial statement recognition, de-recognition, or disclosure.
Income and Expense Allocation – The Trust accounts separately for the assets, liabilities and operations of each of its investment portfolios. Expenses that are directly attributable to more than one investment portfolio are allocated among the respective investment portfolios in an equitable manner.
Redemption Fees – A shareholder who redeems or exchanges shares within 180 days of purchase will incur a redemption fee of 1.00% of the current net asset value of shares redeemed or exchanged, subject to certain limitations. The fee is charged for the benefit of the remaining shareholders and will be paid to the Fund to help offset transaction costs. The fee is accounted for as an addition to paid-in capital. The Fund reserves the right to modify the terms of or terminate the fee at any time. There are limited exceptions to the imposition of the redemption fee.
Commitments and Contingencies – In the normal course of business, the Fund enters into contracts that provide general indemnifications by the Fund to the counterparty to the contract. The Fund’s maximum exposure under these arrangements is dependent on future claims that may be made against the Fund and, therefore, cannot be estimated; however, based on experience, the risk of loss from such claims is considered remote.
12
FOUNTAINHEAD SPECIAL VALUE FUNDNOTES TO FINANCIAL STATEMENTS
Note 3. Fees and Expenses
Investment Adviser – King Investment Advisors, Inc. (the “Adviser”) is the investment adviser to the Fund. Pursuant to an investment advisory agreement, the Adviser receives an advisory fee from the Fund at an annual rate of 0.90% of the Fund’s average daily net assets.
Distribution – Foreside Fund Services, LLC serves as the Fund’s distributor (the “Distributor”). The Distributor is not affiliated with the Adviser or Atlantic Fund Administration, LLC (d/b/a Atlantic Fund Services) (“Atlantic”) or their affiliates. The Distributor receives no compensation from the Fund for its distribution services.
Other Service Providers – Atlantic provides fund accounting, fund administration, compliance and transfer agency services to the Fund. Atlantic also provides certain shareholder report production, and EDGAR conversion and filing services. Pursuant to an Atlantic services agreement, the Fund pays Atlantic customary fees for its services. Atlantic provides a Principal Executive Officer, a Principal Financial Officer, a Chief Compliance Officer, and an Anti-Money Laundering Officer to the Fund, as well as certain additional compliance support functions.
Trustees and Officers – The Trust pays each independent Trustee an annual retainer fee of $45,000 for service to the Trust ($66,000 for the Chairman). In addition, for the period ended March 31, 2012, the Chairman received a monthly stipend of $500 to cover certain expenses incurred in connection with his duties to the Trust. The stipend was discontinued April 1, 2012. The Trustees and Chairman may receive additional fees for special Board meetings. Each Trustee is also reimbursed for all reasonable out-of-pocket expenses incurred in connection with his duties as a Trustee, including travel and related expenses incurred in attending Board meetings. The amount of Trustees’ fees attributable to the Fund is disclosed in the Statement of Operations. Certain officers of the Trust are also officers or employees of the above named service providers, and during their terms of office received no compensation from the Fund.
Note 4. Expense Reimbursements and Fees Waived
The Adviser has contractually agreed to waive a portion of its fee and reimburse certain expenses through March 1, 2013, to limit annual operating expenses to 1.75%. Other fund service providers have voluntarily agreed to waive a portion of their fees. These voluntary waivers and reimbursements may be reduced or eliminated at any time with the consent of the Board of Trustees. For the year ended October 31, 2012, fees waived were as follows:
| Investment Adviser Fees Waived | | | Other Waivers | | | Total Fees Waived | |
| $ | 82,432 | | | $ | 79,628 | | | $ | 162,060 | |
Note 5. Security Transactions
The cost of purchases and proceeds from sales of investment securities (including maturities), other than short-term investments during the year ended October 31, 2012, were $8,220,027 and $9,315,878, respectively.
13
FOUNTAINHEAD SPECIAL VALUE FUNDNOTES TO FINANCIAL STATEMENTS
Note 6. Federal Income Tax and Investment Transactions
As of October 31, 2012, distributable earnings (accumulated loss) on a tax basis were as follows:
| Capital and Other Losses | | $ | (241,532 | ) |
| Unrealized Appreciation | | $ | 452,580 | |
| Total | | $ | 211,048 | |
The difference between components of distributable earnings on a tax basis and the amounts reflected in the Statement of Assets and Liabilities are primarily due to partnerships.
As of October 31, 2012, the Fund had capital loss carryforwards to offset future capital gains of $134,462, expiring in 2017.
For tax purposes, the current late year ordinary loss was $107,070 (realized during the period January 1, 2012 through October 31, 2012). This loss was recognized for tax purposes on the first business day of the Fund’s next fiscal year, November 1, 2012.
On the Statement of Assets and Liabilities, as a result of permanent book to tax differences, certain amounts have been reclassified for the year ended October 31, 2012. The following reclassification was the result of net operating losses, REIT adjustments and partnership distributions and has no impact on the net assets of the Fund.
| Accumulated Net Investment Income (Loss) | | $ | 8,275 | |
| Undistributed Net Realized Gain (Loss) | | | 14,279 | |
| Paid-in-Capital | | | (22,554 | ) |
Note 7. Recent Accounting Pronouncements
In May 2011, FASB issued ASU No. 2011-04 “Amendments to Achieve Common Fair Value Measurement and Disclosure Requirements in U.S. GAAP and IFRSs.” ASU No. 2011-04 establishes common requirements for measuring fair value and for disclosing information about fair value measurements in accordance with U.S. GAAP and International Financial Reporting Standards (“IFRSs”). ASU No. 2011-04 is effective for interim and annual periods beginning after December 15, 2011. Management has evaluated ASU No. 2011-04 and has determined that it did not have a significant impact on the reporting of the financial statement disclosures.
In December 2011, FASB issued ASU No. 2011-11 “Disclosures about Offsetting Assets and Liabilities” requiring disclosure of both gross and net information related to offsetting and related arrangements enabling users of its financial statements to understand the effect of those arrangements on the entity’s financial position. The objective of this disclosure is to facilitate comparison between those entities that prepare their financial statements on the basis of U.S. GAAP and those entities that prepare their financial statements on the basis of IFRSs. ASU No. 2011-11 is effective for interim and annual periods beginning on or after January 1, 2013. Management is evaluating any impact ASU No. 2011-11 may have on the Fund’s financial statements.
14
FOUNTAINHEAD SPECIAL VALUE FUNDNOTES TO FINANCIAL STATEMENTS
Note 8. Subsequent Events
Subsequent events occurring after the date of this report through the date these financial statements were issued have been evaluated for potential impact and the Fund has had no such events.
15
REPORT OF INDEPENDENT REGISTERED PUBLIC ACCOUNTING FIRM
To the Board of Trustees of Forum Funds and the Shareholders of Fountainhead Special Value Fund:
We have audited the accompanying statement of assets and liabilities of the Fountainhead Special Value Fund, a series of shares of beneficial interest in the Forum Funds, including the schedule of investments, as of October 31, 2012, and the related statement of operations for the year then ended, the statements of changes in net assets for each of the years in the two year period then ended, and the financial highlights for each of the years in the four year period then ended. These financial statements and financial highlights are the responsibility of the Fund's management. Our responsibility is to express an opinion on these financial statements and financial highlights based on our audits. The financial highlights for the year ended October 31, 2008 were audited by other auditors whose report dated December 22, 2008, expressed an unqualified opinion on such financial highlights.
We conducted our audits in accordance with the standards of the Public Company Accounting Oversight Board (United States). Those standards require that we plan and perform the audits to obtain reasonable assurance about whether the financial statements and financial highlights are free of material misstatement. An audit includes examining, on a test basis, evidence supporting the amounts and disclosures in the financial statements. Our procedures included confirmation of securities owned as of October 31, 2012 by correspondence with the custodian and broker or by other appropriate auditing procedures where replies from brokers were not received. An audit also includes assessing the accounting principles used and significant estimates made by management, as well as evaluating the overall financial statement presentation. We believe that our audits provide a reasonable basis for our opinion.
In our opinion, the financial statements and financial highlights referred to above present fairly, in all material respects, the financial position of the Fountainhead Special Value Fund as of October 31, 2012, the results of its operations for the year then ended, the changes in its net assets for each of the years in the two year period then ended, and the financial highlights for each of the years in the four year period then ended, in conformity with accounting principles generally accepted in the United States of America.

BBD, LLP
Philadelphia, Pennsylvania
December 17, 2012
16
FOUNTAINHEAD SPECIAL VALUE FUNDADDITIONAL INFORMATION (Unaudited)
Proxy Voting Information
A description of the policies and procedures that the Fund uses to determine how to vote proxies relating to securities held in the Fund’s portfolio is available, without charge and upon request, by calling (800) 868-9535 and on the U.S. Securities and Exchange Commission’s (the “SEC”) website at www.sec.gov. The Fund’s proxy voting record for the most recent twelve-month period ended June 30 is available, without charge and upon request, by calling (800) 868-9535 and on the SEC’s website at www.sec.gov.
Availability of Quarterly Portfolio Schedules
The Fund files its complete schedule of portfolio holdings with the SEC for the first and third quarters of each fiscal year on Form N-Q. These filings are available, without charge and upon request on the SEC’s website at www.sec.gov or may be reviewed and copied at the SEC’s Public Reference Room in Washington, DC. Information on the operation of the Public Reference Room may be obtained by calling (800) SEC-0330.
Shareholder Expense Example
As a shareholder of the Fund, you incur two types of costs: (1) transaction costs, including redemption fees, and (2) ongoing costs, including management fees and other Fund expenses. This example is intended to help you understand your ongoing costs (in dollars) of investing in the Fund, and to compare these costs with the ongoing costs of investing in other mutual funds.
The example is based on an investment of $1,000 invested at the beginning of the period and held for the entire period from May 1, 2012, through October 31, 2012.
Actual Expenses – The first line of the table below provides information about actual account values and actual expenses. You may use the information in this line, together with the amount you invested, to estimate the expenses that you paid over the period. Simply divide your account value by $1,000 (for example, an $8,600 account value divided by $1,000 = 8.6), then multiply the result by the number in the first line under the heading entitled “Expenses Paid During Period” to estimate the expenses you paid on your account during the period.
Hypothetical Example for Comparison Purposes – The second line of the table below provides information about hypothetical account values and hypothetical expenses based on the Fund’s actual expense ratio and an assumed rate of return of 5% per year before expenses, which is not the Fund’s actual return. The hypothetical account values and expenses may not be used to estimate the actual ending account balance or expenses you paid for the period. You may use this information to compare the ongoing costs of investing in the Fund and other funds. To do so, compare this 5% hypothetical example with the 5% hypothetical examples that appear in the shareholder reports of other funds.
Please note that the expenses shown in the table are meant to highlight your ongoing costs only and do not reflect any transactional costs, such as redemption fees. Therefore, the second line of the table is useful in comparing ongoing costs only, and will not help you determine the relative total costs of owning different funds. In addition, if these transactional costs were included, your costs would have been higher.
17
FOUNTAINHEAD SPECIAL VALUE FUNDADDITIONAL INFORMATION (Unaudited)
| | | Beginning | | | Ending | | | Expenses | | | Annualized |
| | | Account Value | | | Account Value | | | Paid During | | | Expense |
| | | May 1, 2012 | | | October 31, 2012 | | | Period* | | | Ratio* |
| Actual | | $ | 1,000.00 | | | $ | 1,000.49 | | | $ | 8.80 | | | | 1.75 | % |
| Hypothetical (5% return before taxes) | | $ | 1,000.00 | | | $ | 1,016.34 | | | $ | 8.87 | | | | 1.75 | % |
| * | Expenses are equal to the Fund’s annualized expense ratio multiplied by the average account value over the period, multiplied by the number of days in the most recent fiscal half-year divided by 366 to reflect the half-year period. |
Trustees and Officers of the Trust
The Board is responsible for oversight of the management of the Trust’s business affairs and of the exercise of all the Trust’s powers except those reserved for the shareholders. The following table provides information about each Trustee and certain officers of the Trust. Each Trustee and officer holds office until the person resigns, is removed, or is replaced. Unless otherwise noted, the persons have held their principal occupations for more than five years. The address for all Trustees and officers is Three Canal Plaza, Suite 600, Portland, Maine 04101. Mr. Keffer is considered an Interested Trustee due to his affiliation with Atlantic. The Fund’s Statement of Additional Information includes additional information about the Trustees and is available, without charge and upon request, by calling (800) 868-9535.
Name and Year of Birth | Position with the Trust | Length of Time Served | Principal Occupation(s) During Past Five Years | Number of Series of Trust Overseen by Trustee | Other Directorships Held by Trustee |
| Independent Trustees | | | | | |
J. Michael Parish Born: 1943 | Chairman of the Board; Trustee; Chairman, Nominating Committee and Qualified Legal Compliance Committee | Since 1989 (Chairman since 2004) | Retired since 2003. | 21 | 0 |
Costas Azariadis Born: 1943 | Trustee; Chairman, Valuation Committee | Since 1989 | Professor of Economics, Washington University since 2006. | 21 | 0 |
James C. Cheng Born: 1942 | Trustee; Chairman, Audit Committee | Since 1989 | President, Technology Marketing Associates (marketing company for small- and medium-sized businesses in New England) since 1991. | 21 | 0 |
18
FOUNTAINHEAD SPECIAL VALUE FUNDADDITIONAL INFORMATION (Unaudited)
Name and Year of Birth | Position with the Trust | Length of Time Served | Principal Occupation(s) During Past Five Years | Number of Series of Trust Overseen by Trustee | Other Directorships Held by Trustee |
| Independent Trustees (continued) | | | | | |
David Tucker Born: 1958 | Trustee | Since 2011 | Director, Blue Sky Experience since 2008; Senior Vice President & General Counsel, American Century Companies 1998-2008. | 21 | Director, Forum ETF Trust. |
| Interested Trustee | | | | | |
John Y. Keffer1 Born: 1942 | Trustee; Vice Chairman | Since 1989 | Chairman, Atlantic since 2008; President, Forum Foundation (a charitable organization) since 2005; President, Forum Trust, LLC (a non-depository trust company chartered in the State of Maine) since 1997. | 21 | Director, Wintergreen Fund, Inc.; Director, Forum ETF Trust |
| Officers | | | | | |
Stacey E. Hong Born: 1966 | President; Principal Executive Officer | Since 2008 | President, Atlantic since 2008; Director, Consulting Services, Foreside Fund Services 2007. | N/A | N/A |
Karen Shaw Born: 1972 | Treasurer; Principal Financial Officer | Since 2008 | Senior Vice President, Atlantic since 2008; Vice President, Citigroup 2003-2008. | N/A | N/A |
David Faherty Born: 1970 | Vice President | Since 2009 | Senior Counsel, Atlantic since 2009; Vice President, Citi Fund Services Ohio, Inc. 2007-2009; Associate Counsel, Investors Bank & Trust Co. 2006-2007. | N/A | N/A |
Michael J. McKeen Born: 1971 | Vice President | Since 2009 | Senior Vice President, Atlantic since 2008; Vice President, Citigroup 2003-2008. | N/A | N/A |
Joshua LaPan Born: 1973 | Vice President | Since 2009 | Manager, Atlantic since 2008; Vice President, Citigroup 2003-2008. | N/A | N/A |
Timothy Bowden Born: 1969 | Vice President | Since 2009 | Manager, Atlantic since 2008; Vice President, Citigroup 2005-2008. | N/A | N/A |
1Atlantic is a subsidiary of Forum Holdings Corp. I, a Delaware corporation that is wholly owned by Mr. Keffer. |
19
FOUNTAINHEAD SPECIAL VALUE FUNDADDITIONAL INFORMATION (Unaudited)
Name and Year of Birth | Position with the Trust | Length of Time Served | Principal Occupation(s) During Past Five Years | Number of Series of Trust Overseen by Trustee | Other Directorships Held by Trustee |
| Officers (continued) | | | | | |
Lina Bhatnagar Born: 1971 | Secretary | Since 2008 | Senior Administration Specialist, Atlantic since 2008; Regulatory Administration Specialist, Citigroup 2006-2008. | N/A | N/A |
CARNE LARGE CAP VALUE FUND
A MESSAGE TO OUR SHAREHOLDERSDear Shareholder,
I am glad to report that the Carne Large Cap Value Fund returned 13.47% in its Institutional Shares and 12.89% in its Investor Shares for the period from November 1, 2011 to October 31, 2012. This compares to a 15.21% total return for the S&P 500 Index. These returns represent substantial absolute returns for the Fund’s shareholders.
The past 12 months seem to have been defined by storms, both literally and metaphorically. A year ago, the U.S. east coast was emerging from Hurricane Irene and capital markets were emerging from the latest European financial typhoon. The effects these two storms dissipated in early December 2011 and Equity markets began a substantial rally as even the Fed was backing away from further monetary accommodation via a QE3. Even the Fed’s lack of action was seen as a prediction of economic strength. Fundamentals of individual equities gladly became the focus of the stock market as the rally continued through the Ides of March. As the spring moved on, warning clouds of the economic storm re-forming were seen in China and were quickly followed by rising yields of European Sovereign debt. The eye of that storm was now revolving around Madrid. Here in the U.S., weakness in the labor market became a thundercloud for our storm, and equities home and abroad continued their pattern of an early summer selloff. Global central banks continued their role as storm-chasers and summits were convened in Europe while the Fed hinted at QE3. While most central bankers seemed under-qualified to work at The Weather Channel, markets began a choppy recovery even while whispers of a new super storm began to circulate. This storm grew from the consequences of a quick fix to the previously imminent unnatural disaster surrounding the raising of the U.S. Federal Government Debt Ceiling. This “can-kicking” budgetary compromise has become Super Storm Sequestration also known as the Fiscal Cliff. While it was talked about it was also largely dismissed as the U.S. Presidential Election approached and, for some unknown reason, faith in the political system seemed to be bolstered. As the kicked can tumbled down the road talking heads concluded that some post-election grand bargain would be reached because failing to do so would be economic and political suicide.
We now have the experience of what a significant autumn weather event on the U.S. east coast feels like. Many to the north of Hurricane Sandy’s eye still must do without basic human essentials such as food, shelter, fuel and power. Currently, we can only speculate what will happen in Washington D.C. and what the Fiscal Cliff would truly feel like. It may be a Band-Aid ripping exercise that causes some short term pain but lets festering wounds heal or it may be a calamity that pushes the economy into a deep and lasting recession. These unknown outcomes are the root of the recent market volatility that greeted President Obama’s re-election as both sides of the political aisle dig in their heels for an old-west style standoff. The equity market appears disappointed over the election outcome and future budget prospects as the antagonists dig in their spurs. Perceptions of slashed revenues for defense and health insurance companies, as well as consumer spending pressures, are causing investors to head for higher ground. A temporary resolution may keep bullets from flying and the result could be a choppy market that may trend higher with multiple sharp moves. Market volatility does not look to be subdued or a one-day event as the political opponents continues to size each other up. Opportunities in individual stocks may be created from the coming confusion, but those without a systematic process to identify profitability and valuation in stocks will be guessing at best. Similarly, those who don’t confront market volatility may be unable to take advantage of ensuing opportunities. Many investors wish to take advantage of volatility but are also unable to do so.
It was this investor desire to seek actively managed equity market returns without overpaying for a replicated benchmark or succumbing to excess volatility that lead to the creation of the Fund in 2009. Equity investors must by definition seek to differentiate from the benchmark if they wish to out-perform the benchmark. This is self-evident, but investors seeking to accomplish this have been at times subject to style drift, closet indexing and excess volatility by the funds in which they have invested. Carne’s investment process is based on the belief that in order for a portfolio to be successful, the process should include an investment strategy based on business fundamentals and valuation that employed discipline while also containing a sustainable process to hedge the volatility of the portfolio. One thing I did not know was how rare this approach was in the long-equity mutual fund world. It also became apparent that style drift, benchmark hugging and market volatility have helped lead to under-performance in many actively managed funds. Investor fatigue with active managers is understandable given that many active portfolios look too much like the benchmark with emphasis on the latest hot stock regardless of investment thesis. At Carne, all day and every day our main focus is on finding equity investments in companies that represent both viable profitability and value. Our approach is subtle while distinctive and resulted in investments that have worked well; in a few cases they have worked extremely well and in some others the investment strategy did not work and I was required to make investment decisions based on the risks outside of a quantitative model.
1
CARNE LARGE CAP VALUE FUND
A MESSAGE TO OUR SHAREHOLDERS
I have been accused by my wife of being an overzealous collector or in her words a “border line hoarder” simply because I refuse to depart with my childhood memorabilia and may occasionally add to it. However, in all my years of shopping I have not found any reliable device for telling the future. Unfortunately, Ouija boards and crystal balls seem to let us down most of the time. The best device I found for predicting the future is the Magic 8 Ball, although the only prediction that seems reliable from that sage invention is when the 8 Ball replies, “Answer Hazy. Ask Again Later.” Given my disillusionment with fortune telling, the only strategy that works for me as an investor is to look at a business’s recent profitability coupled with its current valuation. When looking through some of the Fund’s best performing stocks, they may not at first glance seem to be traditional value names. Two prime examples of this are Expedia Inc. and Apple Inc. which I discussed in the Fund’s Semi-Annual Report of April 30, 2012. Both of these stocks were purchased in 2011 for the portfolio because when evaluating their recent profitability versus their present value it was clear that according to my investment process these equities were compelling investments.
The history of Apple’s business performance in 2011, and investor reaction to it, is a case in point. Apple’s revenues mostly flat lined for the four earnings announcements in calendar year 2011. As a result the stock drifted for the first half of the year before a strong summer rally which concluded with choppy trading in Apple shares in the last few months of 2011. This was the result of a small revenue miss versus the “consensus” estimates in the October 2011 earnings. As is usually the case for our investment strategy, the consensus created opportunity as negative prognostications of future revenue growth caused some to look into their crystal balls and see the demise of Apple, which led them to sell their shares. In November and December of 2011 I evaluated Apple as I do all of the Fund’s holdings. That is by dissecting a company’s financials to look for recent profitability and measure that against the current equity share price. Of course, significant sales growth is not an unwanted or sometimes an unexpected phenomenon but future growth is not a measure by which I make my investments. It is my experience that companies with solid balance sheets and good profitability tend to reward their shareholders in stock appreciation, dividends, stock buy-backs or sometimes other unexpected ways.
Over the past year, Expedia Inc. gave its shareholders a one way ticket to positive returns. As I said in this year’s April 30, Semi-Annual Report, “Over the last few years, Expedia has represented a low asset based business that generated good operating income and traded at a low valuation. Concerns about travel costs and partner agreements hung over the company and kept the stock price depressed. Expedia’s good operating income and productivity showed its true potential when the company spun off Trip Advisor Inc. and the market slowly began to realize how undervalued both companies were. Through the bottoms up research done at Carne I was able to recognize the value built into both of these stocks and in January the Fund increased its position in both names in spite of many Wall Street analysts placing negative ratings on them. In the following months the great earnings power of Expedia and Trip Advisor became more apparent to the market and the Fund benefited from the strong performance in these companies and their stock prices.” Over the past year, Expedia and Trip Advisor have been two of the best performing stocks in the S&P 500 Index. Just as capital can compound and lead to greater wealth, profitability can compound as corporations spin off quality businesses.
The biggest challenge for me as the Fund Manager is evaluating the quality and value investment thesis while keeping an eye on companies or lines of business that are in an inevitable death spiral or are not forthcoming when reporting their business operations. Hewlett Packard Co. has been a stock that I invested in for the Fund based on my profitability and value thesis. During this past summer a large institutional investor noted that there may be “Accounting Issues” at HPQ. This is the largest red flag for me as the Fund manager because I base my investment decisions on corporations’ quarterly and annual financials filed with the SEC. I first look to SEC filed financials instead of softer metrics such as commentary on earnings calls because in a post Sarbanes-Oxley world, if a public corporation files a false financial statement individuals should be held accountable. It was because of Hewlett Packard’s potential accounting issues, ongoing disarray on its board, and the company's disappointing presentation on October 3, 2012, at the annual analyst-day event hosted by CEO Meg Whitman, the Fund completely liquidated its position in Hewlett Packard Co. The meeting was held during market hours and was available to view live via Hewlett Packard’s website. During the meeting Whitman stated, "It’s going to take longer to right this ship than any of us would like” and "2013 will be a fix and rebuild year." Whitman went on to describe the 5 year turnaround story for the company with normalcy returning someplace in 2015. An honest description of business prospects is always welcomed but this presentation lacked any insight into product or service innovations planned for HPQ. The style of the presentation was also clearly disjointed and reflected the lack of opportunity for shareholders of HPQ. The content for what was expected to be a positive event that was set to promote new innovation at Hewlett Packard was so clearly lacking that it left many wondering what happened to this once great American company? As a result, I liquidated the entire HPQ position because I viewed the business and accounting risks as substantially out-weighing the rewards. The Fund had a very disappointing investment and sustained significant losses
2
CARNE LARGE CAP VALUE FUND
A MESSAGE TO OUR SHAREHOLDERS
on the purchase of HPQ for the portfolio. I believe that the management and the Board of Hewlett Packard are responsible for the apparent mismanagement and oversight failures that have occurred at a once iconic firm. HPQ continues to appear on my investment radar but until there are significant changes at the company I must let caution prevail when evaluating the investment thesis there.
Trip Advisor on the positive side and Hewlett Packard on the negative side are prime examples of why I believe a quantitative investment process should be paired with active management to reduce risk and increase return. I trust in quality-value investing but I also know that the third pillar of our investment strategy is essential to the whole: manage the volatility of the portfolio.
I currently see opportunities in stocks surfacing but we do not intend to blindly accept equity market risk. In this current environment we could seek added protection by selling higher S&P 500 Index call option prices which would allow us to look for new investment opportunities. Others may be left to guess about how and when to sell but we have a disciplined program to mitigate some of the stock market’s sharp moves. The Managed Volatility Program, which consists of our strategy’s call selling program, subtracted from returns over the last year but the program performed as expected. The sharp upward moves in the S&P 500 Index in early February and late July cost the Fund some performance. In recent days the Managed Volatility Program has cushioned the downside but since the Magic 8 Ball is saying to “ask again” when I inquire about near term market moves, I will continue to look at the stock market’s and Fund’s volatility to select short-term S&P 500 Index call options that are out-of-the-money (when the strike price of the underlying asset is higher than the current market price). When JP Morgan was once asked what the stock market will do his response was, “It will fluctuate.” That is sage advice for today’s market, and having a strategy to deal with those fluctuations should have a place in every investor’s portfolio.
We can always do better but I am pleased with the Fund’s performance and risk measures since its inception in 2009. We will continue to employ our investment process and look for opportunities while shielding part of the portfolio with our Managed Volatility Program. Thank you for your trust and confidence. On a daily basis, your trust is first in the minds of all of the professionals that work with the Fund. This includes not only those focused on portfolio management, but also the many operational people who do their jobs diligently so that I may do mine. I look forward to hearing from you and as always, Carne Capital is committed to excellence in managed quality-value investing.
Sincerely,
F. Sean Bonner
Founder and Chief Investment Officer
Carne Capital, LLC
IMPORTANT INFORMATION
There is no assurance that the Fund will achieve its investment objective. The Fund is subject to risks of broad market decline or decline in particular holdings, Index Call Option Risk, management risk, focused holdings risk, counterparty risk, sector risk and value stock risk in which stocks may remain undervalued for extended periods of time. Details are located within the Fund’s prospectus. Volatility is a statistical measure of the dispersion of returns for a given security or market index.
Volatility can either be measured by using the standard deviation or variance between returns from that same security or market index. Commonly, the higher the volatility, the riskier the security. An index option is an option providing exposure to the movement of a broad based stock market index. A call option is an option contract giving the owner the right (but not the obligation) to buy a specified amount of an underlying security at a specified price within a specified time. By selling an index call option, the Fund is selling the right to an option buyer to purchase the Index at a particular (strike) price. A call option is out-of-the-money if the stock price is below its strike price. Strike Price is the price at which a specific options contract can be exercised.
The S&P 500 Index is a broad-based, unmanaged measurement of changes in stock market conditions based on the average of 500 widely held common stocks. One cannot invest directly in an index.
3
CARNE LARGE CAP VALUE FUND
A MESSAGE TO OUR SHAREHOLDERS
Effective December 27, 2011, the Fund changed its name from the Waterville Large Cap Value Fund to the Carne Large Cap Value Fund.
The views in this report were those of the Fund manager as of the date this report was printed, and may not reflect their views on the date this report is first published or anytime thereafter. These views are intended to assist the shareholders of the Fund in understanding their investments in the Fund and do not constitute investment advice. This report may contain discussions about investments that may or may not be held by the Fund as of the date of this report. All current and future holdings are subject to risk and to change.
4
CARNE LARGE CAP VALUE FUND
PERFORMANCE CHART AND ANALYSIS (Unaudited)
The following chart reflects the change in the value of a hypothetical $100,000 investment in Institutional Shares, including reinvested dividends and distributions, in the Carne Large Cap Value Fund (the “Fund”) compared with the performance of the benchmark, S&P 500 Index ("S&P 500"), since inception. The S&P 500 is a broad-based, unmanaged measurement of changes in stock market conditions based on the average of 500 widely held common stocks. The total return of the indices includes reinvestment of dividends and income. The total return of the Fund includes operating expenses that reduce returns, while the total returns of the indices do not include expenses. The Fund is professionally managed while the indices are unmanaged and are not available for investment.
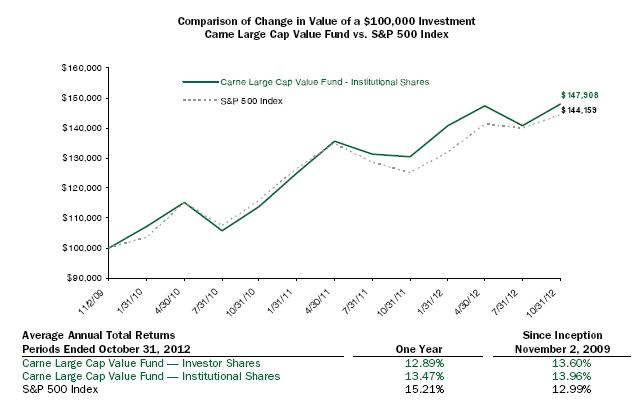
Performance data quoted represents past performance and is no guarantee of future results. Current performance may be lower or higher than the performance data quoted. Investment return and principal value will fluctuate so that shares, when redeemed, may be worth more or less than original cost. For the most recent month-end performance, please call (877) 356-9055. As stated in the Fund's prospectus, the annual operating expense ratios (gross) for Investor Shares and Institutional Shares are 2.10% and 1.73%, respectively. During the period, certain fees were waived and/or expenses reimbursed, otherwise returns would have been lower. The performance table and graph do not reflect the deduction of taxes that a shareholder would pay on Fund distributions or the redemption of Fund shares. Returns greater than one year are annualized.
5
CARNE LARGE CAP VALUE FUND
SCHEDULE OF INVESTMENTS| | Shares | | Security Description | | Value | |
| Common Stock (a) - 99.9% |
| Consumer Discretionary - 28.3% |
| | 57,328 | | Apollo Group, Inc., Class A (b) | | $ | 1,151,146 | |
| | 70,382 | | Best Buy Co., Inc. | | | 1,070,510 | |
| | 18,396 | | Coach, Inc. | | | 1,031,096 | |
| | 19,024 | | Discovery Communications, Inc., Class A (b) | | | 1,122,797 | |
| | 19,889 | | Expedia, Inc. | | | 1,176,434 | |
| | 57,082 | | GameStop Corp., Class A | | | 1,303,182 | |
| | 62,900 | | Gannett Co., Inc. | | | 1,063,010 | |
| | 60,103 | | Newell Rubbermaid, Inc. | | | 1,240,526 | |
| | 7,491 | | Ralph Lauren Corp. | | | 1,151,292 | |
| | 19,800 | | Scripps Networks Interactive, Inc., Class A | | | 1,202,256 | |
| | 108,754 | | The Interpublic Group of Cos., Inc. | | | 1,098,416 | |
| | 24,965 | | Time Warner, Inc. | | | 1,084,729 | |
| | 21,263 | | Viacom, Inc., Class B | | | 1,090,154 | |
| | | | | | | 14,785,548 | |
| Consumer Staples - 2.2% |
| | 9,811 | | Lorillard, Inc. | | | 1,138,174 | |
| Energy - 2.2% |
| | 29,709 | | HollyFrontier Corp. | | | 1,147,659 | |
| Financial - 11.4% |
| | 18,965 | | CME Group, Inc. | | | 1,060,713 | |
| | 55,468 | | Federated Investors, Inc., Class B | | | 1,289,076 | |
| | 25,593 | | Moody's Corp. | | | 1,232,559 | |
| | 46,270 | | NYSE Euronext | | | 1,145,645 | |
| | 51,720 | | The NASDAQ OMX Group, Inc. | | | 1,231,453 | |
| | | | | | | 5,959,446 | |
| Healthcare - 15.4% |
| | 31,405 | | AmerisourceBergen Corp. | | | 1,238,613 | |
| | 32,607 | | Bristol-Myers Squibb Co. | | | 1,084,183 | |
| | 31,840 | | Forest Laboratories, Inc. (b) | | | 1,073,326 | |
| | 16,117 | | Humana, Inc. | | | 1,197,010 | |
| | 13,227 | | McKesson Corp. | | | 1,234,211 | |
| | 17,350 | | Quest Diagnostics, Inc. | | | 1,001,442 | |
| | 19,700 | | WellPoint, Inc. | | | 1,207,216 | |
| | | | | | | 8,036,001 | |
| Industrials - 19.9% |
| | 16,948 | | General Dynamics Corp. | | | 1,153,820 | |
| | 20,139 | | Joy Global, Inc. | | | 1,257,680 | |
| | 15,619 | | L-3 Communications Holdings, Inc. | | | 1,152,682 | |
| | 12,206 | | Lockheed Martin Corp. | | | 1,143,336 | |
| | 18,075 | | Northrop Grumman Corp. | | | 1,241,572 | |
| | 12,548 | | Parker Hannifin Corp. | | | 987,025 | |
| | 87,883 | | Pitney Bowes, Inc. | | | 1,262,000 | |
| | 20,571 | | Raytheon Co. | | | 1,163,496 | |
| | 90,229 | | SAIC, Inc. | | | 991,617 | |
| | | | | | | 10,353,228 | |
| Information Technology - 18.4% |
| | 16,307 | | Accenture PLC, Class A | | | 1,099,255 | |
| | 1,781 | | Apple, Inc. | | | 1,059,873 | |
| | 44,966 | | CA, Inc. | | | 1,012,634 | |
| | 22,527 | | Harris Corp. | | | 1,031,286 | |
| | 44,638 | | Intel Corp. | | | 965,297 | |
| | 38,613 | | Microsoft Corp. | | | 1,101,822 | |
| | 39,919 | | Seagate Technology PLC | | | 1,090,587 | |
| | 58,018 | | Symantec Corp. (b) | | | 1,055,347 | |
| | 8,343 | | Visa, Inc., Class A | | | 1,157,675 | |
| | | | | | | 9,573,776 | |
| Materials - 2.1% |
| | 5,441 | | CF Industries Holdings, Inc. | | | 1,116,439 | |
| | | Value | |
Total Common Stock (Cost $47,775,192) | | $ | 52,110,271 | |
Total Investments in Securities - 99.9% (Cost $47,775,192)* | | $ | 52,110,271 | |
| | Contracts | | Security Description | | | Strike Price | | Exp. Date | | Value | |
| Call Options Written - (0.1)% | |
| (50) | | S&P 500 Index | | $ | 1,490.00 | | 11/12 | | | (1,000) | |
| (100) | | S&P 500 Index | | | 1,500.00 | | 11/12 | | | (5,000) | |
| (100) | | S&P 500 Index | | | 1,480.00 | | 11/12 | | | (16,100) | |
| (100) | | S&P 500 Index | | | 1,480.00 | | 11/12 | | | (26,000) | |
Total Call Options Written (Premiums Received $(97,940)) | | | (48,100) | |
Total Written Options - (0.1)% (Premiums Received $(97,940))* | | $ | (48,100) | |
| Other Assets & Liabilities, Net – 0.2% | | | 101,406 | |
| Net Assets – 100.0% | | $ | 52,163,577 | |
PLC | Public Limited Company |
| (a) | All or a portion of these securities are pledged as collateral for written options. |
| (b) | Non-income producing security. |
| * | Cost for federal income tax purposes is $48,107,496 and net unrealized appreciation consists of: |
| Gross Unrealized Appreciation | | $ | 6,144,243 | |
| Gross Unrealized Depreciation | | | (2,189,568 | ) |
| Net Unrealized Appreciation | | $ | 3,954,675 | |
The following is a summary of the inputs used to value the Fund’s investments and other financial instruments and liabilities as of October 31, 2012.
The inputs or methodology used for valuing securities are not necessarily an indication of the risks associated with investing in those securities. For more information on valuation inputs, and their aggregation into the levels used in the tables below, please refer to the Security Valuation section in Note 2 of the accompanying Notes to Financial Statements.
| Valuation Inputs | | | Investments in Securities | | | | Other Financial Instruments** | |
| Level 1 - Quoted Prices | | $ | 52,110,271 | | | $ | (48,100 | ) |
| Level 2 - Other Significant Observable Inputs | | | - | | | | - | |
| Level 3 - Significant Unobservable Inputs | | | - | | | | - | |
| Total | | $ | 52,110,271 | | | $ | (48,100 | ) |
The Level 1 inputs displayed in the Investments in Securities column of this table are Common Stock. Refer to the Schedule of Investments for a further breakout of each security by type.
There were no transfers between Level 1 and Level 2 for the year ended October 31, 2012.
| ** | Other Financial Instruments are derivative instruments not reflected in the Total Investments in Securities, such as written call options, which are valued at their market value at year end. |
See Notes to Financial Statements. 6
CARNE LARGE CAP VALUE FUND
SCHEDULE OF INVESTMENTS
| PORTFOLIO HOLDINGS | | | |
| % of Total Investments | | | |
| Consumer Discretionary | | | 28.4 | % |
| Consumer Staples | | | 2.2 | % |
| Energy | | | 2.2 | % |
| Financial | | | 11.4 | % |
| Healthcare | | | 15.4 | % |
| Industrials | | | 19.9 | % |
| Information Technology | | | 18.4 | % |
| Materials | | | 2.1 | % |
| | | | 100.0 | % |
See Notes to Financial Statements. 7
CARNE LARGE CAP VALUE FUND
STATEMENT OF ASSETS AND LIABILITIES| | | | | |
| ASSETS | | | | |
| Total investments, at value (Cost $47,775,192) | | $ | 52,110,271 | |
| Cash | | | 113,792 | |
| Receivables: | | | | |
| Investment securities sold | | | 934,770 | |
| Dividends and interest | | | 42,893 | |
| Prepaid expenses | | | 5,733 | |
| Total Assets | | | 53,207,459 | |
| | | | | |
| LIABILITIES | | | | |
| Payables: | | | | |
| Call options written, at value (Premiums received $97,940) | | | 48,100 | |
| Investment securities purchased | | | 910,016 | |
| Accrued Liabilities: | | | | |
| Investment adviser fees | | | 40,832 | |
| Trustees’ fees and expenses | | | 19 | |
| Fund services fees | | | 14,966 | |
| Other expenses | | | 29,949 | |
| Total Liabilities | | | 1,043,882 | |
| | | | | |
| NET ASSETS | | $ | 52,163,577 | |
| | | | | |
| COMPONENTS OF NET ASSETS | | | | |
| Paid-in capital | | $ | 45,619,663 | |
| Accumulated net realized gain | | | 2,158,995 | |
| Net unrealized appreciation | | | 4,384,919 | |
| NET ASSETS | | $ | 52,163,577 | |
| | | | | |
| SHARES OF BENEFICIAL INTEREST AT NO PAR VALUE (UNLIMITED SHARES AUTHORIZED) | | | | |
| Investor Shares | | | 24,921 | |
| Institutional Shares | | | 3,920,115 | |
| | | | | |
| NET ASSET VALUE, OFFERING AND REDEMPTION PRICE PER SHARE | | | | |
| Investor Shares (based on net assets of $329,734) | | $ | 13.23 | |
| Institutional Shares (based on net assets of $51,833,843) | | $ | 13.22 | |
See Notes to Financial Statements. 8
CARNE LARGE CAP VALUE FUND
STATEMENT OF OPERATIONS| | | | | |
| INVESTMENT INCOME | | | | |
| Dividend income | | $ | 1,093,483 | |
| Interest income | | | 593 | |
| Total Investment Income | | | 1,094,076 | |
| | | | | |
| EXPENSES | | | | |
| Investment adviser fees | | | 451,653 | |
| Fund services fees | | | 184,008 | |
| Transfer agent fees: | | | | |
| Investor Shares | | | 500 | |
| Institutional Shares | | | 239 | |
| Non 12B-1 shareholder servicing fees: | | | | |
| Institutional Shares | | | 43,842 | |
| Distribution fees: | | | | |
| Investor Shares | | | 2,223 | |
| Custodian fees | | | 10,065 | |
| Registration fees: | | | | |
| Investor Shares | | | 1,140 | |
| Institutional Shares | | | 18,592 | |
| Professional fees | | | 78,490 | |
| Trustees' fees and expenses | | | 6,169 | |
| Miscellaneous expenses | | | 24,142 | |
| Total Expenses | | | 821,063 | |
| Fees waived and expenses reimbursed | | | (36,845 | ) |
| Net Expenses | | | 784,218 | |
| | | | | |
| NET INVESTMENT INCOME | | | 309,858 | |
| | | | | |
| NET REALIZED AND UNREALIZED GAIN (LOSS) | | | | |
| Net realized gain (loss) on: | | | | |
| Investments | | | 2,483,007 | |
| Written options | | | (179,511 | ) |
| Net realized gain | | | 2,303,496 | |
| Net change in unrealized appreciation (depreciation) on: | | | | |
| Investments | | | 2,395,696 | |
| Written options | | | 122,372 | |
| Net change in unrealized appreciation (depreciation) | | | 2,518,068 | |
| NET REALIZED AND UNREALIZED GAIN | | | 4,821,564 | |
| INCREASE IN NET ASSETS FROM OPERATIONS | | $ | 5,131,422 | |
| | | | | |
See Notes to Financial Statements. 9
CARNE LARGE CAP VALUE FUND
STATEMENTS OF CHANGES IN NET ASSETS| | | | For the Year Ended October 31, 2012 | | For the Year Ended October 31, 2011 |
| OPERATIONS | | | | | | | | |
| Net investment income | | $ | 309,858 | | | $ | 115,050 | |
| Net realized gain | | | 2,303,496 | | | | 2,861,556 | |
| Net change in unrealized appreciation (depreciation) | | | 2,518,068 | | | | 1,728,742 | |
| Increase in Net Assets Resulting from Operations | | | 5,131,422 | | | | 4,705,348 | |
| | | | | | | | | | |
| DISTRIBUTIONS TO SHAREHOLDERS FROM | | | | | | | | |
| Net investment income: | | | | | | | | |
| | Investor Shares | | | (37 | ) | | | (3,970 | ) |
| | Institutional Shares | | | (330,540 | ) | | | (132,247 | ) |
| Net realized gain: | | | | | | | | |
| | Investor Shares | | | (113,242 | ) | | | (36,407 | ) |
| | Institutional Shares | | | (2,833,476 | ) | | | (746,992 | ) |
| Total Distributions to Shareholders | | | (3,277,295 | ) | | | (919,616 | ) |
| | | | | | | | | | |
| CAPITAL SHARE TRANSACTIONS | | | | | | | | |
| Sale of shares: | | | | | | | | |
| | Investor Shares | | | 187,119 | | | | 3,088,976 | |
| | Institutional Shares | | | 10,155,704 | | | | 4,030,292 | |
| Reinvestment of distributions: | | | | | | | | |
| | Investor Shares | | | 112,128 | | | | 39,734 | |
| | Institutional Shares | | | 3,156,942 | | | | 874,621 | |
| Redemption of shares: | | | | | | | | |
| | Investor Shares | | | (3,490,277 | ) | | | (161,029 | ) |
| | Institutional Shares | | | (3,199,142 | ) | | | (321,902 | ) |
| Increase in Net Assets from Capital Share Transactions | | | 6,922,474 | | | | 7,550,692 | |
| Increase in Net Assets | | | 8,776,601 | | | | 11,336,424 | |
| | | | | | | | | | |
| NET ASSETS | | | | | | | | |
| Beginning of Year | | | 43,386,976 | | | | 32,050,552 | |
| End of Year | | $ | 52,163,577 | | | $ | 43,386,976 | |
| | | | | | | | | | |
| SHARE TRANSACTIONS | | | | | | | | |
| Sale of shares: | | | | | | | | |
| | Investor Shares | | | 14,435 | | | | 252,909 | |
| | Institutional Shares | | | 768,650 | | | | 313,656 | |
| Reinvestment of distributions: | | | | | | | | |
| | Investor Shares | | | 9,733 | | | | 3,375 | |
| | Institutional Shares | | | 270,662 | | | | 74,271 | |
| Redemption of shares: | | | | | | | | |
| | Investor Shares | | | (282,033 | ) | | | (12,985 | ) |
| | Institutional Shares | | | (257,308 | ) | | | (26,290 | ) |
| Increase in Shares | | | 524,139 | | | | 604,936 | |
| | | | | | | | | | |
See Notes to Financial Statements. 10
CARNE LARGE CAP VALUE FUND
FINANCIAL HIGHLIGHTS| These financial highlights reflect selected data for a share outstanding throughout each period. |
| | | For the Year Ended October 31, 2012 | | For the Year Ended October 31, 2011 | | November 2, 2009 (a) through October 31, 2010 | |
| INVESTOR SHARES | | | | | | | | | | | | |
| NET ASSET VALUE, Beginning of Period | $ | 12.67 | | | $ | 11.38 | | | $ | 10.00 | | |
| INVESTMENT OPERATIONS | | | | | | | | | | | | |
| Net investment income (loss) (b) | | 0.05 | | | | (0.01 | ) | | | (0.02 | ) | |
| Net realized and unrealized gain | | 1.44 | | | | 1.59 | | | | 1.40 | | |
| Total from Investment Operations | | 1.49 | | | | 1.58 | | | | 1.38 | | |
| DISTRIBUTIONS TO SHAREHOLDERS FROM | | | | | | | | | | | | |
| Net investment income | | — | (c) | | (0.02 | ) | | | — | | |
| Net realized gain | | (0.93 | ) | | | (0.27 | ) | | | — | | |
| Total Distributions to Shareholders | | (0.93 | ) | | | (0.29 | ) | | | — | | |
| NET ASSET VALUE, End of Period | $ | 13.23 | | | $ | 12.67 | | | $ | 11.38 | | |
| TOTAL RETURN | | 12.89 | % | | 14.05 | % | | 13.80 | %(d) |
| RATIOS/SUPPLEMENTARY DATA | | | | | | | | | | | | |
| Net Assets at End of Period (000's omitted) | $330 | | | $3,582 | | | $449 | | |
| Ratios to Average Net Assets: | | | | | | | | | | | | |
| Net investment income (loss) | | 0.36 | % | | (0.07 | )% | | (0.19 | )%(e) |
| Net expense | | 2.10 | % | | 2.00 | % | | 1.97 | %(e) |
| Gross expense (f) | | 2.33 | % | | 2.15 | % | | 28.33 | %(e) |
| PORTFOLIO TURNOVER RATE | | 101 | % | | 72 | % | | 95 | %(d) |
| INSTITUTIONAL SHARES | | | | | | | | | | | | |
| NET ASSET VALUE, Beginning of Period | $ | 12.68 | | | $ | 11.38 | | | $ | 10.00 | | |
| INVESTMENT OPERATIONS | | | | | | | | | | | | |
| Net investment income (loss) (b) | | 0.09 | | | | 0.04 | | | | (0.02 | ) | |
| Net realized and unrealized gain | | 1.47 | | | | 1.57 | | | | 1.41 | | |
| Total from Investment Operations | | 1.56 | | | | 1.61 | | | | 1.39 | | |
| DISTRIBUTIONS TO SHAREHOLDERS FROM | | | | | | | | | | | | |
| Net investment income | | (0.09 | ) | | | (0.04 | ) | | | (0.01 | ) | |
| Net realized gain | | (0.93 | ) | | | (0.27 | ) | | | — | | |
| Total Distributions to Shareholders | | (1.02 | ) | | | (0.31 | ) | | | (0.01 | ) | |
| NET ASSET VALUE, End of Period | $ | 13.22 | | | $ | 12.68 | | | $ | 11.38 | | |
| TOTAL RETURN | | 13.47 | % | | 14.40 | % | | 13.94 | %(d) |
| RATIOS/SUPPLEMENTARY DATA | | | | | | | | | | | | |
| Net Assets at End of Period (000's omitted) | $51,834 | | | $39,805 | | | $31,601 | | |
| Ratios to Average Net Assets: | | | | | | | | | | | | |
| Net investment income (loss) | | 0.66 | % | | 0.31 | % | | (0.15 | )%(e) |
| Net expense | | 1.65 | % | | 1.64 | % | | 1.95 | %(e) |
| Gross expense (f) | | 1.73 | % | | 1.78 | % | | 2.48 | %(e) |
| PORTFOLIO TURNOVER RATE | | 101 | % | | 72 | % | | 95 | %(d) |
| | | | | | | | | | | | | | |
| (a) | Commencement of operations. |
| (b) | Calculated based on average shares outstanding during each period. |
| (c) | Less than $0.01 per share. |
| (d) | Not annualized. |
| (e) | Annualized. |
| (f) | Reflects the expense ratio excluding any waivers and/ or reimbursements. |
See Notes to Financial Statements. 11
CARNE LARGE CAP VALUE FUND
NOTES TO FINANCIAL STATEMENTS
Note 1. Organization
The Carne Large Cap Value Fund (the “Fund”) is a diversified portfolio of Forum Funds (the “Trust”). The Trust is a Delaware statutory trust that is registered as an open-end, management investment company under the Investment Company Act of 1940 (the “Act”), as amended. Under its Trust Instrument, the Trust is authorized to issue an unlimited number of the Fund’s shares of beneficial interest without par value. The Fund currently offers two classes of shares: Investor Shares and Institutional Shares. The Fund commenced operations on November 2, 2009. The Fund’s investment objective is to achieve long-term capital appreciation.
Note 2. Summary of Significant Accounting Policies
These financial statements are prepared in accordance with accounting principles generally accepted in the United States of America (“GAAP”), which require management to make estimates and assumptions that affect the reported amounts of assets and liabilities, the disclosure of contingent liabilities at the date of the financial statements, and the reported amounts of increase and decrease in net assets from operations during the fiscal year. Actual amounts could differ from those estimates. The following summarizes the significant accounting policies of the Fund:
Security Valuation – Exchange-traded securities and over-the-counter securities are valued using the last quoted sale or official closing price, provided by independent pricing services as of the close of trading on the market or exchange for which they are primarily traded, on each Fund business day. In the absence of a sale, such securities are valued at the mean of the last bid and ask price provided by independent pricing services. Non-exchange traded securities for which quotations are available are valued using the last quoted sales price, or in the absence of a sale at the mean of the last bid and ask prices provided by independent pricing services. Short-term investments that mature in 60 days or less may be valued at amortized cost. Exchange-traded options for which there were no sales reported that day are generally valued at the mean of the last bid and ask prices. Options not traded on an exchange are generally valued at broker-dealer bid quotations.
The Fund values its investments at fair value pursuant to procedures adopted by the Trust's Board of Trustees (the "Board") if (1) market quotations are insufficient or not readily available or (2) the adviser believes that the values available are unreliable. The Trust’s Valuation Committee performs certain functions as they relate to the administration and oversight of the Fund’s valuation procedures. Under these procedures, the Valuation Committee convenes on a regular and ad-hoc basis to review such securities and considers a number of factors, including valuation methodologies and significant unobservable inputs, when arriving at fair value.
The Valuation Committee may work with an adviser to provide valuation inputs. In determining fair valuations, inputs may include market-based analytics which may consider related or comparable assets or liabilities, recent transactions, market multiples, book values and other relevant investment information. Adviser inputs may include an income-based approach in which the anticipated future cash flows of the investment are discounted in determining fair value. Discounts may also be applied based on the nature or duration of any restrictions on the disposition of the investments. The Valuation Committee performs regular reviews of valuation methodologies, key inputs and assumptions, disposition analysis and market activity.
Fair valuation is based on subjective factors and, as a result, the fair value price of an investment may differ from the security’s market price and may not be the price at which the asset may be sold. Fair valuation could result in a different NAV than a NAV determined by using market quotes.
The Fund has a three-tier fair value hierarchy. The basis of the tiers is dependent upon the various “inputs” used to determine the value of the Fund’s investments. These inputs are summarized in the three broad levels listed below:
Level 1 — quoted prices in active markets for identical assets
Level 2 — other significant observable inputs (including quoted prices of similar securities, interest rates, prepayment speeds, credit risk, etc.)
12
CARNE LARGE CAP VALUE FUND
NOTES TO FINANCIAL STATEMENTS
Level 3 — significant unobservable inputs (including the Fund’s own assumptions in determining the fair value of investments)
The aggregate value by input level, as of October 31, 2012, for the Fund’s investments is included at the end of the Fund’s Schedule of Investments.
Security Transactions, Investment Income and Realized Gain and Loss – Investment transactions are accounted for on the trade date. Dividend income is recorded on the ex-dividend date. Foreign dividend income is recorded on the ex-dividend date or as soon as possible after the Fund determines the existence of a dividend declaration after exercising reasonable due diligence. Income and capital gains on some foreign securities may be subject to foreign withholding taxes, which are accrued as applicable. Interest income is recorded on an accrual basis. Premium is amortized and discount is accreted using the effective interest method. Identified cost of investments sold is used to determine the gain and loss for both financial statement and federal income tax purposes.
Written Options – When a fund writes an option, an amount equal to the premium received by the fund is recorded as a liability and is subsequently adjusted to the current value of the option written. Premiums received from writing options that expire unexercised are treated by the fund on the expiration date as realized gain from written options. The difference between the premium and the amount paid on effecting a closing purchase transaction, including brokerage commissions, is also treated as a realized gain, or if the premium is less than the amount paid for the closing purchase transaction, as a realized loss. If a call option is exercised, the premium is added to the proceeds from the sale of the underlying security in determining whether the fund has realized a gain or loss. If a put option is exercised, the premium reduces the cost basis of the securities purchased by the fund. The fund, as writer of an option, bears the market risk of an unfavorable change in the price of the security underlying the written option. Written options are non-income producing securities.
The values of each individual written option outstanding as of October 31, 2012, are disclosed in the Fund’s Schedule of Investments. The volume of open positions may vary on a daily basis as the Fund transacts written options in order to achieve the exposure desired by the adviser. The Fund entered into a total value of $2,512,648 on written options for the year ended October 31, 2012.
Transactions in written options during the year ended October 31, 2012, were as follows:
| | | Calls | |
| | | Number of | | | | | |
| | | Contracts | | | Premiums | |
| Options Outstanding, October 31, 2011 | | (325 | ) | $ | (207,618 | ) |
| Options written | | (5,364 | ) | | | (2,512,648 | ) | |
| Options terminated in closing transactions | | 3,783 | | | 1,930,941 | |
| Options exercised | | - | | | | - | | |
| Options expired | | 1,556 | | | 691,385 | |
| Options Outstanding, October 31, 2012 | | (350 | ) | | $ | (97,940 | ) | |
| | | | | | | | | |
Derivatives Transactions - The Fund’s use of derivatives during the year ended October 31, 2012, was limited to written options. The Fund uses derivative instruments as part of its principal investment strategy to achieve its investment objective. Following is a summary of how the derivatives are treated in the financial statements and their impact on the Fund.
13
CARNE LARGE CAP VALUE FUND
NOTES TO FINANCIAL STATEMENTSThe location on the Statement of Assets and Liabilities of the Fund’s derivative positions by type of exposure, all of which are not accounted for as hedging instruments, is as follows:
Contract Type/ Primary Risk Exposure | | Location on Statement of Assets and Liabilities | | Asset Derivatives | | Location on Statement of Assets and Liabilities | | Liability Derivatives | |
| | | | | | | | | | | | |
| Equity Contracts | | | | | | | | | | | |
| | | - | | | $ - | | Call options written, at value | | | $ (48,100) | |
Realized and unrealized gains and losses on derivatives contracts during the year ended October 31, 2012, by the Fund are recorded in the following locations on the Statement of Operations:
| Contract Type/Primary Risk Exposure | | Location of Gain or (Loss) on Derivatives | | Realized Gain (Loss) on Derivatives | | Change in Unrealized Appreciation (Depreciation) on Derivatives |
| | | | | | | | | |
| Equity Contracts | | | | | | | | |
| | | Realized gain (loss) – Written options and Change in unrealized appreciation (depreciation) – Written options | | $ | (179,511) | | $ | 122,372 |
Distributions to Shareholders – Distributions to shareholders of net investment income, if any, are declared and paid at least quarterly. Distributions to shareholders of net capital gains, if any, are declared and paid annually. Distributions are based on amounts calculated in accordance with applicable federal income tax regulations, which may differ from GAAP. These differences are due primarily to differing treatments of income and gain on various investment securities held by the Fund, timing differences and differing characterizations of distributions made by the Fund. On December 14, 2012, the Fund paid a distribution of $0.4268 and $0.2258 per share in short term capital gains and long term capital gains, respectively, related to the period ended October 31, 2012.
Federal Taxes – The Fund intends to continue to qualify each year as a regulated investment company under Subchapter M of the Internal Revenue Code and to distribute all of its taxable income to shareholders. In addition, by distributing in each calendar year substantially all of its net investment income and capital gains, if any, the Fund will not be subject to a federal excise tax. Therefore, no federal income or excise tax provision is required. The Fund files a U.S. federal income and excise tax return as required. A fund’s federal income tax returns are subject to examination by the Internal Revenue Service for a period of three fiscal years after they are filed. As of October 31, 2012, there are no uncertain tax positions that would require financial statement recognition, de-recognition, or disclosure.
Income and Expense Allocation – The Trust accounts separately for the assets, liabilities and operations of each of its investment portfolios. Expenses that are directly attributable to more than one investment portfolio are allocated among the respective investment portfolios in an equitable manner. The Fund’s class specific expenses are charged to the operations of that class of shares. Income and expenses (other than expenses attributable to a specific class) and realized and unrealized gains or losses on investments are allocated to each class of shares based on the class’ respective net assets to the total net assets of the Fund.
Commitments and Contingencies – In the normal course of business, the Fund enters into contracts that provide general indemnifications by the Fund to the counterparty to the contract. The Fund’s maximum exposure under these arrangements is dependent on future claims that may be made against the Fund and, therefore, cannot be estimated; however, based on experience, the risk of loss from such claims is considered remote.
14
CARNE LARGE CAP VALUE FUND
NOTES TO FINANCIAL STATEMENTSNote 3. Fees and Expenses
Investment Adviser – As of December 27, 2011, Carne Capital, LLC, (the “Adviser”) is the investment adviser to the Fund. Pursuant to an Investment Advisory Agreement, the Adviser receives an advisory fee from the Fund at an annual rate of 0.95% of the Fund’s average daily net assets. Prior to December 27, 2011, Waterville Capital, LLC was the investment adviser to the Fund, and pursuant to an Investment Advisory Agreement received an advisory fee from the Fund at an annual rate of 1.00% of the Fund’s average daily net assets.
Distribution – Foreside Fund Services, LLC serves as the Fund’s distributor (the “Distributor”). The Distributor is not affiliated with the Adviser or Atlantic Fund Administration, LLC (d/b/a Atlantic Fund Services) (“Atlantic”) or their affiliates. The Fund has adopted a Distribution Plan (the “Plan”) for Investor Shares in accordance with Rule 12b-1 of the Act. Under the Plan, the Fund pays the Distributor and/or any other entity as authorized by the Board a fee of up to 0.25% of the average daily net assets of Investor Shares.
Other Service Providers – Atlantic provides fund accounting, fund administration, compliance and transfer agency services to the Fund. Atlantic also provides certain shareholder report production, and EDGAR conversion and filing services. Pursuant to an Atlantic services agreement, the Fund pays Atlantic customary fees for its services. Atlantic provides a Principal Executive Officer, a Principal Financial Officer, a Chief Compliance Officer, and an Anti-Money Laundering Officer to the Fund, as well as certain additional compliance support functions.
Trustees and Officers – The Trust pays each independent Trustee an annual retainer fee of $45,000 for service to the Trust ($66,000 for the Chairman). In addition, for the period ended March 31, 2012, the Chairman received a monthly stipend of $500 to cover certain expenses incurred in connection with his duties to the Trust. The stipend was discontinued April 1, 2012. The Trustees and Chairman may receive additional fees for special Board meetings. Each Trustee is also reimbursed for all reasonable out-of-pocket expenses incurred in connection with his duties as a Trustee, including travel and related expenses incurred in attending Board meetings. The amount of Trustees’ fees attributable to the Fund is disclosed in the Statement of Operations. Certain officers of the Trust are also officers or employees of the above named service providers, and during their terms of office received no compensation from the Fund.
Note 4. Expense Cap Agreement
The Adviser has contractually agreed to reduce a portion of its fees and reimburse expenses to limit total annual fund operating expenses (excluding all taxes, interest, portfolio transaction expenses, dividend on short sales, acquired fund fees and expenses, and extraordinary expenses) of Institutional Shares to 2.00% and Investor Shares to 2.25%, through at least March 1, 2013. Other fund service providers have voluntarily agreed to waive a portion of their fees. Voluntary fee waivers and expense reimbursements may be reduced or eliminated at any time. For the year ended October 31, 2012, fees waived were as follows:
| Investment Adviser Fees Waived | | Other Waivers | | Total Fees Waived |
| $ | 31,845 | | $ | 5,000 | | $ | 36,845 |
Note 5. Security Transactions
The cost of purchases and proceeds from sales of investment securities (including maturities), other than short-term investments during the year ended October 31, 2012, were $51,768,288 and $47,207,515, respectively.
Note 6. Federal Income Tax and Investment Transactions
Distributions during the fiscal years ended as noted were characterized for tax purposes as follows:
| | | 2012 | | | 2011 | |
| Ordinary Income | | $ | 1,915,193 | | | $ | 869,482 | |
| Long-Term Capital Gain | | | 1,362,102 | | | | 50,134 | |
| | | $ | 3,277,295 | | | $ | 919,616 | |
15
CARNE LARGE CAP VALUE FUNDNOTES TO FINANCIAL STATEMENTS
As of October 31, 2012, distributable earnings on a tax basis were as follows:
| Undistributed Ordinary Income | | $ | 1,693,446 | |
| Undistributed Long-Term Gain | | | 895,793 | |
| Unrealized Appreciation | | | 3,954,675 | |
| Total | | $ | 6,543,914 | |
The difference between components of distributable earnings on a tax basis and the amounts reflected in the Statement of Assets and Liabilities are primarily due to mark-to-market on section 1256 contracts and the tax deferral of losses on wash sales.
On the Statement of Assets and Liabilities, as a result of permanent book to tax differences, certain amounts have been reclassified for the year ended October 31, 2012. The following reclassification was the result of re-designation of distributions and has no impact on the net assets of the Fund.
| Accumulated Net Investment Income (Loss) | | $ | 20,719 | |
| Undistributed Net Realized Gain (Loss) | | | (20,719 | ) |
The Fund invests in broad based options which qualify under section 1256 of the Internal Revenue Code. Each section 1256 contract is treated as sold for its fair market value on the last business day of its taxable year and any gain or loss realized upon sale or mark-to-market is treated as 60% long term and 40% short term.
Note 7. Recent Accounting Pronouncements
In May 2011, FASB issued ASU No. 2011-04 “Amendments to Achieve Common Fair Value Measurement and Disclosure Requirements in U.S. GAAP and IFRSs.” ASU No. 2011-04 establishes common requirements for measuring fair value and for disclosing information about fair value measurements in accordance with U.S. GAAP and International Financial Reporting Standards (“IFRSs”). ASU No. 2011-04 is effective for interim and annual periods beginning after December 15, 2011. Management is evaluating the impact ASU No. 2011-04 may have on financial statement disclosures.
In December 2011, FASB issued ASU No. 2011-11 “Disclosures about Offsetting Assets and Liabilities” requiring disclosure of both gross and net information related to offsetting and related arrangements enabling users of its financial statements to understand the effect of those arrangements on the entity’s financial position. The objective of this disclosure is to facilitate comparison between those entities that prepare their financial statements on the basis of U.S. GAAP and those entities that prepare their financial statements on the basis of IFRSs. ASU No. 2011-11 is effective for interim and annual periods beginning on or after January 1, 2013. Management is evaluating any impact ASU No. 2011-11 may have on the Fund’s financial statements.
Note 8. Subsequent Events
Subsequent events occurring after the date of this report through the date these financial statements were issued have been evaluated for potential impact and the Fund has had no such events.
16
REPORT OF INDEPENDENT REGISTERED PUBLIC ACCOUNTING FIRM
To the Board of Trustees of Forum Funds
and the Shareholders of Carne Large Cap Value Fund
We have audited the accompanying statement of assets and liabilities of the Carne Large Cap Value Fund (formerly the Waterville Large Cap Value Fund), a series of shares of beneficial interest in the Forum Funds, including the schedule of investments, as of October 31, 2012, and the related statement of operations for the year then ended, and the statements of changes in net assets for each of the years in the two year period then ended and the financial highlights for each of the years in the two year period then ended and for the period November 2, 2009 (commencement of operations) to October 31, 2010. These financial statements and financial highlights are the responsibility of the Fund's management. Our responsibility is to express an opinion on these financial statements and financial highlights based on our audits.
We conducted our audits in accordance with the standards of the Public Company Accounting Oversight Board (United States). Those standards require that we plan and perform the audits to obtain reasonable assurance about whether the financial statements and financial highlights are free of material misstatement. An audit includes examining, on a test basis, evidence supporting the amounts and disclosures in the financial statements. Our procedures included confirmation of securities owned as of October 31, 2012 by correspondence with the custodian and brokers or by other appropriate auditing procedures where replies from brokers were not received. An audit also includes assessing the accounting principles used and significant estimates made by management, as well as evaluating the overall financial statement presentation. We believe that our audits provide a reasonable basis for our opinion.
In our opinion, the financial statements and financial highlights referred to above present fairly, in all material respects, the financial position of the Carne Large Cap Value Fund as of October 31, 2012, and the results of its operations for the year then ended, and the changes in its net assets for each of the years in the two year period then ended and its financial highlights for each of the years in the two year period then ended and for the period November 2, 2009 to October 31, 2010, in conformity with accounting principles generally accepted in the United States of America.
BBD, LLP
Philadelphia, Pennsylvania
December 17, 2012
17
CARNE LARGE CAP VALUE FUND
ADDITIONAL INFORMATION (Uaudited)Shareholder Proxy Vote
At a special meeting of shareholders, held on May 3, 2012, shares were voted as follows on the proposal presented to shareholders to approve a new Investment Advisory Agreement between the Trust and Carne Capital, LLC with respect to the Fund:
| For | | | Against | | | Abstain | |
| | 3,028,571 | | | | 1 | | | | 801 | |
Proxy Voting Information
A description of the policies and procedures that the Fund uses to determine how to vote proxies relating to securities held in the Fund’s portfolio is available, without charge and upon request, by calling (877) 356-9055 and on the U.S. Securities and Exchange Commission’s (the “SEC”) website at www.sec.gov. The Fund’s proxy voting record for the most recent twelve-month period ended June 30 is available, without charge and upon request, by calling (877) 356-9055 and on the SEC’s website at www.sec.gov.
Availability of Quarterly Portfolio Schedules
The Fund files its complete schedule of portfolio holdings with the SEC for the first and third quarters of each fiscal year on Form N-Q. These filings are available, without charge and upon request on the SEC’s website at www.sec.gov or may be reviewed and copied at the SEC’s Public Reference Room in Washington, DC. Information on the operation of the Public Reference Room may be obtained by calling (800) SEC-0330.
Shareholder Expense Example
As a shareholder of the Fund, you incur ongoing costs, including management fees, distribution (12b-1) fees and other Fund expenses. This example is intended to help you understand your ongoing costs (in dollars) of investing in the Fund and to compare these costs with the ongoing costs of investing in other mutual funds.
The example is based on an investment of $1,000 invested at the beginning of the period and held for the entire period from May 1, 2012, through October 31, 2012.
Actual Expenses – The first line under each share class of the table below provides information about actual account values and actual expenses. You may use the information in this line, together with the amount you invested, to estimate the expenses that you paid over the period. Simply divide your account value by $1,000 (for example, an $8,600 account value divided by $1,000 = 8.6), then multiply the result by the number in the first line under the heading entitled “Expenses Paid During Period” to estimate the expenses you paid on your account during the period.
Hypothetical Example for Comparison Purposes – The second line under each share class of the table below provides information about hypothetical account values and hypothetical expenses based on the Fund’s actual expense ratio and an assumed rate of return of 5% per year before expenses, which is not the Fund’s actual return. The hypothetical account values and expenses may not be used to estimate the actual ending account balance or expenses you paid for the period. You may use this information to compare the ongoing costs of investing in the Fund and other funds. To do so, compare this 5% hypothetical example with the 5% hypothetical examples that appear in the shareholder reports of other funds.
Please note that the expenses shown in the table are meant to highlight your ongoing costs only. Therefore, the second line of the table is useful in comparing ongoing costs only and will not help you determine the relative total costs of owning different funds.
18
CARNE LARGE CAP VALUE FUND
ADDITIONAL INFORMATION (Uaudited)| | | Beginning | | | Ending | | | Expenses | | | Annualized | |
| | | Account Value | | | Account Value | | | Paid During | | | Expense | |
| | | May 1, 2012 | | | October 31, 2012 | | | Period* | | | Ratio* | |
| Investor Shares | | | | | | | | | | | | |
| Actual | | $ | 1,000.00 | | | $ | 999.31 | | | $ | 10.30 | | | | 2.05 | % |
| Hypothetical (5% return before taxes) | | $ | 1,000.00 | | | $ | 1,014.83 | | | $ | 10.38 | | | | 2.05 | % |
| Institutional Shares | | | | | | | | | | | | | | | | |
| Actual | | $ | 1,000.00 | | | $ | 1,003.03 | | | $ | 9.11 | | | | 1.81 | % |
| Hypothetical (5% return before taxes) | | $ | 1,000.00 | | | $ | 1,016.04 | | | $ | 9.17 | | | | 1.81 | % |
| | | | | | | | | | | | | | | | | |
| | *Expenses are equal to the Fund’s annualized expense ratio multiplied by the average account value over the period, multiplied by the number of days in the most recent fiscal half-year divided by 366 to reflect the half-year period. |
Federal Tax Status of Dividends Declared during the Tax Year
For federal income tax purposes, dividends from short-term capital gains are classified as ordinary income.
The Fund designates 46.99% of its income dividend distributed as qualifying for the corporate dividends-received deduction (DRD) and 47.06% for the qualified dividend rate (QDI) as defined in Section 1(h)(11) of the Internal Revenue Code. The Fund also designates 0.02% as qualified interest income exempt from U.S. tax for foreign shareholders (QII) and 83.82% as short-term capital gain dividends exempt from U.S. tax for foreign shareholders (QSD).
Trustees and Officers of the Trust
The Board is responsible for oversight of the management of the Trust’s business affairs and of the exercise of all the Trust’s powers except those reserved for the shareholders. The following table provides information about each Trustee and certain officers of the Trust. Each Trustee and officer holds office until the person resigns, is removed, or is replaced. Unless otherwise noted, the persons have held their principal occupations for more than five years. The address for all Trustees and officers is Three Canal Plaza, Suite 600, Portland, Maine 04101. Mr. Keffer is considered an Interested Trustee due to his affiliation with Atlantic. The Fund’s Statement of Additional Information includes additional information about the Trustees and is available, without charge and upon request, by calling (877) 356-9055.
| Name and Year of Birth | Position with the Trust | Length of Time Served | Principal Occupation(s) During Past Five Years | Number of Series of Trust Overseen by Trustee | Other Directorships Held by Trustee |
| Independent Trustees | | | | | |
J. Michael Parish Born: 1943 | Chairman of the Board; Trustee; Chairman, Nominating Committee and Qualified Legal Compliance Committee | Since 1989 (Chairman since 2004) | Retired since 2003. | 21 | 0 |
Costas Azariadis Born: 1943 | Trustee; Chairman, Valuation Committee | Since 1989 | Professor of Economics, Washington University since 2006. | 21 | 0 |
James C. Cheng Born: 1942 | Trustee; Chairman, Audit Committee | Since 1989 | President, Technology Marketing Associates (marketing company for small- and medium-sized businesses in New England) since 1991. | 21 | 0 |
David Tucker Born: 1958 | Trustee | Since 2011 | Director, Blue Sky Experience since 2008; Senior Vice President & General Counsel, American Century Companies 1998-2008. | 21 | Director, Forum ETF Trust |
19
CARNE LARGE CAP VALUE FUND
ADDITIONAL INFORMATION (Uaudited)
| Name and Year of Birth | Position with the Trust | Length of Time Served | Principal Occupation(s) During Past Five Years | Number of Series of Trust Overseen by Trustee | Other Directorships Held by Trustee |
| Interested Trustee | | | | | |
John Y. Keffer1 Born: 1942 | Trustee; Vice Chairman | Since 1989 | Chairman, Atlantic since 2008; President, Forum Foundation (a charitable organization) since 2005; President, Forum Trust, LLC (a non-depository trust company chartered in the State of Maine) since 1997. | 21 | Director, Wintergreen Fund, Inc.; Director, Forum ETF Trust |
| Officers | | | | | |
Stacey E. Hong Born: 1966 | President; Principal Executive Officer | Since 2008 | President, Atlantic since 2008; Director, Consulting Services, Foreside Fund Services 2007. | N/A | N/A |
Karen Shaw Born: 1972 | Treasurer; Principal Financial Officer | Since 2008 | Senior Vice President, Atlantic since 2008; Vice President, Citigroup 2003-2008. | N/A | N/A |
David Faherty Born: 1970 | Vice President | Since 2009 | Senior Counsel, Atlantic since 2009; Vice President, Citi Fund Services Ohio, Inc. 2007-2009; Associate Counsel, Investors Bank & Trust Co. 2006-2007. | N/A | N/A |
Michael J. McKeen Born: 1971 | Vice President | Since 2009 | Senior Vice President, Atlantic since 2008; Vice President, Citigroup 2003-2008. | N/A | N/A |
Joshua LaPan Born: 1973 | Vice President | Since 2009 | Manager, Atlantic since 2008; Vice President, Citigroup 2003-2008. | N/A | N/A |
Timothy Bowden Born: 1969 | Vice President | Since 2009 | Manager, Atlantic since 2008; Vice President, Citigroup 2005-2008. | N/A | N/A |
Lina Bhatnagar Born: 1971 | Secretary | Since 2008 | Senior Administration Specialist, Atlantic since 2008; Regulatory Administration Specialist, Citigroup 2006-2008. | N/A | N/A |
1Atlantic is a subsidiary of Forum Holdings Corp. I, a Delaware corporation that is wholly owned by Mr. Keffer |
20
ITEM 2. CODE OF ETHICS.
| (a) | As of the end of the period covered by this report, Forum Funds (the “Registrant”) has adopted a code of ethics, which applies to its Principal Executive Officer and Principal Financial Officer (the “Code of Ethics”). |
| (c) | There have been no amendments to the Registrant’s Code of Ethics during the period covered by this report. |
| (d) | There have been no waivers to the Registrant’s Code of Ethics during the period covered by this report. |
(f) (1) A copy of the Code of Ethics is being filed under Item 12(a) hereto.
ITEM 3. AUDIT COMMITTEE FINANCIAL EXPERT.
The Board of Trustees has determined that no member of the Audit Committee is an "audit committee financial expert" as that term is defined under applicable regulatory guidelines.
ITEM 4. PRINCIPAL ACCOUNTANT FEES AND SERVICES.
(a) Audit Fees - The aggregate fees billed for each of the last two fiscal years (the “Reporting Periods”) for professional services rendered by the Registrant’s principal accountant for the audit of the Registrant’s annual financial statements, or services that are normally provided by the principal accountant in connection with the statutory and regulatory filings or engagements for the Reporting Periods, were $28,000 in 2011 and $26,500 in 2012.
(b) Audit-Related Fees – The aggregate fees billed in the Reporting Periods for assurance and related services rendered by the principal accountant that were reasonably related to the performance of the audit of the Registrant’s financial statements and are not reported under paragraph (a) of this Item 4 were $0 in 2011 and $0 in 2012.
(c) Tax Fees - The aggregate fees billed in the Reporting Periods for professional services rendered by the principal accountant to the Registrant for tax compliance, tax advice and tax planning were $6,000 in 2011 and $6,000 in 2012. These services consisted of review or preparation of U.S. federal, state, local and excise tax returns.
(d) All Other Fees - The aggregate fees billed in the Reporting Periods for products and services provided by the principal accountant to the Registrant, other than the services reported in paragraphs (a) through (c) of this Item, were $0 in 2011 and $0 in 2012.
(e) (1) The Audit Committee reviews and approves in advance all audit and “permissible non-audit services” (as that term is defined by the rules and regulations of the Securities and Exchange Commission) to be rendered to a series of the Registrant (each, a “Series”). In addition, the Audit Committee reviews and approves in advance all “permissible non-audit services” to be provided to an investment adviser (not including any sub-adviser) of a Series, or an affiliate of such investment adviser, that is controlling, controlled by or under common control with the investment adviser and provides on-going services to the Registrant (“Affiliate”), by the Series’ principal accountant if the engagement relates directly to the operations and financial reporting of the Series. The Audit Committee considers whether fees paid by a Series’ investment adviser or an Affiliate to the Series’ principal accountant for audit and permissible non-audit services are consistent with the principal accountant’s independence.
(e) (2) No services included in (b) - (d) above were approved pursuant to paragraph (c)(7)(i)(C) of Rule 2-01 of Regulation S-X.
(f) Not applicable
(g) The aggregate non-audit fees billed by the principal accountant for services rendered to the Registrant for the Reporting Periods were $0 in 2010 and $0 in 2011. There were no fees billed in either of the Reporting Periods for non-audit services rendered by the principal accountant to the Registrant’s investment adviser or any Affiliate.
(h) During the Reporting Period, the Registrant's principal accountant provided no non-audit services to the investment advisers or any entity controlling, controlled by or under common control with the investment advisers to the series of the Registrant to which this report relates.
ITEM 5. AUDIT COMMITTEE OF LISTED REGISTRANTS.
Not applicable.
ITEM 6. INVESTMENTS.
| (a) | Included as part of report to shareholders under Item 1. |
ITEM 7. DISCLOSURE OF PROXY VOTING POLICIES AND PROCEDURES FOR CLOSED-END
MANAGEMENT INVESTMENT COMPANIES.
Not applicable.
ITEM 8. PORTFOLIO MANAGERS OF CLOSED-END MANAGEMENT INVESTMENT COMPANIES.
Not applicable.
ITEM 9. PURCHASES OF EQUITY SECURITIES BY CLOSED-END MANAGEMENT INVESTMENT COMPANY AND AFFILIATED PURCHASERS.
Not applicable.
ITEM 10. SUBMISSION OF MATTERS TO A VOTE OF SECURITY HOLDERS
The Registrant does not accept nominees to the board of trustees from shareholders.
ITEM 11. CONTROLS AND PROCEDURES
(a) The Registrant’s Principal Executive Officer and Principal Financial Officer have concluded that the Registrant’s disclosure controls and procedures (as defined in Rule 30a-3(c) under the Investment Company Act of 1940 (the “Act”)) are effective, based on their evaluation of the controls and procedures required by Rule 30a-3(b) under the Act and Rules 13a-15(b) or 15d-15(b) under the Securities Exchange Act of 1934, as of a date within 90 days of the filing date of this report.
(b) There were no changes in the Registrant’s internal control over financial reporting (as defined in
Rule 30a-3(d) under the Act) that occurred during the second fiscal quarter of the period covered by this report that have materially affected, or are reasonably likely to materially affect, the Registrant’s internal control over financial reporting.
ITEM 12. EXHIBITS.
(a)(1) Code of Ethics (Exhibit filed herewith).
(a)(2) Certifications pursuant to Rule 30a-2(a) of the Act, and Section 302 of the Sarbanes-Oxley Act of 2002. (Exhibits filed herewith)
(a)(3) Not applicable.
(b) Certifications pursuant to Rule 30a-2(b) of the Act, and Section 906 of the Sarbanes-Oxley Act of 2002. (Exhibit filed herewith)
SIGNATURES
Pursuant to the requirements of the Securities Exchange Act of 1934 and the Investment Company Act of 1940, the Registrant has duly caused this report to be signed on its behalf by the undersigned, thereunto duly authorized.
Registrant Forum Funds
By /s/ Stacey E. Hong
Stacey E. Hong, Principal Executive Officer
Date 12/14/12
Pursuant to the requirements of the Securities Exchange Act of 1934 and the Investment Company Act of 1940, this report has been signed below by the following persons on behalf of the Registrant and in the capacities and on the dates indicated.
By /s/ Stacey E. Hong
Stacey E. Hong, Principal Executive Officer
Date 12/14/12
By /s/ Karen Shaw
Karen Shaw, Principal Financial Officer
Date 12/14/12