As filed with the Securities and Exchange Commission on August 31, 2012
UNITED STATES
SECURITIES AND EXCHANGE COMMISSION
WASHINGTON, D.C. 20549
FORM N-CSR
CERTIFIED SHAREHOLDER REPORT OF REGISTERED MANAGEMENT
INVESTMENT COMPANIES
Investment Company Act file number 811-03023
FORUM FUNDS
Three Canal Plaza, Suite 600
Portland, Maine 04101
Stacey E. Hong, Principal Executive Officer
Three Canal Plaza, Suite 600
Portland, Maine 04101
207-347-2000
Date of fiscal year end: June 30
Date of reporting period: July 1, 2011 – June 30, 2012
ITEM 1. REPORT TO STOCKHOLDERS.
Annual Report
June 30, 2012
Fund Adviser:
Auxier Asset Management LLC
5285 Meadows Road
Suite 333
Lake Oswego, Oregon 97035
Toll Free: (877) 3AUXIER or (877) 328-9437
| |
AUXIER FOCUS FUND A MESSAGE TO OUR SHAREHOLDERS JUNE 30, 2012 |
| |
AUXIER FOCUS FUND
PERFORMANCE UPDATE
June 30, 2012
| ANNUALIZED |
| | Inception * | Ten Year | Five Year | Three Year | One Year |
Auxier Focus Fund Investor Shares | 6.47% | 6.83% | 2.39% | 13.05% | 2.84% |
| S&P 500 Index | 1.62% | 5.33% | 0.22% | 16.40% | 5.45% |
| CUMULATIVE |
| | Inception * | Ten Year | Five Year | Three Year | One Year |
Auxier Focus Fund Investor Shares | 125.53% | 93.65% | 12.56% | 44.50% | 2.84% |
| S&P 500 Index | 23.15% | 68.13% | 1.09% | 57.70% | 5.45% |
| * Fund inception: July 9, 1999 | | | | |
Performance data quoted represents past performance and is no guarantee of future results. Current performance may be lower or higher than the performance data quoted. Investment return and principal value will fluctuate so that an investor's shares, when redeemed, may be worth more or less than original cost. As stated in the current prospectus, the Fund’s Investor Class Share’s annual operating expense ratio (gross) is 1.32%. The Fund’s adviser has contractually agreed to reduce a portion of its fee and reimburse Fund expenses to limit total annual operating expenses at 1.25%, which is in effect until October 31, 2015. Other share classes may vary. The Fund charges a 2.00% redemption fee on shares redeemed within 180 days of purchase. For the most recent month-end performance, please call (877)328-9437 or visit the Fund’s website at www.auxierasset.com.
Summer 2012 Market Commentary
Auxier Focus Fund declined in value 0.96% in second quarter 2012. But the Fund weathered the sloppy market far better than, the Fund’s benchmark, Standard & Poor’s 500 stock index (the “S&P 500”), which lost a corresponding 2.75%. For the first six months, our low-risk portfolio returned 5.64%, trailing the S&P 500’s 9.49%. And we continue to handily outpace the market over the long term, returning 125.53% cumulatively since inception (July 1999) versus the S&P 500’s 23.15%. This 102 percentage point lead illustrates how we endeavor to exploit the power of compounding by aiming to outperform our peers in down markets rather than chasing glamour stocks during upswings.
High structural debt levels in the developed countries of Europe as well as the United States represent stiff headwinds to global economic growth. The 27 nation European block is the largest economy in the world. Our approach has been to seek out bargain priced securities that can endure the most extreme periods of deleveraging and austerity. Absolute debt (both public and private) in developed countries in general is higher today than in 2007, a year before the financial crisis erupted. Historically, such indebtedness has meant very sluggish growth.
| Top Holdings on 6/30/12 | % Net Assets |
| PepsiCo, Inc. | 3.6 |
| Molson Coors Brewing Co., Class B | 2.4 |
| Tesco PLC, ADR | 2.4 |
| Philip Morris International | 2.2 |
| Merck & Co. Inc. | 2.1 |
| Microsoft Corp. | 1.8 |
| The Procter & Gamble Co. | 1.8 |
| Wal-Mart Stores, Inc. | 1.8 |
| Medtronic, Inc. | 1.6 |
| Hospira, Inc. | 1.5 |
Buying Global Reach on the Cheap
Gloomy headlines out of Europe overshadow some exciting fundamental developments emanating from the 1.8 billion member middle class. It is growing by 150 million people a year and represents over $12 trillion in income that will be spent. The Internet is helping to unleash an exciting new spirit. Asia is undergoing the most rapid urbanization in history. For example, while China’s per capita GDP is still low, wages should double over the next five years. Businesses supplying quality food and necessities are growing twice as fast as the economy. This aspiring middle class is hungry for safe, high-quality western products. New trade agreements with Korea and Columbia are opening up markets for such basics. Many of our companies in the Fund have the scale and distribution networks necessary to meet this growing demand. Indeed, Europe abounds with such “global
| |
AUXIER FOCUS FUND A MESSAGE TO OUR SHAREHOLDERS JUNE 30, 2012 |
| |
reach” stocks that are compelling bargains partly due to the region’s mounting debt crisis. Like farmers, we aim to profit by planting in fertile but recently drought-plagued areas that, now hopelessly out of favor, could produce bountiful harvests once rain returns.
Conventional Wisdom Can Also Be Costly
Achieving above average returns requires a strong research effort, rational approach and superior allocation of investors’ capital. There are no shortcuts. Only a select few businesses typically can thrive in a period of harsh austerity and rapid debt reduction. Popular investment mantras like “buy, hold and forget” and “broad diversification” can actually be hazardous. The most extreme example of the dangers of blindly trusting an index has to be the collapse of Japan’s debt-driven economic boom. On December 29, 1989, the Nikkei index of 225 stocks hit a peak close of 38,915.87. By March 10, 2009, the index had dropped 82% to 7,054.98. There is no heart or soul in these indexes. They lack pioneering entrepreneurs like Jim Sinegal of Costco or Sam Walton of Wal-Mart to power through the tough times. Leverage is often overlooked or misperceived. Jim Grant reminds us that, as recently as 2005, interest rates on Greek 30-year government bonds were a scant 20 basis points1 higher than those on rock-solid German 30-year Bonds. This despite the fact that Greece had been in default over 50% of the time since the early 1800s. The Greek 30-year subsequently lost over 80% of its value by 2011. Today, the California legislature has approved a $100 billion bullet train project even as more and more cities across the state seek bankruptcy protection. Never mind that virtually every company in the vanguard of the great railroad boom of the 1800s, both here and in Britain, had to be reorganized to discharge excessive debts.
All investment classes need to be thoroughly investigated to determine the actual margin of safety. Relying solely on conventional wisdom has historically proved costly. Since 1999, we have witnessed overlapping booms in technology, housing and commodities, with each lasting over 113 months. The public often confused these speculative booms with investments. Now the thundering herd has charged into government bonds. If they only knew that just six countries over the past eight centuries have honored their debt (This Time Is Different: Eight Centuries of Financial Folly by economists Carmen Reinhart and Ken Rogoff). Shrinking purchasing power is hidden short term but lethal long term. In a recent Fortune article, Warren Buffet explained how the U.S. dollar has declined 85% in purchasing power since 1965. It takes $7 dollars today to buy what $1 bought back then.
Unconventional Wisdom From Wealth Creators
It’s often helpful to look back in history to see how exceptional investors reacted when confronted with seemingly insurmountable problems. J. Paul Getty died in 1976 at age 83 with a net worth in excess of $150 billion in today's dollars. His experience during the Great Depression is a valuable study in how to allocate capital. Some Getty insights:
"I began buying common stocks at the depths of the Depression. Prices were at their lowest, and there weren't many stock buyers around. Most people with money to invest were unable to see the forest of potential profit for the multitudinous trees of their largely baseless fears. I had confidence in the future of the American economy and realized the shares of many entirely sound companies with fine potentials were selling at a fraction of their true worth."
"The seasoned investor buys his stocks when they are priced low, holds them for the long-pull rise and takes in-between dips and slumps in stride,"
"Big profits go to the intelligent, careful, patient investor, not to the reckless and overeager speculator."
It’s worth noting the same approach Getty espoused is being practiced today by Carlos Slim, the world's richest man. The Mexican industrialist is capitalizing on the turmoil in Europe by buying undervalued phone stocks. Says Slim: "When hard times hit, you can look at opportunities in a very agile way. Europe is in a good moment."
Your trust and support is appreciated.
Jeff Auxier
| |
AUXIER FOCUS FUND A MESSAGE TO OUR SHAREHOLDERS JUNE 30, 2012 |
| |
Fund returns (i) assume the reinvestment of all dividends and capital gain distributions and (ii) would have been lower during the period if certain fees and expenses had not been waived. Performance shown is for the Fund’s Investor Class shares; returns for other share classes will vary. Performance for Investor Class shares for periods prior to December 10, 2004 reflects performance of the applicable share class of Auxier Focus Fund, a series of Unified Series Trust (the “Predecessor Fund”). Prior to January 3, 2003, the Predecessor Fund was a series of Ameriprime Funds. The performance of the Fund’s Investor Class shares for the period prior to December 10, 2004 reflects the expenses of the Predecessor Fund.
The Fund may invest in value and/or growth stocks. Investments in value stocks are subject to risk that their intrinsic value may never be realized and investments in growth stocks may be susceptible to rapid price swings, especially during periods of economic uncertainty. In addition, the Fund may invest in mid-sized companies which generally carry greater risk than is customarily associated with larger companies. Moreover, if the Fund's portfolio is overweighted in a sector, any negative development affecting that sector will have a greater impact on the Fund than a fund that is not overweighted in that sector. An increase in interest rates typically causes a fall in the value of a debt security (Fixed-Income Securities Risk) with corresponding changes to the Fund’s value.
The S&P 500 Index is a broad-based, unmanaged measurement of changes in stock market conditions based on 500 widely held common stocks. One cannot invest directly in an index.
1 A basis point is one hundredth of a percentage point (0.01%).
The views in this shareholder letter were those of the Fund Manager as of June 30, 2012, and may not reflect his views on the date this letter is first distributed or anytime thereafter. These views are intended to assist readers in understanding the Fund’s investment methodology and do not constitute investment advice.
| |
AUXIER FOCUS FUND PERFORMANCE CHART AND ANALYSIS (Unaudited) JUNE 30, 2012 |
| |
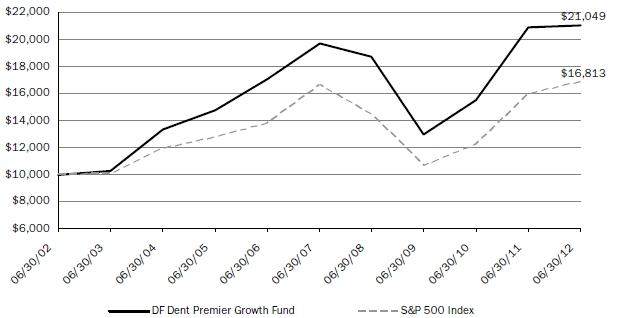
The following chart reflects the change in the value of a hypothetical $10,000 investment in Investor Shares, including reinvested dividends and distributions, in the Fund compared with the performance of the benchmark, the S&P 500, over the past ten fiscal years. The S&P 500 is a broad-based, unmanaged measurement of changes in stock market conditions based on the average of 500 widely held common stocks. The total return of the Fund's classes includes the maximum sales charge of 5.75% (A Shares only) and operating expenses that reduce returns, while the total return of the S&P 500 does not include the effect of sales charges and expenses. A Shares are subject to a 1.00% contingent deferred sales charge on shares purchased without an initial sales charge and redeemed less than one year after purchase. The total return of the S&P 500 includes the reinvestment of dividends and income. The total return of the Fund includes operating expenses that reduce returns, while the total return of the S&P 500 does not include expenses. The Fund is professionally managed while the S&P 500 is unmanaged and is not available for investment.
Performance data quoted represents past performance and is no guarantee of future results. Current performance may be lower or higher than the performance data quoted. Investment return and principal value will fluctuate so that shares, when redeemed, may be worth more or less than original cost. For the most recent month-end performance, please visit the website of the Fund's investment adviser at www.auxierasset.com or call (877)-328-9437. As stated in the Fund's prospectus, the annual operating expense ratios (gross) for Investor Shares, A Shares and Institutional Shares, respectively are 1.32%, 1.60% and 1.22%, respectively. However, the Fund's adviser has agreed to contractually reduce a portion of its fees and to reimburse expenses such that total operating expenses do not exceed 1.25%, 1.25% and 1.10% for Investor Shares, A Shares and Institutional Shares, respectively, through at least October 31, 2015. Shares redeemed or exchanged within 180 days of purchase will be charged a 2.00% redemption fee. The performance table and graph do not reflect the deduction of taxes that a shareholder would pay on Fund distributions or the redemption of Fund shares. Returns greater than one year are annualized.
Performance for Investor Shares for periods prior to December 10, 2004, reflects performance and expenses of Auxier Focus Fund, a series of Unified Series Trust (the “Predecessor Fund”). Prior to January 3, 2003, the Predecessor Fund was a series of Ameriprime Funds.
Comparison of Change in Value of a $10,000 Investment
Investor Shares vs. S&P 500 Index
Average Annual Total Returns Periods Ended June 30, 2012: | | 1 Year | | 5 Years | | 10 Years | | Since Inception(1) |
| Investor Shares | | 2.84 | % | | 2.39 | % | | 6.83 | % | | 6.47 | % |
| S&P 500 Index (Since July 9, 2009) | | 5.45 | % | | 0.22 | % | | 5.33 | % | | 1.62 | % |
A Shares (with sales charge)(2)(3) | | -3.07 | % | | 1.18 | % | | 6.20 | % | | 5.98 | % |
Institutional Shares(3) | | 2.91 | % | | 2.41 | % | | 6.84 | % | | 6.47 | % |

| (1) | Investor, A and Institutional Shares commenced operations on July 9, 1999, July 8, 2005, and May 9, 2012, respectively. |
| (2) | Due to shareholder redemptions on August 21, 2005, net assets of the class were zero from the close of business on that date until September 22, 2005. Financial information presented for the period August 21, 2005 to September 22, 2005 reflects performance of Investor Shares of the Fund. |
| (3) | For A Shares and Institutional Shares, performance for the 5-year, 10-year and since inception periods are blended average annual returns which include the returns of the Investor Shares prior to commencement of operations of the A Shares and Institutional Shares. For Institutional Shares, performance for the 1-year period is a blended average annual return which includes the return of the Investor Shares prior to commencement of operations of the Institutional Shares. |
| |
AUXIER FOCUS FUND SCHEDULE OF INVESTMENTS JUNE 30, 2012 |
| | | Security | | | | | | | | | | | Security | | | | | | |
| | Shares | | Description | | | | | | Value | | | Shares | | Description | | | | | | Value |
| Common Stock - 73.6% | | | | | | | | | 500 | | DE Master Blenders 1753 NV (a) | | | $ | 5,638 |
| Communications - 2.8% | | | | | | | | | 12,725 | | Diageo PLC, ADR | | | | | 1,311,566 |
| | 44,200 | | America Movil SAB de CV, Class A, ADR | | $ | 1,151,852 | | | 48,050 | | Dr. Pepper Snapple Group, Inc. | | | | 2,102,187 |
| | 96,500 | | Corning, Inc. | | | | | 1,247,745 | | | 45,228 | | Express Scripts Holding Co. (a) | | | | 2,525,079 |
| | 6,000 | | DIRECTV, Class A (a) | | | | | 292,920 | | | 5,100 | | Hillshire Brands Co. | | | | | 147,849 |
| | 8,350 | | Motorola Solutions, Inc. | | | | | 401,719 | | | 106,381 | | Hospira, Inc. (a) | | | | | 3,721,207 |
| | 10,000 | | News Corp., Class A | | | | | 222,900 | | | 5,621 | | KAR Auction Services, Inc. (a) | | | | 96,625 |
| | 151,835 | | Oi SA, Preference Shares, ADR | | | | 1,873,644 | | | 16,862 | | Kraft Foods, Inc., Class A | | | | | 651,210 |
| | 44,439 | | Oi SA, ADR | | | | | | 206,641 | | | 9,250 | | Manpower, Inc. | | | | | 339,013 |
| | 100,900 | | Telefonica SA, ADR | | | | | 1,321,790 | | | 143,022 | | Molson Coors Brewing Co., Class B | | | | 5,951,145 |
| | 3,000 | | Viacom, Inc., Class B | | | | | 141,060 | | | 3,760 | | National Beverage Corp. (a) | | | | 56,174 |
| | | | | | | | | | 6,860,271 | | | 1,600 | | Nestle SA, ADR | | | | | 95,584 |
| Consumer Discretionary - 11.9% | | | | | | | | | 46,172 | | Paychex, Inc. | | | | | 1,450,263 |
| | 83,235 | | Apollo Group, Inc., Class A (a) | | | | 3,012,275 | | | 125,400 | | PepsiCo, Inc. | | | | | 8,860,764 |
| | 46,300 | | Arcos Dorados Holdings, Inc., Class A | | | | 684,314 | | | 62,850 | | Philip Morris International, Inc. | | | | 5,484,291 |
| | 45,477 | | Bridgepoint Education, Inc. (a) | | | | 991,399 | | | 860 | | Post Holdings, Inc. (a) | | | | | 26,445 |
| | 27,434 | | Career Education Corp. (a) | | | | 183,533 | | | 144,629 | | PRGX Global, Inc. (a) | | | | | 1,149,801 |
| | 13,650 | | Carnival Corp. | | | | | 467,786 | | | 1,721 | | Ralcorp Holdings, Inc. (a) | | | | | 114,860 |
| | 500 | | Coach, Inc. | | | | | | 29,240 | | | 11,450 | | Safeway, Inc. | | | | | 207,818 |
| | 57,100 | | Comcast Corp., Class A | | | | | 1,825,487 | | | 4,000 | | SAIC, Inc. | | | | | | 48,480 |
| | 3,000 | | Cooper-Standard Holding, Inc. (a) | | | | 110,250 | | | 404,976 | | Tesco PLC, ADR | | | | | 5,912,650 |
| | 52,650 | | CVS Caremark Corp. | | | | | 2,460,334 | | | 34,650 | | The Coca-Cola Co. | | | | | 2,709,283 |
| | 2,297 | | Discovery Communications, Inc., Class A (a) | | | 124,038 | | | 1,500 | | The J.M. Smucker Co. | | | | | 113,280 |
| | 2,297 | | Discovery Communications, Inc., Class C (a) | | | 115,057 | | | 99,400 | | The Kroger Co. | | | | | 2,305,086 |
| | 14,800 | | DR Horton, Inc. | | | | | 272,024 | | | 72,925 | | The Procter & Gamble Co. | | | | 4,466,656 |
| | 37,987 | | Gruma S.A.B. de C.V., ADR (a) | | | | 375,312 | | | 46,380 | | The Western Union Co. | | | | | 781,039 |
| | 198,000 | | H&R Block, Inc. | | | | | 3,164,040 | | | 2,000 | | TreeHouse Foods, Inc. (a) | | | | | 124,580 |
| | 1,000 | | Interface, Inc. | | | | | 13,630 | | | 98,550 | | Unilever NV, ADR | | | | | 3,286,642 |
| | 14,850 | | ITT Educational Services, Inc. (a) | | | | 902,138 | | | 100 | | Valeant Pharmaceuticals International, Inc. (a) | | | 4,479 |
| | 13,200 | | Jamba, Inc. (a) | | | | | 25,872 | | | | | | | | | | | 64,416,604 |
| | 157,943 | | Lincoln Educational Services Corp. | | | | 1,026,629 | | Energy - 4.0% | | | | | | | |
| | 28,000 | | Lowe's Cos., Inc. | | | | | 796,320 | | | 2,600 | | Apache Corp. | | | | | 228,514 |
| | 15,800 | | McDonald's Corp. | | | | | 1,398,774 | | | 86,700 | | BP PLC, ADR | | | | | 3,514,818 |
| | 104,200 | | Newell Rubbermaid, Inc. | | | | | 1,890,188 | | | 16,750 | | Chevron Corp. | | | | | 1,767,125 |
| | 4,900 | | NIKE, Inc., Class B | | | | | 430,122 | | | 15,600 | | ConocoPhillips | | | | | 871,728 |
| | 3,250 | | Sally Beauty Holdings, Inc. (a) | | | | 83,655 | | | 11,200 | | Exxon Mobil Corp. | | | | | 958,384 |
| | 1,738 | | Strayer Education, Inc. | | | | | 189,477 | | | 1,200 | | Gazprom Neft JSC, ADR | | | | | 27,504 |
| | 4,884 | | The Andersons, Inc. | | | | | 208,351 | | | 800 | | Lukoil OAO, ADR (a) | | | | | 44,864 |
| | 18,250 | | The Home Depot, Inc. | | | | | 967,067 | | | 2,500 | | PetroChina Co., Ltd., ADR | | | | 322,850 |
| | 33,233 | | The Interpublic Group of Cos., Inc. | | | | 360,578 | | | 11,700 | | Petroleo Brasileiro SA, ADR | | | | 219,609 |
| | 3,890 | | Time Warner Cable, Inc. | | | | | 319,369 | | | 7,800 | | Phillips 66 (a) | | | | | 259,272 |
| | 15,500 | | Time Warner, Inc. | | | | | 596,750 | | | 2,750 | | Surgutneftegas OJSC, ADR (a) | | | | 22,935 |
| | 21,608 | | Universal Technical Institute, Inc. | | | | 291,924 | | | 22,550 | | Transocean, Ltd. | | | | | 1,008,661 |
| | 25,751 | | Value Line, Inc. | | | | | 306,179 | | | 19,100 | | Valero Energy Corp. | | | | | 461,265 |
| | 62,000 | | Wal-Mart Stores, Inc. | | | | | 4,322,640 | | | 13,800 | | Willbros Group, Inc. (a) | | | | | 89,148 |
| | 15,052 | | Weight Watchers International, Inc. | | | | 776,081 | | | | | | | | | | | 9,796,677 |
| | 8,600 | | Yum! Brands, Inc. | | | | | 554,012 | | Financials - 8.5% | | | | | | | |
| | | | | | | | | | 29,274,845 | | | 42,250 | | Aflac, Inc. | | | | | | 1,799,427 |
| Consumer Staples - 26.2% | | | | | | | | | 15,150 | | American International Group, Inc. (a) | | | | 486,164 |
| | 20,050 | | Alkermes PLC (a) | | | | | 340,249 | | | 1,280 | | Ameriprise Financial, Inc. | | | | | 66,893 |
| | 400,600 | | Alliance One International, Inc. (a) | | | | 1,386,076 | | | 168,133 | | Bank of America Corp. | | | | | 1,375,328 |
| | 62,500 | | Altria Group, Inc. | | | | | 2,159,375 | | | 16,000 | | Berkshire Hathaway, Inc., Class B (a) | | | | 1,333,280 |
| | 2,000 | | Archer-Daniels-Midland Co. | | | | 59,040 | | | 73,224 | | Central Pacific Financial Corp. (a) | | | | 1,033,923 |
| | 210,252 | | Avon Products, Inc. | | | | | 3,408,185 | | | 14,700 | | Janus Capital Group, Inc. | | | | | 114,954 |
| | 19,200 | | Baxter International, Inc. | | | | | 1,020,480 | | | 64,250 | | Marsh & McLennan Cos., Inc. | | | | 2,070,777 |
| | 300 | | Beam, Inc. | | | | | | 18,747 | | | 7,350 | | Mastercard, Inc., Class A | | | | | 3,161,308 |
| | 15,100 | | British American Tobacco PLC, ADR | | | | 1,542,012 | | | 10,300 | | Mercury General Corp. | | | | | 429,201 |
| | 1,000 | | Carlsberg A/S, ADR | | | | | 15,780 | | | 10,650 | | StanCorp Financial Group, Inc. | | | | 395,754 |
| | 4,000 | | Coca Cola Hellenic Bottling Co. SA (a) | | | | 70,868 | | | 123,900 | | The Bank of New York Mellon Corp. | | | | 2,719,605 |
| | 9,200 | | Coca Cola Hellenic Bottling Co. SA, ADR (a) | | | 163,576 | | | 38,418 | | The Travelers Cos., Inc. | | | | | 2,452,605 |
| | 3,404 | | Columbia Sportswear Co. | | | | | 182,522 | | | 56,572 | | TNS, Inc. (a) | | | | | 1,014,902 |
| | | | | | | | | | | | | 7,350 | | U.S. Bancorp | | | | | 236,376 |
| | | | | | | | | | | | | | | | | | | | | |
| See Notes to Financial Statements. | 5 | |
| |
AUXIER FOCUS FUND SCHEDULE OF INVESTMENTS JUNE 30, 2012 |
| |
| | | | Security | | | | | | | | | | | Security | | | | | | |
| | Shares | | Description | | | | | | Value | | | Shares | | | | | | | | Value |
| | 10,324 | | Unum Group | | | | | $ | 197,498 | | Utilities - 0.1% | | | | | | | |
| | 9,500 | | Visa, Inc., Class A | | | | | 1,174,485 | | 5,616 | | FirstService Corp. (a) | | | | | $ | 157,080 |
| | 24,950 | | Waddell & Reed Financial, Inc., Class A | | | | 755,486 | | | | | | | | | | |
| | 7,646 | | Washington Federal, Inc. | | | | | 129,141 | | Total Common Stock | | | | | | |
| | 500 | | Wells Fargo & Co. | | | | | 16,720 | | (Cost $156,901,522) | | | | | | 181,277,348 |
| | 4,380 | | West Coast Bancorp (a) | | | | | 86,067 | | | | | | | | | | | |
| | | | | | | | | | 21,049,894 | | | | | | | Rate | | | | |
| Health Care – 12.6% | | | | | | | | Preferred Stock – 0.4% | | | | | | |
| | 42,600 | | Abbott Laboratories | | | | | 2,746,422 | | | 985,000 | | The Charles Schwab Corp. (b) (Cost $985,000) | 7.50 | % | | | 1,058,853 |
| | 1,032 | | Amgen, Inc. | | | | | | 75,377 | | | | | | | | | | | |
| | 29,400 | | Becton Dickinson and Co. | | | | | 2,197,650 | | | | | | | | | | | |
| | 60,557 | | BioScrip, Inc. (a) | | | | | 449,939 | | | | | | | | | | | |
| | 18,449 | | Coventry Health Care, Inc. | | | | 586,494 | | | | | | | | | | | |
| | 31,300 | | GlaxoSmithKline PLC, ADR | | | | 1,426,341 | | | | | Security | | | | | | |
| | 293,117 | | Health Management Associates, Inc., Class A (a) | | | 2,300,968 | | | Principal | | Description | | | | Maturity | | |
| | 53,450 | | Johnson & Johnson | | | | | 3,611,082 | | Corporate Bonds - 5.5% | | | | | | |
| | 101,053 | | Medtronic, Inc. | | | | | 3,913,783 | | Communications - 0.2% | | | | | | |
| | 123,360 | | Merck & Co., Inc. | | | | | 5,150,280 | | $ | 600,000 | | Telefonica Emisiones SAU | 6.42 | % | 06/20/16 | | 576,255 |
| | 87,782 | | Pfizer, Inc. | | | | | | 2,018,986 | | | | | | | | | | | |
| | 6,842 | | Quest Diagnostics, Inc. | | | | | 409,836 | | Consumer Staples - 1.9% | | | | | | |
| | 31,129 | | UnitedHealth Group, Inc. | | | | | 1,821,046 | | | 1,180,000 | | American Stores Co. | 7.90 | | 05/01/17 | | 1,151,975 |
| | 27,221 | | WellPoint, Inc. | | | | | 1,736,428 | | | 2,140,000 | | Block Financial, LLC | 7.88 | | 01/15/13 | | 2,194,011 |
| | 41,650 | | Zimmer Holdings, Inc. | | | | | 2,680,594 | | | 50,000 | | Constellation Brands, Inc. | 7.25 | | 05/15/17 | | 57,438 |
| | | | | | | | | | 31,125,226 | | | 654,000 | | Smithfield Foods, Inc., Series B | 7.75 | | 05/15/13 | | 683,430 |
| Industrials – 1.8% | | | | | | | | | 115,000 | | SUPERVALU, Inc. | 7.50 | | 11/15/14 | | 117,013 |
| | 21,550 | | AGCO Corp. (a) | | | | | 985,481 | | | 375,000 | | SUPERVALU, Inc. | 8.00 | | 05/01/16 | | 381,562 |
| | 100 | | Deere & Co. | | | | | | 8,087 | | | | | | | | | | | 4,585,429 |
| | 25,000 | | General Electric Co. | | | | | 521,000 | | Energy - 0.3% | | | | | | | |
| | 11,150 | | Granite Construction, Inc. | | | | | 291,127 | | | 190,000 | | El Paso Corp. | 6.70 | | 02/15/27 | | 200,725 |
| | 4,850 | | Illinois Tool Works, Inc. | | | | | 256,517 | | | 424,000 | | Sunoco, Inc. | | 5.75 | | 01/15/17 | | 450,908 |
| | 1,000 | | Johnson Controls, Inc. | | | | | 27,710 | | | | | | | | | | | 651,633 |
| | 1,000 | | POSCO, ADR | | | | | 80,440 | | Financials - 1.5% | | | | | | |
| | 300 | | Potash Corp. of Saskatchewan, Inc. | | | | 13,107 | | | 75,000 | | American Express Credit Corp., Series C | 7.30 | | 08/20/13 | | 80,209 |
| | 12,500 | | Raytheon Co. | | | | | 707,375 | | | 2,370,000 | | Hartford Financial Services Group, Inc. | 5.50 | | 10/15/16 | | 2,568,819 |
| | 3,500 | | Textainer Group Holdings, Ltd. | | | | 129,150 | | | 182,000 | | Hartford Financial Services Group, Inc. | 6.30 | | 03/15/18 | | 199,276 |
| | 3,550 | | The Boeing Co. | | | | | 263,765 | | | 260,000 | | Janus Capital Group, Inc. | 6.70 | | 06/15/17 | | 279,189 |
| | 14,450 | | United Parcel Service, Inc., Class B | | | | 1,138,082 | | | 620,000 | | Zions Bancorporation | 5.50 | | 11/16/15 | | 631,872 |
| | | | | | | | | | 4,421,841 | | | | | | | | | | | 3,759,365 |
| Information Technology – 2.8% | | | | | | | | Health Care - 0.5% | | | | | | |
| | 11,300 | | Automatic Data Processing, Inc. | | | | 628,958 | | | 540,000 | | Health Management Associates, Inc. | 6.13 | | 04/15/16 | | 575,100 |
| | 15,350 | | Dell, Inc. (a) | | | | | | 192,182 | | | 500,000 | | Health Management Associates, Inc. (c) | 7.38 | | 01/15/20 | | 534,375 |
| | 51,800 | | Intel Corp. | | | | | | 1,380,470 | | | 130,000 | | WellPoint, Inc. | 5.25 | | 01/15/16 | | 145,282 |
| | 148,064 | | Microsoft Corp. | | | | | 4,529,278 | | | | | | | | | | | 1,254,757 |
| | 625 | | MoneyGram International, Inc. (a) | | | | 9,125 | | | | | | | | | | | |
| | 1,500 | | Verisk Analytics, Inc., Class A (a) | | | | 73,890 | | | | | | | | | | | |
| | | | | | | | | | 6,813,903 | | | | | | | | | | | |
| Materials – 1.8% | | | | | | | | | | | | | | | | | |
| | 28,700 | | E.I. du Pont de Nemours & Co. | | | | 1,451,359 | | | | | | | | | | | |
| | 7,000 | | LyondellBasell Industries NV, Class A | | | | 281,890 | | | | | | | | | | | |
| | 6,400 | | Precision Castparts Corp. | | | | | 1,052,736 | | | | | | | | | | | |
| | 100 | | Spartech Corp. (a) | | | | | 517 | | | | | | | | | | | |
| | 47,350 | | The Dow Chemical Co. | | | | | 1,491,525 | | | | | | | | | | | |
| | 14,000 | | Vale SA, ADR | | | | | 277,900 | | | | | | | | | | | |
| | | | | | | | | | 4,555,927 | | | | | | | | | | | |
| Telecommunications – 1.1% | | | | | | | | | | | | | | | | | |
| | 27,300 | | AT&T, Inc. | | | | | | 973,518 | | | | | | | | | | | |
| | 52,150 | | SK Telecom Co., Ltd., ADR | | | | 631,015 | | | | | | | | | | | |
| | 27,015 | | Verizon Communications, Inc. | | | | 1,200,547 | | | | | | | | | | | |
| | | | | | | | | | 2,805,080 | | | | | | | | | | | |
| | | | | | | | | | | | | | | | | | | | | |
| See Notes to Financial Statements. | 6 | |
| |
AUXIER FOCUS FUND SCHEDULE OF INVESTMENTS JUNE 30, 2012 |
| |
| | | | Security | | | | | | | | ADR | | American Depositary Receipt | | | | | | |
| | Principal | | Description | | Rate | | Maturity | | Value | | LLC | | Limited Liability Company | | | | | | |
| Materials - 0.8% | | | | | | | | PLC | | Public Limited Company | | | | | | |
| $ | 895,000 | | The Dow Chemical Co. | 5.70 | % | 05/15/18 | $ | 1,048,828 | | (a) | | Non-income producing security. | | | | | | |
| | 203,000 | | Weyerhaeuser Co. | 9.00 | | 10/01/21 | | 261,333 | | (b) | | Variable rate security. Rate presented is as of June 30, 2012. | | |
| | 505,000 | | Weyerhaeuser Co. | 7.95 | | 03/15/25 | | 563,613 | | (c) | | Security exempt from registration under Rule 144A under the Securities Act of 1933. At the period end, the value of these securities |
| | | | | | | | | | 1,873,774 | | | | amounted to $534,375 or 0.2% of net assets. |
| Utilities - 0.3% | | | | | | | | (d) | | Zero coupon bond. Rate presented is yield to maturity. |
| | 100,000 | | Constellation Energy Group, Inc. | 4.55 | | 06/15/15 | | 107,466 | | | | | | | | | | | | |
| | 255,000 | | Energy Future Holdings Corp. | 9.75 | | 10/15/19 | | 263,925 | | * Cost for federal income tax purposes is $170,996,851 and net unrealized appreciation consists of: |
| | 312,000 | | Energy Future Intermediate Holding Co., LLC | 9.75 | | 10/15/19 | | 322,920 | | | Gross Unrealized Appreciation | | | | | $ | 37,071,928 | | |
| | 27,000 | | Nevada Power Co., Series L | 5.88 | | 01/15/15 | | 30,077 | | | Gross Unrealized Depreciation | | | | | | (10,420,408 | ) | |
| | | | | | | | | | 724,388 | | | Net Unrealized Appreciation | | | | | $ | 26,651,520 | | |
| Total Corporate Bonds | | | | | | | | | | | | | | | | | | |
| (Cost $11,808,704) | | | | | | 13,425,601 | | The following is a summary of the inputs used to value the Fund’s investments as of June 30, 2012. |
| | | | | | | | | | | | The inputs or methodology used for valuing securities are not necessarily an indication of the risks associated with investing in those securities. For more information |
| Foreign Municipal Bonds - 0.6% | | | | | | | | on valuation inputs, and their aggregation into the levels used in the tables below, please refer to the Security Valuation section in Note 2 of the accompanying Notes to Financial Statements. |
| | 356,000 | | Ontario Hydro Residual Strip (Canada) (d) | 5.47-5.65 | | 11/27/20 | | 273,621 | | |
| | 605,000 | | Ontario Hydro Residual Strip (Canada) (d) | 5.61 | | 10/15/21 | | 446,070 | | | | | | | | | | | | |
| | 235,000 | | Ontario Hydro Residual Strip (Canada) (d) | 5.75 | | 08/18/22 | | 167,205 | | | | | | Level 1 | | Level 2 | | Level 3 | | Total |
| | 750,000 | | Ontario Hydro Residual Strip (Canada), Series OC20 (d) | 5.51 | | 10/01/20 | | 577,583 | | Investments At Value | | | | | | | | |
| Total Foreign Municipal Bonds | | | | | | | | Common Stock | | | | | | | | | |
| (Cost $906,846) | | | | | | | 1,464,479 | | Communications | | $ | 6,860,271 | $ | - | $ | - | $ | 6,860,271 |
| | | | | | | | | | | | Consumer Discretionary | | 29,274,845 | | - | | - | | 29,274,845 |
| Municipal Bonds - 0.2% | | | | | | | | Consumer Staples | | | 64,416,604 | | - | | - | | 64,416,604 |
| Ohio - 0.2% | | | | | | | | Energy | | | 9,796,677 | | - | | - | | 9,796,677 |
| | 550,000 | | Buckeye Tobacco Settlement Financing Authority (Cost $375,167) 5.88 | | 06/01/47 | | 422,559 | | Financials | | | 21,049,894 | | - | | - | | 21,049,894 |
| Total Fixed Income Securities | | | | | | | | Health Care | | | 31,125,226 | | - | | - | | 31,125,226 |
| (Cost $14,075,717) | | | | | | 15,312,639 | | Industrials | | | 4,421,841 | | - | | - | | 4,421,841 |
| | Shares | | | | | | | | | | Information Technology | | 6,813,903 | | - | | - | | 6,813,903 |
| Money Market Funds - 0.0% | | | | | | | | Materials | | | 4,555,927 | | - | | - | | 4,555,927 |
| | 31 | | Schwab Government Money Fund, 0.01% (b) (Cost $31) | | 31 | | Telecommunications | | 2,805,080 | | - | | - | | 2,805,080 |
| Total Investments - 80.3% | | | | | | | | Utilities | | | 157,080 | | - | | - | | 157,080 |
| (Cost $170,977,270)* | | | | | $ | 197,648,371 | | Preferred Stock | | | - | | 1,058,353 | | - | | 1,058,353 |
| Other Assets and Liabilities, Net – 19.7% | | | | | | 48,641,726 | | Corporate Bonds | | | - | | 13,425,601 | | - | | 13,425,601 |
| Net Assets – 100.0% | | | | | $ | 246,290,097 | | Foreign Municipal Bonds | | - | | 1,464,479 | | - | | 1,464,479 |
| | | | | | | | | | | | Municipal Bonds | | | - | | 422,559 | | - | | 422,559 |
| | | | | | | | | | | | Money Market Funds | | - | | 31 | | - | | 31 |
| | | | | | | | | | | | Total Investments At Value | $ | 181,277,348 | $ | 16,371,023 | $ | - | $ | 197,648,371 |
| | | | | | | | | | | | | | | | | | | | | | |
| | | | | | | | | | | | There were no significant transfers between Level 1 and Level 2 for the year ended June 30, 2012. |
| | | | | | | | | | | | AFA | | | | | | | | | | |
| | | | | | | | | | | | PORTFOLIO HOLDINGS | | | | | | | | | |
| | | | | | | | | | | | % of Net Assets | | | | | | | | | |
| | | | | | | | | | | | Common Stock | | | | | | | 73.6 | | |
| | | | | | | | | | | | Preferred Stock | | | | | | | 0.4 | | |
| | | | | | | | | | | | Corporate Bonds | | | | | | | 5.5 | | |
| | | | | | | | | | | | Foreign Municipal Bonds | | | | | | 0.6 | | |
| | | | | | | | | | | | Municipal Bonds | | | | | | | 0.2 | | |
| | | | | | | | | | | | Money Market Funds | | | | | | 0.0 | | |
| | | | | | | | | | | | Cash and Other Net Assets | | | | | | 19.7 | | |
| | | | | | | | | | | | | | | | | | | | 100.0 | | |
| | | | | | | | | | | | | | | | | | | | | | |
| See Notes to Financial Statements. | 7 | |
| |
AUXIER FOCUS FUND STATEMENT OF ASSETS AND LIABILITIES JUNE 30, 2012 |
| |
| | | | | | | |
| ASSETS | | | | |
| | Total investments, at value (Cost $170,977,270) | | $ | 197,648,371 | |
| | Cash | | | 48,403,696 | |
| | Receivables: | | | | |
| | | Fund shares sold | | | 264,919 | |
| | | Investment securities sold | | | 149,138 | |
| | | Dividends and interest | | | 718,266 | |
| | Prepaid expenses | | | 8,241 | |
| Total Assets | | | 247,192,631 | |
| | | | | | | |
| LIABILITIES | | | | |
| | Payables: | | | | |
| | | Investment securities purchased | | | 622,807 | |
| | | Fund shares redeemed | | | 20,612 | |
| | Accrued Liabilities: | | | | |
| Adviser | Investment adviser fees | | | 182,322 | |
| | | Trustees’ fees and expenses | | | 99 | |
| | | Fund services fees | | | 44,331 | |
| | | Other expenses | | | 32,363 | |
| Total Liabilities | | | 902,534 | |
| | | | | | | |
| NET ASSETS | | $ | 246,290,097 | |
| | | | | | | |
| COMPONENTS OF NET ASSETS | | | | |
| | Paid-in capital | | $ | 216,077,504 | |
| | Undistributed net investment income | | | 1,734,396 | |
| | Accumulated net realized gain | | | 1,807,096 | |
| | Net unrealized appreciation | | | 26,671,101 | |
| NET ASSETS | | $ | 246,290,097 | |
| | | | | | | |
| SHARES OF BENEFICIAL INTEREST AT NO PAR VALUE (UNLIMITED SHARES AUTHORIZED) | | | | |
| | Investor Shares | | | 14,757,217 | |
| | A Shares | | | 102,721 | |
| | Institutional Shares | | | 74,561 | |
| | | | | | | |
NET ASSET VALUE, OFFERING AND REDEMPTION PRICE PER SHARE* | | | | |
| | Investor Shares (based on net assets of $243,365,965) | | $ | 16.49 | |
| | A Shares (based on net assets of $1,693,925) | | $ | 16.49 | |
| | A Shares Maximum Public Offering Price Per Share (net asset value per share/(100%-5.75%)) | | $ | 17.50 | |
| | Institutional Shares (based on net assets of $1,230,207) | | $ | 16.50 | |
| * | Shares redeemed or exchanged within 180 days of purchase are charged a 2.00% redemption fee. |
| See Notes to Financial Statements. | 8 | |
| |
AUXIER FOCUS FUND STATEMENT OF OPERATIONS YEAR ENDED JUNE 30, 2012 |
| |
| | | | | | | | |
| INVESTMENT INCOME | | | | | |
| | Dividend income (Net of foreign withholding taxes of $56,312) | | $ | 4,237,300 | | |
| | Interest income | | | 1,135,995 | | |
| Total Investment Income | | | 5,373,295 | | |
| Adviser | | | | | |
| EXPENSES | | | | | |
| | Investment adviser fees | | | 2,436,775 | | |
| | Fund services fees | | | 74,064 | | |
| | Transfer agent fees: | | | | | |
| | Investor Shares | | | 58,296 | | |
| | A Shares | | | 255 | | |
| | Institutional Shares | | | 79 | | |
| | Distribution fees: | | | | | |
| | A Shares | | | 2,845 | | |
| | Custodian fees | | | 6,129 | | |
| | Registration fees: | | | | | |
| | Investor Shares | | | 19 | | |
| | A Shares | | | 14 | | |
| | Professional fees | | | 23,313 | | |
| | Trustees' fees and expenses | | | 11,285 | | |
| | Miscellaneous expenses | | | 10,111 | | |
| Total Expenses | | | 2,623,185 | | |
| | Fees waived and expenses reimbursed | | | (44,279 | ) | |
| Net Expenses | | | 2,578,906 | | |
| | | | | | | | |
| NET INVESTMENT INCOME | | | 2,794,389 | | |
| | | | | | | | |
| NET REALIZED AND UNREALIZED GAIN (LOSS) | | | | | |
| | Net realized gain (loss) on: | | | | | |
| | Investments | | | 2,387,288 | | |
| | Foreign currency transactions | | | (637 | ) | |
| | Net realized gain | | | 2,386,651 | | |
| | Net change in unrealized appreciation (depreciation) on: | | | | | |
| | Investments | | | 4,018,817 | | |
| | Net change in unrealized appreciation (depreciation) | | | 4,018,817 | | |
| NET REALIZED AND UNREALIZED GAIN | | | 6,405,468 | | |
| INCREASE IN NET ASSETS FROM OPERATIONS | | $ | 9,199,857 | | |
| | | | | | | | |
| See Notes to Financial Statements. | 9 | |
| |
AUXIER FOCUS FUND STATEMENTS OF CHANGES IN NET ASSETS |
| |
| | | June 30, 2012 | # | | 41090 | # | | | # | | | 40724 | | | | | |
| | | | | For the Year Ended June 30, 2012 | | For the Year Ended June 30, 2011 | |
| OPERATIONS | | | | | | Shares | | | | | | | Shares | | |
| | Net investment income | | $ | 2,794,389 | | | | | | $ | 2,141,944 | | | | | |
| | Net realized gain | | | 2,386,651 | | | | | | | 2,423,959 | | | | | |
| | Net change in unrealized appreciation (depreciation) | | | 4,018,817 | | | | | | | 22,114,894 | | | | | |
| Increase in Net Assets Resulting from Operations | | | 9,199,857 | | | | | | | 26,680,797 | | | | | |
| | | | | | | | | | | | | | | | | | |
| DISTRIBUTIONS TO SHAREHOLDERS FROM | | | | | | | | | | | | | | | |
| | Net investment income: | | | | | | | | | | | | | | | |
| | | Investor Shares | | | (2,114,894 | ) | | | | | | (2,383,997 | ) | | | | |
| | | A Shares | | | (13,062 | ) | | | | | | (2,623 | ) | | | | |
| | Net realized gain: | | | | | | | | | | | | | | | |
| | | Investor Shares | | | (2,884,600 | ) | | | | | | (77,655 | ) | | | | |
| | | A Shares | | | (17,043 | ) | | | | | | (87 | ) | | | | |
| Total Distributions to Shareholders | | | (5,029,599 | ) | | | | | | (2,464,362 | ) | | | | |
| | | | | | | | | | | | | | | | | | |
| CAPITAL SHARE TRANSACTIONS | | | | | | | | | | | | | | | |
| | Sale of shares: | | | | | | | | | | | | | | | |
| | | Investor Shares | | | 103,203,829 | | | 6,529,964 | | | | 52,157,159 | | | 3,353,252 | | |
| | | A Shares | | | 979,449 | | | 62,557 | | | | 495,798 | | | 30,902 | | |
| | | Institutional Shares | | | 1,218,054 | | | 74,992 | | | | - | | | - | | |
| | Reinvestment of distributions: | | | | | | | | | | | | | | | |
| | | Investor Shares | | | 4,913,643 | | | 317,980 | | | | 2,420,510 | | | 159,532 | | |
| | | A Shares | | | 28,684 | | | 1,855 | | | | 2,710 | | | 179 | | |
| | Redemption of shares: | | | | | | | | | | | | | | | |
| | | Investor Shares | | | (32,622,079 | ) | | (2,041,326 | ) | | | (15,775,082 | ) | | (1,029,404 | ) | |
| | | A Shares | | | (28,719 | ) | | (1,831 | ) | | | (37,201 | ) | | (2,579 | ) | |
| | | Institutional Shares | | | (6,984 | ) | | (431 | ) | | | - | | | - | | |
| | Redemption fees | | | 74,935 | | | - | | | | 10,155 | | | - | | |
| Increase in Net Assets from Capital Share Transactions | | | 77,760,812 | | | 4,943,760 | | | | 39,274,049 | | | 2,511,882 | | |
| Increase in Net Assets | | | 81,931,070 | | | | | | | 63,490,484 | | | | | |
| | | | | | | | | | | | | | | | | | |
| NET ASSETS | | | | | | | | | | | | | | | |
| | Beginning of Year | | | 164,359,027 | | | | | | | 100,868,543 | | | | | |
| | End of Year (Including line (a)) | | $ | 246,290,097 | | | | | | $ | 164,359,027 | | | | | |
| (a) | Undistributed net investment income. | | $ | 1,734,396 | | | | | | $ | 1,068,800 | | | | | |
| See Notes to Financial Statements. | 10 | |
| |
AUXIER FOCUS FUND FINANCIAL HIGHLIGHTS |
| |
These financial highlights reflect selected data for a share outstanding throughout each year. | | | | | | |
| | | For the Years Ended June 30, | |
| | | 2012 | | | | 2011 | | | | 2010 | | | | 2009(a) | | | | 2008 | | |
| INVESTOR SHARES | | | | | | | | | | | | | | | | | | | | |
| NET ASSET VALUE, Beginning of Year | $ | 16.45 | | | $ | 13.49 | | | $ | 12.16 | | | $ | 14.22 | | | $ | 17.06 | | |
| INVESTMENT OPERATIONS | | | | | | | | | | | | | | | | | | | | |
| Net investment income (b) | | 0.22 | | | | 0.26 | | | | 0.32 | | | | 0.19 | | | | 0.18 | | |
| Net realized and unrealized gain (loss) | | 0.20 | (c) | | | 3.00 | | | | 1.27 | | | | (1.77 | ) | | | (2.24 | ) | |
| Total from Investment Operations | | 0.42 | | | | 3.26 | | | | 1.59 | | | | (1.58 | ) | | | (2.06 | ) | |
| DISTRIBUTIONS TO | | | | | | | | | | | | | | | | | | | | |
| SHAREHOLDERS FROM | | | | | | | | | | | | | | | | | | | | |
| Net investment income | | (0.16 | ) | | | (0.29 | ) | | | (0.26 | ) | | | (0.16 | ) | | | (0.31 | ) | |
| Net realized gain | | (0.23 | ) | | | (0.01 | ) | | | — | | | | (0.32 | ) | | | (0.47 | ) | |
| Total Distributions to Shareholders | | (0.39 | ) | | | (0.30 | ) | | | (0.26 | ) | | | (0.48 | ) | | | (0.78 | ) | |
REDEMPTION FEES (b) | | 0.01 | | | | — | (d) | | — | (d) | | — | (d) | | — | (d) |
| NET ASSET VALUE, End of Year | $ | 16.49 | | | $ | 16.45 | | | $ | 13.49 | | | $ | 12.16 | | | $ | 14.22 | | |
| TOTAL RETURN | | 2.84 | % | | 24.35 | % | | 12.99 | % | | (10.92 | )% | | (12.56 | )% |
| RATIOS/SUPPLEMENTARY DATA | | | | | | | | | | | | | | | | | | | | |
| Net Assets at End of Year (000's omitted) | $243,366 | | | $163,699 | | | $100,712 | | | $84,660 | | | $103,664 | | |
| Ratios to Average Net Assets: | | | | | | | | | | | | | | | | | | | | |
| Net investment income | | 1.36 | % | | 1.68 | % | | 2.29 | % | | 1.53 | % | | 1.10 | % |
| Net expense | | 1.25 | % | | 1.25 | % | | 1.30 | % | | 1.35 | % | | 1.35 | % |
| Gross expense (e) | | 1.27 | % | | 1.25 | % | | 1.30 | % | | 1.35 | % | | 1.36 | % |
| PORTFOLIO TURNOVER RATE | | 8 | % | | 20 | % | | 15 | % | | 24 | % | | 19 | % |
| | | | | | | | | | | | | | | | | | | | | | |
| (a) | Effective November 1, 2008, C Shares were reclassified as Investor Shares. For the Period July 1, 2008 through November 1, 2008, total return for C Shares was (12.68)%. For the aforementioned period, the annualized gross expenses and net expenses ratios were 2.35% and 2.10%, respectively. |
| (b) | Calculated based on average shares outstanding during each year. |
| (c) | The net realized and unrealized gain (loss) per share does not correlate to the aggregate of the net realized and unrealized loss in the Statement of Operations for the year ended June 30, 2012, primarily due to the timing of the sales and repurchases of the Fund’s shares in relation to fluctuating market values for the Fund’s portfolio. |
| (d) | Less than $0.01 per share. |
| (e) | Reflects the expense ratio excluding any waivers and/or reimbursements. |
| See Notes to Financial Statements. | 11 | |
| |
AUXIER FOCUS FUND FINANCIAL HIGHLIGHTS |
| |
These financial highlights reflect selected data for a share outstanding throughout each year. | | | | | | |
| | | For the Years Ended June 30, | |
| | | 2012 | | | | 2011 | | | | 2010 | | | | 2009 | | | | 2008 | | |
| A SHARES | | | | | | | | | | | | | | | | | | | | |
| NET ASSET VALUE, Beginning of Year | $ | 16.45 | | | $ | 13.49 | | | $ | 12.17 | | | $ | 14.22 | | | $ | 17.07 | | |
| INVESTMENT OPERATIONS | | | | | | | | | | | | | | | | | | | | |
| Net investment income (a) | | 0.22 | | | | 0.25 | | | | 0.32 | | | | 0.18 | | | | 0.17 | | |
| Net realized and unrealized gain (loss) | | 0.21 | (b) | | | 3.01 | | | | 1.26 | | | | (1.75 | ) | | | (2.24 | ) | |
| Total from Investment Operations | | 0.43 | | | | 3.26 | | | | 1.58 | | | | (1.57 | ) | | | (2.07 | ) | |
| DISTRIBUTIONS TO | | | | | | | | | | | | | | | | | | | | |
| SHAREHOLDERS FROM | | | | | | | | | | | | | | | | | | | | |
| Net investment income | | (0.16 | ) | | | (0.29 | ) | | | (0.26 | ) | | | (0.16 | ) | | | (0.31 | ) | |
| Net realized gain | | (0.23 | ) | | | (0.01 | ) | | | — | | | | (0.32 | ) | | | (0.47 | ) | |
| Total Distributions to Shareholders | | (0.39 | ) | | | (0.30 | ) | | | (0.26 | ) | | | (0.48 | ) | | | (0.78 | ) | |
REDEMPTION FEES (a) | | — | (c) | | | — | (c) | | — | (c) | | — | (c) | | — | (c) |
| NET ASSET VALUE, End of Year | $ | 16.49 | | | $ | 16.45 | | | $ | 13.49 | | | $ | 12.17 | | | $ | 14.22 | | |
TOTAL RETURN (d) | | 2.84 | % | | 24.35 | % | | 12.90 | % | | (10.85 | )% | | (12.61 | )% |
| RATIOS/SUPPLEMENTARY DATA | | | | | | | | | | | | | | | | | | | | |
| Net Assets at End of Year (000's omitted) | $1,694 | | | $660 | | | $157 | | | $148 | | | $208 | | |
| Ratios to Average Net Assets: | | | | | | | | | | | | | | | | | | | | |
| Net investment income | | 1.39 | % | | 1.61 | % | | 2.29 | % | | 1.49 | % | | 1.08 | % |
| Net expense | | 1.25 | % | | 1.25 | % | | 1.30 | % | | 1.35 | % | | 1.35 | % |
| Gross expense (e) | | 1.52 | % | | 1.50 | % | | 1.55 | % | | 1.60 | % | | 1.60 | % |
| PORTFOLIO TURNOVER RATE | | 8 | % | | 20 | % | | 15 | % | | 24 | % | | 19 | % |
| | | | | | | | | | | | | | | | | | | | | | |
| (a) | Calculated based on average shares outstanding during each year. |
| (b) | The net realized and unrealized gain (loss) per share does not correlate to the aggregate of the net realized and unrealized loss in the Statement of Operations for the year ended June 30, 2012, primarily due to the timing of the sales and repurchases of the Fund’s shares in relation to fluctuating market values for the Fund’s portfolio. |
| (c) | Less than $0.01 per share. |
| (d) | Total Return does not include the effect of front end sales charge or contingent deferred sales charge. |
| (e) | Reflects the expense ratio excluding any waivers and/or reimbursements. |
| See Notes to Financial Statements. | 12 | |
| |
AUXIER FOCUS FUND FINANCIAL HIGHLIGHTS |
| |
These financial highlights reflect selected data for a share outstanding throughout the period. |
| | | May 9, 2012 (a) through June 30, 2012 | |
| INSTITUTIONAL SHARES | | | | |
| NET ASSET VALUE, Beginning of Period | $ | 16.27 | | |
| INVESTMENT OPERATIONS | | | | |
| Net investment income (b) | | 0.04 | | |
| Net realized and unrealized gain (loss) | | 0.19 | | |
| Total from Investment Operations | | 0.23 | | |
REDEMPTION FEES (b) | | — | (c) | |
| NET ASSET VALUE, End of Period | $ | 16.50 | | |
| TOTAL RETURN | | 1.41 | %(d) | |
| RATIOS/SUPPLEMENTARY DATA | | | | |
| Net Assets at End of Period (000's omitted) | | $1,230 | | |
| Ratios to Average Net Assets: | | | | |
| Net investment income | | 1.62 | %(e) | |
| Net expense | | 1.10 | %(e) | |
| Gross expense (f) | | 1.50 | %(e) | |
| PORTFOLIO TURNOVER RATE | | 8 | %(d) | |
| | | | | | |
| (a) | Commencement of operations. |
| (b) | Calculated based on average shares outstanding during each period. |
| (c) | Less than $0.01 per share. |
| (d) | Not annualized. |
| (e) | Annualized. |
| (f) | Reflects the expense ratio excluding any waivers and/or reimbursements. |
| See Notes to Financial Statements. | 13 | |
| |
AUXIER FOCUS FUND NOTES TO FINANCIAL STATEMENTS JUNE 30, 2012 |
| |
Note 1. Organization
The Auxier Focus Fund (the “Fund”) is a diversified portfolio of Forum Funds (the “Trust”). The Trust is a Delaware statutory trust that is registered as an open-end, management investment company under the Investment Company Act of 1940 (the “Act”), as amended. Under its Trust Instrument, the Trust is authorized to issue an unlimited number of the Fund’s shares of beneficial interest without par value. The Fund currently offers three classes of shares: Investor Shares, A Shares and Institutional Shares. A Shares are offered at net asset value plus a maximum sales charge of 5.75%. A Shares are also subject to contingent deferred sales charge (“CDSC”) of 1.00% on purchases without an initial sales charge and redeemed less than one year after they are purchased. Investor Shares and Institutional Shares are not subject to a sales charge. Investor Shares, A Shares and Institutional Shares commenced operations on July 9, 1999, July 8, 2005 and May 9, 2012, respectively. The Fund’s investment objective is to provide long-term capital appreciation.
On August 27, 2008, the Board of Trustees of the Trust approved the conversion of the Fund’s C Shares into Investor Shares. On November 1, 2008, each shareholder of C Shares received Investor Shares in a dollar amount equal to their investment in C Shares as of that date.
Note 2. Summary of Significant Accounting Policies
These financial statements are prepared in accordance with accounting principles generally accepted in the United States of America (“GAAP”), which require management to make estimates and assumptions that affect the reported amounts of assets and liabilities, the disclosure of contingent liabilities at the date of the financial statements, and the reported amounts of increase and decrease in net assets from operations during the fiscal year. Actual amounts could differ from those estimates. The following summarizes the significant accounting policies of the Fund:
Security Valuation – Exchange-traded securities and over-the-counter securities are valued using the last quoted sale or official closing price, provided by independent pricing services as of the close of trading on the market or exchange for which they are primarily traded, on each Fund business day. In the absence of a sale, such securities are valued at the mean of the last bid and ask price provided by independent pricing services. Non-exchange traded securities for which quotations are available are valued using the last quoted sales price, or in the absence of a sale at the mean of the last bid and ask prices provided by independent pricing services. Debt securities may be valued at prices supplied by a fund’s pricing agent based on broker or dealer supplied valuations or matrix pricing, a method of valuing securities by reference to the value of other securities with similar characteristics such as rating, interest rate and maturity. Shares of open-end mutual funds are valued at net asset value (“NAV”). Short-term investments that mature in 60 days or less may be valued at amortized cost.
The Fund values its investments at fair value pursuant to procedures adopted by the Trust's Board of Trustees (the "Board") if (1) market quotations are insufficient or not readily available or (2) the adviser believes that the values available are unreliable. Fair valuation is based on subjective factors and, as a result, the fair value price of an investment may differ from the security’s market price and may not be the price at which the asset may be sold. Fair valuation could result in a different NAV than a NAV determined by using market quotes.
The Fund has a three-tier fair value hierarchy. The basis of the tiers is dependent upon the various “inputs” used to determine the value of the Fund’s investments. These inputs are summarized in the three broad levels listed below:
Level 1 — quoted prices in active markets for identical assets
Level 2 — other significant observable inputs (including quoted prices of similar securities, interest rates, prepayment speeds, credit risk, etc.)
Level 3 — significant unobservable inputs (including the Fund’s own assumptions in determining the fair value of investments)
The aggregate value by input level, as of June 30, 2012 with the exception of the Institutional Shares which is based on the period from May 9, 2012, through June 30, 2012, for the Fund’s investments is included at the end of the Fund’s Schedule of
| |
AUXIER FOCUS FUND NOTES TO FINANCIAL STATEMENTS JUNE 30, 2012 |
| |
Investments.
Security Transactions, Investment Income and Realized Gain and Loss – Investment transactions are accounted for on the trade date. Dividend income is recorded on the ex-dividend date. Foreign dividend income is recorded on the ex-dividend date or as soon as possible after the Fund determines the existence of a dividend declaration after exercising reasonable due diligence. Income and capital gains on some foreign securities may be subject to foreign withholding taxes, which are accrued as applicable. Interest income is recorded on an accrual basis. Premium is amortized and discount is accreted using the effective interest method. Identified cost of investments sold is used to determine the gain and loss for both financial statement and federal income tax purposes.
Foreign Currency Translations – Foreign currency amounts are translated into U.S. dollars as follows: (1) assets and liabilities at the rate of exchange at the end of the respective period; and (2) purchases and sales of securities and income and expenses at the rate of exchange prevailing on the dates of such transactions. The portion of the results of operations arising from changes in the exchange rates and the portion due to fluctuations arising from changes in the market prices of securities are not isolated. Such fluctuations are included with the net realized and unrealized gain or loss on investments.
Distributions to Shareholders – Distributions to shareholders of net investment income and net capital gains, if any, are declared and paid at least annually. Distributions are based on amounts calculated in accordance with applicable federal income tax regulations, which may differ from GAAP. These differences are due primarily to differing treatments of income and gain on various investment securities held by the Fund, timing differences and differing characterizations of distributions made by the Fund.
Federal Taxes – The Fund intends to continue to qualify each year as a regulated investment company under Subchapter M of the Internal Revenue Code and to distribute all of its taxable income to shareholders. In addition, by distributing in each calendar year substantially all of its net investment income and capital gains, if any, the Fund will not be subject to a federal excise tax. Therefore, no federal income or excise tax provision is required. The Fund files a U.S. federal income and excise tax return as required. A fund’s federal income tax returns are subject to examination by the Internal Revenue Service for a period of three fiscal years after they are filed. As of June 30, 2012, there are no uncertain tax positions that would require financial statement recognition, de-recognition, or disclosure.
Income and Expense Allocation – The Trust accounts separately for the assets, liabilities and operations of each of its investment portfolios. Expenses that are directly attributable to more than one investment portfolio are allocated among the respective investment portfolios in an equitable manner.
The Fund’s class specific expenses are charged to the operations of that class of shares. Income and expenses (other than expenses attributable to a specific class) and realized and unrealized gains or losses on investments are allocated to each class of shares based on the class’ respective net assets to the total net assets of the Fund.
Redemption Fees – A shareholder who redeems or exchanges shares within 180 days of purchase will incur a redemption fee of 2.00% of the current net asset value of shares redeemed or exchanged, subject to certain limitations. The fee is charged for the benefit of the remaining shareholders and will be paid to the Fund to help offset transaction costs. The fee is accounted for as an addition to paid-in capital. The Fund reserves the right to modify the terms of or terminate the fee at any time. There are limited exceptions to the imposition of the redemption fee.
Commitments and Contingencies – In the normal course of business, the Fund enters into contracts that provide general indemnifications by the Fund to the counterparty to the contract. The Fund’s maximum exposure under these arrangements is dependent on future claims that may be made against the Fund and, therefore, cannot be estimated; however, based on experience, the risk of loss from such claims is considered remote.
Note 3. Fees and Expenses
Investment Adviser – Auxier Asset Management LLC (the “Adviser”), is the investment adviser to the Fund. Pursuant to an investment advisory agreement, the Adviser receives an advisory fee from the Fund at an annual rate of 1.00% of the Fund’s
| |
AUXIER FOCUS FUND NOTES TO FINANCIAL STATEMENTS JUNE 30, 2012 |
| |
average daily assets. Prior to April 5, 2012, the Adviser received an advisory fee from the Fund at an annual rate of 1.25% of the Fund’s average daily assets.
Prior to April 5, 2012, under the terms of the Investment Advisory Agreement, the Adviser provided investment advisory services to the Fund and was obligated to pay all expenses of the Fund except any expenses they were authorized to pay under Rule 12b-1, brokerage fees and commissions, borrowing costs, taxes, certain compensation expenses of the Trustees, and extraordinary and non-recurring expenses.
Distribution – Foreside Fund Services, LLC serves as the Fund’s distributor (the “Distributor”). The Distributor is not affiliated with the Adviser or Atlantic Fund Administration, LLC (d/b/a Atlantic Fund Services) (“Atlantic”) or their affiliates. The Fund has adopted a Distribution Plan (the “Plan”) for A Shares of the Fund in accordance with Rule 12b-1 of the Act. Under the Plan, the Fund pays the Distributor and/or any other entity as authorized by the Board a fee of up to 0.25% of the average daily net assets of A Shares. The Distributor had no role in determining the investment policies or which securities are to be purchased or sold by the Trust or its Funds.
For the year ended June 30, 2012 with the exception of the Institutional Shares which is based on the period from May 9, 2012, through June 30, 2012, there were $44,096 in front-end sales charges assessed on the sale of A Shares and no contingent deferred sales charges were assessed on the sale of A Shares. The Distributor received $6,614 of the total front-end sales charges.
Other Service Providers – Atlantic provides fund accounting, fund administration, compliance and transfer agency services to the Fund. Atlantic also provides certain shareholder report production, and EDGAR conversion and filing services. Atlantic provides a Principal Executive Officer, a Principal Financial Officer, a Chief Compliance Officer, and an Anti-Money Laundering Officer to the Fund, as well as certain additional compliance support functions.
Trustees and Officers – The Trust pays each independent Trustee an annual retainer fee of $45,000 for service to the Trust ($66,000 for the Chairman). In addition, for the year ended March 31, 2012, the Chairman received a monthly stipend of $500 to cover certain expenses incurred in connection with his duties to the Trust. The stipend was discontinued April 1, 2012. The Trustees and Chairman may receive additional fees for special Board meetings. Each Trustee is also reimbursed for all reasonable out-of-pocket expenses incurred in connection with his duties as a Trustee, including travel and related expenses incurred in attending Board meetings. The amount of Trustees’ fees attributable to the Fund is disclosed in the Statement of Operations. Certain officers of the Trust are also officers or employees of the above named service providers, and during their terms of office received no compensation from the Fund.
Note 4. Expense Reimbursements and Fees Waived
The Adviser has contractually agreed to waive a portion of its fees and reimburse expenses through October 31, 2015, to the extent necessary to maintain the total operating expenses at 1.25% of average daily net assets of the Investor Shares and A Shares and 1.10% of average daily net assets of Institutional Shares. These contractual waivers may be changed or eliminated at any time with consent of the Board. For the year ended June 30, 2012 with the exception of the Institutional Shares which is based on the period from May 9, 2012, through June 30, 2012, fees waived and expenses reimbursed were as follows:
| Investment Adviser Fees Waived | | Investment Adviser Expenses Reimbursed | | Other Waivers | | Total Fees Waived and Expenses Reimbursed |
| | $21,329 | | | $7,768 | | | $15,182 | | | $44,279 |
Note 5. Security Transactions
The cost of purchases and proceeds from sales of investment securities (including maturities), other than short-term investments during the year ended June 30, 2012 with the exception of the Institutional Shares which is based on the period from May 9, 2012, through June 30, 2012, were $70,704,856 and $13,246,479, respectively.
| |
AUXIER FOCUS FUND NOTES TO FINANCIAL STATEMENTS JUNE 30, 2012 |
| |
Note 6. Federal Income Tax and Investment Transactions
Distributions during the fiscal years ended as noted were characterized for tax purposes as follows:
| Ordinary Income | | $ | 2,278,235 | | $ | 2,464,362 |
| Long-Term Capital Gain | | | 2,751,364 | | | - |
| | | $ | 5,029,599 | | $ | 2,464,362 |
As of June 30, 2012, distributable earnings (accumulated loss) on a tax basis were as follows:
| Undistributed Ordinary Income | | $ | 2,521,670 | |
| Undistributed Long-Term Gain | | | 1,039,403 | |
| Unrealized Appreciation | | | 26,651,520 | |
| Total | | $ | 30,212,593 | |
The difference between components of distributable earnings on a tax basis and the amounts reflected in the Statement of Assets and Liabilities are primarily due to wash sales and passive foreign investment companies.
On the Statement of Assets and Liabilities, as a result of permanent book to tax differences, certain amounts have been reclassified for the year ended June 30, 2012 with the exception of the Institutional Shares which is based on the period from May 9, 2012, through June 30, 2012. The following reclassification was the result of real estate investment trusts and currency gain/loss reclassification and has no impact on the net assets of the Fund.
| Accumulated Net Investment Income (Loss) | | $ | (837 | ) |
| Undistributed Net Realized Gain (Loss) | | | 837 | |
Note 7. Recent Accounting Pronouncements
In May 2011, FASB issued ASU No. 2011-04 “Amendments to Achieve Common Fair Value Measurement and Disclosure Requirements in U.S. GAAP and IFRSs.” ASU No. 2011-04 establishes common requirements for measuring fair value and for disclosing information about fair value measurements in accordance with U.S. GAAP and International Financial Reporting Standards (“IFRSs”). ASU No. 2011-04 is effective for interim and annual periods beginning after December 15, 2011. Management is evaluating the impact ASU No. 2011-04 may have on financial statement disclosures.
In December 2011, FASB issued ASU No. 2011-11 “Disclosures about Offsetting Assets and Liabilities” requiring disclosure of both gross and net information related to offsetting and related arrangements enabling users of its financial statements to understand the effect of those arrangements on the entity’s financial position. The objective of this disclosure is to facilitate comparison between those entities that prepare their financial statements on the basis of U.S. GAAP and those entities that prepare their financial statements on the basis of IFRSs. ASU No. 2011-11 is effective for interim and annual periods beginning on or after January 1, 2013. Management is evaluating any impact ASU No. 2011-11 may have on the Fund’s financial statements.
Note 8. Subsequent Events
Subsequent events occurring after the date of this report through the date these financial statements were issued have been evaluated for potential impact and the Fund has had no such events.
| |
REPORT OF INDEPENDENT REGISTERED PUBLIC ACCOUNTING FIRM |
| |
To the Board of Trustees of Forum Funds
and the Shareholders of Auxier Focus Fund
We have audited the accompanying statement of assets and liabilities of the Auxier Focus Fund, a series of shares of beneficial interest in the Forum Funds, including the schedule of investments, as of June 30, 2012, and the related statement of operations for the year then ended, the statements of changes in net assets for each of the years in the two year period then ended and the financial highlights for each of the years in the four year period then ended. These financial statements and financial highlights are the responsibility of the Fund's management. Our responsibility is to express an opinion on these financial statements and financial highlights based on our audits. The financial highlights for the year ended June 30, 2008 were audited by other auditors whose report dated August 25, 2008, expressed an unqualified opinion on such financial highlights.
We conducted our audits in accordance with the standards of the Public Company Accounting Oversight Board (United States). Those standards require that we plan and perform the audits to obtain reasonable assurance about whether the financial statements and financial highlights are free of material misstatement. An audit includes examining, on a test basis, evidence supporting the amounts and disclosures in the financial statements. Our procedures included confirmation of securities owned as of June 30, 2012 by correspondence with the custodian and brokers. An audit also includes assessing the accounting principles used and significant estimates made by management, as well as evaluating the overall financial statement presentation. We believe that our audits provide a reasonable basis for our opinion.
In our opinion, the financial statements and financial highlights referred to above present fairly, in all material respects, the financial position of the Auxier Focus Fund as of June 30, 2012, the results of its operations for the year then ended, the changes in its net assets for each of the years in the two year period then ended and its financial highlights for each of the years in the four year period then ended, in conformity with accounting principles generally accepted in the United States of America.
BBD, LLP
Philadelphia, Pennsylvania
August 24, 2012
| |
AUXIER FOCUS FUND ADDITIONAL INFORMATION (Unaudited) JUNE 30, 2012 |
| |
Investment Advisory Agreement Approval
At a Board meeting held on January 30, 2012, the Board, including the Independent Trustees, considered the approval of the amendment of the investment advisory agreement pertaining to the Fund (the “New Agreement”). In considering the New Agreement, the Board reviewed information furnished by the Adviser regarding: (1) services to be provided to the Fund including the nature, extent and quality of such services; (2) the compensation to be paid to The Adviser including the cost of advisory services to be provided and profits to be realized by The Adviser and its affiliates from the relationship with the Fund, including the expense limitation arrangements for the Fund; (3) the extent to which economies of scale would be realized as the Fund grows and whether the advisory fee reflects these economies of scale for the benefit of the Fund’s investors; and (4) other benefits received by the Adviser and its affiliates from their relationship with the Fund. In particular, the Board focused on the following factors and made the following conclusions in considering approval of the New Agreement:
Compensation and Economies of Scale
The Board considered the Adviser’s proposed compensation for providing advisory services to the Fund and analyzed comparative information on fees and total expenses of similar mutual funds and other accounts managed by the adviser. The Board also considered the adviser’s representation that it is not yet likely to experience economies of scale in its management of the Fund under the New Agreement due to the amount of assets held by the Fund but that it has agreed to contractually waive its fees and/or reimburse the Fund to the extent that total annual operating expenses exceed the fee rate under the current agreement through October 15, 2015. Based on the foregoing, the Board concluded that the adviser’s advisory fee rate to be charged to the Fund under the New Agreement was fair and reasonable.
Expense Limitation Arrangement
The Board also considered that the Adviser has agreed to contractually waive a portion of its fees under the New Agreement and/or to reimburse Fund expenses in order to limit the Fund’s total annual operating expenses to 1.25% of average daily net assets with respect to each of the Investor Shares class and the A Shares class. The Board considered that the Adviser has agreed to maintain such contractual expense limitation arrangement for the Fund through at least October 15, 2015 and, thus, Fund total annual expenses will not increase for at least three years as a result of the New Agreement. The Board did note, however, that total annual operating expenses may increase at the end of this waiver period but weighed this with (1) the proposed operation of the expense limitation arrangement, particularly its automatic renewal feature and (2) the Adviser’s representation that the unified fee structure had restricted certain investors from investing in the Fund and the Adviser’s expectation that those investors would be free to invest in the Fund once the proposed traditional fee structure is implemented, leading to an increase in Fund assets and, therefore, lower the Fund’s total expenses.
Costs of Services and Profitability
The Board considered information provided by the Adviser regarding its costs of services and profitability with respect to the Fund, taking into account the proposed advisory fee under the New Agreement. The Board concluded that the expected level of the Adviser’s profits attributable to management of the Fund under the New Agreement did not differ substantially from the Adviser’s profits under the current agreement. Thus, in light of the fact that the Adviser would unbundle the current fee rate for the Fund, the Board concluded that the Adviser’s expected level of profits attributable to management of the Fund likely would be reasonable in light of the services to be provided by the Adviser on behalf of the Fund.
In reaching its decision, the Board considered that the Adviser represented that there would be no substantive changes to the services being provided to the Fund. The Board also took into consideration that it renewed the Fund’s current agreement at its December 16, 2011, meeting (“December Meeting”). The Board further considered that the Adviser had represented that there have been no material changes to the information it provided in connection with the Board’s consideration at the December Meeting. The Board noted that the New Agreement would become effective April 5, 2012.
In reaching its decision to approve the New Agreement, the Board also relied upon its analysis and determinations made at its December Meeting to renew the current agreement, as well as information provided and discussed throughout the year at regularly scheduled Board meetings as follows:
| |
AUXIER FOCUS FUND ADDITIONAL INFORMATION (Unaudited) JUNE 30, 2012 |
| |
Performance
The Board considered the Fund’s performance for both the one-year and since inception (annualized) periods ended November 30, 2011. The Board noted that the Fund outperformed its benchmark, the S&P 500 Index, for both the one-year period and since inception. Given, among other things, the Fund’s performance during those periods, the Board concluded that the Fund’s performance was reasonable relative to its benchmark and that the Fund and its shareholders could benefit from the Adviser’s management of the Fund.
Other Benefits
The Board noted the Adviser’s representation that the Adviser does not expect to receive any kind of benefit or compensation from its relationship with the Fund, other than its contractual advisory fees. Based on the foregoing representation, the Board concluded that other benefits received by the Adviser from its relationship with the Fund were not a material factor to consider in approving the continuation of the Advisory Agreement.
Based upon its review, the Board concluded that the overall arrangement between the Fund and the Adviser is fair and reasonable in light of the services to be performed, expenses to be incurred and such other matters as the Board considered relevant in the exercise of its reasonable business judgment, and that approval of the New Agreement would be in the best interests of the Fund and its shareholders. The Board approved the New Agreement and recommended approval of the New Agreement by the Fund’s shareholders.
Shareholder Proxy Vote
At a special meeting of shareholders, held on April 5, 2012, shares were voted as follows on the proposal presented to shareholders to approve a new Investment Advisory Agreement between the Trust and Auxier Asset Management LLC with respect to the Fund:
| For | | Against | | Abstain |
| 6,643,055 | | 180,595 | | 592,938 |
Proxy Voting Information
A description of the policies and procedures that the Fund uses to determine how to vote proxies relating to securities held in the Fund’s portfolio is available, without charge and upon request, by calling (877) 328-9437, on the Fund's website at www.auxierasset.com and on the U.S. Securities and Exchange Commission’s (the “SEC”) website at www.sec.gov. The Fund’s proxy voting record for the most recent twelve-month period ended June 30 is available, without charge and upon request, by calling (877) 328-9437 and on the SEC’s website at www.sec.gov.
Availability of Quarterly Portfolio Schedules
The Fund files its complete schedule of portfolio holdings with the SEC for the first and third quarters of each fiscal year on Form N-Q. These filings are available, without charge and upon request on the SEC’s website at www.sec.gov or may be reviewed and copied at the SEC’s Public Reference Room in Washington, DC. Information on the operation of the Public Reference Room may be obtained by calling (800) SEC-0330.
Shareholder Expense Example
As a shareholder of the Fund, you incur two types of costs: (1) transaction costs, including sales charges (loads) on purchase payments on certain classes, redemption fees, exchange fees, and CDSC fees, and (2) ongoing costs, including management fees, 12b-1 fees, and other Fund expenses. This example is intended to help you understand your ongoing costs (in dollars) of investing in the Fund, and to compare these costs with the ongoing costs of investing in other mutual funds.
| |
AUXIER FOCUS FUND ADDITIONAL INFORMATION (Unaudited) JUNE 30, 2012 |
| |
The example is based on an investment of $1,000 invested at the beginning of the period and held for the entire period from January 1, 2012, through June 30, 2012 with the exception of the Institutional Shares which is based on the period from May 9, 2012, through June 30, 2012.
Actual Expenses – The first line under each share class of the table below provides information about actual account values and actual expenses. You may use the information in this line, together with the amount you invested, to estimate the expenses that you paid over the period. Simply divide your account value by $1,000 (for example, an $8,600 account value divided by $1,000 = 8.6), then multiply the result by the number in the first line under the heading entitled “Expenses Paid During Period” to estimate the expenses you paid on your account during the period.
Hypothetical Example for Comparison Purposes – The second line under each share class of the table below provides information about hypothetical account values and hypothetical expenses based on the Fund’s actual expense ratio and an assumed rate of return of 5% per year before expenses, which is not the Fund’s actual return. The hypothetical account values and expenses may not be used to estimate the actual ending account balance or expenses you paid for the period. You may use this information to compare the ongoing costs of investing in the Fund and other funds. To do so, compare this 5% hypothetical example with the 5% hypothetical examples that appear in the shareholder reports of other funds.
Please note that the expenses shown in the table are meant to highlight your ongoing costs only and do not reflect any transactional costs, such as sales charges (loads) on purchase payments on certain classes, redemption fees, exchange fees, and CDSC fees. Therefore, the second line of the table is useful in comparing ongoing costs only, and will not help you determine the relative total costs of owning different funds. In addition, if these transactional costs were included, your costs would have been higher.
| | Beginning | | Ending | | Expenses | | Annualized |
| | Account Value | | Account Value | | Paid During | | Expense |
| | January 1, 2012 | | June 30, 2012 | | Period* | | Ratio* |
| Investor Shares | | | | | | | | | | | |
| Actual | $ | 1,000.00 | | $ | 1,056.37 | | $ | 6.39 | | 1.25 | % |
| Hypothetical (5% return before taxes) | $ | 1,000.00 | | $ | 1,018.65 | | $ | 6.27 | | 1.25 | % |
| A Shares | | | | | | | | | | | |
| Actual | $ | 1,000.00 | | $ | 1,056.37 | | $ | 6.39 | | 1.25 | % |
| Hypothetical (5% return before taxes) | $ | 1,000.00 | | $ | 1,018.65 | | $ | 6.27 | | 1.25 | % |
| | Beginning | | Ending | | Expenses | | Annualized |
| | Account Value | | Account Value | | Paid During | | Expense |
| | May 9, 2012 | | June 30, 2012 | | Period* | | Ratio* |
| Institutional Shares | | | | | | | | | | | |
| Actual | $ | 1,000.00 | | $ | 1,014.10 | | $ | 1.57 | | 1.10 | % |
| Hypothetical (5% return before taxes) | $ | 1,000.00 | | $ | 1,019.39 | | $ | 5.52 | | 1.10 | % |
| | | | | | | | | | | | |
| | *Expenses are equal to the Fund’s annualized expense ratio multiplied by the average account value over the period, multiplied by the number of days in the most recent fiscal half-year divided by 366 to reflect the half-year period (except for the Institutional Shares actual return information which reflects the 52-day period between May 9, 2012, the commencement of operations, through June 30, 2012.) |
Federal Tax Status of Dividends Declared during the Tax Year
For federal income tax purposes, dividends from short-term capital gains are classified as ordinary income. The Fund designates 77.38% of its income dividend distributed as qualifying for the corporate dividends-received deduction (DRD) and 94.32% for the qualified dividend rate (QDI) as defined in Section 1(h)(11) of the Internal Revenue Code. The Fund also designates 27.08% of its income dividends as qualified interest income exempt from U.S. tax for foreign shareholders (QII) and 6.60% of its income dividends as qualified short-term gain exempt from U.S. tax for foreign shareholders (QSD).
| |
AUXIER FOCUS FUND ADDITIONAL INFORMATION (Unaudited) JUNE 30, 2012 |
| |
Trustees and Officers of the Trust
The Board is responsible for oversight of the management of the Trust’s business affairs and of the exercise of all the Trust’s powers except those reserved for the shareholders. The following table provides information about each Trustee and certain officers of the Trust. Each Trustee and officer holds office until the person resigns, is removed, or is replaced. Unless otherwise noted, the persons have held their principal occupations for more than five years. The address for all Trustees and officers is Three Canal Plaza, Suite 600, Portland, Maine 04101. Mr. Keffer is considered an Interested Trustee due to his affiliation with Atlantic. The Fund’s Statement of Additional Information includes additional information about the Trustees and is available, without charge and upon request, by calling (877) 328-9437.
| Name and Year of Birth | Position with the Trust | Length of Time Served | Principal Occupation(s) During Past Five Years | Number of Series of Trust Overseen by Trustee | Other Directorships Held by Trustee |
| Independent Trustees | | | | | |
J. Michael Parish Born: 1943 | Chairman of the Board; Trustee; Chairman, Nominating Committee and Qualified Legal Compliance Committee | Since 1989 (Chairman since 2004) | Retired since 2003. | 21 | 0 |
Costas Azariadis Born: 1943 | Trustee; Chairman, Valuation Committee | Since 1989 | Professor of Economics, Washington University since 2006. | 21 | 0 |
James C. Cheng Born: 1942 | Trustee; Chairman, Audit Committee | Since 1989 | President, Technology Marketing Associates (marketing company for small- and medium-sized businesses in New England) since 1991. | 21 | 0 |
David Tucker Born: 1958 | Trustee | Since 2011 | Director, Blue Sky Experience since 2008; Senior Vice President & General Counsel, American Century Companies 1998-2008. | 21 | 0 |
| Interested Trustee | | | | | |
John Y. Keffer1 Born: 1942 | Trustee; Vice Chairman | Since 1989 | Chairman, Atlantic since 2008; President, Forum Foundation (a charitable organization) since 2005; President, Forum Trust, LLC (a non-depository trust company chartered in the State of Maine) since 1997. | 21 | Director, Wintergreen Fund, Inc.; Director, Forum ETF Trust |
1Atlantic is a subsidiary of Forum Holdings Corp. I, a Delaware corporation that is wholly owned by Mr. Keffer. |
| |
AUXIER FOCUS FUND ADDITIONAL INFORMATION (Unaudited) JUNE 30, 2012 |
| |
| Name and Year of Birth | Position with the Trust | Length of Time Served | Principal Occupation(s) During Past Five Years | Number of Series of Trust Overseen by Trustee | Other Directorships Held by Trustee |
| Officers | | | | | |
Stacey E. Hong Born: 1966 | President; Principal Executive Officer | Since 2008 | President, Atlantic since 2008; Director, Consulting Services, Foreside Fund Services 2007. | N/A | N/A |
Karen Shaw Born: 1972 | Treasurer; Principal Financial Officer | Since 2008 | Senior Vice President, Atlantic since 2008; Vice President, Citigroup 2003-2008. | N/A | N/A |
David Faherty Born: 1970 | Vice President | Since 2009 | Senior Counsel, Atlantic since 2009; Vice President, Citi Fund Services Ohio, Inc. 2007-2009; Associate Counsel, Investors Bank & Trust Co. 2006-2007. | N/A | N/A |
Michael J. McKeen Born: 1971 | Vice President | Since 2009 | Senior Vice President, Atlantic since 2008; Vice President, Citigroup 2003-2008. | N/A | N/A |
Joshua LaPan Born: 1973 | Vice President | Since 2009 | Manager, Atlantic since 2008; Vice President, Citigroup 2003-2008. | N/A | N/A |
Timothy Bowden Born: 1969 | Vice President | Since 2009 | Manager, Atlantic since 2008; Vice President, Citigroup 2005-2008. | N/A | N/A |
Lina Bhatnagar Born: 1971 | Secretary | Since 2008 | Senior Administration Specialist, Atlantic since 2008; Regulatory Administration Specialist, Citigroup 2006-2008. | N/A | N/A |
THIS PAGE INTENTIONALLY LEFT BLANK
FOR MORE INFORMATION
P.O. Box 588
Portland, Maine 04112
(877) 3AUXIER
(877) 328-9437
INVESTMENT ADVISER
Auxier Asset Management LLC
5285 Meadows Road
Suite 333
Lake Oswego, Oregon 97035
TRANSFER AGENT
Atlantic Fund Services
P.O. Box 588
Portland, Maine 04112
DISTRIBUTOR
Foreside Fund Services, LLC
Three Canal Plaza, Suite 100
Portland, Maine 04101
www.foreside.com
This report is submitted for the general information of the shareholders of the Fund. It is not authorized for
distribution to prospective investors unless preceded or accompanied by an effective prospectus, which includes
information regarding the Fund’s risks, objectives, fees and expenses, experience of its management, and other
information.
204-ANR-0612
| |
DF DENT GROWTH FUNDS TABLE OF CONTENTS JUNE 30, 2012 |
| |
| DF Dent Premier Growth Fund | |
| A Message to Our Shareholders | 1 |
| Performance Chart and Analysis (Unaudited) | 12 |
| Schedule of Investments | 13 |
| Statement of Assets and Liabilities | 15 |
| Statement of Operations | 16 |
| Statements of Changes in Net Assets | 17 |
| Financial Highlights | 18 |
| DF Dent Midcap Growth Fund | |
| A Message to Our Shareholders | 19 |
| Performance Chart and Analysis (Unaudited) | 25 |
| Schedule of Investments | 26 |
| Statement of Assets and Liabilities | 28 |
| Statement of Operations | 29 |
| Statement of Changes in Net Assets | 30 |
| Financial Highlights | 31 |
| DF Dent Growth Funds | |
| Notes to Financial Statements | 32 |
| Report of Independent Registered Public Accounting Firm | 37 |
| Additional Information (Unaudited) | 38 |
| |
DF DENT PREMIER GROWTH FUND A MESSAGE TO OUR SHAREHOLDERS JUNE 30, 2012 |
| |
Dear Fellow Shareholders,
Performance
For the fiscal year ended June 30, 2012, the DF Dent Premier Growth Fund (“Fund”) experienced a total return of +0.74%, underperforming the total return of +5.45% for the S&P 500 Index (“S&P 500 Index”), which is the benchmark used for performance comparisons, by 4.71%. The S&P 500 Index is weighted by market capitalization of its component companies. However, with each component having equal weighting, the S&P 500 Equal Weight Index (“S&P 500 EWI”) had a negative total return in the past 12 months of -0.12% (see page 5 for additional information). Your Fund has outperformed the S&P 500 Index in 8 of the 11 fiscal years since the Fund’s inception in July 2001 with a cumulative total return of +87.76% versus +40.30% for the Index. On a quarterly basis since the Fund’s inception, it has outperformed the S&P 500 Index in 30 of the 44 calendar quarters.
For a longer-term perspective, the Fund’s one-year, five-year and ten-year average annual total returns for the period ended June 30, 2012, were 0.74%, 1.35%, and 7.73%, respectively. Performance data quoted represents past performance and is no guarantee of future results. Current performance may be lower or higher than the performance data quoted. Investment return and principal value will fluctuate so that an investor’s shares, when redeemed, may be worth more or less than original cost. For the most recent month-end performance, please call (866) 233-3368. As stated in the current prospectus, the Fund’s annual operating expense ratio (gross) is 1.25%. However, the Fund’s Adviser has contractually agreed to waive a portion of its fees and/or reimburse certain expenses to limit total operating expense to 1.10% on the first $150 million in Fund net assets and to 0.90% on net assets exceeding $150 million. This agreement is in effect through October 31, 2014. The expense cap may be changed or eliminated with the consent of the Board of Trustees. During the period, certain fees were waived and/or expenses reimbursed; otherwise, returns would have been lower.
Expense Ratio Management
Your Fund’s Adviser, D.F. Dent & Company, has again agreed to maintain your Fund’s expense ratio through October 31, 2014, at a net 1.10% on the first $150 million of net assets and 0.90% on net assets exceeding $150 million by reimbursing expenses and waiving a portion of management fees. The record of expense reimbursement and management fee waivers for the eleven years of your Fund’s existence is as follows:
| Year Ending | | | Expense Reimbursement | | | Management Fee Waived |
| 06/30/02 | | $ | 60,201 | | $ | 60,019 |
| 06/30/03 | | | 38,066 | | | 90,163 |
| 06/30/04 | | | 0 | | | 129,060 |
| 06/30/05 | | | 0 | | | 141,907 |
| 06/30/06 | | | 0 | | | 142,664 |
| 06/30/07 | | | 0 | | | 161,128 |
| 06/30/08 | | | 0 | | | 95,665 |
| 06/30/09 | | | 0 | | | 234,053 |
| 06/30/10 | | | 0 | | | 204,148 |
| 06/30/11 | | | 0 | | | 211,784 |
| 06/30/12 | | | 0 | | | 240,847 |
| Total | | $ | 98,267 | | $ | 1,711,438 |
| |
DF DENT PREMIER GROWTH FUND A MESSAGE TO OUR SHAREHOLDERS JUNE 30, 2012 |
| |
Portfolio Turnover
Annual portfolio turnover since inception has been as follows:
2002* 2003 2004 2005 2006 2007 2008 2009 2010 2011 2012
Portfolio Turnover** 0% 14% 20% 7% 25% 17% 21% 16% 8% 21% 14%
Average
14.8%
We believe these low portfolio turnover rates are consistent with our investment strategy of holding positions for long periods and minimizing transaction expenses for shareholders. Brokerage expenses for the entire 2012 fiscal year’s trading amounted to less than 1 cent per share of your Fund. Thus, trading expense remained very low because of low portfolio turnover.
* The Fund commenced operations on July 16, 2001.
** Percentage calculated based on total value of investments.
Asset Allocation
Year-end asset allocation by market capitalization for the past five years was:
| | | 06/30/08* | | 06/30/09* | | 06/30/10* | | 06/30/11* | | 06/30/12* |
| Large Capitalization | | 28.0 | % | | 41.0 | % | | 54.7 | % | | 49.4 | % | | 50.3 | % |
| Mid Capitalization | | 56.9 | % | | 51.3 | % | | 35.9 | % | | 38.0 | % | | 38.6 | % |
| Small Capitalization | | 13.8 | % | | 7.7 | % | | 7.8 | % | | 12.4 | % | | 11.0 | % |
| Reserve Funds | | 1.3 | % | | 0.0 | % | | 1.6 | % | | 0.2 | % | | 0.1 | % |
| Total Fund | | 100.0 | % | | 100.0 | % | | 100.0 | % | | 100.0 | % | | 100.0 | % |
* Percentages calculated based on total value of investments.
The Fund’s Prospectus has defined Mid Capitalization companies as those in the $1.5 billion to $7.0 billion market capitalization range.
Changes in the above Asset Allocation largely reflect the movement of companies from one category to another due to market fluctuations. Many companies “graduated” from Mid Cap to Large Cap in the past 3 years due to appreciation since the market trough in 2009. We seek to invest in great companies rather than allocate holdings in accordance to an arbitrary market capitalization parameter.
Attribution
We have once again included in the Management Discussion of Fund Performance section later in this report a bar graph of your Fund’s sector allocation versus the S&P 500 Index and a discussion of that allocation accompanied with commentary on stock selection within sectors of the Index.
| |
DF DENT PREMIER GROWTH FUND A MESSAGE TO OUR SHAREHOLDERS JUNE 30, 2012 |
| |
Concentration
We have made an effort during the past four years to increase the position size in our favorite “core” holdings. We do not consider this strategy to be “over concentrated,” but the portfolio is “focused” as that term is used within the mutual fund industry. In the past five years, our concentration in the top 10 holdings has been as follows:
| Top 10 Holdings | | 06/30/08 | | 06/30/09 | | 06/30/10 | | 06/30/11 | | 06/30/12 |
| % of Fund | | 36.7 | % | | 55.82 | % | | 54.97 | % | | 52.46 | % | | 49.35 | % |
| Average Position Size of Top 10 | | 3.7 | % | | 5.6 | % | | 5.5 | % | | 5.2 | % | | 4.9 | % |
We wrote in each of the past three years that we had reached the desired level of concentration and did not intend to increase concentration beyond the 06/30/09 level shown above. The slight reduction in concentration this past year was the result of modest trimming of the positions in Fastenal and IDEXX, both of which had performed strongly reaching price targets. Proceeds were recycled into new investments. We continue to believe that the current concentration in the top 10 positions is appropriate, at the desired level, and positioned to enhanced performance.
Management Ownership of Fund
Employees, their families, and the Adviser’s retirement plan increased their ownership of the Fund from 11.0% one year ago to 11.5% of the Fund as of 06/30/2012.
A Few Anecdotes
As reported recently in the Wall Street Journal, Boeing is using 3D printing in “additive manufacturing” to build highly sophisticated and technically complex aircraft parts. 3D Systems Corp., your Fund’s third best performer in the fiscal year ending 06/30/2012, designs and manufactures such 3D printers. When the dishwasher broke down in a Boeing cafeteria recently, the plumber not wanting to wait for shipment of a plastic replacement part asked a Boeing engineer to replicate the part physically on his 3D printer. The job was completed in 30 minutes. The applications and efficiencies for 3D printing are still in the early discovery phase.
IDEXX Laboratories, Inc. has developed an iPad application whereby customers may read lab results for their companion animals directly rather than calling in and waiting for their veterinarian’s availability, saving time for the customer and the veterinarian.
Stericycle, Inc. is using routing technology in medical waste collection to improve efficiency while reducing fuel expense and its carbon footprint. Routes maximize right hand turns to reduce waiting times for left turns and red lights.
Fastenal’s contract signings for automated vending machines have accelerated beyond its recent placement rates. Customers with these vending machines have significantly increased their purchasing from Fastenal.
| |
DF DENT PREMIER GROWTH FUND A MESSAGE TO OUR SHAREHOLDERS JUNE 30, 2012 |
| |
Commentary
Both scholars and professional investors generally agree that a stock’s value is the present value of its future cash flows. While not a cash flow yield, the earnings yield is a measure of the current earnings return from a dollar invested in a company. Thus, it may be compared to the current return from a dollar invested in a bond or Treasury note. The top panel of the charts below shows the earnings yield of the S&P 500 Index and the 10-year Treasury yield for the past 46 years. Not since the 1970s has the earnings yield of stocks exceeded the 10-year Treasury yield by as much as today’s levels. The lower panel reveals the magnitude of these yield spreads.
We believe there are two reasons for these record yield spreads of stocks over Treasuries:
| 1. | Artificial ultra low Treasury yields resulting from the Fed’s stimulative policies; and |
| 2. | High stock earnings yields resulting from a “flight to safety” by investors who are frightened by events of the past few years and fearful of the domestic and international uncertainties of today’s world. |
The question then becomes, “Is this the new normal, or do we return in time back to an environment where bond yields exceed stock yields?” We would side with academic scholars and other professional investors and
| |
DF DENT PREMIER GROWTH FUND A MESSAGE TO OUR SHAREHOLDERS JUNE 30, 2012 |
| |
argue that the two reasons listed above are transitory, and that corporate earnings yields versus Treasury yields will revert back to their historical relationship in time. Why? Treasury yields are so low today that they can be justified only if we experience sustained deflation in the future. This is highly unlikely given the monetary policies of major central banks. With respect to the second reason listed above, we believe that the international worries of the past 2 years are already embedded in current low stock valuations, and that 6 months from now the uncertainties of the US fiscal, political, and tax policies, if not completely resolved, will become “less uncertain.” The stock market abhors uncertainty, and the removal of some uncertainty should be beneficial to equity markets.
A couple of additional observations on this past year’s performance, which was below your Fund’s trend line, follow: The S&P 500 Index is a capitalization weighted benchmark. Your Fund’s weightings in specific investments reflect the Adviser’s conviction on each company, not the companies’ market capitalizations. Unweight the S&P 500 Index, giving each company equal weighting, and its return becomes -0.12% rather than the +5.45% as reported above as shown in the S&P 500 EWI. The main reason: Apple’s heavy weighting in the S&P 500, given its largest capitalization, and its strong performance in the past 12 months. Secondly, stocks such as Coca Cola, IBM, Microsoft, AT&T, and Intel along with many high yield funds all outperformed your Fund in the past 12 months. In a low yield environment, numerous investors sought yield in either low grade bonds or high quality stocks with good yields. Thus, the above quality large cap stocks have enjoyed good results contributing to the Index’s return in the past year. Certainly a good strategy over the past 12 months. However, we invest in growth companies which we believe possess higher long term growth prospects than more mature large cap companies. Your Fund is comprised of companies which the Adviser believes are in earlier stages of their growth trajectories and offer the potential of higher growth rates in future years. On a secular rather than an annual basis, we believe that high growth will trump yield as it has in the past.
New Member of Adviser’s Team
We are pleased to announce the addition of Dr. Gary Wu to the professional staff of the Fund’s adviser. Gary grew up in China and graduated from the Peking University Medical School. He then received a Ph.D in Molecular Biology from Columbia University. Gary began his business career after graduate school in management consulting moving on to investment management and private equity. Gary is a CFA with 8 years of investment management experience, and we are looking forward to the contributions he will make in our investment research supporting your Fund.
Once again, we appreciate the trust you have placed with us with your investment and will work diligently to earn that trust each day.
Respectively Submitted,
Daniel F. Dent
| |
DF DENT PREMIER GROWTH FUND A MESSAGE TO OUR SHAREHOLDERS JUNE 30, 2012 |
| |
IMPORTANT INFORMATION:
Investing involves risks, including the possible loss of principal. The Fund invests in small and medium size companies. Investments in these companies, especially smaller companies, carry greater risk than is customarily associated with larger companies for various reasons such as increased volatility of earnings and prospects, narrower markets, limited financial resources and less liquid stock. The Fund will typically invest in the securities of fewer issuers. If the Fund’s portfolio is over weighted in a sector, any negative development affecting that sector will have a greater impact on the Fund than a fund that is not over weighted in that sector.
The S&P 500 Index is a broad-based, unmanaged measurement of changes in stock market conditions based on the average of 500 widely held stocks. The S&P 500 Equal Weight Index (S&P 500 EWI) is the equal-weight version of the widely regarded S&P 500. The index has the same constituents as the capitalization weighted S&P 500, but each company in the S&P 500 EWI is allocated a fixed weight. One cannot invest directly in an index.
| |
DF DENT PREMIER GROWTH FUND MANAGEMENT DISCUSSION OF FUND PERFORMANCE JUNE 30, 2012 |
| |
Performance
For the fiscal year ended June 30, 2012, the DF Dent Premier Growth Fund (“Fund”) experienced a total return of +0.74% versus a total return of +5.45% for the S&P 500 Index, the benchmark we use for performance reporting. Please recall that the Fund reported a +34.87% total return in the prior fiscal year ending 06/30/2011. While we seek companies which deliver consistent growth, and most do, the returns of their stocks for specific periods can vary widely from one reporting period to the next. Thus, performance versus the S&P 500 Index for longer periods ending June 30, 2012 as reported below is more meaningful:
| Period Ending 06/30/12 | | DF Dent Premier Growth Fund | | S&P 500 Index | | Outperformance (Underperformance) |
| Six Months | | + | 5.72 | % | | + | 9.49 | % | | – | 3.77 | % |
| Twelve Months | | + | 0.74 | % | | + | 5.45 | % | | – | 4.71 | % |
| Five Years (annualized) | | + | 1.35 | % | | + | 0.22 | % | | + | 1.13 | % |
| Five Years (cumulative) | | + | 6.93 | % | | + | 1.09 | % | | + | 5.84 | % |
| Since Inception (07/16/01) (annualized) | | + | 5.92 | % | | + | 3.14 | % | | + | 2.78 | % |
| Since Inception (07/16/01) (cumulative) | | + | 87.76 | % | | + | 40.30 | % | | + | 47.46 | % |
| | | | | | | | | | | | | |
Past performance is not indicative of future performance.
The past 12 months have been especially challenging for growth investing. While your Fund managed to record only a slightly positive return for the past 12 months, we feel the portfolio companies’ operating results were quite satisfactory. While your Fund’s 12 month return of +0.74% exceeded the average return of the 504 funds within the Lipper Multi-Cap Growth peer group of -1.10% and the S&P 500 Equal Weighted Index (“S&P 500 EWI”) return of -0.12%, we invest in companies that have generated higher returns in the past and we believe will deliver strong growth in the future.
Your Fund’s cumulative total return outperformance since inception (07/16/2001) over the Index for the past five years has progressed as follows (for the periods ending):
06/30/2008 06/30/2009 06/30/2010 06/30/2011 06/30/2012
+46.44% +26.88% +36.39% +55.33% +47.46%
While your Fund has outperformed the S&P 500 Index over multi-year periods, it is not uncommon after years of good relative performance such as we experienced in 2010 and 2011 to give back some of the excess returns as you can see in 2012. Just as past excess performance gave way to recent modest underperformance, we believe that recent underperformance will give way to improving returns.
Although your Fund appreciated slightly in fiscal 2012, there was considerable market volatility. The single most important market factor impacting the Fund’s performance was the weakness in energy prices, especially natural gas. Ultra Petroleum Corp., a natural gas producer, was the Fund’s worst performer, while Schlumberger, Ltd. and Gardner Denver, Inc. with exposure to the energy servicing markets both performed
| |
DF DENT PREMIER GROWTH FUND MANAGEMENT DISCUSSION OF FUND PERFORMANCE JUNE 30, 2012 |
| |
poorly. The uncertainty of Education Department (DOE) proposed regulation in the form of “Gainful Employment” metrics to restrict student funding cast a cloud over the publicly held education stocks hurting the returns of your three holdings. We met numerous times with the managements of these companies and remain confident in each company’s ability to serve its particular niche of these underserved learning markets for children and adults. Proposed regulations promulgated at year-end were considerably less onerous than investors had feared.
As reported later, industrial companies lead by Fastenal, 3D Systems, and Roper were included within the five best contributors to the Fund in the past fiscal year. Our overweight in industrials enhanced performance.
Capital Gains Distribution Policy
It is the Fund’s policy to distribute all net realized capital gains to shareholders in December following the end of each fiscal year (06/30). Capital gains distributions were made in December of 2005, 2006, 2007, and 2008, but not 2009, 2010 or 2011. Shareholder redemptions during the sharp market decline of 2008-2009 forced the Fund to realize significant capital losses at that time which may be carried forward for 8 years.
The loss carryforward is summarized below:
Loss carryforward as of 06/30/2011 $47,097,229 ($5.26 per share)
Less net gains realized in fiscal 06/30/2012 - 7,696,650 ($0.92 per share)
Equals loss carryforward as of 06/30/2012 39,400,579 ($4.69 per share)
In the 06/30/2012 fiscal year your Fund realized capital gains of $7,696,650, or $0.92 per share, which are completely offset by this loss carryforward. While an unrealized gain of $32,443,150 remained in the Fund as of 06/30/2012, the remaining 06/30/2012 loss carryforward of $39,400,579 or $4.69 per share may be utilized in the future to offset the possible realization of these gains. This loss carryforward can offset capital gains up to $9,922,473 realized until 06/30/2017 and $29,478,106 realized until 06/30/2018. As such, we view the loss carryforward as a “hidden asset” which can shelter future capital gains, if realized, against future capital gains distributions and taxes as was the case in the fiscal year just concluded.
Attribution Analysis
The following bar chart presents the Sector weightings of your Fund versus the Sector weightings of the S&P 500 Index as of June 30, 2012:
| |
DF DENT PREMIER GROWTH FUND MANAGEMENT DISCUSSION OF FUND PERFORMANCE JUNE 30, 2012 |
| |
Source: FactSet
Information Technology followed by Industrials represented the two greatest over-weightings in the Fund as of 06/30/2012. The performance of these 2 sectors within the Fund exceeded the performance of these sectors within the Index for the past year. Financials, the 3rd heaviest weighting, also outperformed the Index’s Financials largely due to the avoidance of any bank stocks in your Fund. Financials within the Fund contributed a 14.6% return versus a loss of -0.71% within the Index. While the Fund and the Index had approximately equal weightings in Energy at year end, the Fund’s energy holdings underperformed due to price declines in Apache, Ultra Petroleum, and Schlumberger. Our ongoing concerns about consumer spending and the jobs picture kept us under-weighted in the Consumer Sectors, which rebounded during the year without our participation.
As mentioned above, company selection within Energy and avoidance of the Consumer Sectors were detrimental to Fund performance in the past year. The Fund’s investments in all other Sectors made positive contributions to performance during the year. The Fund’s 4.71% under-performance versus the Index, reported above, was entirely attributable to Energy stock selection and the lack of Consumer exposure.
| |
DF DENT PREMIER GROWTH FUND MANAGEMENT DISCUSSION OF FUND PERFORMANCE JUNE 30, 2012 |
| |
Strategy and Trends
Our strategy, as always, has been to invest in “best in class” companies lead by strong management teams with documented track records of delivering results within growth markets. Best in class may be determined by a number of considerations such as leading market share, best profitability, highest organic growth rate, consistency of operating results, highest return on invested capital, corporate culture and work ethic, shareholder friendly capital allocation, and most importantly overall management integrity.
Reviewing the recently completed fiscal year, we maintained significant over-weighting in the Industrial Sector. This strategy worked well last fall and winter, but most likely held the Fund back in the spring of 2012 as the U.S. economic recovery lost momentum. The weighting in Information Technology was increased from 21.07% at the beginning of 2012 to 28.02% as of June 30, 2012. New additions in Concur Technologies and NIC, Inc. along with strong performance from Visa, 3D Systems, and DealerTrak Holdings contributed to the increase in the Information Technology weighting. We continue to believe that technology companies offer attractive opportunities as they address improving productivity through efficiency and labor cost savings.
Best and Worst Performers
Five Best Contributors (Unaudited)
| Investments | | Realized and Unrealized Appreciation and Income in Fiscal Year 2012 | | Per Share As of 06/30/12 | |
| Fastenal Co. | | $ | 2,170,044 | | $ | 0.26 | |
| Visa, Inc., Class A | | | 2,048,105 | | | 0.24 | |
| 3D Systems Corp. | | | 1,664,492 | | | 0.20 | |
| Roper Industries, Inc. | | | 1,377,019 | | | 0.16 | |
| IDEXX Laboratories, Inc. | | | 1,302,935 | | | 0.16 | |
| | | $ | 8,562,595 | | $ | 1.02 | |
Five Poorest Contributors (Unaudited)
| Investments | | Realized and Unrealized Loss and Income in Fiscal Year 2012 | | Per Share As of 06/30/12 | |
| Ultra Petroleum Corp. | | $ | (2,899,350) | | $ | (0.35) | |
| Expeditors International of Washington, Inc. | | | (1,726,813) | | | (0.21) | |
| Schlumberger, Ltd. | | | (1,390,296) | | | (0.17) | |
| National American University Holdings, Inc. | | | (1,182,012) | | | (0.14) | |
| II-VI, Inc. | | | (1,145,296) | | | (0.14) | |
| | | $ | (8,343,767) | | $ | (1.01) | |
| |
DF DENT PREMIER GROWTH FUND MANAGEMENT DISCUSSION OF FUND PERFORMANCE JUNE 30, 2012 |
| |
Our Gold Medal goes to Fastenal, your Fund’s largest holding over most of the year, which was the #1, #2, and #1 contributor to Fund performance in each of the past 3 fiscal years, respectively. The stock has done so well that we needed to trim back the position during the past fiscal year.
Our Silver Medal goes to IDEXX, a Fund top 5 holding over the past 3 years, which was the #3, #5, and #5 contributor to performance in each of the past 3 fiscal years, respectively. We also trimmed IDEXX to reduce its position size.
Our Bronze Medal goes to Roper Industries, which was the #4 contributor in each of the past 2 fiscal years.
However, Expeditors International went from 3rd Best last fiscal year to 3rd Worst this fiscal year. 3D Systems went from 3rd Worst last year to 3rd Best this year.
Proceeds from trimming strong performers back to targeted position sizes are often recycled to finance purchases in new investments. There were 5 new investments in the 2012 fiscal year.
The views in this report contained herein were those of the Fund’s Adviser as of June 30, 2012, and may not reflect the Adviser’s views on the date this report is first published or anytime thereafter. This report may contain discussions about certain investments both held and not held in the portfolio as of the report date. All current and future holdings are subject to risk and are subject to change. While these views are intended to assist shareholders in understanding their investment in the Fund, they do not constitute investment or tax advice, are not a guarantee of future performance and are not intended as an offer or solicitation with respect to the purchase or sale of any security.
| |
DF DENT PREMIER GROWTH FUND PERFORMANCE CHART AND ANALYSIS (Unaudited) JUNE 30, 2012 |
| |
The following chart reflects the change in the value of a hypothetical $10,000 investment, including reinvested dividends and distributions, in the DF Dent Premier Growth Fund (the “Fund”) compared with the performance of the benchmark, S&P 500 Index ("S&P 500"), over the past ten fiscal years. The S&P 500 is a broad-based, unmanaged measurement of changes in stock market conditions based on the average of 500 widely held common stocks. The total return of the S&P 500 includes the reinvestment of dividends and income. The total return of the Fund includes operating expenses that reduce returns, while the total return of the S&P 500 does not include expenses. The Fund is professionally managed while the S&P 500 is unmanaged and is not available for investment.
Performance data quoted represents past performance and is no guarantee of future results. Current performance may be lower or higher than the performance data quoted. Investment return and principal value will fluctuate so that shares, when redeemed, may be worth more or less than original cost. For the most recent month-end performance, please call (866) 233-3368. As stated in the Fund’s prospectus, the annual operating expense ratio (gross) is 1.25%. However, the Fund’s adviser has contractually agreed to reduce a portion of its fees and reimburse expenses to limit total operating expenses to 1.10% on the first $150 million in Fund net assets and to 0.90% on net assets exceeding the $150 million, through October 31, 2014. During the period, certain fees were waived and/or expenses reimbursed; otherwise, returns would have been lower. The performance table and graph do not reflect the deduction of taxes that a shareholder would pay on Fund distributions or the redemption of Fund shares. Returns greater than one year are annualized.
Comparison of Change in Value of a $10,000 Investment
DF Dent Premier Growth Fund vs. S&P 500 Index
| Average Annual Total Returns | | | | | | |
| Periods Ended June 30, 2012 | | One Year | | Five Years | | Ten Years |
| DF Dent Premier Growth Fund | | 0.74 | % | | 1.35 | % | | 7.73 | % |
| S&P 500 Index | | 5.45 | % | | 0.22 | % | | 5.33 | % |
| |
DF DENT PREMIER GROWTH FUND SCHEDULE OF INVESTMENTS JUNE 30, 2012 |
| |
| Shares | | Security | | Value | | Shares | | Security | | Value |
| | Description | | | | Description | |
| Common Stock - 100.2% | | | | | | | | |
| Agriculture - 2.4% | | Industrial Applications - 6.5% |
| | 82,000 | | Potash Corp. of Saskatchewan, Inc. | $ | | 3,582,580 | | | | 140,000 | | II-VI, Inc. (a) | $ | 2,333,800 | |
| | | | | | | | | | | 75,000 | | Roper Industries, Inc. | | 7,393,500 | |
| | | | | | | | | | | 9,727,300 | |
| Biotechnology - 2.0% | | Infrastructure - 2.5% |
| | 46,500 | | Celgene Corp. (a) | | | 2,983,440 | | | | 97,000 | | Jacobs Engineering Group, Inc. (a) | | 3,672,420 | |
| | | | | | | | | | | | |
| | | | | | | | | | | | | | | | |
| Business Services - 10.9% | | Insurance - 2.5% |
| | 62,000 | | Ecolab, Inc. | | | 4,248,860 | | | | 4,850 | | Markel Corp. (a) | | 2,142,245 | |
| | 135,000 | | Expeditors International of Washington, Inc. | | | 5,231,250 | | | | 20,000 | | RenaissanceRe Holdings, Ltd. | | 1,520,200 | |
| | 150,000 | | Healthcare Services Group, Inc. | | | 2,907,000 | | | | 3,662,445 | |
| | 40,000 | | NIC, Inc. | | | 508,000 | | | Life Sciences - 4.9% |
| | 37,000 | | Stericycle, Inc. (a) | | | 3,391,790 | | | | 75,400 | | IDEXX Laboratories, Inc. (a) | | 7,248,202 | |
| | | | | | | 16,286,900 | | | | | |
| Communications Equipment - 1.7% | | | | | | | | |
| | 85,000 | | ADTRAN, Inc. | | | 2,566,150 | | | Machinery - 4.2% |
| | | | | | | | | | | 111,000 | | 3D Systems Corp. (a) | | 3,789,540 | |
| | | | | | | | | | | 46,000 | | Gardner Denver, Inc. | | 2,433,860 | |
| Distribution and Industrial Supplies - 11.6% | | | 6,223,400 | |
| | 86,000 | | Beacon Roofing Supply, Inc. (a) | | | 2,168,920 | | | Medical Products - 3.3% |
| | 254,000 | | Fastenal Co. | | | 10,238,740 | | | | 155,000 | | ResMed, Inc. (a) | | 4,836,000 | |
| | 147,000 | | LKQ Corp. (a) | | | 4,909,800 | | | | | |
| | | | | | | 17,317,460 | | | | | | | | | |
| Educational Services - 3.4% | | Pharmaceuticals - 0.9% |
| | 54,000 | | American Public Education, Inc. (a) | | | 1,728,000 | | | | 35,000 | | Teva Pharmaceutical Industries, Ltd., ADR | | 1,380,400 | |
| | 90,000 | | K12, Inc. (a) | | | 2,097,000 | | | | | |
| | 270,000 | | National American University Holdings, Inc. | | | 1,161,000 | | | | | | | | | |
| | | | | | | 4,986,000 | | | Software - 9.5% |
| Electronics - 3.0% | | | 141,000 | | ANSYS, Inc. (a) | | 8,898,510 | |
| | 96,000 | | Trimble Navigation, Ltd. (a) | | | 4,416,960 | | | | 27,000 | | Concur Technologies, Inc. (a) | | 1,838,700 | |
| | | | | | | | | | | 114,000 | | DealerTrack Holdings, Inc. (a) | | 3,432,540 | |
| | | | | | | | | | | 14,169,750 | |
| Energy Equipment and Services - 6.2% | | Wireless Telecommunication Services - 9.2% |
| | 44,000 | | Core Laboratories NV | | | 5,099,600 | | | | 50,000 | | American Tower Corp. REIT | | 3,495,500 | |
| | 64,000 | | Schlumberger, Ltd. | | | 4,154,240 | | | | 183,000 | | QUALCOMM, Inc. | | 10,189,440 | |
| | | | | | | 9,253,840 | | | | 13,684,940 | |
| | | | | | | | | | | | | | | | |
| Energy Sources - 4.4% | | Total Common Stock | | | |
| | 28,000 | | Apache Corp. | | | 2,460,920 | | | (Cost $116,694,612) | | 149,137,762 | |
| | 23,000 | | Concho Resources, Inc. (a) | | | 1,957,760 | | | Total Investments - 100.2% | | | |
| | 95,500 | | Ultra Petroleum Corp. (a) | | | 2,203,185 | | | (Cost $116,694,612)* | $ | 149,137,762 | |
| | | | | | | 6,621,865 | | | Other Assets & Liabilities, Net – (0.2)% | | (251,451 | ) |
| | | | | | | | | | Net Assets – 100.0% | $ | 148,886,311 | |
| Financial Services - 11.1% | | | | | | | | |
| | 105,000 | | SEI Investments Co. | | | 2,088,450 | | | | | | | | | |
| | 131,000 | | T. Rowe Price Group, Inc. | | | 8,247,760 | | | | | | | | | |
| | 50,000 | | Visa, Inc., Class A | | | 6,181,500 | | | | | | | | | |
| | | | | | | 16,517,710 | | | | | | | | | |
| See Notes to Financial Statements. | 13 | DF DENT GROWTH FUNDS |
| |
DF DENT PREMIER GROWTH FUND SCHEDULE OF INVESTMENTS JUNE 30, 2012 |
| |
| ADR | American Depositary Receipt | | | | PORTFOLIO HOLDINGS | | | |
| REIT | Real Estate Investment Trust | | | | % of Net Assets | | | |
| (a) | Non-income producing security. | | | | Agriculture | 2.4 | | % |
| | | | | | | Biotechnology | 2.0 | | % |
| | | | | | | Business Services | 10.9 | | % |
| * Cost for federal income tax purposes is $116,694,612 and net unrealized appreciation consists of: | | Communications Equipment | 1.7 | | % |
| Gross Unrealized Appreciation | | $ | 41,352,463 | | | Distribution and Industrial Supplies | 11.6 | | % |
| Gross Unrealized Depreciation | | | (8,909,313 | ) | | Educational Services | 3.4 | | % |
| Net Unrealized Appreciation | | $ | 32,443,150 | | | Electronics | 3.0 | | % |
| | | | | | | Energy Equipment and Services | 6.2 | | % |
The following is a summary of the inputs used to value the Fund’s investments as of June 30, 2012. | | Energy Sources | 4.4 | | % |
| The inputs or methodology used for valuing securities are not necessarily an indication of the risks associated with investing in those securities. For more information on valuation inputs, and their aggregation into the levels used in the tables below, please refer to the Security Valuation section in Note 2 of the accompanying Notes to Financial Statements. | | Financial Services | 11.1 | | % |
| | | Industrial Applications | 6.5 | | % |
| Valuation Inputs | | Investments in Securities | | Infrastructure | 2.5 | | % |
| | | | | | | Insurance | 2.5 | | % |
| Level 1 - Quoted Prices | | $ | 149,137,762 | | | Life Sciences | 4.9 | | % |
| Level 2 - Other Significant Observable Inputs | | | - | | | Machinery | 4.2 | | % |
| Level 3 - Significant Unobservable Inputs | | | - | | | Medical Products | 3.3 | | % |
| Total | | $ | 149,137,762 | | | Pharmaceuticals | 0.9 | | % |
| | | | | | | Software | 9.5 | | % |
| The Level 1 inputs displayed in this table are Common Stock. Refer to the Schedule of Investments for a further breakout of each security by type. | | Wireless Telecommunication Services | 9.2 | | % |
| There were no significant transfers between Level 1 and Level 2 for the year ended June 30, 2012. | | Other Assets & Liabilities, Net | (0.2 | ) | % |
| | | | | | | | 100.0 | | % |
| See Notes to Financial Statements. | 14 | DF DENT GROWTH FUNDS |
| |
DF DENT PREMIER GROWTH FUND STATEMENT OF ASSETS AND LIABILITIES JUNE 30, 2012 |
| |
| ASSETS | | | | |
| | Total investments, at value (Cost $116,694,612) | | $ | 149,137,762 | |
| | Cash | | | 97,911 | |
| | Receivables: | | | | |
| | | Fund shares sold | | | 500 | |
| | | Dividends and interest | | | 55,188 | |
| | Prepaid expenses | | | 14,078 | |
| Total Assets | | | 149,305,439 | |
| | | | | | | |
| LIABILITIES | | | | |
| | Payables: | | | | |
| | | Fund shares redeemed | | | 50,000 | |
| | Accrued Liabilities: | | | | |
| Adviser | Investment adviser fees | | | 319,577 | |
| | | Trustees’ fees and expenses | | | 61 | |
| | | Fund services fees | | | 22,150 | |
| | | Other expenses | | | 27,340 | |
| Total Liabilities | | | 419,128 | |
| | | | | | | |
| NET ASSETS | | $ | 148,886,311 | |
| | | | | | | |
| COMPONENTS OF NET ASSETS | | | | |
| | Paid-in capital | | $ | 156,038,040 | |
| | Accumulated net investment loss | | | (194,300 | ) |
| | Accumulated net realized loss | | | (39,400,579 | ) |
| | Net unrealized appreciation | | | 32,443,150 | |
| NET ASSETS | | $ | 148,886,311 | |
| SHARES OF BENEFICIAL INTEREST AT NO PAR VALUE (UNLIMITED SHARES AUTHORIZED) | | | 8,398,831 | |
| NET ASSET VALUE, OFFERING AND REDEMPTION PRICE PER SHARE | | $ | 17.73 | |
| | | | | | | |
| See Notes to Financial Statements. | 15 | DF DENT GROWTH FUNDS |
| |
DF DENT PREMIER GROWTH FUND STATEMENT OF OPERATIONS YEAR ENDED JUNE 30, 2012 |
| |
| | | | | | | | |
| INVESTMENT INCOME | | | | | |
| | Dividend income | | $ | 1,208,698 | | |
| | Interest income | | | 379 | | |
| Total Investment Income | | | 1,209,077 | | |
| Adviser | | | | | |
| EXPENSES | | | | | |
| | Investment adviser fees | | | 1,477,714 | | |
| | Fund services fees | | | 314,038 | | |
| | Custodian fees | | | 14,990 | | |
| | Registration fees | | | 19,115 | | |
| | Professional fees | | | 40,502 | | |
| | Trustees' fees and expenses | | | 5,315 | | |
| | Miscellaneous expenses | | | 32,285 | | |
| Total Expenses | | | 1,903,959 | | |
| | Fees waived and expenses reimbursed | | | (284,648 | ) | |
| Net Expenses | | | 1,619,311 | | |
| | | | | | | | |
| NET INVESTMENT LOSS | | | (410,234 | ) | |
| | | | | | | | |
| NET REALIZED AND UNREALIZED GAIN (LOSS) | | | | | |
| | Net realized gain on investments | | | 7,753,414 | | |
| | Net change in unrealized appreciation (depreciation) on investments | | | (6,635,851 | ) | |
| NET REALIZED AND UNREALIZED GAIN | | | 1,117,563 | | |
| INCREASE IN NET ASSETS FROM OPERATIONS | | $ | 707,329 | | |
| | | | | | | | |
| See Notes to Financial Statements. | 16 | DF DENT GROWTH FUNDS |
| |
DF DENT PREMIER GROWTH FUND STATEMENTS OF CHANGES IN NET ASSETS |
| |
| | | June 30, 2012 | | | 41090 | # | # | | | 40724 | |
| | | | | For the Year Ended June 30, 2012 | | | For the Year Ended June 30, 2011 |
| OPERATIONS | | | | | | | | | |
| | Net investment loss | | $ | (410,234 | ) | | | $ | (396,219 | ) |
| | Net realized gain | | | 7,753,414 | | | | | 6,821,267 | |
| | Net change in unrealized appreciation (depreciation) | | | (6,635,851 | ) | | | | 35,251,826 | |
| Increase in Net Assets Resulting from Operations | | | 707,329 | | | | | 41,676,874 | |
| | | | | | | | | | | | |
| CAPITAL SHARE TRANSACTIONS | | | | | | | | | |
| | Sale of shares | | | 4,388,239 | | | | | 23,320,760 | |
| | Redemption of shares | | | (13,863,839 | ) | | | | (30,947,880 | ) |
| Decrease in Net Assets from Capital Share Transactions | | | (9,475,600 | ) | | | | (7,627,120 | ) |
| Increase (Decrease) in Net Assets | | | (8,768,271 | ) | | | | 34,049,754 | |
| | | | | | | | | | | | |
| NET ASSETS | | | | | | | | | |
| | Beginning of Year | | | 157,654,582 | | | | | 123,604,828 | |
| | End of Year (Including line (a)) | | $ | 148,886,311 | | | | $ | 157,654,582 | |
| | | | | | | | | | | | |
| SHARE TRANSACTIONS | | | | | | | | | |
| | Sale of shares | | | 252,190 | | | | | 1,523,122 | |
| | Redemption of shares | | | (812,727 | ) | | | | (2,036,042 | ) |
| Decrease in Shares | | | (560,537 | ) | | | | (512,920 | ) |
| | | | | | | | | | | | |
| (a) | Accumulated net investment loss. | | $ | (194,300 | ) | | | $ | - | |
| See Notes to Financial Statements. | 17 | DF DENT GROWTH FUNDS |
| |
DF DENT PREMIER GROWTH FUND FINANCIAL STATEMENTS |
| |
These financial highlights reflect selected data for a share outstanding throughout each year. | | | | | | |
| | | For the Years Ended June 30, |
| | | 2012 | | 2011 | | 2010 | | 2009 | | 2008 | |
| NET ASSET VALUE, Beginning | | | | | | | | | | | | | | | | | | | | |
| of Year | $ | 17.60 | | | $ | 13.05 | | | $ | 10.94 | | | $ | 16.20 | | | $ | 17.25 | | |
| INVESTMENT OPERATIONS | | | | | | | | | | | | | | | | | | | | |
| Net investment loss (a) | | (0.05 | ) | | | (0.04 | ) | | | (0.04 | ) | | | (0.03 | ) | | | (0.05 | ) | |
| Net realized and unrealized | | | | | | | | | | | | | | | | | | | | |
| | gain (loss) | | 0.18 | | | | 4.59 | | | | 2.15 | | | | (4.96 | ) | | | (0.76 | ) | |
| Total from Investment | | | | | | | | | | | | | | | | | | | | |
| | Operations | | 0.13 | | | | 4.55 | | | | 2.11 | | | | (4.99 | ) | | | (0.81 | ) | |
| DISTRIBUTIONS TO | | | | | | | | | | | | | | | | | | | | |
| SHAREHOLDERS FROM | | | | | | | | | | | | | | | | | | | | |
| Net realized gain | | — | | | | — | | | | — | | | | (0.27 | ) | | | (0.24 | ) | |
| NET ASSET VALUE, End | | | | | | | | | | | | | | | | | | | | |
| of Year | $ | 17.73 | | | $ | 17.60 | | | $ | 13.05 | | | $ | 10.94 | | | $ | 16.20 | | |
| TOTAL RETURN | | 0.74 | % | | 34.87 | % | | 19.29 | % | | (30.64 | )% | | (4.88 | )% |
| | | | | | | | | | | | | | | | | | | | | |
| RATIOS/SUPPLEMENTARY DATA | | | | | | | | | | | | | | | | | | | | |
| Net Assets at End of | | | | | | | | | | | | | | | | | | | | |
| | Year (000's omitted) | $148,886 | | | $157,655 | | | $123,605 | | | $117,391 | | | $243,183 | | |
| Ratios to Average Net Assets: | | | | | | | | | | | | | | | | | | | | |
| Net investment loss | | (0.28 | )% | | (0.27 | )% | | (0.29 | )% | | (0.25 | )% | | (0.31 | )% |
| Net expense | | 1.10 | % | | 1.10 | % | | 1.10 | % | | 1.10 | % | | 1.15 | % |
| Gross expense (b) | | 1.29 | % | | 1.25 | % | | 1.27 | % | | 1.26 | % | | 1.19 | % |
| PORTFOLIO TURNOVER RATE | | 14 | % | | 21 | % | | 8 | % | | 16 | % | | 21 | % |
| | | | | | | | | | | | | | | | | | | | | | |
| (a) | Calculated based on average shares outstanding during each year. |
| (b) | Reflects the expense ratio excluding any waivers and/or reimbursements. |
| See Notes to Financial Statements. | 18 | DF DENT GROWTH FUNDS |
| |
DF DENT MIDCAP GROWTH FUND A MESSAGE TO OUR SHAREHOLDERS JUNE 30, 2012 |
| |
Dear Fellow Shareholders:
Performance
For the period July 1, 2011, through June 30, 2012, the DF Dent Midcap Growth Fund (the “Fund”) experienced a total return of +3.20%, outperforming the total return of -4.50% for the Russell Midcap Growth Index (the “Index”), which is the benchmark we have used for performance comparisons, by 7.70%.
Expense Ratio
Your Fund’s Adviser, D.F. Dent and Company, Inc. (the “Adviser”), has contractually agreed to maintain your Fund’s expense ratio through October 31, 2014, at a net 1.10% on the first $150 million of net assets and 0.90% on net assets exceeding $150 million, by reimbursing expenses and waiving a portion of management fees. Per the prospectus, the Fund’s total gross operating expense ratio is 3.84%.
Concentration
The Fund’s concentration in its top 10 holdings is as follows:
| Top 10 Holdings | | 06/30/12 |
| % of Fund | | 42.69 | % |
| Average Position Size of Top 10 | | 4.3 | % |
We believe that the current concentration in the top 10 positions is appropriate at its current level and has the potential to enhance long-term performance.
Management Ownership of Fund
Employees, their families, and the Adviser’s retirement plan owned over 36% of Fund as of June 30, 2012. There were only management purchases and no management redemptions during the fiscal year ended June 30, 2012.
Commentary
Both scholars and professional investors generally agree that a stock’s value is the present value of its future cash flows. While not a cash flow yield, the earnings yield is a measure of the current earnings return from a dollar invested in a company. Thus, it may be compared to the current return from a dollar invested in a bond or Treasury note. The top panel of the charts below shows the earnings yield of the S&P 500 Index and the 10-year Treasury yield for the past 46 years. Not since the 1970s has earnings yield of stocks exceeded the 10-year Treasury yield by as much as today’s levels. The lower panel reveals the magnitude of these yield spreads.
| |
DF DENT MIDCAP GROWTH FUND A MESSAGE TO OUR SHAREHOLDERS JUNE 30, 2012 |
| |
We believe there are two reasons for these record yield spreads between stocks and Treasuries:
| 1. | Artificially ultra-low Treasury yields resulting from the Fed’s stimulative policies; and |
| 2. | High stock earnings yields resulting from a “flight to safety” by investors who are frightened by events of the past few years and fearful of the domestic and international uncertainties of today’s world. |
The question then becomes, “Is this the new normal, or do we return in time back to an environment where bond yields exceed stock yields?” We would side with academic scholars and other professional investors and argue that the two reasons listed above are transitory, and that corporate earnings yields versus Treasury yields will revert back to their historical relationship in time. Why? Treasury yields are so low today that they can be justified only if we experience sustained deflation in the future. This is highly unlikely given the monetary policies of major central banks. With respect to the second reason listed above, we believe that the international worries of the past two years are already embedded in current low stock valuations, and that six months from now the uncertainties of the U.S. fiscal, political, and tax policies, if not completely resolved, will become “less uncertain.” The stock market abhors uncertainty, and the removal of some uncertainty should be beneficial to equity markets.
| |
DF DENT MIDCAP GROWTH FUND A MESSAGE TO OUR SHAREHOLDERS JUNE 30, 2012 |
| |
Our strategy, as always, has been to invest in “best-in-class”* companies lead by strong management teams with documented track records of delivering results within growth markets. Best-in-class may be determined by a number of considerations such as leading market share, highest profitability, highest organic growth rate, consistency of operating results, highest return on invested capital, corporate culture and work ethic, shareholder friendly capital allocation, and most importantly overall management integrity. We will continue to use this strategy in managing the Fund’s portfolio.
Attribution Analysis
The following bar chart presents the sector weightings of your Fund versus the sector weightings of the Russell Midcap Growth Index as of June 30, 2012:
Source: FactSet
Your Fund was most significantly over-weighted versus the benchmark Russell Midcap Growth Index benchmark in Information Technology, Industrials, Financials and Energy. We continue to believe that technology companies offer attractive opportunities as they address improving productivity through efficiency and labor cost savings. In Information Technology, your Fund’s overweighting detracted slightly from the fiscal year’s performance, while stock selection within the Information Technology sector was a significant positive contributor to performance. The same happened with respect to the Energy sector but to a lesser extent. The over-weightings in Industrials and Financials also contributed to performance.
| |
DF DENT MIDCAP GROWTH FUND A MESSAGE TO OUR SHAREHOLDERS JUNE 30, 2012 |
| |
Your fund was most significantly under-weighted versus the benchmark Russell Midcap Growth Index in Consumer Discretionary, Consumer Staples, Materials and Health Care. Your Fund’s under-weighting in Consumer Discretionary and Consumer Staples detracted from performance as the consumer sectors rallied during the fiscal year. In the Materials and Health Care sectors, the under-weighting detracted from performance, but stock selection mitigated this effect, and these sectors actually contributed to relative performance versus the benchmark.
Five Best Contributors (Unaudited)
| Investments | | Realized and Unrealized Appreciation and Income in Fiscal Year 2012 | | Per Share As of 6/30/12 | |
| 3D Systems Corp. | | $ | 59,294 | | $ | 0.10 | |
| DealerTrak Holdings, Inc. | | | 37,248 | | | 0.06 | |
| Concur Technologies, Inc. | | | 30,950 | | | 0.05 | |
| Fastenal Co. | | | 28,244 | | | 0.04 | |
| LKQ Corp. | | | 13,789 | | | 0.02 | |
| | | $ | 169,525 | | $ | 0.27 | |
Five Worst Contributors (Unaudited)
| Investments | | Realized and Unrealized Loss and Income in Fiscal Year 2012 | | Per Share As of 6/30/12 | |
| Ultra Petroleum Corp. | | $ | (22,014) | | $ | (0.04) | |
| Unit Corp. | | | (14,367) | | | (0.02) | |
| Expeditors International of Washington, Inc. | | | (13,926) | | | (0.02) | |
| II-VI, Inc. | | | (13,389) | | | (0.02) | |
| American Public Education, Inc. | | | (4,662) | | | (0.01) | |
| | | $ | (68,358) | | $ | (0.11) | |
| |
DF DENT MIDCAP GROWTH FUND A MESSAGE TO OUR SHAREHOLDERS JUNE 30, 2012 |
| |
DF DENT MIDCAP GROWTH FUND
FIVE LARGEST EQUITY HOLDINGS (UNAUDITED)
JUNE 30, 2012
Shares | | Security | | | Total Cost | | | Market Value | | Percent of Net Assets of the Fund | |
| 8,954 | | Fastenal Co. | | $ | 336,672 | | $ | 360,936 | | 5.62 | % |
| 3,670 | | IDEXX Laboratories, Inc. | | | 310,630 | | | 352,797 | | 5.49 | |
| 5,335 | | ANSYS, Inc. | | | 317,360 | | | 336,692 | | 5.24 | |
| 6,750 | | Trimble Navigation, Ltd. | | | 296,451 | | | 310,568 | | 4.83 | |
| 4,144 | | T. Rowe Price Group, Inc. | | | 237,859 | | | 260,906 | | 4.06 | |
| | | | | $ | 1,498,972 | | $ | 1,621,899 | | 25.24 | %% |
As always, we acknowledge the responsibility you have conveyed by entrusting your investment to the DF Dent Midcap Growth Fund and will work diligently on your behalf.
Respectively Submitted,
Thomas F. O'Neil, Jr. Matthew F. Dent
Gary D. Mitchell Bruce L. Kennedy
* The determination of “best-in-class” is solely the opinion of the Fund’s Adviser, and such opinion is subject to change. Those companies that hold leading market share positions, strong growth potential, historically good profitability, and management teams known for integrity and good corporate governance are generally considered to be “best in class.”
| |
DF DENT MIDCAP GROWTH FUND A MESSAGE TO OUR SHAREHOLDERS JUNE 30, 2012 |
| |
IMPORTANT INFORMATION:
Investing involves risks, including the possible loss of principal. The Fund invests in small- and medium- size companies, which carry greater risk than is customarily associated with larger, more established companies. With non-diversification risk, the Fund will typically invest in securities of fewer issuers, which exposes the Fund to greater market risk. Investing in ADRs (American Depositary Receipt) carries risks of political and financial instability, less liquidity and greater volatility, as well as risks associated with the lack of reliable accounting and financial information. The Fund is also subject to other risks, such as Real Estate Investment Trust (REIT) risk with possible real estate market declines, which are detailed in the Fund’s prospectus.
The Russell Midcap Growth Index measures the performance of the mid-cap growth segment of the U.S. equity universe. It includes those Russell Midcap Index companies with higher price-to-book ratios and higher forecasted growth values. The S&P 500 Index is a broad-based, unmanaged measurement of changes in stock market conditions based on the average of 500 widely held stocks. One cannot invest directly in an index.
The views in this report contained herein were those of the Fund’s Adviser as of June 30, 2012, and may not reflect the Adviser’s views on the date this report is first published or anytime thereafter. This report may contain discussions about certain investments both held and not held in the portfolio as of the report date. All current and future holdings are subject to risk and are subject to change. While these views are intended to assist shareholders in understanding their investment in the Fund, they do not constitute investment or tax advice, are not a guarantee of future performance and are not intended as an offer or solicitation with respect to the purchase or sale of any security.
| |
DF DENT MIDCAP GROWTH FUND PERFORMANCE CHART AND ANALYSIS (Unaudited) JUNE 30, 2012 |
| |
The following chart reflects the change in the value of a hypothetical $10,000 investment, including reinvested dividends and distributions, in the DF Dent Midcap Growth Fund (the “Fund”) compared with the performance of the benchmark, the Russell Midcap Growth Index ("Russell Midcap Growth"), since inception. The Russell Midcap Growth measures the performance of the mid-cap growth segment of the U.S. equity universe. It includes those Russell Midcap Index companies with higher price-to-book ratios and higher forecasted growth values. The total return of the Russell Midcap Growth includes the reinvestment of dividends and income. The total return of the Fund includes operating expenses that reduce returns, while the total return of the Russell Midcap Growth does not include expenses. The Fund is professionally managed while the Russell Midcap Growth is unmanaged and is not available for investment.
Performance data quoted represents past performance and is no guarantee of future results. Current performance may be lower or higher than the performance data quoted. Investment return and principal value will fluctuate so that shares, when redeemed, may be worth more or less than original cost. For the most recent month-end performance, please call (866) 233-3368. As stated in the Fund’s prospectus, the annual operating expense ratio (gross) is 3.84%. However, the Fund’s adviser has contractually agreed to reduce a portion of its fees and reimburse expenses to limit total operating expenses to 1.10% on the first $150 million in net assets and 0.90% on net assets exceeding $150 million, through October 31, 2014. During the period, certain fees were waived and/or expenses reimbursed; otherwise, returns would have been lower. Shares redeemed within 60 days of purchase will be charged a 2.00% redemption fee. The performance table and graph do not reflect the deduction of taxes that a shareholder would pay on Fund distributions or the redemption of Fund shares.
Comparison of Change in Value of a $10,000 Investment
DF Dent Midcap Growth Fund vs. Russell Midcap Growth Index
| Total Returns | | Since Inception |
| Period Ended June 30, 2012 | | 07/01/11 |
| DF Dent Midcap Growth Fund | | 3.20 | % |
| Russell Midcap Growth Index | | -4.50 | % |
| |
DF DENT MIDCAP GROWTH FUND SCHEDULE OF INVESTMENTS JUNE 30, 2012 |
| |
| Shares | | Security | | Value | | Shares | | Security | | Value |
| | Description | | | | Description | |
| Common Stock - 99.3% | | Insurance - 3.6% |
| Business Services - 12.2% | | | 310 | | Markel Corp. (a) | $ | 136,927 |
| | 2,735 | | | $ | 187,430 | | | 1,250 | | RenaissanceRe Holdings, Ltd. | | 95,013 |
| | 6,117 | | Expeditors International of Washington, Inc. | | 237,034 | | | | | | | 231,940 |
| | 5,250 | | Healthcare Services Group, Inc. | | 101,745 | | Life Sciences - 7.4% |
| | 10,620 | | NIC, Inc. | | 134,874 | | | 3,670 | | IDEXX Laboratories, Inc. (a) | | 352,797 |
| | 1,335 | | Stericycle, Inc. (a) | | 122,379 | | | 1,620 | | Techne Corp. | | 120,204 |
| | | | | | 783,462 | | | | | | | 473,001 |
| Communications Equipment - 2.5% | | Machinery - 6.3% |
| | 5,335 | | ADTRAN, Inc. | | 161,064 | | | 6,555 | | 3D Systems Corp. (a) | | 223,788 |
| | | | | | | | | 3,405 | | Gardner Denver, Inc. | | 180,158 |
| Distribution and Industrial Supplies - 8.4% | | | | | | | 403,946 |
| | 8,954 | | Fastenal Co. | | 360,936 | | Medical Products - 3.1% |
| | 5,335 | | LKQ Corp. (a) | | 178,189 | | | 6,315 | | ResMed, Inc. (a) | | 197,028 |
| | | | | | 539,125 | | | | | | | |
| Educational Services - 5.3% | | Software - 14.7% |
| | 4,875 | | American Public Education, Inc. (a) | | 156,000 | | | 5,335 | | ANSYS, Inc. (a) | | 336,692 |
| | 7,865 | | K12, Inc. (a) | | 183,254 | | | 2,360 | | Concur Technologies, Inc. (a) | | 160,716 |
| | | | | | 339,254 | | | 1,620 | | CoStar Group, Inc. (a) | | 131,544 |
| Electronics - 4.8% | | | 6,732 | | DealerTrack Holdings, Inc. (a) | | 202,701 |
| | 6,750 | | Trimble Navigation, Ltd. (a) | | 310,568 | | | 4,815 | | RealPage, Inc. (a) | | 111,515 |
| | | | | | | | | | | | | 943,168 |
| Energy Equipment and Services - 2.2% | | Wireless Telecommunication Services - 2.7% |
| | 1,227 | | Core Laboratories NV | | 142,209 | | | 2,495 | | American Tower Corp. REIT | | 174,425 |
| | | | | | | | | | | | | |
| Energy Sources - 7.9% | | Total Common Stock | | |
| | 2,230 | | Concho Resources, Inc. (a) | | 189,817 | | (Cost $5,986,759) | | 6,375,413 |
| | 3,277 | | Range Resources Corp. | | 202,748 | | Total Investments - 99.3% | | |
| | 4,895 | | Ultra Petroleum Corp. (a) | | 112,928 | | (Cost $5,986,759)* | $ | 6,375,413 |
| | | | | | 505,493 | | Other Assets & Liabilities, Net – 0.7% | | 48,041 |
| Financial Services - 8.6% | | Net Assets – 100.0% | $ | 6,423,454 |
| | 6,120 | | Financial Engines, Inc. (a) | | 131,274 | | | | | | | |
| | 8,173 | | SEI Investments Co. | | 162,561 | | REIT | | Real Estate Investment Trust | | |
| | 4,144 | | T. Rowe Price Group, Inc. | | 260,906 | | (a) | | Non-income producing security. | | |
| | | | | | 554,741 | | | | | | | |
| Industrial Applications - 6.7% | | | | | | | |
| | 6,782 | | II-VI, Inc. (a) | | 113,056 | | | | | | | |
| | 1,835 | | Polypore International, Inc. (a) | | 74,116 | | | | | | | |
| | 2,470 | | Roper Industries, Inc. | | 243,492 | | | | | | | |
| | | | | | 430,664 | | | | | | | |
| Infrastructure - 2.9% | | | | | | | |
| | 4,895 | | Jacobs Engineering Group, Inc. (a) | | 185,325 | | | | | | | |
| See Notes to Financial Statements. | 26 | DF DENT GROWTH FUNDS |
| |
DF DENT MIDCAP GROWTH FUND SCHEDULE OF INVESTMENTS JUNE 30, 2012 |
| |
| * Cost for federal income tax purposes is $5,992,339 and net unrealized appreciation consists of: | | PORTFOLIO HOLDINGS | | |
| | % of Net Assets | | |
| | | | | | | Business Services | 12.2 | % |
| Gross Unrealized Appreciation | | $ | 525,066 | | | Communications Equipment | 2.5 | % |
| Gross Unrealized Depreciation | | | (141,992 | ) | | Distribution and Industrial Supplies | 8.4 | % |
| Net Unrealized Appreciation | | $ | 383,074 | | | Educational Services | 5.3 | % |
| | | | | | | Electronics | 4.8 | % |
| The following is a summary of the inputs used to value the Fund’s investments as of June 30, 2012. | | Energy Equipment and Services | 2.2 | % |
| | Energy Sources | 7.9 | % |
| | | | | | | Financial Services | 8.6 | % |
| The inputs or methodology used for valuing securities are not necessarily an indication of the risks associated with investing in those securities. For more information on valuation inputs, and their aggregation into the levels used in the tables below, please refer to the Security Valuation section in Note 2 of the accompanying Notes to Financial Statements. | | Industrial Applications | 6.7 | % |
| | Infrastructure | 2.9 | % |
| | Insurance | 3.6 | % |
| | Life Sciences | 7.4 | % |
| | Machinery | 6.3 | % |
| | | | | | | Medical Products | 3.1 | % |
| | | Investments in Securities | | Software | 14.7 | % |
| Valuation Inputs | | | Wireless Telecommunication Services | 2.7 | % |
| Level 1 - Quoted Prices | | $ | 6,375,413 | | | Other Assets & Liabilities, Net | 0.7 | % |
| Level 2 - Other Significant Observable Inputs | | | - | | | | 100.0 | % |
| Level 3 - Significant Unobservable Inputs | | | - | | | | | |
| Total | | $ | 6,375,413 | | | | | |
| | | | | | | | | |
| The Level 1 inputs displayed in this table are Common Stock. Refer to the Schedule of Investments for a further breakout of each security by type. | | | | |
| There were no significant transfers between Level 1 and Level 2 for the year ended June 30, 2012. | | | | |
| | | | | | | | | |
| | | | | | | | | |
| | | | | | | | | |
| See Notes to Financial Statements. | 27 | DF DENT GROWTH FUNDS |
| |
DF DENT MIDCAP GROWTH FUND STATEMENT OF ASSETS AND LIABILITIES JUNE 30, 2012 |
| |
| ASSETS | | | | |
| | Total investments, at value (Cost $5,986,759) | | $ | 6,375,413 | |
| | Cash | | | 23,285 | |
| | Receivables: | | | | |
| | | Fund shares sold | | | 30,000 | |
| | | Investment securities sold | | | 97,166 | |
| | | Dividends and interest | | | 1,273 | |
| Adviser | From investment adviser | | | 9,533 | |
| | Prepaid expenses | | | 2,232 | |
| Total Assets | | | 6,538,902 | |
| | | | | | | |
| LIABILITIES | | | | |
| | Payables: | | | | |
| | | Investment securities purchased | | | 97,374 | |
| | Accrued Liabilities: | | | | |
| | | Fund services fees | | | 1,110 | |
| | | Other expenses | | | 16,964 | |
| Total Liabilities | | | 115,448 | |
| | | | | | | |
| NET ASSETS | | $ | 6,423,454 | |
| | | | | | | |
| COMPONENTS OF NET ASSETS | | | | |
| | Paid-in capital | | $ | 6,047,668 | |
| | Accumulated net investment loss | | | (7,288 | ) |
| | Accumulated net realized loss | | | (5,580 | ) |
| | Net unrealized appreciation | | | 388,654 | |
| NET ASSETS | | $ | 6,423,454 | |
| SHARES OF BENEFICIAL INTEREST AT NO PAR VALUE (UNLIMITED SHARES AUTHORIZED) | | | 622,566 | |
NET ASSET VALUE, OFFERING AND REDEMPTION PRICE PER SHARE* | | $ | 10.32 | |
| * | Shares redeemed or exchanged within 60 days of purchase are charged a 2.00% redemption fee. |
| See Notes to Financial Statements. | 28 | DF DENT GROWTH FUNDS |
| |
DF DENT MIDCAP GROWTH FUND STATEMENT OF OPERATIONS PERIOD ENDED JUNE 30, 2012* |
| |
| | | | | | | | |
| INVESTMENT INCOME | | | | | |
| | Dividend income (Net of foreign withholding taxes of $49) | | $ | 10,823 | | |
| | Interest income | | | 139 | | |
| Total Investment Income | | | 10,962 | | |
| Adviser | | | | | |
| EXPENSES | | | | | |
| | Investment adviser fees | | | 19,934 | | |
| | Fund services fees | | | 9,863 | | |
| | Custodian fees | | | 5,000 | | |
| | Registration fees | | | 756 | | |
| | Professional fees | | | 22,362 | | |
| | Trustees' fees and expenses | | | 58 | | |
| | Reports to shareholders | | | 5,505 | | |
| | Miscellaneous expenses | | | 5,256 | | |
| Total Expenses | | | 68,734 | | |
| | Fees waived and expenses reimbursed | | | (46,805 | ) | |
| Net Expenses | | | 21,929 | | |
| | | | | | | | |
| NET INVESTMENT LOSS | | | (10,967 | ) | |
| | | | | | | | |
| NET REALIZED AND UNREALIZED GAIN (LOSS) | | | | | |
| | Net realized loss on investments | | | (1,943 | ) | |
| | Net change in unrealized appreciation (depreciation) on investments | | | 388,654 | | |
| NET REALIZED AND UNREALIZED GAIN | | | 386,711 | | |
| INCREASE IN NET ASSETS FROM OPERATIONS | | $ | 375,744 | | |
| | | | | | | | |
| * | Commencement of operations was July 1, 2011. | | | | | |
| See Notes to Financial Statements. | 29 | DF DENT GROWTH FUNDS |
| |
DF DENT MIDCAP GROWTH FUND STATEMENT OF CHANGES IN NET ASSETS |
| |
| | | June 30, 2012 | # | | 41090 | # | # |
| | | | | July 1, 2011* through June 30, 2012 | |
| OPERATIONS | | | | | |
| | Net investment loss | | $ | (10,967 | ) | |
| | Net realized loss | | | (1,943 | ) | |
| | Net change in unrealized appreciation (depreciation) | | | 388,654 | | |
| Increase in Net Assets Resulting from Operations | | | 375,744 | | |
| | | | | | | | |
| CAPITAL SHARE TRANSACTIONS | | | | | |
| | Sale of shares | | | 6,053,750 | | |
| | Redemption of shares | | | (6,040 | ) | |
| Increase in Net Assets from Capital Share Transactions | | | 6,047,710 | | |
| Increase in Net Assets | | | 6,423,454 | | |
| | | | | | | | |
| NET ASSETS | | | | | |
| | Beginning of Period | | | - | | |
| | End of Period (Including line (a)) | | $ | 6,423,454 | | |
| | | | | | | | |
| SHARE TRANSACTIONS | | | | | |
| | Sale of shares | | | 623,167 | | |
| | Redemption of shares | | | (601 | ) | |
| Increase in Shares | | | 622,566 | | |
| | | | | | | | |
| (a) | Accumulated net investment loss. | | $ | (7,288 | ) | |
| * | Commencement of operations. | | | | | |
| See Notes to Financial Statements. | 30 | DF DENT GROWTH FUNDS |
| |
DF DENT MIDCAP GROWTH FUND FINANCIAL HIGHLIGHTS |
| |
These financial highlights reflect selected data for a share outstanding throughout the period. |
| | | July 1, 2011 (a) through June 30, 2012 | |
| NET ASSET VALUE, Beginning of Period | $ | 10.00 | | |
| INVESTMENT OPERATIONS | | | | |
| Net investment loss (b) | | (0.05 | ) | |
| Net realized and unrealized gain | | 0.37 | | |
| Total from Investment Operations | | 0.32 | | |
| NET ASSET VALUE, End of Period | $ | 10.32 | | |
| TOTAL RETURN | | 3.20 | %(c) |
| | | | | |
| RATIOS/SUPPLEMENTARY DATA | | | | |
| Net Assets at End of Period (000's omitted) | | $6,423 | | |
| Ratios to Average Net Assets: | | | | |
| Net investment loss | | (0.55 | )%(d) |
| Net expense | | 1.10 | %(d) |
| Gross expense (e) | | 3.45 | %(d) |
| PORTFOLIO TURNOVER RATE | | 24 | %(c) |
| | | | | | |
| (a) | Commencement of operations. |
| (b) | Calculated based on average shares outstanding during the period. |
| (c) | Not annualized. |
| (d) | Annualized. |
| (e) | Reflects the expense ratio excluding any waivers and/or reimbursements. |
| See Notes to Financial Statements. | 31 | DF DENT GROWTH FUNDS |
| |
DF DENT GROWTH FUNDS NOTES TO FINANCIAL STATEMENTS JUNE 30, 2012 |
| |
Note 1. Organization
The DF Dent Premier Growth Fund and DF Dent Midcap Growth Fund (individually, a “Fund” and, collectively the “Funds”) are diversified and non-diversified portfolios of Forum Funds (the “Trust”), respectively. The Trust is a Delaware statutory trust that is registered as an open-end, management investment company under the Investment Company Act of 1940 (the “Act”), as amended. Under its Trust Instrument, the Trust is authorized to issue an unlimited number of each Fund’s shares of beneficial interest without par value. The DF Dent Premier Growth Fund and the DF Dent Midcap Growth Fund commenced operations on July 16, 2001 and July 1, 2011, respectively. The Funds seek long-term capital appreciation.
Note 2. Summary of Significant Accounting Policies
These financial statements are prepared in accordance with accounting principles generally accepted in the United States of America (“GAAP”), which require management to make estimates and assumptions that affect the reported amounts of assets and liabilities, the disclosure of contingent liabilities at the date of the financial statements, and the reported amounts of increase and decrease in net assets from operations during the fiscal year. Actual amounts could differ from those estimates. The following summarizes the significant accounting policies of each Fund:
Security Valuation – Exchange-traded securities and over-the-counter securities are valued using the last quoted sale or official closing price, provided by independent pricing services as of the close of trading on the market or exchange for which they are primarily traded, on each Fund business day. In the absence of a sale, such securities are valued at the mean of the last bid and ask price provided by independent pricing services. Non-exchange traded securities for which quotations are available are valued using the last quoted sales price, or in the absence of a sale at the mean of the last bid and ask prices provided by independent pricing services. Shares of open-end mutual funds are valued at net asset value (“NAV”). Short-term investments that mature in 60 days or less may be valued at amortized cost.
Each Fund values its investments at fair value pursuant to procedures adopted by the Trust's Board of Trustees (the "Board") if (1) market quotations are insufficient or not readily available or (2) the adviser believes that the values available are unreliable. Fair valuation is based on subjective factors and, as a result, the fair value price of an investment may differ from the security’s market price and may not be the price at which the asset may be sold. Fair valuation could result in a different NAV than a NAV determined by using market quotes.
Each Fund has a three-tier fair value hierarchy. The basis of the tiers is dependent upon the various “inputs” used to determine the value of each Fund’s investments. These inputs are summarized in the three broad levels listed below:
Level 1 — quoted prices in active markets for identical assets
Level 2 — other significant observable inputs (including quoted prices of similar securities, interest rates, prepayment speeds, credit risk, etc.)
| |
DF DENT GROWTH FUNDS NOTES TO FINANCIAL STATEMENTS JUNE 30, 2012 |
| |
Level 3 — significant unobservable inputs (including each Fund’s own assumptions in determining the fair value of investments)
The aggregate value by input level, as of June 30, 2012, for each Fund’s investments is included at the end of each Fund’s Schedule of Investments.
Security Transactions, Investment Income and Realized Gain and Loss – Investment transactions are accounted for on the trade date. Dividend income is recorded on the ex-dividend date. Foreign dividend income is recorded on the ex-dividend date or as soon as possible after each Fund determines the existence of a dividend declaration after exercising reasonable due diligence. Income and capital gains on some foreign securities may be subject to foreign withholding taxes, which are accrued as applicable. Interest income is recorded on an accrual basis. Premium is amortized and discount is accreted using the effective interest method. Identified cost of investments sold is used to determine the gain and loss for both financial statement and federal income tax purposes.
Distributions to Shareholders – Distributions to shareholders of net investment income and net capital gains, if any, are declared and paid at least annually. Distributions are based on amounts calculated in accordance with applicable federal income tax regulations, which may differ from GAAP. These differences are due primarily to differing treatments of income and gain on various investment securities held by each Fund, timing differences and differing characterizations of distributions made by each Fund.
Federal Taxes – Each Fund intends to continue to qualify each year as a regulated investment company under Subchapter M of the Internal Revenue Code and to distribute all of its taxable income to shareholders. In addition, by distributing in each calendar year substantially all of its net investment income and capital gains, if any, the Fund will not be subject to a federal excise tax. Therefore, no federal income or excise tax provision is required. Each Fund files a U.S. federal income and excise tax return as required. A fund’s federal income tax returns are subject to examination by the Internal Revenue Service for a period of three fiscal years after they are filed. As of June 30, 2012, there are no uncertain tax positions that would require financial statement recognition, de-recognition, or disclosure.
Income and Expense Allocation – The Trust accounts separately for the assets, liabilities and operations of each of its investment portfolios. Expenses that are directly attributable to more than one investment portfolio are allocated among the respective investment portfolios in an equitable manner.
Redemption Fees – A shareholder who redeems shares of the DF Dent Midcap Growth Fund within 60 days of purchase will incur a redemption fee of 2.00% of the current net asset value of shares redeemed, subject to certain limitations. The fee is charged for the benefit of the remaining shareholders and will be paid to the Fund to help offset transaction costs. The fee is accounted for as an addition to paid-in capital. The Fund reserves the right to modify the terms of or terminate the fee at any time. There are limited exceptions to the imposition of the redemption fee.
Commitments and Contingencies – In the normal course of business, each Fund enters into contracts that
| |
DF DENT GROWTH FUNDS NOTES TO FINANCIAL STATEMENTS JUNE 30, 2012 |
| |
provide general indemnifications by each Fund to the counterparty to the contract. Each Fund’s maximum exposure under these arrangements is dependent on future claims that may be made against each Fund and, therefore, cannot be estimated; however, based on experience, the risk of loss from such claims is considered remote.
Note 3. Fees and Expenses
Investment Adviser – D.F. Dent and Company, Inc. (the “Adviser”) is the investment adviser to each Fund. Pursuant to an investment advisory agreement, the Adviser receives an advisory fee from each Fund at an annual rate of 1.00% of each Fund’s average daily net assets.
Distribution – Foreside Fund Services, LLC serves as each Fund’s distributor (the “Distributor”). The Distributor receives no compensation from the Funds for its distribution services. The Distributor is not affiliated with the Adviser or Atlantic Fund Administration, LLC (d/b/a Atlantic Fund Services) (“Atlantic”) or their affiliates.
Other Service Providers – Atlantic provides fund accounting, fund administration, compliance and transfer agency services to each Fund. Atlantic also provides certain shareholder report production, and EDGAR conversion and filing services. Pursuant to an Atlantic services agreement, each Fund pays Atlantic customary fees for its services. Atlantic provides a Principal Executive Officer, a Principal Financial Officer, a Chief Compliance Officer, and an Anti-Money Laundering Officer to each Fund, as well as certain additional compliance support functions.
Trustees and Officers – The Trust pays each independent Trustee an annual retainer fee of $45,000 for service to the Trust ($66,000 for the Chairman). In addition, for the year ended March 31, 2012, the Chairman received a monthly stipend of $500 to cover certain expenses incurred in connection with his duties to the Trust. The stipend was discontinued April 1, 2012. The Trustees and Chairman may receive additional fees for special Board meetings. Each Trustee is also reimbursed for all reasonable out-of-pocket expenses incurred in connection with his duties as a Trustee, including travel and related expenses incurred in attending Board meetings. The amount of Trustees’ fees attributable to each Fund is disclosed in the Statement of Operations. Certain officers of the Trust are also officers or employees of the above named service providers, and during their terms of office received no compensation from each Fund.
Note 4. Fees Waived
The Adviser has contractually agreed to reduce a portion of its fee and reimburse certain expenses through October 31, 2014, to the extent that annual operating expenses exceed 1.10% on the first $150 million of net assets and to the extent that annual operating expenses exceed 0.90% on net assets exceeding $150 million of each Fund. Other fund service providers have voluntarily agreed to waive and reimburse a portion of their fees. These voluntary fee waivers and reimbursements may be reduced or eliminated at any time. For the year ended June 30, 2012, fees waived were as follows:
| |
DF DENT GROWTH FUNDS NOTES TO FINANCIAL STATEMENTS JUNE 30, 2012 |
| |
| | | Investment Adviser Fees Waived | | Investment Adviser Expenses Reimbursed | | Other Waivers | | Total Fees Waived and Expenses Reimbursed |
| DF Dent Premier Growth Fund | | $ | 240,847 | | $ | - | | $ | 43,801 | | $ | 284,648 |
| DF Dent Midcap Growth Fund | | | 19,759 | | | 26,452 | | | 594 | | | 46,805 |
Note 5. Security Transactions
The cost of purchases and proceeds from sales of investment securities (including maturities), other than short-term investments during the year ended June 30, 2012, were as follows:
| | | | | Purchases | | Sales |
| DF Dent Premier Growth Fund | | $20,063,783 | | $29,998,494 |
| DF Dent Midcap Growth Fund | | 6,528,701 | | 539,999 |
| | | | | |
Note 6. Federal Income Tax and Investment Transactions
As of June 30, 2012, distributable earnings (accumulated loss) on a tax basis were as follows:
| | | Capital and Other Losses | | Unrealized Appreciation | | Total |
| DF Dent Premier Growth Fund | | $ | (39,594,879 | ) | | $ | 32,443,150 | | | $ | (7,151,729 | ) |
| DF Dent Midcap Growth Fund | | | (7,288 | ) | | | 383,074 | | | | 375,786 | |
| | | | | | | | | | | | | |
The difference between components of distributable earnings on a tax basis and the amounts reflected in the Statement of Assets and Liabilities are primarily due to wash sales.
For tax purposes, the current deferred late year ordinary loss was $194,300 and $7,288 (realized during the period November 1, 2011 through June 30, 2012) for DF Dent Premier Growth Fund and DF Dent Midcap Growth Fund, respectively. These losses will be recognized for tax purposes on the first business day of each Fund’s next fiscal year, July 1, 2012.
As of June 30, 2012, the DF Dent Premier Growth Fund had capital loss carryforwards to offset future capital gains of $9,922,473 and $29,478,106, expiring in 2017 and 2018, respectively.
On the Statements of Assets and Liabilities, as a result of permanent book to tax differences, certain amounts have been reclassified for the year ended June 30, 2012. The following reclassifications were the result of net operating losses and non-deductible offering costs and have no impact on the net assets of each Fund.
| |
DF DENT GROWTH FUNDS NOTES TO FINANCIAL STATEMENTS JUNE 30, 2012 |
| |
| | | Accumulated Net Investment Income (Loss) | | Undistributed Net Realized Gain (Loss) | | Paid-in-Capital |
| DF Dent Premier Growth Fund | | $ | 215,934 | | | $ | - | | | $ | (215,934 | ) |
| DF Dent Midcap Growth Fund | | | 3,679 | | | | (3,637 | ) | | | (42 | ) |
Note 7. Recent Accounting Pronouncements
In May 2011, FASB issued ASU No. 2011-04 “Amendments to Achieve Common Fair Value Measurement and Disclosure Requirements in U.S. GAAP and IFRSs.” ASU No. 2011-04 establishes common requirements for measuring fair value and for disclosing information about fair value measurements in accordance with U.S. GAAP and International Financial Reporting Standards (“IFRSs”). ASU No. 2011-04 is effective for interim and annual periods beginning after December 15, 2011. Management is evaluating the impact ASU No. 2011-04 may have on financial statement disclosures.
In December 2011, FASB issued ASU No. 2011-11 “Disclosures about Offsetting Assets and Liabilities” requiring disclosure of both gross and net information related to offsetting and related arrangements enabling users of its financial statements to understand the effect of those arrangements on the entity’s financial position. The objective of this disclosure is to facilitate comparison between those entities that prepare their financial statements on the basis of U.S. GAAP and those entities that prepare their financial statements on the basis of IFRSs. ASU No. 2011-11 is effective for interim and annual periods beginning on or after January 1, 2013. Management is evaluating any impact ASU No. 2011-11 may have on each Fund’s financial statements.
Note 8. Subsequent Events
Subsequent events occurring after the date of this report through the date these financial statements were issued have been evaluated for potential impact and each Fund has had no such events.
| |
REPORT OF INDEPENDENT REGISTERED PUBLIC ACCOUNTING FIRM |
| |
To the Board of Trustees of Forum Funds and the Shareholders of
DF Dent Premier Growth Fund and DF Dent Midcap Growth Fund
We have audited the accompanying statements of assets and liabilities of the DF Dent Premier Growth Fund and DF Dent Midcap Growth Fund, each a series of shares of beneficial interest in the Forum Funds, including the schedules of investments, as of June 30, 2012, and the related statements of operations for the year then ended and for the period July 1, 2011(Commencement of Operations for DF Dent Midcap Growth Fund) through June 30, 2012, and the statements of changes in net assets for each of the years or period in the two year period then ended and the financial highlights for each of the years or period in the four year period then ended. These financial statements and financial highlights are the responsibility of the Fund's management. Our responsibility is to express an opinion on these financial statements and financial highlights based on our audits. The financial highlights of DF Dent Premier Growth Fund for the year ended June 30, 2008 were audited by other auditors whose report dated August 25, 2008, expressed an unqualified opinion on such financial highlights.
We conducted our audits in accordance with the standards of the Public Company Accounting Oversight Board (United States). Those standards require that we plan and perform the audits to obtain reasonable assurance about whether the financial statements and financial highlights are free of material misstatement. An audit includes examining, on a test basis, evidence supporting the amounts and disclosures in the financial statements. Our procedures included confirmation of securities owned as of June 30, 2012 by correspondence with the custodian and brokers. An audit also includes assessing the accounting principles used and significant estimates made by management, as well as evaluating the overall financial statement presentation. We believe that our audits provide a reasonable basis for our opinion.
In our opinion, the financial statements and financial highlights referred to above present fairly, in all material respects, the financial position of the DF Dent Premier Growth Fund and DF Dent Midcap Growth Fund as of June 30, 2012, the results of their operations for the year or period then ended, the changes in their net assets for each of the years or period in the two year period then ended and their financial highlights for each of the years or period in the four year period then ended, in conformity with accounting principles generally accepted in the United States of America.
BBD, LLP
Philadelphia, Pennsylvania
August 24, 2012
| |
DF DENT GROWTH FUNDS ADDITIONAL INFORMATION (Unaudited) JUNE 30, 2012 |
| |
Investment Advisory Agreement Approval
At the June 15, 2012 Board meeting, the Board, including the Independent Trustees, considered the continuation of the investment advisory agreement pertaining to the DF Dent Premier Growth Fund and the DF Dent Midcap Growth Fund (the “Advisory Agreement”). In evaluating the Advisory Agreement for the Funds, the Board reviewed materials furnished by the Adviser and Atlantic, including information regarding the Adviser, its personnel, operations and financial condition. Specifically, the Board considered, among other matters: (1) the nature, extent and quality of the services to be provided to the Funds by the Adviser, including information on the investment performance of the Adviser; (2) the costs of the services to be provided and profitability to the Adviser with respect to its relationship with the Funds; (3) the advisory fee and the total expense ratio of the Funds compared to relevant peer groups of funds; (4) the extent to which economies of scale would be realized as the Funds grow and whether the advisory fee would enable each Fund’s investors to share in the benefits of economies of scale; and (5) other benefits received by the Adviser from its relationship with the Funds. In their deliberations, the Board did not identify any particular information that was all-important or controlling and attributed different weights to the various factors. In particular, the Board focused on the factors discussed below.
Nature, Extent and Quality of Services
Based on a presentation from senior representatives of the Adviser and a discussion of the Adviser’s personnel, operations and financial condition, the Board considered the quality of services provided by the Adviser under the Advisory Agreement between the Trust and the Adviser. In this regard, the Board considered information regarding the experience, qualifications and professional background of the portfolio managers and other personnel at the Adviser with principal investment responsibility for the Funds’ investments as well as the investment philosophy and decision-making processes of those professionals and the capability and integrity of the Adviser’s senior management and staff. The Board considered the adequacy of the Adviser’s resources and quality of services provided by the Adviser under the Advisory Agreement between the Trust and the Adviser.
Costs of Services and Profitability
The Board considered information provided by the Adviser regarding its costs of services and its profitability with respect to the Funds. In this regard, the Board considered the Adviser’s resources devoted to each of the Funds as well as the Adviser’s discussion of costs and profitability. Based on these and other applicable considerations, the Board concluded that the Adviser’s profits attributable to management of the Funds were reasonable in the context of all factors considered.
Performance
The Board reviewed performance of the DF Dent Premier Growth Fund and the Adviser’s discussion of its investment philosophy. The Board noted that the DF Dent Premier Growth Fund underperformed its benchmark for the 1-year period but outperformed it for the 5-year and since inception periods. The Board also noted that the DF Dent Midcap Growth Fund outperformed its benchmark for the six months and since inception period
| |
DF DENT GROWTH FUNDS ADDITIONAL INFORMATION (Unaudited) JUNE 30, 2012 |
| |
noting the DF Dent Midcap Growth Fund commenced operations on July 1, 2011. The Board concluded that the Funds’ performance was reasonable relative to their benchmarks and that each Fund and their shareholders could benefit from the Adviser’s management of each Fund.
Compensation
The Board considered the Adviser’s compensation for providing advisory services to each Fund and analyzed comparative information on fee rates and total expenses of similar mutual funds. The Board noted that the Adviser’s actual advisory fee rate for the DF Dent Premier Growth Fund was above the median fee of that Fund’s Lipper Inc. peer group and that the Adviser’s actual advisory fee rate for the DF Dent Midcap Growth Fund was the lowest of that Fund’s Lipper Inc. peer group. The Board also noted that the DF Dent Premier Growth Fund’s actual total expense ratio was higher than the median fee of that Fund’s peer group and that the DF Dent Midcap Growth Fund’s actual total expense ratio was lower than the median of its peer group. Based on the foregoing, the Board concluded that the Adviser’s advisory fee rate charged to the Funds appeared to be within a reasonable range in light of the services it provides to each of the Funds.
Economies of Scale
The Board considered whether the Funds would benefit from any economies of scale. In this respect, the Board noted the Adviser’s representation that the Funds could benefit from economies of scale as assets grow, and that the Adviser has contractually agreed to reduce the total expenses through October 31, 2014, to 1.10% for each Fund on assets up to $150 million and down to 0.90% for each Fund on assets exceeding $150 million.
Other Benefits
The Board noted the Adviser’s representation that, aside from its contractual advisory fees, it does not benefit in a material way from its relationship with the Funds other than soft-dollar research benefits. Based on the foregoing representation, the Board concluded that other benefits received by the Adviser from its relationship with the Funds were not a material factor to consider in approving the continuation of the Advisory Agreement.
Conclusion
The Board did not identify any single factor as being of paramount importance, and different Trustees may have given different weight to different factors. The Board reviewed a memorandum from Trust counsel discussing the legal standards applicable to its consideration of the Advisory Agreement. Based on its review, including consideration of each of the factors referenced above, the Board determined, in the exercise of its business judgment, that the advisory arrangement, as outlined in the Advisory Agreement, was fair and reasonable in light of the services performed or to be performed, expenses incurred or to be incurred and such other matters as the Board considered relevant in the exercise of its reasonable business judgment.
| |
DF DENT GROWTH FUNDS ADDITIONAL INFORMATION (Unaudited) JUNE 30, 2012 |
| |
Proxy Voting Information
A description of the policies and procedures that each Fund uses to determine how to vote proxies relating to securities held in each Fund’s portfolio is available, without charge and upon request, by calling (866) 233-3368 and on the U.S. Securities and Exchange Commission’s (the “SEC”) website at www.sec.gov. Each Fund’s proxy voting record for the most recent twelve-month period ended June 30 is available, without charge and upon request, by calling (866) 233-3368 and on the SEC’s website at www.sec.gov.
Availability of Quarterly Portfolio Schedules
Each Fund files its complete schedule of portfolio holdings with the SEC for the first and third quarters of each fiscal year on Form N-Q. These filings are available, without charge and upon request on the SEC’s website at www.sec.gov or may be reviewed and copied at the SEC’s Public Reference Room in Washington, DC. Information on the operation of the Public Reference Room may be obtained by calling (800) SEC-0330.
Shareholder Expense Example
As a shareholder of the Funds, you incur two types of costs: (1) transaction costs, including redemption fees, and (2) ongoing costs, including management fees and other Fund expenses. This example is intended to help you understand your ongoing costs (in dollars) of investing in the Funds, and to compare these costs with the ongoing costs of investing in other mutual funds.
The example is based on an investment of $1,000 invested at the beginning of the period and held for the entire period from January 1, 2012, through June 30, 2012.
Actual Expenses – The first line of the table below provides information about actual account values and actual expenses. You may use the information in this line, together with the amount you invested, to estimate the expenses that you paid over the period. Simply divide your account value by $1,000 (for example, an $8,600 account value divided by $1,000 = 8.6), then multiply the result by the number in the first line under the heading entitled “Expenses Paid During Period” to estimate the expenses you paid on your account during the period.
Hypothetical Example for Comparison Purposes – The second line of the table below provides information about hypothetical account values and hypothetical expenses based on each Fund’s actual expense ratio and an assumed rate of return of 5% per year before expenses, which is not each Fund’s actual return. The hypothetical account values and expenses may not be used to estimate the actual ending account balance or expenses you paid for the period. You may use this information to compare the ongoing costs of investing in each Fund and other funds. To do so, compare this 5% hypothetical example with the 5% hypothetical examples that appear in the shareholder reports of other funds.
Please note that the expenses shown in the table are meant to highlight your ongoing costs only and do not reflect any transactional costs, such as redemption fees. Therefore, the second line of the table is useful in
| |
DF DENT GROWTH FUNDS ADDITIONAL INFORMATION (Unaudited) JUNE 30, 2012 |
| |
comparing ongoing costs only, and will not help you determine the relative total costs of owning different funds. In addition, if these transactional costs were included, your costs would have been higher.
| | Beginning | | Ending | | Expenses | | Annualized |
| | Account Value | | Account Value | | Paid During | | Expense |
| | January 1, 2012 | | June 30, 2012 | | Period* | | Ratio* |
| DF Dent Premier Growth Fund | | | | | | | |
| Actual | $ | 1,000.00 | | $ | 1,057.24 | | $ | 5.58 | | 1.09 | % |
| Hypothetical (5% return before taxes) | $ | 1,000.00 | | $ | 1,019.44 | | $ | 5.47 | | 1.09 | % |
| DF Dent Midcap Growth Fund | | | | | | | | | | | |
| Actual | $ | 1,000.00 | | $ | 1,073.88 | | $ | 5.67 | | 1.10 | % |
| Hypothetical (5% return before taxes) | $ | 1,000.00 | | $ | 1,019.39 | | $ | 5.52 | | 1.10 | % |
| * | Expenses are equal to the Fund’s annualized expense ratio multiplied by the average account value over the period, multiplied by the number of days in the most recent fiscal half-year divided by 366 to reflect the half-year period. |
Trustees and Officers of the Trust
The Board is responsible for oversight of the management of the Trust’s business affairs and of the exercise of all the Trust’s powers except those reserved for the shareholders. The following table provides information about each Trustee and certain officers of the Trust. Each Trustee and officer holds office until the person resigns, is removed, or is replaced. Unless otherwise noted, the persons have held their principal occupations for more than five years. The address for all Trustees and officers is Three Canal Plaza, Suite 600, Portland, Maine 04101. Mr. Keffer is considered an Interested Trustee due to his affiliation with Atlantic. Each Fund’s Statement of Additional Information includes additional information about the Trustees and is available, without charge and upon request, by calling (866) 233-3368.
| Name and Year of Birth | Position with the Trust | Length of Time Served | Principal Occupation(s) During Past Five Years | Number of Series of Trust Overseen by Trustee | Other Directorships Held by Trustee |
| Independent Trustees | | | | | |
J. Michael Parish Born: 1943 | Chairman of the Board; Trustee; Chairman, Nominating Committee and Qualified Legal Compliance Committee | Since 1989 (Chairman since 2004) | Retired since 2003. | 21 | 0 |
Costas Azariadis Born: 1943 | Trustee; Chairman, Valuation Committee | Since 1989 | Professor of Economics, Washington University since 2006. | 21 | 0 |
| |
DF DENT GROWTH FUNDS ADDITIONAL INFORMATION (Unaudited) JUNE 30, 2012 |
| |
| Name and Year of Birth | Position with the Trust | Length of Time Served | Principal Occupation(s) During Past Five Years | Number of Series of Trust Overseen by Trustee | Other Directorships Held by Trustee |
Independent Trustees – continued James C. Cheng Born: 1942 | Trustee; Chairman, Audit Committee | Since 1989 | President, Technology Marketing Associates (marketing company for small- and medium-sized businesses in New England) since 1991. | 21 | 0 |
David Tucker Born: 1958 | Trustee | Since 2011 | Director, Blue Sky Experience since 2008; Senior Vice President & General Counsel, American Century Companies 1998-2008. | 21 | 0 |
| Interested Trustee | | | | | |
John Y. Keffer1 Born: 1942 | Trustee; Vice Chairman | Since 1989 | Chairman, Atlantic since 2008; President, Forum Foundation (a charitable organization) since 2005; President, Forum Trust, LLC (a non-depository trust company chartered in the State of Maine) since 1997. | 21 | Director, Wintergreen Fund, Inc.; Director, Forum ETF Trust |
| Officers | | | | | |
Stacey E. Hong Born: 1966 | President; Principal Executive Officer | Since 2008 | President, Atlantic since 2008; Director, Consulting Services, Foreside Fund Services 2007. | N/A | N/A |
Karen Shaw Born: 1972 | Treasurer; Principal Financial Officer | Since 2008 | Senior Vice President, Atlantic since 2008; Vice President, Citigroup 2003-2008. | N/A | N/A |
David Faherty Born: 1970 | Vice President | Since 2009 | Senior Counsel, Atlantic since 2009; Vice President, Citi Fund Services Ohio, Inc. 2007-2009; Associate Counsel, Investors Bank & Trust Co. 2006-2007. | N/A | N/A |
Michael J. McKeen Born: 1971 | Vice President | Since 2009 | Senior Vice President, Atlantic since 2008; Vice President, Citigroup 2003-2008. | N/A | N/A |
Joshua LaPan Born: 1973 | Vice President | Since 2009 | Manager, Atlantic since 2008; Vice President, Citigroup 2003-2008. | N/A | N/A |
Timothy Bowden Born: 1969 | Vice President | Since 2009 | Manager, Atlantic since 2008; Vice President, Citigroup 2005-2008. | N/A | N/A |
Lina Bhatnagar Born: 1971 | Secretary | Since 2008 | Senior Administration Specialist, Atlantic since 2008; Regulatory Administration Specialist, Citigroup 2006-2008. | N/A | N/A |
1Atlantic is a subsidiary of Forum Holdings Corp. I, a Delaware corporation that is wholly owned by Mr. Keffer. |
[THIS PAGE INTENTIONALLY LEFT BLANK]
[THIS PAGE INTENTIONALLY LEFT BLANK]
A Message to Our Shareholders | 1 |
Performance Charts and Analysis (Unaudited) | 7 |
Schedules of Investments | 9 |
Statements of Assets and Liabilities | 13 |
Statements of Operations | 14 |
Statements of Changes in Net Assets | 15 |
Financial Highlights | 16 |
Notes to Financial Statements | 17 |
Report of Independent Registered Public Accounting Firm | 22 |
| Additional Information (Unaudited) | 23 |
| |
GOLDEN FUNDS A MESSAGE TO OUR SHAREHOLDERS JUNE 30, 2012 |
| |
Dear Shareholder,
We are pleased to present the annual report for the Golden Large Cap Core Fund and the Golden Small Cap Core Fund (the “Funds”) for the period of July 1, 2011 through June 30, 2012.
Market Review
Third Quarter of 2011
During the third quarter of 2011, the U.S. equity markets experienced their worst decline since the fourth quarter of 2008. Not only was the magnitude of the decline difficult to bear, but the level of daily volatility was also extreme as the S&P 500® Index (“S&P 500”) experienced 18 days in which it moved higher or lower by at least 2 percent.
The volatility was understandable given the negative news over the course of the quarter. July started out with generally weak data on manufacturing, employment, and retail sales. As the month progressed, it became clear that the politicians in Washington, DC were going to make the debate over whether to increase the statutory debt limit an exercise in brinksmanship. As a result, investors increasingly began to fear a government shutdown and a potential default on U.S. government debt. All the while, European sovereign debt concerns continued to simmer in the background. At the eleventh hour, Congress increased the debt ceiling and agreed to a meager deficit reduction package that “kicked the can down the road” slightly, but the package generally abdicated the duty of the entire Congress by delegating the task of enumerating the specific budget cuts to a new super-committee of 12 congressmen and senators. In response, Standard and Poors downgraded the rating of U.S. government debt from AAA to AA+, and the stock market subsequently cratered. Investor confidence and consumer confidence was shattered and the heightened level of uncertainty about the future increased the expectations for another recession and the possibility of another financial crisis emanating out of Europe.
Fourth Quarter of 2011
The U.S. equity markets finished 2011 with a strong quarter. The Russell 1000® Index (“Russell 1000”) returned 11.8% in the fourth quarter, bringing its 2011 return into positive territory at 1.5%. The Russell 2000® Index (“Russell 2000”) returned 15.5% in the quarter, but this did not make up for losses earlier in the year as it finished 2011 down -4.2%. The markets experienced the reversal of several trends from earlier in the year; specifically, smaller capitalization stocks outperformed their larger peers, while higher beta stocks outperformed lower beta stocks during the fourth quarter.
As noted above, equity markets were overwhelmed with a sense of negativity that led to significant declines in the third quarter. However, in October, U.S. economic data began to show signs of stabilization, and the markets rallied from the previous quarter’s declines. Some indices for manufacturing and servicing activity showed slight improvements while others continued to disappoint; employment reports continued to show net job additions, though the unemployment rate was unchanged; new home sales provided some encouragement; and the initial third quarter gross domestic product (“GDP”) estimate came in at 2.5% (it was
| |
GOLDEN FUNDS A MESSAGE TO OUR SHAREHOLDERS JUNE 30, 2012 |
| |
later revised to 2.0%). Through most of November, a pessimistic tone once again pervaded the markets, and fears took hold that the European sovereign debt crisis could escalate and drag down the U.S. recovery. Despite the negative mood, economic data continued to show signs of stabilization, including a rise in consumer confidence and a decline in the unemployment rate to 8.6%. The markets dipped in mid-December, but finished the month slightly higher than they began.
First Quarter of 2012
The U.S. equity markets started 2012 with a strong quarter as they extended the rally that began in the fourth quarter of 2011. The Russell 1000 benchmark for large cap stocks returned 12.90% while the Russell 2000 benchmark for small cap stocks returned 12.44% in the quarter. On March 26, the S&P 500 closed at its highest level since May of 2008.
Investors exhibited a desire to take on more risk as evidenced by the selloff in U.S. government bonds and the strong rally in areas of the market generally considered to be riskier. Treasuries had their worst quarter since the fourth quarter of 2010 with 10-year note yields climbing 0.34 percentage points from the end of 2011 to yield 2.22%. Meanwhile, the Nasdaq Composite Index surged 18.7% during the quarter (its best start to a year since 1991) and the MSCI Emerging Markets Index (MXEF) rose 13.65% (its best first quarter since 1992).
Over the course of the quarter, U.S. economic data continued to indicate an economy that is growing, although at a tepid pace. Positives included a fourth quarter GDP estimate of 3.0%, continued net job additions, an unemployment rate that fell to 8.3%, generally benign inflation measures, and mostly expansionary readings from indices for manufacturing and servicing activity. However, some of those indices fell short of economists’ consensus expectations; most measures of the real estate market continued to be weak; the trade deficit increased due to slower exports and faster imports; and gasoline prices rose. Central banks around the world took actions to provide liquidity to their markets to support further growth and reduce risks in their markets. In the U.S., the Federal Reserve Bank (“Fed”) communicated plans to maintain exceptionally low rates until late 2014, and Chairman Bernanke was very visible during the quarter, reminding investors that the Fed is committed to “continued accommodative policies.” Among other central banks, the Bank of Japan revealed plans to expand its asset-purchase program and said it will target 1 percent inflation “for the time being;” the Bank of England announced plans to enlarge its asset-purchase program; and the European Central Bank awarded a second round of three-year loans to European banks to ease financial conditions in Europe. Even the People’s Bank of China took an expansionary policy stance as it cut its reserve requirement ratio for banks. The stock market shook off the general economic malaise and, instead, was encouraged by the actions of central banks around the world.
Second Quarter of 2012
The U.S. equity markets moved lower over the course of the second quarter as the economy showed signs of weakening and the European debt crisis continued to weigh on the markets. The Russell 1000 returned -3.12% while the Russell 2000 returned -3.47% in the quarter.
| |
GOLDEN FUNDS A MESSAGE TO OUR SHAREHOLDERS JUNE 30, 2012 |
| |
Over the course of the quarter, much of the reported U.S. economic data fell short of economists’ expectations with the overall tone of the data indicating slow growth of the economy. The disappointing data included: first quarter GDP of 1.9%, measures of manufacturing and services that were generally at levels only slightly above the levels indicating expansion, jobs reports that showed a very slow pace of jobs growth, an unemployment rate hovering around 8.2%, and measures showing low levels of consumer confidence. Some bright spots in the data included generally benign inflation measures (as a result of falling energy prices) and somewhat surprising strength in the housing market.
There were a number of significant developments during the quarter on the monetary, fiscal, and political fronts. In the U.S., the Fed announced an extension to its “Operation Twist” program to extend the duration of its U.S. Treasury holdings. We view this as a nod from the Fed that it is prepared to provide additional stimulus should the economy falter. Also in the U.S., the Supreme Court ruled to uphold the key provisions of the Affordable Care Act signed into law by President Obama in 2010. This legislation has implications for the entire U.S. economy that will impact markets as the law is implemented over time. In Europe, a summit held by European leaders produced an agreement to create a single Eurozone banking supervisor and to use the European Stability Mechanism (ESM) rescue fund to directly assist troubled banks. This has generally been viewed as an important step in breaking the troubled relationships between struggling sovereigns and their struggling banks. Also, in Greece, the parliamentary elections resulted in a victory for the “pro-bailout” moderates, reducing fears of an immediate Greek exit from the Eurozone.
Golden Large Cap Core Fund
The Fund seeks to achieve long-term capital appreciation by investing in large capitalization domestic equities. The goal of the Fund is to construct an actively managed portfolio of fundamentally sound large-cap companies that we believe exhibit the likelihood of meeting or exceeding analysts’ earnings expectations.
For the one-year period ending June 30, 2012, the Fund delivered a total return of 4.44%. The Fund’s return trailed the 5.45% total return of the S&P 500, the Fund’s benchmark index, for the same period. The market was very volatile during the period. The mid single digit benchmark return masks the much larger swings in quarterly returns ranging from -13.9% in the third quarter of 2011 to +12.6% in the first quarter of 2012.
The Fund’s best source of advantage relative to the S&P 500 came from the Consumer Discretionary sector. Stock selection within this group was particularly strong, led by advances in Foot Locker (FL), Home Depot (HD), and Ross Stores (ROST). Each of these companies delivered financial results that exceeded both management and investor expectations. Given the uncertain economic and employment environment, our retail holdings in the Fund were selected to benefit from the continued trend for consumer spending on athletic apparel (Foot Locker), home improvement spending rather than new construction (Home Depot), and consumers trading down to discount clothing stores (Ross Stores).
The Energy and Health Care sectors were the primary sources of relative underperformance during the period. Within the S&P 500, Energy was the worst performing sector over the past year. The Fund lost ground to the S&P 500 due to its overweight exposure to this underperforming group. Crude oil prices remained stubbornly high for some time, but they have fallen recently due, in part, to the weak economy and reduced
| |
GOLDEN FUNDS A MESSAGE TO OUR SHAREHOLDERS JUNE 30, 2012 |
| |
demand for energy products. Notable underperformers included Halliburton (HAL) and Denbury Resources (DNR). Within the Health Care sector, the Fund’s overweight exposure to health care equipment and services stocks detracted value relative to the S&P 500 as that industry group underperformed the overall sector during the period. Stock selection among pharmaceutical, biotechnology and life sciences stocks also detracted value. Agilent Technologies (A) and Forest Laboratories (FRX) were notable underperformers.
Golden Small Cap Core Fund
The Fund seeks to achieve maximum long-term total return by investing in small capitalization domestic equities. The goal of the Fund is to construct an actively managed portfolio of fundamentally sound small-cap companies that we believe exhibit the likelihood of meeting or exceeding analysts’ earnings expectations.
For the one-year period ending June 30, 2012, the Fund generated a total return of -4.14%. This return trailed the -2.08% total return of the Russell 2000, the Fund’s benchmark index, for the same period.
Stock selection added value for the Fund in six out of ten economic sectors. The best relative results came from the Energy, Consumer Discretionary, Industrials, and Technology sectors. Relative weakness was found in Materials, Financials, and Consumer Staples. Another impact on overall performance can be seen in a comparison of Russell 2000 and S&P 500 returns, which provide an indication that investing in smaller companies yielded weak relative performance when compared to returns from larger capitalization companies over the period.
The Fund’s Energy sector offered the best performance relative to the Russell 2000 sector return during the period. Two of the portfolio’s best performers were Western Refining (WNR) and CVR Energy (CVI). Western Refining benefitted from improving margins due to lower crude prices, and CVR Energy became a target of Carl Icahn, who sought a majority stake in the company. We also experienced weak results from some companies, including Oil States International (OIS), Cloud Peak Energy (CLD), and Stone Energy (SGY). While the sector was the source of the strongest stock selection in the Fund, its overweight position detracted from relative results as the sector was the worst performer in the Russell 2000.
The Fund’s holdings within the Consumer Discretionary sector included several strong performers such as Sally Beauty Holdings (SBH), Service Corp. International (SCI), Coinstar (CSTR), and Aeropostale (ARO). There were also a few companies that saw their share prices decline due to weakening fundamentals. These companies included Ruby Tuesday (RT), Standard Motor Products (SMP), and Tupperware Brands (TUP).
The Fund’s Industrials sector return was essentially flat while the Russell 2000 saw a nearly 5% decline within the sector. An overweight exposure to this sector detracted modestly from the Fund’s relative results, though stock selection, particularly among transportation companies, added value. Old Dominion Freight Line (ODFL) and Saia, Inc. (SAIA) delivered solid returns as shipping trends that favored less-than-truckload service providers played to the strengths of these two companies. Within the Capital Goods industry, EnerSys (ENS), Chart Industries (GTLS), and Cubic Corp (CUB), all had strong financial results and their shares
| |
GOLDEN FUNDS A MESSAGE TO OUR SHAREHOLDERS JUNE 30, 2012 |
| |
reacted positively. We did, however, see declines in the shares of companies, including Crane (CR), MasTec, Inc. (MTZ), and Robbins & Meyers (RBN).
The Technology sector was an underperforming sector within the Russell 2000 over the period and finished with a return in negative territory. Exposure to the sector had little impact on relative performance, and the Fund concluded the year with an underweight position. Stock selection decisions added value overall, with most of the benefit coming from the Semiconductor and Semiconductor Equipment industry group. The Fund’s best performer in the sector for the year was Cirrus Logic (CRUS). Cirrus boasted strong performance driven by order demand and made positive comments about expected strong demand later in the year. The source for this demand could be the highly anticipated iPhone 5 launch since Apple (AAPL) uses Cirrus circuitry. Two sources of weakness in the sector for the Fund were Power-One (PWER) and InterDigital (IDCC). Power-One announced a negative earnings surprise, and InterDigital concluded its strategic alternatives review process without resulting in an offer for the whole company as many investors had come to expect.
Performance within Financials detracted in terms of both stock selection and sector positioning. The Fund was underweight for the period, which detracted from performance, and stock selection also contributed to the shortfall. Although the Fund maintained an underweight exposure to banks, its lone holding in the group, Ocwen Financial (OCN), performed exceptionally well for the period. The Fund’s insurance holdings performed fairly well, but they did not match the relatively strong returns for the group within the Russell 2000. While ProAssurance (PRA) and American Financial Group (AFG) posted solid gains, they were offset by weakness in companies including FBL Financial (FBL), Meadowbrook Insurance Group, and StanCorp Financial (SFG). The biggest drag came from the Real Estate and Diversified Financials industry groups, as Ashford Hospitality Trust (AHT) and EZCorp (EZPW) experienced significant declines.
Within the Health Care sector, MModal (MODL), which provides medical transcription software technology to hospitals and physician practices, delivered the best performance within the group due to solid earnings fundamentals. Other strong performers included Cyberonics (CYBX) and HealthSpring (HS). One holding, Kindred Healthcare (KND), was hit hard after news came out that Medicare would make a sizeable cut to nursing home payments in 2012.
The Materials sector was especially challenging during the year and contributed most to negative stock selection results. We had moved to an overweight position earlier in the year in anticipation of a pickup in inflation in order to increase exposure to commodity-related companies that would benefit from rising prices. In hindsight, we may have been a bit early on that call, as companies including Silver Standard Resources (SSRI), Coeur d’Alene Mines (CDE), Materion Corp (MTRN), and Rock-Tenn Co. (RKT) all experienced sharp declines.
Market Outlook
As the third quarter begins, investors are breathing a sigh of relief based on the monetary policy actions of global central banks and statements by Eurozone political leaders aimed at addressing the weaknesses in the European banking system.
| |
GOLDEN FUNDS A MESSAGE TO OUR SHAREHOLDERS JUNE 30, 2012 |
| |
Clearly, the global economy is showing signs of weakness and there are a number of large and potentially catastrophic risks that must be avoided. Among the greatest risks are: the potential for financial contagion in the global banking system; the impending “fiscal cliff” in the U.S. at the beginning of 2013; and a “hard landing” in China’s economy. These are all well known risks, and monetary and political authorities are taking steps to avoid or mitigate the negative impacts should any of these risks materialize. Central banks are providing considerable monetary stimulus. In the U.S., the Fed has extended its “Operation Twist,” and we are experiencing negative real interest rates (10 year Treasury yields are lower than the core inflation rate). In the U.K., the Bank of England is actively engaged in a program of quantitative easing. In China, the authorities have implemented a series of cuts to the reserve requirement ratio for banks as well as policy rate cuts. In Europe, the European Central Bank has recently implemented long term lending operations; policy rate cuts; and easing of collateral requirements to relieve stress in the bank funding and sovereign debt markets. Additionally, the European Union is taking steps to contain financial system contagion from potential defaults or restructurings of sovereign debt and from the potential for countries to exit the Euro currency.
Despite this difficult environment, the U.S. economy has remained remarkably resilient. Although it is weak, it is still growing. While both investor sentiment and consumer confidence have been weak, the recent pullback in energy prices and the nascent strength in the housing market may provide a foundation for improvement. The heightened level of uncertainty has kept U.S. equities relatively inexpensive as measured by valuation multiples compared to historical averages. Equities also appear inexpensive relative to fixed income investments as measured by relative yields (e.g. equity dividend yields or earnings yields versus 10 year U.S. Treasury note yields). Additionally, analysts have recently been lowering their estimates of future profits for U.S. corporations, and they may have lowered the bar far enough that we could be set up for positive surprises.
We value and appreciate our relationship with the Funds and thank you for your support.
Sincerely,
Greg W. Golden, CFA Jeff C. Moser, CFA
The views expressed in this report are those of the Funds’ managers as of June 30, 2012, and may not reflect their views on the date this report is first published or anytime thereafter. These views are intended to assist shareholders of the Funds in understanding their investments in the Funds and do not constitute investment advice. Investing in the securities of small capitalization companies involves greater risk and the possibility of greater price volatility than investing in larger capitalization and more established companies.
| |
GOLDEN LARGE CAP CORE FUND PERFORMANCE CHART AND ANALYSIS (Unaudited) JUNE 30, 2012 |
| |
The following chart reflects the change in the value of a hypothetical $10,000 investment in Institutional Shares, including reinvested dividends and distributions, in the Golden Large Cap Core Fund (the “Fund”) compared with the performance of the benchmark, the S&P 500 Index (S&P 500"), since inception. The S&P 500 is a broad-based, unmanaged measurement of changes in stock market conditions based on the average of 500 widely held common stocks. The total return of the S&P 500 includes the reinvestment of dividends and income. The total return of the Fund includes operating expenses that reduce returns, while the total return of the S&P 500 does not include expenses. The Fund is professionally managed while the S&P 500 is unmanaged and is not available for investment.
Performance data quoted represents past performance and is no guarantee of future results. Current performance may be lower or higher than the performance data quoted. Investment return and principal value will fluctuate so that shares, when redeemed, may be worth more or less than original cost. For the most recent month-end performance, please call (800) 206-8610. As stated in the Fund's prospectus, the annual operating expense ratios (gross) for Institutional Shares is 0.70%. The Fund's adviser has agreed to contractually reduce a portion of its fees and to reimburse expenses such that total operating expenses do not exceed 0.70% for Institutional Shares, through at least October 31, 2012. The performance table and graph do not reflect the deduction of taxes that a shareholder would pay on Fund distributions or the redemption of Fund shares. Returns greater than one year are annualized.
| |
GOLDEN SMALL CAP CORE FUND PERFORMANCE CHART AND ANALYSIS (Unaudited) JUNE 30, 2012 |
| |
The following chart reflects the change in the value of a hypothetical $10,000 investment in Institutional Shares, including reinvested dividends and distributions, in the Golden Small Cap Core Fund (the “Fund”) compared with the performance of the primary benchmark, the Russell 2000 Index ("Russell 2000"), and the secondary benchmark, the S&P 600 Index ("S&P 600"), since inception. The Russell 2000, is an unmanaged, market value weighted index, which measures performance of the 2,000 companies that are between the 1,000th and 3,000th largest in the market. The S&P 600 is designed to be an accurate measure of the performance of small companies, reflecting the risk and return characteristics of the broader smallcap universe. The total return of the indices include the reinvestment of dividends and income. The total return of the Fund includes operating expenses that reduce returns, while the total return of the indices do not include expenses. The Fund is professionally managed while the indices are unmanaged and are not available for investment.
Performance data quoted represents past performance and is no guarantee of future results. Current performance may be lower or higher than the performance data quoted. Investment return and principal value will fluctuate so that shares, when redeemed, may be worth more or less than original cost. For the most recent month-end performance, please call (800) 206-8610. As stated in the Fund's prospectus, the annual operating expense ratios (gross) for Institutional Shares is 1.10%. However, the Fund's adviser has agreed to contractually reduce a portion of its fees and to reimburse expenses such that total operating expenses do not exceed 1.10% for Institutional Shares, through at least October 31, 2012. The performance table and graph do not reflect the deduction of taxes that a shareholder would pay on Fund distributions or the redemption of Fund shares. Returns greater than one year are annualized.
| |
GOLDEN LARGE CAP CORE FUND SCHEDULE OF INVESTMENTS JUNE 30, 2012 |
| |
| Shares | | Security | | Value | | Shares | | Security | | Value |
| | Description | | | | Description | |
| Common Stock - 98.9% | | Materials - 3.5% |
Consumer Discretionary - 12.8% | | | 13,981 | | Rockwood Holdings, Inc. | $ | | 620,057 | |
| | 21,297 | | CBS Corp., Class B | $ | | 698,116 | | | | 12,030 | | WR Grace & Co. (a) | | | 606,914 | |
| | 27,805 | | Comcast Corp., Class A | | | 888,926 | | | | | | | | | 1,226,971 | |
| | 22,751 | | Foot Locker, Inc. | | | 695,725 | | | Technology - 22.6% |
| | 21,374 | | GNC Holdings, Inc., Class A | | | 837,861 | | | | 5,935 | | Alliance Data Systems Corp. (a) | | | 801,225 | |
| | 10,332 | | Ross Stores, Inc. | | | 645,440 | | | | 1,554 | | Apple, Inc. (a) | | | 907,536 | |
| | 13,003 | | The Home Depot, Inc. | | | 689,029 | | | | 38,630 | | Cisco Systems, Inc. | | | 663,277 | |
| | | | | | | 4,455,097 | | | | 26,234 | | EMC Corp. (a) | | | 672,377 | |
| Consumer Staples - 6.5% | | | 15,353 | | IAC/InterActiveCorp | | | 700,097 | |
| | 18,088 | | CVS Caremark Corp. | | | 845,252 | | | | 4,592 | | IBM Corp. | | | 898,103 | |
| | 13,605 | | Herbalife, Ltd. | | | 657,530 | | | | 27,482 | | Intel Corp. | | | 732,395 | |
| | 10,788 | | Wal-Mart Stores, Inc. | | | 752,139 | | | | 21,120 | | Microsoft Corp. | | | 646,061 | |
| | | | | | | 2,254,921 | | | | 22,581 | | Oracle Corp. | | | 670,656 | |
| Energy - 12.5% | | | 10,539 | | QUALCOMM, Inc. | | | 586,812 | |
| | 7,086 | | Chevron Corp. | | | 747,573 | | | | 42,489 | | Symantec Corp. (a) | | | 620,764 | |
| | 12,123 | | ConocoPhillips | | | 677,433 | | | | | | | | | 7,899,303 | |
| | 37,044 | | Denbury Resources, Inc. (a) | | | 559,735 | | | Telecommunications - 2.2% |
| | 7,319 | | Exxon Mobil Corp. | | | 626,287 | | | | 17,643 | | Verizon Communications, Inc. | | | 784,055 | |
| | 20,482 | | Halliburton Co. | | | 581,484 | | | | | | | | | | |
| | 8,144 | | National Oilwell Varco, Inc. | | | 524,799 | | | Utilities - 2.0% |
| | 7,558 | | Occidental Petroleum Corp. | | | 648,250 | | | | 30,242 | | Duke Energy Corp. | | | 697,380 | |
| | | | | | | 4,365,561 | | | | | | | | | | |
| Financials - 11.7% | | Total Common Stock | | | |
| | 10,261 | | ACE, Ltd. | | | 760,648 | | | (Cost $26,831,856) | | 34,505,667 | |
| | 49,116 | | Fifth Third Bancorp | | | 658,154 | | | Total Investments - 98.9% | | | | |
| | 18,918 | | JPMorgan Chase & Co. | | | 675,940 | | | (Cost $26,831,856)* | | $ | 34,505,667 | |
| | 22,503 | | MetLife, Inc. | | | 694,218 | | | Other Assets & Liabilities, Net – 1.1% | | | 390,551 | |
| | 16,586 | | Raymond James Financial, Inc. | | | 567,905 | | | Net Assets – 100.0% | | $ | 34,896,218 | |
| | 22,725 | | U.S. Bancorp | | | 730,836 | | | | | | | | | | |
| | | | | | | 4,087,701 | | | | | | | | | | |
| Health Care - 15.1% | | (a) | Non-income producing security. | | | | |
| | 9,343 | | Amgen, Inc. | | | 682,413 | | | | | | | | | | |
| | 18,552 | | Bristol-Myers Squibb Co. | | | 666,944 | | | * Cost for federal income tax purposes is $26,908,063 and net unrealized appreciation consists of: |
| | 13,403 | | Cardinal Health, Inc. | | | 562,926 | | |
| | 9,413 | | Celgene Corp. (a) | | | 603,938 | | | Gross Unrealized Appreciation | | $ | 8,842,903 | |
| | 7,558 | | Johnson & Johnson | | | 510,619 | | | Gross Unrealized Depreciation | | | (1,245,299 | ) |
| | 7,162 | | McKesson Corp. | | | 671,438 | | | Net Unrealized Appreciation | | $ | 7,597,604 | |
| | 15,306 | | Questcor Pharmaceuticals, Inc. (a) | | | 814,891 | | | | | | | | | | |
| | 12,784 | | UnitedHealth Group, Inc. | | | 747,864 | | | | | | | | | | |
| | | | | | | 5,261,033 | | | | | | | | | | |
| Industrials - 10.0% | | | | | | | | | |
| | 7,974 | | FedEx Corp. | | | 730,498 | | | | | | | | | | |
| | 34,050 | | General Electric Co. | | | 709,602 | | | | | | | | | | |
| | 15,668 | | Tyco International, Ltd. | | | 828,054 | | | | | | | | | | |
| | 8,755 | | United Technologies Corp. | | | 661,265 | | | | | | | | | | |
| | 10,282 | | WABCO Holdings, Inc. (a) | | | 544,226 | | | | | | | | | | |
| | | | | | | 3,473,645 | | | | | | | | | | |
| See Notes to Financial Statements. | 9 | |
| |
GOLDEN LARGE CAP CORE FUND SCHEDULE OF INVESTMENTS JUNE 30, 2012 |
| |
| The following is a summary of the inputs used to value the Fund’s investments as of June 30, 2012. | | PORTFOLIO HOLDINGS |
| | % of Net Assets |
| The inputs or methodology used for valuing securities are not necessarily an indication of the risks associated with investing in those securities. For more information on valuation inputs, and their aggregation into the levels used in the tables below, please refer to the Security Valuation section in Note 2 of the accompanying Notes to Financial Statements. | | Consumer Discretionary | 12.8 | % |
| | Consumer Staples | 6.5 | % |
| | Energy | 12.5 | % |
| | Financials | 11.7 | % |
| | | Investments in Securities | | Health Care | 15.1 | % |
| Valuation Inputs | | | Industrials | 10.0 | % |
| Level 1 - Quoted Prices | | $ | 34,505,667 | | | Materials | 3.5 | % |
| Level 2 - Other Significant Observable Inputs | | | - | | | Technology | 22.6 | % |
| Level 3 - Significant Unobservable Inputs | | | - | | | Telecommunications | 2.2 | % |
| Total | | $ | 34,505,667 | | | Utilities | 2.0 | % |
| | | | | | | Other Assets & Liabilities, Net | 1.1 | % |
| The Level 1 inputs displayed in this table are Common Stock. Refer to the Schedule of Investments for a further breakout of each security by type. | | | 100.0 | % |
| | | | |
| There were no significant transfers between Level 1 and Level 2 for the year ended June 30, 2012. | | | | |
| | | | | | | | | |
| See Notes to Financial Statements. | 10 | |
| |
GOLDEN SMALL CAP CORE FUND SCHEDULE OF INVESTMENTS JUNE 30, 2012 |
| |
| Shares | | Security | | Value | | Shares | | Security | | Value | |
| | Description | | | | Description | | |
| Common Stock - 98.3% | | | | | | | | | | |
| Consumer Discretionary - 15.0% | | | | 13,332 | | Applied Industrial Technologies, Inc. | $ | | 491,284 | |
| | 11,227 | | Big Lots, Inc. (a) | $ | | 457,949 | | | | 10,884 | | Crane Co. | | | 395,960 | |
| | 21,087 | | Bridgepoint Education, Inc. (a) | | | 459,697 | | | | 10,063 | | Cubic Corp. | | | 483,829 | |
| | 8,257 | | Coinstar, Inc. (a) | | | 566,926 | | | | 19,563 | | Deluxe Corp. | | | 487,901 | |
| | 9,765 | | Core-Mark Holding Co., Inc. | | | 470,087 | | | | 14,198 | | EMCOR Group, Inc. | | | 394,988 | |
| | 41,165 | | Leapfrog Enterprises, Inc. (a) | | | 422,353 | | | | 17,080 | | EnerSys (a) | | | 598,996 | |
| | 43,994 | | Service Corp. International | | | 544,206 | | | | 12,820 | | Old Dominion Freight Line, Inc. (a) | | | 554,978 | |
| | 21,794 | | Standard Motor Products, Inc. | | | 306,859 | | | | 29,076 | | Orbital Sciences Corp. (a) | | | 375,662 | |
| | 19,557 | | The Finish Line, Inc., Class A | | | 408,937 | | | | 32,356 | | Primoris Services Corp. | | | 388,272 | |
| | 8,500 | | Tupperware Brands Corp. | | | 465,460 | | | | 9,100 | | Robbins & Myers, Inc. | | | 380,562 | |
| | | | | | | 4,102,474 | | | | 22,140 | | Saia, Inc. (a) | | | 484,645 | |
| Consumer Staples - 1.4% | | | | | | | | 5,437,353 | |
| | 9,190 | | The Andersons, Inc. | | | 392,045 | | | Materials - 5.9% |
| | | | | | | | | | | 15,338 | | Buckeye Technologies, Inc. | | | 436,980 | |
| Energy - 8.5% | | | 29,560 | | Chemtura Corp. (a) | | | 428,620 | |
| | 25,095 | | C&J Energy Services, Inc. (a) | | | 464,258 | | | | 17,250 | | Coeur d'Alene Mines Corp. (a) | | | 302,910 | |
| | 20,389 | | Cloud Peak Energy, Inc. (a) | | | 344,778 | | | | 6,490 | | Schweitzer-Mauduit International, Inc. | | | 442,228 | |
| | 18,914 | | CVR Energy, Inc. (a) | | | 502,734 | | | | | | | | | 1,610,738 | |
| | 15,550 | | Stone Energy Corp. (a) | | | 394,037 | | | Technology - 15.0% |
| | 27,775 | | Western Refining, Inc. | | | 618,549 | | | | 31,606 | | Advanced Energy Industries, Inc. (a) | | | 424,153 | |
| | | | | | | 2,324,356 | | | | 8,151 | | Anixter International, Inc. | | | 432,411 | |
| Financials - 19.2% | | | 89,105 | | Brocade Communications Systems, Inc. (a) | | | 439,288 | |
| | 14,324 | | American Financial Group, Inc. | | | 561,931 | | | | 6,999 | | CACI International, Inc., Class A (a) | | | 385,085 | |
| | 14,943 | | FBL Financial Group, Inc., Class A | | | 418,553 | | | | 20,079 | | Cirrus Logic, Inc. (a) | | | 599,960 | |
| | 29,696 | | Interactive Brokers Group, Inc., Class A | | | 437,125 | | | | 11,555 | | Diebold, Inc. | | | 426,495 | |
| | 30,130 | | Manning & Napier, Inc. | | | 428,750 | | | | 13,646 | | j2 Global, Inc. | | | 360,527 | |
| | 41,912 | | Meadowbrook Insurance Group, Inc. | | | 368,407 | | | | 21,205 | | QLogic Corp. (a) | | | 290,296 | |
| | 30,759 | | Ocwen Financial Corp. (a) | | | 577,654 | | | | 33,676 | | Sanmina-SCI Corp. (a) | | | 275,806 | |
| | 21,440 | | Omega Healthcare Investors, Inc. REIT | | | 482,400 | | | | 15,852 | | TIBCO Software, Inc. (a) | | | 474,292 | |
| | 10,760 | | Post Properties, Inc. REIT | | | 526,702 | | | | | | | | | 4,108,313 | |
| | 6,599 | | ProAssurance Corp. | | | 587,905 | | | Utilities - 1.6% | |
| | 8,696 | | StanCorp Financial Group, Inc. | | | 323,143 | | | | 16,895 | | Portland General Electric Co. | | | 450,421 | |
| | 8,414 | | World Acceptance Corp. (a) | | | 553,641 | | | | | | | | | | |
| | | | | | | 5,266,211 | | | Total Common Stock | | | |
| Health Care - 11.9% | | (Cost $23,232,056) | | 26,961,212 | |
| | 6,634 | | Chemed Corp. | | | 400,959 | | | Total Investments - 98.3% | | | |
| | 11,850 | | Cyberonics, Inc. (a) | | | 532,539 | | | (Cost $23,232,056)* | $ | 26,961,212 | |
| | 5,868 | | Mednax, Inc. (a) | | | 402,193 | | | Other Assets & Liabilities, Net – 1.7% | | 465,513 | |
| | 42,986 | | MModal, Inc. (a) | | | 557,958 | | | Net Assets – 100.0% | $ | 27,426,725 | |
| | 66,770 | | PDL BioPharma, Inc. | | | 442,685 | | | | | | | | | | |
| | 47,470 | | Select Medical Holdings Corp. (a) | | | 479,922 | | | REIT | Real Estate Investment Trust | | | | |
| | 29,116 | | Spectrum Pharmaceuticals, Inc. (a) | | | 453,045 | | | (a) | Non-income producing security. | | | | |
| | | | | | | 3,269,301 | | | | | | | | | | |
| Industrials - 19.8% | | * Cost for federal income tax purposes is $23,496,930 and net unrealized appreciation consists of: |
| | 4,449 | | Amerco, Inc. | | | 400,276 | | |
| | | | | | | | | | Gross Unrealized Appreciation | | $ | 4,463,561 | |
| | | | | | | | | | Gross Unrealized Depreciation | | | (999,279 | ) |
| | | | | | | | | | Net Unrealized Appreciation | | $ | 3,464,282 | |
| See Notes to Financial Statements. | 11 | |
| |
GOLDEN SMALL CAP CORE FUND SCHEDULE OF INVESTMENTS JUNE 30, 2012 |
| |
| The following is a summary of the inputs used to value the Fund’s investments as of June 30, 2012. | | PORTFOLIO HOLDINGS |
| | % of Net Assets |
| | | | | | | Consumer Discretionary | 15.0 | % |
| The inputs or methodology used for valuing securities are not necessarily an indication of the risks associated with investing in those securities. For more information on valuation inputs, and their aggregation into the levels used in the tables below, please refer to the Security Valuation section in Note 2 of the accompanying Notes to Financial Statements. | | Consumer Staples | 1.4 | % |
| | Energy | 8.5 | % |
| | Financials | 19.2 | % |
| | Health Care | 11.9 | % |
| | Industrials | 19.8 | % |
| Valuation Inputs | | Investments in Securities | | Materials | 5.9 | % |
| | | | | | | Technology | 15.0 | % |
| Level 1 - Quoted Prices | | $ | 26,961,212 | | | Utilities | 1.6 | % |
| Level 2 - Other Significant Observable Inputs | | | - | | | Other Assets & Liabilities, Net | 1.7 | % |
| Level 3 - Significant Unobservable Inputs | | | - | | | | 100.0 | % |
| Total | | $ | 26,961,212 | | | | | |
| | | | | | | | | |
| The Level 1 inputs displayed in this table are Common Stock. Refer to the Schedule of Investments for a further breakout of each security by type. | | | | |
| There were no significant transfers between Level 1 and Level 2 for the year ended June 30, 2012. | | | | |
| See Notes to Financial Statements. | 12 | |
| |
GOLDEN FUNDS STATEMENTS OF ASSETS AND LIABILITIES JUNE 30, 2012 |
| |
| | | | | | GOLDEN LARGE CAP CORE FUND | | | | GOLDEN SMALL CAP CORE FUND | |
| ASSETS | | | | | | | | |
| | Total investments, at value (Cost $26,831,856 and $23,232,056, respectively) | $ | 34,505,667 | | | $ | 26,961,212 | |
| | Cash | | | 469,511 | | | | 513,375 | |
| | Receivables: | | | | | | | | |
| | | Fund shares sold | | | 100,000 | | | | - | |
| | | Dividends and interest | | | 38,870 | | | | 14,594 | |
| Total Assets | | | 35,114,048 | | | | 27,489,181 | |
| | | | | | | | | | | |
| LIABILITIES | | | | | | | | |
| | Payables: | | | | | | | | |
| | | Fund shares redeemed | | | 199,858 | | | | 40,052 | |
| | Accrued Liabilities: | | | | | | | | |
| | | Investment adviser fees | | | 17,955 | | | | 22,391 | |
| | | Trustees’ fees and expenses | | | 17 | | | | 13 | |
| Total Liabilities | | | 217,830 | | | | 62,456 | |
| | | | | | | | | | | |
| NET ASSETS | | $ | 34,896,218 | | | $ | 27,426,725 | |
| | | | | | | | | | | |
| COMPONENTS OF NET ASSETS | | | | | | | | |
| | Paid-in capital | | $ | 27,639,952 | | | $ | 83,848,499 | |
| | Undistributed net investment income | | | 279,121 | | | | - | |
| | Accumulated net realized loss | | | (696,666 | ) | | | (60,150,930 | ) |
| | Net unrealized appreciation | | | 7,673,811 | | | | 3,729,156 | |
| NET ASSETS | | $ | 34,896,218 | | | $ | 27,426,725 | |
| SHARES OF BENEFICIAL INTEREST AT NO PAR VALUE (UNLIMITED SHARES AUTHORIZED) | | | 3,087,368 | | | | 2,576,636 | |
| NET ASSET VALUE, OFFERING AND REDEMPTION PRICE PER SHARE | | $ | 11.30 | | | $ | 10.64 | |
| | | | | | | | | | | |
| See Notes to Financial Statements. | 13 | |
| |
GOLDEN FUNDS STATEMENTS OF OPERATIONS YEAR ENDED JUNE 30, 2012 |
| |
| | | | | | GOLDEN LARGE CAP CORE FUND | | | | GOLDEN SMALL CAP CORE FUND | |
| INVESTMENT INCOME | | | | | | | | |
| | Dividend income | | $ | 1,117,815 | | | $ | 361,091 | |
| | Interest income | | | 1,027 | | | | 662 | |
| Total Investment Income | | | 1,118,842 | | | | 361,753 | |
| Adviser | | | | | | | | |
| EXPENSES | | | | | | | | |
| | Investment adviser fees | | | 445,468 | | | | 405,712 | |
| | Trustees' fees and expenses | | | 2,658 | | | | 1,409 | |
| Total Expenses | | | 448,126 | | | | 407,121 | |
| | Fees waived and expenses reimbursed | | | (2,658 | ) | | | (1,409 | ) |
| Net Expenses | | | 445,468 | | | | 405,712 | |
| | | | | | | | | | | |
| NET INVESTMENT INCOME (LOSS) | | | 673,374 | | | | (43,959 | ) |
| | | | | | | | | | | |
| NET REALIZED AND UNREALIZED GAIN (LOSS) | | | | | | | | |
| | Net realized gain on investments | | | 10,246,359 | | | | 6,017,297 | |
| | Net change in unrealized appreciation (depreciation) on investments | | | (19,594,735 | ) | | | (8,976,528 | ) |
| NET REALIZED AND UNREALIZED LOSS | | | (9,348,376 | ) | | | (2,959,231 | ) |
| DECREASE IN NET ASSETS FROM OPERATIONS | | $ | (8,675,002 | ) | | $ | (3,003,190 | ) |
| | | | | | | | | | | |
| See Notes to Financial Statements. | 14 | |
| |
GOLDEN FUNDS STATEMENTS OF CHANGES IN NET ASSETS |
| |
| | | | | GOLDEN LARGE CAP CORE FUND | | GOLDEN SMALL CAP CORE FUND |
| | | June 30, 2010 | | | | | | | Shares | | | | | | | | Shares | |
| NET ASSETS JUNE 30, 2010 | | $ | 156,712,196 | | | | $156,712,196 | | | $ | 104,234,855 | | | | $104,234,855 | |
| OPERATIONS | | | | | | | | | | | | | | | | |
| | Net investment income (loss) | | | 1,728,683 | | | | | | | | (171,340 | ) | | | | |
| | Net realized gain | | | 16,455,416 | | | | | | | | 28,445,392 | | | | | |
| | Net change in unrealized appreciation (depreciation) | | | 24,229,126 | | | | | | | | 5,589,644 | | | | | |
| Increase in Net Assets Resulting from Operations | | | 42,413,225 | | | | | | | | 33,863,696 | | | | | |
| | | | | | | | | | | | | | | | | | | |
| DISTRIBUTIONS TO SHAREHOLDERS FROM | | | | | | | | | | | | | | | | |
| | Net investment income | | | (2,092,596 | ) | | | | | | | - | | | | | |
| | | | | | | | | | | | | | | | | | | |
| CAPITAL SHARE TRANSACTIONS | | | | | | | | | | | | | | | | |
| | Sale of shares | | | 10,968,235 | | | | 1,071,646 | | | | 2,997,512 | | | | 310,411 | |
| | Reinvestment of distributions | | | 43,587 | | | | 4,195 | | | | - | | | | - | |
| | Redemption of shares | | | (65,288,358 | ) | | | (6,189,916 | ) | | | (87,795,901 | ) | | | (8,703,772 | ) |
| Decrease in Net Assets from Capital Share Transactions | | | (54,276,536 | ) | | | (5,114,075 | ) | | | (84,798,389 | ) | | | (8,393,361 | ) |
| Decrease in Net Assets | | | (13,955,907 | ) | | | | | | | (50,934,693 | ) | | | | |
| NET ASSETS JUNE 30, 2011 (Including line (a)) | | $ | 142,756,289 | | | | | | | $ | 53,300,162 | | | | | |
| OPERATIONS | | | | | | | | | | | | | | | | |
| | Net investment income (loss) | | | 673,374 | | | | | | | | (43,959 | ) | | | | |
| | Net realized gain | | | 10,246,359 | | | | | | | | 6,017,297 | | | | | |
| | Net change in unrealized appreciation (depreciation) | | | (19,594,735 | ) | | | | | | | (8,976,528 | ) | | | | |
| Decrease in Net Assets Resulting from Operations | | | (8,675,002 | ) | | | | | | | (3,003,190 | ) | | | | |
| | | | | | | | | | | | | | | | | | | |
| DISTRIBUTIONS TO SHAREHOLDERS FROM | | | | | | | | | | | | | | | | |
| | Net investment income | | | (1,238,094 | ) | | | | | | | - | | | | | |
| | | | | | | | | | | | | | | | | | | |
| CAPITAL SHARE TRANSACTIONS | | | | | | | | | | | | | | | | |
| | Sale of shares | | | 2,679,571 | | | | 254,202 | | | | 814,327 | | | | 79,897 | |
| | Reinvestment of distributions | | | 48,767 | | | | 4,838 | | | | - | | | | - | |
| | Redemption of shares | | | (100,675,313 | ) | | | (10,027,910 | ) | | | (23,684,574 | ) | | | (2,306,216 | ) |
| Decrease in Net Assets from Capital Share Transactions | | | (97,946,975 | ) | | | (9,768,870 | ) | | | (22,870,247 | ) | | | (2,226,319 | ) |
| Decrease in Net Assets | | | (107,860,071 | ) | | | | | | | (25,873,437 | ) | | | | |
| NET ASSETS JUNE 30, 2012 (Including line (b)) | | $ | 34,896,218 | | | | | | | $ | 27,426,725 | | | | | |
| (a) | Undistributed net investment income June 30, 2011 | | $ | 843,841 | | | | | | | $ | - | | | | | |
| (b) | Undistributed net investment income June 30, 2012 | | $ | 279,121 | | | | | | | $ | - | | | | | |
| See Notes to Financial Statements. | 15 | |
| |
GOLDEN FUNDS FINANCIAL HIGHLIGHTS |
| |
These financial highlights reflect selected data for a share outstanding throughout each year. | | | | | | |
| | | For the Years Ended June 30, | |
| | | 2012 | | 2011 | | 2010 | | 2009 | | 2008 | |
| GOLDEN LARGE CAP CORE FUND | | | | | | | | | | | | | | | | | | | | |
| NET ASSET VALUE, Beginning of Year | $ | 11.10 | | | $ | 8.72 | | | $ | 8.04 | | | $ | 10.82 | | | $ | 12.24 | | |
| INVESTMENT OPERATIONS | | | | | | | | | | | | | | | | | | | | |
| Net investment income (a) | | 0.11 | | | | 0.11 | | | | 0.12 | | | | 0.14 | | | | 0.12 | | |
| Net realized and unrealized gain (loss) | | 0.35 | (b) | | | 2.40 | | | | 0.69 | | | | (2.81 | ) | | | (1.45 | ) | |
| Total from Investment Operations | | 0.46 | | | | 2.51 | | | | 0.81 | | | | (2.67 | ) | | | (1.33 | ) | |
| DISTRIBUTIONS TO SHAREHOLDERS FROM | | | | | | | | | | | | | | | | | | |
| Net investment income | | (0.26 | ) | | | (0.13 | ) | | | (0.13 | ) | | | (0.11 | ) | | | (0.09 | ) | |
| Net realized gain | | — | | | | — | | | | — | | | | — | | | | — | (c) |
| Total Distributions to Shareholders | | (0.26 | ) | | | (0.13 | ) | | | (0.13 | ) | | | (0.11 | ) | | | (0.09 | ) | |
| NET ASSET VALUE, End of Year | $ | 11.30 | | | $ | 11.10 | | | $ | 8.72 | | | $ | 8.04 | | | $ | 10.82 | | |
| TOTAL RETURN | | 4.44 | % | | 28.85 | % | | 9.90 | % | | (24.65 | )% | | (10.90 | )% |
| RATIOS/SUPPLEMENTARY DATA | | | | | | | | | | | | | | | | | | | | |
| Net Assets at End of Year (000's omitted) | $34,896 | | | $142,756 | | | $156,712 | | | $160,219 | | | $133,917 | | |
| Ratios to Average Net Assets: | | | | | | | | | | | | | | | | | | | | |
| Net investment income | | 1.06 | % | | 1.04 | % | | 1.33 | % | | 1.66 | % | | 1.06 | % |
| Net expense | | 0.70 | % | | 0.70 | % | | 0.70 | % | | 0.70 | % | | 0.70 | % |
| Gross expense (d) | | 0.71 | % | | 0.70 | % | | 0.70 | % | | 0.70 | % | | 0.70 | % |
| PORTFOLIO TURNOVER RATE | | 42 | % | | 57 | % | | 49 | % | | 40 | % | | 46 | % |
| GOLDEN SMALL CAP CORE FUND | | | | | | | | | | | | | | | | | | | | |
| NET ASSET VALUE, Beginning of Year | $ | 11.10 | | | $ | 7.90 | | | $ | 6.98 | | | $ | 11.09 | | | $ | 13.60 | | |
| INVESTMENT OPERATIONS | | | | | | | | | | | | | | | | | | | | |
| Net investment loss (a) | | (0.01 | ) | | | (0.02 | ) | | | (0.03 | ) | | | (0.02 | ) | | | (0.04 | ) | |
| Net realized and unrealized gain (loss) | | (0.45 | ) | | | 3.22 | | | | 0.95 | | | | (4.09 | ) | | | (2.36 | ) | |
| Total from Investment Operations | | (0.46 | ) | | | 3.20 | | | | 0.92 | | | | (4.11 | ) | | | (2.40 | ) | |
| DISTRIBUTIONS TO SHAREHOLDERS FROM | | | | | | | | | | | | | | | | | | |
| Net realized gain | | — | | | | — | | | | — | | | | — | | | | (0.11 | ) | |
| NET ASSET VALUE, End of Year | $ | 10.64 | | | $ | 11.10 | | | $ | 7.90 | | | $ | 6.98 | | | $ | 11.09 | | |
| TOTAL RETURN | | (4.14 | )% | | 40.51 | % | | 13.18 | % | | (37.06 | )% | | (17.66 | )% |
| RATIOS/SUPPLEMENTARY DATA | | | | | | | | | | | | | | | | | | | | |
| Net Assets at End of Year (000's omitted) | $27,427 | | | $53,300 | | | $104,235 | | | $131,370 | | | $209,709 | | |
| Ratios to Average Net Assets: | | | | | | | | | | | | | | | | | | | | |
| Net investment loss | | (0.12 | )% | | (0.20 | )% | | (0.39 | )% | (0.28 | )% | | (0.38 | )% |
| Net expense | | 1.10 | % | | 1.10 | % | | 1.10 | % | | 1.10 | % | | 1.10 | % |
| Gross expense (d) | | 1.11 | % | | 1.10 | % | | 1.10 | % | | 1.10 | % | | 1.11 | % |
| PORTFOLIO TURNOVER RATE | | 56 | % | | 55 | % | | 55 | % | | 95 | % | | 72 | % |
| (a) | Calculated based on average shares outstanding during each year. |
| (b) | Per share amount does not reflect the actual net realized gain/(loss) for the period due to the timing of Fund share sales and the amount of per share realized and unrealized gains and losses at such time. |
| (c) | Less than $0.01 per share. |
| (d) | Reflects the expense ratio excluding any waivers and/or reimbursements. |
| See Notes to Financial Statements. | 16 | |
| |
GOLDEN FUNDS NOTES TO FINANCIAL STATEMENTS JUNE 30, 2012 |
| |
Note 1. Organization
The Golden Large Cap Core Fund and Golden Small Cap Core Fund (individually, a “Fund” and, collectively the “Funds”) are diversified portfolios of Forum Funds (the “Trust”). The Trust is a Delaware statutory trust that is registered as an open-end, management investment company under the Investment Company Act of 1940 (the “Act”), as amended. Under its Trust Instrument, the Trust is authorized to issue an unlimited number of each Fund’s shares of beneficial interest without par value. Each Fund currently offers two classes of shares: Institutional Shares and Investor Shares. As of June 30, 2012, Investor Shares had not commenced operations. Golden Large Cap Core Fund seeks to achieve long-term capital appreciation. Golden Small Cap Core Fund seeks to achieve maximum long-term total return. Each Fund commenced operations on September 13, 2005.
Note 2. Summary of Significant Accounting Policies
These financial statements are prepared in accordance with accounting principles generally accepted in the United States of America (“GAAP”), which require management to make estimates and assumptions that affect the reported amounts of assets and liabilities, the disclosure of contingent liabilities at the date of the financial statements, and the reported amounts of increase and decrease in net assets from operations during the fiscal year. Actual amounts could differ from those estimates. The following summarizes the significant accounting policies of each Fund:
Security Valuation – Exchange-traded securities and over-the-counter securities are valued using the last quoted sale or official closing price, provided by independent pricing services as of the close of trading on the market or exchange for which they are primarily traded, on each Fund business day. In the absence of a sale, such securities are valued at the mean of the last bid and ask price provided by independent pricing services. Non-exchange traded securities for which quotations are available are valued using the last quoted sales price, or in the absence of a sale at the mean of the last bid and ask prices provided by independent pricing services. Shares of open-end mutual funds are valued at net asset value (“NAV”). Short-term investments that mature in 60 days or less may be valued at amortized cost.
Each Fund values its investments at fair value pursuant to procedures adopted by the Trust's Board of Trustees (the "Board") if (1) market quotations are insufficient or not readily available or (2) the adviser believes that the values available are unreliable. Fair valuation is based on subjective factors and, as a result, the fair value price of an investment may differ from the security’s market price and may not be the price at which the asset may be sold. Fair valuation could result in a different NAV than a NAV determined by using market quotes.
Each Fund has a three-tier fair value hierarchy. The basis of the tiers is dependent upon the various “inputs” used to determine the value of each Fund’s investments. These inputs are summarized in the three broad levels listed below:
Level 1 — quoted prices in active markets for identical assets
Level 2 — other significant observable inputs (including quoted prices of similar securities, interest rates, prepayment speeds, credit risk, etc.)
| |
GOLDEN FUNDS NOTES TO FINANCIAL STATEMENTS JUNE 30, 2012 |
| |
Level 3 — significant unobservable inputs (including each Fund’s own assumptions in determining the fair value of investments)
The aggregate value by input level, as of June 30, 2012, for each Fund’s investments is included at the end of each Fund’s Schedule of Investments.
Security Transactions, Investment Income and Realized Gain and Loss – Investment transactions are accounted for on the trade date. Dividend income is recorded on the ex-dividend date. Foreign dividend income is recorded on the ex-dividend date or as soon as possible after each Fund determines the existence of a dividend declaration after exercising reasonable due diligence. Income and capital gains on some foreign securities may be subject to foreign withholding taxes, which are accrued as applicable. Interest income is recorded on an accrual basis. Premium is amortized and discount is accreted using the effective interest method. Identified cost of investments sold is used to determine the gain and loss for both financial statement and federal income tax purposes.
Distributions to Shareholders – Distributions to shareholders of net investment income and net capital gains, if any, are declared and paid at least annually. Distributions are based on amounts calculated in accordance with applicable federal income tax regulations, which may differ from GAAP. These differences are due primarily to differing treatments of income and gain on various investment securities held by each Fund, timing differences and differing characterizations of distributions made by each Fund.
Federal Taxes – Each Fund intends to continue to qualify each year as a regulated investment company under Subchapter M of the Internal Revenue Code and to distribute all of their taxable income to shareholders. In addition, by distributing in each calendar year substantially all of their net investment income and capital gains, if any, the Funds will not be subject to a federal excise tax. Therefore, no federal income or excise tax provision is required. Each Fund files a U.S. federal income and excise tax return as required. A fund’s federal income tax returns are subject to examination by the Internal Revenue Service for a period of three fiscal years after they are filed. As of June 30, 2012, there are no uncertain tax positions that would require financial statement recognition, de-recognition, or disclosure.
Income and Expense Allocation – The Trust accounts separately for the assets, liabilities and operations of each of its investment portfolios. Expenses that are directly attributable to more than one investment portfolio are allocated among the respective investment portfolios in an equitable manner.
Commitments and Contingencies – In the normal course of business, each Fund enters into contracts that provide general indemnifications by each Fund to the counterparty to the contract. Each Fund’s maximum exposure under these arrangements is dependent on future claims that may be made against each Fund and, therefore, cannot be estimated; however, based on experience, the risk of loss from such claims is considered remote.
| |
GOLDEN FUNDS NOTES TO FINANCIAL STATEMENTS JUNE 30, 2012 |
| |
Note 3. Fees and Expenses
Investment Adviser – Golden Capital Management, LLC (the “Adviser”) is the investment adviser to the Funds. Pursuant to an Investment Advisory Agreement, the Adviser receives an advisory fee at an annual rate of 0.70% and 1.10% of the average daily net assets of Golden Large Cap Core Fund and Golden Small Cap Core Fund, respectively. Under the terms of the Investment Advisory Agreement, the Adviser provides investment advisory services to the Funds and is obligated to pay all expenses of the Funds except portfolio transaction expenses, borrowing costs, interest, taxes, and certain compensation and expenses of the Board, any expense each Fund is authorized to pay under Rule 12b-1, and extraordinary or non-recurring expenses.
Distribution – Foreside Fund Services, LLC serves as each Fund’s distributor (the “Distributor”). The Distributor receives no compensation from the Funds for its distribution services. The Distributor is not affiliated with the Adviser or Atlantic Fund Administration, LLC (d/b/a Atlantic Fund Services) (“Atlantic”) or their affiliates.
Other Service Providers – Atlantic provides fund accounting, fund administration, compliance and transfer agency services to each Fund. Atlantic also provides certain shareholder report production, and EDGAR conversion and filing services. Atlantic provides a Principal Executive Officer, a Principal Financial Officer, a Chief Compliance Officer, and an Anti-Money Laundering Officer to each Fund, as well as certain additional compliance support functions.
Trustees and Officers – The Trust pays each independent Trustee an annual retainer fee of $45,000 for service to the Trust ($66,000 for the Chairman). In addition, for the year ended March 31, 2012, the Chairman received a monthly stipend of $500 to cover certain expenses incurred in connection with his duties to the Trust. The stipend was discontinued April 1, 2012. The Trustees and Chairman may receive additional fees for special Board meetings. Each Trustee is also reimbursed for all reasonable out-of-pocket expenses incurred in connection with his duties as a Trustee, including travel and related expenses incurred in attending Board meetings. The amount of Trustees’ fees attributable to each Fund is disclosed in the Statement of Operations. Certain officers of the Trust are also officers or employees of the above named service providers, and during their terms of office received no compensation from each Fund.
Note 4. Expense Reimbursements and Fees Waived
The Adviser has contractually agreed to waive a portion of its fees and reimburse certain expenses through October 31, 2012, to limit total annual operating expenses to 0.70% for Institutional Shares and 0.95% for Investor Shares, of the average daily net assets of each respective class of the Golden Large Cap Core Fund. The Adviser also contractually agreed to waive a portion of its fees and reimburse certain expenses through October 31, 2012, to limit total annual operating expenses to 1.10% for Institutional Shares and 1.35% for Investor Shares of average daily net assets of each respective class of the Golden Small Cap Core Fund. For the period ended June 30, 2012, fees waived and reimbursed were as follows:
| | | Investment Adviser Reimbursement |
| Golden Large Cap Core Fund | | $ | 2,658 |
| Golden Small Cap Core Fund | | | 1,409 |
| |
GOLDEN FUNDS NOTES TO FINANCIAL STATEMENTS JUNE 30, 2012 |
| |
Note 5. Security Transactions
The cost of purchases and proceeds from sales of investment securities (including maturities), other than short-term investments during the period ended June 30, 2012, were as follows:
| | | | | Purchases | | Sales |
| Golden Large Cap Core Fund | | $ 26,531,329 | | $ 123,970,362 |
| Golden Small Cap Core Fund | | 20,601,698 | | 43,460,379 |
Note 6. Federal Income Tax and Investment Transactions
Distributions during the fiscal years ended as noted were characterized for tax purposes as follows:
| Golden Large Cap Core Fund |
| 2012 | | | $ | 1,238,094 | |
| 2011 | | | | 2,092,596 | |
As of June 30, 2012, distributable earnings (accumulated loss) on a tax basis were as follows:
| | | Undistributed Ordinary Income | | | Capital and Other Losses | | Unrealized Appreciation | | Total |
| Golden Large Cap Core Fund | | $ | 279,121 | | | $ | (620,459 | ) | | $ | 7,597,604 | | | $ | 7,256,266 | |
| Golden Small Cap Core Fund | | | - | | | | (59,886,056 | ) | | | 3,464,282 | | | | (56,421,774 | ) |
The difference between components of distributable earnings on a tax basis and the amounts reflected in the Statements of Assets and Liabilities are primarily due to wash sales.
As of June 30, 2012, capital loss carryforwards to offset future capital gains were as follows with the respective expiration dates:
| | | 2017 | | 2018 |
| Golden Large Cap Core Fund | | $ | — | | $ | 349,359 |
| Golden Small Cap Core Fund | | | 1,487,066 | | | 57,570,319 |
For tax purposes, the current year post-October loss was $271,100 and $828,671 (realized during the period November 1, 2011 through June 30, 2012) for Golden Large Cap Core Fund and Golden Small Cap Core Fund, respectively. These losses were recognized for tax purposes on the first business day of each Fund’s current fiscal year, July 1, 2012.
| |
GOLDEN FUNDS NOTES TO FINANCIAL STATEMENTS JUNE 30, 2012 |
| |
On the Statement of Assets and Liabilities, as a result of permanent book to tax differences, certain amounts have been reclassified for the year ended June 30, 2012. The following reclassification was the result of real estate investment trust adjustments and net operating losses and has no impact on the net assets of the Fund.
| | Accumulated Net Investment Income | | Undistributed Net Realized Gain | | Paid-in-Capital |
| Golden Small Cap Core Fund | | $ | 43,959 | | | $ | 13,960 | | | $ | (57,919 | ) |
Note 7. Recent Accounting Pronouncements
In May 2011, FASB issued ASU No. 2011-04 “Amendments to Achieve Common Fair Value Measurement and Disclosure Requirements in U.S. GAAP and IFRSs.” ASU No. 2011-04 establishes common requirements for measuring fair value and for disclosing information about fair value measurements in accordance with U.S. GAAP and International Financial Reporting Standards (“IFRSs”). ASU No. 2011-04 is effective for interim and annual periods beginning after December 15, 2011. Management is evaluating the impact ASU No. 2011-04 may have on financial statement disclosures.
In December 2011, FASB issued ASU No. 2011-11 “Disclosures about Offsetting Assets and Liabilities” requiring disclosure of both gross and net information related to offsetting and related arrangements enabling users of its financial statements to understand the effect of those arrangements on the entity’s financial position. The objective of this disclosure is to facilitate comparison between those entities that prepare their financial statements on the basis of U.S. GAAP and those entities that prepare their financial statements on the basis of IFRSs. ASU No. 2011-11 is effective for interim and annual periods beginning on or after January 1, 2013. Management is evaluating any impact ASU No. 2011-11 may have on each Fund’s financial statements.
Note 8. Subsequent Events
Subsequent events occurring after the date of this report through the date these financial statements were issued have been evaluated for potential impact and each Fund has had no such events.
| |
REPORT OF INDEPENDENT REGISTERED PUBLIC ACCOUNTING FIRM |
| |
To the Board of Trustees of Forum Funds and the Shareholders of
Golden Large Cap Core Fund and Golden Small Cap Core Fund
We have audited the accompanying statements of assets and liabilities of Golden Large Cap Core Fund and Golden Small Cap Core Fund, each a series of shares of beneficial interest in the Forum Funds, including the schedules of investments, as of June 30, 2012, and the related statements of operations for the year then ended, the statements of changes in net assets for each of the years in the two year period then ended and the financial highlights for each of the years in the four year period then ended. These financial statements and financial highlights are the responsibility of the Funds’ management. Our responsibility is to express an opinion on these financial statements and financial highlights based on our audits. The financial highlights for the year ended June 30, 2008 were audited by other auditors whose report dated August 25, 2008, expressed an unqualified opinion on such financial highlights.
We conducted our audits in accordance with the standards of the Public Company Accounting Oversight Board (United States). Those standards require that we plan and perform the audits to obtain reasonable assurance about whether the financial statements and financial highlights are free of material misstatement. An audit includes examining, on a test basis, evidence supporting the amounts and disclosures in the financial statements. Our procedures included confirmation of securities owned as of June 30, 2012 by correspondence with the custodian. An audit also includes assessing the accounting principles used and significant estimates made by management, as well as evaluating the overall financial statement presentation. We believe that our audits provide a reasonable basis for our opinion.
In our opinion, the financial statements and financial highlights referred to above present fairly, in all material respects, the financial position of Golden Large Cap Core Fund and Golden Small Cap Core Fund as of June 30, 2012, the results of their operations for the year then ended, the changes in their net assets for each of the years in the two year period then ended and their financial highlights for each of the years in the four year period then ended, in conformity with accounting principles generally accepted in the United States of America.
BBD, LLP
Philadelphia, Pennsylvania
August 24, 2012
| |
GOLDEN FUNDS ADDITIONAL INFORMATION (Unaudited) JUNE 30, 2012 |
| |
Investment Advisory Agreement Approval
At the March 16, 2012 Board meeting, the Board, including the Independent Trustees, considered the approval of the continuance of the investment advisory agreement pertaining to the Funds (the “Advisory Agreement”). In evaluating the Advisory Agreement for the Funds, the Board reviewed materials furnished by the Adviser and the administrator, including information regarding the Adviser, its personnel, operations and financial condition. Specifically, the Board considered, among other matters: (1) the nature, extent and quality of the services to be provided to the Funds by the Adviser, including information on the investment performance of the Adviser; (2) the costs of the services to be provided and profitability to the Adviser with respect to its relationship with the Funds; (3) the advisory fee and total expense ratio of the Funds compared to relevant peer groups of funds; (4) the extent to which economies of scale would be realized as the Funds grow and whether the advisory fee would enable the Funds’ investors to share in the benefits of economies of scale; and (5) other benefits received by the Adviser from its relationship with the Funds. In their deliberations, the Board did not identify any particular information that was all-important or controlling and attributed different weights to the various factors. In particular, the Board focused on the factors discussed below.
Nature, Extent and Quality of Services
Based on a presentation from senior representatives of the Adviser and a discussion of the Adviser’s personnel, operations and financial condition, the Board considered the quality of services provided by the Adviser under the Advisory Agreement between the Trust and the Adviser. In this regard, the Board considered information regarding the experience, qualifications and professional background of the portfolio managers and other personnel at the Adviser with principal investment responsibility for the Funds’ investments as well as the investment philosophy and decision-making processes of those professionals and the capability and integrity of the Adviser’s senior management and staff. The Board considered the adequacy of the Adviser’s resources and quality of services provided by the Adviser under the Advisory Agreement between the Trust and the Adviser.
Costs of Services and Profitability
The Board considered information provided by the Adviser regarding its costs of services and its profitability with respect to the Funds. In this regard, the Board considered the Adviser’s resources devoted to each of the Funds as well as the Adviser’s discussion of costs and profitability. Based on these and other applicable considerations, the Board concluded that the Adviser’s profits attributable to management of the Funds were reasonable in the context of all factors considered.
Performance
The Board reviewed performance of the Funds and the Adviser’s discussion of its investment philosophy. The Board noted that the Golden Large Cap Core Fund underperformed its benchmark for the 1-year, 3-year, 5-year and since inception periods ended February 29, 2012. The Board noted that the Golden Large Cap Core Fund underperformed its benchmark for the 1-year period by 0.01%. The Board also noted that the Golden Small Cap Core Fund had underperformed its benchmark for the 1-year, 3-year, 5-year and since inception
| |
GOLDEN FUNDS ADDITIONAL INFORMATION (Unaudited) JUNE 30, 2012 |
| |
periods ended February 29, 2012. Given, among other things, the Funds’ performance during those periods and the potential long term benefits of the Adviser’s recent acquisition of certain assets and team members from Wells Fargo & Company, the Board concluded that each Fund’s performance was reasonable relative to its benchmark and that each Fund and its shareholders could benefit from the Adviser’s management of the Funds.
Compensation
The Board considered the Adviser’s compensation for providing advisory services to each Fund and analyzed comparative information on fee rates and total expenses of similar mutual funds. The Board noted that the Adviser’s actual advisory fee rate for the Golden Large Cap Core Fund was above the median fee of that Fund’s Lipper Inc. peer group and that the Adviser’s actual advisory fee rate for the Golden Small Cap Core Fund was above the median fee of that Fund’s Lipper Inc. peer group. The Board also noted that the Golden Large Cap Core Fund’s actual total expense ratio was lower than the median fee of that Fund’s peer group and that the Golden Small Cap Core Fund’s actual total expense ratio was lower than the median of its peer group. Based on the foregoing, the Board concluded that the Adviser’s advisory fee rate charged to the Funds appeared to be within a reasonable range in light of the services it provides to each of the Funds.
Economies of Scale
The Board considered whether the Funds would benefit from any economies of scale. In this respect, the Board noted the Adviser’s representation that the Funds potentially could benefit from economies of scale as assets grow, but the Adviser currently is not proposing breakpoints or changes in fees at this time. Based on the foregoing information, the Board concluded that economies of scale were not a material factor in approving the Advisory Agreement.
Other Benefits
The Board noted the Adviser’s representation that, aside from its contractual advisory fees, it does not benefit in a material way from its relationship with the Funds other than soft-dollar research benefits. Based on the foregoing representation, the Board concluded that other benefits received by the Adviser from its relationship with the Funds were not a material factor to consider in approving the continuation of the Advisory Agreement.
Conclusion
The Board did not identify any single factor as being of paramount importance, and different Trustees may have given different weight to different factors. The Board reviewed a memorandum from Trust counsel discussing the legal standards applicable to its consideration of the Advisory Agreement. Based on its review, including consideration of each of the factors referenced above, the Board determined, in the exercise of its business judgment, that the advisory arrangement, as outlined in the Advisory Agreement, was fair and reasonable in light of the services performed, expenses incurred and such other matters as the Board considered relevant in the exercise of its reasonable business judgment.
| |
GOLDEN FUNDS ADDITIONAL INFORMATION (Unaudited) JUNE 30, 2012 |
| |
Proxy Voting Information
A description of the policies and procedures that each Fund uses to determine how to vote proxies relating to securities held in each Fund’s portfolio is available, without charge and upon request, by calling (800) 206-8610 and on the U.S. Securities and Exchange Commission’s (the “SEC”) website at www.sec.gov. Each Fund’s proxy voting record for the most recent twelve-month period ended June 30 is available, without charge and upon request, by calling (800) 206-8610 and on the SEC’s website at www.sec.gov.
Availability of Quarterly Portfolio Schedules
Each Fund files its complete schedule of portfolio holdings with the SEC for the first and third quarters of each fiscal year on Form N-Q. These filings are available, without charge and upon request on the SEC’s website at www.sec.gov or may be reviewed and copied at the SEC’s Public Reference Room in Washington, DC. Information on the operation of the Public Reference Room may be obtained by calling (800) SEC-0330.
Shareholder Expense Example
As a shareholder of the Funds, you incur ongoing costs, including management fees, distribution (12b-1) fees and other Fund expenses. This example is intended to help you understand your ongoing costs (in dollars) of investing in the Funds and to compare these costs with the ongoing costs of investing in other mutual funds.
The example is based on an investment of $1,000 invested at the beginning of the period and held for the entire period from January 1, 2012, through June 30, 2012.
Actual Expenses – The first line of the table below provides information about actual account values and actual expenses. You may use the information in this line, together with the amount you invested, to estimate the expenses that you paid over the period. Simply divide your account value by $1,000 (for example, an $8,600 account value divided by $1,000 = 8.6), then multiply the result by the number in the first line under the heading entitled “Expenses Paid During Period” to estimate the expenses you paid on your account during the period.
Hypothetical Example for Comparison Purposes – The second line of the table below provides information about hypothetical account values and hypothetical expenses based on each Fund’s actual expense ratio and an assumed rate of return of 5% per year before expenses, which is not each Fund’s actual return. The hypothetical account values and expenses may not be used to estimate the actual ending account balance or expenses you paid for the period. You may use this information to compare the ongoing costs of investing in each Fund and other funds. To do so, compare this 5% hypothetical example with the 5% hypothetical examples that appear in the shareholder reports of other funds.
Please note that the expenses shown in the table are meant to highlight your ongoing costs only. Therefore, the second line of the table is useful in comparing ongoing costs only and will not help you determine the relative total costs of owning different funds.
| |
GOLDEN FUNDS ADDITIONAL INFORMATION (Unaudited) JUNE 30, 2012 |
| |
| | Beginning | | Ending | | Expenses | | Annualized |
| | Account Value | | Account Value | | Paid During | | Expense |
| | January 1, 2012 | | June 30, 2012 | | Period* | | Ratio* |
| Golden Large Cap Core Fund | | | | | | | | | | | |
| Actual | $ | 1,000.00 | | $ | 1,121.03 | | $ | 3.69 | | 0.70 | % |
| Hypothetical (5% return before taxes) | $ | 1,000.00 | | $ | 1,021.38 | | $ | 3.52 | | 0.70 | % |
| Golden Small Cap Core Fund | | | | | | | | | | | |
| Actual | $ | 1,000.00 | | $ | 1,040.08 | | $ | 5.58 | | 1.10 | % |
| Hypothetical (5% return before taxes) | $ | 1,000.00 | | $ | 1,019.39 | | $ | 5.52 | | 1.10 | % |
| | | | | | | | | | | | |
| * | Expenses are equal to the Fund’s annualized expense ratio multiplied by the average account value over the period, multiplied by the number of days in the most recent fiscal half-year divided by 366 to reflect the half-year period. |
Federal Tax Status of Dividends Declared during the Tax Year
For federal income tax purposes, dividends from short-term capital gains are classified as ordinary income. The Golden Large Cap Core Fund designates 100.00% of its income dividend distributed as qualifying for the corporate dividends-received deduction (DRD) and 100.00% for the qualified dividend rate (QDI) as defined in Section 1(h)(11) of the Internal Revenue Code. The Golden Large Cap Core Fund also designates 0.13% of its income dividends as qualified interest income exempt from U.S. tax for foreign shareholders (QII).
Trustees and Officers of the Trust
The Board is responsible for oversight of the management of the Trust’s business affairs and of the exercise of all the Trust’s powers except those reserved for the shareholders. The following table provides information about each Trustee and certain officers of the Trust. Each Trustee and officer holds office until the person resigns, is removed, or is replaced. Unless otherwise noted, the persons have held their principal occupations for more than five years. The address for all Trustees and officers is Three Canal Plaza, Suite 600, Portland, Maine 04101. Mr. Keffer is considered an Interested Trustee due to his affiliation with Atlantic. Each Fund’s Statement of Additional Information includes additional information about the Trustees and is available, without charge and upon request, by calling (800) 206-8610.
| |
GOLDEN FUNDS ADDITIONAL INFORMATION (Unaudited) JUNE 30, 2012 |
| |
| Name and Year of Birth | Position with the Trust | Length of Time Served | Principal Occupation(s) During Past Five Years | Number of Series of Trust Overseen by Trustee | Other Directorships Held by Trustee |
| Independent Trustees | | | | | |
J. Michael Parish Born: 1943 | Chairman of the Board; Trustee; Chairman, Nominating Committee and Qualified Legal Compliance Committee | Since 1989 (Chairman since 2004) | Retired since 2003. | 21 | 0 |
Costas Azariadis Born: 1943 | Trustee; Chairman, Valuation Committee | Since 1989 | Professor of Economics, Washington University since 2006. | 21 | 0 |
James C. Cheng Born: 1942 | Trustee; Chairman, Audit Committee | Since 1989 | President, Technology Marketing Associates (marketing company for small- and medium-sized businesses in New England) since 1991. | 21 | 0 |
David Tucker Born: 1958 | Trustee | Since 2011 | Director, Blue Sky Experience since 2008; Senior Vice President & General Counsel, American Century Companies 1998-2008. | 21 | 0 |
| Interested Trustee | | | | | |
John Y. Keffer1 Born: 1942 | Trustee; Vice Chairman | Since 1989 | Chairman, Atlantic since 2008; President, Forum Foundation (a charitable organization) since 2005; President, Forum Trust, LLC (a non-depository trust company chartered in the State of Maine) since 1997. | 21 | Director, Wintergreen Fund, Inc.; Director, Forum ETF Trust |
| Officers | | | | | |
Stacey E. Hong Born: 1966 | President; Principal Executive Officer | Since 2008 | President, Atlantic since 2008; Director, Consulting Services, Foreside Fund Services 2007. | N/A | N/A |
Karen Shaw Born: 1972 | Treasurer; Principal Financial Officer | Since 2008 | Senior Vice President, Atlantic since 2008; Vice President, Citigroup 2003-2008. | N/A | N/A |
David Faherty Born: 1970 | Vice President | Since 2009 | Senior Counsel, Atlantic since 2009; Vice President, Citi Fund Services Ohio, Inc. 2007-2009; Associate Counsel, Investors Bank & Trust Co. 2006-2007. | N/A | N/A |
Michael J. McKeen Born: 1971 | Vice President | Since 2009 | Senior Vice President, Atlantic since 2008; Vice President, Citigroup 2003-2008. | N/A | N/A |
Joshua LaPan Born: 1973 | Vice President | Since 2009 | Manager, Atlantic since 2008; Vice President, Citigroup 2003-2008. | N/A | N/A |
| |
GOLDEN FUNDS ADDITIONAL INFORMATION (Unaudited) JUNE 30, 2012 |
| |
| Name and Year of Birth | Position with the Trust | Length of Time Served | Principal Occupation(s) During Past Five Years | Number of Series of Trust Overseen by Trustee | Other Directorships Held by Trustee |
| Officers - Continued | | | | | |
Timothy Bowden Born: 1969 | Vice President | Since 2009 | Manager, Atlantic since 2008; Vice President, Citigroup 2005-2008. | N/A | N/A |
Lina Bhatnagar Born: 1971 | Secretary | Since 2008 | Senior Administration Specialist, Atlantic since 2008; Regulatory Administration Specialist, Citigroup 2006-2008. | N/A | N/A |
1Atlantic is a subsidiary of Forum Holdings Corp. I, a Delaware corporation that is wholly owned by Mr. Keffer. |
ITEM 2. CODE OF ETHICS.
| (a) | As of the end of the period covered by this report, Forum Funds (the “Registrant”) has adopted a code of ethics, which applies to its Principal Executive Officer and Principal Financial Officer (the “Code of Ethics”). |
| (c) | There have been no amendments to the Registrant’s Code of Ethics during the period covered by this report. |
| (d) | There have been no waivers to the Registrant’s Code of Ethics during the period covered by this report. |
(f) (1) A copy of the Code of Ethics is being filed under Item 12(a) hereto.
ITEM 3. AUDIT COMMITTEE FINANCIAL EXPERT.
The Board of Trustees has determined that no member of the Audit Committee is an "audit committee financial expert" as that term is defined under applicable regulatory guidelines.
ITEM 4. PRINCIPAL ACCOUNTANT FEES AND SERVICES.
(a) Audit Fees - The aggregate fees billed for each of the last two fiscal years (the “Reporting Periods”) for professional services rendered by the Registrant’s principal accountant for the audit of the Registrant’s annual financial statements, or services that are normally provided by the principal accountant in connection with the statutory and regulatory filings or engagements for the Reporting Periods, were $56,000 in 2011 and $61,500 in 2012.
(b) Audit-Related Fees – The aggregate fees billed in the Reporting Periods for assurance and related services rendered by the principal accountant that were reasonably related to the performance of the audit of the Registrant’s financial statements and are not reported under paragraph (a) of this Item 4 were $0 in 2011 and $0 in 2012.
(c) Tax Fees - The aggregate fees billed in the Reporting Periods for professional services rendered by the principal accountant to the Registrant for tax compliance, tax advice and tax planning were $12,000 in 2011 and $15,000 in 2012. These services consisted of review or preparation of U.S. federal, state, local and excise tax returns.
(d) All Other Fees - The aggregate fees billed in the Reporting Periods for products and services provided by the principal accountant to the Registrant, other than the services reported in paragraphs (a) through (c) of this Item, were $0 in 2011 and $0 in 2012.
(e) (1) The Audit Committee reviews and approves in advance all audit and “permissible non-audit services” (as that term is defined by the rules and regulations of the Securities and Exchange Commission) to be rendered to a series of the Registrant (each, a “Series”). In addition, the Audit Committee reviews and approves in advance all “permissible non-audit services” to be provided to an investment adviser (not including any sub-adviser) of a Series, or an affiliate of such investment adviser, that is controlling, controlled by or under common control with the investment adviser and provides on-going services to the Registrant (“Affiliate”), by the Series’ principal accountant if the engagement relates directly to the operations and financial reporting of the Series. The Audit Committee considers whether fees paid by a Series’ investment adviser or an Affiliate to the Series’ principal accountant for audit and permissible non-audit services are consistent with the principal accountant’s independence.
(e) (2) No services included in (b) - (d) above were approved pursuant to paragraph (c)(7)(i)(C) of Rule 2-01 of Regulation S-X.
(f) Not applicable
(g) The aggregate non-audit fees billed by the principal accountant for services rendered to the Registrant for the Reporting Periods were $0 in 2010 and $0 in 2011. There were no fees billed in either of the Reporting Periods for non-audit services rendered by the principal accountant to the Registrant’s investment adviser or any Affiliate.
(h) During the Reporting Period, the Registrant's principal accountant provided no non-audit services to the investment advisers or any entity controlling, controlled by or under common control with the investment advisers to the series of the Registrant to which this report relates.
ITEM 5. AUDIT COMMITTEE OF LISTED REGISTRANTS.
Not applicable.
ITEM 6. INVESTMENTS.
| (a) | Included as part of report to shareholders under Item 1. |
ITEM 7. DISCLOSURE OF PROXY VOTING POLICIES AND PROCEDURES FOR CLOSED-END
MANAGEMENT INVESTMENT COMPANIES.
Not applicable.
ITEM 8. PORTFOLIO MANAGERS OF CLOSED-END MANAGEMENT INVESTMENT COMPANIES.
Not applicable.
ITEM 9. PURCHASES OF EQUITY SECURITIES BY CLOSED-END MANAGEMENT INVESTMENT COMPANY AND AFFILIATED PURCHASERS.
Not applicable.
ITEM 10. SUBMISSION OF MATTERS TO A VOTE OF SECURITY HOLDERS
The Registrant does not accept nominees to the board of trustees from shareholders.
ITEM 11. CONTROLS AND PROCEDURES
(a) The Registrant’s Principal Executive Officer and Principal Financial Officer have concluded that the Registrant’s disclosure controls and procedures (as defined in Rule 30a-3(c) under the Investment Company Act of 1940 (the “Act”)) are effective, based on their evaluation of the controls and procedures required by Rule 30a-3(b) under the Act and Rules 13a-15(b) or 15d-15(b) under the Securities Exchange Act of 1934, as of a date within 90 days of the filing date of this report.
(b) There were no changes in the Registrant’s internal control over financial reporting (as defined in
Rule 30a-3(d) under the Act) that occurred during the second fiscal quarter of the period covered by this report that have materially affected, or are reasonably likely to materially affect, the Registrant’s internal control over financial reporting.
ITEM 12. EXHIBITS.
(a)(1) Code of Ethics (Exhibit filed herewith).
(a)(2) Certifications pursuant to Rule 30a-2(a) of the Act, and Section 302 of the Sarbanes-Oxley Act of 2002. (Exhibits filed herewith)
(a)(3) Not applicable.
(b) Certifications pursuant to Rule 30a-2(b) of the Act, and Section 906 of the Sarbanes-Oxley Act of 2002. (Exhibit filed herewith)
SIGNATURES
Pursuant to the requirements of the Securities Exchange Act of 1934 and the Investment Company Act of 1940, the Registrant has duly caused this report to be signed on its behalf by the undersigned, thereunto duly authorized.
Registrant Forum Funds
| By | /s/ Stacey E. Hong | |
| | Stacey E. Hong, Principal Executive Officer | |
| | | |
| Date | August 24, 2012 | |
Pursuant to the requirements of the Securities Exchange Act of 1934 and the Investment Company Act of 1940, this report has been signed below by the following persons on behalf of the Registrant and in the capacities and on the dates indicated.
| By | /s/ Stacey E. Hong | |
| | Stacey E. Hong, Principal Executive Officer | |
| | | |
| Date | August 24, 2012 | |
| By | /s/ Karen Shaw | |
| | Karen Shaw, Principal Financial Officer | |
| | | |
| Date | August 24, 2012 | |