As filed with the Securities and Exchange Commission on March 4, 2013
UNITED STATES
SECURITIES AND EXCHANGE COMMISSION
WASHINGTON, D.C. 20549
FORM N-CSR
CERTIFIED SHAREHOLDER REPORT OF REGISTERED MANAGEMENT
INVESTMENT COMPANIES
Investment Company Act file number 811-03023
FORUM FUNDS
Three Canal Plaza, Suite 600
Portland, Maine 04101
Stacey E. Hong, Principal Executive Officer
Three Canal Plaza, Suite 600
Portland, Maine 04101
207-347-2000
Date of fiscal year end: December 31
Date of reporting period: January 1, 2012 – December 31, 2012
ITEM 1. REPORT TO STOCKHOLDERS.
| |
ADAMS HARKNESS SMALL CAP GROWTH FUND A MESSAGE TO OUR SHAREHOLDERS DECEMBER 31, 2012 |
| |
Dear Shareholder,
The best way to describe 2012, with respect to the Adams Harkness Small Cap Growth Fund ("Fund"), is with the oft used fisherman’s regret, it was “the one that got away”. At the outset of the year, there was the sense of excitement as the year got off to a strong start with respect to our performance, and the overall strength of the market in the first quarter. Then in the middle of the year we grappled and fought to preserve our gains only to watch our performance evaporate down the home stretch of the year. We could have had a really great year, but at the end when it was all said and done, it was a frustratingly mediocre one with the Fund’s return of 12.93% compared to the benchmark index’s return of 14.59%. So what happened, and why didn’t we land our catch?
2012 was an election year as everyone knows, and election years are usually very good years for the markets. Going into the year, Bernanke and the U.S. Federal Reserve intended to make sure there was enough liquidity to make risk assets more appealing. Corporate profits and the American economy were rebounding at a measured pace, and Europe’s demise had been averted for the time being. Everything set up rather well for the markets to have a strong run in the first half of the year – which is generally what happened. The first quarter of 2012 saw the markets advance at a very strong pace, and the second and third quarters saw the indices gyrate but hold onto those gains. During the first nine months of the year, the Fund outperformed the Russell 2000 Growth Index, its benchmark, as our fundamental process worked rather well, until the election was announced. Once Barack Obama was named President for a second term, the markets started to experience selling pressure that caused us to meaningfully underperform in the fourth quarter of 2012 and consequently underperform our benchmark for the whole year. Once Obama was reelected, it was apparent that tax rates across the board were going to go up including capital gains taxes. Many of the names we invest in or were invested in have seen their shares appreciate over time, and investors faced with paying higher capital gains headed for the exits at an accelerated pace. The other factor that played a significant role in the weakness of the fourth quarter was the “Fiscal Cliff” and the impact it could have on the economy. Once the “Fiscal Cliff” looked like it was going to be resolved the market staged a strong reverse, but our names didn’t keep up – most likely due to tax selling mentioned above. While watching the fourth quarter unfold was extremely frustrating, it did not shake our confidence in the longer term potential of the portfolio.
Looking into the specifics of 2012 the majority of the underperformance can be explained by stock picking more so than sector allocation. The technology, healthcare and consumer discretionary sectors were strong positive contributors to performance with a smaller positive contribution coming from the energy sector. The industrials and materials sectors detracted from performance. With respect to our technology, healthcare, and consumer discretionary holdings, most of the positive contribution can be traced to strong individual stock selection. In technology there were three standout performers for the year, which in order were Mellanox Technologies, Aspen Technology, and Cirrus Logic. Mellanox had two outstanding quarters due to pent up demand for their interconnect technology that goes into Intel based servers. Cirrus Logic’s audio chips go into Apple products, and Aspen is a software as a service, or SaaS, company (which means that it prices its services on a per user, per month basis as opposed to the traditional large software contract model) that is tied to the energy and industrial sector that is enjoying a rising growth rate. On the individual names that detracted meaningfully from performance in 2012, BroadSoft was our biggest laggard. Their earnings results
| |
ADAMS HARKNESS SMALL CAP GROWTH FUND A MESSAGE TO OUR SHAREHOLDERS DECEMBER 31, 2012 |
| |
never quite matched up with investor expectations. Our healthcare holdings contributed positively due to two strong individual performances by Pharmacyclics and Affymax. Pharmacyclics reacted well to positive data surrounding their cancer drugs and Affymax responded well to the release of its generic formulation of Epogen. Lumber Liquidators had a strong 2012 as new management turned around their earnings results. Our two groups that negatively affected results for the year were our industrial and materials holdings. For the year, we were underweight the industrials in the beginning of the year and then moved to be overweight the group by the end of the year which led to an equal weight when looking at the results for the whole year. The underperformance can be entirely explained by stock selection which was not up to par. Our materials sector underperformance can be traced to simply being underweight the group, which had a nice move as the chemical names performed well despite European exposure due to declining natural gas prices, which is a major raw material for the sector.
As we look back on 2012 and look ahead to 2013, certain themes have been and still are evolving and emerging. We have positioned the portfolio to be more exposed to the industrial, energy, and financials sectors because of two themes that intersect all of those sectors. They are the industrial renaissance this country is seeing, and the rebounding housing market. The continuing development of shale oil and gas fields in the United States should have continued positive long term implications for the industrial sector. By sourcing more manufacturing here, the positive economic implications are numerous and profound. Couple that trend with the housing market showing signs of a meaningful recovery emerging in 2012, and one can see multiplicative effects on growth and earnings in those three sectors for small cap names and the market overall. We are of the opinion that loan growth will start to expand leading to more growth for the financial sector, which in turn will lead to more economic activity for both the industrial and housing markets which will likely drive revenue and earnings growth. Looking forward to the other sectors, we still find opportunities in consumer, healthcare, and the technology sectors like the Biotech Revolution underway in treating cancer, and the emergence of Cloud technology still evolving in the technology landscape. There are always opportunities to find individual stocks driven by our investment process and we feel 2013 should be a good year for our discipline. The housing cycle and its economic impact should never be underestimated as it touches so many facets of an economy – industrial utilization, materials demand, labor demand, wealth effects, just to name a few. We caution that there is always a risk that a major macroeconomic event could arise that could negatively impact the market, like another European crisis or war breaking out somewhere in the world. However, with that caution, we are of the opinion that 2013 is setting up very well for the equities market and our discipline and we maintain high hopes we can reel in a good year.
Sincerely,
Mary Lisanti, CFA
President & Portfolio Manager
| |
ADAMS HARKNESS SMALL CAP GROWTH FUND A MESSAGE TO OUR SHAREHOLDERS DECEMBER 31, 2012 |
| |
IMPORTANT RISKS AND DISCLOSURES
An investment in the Fund is subject to risk, including the possible loss of principal amount invested. The Fund invests in smaller companies, which carry greater risk than is associated with larger companies for various reasons such as narrower markets, limited financial resources and less liquid stock.
The Russell 2000 Growth Index measures the performance of the small-cap growth segment of the U.S. equity universe. It includes those Russell 2000 companies with higher price-to-book ratios and higher forecasted growth values. One cannot invest directly in an index.
The views in this report were those of the Fund manager as of December 31, 2012, and may not necessarily reflect her views on the date this report is first published or anytime thereafter. These views are intended to assist shareholders in understanding the Fund’s investment methodology and do not constitute investment advice.
| |
ADAMS HARKNESS SMALL CAP GROWTH FUND PERFORMANCE CHART AND ANALYSIS (Unaudited) DECEMBER 31, 2012 |
| |
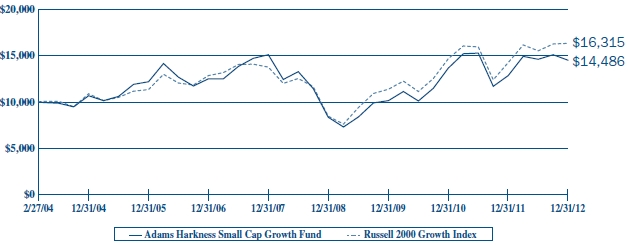
The following chart reflects the change in the value of a hypothetical $10,000 investment, including reinvested dividends and distributions, in the Adams Harkness Small Cap Growth Fund (the “Fund”) compared with the performance of the benchmark, Russell 2000 Growth Index ("Russell 2000 Growth"), since inception. The Russell 2000 Growth, the Fund‘s primary performance benchmark, measures the performance of those Russell 2000 Index companies with higher price-to-book ratios and higher forecasted growth values. The total return of the Russell 2000 Growth includes the reinvestment of dividends and income. The total return of the Fund includes operating expenses that reduce returns, while the total return of the Russell 2000 Growth does not include expenses. The Fund is professionally managed while the Russell 2000 Growth is unmanaged and is not available for investment.
Comparision of Change in Value of a $10,000 Investment
Adams Harkness Small Cap Growth Fund vs. Russell 2000 Growth Index
| Average Annual Total Return as of 12/31/12 | | 1 Year | | 5 Year | | SInce Inception 2/27/04 |
| Adams Harkness Small Cap Growth Fund | | 12.93 | % | | -0.77 | % | | 4.28 | % |
| Russell 2000 Growth Index | | 14.59 | % | | 3.49 | % | | 5.69 | % |
Performance data quoted represents past performance and is no guarantee of future results. Current performance may be lower or higher than the performance data quoted. Investment return and principal value will fluctuate so that shares, when redeemed, may be worth more or less than original cost. For the most recent month-end performance, please call (800) 441-7031, on the Fund's website at www.ahsmallcap.com. As stated in the Fund's prospectus, the annual operating expense ratio (gross) is 3.40%. However, the Fund’s Adviser has voluntarily agreed to waive a portion of its fees and/or reimburse expenses so to cap the expense ratio at 1.80% through April 30, 2013. Shares redeemed or exchanged within 30 days of purchase will be charged a 1.00% redemption fee. The performance table and graph do not reflect the deduction of taxes that a shareholder would pay on Fund distributions or the redemption of Fund shares. Returns greater than one year are annualized.
| |
ADAMS HARKNESS SMALL CAP GROWTH FUND SCHEDULE OF INVESTMENTS DECEMBER 31, 2012 |
| |
| AF | Shares | | Security | | | | | Shares | | Security | | |
| Description | Value | | Description | Value |
| Common Stock - 98.6% | | | 5,940 | | Hercules Offshore, Inc. (a) | $ | 36,709 |
| Biotechnology - 4.2% | | | 1,290 | | PBF Energy, Inc. (a) | | 37,475 |
| | 6,704 | | Affymax, Inc. (a) | $ | 127,376 | | | 3,445 | | PDC Energy, Inc. (a) | | 114,408 |
| | 6,300 | | Ariad Pharmaceuticals, Inc. (a) | | 120,834 | | | 7,625 | | US Silica Holdings, Inc. | | 127,566 |
| | 1,000 | | Infinity Pharmaceuticals, Inc. (a) | | 35,000 | | | | | | | 635,283 |
| | 2,740 | | Ligand Pharmaceuticals, Inc., Class B (a) | | 56,828 | | Financial Services - 7.4% |
| | 6,695 | | NPS Pharmaceuticals, Inc. (a) | | 60,925 | | | 2,755 | | Bank of the Ozarks, Inc. | | 92,210 |
| | 1,415 | | Pharmacyclics, Inc. (a) | | 81,928 | | | 4,155 | | Financial Engines, Inc. (a) | | 115,301 |
| | | | | | 482,891 | | | 15,820 | | Netspend Holdings, Inc. (a) | | 186,993 |
| Business Services - 6.8% | | | 13,065 | | The Bancorp, Inc. (a) | | 143,323 |
| | 1,320 | | CoStar Group, Inc. (a) | | 117,968 | | | 15,640 | | Western Alliance Bancorp. (a) | | 164,689 |
| | 7,950 | | Innerworkings, Inc. (a) | | 109,551 | | | 1,870 | | WEX, Inc. (a) | | 140,942 |
| | 1,675 | | Ultimate Software Group, Inc. (a) | | 158,137 | | | | | | | 843,458 |
| | 5,297 | | United Rentals, Inc. (a) | | 241,119 | | Health-Care - 13.2% |
| | 8,450 | | WageWorks, Inc. (a) | | 150,410 | | | 2,365 | | Abaxis, Inc. | | 87,742 |
| | | | | | 777,185 | | | 4,450 | | Acadia Healthcare Co., Inc. (a) | | 103,818 |
| Consumer Discretionary - 22.1% | | | 19,175 | | AMN Healthcare Services, Inc. (a) | | 221,471 |
| | 750 | | Allegiant Travel Co. | | 55,057 | | | 5,415 | | BioScrip, Inc. (a) | | 58,320 |
| | 3,640 | | Bloomin' Brands, Inc. (a) | | 56,930 | | | 11,210 | | Capital Senior Living Corp. (a) | | 209,515 |
| | 3,105 | | Brown Shoe Co., Inc. | | 57,039 | | | 1,045 | | Conceptus, Inc. (a) | | 21,955 |
| | 9,055 | | Chico's FAS, Inc. | | 167,155 | | | 3,610 | | Cyberonics, Inc. (a) | | 189,633 |
| | 1,300 | | Chuy's Holdings, Inc. (a) | | 29,042 | | | 8,715 | | DexCom, Inc. (a) | | 118,611 |
| | 6,956 | | Conn's, Inc. (a) | | 213,410 | | | 5,960 | | ExamWorks Group, Inc. (a) | | 83,380 |
| | 4,947 | | Del Frisco's Restaurant Group, Inc. (a) | | 77,124 | | | 5,655 | | ICON PLC, ADR (a) | | 156,983 |
| | 2,710 | | Five Below, Inc. (a) | | 86,828 | | | 2,385 | | Medidata Solutions, Inc. (a) | | 93,468 |
| | 7,780 | | Grand Canyon Education, Inc. (a) | | 182,597 | | | 445 | | Medivation, Inc. (a) | | 22,766 |
| | 5,015 | | Greenway Medical Technologies (a) | | 77,030 | | | 300 | | MWI Veterinary Supply, Inc. (a) | | 33,000 |
| | 2,960 | | KB Home | | 46,768 | | | 5,915 | | Spectranetics Corp. (a) | | 87,365 |
| | 4,665 | | Lithia Motors, Inc., Class A | | 174,564 | | | 388 | | Vocera Communications, Inc. (a) | | 9,739 |
| | 2,270 | | Lumber Liquidators Holdings, Inc. (a) | | 119,924 | | | | | | | 1,497,766 |
| | 2,741 | | Natural Grocers by Vitamin Cottage, Inc. (a) | | 52,326 | | Industrials - 19.0% |
| | 2,860 | | Pier 1 Imports, Inc. | | 57,200 | | | 1,000 | | Acuity Brands, Inc. | | 67,730 |
| | 1,715 | | Portfolio Recovery Associates, Inc. (a) | | 183,265 | | | 660 | | American Railcar Industries, Inc. | | 20,942 |
| | 2,830 | | Realogy Holdings Corp (a) | | 118,747 | | | 4,055 | | Beacon Roofing Supply, Inc. (a) | | 134,950 |
| | 4,555 | | Sonic Corp. (a) | | 47,418 | | | 2,645 | | Chemtura Corp. (a) | | 56,233 |
| | 2,630 | | Stage Stores, Inc. | | 65,171 | | | 1,380 | | Eagle Materials, Inc. | | 80,730 |
| | 1,260 | | Steven Madden, Ltd. (a) | | 53,260 | | | 755 | | Genesee & Wyoming, Inc., Class A (a) | | 57,440 |
| | 4,185 | | The Ryland Group, Inc. | | 152,752 | | | 3,465 | | Gentherm, Inc. (a) | | 46,085 |
| | 2,735 | | Tile Shop Holdings, Inc. (a) | | 46,030 | | | 2,455 | | Globe Specialty Metals, Inc. | | 33,756 |
| | 3,625 | | Trex Co., Inc. (a) | | 134,959 | | | 10,480 | | H&E Equipment Services, Inc. | | 157,934 |
| | 3,576 | | Tumi Holdings, Inc. (a) | | 74,560 | | | 16,305 | | Headwaters, Inc. (a) | | 139,571 |
| | 3,270 | | Vitamin Shoppe, Inc. (a) | | 187,567 | | | 3,010 | | IPG Photonics Corp. | | 200,616 |
| | | | | | 2,516,723 | | | 865 | | Lindsay Corp. | | 69,304 |
| Energy - 5.6% | | | 6,350 | | MasTec, Inc. (a) | | 158,306 |
| | 7,385 | | Bonanza Creek Energy, Inc. (a) | | 205,229 | | | 695 | | Middleby Corp. (a) | | 89,106 |
| | 2,980 | | Gulfport Energy Corp. (a) | | 113,896 | | | 4,130 | | Old Dominion Freight Line, Inc. (a) | | 141,576 |
| | | | | | | | | | 7,780 | | On Assignment, Inc. (a) | | 157,778 |
| | | | | | | | | | 2,750 | | Polypore International, Inc. (a) | | 127,875 |
| | | | | | | | | | 4,225 | | Proto Labs, Inc. (a) | | 166,549 |
| See Notes to Financial Statements. | 5 | |
| |
ADAMS HARKNESS SMALL CAP GROWTH FUND SCHEDULE OF INVESTMENTS DECEMBER 31, 2012 |
| |
| | | | | | | | | | | | | |
| | Shares | | Security | | | Value | | The following is a summary of the inputs used to value the Fund’s investments as of December 31, 2012. |
| Description | | |
| | 5,410 | | USG Corp. (a) | $ | 151,859 | |
| | 12,215 | | Wabash National Corp. (a) | | 109,569 | | The inputs or methodology used for valuing securities are not necessarily an indication of the risks associated with investing in those securities. For more information on valuation inputs, and their aggregation into the levels used in the tables below, please refer to the Security Valuation section in Note 2 of the accompanying Notes to Financial Statements. |
| | | | | | 2,167,909 | |
| Materials - 0.5% | |
| | 3,255 | | Celadon Group, Inc. | | 58,818 | | | | | | |
| | | | | | | | Valuation Inputs | | Investments in Securities |
| Retail - 0.9% | | Level 1 - Quoted Prices | | $ | 11,239,302 | |
| | 2,035 | | Michael Kors Holdings, Ltd. (a) | | 103,846 | | Level 2 - Other Significant Observable Inputs | | | - | |
| | | | | | | | Level 3 - Significant Unobservable Inputs | | | - | |
| Software - 2.7% | | Total | | $ | 11,239,302 | |
| | 11,300 | | Aspen Technology, Inc. (a) | | 312,332 | | | | | | |
| | | | | | | | | | | | |
| Technology - 16.2% | | The Level 1 inputs displayed in this table are Common Stock. Refer to the Schedule of Investments for a further breakout of each security by type. |
| | 3,175 | | 3D Systems Corp. (a) | | 169,386 | |
| | 7,190 | | Acme Packet, Inc. (a) | | 159,043 | | There were no transfers between Level 1 and Level 2 for the year ended December 31, 2012. |
| | 6,277 | | Aruba Networks, Inc. (a) | | 130,248 | |
| | 3,760 | | Cavium, Inc. (a) | | 117,350 | | | | | | |
| | 3,280 | | CommVault Systems, Inc. (a) | | 228,649 | | PORTFOLIO HOLDINGS | | | | |
| | 6,295 | | Cornerstone OnDemand, Inc. (a) | | 185,891 | | % of Total Investments | | | | |
| | 1,560 | | Infoblox, Inc. (a) | | 28,033 | | Biotechnology | | | 4.3 | % |
| | 2,080 | | InvenSense, Inc. (a) | | 23,109 | | Business Services | | | 6.9 | % |
| | 3,320 | | Ixia (a) | | 56,373 | | Consumer Discretionary | | | 22.4 | % |
| | 2,200 | | NetSuite, Inc. (a) | | 148,060 | | Energy | | | 5.7 | % |
| | 4,320 | | Qualys, Inc. (a) | | 63,893 | | Financial Services | | | 7.5 | % |
| | 27,045 | | RF Micro Devices, Inc. (a) | | 121,162 | | Health-Care | | | 13.3 | % |
| | 4,795 | | Shutterstock, Inc. (a) | | 124,670 | | Industrials | | | 19.3 | % |
| | 2,255 | | SPS Commerce, Inc. (a) | | 84,044 | | Materials | | | 0.5 | % |
| | 2,535 | | Stratasys, Ltd. (a) | | 203,180 | | Retail | | | 0.9 | % |
| | | | | | 1,843,091 | | Software | | | 2.8 | % |
| Total Common Stock | | Technology | | | 16.4 | % |
| (Cost $10,108,041) | | 11,239,302 | | | | | 100 | % |
| Total Investments - 98.6% | | | | | | | | |
| (Cost $10,108,041)* | $ | 11,239,302 | | | | | | |
| Other Assets & Liabilities, Net – 1.4% | | 156,661 | | | | | | |
| Net Assets – 100.0% | $ | 11,395,963 | | | | | | |
| | | | | | | | | | | | | |
| ADR | American Depositary Receipt | | | | | | | | | |
| PLC | Public Limited Company | | | | | | | | | |
| (a) | Non-income producing security. | | | | | | | | | |
| | | | | | | | | | | | | |
| * Cost for federal income tax purposes is $10,183,302 and net unrealized appreciation consists of: | | | | | | |
| Gross Unrealized Appreciation | $ | 1,234,331 | | | | | | | |
| Gross Unrealized Depreciation | | (178,331 | ) | | | | | | |
| Net Unrealized Appreciation | $ | 1,056,000 | | | | | | | |
| See Notes to Financial Statements. | 6 | |
| |
ADAMS HARKNESS SMALL CAP GROWTH FUND STATEMENT OF ASSETS AND LIABILITIES DECEMBER 31, 2012 |
| |
| ASSETS | | | | |
| | Total investments, at value (Cost $10,108,041) | | $ | 11,239,302 | |
| | Cash | | | 174,746 | |
| | Receivables: | | | | |
| | | Fund shares sold | | | 11,096 | |
| | | Dividends and interest | | | 100 | |
| | Prepaid expenses | | | 5,992 | |
| Total Assets | | | 11,431,236 | |
| | | | | | | |
| LIABILITIES | | | | |
| | Accrued Liabilities: | | | | |
| | Investment adviser fees | | | 3,414 | |
| | | Fund services fees | | | 5,223 | |
| | | Other expenses | | | 26,636 | |
| Total Liabilities | | | 35,273 | |
| | | | | | | |
| NET ASSETS | | $ | 11,395,963 | |
| | | | | | | |
| COMPONENTS OF NET ASSETS | | | | |
| | Paid-in capital | | $ | 12,133,930 | |
| | Undistributed net investment income | | | 108,427 | |
| | Accumulated net realized loss | | | (1,977,655 | ) |
| | Net unrealized appreciation | | | 1,131,261 | |
| NET ASSETS | | $ | 11,395,963 | |
| SHARES OF BENEFICIAL INTEREST AT NO PAR VALUE (UNLIMITED SHARES AUTHORIZED) | | | 853,029 | |
NET ASSET VALUE, OFFERING AND REDEMPTION PRICE PER SHARE* | | $ | 13.36 | |
| * | Shares redeemed or exchanged within 30 days of purchase are charged a 1.00% redemption fee. |
| See Notes to Financial Statements. | 7 | |
| |
ADAMS HARKNESS SMALL CAP GROWTH FUND STATEMENT OF OPERATIONS YEAR ENDED DECEMBER 31, 2012 |
| |
| | | | | | | |
| INVESTMENT INCOME | | | | |
| | Dividend income | | $ | 63,034 | |
| | Interest income | | | 378 | |
| Total Investment Income | | | 63,412 | |
| Adviser | | | | |
| EXPENSES | | | | |
| | Investment adviser fees | | | 117,436 | |
| | Fund services fees | | | 171,163 | |
| | Shareholder service fees | | | 29,359 | |
| | Custodian fees | | | 5,000 | |
| | Registration fees | | | 18,551 | |
| | Professional fees | | | 36,271 | |
| | Trustees' fees and expenses | | | 421 | |
| | Miscellaneous expenses | | | 25,430 | |
| Total Expenses | | | 403,631 | |
| | Fees waived and expenses reimbursed | | | (192,246 | ) |
| Net Expenses | | | 211,385 | |
| | | | | | | |
| NET INVESTMENT LOSS | | | (147,973 | ) |
| | | | | | | |
| NET REALIZED AND UNREALIZED GAIN (LOSS) | | | | |
| | Net realized gain on investments | | | 1,184,973 | |
| | Net change in unrealized appreciation (depreciation) on investments | | | 341,042 | |
| NET REALIZED AND UNREALIZED GAIN | | | 1,526,015 | |
| INCREASE IN NET ASSETS FROM OPERATIONS | | $ | 1,378,042 | |
| | | | | | | |
| See Notes to Financial Statements. | 8 | |
| |
ADAMS HARKNESS SMALL CAP GROWTH FUND STATEMENTS OF CHANGES IN NET ASSETS |
| |
| | | | | For the Year Ended December 31, 2012 | | | For the Year Ended December 31, 2011 |
| OPERATIONS | | | | | | | | | |
| | Net investment loss | | $ | (147,973 | ) | | | $ | (199,335 | ) |
| | Net realized gain | | | 1,184,973 | | | | | 785,802 | |
| | Net change in unrealized appreciation (depreciation) | | | 341,042 | | | | | (1,339,176 | ) |
| Increase (Decrease) in Net Assets Resulting from Operations | | | 1,378,042 | | | | | (752,709 | ) |
| | | | | | | | | | | | |
| CAPITAL SHARE TRANSACTIONS | | | | | | | | | |
| | Sale of shares | | | 1,568,170 | | | | | 2,700,638 | |
| | Redemption of shares | | | (2,315,013 | ) | | | | (4,191,697 | ) |
| | Redemption fees | | | - | | | | | 1,233 | |
| Decrease in Net Assets from Capital Share Transactions | | | (746,843 | ) | | | | (1,489,826 | ) |
| Increase (Decrease) in Net Assets | | | 631,199 | | | | | (2,242,535 | ) |
| | | | | | | | | | | | |
| NET ASSETS | | | | | | | | | |
| | Beginning of Year | | | 10,764,764 | | | | | 13,007,299 | |
| | End of Year (Including line (a)) | | $ | 11,395,963 | | | | $ | 10,764,764 | |
| | | | | | | | | | | | |
| SHARE TRANSACTIONS | | | | | | | | | |
| | Sale of shares | | | 118,819 | | | | | 205,043 | |
| | Redemption of shares | | | (175,946 | ) | | | | (327,768 | ) |
| Decrease in Shares | | | (57,127 | ) | | | | (122,725 | ) |
| | | | | | | | | | | | |
| (a) | Undistributed (distributions in excess of) net investment income. | | $ | 108,427 | | | | $ | (3,400 | ) |
| See Notes to Financial Statements. | 9 | |
| |
ADAMS HARKNESS SMALL CAP GROWTH FUND FINANCIAL HIGHLIGHTS |
| |
These financial highlights reflect selected data for a share outstanding throughout each year. | | | | | |
| | | For the Years Ended December 31, | |
| | | 2012 | | 2011 | | 2010 | | 2009 | | 2008 | |
| | | | | | | | | | | | | | | | | | | | | |
| NET ASSET VALUE, Beginning of Year | $ | 11.83 | | | $ | 12.59 | | | $ | 9.34 | | | $ | 7.69 | | | $ | 14.38 | | |
| INVESTMENT OPERATIONS | | | | | | | | | | | | | | | | | | | | |
| Net investment loss (a) | | (0.17 | ) | | | (0.20 | ) | | | (0.23 | ) | | | (0.23 | ) | | | (0.19 | ) | |
| Net realized and unrealized gain (loss) | | 1.70 | | | | (0.56 | ) | | | 3.48 | | | | 1.88 | | | | (6.23 | ) | |
| Total from Investment Operations | | 1.53 | | | | (0.76 | ) | | | 3.25 | | | | 1.65 | | | | (6.42 | ) | |
| DISTRIBUTIONS TO | | | | | | | | | | | | | | | | | | | | |
| SHAREHOLDERS FROM | | | | | | | | | | | | | | | | | | | | |
| Net realized gain | | — | | | | — | | | | — | | | | — | | | | (0.27 | ) | |
| REDEMPTION FEES (a) | | — | | | | — | (b) | | — | (b) | | — | (b) | | — | (b) |
| NET ASSET VALUE, End of Year | $ | 13.36 | | | $ | 11.83 | | | $ | 12.59 | | | $ | 9.34 | | | $ | 7.69 | | |
| TOTAL RETURN | | 12.93 | % | | (6.04 | )% | | 34.80 | % | | 21.46 | % | | (44.63 | )% |
| RATIOS/SUPPLEMENTARY DATA | | | | | | | | | | | | | | | | | | | | |
| Net Assets at End of Year (000's omitted) | $11,396 | | | $10,765 | | | $13,007 | | | $12,404 | | | $13,978 | | |
| Ratios to Average Net Assets: | | | | | | | | | | | | | | | | | | | | |
| Net investment loss | | (1.26 | )% | | (1.59 | )% | | (2.25 | )% | | (2.97 | )% | | (1.68 | )% |
| Net expense | | 1.80 | % | | 1.80 | % | | 2.34 | % | | 3.08 | % | | 1.90 | % |
| Gross expense (c) | | 3.44 | % | | 3.40 | % | | 3.63 | % | | 4.01 | % | | 2.78 | % |
| PORTFOLIO TURNOVER RATE | | 294 | % | | 324 | % | | 319 | % | | 381 | % | | 521 | % |
| | | | | | | | | | | | | | | | | | | | | | |
| (a) | Calculated based on average shares outstanding during each year. |
| (b) | Less than $0.01 per share. |
| (c) | Reflects the expense ratio excluding any waivers or reimbursements. |
| See Notes to Financial Statements. | 10 | |
| |
ADAMS HARKNESS SMALL CAP GROWTH FUND NOTES TO FINANCIAL STATEMENTS DECEMBER 31, 2012 |
| |
Note 1. Organization
The Adams Harkness Small Cap Growth Fund (the “Fund”) is a diversified portfolio of Forum Funds (the “Trust”). The Trust is a Delaware statutory trust that is registered as an open-end, management investment company under the Investment Company Act of 1940 (the “Act”), as amended. Under its Trust Instrument, the Trust is authorized to issue an unlimited number of the Fund’s shares of beneficial interest without par value. The Fund commenced operations on February 27, 2004. The Fund seeks maximum capital appreciation.
Note 2. Summary of Significant Accounting Policies
These financial statements are prepared in accordance with accounting principles generally accepted in the United States of America (“GAAP”), which require management to make estimates and assumptions that affect the reported amounts of assets and liabilities, the disclosure of contingent liabilities at the date of the financial statements, and the reported amounts of increase and decrease in net assets from operations during the fiscal year. Actual amounts could differ from those estimates. The following summarizes the significant accounting policies of the Fund:
Security Valuation – Exchange-traded securities and over-the-counter securities are valued using the last quoted sale or official closing price, provided by independent pricing services as of the close of trading on the market or exchange for which they are primarily traded, on each Fund business day. In the absence of a sale, such securities are valued at the mean of the last bid and ask price provided by independent pricing services. Non-exchange traded securities for which quotations are available are valued using the last quoted sales price, or in the absence of a sale at the mean of the last bid and ask prices provided by independent pricing services. Shares of open-end mutual funds are valued at net asset value (“NAV”). Short-term investments that mature in 60 days or less may be valued at amortized cost.
The Fund values its investments at fair value pursuant to procedures adopted by the Trust's Board of Trustees (the "Board") if (1) market quotations are insufficient or not readily available or (2) the adviser believes that the values available are unreliable. The Trust’s Valuation Committee performs certain functions as they relate to the administration and oversight of the Fund’s valuation procedures. Under these procedures, the Valuation Committee convenes on a regular and ad-hoc basis to review such securities and considers a number of factors, including valuation methodologies and significant unobservable inputs, when arriving at fair value.
The Valuation Committee may work with an adviser to provide valuation inputs. In determining fair valuations, inputs may include market-based analytics which may consider related or comparable assets or liabilities, recent transactions, market multiples, book values and other relevant investment information. Adviser inputs may include an income-based approach in which the anticipated future cash flows of the investment are discounted in determining fair value. Discounts may also be applied based on the nature or duration of any restrictions on the disposition of the investments. The Valuation Committee performs regular reviews of valuation methodologies, key inputs and assumptions, disposition analysis and market activity.
Fair valuation is based on subjective factors and, as a result, the fair value price of an investment may differ
| |
ADAMS HARKNESS SMALL CAP GROWTH FUND NOTES TO FINANCIAL STATEMENTS DECEMBER 31, 2012 |
| |
from the security’s market price and may not be the price at which the asset may be sold. Fair valuation could result in a different NAV than a NAV determined by using market quotes.
The Fund has a three-tier fair value hierarchy. The basis of the tiers is dependent upon the various “inputs” used to determine the value of the Fund’s investments. These inputs are summarized in the three broad levels listed below:
Level 1 — quoted prices in active markets for identical assets
Level 2 — other significant observable inputs (including quoted prices of similar securities, interest rates, prepayment speeds, credit risk, etc.)
Level 3 — significant unobservable inputs (including the Fund’s own assumptions in determining the fair value of investments)
The aggregate value by input level, as of December 31, 2012, for the Fund’s investments is included at the end of the Fund’s Schedule of Investments.
Security Transactions, Investment Income and Realized Gain and Loss – Investment transactions are accounted for on the trade date. Dividend income is recorded on the ex-dividend date. Foreign dividend income is recorded on the ex-dividend date or as soon as possible after the Fund determines the existence of a dividend declaration after exercising reasonable due diligence. Income and capital gains on some foreign securities may be subject to foreign withholding taxes, which are accrued as applicable. Interest income is recorded on an accrual basis. Premium is amortized and discount is accreted using the effective interest method. Identified cost of investments sold is used to determine the gain and loss for both financial statement and federal income tax purposes.
Distributions to Shareholders – Distributions to shareholders of net investment income, if any, are declared and paid at least quarterly. Distributions to shareholders of net capital gains, if any, are declared and paid annually. Distributions are based on amounts calculated in accordance with applicable federal income tax regulations, which may differ from GAAP. These differences are due primarily to differing treatments of income and gain on various investment securities held by the Fund, timing differences and differing characterizations of distributions made by the Fund.
Federal Taxes – The Fund intends to continue to qualify each year as a regulated investment company under Subchapter M of the Internal Revenue Code and to distribute all of its taxable income to shareholders. In addition, by distributing in each calendar year substantially all of its net investment income and capital gains, if any, the Fund will not be subject to a federal excise tax. Therefore, no federal income or excise tax provision is required. The Fund files a U.S. federal income and excise tax return as required. A fund’s federal income tax returns are subject to examination by the Internal Revenue Service for a period of three fiscal years after they are filed. As of December 31, 2012, there are no uncertain tax positions that would require financial statement recognition, de-recognition, or disclosure.
| |
ADAMS HARKNESS SMALL CAP GROWTH FUND NOTES TO FINANCIAL STATEMENTS DECEMBER 31, 2012 |
| |
Income and Expense Allocation – The Trust accounts separately for the assets, liabilities and operations of each of its investment portfolios. Expenses that are directly attributable to more than one investment portfolio are allocated among the respective investment portfolios in an equitable manner.
Commitments and Contingencies – In the normal course of business, the Fund enters into contracts that provide general indemnifications by the Fund to the counterparty to the contract. The Fund’s maximum exposure under these arrangements is dependent on future claims that may be made against the Fund and, therefore, cannot be estimated; however, based on experience, the risk of loss from such claims is considered remote.
Redemption Fees – A shareholder who redeems or exchanges shares within 30 days of purchase will incur a redemption fee of 1.00% of the current net asset value of shares redeemed or exchanged, subject to certain limitations. The fee is charged for the benefit of the remaining shareholders and will be paid to the Fund to help offset transaction costs. The fee is accounted for as an addition to paid-in capital. The Fund reserves the right to modify the terms of or terminate the fee at any time. There are limited exceptions to the imposition of the redemption fee.
Note 3. Fees and Expenses
Investment Adviser – AH Lisanti Capital Growth, LLC (the “Adviser”) is the investment adviser to the Fund. Pursuant to an investment advisory agreement, the Adviser receives an advisory fee from the Fund at an annual rate of 1.00% of the Fund’s average daily net assets.
Shareholder Service Plan – The Trust has adopted a shareholder service plan for the Fund under which the Fund may reimburse the Fund’s administrator for amounts paid by the administrator for providing shareholder service activities that are not otherwise provided by the transfer agent. The Fund’s administrator may make such payments to various financial institutions, including the Adviser, that provide shareholder servicing to their customers invested in the Fund in amounts of up to 0.25% annually of the average daily net assets of the shares held by such customers.
Distribution – Foreside Fund Services, LLC serves as the Fund’s distributor (the “Distributor”). The Distributor receives no compensation from the Fund for its distribution services. The Distributor is not affiliated with the Adviser or Atlantic Fund Administration, LLC (d/b/a Atlantic Fund Services) (“Atlantic”) or their affiliates.
Other Service Providers – Atlantic provides fund accounting, fund administration, compliance and transfer agency services to the Fund. Atlantic also provides certain shareholder report production, and EDGAR conversion and filing services. Pursuant to an Atlantic services agreement, the Fund pays Atlantic customary fees for its services. Atlantic provides a Principal Executive Officer, a Principal Financial Officer, a Chief Compliance Officer, and an Anti-Money Laundering Officer to the Fund, as well as certain additional compliance support functions.
Trustees and Officers – The Trust pays each independent Trustee an annual retainer fee of $45,000 for
| |
ADAMS HARKNESS SMALL CAP GROWTH FUND NOTES TO FINANCIAL STATEMENTS DECEMBER 31, 2012 |
| |
service to the Trust ($66,000 for the Chairman). In addition, for the period ended March 31, 2012, the Chairman received a monthly stipend of $500 to cover certain expenses incurred in connection with his duties to the Trust. The stipend was discontinued April 1, 2012. The Trustees and Chairman may receive additional fees for special Board meetings. Each Trustee is also reimbursed for all reasonable out-of-pocket expenses incurred in connection with his duties as a Trustee, including travel and related expenses incurred in attending Board meetings. The amount of Trustees’ fees attributable to the Fund is disclosed in the Statement of Operations. Certain officers of the Trust are also officers or employees of the above named service providers, and during their terms of office received no compensation from the Fund.
Note 4. Fees Waived
During the period, certain Fund service providers have voluntarily agreed to waive a portion of their fees. The Fund’s Adviser has voluntarily agreed to waive a portion of its fees and/or reimburse expenses so to cap the expense ratio at 1.80%. These voluntary waivers may be reduced or eliminated at any time. For the fiscal year ended December 31, 2012, fees waived were as follows:
| Investment Adviser Fees Waived | | Other Waivers | | Total Fees Waived |
| $ 83,006 | | $ 109,240 | | $ 192,246 |
Note 5. Security Transactions
The cost of purchases and proceeds from sales of investment securities (including maturities), other than short-term investments during the fiscal year ended December 31, 2012, were $33,813,426 and $34,786,739, respectively.
Note 6. Federal Income Tax and Investment Transactions
As of December 31, 2012, distributable earnings (accumulated loss) on a tax basis were as follows:
| Undistributed Ordinary Income | | $ | 108,427 | |
| Unrealized Appreciation | | | 1,056,000 | |
| Capital and Other Losses | | | (1,902,394 | ) |
| Total | | $ | (737,967 | ) |
The difference between components of distributable earnings on a tax basis and the amounts reflected in the Statement of Assets and Liabilities are primarily due to wash sales and passive foreign investment companies.
As of December 31, 2012, the Fund had capital loss carryforwards to offset future capital gains of $1,766,646, expiring in 2017.
| |
ADAMS HARKNESS SMALL CAP GROWTH FUND NOTES TO FINANCIAL STATEMENTS DECEMBER 31, 2012 |
| |
For tax purposes, the current year post October-loss was $135,748 (realized during the period November 1, 2012 through December 31, 2012). This loss will be recognized for tax purposes on the first business day of the Fund’s next fiscal year, January 1, 2013.
On the Statement of Assets and Liabilities, as a result of permanent book to tax differences, certain amounts have been reclassified for the year ended December 31, 2012. The following reclassification was the result of passive foreign investment companies and has no impact on the net assets of the Fund.
| Accumulated Net Investment Income (Loss) | | $ | 259,800 | |
| Undistributed Net Realized Gain (Loss) | | | (259,800 | ) |
Note 7. Recent Accounting Pronouncements
In December 2011, FASB issued ASU No. 2011-11 “Disclosures about Offsetting Assets and Liabilities” requiring disclosure of both gross and net information related to offsetting and related arrangements enabling users of its financial statements to understand the effect of those arrangements on the entity’s financial position. The objective of this disclosure is to facilitate comparison between those entities that prepare their financial statements on the basis of U.S. GAAP and those entities that prepare their financial statements on the basis of IFRSs. ASU No. 2011-11 is effective for interim and annual periods beginning on or after January 1, 2013. Management is evaluating any impact ASU No. 2011-11 may have on the Fund’s financial statements.
Note 8. Subsequent Events
Subsequent events occurring after the date of this report through the date these financial statements were issued have been evaluated for potential impact and the Fund has had no such events.
| |
REPORT OF INDEPENDENT REGISTERED PUBLIC ACCOUNTING FIRM |
| |
To the Shareholders of Adams Harkness Small Cap Growth Fund
and the Board of Trustees of Forum Funds
We have audited the accompanying statement of assets and liabilities of Adams Harkness Small Cap Growth Fund (the “Fund”), a series of shares of beneficial interest in the Forum Funds, including the schedule of investments, as of December 31, 2012, and the related statement of operations for the year then ended, the statements of changes in net assets for each of the years in the two year period then ended, and the financial highlights for each of the years in the five year period then ended. These financial statements and financial highlights are the responsibility of the Fund's management. Our responsibility is to express an opinion on these financial statements and financial highlights based on our audits.
We conducted our audits in accordance with the standards of the Public Company Accounting Oversight Board (United States). Those standards require that we plan and perform the audits to obtain reasonable assurance about whether the financial statements and financial highlights are free of material misstatement. An audit includes examining, on a test basis, evidence supporting the amounts and disclosures in the financial statements. Our procedures included confirmation of securities owned as of December 31, 2012 by correspondence with the custodian. An audit also includes assessing the accounting principles used and significant estimates made by management, as well as evaluating the overall financial statement presentation. We believe that our audits provide a reasonable basis for our opinion.
In our opinion, the financial statements and financial highlights referred to above present fairly, in all material respects, the financial position of Adams Harkness Small Cap Growth Fund as of December 31, 2012, the results of its operations for the year then ended, the changes in its net assets for each of the years in the two year period then ended and its financial highlights for each of the years in the five year period then ended, in conformity with accounting principles generally accepted in the United States of America.
BBD, LLP
Philadelphia, Pennsylvania
February 21, 2013
| |
ADAMS HARKNESS SMALL CAP GROWTH FUND ADDITIONAL INFORMATION (Unaudited) DECEMBER 31, 2012 |
| |
Investment Advisory Agreement Approval
At the September 21, 2012 Board meeting, the Board, including the Independent Trustees, considered the approval of the continuance of the investment advisory agreement pertaining to the Fund (the “Advisory Agreement”). In evaluating the Advisory Agreement, the Board reviewed materials furnished by the Adviser and the administrator, including information regarding the Adviser, its personnel, operations and financial condition. Specifically, the Board considered, among other matters: (1) the nature, extent and quality of the services to be provided to the Fund by the Adviser, including information on the investment performance of the Adviser; (2) the costs of the services to be provided and profitability to the Adviser with respect to its relationship with the Fund; (3) the advisory fee and total expense ratio of the Fund compared to relevant peer groups of funds; (4) the extent to which economies of scale would be realized as the Fund grows and whether the advisory fee would enable the Fund’s investors to share in the benefits of economies of scale; and (5) other benefits received by the Adviser from its relationship with the Fund. In their deliberations, the Board did not identify any particular information that was all-important or controlling and attributed different weights to the various factors. In particular, the Board focused on the factors discussed below.
Nature, Extent and Quality of Services
Based on a presentation from a senior representative of the Adviser and a discussion of the Adviser’s personnel, operations and financial condition, the Board considered the quality of services provided by the Adviser under the Advisory Agreement between the Trust and the Adviser. In this regard, the Board considered information regarding the experience, qualifications and professional background of the portfolio managers and other personnel at the Adviser with principal investment responsibility for the Fund’s investments as well as the investment philosophy and decision-making processes of those professionals and the capability and integrity of the Adviser’s senior management and staff. The Board considered the adequacy of the Adviser’s resources and quality of services provided by the Adviser under the Advisory Agreement between the Trust and the Adviser.
Costs of Services and Profitability
The Board considered information provided by the Adviser regarding its costs of services and its profitability with respect to the Fund. In this regard, the Board considered the Adviser’s resources devoted to the Fund as well as the Adviser’s discussion of costs and profitability. Based on these and other applicable considerations, the Board concluded that the Adviser’s profits attributable to management of the Fund were reasonable in the context of all factors considered.
Performance
The Board reviewed the performance of the Fund and the Adviser’s discussion of its investment philosophy. The Board considered the Fund’s performance over the one-year, three-year, five-year and since inception (annualized) periods ended August 31, 2012. The Board noted that the Fund outperformed its primary benchmark, the Russell 2000 Growth Index, for the one-year and three-year periods but underperformed its benchmark for the five-year and since inception periods. The Board concluded that the Fund’s performance
| |
ADAMS HARKNESS SMALL CAP GROWTH FUND ADDITIONAL INFORMATION (Unaudited) DECEMBER 31, 2012 |
| |
was reasonable relative to its benchmark and that the Fund and its shareholders could benefit from the Adviser’s management of the Fund.
Compensation
The Board considered the Adviser’s compensation for providing advisory services to the Fund and analyzed comparative information on fee rates, expenses and performance of similar mutual funds. The Board noted that the Adviser’s actual advisory fee rate was the lowest advisory fee rate of its Lipper Inc. peer group. and that the Adviser’s actual total expenses were above the median fee of its Lipper Inc. peer group. The Board also noted the Adviser’s representation that it is subsidizing the Fund and, when including certain payments, makes no money managing the Fund. Based on the foregoing and on all of the information presented, the Board concluded that the Adviser’s advisory fee charged to the Fund was reasonable.
��
Economies of Scale
The Board considered whether the Fund would benefit from any economies of scale. In this respect, the Board noted the Adviser’s representation that the Fund potentially could benefit from economies of scale as assets grow, but the Adviser currently is not proposing breakpoints or changes in fees at this time. Based on the foregoing information, the Board concluded that economies of scale were not a material factor in approving the Advisory Agreement.
Other Benefits
The Board noted the Adviser’s representation that the Adviser does not expect to receive any kind of benefit or compensation from its relationship with the Fund, other than its contractual advisory fees. Based on the foregoing representation, the Board concluded that other benefits received by the Adviser from its relationship with the Fund were not a material factor to consider in approving the continuation of the Advisory Agreement.
Conclusion
The Board did not identify any single factor as being of paramount importance, and different Trustees may have given different weight to different factors. The Board reviewed a memorandum from Trust counsel discussing the legal standards applicable to its consideration of the Advisory Agreement. Based on its review, including consideration of each of the factors referenced above, the Board determined, in the exercise of its business judgment, that the advisory arrangement, as outlined in the Advisory Agreement, was fair and reasonable in light of the services performed or to be performed, expenses incurred or to be incurred and such other matters as the Board considered relevant in the exercise of its reasonable business judgment.
Proxy Voting Information
A description of the policies and procedures that the Fund uses to determine how to vote proxies relating to securities held in the Fund’s portfolio is available, without charge and upon request, by calling (800) 441-7031, on the Fund's website at www.ahsmallcap.com and on the U.S. Securities and Exchange Commission’s
| |
ADAMS HARKNESS SMALL CAP GROWTH FUND ADDITIONAL INFORMATION (Unaudited) DECEMBER 31, 2012 |
| |
(the “SEC”) website at www.sec.gov. The Fund’s proxy voting record for the most recent twelve-month period ended June 30 is available, without charge and upon request, by calling (800) 441-7031, on the Fund's website at www.ahsmallcap.com and on the SEC’s website at www.sec.gov.
Availability of Quarterly Portfolio Schedules
The Fund files its complete schedule of portfolio holdings with the SEC for the first and third quarters of each fiscal year on Form N-Q. These filings are available, without charge and upon request on the SEC’s website at www.sec.gov or may be reviewed and copied at the SEC’s Public Reference Room in Washington, DC. Information on the operation of the Public Reference Room may be obtained by calling (800) SEC-0330.
Shareholder Expense Example
As a shareholder of the Fund, you incur two types of costs: (1) transaction costs, including redemption fees and exchange fees, and (2) ongoing costs, including management fees and other Fund expenses. This example is intended to help you understand your ongoing costs (in dollars) of investing in the Fund, and to compare these costs with the ongoing costs of investing in other mutual funds.
The example is based on an investment of $1,000 invested at the beginning of the period and held for the entire period from July 1, 2012, through December 31, 2012.
Actual Expenses – The first line of the table below provides information about actual account values and actual expenses. You may use the information in this line, together with the amount you invested, to estimate the expenses that you paid over the period. Simply divide your account value by $1,000 (for example, an $8,600 account value divided by $1,000 = 8.6), then multiply the result by the number in the first line under the heading entitled “Expenses Paid During Period” to estimate the expenses you paid on your account during the period.
Hypothetical Example for Comparison Purposes – The second line of the table below provides information about hypothetical account values and hypothetical expenses based on the Fund’s actual expense ratio and an assumed rate of return of 5% per year before expenses, which is not the Fund’s actual return. The hypothetical account values and expenses may not be used to estimate the actual ending account balance or expenses you paid for the period. You may use this information to compare the ongoing costs of investing in the Fund and other funds. To do so, compare this 5% hypothetical example with the 5% hypothetical examples that appear in the shareholder reports of other funds.
Please note that the expenses shown in the table are meant to highlight your ongoing costs only and do not reflect any transactional costs, such as redemption fees and exchange fees. Therefore, the second line of the table is useful in comparing ongoing costs only, and will not help you determine the relative total costs of owning different funds. In addition, if these transactional costs had been included, your costs would have been higher.
| |
ADAMS HARKNESS SMALL CAP GROWTH FUND ADDITIONAL INFORMATION (Unaudited) DECEMBER 31, 2012 |
| |
| | Beginning | | Ending | | Expenses | | Annualized |
| | Account Value | | Account Value | | Paid During | | Expense |
| | July 1, 2012 | | December 31, 2012 | | Period* | | Ratio* |
| Actual | $ | 1,000.00 | | $ | 992.57 | | $ | 9.02 | | 1.80 | % |
| Hypothetical (5% return before taxes) | $ | 1,000.00 | | $ | 1,016.09 | | $ | 9.12 | | 1.80 | % |
| | | | | | | | | | | | |
| | *Expenses are equal to the Fund’s annualized expense ratio multiplied by the average account value over the period, multiplied by the number of days in the most recent fiscal half-year divided by 366 to reflect the half-year period. |
Trustees and Officers of the Trust
The Board is responsible for oversight of the management of the Trust’s business affairs and of the exercise of all the Trust’s powers except those reserved for the shareholders. The following table provides information about each Trustee and certain officers of the Trust. Each Trustee and officer holds office until the person resigns, is removed, or is replaced. Unless otherwise noted, the persons have held their principal occupations for more than five years. The address for all Trustees and officers is Three Canal Plaza, Suite 600, Portland, Maine 04101. Mr. Keffer is considered an Interested Trustee due to his affiliation with Atlantic. The Fund’s Statement of Additional Information includes additional information about the Trustees and is available, without charge and upon request, by calling (800) 441-7031, on the Fund's website at www.ahsmallcap.com.
| Name and Year of Birth | Position with the Trust | Length of Time Served | Principal Occupation(s) During Past Five Years | Number of Series of Trust Overseen by Trustee | Other Directorships Held by Trustee |
| Independent Trustees | | | | | |
J. Michael Parish Born: 1943 | Chairman of the Board; Trustee; Chairman, Nominating Committee and Qualified Legal Compliance Committee | Since 1989 (Chairman since 2004) | Retired since 2003. | 21 | 0 |
Costas Azariadis Born: 1943 | Trustee | Since 1989 | Professor of Economics, Washington University since 2006. | 21 | 0 |
James C. Cheng Born: 1942 | Trustee; Chairman, Audit Committee | Since 1989 | President, Technology Marketing Associates (marketing company for small- and medium-sized businesses in New England) since 1991. | 21 | 0 |
David Tucker Born: 1958 | Trustee | Since 2011 | Director, Blue Sky Experience since 2008; Senior Vice President & General Counsel, American Century Companies 1998-2008. | 21 | Director, Forum ETF Trust |
| |
ADAMS HARKNESS SMALL CAP GROWTH FUND ADDITIONAL INFORMATION (Unaudited) DECEMBER 31, 2012 |
| |
| Name and Year of Birth | Position with the Trust | Length of Time Served | Principal Occupation(s) During Past Five Years | Number of Series of Trust Overseen by Trustee | Other Directorships Held by Trustee |
| Interested Trustee | | | | | |
John Y. Keffer1 Born: 1942 | Trustee; Vice Chairman | Since 1989 | Chairman, Atlantic since 2008; President, Forum Foundation (a charitable organization) since 2005; President, Forum Trust, LLC (a non-depository trust company chartered in the State of Maine) since 1997. | 21 | Director, Wintergreen Fund, Inc.; Director, Forum ETF Trust |
| Officers | | | | | |
Stacey E. Hong Born: 1966 | President; Principal Executive Officer | Since 2008 | President, Atlantic since 2008; Director, Consulting Services, Foreside Fund Services 2007. | N/A | N/A |
Karen Shaw Born: 1972 | Treasurer; Principal Financial Officer | Since 2008 | Senior Vice President, Atlantic since 2008; Vice President, Citigroup 2003-2008. | N/A | N/A |
David Faherty Born: 1970 | Vice President | Since 2009 | Senior Counsel, Atlantic since 2009; Vice President, Citi Fund Services Ohio, Inc. 2007-2009; Associate Counsel, Investors Bank & Trust Co. 2006-2007. | N/A | N/A |
Michael J. McKeen Born: 1971 | Vice President | Since 2009 | Senior Vice President, Atlantic since 2008; Vice President, Citigroup 2003-2008. | N/A | N/A |
Joshua LaPan Born: 1973 | Vice President | Since 2009 | Manager, Atlantic since 2008; Vice President, Citigroup 2003-2008. | N/A | N/A |
Timothy Bowden Born: 1969 | Vice President | Since 2009 | Manager, Atlantic since 2008; Vice President, Citigroup 2005-2008. | N/A | N/A |
Lina Bhatnagar Born: 1971 | Secretary | Since 2008 | Senior Administration Specialist, Atlantic since 2008; Regulatory Administration Specialist, Citigroup 2006-2008. | N/A | N/A |
1Atlantic is a subsidiary of Forum Holdings Corp. I, a Delaware corporation that is wholly owned by Mr. Keffer. |
| A Message to Our Shareholders | 1 |
| Performance Chart and Analysis (Unaudited) | 4 |
| Schedule of Investments | 5 |
| Statement of Assets and Liabilities | 6 |
| Statement of Operations | 7 |
| Statements of Changes in Net Assets | 8 |
| Financial Highlights | 9 |
| Notes to Financial Statements | 10 |
| Report of Independent Registered Public Accounting Firm | 13 |
| Additional Information (Unaudited) | 14 |
The views expressed in this report are those of the investment advisor of The BeeHive Fund (the “Fund”) as of December 31, 2012, and may not reflect their views on the date this report is first published or any time thereafter. These views are intended to assist shareholders of the Fund in understanding their investments in the Fund and do not constitute investment advice. The Fund is subject to various forms of risk including the possible loss of principal. Investing in foreign securities entails risks not associated with domestic equities including economic and political instability and currency fluctuations. Investing in fixed income securities includes the risk that rising interest rates will cause a decline in values. Focused investments in particular industries or market sectors can entail increased volatility and greater market risk than is the case with more broadly diversified investments. Investments in securities of small and mid-capitalization companies involve the possibility of greater volatility than investments in larger capitalization companies. Investments in American Depositary Receipts involve many of the same risks as investing in foreign securities.
| |
THE BEEHIVE FUND A MESSAGE TO OUR SHAREHOLDERS DECEMBER 31, 2012 |
| |
“Caution is the eldest child of wisdom.”
- Victor Hugo
Dear Shareholder,
At this time last year, we wrote that negative factors were overly reflected in stock prices. Since that time, prices have appreciated by nearly 30%. We remain positive towards stocks, especially when contrasted with other asset classes, but the price gains alone have made us incrementally more cautious.
By many measures, 2012 was a successful and bountiful year. Housing prices increased, corporate profits advanced, the economy produced jobs and reduced unemployment, new energy supplies were discovered, and commodity prices stabilized. Stock prices, as measured by the broad indices, appreciated significantly in 2012: The Dow Jones Industrials Average gained 7.3%, while the S&P 500 gained 13.4%, plus a little more in dividends. The BeeHive Fund (The “Fund”) advanced somewhere in the middle of that range and exceeded both during the last two quarters of 2012, even with a conservative positioning.
Yet, the year was a strangely nerve-wracking brew of political fights, elections, international conflict, sovereign debt scares, and natural disasters. Literally up to the last minute, the economic outlook appeared uncertain and susceptible to human error and policy blunders. This kept many investors in a defensive mode and many doomsayers holding influence over the headlines. It, unfortunately, also kept many investors from realizing another year of significant gains.
Our outlook for 2013 is not much different from our view twelve months ago when we foresaw improving fundamentals partially offset by political wrangling, economic imbalances and policy interference. This coming year will be absent either a presidential or mid-term election, but these political cycles have become so extended they are effectively permanent. Unfortunately, the fiscal cliff was averted by deferring the tough decisions into 2013. The debate over spending cuts and the debt ceiling will once again be a huge source of uncertainty this first quarter of 2013. Most importantly, even once resolved and “behind us” the negotiated solutions appear thus far to be insufficient, by a wide margin, to deal with the structural and increasing fiscal deficit and debt burden.
Last year at this time we wrote “the combination of improving fundamentals, low valuations, and persistent investor pessimism are the classic ingredients for very favorable longer term stock returns.” We believe this is still true, yet stock prices are higher (and therefore values are harder to find) and some fundamentals have begun to slow. Pessimism, by some measures has also declined as several surveys indicating investors’ views of U.S. equities have gone from strongly negative to lukewarm. Stocks have gained significantly, well ahead of underlying sales and even earnings growth. Some of this is a reflection of the discounted values following the recent great recession, but this means the margin of safety has been reduced and we need to tread a bit more carefully.
Your Fund
During the past year, we made several new investments that reflect our philosophy of risk/reward analysis.
In the first quarter we purchased SunTrust Banks, MetLife and Johnson Controls. SunTrust (STI) is the ninth largest bank in the U.S. It is a classic regional commercial bank, which means it experienced all the good, the bad, and the ugly of the banking industry in the last decade. We consider its position in the demographically strong Southeast to be an asset, but that has also meant a high exposure to the housing bubble and its subsequent bust (the bad). The problems were compounded by a high rate of defective documentation, which meant the company had to re-purchase previously sold mortgages that defaulted (the ugly). That being said, at the time of our purchase STI was a strong and strengthening franchise, closer to the end than the beginning of its well-known mortgage issues, had repaid TARP completely, and had several initiatives to improve efficiency, profitability and dividends (the good). More importantly, we were able to buy shares at just 58% of stated book value (85% of tangible book value) despite a conservatively estimated 10% return on equity that should improve over time (the great).
MetLife (MET) is the one of the oldest, largest, and best known insurance brands in the country – and increasingly the world. While not immune to the financial crisis (they originated and/or invested in sub-prime mortgages and derivatives), they remained adequately capitalized, did not need TARP funds, and in fact were able to take advantage of weaker competitors (for example, buying AIG’s international life insurance business). While life insurers (including those with a broader mix of business, like MET) have somewhat opaque financials, the basic business of writing policies based on actuarially conservative principles, and then investing the float until the required payout, is a profitable and time-tried concept. MET’s other businesses, including annuities, are generally fee-based with little to no risk for the insurer itself. Demographic trends and the desire for stable investment outcomes should continue to drive an increasing demand for annuities and other retirement products.
| |
THE BEEHIVE FUND A MESSAGE TO OUR SHAREHOLDERS DECEMBER 31, 2012 |
| |
Partly because of lingering fears of a global financial collapse, and partly because of the historically low interest rates MET can earn on their investment portfolio today, we were able to purchase shares at a discount to tangible book value (78%) and under 7x current earnings. We consider this highly attractive in the face of the growing momentum in their domestic retirement segment and international businesses, an anticipated return of capital to shareholders through increased dividends and buy-backs, and an eventual rise in market interest rates.
Founded in 1885, Johnson Controls (JCI) is a company with a long legacy of prudent management and strong investor returns. Today, the business is equally divided between auto interior, auto batteries, and building efficiency. In each segment, JCI is the market leader and is experiencing secular tailwinds. In automotive interiors, JCI is the technology and market share leader in seating and is enjoying the tailwind of production volume recovery in developed markets and strong growth in emerging market auto production. (China is now the largest automobile market by volume and JCI holds an approximately 40% market share.) In building efficiency, JCI is the largest player in the commercial retrofit market where the push for energy efficiency is driving global demand. In automotive batteries, JCI is by far the largest supplier of batteries to both original equipment manufacturers and the aftermarket. The company is using its financial strength to build its competitive advantage by investing to increase production of advanced lead acid batteries demanded by automakers for the heavier electronics loads of today’s vehicles and to enable fuel efficiency technologies like Start/Stop ignition systems. Owing to worries about a European meltdown, a slowing Chinese economy and the unseasonably warm winter (which was not good for replacement battery demand), we were able to purchase shares of JCI at less than 12x our estimate of 2012 earnings. We think that earnings will grow at 15% per year over the next several years.
We made one new significant purchase during the second quarter. Schlumberger (SLB) has long been the gold standard in oil services. We have followed the company and owned it on and off for decades. The recent sell-off in energy commodities, and an even more exaggerated drop in service companies, gave us an attractive entry point.
Subsequent to the close of the second quarter, we purchased a small position in Apple (AAPL). Although the share price of AAPL has increased substantially over the years, the fundamentals have improved at an even greater rate. In the past, our analysis always left us uncomfortable with the downside result if the company had not executed as everybody expected – the fact that it ran the table several times does not change the fact that new product introductions, new product category creation, and an unpredictable change in leadership presented risk. Today, on a multiple of earnings basis, the stock is cheaper than it has been for many years. Moreover, it appears that only modest success of existing product categories is required to achieve current market expectations and that the shares ignore the incredible level of cash on the balance sheet (larger than the total market cap of Amazon).
We also purchased shares of Amarin Corporation (AMRN), a biopharmaceutical company focused on the treatment of cardiovascular disease. AMRN recently received FDA approval for Vascepa (icosapent ethyl), a pure EPA Omega-3 Fatty Acid for treatment of patients with very high triglycerides (TGs). Vascepa’s initial approval targets a sizable patient population of roughly 4 million in the US and about 12 million patients worldwide and it is positioned to be a best in class treatment versus existing TG lowering treatments that have shown to significantly increase bad cholesterol (LDL).
We made an initial investment in Delphi Automotive (DLPH). DLPH has both a storied and checkered past. Born as the internal parts supply organization of GM, even once it was spun-out as an independent company DLPH was still largely beholden to GM as a customer and to GM’s legacy labor structure and pacts. During a bankruptcy proceeding, DLPH retooled its balance sheet, customer base, and business lines and we believe it now offers a compelling play on both the secular and cyclical growth in the global automotive industry.
We took profits in several companies during the year as well. In the first quarter of 2012, we sold our long-time position in Cooper Industries after it announced a sale of the company to Eaton Corp. The sale price was a 27% premium over the prior close, and approximately a 50% return (nearly 60% including dividends received) from our initial purchase in 2008. The deal consisted of cash and Eaton stock; as we do not have as much confidence in the combined entity as we did in Cooper, we exited shortly after the deal was announced.
We trimmed several of our long held positions as values became stretched. We also exited completely out of our successful investment in CVS/Caremark. Our original thesis was based on the synergies a pharmacy benefits manager and retail combination would bring. These benefits became apparent over time, and accelerated rapidly once Walgreens and Express Scripts clashed, allowing CVS to pick up a large number of Walgreen customers. In short, the stock has worked very well and, given a lack of foreseeable catalysts and an uncertain healthcare landscape, we redeployed the capital to better ideas.
Concluding Thoughts
Over the course of the last year, we felt that 2012 should end with much more clarity than it began. Things are indeed clearer, but perhaps not as clear as we had hoped. Spending cuts to the government’s budget will be debated vociferously in 2013, and it is unclear who holds the leverage and what even a moderate solution may be. We have now increased taxes on the wealthy, workers, and
| |
THE BEEHIVE FUND A MESSAGE TO OUR SHAREHOLDERS DECEMBER 31, 2012 |
| |
investors – and even savers through low interest rates. It seems likely, and responsible, that some government spending will be removed from the economy. All things being equal, these actions will result in slower growth in the coming years – yet may do little to address the structural deficit.
But, from the looking glass of our holdings, it is still possible to grow revenues in excess of costs, maintain balance sheet discipline, return cash to shareholders, and trade at a reasonable stock valuation. Under these conditions the rationale to invest in the equities of U.S. and multinational corporations remains compelling. We believe our holdings continue to represent an attractive return profile.
We wish you a happy, healthy and successful 2013!
Regards,
Spears Abacus
| |
THE BEEHIVE FUND PERFORMANCE CHART AND ANALYSIS (Unaudited) DECEMBER 31, 2012 |
| |
The following chart reflects the change in the value of a hypothetical $10,000 investment, including reinvested dividends and distributions, in The BeeHive Fund compared with the performance of the benchmark S&P 500 Index (the “S&P 500”) since inception. The S&P 500 is a broad-based, unmanaged measurement of changes in stock market conditions based on the average of 500 widely held common stocks. The total return of the S&P 500 includes the reinvestment of dividends and income. The total return of the Fund includes operating expenses that reduce returns, while the total return of the S&P 500 does not include expenses. The Fund is professionally managed while the S&P 500 is unmanaged and is not available for investment.

Performance data quoted represents past performance and is no guarantee of future results. Current performance may be lower or higher than the performance data quoted. Investment return and principal value will fluctuate so that shares, when redeemed, may be worth more or less than original cost. For the most recent month-end performance, please call (866) 684-4915. As stated in the Fund’s prospectus, the annual operating expense ratio (gross) is 1.07%. However, the Fund’s advisor has agreed to contractually waive a portion of its fees and to reimburse expenses such that total operating expenses do not exceed 0.99%, until at least April 30, 2013. During the period, certain fees were waived and/or expenses reimbursed; otherwise, returns would have been lower. The performance table and graph do not reflect the deduction of taxes that a shareholder would pay on Fund distributions or the redemption of Fund shares. Returns greater than one year are annualized.
| |
THE BEEHIVE FUND SCHEDULE OF INVESTMENTS DECEMBER 31, 2012 |
| |
| | | | Security | | | | | | ADR | American Depositary Receipt | | | | |
| Shares | Description | | Value | | PLC | Public Limited Company | | | | |
| Common Stock - 95.5% | | (a) | Non-income producing security. | | | | |
| Consumer Discretionary - 17.2% | | (b) | Variable rate security. Rate presented is as of December 31, 2012. |
| | 104,490 | | | $ | 3,905,836 | | | | | | | | |
| | 69,210 | | Delphi Automotive PLC (a) | | 2,647,283 | | | * Cost for federal income tax purposes is $76,655,836 and net unrealized appreciation consists of: |
| | 233,055 | | Digital Generation, Inc. (a) | | 2,530,977 | | |
| | 123,830 | | Imax Corp. (a) | | 2,783,698 | | | Gross Unrealized Appreciation | | $ | 13,778,416 | |
| | 100,930 | | Johnson Controls, Inc. | | 3,098,551 | | | Gross Unrealized Depreciation | | | (3,483,102 | ) |
| | | 14,966,345 | | | Net Unrealized Appreciation | | $ | 10,295,314 | |
| Energy - 12.0% | | | | | | | |
| | 44,361 | | Devon Energy Corp. | | 2,308,546 | | | The following is a summary of the inputs used to value the Fund’s investments as of December 31, 2012. |
| | 114,430 | | Marathon Oil Corp. | | 3,508,424 | | |
| | 36,590 | | Schlumberger, Ltd. | | 2,535,321 | | | | | | | | |
| | 63,675 | | The Williams Cos., Inc. | | 2,084,720 | | | The inputs or methodology used for valuing securities are not necessarily an indication of the risks associated with investing in those securities. For more information on valuation inputs, and their aggregation into the levels used in the tables below, please refer to the Security Valuation section in Note 2 of the accompanying Notes to Financial Statements. |
| | | 10,437,011 | | |
| Financials - 21.7% | |
| | 55,810 | | ACE, Ltd. | | 4,453,638 | | |
| | 69,605 | | Aon PLC | | 3,870,038 | | | | | | | | |
| | 90,191 | | CIT Group, Inc. (a) | | 3,484,980 | | | Valuation Inputs | | Investments in Securities |
| | 125,194 | | MetLife, Inc. | | 4,123,891 | | | Level 1 - Quoted Prices | | $ | 83,035,985 | |
| | 105,040 | | SunTrust Banks, Inc. | | 2,977,884 | | | Level 2 - Other Significant Observable Inputs | | | 3,915,165 | |
| | | 18,910,431 | | | Level 3 - Significant Unobservable Inputs | | | - | |
| Health Care Equipment and Services - 3.0% | | Total | | | $ | 86,951,150 | |
| | 38,645 | | Baxter International, Inc. | | 2,576,076 | | | | | | | | |
| | | | | | The Level 1 inputs displayed in this table are Common Stock. The Level 2 input displayed in this table is a Money Market Fund. Refer to the Schedule of Investments for a further breakout of each security by type. |
| Industrials - 10.0% | |
| | 91,010 | | Republic Services, Inc. | | 2,669,323 | | |
| | 29,280 | | The Boeing Co. | | 2,206,541 | | |
| | 51,560 | | United Parcel Service, Inc., Class B | | 3,801,519 | | | There were no transfers between Level 1 and Level 2 for the year ended December 31, 2012. |
| | | 8,677,383 | | |
| Pharmaceuticals, Biotechnology and Life Sciences - 8.7% | | | | | | | |
| | 109,240 | | Amarin Corp PLC, ADR (a) | | 883,752 | | | PORTFOLIO HOLDINGS | | | | |
| | 53,790 | | Life Technologies Corp. (a) | | 2,640,013 | | | % of Total Investments | | | | |
| | 63,680 | | Thermo Fisher Scientific, Inc. | | 4,061,510 | | | Consumer Discretionary | | | 17.2 | % |
| | | 7,585,275 | | | Energy | | | 12.0 | % |
| Software & Services - 19.5% | | Financials | | | 21.7 | % |
| | 111,354 | | Broadridge Financial Solutions, Inc. | | 2,547,780 | | | Health Care Equipment and Services | | | 3.0 | % |
| | 45,985 | | Check Point Software Technologies, Ltd. (a) | | 2,190,725 | | | Industrials | | | 10.0 | % |
| | 4,731 | | Google, Inc., Class A (a) | | 3,356,029 | | | Pharmaceuticals, Biotechnology and Life Sciences | | | 8.7 | % |
| | 119,285 | | Microsoft Corp. | | 3,188,488 | | | Software and Services | | | 19.5 | % |
| | 108,320 | | Oracle Corp. | | 3,609,222 | | | Technology Hardware and Equipment | | | 3.4 | % |
| | 149,760 | | The Western Union Co. | | 2,038,234 | | | Money Market Fund | | | 4.5 | % |
| | | 16,930,478 | | | | | | | 100.00 | % |
| Technology Hardware and Equipment - 3.4% | | | | | | | |
| | 5,540 | | Apple, Inc. | | 2,952,986 | | | | | | | | |
| Total Common Stock (Cost $72,591,547) | | 83,035,985 | | | | | | | | |
| Money Market Fund - 4.5% | | | | | | | |
| | 3,915,165 | | Fidelity Institutional Cash Money Market Fund, 0.14% (b) *(Cost $3,915,165) | | 3,915,165 | | | | | | | | |
| Total Investments - 100.0% (Cost $76,506,712)* | | $ | 86,951,150 | | | | | | | | |
| Other Assets and Liabilities, Net – (0.0)% | | | (20,836 | ) | | | | | | | |
| Net Assets – 100.0% | | $ | 86,930,314 | | | | | | | | |
| See Notes to Financial Statements. | 5 | |
| |
THE BEEHIVE FUND STATEMENT OF ASSETS AND LIABILITIES DECEMBER 31, 2012 |
| |
| | | | | | | |
| ASSETS | | | | |
| | Total investments, at value (Cost $76,506,712) | | $ | 86,951,150 | |
| | Receivables: | | | | |
| | | Dividends | | | 95,933 | |
| | Prepaid expenses | | | 4,169 | |
| Total Assets | | | 87,051,252 | |
| | | | | | | |
| LIABILITIES | | | | |
| | Payables: | | | | |
| | | Fund shares redeemed | | | 25,691 | |
| | | Distributions payable | | | 5,728 | |
| | Accrued Liabilities: | | | | |
| Advisor | Investment advisor fees | | | 50,317 | |
| | | Trustees’ fees and expenses | | | 40 | |
| | | Fund services fees | | | 14,473 | |
| | | Other expenses | | | 24,689 | |
| Total Liabilities | | | 120,938 | |
| | | | | | | |
| NET ASSETS | | $ | 86,930,314 | |
| | | | | | | |
| COMPONENTS OF NET ASSETS | | | | |
| | Paid-in capital | | $ | 74,822,204 | |
| | Undistributed net investment income | | | 3 | |
| | Accumulated net realized gain | | | 1,663,669 | |
| | Net unrealized appreciation | | | 10,444,438 | |
| NET ASSETS | | $ | 86,930,314 | |
| SHARES OF BENEFICIAL INTEREST AT NO PAR VALUE (UNLIMITED SHARES AUTHORIZED) | | | 8,048,093 | |
| NET ASSET VALUE, OFFERING AND REDEMPTION PRICE PER SHARE | | $ | 10.80 | |
| | | | | | | |
| See Notes to Financial Statements. | 6 | |
| |
THE BEEHIVE FUND STATEMENT OF OPERATIONS YEAR ENDED DECEMBER 31, 2012 |
| |
| | | | | | | |
| INVESTMENT INCOME | | | | |
| | Dividend income | | $ | 1,405,102 | |
| Total Investment Income | | | 1,405,102 | |
| Advisor | | | | |
| EXPENSES | | | | |
| | Investment advisor fees | | | 656,544 | |
| | Fund services fees | | | 172,219 | |
| | Custodian fees | | | 8,877 | |
| | Registration fees | | | 5,957 | |
| | Professional fees | | | 39,210 | |
| | Trustees’ fees and expenses | | | 3,126 | |
| | Miscellaneous expenses | | | 21,887 | |
| Total Expenses | | | 907,820 | |
| | Fees waived and expenses reimbursed | | | (41,182 | ) |
| Net Expenses | | | 866,638 | |
| | | | | | | |
| NET INVESTMENT INCOME | | | 538,464 | |
| | | | | | | |
| NET REALIZED AND UNREALIZED GAIN (LOSS) | | | | |
| | Net realized gain on investments | | | 5,664,357 | |
| | Net change in unrealized appreciation (depreciation) on investments | | | 2,380,296 | |
| NET REALIZED AND UNREALIZED GAIN | | | 8,044,653 | |
| INCREASE IN NET ASSETS FROM OPERATIONS | | $ | 8,583,117 | |
| | | | | | | |
| See Notes to Financial Statements. | 7 | |
| |
THE BEEHIVE FUND STATEMENTS OF CHANGES IN NET ASSETS |
| |
| | | December 31, 2013 | # | | 41274 | # | # | | | 40908 | |
| | | | | For the Year Ended December 31, 2012 | | | For the Year Ended December 31, 2011 |
| OPERATIONS | | | | | | | | | |
| | Net investment income | | $ | 538,464 | | | | $ | 131,807 | |
| | Net realized gain | | | 5,664,357 | | | | | 2,523,793 | |
| | Net change in unrealized appreciation (depreciation) | | | 2,380,296 | | | | | (7,156,269 | ) |
| Increase (Decrease) in Net Assets Resulting from Operations | | | 8,583,117 | | | | | (4,500,669 | ) |
| | | | | | | | | | | | |
| DISTRIBUTIONS TO SHAREHOLDERS FROM | | | | | | | | | |
| | Net investment income | | | (538,461 | ) | | | | (131,807 | ) |
| | Net realized gain | | | (4,994,386 | ) | | | | (1,558,290 | ) |
| Total Distributions to Shareholders | | | (5,532,847 | ) | | | | (1,690,097 | ) |
| | | | | | | | | | | | |
| CAPITAL SHARE TRANSACTIONS | | | | | | | | | |
| | Sale of shares | | | 7,958,469 | | | | | 12,308,244 | |
| | Reinvestment of distributions | | | 5,470,774 | | | | | 1,671,462 | |
| | Redemption of shares | | | (11,947,226 | ) | | | | (1,239,153 | ) |
| Increase in Net Assets from Capital Share Transactions | | | 1,482,017 | | | | | 12,740,553 | |
| Increase in Net Assets | | | 4,532,287 | | | | | 6,549,787 | |
| | | | | | | | | | | | |
| NET ASSETS | | | | | | | | | |
| | Beginning of Year | | | 82,398,027 | | | | | 75,848,240 | |
| | End of Year (Including line (a)) | | $ | 86,930,314 | | | | $ | 82,398,027 | |
| | | | | | | | | | | | |
| SHARE TRANSACTIONS | | | | | | | | | |
| | Sale of shares | | | 699,260 | | | | | 1,093,297 | |
| | Reinvestment of distributions | | | 508,253 | | | | | 163,536 | |
| | Redemption of shares | | | (1,116,979 | ) | | | | (108,087 | ) |
| Increase in Shares | | | 90,534 | | | | | 1,148,746 | |
| | | | | | | | | | | | |
| (a) | Undistributed net investment income. | | $ | 3 | | | | $ | - | |
| See Notes to Financial Statements. | 8 | |
| |
THE BEEHIVE FUND FINANCIAL HIGHLIGHTS |
| |
These financial highlights reflect selected data for a share outstanding throughout each period. | | | | | | |
| | | For the Years Ended December 31, | | September 2, 2008 (a) through | |
| | | 2012 | | | | 2011 | | | | 2010 | | | | 2009 | | | December 31, 2008 | |
| | | | | | | | | | | | | | | | | | | | | |
| NET ASSET VALUE, Beginning of Period | $ | 10.35 | | | $ | 11.14 | | | $ | 9.75 | | | $ | 7.44 | | | $ | 10.00 | | |
| INVESTMENT OPERATIONS | | | | | | | | | | | | | | | | | | | | |
| Net investment income (b) | | 0.07 | | | | 0.02 | | | | 0.05 | | | | 0.05 | | | | 0.02 | | |
| Net realized and unrealized gain (loss) | | 1.11 | | | | (0.59 | ) | | | 1.59 | | | | 2.30 | | | | (2.56 | ) | |
| Total from Investment Operations | | 1.18 | | | | (0.57 | ) | | | 1.64 | | | | 2.35 | | | | (2.54 | ) | |
| | | | | | | | | | | | | | | | | | | | | |
| DISTRIBUTIONS TO SHAREHOLDERS FROM | | | | | | | | | | | | | | | | | | | | |
| Net investment income | | (0.07 | ) | | | (0.02 | ) | | | (0.04 | ) | | | (0.04 | ) | | | (0.02 | ) | |
| Net realized gain | | (0.66 | ) | | | (0.20 | ) | | | (0.21 | ) | | | — | | | | — | | |
| Total Distributions to Shareholders | | (0.73 | ) | | | (0.22 | ) | | | (0.25 | ) | | | (0.04 | ) | | | (0.02 | ) | |
| NET ASSET VALUE, End of Period | $ | 10.80 | | | $ | 10.35 | | | $ | 11.14 | | | $ | 9.75 | | | $ | 7.44 | | |
| TOTAL RETURN | | 11.46 | % | | (5.10 | )% | | 16.90 | % | | 31.59 | % | | (25.45 | )%(c) |
| RATIOS/SUPPLEMENTARY DATA | | | | | | | | | | | | | | | | | | | | |
| Net Assets at End of Period (000’s omitted) | $86,930 | | | $82,398 | | | $75,848 | | | $42,195 | | | $23,668 | | |
| Ratios to Average Net Assets: | | | | | | | | | | | | | | | | | | | | |
| Net investment income | | 0.62 | % | | 0.16 | % | | 0.46 | % | | 0.55 | % | | 0.79 | %(d) |
| Net expense | | 0.99 | % | | 0.99 | % | | 0.99 | % | | 1.00 | % | | 1.00 | %(d) |
| Gross expense (e) | | 1.04 | % | | 1.07 | % | | 1.47 | % | | 1.88 | % | | 3.79 | %(d) |
| PORTFOLIO TURNOVER RATE | | 40 | % | | 34 | % | | 43 | % | | 33 | % | | 7 | %(c) |
| | | | | | | | | | | | | | | | | | | | | | |
| (a) | Commencement of operations. |
| (b) | Calculated based on average shares outstanding during each period. |
| (c) | Not annualized. |
| (d) | Annualized. |
| (e) | Reflects the expense ratio excluding any waivers and/or reimbursements. |
| See Notes to Financial Statements. | 9 | |
| |
THE BEEHIVE FUND NOTES TO FINANCIAL STATEMENTS DECEMBER 31, 2012 |
| |
Note 1. Organization
The BeeHive Fund (the “Fund”) is a diversified portfolio of Forum Funds (the “Trust”). The Trust is a Delaware statutory trust that is registered as an open-end, management investment company under the Investment Company Act of 1940 (the “Act”), as amended. Under its Trust Instrument, the Trust is authorized to issue an unlimited number of the Fund’s shares of beneficial interest without par value. The Fund commenced operations on September 2, 2008. The Fund seeks capital appreciation.
Note 2. Summary of Significant Accounting Policies
These financial statements are prepared in accordance with accounting principles generally accepted in the United States of America (“GAAP”), which require management to make estimates and assumptions that affect the reported amounts of assets and liabilities, the disclosure of contingent liabilities at the date of the financial statements, and the reported amounts of increase and decrease in net assets from operations during the fiscal period. Actual amounts could differ from those estimates. The following summarizes the significant accounting policies of the Fund:
Security Valuation – Exchange-traded securities and over-the-counter securities are valued using the last quoted sale or official closing price, provided by independent pricing services as of the close of trading on the market or exchange for which they are primarily traded, on each Fund business day. In the absence of a sale, such securities are valued at the mean of the last bid and ask price provided by independent pricing services. Non-exchange traded securities for which quotations are available are valued using the last quoted sales price, or in the absence of a sale at the mean of the last bid and ask prices provided by independent pricing services. Shares of open-end mutual funds are valued at net asset value (“NAV”). Short-term investments that mature in 60 days or less may be valued at amortized cost.
The Fund values its investments at fair value pursuant to procedures adopted by the Trust’s Board of Trustees (the “Board”) if (1) market quotations are insufficient or not readily available or (2) the advisor believes that the values available are unreliable. The Trust’s Valuation Committee performs certain functions as they relate to the administration and oversight of the Fund’s valuation procedures. Under these procedures, the Valuation Committee convenes on a regular and ad-hoc basis to review such securities and considers a number of factors, including valuation methodologies and significant unobservable inputs, when arriving at fair value.
The Valuation Committee may work with an advisor to provide valuation inputs. In determining fair valuations, inputs may include market-based analytics which may consider related or comparable assets or liabilities, recent transactions, market multiples, book values and other relevant investment information. Adviser inputs may include an income-based approach in which the anticipated future cash flows of the investment are discounted in determining fair value. Discounts may also be applied based on the nature or duration of any restrictions on the disposition of the investments. The Valuation Committee performs regular reviews of valuation methodologies, key inputs and assumptions, disposition analysis and market activity.
Fair valuation is based on subjective factors and, as a result, the fair value price of an investment may differ from the security’s market price and may not be the price at which the asset may be sold. Fair valuation could result in a different NAV than a NAV determined by using market quotes.
The Fund has a three-tier fair value hierarchy. The basis of the tiers is dependent upon the various “inputs” used to determine the value of the Fund’s investments. These inputs are summarized in the three broad levels listed below:
Level 1 — quoted prices in active markets for identical assets
Level 2 — other significant observable inputs (including quoted prices of similar securities, interest rates, prepayment speeds, credit risk, etc.)
Level 3 — significant unobservable inputs (including the Fund’s own assumptions in determining the fair value of investments)
The aggregate value by input level, as of December 31, 2012, for the Fund’s investments is included at the end of the Fund’s Schedule of Investments.
Security Transactions, Investment Income and Realized Gain and Loss – Investment transactions are accounted for on the trade date. Dividend income is recorded on the ex-dividend date. Foreign dividend income is recorded on the ex-dividend date or as soon as possible
| |
THE BEEHIVE FUND NOTES TO FINANCIAL STATEMENTS DECEMBER 31, 2012 |
| |
after the Fund determines the existence of a dividend declaration after exercising reasonable due diligence. Income and capital gains on some foreign securities may be subject to foreign withholding taxes, which are accrued as applicable. Interest income is recorded on an accrual basis. Premium is amortized and discount is accreted using the effective interest method. Identified cost of investments sold is used to determine the gain and loss for both financial statement and federal income tax purposes.
Distributions to Shareholders – Distributions to shareholders of net investment income and net capital gains, if any, are declared and paid at least annually. Distributions are based on amounts calculated in accordance with applicable federal income tax regulations, which may differ from GAAP. These differences are due primarily to differing treatments of income and gain on various investment securities held by the Fund, timing differences and differing characterizations of distributions made by the Fund.
Federal Taxes – The Fund intends to continue to qualify each year as a regulated investment company under Subchapter M of the Internal Revenue Code and to distribute all of its taxable income to shareholders. In addition, by distributing in each calendar year substantially all of its net investment income and capital gains, if any, the Fund will not be subject to a federal excise tax. Therefore, no federal income or excise tax provision is required. The Fund files a U.S. federal income and excise tax return as required. A fund’s federal income tax returns are subject to examination by the Internal Revenue Service for a period of three fiscal years after they are filed. As of December 31, 2012, there are no uncertain tax positions that would require financial statement recognition, de-recognition, or disclosure.
Income and Expense Allocation – The Trust accounts separately for the assets, liabilities and operations of each of its investment portfolios. Expenses that are directly attributable to more than one investment portfolio are allocated among the respective investment portfolios in an equitable manner.
Commitments and Contingencies – In the normal course of business, the Fund enters into contracts that provide general indemnifications by the Fund to the counterparty to the contract. The Fund’s maximum exposure under these arrangements is dependent on future claims that may be made against the Fund and, therefore, cannot be estimated; however, based on experience, the risk of loss from such claims is considered remote.
Note 3. Fees and Expenses
Investment Advisor – Spears Abacus Advisors LLC (the “Advisor”) is the investment advisor to the Fund. Pursuant to an investment advisory agreement, the Advisor receives an advisory fee from the Fund at an annual rate of 0.75% of the Fund’s average daily net assets.
Distribution – Foreside Fund Services, LLC serves as the Fund’s distributor (the “Distributor”). The Distributor is not affiliated with the Advisor or Atlantic Fund Administration, LLC (d/b/a Atlantic Fund Services) (“Atlantic”) or their affiliates. The Fund has adopted a distribution plan in accordance with Rule 12b-1 of the Act. The Fund may pay the Distributor and/or any other entity as authorized by the Board a fee of 0.25% of the Fund’s average daily net assets. The Fund has suspended payments under its Rule 12b-1 plan until further notice and has not paid any distribution fees to date. The Fund may remove the suspension and make payments under the Rule 12b-1 plan at any time, subject to Board approval.
Other Service Providers – Atlantic provides fund accounting, fund administration, compliance and transfer agency services to the Fund. Atlantic also provides certain shareholder report production, and EDGAR conversion and filing services. Pursuant to an Atlantic services agreement, the Fund pays Atlantic customary fees for its services. Atlantic provides a Principal Executive Officer, a Principal Financial Officer, a Chief Compliance Officer, and an Anti-Money Laundering Officer to the Fund, as well as certain additional compliance support functions.
Trustees and Officers – The Trust pays each independent Trustee an annual retainer fee of $45,000 for service to the Trust ($66,000 for the Chairman). In addition, for the period ended March 31, 2012, the Chairman received a monthly stipend of $500 to cover certain expenses incurred in connection with his duties to the Trust. The stipend was discontinued April 1, 2012. The Trustees and Chairman may receive additional fees for special Board meetings. Each Trustee is also reimbursed for all reasonable out-of-pocket expenses incurred in connection with his duties as a Trustee, including travel and related expenses incurred in attending Board meetings. The amount of Trustees’ fees attributable to the Fund is disclosed in the Statement of Operations. Certain officers of the Trust are also officers or employees of the above named service providers, and during their terms of office received no compensation from the Fund.
Note 4. Expense Reimbursements and Fees Reduced or Waived
The Advisor has contractually agreed to reduce a portion of its fee and reimburse certain expenses through April 30, 2013, to limit annual
| |
THE BEEHIVE FUND NOTES TO FINANCIAL STATEMENTS DECEMBER 31, 2012 |
| |
operating expenses to 0.99%. For the year ended December 31, 2012, fees reduced or waived and expenses reimbursed were $41,182.
The Fund may repay the Advisor for fees reduced and expenses reimbursed pursuant to the expense cap if (1) such payment is made within three years of the fees waived or expense reimbursement, (2) such payment is approved by the Board and (3) and the resulting expenses do not exceed 0.99%. As of December 31, 2012, the following amounts are subject to recapture by the Advisor:
| | | Amount of Fees Reduced and/or Expenses Reimbursed | | Expiration Date to Recoup Fees Reduced and/or Expenses Reimbursed | | Fees Recouped |
| December 31, 2010 | | $ | 127,277 | | December 31, 2013 | | $ | - |
| December 31, 2011 | | $ | 68,302 | | December 31, 2014 | | $ | - |
| December 31, 2012 | | $ | 41,182 | | December 31, 2015 | | $ | - |
Note 5. Security Transactions
The cost of purchases and proceeds from sales of investment securities (including maturities), other than short-term investments during the year ended December 31, 2012, were $33,941,503 and $36,132,584, respectively.
Note 6. Federal Income Tax and Investment Transactions
Distributions during the fiscal years ended as noted were characterized for tax purposes as follows:
| Ordinary Income | | $ | 538,461 | | $ | 131,807 |
| Long-Term Capital Gain | | | 4,994,386 | | | 1,558,290 |
| | | $ | 5,532,847 | | $ | 1,690,097 |
As of December 31, 2012, distributable earnings (accumulated loss) on a tax basis were as follows:
| Undistributed Ordinary Income | | $ | 3 | |
| Undistributed Long-Term Gain | | | 1,812,793 | |
| Unrealized Appreciation | | | 10,295,314 | |
| Total | | $ | 12,108,110 | |
The difference between components of distributable earnings on a tax basis and the amounts reflected in the Statement of Assets and Liabilities are primarily due to wash sales.
Note 7. Recent Accounting Pronouncements
In December 2011, FASB issued ASU No. 2011-11 “Disclosures about Offsetting Assets and Liabilities” requiring disclosure of both gross and net information related to offsetting and related arrangements enabling users of its financial statements to understand the effect of those arrangements on the entity’s financial position. The objective of this disclosure is to facilitate comparison between those entities that prepare their financial statements on the basis of U.S. GAAP and those entities that prepare their financial statements on the basis of IFRSs. ASU No. 2011-11 is effective for interim and annual periods beginning on or after January 1, 2013. Management is evaluating any impact ASU No. 2011-11 may have on the Fund’s financial statements.
Note 8. Subsequent Events
Subsequent events occurring after the date of this report through the date these financial statements were issued have been evaluated for potential impact and the Fund has had no such events.
| |
REPORT OF INDEPENDENT REGISTERED PUBLIC ACCOUNTING FIRM |
| |
To the Board of Trustees of Forum Funds and the Shareholders of The BeeHive Fund
We have audited the accompanying statement of assets and liabilities of The BeeHive Fund (the “Fund”), a series of shares of beneficial interest in the Forum Funds, including the schedule of investments, as of December 31, 2012, and the related statement of operations for the year then ended, the statements of changes in net assets for each of the years in the two year period then ended, and the financial highlights for each of the years in the four year period then ended, and the period September 2, 2008 (commencement of operations) through December 31, 2008. These financial statements and financial highlights are the responsibility of the Fund's management. Our responsibility is to express an opinion on these financial statements and financial highlights based on our audits.
We conducted our audits in accordance with the standards of the Public Company Accounting Oversight Board (United States). Those standards require that we plan and perform the audits to obtain reasonable assurance about whether the financial statements and financial highlights are free of material misstatement. An audit includes examining, on a test basis, evidence supporting the amounts and disclosures in the financial statements. Our procedures included confirmation of securities owned as of December 31, 2012 by correspondence with the custodian. An audit also includes assessing the accounting principles used and significant estimates made by management, as well as evaluating the overall financial statement presentation. We believe that our audits provide a reasonable basis for our opinion.
In our opinion, the financial statements and financial highlights referred to above present fairly, in all material respects, the financial position of The BeeHive Fund as of December 31, 2012, and the results of its operations for the year then ended, the changes in its net assets for each of the years in the two year period then ended, and its financial highlights for each of the years in the four year period then ended, and the period September 2, 2008 through December 31, 2008, in conformity with accounting principles generally accepted in the United States of America.
BBD, LLP
Philadelphia, Pennsylvania
February 21, 2013
| |
THE BEEHIVE FUND ADDITIONAL INFORMATION (Unaudited) DECEMBER 31, 2012 |
| |
Investment Advisory Agreement Approval
At the September 21, 2012, Board meeting, the Board, including the Independent Trustees, considered the approval of the continuance of the investment advisory agreement pertaining to the Fund (the “Advisory Agreement”). In evaluating the Advisory Agreement, the Board reviewed materials furnished by the Advisor and the administrator, including information regarding the Advisor, its personnel, operations and financial condition. Specifically, the Board considered, among other matters: (1) the nature, extent and quality of the services to be provided to the Fund by the Advisor, including information on the investment performance of the Advisor; (2) the costs of the services to be provided and profitability to the Advisor with respect to its relationship with the Fund; (3) the advisory fee and total expense ratio of the Fund compared to relevant peer groups of funds; (4) the extent to which economies of scale would be realized as the Fund grows and whether the advisory fee would enable the Fund’s investors to share in the benefits of economies of scale; and (5) other benefits received by the Advisor from its relationship with the Fund. In their deliberations, the Board did not identify any particular information that was all-important or controlling and attributed different weights to the various factors.
Nature, Extent and Quality of Services
In connection with a presentation from a senior representative of the Advisor and a discussion of the Advisor’s personnel, operations and financial condition, the Board considered the quality of services provided by the Advisor under the Advisory Agreement between the Trust and the Advisor. In this regard, the Board considered information regarding the experience, qualifications and professional background of the portfolio managers and other personnel at the Advisor with principal investment responsibility for the Fund’s investments as well as the investment philosophy and decision-making processes of those professionals and the capability and integrity of the Advisor’s senior management and staff. The Board considered the adequacy of the Advisor’s resources and quality of services provided by the Advisor under the Advisory Agreement between the Trust and the Advisor.
Costs of Services and Profitability
The Board considered information provided by the Advisor regarding its costs of services and its profitability with respect to the Fund. In this regard, the Board considered the Advisor’s resources devoted to the Fund as well as the Advisor’s discussion of costs and profitability. Based on these and other applicable considerations, the Board concluded that the Advisor’s profits attributable to management of the Fund were reasonable in the context of all factors considered.
Performance
The Board reviewed the performance of the Fund and the Advisor’s discussion of its investment philosophy. The Board considered the Fund’s performance over the one-year, three-year and since inception (annualized) periods ended August 31, 2012. The Board noted that the Fund underperformed its primary benchmark, the S&P 500 Index, for each of these periods. The Board noted the Advisor’s representation that due to factors including fear in the marketplace, the market has not recognized what the Advisor believes to be the full value of the securities held by the Fund. The Board also noted that the Fund outperformed its benchmark for the three-month period ended August 31, 2012. Based on the foregoing, the Board determined that the Advisor’s management of the Fund could benefit the Fund and its shareholders.
Compensation
The Board considered the Advisor’s compensation for providing advisory services to the Fund and analyzed comparative information on fee rates and total expenses of similar mutual funds. The Board noted that the Advisor’s actual advisory fee rate of the Fund was below the median of the Fund’s Lipper Inc. peer group and that its total expense ratio was below the median of the Fund’s Lipper Inc. peer group. Based on the foregoing, the Board concluded that the Advisor’s advisory fee rate charged to the Fund appeared to be within a reasonable range in light of the services it provides to the Fund.
Economies of Scale
The Board considered whether the Fund would benefit from any economies of scale. In this respect, the Board noted the Advisor’s representation that the Fund potentially could benefit from economies of scale as assets grow, but the Advisor currently is not proposing breakpoints or changes in fees at this time. Based on the foregoing information, the Board concluded that economies of scale were not a material factor in approving the Advisory Agreement.
| |
THE BEEHIVE FUND ADDITIONAL INFORMATION (Unaudited) DECEMBER 31, 2012 |
| |
Other Benefits
The Board noted the Advisor’s representation that the Advisor does not expect to receive any kind of benefit or compensation from its relationship with the Fund, other than its contractual advisory fees. Based on the foregoing representation, the Board concluded that other benefits received by the Advisor from its relationship with the Fund were not a material factor to consider in approving the continuation of the Advisory Agreement.
Conclusion
The Board did not identify any single factor as being of paramount importance, and different Trustees may have given different weight to different factors. The Board reviewed a memorandum from Trust counsel discussing the legal standards applicable to its consideration of the Advisory Agreement. Based on its review, including consideration of each of the factors referenced above, the Board determined, in the exercise of its business judgment, that the advisory arrangement, as outlined in the Advisory Agreement, was fair and reasonable in light of the services performed or to be performed, expenses incurred or to be incurred and such other matters as the Board considered relevant in the exercise of its reasonable business judgment.
Proxy Voting Information
A description of the policies and procedures that the Fund uses to determine how to vote proxies relating to securities held in the Fund’s portfolio is available, without charge and upon request, by calling (866) 684-4915 and on the U.S. Securities and Exchange Commission’s (the “SEC”) website at www.sec.gov. The Fund’s proxy voting record for the most recent twelve-month period ended June 30 is available, without charge and upon request, by calling (866) 684-4915 and on the SEC’s website at www.sec.gov.
Availability of Quarterly Portfolio Schedules
The Fund files its complete schedule of portfolio holdings with the SEC for the first and third quarters of each fiscal year on Form N-Q. These filings are available, without charge and upon request on the SEC’s website at www.sec.gov or may be reviewed and copied at the SEC’s Public Reference Room in Washington, DC. Information on the operation of the Public Reference Room may be obtained by calling (800) SEC-0330.
Shareholder Expense Example
As a shareholder of the Fund, you incur ongoing costs, including management fees and other Fund expenses. This example is intended to help you understand your ongoing costs (in dollars) of investing in the Fund and to compare these costs with the ongoing costs of investing in other mutual funds.
The example is based on an investment of $1,000 invested at the beginning of the period and held for the entire period from July 1, 2012, through December 31, 2012.
Actual Expenses – The first line of the table below provides information about actual account values and actual expenses. You may use the information in this line, together with the amount you invested, to estimate the expenses that you paid over the period. Simply divide your account value by $1,000 (for example, an $8,600 account value divided by $1,000 = 8.6), then multiply the result by the number in the first line under the heading entitled “Expenses Paid During Period” to estimate the expenses you paid on your account during the period.
Hypothetical Example for Comparison Purposes – The second line of the table below provides information about hypothetical account values and hypothetical expenses based on the Fund’s actual expense ratio and an assumed rate of return of 5% per year before expenses, which is not the Fund’s actual return. The hypothetical account values and expenses may not be used to estimate the actual ending account balance or expenses you paid for the period. You may use this information to compare the ongoing costs of investing in the Fund and other funds. To do so, compare this 5% hypothetical example with the 5% hypothetical examples that appear in the shareholder reports of other funds.
Please note that the expenses shown in the table are meant to highlight your ongoing costs only. Therefore, the second line of the table is useful in comparing ongoing costs only and will not help you determine the relative total costs of owning different funds.
| |
THE BEEHIVE FUND ADDITIONAL INFORMATION (Unaudited) DECEMBER 31, 2012 |
| |
| | Beginning | | Ending | | Expenses | | Annualized |
| | Account Value | | Account Value | | Paid During | | Expense |
| | July 1, 2012 | | December 31, 2012 | | Period* | | Ratio* |
| Actual | $ | 1,000.00 | | $ | 1,068.13 | | $ | 5.15 | | 0.99 | % |
| Hypothetical (5% return before taxes) | $ | 1,000.00 | | $ | 1,020.16 | | $ | 5.03 | | 0.99 | % |
| | | | | | | | | | | | |
| * | Expenses are equal to the Fund’s annualized expense ratio multiplied by the average account value over the period, multiplied by the number of days in the most recent fiscal half-year divided by 366 to reflect the half-year period. |
Federal Tax Status of Dividends Declared during the Tax Year
For federal income tax purposes, dividends from short-term capital gains are classified as ordinary income. The Fund designates 100% of its income dividend distributed as qualifying for the corporate dividends-received deduction (DRD) and 100% for the qualified dividend rate (QDI) as defined in Section 1(h)(11) of the Internal Revenue Code.
Trustees and Officers of the Trust
The Board is responsible for oversight of the management of the Trust’s business affairs and of the exercise of all the Trust’s powers except those reserved for the shareholders. The following table provides information about each Trustee and certain officers of the Trust. Each Trustee and officer holds office until the person resigns, is removed, or is replaced. Unless otherwise noted, the persons have held their principal occupations for more than five years. The address for all Trustees and officers is Three Canal Plaza, Suite 600, Portland, Maine 04101. Mr. Keffer is considered an Interested Trustee due to his affiliation with Atlantic. The Fund’s Statement of Additional Information includes additional information about the Trustees and is available, without charge and upon request, by calling (866) 684-4915.
| Name and Year of Birth | Position with the Trust | Length of Time Served | Principal Occupation(s) During Past Five Years | Number of Series of Trust Overseen by Trustee | Other Directorships Held by Trustee |
| Independent Trustees | | | | | |
J. Michael Parish Born: 1943 | Chairman of the Board; Trustee; Chairman, Nominating Committee and Qualified Legal Compliance Committee | Since 1989 (Chairman since 2004) | Retired since 2003. | 21 | 0 |
Costas Azariadis Born: 1943 | Trustee | Since 1989 | Professor of Economics, Washington University since 2006. | 21 | 0 |
James C. Cheng Born: 1942 | Trustee; Chairman, Audit Committee | Since 1989 | President, Technology Marketing Associates (marketing company for small- and medium-sized businesses in New England) since 1991. | 21 | 0 |
David Tucker Born: 1958 | Trustee | Since 2011 | Director, Blue Sky Experience since 2008; Senior Vice President & General Counsel, American Century Companies 1998-2008. | 21 | Director, Forum ETF Trust |
| |
THE BEEHIVE FUND ADDITIONAL INFORMATION (Unaudited) DECEMBER 31, 2012 |
| |
| Name and Year of Birth | Position with the Trust | Length of Time Served | Principal Occupation(s) During Past Five Years | Number of Series of Trust Overseen by Trustee | Other Directorships Held by Trustee |
| Interested Trustee | | | | | |
John Y. Keffer1 Born: 1942 | Trustee; Vice Chairman | Since 1989 | Chairman, Atlantic since 2008; President, Forum Foundation (a charitable organization) since 2005; President, Forum Trust, LLC (a non-depository trust company chartered in the State of Maine) since 1997. | 21 | Director, Wintergreen Fund, Inc.; Director, Forum ETF Trust |
| Officers | | | | | |
Stacey E. Hong Born: 1966 | President; Principal Executive Officer | Since 2008 | President, Atlantic since 2008; Director, Consulting Services, Foreside Fund Services 2007. | N/A | N/A |
Karen Shaw Born: 1972 | Treasurer; Principal Financial Officer | Since 2008 | Senior Vice President, Atlantic since 2008; Vice President, Citigroup 2003-2008. | N/A | N/A |
David Faherty Born: 1970 | Vice President | Since 2009 | Senior Counsel, Atlantic since 2009; Vice President, Citi Fund Services Ohio, Inc. 2007-2009; Associate Counsel, Investors Bank & Trust Co. 2006-2007. | N/A | N/A |
Michael J. McKeen Born: 1971 | Vice President | Since 2009 | Senior Vice President, Atlantic since 2008; Vice President, Citigroup 2003-2008. | N/A | N/A |
Joshua LaPan Born: 1973 | Vice President | Since 2009 | Manager, Atlantic since 2008; Vice President, Citigroup 2003-2008. | N/A | N/A |
Timothy Bowden Born: 1969 | Vice President | Since 2009 | Manager, Atlantic since 2008; Vice President, Citigroup 2005-2008. | N/A | N/A |
Lina Bhatnagar Born: 1971 | Secretary | Since 2008 | Senior Administration Specialist, Atlantic since 2008; Regulatory Administration Specialist, Citigroup 2006-2008. | N/A | N/A |
1Atlantic is a subsidiary of Forum Holdings Corp. I, a Delaware corporation that is wholly owned by Mr. Keffer. |

| A Message to Our Shareholders | 1 |
| Performance Chart and Analysis (Unaudited) | 7 |
| Schedule of Investments | 8 |
| Statement of Assets and Liabilities | 11 |
| Statement of Operations | 12 |
| Statements of Changes in Net Assets | 13 |
| Financial Highlights | 14 |
| Notes to Financial Statements | 15 |
| Report of Independent Registered Public Accounting Firm | 20 |
| Additional Information (Unaudited) | 21 |
| |
POLARIS GLOBAL VALUE FUND A MESSAGE TO OUR SHAREHOLDERS DECEMBER 31, 2012 |
| |
Dear Fellow Shareholder,
In 2012, security markets were impacted by a confluence of events including the U.S. presidential election and “fiscal cliff”, the European recession, fiscal restraint in Spain, Italy and Portugal and China’s leadership transition. However, global markets rebounded during the year, entering positive territory, as central banks employed stimulus measures, Greece passed its budget and world GDP growth drivers (China and the U.S.) showed signs of stability. For the year ended December 31, 2012, the Polaris Global Value Fund (the “Fund”) was up 21.00%, outperforming the benchmark, the MSCI World Index, at 15.83%.
Beating the benchmark by 517 basis points (5.17%) can be attributed to stock selection, with numerous portfolio companies posting triple-digit returns including U.S.-based Marathon Petroleum Corp., U.K. homebuilder Barratt Developments and Irish convenience food producer Greencore Group. U.S. information technology companies Western Union and Hewlett-Packard underperformed, as did U.S. pharmaceutical company Questcor.
The following table summarized total returns through December 31, 2012.
| | 2012 | Annualized As of December 31, 2012 |
| | YTD | QIV | QIII | QII | QI | 1 Yr | 3 Yrs | 5 Yrs | 10 Yrs | 15 Yrs | 20 Yrs | ITD* |
| Polaris Global Value Fund | 21.00% | 3.36% | 6.28% | -4.17% | 14.94% | 21.00% | 10.26% | -0.46% | 8.91% | 6.28% | 9.95% | 8.97% |
| MSCI World Index | 15.83% | 2.49% | 6.71% | -5.07% | 11.56% | 15.83% | 6.93% | -1.18% | 7.51% | 4.20% | 6.88% | 5.70% |
*Inception-to-date (Inception 7/31/1989)
Performance data quoted represents past performance and is no guarantee of future results. Current performance may be lower or higher than the performance data quoted. Returns for more than one year are annualized. Investment return and principal value will fluctuate so that an investor's shares, when redeemed, may be worth more or less than original cost. For the most recent month end performance, please call (888) 263-5594 or visit the Fund’s website at www.polarisfunds.com. As stated in the current prospectus, the Fund’s annual operating expense ratio (gross) is 1.36%. Quarter end expense ratio is 1.35%; this ratio is based on amounts incurred during the most recent quarter, divided by the average assets for the period multiplied by 366 and divided by the number of days in the quarter. Shares redeemed or exchanged within 180 days of purchase will be charged a 1.00% fee. Fund performance returns shown do not reflect this fee; if reflected, the returns would have been lower. See page 5 for additional disclosure. Short-term performance, in particular, is not a good indication of the Fund's future performance, and an investment should not be made based solely on returns. Because of ongoing market volatility, Fund performance may be subject to substantial short-term changes.
The table above shows that the Fund’s long-term performance has exceeded benchmark returns with lower market risk, as measured by the beta statistic of 0.93 since the Fund’s inception (volatility measurement relative to the MSCI World Index).
2012 PERFORMANCE ANALYSIS:
Eight of 10 sectors reported absolute positive results, with economically-sensitive sectors unsurprisingly outpacing defensives for the year ended December 31, 2012. Nearly one-third of the 21% annual Fund return could be attributed to consumer discretionary stocks. In particular, British homebuilders Barratt Developments, Taylor Wimpey, Persimmon
| |
POLARIS GLOBAL VALUE FUND A MESSAGE TO OUR SHAREHOLDERS DECEMBER 31, 2012 |
| |
and Bellway did well. In November, U.K. mortgage approvals rose to the highest level in 10 months, adding to signs that the Bank of England’s credit-boosting program “Funding for Lending” is helping to ease strains in lending. During the housing crisis, many homebuilders retrenched, shoring up balance sheets, raising capital, reducing debt and focusing on margins over volumes by buying lower priced land and building higher-priced houses versus apartments. With the pending rebound in the U.K. housing market, these lean-operating homebuilders are well positioned to leverage even modest volume increases.
Christian Dior had strong annual results in a relatively lackluster retail environment, further substantiating our conviction that luxury goods thrive even in depressed macro-economic conditions. The company announced six-month (ending October 31, 2012) revenues, which increased 18% over the same period in 2011. Nearly all of Christian Dior’s diversified business lines proved fruitful, with robust demand in wine and spirits, double-digit revenue growth for the Louis Vuitton fashion brand, momentum in its perfume and cosmetic lines and a nearly 26% boost in revenues for Christian Dior Couture.
Financials were the hidden story of the year, proving to be one of the best performing sectors in the MSCI World Index and in our Fund. Hurricane Sandy, the October storm that battered the U.S. Northeast, allowed reinsurers to maintain and, in some cases, raise renewal prices for property-catastrophe reinsurance, after a year in which natural disaster costs fell. Hannover Re and Munich Re saw increased renewal rates, further reinforced by good quarterly numbers, improved combined expense ratios and healthy investment income. Investor AB, a Swedish holding company, also contributed to the financial sector performance. The company, in conjunction with EQT IV Fund, signed an agreement to divest Gambro to the medical technology company Baxter International; total proceeds to Investor AB will be $1.6 billion.
Among U.S. holdings, Southwest Bancorp’s continued success stemmed from management's decision to sell off more than $300 million in problem loans and other non-performing assets at the end of 2011. As a result, Southwest started 2012 with an improved balance sheet and a renewed focus on commercial/healthcare banking in the fairly resilient markets of Oklahoma, Texas and Kansas. The company reported strong earnings results throughout the year and capped the year with repurchase of $70 million of its preferred securities previously sold to the Department of the Treasury, reducing the regulatory burden and saving the cost of preferred dividends.
In materials, the leading containerboard/corrugated manufacturer in Europe, Smurfit Kappa, captured high double digit returns for the year. Independent paper packaging companies unable to absorb cost increases resulting from Chinese demand for recycled paper have closed or reduced production. With fewer competitors and fewer products in the market, Smurfit Kappa was able to marginally increase prices on its product lines, thereby dissipating raw material costs. Additionally, Smurfit announced the acquisition of Orange County Container Group, a private corrugated/containerboard manufacturer with operations in Mexico and Southern U.S. The transaction is expected to increase demographic exposure into Latin America, boost earnings and create nearly $14 million in synergies within two years.
Methanol prices increased during the year, leading to improved cash flow and earnings at Methanex Corp. The company also ramped up its production levels, operating new plants in Canada and Egypt. Belgian chemical company Solvay put a strict focus on free cash flow generation by reducing capital expenditures and boosting management incentives as Solvay integrated Rhodia following its April 2011 acquisition. In a lean operating environment, Solvay announced strong earnings throughout the year and reiterated guidance.
| |
POLARIS GLOBAL VALUE FUND A MESSAGE TO OUR SHAREHOLDERS DECEMBER 31, 2012 |
| |
Irish convenience foods producer Greencore Group was the star performer in consumer staples. Early in the year, the stock price was up on news of a potential takeover bid that management shunned on valuation grounds. In late November, the company issued results for the year ended September 2012, announcing 44.5% revenue growth due to acquisitions, increasing volumes in convenience foods and the successful integration of Uniq. Greencore also established a scale food-to-go business in the U.S. and signed sandwich supply agreements with Starbucks and 7-Eleven. The extra volume may improve U.S. revenues materially in 2013.
While Samsung Electronics posted double-digit gains for the year, the overall information technology sector returns were down. Western Union reported sluggish results on slower economic growth and reduced volumes in the Mexico corridor due to new regulatory standards intended to prevent money transfer services from being used in illegal activities. The company will modify services and pricing to compete more aggressively and win market share, but had to cut guidance for 2013. Other competitors have since announced similar regulatory agreements.
Hewlett-Packard lowered market expectations for a quick turnaround, saying the company will face continued challenges through 2016. The slowdown in government spending globally and tough conditions in the important financial sector are extending the recovery time. The company also had incurred an $8 billion write-down on the value of its 2008 EDS acquisition. With the consumer PC and printing businesses weak, the company is expected to increase layoffs in 2013.
Questcor Pharmaceuticals proved the main detractor to healthcare sector returns. The company experienced considerable headwinds during the year, starting with a report from a short-selling firm regarding generic competitors. The company was subsequently punished on uncertain insurance coverage and an announced investigation of the company’s promotional practices. Although the stock rebounded on impressive third quarter results and increased prescriptions, Questcor stock did not recover to previous levels before year end.
2012 ASSET ALLOCATION:
During the year, we eliminated a number of positions based on companies reaching valuation targets or on projections pointing to company-specific deterioration. The Fund's holding in Japanese shipping company Iino Kaiun was sold due to a depressed outlook for shipping rates. Among financials, we sold Belgian bank and insurer KBC, U.K. bank Lloyds and State Bank of India. We exited U.S. electronic instruments manufacturer Ametek, after a spate of strong performance reached our valuation targets. When South African-based mining company Metorex was acquired by the Jinchuan Group of China for its assets in the Democratic Republic of the Congo, our holdings in the company were sold for cash. We followed our investment discipline and sold to protect downside exposure over the medium term. In expectation of continued worldwide volatility, we held the cash awaiting entry points on market declines.
During the year, several new stocks were purchased in the information technology, consumer discretionary and financial sectors. Italy’s Lottomatica offers counter-cyclical cash flows from its lottery game operations, helping budget strapped governments worldwide raise revenues. The company posted double-digit returns in the quarter, competently executing the rollout of video lottery terminals and increasing the popularity of U.S. multi-state lottery Mega Millions. Among information technology companies, we bought Microsoft on expectations of growth of its Windows 7 and Windows 8 operating systems. We also purchased Xerox and Western Union. We made an investment in a long-followed Massachusetts-based bank, Brookline Bancorp, which offers good value and an increasingly valuable franchise after its
| |
POLARIS GLOBAL VALUE FUND A MESSAGE TO OUR SHAREHOLDERS DECEMBER 31, 2012 |
| |
acquisition of Bancorp Rhode Island. We also purchased U.K. beverage can maker, Rexam. The company is experiencing growth in emerging markets and consolidation of the global industry, now dominated by three companies.
The following table shows the Fund’s asset allocation at December 31, 2012.
Polaris Global Value Fund Asset Allocation
| | Portfolio Weighting | Energy | Utilities | Materials | Industrials | Consumer Discretionary | Consumer Staples | Health Care | Financials | Info. Tech. | Telecom Services | Cash |
| N. America | 41.15% | 3.07% | 2.74% | 2.86% | 2.50% | 1.26% | 2.64% | 6.87% | 12.33% | 4.65% | 2.24% | 0.00% |
| Japan | 6.30% | 0.00% | 0.00% | 1.22% | 0.00% | 0.00% | 3.72% | 0.00% | 0.00% | 0.00% | 1.37% | 0.00% |
| Other Asia | 6.93% | 1.22% | 1.03% | 1.30% | 0.00% | 0.00% | 0.00% | 0.00% | 0.00% | 3.38% | 0.00% | 0.00% |
| Europe & ME | 33.68% | 1.06% | 0.00% | 9.35% | 1.42% | 10.87% | 2.24% | 2.99% | 3.09% | 1.52% | 1.15% | 0.00% |
| Scandinavia | 9.95% | 0.00% | 0.00% | 0.00% | 3.72% | 1.66% | 0.00% | 0.00% | 4.58% | 0.00% | 0.00% | 0.00% |
| Africa & S. America | 1.29% | 1.29% | 0.00% | 0.00% | 0.00% | 0.00% | 0.00% | 0.00% | 0.00% | 0.00% | 0.00% | 0.00% |
| Cash | 0.70% | 0.00% | 0.00% | 0.00% | 0.00% | 0.00% | 0.00% | 0.00% | 0.00% | 0.00% | 0.00% | 0.70% |
| Industry Totals | 100.00% | 6.63% | 3.77% | 14.73% | 7.63% | 13.78% | 8.60% | 9.87% | 19.99% | 9.55% | 4.75% | 0.71% |
Table may not cross foot due to rounding.
INVESTMENT ENVIRONMENT AND STRATEGY:
We are witnessing the beginning of a slow, protracted market recovery, with the U.S. and China driving growth forward. In the U.S., low cost energy and a healthier housing sector have helped buoy the economy; resolution of presidential elections and tax concerns may further steady U.S. markets. China’s effective economic stimulus and seamless leadership transition have helped stabilize the country’s economy, likely leading to a revival of material/industrial demand. Yet, we need to be cautious of credit-strapped European economies and the obvious deceleration in some emerging markets. Mixed markets will persist for the foreseeable future, with some countries and sectors doing better than others. Bottom-up stock selection, focusing on individual company fundamentals (healthy free cash flows, conservative balance sheets and strong management), remains the key to successful investing, especially when facing worldwide macro-economic volatility. In conducting fundamental analysis, we continue to find compelling valuations globally, although the top ranked companies in our screens have not passed further Polaris scrutiny. Nonetheless, higher quality and attractive valuations exist among companies further down our screens.
As always, we welcome your questions and comments.
Sincerely,
Bernard R. Horn, Jr.
Portfolio Manager
| |
POLARIS GLOBAL VALUE FUND A MESSAGE TO OUR SHAREHOLDERS DECEMBER 31, 2012 |
| |
As of December 31, 2012, the Fund’s largest equity holdings and the percentages they represent in the Fund’s portfolio market value were as follows:
| Percentage of Total Net Assets | | Percentage of Total Net Assets |
| Samsung Electronics Co., Ltd. | 2.47% | Duni AB, Class A | 1.66% |
| Greencore Group PLC | 2.24% | Imerys SA | 1.64% |
| Christian Dior SA | 1.95% | Methanex Corp. | 1.63% |
| Taylor Wimpey PLC | 1.95% | Persimmon PLC | 1.62% |
| Barratt Developments PLC | 1.91% | Marathon Petroleum Corp. | 1.61% |
| Bellway PLC | 1.90% | Independent Bank Corp. | 1.58% |
| Hannover Rueckversicherung AG | 1.75% | Lottomatica Group SpA | 1.56% |
| Kone Oyj, Class B | 1.74% | Wincor Nixdorf AG | 1.52% |
| Svenska Handelsbanken AB, Class A | 1.67% | BASF SE | 1.51% |
| Symrise AG | 1.66% | NextEra Energy, Inc. | 1.51% |
The Fund’s annual performance as compared to the benchmark is as follows:
| Historical Calendar Year Annual Returns (years ended December 31) |
| | Polaris Global Value Fund | MSCI World Index | | Polaris Global Value Fund | MSCI World Index |
| 2012 | 21.00% | 15.83% | 2000 | -5.82% | -13.18% |
| 2011 | -8.16% | -5.54% | 1999 | 16.50% | 24.93% |
| 2010 | 20.64% | 11.76% | 1998 | -8.85% | 24.34% |
| 2009 | 35.46% | 29.99% | 1997 | 34.55% | 15.76% |
| 2008 | -46.19% | -40.71% | 1996 | 23.34% | 13.48% |
| 2007 | -3.97% | 9.04% | 1995 | 31.82% | 20.72% |
| 2006 | 24.57% | 20.07% | 1994 | -2.78% | 5.08% |
| 2005 | 10.52% | 9.49% | 1993 | 25.70% | 22.50% |
| 2004 | 23.63% | 14.72% | 1992 | 9.78% | -5.23% |
| 2003 | 47.06% | 33.11% | 1991 | 17.18% | 18.28% |
| 2002 | 3.82% | -19.89% | 1990 | -11.74% | -17.02% |
| 2001 | 2.21% | -16.82% | | | |
| |
POLARIS GLOBAL VALUE FUND A MESSAGE TO OUR SHAREHOLDERS DECEMBER 31, 2012 |
| |
IMPORTANT INFORMATION
The Fund invests in securities of foreign issuers, including issuers located in countries with emerging capital markets. Investments in such securities entail certain risks not associated with investments in domestic securities, such as volatility of currency exchange rates, and in some cases, political and economic instability and relatively illiquid markets. Options trading involves risk and is not suitable for all investors. Fund performance includes reinvestment of dividends and capital gains. Since Inception, some of the Fund’s fees were waived or expenses reimbursed. In the absence of these waivers and reimbursements, performance figures would be lower.
On June 1, 1998, a limited partnership managed by the adviser reorganized into the Fund. The predecessor limited partnership maintained an investment objective and investment policies that were, in all material respects, equivalent to those of the Fund. The Fund’s performance for the periods before June 1, 1998 is that of the limited partnership and includes the expenses of the limited partnership. If the limited partnership’s performance had been readjusted to reflect the second year expenses of the Fund, the Fund’s performance for all the periods would have been lower. The limited partnership was not registered under the Investment Company Act of 1940 (“1940 Act”) and was not subject to certain investment limitations, diversification requirements, and other restrictions imposed by the 1940 Act and the Internal Revenue Code, which, if applicable, may have adversely affected its performance.
The MSCI World Index captures large and mid cap representation across 24 Developed Market countries, including the U.S. The MSCI World Index is unmanaged and does include the reinvestment of dividends, net of withholding taxes. One cannot invest directly in an index.
The views in this letter were those of the Fund manager as of December 31, 2012 and may not reflect the views of the manager on the date this letter is second published or anytime thereafter. These views are intended to assist shareholders of the Fund in understanding their investment and do not constitute investment advice.
| |
POLARIS GLOBAL VALUE FUND PERFORMANCE CHART AND ANALYSIS (Unaudited) DECEMBER 31, 2012 |
| |
The following chart reflects the change in the value of a hypothetical $10,000 investment, including reinvested dividends and distributions, in Polaris Global Value Fund (the “Fund”) compared with the performance of the benchmark, MSCI World Index, over the past ten fiscal years. The MSCI World Index measures the performance of a diverse range of 24 developed countries’ stock markets including the United States, Canada, Europe, the Middle East and the Pacific. The total return of the MSCI World Index includes the reinvestment of dividends and income. The total return of the Fund includes operating expenses that reduce returns, while the total return of the MSCI World Index does not include expenses. The Fund is professionally managed while the MSCI World Index is unmanaged and is not available for investment.
Comparison of Change in Value of a $10,000 Investment
Polaris Global Value Fund vs. MSCI World Index
Average Annual Total Returns Periods Ended December 31, 2012 | | One Year | | Five Year | | Ten Year |
| Polaris Global Value Fund | | 21.00 | % | | -0.46 | % | | 8.91 | % |
| MSCI World Index | | 15.83 | % | | -1.18 | % | | 7.51 | % |
Performance data quoted represents past performance and is no guarantee of future results. Current performance may be lower or higher than the performance data quoted. Investment return and principal value will fluctuate so that shares, when redeemed, may be worth more or less than original cost. For the most recent month-end performance, please call (888) 263-5594 or visit the Fund's website at www.polarisfunds.com. Shares redeemed or exchanged within 180 days of purchase will be charged a 1.00% redemption fee. As stated in the Fund's prospectus, the annual operating expense ratio (gross) is 1.36%. The performance table and graph do not reflect the deduction of taxes that a shareholder would pay on Fund distributions or the redemption of Fund shares. Returns greater than one year are annualized.
| |
POLARIS GLOBAL VALUE FUND SCHEDULE OF INVESTMENTS DECEMBER 31, 2012 |
| |
| | | | Security | | | | | | | | Security | | | |
| Shares | Description | Value | | Shares | Description | Value |
| Italy - 2.5% |
| Belgium - 1.4% | | | 114,389 | | Lottomatica Group SpA | | $ | 2,596,991 |
| | 15,936 | | Solvay SA, Class A | | $ | 2,300,148 | | | 283,950 | | Trevi Finanziaria Industriale SpA | | 1,514,192 |
| | | | | | | | | | | 4,111,183 |
| Canada - 1.6% | | Japan - 6.3% |
| | 85,437 | | Methanex Corp. | | | 2,721,066 | | | 90,900 | | Asahi Group Holdings, Ltd. | | 1,927,435 |
| | | | | | | 32,400 | | KDDI Corp. | | 2,277,555 |
| | | | | | | | | | 46,916 | | MEIJI Holdings Co., Ltd. | | 2,025,346 |
| Finland - 3.7% | | | 432,000 | | Nichirei Corp. | | 2,243,897 |
| | 39,488 | | Kone Oyj, Class B | | | 2,908,420 | | | 1,341,000 | | Showa Denko KK | | 2,027,714 |
| | 38,520 | | Konecranes Oyj | | | 1,299,077 | | | | 10,501,947 |
| | 103,010 | | YIT Oyj | | | 2,009,609 | | Norway - 1.5% |
| | | | 6,217,106 | | | 198,296 | | DNB ASA | | 2,511,815 |
| France - 5.1% | | | | |
| | 19,265 | | Christian Dior SA | | | 3,261,250 | | | | | | | | |
| | 106,100 | | Etablissements Maurel et Prom | | | 1,775,793 | | South Africa - 1.3% |
| | 42,941 | | Imerys SA | | | 2,731,410 | | | 50,270 | | Sasol, Ltd. | | | 2,151,337 |
| | 62,939 | | Transgene SA (a) | | | 671,257 | | | | | |
| | | | 8,439,710 | | | | | | | | |
| Germany - 8.9% | | South Korea - 2.5% |
| | 26,900 | | BASF SE | | | 2,526,300 | | | 2,907 | | Samsung Electronics Co., Ltd. | | | 4,132,783 |
| | 168,900 | | Deutsche Telekom AG | | | 1,916,167 | | | | | |
| | 37,600 | | Hannover Rueckversicherung AG | | | 2,926,194 | | | | | | | | |
| | 12,500 | | Muenchener Rueckversicherungs AG, Class R | | | 2,243,916 | | Sweden - 4.7% |
| | 77,500 | | Symrise AG | | | 2,774,272 | | | 305,200 | | Duni AB, Class A | | | 2,768,935 |
| | 54,216 | | Wincor Nixdorf AG | | | 2,536,889 | | | 89,902 | | Investor AB, Class B | | | 2,350,144 |
| | | | 14,923,738 | | | 78,200 | | Svenska Handelsbanken AB, Class A | | | 2,794,597 |
| Hong Kong - 1.0% | | | | | 7,913,676 |
| | 2,196,000 | | Guangdong Investment, Ltd. | | | 1,725,442 | | Switzerland - 1.4% |
| | | | | | | 37,600 | | Novartis AG | | | 2,361,690 |
| | | | | | | | | | | | |
| India - 0.9% | | | | | | | | |
| | 35,905 | | Infosys, Ltd., ADR | | | 1,518,781 | | Thailand - 1.2% |
| | | | | | | 921,550 | | Thai Oil PCL | | | 2,033,495 |
| | | | | | | | | | | | |
| Ireland - 4.1% | | | | | | | | |
| | 104,342 | | CRH PLC | | | 2,107,213 | | United Kingdom - 10.5% |
| | 2,265,677 | | Greencore Group PLC | | | 3,744,887 | | | 945,302 | | Barratt Developments PLC (a) | | | 3,187,897 |
| | 78,393 | | Smurfit Kappa Group PLC | | | 931,274 | | | 235,618 | | BBA Aviation PLC | | | 853,532 |
| | | | 6,783,374 | | | 188,588 | | Bellway PLC | | | 3,167,677 |
| Israel - 1.2% | | | 30,900 | | BHP Billiton PLC, ADR | | | 2,174,433 |
| | 52,800 | | Teva Pharmaceutical Industries, Ltd., ADR | | | 1,971,552 | | | 207,576 | | Persimmon PLC | | | 2,697,574 |
| | | | | | | 319,800 | | Rexam PLC | | | 2,265,016 |
| | | | | | | | | | 3,040,022 | | Taylor Wimpey PLC | | | 3,249,443 |
| | | | | | | | | | | | 17,595,572 |
| See Notes to Financial Statements. | 8 | |
| |
POLARIS GLOBAL VALUE FUND SCHEDULE OF INVESTMENTS DECEMBER 31, 2012 |
| |
| | | | Security | | | | | | | | Security | | Rate | | Maturity | | | | |
| | Shares | Description | Value | | Principal | Description | Value | |
| United States - 39.6% | | Short-Term Investments - 0.0% | |
| | 50,200 | | Allete, Inc. | | $ | 2,057,196 | | Certificates of Deposit - 0.0% | |
| | 185,050 | | Ameris Bancorp (a) | | 2,311,275 | | | 32,580 | | Middlesex Federal Savings Bank | | 0.50 | | 12/15/13 | | $ | 32,580 | |
| | 152,404 | | Astoria Financial Corp. | | 1,426,501 | | | 32,508 | | Stoneham Savings Bank | | 1.00 | | 11/24/13 | | | 32,508 | |
| | 171,420 | | BNC Bancorp | | 1,373,074 | | Total Certificates of Deposit | | | | |
| | 62,400 | | Brookline Bancorp, Inc. | | 530,400 | | (Cost $65,088) | | 65,088 | |
| | 139,467 | | Brooks Automation, Inc. | | 1,122,709 | | Total Short-Term Investments | | | |
| | 37,851 | | Carter's, Inc. (a) | | 2,106,408 | | (Cost $65,088) | | | 65,088 | |
| | 169,774 | | Colony Bankcorp, Inc. (a) | | 619,675 | | Total Investments – 99.4% | | | | |
| | 62,200 | | Forest Laboratories, Inc. (a) | | 2,196,904 | | (Cost $159,829,855)* | | $ | 166,031,229 | |
| | 538,514 | | Frontier Communications Corp. | | 2,304,840 | | Other Assets & Liabilities, Net – 0.6% | | | 971,768 | |
| | 27,667 | | General Dynamics Corp. | | 1,916,493 | | Net Assets – 100.0% | | $ | 167,002,997 | |
| | 37,400 | | H.J. Heinz Co. | | 2,157,232 | | | | | | | | | | | | | |
| | 94,038 | | Hewlett-Packard Co. | | 1,340,042 | | ADR | | American Depositary Receipt | | | | | | | | |
| | 90,924 | | Independent Bank Corp. | | 2,632,250 | | PCL | | Public Company Limited | | | | | | | | |
| | 112,063 | | International Bancshares Corp. | | 2,022,737 | | PLC | | Public Limited Company | | | | | | | | |
| | 179,565 | | Mac-Gray Corp. | | 2,253,541 | | (a) | | | Non-income producing security. | | | | | | | | |
| | 79,682 | | Marathon Oil Corp. | | 2,443,050 | | | | | | | | | | | | | |
| | 42,591 | | Marathon Petroleum Corp. | | 2,683,233 | | * Cost for federal income tax purposes is $160,167,670 and net unrealized appreciation consists of: | |
| | 68,000 | | Microsoft Corp. | | 1,817,640 | | Gross Unrealized Appreciation | | $ | 36,756,268 | |
| | 36,344 | | NextEra Energy, Inc. | | 2,514,641 | | Gross Unrealized Depreciation | | | (30,892,709 | ) |
| | 27,200 | | Peoples Bancorp, Inc. | | 555,696 | | Net Unrealized Appreciation | | $ | 5,863,559 | |
| | 18,865 | | Praxair, Inc. | | 2,064,774 | | | | | | | | | | | | | |
| | 42,933 | | Quest Diagnostics, Inc. | | 2,501,706 | | | | | | | | | | | | | |
| | 77,801 | | Questcor Pharmaceuticals, Inc. | | 2,078,843 | | | | | | | | | | | | | |
| | 177,097 | | Southwest Bancorp, Inc. (a) | | 1,983,486 | | | | | | | | | | | | | |
| | 32,755 | | The Chubb Corp. | | 2,467,107 | | | | | | | | | | | | | |
| | 26,100 | | The J.M. Smucker Co. | | 2,250,864 | | | | | | | | | | | | | |
| | 121,400 | | The Western Union Co. | | 1,652,254 | | | | | | | | | | | | | |
| | 45,684 | | UnitedHealth Group, Inc. | | 2,477,900 | | | | | | | | | | | | | |
| | 129,700 | | Univest Corp. of Pennsylvania | | 2,217,870 | | | | | | | | | | | | | |
| | 33,351 | | Verizon Communications, Inc. | | 1,443,098 | | | | | | | | | | | | | |
| | 119,838 | | Webster Financial Corp. | | 2,462,671 | | | | | | | | | | | | | |
| | 36,600 | | WellPoint, Inc. | | 2,229,672 | | | | | | | | | | | | | |
| | 269,200 | | Xerox Corp. | | 1,835,944 | | | | | | | | | | | | | |
| | | 66,051,726 | | | | | | | | | | | | | |
| Total Common Stock | | | | | | | | | | | | | | | | |
| (Cost $159,764,767) | | | 165,966,141 | | | | | | | | | | | | | |
| See Notes to Financial Statements. | 9 | |
| |
POLARIS GLOBAL VALUE FUND SCHEDULE OF INVESTMENTS DECEMBER 31, 2012 |
| |
The following is a summary of the inputs used to value the Fund’s investments and other financial instruments as of December 31, 2012.
The inputs or methodology used for valuing securities are not necessarily an indication of the risks associated with investing in those securities. For more information on valuation inputs, and their aggregation into the levels used in the tables below, please refer to the Security Valuation section in Note 2 of the accompanying Notes to Financial Statements.
| | Level 1 | | Level 2 | | Level 3 | | Total |
| Investments At Value |
| Common Stock | | | | | | | | | | | | | | | | |
| Belgium | | $ | 2,300,148 | | | $ | - | | | $ | - | | | $ | 2,300,148 | |
| Canada | | | 2,721,066 | | | | - | | | | - | | | | 2,721,066 | |
| Finland | | | 6,217,106 | | | | - | | | | - | | | | 6,217,106 | |
| France | | | 8,439,710 | | | | - | | | | - | | | | 8,439,710 | |
| Germany | | | 14,923,738 | | | | - | | | | - | | | | 14,923,738 | |
| Hong Kong | | | 1,725,442 | | | | - | | | | - | | | | 1,725,442 | |
| India | | | 1,518,781 | | | | - | | | | - | | | | 1,518,781 | |
| Ireland | | | 6,783,374 | | | | - | | | | - | | | | 6,783,374 | |
| Israel | | | 1,971,552 | | | | - | | | | - | | | | 1,971,552 | |
| Italy | | | 4,111,183 | | | | - | | | | - | | | | 4,111,183 | |
| Japan | | | 10,501,947 | | | | - | | | | - | | | | 10,501,947 | |
| Norway | | | 2,511,815 | | | | - | | | | - | | | | 2,511,815 | |
| South Africa | | | 2,151,337 | | | | - | | | | - | | | | 2,151,337 | |
| South Korea | | | 4,132,783 | | | | - | | | | - | | | | 4,132,783 | |
| Sweden | | | 7,913,676 | | | | - | | | | - | | | | 7,913,676 | |
| Switzerland | | | 2,361,690 | | | | - | | | | - | | | | 2,361,690 | |
| Thailand | | | - | | | | 2,033,495 | | | | - | | | | 2,033,495 | |
| United Kingdom | | | 17,595,572 | | | | - | | | | - | | | | 17,595,572 | |
| United States | | | 66,051,726 | | | | - | | | | - | | | | 66,051,726 | |
| Certificates of Deposit | | | - | | | | 65,088 | | | | - | | | | 65,088 | |
| Total Investments At Value | | $ | 163,932,646 | | | $ | 2,098,583 | | | $ | - | | | $ | 166,031,229 | |
There were no transfers between Level 1 and Level 2 for the year ended December 31, 2012.
| PORTFOLIO HOLDINGS | | |
| % of Total Investments | | |
| Consumer Discretionary | 13.9 | % |
| Consumer Staples | 8.7 | % |
| Energy | 6.7 | % |
| Financials | 20.1 | % |
| Health Care | 9.9 | % |
| Industrials | 7.7 | % |
| Information Technology | 9.6 | % |
| Materials | 14.8 | % |
| Telecommunication Services | 4.8 | % |
| Utilities | 3.8 | % |
| Short-Term Investments | 0.0 | % |
| | 100.0 | % |
| See Notes to Financial Statements. | 10 | |
| |
POLARIS GLOBAL VALUE FUND STATEMENT OF ASSETS AND LIABILITIES DECEMBER 31, 2012 |
| |
| ASSETS | | | | |
| | Total investments, at value (Cost $159,829,855) | | $ | 166,031,229 | |
| | Receivables: | | | | |
| | | Fund shares sold | | | 1,512 | |
| | | Investment securities sold | | | 1,481,734 | |
| | | Dividends and interest | | | 463,930 | |
| | Prepaid expenses | | | 8,267 | |
| Total Assets | | | 167,986,672 | |
| | | | | | | |
| LIABILITIES | | | | |
| | Payables: | | | | |
| | | Fund shares redeemed | | | 209,073 | |
| | | Distributions payable | | | 65,828 | |
| | | Foreign capital gains tax payable | | | 126,783 | |
| | | Due to custodian | | | 220,078 | |
| | Accrued Liabilities: | | | | |
| | Investment adviser fees | | | 274,732 | |
| | | Trustees’ fees and expenses | | | 80 | |
| | | Fund services fees | | | 32,003 | |
| | | Other expenses | | | 55,098 | |
| Total Liabilities | | | 983,675 | |
| | | | | | | |
| NET ASSETS | | $ | 167,002,997 | |
| | | | | | | |
| COMPONENTS OF NET ASSETS | | | | |
| | Paid-in capital | | $ | 276,004,886 | |
| | Undistributed net investment income | | | 2,148,133 | |
| | Accumulated net realized loss | | | (117,227,738 | ) |
| | Net unrealized appreciation | | | 6,077,716 | |
| NET ASSETS | | $ | 167,002,997 | |
| SHARES OF BENEFICIAL INTEREST AT NO PAR VALUE (UNLIMITED SHARES AUTHORIZED) | | | 10,968,648 | |
NET ASSET VALUE, OFFERING AND REDEMPTION PRICE PER SHARE* | | $ | 15.23 | |
| * | Shares redeemed or exchanged within 180 days of purchase are charged a 1.00% redemption fee. | |
| See Notes to Financial Statements. | 11 | |
| |
POLARIS GLOBAL VALUE FUND STATEMENT OF OPERATIONS YEAR ENDED DECEMBER 31, 2012 |
| |
| INVESTMENT INCOME | | | | |
| | Dividend income (Net of foreign withholding taxes of $324,755) | | $ | 4,403,995 | |
| | Interest income | | | 2,656 | |
| Total Investment Income | | | 4,406,651 | |
| | | | | |
| EXPENSES | | | | |
| | Investment adviser fees | | | 1,629,267 | |
| | Fund services fees | | | 382,915 | |
| | Custodian fees | | | 30,836 | |
| | Registration fees | | | 18,784 | |
| | Professional fees | | | 45,038 | |
| | Trustees' fees and expenses | | | 5,815 | |
| | Miscellaneous expenses | | | 104,023 | |
| Total Expenses | | | 2,216,678 | |
| | | | | | | |
| NET INVESTMENT INCOME | | | 2,189,973 | |
| | | | | | | |
| NET REALIZED AND UNREALIZED GAIN (LOSS) | | | | |
| | Net realized gain (loss) on: | | | | |
| | Investments | | | (4,608,030 | ) |
| | Foreign currency transactions | | | (42,866 | ) |
| | Net realized loss | | | (4,650,896 | ) |
| | Net change in unrealized appreciation (depreciation) on: | | | | |
| | Investments | | | 33,151,291 | |
| | Deferred foreign capital gains taxes | | | (43,290 | ) |
| | Foreign currency translations | | | 9,657 | |
| | Net change in unrealized appreciation (depreciation) | | | 33,117,658 | |
| NET REALIZED AND UNREALIZED GAIN | | | 28,466,762 | |
| INCREASE IN NET ASSETS FROM OPERATIONS | | $ | 30,656,735 | |
| | | | | | | |
| See Notes to Financial Statements. | 12 | |
| |
POLARIS GLOBAL VALUE FUND STATEMENTS OF CHANGES IN NET ASSETS |
| |
| | | | | For the Years Ended December 31, |
| | | | | 2012 | | | 2011 |
| OPERATIONS | | | | | | | | | |
| | Net investment income | | $ | 2,189,973 | | | | $ | 1,907,648 | |
| | Net realized gain (loss) | | | (4,650,896 | ) | | | | 5,051,482 | |
| | Net change in unrealized appreciation (depreciation) | | | 33,117,658 | | | | | (20,526,062 | ) |
| Increase (Decrease) in Net Assets Resulting from Operations | | | 30,656,735 | | | | | (13,566,932 | ) |
| | | | | | | | | | | | |
| DISTRIBUTIONS TO SHAREHOLDERS FROM | | | | | | | | | |
| | Net investment income | | | (1,747,553 | ) | | | | (1,595,224 | ) |
| | | | | | | | | | | | |
| CAPITAL SHARE TRANSACTIONS | | | | | | | | | |
| | Sale of shares | | | 8,666,895 | | | | | 7,887,984 | |
| | Reinvestment of distributions | | | 1,681,725 | | | | | 1,533,492 | |
| | Redemption of shares | | | (24,107,586 | ) | | | | (30,889,356 | ) |
| | Redemption fees | | | 4,091 | | | | | 5,524 | |
| Decrease in Net Assets from Capital Share Transactions | | | (13,754,875 | ) | | | | (21,462,356 | ) |
| Increase (Decrease) in Net Assets | | | 15,154,307 | | | | | (36,624,512 | ) |
| | | | | | | | | | | | |
| NET ASSETS | | | | | | | | | |
| | Beginning of Year | | | 151,848,690 | | | | | 188,473,202 | |
| | End of Year (Including line (a)) | | $ | 167,002,997 | | | | $ | 151,848,690 | |
| | | | | | | | | | | | |
| SHARE TRANSACTIONS | | | | | | | | | |
| | Sale of shares | | | 606,644 | | | | | 604,481 | |
| | Reinvestment of distributions | | | 110,422 | | | | | 120,558 | |
| | Redemption of shares | | | (1,684,135 | ) | | | | (2,251,882 | ) |
| Decrease in Shares | | | (967,069 | ) | | | | (1,526,843 | ) |
| | | | | | | | | | | | |
| (a) | Undistributed net investment income. | | $ | 2,148,133 | | | | $ | 1,738,468 | |
| See Notes to Financial Statements. | 13 | |
| |
POLARIS GLOBAL VALUE FUND FINANCIAL HIGHLIGHTS |
| |
These financial highlights reflect selected data for a share outstanding throughout each year. |
| | | For the Years Ended December 31, | |
| | | 2012 | | 2011 | | 2010 | | 2009 | | 2008 | |
| NET ASSET VALUE, Beginning | | | | | | | | | | | | | | | | | | | | |
| of Year | $ | 12.72 | | | $ | 14.00 | | | $ | 11.73 | | | $ | 8.66 | | | $ | 17.51 | | |
| INVESTMENT OPERATIONS | | | | | | | | | | | | | | | | | | | | |
| Net investment income (a) | | 0.19 | | | | 0.15 | | | | 0.11 | | | | 0.09 | | | | 0.25 | | |
| Net realized and unrealized gain (loss) | | 2.48 | | | | (1.29 | ) | | | 2.31 | | | | 2.98 | | | | (8.41 | ) | |
| Total from Investment Operations | | 2.67 | | | | (1.14 | ) | | | 2.42 | | | | 3.07 | | | | (8.16 | ) | |
| DISTRIBUTIONS TO | | | | | | | | | | | | | | | | | | | | |
| SHAREHOLDERS FROM | | | | | | | | | | | | | | | | | | | | |
| Net investment income | | (0.16 | ) | | | (0.14 | ) | | | (0.15 | ) | | | — | (b) | | (0.31 | ) | |
| Net realized gain | | — | | | | — | | | | — | | | | — | | | | (0.38 | ) | |
| Total Distributions to Shareholders | | (0.16 | ) | | | (0.14 | ) | | | (0.15 | ) | | | — | | | | (0.69 | ) | |
| REDEMPTION FEES (a) | | — | (b) | | — | (b) | | — | (b) | | — | (b) | | — | (b) |
| NET ASSET VALUE, End of Year | $ | 15.23 | | | $ | 12.72 | | | $ | 14.00 | | | $ | 11.73 | | | $ | 8.66 | | |
| TOTAL RETURN | | 21.00 | % | | (8.16 | )% | | 20.64 | % | | 35.46 | % | | (46.19 | )% |
| | | | | | | | | | | | | | | | | | | | | |
| RATIOS/SUPPLEMENTARY DATA | | | | | | | | | | | | | | | | | | | | |
| Net Assets at End of Year (000's omitted) | $167,003 | | | $151,849 | | | $188,473 | | | $191,398 | | | $176,263 | | |
| Ratios to Average Net Assets: | | | | | | | | | | | | | | | | | | | | |
| Net investment income | | 1.34 | % | | 1.10 | % | | 0.89 | % | | 0.91 | % | | 1.74 | % |
| Net expense | | 1.36 | % | | 1.36 | % | | 1.38 | % | | 1.45 | % | | 1.43 | % |
| Gross expense | | 1.36 | % | | 1.36 | % | | 1.39 | %(c) | 1.46 | %(c) | 1.43 | %(c) |
| PORTFOLIO TURNOVER RATE | | 14 | % | | 12 | % | | 10 | % | | 22 | % | | 16 | % |
| | | | | | | | | | | | | | | | | | | | | | |
| (a) | Calculated based on average shares outstanding during each year. |
| (b) | Less than $0.01 per share. |
| (c) | Reflects the expense ratio excluding any waivers and/or reimbursements. |
| See Notes to Financial Statements. | 14 | |
| |
POLARIS GLOBAL VALUE FUND NOTES TO FINANCIAL STATEMENTS DECEMBER 31, 2012 |
| |
Note 1. Organization
The Polaris Global Value Fund (the “Fund”) is a diversified portfolio of Forum Funds (the “Trust”). The Trust is a Delaware statutory trust that is registered as an open-end, management investment company under the Investment Company Act of 1940 (the “Act”), as amended. Under its Trust Instrument, the Trust is authorized to issue an unlimited number of the Fund’s shares of beneficial interest without par value. The Fund commenced operations June 1, 1998 after it acquired the net assets of Global Value Limited Partnership (the “Partnership”), in exchange for Fund shares. The Partnership commenced operations on July 31, 1989. The Fund seeks capital appreciation.
Note 2. Summary of Significant Accounting Policies
These financial statements are prepared in accordance with accounting principles generally accepted in the United States of America (“GAAP”), which require management to make estimates and assumptions that affect the reported amounts of assets and liabilities, the disclosure of contingent liabilities at the date of the financial statements, and the reported amounts of increase and decrease in net assets from operations during the fiscal year. Actual amounts could differ from those estimates. The following summarizes the significant accounting policies of the Fund:
Security Valuation – Exchange-traded securities and over-the-counter securities are valued using the last quoted sale or official closing price, provided by independent pricing services as of the close of trading on the market or exchange for which they are primarily traded, on each Fund business day. In the absence of a sale, such securities are valued at the mean of the last bid and ask price provided by independent pricing services. Non-exchange traded securities for which quotations are available are valued using the last quoted sales price, or in the absence of a sale at the mean of the last bid and ask prices provided by independent pricing services. Debt securities may be valued at prices supplied by a fund’s pricing agent based on broker or dealer supplied valuations or matrix pricing, a method of valuing securities by reference to the value of other securities with similar characteristics such as rating, interest rate and maturity. Forward currency contracts are generally valued at the mean of bid and ask prices for the time period interpolated from rates reported by an independent pricing service for proximate time periods. Shares of open-end mutual funds are valued at net asset value (“NAV”). Short-term investments that mature in 60 days or less may be valued at amortized cost.
The Fund values its investments at fair value pursuant to procedures adopted by the Trust's Board of Trustees (the "Board") if (1) market quotations are insufficient or not readily available or (2) the adviser believes that the values available are unreliable. The Trust’s Valuation Committee performs certain functions as they relate to the administration and oversight of the Fund’s valuation procedures. Under these procedures, the Valuation Committee convenes on a regular and ad-hoc basis to review such securities and considers a number of factors, including valuation methodologies and significant unobservable inputs, when arriving at fair value.
The Valuation Committee may work with an adviser to provide valuation inputs. In determining fair valuations, inputs may include market-based analytics which may consider related or comparable assets or liabilities, recent transactions, market multiples, book values and other relevant investment information. Adviser inputs may include an income-based approach in which the anticipated future cash flows of the investment are discounted in determining fair value. Discounts may also be applied based on the nature or duration of any restrictions on the disposition of the investments. The Valuation Committee performs regular reviews of valuation methodologies, key inputs and assumptions, disposition analysis and market activity.
| |
POLARIS GLOBAL VALUE FUND NOTES TO FINANCIAL STATEMENTS DECEMBER 31, 2012 |
| |
Fair valuation is based on subjective factors and, as a result, the fair value price of an investment may differ from the security’s market price and may not be the price at which the asset may be sold. Fair valuation could result in a different NAV than a NAV determined by using market quotes.
The Fund has a three-tier fair value hierarchy. The basis of the tiers is dependent upon the various “inputs” used to determine the value of the Fund’s investments. These inputs are summarized in the three broad levels listed below:
Level 1 — quoted prices in active markets for identical assets
Level 2 — other significant observable inputs (including quoted prices of similar securities, interest rates, prepayment speeds, credit risk, etc.)
Level 3 — significant unobservable inputs (including the Fund’s own assumptions in determining the fair value of investments)
The aggregate value by input level, as of December 31, 2012, for the Fund’s investments is included at the end of the Fund’s Schedule of Investments.
Security Transactions, Investment Income and Realized Gain and Loss – Investment transactions are accounted for on the trade date. Dividend income is recorded on the ex-dividend date. Foreign dividend income is recorded on the ex-dividend date or as soon as possible after the Fund determines the existence of a dividend declaration after exercising reasonable due diligence. Income and capital gains on some foreign securities may be subject to foreign withholding taxes, which are accrued as applicable. Interest income is recorded on an accrual basis. Premium is amortized and discount is accreted using the effective interest method. Identified cost of investments sold is used to determine the gain and loss for both financial statement and federal income tax purposes.
Foreign Currency Translations – Foreign currency amounts are translated into U.S. dollars as follows: (1) assets and liabilities at the rate of exchange at the end of the respective period; and (2) purchases and sales of securities and income and expenses at the rate of exchange prevailing on the dates of such transactions. The portion of the results of operations arising from changes in the exchange rates and the portion due to fluctuations arising from changes in the market prices of securities are not isolated. Such fluctuations are included with the net realized and unrealized gain or loss on investments.
Foreign Currency Transactions – The Fund may enter into transactions to purchase or sell foreign currency contracts and options on foreign currency. Forward currency contracts are agreements to exchange one currency for another at a future date and at a specified price. A fund may use forward currency contracts to facilitate transactions in foreign securities, to manage a fund’s foreign currency exposure and to protect the U.S. dollar value of its underlying portfolio securities against the effect of possible adverse movements in foreign exchange rates. These contracts are intrinsically valued daily based on forward rates, and a fund’s net equity therein, representing unrealized gain or loss on the contracts as measured by the difference between the forward foreign exchange rates at the dates of entry into the contracts and the forward rates at the reporting date, is recorded as a component of net asset value. These instruments involve market risk, credit risk, or both kinds of risks, in excess of the amount recognized in the Statement of Assets and Liabilities. Risks arise from the possible inability of counterparties to meet the terms of their contracts and from movement in currency and securities values and interest rates. Due to the risks associated with these transactions, a fund could incur losses up
| |
POLARIS GLOBAL VALUE FUND NOTES TO FINANCIAL STATEMENTS DECEMBER 31, 2012 |
| |
to the entire contract amount, which may exceed the net unrealized value included in its net asset value.
Distributions to Shareholders – Distributions to shareholders of net investment income and net capital gains, if any, are declared and paid at least annually. Distributions are based on amounts calculated in accordance with applicable federal income tax regulations, which may differ from GAAP. These differences are due primarily to differing treatments of income and gain on various investment securities held by the Fund, timing differences and differing characterizations of distributions made by the Fund.
Federal Taxes – The Fund intends to continue to qualify each year as a regulated investment company under Subchapter M of the Internal Revenue Code and to distribute all of its taxable income to shareholders. In addition, by distributing in each calendar year substantially all of its net investment income and capital gains, if any, the Fund will not be subject to a federal excise tax. Therefore, no federal income or excise tax provision is required. The Fund files a U.S. federal income and excise tax return as required. A fund’s federal income tax returns are subject to examination by the Internal Revenue Service for a period of three fiscal years after they are filed. As of December 31, 2012, there are no uncertain tax positions that would require financial statement recognition, de-recognition, or disclosure.
Income and Expense Allocation – The Trust accounts separately for the assets, liabilities and operations of each of its investment portfolios. Expenses that are directly attributable to more than one investment portfolio are allocated among the respective investment portfolios in an equitable manner.
Redemption Fees – A shareholder who redeems or exchanges shares within 180 days of purchase will incur a redemption fee of 1.00% of the current net asset value of shares redeemed or exchanged, subject to certain limitations. The fee is charged for the benefit of the remaining shareholders and will be paid to the Fund to help offset transaction costs. The fee is accounted for as an addition to paid-in capital. The Fund reserves the right to modify the terms of or terminate the fee at any time. There are limited exceptions to the imposition of the redemption fee.
Commitments and Contingencies – In the normal course of business, the Fund enters into contracts that provide general indemnifications by the Fund to the counterparty to the contract. The Fund’s maximum exposure under these arrangements is dependent on future claims that may be made against the Fund and, therefore, cannot be estimated; however, based on experience, the risk of loss from such claims is considered remote.
Note 3. Fees and Expenses
Investment Adviser – Polaris Capital Management, LLC (the “Adviser”) is the investment adviser to the Fund. Pursuant to an investment advisory agreement, the Adviser receives an advisory fee from the Fund at an annual rate of 1.00% of the Fund’s average daily net assets.
Shareholder Service Plan – The Trust has adopted a shareholder service plan for the Fund under which the Fund may reimburse the Fund’s administrator for amounts paid by the administrator for providing shareholder service activities that are not otherwise provided by the transfer agent. The Fund’s administrator may make such payments to various financial institutions, including the Adviser, that provide shareholder servicing to their customers invested in the Fund in amounts of up to 0.25% annually of the average daily net assets of the shares held by such customers. During the year ended December 31, 2012, the Fund did not make any payments under the shareholder service plan.
| |
POLARIS GLOBAL VALUE FUND NOTES TO FINANCIAL STATEMENTS DECEMBER 31, 2012 |
| |
Distribution – Foreside Fund Services, LLC serves as the Fund’s distributor (the “Distributor”). The Distributor receives no compensation from the Fund for its distribution services. The Distributor is not affiliated with the Adviser or Atlantic Fund Administration, LLC (d/b/a Atlantic Fund Services) (“Atlantic”) or their affiliates.
Other Service Providers – Atlantic provides fund accounting, fund administration, compliance and transfer agency services to the Fund. Atlantic also provides certain shareholder report production, and EDGAR conversion and filing services. Pursuant to an Atlantic services agreement, the Fund pays Atlantic customary fees for its services. Atlantic provides a Principal Executive Officer, a Principal Financial Officer, a Chief Compliance Officer, and an Anti-Money Laundering Officer to the Fund, as well as certain additional compliance support functions.
Trustees and Officers – The Trust pays each independent Trustee an annual retainer fee of $45,000 for service to the Trust ($66,000 for the Chairman). In addition, for the period ended March 31, 2012, the Chairman received a monthly stipend of $500 to cover certain expenses incurred in connection with his duties to the Trust. The stipend was discontinued April 1, 2012. The Trustees and Chairman may receive additional fees for special Board meetings. Each Trustee is also reimbursed for all reasonable out-of-pocket expenses incurred in connection with his duties as a Trustee, including travel and related expenses incurred in attending Board meetings. The amount of Trustees’ fees attributable to the Fund is disclosed in the Statement of Operations. Certain officers of the Trust are also officers or employees of the above named service providers, and during their terms of office received no compensation from the Fund.
Note 4. Security Transactions
The cost of purchases and proceeds from sales of investment securities (including maturities), other than short-term investments during the year ended December 31, 2012, were $22,663,247 and $34,636,788, respectively.
Note 5. Federal Income Tax and Investment Transactions
Distributions during the fiscal years ended as noted were characterized for tax purposes as follows:
| Ordinary Income | | $ | 1,747,553 | | $ | 1,595,224 |
As of December 31, 2012, distributable earnings (accumulated loss) on a tax basis were as follows:
| Undistributed Ordinary Income | | $ | 2,322,136 | |
| Capital and Other Losses | | | (117,063,926 | ) |
| Unrealized Appreciation | | | 5,739,901 | |
| Total | | $ | (109,001,889 | ) |
The difference between components of distributable earnings on a tax basis and the amounts reflected in the Statement of Assets and Liabilities are primarily due to wash sales and investments in passive foreign investment companies.
| |
POLARIS GLOBAL VALUE FUND NOTES TO FINANCIAL STATEMENTS DECEMBER 31, 2012 |
| |
As of December 31, 2012, capital loss carryforwards to offset future capital gains were as follows with the respective expiration dates:
| 2016 | | 2017 | | 2018 | |
| $ | 36,071,788 | | $ | 59,164,411 | | $ | 15,622,903 | |
As a result of the Regulated Investment Company Modernization Act of 2010, net capital losses realized on or after January 1, 2011 (effective date) may be carried forward indefinitely to offset future realized capital gains; however, post-effective losses must be used before pre-effective capital loss carryforwards with expiration dates. Therefore, it is possible that all or a portion of a fund’s pre-effective capital loss carryforwards could expire unused. In addition to the amounts noted in the table above, the Fund has $247,032 available short term capital loss carryforwards and $5,957,792 available long term capital loss carryforwards that have no expiration date.
On the Statement of Assets and Liabilities, as a result of permanent book to tax differences, certain amounts have been reclassified for the year ended December 31, 2012. The following reclassification was the result of currency gain/loss and passive foreign investment company transactions and has no impact on the net assets of the Fund.
| Accumulated Net Investment Income (Loss) | | $ | (32,755 | ) |
| Undistributed Net Realized Gain (Loss) | | | 32,755 | |
Note 6. Recent Accounting Pronouncements
In December 2011, FASB issued ASU No. 2011-11 “Disclosures about Offsetting Assets and Liabilities” requiring disclosure of both gross and net information related to offsetting and related arrangements enabling users of its financial statements to understand the effect of those arrangements on the entity’s financial position. The objective of this disclosure is to facilitate comparison between those entities that prepare their financial statements on the basis of U.S. GAAP and those entities that prepare their financial statements on the basis of IFRSs. ASU No. 2011-11 is effective for interim and annual periods beginning on or after January 1, 2013. Management is evaluating any impact ASU No. 2011-11 may have on the Fund’s financial statements.
Note 7. Subsequent Events
Subsequent events occurring after the date of this report through the date these financial statements were issued have been evaluated for potential impact and the Fund has had no such events.
| |
REPORT OF INDEPENDENT REGISTERED PUBLIC ACCOUNTING FIRM |
| |
To the Shareholders of Polaris Global Value Fund and the Board of Trustees of Forum Funds
We have audited the accompanying statement of assets and liabilities of Polaris Global Value Fund (the “Fund”), a series of shares of beneficial interest in the Forum Funds, including the schedule of investments, as of December 31, 2012, and the related statement of operations for the year then ended, the statements of changes in net assets for each of the years in the two year period then ended, and the financial highlights for each of the years in the five year period then ended. These financial statements and financial highlights are the responsibility of the Fund's management. Our responsibility is to express an opinion on these financial statements and financial highlights based on our audits.
We conducted our audits in accordance with the standards of the Public Company Accounting Oversight Board (United States). Those standards require that we plan and perform the audits to obtain reasonable assurance about whether the financial statements and financial highlights are free of material misstatement. An audit includes examining, on a test basis, evidence supporting the amounts and disclosures in the financial statements. Our procedures included confirmation of securities owned as of December 31, 2012 by correspondence with the custodian. An audit also includes assessing the accounting principles used and significant estimates made by management, as well as evaluating the overall financial statement presentation. We believe that our audits provide a reasonable basis for our opinion.
In our opinion, the financial statements and financial highlights referred to above present fairly, in all material respects, the financial position of Polaris Global Value Fund as of December 31, 2012, and the results of its operations for the year then ended, the changes in its net assets for each of the years in the two year period then ended and its financial highlights for each of the years in the five year period then ended, in conformity with accounting principles generally accepted in the United States of America.
BBD, LLP
Philadelphia, Pennsylvania
February 25, 2013
| |
POLARIS GLOBAL VALUE FUND ADDITIONAL INFORMATION (Unaudited) DECEMBER 31, 2012 |
| |
Proxy Voting Information
A description of the policies and procedures that the Fund uses to determine how to vote proxies relating to securities held in the Fund’s portfolio is available, without charge and upon request, by calling (888) 263-5594 or visit the Fund's website at www.polarisfunds.com and on the U.S. Securities and Exchange Commission’s (the “SEC”) website at www.sec.gov. The Fund’s proxy voting record for the most recent twelve-month period ended June 30 is available, without charge and upon request, by calling (888) 263-5594 or visit the Fund's website at www.polarisfunds.com and on the SEC’s website at www.sec.gov.
Availability of Quarterly Portfolio Schedules
The Fund files its complete schedule of portfolio holdings with the SEC for the first and third quarters of each fiscal year on Form N-Q. These filings are available, without charge and upon request on the SEC’s website at www.sec.gov or may be reviewed and copied at the SEC’s Public Reference Room in Washington, DC. Information on the operation of the Public Reference Room may be obtained by calling (800) SEC-0330.
Shareholder Expense Example
As a shareholder of the Fund, you incur two types of costs: (1) transaction costs, including redemption fees and exchange fees, and (2) ongoing costs, including management fees and other Fund expenses. This example is intended to help you understand your ongoing costs (in dollars) of investing in the Fund, and to compare these costs with the ongoing costs of investing in other mutual funds.
The example is based on an investment of $1,000 invested at the beginning of the period and held for the entire period from July 1, 2012, through December 31, 2012.
Actual Expenses – The first line of the table below provides information about actual account values and actual expenses. You may use the information in this line, together with the amount you invested, to estimate the expenses that you paid over the period. Simply divide your account value by $1,000 (for example, an $8,600 account value divided by $1,000 = 8.6), then multiply the result by the number in the first line under the heading entitled “Expenses Paid During Period” to estimate the expenses you paid on your account during the period.
Hypothetical Example for Comparison Purposes – The second line of the table below provides information about hypothetical account values and hypothetical expenses based on the Fund’s actual expense ratio and an assumed rate of return of 5% per year before expenses, which is not the Fund’s actual return. The hypothetical account values and expenses may not be used to estimate the actual ending account balance or expenses you paid for the period. You may use this information to compare the ongoing costs of investing in the Fund and other funds. To do so, compare this 5% hypothetical example with the 5% hypothetical examples that appear in the shareholder reports of other funds.
Please note that the expenses shown in the table are meant to highlight your ongoing costs only and do not reflect any transactional costs, such as redemption fees and exchange fees. Therefore, the second line of the table is useful in comparing ongoing costs only, and will not help you determine the relative total costs of owning different funds. In addition, if these transactional costs were included, your costs would have been higher.
| |
POLARIS GLOBAL VALUE FUND ADDITIONAL INFORMATION (Unaudited) DECEMBER 31, 2012 |
| |
| | Beginning | | Ending | | Expenses | | Annualized |
| | Account Value | | Account Value | | Paid During | | Expense |
| | July 1, 2012 | | December 31, 2012 | | Period* | | Ratio* |
| Actual | $ | 1,000.00 | | $ | 1,098.56 | | $ | 7.12 | | 1.35 | % |
| Hypothetical (5% return before taxes) | $ | 1,000.00 | | $ | 1,018.35 | | $ | 6.85 | | 1.35 | % |
| | | | | | | | | | | | |
| * | Expenses are equal to the Fund’s annualized expense ratio multiplied by the average account value over the period, multiplied by the number of days in the most recent fiscal half-year divided by 366 to reflect the half-year period. |
Federal Tax Status of Dividends Declared during the Tax Year
For federal income tax purposes, dividends from short-term capital gains are classified as ordinary income. The Fund designates 69.10% of its income dividend distributed as qualifying for the corporate dividends-received deduction (DRD) and 100.00% for the qualified dividend rate (QDI) as defined in Section 1(h)(11) of the Internal Revenue Code. The Fund also designates 0.07% as qualified interest income exempt from U.S. tax for foreign shareholders (QII).
Trustees and Officers of the Trust
The Board is responsible for oversight of the management of the Trust’s business affairs and of the exercise of all the Trust’s powers except those reserved for the shareholders. The following table provides information about each Trustee and certain officers of the Trust. Each Trustee and officer holds office until the person resigns, is removed, or is replaced. Unless otherwise noted, the persons have held their principal occupations for more than five years. The address for all Trustees and officers is Three Canal Plaza, Suite 600, Portland, Maine 04101. Mr. Keffer is considered an Interested Trustee due to his affiliation with Atlantic. The Fund’s Statement of Additional Information includes additional information about the Trustees and is available, without charge and upon request, by calling (888) 263-5594 or visit the Fund's website at www.polarisfunds.com.
| |
POLARIS GLOBAL VALUE FUND ADDITIONAL INFORMATION (Unaudited) DECEMBER 31, 2012 |
| |
| Name and Year of Birth | Position with the Trust | Length of Time Served | Principal Occupation(s) During Past Five Years | Number of Series of Trust Overseen by Trustee | Other Directorships Held by Trustee |
| Independent Trustees | | | | | |
J. Michael Parish Born: 1943 | Chairman of the Board; Trustee; Chairman, Nominating Committee and Qualified Legal Compliance Committee | Since 1989 (Chairman since 2004) | Retired since 2003. | 21 | 0 |
Costas Azariadis Born: 1943 | Trustee; Chairman, Valuation Committee | Since 1989 | Professor of Economics, Washington University since 2006. | 21 | 0 |
James C. Cheng Born: 1942 | Trustee; Chairman, Audit Committee | Since 1989 | President, Technology Marketing Associates (marketing company for small- and medium-sized businesses in New England) since 1991. | 21 | 0 |
David Tucker Born: 1958 | Trustee | Since 2011 | Director, Blue Sky Experience since 2008; Senior Vice President & General Counsel, American Century Companies 1998-2008. | 21 | Director, Forum ETF Trust |
| Interested Trustee | | | | | |
John Y. Keffer1 Born: 1942 | Trustee; Vice Chairman | Since 1989 | Chairman, Atlantic since 2008; President, Forum Foundation (a charitable organization) since 2005; President, Forum Trust, LLC (a non-depository trust company chartered in the State of Maine) since 1997. | 21 | Director, Wintergreen Fund, Inc.; Director, Forum ETF Trust |
1Atlantic is a subsidiary of Forum Holdings Corp. I, a Delaware corporation that is wholly owned by Mr. Keffer. |
| |
POLARIS GLOBAL VALUE FUND ADDITIONAL INFORMATION (Unaudited) DECEMBER 31, 2012 |
| |
| Name and Year of Birth | Position with the Trust | Length of Time Served | Principal Occupation(s) During Past Five Years | Number of Series of Trust Overseen by Trustee | Other Directorships Held by Trustee |
| Officers | | | | | |
Stacey E. Hong Born: 1966 | President; Principal Executive Officer | Since 2008 | President, Atlantic since 2008; Director, Consulting Services, Foreside Fund Services 2007. | N/A | N/A |
Karen Shaw Born: 1972 | Treasurer; Principal Financial Officer | Since 2008 | Senior Vice President, Atlantic since 2008; Vice President, Citigroup 2003-2008. | N/A | N/A |
David Faherty Born: 1970 | Vice President | Since 2009 | Senior Counsel, Atlantic since 2009; Vice President, Citi Fund Services Ohio, Inc. 2007-2009; Associate Counsel, Investors Bank & Trust Co. 2006-2007. | N/A | N/A |
Michael J. McKeen Born: 1971 | Vice President | Since 2009 | Senior Vice President, Atlantic since 2008; Vice President, Citigroup 2003-2008. | N/A | N/A |
Joshua LaPan Born: 1973 | Vice President | Since 2009 | Manager, Atlantic since 2008; Vice President, Citigroup 2003-2008. | N/A | N/A |
Timothy Bowden Born: 1969 | Vice President | Since 2009 | Manager, Atlantic since 2008; Vice President, Citigroup 2005-2008. | N/A | N/A |
Lina Bhatnagar Born: 1971 | Secretary | Since 2008 | Senior Administration Specialist, Atlantic since 2008; Regulatory Administration Specialist, Citigroup 2006-2008. | N/A | N/A |
ITEM 2. CODE OF ETHICS.
| (a) | As of the end of the period covered by this report, Forum Funds (the “Registrant”) has adopted a code of ethics, which applies to its Principal Executive Officer and Principal Financial Officer (the “Code of Ethics”). |
| (c) | There have been no amendments to the Registrant’s Code of Ethics during the period covered by this report. |
| (d) | There have been no waivers to the Registrant’s Code of Ethics during the period covered by this report. |
(f) (1) A copy of the Code of Ethics is being filed under Item 12(a) hereto.
ITEM 3. AUDIT COMMITTEE FINANCIAL EXPERT.
The Board of Trustees has determined that no member of the Audit Committee is an "audit committee financial expert" as that term is defined under applicable regulatory guidelines.
ITEM 4. PRINCIPAL ACCOUNTANT FEES AND SERVICES.
(a) Audit Fees - The aggregate fees billed for each of the last two fiscal years (the “Reporting Periods”) for professional services rendered by the Registrant’s principal accountant for the audit of the Registrant’s annual financial statements, or services that are normally provided by the principal accountant in connection with the statutory and regulatory filings or engagements for the Reporting Periods, were $42,000 in 2011 and $43,300 in 2012.
(b) Audit-Related Fees – The aggregate fees billed in the Reporting Periods for assurance and related services rendered by the principal accountant that were reasonably related to the performance of the audit of the Registrant’s financial statements and are not reported under paragraph (a) of this Item 4 were $0 in 2011 and $0 in 2012.
(c) Tax Fees - The aggregate fees billed in the Reporting Periods for professional services rendered by the principal accountant to the Registrant for tax compliance, tax advice and tax planning were $9,000 in 2011 and $9,000 in 2012. These services consisted of review or preparation of U.S. federal, state, local and excise tax returns.
(d) All Other Fees - The aggregate fees billed in the Reporting Periods for products and services provided by the principal accountant to the Registrant, other than the services reported in paragraphs (a) through (c) of this Item, were $0 in 2011 and $0 in 2012.
(e) (1) The Audit Committee reviews and approves in advance all audit and “permissible non-audit services” (as that term is defined by the rules and regulations of the Securities and Exchange Commission) to be rendered to a series of the Registrant (each, a “Series”). In addition, the Audit Committee reviews and approves in advance all “permissible non-audit services” to be provided to an investment adviser (not including any sub-adviser) of a Series, or an affiliate of such investment adviser, that is controlling, controlled by or under common control with the investment adviser and provides on-going services to the Registrant (“Affiliate”), by the Series’ principal accountant if the engagement relates directly to the operations and financial reporting of the Series. The Audit Committee considers whether fees paid by a Series’ investment adviser or an Affiliate to the Series’ principal accountant for audit and permissible non-audit services are consistent with the principal accountant’s independence.
(e) (2) No services included in (b) - (d) above were approved pursuant to paragraph (c)(7)(i)(C) of Rule 2-01 of Regulation S-X.
(f) Not applicable
(g) The aggregate non-audit fees billed by the principal accountant for services rendered to the Registrant for the Reporting Periods were $0 in 2010 and $0 in 2011. There were no fees billed in either of the Reporting Periods for non-audit services rendered by the principal accountant to the Registrant’s investment adviser or any Affiliate.
(h) During the Reporting Period, the Registrant's principal accountant provided no non-audit services to the investment advisers or any entity controlling, controlled by or under common control with the investment advisers to the series of the Registrant to which this report relates.
ITEM 5. AUDIT COMMITTEE OF LISTED REGISTRANTS.
Not applicable.
ITEM 6. INVESTMENTS.
| (a) | Included as part of report to shareholders under Item 1. |
ITEM 7. DISCLOSURE OF PROXY VOTING POLICIES AND PROCEDURES FOR CLOSED-END
MANAGEMENT INVESTMENT COMPANIES.
Not applicable.
ITEM 8. PORTFOLIO MANAGERS OF CLOSED-END MANAGEMENT INVESTMENT COMPANIES.
Not applicable.
ITEM 9. PURCHASES OF EQUITY SECURITIES BY CLOSED-END MANAGEMENT INVESTMENT COMPANY AND AFFILIATED PURCHASERS.
Not applicable.
ITEM 10. SUBMISSION OF MATTERS TO A VOTE OF SECURITY HOLDERS
The Registrant does not accept nominees to the board of trustees from shareholders.
ITEM 11. CONTROLS AND PROCEDURES
(a) The Registrant’s Principal Executive Officer and Principal Financial Officer have concluded that the Registrant’s disclosure controls and procedures (as defined in Rule 30a-3(c) under the Investment Company Act of 1940 (the “Act”)) are effective, based on their evaluation of the controls and procedures required by Rule 30a-3(b) under the Act and Rules 13a-15(b) or 15d-15(b) under the Securities Exchange Act of 1934, as of a date within 90 days of the filing date of this report.
(b) There were no changes in the Registrant’s internal control over financial reporting (as defined in
Rule 30a-3(d) under the Act) that occurred during the second fiscal quarter of the period covered by this report that have materially affected, or are reasonably likely to materially affect, the Registrant’s internal control over financial reporting.
ITEM 12. EXHIBITS.
(a)(1) Code of Ethics (Exhibit filed herewith).
(a)(2) Certifications pursuant to Rule 30a-2(a) of the Act, and Section 302 of the Sarbanes-Oxley Act of 2002. (Exhibits filed herewith)
(a)(3) Not applicable.
(b) Certifications pursuant to Rule 30a-2(b) of the Act, and Section 906 of the Sarbanes-Oxley Act of 2002. (Exhibit filed herewith)
SIGNATURES
Pursuant to the requirements of the Securities Exchange Act of 1934 and the Investment Company Act of 1940, the Registrant has duly caused this report to be signed on its behalf by the undersigned, thereunto duly authorized.
Registrant Forum Funds
| By | /s/ Stacey E. Hong | |
| | Stacey E. Hong, Principal Executive Officer | |
| | | |
| Date | February 19, 2013 | |
Pursuant to the requirements of the Securities Exchange Act of 1934 and the Investment Company Act of 1940, this report has been signed below by the following persons on behalf of the Registrant and in the capacities and on the dates indicated.
| By | /s/ Stacey E. Hong | |
| | Stacey E. Hong, Principal Executive Officer | |
| | | |
| Date | February 19, 2013 | |
| By | /s/ Karen Shaw | |
| | Karen Shaw, Principal Financial Officer | |
| | | |
| Date | February 19, 2013 | |