As filed with the Securities and Exchange Commission on August 20, 2013
UNITED STATES
SECURITIES AND EXCHANGE COMMISSION
WASHINGTON, D.C. 20549
FORM N-CSR
CERTIFIED SHAREHOLDER REPORT OF REGISTERED MANAGEMENT
INVESTMENT COMPANIES
Investment Company Act file number 811-03023
FORUM FUNDS
Three Canal Plaza, Suite 600
Portland, Maine 04101
Stacey E. Hong, Principal Executive Officer
Three Canal Plaza, Suite 600
Portland, Maine 04101
207-347-2000
Date of fiscal year end: June 30
Date of reporting period: July 1, 2012 – June 30, 2013
ITEM 1. REPORT TO STOCKHOLDERS.
Annual Report
June 30, 2013
Fund Adviser:
Auxier Asset Management LLC
5285 Meadows Road
Suite 333
Lake Oswego, Oregon 97035
Toll Free: (877) 3AUXIER or (877) 328-9437
| |
AUXIER FOCUS FUND A MESSAGE TO OUR SHAREHOLDERS JUNE 30, 2013 |
| |
AUXIER FOCUS FUND
PERFORMANCE UPDATE
June 30, 2013
| | ANNUALIZED | |
| | | Inception * | Ten Year | Five Year | Three Year | One Year | |
| | Auxier Focus Fund Investor Class Shares | 7.06% | 7.74% | 8.17% | 13.74% | 15.06% | |
| | S&P 500 Index | 2.87% | 7.30% | 7.01% | 18.45% | 20.60% | |
| | CUMULATIVE | |
| | | Inception * | Ten Year | Five Year | Three Year | One Year | |
| | Auxier Focus Fund Investor Class Shares | 159.50% | 110.76% | 48.11% | 47.15% | 15.06% | |
| | S&P 500 Index | 48.52% | 102.25% | 40.32% | 66.20% | 20.60% | |
| | * Fund inception: July 9, 1999 | | | | | |
Performance data quoted represents past performance and is no guarantee of future results. Current performance may be lower or higher than the performance data quoted. Investment return and principal value will fluctuate so that an investor's shares, when redeemed, may be worth more or less than original cost. As stated in the current prospectus, the Fund’s Investor Class Share’s annual operating expense ratio (gross) is 1.29%. The Fund’s adviser has contractually agreed to reduce a portion of its fee and reimburse Fund expenses to limit total annual operating expenses at 1.25%, which is in effect until October 31, 2015. Other share classes may vary. The Fund charges a 2.0% redemption fee on shares redeemed within six months of purchase. For the most recent month-end performance, please call (877)328-9437 or visit the Fund’s website at www.auxierasset.com. The recent growth rate in the stock market has helped to produce short-term returns that are not typical and may not continue in the future.
Summer 2013 Market Commentary
Auxier Focus Fund returned 2.03% for second quarter 2013 and 11.79 % for the six months through June 30. The Fund ended the quarter with 84.7% in stocks, 4.1% in bonds and 11.2% in cash. Our stockholdings gained 3.55% for the quarter and 15% for the first half. These returns beat the Standard and Poor’s 500’s (S&P) corresponding 2.91% for the quarter and 13.82%. Since inception in 1999 the Fund’s cumulative return is 159.50%, three times the S&P’s corresponding 48.52%, despite the index’s much higher risk profile. While the S&P is always fully invested in 500 stocks, Auxier Focus’s sturdier allocation averages 77% in stocks.
Commodities as measured by the Dow Jones UBS Commodity Index continued to correct, dropping 9.45% for the quarter. Gold dropped 23 %. The long boom in commodities (over 115 months) brought with it higher levels of debt that tend to accelerate the price declines during corrections. Global production has clearly caught up with demand. Reduced commodity speculation and lower raw material costs typically are favorable for the quality businesses we own.
Bonds as measured by the Lipper Intermediate Investment Grade Index declined in price 2.73% for the quarter. Bond yields have dropped over 85% since their peak some 32 years ago. Historically, the bond market has run in 30-35 year cycles, and we may be embarking on a new cycle of rising rates. Investors often forget that a normally functioning bond market (i.e., not manipulated by the Federal Reserve’s current policies) can be just as volatile as the stock market. If the yield on 10-year Treasury notes rose to the median yield since 2000, 4.27%, investors could suffer losses in bond principal of greater than 20%. In June, investors pulled over $79 billion from bond funds. Given the historic high prices and the dearth of yield, many bonds, like commodities, can now be classified as “speculative.” Risk tends to be correlated with the degree of overvaluation of an asset class. The Fed’s easy-money mandates have led investors to “underprice risk.” For retirees who typically invest for income, it is critical that they are overcompensated for the risk taken. One example: many so-called
| |
AUXIER FOCUS FUND A MESSAGE TO OUR SHAREHOLDERS |
| |
leveraged bond funds (closed-end funds that borrow to enhance returns) suffered 10-15% price declines over just a four-week period.
Where We Find Value Today
We aim to deploy capital at compelling prices created when a stock appears “hopelessly out of favor,” and then harvest fully valued shares in times of “euphoria.” Many of the positive contributors in the quarter were in healthcare names (WellPoint, Hospira, UnitedHealth, Health Management Associates) that were purchased over eighteen months ago at the height of panic and uncertainty surrounding ObamaCare. Extremely depressed price points allowed us to enjoy meaningful upside just to a mean valuation. Another example is H&R Block, which had dropped to an historic low price as the company lost its way through “diworsification.” Then management intensely refocused the business on taxes, and the stock has more than doubled from a very low base.
| Top Holdings on 06/30/2013 | % Assets |
| Pepsico | 3.6 |
| Molson Coors Brewing | 3.5 |
| Tesco | 3.1 |
| Hospira | 2.5 |
| Bank of New York Mellon | 2.2 |
| BP | 2.1 |
| America Movil ADR | 2.0 |
| Merck & Co. | 2.0 |
| Procter & Gamble | 1.9 |
| Microsoft | 1.9 |
When investing in new positions, we are often buying at progressively weaker prices, thereby hurting our short-term performance. We are now finding bargains in quality businesses temporarily weighed down by financial woes in Europe and the UK. Some of the finest grocers in the world can be found in Europe. We have been investing in solid but struggling franchises like Tesco, the leading grocer in the UK. Similar to H&R Block, Tesco lost its way and over-expanded. But now the company is working hard to refocus on their customer. The European telecom industry seems poised for widespread consolidation. Among global players well-positioned in Europe, we have found enticing recessionary valuations in Telefonica (based in Spain) and America Movil (Mexico). We are probably early but after 30 years of weathering recessions and financial panics, we prefer investments subject to time risk, rather than price risk, as we patiently await the upside of pent-up demand being released from the grip of austerity.
Trends That Are Investors’ Friends
There’s lots of potential fire power to fuel meaningful mergers and acquisitions. U.S. corporations are sitting on close to $1 trillion in cash at a time when revenue growth is sluggish. Banks have over $1.6 trillion in reserves. The price of crude oil, one major commodity that’s bucking the global correction, is vulnerable. Worldwide drilling rates are nearing 30-year highs, according to Schlumberger. And technology is in place for oil to tank as well. Additionally, capital spending on fixed investments in the U.S. stands at a 50-year low versus GDP. Rising interest rates could present problems. But they ironically could help strengthen the economy and lending levels because banks would be better compensated for the risk. An increase in net interest margins could expand credit, especially to cash-strapped small businesses. Conventional wisdom holds that higher rates are bad for stocks. But in 1987 long term bond yields spiked from 7% to 10% in just eight months, and yet the stock market gained over 40% before correcting big time on October 19 (aka Black Monday). This untapped lending potential could act as a huge stimulant when that money enters the real economy.
Opportunity abounds today for the dedicated business analyst armed with the right temperament. Great management teams can find ways to build customer value through innovation and execution. Human nature, together with the emotions of fear and greed, will always conspire to create tremendous bargains in the auction markets. Globally, there are more democracies than ever before in history, setting the stage for more market-based reform. Mexico is privatizing its energy industry (the world’s fourth largest in proven reserves) and encouraging competition in telecom and real estate. Even Cuba is introducing more market solutions to boost stagnant standards of living. Communications transparency is educating the masses about the inherent fallacy of centrally planned capital allocation. Look no further than China’s state-directed investment policies, which have contributed to a loss in excess of $700 billion in market value in the past few years. Contrast China’s business bureaucrats with history’s outstanding corporate capital allocators such as Henry Singleton of Teledyne and Tom Murphy of Capital Cities/ABC, both of whom excelled in the humility of decentralization. Hopefully more governments will understand the dangers of state controlled economies.
| |
AUXIER FOCUS FUND A MESSAGE TO OUR SHAREHOLDERS |
| |
In closing, a wise investor once told me that the key to capturing the power of long-term compounding was to avoid speculative bubbles and the valuations they foster. Over the 14-year history of Auxier Focus, we have had to deal with successive technology, housing and commodity booms/busts. The next bubble to pop could be bonds. Unfortunately, over 70% of the world’s liquid assets are held in fixed income securities widely perceived as “safe.” In time, that money should increasingly shift to more productive assets and businesses that can better cope with the now hidden risks of bonds—inflation and diminishing purchasing power.
We appreciate your trust,
Jeff Auxier
Before investing you should carefully consider the Fund’s investment objectives, risks, charges and expenses. This and other information is in the prospectus, a copy of which may be obtained by calling (877) 328-9437 or visiting the Fund’s website. Please read the prospectus carefully before you invest.
Fund returns (i) assume the reinvestment of all dividends and capital gain distributions and (ii) would have been lower during the period if certain fees and expenses had not been waived. Performance shown is for the Fund’s Investor Class shares; returns for other share classes will vary. Performance for Investor Class shares for periods prior to December 10, 2004 reflects performance of the applicable share class of Auxier Focus Fund, a series of Unified Series Trust (the “Predecessor Fund”). Prior to January 3, 2003, the Predecessor Fund was a series of Ameriprime Funds. The performance of the Fund’s Investor Class shares for the period prior to December 10, 2004 reflects the expenses of the Predecessor Fund.
The Fund may invest in value and/or growth stocks. Investments in value stocks are subject to risk that their intrinsic value may never be realized and investments in growth stocks may be susceptible to rapid price swings, especially during periods of economic uncertainty. In addition, the Fund may invest in mid-sized companies which generally carry greater risk than is customarily associated with larger companies. Moreover, if the Fund's portfolio is overweighted in a sector, any negative development affecting that sector will have a greater impact on the Fund than a fund that is not overweighted in that sector. An increase in interest rates typically causes a fall in the value of a debt security (Fixed-Income Securities Risk) with corresponding changes to the Fund’s value. Foreign securities are subject to additional risks including international trade, currency, political, regulatory and diplomatic risks.
The S&P 500 Index is a broad-based, unmanaged measurement of changes in stock market conditions based on 500 widely held common stocks. The Dow Jones UBS Commodity Index is a broadly diversified index that allows investors to track commodity futures through a single, simple measure. The index is composed of futures contracts on physical commodities. The Lipper Intermediate Investment Grade Index is an unmanaged index considered representative of intermediate investment grade debt funds tracked by Lipper. One cannot invest directly in an index.
The recent growth rate in the stock market has helped to produce short-term returns that are not typical and may not continue in the future.
The views in this shareholder letter were those of the Fund Manager as of the letter’s publication date and may not reflect his views on the date this letter is first distributed or anytime thereafter. These views are intended to assist readers in understanding the Fund’s investment methodology and do not constitute investment advice.
| |
AUXIER FOCUS FUND PERFORMANCE CHART AND ANALYSIS (Unaudited) |
| |
The following chart reflects the change in the value of a hypothetical $10,000 investment in Investor Shares, including reinvested dividends and distributions, in the Fund compared with the performance of the benchmark, the S&P 500, over the past ten fiscal years. The S&P 500 is a broad-based, unmanaged measurement of changes in stock market conditions based on the average of 500 widely held common stocks. The total return of the Fund's classes includes the maximum sales charge of 5.75% (A Shares only) and operating expenses that reduce returns, while the total return of the S&P 500 does not include the effect of sales charges and expenses. A Shares are subject to a 1.00% contingent deferred sales charge on shares purchased without an initial sales charge and redeemed less than one year after purchase. The total return of the S&P 500 includes the reinvestment of dividends and income. The total return of the Fund includes operating expenses that reduce returns, while the total return of the S&P 500 does not include expenses. The Fund is professionally managed while the S&P 500 is unmanaged and is not available for investment.

Average Annual Total Returns Periods Ended June 30, 2013: | | 1 Year | | 5 Years | | 10 Years | | Since Inception(1) |
| Investor Shares | | 15.06 | % | | 8.17 | % | | 7.74 | % | | 7.06 | % |
| S&P 500 Index (Since July 9, 2009) | | 20.60 | % | | 7.01 | % | | 7.30 | % | | 2.87 | % |
A Shares (with sales charge)(2)(3) | | 8.45 | % | | 6.90 | % | | 7.10 | % | | 6.61 | % |
Institutional Shares(3) | | 15.28 | % | | 8.23 | % | | 7.77 | % | | 7.08 | % |
| (1) | Investor, A Shares and Institutional Shares commenced operations on July 9, 1999, July 8, 2005, and May 9, 2012, respectively. |
| (2) | Due to shareholder redemptions on August 21, 2005, net assets of the class were zero from the close of business on that date until September 22, 2005. Financial information presented for the period August 21, 2005 to September 22, 2005 reflects performance of Investor Shares of the Fund. |
| (3) | For A Shares and Institutional Shares, performance for the 5-year, 10-year and since inception periods are blended average annual returns which include the returns of the Investor Shares prior to commencement of operations of the A Shares and Institutional Shares. |
Performance data quoted represents past performance and is no guarantee of future results. Current performance may be lower or higher than the performance data quoted. Investment return and principal value will fluctuate so that shares, when redeemed, may be worth more or less than original cost. For the most recent month-end performance, please visit the website of the Fund's investment adviser at www.auxierasset.com or call (877) 328-9437. As stated in the Fund's prospectus, the annual operating expense ratios (gross) for Investor Shares, A Shares and Institutional Shares, respectively are 1.29%, 1.65% and 1.76%, respectively. However, the Fund's adviser has agreed to contractually reduce a portion of its fees and to reimburse expenses such that total operating expenses do not exceed 1.25%, 1.25% and 1.00% for Investor Shares, A Shares and Institutional Shares, respectively, through at least October 31, 2015. Shares redeemed or exchanged within 180 days of purchase will be charged a 2.00% redemption fee. The performance table and graph do not reflect the deduction of taxes that a shareholder would pay on Fund distributions or the redemption of Fund shares. Returns greater than one year are annualized.
Performance for Investor Shares for periods prior to December 10, 2004, reflects performance and expenses of Auxier Focus Fund, a series of Unified Series Trust (the “Predecessor Fund”). Prior to January 3, 2003, the Predecessor Fund was a series of Ameriprime Funds.
| |
AUXIER FOCUS FUND SCHEDULE OF INVESTMENTS |
| |
| | Shares | | Security Description | | Value | |
| Common Stock - 84.3% |
| Communications - 5.8% |
| | 267,500 | | America Movil SAB de CV, ADR | $ | 5,818,125 | |
| | 276,750 | | Corning, Inc. | | 3,938,153 | |
| | 15,499 | | DIRECTV (a) | | 955,048 | |
| | 10,000 | | News Corp., Class A | | 326,000 | |
| | 455,505 | | Oi SA, Preference Shares, ADR | | 819,909 | |
| | 35,794 | | Oi SA, ADR | | 70,156 | |
| | 337,150 | | Telefonica SA, ADR (a) | | 4,318,891 | |
| | 3,000 | | Viacom, Inc., Class B | | 204,150 | |
| | | 16,450,432 | |
| Consumer Discretionary - 11.3% |
| | 132,579 | | Apollo Group, Inc., Class A (a) | | 2,349,300 | |
| | 136,150 | | Arcos Dorados Holdings, Inc., Class A | | 1,590,232 | |
| | 45,477 | | Bridgepoint Education, Inc. (a) | | 553,910 | |
| | 39,380 | | Coach, Inc. | | 2,248,204 | |
| | 37,860 | | Comcast Corp., Class A | | 1,585,577 | |
| | 2,122 | | CST Brands, Inc. (a) | | 65,379 | |
| | 51,490 | | CVS Caremark Corp. | | 2,944,198 | |
| | 2,297 | | Discovery Communications, Inc., Class A (a) | | 177,351 | |
| | 2,297 | | Discovery Communications, Inc., Class C (a) | | 160,009 | |
| | 15,887 | | Gruma S.A.B. de C.V., ADR (a) | | 289,779 | |
| | 176,090 | | H&R Block, Inc. | | 4,886,497 | |
| | 1,100 | | ITT Educational Services, Inc. (a) | | 26,840 | |
| | 2,640 | | Jamba, Inc. (a) | | 39,415 | |
| | 241,878 | | Lincoln Educational Services Corp. | | 1,274,697 | |
| | 28,000 | | Lowe's Cos., Inc. | | 1,145,200 | |
| | 12,750 | | McDonald's Corp. | | 1,262,250 | |
| | 37,650 | | Newell Rubbermaid, Inc. | | 988,313 | |
| | 9,800 | | NIKE, Inc., Class B | | 624,064 | |
| | 3,250 | | Sally Beauty Holdings, Inc. (a) | | 101,075 | |
| | 3,884 | | The Andersons, Inc. | | 206,590 | |
| | 9,925 | | The Home Depot, Inc. | | 768,890 | |
| | 290 | | Time Warner Cable, Inc. | | 32,619 | |
| | 12,650 | | Time Warner, Inc. | | 731,423 | |
| | 21,608 | | Universal Technical Institute, Inc. | | 223,211 | |
| | 19,160 | | Value Line, Inc. | | 162,860 | |
| | 62,000 | | Wal-Mart Stores, Inc. | | 4,618,380 | |
| | 52,552 | | Weight Watchers International, Inc. | | 2,417,392 | |
| | 8,600 | | Yum! Brands, Inc. | | 596,324 | |
| | | 32,069,979 | |
| Consumer Staples - 30.0% |
| | 42,600 | | AbbVie, Inc. | | 1,761,084 | |
| | 11,050 | | Alkermes PLC (a) | | 316,914 | |
| | 451,578 | | Alliance One International, Inc. (a) | | 1,715,996 | |
| | 62,500 | | Altria Group, Inc. | | 2,186,875 | |
| | 187,002 | | Avon Products, Inc. | | 3,932,652 | |
| | 19,200 | | Baxter International, Inc. | | 1,329,984 | |
| | 15,100 | | British American Tobacco PLC, ADR | | 1,554,394 | |
| | 13,200 | | Coca-Cola HBC AG, ADR | | 308,616 | |
| | 3,404 | | Columbia Sportswear Co. | | 213,261 | |
| | 9,375 | | Diageo PLC, ADR | | 1,077,656 | |
| | 48,050 | | Dr. Pepper Snapple Group, Inc. | | 2,206,937 | |
| | 49,228 | | Express Scripts Holding Co. (a) | | 3,036,875 | |
| | 182,889 | | Hospira, Inc. (a) | | 7,006,478 | |
| | 20,100 | | Kelly Services, Inc., Class A | | 351,147 | |
| | 3,620 | | Kraft Foods Group, Inc. | | 202,250 | |
| | 4,450 | | Manpowergroup, Inc. | | 243,860 | |
| | 208,132 | | Molson Coors Brewing Co., Class B | | 9,961,198 | |
| | 16,862 | | Mondelez International, Inc., Class A | | 481,073 | |
| | 15,600 | | Monster Beverage Corp. (a) | | 948,012 | |
| | 3,760 | | National Beverage Corp. (a) | | 65,687 | |
| | 100 | | Nestle SA, ADR | | 6,578 | |
| | 43,052 | | Paychex, Inc. | | 1,572,259 | |
| | 125,400 | | PepsiCo, Inc. | | 10,256,466 | |
| | 62,850 | | Philip Morris International, Inc. | | 5,444,067 | |
| | 109,029 | | PRGX Global, Inc. (a) | | 598,569 | |
| | 583,991 | | Tesco PLC, ADR | | 8,905,863 | |
| | 67,500 | | The Coca-Cola Co. | | 2,707,425 | |
| | 1,500 | | The JM Smucker Co. | | 154,725 | |
| | 119,084 | | The Kroger Co. | | 4,113,161 | |
| | 71,975 | | The Procter & Gamble Co. | | 5,541,355 | |
| | 206,240 | | The Western Union Co. | | 3,528,766 | |
| | 99,000 | | Unilever NV, ADR | | 3,891,690 | |
| | | 85,621,873 | |
| Energy - 4.4% |
| | 4,425 | | Apache Corp. | | 370,948 | |
| | 143,710 | | BP PLC, ADR | | 5,998,455 | |
| | 16,750 | | Chevron Corp. | | 1,982,195 | |
| | 15,600 | | ConocoPhillips | | 943,800 | |
| | 10,200 | | Exxon Mobil Corp. | | 921,570 | |
| | 800 | | Lukoil OAO, ADR | | 46,120 | |
| | 11,700 | | Petroleo Brasileiro SA, ADR | | 157,014 | |
| | 7,800 | | Phillips 66 | | 459,498 | |
| | 22,550 | | Transocean, Ltd. | | 1,081,273 | |
| | 19,100 | | Valero Energy Corp. | | 664,107 | |
| | | 12,624,980 | |
| Financials - 11.8% |
| | 42,250 | | Aflac, Inc. | | 2,455,570 | |
| | 39,000 | | American International Group, Inc. (a) | | 1,743,300 | |
| | 1,280 | | Ameriprise Financial, Inc. | | 103,526 | |
| | 179,083 | | Bank of America Corp. | | 2,303,007 | |
| | 16,000 | | Berkshire Hathaway, Inc., Class B (a) | | 1,790,720 | |
| | 76,724 | | Central Pacific Financial Corp. (a) | | 1,381,032 | |
| | 26,725 | | Franklin Resources, Inc. | | 3,635,135 | |
| | 14,700 | | Janus Capital Group, Inc. | | 125,097 | |
| | 12,675 | | Legg Mason, Inc. | | 393,052 | |
| | 60,700 | | Marsh & McLennan Cos., Inc. | | 2,423,144 | |
| | 7,350 | | Mastercard, Inc., Class A | | 4,222,575 | |
| | 12,745 | | Mercury General Corp. | | 560,270 | |
| | 227,600 | | The Bank of New York Mellon Corp. | | 6,384,180 | |
| | 38,418 | | The Travelers Cos., Inc. | | 3,070,367 | |
| | 7,350 | | U.S. Bancorp | | 265,703 | |
| | 3,974 | | Unum Group | | 116,716 | |
| | 9,500 | | Visa, Inc., Class A | | 1,736,125 | |
| | 23,000 | | Waddell & Reed Financial, Inc., Class A | | 1,000,500 | |
| | 500 | | Wells Fargo & Co. | | 20,635 | |
| | | 33,730,654 | |
| Health Care - 14.1% |
| | 42,600 | | Abbott Laboratories | | 1,485,888 | |
| | 29,400 | | Becton Dickinson and Co. | | 2,905,602 | |
| | 55,725 | | GlaxoSmithKline PLC, ADR | | 2,784,578 | |
| | 315,117 | | Health Management Associates, Inc., Class A (a) | | 4,953,639 | |
| | 53,450 | | Johnson & Johnson | | 4,589,217 | |
| | 1,000 | | Laboratory Corp. of America Holdings (a) | | 100,100 | |
| | 100,753 | | Medtronic, Inc. | | 5,185,757 | |
| | 122,710 | | Merck & Co., Inc. | | 5,699,880 | |
| | 85,132 | | Pfizer, Inc. | | 2,384,547 | |
| | 6,842 | | Quest Diagnostics, Inc. | | 414,831 | |
| | 56,934 | | UnitedHealth Group, Inc. | | 3,728,038 | |
| | 27,221 | | WellPoint, Inc. | | 2,227,767 | |
| | 50,900 | | Zimmer Holdings, Inc. | | 3,814,446 | |
| | | 40,274,290 | |
| See Notes to Financial Statements. | 5 | |
| |
AUXIER FOCUS FUND SCHEDULE OF INVESTMENTS |
| |
| | Shares | | Security Description | | Value | |
| Industrials - 1.5% |
| | 21,550 | | AGCO Corp. | $ | 1,081,594 | |
| | 19,000 | | General Electric Co. | | 440,610 | |
| | 3,350 | | Granite Construction, Inc. | | 99,696 | |
| | 12,500 | | Raytheon Co. | | 826,500 | |
| | 3,500 | | Textainer Group Holdings, Ltd. | | 134,540 | |
| | 3,550 | | The Boeing Co. | | 363,662 | |
| | 14,450 | | United Parcel Service, Inc., Class B | | 1,249,636 | |
| | | 4,196,238 | |
| Information Technology - 2.7% |
| | 52,325 | | Intel Corp. | | 1,267,312 | |
| | 159,114 | | Microsoft Corp. | | 5,494,206 | |
| | 26,150 | | Oracle Corp. | | 803,328 | |
| | | 7,564,846 | |
| Materials - 1.9% |
| | 28,050 | | E.I. du Pont de Nemours & Co. | | 1,472,625 | |
| | 7,000 | | LyondellBasell Industries NV, Class A | | 463,820 | |
| | 13,475 | | Newmont Mining Corp. | | 403,576 | |
| | 6,400 | | Precision Castparts Corp. | | 1,446,464 | |
| | 47,350 | | The Dow Chemical Co. | | 1,523,250 | |
| | 14,000 | | Vale SA, ADR | | 184,100 | |
| | | 5,493,835 | |
| Telecommunications - 0.7% |
| | 27,300 | | AT&T, Inc. | | 966,420 | |
| | 14,800 | | SK Telecom Co., Ltd., ADR | | 300,884 | |
| | 15,835 | | Verizon Communications, Inc. | | 797,134 | |
| | | 2,064,438 | |
| Utilities - 0.1% |
| | 5,616 | | FirstService Corp. | | 175,668 | |
| Total Common Stock (Cost $185,143,551) | | 240,267,233 | |
| Preferred Stock - 0.4% |
| Financials - 0.4% |
| | 985,000 | | The Charles Schwab Corp. (b) (Cost $985,000) | | 7.00 | % | | | 1,103,200 | |
Total Equity Securities (Cost $186,128,551) | | | | | | 241,370,433 | |
| | | | |
| Corporate Non-Convertible Bonds - 3.0% |
| Communications - 0.2% |
| $ | 600,000 | | Telefonica Emisiones SAU | | 6.42 | | 06/20/16 | | 660,284 | |
| | | | |
| Consumer Staples - 0.6% |
| | 1,180,000 | | American Stores Co. | | 7.90 | | 05/01/17 | | 1,306,850 | |
| | 50,000 | | Constellation Brands, Inc. | | 7.25 | | 05/15/17 | | 57,125 | |
| | 375,000 | | SUPERVALU, Inc. | | 8.00 | | 05/01/16 | | 405,469 | |
| | | 1,769,444 | |
| Energy - 0.2% |
| | 190,000 | | El Paso, LLC | | 6.70 | | 02/15/27 | | 192,613 | |
| | 424,000 | | Sunoco, Inc. | | 5.75 | | 01/15/17 | | 459,290 | |
| | | 651,903 | |
| Financials - 1.0% |
| | 1,640,000 | | Hartford Financial Services Group, Inc. | | 5.50 | | 10/15/16 | | 1,819,859 | |
| | 260,000 | | Janus Capital Group, Inc. | | 6.70 | | 06/15/17 | | 290,564 | |
| | 620,000 | | Zions Bancorporation | | 5.50 | | 11/16/15 | | 647,248 | |
| | | 2,757,671 | |
| Health Care - 0.4% |
| | 540,000 | | Health Management Associates, Inc. | | 6.13 | | 04/15/16 | | 583,200 | |
| | 500,000 | | Health Management Associates, Inc. | | 7.38 | | 01/15/20 | | 550,625 | |
| | | 1,133,825 | |
| Materials - 0.4% |
| | 430,000 | | The Dow Chemical Co. | | 5.70 | | 05/15/18 | | 490,813 | |
| | 505,000 | | Weyerhaeuser Co. | | 7.95 | | 03/15/25 | | 627,382 | |
| | | 1,118,195 | |
| Utilities - 0.2% |
| | 255,000 | | Energy Future Holdings Corp. | | 9.75 | | 10/15/19 | | 246,075 | |
| | 312,000 | | Energy Future Intermediate Holding Co., LLC | | 9.75 | | 10/15/19 | | 301,080 | |
| | | 547,155 | |
Total Corporate Non-ConvertibleBonds (Cost $7,355,957) | | 8,638,477 | |
| Foreign Municipal Bonds - 0.5% |
| | 356,000 | | Ontario Hydro Residual Strip (Canada) (c) | | 5.47-5.65 | | 11/27/20 | | 267,411 | |
| | 605,000 | | Ontario Hydro Residual Strip (Canada) (c) | | 5.61 | | 10/15/21 | | 437,491 | |
| | 235,000 | | Ontario Hydro Residual Strip (Canada) (c) | | 5.75 | | 08/18/22 | | 161,088 | |
| | 750,000 | | Ontario Hydro Residual Strip (Canada), Series OC20 (c) | | 5.51 | | 10/01/20 | | 566,005 | |
Total Foreign Municipal Bonds (Cost $974,370) | | 1,431,995 | |
| Municipal Bonds - 0.2% |
| Ohio - 0.2% |
| | 550,000 | | Buckeye Tobacco Settlement Financing Authority (Cost $376,045) | | 5.88 | | 06/01/47 | | 445,115 | |
| | | | |
| U.S. Government & Agency Obligations - 5.6% |
| U.S. Treasury Securities - 5.6% |
| | 5,000,000 | | U.S. Treasury Bill (d) | | 0.04 | | 07/11/13 | | 4,999,980 | |
| | 11,000,000 | | U.S. Treasury Bill (d) | | 0.01 | | 08/01/13 | | 10,999,857 | |
| | | 15,999,837 | |
Total U.S. Government & Agency Obligations (Cost $15,999,897) | | 15,999,837 | |
Total Fixed Income Securities (Cost $24,706,269) | | 26,515,424 | |
| See Notes to Financial Statements. | 6 | |
| |
AUXIER FOCUS FUND SCHEDULE OF INVESTMENTS |
| |
Total Investments - 94.0% (Cost $210,834,820)* | $ | 267,885,857 | |
| Other Assets & Liabilities, Net – 6.0% | | 17,121,129 | |
| Net Assets – 100.0% | $ | 285,006,986 | |
| ADR | American Depositary Receipt |
| LLC | Limited Liability Company |
| PLC | Public Limited Company |
| (a) | Non-income producing security. |
| (b) | Variable rate security. Rate presented is as of June 30, 2013. |
| (c) | Zero coupon bond. Interest rate presented is yield to maturity. |
| (d) | Rate presented is yield to maturity. |
| | * Cost for federal income tax purposes is $210,840,574 and net unrealized appreciation consists of: |
| Gross Unrealized Appreciation | | $ | 66,567,614 | |
| Gross Unrealized Depreciation | | | (9,522,331 | ) |
| Net Unrealized Appreciation | | $ | 57,045,283 | |
The following is a summary of the inputs used to value the Fund’s investments as of June 30, 2013.
The inputs or methodology used for valuing securities are not necessarily an indication of the risks associated with investing in those securities. For more information on valuation inputs, and their aggregation into the levels used in the table below, please refer to the Security Valuation section in Note 2 of the accompanying Notes to Financial Statements.
| | Level 1 | | Level 2 | | Level 3 | | Total |
| Investments At Value |
| Common Stock | | | | | | | | | | | | | | | | |
| Communications | | $ | 16,450,432 | | | $ | - | | | $ | - | | | $ | 16,450,432 | |
| Consumer Discretionary | | | 32,069,979 | | | | - | | | | - | | | | 32,069,979 | |
| Consumer Staples | | | 85,621,873 | | | | - | | | | - | | | | 85,621,873 | |
| Energy | | | 12,624,980 | | | | - | | | | - | | | | 12,624,980 | |
| Financials | | | 33,730,654 | | | | - | | | | - | | | | 33,730,654 | |
| Health Care | | | 40,274,290 | | | | - | | | | - | | | | 40,274,290 | |
| Industrials | | | 4,196,238 | | | | - | | | | - | | | | 4,196,238 | |
| Information Technology | | | 7,564,846 | | | | - | | | | - | | | | 7,564,846 | |
| Materials | | | 5,493,835 | | | | - | | | | - | | | | 5,493,835 | |
| Telecommunications | | | 2,064,438 | | | | - | | | | - | | | | 2,064,438 | |
| Utilities | | | 175,668 | | | | - | | | | - | | | | 175,668 | |
| Preferred Stock | | | - | | | | 1,103,200 | | | | - | | | | 1,103,200 | |
| Corporate Non-Convertible Bonds | | | - | | | | 8,638,477 | | | | - | | | | 8,638,477 | |
| Foreign Municipal Bonds | | | - | | | | 1,431,995 | | | | - | | | | 1,431,995 | |
| Municipal Bonds | | | - | | | | 445,115 | | | | - | | | | 445,115 | |
| U.S. Government & Agency Obligations | | | - | | | | 15,999,837 | | | | - | | | | 15,999,837 | |
| Total Investments At Value | | $ | 240,267,233 | | | $ | 27,618,624 | | | $ | - | | | $ | 267,885,857 | |
There were no transfers between Level 1 and Level 2 for the year ended June 30, 2013.
| PORTFOLIO HOLDINGS | | |
| % of Net Assets | | |
| Common Stock | 84.3 | % |
| Preferred Stock | 0.4 | % |
| Corporate Non-Convertible Bonds | 3.0 | % |
| Foreign Municipal Bonds | 0.5 | % |
| Municipal Bonds | 0.2 | % |
| U.S. Government & Agency Obligations | 5.6 | % |
| Cash and Other Net Assets | 6.0 | % |
| | 100.0 | % |
| See Notes to Financial Statements. | 7 | |
| |
AUXIER FOCUS FUND STATEMENT OF ASSETS AND LIABILITIES |
| |
| ASSETS | | | | |
| | Total investments, at value (Cost $210,834,820) | | $ | 267,885,857 | |
| | Cash | | | 17,103,456 | |
| | Receivables: | | | | |
| | | Fund shares sold | | | 220,051 | |
| | | Investment securities sold | | | 518,312 | |
| | | Dividends and interest | | | 713,401 | |
| | Prepaid expenses | | | 23,179 | |
| Total Assets | | | 286,464,256 | |
| | | | | | | |
| LIABILITIES | | | | |
| | Payables: | | | | |
| | | Investment securities purchased | | | 1,098,652 | |
| | | Fund shares redeemed | | | 33,781 | |
| | Accrued Liabilities: | | | | |
| | Investment adviser fees | | | 239,681 | |
| | | Trustees’ fees and expenses | | | 180 | |
| | | Fund services fees | | | 34,048 | |
| | | Other expenses | | | 50,928 | |
| Total Liabilities | | | 1,457,270 | |
| | | | | | | |
| NET ASSETS | | $ | 285,006,986 | |
| | | | | | | |
| COMPONENTS OF NET ASSETS | | | | |
| | Paid-in capital | | $ | 222,578,263 | |
| | Undistributed net investment income | | | 1,595,099 | |
| | Accumulated net realized gain | | | 3,782,587 | |
| | Net unrealized appreciation | | | 57,051,037 | |
| NET ASSETS | | $ | 285,006,986 | |
| | | | | | | |
| SHARES OF BENEFICIAL INTEREST AT NO PAR VALUE (UNLIMITED SHARES AUTHORIZED) | | | | |
| | Investor Shares | | | 14,930,422 | |
| | A Shares | | | 115,834 | |
| | Institutional Shares | | | 284,729 | |
| | | | | | | |
NET ASSET VALUE, OFFERING AND REDEMPTION PRICE PER SHARE* | | | | |
| | Investor Shares (based on net assets of $277,536,365) | | $ | 18.59 | |
| | A Shares (based on net assets of $2,157,645) | | $ | 18.63 | |
| | A Shares Maximum Public Offering Price Per Share (net asset value per share/(100%-5.75%)) | | $ | 19.77 | |
| | Institutional Shares (based on net assets of $5,312,976) | | $ | 18.66 | |
| * | Shares redeemed or exchanged within 180 days of purchase are charged a 2.00% redemption fee. |
| See Notes to Financial Statements. | 8 | |
| |
AUXIER FOCUS FUND STATEMENT OF OPERATIONS YEAR ENDED JUNE 30, 2013 |
| |
| INVESTMENT INCOME | | | | |
| | Dividend income (Net of foreign withholding taxes of $62,981) | | $ | 5,501,808 | |
| | Interest income | | | 1,053,609 | |
| Total Investment Income | | | 6,555,417 | |
| | | | | |
| EXPENSES | | | | |
| | Investment adviser fees | | | 2,652,258 | |
| | Fund services fees | | | 339,349 | |
| | Transfer agent fees: | | | | |
| | Investor Shares | | | 60,575 | |
| | A Shares | | | 874 | |
| | Institutional Shares | | | 57 | |
| | Distribution fees: | | | | |
| | A Shares | | | 4,840 | |
| | Custodian fees | | | 26,969 | |
| | Registration fees: | | | | |
| | Investor Shares | | | 15,385 | |
| | A Shares | | | 1,832 | |
| | Institutional Shares | | | 7,430 | |
| | Professional fees | | | 48,203 | |
| | Trustees' fees and expenses | | | 8,894 | |
| | Miscellaneous expenses | | | 233,923 | |
| Total Expenses | | | 3,400,589 | |
| | Fees waived and expenses reimbursed | | | (91,117 | ) |
| Net Expenses | | | 3,309,472 | |
| | | | | | | |
| NET INVESTMENT INCOME | | | 3,245,945 | |
| | | | | | | |
| NET REALIZED AND UNREALIZED GAIN (LOSS) | | | | |
| | Net realized gain (loss) on: | | | | |
| | Investments | | | 3,805,414 | |
| | Foreign currency transactions | | | 17 | |
| | Net realized gain | | | 3,805,431 | |
| | Net change in unrealized appreciation (depreciation) on Investments | | | 30,379,936 | |
| NET REALIZED AND UNREALIZED GAIN | | | 34,185,367 | |
| INCREASE IN NET ASSETS FROM OPERATIONS | | $ | 37,431,312 | |
| | | | | | | |
| See Notes to Financial Statements. | 9 | |
| |
AUXIER FOCUS FUND STATEMENTS OF CHANGES IN NET ASSETS |
| |
| | | | | | | | | | | | | | | | | | |
| | | | | For the Year Ended June 30, 2013 | | For the Year Ended June 30, 2012 | |
| OPERATIONS | | | | | | Shares | | | | | | | Shares | | |
| | Net investment income | | $ | 3,245,945 | | | | | | $ | 2,794,389 | | | | | |
| | Net realized gain | | | 3,805,431 | | | | | | | 2,386,651 | | | | | |
| | Net change in unrealized appreciation (depreciation) | | | 30,379,936 | | | | | | | 4,018,817 | | | | | |
| Increase in Net Assets Resulting from Operations | | | 37,431,312 | | | | | | | 9,199,857 | | | | | |
| | | | | | | | | | | | | | | | | | |
| DISTRIBUTIONS TO SHAREHOLDERS FROM | | | | | | | | | | | | | | | |
| | Net investment income: | | | | | | | | | | | | | | | |
| | | Investor Shares | | | (3,345,187 | ) | | | | | | (2,114,894 | ) | | | | |
| | | A Shares | | | (20,863 | ) | | | | | | (13,062 | ) | | | | |
| | | Institutional Shares | | | (25,206 | ) | | | | | | - | | | | | |
| | Net realized gain: | | | | | | | | | | | | | | | |
| | | Investor Shares | | | (1,800,956 | ) | | | | | | (2,884,600 | ) | | | | |
| | | A Shares | | | (13,195 | ) | | | | | | (17,043 | ) | | | | |
| | | Institutional Shares | | | (9,775 | ) | | | | | | - | | | | | |
| Total Distributions to Shareholders | | | (5,215,182 | ) | | | | | | (5,029,599 | ) | | | | |
| | | | | | | | | | | | | | | | | | |
| CAPITAL SHARE TRANSACTIONS | | | | | | | | | | | | | | | |
| | Sale of shares: | | | | | | | | | | | | | | | |
| | | Investor Shares | | | 46,679,365 | | | 2,687,515 | | | | 103,203,829 | | | 6,529,964 | | |
| | | A Shares | | | 327,028 | | | 19,179 | | | | 979,449 | | | 62,557 | | |
| | | Institutional Shares | | | 4,058,596 | | | 226,829 | | | | 1,218,054 | | | 74,992 | | |
| | Reinvestment of distributions: | | | | | | | | | | | | | | | |
| | | Investor Shares | | | 5,041,540 | | | 301,707 | | | | 4,913,643 | | | 317,980 | | |
| | | A Shares | | | 30,079 | | | 1,797 | | | | 28,684 | | | 1,855 | | |
| | | Institutional Shares | | | 34,981 | | | 2,092 | | | | - | | | - | | |
| | Redemption of shares: | | | | | | | | | | | | | | | |
| | | Investor Shares | | | (49,230,617 | ) | | (2,816,017 | ) | | | (32,622,079 | ) | | (2,041,326 | ) | |
| | | A Shares | | | (132,450 | ) | | (7,863 | ) | | | (28,719 | ) | | (1,831 | ) | |
| | | Institutional Shares | | | (340,053 | ) | | (18,753 | ) | | | (6,984 | ) | | (431 | ) | |
| | Redemption fees | | | 32,290 | | | - | | | | 74,935 | | | - | | |
| Increase in Net Assets from Capital Share Transactions | | | 6,500,759 | | | 396,486 | | | | 77,760,812 | | | 4,943,760 | | |
| Increase in Net Assets | | | 38,716,889 | | | | | | | 81,931,070 | | | | | |
| | | | | | | | | | | | | | | | | | |
| NET ASSETS | | | | | | | | | | | | | | | |
| | Beginning of Year | | | 246,290,097 | | | | | | | 164,359,027 | | | | | |
| | End of Year (Including line (a)) | | $ | 285,006,986 | | | | | | $ | 246,290,097 | | | | | |
| (a) | Undistributed net investment income. | | $ | 1,595,099 | | | | | | $ | 1,734,396 | | | | | |
| See Notes to Financial Statements. | 10 | |
| |
AUXIER FOCUS FUND FINANCIAL HIGHLIGHTS |
| |
These financial highlights reflect selected data for a share outstanding throughout each year. | | | | | | |
| | | For the Years Ended June 30, | |
| | | 2013 | | | | 2012 | | | | 2011 | | | | 2010 | | | | 2009(a) | | |
| INVESTOR SHARES | | | | | | | | | | | | | | | | | | | | |
| NET ASSET VALUE, Beginning of Year | $ | 16.49 | | | $ | 16.45 | | | $ | 13.49 | | | $ | 12.16 | | | $ | 14.22 | | |
| INVESTMENT OPERATIONS | | | | | | | | | | | | | | | | | | | | |
| Net investment income (b) | | 0.21 | | | | 0.22 | | | | 0.26 | | | | 0.32 | | | | 0.19 | | |
| Net realized and unrealized gain (loss) | | 2.23 | | | | 0.20 | (c) | | 3.00 | | | | 1.27 | | | | (1.77 | ) | |
| Total from Investment Operations | | 2.44 | | | | 0.42 | | | | 3.26 | | | | 1.59 | | | | (1.58 | ) | |
| DISTRIBUTIONS TO SHAREHOLDERS FROM | | | | | | | | | | | | | | | | | | | | |
| Net investment income | | (0.22 | ) | | | (0.16 | ) | | | (0.29 | ) | | | (0.26 | ) | | | (0.16 | ) | |
| Net realized gain | | (0.12 | ) | | | (0.23 | ) | | | (0.01 | ) | | | — | | | | (0.32 | ) | |
| Total Distributions to Shareholders | | (0.34 | ) | | | (0.39 | ) | | | (0.30 | ) | | | (0.26 | ) | | | (0.48 | ) | |
REDEMPTION FEES (b) | | — | (d) | | 0.01 | | | | — | (d) | | — | (d) | | — | (d) |
| NET ASSET VALUE, End of Year | $ | 18.59 | | | $ | 16.49 | | | $ | 16.45 | | | $ | 13.49 | | | $ | 12.16 | | |
| TOTAL RETURN | | 15.06 | % | | 2.84 | % | | 24.35 | % | | 12.99 | % | | (10.92 | )% |
| RATIOS/SUPPLEMENTARY DATA | | | | | | | | | | | | | | | | | | | | |
| Net Assets at End of Year (000's omitted) | $277,536 | | | $243,366 | | | $163,699 | | | $100,712 | | | $84,660 | | |
| Ratios to Average Net Assets: | | | | | | | | | | | | | | | | | | | | |
| Net investment income | | 1.22 | % | | 1.36 | % | | 1.68 | % | | 2.29 | % | | 1.53 | % |
| Net expense | | 1.25 | % | | 1.25 | % | | 1.25 | % | | 1.30 | % | | 1.35 | % |
| Gross expense (e) | | 1.28 | % | | 1.27 | % | | 1.25 | % | | 1.30 | % | | 1.35 | % |
| PORTFOLIO TURNOVER RATE | | 11 | % | | 8 | % | | 20 | % | | 15 | % | | 24 | % |
| | | | | | | | | | | | | | | | | | | | | | |
| (a) | Effective November 1, 2008, C Shares were reclassified as Investor Shares. For the Period July 1, 2008 through November 1, 2008, total return for C Shares was (12.68)%. For the aforementioned period, the annualized gross expenses and net expenses ratios were 2.35% and 2.10% respectively. |
| (b) | Calculated based on average shares outstanding during each year. |
| (c) | The net realized and unrealized gain (loss) per share does not correlate to the aggregate of the net realized and unrealized loss in the Statement of Operations for the year ended June 30, 2012, primarily due to the timing of the sales and repurchases of the Fund's shares in relation to fluctuating market values for the Fund's portfolio. |
| (d) | Less than $0.01 per share. |
| (e) | Reflects the expense ratio excluding any waivers and/or reimbursements. |
| See Notes to Financial Statements. | 11 | |
| |
AUXIER FOCUS FUND FINANCIAL HIGHLIGHTS |
| |
These financial highlights reflect selected data for a share outstanding throughout each year. | | | | | | |
| | | For the Years Ended June 30, | |
| | | 2013 | | | | 2012 | | | | 2011 | | | | 2010 | | | | 2009 | | |
| A SHARES | | | | | | | | | | | | | | | | | | | | |
| NET ASSET VALUE, Beginning of Year | $ | 16.49 | | | $ | 16.45 | | | $ | 13.49 | | | $ | 12.17 | | | $ | 14.22 | | |
| INVESTMENT OPERATIONS | | | | | | | | | | | | | | | | | | | | |
| Net investment income (a) | | 0.21 | | | | 0.22 | | | | 0.25 | | | | 0.32 | | | | 0.18 | | |
| Net realized and unrealized gain (loss) | | 2.24 | | | | 0.21 | (b) | | 3.01 | | | | 1.26 | | | | (1.75 | ) | |
| Total from Investment Operations | | 2.45 | | | | 0.43 | | | | 3.26 | | | | 1.58 | | | | (1.57 | ) | |
| | | | | | | | | | | | | | | | | | | | | |
| DISTRIBUTIONS TO SHAREHOLDERS FROM | | | | | | | | | | | | | | | | | | | | |
| Net investment income | | (0.19 | ) | | | (0.16 | ) | | | (0.29 | ) | | | (0.26 | ) | | | (0.16 | ) | |
| Net realized gain | | (0.12 | ) | | | (0.23 | ) | | | (0.01 | ) | | | — | | | | (0.32 | ) | |
| Total Distributions to Shareholders | | (0.31 | ) | | | (0.39 | ) | | | (0.30 | ) | | | (0.26 | ) | | | (0.48 | ) | |
| REDEMPTION FEES (a) | | — | (c) | | — | (c) | | — | (c) | | — | (c) | | — | (c) |
| NET ASSET VALUE, End of Year | $ | 18.63 | | | $ | 16.49 | | | $ | 16.45 | | | $ | 13.49 | | | $ | 12.17 | | |
TOTAL RETURN (d) | | 15.06 | % | | 2.84 | % | | 24.35 | % | | 12.90 | % | | (10.85 | )% |
| RATIOS/SUPPLEMENTARY DATA | | | | | | | | | | | | | | | | | | | | |
| Net Assets at End of Year (000's omitted) | $2,158 | | | $1,694 | | | $660 | | | $157 | | | $148 | | |
| Ratios to Average Net Assets: | | | | | | | | | | | | | | | | | | | | |
| Net investment income | | 1.22 | % | | 1.39 | % | | 1.61 | % | | 2.29 | % | | 1.49 | % |
| Net expense | | 1.25 | % | | 1.25 | % | | 1.25 | % | | 1.30 | % | | 1.35 | % |
| Gross expense (e) | | 1.62 | % | | 1.52 | % | | 1.50 | % | | 1.55 | % | | 1.60 | % |
| PORTFOLIO TURNOVER RATE | | 11 | % | | 8 | % | | 20 | % | | 15 | % | | 24 | % |
| | | | | | | | | | | | | | | | | | | | | | |
| (a) | Calculated based on average shares outstanding during each year. |
| (b) | The net realized and unrealized gain (loss) per share does not correlate to the aggregate of the net realized and unrealized loss in the Statement of Operations for the year ended June 30, 2012, primarily due to the timing of the sales and repurchases of the Fund's shares in relation to fluctuating market values for the Fund's portfolio. |
| (c) | Less than $0.01 per share. |
| (d) | Total Return does not include the effect of front end sales charge or contingent deferred sales charge. |
| (e) | Reflects the expense ratio excluding any waivers and/or reimbursements. |
| See Notes to Financial Statements. | 12 | |
| |
AUXIER FOCUS FUND FINANCIAL HIGHLIGHTS |
| |
These financial highlights reflect selected data for a share outstanding throughout each period. |
| | | For the Year Ended June 30, 2013 | | May 9, 2012 (a) through June 30, 2012 | |
| INSTITUTIONAL SHARES | | | | | | | | |
| NET ASSET VALUE, Beginning of Period | $ | 16.50 | | | $ | 16.27 | | |
| INVESTMENT OPERATIONS | | | | | | | | |
| Net investment income (b) | | 0.26 | | | | 0.04 | | |
| Net realized and unrealized gain | | 2.22 | | | | 0.19 | | |
| Total from Investment Operations | | 2.48 | | | | 0.23 | | |
| DISTRIBUTIONS TO SHAREHOLDERS FROM | | | | | | | | |
| Net investment income | | (0.20 | ) | | | — | | |
| Net realized gain | | (0.12 | ) | | | — | | |
| Total Distributions to Shareholders | | (0.32 | ) | | | — | | |
| REDEMPTION FEES (b) | | — | (c) | | | — | (c) | |
| NET ASSET VALUE, End of Period | $ | 18.66 | | | $ | 16.50 | | |
| TOTAL RETURN | | 15.28 | % | | | 1.41 | %(d) | |
| RATIOS/SUPPLEMENTARY DATA | | | | | | | | |
| Net Assets at End of Period (000's omitted) | $ | 5,313 | | | $ | 1,230 | | |
| Ratios to Average Net Assets: | | | | | | | | |
| Net investment income | | 1.48 | % | | | 1.62 | %(e) | |
| Net expense | | 1.00 | % | | | 1.10 | %(e) | |
| Gross expense (f) | | 1.55 | % | | | 1.50 | %(e) | |
| PORTFOLIO TURNOVER RATE | | 11 | % | | | 8 | %(d) | |
| | | | | | | | | | |
| (a) | Commencement of operations. |
| (b) | Calculated based on average shares outstanding during each period. |
| (c) | Less than $0.01 per share. |
| (d) | Not annualized. |
| (e) | Annualized. |
| (f) | Reflects the expense ratio excluding any waivers and/or reimbursements. |
| See Notes to Financial Statements. | 13 | |
| |
AUXIER FOCUS FUND NOTES TO FINANCIAL STATEMENTS |
| |
Note 1. Organization
The Auxier Focus Fund (the “Fund”) is a diversified portfolio of Forum Funds (the “Trust”). The Trust is a Delaware statutory trust that is registered as an open-end, management investment company under the Investment Company Act of 1940 (the “Act”), as amended. Under its Trust Instrument, the Trust is authorized to issue an unlimited number of the Fund’s shares of beneficial interest without par value. The Fund currently offers three classes of shares: Investor Shares, A Shares and Institutional Shares. A Shares are offered at net asset value plus a maximum sales charge of 5.75%. A Shares are also subject to contingent deferred sales charge (“CDSC”) of 1.00% on purchases without an initial sales charge and redeemed less than one year after they are purchased. Investor Shares and Institutional Shares are not subject to a sales charge. Investor Shares, A Shares and Institutional Shares commenced operations on July 9, 1999, July 8, 2005 and May 9, 2012, respectively. The Fund’s investment objective is to provide long-term capital appreciation.
On August 27, 2008, the Board of Trustees of the Trust approved the conversion of the Fund’s C Shares into Investor Shares. On November 1, 2008, each shareholder of C Shares received Investor Shares in a dollar amount equal to their investment in C Shares as of that date.
Note 2. Summary of Significant Accounting Policies
These financial statements are prepared in accordance with accounting principles generally accepted in the United States of America (“GAAP”), which require management to make estimates and assumptions that affect the reported amounts of assets and liabilities, the disclosure of contingent liabilities at the date of the financial statements, and the reported amounts of increase and decrease in net assets from operations during the fiscal year. Actual amounts could differ from those estimates. The following summarizes the significant accounting policies of the Fund:
Security Valuation – Exchange-traded securities and over-the-counter securities are valued using the last quoted sale or official closing price, provided by independent pricing services as of the close of trading on the market or exchange for which they are primarily traded, on each Fund business day. In the absence of a sale, such securities are valued at the mean of the last bid and ask price provided by independent pricing services. Non-exchange traded securities for which quotations are available are valued using the last quoted sales price, or in the absence of a sale at the mean of the last bid and ask prices provided by independent pricing services. Debt securities may be valued at prices supplied by a fund’s pricing agent based on broker or dealer supplied valuations or matrix pricing, a method of valuing securities by reference to the value of other securities with similar characteristics such as rating, interest rate and maturity. Shares of open-end mutual funds are valued at net asset value (“NAV”). Short-term investments that mature in 60 days or less may be valued at amortized cost.
The Fund values its investments at fair value pursuant to procedures adopted by the Trust's Board of Trustees (the "Board") if (1) market quotations are insufficient or not readily available or (2) the adviser believes that the values available are unreliable. The Trust’s Valuation Committee, as defined in the Fund’s registration statement, performs certain functions as they relate to the administration and oversight of the Fund’s valuation procedures. Under these procedures, the Valuation Committee convenes on a regular and ad-hoc basis to review such securities and considers a number of factors, including valuation methodologies and significant unobservable inputs, when arriving at fair value.
The Valuation Committee may work with the adviser to provide valuation inputs. In determining fair valuations, inputs may include market-based analytics which may consider related or comparable assets or liabilities, recent transactions, market multiples, book values and other relevant investment information. Adviser inputs may include an income-based approach in which the anticipated future cash flows of the investment are discounted in determining fair value. Discounts may also be applied based on the nature or duration of any restrictions on the disposition of the investments. The Valuation Committee performs regular reviews of valuation methodologies, key inputs and assumptions, disposition analysis and market activity.
Fair valuation is based on subjective factors and, as a result, the fair value price of an investment may differ from the security’s market price and may not be the price at which the asset may be sold. Fair valuation could result in a different NAV than a NAV determined by using market quotes.
The Fund has a three-tier fair value hierarchy. The basis of the tiers is dependent upon the various “inputs” used to determine
| |
AUXIER FOCUS FUND NOTES TO FINANCIAL STATEMENTS |
| |
the value of the Fund’s investments. These inputs are summarized in the three broad levels listed below:
Level 1 — quoted prices in active markets for identical assets
Level 2 — other significant observable inputs (including quoted prices of similar securities, interest rates, prepayment speeds, credit risk, etc.)
Level 3 — significant unobservable inputs (including the Fund’s own assumptions in determining the fair value of investments)
The aggregate value by input level, as of June 30, 2013, for the Fund’s investments is included at the end of the Fund’s Schedule of Investments.
Security Transactions, Investment Income and Realized Gain and Loss – Investment transactions are accounted for on the trade date. Dividend income is recorded on the ex-dividend date. Foreign dividend income is recorded on the ex-dividend date or as soon as possible after the Fund determines the existence of a dividend declaration after exercising reasonable due diligence. Income and capital gains on some foreign securities may be subject to foreign withholding taxes, which are accrued as applicable. Interest income is recorded on an accrual basis. Premium is amortized and discount is accreted using the effective interest method. Identified cost of investments sold is used to determine the gain and loss for both financial statement and federal income tax purposes.
Foreign Currency Translations – Foreign currency amounts are translated into U.S. dollars as follows: (1) assets and liabilities at the rate of exchange at the end of the respective period; and (2) purchases and sales of securities and income and expenses at the rate of exchange prevailing on the dates of such transactions. The portion of the results of operations arising from changes in the exchange rates and the portion due to fluctuations arising from changes in the market prices of securities are not isolated. Such fluctuations are included with the net realized and unrealized gain or loss on investments.
Distributions to Shareholders – Distributions to shareholders of net investment income and net capital gains, if any, are declared and paid at least annually. Distributions to shareholders are recorded on the ex-dividend date. Distributions are based on amounts calculated in accordance with applicable federal income tax regulations, which may differ from GAAP. These differences are due primarily to differing treatments of income and gain on various investment securities held by the Fund, timing differences and differing characterizations of distributions made by the Fund.
Federal Taxes – The Fund intends to continue to qualify each year as a regulated investment company under Subchapter M of the Internal Revenue Code and to distribute all of its taxable income to shareholders. In addition, by distributing in each calendar year substantially all of its net investment income and capital gains, if any, the Fund will not be subject to a federal excise tax. Therefore, no federal income or excise tax provision is required. The Fund files a U.S. federal income and excise tax return as required. A fund’s federal income tax returns are subject to examination by the Internal Revenue Service for a period of three fiscal years after they are filed. As of June 30, 2013, there are no uncertain tax positions that would require financial statement recognition, de-recognition, or disclosure.
Income and Expense Allocation – The Trust accounts separately for the assets, liabilities and operations of each of its investment portfolios. Expenses that are directly attributable to more than one investment portfolio are allocated among the respective investment portfolios in an equitable manner.
The Fund’s class specific expenses are charged to the operations of that class of shares. Income and expenses (other than expenses attributable to a specific class) and realized and unrealized gains or losses on investments are allocated to each class of shares based on the class’ respective net assets to the total net assets of the Fund.
| |
AUXIER FOCUS FUND NOTES TO FINANCIAL STATEMENTS |
| |
Redemption Fees – A shareholder who redeems shares within 180 days of purchase will incur a redemption fee of 2.00% of the current net asset value of shares redeemed, subject to certain limitations. The fee is charged for the benefit of the remaining shareholders and will be paid to the Fund to help offset transaction costs. The fee is accounted for as an addition to paid-in capital. The Fund reserves the right to modify the terms of or terminate the fee at any time. There are limited exceptions to the imposition of the redemption fee.
Commitments and Contingencies – In the normal course of business, the Fund enters into contracts that provide general indemnifications by the Fund to the counterparty to the contract. The Fund’s maximum exposure under these arrangements is dependent on future claims that may be made against the Fund and, therefore, cannot be estimated; however, based on experience, the risk of loss from such claims is considered remote.
Note 3. Fees and Expenses
Investment Adviser – Auxier Asset Management LLC (the “Adviser”), is the investment adviser to the Fund. Pursuant to an investment advisory agreement, the Adviser receives an advisory fee from the Fund at an annual rate of 1.00% of the Fund’s average daily assets.
Distribution – Foreside Fund Services, LLC serves as the Fund’s distributor (the “Distributor”). The Distributor is not affiliated with the Adviser or Atlantic Fund Administration, LLC (d/b/a Atlantic Fund Services) (“Atlantic”) or their affiliates. The Fund has adopted a Distribution Plan (the “Plan”) for A Shares of the Fund in accordance with Rule 12b-1 of the Act. Under the Plan, the Fund pays the Distributor and/or any other entity as authorized by the Board a fee of up to 0.25% of the average daily net assets of A Shares. The Distributor has no role in determining the investment policies or which securities are to be purchased or sold by the Trust or its Funds.
For the year ended June 30, 2013, there were $12,783 in front-end sales charges assessed on the sale of A Shares and no contingent deferred sales charges were assessed on the sale of A Shares. The Distributor received $1,830 of the total front-end sales charges. Such amounts are set aside by the Distributor and used solely for distribution-related expenses.
Other Service Providers – Atlantic provides fund accounting, fund administration, compliance and transfer agency services to the Fund. Atlantic also provides certain shareholder report production, and EDGAR conversion and filing services. Atlantic provides a Principal Executive Officer, a Principal Financial Officer, a Chief Compliance Officer, and an Anti-Money Laundering Officer to the Fund, as well as certain additional compliance support functions.
Trustees and Officers – The Trust pays each independent Trustee an annual retainer fee of $45,000 for service to the Trust ($66,000 for the Chairman). The Trustees and Chairman may receive additional fees for special Board meetings. Each Trustee is also reimbursed for all reasonable out-of-pocket expenses incurred in connection with his duties as a Trustee, including travel and related expenses incurred in attending Board meetings. The amount of Trustees’ fees attributable to the Fund is disclosed in the Statement of Operations. Certain officers of the Trust are also officers or employees of the above named service providers, and during their terms of office received no compensation from the Fund.
Note 4. Expense Reimbursements and Fees Waived
The Adviser has contractually agreed to waive a portion of its fees and reimburse expenses through October 31, 2015, to the extent necessary to maintain the total operating expenses at 1.25% of average daily net assets of the Investor Shares and A Shares and 1.00% of average daily net assets of Institutional Shares. These contractual waivers may only be raised or eliminated with consent of the Board. Other fund service providers have voluntarily agreed to waive a portion of their fees. These voluntary reductions may be reduced or eliminated at any time. For the year ended June 30, 2013, fees waived and expenses reimbursed were as follows:
| Investment Adviser Fees Waived | | Investment Adviser Expenses Reimbursed | | Other Waivers | | Total Fees Waived |
| $ | 6,397 | | $ | 19,030 | | $ | 65,690 | | $ | 91,117 |
| |
AUXIER FOCUS FUND NOTES TO FINANCIAL STATEMENTS |
| |
Note 5. Security Transactions
The cost of purchases and proceeds from sales of investment securities (including maturities), other than short-term investments during the year ended June 30, 2013, were $45,734,375 and $25,171,492, respectively.
Note 6. Federal Income Tax and Investment Transactions
Distributions paid during the fiscal years ended as noted were characterized for tax purposes as follows:
| Ordinary Income | | $ | 4,175,748 | | $ | 2,278,235 |
| Long-Term Capital Gain | | | 1,039,434 | | | 2,751,364 |
| | | $ | 5,215,182 | | $ | 5,029,599 |
As of June 30, 2013, distributable earnings (accumulated loss) on a tax basis were as follows:
| Undistributed Ordinary Income | | $ | 2,014,198 | |
| Undistributed Long-Term Gain | | | 3,369,242 | |
| Unrealized Appreciation | | | 57,045,283 | |
| Total | | $ | 62,428,723 | |
The difference between components of distributable earnings on a tax basis and the amounts reflected in the Statement of Assets and Liabilities are primarily due to wash sales.
On the Statement of Assets and Liabilities, as a result of permanent book to tax differences, certain amounts have been reclassified for the year ended June 30, 2013. The following reclassification was the result of passive foreign investment companies and currency gain/loss reclassification and has no impact on the net assets of the Fund.
| Accumulated Net Investment Income (Loss) | | $ | 6,014 | |
| Undistributed Net Realized Gain (Loss) | | | (6,014 | ) |
Note 7. Recent Accounting Pronouncements
In December 2011, the Financial Accounting Standards Board (“FASB”) issued Accounting Standards Update (“ASU”) No. 2011-11 related to disclosures about offsetting assets and liabilities. In January 2013, the FASB issued ASU No. 2013-01 which gives additional clarification to ASU 2011-11. The amendments in this ASU require an entity to disclose information about offsetting and related arrangements to enable users of its financial statements to understand the effect of those arrangements on its financial position. The ASU is effective for annual reporting periods beginning on or after January 1, 2013, and interim periods within those annual periods. The guidance requires retrospective application for all comparative periods presented. Management is currently evaluating the impact these amendments may have on the Fund’s financial statements.
Note 8. Subsequent Events
Subsequent events occurring after the date of this report through the date these financial statements were issued have been evaluated for potential impact and the Fund has had no such events.
| |
REPORT OF INDEPENDENT REGISTERED PUBLIC ACCOUNTING FIRM |
| |
To the Board of Trustees of Forum Funds
and the Shareholders of Auxier Focus Fund
We have audited the accompanying statement of assets and liabilities of the Auxier Focus Fund, a series of shares of beneficial interest in the Forum Funds, including the schedule of investments, as of June 30, 2013, and the related statement of operations for the year then ended, the statements of changes in net assets for each of the years in the two year period then ended and the financial highlights for each of the years in the five year period then ended. These financial statements and financial highlights are the responsibility of the Fund's management. Our responsibility is to express an opinion on these financial statements and financial highlights based on our audits.
We conducted our audits in accordance with the standards of the Public Company Accounting Oversight Board (United States). Those standards require that we plan and perform the audits to obtain reasonable assurance about whether the financial statements and financial highlights are free of material misstatement. An audit includes examining, on a test basis, evidence supporting the amounts and disclosures in the financial statements. Our procedures included confirmation of securities owned as of June 30, 2013 by correspondence with the custodian and brokers and by other appropriate auditing procedures where responses from brokers were not received. An audit also includes assessing the accounting principles used and significant estimates made by management, as well as evaluating the overall financial statement presentation. We believe that our audits provide a reasonable basis for our opinion.
In our opinion, the financial statements and financial highlights referred to above present fairly, in all material respects, the financial position of the Auxier Focus Fund as of June 30, 2013, the results of its operations for the year then ended, the changes in its net assets for each of the years in the two year period then ended and its financial highlights for each of the years in the five year period then ended, in conformity with accounting principles generally accepted in the United States of America.
BBD, LLP
Philadelphia, Pennsylvania
August 15, 2013
| |
AUXIER FOCUS FUND ADDITIONAL INFORMATION(Unaudited) |
| |
Proxy Voting Information
A description of the policies and procedures that the Fund uses to determine how to vote proxies relating to securities held in the Fund’s portfolio is available, without charge and upon request, by calling (877) 328-9437, on the Fund's website at www.auxierasset.com and on the U.S. Securities and Exchange Commission’s (the “SEC”) website at www.sec.gov. The Fund’s proxy voting record for the most recent twelve-month period ended June 30 is available, without charge and upon request, by calling (877) 328-9437 and on the SEC’s website at www.sec.gov.
Availability of Quarterly Portfolio Schedules
The Fund files its complete schedule of portfolio holdings with the SEC for the first and third quarters of each fiscal year on Form N-Q. These filings are available, without charge and upon request on the SEC’s website at www.sec.gov or may be reviewed and copied at the SEC’s Public Reference Room in Washington, DC. Information on the operation of the Public Reference Room may be obtained by calling (800) SEC-0330.
Shareholder Expense Example
As a shareholder of the Fund, you incur two types of costs: (1) transaction costs, including sales charges (loads) on purchase payments on certain classes, redemption fees, exchange fees, and CDSC fees, and (2) ongoing costs, including management fees, 12b-1 fees, and other Fund expenses. This example is intended to help you understand your ongoing costs (in dollars) of investing in the Fund, and to compare these costs with the ongoing costs of investing in other mutual funds.
The example is based on an investment of $1,000 invested at the beginning of the period and held for the entire period from January 1, 2013, through June 30, 2013.
Actual Expenses – The first line under each share class of the table below provides information about actual account values and actual expenses. You may use the information in this line, together with the amount you invested, to estimate the expenses that you paid over the period. Simply divide your account value by $1,000 (for example, an $8,600 account value divided by $1,000 = 8.6), then multiply the result by the number in the first line under the heading entitled “Expenses Paid During Period” to estimate the expenses you paid on your account during the period.
Hypothetical Example for Comparison Purposes – The second line under each share class of the table below provides information about hypothetical account values and hypothetical expenses based on the Fund’s actual expense ratio and an assumed rate of return of 5% per year before expenses, which is not the Fund’s actual return. The hypothetical account values and expenses may not be used to estimate the actual ending account balance or expenses you paid for the period. You may use this information to compare the ongoing costs of investing in the Fund and other funds. To do so, compare this 5% hypothetical example with the 5% hypothetical examples that appear in the shareholder reports of other funds.
Please note that the expenses shown in the table are meant to highlight your ongoing costs only and do not reflect any transactional costs, such as sales charges (loads) on purchase payments on certain classes, redemption fees, exchange fees, and CDSC fees. Therefore, the second line of the table is useful in comparing ongoing costs only, and will not help you determine the relative total costs of owning different funds. In addition, if these transactional costs were included, your costs would have been higher.
| | Beginning | | Ending | | Expenses | | Annualized |
| | Account Value | | Account Value | | Paid During | | Expense |
| | January 1, 2013 | | June 30, 2013 | | Period* | | Ratio* |
| Investor Shares | | | | | | | | | | | |
| Actual | $ | 1,000.00 | | $ | 1,117.85 | | $ | 6.56 | | 1.25 | % |
| Hypothetical (5% return before taxes) | $ | 1,000.00 | | $ | 1,018.60 | | $ | 6.26 | | 1.25 | % |
| A Shares | | | | | | | | | | | |
| Actual | $ | 1,000.00 | | $ | 1,118.25 | | $ | 6.57 | | 1.25 | % |
| Hypothetical (5% return before taxes) | $ | 1,000.00 | | $ | 1,018.60 | | $ | 6.26 | | 1.25 | % |
| |
AUXIER FOCUS FUND ADDITIONAL INFORMATION (Unaudited) |
| |
| | Beginning | | Ending | | Expenses | | Annualized |
| | Account Value | | Account Value | | Paid During | | Expense |
| | January 1, 2013 | | June 30, 2013 | | Period* | | Ratio* |
| Institutional Shares | | | | | | | | | | | |
| Actual | $ | 1,000.00 | | $ | 1,120.05 | | $ | 5.05 | | 0.96 | % |
| Hypothetical (5% return before taxes) | $ | 1,000.00 | | $ | 1,020.03 | | $ | 4.81 | | 0.96 | % |
| | | | | | | | | | | | |
| | *Expenses are equal to the Fund’s annualized expense ratio multiplied by the average account value over the period, multiplied by the number of days in the most recent fiscal half-year divided by 365 to reflect the half-year period. |
Federal Tax Status of Dividends Declared during the Tax Year
For federal income tax purposes, dividends from short-term capital gains are classified as ordinary income. The Fund designates 91.62% of its income dividend distributed as qualifying for the corporate dividends-received deduction (DRD) and 100.00% for the qualified dividend rate (QDI) as defined in Section 1(h)(11) of the Internal Revenue Code. The Fund also designates 14.76% of its income dividends as qualified interest income exempt from U.S. tax for foreign shareholders (QII) and 18.79% of its income dividends as qualified short-term gain exempt from U.S. tax for foreign shareholders (QSD).
Trustees and Officers of the Trust
The Board is responsible for oversight of the management of the Trust’s business affairs and of the exercise of all the Trust’s powers except those reserved for the shareholders. The following table provides information about each Trustee and certain officers of the Trust. Each Trustee and officer holds office until the person resigns, is removed, or is replaced. Unless otherwise noted, the persons have held their principal occupations for more than five years. The address for all Trustees and officers is Three Canal Plaza, Suite 600, Portland, Maine 04101. Mr. Keffer is considered an Interested Trustee due to his affiliation with Atlantic. The Fund’s Statement of Additional Information includes additional information about the Trustees and is available, without charge and upon request, by calling (877) 328-9437.
| Name and Year of Birth | Position with the Trust | Length of Time Served | Principal Occupation(s) During Past Five Years | Number of Series of Trust Overseen by Trustee | Other Directorships Held by Trustee |
| Independent Trustees | | | | | |
J. Michael Parish Born: 1943 | Chairman of the Board; Trustee; Chairman, Nominating Committee and Qualified Legal Compliance Committee | Since 1989 (Chairman since 2004) | Retired since 2003. | 24 | 0 |
Costas Azariadis Born: 1943 | Trustee | Since 1989 | Professor of Economics, Washington University since 2006. | 24 | 0 |
James C. Cheng Born: 1942 | Trustee; Chairman, Audit Committee | Since 1989 | President, Technology Marketing Associates (marketing company for small- and medium-sized businesses in New England) since 1991. | 24 | 0 |
| |
AUXIER FOCUS FUND ADDITIONAL INFORMATION (Unaudited) |
| |
| Name and Year of Birth | Position with the Trust | Length of Time Served | Principal Occupation(s) During Past Five Years | Number of Series of Trust Overseen by Trustee | Other Directorships Held by Trustee |
David Tucker Born: 1958 | Trustee | Since 2011 | Director, Blue Sky Experience since 2008; Senior Vice President & General Counsel, American Century Companies 1998-2008. | 24 | Trustee, Forum Funds II and Forum ETF Trust |
| Interested Trustee | | | | | |
John Y. Keffer1 Born: 1942 | Trustee; Vice Chairman | Since 1989 | Chairman, Atlantic since 2008; President, Forum Foundation (a charitable organization) since 2005; President, Forum Trust, LLC (a non-depository trust company chartered in the State of Maine) since 1997. | 24 | Director, Wintergreen Fund, Inc.; Trustee, Forum Funds II and Forum ETF Trust |
| Officers | | | | | |
Stacey E. Hong Born: 1966 | President; Principal Executive Officer | Since 2008 | President, Atlantic since 2008. | N/A | N/A |
Karen Shaw Born: 1972 | Treasurer; Principal Financial Officer | Since 2008 | Senior Vice President, Atlantic since 2008. | N/A | N/A |
David Faherty Born: 1970 | Vice President | Since 2009 | Senior Counsel, Atlantic since 2009; Vice President, Citi Fund Services Ohio, Inc. 2007-2009. | N/A | N/A |
Michael J. McKeen Born: 1971 | Vice President | Since 2009 | Senior Vice President, Atlantic since 2008. | N/A | N/A |
Timothy Bowden Born: 1969 | Vice President | Since 2009 | Manager, Atlantic since 2008. | N/A | N/A |
Geoffrey Ney Born: 1975 | Vice President | Since 2013 | Manager, Atlantic since 2013; Senior Fund Accountant, Atlantic, 2008-2013. | N/A | N/A |
Todd Proulx Born: 1978 | Vice President | Since 2013 | Manager, Atlantic since 2013; Senior Fund Accountant, Atlantic, 2008-2013. | N/A | N/A |
Lina Bhatnagar Born: 1971 | Secretary | Since 2008 | Senior Administration Specialist, Atlantic since 2008. | N/A | N/A |
1Atlantic is a subsidiary of Forum Holdings Corp. I, a Delaware corporation that is wholly owned by Mr. Keffer. |
FOR MORE INFORMATION
P.O. Box 588
Portland, Maine 04112
(877) 3AUXIER
(877) 328-9437
INVESTMENT ADVISER
Auxier Asset Management LLC
5285 Meadows Road
Suite 333
Lake Oswego, Oregon 97035
TRANSFER AGENT
Atlantic Fund Services
P.O. Box 588
Portland, Maine 04112
www.atlanticfundservices.com
DISTRIBUTOR
Foreside Fund Services, LLC
Three Canal Plaza, Suite 100
Portland, Maine 04101
www.foreside.com
This report is submitted for the general information of the shareholders of the Fund. It is not authorized for
distribution to prospective investors unless preceded or accompanied by an effective prospectus, which includes
information regarding the Fund’s risks, objectives, fees and expenses, experience of its management, and other
information.
204-ANR-0613
| DF Dent Premier Growth Fund | |
| A Message to Our Shareholders | 1 |
| Management Discussion of Fund Performance | 7 |
| Performance Chart and Analysis (Unaudited) | 13 |
| Schedule of Investments | 14 |
| Statement of Assets and Liabilities | 16 |
| Statement of Operations | 17 |
| Statements of Changes in Net Assets | 18 |
| Financial Highlights | 19 |
| DF Dent Midcap Growth Fund | |
| A Message to Our Shareholders | 20 |
| Performance Chart and Analysis (Unaudited) | 27 |
| Schedule of Investments | 28 |
| Statement of Assets and Liabilities | 30 |
| Statement of Operations | 31 |
| Statements of Changes in Net Assets | 32 |
| Financial Highlights | 33 |
| DF Dent Growth Funds | |
| Notes to Financial Statements | 34 |
| Report of Independent Registered Public Accounting Firm | 39 |
| Additional Information (Unaudited) | 40 |
| |
DF DENT PREMIER GROWTH FUND A MESSAGE TO OUR SHAREHOLDERS |
| |
Dear Fellow Shareholder,
Performance
For the fiscal year ended June 30, 2013, the DF Dent Premier Growth Fund (the “Fund”) experienced a total return of +21.49%, a modest 0.89% above the return of +20.60% for the S&P 500 Index (the “Index”), which is the benchmark we have used for performance comparisons. Your Fund’s total return exceeded the +18.20% average return of its Lipper Multi-Cap Growth peer group by 3.29% for this time period. Your Fund has outperformed the Index in 9 of the 12 fiscal years since its inception in July 2001 with a cumulative total return of +128.10% versus +69.20% for the Index.
For a longer-term perspective, the Fund’s one-year, five-year and ten-year average annual total return for the periods ended June 30, 2013, were 21.49%, 6.43% and 9.56% respectively. Performance data quoted represents past performance and is no guarantee of future results. Current performance may be lower or higher than the performance data quoted. Investment return and principal value will fluctuate so that an investor’s shares, when redeemed, may be worth more or less than original cost. For the most recent month-end performance, please call (866) 233-3368. As stated in the current prospectus, the Fund’s annual operating expense ratio (gross) is 1.29%. However, the Fund’s Adviser has contractually agreed to waive a portion of its fees and/or reimburse certain expenses to limit total operating expense to 1.10% on the first $150 million in Fund net assets and to 0.90% on net assets exceeding $150 million. This agreement is in effect through October 31, 2015. The expense cap may be changed or eliminated only with the consent of the Board of Trustees. During the period, certain fees were waived and/or expenses reimbursed; otherwise, returns would have been lower.
Expense Ratio
Your Fund’s Adviser, D.F. Dent and Company, has agreed to maintain your Fund’s expense ratio at a net 1.10% on the first $150 million of net assets and 0.90% on net assets exceeding $150 million through October 31, 2015 by reimbursing expenses and waiving management fees. During the past six months, the net assets in your Fund have appreciated resulting in the total net assets of $174.8 million as of June 30, 2013. This has caused the Fund to reach the lower 0.90% annual fee on the incremental assets above $150 million and has resulted in the lowest expense ratio in the Fund’s history. If the Fund assets decline, the expense ratio will increase to the capped level of 1.10%. If the Fund assets increase further, the effective annual expense ratio may decline further. The record of expense reimbursement and management fee waivers for the first twelve years of your Fund is as follows:
| |
DF DENT PREMIER GROWTH FUND A MESSAGE TO OUR SHAREHOLDERS |
| |
| Year Ending | | Expense Reimbursement | | Management Fee Waived |
| 06/30/02 | | $ | 60,201 | | $ | 60,019 |
| 06/30/03 | | | 38,066 | | | 90,163 |
| 06/30/04 | | | 0 | | | 129,060 |
| 06/30/05 | | | 0 | | | 141,907 |
| 06/30/06 | | | 0 | | | 142,664 |
| 06/30/07 | | | 0 | | | 161,128 |
| 06/30/08 | | | 0 | | | 95,665 |
| 06/30/09 | | | 0 | | | 234,053 |
| 06/30/10 | | | 0 | | | 204,148 |
| 06/30/11 | | | 0 | | | 211,784 |
| 06/30/12 | | | 0 | | | 240,847 |
| 06/30/13 | | | 0 | | | 235,380 |
| Total | | $ | 98,267 | | $ | 1,946,818 |
Portfolio Turnover
Annual portfolio turnover since inception has been as follows:
| | | 2002* | | 2003 | | 2004 | | 2005 | | 2006 | | 2007 | | 2008 | | 2009 | | 2010 | | 2011 | | 2012 | | 2013 | | Average |
| Portfolio Turnover** | | 0% | | 14% | | 20% | | 7% | | 25% | | 17% | | 21% | | 16% | | 8% | | 21% | | 14% | | 19% | | 15.17% |
We believe these low portfolio turnover rates are consistent with our investment strategy of holding positions for long periods and minimizing transaction expenses for shareholders. Brokerage expenses for the entire fiscal year’s trading amounted to less than 1 cent per share of your Fund. Thus, trading expense remained very low because of low portfolio turnover.
* The Fund commenced operations on July 16, 2001.
** Percentage calculated based on total value of investments.
Asset Allocation
Year-end asset allocation by market capitalization for the past six years was:
| | | 06/30/08* | | 06/30/09* | | 06/30/10* | | 06/30/11* | | 06/30/12* | | 06/30/13* |
| Large Capitalization | | 50.2 | % | | 36.8 | % | | 43.0 | % | | 50.2 | % | | 50.3 | % | | 51.3 | % |
| Mid Capitalization | | 40.2 | % | | 52.9 | % | | 50.2 | % | | 40.6 | % | | 38.6 | % | | 40.4 | % |
| Small Capitalization | | 9.4 | % | | 10.2 | % | | 6.3 | % | | 9.2 | % | | 11.0 | % | | 5.6 | % |
| Reserve Funds | | 0.2 | % | | 0.1 | % | | 0.5 | % | | 0.0 | % | | 0.1 | % | | 2.7 | % |
| Total Fund | | 100.0 | % | | 100.0 | % | | 100.0 | % | | 100.0 | % | | 100.0 | % | | 100.0 | % |
* Percentages calculated based on total value of investments.
| |
DF DENT PREMIER GROWTH FUND A MESSAGE TO OUR SHAREHOLDERS JUNE 30, 2013 |
| |
The Fund’s Prospectus has defined Mid Capitalization companies as those in the $1.5 billion to $7.0 billion market capitalization range. Two companies “graduated” through appreciation from Small to Mid Capitalization and two companies “graduated” from Mid to Large Capitalization in the past year.
Changes in the above Asset Allocation largely reflect the movement of companies from one category to another due to market fluctuations. Many companies “graduated” from Mid Cap to Large Cap in the past 3 years due to appreciation since the market trough in 2009. The Fund seeks to invest in great companies rather than allocate holdings in accordance to an arbitrary market capitalization parameter.
Attribution
We have once again included in the Management Discussion of Fund Performance section later in this report, a bar graph of your Fund’s sector allocation versus the Index and a discussion of that allocation accompanied with commentary on stock selection within sectors of the Index.
Concentration
We have made an effort during the past five years to maintain or increase the position sizes in our favorite “core” holdings. We do not consider this method to be “over concentrated” or that the portfolio is “focused” as that term is used within the mutual fund industry. During this period, the Fund’s top 10 holdings have been as follows:
| Top 10 Holdings | | 06/30/09 | | 06/30/10 | | 06/30/11 | | 06/30/12 | | 06/30/13 |
| % of Fund | | 55.82 | % | | 54.97 | % | | 52.46 | % | | 49.35 | % | | 44.95 | % |
| Average Position Size of Top 10 | | 5.6 | % | | 5.5 | % | | 5.2 | % | | 4.9 | % | | 4.5 | % |
We wrote in each of the past four years that we had reached the desired level of concentration and did not intend to increase concentration beyond the 06/30/09 level shown above. During the past year, we have sought to build up positions of holdings in high conviction names which previously represented smaller percentages of the portfolio. In other words, we have continued the concentration approach but across a broader group of companies. We continue to believe that the current concentration in the top 10 positions is appropriate, at the desired level, and continues to enhanced performance.
Management Ownership of Fund
Employees, their families, and the Adviser’s retirement plan owned 11.3% of the Fund as of 06/30/2013.
| |
DF DENT PREMIER GROWTH FUND A MESSAGE TO OUR SHAREHOLDERS JUNE 30, 2013 |
| |
Reinvention
A question which we are often asked is, “How can we be confident that a market leader today won’t lose its competitive edge in a year or two and, consequently, its ability to generate above-market returns?” The fundamental answer is that we have faith in the management teams of these companies to “reinvent” their companies, their products and services as many times as is necessary to maintain market leadership. We believe that many of your Fund’s portfolio companies are known for their stability and reliability (as investors, we don’t like surprises and instability). However, we believe strongly that corporate stability and reliability come from a willingness to change with the market, to modify and expand the business model, or to abandon strategies that have worked in the past but may not work in the future. We have found that this “reinvention” and “creative destruction” are strongly correlated to long-term market dominance and sustainable earnings growth.
A few corporate reinvention examples of companies in the Fund’s portfolio that come to mind are the following:
| · | In the early 1990s, Fastenal opened up new stores which represented 30% of the prior year’s store count. When this growth rate became unsustainable the company expanded its product and service offerings to a broad range of industrial supplies thus increasing same-store sales dramatically to make up for the slowdown in new store openings. In the late 1990s Fastenal announced its “Pathway to Profit” growth initiative. Under Pathway to Profit, Fastenal slowed new store openings further and used the savings to hire more outside sales personnel in existing stores. The program has increased same-store sales, operating leverage, and profit margins in existing stores. Fastenal’s more recent vending machine initiative is driving further improvements to Fastenal’s business model. Never satisfied with its successful business model, we believe that management has continually sought to grow by taking it apart and improving- reinvention at its best. |
| · | Stericycle has maintained its strong revenue growth by expanding from its core medical waste collection business to several auxiliary services. Stericycle has leveraged its reputation and customer relationships through the following offerings: |
| § | Steri-Safe, a service where Stericycle provides training to physicians’ offices and hospitals on issues related to blood borne pathogens and OSHA compliance; |
| § | StrongPak, a pharmaceutical waste disposal service; and |
| § | NotifyMD, a service providing inbound and outbound patient communications to physician practices, dental offices, and hospitals. |
| · | Healthcare Services Group, historically a provider of laundry and linen services to senior living facilities, added food services to its list of offerings, thus expanding its addressable market and making its customer relationships stronger and stickier. |
| |
DF DENT PREMIER GROWTH FUND A MESSAGE TO OUR SHAREHOLDERS JUNE 30, 2013 |
| |
| · | Waste Connections, historically a provider of residential and commercial waste services, expanded into the energy waste business in 2012 through its acquisition of R360 Environmental Solutions. Waste Connections saw the strong growth in domestic oil production and predicted a likely strengthening of oilfield waste regulations. R360, a leading provider of oilfield waste treatment and disposal services, offers Waste Connections a major new growth driver. |
| · | Several of your portfolio’s software companies now derive a good portion of their revenues from subscriptions but did not start out that way. Instead, they started out as traditional software companies with revenue streams made up of large upfront license payments, small maintenance fees and possible renewals when the next version of the software was released. These software companies transitioned to a subscription model in which customers, in exchange for a subscription fee, now enjoy the newest version of the software at all times without ever having to install the software on their own machines. A true software-as-a-service (SaaS) offering is “hosted” by the software vendor on the software vendor’s own IT infrastructure, so the customer also saves significant IT infrastructure expense. Subscription-based software companies also realize the improved revenue visibility of a subscription-based model in which the software vendor gets paid a regular, predictable fee rather than having to go out and sell each renewal. The companies were willing to risk severe disruption to their businesses in order to transition to the optimal business model for the next decade. |
Commentary
The above-trend-line return for your Fund and stocks overall in the past fiscal year occurred with a normal list of market worries. There was the “Fiscal Cliff,” sequestration, higher personal taxes, $100 plus crude oil prices and higher gas prices at the pump, unrest and civil wars in the Middle East, China’s slow down, and let’s not forget the cicadas due last May. The market worried, but these events passed without much effect (much like Y2K despite widespread fears). At the beginning of the Fund’s new fiscal year, investors are worried about the slow pace of projected GNP growth and the pace of Federal Reserve “tapering,” and the slowdown in the rate of monthly mortgage purchasing.
In a counterintuitive way, we believe these worries could be good for equities. The proverbial “wall of worry” is a healthy condition for rising stock prices for it reflects caution and restraint amongst investors - in other words, the absence of “Irrational Exuberance,” a term then Chairman of the Federal Reserve, Alan Greenspan, used to describe excesses within the markets. Expectations today are muted, and we believe that could be good for the stock market as it has been in the past year. Despite the ever present worries we think most investors and strategists continue to underestimate one very important factor, the resilience of the U.S. economy. We certainly do not expect the continuation of above trend 20% returns of the past 12 months, but we do expect that stocks will continue to outperform bonds as we predicted in this section last year.
Investors have taken notice of the shift in the landscape of returns from stocks (+20%) versus bonds (-4.18% for the 10 year Treasury) in the past 12 months. After many years of redemptions of domestic mutual funds and purchases of bond funds, the end of your Fund’s fiscal year witnessed positive flows back into domestic mutual funds. We have argued that investing in U.S. equities would be the more attractive opportunity for
| |
DF DENT PREMIER GROWTH FUND A MESSAGE TO OUR SHAREHOLDERS JUNE 30, 2013 |
| |
investors. Indeed, U.S. equity markets have outperformed non-U.S. markets in general and the broad bond market in the past year. We expect this trend to continue as interest rates creep up and the U.S. economy’s modest growth still outpaces the growth in many foreign countries. We believe this should result in continued flows into U.S. equities. Which equities? We believe those growth companies which can sustain superior earnings growth in a slow growth U.S. economy will attract investors. We will continue to manage the DF Dent Premier Growth Fund by investing in those companies that we believe can deliver such growth in the future.
Once again, we appreciate the trust you have placed in us with your investment and will work diligently to earn that trust each day.
Respectively Submitted,
Daniel F. Dent
IMPORTANT INFORMATION:
The recent growth rate in the global equity markets has helped to produce short-term returns for some sectors/asset classes that are not typical and may not continue in the future. Because of ongoing market volatility, Fund performance may be subject to substantial short-term changes.
Investing involves risks, including the possible loss of principal. The Fund invests in small and medium size companies. Investments in these companies, especially smaller companies, carry greater risk than is customarily associated with larger companies for various reasons such as increased volatility of earnings and prospects, narrower markets, limited financial resources and less liquid stock. The Fund will typically invest in the securities of fewer issuers. If the Fund’s portfolio is over weighted in a sector, any negative development affecting that sector will have a greater impact on the Fund than a fund that is not over weighted in that sector.
The S&P 500 Index is a broad-based, unmanaged measurement of changes in stock market conditions based on the average of 500 widely held stocks. One cannot invest directly in an index.
| |
DF DENT PREMIER GROWTH FUND MANAGEMENT DISCUSSION OF FUND PERFORMANCE JUNE 30, 2013 |
| |
Recent Performance
For the fiscal year ended June 30, 2013, the DF Dent Premier Growth Fund (the “Fund”) experienced a total return of +21.49% versus a total return of +20.60% for the S&P 500 Index, the benchmark we use for performance reporting.
| Period Ending 06/30/13 | | DF Dent Premier Growth Fund | | S&P 500 Index | | Outperformance (Underperformance) |
| Six Months | | + | 10.46 | % | | + | 13.82 | % | | - | 3.36 | % |
| Twelve Months | | + | 21.49 | % | | + | 20.60 | % | | + | 0.89 | % |
| Five Years (annualized) | | + | 6.43 | % | | + | 7.01 | % | | - | 0.58 | % |
| Five Years (cumulative) | | + | 36.57 | % | | + | 40.32 | % | | - | 3.75 | % |
| Since Inception (07/16/01) (annualized) | | + | 7.14 | % | | + | 4.50 | % | | + | 2.64 | % |
| Since Inception (07/16/01) (cumulative) | | + | 128.10 | % | | + | 69.20 | % | | + | 58.90 | % |
Past performance is not indicative of future performance.
Your Fund’s 12 month return of +21.49% exceeded the average return of its Lipper Multi-Cap Growth peer group of 18.20% by 3.29% for the June 30, 2013 fiscal year.
Your Fund’s cumulative total return outperformance since inception (07/16/2001) over the Index for the past five years has progressed as follows:
| 06/30/09 | | 06/30/10 | | 06/30/11 | | 06/30/12 | | 06/30/13 |
| + | 26.88 | % | | + | 36.39 | % | | + | 55.33 | % | | + | 47.46 | % | | + | 58.90 | % |
The two most significant market factors affecting your Fund’s performance during this past fiscal year were:
| 1. | The sustained stimulative monetary policy by the Federal Reserve. |
| 2. | A shift in investor sentiment towards equities. |
Quantitative Easing’s most recent operation has been the monthly purchase of $85 billion of mortgage securities to maintain downward pressure on long term interest rates and inject steady liquidity (cash) into the financial markets. While the intent is for that cash to be lent out by banks as loans to stimulate economic expansion (and much of it does just that), we believe that much of the cash finds its way into financial assets such as stocks and bonds, thus driving up their prices. To a great extent, we believe that the stock market’s recovery over the past four years has been supported by this liquidity. We believe that high bond prices (low yields) as well have been sustained by this liquidity.
However, a shift began during the Fund’s fiscal year as the memory of the 2008 market collapse faded, and investors tired of low returns from fixed income investments. Investors sought better returns from better yielding stocks at first and then from a broader group of stocks which had underperformed bonds for the past
| |
DF DENT PREMIER GROWTH FUND MANAGEMENT DISCUSSION OF FUND PERFORMANCE JUNE 30, 2013 |
| |
decade. We believe that investor sentiment shifted markedly to a “risk on” preference. By June 30, 2013, high yield “junk” bonds were yielding less than U.S. Treasuries five years ago, the 10 year U.S. Treasury had a trailing 12 month total return of -4.18%, and U.S. domestic equity mutual funds, of which your Fund is one, were seeing net purchases for the first time in many years. The Fund paralleled this trend and experienced net shareholder purchases in the last two quarters of its fiscal year after four years of net redemptions. Clearly the 20% equity returns in the past 12 months versus the -4.18% return in a “safe” U.S. Treasury has caused a change in investors’ perception of risk and return. As our Semi-Annual Report six months ago stated:
“just as bond outperformance in the past decade caused investors to shift from stocks to bonds, we believe that poor bond performance in a rising interest rate environment in the next 10 years will cause investors to favor stocks over bonds.”
Liquidity (compliments of the Federal Reserve) and this shift in investor sentiment were the two most significant market factors providing a tailwind for the stock market and your Fund in the past year.
The S&P 500 Index (the “Index”) consists of 10 market sectors. Your Fund had no investments in the Index’s worst performing sector, Utilities, in the past year. However, your Fund was significantly over-weighted in the sector’s second worst performing category, Information Technology. Bad news? Not quite. While the Information Technology sector of the Index provided a below market total return of +7.80%, the Fund’s most heavily weighted Information Technology investment achieved a +25.74% return. As such, the stock selection in this sector was the most significant factor in the Fund’s performance. The Fund was underweighted in Health Care and Consumer Discretionary, both of which performed well for the Fund and the Index. The underweighting in Health Care was due to the uncertainty regarding the future impact of the Affordable Health Care Act. Consumer Discretionary was underweighted because of our stagnant outlook for family disposable income, wages, and the poor employment outlook. Your Fund’s +22.34% return in its selected Financials lagged the Index’s +35.60% return in Financials due to the absence of any banks, which we generally do not consider to be long term growth vehicles but interest rate sensitive leveraged financial holdings with asset quality issues. The “net, net” of all this was a modest outperformance as compared to the Index for the year ending 06/30/2013.
Capital Gains Distribution Policy
It is the Fund’s policy to distribute all net realized capital gains to shareholders at least annually. Capital gains distributions were made in December of 2005, 2006, 2007, and 2008, but not since. Shareholder redemptions during the sharp market decline of 2008-2009 forced the Fund to realize significant capital losses at the time, which may be carried forward for eight years.
The loss carry forward consumption in the past fiscal year is summarized below:
| Loss carry-forward as of 06/30/2012 | | $39,400,579 | | ($4.69 per share) |
| Less net gains realized in fiscal 06/30/2013 | | - 6,988,884 | | ($0.86 per share) |
| Equals loss carry-forward as of 06/30/2013 | | $32,411,695 | | ($3.99 per share) |
| |
DF DENT PREMIER GROWTH FUND MANAGEMENT DISCUSSION OF FUND PERFORMANCE JUNE 30, 2013 |
| |
In the 06/30/2013 fiscal year your Fund realized capital gains of $6,988,884, or $0.86 per share, which were completely offset by this loss carry-forward. While an unrealized gain of $56,324,991 remained in the Fund as of 06/30/2013, the remaining 06/30/2013 loss carry-forward of $32,411,695 or $3.99 per share may be utilized in the future to offset the possible realization of these gains. This loss carry-forward can offset capital gains up to $2,933,589 realized until 06/30/2017 and $29,478,106 realized until 06/30/2018. As such, we view the loss carry-forward as a “hidden asset” which can shelter future capital gains, if realized, against future capital gains distributions and taxes as was the case in the fiscal year just concluded.
Attribution Analysis
The following bar chart presents the sector weightings of your Fund (DFDPX) versus the sector weightings of the Index as of June 30, 2013:
Source: FactSet
Sector Weightings
While the above percentages have changed slightly from one year ago, the relative weightings within your Fund versus the Index remain the same. Again, Information Technology followed by Industrials represented the two largest weightings within the Fund. For the second year in a row, each of these two overweighted sectors in the Fund outperformed their respective sectors in the Index. The third largest sector in the Fund, Financials,
| |
DF DENT PREMIER GROWTH FUND MANAGEMENT DISCUSSION OF FUND PERFORMANCE JUNE 30, 2013 |
| |
underperformed due to the absence of banks, which are a large component of the Index. One year ago, Financials in the Fund outperformed that sector in the Index due to the absence of banks in the Fund. We do not see banks in general as attractive long term growth vehicles but as highly leveraged cyclical plays on credit cycles dependent upon asset quality, which fluctuates dramatically within those cycles. We continued to be underweighted in Energy, Consumer Discretionary and Consumer Staples. Four years into the recovery from the Great Recession, the Household Income Index is about 5% below its level at the beginning of the economic recovery, unemployment levels are high, and real median annual household income remains stagnant. In this environment your Fund has avoided companies dependent upon consumer spending even though we have missed some opportunities.
Sector Contribution
Your Fund’s overweighted Information Technology sector contributed +25.74% to performance over the past year versus a calculated contribution of +7.80% for that sector within the Index. Information Technology returns over the year were led by 3D Systems (+92.88%), Visa (+49.01%), and Tyler Technologies (+38.09%). Both Visa and 3D Systems were in the five top performer list for fiscal year 2012 and fiscal year 2013. Industrials were the most overweighted sector in the Fund (at 28.45% versus the Index at 10.15%) and performed well outperforming the Index by about 3% in the 2013 fiscal year. ADTRAN, which was eliminated, had a negative contribution from its -29.59% return within the Information Technology sector and was the worst performing stock in the Fund.
Strategy and Trends
Strategy
Our strategy, as always, has been to invest in “best-in-class”** companies led by strong management teams with documented track records of delivering results within growth markets. Best-in-class may be determined by the Adviser by a number of considerations such as leading market share, best profitability, highest organic growth rate, consistency of operating results, highest return on invested capital, corporate culture and work ethic, shareholder friendly capital allocation, and most importantly overall management integrity.
As previously written, we anticipate a game changing shift away from dependence upon foreign energy sources to increasing domestic production of energy. This is the result of new discoveries in the continental U.S. and offshore enhanced by technologies such as fracking and horizontal drilling to extract greater volumes of natural gas and liquids from given discoveries. Additional purchases of Concho Resources with initial investments in Range Resources and Southwestern Energy increased your Fund’s exposure to domestic energy production while Apache with its greater participation in international energy sources was eliminated from the Fund.
We added to the position in Ecolab while initiating investments in Clean Harbors and Waste Connections, increasing the Fund’s exposure to environmental servicing, an area where we anticipate increased spending in future years. Each of these three companies has major divisions servicing the energy sector of the economy, an area of strong growth as indicated in the paragraph above.
| |
DF DENT PREMIER GROWTH FUND MANAGEMENT DISCUSSION OF FUND PERFORMANCE JUNE 30, 2013 |
| |
Trends
In the 12/31/2012 Semi-Annual Report we wrote that, while investment funds had been traveling overseas, the U.S. was becoming an increasingly attractive place to invest. Today Siemens, Toyota, Air Bus, Maserati, and Honda have all built factories in the U.S. In fact, Honda, once the largest importer of autos into the U.S., is now manufacturing autos and light trucks in the U.S. for export overseas! Once again, in the past year, U.S. equities have outperformed developed and emerging markets overseas. While it may have been “fashionable” and some think sophisticated to invest overseas, the U.S. is where the action has been for investors. Productivity gains, improving efficiencies, abundant inexpensive energy sources, political and economic stability are sustaining increased investment in the U.S. As a domestic fund, we believe your Fund is well positioned to benefit from these trends.
Many companies are outsourcing services and software which are not their primary endeavors to specialists who can deliver these products more efficiently and at a lower cost. We added to the Fund’s positions in Concur Technologies (software as a service managing corporate travel and expense management) and SEI Investments (investment management software and services), while initiating Tyler Technologies ( integrated information management for municipalities) and WageWorks (employee directed benefit programs) as new holdings in the software as a service area. Each of these companies made meaningful contributions to the Fund’s performance in the past year.
Best and Worst Performers
Five Best Contributors (Unaudited) Investments | | Realized and Unrealized Appreciation and Income in Fiscal Year 2013 | | Per Share As of 06/30/13 | |
| 3D Systems Corp. | | $ | 3,355,426 | | $ | 0.41 | |
| Visa, Inc., Class A | | | 2,911,984 | | | 0.36 | |
| LKQ Corp. | | | 2,494,625 | | | 0.31 | |
| Celgene Corp. | | | 2,338,457 | | | 0.29 | |
| ResMed, Inc. | | | 2,113,556 | | | 0.26 | |
| | | $ | 13,214,048 | | $ | 1.63 | |
Five Poorest Contributors (Unaudited) Investments | | Realized and Unrealized Loss and Income in Fiscal Year 2013 | | Per Share As of 06/30/13 | |
| ADTRAN, Inc. | | $ | (802,238) | | $ | (0.10) | |
| IDEXX Laboratories, Inc. | | | (465,814) | | | (0.06) | |
| Potash Corp. of Saskatchewan, Inc. | | | (400,904) | | | (0.05) | |
| Innerworkings, Inc. | | | (319,736) | | | (0.04) | |
| Apache Corp. | | | (292,571) | | | (0.04) | |
| | | $ | (2,281,263) | | $ | (0.29) | |
| |
DF DENT PREMIER GROWTH FUND MANAGEMENT DISCUSSION OF FUND PERFORMANCE JUNE 30, 2013 |
| |
Visa and 3-D Systems are repeat top five performers from one year ago. ResMed returns to this year’s top five list after being on it in 2009 and 2010. These companies are examples of our long term strategy of holding on to the “winners” through up and down markets. However, we did trim the large positions in each of these companies due to their sustained strong performance which resulted in their position sizes in the portfolio exceeding our target levels.
Proceeds from trimming strong performers back to targeted position sizes are often recycled to fund purchases in new investments. There were seven new investments in the 2013 fiscal year.
FIVE LARGEST EQUITY HOLDINGS (UNAUDITED)
June 30, 2013
| Quantity | | Security | | Total Cost | | Market Value | | Percent of Net Assets of the Fund | |
| 240,600 | | Fastenal Co. | | $ | 5,543,661 | | $ | 11,031,510 | | 6.31 | % | |
| 170,000 | | QUALCOMM, Inc. | | | 7,027,243 | | | 10,383,600 | | 5.94 | | |
| 138,000 | | ANSYS, Inc. | | | 4,600,882 | | | 10,087,800 | | 5.77 | | |
| 47,000 | | Visa, Inc., Class A | | | 3,444,607 | | | 8,589,250 | | 4.91 | | |
| 105,000 | | T. Rowe Price Group, Inc. | | | 5,029,686 | | | 7,680,750 | | 4.39 | | |
| | | | | $ | 25,646,079 | | $ | 47,772,910 | | 27.32 | % | |
** The determination of “best-in-class” is solely the opinion of the Fund’s Adviser, and such opinion is subject to change. Those companies that hold leading market share positions, strong growth potential, historically good profitability, and management teams known for integrity and good corporate governance are generally considered to be “best-in--class.”
The views in this report contained herein were those of the Fund’s Adviser as of June 30, 2013, and may not reflect the Adviser’s views on the date this report is first published or anytime thereafter. This report may contain discussions about certain investments both held and not held in the portfolio as of the report date. All current and future holdings are subject to risk and are subject to change. While these views are intended to assist shareholders in understanding their investment in the Fund, they do not constitute investment or tax advice, are not a guarantee of future performance and are not intended as an offer or solicitation with respect to the purchase or sale of any security.
| |
DF DENT PREMIER GROWTH FUND PERFORMANCE CHART AND ANALYSIS (Unaudited) JUNE 30, 2013 |
| |
The following chart reflects the change in the value of a hypothetical $10,000 investment, including reinvested dividends and distributions, in the DF Dent Premier Growth Fund (the “Fund”) compared with the performance of the benchmark, S&P 500 Index ("S&P 500"), over the past ten fiscal years. The S&P 500 is a broad-based, unmanaged measurement of changes in stock market conditions based on the average of 500 widely held common stocks. The total return of the S&P 500 includes the reinvestment of dividends and income. The total return of the Fund includes operating expenses that reduce returns, while the total return of the S&P 500 does not include expenses. The Fund is professionally managed while the S&P 500 is unmanaged and is not available for investment.
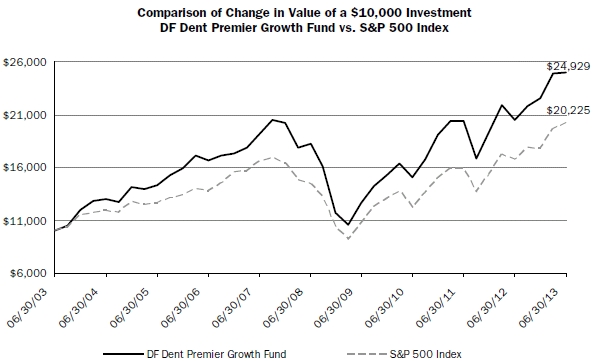
| Average Annual Total Returns | | | | | | |
| Periods Ended June 30, 2013 | | One Year | | Five Years | | Ten Years |
| DF Dent Premier Growth Fund | | 21.49 | % | | 6.43 | % | | 9.56 | % |
| S&P 500 Index | | 20.60 | % | | 7.01 | % | | 7.30 | % |
Performance data quoted represents past performance and is no guarantee of future results. Current performance may be lower or higher than the performance data quoted. Investment return and principal value will fluctuate so that shares, when redeemed, may be worth more or less than original cost. For the most recent month-end performance, please call (866) 233-3368. As stated in the Fund’s current prospectus, the annual operating expense ratio (gross) is 1.29%. However, the Fund’s adviser has contractually agreed to reduce a portion of its fees and reimburse expenses to limit total operating expenses to 1.10% on the first $150 million in Fund net assets and to 0.90% on net assets exceeding the $150 million, through October 31, 2015. During the period, certain fees were waived and/or expenses reimbursed; otherwise, returns would have been lower. The performance table and graph do not reflect the deduction of taxes that a shareholder would pay on Fund distributions or the redemption of Fund shares. Returns greater than one year are annualized.
| |
DF DENT PREMIER GROWTH FUND SCHEDULE OF INVESTMENTS JUNE 30, 2013 |
| |
| | Shares | | Security Description | | Value | |
| Common Stock - 97.4% |
| Consumer Discretionary - 5.6% |
| | 52,800 | | American Public Education, Inc. (a) | | $ | 1,962,048 | |
| | 263,000 | | LKQ Corp. (a) | | 6,772,250 | |
| | 304,051 | | National American University Holdings, Inc. | | 1,137,151 | |
| | | 9,871,449 | |
| Energy - 8.7% |
| | 26,000 | | Concho Resources, Inc. (a) | | 2,176,720 | |
| | 30,000 | | Core Laboratories NV | | 4,549,800 | |
| | 28,000 | | Range Resources Corp. | | 2,164,960 | |
| | 62,600 | | Schlumberger, Ltd. | | 4,485,916 | |
| | 48,000 | | Southwestern Energy Co. (a) | | 1,753,440 | |
| | | 15,130,836 | |
| Financials - 12.8% |
| | 48,900 | | American Tower Corp. REIT | | 3,578,013 | |
| | 11,000 | | Markel Corp. (a) | | 5,796,450 | |
| | 190,000 | | SEI Investments Co. | | 5,401,700 | |
| | 105,000 | | T. Rowe Price Group, Inc. | | 7,680,750 | |
| | | 22,456,913 | |
| Health Care - 6.2% |
| | 44,000 | | Celgene Corp. (a) | | 5,144,040 | |
| | 125,000 | | ResMed, Inc. | | 5,641,250 | |
| | | 10,785,290 | |
| Industrials - 27.0% |
| | 67,000 | | Clean Harbors, Inc. (a) | | 3,385,510 | |
| | 130,200 | | Expeditors International of Washington, Inc. | | 4,948,902 | |
| | 25,000 | | Exponent, Inc. | | 1,477,750 | |
| | 240,600 | | Fastenal Co. | | 11,031,510 | |
| | 155,000 | | Healthcare Services Group, Inc. | | 3,800,600 | |
| | 143,000 | | Innerworkings, Inc. (a) | | 1,551,550 | |
| | 89,000 | | Jacobs Engineering Group, Inc. (a) | | 4,906,570 | |
| | 44,000 | | Roper Industries, Inc. | | 5,465,680 | |
| | 52,000 | | Stericycle, Inc. (a) | | 5,742,360 | |
| | 120,000 | | Waste Connections, Inc. | | 4,936,800 | |
| | | 47,247,232 | |
| Information Technology - 31.9% |
| | 150,000 | | 3D Systems Corp. (a) | | | 6,585,000 | |
| | 138,000 | | ANSYS, Inc. (a) | | 10,087,800 | |
| | 50,000 | | Concur Technologies, Inc. (a) | | 4,069,000 | |
| | 113,386 | | DealerTrack Holdings, Inc. (a) | | 4,017,266 | |
| | 66,000 | | NIC, Inc. (a) | | 1,090,980 | |
| | 170,000 | | QUALCOMM, Inc. | | 10,383,600 | |
| | 17,000 | | Red Hat, Inc. (a) | | 812,940 | |
| | 196,000 | | Trimble Navigation, Ltd. (a) | | 5,097,960 | |
| | 36,000 | | Tyler Technologies, Inc. (a) | | 2,467,800 | |
| | 47,000 | | Visa, Inc., Class A | | 8,589,250 | |
| | 74,000 | | WageWorks, Inc. (a) | | 2,549,300 | |
| | | 55,750,896 | |
| Materials - 5.2% |
| | 69,500 | | Ecolab, Inc. | | 5,920,705 | |
| | 83,000 | | Potash Corp. of Saskatchewan, Inc. | | 3,164,790 | |
| | | 9,085,495 | |
Total Common Stock (Cost $114,003,120) | | 170,328,111 | |
Total Investments - 97.4% (Cost $114,003,120)* | | $ | 170,328,111 | |
| Other Assets & Liabilities, Net – 2.6% | | 4,480,077 | |
| Net Assets – 100.0% | | $ | 174,808,188 | |
| REIT | Real Estate Investment Trust |
| (a) | Non-income producing security. |
| | * Cost for federal income tax purposes is $114,003,120 and net unrealized appreciation consists of: |
| Gross Unrealized Appreciation | | $ | 60,407,049 | |
| Gross Unrealized Depreciation | | | (4,082,058 | ) |
| Net Unrealized Appreciation | | $ | 56,324,991 | |
| See Notes to Financial Statements. | 14 | DF DENT GROWTH FUNDS |
| |
DF DENT PREMIER GROWTH FUND SCHEDULE OF INVESTMENTS JUNE 30, 2013 |
| |
The following is a summary of the inputs used to value the Fund’s investments as of June 30, 2013.
The inputs or methodology used for valuing securities are not necessarily an indication of the risks associated with investing in those securities. For more information on valuation inputs, and their aggregation into the levels used in the table below, please refer to the Security Valuation section in Note 2 of the accompanying Notes to Financial Statements.
| Valuation Inputs | | Investments in Securities |
| Level 1 - Quoted Prices | | $ | 170,328,111 | |
| Level 2 - Other Significant Observable Inputs | | | - | |
| Level 3 - Significant Unobservable Inputs | | | - | |
| Total | | $ | 170,328,111 | |
The Level 1 value displayed in this table is Common Stock. Refer to the Schedule of Investments for a further breakout of each security by industry.
There were no transfers between Level 1 and Level 2 for the year ended June 30, 2013.
| PORTFOLIO HOLDINGS | | |
| % of Net Assets | | |
| Consumer Discretionary | 5.6 | % |
| Energy | 8.7 | % |
| Financials | 12.8 | % |
| Health Care | 6.2 | % |
| Industrials | 27.0 | % |
| Information Technology | 31.9 | % |
| Materials | 5.2 | % |
| Other Assets & Liabilties, Net | 2.6 | % |
| | 100.0 | % |
| See Notes to Financial Statements. | 15 | DF DENT GROWTH FUNDS |
| |
DF DENT PREMIER GROWTH FUND STATEMENT OF ASSETS AND LIABILITIES JUNE 30, 2013 |
| |
| ASSETS | | | | |
| | Total investments, at value (Cost $114,003,120) | | $ | 170,328,111 | |
| | Cash | | | 4,831,134 | |
| | Receivables: | | | | |
| | | Fund shares sold | | | 25,150 | |
| | | Dividends and interest | | | 61,511 | |
| | Prepaid expenses | | | 14,123 | |
| Total Assets | | | 175,260,029 | |
| | | | | | | |
| LIABILITIES | | | | |
| | Payables: | | | | |
| | | Fund shares redeemed | | | 20,000 | |
| | Accrued Liabilities: | | | | |
| | Investment adviser fees | | | 382,722 | |
| | | Trustees’ fees and expenses | | | 117 | |
| | | Fund services fees | | | 21,530 | |
| | | Other expenses | | | 27,472 | |
| Total Liabilities | | | 451,841 | |
| | | | | | | |
| NET ASSETS | | $ | 174,808,188 | |
| | | | | | | |
| COMPONENTS OF NET ASSETS | | | | |
| | Paid-in capital | | $ | 151,130,001 | |
| | Accumulated net investment loss | | | (235,109 | ) |
| | Accumulated net realized loss | | | (32,411,695 | ) |
| | Net unrealized appreciation | | | 56,324,991 | |
| NET ASSETS | | $ | 174,808,188 | |
| SHARES OF BENEFICIAL INTEREST AT NO PAR VALUE (UNLIMITED SHARES AUTHORIZED) | | | 8,114,737 | |
| NET ASSET VALUE, OFFERING AND REDEMPTION PRICE PER SHARE | | $ | 21.54 | |
| | | | | | | |
| See Notes to Financial Statements. | 16 | DF DENT GROWTH FUNDS |
| |
DF DENT PREMIER GROWTH FUND STATEMENT OF OPERATIONS YEAR ENDED JUNE 30, 2013 |
| |
| INVESTMENT INCOME | | | | |
| | Dividend income (Net of foreign withholding taxes of $19,763) | | $ | 1,665,071 | |
| | Interest income | | | 3,249 | |
| Total Investment Income | | | 1,668,320 | |
| | | | | |
| EXPENSES | | | | |
| | Investment adviser fees | | | 1,604,936 | |
| | Fund services fees | | | 299,956 | |
| | Custodian fees | | | 16,249 | |
| | Registration fees | | | 19,567 | |
| | Professional fees | | | 45,439 | |
| | Trustees' fees and expenses | | | 5,385 | |
| | Miscellaneous expenses | | | 30,244 | |
| Total Expenses | | | 2,021,776 | |
| | Fees waived and expenses reimbursed | | | (278,350 | ) |
| Net Expenses | | | 1,743,426 | |
| | | | | | | |
| NET INVESTMENT LOSS | | | (75,106 | ) |
| | | | | | | |
| NET REALIZED AND UNREALIZED GAIN (LOSS) | | | | |
| | Net realized gain on investments | | | 6,988,884 | |
| | Net change in unrealized appreciation (depreciation) on investments | | | 23,881,841 | |
| NET REALIZED AND UNREALIZED GAIN | | | 30,870,725 | |
| INCREASE IN NET ASSETS FROM OPERATIONS | | $ | 30,795,619 | |
| | | | | | | |
| See Notes to Financial Statements. | 17 | DF DENT GROWTH FUNDS |
| |
DF DENT PREMIER GROWTH FUND STATEMENTS OF CHANGES IN NET ASSETS |
| |
| | | | | For the Years Ended June 30, |
| | | | | 2013 | | | 2012 |
| OPERATIONS | | | | | | | | | |
| | Net investment loss | | $ | (75,106 | ) | | | $ | (410,234 | ) |
| | Net realized gain | | | 6,988,884 | | | | | 7,753,414 | |
| | Net change in unrealized appreciation (depreciation) | | | 23,881,841 | | | | | (6,635,851 | ) |
| Increase in Net Assets Resulting from Operations | | | 30,795,619 | | | | | 707,329 | |
| | | | | | | | | | | | |
| CAPITAL SHARE TRANSACTIONS | | | | | | | | | |
| | Sale of shares | | | 12,280,833 | | | | | 4,388,239 | |
| | Redemption of shares | | | (17,154,575 | ) | | | | (13,863,839 | ) |
| Decrease in Net Assets from Capital Share Transactions | | | (4,873,742 | ) | | | | (9,475,600 | ) |
| Increase (Decrease) in Net Assets | | | 25,921,877 | | | | | (8,768,271 | ) |
| | | | | | | | | | | | |
| NET ASSETS | | | | | | | | | |
| | Beginning of Year | | | 148,886,311 | | | | | 157,654,582 | |
| | End of Year (Including line (a)) | | $ | 174,808,188 | | | | $ | 148,886,311 | |
| | | | | | | | | | | | |
| SHARE TRANSACTIONS | | | | | | | | | |
| | Sale of shares | | | 596,924 | | | | | 252,190 | |
| | Redemption of shares | | | (881,018 | ) | | | | (812,727 | ) |
| Decrease in Shares | | | (284,094 | ) | | | | (560,537 | ) |
| | | | | | | | | | | | |
| (a) | Accumulated net investment loss. | | $ | (235,109 | ) | | | $ | (194,300 | ) |
| See Notes to Financial Statements. | 18 | DF DENT GROWTH FUNDS |
| |
DF DENT PREMIER GROWTH FUND FINANCIAL HIGHLIGHTS |
| |
These financial highlights reflect selected data for a share outstanding throughout each year. |
| | | For the Years Ended June 30, |
| | | 2013 | | 2012 | | 2011 | | 2010 | | 2009 |
| NET ASSET VALUE, Beginning | | | | | | | | | | | | | | | | | | | |
| of Year | $ | 17.73 | | | $ | 17.60 | | | $ | 13.05 | | | $ | 10.94 | | | $ | 16.20 | |
| INVESTMENT OPERATIONS | | | | | | | | | | | | | | | | | | | |
| Net investment loss (a) | | (0.01 | ) | | | (0.05 | ) | | | (0.04 | ) | | | (0.04 | ) | | | (0.03 | ) |
| Net realized and unrealized | | | | | | | | | | | | | | | | | | | |
| | gain (loss) | | 3.82 | | | | 0.18 | | | | 4.59 | | | | 2.15 | | | | (4.96 | ) |
| Total from Investment | | | | | | | | | | | | | | | | | | | |
| | Operations | | 3.81 | | | | 0.13 | | | | 4.55 | | | | 2.11 | | | | (4.99 | ) |
| DISTRIBUTIONS TO | | | | | | | | | | | | | | | | | | | |
| SHAREHOLDERS FROM | | | | | | | | | | | | | | | | | | | |
| Net realized gain | | — | | | | — | | | | — | | | | — | | | | (0.27 | ) |
| NET ASSET VALUE, End | | | | | | | | | | | | | | | | | | | |
| of Year | $ | 21.54 | | | $ | 17.73 | | | $ | 17.60 | | | $ | 13.05 | | | $ | 10.94 | |
| TOTAL RETURN | | 21.49 | % | | 0.74 | % | | 34.87 | % | | 19.29 | % | | (30.64 | )% |
| | | | | | | | | | | | | | | | | | | | |
| RATIOS/SUPPLEMENTARY DATA | | | | | | | | | | | | | | | | | | | |
| Net Assets at End of | | | | | | | | | | | | | | | | | | | |
| | Year (000's omitted) | $174,808 | | | $148,886 | | | $157,655 | | | $123,605 | | | $117,391 | |
| Ratios to Average Net Assets: | | | | | | | | | | | | | | | | | | | |
| Net investment loss | | (0.05 | )% | | (0.28 | )% | | (0.27 | )% | | (0.29 | )% | | (0.25 | )% |
| Net expense | | 1.09 | % | | 1.10 | % | | 1.10 | % | | 1.10 | % | | 1.10 | % |
| Gross expense (b) | | 1.26 | % | | 1.29 | % | | 1.25 | % | | 1.27 | % | | 1.26 | % |
| PORTFOLIO TURNOVER RATE | | 19 | % | | 14 | % | | 21 | % | | 8 | % | | 16 | % |
| | | | | | | | | | | | | | | | | | | | | |
| (a) | Calculated based on average shares outstanding during each year. |
| (b) | Reflects the expense ratio excluding any waivers and/or reimbursements. |
| See Notes to Financial Statements. | 19 | DF DENT GROWTH FUNDS |
| |
DF DENT MIDCAP GROWTH FUND A MESSAGE TO OUR SHAREHOLDERS JUNE 30, 2013 |
| |
Dear Fellow Shareholders:
Performance
For the period July 1, 2012, through June 30, 2013, the DF Dent Midcap Growth Fund (the “Fund”) experienced a total return of +26.07%, outperforming the total return of +22.88% for the Russell Midcap Growth Index (the “Index”), which is the benchmark we have used for performance comparisons, by 3.19%. The average one year return for the Midcap Growth category as calculated by Lipper was 19.3% as of June 30, 2013.
Expense Ratio
Your Fund’s Adviser, D.F. Dent and Company, Inc. (the “Adviser”), has contractually agreed to maintain your Fund’s expense ratio through October 31, 2015 at a net 1.10% on the first $150 million of net assets and 0.90% on net assets exceeding $150 million by reimbursing expenses and waiving a portion of management fees. Per the prospectus, the Fund’s gross total operating expense ratio is 3.45%.
Concentration
The Fund’s concentration in its top 10 holdings is as follows:
| Top 10 Holdings | | 06/30/12 | | 06/30/13 |
| % of Fund | | 42.69 | % | | 39.31 | % |
| Average Position Size of Top 10 | | 4.3 | % | | 3.9 | % |
We believe that the current concentration in the top 10 positions is appropriate at its current level and has the potential to enhance long-term performance.
Management Ownership of Fund
Employees, their families, and the Adviser’s retirement plan owned approximately 41% of the Fund as of June 30, 2013. There were only management purchases and no management redemptions during the fiscal year ended June 30, 2013.
Reinvention
Our strategy, as always, has been to invest in “best-in-class”* companies led by strong management teams with documented track records of delivering results within growth markets. Best-in-class may be determined by the Adviser by a number of considerations such as leading market share, highest profitability, highest organic growth rate, consistency of operating results, highest return on invested capital, corporate culture and work ethic, shareholder friendly capital allocation, and most importantly overall management integrity. We will continue to use this strategy in managing the Fund’s portfolio.
| |
DF DENT MIDCAP GROWTH FUND A MESSAGE TO OUR SHAREHOLDERS JUNE 30, 2013 |
| |
A question which we are often asked is, “How can we be confident that a market leader today won’t lose its competitive edge in a year or two and, consequently, its ability to generate above-market returns?” The fundamental answer is that we have faith in the management teams of these companies to “reinvent” their company, their products and services as many times as is necessary to maintain market leadership. We believe that many of your Fund’s portfolio companies are known for their stability and reliability (as investors, we don’t like surprises and instability). However, we believe strongly that corporate stability and reliability come from a willingness to change with the market, to modify and expand the business model, or to abandon strategies that have worked in the past but may not work in the future. We have found that this “reinvention” and “creative destruction” are strongly correlated to long-term market dominance and sustainable earnings growth.
A few corporate reinvention examples of companies in the Fund’s portfolio that come to mind are the following:
| · | In the early 1990s, Fastenal opened up new stores which represented 30% of the prior year’s store count. When this growth rate became unsustainable the company expanded its product and service offerings to a broad range of industrial supplies thus increasing same-store sales dramatically to make up for the slowdown in new store openings. In the late 1990s Fastenal announced its “Pathway to Profit” growth initiative. Under Pathway to Profit, Fastenal slowed new store openings further and used the savings to hire more outside sales personnel in existing stores. The program has increased same-store sales, operating leverage, and profit margins in existing stores. Fastenal’s more recent vending machine initiative is driving further improvements to Fastenal’s business model. Never satisfied with its successful business model, management has continually sought to grow by taking it apart and improving- reinvention at its best. |
| · | Stericycle has maintained its strong revenue growth by expanding from its core medical waste collection business to several auxiliary services. Stericycle has leveraged its reputation and customer relationships through the following offerings: |
§ Steri-Safe, a service where Stericycle provides training to physicians’ offices and hospitals on issues related to blood borne pathogens and OSHA compliance;
§ StrongPak, a pharmaceutical waste disposal service; and
§ NotifyMD, a service providing inbound and outbound patient communications to physician practices, dental offices, and hospitals.
| · | Healthcare Services Group, historically a provider of laundry and linen services to senior living facilities, added food services to its list of offerings, thus expanding its addressable market and making its customer relationships stronger and stickier. |
| |
DF DENT MIDCAP GROWTH FUND A MESSAGE TO OUR SHAREHOLDERS JUNE 30, 2013 |
| |
| · | Waste Connections, historically a provider of residential and commercial waste services, expanded into the energy waste business in 2012 through its acquisition of R360 Environmental Solutions. Waste Connections saw the strong growth in domestic oil production and predicted a likely strengthening of oilfield waste regulations. R360, a leading provider of oilfield waste treatment and disposal services, offers Waste Connections a major new growth driver. |
| · | Several of your portfolio’s software companies now derive a good portion of their revenues from subscriptions but did not start out that way. Instead, they started out as traditional software companies with revenue streams made up of large upfront license payments, small maintenance fees and possible renewals when the next version of the software was released. These software companies transitioned to a subscription model in which customers, in exchange for a subscription fee, now enjoy the newest version of the software at all times without ever having to install the software on their own machines. A true software-as-a-service (SaaS) offering is “hosted” by the software vendor on the software vendor’s own IT infrastructure, so the customer also saves significant IT infrastructure expense. Subscription-based software companies also realize the improved revenue visibility of a subscription-based model in which the software vendor gets paid a regular, predictable fee rather than having to go out and sell each renewal. The companies were willing to risk severe disruption to their businesses in order to transition to the optimal business model for the next decade. |
Commentary
The above-trend-line return for your Fund and stocks overall in the past fiscal year occurred with a normal list of market worries. There was the “Fiscal Cliff,” sequestration, higher personal taxes, $100 plus crude oil prices and higher gas prices at the pump, unrest and civil wars in the Middle East, China’s slow down, and let’s not forget the cicadas due last May. The market worried, but these events passed without much effect (much like Y2K despite widespread fears). At the beginning of the Fund’s new fiscal year, investors are worried about the slow pace of projected GNP growth and the pace of Federal Reserve “tapering,” and the slowdown in the rate of monthly mortgage purchasing.
In a counterintuitive way, we believe these worries could be good for equities. The proverbial “wall of worry” is a healthy condition for rising stock prices for it reflects caution and restraint amongst investors - in other words, the absence of “Irrational Exuberance,” a term then Chairman of the Federal Reserve, Alan Greenspan, used to describe excesses within the markets. Expectations today are muted, and we believe that could be good for the stock market as it has been in the past year. We certainly do not expect the continuation of above trend 20% returns of the past 12 months, but we do expect that stocks will continue to outperform bonds as we predicted in this section last year.
Investors have taken notice of the shift in the landscape of returns from stocks (+20%) versus bonds (-4.18% for the 10 year Treasury) in the past 12 months. After many years of redemptions of domestic mutual funds and purchases of bond funds, the end of your Fund’s fiscal year witnessed positive flows back into domestic mutual funds. We have argued that investing in U.S. equities would be the more attractive opportunity for
| |
DF DENT MIDCAP GROWTH FUND A MESSAGE TO OUR SHAREHOLDERS JUNE 30, 2013 |
| |
investors. Indeed, U.S. equity markets have outperformed non-U.S. markets in general and the broad bond market in the past year. We expect this trend to continue as interest rates creep up and the U.S. economy’s modest growth still outpaces the growth in many foreign countries. We believe this should result in continued flows into U.S. equities. Which equities? We believe those growth companies which can sustain superior earnings growth in a slow growth U.S. economy will attract investors. We will continue to manage the DF Dent Midcap Growth Fund by investing in those companies that we believe can deliver such growth in the future.
Attribution Analysis
The following bar chart presents the sector weightings of your Fund versus the sector weightings of the Index as of June 30, 2013:
Source: FactSet
Your Fund was over-weighted versus the Index in Information Technology, Industrials, Financials and Energy. We continue to believe that technology companies offer attractive opportunities as they address improving productivity through efficiency and labor cost savings. In Information Technology, your Fund’s overweighting
| |
DF DENT MIDCAP GROWTH FUND A MESSAGE TO OUR SHAREHOLDERS JUNE 30, 2013 |
| |
detracted from the fiscal year’s performance, while stock selection within the Information Technology sector was a significant positive contributor to performance. Your Fund’s overweighting in the Financials sector contributed slightly to performance, with a more significant positive effect coming from stock selection within the Financials sector. Your Fund’s overweighting in the Industrials sector contributed to performance, while stock selection within Industrials detracted slightly from performance.
Your fund was most significantly under-weighted versus the Index in Consumer Discretionary, Consumer Staples, Materials and Health Care. Your Fund’s under-weighting in Consumer Discretionary and Consumer Staples detracted from performance as the consumer sectors performed well in the fiscal year. In the Materials sector, the under-weighting contributed positively to performance. In the Health Care sector, the under-weighting had a negligible effect on performance, but the stock selection contributed significantly to performance.
Five Best Contributors (Unaudited)
| Investments | | Realized and Unrealized Appreciation and Income in Fiscal Year 2013 | | Per Share As of 6/30/13 | |
| 3D Systems Corp. | | $ | 191,458 | | $ | 0.26 | |
| Financial Engines, Inc. | | | 158,744 | | | 0.21 | |
| WageWorks, Inc. | | | 123,106 | | | 0.17 | |
| LKQ Corp. | | | 102,010 | | | 0.14 | |
| Tyler Technologies, Inc. | | | 98,114 | | | 0.13 | |
| | | $ | 673,432 | | $ | 0.91 | |
Five Worst Contributors (Unaudited)
| Investments | | Realized and Unrealized Loss and Income in Fiscal Year 2013 | | Per Share As of 6/30/13 | |
| ADTRAN, Inc. | | $ | (53,757) | | $ | (0.07) | |
| Innerworkings, Inc. | | | (33,709) | | | (0.05) | |
| Clean Harbors, Inc. | | | (24,364) | | | (0.03) | |
| RealPage, Inc. | | | (23,872) | | | (0.03) | |
| IDEXX Laboratories, Inc. | | | (22,336) | | | (0.03) | |
| | | $ | (158,038) | | $ | (0.21) | |
| |
DF DENT MIDCAP GROWTH FUND A MESSAGE TO OUR SHAREHOLDERS JUNE 30, 2013 |
| |
FIVE LARGEST EQUITY HOLDINGS (UNAUDITED)
JUNE 30, 2013
Shares | | Security | | | Total Cost | | | Market Value | | Percent of Net Assets of the Fund | |
| 10,949 | | Fastenal Co. | | $ | 428,099 | | $ | 502,012 | | 5.19 | % |
| 6,505 | | ANSYS, Inc. | | | 401,571 | | | 475,516 | | 4.91 | |
| 3,848 | | Stericycle, Inc. | | | 358,085 | | | 424,935 | | 4.39 | |
| 6,455 | | Jacobs Engineering Group, Inc. | | | 266,879 | | | 355,864 | | 3.68 | |
| 12,463 | | SEI Investments Co. | | | 261,140 | | | 354,323 | | 3.66 | |
| | | | | $ | 1,715,774 | | $ | 2,112,650 | | 21.83 | % |
As always, we acknowledge the responsibility you have conveyed by making your investment in the DF Dent Midcap Growth Fund and will work diligently on your behalf.
Respectively Submitted,
Thomas F. O’Neil, Jr.Matthew F. Dent
Gary D. MitchellBruce L. Kennedy
* The determination of “best-in-class” is solely the opinion of the Fund’s Adviser, and such opinion is subject to change. Those companies that hold leading market share positions, strong growth potential, historically good profitability, and management teams known for integrity and good corporate governance are generally considered to be “best-in-class.”
| |
DF DENT MIDCAP GROWTH FUND A MESSAGE TO OUR SHAREHOLDERS JUNE 30, 2013 |
| |
IMPORTANT INFORMATION:
Investing involves risks, including the possible loss of principal. The Fund invests in small- and medium- size companies, which carry greater risk than is customarily associated with larger, more established companies. With non-diversification risk, the Fund will typically invest in securities of fewer issuers, which exposes the Fund to greater market risk. Investing in ADRs (American Depositary Receipt) carries risks of political and financial instability, less liquidity and greater volatility, as well as risks associated with the lack of reliable accounting and financial information. The Fund is also subject to other risks, such as Real Estate Investment Trust (REIT) risk with possible real estate market declines, which are detailed in the Fund’s prospectus.
The Russell Midcap Growth Index measures the performance of the mid-cap growth segment of the U.S. equity universe. It includes those Russell Midcap Index companies with higher price-to-book ratios and higher forecasted growth values. One cannot invest directly in an index.
The views in this report contained herein were those of the Fund’s Adviser as of June 30, 2013, and may not reflect the Adviser’s views on the date this report is first published or anytime thereafter. This report may contain discussions about certain investments both held and not held in the portfolio as of the report date. All current and future holdings are subject to risk and are subject to change. While these views are intended to assist shareholders in understanding their investment in the Fund, they do not constitute investment or tax advice, are not a guarantee of future performance and are not intended as an offer or solicitation with respect to the purchase or sale of any security.
| |
DF DENT MIDCAP GROWTH FUND PERFORMANCE CHART AND ANALYSIS (Unaudited) JUNE 30, 2013 |
| |
The following chart reflects the change in the value of a hypothetical $10,000 investment, including reinvested dividends and distributions, in the DF Dent Midcap Growth Fund (the “Fund”) compared with the performance of the benchmark, the Russell Midcap Growth Index ("Russell Midcap Growth"), since inception. The Russell Midcap Growth measures the performance of the mid-cap growth segment of the U.S. equity universe. It includes those Russell Midcap Index companies with higher price-to-book ratios and higher forecasted growth values. The total return of the Russell Midcap Growth includes the reinvestment of dividends and income. The total return of the Fund includes operating expenses that reduce returns, while the total return of the Russell Midcap Growth does not include expenses. The Fund is professionally managed while the Russell Midcap Growth is unmanaged and is not available for investment.
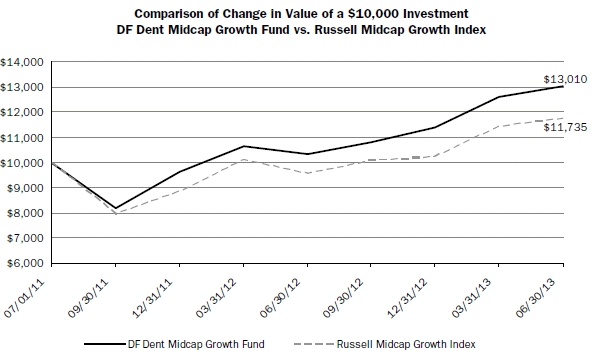
| Average Annual Total Returns | | | | Since Inception |
| Periods Ended June 30, 2013 | | One Year | | 07/01/11 |
| DF Dent Midcap Growth Fund | | 26.07 | % | | 14.06 | % |
| Russell Midcap Growth Index | | 22.88 | % | | 8.33 | % |
Performance data quoted represents past performance and is no guarantee of future results. Current performance may be lower or higher than the performance data quoted. Investment return and principal value will fluctuate so that shares, when redeemed, may be worth more or less than original cost. For the most recent month-end performance, please call (866) 233-3368. As stated in the Fund’s current prospectus, the annual operating expense ratio (gross) is 3.45%. However, the Fund’s adviser has contractually agreed to reduce a portion of its fees and reimburse expenses to limit total operating expenses to 1.10% on the first $150 million in net assets and 0.90% on net assets exceeding $150 million, through October 31, 2015. During the period, certain fees were waived and/or expenses reimbursed; otherwise, returns would have been lower. Shares redeemed within 60 days of purchase will be charged a 2.00% redemption fee. The performance table and graph do not reflect the deduction of taxes that a shareholder would pay on Fund distributions or the redemption of Fund shares. Returns greater than one year are annualized.
| |
DF DENT MIDCAP GROWTH FUND SCHEDULE OF INVESTMENTS JUNE 30, 2013 |
| |
| | Shares | | Security Description | | Value | |
| Common Stock - 98.9% |
| Consumer Discretionary - 5.0% |
| | 4,058 | | American Public Education, Inc. (a) | | $ | 150,795 | |
| | 13,026 | | LKQ Corp. (a) | | 335,420 | |
| | | 486,215 | |
| Energy - 8.8% |
| | 3,639 | | Concho Resources, Inc. (a) | | 304,657 | |
| | 1,497 | | Core Laboratories NV | | 227,035 | |
| | 4,170 | | Range Resources Corp. | | 322,425 | |
| | | 854,117 | |
| Financials - 14.5% |
| | 3,075 | | American Tower Corp. REIT | | 224,998 | |
| | 7,487 | | Financial Engines, Inc. | | 341,332 | |
| | 564 | | Markel Corp. (a) | | 297,200 | |
| | 12,463 | | SEI Investments Co. | | 354,323 | |
| | 2,528 | | T. Rowe Price Group, Inc. | | 184,923 | |
| | | 1,402,776 | |
| Health Care - 7.0% |
| | 8,646 | | ExamWorks Group, Inc. (a) | | 183,555 | |
| | 3,220 | | Illumina, Inc. (a) | | 240,985 | |
| | 5,571 | | ResMed, Inc. | | 251,419 | |
| | | 675,959 | |
| Industrials - 30.4% |
| | 4,943 | | Clean Harbors, Inc. (a) | | 249,770 | |
| | 9,097 | | Expeditors International of Washington, Inc. | | 345,777 | |
| | 2,676 | | Exponent, Inc. | | 158,178 | |
| | 10,949 | | Fastenal Co. | | 502,012 | |
| | 9,242 | | Healthcare Services Group, Inc. | | 226,614 | |
| | 14,185 | | Innerworkings, Inc. (a) | | 153,907 | |
| | 6,455 | | Jacobs Engineering Group, Inc. (a) | | 355,864 | |
| | 1,514 | | Roper Industries, Inc. | | 188,069 | |
| | 3,848 | | Stericycle, Inc. (a) | | 424,935 | |
| | 8,202 | | Waste Connections, Inc. | | 337,430 | |
| | | 2,942,556 | |
| Information Technology - 30.2% |
| | 7,069 | | 3D Systems Corp. (a) | | | 310,329 | |
| | 6,505 | | ANSYS, Inc. (a) | | 475,516 | |
| | 3,719 | | Concur Technologies, Inc. (a) | | 302,652 | |
| | 1,964 | | CoStar Group, Inc. (a) | | 253,493 | |
| | 6,553 | | DealerTrack Holdings, Inc. (a) | | 232,173 | |
| | 10,434 | | NIC, Inc. (a) | | 172,474 | |
| | 5,877 | | RealPage, Inc. (a) | | 107,784 | |
| | 2,914 | | Red Hat, Inc. (a) | | 139,347 | |
| | 13,123 | | Trimble Navigation, Ltd. (a) | | 341,329 | |
| | 4,025 | | Tyler Technologies, Inc. (a) | | 275,914 | |
| | 9,130 | | WageWorks, Inc. (a) | | 314,529 | |
| | | 2,925,540 | |
| Materials - 3.0% |
| | 3,333 | | Ecolab, Inc. | | 283,938 | |
| | | | |
Total Common Stock (Cost $7,529,925) | | 9,571,101 | |
Total Investments - 98.9% (Cost $7,529,925)* | | $ | 9,571,101 | |
| Other Assets & Liabilities, Net – 1.1% | | 108,265 | |
| Net Assets – 100.0% | | $ | 9,679,366 | |
| REIT | Real Estate Investment Trust |
| (a) | Non-income producing security. |
| * | Cost for federal income tax purposes is $7,531,434 and net unrealized appreciation consists of: |
| Gross Unrealized Appreciation | | $ | 2,154,047 | |
| Gross Unrealized Depreciation | | | (114,380 | ) |
| Net Unrealized Appreciation | | $ | 2,039,667 | |
| See Notes to Financial Statements. | 28 | DF DENT GROWTH FUNDS |
| |
DF DENT MIDCAP GROWTH FUND SCHEDULE OF INVESTMENTS JUNE 30, 2013 |
| |
The following is a summary of the inputs used to value the Fund’s investments as of June 30, 2013.
The inputs or methodology used for valuing securities are not necessarily an indication of the risks associated with investing in those securities. For more information on valuation inputs, and their aggregation into the levels used in the table below, please refer to the Security Valuation section in Note 2 of the accompanying Notes to Financial Statements.
| Valuation Inputs | | Investments in Securities |
| Level 1 - Quoted Prices | | $ | 9,571,101 | |
| Level 2 - Other Significant Observable Inputs | | | - | |
| Level 3 - Significant Unobservable Inputs | | | - | |
| Total | | $ | 9,571,101 | |
The Level 1 value displayed in this table is Common Stock. Refer to the Schedule of Investments for a further breakout of each security by industry.
There were no transfers between Level 1 and Level 2 for the year ended June 30, 2013.
| PORTFOLIO HOLDINGS | | |
| % of Net Assets | | |
| Consumer Discretionary | 5.0 | % |
| Energy | 8.8 | % |
| Financials | 14.5 | % |
| Health Care | 7.0 | % |
| Industrials | 30.4 | % |
| Information Technology | 30.2 | % |
| Materials | 3.0 | % |
| Other Assets & Liabilities, Net | 1.1 | % |
| | 100.0 | % |
| See Notes to Financial Statements. | 29 | DF DENT GROWTH FUNDS |
| |
DF DENT MIDCAP GROWTH FUND STATEMENT OF ASSETS AND LIABILITIES JUNE 30, 2013 |
| |
| ASSETS | | | | |
| | Total investments, at value (Cost $7,529,925) | | $ | 9,571,101 | |
| | Cash | | | 135,026 | |
| | Receivables: | | | | |
| | | Dividends and interest | | | 1,863 | |
| | Prepaid expenses | | | 2,511 | |
| Total Assets | | | 9,710,501 | |
| | | | | | | |
| LIABILITIES | | | | |
| | Accrued Liabilities: | | | | |
| | Investment adviser fees | | | 11,404 | |
| | | Trustees’ fees and expenses | | | 6 | |
| | | Fund services fees | | | 1,568 | |
| | | Other expenses | | | 18,157 | |
| Total Liabilities | | | 31,135 | |
| | | | | | | |
| NET ASSETS | | $ | 9,679,366 | |
| | | | | | | |
| COMPONENTS OF NET ASSETS | | | | |
| | Paid-in capital | | $ | 7,502,717 | |
| | Accumulated net realized gain | | | 135,473 | |
| | Net unrealized appreciation | | | 2,041,176 | |
| NET ASSETS | | $ | 9,679,366 | |
| SHARES OF BENEFICIAL INTEREST AT NO PAR VALUE (UNLIMITED SHARES AUTHORIZED) | | | 744,100 | |
NET ASSET VALUE, OFFERING AND REDEMPTION PRICE PER SHARE* | | $ | 13.01 | |
| * | Shares redeemed or exchanged within 60 days of purchase are charged a 2.00% redemption fee. |
| See Notes to Financial Statements. | 30 | DF DENT GROWTH FUNDS |
| |
DF DENT MIDCAP GROWTH FUND STATEMENT OF OPERATIONS YEAR ENDED JUNE 30, 2013 |
| |
| INVESTMENT INCOME | | | | |
| | Dividend income (Net of foreign withholding taxes of $230) | | $ | 54,690 | |
| | Interest income | | | 364 | |
| Total Investment Income | | | 55,054 | |
| | | | | |
| EXPENSES | | | | |
| | Investment adviser fees | | | 76,089 | |
| | Fund services fees | | | 19,331 | |
| | Custodian fees | | | 5,000 | |
| | Registration fees | | | 6,110 | |
| | Professional fees | | | 22,426 | |
| | Trustees' fees and expenses | | | 238 | |
| | Miscellaneous expenses | | | 12,232 | |
| Total Expenses | | | 141,426 | |
| | Fees waived and expenses reimbursed | | | (57,728 | ) |
| Net Expenses | | | 83,698 | |
| | | | | | | |
| NET INVESTMENT LOSS | | | (28,644 | ) |
| | | | | | | |
| NET REALIZED AND UNREALIZED GAIN (LOSS) | | | | |
| | Net realized gain on investments | | | 176,985 | |
| | Net change in unrealized appreciation (depreciation) on investments | | | 1,652,522 | |
| NET REALIZED AND UNREALIZED GAIN | | | 1,829,507 | |
| INCREASE IN NET ASSETS FROM OPERATIONS | | $ | 1,800,863 | |
| | | | | | | |
| See Notes to Financial Statements. | 31 | DF DENT GROWTH FUNDS |
| |
DF DENT MIDCAP GROWTH FUND STATEMENTS OF CHANGES IN NET ASSETS |
| |
| | | | | For the Year Ended June 30, 2013 | | | July 1, 2011* through June 30, 2012 |
| OPERATIONS | | | | | | | | | |
| | Net investment loss | | $ | (28,644 | ) | | | $ | (10,967 | ) |
| | Net realized gain (loss) | | | 176,985 | | | | | (1,943 | ) |
| | Net change in unrealized appreciation (depreciation) | | | 1,652,522 | | | | | 388,654 | |
| Increase in Net Assets Resulting from Operations | | | 1,800,863 | | | | | 375,744 | |
| | | | | | | | | | | | |
| CAPITAL SHARE TRANSACTIONS | | | | | | | | | |
| | Sale of shares | | | 1,634,533 | | | | | 6,053,750 | |
| | Redemption of shares | | | (179,484 | ) | | | | (6,040 | ) |
| Increase in Net Assets from Capital Share Transactions | | | 1,455,049 | | | | | 6,047,710 | |
| Increase in Net Assets | | | 3,255,912 | | | | | 6,423,454 | |
| | | | | | | | | | | | |
| NET ASSETS | | | | | | | | | |
| | Beginning of Period | | | 6,423,454 | | | | | - | |
| | End of Period (Including line (a)) | | $ | 9,679,366 | | | | $ | 6,423,454 | |
| | | | | | | | | | | | |
| SHARE TRANSACTIONS | | | | | | | | | |
| | Sale of shares | | | 136,480 | | | | | 623,167 | |
| | Redemption of shares | | | (14,946 | ) | | | | (601 | ) |
| Increase in Shares | | | 121,534 | | | | | 622,566 | |
| | | | | | | | | | | | |
| (a) | Accumulated net investment loss. | | $ | - | | | | $ | (7,288 | ) |
| * | Commencement of operations. | | | | | | | | | |
| See Notes to Financial Statements. | 32 | DF DENT GROWTH FUNDS |
| |
DF DENT MIDCAP GROWTH FUND FINANCIAL HIGHLIGHTS |
| |
These financial highlights reflect selected data for a share outstanding throughout each period. |
| | | For the Year Ended June 30, 2013 | | July 1, 2011 (a) through June 30, 2012 |
| NET ASSET VALUE, Beginning of Period | $ | 10.32 | | | $ | 10.00 | |
| INVESTMENT OPERATIONS | | | | | | | |
| Net investment loss (b) | | (0.04 | ) | | | (0.05 | ) |
| Net realized and unrealized gain (loss) | | 2.73 | | | | 0.37 | |
| Total from Investment Operations | | 2.69 | | | | 0.32 | |
| NET ASSET VALUE, End of Period | $ | 13.01 | | | $ | 10.32 | |
| TOTAL RETURN | | 26.07 | % | | 3.20 | %(c) |
| | | | | | | | |
| RATIOS/SUPPLEMENTARY DATA | | | | | | | |
| Net Assets at End of Period (000's omitted) | $9,679 | | | $6,423 | |
| Ratios to Average Net Assets: | | | | | | | |
| Net investment loss | | (0.38 | )% | | (0.55 | )%(d) |
| Net expense | | 1.10 | % | | 1.10 | %(d) |
| Gross expense (e) | | 1.86 | % | | 3.45 | %(d) |
| PORTFOLIO TURNOVER RATE | | 35 | % | | 24 | %(c) |
| | | | | | | | | |
| (a) | Commencement of operations. |
| (b) | Calculated based on average shares outstanding during each period. |
| (c) | Not annualized. |
| (d) | Annualized. |
| (e) | Reflects the expense ratio excluding any waivers and/or reimbursements. |
| See Notes to Financial Statements. | 33 | DF DENT GROWTH FUNDS |
| |
DF DENT GROWTH FUNDS NOTES TO FINANCIAL STATEMENTS JUNE 30, 2013 |
| |
Note 1. Organization
DF Dent Premier Growth Fund and DF Dent Midcap Growth Fund (individually, a “Fund” and, collectively the “Funds”) are diversified and non-diversified portfolios of Forum Funds (the “Trust”), respectively. The Trust is a Delaware statutory trust that is registered as an open-end, management investment company under the Investment Company Act of 1940 (the “Act”), as amended. Under its Trust Instrument, the Trust is authorized to issue an unlimited number of each Fund’s shares of beneficial interest without par value. The DF Dent Premier Growth Fund and the DF Dent Midcap Growth Fund commenced operations on July 16, 2001, and July 1, 2011, respectively. The Funds seek long-term capital appreciation.
Note 2. Summary of Significant Accounting Policies
These financial statements are prepared in accordance with accounting principles generally accepted in the United States of America (“GAAP”), which require management to make estimates and assumptions that affect the reported amounts of assets and liabilities, the disclosure of contingent liabilities at the date of the financial statements, and the reported amounts of increase and decrease in net assets from operations during the fiscal year. Actual amounts could differ from those estimates. The following summarizes the significant accounting policies of each Fund:
Security Valuation – Exchange-traded securities and over-the-counter securities are valued using the last quoted sale or official closing price, provided by independent pricing services as of the close of trading on the market or exchange for which they are primarily traded, on each Fund business day. In the absence of a sale, such securities are valued at the mean of the last bid and ask price provided by independent pricing services. Non-exchange traded securities for which quotations are available are valued using the last quoted sales price, or in the absence of a sale at the mean of the last bid and ask prices provided by independent pricing services. Shares of open-end mutual funds are valued at net asset value (“NAV”). Short-term investments that mature in 60 days or less may be valued at amortized cost.
Each Fund values its investments at fair value pursuant to procedures adopted by the Trust's Board of Trustees (the "Board") if (1) market quotations are insufficient or not readily available or (2) the adviser believes that the values available are unreliable. The Trust’s Valuation Committee, as defined in each Fund’s registration statement, performs certain functions as they relate to the administration and oversight of each Fund’s valuation procedures. Under these procedures, the Valuation Committee convenes on a regular and ad-hoc basis to review such securities and considers a number of factors, including valuation methodologies and significant unobservable inputs, when arriving at fair value.
The Valuation Committee may work with the adviser to provide valuation inputs. In determining fair valuations, inputs may include market-based analytics which may consider related or comparable assets or liabilities, recent transactions, market multiples, book values and other relevant investment information. Adviser inputs may include an income-based approach in which the anticipated future cash flows of the investment are discounted in determining fair value. Discounts may also be applied based on the nature or duration of any restrictions on the disposition of the investments. The Valuation Committee performs regular reviews of
| |
DF DENT GROWTH FUNDS NOTES TO FINANCIAL STATEMENTS JUNE 30, 2013 |
| |
valuation methodologies, key inputs and assumptions, disposition analysis and market activity.
Fair valuation is based on subjective factors and, as a result, the fair value price of an investment may differ from the security’s market price and may not be the price at which the asset may be sold. Fair valuation could result in a different NAV than a NAV determined by using market quotes.
Each Fund has a three-tier fair value hierarchy. The basis of the tiers is dependent upon the various “inputs” used to determine the value of each Fund’s investments. These inputs are summarized in the three broad levels listed below:
Level 1 — quoted prices in active markets for identical assets
Level 2 — other significant observable inputs (including quoted prices of similar securities, interest rates, prepayment speeds, credit risk, etc.)
Level 3 — significant unobservable inputs (including each Fund’s own assumptions in determining the fair value of investments)
The aggregate value by input level, as of June 30, 2013, for each Fund’s investments is included at the end of each Fund’s Schedule of Investments.
Security Transactions, Investment Income and Realized Gain and Loss – Investment transactions are accounted for on the trade date. Dividend income is recorded on the ex-dividend date. Foreign dividend income is recorded on the ex-dividend date or as soon as possible after each Fund determines the existence of a dividend declaration after exercising reasonable due diligence. Income and capital gains on some foreign securities may be subject to foreign withholding taxes, which are accrued as applicable. Interest income is recorded on an accrual basis. Premium is amortized and discount is accreted using the effective interest method. Identified cost of investments sold is used to determine the gain and loss for both financial statement and federal income tax purposes.
Distributions to Shareholders – Distributions to shareholders of net investment income and net capital gains, if any, are declared and paid at least annually. Distributions to shareholders are recorded on the ex-dividend date. Distributions are based on amounts calculated in accordance with applicable federal income tax regulations, which may differ from GAAP. These differences are due primarily to differing treatments of income and gain on various investment securities held by each Fund, timing differences and differing characterizations of distributions made by each Fund.
Federal Taxes – Each Fund intends to continue to qualify each year as a regulated investment company under Subchapter M of the Internal Revenue Code and to distribute all of its taxable income to shareholders. In addition, by distributing in each calendar year substantially all of its net investment income and capital gains, if any, the Fund will not be subject to a federal excise tax. Therefore, no federal income or excise tax provision is required. Each Fund files a U.S. federal income and excise tax return as required. A fund’s federal income
| |
DF DENT GROWTH FUNDS NOTES TO FINANCIAL STATEMENTS JUNE 30, 2013 |
| |
tax returns are subject to examination by the Internal Revenue Service for a period of three fiscal years after they are filed. As of June 30, 2013, there are no uncertain tax positions that would require financial statement recognition, de-recognition, or disclosure.
Income and Expense Allocation – The Trust accounts separately for the assets, liabilities and operations of each of its investment portfolios. Expenses that are directly attributable to more than one investment portfolio are allocated among the respective investment portfolios in an equitable manner.
Redemption Fees – A shareholder who redeems shares of the DF Dent Midcap Growth Fund within 60 days of purchase will incur a redemption fee of 2.00% of the current net asset value of shares redeemed, subject to certain limitations. The fee is charged for the benefit of the remaining shareholders and will be paid to the Fund to help offset transaction costs. The fee is accounted for as an addition to paid-in capital. The Fund reserves the right to modify the terms of or terminate the fee at any time. There are limited exceptions to the imposition of the redemption fee.
Commitments and Contingencies – In the normal course of business, each Fund enters into contracts that provide general indemnifications by each Fund to the counterparty to the contract. Each Fund’s maximum exposure under these arrangements is dependent on future claims that may be made against each Fund and, therefore, cannot be estimated; however, based on experience, the risk of loss from such claims is considered remote.
Note 3. Fees and Expenses
Investment Adviser – D.F. Dent and Company, Inc. (the “Adviser”) is the investment adviser to each Fund. Pursuant to an investment advisory agreement, the Adviser receives an advisory fee from each Fund at an annual rate of 1.00% of each Fund’s average daily net assets.
Distribution – Foreside Fund Services, LLC serves as each Fund’s distributor (the “Distributor”). The Funds do not have a distribution (12b-1) plan; accordingly, the Distributor does not receive compensation from the Funds for its distribution (12b-1) services. The Distributor is not affiliated with the Adviser or Atlantic Fund Administration, LLC (d/b/a Atlantic Fund Services) (“Atlantic”) or their affiliates.
Other Service Providers – Atlantic provides fund accounting, fund administration, compliance and transfer agency services to each Fund. Atlantic also provides certain shareholder report production, and EDGAR conversion and filing services. Pursuant to an Atlantic services agreement, each Fund pays Atlantic customary fees for its services. Atlantic provides a Principal Executive Officer, a Principal Financial Officer, a Chief Compliance Officer, and an Anti-Money Laundering Officer to each Fund, as well as certain additional compliance support functions.
Trustees and Officers – The Trust pays each independent Trustee an annual retainer fee of $45,000 for service to the Trust ($66,000 for the Chairman). The Trustees and Chairman may receive additional fees for special Board meetings. Each Trustee is also reimbursed for all reasonable out-of-pocket expenses incurred in
| |
DF DENT GROWTH FUNDS NOTES TO FINANCIAL STATEMENTS JUNE 30, 2013 |
| |
connection with his duties as a Trustee, including travel and related expenses incurred in attending Board meetings. The amount of Trustees’ fees attributable to each Fund is disclosed in the Statement of Operations. Certain officers of the Trust are also officers or employees of the above named service providers, and during their terms of office received no compensation from each Fund.
Note 4. Fees Waived
The Adviser has contractually agreed to reduce a portion of its fee and reimburse certain expenses through October 31, 2015, to the extent that annual operating expenses exceed 1.10% on the first $150 million of net assets and to the extent that annual operating expenses exceed 0.90% on net assets exceeding $150 million of each Fund. Other fund service providers have voluntarily agreed to waive and reimburse a portion of their fees. These voluntary fee waivers and reimbursements may be reduced or eliminated at any time. For the year ended June 30, 2013, fees waived were as follows:
| | Investment Adviser Fees Waived | | Other Waivers | | Total Fees Waived |
| DF Dent Premier Growth Fund | $ | 235,380 | | $ | 42,970 | | $ | 278,350 |
| DF Dent Midcap Growth Fund | | 55,698 | | | 2,030 | | | 57,728 |
Note 5. Security Transactions
The cost of purchases and proceeds from sales of investment securities (including maturities), other than short-term investments during the year ended June 30, 2013, were as follows:
| | | Purchases | | Sales |
| DF Dent Premier Growth Fund | | $ | 29,668,562 | | $ | 39,345,389 |
| DF Dent Midcap Growth Fund | | | 3,960,191 | | | 2,594,010 |
Note 6. Federal Income Tax and Investment Transactions
As of June 30, 2013, distributable earnings (accumulated loss) on a tax basis were as follows:
| | | Undistributed Ordinary Income | | Capital and Other Losses | | Unrealized Appreciation | | Total |
| DF Dent Premier Growth Fund | | $ | - | | | $ | (32,646,804 | ) | | $ | 56,324,991 | | | $ | 23,678,187 | |
| DF Dent Midcap Growth Fund | | | 136,982 | | | | - | | | | 2,039,667 | | | | 2,176,649 | |
The difference between components of distributable earnings on a tax basis and the amounts reflected in the Statement of Assets and Liabilities are primarily due to wash sales.
For tax purposes, the current deferred late year ordinary loss was $235,109 (realized during the period
| |
DF DENT GROWTH FUNDS NOTES TO FINANCIAL STATEMENTS JUNE 30, 2013 |
| |
November 1, 2012 through June 30, 2013) for the DF Dent Premier Growth Fund. This loss will be recognized for tax purposes on the first business day of the Fund’s next fiscal year, July 1, 2013.
As of June 30, 2013, the DF Dent Premier Growth Fund had capital loss carryforwards to offset future capital gains of $2,933,589 and $29,478,106, expiring in 2017 and 2018, respectively.
On the Statements of Assets and Liabilities, as a result of permanent book to tax differences, certain amounts have been reclassified for the year ended June 30, 2013. The following reclassifications were the result of net operating losses and have no impact on the net assets of each Fund.
| | | Accumulated Net Investment Income (Loss) | | Accumulated Net Realized Gain | | Paid-in-Capital |
| DF Dent Premier Growth Fund | | $ | 34,297 | | | $ | - | | | $ | (34,297 | ) |
| DF Dent Midcap Growth Fund | | | 35,932 | | | | (35,932 | ) | | | - | |
Note 7. Recent Accounting Pronouncements
In December 2011, the Financial Accounting Standards Board (“FASB”) issued Accounting Standards Update (“ASU”) No. 2011-11 related to disclosures about offsetting assets and liabilities. In January 2013, the FASB issued ASU No. 2013-01 which gives additional clarification to ASU 2011-11. The amendments in this ASU require an entity to disclose information about offsetting and related arrangements to enable users of its financial statements to understand the effect of those arrangements on its financial position. The ASU is effective for annual reporting periods beginning on or after January 1, 2013, and interim periods within those annual periods. The guidance requires retrospective application for all comparative periods presented. Management is currently evaluating the impact these amendments may have on each Fund’s financial statements.
Note 8. Subsequent Events
Subsequent events occurring after the date of this report through the date these financial statements were issued have been evaluated for potential impact and each Fund has had no such events.
| |
REPORT OF INDEPENDENT REGISTERED PUBLIC ACCOUNTING FIRM |
| |
To the Board of Trustees of Forum Funds and the Shareholders of
DF Dent Premier Growth Fund and DF Dent Midcap Growth Fund
We have audited the accompanying statements of assets and liabilities of the DF Dent Premier Growth Fund and DF Dent Midcap Growth Fund, each a series of shares of beneficial interest in the Forum Funds, including the schedules of investments, as of June 30, 2013, and the related statements of operations for the year then ended, and the statements of changes in net assets for each of the years or period in the two year period then ended and the financial highlights for each of the years or period in the five year period then ended. These financial statements and financial highlights are the responsibility of the Funds’ management. Our responsibility is to express an opinion on these financial statements and financial highlights based on our audits.
We conducted our audits in accordance with the standards of the Public Company Accounting Oversight Board (United States). Those standards require that we plan and perform the audits to obtain reasonable assurance about whether the financial statements and financial highlights are free of material misstatement. An audit includes examining, on a test basis, evidence supporting the amounts and disclosures in the financial statements. Our procedures included confirmation of securities owned as of June 30, 2013 by correspondence with the custodian. An audit also includes assessing the accounting principles used and significant estimates made by management, as well as evaluating the overall financial statement presentation. We believe that our audits provide a reasonable basis for our opinion.
In our opinion, the financial statements and financial highlights referred to above present fairly, in all material respects, the financial position of the DF Dent Premier Growth Fund and DF Dent Midcap Growth Fund as of June 30, 2013, the results of their operations for the year then ended, the changes in their net assets for each of the years or period in the two year period then ended and their financial highlights for each of the years or period in the five year period then ended, in conformity with accounting principles generally accepted in the United States of America.
BBD, LLP
Philadelphia, Pennsylvania
August 15, 2013
| |
DF DENT GROWTH FUNDS ADDITIONAL INFORMATION (Unaudited) JUNE 30, 2013 |
| |
Investment Advisory Agreement Approval
At the June 14, 2013 Board meeting, the Board, including the Independent Trustees, considered the continuation of the investment advisory agreement pertaining to the DF Dent Premier Growth Fund and the DF Dent Midcap Growth Fund (the “Advisory Agreement”). In preparation for its deliberations, the Board had requested and reviewed written responses from the Adviser to a due diligence questionnaire, circulated by Trust counsel on their behalf. They had also discussed the materials with Independent Trustee counsel and, as necessary, with the Fund’s administrator, Atlantic Fund Services. Durings its deliberations, the Board received an oral presentation from the Adviser and was assisted by the advice of Independent Trustee counsel.
In evaluating the Advisory Agreement for the Funds, the Board reviewed materials furnished by the Adviser and Atlantic, including information regarding the Adviser, its personnel, operations and financial condition. Specifically, the Board considered, among other matters: (1) the nature, extent and quality of the services to be provided to the Funds by the Adviser, including information on the investment performance of the Adviser; (2) the costs of the services to be provided and profitability to the Adviser with respect to its relationship with the Funds; (3) the advisory fee and the total expense ratio of the Funds compared to relevant peer groups of funds; (4) the extent to which economies of scale would be realized as the Funds grow and whether the advisory fee would enable each Fund’s investors to share in the benefits of economies of scale; and (5) other benefits received by the Adviser from its relationship with the Funds. In their deliberations, the Board did not identify any particular information that was all-important or controlling and attributed different weights to the various factors. In particular, the Board focused on the factors discussed below.
Nature, Extent and Quality of Services
Based on written and oral presentations from a senior representative of the Adviser and a discussion of the Adviser’s personnel, operations and financial condition, the Board considered the quality of services provided by the Adviser under the Advisory Agreement between the Trust and the Adviser. In this regard, the Board considered information regarding the experience, qualifications and professional background of the portfolio managers and other personnel at the Adviser with principal investment responsibility for the Funds’ investments as well as the investment philosophy and decision-making processes of those professionals and the capability and integrity of the Adviser’s senior management and staff.
The Board further considered the adequacy of the Adviser’s resources. The Board noted the Adviser’s representation that the firm is financially stable and has the operational capability needed to provide investment advisory services to the Funds for the foreseeable future. Based on the presentation and the materials provided by the Adviser in connection with the Board’s consideration of the renewal of the Advisory Agreement, the Board concluded that, overall, it was satisfied with the nature, extent and quality of services to be provided to the Funds under the Advisory Agreement.
Performance
The Board reviewed performance of the Funds and the Adviser’s discussion of its investment philosophy. The Board noted that although the DF Dent Premier Growth Fund underperformed the S&P 500 Index, its primary benchmark, for the 1-year period ended March 31, 2013, it outperformed its benchmark for the 6-month 5-year and since inception periods ended March 31, 2013. The Board also considered the DF Dent Premier
| |
DF DENT GROWTH FUNDS ADDITIONAL INFORMATION (Unaudited) JUNE 30, 2013 |
| |
Growth Fund’s performance relative to its Lipper Inc. (“Lipper”) peer group, noting that, based on the preliminary information provided by Lipper, the DF Dent Premier Growth Fund outperformed the median of its peer group for the 1-year, 3-year and 5-year periods ended March 31, 2013.
The Board noted that the DF Dent Midcap Growth Fund outperformed the Russell Midcap Growth Index, its primary benchmark, for the 6-month and since inception periods ended March 31, 2013. The Board also considered the DF Dent Midcap Growth Fund’s performance relative to its Lipper peer group, noting that, based on the preliminary information provided by Lipper, the DF Dent Midcap Growth Fund, which did not have three years of performance, outperformed the median of its peer group for the 1-year period ended March 31, 2013.
Noting the Funds’ asset growth and performance, and the DF Dent Midcap Growth Fund’s recent performance in particular, the Board concluded that each Fund’s performance was reasonable and that each Fund and its shareholders could benefit from the Adviser’s management of the Funds.
Compensation
The Board considered the Adviser’s compensation for providing advisory services to each Fund and analyzed comparative information on fee rates (after fee waivers), and total expenses of the Funds' relevant Lipper peer groups. The Board noted that the Adviser’s actual advisory fee rate for the DF Dent Premier Growth Fund was above the median of its Lipper peer group. The Board also noted that the total expense ratio of the DF Dent Premier Growth Fund was above the median of its Lipper peer group. Based on data provided by Lipper showing performance of the DF Dent Premier Growth Fund as it relates to the total expenses of the DF Dent Premier Growth Fund, the Board noted that the DF Dent Premier Growth Fund was more expensive than its peer group but that it outperformed its peer group. Based on the foregoing, the Board concluded that the Adviser’s advisory fee rate charged to the DF Dent Premier Growth Fund was reasonable.
Further, the Board noted that the Adviser’s actual advisory fee rate for the DF Dent Midcap Growth Fund was below the median of its Lipper Inc. peer group. The Board also noted that the DF Dent Midcap Growth Fund’s actual total expense ratio was below the median of its Lipper peer group. Based on the foregoing, and in light of the performance of the DF Dent Midcap Growth Fund, the Board concluded that the Adviser’s advisory fee rate charged to the DF Dent Midcap Growth Fund was reasonable.
Costs of Services and Profitability
The Board considered information provided by the Adviser regarding its costs of services and its profitability with respect to the Funds. In this regard, the Board considered the Adviser’s resources devoted to each of the Funds as well as the Adviser’s discussion of costs and profitability. Based on these and other applicable considerations, the Board concluded that the Adviser’s profits attributable to management of the Funds were reasonable in the context of all factors considered.
Economies of Scale
The Board considered whether the Funds would benefit from any economies of scale. In this respect, the Board noted the Adviser’s representation that each Fund could benefit from economies of scale as assets
| |
DF DENT GROWTH FUNDS ADDITIONAL INFORMATION (Unaudited) JUNE 30, 2013 |
| |
grow, and that the Adviser has contractually agreed to cap each Fund’s total expenses (excluding all taxes, interest, portfolio transaction expenses, and extraordinary expenses) through October 31, 2015 at 1.10% on assets of up to $150 million and at 0.90% on assets exceeding $150 million. The Board further noted that currently the shareholders of both Funds were benefitting from the caps, and, because the DF Dent Premier Growth Fund's assets were greater than $150 million, that Fund's expenses were being capped at an average level of less than 1.10%.
Other Benefits
The Board noted the Adviser’s representation that, aside from its contractual advisory fees, it does not benefit in a material way from its relationship with the Funds. Based on the foregoing representation, the Board concluded that other benefits received by the Adviser from its relationship with the Funds were not a material factor to consider in approving the continuation of the Advisory Agreement.
Conclusion
The Board did not identify any single factor as being of paramount importance, and different Trustees may have given different weight to different factors. The Board reviewed a memorandum from Trust counsel discussing the legal standards applicable to its consideration of the Advisory Agreement. Based on its review, including consideration of each of the factors referenced above, the Board determined, in the exercise of its business judgment, that the advisory arrangement, as outlined in the Advisory Agreement, was fair and reasonable in light of the services performed or to be performed, expenses incurred or to be incurred and such other matters as the Board considered relevant in the exercise of its reasonable business judgment.
Proxy Voting Information
A description of the policies and procedures that each Fund uses to determine how to vote proxies relating to securities held in each Fund’s portfolio is available, without charge and upon request, by calling (866) 233-3368 and on the U.S. Securities and Exchange Commission’s (the “SEC”) website at www.sec.gov. Each Fund’s proxy voting record for the most recent twelve-month period ended June 30 is available, without charge and upon request, by calling (866) 233-3368 and on the SEC’s website at www.sec.gov.
Availability of Quarterly Portfolio Schedules
Each Fund files its complete schedule of portfolio holdings with the SEC for the first and third quarters of each fiscal year on Form N-Q. These filings are available, without charge and upon request on the SEC’s website at www.sec.gov or may be reviewed and copied at the SEC’s Public Reference Room in Washington, DC. Information on the operation of the Public Reference Room may be obtained by calling (800) SEC-0330.
Shareholder Expense Example
As a shareholder of the Funds, you incur two types of costs: (1) transaction costs, including redemption fees, and (2) ongoing costs, including management fees and other Fund expenses. This example is intended to help you understand your ongoing costs (in dollars) of investing in the Funds, and to compare these costs with the
| |
DF DENT GROWTH FUNDS ADDITIONAL INFORMATION (Unaudited) JUNE 30, 2013 |
| |
ongoing costs of investing in other mutual funds.
The example is based on an investment of $1,000 invested at the beginning of the period and held for the entire period from January 1, 2013, through June 30, 2013.
Actual Expenses – The first line of the table below provides information about actual account values and actual expenses. You may use the information in this line, together with the amount you invested, to estimate the expenses that you paid over the period. Simply divide your account value by $1,000 (for example, an $8,600 account value divided by $1,000 = 8.6), then multiply the result by the number in the first line under the heading entitled “Expenses Paid During Period” to estimate the expenses you paid on your account during the period.
Hypothetical Example for Comparison Purposes – The second line of the table below provides information about hypothetical account values and hypothetical expenses based on each Fund’s actual expense ratio and an assumed rate of return of 5% per year before expenses, which is not each Fund’s actual return. The hypothetical account values and expenses may not be used to estimate the actual ending account balance or expenses you paid for the period. You may use this information to compare the ongoing costs of investing in each Fund and other funds. To do so, compare this 5% hypothetical example with the 5% hypothetical examples that appear in the shareholder reports of other funds.
Please note that the expenses shown in the table are meant to highlight your ongoing costs only and do not reflect any transactional costs, such as redemption fees. Therefore, the second line of the table is useful in comparing ongoing costs only, and will not help you determine the relative total costs of owning different funds. In addition, if these transactional costs were included, your costs would have been higher.
| | Beginning | | Ending | | Expenses | | Annualized |
| | Account Value | | Account Value | | Paid During | | Expense |
| | January 1, 2013 | | June 30, 2013 | | Period* | | Ratio* |
| DF Dent Premier Growth Fund | | | | | | | | | | | |
| Actual | $ | 1,000.00 | | $ | 1,104.61 | | $ | 5.64 | | 1.08 | % |
| Hypothetical (5% return before taxes) | $ | 1,000.00 | | $ | 1,019.44 | | $ | 5.41 | | 1.08 | % |
DF Dent Midcap Growth Fund | | | | | | | | | | | |
| Actual | $ | 1,000.00 | | $ | 1,144.24 | | $ | 5.85 | | 1.10 | % |
| Hypothetical (5% return before taxes) | $ | 1,000.00 | | $ | 1,019.34 | | $ | 5.51 | | 1.10 | % |
*Expenses are equal to the Fund’s annualized expense ratio multiplied by the average account value over the period, multiplied by the number of days in the most recent fiscal half-year divided by 365 to reflect the half-year period.
| |
DF DENT GROWTH FUNDS ADDITIONAL INFORMATION (Unaudited) JUNE 30, 2013 |
| |
Trustees and Officers of the Trust
The Board is responsible for oversight of the management of the Trust’s business affairs and of the exercise of all the Trust’s powers except those reserved for the shareholders. The following table provides information about each Trustee and certain officers of the Trust. Each Trustee and officer holds office until the person resigns, is removed, or is replaced. Unless otherwise noted, the persons have held their principal occupations for more than five years. The address for all Trustees and officers is Three Canal Plaza, Suite 600, Portland, Maine 04101. Mr. Keffer is considered an Interested Trustee due to his affiliation with Atlantic. Each Fund’s Statement of Additional Information includes additional information about the Trustees and is available, without charge and upon request, by calling (866) 233-3368.
Name and Year of Birth | Position with the Trust | Length of Time Served | Principal Occupation(s) During Past Five Years | Number of Series of Trust Overseen by Trustee | Other Directorships Held by Trustee |
| Independent Trustees | | | | | |
J. Michael Parish Born: 1943 | Chairman of the Board; Trustee; Chairman, Nominating Committee and Qualified Legal Compliance Committee | Since 1989 (Chairman since 2004) | Retired since 2003. | 24 | 0 |
Costas Azariadis Born: 1943 | Trustee | Since 1989 | Professor of Economics, Washington University since 2006. | 24 | 0 |
James C. Cheng Born: 1942 | Trustee; Chairman, Audit Committee | Since 1989 | President, Technology Marketing Associates (marketing company for small- and medium-sized businesses in New England) since 1991. | 24 | 0 |
David Tucker Born: 1958 | Trustee | Since 2011 | Director, Blue Sky Experience since 2008; Senior Vice President & General Counsel, American Century Companies 1998-2008. | 24 | Trustee, Forum Funds II and Forum ETF Trust |
| Interested Trustee | | | | | |
John Y. Keffer1 Born: 1942 | Trustee; Vice Chairman | Since 1989 | Chairman, Atlantic since 2008; President, Forum Foundation (a charitable organization) since 2005; President, Forum Trust, LLC (a non-depository trust company chartered in the State of Maine) since 1997. | 24 | Director, Wintergreen Fund, Inc.; Trustee, Forum Funds II and Forum ETF Trust |
1Atlantic is a subsidiary of Forum Holdings Corp. I, a Delaware corporation that is wholly owned by Mr. Keffer. |
| |
DF DENT GROWTH FUNDS ADDITIONAL INFORMATION (Unaudited) JUNE 30, 2013 |
| |
Name and Year of Birth | Position with the Trust | Length of Time Served | Principal Occupation(s) During Past Five Years | Number of Series of Trust Overseen by Trustee | Other Directorships Held by Trustee |
| Officers | | | | | |
Stacey E. Hong Born: 1966 | President; Principal Executive Officer | Since 2008 | President, Atlantic since 2008. | N/A | N/A |
Karen Shaw Born: 1972 | Treasurer; Principal Financial Officer | Since 2008 | Senior Vice President, Atlantic since 2008. | N/A | N/A |
David Faherty Born: 1970 | Vice President | Since 2009 | Senior Counsel, Atlantic since 2009; Vice President, Citi Fund Services Ohio, Inc. 2007-2009. | N/A | N/A |
Michael J. McKeen Born: 1971 | Vice President | Since 2009 | Senior Vice President, Atlantic since 2008. | N/A | N/A |
Timothy Bowden Born: 1969 | Vice President | Since 2009 | Manager, Atlantic since 2008. | N/A | N/A |
Geoffrey Ney Born: 1975 | Vice President | Since 2013 | Manager, Atlantic since 2013; Senior Fund Accountant, Atlantic, 2008-2013. | N/A | N/A |
Todd Proulx Born: 1978 | Vice President | Since 2013 | Manager, Atlantic since 2013; Senior Fund Accountant, Atlantic, 2008-2013. | N/A | N/A |
Lina Bhatnagar Born: 1971 | Secretary | Since 2008 | Senior Administration Specialist, Atlantic since 2008. | N/A | N/A |
| |
| A Message to Our Shareholders | 1 |
| | |
| Performance Charts and Analysis (Unaudited) | 6 |
| | |
| Schedules of Investments | 8 |
| | |
| Statements of Assets and Liabilities | 12 |
| | |
| Statements of Operations | 13 |
| | |
| Statements of Changes in Net Assets | 14 |
| | |
| Financial Highlights | 15 |
| | |
| Notes to Financial Statements | 16 |
| | |
| Report of Independent Registered Public Accounting Firm | 21 |
| | |
| Additional Information (Unaudited) | 22 |
| |
GOLDEN FUNDS A MESSAGE TO OUR SHAREHOLDERS JUNE 30, 2013 |
| |
Dear Shareholder,
We are pleased to present the annual report for the Golden Large Cap Core Fund and the Golden Small Cap Core Fund (the “Funds”) for the period of July 1, 2012 through June 30, 2013.
Market Review
Third Quarter of 2012
The U.S. equity markets moved higher over the course of the third quarter as investors anticipated monetary stimulus actions by global central banks in response to a weakening global economy. The S&P 500® benchmark for large cap stocks returned 6.35% while the Russell 2000® benchmark for small cap stocks returned 5.25% in the quarter.
Over the course of the quarter, much of the reported economic data fell short of economists’ expectations and pointed to a slowing global economy. The disappointing data included: U.S. second quarter GDP at an anemic 1.3%; measures of manufacturing in the U.S., Euro area, and China that were all consistently at levels indicating contraction; U.S. jobs reports that showed a very slow pace of jobs growth; a U.S. unemployment rate hovering around 8.1%; and measures showing low levels of consumer confidence. Some bright spots in the data included: generally benign inflation measures, and somewhat surprising strength in the housing and automotive markets.
The slowing global economy, the ongoing European debt crisis, and fears of financial contagion pushed central banks around the world to step up to the plate with yet another round of unprecedented actions. In July, Mario Draghi, the president of the European Central Bank (“ECB”), stated that the ECB would do “whatever it takes” to save the Euro. On September 13, the U.S. Federal Reserve (“Fed”) pledged an open-ended third round of asset purchases, specifically, to purchase $40 billion per month of mortgage-backed securities until the labor market has improved “substantially,” and extended its commitment to near zero interest rates through mid-2015. Also in September, the ECB announced an unlimited bond-buying program; the Bank of Japan unexpectedly expanded its asset-purchase fund; and India’s central bank lowered the cash reserve ratio for lenders to 4.5 percent from 4.75 percent.
As central banks engaged in competitive devaluation of their currencies, virtually every tradable asset class moved higher over the quarter including equities, commodities, investment grade corporate debt, high-yield bonds, treasury bonds, and mortgage bonds.
Fourth Quarter of 2012
During the fourth quarter of 2012, the S&P 500® Index declined -0.38% in the fourth quarter, bringing its 2012 return to 16.00%. The Russell 2000® Index returned 1.85% in the quarter to finish 2012 up 16.35%.
In general, October and the first days of November were marked by an elevated level of uncertainty leading into the elections in the U.S. That uncertainty and the subsequent continuation of the divided government contributed to a selloff that led into and immediately followed the election. During the latter stages of the
| |
GOLDEN FUNDS A MESSAGE TO OUR SHAREHOLDERS JUNE 30, 2013 |
| |
election cycle, Americans and investors around the world began to anticipate the “fiscal cliff” negotiations. However, investors appeared to shrug off the ensuing brinksmanship, which had come to be expected, and the U.S. equity markets were able to recoup their earlier losses to end the quarter slightly higher. Economic data was encouraging as it generally exceeded economists’ expectations and pointed to a stabilizing global economy. The positive data included: U.S. third quarter GDP at 3.1%, U.S. jobs reports that showed continued jobs growth, a U.S. unemployment rate that dropped to 7.8%, generally benign inflation measures, and continued strength in the housing and automotive markets. Some weak spots in the data included: a lower savings rate driven by personal spending growth outpacing the growth rate in personal incomes; and continued weakness in the measures of manufacturing in the U.S., euro area, and China.
Once again, the Fed undertook additional unprecedented actions during the quarter. On December 12th, the Fed announced that it would begin another round of quantitative easing in January 2013 by purchasing $45 billion per month of U.S. Treasury securities focusing on longer-term maturities and using newly created reserves. It also introduced a new set of thresholds up to which it will maintain a near-zero interest rate policy, namely, as long as the unemployment rate remains above 6.5% and as long as projected inflation (as forecast by Fed members for periods of one to two years ahead) is expected to remain below 2.5%.
First Quarter of 2013
During the first quarter of 2013, broad measures of the U.S. equity markets posted very strong positive returns to start off the year. The S&P 500® Index returned 10.61% to surpass its previous all-time high set in October 2007. The Russell 2000® Index returned 12.39%.
Overall, economic data reported during the quarter was encouraging as it generally exceeded economists’ expectations. The combination of positive surprises in the economic data and abundant liquidity supplied by the Fed’s ongoing quantitative easing program contributed to the strong rally in the equity markets. The positive data included: U.S. reports that showed continued jobs growth; a U.S. unemployment rate that dropped to 7.7%; generally benign inflation measures; and continued strength in housing markets. However, there were a number of weak spots in the data, and the ratio of positive to negative surprises began to fall toward the end of the quarter. Some weak spots in the data included: a lower savings rate driven by personal spending growth outpacing the growth rate in personal incomes; weak measures of consumer sentiment; U.S. fourth quarter GDP at 0.4%; and continued weakness in the measures of manufacturing in the U.S., Euro area, and China.
Significantly, the U.S. markets shrugged off a two week closure of banks in Cyprus and the potential for bank runs in the peripheral European countries over fears that the Cyprus bailout plan could become a template for future European bank rescues. The agreement between Cyprus and the Troika (the European Union, the ECB, and the International Monetary Fund) will result in depositors with balances over the insured threshold taking a “haircut” on their deposits. The market’s reaction seems to indicate that investors believe that the risk of financial contagion is small and “contained.”
| |
GOLDEN FUNDS A MESSAGE TO OUR SHAREHOLDERS JUNE 30, 2013 |
| |
Second Quarter of 2013
During the second quarter of 2013, the momentum from the strong first quarter continued to push broad measures of the U.S. equity markets higher. The S&P 500® Index returned 2.91% and the Russell 2000® Index returned 3.08%. Global equity markets did not fare as well. The MSCI All-Country World Index fell -0.42%; the MSCI EAFE Index fell -0.98%; and the MSCI Emerging Markets Index ended the quarter down -8.08%.
In the U.S., economic data reported during the quarter indicated a slow-growing economy. The positive data included: U.S. payroll reports that showed continued modest growth in the number of jobs, which kept the unemployment rate hovering around 7.6%; low and slightly falling inflation measures; continued strength in housing and automotive markets; and consumer confidence measures that reached post-recession highs as consumers experience the benefits of improved labor markets, lower gas prices, and higher stock prices. However, there were a number of less inspiring data items including: weak core retail sales; first quarter GDP growth estimated at 1.8%; a rising trade deficit; and continued weakness in the measures of manufacturing.
The most significant events of the quarter were the comments by Fed Chairman Ben Bernanke regarding the Fed’s potential tapering of its $85 billion per month bond buying program. In his May testimony before Congress, Bernanke indicated the Fed could begin to curtail quantitative easing in “its next few meetings” if its members are confident gains in the economy can be sustained. After the June Federal Open Market Committee meeting, Bernanke expanded on his comments by saying that the central bank will probably taper its $85 billion bond buying program later this year, as long as the economy performs in line with Fed projections. These comments sent shock waves through the fixed income markets. While the yield on 10-year U.S. Treasuries soared as high as 2.66% on June 24, from a low of 1.61% on May 1, corporate bonds, inflation protected bonds, and emerging market bonds experienced some of their worst losses in five years. Additionally, volatility was injected into the equity markets as the Chicago Board Options Exchange Volatility Index (VIX) has surged approximately 50% since hitting a six-year low in March.
Golden Large Cap Core Fund
The Fund seeks to achieve long-term capital appreciation by investing in large capitalization domestic equities. The goal of the Fund is to construct an actively managed portfolio of fundamentally sound large-cap companies that we believe exhibit the likelihood of meeting or exceeding analysts’ earnings expectations.
For the one-year period ending June 30, 2013, the Fund delivered a total return of 21.68%. The Fund’s return was just ahead of the 20.60% total return of the S&P 500®, the Fund’s benchmark index, for the same period. The market has steadily improved since early 2009 and rewarded investors that maintained their exposure to equities.
The Fund’s best sources of advantage relative to the S&P 500® over the last 12 months were the Materials and Industrial sectors. Within the Fund, the Materials sector was helped by a strong advance in the shares of chemical company W.R. Grace (GRA) and the fact that we had no representation in the underperforming metals group. In the Industrials sector, we likewise benefitted from favorable stock selection and advantageous industry positioning. We had an overweight exposure to the capital goods industry group
| |
GOLDEN FUNDS A MESSAGE TO OUR SHAREHOLDERS JUNE 30, 2013 |
| |
where strong stock returns from Chicago Bridge & Iron (CBI) and Terex Corp (TEX) reflected the fundamental improvement in the global economy.
The Consumer Discretionary sector was the primary source of relative underperformance during the period. Our investments in the retailing industry group failed to keep pace as TJX Cos. (TJX), Foot Locker (FL), GNC Holdings, and Ross Stores (ROST) all underperformed the broader market. In the hot performing media industry, we sold Walt Disney Co. (DIS) before its shares staged a rally on better-than-expected financial results and better results from its Parks segment.
Golden Small Cap Core Fund
The Fund seeks to achieve maximum long-term total return by investing in small capitalization domestic equities. The goal of the Fund is to construct an actively managed portfolio of fundamentally sound small-cap companies that we believe exhibit the likelihood of meeting or exceeding analysts’ earnings expectations.
For the one-year period ending June 30, 2013, the Fund generated a total return of 27.54%. This return was ahead of the 24.21% total return of the Russell 2000®, the Fund’s benchmark index, for the same period.
Stock selection added value for the Fund in four out of ten economic sectors. The best relative results came from the Industrials, Financials, Energy, and Utilities sectors. Relative weakness was found in the Consumer Discretionary, Information Technology, Materials, and Health Care sectors.
The Industrials sector offered the best performance relative to the Russell 2000® during the period due to the combined effects of the Fund’s overweight exposure and stock selection. Two of the portfolio’s best performers were Primoris Services (PRIM), and TASER International (TASR). Each company’s stock price rose due to strong company fundamentals and consistently positive earnings announcements. Primoris triggered our sell discipline and was sold in early 2013, and we still own TASER as of the date of this report. Stock selection was exceptionally strong within this sector, leading to results that were more than twice that of the Russell 2000® sector return.
The Fund’s holdings within the Financials sector included several strong performers such as Ocwen Financial Corp. (OCN), NetSpend Holdings (NTSP), FBL Financial Group (FFG), and Omega Healthcare Investors (OHI). There were also a few companies that saw their share prices decline due to weakening fundamentals. These companies included Meadowbrook Insurance Group (MIG), and PHH Corp. (PHH).
The two weakest sectors in terms of stock selection were Information Technology and Consumer Discretionary. While our underweight position in Technology was beneficial, negative results from certain holdings, including Cirrus Logic (CRUS) and QLogic Corp. (QLGC), weighed on portfolio results due to expectations of a drop off in iPhone demand. Demand Media (DMD) was the worst performing holding in the sector. The biggest disappointment in the Consumer Discretionary sector was Bridgepoint Education (BPI), which sold off sharply after announcing that its accreditation application for Ashford University had been denied by a regional accreditor.
| |
GOLDEN FUNDS A MESSAGE TO OUR SHAREHOLDERS JUNE 30, 2013 |
| |
Market Outlook
As the third quarter of 2013 begins, investors are grappling with a level of uncertainty with regard to monetary policy that has not been experienced in several years. In the U.S., the Fed is monitoring incoming economic data with a bias toward tapering its accommodative bond-buying program. The People’s Bank of China is taking steps to reign in the country’s shadow-banking system and seems willing to tolerate slightly slower economic growth. The Bank of Japan appears to be “all-in” on monetary stimulus, but the bank has a checkered history when it comes to the resolve to follow through on its policies. The ECB remains in accommodation mode, though elections in Germany this fall will likely result in heated rhetoric around bailouts, monetary policy, and austerity. Considering these monetary policies in conjunction with a lack of fiscal policy clarity in most of the developed world, the recent volatility in markets is likely to continue.
In the U.S., we believe that the second quarter earnings reporting season will be of paramount importance in determining the near-term direction of the equity market. The last several quarters have shown very little revenue growth. Earnings growth has been maintained through a combination of cost containment and financial engineering. Input costs have been held in check with low wage growth, due to slack in the labor market, and falling commodity costs that are due, in part, to a rise in the exchange value of the dollar. Financial engineering through debt refinancing and share buybacks has led to lower interest costs and reduced the number of shares outstanding. As the labor markets improve and the level of interest rates rise, we believe that companies will find it difficult to maintain the recent historically high levels of profit margins. As a result, we expect a generally lower level of correlations among stocks. In this environment, we expect that focusing on company fundamentals will be rewarded.
We value and appreciate our relationship with the Funds and thank you for your support.
Sincerely,
Greg W. Golden, CFA Jeff C. Moser, CFA
The views expressed in this report are those of the Funds’ managers as of June 30, 2013, and may not reflect their views on the date this report is first published or anytime thereafter. These views are intended to assist shareholders of the Funds in understanding their investments in the Funds and do not constitute investment advice. With respect to the Golden Small Cap Core Fund, investing in the securities of small capitalization companies involves greater risk and the possibility of greater price volatility than investing in larger capitalization and more established companies.
| |
GOLDEN LARGE CAP CORE FUND PERFORMANCE CHART AND ANALYSIS (Unaudited) JUNE 30, 2013 |
| |
The following chart reflects the change in the value of a hypothetical $10,000 investment in Institutional Shares, including reinvested dividends and distributions, in the Golden Large Cap Core Fund (the “Fund”) compared with the performance of the benchmark, the S&P 500 Index (S&P 500"), since inception. The S&P 500 is a broad-based, unmanaged measurement of changes in stock market conditions based on the average of 500 widely held common stocks. The total return of the S&P 500 includes the reinvestment of dividends and income. The total return of the Fund includes operating expenses that reduce returns, while the total return of the S&P 500 does not include expenses. The Fund is professionally managed while the S&P 500 is unmanaged and is not available for investment.
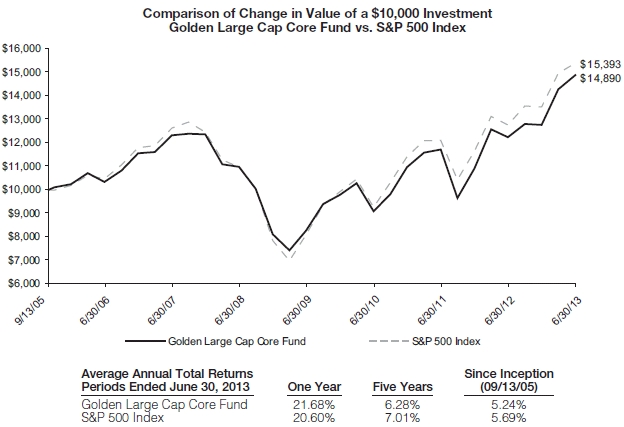
Performance data quoted represents past performance and is no guarantee of future results. Current performance may be lower or higher than the performance data quoted. Investment return and principal value will fluctuate so that shares, when redeemed, may be worth more or less than original cost. For the most recent month-end performance, please call (800) 206-8610. As stated in the Fund's prospectus, the annual operating expense ratios (gross) for Institutional Shares is 0.70%. The Fund's adviser has agreed to contractually reduce a portion of its fees and to reimburse expenses such that total operating expenses do not exceed 0.70% for Institutional Shares through at least October 31, 2013. The performance table and graph do not reflect the deduction of taxes that a shareholder would pay on Fund distributions or the redemption of Fund shares. Returns greater than one year are annualized.
| |
GOLDEN SMALL CAP CORE FUND PERFORMANCE CHART AND ANALYSIS (Unaudited) JUNE 30, 2013 |
| |
The following chart reflects the change in the value of a hypothetical $10,000 investmentin Institutional Shares, including reinvested dividends and distributions, in the Golden Small Cap Core Fund (the “Fund”) compared with the performance of the primary benchmark, the Russell 2000 Index ("Russell 2000"), and the secondary benchmark, the S&P SmallCap 600 Index ("S&P SmallCap 600") since inception. The Russell 2000, is an unmanaged, market value weighted index, which measures performance of the 2,000 companies that are between the 1,000th and 3,000th largest in the market. The S&P SmallCap 600 is designed to be an accurate measure of the performance of small companies, reflecting the risk and return characteristics of the broader smallcap universe. The total return of the indices include the reinvestment of dividends and income. The total return of the Fund includes operating expenses that reduce returns, while the total return of the indices do not include expenses. The Fund is professionally managed while the indices are unmanaged and are not available for investment.

Performance data quoted represents past performance and is no guarantee of future results. Current performance may be lower or higher than the performance data quoted. Investment return and principal value will fluctuate so that shares, when redeemed, may be worth more or less than original cost. For the most recent month-end performance, please call (800) 206-8610. As stated in the Fund's prospectus, the annual operating expense ratios (gross) for Institutional Shares is 1.10%. The Fund's adviser has agreed to contractually reduce a portion of its fees and to reimburse expenses such that total operating expenses do not exceed 1.10% for Institutional Shares through at least October 31, 2013. The performance table and graph do not reflect the deduction of taxes that a shareholder would pay on Fund distributions or the redemption of Fund shares. Returns greater than one year are annualized.
| |
GOLDEN LARGE CAP CORE FUND SCHEDULE OF INVESTMENTS JUNE 30, 2013 |
| |
| | Shares | | Security Description | | Value | |
| Common Stock - 98.8% |
| Consumer Discretionary - 10.4% |
| | 12,940 | | Comcast Corp., Class A | $ | 541,927 | |
| | 14,766 | | Foot Locker, Inc. | | 518,730 | |
| | 11,255 | | Hanesbrands, Inc. | | 578,732 | |
| | 8,325 | | Magna International, Inc. | | 592,907 | |
| | 8,158 | | The Home Depot, Inc. | | 632,000 | |
| | | 2,864,296 | |
| Consumer Staples - 8.1% |
| | 11,068 | | CVS Caremark Corp. | | 632,868 | |
| | 12,505 | | Herbalife, Ltd. | | 564,476 | |
| | 9,725 | | Spectrum Brands Holdings, Inc. | | 553,061 | |
| | 6,778 | | Wal-Mart Stores, Inc. | | 504,893 | |
| | | 2,255,298 | |
| Energy - 8.6% |
| | 4,041 | | Chevron Corp. | | 478,212 | |
| | 7,973 | | ConocoPhillips | | 482,367 | |
| | 4,809 | | Exxon Mobil Corp. | | 434,493 | |
| | 10,745 | | HollyFrontier Corp. | | 459,671 | |
| | 8,810 | | Phillips 66 | | 518,997 | |
| | | 2,373,740 | |
| Financials - 17.2% |
| | 11,990 | | Citigroup, Inc. | | 575,160 | |
| | 31,896 | | Fifth Third Bancorp | | 575,723 | |
| | 12,313 | | JPMorgan Chase & Co. | | 650,003 | |
| | 16,540 | | Lincoln National Corp. | | 603,214 | |
| | 14,608 | | MetLife, Inc. | | 668,462 | |
| | 16,950 | | SunTrust Banks, Inc. | | 535,111 | |
| | 11,675 | | The Allstate Corp. | | 561,801 | |
| | 3,915 | | The Goldman Sachs Group, Inc. | | 592,144 | |
| | | 4,761,618 | |
| Health Care - 15.4% |
| | 13,855 | | Abbott Laboratories | | 483,263 | |
| | 13,365 | | AbbVie, Inc. | | 552,509 | |
| | 5,118 | | Amgen, Inc. | | 504,942 | |
| | 4,983 | | Johnson & Johnson | | 427,840 | |
| | 4,602 | | McKesson Corp. | | 526,929 | |
| | 7,765 | | Thermo Fisher Scientific, Inc. | | 657,152 | |
| | 8,590 | | United Therapeutics Corp. (a) | | 565,394 | |
| | 8,259 | | UnitedHealth Group, Inc. | | 540,799 | |
| | | 4,258,828 | |
| Industrials - 11.7% |
| | 16,500 | | AECOM Technology Corp. (a) | | 524,535 | |
| | 9,660 | | Chicago Bridge & Iron Co. NV | | 576,316 | |
| | 5,169 | | FedEx Corp. | | 509,560 | |
| | 8,440 | | Fluor Corp. | | 500,576 | |
| | 22,430 | | General Electric Co. | | 520,152 | |
| | 24,185 | | Hertz Global Holdings, Inc. (a) | | 599,788 | |
| | | 3,230,927 | |
| Materials - 4.5% |
| | 26,430 | | Berry Plastics Group, Inc. (a) | | 583,310 | |
| | 7,880 | | WR Grace & Co. (a) | | 662,235 | |
| | | 1,245,545 | |
| Technology - 18.8% |
| | 1,134 | | Apple, Inc. | | 449,155 | |
| | 40,565 | | Cadence Design Systems, Inc. (a) | | 587,381 | |
| | 25,055 | | Cisco Systems, Inc. | | 609,087 | |
| | 7,590 | | DST Systems, Inc. | | 495,855 | |
| | 51,415 | | Marvell Technology Group, Ltd. | | 602,069 | |
| | 13,910 | | Microsoft Corp. | | 480,312 | |
| | 14,861 | | Oracle Corp. | | 456,530 | |
| | 6,839 | | QUALCOMM, Inc. | | 417,726 | |
| | 13,530 | | Seagate Technology PLC | | 606,550 | |
| | 21,840 | | Symantec Corp. | | 490,745 | |
| | | 5,195,410 | |
| Telecommunications - 4.1% |
| | 15,965 | | AT&T, Inc. | | 565,161 | |
| | 11,583 | | Verizon Communications, Inc. | | 583,088 | |
| | | 1,148,249 | |
Total Common Stock (Cost $21,064,180) | | 27,333,911 | |
Total Investments - 98.8% (Cost $21,064,180)* | $ | 27,333,911 | |
| Other Assets & Liabilities, Net – 1.2% | | 338,362 | |
| Net Assets – 100.0% | $ | 27,672,273 | |
| PLC | Public Limited Company |
| (a) | Non-income producing security. |
| * | Cost for federal income tax purposes is $21,175,586 and net unrealized appreciation consists of: |
| Gross Unrealized Appreciation | | $ | 6,375,781 | |
| Gross Unrealized Depreciation | | | (217,456 | ) |
| Net Unrealized Appreciation | | $ | 6,158,325 | |
| See Notes to Financial Statements. | 8 | |
| |
GOLDEN LARGE CAP CORE FUND SCHEDULE OF INVESTMENTS JUNE 30, 2013 |
| |
The following is a summary of the inputs used to value the Fund’s investments as of June 30, 2013.
The inputs or methodology used for valuing securities are not necessarily an indication of the risks associated with investing in those securities. For more information on valuation inputs, and their aggregation into the levels used in the table below, please refer to the Security Valuation section in Note 2 of the accompanying Notes to Financial Statements.
| Valuation Inputs | | Investments in Securities |
| Level 1 - Quoted Prices | | $ | 27,333,911 | |
| Level 2 - Other Significant Observable Inputs | | | - | |
| Level 3 - Significant Unobservable Inputs | | | - | |
| Total | | $ | 27,333,911 | |
The Level 1 value displayed in this table is Common Stock. Refer to the Schedule of Investments for a further breakout of each security by industry.
There were no transfers between Level 1 and Level 2 for the year ended June 30, 2013.
| PORTFOLIO HOLDINGS | | |
| % of Net Assets | | |
| Consumer Discretionary | 10.4 | % |
| Consumer Staples | 8.1 | % |
| Energy | 8.6 | % |
| Financials | 17.2 | % |
| Health Care | 15.4 | % |
| Industrials | 11.7 | % |
| Materials | 4.5 | % |
| Technology | 18.8 | % |
| Telecommunications | 4.1 | % |
| Other Assets & Liabilities, Net | 1.2 | % |
| | 100.0 | % |
| See Notes to Financial Statements. | 9 | |
| |
GOLDEN SMALL CAP CORE FUND SCHEDULE OF INVESTMENTS JUNE 30, 2013 |
| |
| | Shares | | Security Description | | Value | |
| Common Stock - 98.3% |
| Consumer Discretionary - 12.1% |
| | 15,280 | | Big 5 Sporting Goods Corp. | $ | 335,396 | |
| | 4,844 | | Coinstar, Inc. (a) | | 284,197 | |
| | 32,165 | | LeapFrog Enterprises, Inc. (a) | | 316,504 | |
| | 29,330 | | Ruth's Hospitality Group, Inc. | | 354,013 | |
| | 23,771 | | Service Corp. International | | 428,591 | |
| | 27,487 | | Smith & Wesson Holding Corp. (a) | | 274,320 | |
| | 12,779 | | Standard Motor Products, Inc. | | 438,831 | |
| | | 2,431,852 | |
| Consumer Staples - 2.0% |
| | 7,080 | | Spectrum Brands Holdings, Inc. | | 402,640 | |
| | | | |
| Energy - 7.2% |
| | 14,704 | | C&J Energy Services, Inc. (a) | | 284,817 | |
| | 7,019 | | CVR Energy, Inc. | | 332,701 | |
| | 10,818 | | Delek US Holdings, Inc. | | 311,342 | |
| | 9,113 | | Stone Energy Corp. (a) | | 200,759 | |
| | 11,228 | | Western Refining, Inc. | | 315,170 | |
| | | 1,444,789 | |
| Financials - 21.7% |
| | 8,395 | | American Financial Group, Inc. | | 410,600 | |
| | 9,970 | | AmTrust Financial Services, Inc. | | 355,929 | |
| | 37,525 | | CapitalSource, Inc. | | 351,985 | |
| | 8,761 | | FBL Financial Group, Inc., Class A | | 381,191 | |
| | 17,399 | | Interactive Brokers Group, Inc., Class A | | 277,862 | |
| | 17,657 | | Manning & Napier, Inc. | | 313,588 | |
| | 12,564 | | Omega Healthcare Investors, Inc. REIT | | 389,735 | |
| | 12,810 | | PHH Corp. (a) | | 261,068 | |
| | 6,306 | | Post Properties, Inc. REIT | | 312,084 | |
| | 7,745 | | ProAssurance Corp. | | 403,979 | |
| | 11,603 | | Sabra Health Care REIT, Inc. | | 302,954 | |
| | 5,097 | | StanCorp Financial Group, Inc. | | 251,843 | |
| | 27,404 | | Susquehanna Bancshares, Inc. | | 352,141 | |
| | | 4,364,959 | |
| Health Care - 12.4% |
| | 8,939 | | AmSurg Corp. (a) | | 313,759 | |
| | 6,530 | | Centene Corp. (a) | | 342,564 | |
| | 10,818 | | HealthSouth Corp. (a) | | 311,558 | |
| | 3,434 | | MEDNAX, Inc. (a) | | 314,486 | |
| | 15,894 | | NuVasive, Inc. (a) | | 394,012 | |
| | 39,135 | | PDL BioPharma, Inc. | | 302,122 | |
| | 27,819 | | Select Medical Holdings Corp. | | 228,116 | |
| | 42,714 | | Sucampo Pharmaceuticals, Inc., Class A (a) | | 281,058 | |
| | | 2,487,675 | |
| Industrials - 19.8% |
| | 2,595 | | AMERCO, Inc. (a) | | 420,131 | |
| | 11,465 | | Deluxe Corp. | | 397,262 | |
| | 8,331 | | EMCOR Group, Inc. | | 338,655 | |
| | 10,021 | | EnerSys | | 491,430 | |
| | 11,520 | | ITT Corp. | | 338,803 | |
| | 9,882 | | Old Dominion Freight Line, Inc. (a) | | 411,289 | |
| | 24,373 | | RPX Corp. (a) | | 409,466 | |
| | 16,531 | | Saia, Inc. (a) | | 495,434 | |
| | 37,941 | | Taser International, Inc. (a) | | 323,257 | |
| | 3,831 | | UniFirst Corp. | | 349,579 | |
| | | 3,975,306 | |
| Materials - 3.9% |
| | 15,859 | | Coeur Mining, Inc. (a) | | 210,925 | |
| | 42,294 | | Primero Mining Corp. (a) | | 189,900 | |
| | 7,606 | | Schweitzer-Mauduit International, Inc. | | 379,387 | |
| | | 780,212 | |
| Technology - 16.0% |
| | 18,516 | | Advanced Energy Industries, Inc. (a) | | 322,364 | |
| | 13,250 | | Angie's List, Inc. (a) | | 351,787 | |
| | 22,713 | | AVG Technologies NV (a) | | 441,768 | |
| | 52,222 | | Brocade Communications Systems, Inc. (a) | | 300,799 | |
| | 4,104 | | CACI International, Inc., Class A (a) | | 260,563 | |
| | 8,435 | | Cirrus Logic, Inc. (a) | | 146,432 | |
| | 12,443 | | CoreLogic, Inc. (a) | | 288,304 | |
| | 22,929 | | Demand Media, Inc. (a) | | 137,574 | |
| | 7,992 | | j2 Global, Inc. | | 339,740 | |
| | 19,741 | | Sanmina Corp. (a) | | 283,283 | |
| | 15,592 | | Unisys Corp. (a) | | 344,115 | |
| | | 3,216,729 | |
| Utilities - 3.2% |
| | 9,895 | | Portland General Electric Co. | | 302,688 | |
| | 7,350 | | The Laclede Group, Inc. | | 335,601 | |
| | | 638,289 | |
Total Common Stock (Cost $15,624,951) | | 19,742,451 | |
Total Investments - 98.3% (Cost $15,624,951)* | $ | 19,742,451 | |
| Other Assets & Liabilities, Net – 1.7% | | 350,064 | |
| Net Assets – 100.0% | $ | 20,092,515 | |
| REIT | Real Estate Investment Trust |
| (a) | Non-income producing security |
| See Notes to Financial Statements. | 10 | |
| |
GOLDEN SMALL CAP CORE FUND SCHEDULE OF INVESTMENTS JUNE 30, 2013 |
| |
| * | Cost for federal income tax purposes is $15,686,700 and net unrealized appreciation consists of: |
| Gross Unrealized Appreciation | | $ | 4,698,426 | |
| Gross Unrealized Depreciation | | | (642,675 | ) |
| Net Unrealized Appreciation | | $ | 4,055,751 | |
The following is a summary of the inputs used to value the Fund’s investments as of June 30, 2013.
The inputs or methodology used for valuing securities are not necessarily an indication of the risks associated with investing in those securities. For more information on valuation inputs, and their aggregation into the levels used in the table below, please refer to the Security Valuation section in Note 2 of the accompanying Notes to Financial Statements.
| Valuation Inputs | | Investments in Securities |
| Level 1 - Quoted Prices | | $ | 19,742,451 | |
| Level 2 - Other Significant Observable Inputs | | | - | |
| Level 3 - Significant Unobservable Inputs | | | - | |
| Total | | $ | 19,742,451 | |
The Level 1 value displayed in this table is Common Stock. Refer to the Schedule of Investments for a further breakout of each security by industry.
There were no transfers between Level 1 and Level 2 for the year ended June 30, 2013.
| PORTFOLIO HOLDINGS | | |
| % of Net Assets | | |
| Consumer Discretionary | 12.1 | % |
| Consumer Staples | 2.0 | % |
| Energy | 7.2 | % |
| Financials | 21.7 | % |
| Health Care | 12.4 | % |
| Industrials | 19.8 | % |
| Materials | 3.9 | % |
| Technology | 16.0 | % |
| Utilities | 3.2 | % |
| Other Assets & Liabilities, Net | 1.7 | % |
| | 100.0 | % |
| See Notes to Financial Statements. | 11 | |
| |
GOLDEN FUNDS STATEMENTS OF ASSETS AND LIABILITIES JUNE 30, 2013 |
| |
| | | | | | GOLDEN LARGE CAP CORE FUND | | | | GOLDEN SMALL CAP CORE FUND | |
| ASSETS | | | | | | | | |
| | Total investments, at value (Cost $21,064,180 and $15,624,951, respectively) | $ | 27,333,911 | | | $ | 19,742,451 | |
| | Receivables: | | | | | | | | |
| | | Investment securities sold | | | 438,101 | | | | 450,614 | |
| | | Dividends and interest | | | 22,135 | | | | 12,877 | |
| Total Assets | | | 27,794,147 | | | | 20,205,942 | |
| | | | | | | | | | | |
| LIABILITIES | | | | | | | | |
| | Payables: | | | | | | | | |
| | | Fund shares redeemed | | | 1,260 | | | | 9,384 | |
| | | Due to custodian | | | 106,524 | | | | 87,466 | |
| | Accrued Liabilities: | | | | | | | | |
| | | Investment adviser fees | | | 14,083 | | | | 16,570 | |
| | | Trustees’ fees and expenses | | | 7 | | | | 7 | |
| Total Liabilities | | | 121,874 | | | | 113,427 | |
| | | | | | | | | | | |
| NET ASSETS | | $ | 27,672,273 | | | $ | 20,092,515 | |
| | | | | | | | | | | |
| COMPONENTS OF NET ASSETS | | | | | | | | |
| | Paid-in capital | | $ | 18,126,026 | | | $ | 71,029,781 | |
| | Undistributed net investment income | | | 143,215 | | | | 289,244 | |
| | Accumulated net realized gain (loss) | | | 3,133,301 | | | | (55,344,010 | ) |
| | Net unrealized appreciation | | | 6,269,731 | | | | 4,117,500 | |
| NET ASSETS | | $ | 27,672,273 | | | $ | 20,092,515 | |
| SHARES OF BENEFICIAL INTEREST AT NO PAR VALUE (UNLIMITED SHARES AUTHORIZED) | | | 2,263,096 | | | | 1,480,284 | |
| NET ASSET VALUE, OFFERING AND REDEMPTION PRICE PER SHARE | | $ | 12.23 | | | $ | 13.57 | |
| | | | | | | | | | | |
| See Notes to Financial Statements. | 12 | |
| |
GOLDEN FUNDS STATEMENTS OF OPERATIONS YEAR ENDED JUNE 30, 2013 |
| |
| | | | | | GOLDEN LARGE CAP CORE FUND | | | | GOLDEN SMALL CAP CORE FUND | | |
| INVESTMENT INCOME | | | | | | | | | |
| | Dividend income (Net of foreign withholding taxes of $368 and $0, respectively) | | $ | 522,246 | | | $ | 546,662 | | |
| | Interest income | | | 570 | | | | 390 | | |
| Total Investment Income | | | 522,816 | | | | 547,052 | | |
| | | | | | | | | | |
| EXPENSES | | | | | | | | | |
| | Investment adviser fees | | | 200,302 | | | | 248,309 | | |
| | Trustees' fees and expenses | | | 1,000 | | | | 797 | | |
| Total Expenses | | | 201,302 | | | | 249,106 | | |
| | Expenses reimbursed | | | (1,000 | ) | | | (797 | ) | |
| Net Expenses | | | 200,302 | | | | 248,309 | | |
| | | | | | | | | | | | |
| NET INVESTMENT INCOME | | | 322,514 | | | | 298,743 | | |
| | | | | | | | | | | | |
| NET REALIZED AND UNREALIZED GAIN (LOSS) | | | | | | | | | |
| | Net realized gain on investments | | | 6,449,793 | | | | 4,785,719 | | |
| | Net change in unrealized appreciation (depreciation) on investments | | | (1,404,080 | ) | | | 388,344 | | |
| NET REALIZED AND UNREALIZED GAIN | | | 5,045,713 | | | | 5,174,063 | | |
| INCREASE IN NET ASSETS FROM OPERATIONS | | $ | 5,368,227 | | | $ | 5,472,806 | | |
| | | | | | | | | | | | |
| See Notes to Financial Statements. | 13 | |
| |
GOLDEN FUNDS STATEMENTS OF CHANGES IN NET ASSETS |
| |
| | | | | GOLDEN LARGE CAP CORE FUND | | GOLDEN SMALL CAP CORE FUND | |
| | | | | | | | | | Shares | | | | | | | | Shares | | |
| NET ASSETS JUNE 30, 2011 | | $ | 142,756,289 | | | | | | | $ | 53,300,162 | | | | | | |
| OPERATIONS | | | | | | | | | | | | | | | | | |
| | Net investment income (loss) | | | 673,374 | | | | | | | | (43,959 | ) | | | | | |
| | Net realized gain | | | 10,246,359 | | | | | | | | 6,017,297 | | | | | | |
| | Net change in unrealized appreciation (depreciation) | | | (19,594,735 | ) | | | | | | | (8,976,528 | ) | | | | | |
| Decrease in Net Assets Resulting from Operations | | | (8,675,002 | ) | | | | | | | (3,003,190 | ) | | | | | |
| | | | | | | | | | | | | | | | | | | | |
| DISTRIBUTIONS TO SHAREHOLDERS FROM | | | | | | | | | | | | | | | | | |
| | Net investment income | | | (1,238,094 | ) | | | | | | | - | | | | | | |
| | | | | | | | | | | | | | | | | | | | |
| CAPITAL SHARE TRANSACTIONS | | | | | | | | | | | | | | | | | |
| | Sale of shares | | | 2,679,571 | | | | 254,202 | | | | 814,327 | | | | 79,897 | | |
| | Reinvestment of distributions | | | 48,767 | | | | 4,838 | | | | - | | | | - | | |
| | Redemption of shares | | | (100,675,313 | ) | | | (10,027,910 | ) | | | (23,684,574 | ) | | | (2,306,216 | ) | |
| Decrease in Net Assets from Capital Share Transactions | | | (97,946,975 | ) | | | (9,768,870 | ) | | | (22,870,247 | ) | | | (2,226,319 | ) | |
| Decrease in Net Assets | | | (107,860,071 | ) | | | | | | | (25,873,437 | ) | | | | | |
| NET ASSETS JUNE 30, 2012 (Including line (a)) | | $ | 34,896,218 | | | | | | | $ | 27,426,725 | | | | | | |
| OPERATIONS | | | | | | | | | | | | | | | | | |
| | Net investment income | | | 322,514 | | | | | | | | 298,743 | | | | | | |
| | Net realized gain | | | 6,449,793 | | | | | | | | 4,785,719 | | | | | | |
| | Net change in unrealized appreciation (depreciation) | | | (1,404,080 | ) | | | | | | | 388,344 | | | | | | |
| Increase in Net Assets Resulting from Operations | | | 5,368,227 | | | | | | | | 5,472,806 | | | | | | |
| | | | | | | | | | | | | | | | | | | | |
| DISTRIBUTIONS TO SHAREHOLDERS FROM | | | | | | | | | | | | | | | | | |
| | Net investment income | | | (458,420 | ) | | | | | | | - | | | | | | |
| | Net realized gain | | | (2,619,826 | ) | | | | | | | - | | | | | | |
| Total Distributions to Shareholders | | | (3,078,246 | ) | | | | | | | - | | | | | | |
| | | | | | | | | | | | | | | | | | | | |
| CAPITAL SHARE TRANSACTIONS | | | | | | | | | | | | | | | | | |
| | Sale of shares | | | 5,571,096 | | | | 483,663 | | | | 242,001 | | | | 18,807 | | |
| | Reinvestment of distributions | | | 527,850 | | | | 49,752 | | | | - | | | | - | | |
| | Redemption of shares | | | (15,612,872 | ) | | | (1,357,687 | ) | | | (13,049,017 | ) | | | (1,115,159 | ) | |
| Decrease in Net Assets from Capital Share Transactions | | | (9,513,926 | ) | | | (824,272 | ) | | | (12,807,016 | ) | | | (1,096,352 | ) | |
| Decrease in Net Assets | | | (7,223,945 | ) | | | | | | | (7,334,210 | ) | | | | | |
| NET ASSETS JUNE 30, 2013 (Including line (b)) | | $ | 27,672,273 | | | | | | | $ | 20,092,515 | | | | | | |
| (a) | Undistributed net investment income June 30, 2012 | | $ | 279,121 | | | | | | | $ | - | | | | | | |
| (b) | Undistributed net investment income June 30, 2013 | | $ | 143,215 | | | | | | | $ | 289,244 | | | | | | |
| See Notes to Financial Statements. | 14 | |
| |
GOLDEN FUNDS FINANCIAL HIGHLIGHTS |
| |
| These financial highlights reflect selected data for a share outstanding throughout each year. | | | | | | |
| | | For the Years Ended June 30, | |
| | | 2013 | | 2012 | | 2011 | | 2010 | | 2009 | |
| GOLDEN LARGE CAP CORE FUND | | | | | | | | | | | | | | | | | | | | |
| NET ASSET VALUE, Beginning of Year | $ | 11.30 | | | $ | 11.10 | | | $ | 8.72 | | | $ | 8.04 | | | $ | 10.82 | | |
| INVESTMENT OPERATIONS | | | | | | | | | | | | | | | | | | | | |
| Net investment income (a) | | 0.13 | | | | 0.11 | | | | 0.11 | | | | 0.12 | | | | 0.14 | | |
| Net realized and unrealized gain (loss) | | 2.09 | | | | 0.35 | (b) | | | 2.40 | | | | 0.69 | | | | (2.81 | ) | |
| Total from Investment Operations | | 2.22 | | | | 0.46 | | | | 2.51 | | | | 0.81 | | | | (2.67 | ) | |
| DISTRIBUTIONS TO SHAREHOLDERS FROM |
| Net investment income | | (0.19 | ) | | | (0.26 | ) | | | (0.13 | ) | | | (0.13 | ) | | | (0.11 | ) | |
| Net realized gain | | (1.10 | ) | | | — | | | | — | | | | — | | | | — | | |
| Total Distributions to Shareholders | | (1.29 | ) | | | (0.26 | ) | | | (0.13 | ) | | | (0.13 | ) | | | (0.11 | ) | |
| NET ASSET VALUE, End of Year | $ | 12.23 | | | $ | 11.30 | | | $ | 11.10 | | | $ | 8.72 | | | $ | 8.04 | | |
| TOTAL RETURN | | 21.68 | % | | 4.44 | % | | 28.85 | % | | 9.90 | % | | (24.65 | )% |
| RATIOS/SUPPLEMENTARY DATA | | | | | | | | | | | | | | | | | | | | |
| Net Assets at End of Year (000's omitted) | $27,672 | | | $34,896 | | | $142,756 | | | $156,712 | | | $160,219 | | |
| Ratios to Average Net Assets: | | | | | | | | | | | | | | | | | | | | |
| Net investment income | | 1.13 | % | | 1.06 | % | | 1.04 | % | | 1.33 | % | | 1.66 | % |
| Net expense | | 0.70 | % | | 0.70 | % | | 0.70 | % | | 0.70 | % | | 0.70 | % |
| Gross expense (c) | | 0.70 | % | | 0.71 | % | | 0.70 | % | | 0.70 | % | | 0.70 | % |
| PORTFOLIO TURNOVER RATE | | 72 | % | | 42 | % | | 57 | % | | 49 | % | | 40 | % |
| GOLDEN SMALL CAP CORE FUND | | | | | | | | | | | | | | | | | | | | |
| NET ASSET VALUE, Beginning of Year | $ | 10.64 | | | $ | 11.10 | | | $ | 7.90 | | | $ | 6.98 | | | $ | 11.09 | | |
| INVESTMENT OPERATIONS | | | | | | | | | | | | | | | | | | | | |
| Net investment income (loss) (a) | | 0.16 | | | | (0.01 | ) | | | (0.02 | ) | | | (0.03 | ) | | | (0.02 | ) | |
| Net realized and unrealized gain (loss) | | 2.77 | | | | (0.45 | ) | | | 3.22 | | | | 0.95 | | | | (4.09 | ) | |
| Total from Investment Operations | | 2.93 | | | | (0.46 | ) | | | 3.20 | | | | 0.92 | | | | (4.11 | ) | |
| NET ASSET VALUE, End of Year | $ | 13.57 | | | $ | 10.64 | | | $ | 11.10 | | | $ | 7.90 | | | $ | 6.98 | | |
| TOTAL RETURN | | 27.54 | % | | (4.14 | )% | | 40.51 | % | | 13.18 | % | | (37.06 | )% |
| RATIOS/SUPPLEMENTARY DATA | | | | | | | | | | | | | | | | | | | | |
| Net Assets at End of Year (000's omitted) | $20,093 | | | $27,427 | | | $53,300 | | | $104,235 | | | $131,370 | | |
| Ratios to Average Net Assets: | | | | | | | | | | | | | | | | | | | | |
| Net investment income (loss) | | 1.32 | % | | (0.12 | )% | | (0.20 | )% | | (0.39 | )% | | (0.28 | )% |
| Net expense | | 1.10 | % | | 1.10 | % | | 1.10 | % | | 1.10 | % | | 1.10 | % |
| Gross expense (c) | | 1.10 | % | | 1.11 | % | | 1.10 | % | | 1.10 | % | | 1.10 | % |
| PORTFOLIO TURNOVER RATE | | 52 | % | | 56 | % | | 55 | % | | 55 | % | | 95 | % |
| (a) | Calculated based on average shares outstanding during each year. |
| (b) | Per share amount does not reflect the actual net realized and unrealized gain/(loss) for the period due to timing of Fund share sales and the amount of per share realized and unrealized gains and losses at such time. |
| (c) | Reflects the expense ratio excluding any waivers and/or reimbursements. |
| See Notes to Financial Statements. | 15 | |
| |
GOLDEN FUNDS NOTES TO FINANCIAL STATEMENTS JUNE 30, 2013 |
| |
Note 1. Organization
Golden Large Cap Core Fund and Golden Small Cap Core Fund (individually, a “Fund” and, collectively the “Funds”) are diversified portfolios of Forum Funds (the “Trust”). The Trust is a Delaware statutory trust that is registered as an open-end, management investment company under the Investment Company Act of 1940 (the “Act”), as amended. Under its Trust Instrument, the Trust is authorized to issue an unlimited number of each Fund’s shares of beneficial interest without par value. Each Fund currently offers two classes of shares: Institutional Shares and Investor Shares. As of June 30, 2013, Investor Shares had not commenced operations. Golden Large Cap Core Fund seeks to achieve long-term capital appreciation. Golden Small Cap Core Fund seeks to achieve maximum long-term total return. Each Fund commenced operations on September 13, 2005.
Note 2. Summary of Significant Accounting Policies
These financial statements are prepared in accordance with accounting principles generally accepted in the United States of America (“GAAP”), which require management to make estimates and assumptions that affect the reported amounts of assets and liabilities, the disclosure of contingent liabilities at the date of the financial statements, and the reported amounts of increase and decrease in net assets from operations during the fiscal year. Actual amounts could differ from those estimates. The following summarizes the significant accounting policies of each Fund:
Security Valuation – Exchange-traded securities and over-the-counter securities are valued using the last quoted sale or official closing price, provided by independent pricing services as of the close of trading on the market or exchange for which they are primarily traded, on each Fund business day. In the absence of a sale, such securities are valued at the mean of the last bid and ask price provided by independent pricing services. Non-exchange traded securities for which quotations are available are valued using the last quoted sales price, or in the absence of a sale at the mean of the last bid and ask prices provided by independent pricing services. Shares of open-end mutual funds are valued at net asset value (“NAV”). Short-term investments that mature in 60 days or less may be valued at amortized cost.
Each Fund values its investments at fair value pursuant to procedures adopted by the Trust's Board of Trustees (the "Board") if (1) market quotations are insufficient or not readily available or (2) the adviser believes that the values available are unreliable. The Trust’s Valuation Committee performs certain functions as they relate to the administration and oversight of each Fund’s valuation procedures. Under these procedures, the Valuation Committee convenes on a regular and ad-hoc basis to review such securities and considers a number of factors, including valuation methodologies and significant unobservable inputs, when arriving at fair value.
The Valuation Committee may work with an adviser to provide valuation inputs. In determining fair valuations, inputs may include market-based analytics which may consider related or comparable assets or liabilities, recent transactions, market multiples, book values and other relevant investment information. Adviser inputs may include an income-based approach in which the anticipated future cash flows of the investment are discounted in determining fair value. Discounts may also be applied based on the nature or duration of any restrictions on the disposition of the investments. The Valuation Committee performs regular reviews of
| |
GOLDEN FUNDS NOTES TO FINANCIAL STATEMENTS JUNE 30, 2013 |
| |
valuation methodologies, key inputs and assumptions, disposition analysis and market activity.
Fair valuation is based on subjective factors and, as a result, the fair value price of an investment may differ from the security’s market price and may not be the price at which the asset may be sold. Fair valuation could result in a different NAV than a NAV determined by using market quotes.
Each Fund has a three-tier fair value hierarchy. The basis of the tiers is dependent upon the various “inputs” used to determine the value of each Fund’s investments. These inputs are summarized in the three broad levels listed below:
Level 1 — quoted prices in active markets for identical assets
Level 2 — other significant observable inputs (including quoted prices of similar securities, interest rates, prepayment speeds, credit risk, etc.)
Level 3 — significant unobservable inputs (including each Fund’s own assumptions in determining the fair value of investments)
The aggregate value by input level, as of June 30, 2013, for each Fund’s investments is included at the end of each Fund’s Schedule of Investments.
Security Transactions, Investment Income and Realized Gain and Loss – Investment transactions are accounted for on the trade date. Dividend income is recorded on the ex-dividend date. Foreign dividend income is recorded on the ex-dividend date or as soon as possible after each Fund determines the existence of a dividend declaration after exercising reasonable due diligence. Income and capital gains on some foreign securities may be subject to foreign withholding taxes, which are accrued as applicable. Interest income is recorded on an accrual basis. Premium is amortized and discount is accreted using the effective interest method. Identified cost of investments sold is used to determine the gain and loss for both financial statement and federal income tax purposes.
Distributions to Shareholders – Distributions to shareholders of net investment income and net capital gains, if any, are declared and paid at least annually. Distributions to shareholders are recorded on the ex-dividend date. Distributions are based on amounts calculated in accordance with applicable federal income tax regulations, which may differ from GAAP. These differences are due primarily to differing treatments of income and gain on various investment securities held by each Fund, timing differences and differing characterizations of distributions made by each Fund.
Federal Taxes – Each Fund intends to continue to qualify each year as a regulated investment company under Subchapter M of the Internal Revenue Code and to distribute all of their taxable income to shareholders. In addition, by distributing in each calendar year substantially all of their net investment income and capital gains, if any, the Funds will not be subject to a federal excise tax. Therefore, no federal income or excise tax provision is required. Each Fund files a U.S. federal income and excise tax return as required. A fund’s federal income tax returns are subject to examination by the Internal Revenue Service for a period of three fiscal years after they are filed. As of June 30, 2013, there are no uncertain tax positions that would
| |
GOLDEN FUNDS NOTES TO FINANCIAL STATEMENTS JUNE 30, 2013 |
| |
require financial statement recognition, de-recognition, or disclosure.
Income and Expense Allocation – The Trust accounts separately for the assets, liabilities and operations of each of its investment portfolios. Expenses that are directly attributable to more than one investment portfolio are allocated among the respective investment portfolios in an equitable manner.
Commitments and Contingencies – In the normal course of business, each Fund enters into contracts that provide general indemnifications by each Fund to the counterparty to the contract. Each Fund’s maximum exposure under these arrangements is dependent on future claims that may be made against each Fund and, therefore, cannot be estimated; however, based on experience, the risk of loss from such claims is considered remote.
Note 3. Fees and Expenses
Investment Adviser – Golden Capital Management, LLC (the “Adviser”) is the investment adviser to the Funds. Pursuant to an Investment Advisory Agreement, the Adviser receives an advisory fee at an annual rate of 0.70% and 1.10% of the average daily net assets of Golden Large Cap Core Fund and Golden Small Cap Core Fund, respectively. Under the terms of the Investment Advisory Agreement, the Adviser provides investment advisory services to the Funds and is obligated to pay all expenses of the Funds except portfolio transaction expenses, borrowing costs, interest, taxes, and certain compensation and expenses of the Board, any expense each Fund is authorized to pay under Rule 12b-1, and extraordinary or non-recurring expenses.
Distribution – Foreside Fund Services, LLC serves as each Fund’s distributor (the “Distributor”). The Funds do not have a distribution (12b-1) plan; accordingly, the Distributor does not receive compensation from the Funds for its distribution (12b-1) services. The Distributor is not affiliated with the Adviser or Atlantic Fund Administration, LLC (d/b/a Atlantic Fund Services) (“Atlantic”) or their affiliates.
Other Service Providers – Atlantic provides fund accounting, fund administration, compliance and transfer agency services to each Fund. Atlantic also provides certain shareholder report production, and EDGAR conversion and filing services. Atlantic provides a Principal Executive Officer, a Principal Financial Officer, a Chief Compliance Officer, and an Anti-Money Laundering Officer to each Fund, as well as certain additional compliance support functions.
Trustees and Officers – The Trust pays each independent Trustee an annual retainer fee of $45,000 for service to the Trust ($66,000 for the Chairman). The Trustees and Chairman may receive additional fees for special Board meetings. Each Trustee is also reimbursed for all reasonable out-of-pocket expenses incurred in connection with his duties as a Trustee, including travel and related expenses incurred in attending Board meetings. The amount of Trustees’ fees attributable to each Fund is disclosed in the Statement of Operations. Certain officers of the Trust are also officers or employees of the above named service providers, and during their terms of office received no compensation from each Fund.
| |
GOLDEN FUNDS NOTES TO FINANCIAL STATEMENTS JUNE 30, 2013 |
| |
Note 4. Expense Reimbursements and Fees Waived
The Adviser has contractually agreed to waive a portion of its fees and reimburse certain expenses through October 31, 2013, to limit total annual operating expenses to 0.70% for Institutional Shares, of the average daily net assets of each respective class of the Golden Large Cap Core Fund. The Adviser also contractually agreed to waive a portion of its fees and reimburse certain expenses through October 31, 2013, to limit total annual operating expenses to 1.10% for Institutional Shares average daily net assets of each respective class of the Golden Small Cap Core Fund. For the year ended June 30, 2013, fees waived and reimbursed were as follows:
| | | Investment Adviser Reimbursement |
| Golden Large Cap Core Fund | | $ | 1,000 |
| Golden Small Cap Core Fund | | | 797 |
Note 5. Security Transactions
The cost of purchases and proceeds from sales of investment securities (including maturities), other than short-term investments during the year ended June 30, 2013, were as follows:
| | | Purchases | | Sales |
| Golden Large Cap Core Fund | | $ | 20,477,960 | | $ | 32,695,429 |
| Golden Small Cap Core Fund | | | 11,601,013 | | | 23,993,837 |
| | | | | | | |
Note 6. Federal Income Tax and Investment Transactions
Distributions during the fiscal years ended as noted were characterized for tax purposes as follows:
| | | Ordinary Income | | Long-Term Capital Gain | | Total |
| Golden Large Cap Core Fund |
| 2013 | | $ | 458,420 | | | $ | 2,619,826 | | | $ | 3,078,246 | |
| 2012 | | | 1,238,094 | | | | - | | | | 1,238,094 | |
| | | | | | | | | | | | | |
As of June 30, 2013, distributable earnings (accumulated loss) on a tax basis were as follows:
| | | Undistributed Ordinary Income | | Undistributed Long-Term Gain | | Capital and Other Losses | | Unrealized Appreciation | | Total |
| Golden Large Cap Core Fund | | $ | 143,215 | | | $ | 3,244,707 | | | $ | - | | | $ | 6,158,325 | | | $ | 9,546,247 | |
| Golden Small Cap Core Fund | | | 289,244 | | | | - | | | | (55,282,261 | ) | | | 4,055,751 | | | | (50,937,266 | ) |
| |
GOLDEN FUNDS NOTES TO FINANCIAL STATEMENTS JUNE 30, 2013 |
| |
The difference between components of distributable earnings on a tax basis and the amounts reflected in the Statements of Assets and Liabilities are primarily due to wash sales and investments in real estate investment trusts.
As of June 30, 2013, capital loss carryforwards to offset future capital gains were as follows with the respective expiration dates:
| | | | 2018 |
| Golden Small Cap Core Fund | | | $ | 55,282,261 |
On the Statement of Assets and Liabilities, as a result of permanent book to tax differences, certain amounts have been reclassified for the year ended June 30, 2013. The following reclassification was the result of real estate investment trust adjustments and has no impact on the net assets of the Fund.
| | | Undistributed Net Investment Income | | Accumulated Net Realized Gain (Loss) | | Paid-in-Capital |
| Golden Small Cap Core Fund | | $ | (9,499 | ) | | $ | 21,201 | | | $ | (11,702 | ) |
Note 7. Recent Accounting Pronouncements
In December 2011, the Financial Accounting Standards Board (“FASB”) issued Accounting Standards Update (“ASU”) No. 2011-11 related to disclosures about offsetting assets and liabilities. In January 2013, the FASB issued ASU No. 2013-01 which gives additional clarification to ASU 2011-11. The amendments in this ASU require an entity to disclose information about offsetting and related arrangements to enable users of its financial statements to understand the effect of those arrangements on its financial position. The ASU is effective for annual reporting periods beginning on or after January 1, 2013, and interim periods within those annual periods. The guidance requires retrospective application for all comparative periods presented. Management is currently evaluating the impact these amendments may have on each Fund’s financial statements.
Note 8. Subsequent Events
Subsequent events occurring after the date of this report through the date these financial statements were issued have been evaluated for potential impact and each Fund has had no such events.
| |
REPORT OF INDEPENDENT REGISTERED PUBLIC ACCOUNTING FIRM |
| |
To the Board of Trustees of Forum Funds and the Shareholders of
Golden Large Cap Core Fund and Golden Small Cap Core Fund
We have audited the accompanying statements of assets and liabilities of Golden Large Cap Core Fund and Golden Small Cap Core Fund, each a series of shares of beneficial interest in the Forum Funds, including the schedules of investments, as of June 30, 2013, and the related statements of operations for the year then ended, the statements of changes in net assets for each of the years in the two year period then ended and the financial highlights for each of the years in the five year period then ended. These financial statements and financial highlights are the responsibility of the Funds’ management. Our responsibility is to express an opinion on these financial statements and financial highlights based on our audits.
We conducted our audits in accordance with the standards of the Public Company Accounting Oversight Board (United States). Those standards require that we plan and perform the audits to obtain reasonable assurance about whether the financial statements and financial highlights are free of material misstatement. An audit includes examining, on a test basis, evidence supporting the amounts and disclosures in the financial statements. Our procedures included confirmation of securities owned as of June 30, 2013 by correspondence with the custodian. An audit also includes assessing the accounting principles used and significant estimates made by management, as well as evaluating the overall financial statement presentation. We believe that our audits provide a reasonable basis for our opinion.
In our opinion, the financial statements and financial highlights referred to above present fairly, in all material respects, the financial position of Golden Large Cap Core Fund and Golden Small Cap Core Fund as of June 30, 2013, the results of their operations for the year then ended, the changes in their net assets for each of the years in the two year period then ended and their financial highlights for each of the years in the five year period then ended, in conformity with accounting principles generally accepted in the United States of America.
BBD, LLP
Philadelphia, Pennsylvania
August 15, 2013
| |
GOLDEN FUNDS ADDITIONAL INFORMATION (Unaudited) JUNE 30, 2013 |
| |
Investment Advisory Agreement Approval
At the March 21-22, 2013 Board meeting, the Board, including the Independent Trustees, considered the approval of the continuance of the investment advisory agreement pertaining to the Funds (the “Advisory Agreement”). In preparation for its deliberations, the Board had requested and reviewed written responses from the Adviser to a due diligence questionnaire, circulated by Trust counsel on their behalf. They had also discussed the materials with Independent Trustee counsel and, as necessary, with the Fund’s administrator, Atlantic Fund Services. Durings its deliberations, the Board received an oral presentation from the Adviser and was assisted by the advice of Independent Trustee counsel.
In evaluating the Advisory Agreement for the Funds, the Board reviewed the materials furnished by the Adviser and the administrator, including information regarding the Adviser, its personnel, operations and financial condition. Specifically, the Board considered, among other matters: (1) the nature, extent and quality of the services to be provided to the Funds by the Adviser, including information on the investment performance of the Adviser; (2) the costs of the services to be provided and profitability to the Adviser with respect to its relationship with the Funds; (3) the advisory fee and total expense ratio of the Funds compared to relevant peer groups of funds; (4) the extent to which economies of scale would be realized as the Funds grow and whether the advisory fee would enable the Funds’ investors to share in the benefits of economies of scale; and (5) other benefits received by the Adviser from its relationship with the Funds. In their deliberations, the Board did not identify any particular information that was all-important or controlling and attributed different weights to the various factors. In particular, the Board focused on the factors discussed below.
Nature, Extent and Quality of Services
Based on a written and oral presentation from a senior representative of the Adviser, including a discussion of the Adviser’s personnel, operations and financial condition, the Board considered the quality of services provided by the Adviser under the Advisory Agreement between the Trust and the Adviser. In this regard, the Board considered information regarding the experience, qualifications and professional background of the portfolio managers and other personnel at the Adviser with principal investment responsibility for the Funds’ investments as well as the investment philosophy and decision-making processes of those professionals and the capability and integrity of the Adviser’s senior management and staff. The Board considered the adequacy of the Adviser’s resources and quality of services provided by the Adviser under the Advisory Agreement between the Trust and the Adviser.
Costs of Services and Profitability
The Board considered information provided by the Adviser regarding its costs of services and its profitability with respect to the Funds. In this regard, the Board considered the Adviser’s resources devoted to the Funds as well as the Adviser’s discussion of costs and profitability. Based on these and other applicable considerations, the Board concluded that the Adviser’s profits attributable to management of the Funds were reasonable in the context of all factors considered.
| |
GOLDEN FUNDS ADDITIONAL INFORMATION (Unaudited) JUNE 30, 2013 |
| |
Performance
The Board reviewed performance of the Golden Funds and the Adviser’s discussion of its investment philosophy. The Board noted that both the Golden Large Cap Core Fund and the Golden Small Cap Core Fund underperformed their benchmarks for the 1-year, 3-year and 5-year periods ended February 28, 2013. The Board also noted, however, that both the Golden Large Cap Core Fund and the Golden Small Cap Core Fund outperformed the median of their respective Lipper Inc. peers. Given, among other things, the Golden Fund’s performance during those periods when compared to each Golden Funds peer group, the Board concluded that each Golden Funds’ performance was reasonable and that each Golden Fund and its shareholders could benefit from the Adviser’s management of the Golden Funds.
Compensation
The Board considered the Adviser’s compensation for providing advisory services to each Golden Fund and analyzed comparative information on fee rates, expenses and performance of similar mutual funds. The Board noted that the Adviser’s actual advisory fee rate for each of the Golden Large Cap Core Fund and the Golden Small Cap Core Fund was above the median fee of that Fund’s Lipper Inc. peer group. The Board noted, however, that the Golden Large Cap Core Fund and the Golden Small Cap Core Fund’s actual total expense ratios were lower than the median fee of each Fund’s respective peer group. Based on the foregoing, the Board concluded that the Adviser’s advisory fee rate charged to the Golden Funds was reasonable.
Economies of Scale
The Board considered whether the Golden Funds would benefit from any economies of scale. In this respect, the Board noted the Adviser’s representation that the Golden Funds potentially could benefit from economies of scale as assets grow, but the Adviser currently is not proposing breakpoints or changes in fees at this time. The Board also noted that the Golden Funds' assets had decreased over the past year. Based on the foregoing information, the Board concluded that economies of scale were not a material factor in approving the Advisory Agreement.
Other Benefits
The Board noted the Adviser’s representation that it does not benefit in a material way from its relationship with the Funds other than its contractual advisory fees and soft-dollar research benefits. Based on the foregoing representation, the Board concluded that other benefits received by the Adviser from its relationship with the Funds were not a material factor to consider in approving the continuation of the Advisory Agreement.
Conclusion
The Board did not identify any single factor as being of paramount importance, and different Trustees may have given different weight to different factors. The Board reviewed a memorandum from Trust counsel discussing the legal standards applicable to its consideration of the Advisory Agreement. Based on its review,
| |
GOLDEN FUNDS ADDITIONAL INFORMATION (Unaudited) JUNE 30, 2013 |
| |
including consideration of each of the factors referenced above, the Board determined, in the exercise of its business judgment, that the advisory arrangement, as outlined in the Advisory Agreement, was fair and reasonable in light of the services performed or to be performed, expenses incurred or to be incurred and such other matters as the Board considered relevant in the exercise of its reasonable business judgment.
Proxy Voting Information
A description of the policies and procedures that each Fund uses to determine how to vote proxies relating to securities held in each Fund’s portfolio is available, without charge and upon request, by calling (800) 206-8610 and on the U.S. Securities and Exchange Commission’s (the “SEC”) website at www.sec.gov. Each Fund’s proxy voting record for the most recent twelve-month period ended June 30 is available, without charge and upon request, by calling (800) 206-8610 and on the SEC’s website at www.sec.gov.
Availability of Quarterly Portfolio Schedules
Each Fund files its complete schedule of portfolio holdings with the SEC for the first and third quarters of each fiscal year on Form N-Q. These filings are available, without charge and upon request on the SEC’s website at www.sec.gov or may be reviewed and copied at the SEC’s Public Reference Room in Washington, DC. Information on the operation of the Public Reference Room may be obtained by calling (800) SEC-0330.
Shareholder Expense Example
As a shareholder of the Funds, you incur ongoing costs, including management fees, distribution (12b-1) fees and other Fund expenses. This example is intended to help you understand your ongoing costs (in dollars) of investing in the Funds and to compare these costs with the ongoing costs of investing in other mutual funds.
The example is based on an investment of $1,000 invested at the beginning of the period and held for the entire period from January 1, 2013, through June 30, 2013.
Actual Expenses – The first line of the table below provides information about actual account values and actual expenses. You may use the information in this line, together with the amount you invested, to estimate the expenses that you paid over the period. Simply divide your account value by $1,000 (for example, an $8,600 account value divided by $1,000 = 8.6), then multiply the result by the number in the first line under the heading entitled “Expenses Paid During Period” to estimate the expenses you paid on your account during the period.
Hypothetical Example for Comparison Purposes – The second line of the table below provides information about hypothetical account values and hypothetical expenses based on each Fund’s actual expense ratio and an assumed rate of return of 5% per year before expenses, which is not each Fund’s actual return. The hypothetical account values and expenses may not be used to estimate the actual ending account balance or expenses you paid for the period. You may use this information to compare the ongoing costs of investing in each Fund and other funds. To do so, compare this 5% hypothetical example with the 5% hypothetical examples that appear in the shareholder reports of other funds.
| |
GOLDEN FUNDS ADDITIONAL INFORMATION (Unaudited) JUNE 30, 2013 |
| |
Please note that the expenses shown in the table are meant to highlight your ongoing costs only. Therefore, the second line of the table is useful in comparing ongoing costs only and will not help you determine the relative total costs of owning different funds.
| | Beginning | | Ending | | Expenses | | Annualized |
| | Account Value | | Account Value | | Paid During | | Expense |
| | January 1, 2013 | | June 30, 2013 | | Period* | | Ratio* |
| Golden Large Cap Core Fund | | | | | | | | | | | |
| Actual | $ | 1,000.00 | | $ | 1,166.99 | | $ | 3.76 | | 0.70 | % |
| Hypothetical (5% return before taxes) | $ | 1,000.00 | | $ | 1,021.32 | | $ | 3.51 | | 0.70 | % |
| Golden Small Cap Core Fund | | | | | | | | | | | |
| Actual | $ | 1,000.00 | | $ | 1,158.84 | | $ | 5.89 | | 1.10 | % |
| Hypothetical (5% return before taxes) | $ | 1,000.00 | | $ | 1,019.34 | | $ | 5.51 | | 1.10 | % |
| | | | | | | | | | | | |
| * | Expenses are equal to the Fund’s annualized expense ratio multiplied by the average account value over the period, multiplied by the number of days in the most recent fiscal half-year divided by 365 to reflect the half-year period. |
Federal Tax Status of Dividends Declared during the Tax Year
For federal income tax purposes, dividends from short-term capital gains are classified as ordinary income. The Golden Large Cap Core Fund designates 100.00% of its income dividend distributed as qualifying for the corporate dividends-received deduction (DRD) and 100.00% for the qualified dividend rate (QDI) as defined in Section 1(h)(11) of the Internal Revenue Code. The Golden Large Cap Core Fund also designates 0.11% of its income dividends as qualified interest income exempt from U.S. tax for foreign shareholders (QII).
Trustees and Officers of the Trust
The Board is responsible for oversight of the management of the Trust’s business affairs and of the exercise of all the Trust’s powers except those reserved for the shareholders. The following table provides information about each Trustee and certain officers of the Trust. Each Trustee and officer holds office until the person resigns, is removed, or is replaced. Unless otherwise noted, the persons have held their principal occupations for more than five years. The address for all Trustees and officers is Three Canal Plaza, Suite 600, Portland, Maine 04101. Mr. Keffer is considered an Interested Trustee due to his affiliation with Atlantic. Each Fund’s Statement of Additional Information includes additional information about the Trustees and is available, without charge and upon request, by calling (800) 206-8610.
| |
GOLDEN FUNDS ADDITIONAL INFORMATION (Unaudited) JUNE 30, 2013 |
| |
| Name and Year of Birth | Position with the Trust | Length of Time Served | Principal Occupation(s) During Past Five Years | Number of Series of Trust Overseen by Trustee | Other Directorships Held by Trustee |
| Independent Trustees | | | | | |
J. Michael Parish Born: 1943 | Chairman of the Board; Trustee; Chairman, Nominating Committee and Qualified Legal Compliance Committee | Since 1989 (Chairman since 2004) | Retired since 2003. | 24 | 0 |
Costas Azariadis Born: 1943 | Trustee | Since 1989 | Professor of Economics, Washington University since 2006. | 24 | 0 |
James C. Cheng Born: 1942 | Trustee; Chairman, Audit Committee | Since 1989 | President, Technology Marketing Associates (marketing company for small- and medium-sized businesses in New England) since 1991. | 24 | 0 |
David Tucker Born: 1958 | Trustee | Since 2011 | Director, Blue Sky Experience since 2008; Senior Vice President & General Counsel, American Century Companies 1998-2008. | 24 | Trustee, Forum Funds II and Forum ETF Trust |
| Interested Trustee | | | | | |
John Y. Keffer1 Born: 1942 | Trustee; Vice Chairman | Since 1989 | Chairman, Atlantic since 2008; President, Forum Foundation (a charitable organization) since 2005; President, Forum Trust, LLC (a non-depository trust company chartered in the State of Maine) since 1997. | 24 | Director, Wintergreen Fund, Inc.; Trustee, Forum Funds II and Forum ETF Trust |
| Officers | | | | | |
Stacey E. Hong Born: 1966 | President; Principal Executive Officer | Since 2008 | President, Atlantic since 2008. | N/A | N/A |
Karen Shaw Born: 1972 | Treasurer; Principal Financial Officer | Since 2008 | Senior Vice President, Atlantic since 2008. | N/A | N/A |
David Faherty Born: 1970 | Vice President | Since 2009 | Senior Counsel, Atlantic since 2009; Vice President, Citi Fund Services Ohio, Inc. 2007-2009. | N/A | N/A |
Michael J. McKeen Born: 1971 | Vice President | Since 2009 | Senior Vice President, Atlantic since 2008. | N/A | N/A |
Timothy Bowden Born: 1969 | Vice President | Since 2009 | Manager, Atlantic since 2008. | N/A | N/A |
Geoffrey Ney Born: 1975 | Vice President | Since 2013 | Manager, Atlantic since 2013; Senior Fund Accountant, Atlantic, 2008-2013. | N/A | N/A |
| |
GOLDEN FUNDS ADDITIONAL INFORMATION (Unaudited) JUNE 30, 2013 |
| |
| Name and Year of Birth | Position with the Trust | Length of Time Served | Principal Occupation(s) During Past Five Years | Number of Series of Trust Overseen by Trustee | Other Directorships Held by Trustee |
| Officers - Continued | | | | | |
Todd Proulx Born: 1978 | Vice President | Since 2013 | Manager, Atlantic since 2013; Senior Fund Accountant, Atlantic, 2008-2013. | N/A | N/A |
Lina Bhatnagar Born: 1971 | Secretary | Since 2008 | Senior Administration Specialist, Atlantic since 2008. | N/A | N/A |
1Atlantic is a subsidiary of Forum Holdings Corp. I, a Delaware corporation that is wholly owned by Mr. Keffer. |
ITEM 2. CODE OF ETHICS.
| (a) | As of the end of the period covered by this report, Forum Funds (the “Registrant”) has adopted a code of ethics, which applies to its Principal Executive Officer and Principal Financial Officer (the “Code of Ethics”). |
| (c) | There have been no amendments to the Registrant’s Code of Ethics during the period covered by this report. |
| (d) | There have been no waivers to the Registrant’s Code of Ethics during the period covered by this report. |
(f) (1) A copy of the Code of Ethics is being filed under Item 12(a) hereto.
ITEM 3. AUDIT COMMITTEE FINANCIAL EXPERT.
The Board of Trustees has determined that no member of the Audit Committee is an "audit committee financial expert" as that term is defined under applicable regulatory guidelines.
ITEM 4. PRINCIPAL ACCOUNTANT FEES AND SERVICES.
(a) Audit Fees - The aggregate fees billed for each of the last two fiscal years (the “Reporting Periods”) for professional services rendered by the Registrant’s principal accountant for the audit of the Registrant’s annual financial statements, or services that are normally provided by the principal accountant in connection with the statutory and regulatory filings or engagements for the Reporting Periods, were $61,500 in 2012 and $64,100 in 2013.
(b) Audit-Related Fees – The aggregate fees billed in the Reporting Periods for assurance and related services rendered by the principal accountant that were reasonably related to the performance of the audit of the Registrant’s financial statements and are not reported under paragraph (a) of this Item 4 were $0 in 2012 and $0 in 2013.
(c) Tax Fees - The aggregate fees billed in the Reporting Periods for professional services rendered by the principal accountant to the Registrant for tax compliance, tax advice and tax planning were $15,000 in 2012 and $15,000 in 2013. These services consisted of review or preparation of U.S. federal, state, local and excise tax returns.
(d) All Other Fees - The aggregate fees billed in the Reporting Periods for products and services provided by the principal accountant to the Registrant, other than the services reported in paragraphs (a) through (c) of this Item, were $0 in 2012 and $0 in 2013.
(e) (1) The Audit Committee reviews and approves in advance all audit and “permissible non-audit services” (as that term is defined by the rules and regulations of the Securities and Exchange Commission) to be rendered to a series of the Registrant (each, a “Series”). In addition, the Audit Committee reviews and approves in advance all “permissible non-audit services” to be provided to an investment adviser (not including any sub-adviser) of a Series, or an affiliate of such investment adviser, that is controlling, controlled by or under common control with the investment adviser and provides on-going services to the Registrant (“Affiliate”), by the Series’ principal accountant if the engagement relates directly to the operations and financial reporting of the Series. The Audit Committee considers whether fees paid by a Series’ investment adviser or an Affiliate to the Series’ principal accountant for audit and permissible non-audit services are consistent with the principal accountant’s independence.
(e) (2) No services included in (b) - (d) above were approved pursuant to paragraph (c)(7)(i)(C) of Rule 2-01 of Regulation S-X.
(f) Not applicable
(g) The aggregate non-audit fees billed by the principal accountant for services rendered to the Registrant for the Reporting Periods were $0 in 2012 and $0 in 2013. There were no fees billed in either of the Reporting Periods for non-audit services rendered by the principal accountant to the Registrant’s investment adviser or any Affiliate.
(h) During the Reporting Period, the Registrant's principal accountant provided no non-audit services to the investment advisers or any entity controlling, controlled by or under common control with the investment advisers to the series of the Registrant to which this report relates.
ITEM 5. AUDIT COMMITTEE OF LISTED REGISTRANTS.
Not applicable.
ITEM 6. INVESTMENTS.
| (a) | Included as part of report to shareholders under Item 1. |
ITEM 7. DISCLOSURE OF PROXY VOTING POLICIES AND PROCEDURES FOR CLOSED-END
MANAGEMENT INVESTMENT COMPANIES.
Not applicable.
ITEM 8. PORTFOLIO MANAGERS OF CLOSED-END MANAGEMENT INVESTMENT COMPANIES.
Not applicable.
ITEM 9. PURCHASES OF EQUITY SECURITIES BY CLOSED-END MANAGEMENT INVESTMENT COMPANY AND AFFILIATED PURCHASERS.
Not applicable.
ITEM 10. SUBMISSION OF MATTERS TO A VOTE OF SECURITY HOLDERS
The Registrant does not accept nominees to the board of trustees from shareholders.
ITEM 11. CONTROLS AND PROCEDURES
(a) The Registrant’s Principal Executive Officer and Principal Financial Officer have concluded that the Registrant’s disclosure controls and procedures (as defined in Rule 30a-3(c) under the Investment Company Act of 1940 (the “Act”)) are effective, based on their evaluation of the controls and procedures required by Rule 30a-3(b) under the Act and Rules 13a-15(b) or 15d-15(b) under the Securities Exchange Act of 1934, as of a date within 90 days of the filing date of this report.
(b) There were no changes in the Registrant’s internal control over financial reporting (as defined in
Rule 30a-3(d) under the Act) that occurred during the second fiscal quarter of the period covered by this report that have materially affected, or are reasonably likely to materially affect, the Registrant’s internal control over financial reporting.
ITEM 12. EXHIBITS.
(a)(1) Code of Ethics (Exhibit filed herewith).
(a)(2) Certifications pursuant to Rule 30a-2(a) of the Act, and Section 302 of the Sarbanes-Oxley Act of 2002. (Exhibits filed herewith)
(a)(3) Not applicable.
(b) Certifications pursuant to Rule 30a-2(b) of the Act, and Section 906 of the Sarbanes-Oxley Act of 2002. (Exhibit filed herewith)
SIGNATURES
Pursuant to the requirements of the Securities Exchange Act of 1934 and the Investment Company Act of 1940, the Registrant has duly caused this report to be signed on its behalf by the undersigned, thereunto duly authorized.
Registrant Forum Funds
| By | /s/ Stacey E. Hong | |
| | Stacey E. Hong, Principal Executive Officer | |
| | | |
| Date | August 16, 2013 | |
Pursuant to the requirements of the Securities Exchange Act of 1934 and the Investment Company Act of 1940, this report has been signed below by the following persons on behalf of the Registrant and in the capacities and on the dates indicated.
| By | /s/ Stacey E. Hong | |
| | Stacey E. Hong, Principal Executive Officer | |
| | | |
| Date | August 16, 2013 |
| By | /s/ Karen Shaw | |
| | Karen Shaw, Principal Financial Officer | |
| | | |
| Date | August 16, 2013 |