As filed with the Securities and Exchange Commission on December 24, 2013
UNITED STATES
SECURITIES AND EXCHANGE COMMISSION
WASHINGTON, D.C. 20549
FORM N-CSR
CERTIFIED SHAREHOLDER REPORT OF REGISTERED MANAGEMENT
INVESTMENT COMPANIES
Investment Company Act file number 811-03023
FORUM FUNDS
Three Canal Plaza, Suite 600
Portland, Maine 04101
Stacey E. Hong, Principal Executive Officer
Three Canal Plaza, Suite 600
Portland, Maine 04101
207-347-2000
Date of fiscal year end: October 31
Date of reporting period: November 1, 2012 – October 31, 2013
ITEM 1. REPORT TO STOCKHOLDERS.
| | | | | |
| CARNE HEDGED EQUITY FUND | | |
| A MESSAGE TO OUR SHAREHOLDERS | |
| OCTOBER 31, 2013 | | | |
| | | | | |
Dear Shareholder,
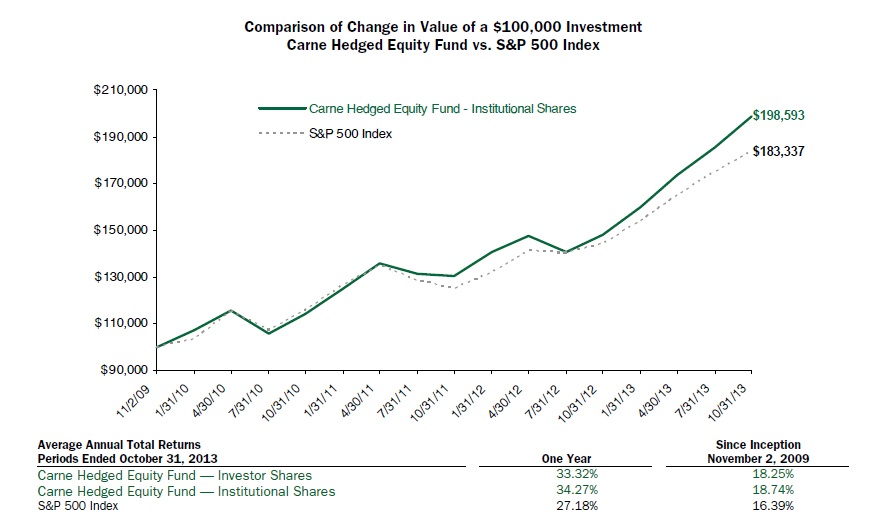
I am pleased to report that the Carne Hedged Equity Fund (the “Fund”) returned 34.27% in its Institutional Shares and 33.32% in its Investor Shares for the period from November 1, 2012 to October 31, 2013. This compares to a 27.18% total return for the S&P 500® Index. These returns represent substantial absolute and relative returns for the Fund’s shareholders.
2013 was the Year of the Snake and anyone who was underinvested in stocks was certainly bitten hard by the unrelenting rally in U.S. Equities. Chinese Mythology talks about the snake as a spotlight magnet that will not be ignored. More mythology research reveals “people are secretly or hopelessly in love with Snakes. Gather those frustrated folk you know and most likely, they are probably in love with a Snake.” This seems a very appropriate description of the current equity Bull Market. Look at almost any financial media source and you will hear that this rally is the “most hated rally ever.” However, the rally continues to all-time highs so it is apparent many investors are secretly and hopelessly in love with this equity market. Anyone who was underweight U.S. stocks or even tried to short U.S. equities could easily be described as frustrated but a rising tide lifts all boats and what is good for the equity market is generally good for the investment business and media. Having looked at the serpentine character of this epic rally it follows that a look at its causes merits some mention. One does not have to look too long or hard to see that this Year of the Snake could easily be renamed the Year of the Consumer.
Consumer discretionary stocks have led this rally as seen by the massive +40.15% 1 year return ending October 31, 2013 for the Consumer Discretionary Select Sector® Index. The Fund has had its largest industry allocation to this sector over the last year and it has been a major driver of the Fund’s high returns. Two companies that appeared snake bitten and given up for dead in this sector were also meaningful drivers of the Fund’s performance. Those companies were Best Buy and GameStop and they have been healthy investments for the Fund. They have shown that all bricks and mortar Consumer Electronics retailers are not going to be extinct any time soon. Neither do we believe that the video game console business will be destroyed by the likes of Zynga and Farmville when Best Buy and GameStop offer the opportunity for gamers to race the new 458 Ferrari Italia at Le Mans or lead a team of operators from SEAL Team 6. A year ago, both Best Buy and GameStop represented the kind of ugly, beaten up stocks that our value investment thesis craves. At first glance a year ago both of these names may have invoked a reaction similar to getting food poisoning. At Carne, this is the world we live in and it is not for the faint of heart. After all, to be a value investor is by definition to be a contrarian. If every investor sees the merits of an investment then it may no longer represent value. A deeper look by us revealed two companies with healthy cash flows, good returns on assets, healthy balance sheets with little or no debt and very competent management teams that are shareholder friendly. These fundamentals combined with very low valuations made for great investments. The simple truth is it takes hard work to uncover these investments and that process does not include listening to talking heads in the media compare Best Buy in December 2012 to the last days of Circuit City before bankruptcy. However, as the season approaches we should point out that we are thankful for these bubbleheads in the media for they help create the value we seek.
The U.S. consumer has had the wind at their back with the Fed staying the course on quantitative easing (QE) and a zero interest rate policy (ZIRP). The exact future effects of QE and ZIRP are currently the subject of much debate but it does seem clear that asset prices and home prices have been helped by these policies. It is true that savers have been injured by these historically low interest rates but those savers are typically not the consumers who will buy a new 65 inch TV from Best Buy or wait in long lines for the midnight release of XBOX ONE. As frivolous as they may seem, these consumers are currently helping push the economy forward. Corporate earnings have been good, not great, but good is good enough to see year over year earnings growth as the economy continues to heal.
This combination of positive year over year earnings and historically low interest rates has made for some interesting corporate actions that are reminiscent of the 1980’s. It may just be a coincidence but 1989 was also a Year of the Snake and the equity market had a very strong rally in that year. The defining financial term of the 1980’s was LBO (Leveraged Buy Out). It is worth noting that the L in LBO is historically cheap because of the F-E-D. Companies are taking full advantage of this cheap access to capital. If management values their earnings stream more than the cash on their books likely yielding close to 0%, then it makes perfect sense to shed the cash and keep the earnings. In 2010 there was a flood of stories about U.S. companies “hoarding” cash on their balance sheets and some investors were very unhappy. Now, you see firms using that cash to buy back shares, increase dividends or help finance acquisitions, and some investors are very unhappy. So we have the usual complainers, but many U.S. companies have healthy balance
| | | | | |
| CARNE HEDGED EQUITY FUND | | |
| A MESSAGE TO OUR SHAREHOLDERS | |
| OCTOBER 31, 2013 | | | |
| | | | | |
sheets and that combined with positive earnings growth and access to cheap leverage will continue to fuel Wall Street’s investment bankers with “1.21 gigawatts” of deals in a Back to the Future sequel over the coming months.
As for what has not worked this year the answer is simple; anything that involves hedging equity market exposure. Our hedging program has dampened the Fund’s volatility and improved other risk measures but it did so at the cost of net returns. Our hedging program is tactical in nature, but we still hold to value principals when looking to hedge. Simply said, we try to find the most bang for your buck when hedging this portfolio. When we see option premiums that appear rich or expensive, we will tend to be sellers of options and when the opposite is true, we will tend to be buyers of options. With extremely low levels of volatility in the market neither side of the hedging strategy has worked well. To be very technical, we have found ourselves looking for what works least bad. Currently, least bad is buying insurance with S&P 500 Index put options where our losses can only amount to the premiums we pay.
It is worth following up on my discussion of Hewlett Packard (HPQ) from one year ago. We were fortunate to liquidate our investment when we did since the stock soon cratered. HPQ made a low in late November 2012 and its stock price soon began to rebound. As HPQ stayed on our investment radar, we continued to monitor their business performance, board and management, and the stock valuation. Over the next few months the Hewlett Packard Board changes we were looking for took place and the business fundamentals stabilized. However, the stock price rebounded sharply and we were forced to be patient in looking to re-engage in our HPQ investment. I am happy to report that we recently were able to once again invest in HPQ and did so not very far above our exit price. We missed out on some return but we saved the pain of having to endure a volatile stock price decline.
In closing, we can always wish to perform better but in the Year of the Snake I am pleased with the Fund’s returns and risk measures. We have also maintained these performance measures since the Fund’s inception in 2009. In response to last year’s shareholder letter I did receive an actual crystal ball and a rather large one at that. I have stared and gazed at it for some time but all I can see are the warnings not to leave it in too sunny a spot lest it focus the sun’s rays and burn my house down. So, given my disillusionment with the combustible nature of fortune telling, I will not try to predict the future but rather continue to employ our investment process and look for opportunities while shielding the portfolio with our Hedging Program. Thank you for your trust and confidence. On a daily basis, your trust is first in the minds of all of the professionals who work with the Fund. This includes not only those focused on portfolio management, but also the many operational people who do their jobs diligently so that I may do mine. I look forward to hearing from you.
Sincerely,
F. Sean Bonner
Founder and Chief Investment Officer
Carne Capital, LLC
IMPORTANT INFORMATION
There is no assurance that the Fund will achieve its investment objective. The Fund is subject to risks of broad market decline or decline in particular holdings, Index Call Option Risk, management risk, focused holdings risk, counterparty risk, sector risk and value stock risk in which stocks may remain undervalued for extended periods of time. Details are located within the Fund’s prospectus.
An index option is an option providing exposure to the movement of a broad based stock market index. A put option is an option giving the contract owner the right (but not the obligation) to sell a specified amount of an underlying security at a specified price within a specified period. Strike price is the specific price at which a specific options contract can be exercised.
Because of ongoing market volatility, Fund performance may be subject to substantial short-term changes. The S&P 500 Index is a broad-based, unmanaged measurement of changes in stock market conditions based on the average of 500 widely held common stocks. One cannot invest directly in an index.
| | | | | |
| CARNE HEDGED EQUITY FUND | | |
| A MESSAGE TO OUR SHAREHOLDERS | |
| October 31, 2013 | | | |
| | | | | |
Effective June 18, 2013, Carne Large Cap Value Fund was renamed Carne Hedged Equity Fund. The investment objective and policies, in all material respects, remain the same.
The views in this report were those of the Fund manager as of the date this report was printed, and may not reflect their views on the date this report is first published or anytime thereafter. These views are intended to assist the shareholders of the Fund in understanding their investments in the Fund and do not constitute investment advice. This report may contain discussions about investments that may or may not be held by the Fund as of the date of this report. All current and future holdings are subject to risk and to change.
| | | |
| CARNE HEDGED EQUITY FUND | | |
| PERFORMANCE CHART AND ANALYSIS (Unaudited) | |
| OCTOBER 31, 2013 | | | |
| | | | | |
The following chart reflects the change in the value of a hypothetical $100,000 investment in Institutional Shares, including reinvested dividends and distributions, in the Carne Hedged Equity Fund (the “Fund”) compared with the performance of the benchmark, S&P 500 Index ("S&P 500"), since inception. The S&P 500 is a broad-based, unmanaged measurement of changes in stock market conditions based on the average of 500 widely held common stocks. The total return of the S&P 500 includes reinvestment of dividends and income. The total return of the Fund includes operating expenses that reduce returns, while the total return of the S&P 500 does not include expenses. The Fund is professionally managed while the S&P 500 is unmanaged and is not available for investment.
Performance data quoted represents past performance and is no guarantee of future results. Current performance may be lower or higher than the performance data quoted. Investment return and principal value will fluctuate so that shares, when redeemed, may be worth more or less than original cost. For the most recent month-end performance, please call (877) 356-9055. As stated in the Fund's prospectus, the annual operating expense ratios (gross) for Investor Shares and Institutional Shares are 2.31% and 1.72%, respectively. However, the Fund's adviser has agreed to contractually reduce a portion of its fees and to reimburse expenses such that total operating expenses do not exceed 2.25% and 2.00% for Investor Shares and Institutional Shares, respectively through at least March 1, 2014. During the period, certain fees were waived and/or expenses reimbursed, otherwise returns would have been lower. The performance table and graph do not reflect the deduction of taxes that a shareholder would pay on Fund distributions or the redemption of Fund shares. Returns greater than one year are annualized.
| | | |
| CARNE HEDGED EQUITY FUND | | |
| SCHEDULE OF INVESTMENTS | | |
| OCTOBER 31, 2013 | | | |
| | | | | |
| | | | Security | | | | | | | | | | | Security | | | | | | | |
| | Shares | | Description | | | | | | Value | | | Shares | | Description | | | | | | Value | |
| Common Stock (a) - 97.4% | | | | | | | | | Materials - 1.8% | | | | | | | | |
| Consumer Discretionary - 32.2% | | | | | | | | | 6,084 | | CF Industries Holdings, Inc. | | | $ | 1,311,710 | |
| | 3,034 | | AutoZone, Inc. (b) | | | | | $ | 1,318,850 | | Total Common Stock | | | | | | | | |
| | 16,580 | | Bed Bath & Beyond, Inc. (b) | | | | | | 1,281,966 | | (Cost $51,771,670) | | | | | | $ | 69,598,863 | |
| | 110,919 | | Best Buy Co., Inc. | | | | | | 4,747,333 | | | | | | | | | | | | |
| | 23,521 | | Coach, Inc. | | | | | | 1,192,044 | | | | | Security | | Strike | | Exp. | | | |
| | 20,155 | | Delphi Automotive PLC | | | | | | 1,152,866 | | | Contracts | | Description | Price | | Date | | Value | |
| | 21,466 | | DIRECTV (b) | | | | | | 1,341,410 | | Purchased Options - 0.8% | | | | | | | | |
| | 24,833 | | GameStop Corp., Class A | | | | | | 1,361,345 | | Put Options Purchased - 0.8% | | | | | | | |
| | 47,878 | | Gannett Co., Inc. | | | | | | 1,324,784 | | | 75 | | S&P 500 Index | $ | 1,750.00 | | 11/13 | $ | 60,000 | |
| | 20,992 | | L Brands, Inc. | | | | | | 1,314,309 | | | 50 | | S&P 500 Index | 1,650.00 | | 11/13 | | 5,500 | |
| | 20,218 | | Omnicom Group, Inc. | | | | | | 1,377,048 | | | 100 | | S&P 500 Index | 1,700.00 | | 12/13 | | 174,000 | |
| | 7,786 | | Ralph Lauren Corp. | | | | | | 1,289,673 | | | 100 | | S&P 500 Index | 1,700.00 | | 12/13 | | 150,500 | |
| | 17,618 | | Ross Stores, Inc. | | | | | | 1,362,752 | | | 50 | | S&P 500 Index | 1,615.00 | | 12/13 | | 25,750 | |
| | 16,421 | | Scripps Networks Interactive, Inc., Class A | | | | | | 1,321,891 | | | 50 | | S&P 500 Index | 1,700.00 | | 01/14 | | 118,000 | |
| | 19,490 | | Time Warner, Inc. | | | | | | 1,339,743 | | | 25 | | S&P 500 Index | 1,600.00 | | 01/14 | | 21,625 | |
| | 15,346 | | Viacom, Inc., Class B | | | | | | 1,278,168 | | Total Put Options Purchased | | | | | | | | |
| | | | | | | | | | 23,004,182 | | (Premiums Paid $714,242) | | | | | | | 555,375 | |
| Consumer Staples - 7.8% | | | | | | | | Total Purchased Options | | | | | | | | |
| | 37,340 | | Altria Group, Inc. | | | | | | 1,390,168 | | (Premiums Paid $714,242) | | | | | | | 555,375 | |
| | 28,617 | | Dr. Pepper Snapple Group, Inc. | | | | | | 1,355,015 | | Total Investments in Securities - 98.2% | | | | | | | |
| | 28,643 | | Lorillard, Inc. | | | | | | 1,461,079 | | (Cost $52,485,912)* | | | | | | $ | 70,154,238 | |
| | 26,294 | | Reynolds American, Inc. | | | | | | 1,350,723 | | | | | | | | | | | | |
| | | | | | | | | | 5,556,985 | | | | | Security | | Strike | | Exp. | | | |
| Energy - 4.0% | | | | | | | | | | Contracts | | Description | | Price | | Date | | Value | |
| | 30,459 | | HollyFrontier Corp. | | | | | | 1,402,942 | | Written Options - (0.2)% | | | | | | | | |
| | 19,941 | | Marathon Petroleum Corp. | | | | | | 1,428,972 | | Call Options Written - (0.2)% | | | | | | | |
| | | | | | | | | | 2,831,914 | | | (100) | | S&P 500 Index | $ | 1,810.00 | | 11/13 | $ | (33,000) | |
| Financial - 3.9% | | | | | | | | | | (100) | | S&P 500 Index | 1,800.00 | | 11/13 | | (35,000) | |
| | 47,086 | | Leucadia National Corp. | | | | | | 1,334,417 | | | (50) | | S&P 500 Index | 1,785.00 | | 11/13 | | (9,000) | |
| | 39,969 | | The NASDAQ OMX Group, Inc. | | | | | | 1,416,102 | | | (45) | | S&P 500 Index | 1,780.00 | | 11/13 | | (675) | |
| | | | | | | | | | 2,750,519 | | | (100) | | S&P 500 Index | 1,775.00 | | 11/13 | | (68,000) | |
| Healthcare - 13.0% | | | | | | | | | Total Call Options Written | | | | | | | |
| | 38,645 | | Abbott Laboratories | | | | | | 1,412,475 | | (Premiums Received $(280,613)) | | | | | | (145,675) | |
| | 28,675 | | AbbVie, Inc. | | | | | | 1,389,304 | | Total Written Options - (0.2)% | | | | | | | |
| | 20,035 | | Aetna, Inc. | | | | | | 1,256,194 | | (Premiums Received $(280,613))* | | | | | $ | (145,675 | ) |
| | 20,992 | | AmerisourceBergen Corp. | | | | | | 1,371,407 | | Other Assets & Liabilities, Net – 2.0% | | | | | | 1,459,639 | |
| | 13,743 | | Humana, Inc. | | | | | | 1,266,417 | | Net Assets – 100.0% | | | | | $ | 71,468,202 | |
| | 24,087 | | Medtronic, Inc. | | | | | | 1,382,594 | | | | | | | | | | | | |
| | 20,758 | | Quest Diagnostics, Inc. | | | | | | 1,243,612 | | PLC | Public Limited Company | | | | | | | |
| | | | | | | | | | 9,322,003 | | (a) | All or a portion of these securities are pledged as collateral for written options. | | | | | |
| Industrials - 13.7% | | | | | | | | | (b) | Non-income producing security. | | | | | | |
| | 19,824 | | Emerson Electric Co. | | | | | | 1,327,613 | | | | | | | | | | | | |
| | 25,130 | | Joy Global, Inc. | | | | | | 1,426,127 | | * Cost for federal income tax purposes is $52,338,545 and net unrealized appreciation consists of: |
| | 13,573 | | L-3 Communications Holdings, Inc. | | | | | | 1,363,408 | | Gross Unrealized Appreciation | | | | | $ | 18,003,282 | |
| | 10,056 | | Lockheed Martin Corp. | | | | | | 1,340,867 | | Gross Unrealized Depreciation | | | | | | | (333,264 | ) |
| | 13,464 | | Northrop Grumman Corp. | | | | | | 1,447,515 | | Net Unrealized Appreciation | | | | | | $ | 17,670,018 | |
| | 70,512 | | Pitney Bowes, Inc. | | | | | | 1,504,726 | | | | | | | | | | | | |
| | 16,642 | | Raytheon Co. | | | | | | 1,370,802 | | | | | | | | | | | | |
| | | | | | | | | | 9,781,058 | | | | | | | | | | | | |
| Information Technology - 21.0% | | | | | | | | | | | | | | | | | | |
| | 16,117 | | Accenture PLC, Class A | | | | | | 1,184,599 | | | | | | | | | | | | |
| | 10,745 | | Apple, Inc. | | | | | | 5,612,651 | | | | | | | | | | | | |
| | 43,230 | | CA, Inc. | | | | | | 1,372,985 | | | | | | | | | | | | |
| | 50,181 | | EMC Corp. | | | | | | 1,207,857 | | | | | | | | | | | | |
| | 61,135 | | Hewlett-Packard Co. | | | | | | 1,489,860 | | | | | | | | | | | | |
| | 21,562 | | Leidos Holdings, Inc. | | | | | | 1,015,355 | | | | | | | | | | | | |
| | 38,668 | | Oracle Corp. | | | | | | 1,295,378 | | | | | | | | | | | | |
| | 12,321 | | Science Applications International Corp. | | | | | | 434,315 | | | | | | | | | | | | |
| | 29,324 | | Seagate Technology PLC | | | | | | 1,427,492 | | | | | | | | | | | | |
| | | | | | | | | | 15,040,492 | | | | | | | | | | | | |
| See Notes to Financial Statements. | 5 | |
| | | |
| CARNE HEDGED EQUITY FUND | | |
| SCHEDULE OF INVESTMENTS | | |
| OCTOBER 31, 2013 | | | |
| | | | | |
The following is a summary of the inputs used to value the Fund’s investments and other financial instruments and liabilities as of October 31, 2013.
The inputs or methodology used for valuing securities are not necessarily an indication of the risks associated with investing in those securities. For more information on valuation inputs, and their aggregation into the levels used in the table below, please refer to the Security Valuation section in Note 2 of the accompanying Notes to Financial Statements.
| Valuation Inputs | | Investments in Securities | | Other Financial Instruments** |
| Level 1 - Quoted Prices | | $ | 70,154,238 | | | $ | (145,675 | ) |
| Level 2 - Other Significant Observable Inputs | | | - | | | | - | |
| Level 3 - Significant Unobservable Inputs | | | - | | | | - | |
| Total | | $ | 70,154,238 | | | $ | (145,675 | ) |
| | **Other Financial Instruments are derivative instruments not reflected in the Total Investments in Securities, such as written call options, which are valued at their market value at year end. |
The Level 1 value displayed in the Investments in Securities column of this table is Common Stock and Purchased Options. Refer to the Schedule of Investments for a further breakout of each security by industry.
There were no transfers between Level 1, Level 2 and Level 3 for the year ended October 31, 2013.
AF
| PORTFOLIO HOLDINGS | | | |
| % of Total Investments | | | |
| Consumer Discretionary | 32.8 | % | |
| Consumer Staples | 7.9 | % | |
| Energy | 4.0 | % | |
| Financial | 3.9 | % | |
| Healthcare | 13.3 | % | |
| Industrials | 14.0 | % | |
| Information Technology | 21.4 | % | |
| Materials | 1.9 | % | |
| Purchased Options | 0.8 | % | |
| | 100.0 | % | |
FA
| See Notes to Financial Statements. | 6 | |
| | | |
| CARNE HEDGED EQUITY FUND | | |
| STATEMENT OF ASSETS AND LIABILITIES | |
| OCTOBER 31, 2013 | | | |
| | | | | |
| | | | | | | |
| ASSETS | | | | |
| | Total investments, at value (Cost $52,485,912) | | $ | 70,154,238 | |
| | Cash | | | 796,433 | |
| | Receivables: | | | | |
| | | Fund shares sold | | | 140,000 | |
| | | Investment securities sold | | | 586,022 | |
| | | Dividends and interest | | | 31,928 | |
| | Prepaid expenses | | | 8,972 | |
| Total Assets | | | 71,717,593 | |
| | | | | | | |
| LIABILITIES | | | | |
| | Payables: | | | | |
| | | Call options written, at value (Premiums received $280,613) | | | 145,675 | |
| | | Investment securities purchased | | | 608 | |
| | Accrued Liabilities: | | | | |
| Adviser | Investment adviser fees | | | 53,595 | |
| | | Trustees’ fees and expenses | | | 21 | |
| | | Fund services fees | | | 15,396 | |
| | | Other expenses | | | 34,096 | |
| Total Liabilities | | | 249,391 | |
| | | | | | | |
| NET ASSETS | | $ | 71,468,202 | |
| | | | | | | |
| COMPONENTS OF NET ASSETS | | | | |
| | Paid-in capital | | $ | 50,472,193 | |
| | Undistributed net investment income | | | 16,632 | |
| | Accumulated net realized gain | | | 3,176,113 | |
| | Net unrealized appreciation | | | 17,803,264 | |
| NET ASSETS | | $ | 71,468,202 | |
| | | | | | | |
| SHARES OF BENEFICIAL INTEREST AT NO PAR VALUE (UNLIMITED SHARES AUTHORIZED) | | | | |
| | Investor Shares | | | 53,543 | |
| | Institutional Shares | | | 4,236,514 | |
| | | | | | | |
| NET ASSET VALUE, OFFERING AND REDEMPTION PRICE PER SHARE | | | | |
| | Investor Shares (based on net assets of $891,758) | | $ | 16.65 | |
| | Institutional Shares (based on net assets of $70,576,444) | | $ | 16.66 | |
FA
| See Notes to Financial Statements. | 7 | |
| | | |
| CARNE HEDGED EQUITY FUND | | |
| STATEMENT OF OPERATIONS | | |
| YEAR ENDED OCTOBER 31, 2013 | | | |
| | | | | |
| | | | | | | |
| INVESTMENT INCOME | | | | |
| | Dividend income | | $ | 1,714,309 | |
| | Interest income | | | 1,360 | |
| Total Investment Income | | | 1,715,669 | |
| Adviser | | | | |
| EXPENSES | | | | |
| | Investment adviser fees | | | 573,556 | |
| | Investment adviser expense reimbursements recouped | | | 451 | |
| | Fund services fees | | | 184,522 | |
| | Transfer agent fees: | | | | |
| | Investor Shares | | | 454 | |
| | Institutional Shares | | | 248 | |
| | Non 12b-1 shareholder servicing fees: | | | | |
| | Institutional Shares | | | 56,293 | |
| | Distribution fees: | | | | |
| | Investor Shares | | | 1,476 | |
| | Custodian fees | | | 10,926 | |
| | Registration fees: | | | | |
| | Investor Shares | | | 1,365 | |
| | Institutional Shares | | | 19,894 | |
| | Professional fees | | | 38,518 | |
| | Trustees' fees and expenses | | | 2,413 | |
| | Miscellaneous expenses | | | 29,032 | |
| Total Expenses | | | 919,148 | |
| | | | | | | |
| NET INVESTMENT INCOME | | | 796,521 | |
| | | | | | | |
| NET REALIZED AND UNREALIZED GAIN (LOSS) | | | | |
| | Net realized gain (loss) on: | | | | |
| | Investments | | | 5,071,427 | |
| | Written options | | | (1,465,050 | ) |
| | Net realized gain | | | 3,606,377 | |
| | Net change in unrealized appreciation (depreciation) on: | | | | |
| | Investments | | | 13,333,247 | |
| | Written options | | | 85,098 | |
| | Net change in unrealized appreciation (depreciation) | | | 13,418,345 | |
| NET REALIZED AND UNREALIZED GAIN | | | 17,024,722 | |
| INCREASE IN NET ASSETS FROM OPERATIONS | | $ | 17,821,243 | |
| | | | | | | |
FA
| See Notes to Financial Statements. | 8 | |
| | | |
| CARNE HEDGED EQUITY FUND | | |
| STATEMENTS OF CHANGES IN NET ASSETS | |
| | | | | |
| | | | | |
| | | October 31, 2013 | # | | 41578 | # | # | | | 41213 | |
| | | | | For the Year Ended October 31, 2013 | | | For the Year Ended October 31, 2012 |
| OPERATIONS | | | | | | | | | |
| | Net investment income | | $ | 796,521 | | | | $ | 309,858 | |
| | Net realized gain | | | 3,606,377 | | | | | 2,303,496 | |
| | Net change in unrealized appreciation (depreciation) | | | 13,418,345 | | | | | 2,518,068 | |
| Increase in Net Assets Resulting from Operations | | | 17,821,243 | | | | | 5,131,422 | |
| | | | | | | | | | | | |
| DISTRIBUTIONS TO SHAREHOLDERS FROM | | | | | | | | | |
| | Net investment income: | | | | | | | | | |
| | | Investor Shares | | | (4,253 | ) | | | | (37 | ) |
| | | Institutional Shares | | | (775,636 | ) | | | | (330,540 | ) |
| | Net realized gain: | | | | | | | | | |
| | | Investor Shares | | | (24,274 | ) | | | | (113,242 | ) |
| | | Institutional Shares | | | (2,564,985 | ) | | | | (2,833,476 | ) |
| Total Distributions to Shareholders | | | (3,369,148 | ) | | | | (3,277,295 | ) |
| | | | | | | | | | | | |
| CAPITAL SHARE TRANSACTIONS | | | | | | | | | |
| | Sale of shares: | | | | | | | | | |
| | | Investor Shares | | | 503,069 | | | | | 187,119 | |
| | | Institutional Shares | | | 3,868,869 | | | | | 10,155,704 | |
| | Reinvestment of distributions: | | | | | | | | | |
| | | Investor Shares | | | 28,013 | | | | | 112,128 | |
| | | Institutional Shares | | | 3,335,105 | | | | | 3,156,942 | |
| | Redemption of shares: | | | | | | | | | |
| | 1 | Investor Shares | | | (113,837 | ) | | | | (3,490,277 | ) |
| | 2 | Institutional Shares | | | (2,768,689 | ) | | | | (3,199,142 | ) |
| Increase in Net Assets from Capital Share Transactions | | | 4,852,530 | | | | | 6,922,474 | |
| Increase in Net Assets | | | 19,304,625 | | | | | 8,776,601 | |
| | | | | | | | | | | | |
| NET ASSETS | | | | | | | | | |
| | Beginning of Year | | | 52,163,577 | | | | | 43,386,976 | |
| | End of Year (Including line (a)) | | $ | 71,468,202 | | | | $ | 52,163,577 | |
| | | | | | | | | | | | |
| SHARE TRANSACTIONS | | | | | | | | | |
| | Sale of shares: | | | | | | | | | |
| | | Investor Shares | | | 34,341 | | | | | 14,435 | |
| | | Institutional Shares | | | 251,851 | | | | | 768,650 | |
| | Reinvestment of distributions: | | | | | | | | | |
| | | Investor Shares | | | 2,173 | | | | | 9,733 | |
| | | Institutional Shares | | | 256,531 | | | | | 270,662 | |
| | Redemption of shares: | | | | | | | | | |
| | | Investor Shares | | | (7,892 | ) | | | | (282,033 | ) |
| | | Institutional Shares | | | (191,983 | ) | | | | (257,308 | ) |
| Increase in Shares | | | 345,021 | | | | | 524,139 | |
| | | | | | | | | | | | |
| (a) | Undistributed net investment income | | $ | 16,632 | | | | $ | - | |
FA
| See Notes to Financial Statements. | 9 | |
| | | |
| CARNE HEDGED EQUITY FUND | | |
| FINANCIAL HIGHLIGHTS | | |
| | | | | |
| | | | | |
These financial highlights reflect selected data for a share outstanding throughout each period.
| | | | | For the Years Ended October 31, | | November 2, 2009 (a) through October 31, | |
| | | | | 2013 | | 2012 | | | 2011 | | | 2010 | |
| INVESTOR SHARES | | | | | | | | | | | | | | | | | | | |
| NET ASSET VALUE, Beginning of Period | | $ | 13.23 | | | $ | 12.67 | | | | $ | 11.38 | | | | $ | 10.00 | | |
| INVESTMENT OPERATIONS | | | | | | | | | | | | | | | | | | | |
| | Net investment income (loss) (b) | | | 0.08 | | | | 0.05 | | | | | (0.01 | ) | | | | (0.02 | ) | |
| | Net realized and unrealized gain | | | 4.10 | | | | 1.44 | | | | | 1.59 | | | | | 1.40 | | |
| Total from Investment Operations | | | 4.18 | | | | 1.49 | | | | | 1.58 | | | | | 1.38 | | |
| DISTRIBUTIONS TO SHAREHOLDERS FROM | | | | | | | | | | | | | | | | | | | |
| | Net investment income | | | (0.11 | ) | | | — | (c) | | | | (0.02 | ) | | | | — | | |
| | Net realized gain | | | (0.65 | ) | | | (0.93 | ) | | | | (0.27 | ) | | | | — | | |
| Total Distributions to Shareholders | | | (0.76 | ) | | | (0.93 | ) | | | | (0.29 | ) | | | | — | | |
| NET ASSET VALUE, End of Period | | $ | 16.65 | | | $ | 13.23 | | | | $ | 12.67 | | | | $ | 11.38 | | |
| TOTAL RETURN | | | 33.32 | % | | | 12.89 | % | | | | 14.05 | % | | | | 13.80 | %(d) | |
| RATIOS/SUPPLEMENTARY DATA | | | | | | | | | | | | | | | | | | | |
| Net Assets at End of Period (000's omitted) | | | $892 | | | | $330 | | | | | $3,582 | | | | | $449 | | |
| Ratios to Average Net Assets: | | | | | | | | | | | | | | | | | | | |
| | Net investment income (loss) | | | 0.56 | % | | | 0.36 | % | | | | (0.07 | )% | | | | (0.19 | )%(e) | |
| | Net expense | | | 2.17 | % | | | 2.10 | % | | | | 2.00 | % | | | | 1.97 | %(e) | |
| | Gross expense | | | 2.17 | % | | | 2.33 | %(f) | | | | 2.15 | %(f) | | | | 28.33 | %(e)(f) | |
| PORTFOLIO TURNOVER RATE | | | 73 | % | | | 101 | % | | | | 72 | % | | | | 95 | %(d) | |
| INSTITUTIONAL SHARES | | | | | | | | | | | | | | | | | | | |
| NET ASSET VALUE, Beginning of Period | | $ | 13.22 | | | $ | 12.68 | | | | $ | 11.38 | | | | $ | 10.00 | | |
| INVESTMENT OPERATIONS | | | | | | | | | | | | | | | | | | | |
| | Net investment income (loss) (b) | | | 0.19 | | | | 0.09 | | | | | 0.04 | | | | | (0.02 | ) | |
| | Net realized and unrealized gain | | | 4.09 | | | | 1.47 | | | | | 1.57 | | | | | 1.41 | | |
| Total from Investment Operations | | | 4.28 | | | | 1.56 | | | | | 1.61 | | | | | 1.39 | | |
| DISTRIBUTIONS TO SHAREHOLDERS FROM | | | | | | | | | | | | | | | | | | | |
| | Net investment income | | | (0.19 | ) | | | (0.09 | ) | | | | (0.04 | ) | | | | (0.01 | ) | |
| | Net realized gain | | | (0.65 | ) | | | (0.93 | ) | | | | (0.27 | ) | | | | — | | |
| Total Distributions to Shareholders | | | (0.84 | ) | | | (1.02 | ) | | | | (0.31 | ) | | | | (0.01 | ) | |
| NET ASSET VALUE, End of Period | | $ | 16.66 | | | $ | 13.22 | | | | $ | 12.68 | | | | $ | 11.38 | | |
| TOTAL RETURN | | | 34.27 | % | | | 13.47 | % | | | | 14.40 | % | | | | 13.94 | %(d) | |
| RATIOS/SUPPLEMENTARY DATA | | | | | | | | | | | | | | | | | | | |
| Net Assets at End of Period (000's omitted) | | | $70,576 | | | | $51,834 | | | | | $39,805 | | | | | $31,601 | | |
| Ratios to Average Net Assets: | | | | | | | | | | | | | | | | | | | |
| | Net investment income (loss) | | | 1.33 | % | | | 0.66 | % | | | | 0.31 | % | | | | (0.15 | )%(e) | |
| | Net expense | | | 1.52 | % | | | 1.65 | % | | | | 1.64 | % | | | | 1.95 | %(e) | |
| | Gross expense | | | 1.52 | % | | | 1.73 | %(f) | | | | 1.78 | %(f) | | | | 2.48 | %(e)(f) | |
| PORTFOLIO TURNOVER RATE | | | 73 | % | | | 101 | % | | | | 72 | % | | | | 95 | %(d) | |
| | | | | | | | | | | | | | | | | | | | | | |
| (a) | Commencement of operations. | | | | | | | | | | | | | | | | | | |
| (b) | Calculated based on average shares outstanding during each period. | | | | | | | | | | | | | | | | | | |
| (c) | Less than $0.01 per share. | | | | | | | | | | | | | | | | | | |
| (d) | Not annualized. | | | | | | | | | | | | | | | | | | |
| (e) | Annualized. | | | | | | | | | | | | | | | | | | |
| (f) | Reflects the expense ratio excluding any waivers and/or reimbursements. | | | | | | | | | | | | | | | | | | |
FA
| See Notes to Financial Statements. | 10 | |
| | | |
| CARNE HEDGED EQUITY FUND | | |
| NOTES TO FINANCIAL STATEMENTS | |
| OCTOBER 31, 2013 | | | |
| | | | | |
Note 1. Organization
The Carne Hedged Equity Fund (the “Fund”) is a diversified portfolio of Forum Funds (the “Trust”). The Trust is a Delaware statutory trust that is registered as an open-end, management investment company under the Investment Company Act of 1940 (the “Act”), as amended. Under its Trust Instrument, the Trust is authorized to issue an unlimited number of the Fund’s shares of beneficial interest without par value. The Fund currently offers two classes of shares: Investor Shares and Institutional Shares. The Fund commenced operations on November 2, 2009. The Fund’s investment objective is to achieve long-term capital appreciation. Effective June 18, 2013, Carne Large Cap Value Fund was renamed Carne Hedged Equity Fund.
Note 2. Summary of Significant Accounting Policies
These financial statements are prepared in accordance with accounting principles generally accepted in the United States of America (“GAAP”), which require management to make estimates and assumptions that affect the reported amounts of assets and liabilities, the disclosure of contingent liabilities at the date of the financial statements, and the reported amounts of increase and decrease in net assets from operations during the fiscal period. Actual amounts could differ from those estimates. The following summarizes the significant accounting policies of the Fund:
Security Valuation – Exchange-traded securities and over-the-counter securities are valued using the last quoted sale or official closing price, provided by independent pricing services as of the close of trading on the market or exchange for which they are primarily traded, on each Fund business day. In the absence of a sale, such securities are valued at the mean of the last bid and ask price provided by independent pricing services. Non-exchange traded securities for which quotations are available are valued using the last quoted sales price, or in the absence of a sale, at the mean of the last bid and ask prices provided by independent pricing services. Short-term investments that mature in 60 days or less may be valued at amortized cost. The Fund values its investments at fair value pursuant to procedures adopted by the Trust's Board of Trustees (the "Board") if (1) market quotations are insufficient or not readily available or (2) the adviser believes that the values available are unreliable. The Trust’s Valuation Committee, as defined in the Fund’s registration statement, performs certain functions as they relate to the administration and oversight of the Fund’s valuation procedures. Under these procedures, the Valuation Committee convenes on a regular and ad-hoc basis to review such securities and considers a number of factors, including valuation methodologies and significant unobservable inputs, when arriving at fair value.
The Valuation Committee may work with the adviser to provide valuation inputs. In determining fair valuations, inputs may include market-based analytics which may consider related or comparable assets or liabilities, recent transactions, market multiples, book values and other relevant investment information. Adviser inputs may include an income-based approach in which the anticipated future cash flows of the investment are discounted in determining fair value. Discounts may also be applied based on the nature or duration of any restrictions on the disposition of the investments. The Valuation Committee performs regular reviews of valuation methodologies, key inputs and assumptions, disposition analysis and market activity.
Fair valuation is based on subjective factors and, as a result, the fair value price of an investment may differ from the security’s market price and may not be the price at which the asset may be sold. Fair valuation could result in a different Net Asset Value (“NAV”) than a NAV determined by using market quotes.
The Fund has a three-tier fair value hierarchy. The basis of the tiers is dependent upon the various “inputs” used to determine the value of the Fund’s investments. These inputs are summarized in the three broad levels listed below:
Level 1 — quoted prices in active markets for identical assets
Level 2 — other significant observable inputs (including quoted prices of similar securities, interest rates, prepayment speeds, credit risk, etc.)
Level 3 — significant unobservable inputs (including the Fund’s own assumptions in determining the fair value of investments)
FA
| | | |
| CARNE HEDGED EQUITY FUND | | |
| NOTES TO FINANCIAL STATEMENTS | |
| OCTOBER 31, 2013 | | | |
| | | | | |
The aggregate value by input level, as of October 31, 2013, for the Fund’s investments is included at the end of the Fund’s Schedule of Investments.
Security Transactions, Investment Income and Realized Gain and Loss – Investment transactions are accounted for on the trade date. Dividend income is recorded on the ex-dividend date. Foreign dividend income is recorded on the ex-dividend date or as soon as possible after the Fund determines the existence of a dividend declaration after exercising reasonable due diligence. Income and capital gains on some foreign securities may be subject to foreign withholding taxes, which are accrued as applicable. Interest income is recorded on an accrual basis. Premium is amortized and discount is accreted using the effective interest method. Identified cost of investments sold is used to determine the gain and loss for both financial statement and federal income tax purposes.
Purchased Options – When a fund purchases an option, an amount equal to the premium paid by the fund is recorded as an investment and is subsequently adjusted to the current value of the option purchased. If an option expires on the stipulated expiration date or if the fund enters into a closing sale transaction, a gain or loss is realized. If a call option is exercised, the cost of the security acquired is increased by the premium paid for the call. If a put option is exercised, a gain or loss is realized from the sale of the underlying security, and the proceeds from such sale are decreased by the premium originally paid. Purchased options are non-income producing securities.
The values of each individual purchased option outstanding as of October 31, 2013, are disclosed in the Fund’s Schedule of Investments. The volume of open purchased option positions may vary on a daily basis as the Fund transacts purchased options in order to achieve the exposure desired by the adviser. The Fund entered into a total value of $3,528,107 on purchased options during the year ended October 31, 2013.
Written Options – When a fund writes an option, an amount equal to the premium received by the fund is recorded as a liability and is subsequently adjusted to the current value of the option written. Premiums received from writing options that expire unexercised are treated by the fund on the expiration date as realized gain from written options. The difference between the premium and the amount paid on effecting a closing purchase transaction, including brokerage commissions, is also treated as a realized gain, or if the premium is less than the amount paid for the closing purchase transaction, as a realized loss. If a call option is exercised, the premium is added to the proceeds from the sale of the underlying security in determining whether the fund has realized a gain or loss. If a put option is exercised, the premium reduces the cost basis of the securities purchased by the fund. The fund, as writer of an option, bears the market risk of an unfavorable change in the price of the security underlying the written option. Written options are non-income producing securities.
The values of each individual written option outstanding as of October 31, 2013, are disclosed in the Fund’s Schedule of Investments. The volume of open positions may vary on a daily basis as the Fund transacts written options in order to achieve the exposure desired by the adviser. The Fund entered into a total value of $3,716,091 on written options for the year ended October 31, 2013.
Transactions in written options during the year ended October 31, 2013, were as follows:
| | | Calls | |
| | | Number of | | | | | |
| | | Contracts | | | Premiums | |
| Options Outstanding, October 31, 2012 | | (350 | ) | | $ | (97,940 | ) | |
| Options written | | (4,963 | ) | | | (3,716,091 | ) | |
| Options terminated in closing transactions | | 4,248 | | | 3,049,378 | |
| Options exercised | | - | | | | - | | |
| Options expired | | 670 | | | 484,040 | |
| Options Outstanding, October 31, 2013 | | (395 | ) | | $ | (280,613 | ) | |
Derivatives Transactions - The Fund’s use of derivatives during the year ended October 31, 2013, was limited to written options and purchased options. The Fund uses derivative instruments as part of its principal investment strategy to achieve its investment objective. Following is a summary of how the derivatives are treated in the financial statements and their impact on the Fund.
FA
| | | |
| CARNE HEDGED EQUITY FUND | | |
| NOTES TO FINANCIAL STATEMENTS | |
| OCTOBER 31, 2013 | | | |
| | | | | |
The location on the Statement of Assets and Liabilities of the Fund’s derivative positions by type of exposure, all of which are not accounted for as hedging instruments, is as follows:
Contract Type/ Primary Risk Exposure | | Location on Statement of Assets and Liabilities | | Asset Derivatives | | Location on Statement of Assets and Liabilities | | Liability Derivatives | |
| | | | | | | | | | | | |
| Equity Contracts | | | | | | | | | | | |
| | | Total investments, at value | | | $ 555,375 | | Call options written, at value | | | $ (145,675) | |
Realized and unrealized gains and losses on derivatives contracts during the year ended October 31, 2013, by the Fund are recorded in the following locations on the Statement of Operations:
| Contract Type/Primary Risk Exposure | | Location of Gain or (Loss) on Derivatives | | Realized Gain (Loss) on Derivatives | | Change in Unrealized Appreciation (Depreciation) on Derivatives |
| | | | | | | | | |
| Equity Contracts | | Net realized gain (loss) – Investments and Change in unrealized appreciation (depreciation) – Investments | | $ | (1,222,490) | | $ | (158,867) |
| | | | | | | | | |
| | | Net realized gain (loss) – Written options and Change in unrealized appreciation (depreciation) – Written options | | | (1,465,050) | | | 85,098 |
Distributions to Shareholders – Distributions to shareholders of net investment income, if any, are declared and paid at least quarterly. Distributions to shareholders of net capital gains, if any, are declared and paid annually. Distributions to shareholders are recorded on the ex-dividend date. Distributions are based on amounts calculated in accordance with applicable federal income tax regulations, which may differ from GAAP. These differences are due primarily to differing treatments of income and gain on various investment securities held by the Fund, timing differences and differing characterizations of distributions made by the Fund. On December 12, 2013, the Fund paid a distribution of $0.14620 and $0.60499 per share in short term capital gains and long term capital gains, respectively, related to the period ended October 31, 2013.
Federal Taxes – The Fund intends to continue to qualify each year as a regulated investment company under Subchapter M of the Internal Revenue Code and to distribute all of its taxable income to shareholders. In addition, by distributing in each calendar year substantially all of its net investment income and capital gains, if any, the Fund will not be subject to a federal excise tax. Therefore, no federal income or excise tax provision is required. The Fund files a U.S. federal income and excise tax return as required. A fund’s federal income tax returns are subject to examination by the Internal Revenue Service for a period of three fiscal years after they are filed. As of October 31, 2013, there are no uncertain tax positions that would require financial statement recognition, de-recognition, or disclosure.
Income and Expense Allocation – The Trust accounts separately for the assets, liabilities and operations of each of its investment portfolios. Expenses that are directly attributable to more than one investment portfolio are allocated among the respective investment portfolios in an equitable manner. The Fund’s class-specific expenses are charged to the operations of that class of shares. Income and expenses (other than expenses attributable to a specific class) and realized and unrealized gains or losses on investments are allocated to each class of shares based on the class’ respective net assets to the total net assets of the Fund.
| | | |
| CARNE HEDGED EQUITY FUND | | |
| NOTES TO FINANCIAL STATEMENTS | |
| OCTOBER 31, 2013 | | | |
| | | | | |
Commitments and Contingencies – In the normal course of business, the Fund enters into contracts that provide general indemnifications by the Fund to the counterparty to the contract. The Fund’s maximum exposure under these arrangements is dependent on future claims that may be made against the Fund and, therefore, cannot be estimated; however, based on experience, the risk of loss from such claims is considered remote.
Note 3. Fees and Expenses
Investment Adviser – Carne Capital, LLC (the “Adviser”) is the investment adviser to the Fund. Pursuant to an investment advisory agreement, the Adviser receives an advisory fee from the Fund at an annual rate of 0.95% of the Fund’s average daily net assets.
Distribution – Foreside Fund Services, LLC serves as the Fund’s distributor (the “Distributor”). The Distributor is not affiliated with the Adviser or Atlantic Fund Administration, LLC (d/b/a Atlantic Fund Services) (“Atlantic”) or their affiliates. The Fund has adopted a Distribution Plan (the “Plan”) for Investor Shares in accordance with Rule 12b-1 of the Act. Under the Plan, the Fund pays the Distributor and/or any other entity as authorized by the Board a fee of up to 0.25% of the average daily net assets of Investor Shares.
Other Service Providers – Atlantic provides fund accounting, fund administration, compliance and transfer agency services to the Fund. Atlantic also provides certain shareholder report production, and EDGAR conversion and filing services. Pursuant to an Atlantic services agreement, the Fund pays Atlantic customary fees for its services. Atlantic provides a Principal Executive Officer, a Principal Financial Officer, a Chief Compliance Officer, and an Anti-Money Laundering Officer to the Fund, as well as certain additional compliance support functions.
Trustees and Officers – The Trust pays each independent Trustee an annual retainer fee of $45,000 for service to the Trust ($66,000 for the Chairman). The Trustees and Chairman may receive additional fees for special Board meetings. Each Trustee is also reimbursed for all reasonable out-of-pocket expenses incurred in connection with his duties as a Trustee, including travel and related expenses incurred in attending Board meetings. The amount of Trustees’ fees attributable to the Fund is disclosed in the Statement of Operations. Certain officers of the Trust are also officers or employees of the above named service providers, and during their terms of office received no compensation from the Fund.
Note 4. Expense Cap Agreement
The Adviser has contractually agreed to waive a portion of its fees and reimburse expenses to limit total annual fund operating expenses (excluding all taxes, interest, portfolio transaction expenses, dividend on short sales, acquired fund fees and expenses, and extraordinary expenses) of Investor Shares to 2.25%, and Institutional Shares to 2.00% through at least March 1, 2014. For the year ended October 31, 2013, there were no fees waived or expenses reimbursed.
The Fund may repay the Adviser fees waived and expenses reimbursed pursuant to the expense cap if (1) such payment is made within three years of the fees waived or expense reimbursement, (2) such payment is approved by the Board and (3) and the resulting class expenses do not exceed 2.25% for Investor Shares or 2.00% for Institutional Shares. For the period December 28, 2011 through October 31, 2013, the Adviser waived fees and/ or reimbursed expenses as follows:
| Year/Period Ended | | Amount of Fees Waived and/or Expenses Reimbursed Eligible for Recoupment | | Expiration Date to Recoup Fees Waived and/or Expenses Reimbursed | | Fees Recouped |
| October 31, 2012 | | $ | 451 | | October 31, 2015 | | $ | 451 |
Note 5. Security Transactions
The cost of purchases and proceeds from sales of investment securities (including maturities), other than short-term investments during the year ended October 31, 2013, were $43,510,157 and $45,807,595, respectively.
| | | |
| CARNE HEDGED EQUITY FUND | | |
| NOTES TO FINANCIAL STATEMENTS | |
| OCTOBER 31, 2013 | | | |
| | | | | |
Note 6. Federal Income Tax and Investment Transactions
Distributions paid during the fiscal years ended as noted were characterized for tax purposes as follows:
| Ordinary Income | | $ | 2,473,339 | | $ | 1,915,193 |
| Long-Term Capital Gain | | | 895,809 | | | 1,362,102 |
| | | $ | 3,369,148 | | $ | 3,277,295 |
As of October 31, 2013, distributable earnings on a tax basis were as follows:
| Undistributed Ordinary Income | | $ | 660,684 | |
| Undistributed Long-Term Gain | | | 2,665,307 | |
| Unrealized Appreciation | | | 17,670,018 | |
| Total | | $ | 20,996,009 | |
The difference between components of distributable earnings on a tax basis and the amounts reflected in the Statement of Assets and Liabilities are primarily due to mark-to-market on section 1256 contracts and the tax deferral of losses on wash sales.
The Fund invests in broad based options which qualify under section 1256 of the Internal Revenue Code. Each section 1256 contract is treated as sold for its fair market value on the last business day of its taxable year and any gain or loss realized upon sale or mark-to-market is treated as 60% long term and 40% short term.
Note 7. Recent Accounting Pronouncements
Management has evaluated Financial Accounting Standards Board's Accounting Standards Update (“ASU”) No. 2011-11 and ASU No. 2013- 01 regarding offsetting assets and liabilities disclosure, and determined the updates did not have an impact on the reporting of financial statement disclosures.
Note 8. Subsequent Events
Subsequent events occurring after the date of this report through the date these financial statements were issued have been evaluated for potential impact and the Fund has had no such events.
| | | |
| | | | | |
| REPORT OF INDEPENDENT REGISTERED PUBLIC ACCOUNTING FIRM | |
| | | | | |
| | | | | |
To the Board of Trustees of Forum Fundsand the Shareholders of Carne Hedged Equity Fund
We have audited the accompanying statement of assets and liabilities of the Carne Hedged Equity Fund (formerly the Carne Large Cap Value Fund), a series of shares of beneficial interest in the Forum Funds (the “Fund”), including the schedule of investments, as of October 31, 2013, and the related statement of operations for the year then ended, the statements of changes in net assets for each of the years in the two-year period then ended and the financial highlights for each of the years in the three-year period then ended and for the period November 2, 2009 (commencement of operations) to October 31, 2010. These financial statements and financial highlights are the responsibility of the Fund's management. Our responsibility is to express an opinion on these financial statements and financial highlights based on our audits.
We conducted our audits in accordance with the standards of the Public Company Accounting Oversight Board (United States). Those standards require that we plan and perform the audits to obtain reasonable assurance about whether the financial statements and financial highlights are free of material misstatement. An audit includes examining, on a test basis, evidence supporting the amounts and disclosures in the financial statements. Our procedures included confirmation of securities owned as of October 31, 2013 by correspondence with the custodian and broker. An audit also includes assessing the accounting principles used and significant estimates made by management, as well as evaluating the overall financial statement presentation. We believe that our audits provide a reasonable basis for our opinion.
In our opinion, the financial statements and financial highlights referred to above present fairly, in all material respects, the financial position of the Carne Hedged Equity Fund as of October 31, 2013, and the results of its operations for the year then ended, the changes in its net assets for each of the years in the two-year period then ended and its financial highlights for each of the years in the three-year period then ended and for the period November 2, 2009 to October 31, 2010, in conformity with accounting principles generally accepted in the United States of America.

BBD, LLP
Philadelphia, Pennsylvania
December 18, 2013
| | | |
| CARNE HEDGED EQUITY FUND | | |
| ADDITIONAL INFORMATION (Unaudited) | |
| OCTOBER 31, 2013 | | | |
| | | | | |
Proxy Voting Information
A description of the policies and procedures that the Fund uses to determine how to vote proxies relating to securities held in the Fund’s portfolio is available, without charge and upon request, by calling (877) 356-9055 and on the U.S. Securities and Exchange Commission’s (the “SEC”) website at www.sec.gov. The Fund’s proxy voting record for the most recent twelve-month period ended June 30 is available, without charge and upon request, by calling (877) 356-9055 and on the SEC’s website at www.sec.gov.
Availability of Quarterly Portfolio Schedules
The Fund files its complete schedule of portfolio holdings with the SEC for the first and third quarters of each fiscal year on Form N-Q. These filings are available, without charge and upon request on the SEC’s website at www.sec.gov or may be reviewed and copied at the SEC’s Public Reference Room in Washington, DC. Information on the operation of the Public Reference Room may be obtained by calling (800) SEC-0330.
Shareholder Expense Example
As a shareholder of the Fund, you incur ongoing costs, including management fees, distribution (12b-1) fees and other Fund expenses. This example is intended to help you understand your ongoing costs (in dollars) of investing in the Fund and to compare these costs with the ongoing costs of investing in other mutual funds.
The example is based on an investment of $1,000 invested at the beginning of the period and held for the entire period from May 1, 2013, through October 31, 2013.
Actual Expenses – The first line under each share class of the table below provides information about actual account values and actual expenses. You may use the information in this line, together with the amount you invested, to estimate the expenses that you paid over the period. Simply divide your account value by $1,000 (for example, an $8,600 account value divided by $1,000 = 8.6), then multiply the result by the number in the first line under the heading entitled “Expenses Paid During Period” to estimate the expenses you paid on your account during the period.
Hypothetical Example for Comparison Purposes – The second line under each share class of the table below provides information about hypothetical account values and hypothetical expenses based on the Fund’s actual expense ratio and an assumed rate of return of 5% per year before expenses, which is not the Fund’s actual return. The hypothetical account values and expenses may not be used to estimate the actual ending account balance or expenses you paid for the period. You may use this information to compare the ongoing costs of investing in the Fund and other funds. To do so, compare this 5% hypothetical example with the 5% hypothetical examples that appear in the shareholder reports of other funds.
Please note that the expenses shown in the table are meant to highlight your ongoing costs only. Therefore, the second line of the table is useful in comparing ongoing costs only and will not help you determine the relative total costs of owning different funds.
| | | |
| CARNE HEDGED EQUITY FUND | | |
| ADDITIONAL INFORMATION (Unaudited) | |
| OCTOBER 31, 2013 | | | |
| | | | | |
| | Beginning | | Ending | | Expenses | | Annualized |
| | Account Value | | Account Value | | Paid During | | Expense |
| | May 1, 2013 | | October 31, 2013 | | Period* | | Ratio* |
| Investor Shares | | | | | | | | | | | |
| Actual | $ | 1,000.00 | | $ | 1,139.23 | | $ | 11.38 | | 2.11 | % |
| Hypothetical (5% return before taxes) | $ | 1,000.00 | | $ | 1,014.57 | | $ | 10.71 | | 2.11 | % |
| Institutional Shares | | | | | | | | | | | |
| Actual | $ | 1,000.00 | | $ | 1,143.14 | | $ | 7.99 | | 1.48 | % |
| Hypothetical (5% return before taxes) | $ | 1,000.00 | | $ | 1,017.74 | | $ | 7.53 | | 1.48 | % |
| | *Expenses are equal to the Fund’s annualized expense ratio multiplied by the average account value over the period, multiplied by the number of days in the most recent fiscal half-year divided by 365 to reflect the half-year period. |
Federal Tax Status of Dividends Declared during the Tax Year
For federal income tax purposes, dividends from short-term capital gains are classified as ordinary income.
The Fund designates 67.58% of its income dividend distributed as qualifying for the corporate dividends-received deduction (DRD) and 68.23% for the qualified dividend rate (QDI) as defined in Section 1(h)(11) of the Internal Revenue Code. The Fund also designates 0.03% as qualified interest income exempt from U.S. tax for foreign shareholders (QII) and 68.47% as short-term capital gain dividends exempt from U.S. tax for foreign shareholders (QSD).
Trustees and Officers of the Trust
The Board is responsible for oversight of the management of the Trust’s business affairs and of the exercise of all the Trust’s powers except those reserved for the shareholders. The following table provides information about each Trustee and certain officers of the Trust. Each Trustee and officer holds office until the person resigns, is removed, or is replaced. Unless otherwise noted, the persons have held their principal occupations for more than five years. The address for all Trustees and officers is Three Canal Plaza, Suite 600, Portland, Maine 04101. Mr. Keffer is considered an Interested Trustee due to his affiliation with Atlantic. The Fund’s Statement of Additional Information includes additional information about the Trustees and is available, without charge and upon request, by calling (877) 356-9055.
| Name and Year of Birth | Position with the Trust | Length of Time Served | Principal Occupation(s) During Past Five Years | Number of Series in Fund Complex1 Overseen by Trustee | Other Directorships Held by Trustee |
| Independent Trustees | | | | | |
J. Michael Parish Born: 1943 | Chairman of the Board; Trustee; Chairman, Nominating Committee and Qualified Legal Compliance Committee | Since 1989 (Chairman since 2004) | Retired since 2003. | 24 | 0 |
Costas Azariadis Born: 1943 | Trustee | Since 1989 | Professor of Economics, Washington University since 2006. | 24 | 0 |
James C. Cheng Born: 1942 | Trustee; Chairman, Audit Committee | Since 1989 | President, Technology Marketing Associates (marketing company for small- and medium-sized businesses in New England) since 1991. | 24 | 0 |
David Tucker Born: 1958 | Trustee | Since 2011 | Director, Blue Sky Experience since 2008; Senior Vice President & General Counsel, American Century Companies 1998-2008. | 25 | Trustee, Forum Funds II and Forum ETF Trust |
1The Fund Complex includes the Trust, Forum Funds II and Forum ETF Trust and is overseen by different Boards of Trustees. |
| | | |
| CARNE HEDGED EQUITY FUND | | |
| ADDITIONAL INFORMATION (Unaudited) | |
| OCTOBER 31, 2013 | | | |
| |
| Name and Year of Birth | Position with the Trust | Length of Time Served | Principal Occupation(s) During Past Five Years | Number of Series in Fund Complex Overseen by Trustee | Other Directorships Held by Trustee |
| Interested Trustee | | | | | |
John Y. Keffer2 Born: 1942 | Trustee; Vice Chairman | Since 1989 | Chairman, Atlantic since 2008; President, Forum Foundation (a charitable organization) since 2005; President, Forum Trust, LLC (a non-depository trust company chartered in the State of Maine) since 1997. | 25 | Director, Wintergreen Fund, Inc.; Trustee, Forum Funds II and Forum ETF Trust |
| Officers | | | | | |
Stacey E. Hong Born: 1966 | President; Principal Executive Officer | Since 2008 | President, Atlantic since 2008. | N/A | N/A |
Karen Shaw Born: 1972 | Treasurer; Principal Financial Officer | Since 2008 | Senior Vice President, Atlantic since 2008. | N/A | N/A |
David Faherty Born: 1970 | Vice President | Since 2009 | Senior Counsel, Atlantic since 2009; Vice President, Citi Fund Services Ohio, Inc. 2007-2009. | N/A | N/A |
Michael J. McKeen Born: 1971 | Vice President | Since 2009 | Senior Vice President, Atlantic since 2008. | N/A | N/A |
Timothy Bowden Born: 1969 | Vice President | Since 2009 | Manager, Atlantic since 2008. | N/A | N/A |
Geoffrey Ney Born: 1975 | Vice President | Since 2013 | Manager, Atlantic since 2013; Senior Fund Accountant, Atlantic, 2008-2013. | N/A | N/A |
Todd Proulx Born: 1978 | Vice President | Since 2013 | Manager, Atlantic since 2013; Senior Fund Accountant, Atlantic, 2008-2013. | N/A | N/A |
Lina Bhatnagar Born: 1971 | Secretary | Since 2008 | Senior Administration Specialist, Atlantic since 2008. | N/A | N/A |
2Atlantic is a subsidiary of Forum Holdings Corp. I, a Delaware corporation that is wholly owned by Mr. Keffer. |
[THIS PAGE INTENTIONALLY LEFT BLANK]

ITEM 2. CODE OF ETHICS.
| (a) | As of the end of the period covered by this report, Forum Funds (the “Registrant”) has adopted a code of ethics, which applies to its Principal Executive Officer and Principal Financial Officer (the “Code of Ethics”). |
| (c) | There have been no amendments to the Registrant’s Code of Ethics during the period covered by this report. |
| (d) | There have been no waivers to the Registrant’s Code of Ethics during the period covered by this report. |
(f) (1) A copy of the Code of Ethics is being filed under Item 12(a) hereto.
ITEM 3. AUDIT COMMITTEE FINANCIAL EXPERT.
The Board of Trustees has determined that no member of the Audit Committee is an "audit committee financial expert" as that term is defined under applicable regulatory guidelines.
ITEM 4. PRINCIPAL ACCOUNTANT FEES AND SERVICES.
(a) Audit Fees - The aggregate fees billed for each of the last two fiscal years (the “Reporting Periods”) for professional services rendered by the Registrant’s principal accountant for the audit of the Registrant’s annual financial statements, or services that are normally provided by the principal accountant in connection with the statutory and regulatory filings or engagements for the Reporting Periods, were $14,000 in 2012 and $14,500 in 2013.
(b) Audit-Related Fees – The aggregate fees billed in the Reporting Periods for assurance and related services rendered by the principal accountant that were reasonably related to the performance of the audit of the Registrant’s financial statements and are not reported under paragraph (a) of this Item 4 were $0 in 2012 and $0 in 2013.
(c) Tax Fees - The aggregate fees billed in the Reporting Periods for professional services rendered by the principal accountant to the Registrant for tax compliance, tax advice and tax planning were $3,000 in 2012 and $3,000 in 2013. These services consisted of review or preparation of U.S. federal, state, local and excise tax returns.
(d) All Other Fees - The aggregate fees billed in the Reporting Periods for products and services provided by the principal accountant to the Registrant, other than the services reported in paragraphs (a) through (c) of this Item, were $0 in 2011 and $0 in 2012.
(e) (1) The Audit Committee reviews and approves in advance all audit and “permissible non-audit services” (as that term is defined by the rules and regulations of the Securities and Exchange Commission) to be rendered to a series of the Registrant (each, a “Series”). In addition, the Audit Committee reviews and approves in advance all “permissible non-audit services” to be provided to an investment adviser (not including any sub-adviser) of a Series, or an affiliate of such investment adviser, that is controlling, controlled by or under common control with the investment adviser and provides on-going services to the Registrant (“Affiliate”), by the Series’ principal accountant if the engagement relates directly to the operations and financial reporting of the Series. The Audit Committee considers whether fees paid by a Series’ investment adviser or an Affiliate to the Series’ principal accountant for audit and permissible non-audit services are consistent with the principal accountant’s independence.
(e) (2) No services included in (b) - (d) above were approved pursuant to paragraph (c)(7)(i)(C) of Rule 2-01 of Regulation S-X.
(f) Not applicable
(g) The aggregate non-audit fees billed by the principal accountant for services rendered to the Registrant for the Reporting Periods were $0 in 2012 and $0 in 2013. There were no fees billed in either of the Reporting Periods for non-audit services rendered by the principal accountant to the Registrant’s investment adviser or any Affiliate.
(h) During the Reporting Period, the Registrant's principal accountant provided no non-audit services to the investment advisers or any entity controlling, controlled by or under common control with the investment advisers to the series of the Registrant to which this report relates.
ITEM 5. AUDIT COMMITTEE OF LISTED REGISTRANTS.
Not applicable.
ITEM 6. INVESTMENTS.
| (a) | Included as part of report to shareholders under Item 1. |
ITEM 7. DISCLOSURE OF PROXY VOTING POLICIES AND PROCEDURES FOR CLOSED-END
MANAGEMENT INVESTMENT COMPANIES.
Not applicable.
ITEM 8. PORTFOLIO MANAGERS OF CLOSED-END MANAGEMENT INVESTMENT COMPANIES.
Not applicable.
ITEM 9. PURCHASES OF EQUITY SECURITIES BY CLOSED-END MANAGEMENT INVESTMENT COMPANY AND AFFILIATED PURCHASERS.
Not applicable.
ITEM 10. SUBMISSION OF MATTERS TO A VOTE OF SECURITY HOLDERS
The Registrant does not accept nominees to the board of trustees from shareholders.
ITEM 11. CONTROLS AND PROCEDURES
(a) The Registrant’s Principal Executive Officer and Principal Financial Officer have concluded that the Registrant’s disclosure controls and procedures (as defined in Rule 30a-3(c) under the Investment Company Act of 1940 (the “Act”)) are effective, based on their evaluation of the controls and procedures required by Rule 30a-3(b) under the Act and Rules 13a-15(b) or 15d-15(b) under the Securities Exchange Act of 1934, as of a date within 90 days of the filing date of this report.
(b) There were no changes in the Registrant’s internal control over financial reporting (as defined in Rule 30a-3(d) under the Act) that occurred during the second fiscal quarter of the period covered by this report that have materially affected, or are reasonably likely to materially affect, the Registrant’s internal control over financial reporting.
ITEM 12. EXHIBITS.
(a)(1) Code of Ethics (Exhibit filed herewith).
(a)(2) Certifications pursuant to Rule 30a-2(a) of the Act, and Section 302 of the Sarbanes-Oxley Act of 2002. (Exhibits filed herewith)
(a)(3) Not applicable.
(b) Certifications pursuant to Rule 30a-2(b) of the Act, and Section 906 of the Sarbanes-Oxley Act of 2002. (Exhibit filed herewith)
SIGNATURES
Pursuant to the requirements of the Securities Exchange Act of 1934 and the Investment Company Act of 1940, the Registrant has duly caused this report to be signed on its behalf by the undersigned, thereunto duly authorized.
Registrant Forum Funds
| | | |
| By: | /s/ Stacey E. Hong | |
| | Stacey E. Hong, Principal Executive Officer | |
| | | |
| Date: | December 23, 2013 | |
| | | |
Pursuant to the requirements of the Securities Exchange Act of 1934 and the Investment Company Act of 1940, this report has been signed below by the following persons on behalf of the Registrant and in the capacities and on the dates indicated.
| | | |
| By: | /s/ Stacey E. Hong | |
| | Stacey E. Hong, Principal Executive Officer | |
| | | |
| Date: | December 23, 2013 | |
| | | |
| | | |
| By: | /s/ Karen Shaw | |
| | Karen Shaw, Principal Financial Officer | |
| | | |
| Date: | December 23, 2013 | |
| | | |