As filed with the Securities and Exchange Commission on June 5, 2014
UNITED STATES
SECURITIES AND EXCHANGE COMMISSION
WASHINGTON, D.C. 20549
FORM N-CSR
CERTIFIED SHAREHOLDER REPORT OF REGISTERED MANAGEMENT
INVESTMENT COMPANIES
Investment Company Act file number 811-03023
FORUM FUNDS
Three Canal Plaza, Suite 600
Portland, Maine 04101
Stacey E. Hong, Principal Executive Officer
Three Canal Plaza, Suite 600
Portland, Maine 04101
207-347-2000
Date of fiscal year end: March 31
Date of reporting period: April 1, 2013 – March 31, 2014
ITEM 1. REPORT TO STOCKHOLDERS.
The views in this report were those of Absolute Strategies Fund and Absolute Opportunities Fund’s (each a “Fund” and collectively the “Funds”) adviser as of March 31, 2014, and may not reflect their views on the date this report is first published or any time thereafter. These views are intended to assist shareholders in understanding their investment in the Funds and do not constitute investment advice. None of the information presented should be construed as an offer to sell or recommendation of any security mentioned herein.
Since the Funds utilize multi-manager strategies with multiple sub-advisers, they may be exposed to varying forms of risk. These risks include, but are not limited to, general market risk, multi-manager risk, non-diversification risk, small company risk, foreign risk, interest rate risk, credit risk, prepayment risk, IPO risk, liquidity risk, high turnover risk, leverage risk, pooled investment vehicle risk and derivatives risk. For a complete description of the Funds’ principal investment risks, please refer to each Fund’s prospectus.
Beta is a measure of an asset’s sensitivity to broad market moves, as measured for instance by the S&P 500® Index. A fund with a realized beta of 0.5 with respect to the S&P 500®Index infers that about 50% of the fund’s returns were explained by the performance of the index (the rest of the performance was independent of the index). Standard deviation indicates the volatility of a fund’s total returns and is useful because it identifies the spread of a fund’s short-term fluctuations. The HFR Indices are equally weighted performance indexes, utilized by numerous hedge fund managers as a benchmark for their own hedge funds. One cannot invest directly in an index.
Absolute Opportunities Fund, Absolute Strategies Fund, Absolute Funds, and Absolute Investment Advisers are registered service marks of Absolute Investment Advisers LLC (“AIA” and “Absolute”) and the respective logos are service marks of AIA; and other marks referred to herein are the trademarks, service marks or registered trademarks of their respective owners.
| |
ABSOLUTE STRATEGIES FUND A MESSAGE TO OUR SHAREHOLDERS MARCH 31, 2014 |
| |
Dear Shareholder,
We are pleased to present the annual report for the Absolute Strategies Fund (the “Fund”) for the 12 month period ended March 31, 2014 (the “Period”). The Fund (Institutional Shares) returned -2.05% for the Period, versus 21.86% for the S&P 500 Index (“S&P 500”) and 4.63% for the HFRX Global Hedge Fund Index.
Fund performance over the last year was a result of having defensive overall positioning. Fund assets were allocated to target very low net exposures. Fund beta to equity indices, bond indices, and hedge fund indices was purposely low and, at times, negative.
The Fund has been positioned defensively based on the belief that low economic growth globally and low cash flow/earnings growth for companies should result in an environment best suited for fundamental stock/bond pickers and those focused on avoiding risk. Instead, low economic growth, low earnings growth, valuation, and fundamentals as a whole seemed to have been mostly ignored during the year. Macro investing, speculation, and, ultimately, momentum seem to have dominated asset prices. The Fund was geared towards fundamentals in a year when fundamentals didn’t seem to matter very much. We firmly believe that long-term equity market valuations are double historical averages and at levels that have only been met 3 other times in history: 1929, 2000, and 2007. Periods of highly correlated, short-term equity rallies in over-valued markets have not been kind to investors. As such, positioning the Fund to participate in such rallies would put it at risk of failing to achieve its objectives of avoiding large drawdowns and permanent loss of capital. These points are further analyzed in the philosophy and outlook section of this letter.
The Fund is designed with a high degree of flexibility to take a patient and conservative stance if we see the potential for significant losses in financial markets. The willingness and discipline to hedge and/or vary capital at risk to a substantial degree is just one thing that we believe separates the Fund from most mutual funds and many hedge funds. We believe investors, like the Fund, who are concerned about long-term diversification will ultimately be greatly rewarded for their patience.
We currently allocate the Fund’s assets to eleven subadvisers (managers) that utilize twelve strategies. As of March 31, 2014, we allocated approximately 98% of the Fund’s assets; the remaining 2% was held in cash for future allocations and rebalancing. Allocations to manager strategies were highly focused as of the Period end. The top five manager allocations made up almost 75% of Fund assets. The largest allocation to a single manager strategy was approximately 18% and the smallest was approximately 1%.
While conservative overall, the Fund has had significant long and short exposures. These exposures are achieved through a mix of equity, credit (or fixed income), and arbitrage strategies. It is important to note that we do not allocate to fill a strategy bucket. We view each manager strategy as unique and vary the Fund’s allocations to achieve its objective of providing risk-adjusted performance. Equity, credit, and arbitrage strategies are currently the predominant Fund exposures; however, it is likely that the Fund will have different exposures over time as manager positions evolve.
Convertible arbitrage strategies made up approximately 20% of Fund assets as of March 31st. This included a mix of hedged income, credit, and volatility trading designed to generate moderate but consistent returns in the current environment. During the Period, these strategies generated single low digit returns on a net basis.
Credit strategies made up approximately 12% of Fund assets as of March 31st. This area is largely focused on asset-backed and non-agency residential mortgage backed securities. The Fund had very little corporate credit exposure given a lack of distressed securities and the fact that bond yields are near all-time lows. During the Period, these strategies generated returns in the high single digits.
Allocations to equity related strategies made up approximately 63% of Fund assets as of March 31st. This included long/short strategies, opportunistic equity strategies, special situations strategies, and a portfolio hedge. During the Period, these strategies produced a small aggregate loss in the low single digits. Over the past year, this group had a balance of both long and short positions. At times, the mix was even net short. The long equity
| |
ABSOLUTE STRATEGIES FUND A MESSAGE TO OUR SHAREHOLDERS MARCH 31, 2014 |
| |
portfolio is largely made up of large-cap companies within consumer staples, health care, and (legacy) technology companies. These are companies with strong brand names and competitive advantages. The short equity portfolio is largely made up of small-cap, cyclical, and financial companies (specifically those in Europe & Asia). These are companies that are trading at high valuations and/or are dependent on a high level of economic growth.
The biggest challenge to Fund performance has been on the short side. During the period, the Fund’s long investments have performed consistent with our expectations, but below market levels due to the factors that have dominated asset prices noted above. The Fund has maintained a significant amount of short equity exposure, including short equity market futures, in large part because that is where we believe the largest mis-pricings to exist. This is similar to the approach we took leading up to 2008. However, back then roughly 30% of the Fund’s assets were allocated to equity market neutral strategies with an additional 15% allocated to opportunistic long strategies that were hedged using an overlay strategy. Currently, we have removed all of our market neutral strategies and instead have increased our allocations to concentrated opportunistic long strategies (stock pickers) that we manage using an equity market futures overlay strategy. We believe the Fund’s current positioning creates a similar overall net exposure to the concentrated opportunistic long strategies group as it had in 2008. The reason for this approach is that market neutral strategies are highly static and performance has not met our expectations due to crowded, quantitative positioning and low interest rates. Instead, we believe exposures that are more dynamic and fundamentally driven provide the Fund with a more asymmetric risk profile focused around valuation arbitrage and added liquidity.
With respect to the overlay strategy, during periods of excessive over-valuation or under-valuation in markets, we may utilize futures positions or other securities to provide added long exposure (under-valued markets) or short exposure (over-valued markets). This may result in the Fund having slightly more or less net exposure than usual, including the potential for certain areas of the Fund to have a slight net short bias which could have a negative or positive impact on performance when segments of the market are extremely overvalued or undervalued. Overall the Fund has a positive net exposure although it had a slight net short bias in equity sensitive investments as of March 31, 2014.
Additionally, the Fund has added allocations to several new managers that also have more flexibility to vary their net exposures between defensive (more short), or aggressive (more long). Those managers are also currently positioned defensively. The difference in the Fund’s performance during the Period vs. prior periods of defensive positioning is the lack of divergence in prices of companies with positive vs. negative fundamentals. The recent share price appreciation of many of the companies in the Fund’s short portfolio makes little sense to us given the multitude of data points that historically would have sent prices lower, e.g. missed revenue/earnings targets, negative guidance, and low or flat or negative earnings growth. However, we believe these divergences are likely to correct over the completion of the current market cycle and the Fund’s performance will likely benefit.
Going forward, we could throw in the towel and cut the Fund’s short exposure in hopes of generating slightly better short term results. Many hedge funds appear to have done just that. Yet doing so would run counter to our investment philosophy and everything that has allowed the Fund to achieve its objectives since its inception. Thus, we remain steadfast in our disciplined approach which we believe will produce solid risk-adjusted performance over a full market cycle.
The Fund’s overall positioning is not meant to express a one-way directional bet on the markets. We believe it is designed to benefit from a convergence in price and valuation and between the long and short exposures. We believe this convergence will be driven by a renewed focus on asset-specific or company-specific fundamentals versus the focus on market momentum which seems to have driven market performance more recently.
It has been disappointing to watch the price and valuation gap between long and short positions widen over the last year. This is especially true considering many of the underlying fundamentals (low economic growth, low earnings growth and valuation) played out the way we thought they would. Given the foregoing, however, we are more excited about the portfolio. We believe that the potential for both absolute and relative performance is greater now than a year ago. We also expect the current lineup of managers to provide the Fund with added
| |
ABSOLUTE STRATEGIES FUND A MESSAGE TO OUR SHAREHOLDERS MARCH 31, 2014 |
| |
flexibility and a larger range of net exposures. This would include a much more aggressive profile and higher net exposure should equity and credit market volatility pick up and valuations move closer to historical averages.
Philosophy and Outlook
One of our Subadviser’s portfolio managers, Robert Mark, recently wrote a quarterly letter highlighting how “groupthink” has caused many a seasoned professional to follow each other off a cliff toward bad decisions. Many studies have been done over the years illustrating how group pressure can alter opinion or even obvious facts. Robert highlights one study in particular by Solomon Asch, a social psychologist, who was well known for conformity experiments. In 1951, Asch brought together a group of students in a study and asked them to solve a set of problems. These were simple problems with obvious answers, such as whether or not two lines were the same length. However, several of the students were actors hired by Asch and their job was to purposely give the wrong answers in front of their peers to see if it would sway the students’ opinions. Asch repeated the study with varying numbers of actor-students calling out the wrong answers. As a result, just one in four of the students consistently gave the right answer when their acting peers disagreed with them.
When everyone around gives an obviously wrong answer, many people tend to second-guess themselves for fear of embarrassment. Our natural desire to conform can undermine our rationality.
We believe a similar phenomenon is affecting the investment community, and it’s as though the actor-peers that Solomon Asch used for this studies are influencing the community’s view of the status quo. In support of our belief we have assembled a modest list of simple yet meaningful facts that are rarely discussed in public by the investing community. The following items may not be as obvious as whether or not two lines are the same length, but they should give pause to a reasonable person, who possesses a moderate understanding of finance and investing, as to whether the current market environment is divorced from fundamentals.
Corporate Earnings and Valuation:
Global equity operating earnings peaked in 2011, yet the MSCI World Equity Index rose almost 50% from 2011-2013 on no earnings growth.
S&P 500 operating earnings grew a cumulative total of 10% from 2011-2013 (expectations were for 36% growth), yet the index gained almost 55% over that time.
Russell 2000 operating earnings fell nearly 20% from 2011-2013 (expectations were for 100% growth), yet the index gained 60% over that time. The Russell 2000 operating P/E ratio is near 50 and the GAAP P/E is over 80. (Note: most published results of the Russell 2000 P/E ratio, such as iShares IWM ETF, now exclude companies with negative earnings and cap all other P/E ratios at 60 in an effort to make the index appear more reasonably valued).
The Shiller cyclically-adjusted P/E ratio of the S&P 500 recently reached 26, a level that has only been met 3 other times in over 130 years of data, 1929, 2000, and 2007; each peak preceded at least a 50% decline in the S&P 500.
Except for the 2000 peak, each of the Price/Sales ratio and Price/EBITDA ratio of the S&P 500 is the highest in history and double the historical average despite historically low growth for revenue and earnings.
Corporate profit margins have always been cyclical and have averaged 6% since 1950. If the S&P 500 profit margin reverted to 6% and maintained a Price to Earnings ratio of 15, the price of the S&P 500 based on current revenue would be around 1000; at a 7% margin it would be around 1150. The price of the S&P 500 as of March 31 was 1872.
| |
ABSOLUTE STRATEGIES FUND A MESSAGE TO OUR SHAREHOLDERS MARCH 31, 2014 |
| |
Economic and Macro Data:
China’s banking assets total $25 trillion and represent 33% of all Global GDP, higher than both Japan and the US at their respective bubble peaks. China credit growth has accounted for more than $15 trillion of the $30 trillion in worldwide credit growth since 2008. To put this in perspective, US subprime totaled $1.2 trillion.
China and Emerging Markets have been the main drivers of economic growth since 2009. Growth has slowed dramatically since 2010 while debt levels have surged. The latest Markit PMI Index for Emerging Markets signaled near-stagnation conditions bordering on contraction.
45% of global imports flow through China and Emerging Markets compared to only 14% for U.S.
Real U.S. GDP growth was only 1.9% in 2013, which was actually lower than 2012’s growth rate. The U.S. has been operating with $1 trillion budget deficits augmented by $1 trillion in Fed monetary liquidity to create about $300 billion in annual economic growth.
Despite claims that the U.S. economy is going to reach sustained GDP growth of 3-4%, U.S. real GDP growth has only been 3% or higher in just 2 out of the past 13 years; both of which occurred during the housing bubble. The average growth rate of the U.S. economy since 1999 has been 1.9%, or right where we are now, even with tremendous stimulus. Q1 2014 GDP growth was near 0%.
Speculative and Miscellaneous concerns
NYSE margin debt is at historic highs and well beyond 2000 and 2007 peaks. U.S. Covenant Lite and PIK lending have surged well beyond 2006-2007 levels.
Many internet, biotech and technology stocks are trading at 1999 dot.com levels. Over the past 6 months, 74% of companies doing IPOs have no earnings, the highest level since March 2000.
The Federal Reserve (“Fed”) has said Quantitative Easing helps to keep interest rates low, yet the yield on the U.S. 10-yr note doubled from July 2012 to December 2013. The Bankrate.com 30-yr mortgage rate rose from 3.4% to 4.5% in 2013.
According to Dallas Fed President Fisher, by the end of QE3 the Fed will hold more than 40% of the mortgage-backed securities (“MBS”) market and almost 25% of outstanding Treasuries. With the decline in mortgage supply, the Fed’s QE is absorbing 85% of fixed-rate MBS issuance; the fall in net MBS supply is outpacing the taper.
Greece, an economy on the verge of bankruptcy with debt to GDP of 175% and a 27% unemployment rate, recently issued 5-yr bonds with a coupon of 4.75%, and a yield of 4.95%. Spain’s 5-yr yield has fallen to parity with both US and UK equivalents (Spanish GDP has not recovered and growth has been negative, unemployment is over 25%, house prices are down 30% and loan delinquencies are over 13%).
The correlation of the HFRI Equity Hedge Index to the Russell 2000 is 90%. The correlation of the HFRI Fund of Funds Index to the S&P 500 is over 80%. Both indices have become more sensitive to equity market beta as the market has become more expensive.
We believe the above facts are very important. There’s no need to defend or object to them because they are basic facts (although we are sure readers will be surprised by many of them). Yet, despite these facts, investor sentiment appears to be uniformly bullish. Overall, however, we believe financial markets have spent the past couple of years discounting a future economic and earnings environment that remains unfulfilled and may now be well out of reach. As suggested above, in our view it’s not a stretch to place fair value on the S&P 500 around 1000. That doesn’t mean the market needs to drop there immediately, but we believe it does mean that the market has already priced in an incredible future scenario.
| |
ABSOLUTE STRATEGIES FUND A MESSAGE TO OUR SHAREHOLDERS MARCH 31, 2014 |
| |
We continue to be amazed by the counterintuitive desire to go long risk in overvalued markets, yet shun risk when markets are undervalued; for so-called “hedge” funds to be doing this is extraordinary. Not only do we see investor preference for risky assets, investors are choosing investments, including higher-beta hedge funds, which have been highly correlated with a market advance devoid of fundamental reasoning. In effect, investors are choosing the highest point in the market cycle to take on aggressive allocations after avoiding aggressive tactics near the low point of the market cycle. From our point of view, this can only be explained by the fear of non-conformity. We view this environment, in which markets are heavily influenced by central bank determinations and QE inspirations, as very fragile and ultimately unsustainable.
Along with other well respected investment managers, we believe in order to achieve investment success over time you must be able to take on non-consensus and sometimes uncomfortable ideas. Most money managers and asset allocators never need to worry about “looking” wrong because they are either passive or they hug a benchmark. Unfortunately for their investors, not looking wrong has absolutely nothing to do with investment risk or avoiding large losses. This ultimately defines our willingness to be uncomfortable and not take the same actions as everyone else. Understanding that the financial industry is currently built on conformity vs. rationality gives us tremendous optimism. The short term periods when are Fund zigs and the overall market zags is exactly what is required for diversification to work over a full market cycle. When the reverse is true, as it has been in the past, our Fund’s performance will likely provide returns that are equally impressive. Given the very high correlations of both traditional and alternative investments to equity markets, we believe the Fund may be one of a very few things in a portfolio that provide real and meaningful diversification.
Sincerely,
Jay Compson
Portfolio Manager
Absolute Investment Advisers LLC
Sources:
St. James Investment Company LLC, Bloomberg, Zero Hedge, Dallas Federal Reserve, yale.edu/shiller, Federal Reserve Bank of St. Louis, iShares.com, Longhorn Capital, U.S. Treasury, Wall Street Journal
| |
ABSOLUTE OPPORTUNITIES FUND A MESSAGE TO OUR SHAREHOLDERS MARCH 31, 2014 |
| |
Dear Shareholder,
We are pleased to present the annual report for the Absolute Opportunities Fund (the “Fund”) for the year ended March 31, 2014 (the “Period”). As a reminder, the Fund was created to access a concentrated number of market inefficiencies and securities mis-pricings and is designed to complement the Absolute Strategies Fund. Many of the Fund’s positions are catalyst or event driven and, at times, may include highly contrarian investments. As such, the Fund is not intended to perform in line with other asset classes. The Fund returned -5.16% over the Period versus 21.86% for the S&P 500 Index and 4.63% for the HFRX Global Hedge Fund Index.
Fund performance over the last year was a result of having significant short exposure during a time when equity and credit (or fixed income) markets went up despite a multitude of data points that historically would have sent prices lower, e.g. missed revenue/earnings targets, negative guidance, low or flat or negative earnings growth. The Fund’s short credit instruments experienced a negative carry, which was largely responsible for the Fund’s loss. We believe the Fund’s long investments performed quite well, however, due to the low beta nature of the Fund’s long portfolio, returns were less than market indices.
To best understand Fund performance and Fund exposures, we believe it is helpful to think of the Fund as having experienced two distinct periods over its history.
2008 (Inception) - 2011
We designed the Fund in early 2008 based on the premise that financial markets were likely to experience some kind of distressed credit environment. The Fund’s original investment manager (“Subadviser”) line-up was geared toward managers with particular expertise in distressed debt, special situations (re-capitalizations, re-organizations), and investing in highly leveraged companies based on in-depth analyses of their capital structures.
The Fund also included Subadvisers whose strategies could take advantage of expected equity market volatility.
That distressed environment did materialize for a period of time and the Fund took advantage of a number of opportunities in both the equity and credit markets while many other managers of “alternative” strategies appeared to be sitting on the sidelines. Most of these opportunities occurred on the long side, resulting in strong performance from inception in October of 2008 through December of 2011 with the Fund returning 29.81% versus 11.47% and 1.21% for the S&P 500 Index and the HFRX Global Hedge Fund Index, respectively. The Fund’s beta to the S&P 500 during that period was just 0.15 highlighting the unique nature of the Fund’s returns.
2012 - Present
This period represents a much different market environment. By 2011, we believe it was clear that a combination of government stimulus (monetary & fiscal) and accounting rule changes effectively ended the distressed cycle much earlier than would have otherwise occurred. Many debts were refinanced, amended, and/or extended rather than being allowed to default. As a result, we were forced us to re-think the Fund’s roster of Subadvisers and shift Fund allocations to achieve what we believe to be a more balanced long and short positioning.
During 2012 – 2013, the Fund did not have a significant long bias and we found it difficult to generate meaningful performance for the Fund. In those years, high beta was rewarded and short exposures were punished. In fact, short exposures suffered despite deteriorating fundamentals for many companies.
Recently we have chosen to maintain that balance of long and short investments rather than throw in the towel on the short side. Indeed, we believe that the largest mis-pricings in the Fund at this point, and therefore the most attractive opportunities, are in the Fund’s short investments. Thus, we think the Fund’s collection of longs and shorts represents a highly unique portfolio that has the ability to generate solid risk-adjusted performance over the next few years without relying on market beta.
| |
ABSOLUTE OPPORTUNITIES FUND A MESSAGE TO OUR SHAREHOLDERS MARCH 31, 2014 |
| |
The Fund’s long investments are largely made up of a concentrated group of special situations equities (selected by Pine Cobble Capital & Sabal Capital). Special situations in which companies may find themselves include those that are a result of a capital structure change (e.g. spin-off), a company operational change (e.g. MLP conversion). A misunderstood company with a unique business prospect (e.g. new product launch) may also be considered a special situations company. Such special situation companies tend to be lower beta investments that don’t necessarily track the equity markets in up or down periods.
The Fund’s short investment strategies are largely dominated by a short-biased investment grade credit strategy (implemented by LakeWater Capital). The Fund also achieves short exposure through an equity market futures overlay strategy. The short-biased investment grade credit strategy has been discussed at length in previous commentaries. As a reminder, it is focused on a highly concentrated group of positions where LakeWater Capital believes there is a mismatch between the credit spread and balance sheet risk of an issuer company. The Fund’s allocation to this strategy has increased significantly over the past few years as credit spreads have narrowed despite balance sheet risk actually going up in some cases. Simply put, we’ve increased the allocation as these mismatches have grown. With respect to the overlay strategy, during periods of excessive over-valuation or under-valuation in markets, we may utilize futures positions or other securities to provide added long exposure (under-valued markets) or short exposure (over-valued markets). This may result in the Fund having slightly more or less net exposure than usual, including the potential for certain areas of the Fund to have a slight net short bias which could have a negative or positive impact on performance when segments of the market are extremely overvalued or undervalued. The Fund currently has a slight net short bias in equity sensitive investments. The Fund also utilizes a long/short strategy (managed by Harvest Capital) focused on agricultural related companies. We think this strategy is attractive because of longer-term secular tailwinds that we believe will propel the agriculture industry and because near-term supply chain dynamics create shorter-term dislocations. Again, this is a lower beta strategy that we believe will do well over time but not necessarily keep up with rising equity markets.
We continue to look for ways to improve Fund exposures and performance. As always, our analysis will be based on an investment approach of sourcing mis-priced securities, long and short. It won’t be based on momentum or guessing on market direction or simply on what worked over the last 6 or 12 months.
As a result, our approach will likely lead the Fund to have performance that looks very different from many other investment funds. At times that may appear great. At times that may feel disappointing. Over a long period of time, however, we believe the Fund will generate solid risk-adjusted returns and help diversify investor portfolios.
Sincerely,
Jay Compson
Portfolio Manager
Absolute Investment Advisers LLC
| |
ABSOLUTE STRATEGIES FUND PERFORMANCE CHART AND ANALYSIS (Unaudited) MARCH 31, 2014 |
| |
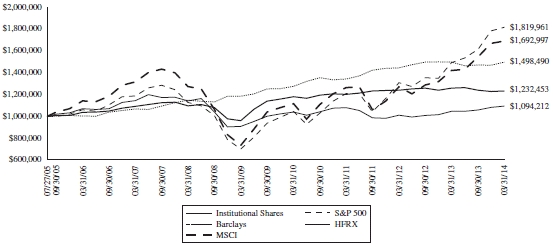
The following charts reflect the change in the value of a hypothetical $1,000,000 investment in Institutional Shares and a $250,000 investment in R Shares, including reinvested dividends and distributions, in Absolute Strategies Fund (the “Fund”) compared with the performance of the benchmarks, the S&P 500 Index ("S&P 500"), Barclays Capital U.S. Aggregate Bond Index ("Barclays Index"), the HFRX Global Hedge Fund Index ("HFRX") and the MSCI World Index ("MSCI World"), since inception. The S&P 500 is a broad-based, unmanaged measurement of changes in stock market conditions based on the average of 500 widely held common stocks. The Barclays Index covers the U.S. dollar-denominated, investment-grade, fixed-rate, taxable bond market of SEC-registered securities. The HFRX is designed to be representative of the overall composition of the hedge fund universe; it is comprised of eight strategies - convertible arbitrage, distressed securities, equity hedge, equity market neutral, event driven, macro, merger arbitrage, and relative value arbitrage. The strategies are asset-weighted based on the distribution of assets in the hedge fund industry. The MSCI World measures the performance of a diverse range of 24 developed countries' stock markets including the United States, Canada, Europe, the Middle East and the Pacific. The total return of the indices include the reinvestment of dividends and income. The total return of the Fund includes operating expenses that reduce returns, while the total return of the indices do not include expenses. The Fund is professionally managed while the indices are unmanaged and are not available for investment.
Comparison of Change in Value of a $1,000,000 Investment
Institutional Shares vs. S&P 500 Index, Barclays Capital U.S. Aggregate Bond Index,
HFRX Global Hedge Fund Index and MSCI World Index
| Average Annual Total Return as of 03/31/14 | | One Year | | Five Years | | Commencement of Investment Operations 07/27/05 |
| Absolute Strategies Fund - Institutional Shares | | -2.05% | | 5.12% | | 2.44% |
| S&P 500 Index | | 21.86% | | 21.16% | | 7.15% |
| Barclays Capital U.S. Aggregate Bond Index | | -0.10% | | 4.80% | | 4.77% |
| HFRX Global Hedge Fund Index | | 4.63% | | 3.82% | | 1.04% |
| MSCI World Index | | 19.07% | | 18.28% | | 6.26% |
| |
ABSOLUTE STRATEGIES FUND PERFORMANCE CHART AND ANALYSIS (Unaudited) MARCH 31, 2014 |
| |
Comparison of Change in Value of a $250,000 Investment
R Shares vs. S&P 500 Index, Barclays Capital U.S. Aggregate Bond Index,
HFRX Global Hedge Fund Index and MSCI World Index
| Average Annual Total Return as of 03/31/14 | | One Year | | Five Years | | Commencement of Investment Operations 07/27/05 |
| Absolute Strategies Fund - R Shares | | -2.05% | | 4.66% | | 2.02% |
| S&P 500 Index | | 21.86% | | 21.16% | | 7.15% |
| Barclays Capital U.S. Aggregate Bond Index | | -0.10% | | 4.80% | | 4.77% |
| HFRX Global Hedge Fund Index | | 4.63% | | 3.82% | | 1.04% |
| MSCI World Index | | 19.07% | | 18.28% | | 6.26% |
Performance data quoted represents past performance and is no guarantee of future results. Current performance may be lower or higher than the performance data quoted. Investment return and principal value will fluctuate so that shares, when redeemed, may be worth more or less than original cost. For the most recent month-end performance, please call (888) 992-2765. As stated in the Fund's prospectus, the annual operating expense ratios (gross) for Institutional Shares and R Shares are 2.47% and 2.87%, respectively. Excluding the effect of expenses attributable to dividends and interest on short sales, the Fund’s total annual operating expense ratios would be 1.74% and 2.14% for Institutional Shares and R Shares, respectively. However, the Fund's adviser has agreed to contractually reduce its advisory fee to 1.55% on average net assets exceeding $4.5 billion but less than $5 billion and to 1.50% on the average net assets exeeeding $5 billion through July 31, 2015. The performance table and graph do not reflect the deduction of taxes that a shareholder would pay on Fund distributions or the redemption of Fund shares. Returns greater than one year are annualized.
| |
ABSOLUTE OPPORTUNITIES FUND PERFORMANCE CHART AND ANALYSIS (Unaudited) MARCH 31, 2014 |
| |
The following charts reflect the change in the value of a hypothetical $1,000,000 investment in Institutional Shares, including reinvested dividends and distributions, in the Absolute Opportunities Fund (the “Fund”) compared with the performance of the benchmarks, the S&P 500 Index ("S&P 500"), HFRX Global Hedge Fund Index ("HFRX"), and the MSCI World Index ("MSCI World"), since inception. The S&P 500 is a broad-based, unmanaged measurement of changes in stock market conditions based on the average of 500 widely held common stocks. The HFRX is designed to be representative of the overall composition of the hedge fund universe; it is comprised of eight strategies - convertible arbitrage, distressed securities, equity hedge, equity market neutral, event driven, macro, merger arbitrage, and relative value arbitrage. The strategies are asset-weighted based on the distribution of assets in the hedge fund industry. The MSCI World measures the performance of a diverse range of 24 developed countries' stock markets including thet United States, Canada, Europe, the Middle East and the Pacific. The total return of the indices include the reinvestment of dividends and income. The total return of the Fund includes operating expenses that reduce returns, while the total return of the indices do not include expenses. The Fund is professionally managed while the indices are unmanaged and are not available for investment.
Comparison of Change in Value of a $1,000,000 Investment
Absolute Opportunities Fund vs. S&P 500 Index,
HFRX Global Hedge Fund Index and MSCI World Index
| Average Annual Total Return as of 03/31/14 | | One Year | | Five Years | | Commencement of Investment Operations 10/21/08 |
| Absolute Opportunites Fund - Institutional Shares | | -5.16% | | 3.14% | | 3.98% |
| S&P 500 Index | | 21.86% | | 21.16% | | 15.71% |
| HFRX Global Hedge Fund Index | | 4.63% | | 3.82% | | 2.28% |
| MSCI World Index | | 19.07% | | 18.28% | | 12.94% |
Performance data quoted represents past performance and is no guarantee of future results. Current performance may be lower or higher than the performance data quoted. Investment return and principal value will fluctuate so that shares, when redeemed, may be worth more or less than original cost. For the most recent month-end performance, please call (888) 992-2765. As stated in the Fund's prospectus, the annual operating expense ratio (gross) is 4.00%. Excluding the effect of expenses attributable to dividends and interest on short sales, the Fund’s total annual operating expense ratio would be 3.01%. However, the Fund's adviser has agreed to contractually waive a portion of its fees and to reimburse expenses to limit total annual operating expenses to 1.95% (excluding all interest, taxes, portfolio transaction expenses, dividends and interest on short sales, acquired fund fees and expenses, proxy expenses, and extraordinary expenses), for the period January 1, 2014 to August 1, 2015. The performance table and graph do not reflect the deduction of taxes that a shareholder would pay on Fund distributions or the redemption of Fund shares. Returns greater than one year are annualized.
| |
ABSOLUTE STRATEGIES FUND PORTFOLIO HOLDINGS SUMMARY (Unaudited) MARCH 31, 2014 |
| |
| Portfolio Breakdown (% of Net Assets) |
| Long Positions |
| Equity Securities | 37.6% | |
| Asset Backed Obligations | 6.5% | |
| Corporate Convertible Bonds | 17.7% | |
| Corporate Non-Convertible Bonds | 2.6% | |
| Exchange Traded Notes | 0.0% | |
| Foreign Government Bonds | 0.0% | |
| Interest Only Bonds | 0.1% | |
| Municipal Bonds | 0.5% | |
| Municipal Demand Notes | 0.1% | |
| Syndicated Loans | 0.1% | |
| U.S. Government & Agency Obligations | 1.0% | |
| Rights | 0.0% | |
| Investment Companies | 9.1% | |
| Short-Term Investments | 0.3% | |
| Purchased Options | 1.6% | |
| Short Positions |
| Equity Securities | -27.6% | |
| Investment Companies | -1.5% | |
| Written Options | -1.1% | |
| Other Assets less Liabilities* | 53.0% | |
| | 100.0% | |
| * | Consists of deposits with the custodian and/or brokers for securities sold short, cash, foreign currency, prepaid expenses, receivables, payables and accrued liabilities. Deposits with the custodian and/or brokers for securities sold short represents 40.1% of net assets. See Note 2. |
| | (% of Equity Holdings) |
| Sector Breakdown | Long | Short |
| Consumer Discretionary | 17.1% | 20.8% | |
| Consumer Staples | 22.1% | 5.1% | |
| Energy | 9.1% | 2.2% | |
| Financial | 16.7% | 30.3% | |
| Healthcare | 7.7% | 2.9% | |
| Industrial | 5.4% | 20.6% | |
| Information Technology | 11.1% | 9.8% | |
| Materials | 3.7% | 4.3% | |
| Telecommunication Services | 6.9% | 4.0% | |
| Utilities | 0.2% | 0.0% | |
| | 100.0% | 100.0% | |
| |
ABSOLUTE STRATEGIES FUND SCHEDULE OF INVESTMENTS MARCH 31, 2014 |
| |
| | | | | | | | | | | | | | | | | | | | | | |
| | | Security | | | | | | | | | | | Security | | | | | | | |
| | Shares | | Description | | | | | | Value | | | Shares | | Description | | | | | | Value | |
| Long Positions - 77.2% | | | | | | | | Energy - 3.1% | | | | | | | |
| Equity Securities - 37.6% | | | | | | | | | 225,000 | | Apache Corp. | | | | | $ | 18,663,750 | |
| Common Stock - 36.6% | | | | | | | | | 60,000 | | ConocoPhillips | | | | | | 4,221,000 | |
| Consumer Discretionary - 6.4% | | | | | | | | | 8,692 | | Continental Resources, Inc. (a) | | | | | | 1,080,155 | |
| | 40,000 | | Apollo Education Group, Inc. (a) | | | | | $ | 1,369,600 | | | 406,200 | | Enbridge, Inc. | | | | | | 18,486,162 | |
| | 186,700 | | Bed Bath & Beyond, Inc. (a)(b)(c)(d) | | | | | | 12,844,960 | | | 168,000 | | Ensco PLC, Class A | | | | | | 8,867,040 | |
| | 158,300 | | CarMax, Inc. (a)(b)(c)(d) | | | | | | 7,408,440 | | | 120,000 | | Exxon Mobil Corp. | | | | | | 11,721,600 | |
| | 147,500 | | Coach, Inc. (b)(c)(d) | | | | | | 7,324,850 | | | 106,000 | | National Oilwell Varco, Inc. | | | | | | 8,254,220 | |
| | 309,500 | | CVS Caremark Corp. (b)(c)(d) | | | | | | 23,169,170 | | | 61,519 | | Ocean Rig UDW, Inc. (a)(b) | | | | | | 1,094,423 | |
| | 152,600 | | DIRECTV (a)(b)(c)(d) | | | | | | 11,661,692 | | | 400,000 | | Spectra Energy Corp. | | | | | | 14,776,000 | |
| | 4,346 | | Dunkin' Brands Group, Inc. | | | | | | 218,082 | | | | | | | | | | | 87,164,350 | |
| | 100,000 | | eBay, Inc. (a) | | | | | | 5,524,000 | | | | | | | | | | | | |
| | 78,212 | | General Motors Co. (c)(d) | | | | | | 2,692,057 | | Financial - 5.9% | | | | | | | |
| | 7,704 | | Google, Inc., Class A (a)(b)(c)(d) | | | | | | 8,586,185 | | | 1,135 | | Affiliated Managers Group, Inc. (a)(b) | | | | | | 227,057 | |
| | 16,974 | | Hanesbrands, Inc. (b) | | | | | | 1,298,172 | | | 80,000 | | American Express Co. (b)(c)(d) | | | | | | 7,202,400 | |
| | 581,400 | | Hertz Global Holdings, Inc. (a)(b)(c)(d) | | | | | | 15,488,496 | | | 266,900 | | American International Group, Inc. (b)(c)(d) | | | | | | 13,347,669 | |
| | 242,800 | | Kohl's Corp. (b)(c)(d) | | | | | | 13,791,040 | | | 52,100 | | Aon PLC (b) | | | | | | 4,390,988 | |
| | 4,346 | | Las Vegas Sands Corp. | | | | | | 351,070 | | | 83,400 | | Bancorp, Inc. (a) | | | | | | 1,568,754 | |
| | 38,000 | | McDonald's Corp. (b) | | | | | | 3,725,140 | | | 601,300 | | Bank of America Corp. (b)(c)(d) | | | | | | 10,342,360 | |
| | 8,692 | | MGM Resorts International (a) | | | | | | 224,775 | | | 50 | | Berkshire Hathaway, Inc., Class A (a)(b) | | | | | | 9,367,505 | |
| | 633,588 | | Office Depot, Inc. (a)(b) | | | | | | 2,616,718 | | | 171,700 | | Berkshire Hathaway, Inc., Class B (a)(b)(c)(d) | | | | | | 21,457,349 | |
| | 184,200 | | Target Corp. (b)(c)(d) | | | | | | 11,145,942 | | | 13,037 | | Blackstone Group LP | | | | | | 433,480 | |
| | 5,215 | | Tesla Motors, Inc. (a) | | | | | | 1,087,067 | | | 276,352 | | DFC Global Corp. (a)(b) | | | | | | 2,440,188 | |
| | 21,730 | | The Goodyear Tire & Rubber Co. | | | | | | 567,805 | | | 470 | | Fairfax Financial Holdings, Ltd. | | | | | | 203,557 | |
| | 72,300 | | The Walt Disney Co. (b)(c)(d) | | | | | | 5,789,061 | | | 214,600 | | JPMorgan Chase & Co. (b)(c)(d) | | | | | | 13,028,366 | |
| | 100,000 | | Viacom, Inc., Class B | | | | | | 8,499,000 | | | 354,700 | | Leucadia National Corp. (b) | | | | | | 9,931,600 | |
| | 239,800 | | Walgreen Co. (b)(c)(d) | | | | | | 15,833,994 | | | 189,700 | | Ocwen Financial Corp. (a) | | | | | | 7,432,446 | |
| | 202,200 | | Wal-Mart Stores, Inc. (b)(c)(d) | | | | | | 15,454,146 | | | 34,856 | | Rayonier, Inc. REIT (b) | | | | | | 1,600,239 | |
| | 60,500 | | Weight Watchers International, Inc. (b)(c)(d) | | | | | | 1,242,670 | | | 150,000 | | Resource America, Inc., Class A | | | | | | 1,285,500 | |
| | 1,738 | | Wynn Resorts, Ltd. | | | | | | 386,097 | | | 30,421 | | Square 1 Financial, Inc. (a) | | | | | | 611,462 | |
| | | | | | | | | | 178,300,229 | | | 588,100 | | The Bank of New York Mellon Corp. (b)(c)(d) | | | | | | 20,754,049 | |
| | | | | | | | | | | | | 72,500 | | The Travelers Cos., Inc. (b) | | | | | | 6,169,750 | |
| Consumer Staples - 8.2% | | | | | | | | | 266,750 | | Wells Fargo & Co. (b)(c)(d) | | | | | | 13,268,145 | |
| | 102,000 | | Aggreko PLC | | | | | | 2,578,560 | | | 420,000 | | WR Berkley Corp. | | | | | | 17,480,400 | |
| | 317,500 | | Avon Products, Inc. | | | | | | 4,648,200 | | | | | | | | | | | 162,543,264 | |
| | 70,000 | | Campbell Soup Co. (b) | | | | | | 3,141,600 | | | | | | | | | | | | |
| | 200,000 | | Express Scripts Holding Co. (a) | | | | | | 15,018,000 | | Healthcare - 2.8% | | | | | | | |
| | 399,780 | | Great Lakes Dredge & Dock Corp. (a)(b) | | | | | | 3,649,992 | | | 82,600 | | Abbott Laboratories (b)(c)(d) | | | | | | 3,180,926 | |
| | 88,000 | | Hengan International Group Co., Ltd. | | | | | | 915,200 | | | 32,655 | | Alere, Inc. (a) | | | | | | 1,121,699 | |
| | 265,000 | | Molson Coors Brewing Co., Class B | | | | | | 15,597,900 | | | 63,000 | | Becton Dickinson and Co. | | | | | | 7,376,040 | |
| | 180,000 | | Nestle SA, ADR | | | | | | 13,539,600 | | | 77,300 | | CR Bard, Inc. | | | | | | 11,438,854 | |
| | 510,000 | | PepsiCo, Inc. (b) | | | | | | 42,585,000 | | | 120,000 | | Johnson & Johnson (c)(d) | | | | | | 11,787,600 | |
| | 211,010 | | Philip Morris International, Inc. | | | | | | 17,275,389 | | | 175,000 | | Medtronic, Inc. | | | | | | 10,769,500 | |
| | 960,000 | | Sysco Corp. | | | | | | 34,684,800 | | | 180,000 | | Novartis AG, ADR | | | | | | 15,303,600 | |
| | 76,400 | | The Clorox Co. | | | | | | 6,723,964 | | | 150,000 | | Stryker Corp. | | | | | | 12,220,500 | |
| | 811,400 | | The Coca-Cola Co. (c)(d) | | | | | | 31,368,724 | | | 40,000 | | WellPoint, Inc. | | | | | | 3,982,000 | |
| | 370,000 | | The Procter & Gamble Co. | | | | | | 29,822,000 | | | | | | | | | | | 77,180,719 | |
| | 638,385 | | TherapeuticsMD, Inc. (a)(b) | | | | | | 4,028,209 | | | | | | | | | | | | |
| | | | | | | | | | 225,577,138 | | Industrial - 2.0% | | | | | | | |
| | | | | | | | | | | | | 95,000 | | CH Robinson Worldwide, Inc. | | | | | | 4,977,050 | |
| | | | | | | | | | | | | 10,215 | | EnPro Industries, Inc. (a)(b) | | | | | | 742,324 | |
| | | | | | | | | | | | | | | | | | | | | | |
| See Notes to Financial Statements. | 12 | ABSOLUTE FUNDS |
| |
ABSOLUTE STRATEGIES FUND SCHEDULE OF INVESTMENTS MARCH 31, 2014 |
| |
| | | Security | | | | | | | | | | | | | | | | | | |
| | Shares | | Description | | | | | | Value | | | | | Security | | | | | | | |
| | 460,400 | | Expeditors International of Washington, Inc. (b)(c)(d) | | | | | $ | 18,245,652 | | | Shares | | Description | | | | | | Value | |
| | 151,704 | | Global Brass & Copper Holdings, Inc. (b) | | | | | | 2,392,372 | | | 42,246 | | FTD Cos., Inc. (a) | | | | | $ | 1,343,845 | |
| | 44,943 | | ITT Corp. (b) | | | | | | 1,921,763 | | | 120,089 | | Lee Enterprises, Inc. (a)(b) | | | | | | 536,798 | |
| | 62,252 | | KBR, Inc. | | | | | | 1,660,883 | | | 159,014 | | News Corp., Class A (a)(b) | | | | | | 2,738,221 | |
| | 173,747 | | Quality Distribution, Inc. (a)(b) | | | | | | 2,256,973 | | | 300,000 | | Orange SA, ADR | | | | | | 4,407,000 | |
| | 35,768 | | Rock-Tenn Co., Class A (b) | | | | | | 3,776,028 | | | 8,692 | | Palo Alto Networks, Inc. (a) | | | | | | 596,271 | |
| | 87,500 | | The Boeing Co. (b)(c)(d) | | | | | | 10,980,375 | | | 15,210 | | Pandora Media, Inc. (a) | | | | | | 461,167 | |
| | 152,365 | | Tutor Perini Corp. (a)(b) | | | | | | 4,368,305 | | | 477,984 | | Parkervision, Inc. (a)(b) | | | | | | 2,294,323 | |
| | 41,100 | | United Parcel Service, Inc., Class B (b)(c)(d) | | | | | | 4,002,318 | | | 2,173 | | Qihoo 360 Technology Co., Ltd., ADR (a) | | | | | | 216,388 | |
| | | | | | | | | | 55,324,043 | | | 364,000 | | Spark Networks, Inc. (a) | | | | | | 1,903,720 | |
| | | | | | | | | | | | | 6,519 | | Splunk, Inc. (a) | | | | | | 466,043 | |
| Information Technology - 4.2% | | | | | | | | | 89,538 | | Telephone & Data Systems, Inc. (b) | | | | | | 2,346,791 | |
| | 130,800 | | Accenture PLC, Class A (b)(c)(d) | | | | | | 10,427,376 | | | 700,000 | | Twenty-First Century Fox, Inc., Class B | | | | | | 21,784,000 | |
| | 29,750 | | Apple, Inc. (b)(d) | | | | | | 15,968,015 | | | 52,363 | | Verizon Communications, Inc. (b) | | | | | | 2,490,908 | |
| | 109,486 | | CareView Communications, Inc. (a) | | | | | | 72,261 | | | 113,578 | | Vitacost.com, Inc. (a)(b) | | | | | | 805,268 | |
| | 107,500 | | Check Point Software Technologies, Ltd. (a) | | | | | | 7,270,225 | | | 108,600 | | Vodafone Group PLC, ADR (b) | | | | | | 3,997,566 | |
| | 502,500 | | Corning, Inc. (b)(c)(d) | | | | | | 10,462,050 | | | | | | | | | | | 70,593,614 | |
| | 102,400 | | Electronic Arts, Inc. (a)(b) | | | | | | 2,970,624 | | | | | | | | | | | | |
| | 244,584 | | FormFactor, Inc. (a)(b) | | | | | | 1,562,892 | | Utilities - 0.0% | | | | | | | |
| | 20,100 | | Hewlett-Packard Co. | | | | | | 650,436 | | | 49,903 | | Dynegy, Inc. (a)(b) | | | | | | 1,244,581 | |
| | 75 | | International Business Machines Corp. | | | | | | 14,437 | | | | | | | | | | | | |
| | 29,000 | | Intuit, Inc. (b) | | | | | | 2,254,170 | | Total Common Stock | | | | | | | |
| | 21,730 | | Micron Technology, Inc. (a) | | | | | | 514,132 | | (Cost $756,844,277) | | | | | | 1,011,644,514 | |
| | 860,000 | | Microsoft Corp. (d) | | | | | | 35,251,400 | | | | | Security | | | | | | | |
| | 64,597 | | NCR Corp. (a)(b) | | | | | | 2,361,020 | | | Shares | | Description | | Rate | | | | Value | |
| | 440,000 | | Oracle Corp. | | | | | | 18,000,400 | | Preferred Stock - 1.0% | | | | | | | |
| | 32,000 | | QUALCOMM, Inc. (b)(d) | | | | | | 2,523,520 | | Consumer Staples - 0.2% | | | | | | | |
| | 10,864 | | Salesforce.com, Inc. (a) | | | | | | 620,226 | | | 18,089 | | Bunge, Ltd. (b) | | 4.88 | % | | | 1,912,912 | |
| | 40,241 | | Silicon Graphics International Corp. (a) | | | | | | 494,159 | | | 6,472 | | Post Holdings, Inc. (b)(e) | | 3.75 | | | | 824,274 | |
| | 63,369 | | Skyworks Solutions, Inc. (a)(b) | | | | | | 2,377,605 | | | 1,252 | | Universal Corp. (b) | | 6.75 | | | | 1,591,135 | |
| | 4,346 | | Tableau Software, Inc., Class A (a) | | | | | | 330,643 | | | | | | | | | | | 4,328,321 | |
| | 27,549 | | Verint Systems, Inc. (a)(b) | | | | | | 1,291,910 | | | | | | | | | | | | |
| | 19,387 | | Vocera Communications, Inc. (a) | | | | | | 316,590 | | Energy - 0.3% | | | | | | | |
| | | | | | | | | | 115,734,091 | | | 1,299 | | Chesapeake Energy Corp. (b)(e) | | 5.75 | | | | 1,458,940 | |
| | | | | | | | | | | | | 4,349 | | Energy XXI Bermuda, Ltd. (b) | | 5.63 | | | | 1,181,025 | |
| Materials - 1.4% | | | | | | | | | 12,844 | | Goodrich Petroleum Corp., Series B (b) | | 5.38 | | | | 543,301 | |
| | 19,210 | | Century Aluminum Co. (a) | | | | | | 253,764 | | | 4,710 | | Penn Virginia Corp., Series A (b) | | 6.00 | | | | 1,418,087 | |
| | 111,002 | | Constellium NV, Class A (a)(b) | | | | | | 3,257,909 | | | 20,954 | | Sanchez Energy Corp. (b) | | 4.88 | | | | 1,568,931 | |
| | 230,000 | | Franco-Nevada Corp. | | | | | | 10,547,800 | | | 6,620 | | Sanchez Energy Corp., Series B (e) | | 6.50 | | | | 505,503 | |
| | 149,242 | | Noranda Aluminum Holding Corp. | | | | | | 613,384 | | | 6,236 | | SandRidge Energy, Inc. (b) | | 7.00 | | | | 629,446 | |
| | 68,000 | | Praxair, Inc. | | | | | | 8,905,960 | | | | | | | | | | | 7,305,233 | |
| | 165,000 | | Royal Gold, Inc. | | | | | | 10,332,300 | | | | | | | | | | | | |
| | 43,600 | | Sigma-Aldrich Corp. | | | | | | 4,071,368 | | Financial - 0.4% | | | | | | | |
| | | | | | | | | | 37,982,485 | | | 56,652 | | Alexandria Real Estate Equities, Inc. REIT, Series D (b) | | 7.00 | | | | 1,522,239 | |
| | | | | | | | | | | | | 20,316 | | AMG Capital Trust II (b) | | 5.15 | | | | 1,306,573 | |
| Telecommunication Services - 2.6% | | | | | | | | | 368 | | Bank of America Corp., Series L (b) | | 7.25 | | | | 422,142 | |
| | 800,000 | | Cisco Systems, Inc. | | | | | | 17,928,000 | | | 20,298 | | Health Care REIT, Inc., Series I (b) | | 6.50 | | | | 1,127,148 | |
| | 127,628 | | CommScope Holding Co., Inc. (a)(b) | | | | | | 3,149,859 | | | 16,503 | | iStar Financial, Inc. REIT, Series J (b) | | 4.50 | | | | 1,064,443 | |
| | 45,017 | | Comverse, Inc. (a)(b) | | | | | | 1,556,688 | | | 5,148 | | KeyCorp, Series A (b) | | 7.75 | | | | 669,137 | |
| | 26,075 | | Facebook, Inc., Class A (a) | | | | | | 1,570,758 | | | | | | | | | | | | |
| See Notes to Financial Statements. | 13 | ABSOLUTE FUNDS |
| |
ABSOLUTE STRATEGIES FUND SCHEDULE OF INVESTMENTS MARCH 31, 2014 |
| |
| | | | Security | | | | | | | | | | | Security | | | | | | | |
| | Shares | | Description | | Rate | | | | Value | | | Principal | | Description | | Rate | | Maturity | | Value | |
| | 15,413 | | Lexington Realty Trust REIT, Series C | | 6.50 | % | | $ | 722,870 | | $ | 124,382 | | Adjustable Rate Mortgage Trust, Series 2005-3 8A32 (b)(h) | | 0.47 | % | 07/25/35 | $ | 120,248 | |
| | 528 | | OFG Bancorp, Series C (b) | | 8.75 | | | | 844,932 | | | 1,227,225 | | Adjustable Rate Mortgage Trust, Series 2006-1 2A1 (h) | | 2.99 | | 03/25/36 | | 944,585 | |
| | 1,375 | | Wells Fargo & Co., Series L | | 7.50 | | | | 1,612,875 | | | 65,657 | | Adjustable Rate Mortgage Trust, Series 2006-1 3A3 (h) | | 2.75 | | 03/25/36 | | 50,047 | |
| | 1,141 | | Wintrust Financial Corp., Series C (b) | | 5.00 | | | | 1,475,741 | | | 400,000 | | Alm Loan Funding, Series 2012-7A A1 (e)(h) | | 1.66 | | 10/19/24 | | 399,380 | |
| | | | | | | | | | 10,768,100 | | | 850,885 | | Alta Wind Holdings, LLC (e) | | 7.00 | | 06/30/35 | | 936,675 | |
Healthcare - 0.1% | | | | | | | | | | 1,940,801 | | American Airlines Pass Through Trust, Series 2013-2 Class A (b)(e) | | 4.95 | | 01/15/23 | | 2,091,213 | |
| | 3,639 | | Alere, Inc., Series B (b) | | 3.00 | | | | 1,049,542 | | | 195,316 | | American Home Mortgage Assets Trust, Series 2007-4 A2 (h) | | 0.34 | | 08/25/37 | | 181,631 | |
| | 70 | | HealthSouth Corp. (b)(e) | | 6.50 | | | | 91,280 | | | 903,629 | | ARES XII CLO, Ltd., Series 2007-12A A (e)(h) | | 0.86 | | 11/25/20 | | 899,487 | |
| | 591 | | HealthSouth Corp., Series A (b) | | 6.50 | | | | 770,664 | | | 1,125,148 | | Asset Backed Funding Certificates, Series 2007-NC1 M2 (e)(h) | | 1.40 | | 05/25/37 | | 7,216 | |
| | 10,378 | | Omnicare Capital Trust II, Series B (b) | | 4.00 | | | | 763,432 | | | 1,285,000 | | Astoria Depositor Corp. (e) | | 8.14 | | 05/01/21 | | 1,349,250 | |
| | | | | | | | | | 2,674,918 | | | 751,160 | | AWAS Aviation Capital, Ltd. (e) | | 7.00 | | 10/17/16 | | 781,206 | |
Industrial - 0.0% | | | | | | | | | | 500,000 | | Axis Equipment Finance Receivables, LLC, Series 2012-1I D (b)(f) | | 5.50 | | 11/20/15 | | 502,150 | |
| | 18,041 | | Continental Airlines Finance Trust II (b) | | 6.00 | | | | 911,071 | | | 500,000 | | Axis Equipment Finance Receivables, LLC, Series 2012-1I E1 (b)(f) | | 6.25 | | 04/20/16 | | 503,160 | |
| | | | | | | | | | | | | 550,000 | | Axis Equipment Finance Receivables, LLC, Series 2012-1I E2 (b)(f) | | 7.00 | | 03/20/17 | | 529,594 | |
| Materials - 0.0% | | | | | | | | | | | | | | | | | | | |
| | 32,397 | | ArcelorMittal, Series MTUS (b) | | 6.00 | | | | 776,880 | | | | | | | | | | | | |
| | | | | | | | | | | | | | | | | | | | | | |
| Telecommunication Services - 0.0% | | | | | | | | | | | | | | | | | | | |
| | 6,790 | | Iridium Communications, Inc. (b)(e) | | 7.00 | | | | 700,219 | | | | | | | | | | | | |
| | | | | | | | | | | | | | | | | | | | | | |
| Utilities - 0.0% | | | | | | | | | | | | | | | | | | | |
| | 20,534 | | CenterPoint Energy, Inc. (b)(g) | | 3.72 | | | | 1,085,735 | | | | | | | | | | | | |
| Total Preferred Stock | | | | | | | | | | | | | | | | | | | |
| (Cost $20,764,526) | | | | | | | 28,550,477 | | | | | | | | | | | | |
| Total Equity Securities | | | | | | | | | | | | | | | | | | | |
| (Cost $777,608,803) | | | | | | 1,040,194,991 | | | | | | | | | | | | |
| | | | | | | | | | | | | | | | | | | | | | |
| | | | Security | | | | | | | | | | | | | | | | | | |
| | Principal | | Description | | Rate | | Maturity | | Value | | | | | | | | | | | | |
| Fixed Income Securities - 28.6% | | | | | | | | | | | | | | | | | | |
| Asset Backed Obligations - 6.5% | | | | | | | | | | | | | | | | | | |
| $ | 480,884 | | ACE Securities Corp. Home Equity Loan Trust, Series 2007-HE1 A2A (h) | | 0.24 | | 01/25/37 | | 283,399 | | | | | | | | | | | | |
| | 873,283 | | ACS Pass Through Trust, Series 2007-1A G1 (b)(e)(h) | | 0.46 | | 06/14/37 | | 830,754 | | | | | | | | | | | | |
| | 1,387,668 | | Adjustable Rate Mortgage Trust, Series 2005-11 2A41 (h) | | 2.63 | | 02/25/36 | | 1,340,734 | | | | | | | | | | | | |
| | 98,426 | | Adjustable Rate Mortgage Trust, Series 2005-12 2A1 (h) | | 2.79 | | 03/25/36 | | 76,784 | | | | | | | | | | | | |
| See Notes to Financial Statements. | 14 | ABSOLUTE FUNDS |
| |
ABSOLUTE STRATEGIES FUND SCHEDULE OF INVESTMENTS MARCH 31, 2014 |
| |
| | | | Security | | | | | | | | | | | Security | | | | | | | |
| | Principal | | Description | | Rate | | Maturity | | Value | | | Principal | | Description | | Rate | | Maturity | | Value | |
| $ | 1,067,031 | | Banc of America Alternative Loan Trust, Series 2005-2 4A1 | | 5.50 | % | 03/25/20 | $ | 1,117,435 | | $ | 193,705 | | Bear Stearns Adjustable Rate Mortgage Trust, Series 2007-5 1A1 (h) | | 2.68 | % | 08/25/47 | $ | 144,517 | |
| | 215,732 | | Banc of America Alternative Loan Trust, Series 2005-8 2CB1 | | 6.00 | | 09/25/35 | | 198,867 | | | 205,739 | | Bear Stearns ALT-A Trust, Series 2005-4 1A1 (h) | | 0.59 | | 04/25/35 | | 191,428 | |
| | 52,319 | | Banc of America Funding Corp., Series 2006-E 2A1 (h) | | 2.81 | | 06/20/36 | | 43,891 | | | 191,479 | | Bear Stearns ALT-A Trust, Series 2005-8 11A1 (h) | | 0.69 | | 10/25/35 | | 169,164 | |
| | 221,420 | | Banc of America Funding Corp., Series 2006-F 1A1 (h) | | 2.61 | | 07/20/36 | | 219,570 | | | 409,123 | | Bear Stearns ALT-A Trust, Series 2006-1 22A1 (h) | | 2.41 | | 02/25/36 | | 305,833 | |
| | 44,443 | | Banc of America Funding Corp., Series 2006-G 2A3 (b)(h) | 0.33 | | 07/20/36 | | 44,408 | | | 1,881,887 | | Bear Stearns ALT-A Trust, Series 2006-2 21A1 (h) | | 2.58 | | 03/25/36 | | 1,282,026 | |
| | 181,792 | | Banc of America Funding Corp., Series 2006-H 6A1 (h) | | 0.35 | | 10/20/36 | | 130,664 | | | 181,825 | | Bear Stearns ALT-A Trust, Series 2006-2 23A1 (h) | | 2.61 | | 03/25/36 | | 129,143 | |
| | 114,634 | | Banc of America Funding Corp., Series 2007-E 4A1 (h) | | 2.67 | | 07/20/47 | | 91,461 | | | 1,172,687 | | Bear Stearns ALT-A Trust, Series 2006-3 1A1 (h) | | 0.53 | | 05/25/36 | | 778,278 | |
| | 1,488,207 | | Bayview Commercial Asset Trust, Series 2004-3 A1 (e)(h) | 0.52 | | 01/25/35 | | 1,386,365 | | | 1,288,974 | | Bear Stearns ALT-A Trust, Series 2006-4 11A1 (h) | | 0.47 | | 08/25/36 | | 884,235 | |
| | 1,225,000 | | Bayview Commercial Mortgage Pass-Through Trust, Series 2006-SP1 M1 (b)(e)(h) | | 0.60 | | 04/25/36 | | 1,049,462 | | | 75,972 | | Bear Stearns Asset Backed Securities Trust, Series 2005-TC2 A3 (b)(h) | | 0.52 | | 08/25/35 | | 75,273 | |
| | 54,920 | | Bayview Financial Mortgage Pass-Through Trust, Series 2005-D AF3 (b)(h) | | 5.50 | | 12/28/35 | | 56,069 | | | 191,729 | | Bear Stearns Commercial Mortgage Securities Trust, Series 2005-T20 AAB (b)(h) | | 5.12 | | 10/12/42 | | 193,706 | |
| | 2,314,104 | | BCAP, LLC, Series 2013-RR2 6A1 (e)(h) | | 3.00 | | 06/26/37 | | 2,319,271 | | | 1,200,000 | | BlueMountain CLO, Ltd., Series 2013-1A A1 (e)(h) | | 1.44 | | 05/15/25 | | 1,187,171 | |
| | 85,261 | | Beacon Container Finance, LLC, Series 2012-1A A (b)(e) | 3.72 | | 09/20/27 | | 85,563 | | | 55,867 | | BNC Mortgage Loan Trust, Series 2007-1 A2 (b)(h) | | 0.21 | | 03/25/37 | | 55,013 | |
| | | | | | | | | | | | | 1,500,000 | | BNC Mortgage Loan Trust, Series 2007-3 A3 (h) | | 0.28 | | 07/25/37 | | 1,362,594 | |
| | | | | | | | | | | | | 63,125 | | BNC Mortgage Loan Trust, Series 2007-4 A3A (h) | | 0.40 | | 11/25/37 | | 62,931 | |
| | | | | | | | | | | | | | | | | | | | | | |
| See Notes to Financial Statements. | 15 | ABSOLUTE FUNDS |
| |
ABSOLUTE STRATEGIES FUND SCHEDULE OF INVESTMENTS MARCH 31, 2014 |
| |
| | | | Security | | | | | | | | | | | Security | | | | | | | |
| | Principal | | Description | | Rate | | Maturity | | Value | | | Principal | | Description | | Rate | | Maturity | | Value | |
| $ | 200,106 | | Centex Home Equity Loan Trust, Series 2005-C AF6 (g) | | 4.64 | % | 06/25/35 | $ | 197,948 | | $ | 832,136 | | Conseco Finance Home Equity Loan Trust, Series 2002-C BF1 (h) | | 8.00 | % | 06/15/32 | $ | 912,905 | |
| | 853,276 | | Chase Mortgage Finance Trust, Series 2007-A1 8A1 (h) | | 2.65 | | 02/25/37 | | 870,506 | | | 787,107 | | Conseco Finance Securitizations Corp., Series 2001-4 A4 (b) | | 7.36 | | 08/01/32 | | 861,546 | |
| | 313,088 | | ChaseFlex Trust, Series 2007-1 2A9 | | 6.00 | | 02/25/37 | | 277,177 | | | 461,778 | | Continental Airlines Pass Through Trust, Series 2007-1 B (b) | 6.90 | | 04/19/22 | | 500,151 | |
| | 100,000 | | CIFC Funding Ltd., Series 2012-2A A1L (b)(e)(h) | | 1.64 | | 12/05/24 | | 99,816 | | | 658,730 | | Continental Airlines Pass Through Trust, Series 2009-1 (b) | 9.00 | | 07/08/16 | | 754,246 | |
| | 630,000 | | CIFC Funding, Ltd., Series 2012-2A A3L (e)(h) | | 3.24 | | 12/05/24 | | 624,240 | | | 697,738 | | Coso Geothermal Power Holdings, LLC (e) | | 7.00 | | 07/15/26 | | 404,688 | |
| | 675,000 | | CIFC Funding, Ltd., Series 2013-3A B (e)(h) | | 2.91 | | 10/24/25 | | 663,325 | | | 59,366 | | Countrywide Alternative Loan Trust, Series 2004-J10 4CB1 | 6.50 | | 10/25/34 | | 63,922 | |
| | 1,514,879 | | CIT Education Loan Trust, Series 2007-1 A (e)(h) | | 0.32 | | 03/25/42 | | 1,417,672 | | | 64,688 | | Countrywide Alternative Loan Trust, Series 2005-50CB 1A1 | 5.50 | | 11/25/35 | | 58,969 | |
| | 1,200,000 | | Citicorp Residential Mortgage Trust, Series 2006-2 A5 (g) | | 6.04 | | 09/25/36 | | 1,155,853 | | | 225,124 | | Countrywide Alternative Loan Trust, Series 2005-73CB 1A8 | | 5.50 | | 01/25/36 | | 210,863 | |
| | 1,200,000 | | Citicorp Residential Mortgage Trust, Series 2007-1 A5 (g) | | 6.05 | | 03/25/37 | | 1,107,184 | | | 669,057 | | Countrywide Alternative Loan Trust, Series 2005-J10 1A16 | | 5.50 | | 10/25/35 | | 615,733 | |
| | 317,712 | | Citigroup Mortgage Loan Trust, Inc., Series 2006-WF1 A2D (g) | | 5.62 | | 03/25/36 | | 215,835 | | | 483,333 | | Countrywide Alternative Loan Trust, Series 2005-J12 2A1 (h) | | 0.42 | | 08/25/35 | | 292,039 | |
| | 499,787 | | Citigroup Mortgage Loan Trust, Inc., Series 2007-AR8 2A1A (h) | | 2.76 | | 07/25/37 | | 423,229 | | | 262,920 | | Countrywide Alternative Loan Trust, Series 2006-36T2 1A1 (h) | | 0.47 | | 12/25/36 | | 167,914 | |
| | 285,000 | | Citigroup Mortgage Loan Trust, Inc., Series 2007-WFH4 A2C (h) | | 1.45 | | 07/25/37 | | 227,289 | | | 29,205 | | Countrywide Alternative Loan Trust, Series 2006-7CB 3A1 | | 5.25 | | 05/25/21 | | 25,405 | |
| | 130,514 | | CitiMortgage Alternative Loan Trust, Series 2006-A7 1A12 | | 6.00 | | 12/25/36 | | 114,223 | | | 290,874 | | Countrywide Alternative Loan Trust, Series 2007-16CB 4A7 | | 6.00 | | 08/25/37 | | 263,250 | |
| | 50,716 | | CitiMortgage Alternative Loan Trust, Series 2007-A4 1A6 | | 5.75 | | 04/25/37 | | 44,145 | | | | | | | | | | | | |
| | | | | | | | | | | | | | | | | | | | | | |
| See Notes to Financial Statements. | 16 | ABSOLUTE FUNDS |
| |
ABSOLUTE STRATEGIES FUND SCHEDULE OF INVESTMENTS MARCH 31, 2014 |
| |
| | | | Security | | | | | | | | | | | Security | | | | | | | |
| | Principal | | Description | | Rate | | Maturity | | Value | | | Principal | | Description | | Rate | | Maturity | | Value | |
| $ | 223,657 | | Countrywide Alternative Loan Trust, Series 2007-19 1A34 | | 6.00 | % | 08/25/37 | $ | 186,697 | | $ | 1,359,067 | | Credit-Based Asset Servicing and Securitization, LLC, Series 2006-CB8 A2B (h) | | 0.26 | % | 10/25/36 | $ | 1,280,411 | |
| | 123,581 | | Countrywide Asset-Backed Certificates, Series 2004-7 MV3 (b)(h) | | 1.20 | | 12/25/34 | | 123,026 | | | 2,643,525 | | Credit-Based Asset Servicing and Securitization, LLC, Series 2007-CB2 A2E (b)(g) | | 4.82 | | 02/25/37 | | 1,944,958 | |
| | 1,414,415 | | Countrywide Asset-Backed Certificates, Series 2007-13 2A1 (h) | | 1.05 | | 10/25/47 | | 1,233,276 | | | 1,351,859 | | Credit-Based Asset Servicing and Securitization, LLC, Series 2007-CB5 A3 (h) | | 0.40 | | 04/25/37 | | 909,909 | |
| | 1,279,942 | | Countrywide Home Loan Mortgage Pass Through Trust, Series 2004-HYB5 3A1 (h) | | 2.62 | | 04/20/35 | | 1,138,707 | | | 490,000 | | Cronos Containers Program, Ltd., Series 2012-1A A (e) | | 4.21 | | 05/18/27 | | 491,384 | |
| | 237,048 | | Countrywide Home Loan Mortgage Pass Through Trust, Series 2007-HY3 4A1 (h) | | 5.24 | | 06/25/47 | | 221,484 | | | 425,000 | | Cronos Containers Program, Ltd., Series 2012-2A A (e) | | 3.81 | | 09/18/27 | | 428,680 | |
| | 81,304 | | Countrywide Home Loan Mortgage Pass Through Trust, Series 2007-HY5 1A1 (h) | | 2.86 | | 09/25/47 | | 71,395 | | | 881,008 | | CSAB Mortgage Backed Trust, Series 2007-1 1A1A (h) | | 5.90 | | 05/25/37 | | 492,386 | |
| | 17,543 | | Credit Suisse First Boston Mortgage Securities Corp., Series 2003-AR24 2A4 (h) | | 2.58 | | 10/25/33 | | 17,087 | | | 1,513,483 | | CSMC Trust, Series 2013-3R 5A1 (e)(h) | | 2.50 | | 10/27/36 | | 1,519,603 | |
| | 389,563 | | Credit Suisse First Boston Mortgage Securities Corp., Series 2005-11 8A9 | | 5.25 | | 12/25/35 | | 395,439 | | | 75,000 | | DBRR Trust, Series 2011-LC2 A4A (b)(e)(h) | | 4.54 | | 07/12/44 | | 81,420 | |
| | 77,996 | | Credit Suisse First Boston Mortgage Securities Corp., Series 2005-6 8A1 (b) | | 4.50 | | 07/25/20 | | 79,366 | | | 158,431 | | Delta Air Lines Pass Through Trust, Series 2002-1 G-1 (b) | | 6.72 | | 01/02/23 | | 186,354 | |
| | 84,419 | | Credit Suisse Mortgage Capital Mortgage-Backed Trust, Series 2006-8 3A1 | | 6.00 | | 10/25/21 | | 80,919 | | | 656,294 | | Deutsche Alt-A Securities, Inc. Mortgage Loan Trust, Series 2007-AR1 A4 (h) | | 0.31 | | 01/25/47 | | 472,138 | |
| | 1,372,601 | | Credit-Based Asset Servicing and Securitization, LLC, Series 2006-CB7 A5 (h) | | 0.39 | | 10/25/36 | | 900,425 | | | 241,303 | | Deutsche Alt-B Securities, Inc. Mortgage Loan Trust, Series 2006-AB2 A5B (g) | | 6.09 | | 06/25/36 | | 195,700 | |
| | | | | | | | | | | | | 600,000 | | Dryden XXII Senior Loan Fund, Series 2013-30A C (e)(h) | | 3.09 | | 11/15/25 | | 599,863 | |
| | | | | | | | | | | | | | | | | | | | | | |
| See Notes to Financial Statements. | 17 | ABSOLUTE FUNDS |
| |
ABSOLUTE STRATEGIES FUND SCHEDULE OF INVESTMENTS MARCH 31, 2014 |
| |
| | | | Security | | | | | | | | | | | Security | | | | | | | |
| | Principal | | Description | | Rate | | Maturity | | Value | | | Principal | | Description | | Rate | | Maturity | | Value | |
| $ | 1,000,000 | | Dryden XXVI Senior Loan Fund, Series 2013-26A C (e)(h) | | 2.74 | % | 07/15/25 | $ | 967,470 | | $ | 577,593 | | GE Business Loan Trust, Series 2004-1 A (b)(e)(h) | | 0.45 | % | 05/15/32 | $ | 552,335 | |
| | 2,015,000 | | Education Loan Asset-Backed Trust I, Series 2013-1 A2 (e)(h) | | 0.95 | | 04/26/32 | | 1,989,621 | | | 887,513 | | GE Business Loan Trust, Series 2005-1A A3 (b)(e)(h) | | 0.41 | | 06/15/33 | | 833,956 | |
| | 2,920,000 | | Equifirst Loan Securitization Trust, Series 2007-1 A2B (h) | | 0.34 | | 04/25/37 | | 2,158,966 | | | 127,856 | | GE Business Loan Trust, Series 2005-2A A (b)(e)(h) | | 0.40 | | 11/15/33 | | 118,818 | |
| | 61,248 | | Equity One Mortgage Pass-Through Trust, Series 2002-4 M1 (h) | | 5.22 | | 02/25/33 | | 58,598 | | | 49,175 | | GE Business Loan Trust, Series 2005-2A B (b)(e)(h) | | 0.66 | | 11/15/33 | | 45,139 | |
| | 2,851,797 | | First Franklin Mortgage Loan Trust, Series 2006-FF18 A2B (h) | | 0.26 | | 12/25/37 | | 1,696,748 | | | 103,895 | | Goal Capital Funding Trust, Series 2006-1 A3 (b)(h) | | 0.35 | | 11/25/26 | | 102,958 | |
| | 1,190,529 | | First Horizon Alternative Mortgage Securities Trust, Series 2005-AA3 2A1 (h) | | 2.25 | | 05/25/35 | | 964,433 | | | 1,300,000 | | GoldenTree Loan Opportunities VII, Ltd., Series 2013-7A A (e)(h) | | 1.39 | | 04/25/25 | | 1,283,275 | |
| | 402,476 | | First Horizon Alternative Mortgage Securities Trust, Series 2006-FA8 1A1 | | 6.25 | | 02/25/37 | | 349,549 | | | 274,399 | | Green Tree Financial Corp., Series 1997-1 A6 (b) | | 7.29 | | 03/15/28 | | 279,215 | |
| | 474,261 | | First Horizon Alternative Mortgage Securities Trust, Series 2006-FA8 1A8 (h) | | 0.52 | | 02/25/37 | | 309,702 | | | 769,577 | | Green Tree, Series 2008-MH1 A2 (b)(e)(h) | | 8.97 | | 04/25/38 | | 832,310 | |
| | 216,457 | | FNMA, Series 2012-M15, Class A (b)(h) | | 2.66 | | 10/25/22 | | 211,431 | | | 747,286 | | Green Tree, Series 2008-MH1 A3 (b)(e)(h) | | 8.97 | | 04/25/38 | | 808,202 | |
| | 148,447 | | FPL Energy National Wind Portfolio, LLC (e) | | 6.13 | | 03/25/19 | | 146,247 | | | 250,000 | | GS Mortgage Securities Trust, Series 2011-GC5 A4 | | 3.71 | | 08/10/44 | | 261,270 | |
| | 1,860,005 | | GCO Education Loan Funding Master Trust-II, Series 2006-2AR A1RN (b)(e)(h) | | 0.80 | | 08/27/46 | | 1,794,832 | | | 270,080 | | GSAA Home Equity Trust, Series 2005-12 AF3 (h) | | 5.07 | | 09/25/35 | | 255,026 | |
| | 968,871 | | GE Business Loan Trust, Series 2003-2A A (e)(h) | | 0.53 | | 11/15/31 | | 929,142 | | | 1,372,438 | | GSAA Home Equity Trust, Series 2006-20 1A1 (h) | | 0.22 | | 12/25/46 | | 773,024 | |
| | | | | | | | | | | | | 1,222,499 | | GSAA Home Equity Trust, Series 2007-5 2A3A (h) | | 0.47 | | 04/25/47 | | 710,623 | |
| | | | | | | | | | | | | 2,503,163 | | GSAA Trust, Series 2007-3 1A1B (h) | | 0.25 | | 03/25/47 | | 371,655 | |
| | | | | | | | | | | | | 354,800 | | GSR Mortgage Loan Trust, Series 2004-14 3A2 (h) | | 2.76 | | 12/25/34 | | 319,943 | |
| | | | | | | | | | | | | | | | | | | | | | |
| See Notes to Financial Statements. | 18 | ABSOLUTE FUNDS |
| |
ABSOLUTE STRATEGIES FUND SCHEDULE OF INVESTMENTS MARCH 31, 2014 |
| |
| | | | Security | | | | | | | | | | | Security | | | | | | | |
| | Principal | | Description | | Rate | | Maturity | | Value | | | Principal | | Description | | Rate | | Maturity | | Value | |
| $ | 1,525,000 | | GSR Mortgage Loan Trust, Series 2004-9 5A7 (h) | | 2.62 | % | 08/25/34 | $ | 1,476,604 | | $ | 304,965 | | Indymac Index Mortgage Loan Trust, Series 2005-AR5 1A1 (h) | | 2.52 | % | 05/25/35 | $ | 222,777 | |
| | 199,454 | | GSR Mortgage Loan Trust, Series 2005-AR5 1A1 (h) | | 2.72 | | 10/25/35 | | 177,280 | | | 1,613,313 | | Indymac Index Mortgage Loan Trust, Series 2006-AR19 1A2 (b)(h) | | 2.77 | | 08/25/36 | | 1,142,587 | |
| | 860,000 | | Halcyon Loan Advisors Funding, Ltd., Series 2012-2A C (e)(h) | | 3.08 | | 12/20/24 | | 855,028 | | | 79,174 | | Indymac Index Mortgage Loan Trust, Series 2006-AR25 3A1 (h) | | 2.71 | | 09/25/36 | | 58,016 | |
| | 15,476 | | HarborView Mortgage Loan Trust, Series 2004-8 2A4A (b)(h) | | 0.56 | | 11/19/34 | | 12,916 | | | 151,096 | | Indymac Index Mortgage Loan Trust, Series 2006-AR29 A1 (h) | | 0.32 | | 11/25/36 | | 112,079 | |
| | 68,000 | | Hewett's Island Clo V, Ltd., Series 2006-5A D (e)(h) | | 1.69 | | 12/05/18 | | 65,934 | | | 201,599 | | Indymac Index Mortgage Loan Trust, Series 2006-AR33 3A1 (h) | | 2.95 | | 01/25/37 | | 175,314 | |
| | 243,019 | | HomeBanc Mortgage Trust, Series 2004-1 2A (h) | | 1.01 | | 08/25/29 | | 229,974 | | | 2,516,643 | | Indymac Index Mortgage Loan Trust, Series 2006-AR41 A3 (h) | | 0.33 | | 02/25/37 | | 1,825,215 | |
| | 900,000 | | HSBC Home Equity Loan Trust, Series 2006-3 A4 (h) | | 0.40 | | 03/20/36 | | 878,917 | | | 749,978 | | Indymac Index Mortgage Loan Trust, Series 2006-AR7 1A1 (h) | | 2.88 | | 05/25/36 | | 556,934 | |
| | 83,283 | | HSBC Home Equity Loan Trust, Series 2006-4 A3V (h) | | 0.31 | | 03/20/36 | | 83,033 | | | 1,520,341 | | Indymac Index Mortgage Loan Trust, Series 2006-AR7 3A1 (h) | | 2.70 | | 05/25/36 | | 1,185,632 | |
| | 153,996 | | HSBC Home Equity Loan Trust, Series 2007-3 APT (b)(h) | | 1.36 | | 11/20/36 | | 153,257 | | | 391,476 | | Indymac Index Mortgage Loan Trust, Series 2006-AR7 4A1 (h) | | 2.89 | | 05/25/36 | | 268,779 | |
| | 209,923 | | HSI Asset Loan Obligation Trust, Series 2007-AR2 2A1 (h) | | 2.78 | | 09/25/37 | | 163,149 | | | 450,000 | | Indymac Index Mortgage Loan Trust, Series 2006-R1 A3 (h) | | 4.69 | | 12/25/35 | | 364,109 | |
| | 1,065,930 | | Indiantown Cogeneration LP, Series A-10 (b) | | 9.77 | | 12/15/20 | | 1,202,485 | | | 367,119 | | Indymac Index Mortgage Loan Trust, Series 2007-FLX2 A1C (h) | | 0.34 | | 04/25/37 | | 263,753 | |
| | 208,965 | | Indymac INDA Mortgage Loan Trust, Series 2007-AR7 1A1 (h) | | 2.82 | | 11/25/37 | | 199,574 | | | 699,669 | | Indymac Manufactured Housing Contract Pass Through Certificates, Series 1998-2 A4 (b)(h) | | 6.64 | | 08/25/29 | | 697,723 | |
| | 1,087,233 | | Indymac Index Mortgage Loan Trust, Series 2004-AR12 A1 (h) | | 0.93 | | 12/25/34 | | 920,607 | | | | | | | | | | | | |
| | 554,573 | | Indymac Index Mortgage Loan Trust, Series 2004-AR7 A2 (h) | | 1.01 | | 09/25/34 | | 483,245 | | | | | | | | | | | | |
| | | | | | | | | | | | | | | | | | | | | | |
| See Notes to Financial Statements. | 19 | ABSOLUTE FUNDS |
| |
ABSOLUTE STRATEGIES FUND SCHEDULE OF INVESTMENTS MARCH 31, 2014 |
| |
| | | | Security | | | | | | | | | | | Security | | | | | | | |
| | Principal | | Description | | Rate | | Maturity | | Value | | | Principal | | Description | | Rate | | Maturity | | Value | |
| $ | 250,000 | | ING Investment Management Co., Series 2012-4A A1 (e)(h) | | �� 1.63 | % | 10/15/23 | $ | 249,536 | | $ | 2,373,353 | | JP Morgan Mortgage Trust, Series 2006-S2 2A2 | | 5.88 | % | 06/25/21 | $ | 2,376,212 | |
| | 1,000,000 | | ING Investment Management Co., Series 2013-3A B (e)(h) | | 2.94 | | 01/18/26 | | 993,742 | | | 955,098 | | JP Morgan Mortgage Trust, Series 2007-A1 5A2 (b)(h) | | 2.66 | | 07/25/35 | | 959,728 | |
| | 677,330 | | JetBlue Airways Pass Through Trust, Series 2004-2 G1 (h) | | 0.61 | | 08/15/16 | | 668,863 | | | 45,112 | | JP Morgan Mortgage Trust, Series 2007-A2 4A1M (h) | | 4.86 | | 04/25/37 | | 41,394 | |
| | 2,000,000 | | JetBlue Airways Pass Through Trust, Series 2004-2 G-2 (h) | | 0.69 | | 11/15/16 | | 1,965,000 | | | 1,500,000 | | KKR Financial CLO, Ltd., Series 2005-1A B (e)(h) | | 0.69 | | 04/26/17 | | 1,491,428 | |
| | 2,705,946 | | JP Morgan Alternative Loan Trust, Series 2006-A2 3A1 (h) | | 2.94 | | 05/25/36 | | 2,131,260 | | | 909,063 | | Lehman ABS Manufactured Housing Contract Trust, Series 2001-B A6 (b)(h) | | 6.47 | | 04/15/40 | | 979,281 | |
| | 2,930,588 | | JP Morgan Mortgage Acquisition Trust, Series 2006-WMC3 A4 (h) | | 0.30 | | 08/25/36 | | 1,548,054 | | | 8,959 | | Lehman Mortgage Trust, Series 2006-1 3A3 | | 5.50 | | 02/25/36 | | 8,959 | |
| | 400,000 | | JP Morgan Mortgage Acquisition Trust, Series 2007-CH3 A4 (h) | | 0.36 | | 03/25/37 | | 341,928 | | | 196,924 | | Lehman XS Trust, Series 2005-6 1A1 (h) | | 0.41 | | 11/25/35 | | 133,176 | |
| | 1,110,000 | | JP Morgan Mortgage Acquisition Trust, Series 2007-CH4 A5 (h) | | 0.39 | | 05/25/37 | | 640,412 | | | 1,605,962 | | Lehman XS Trust, Series 2006-13 1A2 (h) | | 0.32 | | 09/25/36 | | 1,326,630 | |
| | 2,590,000 | | JP Morgan Mortgage Acquisition Trust, Series 2007-HE1 AF2 (g) | | 4.55 | | 03/25/47 | | 1,979,760 | | | 833,982 | | Lehman XS Trust, Series 2006-14N 3A2 (h) | | 0.27 | | 08/25/36 | | 613,636 | |
| | 2,938,000 | | JP Morgan Mortgage Acquisition Trust, Series 2007-HE1 AV4 (h) | | 0.43 | | 03/25/47 | | 1,639,137 | | | 1,535,840 | | Lehman XS Trust, Series 2006-19 A2 (h) | | 0.32 | | 12/25/36 | | 1,244,379 | |
| | 163,897 | | JP Morgan Mortgage Trust, Series 2005-A5 TA1 (h) | | 5.25 | | 08/25/35 | | 163,932 | | | 1,733,952 | | Lehman XS Trust, Series 2006-9 A1B (h) | | 0.31 | | 05/25/46 | | 1,406,265 | |
| | 1,600,293 | | JP Morgan Mortgage Trust, Series 2006-A3 2A1 (h) | | 2.75 | | 05/25/36 | | 1,334,571 | | | 1,270,000 | | Limerock CLO, Series 2014-2A A (e)(h) | | 1.73 | | 04/18/26 | | 1,271,267 | |
| | | | | | | | | | | | | 289,197 | | MASTR Adjustable Rate Mortgages Trust, Series 2007-R5 A1 (e)(h) | | 2.52 | | 11/25/35 | | 214,135 | |
| | | | | | | | | | | | | 885,000 | | MASTR Asset Backed Securities Trust, Series 2007-HE1 A3 (h) | | 0.36 | | 05/25/37 | | 600,646 | |
| | | | | | | | | | | | | 13,442 | | MASTR Seasoned Securitization Trust, Series 2004-1 4A1 (b)(h) | | 2.58 | | 10/25/32 | | 13,462 | |
| | | | | | | | | | | | | | | | | | | | | | |
| See Notes to Financial Statements. | 20 | ABSOLUTE FUNDS |
| |
ABSOLUTE STRATEGIES FUND SCHEDULE OF INVESTMENTS MARCH 31, 2014 |
| |
| | | | Security | | | | | | | | | | | Security | | | | | | | |
| | Principal | | Description | | Rate | | Maturity | | Value | | | Principal | | Description | | Rate | | Maturity | | Value | |
| $ | 1,068,693 | | Merrill Lynch First Franklin Mortgage Loan Trust, Series 2007-1 A2C (h) | | 0.40 | % | 04/25/37 | $ | 590,237 | | $ | 1,655,152 | | Morgan Stanley Mortgage Loan Trust, Series 2006-11 1A3 (g) | | 6.42 | % | 08/25/36 | $ | 850,007 | |
| | 61,655 | | Merrill Lynch First Franklin Mortgage Loan Trust, Series 2007-1 A2D (h) | | 0.49 | | 04/25/37 | | 34,487 | | | 2,381,410 | | Morgan Stanley Mortgage Loan Trust, Series 2006-7 5A2 (h) | | 5.96 | | 06/25/36 | | 1,423,781 | |
| | 1,347,163 | | Merrill Lynch First Franklin Mortgage Loan Trust, Series 2007-3 A2B (h) | | 0.28 | | 06/25/37 | | 873,863 | | | 215,040 | | Morgan Stanley Mortgage Loan Trust, Series 2007-13 6A1 | | 6.00 | | 10/25/37 | | 176,052 | |
| | 2,241,000 | | Merrill Lynch First Franklin Mortgage Loan Trust, Series 2007-3 A2C (h) | | 0.33 | | 06/25/37 | | 1,463,900 | | | 2,509,364 | | Morgan Stanley Reremic Trust, Series 2013-R3 12A (e)(h) | | 2.71 | | 01/26/47 | | 2,522,632 | |
| | 2,869,681 | | Merrill Lynch First Franklin Mortgage Loan Trust, Series 2007-4 2A4 (h) | | 0.40 | | 07/25/37 | | 1,751,472 | | | 985,113 | | Nelnet Student Loan Trust, Series 2012-5A A (e)(h) | | 0.75 | | 10/27/36 | | 989,222 | |
| | 774,826 | | Mid-State Capital Corp. Trust, Series 2006-1A (e) | | 5.79 | | 10/15/40 | | 821,673 | | | 1,270,000 | | Neuberger Berman CLO, Ltd. (e)(h) | | 1.74 | | 04/15/26 | | 1,269,211 | |
| | 200,000 | | Morgan Stanley ABS Capital I, Inc. Trust, Series 2004-NC7 M2 (b)(h) | | 1.08 | | 07/25/34 | | 190,763 | | | 1,270,000 | | Nomad CLO, Ltd., Series 2013-1A A1 (e)(h) | | 1.44 | | 01/15/25 | | 1,255,869 | |
| | 1,843,713 | | Morgan Stanley ABS Capital I, Inc. Trust, Series 2007-HE1 A2C (h) | | 0.30 | | 11/25/36 | | 1,139,756 | | | 352,210 | | Nomura Asset Acceptance Corp. Alternative Loan Trust, Series 2007-1 1A1A (g) | | 6.00 | | 03/25/47 | | 269,769 | |
| | 1,651,264 | | Morgan Stanley Capital I Trust, Series 2005-T19 A4A | | 4.89 | | 06/12/47 | | 1,718,522 | | | 1,470,873 | | Nomura Home Equity Loan, Inc. Home Equity Loan Trust, Series 2005-HE1 M3 (h) | | 0.63 | | 09/25/35 | | 1,376,736 | |
| | 200,000 | | Morgan Stanley Capital I Trust, Series 2006-T21 A4 (h) | | 5.16 | | 10/12/52 | | 211,807 | | | 1,261,467 | | NovaStar Mortgage Funding Trust, Series 2006-2 A2C (h) | 0.30 | | 06/25/36 | | 714,278 | |
| | 165,000 | | Morgan Stanley Capital I Trust, Series 2007-T27 A4 (b)(h) | 5.65 | | 06/11/42 | | 184,834 | | | 910,710 | | Oakwood Mortgage Investors, Inc., Series 1999-B A4 | | 6.99 | | 12/15/26 | | 975,061 | |
| | 150,000 | | Morgan Stanley Capital I Trust, Series 2011-C3 A4 (b) | | 4.12 | | 07/15/49 | | 158,615 | | | 77,599 | | Opteum Mortgage Acceptance Corp. Asset Backed Pass-Through Certificates, Series 2005-5 2A1B (h) | | 5.64 | | 12/25/35 | | 79,094 | |
| | 120,140 | | Morgan Stanley Dean Witter Capital I Trust, Series 2001-TOP3 C (b) | | 6.79 | | 07/15/33 | | 122,098 | | | | | | | | | | | | |
| | | | | | | | | | | | | | | | | | | | | | |
| See Notes to Financial Statements. | 21 | ABSOLUTE FUNDS |
| |
ABSOLUTE STRATEGIES FUND SCHEDULE OF INVESTMENTS MARCH 31, 2014 |
| |
| | | | Security | | | | | | | | | | | Security | | | | | | | |
| | Principal | | Description | | Rate | | Maturity | | Value | | | Principal | | Description | | Rate | | Maturity | | Value | |
| $ | 606,489 | | Origen Manufactured Housing Contract Trust, Series 2004-A M2 (b)(h) | | 6.64 | % | 01/15/35 | $ | 667,682 | | $ | 1,165,668 | | Residential Asset Securitization Trust, Series 2007-A5 1A2 (h) | | 0.55 | % | 05/25/37 | $ | 450,048 | |
| | 4,872,285 | | Ownit Mortgage Loan Trust, Series 2006-6 A2C (h) | | 0.31 | | 09/25/37 | | 2,530,801 | | | 100,000 | | Ruby Pipeline, LLC (b)(e) | | 6.00 | | 04/01/22 | | 107,627 | |
| | 220,000 | | Popular ABS Mortgage Pass-Through Trust, Series 2007-A A3 (h) | | 0.46 | | 06/25/47 | | 137,363 | | | 1,234,894 | | Saxon Asset Securities Trust, Series 2005-4 A1B (h) | | 0.53 | | 11/25/37 | | 1,148,673 | |
| | 985,857 | | Prudential Holdings, LLC (e) | | 8.70 | | 12/18/23 | | 1,243,446 | | | 1,365,000 | | Saxon Asset Securities Trust, Series 2007-1 A2C (h) | | 0.30 | | 01/25/47 | | 998,036 | |
| | 517,188 | | Residential Accredit Loans, Inc., Series 2005-QO3 A1 (h) | | 0.55 | | 10/25/45 | | 379,637 | | | 2,263,074 | | Securitized Asset Backed Receivables, LLC Trust, Series 2007-BR5 A2C (h) | | 0.50 | | 05/25/37 | | 1,525,187 | |
| | 648,847 | | Residential Accredit Loans, Inc., Series 2005-QO5 A1 (b)(h) | | 1.13 | | 01/25/46 | | 470,501 | | | 221,703 | | Securitized Asset Backed Receivables, LLC Trust, Series 2007-NC1 A2B (h) | | 0.30 | | 12/25/36 | | 119,230 | |
| | 443,655 | | Residential Accredit Loans, Inc., Series 2006-QS10 A1 | | 6.00 | | 08/25/36 | | 371,771 | | | 2,258,870 | | Securitized Asset Backed Receivables, LLC Trust, Series 2007-NC2 A2B (h) | | 0.29 | | 01/25/37 | | 1,379,578 | |
| | 228,989 | | Residential Accredit Loans, Inc., Series 2006-QS17 A4 | | 6.00 | | 12/25/36 | | 180,092 | | | 1,175,691 | | SLC Student Loan Trust, Series 2004-1 B (h) | | 0.53 | | 08/15/31 | | 1,058,560 | |
| | 349,555 | | Residential Accredit Loans, Inc., Series 2007-QS1 1A1 | | 6.00 | | 01/25/37 | | 284,263 | | | 952,354 | | SLC Student Loan Trust, Series 2005-2 B (h) | | 0.51 | | 03/15/40 | | 856,193 | |
| | 173,282 | | Residential Accredit Loans, Inc., Series 2007-QS5 A1 | | 5.50 | | 03/25/37 | | 136,071 | | | 1,100,000 | | SLC Student Loan Trust, Series 2006-2 A5 (h) | | 0.33 | | 09/15/26 | | 1,078,950 | |
| | 712,851 | | Residential Accredit Loans, Inc., Series 2007-QS8 A6 | | 6.00 | | 06/25/37 | | 583,918 | | | 36,767 | | SLM Student Loan Trust, Series 2004-8 B (b)(h) | | 0.70 | | 01/25/40 | | 33,183 | |
| | 413,167 | | Residential Asset Mortgage Products Trust, Series 2004-SL3 A4 | | 8.50 | | 12/25/31 | | 393,784 | | | 1,300,000 | | SLM Student Loan Trust, Series 2006-2 A6 (h) | | 0.41 | | 01/25/41 | | 1,189,265 | |
| | 3,044 | | Residential Asset Mortgage Products, Inc., Series 2004-RZ1 AI7 (b)(h) | | 4.03 | | 01/25/33 | | 3,235 | | | 1,300,000 | | SLM Student Loan Trust, Series 2006-8 A6 (h) | | 0.40 | | 01/25/41 | | 1,165,835 | |
| | 411,509 | | Residential Asset Securitization Trust, Series 2006-A10 A5 | | 6.50 | | 09/25/36 | | 313,861 | | | 722,925 | | SLM Student Loan Trust, Series 2007-6 B (b)(h) | | 1.09 | | 04/27/43 | | 647,181 | |
| | | | | | | | | | | | | | | | | | | | | | |
| See Notes to Financial Statements. | 22 | ABSOLUTE FUNDS |
| |
ABSOLUTE STRATEGIES FUND SCHEDULE OF INVESTMENTS MARCH 31, 2014 |
| |
| | | | Security | | | | | | | | | | | Security | | | | | | | |
| | Principal | | Description | | Rate | | Maturity | | Value | | | Principal | | Description | | Rate | | Maturity | | Value | |
| $ | 735,000 | | SLM Student Loan Trust, Series 2008-2 B (b)(h) | | 1.44 | % | 01/25/29 | $ | 668,514 | | $ | 180,876 | | Structured Asset Securities Corp. Mortgage Loan Trust, Series 2005-4XS 2A1A (b)(h) | | 1.90 | % | 03/25/35 | $ | 181,836 | |
| | 735,000 | | SLM Student Loan Trust, Series 2008-3 B (b)(h) | | 1.44 | | 04/25/29 | | 681,840 | | | 1,028,051 | | Structured Asset Securities Corp. Mortgage Pass-Through Certificates, Series 2003-26A 3A5 (b)(h) | | 2.44 | | 09/25/33 | | 1,026,614 | |
| | 735,000 | | SLM Student Loan Trust, Series 2008-4 B (b)(h) | | 2.09 | | 04/25/29 | | 726,903 | | | 1,683,188 | | Structured Receivables Finance, LLC, Series 2010-A B (e)(f) | | 7.61 | | 01/16/46 | | 1,998,093 | |
| | 735,000 | | SLM Student Loan Trust, Series 2008-5 B (b)(h) | | 2.09 | | 07/25/29 | | 745,650 | | | 900,000 | | Structured Receivables Finance, LLC, Series 2010-B B (e)(f) | | 7.97 | | 08/15/36 | | 1,103,777 | |
| | 735,000 | | SLM Student Loan Trust, Series 2008-6 B (b)(h) | | 2.09 | | 07/25/29 | | 727,173 | | | 1,275,000 | | Symphony CLO IX, LP, Series 2012-9A C (e)(h) | | 3.49 | | 04/16/22 | | 1,275,278 | |
| | 735,000 | | SLM Student Loan Trust, Series 2008-7 B (b)(h) | | 2.09 | | 07/25/29 | | 720,607 | | | 187,500 | | TAL Advantage, LLC, Series 2006-1A (b)(e)(h) | | 0.35 | | 04/20/21 | | 185,383 | |
| | 735,000 | | SLM Student Loan Trust, Series 2008-8 B (b)(h) | | 2.49 | | 10/25/29 | | 757,937 | | | 110,833 | | Textainer Marine Containers, Ltd., Series 2005-1A A (b)(e)(h) | | 0.41 | | 05/15/20 | | 110,621 | |
| | 735,000 | | SLM Student Loan Trust, Series 2008-9 B (b)(h) | | 2.49 | | 10/25/29 | | 769,722 | | | 526,887 | | Trinity Rail Leasing LP, Series 2006-1A A1 (b)(e) | | 5.90 | | 05/14/36 | | 576,564 | |
| | 921,455 | | Soundview Home Loan Trust, Series 2006-EQ2 A4 (h) | | 0.39 | | 01/25/37 | | 592,992 | | | 728,995 | | Trip Rail Master Funding, LLC, Series 2011-1A A1A (b)(e) | | 4.37 | | 07/15/41 | | 773,088 | |
| | 3,349,000 | | Soundview Home Loan Trust, Series 2007-OPT2 2A4 (h) | 0.40 | | 07/25/37 | | 2,110,128 | | | 154,688 | | Triton Container Finance, LLC, Series 2007-1A (b)(e)(h) | | 0.29 | | 02/26/19 | | 154,089 | |
| | 816,579 | | Spirit Master Funding, LLC, Series 2005-1 A1 (b)(e) | | 5.05 | | 07/20/23 | | 836,259 | | | 653,333 | | Triton Container Finance, LLC, Series 2012-1A A (e) | | 4.21 | | 05/14/27 | | 655,333 | |
| | 70,344 | | Structured Adjustable Rate Mortgage Loan Trust, Series 2006-1 7A3 (h) | | 5.08 | | 02/25/36 | | 69,930 | | | 416,289 | | UAL Pass Through Trust, Series 2009-1 | | 10.40 | | 11/01/16 | | 474,570 | |
| | 775,386 | | Structured Adjustable Rate Mortgage Loan Trust, Series 2006-1 7A4 (h) | | 5.08 | | 02/25/36 | | 635,172 | | | 179,382 | | US Airways Pass Through Trust, Series 2012-2A | | 4.63 | | 06/03/25 | | 188,800 | |
| | 65,558 | | Structured Adjustable Rate Mortgage Loan Trust, Series 2007-3 3A1 (h) | | 3.98 | | 04/25/47 | | 52,804 | | | | | | | | | | | | |
| | | | | | | | | | | | | | | | | | | | | | |
| See Notes to Financial Statements. | 23 | ABSOLUTE FUNDS |
| |
ABSOLUTE STRATEGIES FUND SCHEDULE OF INVESTMENTS MARCH 31, 2014 |
| |
| | | | Security | | | | | | | | | | | Security | | | | | | | |
| | Principal | | Description | | Rate | | Maturity | | Value | | | Principal | | Description | | Rate | | Maturity | | Value | |
| $ | 162,657 | | Wachovia Bank Commercial Mortgage Trust, Series 2005-C20 A7 (b)(h) | | 5.12 | % | 07/15/42 | $ | 170,022 | | $ | 1,998,680 | | Washington Mutual Mortgage Pass-Through Certificates, Series 2006-AR7 A1A (h) | | 1.05 | % | 09/25/46 | $ | 1,277,173 | |
| | 11,986 | | WaMu Mortgage Pass-Through Certificates, Series 2002-AR18 A (b)(h) | | 2.50 | | 01/25/33 | | 12,213 | | | 2,282,952 | | Washington Mutual Mortgage Pass-Through Certificates, Series 2007-OA2 2A (h) | | 0.83 | | 01/25/47 | | 1,634,317 | |
| | 919,649 | | WaMu Mortgage Pass-Through Certificates, Series 2005-AR7 A2 (h) | | 2.41 | | 08/25/35 | | 919,954 | | | 2,038,904 | | Washington Mutual Mortgage Pass-Through Certificates, Series 2007-OA3 2A (h) | | 0.88 | | 02/25/47 | | 1,434,771 | |
| | 277,121 | | WaMu Mortgage Pass-Through Certificates, Series 2006-AR12 2A3 (h) | | 1.83 | | 10/25/36 | | 225,703 | | | 28,397 | | Wells Fargo Alternative Loan Trust, Series 2005-2 A4 (b)(h) | | 0.49 | | 10/25/35 | | 28,464 | |
| | 166,783 | | WaMu Mortgage Pass-Through Certificates, Series 2006-AR16 1A1 (h) | | 2.05 | | 12/25/36 | | 144,802 | | | 223,172 | | Wells Fargo Home Equity Asset-Backed Securities Trust, Series 2006-3 A2 (h) | | 0.30 | | 01/25/37 | | 204,505 | |
| | 308,432 | | WaMu Mortgage Pass-Through Certificates, Series 2007-HY3 4A1 (h) | | 2.47 | | 03/25/37 | | 290,699 | | | 115,000 | | WF-RBS Commercial Mortgage Trust, Series 2011-C5 A4 (b) | | 3.67 | | 11/15/44 | | 118,562 | |
| | 523,384 | | Washington Mutual Mortgage Pass-Through Certificates, Series 2005-3 2A3 (h) | | 0.70 | | 05/25/35 | | 355,922 | | | 850,000 | | Yandex NV (b)(e) | | 1.13 | | 12/15/18 | | 791,031 | |
| | 376,628 | | Washington Mutual Mortgage Pass-Through Certificates, Series 2005-4 CB13 (h) | | 0.65 | | 06/25/35 | | 285,684 | | Total Asset Backed Obligations | | | | | | | |
| | 1,253,091 | | Washington Mutual Mortgage Pass-Through Certificates, Series 2006-1 4CB | | 6.50 | | 02/25/36 | | 830,311 | | (Cost $156,036,525) | | | | | | 178,682,655 | |
| | 470,020 | | Washington Mutual Mortgage Pass-Through Certificates, Series 2006-7 A1A (g) | | 4.91 | | 09/25/36 | | 292,382 | | | | | | | | | | | | |
| | | | | | | | | | | | Corporate Convertible Bonds - 17.7% | | | | | | | |
| | | | | | | | | | | | Consumer Discretionary - 1.9% | | | | | | | |
| | | | | | | | | | | | | 349,000 | | Callaway Golf Co. (b) | | 3.75 | | 08/15/19 | | 498,416 | |
| | | | | | | | | | | | | 2,676,000 | | Equinix, Inc. (b) | | 3.00 | | 10/15/14 | | 4,415,400 | |
| | | | | | | | | | | | | 1,000,000 | | Exide Technologies (b)(f)(h)(i) | | 0.00 | | 09/18/13 | | 200,000 | |
| | | | | | | | | | | | | 5,432,000 | | Home Inns & Hotels Management, Inc. (b) | | 2.00 | | 12/15/15 | | 5,279,225 | |
| | | | | | | | | | | | | 780,000 | | Iconix Brand Group, Inc. (b) | | 2.50 | | 06/01/16 | | 1,063,238 | |
| | | | | | | | | | | | | 5,000,000 | | JAKKS Pacific, Inc. (b)(e) | | 4.25 | | 08/01/18 | | 5,171,875 | |
| | | | | | | | | | | | | 266,000 | | Jarden Corp. (b)(e) | | 1.13 | | 03/15/34 | | 265,501 | |
| | | | | | | | | | | | | 572,000 | | KB Home (b) | | 1.38 | | 02/01/19 | | 590,590 | |
| | | | | | | | | | | | | 461,000 | | Lennar Corp. (b)(e) | | 2.75 | | 12/15/20 | | 843,630 | |
| | | | | | | | | | | | | | | | | | | | | | |
| See Notes to Financial Statements. | 24 | ABSOLUTE FUNDS |
| |
ABSOLUTE STRATEGIES FUND SCHEDULE OF INVESTMENTS MARCH 31, 2014 |
| |
| | | | Security | | | | | | | | | | | Security | | | | | | | |
| | Principal | | Description | | Rate | | Maturity | | Value | | | Principal | | Description | | Rate | | Maturity | | Value | |
| $ | 2,083,000 | | Live Nation Entertainment, Inc. | | 2.88 | % | 07/15/27 | $ | 2,122,056 | | $ | 8,000,000 | | Healthways, Inc. (b) | | 1.50 | % | 07/01/18 | $ | 8,635,000 | |
| | 4,750,000 | | M/I Homes, Inc. (b) | | 3.25 | | 09/15/17 | | 5,774,219 | | | 1,500,000 | | Protalix BioTherapeutics, Inc. (b)(e) | | 4.50 | | 09/15/18 | | 1,593,750 | |
| | 746,000 | | Meritage Homes Corp. (b) | | 1.88 | | 09/15/32 | | 793,091 | | | 453,000 | | ServiceSource International, Inc. (b)(e) | | 1.50 | | 08/01/18 | | 427,802 | |
| | 896,000 | | Meritor, Inc. (b) | | 7.88 | | 03/01/26 | | 1,372,000 | | | 3,630,000 | | Spectrum Pharmaceuticals, Inc. (b)(e) | | 2.75 | | 12/15/18 | | 3,620,925 | |
| | 486,000 | | Navistar International Corp. (b)(e) | | 4.50 | | 10/15/18 | | 477,495 | | | | | | | | | | | 50,121,944 | |
| | 3,407,000 | | Navistar International Corp. (b)(e) | | 4.75 | | 04/15/19 | | 3,417,647 | | Energy - 0.9% | | | | | | | |
| | 3,000,000 | | Regis Corp. (b) | | 5.00 | | 07/15/14 | | 3,063,750 | | | 415,000 | | Alon USA Energy, Inc. (b)(e) | | 3.00 | | 09/15/18 | | 500,853 | |
| | 356,000 | | Standard Pacific Corp. (b) | | 1.25 | | 08/01/32 | | 443,220 | | | 475,000 | | BPZ Resources, Inc. (b) | | 8.50 | | 10/01/17 | | 548,031 | |
| | 400,000 | | Steinhoff Finance Holding GmbH (e) | | 6.38 | | 05/26/17 | | 699,846 | | | 920,000 | | Chesapeake Energy Corp. | | 2.50 | | 05/15/37 | | 940,700 | |
| | 1,701,000 | | Tesla Motors, Inc. (b) | | 1.25 | | 03/01/21 | | 1,547,910 | | | 3,000,000 | | Clean Energy Fuels Corp. (b)(e) | | 5.25 | | 10/01/18 | | 2,737,500 | |
| | 742,000 | | The Ryland Group, Inc. (b) | | 1.63 | | 05/15/18 | | 1,059,205 | | | 575,000 | | Cobalt International Energy, Inc. (b) | | 2.63 | | 12/01/19 | | 542,297 | |
| | 4,100,000 | | Titan Machinery, Inc. (b) | | 3.75 | | 05/01/19 | | 3,497,812 | | | 532,000 | | Emerald Oil, Inc. (b)(e) | | 2.00 | | 04/01/19 | | 551,950 | |
| | 440,000 | | Vector Group, Ltd. (b)(h) | | 2.50 | | 01/15/19 | | 605,013 | | | 6,733,000 | | Green Plains Renewable Energy, Inc. (b)(e) | | 3.25 | | 10/01/18 | | 10,520,313 | |
| | 500,000 | | Vector Group, Ltd. (b) | | 1.75 | | 04/15/20 | | 524,063 | | | 3,414,000 | | JinkoSolar Holding Co., Ltd. (b)(e) | | 4.00 | | 02/01/19 | | 3,098,205 | |
| | 5,150,000 | | Wabash National Corp. (b) | | 3.38 | | 05/01/18 | | 7,177,812 | | | 800,000 | | Newpark Resources, Inc. (b) | | 4.00 | | 10/01/17 | | 1,026,000 | |
| | 470,000 | | WESCO International, Inc. (b) | | 6.00 | | 09/15/29 | | 1,397,075 | | | 461,000 | | Peabody Energy Corp. | | 4.75 | | 12/15/41 | | 375,139 | |
| | | | | | | | | | 52,300,089 | | | 695,000 | | Pengrowth Energy Corp. | | 6.25 | | 03/31/17 | | 655,393 | |
| | | | | | | | | | | | | 1,066,000 | | SolarCity Corp. (b) | | 2.75 | | 11/01/18 | | 1,379,138 | |
| Consumer Staples - 1.8% | | | | | | | | | 750,000 | | Solazyme, Inc. | | 5.00 | | 10/01/19 | | 804,375 | |
| | 6,488,000 | | Albany Molecular Research, Inc. (b)(e) | | 2.25 | | 11/15/18 | | 8,815,570 | | | 1,378,000 | | Vantage Drilling Co. (b)(e) | | 5.50 | | 07/15/43 | | 1,447,761 | |
| | 4,730,000 | | Array BioPharma, Inc. (b) | | 3.00 | | 06/01/20 | | 4,892,594 | | | | | | | | | | | 25,127,655 | |
| | 2,468,000 | | Ascent Capital Group, Inc. (b) | | 4.00 | | 07/15/20 | | 2,471,085 | | Financial - 2.0% | | | | | | | |
| | 2,000,000 | | Carriage Services, Inc. (b)(e) | | 2.75 | | 03/15/21 | | 2,105,010 | | | 668,000 | | American Residential Properties OP LP (b)(e) | | 3.25 | | 11/15/18 | | 711,837 | |
| | 401,000 | | Chiquita Brands International, Inc. (b) | | 4.25 | | 08/15/16 | | 410,022 | | | 406,000 | | AmTrust Financial Services, Inc. (b) | | 5.50 | | 12/15/21 | | 595,805 | |
| | 5,817,000 | | Ctrip.com International, Ltd. (b)(e) | | 1.25 | | 10/15/18 | | 5,795,186 | | | 9,930,000 | | CBIZ, Inc. (b)(e) | | 4.88 | | 10/01/15 | | 13,256,550 | |
| | 7,000,000 | | Emergent Biosolutions, Inc. (b)(e) | | 2.88 | | 01/15/21 | | 7,542,500 | | | 120,000 | | DFC Global Corp. (b) | | 3.25 | | 04/15/17 | | 102,900 | |
| | 4,000,000 | | Endologix, Inc. (b) | | 2.25 | | 12/15/18 | | 3,812,500 | | | 3,500,000 | | Encore Capital Group, Inc. (b) | | 3.00 | | 11/27/17 | | 5,438,125 | |
| | | | | | | | | | | | | | | | | | | | | | |
| See Notes to Financial Statements. | 25 | ABSOLUTE FUNDS |
| |
ABSOLUTE STRATEGIES FUND SCHEDULE OF INVESTMENTS MARCH 31, 2014 |
| |
| | | | Security | | | | | | | | | | | Security | | | | | | | |
| | Principal | | Description | | Rate | | Maturity | | Value | | | Principal | | Description | | Rate | | Maturity | | Value | |
| $ | 6,885,000 | | Encore Capital Group, Inc. (b)(e) | | 3.00 | % | 07/01/20 | $ | 8,008,116 | | $ | 3,550,000 | | Volcano Corp. (b) | | 1.75 | % | 12/01/17 | $ | 3,530,031 | |
| | 124,000 | | Encore Capital Group, Inc. (b)(e) | | 2.88 | | 03/15/21 | | 122,605 | | | 959,000 | | Wright Medical Group, Inc. (b) | | 2.00 | | 08/15/17 | | 1,308,436 | |
| | 891,000 | | Forest City Enterprises, Inc. (b) | | 4.25 | | 08/15/18 | | 999,034 | | | | | | | | | | | 36,563,344 | |
| | 7,405,000 | | Forestar Group, Inc. (b) | | 3.75 | | 03/01/20 | | 7,937,234 | | | | | | | | | | | | |
| | 4,000,000 | | FXCM, Inc. (b)(e) | | 2.25 | | 06/15/18 | | 4,150,000 | | Industrial - 2.7% | | | | | | | |
| | 6,000,000 | | Gain Capital Holdings, Inc. (b)(e) | | 4.13 | | 12/01/18 | | 6,787,500 | | | 3,655,000 | | AAR Corp., Series B (b) | | 2.25 | | 03/01/16 | | 3,762,366 | |
| | 246,000 | | Jefferies Group, LLC (b) | | 3.88 | | 11/01/29 | | 262,759 | | | 416,000 | | Aecon Group, Inc. | | 5.50 | | 12/31/18 | | 420,516 | |
| | 3,772,000 | | Meadowbrook Insurance Group, Inc. (b) | | 5.00 | | 03/15/20 | | 3,518,333 | | | 488,000 | | Aegean Marine Petroleum Network, Inc. (b) | | 4.00 | | 11/01/18 | | 491,355 | |
| | 776,000 | | MGIC Investment Corp. (b)(e) | | 9.00 | | 04/01/63 | | 948,175 | | | 5,307,000 | | AirTran Holdings, Inc. (b) | | 5.25 | | 11/01/16 | | 10,328,749 | |
| | 706,000 | | Portfolio Recovery Associates, Inc. (b)(e) | | 3.00 | | 08/01/20 | | 841,022 | | | 7,500,000 | | Altra Industrial Motion Corp. (b) | | 2.75 | | 03/01/31 | | 10,701,562 | |
| | 537,000 | | Radian Group, Inc. (b) | | 2.25 | | 03/01/19 | | 823,288 | | | 1,800,000 | | Bristow Group, Inc. (b) | | 3.00 | | 06/15/38 | | 2,237,625 | |
| | 1,153,000 | | Walter Investment Management Corp. (b) | | 4.50 | | 11/01/19 | | 1,093,909 | | | 1,500,000 | | Canadian Solar, Inc. (b)(e) | | 4.25 | | 02/15/19 | | 1,514,062 | |
| | | | | | | | | | 55,597,192 | | | 1,020,000 | | Cemex SAB de CV (b) | | 3.75 | | 03/15/18 | | 1,461,788 | |
| | | | | | | | | | | | | 340,000 | | Fluidigm Corp. (b) | | 2.75 | | 02/01/34 | | 388,663 | |
| Healthcare - 1.3% | | | | | | | | | 910,000 | | Genco Shipping & Trading, Ltd. (b) | | 5.00 | | 08/15/15 | | 750,750 | |
| | 5,500,000 | | Accuray, Inc. (b) | | 3.75 | | 08/01/16 | | 6,603,438 | | | 1,668,000 | | General Cable Corp. (b)(g) | | 4.50 | | 11/15/29 | | 1,680,510 | |
| | 498,000 | | Allscripts Healthcare Solutions, Inc. (b)(e) | | 1.25 | | 07/01/20 | | 616,898 | | | 7,595,000 | | Griffon Corp. (b)(e) | | 4.00 | | 01/15/17 | | 8,610,831 | |
| | 5,368,000 | | AMAG Pharmaceuticals, Inc. (b) | | 2.50 | | 02/15/19 | | 5,438,455 | | | 10,729,000 | | Kaman Corp. (b)(e) | | 3.25 | | 11/15/17 | | 14,034,873 | |
| | 382,000 | | Cubist Pharmaceuticals, Inc. (b) | | 2.50 | | 11/01/17 | | 976,965 | | | 3,481,000 | | Layne Christensen Co. (b)(e) | | 4.25 | | 11/15/18 | | 3,637,645 | |
| | 201,000 | | Illumina, Inc. (b)(e) | | 0.25 | | 03/15/16 | | 365,695 | | | 399,000 | | PHH Corp. (b) | | 6.00 | | 06/15/17 | | 863,336 | |
| | 259,000 | | Incyte Corp., Ltd. (b) | | 4.75 | | 10/01/15 | | 1,575,853 | | | 3,750,000 | | RTI International Metals, Inc. (b) | | 1.63 | | 10/15/19 | | 3,705,469 | |
| | 548,000 | | Incyte Corp., Ltd. (b)(e) | | 1.25 | | 11/15/20 | | 704,865 | | | 2,741,000 | | TTM Technologies, Inc. (b) | | 1.75 | | 12/15/20 | | 3,049,362 | |
| | 4,800,000 | | Molina Healthcare, Inc. (b) | | 3.75 | | 10/01/14 | | 5,946,000 | | | 3,025,000 | | UTi Worldwide, Inc. (b)(e) | | 4.50 | | 03/01/19 | | 3,236,750 | |
| | 190,000 | | Omnicare, Inc. (b) | | 3.75 | | 12/15/25 | | 431,775 | | | 3,472,000 | | Vishay Intertechnology, Inc. (b)(e) | | 2.25 | | 06/01/42 | | 4,643,800 | |
| | 541,000 | | The Medicines Co. (b) | | 1.38 | | 06/01/17 | | 661,034 | | | | | | | | | | | 75,520,012 | |
| | 3,243,000 | | Theravance, Inc. (b) | | 2.13 | | 01/15/23 | | 4,195,631 | | | | | | | | | | | | |
| | 1,500,000 | | Vivus, Inc. (b)(e) | | 4.50 | | 05/01/20 | | 1,140,938 | | Information Technology - 3.3% | | | | | | | |
| | 3,022,000 | | Volcano Corp. (b) | | 2.88 | | 09/01/15 | | 3,067,330 | | | 434,000 | | Bottomline Technologies (de), Inc. (b) | | 1.50 | | 12/01/17 | | 569,354 | |
| | | | | | | | | | | | | 1,707,000 | | Cadence Design Systems, Inc. (b) | | 2.63 | | 06/01/15 | | 3,534,557 | |
| | | | | | | | | | | | | 5,450,000 | | Ciena Corp. (b)(e) | | 4.00 | | 03/15/15 | | 6,907,875 | |
| | | | | | | | | | | | | 696,000 | | Ciena Corp. (b)(e) | | 4.00 | | 12/15/20 | | 988,320 | |
| | | | | | | | | | | | | | | | | | | | | | |
| See Notes to Financial Statements. | 26 | ABSOLUTE FUNDS |
| |
ABSOLUTE STRATEGIES FUND SCHEDULE OF INVESTMENTS MARCH 31, 2014 |
| |
| | | | Security | | | | | | | | | | | Security | | | | | | | |
| | Principal | | Description | | Rate | | Maturity | | Value | | | Principal | | Description | | Rate | | Maturity | | Value | |
| $ | 6,166,000 | | Cornerstone OnDemand, Inc. (b)(e) | | 1.50 | % | 07/01/18 | $ | 7,060,070 | | $ | 8,500,000 | | Silver Standard Resources, Inc. (b)(e) | | 2.88 | % | 02/01/33 | $ | 7,501,250 | |
| | 4,455,000 | | GT Advanced Technologies, Inc. (b) | | 3.00 | | 10/01/17 | | 10,263,206 | | | 2,000,000 | | Steel Dynamics, Inc. (b) | | 5.13 | | 06/15/14 | | 2,167,500 | |
| | 3,598,000 | | GT Advanced Technologies, Inc. (b) | | 3.00 | | 12/15/20 | | 5,831,009 | | | 768,000 | | Sterlite Industries India, Ltd. (b) | | 4.00 | | 10/30/14 | | 772,800 | |
| | 563,000 | | Medidata Solutions, Inc. (b)(e) | | 1.00 | | 08/01/18 | | 689,323 | | | 802,000 | | Stillwater Mining Co. (b) | | 1.75 | | 10/15/32 | | 1,049,618 | |
| | 7,000,000 | | Mentor Graphics Corp. (b) | | 4.00 | | 04/01/31 | | 8,741,250 | | | | | | | | | | | 23,998,526 | |
| | 301,000 | | Microchip Technology, Inc. (b) | | 2.13 | | 12/15/37 | | 559,860 | | | | | | | | | | | | |
| | 358,000 | | Novellus Systems, Inc. (b) | | 2.63 | | 05/15/41 | | 612,851 | | Telecommunication Services - 2.9% | | | | | | | |
| | 3,200,000 | | Photronics, Inc. (b) | | 5.50 | | 10/01/14 | | 5,624,000 | | | 9,000,000 | | Alaska Communications Systems Group, Inc. (b)(e) | | 6.25 | | 05/01/18 | | 7,548,750 | |
| | 9,708,000 | | Photronics, Inc. (b) | | 3.25 | | 04/01/16 | | 10,703,070 | | | 253,458 | | Alcatel-Lucent, Series ALU (e) | | 4.25 | | 07/01/18 | | 659,280 | |
| | 359,000 | | Proofpoint, Inc. (b)(e) | | 1.25 | | 12/15/18 | | 422,722 | | | 11,012,000 | | Blucora, Inc. (b)(e) | | 4.25 | | 04/01/19 | | 12,471,090 | |
| | 5,600,000 | | Quantum Corp. (b) | | 4.50 | | 11/15/17 | | 5,736,500 | | | 5,200,000 | | Comtech Telecommunications Corp. (b) | | 3.00 | | 05/01/29 | | 5,346,250 | |
| | 5,000,000 | | Radisys Corp. (b)(f) | | 4.50 | | 02/15/15 | | 4,701,000 | | | 7,650,000 | | Dealertrack Technologies, Inc. (b) | | 1.50 | | 03/15/17 | | 10,891,687 | |
| | 5,000,000 | | Rudolph Technologies, Inc. (b)(e) | | 3.75 | | 07/15/16 | | 5,725,000 | | | 1,476,000 | | HomeAway, Inc. (b)(e) | | 0.13 | | 04/01/19 | | 1,503,675 | |
| | 387,000 | | SanDisk Corp. (b) | | 1.50 | | 08/15/17 | | 638,308 | | | 3,750,000 | | Infinera Corp. (b)(e) | | 1.75 | | 06/01/18 | | 3,909,375 | |
| | 370,000 | | ServiceNow, Inc. (b)(e)(j) | | - | | 11/01/18 | | 398,213 | | | 4,078,000 | | InterDigital, Inc. (b) | | 2.50 | | 03/15/16 | | 4,243,669 | |
| | 601,000 | | Spansion, LLC (b)(e) | | 2.00 | | 09/01/20 | | 844,781 | | | 2,250,000 | | Leap Wireless International, Inc. | | 4.50 | | 07/15/14 | | 2,278,125 | |
| | 799,000 | | SunEdison, Inc. (b)(e) | | 2.75 | | 01/01/21 | | 1,188,013 | | | 2,000,000 | | ModusLink Global Solutions, Inc. (b)(e)(f) | | 5.25 | | 03/01/19 | | 2,026,200 | |
| | 385,000 | | Take-Two Interactive Software, Inc. (b) | | 1.75 | | 12/01/16 | | 507,478 | | | 6,500,000 | | Move, Inc. (b)(e) | | 2.75 | | 09/01/18 | | 6,386,250 | |
| | 6,000,000 | | Take-Two Interactive Software, Inc. (b) | | 1.00 | | 07/01/18 | | 7,380,000 | | | 895,000 | | Qihoo 360 Technology Co., Ltd. (b)(e) | | 2.50 | | 09/15/18 | | 1,058,897 | |
| | 1,500,000 | | TeleCommunication Systems, Inc. (e) | | 4.50 | | 11/01/14 | | 1,507,500 | | | 538,000 | | SINA Corp. (b)(e) | | 1.00 | | 12/01/18 | | 514,126 | |
| | 648,000 | | VeriSign, Inc. (b) | | 3.25 | | 08/15/37 | | 1,071,630 | | | 537,000 | | SouFun Holdings, Ltd. (b)(e) | | 2.00 | | 12/15/18 | | 523,575 | |
| | | | | | | | | | 92,205,890 | | | 779,000 | | Vipshop Holdings, Ltd. (b) | | 1.50 | | 03/15/19 | | 794,580 | |
| | | | | | | | | | | | | 7,150,000 | | Web.com Group, Inc. (b) | | 1.00 | | 08/15/18 | | 8,450,406 | |
| Materials - 0.9% | | | | | | | | | 6,175,000 | | WebMD Health Corp. (b) | | 2.25 | | 03/31/16 | | 6,263,766 | |
| | 590,000 | | B2Gold Corp. (b)(e) | | 3.25 | | 10/01/18 | | 619,872 | | | 1,510,000 | | WebMD Health Corp. | | 2.50 | | 01/31/18 | | 1,529,819 | |
| | 7,540,000 | | Horsehead Holding Corp. (b) | | 3.80 | | 07/01/17 | | 9,834,987 | | | 1,984,000 | | WebMD Health Corp. (b)(e) | | 1.50 | | 12/01/20 | | 2,021,200 | |
| | 2,017,000 | | Primero Mining Corp. | | 6.50 | | 03/31/16 | | 2,052,499 | | | | | | | | | | | | |
| | | | | | | | | | | | | | | | | | | | | | |
| See Notes to Financial Statements. | 27 | ABSOLUTE FUNDS |
| |
ABSOLUTE STRATEGIES FUND SCHEDULE OF INVESTMENTS MARCH 31, 2014 |
| |
| | | | Security | | | | | | | | | | | Security | | | | | | | |
| | Principal | | Description | | Rate | | Maturity | | Value | | | Principal | | Description | | Rate | | Maturity | | Value | |
| $ | 468,000 | | Yahoo!, Inc. (b)(e)(j) | | 0.00 | % | 12/01/18 | $ | 477,945 | | $ | 80,000 | | Bank of America Corp., MTN (h) | | 8.68 | % | 05/02/17 | $ | 88,104 | |
| | | | | | | | | | 78,898,665 | | | 80,000 | | Bank of America Corp., MTN (h) | | 8.95 | | 05/18/17 | | 88,704 | |
| Total Corporate Convertible Bonds | | | | | | | | | 80,000 | | Bank of America Corp., MTN (h) | | 9.57 | | 06/06/17 | | 90,400 | |
| (Cost $427,537,978) | | | | | | 490,333,317 | | | 20,000 | | Bank of America Corp., MTN, Series L | | 5.65 | | 05/01/18 | | 22,630 | |
| | | | | | | | | | | | | 1,500,000 | | Bank of America NA BKNT (b) | | 6.10 | | 06/15/17 | | 1,697,952 | |
| Corporate Non-Convertible Bonds - 2.6% | | | | | | | | | 750,000 | | Bank of America NA BKNT (h) | | 0.53 | | 06/15/17 | | 738,386 | |
| Consumer Discretionary - 0.1% | | | | | | | | | 1,540,000 | | Chase Capital III, Series C (b)(h) | | 0.79 | | 03/01/27 | | 1,301,300 | |
| | 1,416,000 | | Jarden Corp. | | 7.50 | | 05/01/17 | | 1,637,250 | | | 925,000 | | Chase Capital VI (h) | | 0.86 | | 08/01/28 | | 781,625 | |
| | 2,000,000 | | K Hovnanian Enterprises, Inc. | | 8.63 | | 01/15/17 | | 2,222,500 | | | 500,000 | | CIT Group, Inc. (e) | | 4.75 | | 02/15/15 | | 515,000 | |
| | | | | | | | | | 3,859,750 | | | 40,000 | | CIT Group, Inc. (b)(e) | | 6.63 | | 04/01/18 | | 44,950 | |
| | | | | | | | | | | | | 150,000 | | Citigroup, Inc. | | 5.85 | | 08/02/16 | | 165,669 | |
| Consumer Staples - 0.2% | | | | | | | | | 90,000 | | Citigroup, Inc. | | 6.13 | | 05/15/18 | | 103,535 | |
| | 2,750,000 | | Monitronics International, Inc. (b) | | 9.13 | | 04/01/20 | | 2,956,250 | | | 3,750,000 | | Citigroup, Inc. (b)(h) | | 0.78 | | 08/25/36 | | 2,958,679 | |
| | 1,500,000 | | North Shore-Long Island Jewish Health Care, Inc. | | 6.15 | | 11/01/43 | | 1,728,727 | | | 1,300,000 | | Credit Suisse, Series YCD (b)(h) | | 0.56 | | 08/24/15 | | 1,300,084 | |
| | 60,000 | | NYU Hospitals Center (b) | | 5.75 | | 07/01/43 | | 67,163 | | | 965,000 | | Discover Financial Services | | 3.85 | | 11/21/22 | | 948,991 | |
| | | | | | | | | | 4,752,140 | | | 150,000 | | Duke Realty LP REIT | | 7.38 | | 02/15/15 | | 158,546 | |
| | | | | | | | | | | | | 1,180,000 | | Farmers Exchange Capital II (b)(e)(h) | | 6.15 | | 11/01/53 | | 1,292,852 | |
| Energy - 0.4% | | | | | | | | | 200,000 | | Ford Motor Credit Co., LLC (b) | | 1.70 | | 05/09/16 | | 202,337 | |
| | 2,297,000 | | Alon Refining Krotz Springs, Inc. | | 13.50 | | 10/15/14 | | 2,309,921 | | | 150,000 | | General Electric Capital Corp., MTN | | 5.38 | | 10/20/16 | | 166,724 | |
| | 750,000 | | Arch Coal, Inc. (e) | | 8.00 | | 01/15/19 | | 751,875 | | | 150,000 | | General Electric Capital Corp., MTN | | 3.10 | | 01/09/23 | | 147,062 | |
| | 607,000 | | Berry Petroleum Co., LLC | | 10.25 | | 06/01/14 | | 615,346 | | | 900,000 | | General Electric Capital Corp., MTN (b)(h) | | 0.62 | | 05/05/26 | | 825,390 | |
| | 500,000 | | Chesapeake Energy Corp. | | 9.50 | | 02/15/15 | | 535,625 | | | 2,200,000 | | General Electric Capital Corp., MTN (h) | | 0.72 | | 08/15/36 | | 1,834,598 | |
| | 2,075,000 | | El Paso, LLC | | 6.88 | | 06/15/14 | | 2,094,453 | | | 150,000 | | HBOS PLC, MTN (e) | | 6.75 | | 05/21/18 | | 170,252 | |
| | 1,496,000 | | Energy Transfer Partners LP (b)(h) | | 3.26 | | 11/01/66 | | 1,376,320 | | | 100,000 | | HCP, Inc. | | 2.63 | | 02/01/20 | | 97,815 | |
| | 910,000 | | Newfield Exploration Co. | | 5.63 | | 07/01/24 | | 948,675 | | | 232,000 | | HCP, Inc. REIT | | 5.63 | | 05/01/17 | | 260,126 | |
| | 55,000 | | Petrobras Global Finance BV (b)(h) | | 1.85 | | 05/20/16 | | 54,519 | | | | | | | | | | | | |
| | 130,000 | | Plains Exploration & Production Co. (b) | | 6.88 | | 02/15/23 | | 145,275 | | | | | | | | | | | | |
| | 122,000 | | The Williams Cos., Inc. | | 7.88 | | 09/01/21 | | 145,161 | | | | | | | | | | | | |
| | 500,000 | | Walter Energy, Inc. (e) | | 9.50 | | 10/15/19 | | 510,625 | | | | | | | | | | | | |
| | | | | | | | | | 9,487,795 | | | | | | | | | | | | |
| Financial - 1.5% | | | | | | | | | | | | | | | | | | |
| | 2,500,000 | | Ally Financial, Inc. (j) | | 0.00 | | 06/15/15 | | 2,428,125 | | | | | | | | | | | | |
| | 185,000 | | Bank of America Corp. | | 5.63 | | 10/14/16 | | 204,536 | | | | | | | | | | | | |
| | 15,000 | | Bank of America Corp., MTN | | 7.38 | | 05/15/14 | | 15,121 | | | | | | | | | | | | |
| | | | | | | | | | | | | | | | | | | | | | |
| See Notes to Financial Statements. | 28 | ABSOLUTE FUNDS |
| |
ABSOLUTE STRATEGIES FUND SCHEDULE OF INVESTMENTS MARCH 31, 2014 |
| |
| | | | Security | | | | | | | | | | | Security | | | | | | | |
| | Principal | | Description | | Rate | | Maturity | | Value | | | Principal | | Description | | Rate | | Maturity | | Value | |
| $ | 1,380,000 | | Health Care REIT, Inc. (b) | | 4.95 | % | 01/15/21 | $ | 1,501,617 | | $ | 86,000 | | The Goldman Sachs Group, Inc., MTN | | 7.50 | % | 02/15/19 | $ | 104,151 | |
| | 60,000 | | Health Care REIT, Inc. | | 5.25 | | 01/15/22 | | 66,196 | | | 100,000 | | The Goldman Sachs Group, Inc., MTN, Series B (h) | | 0.64 | | 07/22/15 | | 99,983 | |
| | 35,000 | | Health Care REIT, Inc. | | 6.50 | | 03/15/41 | | 42,778 | | | 1,500,000 | | The Goldman Sachs Group, Inc., Series D (b) | | 6.00 | | 06/15/20 | | 1,724,728 | |
| | 1,409,000 | | Healthcare Realty Trust, Inc. REIT | | 6.50 | | 01/17/17 | | 1,591,015 | | | 477,000 | | Thornburg Mortgage, Inc. (i) | | 8.00 | | 05/15/13 | | 81,391 | |
| | 540,000 | | Healthcare Realty Trust, Inc. REIT | | 5.75 | | 01/15/21 | | 599,025 | | | 15,000 | | WEA Finance, LLC / WT Finance Aust Pty, Ltd. (e) | | �� 6.75 | | 09/02/19 | | 18,052 | |
| | 175,000 | | International Lease Finance Corp. (e) | | 6.75 | | 09/01/16 | | 195,563 | | | 100,000 | | ZFS Finance USA Trust II (b)(e)(h) | | 6.45 | | 12/15/65 | | 108,500 | |
| | 500,000 | | iStar Financial, Inc. | | 6.05 | | 04/15/15 | | 523,750 | | | | | | | | | | | 40,304,815 | |
| | 150,000 | | JPMorgan Chase & Co. | | 4.50 | | 01/24/22 | | 161,980 | | Industrial - 0.1% | | | | | | | |
| | 725,000 | | JPMorgan Chase Capital XIII, Series M (h) | | 1.18 | | 09/30/34 | | 607,187 | | | 1,000,000 | | Sydney Airport Finance Co Pty, Ltd. (e) | | 5.13 | | 02/22/21 | | 1,084,028 | |
| | 3,340,000 | | JPMorgan Chase Capital XXI, Series U (h) | | 1.19 | | 02/02/37 | | 2,647,317 | | | 125,000 | | Sydney Airport Finance Co. Pty, Ltd. (e) | | 3.90 | | 03/22/23 | | 122,500 | |
| | 450,000 | | JPMorgan Chase Capital XXIII (h) | | 1.24 | | 05/15/47 | | 346,500 | | | | | | | | | | | 1,206,528 | |
| | 700,000 | | Macquarie Bank, Ltd. (e) | | 6.63 | | 04/07/21 | | 793,112 | | Information Technology - 0.0% | | | | | | | |
| | 90,000 | | Morgan Stanley | | 4.20 | | 11/20/14 | | 92,056 | | | 1,000,000 | | EarthLink Holdings Corp. | | 7.38 | | 06/01/20 | | 1,045,000 | |
| | 100,000 | | Morgan Stanley, MTN | | 6.00 | | 05/13/14 | | 100,619 | | | | | | | | | | | | |
| | 250,000 | | Morgan Stanley, MTN (b)(h) | | 0.69 | | 10/18/16 | | 249,533 | | Materials - 0.0% | | | | | | | |
| | 2,575,000 | | Nationwide Mutual Insurance Co. (b)(e)(h) | | 5.81 | | 12/15/24 | | 2,610,406 | | | 1,000,000 | | ArcelorMittal | | 4.25 | | 02/25/15 | | 1,023,750 | |
| | 2,282,000 | | Nuveen Investments, Inc. | | 5.50 | | 09/15/15 | | 2,327,640 | | | 65,000 | | Barrick Gold Corp. (b) | | 4.10 | | 05/01/23 | | 61,776 | |
| | 770,000 | | Raymond James Financial, Inc. | | 8.60 | | 08/15/19 | | 975,334 | | | | | | | | | | | 1,085,526 | |
| | 1,000,000 | | Realogy Group, LLC / The Sunshine Group Florida, Ltd. (e) | | 3.38 | | 05/01/16 | | 1,010,000 | | | | | | | | | | | | |
| | 900,000 | | Royal Bank of Scotland Group PLC | | 6.10 | | 06/10/23 | | 935,858 | | Telecommunication Services - 0.2% | | | | | | | |
| | 1,600,000 | | SL Green Realty Corp. / SL Green Operating Partnership / Reckson Operating Partnership | | 5.00 | | 08/15/18 | | 1,734,834 | | | 2,250,000 | | Clear Channel Communications, Inc. | | 5.50 | | 09/15/14 | | 2,266,875 | |
| | 355,000 | | The Goldman Sachs Group, Inc. | | 6.15 | | 04/01/18 | | 406,197 | | | 2,100,000 | | DISH DBS Corp. | | 6.63 | | 10/01/14 | | 2,157,750 | |
| | | | | | | | | | | | | 500,000 | | FairPoint Communications, Inc. (e) | | 8.75 | | 08/15/19 | | 537,500 | |
| | | | | | | | | | | | | 1,000,000 | | Windstream Corp. | | 7.88 | | 11/01/17 | | 1,152,500 | |
| | | | | | | | | | | | | | | | | | | | | 6,114,625 | |
| | | | | | | | | | | | | | | | | | | | | | |
| | | | | | | | | | | | Utilities - 0.1% | | | | | | | |
| | | | | | | | | | | | | 840,000 | | FirstEnergy Corp., Series A | | 2.75 | | 03/15/18 | | 838,229 | |
| | | | | | | | | | | | | 675,000 | | GenOn Americas Generation, LLC | | 8.50 | | 10/01/21 | | 648,000 | |
| | | | | | | | | | | | | 1,000,000 | | IPALCO Enterprises, Inc. | | 5.00 | | 05/01/18 | | 1,062,500 | |
| | | | | | | | | | | | | 150,000 | | Metropolitan Edison Co. (e) | | 3.50 | | 03/15/23 | | 144,409 | |
| | | | | | | | | | | | | 145,000 | | Oncor Electric Delivery Co., LLC | | 6.80 | | 09/01/18 | | 171,173 | |
| | | | | | | | | | | | | | | | | | | | | | |
| See Notes to Financial Statements. | 29 | ABSOLUTE FUNDS |
| |
ABSOLUTE STRATEGIES FUND SCHEDULE OF INVESTMENTS MARCH 31, 2014 |
| |
| | | | Security | | | | | | | | | | | Security | | | | | | | |
| | Principal | | Description | | Rate | | Maturity | | Value | | | Principal | | Description | | Rate | | Maturity | | Value | |
| $ | 115,000 | | PNM Resources, Inc. | | 9.25 | % | 05/15/15 | $ | 125,926 | | $ | 750,000 | | State of California | | 7.95 | % | 03/01/36 | $ | 883,373 | |
| | 80,000 | | Public Service Co. of New Mexico | | 7.95 | | 05/15/18 | | 95,476 | | | | | | | | | | | 3,452,012 | |
| | 600,000 | | Sabine Pass LNG LP (e) | | 7.50 | | 11/30/16 | | 645,000 | | Illinois - 0.2% | | | | | | | |
| | | | | | | | | | 3,730,713 | | | 1,625,000 | | City of Chicago IL | | 6.05 | | 01/01/29 | | 1,647,409 | |
| Total Corporate Non-Convertible Bonds | | | | | | | | | 85,000 | | State of Illinois (b) | | 4.35 | | 06/01/18 | | 90,074 | |
| (Cost $65,946,817) | | | | | | 71,586,892 | | | 1,000,000 | | State of Illinois | | 6.20 | | 07/01/21 | | 1,125,730 | |
| | | | | | | | | | | | | 2,105,000 | | State of Illinois (b) | | 4.95 | | 06/01/23 | | 2,200,251 | |
| Exchange Traded Notes - 0.0% | | | | | | | | | 100,000 | | State of Illinois (b) | | 5.10 | | 06/01/33 | | 98,793 | |
| | 20,500 | | iPATH S&P 500 VIX Mid-Term Futures ETN (a)(b) | | | | | $ | 310,370 | | | | | | | | | | | 5,162,257 | |
| | | | (Cost $948,087) | | | | | | | | New York - 0.1% | | | | | | | |
| | | | | | | | | | | | | 1,050,000 | | City of New York NY (b) | | 6.65 | | 12/01/31 | | 1,209,379 | |
| Foreign Government Bonds - 0.0% | | | | | | | | | 1,025,000 | | New York City Water & Sewer System | | 6.49 | | 06/15/42 | | 1,136,008 | |
| | 220,000 | | Kommunalbanken AS (b)(e)(h) | | 0.23 | % | 08/28/14 | | 220,032 | | | | | | | | | | | 2,345,387 | |
| | 230,000 | | Kommuninvest I Sverige AB (b)(e)(h) | | 0.23 | | 09/12/14 | | 230,057 | | North Carolina - 0.1% | | | | | | | |
Total Foreign Government Bonds | | | | | | 450,089 | | | 1,800,000 | | North Carolina State Education Assistance Authority, Series 2011-1 A3 (h) | | 1.14 | | 10/25/41 | | 1,816,254 | |
| (Cost $450,000) | | | | | | | | | | | | | | | | | | |
| | | | | | | | | | | | Texas - 0.0% | | | | | | | |
| Interest Only Bonds - 0.1% | | | | | | | | | 100,000 | | City of Houston TX (b) | | 6.29 | | 03/01/32 | | 120,400 | |
| | 23,343,761 | | Lehman ABS Manufactured Housing Contract Trust, Series 2001-B AIOC (h) | | 0.55 | | 04/15/40 | | 518,696 | | Total Municipal Bonds | | | | | | | |
| | 54,368,447 | | Residential Accredit Loans, Inc., Series 2006-QS11 AV (h) | 0.33 | | 08/25/36 | | 745,038 | | (Cost $12,740,899) | | | | | | 12,896,310 | |
| | 26,373,723 | | Residential Accredit Loans, Inc., Series 2006-QS6 1AV (h) | 0.74 | | 06/25/36 | | 835,678 | | Municipal Demand Notes - 0.1% | | | | | | | |
| | 59,529,580 | | Residential Accredit Loans, Inc., Series 2007-QS2 AV (h) | 0.31 | | 01/25/37 | | 694,442 | | Arizona - 0.1% | | | | | | | |
| | 59,773,396 | | Residential Accredit Loans, Inc., Series 2007-QS3 AV (h) | 0.32 | | 02/25/37 | | 828,340 | | | 1,500,000 | | Arizona Health Facilities Authority (h) | | 0.98 | | 01/01/37 | | 1,203,960 | |
| Total Interest Only Bonds | | | | | | 3,622,194 | | Total Municipal Demand Notes | | | | | | | |
| (Cost $2,084,452) | | | | | | | | (Cost $1,133,653) | | | | | | 1,203,960 | |
| | | | | | | | | | | | Syndicated Loans - 0.1% | | | | | | | |
| Municipal Bonds - 0.5% | | | | | | | | | 1,000,000 | | Arch Coal, Inc. (h) | | 6.25 | | 05/16/18 | | 985,625 | |
| California - 0.1% | | | | | | | | | 877,352 | | HCA, Inc. (h) | | 3.00 | | 05/01/18 | | 878,381 | |
| | 60,000 | | State of California | | 6.20 | | 03/01/19 | | 70,562 | | | 1,000,000 | | Southern Pacific (h) | | 11.00 | | 03/31/19 | | 1,015,000 | |
| | 2,065,000 | | State of California | | 5.70 | | 11/01/21 | | 2,413,820 | | | 1,000,000 | | Travelport, LLC (h) | | 9.50 | | 01/31/16 | | 1,037,916 | |
| | 70,000 | | State of California (b) | | 6.65 | | 03/01/22 | | 84,257 | | Total Syndicated Loans | | | | | | 3,916,922 | |
| | | | | | | | | | | | (Cost $3,845,141) | | | | | | | |
| | | | | | | | | | | | U.S. Government & Agency Obligations - 1.0% | | | | | | | |
| | | | | | | | | | | | Agency - 0.0% | | | | | | | |
| | | | | | | | | | | | | 170,000 | | FFCB (b)(h) | | 0.18 | | 09/14/16 | | 170,092 | |
| | | | | | | | | | | | | 170,000 | | FFCB (b)(h) | | 0.21 | | 02/27/17 | | 170,169 | |
| | | | | | | | | | | | | 220,000 | | FHLB (b)(g) | | 0.75 | | 05/26/28 | | 213,710 | |
| | | | | | | | | | | | | | | | | | | | | 553,971 | |
| See Notes to Financial Statements. | 30 | ABSOLUTE FUNDS |
| |
ABSOLUTE STRATEGIES FUND SCHEDULE OF INVESTMENTS MARCH 31, 2014 |
| |
| | | | Security | | | | | | | | | | | Security | | | | | | | |
| | Principal | | Description | | Rate | | Maturity | | Value | | | Principal | | Description | | Rate | | Maturity | | Value | |
| Discount Note - 0.1% | | | | | | | | | | | | | | | | | | |
| $ | 185,000 | | FHLB (b)(j) | | 0.06 | % | 04/21/14 | $ | 184,998 | | $ | 2,823,947 | | GNMA, Series 2010-4, Class SL (h) | | 6.25 | % | 01/16/40 | $ | 426,512 | |
| | 715,000 | | FHLB (b)(j) | | 0.07 | | 04/25/14 | | 714,991 | | | | | | | | | | | 7,175,316 | |
| | 380,000 | | FHLB (b)(j) | | 0.07 | | 05/16/14 | | 379,991 | | Mortgage Securities - 0.4% | | | | | | | |
| | 1,030,000 | | FHLB (b)(j) | | 0.07 | | 05/21/14 | | 1,029,971 | | | 182,097 | | FHLMC Gold Pool #A96411 | | 4.00 | | 01/01/41 | | 189,798 | |
| | 745,000 | | FHLB (b)(j) | | 0.06 | | 05/30/14 | | 744,975 | | | 60,693 | | FHLMC Gold Pool #G01864 (b) | | 5.00 | | 01/01/34 | | 66,305 | |
| | 355,000 | | FHLMC (b)(j) | | 0.06 | | 04/07/14 | | 354,999 | | | 124,475 | | FHLMC Gold Pool #G05866 | | 4.50 | | 02/01/40 | | 134,112 | |
| | | | | | | | | | 3,409,925 | | | 156,312 | | FHLMC Gold Pool #G06361 | | 4.00 | | 03/01/41 | | 163,051 | |
| Interest Only Bonds - 0.2% | | | | | | | | | 54,499 | | FHLMC Gold Pool #G13475 (b) | | 6.00 | | 01/01/24 | | 59,846 | |
| | 4,288,261 | | FHLMC, Series 3262, Class KS (h) | | 6.26 | | 01/15/37 | | 514,080 | | | 8,303 | | FHLMC Gold Pool #H03161 (b) | | 6.50 | | 08/01/37 | | 9,007 | |
| | 6,566,044 | | FHLMC, Series 3271, Class SB (h) | | 5.90 | | 02/15/37 | | 799,776 | | | 205,292 | | FHLMC Gold Pool #Q20178 | | 3.50 | | 07/01/43 | | 206,950 | |
| | 3,698,710 | | FHLMC, Series 3404, Class AS (h) | | 5.74 | | 01/15/38 | | 522,344 | | | 323,820 | | FHLMC Gold Pool #U90791 | | 4.00 | | 01/01/43 | | 334,195 | |
| | 4,961,556 | | FHLMC, Series 4030, Class HS (h) | | 6.46 | | 04/15/42 | | 753,875 | | | 155,000 | | FHLMC Multifamily Structured Pass Through Certificates, Series K009 A2 | | 3.81 | | 08/25/20 | | 166,089 | |
| | 3,216,643 | | FNMA, Series 2005-92, Class US (h) | | 5.95 | | 10/25/25 | | 387,290 | | | 175,000 | | FHLMC Multifamily Structured Pass Through Certificates, Series K010, Class A2 (b) | | 4.33 | | 10/25/20 | | 192,801 | |
| | 4,514,038 | | FNMA, Series 2006-125, Class SM (h) | | 7.05 | | 01/25/37 | | 826,974 | | | 215,000 | | FHLMC Multifamily Structured Pass Through Certificates, Series K020, Class A2 (b) | | 2.37 | | 05/25/22 | | 205,768 | |
| | 327,981 | | FNMA, Series 2006-27, Class SH (b)(h) | | 6.55 | | 04/25/36 | | 49,710 | | | 12,494 | | FHLMC, Series 2433, Class SA (b)(h) | | 20.53 | | 02/15/32 | | 18,860 | |
| | 5,300,930 | | FNMA, Series 2007-52, Class LS (h) | | 5.90 | | 06/25/37 | | 691,298 | | | 1,978 | | FHLMC, Series 2929, Class PE (b) | | 5.00 | | 05/15/33 | | 1,977 | |
| | 1,279,142 | | FNMA, Series 2007-68, Class SC (h) | | 6.55 | | 07/25/37 | | 201,370 | | | 383,223 | | FHLMC, Series 3442, Class MT (h) | | 0.16 | | 07/15/34 | | 356,857 | |
| | 473,062 | | FNMA, Series 2007-77, Class SK (b)(h) | | 5.72 | | 08/25/37 | | 59,396 | | | 215,000 | | FNCI25 - FNMA TBA | | 2.50 | | 04/15/29 | | 214,899 | |
| | 5,366,808 | | FNMA, Series 2009-115, Class SB (h) | | 6.10 | | 01/25/40 | | 731,821 | | | 270,000 | | FNCI3 - FNMA TBA | | 3.00 | | 04/15/29 | | 277,425 | |
| | 1,259,997 | | FNMA, Series 2010-35, Class IA | | 5.00 | | 07/25/38 | | 51,858 | | | 35,000 | | FNCI3 - FNMA TBA | | 3.00 | | 04/15/29 | | 35,963 | |
| | 2,507,513 | | GNMA, Series 2007-78, Class SG (h) | | 6.38 | | 12/20/37 | | 385,195 | | | 235,000 | | FNCI35 - FNMA TBA | | 3.50 | | 04/15/29 | | 246,456 | |
| | 3,673,641 | | GNMA, Series 2008-51, Class GS (h) | | 6.08 | | 06/16/38 | | 617,633 | | | | | | | | | | | | |
| | 300,335 | | GNMA, Series 2009-106, Class KS (b)(h) | | 6.24 | | 11/20/39 | | 45,457 | | | | | | | | | | | | |
| | 591,007 | | GNMA, Series 2010-158, Class EI (b) | | 4.00 | | 12/16/25 | | 75,598 | | | | | | | | | | | | |
| | 215,754 | | GNMA, Series 2010-4, Class NS (h) | | 6.24 | | 01/16/40 | | 35,129 | | | | | | | | | | | | |
| | | | | | | | | | | | | | | | | | | | | | |
| See Notes to Financial Statements. | 31 | ABSOLUTE FUNDS |
| |
ABSOLUTE STRATEGIES FUND SCHEDULE OF INVESTMENTS MARCH 31, 2014 |
| |
| | | | Security | | | | | | | | | | | Security | | | | | | | |
| | Principal | | Description | | Rate | | Maturity | | Value | | | Principal | | Description | | Rate | | Maturity | | Value | |
| $ | 575,000 | | FNCL3 - FNMA TBA | | 3.00 | % | 04/15/44 | $ | 555,145 | | $ | 160,327 | | FNMA Pool #AJ0764 | | 4.50 | % | 09/01/41 | $ | 171,405 | |
| | 5,000 | | FNCL3 - FNMA TBA | | 3.00 | | 04/15/44 | | 4,827 | | | 237,887 | | FNMA Pool #AL0149 | | 4.00 | | 02/01/41 | | 247,921 | |
| | 290,000 | | FNCL3 - FNMA TBA | | 3.00 | | 04/15/44 | | 279,986 | | | 129,857 | | FNMA Pool #AL0851 | | 6.00 | | 10/01/40 | | 144,785 | |
| | 235,000 | | FNCL35 - FNMA TBA | | 3.50 | | 04/15/44 | | 236,469 | | | 211,193 | | FNMA Pool #AL3306 | | 2.46 | | 04/01/23 | | 203,244 | |
| | 275,000 | | FNCL35 - FNMA TBA | | 3.50 | | 04/15/44 | | 276,719 | | | 415,709 | | FNMA Pool #MA1527 | | 3.00 | | 08/01/33 | | 415,141 | |
| | 15,000 | | FNCL4 - FNMA TBA | | 4.00 | | 04/15/44 | | 15,595 | | | 311,725 | | FNMA Pool #MA1608 | | 3.50 | | 10/01/33 | | 320,934 | |
| | 315,000 | | FNCL4 - FNMA TBA | | 4.00 | | 04/15/44 | | 327,502 | | | 37,508 | | FNMA, Series 2001-52, Class YZ (b) | | 6.50 | | 10/25/31 | | 42,063 | |
| | 380,000 | | FNCL4 - FNMA TBA | | 4.00 | | 04/15/44 | | 395,081 | | | 17,507 | | FNMA, Series 2001-81, Class QG (b) | | 6.50 | | 01/25/32 | | 19,384 | |
| | 345,000 | | FNCL4 - FNMA TBA | | 4.00 | | 04/15/44 | | 358,692 | | | 603,123 | | FNMA, Series 2003-64, Class KS (h) | | 9.44 | | 07/25/18 | | 658,495 | |
| | 70,000 | | FNCL45 - FNMA TBA | | 4.50 | | 04/15/44 | | 74,692 | | | 142,929 | | FNMA, Series 2006-4, Class WE | | 4.50 | | 02/25/36 | | 152,933 | |
| | 230,000 | | FNCL45 - FNMA TBA | | 4.50 | | 04/15/44 | | 245,417 | | | 180,000 | | FNMA, Series 2013-M7, Class A2 | | 2.28 | | 12/27/22 | | 179,867 | |
| | 65,709 | | FNMA Pool #545639 (b) | | 6.50 | | 04/01/32 | | 74,973 | | | 200,000 | | G2SF35 - GNMA TBA | | 3.50 | | 04/15/44 | | 204,156 | |
| | 2,772 | | FNMA Pool #673743 (b)(h) | | 2.63 | | 11/01/32 | | 2,819 | | | 245,000 | | G2SF45 - GNMA TBA | | 4.50 | | 04/15/44 | | 264,179 | |
| | 99,921 | | FNMA Pool #734922 | | 4.50 | | 09/01/33 | | 106,973 | | | 7,100 | | GNMA II Pool #080610 (b)(h) | | 1.63 | | 06/20/32 | | 7,393 | |
| | 51,146 | | FNMA Pool #735646 | | 4.50 | | 07/01/20 | | 54,316 | | | 20,899 | | GNMA II Pool #081136 (b)(h) | | 2.13 | | 11/20/34 | | 21,858 | |
| | 44,003 | | FNMA Pool #735861 (b) | | 6.50 | | 09/01/33 | | 50,192 | | | 21,804 | | GNMA II Pool #081432 (b)(h) | | 1.63 | | 08/20/35 | | 22,679 | |
| | 36,631 | | FNMA Pool #735881 (b) | | 6.00 | | 11/01/34 | | 41,353 | | | 19,314 | | GNMA II Pool #081435 (b)(h) | | 1.63 | | 08/20/35 | | 20,088 | |
| | 18,602 | | FNMA Pool #764388 (b)(h) | | 3.88 | | 03/01/34 | | 19,896 | | | | | | | | | | | 10,698,079 | |
| | 60,947 | | FNMA Pool #776708 (b) | | 5.00 | | 05/01/34 | | 67,383 | | | | | | | | | | | | |
| | 85,650 | | FNMA Pool #888219 | | 5.50 | | 03/01/37 | | 94,657 | | U.S. Treasury Securities - 0.3% | | | | | | | |
| | 21,959 | | FNMA Pool #895606 (b)(h) | | 5.78 | | 06/01/36 | | 23,630 | | | 62,000 | | U.S. Treasury Bill (k) | | 0.06 | | 04/24/14 | | 61,999 | |
| | 105,823 | | FNMA Pool #897164 | | 6.50 | | 08/01/36 | | 120,580 | | | 405,000 | | U.S. Treasury Bond (b) | | 3.75 | | 11/15/43 | | 419,365 | |
| | 156,371 | | FNMA Pool #962723 | | 5.50 | | 04/01/38 | | 174,410 | | | 607,997 | | U.S. Treasury Inflation Indexed Bond (b) | | 2.00 | | 07/15/14 | | 618,279 | |
| | 224,600 | | FNMA Pool #963997 | | 5.50 | | 06/01/38 | | 250,650 | | | 1,419,227 | | U.S. Treasury Inflation Indexed Bond (b) | | 0.50 | | 04/15/15 | | 1,449,117 | |
| | 35,819 | | FNMA Pool #974148 | | 5.50 | | 02/01/38 | | 39,551 | | | 524,507 | | U.S. Treasury Inflation Indexed Bond (b) | | 0.13 | | 04/15/16 | | 539,099 | |
| | 153,184 | | FNMA Pool #AB1613 | | 4.00 | | 10/01/40 | | 159,837 | | | 473,685 | | U.S. Treasury Inflation Indexed Bond (b) | | 0.13 | | 04/15/17 | | 482,708 | |
| | 161,438 | | FNMA Pool #AB3864 | | 3.50 | | 11/01/41 | | 162,765 | | | 222,596 | | U.S. Treasury Inflation Indexed Bond (b) | | 0.13 | | 04/15/18 | | 227,875 | |
| | 139,023 | | FNMA Pool #AD0791 (b) | | 4.76 | | 02/01/20 | | 156,165 | | | | | | | | | | | | |
| | 161,662 | | FNMA Pool #AE0600 (b) | | 3.98 | | 11/01/20 | | 174,767 | | | | | | | | | | | | |
| | 157,900 | | FNMA Pool #AE0605 (b) | | 4.67 | | 07/01/20 | | 176,153 | | | | | | | | | | | | |
| | | | | | | | | | | | | | | | | | | | | | |
| See Notes to Financial Statements. | 32 | ABSOLUTE FUNDS |
| |
ABSOLUTE STRATEGIES FUND SCHEDULE OF INVESTMENTS MARCH 31, 2014 |
| |
| | | | Security | | | | | | | | | | | Security | | | | | | | |
| | Principal | | Description | | Rate | | Maturity | | Value | | | Principal | | Description | | Rate | | Maturity | | Value | |
| $ | 245,872 | | U.S. Treasury Inflation Indexed Bond (b) | | 1.38 | % | 02/15/44 | $ | 251,507 | | $ | 500,000 | | Mohawk Industries, Inc. (k) | | 0.50 | % | 04/16/14 | $ | 499,896 | |
| | 115,000 | | U.S. Treasury Note (b) | | 1.63 | | 03/31/19 | | 114,421 | | | 320,000 | | National Rural Utilities (b)(k) | | 0.10 | | 04/15/14 | | 319,987 | |
| | 665,000 | | U.S. Treasury Note (b) | | 2.13 | | 01/31/21 | | 658,557 | | | 2,000,000 | | PPL Energy Supply, Inc. (k) | | 0.45 | | 04/01/14 | | 2,000,000 | |
| | 2,135,000 | | U.S. Treasury Note (b) | | 2.75 | | 02/15/24 | | 2,139,838 | | | 2,135,000 | | Textron, Inc. (k) | | 0.51 | | 04/02/14 | | 2,134,970 | |
| | | | | | | | | | 6,962,765 | | Total Commercial Paper | | | | | | | |
| Total U.S. Government & Agency Obligations | | | | | | | | (Cost $6,954,828) | | | | | | 6,954,828 | |
| (Cost $25,959,998) | | | | | | 28,800,056 | | Total Short-Term Investments | | | | | | | |
| Total Fixed Income Securities | | | | | | | | (Cost $6,954,828) | | | | | | 6,954,828 | |
| (Cost $696,683,550) | | | | | | 791,802,765 | | | | | Security | | Strike | | Exp. | | | |
| | | | Security | | | | | | | | | Contracts | | Description | | Price | | Date | | Value | |
| | Shares | | Description | | | | | | Value | | Purchased Options - 1.6% | | | | | | | |
| Rights - 0.0% | | | | | | | | Call Options Purchased - 0.7% | | | | | | | |
| | 150,000 | | Comdisco Holding Co., Inc. (a)(l) | | | | | | 10,500 | | | 217 | | Facebook, Inc. | $ | 60.00 | | 04/14 | | 28,210 | |
| Total Rights | | | | | | | | | 2,985 | | General Motors Co. | | 20.00 | | 01/15 | | 4,358,100 | |
| (Cost $43,782) | | | | | | 10,500 | | | 516 | | Johnson & Johnson | | 55.00 | | 01/15 | | 2,229,120 | |
| Investment Companies - 9.1% | | | | | | | | | 3,476 | | Parkervision, Inc. | | 7.00 | | 10/14 | | 165,110 | |
| | 37,632 | | BlackRock Credit Allocation Income Trust | | | | | | 508,785 | | | 4,346 | | Powershares DB U.S. Dollar Index Bullish Fund | | 22.00 | | 09/14 | | 78,228 | |
| | 61,990 | | BlackRock Floating Rate Income Trust | | | | | | 882,738 | | | 8,480 | | SPDR S&P 500 ETF Trust | | 210.00 | | 01/15 | | 771,680 | |
| | 71,620 | | DoubleLine Income Solutions Fund | | | | | | 1,519,776 | | | 9,772 | | SPDR S&P 500 ETF Trust | | 183.00 | | 01/15 | | 10,807,832 | |
| | 55,320 | | DoubleLine Opportunistic Credit Fund | | | | | | 1,280,658 | | Total Call Options Purchased | | | | | | | |
| | 69,698 | | Eaton Vance Limited Duration Income Fund | | | | | | 1,062,895 | | (Premiums Paid $15,721,712) | | | | | | 18,438,280 | |
| | 125,350 | | Invesco Senior Income Trust | | | | | | 629,257 | | | | | | | | | | | | |
| | 21,000 | | iShares Barclays TIPS Bond ETF | | | | | | 2,354,100 | | Put Options Purchased - 0.9% | | | | | | | |
| | 41,200 | | Montgomery Street Income Securities, Inc. | | | | | | 662,908 | | | 152 | | Amedisys, Inc. | | 15.00 | | 06/14 | | 21,432 | |
| | 70,200 | | Nuveen Credit Strategies Income Fund | | | | | | 667,602 | | | 108 | | Angie's List, Inc. | | 17.50 | | 05/14 | | 57,348 | |
| | 92,598 | | PCM Fund, Inc. | | | | | | 1,127,844 | | | 283 | | BE Aerospace, Inc. | | 70.00 | | 10/14 | | 43,158 | |
| | 57,500 | | PIMCO Dynamic Credit Income Fund | | | | | | 1,299,500 | | | 868 | | Canadian Solar, Inc. | | 25.00 | | 04/14 | | 13,020 | |
| | 45,200 | | PIMCO Dynamic Income Fund | | | | | | 1,370,464 | | | 74 | | Chipotle Mexican Grill | | 540.00 | | 01/15 | | 351,870 | |
| | 38,380 | | PIMCO Income Opportunity Fund | | | | | | 1,083,467 | | | 1,520 | | Citigroup, Inc. | | 40.00 | | 09/14 | | 89,680 | |
| | 98,012 | | PIMCO Income Strategy Fund II | | | | | | 1,019,325 | | | 4,343 | | Citigroup, Inc. | | 30.00 | | 09/14 | | 34,744 | |
| | 5,000 | | ProShares UltraShort 20+ Year Treasury (a)(b) | | | | | | 337,750 | | | 869 | | Deutsche Bank AG | | 40.00 | | 10/14 | | 158,592 | |
| | 1,257,062 | | SPDR S&P 500 ETF Trust (b)(c)(d) | | | | | | 235,120,876 | | | 869 | | iShares FTSE China 25 Index Fund | | 32.50 | | 06/14 | | 38,671 | |
| | 27,400 | | Western Asset Mortgage Defined Opportunity Fund, Inc. | | | | | | 632,666 | | | 3,694 | | iShares iBoxx High Yield Fund | | 90.00 | | 09/14 | | 543,018 | |
| Total Investment Companies | | | | | | | | | 651 | | iShares Russell 2000 ETF | | 110.00 | | 06/14 | | 140,942 | |
| (Cost $161,163,452) | | | | | | 251,560,611 | | | 4,292 | | iShares Russell 2000 ETF | | 90.00 | | 12/14 | | 802,604 | |
| | | | Security | | | | | | | | | 273 | | SPDR S&P 500 ETF Trust | | 180.00 | | 06/14 | | 73,164 | |
| | Principal | | Description | | Rate | | Maturity | | Value | | | 19,327 | | SPDR S&P 500 ETF Trust | | 183.00 | | 01/15 | | 17,790,503 | |
| Short-Term Investments - 0.3% | | | | | | | | | 9,663 | | SPDR S&P 500 ETF Trust | | 165.00 | | 01/15 | | 4,155,090 | |
| Commercial Paper - 0.3% | | | | | | | | | | | | | | | | | | |
| $ | 2,000,000 | | Mohawk Industries, Inc. (k) | | 0.45 | % | 04/02/14 | | 1,999,975 | | | | | | | | | | | | |
| | | | | | | | | | | | | | | | | | | | | | |
| See Notes to Financial Statements. | 33 | ABSOLUTE FUNDS |
| |
ABSOLUTE STRATEGIES FUND SCHEDULE OF INVESTMENTS MARCH 31, 2014 |
| |
| | | | Security | | Strike | | Exp. | | | | | | | | | | | | | | |
| | Contracts | | Description | | Price | | Date | | Value | | | | | | | | | | | | |
| | 12,329 | | SPDR S&P 500 ETF Trust | $ | 130.00 | | 01/15 | $ | 1,128,103 | | | | | | | | | | | | |
| | 12,663 | | SPDR S&P 500 ETF Trust | | 90.00 | | 01/15 | | 151,956 | | | | | | | | | | | | |
| | 633 | | Whole Foods Market, Inc. | | 45.25 | | 01/15 | | 170,277 | | | | | | | | | | | | |
| | 217 | | Yum! Brands, Inc. | | 65.00 | | 10/14 | | 37,107 | | | | | | | | | | | | |
| Total Put Options Purchased | | | | | | | | | | | | | | | | | | |
| (Premiums Paid $32,977,472) | | | | | | 25,801,279 | | | | | | | | | | | | |
| Total Purchased Options | | | | | | | | | | | | | | | | | | |
| (Premiums Paid $48,699,184) | | | | | | 44,239,559 | | | | | | | | | | | | |
| Total Long Positions - 77.2% | | | | | | | | | | | | | | | | | | |
| (Cost $1,691,153,599)* | | | | | $ | 2,134,763,254 | | | | | | | | | | | | |
| Total Short Positions - (29.1)% | | | | | | | | | | | | | | | | | | |
| (Cost $(774,982,543))* | | | | | | (802,988,959 | ) | | | | | | | | | | | |
| Total Written Options - (1.1)% | | | | | | | | | | | | | | | | | | |
| (Premiums Received $(34,736,623))* | | | | | | (30,154,358 | ) | | | | | | | | | | | |
| Other Assets & Liabilities, Net – 53.0% | | | | | | 1,462,643,206 | | | | | | | | | | | | |
| Net Assets – 100.0% | | | | | $ | 2,764,263,143 | | | | | | | | | | | | |
| | | | | | | | | | | | | | | | | | | | | | |
| See Notes to Financial Statements. | 34 | ABSOLUTE FUNDS |
| |
ABSOLUTE STRATEGIES FUND SCHEDULE OF SECURITIES SOLD SHORT MARCH 31, 2014 |
| |
| | | | Security | | | | | | | | | | | Security | | | | | | | |
| | Shares | | Description | | | | | | Value | | | Shares | | Description | | | | | | Value | |
| Short Positions - (29.1)% | | | | | | | | | (22,383) | | Vector Group, Ltd. | | | | | $ | (482,130) | |
| Common Stock - (27.6)% | | | | | | | | | (10,355) | | Vera Bradley, Inc. | | | | | | (279,481) | |
| Consumer Discretionary - (5.7)% | | | | | | | | | (9,812) | | Vitamin Shoppe, Inc. | | | | | | (466,266) | |
| | (6,717) | | Buffalo Wild Wings, Inc. | | | | | $ | (1,000,161) | | | (313,400) | | Wabash National Corp. | | | | | | (4,312,384) | |
| | (39,548) | | Callaway Golf Co. | | | | | | (404,181) | | | (15,790) | | WESCO International, Inc. | | | | | | (1,314,044) | |
| | (11,037) | | Chico's FAS, Inc. | | | | | | (176,923) | | | (104,200) | | Yum! Brands, Inc. | | | | | | (7,855,638) | |
| | (6,463) | | Deckers Outdoor Corp. | | | | | | (515,295) | | | | | | | | | | | (158,301,152) | |
| | (117,600) | | Dick's Sporting Goods, Inc. | | | | | | (6,422,136) | | Consumer Staples - (1.4)% | | | | | | | |
| | (11,098) | | Dorman Products, Inc. | | | | | | (655,448) | | | (323,332) | | Albany Molecular Research, Inc. | | | | | | (6,010,742) | |
| | (26,371) | | Equinix, Inc. | | | | | | (4,874,416) | | | (49,798) | | Amedisys, Inc. | | | | | | (741,492) | |
| | (20,000) | | Exide Technologies | | | | | | (4,600) | | | (431,500) | | Array BioPharma, Inc. | | | | | | (2,028,050) | |
| | (5,108) | | FactSet Research Systems, Inc. | | | | | | (550,694) | | | (16,562) | | Ascent Capital Group, Inc., Class A | | | | | | (1,251,259) | |
| | (7,828) | | Family Dollar Stores, Inc. | | | | | | (454,102) | | | (7,174) | | Bunge, Ltd. | | | | | | (570,405) | |
| | (170,500) | | Fastenal Co. | | | | | | (8,409,060) | | | (56,100) | | Carriage Services, Inc. | | | | | | (1,023,264) | |
| | (600,500) | | Ford Motor Co. | | | | | | (9,367,800) | | | (3,392) | | Chiquita Brands International, Inc. | | | | | | (42,230) | |
| | (68,500) | | Fossil Group, Inc. | | | | | | (7,987,785) | | | (33,802) | | Ctrip.com International, Ltd., ADR | | | | | | (1,704,297) | |
| | (48,430) | | FTI Consulting, Inc. | | | | | | (1,614,656) | | | (143,191) | | Emergent Biosolutions, Inc. | | | | | | (3,618,437) | |
| | (8,251) | | Genesco, Inc. | | | | | | (615,277) | | | (83,000) | | Endologix, Inc. | | | | | | (1,068,210) | |
| | (99,000) | | Genuine Parts Co. | | | | | | (8,598,150) | | | (297,516) | | Healthways, Inc. | | | | | | (5,099,424) | |
| | (147,650) | | Harley-Davidson, Inc. | | | | | | (9,834,967) | | | (29,300) | | Keurig Green Mountain, Inc. | | | | | | (3,093,787) | |
| | (31,715) | | Home Inns & Hotels Management, Inc., ADR | | | | | | (1,024,077) | | | (18,793) | | LifeLock, Inc. | | | | | | (321,548) | |
| | (20,294) | | Iconix Brand Group, Inc. | | | | | | (796,945) | | | (9,110) | | On Assignment, Inc. | | | | | | (351,555) | |
| | (7,592) | | iRobot Corp. | | | | | | (311,652) | | | (11,803) | | Post Holdings, Inc. | | | | | | (650,581) | |
| | (297,404) | | JAKKS Pacific, Inc. | | | | | | (2,147,257) | | | (90,848) | | Protalix BioTherapeutics, Inc. | | | | | | (416,084) | |
| | (2,595) | | Jarden Corp. | | | | | | (155,259) | | | (8,345) | | Questcor Pharmaceuticals, Inc. | | | | | | (541,841) | |
| | (180,750) | | Johnson Controls, Inc. | | | | | | (8,553,090) | | | (12,564) | | ServiceSource International, Inc. | | | | | | (106,040) | |
| | (11,287) | | KB Home | | | | | | (191,766) | | | (208,541) | | Spectrum Pharmaceuticals, Inc. | | | | | | (1,634,962) | |
| | (39,400) | | L Brands, Inc. | | | | | | (2,236,738) | | | (105,800) | | The Estee Lauder Cos., Inc., Class A | | | | | | (7,075,904) | |
| | (18,455) | | Lennar Corp., Class A | | | | | | (731,187) | | | (19,099) | | Universal Corp. | | | | | | (1,067,443) | |
| | (2,194) | | Lululemon Athletica, Inc. | | | | | | (115,383) | | | | | | | | | | | (38,417,555) | |
| | (135,000) | | M/I Homes, Inc. | | | | | | (3,026,700) | | Energy - (0.6)% | | | | | | | |
| | (7,095) | | Meritage Homes Corp. | | | | | | (297,139) | | | (21,268) | | Alon USA Energy, Inc. | | | | | | (317,744) | |
| | (51,492) | | Meritor, Inc. | | | | | | (630,777) | | | (70,967) | | BPZ Resources, Inc. | | | | | | (225,675) | |
| | (23,375) | | Multimedia Games Holding Co., Inc. | | | | | | (678,810) | | | (30,042) | | Chesapeake Energy Corp. | | | | | | (769,676) | |
| | (38,429) | | Navistar International Corp. | | | | | | (1,301,590) | | | (53,080) | | Clean Energy Fuels Corp. | | | | | | (474,535) | |
| | (2,173) | | Netflix, Inc. | | | | | | (764,961) | | | (8,866) | | Cobalt International Energy, Inc. | | | | | | (162,425) | |
| | (28,400) | | Nordstrom, Inc. | | | | | | (1,773,580) | | | (26,327) | | Emerald Oil, Inc. | | | | | | (176,917) | |
| | (24,100) | | Nu Skin Enterprises, Inc., Class A | | | | | | (1,996,685) | | | (26,463) | | Energy XXI Bermuda, Ltd. | | | | | | (623,733) | |
| | (4,643) | | Panera Bread Co., Class A | | | | | | (819,350) | | | (13,311) | | Goodrich Petroleum Corp. | | | | | | (210,580) | |
| | (11,805) | | PetSmart, Inc. | | | | | | (813,246) | | | (254,509) | | Green Plains Renewable Energy, Inc. | | | | | | (7,625,090) | |
| | (50,500) | | Polaris Industries, Inc. | | | | | | (7,055,355) | | | (34,449) | | JinkoSolar Holding Co., Ltd., ADR | | | | | | (962,850) | |
| | (31,724) | | Popeyes Louisiana Kitchen, Inc. | | | | | | (1,289,263) | | | (52,971) | | Newpark Resources, Inc. | | | | | | (606,518) | |
| | (3,600) | | priceline.com, Inc. | | | | | | (4,290,804) | | | (72,930) | | Penn Virginia Corp. | | | | | | (1,275,546) | |
| | (61,650) | | PriceSmart, Inc. | | | | | | (6,222,335) | | | (52,126) | | Sanchez Energy Corp. | | | | | | (1,544,493) | |
| | (48,650) | | Rackspace Hosting, Inc. | | | | | | (1,596,693) | | | (65,565) | | SandRidge Energy, Inc. | | | | | | (402,569) | |
| | (65,424) | | Red Robin Gourmet Burgers, Inc. | | | | | | (4,689,592) | | | (12,101) | | SolarCity Corp. | | | | | | (757,765) | |
| | (30,412) | | Regis Corp. | | | | | | (416,644) | | | (32,969) | | Solazyme, Inc. | | | | | | (382,770) | |
| | (7,088) | | Sears Holdings Corp. | | | | | | (338,523) | | | (302,748) | | Vantage Drilling Co. | | | | | | (517,699) | |
| | (4,342) | | SeaWorld Entertainment, Inc. | | | | | | (131,259) | | | | | | | | | | | (17,036,585) | |
| | (18,600) | | Signet Jewelers, Ltd. | | | | | | (1,968,996) | | Financial - (8.4)% | | | | | | | |
| | (271,500) | | Southwest Airlines Co. | | | | | | (6,410,115) | | | (2,884) | | Affiliated Managers Group, Inc. | | | | | | (576,944) | |
| | (28,414) | | Standard Pacific Corp. | | | | | | (236,120) | | | (10,574,000) | | Agricultural Bank of China, Ltd., Class H | | | | | | (4,607,764) | |
| | (80,976) | | Steinhoff International Holdings, Ltd. | | | | | | (397,141) | | | (3,818) | | Alexandria Real Estate Equities, Inc. REIT | | | | | | (277,034) | |
| | (2,708) | | Tesla Motors, Inc. | | | | | | (564,483) | | | (173,777) | | Allianz SE, ADR | | | | | | (2,928,142) | |
| | (16,166) | | The Buckle, Inc. | | | | | | (740,403) | | | (19,925) | | American Residential Properties, Inc. REIT | | | | | | (358,251) | |
| | (68,180) | | The Home Depot, Inc. | | | | | | (5,395,083) | | | (17,036) | | AmTrust Financial Services, Inc. | | | | | | (640,724) | |
| | (18,071) | | The Ryland Group, Inc. | | | | | | (721,575) | | | (1,356,679) | | Banco Santander SA, ADR | | | | | | (12,996,985) | |
| | (1,305) | | Time Warner Cable, Inc. | | | | | | (179,020) | | | (620,820) | | Bank of America Corp. | | | | | | (10,678,104) | |
| | (20,500) | | Titan Machinery, Inc. | | | | | | (321,235) | | | | | | | | | | | | |
| | (13,600) | | Ulta Salon Cosmetics & Fragrance, Inc. | | | | | | (1,325,728) | | | | | | | | | | | | |
| | (73,900) | | Under Armour, Inc., Class A | | | | | | (8,471,896) | | | | | | | | | | | | |
| | (7,489) | | United Continental Holdings, Inc. | | | | | | (334,234) | | | | | | | | | | | | |
| | (15,653) | | United Stationers, Inc. | | | | | | (642,869) | | | | | | | | | | | | |
| See Notes to Financial Statements. | 35 | ABSOLUTE FUNDS |
| |
ABSOLUTE STRATEGIES FUND SCHEDULE OF SECURITIES SOLD SHORT MARCH 31, 2014 |
| |
| | | | Security | | | | | | | | | | | Security | | | | | | | |
| | Shares | | Description | | | | | | Value | | | Shares | | Description | | | | | | Value | |
| | (11,041,000) | | Bank of China, Ltd., Class H | | | | | $ | (4,896,672) | | | (4,346) | | Vertex Pharmaceuticals, Inc. | | | | | $ | (307,349) | |
| | (7,165,000) | | Bank of Communications Co., Ltd., Class H | | | | | | (4,683,369) | | | (18,300) | | Vivus, Inc. | | | | | | (108,702) | |
| | (685,102) | | Barclays PLC, ADR | | | | | | (10,756,101) | | | (55,665) | | Volcano Corp. | | | | | | (1,097,157) | |
| | (244,000) | | BB&T Corp. | | | | | | (9,801,480) | | | (29,079) | | Wright Medical Group, Inc. | | | | | | (903,485) | |
| | (13,032) | | Canadian Imperial Bank of Commerce | | | | | | (1,123,228) | | | | | | | | | | | (22,202,578) | |
| | (966,116) | | CBIZ, Inc. | | | | | | (8,849,623) | | Industrial - (5.7)% | | | | | | | |
| | (9,064,000) | | China CITIC Bank Corp., Ltd., Class H | | | | | | (5,223,500) | | | (39,100) | | AAR Corp. | | | | | | (1,014,645) | |
| | (6,749,000) | | China Construction Bank Corp., Class H | | | | | | (4,724,692) | | | (10,400) | | Aecon Group, Inc. | | | | | | (161,903) | |
| | (2,567,000) | | China Merchants Bank Co., Ltd., Class H | | | | | | (4,653,132) | | | (20,571) | | Aegean Marine Petroleum Network, Inc. | | | | | | (202,830) | |
| | (223,500) | | Citigroup, Inc. | | | | | | (10,638,600) | | | (219,800) | | Altra Industrial Motion Corp. | | | | | | (7,846,860) | |
| | (347,865) | | Deutsche Bank AG | | | | | | (15,594,788) | | | (324,100) | | Atlas Copco AB, Class A | | | | | | (9,348,990) | |
| | (1,690) | | DFC Global Corp. | | | | | | (14,923) | | | (35,655) | | Briggs & Stratton Corp. | | | | | | (793,324) | |
| | (204,451) | | Encore Capital Group, Inc. | | | | | | (9,343,411) | | | (21,700) | | Bristow Group, Inc. | | | | | | (1,638,784) | |
| | (320,000) | | Erste Group Bank AG | | | | | | (10,933,027) | | | (22,600) | | Canadian Solar, Inc. | | | | | | (724,104) | |
| | (17,378) | | Financial Engines, Inc. | | | | | | (882,455) | | | (74,058) | | Caterpillar, Inc. | | | | | | (7,359,144) | |
| | (38,342) | | Forest City Enterprises, Inc., Class A | | | | | | (732,332) | | | (86,893) | | Cemex SAB de CV, ADR | | | | | | (1,097,459) | |
| | (199,655) | | Forestar Group, Inc. | | | | | | (3,553,859) | | | (158,100) | | Colfax Corp. | | | | | | (11,277,273) | |
| | (116,735) | | FXCM, Inc., Class A | | | | | | (1,724,176) | | | (11,149) | | Deere & Co. | | | | | | (1,012,329) | |
| | (307,372) | | Gain Capital Holdings, Inc. | | | | | | (3,322,691) | | | (218,800) | | Donaldson Co., Inc. | | | | | | (9,277,120) | |
| | (1,563,909) | | Grupo Financiero Banorte SAB de CV, Class O | | | | | | (10,576,196) | | | (122,407) | | Eaton Corp. PLC | | | | | | (9,195,214) | |
| | (11,181) | | Health Care REIT, Inc. | | | | | | (666,388) | | | (153,775) | | Emerson Electric Co. | | | | | | (10,272,170) | |
| | (7,607,000) | | Industrial & Commercial Bank of China, Ltd., Class H | | | | | | (4,678,062) | | | (4,250) | | Fluidigm Corp. | | | | | | (187,298) | |
| | (55,742) | | iStar Financial, Inc., REIT | | | | | | (822,752) | | | (119,425) | | Fluor Corp. | | | | | | (9,282,905) | |
| | (5,346) | | KeyCorp | | | | | | (76,127) | | | (14,200) | | Genco Shipping & Trading, Ltd. | | | | | | (24,992) | |
| | (858) | | Leucadia National Corp. | | | | | | (24,024) | | | (38,828) | | General Cable Corp. | | | | | | (994,385) | |
| | (263,903) | | Meadowbrook Insurance Group, Inc. | | | | | | (1,538,554) | | | (363,700) | | General Electric Co. | | | | | | (9,416,193) | |
| | (1) | | MetLife, Inc. | | | | | | (53) | | | (71,436) | | GrafTech International, Ltd. | | | | | | (780,081) | |
| | (12,859) | | MGIC Investment Corp. | | | | | | (109,559) | | | (190,950) | | Greif, Inc., Class A | | | | | | (10,022,966) | |
| | (7,113) | | Moody's Corp. | | | | | | (564,203) | | | (260,345) | | Griffon Corp. | | | | | | (3,108,519) | |
| | (781,000) | | Nordea Bank AB | | | | | | (11,077,330) | | | (11,164) | | Haynes International, Inc. | | | | | | (602,856) | |
| | (38,411) | | OFG Bancorp | | | | | | (660,285) | | | (230,631) | | Kaman Corp. | | | | | | (9,382,069) | |
| | (665,500) | | OTP Bank PLC | | | | | | (12,745,256) | | | (97,255) | | Layne Christensen Co. | | | | | | (1,769,068) | |
| | (45,600) | | Plum Creek Timber Co., Inc. REIT | | | | | | (1,917,024) | | | (6,197) | | Lindsay Corp. | | | | | | (546,451) | |
| | (7,202) | | Portfolio Recovery Associates, Inc. | | | | | | (416,708) | | | (13,038) | | Lockheed Martin Corp. | | | | | | (2,128,323) | |
| | (39,835) | | Radian Group, Inc. | | | | | | (598,720) | | | (4,343) | | Nordson Corp. | | | | | | (306,138) | |
| | (128,200) | | Royal Bank of Canada | | | | | | (8,459,918) | | | (26,369) | | PHH Corp. | | | | | | (681,375) | |
| | (372,000) | | Swedbank AB, Class A | | | | | | (9,983,530) | | | (54,300) | | RTI International Metals, Inc. | | | | | | (1,508,454) | |
| | (21,729) | | The NASDAQ OMX Group, Inc. | | | | | | (802,669) | | | (408,700) | | Sandvik AB | | | | | | (5,774,704) | |
| | (11,305) | | Walter Investment Management Corp. REIT | | | | | | (337,228) | | | (309,300) | | SKF AB, Class B | | | | | | (7,918,516) | |
| | (204,300) | | Wells Fargo & Co. | | | | | | (10,161,882) | | | (25,448) | | Smith & Wesson Holding Corp. | | | | | | (372,050) | |
| | (290,700) | | Weyerhaeuser Co. REIT | | | | | | (8,532,045) | | | (204,838) | | TTM Technologies, Inc. | | | | | | (1,730,881) | |
| | (23,195) | | Wintrust Financial Corp. | | | | | | (1,128,669) | | | (122,209) | | UTi Worldwide, Inc. | | | | | | (1,294,193) | |
| | | | | | | | | | (230,393,189) | | | (64,900) | | Valmont Industries, Inc. | | | | | | (9,659,716) | |
| Healthcare - (0.8)% | | | | | | | | | (256,575) | | Vishay Intertechnology, Inc. | | | | | | (3,817,836) | |
| | (311,800) | | Accuray, Inc. | | | | | | (2,993,280) | | | (80,000) | | Wartsila OYJ Abp | | | | | | (4,345,658) | |
| | (15,739) | | Alere, Inc. | | | | | | (540,635) | | | | | | | | | | | (156,877,776) | |
| | (21,149) | | Allscripts Healthcare Solutions, Inc. | | | | | | (381,316) | | Information Technology - (2.7)% | | | | | | | |
| | (126,132) | | AMAG Pharmaceuticals, Inc. | | | | | | (2,440,654) | | | (12,646) | | ACI Worldwide, Inc. | | | | | | (748,517) | |
| | (4,346) | | BioMarin Pharmaceutical, Inc. | | | | | | (296,441) | | | (43,800) | | Akamai Technologies, Inc. | | | | | | (2,549,598) | |
| | (11,874) | | Cubist Pharmaceuticals, Inc. | | | | | | (868,583) | | | (111,000) | | Autodesk, Inc. | | | | | | (5,458,980) | |
| | (12,415) | | HealthSouth Corp. | | | | | | (446,071) | | | (10,811) | | Bottomline Technologies (de), Inc. | | | | | | (380,007) | |
| | (2,108) | | Illumina, Inc. | | | | | | (313,375) | | | (222,982) | | Cadence Design Systems, Inc. | | | | | | (3,465,140) | |
| | (37,600) | | Incyte Corp., Ltd. | | | | | | (2,012,352) | | | (20,975) | | Castlight Health, Inc., Class B | | | | | | (445,089) | |
| | (119,100) | | Molina Healthcare, Inc. | | | | | | (4,473,396) | | | (24,917) | | CGI Group, Inc., Class A | | | | | | (770,434) | |
| | (18,543) | | Omnicare, Inc. | | | | | | (1,106,461) | | | (206,727) | | Ciena Corp. | | | | | | (4,700,972) | |
| | (2,173) | | Regeneron Pharmaceuticals, Inc. | | | | | | (652,508) | | | (73,562) | | Cornerstone OnDemand, Inc. | | | | | | (3,521,413) | |
| | (13,524) | | The Medicines Co. | | | | | | (384,352) | | | (10,211) | | Diebold, Inc. | | | | | | (407,317) | |
| | (92,969) | | Theravance, Inc. | | | | | | (2,876,461) | | | (41,001) | | Digital River, Inc. | | | | | | (714,647) | |
| | | | | | | | | | | | | (746,119) | | GT Advanced Technologies, Inc. | | | | | | (12,721,329) | |
| | | | | | | | | | | | | (9,175) | | Lam Research Corp. | | | | | | (504,625) | |
| | | | | | | | | | | | | (15,859) | | Lexmark International, Inc., Class A | | | | | | (734,113) | |
| | | | | | | | | | | | | | | | | | | | | | |
| See Notes to Financial Statements. | 36 | ABSOLUTE FUNDS |
| |
ABSOLUTE STRATEGIES FUND SCHEDULE OF SECURITIES SOLD SHORT MARCH 31, 2014 |
| |
| | | | Security | | | | | | | | | | | Security | | | | | | | |
| | Shares | | Description | | | | | | Value | | | Shares | | Description | | | | | | Value | |
| | (59,178) | | LivePerson, Inc. | | | | | $ | (714,278) | | Investment Companies - (1.5)% | | | | | | | |
| | (6,593) | | Medidata Solutions, Inc. | | | | | | (358,264) | | | (187,494) | | iShares Russell 2000 ETF | | | | | $ | (21,813,052) | |
| | (198,100) | | Mentor Graphics Corp. | | | | | | (4,362,162) | | | (108,649) | | SPDR S&P 500 ETF Trust | | | | | | (20,321,709) | |
| | (10,704) | | Microchip Technology, Inc. | | | | | | (511,223) | | Total Investment Companies | | | | | | | |
| | (1,025,445) | | Photronics, Inc. | | | | | | (8,747,046) | | (Proceeds $(42,264,057)) | | | | | | (42,134,761) | |
| | (6,546) | | Proofpoint, Inc. | | | | | | (242,726) | | Total Short Positions - (29.1)% | | | | | | | |
| | (12,764) | | Qlik Technologies, Inc. | | | | | | (339,395) | | (Proceeds $(774,982,543)) | | | | | $ | (802,988,959) | |
| | (1,995,512) | | Quantum Corp. | | | | | | (2,434,525) | | | | | | | | | | | | |
| | (37,850) | | Radisys Corp. | | | | | | (135,881) | | | | | | | | | | | | |
| | (215,861) | | Rudolph Technologies, Inc. | | | | | | (2,462,974) | | | | | | | | | | | | |
| | (6,038) | | SanDisk Corp. | | | | | | (490,225) | | | | | | | | | | | | |
| | (116,300) | | SAP AG, ADR | | | | | | (9,456,353) | | | | | | | | | | | | |
| | (3,308) | | ServiceNow, Inc. | | | | | | (198,215) | | | | | | | | | | | | |
| | (34,212) | | Spansion, Inc., Class A | | | | | | (595,973) | | | | | | | | | | | | |
| | (45,304) | | SunEdison, Inc. | | | | | | (853,527) | | | | | | | | | | | | |
| | (207,529) | | Take-Two Interactive Software, Inc. | | | | | | (4,551,111) | | | | | | | | | | | | |
| | (3,739) | | The Dun & Bradstreet Corp. | | | | | | (371,470) | | | | | | | | | | | | |
| | (16,744) | | VeriSign, Inc. | | | | | | (902,669) | | | | | | | | | | | | |
| | | | | | | | | | (74,850,198) | | | | | | | | | | | | |
| Materials - (1.2)% | | | | | | | | | | | | | | | | | | |
| | (34,010) | | ArcelorMittal, ADR | | | | | | (549,262) | | | | | | | | | | | | |
| | (90,642) | | B2Gold Corp. | | | | | | (243,827) | | | | | | | | | | | | |
| | (87,625) | | BHP Billiton, Ltd., ADR | | | | | | (5,938,346) | | | | | | | | | | | | |
| | (362,021) | | Horsehead Holding Corp. | | | | | | (6,089,193) | | | | | | | | | | | | |
| | (1,997,621) | | Mexichem SAB de CV | | | | | | (7,038,456) | | | | | | | | | | | | |
| | (4,343) | | Reliance Steel & Aluminum Co. | | | | | | (306,876) | | | | | | | | | | | | |
| | (112,550) | | Rio Tinto PLC, ADR | | | | | | (6,283,667) | | | | | | | | | | | | |
| | (1,768) | | Sesa Sterlite, Ltd., ADR | | | | | | (21,959) | | | | | | | | | | | | |
| | (224,281) | | Silver Standard Resources, Inc. | | | | | | (2,227,110) | | | | | | | | | | | | |
| | (60,900) | | Steel Dynamics, Inc. | | | | | | (1,083,411) | | | | | | | | | | | | |
| | (50,922) | | Stillwater Mining Co. | | | | | | (754,155) | | | | | | | | | | | | |
| | (29,700) | | The Dow Chemical Co. | | | | | | (1,443,123) | | | | | | | | | | | | |
| | (12,931) | | United States Steel Corp. | | | | | | (357,025) | | | | | | | | | | | | |
| | (4,691) | | US Silica Holdings, Inc. | | | | | | (179,055) | | | | | | | | | | | | |
| | | | | | | | | | (32,515,465) | | | | | | | | | | | | |
| Telecommunication Services - (1.1)% | | | | | | | | | | | | | | | | | | |
| | (38,801) | | Alaska Communications Systems Group, Inc. | | | | | | (74,886) | | | | | | | | | | | | |
| | (134,374) | | Alcatel-Lucent | | | | | | (529,814) | | | | | | | | | | | | |
| | (326,546) | | Blucora, Inc. | | | | | | (6,429,691) | | | | | | | | | | | | |
| | (26,600) | | Comtech Telecommunications Corp. | | | | | | (847,476) | | | | | | | | | | | | |
| | (162,300) | | Dealertrack Technologies, Inc. | | | | | | (7,983,537) | | | | | | | | | | | | |
| | (11,043) | | HomeAway, Inc. | | | | | | (415,990) | | | | | | | | | | | | |
| | (155,131) | | Infinera Corp. | | | | | | (1,408,589) | | | | | | | | | | | | |
| | (7,500) | | InterDigital, Inc. | | | | | | (248,325) | | | | | | | | | | | | |
| | (57,819) | | Iridium Communications, Inc. | | | | | | (434,221) | | | | | | | | | | | | |
| | (207,489) | | ModusLink Global Solutions, Inc. | | | | | | (877,678) | | | | | | | | | | | | |
| | (185,693) | | Move, Inc. | | | | | | (2,146,611) | | | | | | | | | | | | |
| | (4,842) | | Qihoo 360 Technology Co., Ltd., ADR | | | | | | (482,166) | | | | | | | | | | | | |
| | (1,860) | | SINA Corp. | | | | | | (112,363) | | | | | | | | | | | | |
| | (3,019) | | SouFun Holdings, Ltd., ADR | | | | | | (206,560) | | | | | | | | | | | | |
| | (5,400) | | Time Warner, Inc. | | | | | | (352,782) | | | | | | | | | | | | |
| | (2,169) | | Vipshop Holdings, Ltd., ADR | | | | | | (323,832) | | | | | | | | | | | | |
| | (142,700) | | Web.com Group, Inc. | | | | | | (4,856,081) | | | | | | | | | | | | |
| | (50,296) | | WebMD Health Corp. | | | | | | (2,082,254) | | | | | | | | | | | | |
| | (4,119) | | Yahoo!, Inc. | | | | | | (147,872) | | | | | | | | | | | | |
| | (9,903) | | Yandex NV, Class A | | | | | | (298,972) | | | | | | | | | | | | |
| | | | | | | | | | (30,259,700) | | | | | | | | | | | | |
| Total Common Stock | | | | | | | | | | | | | | | | | | |
| (Proceeds $(732,718,486)) | | | | | | (760,854,198) | | | | | | | | | | | | |
| | | | | | | | | | | | | | | | | | | | | | |
| | | | | | | | | | | | | | | | | | | | | | |
| See Notes to Financial Statements. | 37 | ABSOLUTE FUNDS |
| |
ABSOLUTE STRATEGIES FUND SCHEDULE OF CALL AND PUT OPTIONS WRITTEN MARCH 31, 2014 |
| |
| | | | Security | | Strike | | Exp. | | | | | | | Security | | Strike | | Exp. | | | |
| | Contracts | | Description | | Price | | Date | | Value | | | Contracts | | Description | | Price | | Date | | Value | |
| Written Options - (1.1)% | | | | | | | | Put Options Written - (0.5)% | | | | | | | |
| Call Options Written - (0.6)% | | | | | | | | | (418) | | Abbott Laboratories | $ | 35.00 | | 01/15 | $ | (62,700) | |
| | (418) | | Abbott Laboratories | $ | 42.00 | | 01/15 | $ | (44,726) | | | (654) | | Accenture PLC | | 72.50 | | 01/15 | | (235,440) | |
| | (654) | | Accenture PLC | | 87.50 | | | | (147,150) | | | (400) | | American Express Co. | | 80.00 | | 01/15 | | (126,000) | |
| | (400) | | American Express Co. | | 97.50 | | 01/15 | | (133,200) | | | (1,335) | | American International Group, Inc. | | 45.00 | | 01/15 | | (301,710) | |
| | (1,335) | | American International Group, Inc. | | 60.00 | | 01/15 | | (132,165) | | | (136) | | Apple, Inc. | | 490.00 | | 01/15 | | (365,840) | |
| | (3,077) | | Bank of America Corp. | | 20.00 | | 01/15 | | (166,158) | | | (3,077) | | Bank of America Corp. | | 15.00 | | 01/15 | | (206,159) | |
| | (949) | | Bed Bath & Beyond, Inc. | | 75.00 | | 01/15 | | (322,660) | | | (949) | | Bed Bath & Beyond, Inc. | | 60.00 | | 01/15 | | (219,219) | |
| | (1,252) | | Berkshire Hathaway, Inc., Class B | | 125.00 | | 01/15 | | (845,100) | | | (1,252) | | Berkshire Hathaway, Inc., Class B | | 105.00 | | 01/15 | | (185,296) | |
| | (792) | | CarMax, Inc. | | 50.00 | | 01/15 | | (245,520) | | | (792) | | CarMax, Inc. | | 40.00 | | 01/15 | | (140,580) | |
| | (37) | | Chipotle Mexican Grill | | 580.00 | | 01/15 | | (209,050) | | | (74) | | Chipotle Mexican Grill | | 490.00 | | 01/15 | | (215,710) | |
| | (738) | | Coach, Inc. | | 62.50 | | 01/15 | | (53,505) | | | (738) | | Coach, Inc. | | 45.00 | | 01/15 | | (202,950) | |
| | (2,163) | | Corning, Inc. | | 22.00 | | 01/15 | | (263,886) | | | (2,163) | | Corning, Inc. | | 15.00 | | 01/15 | | (62,727) | |
| | (848) | | CVS Caremark Corp. | | 75.00 | | 01/15 | | (398,560) | | | (848) | | CVS Caremark Corp. | | 62.50 | | 01/15 | | (114,904) | |
| | (763) | | DIRECTV | | 77.50 | | 01/15 | | (511,210) | | | (688) | | Darden Restaurants, Inc. | | 42.00 | | 04/15 | | (688) | |
| | (772) | | Expeditors International of Washington, Inc. | | 47.50 | | 01/15 | | (55,970) | | | (463) | | Deere & Co. | | 80.00 | | 01/15 | | (118,528) | |
| | (1,752) | | General Motors Co. | | 45.00 | | 01/15 | | (98,112) | | | (763) | | DIRECTV | | 62.50 | | 01/15 | | (178,161) | |
| | (32) | | Google, Inc., Class A | | 1,230.00 | | 01/15 | | (177,280) | | | (772) | | Expeditors International of Washington, Inc. | | 37.50 | | 01/15 | | (189,140) | |
| | (2,907) | | Hertz Global Holdings, Inc. | | 30.00 | | 01/15 | | (558,144) | | | (1,752) | | General Motors Co. | | 35.00 | | 01/15 | | (692,040) | |
| | (13,546) | | iShares Russell 2000 ETF | | 130.00 | | 01/15 | | (2,736,292) | | | (32) | | Google, Inc., Class A | | 1,010.00 | | 01/15 | | (162,880) | |
| | (259) | | Johnson & Johnson | | 100.00 | | 01/15 | | (93,240) | | | (2,907) | | Hertz Global Holdings, Inc. | | 22.00 | | 01/15 | | (392,445) | |
| | (1,073) | | JPMorgan Chase & Co. | | 65.00 | | 01/15 | | (229,622) | | | (3,477) | | iShares iBoxx High Yield Fund | | 85.00 | | 09/15 | | (198,189) | |
| | (1,214) | | Kohl's Corp. | | 62.50 | | 01/15 | | (264,045) | | | (259) | | Johnson & Johnson | | 82.50 | | 01/15 | | (34,577) | |
| | (9,772) | | SPDR S&P 500 ETF Trust | | 192.00 | | 01/15 | | (5,902,288) | | | (1,073) | | JPMorgan Chase & Co. | | 52.50 | | 01/15 | | (207,625) | |
| | (921) | | Target Corp. | | 67.50 | | 01/15 | | (108,678) | | | (293) | | Keurig Green Mountain, Inc. | | 100.00 | | 01/15 | | (514,215) | |
| | (1,591) | | The Bank of New York Mellon Corp. | | 40.00 | | 01/15 | | (130,462) | | | (293) | | Keurig Green Mountain, Inc. | | 55.00 | | 01/15 | | (61,530) | |
| | (438) | | The Boeing Co. | | 150.00 | | 01/15 | | (97,236) | | | (1,214) | | Kohl's Corp. | | 45.00 | | 01/15 | | (151,750) | |
| | (710) | | The Coca-Cola Co. | | 45.00 | | 01/15 | | (16,330) | | | (2,535) | | Microsoft Corp. | | 28.00 | | 01/15 | | (68,445) | |
| | (367) | | The Walt Disney Co. | | 85.00 | | 01/15 | | (159,645) | | | (330) | | QUALCOMM, Inc. | | 65.00 | | 01/15 | | (51,480) | |
| | (206) | | United Parcel Service, Inc., Class B | | 110.00 | | 01/15 | | (19,364) | | | (28,302) | | Sirius XM Holdings, Inc. | | 3.50 | | 01/15 | | (1,669,818) | |
| | (1,213) | | Walgreen Co. | | 65.00 | | 01/15 | | (721,735) | | | (28,990) | | SPDR S&P 500 ETF Trust | | 146.00 | | 01/15 | | (5,464,615) | |
| | (781) | | Wal-Mart Stores, Inc. | | 85.00 | | 01/15 | | (62,480) | | | (282) | | Stanley Black & Decker, Inc. | | 70.00 | | 01/15 | | (91,650) | |
| | (605) | | Weight Watchers International, Inc. | | 45.00 | | 01/15 | | (605) | | | (921) | | Target Corp. | | 55.00 | | 01/15 | | (207,225) | |
| | (1,054) | | Wells Fargo & Co. | | 50.00 | | 01/15 | | (270,878) | | | (1,591) | | The Bank of New York Mellon Corp. | | 30.00 | | 01/15 | | (152,736) | |
| | (633) | | Whole Foods Market, Inc. | | 60.00 | | 01/15 | | (110,775) | | | (438) | | The Boeing Co. | | 125.00 | | 01/15 | | (469,755) | |
| Total Call Options Written | �� | | | | | | | | (710) | | The Coca-Cola Co. | | 35.00 | | 01/15 | | (70,290) | |
| (Premiums Received $(16,192,614)) | | | | | | (15,286,071) | | | (367) | | The Walt Disney Co. | | 65.00 | | 01/15 | | (71,565) | |
| | | | | | | | | | | | | | | | | | | | | | |
| See Notes to Financial Statements. | 38 | ABSOLUTE FUNDS |
| |
ABSOLUTE STRATEGIES FUND SCHEDULE OF CALL AND PUT OPTIONS WRITTEN MARCH 31, 2014 |
| |
| | | | Security | | Strike | | Exp. | | | | | | | | | | | | | | |
| | Contracts | | Description | | Price | | Date | | Value | | | | | | | | | | | | |
| | (206) | | United Parcel Service, Inc., Class B | $ | 90.00 | | 01/15 | $ | (63,860) | | | | | | | | | | | | |
| | (1,213) | | Walgreen Co. | | 52.50 | | 01/15 | | (163,755) | | | | | | | | | | | | |
| | (781) | | Wal-Mart Stores, Inc. | | 70.00 | | 01/15 | | (149,952) | | | | | | | | | | | | |
| | (605) | | Weight Watchers International, Inc. | | 30.00 | | 01/15 | | (756,250) | | | | | | | | | | | | |
| | (1,054) | | Wells Fargo & Co. | | 40.00 | | 01/15 | | (75,888) | | | | | | | | | | | | |
| Total Put Options Written | | | | | | | | | | | | | | | | | | |
| (Premiums Received $(18,544,009)) | | | | | | (14,868,287) | | | | | | | | | | | | |
| Total Written Options - (1.1)% | | | | | | | | | | | | | | | | | | |
| (Premiums Received $(34,736,623)) | | | | | $ | (30,154,358) | | | | | | | | | | | | |
| | | | | | | | | | | | | | | | | | | | | | |
| See Notes to Financial Statements. | 39 | ABSOLUTE FUNDS |
| |
ABSOLUTE STRATEGIES FUND NOTES TO SCHEDULES OF INVESTMENTS, SECURITIES SOLD SHORT AND CALL AND PUT OPTIONS WRITTEN MARCH 31, 2014 |
| |
| | | | | | | | | | | |
| | ADR | American Depositary Receipt | | (e) | Security exempt from registration under Rule 144A under the Securities Act of 1933. At the period end, the value of these securities amounted to $272,269,029 or 9.8% of net assets. | |
| | BKNT | Bank Note | | (f) | Security fair valued in accordance with procedures adopted by the Board of Trustees. At the period end, the value of these securities amounted to $11,563,974 or 0.4% of net assets. | |
| | ETF | Exchange Traded Fund | | (g) | Debt obligation initially issued at one coupon rate which converts to higher coupon rate at a specified date. Rate presented is as of March 31, 2014. | |
| | ETN | Exchange Traded Note | | (h) | Variable rate security. Rate presented is as of March 31, 2014. | |
| | FHLB | Federal Home Loan Bank | | (i) | Security is currently in default and is on scheduled interest or principal payment. | |
| | FHLMC | Federal Home Loan Mortgage Corporation | | (j) | Zero coupon bond. Interest rate presented is yield to maturity. | |
| | FNMA | Federal National Mortgage Association | | (k) | Rate presented is yield to maturity. | |
| | GNMA | Government National Mortgage Association | | (l) | Holders of Comdisco Holding Co., Inc. were issued contingent equity distribution rights pursuant to the Comdisco, Inc. First Amended Joint Plan of Reorganization. Accordingly, there is no associated strike price or expiration date. | |
| | LLC | Limited Liability Company | | | |
| | LP | Limited Partnership | | | | | | |
| | MTN | Medium Term Note | | | | | | |
| | PLC | Public Limited Company | | | | | | |
| | REIT | Real Estate Investment Trust | | | | | | |
| | (a) | Non-income producing security. | | | | | | |
| | (b) | All or a portion of this security is held as collateral for securities sold short. | | | | | | |
| | (c) | Subject to call option written by the Fund. | | | | | | |
| | (d) | Subject to put option written by the Fund. | | | | | | |
| | | | | | | | | | | |
| | | | | | | | | | | | | | | | | | |
| | At March 31, 2014, the Fund held the following credit default swap agreement: | | | | | | | | | | | | | |
| | | | | | | | | | | | | | | | | | |
| | Credit Default Swap – Sell Protection | | | | | | | | | | | | | | |
| | | | | | | | | | | | | | | | | | |
| | Counterparty | | Reference Entity / Obligation | | Receive Rate | | Termination Date | | Credit Spread as of 03/31/14 (1) | | | Notional Amount | | | Net Unrealized Appreciation | | |
| | Barclays Capital, Inc. | INDEX CDX HY CDS | | 5.00 | % | 06/20/17 | | 2.28 | % | $ | (990,000 | ) | $ | 133,659 | | |
| | | | | | | | | | | | | | | | | | |
| | (1) Credit spreads are an indication of the seller’s performance risk, related to the likelihood of a credit event occurring that would require a seller to make payment to a buyer. Credit spreads are used to determine the value of swap contracts and reflect the cost of buying/selling protection, which may include upfront payments made to enter into the contract. | |
| | |
| | The notional amounts are equal to the potential payment that the Fund could be required to make as a seller of credit protection. | |
| | The Fund enters contracts to sell protection to create a long credit position. Credit events that could require payment are bankruptcy, failure to pay, restructuring, obligation acceleration, obligation default, or repudiation/moratorium. | |
| | |
| | | | | | | | | | | | | | | | | | |
| | At March 31, 2014, the Fund held the following futures contracts: | | | | | | | | | | |
| | Contracts | | Type | | Expiration Date | | Notional Contract Value | | Net Unrealized Appreciation (Depreciation) | |
| | 3 | | U.S. 10-year Note Future | | 06/19/14 | $ | 372,194 | $ | (1,694) | |
| | 7 | | U.S. 5-year Note Future | | 06/30/14 | | 836,445 | | (3,773) | |
| | 6 | | U.S. Ultra Bond Future | | 06/19/14 | | 844,762 | | 22,051 | |
| | (800) | | Euro FX Currency Future | | 06/16/14 | | (139,016,800) | | 1,276,800 | |
| | (6,500) | | Russell 2000 Mini Future | | 06/20/14 | | (769,778,750) | | 8,953,750 | |
| | (2,250) | | S&P 500 Emini Future | | 06/20/14 | | (206,966,250) | | (2,790,000) | |
| | (30) | | U.S. 10-year Note Future | | 06/19/14 | | (3,709,686) | | 4,686 | |
| | (415) | | U.S. 5-year Note Future | | 06/30/14 | | (49,511,451) | | 145,904 | |
| | (40) | | U.S. 2-year Note Future | | 06/30/14 | | (8,786,248) | | 3,748 | |
| | (20) | | U.S. Long Bond Future | | 06/19/14 | | (2,624,376) | | (39,999) | |
| | | | | | | $ | (1,178,340,160) | $ | 7,571,473 | |
| | AFA | | | | | | | | | |
| See Notes to Financial Statements. | 40 | ABSOLUTE FUNDS |
| |
ABSOLUTE STRATEGIES FUND NOTES TO SCHEDULES OF INVESTMENTS, SECURITIES SOLD SHORT AND CALL AND PUT OPTIONS WRITTEN MARCH 31, 2014 |
| |
| | | | | | | | | | | | | | | |
| | The values of each individual forward currency contract outstanding in the Absolute Strategies Fund as of March 31, 2014, are disclosed in the table below. | | | | |
| | Contracts to Sell | | Settlement Date | | Settlement Value | | Net Unrealized Appreciation (Depreciation) | | | | | |
| | (280,000) | | Canadian Dollars | | 06/18/14 | $ | 252,766 | $ | (32) | | | | | |
| | (549,925) | | European Union Euro | | 04/02/14 | | 755,927 | | (1,677) | | | | | |
| | (222,725) | | European Union Euro | | 06/18/14 | | 310,174 | | 3,372 | | | | | |
| | (92,400) | | European Union Euro | | 06/18/14 | | 128,674 | | 1,394 | | | | | |
| | (169,198,536) | | Hungarian Forint | | 04/02/14 | | 750,804 | | (7,714) | | | | | |
| | (4,852,449) | | Swedish Krona | | 04/02/14 | | 745,527 | | (4,199) | | | | | |
| | (4,943,179) | | Swedish Krona | | 04/02/14 | | 759,466 | | (4,278) | | | | | |
| | (4,947,576) | | Swedish Krona | | 04/02/14 | | 760,142 | | (4,280) | | | | | |
| | | | | | | | | $ | (17,414) | | | | | |
| | | | | | | | | | | | | | | |
| | * Cost for federal income tax purposes is $1,027,841,126 and net unrealized appreciation consists of: | | | | | |
| | Gross Unrealized Appreciation | | | | | | $ | 456,370,390 | | | | | |
| | Gross Unrealized Depreciation | | | | | | | (182,591,579) | | | | | |
| | Net Unrealized Appreciation | | | | | | $ | 273,778,811 | | | | | |
| | | | | | | | | | | | | | | |
| | | | | | | | | | | | | | | |
| | The following is a summary of the inputs used to value the Fund’s investments and other financial instruments and liabilities as of March 31, 2014. | | | | | |
| | The inputs or methodology used for valuing securities are not necessarily an indication of the risks associated with investing in those securities. For more information on valuation inputs, and their aggregation into the levels used in the table below, please refer to the Security Valuation section in Note 2 of the accompanying Notes to Financial Statements. | |
| | |
| | | | | | | | | | | | | | | |
| See Notes to Financial Statements. | 41 | ABSOLUTE FUNDS |
| |
ABSOLUTE STRATEGIES FUND NOTES TO SCHEDULES OF INVESTMENTS, SECURITIES SOLD SHORT AND CALL AND PUT OPTIONS WRITTEN MARCH 31, 2014 |
| |
| | | | | | Level 1 | | Level 2 | | Level 3 | | Total | |
| | Assets | | | | | | | | | | | |
| | Investments At Value | | | | | | | | | |
| | Common Stock | | | | | | | | | |
| | | Consumer Discretionary | $ | 178,300,229 | $ | - | $ | - | $ | 178,300,229 | |
| | | Consumer Staples | | 225,577,138 | | - | | - | | 225,577,138 | |
| | | Energy | | 87,164,350 | | - | | - | | 87,164,350 | |
| | | Financial | | 162,543,264 | | - | | - | | 162,543,264 | |
| | | Healthcare | | 77,180,719 | | - | | - | | 77,180,719 | |
| | | Industrial | | 55,324,043 | | - | | - | | 55,324,043 | |
| | | Information Technology | | 115,734,091 | | - | | - | | 115,734,091 | |
| | | Materials | | 37,982,485 | | - | | - | | 37,982,485 | |
| | | Telecommunication Services | | 70,593,614 | | - | | - | | 70,593,614 | |
| | | Utilities | | 1,244,581 | | - | | - | | 1,244,581 | |
| | Preferred Stock | | | | | | | | | |
| | | Consumer Staples | | 1,591,135 | | 2,737,186 | | - | | 4,328,321 | |
| | | Energy | | 1,961,388 | | 5,343,845 | | - | | 7,305,233 | |
| | | Financial | | 1,064,443 | | 9,703,657 | | - | | 10,768,100 | |
| | | Healthcare | | - | | 2,674,918 | | - | | 2,674,918 | |
| | | Industrial | | - | | 911,071 | | - | | 911,071 | |
| | | Materials | | - | | 776,880 | | - | | 776,880 | |
| | | Telecommunication Services | | - | | 700,219 | | - | | 700,219 | |
| | | Utilities | | - | | 1,085,735 | | - | | 1,085,735 | |
| | Asset Backed Obligations | | - | | 174,045,881 | | 4,636,774 | | 178,682,655 | |
| | Corporate Convertible Bonds | | - | | 483,406,117 | | 6,927,200 | | 490,333,317 | |
| | Corporate Non-Convertible Bonds | | - | | 71,586,892 | | - | | 71,586,892 | |
| | Exchange Traded Notes | | 310,370 | | - | | - | | 310,370 | |
| | Foreign Government Bonds | | - | | 450,089 | | - | | 450,089 | |
| | Interest Only Bonds | | - | | 3,622,194 | | - | | 3,622,194 | |
| | Municipal Bonds | | - | | 12,896,310 | | - | | 12,896,310 | |
| | Municipal Demand Notes | | - | | 1,203,960 | | - | | 1,203,960 | |
| | Syndicated Loans | | - | | 3,916,922 | | - | | 3,916,922 | |
| | U.S. Government & Agency Obligations | | - | | 28,800,056 | | - | | 28,800,056 | |
| | Rights | | 10,500 | | - | | - | | 10,500 | |
| | Investment Companies | | 251,560,611 | | - | | - | | 251,560,611 | |
| | Commercial Paper | | - | | 6,954,828 | | - | | 6,954,828 | |
| | Purchased Options | | 44,239,559 | | - | | - | | 44,239,559 | |
| | Total Investments At Value | $ | 1,312,382,520 | $ | 810,816,760 | $ | 11,563,974 | $ | 2,134,763,254 | |
| | | | | | | | | | | | | |
| | Other Financial Instruments** | | | | | | | | | |
| | Credit Default Swaps | | - | | 133,659 | | - | | 133,659 | |
| | Forward Currency Contracts | | - | | 4,766 | | - | | 4,766 | |
| | Futures | | 10,406,939 | | - | | - | | 10,406,939 | |
| | Total Other Financial Instruments | $ | 10,406,939 | $ | 138,425 | $ | - | $ | 10,545,364 | |
| | Total Assets | $ | 1,336,487,430 | $ | 797,257,214 | $ | 11,563,974 | $ | 2,145,308,618 | |
| | | | | | | | | | | | | |
| | Liabilities | | | | | | | | | |
| | Securities Sold Short | | | | | | | | | |
| | Common Stock | $ | (760,854,198) | $ | - | $ | - | $ | (760,854,198) | |
| | Investment Companies | | (42,134,761) | | - | | - | | (42,134,761) | |
| | Total Securities Sold Short | $ | (802,988,959) | $ | - | $ | - | $ | (802,988,959) | |
| | Other Financial Instruments** | | | | | | | | | |
| | Written Options | | (30,153,065) | | (1,293) | | - | | (30,154,358) | |
| | Forward Currency Contracts | | - | | (22,180) | | - | | (22,180) | |
| | Futures | | (2,835,466) | | - | | - | | (2,835,466) | |
| | Total Other Financial Instruments | $ | (32,988,531) | $ | (23,473) | $ | - | $ | (33,012,004) | |
| | Total Liabilities | $ | (835,977,490) | $ | (23,473) | $ | - | $ | (836,000,963) | |
| | | | | | | | | | | | | |
| | | | | | | | | | | | | |
| | ** Other Financial Instruments are derivative instruments not reflected in the Schedule of Investments and Schedule of Securities Sold Short, such as credit default swaps, forward currency contracts and futures, which are valued at the unrealized appreciation (depreciation) of the instrument. Written options are reported at their market value at year end. |
| |
| See Notes to Financial Statements. | 42 | ABSOLUTE FUNDS |
| |
ABSOLUTE STRATEGIES FUND NOTES TO SCHEDULES OF INVESTMENTS, SECURITIES SOLD SHORT AND CALL AND PUT OPTIONS WRITTEN MARCH 31, 2014 |
| |
| | The following is a reconciliation of Level 3 assets for which significant unobservable inputs were used to determine fair value. |
| | | | | | | | | | | | | |
| | | | | | Asset Backed Obligations | | Corporate Convertible Bonds | | Corporate Non- Convertible Bonds | | U.S. Government & Agency Obligations | |
| | | | | | | | | | | | | |
| | Balance as of 03/31/13 | $ | 1,953,489 | $ | 4,796,000 | $ | 38,160 | $ | 216,839 | |
| | Accrued Accretion / (Amortization) | | 55,549 | | 23,986 | | - | | (33) | |
| | Change in Unrealized Appreciation / (Depreciation) | | 171,160 | | (142,786) | | 43,231 | | (9,750) | |
| | Purchases | | 3,084,503 | | 2,050,000 | | - | | - | |
| | Sales | | (581,401) | | - | | - | | - | |
| | Paydowns | | (46,526) | | - | | - | | (3,812) | |
| | Transfers In / (Out) | | - | | 200,000 | | (81,391) | | (203,244) | |
| | Balance as of 03/31/14 | $ | 4,636,774 | $ | 6,927,200 | $ | - | $ | - | |
| | Net change in unrealized appreciation / (depreciation) from investments held as of 03/31/14*** | $ | 180,326 | $ | (904,860) | $ | 43,231 | $ | (9,750) | |
| | | | | | | | | | | | | |
| | | | | | | | | | | | | |
| | *** The change in unrealized appreciation/(depreciation) is included in net changes in unrealized appreciation/(depreciation) of investments in the accompanying Statements of Operations. | |
| | | | | | | | | | | | | |
| | The Fund utilizes the end of period methodology when determining transfers in or out of the Level 3 category. | |
| | There were no transfers among Level 1 and Level 2 for the year ended March 31, 2014. | |
| See Notes to Financial Statements. | 43 | ABSOLUTE FUNDS |
| |
ABSOLUTE OPPORTUNITIES FUND PORTFOLIO HOLDINGS SUMMARY (Unaudited) MARCH 31, 2014 |
| |
| Portfolio Breakdown (% of Net Assets) |
| Long Positions |
| Equity Securities | 44.4% | |
| Corporate Non-Convertible Bonds | 0.9% | |
| Syndicated Loans | 0.1% | |
| Warrants | 1.1% | |
| Short-Term Investments | 13.0% | |
| Purchased Options | 0.2% | |
| Short Positions |
| Equity Securities | -13.1% | |
| Investment Companies | -6.9% | |
| Other Assets less Liabilities* | 60.3% | |
| | 100.0% | |
| * | Consists of deposits with the custodian and/or brokers for securities sold short, cash, foreign currency, prepaid expenses, receivables, payables, and accrued liabilities. Deposits with the custodian and/or brokers for securities sold short represents 22.6% of net assets. See Note 2. |
| | (% of Equity Holdings) |
| Sector Breakdown | Long | Short |
| Consumer Discretionary | 18.7% | 27.1% | |
| Consumer Staples | 7.5% | 42.3% | |
| Energy | 25.9% | 2.1% | |
| Financial | 9.0% | 1.2% | |
| Industrial | 13.9% | 13.5% | |
| Information Technology | 3.1% | 5.8% | |
| Materials | 13.0% | 7.4% | |
| Telecommunication Services | 6.9% | 0.6% | |
| Utilities | 2.0% | 0.0% | |
| | 100.0% | 100.0% | |
| See Notes to Financial Statements. | 44 | ABSOLUTE FUNDS |
| |
ABSOLUTE OPPORTUNITIES FUND SCHEDULE OF INVESTMENTS MARCH 31, 2014 |
| |
| | | | | | | | | | | | | | | | | | | | | | |
| | | | Security | | | | | | | | | | | Security | | | | | | | |
| | Shares | | Description | | | | | | Value | | | Shares | | Description | | | | | | Value | |
| Long Positions - 59.7% | | | | | | | | | 65,369 | | Great Lakes Dredge & Dock Corp. (a)(b) | | | | | $ | 596,819 | |
| Equity Securities - 44.4% | | | | | | | | | 7,336 | | ITT Corp. (b) | | | | | | 313,687 | |
| Common Stock - 44.4% | | | | | | | | | 10,266 | | KBR, Inc. | | | | | | 273,897 | |
| Consumer Discretionary - 8.3% | | | | | | | | | 3,839 | | Masonite International Corp. (a) | | | | | | 216,980 | |
| | 8,171 | | Buffalo Wild Wings, Inc. (a)(b) | | | | | $ | 1,216,662 | | | 28,140 | | Quality Distribution, Inc. (a)(b) | | | | | | 365,539 | |
| | 12,380 | | Bunge, Ltd. | | | | | | 984,334 | | | 43,329 | | Trimble Navigation, Ltd. (a)(b) | | | | | | 1,684,198 | |
| | 27,131 | | Gaming and Leisure Properties, Inc. REIT | | | | | | 989,196 | | | 24,959 | | Tutor Perini Corp. (a)(b) | | | | | | 715,575 | |
| | 5,497 | | General Motors Co. | | | | | | 189,207 | | | | | | | | | | | 7,135,341 | |
| | 2,779 | | Hanesbrands, Inc. (b) | | | | | | 212,538 | | Information Technology - 1.4% | | | | | | | |
| | 33,660 | | Isle of Capri Casinos, Inc. (a) | | | | | | 258,172 | | | 433 | | Apple, Inc. (b) | | | | | | 232,408 | |
| | 14,595 | | Jack in the Box, Inc. (a) | | | | | | 860,229 | | | 40,336 | | FormFactor, Inc. (a)(b) | | | | | | 257,747 | |
| | 12,380 | | Lithia Motors, Inc., Class A (b) | | | | | | 822,775 | | | 10,676 | | NCR Corp. (a)(b) | | | | | | 390,208 | |
| | 97,522 | | Luby's, Inc. (a) | | | | | | 600,735 | | | 6,589 | | Silicon Graphics International Corp. (a) | | | | | | 80,913 | |
| | 6,061 | | Mattress Firm Holding Corp. (a) | | | | | | 289,898 | | | 10,443 | | Skyworks Solutions, Inc. (a)(b) | | | | | | 391,821 | |
| | 103,855 | | Office Depot, Inc. (a)(b) | | | | | | 428,921 | | | 4,537 | | Verint Systems, Inc. (a)(b) | | | | | | 212,763 | |
| | 7,158 | | Tempur Sealy International, Inc. (a) | | | | | | 362,696 | | | 3,197 | | Vocera Communications, Inc. (a) | | | | | | 52,207 | |
| | 15,846 | | Tractor Supply Co. (b) | | | | | | 1,119,203 | | | | | | | | | | | 1,618,067 | |
| | 25,997 | | Vitamin Shoppe, Inc. (a)(b) | | | | | | 1,235,377 | | Materials - 5.8% | | | | | | | |
| | | | | | | | | | 9,569,943 | | | 7,295 | | Agrium, Inc. | | | | | | 711,408 | |
| Consumer Staples - 3.3% | | | | | | | | | 4,704 | | CF Industries Holdings, Inc. (b) | | | | | | 1,226,051 | |
| | 5,384 | | Alere, Inc. (a) | | | | | | 184,941 | | | 18,128 | | Constellium NV, Class A (a)(b) | | | | | | 532,057 | |
| | 24,759 | | Calavo Growers, Inc. | | | | | | 880,925 | | | 13,440 | | E.I. du Pont de Nemours & Co. | | | | | | 901,824 | |
| | 15,124 | | Diamond Foods, Inc. (a) | | | | | | 528,281 | | | 12,157 | | FMC Corp. | | | | | | 930,740 | |
| | 22,283 | | Tyson Foods, Inc., Class A (b) | | | | | | 980,675 | | | 9,904 | | Monsanto Co. (b) | | | | | | 1,126,778 | |
| | 43,782 | | Zoetis, Inc. (b) | | | | | | 1,267,051 | | | 33,425 | | Potash Corp. of Saskatchewan, Inc. | | | | | | 1,210,653 | |
| | | | | | | | | | 3,841,873 | | | | | | | | | | | 6,639,511 | |
| Energy - 11.5% | | | | | | | | Telecommunication Services - 3.0% | | | | | | | |
| | 68,486 | | Crestwood Equity Partners LP (b) | | | | | | 947,846 | | | 21,067 | | CommScope Holding Co., Inc. (a)(b) | | | | | | 519,933 | |
| | 28,837 | | Crestwood Midstream Partners LP | | | | | | 649,986 | | | 7,359 | | Comverse, Inc. (a)(b) | | | | | | 254,474 | |
| | 55,739 | | Kodiak Oil & Gas Corp. (a) | | | | | | 676,672 | | | 6,968 | | FTD Cos., Inc. (a) | | | | | | 221,652 | |
| | 11,721 | | NuStar Energy LP | | | | | | 644,069 | | | 19,545 | | Lee Enterprises, Inc. (a)(b) | | | | | | 87,366 | |
| | 25,500 | | NuStar GP Holdings, LLC | | | | | | 868,020 | | | 26,037 | | News Corp., Class A (a)(b) | | | | | | 448,357 | |
| | 10,061 | | Ocean Rig UDW, Inc. (a)(b) | | | | | | 178,985 | | | 9,904 | | OpenTable, Inc. (a)(b) | | | | | | 761,915 | |
| | 12,267 | | Phillips 66 Partners LP | | | | | | 595,808 | | | 14,780 | | Telephone & Data Systems, Inc. (b) | | | | | | 387,384 | |
| | 52,971 | | QEP Midstream Partners LP (b) | | | | | | 1,238,462 | | | 8,826 | | Tribune Co. (a)(b) | | | | | | 702,991 | |
| | 49,293 | | QEP Resources, Inc. (b) | | | | | | 1,451,186 | | | 18,762 | | Vitacost.com, Inc. (a)(b) | | | | | | 133,023 | |
| | 25,775 | | Rose Rock Midstream LP (b) | | | | | | 1,069,405 | | | | | | | | | | | 3,517,095 | |
| | 23,376 | | SemGroup Corp., Class A (b) | | | | | | 1,535,336 | | Utilities - 0.9% | | | | | | | |
| | 24,145 | | Summit Midstream Partners LP | | | | | | 1,038,959 | | | 21,047 | | Western Gas Equity Partners LP | | | | | | 1,033,618 | |
| | 14,647 | | Susser Petroleum Partners LP | | | | | | 514,842 | | Total Common Stock | | | | | | | |
| | 29,276 | | Tallgrass Energy Partners LP | | | | | | 1,065,939 | | (Cost $42,156,796) | | | | | | 51,189,038 | |
| | 19,420 | | Valero Energy Partners LP | | | | | | 768,838 | | Total Equity Securities | | | | | | | |
| | | | | | | | | | 13,244,353 | | (Cost $42,156,796) | | | | | | 51,189,038 | |
| Financial - 4.0% | | | | | | | | | | | Security | | | | | | | |
| | 163,445 | | Coventree, Inc. (a)(c) | | | | | | 36,962 | | | Principal | | Description | | Rate | | Maturity | | Value | |
| | 45,519 | | DFC Global Corp. (a)(b) | | | | | | 401,933 | | Fixed Income Securities - 1.0% | | | | | | | |
| | 489,865 | | Gramercy Property Trust, Inc. REIT | | | | | | 2,527,703 | | Corporate Non-Convertible Bonds - 0.9% | | | | | | | |
| | 29,005 | | NorthStar Realty Finance Corp. REIT | | | | | | 468,141 | | Energy - 0.9% | | | | | | | |
| | 5,707 | | Rayonier, Inc. REIT (b) | | | | | | 262,008 | | $ | 987,000 | | Alon Refining Krotz Springs, Inc. | | 13.50 | % | 10/15/14 | | 992,552 | |
| | 31,000 | | Starwood Waypoint Residential Trust REIT (a) | | | | | | 892,490 | | Total Corporate Non-Convertible Bonds | | | | | | | |
| | | | | | | | | | 4,589,237 | | (Cost $991,673) | | | | | | 992,552 | |
| Industrial - 6.2% | | | | | | | | | | | | | | | | | | |
| | 41,338 | | Briggs & Stratton Corp. | | | | | | 919,771 | | Syndicated Loans - 0.1% | | | | | | | |
| | 25,518 | | Builders FirstSource, Inc. (a) | | | | | | 232,469 | | | 2,450,401 | | Cinram International, Inc. (d) | | 10.25 | | 12/31/49 | | 134,772 | |
| | 65,068 | | Darling International, Inc. (a)(b) | | | | | | 1,302,661 | | Total Syndicated Loans (Cost $1,597,803) | | | | | | 134,772 | |
| | 1,645 | | EnPro Industries, Inc. (a)(b) | | | | | | 119,542 | | Total Fixed Income Securities (Cost $2,589,476) | | | | | | 1,127,324 | |
| | 24,997 | | Global Brass & Copper Holdings, Inc. (b) | | | | | | 394,203 | | | | | | | | | | | | |
| See Notes to Financial Statements. | 45 | ABSOLUTE FUNDS |
| |
ABSOLUTE OPPORTUNITIES FUND SCHEDULE OF INVESTMENTS MARCH 31, 2014 |
| |
| | | | | | | | | | | | | | | | | | | | | | |
| | | | Security | | | | | | | | | | | | | | | | | | |
| | Shares | | Description | | Strike Price | | Exp. Date | | Value | | | | | | | | | | | | |
| Warrants - 1.1% | | | | | | | | | | | | | | | | | | | | |
| | 705,519 | | Kinder Morgan, Inc. (a)(b) | $ | 100.00 | | 05/14 | $ | 1,248,769 | | | | | | | | | | | | |
| Total Warrants | | | | | | | | | | | | | | | | | | | | |
| (Cost $1,051,139) | | | | | | 1,248,769 | | | | | | | | | | | | |
| | | | Security | | | | | | | | | | | | | | | | | | |
| | Principal | | Description | | Rate | | Maturity | | Value | | | | | | | | | | | | |
| Short-Term Investments - 13.0% | | | | | | | | | | | | | | | | | | |
| Commercial Paper (e) - 13.0% | | | | | | | | | | | | | | | | | | |
| $ | 1,500,000 | | Akzo Nobel NV | | 0.31 | % | 04/28/14 | | 1,499,651 | | | | | | | | | | | | |
| | 1,500,000 | | Cabot Corp. | | 0.28 | | 04/25/14 | | 1,499,720 | | | | | | | | | | | | |
| | 1,500,000 | | Commonwealth Edison Co. | | 0.26 | | 04/24/14 | | 1,499,751 | | | | | | | | | | | | |
| | 1,500,000 | | Edison International | | 0.45 | | 04/07/14 | | 1,499,888 | | | | | | | | | | | | |
| | 1,500,000 | | Enbridge US, Inc. | | 0.26 | | 04/25/14 | | 1,499,740 | | | | | | | | | | | | |
| | 1,500,000 | | Mohawk Industries, Inc. | | 0.55 | | 04/16/14 | | 1,499,656 | | | | | | | | | | | | |
| | 1,500,000 | | Molson Coors Brewing Co. | | 0.35 | | 04/14/14 | | 1,499,810 | | | | | | | | | | | | |
| | 1,500,000 | | Textron, Inc. | | 0.63 | | 04/01/14 | | 1,500,000 | | | | | | | | | | | | |
| | 1,500,000 | | Time Warner Cable, Inc. | | 0.26 | | 05/02/14 | | 1,499,664 | | | | | | | | | | | | |
| | 1,500,000 | | Wyndham Worldwide Corp. | | 0.50 | | 04/11/14 | | 1,499,792 | | | | | | | | | | | | |
| Total Commercial Paper | | | | | | | | | | | | | | | | | | |
| (Cost $14,997,672) | | | | | | | 14,997,672 | | | | | | | | | | | | |
| Total Short-Term Investments | | | | | | | | | | | | | | | | | | |
| (Cost $14,997,672) | | | | | | | | 14,997,672 | | | | | | | | | | | | |
| | | | Security | | Strike | | Exp. | | | | | | | | | | | | | | |
| | Contracts | | Description | | Price | | Date | | Value | | | | | | | | | | | | |
| Purchased Options - 0.2% | | | | | | | | | | | | | | | | | | |
| Call Options Purchased - 0.2% | | | | | | | | | | | | | | | | | | |
| | 278 | | Hertz Global Holdings, Inc. | | 26.00 | | 06/14/14 | | 56,990 | | | | | | | | | | | | |
| | 130 | | NuStar Energy LP | | 55.00 | | 06/14/14 | | 26,650 | | | | | | | | | | | | |
| | 475 | | NuStar GP Holdings, LLC | | 35.00 | | 06/14/14 | | 73,625 | | | | | | | | | | | | |
| Total Call Options Purchased | | | | | | | | | | | | | | | | | | |
| (Premiums Paid $155,920) | | | | | | 157,265 | | | | | | | | | | | | |
| | | | | | | | | | | | | | | | | | | | | |
| Put Options Purchased - 0.0% | | | | | | | | | | | | | | | | | | |
| | 36 | | Amedisys, Inc. | | 15.00 | | 06/14 | | 5,076 | | | | | | | | | | | | |
| | 25 | | Angie's List, Inc. | | 17.50 | | 05/14 | | 13,275 | | | | | | | | | | | | |
| | 45 | | SPDR S&P 500 ETF Trust | | 180.00 | | 06/14 | | 12,060 | | | | | | | | | | | | |
| Total Put Options Purchased | | | | | | | | | | | | | | | | | | |
| (Premiums Paid $31,755) | | | | | | 30,411 | | | | | | | | | | | | |
| Total Purchased Options | | | | | | | | | | | | | | | | | | |
| (Premiums Paid $187,675) | | | | | | 187,676 | | | | | | | | | | | | |
| Total Long Positions - 59.7% | | | | | | | | | | | | | | | | | | |
| (Cost $60,982,758)* | | | | | $ | 68,750,479 | | | | | | | | | | | | |
| Total Short Positions - (20.0)% | | | | | | | | | | | | | | | | | | |
| (Proceeds $(22,812,033))* | | | | | | (23,007,156) | | | | | | | | | | | | |
| Other Assets & Liabilities, Net – 60.3% | | | | | | 69,465,094 | | | | | | | | | | | | |
| Net Assets – 100.0% | | | | | $ | 115,208,417 | | | | | | | | | | | | |
| | | | | | | | | | | | | | | | | | | | | | |
| | | | | | | | | | | | | | | | | | | | | | |
| | | | | | | | | | | | | | | | | | | | | | |
| See Notes to Financial Statements. | 46 | ABSOLUTE FUNDS |
| |
ABSOLUTE OPPORTUNITIES FUND SCHEDULE OF SECURITIES SOLD SHORT MARCH 31, 2014 |
| |
| AFA | | | | | | | | | | | | | | | | | | | | | |
| | | | Security | | | | | | | | | | | Security | | | | | | | |
| | Shares | | Description | | | | | | Value | | | Shares | | Description | | | | | | Value | |
| Short Positions - (20.0)% | | | | | | | | | (1,840) | | Haynes International, Inc. | | | | | $ | (99,360) | |
| Common Stock - (13.1)% | | | | | | | | | (1,016) | | Lindsay Corp. | | | | | | (89,591) | |
| Consumer Discretionary - (3.5)% | | | | | | | | | (8,416) | | Raven Industries, Inc. | | | | | | (275,624) | |
| | (7,923) | | Bob Evans Farms, Inc. | | | | | $ | (396,388) | | | (4,141) | | Smith & Wesson Holding Corp. | | | | | | (60,541) | |
| | (391) | | Buffalo Wild Wings, Inc. | | | | | | (58,220) | | | (3,219) | | Valmont Industries, Inc. | | | | | | (479,116) | |
| | (1,822) | | Chico's FAS, Inc. | | | | | | (29,207) | | | | | | | | | | | (2,026,277) | |
| | (1,065) | | Deckers Outdoor Corp. | | | | | | (84,912) | | Information Technology - (0.8)% | | | | | | | |
| | (49,519) | | Denny's Corp. | | | | | | (318,407) | | | (2,076) | | ACI Worldwide, Inc. | | | | | | (122,878) | |
| | (1,819) | | Dorman Products, Inc. | | | | | | (107,430) | | | (3,459) | | Castlight Health, Inc., Class B | | | | | | (73,400) | |
| | (836) | | FactSet Research Systems, Inc. | | | | | | (90,129) | | | (4,109) | | CGI Group, Inc., Class A | | | | | | (127,050) | |
| | (1,287) | | Family Dollar Stores, Inc. | | | | | | (74,659) | | | (1,668) | | Diebold, Inc. | | | | | | (66,536) | |
| | (26,683) | | Fox Factory Holding Corp. | | | | | | (504,309) | | | (6,709) | | Digital River, Inc. | | | | | | (116,938) | |
| | (2,958) | | FTI Consulting, Inc. | | | | | | (98,620) | | | (2,596) | | Lexmark International, Inc., Class A | | | | | | (120,169) | |
| | (1,362) | | Genesco, Inc. | | | | | | (101,564) | | | (10,509) | | LivePerson, Inc. | | | | | | (126,844) | |
| | (1,252) | | iRobot Corp. | | | | | | (51,395) | | | (2,106) | | Qlik Technologies, Inc. | | | | | | (55,999) | |
| | (362) | | Lululemon Athletica, Inc. | | | | | | (19,037) | | | (608) | | The Dun & Bradstreet Corp. | | | | | | (60,405) | |
| | (3,854) | | Multimedia Games Holding Co., Inc. | | | | | | (111,920) | | | | | | | | | | | (870,219) | |
| | (12,380) | | Noodles & Co. | | | | | | (488,639) | | Materials - (1.0)% | | | | | | | |
| | (3,438) | | Panera Bread Co., Class A | | | | | | (606,704) | | | (21,045) | | American Vanguard Corp. | | | | | | (455,624) | |
| | (1,946) | | PetSmart, Inc. | | | | | | (134,060) | | | (6,082) | | Compass Minerals International, Inc. | | | | | | (501,887) | |
| | (1,168) | | Sears Holdings Corp. | | | | | | (55,784) | | | (3,909) | | Rentech Nitrogen Partners LP | | | | | | (72,747) | |
| | (2,654) | | The Buckle, Inc. | | | | | | (121,553) | | | (2,138) | | United States Steel Corp. | | | | | | (59,030) | |
| | (44,567) | | The Wendy's Co. | | | | | | (406,451) | | | (777) | | US Silica Holdings, Inc. | | | | | | (29,658) | |
| | (2,582) | | United Stationers, Inc. | | | | | | (106,043) | | | | | | | | | | | (1,118,946) | |
| | (1,693) | | Vera Bradley, Inc. | | | | | | (45,694) | | Telecommunication Services - (0.1)% | | | | | | | |
| | (1,618) | | Vitamin Shoppe, Inc. | | | | | | (76,887) | | | (2,282) | | WebMD Health Corp. | | | | | | (94,475) | |
| | | | | | | | | | (4,088,012) | | Total Common Stock | | | | | | | |
| Consumer Staples - (5.5)% | | | | | | | | (Proceeds $(15,398,816)) | | | | | | (15,066,680) | |
| | (8,178) | | Amedisys, Inc. | | | | | | (121,770) | | | | | | | | | | | | |
| | (26,864) | | Amira Nature Foods, Ltd. | | | | | | (457,762) | | Investment Companies - (6.9)% | | | | | | | |
| | (9,904) | | Annie's, Inc. | | | | | | (398,042) | | | (8,310) | | Consumer Staples Select Sector SPDR Fund | | | | | | (357,829) | |
| | (7,428) | | Campbell Soup Co. | | | | | | (333,369) | | | (10,180) | �� | iShares 20+ Year Treasury Bond ETF | | | | | | (1,110,638) | |
| | (9,161) | | Dr. Pepper Snapple Group, Inc. | | | | | | (498,908) | | | (26,317) | | iShares Russell 2000 ETF | | | | | | (3,061,720) | |
| | (24,325) | | Fairway Group Holdings Corp. | | | | | | (185,843) | | | (10,793) | | iShares U.S. Real Estate ETF | | | | | | (730,362) | |
| | (5,812) | | Healthways, Inc. | | | | | | (99,618) | | | (7,770) | | SPDR Barclays High Yield Bond ETF | | | | | | (320,979) | |
| | (8,418) | | Hormel Foods Corp. | | | | | | (414,755) | | | (12,612) | | SPDR S&P 500 ETF Trust | | | | | | (2,358,948) | |
| | (3,101) | | LifeLock, Inc. | | | | | | (53,058) | | Total Investment Companies | | | | | | | |
| | (1,501) | | On Assignment, Inc. | | | | | | (57,924) | | (Proceeds $(7,413,217)) | | | | | | (7,940,476) | |
| | (5,942) | | PepsiCo, Inc. | | | | | | (496,157) | | Total Short Positions - (20.0)% | | | | | | | |
| | (17,022) | | Pilgrim's Pride Corp. | | | | | | (356,100) | | (Proceeds $(22,812,033)) | | | | | $ | (23,007,156) | |
| | (1,376) | | Questcor Pharmaceuticals, Inc. | | | | | | (89,344) | | | | | | | | | | | | |
| | (6,685) | | Sanderson Farms, Inc. | | | | | | (524,706) | | | | | | | | | | | | |
| | (12,693) | | SodaStream International, Ltd. | | | | | | (559,761) | | | | | | | | | | | | |
| | (22,519) | | The Chefs' Warehouse, Inc. | | | | | | (481,907) | | | | | | | | | | | | |
| | (9,409) | | The Fresh Market, Inc. | | | | | | (316,142) | | | | | | | | | | | | |
| | (7,923) | | The Scotts Miracle-Gro Co., Class A | | | | | | (485,521) | | | | | | | | | | | | |
| | (6,190) | | TreeHouse Foods, Inc. | | | | | | (445,618) | | | | | | | | | | | | |
| | | | | | | | | | (6,376,305) | | | | | | | | | | | | |
| Energy - (0.3)% | | | | | | | | | | | | | | | | | | |
| | (26,740) | | Renewable Energy Group, Inc. | | | | | | (320,345) | | | | | | | | | | | | |
| | | | | | | | | | | | | | | | | | | | | | |
| Financial - (0.1)% | | | | | | | | | | | | | | | | | | |
| | (2,500) | | Altisource Residential Corp. REIT | | | | | | (78,900) | | | | | | | | | | | | |
| | (1,175) | | Moody's Corp. | | | | | | (93,201) | | | | | | | | | | | | |
| | | | | | | | | | (172,101) | | | | | | | | | | | | |
| Industrial - (1.8)% | | | | | | | | | | | | | | | | | | |
| | (5,855) | | Briggs & Stratton Corp. | | | | | | (130,274) | | | | | | | | | | | | |
| | (1,026) | | Caterpillar, Inc. | | | | | | (101,953) | | | | | | | | | | | | |
| | (7,281) | | Deere & Co. | | | | | | (661,115) | | | | | | | | | | | | |
| | (11,786) | | GrafTech International, Ltd. | | | | | | (128,703) | | | | | | | | | | | | |
| | | | | | | | | | | | | | | | | | | | | | |
| See Notes to Financial Statements. | 47 | ABSOLUTE FUNDS |
| |
ABSOLUTE OPPORTUNITIES FUND NOTES TO SCHEDULE OF INVESTMENTS AND SECURITIES SOLD SHORT MARCH 31, 2014 |
| |
| ETF | Exchange Traded Fund | | (d) | Security is currently in default and is on scheduled interest or principal payment. |
| LLC | Limited Liability Company | | (e) | Rate presented is yield to maturity. |
| LP | Limited Partnership | | | | | |
| REIT | Real Estate Investment Trust | | | | | |
| (a) | Non-income producing security. | | | | | |
| (b) | All or a portion of this security is held as collateral for securities sold short. | | | | | |
| (c) | Security fair valued in accordance with procedures adopted by the Board of Trustees. At the period end, the value of these securities amounted to $36,962 or 0.0% of net assets. | | | | | |
At March 31, 2014, the Fund held the following credit default swap agreements:
Credit Default Swaps – Buy Protection
| Counterparty | | Reference Entity / Obligation | | Pay Rate | | Termination Date | | Credit Spread as of 03/31/14 (1) | | Notional Amount | | Net Unrealized Depreciation |
| Deutsche Bank Alex Brown, Inc. | | Carnival Corp. 6.65%, 01/15/28 | | 1.00% | | 06/20/19 | | 0.73% | | $ | 10,000,000 | | | $ | (10,257 | ) | |
| Deutsche Bank Alex Brown, Inc. | | Dow Chemical Co., 7.38%, 11/01/29 | | 1.00% | | 06/20/19 | | 0.70 | | | 5,000,000 | | | | (21,518 | ) | |
| Barclays | | Dow Chemical Co., 7.38%, 11/01/29 | | 1.00% | | 12/20/18 | | 0.61 | | | 5,000,000 | | | | (70,159 | ) | |
| Barclays | | Kimco Realty Corp., 6.88%, 10/01/19 | | 1.00% | | 12/20/18 | | 0.68 | | | 5,000,000 | | | | (82,697 | ) | |
| Barclays | | Kimco Realty Corp., 6.88%, 10/01/19 | | 1.00% | | 06/20/19 | | 0.74 | | | 5,000,000 | | | | (17,493 | ) | |
| Deutsche Bank Alex Brown, Inc. | | Macy's Retail Holdings, Inc., 7.45%, 07/15/17 | | 1.00% | | 06/20/19 | | 0.66 | | | 10,000,000 | | | | (34,551 | ) | |
| Deutsche Bank Alex Brown, Inc. | | Nordstrom, Inc., 6.95%, 03/15/28 | | 1.00% | | 06/20/19 | | 0.64 | | | 5,000,000 | | | | (14,637 | ) | |
| Barclays | | Nordstrom, Inc., 6.95%, 03/15/28 | | 1.00% | | 06/20/19 | | 0.64 | | | 5,000,000 | | | | (7,119 | ) | |
| Deutsche Bank Alex Brown, Inc. | | Ryder System, Inc., 6.95%, 12/01/25 | | 1.00% | | 06/20/19 | | 0.69 | | | 10,000,000 | | | | (42,933 | ) | |
| Goldman Sachs & Co. | | Ryder System, Inc., 6.95%, 12/01/25 | | 1.00% | | 06/20/19 | | 0.69 | | | 5,000,000 | | | | (6,637 | ) | |
| BNP Paribas | | Ryder System, Inc., 6.95%, 12/01/25 | | 1.00% | | 06/20/19 | | 0.69 | | | 5,000,000 | | | | (16,565 | ) | |
| Goldman Sachs & Co. | | Southwest Airlines Co., 5.13%, 03/01/17 | | 1.00% | | 06/20/19 | | 0.70 | | | 15,000,000 | | | | (20,027 | ) | |
| | | | | | | | | | | | | | | $ | (344,593 | ) | |
AFA
(1) Credit spreads are an indication of the seller’s performance risk, related to the likelihood of a credit event occurring that would require a seller to make payment to a buyer. Credit spreads are used to determine the value of swap contracts and reflect the cost of buying/selling protection, which may include upfront payments made to enter into the contact.
| At March 31, 2014, the Fund sold the following futures contracts: |
| Contracts | | Type | | Expiration Date | | Notional Contract Value | | Net Unrealized Appreciation |
| (325 | ) | | Russell 2000 Mini Future | | 06/20/14 | | $ | (38,489,253 | ) | | $ | 448,003 | |
AFA
| * | Cost for federal income tax purposes is $40,147,550 and net unrealized appreciation consists of: |
| Gross Unrealized Appreciation | | $ | 10,299,507 | |
| Gross Unrealized Depreciation | | | (4,703,734 | ) |
| Net Unrealized Appreciation | | $ | 5,595,773 | |
| See Notes to Financial Statements. | 48 | ABSOLUTE FUNDS |
| |
ABSOLUTE OPPORTUNITIES FUND NOTES TO SCHEDULE OF INVESTMENTS AND SECURITIES SOLD SHORT MARCH 31, 2014 |
| |
The following is a summary of the inputs used to value the Fund’s investments and other financial instruments and liabilities as of March 31, 2014.
The inputs or methodology used for valuing securities are not necessarily an indication of the risks associated with investing in those securities. For more information on valuation inputs, and their aggregation into the levels used in the table below, please refer to the Security Valuation section in Note 2 of the accompanying Notes to Financial Statements.
| | Level 1 | | Level 2 | | Level 3 | | Total |
| Assets |
| Investments At Value |
| Common Stock | | | | | | | | | | | | | | | | |
| Consumer Discretionary | | $ | 9,569,943 | | | $ | - | | | $ | - | | | $ | 9,569,943 | |
| Consumer Staples | | | 3,841,873 | | | | - | | | | - | | | | 3,841,873 | |
| Energy | | | 13,244,353 | | | | - | | | | - | | | | 13,244,353 | |
| Financial | | | 4,552,275 | | | | - | | | | 36,962 | | | | 4,589,237 | |
| Industrial | | | 7,135,341 | | | | - | | | | - | | | | 7,135,341 | |
| Information Technology | | | 1,618,067 | | | | - | | | | - | | | | 1,618,067 | |
| Materials | | | 6,639,511 | | | | - | | | | - | | | | 6,639,511 | |
| Telecommunication Services | | | 3,517,095 | | | | - | | | | - | | | | 3,517,095 | |
| Utilities | | | 1,033,618 | | | | - | | | | - | | | | 1,033,618 | |
| Corporate Non-Convertible Bonds | | | - | | | | 992,552 | | | | - | | | | 992,552 | |
| Syndicated Loans | | | - | | | | 134,772 | | | | - | | | | 134,772 | |
| Warrants | | | 1,248,769 | | | | - | | | | - | | | | 1,248,769 | |
| Commercial Paper | | | - | | | | 14,997,672 | | | | - | | | | 14,997,672 | |
| Purchased Options | | | 187,676 | | | | - | | | | - | | | | 187,676 | |
| Total Investments At Value | | $ | 52,588,521 | | | $ | 16,124,996 | | | $ | 36,962 | | | $ | 68,750,479 | |
| Other Financial Instruments** | | | | | | | | | | | | | | | | |
| Futures | | | 448,003 | | | | - | | | | - | | | | 448,003 | |
| Total Assets | | $ | 53,036,524 | | | $ | 16,124,996 | | | $ | 36,962 | | | $ | 69,198,482 | |
| Common Stock | | | (15,066,680 | ) | | | - | | | | - | | | | (15,066,680 | ) |
| Investment Companies | | | (7,940,476 | ) | | | - | | | | - | | | | (7,940,476 | ) |
| Total Securities Sold Short | | $ | (23,007,156 | ) | | $ | - | | | $ | - | | | $ | (23,007,156 | ) |
| Other Financial Instruments** | | | | | | | | | | | | | | | | |
| Credit Default Swaps | | | - | | | | (344,593 | ) | | | - | | | | (344,593 | ) |
| Total Liabilities | | $ | (23,007,156 | ) | | $ | (344,593 | ) | | $ | - | | | $ | (23,351,749 | ) |
| ** | Other Financial Instruments are derivative instruments not reflected in the Schedule of Investments and Schedule of Securities Sold Short, such as futures and credit default swaps, which are valued at the unrealized appreciation (depreciation) of the instrument. |
| See Notes to Financial Statements. | 49 | ABSOLUTE FUNDS |
| |
ABSOLUTE OPPORTUNITIES FUND NOTES TO SCHEDULE OF INVESTMENTS AND SECURITIES SOLD SHORT MARCH 31, 2014 |
| |
The following is a reconciliation of Level 3 investments for which significant unobservable inputs were used to determine fair value.
| | | Common Stock | | Corporate Non-Convertible Bonds | | Warrants |
| Balance as of 03/31/13 | | $ | 40,224 | | | $ | 1,693,497 | | | $ | 3,358 | |
| Accrued Accretion / (Amortization) | | | - | | | | 92,762 | | | | - | |
Realized Gain / (Loss) | | | - | | | | 925,615 | | | | 509 | |
Change in Unrealized Appreciation / (Depreciation) | | | (3,262 | ) | | | (1,045,715 | ) | | | (3,358 | ) |
| Sales | | | - | | | | (1,666,159 | ) | | | (509 | ) |
| Balance as of 03/31/14 | | $ | 36,962 | | | $ | - | | | $ | - | |
| Net change in unrealized appreciation / (depreciation) from investments held as of 03/31/14*** | | $ | (3,262 | ) | | $ | - | | | $ | - | |
*** The change in unrealized appreciation/(depreciation) is included in net changes in unrealized appreciation/(depreciation) of investments in the accompanying Statements of Operations.
There were no transfers among Level 1, Level 2 and Level 3 for the year ended March 31, 2014.
| See Notes to Financial Statements. | 50 | ABSOLUTE FUNDS |
| |
ABSOLUTE FUNDS STATEMENTS OF ASSETS AND LIABILITIES MARCH 31, 2014 |
| |
| | | | | | ABSOLUTE STRATEGIES FUND | | | | ABSOLUTE OPPORTUNITIES FUND | |
| ASSETS | | | | | | | | |
| | Total investments, at value (Cost $1,691,153,599 and $60,982,758, respectively) | $ | 2,134,763,254 | | | $ | 68,750,479 | |
| | Deposits with brokers | | | 1,109,093,430 | | | | 26,033,094 | |
| | Cash | | | 387,509,037 | | | | 45,211,219 | |
| | Foreign currency (Cost $0 and $1,795, respectively) | | | - | | | | 1,945 | |
| | Receivables: | | | | | | | | |
| | | Fund shares sold | | | 6,117,935 | | | | 87,139 | |
| | | Investment securities sold | | | 52,421,203 | | | | 2,360,416 | |
| | | Dividends and interest | | | 8,482,905 | | | | 86,709 | |
| | | From administrator | | | - | | | | 46,581 | |
| | | Variation margin | | | 8,563 | | | | - | |
| | Swap premiums paid | | | - | | | | 6,630 | |
| | Unrealized appreciation on swap agreements | | | 133,659 | | | | - | |
| | Unrealized appreciation on forward currency contracts | | | 4,766 | | | | - | |
| | Prepaid expenses | | | 31,947 | | | | 12,027 | |
| Total Assets | | | 3,698,566,699 | | | | 142,596,239 | |
| | | | | | | | | | | |
| LIABILITIES | | | | | | | | |
| | Swap premiums received | | | 49,710 | | | | 1,035,633 | |
| | Unrealized depreciation on swap agreements | | | - | | | | 344,593 | |
| | Unrealized depreciation on forward currency contracts | | | 22,180 | | | | - | |
| | Securities sold short, at value (Proceeds $774,982,543 and $22,812,033, respectively) | | | 802,988,959 | | | | 23,007,156 | |
| | Call options written, at value (Premiums received $16,192,614 and $0, respectively) | | | 15,286,071 | | | | - | |
| | Put options written, at value (Premiums received $18,544,009 and $0, respectively) | | | 14,868,287 | | | | - | |
| | Payables: | | | | | | | | |
| | | Investment securities purchased | | | 49,036,503 | | | | 1,810,193 | |
| | | Fund shares redeemed | | | 10,642,885 | | | | 161,647 | |
| | | Dividends and interest on securities sold short | | | 1,391,592 | | | | 20,277 | |
| | | Variation margin | | | 17,135,814 | | | | 763,750 | |
| | | Due to broker | | | 18,274,179 | | | | - | |
| | | Other | | | 29,267 | | | | - | |
| | Accrued Liabilities: | | | | | | | | |
| | | Investment adviser fees | | | 4,042,397 | | | | 152,399 | |
| | | Trustees’ fees and expenses | | | 1,900 | | | | 80 | |
| | | Fund services fees | | | 118,901 | | | | 10,658 | |
| | | Other expenses | | | 414,911 | | | | 81,436 | |
| Total Liabilities | | | 934,303,556 | | | | 27,387,822 | |
| | | | | | | | | | | |
| NET ASSETS | | $ | 2,764,263,143 | | | $ | 115,208,417 | |
| See Notes to Financial Statements. | 51 | ABSOLUTE FUNDS |
| |
ABSOLUTE FUNDS STATEMENTS OF ASSETS AND LIABILITIES MARCH 31, 2014 |
| |
| | | | | | ABSOLUTE STRATEGIES FUND | | | | ABSOLUTE OPPORTUNITIES FUND | |
| COMPONENTS OF NET ASSETS | | | | | | | | |
| | Paid-in capital | | $ | 2,612,274,110 | | | $ | 112,260,287 | |
| | Accumulated net investment income (loss) | | | 10,781 | | | | (1,922,673 | ) |
| | Accumulated net realized loss | | | (275,960,958 | ) | | | (2,805,355 | ) |
| | Net unrealized appreciation | | | 427,939,210 | | | | 7,676,158 | |
| NET ASSETS | | $ | 2,764,263,143 | | | $ | 115,208,417 | |
| | | | | | | | | | | |
| SHARES OF BENEFICIAL INTEREST AT NO PAR VALUE (UNLIMITED SHARES AUTHORIZED) | | | | | | | | |
| | Institutional Shares | | | 245,081,286 | | | | 10,443,640 | |
| | R Shares | | | 6,109,479 | | | | - | |
| | | | | | | | | | | |
| NET ASSET VALUE, OFFERING AND REDEMPTION PRICE PER SHARE | | | | | | | | |
| | Institutional Shares (based on net assets of $2,697,674,615 and $115,208,417, respectively) | | $ | 11.01 | | | $ | 11.03 | |
| | R Shares (based on net assets of $66,588,528 and $0, respectively) | | $ | 10.90 | | | $ | - | |
| See Notes to Financial Statements. | 52 | ABSOLUTE FUNDS |
| |
ABSOLUTE FUNDS STATEMENTS OF OPERATIONS YEAR ENDED MARCH 31, 2014 |
| |
| | | | | | ABSOLUTE STRATEGIES FUND | | | | ABSOLUTE OPPORTUNITIES FUND | | |
| INVESTMENT INCOME | | | | | | | | | |
| | Dividend income (Net of foreign withholding taxes of $267,365 and $9,581, respectively) | | $ | 36,151,696 | | | $ | 2,279,775 | | |
| | Interest income (Net of foreign withholding taxes of $2,572 and $0, respectively) | | | 19,863,900 | | | | 1,168,235 | | |
| Total Investment Income | | | 56,015,596 | | | | 3,448,010 | | |
| Adviser | | | | | | | | | |
| EXPENSES | | | | | | | | | |
| | Investment adviser fees | | | 56,195,212 | | | | 7,608,470 | | |
| | Fund services fees | | | 1,240,977 | | | | 157,455 | | |
| | Transfer agent fees: | | | | | | | | | |
| | Institutional Shares | | | 157,997 | | | | 21,738 | | |
| | R Shares | | | 114,914 | | | | - | | |
| | Distribution fees: | | | | | | | | | |
| | R Shares | | | 200,801 | | | | - | | |
| | Custodian fees | | | 551,874 | | | | 150,042 | | |
| | Registration fees: | | | | | | | | | |
| | Institutional Shares | | | 68,277 | | | | 34,324 | | |
| | R Shares | | | 25,153 | | | | - | | |
| | Professional fees | | | 217,692 | | | | 89,647 | | |
| | Trustees' fees and expenses | | | 134,289 | | | | 18,125 | | |
| | Dividend expense on securities sold short | | | 18,737,677 | # | | | 722,489 | # | |
| | Interest expense | | | 6,437,704 | # | | | 360,526 | 0 | |
| | Miscellaneous expenses | | | 2,883,571 | | | | 366,421 | | |
| Total Expenses | | | 86,966,138 | | | | 9,529,237 | | |
| | Fees waived | | | (646,931 | ) | | | (686,328 | ) | |
| Net Expenses | | | 86,319,207 | | | | 8,842,909 | | |
| | | | | | | | | | | | |
| NET INVESTMENT LOSS | | | (30,303,611 | ) | | | (5,394,899 | ) | |
| | | | | | | | | | | | |
| NET REALIZED AND UNREALIZED GAIN (LOSS) | | | | | | | | | |
| | Net realized gain (loss) on: | | | | | | | | | |
| | Investments | | | 577,118,695 | | | | 55,138,971 | | |
| | Foreign currency transactions | | | (508,436 | ) | | | 206,732 | | |
| | Futures | | | (237,201,954 | ) | | | (15,051,013 | ) | |
| | Securities sold short | | | (327,289,845 | ) | | | (12,266,991 | ) | |
| | Written options | | | 10,075,830 | | | | 82,342 | | |
| | Swaps | | | 65,617 | | | | (9,240,959 | ) | |
| | Net realized gain | | | 22,259,907 | | | | 18,869,082 | | |
| See Notes to Financial Statements. | 53 | ABSOLUTE FUNDS |
| |
ABSOLUTE FUNDS STATEMENTS OF OPERATIONS YEAR ENDED MARCH 31, 2014 |
| |
| | | | | | ABSOLUTE STRATEGIES FUND | | | | ABSOLUTE OPPORTUNITIES FUND | | |
| | Net change in unrealized appreciation (depreciation) on: | | | | | | | | | |
| | Investments | | $ | (163,514,708 | ) | | $ | (33,310,582 | ) | |
| | Foreign currency translations | | | (67,085 | ) | | | 5,663 | | |
| | Futures | | | 29,696,672 | | | | 1,589,441 | | |
| | Securities sold short | | | 64,976,398 | | | | 2,742,860 | | |
| | Written options | | | 2,201,034 | | | | 30,014 | | |
| | Swaps | | | 16,083 | | | | 666,780 | | |
| | Net change in unrealized appreciation (depreciation) | | | (66,691,606 | ) | | | (28,275,824 | ) | |
| NET REALIZED AND UNREALIZED LOSS | | | (44,431,699 | ) | | | (9,406,742 | ) | |
| DECREASE IN NET ASSETS RESULTING FROM OPERATIONS | | $ | (74,735,310 | ) | | $ | (14,801,641 | ) | |
| | | | | | | | | | | | |
| See Notes to Financial Statements. | 54 | ABSOLUTE FUNDS |
| |
ABSOLUTE FUNDS STATEMENTS OF CHANGES IN NET ASSETS |
| |
| | | | | ABSOLUTE STRATEGIES FUND | | ABSOLUTE OPPORTUNITIES FUND | |
| | | | | | | | | | | | | | | | | | | | |
| | | March 31, 2012 | | | | | | | Shares | | | | | | | | Shares | | |
| NET ASSETS MARCH 31, 2012 | | $ | 3,983,432,430 | | | | $ 3,983,432,430 | | | $ | 510,920,929 | | | | $510,920,929 | | |
| | | | | | | | | | | | | | | | | | | | |
| OPERATIONS | | | | | | | | | | | | | | | | | |
| | Net investment loss | | | (36,537,064 | ) | | | | | | | (9,761,973 | ) | | | | | |
| | Net realized loss | | | (30,715,024 | ) | | | | | | | (7,899,950 | ) | | | | | |
| | Net change in unrealized appreciation (depreciation) | | | 116,634,001 | | | | | | | | 18,701,069 | | | | | | |
| Increase in Net Assets Resulting from Operations | | | 49,381,913 | | | | | | | | 1,039,146 | | | | | | |
| | | | | | | | | | | | | | | | | | | | |
| CAPITAL SHARE TRANSACTIONS | | | | | | | | | | | | | | | | | |
| | Sale of shares: | | | | | | | | | | | | | | | | | |
| | | Institutional Shares | | | 1,275,564,625 | | | | 114,078,621 | | | | 126,849,777 | | | | 10,997,972 | | |
| | | R Shares | | | 36,451,388 | | | | 3,273,000 | | | | - | | | | - | | |
| | Redemption of shares: | | | | | | | | | | | | | | | | | |
| | | Institutional Shares | | | (1,413,621,327 | ) | | | (126,745,214 | ) | | | (256,362,656 | ) | | | (22,218,799 | ) | |
| | | R Shares | | | (42,962,020 | ) | | | (3,864,023 | ) | | | - | | | | - | | |
| Decrease in Net Assets from Capital Share Transactions | | | (144,567,334 | ) | | | (13,257,616 | ) | | | (129,512,879 | ) | | | (11,220,827 | ) | |
| Decrease in Net Assets | | | (95,185,421 | ) | | | | | | | (128,473,733 | ) | | | | | |
| | | March 31, 2013 | | | | | | | | | | | | | | | | | |
| NET ASSETS MARCH 31, 2013 (Including line (a)) | | $ | 3,888,247,009 | | | | | | | $ | 382,447,196 | | | | | | |
| | | | | | | | | | | | | | | | | | | | |
| OPERATIONS | | | | | | | | | | | | | | | | | |
| | Net investment loss | | | (30,303,611 | ) | | | | | | | (5,394,899 | ) | | | | | |
| | Net realized gain | | | 22,259,907 | | | | | | | | 18,869,082 | | | | | | |
| | Net change in unrealized appreciation (depreciation) | | | (66,691,606 | ) | | | | | | | (28,275,824 | ) | | | | | |
| Decrease in Net Assets Resulting from Operations | | | (74,735,310 | ) | | | | | | | (14,801,641 | ) | | | | | |
| | | | | | | | | | | | | | | | | | | | |
| CAPITAL SHARE TRANSACTIONS | | | | | | | | | | | | | | | | | |
| | Sale of shares: | | | | | | | | | | | | | | | | | |
| | | Institutional Shares | | | 840,977,946 | | | | 75,443,988 | | | | 61,461,658 | | | | 5,391,862 | | |
| | | R Shares | | | 24,205,043 | | | | 2,185,483 | | | | - | | | | - | | |
| | Redemption of shares: | | | | | | | | | | | | | | | | | |
| | | Institutional Shares | | | (1,870,531,696 | ) | | | (168,395,529 | ) | | | (313,898,796 | ) | | | (27,820,270 | ) | |
| | | R Shares | | | (43,899,849 | ) | | | (3,980,271 | ) | | | - | | | | - | | |
| Decrease in Net Assets from Capital Share Transactions | | | (1,049,248,556 | ) | | | (94,746,329 | ) | | | (252,437,138 | ) | | | (22,428,408 | ) | |
| Decrease in Net Assets | | | (1,123,983,866 | ) | | | | | | | (267,238,779 | ) | | | | | |
| | | March 31, 2014 | | | | | | | | | | | | | | | | | |
| NET ASSETS MARCH 31, 2014 (Including line (b)) | | $ | 2,764,263,143 | | | | | | | $ | 115,208,417 | | | | | | |
| | | | | | | | | | | | | | | | | | | | |
| (a) | Accumulated net investment income (loss) March 31, 2013 | | $ | (4,777,213 | ) | | | | | | $ | (4,401,844 | ) | | | | | |
| | | | | | | | | | | | | | | | | | | | |
| (b) | Accumulated net investment income (loss) March 31, 2014 | | $ | 10,781 | | | | | | | $ | (1,922,673 | ) | | | | | |
| See Notes to Financial Statements. | 55 | ABSOLUTE FUNDS |
| |
ABSOLUTE STRATEGIES FUND FINANCIAL HIGHLIGHTS |
| |
These financial highlights reflect selected data for a share outstanding throughout each year. | | | | | | |
| | | For the Years Ended March 31, | | |
| | | 2014 | | 2013 | | 2012 | | 2011 | | 2010 | |
| INSTITUTIONAL SHARES | | | | | | | | | | | | | | | | | | | | |
| NET ASSET VALUE, Beginning | | | | | | | | | | | | | | | | | | | | |
| of Year | $ | 11.24 | | | $ | 11.09 | | | $ | 10.80 | | | $ | 10.66 | | | $ | 8.79 | | |
| INVESTMENT OPERATIONS | | | | | | | | | | | | | | | | | | | | |
| Net investment income (loss) (a) | | (0.10 | ) | | | (0.10 | ) | | | (0.09 | ) | | | (0.02 | ) | | | 0.10 | | |
| Net realized and unrealized | | | | | | | | | | | | | | | | | | | | |
| | gain (loss) | | (0.13 | ) | | | 0.25 | | | | 0.45 | | | | 0.20 | | | | 1.91 | | |
| Total from Investment | | | | | | | | | | | | | | | | | | | | |
| | Operations | | (0.23 | ) | | | 0.15 | | | | 0.36 | | | | 0.18 | | | | 2.01 | | |
| DISTRIBUTIONS TO | | | | | | | | | | | | | | | | | | | | |
| SHAREHOLDERS FROM | | | | | | | | | | | | | | | | | | | | |
| Net investment income | | — | | | | — | | | | (0.02 | ) | | | (0.04 | ) | | | (0.14 | ) | |
| Net realized gain | | — | | | | — | | | | (0.05 | ) | | | — | | | | — | (b) | |
| Total Distributions to | | | | | | | | | | | | | | | | | | | | |
| | Shareholders | | — | | | | — | | | | (0.07 | ) | | | (0.04 | ) | | | (0.14 | ) | |
| NET ASSET VALUE, End | | | | | | | | | | | | | | | | | | | | |
| of Year | $ | 11.01 | | | $ | 11.24 | | | $ | 11.09 | | | $ | 10.80 | | | $ | 10.66 | | |
| TOTAL RETURN | | (2.05 | )% | | 1.35 | % | | 3.36 | % | | 1.73 | % | | 22.95 | % | |
| RATIOS/SUPPLEMENTARY | | | | | | | | | | | | | | | | | | | | |
| DATA | | | | | | | | | | | | | | | | | | | | |
| Net Assets at End of | | | | | | | | | | | | | | | | | | | | |
| | Year (000's omitted) | $2,697,675 | | | $3,799,857 | | | $3,899,319 | | | $3,300,120 | | | $2,116,412 | | |
| Ratios to Average Net Assets: | | | | | | | | | | | | | | | | | | | | |
| Net investment income (loss) | | (0.85 | )% | | (0.87 | )% | | (0.80 | )% | | (0.20 | )% | | 0.98 | % | |
| Net expense (c) | | 1.73 | % | | 1.73 | % | | 1.73 | % | | 1.73 | % | | 1.78 | % | |
| Dividend and interest expense | | 0.72 | % | | 0.84 | % | | 0.85 | % | | 0.53 | % | | 0.34 | % | |
| Gross expense | | 2.47 | %(d) | 2.57 | % | | 2.58 | % | | 2.26 | %(d) | 2.12 | %(d) | |
| PORTFOLIO TURNOVER RATE | | 75 | % | | 68 | % | | 112 | % | | 192 | % | | 114 | % | |
| | | | | | | | | | | | | | | | | | | | | | |
| (a) | Calculated based on average shares outstanding during each year. | |
| (b) | Less than $0.01 per share. | |
| (c) | Excludes dividend and interest expense. | |
| (d) | Reflects the expense ratio excluding any waivers and/or reimbursements. | |
| See Notes to Financial Statements. | 56 | ABSOLUTE FUNDS |
| |
ABSOLUTE STRATEGIES FUND FINANCIAL HIGHLIGHTS |
| |
These financial highlights reflect selected data for a share outstanding throughout each year. | | | | | | |
| | | For the Years Ended March 31, | | |
| | | 2014 | | 2013 | | 2012 | | 2011 | | 2010 | |
| R SHARES | | | | | | | | | | | | | | | | | | | | |
| NET ASSET VALUE, Beginning | | | | | | | | | | | | | | | | | | | | |
| of Year | $ | 11.18 | | | $ | 11.08 | | | $ | 10.82 | | | $ | 10.67 | | | $ | 8.82 | | |
| INVESTMENT OPERATIONS | | | | | | | | | | | | | | | | | | | | |
| Net investment income (loss) (a) | | (0.14 | ) | | | (0.15 | ) | | | (0.16 | ) | | | (0.10 | ) | | | 0.05 | | |
| Net realized and unrealized | | | | | | | | | | | | | | | | | | | | |
| | gain (loss) | | (0.14 | ) | | | 0.25 | | | | 0.47 | | | | 0.26 | | | | 1.91 | | |
| Total from Investment | | | | | | | | | | | | | | | | | | | | |
| | Operations | | (0.28 | ) | | | 0.10 | | | | 0.31 | | | | 0.16 | | | | 1.96 | | |
| DISTRIBUTIONS TO | | | | | | | | | | | | | | | | | | | | |
| SHAREHOLDERS FROM | | | | | | | | | | | | | | | | | | | | |
| Net investment income | | — | | | | — | | | | — | | | | (0.01 | ) | | | (0.11 | ) | |
| Net realized gain | | — | | | | — | | | | (0.05 | ) | | | — | | | | — | (b) |
| Total Distributions to | | | | | | | | | | | | | | | | | | | | |
| | Shareholders | | — | | | | — | | | | (0.05 | ) | | | (0.01 | ) | | | (0.11 | ) | |
| NET ASSET VALUE, End | | | | | | | | | | | | | | | | | | | | |
| of Year | $ | 10.90 | | | $ | 11.18 | | | $ | 11.08 | | | $ | 10.82 | | | $ | 10.67 | | |
| TOTAL RETURN | | (2.50 | )% | | 0.90 | % | | 2.87 | % | | 1.49 | % | | 22.28 | % |
| RATIOS/SUPPLEMENTARY | | | | | | | | | | | | | | | | | | | | |
| DATA | | | | | | | | | | | | | | | | | | | | |
| Net Assets at End of | | | | | | | | | | | | | | | | | | | | |
| | Year (000's omitted) | $66,589 | | | $88,390 | | | $94,113 | | | $101,868 | | | $93,696 | | |
| Ratios to Average Net Assets: | | | | | | | | | | | | | | | | | | | | |
| Net investment income (loss) | | (1.23 | )% | | (1.34 | )% | | (1.43 | )% | | (0.95 | )% | | 0.52 | % |
| Net expense (c) | | 2.19 | % | | 2.14 | % | | 2.14 | % | | 2.11 | % | | 2.22 | % |
| Dividend and interest expense | | 0.73 | % | | 0.84 | % | | 0.81 | % | | 0.53 | % | | 0.34 | % |
| Gross expense | | 2.93 | %(d) | 2.98 | % | | 2.95 | % | | 2.64 | %(d) | 2.56 | %(d) |
| PORTFOLIO TURNOVER RATE | | 75 | % | | 68 | % | | 112 | % | | 192 | % | | 114 | % |
| | | | | | | | | | | | | | | | | | | | | | |
| (a) | Calculated based on average shares outstanding during each year. |
| (b) | Less than $0.01 per share. |
| (c) | Excludes dividend and interest expense. |
| (d) | Reflects the expense ratio excluding any waivers and/or reimbursements. |
| See Notes to Financial Statements. | 57 | ABSOLUTE FUNDS |
| |
ABSOLUTE OPPORTUNITIES FUND FINANCIAL HIGHLIGHTS |
| |
These financial highlights reflect selected data for a share outstanding throughout each year. | | | | | | |
| | | For the Years Ended March 31, | |
| | | 2014 | | 2013 | | 2012 | | 2011 | | 2010 | |
| INSTITUTIONAL SHARES | | | | | | | | | | | | | | | | | | | | |
| NET ASSET VALUE, Beginning | | | | | | | | | | | | | | | | | | | | |
| of Year | $ | 11.63 | | | $ | 11.59 | | | $ | 12.41 | | | $ | 11.77 | | | $ | 10.57 | | |
| INVESTMENT OPERATIONS | | | | | | | | | | | | | | | | | | | | |
| Net investment loss (a) | | (0.22 | ) | | | (0.26 | ) | | | (0.25 | ) | | | (0.13 | ) | | | (0.11 | ) | |
| Net realized and unrealized | | | | | | | | | | | | | | | | | | | | |
| | gain (loss) | | (0.38 | ) | | | 0.30 | | | | (0.21 | ) | | | 0.95 | | | | 2.11 | | |
| Total from Investment | | | | | | | | | | | | | | | | | | | | |
| | Operations | | (0.60 | ) | | | 0.04 | | | | (0.46 | ) | | | 0.82 | | | | 2.00 | | |
| DISTRIBUTIONS TO | | | | | | | | | | | | | | | | | | | | |
| SHAREHOLDERS FROM | | | | | | | | | | | | | | | | | | | | |
| Net investment income | | — | | | | — | | | | — | | | | — | | | | (0.01 | ) | |
| Net realized gain | | — | | | | — | | | | (0.36 | ) | | | (0.18 | ) | | | (0.75 | ) | |
| Return of capital | | — | | | | — | | | | — | | | | — | | | | (0.04 | ) | |
| Total Distributions to | | | | | | | | | | | | | | | | | | | | |
| | Shareholders | | — | | | | — | | | | (0.36 | ) | | | (0.18 | ) | | | (0.80 | ) | |
| NET ASSET VALUE, End | | | | | | | | | | | | | | | | | | | | |
| of Year | $ | 11.03 | | | $ | 11.63 | | | $ | 11.59 | | | $ | 12.41 | | | $ | 11.77 | | |
| TOTAL RETURN | | (5.16 | )% | | 0.34 | % | | (3.68 | )% | | 6.98 | % | | 19.00 | % |
| RATIOS/SUPPLEMENTARY | | | | | | | | | | | | | | | | | | | | |
| DATA | | | | | | | | | | | | | | | | | | | | |
| Net Assets at End of | | | | | | | | | | | | | | | | | | | | |
| | Year (000's omitted) | $115,208 | | | $382,447 | | | $510,921 | | | $593,127 | | | $285,639 | | |
| Ratios to Average Net Assets: | | | | | | | | | | | | | | | | | | | | |
| Net investment loss | | (1.95 | )% | | (2.25 | )% | | (2.12 | )% | | (1.05 | )% | | (0.90 | )% |
| Net expense (b) | | 2.80 | % | | 2.95 | % | | 2.95 | % | | 2.95 | % | | 2.95 | % |
| Dividend and interest expense | | 0.39 | % | | 0.99 | % | | 0.61 | % | | 0.42 | % | | 0.46 | % |
| Gross expense (c) | | 3.44 | % | | 4.00 | % | | 3.58 | % | | 3.42 | % | | 3.66 | % |
| PORTFOLIO TURNOVER RATE | | 157 | % | | 205 | % | | 430 | % | | 630 | % | | 597 | % |
| | | | | | | | | | | | | | | | | | | | | | |
| (a) | Calculated based on average shares outstanding during each year. |
| (b) | Excludes dividend and interest expense. |
| (c) | Reflects the expense ratio excluding any waivers and/or reimbursements. |
| See Notes to Financial Statements. | 58 | ABSOLUTE FUNDS |
| |
ABSOLUTE FUNDS NOTES TO FINANCIAL STATEMENTS MARCH 31, 2014 |
| |
Note 1. Organization
Absolute Strategies Fund and Absolute Opportunities Fund (individually, a “Fund” and, collectively the “Funds”) are non-diversified portfolios of Forum Funds (the “Trust”). The Trust is a Delaware statutory trust that is registered as an open-end, management investment company under the Investment Company Act of 1940 (the “Act”), as amended. Under its Trust Instrument, the Trust is authorized to issue an unlimited number of each Fund’s shares of beneficial interest without par value. Absolute Strategies Fund currently offers two classes of shares: Institutional Shares and R Shares. Institutional and R Shares commenced operations on July 11, 2005. Absolute Strategies Fund seeks to achieve long-term capital appreciation with an emphasis on absolute (positive) returns and low sensitivity to traditional financial market indices, such as the S&P 500 Index. Absolute Opportunities Fund currently offers Institutional Shares. Absolute Opportunities Fund commenced operations on October 21, 2008. Absolute Opportunities Fund seeks to achieve long-term capital appreciation with an emphasis on risk-adjusted returns and lower volatility than traditional equity market indices, such as the S&P 500 Index.
Note 2. Summary of Significant Accounting Policies
These financial statements are prepared in accordance with accounting principles generally accepted in the United States of America (“GAAP”), which require management to make estimates and assumptions that affect the reported amounts of assets and liabilities, the disclosure of contingent liabilities at the date of the financial statements, and the reported amounts of increases and decreases in net assets from operations during the fiscal year. Actual amounts could differ from those estimates. The following summarizes the significant accounting policies of each Fund:
Security Valuation – Exchange-traded securities and over-the-counter securities are valued using the last quoted trade or official closing price, provided by independent pricing services as of the close of trading on the market or exchange for which they are primarily traded, on each Fund business day. In the absence of a sale, such securities are valued at the mean of the last bid and ask price provided by independent pricing services. Non-exchange traded securities for which quotations are available are valued using the last quoted sales price, or in the absence of a sale, at the mean of the last bid and ask prices provided by independent pricing services. Debt securities may be valued at prices supplied by a fund’s pricing agent based on broker or dealer supplied valuations or matrix pricing, a method of valuing securities by reference to the value of other securities with similar characteristics such as rating, interest rate and maturity. Exchange-traded options for which the last quoted sale price is outside the closing bid and ask price, will be valued at the mean of the closing bid and ask price. Shares of open-end mutual funds are valued at net asset value (“NAV”). Futures contracts listed for trading on a securities exchange or board of trade shall be valued at the last quoted sales price or in the absence of a sale at the mean of the last bid and asked prices. Short-term investments that mature in 60 days or less may be valued at amortized cost.
Each Fund values its investments and other financial instruments at fair value pursuant to procedures adopted by the Trust's Board of Trustees (the "Board") if (1) market quotations are insufficient or not readily available or (2) the adviser believes that the values available are unreliable. The Trust’s Valuation Committee, as defined in each Fund’s registration statement, performs certain functions as they relate to the administration and oversight of each Fund’s valuation procedures. Under these procedures, the Valuation Committee convenes on a regular and ad-hoc basis to review such securities and considers a number of factors, including valuation methodologies and significant unobservable inputs, when arriving at fair value.
The Valuation Committee may work with an adviser to provide valuation inputs. In determining fair valuations, inputs may include market-based analytics which may consider related or comparable assets or liabilities, recent transactions, market multiples, book values and other relevant investment information. Adviser inputs may include an income-based approach in which the anticipated future cash flows of the investment are discounted in determining fair value. Discounts may also be applied based on the nature or duration of any restrictions on the disposition of the investments. The Valuation Committee performs regular reviews of valuation methodologies, key inputs and assumptions, disposition analysis and market activity.
Fair valuation is based on subjective factors and, as a result, the fair value price of an investment may differ from
| |
ABSOLUTE FUNDS NOTES TO FINANCIAL STATEMENTS MARCH 31, 2014 |
| |
the security’s market price and may not be the price at which the asset may be sold. Fair valuation could result in a different NAV than a NAV determined by using market quotes.
Each Fund has a three-tier fair value hierarchy. The basis of the tiers is dependent upon the various “inputs” used to determine the value of each Fund’s investments. These inputs are summarized in the three broad levels listed below:
Level 1 — quoted prices in active markets for identical assets
Level 2 — other significant observable inputs (including quoted prices of similar securities, interest rates, prepayment speeds, credit risk, etc.)
Level 3 — significant unobservable inputs (including each Fund’s own assumptions in determining the fair value of investments)
The aggregate value by input level, as of March 31, 2014, for each Fund’s investments is included in the Notes to Schedules of Investments, Securities Sold Short and Call and Put Options Written.
Security Transactions, Investment Income and Realized Gain and Loss – Investment transactions are accounted for on the trade date. Dividend income and expense are recorded on the ex-dividend date. Foreign dividend income and expense are recorded on the ex-dividend date or as soon as possible after each Fund determines the existence of a dividend declaration after exercising reasonable due diligence. Income and capital gains on some foreign securities may be subject to foreign withholding taxes, which are accrued as applicable. Interest income is recorded on an accrual basis. Premium is amortized and discount is accreted using the effective interest method. Identified cost of investments sold is used to determine the gain and loss for both financial statement and federal income tax purposes. Each Fund estimates components of distributions from real estate investment trusts (“REITs”). Distributions received in excess of income are recorded as a reduction of the cost of the related investments.
Foreign Currency Translations – Foreign currency amounts are translated into U.S. dollars as follows: (1) assets and liabilities at the rate of exchange at the end of the respective period; and (2) purchases and sales of securities and income and expenses at the rate of exchange prevailing on the dates of such transactions. The portion of the results of operations arising from changes in the exchange rates and the portion due to fluctuations arising from changes in the market prices of securities are not isolated. Such fluctuations are included with the net realized and unrealized gain or loss on investments.
Futures Contracts – Each Fund may purchase futures contracts to gain exposure to market changes, which may be more efficient or cost effective than actually buying the securities. A futures contract is an agreement between parties to buy or sell a security at a set price on a future date. Upon entering into such a contract, a fund is required to pledge to the broker an amount of cash, U.S. Government obligations or other high-quality debt securities equal to the minimum “initial margin” requirements of the exchange on which the futures contract is traded. Pursuant to the contract, the fund agrees to receive from or pay to the broker an amount of cash equal to the daily fluctuation in the value of the contract. Such receipts or payments are known as “variation margin” and are recorded by the fund as unrealized gains or losses. When the contract is closed, the fund records a realized gain or loss equal to the difference between the value of the contract at the time it was opened and value at the time it was closed. Risks of entering into futures contracts include the possibility that there may be an illiquid market and that a change in the value of the contract may not correlate with changes in the value of the underlying securities.
Notional amounts of each individual futures contract outstanding as of March 31, 2014, for each Fund, are disclosed in the Notes to Schedule of Investments, Securities Sold Short and Call and Put Options Written.
Securities Sold Short – Each Fund may sell a security short to increase investment returns. Each Fund may also
| |
ABSOLUTE FUNDS NOTES TO FINANCIAL STATEMENTS MARCH 31, 2014 |
| |
sell a security short in anticipation of a decline in the market value of a security. A short sale is a transaction in which a fund sells a security that it does not own. To complete the transaction, the fund must borrow the security in order to deliver it to the buyer. The fund must replace the borrowed security by purchasing it at market price at the time of replacement; the price may be higher or lower than the price at which the fund sold the security. The fund incurs a loss from a short sale if the price of the security increases between the date of the short sale and the date on which the fund replaces the borrowed security. The fund realizes a profit if the price of the security declines between those dates.
Until the fund replaces the borrowed security, the fund will maintain on its books and records cash and long securities to sufficiently cover its short position on a daily basis. The collateral for the securities sold short includes the Deposits with Brokers as shown on the Statements of Assets and Liabilities and the securities held long as shown on the Schedules of Investments. Dividends and interest paid on securities sold short are recorded as an expense on each Fund’s Statement of Operations.
Purchased Options – When a fund purchases an option, an amount equal to the premium paid by the fund is recorded as an investment and is subsequently adjusted to the current value of the option purchased. If an option expires on the stipulated expiration date or if the fund enters into a closing sale transaction, a gain or loss is realized. If a call option is exercised, the cost of the security acquired is increased by the premium paid for the call. If a put option is exercised, a gain or loss is realized from the sale of the underlying security, and the proceeds from such sale are decreased by the premium originally paid. Purchased options are non-income producing securities.
The values of each individual purchased option outstanding as of March 31, 2014, are disclosed in each Fund’s Schedule of Investments.
Written Options – When a fund writes an option, an amount equal to the premium received by the fund is recorded as a liability and is subsequently adjusted to the current value of the option written. Premiums received from writing options that expire unexercised are treated by the fund on the expiration date as realized gain from written options. The difference between the premium and the amount paid on effecting a closing purchase transaction, including brokerage commissions, is also treated as a realized gain, or if the premium is less than the amount paid for the closing purchase transaction, as a realized loss. If a call option is exercised, the premium is added to the proceeds from the sale of the underlying security in determining whether the fund has realized a gain or loss. If a put option is exercised, the premium reduces the cost basis of the securities purchased by the fund. The fund, as writer of an option, bears the market risk of an unfavorable change in the price of the security underlying the written option. Written options are non-income producing securities.
The values of each individual written option outstanding as of March 31, 2014, if any, are disclosed in each Fund’s Schedule of Call and Put Options Written. There were no written options outstanding at March 31, 2014, for the Absolute Opportunities Fund.
Transactions in written options during the year ended March 31, 2014, were as follows:
| Absolute Strategies Fund | | | | | | | | | | | | | | |
| | | Calls | | Puts |
| | | Number of | | | | | | Number of | | | | |
| | | Contracts | | | Premiums Received | | Contracts | | Premiums Received |
| Options Outstanding, March 31, 2013 | | (112,745 | ) | | $ | (17,248,328 | ) | | (143,309 | ) | | $ | (23,640,990 | ) |
| Options written | | (112,523 | ) | | | (43,077,312 | ) | | (135,686 | ) | | | (24,146,549 | ) |
| Options terminated in closing transactions | | 64,401 | | | 15,022,871 | | 120,168 | | | 17,805,552 | |
| Options exercised | | 85,445 | | | 27,063,652 | | 1,863 | | | 528,246 | |
| Options expired | | 22,150 | | | 2,046,503 | | 61,817 | | | 10,909,732 | |
| Options Outstanding, March 31, 2014 | | (53,272 | ) | | $ | (16,192,614 | ) | | (95,147 | ) | | $ | (18,544,009 | ) |
| | | | | | | | | | | | | | | |
| |
ABSOLUTE FUNDS NOTES TO FINANCIAL STATEMENTS MARCH 31, 2014 |
| |
| Absolute Opportunities Fund | | | | | | | | | | | | | | |
| | | Calls | | Puts |
| | | Number of | | | | | | Number of | | | | |
| | | Contracts | | | Premiums Received | | Contracts | | Premiums Received |
| Options Outstanding, March 31, 2013 | | - | | | $ | - | | | (1,400 | ) | | $ | (48,386 | ) |
| Options written | | (593 | ) | | | (21,438 | ) | | (399 | ) | | | (19,247 | ) |
| Options terminated in closing transactions | | 593 | | | 21,438 | | - | | | | - | |
| Options exercised | | - | | | | - | | | - | | | | - | |
| Options expired | | - | | | | - | | | 1,799 | | | 67,633 | |
| Options Outstanding, March 31, 2014 | | - | | | $ | - | | | - | | | $ | - | |
Credit Default Swaps – Each Fund may invest in credit default swaps. A credit default swap gives one party (the buyer) the right to recoup the economic value of a decline in the value of debt securities of the reference issuer (including sovereign debt obligations) if a credit event (a downgrade or default) occurs. This value is obtained by delivering a debt security of the reference issuer to the party in return for a previously agreed payment from the other party (frequently, the par value of the debt security). Credit default swaps may require initial premium (discount) payments as well as periodic payments (receipts) related to the interest leg of the swap or to the default of a reference obligation.
If a fund is a seller of a credit default swap contract, the fund would be required to pay the par (or other agreed upon) value of a referenced debt obligation to the counterparty in the event of a default or other credit event by the reference issuer, such as a U.S. or foreign corporate issuer, with respect to such debt obligations. In return, the fund would receive from the counterparty a periodic stream of payments over the term of the contract provided that no event of default has occurred. If no default occurs, the fund would keep the stream of payments and would have no payment obligations. As the seller, the fund would be subject to investment exposure on the notional amount of the swap.
If a fund is the buyer of a credit default swap contract, the fund would have the right to deliver a referenced debt obligation and receive the par (or other agreed-upon) value of such debt obligation from the counterparty in the event of a default or other credit event (such as a credit downgrade) by the reference issuer, such as a U.S. or foreign corporation, with respect to its debt obligations. In return, the fund would pay the counterparty a periodic stream of payments over the term of the contract provided that no event of default has occurred. If no default occurs, the counterparty would keep the stream of payments and would have no further obligations to the fund.
Notional amounts of each individual credit default swap agreement outstanding as of March 31, 2014, for each Fund, are disclosed in the Notes to Schedule of Investments, Securities Sold Short and Call and Put Options Written.
Interest Rate Swaps – Each Fund may enter into interest rate swaps for investment purposes to manage exposure to fluctuations in interest rates or to add leverage.
Interest rate swaps represent an agreement between two counterparties to exchange cash flows based on the difference in two interest rates, applied to the notional principal amount for a specified period. The payment flows are usually netted against each other, with the difference being paid by one party to the other. The Fund settles accrued net receivables or payables under the swap contracts on a periodic basis.
The primary risk associated with interest rate swaps is that unfavorable changes in interest rates could adversely impact the Funds.
Notional amounts of each individual interest rate swap agreement outstanding as of March 31, 2014, if any, are
| |
ABSOLUTE FUNDS NOTES TO FINANCIAL STATEMENTS MARCH 31, 2014 |
| |
disclosed in each Fund’s Notes to Schedule of Investments, Securities Sold Short and Call and Put Options Written. The Funds did not enter into any interest rate swaps during the year ended March 31, 2014.
Restricted Securities – Each Fund may invest in securities that are subject to legal or contractual restrictions on resale (“restricted securities”). Restricted securities may be resold in transactions that are exempt from registration under the Federal securities laws or if the securities are registered to the public. The sale or other disposition of these securities may involve additional expenses and the prompt sale of these securities at an acceptable price may be difficult. Information regarding restricted securities held by each Fund is included in their Schedule of Investments, if applicable.
When-Issued Transactions – Each Fund may purchase securities on a forward commitment or ‘when-issued’ basis. A fund records a when-issued transaction on the trade date and will segregate with the custodian qualifying assets that have a value sufficient to make payment for the securities purchased. Securities purchased on a when-issued basis are marked-to-market daily and the fund begins earning interest on the settlement date. Losses may arise due to changes in the market value of the underlying securities or if the counterparty does not perform under the contract.
Distributions to Shareholders – Distributions to shareholders of net investment income, if any, are declared and paid at least semi-annually. Distributions to shareholders of net capital gains, if any, are declared and paid annually. Distributions to shareholders are recorded on the ex-dividend date. Distributions are based on amounts calculated in accordance with applicable federal income tax regulations, which may differ from GAAP. These differences are due primarily to differing treatments of income and gain on various investment securities held by each Fund, timing differences and differing characterizations of distributions made by each Fund.
Federal Taxes – Each Fund intends to continue to qualify each year as a regulated investment company under Subchapter M of the Internal Revenue Code and to distribute all of their taxable income to shareholders. In addition, by distributing in each calendar year substantially all of their net investment income and capital gains, if any, the Funds will not be subject to a federal excise tax. Therefore, no federal income or excise tax provision is required. Each Fund files a U.S. federal income and excise tax return as required. A fund’s federal income tax returns are subject to examination by the Internal Revenue Service for a period of three fiscal years after they are filed. As of March 31, 2014, there are no uncertain tax positions that would require financial statement recognition, de-recognition, or disclosure.
Income and Expense Allocation – The Trust accounts separately for the assets, liabilities and operations of each of its investment portfolios. Expenses that are directly attributable to more than one investment portfolio are allocated among the respective investment portfolios in an equitable manner.
Absolute Strategies Fund’s class specific expenses are charged to the operations of that class of shares. Income and expenses (other than expenses attributable to a specific class) and realized and unrealized gains or losses on investments are allocated to each class of shares based on the class’ respective net assets to the total net assets of the Fund.
Commitments and Contingencies – In the normal course of business, each Fund enters into contracts that provide general indemnifications by each Fund to the counterparty to the contract. Each Fund’s maximum exposure under these arrangements is dependent on future claims that may be made against each Fund and, therefore, cannot be estimated; however, based on experience, the risk of loss from such claims is considered remote.
Note 3. Fees and Expenses
Investment Adviser – Absolute Investment Advisers LLC (the “Adviser”) is the investment adviser to the Funds. Pursuant to an Investment Advisory Agreement, the Adviser receives an advisory fee at an annual rate of 1.60% and 2.75% of the average daily net assets of Absolute Strategies Fund and Absolute Opportunities Fund, respectively.
| |
ABSOLUTE FUNDS NOTES TO FINANCIAL STATEMENTS MARCH 31, 2014 |
| |
Each sub-advisory fee, calculated as a percentage of each Fund’s average daily net assets, is paid by the Adviser.
Distribution – Foreside Fund Services, LLC serves as each Fund’s distributor (the “Distributor”). The Distributor is not affiliated with the Adviser or Atlantic Fund Administration, LLC (d/b/a Atlantic Fund Services) (“Atlantic”) or their affiliates. Absolute Strategies Fund has adopted a Distribution Plan (the “Plan”) for R Shares of the Fund in accordance with Rule 12b-1 of the Act. Under the Plan, the Fund pays the Distributor and/or any other entity as authorized by the Board a fee of up to 0.25% of the average daily net assets of R Shares.
Other Service Providers – Atlantic provides fund accounting, fund administration, compliance and transfer agency services to each Fund. Atlantic also provides certain shareholder report production, and EDGAR conversion and filing services. Pursuant to an Atlantic services agreement, each Fund pays Atlantic customary fees for its services. Atlantic provides a Principal Executive Officer, a Principal Financial Officer, a Chief Compliance Officer, and an Anti-Money Laundering Officer to each Fund, as well as certain additional compliance support functions.
Trustees and Officers – The Trust pays each independent Trustee an annual retainer fee of $45,000 for service to the Trust ($66,000 for the Chairman). The Trustees and Chairman may receive additional fees for special Board meetings. Each Trustee is also reimbursed for all reasonable out-of-pocket expenses incurred in connection with his duties as a Trustee, including travel and related expenses incurred in attending Board meetings. The amount of Trustees’ fees attributable to each Fund is disclosed in the Statement of Operations. Certain officers of the Trust are also officers or employees of the above named service providers, and during their terms of office received no compensation from each Fund.
Note 4. Expense Reimbursements and Fees Waived
The Adviser has contractually agreed to waive its fees and/or reimburse expenses to limit total annual operating expenses (excluding all taxes, interest, portfolio transaction expenses, dividend and interest expenses on short sales, acquired fund fees, proxy expenses and extraordinary expenses) of Institutional Shares of Absolute Opportunities Fund to 1.95% for the period January 1, 2014 to August 1, 2015. Prior to January 1, 2014, the Adviser waived fees and reimbursed expenses to limit total annual operating expenses to 2.95%. The Adviser has also contractually agreed to reduce its advisory fee through July 31, 2014 for Absolute Strategies Fund, to 1.55% on average net assets exceeding $4.5 billion but less then $5 billion, and to 1.50% on the average net assets exceeding $5 billion. The Adviser waived fees of $646,931 and $686,328, for Absolute Strategies Fund and Absolute Opportunities Fund, respectively, for the year ended March 31, 2014.
Note 5. Security Transactions
The cost of purchases and proceeds from sales of investment securities (including maturities), other than short-term investments during the year ended March 31, 2014, were as follows:
| Absolute Strategies Fund |
| |
| Non-U.S. Government Obligations | | U.S. Government Obligations |
| Purchases | | Sales | | Purchases | | Sales |
| $ | 2,002,823,982 | | $ | 3,524,117,527 | | $ | 93,343,026 | | $ | 159,474,445 |
Absolute Strategies Fund placed a portion of it’s portfolio transactions with a brokerage firm affiliated with a sub-adviser. The commissions paid to this affiliated firm were $48,397 for the period.
| Absolute Opportunities Fund |
| |
| Non-U.S. Government Obligations | | |
| Purchases | | Sales | | | | |
| $ | 200,846,990 | | $ | 345,320,711 | | | | | | |
| |
ABSOLUTE FUNDS NOTES TO FINANCIAL STATEMENTS MARCH 31, 2014 |
| |
Note 6. Summary of Derivative Activity
The volume of open derivative positions may vary on a daily basis as each Fund transacts derivative contracts in order to achieve the exposure desired by the Adviser. The notional value of activity for the year ended March 31, 2014 for any derivative type during the period is as follows:
| | | Absolute Strategies | | Absolute Opportunities |
| Forward Currency Contracts | | $ | 201,368,715 | | | $ | 3,832,294 | |
| Futures | | | 5,092,544,855 | | | | 256,237,810 | |
| Purchased Options | | | 100,812,945 | | | | 1,564,028 | |
| Written Options | | | (67,223,861 | ) | | | (40,685 | ) |
| Credit Default Swaps | | | - | | | | 525,000,000 | |
Each Fund’s use of derivatives during the year ended March 31, 2014, was limited to credit default swaps, options, forward currency contracts and futures contracts.
Following is a summary of the effect of derivatives on the Statements of Assets and Liabilities as of March 31, 2014:
| Absolute Strategies Fund | | | | | | | | | | |
| Location: | | Credit Contracts | | Currency Contracts | | Equity Contracts | | Forward Currency Contracts | | Interest Contracts |
| Asset derivatives: | | | | | | | | | | | | | | | | | | | | |
| Unrealized gain on swap agreements | | $ | 133,659 | | | $ | - | | | $ | - | | | $ | - | | | $ | - | |
| Unrealized gain on forward currency contracts | | | - | | | | - | | | | - | | | | 4,766 | | | | - | |
| Receivable – variation margin | | | - | | | | - | | | | - | | | | - | | | | 8,563 | |
| Total investments, at value | | | - | | | | - | | | | 44,239,559 | | | | - | | | | - | |
| Total asset derivatives | | $ | 133,659 | | | $ | - | | | $ | 44,239,559 | | | $ | 4,766 | | | $ | 8,563 | |
| | | | | | | | | | | | | | | | | | | | | |
| Liability derivatives: | | | | | | | | | | | | | | | | | | | | |
| Swap premiums received | | | (49,710 | ) | | | - | | | | - | | | | - | | | | - | |
| Payable – variation margin | | | - | | | | (240,000 | ) | | | (16,863,689 | ) | | | - | | | | (32,125 | ) |
| Call options written, at value | | | - | | | | - | | | | (15,286,071 | ) | | | - | | | | - | |
| Put options written, at value | | | - | | | | - | | | | (14,868,287 | ) | | | - | | | | - | |
| Unrealized loss on forward currency contracts | | | - | | | | - | | | | - | | | | (22,180 | ) | | | - | |
| Total liability derivatives | | $ | (49,710 | ) | | $ | (240,000 | ) | | $ | (47,018,047 | ) | | $ | (22,180 | ) | | $ | (32,125 | ) |
| Absolute Opportunities Fund | | | | | |
| Location: | | Credit Contracts | | Equity Contracts | |
| Asset derivatives: | | | | | | | | | |
| Swap premiums paid | | $ | 6,630 | | | $ | - | | |
| Total investments, at value | | | - | | | | 187,676 | | |
| Total asset derivatives | | $ | 6,630 | | | $ | 187,676 | | |
| | | | | | | | | | |
| Liability derivatives: | | | | | | | | | |
| Swap premiums received | | | (1,035,633 | ) | | | - | | |
| Unrealized loss on swap agreements | | | (344,593 | ) | | | - | | |
| Payable – variation margin | | | - | | | | (763,750 | ) | |
| Total liability derivatives | | $ | (1,380,226 | ) | | $ | (763,750 | ) | |
| |
ABSOLUTE FUNDS NOTES TO FINANCIAL STATEMENTS MARCH 31, 2014 |
| |
Realized and unrealized gains and losses on derivatives contracts during the year ended March 31, 2014, by each Fund are recorded in the following locations on the Statements of Operations:
| Absolute Strategies Fund | | | | | | | | | | |
| Location: | | Credit Contracts | | Currency Contracts | | Equity Contracts | | Forward Currency Contracts | | Interest Contracts |
| Net realized gain (loss) on: | | | | | | | | | | | | | | | | | | | | |
| Swaps | | $ | 65,617 | | | $ | - | | | $ | - | | | $ | - | | | $ | - | |
| Futures | | | - | | | | (9,293,000 | ) | | | (232,265,980 | ) | | | - | | | | 4,357,026 | |
| Investments | | | - | | | | - | | | | (41,330,741 | ) | | | - | | | | - | |
| Written options | | | - | | | | - | | | | 10,075,830 | | | | - | | | | - | |
| Foreign currency transactions | | | - | | | | - | | | | - | | | | (254,090 | ) | | | - | |
| Total net realized gain (loss) | | $ | 65,617 | | | $ | (9,293,000 | ) | | $ | (263,520,891 | ) | | $ | (254,090 | ) | | $ | 4,357,026 | |
| | | | | | | | | | | | | | | | | | | | | |
| Net change in unrealized appreciation (depreciation) on: | | | | | | | | | | | | | | | | | | | | |
| Swaps | | | 16,083 | | | | - | | | | - | | | | - | | | | - | |
| Futures | | | - | | | | (162,400 | ) | | | 29,251,621 | | | | - | | | | 607,451 | |
| Investments | | | - | | | | - | | | | 9,006,060 | | | | - | | | | - | |
| Written options | | | - | | | | - | | | | 2,201,034 | | | | - | | | | - | |
| Foreign currency translations | | | - | | | | - | | | | - | | | | (17,414 | ) | | | - | |
| Total net change in unrealized appreciation (depreciation) | | $ | 16,083 | | | $ | (162,400 | ) | | $ | 40,058,715 | | | $ | (17,414 | ) | | $ | 607,451 | |
| Absolute Opportunities Fund | | | | | | | | | |
| Location: | | Credit Contracts | | Currency Contracts | | Equity Contracts | | Forward Currency Contracts | |
| Net realized gain (loss) on: | | | | | | | | | | | | | | | | | |
| Swaps | | $ | (9,240,959 | ) | | $ | - | | | $ | - | | | $ | - | | |
| Futures | | | - | | | | (960,225 | ) | | | (14,090,788 | ) | | | - | | |
| Investments | | | - | | | | - | | | | (922,521 | ) | | | - | | |
| Written options | | | - | | | | - | | | | 82,342 | | | | - | | |
| Foreign currency transactions | | | - | | | | - | | | | - | | | | 3,860 | | |
| Total net realized gain (loss) | | $ | (9,240,959 | ) | | $ | (960,225 | ) | | $ | (14,930,967 | ) | | $ | 3,860 | | |
| | | | | | | | | | | | | | | | | | |
| Net change in unrealized appreciation (depreciation) on: | | | | | | | | | | | | | | | | | |
| Swaps | | | 666,780 | | | | - | | | | - | | | | - | | |
| Futures | | | - | | | | (179,900 | ) | | | 1,769,341 | | | | - | | |
| Investments | | | - | | | | - | | | | 207,059 | | | | - | | |
| Written options | | | - | | | | - | | | | 30,014 | | | | - | | |
| Foreign currency translations | | | - | | | | - | | | | - | | | | 216 | | |
| Total net change in unrealized appreciation (depreciation) | | $ | 666,780 | | | $ | (179,900 | ) | | $ | 2,006,414 | | | $ | 216 | | |
Asset (Liability) amounts shown in the table below represent amounts for derivative related investments at March 31, 2014. These amounts may be collateralized by cash or financial instruments.
| | | Gross Asset (Liability) as Presented in the Statement of Assets and Liabilities | | Financial Instruments (Received) Pledged** | | Cash Collateral (Received) Pledged** | | Net Amount |
| | | | | | | | | | | | | | | | | |
| Absolute Strategies Fund | | | | | | | | | | | | | | | | |
| | | | | | | | | | | | | | | | | |
| Assets: | | | | | | | | | | | | | | | | |
| Over-the-counter derivatives* | | $ | 44,386,547 | | | $ | (4,766 | ) | | $ | (44,381,781 | ) | | $ | - | |
| Liabilities: | | | | | | | | | | | | | | | | |
| Over-the-counter derivatives* | | | (47,362,062 | ) | | | 30,154,358 | | | | 17,207,704 | | | | - | |
| Absolute Opportunities Fund | | | | | | | | |
| | | | | | | | | |
| Assets: | | | | | | | | | | | | | | | | |
| Over-the-counter derivatives* | | $ | 194,306 | | | $ | - | | | $ | (194,306 | ) | | $ | - | |
| Liabilities: | | | | | | | | | | | | | | | | |
| Over-the-counter derivatives* | | | (2,143,976 | ) | | | - | | | | 2,143,976 | | | | - | |
| |
ABSOLUTE FUNDS NOTES TO FINANCIAL STATEMENTS MARCH 31, 2014 |
| |
| * | Over-the-counter derivatives may consist of forward currency contracts, options contracts, futures contracts and swap agreements. The amounts disclosed above represent the exposure to one or more counterparties. For further detail on individual derivative contracts and the corresponding unrealized appreciation (depreciation), see the Notes to Schedule of Investments. |
| ** | The actual financial instruments and cash collateral (received) pledged may be in excess of the amounts shown in the table. The table only reflects collateral amounts up to the amount of the financial instrument disclosed on the Statements of Assets and Liabilities. |
Note 7. Federal Income Tax
As of March 31, 2014, distributable earnings (accumulated loss) on a tax basis were as follows:
| | | | | | Capital and Other Losses | | Unrealized Appreciation | | Total |
| Absolute Strategies Fund | | $ | (121,987,776 | ) | | $ | 273,976,809 | | | $ | 151,989,033 | | | | |
| Absolute Opportunities Fund | | | (2,329,172 | ) | | | 5,277,302 | | | | 2,948,130 | | | | |
The difference between components of distributable earnings on a tax basis and the amounts reflected in the Statements of Assets and Liabilities are primarily due to wash sales, futures, passive foreign investment holdings, real estate investment trusts, constructive sales, straddles, convertible bond premium, contingent payment debt instruments, cover loss deferrals, short dividends, registered investment companies, partnerships, currency contracts and credit default swaps.
For tax purposes, the current deferred late year ordinary loss was $1,001,160 (realized during the period January 1, 2014 through March 31, 2014) for Absolute Opportunities Fund. This loss will be recognized for tax purposes on the first business day of the Fund’s current fiscal year, April 1, 2014.
Absolute Strategies Fund and Absolute Opportunities Fund had $121,987,776 and $1,328,012, respectively, of available short term capital loss carryforwards that have no expiration date.
On the Statements of Assets and Liabilities, as a result of permanent book to tax differences, certain amounts have been reclassified for the year ended March 31, 2014. The following reclassifications were the result of book to tax differences resulting from real estate investment trusts, partnerships, passive foreign investment holdings, grantor trusts, straddles, constructive sales, short dividend reclassifications, currency, paydowns, convertible bond premium adjustments, contingent payment debt instruments, credit default swap income, inflation indexed securities and net operating losses and has no impact on the net assets of each Fund.
| | | Accumulated Net Investment Income (Loss) | | Accumulated Net Realized Gain (Loss) | | Paid-in-Capital |
| Absolute Strategies Fund | | $ | 35,091,605 | | | $ | (32,806,590 | ) | | $ | (2,285,015 | ) |
| Absolute Opportunities Fund | | | 7,874,070 | | | | 1,539,065 | | | | (9,413,135 | ) |
Note 8. Subsequent Events
Subsequent events occurring after the date of this report through the date these financial statements were issued have been evaluated for potential impact and each Fund has had no such events.
| |
REPORT OF INDEPENDENT REGISTERED PUBLIC ACCOUNTING FIRM |
| |
To the Shareholders of Absolute Strategies Fund
and Absolute Opportunities Fund
and the Board of Trustees of Forum Funds
We have audited the accompanying statements of assets and liabilities of the Absolute Strategies Fund and Absolute Opportunities Fund, each a series of shares of beneficial interest in the Forum Funds, including the schedules of investments, as of March 31, 2014, and the related statements of operations for the year then ended, the statements of changes in net assets for each of the years in the two-year period then ended and the financial highlights for each of the years in the five-year period then ended. These financial statements and financial highlights are the responsibility of the Funds' management. Our responsibility is to express an opinion on these financial statements and financial highlights based on our audits.
We conducted our audits in accordance with the standards of the Public Company Accounting Oversight Board (United States). Those standards require that we plan and perform the audits to obtain reasonable assurance about whether the financial statements and financial highlights are free of material misstatement. An audit includes examining, on a test basis, evidence supporting the amounts and disclosures in the financial statements. Our procedures included confirmation of securities owned as of March 31, 2014 by correspondence with the custodian and brokers and by other appropriate auditing procedures where responses from brokers were not received. An audit also includes assessing the accounting principles used and significant estimates made by management, as well as evaluating the overall financial statement presentation. We believe that our audits provide a reasonable basis for our opinion.
In our opinion, the financial statements and financial highlights referred to above present fairly, in all material respects, the financial position of the Absolute Strategies Fund and Absolute Opportunities Fund as of March 31, 2014, and the results of their operations for the year then ended, the changes in their net assets for each of the years in the two-year period then ended, and their financial highlights for each of the years in the five-year period then ended, in conformity with accounting principles generally accepted in the United States of America.
BBD, LLP
Philadelphia, Pennsylvania
May 30, 2014
| |
ABSOLUTE FUNDS ADDITIONAL INFORMATION (Unaudited) MARCH 31, 2014 |
| |
Investment Advisory Agreement Approval
At the March 21, 2014 Board meeting, the Board, including the Independent Trustees, considered the approval of the continuance of the investment advisory agreement between the Adviser and the Trust pertaining to the Absolute Funds (the “Advisory Agreement”) and the subadvisory agreements between the Adviser and the following subadvisers to the Absolute Funds: Harvest Capital Strategies LLC; Horizon Asset Management LLC; Kovitz Investment Group, LLC; LakeWater Capital LLC; Longhorn Capital Partners, LLC; Madden Asset Management, LLC; MetWest Asset Management, LLC; Mohican Financial Management, LLC; Pine Cobble Capital, LLC; Sabal Capital Management, LLC; SSI Investment Management, Inc.; St. James Investment Company, LLC and Yacktman Asset Management LP. (the “Subadvisers”) (the "Subadvisory Agreements"). In preparation for its deliberations, the Board requested and reviewed written responses from the Adviser and Subadvisers to due diligence questionnaires circulated on the Board's behalf. The Board also discussed the materials with Independent Trustee counsel and, with the Trust's administrator, Atlantic Fund Services. During its deliberations, the Board also received an oral presentation from the Adviser, and was assisted by the advice of Independent Trustee counsel.
In evaluating the Advisory Agreement and the Subadvisory Agreements for the Absolute Funds, the Board reviewed written materials furnished by the Adviser, Subadvisers and the administrator, including information regarding the Adviser's and Subadvisers' personnel, operations and financial condition. In addition, the Board considered that the evaluation process with respect to the Adviser and Subadvisers is an ongoing one that extends over multiple review periods and, in this regard, the Board considers information at each regularly scheduled meeting including, among other things, information concerning the Funds' performance and services provided by the Adviser and, under certain circumstances, by the Subadvisers.
At the meeting, the Board considered, among other matters: (1) the nature, extent and quality of the services to be provided to the Funds by the Adviser and Subadvisers, including information on the investment performance of the Funds and Subadvisers; (2) the costs of the services provided and profitability to the Adviser with respect to its relationship with each of the Funds; (3) the advisory fee and total expense ratio each Fund compared to a relevant peer group of funds; (4) the extent to which economies of scale may be realized as the Funds grow and whether the advisory fee enables each Fund's investors to share in the benefits of economies of scale; and (5) other benefits received by the Adviser and Subadvisers from their respective relationships with the Funds.
Nature, Extent and Quality of Services
Based on the written materials received and a presentation from senior representatives of the Adviser as well as a discussion with the Adviser about the personnel, operations and financial condition of itself and each Subadviser, and discussions with the Trust's CCO regarding the Adviser and the Subadvisers, the Board considered the nature, extent and quality of services provided by the Adviser under the Advisory Agreement and by each Subadviser under each Subadvisory Agreement. In this regard, the Board reviewed information regarding the experience, qualifications and professional background of the portfolio managers and other personnel at the Adviser and the Subadvisers with principal investment responsibility for the Absolute Funds’ investments; the investment philosophy and decision-making processes of the Adviser's and Subadvisers' investment professionals; the capability and integrity of the Adviser's and each Subadviser’s senior management and staff; the quality of the Adviser's and each Subadviser’s services with respect to regulatory compliance; and the Adviser's and each Subadviser’s representation that it is financially stable and able to provide investment advisory services to the applicable Absolute Fund. The Board also considered the Adviser’s analysis and recommendations regarding each Subadviser. The Board concluded that, overall, it was satisfied with the nature, extent and quality of services to be provided to the Absolute Funds by the Adviser under the Advisory Agreement and each Subadviser under each of the respective Subadvisory Agreements.
Costs of Services and Profitability
The Board evaluated information provided by the Adviser regarding its costs of services and its profitability with respect to each Absolute Fund. In this regard, the Board reviewed the Adviser’s resources devoted to the Absolute Funds as well as the Adviser’s discussion of costs and profitability. The Board also considered the percentage and
| |
ABSOLUTE FUNDS ADDITIONAL INFORMATION (Unaudited) MARCH 31, 2014 |
| |
amount of the Adviser’s fee that the Adviser retained and the percentage and amount of the fee that was paid to the Subadvisers. Based on these and other applicable considerations, the Board concluded that the Adviser’s profits attributable to the management of the Absolute Funds were reasonable in the context of all factors considered.
The Board did not consider information regarding the costs of services provided or profits realized by each Subadviser from its relationship with the Absolute Funds, noting instead the arms-length nature of the relationship between the Adviser and the Subadvisers with respect to the negotiation of the subadvisory fee rate on behalf of each Absolute Fund and that the Adviser, and not the Fund, was responsible for paying the subadvisory fees due under each Subadvisory Agreement. The Board concluded that each Subadviser’s profitability was not a material factor in determining whether or not to approve the Subadvisory Agreements.
Performance
The Board reviewed the performance of the Absolute Funds in light of each Fund's investment objective and strategy and the Adviser's discussion of the performance of each of the Subadvisers. The Board reviewed the Absolute Strategies Fund’s performance over the 1-year, 3-year and 5-year periods ended January 31, 2014, compared to a peer group identified by Lipper Inc. The Board noted that the Absolute Strategies Fund underperformed its Lipper Inc. peer group during the 1-year and 3-year periods, though its performance for the 5-year period was near the median of the peer group. The Board reviewed the Absolute Opportunities Fund's performance over the 1-year, 3-year and 5-year periods ended January 31, 2014, also as compared to a peer group identified by Lipper Inc. The Board noted that the Absolute Opportunities Fund underperformed its Lipper Inc. peer group for all of the periods. Addressing the Funds’ apparent underperformance relative to their Lipper Inc. peer groups, the Adviser asserted that it does not view the funds in the peer group identified by Lipper Inc. to be comparable to the Funds and, referencing the hedge-fund-like strategies of the Funds, explained the basis for this assertion.
The Board evaluated the Adviser's opinion that hedge funds and hedge funds of funds provide the most relevant performance comparisons for the Absolute Funds. In this regard, the Board considered the performance of the Absolute Funds relative to the HFRX Global Hedge Fund Index. The Board considered that, since the Absolute Strategies Fund's inception on July 27, 2005, the Fund had better cumulative returns than the HFRX Global Hedge Fund Index. The Board also considered that, since the Absolute Opportunities Fund's inception on October 21, 2008, it posted better cumulative returns than the HFRX Global Hedge Fund Index.
The Board reviewed each Absolute Fund's performance compared to another mutual fund that was not included in the Absolute Funds' Lipper Inc. peer groups but that the Adviser represented to the Board provided a meaningful comparison (a "Comparable Fund"). The Board considered the Adviser’s explanation as to why the performance of the Comparable Fund should be taken into account in evaluating the performance of the Absolute Funds and considered the Funds’ performance relative to the Comparable Fund and a statement by the Adviser that, since their respective inceptions, the cumulative returns of both the Absolute Funds compared favorably with those of the Comparable Fund over the same periods.
With respect to Subadviser performance, the Board evaluated the Adviser's assessment of each Subadviser's performance. The Board acknowledged the Adviser's representation that the different Subadvisers could be expected to achieve different performance results in light of the differences in their strategies. The Board also weighed the Adviser’s explanation that, standing alone, no Subadviser should necessarily be expected to perform in line with the market or with the relevant Absolute Fund's benchmarks. In this regard, the Board noted that the Adviser emphasized its responsibility for allocating each Absolute Fund’s assets among Subadvisers in order to achieve the applicable Absolute Fund’s investment objective. Under the circumstances, and considering the level of each Absolute Fund’s assets, the Board determined that it was appropriate to evaluate the contribution of each Subadviser to the performance of the Absolute Funds and the performance of each Absolute Fund as a whole. In addition, the Board concluded that the Absolute Funds and their shareholders could benefit from the renewal of the Advisory Agreement and of each applicable Subadvisory Agreement.
| |
ABSOLUTE FUNDS ADDITIONAL INFORMATION (Unaudited) MARCH 31, 2014 |
| |
Compensation
The Board evaluated the Adviser's compensation for providing advisory services to each Absolute Fund. The Board considered the Adviser’s representation that the actual advisory fee rates and total expense ratios of hedge funds provide fairer points of comparison for the Absolute Funds than the fee rates and expense ratios of the funds in the Lipper Inc. peer groups. In this regard, the Board weighed the Adviser’s explanation that the complex strategies of hedge funds are more similar to the strategy of each of the Absolute Funds than the mutual funds in the Lipper Inc. peer groups. In addition, with respect to advisory fee rates and total expenses, the Board noted the Adviser's representation that hedge funds’ fees typically consist of a base advisory fee as high as 2% and performance fee as high as 20%. The Board recognized that the Adviser’s fees do not include performance fees and that the Adviser pays all of the Subadvisers out of its advisory fee.
The Board took into consideration comparative information on each Absolute Fund's actual advisory fee rate and total expenses compared to its Lipper Inc. peer group. In this regard, among other things, the Board noted that the Adviser’s actual advisory fee rate and the total expense ratio of each Absolute Fund was the highest of the funds in its Lipper Inc. peer group. The Board noted also that, with respect to the Absolute Strategies Fund, the Adviser had implemented breakpoints that would reduce the advisory fee rate charged to the Fund at certain asset levels. In addition, with respect to the Absolute Opportunities Fund, the Board recognized that the Adviser had recently contractually agreed to cap the Fund's total operating expenses (excluding all taxes, interest, portfolio transaction expenses, dividend and interest expense on short sales, acquired fund fees and expenses, proxy expenses and extraordinary expenses) at 1.95% until August 1, 2015 (“Expense Cap”), and that the Expense Cap was not fully reflected in that Fund's Lipper Inc. comparison. The Board further acknowledged the Adviser’s representation that, although the Absolute Opportunities Fund maintained the highest total expense ratio of its Lipper Inc. peer group with the Expense Cap, the Adviser expected the Expense Cap to make the Fund more competitive.
Under these circumstances, the Board concluded that it is difficult to make meaningful comparisons between the Absolute Funds’ actual advisory fee rates and total expense ratios and those of the Absolute Funds’ Lipper Inc. peer groups due to, among other things, variations between the services provided by the Adviser to the Absolute Funds and those provided to the Lipper Inc. peer group funds by their advisers. Further, the Board concluded that the complex investment strategies provided to the Absolute Funds by the Adviser are comparable to the strategies provided to hedge funds by their advisers at much higher advisory fee rates. Based on the foregoing, and on all of the information presented, the Board concluded that the advisory fees paid to the Adviser by the Absolute Funds were reasonable.
Economies of Scale
The Board considered whether either of the Absolute Funds could benefit from economies of scale. The Board noted the Adviser's explanation that it is difficult for either Absolute Fund to achieve large economies of scale because the investment strategies of the Subadvisers, which are employed by the Funds, are not high-capacity strategies – meaning the Subadvisers generally cannot successfully manage ever-larger amounts of assets. The Board also noted the Adviser’s explanation that, to the extent it was able to obtain fee breaks with certain Subadvisers, the Adviser's profitability may not increase commensurately given the potential need for the Adviser to hire additional Subadvisers at different, including higher, subadvisory fee rates. In this regard, the Board recognized the Adviser's representation that it expects to pay higher subadvisory fees in the future given that the Subadvisers’ strategies are not high-capacity strategies and that the Funds face increased competition in identifying and retaining Subadvisers.
The Board noted that, with respect to the Absolute Strategies Fund, the Adviser had implemented fee breakpoints by contractually waiving its advisory fee to 1.55% on assets in excess of $4.5 billion and to 1.50% on assets in excess of $5 billion (the "Fee Break"). The Board recognized that, although the Absolute Strategies Fund’s current asset level was below $4.5 billion, the Adviser had recently lifted the “soft close” on the Fund and was actively seeking new investors for the Fund. In addition, the Board recognized that the Adviser had agreed to renew the Fee Break until August 1, 2015.
| |
ABSOLUTE FUNDS ADDITIONAL INFORMATION (Unaudited) MARCH 31, 2014 |
| |
With respect to the Absolute Opportunities Fund, the Board considered the Adviser's representation that the Absolute Opportunities Fund potentially could benefit from economies of scale as assets grow. The Board acknowledged, however, the Adviser’s opinion that the Fund is not currently operating at an asset level that generates economies of scale and the fact that the Adviser currently forgoes approximately one half of its advisory fee pursuant to the Expense Cap. In this regard, the Board recognized that the Adviser currently is not proposing breakpoints or changes in fees for the Absolute Opportunities Fund at this time.
Based on the foregoing information, and other considerations, the Board concluded that shareholders of the Absolute Strategies Fund should have an opportunity to share in future economies of scale and that economies of scale were not yet a material factor to be considered with respect to the Absolute Opportunities Fund.
Other Benefits
The Board noted the Adviser’s representation that, aside from its contractual advisory fees, it does not benefit in a material way from its relationship with the Funds. Based on the foregoing representation, the Board concluded that other benefits received by the Adviser from its relationship with the Funds were not a material factor to consider in approving the continuation of the Advisory Agreement.
Conclusion
The Board did not identify any single factor as being of paramount importance, and different Trustees may have given different weight to different factors. In light of the fact that each Fund is a multi-manager Fund, however, for which the Adviser identifies Subadvisers whose strategies it seeks to combine to achieve the Fund’s investment objective, when considering the renewal of the Subadvisory Agreements, the Board gave significant weight to the Adviser’s recommendation that each Subadvisory Agreement be renewed and to the Adviser’s representation that the reappointment of the Subadvisers would positively contribute to the Adviser’s successful execution of the Funds’ overall strategies. The Board reviewed a memorandum from Trust counsel discussing the legal standards applicable to its consideration of the Advisory Agreement and Subadvisory Agreements. Based on its review, including consideration of each of the factors referenced above, the Board determined, in the exercise of its reasonable business judgment, that the advisory arrangement, as outlined in each Advisory Agreement and in each Subadvisory Agreement, was fair and reasonable in light of the services performed or to be performed, expenses incurred or to be incurred and such other matters as the Board considered relevant.
Proxy Voting Information
A description of the policies and procedures that each Fund uses to determine how to vote proxies relating to securities held in each Fund’s portfolio is available, without charge and upon request, by calling (888) 992-2765 and on the U.S. Securities and Exchange Commission’s (the “SEC”) website at www.sec.gov. Each Fund’s proxy voting record for the most recent twelve-month period ended June 30 is available, without charge and upon request, by calling (888) 992-2765 and on the SEC’s website at www.sec.gov.
Availability of Quarterly Portfolio Schedules
Each Fund files its complete schedule of portfolio holdings with the SEC for the first and third quarters of each fiscal year on Form N-Q. These filings are available, without charge and upon request on the SEC’s website at www.sec.gov or may be reviewed and copied at the SEC’s Public Reference Room in Washington, DC. Information on the operation of the Public Reference Room may be obtained by calling (800) SEC-0330.
Shareholder Expense Example
As a shareholder of the Funds, you incur ongoing costs, including management fees, distribution (12b-1) fees and other Fund expenses. This example is intended to help you understand your ongoing costs (in dollars) of investing in the Funds and to compare these costs with the ongoing costs of investing in other mutual funds.
| |
ABSOLUTE FUNDS ADDITIONAL INFORMATION (Unaudited) MARCH 31, 2014 |
| |
The example is based on an investment of $1,000 invested at the beginning of the period and held for the entire period from October 1, 2013, through March 31, 2014.
Actual Expenses – The first line under each share class of the table below provides information about actual account values and actual expenses. You may use the information in this line, together with the amount you invested, to estimate the expenses that you paid over the period. Simply divide your account value by $1,000 (for example, an $8,600 account value divided by $1,000 = 8.6), then multiply the result by the number in the first line under the heading entitled “Expenses Paid During Period” to estimate the expenses you paid on your account during the period.
Hypothetical Example for Comparison Purposes – The second line under each share class of the table below provides information about hypothetical account values and hypothetical expenses based on each Fund’s actual expense ratio and an assumed rate of return of 5% per year before expenses, which is not each Fund’s actual return. The hypothetical account values and expenses may not be used to estimate the actual ending account balance or expenses you paid for the period. You may use this information to compare the ongoing costs of investing in each Fund and other funds. To do so, compare this 5% hypothetical example with the 5% hypothetical examples that appear in the shareholder reports of other funds.
Please note that the expenses shown in the table are meant to highlight your ongoing costs only. Therefore, the second line of the table is useful in comparing ongoing costs only, and will not help you determine the relative total costs of owning different funds.
| | Beginning | | Ending | | Expenses | | Annualized |
| | Account Value | | Account Value | | Paid During | | Expense |
| | October 1, 2013 | | March 31, 2014 | | Period* | | Ratio* |
| Absolute Strategies Fund | | | | | | | | | | | |
| Institutional Shares | | | | | | | | | | | |
| Actual | $ | 1,000.00 | | $ | 994.58 | | $ | 11.39 | | 2.29 | % |
| Hypothetical (5% return before taxes) | $ | 1,000.00 | | $ | 1,013.51 | | $ | 11.50 | | 2.29 | % |
| R Shares | | | | | | | | | | | |
| Actual | $ | 1,000.00 | | $ | 991.81 | | $ | 13.71 | | 2.76 | % |
| Hypothetical (5% return before taxes) | $ | 1,000.00 | | $ | 1,011.17 | | $ | 13.84 | | 2.76 | % |
| | | | | | | | | | | | |
| Absolute Opportunities Fund | | | | | | | | | | | |
| Institutional Shares | | | | | | | | | | | |
| Actual | $ | 1,000.00 | | $ | 972.64 | | $ | 14.61 | | 2.97 | % |
| Hypothetical (5% return before taxes) | $ | 1,000.00 | | $ | 1,010.12 | | $ | 14.88 | | 2.97 | % |
| | | | | | | | | | | | |
| * | Expenses are equal to the Fund’s annualized expense ratio multiplied by the average account value over the period, multiplied by the number of days in the most recent fiscal half-year divided by 365 to reflect the half-year period. |
Trustees and Officers of the Trust
The Board is responsible for oversight of the management of the Trust’s business affairs and of the exercise of all the Trust’s powers except those reserved for the shareholders. The following table provides information about each Trustee and certain officers of the Trust. Each Trustee and officer holds office until the person resigns, is removed, or is replaced. Unless otherwise noted, the persons have held their principal occupations for more than five years. The address for all Trustees and officers is Three Canal Plaza, Suite 600, Portland, Maine 04101. Mr. Keffer is considered an Interested Trustee due to his affiliation with Atlantic. Each Fund’s Statement of Additional Information includes additional information about the Trustees and is available, without charge and upon request, by calling (888) 992-2765.
| |
ABSOLUTE FUNDS ADDITIONAL INFORMATION (Unaudited) MARCH 31, 2014 |
| |
| Name and Year of Birth | Position with the Trust | Length of Time Served | Principal Occupation(s) During Past Five Years | Number of Series of Fund Complex¹ Overseen by Trustee | Other Directorships Held by Trustee |
| Independent Trustees | | | | | |
J. Michael Parish Born: 1943 | Chairman of the Board; Trustee; Chairman, Nominating Committee and Qualified Legal Compliance Committee | Since 1989 (Chairman since 2004) | Retired since 2003. | 24 | 0 |
Costas Azariadis Born: 1943 | Trustee | Since 1989 | Professor of Economics, Washington University since 2006. | 24 | 0 |
James C. Cheng Born: 1942 | Trustee; Chairman, Audit Committee | Since 1989 | President, Technology Marketing Associates (marketing company for small- and medium-sized businesses in New England) since 1991. | 24 | 0 |
David Tucker Born: 1958 | Trustee | Since 2011 | Director, Blue Sky Experience since 2008; Senior Vice President & General Counsel, American Century Companies 1998-2008. | 28 | Trustee, Forum Funds II and Forum ETF Trust |
| Interested Trustee | | | | | |
John Y. Keffer2 Born: 1942 | Trustee; Vice Chairman | Since 1989 | Chairman, Atlantic since 2008; President, Forum Foundation (a charitable organization) since 2005; President, Forum Trust, LLC (a non-depository trust company chartered in the State of Maine) since 1997. | 28 | Director, Wintergreen Fund, Inc.; Trustee, Forum Funds II and Forum ETF Trust |
| Officers | | | | | |
Stacey E. Hong Born: 1966 | President; Principal Executive Officer | Since 2008 | President, Atlantic since 2008. | N/A | N/A |
Karen Shaw Born: 1972 | Treasurer; Principal Financial Officer | Since 2008 | Senior Vice President, Atlantic since 2008. | N/A | N/A |
Zachary Tackett Born: 1988 | Vice President; Secretary; Anti-Money Laundering Compliance Officer | Since 2014 | Associate Counsel, Atlantic since 2014; Intern Associate, Coakley & Hyde, PLLC, 2010-2013. | N/A | N/A |
Michael J. McKeen Born: 1971 | Vice President | Since 2009 | Senior Vice President, Atlantic since 2008. | N/A | N/A |
Timothy Bowden Born: 1969 | Vice President | Since 2009 | Manager, Atlantic since 2008. | N/A | N/A |
Geoffrey Ney Born: 1975 | Vice President | Since 2013 | Manager, Atlantic since 2013; Senior Fund Accountant, Atlantic, 2008-2013. | N/A | N/A |
Todd Proulx Born: 1978 | Vice President | Since 2013 | Manager, Atlantic since 2013; Senior Fund Accountant, Atlantic, 2008-2013. | N/A | N/A |
1The Fund Complex includes the Trust, Forum Funds II and Forum ETF Trust and is overseen by different Boards of Trustees. 2Atlantic is a subsidiary of Forum Holdings Corp. I, a Delaware corporation that is wholly owned by Mr. Keffer. |
[INTENTIONALLY LEFT BLANK]
[INTENTIONALLY LEFT BLANK]