As filed with the Securities and Exchange Commission on June 20, 2014
UNITED STATES
SECURITIES AND EXCHANGE COMMISSION
WASHINGTON, D.C. 20549
FORM N-CSR
CERTIFIED SHAREHOLDER REPORT OF REGISTERED MANAGEMENT
INVESTMENT COMPANIES
Investment Company Act file number 811-03023
FORUM FUNDS
Three Canal Plaza, Suite 600
Portland, Maine 04101
Stacey E. Hong, Principal Executive Officer
Three Canal Plaza, Suite 600
Portland, Maine 04101
207-347-2000
Date of fiscal year end: April 30
Date of reporting period: July 1, 2013 – April 30, 2014
ITEM 1. REPORT TO STOCKHOLDERS.
MONONGAHELA ALL CAP VALUE FUND |
Annual Report
April 30, 2014
MONONGAHELA ALL CAP VALUE FUNDA MESSAGE TO OUR SHAREHOLDERS
Dear Shareholder,
We are pleased to offer the first annual report of the Monongahela All Cap Value Fund (the “Fund”.) During our shortened initial fiscal year (July 1, 2013 to April 30, 2014), the market continued to provide outsized returns. The S&P 500 Index was up 18.63% during that period while our Fund was up 14.29%.
In an environment of historically low interest rates, we were able to find value across the market cap spectrum. Our two largest positions as of the close of our fiscal year (April 30th), International Business Machines (“IBM”) and II-VI Corporation represent opposite ends of the capitalization universe.
IBM has fallen out of favor as the transition from hardware to service to cloud sourcing continues. Virginia Rometty, the company’s relatively new chairwoman, continues shedding older, lower-margin businesses and migrating towards analytics and cloud sourcing. While the outcome of her efforts is yet to be known, the healthy balance sheet and above average dividend gives us the patience to stay with this 103 year old company.
Our second largest position, II-VI Corporation is under $1 billion in market capitalization. A designer and manufacturer of optic electronic components and engineered materials, the company has struggled with acquisition indigestion and disappointing profit margins. This has pushed the stock towards the bottom of a three year range. While recent results have been disappointing, management is addressing the issues and our earnings and cash flow forecast suggest discounted value at this level.
We believe that successful portfolio management demands culling underperforming positions where the investment thesis has changed, as well as the (always pleasant) task of harvesting positions that have significantly exceeded what we believe to be their intrinsic value. In the category of changing theses, two positions were removed in the energy and infrastructure segments. Talisman Energy Inc. was sold at a small loss and Patterson-UTI Energy Inc. was sold at a profit. While both companies have an expertise in difficult natural gas and energy extraction, industry margins are being crimped by massive supply with the success of shale oil/gas production. Lower prices may reduce profit margins and we decided to move to the sidelines.
Our original thesis in the banking sector was that a gradual tightening of money should improve margins on a regional basis. The regional banking sector is experiencing extraordinarily low and tight interest margin spreads. Although Allegheny Valley Bancorp Inc. appears to us to be well managed and risk adverse, the low interest rate environment is pressuring profitability. We applaud them for avoiding risk but have sold the position at a small loss until we have better clarity on our interest rate outlook and a return to a more normalized interest rate environment.
Darden Restaurant was sold in March after an entrenched management battled with activist investors and disagreed over the proper course of action. While the battle rages on, we fear the inherent value of Darden is being degraded and decided to remove the position at a very small profit.
Mako Surgical Corp., a medical device company, provided our largest gain of the year. They were purchased by a larger competitor, Stryker Corp with a gain of $49,607, up approximately 125% from the purchase price. This one clearly soared above our modeled intrinsic value.
At this point in time, we are settled into a comfortable pace that will allow us to construct a deep value portfolio. Value investing demands discipline, patience and a certain callousness towards short term trends and fads. As you examine our annual report, please enjoy perusing our schedule of investments and examining the eclectic portfolio of value.
We would also like to share with you an interesting read, which illuminates an additional component on the investment process. Michael Lewis, a financial journalist, has written an exposé on High Frequency Trading (HFT) as described in Lewis’ latest book Flash Boys, a Wall Street Revolt. With equal measure of poetic license and hyperbole, Lewis spins a yarn of what he considers the insidious world of High Frequency Trading.
By way of definition, HFT uses computer driven models to exploit small price discrepancies on various stock
1
MONONGAHELA ALL CAP VALUE FUNDA MESSAGE TO OUR SHAREHOLDERS
exchanges. HFT firms develop proprietary trading strategies that allow them to move in and out of positions in milliseconds, aiming to capture a fraction of a cent on each short-term trade. They typically avoid leverage and holding positions overnight: profits are generated by voluminous trading. High frequency traders seem to us most often to compete against other HFT firms, and thrive on volume, not fundamentals.
The rise in HFT coincides with a regulation passed in 2005 that was designed to open the market and provide investors with trading options other than the New York Stock Exchange and the Nasdaq. The theory was that more exchanges would mean greater competition and better pricing. In reality, more exchanges meant more opportunities to exploit small pricing anomalies among the markets. Today there are 16 registered stock exchanges and numerous dark pools (dark pools are in-house markets maintained by the larger firms). The key to successfully exploiting minute price discrepancies in these exchanges is speed. In a world measured in milliseconds, being the first to see order flow gives one a tremendous advantage over the competition. Lewis notes “Someone out there was using the fact that stock market orders arrived at different times at different exchanges to front-run orders.” The predatory behavior of HFT traders adds no value to the investment or trading process. The combination of high frequency trading, dark pools and payment for order flow exaggerates volume but adds zero liquidity.
To put the need for speed in HFT in perspective, the earliest chapters of the book describe the unfathomable expenditures of time and money that HFT firms will deploy in order to gain an advantage measured in milliseconds in seeing market orders. Mr. Lewis estimates that Spread Networks, a start-up firm, spent over $300 million to lay a secret fiber optic cable between Chicago and New Jersey, bypassing the conventional telecom carriers to gain time. The newer, faster optic line could then be leased to HFT firms at astronomical prices.
Another HFT strategy involved the payment of hundreds of millions of dollars each year to physically locate computer servers close to stock exchanges so that trades could be executed milliseconds ahead of others. Mr. Lewis argues that HFT systems glean critical information from the stream of trading data flowing into their systems: this allows them to see which stocks other investors want to buy before the investors’ orders are executed. These systems and pricing tiers are designed specifically for high-speed trading. They are charging higher rates for faster speeds and more data for select clients. The more you pay, the faster you trade. In theory, the faster you trade, the more money you make.
The remainder of the narrative details the struggles of a small group of individuals to create an exchange that eliminates the advantages offered to HFT. Theoretically, the new electronic exchange (IEX) envisioned and developed by Brad Katsuyama will allow all investors the ability to trade at the same time, no matter what superfast fiber-optic cable others build to gain an advantage. It is a fascinating read.
While trading is an important component of portfolio management, it pales in comparison to the significance of solid fundamental research. Successful value investing at its core is a slow process, requiring exhaustive research and the patience to buy at discounted value. As value investors, we identify investment opportunities, often out of favor short-term and have the patience to stay the course. While a low turnover rate is important, we are quick to correct mistakes or make adjustments when necessary. We are pleased to open the fund with a 14.29% gain in our shorter initial fiscal year and look forward to adding value in the future.


Mark Rodgers Michael C. Rodgers
Co-Manager Co-Manager
IMPORTANT RISKS AND DISCLOSURES:
Mutual fund investing involves risk, including possible loss of principal. A value investing strategy involves the risk that undervalued securities may not appreciate as anticipated or will remain undervalued for long periods of time. Securities of micro-, small- and mid-capitalization companies may be more volatile and less liquid than those of large-cap companies due to limited resources or product lines and greater sensitivity to adverse economic conditions.
2
MONONGAHELA ALL CAP VALUE FUNDA MESSAGE TO OUR SHAREHOLDERS
The views in this report were those of the Fund managers as of April 30, 2014 and may not reflect their views on the date this report is first published or any time thereafter. These views are intended to assist shareholders in understanding their investment in the Fund and do not constitute investment advice. This letter may contain discussions about certain investments both held and not held in the portfolio. All current and future holdings are subject to risk and to change.
3
MONONGAHELA ALL CAP VALUE FUNDPERFORMANCE CHART AND ANALYSIS (Unaudited)
The following chart reflects the change in the value of a hypothetical $10,000 investment, including reinvested dividends and distributions, in the Monongahela All Cap Value Fund (the “Fund”) compared with the performance of the benchmark, the S&P 500 Index (the “S&P 500”), since inception. The S&P 500 is a broad-based, unmanaged measurement of changes in stock market conditions based on the average of 500 widely held common stocks. The total return of the S&P 500 includes the reinvestment of dividends and income. The total return of the Fund includes operating expenses that reduce returns, while the total return of the S&P 500 does not include expenses. The Fund is professionally managed while the S&P 500 is unmanaged and is not available for investment.
Comparison of Change in Value of a $10,000 Investment
Monongahela All Cap Value Fund vs. S&P 500 Index
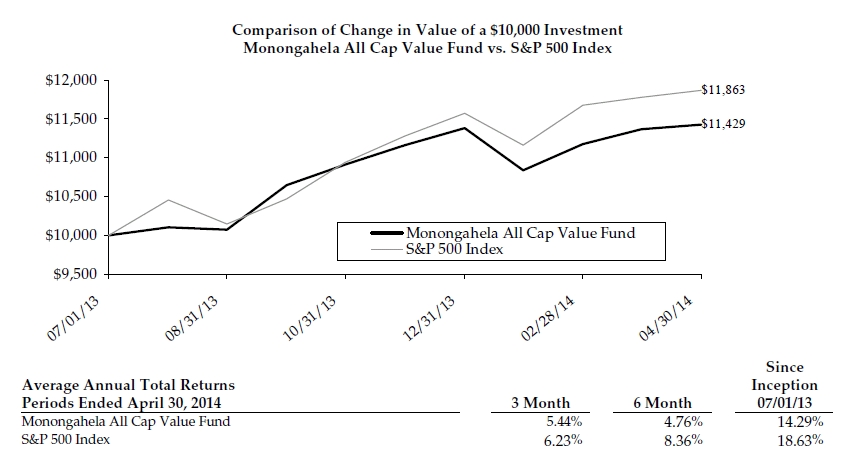
Performance data quoted represents past performance and is no guarantee of future results. Current performance may be lower or higher than the performance data quoted. Investment return and principal value will fluctuate so that shares, when redeemed, may be worth more or less than original cost. For the most recent month-end performance, please call (855) 392-9331. As stated in the Fund's prospectus, the annual operating expense ratio (gross) was estimated to be 1.29%. However, the Fund's adviser has agreed to contractually waive a portion of its fees and to reimburse certain expenses to limit total operating expenses to 0.85% (excluding all taxes, interest, portfolio transaction expenses, dividend and interest expense on short sales, acquired fund fees and expenses, proxy expenses and extraordinary expenses), which is in effect until September 1, 2016. During the period, certain fees were waived and/or expenses reimbursed; otherwise, returns would have been lower. Shares redeemed or exchanged within 60 days of purchase will be charged a 1.00% redemption fee. The performance table and graph do not reflect the deduction of taxes that a shareholder would pay on Fund distributions or the redemption of Fund shares.
4
MONONGAHELA ALL CAP VALUE FUNDSCHEDULE OF INVESTMENTS
A
| | Shares | | Security Description | | Value | |
| Common Stock - 95.5% |
| Communications - 2.9% |
| | | | 1,550 | | Verizon Communications, Inc. | | $ | 72,432 | |
| Consumer Discretionary - 6.9% |
| | | | 2,000 | | Coach, Inc. | | | 89,300 | |
| | | | 1,900 | | Murphy USA, Inc. (a) | | | 80,750 | |
| | | | | | | | | 170,050 | |
| Consumer Staples - 11.5% |
| | | | 1,400 | | Alico, Inc. | | | 48,888 | |
| | | | 1,700 | | Campbell Soup Co. | | | 77,333 | |
| | | | 2,700 | | ConAgra Foods, Inc. | | | 82,377 | |
| | | | 1,400 | | Dr. Pepper Snapple Group, Inc. | | | 77,588 | |
| | | | | | | | | 286,186 | |
| Energy - 8.8% |
| | | | 1,000 | | Apache Corp. | | | 86,800 | |
| | | | 4,000 | | Bolt Technology Corp. | | | 67,520 | |
| | | | 500 | | Chevron Corp. | | | 62,760 | |
| | | | | | | | | 217,080 | |
| Financials - 7.1% |
| | | | 10,000 | | Aegon NV, ADR | | | 92,200 | |
| | | | 8,000 | | Susquehanna Bancshares, Inc. | | | 82,880 | |
| | | | | | | | | 175,080 | |
| Health Care - 13.3% |
| | | | 1,000 | | Edwards Lifesciences Corp. (a) | | | 81,470 | |
| | | | 1,000 | | Eli Lilly & Co. | | | 59,100 | |
| | | | 2,700 | | Hanger, Inc. (a) | | | 93,609 | |
| | | | 3,200 | | Osiris Therapeutics, Inc. (a) | | | 45,536 | |
| | | | 500 | | Teleflex, Inc. | | | 51,045 | |
| | | | | | | | | 330,760 | |
| Industrials - 11.3% |
| | | | 3,200 | | Aegion Corp. (a) | | | 81,568 | |
| | | | 2,293 | | Ampco-Pittsburgh Corp. | | | 45,929 | |
| | | | 1,500 | | CH Robinson Worldwide, Inc. | | | 88,350 | |
| | | | 1,000 | | Triumph Group, Inc. | | | 64,810 | |
| | | | | | | | | 280,657 | |
| Materials - 10.7% |
| | | | 1,750 | | Allegheny Technologies, Inc. | | | 72,100 | |
| | | | 2,000 | | Freeport-McMoRan Copper & Gold, Inc. | | | 68,740 | |
| | | | 2,500 | | Newmont Mining Corp. | | | 62,075 | |
| | | | 1,250 | | The Mosaic Co. | | | 62,550 | |
| | | | | | | | | 265,465 | |
| Technology - 23.0% |
| | | | 1,000 | | Canon, Inc., ADR | | | 31,280 | |
| | | | 3,200 | | Corning, Inc. | | | 66,912 | |
| | | | 1,400 | | eBay, Inc. (a) | | | 72,562 | |
| | | | 800 | | F5 Networks, Inc. (a) | | | 84,136 | |
| | | | 300 | | Harris Corp. | | | 22,056 | |
| | | | 6,700 | | II-VI, Inc. (a) | | | 96,480 | |
| | | | 500 | | International Business Machines Corp. | | | 98,235 | |
| | | | 1,400 | | Netscout Systems, Inc. (a) | | | 54,544 | |
| | | | 15,000 | | Schmitt Industries, Inc. (a) | | | 43,200 | |
| | | | | | | | | 569,405 | |
Total Common Stock (Cost $2,226,807) | | | | | | | | 2,367,115 | |
| Money Market Fund - 5.8% | | | | | | | | | |
| | | | 144,465 | | Dreyfus Treasury Prime Cash Management, 0.00% (b) (cost $144,465) | | | 144,465 | |
Total Investments - 101.3% (Cost $2,371,272)* | | | | | | | $ | 2,511,580 | |
| Other Assets & Liabilities, Net – (1.3)% | | | | | | | | (33,047 | ) |
| Net Assets – 100.0% | | | | | | | $ | 2,478,533 | |
| ADR | American Depositary Receipt |
| (a) | Non-income producing security. |
| (b) | Variable rate security. Rate presented is as of April 30, 2014. |
| * | Cost for federal income tax purposes is $2,371,568 and net unrealized appreciation consists of: |
| Gross Unrealized Appreciation | | $ | 203,424 | |
| Gross Unrealized Depreciation | | | (63,412 | ) |
| Net Unrealized Appreciation | | $ | 140,012 | |
The following is a summary of the inputs used to value the Fund’s investments as of April 30, 2014.
The inputs or methodology used for valuing securities are not necessarily an indication of the risks associated with investing in those securities. For more information on valuation inputs, and their aggregation into the levels used in the table below, please refer to the Security Valuation section in Note 2 of the accompanying Notes to Financial Statements.
| Valuation Inputs | | Investments in Securities |
| Level 1 - Quoted Prices | | $ | 2,367,115 | |
| Level 2 - Other Significant Observable Inputs | | | 144,465 | |
| Level 3 - Significant Unobservable Inputs | | | - | |
| Total | | $ | 2,511,580 | |
The Level 1 value displayed in this table is Common Stock. The Level 2 value displayed in this table is a Money Market Fund. Refer to the Schedule of Investments for a further breakout of each security by industry.
There were no transfers among Level 1, Level 2 and Level 3 for the period ended April 30, 2014.
AFA
| PORTFOLIO HOLDINGS | | | |
| % of Total Investments | | | |
| Communications | | | 2.9 | % |
| Consumer Discretionary | | | 6.8 | % |
| Consumer Staples | | | 11.4 | % |
| Energy | | | 8.6 | % |
| Financials | | | 7.0 | % |
| Health Care | | | 13.2 | % |
| Industrials | | | 11.2 | % |
| Materials | | | 10.6 | % |
| Technology | | | 22.6 | % |
| Money Market Fund | | | 5.7 | % |
| | | | 100.0 | % |
AFA
See Notes to Financial Statements. 5
MONONGAHELA ALL CAP VALUE FUNDSTATEMENT OF ASSETS AND LIABILITIES
| | | | | | | |
| ASSETS | | | | |
| | Total investments, at value (Cost $2,371,272) | | $ | 2,511,580 | |
| | Receivables: | | | | |
| | | Dividends | | | 3,043 | |
| Adviser | From investment adviser | | | 15,050 | |
| | Prepaid expenses | | | 2,561 | |
| | Deferred offering costs | | | 4,017 | |
| Total Assets | | | 2,536,251 | |
| | | | | | | |
| LIABILITIES | | | | |
| | Payables: | | | | |
| | | Investment securities purchased | | | 31,602 | |
| | Accrued Liabilities: | | | | |
| | | Fund services fees | | | 6,560 | |
| | | Other expenses | | | 19,556 | |
| Total Liabilities | | | 57,718 | |
| | | | | | | |
| NET ASSETS | | $ | 2,478,533 | |
| | | | | | | |
| COMPONENTS OF NET ASSETS | | | | |
| | Paid-in capital | | $ | 2,291,705 | |
| | Undistributed net investment income | | | 6,537 | |
| | Accumulated net realized gain | | | 39,983 | |
| | Net unrealized appreciation | | | 140,308 | |
| NET ASSETS | | $ | 2,478,533 | |
| SHARES OF BENEFICIAL INTEREST AT NO PAR VALUE (UNLIMITED SHARES AUTHORIZED) | | | 220,238 | |
| NET ASSET VALUE, OFFERING AND REDEMPTION PRICE PER SHARE* | | $ | 11.25 | |
| * Shares redeemed or exchanged within 60 days of purchase are charged a 1.00% redemption fee. | | | | |
See Notes to Financial Statements. 6
MONONGAHELA ALL CAP VALUE FUNDSTATEMENT OF OPERATIONS
PERIOD ENDED APRIL 30, 2014*
| | | | | | | | |
| INVESTMENT INCOME | | | | | |
| | Dividend income (Net of foreign withholding taxes of $91) | | $ | 20,692 | | |
| Total Investment Income | | | 20,692 | | |
| | | | | | |
| EXPENSES | | | | | |
| | Investment adviser fees | | | 10,434 | | |
| | Fund services fees | | | 136,095 | | |
| | Custodian fees | | | 6,855 | | |
| | Registration fees | | | 1,059 | | |
| | Professional fees | | | 22,530 | | |
| | Trustees' fees and expenses | | | 52 | | |
| | Offering costs | | | 20,083 | | |
| | Miscellaneous expenses | | | 9,370 | | |
| Total Expenses | | | 206,478 | | |
| | Fees waived and expenses reimbursed | | | (194,654 | ) | |
| Net Expenses | | | 11,824 | | |
| | | | | | | | |
| NET INVESTMENT INCOME | | | 8,868 | | |
| | | | | | | | |
| NET REALIZED AND UNREALIZED GAIN | | | | | |
| | Net realized gain on investments | | | 61,129 | | |
| | Net change in unrealized appreciation on investments | | | 140,308 | | |
| NET REALIZED AND UNREALIZED GAIN | | | 201,437 | | |
| INCREASE IN NET ASSETS RESULTING FROM OPERATIONS | | $ | 210,305 | | |
| | | | | | | | |
| * | Commencement of operations was July 1, 2013. | | | | | |
See Notes to Financial Statements. 7
MONONGAHELA ALL CAP VALUE FUNDSTATEMENT OF CHANGES IN NET ASSETS
| | | | | July 1, 2013* through April 30, 2014 | |
| OPERATIONS | | | | | |
| | Net investment income | | $ | 8,868 | | |
| | Net realized gain | | | 61,129 | | |
| | Net change in unrealized appreciation | | | 140,308 | | |
| Increase in Net Assets Resulting from Operations | | | 210,305 | | |
| | | | | | | | |
| DISTRIBUTIONS TO SHAREHOLDERS FROM | | | | | |
| | Net investment income | | | (4,270 | ) | |
| | Net realized gain | | | (21,146 | ) | |
| Total Distributions to Shareholders | | | (25,416 | ) | |
| | | | | | | | |
| CAPITAL SHARE TRANSACTIONS | | | | | |
| | Sale of shares | | | 2,356,177 | | |
| | Reinvestment of distributions | | | 25,416 | | |
| | Redemption of shares | | | (87,999 | ) | |
| | Redemption fees | | | 50 | | |
| Increase in Net Assets from Capital Share Transactions | | | 2,293,644 | | |
| Increase in Net Assets | | | 2,478,533 | | |
| | | | | | | | |
| NET ASSETS | | | | | |
| | Beginning of Period | | | - | | |
| | End of Period (Including line (a)) | | $ | 2,478,533 | | |
| | | | | | | | |
| SHARE TRANSACTIONS | | | | | |
| | Sale of shares | | | 225,788 | | |
| | Reinvestment of distributions | | | 2,339 | | |
| | Redemption of shares | | | (7,889 | ) | |
| Increase in Shares | | | 220,238 | | |
| | | | | | | | |
| (a) | Undistributed net investment income | | $ | 6,537 | | |
| * | Commencement of operations. | | | | | |
See Notes to Financial Statements. 8
MONONGAHELA ALL CAP VALUE FUNDFINANCIAL HIGHLIGHTS
| These financial highlights reflect selected data for a share outstanding throughout the period. |
| | | July 1, 2013 (a) through April 30, 2014 | |
| NET ASSET VALUE, Beginning of Period | $ | 10.00 | | |
| INVESTMENT OPERATIONS | | | | |
| Net investment income (b) | | 0.06 | | |
| Net realized and unrealized gain | | 1.36 | | |
| Total from Investment Operations | | 1.42 | | |
| DISTRIBUTIONS TO SHAREHOLDERS FROM | | | | |
| Net investment income | | (0.03 | ) | |
| Net realized gain | | (0.14 | ) | |
| Total Distributions to Shareholders | | (0.17 | ) | |
| REDEMPTION FEES (b) | | — | (c) |
| NET ASSET VALUE, End of Period | $ | 11.25 | | |
| TOTAL RETURN | | 14.29 | %(d) | |
| RATIOS/SUPPLEMENTARY DATA | | | | |
| Net Assets at End of Period (000's omitted) | $2,479 | | |
| Ratios to Average Net Assets: | | | | | |
| Net investment income | | 0.64 | %(e) | |
| Net expense | | 0.85 | %(e) | |
| Gross expense (f) | | 14.84 | %(e) | |
| PORTFOLIO TURNOVER RATE | | 32 | %(d) | |
| | | | | | | |
| (a) | Commencement of operations. |
| (b) | Calculated based on average shares outstanding during the period. |
| (c) | Less than $0.01 per share. |
| (d) | Not annualized. |
| (e) | Annualized. |
| (f) | Reflects the expense ratio excluding any waivers and/or reimbursements. |
See Notes to Financial Statements. 9
MONONGAHELA ALL CAP VALUE FUNDNOTES TO FINANCIAL STATEMENTS
Note 1. Organization
The Monongahela All Cap Value Fund (the “Fund”) is a diversified portfolio of Forum Funds (the “Trust”). The Trust is a Delaware statutory trust that is registered as an open-end, management investment company under the Investment Company Act of 1940 (the “Act”), as amended. Under its Trust Instrument, the Trust is authorized to issue an unlimited number of the Fund’s shares of beneficial interest without par value. The Fund commenced operations on July 1, 2013. The Fund seeks total return through long-term capital appreciation and income.
Note 2. Summary of Significant Accounting Policies
These financial statements are prepared in accordance with accounting principles generally accepted in the United States of America (“GAAP”), which require management to make estimates and assumptions that affect the reported amounts of assets and liabilities, the disclosure of contingent liabilities at the date of the financial statements, and the reported amounts of increases and decreases in net assets from operations during the fiscal period. Actual amounts could differ from those estimates. The following summarizes the significant accounting policies of the Fund:
Security Valuation – Exchange-traded securities and over-the-counter securities are valued using the last quoted trade or official closing price, provided by independent pricing services as of the close of trading on the market or exchange for which they are primarily traded, on each Fund business day. In the absence of a sale, such securities are valued at the mean of the last bid and ask price provided by independent pricing services. Non-exchange traded securities for which quotations are available are valued using the last quoted sales price, or in the absence of a sale, at the mean of the last bid and ask prices provided by independent pricing services. Short-term investments that mature in 60 days or less may be valued at amortized cost.
The Fund values its investments at fair value pursuant to procedures adopted by the Trust's Board of Trustees (the "Board") if (1) market quotations are insufficient or not readily available or (2) the adviser believes that the values available are unreliable. The Trust’s Valuation Committee, as defined in the Fund’s registration statement, performs certain functions as they relate to the administration and oversight of the Fund’s valuation procedures. Under these procedures, the Valuation Committee convenes on a regular and ad-hoc basis to review such securities and considers a number of factors, including valuation methodologies and significant unobservable inputs, when arriving at fair value.
The Valuation Committee may work with the adviser to provide valuation inputs. In determining fair valuations, inputs may include market-based analytics which may consider related or comparable assets or liabilities, recent transactions, market multiples, book values and other relevant investment information. Adviser inputs may include an income-based approach in which the anticipated future cash flows of the investment are discounted in determining fair value. Discounts may also be applied based on the nature or duration of any restrictions on the disposition of the investments. The Valuation Committee performs regular reviews of valuation methodologies, key inputs and assumptions, disposition analysis and market activity.
Fair valuation is based on subjective factors and, as a result, the fair value price of an investment may differ from the security’s market price and may not be the price at which the asset may be sold. Fair valuation could result in a different NAV than a NAV determined by using market quotes.
The Fund has a three-tier fair value hierarchy. The basis of the tiers is dependent upon the various “inputs” used to determine the value of the Fund’s investments. These inputs are summarized in the three broad levels listed below:
Level 1 — quoted prices in active markets for identical assets and liabilities
Level 2 — other significant observable inputs (including quoted prices of similar securities, interest rates, prepayment speeds, credit risk, etc.)
Level 3 — significant unobservable inputs (including the Fund’s own assumptions in determining the fair value of investments)
10
MONONGAHELA ALL CAP VALUE FUNDNOTES TO FINANCIAL STATEMENTS
The aggregate value by input level, as of April 30, 2014, for the Fund’s investments is included at the end of the Fund’s Schedule of Investments.
Security Transactions, Investment Income and Realized Gain and Loss – Investment transactions are accounted for on the trade date. Dividend income is recorded on the ex-dividend date. Foreign dividend income is recorded on the ex-dividend date or as soon as possible after the Fund determines the existence of a dividend declaration after exercising reasonable due diligence. Income and capital gains on some foreign securities may be subject to foreign withholding taxes, which are accrued as applicable. Interest income is recorded on an accrual basis. Premium is amortized and discount is accreted using the effective interest method. Identified cost of investments sold is used to determine the gain and loss for both financial statement and federal income tax purposes.
Distributions to Shareholders – Distributions to shareholders of net investment income and net capital gains, if any, are declared and paid at least annually. Distributions to shareholders are recorded on the ex-dividend date. Distributions are based on amounts calculated in accordance with applicable federal income tax regulations, which may differ from GAAP. These differences are due primarily to differing treatments of income and gain on various investment securities held by the Fund, timing differences and differing characterizations of distributions made by the Fund.
Federal Taxes – The Fund intends to continue to qualify each year as a regulated investment company under Subchapter M of the Internal Revenue Code and to distribute all of its taxable income to shareholders. In addition, by distributing in each calendar year substantially all of its net investment income and capital gains, if any, the Fund will not be subject to a federal excise tax. Therefore, no federal income or excise tax provision is required. The Fund files a U.S. federal income and excise tax return as required. A fund’s federal income tax returns are subject to examination by the Internal Revenue Service for a period of three fiscal years after they are filed. As of April 30, 2014, there are no uncertain tax positions that would require financial statement recognition, de-recognition, or disclosure.
Income and Expense Allocation – The Trust accounts separately for the assets, liabilities and operations of each of its investment portfolios. Expenses that are directly attributable to more than one investment portfolio are allocated among the respective investment portfolios in an equitable manner.
Redemption Fees – A shareholder who redeems or exchanges shares within 60 days of purchase will incur a redemption fee of 1.00% of the current net asset value of shares redeemed or exchanged, subject to certain limitations. The fee is charged for the benefit of the remaining shareholders and will be paid to the Fund to help offset transaction costs. The fee is accounted for as an addition to paid-in capital. The Fund reserves the right to modify the terms of or terminate the fee at any time. There are limited exceptions to the imposition of the redemption fee.
Commitments and Contingencies – In the normal course of business, the Fund enters into contracts that provide general indemnifications by the Fund to the counterparty to the contract. The Fund’s maximum exposure under these arrangements is dependent on future claims that may be made against the Fund and, therefore, cannot be estimated; however, based on experience, the risk of loss from such claims is considered remote.
Offering Costs – Offering costs for the Fund of $24,100 consist of fees related to the mailing and printing of the initial prospectus, certain startup legal costs, and initial registration filings. Such costs are amortized over a twelve-month period beginning with the commencement of operations of the Fund.
Note 3. Fees and Expenses
Investment Adviser – Rodgers Brothers, Inc. d/b/a Monongahela Capital Management (the “Adviser”) is the investment adviser to the Fund. Pursuant to an investment advisory agreement, the Adviser receives an advisory fee from the Fund at an annual rate of 0.75% of the Fund’s average daily net assets.
Distribution – Foreside Fund Services, LLC serves as the Fund’s distributor (the “Distributor”). The Distributor is not affiliated with the Adviser or Atlantic Fund Administration, LLC (d/b/a Atlantic Fund Services) (“Atlantic”) or their
11
MONONGAHELA ALL CAP VALUE FUNDNOTES TO FINANCIAL STATEMENTS
affiliates. The Fund does not have a distribution (12b-1) plan; accordingly, the Distributor does not receive compensation from the Fund for its distribution (12b-1) services.
Other Service Providers – Atlantic provides fund accounting, fund administration, compliance and transfer agency services to the Fund. Atlantic also provides certain shareholder report production, and EDGAR conversion and filing services. Pursuant to an Atlantic services agreement, the Fund pays Atlantic customary fees for its services. Atlantic provides a Principal Executive Officer, a Principal Financial Officer, a Chief Compliance Officer, and an Anti-Money Laundering Officer to the Fund, as well as certain additional compliance support functions.
Trustees and Officers – The Trust pays each independent Trustee an annual retainer fee of $45,000 for service to the Trust ($66,000 for the Chairman). The Trustees and Chairman may receive additional fees for special Board meetings. Each Trustee is also reimbursed for all reasonable out-of-pocket expenses incurred in connection with his duties as a Trustee, including travel and related expenses incurred in attending Board meetings. The amount of Trustees’ fees attributable to the Fund is disclosed in the Statement of Operations. Certain officers of the Trust are also officers or employees of the above named service providers, and during their terms of office received no compensation from the Fund.
Note 4. Expense Reimbursements and Fees Waived
The Adviser has contractually agreed to waive a portion of its fee and reimburse certain expenses through September 1, 2016, to limit annual operating expenses to 0.85% (excluding all taxes, interest, portfolio transaction expenses, dividend and interest expense on short sales, acquired fund fees and expenses, proxy expenses and extraordinary expenses). Other Fund service providers have voluntarily agreed to waive a portion of their fees. The contractual waivers may be changed or eliminated at any time with the consent of the Board and voluntary fee waivers and expense reimbursements may be reduced or eliminated at any time. For the period ended April 30, 2014, fees waived and expenses reimbursed were as follows:
| Investment Adviser Fees Waived | | Investment Adviser Expenses Reimbursed | | Other Waivers | | Total Fees Waived and Expenses Reimbursed |
| $ | 10,434 | | $ | 113,616 | | $ | 70,604 | | $ | 194,654 |
Note 5. Security Transactions
The cost of purchases and proceeds from sales of investment securities (including maturities), other than short-term investments during the period ended April 30, 2014, were $2,631,335 and $465,658, respectively.
Note 6. Federal Income Tax
On the Statement of Assets and Liabilities, as a result of permanent book to tax differences, certain amounts have been reclassified for the period ended April 30, 2014. The following reclassification was the result of non-deductible offering costs and has no impact on the net assets of the Fund.
| Undistributed Net Investment Income | | $ | 1,939 | |
| Paid-in Capital | | | (1,939 | ) |
12
MONONGAHELA ALL CAP VALUE FUNDNOTES TO FINANCIAL STATEMENTS
As of April 30, 2014, distributable earnings on a tax basis were as follows:
| Undistributed Ordinary Income | | $ | 46,816 | |
| Unrealized Appreciation | | | 140,012 | |
| Total | | $ | 186,828 | |
The difference between components of distributable earnings on a tax basis and the amounts reflected in the Statement of Assets and Liabilities are primarily due to wash sales and the treatment of short-term capital gains.
Distributions paid during the fiscal period ended were characterized for tax purposes as follows:
Note 7. Subsequent Events
Subsequent events occurring after the date of this report through the date these financial statements were issued have been evaluated for potential impact and the Fund has had no such events.
13
REPORT OF INDEPENDENT REGISTERED PUBLIC ACCOUNTING FIRM
To Shareholders of Monongahela All Cap Value Fund
and the Board of Trustees of Forum Funds
We have audited the accompanying statement of assets and liabilities of the Monongahela All Cap Value Fund, a series of shares of beneficial interest in the Forum Funds, including the schedule of investments, as of April 30, 2014, and the related statements of operations, changes in net assets and the financial highlights for the period July 1, 2013 (commencement of operations) to April 30, 2014. These financial statements and financial highlights are the responsibility of the Fund's management. Our responsibility is to express an opinion on these financial statements and financial highlights based on our audit.
We conducted our audit in accordance with the standards of the Public Company Accounting Oversight Board (United States). Those standards require that we plan and perform the audit to obtain reasonable assurance about whether the financial statements and financial highlights are free of material misstatement. An audit includes examining, on a test basis, evidence supporting the amounts and disclosures in the financial statements. Our procedures included confirmation of securities owned as of April 30, 2014 by correspondence with the custodian and brokers. An audit also includes assessing the accounting principles used and significant estimates made by management, as well as evaluating the overall financial statement presentation. We believe that our audit provides a reasonable basis for our opinion.
In our opinion, the financial statements and financial highlights referred to above present fairly, in all material respects, the financial position of the Monongahela All Cap Value Fund as of April 30, 2014, and the results of its operations, the changes in its net assets and its financial highlights for the period July 1, 2013 to April 30, 2014, in conformity with accounting principles generally accepted in the United States of America.
BBD, LLP
Philadelphia, Pennsylvania
June 18, 2014
14
MONONGAHELA ALL CAP VALUE FUNDADDITIONAL INFORMATION (Unaudited)
Proxy Voting Information
A description of the policies and procedures that the Fund uses to determine how to vote proxies relating to securities held in the Fund’s portfolio is available, without charge and upon request, by calling (855) 392-9331 and on the U.S. Securities and Exchange Commission’s (the “SEC”) website at www.sec.gov. The Fund’s proxy voting record for the most recent twelve-month period ended June 30 is available, without charge and upon request, by calling (855) 392-9331 and on the SEC’s website at www.sec.gov.
Availability of Quarterly Portfolio Schedules
The Fund files its complete schedule of portfolio holdings with the SEC for the first and third quarters of each fiscal year on Form N-Q. These filings are available, without charge and upon request on the SEC’s website at www.sec.gov or may be reviewed and copied at the SEC’s Public Reference Room in Washington, DC. Information on the operation of the Public Reference Room may be obtained by calling (800) SEC-0330.
Shareholder Expense Example
As a shareholder of the Fund, you incur two types of costs: (1) transaction costs, including redemption fees, and (2) ongoing costs, including management fees and other Fund expenses. This example is intended to help you understand your ongoing costs (in dollars) of investing in the Fund, and to compare these costs with the ongoing costs of investing in other mutual funds.
The example is based on an investment of $1,000 invested at the beginning of the period and held for the entire period from November 1, 2013, through April 30, 2014.
Actual Expenses – The first line of the table below provides information about actual account values and actual expenses. You may use the information in this line, together with the amount you invested, to estimate the expenses that you paid over the period. Simply divide your account value by $1,000 (for example, an $8,600 account value divided by $1,000 = 8.6), then multiply the result by the number in the first line under the heading entitled “Expenses Paid During Period” to estimate the expenses you paid on your account during the period.
Hypothetical Example for Comparison Purposes – The second line of the table below provides information about hypothetical account values and hypothetical expenses based on the Fund’s actual expense ratio and an assumed rate of return of 5% per year before expenses, which is not the Fund’s actual return. The hypothetical account values and expenses may not be used to estimate the actual ending account balance or expenses you paid for the period. You may use this information to compare the ongoing costs of investing in the Fund and other funds. To do so, compare this 5% hypothetical example with the 5% hypothetical examples that appear in the shareholder reports of other funds.
Please note that the expenses shown in the table are meant to highlight your ongoing costs only and do not reflect any transactional costs, such as redemption fees. Therefore, the second line of the table is useful in comparing ongoing costs only, and will not help you determine the relative total costs of owning different funds. In addition, if these transactional costs were included, your costs would have been higher.
| | | Beginning | | | Ending | | | Expenses | | | Annualized |
| | | Account Value | | | Account Value | | | Paid During | | | Expense |
| | | November 1, 2013 | | | April 30, 2014 | | | Period* | | | Ratio* |
| Actual | | $ | 1,000.00 | | | $ | 1,047.57 | | | $ | 4.32 | | | | 0.85 | % |
| Hypothetical (5% return before taxes) | | $ | 1,000.00 | | | $ | 1,020.58 | | | $ | 4.26 | | | | 0.85 | % |
| * | Expenses are equal to the Fund’s annualized expense ratio multiplied by the average account value over the period, multiplied by the number of days in the most recent fiscal half-year divided by 365 to reflect the half-year period. |
15
MONONGAHELA ALL CAP VALUE FUNDADDITIONAL INFORMATION (Unaudited)
Federal Tax Status of Dividends Declared during the Tax Year
For federal income tax purposes, dividends from short-term capital gains are classified as ordinary income. The Fund designates 27.93% of its income dividend distributed as qualifying for the corporate dividends-received deduction (DRD) and 28.51% for the qualified dividend rate (QDI) as defined in Section 1(h)(11) of the Internal Revenue Code. The Fund also designates 83.20% as short-term capital gain dividends exempt from U.S. tax for foreign shareholders (QSD).
Trustees and Officers of the Trust
The Board is responsible for oversight of the management of the Trust’s business affairs and of the exercise of all the Trust’s powers except those reserved for the shareholders. The following table provides information about each Trustee and certain officers of the Trust. Each Trustee and officer holds office until the person resigns, is removed, or is replaced. Unless otherwise noted, the persons have held their principal occupations for more than five years. The address for all Trustees and officers is Three Canal Plaza, Suite 600, Portland, Maine 04101. Mr. Keffer is considered an Interested Trustee due to his affiliation with Atlantic. The Fund’s Statement of Additional Information includes additional information about the Trustees and is available, without charge and upon request, by calling (855) 392-9331.
| Name and Year of Birth | Position with the Trust | Length of Time Served | Principal Occupation(s) During Past Five Years | Number of Series of Fund Complex¹ Overseen by Trustee | Other Directorships Held by Trustee |
| Independent Trustees | | | | | |
J. Michael Parish Born: 1943 | Chairman of the Board; Trustee; Chairman, Nominating Committee and Qualified Legal Compliance Committee | Since 1989 (Chairman since 2004) | Retired since 2003. | 24 | 0 |
Costas Azariadis Born: 1943 | Trustee | Since 1989 | Professor of Economics, Washington University since 2006. | 24 | 0 |
James C. Cheng Born: 1942 | Trustee; Chairman, Audit Committee | Since 1989 | President, Technology Marketing Associates (marketing company for small- and medium-sized businesses in New England) since 1991. | 24 | 0 |
David Tucker Born: 1958 | Trustee | Since 2011 | Director, Blue Sky Experience since 2008; Senior Vice President & General Counsel, American Century Companies 1998-2008. | 28 | Trustee, Forum Funds II and Forum ETF Trust |
| Interested Trustee | | | | | |
John Y. Keffer2 Born: 1942 | Trustee; Vice Chairman | Since 1989 | Chairman, Atlantic since 2008; President, Forum Foundation (a charitable organization) since 2005; President, Forum Trust, LLC (a non-depository trust company chartered in the State of Maine) since 1997. | 28 | Director, Wintergreen Fund, Inc.; Trustee, Forum Funds II and Forum ETF Trust |
| Officers | | | | | |
Stacey E. Hong Born: 1966 | President; Principal Executive Officer | Since 2008 | President, Atlantic since 2008. | N/A | N/A |
Karen Shaw Born: 1972 | Treasurer; Principal Financial Officer | Since 2008 | Senior Vice President, Atlantic since 2008. | N/A | N/A |
Zachary Tackett Born: 1988 | Vice President; Secretary; Anti-Money Laundering Compliance Officer | Since 2014 | Associate Counsel, Atlantic since 2014; Intern Associate, Coakley & Hyde, PLLC, 2010-2013. | N/A | N/A |
Michael J. McKeen Born: 1971 | Vice President | Since 2009 | Senior Vice President, Atlantic since 2008. | N/A | N/A |
1The Fund Complex includes the Trust, Forum Funds II and Forum ETF Trust and is overseen by different Boards of Trustees. 2Atlantic is a subsidiary of Forum Holdings Corp. I, a Delaware corporation that is wholly owned by Mr. Keffer. |
16
MONONGAHELA ALL CAP VALUE FUNDADDITIONAL INFORMATION (Unaudited)
| Name and Year of Birth | Position with the Trust | Length of Time Served | Principal Occupation(s) During Past Five Years | Number of Series of Fund Complex Overseen by Trustee | Other Directorships Held by Trustee |
| Officers (continued) | | | | | |
Timothy Bowden Born: 1969 | Vice President | Since 2009 | Manager, Atlantic since 2008. | N/A | N/A |
Geoffrey Ney Born: 1975 | Vice President | Since 2013 | Manager, Atlantic since 2013; Senior Fund Accountant, Atlantic, 2008-2013. | N/A | N/A |
Todd Proulx Born: 1978 | Vice President | Since 2013 | Manager, Atlantic since 2013; Senior Fund Accountant, Atlantic, 2008-2013. | N/A | N/A |
| |
17
MONONGAHELA ALL CAP VALUE FUND
FOR MORE INFORMATION:
P.O. Box 588
Portland, ME 04112
(855) 392-9331 (toll free)
mcmvalue.ta@atlanticfundservices.com
www.Moncapfund.com
INVESTMENT ADVISER
Monongahela Capital Management
800 Cranberry Woods, Suite 200
Cranberry Township, PA 16066
TRANSFER AGENT
Atlantic Fund Services
P.O. Box 588
Portland, ME 04112
www.atlanticfundservices.com
DISTRIBUTOR
Foreside Fund Services, LLC
Three Canal Plaza, Suite 100
Portland, Maine 04101
www.foreside.com
This report is submitted for the general information of the shareholders of the Fund. It is not authorized for distribution to prospective investors unless preceded or accompanied by an effective prospectus, which includes information regarding the Fund’s risks, objectives, fees and expenses, experience of its management, and other information.
211-ANR-0414
ITEM 2. CODE OF ETHICS.
| (a) | As of the end of the period covered by this report, Forum Funds (the “Registrant”) has adopted a code of ethics, which applies to its Principal Executive Officer and Principal Financial Officer (the “Code of Ethics”). |
| (c) | There have been no amendments to the Registrant’s Code of Ethics during the period covered by this report. |
| (d) | There have been no waivers to the Registrant’s Code of Ethics during the period covered by this report. |
| (f)(1) | A copy of the Code of Ethics is being filed under Item 12(a) hereto. |
ITEM 3. AUDIT COMMITTEE FINANCIAL EXPERT.
The Board of Trustees has determined that no member of the Audit Committee is an "audit committee financial expert" as that term is defined under applicable regulatory guidelines.
ITEM 4. PRINCIPAL ACCOUNTANT FEES AND SERVICES.
(a) Audit Fees - The aggregate fees billed for each of the last two fiscal years (the “Reporting Periods”) for professional services rendered by the Registrant’s principal accountant for the audit of the Registrant’s annual financial statements, or services that are normally provided by the principal accountant in connection with the statutory and regulatory filings or engagements for the Reporting Periods, were $0 in 2013 and $10,320 in 2014.
(b) Audit-Related Fees – The aggregate fees billed in the Reporting Periods for assurance and related services rendered by the principal accountant that were reasonably related to the performance of the audit of the Registrant’s financial statements and are not reported under paragraph (a) of this Item 4 were $0 in 2013 and $0 in 2014.
(c) Tax Fees - The aggregate fees billed in the Reporting Periods for professional services rendered by the principal accountant to the Registrant for tax compliance, tax advice and tax planning were $0 in 2013 and $3,000 in 2014. These services consisted of review or preparation of U.S. federal, state, local and excise tax returns.
(d) All Other Fees - The aggregate fees billed in the Reporting Periods for products and services provided by the principal accountant to the Registrant, other than the services reported in paragraphs (a) through (c) of this Item, were $0 in 2013 and $0 in 2014.
(e) (1) The Audit Committee reviews and approves in advance all audit and “permissible non-audit services” (as that term is defined by the rules and regulations of the Securities and Exchange Commission) to be rendered to a series of the Registrant (each, a “Series”). In addition, the Audit Committee reviews and approves in advance all “permissible non-audit services” to be provided to an investment adviser (not including any sub-adviser) of a Series, or an affiliate of such investment adviser, that is controlling, controlled by or under common control with the investment adviser and provides on-going services to the Registrant (“Affiliate”), by the Series’ principal accountant if the engagement relates directly to the operations and financial reporting of the Series. The Audit Committee considers whether fees paid by a Series’ investment adviser or an Affiliate to the Series’ principal accountant for audit and permissible non-audit services are consistent with the principal accountant’s independence.
(e) (2) No services included in (b) - (d) above were approved pursuant to paragraph (c)(7)(i)(C) of Rule 2-01 of Regulation S-X.
(f) Not applicable
(g) The aggregate non-audit fees billed by the principal accountant for services rendered to the Registrant for the Reporting Periods were $0 in 2013 and $0 in 2014. There were no fees billed in either of the Reporting Periods for non-audit services rendered by the principal accountant to the Registrant’s investment adviser or any Affiliate.
(h) During the Reporting Period, the Registrant's principal accountant provided no non-audit services to the investment advisers or any entity controlling, controlled by or under common control with the investment advisers to the series of the Registrant to which this report relates.
ITEM 5. AUDIT COMMITTEE OF LISTED REGISTRANTS.
Not applicable.
ITEM 6. INVESTMENTS.
| (a) | Included as part of report to shareholders under Item 1. |
ITEM 7. DISCLOSURE OF PROXY VOTING POLICIES AND PROCEDURES FOR CLOSED-END
MANAGEMENT INVESTMENT COMPANIES.
Not applicable.
ITEM 8. PORTFOLIO MANAGERS OF CLOSED-END MANAGEMENT INVESTMENT COMPANIES.
Not applicable.
ITEM 9. PURCHASES OF EQUITY SECURITIES BY CLOSED-END MANAGEMENT INVESTMENT COMPANY AND AFFILIATED PURCHASERS.
Not applicable.
ITEM 10. SUBMISSION OF MATTERS TO A VOTE OF SECURITY HOLDERS
The Registrant does not accept nominees to the board of trustees from shareholders.
ITEM 11. CONTROLS AND PROCEDURES
(a) The Registrant’s Principal Executive Officer and Principal Financial Officer have concluded that the Registrant’s disclosure controls and procedures (as defined in Rule 30a-3(c) under the Investment Company Act of 1940 (the “Act”)) are effective, based on their evaluation of the controls and procedures required by Rule 30a-3(b) under the Act and Rules 13a-15(b) or 15d-15(b) under the Securities Exchange Act of 1934, as of a date within 90 days of the filing date of this report.
(b) There were no changes in the Registrant’s internal control over financial reporting (as defined in
Rule 30a-3(d) under the Act) that occurred during the second fiscal quarter of the period covered by this report that have materially affected, or are reasonably likely to materially affect, the Registrant’s internal control over financial reporting.
ITEM 12. EXHIBITS.
(a)(1) Code of Ethics (Exhibit filed herewith).
(a)(2) Certifications pursuant to Rule 30a-2(a) of the Act, and Section 302 of the Sarbanes-Oxley Act of 2002. (Exhibits filed herewith)
(a)(3) Not applicable.
(b) Certifications pursuant to Rule 30a-2(b) of the Act, and Section 906 of the Sarbanes-Oxley Act of 2002. (Exhibit filed herewith)
SIGNATURES
Pursuant to the requirements of the Securities Exchange Act of 1934 and the Investment Company Act of 1940, the Registrant has duly caused this report to be signed on its behalf by the undersigned, thereunto duly authorized.
Registrant Forum Funds
By /s/ Stacey E. Hong
Stacey E. Hong, Principal Executive Officer
Date June 10, 2014
Pursuant to the requirements of the Securities Exchange Act of 1934 and the Investment Company Act of 1940, this report has been signed below by the following persons on behalf of the Registrant and in the capacities and on the dates indicated.
By /s/ Stacey E. Hong
Stacey E. Hong, Principal Executive Officer
Date June 10, 2014
By /s/ Karen Shaw
Karen Shaw, Principal Financial Officer
Date June 10, 2014
