| | | | | |
| POLARIS GLOBAL VALUE FUND | |
| A MESSAGE TO OUR SHAREHOLDERS (Unaudited) |
| DECEMBER 31, 2013 | | | |
| | | | | |
Dear Fellow Shareholder,
For the year ended December 31, 2013, the total return for the Polaris Global Value Fund (“the Fund”) was 36.94%, as compared to the MSCI World Index benchmark at 26.68%. We are pleased with the +10.26% outperformance, attributable primarily to stock picking. The flexibility to invest in companies with strong sustainable free cash flows, in any country (developed and emerging), industry and market capitalization, helped deliver satisfactory returns in 2013. The Fund achieved a four-star Morningstar Overall Rating™ for risk-adjusted performance among 797 World Stock funds for the calendar year ended December 31, 2013.
| | 2013 | Annualized As of December 31, 2013 |
| | YTD | QIV | QIII | QII | QI | 1 Yr | 3 Yrs | 5 Yrs | 10 Yrs | 15 Yrs | 20 Yrs | ITD* |
| Polaris Global Value Fund | 36.94% | 12.19% | 6.78% | 3.32% | 10.64% | 36.94% | 15.02% | 19.98% | 8.14% | 9.20% | 10.42% | 10.00% |
| MSCI World Index | 26.68% | 8.00% | 8.18% | 0.65% | 7.73% | 26.68% | 11.49% | 15.02% | 6.98% | 4.33% | 7.06% | 6.48% |
*Inception-to-date (Inception 7/31/1989)
Performance data quoted represents past performance and is no guarantee of future results. Current performance may be lower or higher than the performance data quoted. Returns for more than one year are annualized. Investment return and principal value will fluctuate so that an investor's shares, when redeemed, may be worth more or less than original cost. For the most recent month end performance, please call (888) 263-5594. As stated in the current prospectus, the Fund’s annual operating expense ratio (gross) is 1.36%. The Fund’s Adviser voluntarily waived its fee for the last three months of 2013, reducing the Fund’s net expense ratio to 1.04% for calendar year 2013. In the December 13, 2013 supplement to the current prospectus, the Fund’s annual operating expense ratio has been reduced to 0.99%, effective January 1, 2014. Fund performance returns shown do not reflect fees; if reflected, the returns would have been lower. See page 6 for additional disclosure. Short-term performance, in particular, is not a good indication of the Fund's future performance, and an investment should not be made based solely on returns.
2013 PERFORMANCE ANALYSIS:
We are satisfied with the performance, as this marks the second consecutive calendar year of substantial outperformance versus the MSCI World Index benchmark (+10.26% in 2013; +5.17% in 2012). More than half of the annual return was from companies in the U.S., U.K., Germany and Ireland. Results for the year mirrored the results for the fourth quarter, with outperformance in 8 out of 10 sectors. Financials, consumer discretionary, consumer staples and materials were the top contributors. Energy and utility sectors added to full-year results, but to a lesser extent.
Seventeen of eighteen financial holdings were in positive absolute territory for the year, led by U.S. banks Ameris Bancorp, BNC Bancorp and Webster Financial. In late 2012, Ameris started consolidating less profitable branches; in 2013, it announced the acquisition of Prosperity Banking Company, which is expected to boost assets and earnings in the coming year. BNC Bancorp reported decreased non-performing assets, accelerated loan growth, increased net interest margins and steady mortgage revenues despite an industry-wide slowdown in refinancing activity. Svenska Handelsbanken remained one of the best-managed European banks, with solid cost controls, asset quality and overseas net interest income growth. Standard Chartered was in negative territory after releasing repetitive earnings downgrades.
| | | | | |
| POLARIS GLOBAL VALUE FUND | |
| A MESSAGE TO OUR SHAREHOLDERS (Unaudited) |
| DECEMBER 31, 2013 | | | |
| | | | | |
In consumer discretionary, British homebuilders posted double-digit gains, which slightly moderated toward year end as the U.K. government scaled back on its assisted home buying program. In our opinion, reduced government support for buyers who cannot otherwise afford property leads to better sustainability of the British housing market.
The consumer staples sector was up for the year, far surpassing the benchmark sector result. While both Japanese brewery and dairy companies achieved healthy returns, the predominant story was Irish convenience food producer Greencore Group. As the top portfolio contributor to performance this year, Greencore’s stock advanced as sales of its product categories increased in the U.K. grocery market. In addition, Greencore’s stock was included in the FTSE 250. The company saw its stock price rise further after turning a profit on its U.S. operations, validating the geographic expansion.
With an overweight position and strong outperformance compared to the benchmark, the materials sector was the fourth largest contributor to the annual results. Imerys had double-digit returns backed by improving market conditions and strategic changes to its business, which included divesting non-core assets and focusing on growth segments. Canadian methanol producer Methanex was able to leverage higher prices (difference between gas and oil) and capture better margins due to methanol demand not only for paints and plastics but also for fuel additives and adhesives. Additionally, Methanex’s new growth projects are expected to expand annual operating capacity by 60% over the next three years. On the other end of the spectrum, Australian multinational mining and petroleum company BHP Billiton fell on lower metal prices and lower demand from Asia. Japanese materials company Showa Denko was negatively impacted by slower petrochemical and chemical sales as well as lower sales of hard disk drives.
In industrials, Finnish building service company Caverion demerged from YIT. Caverion has since cycled through cost adjustments, enhanced its service business in Northern Europe and improved profitability, resulting in a double-digit stock jump during the year.
Information technology had some of the best and worst performers in Xerox and Samsung Electronics, respectively. Xerox projected flat earnings per share as increases in business services (with a new government contract) will likely offset document printing declines. The company also stepped up merger and acquisition transactions and share buybacks – all of which encouraged investors during the year. Samsung Electronics dropped, as its sales of its Galaxy S4 smartphone fell short of expectations.
The Fund’s health care portfolio was one of only two sectors to underperform the sector benchmarks during the year. Pharmaceutical maker Forest Laboratories benefited from a company restructuring and a stock buyback, which signaled management’s confidence in the product pipeline and cash flow generation capability after Lexapro became a generic drug. Health insurers Wellpoint and United Health Group were up after offering positive guidance for 2014, predicting stable earnings despite uncertainty related to the Affordable Care Act. Detracting from results was Quest Diagnostics, which noted fewer test requests nationwide attributable to high-deductible consumer healthcare plans and the cost-conscious private health care system.
In telecom, Freenet announced good results in a consolidating market, while introducing new products. KDDI capitalized on the smartphone shift, as it beat competitors to market in Japan with its unique triple play offering. Deutsche Telekom experienced good revenue and earnings growth led by T-Mobile after its MetroPCS merger. The publicly traded U.S. subsidiary went on the offensive with competitive rates, a strong LTE network and an iPhone
| | | | | |
| POLARIS GLOBAL VALUE FUND | |
| A MESSAGE TO OUR SHAREHOLDERS (Unaudited) |
| DECEMBER 31, 2013 | | | |
| | | | | |
offering, all of which culminated with a million-plus addition to the subscriber base.
The energy sector was buoyed by Marathon Oil, Maurel et Prom, Sasol Ltd. and Marathon Petroleum, but these results were mitigated by declines in Thai Oil. The company was affected by the political turbulence in Thailand. However, we do not think the unrest should impinge on long-term future cash flows, as Thai Oil provides an important country resource.
2013 ASSET ALLOCATION:
During the year, we sold five holdings (at a profit) to make room for eight new portfolio companies. We sold Japanese convenience food maker and cold storage facilities operator Nichirei and Irish containerboard manufacturer Smurfit Kappa, as they reached our valuation targets. When U.S.-based H.J. Heinz was acquired by Berkshire Hathaway and 3G Capital, the Fund’s holdings in the company were sold for cash. The Fund’s position in Questcor Pharmaceuticals was eliminated after making substantial profits on the stock, as concerns arose about a sales practice investigation. Laundry systems service Mac-Gray saw its stock price advance from $15 to $21 during the fourth quarter, after announcing its acquisition by CSC Fenway. The stock was subsequently sold at a profit.
Capital from sales was redeployed to existing holdings and to a number of new purchases, including Standard Chartered, an international banking group focused in Asia, Africa and the Middle East; Freenet AG, a German telecommunications and web content provider/reseller; Loomis AB, an international cash handling business, with efficiency services; Ipsos SA of France, a market research firm for global consumer product companies; Regal Entertainment, which operates the largest movie theater chain in the U.S.; Finnish building service company Caverion; and Tullow Oil, an independent oil explorer focused in emerging market countries throughout Africa. In October, we purchased U.S. direct mail/geography targeted advertising company Valassis Communications. Less than two months later, Valassis stock rose on news of an acquisition bid by a private equity company.
The following table shows the Fund’s asset allocation at December 31, 2013.
Polaris Global Value Fund Asset Allocation
| | Portfolio Weighting | Energy | Utilities | Materials | Industrials | Consumer Discretionary | Consumer Staples | Health Care | Financials | Info. Tech. | Telecom Services | Cash |
| N. America | 37.49% | 2.26% | 2.51% | 3.35% | 1.18% | 3.30% | 1.21% | 5.59% | 12.21% | 4.65% | 1.24% | 0.00% |
| Japan | 4.73% | 0.00% | 0.00% | 0.46% | 0.00% | 0.00% | 2.49% | 0.00% | 0.00% | 0.00% | 1.78% | 0.00% |
| Other Asia | 4.90% | 0.70% | 0.96% | 0.86% | 0.00% | 0.00% | 0.00% | 0.00% | 0.00% | 2.38% | 0.00% | 0.00% |
| Europe & ME | 36.44% | 2.42% | 0.00% | 7.97% | 2.02% | 9.55% | 3.87% | 2.63% | 3.82% | 1.39% | 2.76% | 0.00% |
| Scandinavia | 9.80% | 0.00% | 0.00% | 0.00% | 3.86% | 1.77% | 0.00% | 0.00% | 4.17% | 0.00% | 0.00% | 0.00% |
| Africa & S. America | 1.10% | 1.10% | 0.00% | 0.00% | 0.00% | 0.00% | 0.00% | 0.00% | 0.00% | 0.00% | 0.00% | 0.00% |
| Cash | 5.55% | 0.00% | 0.00% | 0.00% | 0.00% | 0.00% | 0.00% | 0.00% | 0.00% | 0.00% | 0.00% | 5.54% |
| Industry Totals | 100.00% | 6.49% | 3.46% | 12.64% | 7.06% | 14.62% | 7.56% | 8.22% | 20.20% | 8.43% | 5.78% | 5.54% |
Table may not cross foot due to rounding.
| | | | | |
| POLARIS GLOBAL VALUE FUND | |
| A MESSAGE TO OUR SHAREHOLDERS (Unaudited) |
| DECEMBER 31, 2013 | | | |
| | | | | |
INVESTMENT ENVIRONMENT AND STRATEGY:
As would be expected after a stellar year for world markets, with the MSCI World Index up 26.68%, MSCI Europe Index up 25.23% and MSCI EAFE Index at 22.78%, fewer undervalued companies are present at the start of 2014 than at the beginning of 2013. Notwithstanding higher stock prices, our research team continues to pinpoint new investment opportunities. We made evolutionary improvements to our screening technology and investment process during 2013, which have allowed us to uncover companies not previously filtering through our screens. Currently, our screens are dominated by Asian companies, which is not surprising considering the MSCI Emerging Markets Index was down -2.60% in 2013, a dramatic underperformance relative to developed countries. Additionally, we are carefully assessing valuations of previously-depressed European companies, many of which are reporting positive near-term industry trends.
FUND UPDATES:
The Fund’s Adviser waived its fee for the last three months of 2013, reducing the Fund’s net expense ratio to 1.04% for calendar year 2013. As of January 1, 2014, the Adviser will waive its fees, along with fee reductions by the Fund’s administrator, to reduce the expense ratio to 0.99%. Through a contractual agreement, the Adviser will waive its fee and/or reimburse Fund expenses to limit Total Annual Fund Operating Expenses to 0.99% for the period January 1, 2014 through April 30, 2015. With this new reduction, the Fund will have an expense ratio that is lower than 79% of its peers in the Morningstar World Stock Fund Universe (out of 984 Funds for the 1-year track record and reported expense ratio as of 11/30/13; data source: Morningstar). Additional details are reflected in the December 13, 2013 supplement to the prospectus, available at www.polarisfunds.com.
The Fund declared a net investment income dividend of $0.21560 per share to shareholders of record as of December 30, 2013. The Fund did not distribute any capital gains for 2013, which may prove to be a substantial tax benefit to shareholders. As of December 31, 2013, the capital loss carryover stands at approximately $111,000,000, which may provide tax efficient returns in the years to come. Please contact your tax advisor regarding your individual tax situation.
As always, we welcome your questions and comments.
Sincerely,

Bernard R. Horn, Jr.
Portfolio Manager
| | | | | |
| POLARIS GLOBAL VALUE FUND | |
| A MESSAGE TO OUR SHAREHOLDERS (Unaudited) |
| DECEMBER 31, 2013 | | | |
| |
As of December 31, 2013, the Fund’s largest equity holdings and the percentages they represent in the Fund’s portfolio market value were as follows and are subject to change:
| Percentage of Total Net Assets | | Percentage of Total Net Assets |
| Greencore Group PLC | 3.86% | Svenska Handelsbanken AB, Class A | 1.71% |
| Methanex Corp. | 2.25% | Imerys SA | 1.66% |
| KDDI Corp. | 1.77% | Forest Laboratories Inc. | 1.66% |
| Duni AB, Class A | 1.76% | Christian Dior SA | 1.62% |
| Ameris Bancorp | 1.74% | Symrise AG | 1.59% |
The Fund’s annual performance as compared to the benchmark is as follows:
| Historical Calendar Year Annual Returns (years ended December 31) |
| | Polaris Global Value | MSCI World Index | | Polaris Global Value | MSCI World Index |
| 2013 | 36.94% | 26.68% | 2001 | 2.21% | -16.82% |
| 2012 | 21.00% | 15.83% | 2000 | -5.82% | -13.18% |
| 2011 | -8.16% | -5.54% | 1999 | 16.50% | 24.93% |
| 2010 | 20.64% | 11.76% | 1998 | -8.85% | 24.34% |
| 2009 | 35.46% | 29.99% | 1997 | 34.55% | 15.76% |
| 2008 | -46.19% | -40.71% | 1996 | 23.34% | 13.48% |
| 2007 | -3.97% | 9.04% | 1995 | 31.82% | 20.72% |
| 2006 | 24.57% | 20.07% | 1994 | -2.78% | 5.08% |
| 2005 | 10.52% | 9.49% | 1993 | 25.70% | 22.50% |
| 2004 | 23.63% | 14.72% | 1992 | 9.78% | -5.23% |
| 2003 | 47.06% | 33.11% | 1991 | 17.18% | 18.28% |
| 2002 | 3.82% | -19.89% | 1990 | -11.74% | -17.02% |
| | | | | |
| POLARIS GLOBAL VALUE FUND | |
| A MESSAGE TO OUR SHAREHOLDERS (Unaudited) |
| DECEMBER 31, 2013 | | | |
| |
IMPORTANT INFORMATION
The Fund invests in securities of foreign issuers, including issuers located in countries with emerging capital markets. Investments in such securities entail certain risks not associated with investments in domestic securities, such as volatility of currency exchange rates, and in some cases, political and economic instability and relatively illiquid markets. Options trading involves risk and is not suitable for all investors. Fund performance includes reinvestment of dividends and capital gains. Since Inception, some of the Fund’s fees were waived or expenses reimbursed. In the absence of these waivers and reimbursements, performance figures would be lower.
On June 1, 1998, a limited partnership managed by the adviser reorganized into the Fund. The predecessor limited partnership maintained an investment objective and investment policies that were, in all material respects, equivalent to those of the Fund. The Fund’s performance for the periods before June 1, 1998 is that of the limited partnership and includes the expenses of the limited partnership. If the limited partnership’s performance had been readjusted to reflect the second year expenses of the Fund, the Fund’s performance for all the periods would have been lower. The limited partnership was not registered under the Investment Company Act of 1940 (“1940 Act”) and was not subject to certain investment limitations, diversification requirements, and other restrictions imposed by the 1940 Act and the Internal Revenue Code, which, if applicable, may have adversely affected its performance.
For each fund with at least a three-year history, Morningstar calculates a Morningstar Rating™ based on a Morningstar Risk-Adjusted Return measure that accounts for variation in a fund’s monthly performance (including the effects of sales charges, loads, and redemption fees), placing more emphasis on downward variations and rewarding consistent performance. The top 10% of funds in each category receive 5 stars, the next 22.5% receive 4 stars, the next 35% receive 3 stars, the next 22.5% receive 2 stars and the bottom 10% receive 1 star. The Overall Morningstar Rating for a fund is derived from a weighted average of the performance figures associated with its 3-year Morningstar Rating metrics. The Fund received a Morningstar Rating of a 4-star, 5-stars, 4-star and 3-star against the World Stock Funds for the following periods: Overall (out of 797 funds), three-year (out of 797 funds), five-year (out of 638 funds) and ten-year (out of 324 funds), respectively. © 2014 Morningstar, Inc. All Rights Reserved. The information contained herein: (1) is proprietary to Morningstar; (2) may not be copied or distributed; and (3) is not warranted to be accurate, complete or timely. Neither Morningstar nor its content providers are responsible for any damages or losses arising from any use of this information.
The MSCI World Index, net dividends reinvested measures the performance of a diverse range of global stock markets in the United States, Canada, Europe, Australia, New Zealand and the Far East. The MSCI World Index is unmanaged and includes the reinvestment of dividends, net of withholding taxes. The MSCI Europe Index is a market capitalization weighted index composed of over 500 securities representing 15 European countries. The MSCI Europe Australasia Far East (EAFE) Index is an unmanaged free float-adjusted market capitalization index that is designed to measure the equity market performance of developed markets, excluding the US & Canada. The MSCI Emerging Market Index is an unmanaged free float-adjusted market capitalization index that is designed to measure equity market performance of emerging markets. One cannot invest directly in an index or an average.
The views in this letter were those of the Fund manager as of December 31, 2013 and may not reflect the views of the manager after the publication date. These views are intended to assist shareholders of the Fund in understanding their investment and do not constitute investment advice.
| | | | | |
| POLARIS GLOBAL VALUE FUND | |
| PERFORMANCE CHART AND ANALYSIS (Unaudited) |
| DECEMBER 31, 2013 | | | |
| |
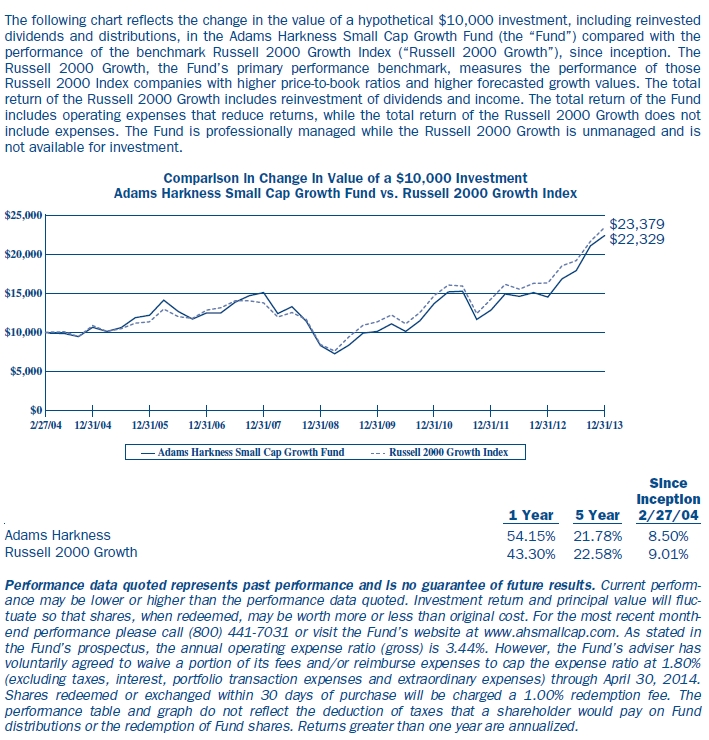
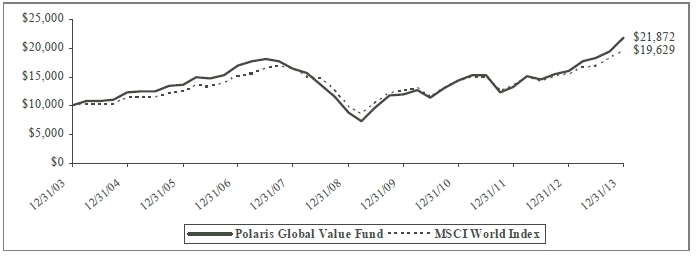
The following chart reflects the change in the value of a hypothetical $10,000 investment, including reinvested dividends and distributions, in Polaris Global Value Fund (the “Fund”) compared with the performance of the benchmark, MSCI World Index, over the past ten fiscal years. The MSCI World Index measures the performance of a diverse range of 24 developed countries’ stock markets including the United States, Canada, Europe, the Middle East and the Pacific. The total return of the MSCI World Index includes the reinvestment of dividends and income. The total return of the Fund includes operating expenses that reduce returns, while the total return of the MSCI World Index does not include expenses. The Fund is professionally managed while the MSCI World Index is unmanaged and is not available for investment.Polaris Global Value Fund vs. MSCI World Index