As filed with the Securities and Exchange Commission on August 29, 2014
UNITED STATES
SECURITIES AND EXCHANGE COMMISSION
WASHINGTON, D.C. 20549
FORM N-CSR
CERTIFIED SHAREHOLDER REPORT OF REGISTERED MANAGEMENT
INVESTMENT COMPANIES
Investment Company Act file number 811-03023
FORUM FUNDS
Three Canal Plaza, Suite 600
Portland, Maine 04101
Stacey E. Hong, Principal Executive Officer
Three Canal Plaza, Suite 600
Portland, Maine 04101
207-347-2000
Date of fiscal year end: June 30
Date of reporting period: July 1, 2013 – June 30, 2014
ITEM 1. REPORT TO STOCKHOLDERS.
A MESSAGE TO OUR SHAREHOLDERS (Unaudited)
AUXIER FOCUS FUND
PERFORMANCE UPDATE
June 30, 2014
| | ANNUALIZED | |
| | | Inception * | Ten Year | Five Year | Three Year | One Year | |
| | Auxier Focus Fund Investor Class Shares | 7.60% | 7.40% | 13.93% | 10.95% | 15.43% | |
| | S&P 500 Index | 4.20% | 7.78% | 18.83% | 16.58% | 24.61% | |
| | CUMULATIVE | |
| | | Inception * | Ten Year | Five Year | Three Year | One Year | |
| | Auxier Focus Fund Investor Class Shares | 199.54% | 104.15% | 91.92% | 36.60% | 15.43% | |
| | S&P 500 Index | 85.07% | 111.59% | 136.98% | 58.46% | 24.61% | |
| | * Fund inception: July 9, 1999 | | | | | |
Performance data quoted represents past performance and is no guarantee of future results. Current performance may be lower or higher than the performance data quoted. Investment return and principal value will fluctuate so that an investor's shares, when redeemed, may be worth more or less than original cost. As stated in the current prospectus, the Fund’s Investor Class Share’s annual operating expense ratio (gross) is 1.28%. The Fund’s adviser has contractually agreed to waive a portion of its fee and/or reimburse Fund expenses to limit total annual operating expenses (excluding all taxes, interest, portfolio transaction expenses, dividend expenses on short sales and extraordinary expenses) to 1.25%, through October 31, 2015. Other share classes may vary. The Fund charges a 2.0% redemption fee on shares redeemed within six months of purchase. For the most recent month-end performance, please call (877)328-9437 or visit the Adviser’s website at www.auxierasset.com. The recent growth rate in the stock market has helped to produce short-term returns that are not typical and may not continue in the future.
Summer 2014 Market Commentary
Auxier Focus Fund returned 3.96% for the second quarter. The Fund’s stockholdings gained 5.46%, outpacing the corresponding returns of 5.23% for Standard and Poor’s 500 Stock Index and 2.83% for the Dow Jones Industrial Average. Foreign stocks comprised about 18% of the Fund portfolio. Note that since inception in 1999, Auxier Focus’ stock exposure has averaged 72%, a much lower risk stance than the S&P 500 and Dow Jones Industrial Average (both 100% invested in stocks). Yet we nonetheless outperformed both indices for the period. A hypothetical $10,000 investment in the Fund on July 9, 1999 through June 30, 2014 would have grown to $29,954. That’s 61% more than the S&P 500’s $18,507 and 39% better than the Dow’s $21,484 for a similar investment.
July 2014 marks the Fund’s 15th anniversary. That period included two 40% market corrections; and the worst recorded ten-year U.S. market returns (1999-2009); and numerous mega-cap financial institutions being wiped out. Since 1999 we have sought to match good markets and outperform in flat and declining markets. The power of compounding is so underappreciated. We strive to keep it going and keep shareholders in the game longer term by identifying, quantifying and minimizing risk. We have over thirty years of experience navigating numerous market downturns, a healthy respect for the extremes in market behavior and a systematic approach based on price and value.
The benefits of such bargain hunting, compounded over decades, are illustrated by a recent James Cullen study. He found that a $1 million investment in the S&P 500 in 1968 grew to $79 million by the end of 2013. Sounds mighty impressive until you learn that $1 million invested in the 20% of the S&P 500 with the lowest price-to-earnings ratio correspondingly multiplied to $578 million, a sixfold return advantage. Yes, it’s difficult to buy the unloved, especially in roaring up markets. History, however, shows that investors consistently overpay to get rich quick. Then they tend to suffer as their portfolio is “torpedoed” by high priced, high expectation momentum stocks that fall short and crash, interrupting the compounding process.
1
A MESSAGE TO OUR SHAREHOLDERS (Unaudited)
Reduced Purchasing Power’s Insidious Risk
Those enormous returns reported in Cullen’s study include of course lots of inflation. Over the past 50 years, investors would have needed a sevenfold return just to maintain the purchasing power of their original investment. For example, it would take over 30 years after tax to double your money with a ten-year U.S. Treasury Bond yielding a recent 2.5%.
The Fed’s pro-inflation policies are starting to work. The seeds of inflation are showing up in skilled labor shortages. According to the Department of Labor, more than half of the country’s tradesmen are over 45. Shortages of carpenters, welders, plumbers and cement masons are driving wages and benefits higher. Baby boomers are big travelers and look at the prices of rental cars, airfares, lodging etc. People are demanding better quality food, pushing up costs and prices. Meat prices are soaring. California, one of the biggest producers of agricultural products, is suffering drought in 82% of the state. To stay ahead of inflation, we seek businesses that have stable demand, nominal mandatory capital spending needs, sustainable pricing, high rates of return on capital and excess cash flow. We firmly believe that investors need to seek investments with potential to be double to triple plays over a number of years—not months—to maintain purchasing power while deferring tax burdens. In 1949, the U.S. Treasury ten-year note yield dropped to under 2.8%. The decade following was one of the best in history for stocks, while bonds endured a principal-depleting bear market that continued through 1981.
The Portfolio
So far in 2014 merger activity has accelerated as deals totaling $771 billion have been announced. U.S. corporations are sitting on close to $2 trillion in cash with access to very cheap credit. In past cycles we have benefited as our portfolio typically has companies with attributes attractive to both corporate and private equity buyers. High return businesses sporting high free cash flow yields often become targets. DIRECTV is a recent example. In addition, tax inversions are the current craze. In this maneuver, U.S. companies are buying competitors domiciled in lower tax countries and then moving headquarters to take advantage of the lower tax rates. Fund stockholdings that are impacted include AbbVie, Medtronic and Hospira. Activist investors are also adding positive catalysts to our positions like Pepsico, Bank of New York and Dow Chemical. On the downside, retailers in general continue to suffer from excess supply in retail space and the transition to online shopping.

Fetching Bargains Among Unfashionable Stocks
Looking across the investment spectrum, the plethora of U.S. initial public offerings (IPOs) look overpriced (e.g., biotechs and internet stocks) with many trading over fourteen times sales (versus less than 1.6 times sales for the S&P 500). The proliferation of “covenant lite” bonds adds to the risk in junk bonds. Liquidity in corporate bonds has shrunk so much (by some estimates 70% since 2007) that the Federal Reserve has floated the idea of backend surrender charges levied when you sell bond funds. High quality bonds suffer from the potential for principal loss if rates rise together with the long-term loss of purchasing power. Some bond rates in Europe are at low levels not seen in 300 years. Investors scrambling for yield have bid up shares of electric utilities that suffer from negative cash flows in the face of major capital spending programs. In the 1980s, we enjoyed tremendous bargain opportunities in utility stocks. Many had crashed from cost overruns as the industry embarked on record nuclear power plant construction in an environment of high oil prices. The ratepayers refused to cover the costs and shareholders were hammered, which created outstanding buys.
We continue to believe that the best approach today is to be very selective, flexible and focused on quality businesses that have temporarily fallen out of favor with the investment community. Managements’ capital allocation needs to be monitored closely in higher markets. A recent example of value-added managerial behavior took place with America Movil, run by Carlos Slim and family. The headlines were extremely negative in the midst of a Mexican telecom deregulation. At the same time AT&T was liquidating a multibillion dollar position in America Movil. The Slim family proceeded to step up and buy over $5 billion worth of their stock with family money. They then aggressively started breaking up the Mexican operations.
2
A MESSAGE TO OUR SHAREHOLDERS (Unaudited)
This is a family with generations of experience and an outstanding record of deploying capital in times of distress. The bad news had driven the price of the stock to an attractive 11 times earnings. This was a bargain for a proven capital allocator that has consistently reinvested in the business. Molson Coors is another example of a business with heavy family ownership that has endured for centuries and has been quietly executing and innovating in an unexciting industry. We like companies whose leadership has heavy ownership, steadfast focus on building the business and a history of executing for the long term—not in building to sell or in cashing out stock options.
Lessons Learned Over the Fund’s First 15 Years
- Better to focus on the direction of a company’s underlying cash flows than on stated earnings.
- Talk is cheap. Understand the accounting and start with numbers. Promoters come out of the woodwork when rates are low and investors blindly stretch for yield.
- Overpaying and over-borrowing. Both are recurring investment sins that consistently destroy shareholder value.
- Look for skin in the game. Barron’s recently reported that half of U.S. mutual fund managers had zero invested in their funds. The average tenure is less than five years.
- Bigger is not safer. The balance sheet needs to be monitored closely as big firms often employ excessive leverage in good times. In 2008, many of the so called “blue chip” financials were leveraging up over 70 to 1. Banks had some of the best dividends but were built on a foundation of borrowed money.
- There are no shortcuts in risk management. Our daily research commitment strives to increase odds, reduce risk and maintain the compounding process. Price discovery is paramount.
- Humility, a rational temperament and a long-term orientation are crucial to surviving and thriving in the changing auction markets.
We appreciate your trust.
Sincerely,
Jeff Auxier
Fund returns (i) assume the reinvestment of all dividends and capital gain distributions and (ii) would have been lower during the period if certain fees and expenses had not been waived. Performance shown is for the Fund’s Investor Class shares; returns for other share classes will vary. Performance for Investor Class shares for periods prior to December 10, 2004 reflects performance of the applicable share class of Auxier Focus Fund, a series of Unified Series Trust (the “Predecessor Fund”). Prior to January 3, 2003, the Predecessor Fund was a series of Ameriprime Funds. The performance of the Fund’s Investor Class shares for the period prior to December 10, 2004 reflects the expenses of the Predecessor Fund.
The Fund may invest in value and/or growth stocks. Investments in value stocks are subject to risk that their intrinsic value may never be realized and investments in growth stocks may be susceptible to rapid price swings, especially during periods of economic uncertainty. In addition, the Fund may invest in mid-sized companies which generally carry greater risk than is customarily associated with larger companies. Moreover, if the Fund's portfolio is overweighted in a sector, any negative development affecting that sector will have a greater impact on the Fund than a fund that is not overweighted in that sector. An increase in interest rates typically causes a fall in the value of a debt security (Fixed-Income Securities Risk) with corresponding changes to the Fund’s value. Foreign securities are subject to additional risks including international trade, currency, political, regulatory and diplomatic risks
The S&P 500 Index is a broad-based, unmanaged measurement of changes in stock market conditions based on 500 widely held common stocks. The Dow Jones Industrial Average is a price-weighted average of 30 significant stocks traded on the New York Stock Exchange and the Nasdaq. One cannot invest directly in an index or average
Price-to-earnings ratio is a valuation ratio of a company's current share price compared to its per-share earnings.
3
A MESSAGE TO OUR SHAREHOLDERS (Unaudited)
The views in this shareholder letter were those of the Fund Manager as of the letter’s publication date and may not reflect his views on the date this letter is first distributed or anytime thereafter. These views are intended to assist readers in understanding the Fund’s investment methodology and do not constitute investment advice
4
PERFORMANCE CHART AND ANALYSIS (Unaudited)
The following chart reflects the change in the value of a hypothetical $10,000 investment in Investor Shares, including reinvested dividends and distributions, in the Fund compared with the performance of the benchmark, the S&P 500 Index ("S&P 500"), over the past ten fiscal years. The S&P 500 is a broad-based, unmanaged measurement of changes in stock market conditions based on the average of 500 widely held common stocks. The total return of the Fund's classes includes the maximum sales charge of 5.75% (A Shares only) and operating expenses that reduce returns, while the total return of the S&P 500 does not include the effect of sales charges and expenses. A Shares are subject to a 1.00% contingent deferred sales charge on shares purchased without an initial sales charge and redeemed less than one year after purchase. The total return of the S&P 500 includes the reinvestment of dividends and income. The total return of the Fund includes operating expenses that reduce returns, while the total return of the S&P 500 does not include expenses. The Fund is professionally managed while the S&P 500 is unmanaged and is not available for investment.
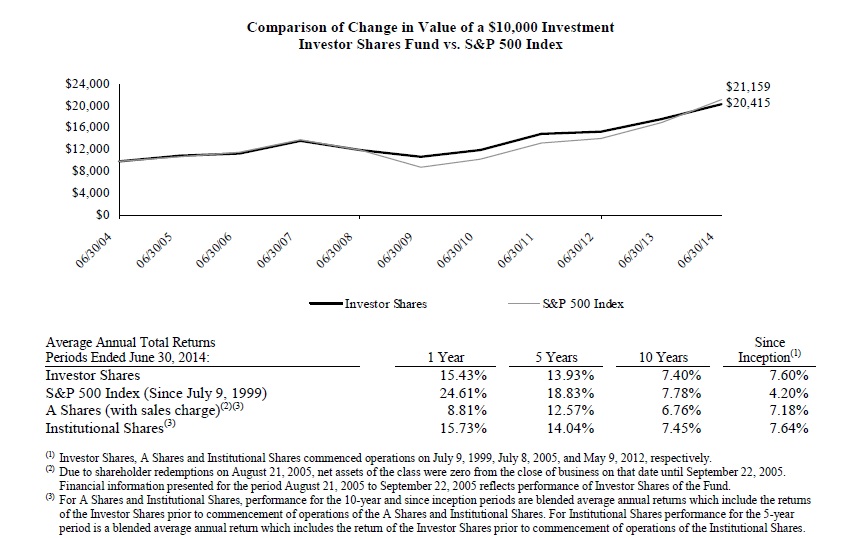
Performance data quoted represents past performance and is no guarantee of future results. Current performance may be lower or higher than the performance data quoted. Investment return and principal value will fluctuate so that shares, when redeemed, may be worth more or less than original cost. For the most recent month-end performance, please visit the website of the Fund's investment adviser at www.auxierasset.com or call (877) 328-9437. As stated in the Fund's prospectus, the annual operating expense ratios (gross) for Institutional Shares, Investor Shares and A Shares are 1.55%, 1.28% and 1.62%, respectively. However, the Fund's adviser has contractually agreed to waive a portion of its fees and/or to reimburse expenses to limit total annual fund operating expenses (excluding all taxes, interest, portfolio transaction expenses, dividend expenses on short sales, and extraordinary expenses) to 1.00%, 1.25% and 1.25% for Institutional Shares, Investor Shares and A Shares,respectively through October 31, 2015. Shares redeemed or exchanged within 180 days of purchase will be charged a 2.00% redemption fee. The performance table and graph do not reflect the deduction of taxes that a shareholder would pay on Fund distributions or the redemption of Fund shares. Returns greater than one year are annualized.
Performance for Investor Shares for periods prior to December 10, 2004, reflects performance and expenses of Auxier Focus Fund, a series of Unified Series Trust (the “Predecessor Fund”). Prior to January 3, 2003, the Predecessor Fund was a series of Ameriprime Funds.
5
| Shares | | Security Description | | | | Value | |
| | | | | | | | |
| Common Stock - 90.8% | | | | | | | |
| Communications - 7.2% | | | | | | | |
| | 290,875 | | America Movil SAB de CV, ADR | | | | $ | 6,035,656 | |
| | 23,834 | | Cisco Systems, Inc. | | | | | 592,275 | |
| | 276,750 | | Corning, Inc. | | | | | 6,074,663 | |
| | 15,499 | | DIRECTV (a) | | | | | 1,317,570 | |
| | 1,100 | | eBay, Inc. (a) | | | | | 55,066 | |
| | 388,000 | | Telefonica SA, ADR | | | | | 6,658,080 | |
| | 10,000 | | Twenty-First Century Fox, Inc., Class A | | | | | 351,500 | |
| | 3,000 | | Viacom, Inc., Class B | | | | | 260,190 | |
| | | | | | | | | 21,345,000 | |
| Consumer Discretionary - 11.1% | | | | | | |
| | 132,579 | | Apollo Education Group, Inc. (a) | | | | | 4,143,094 | |
| | 95,150 | | Arcos Dorados Holdings, Inc. | | | | | 1,065,680 | |
| | 39,380 | | Coach, Inc. | | | | | 1,346,402 | |
| | 37,860 | | Comcast Corp., Class A | | | | | 2,032,325 | |
| | 47,694 | | CST Brands, Inc. | | | | | 1,645,443 | |
| | 51,490 | | CVS Caremark Corp. | | | | | 3,880,801 | |
| | 1,547 | | Discovery Communications, Inc., Class A (a) | | | | | 114,911 | |
| | 1,547 | | Discovery Communications, Inc., Class C (a) | | | | | 112,297 | |
| | 13,875 | | General Motors Co. | | | | | 503,663 | |
| | 164,150 | | H&R Block, Inc. | | | | | 5,502,308 | |
| | 249,878 | | Lincoln Educational Services Corp. | | | | | 1,121,952 | |
| | 23,850 | | Lowe's Cos., Inc. | | | | | 1,144,561 | |
| | 10,750 | | McDonald's Corp. | | | | | 1,082,955 | |
| | 3,250 | | Sally Beauty Holdings, Inc. (a) | | | | | 81,510 | |
| | 1,176 | | The Andersons, Inc. | | | | | 60,658 | |
| | 5,725 | | The Home Depot, Inc. | | | | | 463,496 | |
| | 290 | | Time Warner Cable, Inc. | | | | | 42,717 | |
| | 12,650 | | Time Warner, Inc. | | | | | 888,663 | |
| | 6,185 | | Vitamin Shoppe, Inc. (a) | | | | | 266,079 | |
| | 61,000 | | Wal-Mart Stores, Inc. | | | | | 4,579,270 | |
| | 116,102 | | Weight Watchers International, Inc. | | | | | 2,341,777 | |
| | 8,600 | | Yum! Brands, Inc. | | | | | 698,320 | |
| | | | | | | | | 33,118,882 | |
| Consumer Staples - 28.7% | | | | | | | | |
| | 36,600 | | AbbVie, Inc. | | | | | 2,065,704 | |
| | 3,400 | | Alkermes PLC (a) | | | | | 171,122 | |
| | 441,378 | | Alliance One International, Inc. (a) | | | | | 1,103,445 | |
| | 62,500 | | Altria Group, Inc. | | | | | 2,621,250 | |
| | 143,647 | | Avon Products, Inc. | | | | | 2,098,683 | |
| | 19,200 | | Baxter International, Inc. | | | | | 1,388,160 | |
| | 15,100 | | British American Tobacco PLC, ADR | | | | | 1,798,108 | |
| | 13,200 | | Coca-Cola HBC AG, ADR (a) | | | | | 300,300 | |
| | 21,580 | | Community Health Systems, Inc. (a) | | | | | 979,084 | |
| | 54,435 | | ConAgra Foods, Inc. | | | | | 1,615,631 | |
| | 8,785 | | Diageo PLC, ADR | | | | | 1,118,067 | |
| | 35,050 | | Dr. Pepper Snapple Group, Inc. | | | | | 2,053,229 | |
| | 49,228 | | Express Scripts Holding Co. (a) | | | | | 3,412,977 | |
| | 108,258 | | Hospira, Inc. (a) | | | | | 5,561,213 | |
| | 20,100 | | Kelly Services, Inc., Class A | | | | | 345,117 | |
| | 181,832 | | Molson Coors Brewing Co., Class B | | | | | 13,484,661 | |
| | 13,100 | | Monster Beverage Corp. (a) | | | | | 930,493 | |
| | 108,710 | | PepsiCo, Inc. | | | | | 9,712,151 | |
| | 76,400 | | Philip Morris International, Inc. | | | | | 6,441,284 | |
| | 548,921 | | Tesco PLC, ADR | | | | | 8,041,693 | |
| | 66,500 | | The Coca-Cola Co. | | | | | 2,816,940 | |
| | 1,100 | | The JM Smucker Co. | | | | | 117,227 | |
| | 119,084 | | The Kroger Co. | | | | | 5,886,322 | |
| | 45,925 | | The Procter & Gamble Co. | | | | | 3,609,246 | |
| | 215,090 | | The Western Union Co. | | | | | 3,729,661 | |
| | | | | | | | | | |
| Shares | | Security Description | | | | Value | |
| | | | | | | | | | |
| | 96,000 | | Unilever NV, ADR | | | | $ | 4,200,960 | |
| | | | | | | | | 85,602,728 | |
| Energy - 5.4% | | | | | | | | |
| | 10,235 | | Apache Corp. | | | | | 1,029,846 | |
| | 143,710 | | BP PLC, ADR | | | | | 7,580,702 | |
| | 16,750 | | Chevron Corp. | | | | | 2,186,712 | |
| | 15,600 | | ConocoPhillips | | | | | 1,337,388 | |
| | 9,200 | | Exxon Mobil Corp. | | | | | 926,256 | |
| | 800 | | Lukoil OAO, ADR | | | | | 47,856 | |
| | 11,700 | | Petroleo Brasileiro SA, ADR | | | | | 171,171 | |
| | 7,800 | | Phillips 66 | | | | | 627,354 | |
| | 1,100 | | Royal Dutch Shell PLC, ADR | | | | | 90,607 | |
| | 22,550 | | Transocean, Ltd. | | | | | 1,015,427 | |
| | 19,100 | | Valero Energy Corp. | | | | | 956,910 | |
| | | | | | | | | 15,970,229 | |
| Financials - 15.3% | | | | | | | | |
| | 42,250 | | Aflac, Inc. | | | | | 2,630,063 | |
| | 39,000 | | American International Group, Inc. | | | | | 2,128,620 | |
| | 1,280 | | Ameriprise Financial, Inc. | | | | | 153,600 | |
| | 186,683 | | Bank of America Corp. | | | | | 2,869,318 | |
| | 16,000 | | Berkshire Hathaway, Inc., Class B (a) | | | | | 2,024,960 | |
| | 570 | | Capital One Financial Corp. | | | | | 47,082 | |
| | 76,724 | | Central Pacific Financial Corp. | | | | | 1,522,971 | |
| | 23,050 | | Citigroup, Inc. | | | | | 1,085,655 | |
| | 123,593 | | Credit Suisse Group AG, ADR | | | | | 3,506,333 | |
| | 80,175 | | Franklin Resources, Inc. | | | | | 4,637,322 | |
| | 24,900 | | Legg Mason, Inc. | | | | | 1,277,619 | |
| | 51,390 | | Marsh & McLennan Cos., Inc. | | | | | 2,663,030 | |
| | 61,950 | | MasterCard, Inc., Class A | | | | | 4,551,467 | |
| | 12,745 | | Mercury General Corp. | | | | | 599,525 | |
| | 500 | | The Allstate Corp. | | | | | 29,360 | |
| | 227,600 | | The Bank of New York Mellon Corp. | | | | | 8,530,448 | |
| | 38,418 | | The Travelers Cos., Inc. | | | | | 3,613,981 | |
| | 7,350 | | U.S. Bancorp | | | | | 318,402 | |
| | 3,974 | | Unum Group | | | | | 138,136 | |
| | 7,900 | | Visa, Inc., Class A | | | | | 1,664,609 | |
| | 23,000 | | Waddell & Reed Financial, Inc., Class A | | | | | 1,439,570 | |
| | 500 | | Wells Fargo & Co. | | | | | 26,280 | |
| | | | | | | | | 45,458,351 | |
| Health Care - 14.7% | | | | | | | | |
| | 42,600 | | Abbott Laboratories | | | | | 1,742,340 | |
| | 25,700 | | Becton Dickinson and Co. | | | | | 3,040,310 | |
| | 52,725 | | GlaxoSmithKline PLC, ADR | | | | | 2,819,733 | |
| | 50,950 | | Johnson & Johnson | | | | | 5,330,389 | |
| | 1,100 | | Laboratory Corp. of America Holdings (a) | | | | | 112,640 | |
| | 98,153 | | Medtronic, Inc. | | | | | 6,258,235 | |
| | 106,610 | | Merck & Co., Inc. | | | | | 6,167,388 | |
| | 63,782 | | Pfizer, Inc. | | | | | 1,893,050 | |
| | 54,267 | | Quest Diagnostics, Inc. | | | | | 3,184,930 | |
| | 63,674 | | UnitedHealth Group, Inc. | | | | | 5,205,350 | |
| | 27,221 | | WellPoint, Inc. | | | | | 2,929,252 | |
| | 49,400 | | Zimmer Holdings, Inc. | | | | | 5,130,684 | |
| | | | | | | | | 43,814,301 | |
| Industrials - 1.6% | | | | | | | | |
| | 21,550 | | AGCO Corp. | | | | | 1,211,541 | |
| | 22,030 | | Brady Corp., Class A | | | | | 658,036 | |
| | 19,000 | | General Electric Co. | | | | | 499,320 | |
| | 12,500 | | Raytheon Co. | | | | | 1,153,125 | |
| | 3,500 | | Textainer Group Holdings, Ltd. | | | | | 135,170 | |
| | 2,550 | | The Boeing Co. | | | | | 324,436 | |
| | | | | | | | | | |
See Notes to Financial Statements. 6
| Shares | | Security Description | | | | Value | |
| | | | | | | | | | |
| | 8,515 | | United Parcel Service, Inc., Class B | | | | $ | 874,150 | |
| | | | | | | | | 4,855,778 | |
| Information Technology - 3.9% | | | | | | |
| | 52,325 | | Intel Corp. | | | | | 1,616,842 | |
| | 159,114 | | Microsoft Corp. | | | | | 6,635,054 | |
| | 82,320 | | Oracle Corp. | | | | | 3,336,430 | |
| | | | | | | | | 11,588,326 | |
| Materials - 2.4% | | | | | | | | |
| | 28,050 | | E.I. du Pont de Nemours & Co. | | | | | 1,835,592 | |
| | 7,000 | | LyondellBasell Industries NV, Class A | | | | | 683,550 | |
| | 19,175 | | Newmont Mining Corp. | | | | | 487,812 | |
| | 6,400 | | Precision Castparts Corp. | | | | | 1,615,360 | |
| | 47,350 | | The Dow Chemical Co. | | | | | 2,436,631 | |
| | 14,000 | | Vale SA, ADR | | | | | 185,220 | |
| | | | | | | | | 7,244,165 | |
| Telecommunications - 0.4% | | | | | | |
| | 27,300 | | AT&T, Inc. | | | | | 965,328 | |
| | 7,335 | | Verizon Communications, Inc. | | | | | 358,902 | |
| | | | | | | | | 1,324,230 | |
| Utilities - 0.1% | | | | | | | | |
| | 5,616 | | FirstService Corp. | | | | | 284,113 | |
Total Common Stock (Cost $183,017,581) | | | | | | | 270,606,103 | |
| Rights - 0.0% | | | | | | | | |
| | 310,867 | | Community Health Systems, Inc. (a) (Cost $0) | | | | | 20,797 | |
Total Equity Securities (Cost $183,017,581) | | | | | | | 270,626,900 | |
| | | | | | | | | | |
| Principal | | | Rate | Maturity | | | |
| | | | | | | | | | |
| Corporate Non-Convertible Bonds - 0.1% | | | | | | |
| Materials - 0.1% | | | | | | | | |
| $ | 200,000 | | Newmont Mining Corp. (Cost $187,777) | 3.50% | 03/15/22 | | $ | 193,150 | |
| | | | | | | | | | |
| | | | | | | | | | |
| | | | | | | | | | |
| | | | | | | | | | |
| Municipal Bonds - 0.1% | | | | | | | | |
| Ohio - 0.1% | | | | | | | | |
| | 550,000 | | Buckeye Tobacco Settlement Financing Authority (Cost $376,998) | 5.88 | 06/01/47 | | | 437,481 | |
| | | | | | | | | | |
Total Fixed Income Securities (Cost $564,775) | | | | | 630,631 | |
Total Investments - 91.0% (Cost $183,582,356)* | | | | $ | 271,257,531 | |
| Other Assets & Liabilities, Net – 9.0% | | | | | 26,945,962 | |
| Net Assets – 100.0% | | | | | | $ | 298,203,493 | |
| ADR | American Depositary Receipt |
| PLC | Public Limited Company |
| (a) | Non-income producing security. |
| | * Cost for federal income tax purposes is $183,585,566 and net unrealized appreciation consists of: |
| Gross Unrealized Appreciation | | $ | 95,664,659 | |
| Gross Unrealized Depreciation | | | (7,992,694 | ) |
| Net Unrealized Appreciation | | $ | 87,671,965 | |
The following is a summary of the inputs used to value the Fund’s investments as of June 30, 2014.
The inputs or methodology used for valuing securities are not necessarily an indication of the risks associated with investing in those securities. For more information on valuation inputs, and their aggregation into the levels used in the table below, please refer to the Security Valuation section in Note 2 of the accompanying Notes to Financial Statements.
| | Level 1 | | Level 2 | | Level 3 | | Total |
| Investments At Value |
| Common Stock | | | | | | | | | | | | | | | | |
| Communications | | $ | 21,345,000 | | | $ | - | | | $ | - | | | $ | 21,345,000 | |
| Consumer Discretionary | | | 33,118,882 | | | | - | | | | - | | | | 33,118,882 | |
| Consumer Staples | | | 85,602,728 | | | | - | | | | - | | | | 85,602,728 | |
| Energy | | | 15,970,229 | | | | - | | | | - | | | | 15,970,229 | |
| Financials | | | 45,458,351 | | | | - | | | | - | | | | 45,458,351 | |
| Health Care | | | 43,814,301 | | | | - | | | | - | | | | 43,814,301 | |
| Industrials | | | 4,855,778 | | | | - | | | | - | | | | 4,855,778 | |
| Information Technology | | | 11,588,326 | | | | - | | | | - | | | | 11,588,326 | |
| Materials | | | 7,244,165 | | | | - | | | | - | | | | 7,244,165 | |
| Telecommunications | | | 1,324,230 | | | | - | | | | - | | | | 1,324,230 | |
| Utilities | | | 284,113 | | | | - | | | | - | | | | 284,113 | |
| Corporate Non-Convertible Bonds | | | - | | | | 193,150 | | | | - | | | | 193,150 | |
| Municipal Bonds | | | - | | | | 437,481 | | | | - | | | | 437,481 | |
| Rights | | | 20,797 | | | | - | | | | - | | | | 20,797 | |
| Total Assets | | $ | 270,626,900 | | | $ | 630,631 | | | | - | | | $ | 271,257,531 | |
The Fund utilizes the end of period methodology when determining transfers. There were no transfers among Level 1, Level 2 and Level 3 for the year ended June 30, 2014.
AFA
| PORTFOLIO HOLDINGS | | | |
| % of Net Assets | | | |
| Common Stock | | | 90.8 | % |
| Corporate Non-Convertible Bonds | | | 0.1 | % |
| Municipal Bonds | | | 0.1 | % |
| Rights | | | 0.0 | % |
| Cash and Other Net Assets | | | 9.0 | % |
| | | | 100.0 | % |
AFA
See Notes to Financial Statements. 7
STATEMENT OF ASSETS AND LIABILITIES
| | | | | | |
| ASSETS | | | | |
| | Total investments, at value (Cost $183,582,356) | | $ | 271,257,531 | |
| | Cash | | | 25,982,938 | |
| | Receivables: | | | | |
| | Fund shares sold | | | 450,589 | |
| | Investment securities sold | | | 495,636 | |
| | Dividends and interest | | | 641,458 | |
| | Prepaid expenses | | | 24,288 | |
| Total Assets | | | 298,852,440 | |
| | | | | | |
| LIABILITIES | | | | |
| | Payables: | | | | |
| | Investment securities purchased | | | 51,928 | |
| | Fund shares redeemed | | | 282,414 | |
| | Accrued Liabilities: | | | | |
| | Investment adviser fees | | | 244,907 | |
| | Trustees’ fees and expenses | | | 185 | |
| | Fund services fees | | | 31,579 | |
| | Other expenses | | | 37,934 | |
| Total Liabilities | | | 648,947 | |
| | | | | | |
| NET ASSETS | | $ | 298,203,493 | |
| | | | | | |
| COMPONENTS OF NET ASSETS | | | | |
| | Paid-in capital | | $ | 202,925,910 | |
| | Undistributed net investment income | | | 1,537,864 | |
| | Accumulated net realized gain | | | 6,064,544 | |
| | Net unrealized appreciation | | | 87,675,175 | |
| NET ASSETS | | $ | 298,203,493 | |
| | | | | | |
| SHARES OF BENEFICIAL INTEREST AT NO PAR VALUE (UNLIMITED SHARES AUTHORIZED) | | | | |
| | Investor Shares | | | 13,736,373 | |
| | A Shares | | | 245,027 | |
| | Institutional Shares | | | 382,655 | |
| | | | | | |
NET ASSET VALUE, OFFERING AND REDEMPTION PRICE PER SHARE* | | | | |
| | Investor Shares (based on net assets of $285,094,375) | | $ | 20.75 | |
| | A Shares (based on net assets of $5,107,641) | | $ | 20.85 | |
| | A Shares Maximum Public Offering Price Per Share (net asset value per share/(100%-5.75%)) | | $ | 22.12 | |
| | Institutional Shares (based on net assets of $8,001,477) | | $ | 20.91 | |
| * | Shares redeemed or exchanged within 180 days of purchase are charged a 2.00% redemption fee. |
See Notes to Financial Statements. 8
| | | | | |
| INVESTMENT INCOME | | | | |
| Dividend income (Net of foreign withholding taxes of $81,491) | | $ | 6,218,343 | |
| Interest income | | | 498,306 | |
| Total Investment Income | | | 6,716,649 | |
| Adviser | | | | |
| EXPENSES | | | | |
| Investment adviser fees | | | 3,008,313 | |
| Fund services fees | | | 365,417 | |
| Transfer agent fees: | | | | |
| Investor Shares | | | 78,799 | |
| A Shares | | | 1,350 | |
| Institutional Shares | | | 126 | |
| Distribution fees: | | | | |
| A Shares | | | 8,863 | |
| Custodian fees | | | 30,241 | |
| Registration fees: | | | | |
| Investor Shares | | | 19,233 | |
| A Shares | | | 4,772 | |
| Institutional Shares | | | 13,604 | |
| Professional fees | | | 48,787 | |
| Trustees' fees and expenses | | | 11,541 | |
| Miscellaneous expenses | | | 220,293 | |
| Total Expenses | | | 3,811,339 | |
| Fees waived and expenses reimbursed | | | (108,940 | ) |
| Net Expenses | | | 3,702,399 | |
| | | | | |
| NET INVESTMENT INCOME | | | 3,014,250 | |
| | | | | |
| NET REALIZED AND UNREALIZED GAIN (LOSS) | | | | |
| Net realized gain on: | | | | |
| Investments | | | 9,279,954 | |
| Foreign currency transactions | | | 48,101 | |
| Net realized gain | | | 9,328,055 | |
| Net change in unrealized appreciation (depreciation) on Investments | | | 30,624,138 | |
| NET REALIZED AND UNREALIZED GAIN | | | 39,952,193 | |
| INCREASE IN NET ASSETS RESULTING FROM OPERATIONS | | $ | 42,966,443 | |
| | | | | |
See Notes to Financial Statements. 9
STATEMENTS OF CHANGES IN NET ASSETS
| | | | | For the Year Ended June 30, 2014 | | For the Year Ended June 30, 2013 | |
| OPERATIONS | | | | | | Shares | | | | | | | Shares | | |
| | Net investment income | | $ | 3,014,250 | | | | | | $ | 3,245,945 | | | | | |
| | Net realized gain | | | 9,328,055 | | | | | | | 3,805,431 | | | | | |
| | Net change in unrealized appreciation (depreciation) | | | 30,624,138 | | | | | | | 30,379,936 | | | | | |
| Increase in Net Assets Resulting from Operations | | | 42,966,443 | | | | | | | 37,431,312 | | | | | |
| | | | | | | | | | | | | | | | | | |
| DISTRIBUTIONS TO SHAREHOLDERS FROM | | | | | | | | | | | | | | | |
| | Net investment income: | | | | | | | | | | | | | | | |
| | | Investor Shares | | | (3,247,269 | ) | | | | | | (3,345,187 | ) | | | | |
| | | A Shares | | | (30,251 | ) | | | | | | (20,863 | ) | | | | |
| | | Institutional Shares | | | (66,782 | ) | | | | | | (25,206 | ) | | | | |
| | Net realized gain: | | | | | | | | | | | | | | | |
| | | Investor Shares | | | (6,549,711 | ) | | | | | | (1,800,956 | ) | | | | |
| | | A Shares | | | (73,681 | ) | | | | | | (13,195 | ) | | | | |
| | | Institutional Shares | | | (149,889 | ) | | | | | | (9,775 | ) | | | | |
| Total Distributions to Shareholders | | | (10,117,583 | ) | | | | | | (5,215,182 | ) | | | | |
| | | | | | | | | | | | | | | | | | |
| CAPITAL SHARE TRANSACTIONS | | | | | | | | | | | | | | | |
| | Sale of shares: | | | | | | | | | | | | | | | |
| | | Investor Shares | | | 39,233,303 | | | 1,999,149 | | | | 46,679,365 | | | 2,687,515 | | |
| | | A Shares | | | 2,512,274 | | | 127,528 | | | | 327,028 | | | 19,179 | | |
| | | Institutional Shares | | | 2,223,679 | | | 110,806 | | | | 4,058,596 | | | 226,829 | | |
| | Reinvestment of distributions: | | | | | | | | | | | | | | | |
| | | Investor Shares | | | 9,563,734 | | | 488,464 | | | | 5,041,540 | | | 301,707 | | |
| | | A Shares | | | 95,499 | | | 4,869 | | | | 30,079 | | | 1,797 | | |
| | | Institutional Shares | | | 216,672 | | | 11,017 | | | | 34,981 | | | 2,092 | | |
| | Redemption of shares: | | | | | | | | | | | | | | | |
| | 1 | Investor Shares | | | (72,978,455 | ) | | (3,681,662 | ) | | | (49,230,617 | ) | | (2,816,017 | ) | |
| | 2 | A Shares | | | (62,884 | ) | | (3,204 | ) | | | (132,450 | ) | | (7,863 | ) | |
| | 3 | Institutional Shares | | | (470,453 | ) | | (23,897 | ) | | | (340,053 | ) | | (18,753 | ) | |
| | Redemption fees | | | 14,278 | | | - | | | | 32,290 | | | - | | |
| Increase (Decrease) in Net Assets from Capital Share Transactions | | (19,652,353 | ) | | (966,930 | ) | | | 6,500,759 | | | 396,486 | | |
| Increase in Net Assets | | | 13,196,507 | | | | | | | 38,716,889 | | | | | |
| | | | | | | | | | | | | | | | | | |
| NET ASSETS | | | | | | | | | | | | | | | |
| | Beginning of Year | | | 285,006,986 | | | | | | | 246,290,097 | | | | | |
| | End of Year (Including line (a)) | | $ | 298,203,493 | | | | | | $ | 285,006,986 | | | | | |
| (a) | Undistributed net investment income | | $ | 1,537,864 | | | | | | $ | 1,595,099 | | | | | |
| See Notes to Financial Statements. | 10 | |
| These financial highlights reflect selected data for a share outstanding throughout each year. | | | | | | |
| | | For the Years Ended June 30, | |
| | | 2014 | | | | 2013 | | | | 2012 | | | | 2011 | | | | 2010 | | |
| INVESTOR SHARES | | | | | | | | | | | | | | | | | | | | |
| NET ASSET VALUE, Beginning of Year | $ | 18.59 | | | $ | 16.49 | | | $ | 16.45 | | | $ | 13.49 | | | $ | 12.16 | | |
| INVESTMENT OPERATIONS | | | | | | | | | | | | | | | | | | | | |
| Net investment income (a) | | 0.20 | | | | 0.21 | | | | 0.22 | | | | 0.26 | | | | 0.32 | | |
| Net realized and unrealized gain | | 2.63 | | | | 2.23 | | | | 0.20 | (b) | | 3.00 | | | | 1.27 | | |
| Total from Investment Operations | | 2.83 | | | | 2.44 | | | | 0.42 | | | | 3.26 | | | | 1.59 | | |
| DISTRIBUTIONS TO SHAREHOLDERS FROM | | | | | | | | | | | | | | | | | | |
| Net investment income | | (0.22 | ) | | | (0.22 | ) | | | (0.16 | ) | | | (0.29 | ) | | | (0.26 | ) | |
| Net realized gain | | (0.45 | ) | | | (0.12 | ) | | | (0.23 | ) | | | (0.01 | ) | | | — | | |
| Total Distributions to Shareholders | | (0.67 | ) | | | (0.34 | ) | | | (0.39 | ) | | | (0.30 | ) | | | (0.26 | ) | |
| REDEMPTION FEES (a) | | — | (c) | | — | (c) | | 0.01 | | | | — | (c) | | — | (c) |
| NET ASSET VALUE, End of Year | $ | 20.75 | | | $ | 18.59 | | | $ | 16.49 | | | $ | 16.45 | | | $ | 13.49 | | |
| TOTAL RETURN | | 15.43 | % | | 15.06 | % | | 2.84 | % | | 24.35 | % | | 12.99 | % |
| RATIOS/SUPPLEMENTARY DATA | | | | | | | | | | | | | | | | | | | | |
| Net Assets at End of Year (000's omitted) | $285,094 | | | $277,536 | | | $243,366 | | | $163,699 | | | $100,712 | | |
| Ratios to Average Net Assets: | | | | | | | | | | | | | | | | | | | | |
| Net investment income | | 1.00 | % | | 1.22 | % | | 1.36 | % | | 1.68 | % | | 2.29 | % |
| Net expense | | 1.24 | % | | 1.25 | % | | 1.25 | % | | 1.25 | % | | 1.30 | % |
| Gross expense (d) | | 1.26 | % | | 1.28 | % | | 1.27 | % | | 1.25 | % | | 1.30 | % |
| PORTFOLIO TURNOVER RATE | | 9 | % | | 11 | % | | 8 | % | | 20 | % | | 15 | % |
| | | | | | | | | | | | | | | | | | | | | | |
| (a) | Calculated based on average shares outstanding during each year. |
| (b) | The net realized and unrealized gain (loss) per share does not correlate to the aggregate of the net realized and unrealized loss in the Statement of Operations for the year ended June 30, 2012, primarily due to the timing of the sales and repurchases of the Fund's shares in relation to fluctuating market values for the Fund's portfolio. |
| (c) | Less than $0.01 per share. |
| (d) | Reflects the expense ratio excluding any waivers and/or reimbursements. |
See Notes to Financial Statements. 11
| These financial highlights reflect selected data for a share outstanding throughout each year. | | | | | | |
| | | For the Years Ended June 30, | |
| | | 2014 | | | | 2013 | | | | 2012 | | | | 2011 | | | | 2010 | | |
| A SHARES | | | | | | | | | | | | | | | | | | | | |
| NET ASSET VALUE, Beginning of Year | $ | 18.63 | | | $ | 16.49 | | | $ | 16.45 | | | $ | 13.49 | | | $ | 12.17 | | |
| INVESTMENT OPERATIONS | | | | | | | | | | | | | | | | | | | | |
| Net investment income (a) | | 0.20 | | | | 0.21 | | | | 0.22 | | | | 0.25 | | | | 0.32 | | |
| Net realized and unrealized gain | | 2.64 | | | | 2.24 | | | | 0.21 | (b) | | 3.01 | | | | 1.26 | | |
| Total from Investment Operations | | 2.84 | | | | 2.45 | | | | 0.43 | | | | 3.26 | | | | 1.58 | | |
| | | | | | | | | | | | | | | | | | | | | |
| DISTRIBUTIONS TO SHAREHOLDERS FROM | | | | | | | | | | | | | | | | | | |
| Net investment income | | (0.17 | ) | | | (0.19 | ) | | | (0.16 | ) | | | (0.29 | ) | | | (0.26 | ) | |
| Net realized gain | | (0.45 | ) | | | (0.12 | ) | | | (0.23 | ) | | | (0.01 | ) | | | — | | |
| Total Distributions to Shareholders | | (0.62 | ) | | | (0.31 | ) | | | (0.39 | ) | | | (0.30 | ) | | | (0.26 | ) | |
| REDEMPTION FEES (a) | | — | (c) | | — | (c) | | — | (c) | | — | (c) | | — | (c) |
| NET ASSET VALUE, End of Year | $ | 20.85 | | | $ | 18.63 | | | $ | 16.49 | | | $ | 16.45 | | | $ | 13.49 | | |
| TOTAL RETURN (d) | | 15.45 | % | | 15.06 | % | | 2.84 | % | | 24.35 | % | | 12.90 | % |
| RATIOS/SUPPLEMENTARY DATA | | | | | | | | | | | | | | | | | | | | |
| Net Assets at End of Year (000's omitted) | $5,108 | | | $2,158 | | | $1,694 | | | $660 | | | $157 | | |
| Ratios to Average Net Assets: | | | | | | | | | | | | | | | | | | | | |
| Net investment income | | 1.02 | % | | 1.22 | % | | 1.39 | % | | 1.61 | % | | 2.29 | % |
| Net expense | | 1.25 | % | | 1.25 | % | | 1.25 | % | | 1.25 | % | | 1.30 | % |
| Gross expense (e) | | 1.62 | % | | 1.62 | % | | 1.52 | % | | 1.50 | % | | 1.55 | % |
| PORTFOLIO TURNOVER RATE | | 9 | % | | 11 | % | | 8 | % | | 20 | % | | 15 | % |
| | | | | | | | | | | | | | | | | | | | | | |
| (a) | Calculated based on average shares outstanding during each year. |
| (b) | The net realized and unrealized gain (loss) per share does not correlate to the aggregate of the net realized and unrealized loss in the Statement of Operations for the year ended June 30, 2012, primarily due to the timing of the sales and repurchases of the Fund's shares in relation to fluctuating market values for the Fund's portfolio. |
| (c) | Less than $0.01 per share. |
| (d) | Total Return does not include the effect of front end sales charge or contingent deferred sales charge. |
| (e) | Reflects the expense ratio excluding any waivers and/or reimbursements. |
See Notes to Financial Statements. 12
| These financial highlights reflect selected data for a share outstanding throughout each period. |
| | | For the Years Ended June 30, | | May 9, 2012 (a) through | |
| | | 2014 | | | | 2013 | | | June 30, 2012 | |
| INSTITUTIONAL SHARES | | | | | | | | | | | | |
| NET ASSET VALUE, Beginning of Period | $ | 18.66 | | | $ | 16.50 | | | $ | 16.27 | | |
| INVESTMENT OPERATIONS | | | | | | | | | | | | |
| Net investment income (b) | | 0.25 | | | | 0.26 | | | | 0.04 | | |
| Net realized and unrealized gain | | 2.64 | | | | 2.22 | | | | 0.19 | | |
| Total from Investment Operations | | 2.89 | | | | 2.48 | | | | 0.23 | | |
| DISTRIBUTIONS TO SHAREHOLDERS FROM | | | | | | | | | | | | |
| Net investment income | | (0.19 | ) | | | (0.20 | ) | | | — | | |
| Net realized gain | | (0.45 | ) | | | (0.12 | ) | | | — | | |
| Total Distributions to Shareholders | | (0.64 | ) | | | (0.32 | ) | | | — | | |
| REDEMPTION FEES (b) | | — | (c) | | — | (c) | | — | (c) |
| NET ASSET VALUE, End of Period | $ | 20.91 | | | $ | 18.66 | | | $ | 16.50 | | |
| TOTAL RETURN | | 15.73 | % | | 15.28 | % | | 1.41 | %(d) |
| RATIOS/SUPPLEMENTARY DATA | | | | | | | | | | | | |
| Net Assets at End of Period (000's omitted) | $8,001 | | | $5,313 | | | $1,230 | | |
| Ratios to Average Net Assets: | | | | | | | | | | | | |
| Net investment income | | 1.25 | % | | 1.48 | % | | 1.62 | %(e) |
| Net expense | | 1.00 | % | | 1.00 | % | | 1.10 | %(e) |
| Gross expense (f) | | 1.47 | % | | 1.55 | % | | 1.50 | %(e) |
| PORTFOLIO TURNOVER RATE | | 9 | % | | 11 | % | | 8 | %(d) |
| | | | | | | | | | | | | | |
| (a) | Commencement of operations. |
| (b) | Calculated based on average shares outstanding during each period. |
| (c) | Less than $0.01 per share. |
| (d) | Not annualized. |
| (e) | Annualized. |
| (f) | Reflects the expense ratio excluding any waivers and/or reimbursements. |
See Notes to Financial Statements. 13
NOTES TO FINANCIAL STATEMENTS
The Auxier Focus Fund (the “Fund”) is a diversified portfolio of Forum Funds (the “Trust”). The Trust is a Delaware statutory trust that is registered as an open-end, management investment company under the Investment Company Act of 1940 (the “Act”), as amended. Under its Trust Instrument, the Trust is authorized to issue an unlimited number of the Fund’s shares of beneficial interest without par value.
Note 2. Summary of Significant Accounting Policies
These financial statements are prepared in accordance with accounting principles generally accepted in the United States of America (“GAAP”), which require management to make estimates and assumptions that affect the reported amounts of assets and liabilities, the disclosure of contingent liabilities at the date of the financial statements, and the reported amounts of increases and decreases in net assets from operations during the fiscal year. Actual amounts could differ from those estimates. The following summarizes the significant accounting policies of the Fund:
Security Valuation – Exchange-traded securities and over-the-counter securities are valued using the last quoted trade or official closing price, provided by independent pricing services as of the close of trading on the market or exchange for which they are primarily traded, on each Fund business day. In the absence of a sale, such securities are valued at the mean of the last bid and ask price provided by independent pricing services. Non-exchange traded securities for which quotations are available are valued using the last quoted sales price, or in the absence of a sale, at the mean of the last bid and ask prices provided by independent pricing services. Debt securities may be valued at prices supplied by a fund’s pricing agent based on broker or dealer supplied valuations or matrix pricing, a method of valuing securities by reference to the value of other securities with similar characteristics such as rating, interest rate and maturity. Shares of open-end mutual funds are valued at net asset value (“NAV”). Short-term investments that mature in 60 days or less may be valued at amortized cost.
The Fund values its investments at fair value pursuant to procedures adopted by the Trust's Board of Trustees (the "Board") if (1) market quotations are insufficient or not readily available or (2) the adviser believes that the values available are unreliable. The Trust’s Valuation Committee, as defined in the Fund’s registration statement, performs certain functions as they relate to the administration and oversight of the Fund’s valuation procedures. Under these procedures, the Valuation Committee convenes on a regular and ad-hoc basis to review such securities and considers a number of factors, including valuation methodologies and significant unobservable inputs, when arriving at fair value.
The Valuation Committee may work with the adviser to provide valuation inputs. In determining fair valuations, inputs may include market-based analytics which may consider related or comparable assets or liabilities, recent transactions, market multiples, book values and other relevant investment information. Adviser inputs may include an income-based approach in which the anticipated future cash flows of the investment are discounted in determining fair value. Discounts may also be applied based on the nature or duration of any restrictions on the disposition of the investments. The Valuation Committee performs regular reviews of valuation methodologies, key inputs and assumptions, disposition analysis and market activity.
Fair valuation is based on subjective factors and, as a result, the fair value price of an investment may differ from the security’s market price and may not be the price at which the asset may be sold. Fair valuation could result in a different Net Asset Value ("NAV") than a NAV determined by using market quotes.
The Fund has a three-tier fair value hierarchy. The basis of the tiers is dependent upon the various “inputs” used to determine the value of the Fund’s investments. These inputs are summarized in the three broad levels listed below:
Level 1 — quoted prices in active markets for identical assets and liabilities
Level 2 — other significant observable inputs (including quoted prices of similar securities, interest rates, prepayment speeds, credit risk, etc.)
Level 3 — significant unobservable inputs (including the Fund’s own assumptions in determining the fair value of investments)
14
NOTES TO FINANCIAL STATEMENTS
The aggregate value by input level, as of June 30, 2014, for the Fund’s investments is included at the end of the Fund’s Schedule of Investments.
Security Transactions, Investment Income and Realized Gain and Loss – Investment transactions are accounted for on the trade date. Dividend income is recorded on the ex-dividend date. Foreign dividend income is recorded on the ex-dividend date or as soon as possible after the Fund determines the existence of a dividend declaration after exercising reasonable due diligence. Income and capital gains on some foreign securities may be subject to foreign withholding taxes, which are accrued as applicable. Interest income is recorded on an accrual basis. Premium is amortized and discount is accreted using the effective interest method. Identified cost of investments sold is used to determine the gain and loss for both financial statement and federal income tax purposes.
Foreign Currency Translations – Foreign currency amounts are translated into U.S. dollars as follows: (1) assets and liabilities at the rate of exchange at the end of the respective period; and (2) purchases and sales of securities and income and expenses at the rate of exchange prevailing on the dates of such transactions. The portion of the results of operations arising from changes in the exchange rates and the portion due to fluctuations arising from changes in the market prices of securities are not isolated. Such fluctuations are included with the net realized and unrealized gain or loss on investments.
Distributions to Shareholders – Distributions to shareholders of net investment income and net capital gains, if any, are declared and paid at least annually. Distributions to shareholders are recorded on the ex-dividend date. Distributions are based on amounts calculated in accordance with applicable federal income tax regulations, which may differ from GAAP. These differences are due primarily to differing treatments of income and gain on various investment securities held by the Fund, timing differences and differing characterizations of distributions made by the Fund.
Federal Taxes – The Fund intends to continue to qualify each year as a regulated investment company under Subchapter M of the Internal Revenue Code and to distribute all of its taxable income to shareholders. In addition, by distributing in each calendar year substantially all of its net investment income and capital gains, if any, the Fund will not be subject to a federal excise tax. Therefore, no federal income or excise tax provision is required. The Fund files a U.S. federal income and excise tax return as required. A fund’s federal income tax returns are subject to examination by the Internal Revenue Service for a period of three fiscal years after they are filed. As of June 30, 2014, there are no uncertain tax positions that would require financial statement recognition, de-recognition, or disclosure.
Income and Expense Allocation – The Trust accounts separately for the assets, liabilities and operations of each of its investment portfolios. Expenses that are directly attributable to more than one investment portfolio are allocated among the respective investment portfolios in an equitable manner.
The Fund’s class-specific expenses are charged to the operations of that class of shares. Income and expenses (other than expenses attributable to a specific class) and realized and unrealized gains or losses on investments are allocated to each class of shares based on the class’ respective net assets to the total net assets of the Fund.
Redemption Fees – A shareholder who redeems shares within 180 days of purchase will incur a redemption fee of 2.00% of the current net asset value of shares redeemed, subject to certain limitations. The fee is charged for the benefit of the remaining shareholders and will be paid to the Fund to help offset transaction costs. The fee is accounted for as an addition to paid-in capital. The Fund reserves the right to modify the terms of or terminate the fee at any time. There are limited exceptions to the imposition of the redemption fee.
Commitments and Contingencies – In the normal course of business, the Fund enters into contracts that provide general indemnifications by the Fund to the counterparty to the contract. The Fund’s maximum exposure under these arrangements is dependent on future claims that may be made against the Fund and, therefore, cannot be estimated; however, based on experience, the risk of loss from such claims is considered remote.
Note 3. Fees and Expenses
Investment Adviser – Auxier Asset Management LLC (the “Adviser”), is the investment adviser to the Fund. Pursuant to an
15
NOTES TO FINANCIAL STATEMENTS
investment advisory agreement, the Adviser receives an advisory fee from the Fund at an annual rate of 1.00% of the Fund’s average daily assets.
Distribution – Foreside Fund Services, LLC serves as the Fund’s distributor (the “Distributor”). The Distributor is not affiliated with the Adviser or Atlantic Fund Administration, LLC (d/b/a Atlantic Fund Services) (“Atlantic”) or their affiliates. The Fund has adopted a Distribution Plan (the “Plan”) for A Shares of the Fund in accordance with Rule 12b-1 of the Act. Under the Plan, the Fund pays the Distributor and/or any other entity as authorized by the Board a fee of up to 0.25% of the average daily net assets of A Shares. The Distributor has no role in determining the investment policies or which securities are to be purchased or sold by the Trust or its Funds.
For the year ended June 30, 2014, there were $109,867 in front-end sales charges assessed on the sale of A Shares and no contingent deferred sales charges were assessed on the sale of A Shares. The Distributor received $19,396 of the total front-end sales charges. Such amounts are set aside by the Distributor and used solely for distribution-related expenses.
Other Service Providers – Atlantic provides fund accounting, fund administration, compliance and transfer agency services to the Fund. Atlantic also provides certain shareholder report production, and EDGAR conversion and filing services. Atlantic provides a Principal Executive Officer, a Principal Financial Officer, a Chief Compliance Officer, and an Anti-Money Laundering Officer to the Fund, as well as certain additional compliance support functions.
Trustees and Officers – The Trust pays each independent Trustee an annual retainer fee of $45,000 for service to the Trust ($66,000 for the Chairman). The Trustees and Chairman may receive additional fees for special Board meetings. Each Trustee is also reimbursed for all reasonable out-of-pocket expenses incurred in connection with his duties as a Trustee, including travel and related expenses incurred in attending Board meetings. The amount of Trustees’ fees attributable to the Fund is disclosed in the Statement of Operations. Certain officers of the Trust are also officers or employees of the above named service providers, and during their terms of office received no compensation from the Fund.
Note 4. Expense Reimbursements and Fees Waived
The Adviser has contractually agreed to waive a portion of its fees and reimburse expenses through October 31, 2015, to the extent necessary to maintain the total operating expenses (excluding all taxes, interest, portfolio transaction expenses, dividend expenses on short sales, and extraordinary expenses) at 1.25% of average daily net assets of the Investor Shares and A Shares and 1.00% of average daily net assets of Institutional Shares. These contractual waivers may only be raised or eliminated with consent of the Board. Other fund service providers have voluntarily agreed to waive a portion of their fees. These voluntary reductions may be reduced or eliminated at any time. For the year ended June 30, 2014, fees waived and expenses reimbursed were as follows:
| Investment Adviser Expenses Reimbursed | | | Other Waivers | | | Total Fees Waived and Expenses Reimbursed | |
| $ | 41,258 | | | $ | 67,682 | | | $ | 108,940 | |
| | | | | | | | | | | |
Note 5. Security Transactions
The cost of purchases and proceeds from sales of investment securities (including maturities), other than short-term investments during the year ended June 30, 2014, were $23,005,588 and $41,123,143, respectively.
16
NOTES TO FINANCIAL STATEMENTS
Distributions paid during the fiscal years ended as noted were characterized for tax purposes as follows:
| Ordinary Income | | $ | 3,868,873 | | $ | 4,175,748 |
| Long-Term Capital Gain | | | 6,248,710 | | | 1,039,434 |
| | | $ | 10,117,583 | | $ | 5,215,182 |
As of June 30, 2014, distributable earnings (accumulated loss) on a tax basis were as follows:
| Undistributed Ordinary Income | | $ | 1,561,515 | |
| Undistributed Long-Term Gain | | | 6,044,103 | |
| Unrealized Appreciation | | | 87,671,965 | |
| Total | | $ | 95,277,583 | |
The difference between components of distributable earnings on a tax basis and the amounts reflected in the Statement of Assets and Liabilities are primarily due to wash sales.
On the Statement of Assets and Liabilities, as a result of permanent book to tax differences, certain amounts have been reclassified for the year ended June 30, 2014. The following reclassification was the result of currency gain/loss reclassifications and has no impact on the net assets of the Fund.
| Undistributed Net Investment Income | | $ | 272,817 | |
| Accumulated Net Realized Gain | | | (272,817 | ) |
Note 7. Subsequent Events
Subsequent events occurring after the date of this report through the date these financial statements were issued have been evaluated for potential impact and the Fund has had no such events.
17
REPORT OF INDEPENDENT REGISTERED PUBLIC ACCOUNTING FIRM
To the Board of Trustees of Forum Funds
and the Shareholders of Auxier Focus Fund
We have audited the accompanying statement of assets and liabilities of the Auxier Focus Fund, a series of shares of beneficial interest in the Forum Funds, including the schedule of investments, as of June 30, 2014, and the related statement of operations for the year then ended, the statements of changes in net assets for each of the years in the two-year period then ended and the financial highlights for each of the years in the five-year period then ended. These financial statements and financial highlights are the responsibility of the Fund’s management. Our responsibility is to express an opinion on these financial statements and financial highlights based on our audits.
We conducted our audits in accordance with the standards of the Public Company Accounting Oversight Board (United States). Those standards require that we plan and perform the audits to obtain reasonable assurance about whether the financial statements and financial highlights are free of material misstatement. An audit includes examining, on a test basis, evidence supporting the amounts and disclosures in the financial statements. Our procedures included confirmation of securities owned as of June 30, 2014 by correspondence with the custodian and brokers. An audit also includes assessing the accounting principles used and significant estimates made by management, as well as evaluating the overall financial statement presentation. We believe that our audits provide a reasonable basis for our opinion.
In our opinion, the financial statements and financial highlights referred to above present fairly, in all material respects, the financial position of the Auxier Focus Fund as of June 30, 2014, and the results of its operations for the year then ended, the changes in its net assets for each of the years in the two-year period then ended and its financial highlights for each of the years in the five-year period then ended, in conformity with accounting principles generally accepted in the United States of America.
BBD, LLP
Philadelphia, Pennsylvania
August 21, 2014
18
ADDITIONAL INFORMATION (Unaudited)
Proxy Voting Information
A description of the policies and procedures that the Fund uses to determine how to vote proxies relating to securities held in the Fund’s portfolio is available, without charge and upon request, by calling (877) 328-9437, on the Fund's website at www.auxierasset.com and on the U.S. Securities and Exchange Commission’s (the “SEC”) website at www.sec.gov. The Fund’s proxy voting record for the most recent twelve-month period ended June 30 is available, without charge and upon request, by calling (877) 328-9437 and on the SEC’s website at www.sec.gov.
Availability of Quarterly Portfolio Schedules
The Fund files its complete schedule of portfolio holdings with the SEC for the first and third quarters of each fiscal year on Form N-Q. These filings are available, without charge and upon request on the SEC’s website at www.sec.gov or may be reviewed and copied at the SEC’s Public Reference Room in Washington, DC. Information on the operation of the Public Reference Room may be obtained by calling (800) SEC-0330.
Shareholder Expense Example
As a shareholder of the Fund, you incur two types of costs: (1) transaction costs, including sales charges (loads) on purchase payments on certain classes, redemption fees, exchange fees, and CDSC fees, and (2) ongoing costs, including management fees, 12b-1 fees, and other Fund expenses. This example is intended to help you understand your ongoing costs (in dollars) of investing in the Fund, and to compare these costs with the ongoing costs of investing in other mutual funds.
The example is based on an investment of $1,000 invested at the beginning of the period and held for the entire period from January 1, 2014, through June 30, 2014.
Actual Expenses – The first line under each share class of the table below provides information about actual account values and actual expenses. You may use the information in this line, together with the amount you invested, to estimate the expenses that you paid over the period. Simply divide your account value by $1,000 (for example, an $8,600 account value divided by $1,000 = 8.6), then multiply the result by the number in the first line under the heading entitled “Expenses Paid During Period” to estimate the expenses you paid on your account during the period.
Hypothetical Example for Comparison Purposes – The second line under each share class of the table below provides information about hypothetical account values and hypothetical expenses based on the Fund’s actual expense ratio and an assumed rate of return of 5% per year before expenses, which is not the Fund’s actual return. The hypothetical account values and expenses may not be used to estimate the actual ending account balance or expenses you paid for the period. You may use this information to compare the ongoing costs of investing in the Fund and other funds. To do so, compare this 5% hypothetical example with the 5% hypothetical examples that appear in the shareholder reports of other funds.
Please note that the expenses shown in the table are meant to highlight your ongoing costs only and do not reflect any transactional costs, such as sales charges (loads) on purchase payments on certain classes, redemption fees, exchange fees, and CDSC fees. Therefore, the second line of the table is useful in comparing ongoing costs only, and will not help you determine the relative total costs of owning different funds. In addition, if these transactional costs were included, your costs would have been higher.
| | Beginning | | Ending | | Expenses | | Annualized |
| | Account Value | | Account Value | | Paid During | | Expense |
| | January 1, 2014 | | June 30, 2014 | | Period* | | Ratio* |
| Investor Shares | | | | | | | | | | | |
| Actual | $ | 1,000.00 | | $ | 1,042.19 | | $ | 6.18 | | 1.22 | % |
| Hypothetical (5% return before taxes) | $ | 1,000.00 | | $ | 1,018.74 | | $ | 6.11 | | 1.22 | % |
| A Shares | | | | | | | | | | | |
| Actual | $ | 1,000.00 | | $ | 1,042.50 | | $ | 6.33 | | 1.25 | % |
| Hypothetical (5% return before taxes) | $ | 1,000.00 | | $ | 1,018.60 | | $ | 6.26 | | 1.25 | % |
19
ADDITIONAL INFORMATION (Unaudited)
| | | | | | | | |
| | Beginning | | Ending | | Expenses | | Annualized |
| | Account Value | | Account Value | | Paid During | | Expense |
| | January 1, 2014 | | June 30, 2014 | | Period* | | Ratio* |
| Institutional Shares | | | | | | | | | | | |
| Actual | $ | 1,000.00 | | $ | 1,043.93 | | $ | 5.07 | | 1.00 | % |
| Hypothetical (5% return before taxes) | $ | 1,000.00 | | $ | 1,019.84 | | $ | 5.01 | | 1.00 | % |
| | | | | | | | | | | | |
| * | Expenses are equal to the Fund’s annualized expense ratio multiplied by the average account value over the period, multiplied by the number of days in the most recent fiscal half-year divided by 365 to reflect the half-year period. |
Federal Tax Status of Dividends Declared during the Fiscal Year
For federal income tax purposes, dividends from short-term capital gains are classified as ordinary income. The Fund designates 100.00% of its income dividend distributed as qualifying for the corporate dividends-received deduction (DRD) and 100.00% for the qualified dividend rate (QDI) as defined in Section 1(h)(11) of the Internal Revenue Code. The Fund also designates 8.67% of its income dividends as qualified interest income exempt from U.S. tax for foreign shareholders (QII) and 13.56% of its income dividends as qualified short-term gain exempt from U.S. tax for foreign shareholders (QSD).
Trustees and Officers of the Trust
The Board is responsible for oversight of the management of the Trust’s business affairs and of the exercise of all the Trust’s powers except those reserved for the shareholders. The following table provides information about each Trustee and certain officers of the Trust. Each Trustee and officer holds office until the person resigns, is removed, or is replaced. Unless otherwise noted, the persons have held their principal occupations for more than five years. The address for all Trustees and officers is Three Canal Plaza, Suite 600, Portland, Maine 04101. Mr. Keffer is considered an Interested Trustee due to his affiliation with Atlantic. The Fund’s Statement of Additional Information includes additional information about the Trustees and is available, without charge and upon request, by calling (877) 328-9437.
| Name and Year of Birth | Position with the Trust | Length of Time Served | Principal Occupation(s) During Past Five Years | Number of Series of Fund Complex¹ Overseen by Trustee | Other Directorships Held by Trustee |
| Independent Trustees | | | | | |
J. Michael Parish Born: 1943 | Chairman of the Board; Trustee; Chairman, Nominating Committee and Qualified Legal Compliance Committee | Since 1989 (Chairman since 2004) | Retired since 2003. | 24 | 0 |
Costas Azariadis Born: 1943 | Trustee | Since 1989 | Professor of Economics, Washington University since 2006. | 24 | 0 |
James C. Cheng Born: 1942 | Trustee; Chairman, Audit Committee | Since 1989 | President, Technology Marketing Associates (marketing company for small- and medium-sized businesses in New England) since 1991. | 24 | 0 |
David Tucker Born: 1958 | Trustee | Since 2011 | Director, Blue Sky Experience since 2008; Senior Vice President & General Counsel, American Century Companies 1998-2008. | 28 | Trustee, Forum Funds II and Forum ETF Trust |
1The Fund Complex includes the Trust, Forum Funds II and Forum ETF Trust and is overseen by different Boards of Trustees. |
20
ADDITIONAL INFORMATION (Unaudited)
| Name and Year of Birth | Position with the Trust | Length of Time Served | Principal Occupation(s) During Past Five Years | Number of Series of Fund Complex¹ Overseen by Trustee | Other Directorships Held by Trustee |
| Interested Trustee | | | | | |
John Y. Keffer2 Born: 1942 | Trustee; Vice Chairman | Since 1989 | Chairman, Atlantic since 2008; President, Forum Investment Advisors, LLC since 2011; President, Forum Foundation (a charitable organization) since 2005; President, Forum Trust, LLC (a non-depository trust company chartered in the State of Maine) since 1997. | 28 | Director, Wintergreen Fund, Inc.; Trustee, Forum Funds II, Forum ETF Trust and ALTX Trust |
| Officers | | | | | |
Stacey E. Hong Born: 1966 | President; Principal Executive Officer | Since 2008 | President, Atlantic since 2008. | N/A | N/A |
Karen Shaw Born: 1972 | Treasurer; Principal Financial Officer | Since 2008 | Senior Vice President, Atlantic since 2008. | N/A | N/A |
Zachary Tackett Born: 1988 | Vice President; Secretary; Anti-Money Laundering Compliance Officer | Since 2014 | Associate Counsel, Atlantic since 2014; Intern Associate, Coakley & Hyde, PLLC, 2010-2013. | N/A | N/A |
Michael J. McKeen Born: 1971 | Vice President | Since 2009 | Senior Vice President, Atlantic since 2008. | N/A | N/A |
Timothy Bowden Born: 1969 | Vice President | Since 2009 | Manager, Atlantic since 2008. | N/A | N/A |
Geoffrey Ney Born: 1975 | Vice President | Since 2013 | Manager, Atlantic since 2013; Senior Fund Accountant, Atlantic, 2008-2013. | N/A | N/A |
Todd Proulx Born: 1978 | Vice President | Since 2013 | Manager, Atlantic since 2013; Senior Fund Accountant, Atlantic, 2008-2013. | N/A | N/A |
1The Fund Complex includes the Trust, Forum Funds II and Forum ETF Trust and is overseen by different Boards of Trustees. 2Atlantic is a subsidiary of Forum Holdings Corp. I, a Delaware corporation that is wholly owned by Mr. Keffer. |
DF Dent Premier Growth Fund
A Message to Our Shareholders (Unaudited) .............................................................................................. 1
Management Discussion of Fund Performance (Unaudited) ..................................................................... 8
Performance Chart and Analysis (Unaudited) ............................................................................................ 14
Schedule of Investments ................................................................................................................................ 15
Statement of Assets and Liabilities .............................................................................................................. 17
Statement of Operations.................................................................................................................................. 18
Statements of Changes in Net Assets .......................................................................................................... 19
Financial Highlights ........................................................................................................................................ 20
DF Dent Midcap Growth Fund
A Message to Our Shareholders (Unaudited) ............................................................................................ 21
Performance Chart and Analysis (Unaudited) ............................................................................................ 26
Schedule of Investments ................................................................................................................................ 27
Statement of Assets and Liabilities .............................................................................................................. 29
Statement of Operations.................................................................................................................................. 30
Statements of Changes in Net Assets .......................................................................................................... 31
Financial Highlights ........................................................................................................................................ 32
DF Dent Small Cap Growth Fund
A Message to Our Shareholders (Unaudited) ............................................................................................ 33
Performance Chart and Analysis (Unaudited) ............................................................................................ 38
Schedule of Investments ................................................................................................................................ 39
Statement of Assets and Liabilities .............................................................................................................. 41
Statement of Operations.................................................................................................................................. 42
Statement of Changes in Net Assets ............................................................................................................ 43
Financial Highlights ......................................................................................................................................... 44
DF Dent Growth Funds
Notes to Financial Statements ....................................................................................................................... 45
Report of Independent Registered Public Accounting Firm...................................................................... 50
Additional Information (Unaudited).............................................................................................................. 51
DF DENT PREMIER GROWTH FUNDA MESSAGE TO OUR SHAREHOLDERS (Unaudited)
Dear Fellow Shareholder,
Performance
Please find below recent performance results for each of the DF Dent Growth Funds compared against their respective benchmarks for periods ending June 30, 2014:
| | | DF Dent Premier Growth | | DF Dent Midcap Growth | | DF Dent Small Cap Growth |
| 6 Months | | | | | | | | | | | | |
| Fund | | - | 0.23 | % | | - | 1.40 | % | | - | 0.55 | % |
| Benchmark | | S&P 500 | | Russell Midcap Growth | | Russell 2000 Growth |
| Benchmark Performance | | + | 7.14 | % | | + | 6.51 | % | | + | 2.22 | % |
| Fund vs Benchmark | | - | 7.37 | % | | - | 7.91 | % | | - | 2.77 | % |
| | | | | | | | | | | | | |
| 12 Months | | | | | | | | | | | | |
| Fund | | + | 21.49 | % | | + | 22.95 | % | | | N/A | |
| Benchmark | | + | 24.61 | % | | + | 26.04 | % | | | N/A | |
| Fund vs Benchmark | | - | 3.12 | % | | - | 3.09 | % | | | N/A | |
| | | | | | | | | | | | | |
| 5 Years | | | | | | | | | | | | |
| Fund | | + | 19.06 | % | | | N/A | | | | N/A | |
| Benchmark | | + | 18.83 | % | | | N/A | | | | N/A | |
| Fund vs Benchmark | | + | 0.23 | % | | | N/A | | | | N/A | |
| | | | | | | | | | | | | |
| Since Inception | | | | | | | | | | | | |
| Fund | | + | 8.19 | %* | | + | 16.95 | %* | | + | 8.70 | % |
| Benchmark | | + | 5.93 | %* | | + | 13.94 | %* | | + | 9.20 | % |
| Fund vs Benchmark | | + | 2.26 | %* | | + | 3.01 | %* | | - | 0.50 | % |
| * annualized | | | | | | | | | | | | |
| | | | | | | | | | | | | |
| Cumulative Since Inception | | | | | | | | | | | | |
| Fund | | + | 177.13 | % | | + | 59.96 | % | | + | 8.70 | % |
| Benchmark | | + | 110.84 | % | | + | 47.91 | % | | + | 9.20 | % |
| Fund vs Benchmark | | + | 66.29 | % | | + | 12.05 | % | | - | 0.50 | % |
| Inception Date | | 07/16/2001 | | 07/01/2011 | | 11/01/2013 |
N/A- Periods which exceed the life of the particular fund.
Performance data quoted represents past performance and is no guarantee of future results. Current performance may be lower or higher than the performance data quoted. Investment return and principal value will fluctuate so that an investor’s shares, when redeemed, may be worth more or less than original cost. For the most recent month-end performance, please call (866) 233-3368. As stated in the current prospectus, the DF Dent Premier Growth Fund’s and DF Dent Midcap Growth Fund’s annual operating expense ratios (gross) are
1 DF DENT GROWTH FUNDS
DF DENT PREMIER GROWTH FUNDA MESSAGE TO OUR SHAREHOLDERS (Unaudited)
1.26% and 1.86%, respectively. However, the Funds’ Adviser has contractually agreed to waive a portion of its fees and/or reimburse certain expenses to limit total operating expenses to 1.10% on the first $150 million in Fund net assets and to 0.90% on net assets exceeding $150 million. This agreement is in effect through October 31, 2016. The DF Dent Small Cap Growth Fund’s estimated annual operating expense ratio (gross) is 5.80%. However, D.F. Dent and Company (the Fund’s “Adviser”) has contractually agreed to waive a portion of its fees and/or reimburse certain expenses to limit total operating expense to 1.25% through October 31, 2016. These expense caps may be changed or eliminated prior to their expiration date only with the consent of the Board of Trustees. Both the DF Dent Midcap Growth Fund and DF Dent Small Cap Growth Fund charge a 2.00% redemption fee on shares redeemed within 60 days of purchase. Fund performance returns shown do not reflect fees; if reflected, the returns would have been lower. Returns greater than one year are annualized.
DF Dent Premier Growth Fund
For the fiscal year ended June 30, 2014, the DF Dent Premier Growth Fund (the “Fund”) experienced a total return of +21.49%, below the +24.61% total return of the S&P 500 Index (the “Index”), which is the benchmark we have used since the Fund’s inception on July 16, 2001. Oddly enough, the return of +21.49% matched precisely the +21.49% total return of the Fund in the prior fiscal year ending 06/30/2013. As can be observed above, although this year’s return was well above the historic average, it fell below the Index due to the weak relative performance versus the Index in the last 6 months of the fiscal year. As discussed later in the Management Discussion of Fund Performance (“MDFP”) section, higher yielding equities such as utilities and real estate investment trusts, which the Fund does not invest in, led the U.S. equity markets in this period.
Expense Management
Your Fund’s Adviser, D.F. Dent and Company, has again agreed to maintain your Fund’s expense ratio at a net 1.10% on the first $150 million of net assets and 0.90% on net assets exceeding $150 million through October 31, 2016, by reimbursing expenses and waiving management fees. During the past 12 months, the net assets in your Fund have appreciated despite redemptions resulting in total Fund assets of $199.4 million as of June 30, 2014. This has triggered the lower 90 basis point cap on the incremental assets above $150 million resulting in a current annualized expense ratio of about 105 basis points as of June 30, 2014, as is listed within the financial section of this report. This is the lowest expense ratio in the Fund’s history. If the Fund’s assets decline, the expense ratio will increase towards the capped level of 110 basis points. If the Fund assets increase further, the effective annual expense ratio will decline towards 90 basis points. The record of expense reimbursement and management fee waivers for the first eleven years of your Fund is as follows:
2 DF DENT GROWTH FUNDS
DF DENT PREMIER GROWTH FUNDA MESSAGE TO OUR SHAREHOLDERS (Unaudited)
| Year Ending | | Expense Reimbursement | | Management Fee Waived |
| 06/30/02 | | $ | 60,201 | | $ | 60,019 |
| 06/30/03 | | | 38,066 | | | 90,163 |
| 06/30/04 | | | 0 | | | 129,060 |
| 06/30/05 | | | 0 | | | 141,907 |
| 06/30/06 | | | 0 | | | 142,664 |
| 06/30/07 | | | 0 | | | 161,128 |
| 06/30/08 | | | 0 | | | 95,665 |
| 06/30/09 | | | 0 | | | 234,053 |
| 06/30/10 | | | 0 | | | 204,148 |
| 06/30/11 | | | 0 | | | 211,784 |
| 06/30/12 | | | 0 | | | 240,847 |
| 06/30/13 | | | 0 | | | 235,380 |
| 06/30/14 | | | 0 | | | 220,476 |
| Total | | $ | 98,267 | | $ | 2,167,294 |
Portfolio Turnover
Annual portfolio turnover since inception has been as follows:
| | | 2002* | | 2003 | | 2004 | | 2005 | | 2006 | | 2007 | | 2008 | | 2009 | | 2010 | | 2011 | | 2012 | | 2013 | | 2014 | | Average |
| Portfolio Turnover** | | 0% | | 14% | | 20% | | 7% | | 25% | | 17% | | 21% | | 16% | | 8% | | 21% | | 14% | | 19% | | 25% | | 15.92% |
We believe these low portfolio turnover rates are consistent with our investment strategy of holding positions for long periods and minimizing transaction expenses for shareholders. Brokerage expenses for the entire fiscal year’s trading amounted to 1.4 cents per share of your Fund. Thus, trading expenses remained very low because of low portfolio turnover.
* The Fund commenced operations on July 16, 2001.
** Percentage calculated based on total value of investments.
Asset Allocation
Year-end asset allocation by market capitalization for the past six years was:
| | | 06/30/09* | | 06/30/10* | | 06/30/11* | | 06/30/12* | | 06/30/13* | | 06/30/14* | | “Adjusted” 06/30/14* |
| Large Capitalization | | 36.8 | % | | 43.0 | % | | 50.2 | % | | 50.3 | % | | 51.3 | % | | 75.5 | % | | 52.5 | % |
| Mid Capitalization | | 52.9 | % | | 50.2 | % | | 40.6 | % | | 38.6 | % | | 40.4 | % | | 21.8 | % | | 41.4 | % |
| Small Capitalization | | 10.2 | % | | 6.3 | % | | 9.2 | % | | 11.0 | % | | 5.6 | % | | 2.5 | % | | 6.0 | % |
| Reserve Funds | | 0.1 | % | | 0.5 | % | | 0.0 | % | | 0.1 | % | | 2.7 | % | | 0.2 | % | | 0.1 | % |
| Total Fund | | 100.0 | % | | 100.0 | % | | 100.0 | % | | 100.0 | % | | 100.0 | % | | 100.0 | % | | 100.0 | % |
* Percentages calculated based on total value of investments.
3 DF DENT GROWTH FUNDS
DF DENT PREMIER GROWTH FUNDA MESSAGE TO OUR SHAREHOLDERS (Unaudited)
The Fund’s Prospectus has defined mid capitalization companies as those in the $1.5 billion to $7.0 billion market capitalization range. The latest fiscal year witnessed a large increase in the number of issuers held by the Fund in the large cap category along with decreases in mid and small caps. This was the obvious result of many companies “graduating” to the larger market cap categories in the strong market without any change in the capitalization parameters. If we increased the parameters to reflect the “rising tide lifting all boats” of recent market appreciation to a range of $2.0 billion to $10.0 billion for mid cap, which then defines the ceiling and floor for small and large caps respectively, the resulting asset allocation is “adjusted” to the last column above. These “adjusted” percentages are fairly consistent with the three prior years. While we have considered whether the “adjusted” market capitalization ranges may be more appropriate today than those used at the Fund’s inception in 2001, we have elected to continue to use the same parameters to define mid cap companies.
Attribution
We have once again included in the MDFP section later in this report a bar graph of your Fund’s sector allocation versus the Index and a discussion of that allocation accompanied with commentary on stock selection within sectors of the Index.
Concentration
Although we seek to maintain a reasonably concentrated portfolio in core holdings relative to other mutual funds, this concentration has declined in each of the past six years.
| Top 10 Holdings | | 06/30/09 | | 06/30/10 | | 06/30/11 | | 06/30/12 | | 06/30/13 | | 06/30/14 |
| % of Fund | | 55.82 | % | | 54.97 | % | | 52.46 | % | | 49.35 | % | | 44.95 | % | | 42.36 | % |
| Average Position Size of Top 10 | | 5.6 | % | | 5.5 | % | | 5.2 | % | | 4.9 | % | | 4.5 | % | | 4.2 | % |
The above period coincides with the recovery from the March 2009 market trough. Many of the large portfolio holdings reached weightings where we felt the need to reduce exposure to individual stock risk. While meaningful positions were retained in these names, proceeds from trimming back the heavier weightings were redeployed in new investments and to build weightings in smaller positions.
Management Ownership of Fund
Employees, their families, and the Adviser’s retirement plan owned 12% of the Fund as of June 30, 2014.
Commentary
Despite the persistent strength in the major indices, the internal dynamics of the stock market have shifted this year, and many of these trends became more pronounced in the most recent quarter. Unlike 2013, investors have favored more defensive strategies as evidenced by the strong preference for stocks with large capitalizations, low price earnings ratios and high dividend yields.
4 DF DENT GROWTH FUNDS
DF DENT PREMIER GROWTH FUNDA MESSAGE TO OUR SHAREHOLDERS (Unaudited)
These trends adversely impacted the Fund’s investment results in the last six months, as noted at the beginning of this letter. Although we saw a reversal in some of these headwinds in June, the outperformance was not sufficient to offset the disappointing prior five months. As a growth fund, we do not invest in Real Estate Investment Trusts (“REITs”) and utilities, which are primarily income vehicles.
After strong gains over the last several years, in late 2013 and early 2014 we trimmed some stocks in your portfolio that had performed extremely well as described in greater detail later in this report in the Investment Strategy and Trends section of the MDFP. This trimming was in reaction to significant multiple expansion and stock appreciation. In effect, we thought some of these stocks had gone up too far, too fast, and their valuations had become inflated. As has been our practice, if our long-term conviction in your portfolio companies remains strong, we tend to reduce positions in response to short-term overvaluation rather than eliminate them completely.
During 2014, some of these high-multiple stocks experienced significant corrections, supporting our decisions to trim. We might have been more aggressive in reducing our positions, but our high degree of confidence in these companies’ prospects over the next three to five years suggested that further trimming would be unwise. In some cases, we have used recent stock weakness in companies such as 3D Systems as an opportunity to build back positions in those high-conviction names that have underperformed, using lower-conviction ideas as a source of funds.
In the most recent Semi-Annual Report dated December 31, 2013, on page 5 we emphasized by underlining:
“We expect to see meaningful progress in reducing the federal deficit in fiscal 2014.”
In the first 6 months of this fiscal year, as reported by the Potomac Research Group, U.S. Treasury receipts were 10% higher than the prior year versus a 9% projection by the Congressional Budget Office (CBO), and outlays were 4% lower versus 2.6% lower projected by the CBO. This means that the deficit will shrink considerably this year to well under 3% of GDP. This will reduce the issuance of government securities this year and next year contributing to the Federal Reserve’s stated objective to keep interest rates low as long as needed to reduce unemployment and provide stimulus to the economy. We believe these conditions, low interest rates and a stable slowly growing economy, should provide an attractive environment for stocks.
Since it typically takes 28 years to double your money in a 2.5% bond, and real returns from the bond market are close to zero, growth stocks generating earnings growth in excess of 10% look attractive to us. We will continue to focus on investing in quality growth companies with compelling financial metrics, outstanding management teams, and visible growth prospects.
Once again, we appreciate the trust you have placed in us with your investment and will work diligently to earn that trust each day.
5 DF DENT GROWTH FUNDS
DF DENT PREMIER GROWTH FUNDA MESSAGE TO OUR SHAREHOLDERS (Unaudited)
Respectively Submitted,
Daniel F. Dent Bruce L. Kennedy Matthew F. Dent
IMPORTANT INFORMATION:
The recent growth rate in the global equity markets has helped to produce short-term returns for some sectors/asset classes that are not typical and may not continue in the future. Because of ongoing market volatility, Fund performance may be subject to substantial short-term changes.
Investing involves risks, including the possible loss of principal. The DF Dent Premier Growth Fund may invest in small and medium size companies. Investments in these companies, especially smaller companies, carry greater risk than is customarily associated with larger companies for various reasons such as increased volatility of earnings and prospects, narrower markets, limited financial resources and less liquid stock. The Fund will typically invest in the securities of fewer issuers. If the Fund’s portfolio is over weighted in a sector, any negative development affecting that sector will have a greater impact on the Fund than a fund that is not over weighted in that sector.
A basis point equals 0.01%.
The DF Dent Midcap Growth Fund also invests in small and medium size companies. With non-diversification risk, the Fund will typically invest in securities of fewer issuers, which exposes the Fund to greater market risk. Investing in ADRs (American Depositary Receipts) carries risks of political and financial instability, less liquidity and greater volatility, as well as risks associated with the lack of reliable accounting and financial information. The Fund is also subject to other risks, such as REIT risk with possible real estate market declines, which are detailed in the Fund’s prospectus.
The DF Dent Small Cap Growth Fund invests in small size companies, which carry greater risk than is customarily associated with larger, more established companies. With non-diversification risk, the Fund will typically invest in securities of fewer issuers, which exposes the Fund to greater market risk. Investing in ADRs (American Depositary Receipts) carries risks of political and financial instability, less liquidity and greater volatility, as well as risks associated with the lack of reliable accounting and financial information. The Fund is also subject to other risks, such as REIT risk with possible real estate market declines, which are detailed in the Fund’s prospectus. The Fund is newly created and has a limited operating history.
The S&P 500 Index is a broad-based, unmanaged measurement of changes in stock market conditions based on the average of 500 widely held stocks. The Russell Midcap Growth Index measures the performance of the mid-cap growth segment of the U.S. equity universe. It includes those Russell Midcap Index companies with
6 DF DENT GROWTH FUNDS
DF DENT PREMIER GROWTH FUNDA MESSAGE TO OUR SHAREHOLDERS (Unaudited)
higher price-to-book ratios and higher forecasted growth values. The Russell 2000 Growth Index measures the performance of the small cap growth segment of the U.S. equity universe. It includes those Russell Small Cap Index companies with higher price-to-book ratios and higher forecasted growth values. One cannot invest directly in an index.
7 DF DENT GROWTH FUNDS
DF DENT PREMIER GROWTH FUNDMANAGEMENT DISCUSSION OF FUND PERFORMANCE (Unaudited)
Recent Performance
For the fiscal year ending June 30, 2014, DF Dent Premier Growth Fund (the “Fund”) experienced a total return of +21.49% versus a total return of +24.61% for the S&P 500 Index (the “Index”), the benchmark we use for performance comparisons. Performance versus the Index for various periods ending June 30, 2014, was as follows:
| Period Ending 06/30/2014 | | DF Dent Premier Growth Fund | | S&P 500 Index | | Outperformance (Underperformance) |
| Six Months | | - | 0.23 | % | | + | 7.14 | % | | - | 7.37 | % |
| Twelve Months | | + | 21.49 | % | | + | 24.61 | % | | - | 3.12 | % |
| Five Years (annualized) | | + | 19.06 | % | | + | 18.83 | % | | + | 0.23 | % |
| Five Years (cumulative) | | + | 139.21 | % | | + | 136.98 | % | | + | 2.23 | % |
| Since Inception (07/16/01) (annualized) | | + | 8.19 | % | | + | 5.93 | % | | + | 2.26 | % |
| Since Inception (07/16/01) (cumulative) | | + | 177.13 | % | | + | 110.84 | % | | + | 66.29 | % |
Past performance is not indicative of future performance.
As shown above your Fund’s return of 21.49% underperformed the Index by 3.12% in the fiscal year ended on June 30, 2014. This underperformance was heavily influenced by the last six months of the fiscal year, as also shown above. What was the cause of this underperformance?
The Index benefited from very strong returns in utilities and real estate investment trusts (REITs) in the past six months. As a growth fund, we held no positions in public utilities and only one position in a company, American Tower, which recently converted to be a REIT. Public utilities and REITs are considered yield vehicles. They experienced recent Index-beating performance, lifting the Index during the past six months as investors hungered for income. Low single-digit government and corporate bond rates and near-zero money market rates caused many investors to invest in high yielding stocks as “bond substitutes.” Consequently, these “bond substitutes” have recently performed very well, and we have not participated in that party given our character as a growth fund. If interest rates rise from today’s historic low levels, one would expect “bond substitutes” to perform poorly along with the overall bond market.
Sector Allocation and Attribution
The following bar chart presents the sector weightings of your Fund (DFDPX) versus the sector weightings of the Index as of June 30, 2014:
8 DF DENT GROWTH FUNDS
DF DENT PREMIER GROWTH FUNDMANAGEMENT DISCUSSION OF FUND PERFORMANCE (Unaudited)
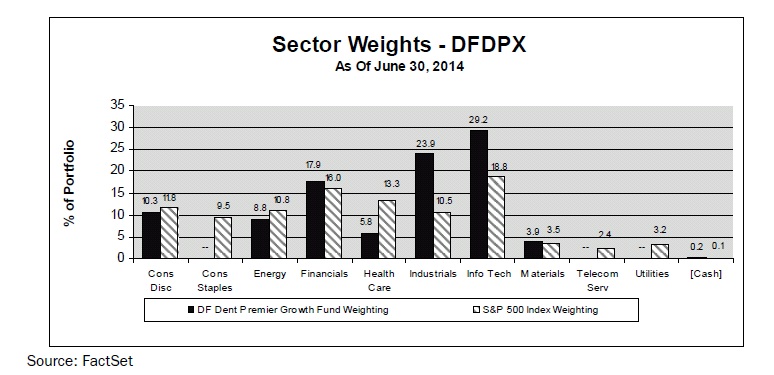
The Index is composed of ten basic sectors. Your Fund’s positions in four of these sectors outperformed their respective Index sectors: Consumer Discretionary, Energy, Financials, and Health Care. The Fund did not have any positions in three sectors: Consumer Staples, Telecommunications Services, and Utilities. Since these three sectors all underperformed the Index’s other sectors in the fiscal year, we believe the avoidance of investments in these areas helped the Fund’s performance as compared to the Index. Despite this, utilities had strong performance in the past six months when overall market trends weakened as mentioned above. The Fund underperformed the Index in three sectors: Industrials, Information Technology, and Materials. Performance of the Fund’s investments in the Industrial sector was disappointing at a +12.66% annual return versus +28.58% for that sector within the Index. The Industrial sector’s underperformance was entirely responsible for the Fund’s underperformance versus the Index this year. The Fund’s Information Technology sector delivered a +25.30% return in the fiscal year, below that sector’s +31.94% return in the Index, thus underperforming the Index’s sector while still outperforming the Index’s overall return of +24.61%. In the prior fiscal year, the Fund’s Information Technology sector contributed a +25.74% return versus only a +7.80% return for the Information Technology sector within the Index. Thus, while a +25.30% return for the past year lagged that sector within the Index, we are ahead nicely for the past two years. The Fund underperformed slightly in the last and smallest Sector, Materials, because of a small holding in Potash Corp. of Saskatchewan, Inc. which was eliminated. The Fund’s only other holding in this sector, Ecolab Inc., performed nicely with a total return of +32.03% for the year.
At this point in the MDFP we normally answer the question, “Why did the Fund underperform/outperform the Index?” In each of the past two fiscal years, both the Fund and the Index achieved returns in excess of 20%.
9 DF DENT GROWTH FUNDS
DF DENT PREMIER GROWTH FUNDMANAGEMENT DISCUSSION OF FUND PERFORMANCE (Unaudited)
Both years have witnessed very low interest rates with the 10-year Treasury bond trading around the 2.50% level and money market rates near zero. Why 20% plus returns in stocks? In the fiscal year ending June 30, 2013, there appeared to be growing acceptance that the economy was sustaining its recovery albeit at a sluggish pace considering the recentness of the Great Recession. Thus, with accommodative monetary policy, price earnings multiples expanded more than earnings growth as confidence grew in the economy. The Fund outperformed the Index that year. In the recent fiscal year ended June 30, 2014, the Federal Reserve began its policy of “tapering” or reducing its monthly purchases of certain debt securities. Initially, investors worried that “tapering” would cause interest rates to increase. Interest rates did not increase, and there was growing acceptance that interest rates would remain low for the foreseeable future, but more specifically until inflation increased or the labor market improved. Since neither of these appeared imminent, investors sought “bond substitutes” in an attempt to maintain or to increase portfolio yields. Higher-yielding good-quality stocks such as large capitalization equities with 2% plus yields, utilities, and REITs all performed well in the last six months of the fiscal year. Since current income is not an objective of your Fund, we did not participate in this party. Although the Fund’s total return exceeded 20%, it lagged the Index in this fiscal year as the Index benefited from the relative performance of its heavy exposure to higher-yielding equities.
Investment Strategy and Trends
Our investment strategy in managing the Fund remains constant: emphasize what we consider to be “best in class”* companies, keep portfolio turnover low (25% for the fiscal year), and stay fully invested when reasonable. Although public opinion has embraced diversification in the aftermath of the 2008 financial crisis, we have learned over the past 38 years of D.F. Dent and Co.’s history that well designed strategically focused portfolios have outperformed highly diversified portfolios. Thus, we attempt to keep the number of companies held in the Fund to less than 40 (38 companies held at fiscal year ending June 30, 2014). We only add a new position to the Fund if we believe its return will be higher than, or enhance, the overall portfolio. Why else would we add that investment? Therefore, there must be one holding or more which must be sold to make room for any new investment. Following this strategy we eliminated 11 positions from the Fund while adding only eight new names in this fiscal year.
There were two meaningful shifts in strategy based upon investment opportunities in the past year:
| 1. | We increased the Fund’s exposure to the Consumer Discretionary sector from 5.64% to 10.34%. This resulted from investments in Signet Jewelers, CarMax, IMAX Corp., and Panera Bread Company. The first two have already achieved nice results within the portfolio. As previously noted, this sector of the Fund out-performed its sector within the Index. |
| 2. | We increased the Fund’s exposure to the Financial sector from 12.82% to an over weighted position of 17.87%. We established core positions in Discovery Financial Services and Moody’s while adding to existing positions in American Tower and Markel. Each of these four investments achieved total returns in the Fund exceeding the Financial sector’s return in the Index. |
10 DF DENT GROWTH FUNDS
DF DENT PREMIER GROWTH FUNDMANAGEMENT DISCUSSION OF FUND PERFORMANCE (Unaudited)
Over the course of the year, many of our favorite Information Technology investments reached very full valuation levels in our opinion. Our strategy was to trim back rather than eliminate positions at such times remembering that we seek to own “best in class” companies over long time periods. We reduced position sizes at higher valuations in ANSYS, Dealertrack, and 3D Systems when strong appreciation carried these stocks to what we considered to be full valuation. For example, the Fund began the year with 150,000 shares of 3D systems priced at $43.90 per share. We sold 84,000 shares scaling up from $50 to $95 per share with proceeds of $6.5 million almost matching the original cost basis of the entire 150,000 shares. The stock then sold off sharply in 2014 when we repurchased 12,000 shares in the Fund at prices below $50 per share. The result: 3D Systems made the best total contribution to the Fund in both fiscal year 2013 and fiscal year 2014. This example is not to gloat over one stock but to point out the advantage of trimming positions in strong growth situations during periods of over-valuation, maintaining a meaningful position, and adding to the position during periods of under valuation. The same strategy was also employed successfully with ANSYS during the fiscal year.
A constant strategy employed by the Fund is to invest in high-growth companies without regard to differentials in current income. In theory, companies with sustainable high returns on equity (let’s say >15%) should be able to reinvest most of the 15% return compounding shareholders’ equity at the reinvestment rate. This reinvestment rate then becomes the company’s potential growth rate on the assumption that the high return on equity is sustainable. This strategy has worked well in the past but not in the first six months of calendar 2014 as investors sought dividends from stocks as “bond substitutes” as previously mentioned.
The Fund invested in industries that have benefited from the following ongoing trends:
| · | Growth in domestic energy production- Concho Resources, Range Resources, and Southwestern Energy. |
| · | Increased value of information and data- Moody’s, SEI Investments, Verisk Analytics, Costar Group. |
| · | Delivery of productivity software- ANSYS, Red Hat, Trimble. |
| · | Consolidation of business services- WageWorks, ExamWorks, Healthcare Services Group. |
11 DF DENT GROWTH FUNDS
DF DENT PREMIER GROWTH FUNDMANAGEMENT DISCUSSION OF FUND PERFORMANCE (Unaudited)
Best and Worst Performers
Five Best Contributors Investments | | Fund Realized and Unrealized Appreciation and Income in Fiscal Year 2014 | | Fund Per Share As of 06/30/14 | |
| 3D Systems Corp. | | $ | 3,885,705 | | $ | 0.51 | |
| QUALCOMM, Inc. | | | 3,215,719 | | | 0.42 | |
| Schlumberger, Ltd. | | | 2,615,942 | | | 0.34 | |
| Celgene Corp. | | | 2,315,668 | | | 0.30 | |
| Trimble Navigation, Ltd. | | | 2,198,008 | | | 0.29 | |
| | | $ | 14,231,042 | | $ | 1.86 | |
Five Poorest Contributors Investments | | Fund Realized and Unrealized Loss and Income in Fiscal Year 2014 | | Fund Per Share As of 06/30/14 | |
| Liquidity Services, Inc. | | $ | (677,423) | | $ | (0.09) | |
| Innerworkings, Inc. | | | (623,658) | | | (0.08) | |
| Potash Corp. of Saskatchewan, Inc. | | | (425,405) | | | (0.06) | |
| Verisk Analytics, Inc., Class A | | | (141,053) | | | (0.02) | |
| Panera Bread Co., Class A | | | (110,173) | | | (0.01) | |
| | | $ | (1,977,712) | | $ | (0.26) | |
Two of the best performers, 3D Systems and Celgene, were repeats for last year’s Best Contributors list. Liquidity Services, Innerworkings, and Potash were sold during the fiscal year because of disappointing fundamentals.
Capital Gains Distribution Policy
As previously reported, it is the Adviser’s policy to distribute all net realized capital gains in December of each year. However, there have been no capital gains distributed in the past 5 years. This was the result of large losses realized in late 2008 and early 2009 by selling stocks at depressed prices to meet redemptions by large shareholders. This large loss carry-forward has offset gains realized in 2011, 2012, 2013 and 2014. The status of the loss carry-forward follows:
| Date | | Loss Carry-Forward | | Per Share | | Unrealized Gain | | Per Share |
| December 31, 2011 | | $42,570,602 | | $4.97 | | $27,107,876 | | $3.16 |
| June 30, 2012 | | $39,400,579 | | $4.69 | | $32,443,150 | | $3.86 |
| December 31, 2012 | | $37,625,757 | | $4.74 | | $45,031,233 | | $5.68 |
| June 30, 2013 | | $32,411,695 | | $3.99 | | $56,324,991 | | $6.93 |
| December 31, 2013 | | $22,691,613 | | $2.91 | | $84,915,752 | | $10.90 |
| June 30, 2014 | | $14,769,777 | | $1.94 | | $76,715,476 | | $10.07 |
12 DF DENT GROWTH FUNDS
DF DENT PREMIER GROWTH FUNDMANAGEMENT DISCUSSION OF FUND PERFORMANCE (Unaudited)
The June 30, 2014 loss carry-forward of $14,769,777 can offset capital gains realized until June 30, 2018. This in no way implies that such gains will in fact be realized, but it does mean that such gains, if and when realized, may be offset by the remaining loss carry-forward to reduce required taxable capital gains distributions. Thus, the Adviser views the loss carry-forward as a “hidden asset” which can shelter future capital gains, if realized, against future capital gains distributions and taxes as has been the case since 2010.
The Fund realized capital gains of $17,641,918 in the 2014 fiscal year which were entirely sheltered from required distributions and capital gains taxes.
FIVE LARGEST EQUITY HOLDINGS
JUNE 30, 2014
| Quantity | | Security | | Total Cost | | Market Value | | Percent of Net Assets of the Fund | |
| 240,600 | | Fastenal Co. | | $ | 5,543,661 | | $ | 11,907,294 | | 5.97 | % | |
| 148,360 | | QUALCOMM, Inc. | | | 6,234,384 | | | 11,750,112 | | 5.89 | | |
| 43,000 | | Visa, Inc., Class A | | | 3,199,402 | | | 9,060,530 | | 4.54 | | |
| 12,000 | | Markel Corp. | | | 5,388,687 | | | 7,867,680 | | 3.95 | | |
| 69,500 | | Ecolab, Inc. | | | 3,771,941 | | | 7,738,130 | | 3.88 | | |
| | | | | $ | 24,138,075 | | $ | 48,323,746 | | 24.23 | % | |
While the above five largest holdings represent 24.23% of the Fund, their total unrealized gain of $24,185,671 represents 31.53% of the Fund’s total net unrealized gain of $76,715,476 on 06/30/2014. The greater percentage of the net unrealized gain is due to the fact that these larger holdings tend to have been held by the Fund for longer periods of time than more recent investments. The first three of the above five largest holdings were on last year’s list of five largest holdings.
* The determination of “best-in-class” is solely the opinion of the Fund’s Adviser, and such opinion is subject to change. Those companies that hold leading market share positions, strong growth potential, historically good profitability, and management teams known for integrity and good corporate governance are generally considered to be “best-in-class.”
The views in this report contained herein were those of the Fund’s Adviser as of June 30, 2014, and may not reflect the Adviser’s views on the date this report is first published or anytime thereafter. This report may contain discussions about certain investments both held and not held in the portfolio as of the report date. All current and future holdings are subject to risk and are subject to change. While these views are intended to assist shareholders in understanding their investment in the Fund, they do not constitute investment or tax advice, are not a guarantee of future performance and are not intended as an offer or solicitation with respect to the purchase or sale of any security.
13 DF DENT GROWTH FUNDS
DF DENT PREMIER GROWTH FUNDPERFORMANCE CHART AND ANALYSIS (Unaudited)
The following chart reflects the change in the value of a hypothetical $10,000 investment, including reinvested dividends and distributions, in the DF Dent Premier Growth Fund (the “Fund”) compared with the performance of the benchmark, S&P 500 Index ("S&P 500"), over the past ten fiscal years. The S&P 500 is a broad-based, unmanaged measurement of changes in stock market conditions based on the average of 500 widely held common stocks. The total return of the S&P 500 includes the reinvestment of dividends and income. The total return of the Fund includes operating expenses that reduce returns, while the total return of the S&P 500 does not include expenses. The Fund is professionally managed while the S&P 500 is unmanaged and is not available for investment.

Performance data quoted represents past performance and is no guarantee of future results. Current performance may be lower or higher than the performance data quoted. Investment return and principal value will fluctuate so that shares, when redeemed, may be worth more or less than original cost. For the most recent month-end performance, please call (866) 233-3368. As stated in the Fund’s current prospectus, the annual operating expense ratio (gross) is 1.26%. However, the Fund’s adviser has contractually agreed to reduce a portion of its fees and reimburse expenses to limit total operating expenses (excluding all taxes, interest, portfolio transaction expenses, and extraordinary expenses) to 1.10% on the first $150 million in Fund net assets and to 0.90% on net assets exceeding the $150 million, through October 31, 2016. During the period, certain fees were waived and/or expenses reimbursed; otherwise, returns would have been lower. The performance table and graph do not reflect the deduction of taxes that a shareholder would pay on Fund distributions or the redemption of Fund shares. Returns greater than one year are annualized.
14 DF DENT GROWTH FUNDS
DF DENT PREMIER GROWTH FUNDSCHEDULE OF INVESTMENTS
AFA
| | Shares | | Security Description | | Value | |
| Common Stock - 100.1% |
| Consumer Discretionary - 10.4% |
| | 60,000 | | CarMax, Inc. (a) | | $ | 3,120,600 | |
| | 90,000 | | Imax Corp. (a) | | 2,563,200 | |
| | 275,000 | | LKQ Corp. (a) | | 7,339,750 | |
| | 12,000 | | Panera Bread Co., Class A (a) | | 1,797,960 | |
| | 53,000 | | Signet Jewelers, Ltd. | | 5,861,270 | |
| | | 20,682,780 | |
| Energy - 8.8% |
| | 30,000 | | Concho Resources, Inc. (a) | | 4,335,000 | |
| | 24,000 | | Core Laboratories NV | | 4,009,440 | |
| | 26,000 | | Range Resources Corp. | | 2,260,700 | |
| | 41,000 | | Schlumberger, Ltd. | | 4,835,950 | |
| | 48,000 | | Southwestern Energy Co. (a) | | 2,183,520 | |
| | | 17,624,610 | |
| Financials - 17.9% |
| | 57,000 | | American Tower Corp. REIT | | 5,128,860 | |
| | 110,000 | | Discover Financial Services | | 6,817,800 | |
| | 12,000 | | Markel Corp. (a) | | 7,867,680 | |
| | 80,000 | | Moody's Corp. | | 7,012,800 | |
| | 180,000 | | SEI Investments Co. | | 5,898,600 | |
| | 50,000 | | Verisk Analytics, Inc., Class A (a) | | 3,001,000 | |
| | | 35,726,740 | |
| Health Care - 5.8% |
| | 80,000 | | Celgene Corp. (a) | | 6,870,400 | |
| | 90,000 | | ExamWorks Group, Inc. (a) | | 2,855,700 | |
| | 4,500 | | Intuitive Surgical, Inc. (a) | | 1,853,100 | |
| | | 11,579,200 | |
| Industrials - 24.0% |
| | 30,000 | | Exponent, Inc. | | 2,223,300 | |
| | 240,600 | | Fastenal Co. | | 11,907,294 | |
| | 143,000 | | Healthcare Services Group, Inc. | | 4,209,920 | |
| | 74,065 | | Jacobs Engineering Group, Inc. (a) | | 3,946,183 | |
| | 44,000 | | Roper Industries, Inc. | | 6,424,440 | |
| | 65,000 | | Stericycle, Inc. (a) | | 7,697,300 | |
| | 90,000 | | WageWorks, Inc. (a) | | 4,338,900 | |
| | 145,000 | | Waste Connections, Inc. | | 7,039,750 | |
| | | 47,787,087 | |
AFA
| | Shares | | Security Description | | Value | |
| Information Technology - 29.3% |
| | 78,000 | | 3D Systems Corp. (a) | | $ | 4,664,400 | |
| | 95,783 | | ANSYS, Inc. (a) | | 7,262,267 | |
| | 47,000 | | Concur Technologies, Inc. (a) | | 4,386,980 | |
| | 10,000 | | CoStar Group, Inc. (a) | | 1,581,700 | |
| | 80,000 | | Dealertrack Technologies, Inc. (a) | | 3,627,200 | |
| | 148,360 | | QUALCOMM, Inc. | | 11,750,112 | |
| | 108,000 | | Red Hat, Inc. (a) | | 5,969,160 | |
| | 178,000 | | Trimble Navigation, Ltd. (a) | | 6,577,100 | |
| | 39,000 | | Tyler Technologies, Inc. (a) | | 3,557,190 | |
| | 43,000 | | Visa, Inc., Class A | | 9,060,530 | |
| | | 58,436,639 | |
| Materials - 3.9% |
| | 69,500 | | Ecolab, Inc. | | 7,738,130 | |
Total Common Stock (Cost $122,859,710) | | 199,575,186 | |
Total Investments - 100.1% (Cost $122,859,710)* | $ | 199,575,186 | |
| Other Assets & Liabilities, Net – (0.1)% | | (165,827 | ) |
| Net Assets – 100.0% | $ | $199,409,359 | |
| REIT | Real Estate Investment Trust |
| (a) | Non-income producing security. |
| | * Cost for federal income tax purposes is $122,859,710 and net unrealized appreciation consists of: |
| Gross Unrealized Appreciation | | $ | 77,616,582 | |
| Gross Unrealized Depreciation | | | (901,106 | ) |
| Net Unrealized Appreciation | | $ | 76,715,476 | |
See Notes to Financial Statements. 15 DF DENT GROWTH FUNDS
DF DENT PREMIER GROWTH FUNDSCHEDULE OF INVESTMENTS
The following is a summary of the inputs used to value the Fund’s investments as of June 30, 2014.
The inputs or methodology used for valuing securities are not necessarily an indication of the risks associated with investing in those securities. For more information on valuation inputs, and their aggregation into the levels used in the table below, please refer to the Security Valuation section in Note 2 of the accompanying Notes to Financial Statements.
| Valuation Inputs | | Investments in Securities |
| Level 1 - Quoted Prices | | $ | 199,575,186 | |
| Level 2 - Other Significant Observable Inputs | | | - | |
| Level 3 - Significant Unobservable Inputs | | | - | |
| Total | | $ | 199,575,186 | |
The Level 1 value displayed in this table is Common Stock. Refer to the Schedule of Investments for a further breakout of each security by industry.
The Fund utilizes the end of period methodology when determining transfers. There were no transfers among Level 1, Level 2 and Level 3 for the year ended June 30, 2014.
| PORTFOLIO HOLDINGS | | | |
| % of Net Assets | | | |
| Consumer Discretionary | | | 10.4 | % |
| Energy | | | 8.8 | % |
| Financials | | | 17.9 | % |
| Health Care | | | 5.8 | % |
| Industrials | | | 24.0 | % |
| Information Technology | | | 29.3 | % |
| Materials | | | 3.9 | % |
| Other Assets & Liabilities, Net | | | (0.1 | )% |
| | | | 100.0 | % |
See Notes to Financial Statements. 16 DF DENT GROWTH FUNDS
DF DENT PREMIER GROWTH FUNDSTATEMENT OF ASSETS AND LIABILITIES
| ASSETS | | | | |
| Total investments, at value (Cost $122,859,710) | | $ | 199,575,186 | |
| Cash | | | 290,462 | |
| Receivables: | | | | |
| Fund shares sold | | | 150 | |
| Dividends and interest | | | 61,318 | |
| Prepaid expenses | | | 15,682 | |
| Total Assets | | | 199,942,798 | |
| | | | | |
| LIABILITIES | | | | |
| Payables: | | | | |
| Fund shares redeemed | | | 48,994 | |
| Accrued Liabilities: | | | | |
| Investment adviser fees | | | 442,586 | |
| Trustees’ fees and expenses | | | 121 | |
| Fund services fees | | | 14,355 | |
| Other expenses | | | 27,383 | |
| Total Liabilities | | | 533,439 | |
| | | | | |
| NET ASSETS | | $ | 199,409,359 | |
| | | | | |
| COMPONENTS OF NET ASSETS | | | | |
| Paid-in capital | | $ | 137,814,609 | |
| Accumulated net investment loss | | | (350,949 | ) |
| Accumulated net realized loss | | | (14,769,777 | ) |
| Net unrealized appreciation | | | 76,715,476 | |
| NET ASSETS | | $ | 199,409,359 | |
| SHARES OF BENEFICIAL INTEREST AT NO PAR VALUE (UNLIMITED SHARES AUTHORIZED) | | | 7,621,040 | |
| NET ASSET VALUE, OFFERING AND REDEMPTION PRICE PER SHARE | | $ | 26.17 | |
| | | | | |
See Notes to Financial Statements. 17 DF DENT GROWTH FUNDS
DF DENT PREMIER GROWTH FUNDSTATEMENT OF OPERATIONS
| INVESTMENT INCOME | | | | |
| Dividend income (Net of foreign withholding taxes of $16,095) | | $ | 1,463,925 | |
| Interest income | | | 4,772 | |
| Total Investment Income | | | 1,468,697 | |
| | | | | |
| EXPENSES | | | | |
| Investment adviser fees | | | 1,978,616 | |
| Fund services fees | | | 256,172 | |
| Custodian fees | | | 19,859 | |
| Registration fees | | | 23,540 | |
| Professional fees | | | 50,063 | |
| Trustees' fees and expenses | | | 7,566 | |
| Miscellaneous expenses | | | 31,663 | |
| Total Expenses | | | 2,367,479 | |
| Fees waived and expenses reimbursed | | | (286,718 | ) |
| Net Expenses | | | 2,080,761 | |
| | | | | |
| NET INVESTMENT LOSS | | | (612,064 | ) |
| | | | | |
| NET REALIZED AND UNREALIZED GAIN (LOSS) | | | | |
| Net realized gain on investments | | | 17,641,918 | |
| Net change in unrealized appreciation (depreciation) on investments | | | 20,390,485 | |
| NET REALIZED AND UNREALIZED GAIN | | | 38,032,403 | |
| INCREASE IN NET ASSETS RESULTING FROM OPERATIONS | | $ | 37,420,339 | |
| | | | | |
See Notes to Financial Statements. 18 DF DENT GROWTH FUNDS
DF DENT PREMIER GROWTH FUNDSTATEMENTS OF CHANGES IN NET ASSETS
| | | | | For the Years Ended June 30, |
| | | | | 2014 | | | 2013 |
| OPERATIONS | | | | | | | | | |
| | Net investment loss | | $ | (612,064 | ) | | | $ | (75,106 | ) |
| | Net realized gain | | | 17,641,918 | | | | | 6,988,884 | |
| | Net change in unrealized appreciation (depreciation) | | | 20,390,485 | | | | | 23,881,841 | |
| Increase in Net Assets Resulting from Operations | | | 37,420,339 | | | | | 30,795,619 | |
| | | | | | | | | | | | |
| CAPITAL SHARE TRANSACTIONS | | | | | | | | | |
| | Sale of shares | | | 18,923,115 | | | | | 12,280,833 | |
| | Redemption of shares | | | (31,742,283 | ) | | | | (17,154,575 | ) |
| Decrease in Net Assets from Capital Share Transactions | | | (12,819,168 | ) | | | | (4,873,742 | ) |
| Increase in Net Assets | | | 24,601,171 | | | | | 25,921,877 | |
| | | | | | | | | | | | |
| NET ASSETS | | | | | | | | | |
| | Beginning of Year | | | 174,808,188 | | | | | 148,886,311 | |
| | End of Year (Including line (a)) | | $ | 199,409,359 | | | | $ | 174,808,188 | |
| | | | | | | | | | | | |
| SHARE TRANSACTIONS | | | | | | | | | |
| | Sale of shares | | | 775,360 | | | | | 596,924 | |
| | Redemption of shares | | | (1,269,057 | ) | | | | (881,018 | ) |
| Decrease in Shares | | | (493,697 | ) | | | | (284,094 | ) |
| | | | | | | | | | | | |
| (a) | Accumulated net investment loss | | $ | (350,949 | ) | | | $ | (235,109 | ) |
See Notes to Financial Statements. 19 DF DENT GROWTH FUNDS
DF DENT PREMIER GROWTH FUNDFINANCIAL HIGHLIGHTS
| These financial highlights reflect selected data for a share outstanding throughout each year. |
| | | For the Years Ended June 30, | |
| | | 2014 | | 2013 | | 2012 | | 2011 | | 2010 | |
| NET ASSET VALUE, Beginning | | | | | | | | | | | | | | | | | | | | |
| of Year | $ | 21.54 | | | $ | 17.73 | | | $ | 17.60 | | | $ | 13.05 | | | $ | 10.94 | | |
| INVESTMENT OPERATIONS | | | | | | | | | | | | | | | | | | | | |
| Net investment loss (a) | | (0.08 | ) | | | (0.01 | ) | | | (0.05 | ) | | | (0.04 | ) | | | (0.04 | ) | |
| Net realized and unrealized | | | | | | | | | | | | | | | | | | | | |
| | gain (loss) | | 4.71 | | | | 3.82 | | | | 0.18 | | | | 4.59 | | | | 2.15 | | |
| Total from Investment | | | | | | | | | | | | | | | | | | | | |
| | Operations | | 4.63 | | | | 3.81 | | | | 0.13 | | | | 4.55 | | | | 2.11 | | |
| NET ASSET VALUE, End | | | | | | | | | | | | | | | | | | | | |
| of Year | $ | 26.17 | | | $ | 21.54 | | | $ | 17.73 | | | $ | 17.60 | | | $ | 13.05 | | |
| TOTAL RETURN | | 21.49 | % | | 21.49 | % | | 0.74 | % | | 34.87 | % | | 19.29 | % |
| | | | | | | | | | | | | | | | | | | | | |
| RATIOS/SUPPLEMENTARY DATA | | | | | | | | | | | | | | | | | | | | |
| Net Assets at End of | | | | | | | | | | | | | | | | | | | | |
| | Year (000's omitted) | $199,409 | | | $174,808 | | | $148,886 | | | $157,655 | | | $123,605 | | |
| Ratios to Average Net Assets: | | | | | | | | | | | | | | | | | | | | |
| Net investment loss | | (0.31 | )% | | (0.05 | )% | | (0.28 | )% | | (0.27 | )% | | (0.29 | )% |
| Net expense | | 1.05 | % | | 1.09 | % | | 1.10 | % | | 1.10 | % | | 1.10 | % |
| Gross expense (b) | | 1.20 | % | | 1.26 | % | | 1.29 | % | | 1.25 | % | | 1.27 | % |
| PORTFOLIO TURNOVER RATE | | 25 | % | | 19 | % | | 14 | % | | 21 | % | | 8 | % |
| | | | | | | | | | | | | | | | | | | | | | |
| (a) | Calculated based on average shares outstanding during each year. |
| (b) | Reflects the expense ratio excluding any waivers and/or reimbursements. |
See Notes to Financial Statements. 20 DF DENT GROWTH FUNDS
DF DENT MIDCAP GROWTH FUNDA MESSAGE TO OUR SHAREHOLDERS (Unaudited)
Dear Fellow Shareholders:
Performance
For the period July 1, 2013, through June 30, 2014, the DF Dent Midcap Growth Fund (the “Fund”) experienced a total return of +22.95%, underperforming the total return of +26.04% for the Russell Midcap Growth Index (the “Index”), which is the benchmark we have used for performance comparisons, by -3.09%.
Expense Ratio
Your Fund’s Adviser, D.F. Dent and Company, Inc. (the “Adviser”), has contractually agreed to maintain your Fund’s expense ratio (excluding all taxes, interest, portfolio transaction expenses, and extraordinary expenses) through October 31, 2016, at a net 1.10% on the first $150 million of net assets and 0.90% on net assets exceeding $150 million by reimbursing expenses and waiving a portion of management fees. Per the prospectus, the Fund’s gross total operating expense ratio is 1.86%.
Concentration
The Fund’s concentration in its top 10 holdings is as follows:
| Top 10 Holdings | | | 06/30/14 |
| % of Fund | | | 38.54 | % |
| Average Position Size of Top 10 Per Holding | | | 3.85 | % |
We believe that the current concentration in the top 10 positions is appropriate at its current level and has the potential to enhance long-term performance.
Management Ownership of Fund
Employees, their families, and the Adviser’s retirement plan owned approximately 33% of the Fund as of June 30, 2014. There were only management purchases and no management redemptions during the fiscal year ended June 30, 2014.
Portfolio Commentary
Despite the persistent strength of the major indices, the internal dynamics of the stock market have shifted this year. Unlike 2013, investors have favored more defensive strategies as evidenced by the strong preference for stocks with large capitalizations, low price earnings ratios and high dividend yields. These trends adversely impacted the investment results from your growth-oriented Fund.
After strong gains over the last several years, in late 2013 and early 2014 we trimmed some stocks in your Fund’s portfolio that had performed extremely well. This trimming was in reaction to significant multiple
21 DF DENT GROWTH FUNDS
DF DENT MIDCAP GROWTH FUNDA MESSAGE TO OUR SHAREHOLDERS (Unaudited)
expansion and stock appreciation. In effect, we thought some of these stocks had gone up too far in price, too fast, and their valuations had become inflated. As has been our practice, if our long-term conviction in your portfolio companies remains strong, we tend to reduce positions in response to short-term overvaluation rather than eliminate them completely.
During 2014, some of these high-multiple stocks experienced significant corrections, supporting our decisions to trim. We might have been more aggressive in reducing our positions, but our high degree of confidence in these companies’ prospects over the next three to five years suggested that further trimming would be unwise. In some cases, we have used recent stock weakness as an opportunity to add to those high-conviction names that have underperformed, using lower-conviction ideas as a source of funds.
Despite these efforts, after several years of strong portfolio performance, the first half of this year has been a soft one on a relative basis. We have experienced periods like this in the past and no doubt will experience them again in the future. Your Fund is characterized by low turnover and a long-term focus. Your Fund is concentrated in high-quality, well-managed companies with the potential for above average growth rates. However, the Fund’s performance will not always move in a straight line nor parallel to the market indices. While we do not enjoy periods of short-term relative underperformance, we remain steadfast in our investment philosophy, approach and discipline.
Taking a long-term view, we believe we may be in the fourth secular bull market of the last hundred years. Several positive factors underlie the current state of the stock market: a slowly but steadily expanding economy and corresponding earnings growth, a still accommodative Federal Reserve, stability on taxes, a sharply declining federal budget deficit, and the unlikelihood of another budget crisis. However, we caution that secular bull markets still have periodic cyclical downward swings, so investors should not be surprised to see periodic corrections, particularly in segments of the market that have outperformed over the last five years. In addition, a global shock (e.g., increasing unrest in the Middle East, border disputes in Asia, a terrorist event in Europe or the U.S.) could change investor sentiment for the worse.
In the coming years, we think it likely that more capital will be reallocated to equities, particularly companies with strong earnings growth, as retail investors continue to gain confidence in the equity markets. In a world where cash pays you nearly nothing and where a bond yielding 2.5% requires over 28 years to double your money, equities still seem to us to be the preferred asset class. We believe that midcap growth equities that can sustain strong earnings growth in a slow growth U.S. economy will attract investors and will continue to manage the Fund by focusing on those types of companies.
Attribution Analysis
The following bar chart presents the sector weightings of your Fund versus the sector weightings of the Index as of June 30, 2014:
22 DF DENT GROWTH FUNDS
DF DENT MIDCAP GROWTH FUNDA MESSAGE TO OUR SHAREHOLDERS (Unaudited)
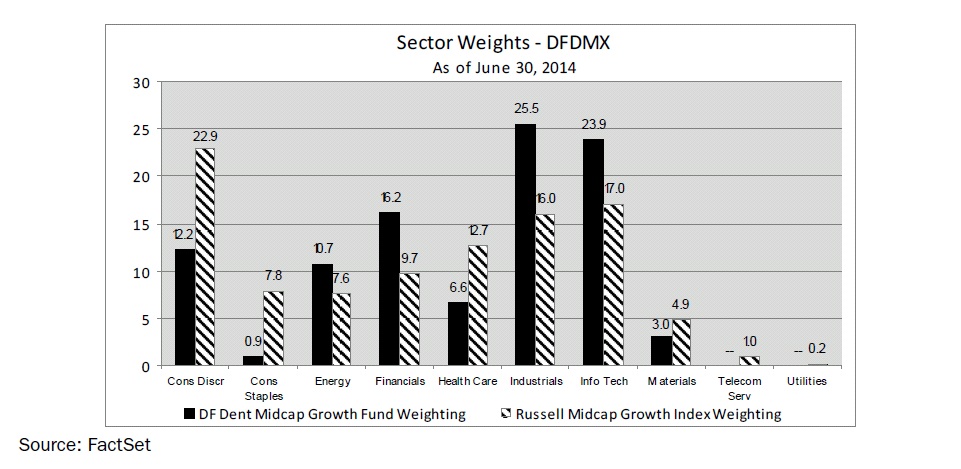
Your Fund was overweight versus the Index benchmark in Energy, Financials, Industrials and Information Technology. In Energy, the overweighting contributed to performance, but stock selection detracted slightly from performance. Your Fund’s overweighting in the Financials sector and stock selection within the Financials sector both detracted slightly from performance. Your Fund’s overweighting in the Industrials sector contributed slightly to performance, with a more significant negative effect coming from stock selection. We continue to believe that technology companies offer attractive opportunities as they address improving productivity through efficiency and labor cost savings. The Information Technology sector has been relatively weak over the past six months and one-year periods, and your Fund’s overweight position has detracted slightly from performance. However, stock selection has been the main determinant of whether Information Technology as a whole has contributed or detracted from performance. For the six months ending June 30, 2014, stock selection within the Information Technology sector was a significant detractor from performance, but for the year ending June 30, 2014, stock selection within the Information Technology sector was a positive contributor to performance.
Your Fund was most significantly under-weight versus the Index in the Consumer Discretionary, Consumer Staples, Health Care and Materials sectors. Your Fund’s under-weight position in the Consumer Discretionary and Consumer Staples sectors contributed slightly to performance. Stock selection in the Consumer Discretionary sector was also a slight positive contributor to performance, but stock selection in the Consumer Staples sector hurt performance slightly. In the Health Care sector, the Fund’s under-weight position had a slightly negative effect on performance, but stock selection contributed significantly to performance. In the Materials sector, the Fund’s under-weight position detracted slightly from performance with stock selection a slight positive.
23 DF DENT GROWTH FUNDS
DF DENT MIDCAP GROWTH FUNDA MESSAGE TO OUR SHAREHOLDERS (Unaudited)
Best and Worst Performers
Five Best Contributors Investments | | Fund Realized and Unrealized Appreciation and Income in Fiscal Year 2014 | | Fund Per Share As of 6/30/14 | |
| Illumina, Inc. | | $ | 312,350 | | $ | 0.30 | |
| Concho Resources, Inc. | | | 204,079 | | | 0.20 | |
| Trimble Navigation, Ltd. | | | 189,011 | | | 0.18 | |
| 3D Systems Corp. | | | 155,031 | | | 0.15 | |
| Signet Jewelers, Ltd. | | | 133,047 | | | 0.13 | |
| | | $ | 993,518 | | $ | 0.96 | |
Five Worst Contributors Investments | | Fund Realized and Unrealized Loss and Income in Fiscal Year 2014 | | Fund Per Share As of 6/30/14 | |
| Innerworkings, Inc. | | $ | (62,707) | | $ | (0.06) | |
| Tangoe, Inc. | | | (39,110) | | | (0.04) | |
| Dorman Products, Inc. | | | (21,688) | | | (0.02) | |
| Verisk Analystics, Inc., Class A | | | (20,465) | | | (0.02) | |
| RealPage, Inc. | | | (19,833) | | | (0.02) | |
| | | $ | (163,803) | | $ | (0.16) | |
FIVE LARGEST EQUITY HOLDINGS
JUNE 30, 2014
Shares | | Security | | | Total Cost | | | Market Value | | Percent of Net Assets of the Fund | |
| 17,731 | | Fastenal Co. | | $ | 746,032 | | $ | 877,507 | | 5.47 | % |
| 8,235 | | Moody’s Corp. | | | 626,754 | | | 721,880 | | 4.50 | |
| 8,446 | | ANSYS, Inc. | | | 561,248 | | | 640,376 | | 3.99 | |
| 945 | | Markel Corp. | | | 458,813 | | | 619,580 | | 3.87 | |
| 16,540 | | Trimble Navigation, Ltd. | | | 394,799 | | | 611,153 | | 3.81 | |
| | | | | $ | 2,787,646 | | $ | 3,470,496 | | 21.64 | % |
As always, we acknowledge the responsibility you have conveyed by making your investment in the DF Dent Midcap Growth Fund and will work diligently on your behalf.
24 DF DENT GROWTH FUNDS
DF DENT MIDCAP GROWTH FUNDA MESSAGE TO OUR SHAREHOLDERS (Unaudited)
Respectively Submitted,
Thomas F. O’Neil, Jr. Matthew F. Dent
Gary D. Mitchell Bruce L. Kennedy
* The determination of “best-in-class” is solely the opinion of the Fund’s Adviser, and such opinion is subject to change. Those companies that hold leading market share positions, strong growth potential, historically good profitability, and management teams known for integrity and good corporate governance are generally considered to be “best-in-class.”
IMPORTANT INFORMATION:
Investing involves risks, including the possible loss of principal. The Fund invests in small- and medium- size companies, which carry greater risk than is customarily associated with larger, more established companies. With non-diversification risk, the Fund will typically invest in securities of fewer issuers, which exposes the Fund to greater market risk. Investing in ADRs (American Depository Receipt) carries risks of political and financial instability, less liquidity and greater volatility, as well as risks associated with the lack of reliable accounting and financial information. The Fund is also subject to other risks, such as Real Estate Investment Trust (REIT) risk with possible real estate market declines, which are detailed in the Fund’s prospectus.
The Russell Midcap Growth Index measures the performance of the mid-cap growth segment of the U.S. equity universe. It includes those Russell Midcap Index companies with higher price-to-book ratios and higher forecasted growth values. One cannot invest directly in an index.
The views in this report contained herein were those of the Adviser as of June 30, 2014, and may not reflect the Adviser’s views on the date this report is first published or anytime thereafter. This report may contain discussions about certain investments both held and not held in the portfolio as of the report date. All current and future holdings are subject to risk and are subject to change. While these views are intended to assist shareholders in understanding their investment in the Fund, they do not constitute investment or tax advice, are not a guarantee of future performance and are not intended as an offer or solicitation with respect to the purchase or sale of any security.
25 DF DENT GROWTH FUNDS
DF DENT MIDCAP GROWTH FUNDPERFORMANCE CHART AND ANALYSIS (Unaudited)
The following chart reflects the change in the value of a hypothetical $10,000 investment, including reinvested dividends and distributions, in the DF Dent Midcap Growth Fund (the “Fund”) compared with the performance of the benchmark, the Russell Midcap Growth Index ("Russell Midcap Growth"), since inception. The Russell Midcap Growth measures the performance of the mid-cap growth segment of the U.S. equity universe. It includes those Russell Midcap Index companies with higher price-to-book ratios and higher forecasted growth values. The total return of the Russell Midcap Growth includes the reinvestment of dividends and income. The total return of the Fund includes operating expenses that reduce returns, while the total return of the Russell Midcap Growth does not include expenses. The Fund is professionally managed while the Russell Midcap Growth is unmanaged and is not available for investment.
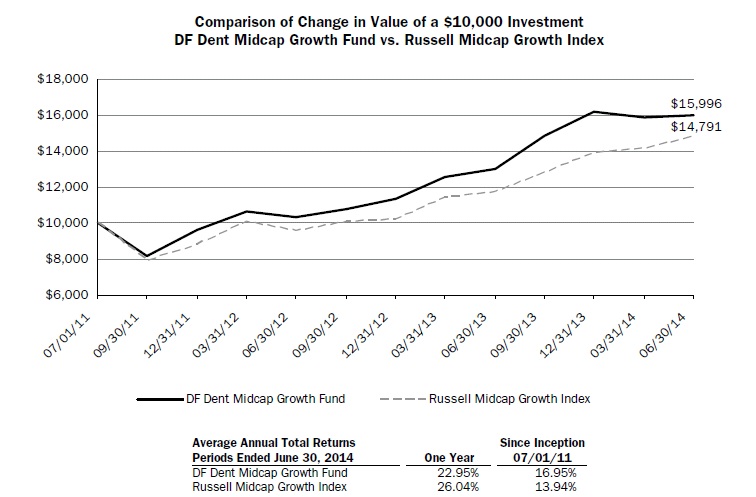
Performance data quoted represents past performance and is no guarantee of future results. Current performance may be lower or higher than the performance data quoted. Investment return and principal value will fluctuate so that shares, when redeemed, may be worth more or less than original cost. For the most recent month-end performance, please call (866) 233-3368. As stated in the Fund’s current prospectus, the annual operating expense ratio (gross) is 1.86%. However, the Fund’s adviser has contractually agreed to reduce a portion of its fees and reimburse expenses to limit total operating expenses (excluding all taxes, interest, portfolio transaction expenses, and extraordinary expenses) to 1.10% on the first $150 million in net assets and 0.90% on net assets exceeding $150 million, through October 31, 2016. During the period, certain fees were waived and/or expenses reimbursed; otherwise, returns would have been lower. Shares redeemed within 60 days of purchase will be charged a 2.00% redemption fee. The performance table and graph do not reflect the deduction of taxes that a shareholder would pay on Fund distributions or the redemption of Fund shares. Returns greater than one year are annualized.
26 DF DENT GROWTH FUNDS
DF DENT MIDCAP GROWTH FUNDSCHEDULE OF INVESTMENTS
AFA
| | Shares | | Security Description | | Value | |
| Common Stock - 99.3% |
| Consumer Discretionary - 12.3% |
| | 6,951 | | CarMax, Inc. (a) | | $ | 361,521 | |
| | 5,325 | | Dorman Products, Inc. (a) | | 262,629 | |
| | 11,787 | | Imax Corp. (a) | | 335,694 | |
| | 20,848 | | LKQ Corp. (a) | | 556,433 | |
| | 4,067 | | Signet Jewelers, Ltd. | | 449,770 | |
| | | 1,966,047 | |
| Consumer Staples - 0.9% |
| | 1,719 | | PriceSmart, Inc. | | 149,622 | |
| | | | |
| Energy - 10.8% |
| | 3,324 | | Concho Resources, Inc. (a) | | 480,318 | |
| | 1,956 | | Core Laboratories NV | | 326,769 | |
| | 5,412 | | Range Resources Corp. | | 470,574 | |
| | 9,875 | | Southwestern Energy Co. (a) | | 449,214 | |
| | | 1,726,875 | |
| Financials - 16.2% |
| | 6,951 | | Financial Engines, Inc. | | 314,741 | |
| | 945 | | Markel Corp. (a) | | 619,580 | |
| | 8,235 | | Moody's Corp. | | 721,880 | |
| | 16,188 | | SEI Investments Co. | | 530,481 | |
| | 6,907 | | Verisk Analytics, Inc., Class A (a) | | 414,558 | |
| | | 2,601,240 | |
| Health Care - 6.6% |
| | 8,028 | | CareFusion Corp. (a) | | 356,042 | |
| | 11,238 | | ExamWorks Group, Inc. (a) | | 356,582 | |
| | 1,938 | | Illumina, Inc. (a) | | 346,010 | |
| | | 1,058,634 | |
| Industrials - 25.6% |
| | 4,968 | | Expeditors International of Washington, Inc. | | 219,387 | |
| | 3,477 | | Exponent, Inc. | | 257,680 | |
| | 17,731 | | Fastenal Co. | | 877,507 | |
| | 12,007 | | Healthcare Services Group, Inc. | | 353,486 | |
| | 5,896 | | Jacobs Engineering Group, Inc. (a) | | 314,139 | |
| | 3,099 | | Roper Industries, Inc. | | 452,485 | |
| | 4,995 | | Stericycle, Inc. (a) | | 591,508 | |
| | 10,776 | | WageWorks, Inc. (a) | | 519,511 | |
| | 10,653 | | Waste Connections, Inc. | | 517,203 | |
| | | 4,102,906 | |
AFA
| | Shares | | Security Description | | Value | |
| Information Technology - 23.9% |
| | 7,523 | | 3D Systems Corp. (a) | | $ | 449,875 | |
| | 8,446 | | ANSYS, Inc. (a) | | 640,376 | |
| | 4,067 | | Concur Technologies, Inc. (a) | | 379,614 | |
| | 1,706 | | CoStar Group, Inc. (a) | | 269,838 | |
| | 9,061 | | Dealertrack Technologies, Inc. (a) | | 410,826 | |
| | 9,501 | | Red Hat, Inc. (a) | | 525,120 | |
| | 13,721 | | Tangoe, Inc. (a) | | 206,638 | |
| | 16,540 | | Trimble Navigation, Ltd. (a) | | 611,153 | |
| | 3,715 | | Tyler Technologies, Inc. (a) | | 338,845 | |
| | | 3,832,285 | |
| Materials - 3.0% |
| | 4,330 | | Ecolab, Inc. | | 482,102 | |
Total Common Stock (Cost $12,204,894) | | 15,919,711 | |
Total Investments - 99.3% (Cost $12,204,894)* | $ | 15,919,711 | |
| Other Assets & Liabilities, Net – 0.7% | | 112,753 | |
| Net Assets – 100.0% | $ | 16,032,464 | |
| (a) | Non-income producing security. |
| | * Cost for federal income tax purposes is $12,237,014 and net unrealized appreciation consists of: |
| Gross Unrealized Appreciation | | $ | 3,940,034 | |
| Gross Unrealized Depreciation | | | (257,337 | ) |
| Net Unrealized Appreciation | | $ | 3,682,697 | |
See Notes to Financial Statements.
27 DF DENT GROWTH FUNDS
DF DENT MIDCAP GROWTH FUNDSCHEDULE OF INVESTMENTS
The following is a summary of the inputs used to value the Fund’s investments as of June 30, 2014.
The inputs or methodology used for valuing securities are not necessarily an indication of the risks associated with investing in those securities. For more information on valuation inputs, and their aggregation into the levels used in the table below, please refer to the Security Valuation section in Note 2 of the accompanying Notes to Financial Statements.
| Valuation Inputs | | Investments in Securities |
| Level 1 - Quoted Prices | | $ | 15,919,711 | |
| Level 2 - Other Significant Observable Inputs | | | - | |
| Level 3 - Significant Unobservable Inputs | | | - | |
| Total | | $ | 15,919,711 | |
The Level 1 value displayed in this table is Common Stock. Refer to the Schedule of Investments for a further breakout of each security by industry.
The Fund utilizes the end of period methodology when determining transfers. There were no transfers among Level 1, Level 2 and Level 3 for the year ended June 30, 2014.
| PORTFOLIO HOLDINGS | | |
| % of Net Assets | | |
| Consumer Discretionary | 12.3 | % |
| Consumer Staples | 0.9 | % |
| Energy | 10.8 | % |
| Financials | 16.2 | % |
| Health Care | 6.6 | % |
| Industrials | 25.6 | % |
| Information Technology | 23.9 | % |
| Materials | 3.0 | % |
| Other Assets & Liabilities, Net | 0.7 | % |
| | 100.0 | % |
See Notes to Financial Statements.
28 DF DENT GROWTH FUNDS
DF DENT MIDCAP GROWTH FUNDSTATEMENT OF ASSETS AND LIABILITIES
| ASSETS | | | | |
| | Total investments, at value (Cost $12,204,894) | | $ | 15,919,711 | |
| | Cash | | | 145,202 | |
| | Receivables: | | | | |
| | Dividends and interest | | | 1,627 | |
| | Prepaid expenses | | | 3,477 | |
| Total Assets | | | 16,070,017 | |
| | | | | | |
| LIABILITIES | | | | |
| | Accrued Liabilities: | | | | |
| | Investment adviser fees | | | 12,065 | |
| | Trustees’ fees and expenses | | | 8 | |
| | Fund services fees | | | 5,786 | |
| | Other expenses | | | 19,694 | |
| Total Liabilities | | | 37,553 | |
| | | | | | |
| NET ASSETS | | $ | 16,032,464 | |
| | | | | | |
| COMPONENTS OF NET ASSETS | | | | |
| | Paid-in capital | | $ | 11,971,374 | |
| | Accumulated net realized gain | | | 346,273 | |
| | Net unrealized appreciation | | | 3,714,817 | |
| NET ASSETS | | $ | 16,032,464 | |
| SHARES OF BENEFICIAL INTEREST AT NO PAR VALUE (UNLIMITED SHARES AUTHORIZED) | | | 1,037,029 | |
NET ASSET VALUE, OFFERING AND REDEMPTION PRICE PER SHARE* | | $ | 15.46 | |
| * | Shares redeemed or exchanged within 60 days of purchase are charged a 2.00% redemption fee. |
See Notes to Financial Statements.
29 DF DENT GROWTH FUNDS
DF DENT MIDCAP GROWTH FUNDSTATEMENT OF OPERATIONS
| INVESTMENT INCOME | | | | |
| Dividend income (Net of foreign withholding taxes of $407) | | $ | 60,373 | |
| Interest income | | | 623 | |
| Total Investment Income | | | 60,996 | |
| | | | | |
| EXPENSES | | | | |
| Investment adviser fees | | | 129,962 | |
| Fund services fees | | | 92,616 | |
| Custodian fees | | | 5,000 | |
| Registration fees | | | 5,672 | |
| Professional fees | | | 23,242 | |
| Trustees' fees and expenses | | | 474 | |
| Miscellaneous expenses | | | 13,430 | |
| Total Expenses | | | 270,396 | |
| Fees waived and expenses reimbursed | | | (127,438 | ) |
| Net Expenses | | | 142,958 | |
| | | | | |
| NET INVESTMENT LOSS | | | (81,962 | ) |
| | | | | |
| NET REALIZED AND UNREALIZED GAIN (LOSS) | | | | |
| Net realized gain on investments | | | 706,354 | |
| Net change in unrealized appreciation (depreciation) on investments | | | 1,673,641 | |
| NET REALIZED AND UNREALIZED GAIN | | | 2,379,995 | |
| INCREASE IN NET ASSETS RESULTING FROM OPERATIONS | | $ | 2,298,033 | |
| | | | | |
See Notes to Financial Statements.
30 DF DENT GROWTH FUNDS
DF DENT MIDCAP GROWTH FUNDSTATEMENTS OF CHANGES IN NET ASSETS
| | | | | For the Years Ended June 30, |
| | | | | 2014 | | | 2013 |
| OPERATIONS | | | | | | | | | |
| | Net investment loss | | $ | (81,962 | ) | | | $ | (28,644 | ) |
| | Net realized gain | | | 706,354 | | | | | 176,985 | |
| | Net change in unrealized appreciation (depreciation) | | | 1,673,641 | | | | | 1,652,522 | |
| Increase in Net Assets Resulting from Operations | | | 2,298,033 | | | | | 1,800,863 | |
| | | | | | | | | | | | |
| DISTRIBUTIONS TO SHAREHOLDERS FROM | | | | | | | | | |
| | Net realized gain | | | (413,592 | ) | | | | - | |
| | | | | | | | | | | | |
| CAPITAL SHARE TRANSACTIONS | | | | | | | | | |
| | Sale of shares | | | 4,405,986 | | | | | 1,634,533 | |
| | Reinvestment of distributions | | | 391,979 | | | | | - | |
| | Redemption of shares | | | (329,348 | ) | | | | (179,484 | ) |
| | Redemption fees | | | 40 | | | | | - | |
| Increase in Net Assets from Capital Share Transactions | | | 4,468,657 | | | | | 1,455,049 | |
| Increase in Net Assets | | | 6,353,098 | | | | | 3,255,912 | |
| | | | | | | | | | | | |
| NET ASSETS | | | | | | | | | |
| | Beginning of Year | | | 9,679,366 | | | | | 6,423,454 | |
| | End of Year | | $ | 16,032,464 | | | | $ | 9,679,366 | |
| | | | | | | | | | | | |
| SHARE TRANSACTIONS | | | | | | | | | |
| | Sale of shares | | | 288,962 | | | | | 136,480 | |
| | Reinvestment of distributions | | | 26,361 | | | | | - | |
| | Redemption of shares | | | (22,394 | ) | | | | (14,946 | ) |
| Increase in Shares | | | 292,929 | | | | | 121,534 | |
| | | | | | | | | | | | |
See Notes to Financial Statements.
31 DF DENT GROWTH FUNDS
DF DENT MIDCAP GROWTH FUNDFINANCIAL HIGHLIGHTS
| These financial highlights reflect selected data for a share outstanding throughout each period. |
| | | For the Year Ended June 30, 2014 | | For the Year Ended June 30, 2013 | | July 1, 2011 (a) through June 30, 2012 | |
| NET ASSET VALUE, Beginning of Period | $ | 13.01 | | | $ | 10.32 | | | $ | 10.00 | | |
| INVESTMENT OPERATIONS | | | | | | | | | | | | |
| Net investment loss (b) | | (0.09 | ) | | | (0.04 | ) | | | (0.05 | ) | |
| Net realized and unrealized gain (loss) | | 3.06 | | | | 2.73 | | | | 0.37 | | |
| Total from Investment Operations | | 2.97 | | | | 2.69 | | | | 0.32 | | |
| DISTRIBUTIONS TO SHAREHOLDERS FROM | | | | | | | | | | | | |
| Net realized gain | | (0.52 | ) | | | — | | | | — | | |
| REDEMPTION FEES (b) | | — | (c) | | — | | | | — | | |
| NET ASSET VALUE, End of Period | $ | 15.46 | | | $ | 13.01 | | | $ | 10.32 | | |
| TOTAL RETURN | | 22.95 | % | | 26.07 | % | | 3.20 | %(d) |
| | | | | | | | | | | | | |
| RATIOS/SUPPLEMENTARY DATA | | | | | | | | | | | | |
| Net Assets at End of Period (000's omitted) | $16,032 | | | $9,679 | | | $6,423 | | |
| Ratios to Average Net Assets: | | | | | | | | | | | | |
| Net investment loss | | (0.63 | )% | | (0.38 | )% | | (0.55 | )%(e) |
| Net expense | | 1.10 | % | | 1.10 | % | | 1.10 | %(e) |
| Gross expense (f) | | 2.08 | % | | 1.86 | % | | 3.45 | %(e) |
| PORTFOLIO TURNOVER RATE | | 32 | % | | 35 | % | | 24 | %(d) |
| | | | | | | | | | | | | | |
| (a) | Commencement of operations. |
| (b) | Calculated based on average shares outstanding during each period. |
| (c) | Less than $0.01 per share. |
| (d) | Not annualized. |
| (e) | Annualized. |
| (f) | Reflects the expense ratio excluding any waivers and/or reimbursements. |
See Notes to Financial Statements.
32 DF DENT GROWTH FUNDS
DF DENT SMALL CAP GROWTH FUNDA MESSAGE TO OUR SHAREHOLDERS (Unaudited)
Dear Fellow Shareholders:
Performance
The DF Dent Small Cap Growth Fund (the “Fund”) experienced a total return of +8.70% for the period of November 1, 2013 (the date of inception for the Fund), through June 30, 2014. This represents an underperformance of -0.5% relative to the total return of +9.20% for the Russell 2000 Growth Index (the “Index”), which is the benchmark we have used for performance comparisons, for the same timeframe.
Expense Ratio
The estimated gross operating expense ratio for the Fund is currently 5.80%, which is high given the small size of Fund assets relative to certain fixed expenses. However, per the Fund’s prospectus, your Fund’s adviser, D.F. Dent and Company, Inc. (the “Adviser”), has contractually agreed to waive a portion of its fees and/or reimburse expenses so as to maintain your Fund’s expense ratio (excluding all taxes, interest, portfolio transaction expenses, and extraordinary expenses) at a net 1.25% through at least October 31, 2016.
Concentration
The Fund’s concentration in its top 10 holdings is as follows:
| Top 10 Holdings | | | 06/30/14 |
| % of Fund | | | 30.7 | % |
| Average Position Size of Top 10 Per Holding | | | 3.1 | % |
We believe that the current concentration in the top 10 positions is appropriate at its current level and has the potential to enhance long-term performance.
Management Ownership of Fund
Employees, their families, and the Adviser’s retirement plan owned approximately 64% of the Fund as of June 30, 2014. There were only management purchases and no management redemptions during the fiscal period ended June 30, 2014.
Portfolio Commentary
Since the Fund’s inception in November 2013, most U.S. stock market indices have appreciated considerably. The movements upward, however, have not been uniform throughout the period or across the asset class, and the seemingly persistent strength in the market has somewhat masked a strong change in investor appetite. Of note, many of the leaders in 2013 have pivoted to laggards in the first half of 2014. Smaller capitalization stocks in general, and growth-oriented smaller capitalization stocks in particular, are examples of this dynamic, with the Russell 2000 Growth Index generating a total return of 43.2% in 2013 and just a 2.2%
33 DF DENT GROWTH FUNDS
DF DENT SMALL CAP GROWTH FUNDA MESSAGE TO OUR SHAREHOLDERS (Unaudited)
return in the first half of 2014. Since inception, your Fund has followed a similar trend with a very strong start at the end of 2013 (from November 1st through the end of 2013, the Fund returned 9.3%, outperforming the Russell 2000 Growth’s returns of 6.8% over the same period), followed by a flattish first half of 2014. While this trend did reverse somewhat in June, the Adviser is not a market prognosticator and cannot predict when smaller, growth-oriented companies may return in earnest to relative favor, if ever. Rather, the Adviser remains vigilant in its pursuit of high-quality, market-leading companies with durable earnings and business models and believes that, should such companies generate considerable cash flow and earnings per share growth over time, shareholders would likely be suitably rewarded.
Investment Tenet Highlight: Prudent Capital Allocation
As described in the Fund’s inaugural Message to Shareholders at the end of 2013, when evaluating investment opportunities, the Adviser believes it is paramount to identify and invest in companies run by “excellent management teams with proven execution skills.” As one would expect, this excellence includes managements that possess forward-thinking strategies and vision, deep industry expertise and often “skin in the game” in the form of stock ownership to align their interests with those of shareholders. Another aspect of management excellence the Adviser feels is often overlooked and undervalued is prudent capital allocation: deciding how best to invest capital or earnings generated by the business to drive the most future shareholder value. Said differently, the first half of a CEO’s job is to set out on a strategy to grow a business and its profits. This is the half on which most of the market is focused and many great visionary CEOs (such as Steve Jobs or Jeff Bezos) embody this trait. The second half of a CEO’s job is to determine how best to invest those profits she or he helped generate so that earnings per share – and total shareholder return – may be higher in the future. These capital allocation decisions – determining whether to reinvest in growth of an existing business, acquire another business, pay down debt, or return capital to shareholders (in the form of dividends or stock buybacks), while often underappreciated by the market, can have a profound effect on the company’s success and ultimately total shareholder return.
By way of example, consider Atrion Corporation, your Fund’s largest investment position. Atrion develops medical subcomponents of products sold to various healthcare markets. Its components are generally proprietary, specialized and tend to represent small portions of the overall spending on the product, thereby enabling Atrion to generate enviable operating margins and potential profits. Atrion management’s interest appears to us as appropriately aligned with shareholders – collectively, with the Board of Directors they own more than 20% of the shares outstanding – and has done a solid job identifying new business opportunities and developing the growth strategy. But what truly sets Atrion apart has been its capital allocation over time. Management looks first to profitably grow the business organically and has successfully done so, doubling revenues over the last 10 years (nearly 8% organic growth annually) and steadily improving operating margins. But management will not grow for growth’s sake, and will walk away from business that does not exceed the company’s lofty return threshold. Rather than “empire build,” management has actually sold many businesses that did not generate sufficient returns and has routinely determined that the best use of excess capital is to return it to shareholders either via dividends or buybacks. Specifically, over the last 15 years, in addition to returning more than $33.50 per share to shareholders in the form of dividends, Atrion has retired more than 37% of the shares outstanding. This prudent capital allocation has had the effect of amplifying the already
34 DF DENT GROWTH FUNDS
DF DENT SMALL CAP GROWTH FUNDA MESSAGE TO OUR SHAREHOLDERS (Unaudited)
impressive sales and operating margin growth: over the last 15 years, sales have grown more than 200%, earnings have grown more than 1100% and earnings per share have grown in excess of 1800%. The Adviser endeavors to find more companies like Atrion run by excellent capital allocators.
Attribution Analysis
Your Fund’s greatest source of outperformance came from the Consumer Discretionary sector, which was almost fully offset by the greatest source of underperformance from the Information Technology sector. In both sectors, the Fund was modestly underweight relative to the Index during the period, with the outperformance and underperformance coming almost exclusively from favorable and unfavorable security selection, respectively.
Your Fund was significantly overweight versus the Index benchmark in Industrials and modestly overweight in Financials. We continue to believe that well-run Industrial companies with market-leading positions and above-average, high-return growth opportunities represent excellent investments for the Fund. Your Fund’s overweighting in Industrials was a positive contributor to performance, somewhat offset by stock selection within the Industrials sector, which was a modest negative contributor to performance. Excluding one investment in Financials, your Fund’s overweighting and stock selection within the Financials both provided a slightly positive contribution to performance. However, including the large underperformer, Financials were a slight drag on performance.
Your Fund was most significantly under-weight versus the Index in Materials and Health Care. In both sectors, your Fund’s under-weighting detracted slightly from performance as both sectors performed well during the period. Also in both under-weighted sectors, stock selection provided near-negligible, albeit slightly negative contribution to performance.
All in all, the Adviser feels comfortable with the portfolio of investments your Fund holds, both in terms of sector weightings and the favorable attributes of the underlying securities, including high levels of earnings growth, solid management teams and durable, cash flow-generating franchises.
The following bar chart presents the sector weightings of your Fund versus the sector weightings of the Index as of June 30, 2014:
35
DF DENT GROWTH FUNDS
DF DENT SMALL CAP GROWTH FUNDA MESSAGE TO OUR SHAREHOLDERS (Unaudited)
Best and Worst Performers
Five Best Contributors Investments | | Fund Realized and Unrealized Appreciation and Income in Fiscal Period 2014 | | Fund Per Share As of 6/30/14 | |
| Zoe’s Kitchen, Inc. | | $ | 68,715 | | $ | 0.32 | |
| Atrion Corp. | | | 15,313 | | | 0.07 | |
| Quality Distribution, Inc. | | | 11,931 | | | 0.06 | |
| Amber Road, Inc. | | | 11,164 | | | 0.05 | |
| Envestnet, Inc. | | | 9,783 | | | 0.05 | |
| | | $ | 116,906 | | $ | 0.55 | |
Five Worst Contributors Investments | | Fund Realized and Unrealized Loss and Income in Fiscal Period 2014 | | Fund Per Share As of 6/30/14 | |
| Liquidity Services, Inc. | | $ | (11,499) | | $ | (0.05) | |
| Financial Engines, Inc. | | | (9,680) | | | (0.04) | |
| PriceSmart, Inc. | | | (8,346) | | | (0.04) | |
| CoStar Group, Inc. | | | (6,988) | | | (0.03) | |
| Beacon Roofing Supply, Inc. | | | (5,585) | | | (0.03) | |
| | | $ | (42,098) | | $ | (0.19) | |
36
�� DF DENT GROWTH FUNDS
DF DENT SMALL CAP GROWTH FUNDA MESSAGE TO OUR SHAREHOLDERS (Unaudited)
FIVE LARGEST EQUITY HOLDINGS
JUNE 30, 2014
Shares | | Security | | Total Cost | | Market Value | | Percent of Net Assets of the Fund |
| 318 | | Atrion Corp. | | $ | 89,254 | | $ | 103,668 | | 4.40 | % |
| 2,710 | | Healthcare Services Group, Inc. | | | 75,172 | | | 79,782 | | 3.39 | |
| 2,408 | | ExamWorks Group, Inc. | | | 72,543 | | | 76,406 | | 3.24 | |
| 1,567 | | WageWorks, Inc. | | | 79,805 | | | 75,545 | | 3.20 | |
| 2,033 | | Zoe’s Kitchen, Inc. | | | 30,495 | | | 69,894 | | 2.97 | |
| | | | | $ | 347,269 | | $ | 405,295 | | 17.20 | %% |
As always, we appreciate the confidence you have placed in D.F. Dent and Company and are conscious of the responsibility that you have entrusted to us. We will continue to work diligently on your behalf.
Respectively Submitted,
Matthew F. Dent Gary Wu Austin G. Root
IMPORTANT INFORMATION:
Investing involves risks, including the possible loss of principal. The Fund invests in small- and medium- size companies, which carry greater risk than is customarily associated with larger, more established companies. With respect to non-diversification risk, the Fund will typically invest in securities of fewer issuers, which exposes the Fund to greater market risk. Investing in ADRs (American Depository Receipt) carries risks of political and financial instability, less liquidity and greater volatility, as well as risks associated with the lack of reliable accounting and financial information. The Fund is also subject to other risks, such as Real Estate Investment Trust (REIT) risk with possible real estate market declines, which are detailed in the Fund’s prospectus.
The Russell 2000 Growth Index measures the performance of the small cap growth segment of the U.S. equity universe. It includes those Russell Small Cap Index companies with higher price-to-book ratios and higher forecasted growth values. One cannot invest directly in an index.
The views in this report contained herein were those of the Adviser as of June 30, 2014, and may not reflect the Adviser’s views on the date this report is first published or anytime thereafter. This report may contain discussions about certain investments both held and not held in the portfolio as of the report date. All current and future holdings are subject to risk and are subject to change. While these views are intended to assist shareholders in understanding their investment in the Fund, they do not constitute investment or tax advice, are not a guarantee of future performance and are not intended as an offer or solicitation with respect to the purchase or sale of any security.
37
DF DENT GROWTH FUNDS
DF DENT SMALL CAP GROWTH FUNDPERFORMANCE CHART AND ANALYSIS (Unaudited)
The following chart reflects the change in the value of a hypothetical $10,000 investment, including reinvested dividends and distributions, in DF Dent Small Cap Growth Fund (the “Fund”) compared with the performance of the benchmark, the Russell 2000 Growth Index ("Russell 2000 Growth"), since inception. The Russell 2000 Growth, the Fund‘s primary performance benchmark, measures the performance of those Russell 2000 Index companies with higher price-to-book ratios and higher forecasted growth values. The total return of the Russell 2000 Growth includes the reinvestment of dividends and income. The total return of the Fund includes operating expenses that reduce returns, while the total return of the Russell 2000 Growth does not include expenses. The Fund is professionally managed while the Russell 2000 Growth is unmanaged and is not available for investment.
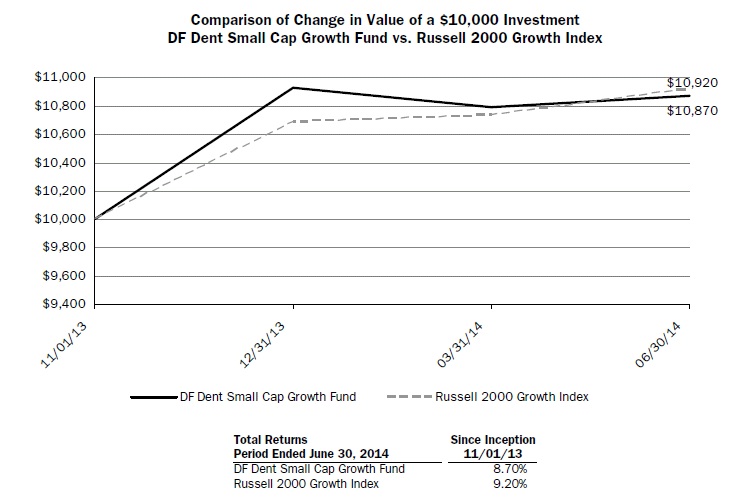
Performance data quoted represents past performance and is no guarantee of future results. Current performance may be lower or higher than the performance data quoted. Investment return and principal value will fluctuate so that shares, when redeemed, may be worth more or less than original cost. For the most recent month-end performance, please call (866) 233-3368. As stated in the Fund’s current prospectus, the estimated annual operating expense ratio (gross) is 5.80%. However, the Fund’s adviser has contractually agreed to reduce a portion of its fees and reimburse expenses to limit total operating expenses (excluding all taxes, interest, portfolio transaction expenses, and extraordinary expenses) to 1.25%, through October 31, 2016. During the period, certain fees were waived and/or expenses reimbursed; otherwise, returns would have been lower. Shares redeemed within 60 days of purchase will be charged a 2.00% redemption fee. The performance table and graph do not reflect the deduction of taxes that a shareholder would pay on Fund distributions or the redemption of Fund shares.
38 DF DENT GROWTH FUNDS
DF DENT SMALL CAP GROWTH FUNDSCHEDULE OF INVESTMENTS
| | Shares | | Security Description | | Value | |
| Common Stock - 99.7% |
| Consumer Discretionary - 18.4% |
| | 339 | | Carter's, Inc. | | $ | 23,367 | |
| | 1,287 | | Dorman Products, Inc. (a) | | 63,475 | |
| | 2,985 | | Einstein Noah Restaurant Group, Inc. | | 47,939 | |
| | 622 | | Hibbett Sports, Inc. (a) | | 33,694 | |
| | 496 | | HomeAway, Inc. (a) | | 17,271 | |
| | 2,106 | | Imax Corp. (a) | | 59,979 | |
| | 791 | | Monro Muffler Brake, Inc. | | 42,073 | |
| | 196 | | Panera Bread Co., Class A (a) | | 29,366 | |
| | 1,637 | | Performance Sports Group, Ltd. (a) | | 28,167 | |
| | 420 | | Sotheby's | | 17,636 | |
| | 2,033 | | Zoe's Kitchen, Inc. (a) | | 69,894 | |
| | | 432,861 | |
| Consumer Staples - 4.0% |
| | 1,018 | | Calavo Growers, Inc. | | 34,439 | |
| | 2,356 | | Inventure Foods, Inc. (a) | | 26,552 | |
| | 378 | | PriceSmart, Inc. | | 32,901 | |
| | | 93,892 | |
| Energy - 5.0% |
| | 130 | | Core Laboratories NV | | 21,718 | |
| | 1,245 | | Laredo Petroleum, Inc. (a) | | 38,570 | |
| | 320 | | Oil States International, Inc. (a) | | 20,509 | |
| | 532 | | Unit Corp. (a) | | 36,617 | |
| | | 117,414 | |
| Financials - 10.1% |
| | 1,083 | | Financial Engines, Inc. | | 49,038 | |
| | 817 | | Glacier Bancorp, Inc. | | 23,186 | |
| | 34 | | Markel Corp. (a) | | 22,292 | |
| | 1,448 | | OneBeacon Insurance Group, Ltd., Class A | | 22,502 | |
| | 673 | | ProAssurance Corp. | | 29,881 | |
| | 613 | | Waddell & Reed Financial, Inc., Class A | | 38,368 | |
| | 731 | | WSFS Financial Corp. | | 53,853 | |
| | | 239,120 | |
| Health Care - 13.4% |
| | 318 | | Atrion Corp. | | 103,668 | |
| | 668 | | Cepheid, Inc. (a) | | 32,024 | |
| | 881 | | DexCom, Inc. (a) | | 34,940 | |
| | 2,408 | | ExamWorks Group, Inc. (a) | | 76,406 | |
| | 148 | | MWI Veterinary Supply, Inc. (a) | | 21,015 | |
| | 1,650 | | Novadaq Technologies, Inc. (a) | | 27,192 | |
| | 398 | | The Advisory Board Co. (a) | | 20,616 | |
| | | 315,861 | |
| | Shares | | Security Description | | Value | |
| Industrials – 28.2% |
| | 1,511 | | Beacon Roofing Supply, Inc. (a) | $ | 50,044 |
| | 640 | | Civeo Corp. (a) | 16,019 |
| | 3,800 | | Douglas Dynamics, Inc. | 66,956 |
| | 916 | | Envestnet, Inc. (a) | 44,811 |
| | 862 | | Exponent, Inc. | 63,883 |
| | 2,710 | | Healthcare Services Group, Inc. | 79,782 |
| | 532 | | MSC Industrial Direct Co., Inc. | 50,881 |
| | 4,345 | | Quality Distribution, Inc. (a) | 64,567 |
| | 1,871 | | Raven Industries, Inc. | 62,005 |
| | 1,878 | | Rexnord Corp. (a) | 52,866 |
| | 438 | | The Middleby Corp. (a) | 36,231 |
| | 1,567 | | WageWorks, Inc. (a) | 75,545 |
| | | | | 663,590 |
| Information Technology - 20.2% |
| | 590 | | 3D Systems Corp. (a) | 35,282 |
| | 3,162 | | Amber Road, Inc. (a) | 51,003 |
| | 349 | | Badger Meter, Inc. | 18,375 |
| | 227 | | Concur Technologies, Inc. (a) | 21,188 |
| | 353 | | CoStar Group, Inc. (a) | 55,834 |
| | 1,178 | | Dealertrack Technologies, Inc. (a) | 53,410 |
| | 1,586 | | Ellie Mae, Inc. (a) | 49,372 |
| | 360 | | Guidewire Software, Inc. (a) | 14,638 |
| | 257 | | Littelfuse, Inc. | 23,888 |
| | 427 | | NVE Corp. (a) | 23,737 |
| | 302 | | Shutterfly, Inc. (a) | 13,004 |
| | 2,116 | | Tangoe, Inc. (a) | 31,867 |
| | 180 | | The Ultimate Software Group, Inc. (a) | 24,871 |
| | 655 | | Tyler Technologies, Inc. (a) | 59,743 |
| | 476,212 |
| Materials - 0.4% |
| | 811 | | Marrone Bio Innovations, Inc. (a) | 9,424 |
| | |
Total Common Stock (Cost $2,245,589) | 2,348,374 |
Total Investments - 99.7% (Cost $2,245,589)* | $ | 2,348,374 |
| Other Assets & Liabilities, Net – 0.3% | 7,792 |
| Net Assets – 100.0% | $ | 2,356,166 |
| (a) | Non-income producing security. |
| | * Cost for federal income tax purposes is $2,254,543 and net unrealized appreciation consists of: |
| Gross Unrealized Appreciation | | $ | 187,033 | |
| Gross Unrealized Depreciation | | | (93,202 | ) |
| Net Unrealized Appreciation | | $ | 93,831 | |
See Notes to Financial Statements.
39
DF DENT GROWTH FUNDS
DF DENT SMALL CAP GROWTH FUNDSCHEDULE OF INVESTMENTS
The following is a summary of the inputs used to value the Fund’s investments as of June 30, 2014.
The inputs or methodology used for valuing securities are not necessarily an indication of the risks associated with investing in those securities. For more information on valuation inputs, and their aggregation into the levels used in the table below, please refer to the Security Valuation section in Note 2 of the accompanying Notes to Financial Statements.
| Valuation Inputs | | Investments in Securities |
| Level 1 - Quoted Prices | | $ | 2,384,374 | |
| Level 2 - Other Significant Observable Inputs | | | - | |
| Level 3 - Significant Unobservable Inputs | | | - | |
| Total | | $ | 2,384,374 | |
The Level 1 value displayed in this table is Common Stock. Refer to the Schedule of Investments for a further breakout of each security by industry.
The Fund utilizes the end of period methodology when determining transfers. There were no transfers among Level 1, Level 2 and Level 3 for the period ended June 30, 2014.
| PORTFOLIO HOLDINGS | | | |
| % of Net Assets | | | |
| Consumer Discretionary | | | 18.4 | % |
| Consumer Staples | | | 4.0 | % |
| Energy | | | 5.0 | % |
| Financials | | | 10.1 | % |
| Health Care | | | 13.4 | % |
| Industrials | | | 28.2 | % |
| Information Technology | | | 20.2 | % |
| Materials | | | 0.4 | % |
| Other Assets & Liabilities, Net | | | 0.3 | % |
| | | | 100.0 | % |
See Notes to Financial Statements.
40
DF DENT GROWTH FUNDS
DF DENT SMALL CAP GROWTH FUNDSTATEMENT OF ASSETS AND LIABILITIES
| ASSETS | | | | |
| | Total investments, at value (Cost $2,245,589) | | $ | 2,348,374 | |
| | Cash | | | 35,980 | |
| | Receivables: | | | | |
| | | Investment securities sold | | | 24,339 | |
| | | Dividends and interest | | | 652 | |
| | From investment adviser | | | 20,347 | |
| | Prepaid expenses | | | 2,147 | |
| Total Assets | | | 2,431,839 | |
| | | | | | | |
| LIABILITIES | | | | |
| | Payables: | | | | |
| | | Investment securities purchased | | | 52,642 | |
| | Accrued Liabilities: | | | | |
| | | Fund services fees | | | 5,597 | |
| | | Other expenses | | | 17,434 | |
| Total Liabilities | | | 75,673 | |
| | | | | | | |
| NET ASSETS | | $ | 2,356,166 | |
| | | | | | | |
| COMPONENTS OF NET ASSETS | | | | |
| | Paid-in capital | | $ | 2,245,101 | |
| | Accumulated net investment loss | | | (628 | ) |
| | Accumulated net realized gain | | | 8,908 | |
| | Net unrealized appreciation | | | 102,785 | |
| NET ASSETS | | $ | 2,356,166 | |
| SHARES OF BENEFICIAL INTEREST AT NO PAR VALUE (UNLIMITED SHARES AUTHORIZED) | | | 216,673 | |
NET ASSET VALUE, OFFERING AND REDEMPTION PRICE PER SHARE* | | $ | 10.87 | |
| * | Shares redeemed or exchanged within 60 days of purchase are charged a 2.00% redemption fee. |
See Notes to Financial Statements.
41
DF DENT GROWTH FUNDS
DF DENT SMALL CAP GROWTH FUNDSTATEMENT OF OPERATIONS
PERIOD ENDED JUNE 30, 2014*
| INVESTMENT INCOME | | | | |
| | Dividend income (Net of foreign withholding taxes of $15) | | $ | 7,815 | |
| | Interest income | | | 49 | |
| Total Investment Income | | | 7,864 | |
| | | | | |
| EXPENSES | | | | |
| | Investment adviser fees | | | 10,453 | |
| | Fund services fees | | | 68,155 | |
| | Custodian fees | | | 3,333 | |
| | Registration fees | | | 1,377 | |
| | Professional fees | | | 17,996 | |
| | Trustees' fees and expenses | | | 29 | |
| | Miscellaneous expenses | | | 10,357 | |
| Total Expenses | | | 111,700 | |
| | Fees waived and expenses reimbursed | | | (98,634 | ) |
| Net Expenses | | | 13,066 | |
| | | | | | |
| NET INVESTMENT LOSS | | | (5,202 | ) |
| | | | | | |
| NET REALIZED AND UNREALIZED GAIN (LOSS) | | | | |
| | Net realized gain on investments | | | 13,119 | |
| | Net change in unrealized appreciation (depreciation) on investments | | | 102,785 | |
| NET REALIZED AND UNREALIZED GAIN | | | 115,904 | |
| INCREASE IN NET ASSETS RESULTING FROM OPERATIONS | | $ | 110,702 | |
| | | | | | |
| * | Commencement of operations was November 1, 2013. | | | | |
See Notes to Financial Statements.
42
DF DENT GROWTH FUNDS
DF DENT SMALL CAP GROWTH FUNDSTATEMENT OF CHANGES IN NET ASSETS
| | | | November 1, 2013* through June 30, 2014 |
| OPERATIONS | | | | |
| | Net investment loss | | $ | (5,202 | ) |
| | Net realized gain | | | 13,119 | |
| | Net change in unrealized appreciation (depreciation) | | | 102,785 | |
| Increase in Net Assets Resulting from Operations | | | 110,702 | |
| | | | | | |
| CAPITAL SHARE TRANSACTIONS | | | | |
| | Sale of shares | | | 2,312,137 | |
| | Redemption of shares | | | (66,673 | ) |
| Increase in Net Assets from Capital Share Transactions | | | 2,245,464 | |
| Increase in Net Assets | | | 2,356,166 | |
| | | | | | |
| NET ASSETS | | | | |
| | Beginning of Period | | | - | |
| | End of Period (Including line (a)) | | $ | 2,356,166 | |
| | | | | | |
| SHARE TRANSACTIONS | | | | |
| | Sale of shares | | | 223,267 | |
| | Redemption of shares | | | (6,594 | ) |
| Increase in Shares | | | 216,673 | |
| | | | | | |
| (a) | Accumulated net investment loss | | $ | (628 | ) |
| * | Commencement of operations. | | | | |
See Notes to Financial Statements.
43
DF DENT GROWTH FUNDS
DF DENT SMALL CAP GROWTH FUNDFINANCIAL HIGHLIGHTS
| These financial highlights reflect selected data for a share outstanding throughout the period. |
| | | November 1, 2013 (a) through June 30, 2014 | |
| NET ASSET VALUE, Beginning of Period | $ | 10.00 | | |
| INVESTMENT OPERATIONS | | | | |
| Net investment loss (b) | | (0.03 | ) | |
| Net realized and unrealized gain (loss) | | 0.90 | | |
| Total from Investment Operations | | 0.87 | | |
| NET ASSET VALUE, End of Period | $ | 10.87 | | |
| TOTAL RETURN | | 8.70 | %(c) |
| | | | | |
| RATIOS/SUPPLEMENTARY DATA | | | | |
| Net Assets at End of Period (000's omitted) | $2,356 | | |
| Ratios to Average Net Assets: | | | | |
| Net investment loss | | (0.50 | )%(d) |
| Net expense | | 1.25 | %(d) |
| Gross expense (e) | | 10.69 | %(d) |
| PORTFOLIO TURNOVER RATE | | 37 | %(c) |
| | | | | | |
| (a) | Commencement of operations. |
| (b) | Calculated based on average shares outstanding during the period. |
| (c) | Not annualized. |
| (d) | Annualized. |
| (e) | Reflects the expense ratio excluding any waivers and/or reimbursements. |
See Notes to Financial Statements.
44
DF DENT GROWTH FUNDS
NOTES TO FINANCIAL STATEMENTS
JUNE 30, 2014
Note 1. Organization
DF Dent Premier Growth Fund is a diversified portfolio of Forum Funds (the “Trust”) and DF Dent Midcap Growth Fund and DF Dent Small Cap Growth Fund (individually, a “Fund” and, collectively the “Funds”) are non-diversified portfolios of the Trust. The Trust is a Delaware statutory trust that is registered as an open-end, management investment company under the Investment Company Act of 1940 (the “Act”), as amended. Under its Trust Instrument, the Trust is authorized to issue an unlimited number of each Fund’s shares of beneficial interest without par value. The DF Dent Premier Growth Fund, the DF Dent Midcap Growth Fund and the DF Dent Small Cap Growth Fund commenced operations on July 16, 2001, July 1, 2011, and November 1, 2013, respectively. The Funds seek long-term capital appreciation.
Note 2. Summary of Significant Accounting Policies
These financial statements are prepared in accordance with accounting principles generally accepted in the United States of America (“GAAP”), which require management to make estimates and assumptions that affect the reported amounts of assets and liabilities, the disclosure of contingent liabilities at the date of the financial statements, and the reported amounts of increases and decreases in net assets from operations during the fiscal year. Actual amounts could differ from those estimates. The following summarizes the significant accounting policies of each Fund:
Security Valuation – Exchange-traded securities and over-the-counter securities are valued using the last quoted trade or official closing price, provided by independent pricing services as of the close of trading on the market or exchange for which they are primarily traded, on each Fund business day. In the absence of a sale, such securities are valued at the mean of the last bid and ask price provided by independent pricing services. Non-exchange traded securities for which quotations are available are valued using the last quoted sales price, or in the absence of a sale, at the mean of the last bid and ask prices provided by independent pricing services. Shares of open-end mutual funds are valued at net asset value (“NAV”). Short-term investments that mature in 60 days or less may be valued at amortized cost.
Each Fund values its investments at fair value pursuant to procedures adopted by the Trust's Board of Trustees (the "Board") if (1) market quotations are insufficient or not readily available or (2) the adviser believes that the values available are unreliable. The Trust’s Valuation Committee, as defined in each Fund’s registration statement, performs certain functions as they relate to the administration and oversight of each Fund’s valuation procedures. Under these procedures, the Valuation Committee convenes on a regular and ad-hoc basis to review such securities and considers a number of factors, including valuation methodologies and significant unobservable inputs, when arriving at fair value.
The Valuation Committee may work with the adviser to provide valuation inputs. In determining fair valuations, inputs may include market-based analytics which may consider related or comparable assets or liabilities, recent transactions, market multiples, book values and other relevant investment information. Adviser inputs may include an income-based approach in which the anticipated future cash flows of the investment are discounted in determining fair value. Discounts may also be applied based on the nature or duration of any
45 DF DENT GROWTH FUNDS
NOTES TO FINANCIAL STATEMENTS
JUNE 30, 2014
restrictions on the disposition of the investments. The Valuation Committee performs regular reviews of valuation methodologies, key inputs and assumptions, disposition analysis and market activity.
Fair valuation is based on subjective factors and, as a result, the fair value price of an investment may differ from the security’s market price and may not be the price at which the asset may be sold. Fair valuation could result in a different NAV than a NAV determined by using market quotes.
Each Fund has a three-tier fair value hierarchy. The basis of the tiers is dependent upon the various “inputs” used to determine the value of each Fund’s investments. These inputs are summarized in the three broad levels listed below:
Level 1 — quoted prices in active markets for identical assets and liabilities
Level 2 — other significant observable inputs (including quoted prices of similar securities, interest rates, prepayment speeds, credit risk, etc.)
Level 3 — significant unobservable inputs (including each Fund’s own assumptions in determining the fair value of investments)
The aggregate value by input level, as of June 30, 2014, for each Fund’s investments is included at the end of each Fund’s Schedule of Investments.
Security Transactions, Investment Income and Realized Gain and Loss – Investment transactions are accounted for on the trade date. Dividend income is recorded on the ex-dividend date. Foreign dividend income is recorded on the ex-dividend date or as soon as possible after each Fund determines the existence of a dividend declaration after exercising reasonable due diligence. Income and capital gains on some foreign securities may be subject to foreign withholding taxes, which are accrued as applicable. Interest income is recorded on an accrual basis. Premium is amortized and discount is accreted using the effective interest method. Identified cost of investments sold is used to determine the gain and loss for both financial statement and federal income tax purposes.
Distributions to Shareholders – Distributions to shareholders of net investment income and net capital gains, if any, are declared and paid at least annually. Distributions to shareholders are recorded on the ex-dividend date. Distributions are based on amounts calculated in accordance with applicable federal income tax regulations, which may differ from GAAP. These differences are due primarily to differing treatments of income and gain on various investment securities held by each Fund, timing differences and differing characterizations of distributions made by each Fund.
Federal Taxes – Each Fund intends to continue to qualify each year as a regulated investment company under Subchapter M of the Internal Revenue Code and to distribute all of its taxable income to shareholders. In addition, by distributing in each calendar year substantially all of its net investment income and capital gains, if any, the Fund will not be subject to a federal excise tax. Therefore, no federal income or excise tax provision
46 DF DENT GROWTH FUNDS
NOTES TO FINANCIAL STATEMENTS
JUNE 30, 2014
is required. Each Fund files a U.S. federal income and excise tax return as required. A fund’s federal income tax returns are subject to examination by the Internal Revenue Service for a period of three fiscal years after they are filed. As of June 30, 2014, there are no uncertain tax positions that would require financial statement recognition, de-recognition, or disclosure.
Income and Expense Allocation – The Trust accounts separately for the assets, liabilities and operations of each of its investment portfolios. Expenses that are directly attributable to more than one investment portfolio are allocated among the respective investment portfolios in an equitable manner.
Redemption Fees – A shareholder who redeems shares of the DF Dent Midcap Growth Fund and the DF Dent Small Cap Growth Fund within 60 days of purchase may incur a redemption fee of 2.00% of the current net asset value of shares redeemed, subject to certain limitations. The fee is charged for the benefit of the remaining shareholders and will be paid to each Fund to help offset transaction costs. The fee is accounted for as an addition to paid-in capital. Each Fund reserves the right to modify the terms of or terminate the fee at any time. There are limited exceptions to the imposition of the redemption fee.
Commitments and Contingencies – In the normal course of business, each Fund enters into contracts that provide general indemnifications by each Fund to the counterparty to the contract. Each Fund’s maximum exposure under these arrangements is dependent on future claims that may be made against each Fund and, therefore, cannot be estimated; however, based on experience, the risk of loss from such claims is considered remote.
Note 3. Fees and Expenses
Investment Adviser – D.F. Dent and Company, Inc. (the “Adviser”) is the investment adviser to each Fund. Pursuant to an investment advisory agreement, the Adviser receives an advisory fee from each Fund at an annual rate of 1.00% of each Fund’s average daily net assets.
Distribution – Foreside Fund Services, LLC serves as each Fund’s distributor (the “Distributor”). The Funds do not have a distribution (12b-1) plan; accordingly, the Distributor does not receive compensation from the Funds for its distribution (12b-1) services. The Adviser compensates the Distributor directly for its services. The Distributor is not affiliated with the Adviser or Atlantic Fund Administration, LLC (d/b/a Atlantic Fund Services) (“Atlantic”) or their affiliates.
Other Service Providers – Atlantic provides fund accounting, fund administration, compliance and transfer agency services to each Fund. Atlantic also provides certain shareholder report production, and EDGAR conversion and filing services. Pursuant to an Atlantic services agreement, each Fund pays Atlantic customary fees for its services. Atlantic provides a Principal Executive Officer, a Principal Financial Officer, a Chief Compliance Officer, and an Anti-Money Laundering Officer to each Fund, as well as certain additional compliance support functions.
Trustees and Officers – The Trust pays each independent Trustee an annual retainer fee of $45,000 for
47 DF DENT GROWTH FUNDS
NOTES TO FINANCIAL STATEMENTS
JUNE 30, 2014
service to the Trust ($66,000 for the Chairman). The Trustees and Chairman may receive additional fees for special Board meetings. Each Trustee is also reimbursed for all reasonable out-of-pocket expenses incurred in connection with his duties as a Trustee, including travel and related expenses incurred in attending Board meetings. The amount of Trustees’ fees attributable to each Fund is disclosed in the Statement of Operations. Certain officers of the Trust are also officers or employees of the above named service providers, and during their terms of office received no compensation from each Fund.
Note 4. Fees Waived
The Adviser has contractually agreed to reduce a portion of its fee and reimburse certain expenses through October 31, 2016, for the DF Dent Premier Growth Fund and the DF Dent Midcap Growth Fund, to the extent that total annual operating expenses (excluding all taxes, interest, portfolio transaction expenses, and extraordinary expenses) exceed 1.10% on the first $150 million of net assets and to the extent that annual operating expenses exceed 0.90% on net assets exceeding $150 million of each Fund. The Adviser has also contractually agreed to reduce a portion of its fee and reimburse expenses to limit total annual operating expenses (excluding all taxes, interest, portfolio transaction expenses, and extraordinary expenses) to 1.25% through October 31, 2016, for the DF Dent Small Cap Growth Fund. Other fund service providers have voluntarily agreed to waive and reimburse a portion of their fees. These voluntary fee waivers and reimbursements may be reduced or eliminated at any time. For the year ended June 30, 2014, fees waived were as follows:
| | | Investment Adviser Fees Waived | | | Investment Adviser Expenses Reimbursed | | | Other Waivers | | | Total Fees Waived and Expenses Reimbursed | |
| DF Dent Premier Growth Fund | | $ | 220,476 | | | $ | - | | | $ | 66,242 | | | $ | 286,718 | |
| DF Dent Midcap Growth Fund | | | 99,357 | | | | - | | | | 28,081 | | | | 127,438 | |
| DF Dent Small Cap Growth Fund | | | 10,453 | | | | 63,504 | | | | 24,677 | | | | 98,634 | |
Note 5. Security Transactions
The cost of purchases and proceeds from sales of investment securities (including maturities), other than short-term investments during the year ended June 30, 2014, were as follows:
| | | Purchases | | Sales |
| DF Dent Premier Growth Fund | | $ | 48,005,788 | | $ | 56,791,021 |
| DF Dent Midcap Growth Fund | | | 7,956,789 | | | 3,988,174 |
| DF Dent Small Cap Growth Fund | | | 2,789,472 | | | 557,001 |
48 DF DENT GROWTH FUNDS
NOTES TO FINANCIAL STATEMENTS
JUNE 30, 2014
Note 6. Federal Income Tax
Distributions paid during each fiscal year ended were characterized for tax purposes as follows:
| | | Ordinary Income | | Long-Term Capital Gain | | Total |
| DF Dent Midcap Growth Fund |
| 2014 | | $ | 218,253 | | | $ | 195,339 | | | $ | 413,592 | |
As of June 30, 2014, distributable earnings (accumulated loss) on a tax basis were as follows:
| | | Undistributed Ordinary Income | | Undistributed Long-Term Gain | | Capital and Other Losses | | Unrealized Appreciation | | Total |
| DF Dent Premier Growth Fund | | $ | - | | | $ | - | | | $ | (15,120,726 | ) | | $ | 76,715,476 | | | $ | 61,594,750 | |
| DF Dent Midcap Growth Fund | | | 56,361 | | | | 322,032 | | | | - | | | | 3,682,697 | | | | 4,061,090 | |
| DF Dent Small Cap Growth Fund | | | 17,234 | | | | - | | | | - | | | | 93,831 | | | | 111,065 | |
The difference between components of distributable earnings on a tax basis and the amounts reflected in the Statement of Assets and Liabilities are primarily due to passive foreign investment holdings (PFICs), wash sales and short-term gains.
For tax purposes, the current deferred late year ordinary loss was $350,949 (realized during the period November 1, 2013 through June 30, 2014) for the DF Dent Premier Growth Fund. This loss will be recognized for tax purposes on the first business day of the Fund’s current fiscal year, July 1, 2014.
As of June 30, 2014, the DF Dent Premier Growth Fund had capital loss carryforwards to offset future capital gains of $14,769,777, expiring in 2018.
On the Statements of Assets and Liabilities, as a result of permanent book to tax differences, certain amounts have been reclassified for the year ended June 30, 2014. The following reclassifications were the result of net operating losses and non-deductible offering costs and have no impact on the net assets of each Fund.
| | | Accumulated Net Investment Income (Loss) | | Accumulated Net Realized Gain (Loss) | | Paid-in Capital |
| DF Dent Premier Growth Fund | | $ | 496,224 | | | $ | - | | | $ | (496,224 | ) |
| DF Dent Midcap Growth Fund | | | 81,962 | | | | (81,962 | ) | | | - | |
| DF Dent Small Cap Growth Fund | | | 4,574 | | | | (4,211 | ) | | | (363 | ) |
Note 7. Subsequent Events
Subsequent events occurring after the date of this report through the date these financial statements were issued have been evaluated for potential impact and each Fund has had no such events.
49 DF DENT GROWTH FUNDS
REPORT OF INDEPENDENT REGISTERED PUBLIC ACCOUNTING FIRM
To the Board of Trustees of Forum Funds and the Shareholders of
DF Dent Premier Growth Fund, DF Dent Midcap Growth Fund and DF Dent Small Cap Growth Fund
We have audited the accompanying statements of assets and liabilities of the DF Dent Premier Growth Fund, DF Dent Midcap Growth Fund and DF Dent Small Cap Growth Fund (the "Funds"), each a series of shares of beneficial interest in the Forum Funds, including the schedules of investments, as of June 30, 2014, and the related statements of operations for the year then ended and for the period November 1, 2013 (commencement of operations) through June 30, 2014 for DF Dent Small Cap Growth Fund, the statements of changes in net assets for each of the years or period presented in the two-year period then ended and the financial highlights for each of the years or periods presented in the five-year period then ended. These financial statements and financial highlights are the responsibility of the Funds' management. Our responsibility is to express an opinion on these financial statements and financial highlights based on our audits.
We conducted our audits in accordance with the standards of the Public Company Accounting Oversight Board (United States). Those standards require that we plan and perform the audits to obtain reasonable assurance about whether the financial statements and financial highlights are free of material misstatement. An audit includes examining, on a test basis, evidence supporting the amounts and disclosures in the financial statements. Our procedures included confirmation of securities owned as of June 30, 2014 by correspondence with the custodian and brokers. An audit also includes assessing the accounting principles used and significant estimates made by management, as well as evaluating the overall financial statement presentation. We believe that our audits provide a reasonable basis for our opinion.
In our opinion, the financial statements and financial highlights referred to above present fairly, in all material respects, the financial position of the DF Dent Premier Growth Fund, DF Dent Midcap Growth Fund and DF Dent Small Cap Growth Fund as of June 30, 2014, and the results of their operations for the year or period then ended, the changes in their net assets for each of the years or period presented in the two-year period then ended and their financial highlights for each of the years or periods presented in the five-year period then ended, in conformity with accounting principles generally accepted in the United States of America.
BBD, LLP
Philadelphia, Pennsylvania
August 21, 2014
50 DF DENT GROWTH FUNDS
ADDITIONAL INFORMATION (Unaudited)
JUNE 30, 2014
Investment Advisory Agreement Approval
At the June 13, 2014 Board meeting, the Board, including all of the Independent Trustees, considered the approval of the continuance of the investment advisory agreement between the Adviser and the Trust pertaining to the Funds (the “Advisory Agreement”). In preparation for its deliberations, the Board requested written responses from the Adviser to a due diligence questionnaire circulated on the Board's behalf. The Board also discussed the materials with Independent Trustee counsel and, as necessary, with the Trust's administrator, Atlantic Fund Services. During its deliberations, the Board received an oral presentation from the Adviser, and was assisted by the advice of Independent Trustee counsel.
In evaluating the Advisory Agreement for the Funds, the Board reviewed written materials furnished by the Adviser and the administrator, including information regarding the Adviser's personnel, operations and financial condition. In addition, the Board recognized that the evaluation process with respect to the Adviser is an ongoing one and, in this regard, the Board considered information provided at regularly scheduled meetings during the past year, including, among other things, information concerning the Funds' performance and services provided by the Adviser and by the Trust’s CCO.
At the meeting, the Board reviewed, among other matters: (1) the nature, extent and quality of the services provided to the Funds by the Adviser, including information on the investment performance of the Funds and Adviser; (2) the costs of the services provided and profitability to the Adviser with respect to its relationship with the Funds; (3) the advisory fee and total expense ratio of the Funds compared to a relevant peer group of funds; (4) the extent to which economies of scale may be realized as the Funds grow and whether the advisory fee enables each Fund's investors to share in the benefits of economies of scale; and (5) other benefits received by the Adviser from its relationship with the Funds.
Nature, Extent and Quality of Services
Based on written materials received, a presentation from senior representatives of the Adviser and a discussion with the Adviser about the Adviser’s personnel, operations and financial condition, and with the Trust’s CCO about the Adviser, the Board considered the quality of services provided by the Adviser under the Advisory Agreement. In this regard, the Board considered information regarding the experience, qualifications and professional background of the portfolio managers and other personnel at the Adviser with principal responsibility for the Funds, as well as the investment philosophy and decision-making process of those professionals and the capability and integrity of the Adviser’s senior management and staff.
The Board considered also the adequacy of the Adviser’s resources. The Board noted the Adviser’s representation that the firm is financially stable and has the operational capability needed to provide investment advisory services to the Funds for the foreseeable future. Based on the presentation and the materials provided by the Adviser in connection with the Board’s consideration of the renewal of the Advisory Agreement, the Board concluded that, overall, it was satisfied with the nature, extent and quality of services to be provided to the Funds under the Advisory Agreement.
51
DF DENT GROWTH FUNDS
ADDITIONAL INFORMATION (Unaudited)
JUNE 30, 2014
Performance
In connection with a presentation by the Adviser regarding its approach to managing the Funds, the Board reviewed the performance of the each Fund compared to its respective benchmark. The Board observed that, although the DF Dent Premier Growth Fund slightly underperformed the S&P 500 Index, its primary benchmark, for the one-year and three-year periods ended March 31, 2014, it outperformed its benchmark for the five-year and since-inception periods ended March 31, 2014. The Board noted the Adviser’s representation that Morningstar does not rate a multi-cap growth category, and consequently, places the Premier Growth in its midcap growth group, which has been a top performing peer group. As a result, the Morningstar ratings have been lower in the past few years as midcap growth has outperformed multi-cap growth. The Board also considered the DF Dent Premier Growth Fund’s performance relative to its Lipper Inc. (“Lipper”) peer group, noting that, based on the information provided by Lipper, the DF Dent Premier Growth Fund underperformed the median of its peer group for the one-year and three-year periods ended March 31, 2014, but outperformed the median of its peer group for the five-year period ended March 31, 2014.
The Board noted that the DF Dent Midcap Growth Fund outperformed its primary benchmark, the Russell Midcap Growth Index, for the one-year period ended March 31, 2014 and had outperformed its primary benchmark since the inception of the Fund on July 1, 2012. The Board also considered the DF Dent Midcap Growth Fund’s performance relative to its Lipper peer group, noting that, based on the information provided by Lipper, the DF Dent Midcap Growth Fund outperformed the median of its peer group for the one-year period ended March 31, 2014.
The Board considered that the DF Dent Small Cap Growth Fund underperformed its primary benchmark, the Russell 2000 Small Cap Growth Index, for the three-month period ended March 31, 2014, but outperformed its primary benchmark for the period since inception. The Board noted that no Lipper performance data was available for the DF Dent Small Cap Growth Fund relative to its peers because Lipper performance comparison data was only available for periods in excess of 12 months and the DF Dent Small Cap Growth Fund had only been operational since November 2013.
Noting the Funds’ asset growth and performance, the Board concluded that the performance of each Fund was reasonable and that each Fund and its shareholders could benefit from the Adviser’s management of the Funds.
Compensation
The Board evaluated the Adviser’s compensation for providing advisory services to each of the Funds and analyzed comparative information on “actual” advisory fee rates (i.e., after fee waivers), and actual total expenses of the Funds' Lipper peer groups. The Board noted that the Adviser’s actual advisory fee rate and total expense ratio for the DF Dent Premier Growth Fund were among the highest in its Lipper peer group. The Board considered the Adviser’s representation that it had agreed to maintain the expense ratio for the DF Dent Premier Growth Fund at 110 basis points on the first $150 million in fund net assets and to cap the expense ratio at 90 basis points on fund net assets exceeding $150 million. The Board also noted the Adviser’s representation that it historically offered lower fee schedules for large institutional investors and non-profit
51 �� DF DENT GROWTH FUNDS
ADDITIONAL INFORMATION (Unaudited)
JUNE 30, 2014
accounts, which accounts have similar objectives to the Funds but entail much less burdensome administrative, reporting, and compliance expenses. Based on the foregoing, the Board concluded that the Adviser’s advisory fee rate charged to the DF Dent Premier Growth Fund was reasonable.
With respect to the DF Dent Midcap Growth Fund, the Board noted that the Adviser’s actual advisory fee rate was the lowest in its Lipper Inc. peer group. The Board also noted that the DF Dent Midcap Growth Fund’s actual total expense ratio was below the median of its Lipper peer group. Based on the foregoing, the Board concluded that the Adviser’s advisory fee rate charged to the DF Dent Midcap Growth Fund was reasonable.
With respect to the DF Dent Small Cap Growth Fund, the Board noted that the Adviser’s actual advisory fee rate was the lowest in its Lipper Inc. peer group. The Board also noted that the DF Dent Small Cap Growth Fund’s actual total expense ratio was below the median of its Lipper peer group. Based on the foregoing, the Board concluded that the Adviser’s advisory fee rate charged to the DF Dent Small Cap Growth Fund was reasonable.
Cost of Services and Profitability
The Board considered information provided by the Adviser regarding the costs of services and its profitability with respect to the Funds. In this regard, the Board considered the Adviser’s operating expenses and other resources devoted to the Funds, as well as the Adviser’s discussion of costs and profitability. The Board noted that the Funds represent a smaller percentage of the Adviser’s total assets under management, as of December 31, 2013, and yet the Funds represent a higher percentage of the Adviser’s overall administrative, reporting, and compliance expenses. Based on these and other applicable considerations, the Board concluded that the Adviser’s profits attributable to management of the Funds were reasonable in the context of all factors considered.
Economies of Scale
The Board evaluated whether the Funds would benefit from any economies of scale. In this respect, the Board noted the Adviser’s representation that each Fund could benefit from economies of scale as assets grow, and that the Adviser has contractually agreed to cap the DF Dent Premier Growth Fund’s and the DF Dent Midcap Growth Fund’s total expenses (excluding all taxes, interest, portfolio transaction expenses, and extraordinary expenses) through October 31, 2015 at 1.10% on assets of up to $150 million and at 0.90% on assets exceeding $150 million. The Board further noted that currently the shareholders of both the DF Dent Premier Growth and DF Dent Midcap Growth Funds were benefitting from the expense caps, and, because the DF Dent Premier Growth Fund's assets were greater than $150 million, that Fund's expenses were being capped at an average level of less than 1.10%. With respect to the DF Dent Small Cap Growth Fund, the Board noted that the Adviser has contractually agreed to cap the DF Dent Small Cap Growth Fund’s total expenses (excluding all taxes, interest, portfolio transaction expenses, and extraordinary expenses) so that they do not exceed 1.25% for the period November 1, 2013 through October 21, 2016. The Board also noted the Adviser’s representation that the DF Dent Small Cap Growth Fund potentially could benefit from economies of scale as assets grow, but the Adviser was not proposing breakpoints or changes in fees at this time because the DF Dent Small Cap Growth Fund only commenced operations in November 2013, and had not yet achieved scale.
53
DF DENT GROWTH FUNDS
ADDITIONAL INFORMATION (Unaudited)
JUNE 30, 2014
Other Benefits
The Board noted the Adviser’s representation that, aside from its contractual advisory fees, it does not benefit in a material way from its relationship with the Funds. Based on the foregoing representation, the Board concluded that other benefits received by the Adviser from its relationship with the Funds were not a material factor to consider in approving the continuation of the Advisory Agreement.
Conclusion
The Board did not identify any single factor as being of paramount importance, and different Trustees may have given different weight to different factors. The Board reviewed a memorandum from Trust counsel discussing the legal standards applicable to its consideration of the Advisory Agreement. Based on its review, including consideration of each of the factors referenced above, the Board determined, in the exercise of its business judgment, that the advisory arrangement, as outlined in the Advisory Agreement, was fair and reasonable in light of the services performed or to be performed, expenses incurred or to be incurred and such other matters as the Board considered relevant in the exercise of its reasonable business judgment.
Proxy Voting Information
A description of the policies and procedures that each Fund uses to determine how to vote proxies relating to securities held in each Fund’s portfolio is available, without charge and upon request, by calling (866) 233-3368 and on the U.S. Securities and Exchange Commission’s (the “SEC”) website at www.sec.gov. Each Fund’s proxy voting record for the most recent twelve-month period ended June 30 is available, without charge and upon request, by calling (866) 233-3368 and on the SEC’s website at www.sec.gov.
Availability of Quarterly Portfolio Schedules
Each Fund files its complete schedule of portfolio holdings with the SEC for the first and third quarters of each fiscal year on Form N-Q. These filings are available, without charge and upon request on the SEC’s website at www.sec.gov or may be reviewed and copied at the SEC’s Public Reference Room in Washington, DC. Information on the operation of the Public Reference Room may be obtained by calling (800) SEC-0330.
Shareholder Expense Example
As a shareholder of the Funds, you incur two types of costs: (1) transaction costs, including redemption fees, and (2) ongoing costs, including management fees and other Fund expenses. This example is intended to help you understand your ongoing costs (in dollars) of investing in the Funds, and to compare these costs with the ongoing costs of investing in other mutual funds.
The example is based on an investment of $1,000 invested at the beginning of the period and held for the entire period from January 1, 2014, through June 30, 2014.
54
DF DENT GROWTH FUNDS
ADDITIONAL INFORMATION (Unaudited)
JUNE 30, 2014
Actual Expenses – The first line of the table below provides information about actual account values and actual expenses. You may use the information in this line, together with the amount you invested, to estimate the expenses that you paid over the period. Simply divide your account value by $1,000 (for example, an $8,600 account value divided by $1,000 = 8.6), then multiply the result by the number in the first line under the heading entitled “Expenses Paid During Period” to estimate the expenses you paid on your account during the period.
Hypothetical Example for Comparison Purposes – The second line of the table below provides information about hypothetical account values and hypothetical expenses based on each Fund’s actual expense ratio and an assumed rate of return of 5% per year before expenses, which is not each Fund’s actual return. The hypothetical account values and expenses may not be used to estimate the actual ending account balance or expenses you paid for the period. You may use this information to compare the ongoing costs of investing in each Fund and other funds. To do so, compare this 5% hypothetical example with the 5% hypothetical examples that appear in the shareholder reports of other funds.
Please note that the expenses shown in the table are meant to highlight your ongoing costs only and do not reflect any transactional costs, such as redemption fees. Therefore, the second line of the table is useful in comparing ongoing costs only, and will not help you determine the relative total costs of owning different funds. In addition, if these transactional costs were included, your costs would have been higher.
| | Beginning | | Ending | | Expenses | | Annualized |
| | Account Value | | Account Value | | Paid During | | Expense |
| | January 1, 2014 | | June 30, 2014 | | Period* | | Ratio* |
| DF Dent Premier Growth Fund | | | | | | | | | | | |
| Actual | $ | 1,000.00 | | $ | 997.71 | | $ | 5.20 | | 1.05 | % |
| Hypothetical (5% return before taxes) | $ | 1,000.00 | | $ | 1,019.59 | | $ | 5.26 | | 1.05 | % |
| DF Dent Midcap Growth Fund | | | | | | | | | | | |
| Actual | $ | 1,000.00 | | $ | 985.98 | | $ | 5.42 | | 1.10 | % |
| Hypothetical (5% return before taxes) | $ | 1,000.00 | | $ | 1,019.34 | | $ | 5.51 | | 1.10 | % |
| DF Dent Small Cap Growth Fund | | | | | | | | | | | |
| Actual | $ | 1,000.00 | | $ | 994.51 | | $ | 6.18 | | 1.25 | % |
| Hypothetical (5% return before taxes) | $ | 1,000.00 | | $ | 1,018.60 | | $ | 6.26 | | 1.25 | % |
| * | Expenses are equal to the Fund’s annualized expense ratio multiplied by the average account value over the period, multiplied by the number of days in the most recent fiscal half-year divided by 365 to reflect the half-year period. |
Federal Tax Status of Dividends Declared during the Fiscal Year
For federal income tax purposes, dividends from short-term capital gains are classified as ordinary income. The DF Dent Midcap Growth Fund designates 38.46% of its income dividend distributed as qualifying for the corporate dividends received deduction (DRD) and 40.08% for the qualified dividend rate (QDI) as defined in Section 1(h)(11) of the Internal Revenue Code. The DF Dent Midcap Growth Fund also designates 100.00% as short-term capital gain dividends exempt from U.S. tax for foreign shareholders (QSD).
55 DF DENT GROWTH FUNDS
ADDITIONAL INFORMATION (Unaudited)
JUNE 30, 2014
Trustees and Officers of the Trust
The Board is responsible for oversight of the management of the Trust’s business affairs and of the exercise of all the Trust’s powers except those reserved for the shareholders. The following table provides information about each Trustee and certain officers of the Trust. Each Trustee and officer holds office until the person resigns, is removed, or is replaced. Unless otherwise noted, the persons have held their principal occupations for more than five years. The address for all Trustees and officers is Three Canal Plaza, Suite 600, Portland, Maine 04101. Mr. Keffer is considered an Interested Trustee due to his affiliation with Atlantic. Each Fund’s Statement of Additional Information includes additional information about the Trustees and is available, without charge and upon request, by calling (866) 233-3368.
| Name and Year of Birth | Position with the Trust | Length of Time Served | Principal Occupation(s) During Past Five Years | Number of Series of Fund Complex¹ Overseen by Trustee | Other Directorships Held by Trustee |
| Independent Trustees | | | | | |
J. Michael Parish Born: 1943 | Chairman of the Board; Trustee; Chairman, Nominating Committee and Qualified Legal Compliance Committee | Since 1989 (Chairman since 2004) | Retired since 2003. | 24 | 0 |
Costas Azariadis Born: 1943 | Trustee | Since 1989 | Professor of Economics, Washington University since 2006. | 24 | 0 |
James C. Cheng Born: 1942 | Trustee; Chairman, Audit Committee | Since 1989 | President, Technology Marketing Associates (marketing company for small- and medium-sized businesses in New England) since 1991. | 24 | 0 |
David Tucker Born: 1958 | Trustee | Since 2011 | Director, Blue Sky Experience since 2008; Senior Vice President & General Counsel, American Century Companies 1998-2008. | 28 | Trustee, Forum Funds II and Forum ETF Trust |
| Interested Trustee | | | | | |
John Y. Keffer2 Born: 1942 | Trustee; Vice Chairman | Since 1989 | Chairman, Atlantic since 2008; President, Forum Investment Advisors, LLC since 2011; President, Forum Foundation (a charitable organization) since 2005; President, Forum Trust, LLC (a non-depository trust company chartered in the State of Maine) since 1997. | 28 | Director, Wintergreen Fund, Inc.; Trustee, Forum Funds II, Forum ETF Trust and ALTX Trust |
1The Fund Complex includes the Trust, Forum Funds II and Forum ETF Trust and is overseen by different Boards of Trustees. 2Atlantic is a subsidiary of Forum Holdings Corp. I, a Delaware corporation that is wholly owned by Mr. Keffer. |
56
DF DENT GROWTH FUNDS
ADDITIONAL INFORMATION (Unaudited)
JUNE 30, 2014
| Name and Year of Birth | Position with the Trust | Length of Time Served | Principal Occupation(s) During Past Five Years | Number of Series of Fund Complex¹ Overseen by Trustee | Other Directorships Held by Trustee |
| Officers | | | | | |
Stacey E. Hong Born: 1966 | President; Principal Executive Officer | Since 2008 | President, Atlantic since 2008. | N/A | N/A |
Karen Shaw Born: 1972 | Treasurer; Principal Financial Officer | Since 2008 | Senior Vice President, Atlantic since 2008. | N/A | N/A |
Zachary Tackett Born: 1988 | Vice President; Secretary; Anti-Money Laundering Compliance Officer | Since 2014 | Associate Counsel, Atlantic since 2014; Intern Associate, Coakley & Hyde, PLLC, 2010-2013. | N/A | N/A |
Michael J. McKeen Born: 1971 | Vice President | Since 2009 | Senior Vice President, Atlantic since 2008. | N/A | N/A |
Timothy Bowden Born: 1969 | Vice President | Since 2009 | Manager, Atlantic since 2008. | N/A | N/A |
Geoffrey Ney Born: 1975 | Vice President | Since 2013 | Manager, Atlantic since 2013; Senior Fund Accountant, Atlantic, 2008-2013. | N/A | N/A |
Todd Proulx Born: 1978 | Vice President | Since 2013 | Manager, Atlantic since 2013; Senior Fund Accountant, Atlantic, 2008-2013. | N/A | N/A |
1The Fund Complex includes the Trust, Forum Funds II and Forum ETF Trust and is overseen by different Boards of Trustees. |
| A Message to Our Shareholders | | 1 |
| Performance Charts and Analysis (Unaudited) | | 6 |
| Schedules of Investments | | 8 |
| Statements of Assets and Liabilities | | 12 |
| Statements of Operations | | 13 |
| Statements of Changes in Net Assets | | 14 |
| Financial Highlights | | 15 |
| Notes to Financial Statements | | 17 |
| Report of Independent Registered Public Accounting Firm | | 22 |
| Additional Information (Unaudited) | | 23 |
| | | |
A MESSAGE TO OUR SHAREHOLDERS
Dear Shareholder,
We are pleased to present the annual report for the Golden Large Cap Core Fund and the Golden Small Cap Core Fund (the “Funds”) for the period of July 1, 2013 through June 30, 2014.
Market Review
Third Quarter of 2013
During the third quarter of 2013, the momentum from the strong first half of 2013 continued to push broad measures of the U.S. equity markets higher. The Russell 1000® Index returned 6.02%; the Russell 2000® Index of small cap stocks returned 10.21%; and the S&P 500® Index rose 5.24%. Global equity markets posted strong returns as well. The MSCI All-Country World Index rose 7.90%; the MSCI EAFE Index rose 11.56%; and the MSCI Emerging Markets Index ended the quarter up 5.77%.
In the U.S., economic data reported during the quarter continued to indicate a slow-growing economy. The positive data included: U.S. payroll reports that showed continued modest growth in the number of jobs, which pushed the unemployment rate down to 7.3%; very low measures of inflation; strengthening in the manufacturing and services sectors of the economy; and consumer confidence measures near post-recession highs as consumers benefited from improved labor markets and higher stock prices. Some of the weak economic data items of note included: a continuation of the weak core retail sales trend; second quarter GDP growth estimated at 2.5%; a persistently high trade deficit; and the first indications of cooling in the housing market.
Over the course of the quarter, many investors were concerned about the Federal Reserve’s (“Fed”) $85 billion per month bond buying program. Consensus seemed to expect tapering to begin in September; though, the Fed surprised the market when it made no change to its policy.
Fourth Quarter of 2013
The fourth quarter of 2013 saw U.S. equity markets move higher to cap off a year of impressive returns. Global equity markets trailed the U.S., though they also posted impressive calendar year returns and positive returns in the quarter. Emerging markets were the exception as the MSCI Emerging Markets Index ended the year in negative territory.
In the U.S., data released during the quarter continued to indicate economic growth. The positive data included: U.S. payroll reports that showed continued modest growth in the number of jobs, which pushed the unemployment rate down to 7.0%; very low measures of inflation; modest growth in the manufacturing and services sectors of the economy; and third quarter GDP growth estimated at 4.1%. Some of the weaker economic data items included: consumer confidence measures that retreated from their recent post-recession highs despite improved labor markets and higher stock prices; a continuation of the weak core retail sales trend; weak growth in personal incomes; and mixed data in the U.S. housing market.
1
A MESSAGE TO OUR SHAREHOLDERS
On the fiscal policy front, a temporary budget deal was reached, and it provided some stability to the fiscal outlook. On the monetary policy front, the Fed surprised the market at its December meeting when it announced a reduction in its $85 billion per month bond buying program. The reduction was set to begin in January, at which point the Fed would begin reducing its monthly asset purchases by $10 billion.
First Quarter of 2014
During the first quarter of 2014, most broad measures of the global equity markets posted modest positive returns. In the U.S., large cap stocks outpaced small caps. Outside the U.S., developed market small cap stocks generated strong returns, while emerging markets were down slightly.
In the U.S., most measures of the economy indicated continued slow growth. Manufacturing continued expanding slowly; retail sales reports were weak; unemployment hovered around 6.7%; inflation was low; and surveys of consumer confidence improved modestly over the quarter. While many economic reports fell short of consensus expectations, much of the weakness was attributed to worse-than-normal winter weather.
The Fed continued to reduce the scale of its quantitative easing program over the course of the quarter.
Second Quarter of 2014
During the second quarter of 2014, most broad measures of the global equity markets posted positive returns. In the U.S., large cap stocks outpaced small caps. Outside the U.S., emerging market stocks generated the strongest returns, while developed market small caps slightly trailed larger cap stocks.
In the U.S., Q1 GDP was revised significantly lower to -2.9%. While the GDP revision was much larger than expected, most of the real-time measures of economic activity indicated that Q2 should return to the recent trend of slow growth. Manufacturing results indicated slow expansion; retail sales reports indicated weak growth; unemployment continued to improve to the current rate of 6.1%; inflation remained low; and surveys of consumer confidence improved modestly over the quarter.
The Fed continued to steadily reduce the scale of its quantitative easing program over the course of the quarter, but Fed officials emphasized that the near-zero interest rate policy will be maintained for a considerable time after the bond-buying program ends in October.
Golden Large Cap Core Fund
The Fund seeks to achieve long-term capital appreciation by investing in large capitalization domestic equities. The goal of the Fund is to construct an actively managed portfolio of fundamentally sound large-cap companies that we believe exhibit the likelihood of meeting or exceeding analysts’ earnings expectations.
For the one-year period ending June 30, 2014, the Fund delivered a total return of 27.56%. The Fund’s return was ahead of the 24.61% total return of the S&P 500, the Fund’s benchmark index, for the same period. The
2
A MESSAGE TO OUR SHAREHOLDERS
market has steadily improved since early 2009 and rewarded investors that maintained their exposure to equities.
The Fund’s best sources of advantage relative to the S&P 500 over the last 12 months were the Consumer Discretionary and Consumer Staples sectors, most notably, stock selection within those sectors. Within the Fund, the Consumer Discretionary sector was helped by a strong advance in the shares of apparel company Hanesbrands Inc. (HBI). The company’s Innovate to Elevate strategy has successfully powered fundamental improvements through product innovation, supply chain efficiencies, and synergies from acquisitions. In the Consumer Staples sector, the Fund’s strength was led by Herbalife Ltd. (HLF) and CVS Caremark (CVS). Herbalife has been able to grow sales volume by promoting daily consumption programs and expanding its sales force. CVS Caremark’s pharmacy segment has experienced growth in drug distribution that is at least partially attributable to the Affordable Care Act.
The Energy sector was the primary source of relative underperformance during the period. The weakness was based largely on our underweight exposure to oil producers in the rising crude oil environment that characterized the first half of 2014. In addition, shares of Valero Energy (VLO), an independent oil refiner that was recently added to the Fund, declined when the Commerce Department announced that it would begin to allow the export of unrefined crude oil. Stock selection in the Materials sector also detracted over the period. Three of the Fund’s four holdings in the sector underperformed, as compared to the return of the Materials sector in the benchmark, led by shares of Berry Plastics Group (BERY), which declined over our holding period.
Golden Small Cap Core Fund
The Fund seeks to achieve maximum long-term total return by investing in small capitalization domestic equities. The goal of the Fund is to construct an actively managed portfolio of fundamentally sound small-cap companies that we believe exhibit the likelihood of meeting or exceeding analysts’ earnings expectations.
For the one-year period ending June 30, 2014, the Fund delivered a total return of 25.21%. The Fund’s return was ahead of the 23.64% total return of the Russell 2000, the Fund’s benchmark index, for the same period. The market has steadily improved since early 2009 and rewarded investors that maintained their exposure to equities.
Overall, stock selection and sector weighting decisions added value relative to the benchmark for the twelve month period. The Fund benefitted most from stock selection within the Health Care and Industrials sectors. Top performers within these groups included generic pharmaceutical company Lannett (LCI), specialty hospital and rehabilitation clinic Select Medical Holdings (SEM), electrical weapons manufacturer Taser International (TASR), and check printer and business services company Deluxe Corp (DLX). Our overweight exposure to Industrials was also favorable as the sector benefited from a rebound in capital spending and a strong transportation industry.
The Fund’s weakest results relative to the benchmark came from the Financials sector. While an underweight exposure to this sector was beneficial, stock selection was weak within the Banks, Insurance, and Real
3
A MESSAGE TO OUR SHAREHOLDERS
Estate industries as Susquehanna Bancshares (SUSQ), Employer Holdings (EIG), and American Residential Properties (ARPI) were notable detractors. Stock selection was also weak in the Information Technology sector where Angie’s List (ANGI) was the bottom performer.
Market Outlook
As we begin the third quarter of 2014, investors seem to have re-embraced risk. Emerging market stocks have recently rallied. Junk bond spreads over U.S. Treasury bonds have tightened to the lowest levels since 2007. Peripheral European sovereign bond yields are near historic low levels. To those with a bullish outlook, these conditions could indicate that investors have positioned themselves for a strengthening global economy. To those espousing a more bearish outlook, they could represent unwarranted optimism.
Global central bank policies are beginning to diverge. The U.S. Federal Reserve is on a path to end its quantitative easing policy by the end of the year. The Bank of Japan has expressed its intention to continue its aggressive monetary policies. The European Central Bank has recently become more accommodative and has hinted toward the possibility of even more aggressive policies should the inflation rate fall further.
The equity markets have generally benefitted from multiple expansion over the course of this market cycle. The table below shows the current consensus estimates for sales and earnings growth in Q2 (reporting season begins early in July) and for the full year.
| | | Q2 '14 Sales Growth Estimate | | | Q2 '14 EPS Growth Estimate | | | 2014 Sales Growth Estimate | | | 2014 EPS Growth Estimate | |
| S&P 500 | | | 2.6 | % | | | 4.8 | % | | | 3.3 | % | | | 7.5 | % |
| Russell 2000 | | | 7.7 | % | | | 27.9 | % | | | 8.4 | % | | | 60.8 | % |
| MSCI AC World | | | 2.8 | % | | | 6.8 | % | | | 3.7 | % | | | 11.0 | % |
| MSCI EM (Emerging Markets) | | | 6.1 | % | | | 14.2 | % | | | 5.8 | % | | | 10.7 | % |
| MSCI EAFE | | | 0.0 | % | | | 1.2 | % | | | 1.8 | % | | | 17.1 | % |
| Source: FactSet | | | | | | | | | | | | | | | | |
The most optimistic expectations are for U.S. small caps and for international developed markets large cap stocks. As valuations increase, we believe it becomes even more important to focus on company fundamentals. As we select investments in the new quarter, we will seek to identify companies that can generate the earnings necessary to justify their valuations and meet investor expectations.
We value and appreciate our relationship with the Funds and thank you for your support.
4
A MESSAGE TO OUR SHAREHOLDERS
Sincerely,
Greg W. Golden, CFA Jeff C. Moser, CFA
The views expressed in this report are those of the Funds’ managers as of June 30, 2014, and may not reflect their views on the date this report is first published or anytime thereafter. These views are intended to assist shareholders of the Funds in understanding their investments in the Funds and do not constitute investment advice. With respect to the Golden Small Cap Core Fund, investing in the securities of small capitalization companies involves greater risk and the possibility of greater price volatility than investing in larger capitalization and more established companies.
5
GOLDEN LARGE CAP CORE FUNDPERFORMANCE CHART AND ANALYSIS (Unaudited)
The following chart reflects the change in the value of a hypothetical $10,000 investment in Institutional Shares, including reinvested dividends and distributions, in the Golden Large Cap Core Fund (the “Fund”) compared with the performance of the benchmark, the S&P 500 Index ("S&P 500"), since inception. The S&P 500 is a broad-based, unmanaged measurement of changes in stock market conditions based on the average of 500 widely held common stocks. The total return of the S&P 500 includes the reinvestment of dividends and income. The total return of the Fund includes operating expenses that reduce returns, while the total return of the S&P 500 does not include expenses. The Fund is professionally managed while the S&P 500 is unmanaged and is not available for investment.
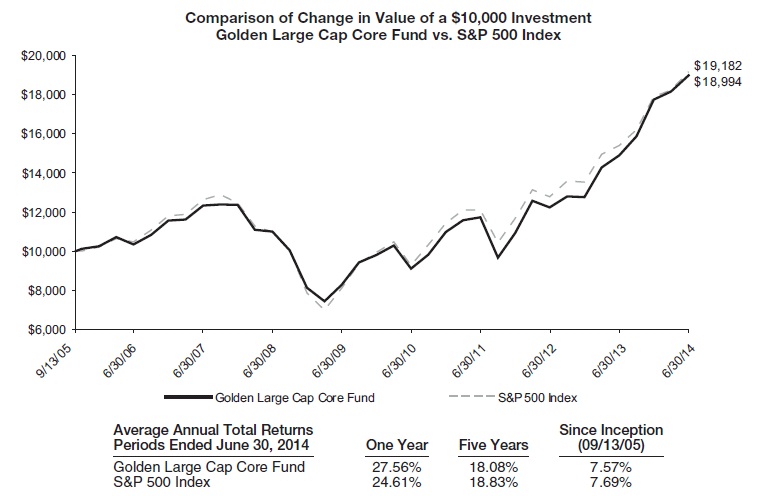
Performance data quoted represents past performance and is no guarantee of future results. Current performance may be lower or higher than the performance data quoted. Investment return and principal value will fluctuate so that shares, when redeemed, may be worth more or less than original cost. For the most recent month-end performance, please call (800) 206-8610. As stated in the Fund’s current prospectus, the annual operating expense ratio (gross) for Institutional Shares is 0.70%. The Fund’s adviser has contractually agreed to reduce a portion of its fees and reimburse expenses such that total operating expenses do not exceed 0.70% for Institutional Shares, through at least October 31, 2014. During the period, certain fees were waived and/or expenses reimbursed; otherwise, returns would have been lower. The performance table and graph do not reflect the deduction of taxes that a shareholder would pay on Fund distributions or the redemption of Fund shares. Returns greater than one year are annualized.
6
GOLDEN SMALL CAP CORE FUNDPERFORMANCE CHART AND ANALYSIS (Unaudited)
The following chart reflects the change in the value of a hypothetical $10,000 investment in Institutional Shares, including reinvested dividends and distributions, in the Golden Small Cap Core Fund (the “Fund”) compared with the performance of the primary benchmark, the Russell 2000 Index ("Russell 2000"), and the secondary benchmark, the S&P SmallCap 600 Index ("S&P SmallCap 600") since inception. The Russell 2000, is an unmanaged, market value weighted index, which measures performance of the 2,000 companies that are between the 1,000th and 3,000th largest in the market. The S&P SmallCap 600 is designed to be an accurate measure of the performance of small companies, reflecting the risk and return characteristics of the broader smallcap universe. The total return of the indices include the reinvestment of dividends and income. The total return of the Fund includes operating expenses that reduce returns, while the total return of the indices do not include expenses. The Fund is professionally managed while the indices are unmanaged and are not available for investment.
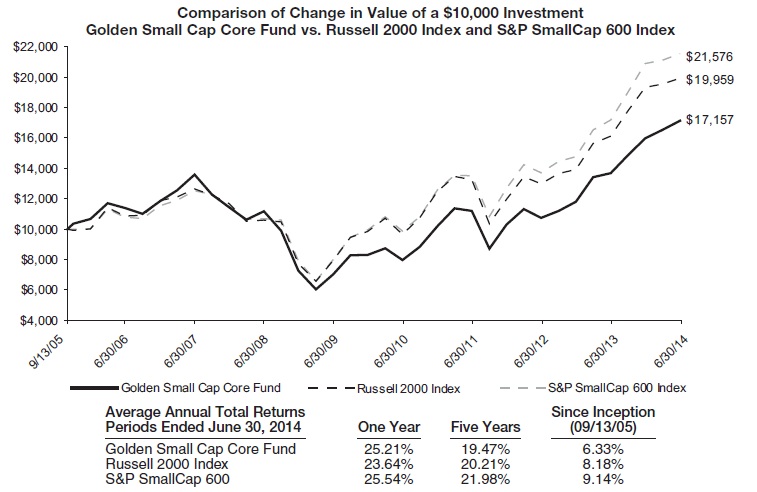
Performance data quoted represents past performance and is no guarantee of future results. Current performance may be lower or higher than the performance data quoted. Investment return and principal value will fluctuate so that shares, when redeemed, may be worth more or less than original cost. For the most recent month-end performance, please call (800) 206-8610. As stated in the Fund’s current prospectus, the annual operating expense ratio (gross) for Institutional Shares is 1.10%. The Fund’s adviser has contractually agreed to reduce a portion of its fees and reimburse expenses such that total operating expenses do not exceed 1.10% for Institutional Shares, through at least October 31, 2014. During the period, certain fees were waived and/or expenses reimbursed; otherwise, returns would have been lower. The performance table and graph do not reflect the deduction of taxes that a shareholder would pay on Fund distributions or the redemption of Fund shares. Returns greater than one year are annualized.
7
GOLDEN LARGE CAP CORE FUNDSCHEDULE OF INVESTMENTS
| | Shares | | Security Description | | Value | |
| Common Stock - 98.5% |
| Consumer Discretionary - 14.8% |
| | 26,513 | | Comcast Corp., Class A | $ | 1,423,218 | |
| | 70,101 | | Ford Motor Co. | | 1,208,541 | |
| | 23,049 | | Hanesbrands, Inc. | | 2,268,943 | |
| | 16,574 | | Lear Corp. | | 1,480,390 | |
| | 24,140 | | Lowe's Cos., Inc. | | 1,158,479 | |
| | 17,042 | | Magna International, Inc. | | 1,836,275 | |
| | 16,709 | | The Home Depot, Inc. | | 1,352,761 | |
| | | 10,728,607 | |
| Consumer Staples - 9.4% |
| | 32,815 | | Archer-Daniels-Midland Co. | | 1,447,469 | |
| | 22,685 | | CVS Caremark Corp. | | 1,709,768 | |
| | 19,637 | | Herbalife, Ltd. | | 1,267,372 | |
| | 186,299 | | Rite Aid Corp. (a) | | 1,335,764 | |
| | 13,895 | | Wal-Mart Stores, Inc. | | 1,043,098 | |
| | | 6,803,471 | |
| Energy - 7.2% |
| | 9,909 | | Chevron Corp. | | 1,293,620 | |
| | 13,240 | | Exxon Mobil Corp. | | 1,333,003 | |
| | 18,053 | | Phillips 66 | | 1,452,003 | |
| | 23,169 | | Valero Energy Corp. | | 1,160,767 | |
| | | 5,239,393 | |
| Financials - 13.3% |
| | 86,419 | | Bank of America Corp. | | 1,328,260 | |
| | 10,766 | | Berkshire Hathaway, Inc., Class B (a) | | 1,362,545 | |
| | 24,587 | | Citigroup, Inc. | | 1,158,048 | |
| | 65,971 | | E*TRADE Financial Corp. (a) | | 1,402,543 | |
| | 33,783 | | Lincoln National Corp. | | 1,737,798 | |
| | 41,965 | | Morgan Stanley | | 1,356,728 | |
| | 35,732 | | Voya Financial, Inc. | | 1,298,501 | |
| | | 9,644,423 | |
| Health Care - 15.5% |
| | 7,530 | | Actavis PLC (a) | | 1,679,567 | |
| | 17,388 | | Aetna, Inc. | | 1,409,819 | |
| | 102,966 | | Boston Scientific Corp. (a) | | 1,314,876 | |
| | 19,856 | | Cardinal Health, Inc. | | 1,361,327 | |
| | 16,986 | | Gilead Sciences, Inc. (a) | | 1,408,309 | |
| | 10,210 | | Johnson & Johnson | | 1,068,170 | |
| | 9,425 | | McKesson Corp. | | 1,755,029 | |
| | 14,150 | | United Therapeutics Corp. (a) | | 1,252,134 | |
| | | 11,249,231 | |
| Industrials - 10.5% |
| | 51,065 | | Delta Air Lines, Inc. | | 1,977,237 | |
| | 11,213 | | Northrop Grumman Corp. | | 1,341,411 | |
| | 61,551 | | Southwest Airlines Co. | | 1,653,260 | |
| | 9,349 | | The Boeing Co. | | 1,189,473 | |
| | 33,744 | | Trinity Industries, Inc. | | 1,475,288 | |
| | | 7,636,669 | |
| | Shares | | Security Description | | Value | |
| Information Technology - 24.1% |
| | 16,367 | | Apple, Inc. | $ | 1,520,985 | |
| | 51,232 | | Cisco Systems, Inc. | | 1,273,115 | |
| | 15,551 | | DST Systems, Inc. | | 1,433,336 | |
| | 20,393 | | Facebook, Inc., Class A (a) | | 1,372,245 | |
| | 40,445 | | Hewlett-Packard Co. | | 1,362,188 | |
| | 105,334 | | Marvell Technology Group, Ltd. | | 1,509,436 | |
| | 16,195 | | MasterCard, Inc., Class A | | 1,189,847 | |
| | 64,853 | | Micron Technology, Inc. (a) | | 2,136,907 | |
| | 28,490 | | Microsoft Corp. | | 1,188,033 | |
| | 30,459 | | Oracle Corp. | | 1,234,503 | |
| | 16,486 | | QUALCOMM, Inc. | | 1,305,691 | |
| | 19,138 | | SanDisk Corp. | | 1,998,581 | |
| | | 17,524,867 | |
| Materials - 2.1% |
| | 30,245 | | The Dow Chemical Co. | | 1,556,408 | |
| Telecommunications - 1.6% |
| | 23,749 | | Verizon Communications, Inc. | | 1,162,038 | |
| | | | |
Total Common Stock (Cost $59,692,410) | | 71,545,107 | |
Total Long Positions - 98.5% (Cost $59,692,410)* | $ | 71,545,107 | |
| Other Assets & Liabilities, Net – 1.5% | | 1,071,642 | |
| Net Assets – 100.0% | $ | 72,616,749 | |
| PLC | Public Limited Company |
| (a) | Non-income producing security. |
| | * Cost for federal income tax purposes is $59,801,037 and net unrealized appreciation consists of: |
| Gross Unrealized Appreciation | | $ | 12,396,377 | |
| Gross Unrealized Depreciation | | | (652,307 | ) |
| Net Unrealized Appreciation | | $ | 11,744,070 | |
See Notes to Financial Statements. 8
GOLDEN LARGE CAP CORE FUNDSCHEDULE OF INVESTMENTS
The following is a summary of the inputs used to value the Fund’s investments as of June 30, 2014.
The inputs or methodology used for valuing securities are not necessarily an indication of the risks associated with investing in those securities. For more information on valuation inputs, and their aggregation into the levels used in the table below, please refer to the Security Valuation section in Note 2 of the accompanying Notes to Financial Statements.
| Valuation Inputs | | Investments in Securities |
| Level 1 - Quoted Prices | | $ | 71,545,107 | |
| Level 2 - Other Significant Observable Inputs | | | - | |
| Level 3 - Significant Unobservable Inputs | | | - | |
| Total | | $ | 71,545,107 | |
The Level 1 value displayed in this table is Common Stock. Refer to the Schedule of Investments for a further breakout of each security by industry.
The Fund utilizes the end of period methodology when determining transfers. There were no transfers among Level 1, Level 2 and Level 3 for the year ended June 30, 2014.
| PORTFOLIO HOLDINGS | | | |
| % of Net Assets | | | |
| Consumer Discretionary | | | 14.8 | % |
| Consumer Staples | | | 9.4 | % |
| Energy | | | 7.2 | % |
| Financials | | | 13.3 | % |
| Health Care | | | 15.5 | % |
| Industrials | | | 10.5 | % |
| Information Technology | | | 24.1 | % |
| Materials | | | 2.1 | % |
| Telecommunications | | | 1.6 | % |
| Other Assets & Liabilities, Net | | | 1.5 | % |
| | | | 100.0 | % |
See Notes to Financial Statements. 9
GOLDEN SMALL CAP CORE FUNDSCHEDULE OF INVESTMENTS
| | Shares | | Security Description | | Value | |
| Common Stock - 99.2% |
| Consumer Discretionary - 12.0% |
| | 6,541 | | Capella Education Co. | $ | 355,765 | |
| | 18,356 | | LifeLock, Inc. (a) | | 256,250 | |
| | 26,638 | | Ruth's Hospitality Group, Inc. | | 328,979 | |
| | 10,349 | | Skechers U.S.A., Inc., Class A (a) | | 472,949 | |
| | 24,962 | | Smith & Wesson Holdings Corp. (a) | | 362,948 | |
| | 12,904 | | Tower International, Inc. (a) | | 475,383 | |
| | 8,483 | | Universal Electronics, Inc. (a) | | 414,649 | |
| | | 2,666,923 | |
| Consumer Staples - 4.9% |
| | 6,048 | | Cal-Maine Foods, Inc. | | 449,487 | |
| | 8,336 | | Inter Parfums, Inc. | | 246,329 | |
| | 4,050 | | Sanderson Farms, Inc. | | 393,660 | |
| | | 1,089,476 | |
| Energy - 6.4% |
| | 14,693 | | Green Plains Renewable Energy, Inc. | | 482,959 | |
| | 9,928 | | Matrix Service Co. (a) | | 325,539 | |
| | 20,412 | | Renewable Energy Group, Inc. (a) | | 234,126 | |
| | 8,276 | | Stone Energy Corp. (a) | | 387,234 | |
| | | 1,429,858 | |
| Financials - 18.5% |
| | 7,175 | | American Financial Group, Inc. | | 427,343 | |
| | 9,962 | | Amtrust Financial Services, Inc. | | 416,511 | |
| | 10,000 | | Employers Holdings, Inc. | | 211,800 | |
| | 7,956 | | FBL Financial Group, Inc., Class A | | 365,976 | |
| | 16,839 | | FXCM, Inc., Class A | | 251,911 | |
| | 13,082 | | HFF, Inc., Class A | | 486,520 | |
| | 26,224 | | Maiden Holdings, Ltd. | | 317,048 | |
| | 20,142 | | OFG Bancorp | | 370,814 | |
| | 7,031 | | ProAssurance Corp. | | 312,176 | |
| | 12,071 | | QTS Realty Trust, Inc., Class A REIT | | 345,593 | |
| | 24,889 | | Susquehanna Bancshares, Inc. | | 262,828 | |
| | 20,988 | | United Community Banks, Inc. | | 343,574 | |
| | | 4,112,094 | |
| Health Care - 15.8% |
| | 8,119 | | Amsurg Corp. (a) | | 369,983 | |
| | 5,931 | | Centene Corp. (a) | | 448,443 | |
| | 9,824 | | HealthSouth Corp. | | 352,387 | |
| | 9,308 | | Insys Therapeutics, Inc. (a) | | 290,689 | |
| | 9,825 | | Lannett Co., Inc. (a) | | 487,516 | |
| | 11,682 | | NuVasive, Inc. (a) | | 415,529 | |
| | 35,542 | | PDL BioPharma, Inc. | | 344,047 | |
| | 13,892 | | PharMerica Corp. (a) | | 397,172 | |
| | 25,262 | | Select Medical Holdings Corp. | | 394,087 | |
| | | 3,499,853 | |
| Industrials - 15.9% |
| | 1,726 | | AMERCO | | 501,852 | |
| | 3,445 | | Barrett Business Services, Inc. | | 161,915 | |
| | Shares | | Security Description | | Value | |
| | 7,391 | | Deluxe Corp. | $ | 432,965 | |
| | 7,569 | | EMCOR Group, Inc. | | 337,048 | |
| | 6,053 | | EnerSys, Inc. | | 416,386 | |
| | 9,714 | | ITT Corp. | | 467,243 | |
| | 6,888 | | Old Dominion Freight Line, Inc. (a) | | 438,628 | |
| | 22,134 | | RPX Corp. (a) | | 392,878 | |
| | 3,477 | | UniFirst Corp. | | 368,562 | |
| | | 3,517,477 | |
| Information Technology - 19.1% |
| | 20,630 | | AVG Technologies NV (a) | | 415,282 | |
| | 14,018 | | Benchmark Electronics, Inc. (a) | | 357,179 | |
| | 44,870 | | Brocade Communications Systems, Inc. | | 412,804 | |
| | 7,661 | | Cirrus Logic, Inc. (a) | | 174,211 | |
| | 16,626 | | Fabrinet (a) | | 342,496 | |
| | 23,184 | | Inphi Corp. (a) | | 340,341 | |
| | 7,261 | | j2 Global, Inc. | | 369,294 | |
| | 44,580 | | Lattice Semiconductor Corp. (a) | | 367,785 | |
| | 37,891 | | RF Micro Devices, Inc. (a) | | 363,375 | |
| | 17,931 | | Sanmina Corp. (a) | | 408,468 | |
| | 25,473 | | TiVo, Inc. (a) | | 328,856 | |
| | 14,164 | | Unisys Corp. (a) | | 350,417 | |
| | | 4,230,508 | |
| Materials - 3.3% |
| | 18,649 | | FutureFuel Corp. | | 309,387 | |
| | 23,776 | | Stillwater Mining Co. (a) | | 417,269 | |
| | | 726,656 | |
| Telecommunications - 1.5% |
| | 23,984 | | Inteliquent, Inc. | | 332,658 | |
| | | | |
| Utilities - 1.8% |
| | 6,939 | | New Jersey Resources Corp. | | 396,633 | |
Total Common Stock (Cost $16,802,841) | | 22,002,136 | |
Total Investments - 99.2% (Cost $16,802,841)* | $ | 22,002,136 | |
| Other Assets & Liabilities, Net – 0.8% | | 168,015 | |
| Net Assets – 100.0% | $ | 22,170,151 | |
| REIT | Real Estate Investment Trust |
| (a) | Non-income producing security. |
See Notes to Financial Statements. 10
GOLDEN SMALL CAP CORE FUNDSCHEDULE OF INVESTMENTS
| | * Cost for federal income tax purposes is $16,817,260 and net unrealized appreciation consists of: |
| Gross Unrealized Appreciation | | $ | 5,811,465 | |
| Gross Unrealized Depreciation | | | (626,589 | ) |
| Net Unrealized Appreciation | | $ | 5,184,876 | |
The following is a summary of the inputs used to value the Fund’s investments as of June 30, 2014.
The inputs or methodology used for valuing securities are not necessarily an indication of the risks associated with investing in those securities. For more information on valuation inputs, and their aggregation into the levels used in the table below, please refer to the Security Valuation section in Note 2 of the accompanying Notes to Financial Statements.
| Valuation Inputs | | Investments in Securities |
| Level 1 - Quoted Prices | | $ | 22,002,136 | |
| Level 2 - Other Significant Observable Inputs | | | - | |
| Level 3 - Significant Unobservable Inputs | | | - | |
| Total | | $ | 22,002,136 | |
The Level 1 value displayed in this table is Common Stock. Refer to the Schedule of Investments for a further breakout of each security by industry.
The Fund utilizes the end of period methodology when determining transfers. There were no transfers among Level 1, Level 2 and Level 3 for the year ended June 30, 2014.
| PORTFOLIO HOLDINGS | | | |
| % of Net Assets | | | |
| Consumer Discretionary | | | 12.0 | % |
| Consumer Staples | | | 4.9 | % |
| Energy | | | 6.4 | % |
| Financials | | | 18.5 | % |
| Health Care | | | 15.8 | % |
| Industrials | | | 15.9 | % |
| Information Technology | | | 19.1 | % |
| Materials | | | 3.3 | % |
| Telecommunications | | | 1.5 | % |
| Utilities | | | 1.8 | % |
| Other Assets & Liabilities, Net | | | 0.8 | % |
| | | | 100.0 | % |
See Notes to Financial Statements. 11
STATEMENTS OF ASSETS AND LIABILITIES
JUNE 30, 2014
| | | GOLDEN LARGE CAP CORE FUND | | | GOLDEN SMALL CAP CORE FUND | | |
| ASSETS | | | | | | | |
| Total investments, at value (Cost $59,692,410 and $16,802,841, respectively) | | $ | 71,545,107 | | | $ | 22,002,136 | | |
| Cash | | | 957,817 | | | | 163,057 | | |
| Receivables: | | | | | | | | | |
| Fund shares sold | | | 605,425 | | | | - | | |
| Dividends and interest | | | 45,536 | | | | 24,310 | | |
| Total Assets | | | 73,153,885 | | | | 22,189,503 | | |
| | | | | | | | | | |
| LIABILITIES | | | | | | | | | |
| Payables: | | | | | | | | | |
| Investment securities purchased | | | 504,071 | | | | - | | |
| Fund shares redeemed | | | 11,991 | | | | 2,085 | | |
| Accrued Liabilities: | | | | | | | | | |
| Investment adviser fees | | | 21,064 | | | | 17,264 | | |
| Trustees’ fees and expenses | | | 10 | | | | 3 | | |
| Total Liabilities | | | 537,136 | | | | 19,352 | | |
| | | | | | | | | | |
| NET ASSETS | | $ | 72,616,749 | | | $ | 22,170,151 | | |
| | | | | | | | | | |
| COMPONENTS OF NET ASSETS | | | | | | | | | |
| Paid-in capital | | $ | 58,180,740 | | | $ | 68,745,257 | | |
| Undistributed net investment income | | | 243,886 | | | | 55,312 | | |
| Accumulated net realized gain (loss) | | | 2,339,426 | | | | (51,829,713 | | |
| Net unrealized appreciation | | | 11,852,697 | | | | 5,199,295 | | |
| NET ASSETS | | $ | 72,616,749 | | | $ | 22,170,151 | | |
| SHARES OF BENEFICIAL INTEREST AT NO PAR VALUE (UNLIMITED SHARES AUTHORIZED) | | | 5,253,149 | | | | 1,323,092 | | |
| NET ASSET VALUE, OFFERING AND REDEMPTION PRICE PER SHARE | | $ | 13.82 | | | $ | 16.76 | | |
| | | | | | | | | | |
See Notes to Financial Statements. 12
STATEMENTS OF OPERATIONS
YEAR ENDED JUNE 30, 2014
| | | GOLDEN LARGE CAP CORE FUND | | | GOLDEN SMALL CAP CORE FUND | |
| INVESTMENT INCOME | | | | | | |
| Dividend income (Net of foreign withholding taxes of $2,779 and $319, respectively) | | $ | 778,430 | | | $ | 286,695 | |
| Interest income | | | 1,467 | | | | 285 | |
| Total Investment Income | | | 779,897 | | | | 286,980 | |
| Adviser | | | | | | | | |
| EXPENSES | | | | | | | | |
| Investment adviser fees | | | 337,311 | | | | 225,527 | |
| Trustees' fees and expenses | | | 1,615 | | | | 789 | |
| Total Expenses | | | 338,926 | | | | 226,316 | |
| Expenses reimbursed | | | (1,615 | ) | | | (789 | ) |
| Net Expenses | | | 337,311 | | | | 225,527 | |
| | | | | | | | | |
| NET INVESTMENT INCOME | | | 442,586 | | | | 61,453 | |
| | | | | | | | | |
| NET REALIZED AND UNREALIZED GAIN (LOSS) | | | | | | | | |
| Net realized gain on investments | | | 4,585,545 | | | | 3,508,159 | |
| Net change in unrealized appreciation (depreciation) on investments | | | 5,582,966 | | | | 1,081,795 | |
| NET REALIZED AND UNREALIZED GAIN | | | 10,168,511 | | | | 4,589,954 | |
| INCREASE IN NET ASSETS RESULTING FROM OPERATIONS | | $ | 10,611,097 | | | $ | 4,651,407 | |
| | | | | | | | | |
See Notes to Financial Statements. 13
STATEMENTS OF CHANGES IN NET ASSETS
| | | | GOLDEN LARGE CAP CORE FUND | | GOLDEN SMALL CAP CORE FUND |
| | June 30, 2012 | | | | | Shares | | | | | | Shares | |
| NET ASSETS JUNE 30, 2012 | | $ | 34,896,218 | | | | | $ | 27,426,725 | | | |
| OPERATIONS | | | | | | | | | | | | |
| | Net investment income | | | 322,514 | | | | | | 298,743 | | | |
| | Net realized gain | | | 6,449,793 | | | | | | 4,785,719 | | | |
| | Net change in unrealized appreciation (depreciation) | | | (1,404,080 | ) | | | | | 388,344 | | | |
| Increase in Net Assets Resulting from Operations | | | 5,368,227 | | | | | | 5,472,806 | | | |
| DISTRIBUTIONS TO SHAREHOLDERS FROM | | | | | | | | | | | | |
| | Net investment income | | | (458,420 | ) | | | | | - | | | |
| | Net realized gain | | | (2,619,826 | ) | | | | | - | | | |
| Total Distributions to Shareholders | | | (3,078,246 | ) | | | | | - | | | |
| CAPITAL SHARE TRANSACTIONS | | | | | | | | | | | | |
| | Sale of shares | | | 5,571,096 | | 483,663 | | | | 242,001 | | 18,807 | |
| | Reinvestment of distributions | | | 527,850 | | 49,752 | | | | - | | - | |
| | Redemption of shares | | | (15,612,872 | ) | (1,357,687 | ) | | | (13,049,017 | ) | (1,115,159 | ) |
| Decrease in Net Assets from Capital Share Transactions | | | (9,513,926 | ) | (824,272 | ) | | | (12,807,016 | ) | (1,096,352 | ) |
| Decrease in Net Assets | | | (7,223,945 | ) | | | | | (7,334,210 | ) | | |
| NET ASSETS JUNE 30, 2013 (Including line (a)) | | $ | 27,672,273 | | | | | $ | 20,092,515 | | | |
| OPERATIONS | | | | | | | | | | | | |
| | Net investment income | | | 442,586 | | | | | | 61,453 | | | |
| | Net realized gain | | | 4,585,545 | | | | | | 3,508,159 | | | |
| | Net change in unrealized appreciation (depreciation) | | | 5,582,966 | | | | | | 1,081,795 | | | |
| Increase in Net Assets Resulting from Operations | | | 10,611,097 | | | | | | 4,651,407 | | | |
| DISTRIBUTIONS TO SHAREHOLDERS FROM | | | | | | | | | | | | |
| | Net investment income | | | (341,915 | ) | | | | | (289,247 | ) | | |
| | Net realized gain | | | (5,379,420 | ) | | | | | - | | | |
| Total Distributions to Shareholders | | | (5,721,335 | ) | | | | | (289,247 | ) | | |
| CAPITAL SHARE TRANSACTIONS | | | | | | | | | | | | |
| | Sale of shares | | | 47,332,098 | | 3,536,968 | | | | 2,525,935 | | 157,893 | |
| | Reinvestment of distributions | | | 651,562 | | 52,404 | | | | 38,250 | | 2,450 | |
| | Redemption of shares | | | (7,928,946 | ) | (599,319 | ) | | | (4,848,709 | ) | (317,535 | ) |
| Increase (Decrease) in Net Assets from Capital Share Transactions | | 40,054,714 | | 2,990,053 | | | | (2,284,524 | ) | (157,192 | ) |
| Increase in Net Assets | | | 44,944,476 | | | | | | 2,077,636 | | | |
| NET ASSETS JUNE 30, 2014 (Including line (b)) | | $ | 72,616,749 | | | | | $ | 22,170,151 | | | |
| (a) | Undistributed net investment income June 30, 2013 | | $ | 143,215 | | | | | $ | 289,244 | | | |
| (b) | Undistributed net investment income June 30, 2014 | | $ | 243,886 | | | | | $ | 55,312 | | | |
See Notes to Financial Statements. 14
GOLDEN LARGE CAP CORE FUNDFINANCIAL HIGHLIGHTS
| These financial highlights reflect selected data for a share outstanding throughout each year. | | | | | | |
| | | For the Years Ended June 30, | |
| | | 2014 | | 2013 | | 2012 | | 2011 | | 2010 | |
| NET ASSET VALUE, Beginning of Year | $ | 12.23 | | | $ | 11.30 | | | $ | 11.10 | | | $ | 8.72 | | | $ | 8.04 | | |
| INVESTMENT OPERATIONS | | | | | | | | | | | | | | | | | | | | |
| Net investment income (a) | | 0.12 | | | | 0.13 | | | | 0.11 | | | | 0.11 | | | | 0.12 | | |
| Net realized and unrealized gain | | 3.06 | | | | 2.09 | | | | 0.35 | (b) | | | 2.40 | | | | 0.69 | | |
| Total from Investment Operations | | 3.18 | | | | 2.22 | | | | 0.46 | | | | 2.51 | | | | 0.81 | | |
| | | | | | | | | | | | | | | | | | | | | |
| DISTRIBUTIONS TO SHAREHOLDERS FROM | | | | | | | | | | | | | | | | | | |
| Net investment income | | (0.09 | ) | | | (0.19 | ) | | | (0.26 | ) | | | (0.13 | ) | | | (0.13 | ) | |
| Net realized gain | | (1.50 | ) | | | (1.10 | ) | | | — | | | | — | | | | — | | |
| Total Distributions to Shareholders | | (1.59 | ) | | | (1.29 | ) | | | (0.26 | ) | | | (0.13 | ) | | | (0.13 | ) | |
| NET ASSET VALUE, End of Year | $ | 13.82 | | | $ | 12.23 | | | $ | 11.30 | | | $ | 11.10 | | | $ | 8.72 | | |
| TOTAL RETURN | | 27.56 | % | | 21.68 | % | | 4.44 | % | | 28.85 | % | | 9.90 | % |
| | | | | | | | | | | | | | | | | | | | | |
| RATIOS/SUPPLEMENTARY DATA | | | | | | | | | | | | | | | | | | | | |
| Net Assets at End of Year (000's omitted) | $72,617 | | | $27,672 | | | $34,896 | | | $142,756 | | | $156,712 | | |
| Ratios to Average Net Assets: | | | | | | | | | | | | | | | | | | | | |
| Net investment income | | 0.92 | % | | 1.13 | % | | 1.06 | % | | 1.04 | % | | 1.33 | % |
| Net expense | | 0.70 | % | | 0.70 | % | | 0.70 | % | | 0.70 | % | | 0.70 | % |
| Gross expense (c) | | 0.70 | % | | 0.70 | % | | 0.71 | % | | 0.70 | % | | 0.70 | % |
| PORTFOLIO TURNOVER RATE | | 70 | % | | 72 | % | | 42 | % | | 57 | % | | 49 | % |
| | | | | | | | | | | | | | | | | | | | | | |
| (a) | Calculated based on average shares outstanding during each year. |
| (b) | The net realized and unrealized gain (loss) per share does not correlate to the aggregate of the net realized and unrealized loss in the Statement of Operations for the year ended June 30, 2012, primarily due to the timing of the sales and repurchases of the Fund’s shares in relation to fluctuating market values for the Fund’s portfolio. |
| (c) | Reflects the expense ratio excluding any waivers and/or reimbursements. |
See Notes to Financial Statements. 15
GOLDEN SMALL CAP CORE FUNDFINANCIAL HIGHLIGHTS
| These financial highlights reflect selected data for a share outstanding throughout each year. | | | | | | |
| | | For the Years Ended June 30, | |
| | | 2014 | | 2013 | | 2012 | | 2011 | | 2010 | |
| NET ASSET VALUE, Beginning of Year | $ | 13.57 | | | $ | 10.64 | | | $ | 11.10 | | | $ | 7.90 | | | $ | 6.98 | | |
| INVESTMENT OPERATIONS | | | | | | | | | | | | | | | | | | | | |
| Net investment income (loss) (a) | | 0.05 | | | | 0.16 | | | | (0.01 | ) | | | (0.02 | ) | | | (0.03 | ) | |
| Net realized and unrealized gain (loss) | | 3.36 | | | | 2.77 | | | | (0.45 | ) | | | 3.22 | | | | 0.95 | | |
| Total from Investment Operations | | 3.41 | | | | 2.93 | | | | (0.46 | ) | | | 3.20 | | | | 0.92 | | |
| | | | | | | | | | | | | | | | | | | | | |
| DISTRIBUTIONS TO SHAREHOLDERS FROM | | | | | | | | | | | | | | | | | | |
| Net investment income | | (0.22 | ) | | | — | | | | — | | | | — | | | | — | | |
| NET ASSET VALUE, End of Year | $ | 16.76 | | | $ | 13.57 | | | $ | 10.64 | | | $ | 11.10 | | | $ | 7.90 | | |
| TOTAL RETURN | | 25.21 | % | | 27.54 | % | | (4.14 | )% | | 40.51 | % | | 13.18 | % |
| | | | | | | | | | | | | | | | | | | | | |
| RATIOS/SUPPLEMENTARY DATA | | | | | | | | | | | | | | | | | | | | |
| Net Assets at End of Year (000's omitted) | $22,170 | | | $20,093 | | | $27,427 | | | $53,300 | | | $104,235 | | |
| Ratios to Average Net Assets: | | | | | | | | | | | | | | | | | | | | |
| Net investment income (loss) | | 0.30 | % | | 1.32 | % | | (0.12 | )% | | (0.20 | )% | | (0.39 | )% |
| Net expense | | 1.10 | % | | 1.10 | % | | 1.10 | % | | 1.10 | % | | 1.10 | % |
| Gross expense (b) | | 1.10 | % | | 1.10 | % | | 1.11 | % | | 1.10 | % | | 1.10 | % |
| PORTFOLIO TURNOVER RATE | | 68 | % | | 52 | % | | 56 | % | | 55 | % | | 55 | % |
| | | | | | | | | | | | | | | | | | | | | | |
| (a) | Calculated based on average shares outstanding during each year. |
| (b) | Reflects the expense ratio excluding any waivers and/or reimbursements. |
See Notes to Financial Statements. 16
GOLDEN FUNDS
NOTES TO FINANCIAL STATEMENTS
JUNE 30, 2014
Note 1. Organization
Golden Large Cap Core Fund and Golden Small Cap Core Fund (individually, a “Fund” and, collectively the “Funds”) are diversified portfolios of Forum Funds (the “Trust”). The Trust is a Delaware statutory trust that is registered as an open-end, management investment company under the Investment Company Act of 1940 (the “Act”), as amended. Under its Trust Instrument, the Trust is authorized to issue an unlimited number of each Fund’s shares of beneficial interest without par value. Each Fund currently offers two classes of shares: Institutional Shares and Investor Shares. As of June 30, 2014, Investor Shares had not commenced operations. Golden Large Cap Core Fund seeks to achieve long-term capital appreciation. Golden Small Cap Core Fund seeks to achieve maximum long-term total return. Each Fund commenced operations on September 13, 2005.
Note 2. Summary of Significant Accounting Policies
These financial statements are prepared in accordance with accounting principles generally accepted in the United States of America (“GAAP”), which require management to make estimates and assumptions that affect the reported amounts of assets and liabilities, the disclosure of contingent liabilities at the date of the financial statements, and the reported amounts of increases and decreases in net assets from operations during the fiscal year. Actual amounts could differ from those estimates. The following summarizes the significant accounting policies of each Fund:
Security Valuation – Exchange-traded securities and over-the-counter securities are valued using the last quoted trade or official closing price, provided by independent pricing services as of the close of trading on the market or exchange for which they are primarily traded, on each Fund business day. In the absence of a sale, such securities are valued at the mean of the last bid and ask price provided by independent pricing services. Non-exchange traded securities for which quotations are available are valued using the last quoted sales price, or in the absence of a sale, at the mean of the last bid and ask prices provided by independent pricing services. Shares of open-end mutual funds are valued at net asset value (“NAV”). Short-term investments that mature in 60 days or less may be valued at amortized cost.
Each Fund values its investments at fair value pursuant to procedures adopted by the Trust's Board of Trustees (the "Board") if (1) market quotations are insufficient or not readily available or (2) the adviser believes that the values available are unreliable. The Trust’s Valuation Committee, as defined in each Fund’s registration statement, performs certain functions as they relate to the administration and oversight of each Fund’s valuation procedures. Under these procedures, the Valuation Committee convenes on a regular and ad-hoc basis to review such securities and considers a number of factors, including valuation methodologies and significant unobservable inputs, when arriving at fair value.
The Valuation Committee may work with the adviser to provide valuation inputs. In determining fair valuations, inputs may include market-based analytics which may consider related or comparable assets or liabilities, recent transactions, market multiples, book values and other relevant investment information. Adviser inputs may include an income-based approach in which the anticipated future cash flows of the investment are discounted in determining fair value. Discounts may also be applied based on the nature or duration of any restrictions on the disposition of the investments. The Valuation Committee performs regular
17
GOLDEN FUNDS
NOTES TO FINANCIAL STATEMENTS
JUNE 30, 2014
reviews of valuation methodologies, key inputs and assumptions, disposition analysis and market activity.
Fair valuation is based on subjective factors and, as a result, the fair value price of an investment may differ from the security’s market price and may not be the price at which the asset may be sold. Fair valuation could result in a different NAV than a NAV determined by using market quotes.
Each Fund has a three-tier fair value hierarchy. The basis of the tiers is dependent upon the various “inputs” used to determine the value of each Fund’s investments. These inputs are summarized in the three broad levels listed below:
Level 1 — quoted prices in active markets for identical assets and liabilities
Level 2 — other significant observable inputs (including quoted prices of similar securities, interest rates, prepayment speeds, credit risk, etc.)
Level 3 — significant unobservable inputs (including each Fund’s own assumptions in determining the fair value of investments)
The aggregate value by input level, as of June 30, 2014, for each Fund’s investments is included at the end of each Fund’s Schedule of Investments.
Security Transactions, Investment Income and Realized Gain and Loss – Investment transactions are accounted for on the trade date. Dividend income is recorded on the ex-dividend date. Foreign dividend income is recorded on the ex-dividend date or as soon as possible after each Fund determines the existence of a dividend declaration after exercising reasonable due diligence. Income and capital gains on some foreign securities may be subject to foreign withholding taxes, which are accrued as applicable. Interest income is recorded on an accrual basis. Premium is amortized and discount is accreted using the effective interest method. Identified cost of investments sold is used to determine the gain and loss for both financial statement and federal income tax purposes.
Distributions to Shareholders – Distributions to shareholders of net investment income and net capital gains, if any, are declared and paid at least annually. Distributions to shareholders are recorded on the ex-dividend date. Distributions are based on amounts calculated in accordance with applicable federal income tax regulations, which may differ from GAAP. These differences are due primarily to differing treatments of income and gain on various investment securities held by each Fund, timing differences and differing characterizations of distributions made by each Fund.
Federal Taxes – Each Fund intends to continue to qualify each year as a regulated investment company under Subchapter M of the Internal Revenue Code and to distribute all of their taxable income to shareholders. In addition, by distributing in each calendar year substantially all of their net investment income and capital gains, if any, the Funds will not be subject to a federal excise tax. Therefore, no federal income or excise tax provision is required. Each Fund files a U.S. federal income and excise tax return as required. A fund’s federal income tax returns are subject to examination by the Internal Revenue Service for a period of three fiscal years after they are filed. As of June 30, 2014, there are no uncertain tax positions that would
18
GOLDEN FUNDS
NOTES TO FINANCIAL STATEMENTS
JUNE 30, 2014
require financial statement recognition, de-recognition, or disclosure.
Income and Expense Allocation – The Trust accounts separately for the assets, liabilities and operations of each of its investment portfolios. Expenses that are directly attributable to more than one investment portfolio are allocated among the respective investment portfolios in an equitable manner.
Commitments and Contingencies – In the normal course of business, each Fund enters into contracts that provide general indemnifications by each Fund to the counterparty to the contract. Each Fund’s maximum exposure under these arrangements is dependent on future claims that may be made against each Fund and, therefore, cannot be estimated; however, based on experience, the risk of loss from such claims is considered remote.
Note 3. Fees and Expenses
Investment Adviser – Golden Capital Management, LLC (the “Adviser”) is the investment adviser to the Funds. Pursuant to an Investment Advisory Agreement, the Adviser receives an advisory fee at an annual rate of 0.70% and 1.10% of the average daily net assets of Golden Large Cap Core Fund and Golden Small Cap Core Fund, respectively. Under the terms of the Investment Advisory Agreement, the Adviser provides investment advisory services to the Funds and is obligated to pay all expenses of the Funds except portfolio transaction expenses, borrowing costs, interest, taxes, certain compensation and expenses of the Board, any expenses the Funds are authorized to pay under Rule 12b-1, and extraordinary expenses.
Distribution – Foreside Fund Services, LLC serves as each Fund’s distributor (the “Distributor”). The Funds do not have a distribution (12b-1) plan; accordingly, the Distributor does not receive compensation from the Funds for its distribution (12b-1) services. The Adviser compensates the Distributor directly for its services. The Distributor is not affiliated with the Adviser or Atlantic Fund Administration, LLC (d/b/a Atlantic Fund Services) (“Atlantic”) or their affiliates.
Other Service Providers – Atlantic provides fund accounting, fund administration, compliance and transfer agency services to each Fund. Atlantic also provides certain shareholder report production, and EDGAR conversion and filing services. Atlantic provides a Principal Executive Officer, a Principal Financial Officer, a Chief Compliance Officer, and an Anti-Money Laundering Officer to each Fund, as well as certain additional compliance support functions.
Trustees and Officers – The Trust pays each independent Trustee an annual retainer fee of $45,000 for service to the Trust ($66,000 for the Chairman). The Trustees and Chairman may receive additional fees for special Board meetings. Each Trustee is also reimbursed for all reasonable out-of-pocket expenses incurred in connection with his duties as a Trustee, including travel and related expenses incurred in attending Board meetings. The amount of Trustees’ fees attributable to each Fund is disclosed in the Statement of Operations. Certain officers of the Trust are also officers or employees of the above named service providers, and during their terms of office received no compensation from each Fund.
19
GOLDEN FUNDS
NOTES TO FINANCIAL STATEMENTS
JUNE 30, 2014
Note 4. Expense Reimbursements and Fees Waived
The Adviser has contractually agreed to waive its fees and/or reimburse certain expenses through October 31, 2014, to limit total annual operating expenses to 0.70% (excluding all taxes, interest, portfolio transaction expenses, dividend and interest expenses on short sales, acquired fund fees and expenses, proxy expenses and extraordinary expenses) for Institutional Shares of the Golden Large Cap Core Fund. The Adviser also contractually agreed to waive a portion of its fees and reimburse certain expenses through October 31, 2014, to limit total annual operating expenses to 1.10% (excluding all taxes, interest, portfolio transaction expenses, dividend and interest expenses on short sales, acquired fund fees and expenses, proxy expenses and extraordinary expenses) for Institutional Shares of the Golden Small Cap Core Fund. For the year ended June 30, 2014, fees waived and reimbursed were as follows:
| | | Investment Adviser Reimbursement |
| Golden Large Cap Core Fund | | $ | 1,615 | |
| Golden Small Cap Core Fund | | | 789 | |
Note 5. Security Transactions
The cost of purchases and proceeds from sales of investment securities (including maturities), other than short-term investments during the year ended June 30, 2014, were as follows:
| | | Purchases | | | Sales | |
| Golden Large Cap Core Fund | | $ | 67,887,635 | | | $ | 33,840,038 | |
| Golden Small Cap Core Fund | | | 13,956,313 | | | | 16,286,582 | |
Note 6. Federal Income Tax
Distributions paid during the fiscal years ended as noted were characterized for tax purposes as follows:
| | | Ordinary Income | | Long-Term Capital Gain | | Total |
| Golden Large Cap Core Fund |
| 2014 | | $ | 1,146,780 | | | $ | 4,574,555 | | | $ | 5,721,335 | |
| 2013 | | | 458,420 | | | | 2,619,826 | | | | 3,078,246 | |
| Golden Small Cap Core Fund |
| 2014 | | | 289,247 | | | | - | | | | 289,247 | |
As of June 30, 2014, distributable earnings (accumulated loss) on a tax basis were as follows:
| | | Undistributed Ordinary Income | | Undistributed Long-Term Gain | | Capital and Other Losses | | Unrealized Appreciation | | Total |
| Golden Large Cap Core Fund | | $ | 726,107 | | | $ | 1,965,832 | | | $ | - | | | $ | 11,744,070 | | | $ | 14,436,009 | |
| Golden Small Cap Core Fund | | | 55,312 | | | | - | | | | (51,815,294 | ) | | | 5,184,876 | | | | (46,575,106 | ) |
20
GOLDEN FUNDS
NOTES TO FINANCIAL STATEMENTS
JUNE 30, 2014
The difference between components of distributable earnings on a tax basis and the amounts reflected in the Statements of Assets and Liabilities are primarily due to wash sales, short term gains and investments in real estate investment trusts.
On the Statement of Assets and Liabilities, as a result of permanent book to tax differences, certain amounts have been reclassified for the year ended June 30, 2014. The following reclassification was the result of real estate investment trust adjustments and has no impact on the net assets of the Fund.
| | | Undistributed Net Investment Income | | Accumulated Net Realized Gain (Loss) |
| Golden Small Cap Core Fund | | | (6,138 | ) | | | 6,138 | |
As of June 30, 2014, capital loss carryforwards to offset future capital gains were as follows with the respective expiration dates:
| | | 2018 | |
| Golden Small Cap Core Fund | | $ | 51,815,294 | |
Note 7. Subsequent Events
Subsequent events occurring after the date of this report through the date these financial statements were issued have been evaluated for potential impact and each Fund has had no such events.
21
REPORT OF INDEPENDENT REGISTERED PUBLIC ACCOUNTING FIRM
To the Board of Trustees of Forum Funds
and the Shareholders of Golden Large Cap Core Fund and Golden Small Cap Core Fund
We have audited the accompanying statements of assets and liabilities of the Golden Large Cap Core Fund and Golden Small Cap Core Fund, each a series of shares of beneficial interest in the Forum Funds, including the schedules of investments, as of June 30, 2014, and the related statements of operations for the year then ended, the statements of changes in net assets for each of the years in the two-year period then ended and the financial highlights for each of the years in the five-year period then ended. These financial statements and financial highlights are the responsibility of the Funds' management. Our responsibility is to express an opinion on these financial statements and financial highlights based on our audits.
We conducted our audits in accordance with the standards of the Public Company Accounting Oversight Board (United States). Those standards require that we plan and perform the audits to obtain reasonable assurance about whether the financial statements and financial highlights are free of material misstatement. An audit includes examining, on a test basis, evidence supporting the amounts and disclosures in the financial statements. Our procedures included confirmation of securities owned as of June 30, 2014 by correspondence with the custodian and brokers. An audit also includes assessing the accounting principles used and significant estimates made by management, as well as evaluating the overall financial statement presentation. We believe that our audits provide a reasonable basis for our opinion.
In our opinion, the financial statements and financial highlights referred to above present fairly, in all material respects, the financial position of the Golden Large Cap Core Fund and Golden Small Cap Core Fund as of June 30, 2014, and the results of their operations for the year then ended, the changes in their net assets for each of the years in the two-year period then ended and their financial highlights for each of the years in the five-year period then ended, in conformity with accounting principles generally accepted in the United States of America.
BBD, LLP
Philadelphia, Pennsylvania
August 21, 2014
22
GOLDEN FUNDS
ADDITIONAL INFORMATION (Unaudited)
JUNE 30, 2014
Proxy Voting Information
A description of the policies and procedures that each Fund uses to determine how to vote proxies relating to securities held in each Fund’s portfolio is available, without charge and upon request, by calling (800) 206-8610 and on the U.S. Securities and Exchange Commission’s (the “SEC”) website at www.sec.gov. Each Fund’s proxy voting record for the most recent twelve-month period ended June 30 is available, without charge and upon request, by calling (800) 206-8610 and on the SEC’s website at www.sec.gov.
Availability of Quarterly Portfolio Schedules
Each Fund files its complete schedule of portfolio holdings with the SEC for the first and third quarters of each fiscal year on Form N-Q. These filings are available, without charge and upon request on the SEC’s website at www.sec.gov or may be reviewed and copied at the SEC’s Public Reference Room in Washington, DC. Information on the operation of the Public Reference Room may be obtained by calling (800) SEC-0330.
Shareholder Expense Example
As a shareholder of the Funds, you incur ongoing costs, including management fees, distribution (12b-1) fees and other Fund expenses. This example is intended to help you understand your ongoing costs (in dollars) of investing in the Funds and to compare these costs with the ongoing costs of investing in other mutual funds.
The example is based on an investment of $1,000 invested at the beginning of the period and held for the entire period from January 1, 2014, through June 30, 2014.
Actual Expenses – The first line of the table below provides information about actual account values and actual expenses. You may use the information in this line, together with the amount you invested, to estimate the expenses that you paid over the period. Simply divide your account value by $1,000 (for example, an $8,600 account value divided by $1,000 = 8.6), then multiply the result by the number in the first line under the heading entitled “Expenses Paid During Period” to estimate the expenses you paid on your account during the period.
Hypothetical Example for Comparison Purposes – The second line of the table below provides information about hypothetical account values and hypothetical expenses based on each Fund’s actual expense ratio and an assumed rate of return of 5% per year before expenses, which is not each Fund’s actual return. The hypothetical account values and expenses may not be used to estimate the actual ending account balance or expenses you paid for the period. You may use this information to compare the ongoing costs of investing in each Fund and other funds. To do so, compare this 5% hypothetical example with the 5% hypothetical examples that appear in the shareholder reports of other funds.
Please note that the expenses shown in the table are meant to highlight your ongoing costs only. Therefore, the second line of the table is useful in comparing ongoing costs only, and will not help you determine the relative total costs of owning different funds.
23
GOLDEN FUNDS
ADDITIONAL INFORMATION (Unaudited)
JUNE 30, 2014
| | Beginning | | Ending | | Expenses | | Annualized |
| | Account Value | | Account Value | | Paid During | | Expense |
| | January 1, 2014 | | June 30, 2014 | | Period* | | Ratio* |
| Golden Large Cap Core | | | | | | | | | | | |
| Actual | $ | 1,000.00 | | $ | 1,070.48 | | $ | 3.59 | | 0.70 | % |
| Hypothetical (5% return before taxes) | $ | 1,000.00 | | $ | 1,021.32 | | $ | 3.51 | | 0.70 | % |
| Golden Small Cap Core | | | | | | | | | | | |
| Actual | $ | 1,000.00 | | $ | 1,073.66 | | $ | 5.66 | | 1.10 | % |
| Hypothetical (5% return before taxes) | $ | 1,000.00 | | $ | 1,019.34 | | $ | 5.51 | | 1.10 | % |
| * | Expenses are equal to the Fund’s annualized expense ratio multiplied by the average account value over the period, multiplied by the number of days in the most recent fiscal half-year divided by 365 to reflect the half-year period. |
Federal Tax Status of Dividends Declared during the Fiscal Year
For federal income tax purposes, dividends from short-term capital gains are classified as ordinary income. The Golden Large Cap Core Fund designates 47.74% of its income dividend distributed as qualifying for the corporate dividends-received deduction (DRD) and 51.21% for the qualified dividend rate (QDI) as defined in Section 1(h)(11) of the Internal Revenue Code. The Golden Large Cap Core Fund also designates 0.06% as qualified interest income exempt from U.S. tax for foreign shareholders (QII) and 70.18% as short-term capital gain dividends exempt from U.S. tax for foreign shareholders (QSD).
The Golden Small Cap Core Fund designates 100.00% of its income dividend distributed as DRD and 100.00% for QDI. The Golden Small Cap Core Fund also designates 0.09% as QII.
Trustees and Officers of the Trust
The Board is responsible for oversight of the management of the Trust’s business affairs and of the exercise of all the Trust’s powers except those reserved for the shareholders. The following table provides information about each Trustee and certain officers of the Trust. Each Trustee and officer holds office until the person resigns, is removed, or is replaced. Unless otherwise noted, the persons have held their principal occupations for more than five years. The address for all Trustees and officers is Three Canal Plaza, Suite 600, Portland, Maine 04101. Mr. Keffer is considered an Interested Trustee due to his affiliation with Atlantic. Each Fund’s Statement of Additional Information includes additional information about the Trustees and is available, without charge and upon request, by calling (800) 206-8610.
24
GOLDEN FUNDS
ADDITIONAL INFORMATION (Unaudited)
JUNE 30, 2014
| Name and Year of Birth | Position with the Trust | Length of Time Served | Principal Occupation(s) During Past Five Years | Number of Series of Fund Complex¹ Overseen by Trustee | Other Directorships Held by Trustee |
| Independent Trustees | | | | | |
J. Michael Parish Born: 1943 | Chairman of the Board; Trustee; Chairman, Nominating Committee and Qualified Legal Compliance Committee | Since 1989 (Chairman since 2004) | Retired since 2003. | 24 | 0 |
Costas Azariadis Born: 1943 | Trustee | Since 1989 | Professor of Economics, Washington University since 2006. | 24 | 0 |
James C. Cheng Born: 1942 | Trustee; Chairman, Audit Committee | Since 1989 | President, Technology Marketing Associates (marketing company for small- and medium-sized businesses in New England) since 1991. | 24 | 0 |
David Tucker Born: 1958 | Trustee | Since 2011 | Director, Blue Sky Experience since 2008; Senior Vice President & General Counsel, American Century Companies 1998-2008. | 28 | Trustee, Forum Funds II and Forum ETF Trust |
| Interested Trustee | | | | | |
John Y. Keffer2 Born: 1942 | Trustee; Vice Chairman | Since 1989 | Chairman, Atlantic since 2008; President, Forum Investment Advisors, LLC since 2011; President, Forum Foundation (a charitable organization) since 2005; President, Forum Trust, LLC (a non-depository trust company chartered in the State of Maine) since 1997. | 28 | Director, Wintergreen Fund, Inc.; Trustee, Forum Funds II, Forum ETF Trust and ALTX Trust |
| Officers | | | | | |
Stacey E. Hong Born: 1966 | President; Principal Executive Officer | Since 2008 | President, Atlantic since 2008. | N/A | N/A |
Karen Shaw Born: 1972 | Treasurer; Principal Financial Officer | Since 2008 | Senior Vice President, Atlantic since 2008. | N/A | N/A |
Zachary Tackett Born: 1988 | Vice President; Secretary; Anti-Money Laundering Compliance Officer | Since 2014 | Associate Counsel, Atlantic since 2014; Intern Associate, Coakley & Hyde, PLLC, 2010-2013. | N/A | N/A |
Michael J. McKeen Born: 1971 | Vice President | Since 2009 | Senior Vice President, Atlantic since 2008. | N/A | N/A |
Timothy Bowden Born: 1969 | Vice President | Since 2009 | Manager, Atlantic since 2008. | N/A | N/A |
1The Fund Complex includes the Trust, Forum Funds II and Forum ETF Trust and is overseen by different Boards of Trustees. 2Atlantic is a subsidiary of Forum Holdings Corp. I, a Delaware corporation that is wholly owned by Mr. Keffer. |
25
GOLDEN FUNDS
ADDITIONAL INFORMATION (Unaudited)
JUNE 30, 2014
| Name and Year of Birth | Position with the Trust | Length of Time Served | Principal Occupation(s) During Past Five Years | Number of Series of Fund Complex¹ Overseen by Trustee | Other Directorships Held by Trustee |
| Officers - continued | | | | | |
Geoffrey Ney Born: 1975 | Vice President | Since 2013 | Manager, Atlantic since 2013; Senior Fund Accountant, Atlantic, 2008-2013. | N/A | N/A |
Todd Proulx Born: 1978 | Vice President | Since 2013 | Manager, Atlantic since 2013; Senior Fund Accountant, Atlantic, 2008-2013. | N/A | N/A |
1The Fund Complex includes the Trust, Forum Funds II and Forum ETF Trust and is overseen by different Boards of Trustees. |
ITEM 2. CODE OF ETHICS.
| (a) | As of the end of the period covered by this report, Forum Funds (the “Registrant”) has adopted a code of ethics, which applies to its Principal Executive Officer and Principal Financial Officer (the “Code of Ethics”). |
| (c) | There have been no amendments to the Registrant’s Code of Ethics during the period covered by this report. |
| (d) | There have been no waivers to the Registrant’s Code of Ethics during the period covered by this report. |
(f) (1) A copy of the Code of Ethics is being filed under Item 12(a) hereto.
ITEM 3. AUDIT COMMITTEE FINANCIAL EXPERT.
The Board of Trustees has determined that no member of the Audit Committee is an "audit committee financial expert" as that term is defined under applicable regulatory guidelines.
ITEM 4. PRINCIPAL ACCOUNTANT FEES AND SERVICES.
(a) Audit Fees - The aggregate fees billed for each of the last two fiscal years (the “Reporting Periods”) for professional services rendered by the Registrant’s principal accountant for the audit of the Registrant’s annual financial statements, or services that are normally provided by the principal accountant in connection with the statutory and regulatory filings or engagements for the Reporting Periods, were $64,100 in 2013 and $77,000 in 2014.
(b) Audit-Related Fees – The aggregate fees billed in the Reporting Periods for assurance and related services rendered by the principal accountant that were reasonably related to the performance of the audit of the Registrant’s financial statements and are not reported under paragraph (a) of this Item 4 were $0 in 2013 and $0 in 2014.
(c) Tax Fees - The aggregate fees billed in the Reporting Periods for professional services rendered by the principal accountant to the Registrant for tax compliance, tax advice and tax planning were $15,000 in 2013 and $18,000 in 2014. These services consisted of review or preparation of U.S. federal, state, local and excise tax returns.
(d) All Other Fees - The aggregate fees billed in the Reporting Periods for products and services provided by the principal accountant to the Registrant, other than the services reported in paragraphs (a) through (c) of this Item, were $0 in 2013 and $0 in 2014.
(e) (1) The Audit Committee reviews and approves in advance all audit and “permissible non-audit services” (as that term is defined by the rules and regulations of the Securities and Exchange Commission) to be rendered to a series of the Registrant (each, a “Series”). In addition, the Audit Committee reviews and approves in advance all “permissible non-audit services” to be provided to an investment adviser (not including any sub-adviser) of a Series, or an affiliate of such investment adviser, that is controlling, controlled by or under common control with the investment adviser and provides on-going services to the Registrant (“Affiliate”), by the Series’ principal accountant if the engagement relates directly to the operations and financial reporting of the Series. The Audit Committee considers whether fees paid by a Series’ investment adviser or an Affiliate to the Series’ principal accountant for audit and permissible non-audit services are consistent with the principal accountant’s independence.
(e) (2) No services included in (b) - (d) above were approved pursuant to paragraph (c)(7)(i)(C) of Rule 2-01 of Regulation S-X.
(f) Not applicable
(g) The aggregate non-audit fees billed by the principal accountant for services rendered to the Registrant for the Reporting Periods were $0 in 2013 and $0 in 2014. There were no fees billed in either of the Reporting Periods for non-audit services rendered by the principal accountant to the Registrant’s investment adviser or any Affiliate.
(h) During the Reporting Period, the Registrant's principal accountant provided no non-audit services to the investment advisers or any entity controlling, controlled by or under common control with the investment advisers to the series of the Registrant to which this report relates.
ITEM 5. AUDIT COMMITTEE OF LISTED REGISTRANTS.
Not applicable.
ITEM 6. INVESTMENTS.
| (a) | Included as part of report to shareholders under Item 1. |
ITEM 7. DISCLOSURE OF PROXY VOTING POLICIES AND PROCEDURES FOR CLOSED-END
MANAGEMENT INVESTMENT COMPANIES.
Not applicable.
ITEM 8. PORTFOLIO MANAGERS OF CLOSED-END MANAGEMENT INVESTMENT COMPANIES.
Not applicable.
ITEM 9. PURCHASES OF EQUITY SECURITIES BY CLOSED-END MANAGEMENT INVESTMENT COMPANY AND AFFILIATED PURCHASERS.
Not applicable.
ITEM 10. SUBMISSION OF MATTERS TO A VOTE OF SECURITY HOLDERS
The Registrant does not accept nominees to the board of trustees from shareholders.
ITEM 11. CONTROLS AND PROCEDURES
(a) The Registrant’s Principal Executive Officer and Principal Financial Officer have concluded that the Registrant’s disclosure controls and procedures (as defined in Rule 30a-3(c) under the Investment Company Act of 1940 (the “Act”)) are effective, based on their evaluation of the controls and procedures required by Rule 30a-3(b) under the Act and Rules 13a-15(b) or 15d-15(b) under the Securities Exchange Act of 1934, as of a date within 90 days of the filing date of this report.
(b) There were no changes in the Registrant’s internal control over financial reporting (as defined in
Rule 30a-3(d) under the Act) that occurred during the second fiscal quarter of the period covered by this report that have materially affected, or are reasonably likely to materially affect, the Registrant’s internal control over financial reporting.
ITEM 12. EXHIBITS.
(a)(1) Code of Ethics (Exhibit filed herewith).
(a)(2) Certifications pursuant to Rule 30a-2(a) of the Act, and Section 302 of the Sarbanes-Oxley Act of 2002. (Exhibits filed herewith)
(a)(3) Not applicable.
(b) Certifications pursuant to Rule 30a-2(b) of the Act, and Section 906 of the Sarbanes-Oxley Act of 2002. (Exhibit filed herewith)
SIGNATURES
Pursuant to the requirements of the Securities Exchange Act of 1934 and the Investment Company Act of 1940, the Registrant has duly caused this report to be signed on its behalf by the undersigned, thereunto duly authorized.
Registrant Forum Funds
By /s/ Stacey E. Hong
Stacey E. Hong, Principal Executive Officer
Date 8/22/14
Pursuant to the requirements of the Securities Exchange Act of 1934 and the Investment Company Act of 1940, this report has been signed below by the following persons on behalf of the Registrant and in the capacities and on the dates indicated.
By /s/ Stacey E. Hong
Stacey E. Hong, Principal Executive Officer
By /s/ Karen Shaw
Karen Shaw, Principal Financial Officer