As filed with the Securities and Exchange Commission on March 4, 2013
UNITED STATES
SECURITIES AND EXCHANGE COMMISSION
WASHINGTON, D.C. 20549
FORM N-CSR
CERTIFIED SHAREHOLDER REPORT OF REGISTERED MANAGEMENT
INVESTMENT COMPANIES
Investment Company Act file number 811-03023
FORUM FUNDS
Three Canal Plaza, Suite 600
Portland, Maine 04101
Stacey E. Hong, Principal Executive Officer
Three Canal Plaza, Suite 600
Portland, Maine 04101
207-347-2000
Date of fiscal year end: June 30
Date of reporting period: July 1, 2012 – December 31, 2012
ITEM 1. REPORT TO STOCKHOLDERS
Auxier Focus Fund
Semi-Annual Report
December 31, 2012
(Unaudited)
Fund Adviser:
Auxier Asset Management LLC
5285 Meadows Road
Suite 333
Lake Oswego, Oregon 97035
Toll Free: (877) 3AUXIER or (877) 328-9437
| | | | | | | | | |
| AUXIER FOCUS FUND | | | | |
| A MESSAGE TO OUR SHAREHOLDERS | | | | |
| DECEMBER 31, 2012 | | | | |
| | | | | | | | | |
AUXIER FOCUS FUND
PERFORMANCE UPDATE
December 31, 2012
| | ANNUALIZED | |
| | | Inception * | Ten Year | Five Year | Three Year | One Year | |
| | Auxier Focus Fund Investor Class Shares | 6.45% | 7.52% | 3.54% | 8.12% | 8.73% | |
| | S&P 500 Index | 1.99% | 7.10% | 1.66% | 10.87% | 16.00% | |
| | CUMULATIVE | |
| | | Inception * | Ten Year | Five Year | Three Year | One Year | |
| | Auxier Focus Fund Investor Class Shares | 132.14% | 106.39% | 19.02% | 26.38% | 8.73% | |
| | S&P 500 Index | 30.48% | 98.58% | 8.59% | 36.30% | 16.00% | |
| | * Fund inception: July 9, 1999 | | | | | |
Performance data quoted represents past performance and is no guarantee of future results. Current performance may be lower or higher than the performance data quoted. Investment return and principal value will fluctuate so that an investor's shares, when redeemed, may be worth more or less than original cost. As stated in the current prospectus, Auxier Focus Fund’s (the “Fund”) Investor Class Share’s annual operating expense ratio (gross) is 1.29%. The Fund’s adviser has contractually agreed to reduce a portion of its fee and reimburse Fund expenses to limit total annual operating expenses at 1.25%, which is in effect until October 31, 2015. Other share classes may vary. The Fund charges a 2.0% redemption fee on shares redeemed within six months of purchase. For the most recent month-end performance, please call (877)328-9437 or visit the Fund’s website at www.auxierasset.com.
Year End 2012 Market Commentary
Auxier Focus Fund returned 0.20% in fourth quarter 2012, versus a 0.38% decline for Standard & Poor’s 500 Index (the “S&P 500”). The Fund returned 8.73% for the full year, compared with a 16.00% gain for the S&P 500. Our 2012 underperformance is partly due to the portfolio’s lower-risk 75% exposure to stocks (the S&P 500 is 100%). The Fund’s stockholdings returned 12.12% last year. What’s more, market returns were not broad based. Even with historic low interest rates, the Dow Jones Utility Average only increased 1.64% for the year. The Dow Jones UBS Commodity Index declined 1.06% despite the Federal Reserve’s massive $85 billion a month bond buying program (think printing money). The Dow Jones Credit Suisse Hedge Fund Index climbed 5.4%. And we continue to trounce the market longer term. Since inception in 1999, the Fund has an annualized returned of 6.45%, more than triple the S&P 500’s corresponding 1.99%.

Outperforming the market so significantly over time demands stringent risk management. We are constantly gauging a security’s risk profile to make sure our investors are adequately compensated. The power of compounding is so phenomenal that a long-term investor should strive to avoid losses that interrupt the process. We did not believe the Federal Reserve would instigate an $85 billion a month bond buying campaign, dubbed “unlimited QE,” that’s focused on the unemployment level. Allocating roughly a trillion dollars at today’s record-high bond prices makes no sense. Excessive borrowing to buy wildly overpriced assets are common causes of capital destruction. Misallocation based on extremely easy credit has contributed materially to the two major market declines in the past 12 years. This past year the mindless rush for yield drove investors into the danger zone once again. “Stretching for yield” without understanding the source or true risk for yield contributed to the financial crisis in 2008. This year, across the globe, total central bank stimulus could exceed $8 trillion. This is unprecedented, can’t be ignored, and
| | | | | | | | | |
| AUXIER FOCUS FUND | | | | |
| A MESSAGE TO OUR SHAREHOLDERS | | | | |
| DECEMBER 31, 2012 | | | | |
| | | | | | | | | |
provides a powerful but artificial tailwind for equities. However, we are always looking ahead to identify tempests that can undermine compounding of the portfolio.
Capitalizing on the Fiscal Cliff
The budgetary high-wire act staged in Washington, DC in the fourth quarter of 2012 spooked many investors, permitting us to scoop up some high-return enterprises with growing free cash flow yields. We’ve often found the best investment to be the nurtured business, blessed with exceptional management and a superior product or service, temporarily and substantially mispriced by the stock market. The goal is to achieve a double or triple play together with growing dividend yields as the valuation expands with improving fundamentals. Our experience of investing in superior business franchises, selling at 10-11 times earnings, has been a winning proposition over the long term. Discipline, rationality and selectivity are critical. We are more comfortable taking a time risk than a price risk. This approach to compounding is the best way we have found to outpace purchasing power risk (a.k.a. inflation). This is especially true given today’s record low interest rates and central banks printing money aggressively. We try to make sure the portfolio has a compelling risk/reward basis, lately priced at a 20-30% discount to the market by most financial metrics. We review hundreds of companies a year and are very selective in the few businesses we buy based on price and value.
Seeking Profits From Hard Times and Spinoffs
Experience has taught us that recessions are an opportunistic but short-lived time to shop for quality assets. Consider that, since 1947, the United States has been in recession less than 5% of the time. This past year we've found good value in recessionary European markets, home to some powerful franchises that have a global reach into growing emerging economies with aspiring middle classes. Hard times typically provide lower-risk entry points (although it does not feel like it at the time) for our portfolio. We like situations in which the growth of an enterprise or economy is underappreciated and thus undervalued in the marketplace. To paraphrase Chicago Mayor Rahm Emanuel, the Obama Administration's first chief of staff, a crisis (read recession) is a terrible thing to waste. Better to ignore gloomy headlines and buy the best quality cheap, which I strived to do as a portfolio manager in such earlier market meltdowns as 1982's Mexican default, 1987's Black Monday, and the 1990s savings & loan debacle.
In addition, many global blue chip conglomerates possess tremendous hidden value in the form of so-called spinoffs of attractive subsidiaries as publicly traded stocks. Unleashing the entrepreneurial spirit of a smaller enterprise can offer exciting return potential. Further, many of our holdings that have launched spinoffs also have characteristics appealing to private equity buyers. This may provide a performance catalyst in a flat market. Due to the abundance of cheap financing, 2013 may mark the return of the leveraged buyout (LBO). Buyout activity surged to the $400 billion level back in 2006-07, when a bunch of our holdings were acquired. Efunds, a credit card processor for which we paid an average of $12.90 a share during the 2002 recession, was taken private by FIS at $36.50 in 2007.
Our Take on Technology, Natural Gas and Commodities
Prospective investors in the Fund often ask why we steadfastly avoid such high-profile tech stocks as Apple and Facebook that dominate coverage on CNBC and other financial media. Our answer is that we prefer to own comparatively mundane businesses like Unilever and Tesco PLC that actually have benefited from technology’s inexorable march toward lower unit prices and profit margins. According to Google Chairman Eric Schmidt, every two days we now create as much information as we did from the dawn of civilization up until 2003. Your iPad is some 150,000% more powerful than the first laptop computer. Many of us still think in terms of linear growth (like simple interest). The world of data is actually growing much faster—exponentially (like compound interest). The impact on your portfolio? Through the rapid advances of technology, the toughest, seemingly insurmountable problems will be solved. The risk may not be in shortages but in gluts of supply. Natural gas is an example. Prices since 2006 are down over 70% due to new fracking and horizontal drilling technology. The same thing can happen in other problem areas like healthcare, government and education. Small teams armed with powerful technology will restructure entire industries. Swamped by data, it is imperative that investors and risk managers be rigorous researchers. After a 115 month commodity boom, despite fears of shortages, commodity prices have corrected some 18% off the 2011 highs. Again, high prices are a magnet for the forces of technology and innovation. High commodity prices have been a headwind the past five years for many businesses. The correction in commodities could benefit many of our global consumer businesses, such as the aforementioned Unilever and Tesco PLC.
| | | | | | | | | |
| AUXIER FOCUS FUND | | | | |
| A MESSAGE TO OUR SHAREHOLDERS | | | | |
| DECEMBER 31, 2012 | | | | |
| | | | | | | | | |
Why We Excel Over the Long Haul
The worst ten-year period for U.S. stocks in our history was from 1999-2009. We had two 40% declines in the past 12 years. Now consider a $10,000 investment in Auxier Focus since its inception in July 1999 through year-end 2012. That investment grew to $23,214, some 56% greater than a corresponding $13,048 stake in the S&P 500. Moreover, on a risk adjusted basis, the Fund’s results were even better because its exposure to stocks averaged approximately 75%. This highlights some of the historical benefits of our focused, long term, price/value approach and underscores the importance of outperforming markets in bad times. Our commitment and passion for research is as strong as it ever has been. Our experience in stock and bond selection dates back to the early 1980s. This knowledge is invaluable when quantifying risk, in order to seek the abundant rewards of compounding.
Your trust and support is appreciated.
Jeff Auxier
IMPORTANT RISKS AND DISCLOSURES
Fund returns (i) assume the reinvestment of all dividends and capital gain distributions and (ii) would have been lower during the period if certain fees and expenses had not been waived. Performance shown is for the Fund’s Investor Class shares; returns for other share classes will vary. Performance for Investor Class shares for periods prior to December 10, 2004 reflects performance of the applicable share class of Auxier Focus Fund, a series of Unified Series Trust (the “Predecessor Fund”). Prior to January 3, 2003, the Predecessor Fund was a series of Ameriprime Funds. The performance of the Fund’s Investor Class shares for the period prior to December 10, 2004 reflects the expenses of the Predecessor Fund.
The Fund may invest in value and/or growth stocks. Investments in value stocks are subject to risk that their intrinsic value may never be realized and investments in growth stocks may be susceptible to rapid price swings, especially during periods of economic uncertainty. In addition, the Fund may invest in mid-sized companies which generally carry greater risk than is customarily associated with larger companies. Moreover, if the Fund's portfolio is overweighted in a sector, any negative development affecting that sector will have a greater impact on the Fund than a fund that is not overweighted in that sector. An increase in interest rates typically causes a fall in the value of a debt security (Fixed-Income Securities Risk) with corresponding changes to the Fund’s value.
The S&P 500 Index is a broad-based, unmanaged measurement of changes in stock market conditions based on 500 widely held common stocks. The Dow Jones Utility Average is a price-weighted average of 15 utility stocks traded in the United States. The Dow Jones-UBS Commodity Index is a broadly diversified index that allows investors to track commodity futures through a single, simple measure. The index is composed of futures contracts on physical commodities. The Dow Jones Credit Suisse Hedge Fund Index is an asset-weighted benchmark that measures hedge fund performance and seeks to provide the most accurate representation of the hedge fund universe. One cannot invest directly in an index or an average.
The views in this shareholder letter were those of the Fund Manager as of the letter’s publication date and may not reflect his views on the date this letter is first distributed or anytime thereafter. These views are intended to assist readers in understanding the Fund’s investment methodology and do not constitute investment advice.
| | | | | | | | | |
| AUXIER FOCUS FUND | | | | |
| PERFORMANCE CHART AND ANALYSIS | | | | |
| DECEMBER 31, 2012 | | | | |
| | | | | | | | | |
The following chart reflects the change in the value of a hypothetical $10,000 investment in Investor Shares, including reinvested dividends and distributions, in the Fund compared with the performance of the benchmark, the S&P 500 Index ("S&P 500"), over the past ten fiscal periods. The S&P 500 is a broad-based, unmanaged measurement of changes in stock market conditions based on the average of 500 widely held common stocks. The total return of the Fund's classes includes the maximum sales charge of 5.75% (A Shares only) and operating expenses that reduce returns, while the total return of the S&P 500 does not include the effect of sales charges and expenses. A Shares are subject to a 1.00% contingent deferred sales charge on shares purchased without an initial sales charge and redeemed less than one year after purchase. The total return of the S&P 500 includes the reinvestment of dividends and income. Fund is professionally managed while the S&P 500 is unmanaged and is not available for investment.
Comparison of Change in Value of a $10,000 Investment
Investor Shares vs. S&P 500 Index
Average Annual Total Returns Periods Ended December 31, 2012: | | 1 Year | | 5 Years | | 10 Years | | Since Inception(1) |
| Investor Shares | | 8.73 | % | | 3.54 | % | | 7.52 | % | | 6.45 | % |
| S&P 500 Index (Since July 9, 2009) | | 16.00 | % | | 1.66 | % | | 7.10 | % | | 1.99 | % |
A Shares (with sales charge)(2)(3) | | 2.45 | % | | 2.29 | % | | 6.87 | % | | 5.98 | % |
Institutional Shares(3) | | 8.79 | % | | 3.56 | % | | 7.52 | % | | 6.45 | % |
| (1) | Investor, A Shares and Institutional Shares commenced operations on July 9, 1999, July 8, 2005, and May 9, 2012, respectively. |
| (2) | Due to shareholder redemptions on August 21, 2005, net assets of the class were zero from the close of business on that date until September 22, 2005. Financial information presented for the period August 21, 2005 to September 22, 2005 reflects performance of Investor Shares of the Fund. |
| (3) | For A Shares and Institutional Shares, performance for the 5-year, 10-year and since inception periods are blended average annual returns which include the returns of the Investor Shares prior to commencement of operations of the A Shares and Institutional Shares. For Institutional Shares, performance for the 1-year period is a blended average annual which includes the return of the Investor Shares prior to commencement of operations of the Institutional Shares. |
Performance data quoted represents past performance and is no guarantee of future results. Current performance may be lower or higher than the performance data quoted. Investment return and principal value will fluctuate so that shares, when redeemed, may be worth more or less than original cost. For the most recent month-end performance, please visit the website of the Fund's investment adviser at www.auxierasset.com or call (877)-328-9437. As stated in the Fund's prospectus, the annual operating expense ratios (gross) for Investor Shares, A Shares and Institutional Shares, respectively are 1.29%, 1.65% and 1.76%, respectively. However, the Fund's adviser has agreed to contractually reduce a portion of its fees and to reimburse expenses such that total operating expenses do not exceed 1.25%, 1.25% and 1.10% for Investor Shares, A Shares and Institutional Shares, respectively, through at least October 31, 2015. Shares redeemed or exchanged within 180 days of purchase will be charged a 2.00% redemption fee. The performance table and graph do not reflect the deduction of taxes that a shareholder would pay on Fund distributions or the redemption of Fund shares. Returns greater than one year are annualized.
Performance for Investor Shares for periods prior to December 10, 2004, reflects performance and expenses of Auxier Focus Fund, a series of Unified Series Trust (the “Predecessor Fund”). Prior to January 3, 2003, the Predecessor Fund was a series of Ameriprime Funds.
| | | | | | | | | |
| AUXIER FOCUS FUND | | | | |
| SCHEDULE OF INVESTMENTS | | | | |
| DECEMBER 31, 2012 | | | | |
| | | | | | | | | |
| | | | | | | | | | | | | | | | | | | | | | |
| | | | Security | | | | | | | | | | | Security | | | | | | | |
| | Shares | | Description | | | | | | Value | | | Shares | | Description | | | | | | Value | |
| | | | | | | | | | | | | 20,100 | | Kelly Services, Inc., Class A | | | | | $ | 316,374 | |
| Common Stock - 79.7% | | | | | | | | | 5,620 | | Kraft Foods Group, Inc. | | | | | | 255,541 | |
| Communications - 2.9% | | | | | | | | | 9,250 | | Manpower, Inc. | | | | | | 392,570 | |
| | 69,900 | | America Movil SAB de CV, ADR | | | | | $ | 1,617,487 | | | 190,722 | | Molson Coors Brewing Co., Class B | | | | | | 8,160,994 | |
| | 96,500 | | Corning, Inc. | | | | | | 1,217,830 | | | 16,862 | | Mondelez International, Inc., Class A | | | | | | 429,475 | |
| | 6,000 | | DIRECTV (a) | | | | | | 300,960 | | | 100 | | Monster Beverage Corp. (a) | | | | | | 5,288 | |
| | 10,000 | | News Corp., Class A | | | | | | 255,400 | | | 3,760 | | National Beverage Corp. | | | | | | 54,858 | |
| | 455,505 | | Oi SA, ADR | | | | | | 1,826,575 | | | 1,600 | | Nestle SA, ADR | | | | | | 104,272 | |
| | 44,439 | | Oi SA, ADR | | | | | | 191,088 | | | 46,172 | | Paychex, Inc. | | | | | | 1,437,796 | |
| | 140,100 | | Telefonica SA, ADR | | | | | | 1,889,949 | | | 125,400 | | PepsiCo, Inc. | | | | | | 8,581,122 | |
| | 3,000 | | Viacom, Inc., Class B | | | | | | 158,220 | | | 62,850 | | Philip Morris International, Inc. | | | | | | 5,256,774 | |
| | | | | | | | | | 7,457,509 | | | 109,029 | | PRGX Global, Inc. (a) | | | | | | 703,237 | |
| Consumer Discretionary - 11.5% | | | | | | | | | 502,876 | | Tesco PLC, ADR | | | | | | 8,337,684 | |
| | 127,485 | | Apollo Group, Inc., Class A (a) | | | | | | 2,666,986 | | | 69,300 | | The Coca-Cola Co. | | | | | | 2,512,125 | |
| | 136,150 | | Arcos Dorados Holdings, Inc., Class A | | | | | | 1,628,354 | | | 1,500 | | The J.M. Smucker Co. | | | | | | 129,360 | |
| | 45,477 | | Bridgepoint Education, Inc. (a) | | | | | | 468,413 | | | 119,084 | | The Kroger Co. | | | | | | 3,098,566 | |
| | 500 | | Coach, Inc. | | | | | | 27,755 | | | 72,925 | | The Procter & Gamble Co. | | | | | | 4,950,878 | |
| | 57,100 | | Comcast Corp., Class A | | | | | | 2,134,398 | | | 179,190 | | The Western Union Co. | | | | | | 2,438,776 | |
| | 52,650 | | CVS Caremark Corp. | | | | | | 2,545,627 | | | 4,650 | | Tyson Foods, Inc., Class A | | | | | | 90,210 | |
| | 2,297 | | Discovery Communications, Inc., Class A (a) | | | | | | 145,814 | | | 100,200 | | Unilever NV, ADR | | | | | | 3,837,660 | |
| | 2,297 | | Discovery Communications, Inc., Class C (a) | | | | | | 134,374 | | | | | | | | | | | 72,757,678 | |
| | 37,987 | | Gruma S.A.B. de C.V., ADR (a) | | | | | | 462,302 | | Energy - 4.8% | | | | | | | |
| | 222,400 | | H&R Block, Inc. | | | | | | 4,129,968 | | | 2,600 | | Apache Corp. | | | | | | 204,100 | |
| | 1,000 | | Interface, Inc. | | | | | | 16,080 | | | 136,200 | | BP PLC, ADR | | | | | | 5,671,368 | |
| | 14,850 | | ITT Educational Services, Inc. (a) | | | | | | 257,054 | | | 16,750 | | Chevron Corp. | | | | | | 1,811,345 | |
| | 13,200 | | Jamba, Inc. (a) | | | | | | 29,568 | | | 15,600 | | ConocoPhillips | | | | | | 904,644 | |
| | 216,343 | | Lincoln Educational Services Corp. | | | | | | 1,209,357 | | | 11,200 | | Exxon Mobil Corp. | | | | | | 969,360 | |
| | 28,000 | | Lowe's Cos., Inc. | | | | | | 994,560 | | | 1,200 | | Gazprom Neft JSC, ADR | | | | | | 28,512 | |
| | 15,800 | | McDonald's Corp. | | | | | | 1,393,718 | | | 800 | | Lukoil OAO, ADR | | | | | | 54,000 | |
| | 77,900 | | Newell Rubbermaid, Inc. | | | | | | 1,734,833 | | | 2,500 | | PetroChina Co., Ltd., ADR | | | | | | 359,450 | |
| | 9,800 | | NIKE, Inc., Class B | | | | | | 505,680 | | | 11,700 | | Petroleo Brasileiro SA, ADR | | | | | | 227,799 | |
| | 3,250 | | Sally Beauty Holdings, Inc. (a) | | | | | | 76,603 | | | 7,800 | | Phillips 66 | | | | | | 414,180 | |
| | 4,884 | | The Andersons, Inc. | | | | | | 209,524 | | | 2,750 | | Surgutneftegas OJSC, ADR | | | | | | 24,805 | |
| | 18,250 | | The Home Depot, Inc. | | | | | | 1,128,762 | | | 22,550 | | Transocean, Ltd. | | | | | | 1,006,857 | |
| | 3,890 | | Time Warner Cable, Inc. | | | | | | 378,069 | | | 19,100 | | Valero Energy Corp. | | | | | | 651,692 | |
| | 15,500 | | Time Warner, Inc. | | | | | | 741,365 | | | | | | | | | | | 12,328,112 | |
| | 21,608 | | Universal Technical Institute, Inc. | | | | | | 216,944 | | Financials - 12.1% | | | | | | | |
| | 23,751 | | Value Line, Inc. | | | | | | 213,046 | | | 100 | | Affiliated Managers Group, Inc. (a) | | | | | | 13,015 | |
| | 62,000 | | Wal-Mart Stores, Inc. | | | | | | 4,230,260 | | | 42,250 | | Aflac, Inc. | | | | | | 2,244,320 | |
| | 21,752 | | Weight Watchers International, Inc. | | | | | | 1,138,935 | | | 39,000 | | American International Group, Inc. (a) | | | | | | 1,376,700 | |
| | 8,600 | | Yum! Brands, Inc. | | | | | | 571,040 | | | 1,280 | | Ameriprise Financial, Inc. | | | | | | 80,166 | |
| | | | | | | | | | 29,389,389 | | | 168,133 | | Bank of America Corp. | | | | | | 1,950,343 | |
| Consumer Staples - 28.4% | | | | | | | | | 16,000 | | Berkshire Hathaway, Inc., Class B (a) | | | | | | 1,435,200 | |
| | 15,050 | | Alkermes PLC (a) | | | | | | 278,726 | | | 76,724 | | Central Pacific Financial Corp. (a) | | | | | | 1,196,127 | |
| | 410,600 | | Alliance One International, Inc. (a) | | | | | | 1,494,584 | | | 26,725 | | Franklin Resources, Inc. | | | | | | 3,359,332 | |
| | 62,500 | | Altria Group, Inc. | | | | | | 1,963,750 | | | 14,700 | | Janus Capital Group, Inc. | | | | | | 125,244 | |
| | 2,000 | | Archer-Daniels-Midland Co. | | | | | | 54,780 | | | 64,250 | | Marsh & McLennan Cos., Inc. | | | | | | 2,214,697 | |
| | 218,252 | | Avon Products, Inc. | | | | | | 3,134,099 | | | 7,350 | | Mastercard, Inc., Class A | | | | | | 3,610,908 | |
| | 19,200 | | Baxter International, Inc. | | | | | | 1,279,872 | | | 14,245 | | Mercury General Corp. | | | | | | 565,384 | |
| | 300 | | Beam, Inc. | | | | | | 18,327 | | | 10,650 | | StanCorp Financial Group, Inc. | | | | | | 390,536 | |
| | 15,100 | | British American Tobacco PLC, ADR | | | | | | 1,528,875 | | | 227,600 | | The Bank of New York Mellon Corp. | | | | | | 5,849,320 | |
| | 1,000 | | Carlsberg A/S, ADR | | | | | | 19,700 | | | 38,418 | | The Travelers Cos., Inc. | | | | | | 2,759,181 | |
| | 4,000 | | Coca Cola Hellenic Bottling Co. SA | | | | | | 93,453 | | | 49,697 | | TNS, Inc. (a) | | | | | | 1,030,219 | |
| | 9,200 | | Coca Cola Hellenic Bottling Co. SA, ADR | | | | | | 216,844 | | | 7,350 | | U.S. Bancorp | | | | | | 234,759 | |
| | 3,404 | | Columbia Sportswear Co. | | | | | | 181,638 | | | 10,324 | | Unum Group | | | | | | 214,946 | |
| | 500 | | DE Master Blenders 1753 NV (a) | | | | | | 5,754 | | | 9,500 | | Visa, Inc., Class A | | | | | | 1,440,010 | |
| | 12,725 | | Diageo PLC, ADR | | | | | | 1,483,481 | | | 24,950 | | Waddell & Reed Financial, Inc., Class A | | | | | | 868,759 | |
| | 48,050 | | Dr. Pepper Snapple Group, Inc. | | | | | | 2,122,849 | | | 7,646 | | Washington Federal, Inc. | | | | | | 128,988 | |
| | 49,228 | | Express Scripts Holding Co. (a) | | | | | | 2,658,312 | | | 500 | | Wells Fargo & Co. | | | | | | 17,090 | |
| | 5,100 | | Hillshire Brands Co. | | | | | | 143,514 | | | | | | | | | | | 31,105,244 | |
| | 159,589 | | Hospira, Inc. (a) | | | | | | 4,985,560 | | | | | | | | | | | | |
| | | | | | | | | | | | | | | | | | | | | | |
| See Notes to Financial Statements. | 5 | |
| | | | | | | | | |
| AUXIER FOCUS FUND | | | | |
| SCHEDULE OF INVESTMENTS | | | | |
| DECEMBER 31, 2012 | | | | |
| | | | | | | | | |
| | | | Security | | | | | | | | | | | Security | | | | | | | |
| | Shares | | Description | | | | | | Value | | | Principal | | Description | | Rate | | Maturity | | Value | |
| Health Care - 13.2% | | | | | | | | Corporate Non-Convertible Bonds - 4.4% | | | | | | | |
| | 42,600 | | Abbott Laboratories | | | | | $ | 2,790,300 | | Communications - 0.2% | | | | | | | |
| | 29,400 | | Becton Dickinson and Co. | | | | | | 2,298,786 | | $ | 600,000 | | Telefonica Emisiones SAU | | 6.42 | % | 06/20/16 | $ | 665,400 | |
| | 47,482 | | BioScrip, Inc. (a) | | | | | | 511,381 | | | | | | | | | | | | |
| | 55,725 | | GlaxoSmithKline PLC, ADR | | | | | | 2,422,366 | | Consumer Staples - 0.6% | | | | | | | |
| | 308,117 | | Health Management Associates, Inc., Class A (a) | | | | | | 2,871,651 | | | 1,180,000 | | American Stores Co. | | 7.90 | | 05/01/17 | | 1,123,950 | |
| | 53,450 | | Johnson & Johnson | | | | | | 3,746,845 | | | 50,000 | | Constellation Brands, Inc. | | 7.25 | | 05/15/17 | | 59,125 | |
| | 101,053 | | Medtronic, Inc. | | | | | | 4,145,194 | | | 115,000 | | SUPERVALU, Inc. | | 7.50 | | 11/15/14 | | 112,125 | |
| | 123,360 | | Merck & Co., Inc. | | | | | | 5,050,358 | | | 375,000 | | SUPERVALU, Inc. | | 8.00 | | 05/01/16 | | 359,062 | |
| | 86,982 | | Pfizer, Inc. | | | | | | 2,181,509 | | | | | | | | | | | 1,654,262 | |
| | 6,842 | | Quest Diagnostics, Inc. | | | | | | 398,683 | | Energy - 0.3% | | | | | | | |
| | 41,559 | | UnitedHealth Group, Inc. | | | | | | 2,254,160 | | | 190,000 | | El Paso Corp. | | 6.70 | | 02/15/27 | | 199,262 | |
| | 27,221 | | WellPoint, Inc. | | | | | | 1,658,303 | | | 424,000 | | Sunoco, Inc. | | 5.75 | | 01/15/17 | | 478,447 | |
| | 50,900 | | Zimmer Holdings, Inc. | | | | | | 3,392,994 | | | | | | | | | | | 677,709 | |
| | | | | | | | | | 33,722,530 | | Financials - 1.7% | | | | | | | |
| Industrials - 1.7% | | | | | | | | | 2,370,000 | | Hartford Financial Services Group, Inc. | | 5.50 | | 10/15/16 | | 2,654,997 | |
| | 21,550 | | AGCO Corp. (a) | | | | | | 1,058,536 | | | 720,000 | | International Lease Finance Corp., MTN | | 6.63 | | 11/15/13 | | 750,600 | |
| | 100 | | Deere & Co. | | | | | | 8,642 | | | 260,000 | | Janus Capital Group, Inc. | | 6.70 | | 06/15/17 | | 297,448 | |
| | 25,000 | | General Electric Co. | | | | | | 524,750 | | | 620,000 | | Zions Bancorporation | | 5.50 | | 11/16/15 | | 643,563 | |
| | 11,150 | | Granite Construction, Inc. | | | | | | 374,863 | | | | | | | | | | | 4,346,608 | |
| | 4,850 | | Illinois Tool Works, Inc. | | | | | | 294,929 | | Health Care - 0.5% | | | | | | | |
| | 300 | | Potash Corp. of Saskatchewan, Inc. | | | | | | 12,207 | | | 540,000 | | Health Management Associates, Inc. | | 6.13 | | 04/15/16 | | 585,900 | |
| | 12,500 | | Raytheon Co. | | | | | | 719,500 | | | 500,000 | | Health Management Associates, Inc., Series WI | | 7.38 | | 01/15/20 | | 542,500 | |
| | 3,500 | | Textainer Group Holdings, Ltd. | | | | | | 110,110 | | | 130,000 | | WellPoint, Inc. | | 5.25 | | 01/15/16 | | 144,973 | |
| | 3,550 | | The Boeing Co. | | | | | | 267,528 | | | | | | | | | | | 1,273,373 | |
| | 14,450 | | United Parcel Service, Inc., Class B | | | | | | 1,065,398 | | Materials - 0.8% | | | | | | | |
| | 100 | | Waste Management, Inc. | | | | | | 3,374 | | | 895,000 | | The Dow Chemical Co. | | 5.70 | | 05/15/18 | | 1,065,657 | |
| | | | | | | | | | 4,439,837 | | | 203,000 | | Weyerhaeuser Co. | | 9.00 | | 10/01/21 | | 264,619 | |
| Information Technology - 2.1% | | | | | | | | | 505,000 | | Weyerhaeuser Co. | | 7.95 | | 03/15/25 | | 638,663 | |
| | 4,181 | | Automatic Data Processing, Inc. | | | | | | 238,359 | | | | | | | | | | | 1,968,939 | |
| | 51,800 | | Intel Corp. | | | | | | 1,068,634 | | Utilities - 0.3% | | | | | | | |
| | 148,064 | | Microsoft Corp. | | | | | | 3,957,751 | | | 100,000 | | Constellation Energy Group, Inc. | | 4.55 | | 06/15/15 | | 107,998 | |
| | 1,500 | | Verisk Analytics, Inc., Class A (a) | | | | | | 76,500 | | | 255,000 | | Energy Future Holdings Corp. | | 9.75 | | 10/15/19 | | 283,050 | |
| | | | | | | | | | 5,341,244 | | | 312,000 | | Energy Future Intermediate Holding Co., LLC | | 9.75 | | 10/15/19 | | 346,320 | |
| Materials - 1.8% | | | | | | | | | 27,000 | | Nevada Power Co., Series L | | 5.88 | | 01/15/15 | | 29,743 | |
| | 28,700 | | E.I. du Pont de Nemours & Co. | | | | | | 1,290,639 | | | | | | | | | | | 767,111 | |
| | 7,000 | | LyondellBasell Industries NV, Class A | | | | | | 399,630 | | Total Corporate Non-Convertible Bonds | | | | | | | |
| | 6,400 | | Precision Castparts Corp. | | | | | | 1,212,288 | | (Cost $9,643,094) | | | | | | 11,353,402 | |
| | 47,350 | | The Dow Chemical Co. | | | | | | 1,530,352 | | | | | | | | | | | | |
| | 14,000 | | Vale SA, ADR | | | | | | 293,440 | | | | | | | | | | | | |
| | | | | | | | | | 4,726,349 | | | | | | | | | | | | |
| Telecommunications - 1.1% | | | | | | | | | | | | | | | | | | |
| | 27,300 | | AT&T, Inc. | | | | | | 920,283 | | | | | | | | | | | | |
| | 52,150 | | SK Telecom Co., Ltd., ADR | | | | | | 825,535 | | | | | | | | | | | | |
| | 27,015 | | Verizon Communications, Inc. | | | | | | 1,168,939 | | | | | | | | | | | | |
| | | | | | | | | | 2,914,757 | | | | | | | | | | | | |
| Utilities - 0.1% | | | | | | | | | | | | | | | | | | |
| | 5,616 | | FirstService Corp. (a) | | | | | | 158,708 | | | | | | | | | | | | |
| Total Common Stock | | | | | | | | | | | | | | | | | | |
| (Cost $175,063,917) | | | | | | 204,341,357 | | | | | | | | | | | | |
| | | | | | Rate | | | | | | | | | | | | | | | | |
| Preferred Stock - 0.4% | | | | | | | | | | | | | | | | | | |
| Financials - 0.4% | | | | | | | | | | | | | | | | | | |
| | 985,000 | | The Charles Schwab Corp. (b) (Cost $985,000) | | 7.00 | % | | | 1,129,756 | | | | | | | | | | | | |
| Total Equity Securities | | | | | | | | | | | | | | | | | | |
| (Cost $176,048,917) | | | | | | 205,471,113 | | | | | | | | | | | | |
| | | | | | | | | | | | | | | | | | | | | | |
| See Notes to Financial Statements. | 6 | |
| | | | | | | | | |
| AUXIER FOCUS FUND | | | | |
| SCHEDULE OF INVESTMENTS | | | | |
| DECEMBER 31, 2012 | | | | |
| | | | | | | | | |
| | | | | | | | | | | | | | | | | | | | | | |
| | | | Security | | | | | | | | The following is a summary of the inputs used to value the Fund’s investments as of December 31, 2012. | |
| | Principal | | Description | | Rate | | Maturity | | Value | | The inputs or methodology used for valuing securities are not necessarily an indication of the risks associated with investing in those securities. For more nformation on valuation inputs, and their aggregation into the levels used in the tables below, please refer to the Security Valuation section in Note 2 of the accompanying Notes to Financial Statements. | |
| Foreign Municipal Bonds - 0.6% | | | | | | | | |
| $ | 356,000 | | Ontario Hydro Residual Strip (Canada) (c) | | 5.47-5.65 | % | 11/27/20 | $ | 285,161 | | |
| | 605,000 | | Ontario Hydro Residual Strip (Canada) (c) | | 5.61 | | 10/15/21 | | 468,636 | | | | | Level 1 | | Level 2 | | Level 3 | | Total | |
| | 235,000 | | Ontario Hydro Residual Strip (Canada) (c) | | 5.75 | | 08/18/22 | | 174,338 | | Common Stock | | | | | | | | | |
| | 750,000 | | Ontario Hydro Residual Strip (Canada), Series OC20 (c) | | 5.51 | | 10/01/20 | | 602,413 | | Communications | $ | 7,457,509 | $ | - | $ | - | $ | 7,457,509 | |
| Total Foreign Municipal Bonds | | | | | | | | Consumer Discretionary | | 29,389,389 | | - | | - | | 29,389,389 | |
| (Cost $940,744) | | | | | | 1,530,548 | | Consumer Staples | | 72,757,678 | | - | | - | | 72,757,678 | |
| | | | | | | | | | | | Energy | | 12,328,112 | | - | | - | | 12,328,112 | |
| Municipal Bonds - 0.2% | | | | | | | | Financials | | 31,105,244 | | - | | - | | 31,105,244 | |
| Ohio - 0.2% | | | | | | | | Health Care | | 33,722,530 | | - | | - | | 33,722,530 | |
| | 550,000 | | Buckeye Tobacco Settlement Financing Authority (Cost $375,597) | | | | | | | | Industrials | | 4,439,837 | | - | | - | | 4,439,837 | |
| | | | | 5.88 | | 06/01/47 | | 493,966 | | Information Technology | | 5,341,244 | | - | | - | | 5,341,244 | |
| Total Fixed Income Securities | | | | | | | | Materials | | 4,726,349 | | - | | - | | 4,726,349 | |
| (Cost $10,959,435) | | | | | | 13,377,916 | | Telecommunications | | 2,914,757 | | - | | - | | 2,914,757 | |
| Total Investments - 85.3% | | | | | | | | Utilities | | 158,708 | | - | | - | | 158,708 | |
| (Cost $187,008,352)* | | | | | $ | 218,849,029 | | Preferred Stock | | | | | | | | | |
| Other Assets & Liabilities, Net – 14.7% | | | | | | 37,567,835 | | Financials | | - | | 1,129,756 | | - | | 1,129,756 | |
| Net Assets – 100.0% | | | | | $ | 256,416,863 | | Corporate Non-Convertible Bonds | | - | | 11,353,402 | | - | | 11,353,402 | |
| | | | | | | | | | | | Foreign Municipal Bonds | | - | | 1,530,548 | | - | | 1,530,548 | |
| | | | | | | | | | | | Municipal Bonds | | - | | 493,966 | | - | | 493,966 | |
| ADR | American Depositary Receipt | | | | | | | | Total Assets | $ | 204,341,357 | $ | 14,507,672 | $ | - | $ | 218,849,029 | |
| LLC | Limited Liability Company | | | | | | | | | | | | | | | | | | |
| MTN | Medium Term Note | | | | | | | | There were no transfers between Level 1 and Level 2 for the period ended December 31, 2012. | |
| PLC | Public Limited Company | | | | | | | | AFA | | | | | | | | | | |
| (a) | Non-income producing security. | | | | | | | | PORTFOLIO HOLDINGS | | | | | | | | |
| (b) | Variable rate security. Rate presented is as of December 31, 2012. | | | | | | | | % of Net Assets | | | | | | | | |
| (c) | Zero coupon bond. Interest rate presented is yield to maturity. | | | | | | | | Common Stock | | | | | | 79.7 | % | |
| | | | | | | | | | | | Preferred Stock | | | | | | 0.4 | % | |
| | | | | | | | | | | | Corporate Non-Convertible Bonds | | | | | | 4.4 | % | |
* Cost for federal income tax purposes is substantially the same as for financial statement purposes and net unrealized appreciation | | | | Foreign Municipal Bonds | | | | | | 0.6 | % | |
| consists of: | | Municipal Bonds | | | | | | 0.2 | % | |
| | | | | | | | | | | | Cash & Other Net Assets | | | | | | 14.7 | % | |
| Gross Unrealized Appreciation | | | $ | 40,959,056 | | | | | | | | | | | | 100.0 | % | |
| Gross Unrealized Depreciation | | | | | (9,118,379 | | | | AFA | | | | | | | | | | |
| Net Unrealized Appreciation | | | | $ | 31,840,677 | | | | | | | | | | | | | | |
| | | | | | | | | | | | | | | | | | | | | | |
| | | | | | | | | | | | | | | | | | | | | | |
| See Notes to Financial Statements. | 7 | |
| | | | | | | | | |
| AUXIER FOCUS FUND | | | | |
| STATEMENT OF ASSETS AND LIABILITIES | | | | |
| DECEMBER 31, 2012 | | | | |
| | | | | | | | | |
| | | | | | | |
| ASSETS | | | | |
| | Total investments, at value (Cost $187,008,352) | | $ | 218,849,029 | |
| | Cash | | | 37,517,362 | |
| | Receivables: | | | | |
| | | Fund shares sold | | | 1,121,855 | |
| | | Investment securities sold | | | 331,155 | |
| | | Dividends and interest | | | 609,427 | |
| | Prepaid expenses | | | 13,370 | |
| Total Assets | | | 258,442,198 | |
| | | | | | | |
| LIABILITIES | | | | |
| | Payables: | | | | |
| | | Investment securities purchased | | | 315,769 | |
| | | Fund shares redeemed | | | 1,351,308 | |
| | | Distributions payable | | | 75,920 | |
| | Accrued Liabilities: | | | | |
| Adviser | Investment adviser fees | | | 213,413 | |
| | | Trustees’ fees and expenses | | | 227 | |
| | | Fund services fees | | | 36,829 | |
| | | Other expenses | | | 31,869 | |
| Total Liabilities | | | 2,025,335 | |
| | | | | | | |
| NET ASSETS | | $ | 256,416,863 | |
| | | | | | | |
| COMPONENTS OF NET ASSETS | | | | |
| | Paid-in capital | | $ | 224,262,128 | |
| | Distributions in excess of net investment income | | | (25,786 | ) |
| | Accumulated net realized gain | | | 339,844 | |
| | Net unrealized appreciation | | | 31,840,677 | |
| NET ASSETS | | $ | 256,416,863 | |
| | | | | | | |
| SHARES OF BENEFICIAL INTEREST AT NO PAR VALUE (UNLIMITED SHARES AUTHORIZED) | | | | |
| | Investor Shares | | | 15,164,202 | |
| | A Shares | | | 112,724 | |
| | Institutional Shares | | | 145,163 | |
| | | | | | | |
NET ASSET VALUE, OFFERING AND REDEMPTION PRICE PER SHARE* | | | | |
| | Investor Shares (based on net assets of $252,119,825) | | $ | 16.63 | |
| | A Shares (based on net assets of $1,878,095) | | $ | 16.66 | |
| | A Shares Maximum Public Offering Price Per Share (net asset value per share/(100%-5.75%)) | | $ | 17.68 | |
| | Institutional Shares (based on net assets of $2,418,943) | | $ | 16.66 | |
| * | Shares redeemed or exchanged within 180 days of purchase are charged a 2.00% redemption fee. |
| See Notes to Financial Statements. | 8 | |
| | | | | | | | | |
| AUXIER FOCUS FUND | | | | |
| STATEMENT OF OPERATIONS | | | | |
| SIX MONTHS ENDED DECEMBER 31, 2012 | | | | |
| | | | | | | | | |
| | | | | | | |
| INVESTMENT INCOME | | | | |
| | Dividend income (Net of foreign withholding taxes of $16,230) | | $ | 2,630,606 | |
| | Interest income | | | 582,102 | |
| Total Investment Income | | | 3,212,708 | |
| Adviser | | | | |
| EXPENSES | | | | |
| | Investment adviser fees | | | 1,266,138 | |
| | Fund services fees | | | 166,034 | |
| | Transfer agent fees: | | | | |
| | Investor Shares | | | 23,766 | |
| | A Shares | | | 370 | |
| | Institutional Shares | | | 29 | |
| | Distribution fees: | | | | |
| | A Shares | | | 2,257 | |
| | Custodian fees | | | 13,041 | |
| | Registration fees: | | | | |
| | Investor Shares | | | 9,627 | |
| | A Shares | | | 1,078 | |
| | Institutional Shares | | | 3,294 | |
| | Professional fees | | | 21,834 | |
| | Trustees' fees and expenses | | | 4,369 | |
| | Miscellaneous expenses | | | 123,780 | |
| Total Expenses | | | 1,635,617 | |
| | Fees waived and expenses reimbursed | | | (53,983 | ) |
| Net Expenses | | | 1,581,634 | |
| | | | | | | |
| NET INVESTMENT INCOME | | | 1,631,074 | |
| | | | | | | |
| NET REALIZED AND UNREALIZED GAIN (LOSS) | | | | |
| | Net realized gain (loss) on: | | | | |
| | Investments | | | 356,642 | |
| | Foreign currency transactions | | | 32 | |
| | Net realized gain | | | 356,674 | |
| | Net change in unrealized appreciation (depreciation) on: | | | | |
| | Investments | | | 5,169,576 | |
| | Net change in unrealized appreciation (depreciation) | | | 5,169,576 | |
| NET REALIZED AND UNREALIZED GAIN | | | 5,526,250 | |
| INCREASE IN NET ASSETS FROM OPERATIONS | | $ | 7,157,324 | |
| | | | | | | |
| See Notes to Financial Statements. | 9 | |
| | | | | | | | | |
| AUXIER FOCUS FUND | | | | |
| STATEMENT OF CHANGES IN NET ASSETS | | | | |
| | | | | |
| | | | | | | | | |
| | | June 30, 2013 | # | | 41274 | # | | | # | | | 41090 | | | | | |
| | | | | For the Six Months Ended December 31, 2012 | | For the Year Ended June 30, 2012 | |
| OPERATIONS | | | | | | Shares | | | | | | | Shares | | |
| | Net investment income | | $ | 1,631,074 | | | | | | $ | 2,794,389 | | | | | |
| | Net realized gain | | | 356,674 | | | | | | | 2,386,651 | | | | | |
| | Net change in unrealized appreciation (depreciation) | | | 5,169,576 | | | | | | | 4,018,817 | | | | | |
| Increase in Net Assets Resulting from Operations | | | 7,157,324 | | | | | | | 9,199,857 | | | | | |
| | | | | | | | | | | | | | | | | | |
| DISTRIBUTIONS TO SHAREHOLDERS FROM | | | | | | | | | | | | | | | |
| | Net investment income: | | | | | | | | | | | | | | | |
| | | Investor Shares | | | (3,345,187 | ) | | | | | | (2,114,894 | ) | | | | |
| | | A Shares | | | (20,863 | ) | | | | | | (13,062 | ) | | | | |
| | | Institutional Shares | | | (25,206 | ) | | | | | | - | | | | | |
| | Net realized gain: | | | | | | | | | | | | | | | |
| | | Investor Shares | | | (1,800,956 | ) | | | | | | (2,884,600 | ) | | | | |
| | | A Shares | | | (13,195 | ) | | | | | | (17,043 | ) | | | | |
| | | Institutional Shares | | | (9,775 | ) | | | | | | - | | | | | |
| Total Distributions to Shareholders | | | (5,215,182 | ) | | | | | | (5,029,599 | ) | | | | |
| | | | | | | | | | | | | | | | | | |
| CAPITAL SHARE TRANSACTIONS | | | | | | | | | | | | | | | |
| | Sale of shares: | | | | | | | | | | | | | | | |
| | | Investor Shares | | | 21,567,451 | | | 1,291,472 | | | | 103,203,829 | | | 6,529,964 | | |
| | | A Shares | | | 250,354 | | | 14,900 | | | | 979,449 | | | 62,557 | | |
| | | Institutional Shares | | | 1,158,761 | | | 68,510 | | | | 1,218,054 | | | 74,992 | | |
| | Reinvestment of distributions: | | | | | | | | | | | | | | | |
| | | Investor Shares | | | 5,041,540 | | | 301,707 | | | | 4,913,643 | | | 317,980 | | |
| | | A Shares | | | 30,079 | | | 1,797 | | | | 28,684 | | | 1,855 | | |
| | | Institutional Shares | | | 34,981 | | | 2,092 | | | | - | | | - | | |
| | Redemption of shares: | | | | | | | | | | | | | | | |
| | 1 | Investor Shares | | | (19,804,134 | ) | | (1,186,194 | ) | | | (32,622,079 | ) | | (2,041,326 | ) | |
| | 2 | A Shares | | | (110,449 | ) | | (6,694 | ) | | | (28,719 | ) | | (1,831 | ) | |
| | 3 | Institutional Shares | | | - | | | - | | | | (6,984 | ) | | (431 | ) | |
| | Redemption fees | | | 16,041 | | | - | | | | 74,935 | | | - | | |
| Increase in Net Assets from Capital Share Transactions | | | 8,184,624 | | | 487,590 | | | | 77,760,812 | | | 4,943,760 | | |
| Increase in Net Assets | | | 10,126,766 | | | | | | | 81,931,070 | | | | | |
| | | | | | | | | | | | | | | | | | |
| NET ASSETS | | | | | | | | | | | | | | | |
| | Beginning of Period | | | 246,290,097 | | | | | | | 164,359,027 | | | | | |
| | End of Period (Including line (a)) | | $ | 256,416,863 | | | | | | $ | 246,290,097 | | | | | |
| (a) | Undistributed (distributions in excess of) net investment income. | | $ | (25,786 | ) | | | | | $ | 1,734,396 | | | | | |
| See Notes to Financial Statements. | 10 | |
| | | | | | | | | |
| AUXIER FOCUS FUND | | | | |
| FINANCIAL HIGHLIGHTS | | | | |
| | | | | |
| | | | | | | | | |
| These financial highlights reflect selected data for a share outstanding throughout each period. | | | | | | | | | |
| | | For the Six | | For the Years Ended June 30, |
| | | Months Ended December 31, 2012 | | 2012 | | 2011 | | 2010 | | 2009(a) | | 2008 |
| INVESTOR SHARES | | | | | | | | | | | | | | | | | | | | | | | |
| NET ASSET VALUE, Beginning | | | | | | | | | | | | | | | | | | | | | |
| of Period | $ | 16.49 | | | $ | 16.45 | | | $ | 13.49 | | | $ | 12.16 | | | $ | 14.22 | | | $ | 17.06 | |
| INVESTMENT OPERATIONS | | | | | | | | | | | | | | | | | | | | | | | |
| Net investment income (b) | | 0.11 | | | | 0.22 | | | | 0.26 | | | | 0.32 | | | | 0.19 | | | | 0.18 | |
| Net realized and unrealized gain (loss) | | 0.37 | | | | 0.20 | (c) | | | 3.00 | | | | 1.27 | | | | (1.77 | ) | | | (2.24 | ) |
| Total from Investment Operations | | 0.48 | | | | 0.42 | | | | 3.26 | | | | 1.59 | | | | (1.58 | ) | | | (2.06 | ) |
| DISTRIBUTIONS TO | | | | | | | | | | | | | | | | | | | | | | | |
| SHAREHOLDERS FROM | | | | | | | | | | | | | | | | | | | | | | | |
| Net investment income | | (0.22 | ) | | | (0.16 | ) | | | (0.29 | ) | | | (0.26 | ) | | | (0.16 | ) | | | (0.31 | ) |
| Net realized gain | | (0.12 | ) | | | (0.23 | ) | | | (0.01 | ) | | | — | | | | (0.32 | ) | | | (0.47 | ) |
| Total Distributions to Shareholders | | (0.34 | ) | | | (0.39 | ) | | | (0.30 | ) | | | (0.26 | ) | | | (0.48 | ) | | | (0.78 | ) |
| REDEMPTION FEES (b) | | — | (d) | | 0.01 | | | | — | (d) | | — | (d) | | — | (d) | | — | (d) |
| NET ASSET VALUE, End | | | | | | | | | | | | | | | | | | | | | | | |
| of Period | $ | 16.63 | | | $ | 16.49 | | | $ | 16.45 | | | $ | 13.49 | | | $ | 12.16 | | | $ | 14.22 | |
| TOTAL RETURN | | 2.93 | %(e) | 2.84 | % | | 24.35 | % | | 12.99 | % | | (10.92 | )% | | (12.56 | )% |
| RATIOS/SUPPLEMENTARY DATA | | | | | | | | | | | | | | | | | | | | | | | |
| Net Assets at End of | | | | | | | | | | | | | | | | | | | | | | | |
| | Period (000's omitted) | $252,120 | | | $243,366 | | | $163,699 | | | $100,712 | | | $84,660 | | | $103,664 | |
| Ratios to Average Net Assets: | | | | | | | | | | | | | | | | | | | | | | | |
| Net investment income | | 1.28 | %(f) | 1.36 | % | | 1.68 | % | | 2.29 | % | | 1.53 | % | | 1.10 | % |
| Net expense | | 1.25 | %(f) | 1.25 | % | | 1.25 | % | | 1.30 | % | | 1.35 | % | | 1.35 | % |
| Gross expense (g) | | 1.28 | %(f) | 1.27 | % | | 1.25 | % | | 1.30 | % | | 1.35 | % | | 1.36 | % |
| PORTFOLIO TURNOVER RATE | | 4 | %(e) | 8 | % | | 20 | % | | 15 | % | | 24 | % | | 19 | % |
| | | | | | | | | | | | | | | | | | | | | | | | | |
| (a) | Effective November 1, 2008, C Shares were reclassified as Investor Shares. For the Period July 1, 2008 through November 1, 2008, total return for C shares was (12.68)%. For the aforementioned period, the annualized gross expenses and net expenses ratios were 2.35% and 2.10%, respectively. |
| (b) | Calculated based on average shares outstanding during each period. |
| (c) | The net realized and unrealized gain (loss) per share does not correlate to the aggregate of the net realized and unrealized loss in the Statement of Operations, primarily due to the timing of the sales and repurchases of the Fund's shares in relation to fluctuating market values for the Fund's portfolio. |
| (d) | Less than $0.01 per share. |
| (e) | Not annualized. |
| (f) | Annualized. |
| (g) | Reflects the expense ratio excluding any waivers and/or reimbursements. |
| See Notes to Financial Statements. | 11 | |
| | | | | | | | | |
| AUXIER FOCUS FUND | | | | |
| FINANCIAL HIGHLIGHTS | | | | |
| | | | | |
| | | | | | | | | |
| These financial highlights reflect selected data for a share outstanding throughout each period. | | | | | | | | | |
| | | For the Six | | For the Years Ended June 30, |
| | | Months Ended December 31, 2012 | | 2012 | | 2011 | | 2010 | | 2009 | | 2008 |
| A SHARES | | | | | | | | | | | | | | | | | | | | | | | |
| NET ASSET VALUE, Beginning | | | | | | | | | | | | | | | | | | | | | |
| of Period | $ | 16.49 | | | $ | 16.45 | | | $ | 13.49 | | | $ | 12.17 | | | $ | 14.22 | | | $ | 17.07 | |
| INVESTMENT OPERATIONS | | | | | | | | | | | | | | | | | | | | | | | |
| Net investment income (a) | | 0.11 | | | | 0.22 | | | | 0.25 | | | | 0.32 | | | | 0.18 | | | | 0.17 | |
| Net realized and unrealized gain (loss) | | 0.37 | | | | 0.21 | (b) | | | 3.01 | | | | 1.26 | | | | (1.75 | ) | | | (2.24 | ) |
| Total from Investment | | | | | | | | | | | | | | | | | | | | | | | |
| | Operations | | 0.48 | | | | 0.43 | | | | 3.26 | | | | 1.58 | | | | (1.57 | ) | | | (2.07 | ) |
| DISTRIBUTIONS TO | | | | | | | | | | | | | | | | | | | | | | | |
| SHAREHOLDERS FROM | | | | | | | | | | | | | | | | | | | | | | | |
| Net investment income | | (0.19 | ) | | | (0.16 | ) | | | (0.29 | ) | | | (0.26 | ) | | | (0.16 | ) | | | (0.31 | ) |
| Net realized gain | | (0.12 | ) | | | (0.23 | ) | | | (0.01 | ) | | | — | | | | (0.32 | ) | | | (0.47 | ) |
| Total Distributions to Shareholders | | (0.31 | ) | | | (0.39 | ) | | | (0.30 | ) | | | (0.26 | ) | | | (0.48 | ) | | | (0.78 | ) |
| REDEMPTION FEES (a) | | — | (c) | | — | (c) | | — | (c) | | — | (c) | | — | (c) | | — | (c) |
| NET ASSET VALUE, End of Period | $ | 16.66 | | | $ | 16.49 | | | $ | 16.45 | | | $ | 13.49 | | | $ | 12.17 | | | $ | 14.22 | |
| TOTAL RETURN (d) | | 2.90 | %(e) | 2.84 | % | | 24.35 | % | | 12.90 | % | | (10.85 | )% | | (12.61 | )% |
| RATIOS/SUPPLEMENTARY DATA | | | | | | | | | | | | | | | | | | | | | | | |
| Net Assets at End of | | | | | | | | | | | | | | | | | | | | | | | |
| | Period (000's omitted) | $1,878 | | | $1,694 | | | $660 | | | $157 | | | $148 | | | $208 | |
| Ratios to Average Net Assets: | | | | | | | | | | | | | | | | | | | | | | | |
| Net investment income | | 1.28 | %(f) | 1.39 | % | | 1.61 | % | | 2.29 | % | | 1.49 | % | | 1.08 | % |
| Net expense | | 1.25 | %(f) | 1.25 | % | | 1.25 | % | | 1.30 | % | | 1.35 | % | | 1.35 | % |
| Gross expense (g) | | 1.65 | %(f) | 1.52 | % | | 1.50 | % | | 1.55 | % | | 1.60 | % | | 1.60 | % |
| PORTFOLIO TURNOVER RATE | | 4 | %(e) | 8 | % | | 20 | % | | 15 | % | | 24 | % | | 19 | % |
| | | | | | | | | | | | | | | | | | | | | | | | | |
| (a) | Calculated based on average shares outstanding during each period. |
| (b) | The net realized and unrealized gain (loss) per share does not correlate to the aggregate of the net realized and unrealized loss in the Statement of Operations, primarily due to the timing of the sales and repurchases of the Fund's shares in relation to fluctuating market values for the Fund's portfolio. |
| (c) | Less than $0.01 per share. |
| (d) | Total return does not include the effect of front end sales charge or contingent deferred sales charge. |
| (e) | Not annualized. |
| (f) | Annualized. |
| (g) | Reflects the expense ratio excluding any waivers and/or reimbursements. |
| See Notes to Financial Statements. | 12 | |
| | | | | | | | | |
| AUXIER FOCUS FUND | | | | |
| FINANCIAL HIGHLIGHTS | | | | |
| | | | | |
| | | | | | | | | |
| These financial highlights reflect selected data for a share outstanding throughout each period. |
| | | For the Six Months Ended December 31, 2012 | | May 9, 2012 (a) through June 30, 2012 | |
| INSTITUTIONAL SHARES | | | | | | | | |
| NET ASSET VALUE, Beginning of Period | $ | 16.50 | | | $ | 16.27 | | |
| INVESTMENT OPERATIONS | | | | | | | | |
| Net investment income (b) | | 0.12 | | | | 0.04 | | |
| Net realized and unrealized gain (loss) | | 0.36 | | | | 0.19 | | |
| Total from Investment Operations | | 0.48 | | | | 0.23 | | |
| DISTRIBUTIONS TO SHAREHOLDERS FROM | | | | | | | | |
| Net investment income | | (0.20 | ) | | | — | | |
| Net realized gain | | (0.12 | ) | | | — | | |
| Total Distributions to Shareholders | | (0.32 | ) | | | — | | |
| REDEMPTION FEES (b) | | — | (c) | | — | (c) | |
| NET ASSET VALUE, End of Period | $ | 16.66 | | | $ | 16.50 | | |
| TOTAL RETURN | | 2.93 | %(d) | 1.41 | %(d) | |
| RATIOS/SUPPLEMENTARY DATA | | | | | | | | |
| Net Assets at End of Period (000's omitted) | | $2,419 | | | | $1,230 | | |
| Ratios to Average Net Assets: | | | | | | | | |
| Net investment income | | 1.42 | %(e) | 1.62 | %(e) | |
| Net expense | | 1.10 | %(e) | 1.10 | %(e) | |
| Gross expense (f) | | 1.73 | %(e) | 1.50 | %(e) | |
| PORTFOLIO TURNOVER RATE | | 4 | %(d) | 8 | %(d) | |
| | | | | | | | | | |
| (a) | Commencement of operations. |
| (b) | Calculated based on average shares outstanding during each period. |
| (c) | Less than $0.01 per share. |
| (d) | Not annualized. |
| (e) | Annualized. |
| (f) | Reflects the expense ratio excluding any waivers and/or reimbursements. |
| See Notes to Financial Statements. | 13 | |
| | | | | | | | | |
| AUXIER FOCUS FUND | | | | |
| NOTES TO FINANCIAL STATEMENTS | | | | |
| DECEMBER 31, 2012 | | | | |
| | | | | | | | | |
Note 1. Organization
The Auxier Focus Fund (the “Fund”) is a diversified portfolio of Forum Funds (the “Trust”). The Trust is a Delaware statutory trust that is registered as an open-end, management investment company under the Investment Company Act of 1940 (the “Act”), as amended. Under its Trust Instrument, the Trust is authorized to issue an unlimited number of the Fund’s shares of beneficial interest without par value. The Fund currently offers three classes of shares: Investor Shares, A Shares and Institutional Shares. A Shares are offered at net asset value plus a maximum sales charge of 5.75%. A Shares are also subject to contingent deferred sales charge (“CDSC”) of 1.00% on purchases without an initial sales charge and redeemed less than one year after they are purchased. Investor Shares and Institutional Shares are not subject to a sales charge. Investor Shares, A Shares and Institutional Shares commenced operations on July 9, 1999, July 8, 2005 and May 9, 2012, respectively. The Fund’s investment objective is to provide long-term capital appreciation.
On August 27, 2008, the Board of Trustees of the Trust approved the conversion of the Fund’s C Shares into Investor Shares. On November 1, 2008, each shareholder of C Shares received Investor Shares in a dollar amount equal to their investment in C Shares as of that date.
Note 2. Summary of Significant Accounting Policies
These financial statements are prepared in accordance with accounting principles generally accepted in the United States of America (“GAAP”), which require management to make estimates and assumptions that affect the reported amounts of assets and liabilities, the disclosure of contingent liabilities at the date of the financial statements, and the reported amounts of increase and decrease in net assets from operations during the fiscal year. Actual amounts could differ from those estimates. The following summarizes the significant accounting policies of the Fund:
Security Valuation – Exchange-traded securities and over-the-counter securities are valued using the last quoted sale or official closing price, provided by independent pricing services as of the close of trading on the market or exchange for which they are primarily traded, on each Fund business day. In the absence of a sale, such securities are valued at the mean of the last bid and ask price provided by independent pricing services. Non-exchange traded securities for which quotations are available are valued using the last quoted sales price, or in the absence of a sale at the mean of the last bid and ask prices provided by independent pricing services. Debt securities may be valued at prices supplied by a fund’s pricing agent based on broker or dealer supplied valuations or matrix pricing, a method of valuing securities by reference to the value of other securities with similar characteristics such as rating, interest rate and maturity. Shares of open-end mutual funds are valued at net asset value (“NAV”). Short-term investments that mature in 60 days or less may be valued at amortized cost.
The Fund values its investments at fair value pursuant to procedures adopted by the Trust's Board of Trustees (the "Board") if (1) market quotations are insufficient or not readily available or (2) the adviser believes that the values available are unreliable. The Trust’s Valuation Committee performs certain functions as they relate to the administration and oversight of the Fund’s valuation procedures. Under these procedures, the Valuation Committee convenes on a regular and ad-hoc basis to review such securities and considers a number of factors, including valuation methodologies and significant unobservable inputs, when arriving at fair value.
The Valuation Committee may work with an adviser to provide valuation inputs. In determining fair valuations, inputs may include market-based analytics which may consider related or comparable assets or liabilities, recent transactions, market multiples, book values and other relevant investment information. Adviser inputs may include an income-based approach in which the anticipated future cash flows of the investment are discounted in determining fair value. Discounts may also be applied based on the nature or duration of any restrictions on the disposition of the investments. The Valuation Committee performs regular reviews of valuation methodologies, key inputs and assumptions, disposition analysis and market activity.
Fair valuation is based on subjective factors and, as a result, the fair value price of an investment may differ from the security’s market price and may not be the price at which the asset may be sold. Fair valuation could result in a different NAV than a NAV determined by using market quotes.
The Fund has a three-tier fair value hierarchy. The basis of the tiers is dependent upon the various “inputs” used to determine
| | | | | | | | | |
| AUXIER FOCUS FUND | | | | |
| NOTES TO FINANCIAL STATEMENTS | | | | |
| DECEMBER 31, 2012 | | | | |
| | | | | | | | | |
the value of the Fund’s investments. These inputs are summarized in the three broad levels listed below:
Level 1 — quoted prices in active markets for identical assets
Level 2 — other significant observable inputs (including quoted prices of similar securities, interest rates, prepayment speeds, credit risk, etc.)
Level 3 — significant unobservable inputs (including the Fund’s own assumptions in determining the fair value of investments)
The aggregate value by input level, as of December 31, 2012, for the Fund’s investments is included at the end of the Fund’s Schedule of Investments.
Security Transactions, Investment Income and Realized Gain and Loss – Investment transactions are accounted for on the trade date. Dividend income is recorded on the ex-dividend date. Foreign dividend income is recorded on the ex-dividend date or as soon as possible after the Fund determines the existence of a dividend declaration after exercising reasonable due diligence. Income and capital gains on some foreign securities may be subject to foreign withholding taxes, which are accrued as applicable. Interest income is recorded on an accrual basis. Premium is amortized and discount is accreted using the effective interest method. Identified cost of investments sold is used to determine the gain and loss for both financial statement and federal income tax purposes.
Foreign Currency Translations – Foreign currency amounts are translated into U.S. dollars as follows: (1) assets and liabilities at the rate of exchange at the end of the respective period; and (2) purchases and sales of securities and income and expenses at the rate of exchange prevailing on the dates of such transactions. The portion of the results of operations arising from changes in the exchange rates and the portion due to fluctuations arising from changes in the market prices of securities are not isolated. Such fluctuations are included with the net realized and unrealized gain or loss on investments.
Distributions to Shareholders – Distributions to shareholders of net investment income and net capital gains, if any, are declared and paid at least annually. Distributions are based on amounts calculated in accordance with applicable federal income tax regulations, which may differ from GAAP. These differences are due primarily to differing treatments of income and gain on various investment securities held by the Fund, timing differences and differing characterizations of distributions made by the Fund.
Federal Taxes – The Fund intends to continue to qualify each year as a regulated investment company under Subchapter M of the Internal Revenue Code and to distribute all of its taxable income to shareholders. In addition, by distributing in each calendar year substantially all of its net investment income and capital gains, if any, the Fund will not be subject to a federal excise tax. Therefore, no federal income or excise tax provision is required. The Fund files a U.S. federal income and excise tax return as required. A fund’s federal income tax returns are subject to examination by the Internal Revenue Service for a period of three fiscal years after they are filed. As of December 31, 2012, there are no uncertain tax positions that would require financial statement recognition, de-recognition, or disclosure.
Income and Expense Allocation – The Trust accounts separately for the assets, liabilities and operations of each of its investment portfolios. Expenses that are directly attributable to more than one investment portfolio are allocated among the respective investment portfolios in an equitable manner.
The Fund’s class specific expenses are charged to the operations of that class of shares. Income and expenses (other than expenses attributable to a specific class) and realized and unrealized gains or losses on investments are allocated to each class of shares based on the class’ respective net assets to the total net assets of the Fund.
| | | | | | | | | |
| AUXIER FOCUS FUND | | | | |
| NOTES TO FINANCIAL STATEMENTS | | | | |
| DECEMBER 31, 2012 | | | | |
| |
Redemption Fees – A shareholder who redeems or exchanges shares within 180 days of purchase will incur a redemption fee of 2.00% of the current net asset value of shares redeemed or exchanged, subject to certain limitations. The fee is charged for the benefit of the remaining shareholders and will be paid to the Fund to help offset transaction costs. The fee is accounted for as an addition to paid-in capital. The Fund reserves the right to modify the terms of or terminate the fee at any time. There are limited exceptions to the imposition of the redemption fee.
Commitments and Contingencies – In the normal course of business, the Fund enters into contracts that provide general indemnifications by the Fund to the counterparty to the contract. The Fund’s maximum exposure under these arrangements is dependent on future claims that may be made against the Fund and, therefore, cannot be estimated; however, based on experience, the risk of loss from such claims is considered remote.
Note 3. Fees and Expenses
Investment Adviser – Auxier Asset Management LLC (the “Adviser”), is the investment adviser to the Fund. Pursuant to an investment advisory agreement, the Adviser receives an advisory fee from the Fund at an annual rate of 1.00% of the Fund’s average daily assets.
Distribution – Foreside Fund Services, LLC serves as the Fund’s distributor (the “Distributor”). The Distributor is not affiliated with the Adviser or Atlantic Fund Administration, LLC (d/b/a Atlantic Fund Services) (“Atlantic”) or their affiliates. The Fund has adopted a Distribution Plan (the “Plan”) for A Shares of the Fund in accordance with Rule 12b-1 of the Act. Under the Plan, the Fund pays the Distributor and/or any other entity as authorized by the Board a fee of up to 0.25% of the average daily net assets of A Shares. The Distributor had no role in determining the investment policies or which securities are to be purchased or sold by the Trust or its Funds.
For the period ended December 31, 2012, there were $9,857 in front-end sales charges assessed on the sale of A Shares and no contingent deferred sales charges were assessed on the sale of A Shares. The Distributor received $1,429 of the total front-end sales charges. Such amounts are set aside by the Distributor and used solely for distribution-related expenses.
Other Service Providers – Atlantic provides fund accounting, fund administration, compliance and transfer agency services to the Fund. Atlantic also provides certain shareholder report production, and EDGAR conversion and filing services. Atlantic provides a Principal Executive Officer, a Principal Financial Officer, a Chief Compliance Officer, and an Anti-Money Laundering Officer to the Fund, as well as certain additional compliance support functions.
Trustees and Officers – The Trust pays each independent Trustee an annual retainer fee of $45,000 for service to the Trust ($66,000 for the Chairman). The Trustees and Chairman may receive additional fees for special Board meetings. Each Trustee is also reimbursed for all reasonable out-of-pocket expenses incurred in connection with his duties as a Trustee, including travel and related expenses incurred in attending Board meetings. The amount of Trustees’ fees attributable to the Fund is disclosed in the Statement of Operations. Certain officers of the Trust are also officers or employees of the above named service providers, and during their terms of office received no compensation from the Fund.
Note 4. Expense Reimbursements and Fees Waived
The Adviser has contractually agreed to waive a portion of its fees and reimburse expenses through October 31, 2015, to the extent necessary to maintain the total operating expenses at 1.25% of average daily net assets of the Investor Shares and A Shares and 1.10% of average daily net assets of Institutional Shares. These contractual waivers may be changed or eliminated at any time with consent of the Board. For the period ended December 31, 2012, fees waived and expenses reimbursed were as follows:
| Investment Adviser Fees Waived | | Other Waivers | | Total Fees Waived |
| $ | 21,132 | | $ | 32,851 | | $ | 53,983 |
| | | | | | | | |
| | | | | | | | | |
| AUXIER FOCUS FUND | | | | |
| NOTES TO FINANCIAL STATEMENTS | | | | |
| DECEMBER 31, 2012 | | | | |
| |
Note 5. Security Transactions
The cost of purchases and proceeds from sales of investment securities (including maturities), other than short-term investments during the period ended December 31, 2012, were $24,753,492 and $8,473,210, respectively.
Note 6. Federal Income Tax and Investment Transactions
As of June 30, 2012, distributable earnings (accumulated loss) on a tax basis were as follows:
| Undistributed Ordinary Income | | $ | 2,521,670 | |
| Undistributed Long-Term Gain | | | 1,039,403 | |
| Unrealized Appreciation | | | 26,651,520 | |
| Total | | $ | 30,212,593 | |
The difference between components of distributable earnings on a tax basis and the amounts reflected in the Statement of Assets and Liabilities are primarily due to wash sales and passive foreign investment companies.
Note 7. Recent Accounting Pronouncements
In May 2011, FASB issued ASU No. 2011-04 “Amendments to Achieve Common Fair Value Measurement and Disclosure Requirements in U.S. GAAP and IFRSs.” ASU No. 2011-04 establishes common requirements for measuring fair value and for disclosing information about fair value measurements in accordance with U.S. GAAP and International Financial Reporting Standards (“IFRSs”). ASU No. 2011-04 is effective for interim and annual periods beginning after December 15, 2011. Management has evaluated ASU No. 2011-04 and has determined that it did not have a significant impact on the reporting of the financial statement disclosures.
In December 2011, FASB issued ASU No. 2011-11 “Disclosures about Offsetting Assets and Liabilities” requiring disclosure of both gross and net information related to offsetting and related arrangements enabling users of its financial statements to understand the effect of those arrangements on the entity’s financial position. The objective of this disclosure is to facilitate comparison between those entities that prepare their financial statements on the basis of U.S. GAAP and those entities that prepare their financial statements on the basis of IFRSs. ASU No. 2011-11 is effective for interim and annual periods beginning on or after January 1, 2013. Management is evaluating any impact ASU No. 2011-11 may have on the Fund’s financial statements.
Note 8. Subsequent Events
Subsequent events occurring after the date of this report through the date these financial statements were issued have been evaluated for potential impact and the Fund has had no such events.
| | | | | | | | | |
| AUXIER FOCUS FUND | | | | |
| ADDITIONAL INFORMATION | | | | |
| DECEMBER 31, 2012 | | | | |
| |
Proxy Voting Information
A description of the policies and procedures that the Fund uses to determine how to vote proxies relating to securities held in the Fund’s portfolio is available, without charge and upon request, by calling (877) 328-9437, on the Fund's website at www.auxierasset.com and on the U.S. Securities and Exchange Commission’s (the “SEC”) website at www.sec.gov. The Fund’s proxy voting record for the most recent twelve-month period ended June 30 is available, without charge and upon request, by calling (877) 328-9437 and on the SEC’s website at www.sec.gov.
Availability of Quarterly Portfolio Schedules
The Fund files its complete schedule of portfolio holdings with the SEC for the first and third quarters of each fiscal year on Form N-Q. These filings are available, without charge and upon request on the SEC’s website at www.sec.gov or may be reviewed and copied at the SEC’s Public Reference Room in Washington, DC. Information on the operation of the Public Reference Room may be obtained by calling (800) SEC-0330.
Shareholder Expense Example
As a shareholder of the Fund, you incur two types of costs: (1) transaction costs, including sales charges (loads) on purchase payments on certain classes, redemption fees, exchange fees, and CDSC fees, and (2) ongoing costs, including management fees, 12b-1 fees, and other Fund expenses. This example is intended to help you understand your ongoing costs (in dollars) of investing in the Fund, and to compare these costs with the ongoing costs of investing in other mutual funds.
The example is based on an investment of $1,000 invested at the beginning of the period and held for the entire period from July 1, 2012, through December 31, 2012.
Actual Expenses – The first line under each share class of the table below provides information about actual account values and actual expenses. You may use the information in this line, together with the amount you invested, to estimate the expenses that you paid over the period. Simply divide your account value by $1,000 (for example, an $8,600 account value divided by $1,000 = 8.6), then multiply the result by the number in the first line under the heading entitled “Expenses Paid During Period” to estimate the expenses you paid on your account during the period.
Hypothetical Example for Comparison Purposes – The second line under each share class of the table below provides information about hypothetical account values and hypothetical expenses based on the Fund’s actual expense ratio and an assumed rate of return of 5% per year before expenses, which is not the Fund’s actual return. The hypothetical account values and expenses may not be used to estimate the actual ending account balance or expenses you paid for the period. You may use this information to compare the ongoing costs of investing in the Fund and other funds. To do so, compare this 5% hypothetical example with the 5% hypothetical examples that appear in the shareholder reports of other funds.
Please note that the expenses shown in the table are meant to highlight your ongoing costs only and do not reflect any transactional costs, such as sales charges (loads) on purchase payments on certain classes, redemption fees, exchange fees, and CDSC fees. Therefore, the second line of the table is useful in comparing ongoing costs only, and will not help you determine the relative total costs of owning different funds. In addition, if these transactional costs were included, your costs would have been higher.
| | | | | | | | | |
| AUXIER FOCUS FUND | | | | |
| ADDITIONAL INFORMATION | | | | |
| DECEMBER 31, 2012 | | | | |
| |
| | Beginning Account Value | | Ending Account Value | | Expenses Paid During | | Annualized Expense |
| | July 1, 2012 | | December 31, 2012 | | Period* | | Ratio* |
| Investor Shares | | | | | | | | | | | |
| Actual | $ | 1,000.00 | | $ | 1,029.33 | | $ | 6.39 | | 1.25 | % |
| Hypothetical (5% return before taxes) | $ | 1,000.00 | | $ | 1,018.90 | | $ | 6.36 | | 1.25 | % |
| A Shares | | | | | | | | | | | |
| Actual | $ | 1,000.00 | | $ | 1,028.95 | | $ | 6.39 | | 1.25 | % |
| Hypothetical (5% return before taxes) | $ | 1,000.00 | | $ | 1,018.90 | | $ | 6.36 | | 1.25 | % |
| Institutional Shares | | | | | | | | | | | |
| Actual | $ | 1,000.00 | | $ | 1,029.27 | | $ | 5.63 | | 1.10 | % |
| Hypothetical (5% return before taxes) | $ | 1,000.00 | | $ | 1,019.66 | | $ | 5.60 | | 1.10 | % |
| | | | | | | | | | | | |
| | *Expenses are equal to the Fund’s annualized expense ratio multiplied by the average account value over the period, multiplied by the number of days in the most recent fiscal half-year divided by 365 to reflect the half-year period. |
Auxier Focus Fund
FOR MORE INFORMATION
P.O. Box 588
Portland, Maine 04112
(877) 3AUXIER
(877) 328-9437
INVESTMENT ADVISER
Auxier Asset Management LLC
5285 Meadows Road
Suite 333
Lake Oswego, Oregon 97035
TRANSFER AGENT
Atlantic Fund Services
P.O. Box 588
Portland, Maine 04112
DISTRIBUTOR
Foreside Fund Services, LLC
Three Canal Plaza, Suite 100
Portland, Maine 04101
www.foreside.com
This report is submitted for the general information of the shareholders of the Fund. It is not authorized for
distribution to prospective investors unless preceded or accompanied by an effective prospectus, which includes
information regarding the Fund’s risks, objectives, fees and expenses, experience of its management, and other
information.
204-SAR-1212
| | | | | | | | | |
DF DENT GROWTH FUNDS | | | | | |
| TABLE OF CONTENTS | | | | | |
| DECEMBER 31, 2012 | | | | | |
| | | | | | | | | |
| DF Dent Premier Growth Fund | | | | | | | | |
| A Message to Our Shareholders | | | | | | | 1 | |
| Management Discussion of Fund Performance | | | | | | | 8 | |
| Performance Chart and Analysis | | | | | | | 15 | |
| Schedule of Investments | | | | | | | 16 | |
| Statement of Assets and Liabilities | | | | | | | 18 | |
| Statement of Operations | | | | | | | 19 | |
| Statements of Changes in Net Assets | | | | | | | 20 | |
| Financial Highlights | | | | | | | 21 | |
| | | | | | | | | |
| DF Dent Midcap Growth Fund | | | | | | | | |
| Performance Chart and Analysis | | | | | | | 22 | |
| Schedule of Investments | | | | | | | 23 | |
| Statement of Assets and Liabilities | | | | | | | 25 | |
| Statement of Operations | | | | | | | 26 | |
| Statements of Changes in Net Assets | | | | | | | 27 | |
| Financial Highlights | | | | | | | 28 | |
| | | | | | | | | |
| Additional Information | | | | | | | | |
| Notes to Financial Statements | | | | | | | 29 | |
| Additional Information | | | | | | | 34 | |
| | | | | | | | | |
DF DENT PREMIER GROWTH FUND | | | | | |
| A MESSAGE TO OUR SHAREHOLDERS | | | | | |
| DECEMBER 31, 2012 | | | | | |
| | | | | | | | | |
Dear Fellow Shareholder,
Performance
Your DF Dent Premier Growth Fund’s (the “Fund”) total return in 2012 was +16.28% versus +16.00% for the S&P 500 Index (the “Index”), the Fund’s benchmark used for comparisons. The average return for Multi-Cap Growth Funds as calculated by Lipper was +15.3% for 2012. Since inception (07/16/2001), your Fund has achieved a cumulative return of +106.50%, which exceeds the +48.65% cumulative total return for the Index by 57.85%. This represents an annual return of 6.53% versus the Index’s 3.52% since inception, or an excess annual return of 3.01% over the benchmark since inception. Performance for various periods ending December 31, 2012 can be found later in this report in the Management Discussion of Fund Performance Section following this message.
For a longer-term perspective, the Fund’s one-year, five-year, ten-year and since inception average annual total return for the periods ended December 31, 2012, were 16.28%, 2.22%, 9.70% and 6.53%, respectively. Performance data quoted represents past performance and is no guarantee of future results. Current performance may be lower or higher than the performance data quoted. Investment return and principal value will fluctuate so that an investor’s shares, when redeemed, may be worth more or less than original cost. For the most recent month-end performance, please call (866) 233-3368. As stated in the current prospectus, the Fund’s annual operating expense ratio (gross) is 1.29%. However, the Fund’s Adviser has contractually agreed to waive a portion of its fees and/or reimburse certain expenses to limit total operating expense to 1.10% on the first $150 million in Fund net assets and to 0.90% on net assets exceeding $150 million; otherwise, returns would have been lower. This agreement is in effect through October 31, 2015. The expense cap may be changed or eliminated only with the consent of the Board of Trustees.
Expense Ratio
Your Fund’s Adviser, D. F. Dent and Company, Inc. (the “Adviser”), has contractually agreed in recent years to waive a portion of its management fee and reimburse expenses in order to limit Total Annual Fund Operating Expenses to 1.10% of net assets (the Expense Cap). Starting November 1, 2010 and through October 31, 2015 the Adviser has contractually agreed to continue this Expense Cap of 1.10% on the first $150 million of net assets and a further Expense Cap of 0.90% on assets exceeding $150 million. The purpose of this lower Expense Cap at the break point of $150 million is to share with you the economies of scale derived from your Fund’s growth. As of December 31, 2012, the net assets in your Fund were $154.7 million.
Portfolio Turnover
Portfolio turnover, when measured by security purchases as a percentage of the average market value, was 13.23% for the calendar year 2012, significantly below our peer group and at the lower end of your Fund’s historic turnover range. Portfolio turnover rate in recent years may be found later in the “Financial Highlights” section of this report.
| | | | | | | | | |
DF DENT PREMIER GROWTH FUND | | | | | |
| A MESSAGE TO OUR SHAREHOLDERS | | | | | |
| DECEMBER 31, 2012 | | | | | |
| | | | | | | | | |
Management Ownership of Fund
The Adviser’s retirement plan, employees of the Adviser and related family members collectively own 11.7% of the Fund. The Fund is the largest investment of the Adviser’s retirement plan (at 26 % of the retirement plan’s assets) as was the case one year ago. The DF Dent Midcap Growth Fund, our second mutual fund which launched on July 1, 2011, represented another 3.75% of the plan’s assets. None of these shareholders has ever sold a share in either Fund. As Warren Buffet has said, “We eat our own cooking.”
Asset Allocation
Year-end asset allocation by market capitalization for the past five years was:
| | | 12/31/08* | | 12/31/09* | | 12/31/10* | | 12/31/11* | | 12/31/12* |
| Large Capitalization | | 28.0 | % | | 41.0 | % | | 54.7 | % | | 49.4 | % | | 55.0 | % |
| Mid Capitalization | | 56.9 | % | | 51.3 | % | | 35.9 | % | | 38.0 | % | | 36.8 | % |
| Small Capitalization | | 13.8 | % | | 7.7 | % | | 7.8 | % | | 12.4 | % | | 7.8 | % |
| Reserve Funds | | 1.3 | % | | 0.0 | % | | 1.6 | % | | 0.2 | % | | 0.4 | % |
| Total Fund | | 100.0 | % | | 100.0 | % | | 100.0 | % | | 100.0 | % | | 100.0 | % |
* Percentages calculated based on total value of investments.
The lower percentage in Large Capitalization and concurrent higher percentages in Mid and Small Capitalization as of 12/31/08 represented the severe market decline the fourth quarter of 2008 which drove down the market capitalizations of many Fund holdings. The market recovery in 2009 and 2010 then resulted in many long term core holdings moving up a category, especially from Mid Cap where the ceiling is $7 billion to Large Cap where the floor is $7 billion.
Similarly, market appreciation in 2012 drove some of the Mid Cap companies into the Large Cap category while some of the Small Cap companies graduated to Mid Cap. The Fund maintained its fully invested policy in 2012 as reserve funds averaged less than 1% through the year.
Six Mid Cap companies and one Small Cap company, together representing 9.7% of the Fund one year ago, were eliminated in 2012. Positions were initiated in four Mid Cap, two Large Cap, and two Small Cap companies representing 8.5% of the Fund’s 12/31/2012 net assets.
Concentration
Five years ago, I wrote of our intent to continue our program to increase concentration in what we consider the strongest “best-in-class”** companies. We have continued this program by reducing and eliminating small positions in what we consider to be less promising companies. The total number of equities held was reduced from 52 on 12/31/2007 to 35 on 12/31/2010 to 38 on 12/31/2011 and to 39 on 12/31/12. The strategy is to have larger positions in the 35-40 companies we like most rather than owning an additional 10 or so companies that we view less favorably. Allocations in the 10 largest positions in the Fund were as follows on the indicated dates:
| | | | | | | | | |
DF DENT PREMIER GROWTH FUND | | | | | |
| A MESSAGE TO OUR SHAREHOLDERS | | | | | |
| DECEMBER 31, 2012 | | | | | |
| |
| Top 10 Holdings | | 12/31/08 | | 12/31/09 | | 12/31/10 | | 12/31/11 | | 12/31/12 |
| % of Fund | | 53.0 | % | | 53.8 | % | | 55.4 | % | | 51.4 | % | | 49.1 | % |
| Average Position Size of Top 10 | | 5.30 | % | | 5.38 | % | | 5.54 | % | | 5.14 | % | | 4.91 | % |
The above concentration level of the past five years has been fairly constant, and we do not intend to alter it in the foreseeable future.
Purchases and Redemptions
Your Fund has not been immune to the trend in recent years of investors exiting U.S. equity mutual funds in favor of international funds, ETFs, and bond mutual funds. In fact, in each of the four years since the financial crisis of 2008 your Fund has seen net redemptions by shareholders. Although the Fund’s net value per share has appreciated by 93% in the past four years since the financial crisis, we have witnessed net redemptions in 15 of those 16 calendar quarters. During this time, the Fund’s net assets have increased from $120.0 million on 12/31/2008 to $154.7 million on 12/31/2012, an increase of $34.7 million despite net redemptions of $53.6 million.
Commentary
The following commentary contains 3 sections:
| 1. | An Inflection Point? - Will stocks outperform bonds? |
| 2. | But Where to Invest? – U.S. or overseas? |
| 3. | What to Invest in? – Which sectors? |
An Inflection Point? – Will stocks outperform bonds?
In the past two reports to shareholders we commented upon the flow out of domestic mutual funds into bond funds (12/31/2011 Semi-Annual Report) and the fact that the earnings yields from stocks exceeded the yields from bonds by the greatest magnitude in the past 30 years (06/30/2012 Annual Report). The two were clearly related as investors reacted to the outperformance of bonds over stocks in the 2000-2010 decade by shifting their asset preference from stocks to bonds.
We believe we are currently at an inflection point where stocks will begin to outperform bonds. As can be seen in the chart below, the trailing 10 year return from the Index has been negative only twice since 1935 and reached a low of only 2% in 1974. In the years after these past periods of low equity returns, equities have done quite well.
| | | | | | | | | |
DF DENT PREMIER GROWTH FUND | | | | | |
| A MESSAGE TO OUR SHAREHOLDERS | | | | | |
| DECEMBER 31, 2012 | | | | | |
| |

The 10 year U.S. Treasury ended 2012 yielding a meager 1.76%, down from 1.89% the year before. At some point the Federal Reserve’s support of low yields through its mortgage buying program may end. Similarly, its policy of zero interest rates which has resulted in negative real interest rates may be phased out as the economy recovers gradually. Our calculations indicate that a mere 0.25% increase in 10 year rates would potentially result in a negative total return for 10 year Treasuries over the next year. We think this will occur within the next year causing poor performance in bonds. Furthermore, just as bond outperformance in the past decade caused investors to shift from stocks to bonds, we believe that poor bond performance in a rising interest rate environment in the next 10 years will cause investors to favor stocks over bonds. The result would represent a normal cyclical pattern where stocks then outperform bonds.
| | | | | | | | | |
DF DENT PREMIER GROWTH FUND | | | | | |
| A MESSAGE TO OUR SHAREHOLDERS | | | | | |
| DECEMBER 31, 2012 | | | | | |
| |
But Where to Invest? – U.S. or overseas?
As presented in the Strategy and Trends Sections of the following “Management Discussion of Fund Performance”, there are powerful trends improving the attractiveness of investing domestically in the United States. Yes, the many worries from 2011 and 2012 about Europe, China, our dysfunctional Congress, and federal debt levels are still there. However, the operative question for investors is, “Will those concerns be greater or less in the next year?” If those concerns diminish in 2013 versus 2012, investors’ collective fears of investing may also diminish. We contend that greater clarity around these issues will arrive as 2013 unfolds. The European economy while in recession has not collapsed as many had feared. China’s growth has slowed but appears to be stabilizing. The U.S. fiscal deficit and debt ceiling issues will likely have been painfully addressed if only partially by mid-2013. So to answer the above question, “Will those concerns be greater or less in the next year?” we believe that at the margin they will be less by mid-2013 which would be supportive of the equity market.
Furthermore, the United States is becoming a more attractive country for investment contrary to what one hears in the financial media. The dollar has declined by 21% in the past 10 years making investment in the U.S. and purchase of our products more attractive to foreigners (as well as making the purchase of “Made in the USA” products more attractive to Americans). We have seen a significant improvement in productivity, and our labor cost disadvantage versus Asia has diminished. “Insourcing” is replacing “outsourcing” as shipping costs for components from overseas has increased. The United States offers deep and liquid capital markets for growth capital. And then there is energy. The U.S. is in the midst of a profound reversal in its energy status. Shale oil and natural gas have been discovered in abundance and are being extracted by new technologies. Net petroleum imports have been cut in half from $22 billion to $11 billion in the past eight years with predictions by the International Energy Agency that the U.S. will be the world’s largest producer of oil by 2020 and a net exporter of energy within the next eight years. These developments caused Bill Conway, a co-founder of the Carlyle Group which has invested all over the world in the past 25 years, to write in an op/ed in the Nov. 19, 2012 edition of the Wall Street Journal:
“Nowhere on the globe can my firm invest in companies
with as much confidence as we do in the U.S.”
We agree.
What to Invest in? – Which sectors?
If one agrees that we are at an inflection point marking the end of the 30 year bull market in bonds where interest rates have reached secular lows and that investment opportunities in the U.S. could become more appealing as worries of the past two years lessen, it would be reasonable to conclude that investors would shift their asset allocation more towards U.S. equities while reducing the allocation to bonds and foreign equities, a clear reversal of the recent past. Mutual fund flows in late 2012 suggested such a shift in investor preferences could be starting.
| | | | | | | | | |
DF DENT PREMIER GROWTH FUND | | | | | |
| A MESSAGE TO OUR SHAREHOLDERS | | | | | |
| DECEMBER 31, 2012 | | | | | |
| |
The U.S. economy is expected to experience a subdued rate of growth in the foreseeable future for many reasons: household deleveraging, downward pressure on disposable income from tax increases and rising food prices, and restraints on government spending if not actual sequestration. In such an environment, we are favoring defensive investments and strong growth companies that have the potential to “power through” the sluggish economic environment. The four largest sectors in your Fund as shown in the “Sector Allocation and Attribution” section later in this report are Information Technology, Industrials, Financials and Health Care. Together these sectors represented 79% of the Fund. Information Technology includes companies with some of the highest growth rates within the Fund such as Ansys, 3D Systems, and Concur Technologies. Each of these companies generated double digit returns in 2012, and we expect their high growth rates to continue. Industrials includes many niche companies such as Fastenal, Stericycle, and InnerWorkings which are increasing their respective market shares through unique services and product offerings. Thus, these companies have been reporting sustainable growth rates well in excess of the overall industrial economy. Financials include T. Rowe Price, specialty insurer Markel, and American Tower Corp. (a Financial now since it has recently converted over to a REIT status versus communications service). Unlike many financials such as banks, which hold questionable assets, each of these three financials possessed rock solid balance sheets. The Health Care investments ResMed and Idexx address specialty growth markets of sleep disorders and veterinary services respectively with leading market shares. In the environmental services area, Ecolab, Waste Connections, and Clean Harbors represent defensive investments with consistent revenue profiles which are less sensitive to the economy’s anticipated slow growth rate. Each of these three environmental companies was able to make significant accretive acquisitions in the past year because of their balance sheet strengths. Growth may be achieved not only from revenue and margin improvement, but from strong balance sheets as well.
In conclusion, while there are the normal economic uncertainties before us, we have great confidence in the management teams of your Fund’s holdings and their ability to navigate these uncertain times. We will continue to monitor their results and research new opportunities for your Fund. This is our duty to you, and we are grateful that you have entrusted us with this responsibility.
Respectively Submitted,

Daniel F. Dent
** The determination of “best-in-class” is solely the opinion of the Fund’s Adviser, and such opinion is subject to change. Those companies that hold leading market share positions, strong growth potential, historically good profitability, and management teams known for integrity and good corporate governance are generally considered to be “best in class.”
| | | | | | | | | |
DF DENT PREMIER GROWTH FUND | | | | | |
| A MESSAGE TO OUR SHAREHOLDERS | | | | | |
| DECEMBER 31, 2012 | | | | | |
| |
IMPORTANT INFORMATION:
The recent growth rate in the global equity markets has helped to produce short-term returns for some sectors/asset classes that are not typical and may not continue in the future. Because of ongoing market volatility, Fund performance may be subject to substantial short-term changes.
Investing involves risks, including the possible loss of principal. The Fund invests in small and medium size companies. Investments in these companies, especially smaller companies, carry greater risk than is customarily associated with larger companies for various reasons such as increased volatility of earnings and prospects, narrower markets, limited financial resources and less liquid stock. The Fund will typically invest in the securities of fewer issuers. If the Fund’s portfolio is over weighted in a sector, any negative development affecting that sector will have a greater impact on the Fund than a fund that is not over weighted in that sector.
The S&P 500 Index is a broad-based, unmanaged measurement of changes in stock market conditions based on the average of 500 widely held stocks. One cannot invest directly in an index.
| | | | | | | | | |
DF DENT PREMIER GROWTH FUND | | | | | |
| MANAGEMENT DISCUSSION OF FUND PERFORMANCE | | | | | |
| DECEMBER 31, 2012 | | | | | |
| |
Recent Performance
For the first six months of the fiscal year beginning July 1, 2012, your DF Dent Premier Growth Fund (the “Fund”) experienced a total return of +9.98% versus a total return of +5.95% for the S&P 500 Index (the “Index”), the benchmark we use for performance comparisons. Performance versus the Index for various periods ending December 31, 2012 was as follows:
| Period Ending 12/31/12 | | DF Dent Premier Growth Fund | | S&P 500 Index | | Outperformance (Underperformance) |
| Six Months | | + | 9.98 | % | | + | 5.95 | % | | + | 4.03 | % |
| Twelve Months | | + | 16.28 | % | | + | 16.00 | % | | + | 0.28 | % |
| Five Years (annualized) | | + | 2.22 | % | | + | 1.66 | % | | + | 0.56 | % |
| Five Years (cumulative) | | + | 11.58 | % | | + | 8.59 | % | | + | 2.99 | % |
| Since Inception (07/16/01) (annualized) | | + | 6.53 | % | | + | 3.52 | % | | + | 3.01 | % |
| Since Inception (07/16/01) (cumulative) | | + | 106.50 | % | | + | 48.65 | % | | + | 57.85 | % |
Past performance is not indicative of future performance.
For the 2012 calendar year your Fund finished slightly ahead of the Index as the result of improving performance in the year’s second half after lagging during the year’s first half. While the six month and yearly performance does vary versus the Index, the Fund’s outperformance on an annual basis since inception has held relatively steady at about 3%. The Fund’s Adviser believes this is the most meaningful comparison for long term shareholders. The above cumulative return of more than two times the Index for over 11 years since inception speaks for itself versus an indexing approach to investing for the long term.
There were the usual market crosscurrents affecting the Fund’s performance in 2012. After a good start in 2012, continuing concerns of contagion from the European recession and debt crisis and a slowdown in China caused weakness in the second quarter in U.S. markets. Although U.S. economic growth was modest over the year, U.S. investors became less fearful in the second half of 2012 that the contagion from foreign markets would affect the domestic economy and the U.S. stock market. Investors fretted over the uncertain political future in the fourth quarter with the Presidential election and completed the year in a state of confusion if not dismay about Congress’s political haggling over the fiscal cliff.
What sense might an investor make of all this? First, these market concerns buffeted equities and your Fund from month to month. However, as time passed the equity market did climb the proverbial “wall of worry” making 2012 one of the strongest years in recent history. Second, the growth companies in your Fund overall delivered strong operating results and profit growth. This drove performance in the year’s second half.
One year ago this section of the Semi-Annual Report mentioned two “significant market factors” supporting the Fund’s 2011 performance:
| 1. | Abundant liquidity from the Federal Reserve |
| | | | | | | | | |
DF DENT PREMIER GROWTH FUND | | | | | |
| MANAGEMENT DISCUSSION OF FUND PERFORMANCE | | | | | |
| DECEMBER 31, 2012 | | | | | |
| |
And three “significant market factors” restraining equity performance:
| 1. | Uncertainty regarding the European debt crisis |
| 2. | The debacle in Washington over the deficit and federal debt |
| 3. | Investor distrust of equity markets due to recent scandals, volatility, etc. |
That was our commentary last year on market factors influencing the 2011 market which was flat for the year (Fund up +1.70% and the Index up +2.11% for 2011). What changed in 2012 which resulted in +16% returns? The first two factors supporting equity prices remained in place. However, while the three negative influences remained, they no longer weighed as heavily on the markets. European sovereign debt problems persist but no longer present a daily crisis. The efficient equity market was remarkably stable in December of 2012 while Congress stumbled towards the fiscal cliff. Somehow the equity market through its discounting process perceived that as messy as the situation in Washington became, we would muddle through it with a less than perfect resolution which avoided the disaster predicted in the media. Lastly, while investor distrust of equities continues as evidenced by the year-long exodus from U.S. equity funds, for the time being these scandals were no longer front page stories in the media. In summary, the positive factors of 2011 continued in 2012 while the negatives decreased. The result was that two years of respectable growth were realized mostly in the second year, 2012.
Your Fund’s outperformance of the benchmark, especially in the second half of 2012, was largely attributable to the contributions of the Information Technology sector, which carried the largest weighting by year end. Visa, Trimble Navigation, Concur Technologies, and 3D Systems all generated total returns of more than twice the Index in 2012. These strong contributions were partially offset by weak performance in the Energy sector where weak natural gas prices affected stock performance. Unit Corp. and Ultra Petroleum were poor performers in 2012 and eliminated from the Fund in favor of Concho Resources, Range Resources, and Southwestern Energy, which we believe possess stronger asset positions and better production growth prospects.
Our investment strategy in managing the Fund remains constant: emphasize what we consider to be “best-in-class” companies, keep portfolio turnover low (13.2% for the year), and stay reasonably fully invested. Each of these three strategies served the Fund very well in 2012.
Capital Gains Distribution Policy
As previously reported, it is the Adviser’s policy to distribute all net realized capital gains in December of each year. However, there have been no capital gains distributed in the past four years. This was the result of large losses realized in late 2008 and early 2009 by selling stocks at depressed prices to meet redemptions by large shareholders. This large loss carry-forward has offset gains realized in 2010, 2011, and 2012. The status of the loss carry-forward follows:
| | | | | | | | | |
DF DENT PREMIER GROWTH FUND | | | | | |
| MANAGEMENT DISCUSSION OF FUND PERFORMANCE | | | | | |
| DECEMBER 31, 2012 | | | | | |
| |
| Date | | Loss Carry-Forward | | Per Share | | Unrealized Gain | | Per Share |
| December 31, 2011 | | $42,570,602 | | $4.97 | | $27,107,876 | | $3.16 |
| June 30, 2012 | | $39,400,579 | | $4.69 | | $32,443,150 | | $3.86 |
| December 31, 2012 | | $37,625,757 | | $4.74 | | $45,031,233 | | $5.68 |
The December 31, 2012 loss carry-forward of $37,625,757 can offset capital gains up to $8,147,651 realized until 06/30/2017 and $29,478,106 realized until 06/30/2018. This in no way implies that such gains will in fact be realized, but it does mean that such gains, if and when realized, may be offset by the remaining loss carry-forward to reduce required taxable capital gains distributions. Thus, the Adviser views the loss carry-forward as a “hidden asset” which can shelter future capital gains, if realized, against future capital gains distributions and taxes as has been the case in 2010, 2011, and 2012.
Sector Allocation and Attribution
The following bar chart presents the sector weightings of your Fund (DFDPX) versus the sector weightings of the S&P 500 Index as of December 31, 2012:
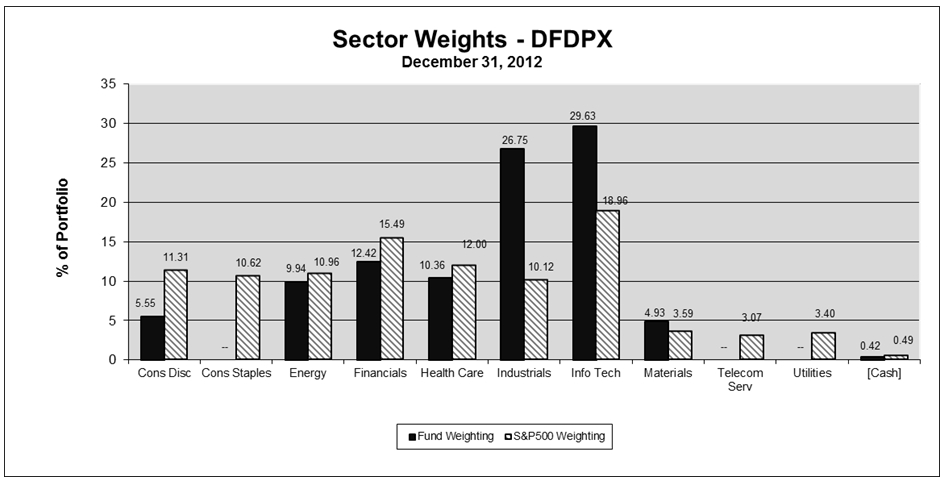
Source: FactSet
As can be seen in the preceding chart, the Fund’s largest portfolio weighting was in Information Technology (IT) followed by Industrials. We increased the Fund’s weighting in this Sector significantly over the course of 2012, and its return of +31.9% in 2012 compared with a return of +14.9% in the Index’s IT Sector. The second largest weighting in the Industrial Sector performed in line with the Index generating a +15% return in
| | | | | | | | | |
DF DENT PREMIER GROWTH FUND | | | | | |
| MANAGEMENT DISCUSSION OF FUND PERFORMANCE | | | | | |
| DECEMBER 31, 2012 | | | | | |
| |
2012. Energy and Health Care were both approximately market weighted over the year. Our energy holdings performed poorly largely due to weak natural gas prices, but the health care selections had a good year. As a growth fund, the portfolio had no holdings in the utilities, the worst performing Sector in the Index in 2012. While the above bar chart represents the Sector allocation as of December 31, 2012, the table below reflects the average weightings over the course of the year. Thus, the weightings in the above chart and the below table are not precisely the same.
| | | Fund | | Index |
| | | Weighing | | Return | | Weighting | | Return |
| Information Technology | | + | 27.4 | % | | + | 31.9 | % | | + | 19.8 | % | | + | 14.9 | % |
| Industrials | | + | 27.9 | % | | + | 15.3 | % | | + | 10.3 | % | | + | 15.4 | % |
| Energy | | + | 11.3 | % | | – | 9.8 | % | | + | 11.2 | % | | + | 4.5 | % |
| Health Care | | + | 11.1 | % | | + | 28.1 | % | | + | 11.8 | % | | + | 17.8 | % |
Within Information Technology the strongest performer was 3D Systems, a leading designer, developer, and manufacturer of 3D printers and materials utilizing computer aided technology in additive manufacturing. Visa, Trimble, and Concur all generated returns in excess of 30% responding to strong operating results in 2012.
The Industrials Sector tends to be a “catch all” sector for companies which do not fit neatly into one of the other nine designated sectors. Roper Industries, Stericycle, Health Care Services Group, and Beacon Roofing experienced returns that were higher than the Index in 2012. On the other hand, Gardner Denver, Expeditors International. Jacobs Engineering, and II-VI underperformed resulting in the market-like return shown above. Fastenal, your Fund’s best performer in recent years, had a total return of “only” 10.07% in 2012.
Our stock selection in energy was poor. As noted above, the weakness in natural gas prices due to excessive supply and weak demand took its toll. We eliminated positions in Ultra Petroleum and Unit Corp. and trimmed Apache in 2012. While our Energy Sector selections performed poorly in 2012, we do see resurgence in U.S. domestic oil and gas production in the coming years as predicted by the International Energy Agency. Proceeds from these sales were reinvested in companies which we believe possess stronger domestic production growth prospects such as Concho and Range Resources.
As always, the Health Care Sector experienced many crosscurrents from technology, regulatory, and political directions. Our commitment to stay with dominant niche companies specializing in their particular disciplines (“stick to your knitting”) worked well in 2012. Veterinarian supplier Idexx, which has been a strong long term performer, and ResMed, a leading supplier of sleep disorder products, both made strong contributions to the Fund’s performance in 2012.
| | | | | | | | | |
DF DENT PREMIER GROWTH FUND | | | | | |
| MANAGEMENT DISCUSSION OF FUND PERFORMANCE | | | | | |
| DECEMBER 31, 2012 | | | | | |
| |
Strategy and Trends
Strategy
As reported by Bloomberg News on Jan. 4, 2013, the year 2012 was a time when “Almost All Wall Street Got 2012 Wrong.” U.S. equity markets outperformed emerging markets despite money flowing overseas constantly from U.S. equity mutual funds, and hedge funds underperformed the S&P 500 for the fourth year in a row. Our strategy essentially ignored the worries over Europe (the debt crisis and recessionary fears had already been in the news and discounted in the prior year), the concerns over a Chinese slowdown (Is a decline in Chinese growth from an unsustainable growth rate of 9% to “only” 7% a cause for concern in the U.S.?), and the Washington gridlock over the fiscal cliff.
Were we ostriches with our heads in the sand? We hope you do not think so as investors in our Fund. Once again, we relied upon what we consider to be “best-in-class” managements of integrity to navigate through a difficult and perplexing economic environment. To traverse the shifting sands of economic change, we have found that these management teams were best positioned to adapt, reinvent themselves and minimize market risk over time. There will be times (calendar quarters and years) when the equities of these companies will underperform (Fastenal in 2012), but over the long run these management teams have proven their talents in adhering to sound strategic growth plans, executing business operations, and historically providing strong risk adjusted returns to shareholders. This has been our strategy and will continue going forward.
Trends
While investment funds have been traveling overseas as previously mentioned, business trends and corporate investment have been moving in the opposite direction. Jobs and manufacturing which previously found lower costs overseas have seen the cost differentials narrow. Labor costs and shipping expenses from outsourcing to overseas markets have been increasing. The CEO of General Electric recently noted that “insourcing” is replacing “outsourcing”, which has become an outdated business model. As reported in early 2013 in the Financial Times, manufacturing is beginning to return to the U.S. where dramatic improvements in productivity, a weakened U.S. Dollar (down 21% in the past 10 years), and an abundance of cheap energy in the form of natural gas have changed the competitive landscape. Bill Conway, a co-founder of the Carlyle Group which for many years has invested all over the world, recently wrote in an opinion article for The Wall Street Journal on November 19, 2012, as mentioned in the preceding Shareholder Letter that “Nowhere on the globe can my firm invest in companies with as much confidence as we do in the U.S.” Considering the political stability, rule of law, freedom, regulatory oversight, top flight universities and hospitals, Silicon Valley with its ongoing innovation, significant improvements in productivity, standardized accounting, and deep liquid capital markets in the U.S., he wrote that many investors have been missing what is occurring domestically as they have moved funds overseas. In a world of no return where investors are seeking safety in addition to growth he wrote that “The United States offers a powerful combination of the two.”
So despite the media’s fascination with our problems (which are real) there is also much to be said for investing in the only country and markets which offer the above attributes and trends.
| | | | | | | | | |
DF DENT PREMIER GROWTH FUND | | | | | |
| MANAGEMENT DISCUSSION OF FUND PERFORMANCE | | | | | |
| DECEMBER 31, 2012 | | | | | |
| |
Best and Worst Performers
Five Best Contributors
| Investments | | Realized and Unrealized Appreciation and Income in Calendar Year 2012 | | Per Share As of 12/31/12 | |
| 3D Systems Corp. | | $ | 4,301,753 | | $ | 0.54 | |
| Visa, Inc., Class A | | | 2,543,030 | | | 0.32 | |
| ResMed, Inc. | | | 2,528,504 | | | 0.32 | |
| Roper Industries, Inc. | | | 1,979,232 | | | 0.25 | |
| LKQ Corp. | | | 1,788,073 | | | 0.23 | |
| | | $ | 13,140,592 | | $ | 1.66 | |
Five Poorest Contributors
| Investments | | Realized and Unrealized Loss and Income in Calendar Year 2012 | | Per Share As of 12/31/12 | |
| Ultra Petroleum Corp. | | $ | (1,014,959) | | $ | (0.13) | |
| ADTRAN, Inc. | | | (877,176) | | | (0.11) | |
| National American University Holdings, Inc. | | | (853,093) | | | (0.11) | |
| American Public Education, Inc. | | | (389,548) | | | (0.05) | |
| Concho Resources, Inc. | | | (303,727) | | | (0.04) | |
| | | $ | (3,438,503) | | $ | (0.44) | |
FIVE LARGEST EQUITY HOLDINGS
DECEMBER 31, 2012
| Quantity | | Security | | Total Cost | | Market Value | | Percent of Net Assets of the Fund | |
| 240,600 | | Fastenal Co. | | $ | 5,543,661 | | $ | 11,223,614 | | 7.26 | % | |
| 170,000 | | QUALCOMM, Inc. | | | 6,896,332 | | | 10,543,400 | | 6.82 | | |
| 138,000 | | ANSYS, Inc. | | | 4,600,882 | | | 9,292,920 | | 6.01 | | |
| 125,000 | | T. Rowe Price Group, Inc. | | | 5,669,131 | | | 8,141,250 | | 5.26 | | |
| 48,900 | | Visa, Inc., Class A | | | 3,556,698 | | | 7,412,262 | | 4.79 | | |
| | | | | $ | 26,266,704 | | $ | 46,613,446 | | 30.14 | % | |
| | | | | | | | | |
DF DENT PREMIER GROWTH FUND | | | | | |
| MANAGEMENT DISCUSSION OF FUND PERFORMANCE | | | | | |
| DECEMBER 31, 2012 | | | | | |
| |
While the above five largest holdings represent 30% of the Fund, their total unrealized gain of $20,346,742 represents 45% of the Fund’s total unrealized gain of $45,031,233 on December 31, 2012. Each of the above five largest holdings generated a double digit return in 2012. The first four companies are repeats from last year’s top five list, while Visa climbed onto the list with its 50% total return in 2012. We consider this a confirmation of the Adviser’s long term strategy to hold on to significant positions in the highest quality companies.
The views in this report contained herein were those of the Fund’s Adviser as of December 31, 2012, and may not reflect the Adviser’s views on the date this report is first published or anytime thereafter. This report may contain discussions about certain investments both held and not held in the portfolio as of the report date. All current and future holdings are subject to risk and are subject to change. While these views are intended to assist shareholders in understanding their investment in the Fund, they do not constitute investment or tax advice, are not a guarantee of future performance and are not intended as an offer or solicitation with respect to the purchase or sale of any security.
| | | | | | | | | |
DF DENT PREMIER GROWTH FUND | | | | | |
| PERFORMANCE CHART AND ANALYSIS | | | | | |
| DECEMBER 31, 2012 | | | | | |
| |
The following chart reflects the change in the value of a hypothetical $10,000 investment, including reinvested dividends and distributions, in DF Dent Premier Growth Fund (the “Fund”) compared with the performance of the benchmark, S&P 500 Index ("S&P 500"), over the past ten fiscal years. The S&P 500 is a broad-based, unmanaged measurement of changes in stock market conditions based on the average of 500 widely held common stocks. The total return of the S&P 500 includes the reinvestment of dividends and income. The total return of the Fund includes operating expenses that reduce returns, while the total return of the S&P 500 does not include expenses. The Fund is professionally managed while the S&P 500 is unmanaged and is not available for investment.
Comparison of Change in Value of a $10,000 Investment
DF Dent Premier Growth Fund vs. S&P 500 Index

| Average Annual Total Returns | | | | | | | | |
| Periods Ended December 31, 2012 | | Six Months | | One Year | | Five Years | | Ten Years |
| DF Dent Premier Growth Fund | | 9.98 | % | | 16.28 | % | | 2.22 | % | | 9.70 | % |
| S&P 500 Index | | 5.95 | % | | 16.00 | % | | 1.66 | % | | 7.10 | % |
Performance data quoted represents past performance and is no guarantee of future results. Current performance may be lower or higher than the performance data quoted. Investment return and principal value will fluctuate so that shares, when redeemed, may be worth more or less than original cost. For the most recent month-end performance, please call (866) 233-3368. As stated in the Fund’s current prospectus, the annual operating expense ratio (gross) is 1.29%. However, the Fund’s adviser has contractually agreed to reduce a portion of its fees and reimburse expenses to limit total operating expenses to 1.10% on the first $150 million in Fund net assets and to 0.90% on net assets exceeding the $150 million, through October 31, 2015. During the period, certain fees were waived and/or expenses reimbursed; otherwise, returns would have been lower. The performance table and graph do not reflect the deduction of taxes that a shareholder would pay on Fund distributions or the redemption of Fund shares. Returns greater than one year are annualized.
| | | | | | | | | |
DF DENT PREMIER GROWTH FUND | | | | | |
| SCHEDULE OF INVESTMENTS | | | | | |
| DECEMBER 31, 2012 | | | | | |
| |
| | | | Security | | | | | | | | Security | | | | |
| | Shares | | Description | | | Value | | | Shares | | Description | | | Value | |
| | | | | Information Technology - 29.7% | | | | |
| Consumer Discretionary - 5.6% | | | | | | 105,000 | | 3D Systems Corp. (a) | $ | 5,601,750 | |
| | 52,800 | | American Public Education, Inc. (a) | | $ | 1,906,608 | | | 70,000 | | ADTRAN, Inc. | | 1,367,800 | |
| | 264,000 | | LKQ Corp. (a) | | | 5,570,400 | | | 138,000 | | ANSYS, Inc. (a) | | 9,292,920 | |
| | 290,000 | | National American University Holdings, Inc. | | | 1,116,500 | | | 32,300 | | Concur Technologies, Inc. (a) | 2,180,896 | |
| | | | | | | 8,593,508 | | | 113,386 | | DealerTrack Holdings, Inc. (a) | 3,256,446 | |
| Energy - 10.0% | | | | | | 40,000 | | NIC, Inc. | | | 653,600 | |
| | 23,000 | | Apache Corp. | | | 1,805,500 | | | 170,000 | | QUALCOMM, Inc. | | 10,543,400 | |
| | 22,500 | | Concho Resources, Inc. (a) | | | 1,812,600 | | | 94,000 | | Trimble Navigation, Ltd. (a) | 5,619,320 | |
| | 40,000 | | Core Laboratories NV | | | 4,372,400 | | | 48,900 | | Visa, Inc., Class A | | 7,412,262 | |
| | 31,300 | | Range Resources Corp. | | | 1,966,579 | | | | | | | | 45,928,394 | |
| | 62,600 | | Schlumberger, Ltd. | | | 4,337,554 | | Materials - 4.9% | | | | | |
| | 33,000 | | Southwestern Energy Co. (a) | | | 1,102,530 | | | 60,700 | | Ecolab, Inc. | | | 4,364,330 | |
| | | | | | | 15,397,163 | | | 80,300 | | Potash Corp. of Saskatchewan, Inc. | 3,267,407 | |
| Financials - 12.4% | | | | | | | | | | | 7,631,737 | |
| | 48,900 | | American Tower Corp. REIT | | | 3,778,503 | | Total Common Stock | | | | |
| | 8,000 | | Markel Corp. (a) | | | 3,467,360 | | (Cost $109,286,681) | | | 154,317,914 | |
| | 165,000 | | SEI Investments Co. | | | 3,851,100 | | Total Investments – 99.8% | | | | |
| | 125,000 | | T. Rowe Price Group, Inc. | | | 8,141,250 | | (Cost $109,286,681)* | | $ | 154,317,914 | |
| | | | | | | 19,238,213 | | Other Assets & Liabilities, Net – 0.2% | | | 339,042 | |
| Health Care - 10.4% | | | | | Net Assets – 100.0% | | | $ | 154,656,956 | |
| | 44,000 | | Celgene Corp. (a) | | | 3,463,680 | | | | | | | | | |
| | 64,000 | | IDEXX Laboratories, Inc. (a) | | | 5,939,200 | | | | | | | | | |
| | 134,000 | | ResMed, Inc. | | | 5,570,380 | | ADR | American Depositary Receipt | | | | |
| | 29,300 | | Teva Pharmaceutical Industries, Ltd., ADR | | | 1,094,062 | | REIT | Real Estate Investment Trust | | | | |
| | | | | | | 16,067,322 | | (a) | Non-income producing security. | | | | |
| Industrials - 26.8% | | | | | | | | | | | | |
| | 18,700 | | Clean Harbors, Inc. (a) | | | 1,028,687 | | * Cost for federal income tax purposes is substantially the same as for financial statement purposes and net unrealized appreciation consists of: | |
| | 130,200 | | Expeditors International of Washington, Inc. | | | 5,149,410 | | | | | | | | | |
| | 240,600 | | Fastenal Co. | | | 11,233,614 | | Gross Unrealized Appreciation | | | $ | 49,973,210 | |
| | 24,000 | | Gardner Denver, Inc. | | | 1,644,000 | | Gross Unrealized Depreciation | | | | (4,941,977 | ) |
| | 150,000 | | Healthcare Services Group, Inc. | | | 3,484,500 | | Net Unrealized Appreciation | | | $ | 45,031,233 | |
| | 140,000 | | II-VI, Inc. (a) | | | 2,557,800 | | | | | | | | | |
| | 85,000 | | Innerworkings, Inc. (a) | | | 1,171,300 | | | | | | | | | |
| | 89,000 | | Jacobs Engineering Group, Inc. (a) | | | 3,788,730 | | | | | | | | | |
| | 60,000 | | Roper Industries, Inc. | | | 6,688,800 | | | | | | | | | |
| | 37,000 | | Stericycle, Inc. (a) | | | 3,450,990 | | | | | | | | | |
| | 37,400 | | Waste Connections, Inc. | | | 1,263,746 | | | | | | | | | |
| | | | | | | 41,461,577 | | | | | | | | | |
| | | | | | | | | | | | | | | | |
| See Notes to Financial Statements. | 16 | DF DENT GROWTH FUNDS |
| | | | | | | | | |
DF DENT PREMIER GROWTH FUND | | | | | |
| SCHEDULE OF INVESTMENTS | | | | | |
| DECEMBER 31, 2012 | | | | | |
| |
| | | | | | | | | | | | | | | |
| The following is a summary of the inputs used to value the Fund’s investments as of December 31, 2012. | | | PORTFOLIO HOLDINGS | | | |
| The inputs or methodology used for valuing securities are not necessarily an indication of the risks associated with investing in those securities. For more information on valuation inputs, and their aggregation into the levels used in the tables below, please refer to the Security Valuation section in Note 2 of the accompanying Notes to Financial Statements. | | | % of Net Assets | | | |
| | | Consumer Discretionary | | 5.6 | % |
| | | Energy | | 10.0 | % |
| | | | | | | | | | Financials | | 12.4 | % |
| | Valuation Inputs | | | | | Investments in Securities | | | Health Care | | 10.4 | % |
| | Level 1 - Quoted Prices | | $ | 154,317,914 | | | Industrials | | 26.8 | % |
| | Level 2 - Other Significant Observable Inputs | | | - | | | Information Technology | | 29.7 | % |
| | Level 3 - Significant Unobservable Inputs | | | - | | | Materials | | 4.9 | % |
| | Total | | | | $ | 154,317,914 | | | Other Assets & Liabilities, Net | | 0.2 | % |
| | | | | | | | | | | | | | 100.0 | % |
| The Level 1 inputs displayed in this table are Common Stock. Refer to the Schedule of Investments for a further breakout of each security by type. | | | | | | | | |
| There were no transfers between Level 1 and Level 2 for the period ended December 31, 2012. | | | | | | | | |
| | | | | | | | | | | | | | | |
| See Notes to Financial Statements. | 17 | DF DENT GROWTH FUNDS |
| | | | | | | | | |
DF DENT PREMIER GROWTH FUND | | | | | |
| SCHEDULE OF ASSETS AND LIABILITIES | | | | | |
| DECEMBER 31, 2012 | | | | | |
| |
| ASSETS | | | | |
| | Total investments, at value (Cost $109,286,681) | | $ | 154,317,914 | |
| | Cash | | | 657,306 | |
| | Receivables: | | | | |
| | | Fund shares sold | | | 57,898 | |
| | | Dividends and interest | | | 17,268 | |
| | Prepaid expenses | | | 10,468 | |
| Total Assets | | | 155,060,854 | |
| | | | | | | |
| LIABILITIES | | | | |
| | Payables: | | | | |
| | | Fund shares redeemed | | | 37,526 | |
| | Accrued Liabilities: | | | | |
| | Investment adviser fees | | | 325,154 | |
| | | Trustees’ fees and expenses | | | 87 | |
| | | Fund services fees | | | 23,110 | |
| | | Other expenses | | | 18,021 | |
| Total Liabilities | | | 403,898 | |
| | | | | | | |
| NET ASSETS | | $ | 154,656,956 | |
| | | | | | | |
| COMPONENTS OF NET ASSETS | | | | |
| | Paid-in capital | | $ | 147,285,778 | |
| | Distributions in excess of net investment income | | | (34,298 | ) |
| | Accumulated net realized loss | | | (37,625,757 | ) |
| | Net unrealized appreciation | | | 45,031,233 | |
| NET ASSETS | | $ | 154,656,956 | |
| SHARES OF BENEFICIAL INTEREST AT NO PAR VALUE (UNLIMITED SHARES AUTHORIZED) | | | 7,932,254 | |
| NET ASSET VALUE, OFFERING AND REDEMPTION PRICE PER SHARE | | $ | 19.50 | |
| | | | | | | |
| See Notes to Financial Statements. | 18 | DF DENT GROWTH FUNDS |
| | | | | | | | | |
DF DENT PREMIER GROWTH FUND | | | | | |
| STATEMENT OF OPERATIONS | | | | | |
| SIX MONTHS ENDED DECEMBER 31, 2012 | | | | | |
| | | | | | | | | |
| INVESTMENT INCOME | | | | |
| | Dividend income (Net of foreign withholding taxes of $10,980) | | $ | 994,769 | |
| | Interest income | | | 472 | |
| Total Investment Income | | | 995,241 | |
| Adviser | | | | |
| EXPENSES | | | | |
| | Investment adviser fees | | | 761,136 | |
| | Fund services fees | | | 151,011 | |
| | Custodian fees | | | 7,689 | |
| | Registration fees | | | 10,048 | |
| | Professional fees | | | 21,845 | |
| | Trustees' fees and expenses | | | 2,588 | |
| | Miscellaneous expenses | | | 20,332 | |
| Total Expenses | | | 974,649 | |
| | Fees waived and expenses reimbursed | | | (139,410 | ) |
| Net Expenses | | | 835,239 | |
| | | | | | | |
| NET INVESTMENT INCOME | | | 160,002 | |
| | | | | | | |
| NET REALIZED AND UNREALIZED GAIN (LOSS) | | | | |
| | Net realized gain on investments | | | 1,774,822 | |
| | Net change in unrealized appreciation (depreciation) on investments | | | 12,588,083 | |
| NET REALIZED AND UNREALIZED GAIN | | | 14,362,905 | |
| INCREASE IN NET ASSETS FROM OPERATIONS | | $ | 14,522,907 | |
| | | | | | | |
| See Notes to Financial Statements. | 19 | DF DENT GROWTH FUNDS |
| | | | | | | | | |
DF DENT PREMIER GROWTH FUND | | | | | |
| STATEMENT OF CHANGES IN NET ASSETS | | | | | |
| | | | | | |
| | | | | | | | | |
| | | June 30, 2013 | | | 41274 | # | # | | | 41090 | |
| | | | | For the Six Months Ended December 31, 2012 | | | For the Year Ended June 30, 2012 |
| OPERATIONS | | | | | | | | | |
| | Net investment income (loss) | | $ | 160,002 | | | | $ | (410,234 | |
| | Net realized gain | | | 1,774,822 | | | | | 7,753,414 | |
| | Net change in unrealized appreciation (depreciation) | | | 12,588,083 | | | | | (6,635,851 | |
| Increase in Net Assets Resulting from Operations | | | 14,522,907 | | | | | 707,329 | |
| | | | | | | | | | | | |
| CAPITAL SHARE TRANSACTIONS | | | | | | | | | |
| | Sale of shares | | | 2,984,449 | | | | | 4,388,239 | |
| | Redemption of shares | | | (11,736,711 | ) | | | | (13,863,839 | |
| Decrease in Net Assets from Capital Share Transactions | | | (8,752,262 | ) | | | | (9,475,600 | |
| Increase (Decrease) in Net Assets | | | 5,770,645 | | | | | (8,768,271 | |
| | | | | | | | | | | | |
| NET ASSETS | | | | | | | | | |
| | Beginning of Period | | | 148,886,311 | | | | | 157,654,582 | |
| | End of Period (Including line (a)) | | $ | 154,656,956 | | | | $ | 148,886,311 | |
| | | | | | | | | | | | |
| SHARE TRANSACTIONS | | | | | | | | | |
| | Sale of shares | | | 159,064 | | | | | 252,190 | |
| | Redemption of shares | | | (625,641 | ) | | | | (812,727 | |
| Decrease in Shares | | | (466,577 | ) | | | | (560,537 | |
| | | | | | | | | | | | |
| (a) | Distributions in excess of net investment income. | | $ | (34,298 | ) | | | $ | (194,300 | |
| See Notes to Financial Statements. | 20 | DF DENT GROWTH FUNDS |
| | | | | | | | | |
DF DENT PREMIER GROWTH FUND | | | | | |
| FINANCIAL HIGHLIGHTS | | | | | |
| | | | | | |
| | | | | | | | | |
These financial highlights reflect selected data for a share outstanding throughout each period. | | | | | | | | | |
| | | For the Six Months Ended December 31, | | For the Years Ended June 30, |
| | | 2012 | | 2012 | | 2011 | | 2010 | | 2009 | | 2008 |
| NET ASSET VALUE, Beginning | | | | | | | | | | | | | | | | | | | | | |
| of Period | $ | 17.73 | | | $ | 17.60 | | | $ | 13.05 | | | $ | 10.94 | | | $ | 16.20 | | | $ | 17.25 | |
| INVESTMENT OPERATIONS | | | | | | | | | | | | | | | | | | | | | | | |
| Net investment income (loss) (a) | | 0.02 | | | | (0.05 | ) | | | (0.04 | ) | | | (0.04 | ) | | | (0.03 | ) | | | (0.05 | ) |
| Net realized and unrealized | | | | | | | | | | | | | | | | | | | | | | | |
| | gain (loss) | | 1.75 | | | | 0.18 | | | | 4.59 | | | | 2.15 | | | | (4.96 | ) | | | (0.76 | ) |
| Total from Investment Operations | | 1.77 | | | | 0.13 | | | | 4.55 | | | | 2.11 | | | | (4.99 | ) | | | (0.81 | ) |
| DISTRIBUTIONS TO | | | | | | | | | | | | | | | | | | | | | | | |
| SHAREHOLDERS FROM | | | | | | | | | | | | | | | | | | | | | | | |
| Net realized gain | | — | | | | — | | | | — | | | | — | | | | (0.27 | ) | | | (0.24 | ) |
| NET ASSET VALUE, End of Period | $ | 19.50 | | | $ | 17.73 | | | $ | 17.60 | | | $ | 13.05 | | | $ | 10.94 | | | $ | 16.20 | |
| TOTAL RETURN | | 9.98 | %(b) | 0.74 | % | | 34.87 | % | | 19.29 | % | | (30.64 | )% | | (4.88 | )% |
| | | | | | | | | | | | | | | | | | | | | | | | |
| RATIOS/SUPPLEMENTARY DATA | | | | | | | | | | | | | | | | | | | | | | | |
| Net Assets at End of | | | | | | | | | | | | | | | | | | | | | | | |
| | Period (000's omitted) | $154,657 | | | $148,886 | | | $157,655 | | | $123,605 | | | $117,391 | | | $243,183 | |
| Ratios to Average Net Assets: | | | | | | | | | | | | | | | | | | | | | | | |
| Net investment income (loss) | | 0.21 | %(c) | (0.28 | )% | | (0.27 | )% | | (0.29 | )% | | (0.25 | )% | | (0.31 | )% |
| Net expense | | 1.10 | %(c) | 1.10 | % | | 1.10 | % | | 1.10 | % | | 1.10 | % | | 1.15 | % |
| Gross expense (d) | | 1.28 | %(c) | 1.29 | % | | 1.25 | % | | 1.27 | % | | 1.26 | % | | 1.19 | % |
| PORTFOLIO TURNOVER RATE | | 7 | %(b) | 14 | % | | 21 | % | | 8 | % | | 16 | % | | 21 | % |
| | | | | | | | | | | | | | | | | | | | | | | | | |
| (a) | Calculated based on average shares outstanding during each period. |
| (b) | Not annualized. |
| (c) | Annualized. |
| (d) | Reflects the expense ratio excluding any waivers and/or reimbursements. |
| See Notes to Financial Statements. | 21 | DF DENT GROWTH FUNDS |
| | | | | | | | | |
DF DENT MIDCAP GROWTH FUND | | | | | |
| PERFORMANCE CHART AND ANALYSIS | | | | | |
| DECEMBER 31, 2012 | | | | | |
| | | | | | | | | |
The following chart reflects the change in the value of a hypothetical $10,000 investment, including reinvested dividends and distributions, in DF Dent Midcap Growth Fund (the “Fund”) compared with the performance of the benchmark, the Russell Midcap Growth Index ("Russell Midcap Growth"), since inception. The Russell Midcap Growth measures the performance of the mid-cap growth segment of the U.S. equity universe. It includes those Russell Midcap Index companies with higher price-to-book ratios and higher forecasted growth values. The total return of the Russell Midcap Growth includes the reinvestment of dividends and income. The total return of the Fund includes operating expenses that reduce returns, while the total return of the Russell Midcap Growth does not include expenses. The Fund is professionally managed while the Russell Midcap Growth is unmanaged and is not available for investment.
Comparison of Change in Value of a $10,000 Investment
DF Dent Midcap Growth Fund vs. Russell Midcap Index

| Average Annual Total Returns | | | | | | Since Inception |
| Periods Ended December 31, 2012 | | Six Months | | One Year | | 07/01/11 |
| DF Dent Midcap Growth Fund | | 10.17 | % | | 18.31 | % | | 8.93 | % |
| Russell Midcap Index | | 7.13 | % | | 15.81 | % | | 1.53 | % |
Performance data quoted represents past performance and is no guarantee of future results. Current performance may be lower or higher than the performance data quoted. Investment return and principal value will fluctuate so that shares, when redeemed, may be worth more or less than original cost. For the most recent month-end performance, please call (866) 233-3368. As stated in the Fund’s current prospectus, the annual operating expense ratio (gross) is 3.45%. However, the Fund’s adviser has contractually agreed to reduce a portion of its fees and reimburse expenses to limit total operating expenses to 1.10% on the first $150 million in net assets and 0.90% on net assets exceeding $150 million, through October 31, 2015. During the period, certain fees were waived and/or expenses reimbursed; otherwise, returns would have been lower. Shares redeemed within 60 days of purchase will be charged a 2.00% redemption fee. The performance table and graph do not reflect the deduction of taxes that a shareholder would pay on Fund distributions or the redemption of Fund shares.
| See Notes to Financial Statements. | 22 | DF DENT GROWTH FUNDS |
| | | | | | | | | |
DF DENT MIDCAP GROWTH FUND | | | | | |
| SCHEDULE OF INVESTMENTS | | | | | |
| DECEMBER 31, 2012 | | | | | |
| | | | | | | | | |
| | | | Security | | | | | | | | | | | | |
| | Shares | | Description | | | Value | | | | | Security | | | | |
| | | | | | Shares | | Description | | | Value | |
| Consumer Discretionary - 6.8% | | | | | Information Technology - continued | | | | |
| | 5,145 | | American Public Education, Inc. (a) | | $ | 185,786 | | | 6,775 | | Trimble Navigation, Ltd. (a) | $ | 405,009 | |
| | 4,150 | | K12, Inc. (a) | | | 84,826 | | | 3,480 | | Tyler Technologies, Inc. (a) | 168,571 | |
| | 11,255 | | LKQ Corp. (a) | | | 237,480 | | | | | | | | 2,240,326 | |
| | | | | | | 508,092 | | Materials - 2.8% | | | | | |
| Energy - 8.4% | | | | | | 2,885 | | Ecolab, Inc. | | | 207,432 | |
| | 2,350 | | Concho Resources, Inc. (a) | | | 189,316 | | Total Common Stock | | | | |
| | 1,292 | | Core Laboratories NV | | | 141,229 | | (Cost $6,313,929) | | | 7,347,334 | |
| | 4,752 | | Range Resources Corp. | | | 298,568 | | Total Investments - 97.8% | | | | |
| | | | | | | 629,113 | | (Cost $6,313,929)* | | $ | 7,347,334 | |
| Financials - 15.0% | | | | | Other Assets & Liabilities, Net – 2.2% | | | 162,887 | |
| | 2,630 | | American Tower Corp. REIT | | | 203,220 | | Net Assets – 100.0% | | $ | 7,510,221 | |
| | 6,455 | | Financial Engines, Inc. (a) | | | 179,126 | | | | | | | | | |
| | 485 | | Markel Corp. (a) | | | 210,209 | | | | | | | | | |
| | 10,748 | | SEI Investments Co. | | | 250,858 | | | | | | | | | |
| | 4,369 | | T. Rowe Price Group, Inc. | | | 284,553 | | REIT | Real Estate Investment Trust | | | | |
| | | | | | | 1,127,966 | | (a) | Non-income producing security. | | | | |
| Health Care - 7.4% | | | | | | | | | | | | |
| | 2,220 | | IDEXX Laboratories, Inc. (a) | | | 206,016 | | * Cost for federal income tax purposes is substantially the same as for financial statement purposes and net unrealized appreciation consists of: | |
| | 2,765 | | Illumina, Inc. (a) | | | 153,706 | | |
| | 4,820 | | ResMed, Inc. | | | 200,368 | | Gross Unrealized Appreciation | | | $ | 1,120,834 | |
| | | | | | | 560,090 | | Gross Unrealized Depreciation | | | | (87,429 | ) |
| Industrials - 27.6% | | | | | Net Unrealized Appreciation | | | $ | 1,033,405 | |
| | 2,570 | | Clean Harbors, Inc. (a) | | | 141,376 | | | | | | | | | |
| | 7,842 | | Expeditors International of Washington, Inc. | | | 310,151 | | The following is a summary of the inputs used to value the Fund’s investments as of December 31, 2012. | |
| | 9,454 | | Fastenal Co. | | | 441,407 | | The inputs or methodology used for valuing securities are not necessarily an indication of the risks associated with investing in those securities. For more information on valuation inputs, and their aggregation into the levels used in the tables below, please refer to the Security Valuation section in Note 2 of the accompanying Notes to Financial Statements. | |
| | 1,125 | | Gardner Denver, Inc. | | | 77,063 | | |
| | 5,535 | | Healthcare Services Group, Inc. | | | 128,578 | | |
| | 9,467 | | II-VI, Inc. (a) | | | 172,962 | | | | | | | | | |
| | 11,530 | | Innerworkings, Inc. (a) | | | 158,883 | | Valuation Inputs | | | Investments in Securities | |
| | 3,885 | | Jacobs Engineering Group, Inc. (a) | | | 165,384 | | Level 1 - Quoted Prices | | $ | 7,347,334 | |
| | 1,309 | | Roper Industries, Inc. | | | 145,927 | | Level 2 - Other Significant Observable Inputs | | | - | |
| | 2,325 | | Stericycle, Inc. (a) | | | 216,853 | | Level 3 - Significant Unobservable Inputs | | | - | |
| | 3,425 | | Waste Connections, Inc. | | | 115,731 | | Total | | | | | $ | 7,347,334 | |
| | | | | | | 2,074,315 | | | | | | | | | |
| Information Technology - 29.8% | | | | | The Level 1 inputs displayed in this table are Common Stock. Refer to the Schedule of Investments for a further breakout of each security by type. | |
| | 5,590 | | 3D Systems Corp. (a) | | | 298,227 | | |
| | 8,070 | | ADTRAN, Inc. | | | 157,688 | | There were no transfers between Level 1 and Level 2 for the period ended December 31, 2012. | |
| | 5,625 | | ANSYS, Inc. (a) | | | 378,787 | | | | | | | | | |
| | 2,490 | | Concur Technologies, Inc. (a) | | | 168,125 | | | | | | | | | |
| | 1,705 | | CoStar Group, Inc. (a) | | | 152,376 | | | | | | | | | |
| | 7,622 | | DealerTrack Holdings, Inc. (a) | | | 218,904 | | | | | | | | | |
| | 11,210 | | NIC, Inc. | | | 183,171 | | | | | | | | | |
| | 5,075 | | RealPage, Inc. (a) | | | 109,468 | | | | | | | | | |
| | | | | | | | | | | | | | | | |
| See Notes to Financial Statements. | 23 | DF DENT GROWTH FUNDS |
| | | | | | | | | |
DF DENT MIDCAP GROWTH FUND | | | | | |
| SCHEDULE OF INVESTMENTS | | | | | |
| DECEMBER 31, 2012 | | | | | |
| | | | | | | | | |
| | | | | | | | | | | | | | | | | |
| PORTFOLIO HOLDINGS | | | | | | | | | | | | | |
| % of Net Assets | | | | | | | | | | | | | | |
| Consumer Discretionary | | | 6.8 | % | | | | | | | | | | |
| Energy | | | 8.4 | % | | | | | | | | | | |
| Financials | | | 15.0 | % | | | | | | | | | | |
| Health Care | | | 7.4 | % | | | | | | | | | | |
| Industrials | | | 27.6 | % | | | | | | | | | | |
| Information Technology | | 29.8 | % | | | | | | | | | | |
| Materials | | | 2.8 | % | | | | | | | | | | |
| Other Assets & Liabilities, Net | | 2.2 | % | | | | | | | | | | |
| | | | | | 100.0 | % | | | | | | | | | | |
| | | | | | | | | | | | | | | | | |
| See Notes to Financial Statements. | 24 | DF DENT GROWTH FUNDS |
| | | | | | | | | |
DF DENT MIDCAP GROWTH FUND | | | | | |
| SCHEDULE OF ASSETS AND LIABILITIES | | | | | |
| DECEMBER 31, 2012 | | | | | |
| | | | | | | | | |
| ASSETS | | | | |
| | Total investments, at value (Cost $6,313,929) | | $ | 7,347,334 | |
| | Cash | | | 173,497 | |
| | Receivables: | | | | |
| | | Fund shares sold | | | 20,018 | |
| | | Interest | | | 13 | |
| | Prepaid expenses | | | 3,175 | |
| Total Assets | | | 7,544,037 | |
| | | | | | | |
| LIABILITIES | | | | |
| | Payables: | | | | |
| | | Fund shares redeemed | | | 20,018 | |
| | Accrued Liabilities: | | | | |
| r | Investment adviser fees | | | 3,871 | |
| | | Trustees’ fees and expenses | | | 15 | |
| | | Fund services fees | | | 1,633 | |
| | | Other expenses | | | 8,279 | |
| Total Liabilities | | | 33,816 | |
| | | | | | | |
| NET ASSETS | | $ | 7,510,221 | |
| | | | | | | |
| COMPONENTS OF NET ASSETS | | | | |
| | Paid-in capital | | $ | 6,451,555 | |
| | Distributions in excess of net investment income | | | (9,574 | ) |
| | Accumulated net realized gain | | | 34,835 | |
| | Net unrealized appreciation | | | 1,033,405 | |
| NET ASSETS | | $ | 7,510,221 | |
| SHARES OF BENEFICIAL INTEREST AT NO PAR VALUE (UNLIMITED SHARES AUTHORIZED) | | | 660,644 | |
NET ASSET VALUE, OFFERING AND REDEMPTION PRICE PER SHARE* | | $ | 11.37 | |
| * | Shares redeemed or exchanged within 60 days of purchase are charged a 2.00% redemption fee. |
| See Notes to Financial Statements. | 25 | DF DENT GROWTH FUNDS |
| | | | | | | | | |
DF DENT MIDCAP GROWTH FUND | | | | | |
| STATEMENT OF OPERATIONS | | | | | |
| SIX MONTHS ENDED DECEMBER 31, 2012 | | | | | |
| | | | | | | | | |
| INVESTMENT INCOME | | | | |
| | Dividend income (Net of foreign withholding taxes of $103) | | $ | 35,041 | |
| | Interest income | | | 95 | |
| Total Investment Income | | | 35,136 | |
| | | | | |
| EXPENSES | | | | |
| | Investment adviser fees | | | 34,019 | |
| | Fund services fees | | | 9,384 | |
| | Custodian fees | | | 2,585 | |
| | Registration fees | | | 2,967 | |
| | Professional fees | | | 11,359 | |
| | Trustees' fees and expenses | | | 113 | |
| | Miscellaneous expenses | | | 5,548 | |
| Total Expenses | | | 65,975 | |
| | Fees waived and expenses reimbursed | | | (28,553 | ) |
| Net Expenses | | | 37,422 | |
| | | | | | | |
| NET INVESTMENT LOSS | | | (2,286 | ) |
| | | | | | | |
| NET REALIZED AND UNREALIZED GAIN (LOSS) | | | | |
| | Net realized gain on investments | | | 40,415 | |
| | Net change in unrealized appreciation (depreciation) on investments | | | 644,751 | |
| NET REALIZED AND UNREALIZED GAIN | | | 685,166 | |
| INCREASE IN NET ASSETS FROM OPERATIONS | | $ | 682,880 | |
| | | | | | | |
| See Notes to Financial Statements. | 26 | DF DENT GROWTH FUNDS |
| | | | | | | | | |
DF DENT MIDCAP GROWTH FUND | | | | | |
| STATEMENT OF CHANGES IN NET ASSETS | | | | | |
| | | | | | |
| | | | | | | | | |
| | | | | For the Six Months Ended December 31, 2012 | | | July 1, 2011* through June 30, 2012 |
| OPERATIONS | | | | | | | | | |
| | Net investment loss | | $ | (2,286 | ) | | | $ | (10,967 | ) |
| | Net realized gain (loss) | | | 40,415 | | | | | (1,943 | ) |
| | Net change in unrealized appreciation (depreciation) | | | 644,751 | | | | | 388,654 | |
| Increase in Net Assets Resulting from Operations | | | 682,880 | | | | | 375,744 | |
| | | | | | | | | | | | |
| CAPITAL SHARE TRANSACTIONS | | | | | | | | | |
| | Sale of shares | | | 451,038 | | | | | 6,053,750 | |
| | Redemption of shares | | | (47,151 | ) | | | | (6,040 | ) |
| Increase in Net Assets from Capital Share Transactions | | | 403,887 | | | | | 6,047,710 | |
| Increase in Net Assets | | | 1,086,767 | | | | | 6,423,454 | |
| | | | | | | | | | | | |
| NET ASSETS | | | | | | | | | |
| | Beginning of Period | | | 6,423,454 | | | | | - | |
| | End of Period (Including line (a)) | | $ | 7,510,221 | | | | $ | 6,423,454 | |
| | | | | | | | | | | | |
| SHARE TRANSACTIONS | | | | | | | | | |
| | Sale of shares | | | 42,358 | | | | | 623,167 | |
| | Redemption of shares | | | (4,280 | ) | | | | (601 | ) |
| Increase in Shares | | | 38,078 | | | | | 622,566 | |
| | | | | | | | | | | | |
| (a) | Distributions in excess of net investment income. | | $ | (9,574 | ) | | | $ | (7,288 | ) |
| * | Commencement of operations. | | | | | | | | | |
| See Notes to Financial Statements. | 27 | DF DENT GROWTH FUNDS |
| | | | | | | | | |
DF DENT MIDCAP GROWTH FUND | | | | | |
| FINANCIAL HIGHLIGHTS | | | | | |
| | | | | | |
| | | | | | | | | |
These financial highlights reflect selected data for a share outstanding throughout each period. |
| | | For the Six Months Ended December 31, 2012 | | July 1, 2011 (a) through June 30, 2012 |
| | | | | | | |
| NET ASSET VALUE, Beginning of Period | $ | 10.32 | | | $ | 10.00 | | |
| INVESTMENT OPERATIONS | | | | | | | | |
| Net investment loss (b) | | — | (c) | | (0.05 | ) | |
| Net realized and unrealized gain (loss) | | 1.05 | | | | 0.37 | | |
| Total from Investment Operations | | 1.05 | | | | 0.32 | | |
| NET ASSET VALUE, End of Period | $ | 11.37 | | | $ | 10.32 | | |
| TOTAL RETURN | | 10.17 | %(d) | 3.20 | %(d) |
| | | | | | | | | |
| RATIOS/SUPPLEMENTARY DATA | | | | | | | | |
| Net Assets at End of Period (000's omitted) | $7,510 | | | $6,423 | | |
| Ratios to Average Net Assets: | | | | | | | | |
| Net investment loss | | (0.07 | )%(e) | (0.55 | )%(e) |
| Net expense | | 1.10 | %(e) | 1.10 | %(e) |
| Gross expense (f) | | 1.93 | %(e) | 3.45 | %(e) |
| PORTFOLIO TURNOVER RATE | | 18 | %(d) | 24 | %(d) |
| | | | | | | | | | |
| (a) | Commencement of operations. |
| (b) | Calculated based on average shares outstanding during each period. |
| (c) | Less than $0.01 per share. |
| (d) | Not annualized. |
| (e) | Annualized. |
| (f) | Reflects the expense ratio excluding any waivers and/or reimbursements. |
| See Notes to Financial Statements. | 28 | DF DENT GROWTH FUNDS |
| | | | | | | | | |
DF DENT GROWTH FUNDS | | | | | |
| NOTES TO FINANCIAL STATEMENTS | | | | | |
| DECEMBER 31, 2012 | | | | | |
| | | | | | | | | |
Note 1. Organization
DF Dent Premier Growth Fund and DF Dent Midcap Growth Fund (individually, a “Fund” and, collectively the “Funds”) are diversified and non-diversified portfolios of Forum Funds (the “Trust”), respectively. The Trust is a Delaware statutory trust that is registered as an open-end, management investment company under the Investment Company Act of 1940 (the “Act”), as amended. Under its Trust Instrument, the Trust is authorized to issue an unlimited number of each Fund’s shares of beneficial interest without par value. The DF Dent Premier Growth Fund and the DF Dent Midcap Growth Fund commenced operations on July 16, 2001, and July 1, 2011, respectively. The Funds seek long-term capital appreciation.
Note 2. Summary of Significant Accounting Policies
These financial statements are prepared in accordance with accounting principles generally accepted in the United States of America (“GAAP”), which require management to make estimates and assumptions that affect the reported amounts of assets and liabilities, the disclosure of contingent liabilities at the date of the financial statements, and the reported amounts of increase and decrease in net assets from operations during the fiscal period. Actual amounts could differ from those estimates. The following summarizes the significant accounting policies of each Fund:
Security Valuation – Exchange-traded securities and over-the-counter securities are valued using the last quoted sale or official closing price, provided by independent pricing services as of the close of trading on the market or exchange for which they are primarily traded, on each Fund business day. In the absence of a sale, such securities are valued at the mean of the last bid and ask price provided by independent pricing services. Non-exchange traded securities for which quotations are available are valued using the last quoted sales price, or in the absence of a sale at the mean of the last bid and ask prices provided by independent pricing services. Shares of open-end mutual funds are valued at net asset value (“NAV”). Short-term investments that mature in 60 days or less may be valued at amortized cost.
Each Fund values its investments at fair value pursuant to procedures adopted by the Trust's Board of Trustees (the "Board") if (1) market quotations are insufficient or not readily available or (2) the adviser believes that the values available are unreliable. The Trust’s Valuation Committee performs certain functions as they relate to the administration and oversight of each Fund’s valuation procedures. Under these procedures, the Valuation Committee convenes on a regular and ad-hoc basis to review such securities and considers a number of factors, including valuation methodologies and significant unobservable inputs, when arriving at fair value.
The Valuation Committee may work with an adviser to provide valuation inputs. In determining fair valuations, inputs may include market-based analytics which may consider related or comparable assets or liabilities, recent transactions, market multiples, book values and other relevant investment information. Adviser inputs may include an income-based approach in which the anticipated future cash flows of the investment are discounted in determining fair value. Discounts may also be applied based on the nature or duration of any restrictions on the disposition of the investments. The Valuation Committee performs regular reviews of valuation methodologies, key inputs and assumptions, disposition analysis and market activity.
| | | | | | | | | |
DF DENT GROWTH FUNDS | | | | | |
| NOTES TO FINANCIAL STATEMENTS | | | | | |
| DECEMBER 31, 2012 | | | | | |
| | | | | | | | | |
Fair valuation is based on subjective factors and, as a result, the fair value price of an investment may differ from the security’s market price and may not be the price at which the asset may be sold. Fair valuation could result in a different NAV than a NAV determined by using market quotes.
Each Fund has a three-tier fair value hierarchy. The basis of the tiers is dependent upon the various “inputs” used to determine the value of each Fund’s investments. These inputs are summarized in the three broad levels listed below:
Level 1 — quoted prices in active markets for identical assets
Level 2 — other significant observable inputs (including quoted prices of similar securities, interest rates, prepayment speeds, credit risk, etc.)
Level 3 — significant unobservable inputs (including each Fund’s own assumptions in determining the fair value of investments)
The aggregate value by input level, as of December 31, 2012, for each Fund’s investments is included at the end of each Fund’s Schedule of Investments.
Security Transactions, Investment Income and Realized Gain and Loss – Investment transactions are accounted for on the trade date. Dividend income is recorded on the ex-dividend date. Foreign dividend income is recorded on the ex-dividend date or as soon as possible after each Fund determines the existence of a dividend declaration after exercising reasonable due diligence. Income and capital gains on some foreign securities may be subject to foreign withholding taxes, which are accrued as applicable. Interest income is recorded on an accrual basis. Premium is amortized and discount is accreted using the effective interest method. Identified cost of investments sold is used to determine the gain and loss for both financial statement and federal income tax purposes.
Distributions to Shareholders – Distributions to shareholders of net investment income and net capital gains, if any, are declared and paid at least annually. Distributions are based on amounts calculated in accordance with applicable federal income tax regulations, which may differ from GAAP. These differences are due primarily to differing treatments of income and gain on various investment securities held by each Fund, timing differences and differing characterizations of distributions made by each Fund.
Federal Taxes – Each Fund intends to continue to qualify each year as a regulated investment company under Subchapter M of the Internal Revenue Code and to distribute all of its taxable income to shareholders. In addition, by distributing in each calendar year substantially all of its net investment income and capital gains, if any, the Fund will not be subject to a federal excise tax. Therefore, no federal income or excise tax provision is required. Each Fund files a U.S. federal income and excise tax return as required. A fund’s federal income tax returns are subject to examination by the Internal Revenue Service for a period of three fiscal years after they are filed. As of December 31, 2012, there are no uncertain tax positions that would require financial statement recognition, de-recognition, or disclosure.
| | | | | | | | | |
DF DENT GROWTH FUNDS | | | | | |
| NOTES TO FINANCIAL STATEMENTS | | | | | |
| DECEMBER 31, 2012 | | | | | |
| | | | | | | | | |
Income and Expense Allocation – The Trust accounts separately for the assets, liabilities and operations of each of its investment portfolios. Expenses that are directly attributable to more than one investment portfolio are allocated among the respective investment portfolios in an equitable manner.
Redemption Fees – A shareholder who redeems shares of the DF Dent Midcap Growth Fund within 60 days of purchase will incur a redemption fee of 2.00% of the current net asset value of shares redeemed, subject to certain limitations. The fee is charged for the benefit of the remaining shareholders and will be paid to the Fund to help offset transaction costs. The fee is accounted for as an addition to paid-in capital. The Fund reserves the right to modify the terms of or terminate the fee at any time. There are limited exceptions to the imposition of the redemption fee.
Commitments and Contingencies – In the normal course of business, each Fund enters into contracts that provide general indemnifications by each Fund to the counterparty to the contract. Each Fund’s maximum exposure under these arrangements is dependent on future claims that may be made against each Fund and, therefore, cannot be estimated; however, based on experience, the risk of loss from such claims is considered remote.
Note 3. Fees and Expenses
Investment Adviser – D.F. Dent and Company, Inc. (the “Adviser”) is the investment adviser to each Fund. Pursuant to an investment advisory agreement, the Adviser receives an advisory fee from each Fund at an annual rate of 1.00% of each Fund’s average daily net assets.
Distribution – Foreside Fund Services, LLC serves as each Fund’s distributor (the “Distributor”). The Distributor receives no compensation from the Funds for its distribution services. The Distributor is not affiliated with the Adviser or Atlantic Fund Administration, LLC (d/b/a Atlantic Fund Services) (“Atlantic”) or their affiliates.
Other Service Providers – Atlantic provides fund accounting, fund administration, compliance and transfer agency services to each Fund. Atlantic also provides certain shareholder report production, and EDGAR conversion and filing services. Pursuant to an Atlantic services agreement, each Fund pays Atlantic customary fees for its services. Atlantic provides a Principal Executive Officer, a Principal Financial Officer, a Chief Compliance Officer, and an Anti-Money Laundering Officer to each Fund, as well as certain additional compliance support functions.
Trustees and Officers – The Trust pays each independent Trustee an annual retainer fee of $45,000 for service to the Trust ($66,000 for the Chairman). The Trustees and Chairman may receive additional fees for special Board meetings. Each Trustee is also reimbursed for all reasonable out-of-pocket expenses incurred in connection with his duties as a Trustee, including travel and related expenses incurred in attending Board meetings. The amount of Trustees’ fees attributable to each Fund is disclosed in the Statement of Operations. Certain officers of the Trust are also officers or employees of the above named service providers, and during their terms of office received no compensation from each Fund.
| | | | | | | | | |
DF DENT GROWTH FUNDS | | | | | |
| NOTES TO FINANCIAL STATEMENTS | | | | | |
| DECEMBER 31, 2012 | | | | | |
| | | | | | | | | |
Note 4. Fees Waived
The Adviser has contractually agreed to reduce a portion of its fee and reimburse certain expenses through October 31, 2015, to the extent that annual operating expenses exceed 1.10% on the first $150 million of net assets and to the extent that annual operating expenses exceed 0.90% on net assets exceeding $150 million of each Fund. Other fund service providers have voluntarily agreed to waive and reimburse a portion of their fees. These voluntary fee waivers and reimbursements may be reduced or eliminated at any time. For the period ended December 31, 2012, fees waived were as follows:
| | Investment Adviser Fees Waived | | Other Waivers | | Total Fees Waived |
| DF Dent Premier Growth Fund | $ | 117,678 | | $ | 21,732 | | $ | 139,410 |
| DF Dent Midcap Growth Fund | | 27,583 | | | 970 | | | 28,553 |
Note 5. Security Transactions
The cost of purchases and proceeds from sales of investment securities (including maturities), other than short-term investments during the period ended December 31, 2012, were as follows:
| | | Purchases | | Sales |
| DF Dent Premier Growth Fund | | $ | 9,886,504 | | $ | 19,065,707 |
| DF Dent Midcap Growth Fund | | | 1,482,992 | | | 1,196,237 |
Note 6. Federal Income Tax and Investment Transactions
As of June 30, 2012, distributable earnings (accumulated loss) on a tax basis were as follows:
| | | Capital and Other Losses | | Unrealized Appreciation | | Total |
| DF Dent Premier Growth Fund | | $ | (39,594,879 | ) | | $ | 32,443,150 | | | $ | (7,151,729 | ) |
| DF Dent Midcap Growth Fund | | | (7,288 | ) | | | 383,074 | | | | 375,786 | |
The difference between components of distributable earnings on a tax basis and the amounts reflected in the Statement of Assets and Liabilities are primarily due to wash sales.
For tax purposes, the prior deferred late year ordinary loss was $194,300 and $7,288 (realized during the period November 1, 2011 through June 30, 2012) for DF Dent Premier Growth Fund and DF Dent Midcap Growth Fund, respectively. These losses were recognized for tax purposes on the first business day of each
| | | | | | | | | |
DF DENT GROWTH FUNDS | | | | | |
| NOTES TO FINANCIAL STATEMENTS | | | | | |
| DECEMBER 31, 2012 | | | | | |
| |
Fund’s current fiscal year, July 1, 2012.
As of June 30, 2012, the DF Dent Premier Growth Fund had capital loss carryforwards to offset future capital gains of $9,922,473 and $29,478,106, expiring in 2017 and 2018, respectively.
Note 7. Recent Accounting Pronouncements
In May 2011, FASB issued ASU No. 2011-04 “Amendments to Achieve Common Fair Value Measurement and Disclosure Requirements in U.S. GAAP and IFRSs.” ASU No. 2011-04 establishes common requirements for measuring fair value and for disclosing information about fair value measurements in accordance with U.S. GAAP and International Financial Reporting Standards (“IFRSs”). ASU No. 2011-04 is effective for interim and annual periods beginning after December 15, 2011. Management has evaluated ASU No. 2011-04 and has determined that it did not have a significant impact on the reporting of the financial statement disclosures.
In December 2011, FASB issued ASU No. 2011-11 “Disclosures about Offsetting Assets and Liabilities” requiring disclosure of both gross and net information related to offsetting and related arrangements enabling users of its financial statements to understand the effect of those arrangements on the entity’s financial position. The objective of this disclosure is to facilitate comparison between those entities that prepare their financial statements on the basis of U.S. GAAP and those entities that prepare their financial statements on the basis of IFRSs. ASU No. 2011-11 is effective for interim and annual periods beginning on or after January 1, 2013. Management is evaluating any impact ASU No. 2011-11 may have on each Fund’s financial statements.
Note 8. Subsequent Events
Subsequent events occurring after the date of this report through the date these financial statements were issued have been evaluated for potential impact and each Fund has had no such events.
| | | | | | | | | |
DF DENT GROWTH FUNDS | | | | | |
| ADDITIONAL INFORMATION | | | | | |
| DECEMBER 31, 2012 | | | | | |
| |
Proxy Voting Information
A description of the policies and procedures that each Fund uses to determine how to vote proxies relating to securities held in each Fund’s portfolio is available, without charge and upon request, by calling (866) 233-3368 and on the U.S. Securities and Exchange Commission’s (the “SEC”) website at www.sec.gov. Each Fund’s proxy voting record for the most recent twelve-month period ended June 30 is available, without charge and upon request, by calling (866) 233-3368 and on the SEC’s website at www.sec.gov.
Availability of Quarterly Portfolio Schedules
Each Fund files its complete schedule of portfolio holdings with the SEC for the first and third quarters of each fiscal year on Form N-Q. These filings are available, without charge and upon request on the SEC’s website at www.sec.gov or may be reviewed and copied at the SEC’s Public Reference Room in Washington, DC. Information on the operation of the Public Reference Room may be obtained by calling (800) SEC-0330.
Shareholder Expense Example
As a shareholder of the Funds, you incur two types of costs: (1) transaction costs, including redemption fees, and (2) ongoing costs, including management fees and other Fund expenses. This example is intended to help you understand your ongoing costs (in dollars) of investing in the Funds, and to compare these costs with the ongoing costs of investing in other mutual funds.
The example is based on an investment of $1,000 invested at the beginning of the period and held for the entire period from July 1, 2012, through December 31, 2012.
Actual Expenses – The first line of the table below provides information about actual account values and actual expenses. You may use the information in this line, together with the amount you invested, to estimate the expenses that you paid over the period. Simply divide your account value by $1,000 (for example, an $8,600 account value divided by $1,000 = 8.6), then multiply the result by the number in the first line under the heading entitled “Expenses Paid During Period” to estimate the expenses you paid on your account during the period.
Hypothetical Example for Comparison Purposes – The second line of the table below provides information about hypothetical account values and hypothetical expenses based on each Fund’s actual expense ratio and an assumed rate of return of 5% per year before expenses, which is not each Fund’s actual return. The hypothetical account values and expenses may not be used to estimate the actual ending account balance or expenses you paid for the period. You may use this information to compare the ongoing costs of investing in each Fund and other funds. To do so, compare this 5% hypothetical example with the 5% hypothetical examples that appear in the shareholder reports of other funds.
Please note that the expenses shown in the table are meant to highlight your ongoing costs only and do not reflect any transactional costs, such as redemption fees. Therefore, the second line of the table is useful in comparing ongoing costs only, and will not help you determine the relative total costs of owning different
| | | | | | | | | |
DF DENT GROWTH FUNDS | | | | | |
| ADDITIONAL INFORMATION | | | | | |
| DECEMBER 31, 2012 | | | | | |
| |
funds. In addition, if these transactional costs were included, your costs would have been higher.
| | Beginning | | Ending | | Expenses | | Annualized |
| | Account Value | | Account Value | | Paid During | | Expense |
| DF Dent Premier Growth Fund | July 1, 2012 | | December 31, 2012 | | Period* | | Ratio* |
| Actual | $ | 1,000.00 | | $ | 1,099.84 | | $ | 5.82 | | 1.10 | % |
| Hypothetical (5% return before taxes) | $ | 1,000.00 | | $ | 1,019.66 | | $ | 5.60 | | 1.10 | % |
| DF Dent Midcap Growth Fund | | | | | | | | | | | |
| Actual | $ | 1,000.00 | | $ | 1,101.74 | | $ | 5.83 | | 1.10 | % |
| Hypothetical (5% return before taxes) | $ | 1,000.00 | | $ | 1,019.66 | | $ | 5.60 | | 1.10 | % |
| | *Expenses are equal to the Fund’s annualized expense ratio multiplied by the average account value over the period, multiplied by the number of days in the most recent fiscal half-year divided by 365 to reflect the half-year period. |
| | | | | | | | | |
| Performance Charts and Analysis | | | | | | | 1 | |
| | | | | | | | | |
| Schedules of Investments | | | | | | | 3 | |
| | | | | | | | | |
| Statements of Assets and Liabilities | | | | | | | 7 | |
| | | | | | | | | |
| Statements of Operations | | | | | | | 8 | |
| | | | | | | | | |
| Statements of Changes in Net Assets | | | | | | | 9 | |
| | | | | | | | | |
| Financial Highlights | | | | | | | 10 | |
| | | | | | | | | |
| Notes to Financial Statements | | | | | | | 11 | |
| | | | | | | | | |
| Additional Information | | | | | | | 16 | |
| | | | | | | | | |
| | | | | | | | | |
| GOLDEN LARGE CAP CORE FUND | | | | | | | | |
| PERFORMANCE CHART AND ANALYSIS | | | | | | | | |
| DECEMBER 31, 2012 | | | | | | | | |
| | | | | | | | | |
The following chart reflects the change in the value of a hypothetical $10,000 investment in Institutional Shares, including reinvested dividends and distributions, in Golden Large Cap Core Fund (the “Fund”) compared with the performance of the benchmark, the S&P 500 Index (S&P 500"), since inception. The S&P 500 is a broad-based, unmanaged measurement of changes in stock market conditions based on the average of 500 widely held common stocks. The total return of the S&P 500 includes the reinvestment of dividends and income. The total return of the Fund includes operating expenses that reduce returns, while the total return of the S&P 500 does not include expenses. The Fund is professionally managed while the S&P 500 is unmanaged and is not available for investment.
Comparison of Change in Value of a $10,000 Investment
Golden Large Cap Core Fund vs. S&P 500 Index

| Average Annual Total Returns | | | | | | Since Inception |
| Periods Ended December 31, 2012 | | | | Five Years | | (09/13/05) |
| Golden Large Cap Core Fund | | 16.89 | % | | 0.64 | % | | 3.39 | % |
| S&P 500 Index | | 16.00 | % | | 1.66 | % | | 4.22 | % |
Performance data quoted represents past performance and is no guarantee of future results. Current performance may be lower or higher than the performance data quoted. Investment return and principal value will fluctuate so that shares, when redeemed, may be worth more or less than original cost. For the most recent month-end performance, please call (800) 206-8610. As stated in the Fund's prospectus, the annual operating expense ratios (gross) for Institutional Shares and Investor Shares are 0.70% and 0.95%, respectively. However, the Fund's adviser has agreed to contractually reduce a portion of its fees and to reimburse expenses such that total operating expenses do not exceed 0.70% and 0.95% for Institutional Shares and Investor Shares, respectively, through at least October 31, 2013. The performance table and graph do not reflect the deduction of taxes that a shareholder would pay on Fund distributions or the redemption of Fund shares. Returns greater than one year are annualized.
| | | | | | | | | |
| GOLDEN SMALL CAP CORE FUND | | | | | | | | |
| PERFORMANCE CHART AND ANALYSIS | | | | | | | | |
| DECEMBER 31, 2012 | | | | | | | | |
| | | | | | | | | |
The following chart reflects the change in the value of a hypothetical $10,000 investment in Institutional Shares, including reinvested dividends and distributions, in the Golden Small Cap Core Fund (the “Fund”) compared with the performance of the primary benchmark, the Russell 2000 Index ("Russell 2000"), and the secondary benchmark, the S&P 600 Index ("S&P 600"), since inception. The Russell 2000, is an unmanaged, market value weighted index, which measures performance of the 2,000 companies that are between the 1,000th and 3,000th largest in the market. The S&P 600 is designed to be an accurate measure of the performance of small companies, reflecting the risk and return characteristics of the broader smallcap universe. The total return of the indices include the reinvestment of dividends and income. The total return of the Fund includes operating expenses that reduce returns, while the total return of the indices do not include expenses. The Fund is professionally managed while the indices are unmanaged and are not available for investment.
Comparison of Change in Value of a $10,000 Investment
Golden Small Cap Core Fund vs. Russell 200 Index and S&P 600 Index
| Average Annual Total Returns | | | | | | Since Inception |
| Periods Ended December 31, 2012 | | | | Five Years | | (09/13/05) |
| Golden Small Cap Core Fund | | 14.47 | % | | 0.64 | % | | 2.32 | % |
Russell 2000 Index | | 16.35 | % | | 3.56 | % | | 4.65 | % |
| S&P 600 Index | | 16.32 | % | | 5.14 | % | | 5.51 | % |
Performance data quoted represents past performance and is no guarantee of future results. Current performance may be lower or higher than the performance data quoted. Investment return and principal value will fluctuate so that shares, when redeemed, may be worth more or less than original cost. For the most recent month-end performance, please call (800) 206-8610. As stated in the Fund's prospectus, the annual operating expense ratios (gross) for Institutional Shares and Investor Shares are 1.10% and 1.35%, respectively. However, the Fund's adviser has agreed to contractually reduce a portion of its fees and to reimburse expenses such that total operating expenses do not exceed 1.10% and 1.35% for Institutional Shares and Investor Shares, respectively, through at least October 31, 2013. The performance table and graph do not reflect the deduction of taxes that a shareholder would pay on Fund distributions or the redemption of Fund shares. Returns greater than one year are annualized.
| | | | | | | | | |
| GOLDEN LARGE CAP CORE FUND | | | | | | | | |
| SCHEDULE OF INVESTMENTS | | | | | | | | |
| DECEMBER 31, 2012 | | | | | | | | |
| | | | | | | | | |
| AF | | | Security | | | | | | | | Security | | | | |
| AF | Shares | | | | | Value | | | Shares | | Description | | | Value | |
| Common Stock - 96.6% | | | | | | | 6,872 | | WABCO Holdings, Inc. (a) | $ | 447,986 | |
| Consumer Discretionary - 13.2% | | | | | | | | | | | 3,136,515 | |
| | 13,185 | | Comcast Corp., Class A | | $ | 492,855 | | Materials - 2.2% | | | | | |
| | 15,216 | | Foot Locker, Inc. | | | 488,738 | | | 8,040 | | WR Grace & Co. (a) | | 540,529 | |
| | 14,294 | | GNC Holdings, Inc., Class A | | | 475,705 | | | | | | | | | |
| | 6,907 | | Ross Stores, Inc. | | | 374,014 | | Technology - 18.8% | | | | | |
| | 8,278 | | The Home Depot, Inc. | | | 511,994 | | | 7,205 | | Accenture PLC, Class A | | 479,132 | |
| | 9,330 | | The Walt Disney Co. | | | 464,541 | | | 3,330 | | Alliance Data Systems Corp. (a) | 482,051 | |
| | 11,445 | | TJX Cos., Inc. | | | 485,840 | | | 884 | | Apple, Inc. | | | 471,199 | |
| | | | | | | 3,293,687 | | | 41,680 | | Cadence Design Systems, Inc. (a) | 563,097 | |
| Consumer Staples - 7.2% | | | | | | | 25,830 | | Cisco Systems, Inc. | | 507,559 | |
| | 11,343 | | CVS Caremark Corp. | | | 548,434 | | | 17,534 | | EMC Corp. (a) | | 443,610 | |
| | 9,095 | | Herbalife, Ltd. | | | 299,589 | | | 8,783 | | IAC/InterActiveCorp. | | 415,436 | |
| | 10,575 | | Spectrum Brands Holdings, Inc. (a) | | | 475,135 | | | 14,120 | | Microsoft Corp. | | 377,428 | |
| | 6,878 | | Wal-Mart Stores, Inc. | | | 469,286 | | | 15,091 | | Oracle Corp. | | 502,832 | |
| | | | | | | 1,792,444 | | | 7,049 | | QUALCOMM, Inc. | | 437,179 | |
| Energy - 9.3% | | | | | | | | | | | | 4,679,523 | |
| | 4,096 | | Chevron Corp. | | | 442,942 | | Telecommunications - 2.1% | | | | | |
| | 8,103 | | ConocoPhillips | | | 469,893 | | | 11,788 | | Verizon Communications, Inc. | 510,067 | |
| | 4,889 | | Exxon Mobil Corp. | | | 423,143 | | | | | | | | | |
| | 10,995 | | HollyFrontier Corp. | | | 511,817 | | Utilities - 1.7% | | | | | |
| | 9,010 | | Phillips 66 | | | 478,431 | | | 6,740 | | Duke Energy Corp. | | 430,012 | |
| | | | | | | 2,326,226 | | Total Common Stock | | | | | |
| Financials - 16.3% | | | | | | (Cost $19,192,552) | | | | 24,070,064 | |
| | 6,856 | | ACE, Ltd. | | | 547,109 | | Total Investments - 96.6% | | | | | |
| | 32,851 | | Fifth Third Bancorp | | | 499,007 | | (Cost $19,192,552)* | | | $ | 24,070,064 | |
| | 12,648 | | JPMorgan Chase & Co. | | | 556,132 | | Other Assets & Liabilities, Net – 3.4% | | | 841,750 | |
| | 15,048 | | MetLife, Inc. | | | 495,681 | | Net Assets – 100.0% | | | $ | 24,911,814 | |
| | 17,300 | | SunTrust Banks, Inc. | | | 490,455 | | | | | | | | | |
| | 12,010 | | The Allstate Corp. | | | 482,442 | | PLC | Public Limited Company | | | | |
| | 3,990 | | The Goldman Sachs Group, Inc. | | | 508,964 | | (a) | Non-income producing security. | | | | |
| | 15,195 | | U.S. Bancorp | | | 485,328 | | | | | | | | | |
| | | | | | | 4,065,118 | | * Cost for federal income tax purposes is substantially the same as for financial statement purposes and net unrealized appreciation consists of: | |
| Health Care - 13.2% | | | | | | |
| | 7,245 | | Abbott Laboratories | | | 474,547 | | | | | | | | | |
| | 6,248 | | Amgen, Inc. | | | 539,327 | | Gross Unrealized Appreciation | | | $ | 5,202,732 | |
| | 6,298 | | Celgene Corp. (a) | | | 495,779 | | Gross Unrealized Depreciation | | | | (325,220 | ) |
| | 5,053 | | Johnson & Johnson | | | 354,215 | | Net Unrealized Appreciation | | | $ | 4,877,512 | |
| | 4,787 | | McKesson Corp. | | | 464,148 | | | | | | | | | |
| | 7,910 | | Thermo Fisher Scientific, Inc. | | | 504,500 | | | | | | | | | |
| | 8,544 | | UnitedHealth Group, Inc. | | | 463,427 | | | | | | | | | |
| | | | | | | 3,295,943 | | | | | | | | | |
| Industrials - 12.6% | | | | | | | | | | | | | |
| | 12,825 | | Chicago Bridge & Iron Co. NV | | | 594,439 | | | | | | | | | |
| | 5,329 | | FedEx Corp. | | | 488,776 | | | | | | | | | |
| | 8,695 | | Fluor Corp. | | | 510,744 | | | | | | | | | |
| | 22,765 | | General Electric Co. | | | 477,837 | | | | | | | | | |
| | 21,940 | | Terex Corp. (a) | | | 616,733 | | | | | | | | | |
| Notes to Financial Statements. | 3 | |
| | | | | | | | | |
| GOLDEN LARGE CAP CORE FUND | | | | | | | | |
| SCHEDULE OF INVESTMENTS | | | | | | | | |
| DECEMBER 31, 2012 | | | | | | | | |
| | | | | | | | | |
| The following is a summary of the inputs used to value the Fund’s investments as of December 31, 2012. | | | PORTFOLIO HOLDINGS | | | |
| The inputs or methodology used for valuing securities are not necessarily an indication of the risks associated with investing in those securities. For more information on valuation inputs, and their aggregation into the levels used in the tables below, please refer to the Security Valuation section in Note 2 of the accompanying Notes to Financial Statements. | | | % of Net Assets | | | |
| | | Consumer Discretionary | | 13.2 | % |
| | | Consumer Staples | | 7.2 | % |
| | | | | | | | | | Energy | | 9.3 | % |
| | Valuation Inputs | | | Investments in Securities | | | Financials | | 16.3 | % |
| | Level 1 - Quoted Prices | | $ | 24,070,064 | | | Health Care | | 13.2 | % |
| | Level 2 - Other Significant Observable Inputs | | | - | | | Industrials | | 12.6 | % |
| | Level 3 - Significant Unobservable Inputs | | | - | | | Materials | | 2.2 | % |
| | Total | | | | $ | 24,070,064 | | | Technology | | 18.8 | % |
| | | | | | | | | | Telecommunications | | 2.1 | % |
| The Level 1 inputs displayed in this table are Common Stock. Refer to the Schedule of Investments for a further breakout of each security by type. | | | Utilities | | 1.7 | % |
| There were no transfers between Level 1 and Level 2 for the period ended December 31, 2012. | | | Other Assets & Liabilities, Net | | 3.4 | % |
| | | | | | | | | | | | | | 100.0 | % |
| | | | | | | | | | | | | | | |
| Notes to Financial Statements. | 4 | |
| | | | | | | | | |
| GOLDEN SMALL CAP CORE FUND | | | | | | | | |
| SCHEDULE OF INVESTMENTS | | | | | | | | |
| DECEMBER 31, 2012 | | | | | | | | |
| | | | | | | | | |
| AF | | | Security | | | | | AF | | | Security | | | | |
| AF | Shares | | Description | | | Value | | AF | Shares | | Description | | | Value | |
| Common Stock - 98.5% | | | | | | 14,123 | | Deluxe Corp. | $ | 455,326 | |
| Consumer Discretionary - 13.9% | | | | | | 10,263 | | EMCOR Group, Inc. | | 355,202 | |
| | 5,972 | | Coinstar, Inc. (a) | | $ | 310,604 | | | 12,350 | | EnerSys (a) | | | 464,731 | |
| | 7,050 | | Core-Mark Holding Co., Inc. | | | 333,818 | | | 12,182 | | Old Dominion Freight Line, Inc. (a) | 417,599 | |
| | 11,330 | | Francesca's Holdings Corp. (a) | | | 294,127 | | | 23,381 | | Primoris Services Corp. | | 351,650 | |
| | 39,640 | | Leapfrog Enterprises, Inc. (a) | | | 342,093 | | | 16,000 | | Saia, Inc. (a) | | 369,920 | |
| | 29,304 | | Service Corp. International | | | 404,688 | | | 46,763 | | Taser International, Inc. (a) | 418,061 | |
| | 33,885 | | Smith & Wesson Holdings Corp. (a) | | | 285,989 | | | 4,730 | | UniFirst Corp. | | 346,804 | |
| | 15,739 | | Standard Motor Products, Inc. | | | 349,721 | | | | | | | | 3,586,226 | |
| | 14,122 | | The Finish Line, Inc., Class A | | | 267,329 | | Materials - 8.3% | | | | | |
| | 6,140 | | Tupperware Brands Corp. | | | 393,574 | | | 11,078 | | Buckeye Technologies, Inc. | 318,049 | |
| | | | | | | 2,981,943 | | | 21,360 | | Chemtura Corp. (a) | | 454,114 | |
| Consumer Staples - 1.8% | | | | | | 12,455 | | Coeur d'Alene Mines Corp. (a) | 306,393 | |
| | 8,727 | | Spectrum Brands Holdings, Inc. (a) | | | 392,104 | | | 52,130 | | Primero Mining Corp. (a) | | 337,281 | |
| | | | | | | | | | 9,380 | | Schweitzer-Mauduit International, Inc. | 366,101 | |
| Energy - 9.1% | | | | | | | | | | | | 1,781,938 | |
| | 18,120 | | C&J Energy Services, Inc. (a) | | | 388,493 | | Technology - 14.3% | | | | | |
| | 10,879 | | CVR Energy, Inc. (a) | | | 530,787 | | | 22,831 | | Advanced Energy Industries, Inc. (a) | 315,296 | |
| | 13,335 | | Delek US Holdings, Inc. | | | 337,642 | | | 27,995 | | AVG Technologies NV (a) | 443,161 | |
| | 11,235 | | Stone Energy Corp. (a) | | | 230,542 | | | 64,375 | | Brocade Communications Systems, Inc. (a) | 343,119 | |
| | 16,310 | | Western Refining, Inc. | | | 459,779 | | | 5,059 | | CACI International, Inc., Class A (a) | 278,397 | |
| | | | | | | 1,947,243 | | | 10,399 | | Cirrus Logic, Inc. (a) | | 301,259 | |
| Financials - 20.4% | | | | | | | 28,265 | | Demand Media, Inc. (a) | | 262,582 | |
| | 10,349 | | American Financial Group, Inc. | | | 408,993 | | | 8,340 | | Diebold, Inc. | | | 255,287 | |
| | 46,255 | | CapitalSource, Inc. | | | 350,613 | | | 9,861 | | j2 Global, Inc. | | 301,549 | |
| | 10,803 | | FBL Financial Group, Inc., Class A | | | 369,571 | | | 24,336 | | Sanmina Corp. (a) | | 269,399 | |
| | 21,456 | | Interactive Brokers Group, Inc., Class A | | | 293,518 | | | 35,940 | | Sierra Wireless, Inc. (a) | | 285,364 | |
| | 21,770 | | Manning & Napier, Inc. | | | 274,302 | | | | | | | | 3,055,413 | |
| | 33,795 | | Netspend Holdings, Inc. (a) | | | 399,457 | | Utilities - 1.6% | | | | | |
| | 12,924 | | Ocwen Financial Corp. (a) | | | 447,041 | | | 12,195 | | Portland General Electric Co. | 333,655 | |
| | 15,485 | | Omega Healthcare Investors, Inc. REIT | | | 369,317 | | Total Common Stock | | | | |
| | 7,775 | | Post Properties, Inc. REIT | | | 388,361 | | (Cost $17,409,546) | | | | 21,056,011 | |
| | 9,538 | | ProAssurance Corp. | | | 402,408 | | Total Investments - 98.5% | | | | |
| | 6,281 | | StanCorp Financial Group, Inc. | | | 230,324 | | (Cost $17,409,546)* | | | $ | 21,056,011 | |
| | 5,599 | | World Acceptance Corp. (a) | | | 417,462 | | Other Assets & Liabilities, Net – 1.5% | | | 310,712 | |
| | | | | | | 4,351,367 | | Net Assets – 100.0% | | | $ | 21,366,723 | |
| Health Care - 12.3% | | | | | | | | | | | | |
| | 11,020 | | Amsurg Corp. (a) | | | 330,710 | | REIT | Real Estate Investment Trust | | | | |
| | 4,794 | | Chemed Corp. | | | 328,820 | | (a) | Non-income producing security. | | | | |
| | 8,555 | | Cyberonics, Inc. (a) | | | 449,394 | | | | | | | | | |
| | 13,330 | | HealthSouth Corp. (a) | | | 281,396 | | * Cost for federal income tax purposes is substantially the same as for financial statement purposes and net unrealized appreciation consists of: | |
| | 4,238 | | MEDNAX, Inc. (a) | | | 337,006 | | |
| | 48,235 | | PDL BioPharma, Inc. | | | 340,057 | | | | | | | | | |
| | 34,295 | | Select Medical Holdings Corp. | | | 323,402 | | Gross Unrealized Appreciation | | | $ | 4,397,785 | |
| | 21,031 | | Spectrum Pharmaceuticals, Inc. | | | 235,337 | | Gross Unrealized Depreciation | | | | (751,320 | ) |
| | | | | | | 2,626,122 | | Net Unrealized Appreciation | | | $ | 3,646,465 | |
| Industrials - 16.8% | | | | | | | | | | | | |
| | 3,209 | | Amerco, Inc. | | | 406,933 | | The following is a summary of the inputs used to value the Fund’s investments as of December | | | |
| | | | | | | | | | | | | | | | |
| Notes to Financial Statements. | 5 | |
| | | | | | | | | |
| GOLDEN SMALL CAP CORE FUND | | | | | | | | |
| SCHEDULE OF INVESTMENTS | | | | | | | | |
| DECEMBER 31, 2012 | | | | | | | | |
| | | | | | | | | |
| 31, 2012. | | | | | | | | PORTFOLIO HOLDINGS | | | |
| | | | | | | | | | % of Net Assets | | | |
| The inputs or methodology used for valuing securities are not necessarily an indication of the risks associated with investing in those securities. For more information on valuation inputs, and their aggregation into the levels used in the tables below, please refer to the Security Valuation section in Note 2 of the accompanying Notes to Financial Statements. | | | Consumer Discretionary | | 13.9 | % |
| | | Consumer Staples | | 1.8 | % |
| | | Energy | | 9.1 | % |
| | | | | | | | | | Financials | | 20.4 | % |
| | Valuation Inputs | | | Investments in Securities | | | Health Care | | 12.3 | % |
| | | | | | | | | | Industrials | | 16.8 | % |
| | Level 1 - Quoted Prices | | $ | 21,056,011 | | | Materials | | 8.3 | % |
| | Level 2 - Other Significant Observable Inputs | | | - | | | Technology | | 14.3 | % |
| | Level 3 - Significant Unobservable Inputs | | | - | | | Utilities | | 1.6 | % |
| | Total | | $ | 21,056,011 | | | Other Assets & Liabilities, Net | | 1.5 | % |
| | | | | | | | | | | | | | 100.0 | % |
| The Level 1 inputs displayed in this table are Common Stock. Refer to the Schedule of Investments for a further breakout of each security by type. | | | | | | | | |
| There were no transfers between Level 1 and Level 2 for the period ended December 31, 2012. | | | | | | | | |
| | | | | | | | | | | | | | | |
| Notes to Financial Statements. | 6 | |
| | | | | | | | | |
| GOLDEN FUNDS | | | | | | | | |
| STATEMENTS OF ASSETS AND LIABILITIES | | | | | | | | |
| DECEMBER 31, 2012 | | | | | | | | |
| | | | | | | | | |
| | | | | | GOLDEN LARGE CAP CORE FUND | | | | GOLDEN SMALL CAP CORE FUND | |
| ASSETS | | | | | | | | |
| | Total investments, at value (Cost $19,192,552 and $17,409,546, respectively) | $ | 24,070,064 | | | $ | 21,056,011 | |
| | Cash | | | 973,585 | | | | 380,803 | |
| | Receivables: | | | | | | | | |
| | | Fund shares sold | | | 306,500 | | | | 10,000 | |
| | | Dividends and interest | | | 16,220 | | | | 5,340 | |
| Total Assets | | | 25,366,369 | | | | 21,452,154 | |
| | | | | | | | | | | |
| LIABILITIES | | | | | | | | |
| | Payables: | | | | | | | | |
| | | Fund shares redeemed | | | 34,165 | | | | 83,936 | |
| | | Distributions payable | | | 419,453 | | | | - | |
| | Accrued Liabilities: | | | | | | | | |
| | | Investment adviser fees | | | 927 | | | | 1,485 | |
| | | Trustees’ fees and expenses | | | 10 | | | | 10 | |
| Total Liabilities | | | 454,555 | | | | 85,431 | |
| | | | | | | | | | | |
| NET ASSETS | | $ | 24,911,814 | | | $ | 21,366,723 | |
| | | | | | | | | | | |
| COMPONENTS OF NET ASSETS | | | | | | | | |
| | Paid-in capital | | $ | 19,457,308 | | | $ | 75,527,608 | |
| | Undistributed (distributions in excess of) net investment income | | | (109 | ) | | | 194,301 | |
| | Accumulated net realized gain (loss) | | | 577,103 | | | | (58,001,651 | ) |
| | Net unrealized appreciation | | | 4,877,512 | | | | 3,646,465 | |
| NET ASSETS | | $ | 24,911,814 | | | $ | 21,366,723 | |
| SHARES OF BENEFICIAL INTEREST AT NO PAR VALUE (UNLIMITED SHARES AUTHORIZED) | | | 2,377,895 | | | | 1,825,170 | |
| NET ASSET VALUE, OFFERING AND REDEMPTION PRICE PER SHARE | | $ | 10.48 | | | $ | 11.71 | |
| | | | | | | | | | | |
| Notes to Financial Statements. | 7 | |
| | | | | | | | | |
| GOLDEN FUNDS | | | | | | | | |
| STATEMENTS OF OPERATIONS | | | | | | | | |
| SIX MONTHS ENDED DECEMBER 31, 2012 | | | | | | | | |
| | | | | | | | | |
| | | June | | | GOLDEN LARGE CAP CORE FUND | | | | GOLDEN SMALL CAP CORE FUND | | |
| INVESTMENT INCOME | | | | | | | | | |
| | Dividend income (Net of foreign withholding taxes of $222 and $0, respectively) | | $ | 285,365 | | | $ | 325,884 | | |
| | Interest income | | | 259 | | | | 207 | | |
| Total Investment Income | | | 285,624 | | | | 326,091 | | |
| Adviser | | | | | | | | | |
| EXPENSES | | | | | | | | | |
| | Investment adviser fees | | | 106,434 | | | | 131,790 | | |
| | Trustees' fees and expenses | | | 543 | | | | 427 | | |
| Total Expenses | | | 106,977 | | | | 132,217 | | |
| | Fees waived and expenses reimbursed | | | (543 | ) | | | (427 | ) | |
| Net Expenses | | | 106,434 | | | | 131,790 | | |
| | | | | | | | | | | | |
| NET INVESTMENT INCOME | | | 179,190 | | | | 194,301 | | |
| | | | | | | | | | | | |
| NET REALIZED AND UNREALIZED GAIN (LOSS) | | | | | | | | | |
| | Net realized gain on investments | | | 3,893,595 | | | | 2,149,279 | | |
| | Net change in unrealized appreciation (depreciation) on investments | | | (2,796,299 | ) | | | (82,691 | ) | |
| NET REALIZED AND UNREALIZED GAIN | | | 1,097,296 | | | | 2,066,588 | | |
| INCREASE IN NET ASSETS FROM OPERATIONS | | $ | 1,276,486 | | | $ | 2,260,889 | | |
| | | | | | | | | | | | |
| Notes to Financial Statements. | 8 | |
| | | | | | | | | |
| GOLDEN FUNDS | | | | | | | | |
| STATEMENTS OF CHANGES IN NET ASSETS | | | | | | | | |
| | | | | | | | | |
| | | | | | | | | |
| | | | | GOLDEN LARGE CAP CORE FUND | | GOLDEN SMALL CAP CORE FUND |
| | | June 2011 | | | | | | | Shares | | | | | | | | Shares | |
| NET ASSETS JUNE 30, 2011 | | $ | 142,756,289 | | | | $142,756,289 | | | $ | 53,300,162 | | | | $53,300,162 | |
| OPERATIONS | | | | | | | | | | | | | | | | |
| | Net investment income (loss) | | | 673,374 | | | | | | | | (43,959 | ) | | | | |
| | Net realized gain | | | 10,246,359 | | | | | | | | 6,017,297 | | | | | |
| | Net change in unrealized appreciation (depreciation) | | | (19,594,735 | ) | | | | | | | (8,976,528 | ) | | | | |
| Decrease in Net Assets Resulting from Operations | | | (8,675,002 | ) | | | | | | | (3,003,190 | ) | | | | |
| | | | | | | | | | | | | | | | | | | |
| DISTRIBUTIONS TO SHAREHOLDERS FROM | | | | | | | | | | | | | | | | |
| | Net investment income | | | (1,238,094 | ) | | | | | | | - | | | | | |
| | | | | | | | | | | | | | | | | | | |
| CAPITAL SHARE TRANSACTIONS | | | | | | | | | | | | | | | | |
| | Sale of shares | | | 2,679,571 | | | | 254,202 | | | | 814,327 | | | | 79,897 | |
| | Reinvestment of distributions | | | 48,767 | | | | 4,838 | | | | - | | | | - | |
| | Redemption of shares | | | (100,675,313 | ) | | | (10,027,910 | ) | | | (23,684,574 | ) | | | (2,306,216 | |
| Decrease in Net Assets from Capital Share Transactions | | | (97,946,975 | ) | | | (9,768,870 | ) | | | (22,870,247 | ) | | | (2,226,319 | |
| Decrease in Net Assets | | | (107,860,071 | ) | | | | | | | (25,873,437 | ) | | | | |
| | | June 30, 2012 | | | | | | | | | | | | | | | | |
| NET ASSETS JUNE 30, 2012 (Including line (a)) | | $ | 34,896,218 | | | | | | | $ | 27,426,725 | | | | | |
| OPERATIONS | | | | | | | | | | | | | | | | |
| | Net investment income | | | 179,190 | | | | | | | | 194,301 | | | | | |
| | Net realized gain | | | 3,893,595 | | | | | | | | 2,149,279 | | | | | |
| | Net change in unrealized appreciation (depreciation) | | | (2,796,299 | ) | | | | | | | (82,691 | ) | | | | |
| Increase in Net Assets Resulting from Operations | | | 1,276,486 | | | | | | | | 2,260,889 | | | | | |
| | | | | | | | | | | | | | | | | | | |
| DISTRIBUTIONS TO SHAREHOLDERS FROM | | | | | | | | | | | | | | | | |
| | Net investment income | | | (458,420 | ) | | | | | | | - | | | | | |
| | Net realized gain | | | (2,619,826 | ) | | | | | | | - | | | | | |
| Total Distributions to Shareholders | | | (3,078,246 | ) | | | | | | | - | | | | | |
| | | | | | | | | | | | | | | | | | | |
| CAPITAL SHARE TRANSACTIONS | | | | | | | | | | | | | | | | |
| | Sale of shares | | | 2,962,314 | | | | 259,430 | | | | 36,840 | | | | 3,238 | |
| | Reinvestment of distributions | | | 527,850 | | | | 49,752 | | | | - | | | | - | |
| | Redemption of shares | | | (11,672,808 | ) | | | (1,018,655 | ) | | | (8,357,731 | ) | | | (754,704 | |
| Decrease in Net Assets from Capital Share Transactions | | | (8,182,644 | ) | | | (709,473 | ) | | | (8,320,891 | ) | | | (751,466 | |
| Decrease in Net Assets | | | (9,984,404 | ) | | | | | | | (6,060,002 | ) | | | | |
| NET ASSETS DECEMBER 31, 2012 (Including line (b)) | | $ | 24,911,814 | | | | | | | $ | 21,366,723 | | | | | |
| (a) | Undistributed net investment income June 30, 2012 | | $ | 279,121 | | | | | | | $ | - | | | | | |
| (b) | Undistributed (distributions in excess of) net investment income December 31, 2012 | | $ | (109 | ) | | | | | | $ | 194,301 | | | | | |
| Notes to Financial Statements. | 9 | |
| | | | | | | | | |
| GOLDEN FUNDS | | | | | | | | |
| FINANCIAL HIGHLIGHTS | | | | | | | | |
| | | | | | | | | |
| | | | | | | | | |
| These financial highlights reflect selected data for a share outstanding throughout each period. | | | | | | | | | | | | | | | | |
| | | | For the Six | | | | | | | | | | | | | | | | |
| | | | Months Ended | | | | | | | | | | | | | | | | |
| | | | December 31, | | For the Years Ended June 30, |
| | | | 2012 | | | 2012 | | | 2011 | | | 2010 | | | 2009 | | | 2008 | |
| GOLDEN LARGE CAP CORE FUND | | | | | | | | | | | | | | | | | | |
| NET ASSET VALUE, Beginning of Period | $ | 11.30 | | $ | 11.10 | | $ | 8.72 | | $ | 8.04 | | $ | 10.82 | | $ | 12.24 | |
| Net investment income (a) | | 0.07 | | | 0.11 | | | 0.11 | | | 0.12 | | | 0.14 | | | 0.12 | |
| Net realized and unrealized gain (loss) | | 0.40 | | | 0.35 | | | 2.40 | | | 0.69 | | | (2.81 | ) | | (1.45 | ) |
| Total from Investment Operations | | 0.47 | | | 0.46 | | | 2.51 | | | 0.81 | | | (2.67 | ) | | (1.33 | ) |
| DISTRIBUTIONS TO SHAREHOLDERS FROM | | | | | | | | | | | | | | | | | | |
| Net investment income | | (0.19 | ) | | (0.26 | ) | | (0.13 | ) | | (0.13 | ) | | (0.11 | ) | | (0.09 | ) |
| Net realized gain | | (1.10 | ) | | — | | | — | | | — | | | — | | | — | (b) |
| Total Distributions to Shareholders | | (1.29 | ) | | (0.26 | ) | | (0.13 | ) | | (0.13 | ) | | (0.11 | ) | | (0.09 | ) |
| NET ASSET VALUE, End of Period | $ | 10.48 | | $ | 11.30 | | $ | 11.10 | | $ | 8.72 | | $ | 8.04 | | $ | 10.82 | |
| TOTAL RETURN | | 4.27 | %(c) | | 4.44 | % | | 28.85 | % | | 9.90 | % | | (24.65 | )% | | (10.90 | )% |
| RATIOS/SUPPLEMENTARY DATA | | | | | | | | | | | | | | | | | | |
| | | | | | | | | | | | | | | | | | | | |
| Net Assets at End of Period (000's omitted) | | $24,912 | | | $34,896 | | | $142,756 | | | $156,712 | | | $160,219 | | | $133,917 | |
| Ratios to Average Net Assets: | | | | | | | | | | | | | | | | | | |
| Net investment income | | 1.18 | %(d) | | 1.06 | % | | 1.04 | % | | 1.33 | % | | 1.66 | % | | 1.06 | % |
| Net expense | | 0.70 | %(d) | | 0.70 | % | | 0.70 | % | | 0.70 | % | | 0.70 | % | | 0.70 | % |
| Gross expense (e) | | 0.70 | %(d) | | 0.71 | % | | 0.70 | % | | 0.70 | % | | 0.70 | % | | 0.70 | % |
| PORTFOLIO TURNOVER RATE | | 34 | %(c) | | 42 | % | | 57 | % | | 49 | % | | 40 | % | | 46 | % |
| | | | | | | | | | | | | | | | | | | | |
| | | | | | | | | | | | | | | | | | | | |
| GOLDEN SMALL CAP CORE FUND | | | | | | | | | | | | | | | | | | |
| NET ASSET VALUE, Beginning of Period | $ | 10.64 | | $ | 11.10 | | $ | 7.90 | | $ | 6.98 | | $ | 11.09 | | $ | 13.60 | |
| INVESTMENT OPERATIONS | | | | | | | | | | | | | | | | | | |
| Net investment income (loss) (a) | | 0.09 | | | (0.01 | ) | | (0.02 | ) | | (0.03 | ) | | (0.02 | ) | | (0.04 | ) |
| Net realized and unrealized gain (loss) | | 0.98 | | | (0.45 | ) | | 3.22 | | | 0.95 | | | (4.09 | ) | | (2.36 | ) |
| Total from Investment Operations | | 1.07 | | | (0.46 | ) | | 3.20 | | | 0.92 | | | (4.11 | ) | | (2.40 | ) |
| DISTRIBUTIONS TO SHAREHOLDERS FROM | | | | | | | | | | | | | | | | | | |
| Net realized gain | | — | | | — | | | — | | | — | | | — | | | (0.11 | ) |
| NET ASSET VALUE, End of Period | $ | 11.71 | | $ | 10.64 | | $ | 11.10 | | $ | 7.90 | | $ | 6.98 | | $ | 11.09 | |
| TOTAL RETURN | | 10.06 | %(c) | | (4.14 | )% | | 40.51 | % | | 13.18 | % | | (37.06 | )% | | (17.66 | )% |
| RATIOS/SUPPLEMENTARY DATA | | | | | | | | | | | | | | | | | | |
| Net Assets at End of Period (000's omitted) | | $21,367 | | | $27,427 | | | $53,300 | | | $104,235 | | | $131,370 | | | $209,709 | |
| Ratios to Average Net Assets: | | | | | | | | | | | | | | | | | | |
| Net investment income (loss) | | 1.62 | %(d) | | (0.12 | )% | | (0.20 | )% | | (0.39 | )% | | (0.28 | )% | | (0.38 | )% |
| Net expense | | 1.10 | %(d) | | 1.10 | % | | 1.10 | % | | 1.10 | % | | 1.10 | % | | 1.10 | % |
| Gross expense (e) | | 1.10 | %(d) | | 1.11 | % | | 1.10 | % | | 1.10 | % | | 1.10 | % | | 1.11 | % |
| PORTFOLIO TURNOVER RATE | | 26 | %(c) | | 56 | % | | 55 | % | | 55 | % | | 95 | % | | 72 | % |
| | | | | | | | | | | | | | | | | | | | |
| (a) | Calculated based on average shares outstanding during each period. | | | | | | | | | | | | | | | | |
| (b) | Less than $0.01 per share. | | | | | | | | | | | | | | | | | |
| (c) | Not annualized. | | | | | | | | | | | | | | | | | |
| (d) | Annualized. | | | | | | | | | | | | | | | | | |
| (e) | Reflects the expense ratio excluding any waivers and/or reimbursements. | | | | | | | | | | | | | | | | |
| | | | | | | | | | | | | | | | | | | | |
| | | | | | | | | | | | | | | | | | | | |
| | | | | | | | | | | | | | | | | | | | |
| Notes to Financial Statements. | 10 | |
| | | | | | | | | |
| GOLDEN FUNDS | | | | | | | | |
| NOTES TO FINANCIAL STATEMENTS | | | | | | | | |
| DECEMBER 31, 2012 | | | | | | | | |
| | | | | | | | | |
Note 1. Organization
Golden Large Cap Core Fund and Golden Small Cap Core Fund (individually, a “Fund” and, collectively the “Funds”) are diversified portfolios of Forum Funds (the “Trust”). The Trust is a Delaware statutory trust that is registered as an open-end, management investment company under the Investment Company Act of 1940 (the “Act”), as amended. Under its Trust Instrument, the Trust is authorized to issue an unlimited number of each Fund’s shares of beneficial interest without par value. Each Fund currently offers two classes of shares: Institutional Shares and Investor Shares. As of December 31, 2012, Investor Shares had not commenced operations. Golden Large Cap Core Fund seeks to achieve long-term capital appreciation. Golden Small Cap Core Fund seeks to achieve maximum long-term total return. Each Fund commenced operations on September 13, 2005.
Note 2. Summary of Significant Accounting Policies
These financial statements are prepared in accordance with accounting principles generally accepted in the United States of America (“GAAP”), which require management to make estimates and assumptions that affect the reported amounts of assets and liabilities, the disclosure of contingent liabilities at the date of the financial statements, and the reported amounts of increase and decrease in net assets from operations during the fiscal period. Actual amounts could differ from those estimates. The following summarizes the significant accounting policies of each Fund:
Security Valuation – Exchange-traded securities and over-the-counter securities are valued using the last quoted sale or official closing price, provided by independent pricing services as of the close of trading on the market or exchange for which they are primarily traded, on each Fund business day. In the absence of a sale, such securities are valued at the mean of the last bid and ask price provided by independent pricing services. Non-exchange traded securities for which quotations are available are valued using the last quoted sales price, or in the absence of a sale at the mean of the last bid and ask prices provided by independent pricing services. Shares of open-end mutual funds are valued at net asset value (“NAV”). Short-term investments that mature in 60 days or less may be valued at amortized cost.
Each Fund values its investments at fair value pursuant to procedures adopted by the Trust's Board of Trustees (the "Board") if (1) market quotations are insufficient or not readily available or (2) the adviser believes that the values available are unreliable. The Trust’s Valuation Committee performs certain functions as they relate to the administration and oversight of each Fund’s valuation procedures. Under these procedures, the Valuation Committee convenes on a regular and ad-hoc basis to review such securities and considers a number of factors, including valuation methodologies and significant unobservable inputs, when arriving at fair value.
The Valuation Committee may work with an adviser to provide valuation inputs. In determining fair valuations, inputs may include market-based analytics which may consider related or comparable assets or liabilities, recent transactions, market multiples, book values and other relevant investment information. Adviser inputs may include an income-based approach in which the anticipated future cash flows of the investment are discounted in determining fair value. Discounts may also be applied based on the nature or duration of any restrictions on the disposition of the investments. The Valuation Committee performs regular reviews of
| | | | | | | | | |
| GOLDEN FUNDS | | | | | | | | |
| NOTES TO FINANCIAL STATEMENTS | | | | | | | | |
| DECEMBER 31, 2012 | | | | | | | | |
| | | | | | | | | |
valuation methodologies, key inputs and assumptions, disposition analysis and market activity.
Fair valuation is based on subjective factors and, as a result, the fair value price of an investment may differ from the security’s market price and may not be the price at which the asset may be sold. Fair valuation could result in a different NAV than a NAV determined by using market quotes.
Each Fund has a three-tier fair value hierarchy. The basis of the tiers is dependent upon the various “inputs” used to determine the value of each Fund’s investments. These inputs are summarized in the three broad levels listed below:
Level 1 — quoted prices in active markets for identical assets
Level 2 — other significant observable inputs (including quoted prices of similar securities, interest rates, prepayment speeds, credit risk, etc.)
Level 3 — significant unobservable inputs (including each Fund’s own assumptions in determining the fair value of investments)
The aggregate value by input level, as of December 31, 2012, for each Fund’s investments is included at the end of each Fund’s Schedule of Investments.
Security Transactions, Investment Income and Realized Gain and Loss – Investment transactions are accounted for on the trade date. Dividend income is recorded on the ex-dividend date. Foreign dividend income is recorded on the ex-dividend date or as soon as possible after each Fund determines the existence of a dividend declaration after exercising reasonable due diligence. Income and capital gains on some foreign securities may be subject to foreign withholding taxes, which are accrued as applicable. Interest income is recorded on an accrual basis. Premium is amortized and discount is accreted using the effective interest method. Identified cost of investments sold is used to determine the gain and loss for both financial statement and federal income tax purposes.
Distributions to Shareholders – Distributions to shareholders of net investment income and net capital gains, if any, are declared and paid at least annually. Distributions are based on amounts calculated in accordance with applicable federal income tax regulations, which may differ from GAAP. These differences are due primarily to differing treatments of income and gain on various investment securities held by each Fund, timing differences and differing characterizations of distributions made by each Fund.
Federal Taxes – Each Fund intends to continue to qualify each year as a regulated investment company under Subchapter M of the Internal Revenue Code and to distribute all of their taxable income to shareholders. In addition, by distributing in each calendar year substantially all of their net investment income and capital gains, if any, the Funds will not be subject to a federal excise tax. Therefore, no federal income or excise tax provision is required. Each Fund files a U.S. federal income and excise tax return as required. A fund’s federal income tax returns are subject to examination by the Internal Revenue Service for a period of three fiscal years after they are filed. As of December 31, 2012, there are no uncertain tax positions that would require financial statement recognition, de-recognition, or disclosure.
| | | | | | | | | |
| GOLDEN FUNDS | | | | | | | | |
| NOTES TO FINANCIAL STATEMENTS | | | | | | | | |
| DECEMBER 31, 2012 | | | | | | | | |
| | | | | | | | | |
Income and Expense Allocation – The Trust accounts separately for the assets, liabilities and operations of each of its investment portfolios. Expenses that are directly attributable to more than one investment portfolio are allocated among the respective investment portfolios in an equitable manner.
Commitments and Contingencies – In the normal course of business, each Fund enters into contracts that provide general indemnifications by each Fund to the counterparty to the contract. Each Fund’s maximum exposure under these arrangements is dependent on future claims that may be made against each Fund and, therefore, cannot be estimated; however, based on experience, the risk of loss from such claims is considered remote.
Note 3. Fees and Expenses
Investment Adviser – Golden Capital Management, LLC (the “Adviser”) is the investment adviser to the Funds. Pursuant to an Investment Advisory Agreement, the Adviser receives an advisory fee at an annual rate of 0.70% and 1.10% of the average daily net assets of Golden Large Cap Core Fund and Golden Small Cap Core Fund, respectively. Under the terms of the Investment Advisory Agreement, the Adviser provides investment advisory services to the Funds and is obligated to pay all expenses of the Funds except portfolio transaction expenses, borrowing costs, interest, taxes, and certain compensation and expenses of the Board, any expense each Fund is authorized to pay under Rule 12b-1, and extraordinary or non-recurring expenses.
Distribution – Foreside Fund Services, LLC serves as each Fund’s distributor (the “Distributor”). The Distributor receives no compensation from the Funds for its distribution services. The Distributor is not affiliated with the Adviser or Atlantic Fund Administration, LLC (d/b/a Atlantic Fund Services) (“Atlantic”) or their affiliates.
Other Service Providers – Atlantic provides fund accounting, fund administration, compliance and transfer agency services to each Fund. Atlantic also provides certain shareholder report production, and EDGAR conversion and filing services. Atlantic provides a Principal Executive Officer, a Principal Financial Officer, a Chief Compliance Officer, and an Anti-Money Laundering Officer to each Fund, as well as certain additional compliance support functions.
Trustees and Officers – The Trust pays each independent Trustee an annual retainer fee of $45,000 for service to the Trust ($66,000 for the Chairman). The Trustees and Chairman may receive additional fees for special Board meetings. Each Trustee is also reimbursed for all reasonable out-of-pocket expenses incurred in connection with his duties as a Trustee, including travel and related expenses incurred in attending Board meetings. The amount of Trustees’ fees attributable to each Fund is disclosed in the Statement of Operations. Certain officers of the Trust are also officers or employees of the above named service providers, and during their terms of office received no compensation from each Fund.
| | | | | | | | | |
| GOLDEN FUNDS | | | | | | | | |
| NOTES TO FINANCIAL STATEMENTS | | | | | | | | |
| DECEMBER 31, 2012 | | | | | | | | |
| | | | | | | | | |
Note 4. Expense Reimbursements and Fees Waived
The Adviser has contractually agreed to waive a portion of its fees and reimburse certain expenses through October 31, 2013, to limit total annual operating expenses to 0.70% for Institutional Shares and 0.95% for Investor Shares, of the average daily net assets of each respective class of the Golden Large Cap Core Fund. The Adviser also contractually agreed to waive a portion of its fees and reimburse certain expenses through October 31, 2013, to limit total annual operating expenses to 1.10% for Institutional Shares and 1.35% for Investor Shares of average daily net assets of each respective class of the Golden Small Cap Core Fund. For the period ended December 31, 2012, fees waived and reimbursed were as follows:
| | | Investment Adviser Reimbursement |
| Golden Large Cap Core Fund | | $ | 543 |
| Golden Small Cap Core Fund | | | 427 |
Note 5. Security Transactions
The cost of purchases and proceeds from sales of investment securities (including maturities), other than short-term investments during the period ended December 31, 2012, were as follows:
| | | Purchases | | Sales |
| Golden Large Cap Core Fund | | $ | 10,148,259 | | $ | 21,681,158 |
| Golden Small Cap Core Fund | | $ | 6,145,698 | | $ | 14,117,488 |
| | | | | | | |
Note 6. Federal Income Tax and Investment Transactions
As of June 30, 2012, distributable earnings (accumulated loss) on a tax basis were as follows:
| �� | | Undistributed Ordinary Income | | Capital and Other Losses | | Unrealized Appreciation (Depreciation) | | Total |
| Golden Large Cap Core Fund | | $ | 279,121 | | | $ | (620,459 | ) | | $ | 7,597,604 | | | $ | 7,256,266 | |
| Golden Small Cap Core Fund | | | - | | | | (59,886,056 | ) | | | 3,464,282 | | | | (56,421,774 | ) |
| | | | | | | | | | | | | | | | | |
The difference between components of distributable earnings on a tax basis and the amounts reflected in the Statements of Assets and Liabilities are primarily due to wash sales.
As of June 30, 2012, capital loss carryforwards to offset future capital gains were as follows with the respective expiration dates:
| | | 2017 | | 2018 |
| Golden Large Cap Core Fund | | $ | — | | $ | 349,359 |
| Golden Small Cap Core Fund | | | 1,487,066 | | | 57,570,319 |
| | | | | | | | | |
| GOLDEN FUNDS | | | | | | | | |
| NOTES TO FINANCIAL STATEMENTS | | | | | | | | |
| DECEMBER 31, 2012 | | | | | | | | |
| | | | | | | | | |
Note 7. Recent Accounting Pronouncements
In May 2011, FASB issued ASU No. 2011-04 “Amendments to Achieve Common Fair Value Measurement and Disclosure Requirements in U.S. GAAP and IFRSs.” ASU No. 2011-04 establishes common requirements for measuring fair value and for disclosing information about fair value measurements in accordance with U.S. GAAP and International Financial Reporting Standards (“IFRSs”). ASU No. 2011-04 is effective for interim and annual periods beginning after December 15, 2011. Management has evaluated ASU No. 2011-04 and has determined that it did not have a significant impact on the reporting of the financial statement disclosures.
In December 2011, FASB issued ASU No. 2011-11 “Disclosures about Offsetting Assets and Liabilities” requiring disclosure of both gross and net information related to offsetting and related arrangements enabling users of its financial statements to understand the effect of those arrangements on the entity’s financial position. The objective of this disclosure is to facilitate comparison between those entities that prepare their financial statements on the basis of U.S. GAAP and those entities that prepare their financial statements on the basis of IFRSs. ASU No. 2011-11 is effective for interim and annual periods beginning on or after January 1, 2013. Management is evaluating any impact ASU No. 2011-11 may have on each Fund’s financial statements.
Subsequent Events
Subsequent events occurring after the date of this report through the date these financial statements were issued have been evaluated for potential impact and each Fund has had no such events.
| | | | | | | | | |
| GOLDEN FUNDS | | | | | | | | |
| ADDITIONAL INFORMATION | | | | | | | | |
| DECEMBER 31, 2012 | | | | | | | | |
| | | | | | | | | |
Proxy Voting Information
A description of the policies and procedures that each Fund uses to determine how to vote proxies relating to securities held in each Fund’s portfolio is available, without charge and upon request, by calling (800) 206-8610 and on the U.S. Securities and Exchange Commission’s (the “SEC”) website at www.sec.gov. Each Fund’s proxy voting record for the most recent twelve-month period ended June 30 is available, without charge and upon request, by calling (800) 206-8610 and on the SEC’s website at www.sec.gov.
Availability of Quarterly Portfolio Schedules
Each Fund files its complete schedule of portfolio holdings with the SEC for the first and third quarters of each fiscal year on Form N-Q. These filings are available, without charge and upon request on the SEC’s website at www.sec.gov or may be reviewed and copied at the SEC’s Public Reference Room in Washington, DC. Information on the operation of the Public Reference Room may be obtained by calling (800) SEC-0330.
Shareholder Expense Example
As a shareholder of the Funds, you incur ongoing costs, including management fees, distribution (12b-1) fees and other Fund expenses. This example is intended to help you understand your ongoing costs (in dollars) of investing in the Funds and to compare these costs with the ongoing costs of investing in other mutual funds.
The example is based on an investment of $1,000 invested at the beginning of the period and held for the entire period from July 1, 2012, through December 31, 2012.
Actual Expenses – The first line of the table below provides information about actual account values and actual expenses. You may use the information in this line, together with the amount you invested, to estimate the expenses that you paid over the period. Simply divide your account value by $1,000 (for example, an $8,600 account value divided by $1,000 = 8.6), then multiply the result by the number in the first line under the heading entitled “Expenses Paid During Period” to estimate the expenses you paid on your account during the period.
Hypothetical Example for Comparison Purposes – The second line of the table below provides information about hypothetical account values and hypothetical expenses based on each Fund’s actual expense ratio and an assumed rate of return of 5% per year before expenses, which is not each Fund’s actual return. The hypothetical account values and expenses may not be used to estimate the actual ending account balance or expenses you paid for the period. You may use this information to compare the ongoing costs of investing in each Fund and other funds. To do so, compare this 5% hypothetical example with the 5% hypothetical examples that appear in the shareholder reports of other funds.
Please note that the expenses shown in the table are meant to highlight your ongoing costs only. Therefore, the second line of the table is useful in comparing ongoing costs only and will not help you determine the relative total costs of owning different funds.
| | | | | | | | | |
| GOLDEN FUNDS | | | | | | | | |
| ADDITIONAL INFORMATION | | | | | | | | |
| DECEMBER 31, 2012 | | | | | | | | |
| | | | | | | | | |
| | Beginning | | Ending | | Expenses | | Annualized |
| | Account Value | | Account Value | | Paid During | | Expense |
| | July 1, 2012 | | December 31, 2012 | | Period* | | Ratio* |
| Golden Large Cap Core | | | | | | | | | | | |
| Actual | $ | 1,000.00 | | $ | 1,042.67 | | $ | 3.60 | | 0.70 | % |
| Hypothetical (5% return before taxes) | $ | 1,000.00 | | $ | 1,021.68 | | $ | 3.57 | | 0.70 | % |
| Golden Small Cap Core | | | | | | | | | | | |
| Actual | $ | 1,000.00 | | $ | 1,100.56 | | $ | 5.82 | | 1.10 | % |
| Hypothetical (5% return before taxes) | $ | 1,000.00 | | $ | 1,019.66 | | $ | 5.60 | | 1.10 | % |
| | | | | | | | | | | | |
| * | Expenses are equal to the Fund’s annualized expense ratio multiplied by the average account value over the period, multiplied by the number of days in the most recent fiscal half-year divided by 365 to reflect the half-year period. |
ITEM 2. CODE OF ETHICS.
Not applicable.
ITEM 3. AUDIT COMMITTEE FINANCIAL EXPERT.
Not applicable.
ITEM 4. PRINCIPAL ACCOUNTANT FEES AND SERVICES.
Not applicable.
ITEM 5. AUDIT COMMITTEE OF LISTED REGISTRANTS.
Not applicable
ITEM 6. INVESTMENTS.
| (a) | Included as part of report to shareholders under Item 1. |
ITEM 7. DISCLOSURE OF PROXY VOTING POLICIES AND PROCEDURES FOR CLOSED-END
MANAGEMENT INVESTMENT COMPANIES.
Not applicable.
ITEM 8. PORTFOLIO MANAGERS OF CLOSED-END MANAGEMENT INVESTMENT COMPANIES.
Not applicable.
ITEM 9. PURCHASES OF EQUITY SECURITIES BY CLOSED-END MANAGEMENT INVESTMENT COMPANY AND AFFILIATED PURCHASERS.
Not applicable.
ITEM 10. SUBMISSION OF MATTERS TO A VOTE OF SECURITY HOLDERS
The Registrant does not accept nominees to the board of trustees from shareholders.
ITEM 11. CONTROLS AND PROCEDURES
(a) The Registrant’s Principal Executive Officer and Principal Financial Officer have concluded that the Registrant’s disclosure controls and procedures (as defined in Rule 30a-3(c) under the Investment Company Act of 1940 (the “Act”)) are effective, based on their evaluation of the controls and procedures required by Rule 30a-3(b) under the Act and Rules 13a-15(b) or 15d-15(b) under the Securities Exchange Act of 1934, as of a date within 90 days of the filing date of this report.
(b) There were no changes in the Registrant’s internal control over financial reporting (as defined in
Rule 30a-3(d) under the Act) that occurred during the second fiscal quarter of the period covered by this report that have materially affected, or are reasonably likely to materially affect, the Registrant’s internal control over financial reporting.
ITEM 12. EXHIBITS.
(a)(1) Not applicable.
(a)(2) Certifications pursuant to Rule 30a-2(a) of the Act, and Section 302 of the Sarbanes-Oxley Act of 2002. (Exhibits filed herewith)
(a)(3) Not applicable.
(b) Certifications pursuant to Rule 30a-2(b) of the Act, and Section 906 of the Sarbanes-Oxley Act of 2002. (Exhibit filed herewith)
SIGNATURES
Pursuant to the requirements of the Securities Exchange Act of 1934 and the Investment Company Act of 1940, the Registrant has duly caused this report to be signed on its behalf by the undersigned, thereunto duly authorized.
Registrant Forum Funds
| | | | |
| | By: | /s/ Stacey E. Hong | |
| | | Stacey E. Hong, Principal Executive Officer | |
| | | | |
| | Date: | February 19, 2013 | |
| | | | |
Pursuant to the requirements of the Securities Exchange Act of 1934 and the Investment Company Act of 1940, this report has been signed below by the following persons on behalf of the Registrant and in the capacities and on the dates indicated.
| | | | |
| | By: | /s/ Stacey E. Hong | |
| | | Stacey E. Hong, Principal Executive Officer | |
| | | | |
| | Date: | February 19, 2013 | |
| | | | |
| | By: | /s/ Karen Shaw | |
| | | Karen Shaw, Principal Financial Officer | |
| | | | |
| | Date: | February 19, 2013 | |
| | | | |