WASHINGTON, D.C. 20549
Stacey E. Hong, Principal Executive Officer
ITEM 1. REPORT TO STOCKHOLDERS.
| | | |
ADAMS HARKNESS SMALL CAP GROWTH FUND A MESSAGE TO OUR SHAREHOLDERS (Unaudited) | | |
2014 was a confounding year for many small cap growth investors. After very strong outperformance in 2013, relative to larger capitalization stocks (as measured by the S&P 500), small cap growth stocks underperformed for the majority of 2014. For the year ending December 31, 2014, the Fund underperformed its benchmark, the Russell 2000 Growth Index, returning 1.14% versus 5.60% for the Index.
In addition to being a more subdued year than 2013 in terms of returns, it was also more complicated in terms of the investing landscape. The year started out strongly, but in March-April the market had a “growth swoon.” It began, initially, as investors anticipated the Federal Reserve raising rates after comments made by the new Chairperson of the Federal Reserve; it gathered strength as the unusually severe winter weather impacted the economy. This correction disproportionately hit the higher multiple, higher growth stocks in which the Fund invests, as is always the case when the future is called into question. As it turned out, investors’ fears in the first quarter were unfounded. While first quarter GDP turned out to be slightly negative when finally reported, it was due to the curtailment of activity as a result of the winter storms, and the economy reaccelerated through late spring into summer. The slowdown in the economy in the late winter/early spring, and then the unfolding crisis in Europe with Ukraine and Russia, combined with our own low inflation numbers, kept the Federal Reserve on hold. The combination of reasonably steady economic growth combined with low interest rates and low inflation should have provided a better environment for smaller high growth stocks, and indeed many stocks that corrected in the first quarter had recovered to their first quarter highs, if not higher, by the end of the year. However, most of that recovery came in the fourth quarter, and for the year, smaller cap higher growth stocks had modest returns.
The Fund’s underperformance was driven primarily by the performance of its technology holdings; the correction in the first quarter hit the higher growth “software as a service” (SaaS) stocks harder than most other groups, and the Fund was overweight those names due to their strong secular growth outlook. Particular names of note were Demandware, Inc. and Textura Corp. Other names in the technology sector that detracted from performance were Rubicon Technology, Advanced Energy Industries, and CommVault Systems. As a result of our technology performance this year, we tweaked our approach to that sector. We are paying more attention to the weights in the different subsectors and are focused on much more predictable growth companies, as opposed to solely focusing on companies with strong operating leverage due to new product cycles. For the year, Energy and Consumer Discretionary were the strongest contributors to performance, although Health Care and Industrials contributed positively to returns as well. Among the Fund’s strongest contributors were Gentherm Incorporated and JetBlue Airways Corporation, as well as Pacira Pharmaceuticals and Knight Transportation, Inc. Financials detracted from returns, and the biggest detractor was the technology sector.
We believe that economic growth in the United States is driven by creativity and innovation; the rise of new technologies and new ways of doing things can drive growth disproportionately in certain areas. As growth investors, we try to identify these new secular innovations early in their life cycle; we call this part of our process “thematic investing.” Despite the modest returns of the asset class (as measured by the Russell
| | | |
ADAMS HARKNESS SMALL CAP GROWTH FUND A MESSAGE TO OUR SHAREHOLDERS (Unaudited) | | |
2000 Growth Index), 2014 stands out in our minds as the year several of these investment themes made dramatic strides in their development. We highlight a few of these in the paragraphs below.
The Biotechnology Revolution—while biotechnology has been a part of the health care landscape for the past twenty years, the coding of the human genome created a body of knowledge that has enabled significant advances in the science of biotechnology. Increasingly, “genomic” drugs are being developed and commercialized—these drugs are more specific and therefore significantly more potent than previous drugs; they also do not appear to have as many side effects as chemically based drugs, and their efficacy can be determined much earlier in the development cycle. The industry has also vastly improved its data capabilities and as a result has dramatically increased its ability to identify the patients in whom these drugs will be effective. As a result, the time to regulatory approval is beginning to shorten. The Food and Drug Administration set up a special “breakthrough” designation that enables drugs that are differentiated to expedite approval; in 2014, 68 drugs, mostly genomically based, received this designation. These changes are very positive for investors in biotechnology companies. Historically, investing in smaller biotechnology companies was extremely high risk: investors had to wait a long time (sometimes as long as a decade or more) for drug approvals; it was very difficult to determine which drugs might make it all the way through to approval; and companies usually needed to raise additional rounds of capital to complete the trials. Now, drug approvals will occur much more quickly, and it is easier to identify earlier in the process which drugs will be successful. Lastly, many of the smaller companies have been much better capitalized before coming public and very few are “serial capital raisers.” Although the biotechnology sector has been performing strongly for the past four years, we believe investors have been slow to believe that “it’s different this time”; this year, in our opinion, really crystallized the thesis we laid out above in investors’ minds. We saw a lot of data from Phase I and Phase II trials that showed much better efficacy than expected; additionally, we saw some smaller companies acquired by larger companies at valuations not seen previously. Despite the strong performance the past few years, we believe we are still reasonably early in the evolution of this theme.
Re-energizing America—the North American continent passed a milestone this year in becoming energy independent—between Canada, the U.S. and Mexico we are able to generate enough oil and gas to supply our own needs. This occurs a bit more than a decade after the large multinational energy companies left the U.S. as there was no exploration left to do; and indeed, our energy independence has come about as a result of technological advances that have enabled us to get these energy stores, which were well identified but difficult to remove, out of the ground. The re-emergence of the United States as an energy powerhouse has many implications: it has driven U.S. domestic growth, picking up the slack from a slower than anticipated housing recovery; it has driven job growth in the U.S. particularly in Texas, Louisiana, and North Dakota; and it has altered the balance of power in the global energy complex, with interesting ramifications for Europe, Russia, and the Middle East. This year saw the maturation of the industry, and the continued evolution towards a manufacturing/infrastructure complex that could make the United States energy independent for decades and ultimately enable us to export energy throughout the world. It is, in our minds, hard to understate how significant that is: after years of importing cheaper goods from China, and seeing manufacturing leave our shores in search of cheaper labor, the United States now stands in a position to become a powerhouse exporter, and is among the most competitive manufacturing sites in the world. Whatever happens to the price of oil, the tide of change cannot be rolled back, and the implications will be far reaching and last for decades.
| | | |
ADAMS HARKNESS SMALL CAP GROWTH FUND A MESSAGE TO OUR SHAREHOLDERS (Unaudited) | | |
America’s Industrial Renaissance— As students of smaller high growth companies, we believe we see the best of Americans—their ingenuity, their creativity, their “never say die” in the face of adversity. While we have seen individual companies not succeed in their goals, as a group, we believe that smaller growth companies represent an energy, a vitality, and a willingness to take prudent risks that have the ability to change the face of not just their fortunes but the fortunes of all of us. As stewards of your capital, one of our charters is to be intellectually agnostic—we look for improvements in return on invested capital, because if that occurs, then we believe that all the other things that drive stock appreciation, such as accelerating revenues and earnings growth and higher price/earnings ratios, follow. For smaller companies, when faced with adversity, they must adapt or die. While some die, it has been our experience that many adapt, and the early identification of those key adapters is one of the ways, we believe, that we add potential returns to your capital. Nowhere is this more apparent than the transportation industry—specifically the truckers and the airlines. Both of these, historically, have been low return, capital intensive industries, half deregulated, highly cyclical, and deemed unworthy of investors’ attention, except for very brief periods of time, for the most part. But the past several years have seen many changes for the better in these sectors. Airlines have discovered that discounting fares to fill planes is not the way to reward shareholders, and pricing discipline and controlled expansion have dramatically increased profitability in the industry over the past five years. Truckers have been facing major cost increases due to regulatory changes and, until recently, the rising cost of fuel; they also have been rationalizing fleets and trying to hold the line on prices. The result has been dramatic increases in profitability, which may prove to be secular as demand continues to pick up as the economy continues to grow. 2014 was the year that investors began to believe that these changes might be secular as opposed to cyclical, and began to reward both sectors with higher price earnings ratios.
While there continue to be macroeconomic challenges to world growth—the Russia/Ukraine situation, the European Union, the Greek situation, and the Middle East are on investors’ radar now, but there will surely be others—we remain very positive on the outlook for smaller high growth companies in 2015. The long period of underperformance relative to larger stocks has erased a lot of the valuation premium that small growth companies enjoyed at the end of 2013, and the macroeconomic backdrop of slow but steady growth and very low inflation favors them. We believe that 2015 will turn out to be another “stockpicker’s market.” We continue to work hard on your behalf and thank you for investing in the Fund.
Sincerely,
Mary Lisanti, CFA
President & Portfolio Manager
| | | |
ADAMS HARKNESS SMALL CAP GROWTH FUND A MESSAGE TO OUR SHAREHOLDERS (Unaudited) | | |
IMPORTANT RISKS AND DISCLOSURES
An investment in the Fund is subject to risk, including the possible loss of principal amount invested. The Fund invests in smaller companies, which carry greater risk than is associated with larger companies for various reasons such as narrower markets, limited financial resources and less liquid stock.
The S&P 500 Index is a broad-based, unmanaged measurement of changes in stock market conditions based on the average of 500 widely held common stocks. The Russell 2000 Growth Index measures the performance of the small-cap growth segment of the U.S. equity universe. It includes those Russell 2000 companies with higher price-to-value ratios and higher forecasted growth values. One cannot invest directly in an index.
The views in this report were those of the Fund manager as of December 31, 2014, and may not necessarily reflect her views on the date this report is first published or anytime thereafter. These views are intended to assist shareholders in understanding the Fund’s investment methodology and do not constitute investment advice. Although the Adviser believes it has a reasonable basis for any opinions or views expressed, actual results may differ, sometimes significantly so, from those expected or expressed. All current and future holdings of the Fund are subject to risk and are subject to change.
| | | |
ADAMS HARKNESS SMALL CAP GROWTH FUND PERFORMANCE CHART AND ANALYSIS (Unaudited) | | |
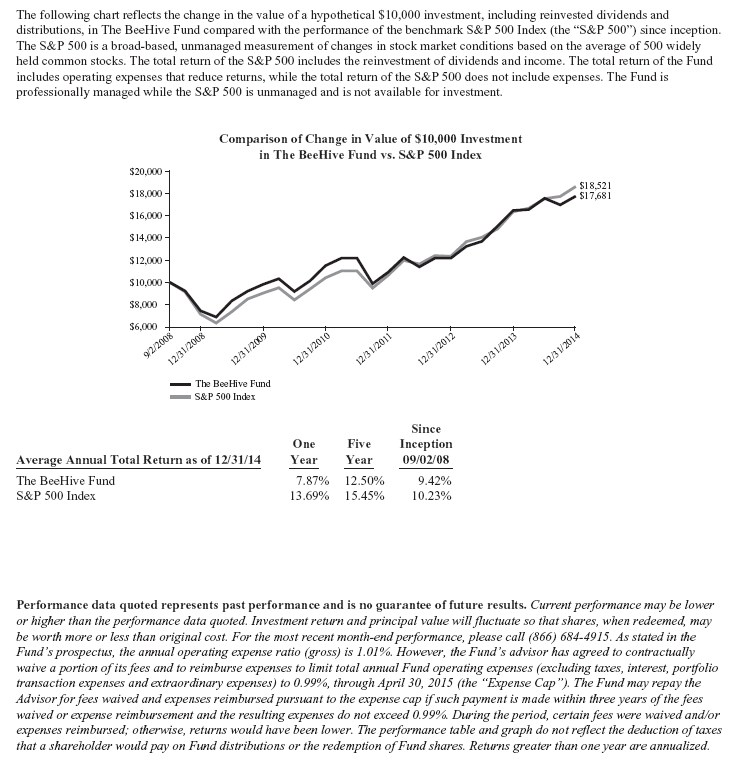
The following chart reflects the change in the value of a hypothetical $10,000 investment, including reinvested dividends and distributions, in Adams Harkness Small Cap Growth Fund (the “Fund”) compared with the performance of the benchmark, Russell 2000 Growth Index ("Russell 2000 Growth"), since inception. The Russell 2000 Growth, the Fund‘s primary performance benchmark, measures the performance of those Russell 2000 Index companies with higher price-to-value ratios and higher forecasted growth values. The total return of the Russell 2000 Growth includes the reinvestment of dividends and income. The total return of the Fund includes operating expenses that reduce returns, while the total return of the Russell 2000 Growth does not include expenses. The Fund is professionally managed while the Russell 2000 Growth is unmanaged and is not available for investment.
Comparison of Change in Value of a $10,000 Investment
Adams Harkness Small Cap Growth Fund vs. Russell 2000 Growth Index
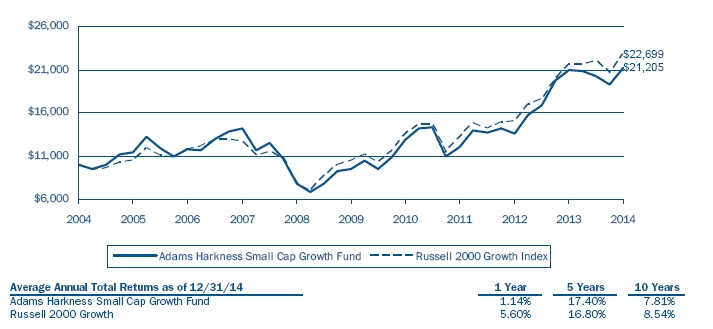
Performance data quoted represents past performance and is no guarantee of future results. Current performance may be lower or higher than the performance data quoted. Investment return and principal value will fluctuate so that shares, when redeemed, may be worth more or less than original cost. For the most recent month-end performance, please call (800) 441-7031, on the Fund's website at www.ahsmallcap.com. As stated in the Fund's prospectus, the annual operating expense ratio (gross) is 2.71%. However, the Fund’s Adviser has voluntarily agreed to waive a portion of its fees and/or reimburse expenses so to cap the expense ratio at 1.80% (excluding taxes, interest, portfolio transaction expenses, and extraordinary expenses) through April 30, 2015. Shares redeemed or exchanged within 30 days of purchase will be charged a 1.00% redemption fee. The performance table and graph do not reflect the deduction of taxes that a shareholder would pay on Fund distributions or the redemption of Fund shares. Returns greater than one year are annualized.
| | | |
ADAMS HARKNESS SMALL CAP GROWTH FUND | | |
| Shares | | Security Description | | Value | |
| Common Stock - 97.3% |
| Apparel & Luxury Goods - 1.4% |
| | 3,416 | | G-III Apparel Group, Ltd. (a) | $ | 345,050 | |
| Biotechnology - 5.7% |
| | 15,025 | | ACADIA Pharmaceuticals, Inc. (a) | | 477,044 | |
| | 1,470 | | Bluebird Bio, Inc. (a) | | 134,828 | |
| | 4,015 | | Isis Pharmaceuticals, Inc. (a) | | 247,886 | |
| | 26,920 | | MiMedx Group, Inc. (a) | | 310,388 | |
| | 6,625 | | Zafgen, Inc. (a) | | 204,315 | |
| | | 1,374,461 | |
| Consumer Discretionary - 20.1% |
| | 4,090 | | BJ's Restaurants, Inc. (a) | | 205,359 | |
| | 9,590 | | Boot Barn Holdings, Inc. (a) | | 174,538 | |
| | 705 | | Buffalo Wild Wings, Inc. (a) | | 127,168 | |
| | 12,180 | | Burlington Stores, Inc. (a) | | 575,627 | |
| | 1,190 | | Core-Mark Holding Co., Inc. | | 73,697 | |
| | 8,260 | | Dave & Buster's Entertainment, Inc. (a) | 225,498 | |
| | 5,845 | | Fiesta Restaurant Group, Inc. (a) | | 355,376 | |
| | 4,940 | | Gentherm, Inc. (a) | | 180,903 | |
| | 3,100 | | Jack in the Box, Inc. | | 247,876 | |
| | 4,895 | | Kirkland's, Inc. (a) | | 115,718 | |
| | 20,915 | | LifeLock, Inc. (a) | | 387,137 | |
| | 1,875 | | Lumber Liquidators Holdings, Inc. (a) | | 124,331 | |
| | 5,370 | | Motorcar Parts of America, Inc. (a) | | 166,953 | |
| | 4,320 | | Select Comfort Corp. (a) | | 116,769 | |
| | 4,075 | | Skechers U.S.A., Inc., Class A (a) | | 225,144 | |
| | 16,090 | | Sonic Corp. | | 438,131 | |
| | 8,830 | | The Ryland Group, Inc. | | 340,485 | |
| | 18,105 | | Tuesday Morning Corp. (a) | | 392,878 | |
| | 4,030 | | Vera Bradley, Inc. (a) | | 82,131 | |
| | 7,020 | | Zumiez, Inc. (a) | | 271,182 | |
| | | 4,826,901 | |
| Consumer Finance - 1.1% |
| | 6,845 | | Blackhawk Network Holdings, Inc. (a) | | 265,586 | |
| Consumer Staples - 1.0% |
| | 15,235 | | Smart & Final Stores, Inc. (a) | | 239,647 | |
| Energy - 2.2% |
| | 2,595 | | Diamondback Energy, Inc. (a) | | 155,129 | |
| | 9,670 | | Rice Energy, Inc. (a) | | 202,780 | |
| | 14,144 | | Synergy Resources Corp. (a) | | 177,366 | |
| | | 535,275 | |
| Financial Services - 6.4% |
| | 9,935 | | Bank of the Ozarks, Inc. | | 376,735 | |
| | 5,005 | | On Deck Capital, Inc. (a) | | 112,262 | |
| | 11,100 | | Square 1 Financial, Inc. (a) | | 274,170 | |
| | 17,090 | | Sterling Bancorp | | 245,754 | |
| | Shares | | Security Description | | Value | |
| | 5,290 | | Tree.com, Inc. (a) | $ | 255,719 | |
| | 10,025 | | Western Alliance Bancorp. (a) | | 278,695 | |
| | | 1,543,335 | |
| Health-Care - 20.8% |
| | 5,775 | | AAC Holdings, Inc. (a) | | 178,563 | |
| | 9,600 | | Acadia Healthcare Co., Inc. (a) | | 587,616 | |
| | 1,900 | | Adeptus Health, Inc., Class A (a) | | 71,060 | |
| | 5,655 | | AMAG Pharmaceuticals, Inc. (a) | | 241,016 | |
| | 3,160 | | Amsurg Corp. (a) | | 172,947 | |
| | 3,615 | | Cempra, Inc. (a) | | 84,989 | |
| | 7,033 | | DexCom, Inc. (a) | | 387,167 | |
| | 8,574 | | ExamWorks Group, Inc. (a) | | 356,593 | |
| | 7,060 | | HealthEquity, Inc. (a) | | 179,677 | |
| | 3,775 | | ICON PLC (a) | | 192,487 | |
| | 9,315 | | INC Research Holdings, Inc., Class A (a) | | 239,302 | |
| | 6,605 | | Inogen, Inc. (a) | | 207,199 | |
| | 60 | | Juno Therapeutics, Inc. (a) | | 3,133 | |
| | 8,309 | | LDR Holding Corp. (a) | | 272,369 | |
| | 4,585 | | Molina Healthcare, Inc. (a) | | 245,435 | |
| | 5,375 | | Natus Medical, Inc. (a) | | 193,715 | |
| | 10,025 | | NuVasive, Inc. (a) | | 472,779 | |
| | 3,555 | | Team Health Holdings, Inc. (a) | | 204,519 | |
| | 10,535 | | The Spectranetics Corp. (a) | | 364,300 | |
| | 11,910 | | Zeltiq Aesthetics, Inc. (a) | | 332,408 | |
| | | 4,987,274 | |
| Industrials - 14.2% |
| | 810 | | Allegiant Travel Co. (a) | | 121,767 | |
| | 8,015 | | Echo Global Logistics, Inc. (a) | | 234,038 | |
| | 10,830 | | InnerWorkings, Inc. (a) | | 84,366 | |
| | 23,845 | | JetBlue Airways Corp. (a) | | 378,182 | |
| | 13,485 | | Knight Transportation, Inc. | | 453,905 | |
| | 4,565 | | Neff Corp., Class A (a) | | 51,448 | |
| | 11,875 | | Paylocity Holding Corp. (a) | | 310,056 | |
| | 6,350 | | Polypore International, Inc. (a) | | 298,767 | |
| | 3,140 | | Saia, Inc. (a) | | 173,830 | |
| | 19,300 | | TASER International, Inc. (a) | | 511,064 | |
| | 10,010 | | TriNet Group, Inc. (a) | | 313,113 | |
| | 11,300 | | XPO Logistics, Inc. (a) | | 461,944 | |
| | | 3,392,480 | |
| Pharmaceuticals - 1.1% |
| | 14,838 | | Flamel Technologies SA, ADR (a) | | 254,175 | |
| Specialty Retail - 1.8% |
| | 4,000 | | Mattress Firm Holding Corp. (a) | | 232,320 | |
| | 1,935 | | Restoration Hardware Holdings, Inc. (a) | 185,779 | |
| | | 418,099 | |
| Technology - 21.5% |
| | 7,725 | | Cavium, Inc. (a) | | 477,560 | |
| | 6,130 | | Cognex Corp. (a) | | 253,353 | |
| See Notes to Financial Statements. | 6 | |
| | | |
ADAMS HARKNESS SMALL CAP GROWTH FUND | | |
| | | | | | | |
| | Shares | | Security Description | | Value | |
| Technology (contuinued) | | | | | |
| | 9,410 | | Constant Contact, Inc. (a) | $ | 345,347 | |
| | 2,615 | | Demandware, Inc. (a) | | 150,467 | |
| | 4,510 | | FleetMatics Group PLC (a) | | 160,060 | |
| | 1,870 | | HubSpot, Inc. (a) | | 62,851 | |
| | 9,205 | | Imperva, Inc. (a) | | 455,003 | |
| | 8,640 | | Infoblox, Inc. (a) | | 174,614 | |
| | 17,485 | | Integrated Device Technology, Inc. (a) | | 342,706 | |
| | 5,720 | | LivePerson, Inc. (a) | | 80,652 | |
| | 8,220 | | LogMeIn, Inc. (a) | | 405,575 | |
| | 9,040 | | Manhattan Associates, Inc. (a) | | 368,109 | |
| | 9,270 | | Marketo, Inc. (a) | | 303,314 | |
| | 6,830 | | Proofpoint, Inc. (a) | | 329,411 | |
| | 14,815 | | Q2 Holdings, Inc. (a) | | 279,115 | |
| | 9,060 | | Qualys, Inc. (a) | | 342,015 | |
| | 23,825 | | RF Micro Devices, Inc. (a) | | 395,257 | |
| | 2,640 | | Synchronoss Technologies, Inc. (a) | | 110,510 | |
| | 3,140 | | Veeco Instruments, Inc. (a) | | 109,523 | |
| | | 5,145,442 | |
Total Common Stock (Cost $19,747,889) | | 23,327,725 | |
Total Investments - 97.3% (Cost $19,747,889)* | $ | 23,327,725 | |
| Other Assets & Liabilities, Net – 2.7% | | 647,824 | |
| Net Assets – 100.0% | $ | 23,975,549 | |
| ADR | American Depositary Receipt |
| PLC | Public Limited Company |
| (a) | Non-income producing security. |
| | * Cost for federal income tax purposes is $19,929,037 and net unrealized appreciation consists of: |
| Gross Unrealized Appreciation | | $ | 3,719,810 | |
| Gross Unrealized Depreciation | | | (321,122 | ) |
| Net Unrealized Appreciation | | $ | 3,398,688 | |
The following is a summary of the inputs used to value the Fund’s investments as of December 31, 2014.
The inputs or methodology used for valuing securities are not necessarily an indication of the risks associated with investing in those securities. For more information on valuation inputs, and their aggregation into the levels used in the table below, please refer to the Security Valuation section in Note 2 of the accompanying Notes to Financial Statements.
| Valuation Inputs | | Investments in Securities |
| Level 1 - Quoted Prices | | $ | 23,327,725 | |
| Level 2 - Other Significant Observable Inputs | | | - | |
| Level 3 - Significant Unobservable Inputs | | | - | |
| Total | | $ | 23,327,725 | |
The Level 1 value displayed in this table is Common Stock. Refer to this Schedule of Investments for a further breakout of each security by industry.
The Fund utilizes the end of period methodology when determining transfers. There were no transfers among Level 1, Level 2 and Level 3 for the year ended December 31, 2014.
AFA
| PORTFOLIO HOLDINGS | | |
| % of Total Investments | | |
| Apparel & Luxury Goods | 1.5 | % |
| Biotechnology | 5.9 | % |
| Consumer Discretionary | 20.7 | % |
| Consumer Finance | 1.1 | % |
| Consumer Staples | 1.0 | % |
| Energy | 2.3 | % |
| Financial Services | 6.6 | % |
| Health-Care | 21.4 | % |
| Industrials | 14.5 | % |
| Pharmaceuticals | 1.1 | % |
| Specialty Retail | 1.8 | % |
| Technology | 22.1 | % |
| | 100.0 | % |
| See Notes to Financial Statements. | 7 | |
| | | |
ADAMS HARKNESS SMALL CAP GROWTH FUND STATEMENT OF ASSETS AND LIABILITIES | | |
| | | | | | | |
| ASSETS | | | | |
| | Total investments, at value (Cost $19,747,889) | | $ | 23,327,725 | |
| | Cash | | | 644,029 | |
| | Receivables: | | | | |
| | | Fund shares sold | | | 47,800 | |
| | | Interest | | | 57 | |
| | Prepaid expenses | | | 9,812 | |
| Total Assets | | | 24,029,423 | |
| | | | | | | |
| LIABILITIES | | | | |
| | Payables: | | | | |
| | | Fund shares redeemed | | | 4,000 | |
| | Accrued Liabilities: | | | | |
| Adviser | Investment adviser fees | | | 9,292 | |
| | | Trustees’ fees and expenses | | | 15 | |
| | | Fund services fees | | | 11,206 | |
| | | Other expenses | | | 29,361 | |
| Total Liabilities | | | 53,874 | |
| | | | | | | |
| NET ASSETS | | $ | 23,975,549 | |
| | | | | | | |
| COMPONENTS OF NET ASSETS | | | | |
| | Paid-in capital | | $ | 20,250,615 | |
| | Accumulated net realized gain | | | 145,098 | |
| | Net unrealized appreciation | | | 3,579,836 | |
| NET ASSETS | | $ | 23,975,549 | |
| SHARES OF BENEFICIAL INTEREST AT NO PAR VALUE (UNLIMITED SHARES AUTHORIZED) | | | 1,280,093 | |
NET ASSET VALUE, OFFERING AND REDEMPTION PRICE PER SHARE* | | $ | 18.73 | |
| * | Shares redeemed or exchanged within 30 days of purchase are charged a 1.00% redemption fee. |
| See Notes to Financial Statements. | 8 | |
| | | |
ADAMS HARKNESS SMALL CAP GROWTH FUND YEAR ENDED DECEMBER 31, 2014 | | |
| | | | | | | |
| INVESTMENT INCOME | | | | |
| | Dividend income | | $ | 40,108 | |
| | Interest income | | | 1,211 | |
| Total Investment Income | | | 41,319 | |
| Adviser | | | | |
| EXPENSES | | | | |
| | Investment adviser fees | | | 270,507 | |
| | Fund services fees | | | 184,084 | |
| | Shareholder service fees | | | 67,627 | |
| | Custodian fees | | | 5,000 | |
| | Registration fees | | | 20,515 | |
| | Professional fees | | | 34,101 | |
| | Trustees' fees and expenses | | | 1,292 | |
| | Miscellaneous expenses | | | 31,857 | |
| Total Expenses | | | 614,983 | |
| | Fees waived and expenses reimbursed | | | (128,070 | ) |
| Net Expenses | | | 486,913 | |
| | | | | | | |
| NET INVESTMENT LOSS | | | (445,594 | ) |
| | | | | | | |
| NET REALIZED AND UNREALIZED GAIN (LOSS) | | | | |
| | Net realized gain on investments | | | 394,459 | |
| | Net change in unrealized appreciation (depreciation) on investments | | | (337,424 | ) |
| NET REALIZED AND UNREALIZED GAIN | | | 57,035 | |
| DECREASE IN NET ASSETS RESULTING FROM OPERATIONS | | $ | (388,559 | ) |
| | | | | | | |
| See Notes to Financial Statements. | 9 | |
| | | |
ADAMS HARKNESS SMALL CAP GROWTH FUND STATEMENTS OF CHANGES IN NET ASSETS | | |
| | | December 31, 2015 | # | | 42004 | # | # | | | 41639 | |
| | | | | For the Year Ended December 31, 2014 | | | For the Year Ended December 31, 2013 |
| OPERATIONS | | | | | | | | | |
| | Net investment loss | | $ | (445,594 | ) | | | $ | (294,871 | ) |
| | Net realized gain | | | 394,459 | | | | | 4,504,662 | |
| | Net change in unrealized appreciation (depreciation) | | | (337,424 | ) | | | | 2,785,999 | |
| Increase (Decrease) in Net Assets Resulting from Operations | | | (388,559 | ) | | | | 6,995,790 | |
| | | | | | | | | | | | |
| DISTRIBUTIONS TO SHAREHOLDERS FROM | | | | | | | | | |
| | Net investment income | | | - | | | | | (108,434 | ) |
| | Net realized gain | | | (1,218,666 | ) | | | | (1,251,341 | ) |
| Total Distributions to Shareholders | | | (1,218,666 | ) | | | | (1,359,775 | ) |
| | | | | | | | | | | | |
| CAPITAL SHARE TRANSACTIONS | | | | | | | | | |
| | Sale of shares | | | 8,145,314 | | | | | 21,288,627 | |
| | Reinvestment of distributions | | | 1,168,489 | | | | | 1,266,338 | |
| | Redemption of shares | | | (16,124,007 | ) | | | | (7,197,567 | ) |
| | Redemption fees | | | 1,675 | | | | | 1,927 | |
| Increase (Decrease) in Net Assets from Capital Share Transactions | | (6,808,529 | ) | | | | 15,359,325 | |
| Increase (Decrease) in Net Assets | | | (8,415,754 | ) | | | | 20,995,340 | |
| | | | | | | | | | | | |
| NET ASSETS | | | | | | | | | |
| | Beginning of Year | | | 32,391,303 | | | | | 11,395,963 | |
| | End of Year (Including line (a)) | | $ | 23,975,549 | | | | $ | 32,391,303 | |
| | | | | | | | | | | | |
| SHARE TRANSACTIONS | | | | | | | | | |
| | Sale of shares | | | 424,225 | | | | | 1,126,394 | |
| | Reinvestment of distributions | | | 64,557 | | | | | 70,105 | |
| | Redemption of shares | | | (866,775 | ) | | | | (391,442 | ) |
| Increase (Decrease) in Shares | | | (377,993 | ) | | | | 805,057 | |
| | | | | | | | | | | | |
| (a) | Distributions in excess of net investment income. | | $ | - | | | | $ | (496 | ) |
| See Notes to Financial Statements. | 10 | |
| | | |
ADAMS HARKNESS SMALL CAP GROWTH FUND | | |
| These financial highlights reflect selected data for a share outstanding throughout each year. | | | | | |
| | | For the Years Ended December 31, |
| 2014 | | 2013 | | 2012 | | 2011 | | 2010 | |
| NET ASSET VALUE, Beginning of Year | $ | 19.54 | | | $ | 13.36 | | | $ | 11.83 | | | $ | 12.59 | | | $ | 9.34 | | |
| INVESTMENT OPERATIONS | | | | | | | | | | | | | | | | | | | | |
| Net investment loss (a) | | (0.31 | ) | | | (0.29 | ) | | | (0.17 | ) | | | (0.20 | ) | | | (0.23 | ) | |
| Net realized and unrealized gain (loss) | | 0.50 | | | | 7.43 | | | | 1.70 | | | | (0.56 | ) | | | 3.48 | | |
| Total from Investment Operations | | 0.19 | | | | 7.14 | | | | 1.53 | | | | (0.76 | ) | | | 3.25 | | |
| DISTRIBUTIONS TO SHAREHOLDERS FROM | | | | | | | | | | | | | | | | | | | |
| Net investment income | | — | | | | (0.13 | ) | | | — | | | | — | | | | — | | |
| Net realized gain | | (1.00 | ) | | | (0.83 | ) | | | — | | | | — | | | | — | | |
| Total Distributions to Shareholders | | (1.00 | ) | | | (0.96 | ) | | | — | | | | — | | | | — | | |
| REDEMPTION FEES (a) | | — | (b) | | — | (b) | | — | | | | — | (b) | | — | (b) |
| NET ASSET VALUE, End of Year | $ | 18.73 | | | $ | 19.54 | | | $ | 13.36 | | | $ | 11.83 | | | $ | 12.59 | | |
| TOTAL RETURN | | 1.14 | % | | 54.15 | % | | 12.93 | % | | (6.04 | )% | | 34.80 | % |
| RATIOS/SUPPLEMENTARY DATA | | | | | | | | | | | | | | | | | | | | |
| Net Assets at End of Year (000's omitted) | $23,976 | | | $32,391 | | | $11,396 | | | $10,765 | | | $13,007 | | |
| Ratios to Average Net Assets: | | | | | | | | | | | | | | | | | | | | |
| Net investment loss | | (1.65 | )% | | (1.66 | )% | | (1.26 | )% | | (1.59 | )% | | (2.25 | )% |
| Net expenses | | 1.80 | % | | 1.80 | % | | 1.80 | % | | 1.80 | % | | 2.34 | % |
| Gross expenses (c) | | 2.27 | % | | 2.71 | % | | 3.44 | % | | 3.40 | % | | 3.63 | % |
| PORTFOLIO TURNOVER RATE | | 263 | % | | 295 | % | | 294 | % | | 324 | % | | 319 | % |
| | | | | | | | | | | | | | | | | | | | | | |
| (a) | Calculated based on average shares outstanding during each year. |
| (b) | Less than $0.01 per share. |
| (c) | Reflects the expense ratio excluding any waivers and/or reimbursements. |
| See Notes to Financial Statements. | 11 | |
| | | |
ADAMS HARKNESS SMALL CAP GROWTH FUND NOTES TO FINANCIAL STATEMENTS | | |
Note 1. Organization
The Adams Harkness Small Cap Growth Fund (the “Fund”) is a diversified portfolio of Forum Funds (the “Trust”). The Trust is a Delaware statutory trust that is registered as an open-end, management investment company under the Investment Company Act of 1940 (the “Act”), as amended. Under its Trust Instrument, the Trust is authorized to issue an unlimited number of the Fund’s shares of beneficial interest without par value. The Fund commenced operations on February 27, 2004. The Fund seeks maximum capital appreciation.
Note 2. Summary of Significant Accounting Policies
These financial statements are prepared in accordance with accounting principles generally accepted in the United States of America (“GAAP”), which require management to make estimates and assumptions that affect the reported amounts of assets and liabilities, the disclosure of contingent liabilities at the date of the financial statements, and the reported amounts of increases and decreases in net assets from operations during the fiscal year. Actual amounts could differ from those estimates. The following summarizes the significant accounting policies of the Fund:
Security Valuation – Exchange-traded securities and over-the-counter securities are valued using the last quoted trade or official closing price, provided by independent pricing services as of the close of trading on the market or exchange for which they are primarily traded, on each Fund business day. In the absence of a sale, such securities are valued at the mean of the last bid and ask price provided by independent pricing services. Non-exchange traded securities for which quotations are available are valued using the last quoted sales price, or in the absence of a sale, at the mean of the last bid and ask prices provided by independent pricing services. Shares of open-end mutual funds are valued at net asset value (“NAV”). Short-term investments that mature in 60 days or less may be valued at amortized cost.
The Fund values its investments at fair value pursuant to procedures adopted by the Trust's Board of Trustees (the "Board") if (1) market quotations are insufficient or not readily available or (2) the adviser believes that the values available are unreliable. The Trust’s Valuation Committee, as defined in the Fund’s registration statement, performs certain functions as they relate to the administration and oversight of the Fund’s valuation procedures. Under these procedures, the Valuation Committee convenes on a regular and ad-hoc basis to review such investments and considers a number of factors, including valuation methodologies and significant unobservable inputs, when arriving at fair value.
The Valuation Committee may work with the adviser to provide valuation inputs. In determining fair valuations, inputs may include market-based analytics which may consider related or comparable assets or liabilities, recent transactions, market multiples, book values and other relevant investment information. Adviser inputs may include an income-based approach in which the anticipated future cash flows of the investment are discounted in determining fair value. Discounts may also be applied based on the nature or duration of any restrictions on the disposition of the investments. The Valuation Committee performs regular reviews of valuation methodologies, key inputs and assumptions, disposition analysis and market activity.
| | | |
ADAMS HARKNESS SMALL CAP GROWTH FUND NOTES TO FINANCIAL STATEMENTS | | |
Fair valuation is based on subjective factors and, as a result, the fair value price of an investment may differ from the security’s market price and may not be the price at which the asset may be sold. Fair valuation could result in a different Net Asset Value ("NAV") than a NAV determined by using market quotes.
The Fund has a three-tier fair value hierarchy. The basis of the tiers is dependent upon the various “inputs” used to determine the value of the Fund’s investments. These inputs are summarized in the three broad levels listed below:
Level 1 — quoted prices in active markets for identical assets and liabilities
Level 2 — other significant observable inputs (including quoted prices of similar securities, interest rates, prepayment speeds, credit risk, etc.)
Level 3 — significant unobservable inputs (including the Fund’s own assumptions in determining the fair value of investments)
The aggregate value by input level, as of December 31, 2014, for the Fund’s investments is included at the end of the Fund’s Schedule of Investments.
Security Transactions, Investment Income and Realized Gain and Loss – Investment transactions are accounted for on the trade date. Dividend income is recorded on the ex-dividend date. Foreign dividend income is recorded on the ex-dividend date or as soon as possible after the Fund determines the existence of a dividend declaration after exercising reasonable due diligence. Income and capital gains on some foreign securities may be subject to foreign withholding taxes, which are accrued as applicable. Interest income is recorded on an accrual basis. Premium is amortized and discount is accreted using the effective interest method. Identified cost of investments sold is used to determine the gain and loss for both financial statement and federal income tax purposes.
Distributions to Shareholders – Distributions to shareholders of net investment income, if any, are declared and paid at least quarterly. Distributions to shareholders of net capital gains, if any, are declared and paid annually. Distributions to shareholders are recorded on the ex-dividend date. Distributions are based on amounts calculated in accordance with applicable federal income tax regulations, which may differ from GAAP. These differences are due primarily to differing treatments of income and gain on various investment securities held by the Fund, timing differences and differing characterizations of distributions made by the Fund.
Federal Taxes – The Fund intends to qualify each year as a regulated investment company under Subchapter M of the Internal Revenue Code and to distribute all of its taxable income to shareholders. In addition, by distributing in each calendar year substantially all of its net investment income and capital gains, if any, the Fund will not be subject to a federal excise tax. Therefore, no federal income or excise tax provision is required. The Fund files a U.S. federal income and excise tax return as required. A fund’s federal income tax returns are subject to examination by the Internal Revenue Service for a period of three fiscal years after they
| | | |
ADAMS HARKNESS SMALL CAP GROWTH FUND NOTES TO FINANCIAL STATEMENTS | | |
are filed. As of December 31, 2014, there are no uncertain tax positions that would require financial statement recognition, de-recognition, or disclosure.
Income and Expense Allocation – The Trust accounts separately for the assets, liabilities and operations of each of its investment portfolios. Expenses that are directly attributable to more than one investment portfolio are allocated among the respective investment portfolios in an equitable manner.
Commitments and Contingencies – In the normal course of business, the Fund enters into contracts that provide general indemnifications by the Fund to the counterparty to the contract. The Fund’s maximum exposure under these arrangements is dependent on future claims that may be made against the Fund and, therefore, cannot be estimated; however, based on experience, the risk of loss from such claims is considered remote.
Redemption Fees – A shareholder who redeems or exchanges shares within 30 days of purchase will incur a redemption fee of 1.00% of the current net asset value of shares redeemed or exchanged, subject to certain limitations. The fee is charged for the benefit of the remaining shareholders and will be paid to the Fund to help offset transaction costs. The fee is accounted for as an addition to paid-in capital. The Fund reserves the right to modify the terms of or terminate the fee at any time. There are limited exceptions to the imposition of the redemption fee.
Note 3. Cash – Concentration in Uninsured Account
For cash management purposes the Fund may concentrate cash with the Fund’s custodian. This typically results in cash balances exceeding the Federal Deposit Insurance Corporation (“FDIC”) insurance limits. As of December 31, 2014, the Fund held $394,029 as cash reserves at MUFG Union Bank, N.A. that exceeded the FDIC insurance limit.
Note 4. Fees and Expenses
Investment Adviser – AH Lisanti Capital Growth, LLC (the “Adviser”) is the investment adviser to the Fund. Pursuant to an investment advisory agreement, the Adviser receives an advisory fee from the Fund at an annual rate of 1.00% of the Fund’s average daily net assets.
Shareholder Service Plan – The Trust has adopted a shareholder service plan for the Fund under which the Fund may reimburse the Fund’s administrator for amounts paid by the administrator for providing shareholder service activities that are not otherwise provided by the transfer agent. The Fund’s administrator may make such payments to various financial institutions, including the Adviser, that provide shareholder servicing to their customers invested in the Fund in amounts of up to 0.25% annually of the average daily net assets of the shares held by such customers.
Distribution – Foreside Fund Services, LLC serves as the Fund’s distributor (the “Distributor”). The Fund does not have a distribution (12b-1) plan; accordingly, the Distributor does not receive compensation from the Fund
| | | |
ADAMS HARKNESS SMALL CAP GROWTH FUND NOTES TO FINANCIAL STATEMENTS | | |
for its distribution (12b-1) services. The Adviser compensates the Distributor directly for its services. The Distributor is not affiliated with the Adviser or Atlantic Fund Administration, LLC (d/b/a Atlantic Fund Services) (“Atlantic”) or their affiliates.
Other Service Providers – Atlantic provides fund accounting, fund administration, compliance and transfer agency services to the Fund. Atlantic also provides certain shareholder report production, and EDGAR conversion and filing services. Pursuant to an Atlantic services agreement, the Fund pays Atlantic customary fees for its services. Atlantic provides a Principal Executive Officer, a Principal Financial Officer, a Chief Compliance Officer, and an Anti-Money Laundering Officer to the Fund, as well as certain additional compliance support functions.
Trustees and Officers – The Trust pays each independent Trustee an annual retainer fee of $45,000 for service to the Trust ($66,000 for the Chairman). The Trustees and Chairman may receive additional fees for special Board meetings. Each Trustee is also reimbursed for all reasonable out-of-pocket expenses incurred in connection with his duties as a Trustee, including travel and related expenses incurred in attending Board meetings. The amount of Trustees’ fees attributable to the Fund is disclosed in the Statement of Operations. Certain officers of the Trust are also officers or employees of the above named service providers, and during their terms of office received no compensation from the Fund.
Note 5. Fees Waived
During the year, certain Fund service providers have voluntarily agreed to waive a portion of their fees. The Fund’s Adviser has voluntarily agreed to waive a portion of its fees and/or reimburse expenses to cap the expense ratio at 1.80% (excluding taxes, interest, portfolio transaction expenses, and extraordinary expenses). These voluntary waivers may be reduced or eliminated at any time. For the year ended December 31, 2014, fees waived were as follows:
| Investment Adviser Fees Waived | | Other Waivers | | Total Fees Waived |
| $ | 78,051 | | $ | 50,019 | | $ | 128,070 |
| | | | | | | | |
Note 6. Security Transactions
The cost of purchases and proceeds from sales of investment securities (including maturities), other than short-term investments during the year ended December 31, 2014, were $69,744,974 and $77,785,023, respectively.
| | | |
ADAMS HARKNESS SMALL CAP GROWTH FUND NOTES TO FINANCIAL STATEMENTS | | |
Note 7. Federal Income Tax
Distributions paid during the fiscal years ended as noted were characterized for tax purposes as follows:
| Ordinary Income | | $ | 910,220 | | $ | 714,744 |
| Long-Term Capital Gain | | | 308,446 | | | 645,031 |
| | | $ | 1,218,666 | | $ | 1,359,775 |
As of December 31, 2014, distributable earnings on a tax basis were as follows:
| Undistributed Long-Term Gain | | $ | 326,246 | |
| Unrealized Appreciation | | | 3,398,688 | |
| Total | | $ | 3,724,934 | |
The difference between components of distributable earnings on a tax basis and the amounts reflected in the Statement of Assets and Liabilities are primarily due to wash sales.
On the Statement of Assets and Liabilities, as a result of permanent book to tax differences, certain amounts have been reclassified for the year ended December 31, 2014. The following reclassifications were the result of net operating loss and passive foreign investment company transactions and have no impact on the net assets of the Fund.
| Undistributed Net Investment Income (Loss) | | $ | 446,090 | |
| Accumulated Net Realized Gain (Loss) | | | (11,979 | ) |
| Paid-in-Capital | | | (434,111 | ) |
Note 8. Subsequent Events
Subsequent events occurring after the date of this report through the date these financial statements were issued have been evaluated for potential impact and the Fund has had no such events.
| | | |
REPORT OF INDEPENDENT REGISTERED PUBLIC ACCOUNTING FIRM | | |
To the Shareholders of the Adams Harkness Small Cap Growth Fund
and the Board of Trustees of Forum Funds
We have audited the accompanying statement of assets and liabilities of Adams Harkness Small Cap Growth Fund (the “Fund”), a series of shares of beneficial interest in the Forum Funds, including the schedule of investments, as of December 31, 2014, and the related statement of operations for the year then ended, the statements of changes in net assets for each of the years in the two-year period then ended, and the financial highlights for each of the years in the five-year period then ended. These financial statements and financial highlights are the responsibility of the Fund's management. Our responsibility is to express an opinion on these financial statements and financial highlights based on our audits.
We conducted our audits in accordance with the standards of the Public Company Accounting Oversight Board (United States). Those standards require that we plan and perform the audits to obtain reasonable assurance about whether the financial statements and financial highlights are free of material misstatement. An audit includes examining, on a test basis, evidence supporting the amounts and disclosures in the financial statements. Our procedures included confirmation of securities owned as of December 31, 2014 by correspondence with the custodian. An audit also includes assessing the accounting principles used and significant estimates made by management, as well as evaluating the overall financial statement presentation. We believe that our audits provide a reasonable basis for our opinion.
In our opinion, the financial statements and financial highlights referred to above present fairly, in all material respects, the financial position of Adams Harkness Small Cap Growth Fund as of December 31, 2014, the results of its operations for the year then ended, the changes in its net assets for each of the years in the two-year period then ended and its financial highlights for each of the years in the five-year period then ended, in conformity with accounting principles generally accepted in the United States of America.
BBD, LLP
Philadelphia, Pennsylvania
February 26, 2015
| | | |
ADAMS HARKNESS SMALL CAP GROWTH FUND ADDITIONAL INFORMATION (Unaudited) | | |
Investment Advisory Agreement Approval
At the September 12, 2014 Board meeting, the Board, including the Independent Trustees, considered the approval of the continuance of the investment advisory agreement between AH Lisanti Capital Growth, LLC (the “Adviser”) and the Trust pertaining to the Fund (the “Advisory Agreement”). In preparation for its deliberations, the Board requested and reviewed written responses from the Adviser to a due diligence questionnaire circulated on the Board's behalf. The Board also discussed the materials with Independent Trustee counsel and, as necessary, with the Trust's administrator, Atlantic Fund Services. During its deliberations, the Board received an oral presentation from the Adviser, and was assisted by the advice of Independent Trustee counsel.
In evaluating the Advisory Agreement for the Fund, the Board reviewed written materials furnished by the Adviser and the administrator, including information regarding the Adviser's personnel, operations and financial condition. In addition, the Board recognized that the evaluation process with respect to the Adviser is an ongoing one and, in this regard, the Board considered information provided at regularly scheduled meetings during the past year, including, among other things, information concerning the Fund’s performance and services provided by the Adviser.
At the meeting, the Board reviewed, among other matters: (1) the nature, extent and quality of the services provided to the Fund by the Adviser, including information on the investment performance of the Fund and Adviser; (2) the costs of the services provided and profitability to the Adviser of its relationship with the Fund; (3) the advisory fee and total expense ratio of the Fund compared to a relevant peer group of funds; (4) the extent to which economies of scale may be realized as the Fund grow and whether the advisory fee enables each Fund's investors to share in the benefits of economies of scale; and (5) other benefits received by the Adviser from its relationship with the Fund.
Nature, Extent and Quality of Services
Based on written materials received, a presentation from a senior representative of the Adviser and a discussion with the Adviser about the Adviser’s personnel, operations and financial condition and with the Trust’s CCO about the Adviser, the Board considered the quality of services provided by the Adviser under the Advisory Agreement. In this regard, the Board considered information regarding the experience, qualifications and professional background of the portfolio manager and other personnel at the Adviser with principal responsibility for the Fund, as well as the investment philosophy and decision-making process of those professionals and the capability and integrity of the Adviser’s senior management and staff.
The Board considered also the adequacy of the Adviser’s resources. The Board noted the Adviser’s representations that the firm is in good financial condition, currently profitable, and anticipates continuing to build profitability and cash as its assets grow. Based on the presentation and the materials provided by the Adviser in connection with the Board’s consideration of the renewal of the Advisory Agreement, the Board concluded that, overall, it was satisfied with the nature, extent and quality of services to be provided to the Fund under the Advisory Agreement.
| | | |
ADAMS HARKNESS SMALL CAP GROWTH FUND ADDITIONAL INFORMATION (Unaudited) | | |
Performance
In connection with a presentation by the Adviser regarding its approach to managing the Fund, the Board reviewed the performance of the Fund compared to its benchmark. The Board observed that the Fund underperformed the Russell 2000 Growth Index, the Fund’s primary benchmark, for the one-year and three-year periods ended July 31, 2014, but outperformed the benchmark for the five-year period ended July 31, 2014. The Board noted the Adviser’s representation that performance was down for small capitalization growth companies generally through the first six months of 2014 due, in part, to the Federal Reserve’s tapering efforts and inflation in the food and petroleum markets, among other reasons. The Board also considered the Fund’s performance relative to its Lipper, Inc. (“Lipper”) peer group, noting that, based on the information provided by Lipper, the Fund underperformed the median of its Lipper peer group for the one-year period ended July 31, 2014 but outperformed the median of its peers for the three-year and five-year periods ended July 31, 2014. Based on the foregoing, the Board determined that the Fund’s performance was reasonable and that the Fund and its shareholders could benefit from the Adviser’s management.
Compensation
The Board evaluated the Adviser’s compensation for providing advisory services to the Fund and analyzed comparative information on “actual” advisory fee rates and actual total expenses of the relevant Lipper peer group of the Fund. The Board noted that the Adviser’s actual advisory fee rate for the Fund was less than the median of its Lipper peer group, but that the actual total expense ratio was higher the median of its Lipper peer group, representing a significant waiver of management fees by the Adviser. The Board further noted the Adviser’s representation that the Adviser intends to continue the voluntary expense cap with respect to the Fund. Based on the foregoing, the Board concluded that the Adviser’s advisory fee rate charged to the Fund was reasonable.
Cost of Services and Profitability
The Board considered information provided by the Adviser regarding the costs of services and its profitability with respect to the Fund. In this regard, the Board considered the Adviser’s resources devoted to the Fund, as well as the Adviser’s discussion of the aggregate costs and profitability of its mutual fund activities. The Board also noted the Adviser’s representation that the Adviser is subsidizing the Fund and has foregone the majority of its management fee such that the net fee the Adviser receives for managing the mutual fund is consistent with or significantly below its other clients. Based on these and other applicable considerations, the Board concluded that the Adviser’s profits attributable to management of the Fund were reasonable in the context of all factors considered.
Economies of Scale
The Board evaluated whether the Fund would benefit from any economies of scale. In this respect, the Board noted the Adviser’s representation that, given the small size of the Fund, it was not feasible at the time to discuss breakpoints. The Board further noted the Adviser’s representation that it was not industry standard to provide for such breakpoints on small capitalization growth funds because of the costly, research-intensive
| | | |
ADAMS HARKNESS SMALL CAP GROWTH FUND ADDITIONAL INFORMATION (Unaudited) | | |
nature of operating such funds. Based on the foregoing information, the Board concluded that economies of scale were not a material factor in approving the Advisory Agreement.
Other Benefits
The Board noted the Adviser’s representation that it would be receiving a benefit arising from the use of soft dollars in connection with Fund trades, which will be used for the acquisition of research that may benefit not only the Fund, but potentially other clients of the Adviser. The Board further noted that, because the institutional clients benefitted from the soft dollar usage comprise the majority of the Fund’s assets, the Fund benefits from such institutional relationships.
Conclusion
The Board did not identify any single factor as being of paramount importance, and different Trustees may have given different weight to different factors. The Board reviewed a memorandum from Fund Counsel discussing the legal standards applicable to its consideration of the Advisory Agreement. Based on its review, including consideration of each of the factors referenced above, the Board determined, in the exercise of its reasonable business judgment, that the advisory arrangement, as outlined in the Advisory Agreement, was fair and reasonable in light of the services performed or to be performed, expenses incurred or to be incurred and such other matters as the Board considered relevant.
Proxy Voting Information
A description of the policies and procedures that the Fund uses to determine how to vote proxies relating to securities held in the Fund’s portfolio is available, without charge and upon request, by calling (800) 441-7031, on the Fund's website at www.ahsmallcap.com and on the U.S. Securities and Exchange Commission’s (the “SEC”) website at www.sec.gov. The Fund’s proxy voting record for the most recent twelve-month period ended June 30 is available, without charge and upon request, by calling (800) 441-7031, on the Fund's website at www.ahsmallcap.com and on the SEC’s website at www.sec.gov.
Availability of Quarterly Portfolio Schedules
The Fund files its complete schedule of portfolio holdings with the SEC for the first and third quarters of each fiscal year on Form N-Q. These filings are available, without charge and upon request on the SEC’s website at www.sec.gov or may be reviewed and copied at the SEC’s Public Reference Room in Washington, DC. Information on the operation of the Public Reference Room may be obtained by calling (800) SEC-0330.
Shareholder Expense Example
As a shareholder of the Fund, you incur two types of costs: (1) transaction costs, including redemption fees and exchange fees, and (2) ongoing costs, including management fees and other Fund expenses. This example is intended to help you understand your ongoing costs (in dollars) of investing in the Fund, and to compare these costs with the ongoing costs of investing in other mutual funds.
| | | |
ADAMS HARKNESS SMALL CAP GROWTH FUND ADDITIONAL INFORMATION (Unaudited) | | |
The example is based on an investment of $1,000 invested at the beginning of the period and held for the entire period from July 1, 2014, through December 31, 2014.
Actual Expenses – The first line of the table below provides information about actual account values and actual expenses. You may use the information in this line, together with the amount you invested, to estimate the expenses that you paid over the period. Simply divide your account value by $1,000 (for example, an $8,600 account value divided by $1,000 = 8.6), then multiply the result by the number in the first line under the heading entitled “Expenses Paid During Period” to estimate the expenses you paid on your account during the period.
Hypothetical Example for Comparison Purposes – The second line of the table below provides information about hypothetical account values and hypothetical expenses based on the Fund’s actual expense ratio and an assumed rate of return of 5% per year before expenses, which is not the Fund’s actual return. The hypothetical account values and expenses may not be used to estimate the actual ending account balance or expenses you paid for the period. You may use this information to compare the ongoing costs of investing in the Fund and other funds. To do so, compare this 5% hypothetical example with the 5% hypothetical examples that appear in the shareholder reports of other funds.
Please note that the expenses shown in the table are meant to highlight your ongoing costs only and do not reflect any transactional costs, such as redemption fees and exchange fees. Therefore, the second line of the table is useful in comparing ongoing costs only, and will not help you determine the relative total costs of owning different funds. In addition, if these transactional costs had been included, your costs would have been higher.
| | Beginning | | Ending | | Expenses | | Annualized |
| | Account Value | | Account Value | | Paid During | | Expense |
| | July 1, 2014 | | December 31, 2014 | | Period* | | Ratio* |
| Actual | $ | 1,000.00 | | $ | 1,047.25 | | $ | 9.29 | | 1.80 | % |
| Hypothetical (5% return before taxes) | $ | 1,000.00 | | $ | 1,016.13 | | $ | 9.15 | | 1.80 | % |
| | | | | | | | | | | | |
| | *Expenses are equal to the Fund’s annualized expense ratio multiplied by the average account value over the period, multiplied by the number of days in the most recent fiscal half-year divided by 365 to reflect the half-year period. |
Federal Tax Status of Dividends Declared during the Fiscal Year
For federal income tax purposes, dividends from short-term capital gains are classified as ordinary income. The Fund designates 1.47% of its income dividend distributed as qualifying for the corporate dividends-received deduction (DRD) and 1.53% for the qualified dividend rate (QDI) as defined in Section 1(h)(11) of the Internal Revenue Code. The Fund also designates 100.00% as short-term capital gain dividends exempt from U.S. tax for foreign shareholders (QSD).
| | | |
ADAMS HARKNESS SMALL CAP GROWTH FUND ADDITIONAL INFORMATION (Unaudited) | | |
Trustees and Officers of the Trust
The Board is responsible for oversight of the management of the Trust’s business affairs and of the exercise of all the Trust’s powers except those reserved for the shareholders. The following table provides information about each Trustee and certain officers of the Trust. Each Trustee and officer holds office until the person resigns, is removed, or is replaced. Unless otherwise noted, the persons have held their principal occupations for more than five years. The address for all Trustees and officers is Three Canal Plaza, Suite 600, Portland, Maine 04101. Mr. Keffer is considered an Interested Trustee due to his affiliation with Atlantic. The Fund’s Statement of Additional Information includes additional information about the Trustees and is available, without charge and upon request, by calling (800) 441-7031, on the Fund's website at www.ahsmallcap.com.
| Name and Year of Birth | Position with the Trust | Length of Time Served | Principal Occupation(s) During Past Five Years | Number of Series of Fund Complex¹ Overseen by Trustee | Other Directorships Held by Trustee |
| Independent Trustees | | | | | |
J. Michael Parish Born: 1943 | Chairman of the Board; Trustee; Chairman, Nominating Committee and Qualified Legal Compliance Committee | Since 1989 (Chairman since 2004) | Retired since 2003; formerly, Partner, Wolf, Block, Schorr and Solis-Cohen, LLP (law firm) 2002-2003; Partner, Thelen Reid & Priest LLP (law firm) 1995-2002. | 27 | None |
Costas Azariadis Born: 1943 | Trustee | Since 1989 | Professor of Economics, Washington University since 2006. | 27 | None |
James C. Cheng Born: 1942 | Trustee; Chairman, Audit Committee | Since 1989 | President, Technology Marketing Associates (marketing company for small- and medium-sized businesses in New England) since 1991. | 27 | None |
David Tucker Born: 1958 | Trustee | Since 2011 | Director, Blue Sky Experience since 2008; Senior Vice President & General Counsel, American Century Companies 1998-2008. | 36 | Trustee, Forum Funds II and Forum ETF Trust |
| Interested Trustee | | | | | |
John Y. Keffer2 Born: 1942 | Trustee; Vice Chairman | Since 1989 | Chairman, Atlantic since 2008; President, Forum Investment Advisors, LLC since 2011; President, Forum Foundation (a charitable organization) since 2005; President, Forum Trust, LLC (a non-depository trust company chartered in the State of Maine) since 1997. | 36 | Director, Wintergreen Fund, Inc.; Trustee, Forum Funds II, Forum ETF Trust and ALTMFX Trust |
1The Fund Complex includes the Trust, Forum Funds II and Forum ETF Trust and is overseen by different Boards of Trustees.
2Atlantic is a subsidiary of Forum Holdings Corp. I, a Delaware corporation that is wholly owned by Mr. Keffer.
| | | |
ADAMS HARKNESS SMALL CAP GROWTH FUND ADDITIONAL INFORMATION (Unaudited) | | |
| Name and Year of Birth | Position with the Trust | Length of Time Served | Principal Occupation(s) During Past Five Years | Number of Series of Fund Complex¹ Overseen by Trustee | Other Directorships Held by Trustee |
Officers Stacey E. Hong Born: 1966 | President; Principal Executive Officer | Since 2008 | President, Atlantic since 2008. | N/A | N/A |
Karen Shaw Born: 1972 | Treasurer; Principal Financial Officer | Since 2008 | Senior Vice President, Atlantic since 2008. | N/A | N/A |
Zachary Tackett Born: 1988 | Vice President; Secretary; Anti-Money Laundering Compliance Officer | Since 2014 | Associate Counsel, Atlantic since 2014; Intern Associate, Coakley & Hyde, PLLC, 2010-2013. | N/A | N/A |
Michael J. McKeen Born: 1971 | Vice President | Since 2009 | Senior Vice President, Atlantic since 2008. | N/A | N/A |
Timothy Bowden Born: 1969 | Vice President | Since 2009 | Manager, Atlantic since 2008. | N/A | N/A |
Geoffrey Ney Born: 1975 | Vice President | Since 2013 | Manager, Atlantic since 2013; Senior Fund Accountant, Atlantic, 2008-2013. | N/A | N/A |
Todd Proulx Born: 1978 | Vice President | Since 2013 | Manager, Atlantic since 2013; Senior Fund Accountant, Atlantic, 2008-2013. | N/A | N/A |
1The Fund Complex includes the Trust, Forum Funds II and Forum ETF Trust and is overseen by different Boards of Trustees. |
| A Message to Our Shareholders (Unaudited) | 1 |
| Performance Chart and Analysis (Unaudited) | 7 |
| Schedule of Investments | 8 |
| Statement of Assets and Liabilities | 12 |
| Statement of Operations | 13 |
| Statements of Changes in Net Assets | 14 |
| Financial Highlights | 15 |
| Notes to Financial Statements | 16 |
| Report of Independent Registered Public Accounting Firm | 21 |
| Additional Information (Unaudited) | 22 |
POLARIS GLOBAL VALUE FUND A MESSAGE TO OUR SHAREHOLDERS (Unaudited) DECEMBER 31, 2014 | | |
Dear Fellow Shareholder,
For the year ended December 31, 2014, the total return for the Polaris Global Value Fund (the “Fund”) was 3.68%, as compared to the MSCI World Index (the “Index”) benchmark at 4.94%. Strong outperformance among U.S. stocks drove performance in the Index. The U.S. market now represents more than 58% of the Index; the Fund’s underweight position in U.S. holdings detracted from returns. However, the Fund remained in absolute positive territory, boosted by performance in seven out of 10 sectors. The Fund holds a four-star Morningstar Overall Rating™ for risk-adjusted performance among 881 World Stock funds for the period ended December 31, 2014.
| | 2014 | Annualized As of December 31, 2014 |
| | YTD | QIV | QIII | QII | QI | 1 Yr | 3 Yrs | 5 Yrs | 10 Yrs | 15 Yrs | 20 Yrs | ITD* |
| Polaris Global Value Fund | 3.68% | 2.39% | -5.13% | 2.23% | 4.41% | 3.68% | 19.76% | 13.74% | 6.25% | 8.36% | 10.78% | 9.74% |
| MSCI World Index | 4.94% | 1.01% | -2.16% | 4.86% | 1.26% | 4.94% | 15.47% | 10.20% | 6.03% | 3.12% | 7.05% | 6.42% |
*Inception-to-date (Inception 7/31/1989)
Performance data quoted represents past performance and is no guarantee of future results. Current performance may be lower or higher than the performance data quoted. Returns for more than one year are annualized. Investment return and principal value will fluctuate so that an investor's shares, when redeemed, may be worth more or less than original cost. For the most recent month end performance, please call (888) 263-5594. As stated in the current prospectus, the Fund’s annual operating expense ratio is 1.32%. The Fund’s annual operating expense ratio has been reduced to 0.99%, effective January 1, 2014 through April 30, 2015, due to the Adviser’s contractual agreement to waive its fee and/or reimburse expenses to limit Total Annual Fund Operating Expenses. Shares redeemed or exchanged within 180 days of purchase will be charged at 1.00% fee. Fund performance returns shown do not reflect fees; if reflected, the returns would have been lower. Short-term performance is not a good indication of the Fund's future performance, and an investment should not be made based solely on returns.
2014 PERFORMANCE ANALYSIS:
The vast majority of healthcare stocks achieved double-digit returns for the year ended 2014, including Actavis, Anthem Inc. and United Health. In July, Actavis announced the completion of its acquisition of Forest Laboratories Inc. (a previous Fund holding), in a $28 billion transaction. The Fund maintained a position in Actavis, as its pro-forma financial statements fit the Polaris valuation profile. The aggressive acquisition by Actavis also boosted the stock price of Teva Pharmaceutical, another large generic drug maker. Anthem Inc. (previously WellPoint Inc.) and UnitedHealth Group were up, after adding new subscribers and controlling health care cost increases.
Irish convenience food producer Greencore added to consumer staples sector gains, after reporting results that exceeded competitors and industry expectations. The company continued to execute on its U.K. food-to-go business, while making strategic U.S. investments to support several large customers. In Japan, Meiji Holdings Co Ltd. reported healthier margins and rising profitability. Over the past five years, Meiji successfully reorganized the dairy and pharmaceutical business lines, implemented structural reforms, increased overseas operations and successfully passed price increases onto consumers. Asahi Group captured market share for beer in Japan and its soft drink margins continued to improve.
British homebuilders led the consumer discretionary sector, benefiting from rising prices and volume gains in new
POLARIS GLOBAL VALUE FUND A MESSAGE TO OUR SHAREHOLDERS (Unaudited) DECEMBER 31, 2014 | | |
housing. Additionally, the U.K. government extended its new home buying program beyond 2016, upon which Barratt Developments, Persimmon, Bellway and Taylor Wimpey may capitalize. With falling cotton prices due to bumper U.S. harvests and increased demand for apparel, Carter’s Inc. announced healthy same store sales and new store openings. Encouraging profit margins at Swedish tableware maker Duni were attributable to organic growth, recent product launches, the completion of the Paper+Design Group acquisition and efficiency programs.
Information technology also made a positive contribution to the Fund’s annual performance, led by Hewlett-Packard (H-P), Microsoft and Xerox Corp. H-P posted solid returns on the back of broad-based PC revenue and unit growth. Later in the year, the company announced plans to split into two publicly traded companies: one that will focus on enterprise technology, storage, service and cloud platforms and one that will focus on consumer-driven products and printers. Investors rewarded these efforts. Microsoft announced strong earnings, promoting its cloud strategy and game console sales. The company has also spent extensive time and resources developing an integrated operating system for laptops, tablets, phones, etc. that may stem product attrition. Xerox reported better than expected results, and subsequently struck a deal to sell its information technology outsourcing business to France’s Atos for $1.05 billion.
Among utilities, Allete’s stock price was up, based on news of wind energy expansion and electrical retrofit projects. In addition to capital expenditure projects coming to fruition, the company referenced burgeoning demand from its industrial customers. Hong Kong water utility Guangdong Investment Ltd. instituted quarterly reporting, signaling greater transparency for investors, and announced wastewater expansion initiatives. It also renewed its contract to supply water to Hong Kong, with higher-than-expected tariff increases of approximately 6% per year for each of the next three years.
In the telecom sector, Frontier Communications’ stock price surged when its direct competitor, Windstream Holdings, announced a REIT restructuring plan. If Windstream proves successful in this endeavor, other rural carriers, like Frontier, may follow suit. Frontier subsequently reported optimistic revenue projections, and closed the AT&T Connecticut wireline acquisition during the year. Germany’s Freenet AG posted strong quarterly gains, while reaffirming its outlook for 2015. The company’s performance can be attributed to a growing subscriber base and focused business model (mobile and digital lifestyle services).
The vast majority of the Fund’s U.S. financial holdings were in absolute positive territory for the year. The end of the Federal Reserve quantitative easing program signaled the potential for higher interest rates (and possibly improved net interest margins) in 2015; although rising margins have yet to materialize, many investors looked favorably on this prospect. Increasing loan balances and decreasing loan loss provisions buoyed net income at financial institutions over the past few quarters. In addition to these metrics, some U.S. banks capitalized on recent acquisitions or realized synergies from integrations. In particular, Ameris Bancorp reported improved net income, higher interest margins and additional revenues from the acquisition of The Prosperity Banking Co. The company also reinstituted the dividend that they eliminated during the 2008-2009 credit crisis, repaid TARP and continued expansion with the purchase of Coastal Bankshares.
For the first three quarters of 2014, DNB Bank ASA, Norway’s largest bank, posted positive results with lower loan losses from shipping, deposit growth and increased mortgages and lending in the Baltics and Poland. In the fourth quarter, DNB and fellow Norwegian bank Sparebank 1 SR, declined on oil-related concerns, although neither institution holds more than 10% of loan books in direct oil- and gas-related businesses. We believe that the stock price drops were
POLARIS GLOBAL VALUE FUND A MESSAGE TO OUR SHAREHOLDERS (Unaudited) DECEMBER 31, 2014 | | |
more magnified than warranted. British multinational banking and financial services company, Standard Chartered, announced slower growth in emerging markets and a write-down on its South Korean business. The state of New York opened another investigation of Standard Chartered’s compliance practices.
In a world of continued geopolitical turmoil, General Dynamics’ defense business was a top performer. The industrial sector company saw growth in its business jet sales, and was awarded U.S. and U.K. governmental contracts for nuclear submarines and armored fighting vehicles, respectively. Loomis AB posted healthy earnings, increased margins and a new contract with Bank of America. At the opposite end of the spectrum, YIT Oyj, which primarily handles construction in Russia and Finland, saw its stock price drop due to slowing Finnish construction activity and the current turmoil in Russia and the Ukraine. In a bit of inopportune timing, Italian engineering firm Trevi Finanziaria conducted a capital raise in the second half of 2014 to expand its oil drilling business. We believe Trevi has been unfairly penalized by the commodity price decline, as the company announced all-time high order books for oil drilling and improved financial metrics.
In the materials sector, Norwegian fertilizer maker Yara International saw its stock price rise after reporting record deliveries of value-added products with pricing premiums. Yara detailed solid European and Latin American order books for 2014, and alluded to better operating margins on declining European natural gas prices. Another sector gainer was German flavors/fragrance maker Symrise, which announced stable results from each of its divisions worldwide, with notable sales in emerging markets. Symrise also conducted a capital raise to finance its planned acquisition of French food ingredient maker Diana Group. While the market lauded this strategic initiative, the same could not be said for German chemical company LANXESS, which also conducted a capital raise. LANXESS issued new shares equivalent to 10% of its equity capital to fund restructuring. Although investors deemed this as negative news, we expected such measures and were pleased to see action initiated by the well-respected former CFO who recently rejoined the company as CEO. Canadian methanol producer Methanex was hampered toward the end of the year by lower methanol prices that fell with oil prices, and earlier by natural gas supply constraints, causing reduced production at one Trinidad plant and restricted activity in Chile and Egypt. Lower commodity prices also impacted Australia’s BHP Billiton, which produces iron ore and oil.
Energy sector stocks were the most volatile of the year. In the second quarter, high energy prices in combination with merger & acquisition activity in oil exploration and production helped boost energy sector performance. The Index energy sector was up nearly 12% for the June 2014 quarter-end. By the end of 2014, oil prices dropped precipitously, as did most of the stocks in the sector. Stock price declines were geographically broad-based, as evidenced by the losses incurred at Tullow Oil, Maurel et Prom, Sasol, Thai Oil and Marathon Oil Corp.
POLARIS GLOBAL VALUE FUND A MESSAGE TO OUR SHAREHOLDERS (Unaudited) DECEMBER 31, 2014 | | |
The following table shows the Fund’s asset allocation at December 31, 2014.
Polaris Global Value Fund Asset Allocation
| | MSCI World Index | Portfolio Weighting | Energy | Utilities | Materials | Industrials | Consumer Discretionary | Consumer Staples | Health Care | Financials | Info. Tech. | Telecom Services | Cash |
| N. America | 62.4% | 41.0% | 2.0% | 2.8% | 2.6% | 1.5% | 2.5% | 1.2% | 6.6% | 12.4% | 6.5% | 3.0% | 0.0% |
| Japan | 8.0% | 4.8% | 0.0% | 0.0% | 0.3% | 0.0% | 0.0% | 3.0% | 0.0% | 0.0% | 0.0% | 1.5% | 0.0% |
| Other Asia | 4.6% | 5.8% | 0.9% | 1.0% | 1.0% | 0.0% | 0.3% | 0.0% | 0.0% | 0.0% | 2.5% | 0.0% | 0.0% |
| Europe | 22.7% | 35.6% | 1.3% | 0.0% | 9.2% | 1.7% | 9.7% | 3.9% | 2.9% | 3.4% | 1.1% | 2.5% | 0.0% |
| Scandinavia | 2.3% | 11.4% | 0.0% | 0.0% | 1.2% | 4.3% | 1.6% | 0.0% | 0.0% | 4.3% | 0.0% | 0.0% | 0.0% |
| Africa & S. America | 0.0% | 0.9% | 0.9% | 0.0% | 0.0% | 0.0% | 0.0% | 0.0% | 0.0% | 0.0% | 0.0% | 0.0% | 0.0% |
| Cash | 0.0% | 0.5% | 0.0% | 0.0% | 0.0% | 0.0% | 0.0% | 0.0% | 0.0% | 0.0% | 0.0% | 0.0% | 0.5% |
| Industry Totals | | 100.0% | 5.1% | 3.8% | 14.3% | 7.5% | 14.2% | 8.0% | 9.5% | 20.1% | 10.0% | 7.0% | 0.5% |
Table may not cross foot due to rounding.
INVESTMENT ENVIRONMENT AND STRATEGY:
Our outlook has shifted as a result of recent commodity price declines. We believe the net benefits to oil consuming economies outweigh the reduction in the growth of oil producing regions. Globally, only a small number of countries with small populations benefit from higher oil prices; most all others, including the U.S. and China, are net beneficiaries of lower prices. We will continue to seek out good value investment opportunities, on a stock-by-stock basis, that can capitalize on this trend.
We also believe lower commodity prices will add to deflationary pressures in developed countries, which is a positive economic factor for most economic participants. The exception is indebted governments, which must reduce spending and raise taxes in order to overcome higher levels of real debt that deflation creates. We believe that central bank monetary policy must eventually adapt to this economic reality.
As always, we welcome your questions and comments.
Sincerely,
Bernard R. Horn, Jr., Portfolio Manager
POLARIS GLOBAL VALUE FUND A MESSAGE TO OUR SHAREHOLDERS (Unaudited) DECEMBER 31, 2014 | | |
As of December 31, 2014, the Fund’s largest equity holdings and the percentages they represent in the Fund’s portfolio market value were as follows and are subject to change:
| Percentage of Total Net Assets | | Percentage of Total Net Assets |
| Greencore Group PLC | 3.86% | MEIJI Holdings Co., Ltd. | 1.66% |
| Actavis PLC | 1.93% | Duni AB, Class A | 1.64% |
| Ameris Bancorp | 1.72% | UnitedHealth Group, Inc. | 1.55% |
| Symrise AG | 1.70% | Quest Diagnostics, Inc. | 1.50% |
| Anthem, Inc. | 1.67% | KDDI Corp. | 1.50% |
The Fund’s annual performance as compared to the benchmark is as follows:
Historical Calendar Year Annual Returns (years ended December 31) |
| | Polaris Global Value | MSCI World Index | | Polaris Global Value | MSCI World Index |
| 2014 | 3.68% | 4.94% | 2001 | 2.21% | -16.82% |
| 2013 | 36.94% | 26.68% | 2000 | -5.82% | -13.18% |
| 2012 | 21.00% | 15.83% | 1999 | 16.50% | 24.93% |
| 2011 | -8.16% | -5.54% | 1998 | -8.85% | 24.34% |
| 2010 | 20.64% | 11.76% | 1997 | 34.55% | 15.76% |
| 2009 | 35.46% | 29.99% | 1996 | 23.34% | 13.48% |
| 2008 | -46.19% | -40.71% | 1995 | 31.82% | 20.72% |
| 2007 | -3.97% | 9.04% | 1994 | -2.78% | 5.08% |
| 2006 | 24.57% | 20.07% | 1993 | 25.70% | 22.50% |
| 2005 | 10.52% | 9.49% | 1992 | 9.78% | -5.23% |
| 2004 | 23.63% | 14.72% | 1991 | 17.18% | 18.28% |
| 2003 | 47.06% | 33.11% | 1990 | -11.74% | -17.02% |
| 2002 | 3.82% | -19.89% | | | |
POLARIS GLOBAL VALUE FUND A MESSAGE TO OUR SHAREHOLDERS (Unaudited) DECEMBER 31, 2014 | | |
IMPORTANT INFORMATION
The Fund invests in securities of foreign issuers, including issuers located in countries with emerging capital markets. Investments in such securities entail certain risks not associated with investments in domestic securities, such as volatility of currency exchange rates, and in some cases, political and economic instability and relatively illiquid markets. Options trading involves risk and is not suitable for all investors. Fund performance includes reinvestment of dividends and capital gains. During the period, some of the Fund’s fees were waived or expenses reimbursed. In the absence of these waivers and reimbursements, performance figures would be lower.
On June 1, 1998, a limited partnership managed by the adviser reorganized into the Fund. The predecessor limited partnership maintained an investment objective and investment policies that were, in all material respects, equivalent to those of the Fund. The Fund’s performance for the periods before June 1, 1998 is that of the limited partnership and includes the expenses of the limited partnership. If the limited partnership’s performance had been readjusted to reflect the second year expenses of the Fund, the Fund’s performance for all the periods would have been lower. The limited partnership was not registered under the Investment Company Act of 1940 and was not subject to certain investment limitations, diversification requirements, and other restrictions imposed by the 1940 Act and the Internal Revenue Code, which, if applicable, may have adversely affected its performance.
For each fund with at least a three-year history, Morningstar calculates a Morningstar Rating™ based on a Morningstar Risk-Adjusted Return measure that accounts for variation in a fund’s monthly performance (including the effects of sales charges, loads, and redemption fees), placing more emphasis on downward variations and rewarding consistent performance. The top 10% of funds in each category receive 5 stars, the next 22.5% receive 4 stars, the next 35% receive 3 stars, the next 22.5% receive 2 stars and the bottom 10% receive 1 star. The Overall Morningstar Rating for a fund with at least a ten-year history is derived from a weighted average of the performance figures associated with its three-year, five-year, and ten-year Morningstar Rating metrics. The Fund received a Morningstar Rating of 4-stars, 5-stars, 5-stars and 3-stars against the World Stock Funds for the following periods: Overall (out of 881 funds), three-year (out of 881 funds), five-year (out of 688 funds) and ten-year (out of 346 funds), respectively. © 2015 Morningstar, Inc. All Rights Reserved. The information contained herein: (1) is proprietary to Morningstar; (2) may not be copied or distributed; and (3) is not warranted to be accurate, complete or timely. Neither Morningstar nor its content providers are responsible for any damages or losses arising from any use of this information.
POLARIS GLOBAL VALUE FUND PERFORMANCE CHART AND ANALYSIS (Unaudited) DECEMBER 31, 2014 | | |
The following chart reflects the change in the value of a hypothetical $10,000 investment, including reinvested dividends and distributions, in Polaris Global Value Fund (the “Fund”) compared with the performance of the benchmark, MSCI World Index, over the past ten fiscal years. The MSCI World Index measures the performance of a diverse range of 24 developed countries’ stock markets including the United States, Canada, Europe, the Middle East and the Pacific. The total return of the MSCI World Index includes the reinvestment of dividends and income. The total return of the Fund includes operating expenses that reduce returns, while the total return of the MSCI World Index does not include expenses. The Fund is professionally managed while the MSCI World Index is unmanaged and is not available for investment.
Performance data quoted represents past performance and is no guarantee of future results. Current performance may be lower or higher than the performance data quoted. Investment return and principal value will fluctuate so that shares, when redeemed, may be worth more or less than original cost. For the most recent month-end performance, please call (888) 263-5594. As stated in the Fund’s current prospectus, the annual operating expense ratio (gross) is 1.32%. However, the Fund’s adviser has contractually agreed to waive its fees and/or reimburse expenses to limit total operating expenses to 0.99% (excluding all taxes, interest, portfolio transaction expenses, dividend and interest expense on short sales, acquired fund fees and expenses, proxy expenses and extraordinary expenses), through April 30, 2015. During the period, certain fees were waived and/or expenses reimbursed; otherwise, returns would have been lower. Shares redeemed or exchanged within 180 days of purchase will be charged a 1.00% redemption fee. The performance table and graph do not reflect the deduction of taxes that a shareholder would pay on Fund distributions or the redemption of Fund shares. Returns greater than one year are annualized. Because of ongoing market volatility, Fund performance may be subject to substantial short-term changes.
POLARIS GLOBAL VALUE FUND SCHEDULE OF INVESTMENTS DECEMBER 31, 2014 | | |
| Shares | | Security Description | | Value | |
| Common Stock - 99.6% |
| Australia - 1.0% |
| | 45,900 | | BHP Billiton PLC, ADR | | $ | 1,973,700 | |
| | 707,800 | | Northern Star Resources, Ltd. | | 860,993 | |
| | | 2,834,693 | |
| Belgium - 1.0% |
| | 20,436 | | Solvay SA, Class A | | 2,779,493 | |
| Canada - 1.4% |
| | 85,437 | | Methanex Corp. | | 3,924,748 | |
| Finland - 3.1% |
| | 151,410 | | Caverion Corp. | | 1,218,371 | |
| | 80,376 | | Kone Oyj, Class B | | 3,678,335 | |
| | 98,520 | | Konecranes Oyj | | 2,839,681 | |
| | 148,510 | | YIT Oyj | | 767,339 | |
| | | 8,503,726 | |
| France - 5.4% |
| | 19,265 | | Christian Dior SA | | 3,331,230 | |
| | 38,400 | | Cie Generale des Etablissements Michelin, Class B | | 3,497,490 | |
| | 217,200 | | Etablissements Maurel et Prom (a) | | 2,039,243 | |
| | 1,090 | | Hermes International | | 388,828 | |
| | 42,941 | | Imerys SA | | 3,170,126 | |
| | 61,707 | | IPSOS | | 1,770,765 | |
| | 71,930 | | Transgene SA (a) | | 609,273 | |
| | | 14,806,955 | |
| Germany - 11.0% |
| | 28,400 | | BASF SE | | 2,401,456 | |
| | 212,800 | | Deutsche Telekom AG | | 3,411,857 | |
| | 119,890 | | Freenet AG | | 3,437,503 | |
| | 38,400 | | Hannover Rueck SE | | 3,483,550 | |
| | 72,286 | | LANXESS AG | | 3,363,647 | |
| | 19,100 | | Linde AG | | 3,563,864 | |
| | 14,900 | | Muenchener Rueckversicherungs-Gesellschaft AG in Muenchen, Class R | | 2,988,431 | |
| | 77,500 | | Symrise AG | | 4,701,136 | |
| | 60,016 | | Wincor Nixdorf AG | | 2,920,146 | |
| | | 30,271,590 | |
| Hong Kong - 1.3% |
| | 2,196,000 | | Guangdong Investment, Ltd. | | 2,860,168 | |
| | 10,693,761 | | REXLot Holdings, Ltd. | | 868,778 | |
| | | 3,728,946 | |
| Shares | | Security Description | | Value | |
| India - 1.4% |
| | 121,810 | | Infosys, Ltd., ADR | | $ | 3,832,143 | |
| Ireland - 4.8% |
| | 113,298 | | CRH PLC | | 2,728,216 | |
| | 2,387,491 | | Greencore Group PLC | | 10,649,920 | |
| | | 13,378,136 | |
| Israel - 1.4% |
| | 65,600 | | Teva Pharmaceutical Industries, Ltd., ADR | | 3,772,656 | |
| Italy - 2.0% |
| | 134,389 | | GTECH SpA | | 3,006,796 | |
| | 723,669 | | Trevi Finanziaria Industriale SpA | | 2,478,163 | |
| | | 5,484,959 | |
| Japan - 4.8% |
| | 117,200 | | Asahi Group Holdings, Ltd. | | 3,665,802 | |
| | 64,800 | | KDDI Corp. | | 4,131,555 | |
| | 49,916 | | MEIJI Holdings Co., Ltd. | | 4,588,205 | |
| | 730,000 | | Showa Denko KK | | 908,081 | |
| | | 13,293,643 | |
| Norway - 3.0% |
| | 180,096 | | DNB ASA | | 2,674,980 | |
| | 329,929 | | SpareBank 1 SR-Bank ASA | | 2,324,067 | |
| | 73,000 | | Yara International ASA | | 3,269,476 | |
| | | 8,268,523 | |
| Russian Federation - 0.2% |
| | 137,700 | | Sberbank of Russia, ADR | | 557,685 | |
| South Africa - 0.9% |
| | 64,370 | | Sasol, Ltd. | | 2,398,402 | |
| South Korea - 1.1% |
| | 2,544 | | Samsung Electronics Co., Ltd. | | 3,071,362 | |
| Sweden - 5.4% |
| | 305,200 | | Duni AB, Class A | | 4,541,463 | |
| | 91,802 | | Investor AB, Class B | | 3,352,686 | |
| | 114,203 | | Loomis AB, Class B | | 3,310,847 | |
| | 78,200 | | Svenska Handelsbanken AB, Class A | | 3,677,498 | |
| | | 14,882,494 | |
| See Notes to Financial Statements. | 8 | |
POLARIS GLOBAL VALUE FUND SCHEDULE OF INVESTMENTS DECEMBER 31, 2014 | | |
| Shares | | Security Description | | Value | |
| Switzerland - 1.3% |
| | 39,300 | | Novartis AG | | $ | 3,650,528 | |
| Thailand - 0.9% |
| | 1,921,550 | | Thai Oil PCL | | 2,453,042 | |
| United Kingdom - 8.6% |
| | 524,476 | | Barratt Developments PLC | | 3,850,184 | |
| | 399,975 | | BBA Aviation PLC | | 2,244,245 | |
| | 123,988 | | Bellway PLC | | 3,747,075 | |
| | 146,476 | | Persimmon PLC | | 3,602,537 | |
| | 384,269 | | Rexam PLC | | 2,717,908 | |
| | 154,431 | | Standard Chartered PLC | | 2,317,906 | |
| | 1,738,367 | | Taylor Wimpey PLC | | 3,733,582 | |
| | 248,258 | | Tullow Oil PLC | | 1,601,525 | |
| | | 23,814,962 | |
| United States - 39.6% |
| | 20,689 | | Actavis PLC (a) | | 5,325,555 | |
| | 70,200 | | ALLETE, Inc. | | 3,870,828 | |
| | 185,050 | | Ameris Bancorp | | 4,744,682 | |
| | 36,600 | | Anthem, Inc. | | 4,599,522 | |
| | 227,404 | | Astoria Financial Corp. | | 3,038,117 | |
| | 121,920 | | BNC Bancorp | | 2,098,243 | |
| | 89,000 | | Brookline Bancorp, Inc. | | 892,670 | |
| | 189,467 | | Brooks Automation, Inc. | | 2,415,704 | |
| | 37,851 | | Carter's, Inc. | | 3,304,771 | |
| | 169,774 | | Colony Bankcorp, Inc. (a) | | 1,337,819 | |
| | 159,200 | | Dime Community Bancshares, Inc. | | 2,591,776 | |
| | 107,073 | | FairPoint Communications, Inc. (a) | | 1,521,507 | |
| | 575,114 | | Frontier Communications Corp. | | 3,836,010 | |
| | 29,867 | | General Dynamics Corp. | | 4,110,297 | |
| | 95,400 | | Hewlett-Packard Co. | | 3,828,402 | |
| | 90,924 | | Independent Bank Corp. | | 3,892,456 | |
| | 141,263 | | International Bancshares Corp. | | 3,749,120 | |
| | 67,982 | | Marathon Oil Corp. | | 1,923,211 | |
| | 40,291 | | Marathon Petroleum Corp. | | 3,636,666 | |
| | 85,500 | | Microsoft Corp. | | 3,971,475 | |
| | 36,344 | | NextEra Energy, Inc. | | 3,863,004 | |
| | 33,200 | | Peoples Bancorp, Inc. | | 860,876 | |
| | 25,065 | | Praxair, Inc. | | 3,247,421 | |
| | 61,733 | | Quest Diagnostics, Inc. | | 4,139,815 | |
| | 165,124 | | Regal Entertainment Group, Class A | | 3,527,049 | |
| | 186,097 | | Southwest Bancorp, Inc. | | 3,230,644 | |
| | 37,455 | | The Chubb Corp. | | 3,875,469 | |
| | 32,700 | | The JM Smucker Co. | | 3,302,046 | |
| | Shares | | Security Description | | Value | |
| United States – (continued) |
| | 196,400 | | The Western Union Co. | | $ | 3,517,524 | |
| | 42,384 | | UnitedHealth Group, Inc. | | 4,284,599 | |
| | 63,351 | | Verizon Communications, Inc. | | 2,963,560 | |
| | 117,738 | | Webster Financial Corp. | | 3,830,017 | |
| | 297,900 | | Xerox Corp. | | 4,128,894 | |
| | | 109,459,749 | |
Total Common Stock (Cost $215,581,252) | | 275,168,435 | |
| Rights - 0.0% |
| | 134,389 | | Gtech SPA - Rights (a)(b) (Cost $0) | | 0 | |
| | Principal | | Security Description | | Rate | | Maturity | | Value | |
| Short-Term Investments - 0.0% |
| Certificates of Deposit - 0.0% |
| $ | 33,168 | | Middlesex Federal Savings Bank | | 0.50 | % | 12/15/15 | | 33,168 | |
| | 33,094 | | Salem Five Financial | | 0.80 | | 11/24/15 | | 33,094 | |
Total Certificates of Deposit (Cost $66,262) | | 66,262 | |
Total Short-Term Investments (Cost $66,262) | | 66,262 | |
Total Investments - 99.6% (Cost $215,647,514)* | | $ | 275,234,697 | |
| Other Assets & Liabilities, Net – 0.4% | | 1,001,117 | |
| Net Assets – 100.0% | | $ | 276,235,814 | |
| ADR | American Depositary Receipt |
| PCL | Public Company Limited |
| PLC | Public Limited Company |
| (a) | Non-income producing security. |
| (b) | Security fair valued in accordance with procedures adopted by the Board of Trustees. At the period end, the value of these securities amounted to $0 or 0.0% of net assets. |
| | * Cost for federal income tax purposes is $216,845,955 and net unrealized appreciation consists of: |
| Gross Unrealized Appreciation | | $ | 83,683,365 | |
| Gross Unrealized Depreciation | | | (25,294,623 | ) |
| Net Unrealized Appreciation | | $ | 58,388,742 | |
| See Notes to Financial Statements. | 9 | |
POLARIS GLOBAL VALUE FUND SCHEDULE OF INVESTMENTS DECEMBER 31, 2014 | | |
The following is a summary of the inputs used to value the Fund’s investments as of December 31, 2014.
The inputs or methodology used for valuing securities are not necessarily an indication of the risks associated with investing in those securities. For more information on valuation inputs, and their aggregation into the levels used in the table below, please refer to the Security Valuation section in Note 2 of the accompanying Notes to Financial Statements.
| | Level 1 | | Level 2 | | Level 3 | | Total |
| Investments At Value |
| Common Stock | | | | | | | | | | | | | | | | |
| Australia | | $ | 2,834,693 | | | $ | - | | | $ | - | | | $ | 2,834,693 | |
| Belgium | | | 2,779,493 | | | | - | | | | - | | | | 2,779,493 | |
| Canada | | | 3,924,748 | | | | - | | | | - | | | | 3,924,748 | |
| Finland | | | 8,503,726 | | | | - | | | | - | | | | 8,503,726 | |
| France | | | 14,806,955 | | | | - | | | | - | | | | 14,806,955 | |
| Germany | | | 30,271,590 | | | | - | | | | - | | | | 30,271,590 | |
| Hong Kong | | | 3,728,946 | | | | - | | | | - | | | | 3,728,946 | |
| India | | | 3,832,143 | | | | - | | | | - | | | | 3,832,143 | |
| Ireland | | | 13,378,136 | | | | - | | | | - | | | | 13,378,136 | |
| Israel | | | 3,772,656 | | | | - | | | | - | | | | 3,772,656 | |
| Italy | | | 5,484,959 | | | | - | | | | - | | | | 5,484,959 | |
| Japan | | | 13,293,643 | | | | - | | | | - | | | | 13,293,643 | |
| Norway | | | 8,268,523 | | | | - | | | | - | | | | 8,268,523 | |
| Russian Federation | | | 557,685 | | | | - | | | | - | | | | 557,685 | |
| South Africa | | | 2,398,402 | | | | - | | | | - | | | | 2,398,402 | |
| South Korea | | | 3,071,362 | | | | - | | | | - | | | | 3,071,362 | |
| Sweden | | | 14,882,494 | | | | - | | | | - | | | | 14,882,494 | |
| Switzerland | | | 3,650,528 | | | | - | | | | - | | | | 3,650,528 | |
| Thailand | | | - | | | | 2,453,042 | | | | - | | | | 2,453,042 | |
| United Kingdom | | | 23,814,962 | | | | - | | | | - | | | | 23,814,962 | |
| United States | | | 109,459,749 | | | | - | | | | - | | | | 109,459,749 | |
| Rights | | | - | | | | - | | | | 0 | | | | 0 | |
| Certificates of Deposit | | | - | | | | 66,262 | | | | | - | | | | 66,262 | |
| Total Investments At Value | | $ | 272,715,393 | | | $ | 2,519,304 | | | $ | 0 | | | $ | 275,234,697 | |
The Fund utilizes the end of period methodology when determining transfers. There were no transfers among Level 1, Level 2 and Level 3 for the year ended December 31, 2014.
| See Notes to Financial Statements. | 10 | |
POLARIS GLOBAL VALUE FUND SCHEDULE OF INVESTMENTS DECEMBER 31, 2014 | | |
| PORTFOLIO HOLDINGS | | |
| % of Total Investments | | |
| Consumer Discretionary | 14.2 | % |
| Consumer Staples | 8.1 | % |
| Energy | 5.1 | % |
| Financials | 20.2 | % |
| Health Care | 9.6 | % |
| Industrials | 7.5 | % |
| Information Technology | 10.1 | % |
| Materials | 14.4 | % |
| Telecommunication Services | 7.0 | % |
| Utilities | 3.8 | % |
| Rights | 0.0 | % |
| Short-Term Investments | 0.0 | % |
| | | |
| | 100.0 | % |
| See Notes to Financial Statements. | 11 | |
POLARIS GLOBAL VALUE FUND STATEMENT OF ASSETS AND LIABILITIES DECEMBER 31, 2014 | | |
| ASSETS | | | | |
| | Total investments, at value (Cost $215,647,514) | | $ | 275,234,697 | |
| | Cash | | | 610,462 | |
| | Receivables: | | | | |
| | | Fund shares sold | | | 230,761 | |
| | | Investment securities sold | | | 386,719 | |
| | | Dividends and interest | | | 744,485 | |
| | Prepaid expenses | | | 12,177 | |
| Total Assets | | | 277,219,301 | |
| | | | | | | |
| LIABILITIES | | | | |
| | Payables: | | | | |
| | | Fund shares redeemed | | | 554,126 | |
| | | Distributions payable | | | 148,115 | |
| | | Due to broker | | | 28,570 | |
| | Accrued Liabilities: | | | | |
| | Investment adviser fees | | | 168,674 | |
| | | Trustees’ fees and expenses | | | 90 | |
| | | Fund services fees | | | 35,736 | |
| | | Other expenses | | | 48,176 | |
| Total Liabilities | | | 983,487 | |
| | | | | | | |
| NET ASSETS | | $ | 276,235,814 | |
| | | | | | | |
| COMPONENTS OF NET ASSETS | | | | |
| | Paid-in capital | | $ | 322,700,908 | |
| | Undistributed net investment income | | | 3,468,465 | |
| | Accumulated net realized loss | | | (109,474,968 | ) |
| | Net unrealized appreciation | | | 59,541,409 | |
| NET ASSETS | | $ | 276,235,814 | |
| SHARES OF BENEFICIAL INTEREST AT NO PAR VALUE (UNLIMITED SHARES AUTHORIZED) | | | 13,092,596 | |
NET ASSET VALUE, OFFERING AND REDEMPTION PRICE PER SHARE* | | $ | 21.10 | |
| * | Shares redeemed or exchanged within 180 days of purchase are charged a 1.00% redemption fee. | | | | |
| See Notes to Financial Statements. | 12 | |
POLARIS GLOBAL VALUE FUND STATEMENT OF OPERATIONS YEAR ENDED DECEMBER 31, 2014 | | |
| INVESTMENT INCOME | | | | |
| | Dividend income (Net of foreign withholding taxes of $534,790) | | $ | 6,943,282 | |
| | Interest income | | | 19,295 | |
| Total Investment Income | | | 6,962,577 | |
| | | | | |
| EXPENSES | | | | |
| | Investment adviser fees | | | 2,628,251 | |
| | Fund services fees | | | 460,640 | |
| | Custodian fees | | | 43,587 | |
| | Registration fees | | | 32,095 | |
| | Professional fees | | | 50,472 | |
| | Trustees' fees and expenses | | | 11,691 | |
| | Miscellaneous expenses | | | 135,122 | |
| Total Expenses | | | 3,361,858 | |
| | Fees waived and expenses reimbursed | | | (759,893 | ) |
| Net Expenses | | | 2,601,965 | |
| | | | | | | |
| NET INVESTMENT INCOME | | | 4,360,612 | |
| | | | | | | |
| NET REALIZED AND UNREALIZED GAIN (LOSS) | | | | |
| | Net realized gain (loss) on: | | | | |
| | Investments | | | 1,915,492 | |
| | Foreign currency transactions | | | (67,852 | ) |
| | Net realized gain | | | 1,847,640 | |
| | Net change in unrealized appreciation (depreciation) on: | | | | |
| | Investments | | | 2,098,237 | |
| | Deferred foreign capital gains taxes | | | 70,699 | |
| | Foreign currency translations | | | (67,447 | ) |
| | Net change in unrealized appreciation (depreciation) | | | 2,101,489 | |
| NET REALIZED AND UNREALIZED GAIN | | | 3,949,129 | |
| INCREASE IN NET ASSETS RESULTING FROM OPERATIONS | | $ | 8,309,741 | |
| | | | | | | |
| See Notes to Financial Statements. | 13 | |
POLARIS GLOBAL VALUE FUND STATEMENTS OF CHANGES IN NET ASSETS | | |
| | | | | For the Years Ended December 31, |
| | | | | 2014 | | | 2013 |
| OPERATIONS | | | | | | | | | |
| | Net investment income | | $ | 4,360,612 | | | | $ | 3,261,926 | |
| | Net realized gain | | | 1,847,640 | | | | | 5,790,530 | |
| | Net change in unrealized appreciation (depreciation) | | | 2,101,489 | | | | | 51,362,204 | |
| Increase in Net Assets Resulting from Operations | | | 8,309,741 | | | | | 60,414,660 | |
| | | | | | | | | | | | |
| DISTRIBUTIONS TO SHAREHOLDERS FROM | | | | | | | | | |
| | Net investment income | | | (3,865,393 | ) | | | | (2,322,213 | ) |
| Total Distributions to Shareholders | | | (3,865,393 | ) | | | | (2,322,213 | ) |
| | | | | | | | | | | | |
| CAPITAL SHARE TRANSACTIONS | | | | | | | | | |
| | Sale of shares | | | 72,611,389 | | | | | 14,005,305 | |
| | Reinvestment of distributions | | | 3,717,277 | | | | | 2,234,527 | |
| | Redemption of shares | | | (29,026,075 | ) | | | | (16,893,045 | ) |
| | Redemption fees | | | 43,443 | | | | | 3,201 | |
| Increase (Decrease) in Net Assets from Capital Share Transactions | | 47,346,034 | | | | | (650,012 | ) |
| Increase in Net Assets | | | 51,790,382 | | | | | 57,442,435 | |
| | | | | | | | | | | | |
| NET ASSETS | | | | | | | | | |
| | Beginning of Year | | | 224,445,432 | | | | | 167,002,997 | |
| | End of Year (Including line (a)) | | $ | 276,235,814 | | | | $ | 224,445,432 | |
| | | | | | | | | | | | |
| SHARE TRANSACTIONS | | | | | | | | | |
| | Sale of shares | | | 3,411,701 | | | | | 742,758 | |
| | Reinvestment of distributions | | | 176,173 | | | | | 108,262 | |
| | Redemption of shares | | | (1,369,241 | ) | | | | (945,705 | ) |
| Increase (Decrease) in Shares | | | 2,218,633 | | | | | (94,685 | ) |
| | | | | | | | | | | | |
| (a) | Undistributed net investment income. | | $ | 3,468,465 | | | | $ | 3,041,098 | |
| See Notes to Financial Statements. | 14 | |
POLARIS GLOBAL VALUE FUND FINANCIAL HIGHLIGHTS | | |
| These financial highlights reflect selected data for a share outstanding throughout each year. |
| | | For the Years Ended December 31, | |
| | | 2014 | | 2013 | | 2012 | | 2011 | | 2010 | |
| NET ASSET VALUE, Beginning | | | | | | | | | | | | | | | | | | | | |
| of Year | $ | 20.64 | | | $ | 15.23 | | | $ | 12.72 | | | $ | 14.00 | | | $ | 11.73 | | |
| INVESTMENT OPERATIONS | | | | | | | | | | | | | | | | | | | | |
| Net investment income (a) | | 0.35 | | | | 0.30 | | | | 0.19 | | | | 0.15 | | | | 0.11 | | |
| Net realized and unrealized | | | | | | | | | | | | | | | | | | | | |
| | gain (loss) | | 0.41 | | | | 5.33 | | | | 2.48 | | | | (1.29 | ) | | | 2.31 | | |
| Total from Investment Operations | | 0.76 | | | | 5.63 | | | | 2.67 | | | | (1.14 | ) | | | 2.42 | | |
| DISTRIBUTIONS TO | | | | | | | | | | | | | | | | | | | | |
| SHAREHOLDERS FROM | | | | | | | | | | | | | | | | | | | | |
| Net investment income | | (0.30 | ) | | | (0.22 | ) | | | (0.16 | ) | | | (0.14 | ) | | | (0.15 | ) | |
| REDEMPTION FEES (a) | | — | (b) | | — | (b) | | — | (b) | | — | (b) | | — | (b) |
| NET ASSET VALUE, End of Year | $ | 21.10 | | | $ | 20.64 | | | $ | 15.23 | | | $ | 12.72 | | | $ | 14.00 | | |
| TOTAL RETURN | | 3.68 | % | | 36.94 | % | | 21.00 | % | | (8.16 | )% | | 20.64 | % |
| | | | | | | | | | | | | | | | | | | | | |
| RATIOS/SUPPLEMENTARY DATA | | | | | | | | | | | | | | | | | | | | |
| Net Assets at End of | | | | | | | | | | | | | | | | | | | | |
| | Year (000's omitted) | $276,236 | | | $224,445 | | | $167,003 | | | $151,849 | | | $188,473 | | |
| Ratios to Average Net Assets: | | | | | | | | | | | | | | | | | | | | |
| Net investment income | | 1.66 | % | | 1.70 | % | | 1.34 | % | | 1.10 | % | | 0.89 | % |
| Net expenses | | 0.99 | % | | 1.04 | % | | 1.36 | % | | 1.36 | % | | 1.38 | % |
| Gross expenses | | 1.28 | %(c) | 1.32 | %(c) | 1.36 | % | | 1.36 | % | | 1.39 | %(c) |
| PORTFOLIO TURNOVER RATE | | 3 | % | | 14 | % | | 14 | % | | 12 | % | | 10 | % |
| | | | | | | | | | | | | | | | | | | | | | |
| (a) | Calculated based on average shares outstanding during each year. |
| (b) | Less than $0.01 per share. |
| (c) | Reflects the expense ratio excluding any waivers and/or reimbursements. |
| See Notes to Financial Statements. | 15 | |
POLARIS GLOBAL VALUE FUND NOTES TO FINANCIAL STATEMENTS DECEMBER 31, 2014 | | |
Note 1. Organization
The Polaris Global Value Fund (the “Fund”) is a diversified portfolio of Forum Funds (the “Trust”). The Trust is a Delaware statutory trust that is registered as an open-end, management investment company under the Investment Company Act of 1940 (the “Act”), as amended. Under its Trust Instrument, the Trust is authorized to issue an unlimited number of the Fund’s shares of beneficial interest without par value. The Fund commenced operations June 1, 1998 after it acquired the net assets of Global Value Limited Partnership (the “Partnership”), in exchange for Fund shares. The Partnership commenced operations on July 31, 1989. The Fund seeks capital appreciation.
Note 2. Summary of Significant Accounting Policies
These financial statements are prepared in accordance with accounting principles generally accepted in the United States of America (“GAAP”), which require management to make estimates and assumptions that affect the reported amounts of assets and liabilities, the disclosure of contingent liabilities at the date of the financial statements, and the reported amounts of increases and decreases in net assets from operations during the fiscal year. Actual amounts could differ from those estimates. The following summarizes the significant accounting policies of the Fund:
Security Valuation – Exchange-traded securities and over-the-counter securities are valued using the last quoted trade or official closing price, provided by independent pricing services as of the close of trading on the market or exchange for which they are primarily traded, on each Fund business day. In the absence of a sale, such securities are valued at the mean of the last bid and ask price provided by independent pricing services. Non-exchange traded securities for which quotations are available are valued using the last quoted sales price, or in the absence of a sale, at the mean of the last bid and ask prices provided by independent pricing services. Forward currency contracts are generally valued at the mean of bid and ask prices for the time period interpolated from rates reported by an independent pricing service for proximate time periods. Shares of open-end mutual funds are valued at net asset value (“NAV”). Short-term investments that mature in 60 days or less may be valued at amortized cost.
The Fund values its investments at fair value pursuant to procedures adopted by the Trust's Board of Trustees (the "Board") if (1) market quotations are insufficient or not readily available or (2) the adviser believes that the values available are unreliable. The Trust’s Valuation Committee, as defined in the Fund’s registration statement, performs certain functions as they relate to the administration and oversight of the Fund’s valuation procedures. Under these procedures, the Valuation Committee convenes on a regular and ad-hoc basis to review such investments and considers a number of factors, including valuation methodologies and significant unobservable inputs, when arriving at fair value.
The Valuation Committee may work with the adviser to provide valuation inputs. In determining fair valuations, inputs may include market-based analytics which may consider related or comparable assets or liabilities, recent transactions, market multiples, book values and other relevant investment information. Adviser inputs may include an income-based approach in which the anticipated future cash flows of the investment are discounted in determining fair value. Discounts may also be applied based on the nature or duration of any restrictions on the disposition of the investments. The Valuation Committee performs regular reviews of valuation methodologies, key inputs and assumptions, disposition analysis and market activity.
Fair valuation is based on subjective factors and, as a result, the fair value price of an investment may differ from the
POLARIS GLOBAL VALUE FUND NOTES TO FINANCIAL STATEMENTS DECEMBER 31, 2014 | | |
security’s market price and may not be the price at which the asset may be sold. Fair valuation could result in a different NAV than a NAV determined by using market quotes.
The Fund has a three-tier fair value hierarchy. The basis of the tiers is dependent upon the various “inputs” used to determine the value of the Fund’s investments. These inputs are summarized in the three broad levels listed below:
Level 1 — quoted prices in active markets for identical assets and liabilities
Level 2 — other significant observable inputs (including quoted prices of similar securities, interest rates, prepayment speeds, credit risk, etc.)
Level 3 — significant unobservable inputs (including the Fund’s own assumptions in determining the fair value of investments)
The aggregate value by input level, as of December 31, 2014, for the Fund’s investments is included at the end of the Fund’s Schedule of Investments.
Security Transactions, Investment Income and Realized Gain and Loss – Investment transactions are accounted for on the trade date. Dividend income is recorded on the ex-dividend date. Foreign dividend income is recorded on the ex-dividend date or as soon as possible after the Fund determines the existence of a dividend declaration after exercising reasonable due diligence. Income and capital gains on some foreign securities may be subject to foreign withholding taxes, which are accrued as applicable. Interest income is recorded on an accrual basis. Premium is amortized and discount is accreted using the effective interest method. Identified cost of investments sold is used to determine the gain and loss for both financial statement and federal income tax purposes.
Foreign Currency Translations – Foreign currency amounts are translated into U.S. dollars as follows: (1) assets and liabilities at the rate of exchange at the end of the respective period; and (2) purchases and sales of securities and income and expenses at the rate of exchange prevailing on the dates of such transactions. The portion of the results of operations arising from changes in the exchange rates and the portion due to fluctuations arising from changes in the market prices of securities are not isolated. Such fluctuations are included with the net realized and unrealized gain or loss on investments.
Foreign Currency Transactions – The Fund may enter into transactions to purchase or sell foreign currency contracts and options on foreign currency. Forward currency contracts are agreements to exchange one currency for another at a future date and at a specified price. A fund may use forward currency contracts to facilitate transactions in foreign securities, to manage a fund’s foreign currency exposure and to protect the U.S. dollar value of its underlying portfolio securities against the effect of possible adverse movements in foreign exchange rates. These contracts are intrinsically valued daily based on forward rates, and a fund’s net equity therein, representing unrealized gain or loss on the contracts as measured by the difference between the forward foreign exchange rates at the dates of entry into the contracts and the forward rates at the reporting date, is recorded as a component of net asset value. These instruments involve market risk, credit risk, or both kinds of risks, in excess of the amount recognized in the Statement of Assets and Liabilities. Risks arise from the possible inability of counterparties to meet the terms of their contracts and from movement in currency and securities values and interest rates. Due to the risks associated with these transactions, a fund could incur losses up to the entire contract amount, which may exceed the net unrealized value included in its net asset value.
POLARIS GLOBAL VALUE FUND NOTES TO FINANCIAL STATEMENTS DECEMBER 31, 2014 | | |
Distributions to Shareholders – Distributions to shareholders of net investment income and net capital gains, if any, are declared and paid at least annually. Distributions to shareholders are recorded on the ex-dividend date. Distributions are based on amounts calculated in accordance with applicable federal income tax regulations, which may differ from GAAP. These differences are due primarily to differing treatments of income and gain on various investment securities held by the Fund, timing differences and differing characterizations of distributions made by the Fund.
Federal Taxes – The Fund intends to qualify each year as a regulated investment company under Subchapter M of the Internal Revenue Code and to distribute all of its taxable income to shareholders. In addition, by distributing in each calendar year substantially all of its net investment income and capital gains, if any, the Fund will not be subject to a federal excise tax. Therefore, no federal income or excise tax provision is required. The Fund files a U.S. federal income and excise tax return as required. A fund’s federal income tax returns are subject to examination by the Internal Revenue Service for a period of three fiscal years after they are filed. As of December 31, 2014, there are no uncertain tax positions that would require financial statement recognition, de-recognition, or disclosure.
Income and Expense Allocation – The Trust accounts separately for the assets, liabilities and operations of each of its investment portfolios. Expenses that are directly attributable to more than one investment portfolio are allocated among the respective investment portfolios in an equitable manner.
Redemption Fees – A shareholder who redeems or exchanges shares within 180 days of purchase will incur a redemption fee of 1.00% of the current net asset value of shares redeemed or exchanged, subject to certain limitations. The fee is charged for the benefit of the remaining shareholders and will be paid to the Fund to help offset transaction costs. The fee is accounted for as an addition to paid-in capital. The Fund reserves the right to modify the terms of or terminate the fee at any time. There are limited exceptions to the imposition of the redemption fee.
Commitments and Contingencies – In the normal course of business, the Fund enters into contracts that provide general indemnifications by the Fund to the counterparty to the contract. The Fund’s maximum exposure under these arrangements is dependent on future claims that may be made against the Fund and, therefore, cannot be estimated; however, based on experience, the risk of loss from such claims is considered remote.
Note 3. Cash – Concentration in Uninsured Account
For cash management purposes the Fund may concentrate cash with the Fund’s custodian. This typically results in cash balances exceeding the Federal Deposit Insurance Corporation (“FDIC”) insurance limits. As of December 31, 2014, the Fund held $360,462 as cash reserves at MUFG Union Bank, N.A. that exceeded the FDIC insurance limit.
Note 4. Fees and Expenses
Investment Adviser – Polaris Capital Management, LLC (the “Adviser”) is the investment adviser to the Fund. Pursuant to an investment advisory agreement, the Adviser receives an advisory fee from the Fund at an annual rate of 1.00% of the Fund’s average daily net assets.
Shareholder Service Plan – The Trust has adopted a shareholder service plan for the Fund under which the Fund may reimburse the Fund’s administrator for amounts paid by the administrator for providing shareholder service activities
POLARIS GLOBAL VALUE FUND NOTES TO FINANCIAL STATEMENTS DECEMBER 31, 2014 | | |
that are not otherwise provided by the transfer agent. The Fund’s administrator may make such payments to various financial institutions, including the Adviser, that provide shareholder servicing to their customers invested in the Fund in amounts of up to 0.25% annually of the average daily net assets of the shares held by such customers. During the year ended December 31, 2014, the Fund did not make any payments under the shareholder service plan.
Distribution – Foreside Fund Services, LLC serves as the Fund’s distributor (the “Distributor”). The Fund does not have a distribution (12b-1) plan; accordingly, the Distributor does not receive compensation from the Fund for its distribution (12b-1) services. The Adviser compensates the Distributor directly for its services. The Distributor is not affiliated with the Adviser or Atlantic Fund Administration, LLC (d/b/a Atlantic Fund Services) (“Atlantic”) or their affiliates.
Other Service Providers – Atlantic provides fund accounting, fund administration, compliance and transfer agency services to the Fund. Atlantic also provides certain shareholder report production, and EDGAR conversion and filing services. Pursuant to an Atlantic services agreement, the Fund pays Atlantic customary fees for its services. Atlantic provides a Principal Executive Officer, a Principal Financial Officer, a Chief Compliance Officer, and an Anti-Money Laundering Officer to the Fund, as well as certain additional compliance support functions.
Trustees and Officers – The Trust pays each independent Trustee an annual retainer fee of $45,000 for service to the Trust ($66,000 for the Chairman). The Trustees and Chairman may receive additional fees for special Board meetings. Each Trustee is also reimbursed for all reasonable out-of-pocket expenses incurred in connection with his duties as a Trustee, including travel and related expenses incurred in attending Board meetings. The amount of Trustees’ fees attributable to the Fund is disclosed in the Statement of Operations. Certain officers of the Trust are also officers or employees of the above named service providers, and during their terms of office received no compensation from the Fund.
Note 5. Fees Waived
The Adviser has contractually agreed to waive its fee and/or reimburse Fund expenses to limit annual operating expenses to 0.99% (excluding all taxes, interest, portfolio transaction expenses, dividend and interest expense on short sales, acquired fund fees and expenses, proxy expenses and extraordinary expenses), through April 30, 2015. Other fund service providers have voluntarily agreed to waive and reimburse a portion of their fees. These voluntary fee waivers and reimbursements may be reduced or eliminated at any time. For the year ended December 31, 2014, fees waived were as follows:
| Investment Adviser Fees Waived | | Other Waivers | | Total Fees Waived |
| $ | 707,393 | | $ | 52,500 | | $ | 759,893 |
Note 6. Security Transactions
The cost of purchases and proceeds from sales of investment securities (including maturities), other than short-term investments during the year ended December 31, 2014, were $68,503,693 and $8,427,316, respectively.
POLARIS GLOBAL VALUE FUND NOTES TO FINANCIAL STATEMENTS DECEMBER 31, 2014 | | |
Note 7. Federal Income Tax
Distributions paid during the fiscal years ended as noted were characterized for tax purposes as follows:
| | | 2014 | | 2013 |
| Ordinary Income | | $ | 3,865,393 | | $ | 2,322,213 |
As of December 31, 2014, distributable earnings (accumulated loss) on a tax basis were as follows:
| Undistributed Ordinary Income | | $ | 4,487,685 | |
| Capital and Other Losses | | | (109,295,747 | ) |
| Unrealized Appreciation | | | 58,342,968 | |
| Total | | $ | (46,465,094 | ) |
The difference between components of distributable earnings on a tax basis and the amounts reflected in the Statement of Assets and Liabilities are primarily due to wash sales and investments in passive foreign investment companies.
As of December 31, 2014, capital loss carryforwards to offset future capital gains were as follows with the respective expiration dates:
| 2016 | | 2017 | | 2018 | |
| $ | 34,508,433 | | $ | 59,164,411 | | $ | 15,622,903 | |
On the Statement of Assets and Liabilities, as a result of permanent book to tax differences, certain amounts have been reclassified for the year ended December 31, 2014. The following reclassification was the result of currency gain/loss and has no impact on the net assets of the Fund.
| Undistributed Net Investment Income (Loss) | | $ | (67,852 | ) |
| Accumulated Net Realized Gain (Loss) | | | 67,852 | |
Note 8. Subsequent Events
Subsequent events occurring after the date of this report through the date these financial statements were issued have been evaluated for potential impact and the Fund has had no such events.
REPORT OF INDEPENDENT REGISTERED PUBLIC ACCOUNTING FIRM | | |
To the Shareholders of Polaris Global Value Fund and the Board of Trustees of Forum Funds
We have audited the accompanying statement of assets and liabilities of Polaris Global Value Fund (the “Fund”), a series of shares of beneficial interest in the Forum Funds, including the schedule of investments, as of December 31, 2014, and the related statement of operations for the year then ended, the statements of changes in net assets for each of the years in the two-year period then ended, and the financial highlights for each of the years in the five-year period then ended. These financial statements and financial highlights are the responsibility of the Fund's management. Our responsibility is to express an opinion on these financial statements and financial highlights based on our audits.
We conducted our audits in accordance with the standards of the Public Company Accounting Oversight Board (United States). Those standards require that we plan and perform the audits to obtain reasonable assurance about whether the financial statements and financial highlights are free of material misstatement. An audit includes examining, on a test basis, evidence supporting the amounts and disclosures in the financial statements. Our procedures included confirmation of securities owned as of December 31, 2014 by correspondence with the custodian and broker. An audit also includes assessing the accounting principles used and significant estimates made by management, as well as evaluating the overall financial statement presentation. We believe that our audits provide a reasonable basis for our opinion.
In our opinion, the financial statements and financial highlights referred to above present fairly, in all material respects, the financial position of Polaris Global Value Fund as of December 31, 2014, and the results of its operations for the year then ended, the changes in its net assets for each of the years in the two-year period then ended and its financial highlights for each of the years in the five-year period then ended, in conformity with accounting principles generally accepted in the United States of America.
BBD, LLP
Philadelphia, Pennsylvania
February 26, 2015
POLARIS GLOBAL VALUE FUND ADDITIONAL INFORMATION (Unaudited) DECEMBER 31, 2014 | | |
Proxy Voting Information
A description of the policies and procedures that the Fund uses to determine how to vote proxies relating to securities held in the Fund’s portfolio is available, without charge and upon request, by calling (888) 263-5594 and on the U.S. Securities and Exchange Commission’s (the “SEC”) website at www.sec.gov. The Fund’s proxy voting record for the most recent twelve-month period ended June 30 is available, without charge and upon request, by calling (888) 263-5594 and on the SEC’s website at www.sec.gov.
Availability of Quarterly Portfolio Schedules
The Fund files its complete schedule of portfolio holdings with the SEC for the first and third quarters of each fiscal year on Form N-Q. These filings are available, without charge and upon request on the SEC’s website at www.sec.gov or may be reviewed and copied at the SEC’s Public Reference Room in Washington, DC. Information on the operation of the Public Reference Room may be obtained by calling (800) SEC-0330.
Shareholder Expense Example
As a shareholder of the Fund, you incur two types of costs: (1) transaction costs, including redemption fees and exchange fees, and (2) ongoing costs, including management fees and other Fund expenses. This example is intended to help you understand your ongoing costs (in dollars) of investing in the Fund, and to compare these costs with the ongoing costs of investing in other mutual funds.
The example is based on an investment of $1,000 invested at the beginning of the period and held for the entire period from July 1, 2014, through December 31, 2014.
Actual Expenses – The first line of the table below provides information about actual account values and actual expenses. You may use the information in this line, together with the amount you invested, to estimate the expenses that you paid over the period. Simply divide your account value by $1,000 (for example, an $8,600 account value divided by $1,000 = 8.6), then multiply the result by the number in the first line under the heading entitled “Expenses Paid During Period” to estimate the expenses you paid on your account during the period.
Hypothetical Example for Comparison Purposes – The second line of the table below provides information about hypothetical account values and hypothetical expenses based on the Fund’s actual expense ratio and an assumed rate of return of 5% per year before expenses, which is not the Fund’s actual return. The hypothetical account values and expenses may not be used to estimate the actual ending account balance or expenses you paid for the period. You may use this information to compare the ongoing costs of investing in the Fund and other funds. To do so, compare this 5% hypothetical example with the 5% hypothetical examples that appear in the shareholder reports of other funds.
Please note that the expenses shown in the table are meant to highlight your ongoing costs only and do not reflect any transactional costs, such as redemption fees and exchange fees. Therefore, the second line of the table is useful in comparing ongoing costs only, and will not help you determine the relative total costs of owning different funds. In addition, if these transactional costs were included, your costs would have been higher.
POLARIS GLOBAL VALUE FUND ADDITIONAL INFORMATION (Unaudited) DECEMBER 31, 2014 | | |
| | Beginning | | Ending | | Expenses | | Annualized |
| | Account Value | | Account Value | | Paid During | | Expense |
| | July 1, 2014 | | December 31, 2014 | | Period* | | Ratio* |
| Actual | $ | 1,000.00 | | $ | 971.36 | | $ | 4.92 | | 0.99 | % |
| Hypothetical (5% return before taxes) | $ | 1,000.00 | | $ | 1,020.21 | | $ | 5.04 | | 0.99 | % |
| * | Expenses are equal to the Fund’s annualized expense ratio multiplied by the average account value over the period, multiplied by the number of days in the most recent fiscal half-year divided by 365 to reflect the half-year period. |
Federal Tax Status of Dividends Declared during the Fiscal Year
For federal income tax purposes, dividends from short-term capital gains are classified as ordinary income. The Fund designates 41.60% of its income dividend distributed as qualifying for the corporate dividends-received deduction (DRD) and 100.00% for the qualified dividend rate (QDI) as defined in Section 1(h)(11) of the Internal Revenue Code. The Fund also designates 0.17% as qualified interest income exempt from U.S. tax for foreign shareholders (QII).
Trustees and Officers of the Trust
The Board is responsible for oversight of the management of the Trust’s business affairs and of the exercise of all the Trust’s powers except those reserved for the shareholders. The following table provides information about each Trustee and certain officers of the Trust. Each Trustee and officer holds office until the person resigns, is removed, or is replaced. Unless otherwise noted, the persons have held their principal occupations for more than five years. The address for all Trustees and officers is Three Canal Plaza, Suite 600, Portland, Maine 04101. Mr. Keffer is considered an Interested Trustee due to his affiliation with Atlantic. The Fund’s Statement of Additional Information includes additional information about the Trustees and is available, without charge and upon request, by calling (888) 263-5594.
POLARIS GLOBAL VALUE FUND ADDITIONAL INFORMATION (Unaudited) DECEMBER 31, 2014 | | |
| Name and Year of Birth | Position with the Trust | Length of Time Served | Principal Occupation(s) During Past Five Years | Number of Series of Fund Complex¹ Overseen by Trustee | Other Directorships Held by Trustee |
| Independent Trustees | | | | | |
J. Michael Parish Born: 1943 | Chairman of the Board; Trustee; Chairman, Nominating Committee and Qualified Legal Compliance Committee | Since 1989 (Chairman since 2004) | Retired since 2003; formerly, Partner, Wolf, Block, Schorr and Solis-Cohen, LLP (law firm) 2002-2003; Partner, Thelen Reid & Priest LLP (law firm) 1995-2002. | 27 | None |
Costas Azariadis Born: 1943 | Trustee | Since 1989 | Professor of Economics, Washington University since 2006. | 27 | None |
James C. Cheng Born: 1942 | Trustee; Chairman, Audit Committee | Since 1989 | President, Technology Marketing Associates (marketing company for small- and medium-sized businesses in New England) since 1991. | 27 | None |
David Tucker Born: 1958 | Trustee | Since 2011 | Director, Blue Sky Experience since 2008; Senior Vice President & General Counsel, American Century Companies 1998-2008. | 36 | Trustee, Forum Funds II and Forum ETF Trust |
| Interested Trustee | | | | | |
John Y. Keffer2 Born: 1942 | Trustee; Vice Chairman | Since 1989 | Chairman, Atlantic since 2008; President, Forum Investment Advisors, LLC since 2011; President, Forum Foundation (a charitable organization) since 2005; President, Forum Trust, LLC (a non-depository trust company chartered in the State of Maine) since 1997. | 36 | Director, Wintergreen Fund, Inc.; Trustee, Forum Funds II, Forum ETF Trust and ALTMFX Trust |
| Officers | | | | | |
Stacey E. Hong Born: 1966 | President; Principal Executive Officer | Since 2008 | President, Atlantic since 2008. | N/A | N/A |
Karen Shaw Born: 1972 | Treasurer; Principal Financial Officer | Since 2008 | Senior Vice President, Atlantic since 2008. | N/A | N/A |
Zachary Tackett Born: 1988 | Vice President; Secretary; Anti-Money Laundering Compliance Officer | Since 2014 | Associate Counsel, Atlantic since 2014; Intern Associate, Coakley & Hyde, PLLC, 2010-2013. | N/A | N/A |
Michael J. McKeen Born: 1971 | Vice President | Since 2009 | Senior Vice President, Atlantic since 2008. | N/A | N/A |
Timothy Bowden Born: 1969 | Vice President | Since 2009 | Manager, Atlantic since 2008. | N/A | N/A |
Geoffrey Ney Born: 1975 | Vice President | Since 2013 | Manager, Atlantic since 2013; Senior Fund Accountant, Atlantic, 2008-2013. | N/A | N/A |
Todd Proulx Born: 1978 | Vice President | Since 2013 | Manager, Atlantic since 2013; Senior Fund Accountant, Atlantic, 2008-2013. | N/A | N/A |
1The Fund Complex includes the Trust, Forum Funds II and Forum ETF Trust and is overseen by different Boards of Trustees. 2Atlantic is a subsidiary of Forum Holdings Corp. I, a Delaware corporation that is wholly owned by Mr. Keffer. |
Note 1. Organization
The BeeHive Fund (the “Fund”) is a diversified portfolio of Forum Funds (the “Trust”). The Trust is a Delaware statutory trust that is registered as an open-end, management investment company under the Investment Company Act of 1940 (the “Act”), as amended. Under its Trust Instrument, the Trust is authorized to issue an unlimited number of the Fund’s shares of beneficial interest without par value. The Fund commenced operations on September 2, 2008. The Fund seeks capital appreciation.
Note 2. Summary of Significant Accounting Policies
These financial statements are prepared in accordance with accounting principles generally accepted in the United States of America (“GAAP”), which require management to make estimates and assumptions that affect the reported amounts of assets and liabilities, the disclosure of contingent liabilities at the date of the financial statements, and the reported amounts of increases and decreases in net assets from operations during the fiscal period. Actual amounts could differ from those estimates. The following summarizes the significant accounting policies of the Fund:
Security Valuation – Exchange-traded securities and over-the-counter securities are valued using the last quoted trade or official closing price, provided by independent pricing services as of the close of trading on the market or exchange for which they are primarily traded, on each Fund business day. In the absence of a sale, such securities are valued at the mean of the last bid and ask price provided by independent pricing services. Non-exchange traded securities for which quotations are available are valued using the last quoted sales price, or in the absence of a sale, at the mean of the last bid and ask prices provided by independent pricing services. Shares of open-end mutual funds are valued at net asset value (“NAV”). Short-term investments that mature in 60 days or less may be valued at amortized cost.
The Fund values its investments at fair value pursuant to procedures adopted by the Trust’s Board of Trustees (the “Board”) if (1) market quotations are insufficient or not readily available or (2) the Advisor believes that the values available are unreliable. The Trust’s Valuation Committee, as defined in the Fund’s registration statement, performs certain functions as they relate to the administration and oversight of the Fund’s valuation procedures. Under these procedures, the Valuation Committee convenes on a regular and ad-hoc basis to review such investments and considers a number of factors, including valuation methodologies and significant unobservable inputs, when arriving at fair value.
The Valuation Committee may work with the Advisor to provide valuation inputs. In determining fair valuations, inputs may include market-based analytics which may consider related or comparable assets or liabilities, recent transactions, market multiples, book values and other relevant investment information. Advisor inputs may include an income-based approach in which the anticipated future cash flows of the investment are discounted in determining fair value. Discounts may also be applied based on the nature or duration of any restrictions on the disposition of the investments. The Valuation Committee performs regular reviews of valuation methodologies, key inputs and assumptions, disposition analysis and market activity.
Fair valuation is based on subjective factors and, as a result, the fair value price of an investment may differ from the security’s market price and may not be the price at which the asset may be sold. Fair valuation could result in a different NAV than a NAV determined by using market quotes.
The Fund has a three-tier fair value hierarchy. The basis of the tiers is dependent upon the various “inputs” used to determine the value of the Fund’s investments. These inputs are summarized in the three broad levels listed below:
Level 1 — quoted prices in active markets for identical assets and liabilities
Level 2 — other significant observable inputs (including quoted prices of similar securities, interest rates, prepayment speeds, credit risk, etc.)
Level 3 — significant unobservable inputs (including the Fund’s own assumptions in determining the fair value of investments)
The aggregate value by input level, as of December 31, 2014, for the Fund’s investments is included at the end of the Fund’s Schedule of Investments.
THE BEEHIVE FUND NOTES TO FINANCIAL STATEMENTS DECEMBER 31, 2014 | | |
Security Transactions, Investment Income and Realized Gain and Loss – Investment transactions are accounted for on the trade date. Dividend income is recorded on the ex-dividend date. Foreign dividend income is recorded on the ex-dividend date or as soon as possible after the Fund determines the existence of a dividend declaration after exercising reasonable due diligence. Income and capital gains on some foreign securities may be subject to foreign withholding taxes, which are accrued as applicable. Interest income is recorded on an accrual basis. Premium is amortized and discount is accreted using the effective interest method. Identified cost of investments sold is used to determine the gain and loss for both financial statement and federal income tax purposes.
Distributions to Shareholders – Distributions to shareholders of net investment income and net capital gains, if any, are declared and paid at least annually. Distributions to shareholders are recorded on the ex-dividend date. Distributions are based on amounts calculated in accordance with applicable federal income tax regulations, which may differ from GAAP. These differences are due primarily to differing treatments of income and gain on various investment securities held by the Fund, timing differences and differing characterizations of distributions made by the Fund.
Federal Taxes – The Fund intends to continue to qualify each year as a regulated investment company under Subchapter M of the Internal Revenue Code and to distribute all of its taxable income to shareholders. In addition, by distributing in each calendar year substantially all of its net investment income and capital gains, if any, the Fund will not be subject to a federal excise tax. Therefore, no federal income or excise tax provision is required. The Fund files a U.S. federal income and excise tax return as required. A fund’s federal income tax returns are subject to examination by the Internal Revenue Service for a period of three fiscal years after they are filed. As of December 31, 2014, there are no uncertain tax positions that would require financial statement recognition, de-recognition, or disclosure.
Income and Expense Allocation – The Trust accounts separately for the assets, liabilities and operations of each of its investment portfolios. Expenses that are directly attributable to more than one investment portfolio are allocated among the respective investment portfolios in an equitable manner.
Commitments and Contingencies – In the normal course of business, the Fund enters into contracts that provide general indemnifications by the Fund to the counterparty to the contract. The Fund’s maximum exposure under these arrangements is dependent on future claims that may be made against the Fund and, therefore, cannot be estimated; however, based on experience, the risk of loss from such claims is considered remote.
Note 3. Fees and Expenses
Investment Advisor – Spears Abacus Advisors LLC (the “Advisor”) is the investment Advisor to the Fund. Pursuant to an investment advisory agreement, the Advisor receives an advisory fee from the Fund at an annual rate of 0.75% of the Fund’s average daily net assets.
Distribution – Foreside Fund Services, LLC serves as the Fund’s distributor (the “Distributor”). The Distributor is not affiliated with the Advisor or Atlantic Fund Administration, LLC (d/b/a Atlantic Fund Services) (“Atlantic”) or their affiliates. The Fund has adopted a distribution plan in accordance with Rule 12b-1 of the Act. The Fund may pay the Distributor and/or any other entity as authorized by the Board a fee up to 0.25% of the Fund’s average daily net assets. The Fund has suspended payments under its Rule 12b-1 plan until further notice and has not paid any distribution fees to date. The Fund may remove the suspension and make payments under the Rule 12b-1 plan at any time, subject to Board approval.
Other Service Providers – Atlantic provides fund accounting, fund administration, compliance and transfer agency services to the Fund. Atlantic also provides certain shareholder report production, and EDGAR conversion and filing services. Pursuant to an Atlantic services agreement, the Fund pays Atlantic customary fees for its services. Atlantic provides a Principal Executive Officer, a Principal Financial Officer, a Chief Compliance Officer, and an Anti-Money Laundering Officer to the Fund, as well as certain additional compliance support functions.
Trustees and Officers – The Trust pays each independent Trustee an annual retainer fee of $45,000 for service to the Trust ($66,000 for the Chairman). The Trustees and Chairman may receive additional fees for special Board meetings. Each Trustee is also reimbursed for all reasonable out-of-pocket expenses incurred in connection with his duties as a Trustee, including travel and related expenses incurred in attending Board meetings. The amount of Trustees’ fees attributable to the Fund is disclosed in the Statement of
THE BEEHIVE FUND NOTES TO FINANCIAL STATEMENTS DECEMBER 31, 2014 | | |
ITEM 2. CODE OF ETHICS.
| (a) | As of the end of the period covered by this report, Forum Funds (the “Registrant”) has adopted a code of ethics, which applies to its Principal Executive Officer and Principal Financial Officer (the “Code of Ethics”). |
| (c) | There have been no amendments to the Registrant’s Code of Ethics during the period covered by this report. |
| (d) | There have been no waivers to the Registrant’s Code of Ethics during the period covered by this report. |
(f) (1) A copy of the Code of Ethics is being filed under Item 12(a) hereto.
ITEM 3. AUDIT COMMITTEE FINANCIAL EXPERT.
The Board of Trustees has determined that no member of the Audit Committee is an "audit committee financial expert" as that term is defined under applicable regulatory guidelines.
ITEM 4. PRINCIPAL ACCOUNTANT FEES AND SERVICES.
(a) Audit Fees - The aggregate fees billed for each of the last two fiscal years (the “Reporting Periods”) for professional services rendered by the Registrant’s principal accountant for the audit of the Registrant’s annual financial statements, or services that are normally provided by the principal accountant in connection with the statutory and regulatory filings or engagements for the Reporting Periods, were $43,300 in 2013 and $43,300 in 2014.
(b) Audit-Related Fees – The aggregate fees billed in the Reporting Periods for assurance and related services rendered by the principal accountant that were reasonably related to the performance of the audit of the Registrant’s financial statements and are not reported under paragraph (a) of this Item 4 were $0 in 2013 and $0 in 2014.
(c) Tax Fees - The aggregate fees billed in the Reporting Periods for professional services rendered by the principal accountant to the Registrant for tax compliance, tax advice and tax planning were $9,000 in 2013 and $9,000 in 2014. These services consisted of review or preparation of U.S. federal, state, local and excise tax returns.
(d) All Other Fees - The aggregate fees billed in the Reporting Periods for products and services provided by the principal accountant to the Registrant, other than the services reported in paragraphs (a) through (c) of this Item, were $0 in 2013 and $0 in 2014.
(e) (1) The Audit Committee reviews and approves in advance all audit and “permissible non-audit services” (as that term is defined by the rules and regulations of the Securities and Exchange Commission) to be rendered to a series of the Registrant (each, a “Series”). In addition, the Audit Committee reviews and approves in advance all “permissible non-audit services” to be provided to an investment adviser (not including any sub-adviser) of a Series, or an affiliate of such investment adviser, that is controlling, controlled by or under common control with the investment adviser and provides on-going services to the Registrant (“Affiliate”), by the Series’ principal accountant if the engagement relates directly to the operations and financial reporting of the Series. The Audit Committee considers whether fees paid by a Series’ investment adviser or an Affiliate to the Series’ principal accountant for audit and permissible non-audit services are consistent with the principal accountant’s independence.
(e) (2) No services included in (b) - (d) above were approved pursuant to paragraph (c)(7)(i)(C) of Rule 2-01 of Regulation S-X.
(f) Not applicable
(g) The aggregate non-audit fees billed by the principal accountant for services rendered to the Registrant for the Reporting Periods were $0 in 2013 and $0 in 2014. There were no fees billed in either of the Reporting Periods for non-audit services rendered by the principal accountant to the Registrant’s investment adviser or any Affiliate.
(h) During the Reporting Period, the Registrant's principal accountant provided no non-audit services to the investment advisers or any entity controlling, controlled by or under common control with the investment advisers to the series of the Registrant to which this report relates.
ITEM 5. AUDIT COMMITTEE OF LISTED REGISTRANTS.
Not applicable.
ITEM 6. INVESTMENTS.
| (a) | Included as part of report to shareholders under Item 1. |
ITEM 7. DISCLOSURE OF PROXY VOTING POLICIES AND PROCEDURES FOR CLOSED-END
MANAGEMENT INVESTMENT COMPANIES.
Not applicable.
ITEM 8. PORTFOLIO MANAGERS OF CLOSED-END MANAGEMENT INVESTMENT COMPANIES.
Not applicable.
ITEM 9. PURCHASES OF EQUITY SECURITIES BY CLOSED-END MANAGEMENT INVESTMENT COMPANY AND AFFILIATED PURCHASERS.
Not applicable.
ITEM 10. SUBMISSION OF MATTERS TO A VOTE OF SECURITY HOLDERS
The Registrant does not accept nominees to the board of trustees from shareholders.
ITEM 11. CONTROLS AND PROCEDURES
(a) The Registrant’s Principal Executive Officer and Principal Financial Officer have concluded that the Registrant’s disclosure controls and procedures (as defined in Rule 30a-3(c) under the Investment Company Act of 1940 (the “Act”)) are effective, based on their evaluation of the controls and procedures required by Rule 30a-3(b) under the Act and Rules 13a-15(b) or 15d-15(b) under the Securities Exchange Act of 1934, as of a date within 90 days of the filing date of this report.
(b) There were no changes in the Registrant’s internal control over financial reporting (as defined in
Rule 30a-3(d) under the Act) that occurred during the second fiscal quarter of the period covered by this report that have materially affected, or are reasonably likely to materially affect, the Registrant’s internal control over financial reporting.
ITEM 12. EXHIBITS.
(a)(1) Code of Ethics (Exhibit filed herewith).
(a)(2) Certifications pursuant to Rule 30a-2(a) of the Act, and Section 302 of the Sarbanes-Oxley Act of 2002. (Exhibits filed herewith)
(a)(3) Not applicable.
(b) Certifications pursuant to Rule 30a-2(b) of the Act, and Section 906 of the Sarbanes-Oxley Act of 2002. (Exhibit filed herewith)
SIGNATURES
Pursuant to the requirements of the Securities Exchange Act of 1934 and the Investment Company Act of 1940, the Registrant has duly caused this report to be signed on its behalf by the undersigned, thereunto duly authorized.
Registrant Forum Funds
By /s/ Stacey E. Hong
Stacey E. Hong, Principal Executive Officer
Date February 20, 2015
Pursuant to the requirements of the Securities Exchange Act of 1934 and the Investment Company Act of 1940, this report has been signed below by the following persons on behalf of the Registrant and in the capacities and on the dates indicated.
By /s/ Stacey E. Hong
Stacey E. Hong, Principal Executive Officer
Date February 20, 2015
By /s/ Karen Shaw
Karen Shaw, Principal Financial Officer
Date February 20, 2015