As filed with the Securities and Exchange Commission on August 27, 2015
UNITED STATES
SECURITIES AND EXCHANGE COMMISSION
WASHINGTON, D.C. 20549
FORM N-CSR
CERTIFIED SHAREHOLDER REPORT OF REGISTERED MANAGEMENT
INVESTMENT COMPANIES
Investment Company Act file number 811-03023
FORUM FUNDS
Three Canal Plaza, Suite 600
Portland, Maine 04101
Jessica A. Chase, Principal Executive Officer
Three Canal Plaza, Suite 600
Portland, Maine 04101
207-347-2000
Date of fiscal year end: June 30
Date of reporting period: July 1, 2014 – June 30, 2015
ITEM 1. REPORT TO STOCKHOLDERS
| AUXIER FOCUS FUND |
| A MESSAGE TO OUR SHAREHOLDERS (Unaudited) |
| JUNE 30, 2015 |
AUXIER FOCUS FUND
PERFORMANCE UPDATE
June 30, 2015
| | ANNUALIZED | |
| | | Inception * | Ten Year | Five Year | Three Year | One Year | |
| | Auxier Focus Fund Investor Class Shares | 7.29% | 6.76% | 11.77% | 10.90% | 2.69% | |
| | S&P 500 Index | 4.39% | 7.89% | 17.34% | 17.31% | 7.42% | |
| | CUMULATIVE | |
| | | Inception * | Ten Year | Five Year | Three Year | One Year | |
| | Auxier Focus Fund Investor Class Shares | 207.60% | 92.32% | 74.42% | 36.39% | 2.69% | |
| | S&P 500 Index | 98.80% | 113.77% | 122.47% | 61.43% | 7.42% | |
| | * Fund inception: July 9, 1999 | | | | | |
Performance data quoted represents past performance and is no guarantee of future results. Current performance may be lower or higher than the performance data quoted. Investment return and principal value will fluctuate so that an investor's shares, when redeemed, may be worth more or less than original cost. As stated in the current prospectus, the Fund’s Investor Class Share’s annual operating expense ratio (gross) is 1.26%. The Fund’s adviser has contractually agreed to waive a portion of its fee and/or reimburse Fund expenses to limit total annual operating expenses at 1.14%, which is in effect until October 31, 2016. Other share classes may vary. The Fund charges a 2.0% redemption fee on shares redeemed within six months of purchase. For the most recent month-end performance, please call (877 )328-9437 or visit the Adviser’s website at www.auxierasset.com. The recent growth rate in the stock market has helped to produce short-term returns that are not typical and may not continue in the future.
Summer 2015 Market Commentary
The stock market sputtered and stalled in the first half of 2015. Standard & Poor’s 500 index of large U.S. companies rose a scant 0.28% in the second quarter and 1.23% over the six months ended June 30. Auxier Focus Fund trailed the index, declining 0.97% for the quarter and 0.29% for the first half of 2015. One reason is that the Fund is only 70% invested in
| AUXIER FOCUS FUND |
| A MESSAGE TO OUR SHAREHOLDERS (Unaudited) |
| JUNE 30, 2015 |
American companies (the S&P 500 is 100%). The remainder: 17% in foreign stocks, 6% in cash and 7% in so-called work-outs such as corporate spinoffs. What’s more, our lower-risk allocation has handily beaten the benchmark over time. Since inception in 1999, with an average 75%-95% equity exposure, a $10,000 investment in the Fund grew to $30,760 as of June 30, vs. $19,880 for the S&P 500.
Why was the market basically flat in the first half of 2015? One problem was increasingly negative headlines out of Greece, a country with 11 million residents, approximately $335 billion in debt and a GDP about the size of Wisconsin. These captivated the financial press and contributed to heightened market volatility. Another was rising concerns about China’s liberalization of stock ownership and margin accounts. These policies exposed a new generation of investors en masse to the cycles of fear, greed and ultimately folly as Chinese stocks went parabolic, then dropped sharply. Margin debt more than doubled in six months to 2.27 trillion yuan in June. More worrisome: between 2008 and 2013 China’s bank balance sheets grew by $15 trillion to $24 trillion. That growth exceeded the size of the entire U.S. banking system. Japan saw a similar debt growth trajectory in the 1990s. Such velocity in borrowings robs future growth and tends to lead to economic slowdowns.
Correction Protection in Practice
Since 1927, the S&P 500 has averaged a correction of at least 5% every 71 trading days, or once every four months. Since 1900, the Dow Jones Industrial Average has experienced a correction of 20% or more every 42 to 48 months. A long overdue return to higher, more normalized interest rates should lead to greater stock volatility. During such squalls an investor’s “stomach” will become a bigger factor in order to “gut out” difficult times necessary to achieve higher returns. It is so important to understand what you own, why you own it and what you will do when it drops. At Berkshire Hathaway’s recent annual meeting, Warren Buffett commented that Berkshire stock had declined by 50% three times over the past 50 years. When Peter Lynch was running Fidelity’s famed Magellan Fund, he used to share the story about his largest holding in the late 1970s—Taco Bell. He started buying the stock at $14; stuck with it as Taco Bell collapsed to $1 in the energy crisis; and triumphed when it was gobbled up by Pepsi for $39.
Our strategy is to seek out “high return” businesses and buy them at a price compelling enough to earn double to triple play returns over time, minimizing trading costs and taxes. We focus more on “free cash flow yields” than dividend yields. Many of our best ideas don’t work out until year three and four (an eternity in today’s hyperkinetic trading environment). Reason: fixable problems that lead to bargain stock prices often take longer to fix than planned. Health insurers UnitedHealth and Anthem are examples that were so despised and depressed that their free cash flow yields exceeded 20% when we bought them a few years ago. Comparable yields for health insurers now average around 4%. Today these two are extremely popular with investors, and merger activity is heating up after 160% moves. We are more comfortable taking risks involving time rather than price. We prize businesses that are able to earn consistently high rates of return on capital, without high mandatory capital spending, and that can execute through all kinds of economic environments. This provides greater financial flexibility in times when liquidity suddenly vanishes. Managerial execution takes on a much greater importance in today’s higher markets. Those teams that execute can garner huge premiums in valuation.
Portfolio Trends
The portfolio continues to benefit from managerial events like spinoffs. Drugmaker Baxter spun off Baxalta, which is being pursued by hopeful acquirer Shire at a substantial premium. Activists like Nelson Peltz have added value to our Pepsico and Bank of New York holdings. Citigroup’s management is executing well, yet its stock is among the cheapest banks in the country. Bank net interest margins are at 40-year lows and have room for material improvement if interest rates rise. ConAgra is divesting private label Ralcorp, which helped increase value by over 30%. We see cable-TV pioneer John Malone consolidating content companies like Discovery. Kroger has done a phenomenal job in an extremely competitive grocery environment. We see meaningful upside potential in Tesco if the Britain-based supermarket can apply the superior Kroger model to the U.K. and Europe. Delivery giant UPS has twin tailwinds of lower fuel costs combined with increased traffic through shipping enticements like Amazon Prime.
| AUXIER FOCUS FUND |
| A MESSAGE TO OUR SHAREHOLDERS (Unaudited) |
| JUNE 30, 2015 |
Lower Energy Costs Compounded
The U.S., Saudi Arabia and Iraq have increased their collective oil output by two million barrels a day. Iran, which at one point was second only to Saudi Arabia in production, could be a new added factor in supply. Robert Dudley, CEO of BP (formerly British Petroleum) said on a recent earnings call, “I do think the industry needs to prepare for lower for longer.” Historically, these types of price declines have led to rapid industry consolidation. BP seems to be a very likely acquisition candidate as their legal issues are being resolved. Having personally invested during the oil price crashes of 1986 and 1998, I have seen firsthand how lower energy prices are extremely beneficial to the kinds of businesses we own and the economy in general. There typically is an 18 to 20 month delay before the full benefits are felt. The initial cutback on energy related capital spending is painful, but the impact of lower inputs should more than compensate. In 1986 the Saudis flooded the market for crude, fueling a 67% plunge that came close to $10 a barrel. In 1987, the U.S. economy picked up and lending accelerated, driving longer term interest rates up from roughly 7% to 10% into September. Yet the stock market climbed as well—over 40% to a rich price-to-earnings ratio of 22—before succumbing to this 38% rise in interest rates. In 1998, oil again dropped close to $10 a barrel, contributing to a Russian government bond default and a powerful move by investors into the high return business franchises we favor. In both cases the dollar was strong. But robust economic activity overcame the drag on trade of a higher currency. And today’s lower energy prices set the stage for another potential stimulant: a gas tax to fund our badly deteriorating infrastructure. The American Society of Civil Engineers estimates we need to spend $3.6 trillion by 2020.
The Dilemma of Fixed Dollar Investments
Warren Buffett recently stated, “I would stay away from fixed dollar investments.” Former Federal Reserve chairman Alan Greenspan also warned about the high “price to earnings ratio” for U.S. bonds. Since the Fed was established in 1913, the U.S. dollar has depreciated 96%. In 2009, in the depths of a financial crisis, we bought numerous bond issues as corporate interest rate spreads (vs. U.S. Treasuries) exploded from 5% to 22%. Since then the Fed’s relentless easy money policies have shrunk bond yields to levels less than in the depressions of the 1930s and the 1870s. Yet many consumer prices are increasing. Apartment rental rates have spiked 14% since 2010. Auto sales are running over 17 million annualized. Healthcare costs are rising with double digit increases in insurance renewals into 2016. Airports are jam-packed. More people are eating out than eating at home. Household formations are running 1.5 million annually, and housing starts have exceeded 1 million in eight out of the last 10 months. Millennials aged 17-34 outnumber the baby boomers, which means the U.S. will be one of the younger developed countries over the next twenty years.
Should the government dictate bond prices for a depression? A reversion to the mean on bond yields over the past 50 years could lead to losses of principal exceeding 25% on 10 year bonds. Losses would be far worse on longer dated maturities. Not to mention the likely and insidious loss of purchasing power. Exchange traded bond funds reassure investors that their shares provide high liquidity. But the underlying bonds are currently very illiquid due to a material reduction in bond dealers. Over the years I have seen investors lose lots of money by blindly stretching for yield without looking at the underlying source of the income. Fixed income surrogates have had a difficult time lately. The utility industry has negative cash flow largely due to heavy plant expenditures. The Dow Jones Utility Average declined 5.42% in the second quarter. Publicly traded MLPs (Master Limited Partnerships) offer enticing yields and are tremendous sources of funding in the energy sector. But now they are vulnerable if energy prices don’t rebound and if interest rates rise. In the second quarter, the Dow Jones Brookfield Infrastructure MLP Index lost 5.24% while the U.S. Diversified REIT Index lost 11.33%.
Why What Can Go Wrong Will
A free market will in time purge undisciplined behavior and normalize outlier price levels. Back in 2011, we warned about copper prices selling at three times the cost of production. Over the long-term, commodities will typically trade barely over the cost of production. The resulting reversion to the mean in copper can be seen in the stock of producer Freeport-McMoRan, which has dropped from $60 at the peak to under $12 recently. Microsoft wrote off $7.6 billion of a $7.9 billion investment in phone maker Nokia after one year. This highlights how risky the phone business can be and how fast technology is moving. Apple and Samsung are battling against hundreds of competitors in markets where smart phone prices are running under $300 globally. To enjoy high compounded returns, it is imperative to finish the race. That is why we seek exceptional management in the seemingly mundane industries not prone to obsolescence and short-lived torrents of capital. The exponential explosion of data helps to speed time to market and create supply spillovers that are crushing many
| AUXIER FOCUS FUND |
| A MESSAGE TO OUR SHAREHOLDERS (Unaudited) |
| JUNE 30, 2015 |
industries. Ladies handbags were a killer category for a number of years. Now the category is being “killed” with a plethora of supply. Shares of industry leader Michael Kors are down over 50% this past year. It is so important to study supply/demand relationships. A byproduct of easy money is excessive borrowing and overcapacity.
Looking Ahead in 2015
We see most stocks trading in line with their fundamentals as Fed’s stimulus abates. Corrections are ironically a good thing and normal. Instead of depending on rising markets for returns, we are seeking “managerial event” situations in which talented leaders can add value in any kind of economic environment. We see opportunities in such industry consolidations, spinoffs and workouts. Investing is the craft of the specific. Now is the time to make sure you know what you own, why you own it and what you will do if prices drop. Longer term, continuing energy cost savings are a positive backdrop for investors and should provide a solid foundation for steady U.S. economic growth.
We appreciate your trust.
Jeff Auxier
Fund returns (i) assume the reinvestment of all dividends and capital gain distributions and (ii) would have been lower during the period if certain fees and expenses had not been waived. Performance shown is for the Fund’s Investor Class shares; returns for other share classes will vary. Performance for Investor Class shares for periods prior to December 10, 2004 reflects performance of the applicable share class of Auxier Focus Fund, a series of Unified Series Trust (the “Predecessor Fund”). Prior to January 3, 2003, the Predecessor Fund was a series of Ameriprime Funds. The performance of the Fund’s Investor Class shares for the period prior to December 10, 2004 reflects the expenses of the Predecessor Fund.
The Fund may invest in value and/or growth stocks. Investments in value stocks are subject to risk that their intrinsic value may never be realized and investments in growth stocks may be susceptible to rapid price swings, especially during periods of economic uncertainty. In addition, the Fund may invest in mid-sized companies which generally carry greater risk than is customarily associated with larger companies. Moreover, if the Fund's portfolio is overweighted in a sector, any negative development affecting that sector will have a greater impact on the Fund than a fund that is not overweighted in that sector. An increase in interest rates typically causes a fall in the value of a debt security (Fixed-Income Securities Risk) with corresponding changes to the Fund’s value. Foreign securities are subject to additional risks including international trade, currency, political, regulatory and diplomatic risks.
The S&P 500 Index is a broad-based, unmanaged measurement of changes in stock market conditions based on 500 widely held common stocks. The Dow Jones Industrial Average consists of 30 stocks that are considered to be major factors in their industries and that are widely held by individuals and institutional investors. The Dow Jones Utility Average is a price-weighted average of 15 utility stocks traded in the United States. The Dow Jones Brookfield Infrastructure MLP Index is a global measure of Master Limited Partnerships (MLPs) that exhibit strong infrastructure characteristics. The Dow Jones U.S. Diversified REITs Index is a subset of the Dow Jones U.S. Index. It represents the Diversified REITs Subsector as real estate investment trusts or corporations (REITs) or listed property trusts (LPTs) that invest in a variety of property types without a concentration on any single type. One cannot invest directly in an index or average
The views in this shareholder letter were those of the Fund Manager as of the letter’s publication date and may not reflect his views on the date this letter is first distributed or anytime thereafter. These views are intended to assist readers in understanding the Fund’s investment methodology and do not constitute investment advice.
| AUXIER FOCUS FUND |
| PERFORMANCE CHART AND ANALYSIS (Unaudited) |
| JUNE 30, 2015 |
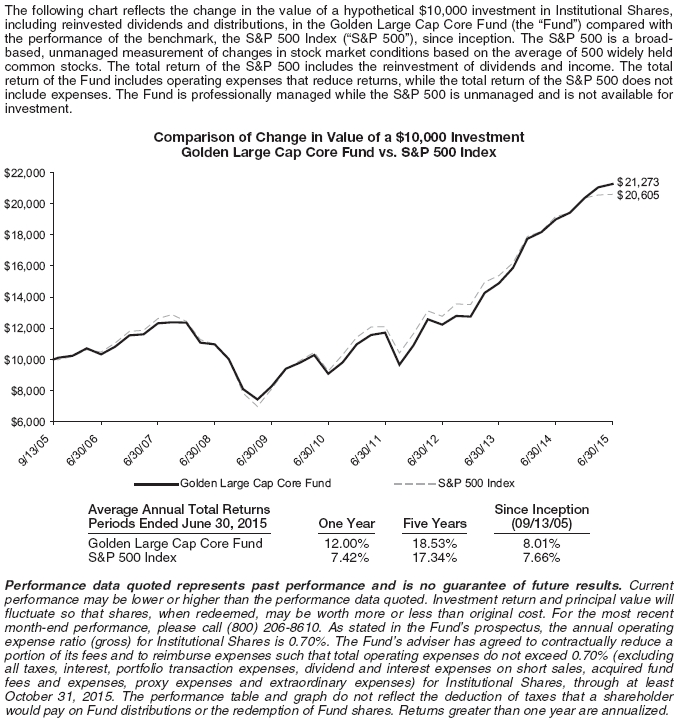
The following chart reflects the change in the value of a hypothetical $10,000 investment in Investor Shares, including reinvested dividends and distributions, in the Fund compared with the performance of the benchmark, the S&P 500 Index ("S&P 500"), over the past ten fiscal years. The S&P 500 is a broad-based, unmanaged measurement of changes in stock market conditions based on the average of 500 widely held common stocks. The total return of the Fund's classes includes the maximum sales charge of 5.75% (A Shares only) and operating expenses that reduce returns, while the total return of the S&P 500 does not include the effect of sales charges and expenses. A Shares are subject to a 1.00% contingent deferred sales charge on shares purchased without an initial sales charge and redeemed less than one year after purchase. The total return of the S&P 500 includes the reinvestment of dividends and income. The total return of the Fund includes operating expenses that reduce returns, while the total return of the S&P 500 does not include expenses. The Fund is professionally managed while the S&P 500 is unmanaged and is not available for investment.
| (1) | Investor, A Shares and Institutional Shares commenced operations on July 9, 1999, July 8, 2005, and May 9, 2012, respectively. |
| (2) | Due to shareholder redemptions on August 21, 2005, net assets of the class were zero from the close of business on that date until September 22, 2005. Financial information presented for the period August 21, 2005 to September 22, 2005 reflects performance of Investor Shares of the Fund. |
| (3) | For A Shares and Institutional Shares, performance for the 10-year and since inception periods are blended average annual returns which include the returns of the Investor Shares prior to commencement of operations of the A Shares and Institutional Shares. For Institutional Shares, performance for the 5-year period is a blended average annual which includes the return of the Investor Shares prior to commencement of operations of the Institutional Shares. |
Performance data quoted represents past performance and is no guarantee of future results. Current performance may be lower or higher than the performance data quoted. Investment return and principal value will fluctuate so that shares, when redeemed, may be worth more or less than original cost. For the most recent month-end performance, please visit the website of the Fund's investment adviser at www.auxierasset.com or call (877) 328-9437. As stated in the Fund's prospectus, the annual operating expense ratios (gross) for Institutional Shares, Investor Shares and A Shares are 1.47%, 1.26% and 1.62%, respectively. However, the Fund's adviser has contractually agreed to waive a portion of its fees and/or to reimburse expenses to limit total annual fund operating expenses (excluding all taxes, interest, portfolio transaction expenses, dividend expenses on short sales, and extraordinary expenses) to 1.00%, 1.14% and 1.25% for Institutional Shares, Investor Shares and A Shares, respectively through October 31, 2016. Shares redeemed or exchanged within 180 days of purchase will be charged a 2.00% redemption fee. The performance table and graph do not reflect the deduction of taxes that a shareholder would pay on Fund distributions or the redemption of Fund shares. Returns greater than one year are annualized.
Performance for Investor Shares for periods prior to December 10, 2004, reflects performance and expenses of Auxier Focus Fund, a series of Unified Series Trust (the “Predecessor Fund”). Prior to January 3, 2003, the Predecessor Fund was a series of Ameriprime Funds.
| AUXIER FOCUS FUND |
| SCHEDULE OF INVESTMENTS |
| JUNE 30, 2015 |
| | | | Security | | | | | | | | | | |
| | Shares | | Description | | | | | | | | | Value | |
| Common Stock - 94.4% | | | | | | | | | | |
| Communications - 5.5% | | | | | | | | | | |
| | 289,525 | | America Movil SAB de CV, ADR | | | | | | | | $ | 6,169,778 | |
| | 23,834 | | Cisco Systems, Inc. | | | | | | | | | 654,481 | |
| | 6,499 | | DIRECTV (a) | | | | | | | | | 603,042 | |
| | 1,100 | | eBay, Inc. (a) | | | | | | | | | 66,264 | |
| | 388,085 | | Telefonica SA, ADR | | | | | | | | | 5,510,807 | |
| | 37,660 | | Twenty-First Century Fox, Inc., Class A | | | | | | | | | 1,225,645 | |
| | 8,695 | | Viacom, Inc., Class B | | | | | | | | | 562,045 | |
| | | | | | | | | | | | | 14,792,062 | |
| Consumer Discretionary - 11.0% | | | | | | | | | | |
| | 117,254 | | Apollo Education Group, Inc., Class A (a) | | | | | | | | | 1,510,232 | |
| | 35,130 | | Coach, Inc. | | | | | | | | | 1,215,849 | |
| | 37,860 | | Comcast Corp., Class A | | | | | | | | | 2,276,900 | |
| | 16,020 | | CST Brands, Inc. | | | | | | | | | 625,741 | |
| | 50,990 | | CVS Health Corp. | | | | | | | | | 5,347,831 | |
| | 92,292 | | Discovery Communications, Inc., Class A (a) | | | | | | | | | 3,069,632 | |
| | 4,641 | | Discovery Communications, Inc., Class C (a) | | | | | | | | | 144,242 | |
| | 16,250 | | General Motors Co. | | | | | | | | | 541,613 | |
| | 153,550 | | H&R Block, Inc. | | | | | | | | | 4,552,757 | |
| | 263,976 | | Lincoln Educational Services Corp. | | | | | | | | | 533,232 | |
| | 18,550 | | Lowe's Cos., Inc. | | | | | | | | | 1,242,294 | |
| | 12,090 | | McDonald's Corp. | | | | | | | | | 1,149,396 | |
| | 3,250 | | Sally Beauty Holdings, Inc. (a) | | | | | | | | | 102,635 | |
| | 1,176 | | The Andersons, Inc. | | | | | | | | | 45,864 | |
| | 4,725 | | The Home Depot, Inc. | | | | | | | | | 525,089 | |
| | 290 | | Time Warner Cable, Inc. | | | | | | | | | 51,669 | |
| | 12,650 | | Time Warner, Inc. | | | | | | | | | 1,105,737 | |
| | 24,135 | | Vitamin Shoppe, Inc. (a) | | | | | | | | | 899,511 | |
| | 50,050 | | Wal-Mart Stores, Inc. | | | | | | | | | 3,550,047 | |
| | 16,602 | | Weight Watchers International, Inc. (a) | | | | | | | | | 80,520 | |
| | 7,050 | | Yum! Brands, Inc. | | | | | | | | | 635,064 | |
| | | | | | | | | | | | | 29,205,855 | |
| Consumer Staples - 22.8% | | | | | | | | | | |
| | 32,735 | | Alliance One International, Inc. (a) | | | | | | | | | 782,694 | |
| | 62,500 | | Altria Group, Inc. | | | | | | | | | 3,056,875 | |
| | 15,100 | | British American Tobacco PLC, ADR | | | | | | | | | 1,634,575 | |
| | 13,200 | | Coca-Cola HBC AG, ADR (a) | | | | | | | | | 282,876 | |
| | 48,435 | | ConAgra Foods, Inc. | | | | | | | | | 2,117,578 | |
| | 8,785 | | Diageo PLC, ADR | | | | | | | | | 1,019,411 | |
| | 30,050 | | Dr. Pepper Snapple Group, Inc. | | | | | | | | | 2,190,645 | |
| | 20,100 | | Kelly Services, Inc., Class A | | | | | | | | | 308,535 | |
| | 106,757 | | Molson Coors Brewing Co., Class B | | | | | | | | | 7,452,706 | |
| | 12,100 | | Monster Beverage Corp. (a) | | | | | | | | | 1,621,642 | |
| | 91,660 | | PepsiCo, Inc. | | | | | | | | | 8,555,544 | |
| | 82,520 | | Philip Morris International, Inc. | | | | | | | | | 6,615,628 | |
| | 530,090 | | Tesco PLC, ADR | | | | | | | | | 5,303,551 | |
| | 64,300 | | The Coca-Cola Co. | | | | | | | | | 2,522,489 | |
| | 2,200 | | The JM Smucker Co. | | | | | | | | | 238,502 | |
| | 106,784 | | The Kroger Co. | | | | | | | | | 7,742,908 | |
| | 38,925 | | The Procter & Gamble Co. | | | | | | | | | 3,045,492 | |
| | 133,920 | | The Western Union Co. | | | | | | | | | 2,722,594 | |
| | 89,400 | | Unilever NV, ADR | | | | | | | | | 3,740,496 | |
| | | | | | | | | | | | | 60,954,741 | |
| Energy - 3.9% | | | | | | | | | | |
| | 144,810 | | BP PLC, ADR | | | | | | | | | 5,786,608 | |
| | 16,750 | | Chevron Corp. | | | | | | | | | 1,615,872 | |
| | 15,600 | | ConocoPhillips | | | | | | | | | 957,996 | |
| | 7,800 | | Phillips 66 | | | | | | | | | 628,368 | |
| | 2,175 | | Royal Dutch Shell PLC, ADR | | | | | | | | | 123,997 | |
| | 19,100 | | Valero Energy Corp. | | | | | | | | | 1,195,660 | |
| | | | | | | | | | | | | 10,308,501 | |
| Financials - 18.4% | | | | | | | | | | |
| | 42,250 | | Aflac, Inc. | | | | | | | | | 2,627,950 | |
| | 39,000 | | American International Group, Inc. | | | | | | | | | 2,410,980 | |
| | 1,280 | | Ameriprise Financial, Inc. | | | | | | | | | 159,910 | |
| | 213,649 | | Bank of America Corp. | | | | | | | | | 3,636,306 | |
| | 16,000 | | Berkshire Hathaway, Inc., Class B (a) | | | | | | | | | 2,177,760 | |
| | 570 | | Capital One Financial Corp. | | | | | | | | | 50,143 | |
| | 71,174 | | Central Pacific Financial Corp. | | | | | | | | | 1,690,383 | |
| | 23,650 | | Citigroup, Inc. | | | | | | | | | 1,306,426 | |
| | 5,616 | | Colliers International Group, Inc. | | | | | | | | | 216,104 | |
| | 130,068 | | Credit Suisse Group AG, ADR | | | | | | | | | 3,589,877 | |
| | 5,616 | | FirstService Corp. | | | | | | | | | 155,956 | |
| | 82,110 | | Franklin Resources, Inc. | | | | | | | | | 4,025,853 | |
| | 24,900 | | Legg Mason, Inc. | | | | | | | | | 1,283,097 | |
| | 41,490 | | Marsh & McLennan Cos., Inc. | | | | | | | | | 2,352,483 | |
| | 60,950 | | MasterCard, Inc., Class A | | | | | | | | | 5,697,606 | |
| | 500 | | The Allstate Corp. | | | | | | | | | 32,435 | |
| | 227,600 | | The Bank of New York Mellon Corp. | | | | | | | | | 9,552,372 | |
| | 38,418 | | The Travelers Cos., Inc. | | | | | | | | | 3,713,484 | |
| | 7,350 | | U.S. Bancorp | | | | | | | | | 318,990 | |
| | 21,849 | | Unum Group | | | | | | | | | 781,102 | |
| | 31,600 | | Visa, Inc., Class A | | | | | | | | | 2,121,940 | |
| | 23,000 | | Waddell & Reed Financial, Inc., Class A | | | | | | | | | 1,088,130 | |
| | 500 | | Wells Fargo & Co. | | | | | | | | | 28,120 | |
| | | | | | | | | | | | | 49,017,407 | |
| Health Care - 22.0% | | | | | | | | | | |
| | 42,600 | | Abbott Laboratories | | | | | | | | | 2,090,808 | |
| | 2,900 | | Alkermes PLC (a) | | | | | | | | | 186,586 | |
| | 23,591 | | Anthem, Inc. | | | | | | | | | 3,872,227 | |
| | 19,200 | | Baxter International, Inc. | | | | | | | | | 1,342,656 | |
| | 17,200 | | Becton Dickinson and Co. | | | | | | | | | 2,436,380 | |
| | 21,580 | | Community Health Systems, Inc. (a) | | | | | | | | | 1,358,893 | |
| | 47,424 | | Express Scripts Holding Co. (a) | | | | | | | | | 4,217,891 | |
| | 65,700 | | GlaxoSmithKline PLC, ADR | | | | | | | | | 2,736,405 | |
| | 62,242 | | Hospira, Inc. (a) | | | | | | | | | 5,521,488 | |
| | 50,950 | | Johnson & Johnson | | | | | | | | | 4,965,587 | |
| | 1,100 | | Laboratory Corp. of America Holdings (a) | | | | | | | | | 133,342 | |
| | 95,003 | | Medtronic PLC | | | | | | | | | 7,039,722 | |
| | 105,610 | | Merck & Co., Inc. | | | | | | | | | 6,012,377 | |
| | 13,582 | | Pfizer, Inc. | | | | | | | | | 455,404 | |
| | 50,267 | | Quest Diagnostics, Inc. | | | | | | | | | 3,645,363 | |
| | 60,674 | | UnitedHealth Group, Inc. | | | | | | | | | 7,402,228 | |
| | 49,400 | | Zimmer Biomet Holdings, Inc. | | | | | | | | | 5,395,962 | |
| | | | | | | | | | | | | 58,813,319 | |
| Industrials - 3.2% | | | | | | | | | | |
| | 7,550 | | AGCO Corp. | | | | | | | | | 428,689 | |
| | 276,750 | | Corning, Inc. | | | | | | | | | 5,460,277 | |
| | 12,500 | | Raytheon Co. | | | | | | | | | 1,196,000 | |
| | 5,675 | | Textainer Group Holdings, Ltd. | | | | | | | | | 147,607 | |
| | 2,550 | | The Boeing Co. | | | | | | | | | 353,736 | |
| | 8,515 | | United Parcel Service, Inc., Class B | | | | | | | | | 825,189 | |
| | | | | | | | | | | | | 8,411,498 | |
| Information Technology - 4.4% | | | | | | | | | | |
| | 52,325 | | Intel Corp. | | | | | | | | | 1,591,465 | |
| | 157,364 | | Microsoft Corp. | | | | | | | | | 6,947,620 | |
| | 82,320 | | Oracle Corp. | | | | | | | | | 3,317,496 | |
| | | | | | | | | | | | | 11,856,581 | |
| Materials - 2.7% | | | | | | | | | | |
| | 28,895 | | E.I. du Pont de Nemours & Co. | | | | | | | | | 1,847,835 | |
| | 7,000 | | LyondellBasell Industries NV, Class A | | | | | | | | | 724,640 | |
| | 10,555 | | Precision Castparts Corp. | | | | | | | | | 2,109,628 | |
| | 47,350 | | The Dow Chemical Co. | | | | | | | | | 2,422,900 | |
| | | | | | | | | | | | | 7,105,003 | |
| | | | | | | | | | | | | | |
| See Notes to Financial Statements. | 6 | |
| AUXIER FOCUS FUND |
| SCHEDULE OF INVESTMENTS |
| JUNE 30, 2015 |
| | | | Security | | | | | | | | | | |
| | Shares | | Description | | | | | | | | | Value | |
| Telecommunications - 0.5% | | | | | | | | | | |
| | 27,300 | | AT&T, Inc. | | | | | | | | $ | 969,696 | |
| | 7,335 | | Verizon Communications, Inc. | | | | | | | | | 341,884 | |
| | | | | | | | | | | | | 1,311,580 | |
| Total Common Stock | | | | | | | | | | |
| (Cost $165,605,119) | | | | | | | | | 251,776,547 | |
| Total Investments - 94.4% | | | | | | | | | | |
(Cost $165,605,119)* | | | | | | | | $ | 251,776,547 | |
| Other Assets & Liabilities, Net – 5.6% | | | | | | | | | 15,041,263 | |
| Net Assets – 100.0% | | | | | | | | $ | 266,817,810 | |
| | | | | | | | | | | | | | |
| ADR | American Depositary Receipt |
| PLC | Public Limited Company |
| (a) | Non-income producing security. |
| * | Cost for federal income tax purposes is $165,616,252 and net unrealized appreciation consists of: |
| Gross Unrealized Appreciation | | $ | 96,540,109 | |
| Gross Unrealized Depreciation | | | (10,379,814 | ) |
| Net Unrealized Appreciation | | $ | 86,160,295 | |
The following is a summary of the inputs used to value the Fund’s investments as of June 30, 2015.
The inputs or methodology used for valuing securities are not necessarily an indication of the risks associated with investing in those securities. For more information on valuation inputs, and their aggregation into the levels used in the table below, please refer to the Security Valuation section in Note 2 of the accompanying Notes to Financial Statements.
| Valuation Inputs | | Investments in Securities |
| Level 1 - Quoted Prices | | $ | 251,776,547 | |
| Level 2 - Other Significant Observable Inputs | | | - | |
| Level 3 - Significant Unobservable Inputs | | | - | |
| Total | | $ | 251,776,547 | |
The Level 1 value displayed in the Investments in Securities column of this table is Common Stock. Refer to this Schedule of Investments for a further breakout of each security by type.
The Fund utilizes the end of period methodology when determining transfers. There were no transfers among Level 1, Level 2 and Level 3 for the year ended June 30, 2015.
| PORTFOLIO HOLDINGS | | |
| % of Net Assets | | |
| Communications | 5.5 | % |
| Consumer Discretionary | 11.0 | % |
| Consumer Staples | 22.8 | % |
| Energy | 3.9 | % |
| Financials | 18.4 | % |
| Health Care | 22.0 | % |
| Industrials | 3.2 | % |
| Information Technology | 4.4 | % |
| Materials | 2.7 | % |
| Telecommunications | 0.5 | % |
| Cash and Other Net Assets | 5.6 | % |
| | 100.0 | % |
| See Notes to Financial Statements. | 7 | |
| AUXIER FOCUS FUND |
| STATEMENT OF ASSETS AND LIABILITIES |
| JUNE 30, 2015 |
| | | | | | | |
| ASSETS | | | | |
| | Total investments, at value (Cost $165,605,119) | | $ | 251,776,547 | |
| | Cash | | | 13,725,661 | |
| | Receivables: | | | | |
| | | Fund shares sold | | | 137,691 | |
| | | Investment securities sold | | | 1,242,971 | |
| | | Dividends and interest | | | 386,236 | |
| | Prepaid expenses | | | 25,897 | |
| Total Assets | | | 267,295,003 | |
| | | | | | | |
| LIABILITIES | | | | |
| | Payables: | | | | |
| | | Investment securities purchased | | | 25,449 | |
| | | Fund shares redeemed | | | 160,938 | |
| | Accrued Liabilities: | | | | |
| Adviser | Investment adviser fees | | | 220,532 | |
| | | Trustees’ fees and expenses | | | 200 | |
| | | Fund services fees | | | 29,318 | |
| | | Other expenses | | | 40,756 | |
| Total Liabilities | | | 477,193 | |
| | | | | | | |
| NET ASSETS | | $ | 266,817,810 | |
| | | | | | | |
| COMPONENTS OF NET ASSETS | | | | |
| | Paid-in capital | | $ | 174,464,381 | |
| | Undistributed net investment income | | | 1,232,798 | |
| | Accumulated net realized gain | | | 4,949,203 | |
| | Net unrealized appreciation | | | 86,171,428 | |
| NET ASSETS | | $ | 266,817,810 | |
| | | | | | | |
| SHARES OF BENEFICIAL INTEREST AT NO PAR VALUE (UNLIMITED SHARES AUTHORIZED) | | | | |
| | Investor Shares | | | 11,313,859 | |
| | A Shares | | | 268,461 | |
| | Institutional Shares | | | 1,415,882 | |
| | | | | | | |
NET ASSET VALUE, OFFERING AND REDEMPTION PRICE PER SHARE* | | | | |
| | Investor Shares (based on net assets of $231,910,822) | | $ | 20.50 | |
| | A Shares (based on net assets of $5,540,827) | | $ | 20.64 | |
| | A Shares Maximum Public Offering Price Per Share (net asset value per share/(100%-5.75%)) | | $ | 21.90 | |
| | Institutional Shares (based on net assets of $29,366,161) | | $ | 20.74 | |
| * | Shares redeemed or exchanged within 180 days of purchase are charged a 2.00% redemption fee. |
| See Notes to Financial Statements. | 8 | |
| AUXIER FOCUS FUND |
| STATEMENT OF OPERATIONS |
| YEAR ENDED JUNE 30, 2015 |
| | | | | | | | |
| INVESTMENT INCOME | | | | | |
| | Dividend income (Net of foreign withholding taxes of $63,825) | | $ | 5,978,574 | | |
| | Interest income | | | 32,294 | | |
| Total Investment Income | | | 6,010,868 | | |
| Adviser | | | | | |
| EXPENSES | | | | | |
| | Investment adviser fees | | | 2,893,674 | | |
| | Fund services fees | | | 357,521 | | |
| | Transfer agent fees: | | | | | |
| | Investor Shares | | | 76,957 | | |
| | A Shares | | | 1,778 | | |
| | Institutional Shares | | | 243 | | |
| | Distribution fees: | | | | | |
| | A Shares | | | 13,548 | | |
| | Custodian fees | | | 29,021 | | |
| | Registration fees: | | | | | |
| | Investor Shares | | | 18,980 | | |
| | A Shares | | | 4,226 | | |
| | Institutional Shares | | | 14,294 | | |
| | Professional fees | | | 48,090 | | |
| | Trustees' fees and expenses | | | 17,076 | | |
| | Miscellaneous expenses | | | 221,945 | | |
| Total Expenses | | | 3,697,353 | | |
| | Fees waived and expenses reimbursed | | | (129,123 | ) | |
| Net Expenses | | | 3,568,230 | | |
| | | | | | | | |
| NET INVESTMENT INCOME | | | 2,442,638 | | |
| | | | | | | | |
| NET REALIZED AND UNREALIZED GAIN (LOSS) | | | | | |
| | Net realized gain on investments | | | 7,121,019 | | |
| | Net change in unrealized appreciation (depreciation) on investments | | | (1,503,747 | ) | |
| NET REALIZED AND UNREALIZED GAIN | | | 5,617,272 | | |
| INCREASE IN NET ASSETS RESULTING FROM OPERATIONS | | $ | 8,059,910 | | |
| | | | | | | | |
| See Notes to Financial Statements. | 9 | |
| AUXIER FOCUS FUND |
| STATEMENTS OF CHANGES IN NET ASSETS |
| |
| | | June 30, 2015 | # | | 42185 | # | | | # | | | 41820 | | | | | |
| | | | | For the Year Ended June 30, 2015 | | For the Year Ended June 30, 2014 | |
| OPERATIONS | | | | | | Shares | | | | | | | Shares | | |
| | Net investment income | | $ | 2,442,638 | | | | | | $ | 3,014,250 | | | | | |
| | Net realized gain | | | 7,121,019 | | | | | | | 9,328,055 | | | | | |
| | Net change in unrealized appreciation (depreciation) | | | (1,503,747 | ) | | | | | | 30,624,138 | | | | | |
| Increase in Net Assets Resulting from Operations | | | 8,059,910 | | | | | | | 42,966,443 | | | | | |
| | | | | | | | | | | | | | | | | | |
| DISTRIBUTIONS TO SHAREHOLDERS FROM | | | | | | | | | | | | | | | |
| | Net investment income: | | | | | | | | | | | | | | | |
| | | Investor Shares | | | (2,637,509 | ) | | | | | | (3,247,269 | ) | | | | |
| | | A Shares | | | (39,538 | ) | | | | | | (30,251 | ) | | | | |
| | | Institutional Shares | | | (70,657 | ) | | | | | | (66,782 | ) | | | | |
| | Net realized gain: | | | | | | | | | | | | | | | |
| | | Investor Shares | | | (7,849,090 | ) | | | | | | (6,549,711 | ) | | | | |
| | | A Shares | | | (148,394 | ) | | | | | | (73,681 | ) | | | | |
| | | Institutional Shares | | | (238,876 | ) | | | | | | (149,889 | ) | | | | |
| Total Distributions to Shareholders | | | (10,984,064 | ) | | | | | | (10,117,583 | ) | | | | |
| | | | | | | | | | | | | | | | | | |
| CAPITAL SHARE TRANSACTIONS | | | | | | | | | | | | | | | |
| | Sale of shares: | | | | | | | | | | | | | | | |
| | | Investor Shares | | | 26,562,823 | | | 1,276,816 | | | | 39,233,303 | | | 1,999,149 | | |
| | | A Shares | | | 873,139 | | | 41,598 | | | | 2,512,274 | | | 127,528 | | |
| | | Institutional Shares | | | 21,941,682 | | | 1,039,287 | | | | 2,223,679 | | | 110,806 | | |
| | Reinvestment of distributions: | | | | | | | | | | | | | | | |
| | | Investor Shares | | | 10,140,585 | | | 499,068 | | | | 9,563,734 | | | 488,464 | | |
| | | A Shares | | | 177,386 | | | 8,692 | | | | 95,499 | | | 4,869 | | |
| | | Institutional Shares | | | 309,533 | | | 15,098 | | | | 216,672 | | | 11,017 | | |
| | Redemption of shares: | | | | | | | | | | | | | | | |
| | 1 | Investor Shares | | | (87,469,825 | ) | | (4,198,398 | ) | | | (72,978,455 | ) | | (3,681,662 | ) | |
| | 2 | A Shares | | | (564,363 | ) | | (26,856 | ) | | | (62,884 | ) | | (3,204 | ) | |
| | 3 | Institutional Shares | | | (443,719 | ) | | (21,158 | ) | | | (470,453 | ) | | (23,897 | ) | |
| | Redemption fees | | | 11,230 | | | - | | | | 14,278 | | | - | | |
| Decrease in Net Assets from Capital Share Transactions | | | (28,461,529 | ) | | (1,365,853 | ) | | | (19,652,353 | ) | | (966,930 | ) | |
| Increase (Decrease) in Net Assets | | | (31,385,683 | ) | | | | | | 13,196,507 | | | | | |
| | | | | | | | | | | | | | | | | | |
| NET ASSETS | | | | | | | | | | | | | | | |
| | Beginning of Year | | | 298,203,493 | | | | | | | 285,006,986 | | | | | |
| | End of Year (Including line (a)) | | $ | 266,817,810 | | | | | | $ | 298,203,493 | | | | | |
| (a) | Undistributed net investment income | | $ | 1,232,798 | | | | | | $ | 1,537,864 | | | | | |
| See Notes to Financial Statements. | 10 | |
| AUXIER FOCUS FUND |
| FINANCIAL HIGHLIGHTS |
| |
| These financial highlights reflect selected data for a share outstanding throughout each year. | | | | | | |
| | | For the Years Ended June 30, | |
| INVESTOR SHARES | | 2015 | | | | 2014 | | | | 2013 | | | | 2012 | | | | 2011 | | |
| NET ASSET VALUE, Beginning of Year | $ | 20.75 | | | $ | 18.59 | | | $ | 16.49 | | | $ | 16.45 | | | $ | 13.49 | | |
| INVESTMENT OPERATIONS | | | | | | | | | | | | | | | | | | | | |
| Net investment income (a) | | 0.17 | | | | 0.20 | | | | 0.21 | | | | 0.22 | | | | 0.26 | | |
| Net realized and unrealized gain | | 0.38 | | | | 2.63 | | | | 2.23 | | | | 0.20 | (b) | | 3.00 | | |
| Total from Investment Operations | | 0.55 | | | | 2.83 | | | | 2.44 | | | | 0.42 | | | | 3.26 | | |
| DISTRIBUTIONS TO SHAREHOLDERS FROM | | | | | | | | | | | | | | | | | |
| Net investment income | | (0.20 | ) | | | (0.22 | ) | | | (0.22 | ) | | | (0.16 | ) | | | (0.29 | ) | |
| Net realized gain | | (0.60 | ) | | | (0.45 | ) | | | (0.12 | ) | | | (0.23 | ) | | | (0.01 | ) | |
| Total Distributions to Shareholders | | (0.80 | ) | | | (0.67 | ) | | | (0.34 | ) | | | (0.39 | ) | | | (0.30 | ) | |
| REDEMPTION FEES (a) | | — | (c) | | — | (c) | | — | (c) | | 0.01 | | | | — | (c) |
| NET ASSET VALUE, End of Year | $ | 20.50 | | | $ | 20.75 | | | $ | 18.59 | | | $ | 16.49 | | | $ | 16.45 | | |
| TOTAL RETURN | | 2.69 | % | | 15.43 | % | | 15.06 | % | | 2.84 | % | | 24.35 | % |
| RATIOS/SUPPLEMENTARY DATA | | | | | | | | | | | | | | | | | | | | |
| Net Assets at End of Year (000's omitted) | $231,911 | | | $285,094 | | | $277,536 | | | $243,366 | | | $163,699 | | |
| Ratios to Average Net Assets: | | | | | | | | | | | | | | | | | | | | |
| Net investment income | | 0.83 | % | | 1.00 | % | | 1.22 | % | | 1.36 | % | | 1.68 | % |
| Net expenses | | 1.24 | % | | 1.24 | % | | 1.25 | % | | 1.25 | % | | 1.25 | % |
| Gross expenses (d) | | 1.27 | % | | 1.26 | % | | 1.28 | % | | 1.27 | % | | 1.25 | % |
| PORTFOLIO TURNOVER RATE | | 4 | % | | 9 | % | | 11 | % | | 8 | % | | 20 | % |
| | | | | | | | | | | | | | | | | | | | | | |
| | | | | | | | | | | | | | | | | | | | | | |
| (a) | Calculated based on average shares outstanding during each year. |
| (b) | The net realized and unrealized gain (loss) per share does not correlate to the aggregate of the net realized and unrealized loss in the Statement of Operations for the year ended June 30, 2012, primarily due to the timing of the sales and repurchases of the Fund's shares in relation to fluctuating market values for the Fund's portfolio. |
| (c) | Less than $0.01 per share. |
| (d) | Reflects the expense ratio excluding any waivers and/or reimbursements. |
| See Notes to Financial Statements. | 11 | |
| AUXIER FOCUS FUND |
| FINANCIAL HIGHLIGHTS |
| |
| These financial highlights reflect selected data for a share outstanding throughout each year. | | | | | | |
| | | For the Years Ended June 30, | |
| A SHARES | | 2015 | | | | 2014 | | | | 2013 | | | | 2012 | | | | 2011 | | |
| NET ASSET VALUE, Beginning of Year | $ | 20.85 | | | $ | 18.63 | | | $ | 16.49 | | | $ | 16.45 | | | $ | 13.49 | | |
| INVESTMENT OPERATIONS | | | | | | | | | | | | | | | | | | | | |
| Net investment income (a) | | 0.18 | | | | 0.20 | | | | 0.21 | | | | 0.22 | | | | 0.25 | | |
| Net realized and unrealized gain | | 0.36 | | | | 2.64 | | | | 2.24 | | | | 0.21 | (b) | | 3.01 | | |
| Total from Investment Operations | | 0.54 | | | | 2.84 | | | | 2.45 | | | | 0.43 | | | | 3.26 | | |
| DISTRIBUTIONS TO SHAREHOLDERS FROM | | | | | | | | | | | | | | | | | | |
| Net investment income | | (0.15 | ) | | | (0.17 | ) | | | (0.19 | ) | | | (0.16 | ) | | | (0.29 | ) | |
| Net realized gain | | (0.60 | ) | | | (0.45 | ) | | | (0.12 | ) | | | (0.23 | ) | | | (0.01 | ) | |
| Total Distributions to Shareholders | | (0.75 | ) | | | (0.62 | ) | | | (0.31 | ) | | | (0.39 | ) | | | (0.30 | ) | |
| REDEMPTION FEES (a) | | — | (c) | | — | (c) | | — | (c) | | — | (c) | | — | (c) |
| NET ASSET VALUE, End of Year | $ | 20.64 | | | $ | 20.85 | | | $ | 18.63 | | | $ | 16.49 | | | $ | 16.45 | | |
| TOTAL RETURN (d) | | 2.63 | % | | 15.45 | % | | 15.06 | % | | 2.84 | % | | 24.35 | % |
| RATIOS/SUPPLEMENTARY DATA | | | | | | | | | | | | | | | | | | | | |
| Net Assets at End of Year (000's omitted) | $5,541 | | | $5,108 | | | $2,158 | | | $1,694 | | | $660 | | |
| Ratios to Average Net Assets: | | | | | | | | | | | | | | | | | | | | |
| Net investment income | | 0.84 | % | | 1.02 | % | | 1.22 | % | | 1.39 | % | | 1.61 | % |
| Net expenses | | 1.25 | % | | 1.25 | % | | 1.25 | % | | 1.25 | % | | 1.25 | % |
| Gross expenses (e) | | 1.56 | % | | 1.62 | % | | 1.62 | % | | 1.52 | % | | 1.50 | % |
| PORTFOLIO TURNOVER RATE | | 4 | % | | 9 | % | | 11 | % | | 8 | % | | 20 | % |
| | | | | | | | | | | | | | | | | | | | | | |
| | | | | | | | | | | | | | | | | | | | | | |
| (a) | Calculated based on average shares outstanding during each year. |
| (b) | The net realized and unrealized gain (loss) per share does not correlate to the aggregate of the net realized and unrealized loss in the Statement of Operations for the year ended June 30, 2012, primarily due to the timing of the sales and repurchases of the Fund's shares in relation to fluctuating market values for the Fund's portfolio. |
| (c) | Less than $0.01 per share. |
| (d) | Total Return does not include the effect of front end sales charge or contingent deferred sales charge. |
| (e) | Reflects the expense ratio excluding any waivers and/or reimbursements. |
| See Notes to Financial Statements. | 12 | |
| AUXIER FOCUS FUND |
| FINANCIAL HIGHLIGHTS |
| |
| These financial highlights reflect selected data for a share outstanding throughout each period. | | |
| | | For the Years Ended June 30, | | May 9, 2012 (a) through | |
| INSTITUTIONAL SHARES | | 2015 | | | | 2014 | | | | 2013 | | | June 30, 2012 | |
| NET ASSET VALUE, Beginning of Period | $ | 20.91 | | | $ | 18.66 | | | $ | 16.50 | | | $ | 16.27 | | |
| INVESTMENT OPERATIONS | | | | | | | | | | | | | | | | |
| Net investment income (b) | | 0.24 | | | | 0.25 | | | | 0.26 | | | | 0.04 | | |
| Net realized and unrealized gain | | 0.36 | | | | 2.64 | | | | 2.22 | | | | 0.19 | | |
| Total from Investment Operations | | 0.60 | | | | 2.89 | | | | 2.48 | | | | 0.23 | | |
| DISTRIBUTIONS TO SHAREHOLDERS FROM | | | | | | | | | | | | | | | | |
| Net investment income | | (0.17 | ) | | | (0.19 | ) | | | (0.20 | ) | | | — | | |
| Net realized gain | | (0.60 | ) | | | (0.45 | ) | | | (0.12 | ) | | | — | | |
| Total Distributions to Shareholders | | (0.77 | ) | | | (0.64 | ) | | | (0.32 | ) | | | — | | |
| REDEMPTION FEES (b) | | — | (c) | | — | (c) | | — | (c) | | — | (c) |
| NET ASSET VALUE, End of Period | $ | 20.74 | | | $ | 20.91 | | | $ | 18.66 | | | $ | 16.50 | | |
| TOTAL RETURN | | 2.93 | % | | 15.73 | % | | 15.28 | % | | 1.41 | %(d) |
| RATIOS/SUPPLEMENTARY DATA | | | | | | | | | | | | | | | | |
| Net Assets at End of Period (000's omitted) | $29,366 | | | $8,001 | | | $5,313 | | | $1,230 | | |
| Ratios to Average Net Assets: | | | | | | | | | | | | | | | | |
| Net investment income | | 1.13 | % | | 1.25 | % | | 1.48 | % | | 1.62 | %(e) |
| Net expenses | | 1.00 | % | | 1.00 | % | | 1.00 | % | | 1.10 | %(e) |
| Gross expenses (f) | | 1.36 | % | | 1.47 | % | | 1.55 | % | | 1.50 | %(e) |
| PORTFOLIO TURNOVER RATE | | 4 | % | | 9 | % | | 11 | % | | 8 | %(d) |
| | | | | | | | | | | | | | | | | | |
| (a) | Commencement of operations. |
| (b) | Calculated based on average shares outstanding during each period. |
| (c) | Less than $0.01 per share. |
| (d) | Not annualized. |
| (e) | Annualized. |
| (f) | Reflects the expense ratio excluding any waivers and/or reimbursements. |
| See Notes to Financial Statements. | 13 | |
| AUXIER FOCUS FUND |
| NOTES TO FINANCIAL STATEMENTS |
| JUNE 30, 2015 |
Note 1. Organization
The Auxier Focus Fund (the “Fund”) is a diversified portfolio of Forum Funds (the “Trust”). The Trust is a Delaware statutory trust that is registered as an open-end, management investment company under the Investment Company Act of 1940 (the “Act”), as amended. Under its Trust Instrument, the Trust is authorized to issue an unlimited number of the Fund’s shares of beneficial interest without par value.
The Fund currently offers three classes of shares: Investor Shares, A Shares and Institutional Shares. A Shares are offered at net asset value plus a maximum sales charge of 5.75%. A Shares are also subject to contingent deferred sales charge (“CDSC”) of 1.00% on purchases without an initial sales charge and redeemed less than one year after they are purchased. Investor Shares and Institutional Shares are not subject to a sales charge. Investor Shares, A Shares and Institutional Shares commenced operations on July 9, 1999, July 8, 2005 and May 9, 2012, respectively. The Fund’s investment objective is to provide long-term capital appreciation.
Note 2. Summary of Significant Accounting Policies
These financial statements are prepared in accordance with accounting principles generally accepted in the United States of America (“GAAP”), which require management to make estimates and assumptions that affect the reported amounts of assets and liabilities, the disclosure of contingent liabilities at the date of the financial statements, and the reported amounts of increases and decreases in net assets from operations during the fiscal year. Actual amounts could differ from those estimates. The following summarizes the significant accounting policies of the Fund:
Security Valuation – Exchange-traded securities and over-the-counter securities are valued using the last quoted trade or official closing price, provided by independent pricing services as of the close of trading on the market or exchange for which they are primarily traded, on each Fund business day. In the absence of a sale, such securities are valued at the mean of the last bid and ask price provided by independent pricing services. Non-exchange-traded securities for which quotations are available are valued using the last quoted sales price, or in the absence of a sale, at the mean of the last bid and ask prices provided by independent pricing services. Debt securities may be valued at prices supplied by a fund’s pricing agent based on broker or dealer supplied valuations or matrix pricing, a method of valuing securities by reference to the value of other securities with similar characteristics such as rating, interest rate and maturity. Shares of open-end mutual funds are valued at net asset value (“NAV”). Short-term investments that mature in 60 days or less may be valued at amortized cost.
The Fund values its investments at fair value pursuant to procedures adopted by the Trust's Board of Trustees (the "Board") if (1) market quotations are insufficient or not readily available or (2) the adviser believes that the values available are unreliable. The Trust’s Valuation Committee, as defined in the Fund’s registration statement, performs certain functions as they relate to the administration and oversight of the Fund’s valuation procedures. Under these procedures, the Valuation Committee convenes on a regular and ad-hoc basis to review such investments and considers a number of factors, including valuation methodologies and significant unobservable inputs, when arriving at fair value.
The Valuation Committee may work with the adviser to provide valuation inputs. In determining fair valuations, inputs may include market-based analytics which may consider related or comparable assets or liabilities, recent transactions, market multiples, book values and other relevant investment information. Adviser inputs may include an income-based approach in which the anticipated future cash flows of the investment are discounted in determining fair value. Discounts may also be applied based on the nature or duration of any restrictions on the disposition of the investments. The Valuation Committee performs regular reviews of valuation methodologies, key inputs and assumptions, disposition analysis and market activity.
Fair valuation is based on subjective factors and, as a result, the fair value price of an investment may differ from the security’s market price and may not be the price at which the asset may be sold. Fair valuation could result in a different Net Asset Value ("NAV") than a NAV determined by using market quotes.
The Fund has a three-tier fair value hierarchy. The basis of the tiers is dependent upon the various “inputs” used to determine the value of the Fund’s investments. These inputs are summarized in the three broad levels listed below:
| AUXIER FOCUS FUND |
| NOTES TO FINANCIAL STATEMENTS |
| JUNE 30, 2015 |
Level 1 — quoted prices in active markets for identical assets and liabilities
Level 2 — other significant observable inputs (including quoted prices of similar securities, interest rates, prepayment speeds, credit risk, etc.)
Level 3 — significant unobservable inputs (including the Fund’s own assumptions in determining the fair value of investments)
The aggregate value by input level, as of June 30, 2015, for the Fund’s investments is included at the end of the Fund’s Schedule of Investments.
Security Transactions, Investment Income and Realized Gain and Loss – Investment transactions are accounted for on the trade date. Dividend income is recorded on the ex-dividend date. Foreign dividend income is recorded on the ex-dividend date or as soon as possible after the Fund determines the existence of a dividend declaration after exercising reasonable due diligence. Income and capital gains on some foreign securities may be subject to foreign withholding taxes, which are accrued as applicable. Interest income is recorded on an accrual basis. Premium is amortized and discount is accreted using the effective interest method. Identified cost of investments sold is used to determine the gain and loss for both financial statement and federal income tax purposes.
Foreign Currency Translations – Foreign currency amounts are translated into U.S. dollars as follows: (1) assets and liabilities at the rate of exchange at the end of the respective period; and (2) purchases and sales of securities and income and expenses at the rate of exchange prevailing on the dates of such transactions. The portion of the results of operations arising from changes in the exchange rates and the portion due to fluctuations arising from changes in the market prices of securities are not isolated. Such fluctuations are included with the net realized and unrealized gain or loss on investments.
Distributions to Shareholders – Distributions to shareholders of net investment income and net capital gains, if any, are declared and paid at least annually. Distributions to shareholders are recorded on the ex-dividend date. Distributions are based on amounts calculated in accordance with applicable federal income tax regulations, which may differ from GAAP. These differences are due primarily to differing treatments of income and gain on various investment securities held by the Fund, timing differences and differing characterizations of distributions made by the Fund.
Federal Taxes – The Fund intends to continue to qualify each year as a regulated investment company under Subchapter M of the Internal Revenue Code and to distribute all of its taxable income to shareholders. In addition, by distributing in each calendar year substantially all of its net investment income and capital gains, if any, the Fund will not be subject to a federal excise tax. Therefore, no federal income or excise tax provision is required. The Fund files a U.S. federal income and excise tax return as required. A fund’s federal income tax returns are subject to examination by the Internal Revenue Service for a period of three fiscal years after they are filed. As of June 30, 2015, there are no uncertain tax positions that would require financial statement recognition, de-recognition or disclosure.
Income and Expense Allocation – The Trust accounts separately for the assets, liabilities and operations of each of its investment portfolios. Expenses that are directly attributable to more than one investment portfolio are allocated among the respective investment portfolios in an equitable manner.
The Fund’s class-specific expenses are charged to the operations of that class of shares. Income and expenses (other than expenses attributable to a specific class) and realized and unrealized gains or losses on investments are allocated to each class of shares based on the class’ respective net assets to the total net assets of the Fund.
Redemption Fees – A shareholder who redeems shares within 180 days of purchase will incur a redemption fee of 2.00% of the current net asset value of shares redeemed, subject to certain limitations. The fee is charged for the benefit of the remaining shareholders and will be paid to the Fund to help offset transaction costs. The fee is accounted for as an addition to paid-in capital. The Fund reserves the right to modify the terms of or terminate the fee at any time. There are limited exceptions to the imposition of the redemption fee.
| AUXIER FOCUS FUND |
| NOTES TO FINANCIAL STATEMENTS |
| JUNE 30, 2015 |
Commitments and Contingencies – In the normal course of business, the Fund enters into contracts that provide general indemnifications by the Fund to the counterparty to the contract. The Fund’s maximum exposure under these arrangements is dependent on future claims that may be made against the Fund and, therefore, cannot be estimated; however, based on experience, the risk of loss from such claims is considered remote.
Note 3. Cash – Concentration in Uninsured Account
For cash management purposes the Fund may concentrate cash with the Fund’s custodian. This typically results in cash balances exceeding the Federal Deposit Insurance Corporation (“FDIC”) insurance limits. As of June 30, 2015, the Fund held $13,475,661 as cash reserves at MUFG Union Bank, N.A. that exceeded the FDIC insurance limit.
Note 4. Fees and Expenses
Investment Adviser – Auxier Asset Management LLC (the “Adviser”), is the investment adviser to the Fund. Pursuant to an investment advisory agreement, the Adviser receives an advisory fee from the Fund at an annual rate of 1.00% of the Fund’s average daily assets.
Distribution – Foreside Fund Services, LLC serves as the Fund’s distributor (the “Distributor”). The Distributor is not affiliated with the Adviser or Atlantic Fund Administration, LLC (d/b/a Atlantic Fund Services) (“Atlantic”) or their affiliates. The Fund has adopted a Distribution Plan (the “Plan”) for A Shares of the Fund in accordance with Rule 12b-1 of the Act. Under the Plan, the Fund pays the Distributor and/or any other entity as authorized by the Board a fee of up to 0.25% of the average daily net assets of A Shares. The Distributor has no role in determining the investment policies or which securities are to be purchased or sold by the Trust or its Funds.
For the year ended June 30, 2015, there were $29,061 front-end sales charges assessed on the sale of A Shares and no contingent deferred sales charges were assessed on the sale of A Shares. The Distributor received $2,154 of the total front-end sales charges. Such amounts are set aside by the Distributor and used solely for distribution-related expenses.
Other Service Providers – Atlantic provides fund accounting, fund administration, compliance and transfer agency services to the Fund. Atlantic also provides certain shareholder report production, and EDGAR conversion and filing services. Atlantic provides a Principal Executive Officer, a Principal Financial Officer, a Chief Compliance Officer, and an Anti-Money Laundering Officer to the Fund, as well as certain additional compliance support functions.
Trustees and Officers – The Trust pays each independent Trustee an annual retainer fee of $45,000 for service to the Trust ($66,000 for the Chairman). The Trustees and Chairman may receive additional fees for special Board meetings. Each Trustee is also reimbursed for all reasonable out-of-pocket expenses incurred in connection with his duties as a Trustee, including travel and related expenses incurred in attending Board meetings. The amount of Trustees’ fees attributable to the Fund is disclosed in the Statement of Operations. Certain officers of the Trust are also officers or employees of the above named service providers, and during their terms of office received no compensation from the Fund.
Effective January 1, 2015, each Independent Trustee’s annual retainer is $50,000 ($66,000 for the Chairman), and the Audit Committee Chairman receives an additional $6,000 annually. Effective April 1, 2015, the Vice Chairman receives an additional $6,000 annually.
Note 5. Expense Reimbursements and Fees Waived
The Adviser has contractually agreed to waive a portion of its fees and reimburse expenses through October 31, 2016, to the extent necessary to maintain the total operating expenses (excluding all taxes, interest, portfolio transaction expenses, dividend expenses on short sales, and extraordinary expenses) at 1.14%, 1.25% and 1.00% of average daily net assets of the Investor Shares, A Shares and Institutional Shares respectively. These contractual waivers may only be raised or eliminated with consent of the Board. Other fund service providers have voluntarily agreed to waive a portion of their fees. Effective July 1, 2015, the expense cap for the Investor Shares changed from 1.25% to 1.14%. These voluntary reductions may be reduced or eliminated at any time. For the year ended June 30, 2015, fees waived and expenses reimbursed were as follows:
| AUXIER FOCUS FUND |
| NOTES TO FINANCIAL STATEMENTS |
| JUNE 30, 2015 |
| Investment Adviser Expenses Reimbursed | | Other Waivers | | Total Fees Waived and Expenses Reimbursed |
| $ | 62,153 | | $ | 66,970 | | $ | 129,123 |
| | | | | | | | |
Note 6. Security Transactions
The cost of purchases and proceeds from sales of investment securities (including maturities), other than short-term investments during the year ended June 30, 2015, were $9,410,389 and $34,496,217, respectively.
Note 7. Federal Income Tax
Distributions paid during the fiscal years ended as noted were characterized for tax purposes as follows:
| | Ordinary Income | | $ | 2,785,128 | | $ | 3,868,873 | |
| | Long-Term Capital Gain | | | 8,198,936 | | | 6,248,710 | |
| | | | $ | 10,984,064 | | $ | 10,117,583 | |
As of June 30, 2015, distributable earnings (accumulated loss) on a tax basis were as follows:
| | Undistributed Ordinary Income | | $ | 1,256,834 | | |
| | Undistributed Long-Term Gain | | | 4,936,300 | | |
| | Unrealized Appreciation | | | 86,160,295 | | |
| | Total | | $ | 92,353,429 | | |
The difference between components of distributable earnings on a tax basis and the amounts reflected in the Statement of Assets and Liabilities are primarily due to wash sales.
Note 8. Recent Accounting Pronouncements
In May 2015, the Financial Accounting Standards Board (“FASB”) issued Accounting Standards Update 2015-07 (“ASU 2015-07”) eliminating the requirement for investments measured at net asset value to be categorized within the fair value hierarchy under GAAP and requiring the disclosure of sufficient information to reconcile the fair value of the remaining assets categorized within the fair value hierarchy to the financial statements. ASU 2015-07 is effective for interim and annual reporting periods beginning after December 15, 2015. Management has reviewed the requirements and believes the adoption of ASU 2015-07 will not have a material impact on the financial statements.
Note 9. Subsequent Events
Subsequent events occurring after the date of this report through the date these financial statements were issued have been evaluated for potential impact and the Fund has had no such events.
| |
| REPORT OF INDEPENDENT REGISTERED PUBLIC ACCOUNTING FIRM |
| |
To the Board of Trustees of Forum Funds
and the Shareholders of Auxier Focus Fund
We have audited the accompanying statement of assets and liabilities of the Auxier Focus Fund, a series of shares of beneficial interest in the Forum Funds, including the schedule of investments, as of June 30, 2015, and the related statement of operations for the year then ended, the statements of changes in net assets for each of the years in the two-year period then ended and the financial highlights for each of the years in the five-year period then ended. These financial statements and financial highlights are the responsibility of the Fund's management. Our responsibility is to express an opinion on these financial statements and financial highlights based on our audits.
We conducted our audits in accordance with the standards of the Public Company Accounting Oversight Board (United States). Those standards require that we plan and perform the audits to obtain reasonable assurance about whether the financial statements and financial highlights are free of material misstatement. An audit includes examining, on a test basis, evidence supporting the amounts and disclosures in the financial statements. Our procedures included confirmation of securities owned as of June 30, 2015 by correspondence with the custodian and brokers. An audit also includes assessing the accounting principles used and significant estimates made by management, as well as evaluating the overall financial statement presentation. We believe that our audits provide a reasonable basis for our opinion.
In our opinion, the financial statements and financial highlights referred to above present fairly, in all material respects, the financial position of the Auxier Focus Fund as of June 30, 2015, and the results of its operations for the year then ended, the changes in its net assets for each of the years in the two-year period then ended and its financial highlights for each of the years in the five-year period then ended, in conformity with accounting principles generally accepted in the United States of America.
Philadelphia, Pennsylvania
August 19, 2015
| AUXIER FOCUS FUND |
| ADDITIONAL INFORMATION (Unaudited) |
| JUNE 30, 2015 |
Proxy Voting Information
A description of the policies and procedures that the Fund uses to determine how to vote proxies relating to securities held in the Fund’s portfolio is available, without charge and upon request, by calling (877) 328-9437, on the Fund's website at www.auxierasset.com and on the U.S. Securities and Exchange Commission’s (the “SEC”) website at www.sec.gov. The Fund’s proxy voting record for the most recent twelve-month period ended June 30 is available, without charge and upon request, by calling (877) 328-9437 and on the SEC’s website at www.sec.gov.
Availability of Quarterly Portfolio Schedules
The Fund files its complete schedule of portfolio holdings with the SEC for the first and third quarters of each fiscal year on Form N-Q. These filings are available, without charge and upon request on the SEC’s website at www.sec.gov or may be reviewed and copied at the SEC’s Public Reference Room in Washington, DC. Information on the operation of the Public Reference Room may be obtained by calling (800) SEC-0330.
Shareholder Expense Example
As a shareholder of the Fund, you incur two types of costs: (1) transaction costs, including sales charges (loads) on purchase payments on certain classes, redemption fees, exchange fees, and CDSC fees, and (2) ongoing costs, including management fees, 12b-1 fees, and other Fund expenses. This example is intended to help you understand your ongoing costs (in dollars) of investing in the Fund, and to compare these costs with the ongoing costs of investing in other mutual funds.
The example is based on an investment of $1,000 invested at the beginning of the period and held for the entire period from January 1, 2015, through June 30, 2015.
Actual Expenses – The first line under each share class of the table below provides information about actual account values and actual expenses. You may use the information in this line, together with the amount you invested, to estimate the expenses that you paid over the period. Simply divide your account value by $1,000 (for example, an $8,600 account value divided by $1,000 = 8.6), then multiply the result by the number in the first line under the heading entitled “Expenses Paid During Period” to estimate the expenses you paid on your account during the period.
Hypothetical Example for Comparison Purposes – The second line under each share class of the table below provides information about hypothetical account values and hypothetical expenses based on the Fund’s actual expense ratio and an assumed rate of return of 5% per year before expenses, which is not the Fund’s actual return. The hypothetical account values and expenses may not be used to estimate the actual ending account balance or expenses you paid for the period. You may use this information to compare the ongoing costs of investing in the Fund and other funds. To do so, compare this 5% hypothetical example with the 5% hypothetical examples that appear in the shareholder reports of other funds.
Please note that the expenses shown in the table are meant to highlight your ongoing costs only and do not reflect any transactional costs, such as sales charges (loads) on purchase payments on certain classes, redemption fees, exchange fees, and CDSC fees. Therefore, the second line of the table is useful in comparing ongoing costs only, and will not help you determine the relative total costs of owning different funds. In addition, if these transactional costs were included, your costs would have been higher.
| AUXIER FOCUS FUND |
| ADDITIONAL INFORMATION (Unaudited) |
| JUNE 30, 2015 |
| | Beginning | | Ending | | Expenses | | Annualized |
| | Account Value | | Account Value | | Paid During | | Expense |
| | January 1, 2015 | | June 30, 2015 | | Period* | | Ratio* |
| Investor Shares | | | | | | | | | | | |
| Actual | $ | 1,000.00 | | $ | 997.08 | | $ | 6.14 | | 1.24 | % |
| Hypothetical (5% return before taxes) | $ | 1,000.00 | | $ | 1,018.65 | | $ | 6.21 | | 1.24 | % |
| A Shares | | | | | | | | | | | |
| Actual | $ | 1,000.00 | | $ | 996.62 | | $ | 6.19 | | 1.25 | % |
| Hypothetical (5% return before taxes) | $ | 1,000.00 | | $ | 1,018.60 | | $ | 6.26 | | 1.25 | % |
| Institutional Shares | | | | | | | | | | | |
| Actual | $ | 1,000.00 | | $ | 998.07 | | $ | 4.95 | | 1.00 | % |
| Hypothetical (5% return before taxes) | $ | 1,000.00 | | $ | 1,019.84 | | $ | 5.01 | | 1.00 | % |
| | | | | | | | | | | | |
| * | Expenses are equal to the Fund’s annualized expense ratio multiplied by the average account value over the period, multiplied by the number of days in the most recent fiscal half-year divided by 365 to reflect the half-year period. |
Federal Tax Status of Dividends Declared during the Fiscal Year
For federal income tax purposes, dividends from short-term capital gains are classified as ordinary income. The Fund designates 100.00% of its income dividend distributed as qualifying for the corporate dividends-received deduction (DRD) and 100.00% for the qualified dividend rate (QDI) as defined in Section 1(h)(11) of the Internal Revenue Code. The Fund also designates 3.29% of its income dividends as qualified interest income exempt from U.S. tax for foreign shareholders (QII) and 1.34% of its income dividends as qualified short-term gain exempt from U.S. tax for foreign shareholders (QSD).
Trustees and Officers of the Trust
The Board is responsible for oversight of the management of the Trust’s business affairs and of the exercise of all the Trust’s powers except those reserved for the shareholders. The following table provides information about each Trustee and certain officers of the Trust. Each Trustee and officer holds office until the person resigns, is removed, or is replaced. Unless otherwise noted, the persons have held their principal occupations for more than five years. The address for all Trustees and officers is Three Canal Plaza, Suite 600, Portland, Maine 04101. Mr. Keffer is considered an Interested Trustee due to his affiliation with Atlantic. The Fund’s Statement of Additional Information includes additional information about the Trustees and is available, without charge and upon request, by calling (877) 328-9437.
| AUXIER FOCUS FUND |
| ADDITIONAL INFORMATION (Unaudited) |
| JUNE 30, 2015 |
| Name and Year of Birth | Position with the Trust | Length of Time Served | Principal Occupation(s) During Past Five Years | Number of Series of Fund Complex¹ Overseen by Trustee | Other Directorships Held by Trustee |
Independent Trustees | | | | | |
J. Michael Parish Born: 1943 | Chairman of the Board; Trustee; Chairman, Nominating Committee and Qualified Legal Compliance Committee | Since 1989 (Chairman since 2004) | Retired since 2003; formerly, Partner, Wolf, Block, Schorr and Solis-Cohen, LLP (law firm) 2002-2003; Partner, Thelen Reid & Priest LLP (law firm) 1995-2002. | 27 | None |
Costas Azariadis Born: 1943 | Trustee | Since 1989 | Professor of Economics, Washington University since 2006. | 27 | None |
James C. Cheng Born: 1942 | Trustee; Chairman, Audit Committee | Since 1989 | President, Technology Marketing Associates (marketing company for small- and medium-sized businesses in New England) since 1991. | 27 | None |
David Tucker Born: 1958 | Trustee; Vice Chairman | Since 2011 (Vice Chairman since 2015) | Director, Blue Sky Experience since 2008; Senior Vice President & General Counsel, American Century Companies 1998-2008. | 36 | Trustee, Forum Funds II and Forum ETF Trust |
Interested Trustee | | | | | |
John Y. Keffer2 Born: 1942 | Trustee; Vice Chairman | Since 1989 | Chairman, Atlantic since 2008; President, Forum Investment Advisors, LLC since 2011; President, Forum Foundation (a charitable organization) since 2005; President, Forum Trust, LLC (a non-depository trust company chartered in the State of Maine) since 1997. | 36 | Director, Wintergreen Fund, Inc.; Trustee, Forum Funds II, Forum ETF Trust and ALTMFX Trust |
Officers | | | | | |
Jessica Chase Born: 1970 | President; Principal Executive Officer | Since 2015 | Senior Vice President, Atlantic since 2008. | N/A | N/A |
Karen Shaw Born: 1972 | Treasurer; Principal Financial Officer | Since 2008 | Senior Vice President, Atlantic since 2008. | N/A | N/A |
Zachary Tackett Born: 1988 | Vice President; Secretary; Anti-Money Laundering Compliance Officer | Since 2014 | Associate Counsel, Atlantic since 2014; Intern Associate, Coakley & Hyde, PLLC, 2010-2013. | N/A | N/A |
Michael J. McKeen Born: 1971 | Vice President | Since 2009 | Senior Vice President, Atlantic since 2008. | N/A | N/A |
Timothy Bowden Born: 1969 | Vice President | Since 2009 | Manager, Atlantic since 2008. | N/A | N/A |
Geoffrey Ney Born: 1975 | Vice President | Since 2013 | Manager, Atlantic since 2013; Senior Fund Accountant, Atlantic, 2008-2013. | N/A | N/A |
Todd Proulx Born: 1978 | Vice President | Since 2013 | Manager, Atlantic since 2013; Senior Fund Accountant, Atlantic, 2008-2013. | N/A | N/A |
1The Fund Complex includes the Trust, Forum Funds II and Forum ETF Trust and is overseen by different Boards of Trustees. 2Atlantic is a subsidiary of Forum Holdings Corp. I, a Delaware corporation that is wholly owned by Mr. Keffer. |
|
| TABLE OF CONTENTS |
| JUNE 30, 2015 |
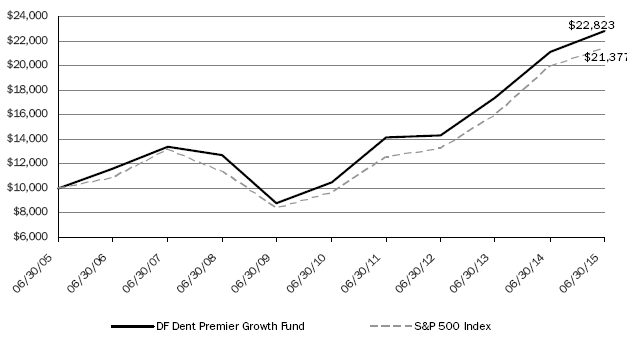
DF DENT PREMIER GROWTH FUND |
A MESSAGE TO OUR SHAREHOLDERS (Unaudited) |
| JUNE 30, 2015 |
Dear Fellow Shareholder,
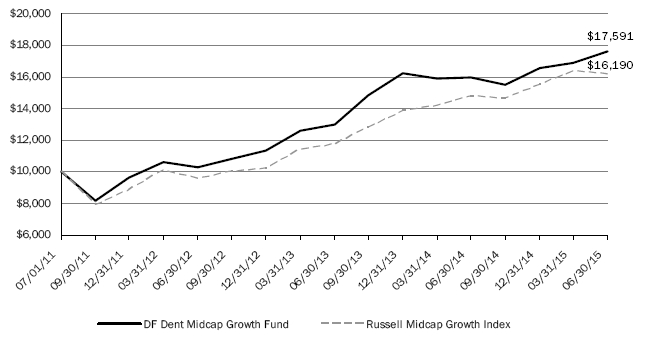
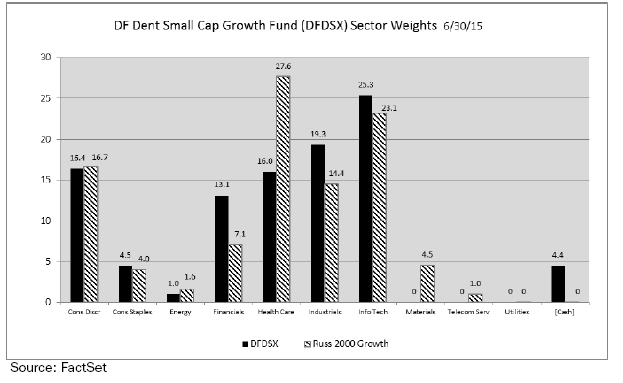
All three DF Dent Growth Funds exceeded the performance of their respective benchmarks for the 6 month, 1 year, and since inception periods ending June 30, 2015:
| | | DF Dent Premier Growth | | DF Dent Midcap Growth | | DF Dent Small Cap Growth |
| 6 Months | | + | 2.80 | % | | + | 6.27 | % | | + | 9.01 | % |
| Benchmark | | S&P 500 | | Russell Midcap Growth | | Russell 2000 Growth |
| Benchmark Performance | | + | 1.23 | % | | + | 4.18 | % | | + | 8.74 | % |
| Fund Outperformance | | + | 1.57 | % | | + | 2.09 | % | | + | 0.27 | % |
| | | | | | | | | | | | | |
| 12 Months | | + | 8.22 | % | | + | 9.97 | % | | + | 13.41 | % |
| Benchmark | | + | 7.42 | % | | + | 9.45 | % | | + | 12.34 | % |
| Fund Outperformance | | + | 0.80 | % | | + | 0.52 | % | | + | 1.07 | % |
| | | | | | | | | | | | | |
| 5 Years | | + | 16.76 | %* | | | N/A | | | | N/A | |
| Benchmark | | + | 17.34 | %* | | | N/A | | | | N/A | |
| Fund Outperformance | | - | 0.58 | %* | | | N/A | | | | N/A | |
| | | | | | | | | | | | | |
| Since Inception | | + | 8.19 | %* | | + | 15.17 | %* | | + | 13.43 | %* |
| Benchmark | | + | 6.03 | %* | | + | 12.80 | %* | | + | 13.10 | %* |
| Fund Outperformance | | + | 2.16 | %* | | + | 2.37 | %* | | + | 0.33 | %* |
| | | | | | | | | | | | | |
* annualized | | | | | | | | | | | | |
| | | | | | | | | | | | | |
| Cumulative Since Inception | | + | 199.90 | % | | + | 75.91 | % | | + | 23.27 | % |
| Benchmark | | + | 126.49 | % | | + | 61.90 | % | | + | 22.68 | % |
| Fund Outperformance | | + | 73.41 | % | | + | 14.01 | % | | + | 0.59 | % |
| Inception Date | | 07/16/2001 | | 07/01/2011 | | 11/01/2013 |
N/A- Periods which exceed the life of the particular fund.
Performance data quoted represents past performance and is no guarantee of future results. Current performance may be lower or higher than the performance data quoted. Investment return and principal value will fluctuate so that an investor’s shares, when redeemed, may be worth more or less than original cost. For the most recent month-end performance, please call (866) 233-3368. As stated in the current prospectus, the DF Dent Premier Growth Fund’s and DF Dent Midcap Growth Fund’s annual operating expense ratios (gross) are 1.20% and 2.08%, respectively. However, D.F. Dent and Company (the Funds’ “Adviser”) has contractually agreed to waive a portion of its fees and/or reimburse certain expenses to limit total operating expenses to 1.10% on the first $150 million in Fund net assets and to 0.90% on net assets exceeding $150 million. This agreement is in effect through October 31, 2019. The DF Dent Small Cap Growth Fund’s estimated annual operating expense ratio (gross) is 10.69%. However, the Adviser has contractually agreed to waive a portion of its fees and/or reimburse certain expenses to limit total operating expense to 1.25% through October 31, 2019. These expense
DF DENT PREMIER GROWTH FUND |
A MESSAGE TO OUR SHAREHOLDERS (Unaudited) |
| JUNE 30, 2015 |
caps may be changed or eliminated prior to their expiration date only with the consent of the Board of Trustees. Both the DF Dent Midcap Growth Fund and DF Dent Small Cap Growth Fund charge a 2.00% redemption fee on shares redeemed within 60 days of purchase. Fund performance returns shown do not reflect fees; if reflected, the returns would have been lower. Returns greater than one year are annualized.
For the fiscal year ended June 30, 2015, the DF Dent Premier Growth Fund (the “Fund”) experienced a total return of +8.22%, +0.80% better than the total return of the S&P 500 (the “Index”), which is the benchmark we have used since the Fund’s inception on July 16, 2001. This result did not change the annual rate of return of +8.19% since inception reported one year ago. Therefore, it is fair to say that the year was very much in line and consistent with your Fund’s long term (14 years) performance record. During this 14 year period, we have experienced two recessions, two wars, the worst financial crisis since the Great Depression, three Presidential election cycles, three Chairmen of the Federal Reserve, six Chairmen of the SEC, a collapse in may commodity prices (oil, iron ore, copper, etc.), and a regulatory overhaul of the financial markets. Investor perceptions of ongoing headline news will continue to drive equity markets over the short term, but we believe that, as in the past, future returns will be determined largely by the underlying growth in cash flow and earnings of the companies in your Fund. Therefore, we seek to find, research, and invest in those companies which we believe have the potential to deliver long term growth in cash flow and earnings.
Expense Ratio Management
Your Fund’s Adviser, D.F. Dent and Company, has again agreed to maintain your Fund’s expense ratio (excluding all taxes, interest, portfolio transaction expenses, and extraordinary expenses) at a net 1.10% on the first $150 million of net assets and 0.90% on net assets exceeding $150 million through October 31, 2019, by reimbursing expenses and waiving management fees. The record of expense reimbursement and management fee waivers for the first fourteen years of your Fund is as follows:
| Year Ending | | Expense Reimbursement | | Management Fee Waived |
| 06/30/02 | | $ | 60,201 | | $ | 60,019 |
| 06/30/03 | | | 38,066 | | | 90,163 |
| 06/30/04 | | | 0 | | | 129,060 |
| 06/30/05 | | | 0 | | | 141,907 |
| 06/30/06 | | | 0 | | | 142,664 |
| 06/30/07 | | | 0 | | | 161,128 |
| 06/30/08 | | | 0 | | | 95,665 |
| 06/30/09 | | | 0 | | | 234,053 |
| 06/30/10 | | | 0 | | | 204,148 |
| 06/30/11 | | | 0 | | | 211,784 |
| 06/30/12 | | | 0 | | | 240,847 |
| 06/30/13 | | | 0 | | | 235,380 |
| 06/30/14 | | | 0 | | | 220,476 |
| 06/30/15 | | | 0 | | | 175,996 |
DF DENT PREMIER GROWTH FUND |
A MESSAGE TO OUR SHAREHOLDERS (Unaudited) |
| JUNE 30, 2015 |
Portfolio Turnover
Annual portfolio turnover since inception has been as follows:
Portfolio Turnover**
2002* 2003 2004 2005 2006 2007 2008 2009 2010 2011 2012 2013 2014 2015
0% 14% 20% 7% 25% 17% 21% 16% 8% 21% 14% 19% 25% 25%
Average
16.57%
We believe these low portfolio turnover rates are consistent with our investment strategy of holding positions for long periods and minimizing transaction expenses for shareholders. Brokerage expenses for the entire fiscal year’s trading amounted to 1.2 cents per share of your Fund. Thus, trading expense remained very low owing to low portfolio turnover.
* The Fund commenced operations on July 16, 2001.
** Percentage calculated based on total value of investments.
Asset Allocation
| | | 06/30/10* | | 06/30/11* | | 06/30/12* | | 06/30/13* | | 06/30/14* | | 06/30/15* | | “Adjusted” 06/30/15* |
| Large Capitalization | | 43.0 | % | | 50.2 | % | | 50.3 | % | | 51.3 | % | | 75.5 | % | | 74.6 | % | | 46.5 | % |
| Mid Capitalization | | 50.2 | % | | 40.6 | % | | 38.6 | % | | 40.4 | % | | 21.8 | % | | 19.2 | % | | 38.9 | % |
| Small Capitalization | | 6.3 | % | | 9.2 | % | | 11.0 | % | | 5.6 | % | | 2.5 | % | | 3.9 | % | | 12.3 | % |
| Reserve Funds | | 0.5 | % | | 0.0 | % | | 0.1 | % | | 2.7 | % | | 0.2 | % | | 2.3 | % | | 2.3 | % |
| Total Fund | | 100.0 | % | | 100.0 | % | | 100.0 | % | | 100.0 | % | | 100.0 | % | | 100.0 | % | | 100.0 | % |
* Percentages calculated based on total value of investments.
Since inception (July 16, 2001), the Fund’s Prospectus has defined Mid Capitalization companies as those in the $1.5 billion to $7.0 billion market capitalization range. The Index stood at 2063 on June 30, 2015, versus merely 1202 at the Fund’s inception. As noted in last year’s Annual Report, recent market appreciation has increased values across most capitalization ranges – “The rising tide lifts all boats.”
In the above table, large cap increased by about 25% and mid cap decreased by about 20% in the two most recent fiscal years. If we shift mid cap upward to a range of $3 billion to $12 billion for the most recent fiscal year, the “Adjusted” market capitalization percentages closely resemble years prior to 2014.
The DF Dent Premier Growth Fund seeks to invest in great companies rather than allocate holdings in accordance with arbitrary market capitalization parameters. The DF Dent Midcap Growth Fund and the DF Dent Small Cap Fund do concentrate in their respective market cap sectors.
DF DENT PREMIER GROWTH FUND |
A MESSAGE TO OUR SHAREHOLDERS (Unaudited) |
| JUNE 30, 2015 |
Attribution
We have once again included in the Management Discussion of Fund Performance section later in this report a bar graph of your Fund’s Sector Weights versus the Index, a discussion of that allocation, performance attribution by Sectors and companies, and commentary on stock selection within Sectors of the Fund.
Concentration
Although we seek to maintain a reasonably concentrated portfolio in core holdings relative to other mutual funds, this concentration has declined over the past 6 years. To us, concentration means High Conviction. It is only logical that our 10 highest conviction companies should carry heavier weightings than the remaining 26 companies. As Warren Buffett wrote in his 1993 Letter to Shareholders:
| | “We believe that a policy of portfolio concentration may well decrease risk if it raises, as it should, both the intensity with which an investor thinks about a business and the comfort-level he must feel with its economic characteristics before buying into it.” |
Top 10 Holdings | | 06/30/09 | | 06/30/10 | | 06/30/11 | | 06/30/12 | | 06/30/13 | | 06/30/14 | | 06/30/15 |
| % of the Fund | | 55.82 | % | | 54.97 | % | | 52.46 | % | | 49.35 | % | | 44.95 | % | | 42.36 | % | | 42.80 | % |
| Average Position Size of Top 10 | | 5.6 | % | | 5.5 | % | | 5.2 | % | | 4.9 | % | | 4.5 | % | | 4.2 | % | | 4.3 | % |
As new investment opportunities have surfaced over the past 6 years since the financial crisis the adviser has recycled some of the profits from companies which became the largest positions within the Fund’s portfolio.
Management Ownership of Fund
Employees, their families, and the Adviser’s retirement plan owned 15% of the Fund as of 06/30/2015.
Commentary
Over the last thirty years, several factors have been associated with above-trend equity returns: (1) falling interest rates, (2) rising profit margins, (3) falling tax rates for multinationals, (4) rising market multiples, and (5) aggressive stock repurchases. We believe that these themes will be less significant drivers of performance in the future.
Specifically, 2015 is a year that follows almost six strong years of U.S. equity performance. Putting the current market environment in some historical context, particularly with respect to interest rates, might be helpful. In the late 1990s, we were also coming off years of strong equity market performance. Interest rates had declined from 13% to 6%, and annual stock market returns were in the high teens. The cycle was largely finished by the time interest rates were at 6%, and we then entered a period of high single digit returns. Looking at today’s backdrop, equities have performed extremely well during a 15-year period in which interest
DF DENT PREMIER GROWTH FUND |
A MESSAGE TO OUR SHAREHOLDERS (Unaudited) |
| JUNE 30, 2015 |
rates have gone from 6% to 2%. Equity valuations are now above historic averages, and, in our view, have little room to climb further. As a result, we believe prospective market returns must be ratcheted down over the next few years, with mid single-digit returns a distinct possibility for broad market benchmarks. However, this environment seems favorable for growth stocks which can deliver mid to high single-digit top line growth along with some operating leverage and accretion from stock repurchases. We believe growth stocks will offer returns that few other asset classes will be able to match and have the potential to outperform the general equity market by several hundred basis points per year over a market cycle.
Investors strongly favored more defensive equity strategies in 2014 and the beginning of 2015. Stocks with very large capitalizations, low price-to-earnings ratios and high dividend yields outperformed significantly. As fixed-income investors searched for bond substitutes in the equity markets, utilities and REITs were the top two performing sectors of the S&P 500. As a result, mega-cap, high-dividend-paying, value stocks performed very well during 2014 and the start of 2015. However, some of these trends seem to have run their course in early 2015 as bond yields have recently risen significantly for the first time since 2013. Ed Clissold of Ned Davis Research Group recently concluded that the valuations of high yielding stocks were the “most stretched.” The mega-caps appear overvalued with their multiples far in excess of their earnings growth rates and at the high end of recent relative valuations. We do not think these multiples have much room to expand and believe that 2015 is shaping up to be a stock-pickers market in which earnings growth is (once again) becoming a primary focus for investors.
Moats and Strategic Acquisitions
“How wide is the moat around the business?” is a question you would hear often if you attended D.F. Dent’s internal investment meetings. Similarly, “What are the barriers to entry in the market and will they grow or shrink over time?” Over the years, these questions have achieved a certain prominence in our investment process. When one is willing to buy a growth stock and hold it for a long period of time, one had better be confident that the company is well-protected from future competitive threats in the foreseeable future.
Many of your portfolio’s most successful investments have been companies that dominate their niches and have sustainable competitive advantages that grow over time. This differentiation, and the “breathing room” it provides, allows management teams to make long-term investments that widen their companies’ moats. Examples include large R&D investments, salesforce expansions, geographic extensions, and mergers and acquisitions. LKQ Corp., Ansys, CoStar Group, Red Hat, Dealertrack Technologies, IMAX and Intuitive Surgical exemplify portfolio companies that have widened their moats through large, recent investments. While the associated spending has dampened current earnings, we believe it is prudent, will help sustain a lasting franchise, and will enhance earnings growth for years to come.
Niche-dominating portfolio companies often make strategic acquisitions to broaden their product lines or expand their geographic reach, and thus widen their moats. These are different than financial acquisitions or leveraged buyouts which are intended to use debt to acquire a company, cut costs, often cut employment, and sell the company at a multiple of “engineered” earnings.
DF DENT PREMIER GROWTH FUND |
A MESSAGE TO OUR SHAREHOLDERS (Unaudited) |
| JUNE 30, 2015 |
In some cases (i.e., Concur Technologies and Dealertrack Technologies), knowledgeable, strategic buyers recognized the wisdom of these investments and emerged to acquire the businesses at premiums before these investments reached their fruition. Your Fund received handsome premiums for both these holdings. The point is that your Fund’s adviser intends to invest your capital strategically just as the knowledgeable buyers (SAP buying Concur and Cox Automotive buying Dealertrack). We are not in it for the deal or a fast buck but seek companies with defensible moats that will protect their franchises and sustain earnings growth in the future.
Once again, we appreciate the trust you have placed in us with your investment and will work diligently to earn that trust each day.
Respectively Submitted,

IMPORTANT INFORMATION:
The recent growth rate in the global equity markets has helped to produce short-term returns for some sectors/asset classes that are not typical and may not continue in the future. Because of ongoing market volatility, Fund performance may be subject to substantial short-term changes.
Investing involves risks, including the possible loss of principal. The DF Dent Premier Growth Fund may invest in small and medium size companies. Investments in these companies, especially smaller companies, carry greater risk than is customarily associated with larger companies for various reasons such as increased volatility of earnings and prospects, narrower markets, limited financial resources and less liquid stock. The Fund will typically invest in the securities of fewer issuers. If the Fund’s portfolio is over-weighted in a sector, any negative development affecting that sector will have a greater impact on the Fund than a fund that is not over-weighted in that sector.
The DF Dent Midcap Growth Fund also invests in small and medium size companies. With non-diversification risk, the Fund will typically invest in securities of fewer issuers, which exposes the Fund to greater market risk. Investing in ADRs (American Depositary Receipts) carries risks of political and financial instability, less liquidity and greater volatility, as well as risks associated with the lack of reliable accounting and financial information. The Fund is also subject to other risks, such as REIT risk with possible real estate market declines, which are detailed in the Fund’s prospectus.
DF DENT PREMIER GROWTH FUND |
A MESSAGE TO OUR SHAREHOLDERS (Unaudited) |
| JUNE 30, 2015 |
The DF Dent Small Cap Growth Fund invests in small size companies, which carry greater risk than is customarily associated with larger, more established companies. With non-diversification risk, the Fund will typically invest in securities of fewer issuers, which exposes the Fund to greater market risk. Investing in ADRs carries risks of political and financial instability, less liquidity and greater volatility, as well as risks associated with the lack of reliable accounting and financial information. The Fund is also subject to other risks, such as REIT risk with possible real estate market declines, which are detailed in the Fund’s prospectus. The Fund is newly created and has limited operating history.
The S&P 500 Index is a broad-based, unmanaged measurement of changes in stock market conditions based on the average of 500 widely held stocks. The Russell Midcap Growth Index measures the performance of the mid-cap growth segment of the U.S. equity universe. It includes those Russell Midcap Index companies with higher price-to-book ratios and higher forecasted growth values. The Russell 2000 Growth Index measures the performance of the small cap growth segment of the U.S. equity universe. It includes those Russell Small Cap Index companies with higher price-to-book ratios and higher forecasted growth values. One cannot invest directly in an index.
DF DENT PREMIER GROWTH FUND |
MANAGEMENT DISCUSSION OF FUND PERFORMANCE (Unaudited) |
| JUNE 30, 2015 |
Recent Performance
For the fiscal year ending June 30, 2015, DF Dent Premier Growth Fund (the “Fund”) experienced a total return of +8.22% versus a total return of +7.42% for the S&P 500 Index (the “Index”), the benchmark we use for performance comparisons. Performance versus the Index for various periods ending June 30, 2015 was as follows:
| Period Ending 06/30/15 | | DF Dent Premier Growth Fund | | S&P 500 Index | | Outperformance (Underperformance) |
| Six Months | | + | 2.80 | % | | + | 1.23 | % | | + | 1.57 | % |
| Twelve Months | | + | 8.22 | % | | + | 7.42 | % | | + | 0.80 | % |
| Five Years (annualized) | | + | 16.76 | % | | + | 17.34 | % | | - | 0.58 | % |
| Five Years (cumulative) | | + | 117.0 | % | | + | 122.47 | % | | - | 5.47 | % |
| Since Inception (07/16/01) (annualized) | | + | 8.19 | % | | + | 6.03 | % | | + | 2.16 | % |
| Since Inception (07/16/01) (cumulative) | | + | 199.90 | % | | + | 126.49 | % | | + | 73.41 | % |
Past performance is not indicative of future performance.
As shown above your Fund modestly outperformed the Index by +0.80% in the fiscal year ending on June 30, 2015.
Your Fund’s annualized return of +8.19% for the 14 years since inception matched what was reported last year for the 13 years since inception. This annualized return exceeded the Index annualized return by +2.16% for the 14 year period. The Fund’s return has exceeded the Index return in 10 of those 14 separate fiscal years since inception. While the Fund’s 5-year annualized return of +16.76% is a respectable number in an absolute sense, it trailed the Index +17.34% annualized return due to the Index’s heavy weighting in large cap high-dividend-yielding companies in 2014 . We believe that the outperformance of high-yielding large cap stocks that contributed to the Index’s outperformance in calendar 2014 as “bond substitutes” has run its course. One of our quantitative research sources, Ned Davis Research, recently concluded that this high yielding group is presently priced well above its long term median valuation.
Fastenal and Qualcomm, two long term favorites, detracted from the Fund’s performance, and the position sizes were reduced in 2015.
Sector Allocation and Attribution
The following bar chart presents the Sector weightings of your Fund (DFDPX) versus the Sector weightings of the Index as of June 30, 2015:
DF DENT PREMIER GROWTH FUND |
MANAGEMENT DISCUSSION OF FUND PERFORMANCE (Unaudited) |
| JUNE 30, 2015 |
The Index is composed of the 10 Sectors indicated above. The Adviser completely avoided 2 of these Sectors, Utilities and Telecommunications Services, for the second year in a row. These two Sectors had below market returns of -2.93% and +1.66% respectively in the recent fiscal year, underperforming the Index once again as in the prior year. Also, your Fund carried a significantly below market weighting in the Energy Sector throughout the year and completely eliminated all energy stocks by fiscal year end. This avoidance also contributed to the Fund’s return as the Index’s Energy return of -22.28% was its worst performing Sector in the fiscal year. Investment management is often about avoidance as well as committing capital to favored sectors. Your Fund continues to avoid these Sectors which performed poorly in fiscal 2015.
The Fund outperformed 5 of the remaining 7 Sectors over the fiscal year. The Fund’s largest weighting at year end was in Financials at 26.46% versus 16.60% in the Index. This overweighting paid off as that Sector generated a +20.51% return in the Fund versus a +9.43% return within the Index. SEI Investments Company, a financial services company, took top honors in your Fund with a +51.25% return in the fiscal year. The Fund’s Information Technology overweighting of 25.71% versus 19.61% in the Index detracted from performance as this Sector in the Fund generated a return of only +3.67% versus +11.04% within the Index. The Fund’s poor performance in Information Technology was entirely attributable to realized losses within the two 3D printing companies, 3D Systems and Stratasys Ltd. One year ago the Fund realized a nice gain in 3D Systems making it the Fund’s 2014 top performer. Both of these companies were eliminated by the end of the Fund’s 2015 fiscal year. The Fund’s overweight positions in Consumer Discretionary and Industrials generated returns of +21.97% and +5.44%, both above the returns of those Sectors within the Index. The Fund’s best performing
DF DENT PREMIER GROWTH FUND |
MANAGEMENT DISCUSSION OF FUND PERFORMANCE (Unaudited) |
| JUNE 30, 2015 |
Sector was Health Care with a total return of +29.14% achieved by positive returns from each company. However, Health Care did not contribute to overall performance versus the Index since the Fund was underweighted by an average 6% relative to the Index over the fiscal year.
Strategic Changes between Sectors
The Adviser made the following changes within Sectors in the fiscal year:
DF DENT PREMIER GROWTH FUND |
MANAGEMENT DISCUSSION OF FUND PERFORMANCE (Unaudited) |
| JUNE 30, 2015 |
The Adviser emphasizes that it does not manage your Fund against the Index or any other benchmark. Rather, the preceding table of changes between Sectors serves as an ex-post guide to review shifts in strategy over the past year. The second line under each Sector’s weighting represents the percentage over or under the Index Sector’s weighting at each date. The last column shows the change in each of the Fund’s Sector weightings over the fiscal year with that change relative to the Index weighting over the fiscal year. For instance, the largest absolute change in the Fund was 8.8% decline in the Energy weighting in the Fund, while the greatest change relative to the Index was the 8.0% increase in Financials.
The greatest strategic change was the complete elimination of energy companies. The Adviser was underweighted and negative on the industry’s outlook one year ago before the collapse in energy prices in the fall of 2014 and eliminated the remaining position during the temporary recovery in energy stocks in the spring of 2015. The largest increase was +8.6% in Financials to 26.5% making it the Fund’s largest Sector. However, characteristic of the Adviser’s strategy, this increase was not a “sector bet”. Rather this increase resulted from 1) strong performance of core holdings in SEI Investments, Moody’s, Markel, and Verisk, 2) along with the addition of PRA Group and McGraw Hill Financial to the portfolio. Consumer Discretionary’s allocation increased by 5.7% as a result of its 22% contribution to the Fund.
Positions in Energy and Industrials were reduced in both absolute and relative terms. The collapse in energy prices made that Sector less attractive but also had negative repercussions for the Industrial Sector which in many ways is dependent upon energy and infrastructure spending. At the same time, Consumer Discretionary’s absolute and relative weightings were increased due to increased disposable income from falling prices at the pump, improving labor markets, and improving demographics as the higher spending millennials became a larger percentage of the population than the more frugal retiring baby boomers. Positions in Carmax, IMAX, LKQ, and Signet Jewelers within the Consumer Discretionary Sector were all increased during the year through additional purchases, and each of these companies generated a double digit return for your Fund. Chipotle replaced Panera in the fast casual restaurant category due to superior near term growth prospects. Information Technology had a disappointing +3.67% return after a +25.30% return in fiscal 2014. The Adviser sees this as only an off year and continues to believe that this Sector, with the second highest weighting, offers excellent long term growth opportunities.
There were no investments in derivatives during the fiscal year.
Best and Worst Performers
Five Best Contributors Investments | | Fund Realized and Unrealized Appreciation and Income in Fiscal Year 2015 | | Fund Per Share As of 06/30/15 | |
| SEI Investments Co. | | $ | 3,024,299 | | $ | 0.49 | |
| Visa, Inc., Class A | | | 2,376,118 | | | 0.39 | |
| Red Hat, Inc. | | | 2,112,772 | | | 0.34 | |
| Celgene Corp. | | | 1,844,022 | | | 0.30 | |
| CarMax, Inc. | | | 1,671,432 | | | 0.27 | |
| | | $ | 11,028,643 | | $ | 1.79 | |
DF DENT PREMIER GROWTH FUND |
MANAGEMENT DISCUSSION OF FUND PERFORMANCE (Unaudited) |
| JUNE 30, 2015 |
Five Poorest Contributors Investments | | Fund Realized and Unrealized Loss and Income in Fiscal Year 2015 | | Fund Per Share As of 06/30/15 | |
| 3D Systems Corp. | | $ | (3,064,324) | | $ | (0.50) | |
| Trimble Navigation, Ltd. | | | (2,200,055) | | | (0.36) | |
| Core Laboratories NV | | | (1,925,095) | | | (0.31) | |
| Fastenal Co. | | | (1,644,489) | | | (0.27) | |
| Qualcomm, Inc. | | | (1,591,743) | | | (0.26) | |
| | | $ | (10,425,706) | | $ | (1.70) | |
Needless to say, 3D Systems Corp. was a major disappointment as we should have sold the entire position rather than about half the position that we did sell at much higher prices in fiscal 2014. However, over the entire multi-year holding period your Fund bought 180,000 shares of 3D Systems at a cost of $17.30 per share and sold the entire position at an average price of $48.32 per share for a gross profit of $5.6 million, or $31.02 per share. Surely, retaining half the Fund’s 3D Systems position in fiscal 2015 was a mistake, but the overall multi-year return from this investment was very favorable. The exit at an average price of $48.32 was also favorable as the stock declined further to $19.52 as of 06/30/2015.
Capital Gains Distribution Policy
As previously reported, it is the Adviser’s policy to distribute all net realized capital gains in December of each year. However, there have been no capital gains distributed in the past 6 years due to the Fund’s loss carry forward from 2008-2009 which was exhausted in the past year. Consequently, it is likely that there will be a capital gains distribution in December 2015.
Five Largest Equity Holdings
June 30, 2015
| Quantity | | Security | | Total Cost | | Market Value | | Percent of Net Assets of the Fund | |
| 136,800 | | Visa Inc., Class A | | $ | 2,378,506 | | $ | 9,186,120 | | 5.28 | % | |
| 184,000 | | SEI Investments Co. | | | 3,921,370 | | | 9,021,520 | | 5.19 | | |
| 288,000 | | LKQ Corp. | | | 4,163,719 | | | 8,710,560 | | 5.01 | | |
| 84,000 | | ANSYS, Inc. | | | 2,574,901 | | | 7,664,160 | | 4.40 | | |
| 69,000 | | Moody’s Corp. | | | 5,057,433 | | | 7,449,240 | | 4.28 | | |
| | | | | $ | 18,095,929 | | $ | 42,031,600 | | 24.16 | % | |
Note that the first 4 companies above made the top 5 holdings because they more than doubled in value versus the Fund’s cost. The adviser prefers to have the investments reach the largest holdings list through appreciation rather than committing a lot of capital to any particular name. This strategy helps to avoid
DF DENT PREMIER GROWTH FUND |
MANAGEMENT DISCUSSION OF FUND PERFORMANCE (Unaudited) |
| JUNE 30, 2015 |
magnified investment mistakes of investing too much in a company that has performed poorly. The gain in Moody’s is not as great since it is a more recent purchase within the Fund.
The views in this report were those of the Fund’s Adviser as of June 30, 2015, and may not reflect the Adviser’s views on the date this report is first published or anytime thereafter. This report may contain discussions about certain investments both held and not held in the portfolio as of the report date. All current and future holdings are subject to risk and are subject to change. While these views are intended to assist shareholders in understanding their investment in the Fund, they do not constitute investment or tax advice, are not a guarantee of future performance and are not intended as an offer or solicitation with respect to the purchase or sale of any security.
DF DENT PREMIER GROWTH FUND |
PERFORMANCE CHART AND ANALYSIS (Unaudited) |
| JUNE 30, 2015 |
The following chart reflects the change in the value of a hypothetical $10,000 investment, including reinvested dividends and distributions, in the DF Dent Premier Growth Fund (the “Fund”) compared with the performance of the benchmark, S&P 500 Index ("S&P 500"), over the past ten fiscal years. The S&P 500 is a broad-based, unmanaged measurement of changes in stock market conditions based on the average of 500 widely held common stocks. The total return of the S&P 500 includes the reinvestment of dividends and income. The total return of the Fund includes operating expenses that reduce returns, while the total return of the S&P 500 does not include expenses. The Fund is professionally managed while the S&P 500 is unmanaged and is not available for investment.
Comparison of Change in Value of a $10,000 Investment
DF Dent Premier Growth Fund vs. S&P 500 Index
| Average Annual Total Returns | | | | | | |
| Periods Ended June 30, 2015 | | One Year | | Five Years | | Ten Years |
| DF Dent Premier Growth Fund | | 8.22 | % | | 16.76 | % | | 8.60 | % |
| S&P 500 Index | | 7.42 | % | | 17.34 | % | | 7.89 | % |
Performance data quoted represents past performance and is no guarantee of future results. Current performance may be lower or higher than the performance data quoted. Investment return and principal value will fluctuate so that shares, when redeemed, may be worth more or less than original cost. For the most recent month-end performance, please call (866) 233-3368. As stated in the Fund’s current prospectus, the annual operating expense ratio (gross) is 1.20%. However, the Fund’s adviser has contractually agreed to waive a portion of its fees and/or reimburse expenses to limit total operating expenses (excluding all taxes, interest, portfolio transaction expenses, and extraordinary expenses) to 1.10% on the first $150 million in Fund net assets and to 0.90% on net assets exceeding the $150 million, through October 31, 2019. During the period, certain fees were waived and/or expenses reimbursed; otherwise, returns would have been lower. The performance table and graph do not reflect the deduction of taxes that a shareholder would pay on Fund distributions or the redemption of Fund shares. Returns greater than one year are annualized.
DF DENT PREMIER GROWTH FUND |
|
| JUNE 30, 2015 |
| | | | Security | | | | | | | | | | |
| | Shares | | Description | | | | | | | | | Value | |
| | | | | | | | | | |
| Consumer Discretionary - 16.0% | | | | | | | | | | |
| | 88,000 | | CarMax, Inc. (a) | | | | | | | | $ | 5,826,480 | |
| | 4,500 | | Chipotle Mexican Grill, Inc. (a) | | | | | | | | | 2,722,455 | |
| | 116,000 | | IMAX Corp. (a) | | | | | | | | | 4,671,320 | |
| | 288,000 | | LKQ Corp. (a) | | | | | | | | | 8,710,560 | |
| | 46,000 | | Signet Jewelers, Ltd. | | | | | | | | | 5,899,040 | |
| | | | | | | | | | | | | 27,829,855 | |
| Financials - 26.5% | | | | | | | | | | |
| | 43,000 | | American Tower Corp. REIT | | | | | | | | | 4,011,470 | |
| | 110,000 | | Discover Financial Services | | | | | | | | | 6,338,200 | |
| | 7,500 | | Markel Corp. (a) | | | | | | | | | 6,005,100 | |
| | 30,000 | | McGraw-Hill Financial, Inc. | | | | | | | | | 3,013,500 | |
| | 69,000 | | Moody's Corp. | | | | | | | | | 7,449,240 | |
| | 90,000 | | PRA Group, Inc. (a) | | | | | | | | | 5,607,900 | |
| | 184,000 | | SEI Investments Co. | | | | | | | | | 9,021,520 | |
| | 64,000 | | Verisk Analytics, Inc., Class A (a) | | | | | | | | | 4,656,640 | |
| | | | | | | | | | | | | 46,103,570 | |
| Health Care - 8.9% | | | | | | | | | | |
| | 8,500 | | Biogen Idec, Inc. (a) | | | | | | | | | 3,433,490 | |
| | 44,000 | | Celgene Corp. (a) | | | | | | | | | 5,092,340 | |
| | 97,000 | | ExamWorks Group, Inc. (a) | | | | | | | | | 3,792,700 | |
| | 6,400 | | Intuitive Surgical, Inc. (a) | | | | | | | | | 3,100,800 | |
| | | | | | | | | | | | | 15,419,330 | |
| Industrials - 17.0% | | | | | | | | | | |
| | 41,000 | | Exponent, Inc. | | | | | | | | | 1,835,980 | |
| | 80,000 | | Fastenal Co. | | | | | | | | | 3,374,400 | |
| | 120,000 | | Healthcare Services Group, Inc. | | | | | | | | | 3,966,000 | |
| | 37,000 | | Roper Technologies, Inc. | | | | | | | | | 6,381,020 | |
| | 42,000 | | Stericycle, Inc. (a) | | | | | | | | | 5,624,220 | |
| | 6,000 | | TransDigm Group, Inc. (a) | | | | | | | | | 1,348,020 | |
| | 85,000 | | WageWorks, Inc. (a) | | | | | | | | | 3,438,250 | |
| | 75,000 | | Waste Connections, Inc. | | | | | | | | | 3,534,000 | |
| | | | | | | | | | | | | 29,501,890 | |
| | | | | | | | | | | | | | |
| Information Technology - 25.7% | | | | | | | | | | |
| | 84,000 | | ANSYS, Inc. (a) | | | | | | | | | 7,664,160 | |
| | 38,000 | | Blackbaud, Inc. | | | | | | | | | 2,164,100 | |
| | 14,600 | | CoStar Group, Inc. (a) | | | | | | | | | 2,938,396 | |
| | 19,000 | | MasterCard, Inc., Class A | | | | | | | | | 1,776,120 | |
| | 89,000 | | QUALCOMM, Inc. | | | | | | | | | 5,574,070 | |
| | 96,000 | | Red Hat, Inc. (a) | | | | | | | | | 7,289,280 | |
| | 120,000 | | Tangoe, Inc. (a) | | | | | | | | | 1,509,600 | |
| | 120,000 | | Trimble Navigation, Ltd. (a) | | | | | | | | | 2,815,200 | |
| | 30,000 | | Tyler Technologies, Inc. (a) | | | | | | | | | 3,881,400 | |
| | 136,800 | | Visa, Inc., Class A | | | | | | | | | 9,186,120 | |
| | | | | | | | | | | | | 44,798,446 | |
| Materials - 3.8% | | | | | | | | | | |
| | 58,000 | | Ecolab, Inc. | | | | | | | | | 6,558,060 | |
| | | | | | | | | | | | | | |
| Total Common Stock | | | | | | | | | | |
| (Cost $106,749,692) | | | | | | | | | 170,211,151 | |
| Total Investments - 97.9% | | | | | | | | | | |
(Cost $106,749,692)* | | | | | | | | $ | 170,211,151 | |
| Other Assets & Liabilities, Net – 2.1% | | | | | | | | | 3,724,866 | |
| Net Assets – 100.0% | | | | | | | | $ | 173,936,017 | |
| | | | | | | | | | | | | | |
| REIT | Real Estate Investment Trust |
| (a) | Non-income producing security. |
| * | Cost for federal income tax purposes is $106,751,927 and net unrealized appreciation consists of: |
| Gross Unrealized Appreciation | | $ | 64,047,912 | |
| Gross Unrealized Depreciation | | | (588,688 | ) |
| Net Unrealized Appreciation | | $ | 63,459,224 | |
| See Notes to Financial Statements. | 15 | DF DENT GROWTH FUNDS |
DF DENT PREMIER GROWTH FUND |
|
| JUNE 30, 2015 |
The following is a summary of the inputs used to value the Fund’s investments as of June 30, 2015.
The inputs or methodology used for valuing securities are not necessarily an indication of the risks associated with investing in those securities. For more information on valuation inputs, and their aggregation into the levels used in the table below, please refer to the Security Valuation section in Note 2 of the accompanying Notes to Financial Statements.
| Valuation Inputs | | Investments in Securities |
| Level 1 - Quoted Prices | | $ | 170,211,151 | |
| Level 2 - Other Significant Observable Inputs | | | - | |
| Level 3 - Significant Unobservable Inputs | | | - | |
| Total | | $ | 170,211,151 | |
The Level 1 value displayed in this table is Common Stock. Refer to this Schedule of Investments for a further breakout of each security by industry.
The Fund utilizes the end of period methodology when determining transfers. There were no transfers among Level 1, Level 2 and Level 3 for the year ended June 30, 2015.
| PORTFOLIO HOLDINGS | | |
| % of Net Assets | | |
| Consumer Discretionary | 16.0 | % |
| Financials | 26.5 | % |
| Health Care | 8.9 | % |
| Industrials | 17.0 | % |
| Information Technology | 25.7 | % |
| Materials | 3.8 | % |
| Other Assets & Liabilities, Net | 2.1 | % |
| | 100.0 | % |
| See Notes to Financial Statements. | 16 | DF DENT GROWTH FUNDS |
DF DENT PREMIER GROWTH FUND |
STATEMENT OF ASSETS AND LIABILITIES |
| JUNE 30, 2015 |
| | | | | | | |
| ASSETS | | | | |
| | Total investments, at value (Cost $106,749,692) | | $ | 170,211,151 | |
| | Cash | | | 4,106,160 | |
| | Receivables: | | | | |
| | | Fund shares sold | | | 28 | |
| | | Dividends and interest | | | 40,617 | |
| | Prepaid expenses | | | 17,118 | |
| Total Assets | | | 174,375,074 | |
| | | | | | | |
| LIABILITIES | | | | |
| | Payables: | | | | |
| | | Fund shares redeemed | | | 490 | |
| | Accrued Liabilities: | | | | |
| Adviser | Investment adviser fees | | | 393,428 | |
| | | Trustees’ fees and expenses | | | 95 | |
| | | Fund services fees | | | 13,052 | |
| | | Other expenses | | | 31,992 | |
| Total Liabilities | | | 439,057 | |
| | | | | | | |
| NET ASSETS | | $ | 173,936,017 | |
| | | | | | | |
| COMPONENTS OF NET ASSETS | | | | |
| | Paid-in capital | | $ | 97,454,769 | |
| | Accumulated net investment loss | | | (341,550 | ) |
| | Accumulated net realized gain | | | 13,361,339 | |
| | Net unrealized appreciation | | | 63,461,459 | |
| NET ASSETS | | $ | 173,936,017 | |
| SHARES OF BENEFICIAL INTEREST AT NO PAR VALUE (UNLIMITED SHARES AUTHORIZED) | | | 6,141,586 | |
| NET ASSET VALUE, OFFERING AND REDEMPTION PRICE PER SHARE | | $ | 28.32 | |
| | | | | | | |
| See Notes to Financial Statements. | 17 | DF DENT GROWTH FUNDS |
DF DENT PREMIER GROWTH FUND |
|
|
| | | | | | | | |
| INVESTMENT INCOME | | | | | |
| | Dividend income (Net of foreign withholding taxes of $8,662) | | $ | 1,256,427 | | |
| | Interest income | | | 1,259 | | |
| Total Investment Income | | | 1,257,686 | | |
| Adviser | | | | | |
| EXPENSES | | | | | |
| | Investment adviser fees | | | 1,829,177 | | |
| | Fund services fees | | | 239,453 | | |
| | Custodian fees | | | 18,242 | | |
| | Registration fees | | | 18,633 | | |
| | Professional fees | | | 48,453 | | |
| | Trustees' fees and expenses | | | 10,837 | | |
| | Miscellaneous expenses | | | 34,974 | | |
| Total Expenses | | | 2,199,769 | | |
| | Fees waived and expenses reimbursed | | | (251,884 | ) | |
| Net Expenses | | | 1,947,885 | | |
| | | | | | | | |
| NET INVESTMENT LOSS | | | (690,199 | ) | |
| | | | | | | | |
| NET REALIZED AND UNREALIZED GAIN (LOSS) | | | | | |
| | Net realized gain on investments | | | 28,131,116 | | |
| | Net change in unrealized appreciation (depreciation) on investments | | | (13,254,017 | ) | |
| NET REALIZED AND UNREALIZED GAIN | | | 14,877,099 | | |
| INCREASE IN NET ASSETS RESULTING FROM OPERATIONS | | $ | 14,186,900 | | |
| | | | | | | | |
| See Notes to Financial Statements. | 18 | DF DENT GROWTH FUNDS |
DF DENT PREMIER GROWTH FUND |
STATEMENTS OF CHANGES IN NET ASSETS |
|
| | | June 30, 2015 | # | | 42185 | # | # | | | 41820 | |
| | | | | For the Years Ended June 30, |
| | | | | 2015 | | | 2014 |
| OPERATIONS | | | | | | | | | |
| | Net investment loss | | $ | (690,199 | ) | | | $ | (612,064 | ) |
| | Net realized gain | | | 28,131,116 | | | | | 17,641,918 | |
| | Net change in unrealized appreciation (depreciation) | | | (13,254,017 | ) | | | | 20,390,485 | |
| Increase in Net Assets Resulting from Operations | | | 14,186,900 | | | | | 37,420,339 | |
| | | | | | | | | | | | |
| CAPITAL SHARE TRANSACTIONS | | | | | | | | | |
| | Sale of shares | | | 2,492,341 | | | | | 18,923,115 | |
| | Redemption of shares | | | (42,152,583 | ) | | | | (31,742,283 | ) |
| Decrease in Net Assets from Capital Share Transactions | | | (39,660,242 | ) | | | | (12,819,168 | ) |
| Increase (Decrease) in Net Assets | | | (25,473,342 | ) | | | | 24,601,171 | |
| | | | | | | | | | | | |
| NET ASSETS | | | | | | | | | |
| | Beginning of Year | | | 199,409,359 | | | | | 174,808,188 | |
| | End of Year (Including line (a)) | | $ | 173,936,017 | | | | $ | 199,409,359 | |
| | | | | | | | | | | | |
| SHARE TRANSACTIONS | | | | | | | | | |
| | Sale of shares | | | 93,371 | | | | | 775,360 | |
| | Redemption of shares | | | (1,572,825 | ) | | | | (1,269,057 | ) |
| Decrease in Shares | | | (1,479,454 | ) | | | | (493,697 | ) |
| | | | | | | | | | | | |
| (a) | Accumulated net investment loss | | $ | (341,550 | ) | | | $ | (350,949 | ) |
| See Notes to Financial Statements. | 19 | DF DENT GROWTH FUNDS |
DF DENT PREMIER GROWTH FUND |
|
|
| These financial highlights reflect selected data for a share outstanding throughout each year. | | | | | |
| | | For the Years Ended June 30, | |
| | | 2015 | | 2014 | | 2013 | | 2012 | | 2011 | |
| NET ASSET VALUE, Beginning | | | | | | | | | | | | | | | | | | | | |
| of Year | $ | 26.17 | | | $ | 21.54 | | | $ | 17.73 | | | $ | 17.60 | | | $ | 13.05 | | |
| INVESTMENT OPERATIONS | | | | | | | | | | | | | | | | | | | | |
| Net investment loss (a) | | (0.10 | ) | | | (0.08 | ) | | | (0.01 | ) | | | (0.05 | ) | | | (0.04 | ) | |
| Net realized and unrealized | | | | | | | | | | | | | | | | | | | | |
| | gain | | 2.25 | | | | 4.71 | | | | 3.82 | | | | 0.18 | | | | 4.59 | | |
| Total from Investment | | | | | | | | | | | | | | | | | | | | |
| | Operations | | 2.15 | | | | 4.63 | | | | 3.81 | | | | 0.13 | | | | 4.55 | | |
| NET ASSET VALUE, End | | | | | | | | | | | | | | | | | | | | |
| of Year | $ | 28.32 | | | $ | 26.17 | | | $ | 21.54 | | | $ | 17.73 | | | $ | 17.60 | | |
| TOTAL RETURN | | 8.22 | % | | 21.49 | % | | 21.49 | % | | 0.74 | % | | 34.87 | % |
| RATIOS/SUPPLEMENTARY | | | | | | | | | | | | | | | | | | | | |
| DATA | | | | | | | | | | | | | | | | | | | | |
| Net Assets at End of | | | | | | | | | | | | | | | | | | | | |
| | Year (000's omitted) | $173,936 | | | $199,409 | | | $174,808 | | | $148,886 | | | $157,655 | | |
| Ratios to Average Net Assets: | | | | | | | | | | | | | | | | | | | | |
| Net investment loss | | (0.38 | )% | | (0.31 | )% | | (0.05 | )% | | (0.28 | )% | | (0.27 | )% |
| Net expenses | | 1.06 | % | | 1.05 | % | | 1.09 | % | | 1.10 | % | | 1.10 | % |
| Gross expenses (b) | | 1.20 | % | | 1.20 | % | | 1.26 | % | | 1.29 | % | | 1.25 | % |
| PORTFOLIO TURNOVER RATE | | 25 | % | | 25 | % | | 19 | % | | 14 | % | | 21 | % |
| | | | | | | | | | | | | | | | | | | | | | |
| | | | | | | | | | | | | | | | | | | | | | |
| (a) | Calculated based on average shares outstanding during each year. |
| (b) | Reflects the expense ratio excluding any waivers and/or reimbursements. |
| See Notes to Financial Statements. | 20 | DF DENT GROWTH FUNDS |
DF DENT MIDCAP GROWTH FUND |
A MESSAGE TO OUR SHAREHOLDERS (Unaudited) |
| JUNE 30, 2015 |
Dear Fellow Shareholders:
Performance
For the period July 1, 2014, through June 30, 2015, the DF Dent Midcap Growth Fund (the “Fund”) experienced a total return of +9.97%, outperforming the total return of +9.45% for the Russell Midcap Growth Index (the “Index”), which is the benchmark we have used for performance comparisons, by 0.52%.
Expense Ratio
Your Fund’s Adviser, D.F. Dent and Company, Inc. (the “Adviser”), has contractually agreed to maintain your Fund’s expense ratio through October 31, 2019 at a net 1.10% on the first $150 million of net assets and 0.90% on net assets exceeding $150 million by reimbursing expenses and waiving a portion of management fees. Per the prospectus, the Fund’s total operating expense ratio is 2.08%.
Concentration
The Fund’s concentration in its top 10 holdings is as follows:
| Top 10 Holdings | | | 06/30/15 |
| % of Fund | | | 45.03 | % |
| Average Position Size of Top 10 | | | 4.50 | % |
We believe that the current concentration in the top 10 positions is appropriate at its current level and has the potential to enhance long-term performance.
Management Ownership of Fund
Employees, their families, and the Adviser’s retirement plan owned approximately 29% of the Fund as of June 30, 2015. There were only management purchases and no management redemptions during the fiscal year ended June 30, 2015.
Portfolio Commentary
Over the last thirty years, several factors have been associated with above-trend equity returns: (1) falling interest rates, (2) rising profit margins, (3) falling tax rates for multinationals, (4) rising market multiples, and (5) aggressive stock repurchases. We believe that these themes will be less significant drivers of performance in the future.
Specifically, 2015 is a year that follows almost six strong years of U.S. equity performance. Putting the current market environment in some historical context, particularly with respect to interest rates, might be helpful. In the late 1990s, we were also coming off years of strong equity market performance. Interest rates
DF DENT MIDCAP GROWTH FUND |
A MESSAGE TO OUR SHAREHOLDERS (Unaudited) |
| JUNE 30, 2015 |
had declined from 13% to 6%, and annual stock market returns were in the high teens. The cycle was largely finished by the time interest rates were at 6%, and we then entered a period of high single digit returns. Looking at today’s backdrop, equities have performed extremely well during a 15-year period in which interest rates have gone from 6% to 2%. Equity valuations are now above historic averages, and, in our view, have little room to climb further. As a result, we believe prospective market returns must be ratcheted down over the next few years, with mid single-digit returns a distinct possibility for broad market benchmarks. However, this environment seems favorable for growth stocks which can deliver mid to high single-digit top line growth along with some operating leverage and accretion from stock repurchases. We believe growth stocks will offer returns that few other asset classes will be able to match and have the potential to outperform the general equity market by several hundred basis points per year over a market cycle.
Investors strongly favored more defensive equity strategies in 2014 and the beginning of 2015. Stocks with very large capitalizations, low price-to-earnings ratios and high dividend yields outperformed significantly. As fixed-income investors searched for bond substitutes in the equity markets, utilities and REITs were the top two performing sectors of the S&P 500. As a result, mega-cap, high-dividend-paying, value stocks performed very well during 2014 and the start of 2015. However, some of these trends seem to have run their course in early 2015 as bond yields have recently risen significantly for the first time since 2013. Ed Clissold of Ned Davis Research Group recently concluded that the valuations of high yielding stocks were the “most stretched.” The mega-caps appear overvalued with their multiples far in excess of their earnings growth rates and at the high end of recent relative valuations. We do not think these multiples have much room to expand and believe that 2015 is shaping up to be a stock-pickers market in which earnings growth is (once again) becoming a primary focus for investors.
Moats and Strategic Acquisitions
“How wide is the moat around the business?” is a question you would hear often if you attended D.F. Dent’s internal investment meetings. Similarly, “What are the barriers to entry in the market and will they grow or shrink over time?” Over the years, these questions have achieved a certain prominence in our investment process. When one is willing to buy a growth stock and hold it for a long period of time, one had better be confident that the company is well-protected from future competitive threats in the foreseeable future.
Many of your portfolio’s most successful investments have been companies that dominate their niches and have sustainable competitive advantages that grow over time. This differentiation, and the “breathing room” it provides, allows management teams to make long-term investments that widen their companies’ moats. Examples include large R&D investments, salesforce expansions, geographic extensions, and mergers and acquisitions. LKQ Corp., Ansys, CoStar Group, Red Hat, Dealertrack Technologies, IMAX and Intuitive Surgical exemplify portfolio companies that have widened their moats through large, recent investments. While the associated spending has dampened current earnings, we believe it is prudent, will help sustain a lasting franchise, and will enhance earnings growth for years to come.
Niche-dominating portfolio companies often make strategic acquisitions to broaden their product lines or expand their geographic reach, and thus widen their moats. These are different than financial acquisitions or
DF DENT MIDCAP GROWTH FUND |
A MESSAGE TO OUR SHAREHOLDERS (Unaudited) |
| JUNE 30, 2015 |
leveraged buyouts which are intended to use debt to acquire a company, cut costs, often cut employment, and sell the company at a multiple of “engineered” earnings.
In some cases (i.e., Concur Technologies and Dealertrack Technologies), knowledgeable, strategic buyers recognized the wisdom of these investments and emerged to acquire the businesses at premiums before these investments reached their fruition. Your Fund received handsome premiums for both these holdings. The point is that your Fund’s adviser intends to invest your capital strategically just as the knowledgeable buyers (SAP buying Concur and Cox Automotive buying Dealertrack). We are not in it for the deal or a fast buck but seek companies with defensible moats that aim to protect their franchises and sustain earnings growth in the future.
Attribution Analysis
The following bar chart presents the sector weightings of your Fund versus the sector weightings of the Index as of June 30, 2015:
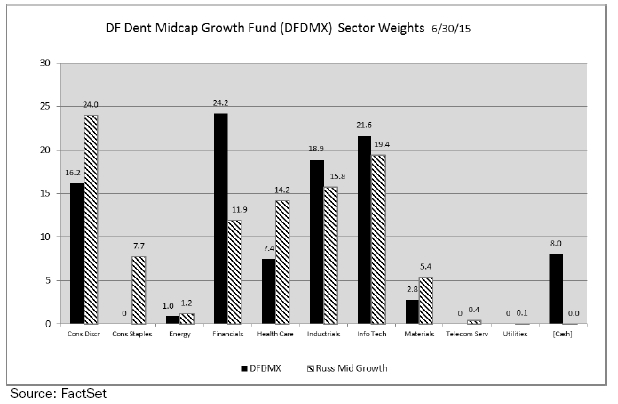
DF DENT MIDCAP GROWTH FUND |
A MESSAGE TO OUR SHAREHOLDERS (Unaudited) |
| JUNE 30, 2015 |
Your Fund was over-weighted versus the Index benchmark in Financials, Industrials and Information Technology. In Financials and Industrials, the overweighting detracted slightly from performance, but the stock selection contributed to performance. Your Fund’s overweighting in the Information Technology sector contributed to performance, but the stock selection detracted from performance.
Your fund was under-weighted versus the Index in Consumer Discretionary, Consumer Staples, Energy, Health Care and Materials. Your Fund’s under-weighting in Consumer Discretionary detracted slightly from performance, but stock selection contributed to performance. In Consumer Staples, the under-weighting and stock selection both detracted slightly from performance. Your Fund’s under-weighting in Health Care detracted from performance, but stock selection contributed to performance.
Positive developments in three long-standing holdings were particularly favorable to performance:
| · | Dealertrack Technologies (TRAK) agreed to be bought by Cox Automotive, a strategic acquirer, for $4 billion. Cox saw significant value in the investments TRAK had made to streamline and improve the automotive sales process. |
| · | LKQ Corp. (LKQ) reported a strong first quarter and gave investors confidence that short-term foreign currency and scrap price headwinds have not altered a favorable long-term investment story. Also, LKQ’s management team was bolstered by the addition of CFO Nick Zarcone, who resigned from his prior role as CFO of Midwestern investment bank, Robert W. Baird, to join LKQ. |
| · | SEI Investments Co. (SEIC) benefitted from continued margin improvement in its large Private Banks division. SEIC’s shares are gaining increased interest from analysts and investors as the company emerges from a period of heightened internal investments. |
Best and Worst Performers
Five Best Contributors Investments | | Fund Realized and Unrealized Appreciation and Income in Fiscal Year 2015 | | Fund Per Share As of 6/30/15 | |
| SEI Investments Co. | | $ | 359,022 | | $ | 0.26 | |
| DealerTrack Technologies, Inc. | | | 347,876 | | | 0.25 | |
| IMAX Corp. | | | 256,512 | | | 0.18 | |
| Red Hat, Inc. | | | 239,091 | | | 0.17 | |
| CarMax, Inc. | | | 214,576 | | | 0.15 | |
| | | $ | 1,418,077 | | $ | 1.01 | |
DF DENT MIDCAP GROWTH FUND |
A MESSAGE TO OUR SHAREHOLDERS (Unaudited) |
| JUNE 30, 2015 |
Five Worst Contributors Investments | | Fund Realized and Unrealized Loss and Income in Fiscal Year 2015 | | Fund Per Share As of 6/30/15 | |
| 3-D Systems Corp. | | $ | (324,211) | | $ | (0.23) | |
| Trimble Navigation, Ltd. | | | (297,724) | | | (0.21) | |
| Range Resources Corp. | | | (197,057) | | | (0.14) | |
| Stratasys, Ltd. | | | (178,704) | | | (0.13) | |
| Core Laboratories NV | | | (155,483) | | | (0.11) | |
| | | $ | (1,153,179) | | $ | (0.82) | |
Five Largest Equity Holdings
June 30, 2015
Shares | | Security | | | Total Cost | | | Market Value | | Percent of Net Assets of the Fund | |
| 14,871 | | ANSYS, Inc. | | $ | 1,101,488 | | $ | 1,356,830 | | 5.96 | % |
| 44,117 | | LKQ Corp. | | | 1,059,006 | | | 1,334,319 | | 5.86 | |
| 23,512 | | SEI Investments Co. | | | 662,019 | | | 1,152,793 | | 5.07 | |
| 10,561 | | Moody’s Corp. | | | 850,987 | | | 1,140,166 | | 5.01 | |
| 15,241 | | PRA Group, Inc. | | | 871,208 | | | 949,667 | | 4.17 | |
| | | | | $ | 4,544,708 | | $ | 5,933,775 | | 26.07 | % |
As always, we acknowledge the responsibility you have conveyed by making your investment in the DF Dent Midcap Growth Fund and will work diligently on your behalf.
Respectively Submitted,
DF DENT MIDCAP GROWTH FUND |
A MESSAGE TO OUR SHAREHOLDERS (Unaudited) |
| JUNE 30, 2015 |
IMPORTANT INFORMATION:
Investing involves risks, including the possible loss of principal. The Fund invests in small- and medium- size companies, which carry greater risk than is customarily associated with larger, more established companies. With non-diversification risk, the Fund will typically invest in securities of fewer issuers, which exposes the Fund to greater market risk. Investing in ADRs (American Depository Receipt) carries risks of political and financial instability, less liquidity and greater volatility, as well as risks associated with the lack of reliable accounting and financial information. The Fund is also subject to other risks, such as Real Estate Investment Trust (REIT) risk with possible real estate market declines, which are detailed in the Fund’s prospectus.
The Russell Midcap Growth Index measures the performance of the mid-cap growth segment of the U.S. equity universe. It includes those Russell Midcap Index companies with higher price-to-book ratios and higher forecasted growth values. One cannot invest directly in an index.
The views in this report contained herein were those of the Fund’s Adviser as of June 30, 2015, and may not reflect the Adviser’s views on the date this report is first published or anytime thereafter. This report may contain discussions about certain investments both held and not held in the portfolio as of the report date. All current and future holdings are subject to risk and are subject to change. While these views are intended to assist shareholders in understanding their investment in the Fund, they do not constitute investment or tax advice, are not a guarantee of future performance and are not intended as an offer or solicitation with respect to the purchase or sale of any security.
DF DENT MIDCAP GROWTH FUND |
PERFORMANCE CHART AND ANALYSIS (Unaudited) |
| JUNE 30, 2015 |
The following chart reflects the change in the value of a hypothetical $10,000 investment, including reinvested dividends and distributions, in the DF Dent Midcap Growth Fund (the “Fund”) compared with the performance of the benchmark, the Russell Midcap Growth Index ("Russell Midcap Growth"), since inception. The Russell Midcap Growth measures the performance of the mid-cap growth segment of the U.S. equity universe. It includes those Russell Midcap Index companies with higher price-to-book ratios and higher forecasted growth values. The total return of the Russell Midcap Growth includes the reinvestment of dividends and income. The total return of the Fund includes operating expenses that reduce returns, while the total return of the Russell Midcap Growth does not include expenses. The Fund is professionally managed while the Russell Midcap Growth is unmanaged and is not available for investment.
Comparison of Change in Value of a $10,000 Investment
DF Dent Midcap Growth Fund vs. Russell Midcap Growth Index
| Average Annual Total Returns | | | | Since Inception |
| Periods Ended June 30, 2015 | | One Year | | 07/01/11 |
| DF Dent Midcap Growth Fund | | 9.97 | % | | 15.17 | % |
| Russell Midcap Growth Index | | 9.45 | % | | 12.80 | % |
Performance data quoted represents past performance and is no guarantee of future results. Current performance may be lower or higher than the performance data quoted. Investment return and principal value will fluctuate so that shares, when redeemed, may be worth more or less than original cost. For the most recent month-end performance, please call (866) 233-3368. As stated in the Fund’s current prospectus, the annual operating expense ratio (gross) is 2.08%. However, the Fund’s adviser has contractually agreed to waive a portion of its fees and/or reimburse expenses to limit total operating expenses (excluding all taxes, interest, portfolio transaction expenses, and extraordinary expenses) to 1.10% on the first $150 million in net assets and 0.90% on net assets exceeding $150 million, through October 31, 2019. During the period, certain fees were waived and/or expenses reimbursed; otherwise, returns would have been lower. Shares redeemed within 60 days of purchase will be charged a 2.00% redemption fee. The performance table and graph do not reflect the deduction of taxes that a shareholder would pay on Fund distributions or the redemption of Fund shares. Returns greater than one year are annualized.
DF DENT MIDCAP GROWTH FUND |
|
| JUNE 30, 2015 |
| | | | Security | | | | | | | | | | |
| | Shares | | Description | | | | | | | | | Value | |
| | | | | | | | | | |
| Consumer Discretionary - 16.2% | | | | | | | | | | |
| | 12,046 | | CarMax, Inc. (a) | | | | | | | | $ | 797,566 | |
| | 22,002 | | IMAX Corp. (a) | | | | | | | | | 886,020 | |
| | 44,117 | | LKQ Corp. (a) | | | | | | | | | 1,334,319 | |
| | 5,218 | | Signet Jewelers, Ltd. | | | | | | | | | 669,156 | |
| | | | | | | | | | | | | 3,687,061 | |
| Energy - 1.0% | | | | | | | | | | |
| | 4,400 | | Range Resources Corp. | | | | | | | | | 217,272 | |
| | | | | | | | | | | | | | |
| Financials - 24.2% | | | | | | | | | | |
| | 14,104 | | Financial Engines, Inc. | | | | | | | | | 599,138 | |
| | 1,061 | | Markel Corp. (a) | | | | | | | | | 849,521 | |
| | 10,561 | | Moody's Corp. | | | | | | | | | 1,140,166 | |
| | 15,241 | | PRA Group, Inc. (a) | | | | | | | | | 949,667 | |
| | 23,512 | | SEI Investments Co. | | | | | | | | | 1,152,793 | |
| | 11,283 | | Verisk Analytics, Inc., Class A (a) | | | | | | | | | 820,951 | |
| | | | | | | | | | | | | 5,512,236 | |
| Health Care - 7.5% | | | | | | | | | | |
| | 11,991 | | AAC Holdings, Inc. (a) | | | | | | | | | 522,328 | |
| | 1,127 | | Bio-Techne Corp. | | | | | | | | | 110,976 | |
| | 18,843 | | ExamWorks Group, Inc. (a) | | | | | | | | | 736,761 | |
| | 676 | | Intuitive Surgical, Inc. (a) | | | | | | | | | 327,522 | |
| | | | | | | | | | | | | 1,697,587 | |
| Industrials - 18.9% | | | | | | | | | | |
| | 12,771 | | Exponent, Inc. | | | | | | | | | 571,885 | |
| | 6,375 | | Fastenal Co. | | | | | | | | | 268,898 | |
| | 22,905 | | Healthcare Services Group, Inc. | | | | | | | | | 757,010 | |
| | 3,977 | | Roper Industries, Inc. | | | | | | | | | 685,873 | |
| | 6,403 | | Stericycle, Inc. (a) | | | | | | | | | 857,426 | |
| | 19,204 | | WageWorks, Inc. (a) | | | | | | | | | 776,802 | |
| | 8,293 | | Waste Connections, Inc. | | | | | | | | | 390,766 | |
| | | | | | | | | | | | | 4,308,660 | |
| Information Technology - 21.6% | | | | | | | | | | |
| | 14,871 | | ANSYS, Inc. (a) | | | | | | | | | 1,356,830 | |
| | 4,965 | | Blackbaud, Inc. | | | | | | | | | 282,757 | |
| | 2,761 | | CoStar Group, Inc. (a) | | | | | | | | | 555,679 | |
| | 12,186 | | Red Hat, Inc. (a) | | | | | | | | | 925,283 | |
| | 45,980 | | Tangoe, Inc. (a) | | | | | | | | | 578,428 | |
| | 25,951 | | Trimble Navigation, Ltd. (a) | | | | | | | | | 608,810 | |
| | 4,767 | | Tyler Technologies, Inc. (a) | | | | | | | | | 616,755 | |
| | | | | | | | | | | | | 4,924,542 | |
| Materials - 2.8% | | | | | | | | | | |
| | 5,557 | | Ecolab, Inc. | | | | | | | | | 628,330 | |
| | | | | | | | | | | | | | |
| Total Common Stock | | | | | | | | | | |
| (Cost $16,071,784) | | | | | | | | | 20,975,688 | |
| Total Investments - 92.2% | | | | | | | | | | |
(Cost $16,071,784)* | | | | | | | | $ | 20,975,688 | |
| Other Assets & Liabilities, Net – 7.8% | | | | | | | | | 1,781,100 | |
| Net Assets – 100.0% | | | | | | | | $ | 22,756,788 | |
| | | | | | | | | | | | | | |
| (a) | Non-income producing security. |
| * | Cost for federal income tax purposes is $16,107,693 and net unrealized appreciation consists of: |
| Gross Unrealized Appreciation | | $ | 5,167,875 | |
| Gross Unrealized Depreciation | | | (299,880 | ) |
| Net Unrealized Appreciation | | $ | 4,867,995 | |
| See Notes to Financial Statements. | 28 | DF DENT GROWTH FUNDS |
DF DENT MIDCAP GROWTH FUND |
|
| JUNE 30, 2015 |
The following is a summary of the inputs used to value the Fund’s investments as of June 30, 2015.
The inputs or methodology used for valuing securities are not necessarily an indication of the risks associated with investing in those securities. For more information on valuation inputs, and their aggregation into the levels used in the table below, please refer to the Security Valuation section in Note 2 of the accompanying Notes to Financial Statements.
| Valuation Inputs | | Investments in Securities |
| Level 1 - Quoted Prices | | $ | 20,975,688 | |
| Level 2 - Other Significant Observable Inputs | | | - | |
| Level 3 - Significant Unobservable Inputs | | | - | |
| Total | | $ | 20,975,688 | |
The Level 1 value displayed in this table is Common Stock. Refer to this Schedule of Investments for a further breakout of each security by industry.
The Fund utilizes the end of period methodology when determining transfers. There were no transfers among Level 1, Level 2 and Level 3 for the year ended June 30, 2015.
| PORTFOLIO HOLDINGS | | |
| % of Net Assets | | |
| Consumer Discretionary | 16.2 | % |
| Energy | 1.0 | % |
| Financials | 24.2 | % |
| Health Care | 7.5 | % |
| Industrials | 18.9 | % |
| Information Technology | 21.6 | % |
| Materials | 2.8 | % |
| Other Assets & Liabilities, Net | 7.8 | % |
| | 100.0 | % |
| See Notes to Financial Statements. | 29 | DF DENT GROWTH FUNDS |
DF DENT MIDCAP GROWTH FUND |
STATEMENT OF ASSETS AND LIABILITIES |
| JUNE 30, 2015 |
| | | | | | | |
| ASSETS | | | | |
| | Total investments, at value (Cost $16,071,784) | | $ | 20,975,688 | |
| | Cash | | | 1,833,659 | |
| | Receivables: | | | | |
| | | Dividends and interest | | | 2,977 | |
| | Prepaid expenses | | | 4,574 | |
| Total Assets | | | 22,816,898 | |
| | | | | | | |
| LIABILITIES | | | | |
| | Accrued Liabilities: | | | | |
| Adviser | Investment adviser fees | | | 31,884 | |
| | | Trustees’ fees and expenses | | | 9 | |
| | | Fund services fees | | | 6,390 | |
| | | Other expenses | | | 21,827 | |
| Total Liabilities | | | 60,110 | |
| | | | | | | |
| NET ASSETS | | $ | 22,756,788 | |
| | | | | | | |
| COMPONENTS OF NET ASSETS | | | | |
| | Paid-in capital | | $ | 17,519,199 | |
| | Accumulated net investment loss | | | (71,155 | ) |
| | Accumulated net realized gain | | | 404,840 | |
| | Net unrealized appreciation | | | 4,903,904 | |
| NET ASSETS | | $ | 22,756,788 | |
| SHARES OF BENEFICIAL INTEREST AT NO PAR VALUE (UNLIMITED SHARES AUTHORIZED) | | | 1,399,097 | |
NET ASSET VALUE, OFFERING AND REDEMPTION PRICE PER SHARE* | | $ | 16.27 | |
| * | Shares redeemed or exchanged within 60 days of purchase are charged a 2.00% redemption fee. | | | | |
| See Notes to Financial Statements. | 30 | DF DENT GROWTH FUNDS |
DF DENT MIDCAP GROWTH FUND |
|
|
| | | | | | | | |
| INVESTMENT INCOME | | | | | |
| | Dividend income (Net of foreign withholding taxes of $699) | | $ | 86,891 | | |
| | Interest income | | | 987 | | |
| Total Investment Income | | | 87,878 | | |
| Adviser | | | | | |
| EXPENSES | | | | | |
| | Investment adviser fees | | | 196,733 | | |
| | Fund services fees | | | 113,339 | | |
| | Custodian fees | | | 5,000 | | |
| | Registration fees | | | 6,714 | | |
| | Professional fees | | | 24,446 | | |
| | Trustees' fees and expenses | | | 1,102 | | |
| | Miscellaneous expenses | | | 13,926 | | |
| Total Expenses | | | 361,260 | | |
| | Fees waived and expenses reimbursed | | | (144,855 | ) | |
| Net Expenses | | | 216,405 | | |
| | | | | | | | |
| NET INVESTMENT LOSS | | | (128,527 | ) | |
| | | | | | | | |
| NET REALIZED AND UNREALIZED GAIN | | | | | |
| | Net realized gain on investments | | | 979,913 | | |
| | Net change in unrealized appreciation on investments | | | 1,189,087 | | |
| NET REALIZED AND UNREALIZED GAIN | | | 2,169,000 | | |
| INCREASE IN NET ASSETS RESULTING FROM OPERATIONS | | $ | 2,040,473 | | |
| | | | | | | | |
| See Notes to Financial Statements. | 31 | DF DENT GROWTH FUNDS |
DF DENT MIDCAP GROWTH FUND |
STATEMENTS OF CHANGES IN NET ASSETS |
|
| | | June 30, 2015 | # | | 42185 | # | # | | | 41820 | |
| | | | | For the Years Ended June 30, |
| | | | | 2015 | | | 2014 |
| OPERATIONS | | | | | | | | | |
| | Net investment loss | | $ | (128,527 | ) | | | $ | (81,962 | ) |
| | Net realized gain | | | 979,913 | | | | | 706,354 | |
| | Net change in unrealized appreciation (depreciation) | | | 1,189,087 | | | | | 1,673,641 | |
| Increase in Net Assets Resulting from Operations | | | 2,040,473 | | | | | 2,298,033 | |
| | | | | | | | | | | | |
| DISTRIBUTIONS TO SHAREHOLDERS FROM | | | | | | | | | |
| | Net realized gain | | | (863,974 | ) | | | | (413,592 | ) |
| Total Distributions to Shareholders | | | (863,974 | ) | | | | (413,592 | ) |
| | | | | | | | | | | | |
| CAPITAL SHARE TRANSACTIONS | | | | | | | | | |
| | Sale of shares | | | 5,193,362 | | | | | 4,405,986 | |
| | Reinvestment of distributions | | | 856,042 | | | | | 391,979 | |
| | Redemption of shares | | | (501,579 | ) | | | | (329,348 | ) |
| | Redemption fees | | | - | | | | | 40 | |
| Increase in Net Assets from Capital Share Transactions | | | 5,547,825 | | | | | 4,468,657 | |
| Increase in Net Assets | | | 6,724,324 | | | | | 6,353,098 | |
| | | | | | | | | | | | |
| NET ASSETS | | | | | | | | | |
| | Beginning of Year | | | 16,032,464 | | | | | 9,679,366 | |
| | End of Year (Including line (a)) | | $ | 22,756,788 | | | | $ | 16,032,464 | |
| | | | | | | | | | | | |
| SHARE TRANSACTIONS | | | | | | | | | |
| | Sale of shares | | | 335,890 | | | | | 288,962 | |
| | Reinvestment of distributions | | | 58,393 | | | | | 26,361 | |
| | Redemption of shares | | | (32,215 | ) | | | | (22,394 | ) |
| Increase in Shares | | | 362,068 | | | | | 292,929 | |
| | | | | | | | | | | | |
| (a) | Accumulated net investment loss | | $ | (71,155 | ) | | | $ | - | |
| See Notes to Financial Statements. | 32 | DF DENT GROWTH FUNDS |
DF DENT MIDCAP GROWTH FUND |
|
|
| These financial highlights reflect selected data for a share outstanding throughout each period. | | |
| | | For the Years Ended June 30, | | | |
| | | 2015 | | 2014 | | 2013 | | July 1, 2011 (a) through June 30, 2012 | |
| NET ASSET VALUE, Beginning of Period | $ | 15.46 | | | $ | 13.01 | | | $ | 10.32 | | | $ | 10.00 | | |
| INVESTMENT OPERATIONS | | | | | | | | | | | | | | | | |
| Net investment loss (b) | | (0.10 | ) | | | (0.09 | ) | | | (0.04 | ) | | | (0.05 | ) | |
| Net realized and unrealized gain | | 1.57 | | | | 3.06 | | | | 2.73 | | | | 0.37 | | |
| Total from Investment Operations | | 1.47 | | | | 2.97 | | | | 2.69 | | | | 0.32 | | |
| DISTRIBUTIONS TO SHAREHOLDERS FROM | | | | | | | | | | | | | | | | |
| Net realized gain | | (0.66 | ) | | | (0.52 | ) | | | — | | | | — | | |
| REDEMPTION FEES (b) | | — | | | | — | (c) | | — | | | | — | | |
| NET ASSET VALUE, End of Period | $ | 16.27 | | | $ | 15.46 | | | $ | 13.01 | | | $ | 10.32 | | |
| TOTAL RETURN | | 9.97 | % | | 22.95 | % | | 26.07 | % | | 3.20 | %(d) |
| | | | | | | | | | | | | | | | | |
| RATIOS/SUPPLEMENTARY DATA | | | | | | | | | | | | | | | | |
| Net Assets at End of Period (000's omitted) | $22,757 | | | $16,032 | | | $9,679 | | | $6,423 | | |
| Ratios to Average Net Assets: | | | | | | | | | | | | | | | | |
| Net investment loss | | (0.65 | )% | | (0.63 | )% | | (0.38 | )% | | (0.55 | )%(e) |
| Net expenses | | 1.10 | % | | 1.10 | % | | 1.10 | % | | 1.10 | %(e) |
| Gross expenses (f) | | 1.84 | % | | 2.08 | % | | 1.86 | % | | 3.45 | %(e) |
| PORTFOLIO TURNOVER RATE | | 45 | % | | 32 | % | | 35 | % | | 24 | %(d) |
| | | | | | | | | | | | | | | | | | |
| | | | | | | | | | | | | | | | | | |
| (a) | Commencement of operations. |
| (b) | Calculated based on average shares outstanding during each period. |
| (c) | Less than $0.01 per share. |
| (d) | Not annualized. |
| (e) | Annualized. |
| (f) | Reflects the expense ratio excluding any waivers and/or reimbursements. |
| See Notes to Financial Statements. | 33 | DF DENT GROWTH FUNDS |
DF DENT SMALL CAP GROWTH FUND |
A MESSAGE TO OUR SHAREHOLDERS (Unaudited) |
| JUNE 30, 2015 |
Dear Fellow Shareholders:
Performance
For the fiscal year ended June 30, 2015, the DF Dent Small Cap Growth Fund (the “Fund”) experienced a total return of +13.41%. This return is net of fees and represents an outperformance of 1.07% relative to the total return of +12.34% for the Russell 2000 Growth Index (the “Index”), which is the benchmark we have used for performance comparisons.
Expense Ratio
The gross operating expense ratio for the Fund, per the prospectus, is 10.69%, which is high given the small size of fund assets relative to certain fixed expenses. However, per the Fund’s prospectus, your Fund’s Adviser, D.F. Dent and Company, Inc. (the “Adviser”), has contractually agreed to waive a portion of its fees and/or reimburse expenses so as to maintain your Fund’s expense ratio at a net 1.25% through at least October 31, 2019.
Concentration
The Fund’s concentration in its top 10 holdings is as follows:
| Top 10 Holdings | | | 06/30/15 |
| Total % of Fund of Top 10 | | | 32.42 | % |
| Average Position Size of Top 10 | | | 3.24 | % |
We believe that the concentration in the top 10 positions is appropriate at its current level and has the potential to enhance long-term performance.
Management Ownership of Fund
Employees, their families, and the Adviser’s retirement plan owned approximately 65% of the Fund as of June 30, 2015. There were only management purchases and no management redemptions during the fiscal year ended June 30, 2015.
Portfolio Commentary
Over the medium to long-term, we continue to expect equities – and, in particular, small cap equities – to outperform other asset classes. But over the shorter term, our expectations are more subdued, particularly as U.S. equity markets have now experienced more than six strong years of performance post-recession in which most indices have more than doubled. Moreover, we believe that many of the main catalysts of extraordinary stock market appreciation over that period (and over the last three decades) – namely (1) falling interest rates; (2) expanding market multiples from below-historical averages to above; and (3) widening corporate profit
DF DENT SMALL CAP GROWTH FUND |
A MESSAGE TO OUR SHAREHOLDERS (Unaudited) |
| JUNE 30, 2015 |
margins to historical highs – have largely played out. While equities could well overshoot to the upside, we would expect future returns to be more modest than recent gains and driven more so by growth in core operations than in the factors above. However, such an environment seems favorable for growth stocks which can deliver outsize revenue growth along with some operating leverage and accretion from stock repurchases. We believe growth stocks will offer returns that few other asset classes will be able to match and also have the potential to materially outperform the broader equity market over a market cycle.
Investors strongly favored more defensive equity strategies in 2014 and the beginning of 2015. Stocks with larger capitalizations, lower price-to-earnings ratios and higher dividend yields outperformed significantly. As fixed-income investors searched for bond substitutes in the equity markets, utilities and REITs were the top two performing sectors of the S&P 500. As a result, mega-cap, high-dividend-paying, value stocks performed very well during 2014 and the start of 2015. However, some of these trends seem to have run their course in early 2015 as bond yields have recently risen significantly for the first time since 2013. Ed Clissold of Ned Davis Research Group recently concluded that the valuations of high yielding stocks were the “most stretched.” The mega-caps appear overvalued with their multiples far in excess of their earnings growth rates and at the high end of recent relative valuations. We do not think these multiples have much room to expand and believe that 2015 is shaping up to be a stock-picker’s market in which earnings growth is (once again) becoming a primary focus for investors.
Investment Tenet Highlight: Moats
“How wide is the moat around the business?” is a question you would hear often if you attended D.F. Dent’s internal investment meetings. Similarly, “What are the barriers to entry in the market and will they grow or shrink over time?” Over the years, these questions have achieved a certain prominence in our investment process. When one is willing to buy a growth stock and hold it for a long period of time, one had better be confident that the company is well-protected from future competitive threats in the foreseeable future.
Many of your portfolio’s most successful investments have been companies that dominate their niches and have sustainable competitive advantages that grow over time. This differentiation, and the “breathing room” it provides, allows management teams to make long-term investments that widen their companies’ moats. Examples include large research and development investments, salesforce expansions, geographic extensions, and mergers and acquisitions. CoStar Group, Concur Technologies, Dealertrack Technologies, Ellie Mae, IMAX, and PRA Group exemplify companies in your Fund that have widened their moats through large, recent investments. While the associated spending may have dampened current earnings, we believe it was prudent, will help sustain an enduring franchise, and will enhance earnings growth over the long term.
In some cases knowledgeable, strategic buyers have recognized the wisdom of the moat-widening investments your companies have made and have acquired the businesses before these investments reached their fruition. Your concentrated Fund of 50-to-60 best-in-class* names has enjoyed no less than five such take-outs in the most recent year, all done at favorable premiums to their previous trading ranges (specifically, these were: Concur Technologies, Dealertrack Technologies, Einstein Noah Restaurant Group, MWI Veterinary Supply, and Quality Distribution). While for the most part we felt the prices paid by the buyers were fair, we were not
DF DENT SMALL CAP GROWTH FUND |
A MESSAGE TO OUR SHAREHOLDERS (Unaudited) |
| JUNE 30, 2015 |
invested “for the deal” but rather owned the companies because we believed their moats and competitive advantages would help generate compelling returns over the long term. Moving forward, we endeavor to continue to stockpile the Fund with such companies whose defensible moats aim to protect their franchises and drive sustainable earnings growth and shareholder returns well into the future.
Attribution Analysis
Consistent with last year, your Fund’s greatest source of outperformance relative to the Index came from the Consumer Discretionary sector. The outperformance was principally due to favorable stock selection among Consumer Discretionary names, and secondarily to the Fund’s modest overweight position within the sector.
Having said that, the sector with the highest absolute performance for your Fund was Health Care, generating a little more than half the total return for the period. On a relative basis, Health Care outperformance was more subdued, with favorable stock selection within the sector being mostly offset by your Fund’s relative underweight position in the sector (note your Fund is underweight mania-driven biotech stocks that have dominated the Index’s returns, soaring on, we believe, overly optimistic forecasts, hype and momentum).
Your Fund’s largest source of underperformance relative to the Index came from the Financials sector. The modest underperformance was driven by stock selection, due entirely to one investment in an asset manager whose stock (and own funds) performed poorly in the period but nevertheless remains attractively valued relative to longer-term expectations. Your Fund was overweight financials, though the overweight position had no material effect on relative performance.
On an absolute basis, the worst performing sector for your Fund was Energy. In step with falling oil prices during the period, the Fund’s investments in energy were down, though the extent of the overall loss was reduced by your Fund’s underweight position in the sector. The fund remains underweight Energy (and Materials) as the Fund’s Advisor expects continued investment in global supply to keep energy prices, returns on invested capital and, ultimately energy company stock prices, lower for longer than market currently forecasts.
Your Fund remains over-weighted versus the Index benchmark in the Industrials sector. We continue to believe that well-run Industrial companies with market-leading positions and above-average, high-return growth opportunities represent excellent investments for the Fund. For the period, your Fund’s exposure to Industrials generated a positive gain on an absolute basis but was roughly flat relative to the Index’s gain in Industrials.
Rounding out the sectors, your Fund had a modest overweight in Consumer Staples and Information Technology. The overweight and stock selection in Consumer Staples had modestly positive impacts on performance to the Index, while the Information Technology weighting and stock selection had no material relative impact. Lastly, your Fund was underweight Materials, which was of benefit relative to the Index, as Materials stocks broadly declined over the period.
DF DENT SMALL CAP GROWTH FUND |
A MESSAGE TO OUR SHAREHOLDERS (Unaudited) |
| JUNE 30, 2015 |
All in, the Advisor feels comfortable with the portfolio of investments your Fund holds, both in terms of sector weightings and the favorable attributes of the underlying securities, including high levels of earnings growth, solid management teams and durable, cash flow-generating franchises.
The following bar chart presents the sector weightings of your Fund versus the sector weightings of the Index as of June 30, 2015 (note this may differ slightly with the commentary above, which relates to average weightings as opposed to period-end weightings):
DF DENT SMALL CAP GROWTH FUND |
A MESSAGE TO OUR SHAREHOLDERS (Unaudited) |
| JUNE 30, 2015 |
Best and Worst Performers
Five Best Contributors (Unaudited) Investments | | Fund Realized and Unrealized Appreciation and Income in Fiscal Year 2015 | | Fund Per Share As of 6/30/15 | |
| AAC Holdings, Inc. | | $ | 168,005 | | $ | 0.38 | |
| Ellie Mae, Inc. | | | 84,961 | | | 0.19 | |
| Dealertrack Technologies, Inc. | | | 57,125 | | | 0.13 | |
| Imax Corp. | | | 45,942 | | | 0.10 | |
| Atrion Corp. | | | 38,598 | | | 0.09 | |
| | | $ | 394,631 | | $ | 0.89 | |
Five Worst Contributors (Unaudited) Investments | | Fund Realized and Unrealized Loss and Income in Fiscal Year 2015 | | Fund Per Share As of 6/30/15 | |
| Amber Road, Inc. | | $ | (57,331) | | $ | (0.13) | |
| 3-D Systems Corp. | | | (37,553) | | | (0.09) | |
| Laredo Petroleum, Inc. | | | (34,447) | | | (0.08) | |
| Unit Corp. | | | (31,678) | | | (0.07) | |
| MSC Industrial, Inc. | | | (15,044) | | | (0.03) | |
| | | $ | (176,054) | | $ | (0.40) | |
Five Largest Equity Holdings
June 30, 2015
Shares | | Security | | Total Cost | | Market Value | | Percent of Net Assets of the Fund |
| 572 | | Atrion Corp. | | $ | 173,593 | | $ | 224,401 | | 4.17 | % |
| 4,763 | | AAC Holdings, Inc. | | | 77,846 | | | 207,476 | | 3.86 | |
| 4,629 | | IMAX Corp. | | | 138,385 | | | 186,410 | | 3.46 | |
| 5,434 | | Healthcare Services Group, Inc. | | | 155,497 | | | 179,594 | | 3.34 | |
| 2,522 | | Ellie Mae, Inc. | | | 86,590 | | | 176,010 | | 3.27 | |
| | | | | $ | 631,911 | | $ | 973,891 | | 18.10 | % |
DF DENT SMALL CAP GROWTH FUND |
A MESSAGE TO OUR SHAREHOLDERS (Unaudited) |
| JUNE 30, 2015 |
As always, we appreciate the confidence you have placed in D.F. Dent and Company and are conscious of the responsibility that you have entrusted to us. We will continue to work diligently on your behalf.
Respectively Submitted,

* The determination of “best-in-class” is solely the opinion of the Fund’s Adviser, and such opinion is subject to change. Those companies that hold leading market share positions, strong growth potential, historically good profitability, and management teams known for integrity and good corporate governance are generally considered to be “best-in-class.”
IMPORTANT INFORMATION:
Investing involves risks, including the possible loss of principal. The Fund invests in small- and medium- size companies, which carry greater risk than is customarily associated with larger, more established companies. With non-diversification risk, the Fund will typically invest in securities of fewer issuers, which exposes the Fund to greater market risk. Investing in ADRs (American Depository Receipt) carries risks of political and financial instability, less liquidity and greater volatility, as well as risks associated with the lack of reliable accounting and financial information. The Fund is also subject to other risks, such as Real Estate Investment Trust (REIT) risk with possible real estate market declines, which are detailed in the Fund’s prospectus.
The Russell 2000 Growth Index measures the performance of the small-cap growth segment of the U.S. equity universe. It includes those Russell 2000 Growth Index companies with higher price-to-book ratios and higher forecasted growth values. One cannot invest directly in an index.
The views in this report contained herein were those of the Fund’s Adviser as of June 30, 2015, and may not reflect the Adviser’s views on the date this report is first published or anytime thereafter. This report may contain discussions about certain investments both held and not held in the portfolio as of the report date. All current and future holdings are subject to risk and are subject to change. While these views are intended to assist shareholders in understanding their investment in the Fund, they do not constitute investment or tax advice, are not a guarantee of future performance and are not intended as an offer or solicitation with respect to the purchase or sale of any security.
DF DENT SMALL CAP GROWTH FUND |
PERFORMANCE CHART AND ANALYSIS (Unaudited) |
| JUNE 30, 2015 |
The following chart reflects the change in the value of a hypothetical $10,000 investment, including reinvested dividends and distributions, in DF Dent Small Cap Growth Fund (the “Fund”) compared with the performance of the benchmark, the Russell 2000 Growth Index ("Russell 2000 Growth"), since inception. The Russell 2000 Growth, the Fund‘s primary performance benchmark, measures the performance of those Russell 2000 Index companies with higher price-to-value ratios and higher forecasted growth values. The total return of the Russell 2000 Growth includes the reinvestment of dividends and income. The total return of the Fund includes operating expenses that reduce returns, while the total return of the Russell 2000 Growth does not include expenses. The Fund is professionally managed while the Russell 2000 Growth is unmanaged and is not available for investment.
Comparison of Change in Value of a $10,000 Investment
DF Dent Small Cap Growth Fund vs. Russell 2000 Growth Index
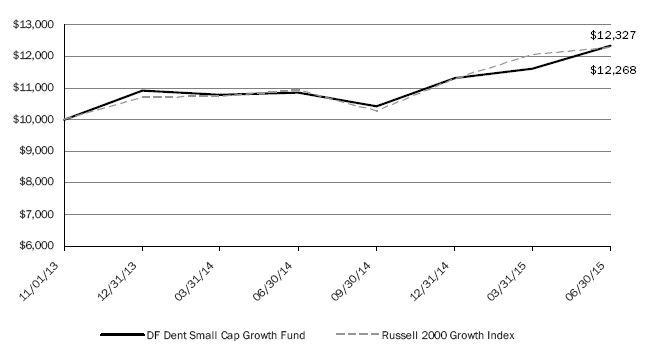
| Average Annual Total Returns | | | | Since Inception |
| Periods Ended June 30, 2015 | | One Year | | 11/01/13 |
| DF Dent Small Cap Growth Fund | | 13.41 | % | | 13.43 | % |
| Russell 2000 Growth Index | | 12.34 | % | | 13.10 | % |
Performance data quoted represents past performance and is no guarantee of future results. Current performance may be lower or higher than the performance data quoted. Investment return and principal value will fluctuate so that shares, when redeemed, may be worth more or less than original cost. For the most recent month-end performance, please call (866) 233-3368. As stated in the Fund’s current prospectus, the estimated annual operating expense ratio (gross) is 10.69%. However, the Fund’s adviser has contractually agreed to waive a portion of its fees and/or reimburse expenses to limit total operating expenses (excluding all taxes, interest, portfolio transaction expenses, and extraordinary expenses) to 1.25%, through October 31, 2019. During the period, certain fees were waived and/or expenses reimbursed; otherwise, returns would have been lower. Shares redeemed within 60 days of purchase will be charged a 2.00% redemption fee. The performance table and graph do not reflect the deduction of taxes that a shareholder would pay on Fund distributions or the redemption of Fund shares. Returns greater than one year are annualized.
DF DENT SMALL CAP GROWTH FUND |
|
| JUNE 30, 2015 |
| | | | Security | | | | | | | | | | |
| | Shares | | Description | | | | | | | | | Value | |
| | | | | | | | | | |
| Consumer Discretionary - 16.4% | | | | | | | | | | |
| | 1,016 | | Carter's, Inc. | | | | | | | | $ | 108,001 | |
| | 2,193 | | Chuy's Holdings, Inc. (a) | | | | | | | | | 58,751 | |
| | 1,280 | | Dorman Products, Inc. (a) | | | | | | | | | 61,005 | |
| | 7,199 | | Good Times Restaurants, Inc. (a) | | | | | | | | | 63,423 | |
| | 4,629 | | IMAX Corp. (a) | | | | | | | | �� | 186,410 | |
| | 2,262 | | Monro Muffler Brake, Inc. | | | | | | | | | 140,606 | |
| | 6,220 | | Performance Sports Group, Ltd. (a) | | | | | | | | | 111,960 | |
| | 839 | | Sotheby's | | | | | | | | | 37,956 | |
| | 2,795 | | Zoe's Kitchen, Inc. (a) | | | | | | | | | 114,427 | |
| | | | | | | | | | | | | 882,539 | |
| Consumer Staples - 4.5% | | | | | | | | | | |
| | 2,040 | | Calavo Growers, Inc. | | | | | | | | | 105,937 | |
| | 7,822 | | Inventure Foods, Inc. (a) | | | | | | | | | 79,393 | |
| | 599 | | PriceSmart, Inc. | | | | | | | | | 54,653 | |
| | | | | | | | | | | | | 239,983 | |
| Energy - 1.0% | | | | | | | | | | |
| | 643 | | Oil States International, Inc. (a) | | | | | | | | | 23,939 | |
| | 1,066 | | Unit Corp. (a) | | | | | | | | | 28,910 | |
| | | | | | | | | | | | | 52,849 | |
| Financials - 14.7% | | | | | | | | | | |
| | 3,422 | | Financial Engines, Inc. | | | | | | | | | 145,367 | |
| | 1,639 | | Glacier Bancorp, Inc. | | | | | | | | | 48,219 | |
| | 2,936 | | OneBeacon Insurance Group, Ltd., Class A | | | | | | | | | 42,601 | |
| | 2,784 | | PRA Group, Inc. (a) | | | | | | | | | 173,471 | |
| | 1,356 | | ProAssurance Corp. | | | | | | | | | 62,661 | |
| | 706 | | The Navigators Group, Inc. (a) | | | | | | | | | 54,757 | |
| | 1,234 | | Waddell & Reed Financial, Inc., Class A | | | | | | | | | 58,381 | |
| | 4,400 | | WSFS Financial Corp. | | | | | | | | | 120,340 | |
| | 4,106 | | Xoom Corp. (a) | | | | | | | | | 86,452 | |
| | | | | | | | | | | | | 792,249 | |
| Health Care - 16.0% | | | | | | | | | | |
| | 4,763 | | AAC Holdings, Inc. (a) | | | | | | | | | 207,476 | |
| | 572 | | Atrion Corp. | | | | | | | | | 224,401 | |
| | 1,346 | | Cepheid (a) | | | | | | | | | 82,308 | |
| | 846 | | DexCom, Inc. (a) | | | | | | | | | 67,663 | |
| | 3,149 | | ExamWorks Group, Inc. (a) | | | | | | | | | 123,126 | |
| | 2,203 | | HealthStream, Inc. (a) | | | | | | | | | 67,015 | |
| | 822 | | National HealthCare Corp. | | | | | | | | | 53,422 | |
| | 3,106 | | Novadaq Technologies, Inc. (a) | | | | | | | | | 37,614 | |
| | | | | | | | | | | | | 863,025 | |
| | | | | | | | | | | | | | |
| Industrials - 19.3% | | | | | | | | | | |
| | 2,254 | | Beacon Roofing Supply, Inc. (a) | | | | | | | | | 74,878 | |
| | 3,024 | | Douglas Dynamics, Inc. | | | | | | | | | 64,955 | |
| | 1,843 | | Envestnet, Inc. (a) | | | | | | | | | 74,512 | |
| | 3,696 | | Exponent, Inc. | | | | | | | | | 165,507 | |
| | 5,434 | | Healthcare Services Group, Inc. | | | | | | | | | 179,594 | |
| | 1,034 | | MSC Industrial Direct Co., Inc. | | | | | | | | | 72,142 | |
| | 4,564 | | Quality Distribution, Inc. (a) | | | | | | | | | 70,559 | |
| | 3,771 | | Rexnord Corp. (a) | | | | | | | | | 90,165 | |
| | 895 | | The Middleby Corp. (a) | | | | | | | | | 100,446 | |
| | 3,659 | | WageWorks, Inc. (a) | | | | | | | | | 148,007 | |
| | | | | | | | | | | | | 1,040,765 | |
| Information Technology - 23.8% | | | | | | | | | | |
| | 1,427 | | 3D Systems Corp. (a) | | | | | | | | | 27,855 | |
| | 8,249 | | Amber Road, Inc. (a) | | | | | | | | | 57,908 | |
| | 1,471 | | Blackbaud, Inc. | | | | | | | | | 83,773 | |
| | 3,356 | | Computer Modelling Group, Ltd. | | | | | | | | | 34,017 | |
| | 452 | | CoStar Group, Inc. (a) | | | | | | | | | 90,970 | |
| | 2,522 | | Ellie Mae, Inc. (a) | | | | | | | | | 176,010 | |
| | 1,730 | | Fleetmatics Group PLC (a) | | | | | | | | | 81,016 | |
| | 1,252 | | Guidewire Software, Inc. (a) | | | | | | | | | 66,268 | |
| | 1,031 | | Littelfuse, Inc. | | | | | | | | | 97,832 | |
| | 2,043 | | Monotype Imaging Holdings, Inc. | | | | | | | | | 49,257 | |
| | 861 | | NVE Corp. | | | | | | | | | 67,502 | |
| | 665 | | Qualys, Inc. (a) | | | | | | | | | 26,833 | |
| | 1,105 | | Shutterfly, Inc. (a) | | | | | | | | | 52,830 | |
| | 1,041 | | SPS Commerce, Inc. (a) | | | | | | | | | 68,498 | |
| | 7,803 | | Tangoe, Inc. (a) | | | | | | | | | 98,162 | |
| | 357 | | The Ultimate Software Group, Inc. (a) | | | | | | | | | 58,669 | |
| | 1,088 | | Tyler Technologies, Inc. (a) | | | | | | | | | 140,765 | |
| | | | | | | | | | | | | 1,278,165 | |
| Total Common Stock | | | | | | | | | | |
| (Cost $4,516,909) | | | | | | | | | 5,149,575 | |
| Total Investments - 95.7% | | | | | | | | | | |
(Cost $4,516,909)* | | | | | | | | $ | 5,149,575 | |
| Other Assets & Liabilities, Net – 4.3% | | | | | | | | | 232,146 | |
| Net Assets – 100.0% | | | | | | | | $ | 5,381,721 | |
| | | | | | | | | | | | | | |
| PLC | Public Limited Company |
| (a) | Non-income producing security. |
| * | Cost for federal income tax purposes is $4,526,548 and net unrealized appreciation consists of: |
| Gross Unrealized Appreciation | | $ | 884,799 | |
| Gross Unrealized Depreciation | | | (261,772 | ) |
| Net Unrealized Appreciation | | $ | 623,027 | |
See Notes to Financial Statements. | 41 | DF DENT GROWTH FUNDS |
DF DENT SMALL CAP GROWTH FUND |
|
| JUNE 30, 2015 |
The following is a summary of the inputs used to value the Fund’s investments as of June 30, 2015.
The inputs or methodology used for valuing securities are not necessarily an indication of the risks associated with investing in those securities. For more information on valuation inputs, and their aggregation into the levels used in the table below, please refer to the Security Valuation section in Note 2 of the accompanying Notes to Financial Statements.
| Valuation Inputs | | Investments in Securities |
| Level 1 - Quoted Prices | | $ | 5,149,575 | |
| Level 2 - Other Significant Observable Inputs | | | - | |
| Level 3 - Significant Unobservable Inputs | | | - | |
| Total | | $ | 5,149,575 | |
The Level 1 value displayed in this table is Common Stock. Refer to this Schedule of Investments for a further breakout of each security by industry.
The Fund utilizes the end of period methodology when determining transfers. There were no transfers among Level 1, Level 2 and Level 3 for the year ended June 30, 2015.
| PORTFOLIO HOLDINGS | | |
| % of Net Assets | | |
| Consumer Discretionary | 16.4 | % |
| Consumer Staples | 4.5 | % |
| Energy | 1.0 | % |
| Financials | 14.7 | % |
| Health Care | 16.0 | % |
| Industrials | 19.3 | % |
| Information Technology | 23.8 | % |
| Other Assets & Liabilities, Net | 4.3 | % |
| | 100.0 | % |
See Notes to Financial Statements. | 42 | DF DENT GROWTH FUNDS |
DF DENT SMALL CAP GROWTH FUND |
STATEMENT OF ASSETS AND LIABILITIES |
| JUNE 30, 2015 |
| | | | | | | |
| ASSETS | | | | |
| | Total investments, at value (Cost $4,516,909) | | $ | 5,149,575 | |
| | Cash | | | 240,883 | |
| | Receivables: | | | | |
| | | Dividends and interest | | | 1,248 | |
| Adviser | From investment adviser | | | 16,178 | |
| | Prepaid expenses | | | 1,020 | |
| Total Assets | | | 5,408,904 | |
| | | | | | | |
| LIABILITIES | | | | |
| | Accrued Liabilities: | | | | |
| | | Trustees’ fees and expenses | | | 3 | |
| | | Fund services fees | | | 6,151 | |
| | | Other expenses | | | 21,029 | |
| Total Liabilities | | | 27,183 | |
| | | | | | | |
| NET ASSETS | | $ | 5,381,721 | |
| | | | | | | |
| COMPONENTS OF NET ASSETS | | | | |
| | Paid-in capital | | $ | 4,692,600 | |
| | Accumulated net investment loss | | | (2,241 | ) |
| | Accumulated net realized gain | | | 58,696 | |
| | Net unrealized appreciation | | | 632,666 | |
| NET ASSETS | | $ | 5,381,721 | |
| SHARES OF BENEFICIAL INTEREST AT NO PAR VALUE (UNLIMITED SHARES AUTHORIZED) | | | 440,308 | |
NET ASSET VALUE, OFFERING AND REDEMPTION PRICE PER SHARE* | | $ | 12.22 | |
| * | Shares redeemed of exchanged within 60 days of purchase are charged a 2.00% redemption fee. | | |
See Notes to Financial Statements. | 43 | DF DENT GROWTH FUNDS |
DF DENT SMALL CAP GROWTH FUND |
|
|
| | | | | | | | |
| INVESTMENT INCOME | | | | | |
| | Dividend income (Net of foreign withholding taxes of $145) | | $ | 31,875 | | |
| | Interest income | | | 142 | | |
| Total Investment Income | | | 32,017 | | |
| Adviser | | | | | |
| EXPENSES | | | | | |
| | Investment adviser fees | | | 37,333 | | |
| | Fund services fees | | | 110,649 | | |
| | Custodian fees | | | 5,000 | | |
| | Registration fees | | | 5,082 | | |
| | Professional fees | | | 22,085 | | |
| | Trustees' fees and expenses | | | 198 | | |
| | Miscellaneous expenses | | | 12,377 | | |
| Total Expenses | | | 192,724 | | |
| | Fees waived and expenses reimbursed | | | (146,058 | ) | |
| Net Expenses | | | 46,666 | | |
| | | | | | | | |
| NET INVESTMENT LOSS | | | (14,649 | ) | |
| | | | | | | | |
| NET REALIZED AND UNREALIZED GAIN | | | | | |
| | Net realized gain on investments | | | 96,064 | | |
| | Net change in unrealized appreciation on investments | | | 529,881 | | |
| NET REALIZED AND UNREALIZED GAIN | | | 625,945 | | |
| INCREASE IN NET ASSETS RESULTING FROM OPERATIONS | | $ | 611,296 | | |
| | | | | | | | |
See Notes to Financial Statements. | 44 | DF DENT GROWTH FUNDS |
DF DENT SMALL CAP GROWTH FUND |
STATEMENTS OF CHANGES IN NET ASSETS |
|
| | | June 30, 2015 | # | | 42185 | # | # | * | | 41820 | |
| | | | | For the Year Ended June 30, 2015 | | | November 1, 2013* through June 30, 2014 |
| OPERATIONS | | | | | | | | | |
| | Net investment loss | | $ | (14,649 | ) | | | $ | (5,202 | ) |
| | Net realized gain | | | 96,064 | | | | | 13,119 | |
| | Net change in unrealized appreciation | | | 529,881 | | | | | 102,785 | |
| Increase in Net Assets Resulting from Operations | | | 611,296 | | | | | 110,702 | |
| | | | | | | | | | | | |
| DISTRIBUTIONS TO SHAREHOLDERS FROM | | | | | | | | | |
| | Net realized gain | | | (33,240 | ) | | | | - | |
| | | | | | | | | | | | |
| CAPITAL SHARE TRANSACTIONS | | | | | | | | | |
| | Sale of shares | | | 2,416,306 | | | | | 2,312,137 | |
| | Reinvestment of distributions | | | 33,193 | | | | | - | |
| | Redemption of shares | | | (2,000 | ) | | | | (66,673 | ) |
| Increase in Net Assets from Capital Share Transactions | | | 2,447,499 | | | | | 2,245,464 | |
| Increase in Net Assets | | | 3,025,555 | | | | | 2,356,166 | |
| | | | | | | | | | | | |
| NET ASSETS | | | | | | | | | |
| | Beginning of Period | | | 2,356,166 | | | | | - | |
| | End of Period (Including line (a)) | | $ | 5,381,721 | | | | $ | 2,356,166 | |
| | | | | | | | | | | | |
| SHARE TRANSACTIONS | | | | | | | | | |
| | Sale of shares | | | 220,718 | | | | | 223,267 | |
| | Reinvestment of distributions | | | 3,096 | | | | | - | |
| | Redemption of shares | | | (179 | ) | | | | (6,594 | ) |
| Increase in Shares | | | 223,635 | | | | | 216,673 | |
| | | | | | | | | | | | |
| (a) | Accumulated net investment loss | | $ | (2,241 | ) | | | $ | (628 | ) |
| * | Commencement of operations. | | | | | | | | | |
See Notes to Financial Statements. | 45 | DF DENT GROWTH FUNDS |
DF DENT SMALL CAP GROWTH FUND |
|
|
| These financial highlights reflect selected data for a share outstanding throughout each period. |
| | | For the Year Ended June 30, 2015 | | November 1, 2013 (a) through June 30, 2014 | |
| | | | | | | | | |
| NET ASSET VALUE, Beginning of Period | $ | 10.87 | | | $ | 10.00 | | |
| INVESTMENT OPERATIONS | | | | | | | | |
| Net investment loss (b) | | (0.04 | ) | | | (0.03 | ) | |
| Net realized and unrealized gain | | 1.48 | | | | 0.90 | | |
| Total from Investment Operations | | 1.44 | | | | 0.87 | | |
| DISTRIBUTIONS TO SHAREHOLDERS FROM | | | | | | | | |
| Net realized gain | | (0.09 | ) | | | — | | |
| NET ASSET VALUE, End of Period | $ | 12.22 | | | $ | 10.87 | | |
| TOTAL RETURN | | 13.41 | % | | 8.70 | %(c) |
| | | | | | | | | |
| RATIOS/SUPPLEMENTARY DATA | | | | | | | | |
| Net Assets at End of Period (000's omitted) | $5,382 | | | $2,356 | | |
| Ratios to Average Net Assets: | | | | | | | | |
| Net investment loss | | (0.39 | )% | | (0.50 | )%(d) |
| Net expenses | | 1.25 | % | | 1.25 | %(d) |
| Gross expenses (e) | | 5.16 | % | | 10.69 | %(d) |
| PORTFOLIO TURNOVER RATE | | 38 | % | | 37 | %(c) |
| | | | | | | | | | |
| | | | | | | | | | |
| (a) | Commencement of operations. |
| (b) | Calculated based on average shares outstanding during each period. |
| (c) | Not annualized. |
| (d) | Annualized. |
| (e) | Reflects the expense ratio excluding any waivers and/or reimbursements. |
See Notes to Financial Statements. | 46 | DF DENT GROWTH FUNDS |
|
NOTES TO FINANCIAL STATEMENTS |
|
Note 1. Organization
DF Dent Premier Growth Fund is a diversified portfolio of Forum Funds (the “Trust”) and DF Dent Midcap Growth Fund and DF Dent Small Cap Growth Fund (individually, a “Fund” and, collectively the “Funds”) are non-diversified portfolios of the Trust. The Trust is a Delaware statutory trust that is registered as an open-end, management investment company under the Investment Company Act of 1940 (the “Act”), as amended. Under its Trust Instrument, the Trust is authorized to issue an unlimited number of each Fund’s shares of beneficial interest without par value. DF Dent Premier Growth Fund, DF Dent Midcap Growth Fund and DF Dent Small Cap Growth Fund commenced operations on July 16, 2001, July 1, 2011, and November 1, 2013, respectively. The Funds seek long-term capital appreciation.
Note 2. Summary of Significant Accounting Policies
These financial statements are prepared in accordance with accounting principles generally accepted in the United States of America (“GAAP”), which require management to make estimates and assumptions that affect the reported amounts of assets and liabilities, the disclosure of contingent liabilities at the date of the financial statements, and the reported amounts of increases and decreases in net assets from operations during the fiscal year. Actual amounts could differ from those estimates. The following summarizes the significant accounting policies of each Fund:
Security Valuation – Exchange-traded securities and over-the-counter securities are valued using the last quoted trade or official closing price, provided by independent pricing services as of the close of trading on the market or exchange for which they are primarily traded, on each Fund business day. In the absence of a sale, such securities are valued at the mean of the last bid and ask price provided by independent pricing services. Non-exchange-traded securities for which quotations are available are valued using the last quoted sales price, or in the absence of a sale, at the mean of the last bid and ask prices provided by independent pricing services. Shares of open-end mutual funds are valued at net asset value (“NAV”). Short-term investments that mature in 60 days or less may be valued at amortized cost.
Each Fund values its investments at fair value pursuant to procedures adopted by the Trust's Board of Trustees (the "Board") if (1) market quotations are insufficient or not readily available or (2) the adviser believes that the values available are unreliable. The Trust’s Valuation Committee, as defined in each Fund’s registration statement, performs certain functions as they relate to the administration and oversight of each Fund’s valuation procedures. Under these procedures, the Valuation Committee convenes on a regular and ad-hoc basis to review such investments and considers a number of factors, including valuation methodologies and significant unobservable inputs, when arriving at fair value.
The Valuation Committee may work with the adviser to provide valuation inputs. In determining fair valuations, inputs may include market-based analytics which may consider related or comparable assets or liabilities, recent transactions, market multiples, book values and other relevant investment information. Adviser inputs may include an income-based approach in which the anticipated future cash flows of the investment are discounted in determining fair value. Discounts may also be applied based on the nature or duration of any
|
NOTES TO FINANCIAL STATEMENTS |
|
restrictions on the disposition of the investments. The Valuation Committee performs regular reviews of valuation methodologies, key inputs and assumptions, disposition analysis and market activity.
Fair valuation is based on subjective factors and, as a result, the fair value price of an investment may differ from the security’s market price and may not be the price at which the asset may be sold. Fair valuation could result in a different NAV than a NAV determined by using market quotes.
Each Fund has a three-tier fair value hierarchy. The basis of the tiers is dependent upon the various “inputs” used to determine the value of each Fund’s investments. These inputs are summarized in the three broad levels listed below:
Level 1 — quoted prices in active markets for identical assets and liabilities
Level 2 — other significant observable inputs (including quoted prices of similar securities, interest rates, prepayment speeds, credit risk, etc.)
Level 3 — significant unobservable inputs (including each Fund’s own assumptions in determining the fair value of investments)
The aggregate value by input level, as of June 30, 2015, for each Fund’s investments is included at the end of each Fund’s Schedule of Investments.
Security Transactions, Investment Income and Realized Gain and Loss – Investment transactions are accounted for on the trade date. Dividend income is recorded on the ex-dividend date. Foreign dividend income is recorded on the ex-dividend date or as soon as possible after each Fund determines the existence of a dividend declaration after exercising reasonable due diligence. Income and capital gains on some foreign securities may be subject to foreign withholding taxes, which are accrued as applicable. Interest income is recorded on an accrual basis. Premium is amortized and discount is accreted using the effective interest method. Identified cost of investments sold is used to determine the gain and loss for both financial statement and federal income tax purposes.
Distributions to Shareholders – Distributions to shareholders of net investment income and net capital gains, if any, are declared and paid at least annually. Distributions to shareholders are recorded on the ex-dividend date. Distributions are based on amounts calculated in accordance with applicable federal income tax regulations, which may differ from GAAP. These differences are due primarily to differing treatments of income and gain on various investment securities held by each Fund, timing differences and differing characterizations of distributions made by each Fund.
Federal Taxes – Each Fund intends to continue to qualify each year as a regulated investment company under Subchapter M of the Internal Revenue Code and to distribute all of its taxable income to shareholders. In addition, by distributing in each calendar year substantially all of its net investment income and capital gains, if any, the Fund will not be subject to a federal excise tax. Therefore, no federal income or excise tax provision
|
NOTES TO FINANCIAL STATEMENTS |
|
is required. Each Fund files a U.S. federal income and excise tax return as required. A fund’s federal income tax returns are subject to examination by the Internal Revenue Service for a period of three fiscal years after they are filed. As of June 30, 2015, there are no uncertain tax positions that would require financial statement recognition, de-recognition or disclosure.
Income and Expense Allocation – The Trust accounts separately for the assets, liabilities and operations of each of its investment portfolios. Expenses that are directly attributable to more than one investment portfolio are allocated among the respective investment portfolios in an equitable manner.
Redemption Fees – A shareholder who redeems shares of DF Dent Midcap Growth Fund and DF Dent Small Cap Growth Fund within 60 days of purchase may incur a redemption fee of 2.00% of the current net asset value of shares redeemed, subject to certain limitations. The fee is charged for the benefit of the remaining shareholders and will be paid to each Fund to help offset transaction costs. The fee is accounted for as an addition to paid-in capital. Each Fund reserves the right to modify the terms of or terminate the fee at any time. There are limited exceptions to the imposition of the redemption fee.
Commitments and Contingencies – In the normal course of business, each Fund enters into contracts that provide general indemnifications by each Fund to the counterparty to the contract. Each Fund’s maximum exposure under these arrangements is dependent on future claims that may be made against each Fund and, therefore, cannot be estimated; however, based on experience, the risk of loss from such claims is considered remote.
Note 3. Cash – Concentration in Uninsured Account
For cash management purposes each Fund may concentrate cash with each Fund’s custodian. This typically results in cash balances exceeding the Federal Deposit Insurance Corporation (“FDIC”) insurance limits. As of June 30, 2015, DF Dent Premier Growth Fund and DF Dent Midcap Growth Fund held $3,856,160 and $1,583,659, respectively, as cash reserves at MUFG Union Bank, N.A. that exceeded the FDIC insurance limit.
Note 4. Fees and Expenses
Investment Adviser – D.F. Dent and Company, Inc. (the “Adviser”) is the investment adviser to each Fund. Pursuant to an investment advisory agreement, the Adviser receives an advisory fee from each Fund at an annual rate of 1.00% of each Fund’s average daily net assets.
Distribution – Foreside Fund Services, LLC serves as each Fund’s distributor (the “Distributor”). The Funds do not have a distribution (12b-1) plan; accordingly, the Distributor does not receive compensation from the Funds for its distribution (12b-1) services. The Adviser compensates the Distributor directly for its services. The Distributor is not affiliated with the Adviser or Atlantic Fund Administration, LLC (d/b/a Atlantic Fund Services) (“Atlantic”) or their affiliates.
Other Service Providers – Atlantic provides fund accounting, fund administration, compliance and transfer
|
NOTES TO FINANCIAL STATEMENTS |
|
agency services to each Fund. Atlantic also provides certain shareholder report production, and EDGAR conversion and filing services. Pursuant to an Atlantic services agreement, each Fund pays Atlantic customary fees for its services. Atlantic provides a Principal Executive Officer, a Principal Financial Officer, a Chief Compliance Officer, and an Anti-Money Laundering Officer to each Fund, as well as certain additional compliance support functions.
Trustees and Officers – The Trust pays each independent Trustee an annual retainer fee of $45,000 for service to the Trust ($66,000 for the Chairman). The Trustees and Chairman may receive additional fees for special Board meetings. Each Trustee is also reimbursed for all reasonable out-of-pocket expenses incurred in connection with his duties as a Trustee, including travel and related expenses incurred in attending Board meetings. The amount of Trustees’ fees attributable to each Fund is disclosed in the Statement of Operations. Certain officers of the Trust are also officers or employees of the above named service providers, and during their terms of office received no compensation from each Fund.
Effective January 1, 2015, each Independent Trustee’s annual retainer is $50,000 ($66,000 for the Chairman), and the Audit Committee Chairman receives an additional $6,000 annually. Effective April 1, 2015, the Vice Chairman receives an additional $6,000 annually.
Note 5. Expenses Reimbursed and Fees Waived
The Adviser has contractually agreed to reduce a portion of its fee and reimburse certain expenses through October 31, 2019, for DF Dent Premier Growth Fund and DF Dent Midcap Growth Fund, to the extent that total annual operating expenses (excluding all taxes, interest, portfolio transaction expenses, and extraordinary expenses) exceed 1.10% on the first $150 million of net assets and to the extent that annual operating expenses exceed 0.90% on net assets exceeding $150 million of each Fund. The Adviser has also contractually agreed to reduce a portion of its fee and reimburse expenses to limit total annual operating expenses (excluding all taxes, interest, portfolio transaction expenses, and extraordinary expenses) to 1.25% through October 31, 2019, for DF Dent Small Cap Growth Fund. Other fund service providers have voluntarily agreed to waive and reimburse a portion of their fees. These voluntary fee waivers and reimbursements may be reduced or eliminated at any time. For the year ended June 30, 2015, fees waived were as follows:
| | Investment Adviser Fees Waived | | Investment Adviser Expenses Reimbursed | | Other Waivers | | Total Fees Waived and Expenses Reimbursed |
| DF Dent Premier Growth Fund | $ | 175,996 | | $ | - | | $ | 75,888 | | $ | 251,884 |
| DF Dent Midcap Growth Fund | | 104,799 | | | - | | | 40,056 | | | 144,855 |
| DF Dent Small Cap Growth Fund | | 37,333 | | | 68,669 | | | 40,056 | | | 146,058 |
Note 6. Security Transactions
The cost of purchases and proceeds from sales of investment securities (including maturities), other than
|
NOTES TO FINANCIAL STATEMENTS |
|
short-term investments during the year ended June 30, 2015, were as follows:
| | | Purchases | | Sales |
| DF Dent Premier Growth Fund | | $ | 45,276,612 | | $ | 89,517,268 |
| DF Dent Midcap Growth Fund | | | 11,490,191 | | | 8,603,214 |
| DF Dent Small Cap Growth Fund | | | 3,563,568 | | | 1,388,313 |
| | | | | | | |
Note 7. Federal Income Tax
Distributions paid during the fiscal years or period ended as noted were characterized for tax purposes as follows:
| | | Ordinary Income | | Long-Term Capital Gain | | Total |
| DF Dent Midcap Growth Fund |
| 2015 | | $ | 165,539 | | | $ | 698,435 | | | $ | 863,974 | | |
| 2014 | | | 218,253 | | | | 195,339 | | | | 413,592 | | |
| DF Dent Small Cap Growth Fund |
| 2015 | | | 33,240 | | | | - | | | | 33,240 | | |
| 2014 | | | - | | | | - | | | | - | | |
The difference between components of distributable earnings on a tax basis and the amounts reflected in the Statements of Assets and Liabilities are primarily due to passive foreign investment holdings (PFICs), wash sales and short-term gains.
For tax purposes, the current year post-October loss was $49,986 for DF Dent Midcap Growth Fund, and the current deferred late year ordinary loss was $341,550 and $71,155 for DF Dent Premier Growth Fund and DF Dent Midcap Growth Fund, respectively (realized during the period November 1, 2014 through June 30, 2015). These losses will be recognized for tax purposes on the first business day of each Fund’s next fiscal year, July 1, 2015.
On the Statements of Assets and Liabilities, as a result of permanent book to tax differences, certain
|
NOTES TO FINANCIAL STATEMENTS |
|
amounts have been reclassified for the year ended June 30, 2015. The following reclassifications were the result of net operating losses and have no impact on the net assets of each Fund.
| | | Accumulated Net Investment Loss | | Accumulated Net Realized Gain (Loss) | | Paid-in Capital |
| DF Dent Premier Growth Fund | | $ | 699,598 | | | $ | - | | | $ | (699,598) | |
| DF Dent Midcap Growth Fund | | | 57,372 | | | | (57,372 | ) | | | - | |
| DF Dent Small Cap Growth Fund | | | 13,036 | | | | (13,036 | ) | | | - | |
Note 8. Recent Accounting Pronouncements
In May 2015, the Financial Accounting Standards Board (“FASB”) issued Accounting Standards Update 2015-07 (“ASU 2015-07”) eliminating the requirement for investments measured at net asset value to be categorized within the fair value hierarchy under GAAP and requiring the disclosure of sufficient information to reconcile the fair value of the remaining assets categorized within the fair value hierarchy to the financial statements. ASU 2015-07 is effective for interim and annual reporting periods beginning after December 15, 2015. Management has reviewed the requirements and believes the adoption of ASU 2015-07 will not have a material impact on the financial statements.
Note 9. Subsequent Events
Subsequent events occurring after the date of this report through the date these financial statements were issued have been evaluated for potential impact and each Fund has had no such events.
|
REPORT OF INDEPENDENT REGISTERED PUBLIC ACCOUNTING FIRM |
|
To the Shareholders of DF Dent Premier Growth Fund, DF Dent Midcap Growth Fund and DF Dent Small Cap Growth Fund and the Board of Trustees of Forum Funds
We have audited the accompanying statements of assets and liabilities of the DF Dent Premier Growth Fund, DF Dent Midcap Growth Fund and DF Dent Small Cap Growth Fund (the "Funds"), each a series of shares of beneficial interest in the Forum Funds, including the schedules of investments, as of June 30, 2015, and the related statements of operations for the year then ended, the statements of changes in net assets for each of the years in the two-year period then ended and for the period November 1, 2013 (commencement of operations) through June 30, 2014 for DF Dent Small Cap Growth Fund and the financial highlights for each of the years or periods presented in the five-year period then ended. These financial statements and financial highlights are the responsibility of the Funds' management. Our responsibility is to express an opinion on these financial statements and financial highlights based on our audits.
We conducted our audits in accordance with the standards of the Public Company Accounting Oversight Board (United States). Those standards require that we plan and perform the audits to obtain reasonable assurance about whether the financial statements and financial highlights are free of material misstatement. An audit includes examining, on a test basis, evidence supporting the amounts and disclosures in the financial statements. Our procedures included confirmation of securities owned as of June 30, 2015 by correspondence with the custodian. An audit also includes assessing the accounting principles used and significant estimates made by management, as well as evaluating the overall financial statement presentation. We believe that our audits provide a reasonable basis for our opinion.
In our opinion, the financial statements and financial highlights referred to above present fairly, in all material respects, the financial position of the DF Dent Premier Growth Fund, DF Dent Midcap Growth Fund and DF Dent Small Cap Growth Fund as of June 30, 2015, and the results of their operations for the year then ended, the changes in their net assets for each of the years or periods presented in the two-year period then ended and their financial highlights for each of the years or periods presented in the five-year period then ended, in conformity with accounting principles generally accepted in the United States of America.

BBD, LLP
Philadelphia, Pennsylvania
August 19, 2015
|
ADDITIONAL INFORMATION (Unaudited) |
|
Investment Advisory Agreement Approval
At the June 12, 2015 Board meeting, the Board, including all of the Independent Trustees, considered the approval of the continuance of the investment advisory agreement between the Adviser and the Trust pertaining to the Funds (the “Advisory Agreement”). In preparation for its deliberations, the Board requested written responses from the Adviser to a due diligence questionnaire circulated on the Board's behalf. The Board also discussed the materials with Independent Trustee counsel and, as necessary, with the Trust's administrator, Atlantic Fund Services. During its deliberations, the Board received an oral presentation from the Adviser, and was assisted by the advice of Independent Trustee counsel.
In evaluating the Advisory Agreement for the Funds, the Board reviewed written materials furnished by the Adviser and the administrator, including information regarding the Adviser's personnel, operations and financial condition. In addition, the Board recognized that the evaluation process with respect to the Adviser is an ongoing one and, in this regard, the Board considered information provided at regularly scheduled meetings during the past year, including, among other things, information concerning the Funds' performance and services provided by the Adviser and by the Trust’s CCO.
At the meeting, the Board reviewed, among other matters: (1) the nature, extent and quality of the services provided to the Funds by the Adviser, including information on the investment performance of the Funds and Adviser; (2) the costs of the services provided and profitability to the Adviser with respect to its relationship with the Funds; (3) the advisory fee and total expense ratio of the Funds compared to a relevant peer group of funds; (4) the extent to which economies of scale may be realized as the Funds grow and whether the advisory fee enables each Fund's investors to share in the benefits of economies of scale; and (5) other benefits received by the Adviser from its relationship with the Funds.
Nature, Extent and Quality of Services
Based on written materials received, a presentation from a senior representative of the Adviser and discussions with the Adviser about the Adviser’s personnel, operations and financial condition, and with the Trust’s CCO about the Adviser, the Board considered the quality of services provided by the Adviser under the Advisory Agreement. In this regard, the Board considered information regarding the experience, qualifications and professional background of the portfolio managers and other personnel at the Adviser with principal responsibility for the Funds, as well as the investment philosophy and decision-making process of those professionals and the capability and integrity of the Adviser’s senior management and staff.
The Board considered also the adequacy of the Adviser’s resources. The Board noted the Adviser’s representation that the firm is in good financial condition and capable of providing high-quality advisory services to the Funds for the foreseeable future. Based on the presentation and the materials provided by the Adviser in connection with the Board’s consideration of the renewal of the Advisory Agreement, the Board concluded that, overall, it was satisfied with the nature, extent and quality of services to be provided to the Funds under the Advisory Agreement.
|
ADDITIONAL INFORMATION (Unaudited) |
|
Performance
In connection with a presentation by the Adviser regarding its approach to managing the Funds, the Board reviewed the performance of the each Fund compared to its respective benchmark. The Board observed that, although the DF Dent Premier Growth Fund underperformed the S&P 500 Index, its primary benchmark, for the one-, three-, and five-year periods ended March 31, 2015, it outperformed its benchmark for the 10-year period ended March 31, 2015 and since the DF Dent Premier Growth Fund’s inception in 2001. The Board also considered the DF Dent Premier Growth Fund’s performance relative to its Lipper Inc. (“Lipper”) peer group, noting that, based on the information provided by Lipper, the DF Dent Premier Growth Fund underperformed the median of its peer group for the one-, three-, and five-year periods ended March 31, 2015. The Board noted the Adviser’s representation that the Fund was underinvested in mega-cap blue chip and high-dividend paying stocks, which represented only a small portion of the Fund’s portfolio but were the best performing stocks in the Fund’s benchmark during 2014. The Board also noted the Adviser’s belief that technology stocks were expected to rebound such that the Fund was well-positioned and no changes in the Fund’s investment strategy had been contemplated.
The Board observed that the DF Dent Midcap Growth Fund underperformed its primary benchmark, the Russell Midcap Growth Index, for the one- and three-year periods ended March 31, 2015, but had outperformed its primary benchmark since the inception of the Fund in 2011. The Board also considered the DF Dent Midcap Growth Fund’s performance relative to its Lipper peer group, noting that, based on the information provided by Lipper, the DF Dent Midcap Growth Fund underperformed the median of its peer group for the one-year period ended March 31, 2015, but outperformed the median of its Lipper peers for the three-year period ended March 31, 2015. The Board noted the Adviser’s representation that the Fund’s performance compared to its Lipper peers and benchmark was more favorable in the longer-term and that the short-term underperformance could be attributed to overexposure to technology and consumer discretionary stocks during 2014.
The Board observed that the DF Dent Small Cap Growth Fund underperformed its primary benchmark, the Russell 2000 Small Cap Growth Index, for the one-year period ended March 31, 2015 and since the Fund’s inception in 2013, but outperformed the median of its Lipper peer group for the one-year period ended March 31, 2015.
Noting the Funds’ asset growth and performance, the Board concluded that the performance of each Fund was reasonable and that each Fund and its shareholders could benefit from the Adviser’s management of the Funds.
Compensation
The Board evaluated the Adviser’s compensation for providing advisory services to each of the Funds and analyzed comparative information on “actual” advisory fee rates (i.e., after fee waivers), and actual total expenses of the Funds' Lipper peer groups. The Board noted that the Adviser’s actual advisory fee rate and total expense ratio for the DF Dent Premier Growth Fund were among the highest in its Lipper peer group. The Board considered the Adviser’s representation that it had agreed to maintain the expense ratio for the DF Dent Premier Growth Fund at 110 basis points on the first $150 million in fund net assets and to cap the expense
|
ADDITIONAL INFORMATION (Unaudited) |
|
ratio at 90 basis points on fund net assets exceeding $150 million. Based on the foregoing and other relevant factors, the Board concluded that the Adviser’s advisory fee rate charged to the DF Dent Premier Growth Fund was reasonable.
With respect to the DF Dent Midcap Growth Fund, the Board noted that the Adviser’s actual advisory fee rate and the Fund’s actual total expense ratio were each lower than the median of its Lipper peer group. Based on the foregoing and other relevant factors, the Board concluded that the Adviser’s advisory fee rate charged to the DF Dent Midcap Growth Fund was reasonable.
With respect to the DF Dent Small Cap Growth Fund, the Board noted that the Adviser’s actual advisory fee rate was the lowest in its Lipper Inc. peer group. The Board also noted that the DF Dent Small Cap Growth Fund’s actual total expense ratio was below the median of its Lipper peer group. Based on the foregoing and other relevant factors, the Board concluded that the Adviser’s advisory fee rate charged to the DF Dent Small Cap Growth Fund was reasonable.
Cost of Services and Profitability
The Board considered information provided by the Adviser regarding the costs of services and its profitability with respect to the Funds. In this regard, the Board considered the Adviser’s operating expenses and other resources devoted to the Funds, as well as the Adviser’s discussion of costs and profitability. The Board noted that the actual advisory fee and actual total expenses were in line with those of the Funds’ respective Lipper peers and that the Adviser had in place a contractual expense waiver to ensure the expense ratios for the Funds remained at reasonable levels, including a tiered breakpoint schedule for the DF Dent Premier Growth Fund. The Board also noted the Adviser’s representation that the Funds represent a relatively small percentage of the Adviser’s total assets under management, as of December 31, 2014, yet the Funds represent a relatively high percentage of the Adviser’s overall administrative, reporting, and compliance expenses. Based on these and other applicable considerations, the Board concluded that the Adviser’s profits attributable to management of the Funds were reasonable in the context of all factors considered.
Economies of Scale
The Board evaluated whether the Funds would benefit from any economies of scale. In this respect, the Board noted the Adviser’s representation that each Fund could benefit from economies of scale as assets grow, and that the Adviser has contractually agreed to cap the DF Dent Premier Growth Fund’s and the DF Dent Midcap Growth Fund’s total expenses (excluding all taxes, interest, portfolio transaction expenses, and extraordinary expenses) through October 31, 2019 at 1.10% on assets of up to $150 million and at 0.90% on assets exceeding $150 million. The Board further noted that currently the shareholders of both the DF Dent Premier Growth and DF Dent Midcap Growth Funds were benefitting from the expense caps, and, because the DF Dent Premier Growth Fund's assets were greater than $150 million, that Fund's expenses were being capped at an average level of less than 1.10%. With respect to the DF Dent Small Cap Growth Fund, the Board noted that the Adviser has contractually agreed to cap the DF Dent Small Cap Growth Fund’s total expenses (excluding all taxes, interest, portfolio transaction expenses, and extraordinary expenses) so that they doe not exceed 1.25% through October 31, 2019. The Board also noted the Adviser’s representation that the DF Dent Small
|
ADDITIONAL INFORMATION (Unaudited) |
|
Cap Growth Fund potentially could benefit from economies of scale as assets grow, but the Adviser was not proposing breakpoints or changes in fees at this time because the DF Dent Small Cap Growth Fund only commenced operations in November 2013, and had not yet achieved scale.
Other Benefits
The Board noted the Adviser’s representation that, aside from its contractual advisory fees, it does not benefit in a material way from its relationship with the Funds. Based on the foregoing representation, the Board concluded that other benefits received by the Adviser from its relationship with the Funds were not a material factor to consider in approving the continuation of the Advisory Agreement.
Conclusion
The Board did not identify any single factor as being of paramount importance, and different Trustees may have given different weight to different factors. The Board reviewed a memorandum from Trust counsel discussing the legal standards applicable to its consideration of the Advisory Agreement. Based on its review, including consideration of each of the factors referenced above, the Board determined, in the exercise of its business judgment, that the advisory arrangement, as outlined in the Advisory Agreement, was fair and reasonable in light of the services performed or to be performed, expenses incurred or to be incurred and such other matters as the Board considered relevant.
Proxy Voting Information
A description of the policies and procedures that each Fund uses to determine how to vote proxies relating to securities held in each Fund’s portfolio is available, without charge and upon request, by calling (866) 233-3368 and on the U.S. Securities and Exchange Commission’s (the “SEC”) website at www.sec.gov. Each Fund’s proxy voting record for the most recent twelve-month period ended June 30 is available, without charge and upon request, by calling (866) 233-3368 and on the SEC’s website at www.sec.gov.
Availability of Quarterly Portfolio Schedules
Each Fund files its complete schedule of portfolio holdings with the SEC for the first and third quarters of each fiscal year on Form N-Q. These filings are available, without charge and upon request on the SEC’s website at www.sec.gov or may be reviewed and copied at the SEC’s Public Reference Room in Washington, DC. Information on the operation of the Public Reference Room may be obtained by calling (800) SEC-0330.
Shareholder Expense Example
As a shareholder of the Funds, you incur two types of costs: (1) transaction costs, including redemption fees, and (2) ongoing costs, including management fees and other Fund expenses. This example is intended to help you understand your ongoing costs (in dollars) of investing in the Funds, and to compare these costs with the ongoing costs of investing in other mutual funds.
|
ADDITIONAL INFORMATION (Unaudited) |
|
The example is based on an investment of $1,000 invested at the beginning of the period and held for the entire period from January 1, 2015, through June 30, 2015.
Actual Expenses – The first line of the table below provides information about actual account values and actual expenses. You may use the information in this line, together with the amount you invested, to estimate the expenses that you paid over the period. Simply divide your account value by $1,000 (for example, an $8,600 account value divided by $1,000 = 8.6), then multiply the result by the number in the first line under the heading entitled “Expenses Paid During Period” to estimate the expenses you paid on your account during the period.
Hypothetical Example for Comparison Purposes – The second line of the table below provides information about hypothetical account values and hypothetical expenses based on each Fund’s actual expense ratio and an assumed rate of return of 5% per year before expenses, which is not each Fund’s actual return. The hypothetical account values and expenses may not be used to estimate the actual ending account balance or expenses you paid for the period. You may use this information to compare the ongoing costs of investing in each Fund and other funds. To do so, compare this 5% hypothetical example with the 5% hypothetical examples that appear in the shareholder reports of other funds.
Please note that the expenses shown in the table are meant to highlight your ongoing costs only and do not reflect any transactional costs, such as redemption fees. Therefore, the second line of the table is useful in comparing ongoing costs only, and will not help you determine the relative total costs of owning different funds. In addition, if these transactional costs were included, your costs would have been higher.
| | Beginning | | Ending | | Expenses | | Annualized |
| | Account Value | | Account Value | | Paid During | | Expense |
| | January 1, 2015 | | June 30, 2015 | | Period* | | Ratio* |
| DF Dent Premier Growth Fund | | | | | | | | | | | |
| Actual | $ | 1,000.00 | | $ | 1,027.96 | | $ | 5.38 | | 1.07 | % |
| Hypothetical (5% return before taxes) | $ | 1,000.00 | | $ | 1,019.49 | | $ | 5.36 | | 1.07 | % |
| | | | | | | | | | | | |
| DF Dent Midcap Growth Fund | | | | | | | | | | | |
| Actual | $ | 1,000.00 | | $ | 1,062.71 | | $ | 5.63 | | 1.10 | % |
| Hypothetical (5% return before taxes) | $ | 1,000.00 | | $ | 1,019.34 | | $ | 5.51 | | 1.10 | % |
| | | | | | | | | | | | |
| DF Dent Small Cap Growth Fund | | | | | | | | | | | |
| Actual | $ | 1,000.00 | | $ | 1,090.10 | | $ | 6.48 | | 1.25 | % |
| Hypothetical (5% return before taxes) | $ | 1,000.00 | | $ | 1,018.60 | | $ | 6.26 | | 1.25 | % |
| | | | | | | | | | | | |
| * | Expenses are equal to each Fund’s annualized expense ratio multiplied by the average account value over the period, multiplied by the number of days in the most recent fiscal half-year divided by 365 to reflect the half-year period. |
|
ADDITIONAL INFORMATION (Unaudited) |
|
Federal Tax Status of Dividends Declared during the Fiscal Year
For federal income tax purposes, dividends from short-term capital gains are classified as ordinary income. DF Dent Midcap Growth Fund designates 61.31% of its income dividend distributed as qualifying for the corporate dividends received deduction (DRD) and 67.25% for the qualified dividend rate (QDI) as defined in Section 1(h)(11) of the Internal Revenue Code. DF Dent Midcap Growth Fund also designates 100.00% as short-term capital gain dividends exempt from U.S. tax for foreign shareholders (QSD).
DF Dent Small Cap Growth Fund designates 38.35% as DRD, 41.85% as QDI and 100.00% for QSD.
Trustees and Officers of the Trust
The Board is responsible for oversight of the management of the Trust’s business affairs and of the exercise of all the Trust’s powers except those reserved for the shareholders. The following table provides information about each Trustee and certain officers of the Trust. Each Trustee and officer holds office until the person resigns, is removed, or is replaced. Unless otherwise noted, the persons have held their principal occupations for more than five years. The address for all Trustees and officers is Three Canal Plaza, Suite 600, Portland, Maine 04101. Mr. Keffer is considered an Interested Trustee due to his affiliation with Atlantic. Each Fund’s Statement of Additional Information includes additional information about the Trustees and is available, without charge and upon request, by calling (866) 233-3368.
| Name and Year of Birth | Position with the Trust | Length of Time Served | Principal Occupation(s) During Past Five Years | Number of Series of Fund Complex¹ Overseen by Trustee | Other Directorships Held by Trustee |
Independent Trustees | | | | | |
J. Michael Parish Born: 1943 | Chairman of the Board; Trustee; Chairman, Nominating Committee and Qualified Legal Compliance Committee | Since 1989 (Chairman since 2004) | Retired since 2003; formerly, Partner, Wolf, Block, Schorr and Solis-Cohen, LLP (law firm) 2002-2003; Partner, Thelen Reid & Priest LLP (law firm) 1995-2002. | 27 | None |
Costas Azariadis Born: 1943 | Trustee | Since 1989 | Professor of Economics, Washington University since 2006. | 27 | None |
James C. Cheng Born: 1942 | Trustee; Chairman, Audit Committee | Since 1989 | President, Technology Marketing Associates (marketing company for small- and medium-sized businesses in New England) since 1991. | 27 | None |
David Tucker Born: 1958 | Trustee; Vice Chairman | Since 2011 (Vice Chairman since 2015) | Director, Blue Sky Experience since 2008; Senior Vice President & General Counsel, American Century Companies 1998-2008. | 36 | Trustee, Forum Funds II and Forum ETF Trust |
1The Fund Complex includes the Trust, Forum Funds II and Forum ETF Trust and is overseen by different Boards of Trustees
|
ADDITIONAL INFORMATION (Unaudited) |
|
Name and Year of Birth | Position with the Trust | Length of Time Served | Principal Occupation(s) During Past Five Years | Number of Series of Fund Complex¹ Overseen by Trustee | xOther Directorships Held by Trustee |
Interested Trustee | | | | | |
John Y. Keffer2 Born: 1942 | Trustee; Vice Chairman | Since 1989 | Chairman, Atlantic since 2008; President, Forum Investment Advisors, LLC since 2011; President, Forum Foundation (a charitable organization) since 2005; President, Forum Trust, LLC (a non-depository trust company chartered in the State of Maine) since 1997. | 36 | Director, Wintergreen Fund, Inc.; Trustee, Forum Funds II, Forum ETF Trust and ALTMFX Trust |
Officers | | | | | |
Jessica Chase Born: 1970 | President; Principal Executive Officer | Since 2015 | Senior Vice President, Atlantic since 2008. | N/A | N/A |
Karen Shaw Born: 1972 | Treasurer; Principal Financial Officer | Since 2008 | Senior Vice President, Atlantic since 2008. | N/A | N/A |
Zachary Tackett Born: 1988 | Vice President; Secretary; Anti-Money Laundering Compliance Officer | Since 2014 | Associate Counsel, Atlantic since 2014; Intern Associate, Coakley & Hyde, PLLC, 2010-2013. | N/A | N/A |
Michael J. McKeen Born: 1971 | Vice President | Since 2009 | Senior Vice President, Atlantic since 2008. | N/A | N/A |
Timothy Bowden Born: 1969 | Vice President | Since 2009 | Manager, Atlantic since 2008. | N/A | N/A |
Geoffrey Ney Born: 1975 | Vice President | Since 2013 | Manager, Atlantic since 2013; Senior Fund Accountant, Atlantic, 2008-2013. | N/A | N/A |
Todd Proulx Born: 1978 | Vice President | Since 2013 | Manager, Atlantic since 2013; Senior Fund Accountant, Atlantic, 2008-2013. | N/A | N/A |
1The Fund Complex includes the Trust, Forum Funds II and Forum ETF Trust and is overseen by different Boards of Trustees. 2Atlantic is a subsidiary of Forum Holdings Corp. I, a Delaware corporation that is wholly owned by Mr. Keffer. |
| GOLDEN FUNDS |
A MESSAGE TO OUR SHAREHOLDERS (Unaudited) |
| JUNE 30, 2015 |
Dear Shareholder,
We are pleased to present the annual report for the Golden Large Cap Core Fund and the Golden Small Cap Core Fund (the “Funds”) for the period of July 1, 2014 through June 30, 2015.
Market Review
Over the 12 months ending June 30, 2015, most broad measures of the U.S. equity markets posted positive returns, and large cap stocks outpaced small cap stocks by a small margin. Outside the U.S. most index returns were much weaker, as many developed and emerging market indexes declined.
| | Index | 12-Month Return | |
| | Russell 1000® | 7.37% | |
| | Russell 2000® | 6.49% | |
| | S&P 500® | 7.42% | |
| | MSCI EAFE | -4.22% | |
| | MSCI Emerging Markets | -5.12% | |
| | As of 6/30/2015 Sources: Interactive Data Corp. and APX | |
Gross domestic product (“GDP”) reports were generally positive over the period. Growth in the second, third and fourth quarters of 2014, and the first quarter of 2015 (reports are delayed by a quarter) were 4.6%, 5.0%, 2.2% and -0.2%, respectively. Manufacturing reports indicated expansion throughout the period; other than a contraction in the first quarter of 2015, retail sales grew; unemployment continued to improve; inflation remained low, and the impact of falling energy prices in late 2014 and early 2015 led to a decline in headline consumer price inflation for part of the period; and surveys of consumer confidence registered high readings. The Federal Reserve completed its quantitative easing program in October 2014 and has since changed its language to prepare investors for potential interest rate increases. The U.S. dollar appreciated against most major currencies for several quarters; though it depreciated during the second quarter of 2015. Additionally, though there was weakness in the first quarter, U.S. corporations were able to generate healthy profits for much of the period as they benefited from a low interest-rate environment, solid consumer confidence, and restrained labor cost increases.
Golden Large Cap Core Fund
The Fund seeks to achieve long-term capital appreciation by investing in large capitalization domestic equities. The goal of the Fund is to construct an actively managed portfolio of fundamentally sound large-cap companies that we believe exhibit the likelihood of meeting or exceeding analysts’ earnings expectations.
For the one-year period ending June 30, 2015, the Fund delivered a total return of 12.00%. The Fund’s return was ahead of the 7.42% total return of the S&P 500®, the Fund’s benchmark index, for the same
|
A MESSAGE TO OUR SHAREHOLDERS (Unaudited) |
| JUNE 30, 2015 |
period. The market has steadily improved since early 2009 and rewarded investors who maintained their exposure to equities.
The Fund’s best sources of advantage relative to the S&P 500® over the last 12 months were from the Health Care, Industrials, and Consumer Discretionary sectors. Favorable stock selection in each of these three sectors helped the Fund outperform. In addition, Health Care and Consumer Discretionary were the two top performing sectors in the benchmark and the Fund was overweight both sectors. In Health Care, managed care companies Centene Corp and Aetna were top performers as each benefited from enrollment growth and controlled medical expenses. Gilead Sciences was another top Health Care performer as demand for the company’s hepatitis C drug soared. Within Industrials, aerostructure manufacturer Spirit AeroSystems and airline operator Southwest Airlines performed well. Within the Consumer Discretionary sector, Lowe’s Companies and Hanesbrands were top performers. Lowe’s has been a beneficiary of the improved housing market (new construction and resale). A corporate initiative titled “Innovate to Elevate” has led to fundamental improvements at apparel company Hanesbrands through product innovation, supply chain efficiencies, and synergies from acquisitions.
Information Technology was the only sector that detracted from the Fund’s relative return versus the benchmark. We suffered losses in SanDisk, Micron Technology, and Intel, the Fund’s top detractors in the sector. Each is significantly exposed to the soft personal computer (“PC”) market. PC unit growth has declined as mobile devices and tablets have improved in function and convenience. We also lost on a relative basis by being underweight Apple Computer, one of the best-performing stocks within the benchmark. Outside the Information Technology sector, Trinity Industries (an Industrials stock with significant rail transportation business), and Halliburton and National Oilwell Varco (Energy stocks with business in drilling and production) were notable detractors.
Golden Small Cap Core Fund
The Fund seeks to achieve long-term capital appreciation by investing in small capitalization domestic equities. The goal of the Fund is to construct an actively managed portfolio of fundamentally sound small-cap companies that we believe exhibit the likelihood of meeting or exceeding analysts’ earnings expectations.
For the one-year period ending June 30, 2015, the Fund delivered a total return of 11.80%. The Fund’s return was ahead of the 6.49% total return of the Russell 2000®, the Fund’s benchmark index, for the same period.
Overall, stock selection and sector weighting decisions added value relative to the benchmark for the twelve month period. The Fund benefited most from stock selection within the Health Care, Financials, and Consumer Discretionary sectors. Top performers within these groups included footwear manufacturer Skechers U.S.A., multi-line managed care provider Centene Corp., and specialty pharmaceutical company Supernus Pharmaceuticals. Value added through sector weighting decisions was most favorable within the Energy sector, where our underweight exposure to the worst performing sector within the Russell 2000 Index proved beneficial.
|
A MESSAGE TO OUR SHAREHOLDERS (Unaudited) |
| JUNE 30, 2015 |
The Fund’s weakest results relative to the benchmark came from the Industrials sector. Stock selection was weak with solar power product manufacturer Enphase Energy, and railcar and marine vessel manufacturer Greenbrier Companies. Stock selection was also weak in the Energy sector where Stone Energy and Matrix Service Company were bottom performers.
Market Outlook
As the third quarter begins, global equity and bond markets are experiencing increased volatility. While the U.S. markets have been relatively calm, it appears that the Fed is poised to raise interest rates sometime before the end of the year, and that is contributing to an increased level of nervousness. Additionally, the second quarter ended with the Shanghai stock market near bear market territory, and the Greek stock market was closed awaiting the outcome of a referendum on a European aid package that would require further austerity.
While the U.S. economy hit a soft patch in the first quarter, it appears likely to recover to the slow growth trajectory of the last several years. A sub-3% growth rate is nothing to get excited about, but there are encouraging aspects of the economy. The strong job market and low energy prices have buoyed consumer confidence and bode well for consumption spending. Outside the U.S., there are cracks in the economies of Europe, Japan, the U.K., China, and a number of emerging markets. However, reflationary policies by the monetary and fiscal authorities in Europe, Japan, and China are being implemented in order to support markets while those economies undergo difficult structural adjustments.
First quarter corporate earnings in the U.S. were weak, though they were significantly influenced by the energy sector, and earnings still managed to exceed analysts’ expectations. Going into second quarter reporting season, the consensus estimate calls for a 4.5% year-over-year decline in earnings. However, given the recovery in the economic data reported during the quarter, this appears to be an overly pessimistic estimate and will likely lead to a positive surprise. The markets have been somewhat supported by corporations using their cash to buy back stock, pay dividends, and pursue mergers and acquisitions, and we believe this trend is likely to continue.
As we have noted over the last year or so, developed market equities appear expensive relative to historical valuation measures. While interest rates have risen recently, they remain low, making equities appear inexpensive versus government bonds on a relative yield basis. We believe there are still opportunities to invest in less expensive stocks with higher quality characteristics such as high free-cash-flow yields, superior earnings stability, and strong balance sheets.
|
A MESSAGE TO OUR SHAREHOLDERS (Unaudited) |
| JUNE 30, 2015 |
Sincerely,
The views expressed in this report are those of the Funds’ managers as of June 30, 2015, and may not reflect their views on the date this report is first published or anytime thereafter. These views are intended to assist shareholders of the Funds in understanding their investments in the Funds and do not constitute investment advice. With respect to the Golden Small Cap Core Fund, investing in the securities of small capitalization companies involves greater risk and the possibility of greater price volatility than investing in larger capitalization and more established companies.
GOLDEN LARGE CAP CORE FUND |
PERFORMANCE CHART AND ANALYSIS (Unaudited) |
| JUNE 30, 2015 |
GOLDEN SMALL CAP CORE FUND |
PERFORMANCE CHART AND ANALYSIS (Unaudited) |
| JUNE 30, 2015 |
| GOLDEN LARGE CAP CORE FUND |
| SCHEDULE OF INVESTMENTS |
| JUNE 30, 2015 |
| | | | Security | | | | | | | | | | |
| | Shares | | | | | | | | | | | Value | |
| Common Stock - 98.3% | | | | | | | | | | |
| Consumer Discretionary - 16.6% | | | | | | | | | | |
| | 33,192 | | Comcast Corp., Class A | | | | | | | | $ | 1,996,167 | |
| | 33,588 | | Foot Locker, Inc. | | | | | | | | | 2,250,732 | |
| | 87,757 | | Ford Motor Co. | | | | | | | | | 1,317,233 | |
| | 71,223 | | Hanesbrands, Inc. | | | | | | | | | 2,373,150 | |
| | 20,747 | | Lear Corp. | | | | | | | | | 2,329,058 | |
| | 30,222 | | Lowe's Cos., Inc. | | | | | | | | | 2,023,967 | |
| | 42,675 | | Magna International, Inc. | | | | | | | | | 2,393,641 | |
| | 20,914 | | The Home Depot, Inc. | | | | | | | | | 2,324,173 | |
| | | | | | | | | | | | | 17,008,121 | |
| Consumer Staples – 6.6% | | | | | | | | | | |
| | 41,082 | | Archer-Daniels-Midland Co. | | | | | | | | | 1,980,974 | |
| | 21,926 | | CVS Health Corp. | | | | | | | | | 2,299,599 | |
| | 54,504 | | Pinnacle Foods, Inc. | | | | | | | | | 2,482,112 | |
| | | | | | | | | | | | | 6,762,685 | |
| Energy - 7.3% | | | | | | | | | | |
| | 21,022 | | ConocoPhillips | | | | | | | | | 1,290,961 | |
| | 16,572 | | Exxon Mobil Corp. | | | | | | | | | 1,378,790 | |
| | 23,726 | | National Oilwell Varco, Inc. | | | | | | | | | 1,145,491 | |
| | 29,006 | | Valero Energy Corp. | | | | | | | | | 1,815,776 | |
| | 42,095 | | Western Refining, Inc. | | | | | | | | | 1,836,184 | |
| | | | | | | | | | | | | 7,467,202 | |
| Financials - 14.3% | | | | | | | | | | |
| | 21,589 | | Capital One Financial Corp. | | | | | | | | | 1,899,184 | |
| | 29,827 | | JPMorgan Chase & Co. | | | | | | | | | 2,021,078 | |
| | 41,514 | | Lincoln National Corp. | | | | | | | | | 2,458,459 | |
| | 52,538 | | Morgan Stanley | | | | | | | | | 2,037,949 | |
| | 10,394 | | The Goldman Sachs Group, Inc. | | | | | | | | | 2,170,163 | |
| | 47,293 | | The Hartford Financial Services Group, Inc. | | | | | | | | | 1,965,970 | |
| | 44,732 | | Voya Financial, Inc. | | | | | | | | | 2,078,696 | |
| | | | | | | | | | | | | 14,631,499 | |
| Health Care - 20.0% | | | | | | | | | | |
| | 21,766 | | Aetna, Inc. | | | | | | | | | 2,774,294 | |
| | 20,115 | | AmerisourceBergen Corp. | | | | | | | | | 2,139,029 | |
| | 11,798 | | Amgen, Inc. | | | | | | | | | 1,811,229 | |
| | 5,321 | | Biogen, Inc. (a) | | | | | | | | | 2,149,365 | |
| | 35,614 | | Centene Corp. (a) | | | | | | | | | 2,863,366 | |
| | 21,261 | | Gilead Sciences, Inc. | | | | | | | | | 2,489,238 | |
| | 10,636 | | McKesson Corp. | | | | | | | | | 2,391,079 | |
| | 29,658 | | Merck & Co., Inc. | | | | | | | | | 1,688,430 | |
| | 17,267 | | UnitedHealth Group, Inc. | | | | | | | | | 2,106,574 | |
| | | | | | | | | | | | | 20,412,604 | |
| Industrials - 9.4% | | | | | | | | | | |
| | 48,615 | | Delta Air Lines, Inc. | | | | | | | | | 1,997,104 | |
| | 14,035 | | Northrop Grumman Corp. | | | | | | | | | 2,226,372 | |
| | 49,308 | | Southwest Airlines Co. | | | | | | | | | 1,631,602 | |
| | 47,114 | | Spirit AeroSystems Holdings, Inc., Class A (a) | | | | | | | | | 2,596,452 | |
| | 42,246 | | Trinity Industries, Inc. | | | | | | | | | 1,116,562 | |
| | | | | | | | | | | | | 9,568,092 | |
| Information Technology - 12.3% | | | | | | | | | | |
| | 20,490 | | Apple, Inc. | | | | | | | | | 2,569,958 | |
| | 64,134 | | Cisco Systems, Inc. | | | | | | | | | 1,761,120 | |
| | 19,469 | | DST Systems, Inc. | | | | | | | | | 2,452,704 | |
| | 66,952 | | Micron Technology, Inc. (a) | | | | | | | | | 1,261,376 | |
| | 35,666 | | Microsoft Corp. | | | | | | | | | 1,574,654 | |
| | 38,129 | | Oracle Corp. | | | | | | | | | 1,536,599 | |
| | 23,959 | | SanDisk Corp. | | | | | | | | | 1,394,893 | |
| | | | | | | | | | | | | 12,551,304 | |
| Materials – 3.8% | | | | | | | | | | |
| | 31,651 | | Avery Dennison Corp. | | | | | | | | | 1,928,812 | |
| | 37,862 | | The Dow Chemical Co. | | | | | | | | | 1,937,399 | |
| | | | | | | | | | | | | 3,866,211 | |
| Technology - 8.0% | | | | | | | | | | |
| | 35,121 | | Electronic Arts, Inc. (a) | | | | | | | | | 2,335,546 | |
| | 51,528 | | Intel Corp. | | | | | | | | | 1,567,224 | |
| | 23,208 | | Skyworks Solutions, Inc. | | | | | | | | | 2,415,953 | |
| | 49,112 | | Tessera Technologies, Inc. | | | | | | | | | 1,865,274 | |
| | | | | | | | | | | | | 8,183,997 | |
| Total Common Stock | | | | | | | | | | |
| (Cost $83,241,901) | | | | | | | | | 100,451,715 | |
| Total Investments - 98.3% | | | | | | | | | | |
(Cost $83,241,901)* | | | | | | | | $ | 100,451,715 | |
| Other Assets & Liabilities, Net – 1.7% | | | | | | | | | 1,761,112 | |
| Net Assets – 100.0% | | | | | | | | $ | 102,212,827 | |
| | | | | | | | | | | | | | |
| (a) | Non-income producing security. |
| * | Cost for federal income tax purposes is $83,609,620 and net unrealized appreciation consists of: |
| Gross Unrealized Appreciation | | $ | 19,770,183 | |
| Gross Unrealized Depreciation | | | (2,928,088 | ) |
| Net Unrealized Appreciation | | $ | 16,842,095 | |
See Notes to Financial Statements. | 7 | |
| GOLDEN LARGE CAP CORE FUND |
| SCHEDULE OF INVESTMENTS |
| JUNE 30, 2015 |
The following is a summary of the inputs used to value the Fund’s investments as of June 30, 2015.
The inputs or methodology used for valuing securities are not necessarily an indication of the risks associated with investing in those securities. For more information on valuation inputs, and their aggregation into the levels used in the table below, please refer to the Security Valuation section in Note 2 of the accompanying Notes to Financial Statements.
| Valuation Inputs | | Investments in Securities |
| Level 1 - Quoted Prices | | $ | 100,451,715 | |
| Level 2 - Other Significant Observable Inputs | | | - | |
| Level 3 - Significant Unobservable Inputs | | | - | |
| Total | | $ | 100,451,715 | |
The Level 1 value displayed in this table is Common Stock. Refer to this Schedule of Investments for a further breakout of each security by industry.
The Fund utilizes the end of period methodology when determining transfers. There were no transfers among Level 1, Level 2 and Level 3 for the year ended June 30, 2015.
| PORTFOLIO HOLDINGS | | |
| % of Net Assets | | |
| Consumer Discretionary | 16.6 | % |
| Consumer Staples | 6.6 | % |
| Energy | 7.3 | % |
| Financials | 14.3 | % |
| Health Care | 20.0 | % |
| Industrials | 9.4 | % |
| Information Technology | 12.3 | % |
| Materials | 3.8 | % |
| Technology | 8.0 | % |
| Other Assets & Liabilities, Net | 1.7 | % |
| | 100.0 | % |
See Notes to Financial Statements. | 8 | |
GOLDEN SMALL CAP CORE FUND |
| SCHEDULE OF INVESTMENTS |
| JUNE 30, 2015 |
| | | | Security | | | | | | | | | | |
| | Shares | | Description | | | | | | | | | Value | |
| Common Stock - 98.4% | | | | | | | | | | |
| Consumer Discretionary - 14.6% | | | | | | | | | | |
| | 19,712 | | Capella Education Co. | | | | | | | | $ | 1,057,943 | |
| | 111,974 | | Denny's Corp. (a) | | | | | | | | | 1,300,018 | |
| | 26,340 | | Drew Industries, Inc. | | | | | | | | | 1,528,247 | |
| | 29,930 | | Gentherm, Inc. (a) | | | | | | | | | 1,643,456 | |
| | 59,463 | | LifeLock, Inc. (a) | | | | | | | | | 975,193 | |
| | 65,124 | | Nutrisystem, Inc. | | | | | | | | | 1,620,285 | |
| | 86,299 | | Ruth's Hospitality Group, Inc. | | | | | | | | | 1,391,140 | |
| | 15,944 | | Skechers U.S.A., Inc., Class A (a) | | | | | | | | | 1,750,492 | |
| | 41,808 | | Tower International, Inc. (a) | | | | | | | | | 1,089,099 | |
| | | | | | | | | | | | | 12,355,873 | |
| Consumer Staples – 2.4% | | | | | | | | | | |
| | 39,194 | | Cal-Maine Foods, Inc. | | | | | | | | | 2,045,927 | |
| | | | | | | | | | | | | | |
| Energy – 3.1% | | | | | | | | | | |
| | 63,470 | | Matrix Service Co. (a) | | | | | | | | | 1,160,232 | |
| | 214,722 | | Teekay Tankers, Ltd., Class A | | | | | | | | | 1,419,312 | |
| | | | | | | | | | | | | 2,579,544 | |
| | | | | | | | | | | | | | |
| Financials - 20.8% | | | | | | | | | | |
| | 32,275 | | AmTrust Financial Services, Inc. | | | | | | | | | 2,114,335 | |
| | 224,827 | | Cowen Group, Inc., Class A (a) | | | | | | | | | 1,438,893 | |
| | 47,749 | | Employers Holdings, Inc. | | | | | | | | | 1,087,722 | |
| | 25,779 | | FBL Financial Group, Inc., Class A | | | | | | | | | 1,487,964 | |
| | 54,902 | | FCB Financial Holdings, Inc., Class A (a) | | | | | | | | | 1,745,884 | |
| | 63,610 | | Federated National Holding Co. | | | | | | | | | 1,539,362 | |
| | 42,389 | | HFF, Inc., Class A | | | | | | | | | 1,768,893 | |
| | 44,660 | | Investment Technology Group, Inc. | | | | | | | | | 1,107,568 | |
| | 84,961 | | Maiden Holdings, Ltd. | | | | | | | | | 1,340,685 | |
| | 69,366 | | National General Holdings Corp. | | | | | | | | | 1,444,894 | |
| | 22,793 | | ProAssurance Corp. | | | | | | | | | 1,053,264 | |
| | 39,109 | | QTS Realty Trust, Inc., Class A REIT | | | | | | | | | 1,425,523 | |
| | | | | | | | | | | | | 17,554,987 | |
| Health Care - 17.2% | | | | | | | | | | |
| | 26,308 | | Amsurg Corp. (a) | | | | | | | | | 1,840,245 | |
| | 137,324 | | BioTelemetry, Inc. (a) | | | | | | | | | 1,294,965 | |
| | 31,819 | | HealthSouth Corp. | | | | | | | | | 1,465,583 | |
| | 25,603 | | Lannett Co., Inc. (a) | | | | | | | | | 1,521,842 | |
| | 123,538 | | MiMedx Group, Inc. (a) | | | | | | | | | 1,431,805 | |
| | 37,852 | | NuVasive, Inc. (a) | | | | | | | | | 1,793,428 | |
| | 45,002 | | PharMerica Corp. (a) | | | | | | | | | 1,498,567 | |
| | 81,849 | | Select Medical Holdings Corp. | | | | | | | | | 1,325,954 | |
| | 136,541 | | Supernus Pharmaceuticals, Inc. (a) | | | | | | | | | 2,318,466 | |
| | | | | | | | | | | | | 14,490,855 | |
| Industrials - 15.1% | | | | | | | | | | |
| | 38,232 | | Argan, Inc. | | | | | | | | | 1,541,897 | |
| | 17,714 | | Astronics Corp. (a) | | | | | | | | | 1,255,745 | |
| | 74,426 | | Blount International, Inc. (a) | | | | | | | | | 812,732 | |
| | 23,947 | | Deluxe Corp. | | | | | | | | | 1,484,714 | |
| | 24,523 | | EMCOR Group, Inc. | | | | | | | | | 1,171,464 | |
| | 82,393 | | Enphase Energy, Inc. (a) | | | | | | | | | 627,011 | |
| | 31,468 | | ITT Corp. | | | | | | | | | 1,316,621 | |
| | 31,627 | | Matson, Inc. | | | | | | | | | 1,329,599 | |
| | 71,709 | | RPX Corp. (a) | | | | | | | | | 1,211,882 | |
| | 16,447 | | The Greenbrier Cos., Inc. | | | | | | | | | 770,542 | |
| | 11,261 | | UniFirst Corp. | | | | | | | | | 1,259,543 | |
| | | | | | | | | | | | | 12,781,750 | |
| Information Technology - 12.7% | | | | | | | | | | |
| | 145,373 | | Brocade Communications Systems, Inc. | | | | | | | | | 1,727,031 | |
| | 75,114 | | Inphi Corp. (a) | | | | | | | | | 1,717,106 | |
| | 23,528 | | j2 Global, Inc. | | | | | | | | | 1,598,492 | |
| | 32,544 | | Methode Electronics, Inc. | | | | | | | | | 893,333 | |
| | 45,756 | | OmniVision Technologies, Inc. (a) | | | | | | | | | 1,198,578 | |
| | 58,098 | | Sanmina Corp. (a) | | | | | | | | | 1,171,256 | |
| | 119,037 | | The Hackett Group Inc. | | | | | | | | | 1,598,667 | |
| | 82,529 | | TiVo, Inc. (a) | | | | | | | | | 836,844 | |
| | | | | | | | | | | | | 10,741,307 | |
| Materials – 4.9% | | | | | | | | | | |
| | 98,754 | | Graphic Packaging Holding Co. | | | | | | | | | 1,375,643 | |
| | 90,625 | | Trecora Resources (a) | | | | | | | | | 1,368,437 | |
| | 51,984 | | Trinseo SA (a) | | | | | | | | | 1,395,251 | |
| | | | | | | | | | | | | 4,139,331 | |
| Technology - 5.9% | | | | | | | | | | |
| | 71,135 | | Integrated Device Technology, Inc. (a) | | | | | | | | | 1,543,630 | |
| | 83,069 | | Pericom Semiconductor Corp. | | | | | | | | | 1,092,357 | |
| | 33,835 | | Tessera Technologies, Inc. | | | | | | | | | 1,285,053 | |
| | 136,659 | | Xcerra Corp. (a) | | | | | | | | | 1,034,509 | |
| | | | | | | | | | | | | 4,955,549 | |
| Telecommunications - 1.7% | | | | | | | | | | |
| | 77,701 | | Inteliquent, Inc. | | | | | | | | | 1,429,698 | |
| | | | | | | | | | | | | | |
| Total Common Stock | | | | | | | | | | |
| (Cost $75,113,313) | | | | | | | | | 83,074,821 | |
| Total Investments - 98.4% | | | | | | | | | | |
(Cost $75,113,313)* | | | | | | | | $ | 83,074,821 | |
| Other Assets & Liabilities, Net – 1.6% | | | | | | | | | 1,342,434 | |
| Net Assets – 100.0% | | | | | | | | $ | 84,417,255 | |
| | | | | | | | | | | | | | |
| REIT | Real Estate Investment Trust |
| (a) | Non-income producing security. |
| * | Cost for federal income tax purposes is $75,143,985 and net unrealized appreciation consists of: |
| Gross Unrealized Appreciation | | $ | 11,684,077 | |
| Gross Unrealized Depreciation | | | (3,753,241 | ) |
| Net Unrealized Appreciation | | $ | 7,930,836 | |
See Notes to Financial Statements. | 9 | |
GOLDEN SMALL CAP CORE FUND |
| SCHEDULE OF INVESTMENTS |
| JUNE 30, 2015 |
The following is a summary of the inputs used to value the Fund’s investments as of June 30, 2015.
The inputs or methodology used for valuing securities are not necessarily an indication of the risks associated with investing in those securities. For more information on valuation inputs, and their aggregation into the levels used in the table below, please refer to the Security Valuation section in Note 2 of the accompanying Notes to Financial Statements.
| Valuation Inputs | | Investments in Securities |
| Level 1 - Quoted Prices | | $ | 83,074,821 | |
| Level 2 - Other Significant Observable Inputs | | | - | |
| Level 3 - Significant Unobservable Inputs | | | - | |
| Total | | $ | 83,074,821 | |
The Level 1 value displayed in this table is Common Stock. Refer to this Schedule of Investments for a further breakout of each security by industry.
The Fund utilizes the end of period methodology when determining transfers. There were no transfers among Level 1, Level 2 and Level 3 for the year ended June 30, 2015.
| PORTFOLIO HOLDINGS | | |
| % of Net Assets | | |
| Consumer Discretionary | 14.6 | % |
| Consumer Staples | 2.4 | % |
| Energy | 3.1 | % |
| Financials | 20.8 | % |
| Health Care | 17.2 | % |
| Industrials | 15.1 | % |
| Information Technology | 12.7 | % |
| Materials | 4.9 | % |
| Technology | 5.9 | % |
| Telecommunications | 1.7 | % |
| Other Assets & Liabilities, Net | 1.6 | % |
| | 100.0 | % |
See Notes to Financial Statements. | 10 | |
| GOLDEN FUNDS |
STATEMENTS OF ASSETS AND LIABILITIES |
| JUNE 30, 2015 |
| | | | | | GOLDEN LARGE CAP CORE FUND | | | | GOLDEN SMALL CAP CORE FUND | |
| ASSETS | | | | | | | | |
| | Total investments, at value (Cost $83,241,901 and $75,113,313, respectively) | $ | 100,451,715 | | | $ | 83,074,821 | |
| | Cash | | | 2,059,261 | | | | 1,620,916 | |
| | Receivables: | | | | | | | | |
| | | Fund shares sold | | | 432,020 | | | | 166,497 | |
| | | Dividends and interest | | | 61,072 | | | | 90,299 | |
| Total Assets | | | 103,004,068 | | | | 84,952,533 | |
| | | | | | | | | | | |
| LIABILITIES | | | | | | | | |
| | Payables: | | | | | | | | |
| | | Investment securities purchased | | | 716,469 | | | | 458,912 | |
| | | Fund shares redeemed | | | 25,446 | | | | 2,267 | |
| | Accrued Liabilities: | | | | | | | | |
| Adviser | Investment adviser fees | | | 49,301 | | | | 74,089 | |
| | | Trustees’ fees and expenses | | | 25 | | | | 10 | |
| Total Liabilities | | | 791,241 | | | | 535,278 | |
| | | | | | | | | | | |
| NET ASSETS | | $ | 102,212,827 | | | $ | 84,417,255 | |
| | | | | | | | | | | |
| COMPONENTS OF NET ASSETS | | | | | | | | |
| | Paid-in capital | | $ | 81,933,721 | | | $ | 125,953,855 | |
| | Undistributed net investment income | | | 377,420 | | | | 153,878 | |
| | Accumulated net realized gain (loss) | | | 2,691,872 | | | | (49,651,986 | ) |
| | Net unrealized appreciation | | | 17,209,814 | | | | 7,961,508 | |
| NET ASSETS | | $ | 102,212,827 | | | $ | 84,417,255 | |
| SHARES OF BENEFICIAL INTEREST AT NO PAR VALUE (UNLIMITED SHARES AUTHORIZED) | | | 6,897,544 | | | | 4,510,769 | |
| NET ASSET VALUE, OFFERING AND REDEMPTION PRICE PER SHARE | | $ | 14.82 | | | $ | 18.71 | |
| | | | | | | | | | | |
See Notes to Financial Statements. | 11 | |
| | | | | | GOLDEN LARGE CAP CORE FUND | | | | GOLDEN SMALL CAP CORE FUND | | |
| INVESTMENT INCOME | | | | | | | | | |
| | Dividend income (Net of foreign withholding taxes of $4,675 and $333, respectively) | | $ | 1,226,533 | | | $ | 616,739 | | |
| | Interest income | | | 1,939 | | | | 1,693 | | |
| Total Investment Income | | | 1,228,472 | | | | 618,432 | | |
| Adviser | | | | | | | | | |
| EXPENSES | | | | | | | | | |
| | Investment adviser fees | | | 595,324 | | | | 464,262 | | |
| | Trustees' fees and expenses | | | 4,788 | | | | 1,950 | | |
| Total Expenses | | | 600,112 | | | | 466,212 | | |
| | Fees waived and expenses reimbursed | | | (4,791 | ) | | | (1,952 | ) | |
| Net Expenses | | | 595,321 | | | | 464,260 | | |
| | | | | | | | | | | | |
| NET INVESTMENT INCOME | | | 633,151 | | | | 154,172 | | |
| | | | | | | | | | | | |
| NET REALIZED AND UNREALIZED GAIN | | | | | | | | | |
| | Net realized gain on investments | | | 3,383,781 | | | | 2,177,443 | | |
| | Net change in unrealized appreciation on investments | | | 5,357,117 | | | | 2,762,213 | | |
| NET REALIZED AND UNREALIZED GAIN | | | 8,740,898 | | | | 4,939,656 | | |
| INCREASE IN NET ASSETS RESULTING FROM OPERATIONS | | $ | 9,374,049 | | | $ | 5,093,828 | | |
| | | | | | | | | | | | |
See Notes to Financial Statements. | 12 | |
| GOLDEN FUNDS |
STATEMENTS OF CHANGES IN NET ASSETS |
|
| | | | | GOLDEN LARGE CAP CORE FUND | | GOLDEN SMALL CAP CORE FUND | |
| | | June 30, 2013 | | | | | | | Shares | | | | | | | | Shares | | |
| NET ASSETS JUNE 30, 2013 | | $ | 27,672,273 | | | | $27,672,273 | | | $ | 20,092,515 | | | | $20,092,515 | | |
| OPERATIONS | | | | | | | | | | | | | | | | | |
| | Net investment income | | | 442,586 | | | | | | | | 61,453 | | | | | | |
| | Net realized gain | | | 4,585,545 | | | | | | | | 3,508,159 | | | | | | |
| | Net change in unrealized appreciation (depreciation) | | 5,582,966 | | | | | | | | 1,081,795 | | | | | | |
| Increase in Net Assets Resulting from Operations | | | 10,611,097 | | | | | | | | 4,651,407 | | | | | | |
| DISTRIBUTIONS TO SHAREHOLDERS FROM | | | | | | | | | | | | | | | | | |
| | Net investment income | | | (341,915 | ) | | | | | | | (289,247 | ) | | | | | |
| | Net realized gain | | | (5,379,420 | ) | | | | | | | - | | | | | | |
| Total Distributions to Shareholders | | | (5,721,335 | ) | | | | | | | (289,247 | ) | | | | | |
| CAPITAL SHARE TRANSACTIONS | | | | | | | | | | | | | | | | | |
| | Sale of shares | | | 47,332,098 | | | | 3,536,968 | | | | 2,525,935 | | | | 157,893 | | |
| | Reinvestment of distributions | | | 651,562 | | | | 52,404 | | | | 38,250 | | | | 2,450 | | |
| | Redemption of shares | | | (7,928,946 | ) | | | (599,319 | ) | | | (4,848,709 | ) | | | (317,535 | ) | |
| Increase (Decrease) in Net Assets from Capital Share Transactions | | 40,054,714 | | | | 2,990,053 | | | | (2,284,524 | ) | | | (157,192 | ) | |
| Increase in Net Assets | | | 44,944,476 | | | | | | | | 2,077,636 | | | | | | |
| NET ASSETS JUNE 30, 2014 (Including line (a)) | | $ | 72,616,749 | | | | | | | $ | 22,170,151 | | | | | | |
| OPERATIONS | | | | | | | | | | | | | | | | | |
| | Net investment income | | | 633,151 | | | | | | | | 154,172 | | | | | | |
| | Net realized gain | | | 3,383,781 | | | | | | | | 2,177,443 | | | | | | |
| | Net change in unrealized appreciation (depreciation) | | 5,357,117 | | | | | | | | 2,762,213 | | | | | | |
| Increase in Net Assets Resulting from Operations | | | 9,374,049 | | | | | | | | 5,093,828 | | | | | | |
| DISTRIBUTIONS TO SHAREHOLDERS FROM | | | | | | | | | | | | | | | | | |
| | Net investment income | | | (499,617 | ) | | | | | | | (55,322 | ) | | | | | |
| | Net realized gain | | | (3,031,335 | ) | | | | | | | - | | | | | | |
| Total Distributions to Shareholders | | | (3,530,952 | ) | | | | | | | (55,322 | ) | | | | | |
| CAPITAL SHARE TRANSACTIONS | | | | | | | | | | | | | | | | | |
| | Sale of shares | | | 44,991,489 | | | | 3,105,827 | | | | 63,438,443 | | | | 3,539,453 | | |
| | Reinvestment of distributions | | | 339,672 | | | | 24,539 | | | | 5,120 | | | | 293 | | |
| | Redemption of shares | | | (21,578,180 | ) | | | (1,485,971 | ) | | | (6,234,965 | ) | | | (352,069 | ) | |
| Increase in Net Assets from Capital Share Transactions | | | 23,752,981 | | | | 1,644,395 | | | | 57,208,598 | | | | 3,187,677 | | |
| Increase in Net Assets | | | 29,596,078 | | | | | | | | 62,247,104 | | | | | | |
| NET ASSETS JUNE 30, 2015 (Including line (b)) | | $ | 102,212,827 | | | | | | | $ | 84,417,255 | | | | | | |
| (a) | Undistributed net investment income June 30, 2014 | | $ | 243,886 | | | | | | | $ | 55,312 | | | | | | |
| (b) | Undistributed net investment income June 30, 2015 | | $ | 377,420 | | | | | | | $ | 153,878 | | | | | | |
See Notes to Financial Statements. | 13 | |
GOLDEN LARGE CAP CORE FUND |
|
|
| These financial highlights reflect selected data for a share outstanding throughout each year. | | | | | | |
| | | For the Years Ended June 30, | |
| 2015 | | 2014 | | 2013 | | 2012 | | 2011 | |
| NET ASSET VALUE, Beginning of Year | $ | 13.82 | | | $ | 12.23 | | | $ | 11.30 | | | $ | 11.10 | | | $ | 8.72 | | |
| INVESTMENT OPERATIONS | | | | | | | | | | | | | | | | | | | | |
| Net investment income (a) | | 0.11 | | | | 0.12 | | | | 0.13 | | | | 0.11 | | | | 0.11 | | |
| Net realized and unrealized gain | | 1.51 | | | | 3.06 | | | | 2.09 | | | | 0.35 | (b) | | 2.40 | | |
| Total from Investment Operations | | 1.62 | | | | 3.18 | | | | 2.22 | | | | 0.46 | | | | 2.51 | | |
| DISTRIBUTIONS TO | | | | | | | | | | | | | | | | | | | | |
| SHAREHOLDERS FROM | | | | | | | | | | | | | | | | | | | | |
| Net investment income | | (0.09 | ) | | | (0.09 | ) | | | (0.19 | ) | | | (0.26 | ) | | | (0.13 | ) | |
| Net realized gain | | (0.53 | ) | | | (1.50 | ) | | | (1.10 | ) | | | — | | | | — | | |
| Total Distributions to Shareholders | | (0.62 | ) | | | (1.59 | ) | | | (1.29 | ) | | | (0.26 | ) | | | (0.13 | ) | |
| NET ASSET VALUE, End of Year | $ | 14.82 | | | $ | 13.82 | | | $ | 12.23 | | | $ | 11.30 | | | $ | 11.10 | | |
| TOTAL RETURN | | 12.00 | % | | 27.56 | % | | 21.68 | % | | 4.44 | % | | 28.85 | % |
| RATIOS/SUPPLEMENTARY DATA | | | | | | | | | | | | | | | | | | | | |
| Net Assets at End of Year (000's omitted) | $102,213 | | | $72,617 | | | $27,672 | | | $34,896 | | | $142,756 | | |
| Ratios to Average Net Assets: | | | | | | | | | | | | | | | | | | | | |
| Net investment income | | 0.74 | % | | 0.92 | % | | 1.13 | % | | 1.06 | % | | 1.04 | % |
| Net expenses | | 0.70 | % | | 0.70 | % | | 0.70 | % | | 0.70 | % | | 0.70 | % |
| Gross expenses (c) | | 0.71 | % | | 0.70 | % | | 0.70 | % | | 0.71 | % | | 0.70 | % |
| PORTFOLIO TURNOVER RATE | | 57 | % | | 70 | % | | 72 | % | | 42 | % | | 57 | % |
| | | | | | | | | | | | | | | | | | | | | | |
| (a) | Calculated based on average shares outstanding during each year. |
| (b) | The net realized and unrealized gain (loss) per share does not correlate to the aggregate of the net realized and unrealized loss in the Statement of Operations for the year ended June 30, 2012, primarily due to the timing of the sales and repurchases of the Fund’s shares in relation to fluctuating market values for the Fund’s portfolio. |
| (c) | Reflects the expense ratio excluding any waivers and/or reimbursements. |
See Notes to Financial Statements. | 14 | |
GOLDEN SMALL CAP CORE FUND |
|
|
| These financial highlights reflect selected data for a share outstanding throughout each year. | | | | | | |
| | | For the Years Ended June 30, | |
| 2015 | | 2014 | | 2013 | | 2012 | | 2011 |
| NET ASSET VALUE, Beginning of Year | $ | 16.76 | | | $ | 13.57 | | | $ | 10.64 | | | $ | 11.10 | | | $ | 7.90 | | |
| INVESTMENT OPERATIONS | | | | | | | | | | | | | | | | | | | | |
| Net investment income (loss) (a) | | 0.06 | | | | 0.05 | | | | 0.16 | | | | (0.01 | ) | | | (0.02 | ) | |
| Net realized and unrealized gain (loss) | | 1.92 | | | | 3.36 | | | | 2.77 | | | | (0.45 | ) | | | 3.22 | | |
| Total from Investment Operations | | 1.98 | | | | 3.41 | | | | 2.93 | | | | (0.46 | ) | | | 3.20 | | |
| DISTRIBUTIONS TO | | | | | | | | | | | | | | | | | | | | |
| SHAREHOLDERS FROM | | | | | | | | | | | | | | | | | | | | |
| Net investment income | | (0.03 | ) | | | (0.22 | ) | | | — | | | | — | | | | — | | |
| NET ASSET VALUE, End of Year | $ | 18.71 | | | $ | 16.76 | | | $ | 13.57 | | | $ | 10.64 | | | $ | 11.10 | | |
| TOTAL RETURN | | 11.80 | % | | 25.21 | % | | 27.54 | % | | (4.14 | )% | | 40.51 | % |
| RATIOS/SUPPLEMENTARY DATA | | | | | | | | | | | | | | | | | | | | |
| Net Assets at End of Year (000's omitted) | $84,417 | | | $22,170 | | | $20,093 | | | $27,427 | | | $53,300 | | |
| Ratios to Average Net Assets: | | | | | | | | | | | | | | | | | | | | |
| Net investment income (loss) | | 0.37 | % | | 0.30 | % | | 1.32 | % | | (0.12 | )% | | (0.20 | )% |
| Net expenses | | 1.10 | % | | 1.10 | % | | 1.10 | % | | 1.10 | % | | 1.10 | % |
| Gross expenses (b) | | 1.10 | % | | 1.10 | % | | 1.10 | % | | 1.11 | % | | 1.10 | % |
| PORTFOLIO TURNOVER RATE | | 57 | % | | 68 | % | | 52 | % | | 56 | % | | 55 | % |
| | | | | | | | | | | | | | | | | | | | | | |
| (a) | Calculated based on average shares outstanding during each year. |
| (b) | Reflects the expense ratio excluding any waivers and/or reimbursements. |
See Notes to Financial Statements. | 15 | |
| GOLDEN FUNDS |
NOTES TO FINANCIAL STATEMENTS |
| JUNE 30, 2015 |
Note 1. Organization
Golden Large Cap Core Fund and Golden Small Cap Core Fund (individually, a “Fund” and, collectively the “Funds”) are diversified portfolios of Forum Funds (the “Trust”). The Trust is a Delaware statutory trust that is registered as an open-end, management investment company under the Investment Company Act of 1940 (the “Act”), as amended. Under its Trust Instrument, the Trust is authorized to issue an unlimited number of each Fund’s shares of beneficial interest without par value. Each Fund currently offers two classes of shares: Institutional Shares and Investor Shares. As of June 30, 2015, Investor Shares had not commenced operations. Golden Large Cap Core Fund seeks to achieve long-term capital appreciation. Golden Small Cap Core Fund seeks to achieve maximum long-term total return. Each Fund commenced operations on September 13, 2005.
Note 2. Summary of Significant Accounting Policies
These financial statements are prepared in accordance with accounting principles generally accepted in the United States of America (“GAAP”), which require management to make estimates and assumptions that affect the reported amounts of assets and liabilities, the disclosure of contingent liabilities at the date of the financial statements, and the reported amounts of increases and decreases in net assets from operations during the fiscal year. Actual amounts could differ from those estimates. The following summarizes the significant accounting policies of each Fund:
Security Valuation – Exchange-traded securities and over-the-counter securities are valued using the last quoted trade or official closing price, provided by independent pricing services as of the close of trading on the market or exchange for which they are primarily traded, on each Fund business day. In the absence of a sale, such securities are valued at the mean of the last bid and ask price provided by independent pricing services. Non-exchange-traded securities for which quotations are available are valued using the last quoted sales price, or in the absence of a sale, at the mean of the last bid and ask prices provided by independent pricing services. Shares of open-end mutual funds are valued at net asset value (“NAV”). Short-term investments that mature in 60 days or less may be valued at amortized cost.
Each Fund values its investments at fair value pursuant to procedures adopted by the Trust's Board of Trustees (the "Board") if (1) market quotations are insufficient or not readily available or (2) the adviser believes that the values available are unreliable. The Trust’s Valuation Committee, as defined in each Fund’s registration statement, performs certain functions as they relate to the administration and oversight of each Fund’s valuation procedures. Under these procedures, the Valuation Committee convenes on a regular and ad-hoc basis to review such investments and considers a number of factors, including valuation methodologies and significant unobservable inputs, when arriving at fair value.
The Valuation Committee may work with the adviser to provide valuation inputs. In determining fair valuations, inputs may include market-based analytics which may consider related or comparable assets or liabilities, recent transactions, market multiples, book values and other relevant investment information. Adviser inputs may include an income-based approach in which the anticipated future cash flows of the investment are discounted in determining fair value. Discounts may also be applied based on the nature or duration of any restrictions on the disposition of the investments. The Valuation Committee performs regular
| GOLDEN FUNDS |
NOTES TO FINANCIAL STATEMENTS |
| JUNE 30, 2015 |
reviews of valuation methodologies, key inputs and assumptions, disposition analysis and market activity.
Fair valuation is based on subjective factors and, as a result, the fair value price of an investment may differ from the security’s market price and may not be the price at which the asset may be sold. Fair valuation could result in a different NAV than a NAV determined by using market quotes.
Each Fund has a three-tier fair value hierarchy. The basis of the tiers is dependent upon the various “inputs” used to determine the value of each Fund’s investments. These inputs are summarized in the three broad levels listed below:
Level 1 — quoted prices in active markets for identical assets and liabilities
Level 2 — other significant observable inputs (including quoted prices of similar securities, interest rates, prepayment speeds, credit risk, etc.)
Level 3 — significant unobservable inputs (including each Fund’s own assumptions in determining the fair value of investments)
The aggregate value by input level, as of June 30, 2015, for each Fund’s investments is included at the end each Fund’s Schedule of Investments.
Security Transactions, Investment Income and Realized Gain and Loss – Investment transactions are accounted for on the trade date. Dividend income is recorded on the ex-dividend date. Foreign dividend income is recorded on the ex-dividend date or as soon as possible after each Fund determines the existence of a dividend declaration after exercising reasonable due diligence. Income and capital gains on some foreign securities may be subject to foreign withholding taxes, which are accrued as applicable. Interest income is recorded on an accrual basis. Premium is amortized and discount is accreted using the effective interest method. Identified cost of investments sold is used to determine the gain and loss for both financial statement and federal income tax purposes.
Distributions to Shareholders – Distributions to shareholders of net investment income and net capital gains, if any, are declared and paid at least annually. Distributions to shareholders are recorded on the ex-dividend date. Distributions are based on amounts calculated in accordance with applicable federal income tax regulations, which may differ from GAAP. These differences are due primarily to differing treatments of income and gain on various investment securities held by each Fund, timing differences and differing characterizations of distributions made by each Fund.
Federal Taxes – Each Fund intends to continue to qualify each year as a regulated investment company under Subchapter M of the Internal Revenue Code and to distribute all of their taxable income to shareholders. In addition, by distributing in each calendar year substantially all of their net investment income and capital gains, if any, the Funds will not be subject to a federal excise tax. Therefore, no federal income or excise tax provision is required. Each Fund files a U.S. federal income and excise tax return as required. A fund’s federal income tax returns are subject to examination by the Internal Revenue Service for a period of three fiscal years after they are filed. As of June 30, 2015, there are no uncertain tax positions that would
| GOLDEN FUNDS |
NOTES TO FINANCIAL STATEMENTS |
| JUNE 30, 2015 |
require financial statement recognition, de-recognition or disclosure.
Income and Expense Allocation – The Trust accounts separately for the assets, liabilities and operations of each of its investment portfolios. Expenses that are directly attributable to more than one investment portfolio are allocated among the respective investment portfolios in an equitable manner.
Commitments and Contingencies – In the normal course of business, each Fund enters into contracts that provide general indemnifications by each Fund to the counterparty to the contract. Each Fund’s maximum exposure under these arrangements is dependent on future claims that may be made against each Fund and, therefore, cannot be estimated; however, based on experience, the risk of loss from such claims is considered remote.
Note 3. Cash – Concentration in Uninsured Account
For cash management purposes each Fund may concentrate cash with each Fund’s custodian. This typically results in cash balances exceeding the Federal Deposit Insurance Corporation (“FDIC”) insurance limits. As of June 30, 2015, the Golden Large Cap Core Fund and Golden Small Cap Core Fund Fund held $1,809,261 and $1,370,916, respectively as cash reserves at MUFG Union Bank, N.A. that exceeded the FDIC insurance limit.
Note 4. Fees and Expenses
Investment Adviser – Golden Capital Management, LLC (the “Adviser”) is the investment adviser to the Funds. Pursuant to an Investment Advisory Agreement, the Adviser receives an advisory fee at an annual rate of 0.70% and 1.10% of the average daily net assets of Golden Large Cap Core Fund and Golden Small Cap Core Fund, respectively. Under the terms of the Investment Advisory Agreement, the Adviser provides investment advisory services to the Funds and is obligated to pay all expenses of the Funds except portfolio transaction expenses, borrowing costs, interest, taxes, certain compensation and expenses of the Board, any expenses the Funds are authorized to pay under Rule 12b-1, and extraordinary expenses.
Distribution – Foreside Fund Services, LLC serves as each Fund’s distributor (the “Distributor”). The Funds do not have a distribution (12b-1) plan; accordingly, the Distributor does not receive compensation from the Funds for its distribution (12b-1) services. The Adviser compensates the Distributor directly for its services. The Distributor is not affiliated with the Adviser or Atlantic Fund Administration, LLC (d/b/a Atlantic Fund Services) (“Atlantic”) or their affiliates.
Other Service Providers – Atlantic provides fund accounting, fund administration, compliance and transfer agency services to each Fund. Atlantic also provides certain shareholder report production, and EDGAR conversion and filing services. Atlantic provides a Principal Executive Officer, a Principal Financial Officer, a Chief Compliance Officer, and an Anti-Money Laundering Officer to each Fund, as well as certain additional compliance support functions.
Trustees and Officers – The Trust pays each independent Trustee an annual retainer fee of $45,000 for service to the Trust ($66,000 for the Chairman). The Trustees and Chairman may receive additional fees for
| GOLDEN FUNDS |
NOTES TO FINANCIAL STATEMENTS |
| JUNE 30, 2015 |
special Board meetings. Each Trustee is also reimbursed for all reasonable out-of-pocket expenses incurred in connection with his duties as a Trustee, including travel and related expenses incurred in attending Board meetings. The amount of Trustees’ fees attributable to each Fund is disclosed in the Statement of Operations. Certain officers of the Trust are also officers or employees of the above named service providers, and during their terms of office received no compensation from each Fund.
Effective January 1, 2015, each Independent Trustee’s annual retainer is $50,000 ($66,000 for the Chairman), and the Audit Committee Chairman receives an additional $6,000 annually. Effective April 1, 2015, the Vice Chairman receives an additional $6,000 annually.
Note 5. Expense Reimbursements and Fees Waived
The Adviser has contractually agreed to waive its fees and/or reimburse certain expenses through October 31, 2015, to limit total annual operating expenses to 0.70% (excluding all taxes, interest, portfolio transaction expenses, dividend and interest expenses on short sales, acquired fund fees and expenses, proxy expenses and extraordinary expenses) for Institutional Shares of the Golden Large Cap Core Fund. The Adviser also has contractually agreed to waive its fees and/or reimburse certain expenses through October 31, 2015, to limit total annual operating expenses to 1.10% (excluding all taxes, interest, portfolio transaction expenses, dividend and interest expenses on short sales, acquired fund fees and expenses, proxy expenses and extraordinary expenses) for Institutional Shares of the Golden Small Cap Core Fund. For the year ended June 30, 2015, fees waived and reimbursed were as follows:
| | | | Investment Adviser Reimbursement |
| | Golden Large Cap Core Fund | | $ | 4,791 | |
| | Golden Small Cap Core Fund | | | 1,952 | |
Note 6. Security Transactions
The cost of purchases and proceeds from sales of investment securities (including maturities), other than short-term investments during the year ended June 30, 2015, were as follows:
| | Purchases | | Sales |
| Golden Large Cap Core Fund | | $ | 67,927,121 | | $ | 47,756,740 |
| Golden Small Cap Core Fund | | | 80,286,292 | | | 24,153,264 |
| GOLDEN FUNDS |
NOTES TO FINANCIAL STATEMENTS |
| JUNE 30, 2015 |
Note 7. Federal Income Tax
Distributions paid during the fiscal years ended as noted were characterized for tax purposes as follows:
| | | Ordinary Income | | Long-Term Capital Gain | | Total | |
| | | Golden Large Cap Core Fund |
2015 | | $ | 981,851 | | | $ | 2,549,101 | | | $ | 3,530,952 | | |
2014 | | | 1,146,780 | | | | 4,574,555 | | | | 5,721,335 | | |
| | Golden Small Cap Core Fund |
2015 | | | 55,322 | | | | - | | | | 55,322 | | |
2014 | | | 289,247 | | | | - | | | | 289,247 | | |
As of June 30, 2015, distributable earnings (accumulated loss) on a tax basis were as follows:
| | | Undistributed Ordinary Income | | Undistributed Long-Term Gain | | Capital and Other Losses | | Unrealized Appreciation | | Total |
| Golden Large Cap Core Fund | | $ | 682,219 | | | $ | 2,754,792 | | | $ | - | | | $ | 16,842,095 | | | $ | 20,279,106 | |
| Golden Small Cap Core Fund | | | 153,878 | | | | - | | | | (49,621,314 | ) | | | 7,930,836 | | | | (41,536,600 | ) |
The difference between components of distributable earnings on a tax basis and the amounts reflected in the Statements of Assets and Liabilities are primarily due to wash sales.
On the Statement of Assets and Liabilities, as a result of permanent book to tax differences, certain amounts have been reclassified for the year ended June 30, 2015. The following reclassification was the result of real estate investment trust adjustments, equity return of capital and passive foreign investment holdings and has no impact on the net assets of the Fund.
| | | Undistributed Net Investment Income | | Accumulated Net Realized Gain (Loss) |
| | Golden Small Cap Core Fund | $ | (284) | | $ | 284 |
As of June 30, 2015, capital loss carryforwards to offset future capital gains were as follows with the respective expiration dates:
| | | | | | 2018 |
| | Golden Small Cap Core Fund | | | | $ | 49,621,314 |
Note 8. Recent Accounting Pronouncements
In May 2015, the Financial Accounting Standards Board (“FASB”) issued Accounting Standards Update 2015-07 (“ASU 2015-07”) eliminating the requirement for investments measured at net asset value to be categorized within the fair value hierarchy under GAAP and requiring the disclosure of sufficient information to reconcile the fair value of the remaining assets categorized within the fair value hierarchy to the financial statements. ASU 2015-07 is effective for interim and annual reporting periods beginning after December 15, 2015. Management has reviewed the requirements and believes the adoption of ASU 2015-07 will not have a
| GOLDEN FUNDS |
NOTES TO FINANCIAL STATEMENTS |
| JUNE 30, 2015 |
material impact on the financial statements.
Note 9. Subsequent Events
Subsequent events occurring after the date of this report through the date these financial statements were issued have been evaluated for potential impact and each Fund has had no such events.
| |
REPORT OF INDEPENDENT REGISTERED PUBLIC ACCOUNTING FIRM |
| |
To the Shareholders of Golden Large Cap Core Fund and Golden Small Cap Core Fund
and the Board of Trustees of Forum Funds
We have audited the accompanying statements of assets and liabilities of the Golden Large Cap Core Fund and Golden Small Cap Core Fund (the "Funds"), each a series of shares of beneficial interest in the Forum Funds, including the schedules of investments, as of June 30, 2015, and the related statements of operations for the year then ended, the statements of changes in net assets for each of the years in the two-year period then ended and the financial highlights for each of the years in the five-year period then ended. These financial statements and financial highlights are the responsibility of the Funds' management. Our responsibility is to express an opinion on these financial statements and financial highlights based on our audits.
We conducted our audits in accordance with the standards of the Public Company Accounting Oversight Board (United States). Those standards require that we plan and perform the audits to obtain reasonable assurance about whether the financial statements and financial highlights are free of material misstatement. An audit includes examining, on a test basis, evidence supporting the amounts and disclosures in the financial statements. Our procedures included confirmation of securities owned as of June 30, 2015 by correspondence with the custodian and brokers. An audit also includes assessing the accounting principles used and significant estimates made by management, as well as evaluating the overall financial statement presentation. We believe that our audits provide a reasonable basis for our opinion.
In our opinion, the financial statements and financial highlights referred to above present fairly, in all material respects, the financial position of the Golden Large Cap Core Fund and Golden Small Cap Core Fund as of June 30, 2015, and the results of their operations for the year then ended, the changes in their net assets for each of the years in the two-year period then ended and their financial highlights for each of the years in the five-year period then ended, in conformity with accounting principles generally accepted in the United States of America.
BBD, LLP
Philadelphia, Pennsylvania
August 19, 2015
| GOLDEN FUNDS |
ADDITIONAL INFORMATION (Unaudited) |
| JUNE 30, 2015 |
Proxy Voting Information
A description of the policies and procedures that each Fund uses to determine how to vote proxies relating to securities held in each Fund’s portfolio is available, without charge and upon request, by calling (800) 206-8610 and on the U.S. Securities and Exchange Commission’s (the “SEC”) website at www.sec.gov. Each Fund’s proxy voting record for the most recent twelve-month period ended June 30 is available, without charge and upon request, by calling (800) 206-8610 and on the SEC’s website at www.sec.gov.
Availability of Quarterly Portfolio Schedules
Each Fund files its complete schedule of portfolio holdings with the SEC for the first and third quarters of each fiscal year on Form N-Q. These filings are available, without charge and upon request on the SEC’s website at www.sec.gov or may be reviewed and copied at the SEC’s Public Reference Room in Washington, DC. Information on the operation of the Public Reference Room may be obtained by calling (800) SEC-0330.
Shareholder Expense Example
As a shareholder of the Funds, you incur ongoing costs, including management fees, distribution (12b-1) fees and other Fund expenses. This example is intended to help you understand your ongoing costs (in dollars) of investing in the Funds and to compare these costs with the ongoing costs of investing in other mutual funds.
The example is based on an investment of $1,000 invested at the beginning of the period and held for the entire period from January 1, 2015, through June 30, 2015.
Actual Expenses – The first line of the table below provides information about actual account values and actual expenses. You may use the information in this line, together with the amount you invested, to estimate the expenses that you paid over the period. Simply divide your account value by $1,000 (for example, an $8,600 account value divided by $1,000 = 8.6), then multiply the result by the number in the first line under the heading entitled “Expenses Paid During Period” to estimate the expenses you paid on your account during the period.
Hypothetical Example for Comparison Purposes – The second line of the table below provides information about hypothetical account values and hypothetical expenses based on each Fund’s actual expense ratio and an assumed rate of return of 5% per year before expenses, which is not each Fund’s actual return. The hypothetical account values and expenses may not be used to estimate the actual ending account balance or expenses you paid for the period. You may use this information to compare the ongoing costs of investing in each Fund and other funds. To do so, compare this 5% hypothetical example with the 5% hypothetical examples that appear in the shareholder reports of other funds.
Please note that the expenses shown in the table are meant to highlight your ongoing costs only. Therefore, the second line of the table is useful in comparing ongoing costs only, and will not help you determine the relative total costs of owning different funds.
| GOLDEN FUNDS |
ADDITIONAL INFORMATION (Unaudited) |
| JUNE 30, 2015 |
| | Beginning | | Ending | | Expenses | | Annualized |
| | Account Value | | Account Value | | Paid During | | Expense |
| | January 1, 2015 | | June 30, 2015 | | Period* | | Ratio* |
| Golden Large Cap Core | | | | | | | | | | | |
| Actual | $ | 1,000.00 | | $ | 1,045.88 | | $ | 3.55 | | 0.70 | % |
| Hypothetical (5% return before taxes) | $ | 1,000.00 | | $ | 1,021.32 | | $ | 3.51 | | 0.70 | % |
| Golden Small Cap Core | | | | | | | | | | | |
| Actual | $ | 1,000.00 | | $ | 1,069.15 | | $ | 5.64 | | 1.10 | % |
| Hypothetical (5% return before taxes) | $ | 1,000.00 | | $ | 1,019.34 | | $ | 5.51 | | 1.10 | % |
| * | Expenses are equal to each Fund’s annualized expense ratio multiplied by the average account value over the period, multiplied by the number of days in the most recent fiscal half-year divided by 365 to reflect the half-year period. |
Federal Tax Status of Dividends Declared during the Fiscal Year
For federal income tax purposes, dividends from short-term capital gains are classified as ordinary income. The Golden Large Cap Core Fund designates 55.84% of its income dividend distributed as qualifying for the corporate dividends-received deduction (DRD) and 58.77% for the qualified dividend rate (QDI) as defined in Section 1(h)(11) of the Internal Revenue Code. The Golden Large Cap Core Fund also designates 0.12% as qualified interest income exempt from U.S. tax for foreign shareholders (QII) and 49.11% as short-term capital gain dividends exempt from U.S. tax for foreign shareholders (QSD).
The Golden Small Cap Core Fund designates 100.00% of its income dividend distributed as DRD and 100.00% for QDI. The Golden Small Cap Core Fund also designates 0.33% as QII.
Trustees and Officers of the Trust
The Board is responsible for oversight of the management of the Trust’s business affairs and of the exercise of all the Trust’s powers except those reserved for the shareholders. The following table provides information about each Trustee and certain officers of the Trust. Each Trustee and officer holds office until the person resigns, is removed, or is replaced. Unless otherwise noted, the persons have held their principal occupations for more than five years. The address for all Trustees and officers is Three Canal Plaza, Suite 600, Portland, Maine 04101. Mr. Keffer is considered an Interested Trustee due to his affiliation with Atlantic. Each Fund’s Statement of Additional Information includes additional information about the Trustees and is available, without charge and upon request, by calling (800) 206-8610.
| GOLDEN FUNDS |
ADDITIONAL INFORMATION (Unaudited) |
| JUNE 30, 2015 |
| Name and Year of Birth | Position with the Trust | Length of Time Served | Principal Occupation(s) During Past Five Years | Number of Series of Fund Complex¹ Overseen by Trustee | Other Directorships Held by Trustee |
Independent Trustees | | | | | |
J. Michael Parish Born: 1943 | Chairman of the Board; Trustee; Chairman, Nominating Committee and Qualified Legal Compliance Committee | Since 1989 (Chairman since 2004) | Retired since 2003; formerly, Partner, Wolf, Block, Schorr and Solis-Cohen, LLP (law firm) 2002-2003; Partner, Thelen Reid & Priest LLP (law firm) 1995-2002. | 27 | None |
Costas Azariadis Born: 1943 | Trustee | Since 1989 | Professor of Economics, Washington University since 2006. | 27 | None |
James C. Cheng Born: 1942 | Trustee; Chairman, Audit Committee | Since 1989 | President, Technology Marketing Associates (marketing company for small- and medium-sized businesses in New England) since 1991. | 27 | None |
David Tucker Born: 1958 | Trustee; Vice Chairman | Since 2011 (Vice Chairman since 2015) | Director, Blue Sky Experience since 2008; Senior Vice President & General Counsel, American Century Companies 1998-2008. | 36 | Trustee, Forum Funds II and Forum ETF Trust |
Interested Trustee | | | | | |
John Y. Keffer2 Born: 1942 | Trustee; Vice Chairman | Since 1989 | Chairman, Atlantic since 2008; President, Forum Investment Advisors, LLC since 2011; President, Forum Foundation (a charitable organization) since 2005; President, Forum Trust, LLC (a non-depository trust company chartered in the State of Maine) since 1997. | 36 | Director, Wintergreen Fund, Inc.; Trustee, Forum Funds II, Forum ETF Trust and ALTMFX Trust |
1The Fund Complex includes the Trust, Forum Funds II and Forum ETF Trust and is overseen by different Boards of Trustees.
2Atlantic is a subsidiary of Forum Holdings Corp. I, a Delaware corporation that is wholly owned by Mr. Keffer.
| GOLDEN FUNDS |
ADDITIONAL INFORMATION (Unaudited) |
| JUNE 30, 2015 |
Name and Year of Birth | Position with the Trust | Length of Time Served | Principal Occupation(s) During Past Five Years | Number of Series of Fund Complex¹ Overseen by Trustee | Other Directorships Held by Trustee |
Officers | | | | | |
Jessica Chase Born: 1970 | President; Principal Executive Officer | Since 2015 | Senior Vice President, Atlantic since 2008. | N/A | N/A |
Karen Shaw Born: 1972 | Treasurer; Principal Financial Officer | Since 2008 | Senior Vice President, Atlantic since 2008. | N/A | N/A |
Zachary Tackett Born: 1988 | Vice President; Secretary; Anti-Money Laundering Compliance Officer | Since 2014 | Associate Counsel, Atlantic since 2014; Intern Associate, Coakley & Hyde, PLLC, 2010-2013. | N/A | N/A |
Michael J. McKeen Born: 1971 | Vice President | Since 2009 | Senior Vice President, Atlantic since 2008. | N/A | N/A |
Timothy Bowden Born: 1969 | Vice President | Since 2009 | Manager, Atlantic since 2008. | N/A | N/A |
Geoffrey Ney Born: 1975 | Vice President | Since 2013 | Manager, Atlantic since 2013; Senior Fund Accountant, Atlantic, 2008-2013. | N/A | N/A |
Todd Proulx Born: 1978 | Vice President | Since 2013 | Manager, Atlantic since 2013; Senior Fund Accountant, Atlantic, 2008-2013. | N/A | N/A |
1The Fund Complex includes the Trust, Forum Funds II and Forum ETF Trust and is overseen by different Boards of Trustees. |
ITEM 2. CODE OF ETHICS.
| (a) | As of the end of the period covered by this report, Forum Funds (the “Registrant”) has adopted a code of ethics, which applies to its Principal Executive Officer and Principal Financial Officer (the “Code of Ethics”). |
| (c) | There have been no amendments to the Registrant’s Code of Ethics during the period covered by this report. |
| (d) | There have been no waivers to the Registrant’s Code of Ethics during the period covered by this report. |
(f) (1) A copy of the Code of Ethics is being filed under Item 12(a) hereto.
ITEM 3. AUDIT COMMITTEE FINANCIAL EXPERT.
The Board of Trustees has determined that no member of the Audit Committee is an "audit committee financial expert" as that term is defined under applicable regulatory guidelines.
ITEM 4. PRINCIPAL ACCOUNTANT FEES AND SERVICES.
(a) Audit Fees - The aggregate fees billed for each of the last two fiscal years (the “Reporting Periods”) for professional services rendered by the Registrant’s principal accountant for the audit of the Registrant’s annual financial statements, or services that are normally provided by the principal accountant in connection with the statutory and regulatory filings or engagements for the Reporting Periods, were $77,000 in 2014 and $79,000 in 2015.
(b) Audit-Related Fees – The aggregate fees billed in the Reporting Periods for assurance and related services rendered by the principal accountant that were reasonably related to the performance of the audit of the Registrant’s financial statements and are not reported under paragraph (a) of this Item 4 were $0 in 2014 and $0 in 2015.
(c) Tax Fees - The aggregate fees billed in the Reporting Periods for professional services rendered by the principal accountant to the Registrant for tax compliance, tax advice and tax planning were $18,000 in 2014 and $18,000 in 2015. These services consisted of review or preparation of U.S. federal, state, local and excise tax returns.
(d) All Other Fees - The aggregate fees billed in the Reporting Periods for products and services provided by the principal accountant to the Registrant, other than the services reported in paragraphs (a) through (c) of this Item, were $0 in 2014 and $0 in 2015.
(e) (1) The Audit Committee reviews and approves in advance all audit and “permissible non-audit services” (as that term is defined by the rules and regulations of the Securities and Exchange Commission) to be rendered to a series of the Registrant (each, a “Series”). In addition, the Audit Committee reviews and approves in advance all “permissible non-audit services” to be provided to an investment adviser (not including any sub-adviser) of a Series, or an affiliate of such investment adviser, that is controlling, controlled by or under common control with the investment adviser and provides on-going services to the Registrant (“Affiliate”), by the Series’ principal accountant if the engagement relates directly to the operations and financial reporting of the Series. The Audit Committee considers whether fees paid by a Series’ investment adviser or an Affiliate to the Series’ principal accountant for audit and permissible non-audit services are consistent with the principal accountant’s independence.
(e) (2) No services included in (b) - (d) above were approved pursuant to paragraph (c)(7)(i)(C) of Rule 2-01 of Regulation S-X.
(f) Not applicable
(g) The aggregate non-audit fees billed by the principal accountant for services rendered to the Registrant for the Reporting Periods were $0 in 2014 and $0 in 2015. There were no fees billed in either of the Reporting Periods for non-audit services rendered by the principal accountant to the Registrant’s investment adviser or any Affiliate.
(h) During the Reporting Period, the Registrant's principal accountant provided no non-audit services to the investment advisers or any entity controlling, controlled by or under common control with the investment advisers to the series of the Registrant to which this report relates.
ITEM 5. AUDIT COMMITTEE OF LISTED REGISTRANTS.
Not applicable.
ITEM 6. INVESTMENTS.
| (a) | Included as part of report to shareholders under Item 1. |
ITEM 7. DISCLOSURE OF PROXY VOTING POLICIES AND PROCEDURES FOR CLOSED-END
MANAGEMENT INVESTMENT COMPANIES.
Not applicable.
ITEM 8. PORTFOLIO MANAGERS OF CLOSED-END MANAGEMENT INVESTMENT COMPANIES.
Not applicable.
ITEM 9. PURCHASES OF EQUITY SECURITIES BY CLOSED-END MANAGEMENT INVESTMENT COMPANY AND AFFILIATED PURCHASERS.
Not applicable.
ITEM 10. SUBMISSION OF MATTERS TO A VOTE OF SECURITY HOLDERS
The Registrant does not accept nominees to the board of trustees from shareholders.
ITEM 11. CONTROLS AND PROCEDURES
(a) The Registrant’s Principal Executive Officer and Principal Financial Officer have concluded that the Registrant’s disclosure controls and procedures (as defined in Rule 30a-3(c) under the Investment Company Act of 1940 (the “Act”)) are effective, based on their evaluation of the controls and procedures required by Rule 30a-3(b) under the Act and Rules 13a-15(b) or 15d-15(b) under the Securities Exchange Act of 1934, as of a date within 90 days of the filing date of this report.
(b) There were no changes in the Registrant’s internal control over financial reporting (as defined in
Rule 30a-3(d) under the Act) that occurred during the second fiscal quarter of the period covered by this report that have materially affected, or are reasonably likely to materially affect, the Registrant’s internal control over financial reporting.
ITEM 12. EXHIBITS.
(a)(1) Code of Ethics (Exhibit filed herewith).
(a)(2) Certifications pursuant to Rule 30a-2(a) of the Act, and Section 302 of the Sarbanes-Oxley Act of 2002. (Exhibits filed herewith)
(a)(3) Not applicable.
(b) Certifications pursuant to Rule 30a-2(b) of the Act, and Section 906 of the Sarbanes-Oxley Act of 2002. (Exhibit filed herewith)
SIGNATURES
Pursuant to the requirements of the Securities Exchange Act of 1934 and the Investment Company Act of 1940, the Registrant has duly caused this report to be signed on its behalf by the undersigned, thereunto duly authorized.
Registrant Forum Funds
| By | | /s/ Jessica A. Chase | |
| | | Jessica A. Chase, Principal Executive Officer | |
| Date | | 8/19/15 | |
Pursuant to the requirements of the Securities Exchange Act of 1934 and the Investment Company Act of 1940, this report has been signed below by the following persons on behalf of the Registrant and in the capacities and on the dates indicated.
| By | | /s/ Jessica A. Chase | |
| | | Jessica A. Chase, Principal Executive Officer | |
| Date | | 8/19/15 | |
| By | | /s/ Karen Shaw | |
| | | Karen Shaw, Principal Financial Officer | |
| Date | | 8/19/15 | |