As filed with the Securities and Exchange Commission on November 24, 2015
UNITED STATES
SECURITIES AND EXCHANGE COMMISSION
WASHINGTON, D.C. 20549
FORM N-CSR
CERTIFIED SHAREHOLDER REPORT OF REGISTERED MANAGEMENT
INVESTMENT COMPANIES
Investment Company Act file number 811-03023
FORUM FUNDS
Three Canal Plaza, Suite 600
Portland, Maine 04101
Jessica Chase, Principal Executive Officer
Three Canal Plaza, Suite 600
Portland, Maine 04101
207-347-2000
Date of fiscal year end: September 30
Date of reporting period: October 1, 2014 – September 30, 2015
ITEM 1. REPORT TO STOCKHOLDERS.

Annual Report
September 30, 2015
Managed by Steinberg Asset Management, LLC
STEINBERG SELECT FUNDA MESSAGE TO OUR SHAREHOLDERS (Unaudited) |
Dear Shareholder,
For the 12-month period ended September 30, 2015 the Steinberg Select Fund (the “Fund”) returned -10.43% as compared to the Russell 3000® Value Index, which returned -4.22%.
Commentary and Attribution
The Fund’s relative performance for the 12-month period was primarily driven by negative stock selection in the Energy and Materials sectors. The Utilities, Industrials, Financials and Consumer Staples sectors also hurt relative performance. This was partially offset by positive relative performance in the Health Care, Consumer Discretionary, Information Technology, and Telecomm Service sectors. The top three contributors to relative performance were Arch Capital Group LTD (ACGL), Alere Inc (ALR) and Euronav NV (EURN). The top 3 detractors from relative performance were Golar LNG LTD (GLNG), Platform Specialty Products Corp (PAH), and Chemours Co (CC).
Our focus is on identifying businesses that we believe will be successful in creating large and enduring value relative to the price we pay for a share of the business. We have chosen this approach because we believe it will lead to superior long-term returns. The highly differentiated nature of the strategy underlying the Fund’s portfolio means that while long-term returns are expected to be superior to the market there will be periods where a disconnect may occur between the return streams of the portfolio and those of the market.
Such a divergence occurred during the first quarter of the most recent fiscal year when our relatively large exposure to energy-related investments weighed heavily on results. We materially reduced the portfolio's exposure to energy and to related equities relatively early in the period of declining crude oil prices. We did not, however, reduce positions in two of our largest energy holdings, Golar LNG Ltd and Navigator Holdings Ltd because we believe the fundamentals of these businesses should not be altered in any material way as a result of recent developments in energy. In fact, we used the sentiment-driven weakness in the prices of these investments to add to holdings in these securities.
Investors' concerns over the macro environment again overshadowed progress toward the creation of value in some of the businesses in the fund during the fourth quarter of the fiscal year. For example, shares in a large retail holding, Hudson’s Bay Company, with substantial real estate assets underpinning the value, declined in part because a third of the business is in Canada, a commodity-driven economy. This occurred despite the fact that the management has called out its Canadian business as performing better than expected and that the company closed on a transformational acquisition at the end of the quarter.
A Year in Review, a Year in Preview – Uncertainty Dominates the Markets
The benchmark Russell 3000® Value Index recorded a loss during the last fiscal year, the first in several years, as uncertainty over the timing of the Federal Reserve's plan to raise interest rates, along with concerns over slowing growth in the world's emerging economies, weighed heavily on markets toward the end of the year. U.S. markets exhibited notable resiliency earlier in the year thanks to the generous liquidity provided by the Fed, rising corporate profits, and the attractiveness of U.S. assets to foreign investors. Later in the year, however, investor focus turned to slowing growth in emerging markets, particularly China, coupled with increased currency instability, widening credit spreads, uncertain reverberations from the sharp decline in energy prices, and a number of corporate earnings shortfalls. These issues combined to create a high level of investor uncertainty and anxiety that translated into the short-but-vicious market correction during August/September of 2015 that amounted to more than a 10% decline in the major averages from peak to trough.
Financial markets subsequently regained their footing and some of the leading indices are now back within shouting distance of recent highs. This recovery appears to be based largely on expectations that policy actions will be taken, particularly here and in China, to effectively reverse the threats to global economic growth and financial stability. However, unless or until such concrete actions actually occur, risks and volatility may remain elevated.
Longer Term Outlook
Slower long-term economic growth and extended stock price multiples point to generally lower equity returns in the years immediately ahead. We expect the broad market return from equities over the next ten years to be meaningfully lower than the 11% annualized return from 1983-2014, and certainly below the 16% of the last five years. This view is based primarily on two factors:
STEINBERG SELECT FUNDA MESSAGE TO OUR SHAREHOLDERS (Unaudited) |
| · | Economic growth will be slower. Rapid debt growth played an important role in supporting demand growth over the last decades. If, as we believe, the debt super cycle has been broken, then future economic growth will be at a slower pace than that experienced since World War II. This will translate into a slower rate of growth for corporate profits, particularly since margins already stand near historic highs. |
| · | Equity valuations are high and bond yields are low. The early 1980s presented an ideal starting point for assets to deliver extraordinarily large returns over a multi-decade period. As that decade began, bond yields were very high and stock multiples were low. Today those conditions have been reversed, which portends for modest long-term market returns. |
Global and Domestic Economic Challenges Create Monetary Policy Imperatives
With quantitative easing coming to an end, the U.S. economy needs to transition to a self-propelled rate of growth sufficient to advance corporate profits at a pace that will support current equity valuations. Unfortunately, economic data has not been supportive thus far and a further down-grading of earnings expectations remains probable in the face of slowing global growth. Moreover, an economic turnaround in China, which is essential to spur overall emerging market growth, may not come soon. Growth in China’s fixed asset investments, which has been the biggest driver in the country’s economic rise over the past ten years, is likely to remain soft as China's excess industrial capacity, believed to be large relative to demand, is absorbed. At the same time, the shift to a consumer-led economy is not far enough along to be able to drive the economy forward at a rate of growth that the world has come to rely on.
In order for global financial markets to advance it will be important for monetary authorities around the globe to ensure sufficient liquidity. In particular, it is incumbent on Chinese policy makers to advance a package of fiscal and monetary measures that will lead to a sustained rebound in China’s economic activity. This should restore confidence in emerging markets and remove the threat of global instability due to a rundown of China's reserves. Equally critical, the U.S. Federal Reserve Board needs to convey, with one voice, a policy message that will instill confidence in financial markets here and abroad, that U.S. monetary policy will be supportive of global growth.
Investment Implications
Slower economic growth tends to favor high active share managers, those whose focused stock selection leads to portfolios with a high degree of variance vs. the benchmark. We believe highly differentiated portfolios, built around securities with asymmetric risk/reward profiles should deliver meaningfully superior long-term returns. This is because the holdings tend to possess unique qualities such as pricing power or strategic assets, and/or are at inflection points in their development or the development of their industry, which allow the businesses to generate returns even in an otherwise challenging environment. Our team manages a concentrated and differentiated portfolio based on individual security selection. Recent results have trailed an overachieving market which has delivered annualized returns well above historical norms. We believe the overachieving broader market returns will mitigate going forward and this portfolio will be well positioned to benefit Fund shareholders.
A New Position
In the current unsettled global market environment we continue to focus on identifying businesses that are uniquely positioned to demonstrate accelerated earnings and free cash flow growth with an emphasis on those that have predominately domestic exposure. For example, during the year we built a position in Aramark. The company is a leader in food and facilities management, a highly fragmented, $900 billion global industry, where the two largest competitors combine for only about 3% of market share. The company, which was recently brought public, has demonstrated steady growth, excellent free cash flow generation, a healthy balance sheet and is led by an accomplished management team. Management has instituted broad-based cost reduction initiatives and a capital investment program that should produce materially higher margins and enhance the company’s competitive position. Further, management has pledged to return the company’s large and growing free cash flow to investors, with the largest proportion expected to come in the form of share repurchases. If this business develops along the lines we anticipate, then over the next three years earnings could more than double. We expect this will be reflected in a rising market value of the business, which should result in positive long-term returns.
STEINBERG SELECT FUNDPERFORMANCE CHART AND ANALYSIS (Unaudited) |
The following chart reflects the change in the value of a hypothetical $100,000 investment in Institutional Shares, including reinvested dividends and distributions, in Steinberg Select Fund (the “Fund”) compared with the performance of the primary benchmark, Russell 3000® Value Index ("Russell 3000® Value"), and the secondary benchmark, S&P 500 Index ("S&P 500") since inception. The Russell 3000® Value measures the performance of those Russell 3000® Index companies with lower price-to-book ratios and lower forecasted growth values. The S&P 500 is a broad-based, unmanaged measurement of changes in stock market conditions based on the average of 500 widely held common stocks. The total return of the Russell 3000® Value and S&P 500 include the reinvestment of dividends and income. The total return of the Fund includes operating expenses that reduce returns, while the total return of the Russell 3000® Value and S&P 500 do not include expenses. The Fund is professionally managed while the Russell 3000® Value and S&P 500 are unmanaged and are not available for investment.
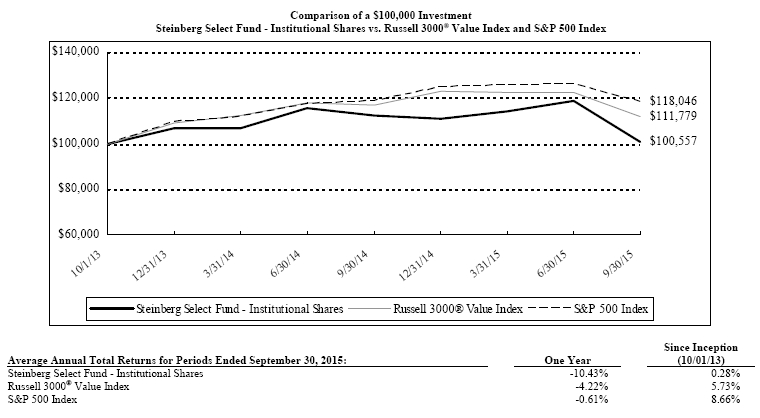
Performance data quoted represents past performance and is no guarantee of future results. Current performance may be lower or higher than the performance data quoted. Investment return and principal value will fluctuate so that shares, when redeemed, may be worth more or less than original cost. For the most recent month-end performance, please call (855) 330-7085. As stated in the Fund's prospectus, the annual operating expense ratios (gross) for Institutional Shares are 1.55%. However, the Fund's adviser has agreed to contractually waive its fees and/or reimburse expenses such that total operating expenses (excluding all taxes, interest, portfolio transaction expenses, acquired fund fees and expenses, proxy expenses and extraordinary expenses) do not exceed 0.75% for Institutional Shares through January 31, 2016 (the “Expense Cap”). The Fund may repay the Adviser for fees waived and expenses reimbursed pursuant to the Expense Cap if such payment is made within three years of the fees waived or expense reimbursement and the resulting total operating expenses for the Institutional Shares does not exceed 0.75%. The performance table and graph do not reflect the deduction of taxes that a shareholder would pay on Fund distributions or the redemption of Fund shares. Returns greater than one year are annualized.
| | Shares | | Security Description | | Value | |
Common Stock - 98.7% |
Consumer Discretionary - 31.0% |
| | 80,200 | | Aramark | $ | 2,377,128 | |
| | 9,420 | | Charter Communications, Inc., Class A (a) | | 1,656,507 | |
| | 188,150 | | Hudson's Bay Co. | | 3,183,535 | |
| | 27,943 | | Jarden Corp. (a) | | 1,365,854 | |
| | 54,225 | | Liberty Global PLC, Class C (a) | | 2,224,309 | |
| | 37,900 | | News Corp., Class A | | 478,298 | |
| | 10,375 | | Twenty-First Century Fox, Inc., Class A | | 279,918 | |
| | 40,855 | | Visteon Corp. (a) | | 4,136,160 | |
| | | 15,701,709 | |
Energy - 10.3% |
| | 41,450 | | Euronav NV | | 576,155 | |
| | 29,740 | | Golar LNG Partners LP | | 436,286 | |
| | 122,800 | | Golar LNG, Ltd. | | 3,423,664 | |
| | 57,225 | | Navigator Holdings, Ltd. (a) | | 763,953 | |
| | | 5,200,058 | |
Financial - 6.6% |
| | 45,338 | | Arch Capital Group, Ltd. (a) | | 3,330,983 | |
Health Care - 22.9% |
| | 40,945 | | Abbott Laboratories | | 1,646,808 | |
| | 71,075 | | Alere, Inc. (a) | | 3,422,261 | |
| | 9,409 | | Allergan PLC (a) | | 2,557,460 | |
| | 12,655 | | Express Scripts Holding Co. (a) | | 1,024,549 | |
| | 14,500 | | Laboratory Corp. of America Holdings (a) | | 1,572,815 | |
| | 11,005 | | Thermo Fisher Scientific, Inc. | | 1,345,691 | |
| | | 11,569,584 | |
Industrials - 11.8% |
| | 64,830 | | Aecom Technology Corp. (a) | | 1,783,473 | |
| | 44,075 | | Covanta Holding Corp. | | 769,109 | |
| | 10,115 | | FedEx Corp. | | 1,456,358 | |
| | 48,310 | | Republic Services, Inc. | | 1,990,372 | |
| | | 5,999,312 | |
Information Technology - 10.2% |
| | 12,725 | | Electronics For Imaging, Inc. (a) | | 550,738 | |
| | 150,675 | | Flextronics International, Ltd. (a) | | 1,588,114 | |
| | 56,955 | | NeuStar, Inc., Class A (a) | | 1,549,746 | |
| | 22,575 | | ViaSat, Inc. (a) | | 1,451,347 | |
| | | 5,139,945 | |
Materials - 5.9% |
| | 73,745 | | Dominion Diamond Corp. | | 787,596 | |
| | 126,000 | | Platform Specialty Products Corp. (a) | | 1,593,900 | |
| | 90,695 | | The Chemours Co. | | 586,797 | |
| | | 2,968,293 | |
Total Common Stock (Cost $49,101,409) | | 49,909,884 | |
Money Market Fund - 1.3% |
| | 648,541 | | Dreyfus Cash Management, 0.06% (b) (Cost $648,541) | | 648,541 | |
Total Investments - 100.0% (Cost $49,749,950)* | $ | 50,558,425 | |
| Other Assets & Liabilities, Net – 0.0% | | 7,916 | |
| Net Assets – 100.0% | $ | 50,566,341 | |
| PLC | Public Limited Company |
| (a) | Non-income producing security. |
| (b) | Variable rate security. Rate presented is as of September 30, 2015. |
| | * Cost for federal income tax purposes is $49,959,803 and net unrealized appreciation consists of: |
| Gross Unrealized Appreciation | | $ | 6,683,305 | |
| Gross Unrealized Depreciation | | | (6,084,683 | ) |
| Net Unrealized Appreciation | | $ | 598,622 | |
The following is a summary of the inputs used to value the Fund’s investments as of September 30, 2015.
The inputs or methodology used for valuing securities are not necessarily an indication of the risks associated with investing in those securities. For more information on valuation inputs, and their aggregation into the levels used in the table below, please refer to the Security Valuation section in Note 2 of the accompanying Notes to Financial Statements.
| Valuation Inputs | | Investments in Securities |
| Level 1 - Quoted Prices | | $ | 49,909,884 | |
| Level 2 - Other Significant Observable Inputs | | | 648,541 | |
| Level 3 - Significant Unobservable Inputs | | | - | |
| Total | | $ | 50,558,425 | |
The Level 1 value displayed in this table is Common Stock. The Level 2 value displayed in this table is a Money Market Fund. Refer to this Schedule of Investments for a further breakout of each security by industry.
The Fund utilizes the end of period methodology when determining transfers. There were no transfers among Level 1, Level 2 and Level 3 for the year ended September 30, 2015.
| PORTFOLIO HOLDINGS | | |
| % of Total Investments | | |
| Consumer Discretionary | 31.0 | % |
| Energy | 10.3 | % |
| Financial | 6.6 | % |
| Health Care | 22.9 | % |
| Industrials | 11.8 | % |
| Information Technology | 10.2 | % |
| Materials | 5.9 | % |
| Money Market Fund | 1.3 | % |
| | 100.0 | % |
| See Notes To Financial Statements. | 4 | |
STEINBERG SELECT FUNDSTATEMENT OF ASSETS AND LIABILITIES |
| | | | | | | |
| ASSETS | | | | |
| | Total investments, at value (Cost $49,749,950) | | $ | 50,558,425 | |
| | Receivables: | | | | |
| | | Dividends | | | 44,329 | |
| | Prepaid expenses | | | 19,841 | |
| Total Assets | | | 50,622,595 | |
| | | | | | | |
| LIABILITIES | | | | |
| | Payables: | | | | |
| | | Fund shares redeemed | | | 9,982 | |
| | Accrued Liabilities: | | | | |
| Adviser | Investment adviser fees | | | 14,498 | |
| | | Trustees’ fees and expenses | | | 73 | |
| | | Fund services fees | | | 8,127 | |
| | | Other expenses | | | 23,574 | |
| Total Liabilities | | | 56,254 | |
| | | | | | | |
| NET ASSETS | | $ | 50,566,341 | |
| | | | | | | |
| COMPONENTS OF NET ASSETS | | | | |
| | Paid-in capital | | $ | 49,403,537 | |
| | Undistributed net investment income | | | 108,395 | |
| | Accumulated net realized gain | | | 245,992 | |
| | Net unrealized appreciation on investments and foreign currency | | | 808,417 | |
| NET ASSETS | | $ | 50,566,341 | |
| | | | | |
SHARES OF BENEFICIAL INTEREST AT NO PAR VALUE (UNLIMITED SHARES AUTHORIZED) Institutional Shares (see note 1) | | | 5,590,321 | |
NET ASSET VALUE, OFFERING AND REDEMPTION PRICE PER SHARE Institutional Shares (see note 1) (based on net assets of $50,566,341) | | $ | 9.05 | |
| | | | | | | |
| See Notes To Financial Statements. | 5 | |
STEINBERG SELECT FUNDSTATEMENT OF OPERATIONS YEAR ENDED SEPTEMBER 30, 2015 |
| | | | | | | | |
| INVESTMENT INCOME | | | | | |
| | Dividend income (Net of foreign withholding taxes of $14,693) | | $ | 572,297 | | |
| Total Investment Income | | | 572,297 | | |
| Adviser | | | | | |
| EXPENSES | | | | | |
| | Investment adviser fees | | | 555,670 | | |
| | Fund services fees | | | 175,133 | | |
| | Transfer agent fees: | | | | | |
| | Institutional Shares | | | 703 | | |
| | Investor Shares | | | 9 | | |
| | Distribution fees: | | | | | |
| | Investor Shares | | | 3 | | |
| | Custodian fees | | | 7,515 | | |
| | Registration fees: | | | | | |
| | Institutional Shares | | | 14,960 | | |
| | Investor Shares | | | 11,828 | | |
| | Professional fees | | | 36,792 | | |
| | Trustees' fees and expenses | | | 3,849 | | |
| | Offering costs: | | | | | |
| | Investor Shares | | | 9,179 | | |
| | Miscellaneous expenses | | | 19,502 | | |
| Total Expenses | | | 835,143 | | |
| | Fees waived and expenses reimbursed | | | (396,454 | ) | |
| Net Expenses | | | 438,689 | | |
| | | | | | | | |
| NET INVESTMENT INCOME | | | 133,608 | | |
| | | | | | | | |
| NET REALIZED AND UNREALIZED GAIN (LOSS) | | | | | |
| | Net realized gain (loss) on: | | | | | |
| | Investments | | | 458,746 | | |
| | Foreign currency transactions | | | (1,448 | ) | |
| | Net realized gain | | | 457,298 | | |
| | Net change in unrealized appreciation (depreciation) on: | | | | | |
| | Investments | | | (6,606,484 | ) | |
| | Foreign currency translations | | | (40 | ) | |
| | Net change in unrealized appreciation (depreciation) | | | (6,606,524 | ) | |
| NET REALIZED AND UNREALIZED LOSS | | | (6,149,226 | ) | |
| DECREASE IN NET ASSETS RESULTING FROM OPERATIONS | | $ | (6,015,618 | ) | |
| | | | | | | | |
| See Notes To Financial Statements. | 6 | |
STEINBERG SELECT FUNDSTATEMENT OF CHANGES IN NET ASSETS |
| | | | | | | | |
| | | | | For the Year Ended September 30, 2015 | | | October 1, 2013* Through September 30, 2014 |
| OPERATIONS | | | | | | | | | |
| | Net investment income | | $ | 133,608 | | | | $ | 304,292 | |
| | Net realized gain | | | 457,298 | | | | | 4,979,981 | |
| | Net change in unrealized appreciation (depreciation) | | | (6,606,524 | ) | | | | 510,738 | |
| Increase (Decrease) in Net Assets Resulting from Operations | | | (6,015,618 | ) | | | | 5,795,011 | |
| | | | | | | | | | | | |
| DISTRIBUTIONS TO SHAREHOLDERS FROM | | | | | | | | | |
| | Net investment income | | | | | | | | | |
| | | Institutional Shares | | | (272,352 | ) | | | | (79,088 | ) |
| | Net realized gain | | | | | | | | | |
| | | Institutional Shares | | | (4,715,878 | ) | | | | (476,599 | ) |
| Total Distributions to Shareholders | | | (4,988,230 | ) | | | | (555,687 | ) |
| | | | | | | | | | | | |
| CAPITAL SHARE TRANSACTIONS | | | | | | | | �� | |
| | Sale of shares: | | | | | | | | | |
| | | Institutional Shares (see note 1) | | | 1,381,214 | | | | | 57,135,512 | |
| | | Investor Shares | | | 100 | | | | | 10,310 | |
| | Reinvestment of distributions: | | | | | | | | | |
| | | Institutional Shares | | | 4,361,180 | | | | | 465,062 | |
| | Redemption of shares: | | | | | | | | | |
| | 1 | Institutional Shares | | | (3,792,695 | ) | | | | (3,219,801 | ) |
| | 2 | Investor Shares | | | (10,017 | ) | | | | - | |
| Increase in Net Assets from Capital Share Transactions | | | 1,939,782 | | | | | 54,391,083 | |
| Increase (Decrease) in Net Assets | | | (9,064,066 | ) | | | | 59,630,407 | |
| | | | | | | | | | | | |
| NET ASSETS | | | | | | | | | |
| | Beginning of Period | | | 59,630,407 | | | | | - | |
| | End of Period (Including line (a)) | | $ | 50,566,341 | | | | $ | 59,630,407 | |
| | | | | | | | | | | | |
| SHARE TRANSACTIONS | | | | | | | | | |
| | Sale of shares: | | | | | | | | | |
| | | Institutional Shares | | | 135,929 | | | | | 5,632,799 | |
| | | Investor Shares | | | 9 | | | | | 915 | |
| | Reinvestment of distributions: | | | | | | | | | |
| | | Institutional Shares | | | 452,425 | | | | | 45,980 | |
| | Redemption of shares: | | | | | | | | | |
| | | Institutional Shares | | | (380,119 | ) | | | | (296,693 | ) |
| | | Investor Shares | | | (924 | ) | | | | - | |
| Increase in Shares | | | 207,320 | | | | | 5,383,001 | |
| | | | | | | | | | | | |
| (a) | Undistributed net investment income | | $ | 108,395 | | | | $ | 248,587 | |
| * | Commencement of operations. | | | | | | | | | |
| See Notes To Financial Statements. | 7 | |
| | | For the Year Ended September 30, 2015 | | | October 1, 2013 (a) through September 30, 2014 | |
| INSTITUTIONAL SHARES | | | | | | |
| NET ASSET VALUE, Beginning of Period | $ | 11.08 | | $ | 10.00 | |
| INVESTMENT OPERATIONS | | | | | | |
| Net investment income (b) | | 0.02 | | | 0.06 | |
| Net realized and unrealized gain (loss) | | (1.12 | ) | | 1.15 | |
| Total from Investment Operations | | (1.10 | ) | | 1.21 | |
| DISTRIBUTIONS TO SHAREHOLDERS FROM | | | | | | |
| Net investment income | | (0.05 | ) | | (0.02 | ) |
| Net realized gain | | (0.88 | ) | | (0.11 | ) |
| Total Distributions to Shareholders | | (0.93 | ) | | (0.13 | ) |
| NET ASSET VALUE, End of Period | $ | 9.05 | | $ | 11.08 | |
| TOTAL RETURN | | (10.34 | )% | | 12.26 | %(c) |
| RATIOS/SUPPLEMENTARY DATA | | | | | | |
| Net Assets at End of Period (000's omitted) | | $50,566 | | | $59,620 | |
| Ratios to Average Net Assets: | | | | | | |
| Net investment income | | 0.23 | % | | 0.59 | %(d) |
| Net expenses | | 0.75 | % | | 0.75 | %(d) |
| Gross expenses (e) | | 1.39 | % | | 1.54 | %(d) |
| PORTFOLIO TURNOVER RATE | | 46 | % | | 44 | %(c) |
| | | October 1, 2014 through November 17, 2014 (f) | | | July 17, 2014 (a) through September 30, 2014 | |
| INSTITUTIONAL SHARES | | | | | | |
| NET ASSET VALUE, Beginning of Period | $ | 11.07 | | $ | 11.27 | |
| INVESTMENT OPERATIONS | | | | | | |
| Net investment income (loss) (b) | | - | (g) | | 0.01 | |
| Net realized and unrealized gain (loss) | | (0.21 | ) | | (0.21 | ) |
| Total from Investment Operations | | (0.21 | ) | | (0.20 | ) |
| NET ASSET VALUE, End of Period | $ | 10.86 | | $ | 11.07 | |
| TOTAL RETURN | | (1.90 | )%(c) | | (1.77 | )%(c) |
| RATIOS/SUPPLEMENTARY DATA | | | | | | |
| Net Assets at End of Period (000's omitted) | | $- | | | $10 | |
| Ratios to Average Net Assets: | | | | | | |
| Net investment income (loss) | | (0.95 | )%(d) | | 0.34 | %(d) |
| Net expenses | | 1.00 | %(d) | | 1.00 | %(d) |
| Gross expenses (e) | | 1,827.45 | %(d) | | 153.75 | %(d) |
| PORTFOLIO TURNOVER RATE | | 46 | %(d) | | 44 | %(c) |
| | | | | | | |
| | | | | | | |
| (a) | Commencement of operations. |
| (b) | Calculated based on average shares outstanding during each period. |
| (c) | Not annualized. |
| (d) | Annualized. |
| (e) | Reflects the expense ratio excluding any waivers and/or reimbursements. |
| (f) | On November 17, 2014, shares were fully redeemed. |
| (g) | Less than $0.01 per share. |
| See Notes To Financial Statements. | 8 | |
STEINBERG SELECT FUNDNOTES TO FINANCIAL STATEMENTS SEPTEMBER 30, 2015 |
Note 1. Organization
The Steinberg Select Fund (the “Fund”) is a non-diversified portfolio of Forum Funds (the “Trust”). The Trust is a Delaware statutory trust that is registered as an open-end, management investment company under the Investment Company Act of 1940 (the “Act”), as amended. Under its Trust Instrument, the Trust is authorized to issue an unlimited number of the Fund’s shares of beneficial interest without par value. The Fund currently offers two classes of shares: Institutional Shares and Investor Shares. Institutional Shares and Investor Shares commenced operations on October 1, 2013, and July 17, 2014, respectively. As of November 17, 2014, the Investor Shares class had no shares outstanding. The Fund seeks long-term capital appreciation.
On October 1, 2013, the Fund commenced operations through a contribution of assets which had been previously managed as separate accounts by the adviser. The net assets, shares issued, cost and net unrealized appreciation on investments relating to this tax-free transaction were as follows:
| Date of Contribution | | Net Assets | | Shares Issued | | Cost of Investments | | Unrealized Gain on Investments |
| October 1, 2013 | | $24,118,400 | | 2,411,840 | | $17,186,358 | | $6,904,203 |
Note 2. Summary of Significant Accounting Policies
These financial statements are prepared in accordance with accounting principles generally accepted in the United States of America (“GAAP”), which require management to make estimates and assumptions that affect the reported amounts of assets and liabilities, the disclosure of contingent liabilities at the date of the financial statements, and the reported amounts of increases and decreases in net assets from operations during the fiscal year. Actual amounts could differ from those estimates. The following summarizes the significant accounting policies of the Fund:
Security Valuation – Exchange-traded securities and over-the-counter securities are valued using the last quoted trade or official closing price, provided by independent pricing services as of the close of trading on the market or exchange for which they are primarily traded, on each Fund business day. In the absence of a sale, such securities are valued at the mean of the last bid and ask price provided by independent pricing services. Non-exchange-traded securities for which quotations are available are valued using the last quoted sales price, or in the absence of a sale, at the mean of the last bid and ask prices provided by independent pricing services. Short-term investments that mature in 60 days or less may be valued at amortized cost.
The Fund values its investments at fair value pursuant to procedures adopted by the Trust's Board of Trustees (the "Board") if (1) market quotations are insufficient or not readily available or (2) the adviser believes that the values available are unreliable. The Trust’s Valuation Committee, as defined in the Fund’s registration statement, performs certain functions as they relate to the administration and oversight of the Fund’s valuation procedures. Under these procedures, the Valuation Committee convenes on a regular and ad-hoc basis to review such investments and considers a number of factors, including valuation methodologies and significant unobservable inputs, when arriving at fair value.
The Valuation Committee may work with the adviser to provide valuation inputs. In determining fair valuations, inputs may include market-based analytics which may consider related or comparable assets or liabilities, recent transactions, market multiples, book values and other relevant investment information. Adviser inputs may include an income-based approach in which the anticipated future cash flows of the investment are discounted in determining fair value. Discounts may also be applied based on the nature or duration of any restrictions on the disposition of the investments. The Valuation Committee performs regular reviews of valuation methodologies, key inputs and assumptions, disposition analysis and market activity.
Fair valuation is based on subjective factors and, as a result, the fair value price of an investment may differ from the security’s market price and may not be the price at which the asset may be sold. Fair valuation could result in a different Net Asset Value ("NAV") than a NAV determined by using market quotes.
The Fund has a three-tier fair value hierarchy. The basis of the tiers is dependent upon the various “inputs” used to determine the value of the Fund’s investments. These inputs are summarized in the three broad levels listed below:
Level 1 — quoted prices in active markets for identical assets and liabilities
Level 2 — other significant observable inputs (including quoted prices of similar securities, interest rates, prepayment speeds, credit risk, etc.)
STEINBERG SELECT FUNDNOTES TO FINANCIAL STATEMENTS SEPTEMBER 30, 2015 |
Level 3 — significant unobservable inputs (including the Fund’s own assumptions in determining the fair value of investments)
The aggregate value by input level, as of September 30, 2015, for the Fund’s investments is included at the end of the Fund’s Schedule of Investments.
Security Transactions, Investment Income and Realized Gain and Loss – Investment transactions are accounted for on the trade date. Dividend income is recorded on the ex-dividend date. Foreign dividend income is recorded on the ex-dividend date or as soon as possible after the Fund determines the existence of a dividend declaration after exercising reasonable due diligence. Income and capital gains on some foreign securities may be subject to foreign withholding taxes, which are accrued as applicable. Interest income is recorded on an accrual basis. Premium is amortized and discount is accreted using the effective interest method. Identified cost of investments sold is used to determine the gain and loss for both financial statement and federal income tax purposes.
Foreign Currency Translations – Foreign currency amounts are translated into U.S. dollars as follows: (1) assets and liabilities at the rate of exchange at the end of the respective period; and (2) purchases and sales of securities and income and expenses at the rate of exchange prevailing on the dates of such transactions. The portion of the results of operations arising from changes in the exchange rates and the portion due to fluctuations arising from changes in the market prices of securities are not isolated. Such fluctuations are included with the net realized and unrealized gain or loss on investments.
Distributions to Shareholders – Distributions to shareholders of net investment income and net capital gains, if any, are declared and paid at least annually. Distributions to shareholders are recorded on the ex-dividend date. Distributions are based on amounts calculated in accordance with applicable federal income tax regulations, which may differ from GAAP. These differences are due primarily to differing treatments of income and gain on various investment securities held by the Fund, timing differences and differing characterizations of distributions made by the Fund.
Federal Taxes – The Fund intends to qualify each year as a regulated investment company under Subchapter M of the Internal Revenue Code and to distribute all of its taxable income to shareholders. In addition, by distributing in each calendar year substantially all of its net investment income and capital gains, if any, the Fund will not be subject to a federal excise tax. Therefore, no federal income or excise tax provision is required. The Fund files a U.S. federal income and excise tax return as required. A fund’s federal income tax returns are subject to examination by the Internal Revenue Service for a period of three fiscal years after they are filed. As of September 30, 2015, there are no uncertain tax positions that would require financial statement recognition, de-recognition, or disclosure.
Income and Expense Allocation – The Trust accounts separately for the assets, liabilities and operations of each of its investment portfolios. Expenses that are directly attributable to more than one investment portfolio are allocated among the respective investment portfolios in an equitable manner. The Fund’s class-specific expenses are charged to the operations of that class of shares. Income and expenses (other than expenses attributable to a specific class) and realized and unrealized gains or losses on investments are allocated to each class of shares based on the class’ respective net assets to the total net assets of the Fund.
Commitments and Contingencies – In the normal course of business, the Fund enters into contracts that provide general indemnifications by the Fund to the counterparty to the contract. The Fund’s maximum exposure under these arrangements is dependent on future claims that may be made against the Fund and, therefore, cannot be estimated; however, based on experience, the risk of loss from such claims is considered remote.
Offering Costs – Offering costs for the Fund of $65,137 consisted of fees related to the mailing and printing of the initial prospectus, certain startup legal costs, and initial registration filings. Such costs are amortized over a twelve-month period beginning with the commencement of operations respective to each class within the Fund. During the year ended September 30, 2015, the Fund expensed $9,179 in offering costs.
Note 3. Fees and Expenses
Investment Adviser – Steinberg Asset Management, LLC (the “Adviser”) is the investment adviser to the Fund. Pursuant to an investment advisory agreement, the Adviser receives an advisory fee from the Fund at an annual rate of 0.95% of the Fund’s average daily net assets.
Distribution – Foreside Fund Services, LLC serves as the Fund’s distributor (the “Distributor”). The Distributor is not affiliated with the Adviser or Atlantic Fund Administration, LLC (d/b/a Atlantic Fund Services) (“Atlantic”) or their affiliates. The Fund has
STEINBERG SELECT FUNDNOTES TO FINANCIAL STATEMENTS SEPTEMBER 30, 2015 |
adopted a Distribution Plan (the “Plan”) for Investor Class shares in accordance with Rule 12b-1 of the Act. Under the Plan, the Fund pays the Distributor and/or any other entity as authorized by the Board a fee of 0.25% of the average daily net assets of the Investor Shares.
Other Service Providers – Atlantic provides fund accounting, fund administration, compliance and transfer agency services to the Fund. Atlantic also provides certain shareholder report production, and EDGAR conversion and filing services. Pursuant to an Atlantic services agreement, the Fund pays Atlantic customary fees for its services. Atlantic provides a Principal Executive Officer, a Principal Financial Officer, a Chief Compliance Officer, and an Anti-Money Laundering Officer to the Fund, as well as certain additional compliance support functions.
Trustees and Officers – The Trust pays each independent Trustee an annual retainer fee of $50,000 for service to the Trust ($66,000 for the Chairman), and the Audit Committee Chairman and Vice Chairman receive an additional $6,000 annually. The Trustees and Chairman may receive additional fees for special Board meetings. Each Trustee is also reimbursed for all reasonable out-of-pocket expenses incurred in connection with his duties as a Trustee, including travel and related expenses incurred in attending Board meetings. The amount of Trustees’ fees attributable to the Fund is disclosed in the Statement of Operations. Certain officers of the Trust are also officers or employees of the above named service providers, and during their terms of office received no compensation from the Fund.
Note 4. Expense Reimbursements and Fees Waived
The Adviser has contractually agreed to waive a portion of its fee and/or reimburse Fund expenses through January 31, 2016, to limit annual operating expenses (excluding all taxes, interest, portfolio transaction expenses, acquired fund fees and expenses, proxy expenses and extraordinary expenses) to 0.75% and 1.00% for Institutional Shares and Investor Shares, respectively. Other Fund service providers have voluntarily agreed to waive a portion of their fees. The contractual waivers may be changed or eliminated at any time with the consent of the Board and voluntary fee waivers and expense reimbursements may be reduced or eliminated at any time. For the year ended September 30, 2015, fees waived and expenses reimbursed were as follows:
| Investment Adviser Fees Waived | | Investment Adviser Expenses Waived | | Other Waivers | | Total Fees Waived and Expenses Reimbursed |
| $ | 298,615 | | $ | 21,048 | | $ | 76,791 | | $ | 396,454 |
| | | | | | | | | | | |
The Fund may repay the Adviser for fees waived and expenses reimbursed pursuant to the expense cap if such payment is made within three years of the fees waived or expense reimbursement and the resulting expenses do not exceed the expense cap. As of September 30, 2015, the amount of waived fees subject to recoupment by the Adviser are as follows:
| | | Amount of Fees Waived and/or Expenses Reimbursed | | Expiration Date to Recoup Fees Waived and/or Expenses Reimbursed | | Fees Recouped |
| September 30, 2014 | | $ | 330,363 | | September 30, 2017 | | $ | - |
| September 30, 2015 | | $ | 319,663 | | September 30, 2018 | | $ | - |
| | | | | | | | | |
Note 5. Security Transactions
The cost of purchases and proceeds from sales of investment securities (including maturities), other than short-term investments during the year ended September 30, 2015, were $25,589,966 and $27,032,668, respectively.
STEINBERG SELECT FUNDNOTES TO FINANCIAL STATEMENTS SEPTEMBER 30, 2015 |
Note 6. Federal Income Tax
Distributions paid during the fiscal year or period ended as noted were characterized for tax purposes as follows:
| | | 2015 | | 2014 |
| Ordinary Income | | $ | 272,352 | | $ | 79,088 |
| Long-Term Capital Gain | | | 4,715,878 | | | 476,599 |
| | | $ | 4,988,230 | | $ | 555,687 |
As of September 30, 2015, distributable earnings (accumulated loss) on a tax basis were as follows:
| Undistributed Ordinary Income | | $ | 108,395 | |
| Undistributed Long-Term Gain | | | 455,845 | |
| Unrealized Appreciation | | | 598,564 | |
| Total | | $ | 1,162,804 | |
The difference between components of distributable earnings on a tax basis and the amounts reflected in the Statement of Assets and Liabilities are primarily due to wash sales.
On the Statement of Assets and Liabilities, as a result of permanent book to tax differences, certain amounts have been reclassified for the year ended September 30, 2015. The following reclassifications were the result of currency gain/loss and have no impact on the net assets of the Fund.
| Undistributed net investment income | | $ | (1,448 | ) |
| Accumulated net realized gain | | | 1,448 | |
Note 7. Recent Accounting Pronouncements
In May 2015, the Financial Accounting Standards Board (“FASB”) issued Accounting Standards Update 2015-07 (“ASU 2015-07”) eliminating the requirement for investments measured at net asset value to be categorized within the fair value hierarchy under GAAP and requiring the disclosure of sufficient information to reconcile the fair value of the remaining assets categorized within the fair value hierarchy to the financial statements. ASU 2015-07 is effective for interim and annual reporting periods beginning after December 15, 2015. Management has reviewed the requirements and believes the adoption of ASU 2015-07 will not have a material impact on the financial statements.
Note 8. Subsequent Events
Subsequent events occurring after the date of this report through the date these financial statements were issued have been evaluated for potential impact and the Fund has had no such events.
REPORT OF INDEPENDENT REGISTERED PUBLIC ACCOUNTING FIRM |
To the Shareholders of Steinberg Select Fund
and the Board of Trustees of Forum Funds
We have audited the accompanying statement of assets and liabilities of the Steinberg Select Fund, a series of shares of beneficial interest in the Forum Funds, including the schedule of investments, as of September 30, 2015, and the related statement of operations for the year then ended and the statements of changes in net assets and the financial highlights for each of the years and periods presented. These financial statements and financial highlights are the responsibility of the Fund's management. Our responsibility is to express an opinion on these financial statements and financial highlights based on our audits.
We conducted our audits in accordance with the standards of the Public Company Accounting Oversight Board (United States). Those standards require that we plan and perform the audits to obtain reasonable assurance about whether the financial statements and financial highlights are free of material misstatement. An audit includes examining, on a test basis, evidence supporting the amounts and disclosures in the financial statements. Our procedures included confirmation of securities owned as of September 30, 2015 by correspondence with the custodian. An audit also includes assessing the accounting principles used and significant estimates made by management, as well as evaluating the overall financial statement presentation. We believe that our audits provide a reasonable basis for our opinion.
In our opinion, the financial statements and financial highlights referred to above present fairly, in all material respects, the financial position of the Steinberg Select Fund as of September 30, 2015, the results of its operations for the year then ended, and the changes in its net assets and its financial highlights for each of the years and periods presented, in conformity with accounting principles generally accepted in the United States of America.
BBD, LLP
Philadelphia, Pennsylvania
November 19, 2015
STEINBERG SELECT FUNDADDITIONAL INFORMATION (Unaudited) SEPTEMBER 30, 2015 |
Investment Advisory Agreement Approval
At the June 12, 2015 Board meeting, the Board, including the Independent Trustees, considered the approval of the continuance of the investment advisory agreement between the Adviser and the Trust pertaining to the Fund (the “Advisory Agreement”). In preparation for its deliberations, the Board requested and reviewed written responses from the Adviser to a due diligence questionnaire circulated on the Board's behalf. The Board also discussed the materials with Fund Counsel and, as necessary, with the Trust's administrator, Atlantic Fund Services. During its deliberations, the Board received an oral presentation from the Adviser, and was assisted by the advice of Trustee Counsel.
In evaluating the Advisory Agreement for the Fund, the Board reviewed written materials furnished by the Adviser and the administrator, including information regarding the Adviser's personnel, operations and financial condition. In addition, the Board recognized that the evaluation process with respect to the Adviser is an ongoing one and, in this regard, the Board considered information provided at regularly scheduled meetings during the past year, including, among other things, information concerning the Fund’s performance and services provided by the Adviser.
At the meeting, the Board reviewed, among other matters: (1) the nature, extent and quality of the services provided to the Fund by the Adviser, including information on the investment performance of the Fund and Adviser; (2) the costs of the services provided and profitability to the Adviser of its relationship with the Fund; (3) the advisory fee and total expense ratio of the Fund compared to a relevant peer group of funds; (4) the extent to which economies of scale may be realized as the Fund grows and whether the advisory fee enables the Fund's investors to share in the benefits of economies of scale; and (5) other benefits received by the Adviser from its relationship with the Fund.
Nature, Extent and Quality of Services
Based on written materials received, a presentation from senior representatives of the Adviser and a discussion with the Adviser about the Adviser’s personnel, operations and financial condition, and with the Trust’s CCO about the Adviser, the Board considered the quality of services provided by the Adviser under the Advisory Agreement. In this regard, the Board considered information regarding the experience, qualifications and professional background of the portfolio managers and other personnel at the Adviser with principal responsibility for the Fund, as well as the investment philosophy and decision-making process of those professionals and the capability and integrity of the Adviser’s senior management and staff.
The Board considered also the adequacy of the Adviser’s resources. The Board noted the Adviser’s representation that the firm is financially stable and has the operational capability needed to provide high-quality investment advisory services to the Fund for the foreseeable future. The Board further noted the Adviser’s representation that there had only been one change to the Adviser’s portfolio management team since the inception of the Fund. Based on the presentation and the materials provided by the Adviser in connection with the Board’s consideration of the renewal of the Advisory Agreement, the Board concluded that, overall, it was satisfied with the nature, extent and quality of services provided to the Fund under the Advisory Agreement.
Performance
In connection with a presentation by the Adviser regarding its approach to managing the Fund, the Board reviewed the performance of the Fund compared to its benchmarks. The Board observed that the Fund underperformed the Russell 3000 Value Index and S&P 500 Index, the Fund’s benchmarks, for the one-year period ended March 31, 2015 and since the Fund’s inception on October 1, 2013. The Board also considered the Fund’s performance relative to its Lipper Inc. (“Lipper”) peer group, noting that, based on the information provided by Lipper, the Fund performed at the median for its peer group for the one-year period ended March 31, 2015. The Board noted the Adviser’s representation that the Fund’s Lipper peers were not necessarily representative of the Fund’s strategy because the Lipper peers were all global multi-cap growth funds. The Board noted the Adviser’s representation that the Fund is not a true “global” fund, though many of the Fund’s holdings identify as non-U.S. holdings due to their foreign domicile. The Board also noted the Adviser’s representation that the Fund employs an all-cap value strategy, not a growth strategy, and that value stocks underperformed growth stocks during the period. The Board further noted the Adviser’s representation that the Fund’s underperformance relative to its benchmarks could be attributed to significant direct and derivative exposure to the energy and technology sectors, which underperformed during 2014, though the Adviser expected each sector to rebound in the long term. The Board then noted the Adviser’s representation that the Fund’s performance was consistent with the performance of a list of peers identified by the Adviser as being more representative of the Fund’s investment strategy for the one-year period ended March 31, 2015. Finally, the Board noted the Adviser’s belief that the Fund was well positioned and that no change in investment approach was necessary. Based on the foregoing, the Board concluded that the Fund’s performance was reasonable and that the Fund and its shareholders could benefit from the Adviser’s management of the Fund.
STEINBERG SELECT FUNDADDITIONAL INFORMATION (Unaudited) SEPTEMBER 30, 2015 |
Compensation
The Board evaluated the Adviser’s compensation for providing advisory services to the Fund and analyzed comparative information on “actual” advisory fee rates (i.e., after fee waivers), and actual total expenses of the Fund's relevant Lipper peer group. The Board noted that the Adviser’s actual advisory fee rate and the Fund's actual total expense ratio were each among the lowest in the Fund's Lipper peer group. Based on the foregoing, the Board concluded that the Adviser’s advisory fee rate charged to the Fund was reasonable.
Costs of Services and Profitability
The Board considered information provided by the Adviser regarding the costs of services and its profitability with respect to the Fund. In this regard, the Board considered the Adviser’s resources devoted to the Fund, as well as the Adviser’s discussion of costs and profitability. The Board noted the Adviser’s representation that it does not separately allocate marketing expenses attributable solely to the Fund from its overall operational expenses, and instead includes in its marketing expense calculation all marketing expenses from products it manages. Based on these and other applicable considerations, the Board concluded that the Adviser’s profits attributable to management of the Fund were reasonable in the context of all factors considered.
Economies of Scale
The Board evaluated whether the Fund would benefit from any economies of scale. In this respect, the Board considered the Adviser’s representation that the Fund could potentially benefit from economies of scale as assets grow and stated that, based on the Fund’s current asset levels, the Adviser was not proposing breakpoints or changes in fees at this time. Based on the foregoing information, the Board concluded that economies of scale were not a material factor in approving the Advisory Agreement.
Other Benefits
The Board noted the Adviser’s representation that, aside from its contractual advisory fees, it does not benefit in a material way from its relationship with the Fund. Based on the foregoing representation, the Board concluded that other benefits received by the Adviser from its relationship with the Fund were not a material factor to consider in approving the continuation of the Advisory Agreement.
Conclusion
The Board did not identify any single factor as being of paramount importance, and different Trustees may have given different weight to different factors. The Board reviewed a memorandum from Fund Counsel discussing the legal standards applicable to its consideration of the Advisory Agreement. Based on its review, including consideration of each of the factors referenced above, the Board determined, in the exercise of its business judgment, that the advisory arrangement, as outlined in the Advisory Agreement, was fair and reasonable in light of the services performed or to be performed, expenses incurred or to be incurred and such other matters as the Board considered relevant.
Proxy Voting Information
A description of the policies and procedures that the Fund uses to determine how to vote proxies relating to securities held in the Fund’s portfolio is available, without charge and upon request, by calling (855) 330-7085 and on the U.S. Securities and Exchange Commission’s (the “SEC”) website at www.sec.gov. The Fund’s proxy voting record for the most recent twelve-month period ended June 30 is available, without charge and upon request, by calling (855) 330-7085 and on the SEC’s website at www.sec.gov.
Availability of Quarterly Portfolio Schedules
The Fund files its complete schedule of portfolio holdings with the SEC for the first and third quarters of each fiscal year on Form N-Q. These filings are available, without charge and upon request on the SEC’s website at www.sec.gov or may be reviewed and copied at the SEC’s Public Reference Room in Washington, DC. Information on the operation of the Public Reference Room may be obtained by calling (800) SEC-0330.
Shareholder Expense Example
As a shareholder of the Fund, you incur ongoing costs, including management fees, distribution (12b-1) fees and other Fund
STEINBERG SELECT FUNDADDITIONAL INFORMATION (Unaudited) SEPTEMBER 30, 2015 |
expenses. This example is intended to help you understand your ongoing costs (in dollars) of investing in the Fund, and to compare these costs with the ongoing costs of investing in other mutual funds.
The example is based on an investment of $1,000 invested at the beginning of the period and held for the entire period from April 1, 2015, through September 30, 2015.
Actual Expenses – The first line of the table below provides information about actual account values and actual expenses. You may use the information in this line, together with the amount you invested, to estimate the expenses that you paid over the period. Simply divide your account value by $1,000 (for example, an $8,600 account value divided by $1,000 = 8.6), then multiply the result by the number in the first line under the heading entitled “Expenses Paid During Period” to estimate the expenses you paid on your account during the period.
Hypothetical Example for Comparison Purposes – The second line of the table below provides information about hypothetical account values and hypothetical expenses based on the Fund’s actual expense ratio and an assumed rate of return of 5% per year before expenses, which is not the Fund’s actual return. The hypothetical account values and expenses may not be used to estimate the actual ending account balance or expenses you paid for the period. You may use this information to compare the ongoing costs of investing in the Fund and other funds. To do so, compare this 5% hypothetical example with the 5% hypothetical examples that appear in the shareholder reports of other funds.
Please note that the expenses shown in the table are meant to highlight your ongoing costs only. Therefore, the second line of the table is useful in comparing ongoing costs only, and will not help you determine the relative total costs of owning different funds.
| | Beginning | | Ending | | Expenses | | Annualized |
| | Account Value | | Account Value | | Paid During | | Expense |
| | April 1, 2015 | | September 30, 2015 | | Period* | | Ratio* |
| Institutional Shares | | | | | | | | | | | |
| Actual | $ | 1,000.00 | | $ | 882.93 | | $ | 3.54 | | 0.75 | % |
| Hypothetical (5% return before taxes) | $ | 1,000.00 | | $ | 1,021.31 | | $ | 3.80 | | 0.75 | % |
| | * Expenses are equal to the Fund's annualized expense ratio multiplied by the average account value over the period, multiplied by the number of days in the most recent fiscal half-year divided by 365 to reflect the half-year period. |
Federal Tax Status of Dividends Declared during the Fiscal Year
For federal income tax purposes, dividends from short-term capital gains are classified as ordinary income. The Fund designates 84.93% of its income dividend distributed as qualifying for the corporate dividends-received deduction (DRD) and 100.00% for the qualified dividend rate (QDI) as defined in Section 1(h)(11) of the Internal Revenue Code.
STEINBERG SELECT FUNDADDITIONAL INFORMATION (Unaudited) SEPTEMBER 30, 2015 |
Trustees and Officers of the Trust
The Board is responsible for oversight of the management of the Trust’s business affairs and of the exercise of all the Trust’s powers except those reserved for the shareholders. The following table provides information about each Trustee and certain officers of the Trust. Each Trustee and officer holds office until the person resigns, is removed, or is replaced. Unless otherwise noted, the persons have held their principal occupations for more than five years. The address for all Trustees and officers is Three Canal Plaza, Suite 600, Portland, Maine 04101. Mr. Keffer is considered an Interested Trustee due to his affiliation with Atlantic. The Fund’s Statement of Additional Information includes additional information about the Trustees and is available, without charge and upon request, by calling (855) 330-7085.
| Name and Year of Birth | Position with the Trust | Length of Time Served | Principal Occupation(s) During Past Five Years | Number of Series of Fund Complex¹ Overseen by Trustee | Other Directorships Held by Trustee |
Independent Trustees | | | | | |
J. Michael Parish Born: 1943 | Chairman of the Board; Trustee; Chairman, Nominating Committee and Qualified Legal Compliance Committee | Since 1989 (Chairman since 2004) | Retired since 2003; formerly, Partner, Wolf, Block, Schorr and Solis-Cohen, LLP (law firm) 2002-2003; Partner, Thelen Reid & Priest LLP (law firm) 1995-2002. | 26 | None |
Costas Azariadis Born: 1943 | Trustee | Since 1989 | Professor of Economics, Washington University since 2006. | 26 | None |
James C. Cheng Born: 1942 | Trustee; Chairman, Audit Committee | Since 1989 | President, Technology Marketing Associates (marketing company for small- and medium-sized businesses in New England) since 1991. | 26 | None |
David Tucker Born: 1958 | Trustee; Vice Chairman | Since 2011 (Vice Chairman since 2015) | Director, Blue Sky Experience since 2008; Senior Vice President & General Counsel, American Century Companies 1998-2008. | 36 | Trustee, Forum Funds II and Forum ETF Trust |
Interested Trustee | | | | | |
John Y. Keffer2 Born: 1942 | Trustee; Vice Chairman | Since 1989 | Chairman, Atlantic since 2008; President, Forum Investment Advisors, LLC since 2011; President, Forum Foundation (a charitable organization) since 2005; President, Forum Trust, LLC (a non-depository trust company chartered in the State of Maine) since 1997. | 36 | Director, Wintergreen Fund, Inc.; Trustee, Forum Funds II, Forum ETF Trust and ALTMFX Trust |
Officers | | | | | |
Jessica Chase Born: 1970 | President; Principal Executive Officer | Since 2015 | Senior Vice President, Atlantic since 2008. | N/A | N/A |
Karen Shaw Born: 1972 | Treasurer; Principal Financial Officer | Since 2008 | Senior Vice President, Atlantic since 2008. | N/A | N/A |
Zachary Tackett Born: 1988 | Vice President; Secretary; Anti-Money Laundering Compliance Officer | Since 2014 | Associate Counsel, Atlantic since 2014; Intern Associate, Coakley & Hyde, PLLC, 2010-2013. | N/A | N/A |
Michael J. McKeen Born: 1971 | Vice President | Since 2009 | Senior Vice President, Atlantic since 2008. | N/A | N/A |
Timothy Bowden Born: 1969 | Vice President | Since 2009 | Manager, Atlantic since 2008. | N/A | N/A |
Geoffrey Ney Born: 1975 | Vice President | Since 2013 | Manager, Atlantic since 2013; Senior Fund Accountant, Atlantic, 2008-2013. | N/A | N/A |
Todd Proulx Born: 1978 | Vice President | Since 2013 | Manager, Atlantic since 2013; Senior Fund Accountant, Atlantic, 2008-2013. | N/A | N/A |
1The Fund Complex includes the Trust, Forum Funds II and Forum ETF Trust and is overseen by different Boards of Trustees. 2Atlantic is a subsidiary of Forum Holdings Corp. I, a Delaware corporation that is wholly owned by Mr. Keffer. |
STEINBERG SELECT FUND
FOR MORE INFORMATION:
P.O. Box 588
Portland, ME 04112
(855) 330-7085 (toll free)
INVESTMENT ADVISER
Steinberg Asset Management, LLC
12 East 49th Street, Suite 1202
New York, NY 10017
TRANSFER AGENT
Atlantic Fund Services
P.O. Box 588
Portland, ME 04112
www.atlanticfundservices.com
DISTRIBUTOR
Foreside Fund Services, LLC
Three Canal Plaza, Suite 100
Portland, Maine 04101
www.foreside.com
This report is submitted for the general information of the shareholders of the Fund. It is not authorized for distribution to prospective investors unless preceded or accompanied by an effective prospectus, which includes information regarding the Fund’s risks, objectives, fees and expenses, experience of its management, and other information.
216-ANR-0915
ITEM 2. CODE OF ETHICS.
| (a) | As of the end of the period covered by this report, Forum Funds (the “Registrant”) has adopted a code of ethics, which applies to its Principal Executive Officer and Principal Financial Officer (the “Code of Ethics”). |
| (c) | There have been no amendments to the Registrant’s Code of Ethics during the period covered by this report. |
| (d) | There have been no waivers to the Registrant’s Code of Ethics during the period covered by this report. |
(f) (1) A copy of the Code of Ethics is being filed under Item 12(a) hereto.
ITEM 3. AUDIT COMMITTEE FINANCIAL EXPERT.
The Board of Trustees has determined that no member of the Audit Committee is an "audit committee financial expert" as that term is defined under applicable regulatory guidelines.
ITEM 4. PRINCIPAL ACCOUNTANT FEES AND SERVICES.
(a) Audit Fees - The aggregate fees billed for each of the last two fiscal years (the “Reporting Periods”) for professional services rendered by the Registrant’s principal accountant for the audit of the Registrant’s annual financial statements, or services that are normally provided by the principal accountant in connection with the statutory and regulatory filings or engagements for the Reporting Periods, were $10,000 in 2014 and $12,900 in 2015.
(b) Audit-Related Fees – The aggregate fees billed in the Reporting Periods for assurance and related services rendered by the principal accountant that were reasonably related to the performance of the audit of the Registrant’s financial statements and are not reported under paragraph (a) of this Item 4 were $0 in 2014 and $0 in 2015.
(c) Tax Fees - The aggregate fees billed in the Reporting Periods for professional services rendered by the principal accountant to the Registrant for tax compliance, tax advice and tax planning were $3,000 in 2014 and $3,000 in 2015. These services consisted of review or preparation of U.S. federal, state, local and excise tax returns.
(d) All Other Fees - The aggregate fees billed in the Reporting Periods for products and services provided by the principal accountant to the Registrant, other than the services reported in paragraphs (a) through (c) of this Item, were $0 in 2014 and $0 in 2015.
(e) (1) The Audit Committee reviews and approves in advance all audit and “permissible non-audit services” (as that term is defined by the rules and regulations of the Securities and Exchange Commission) to be rendered to a series of the Registrant (each, a “Series”). In addition, the Audit Committee reviews and approves in advance all “permissible non-audit services” to be provided to an investment adviser (not including any sub-adviser) of a Series, or an affiliate of such investment adviser, that is controlling, controlled by or under common control with the investment adviser and provides on-going services to the Registrant (“Affiliate”), by the Series’ principal accountant if the engagement relates directly to the operations and financial reporting of the Series. The Audit Committee considers whether fees paid by a Series’ investment adviser or an Affiliate to the Series’ principal accountant for audit and permissible non-audit services are consistent with the principal accountant’s independence.
(e) (2) No services included in (b) - (d) above were approved pursuant to paragraph (c)(7)(i)(C) of Rule 2-01 of Regulation S-X.
(f) Not applicable
(g) The aggregate non-audit fees billed by the principal accountant for services rendered to the Registrant for the Reporting Periods were $0 in 2014 and $0 in 2015. There were no fees billed in either of the Reporting Periods for non-audit services rendered by the principal accountant to the Registrant’s investment adviser or any Affiliate.
(h) During the Reporting Period, the Registrant's principal accountant provided no non-audit services to the investment advisers or any entity controlling, controlled by or under common control with the investment advisers to the series of the Registrant to which this report relates.
ITEM 5. AUDIT COMMITTEE OF LISTED REGISTRANTS.
Not applicable.
ITEM 6. INVESTMENTS.
| (a) | Included as part of report to shareholders under Item 1. |
ITEM 7. DISCLOSURE OF PROXY VOTING POLICIES AND PROCEDURES FOR CLOSED-END
MANAGEMENT INVESTMENT COMPANIES.
Not applicable.
ITEM 8. PORTFOLIO MANAGERS OF CLOSED-END MANAGEMENT INVESTMENT COMPANIES.
Not applicable.
ITEM 9. PURCHASES OF EQUITY SECURITIES BY CLOSED-END MANAGEMENT INVESTMENT COMPANY AND AFFILIATED PURCHASERS.
Not applicable.
ITEM 10. SUBMISSION OF MATTERS TO A VOTE OF SECURITY HOLDERS
The Registrant does not accept nominees to the board of trustees from shareholders.
ITEM 11. CONTROLS AND PROCEDURES
(a) The Registrant’s Principal Executive Officer and Principal Financial Officer have concluded that the Registrant’s disclosure controls and procedures (as defined in Rule 30a-3(c) under the Investment Company Act of 1940 (the “Act”)) are effective, based on their evaluation of the controls and procedures required by Rule 30a-3(b) under the Act and Rules 13a-15(b) or 15d-15(b) under the Securities Exchange Act of 1934, as of a date within 90 days of the filing date of this report.
(b) There were no changes in the Registrant’s internal control over financial reporting (as defined in
Rule 30a-3(d) under the Act) that occurred during the second fiscal quarter of the period covered by this report that have materially affected, or are reasonably likely to materially affect, the Registrant’s internal control over financial reporting.
ITEM 12. EXHIBITS.
(a)(1) Code of Ethics (Exhibit filed herewith).
(a)(2) Certifications pursuant to Rule 30a-2(a) of the Act, and Section 302 of the Sarbanes-Oxley Act of 2002. (Exhibits filed herewith)
(a)(3) Not applicable.
(b) Certifications pursuant to Rule 30a-2(b) of the Act, and Section 906 of the Sarbanes-Oxley Act of 2002. (Exhibit filed herewith)
SIGNATURES
Pursuant to the requirements of the Securities Exchange Act of 1934 and the Investment Company Act of 1940, the Registrant has duly caused this report to be signed on its behalf by the undersigned, thereunto duly authorized.
Registrant Forum Funds
| By | | /s/ Jessica Chase | |
| | | Jessica Chase, Principal Executive Officer | |
| | | | |
| Date | | November 19, 2015 | |
Pursuant to the requirements of the Securities Exchange Act of 1934 and the Investment Company Act of 1940, this report has been signed below by the following persons on behalf of the Registrant and in the capacities and on the dates indicated.
| By | | /s/ Jessica Chase | |
| | | Jessica Chase, Principal Executive Officer | |
| | | | |
| Date | | November 19, 2015 | |
| | | | |
| By | | /s/ Karen Shaw | |
| | | Karen Shaw, Principal Financial Officer | |
| | | | |
| Date | | November 19, 2015 | |