As filed with the Securities and Exchange Commission on February 25, 2016
UNITED STATES
SECURITIES AND EXCHANGE COMMISSION
WASHINGTON, D.C. 20549
FORM N-CSR
CERTIFIED SHAREHOLDER REPORT OF REGISTERED MANAGEMENT
INVESTMENT COMPANIES
Investment Company Act file number 811-03023
FORUM FUNDS
Three Canal Plaza, Suite 600
Portland, Maine 04101
Jessica Chase, Principal Executive Officer
Three Canal Plaza, Suite 600
Portland, Maine 04101
207-347-2000
Date of fiscal year end: December 31
Date of reporting period: January 1, 2015 – December 31, 2015
ITEM 1. REPORT TO STOCKHOLDERS.
| POLARIS GLOBAL VALUE FUND |
| A MESSAGE TO OUR SHAREHOLDERS (Unaudited) |
| DECEMBER 31, 2015 |
Dear Fellow Shareholder,
For the year ended December 31, 2015, the total return for the Polaris Global Value Fund (the “Fund”) was 1.55%, outperforming the MSCI World Index benchmark at -0.87%. Consumer staples, consumer discretionary and financials were the strongest sector contributors. Allergan was the top individual stock performer, benefitting from a spate of M&A transactions. British homebuilders and financials dominated the top 10 individual stock contributions, with Taylor Wimpey, Bellway and Barratt Developments posting double-digit gains. Ameris Bancorp and insurers, The Chubb Corp. and Hannover Re, added materially to returns. Detractors were relegated mainly to the energy sector, with declines at WorleyParsons, Marathon Oil Corp. and Maurel et Prom.
We are pleased with the annual outperformance in this volatile year, as well as our benchmark-beating performance over all longer time periods as reflected below.
| | 2015 | Annualized As of December 31, 2015 |
| | YTD | QIV | QIII | QII | QI | 1 Yr | 3 Yrs | 5 Yrs | 10 Yrs | 15 Yrs | 20 Yrs | ITD* |
| Polaris Global Value Fund | 1.55% | 4.99% | -8.80% | 0.86% | 5.17% | 1.55% | 12.97% | 9.88% | 5.36% | 8.90% | 9.34% | 9.42% |
| MSCI World Index | -0.87% | 5.50% | -8.45% | 0.31% | 2.31% | -0.87% | 9.63% | 7.59% | 4.98% | 4.04% | 6.00% | 6.14% |
*Inception-to-date (Inception 7/31/1989)
Performance data quoted represents past performance and is no guarantee of future results. Current performance may be lower or higher than the performance data quoted. Returns for more than one year are annualized. Investment return and principal value will fluctuate so that an investor's shares, when redeemed, may be worth more or less than original cost. For the most recent month end performance, please call (888) 263-5594. As stated in the current prospectus, the Fund’s annual operating expense ratio (gross) is 1.28%. The Fund’s annual operating expense ratio has been reduced to 0.99%, effective January 1, 2014 through April 30, 2016, due to the Adviser’s contractual agreement to waive its fee and/or reimburse expenses to limit Total Annual Fund Operating Expenses. Shares redeemed or exchanged within 180 days of purchase will be charged at 1.00% fee. Fund performance returns shown do not reflect this fee; if reflected, the returns would have been lower. Short-term performance is not a good indication of the Fund's future performance, and an investment should not be made based solely on returns.
2015 PERFORMANCE ANALYSIS:
In consumer staples, the Irish convenience food producer Greencore Group was up more than 15% before calendar year end. The company rebounded strongly from the third quarter, when it faced cost pressures and one-off start-up facility charges. In the U.K. market, Greencore noted sales growth amongst grocery retailers, including players such as Sainsbury’s and Marks & Spencer. In the U.S., Greencore expanded capacity to service Starbucks and 7-Eleven. Japanese dairy, confectionery and pharmaceutical manufacturer Meiji Holdings’ stock rose markedly following news of a drug licensing agreement. Optimistic market sentiment drove the stock price to the upper end of our valuation target, and we sold Meiji at a profit earlier in the year.
The consumer discretionary sector was led by the aforementioned U.K. homebuilders, which rose as a result of more liberalized land availability. The British government instituted a five-year plan to make more municipal land available for additional housing in an effort to prevent housing prices from accelerating too fast due to supply-demand constraints.
| POLARIS GLOBAL VALUE FUND |
| A MESSAGE TO OUR SHAREHOLDERS (Unaudited) |
| DECEMBER 31, 2015 |
Previously owned government and industrial sites have opened for sale, allowing homebuilders to purchase those sites that are more difficult to remediate and develop. Duni AB, a Swedish supplier of paper goods and tableware, was up on earnings news, growth in its core table top disposables, efficient operation of its paper mill and favorable exchange rates. Chinese lottery company REXLot Holdings, Ltd. diminished sector returns, as the trading suspension continued due to accusations of accounting irregularities. REXLot Holdings also faces bond repayment demands due to the suspension in its stock trading and reported limited ability to withdraw cash recently invested to expand its China operations.
The Fund’s U.S. holdings led financial sector performance, with many banks anticipating that a December 2015 Federal Reserve rate hike would improve net interest margins. However, we believe the impact on bank earnings will likely be muted in the near term. Merger & acquisition activity was the true impetus for stock performance over the past year, with double-digit gains from Ameris, BNC Bancorp and Webster Financial. During the year, Ameris announced a buyout of Jacksonville Bancorp Inc., and the successful integration of 18 Bank of America branches, as well as branches of Merchants & Southern Bank of Florida. BNC continued an accelerated pace of acquisitions, with more than a half dozen announced takeovers during the year. Webster Financial Corp. completed its acquisition of the health savings account business of JPMorgan Chase Bank, thereby acquired approximately 785,000 accounts, including $1.3 billion in deposits and $185 million in other assets. The Chubb Corporation, a property and casualty insurer in the U.S., appreciated rapidly after Zurich-based ACE offered a 30% premium to buy Chubb and form a global property/casualty insurance leader. Standard Chartered, with its heavy Asian emerging markets exposure, was a sector detractor. The stock dropped after the company announced a $4.8 billion rights offering following an earlier dividend cut, both of which were intended to shore up capital in advance of loan and regulatory issues. Increasing impairment reserves impinged on performance of Norwegian banks, DNB Bank and SpareBank 1 SR.
In healthcare, pharmaceutical maker Allergan PLC was expected to achieve 80% of an estimated $1.8 billion in synergies stemming from recent acquisitions by the end of the first quarter of 2016. With valuable drugs like Botox and a rich R&D pipeline, Allergan was approached by Pfizer. Pfizer held preliminary and friendly discussions to acquire Allergan, which will offer Pfizer a low tax domicile in Dublin. M&A activity was also heating up in the health insurer industry, with the CFO of Anthem Inc. suggesting the company could make a “meaningful” acquisition. Thereafter, Anthem entered negotiations to buy Cigna. In addition to this strategy, Anthem also announced strong earnings, deploying capital in the form of share buybacks and dividends. Similarly, UnitedHealth reported better-than-consensus earnings with upside in their Optum and health care segments. Profits at both companies may continue to grow on increased customer enrollments due to the Affordable Care Act. Teva Pharmaceutical achieved strong profits, noting better-than-expected Copaxone sales. The company’s strategic initiatives, including the takeover of Allergan’s Actavis generic drug business and the joint venture with Takeda in Japan, were well received. This will further cement Teva’s position as the global leader in generics and help the company negotiate with its customers.
German telecom provider, Freenet AG, had double-digit gains after publishing strong revenues, attributable to high customer ownership and demand for mobile digital lifestyle services. Japan’s KDDI Corp. had similarly solid results throughout the year, announcing increased operating revenues due to a steady rise in mobile communications sales. Frontier Communications Corp. conducted a secondary offering to finance its acquisition of Verizon’s wireline assets in California, Florida and Texas. The stock apparently declined due to the dilutive effect of this additional equity coming into the market. We believe this to be a short-term concern, as the acquisition is expected to bolster Frontier Communications Corp.’s scale of business over the next few years.
| POLARIS GLOBAL VALUE FUND |
| A MESSAGE TO OUR SHAREHOLDERS (Unaudited) |
| DECEMBER 31, 2015 |
The year was marked by volatility in commodity prices, which had a negative effect on some materials and energy companies. Better performance was noted amongst materials companies whose products ultimately sell into more defensive end markets, like German flavors and fragrance producer Symrise and beverage can supplier Rexam. The stock price of Rexam also rose as it entered talks regarding a possible sale to U.S. competitor Ball Corp. On the other end of the spectrum, Canada’s Methanex Corp. saw methanol prices drop more than 30% due to lower commodity prices. Lower prices of coal used to produce methanol in China also impacted the stock. BHP Billiton was down toward year end, as the company faced concerns about lower prices for its products due to reduced global demand. Additionally, an iron ore joint venture between BHP and Brazil’s Vale experienced a failure of multiple tailing dams.
Energy and oil services stocks dropped in tandem with oil prices over the past year. At the portfolio level, we sought to diversify holdings amongst both oil exploration/production (E&P) and the more impervious refining businesses. By year end, oil E&P companies Tullow Oil, Marathon Oil and Maurel et Prom were sold. Refining companies were retained, based on the premise that lower crude oil input prices will help refining margins. This proved true during the year, with refiners Thai Oil and Marathon Petroleum each achieving double-digit returns. Australia’s WorleyParsons was the main sector detractor.
The following table shows the Fund’s asset allocation at December 31, 2015.
Polaris Global Value Fund Asset Allocation
| | MSCI World Index | Portfolio Weighting | Energy | Utilities | Materials | Industrials | Consumer Discretionary | Consumer Staples | Health Care | Financials | Info. Tech. | Telecom Services | Cash |
| N. America | 61.8% | 40.8% | 1.2% | 2.7% | 2.2% | 2.5% | 2.4% | 1.4% | 5.8% | 13.8% | 5.8% | 3.0% | 0.0% |
| Japan | 9.0% | 3.8% | 0.0% | 0.0% | 1.2% | 0.0% | 0.0% | 1.2% | 0.0% | 0.0% | 0.0% | 1.4% | 0.0% |
| Other Asia | 4.3% | 8.1% | 1.9% | 0.9% | 1.4% | 0.0% | 1.3% | 0.0% | 0.0% | 0.0% | 2.6% | 0.0% | 0.0% |
| Europe | 22.6% | 34.1% | 0.0% | 0.0% | 8.5% | 1.5% | 10.2% | 3.5% | 2.5% | 4.2% | 1.4% | 2.4% | 0.0% |
| Scandinavia | 2.4% | 11.1% | 0.0% | 0.0% | 1.1% | 4.7% | 1.4% | 0.0% | 0.0% | 3.9% | 0.0% | 0.0% | 0.0% |
| Africa & S. America | 0.0% | 0.5% | 0.5% | 0.0% | 0.0% | 0.0% | 0.0% | 0.0% | 0.0% | 0.0% | 0.0% | 0.0% | 0.0% |
| Cash | 0.0% | 1.5% | 0.0% | 0.0% | 0.0% | 0.0% | 0.0% | 0.0% | 0.0% | 0.0% | 0.0% | 0.0% | 1.5% |
| Portfolio Totals | | 100.0% | 3.6% | 3.5% | 14.3% | 8.6% | 15.3% | 6.2% | 8.3% | 21.9% | 9.9% | 6.8% | 1.5% |
Table may not cross foot due to rounding.
INVESTMENT ENVIRONMENT AND STRATEGY:
The first two quarters of 2015 were in positive territory, offering optimism to a skittish market. By the third quarter, the MSCI World Index was down more than 8%. The fourth quarter recovery was a welcome respite from the previous quarter’s stock market volatility. However, we expect to continue to see cross winds amongst the companies in which we invest. Industrial and materials companies may see further weakness, likely offset by gains in consumer discretionary and consumer staples stocks. Lower commodity and energy prices will eventually flow through to the end prices of consumer goods. As costs go down consumption may rise, boding well for the U.S. economy as evidenced by record U.S. car sales and solid housing demand. Other developed markets will likely follow the stronger U.S. economy,
| POLARIS GLOBAL VALUE FUND |
| A MESSAGE TO OUR SHAREHOLDERS (Unaudited) |
| DECEMBER 31, 2015 |
although the time lag is usually two to three years. However, the same can’t be said for emerging markets, which have suffered credit risks, and in some cases currency collapse, related to U.S. dollar borrowing. We are also watching the corporate credit and high yield markets. Credit markets are often first to identify economic problems, which are then later reflected in equity markets.
In the meantime, our research team continues to pinpoint potential investments, many of which are small- and mid-cap companies. Market volatility has increased the number of companies passing our year-end screens, and we believe many of the new companies to be good quality businesses.
As always, we welcome your questions and comments.
Sincerely,
Bernard R. Horn, Jr., Portfolio Manager
| POLARIS GLOBAL VALUE FUND |
| A MESSAGE TO OUR SHAREHOLDERS (Unaudited) |
| DECEMBER 31, 2015 |
As of December 31, 2015, the Fund’s largest equity holdings and the percentages they represent in the Fund’s portfolio market value were as follows and are subject to change:
| Percentage of Total Net Assets | | Percentage of Total Net Assets |
| Greencore Group PLC | 3.53% | Taylor Wimpey PLC | 1.53% |
| Allergan PLC | 1.80% | Hannover Rueck SE | 1.52% |
| Ameris Bancorp | 1.75% | Solvay SA, Class A | 1.48% |
| Bellway PLC | 1.64% | Thai Oil PCL | 1.48% |
| Microsoft Corp. | 1.61% | Independent Bank Corp. | 1.44% |
The Fund’s annual performance as compared to the benchmark has been as follows:
| Historical Calendar Year Annual Returns (years ended December 31) |
| | Polaris Global Value | | MSCI World Index | | Polaris Global Value | | MSCI World Index |
| 2015 | 1.55% | | -0.87% | 2002 | 3.82% | | -19.89% |
| 2014 | 3.68% | | 4.94% | 2001 | 2.21% | | -16.82% |
| 2013 | 36.94% | | 26.68% | 2000 | -5.82% | | -13.18% |
| 2012 | 21.00% | | 15.83% | 1999 | 16.50% | | 24.93% |
| 2011 | -8.16% | | -5.54% | 1998 | -8.85% | | 24.34% |
| 2010 | 20.64% | | 11.76% | 1997 | 34.55% | | 15.76% |
| 2009 | 35.46% | | 29.99% | 1996 | 23.34% | | 13.48% |
| 2008 | -46.19% | | -40.71% | 1995 | 31.82% | | 20.72% |
| 2007 | -3.97% | | 9.04% | 1994 | -2.78% | | 5.08% |
| 2006 | 24.57% | | 20.07% | 1993 | 25.70% | | 22.50% |
| 2005 | 10.52% | | 9.49% | 1992 | 9.78% | | -5.23% |
| 2004 | 23.63% | | 14.72% | 1991 | 17.18% | | 18.28% |
| 2003 | 47.06% | | 33.11% | 1990 | -11.74% | | -17.02% |
| POLARIS GLOBAL VALUE FUND |
| A MESSAGE TO OUR SHAREHOLDERS (Unaudited) |
| DECEMBER 31, 2015 |
IMPORTANT INFORMATION
The Fund invests in securities of foreign issuers, including issuers located in countries with emerging capital markets. Investments in such securities entail certain risks not associated with investments in domestic securities, such as volatility of currency exchange rates, and in some cases, political and economic instability and relatively illiquid markets. Options trading involves risk and is not suitable for all investors. Fund performance includes reinvestment of dividends and capital gains. During the period, some of the Fund’s fees were waived or expenses reimbursed. In the absence of these waivers and reimbursements, performance figures would be lower.
On June 1, 1998, a limited partnership managed by the adviser reorganized into the Fund. The predecessor limited partnership maintained an investment objective and investment policies that were, in all material respects, equivalent to those of the Fund. The Fund’s performance for the periods before June 1, 1998 is that of the limited partnership and includes the expenses of the limited partnership. If the limited partnership’s performance had been readjusted to reflect the second year expenses of the Fund, the Fund’s performance for all the periods would have been lower. The limited partnership was not registered under the Investment Company Act of 1940, as amended (“1940 Act”), and was not subject to certain investment limitations, diversification requirements, and other restrictions imposed by the 1940 Act and the Internal Revenue Code, which, if applicable, may have adversely affected its performance.
The MSCI World Index, net dividends reinvested, measures the performance of a diverse range of global stock markets in the United States, Canada, Europe, Australia, New Zealand and the Far East. The MSCI World Index is unmanaged and does include the reinvestment of dividends, net of withholding taxes. The MSCI Europe Index is a market capitalization weighted index composed of over 500 securities representing 15 European countries. The MSCI Europe Australasia Far East (EAFE) Index is an unmanaged free float-adjusted market capitalization index that is designed to measure the equity market performance of developed markets, excluding the United States and Canada. The MSCI Emerging Market Index is an unmanaged free float-adjusted market capitalization index that is designed to measure equity market performance of emerging markets. One cannot invest directly in an index or an average.
The views in this letter were those of the Fund manager as of December 31, 2015 and may not reflect the views of the manager after the publication date. These views are intended to assist shareholders of the Fund in understanding their investment and do not constitute investment advice.
| POLARIS GLOBAL VALUE FUND |
PERFORMANCE CHART AND ANALYSIS (Unaudited) |
| DECEMBER 31, 2015 |
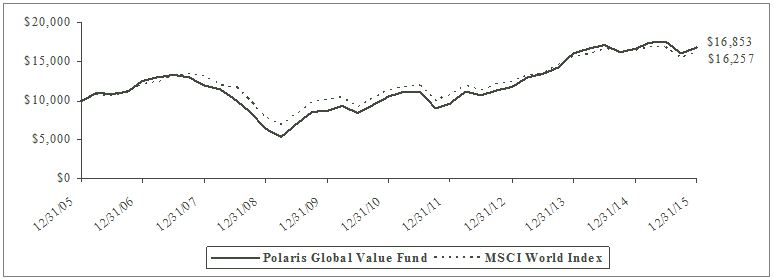
The following chart reflects the change in the value of a hypothetical $10,000 investment, including reinvested dividends and distributions, in Polaris Global Value Fund (the “Fund”) compared with the performance of the benchmark, MSCI World Index, over the past ten fiscal years. The MSCI World Index captures large and mid cap representation across 23 developed markets countries: Australia, Austria, Belgium, Canada, Denmark, Finland, France, Germany, Hong Kong, Ireland, Israel, Italy, Japan, Netherlands, New Zealand, Norway, Portugal, Singapore, Spain, Sweden, Switzerland, the United Kingdom and the United States. The total return of the MSCI World Index includes the reinvestment of dividends and income. The total return of the Fund includes operating expenses that reduce returns, while the total return of the MSCI World Index does not include expenses. The Fund is professionally managed while the MSCI World Index is unmanaged and is not available for investment.
Comparison of Change in Value of a $10,000 Investment
Polaris Global Value Fund vs. MSCI World Index
Average Annual Total Returns Periods Ended December 31, 2015 | | One Year | | Five Year | | Ten Year |
| Polaris Global Value Fund | | 1.55 | % | | 9.88 | % | | 5.36 | % |
| MSCI World Index | | -0.87 | % | | 7.59 | % | | 4.98 | % |
Performance data quoted represents past performance and is no guarantee of future results. Current performance may be lower or higher than the performance data quoted. Investment return and principal value will fluctuate so that shares, when redeemed, may be worth more or less than original cost. For the most recent month-end performance, please call (888) 263-5594 or visit the Fund's website at www.polarisfunds.com. As stated in the Fund’s current prospectus, the annual operating expense ratio (gross) is 1.28%. However, the Fund’s adviser has contractually agreed to waive its fees and/or reimburse expenses to limit total operating expenses to 0.99% (excluding all taxes, interest, portfolio transaction expenses, dividend and interest expense on short sales, acquired fund fees and expenses, proxy expenses and extraordinary expenses), through April 30, 2016. During the period, certain fees were waived and/or expenses reimbursed; otherwise, returns would have been lower. Shares redeemed or exchanged within 180 days of purchase will be charged a 1.00% redemption fee. The performance table and graph do not reflect the deduction of taxes that a shareholder would pay on Fund distributions or the redemption of Fund shares. Returns greater than one year are annualized. Because of ongoing market volatility, Fund performance may be subject to substantial short-term changes.
| POLARIS GLOBAL VALUE FUND |
|
| DECEMBER 31, 2015 |
| Shares | | Security Description | | Value | |
Common Stock - 98.7% |
Australia - 1.9% |
| | 152,900 | | BHP Billiton PLC, ADR | | $ | 3,463,185 | |
| | 707,800 | | Northern Star Resources, Ltd. | | 1,433,851 | |
| | 32,360 | | South32, Ltd., ADR (a) | | 123,454 | |
| | 497,400 | | WorleyParsons, Ltd. | | 1,678,168 | |
| | | 6,698,658 | |
Belgium - 1.5% |
| | 49,670 | | Solvay SA, Class A | | 5,313,139 | |
Canada - 1.0% |
| | 108,237 | | Methanex Corp. | | 3,574,786 | |
Finland - 3.3% |
| | 151,410 | | Caverion Corp. | | 1,485,840 | |
| | 112,476 | | Kone Oyj, Class B | | 4,787,877 | |
| | 149,320 | | Konecranes Oyj | | 3,716,063 | |
| | 346,310 | | YIT Oyj | | 1,970,204 | |
| | | 11,959,984 | |
France - 4.4% |
| | 26,065 | | Christian Dior SE | | 4,440,122 | |
| | 47,900 | | Cie Generale des Etablissements Michelin, Class B | | 4,575,662 | |
| | 65,441 | | Imerys SA | | 4,581,421 | |
| | 102,807 | | IPSOS | | 2,370,815 | |
| | | 15,968,020 | |
Germany - 11.4% |
| | 38,900 | | BASF SE | | 2,989,657 | |
| | 248,664 | | Deutsche Telekom AG | | 4,510,231 | |
| | 119,890 | | Freenet AG | | 4,080,045 | |
| | 47,400 | | Hannover Rueck SE | | 5,442,237 | |
| | 95,486 | | LANXESS AG | | 4,428,878 | |
| | 31,200 | | Linde AG | | 4,540,093 | |
| | 22,600 | | Muenchener Rueckversicherungs-Gesellschaft AG in Muenchen, Class R | | 4,532,649 | |
| | 77,500 | | Symrise AG | | 5,165,403 | |
| | 102,416 | | Wincor Nixdorf AG | | 5,161,564 | |
| | | 40,850,757 | |
Hong Kong - 0.9% |
| | 2,196,000 | | Guangdong Investment, Ltd. | | 3,111,216 | |
| | 18,586,616 | | REXLot Holdings, Ltd. (b) | | 23,983 | |
| | | 3,135,199 | |
| Shares | | Security Description | | Value | |
India - 1.2% |
| | 266,620 | | Infosys, Ltd., ADR | | $ | 4,465,885 | |
Ireland - 3.5% |
| | 2,422,791 | | Greencore Group PLC | | 12,654,457 | |
Israel - 1.2% |
| | 65,600 | | Teva Pharmaceutical Industries, Ltd., ADR | | 4,305,984 | |
Italy - 0.4% |
| | 723,669 | | Trevi Finanziaria Industriale SpA | | 1,439,198 | |
Japan - 3.8% |
| | 141,600 | | Asahi Group Holdings, Ltd. | | 4,475,547 | |
| | 194,400 | | KDDI Corp. | | 5,101,191 | |
| | 3,533,000 | | Showa Denko KK | | 4,173,934 | |
| | | 13,750,672 | |
Norway - 2.6% |
| | 336,096 | | DNB ASA | | 4,169,092 | |
| | 329,929 | | SpareBank 1 SR-Bank ASA | | 1,464,835 | |
| | 87,900 | | Yara International ASA | | 3,802,332 | |
| | | 9,436,259 | |
Russian Federation - 0.2% |
| | 137,700 | | Sberbank of Russia, ADR | | 809,676 | |
South Africa - 0.5% |
| | 64,370 | | Sasol, Ltd. | | 1,745,669 | |
South Korea - 2.7% |
| | 103,200 | | Kia Motors Corp. | | 4,629,500 | |
| | 4,061 | | Samsung Electronics Co., Ltd. | | 4,363,874 | |
| | 1,200 | | Samsung Electronics Co., Ltd. GDR (c) | | 644,748 | |
| | | 9,638,122 | |
Sweden - 5.2% |
| | 305,200 | | Duni AB, Class A | | 5,115,922 | |
| | 114,502 | | Investor AB, Class B | | 4,240,187 | |
| | 156,003 | | Loomis AB, Class B | | 4,888,117 | |
| | 321,700 | | Svenska Handelsbanken AB, Class A | | 4,302,570 | |
| | | 18,546,796 | |
| See Notes to Financial Statements. | 8 | |
| POLARIS GLOBAL VALUE FUND |
|
| DECEMBER 31, 2015 |
| | Shares | | Security Description | | Value | |
Switzerland - 1.3% |
| | 52,500 | | Novartis AG | | $ | 4,549,720 | |
Thailand - 1.5% |
| | 2,896,550 | | Thai Oil PCL | | 5,312,555 | |
United Kingdom - 10.3% |
| | 546,853 | | Barratt Developments PLC | | 5,046,629 | |
| | 1,361,551 | | BBA Aviation PLC | | 3,795,612 | |
| | 140,588 | | Bellway PLC | | 5,877,747 | |
| | 271,389 | | International Game Technology PLC | | 4,391,074 | |
| | 146,476 | | Persimmon PLC | | 4,377,001 | |
| | 396,480 | | Rexam PLC | | 3,533,247 | |
| | 518,044 | | Standard Chartered PLC | | 4,304,979 | |
| | 1,823,990 | | Taylor Wimpey PLC | | 5,461,209 | |
| | | 36,787,498 | |
United States - 39.9% |
| | 20,689 | | Allergan PLC (a) | | 6,465,312 | |
| | 92,400 | | ALLETE, Inc. | | 4,696,692 | |
| | 185,050 | | Ameris Bancorp | | 6,289,849 | |
| | 36,600 | | Anthem, Inc. | | 5,103,504 | |
| | 313,204 | | Astoria Financial Corp. | | 4,964,283 | |
| | 121,920 | | BNC Bancorp | | 3,094,330 | |
| | 228,100 | | Brookline Bancorp, Inc. | | 2,623,150 | |
| | 298,867 | | Brooks Automation, Inc. | | 3,191,900 | |
| | 61,200 | | Capital One Financial Corp. | | 4,417,416 | |
| | 45,451 | | Carter's, Inc. | | 4,046,503 | |
| | 169,774 | | Colony Bankcorp, Inc. (a) | | 1,648,506 | |
| | 228,300 | | Dime Community Bancshares, Inc. | | 3,992,967 | |
| | 147,073 | | FairPoint Communications, Inc. (a) | | 2,363,463 | |
| | 898,614 | | Frontier Communications Corp. | | 4,196,527 | |
| | 32,167 | | General Dynamics Corp. | | 4,418,459 | |
| | 125,100 | | Hewlett Packard Enterprise Co. | | 1,901,520 | |
| | 125,100 | | HP, Inc. | | 1,481,184 | |
| | 111,424 | | Independent Bank Corp. | | 5,183,444 | |
| | 167,963 | | International Bancshares Corp. | | 4,316,649 | |
| | 80,582 | | Marathon Petroleum Corp. | | 4,177,371 | |
| | 103,900 | | Microsoft Corp. | | 5,764,372 | |
| | 46,544 | | NextEra Energy, Inc. | | 4,835,456 | |
| | 42,965 | | Praxair, Inc. | | 4,399,616 | |
| | 61,733 | | Quest Diagnostics, Inc. | | 4,391,686 | |
| | 246,024 | | Regal Entertainment Group, Class A | | 4,642,473 | |
| | 206,097 | | Southwest Bancorp, Inc. | | 3,602,576 | |
| | 37,455 | | The Chubb Corp. | | 4,968,031 | |
| | Shares | | Security Description | | Value | |
| United States - (continued) |
| | 40,600 | | The JM Smucker Co. | | $ | 5,007,604 | |
| | 234,600 | | The Western Union Co. | | 4,201,686 | |
| | 42,384 | | UnitedHealth Group, Inc. | | 4,986,054 | |
| | 92,651 | | Verizon Communications, Inc. | | 4,282,329 | |
| | 117,738 | | Webster Financial Corp. | | 4,378,676 | |
| | 104,600 | | WESCO International, Inc. (a) | | 4,568,928 | |
| | 420,100 | | Xerox Corp. | | 4,465,663 | |
| | | 143,068,179 | |
Total Common Stock (Cost $292,577,880) | | 354,011,213 | |
| | Principal | | Security Description | | Rate | | Maturity | | Value | |
Short-Term Investments - 0.0% |
Certificates of Deposit - 0.0% |
| $ | 33,334 | | Middlesex Federal Savings Bank | | 1.34 | % | 06/18/17 | | 33,334 | |
| | 33,094 | | Salem Five Financial | | 0.25 | | 11/25/16 | | 33,094 | |
Total Certificates of Deposit (Cost $66,428) | | 66,428 | |
Total Short-Term Investments (Cost $66,428) | | 66,428 | |
Total Investments - 98.7% (Cost $292,644,308)* | | $ | 354,077,641 | |
| Other Assets & Liabilities, Net – 1.3% | | 4,715,393 | |
| Net Assets – 100.0% | | $ | 358,793,034 | |
| ADR | American Depositary Receipt |
| GDR | Global Depositary Receipt |
| PCL | Public Company Limited |
| PLC | Public Limited Company |
| (a) | Non-income producing security. |
| (b) | Security fair valued in accordance with procedures adopted by the Board of Trustees. At the period end, the value of these securities amounted to $23,983 or 0.0% of net assets. |
| (c) | Security exempt from registration under Rule 144A under the Securities Act of 1933. At the period end, the value of these securities amounted to $644,748 or 0.2% of net assets. |
| * | Cost for federal income tax purposes is $293,847,661 and net unrealized appreciation consists of: |
| Gross Unrealized Appreciation | | $ | 97,252,615 | |
| Gross Unrealized Depreciation | | | (37,022,635 | ) |
| Net Unrealized Appreciation | | $ | 60,229,980 | |
| See Notes to Financial Statements. | 9 | |
| POLARIS GLOBAL VALUE FUND |
|
| DECEMBER 31, 2015 |
The following is a summary of the inputs used to value the Fund’s investments as of December 31, 2015.
The inputs or methodology used for valuing securities are not necessarily an indication of the risks associated with investing in those securities. For more information on valuation inputs, and their aggregation into the levels used in the table below, please refer to the Security Valuation section in Note 2 of the accompanying Notes to Financial Statements.
| | Level 1 | | Level 2 | | Level 3 | | Total |
| Investments At Value |
| Common Stock | | | | | | | | | | | | | | | | |
| Australia | | $ | 6,698,658 | | | $ | - | | | $ | - | | | $ | 6,698,658 | |
| Belgium | | | 5,313,139 | | | | - | | | | - | | | | 5,313,139 | |
| Canada | | | 3,574,786 | | | | - | | | | - | | | | 3,574,786 | |
| Finland | | | 11,959,984 | | | | - | | | | - | | | | 11,959,984 | |
| France | | | 15,968,020 | | | | - | | | | - | | | | 15,968,020 | |
| Germany | | | 40,850,757 | | | | - | | | | - | | | | 40,850,757 | |
| Hong Kong | | | 3,111,216 | | | | - | | | | 23,983 | | | | 3,135,199 | |
| India | | | 4,465,885 | | | | - | | | | - | | | | 4,465,885 | |
| Ireland | | | 12,654,457 | | | | - | | | | - | | | | 12,654,457 | |
| Israel | | | 4,305,984 | | | | - | | | | - | | | | 4,305,984 | |
| Italy | | | 1,439,198 | | | | - | | | | - | | | | 1,439,198 | |
| Japan | | | 13,750,672 | | | | - | | | | - | | | | 13,750,672 | |
| Norway | | | 9,436,259 | | | | - | | | | - | | | | 9,436,259 | |
| Russian Federation | | | 809,676 | | | | - | | | | - | | | | 809,676 | |
| South Africa | | | 1,745,669 | | | | - | | | | - | | | | 1,745,669 | |
| South Korea | | | 9,638,122 | | | | - | | | | - | | | | 9,638,122 | |
| Sweden | | | 18,546,796 | | | | - | | | | - | | | | 18,546,796 | |
| Switzerland | | | 4,549,720 | | | | - | | | | - | | | | 4,549,720 | |
| Thailand | | | - | | | | 5,312,555 | | | | - | | | | 5,312,555 | |
| United Kingdom | | | 36,787,498 | | | | - | | | | - | | | | 36,787,498 | |
| United States | | | 143,068,179 | | | | - | | | | - | | | | 143,068,179 | |
| Certificates of Deposit | | | - | | | | 66,428 | | | | - | | | | 66,428 | |
| Total Investments At Value | | $ | 348,674,675 | | | $ | 5,378,983 | | | $ | 23,983 | | | $ | 354,077,641 | |
The Fund utilizes the end of period methodology when determining transfers. There were no transfers among Level 1 and Level 2 for the year ended December 31, 2015.
The following is a reconciliation of Level 3 investments for which significant unobservable inputs were used to determine fair value.
| | | | Common Stock | |
| | Balance as of 12/31/14 | | $ | - | | |
| | Transfers in from level 2 | | | 23,983 | | |
| | Balance as of 12/31/15 | | $ | 23,983 | | |
| | Net change in unrealized depreciation from investments held as of 12/31/15** | | $ | (1,456,968 | ) | |
| ** | The change in unrealized appreciation/(depreciation) is included in net change in unrealized appreciation/(depreciation) of investments in the accompanying Statement of Operations. |
| See Notes to Financial Statements. | 10 | |
| POLARIS GLOBAL VALUE FUND |
|
| DECEMBER 31, 2015 |
AFAPORTFOLIO HOLDINGS | | |
| % of Total Investments | | |
| Consumer Discretionary | 16.1 | % |
| Consumer Staples | 6.3 | % |
| Energy | 3.2 | % |
| Financials | 22.2 | % |
| Health Care | 8.4 | % |
| Industrials | 8.7 | % |
| Information Technology | 10.1 | % |
| Materials | 14.5 | % |
| Telecommunication Services | 6.9 | % |
| Utilities | 3.6 | % |
| Short-Term Investments | 0.0 | % |
| | 100.0 | % |
| See Notes to Financial Statements. | 11 | |
| POLARIS GLOBAL VALUE FUND |
STATEMENT OF ASSETS AND LIABILITIES |
| DECEMBER 31, 2015 |
| ASSETS | | | | |
| | Total investments, at value (Cost $292,644,308) | | $ | 354,077,641 | |
| | Cash | | | 10,347,583 | |
| | Receivables: | | | | |
| | | Fund shares sold | | | 206,403 | |
| | | Dividends and interest | | | 1,103,184 | |
| | Prepaid expenses | | | 12,646 | |
| Total Assets | | | 365,747,457 | |
| | | | | | | |
| LIABILITIES | | | | |
| | Payables: | | | | |
| | | Investment securities purchased | | | 5,389,942 | |
| | | Fund shares redeemed | | | 845,975 | |
| | | Distributions payable | | | 217,346 | |
| | | Due to broker | | | 1,679 | |
| | | Foreign capital gains tax payable | | | 205,790 | |
| | Accrued Liabilities: | | | | |
| | | Investment adviser fees | | | 203,508 | |
| | | Trustees’ fees and expenses | | | 250 | |
| | | Fund services fees | | | 40,313 | |
| | | Other expenses | | | 49,620 | |
| Total Liabilities | | | 6,954,423 | |
| | | | | | | |
| NET ASSETS | | $ | 358,793,034 | |
| | | | | | | |
| COMPONENTS OF NET ASSETS | | | | |
| | Paid-in capital | | $ | 407,393,769 | |
| | Undistributed net investment income | | | 3,944,315 | |
| | Accumulated net realized loss | | | (113,692,777 | ) |
| | Net unrealized appreciation | | | 61,147,727 | |
| NET ASSETS | | $ | 358,793,034 | |
| SHARES OF BENEFICIAL INTEREST AT NO PAR VALUE (UNLIMITED SHARES AUTHORIZED) | | | 16,953,247 | |
NET ASSET VALUE, OFFERING AND REDEMPTION PRICE PER SHARE* | | $ | 21.16 | |
| * | Shares redeemed or exchanged within 180 days of purchase are charged a 1.00% redemption fee. | | | | |
| See Notes to Financial Statements. | 12 | |
| POLARIS GLOBAL VALUE FUND |
|
YEAR ENDED DECEMBER 31, 2015 |
| INVESTMENT INCOME | | | | | |
| | Dividend income (Net of foreign withholding taxes of $615,198) | | | $ | 8,186,725 | |
| | Interest income | | | 22,461 | |
| Total Investment Income | | | | 8,209,186 | |
| | | | | | |
| EXPENSES | | | | | |
| | Investment adviser fees | | | 3,265,579 | |
| | Fund services fees | | | 512,712 | |
| | Custodian fees | | | 47,606 | |
| | Registration fees | | | 46,847 | |
| | Professional fees | | | 54,455 | |
| | Trustees' fees and expenses | | | 22,323 | |
| | Miscellaneous expenses | | | 192,583 | |
| Total Expenses | | | | 4,142,105 | |
| | Fees waived and expenses reimbursed | | | (909,174 | ) |
| Net Expenses | | | | 3,232,931 | |
| | | | | | | |
| NET INVESTMENT INCOME | | | | 4,976,255 | |
| | | | | | | |
| NET REALIZED AND UNREALIZED GAIN (LOSS) | | | | | |
| | Net realized loss on: | | | | |
| | Investments | | | (4,217,809 | ) |
| | Foreign currency transactions | | | (12,615 | ) |
| | Net realized loss | | | (4,230,424 | ) |
| | Net change in unrealized appreciation (depreciation) on: | | | | |
| | Investments | | | 1,846,150 | |
| | Deferred foreign capital gains taxes | | | (205,790 | ) |
| | Foreign currency translations | | | (34,042 | ) |
| | Net change in unrealized appreciation (depreciation) | | | 1,606,318 | |
| NET REALIZED AND UNREALIZED LOSS | | | | (2,624,106 | ) |
| INCREASE IN NET ASSETS RESULTING FROM OPERATIONS | | | $ | 2,352,149 | |
| | | | | | | |
| See Notes to Financial Statements. | 13 | |
| POLARIS GLOBAL VALUE FUND |
STATEMENTS OF CHANGES IN NET ASSETS |
|
| | | | For the Years Ended December 31, |
| | | | | 2015 | | | 2014 |
| OPERATIONS | | | | | | | | | |
| | Net investment income | | $ | 4,976,255 | | | | $ | 4,360,612 | |
| | Net realized gain (loss) | | | (4,230,424 | ) | | | | 1,847,640 | |
| | Net change in unrealized appreciation (depreciation) | | | 1,606,318 | | | | | 2,101,489 | |
| Increase in Net Assets Resulting from Operations | | | 2,352,149 | | | | | 8,309,741 | |
| | | | | | | | | | | | |
| DISTRIBUTIONS TO SHAREHOLDERS FROM | | | | | | | | | |
| | Net investment income | | | (4,487,790 | ) | | | | (3,865,393 | ) |
| Total Distributions to Shareholders | | | (4,487,790 | ) | | | | (3,865,393 | ) |
| | | | | | | | | | | | |
| CAPITAL SHARE TRANSACTIONS | | | | | | | | | |
| | Sale of shares | | | 132,763,905 | | | | | 72,611,389 | |
| | Reinvestment of distributions | | | 4,270,819 | | | | | 3,717,277 | |
| | Redemption of shares | | | (52,375,114 | ) | | | | (29,026,075 | ) |
| | Redemption fees | | | 33,251 | | | | | 43,443 | |
| Increase in Net Assets from Capital Share Transactions | | | 84,692,861 | | | | | 47,346,034 | |
| Increase in Net Assets | | | 82,557,220 | | | | | 51,790,382 | |
| | | | | | | | | | | | |
| NET ASSETS | | | | | | | | | |
| | Beginning of Year | | | 276,235,814 | | | | | 224,445,432 | |
| | End of Year (Including line (a)) | | $ | 358,793,034 | | | | $ | 276,235,814 | |
| | | | | | | | | | | | |
| SHARE TRANSACTIONS | | | | | | | | | |
| | Sale of shares | | | 6,065,950 | | | | | 3,411,701 | |
| | Reinvestment of distributions | | | 201,834 | | | | | 176,173 | |
| | Redemption of shares | | | (2,407,133 | ) | | | | (1,369,241 | ) |
| Increase in Shares | | | 3,860,651 | | | | | 2,218,633 | |
| | | | | | | | | | | | |
| (a) | Undistributed net investment income. | | $ | 3,944,315 | | | | $ | 3,468,465 | |
| See Notes to Financial Statements. | 14 | |
| POLARIS GLOBAL VALUE FUND |
|
| |
| These financial highlights reflect selected data for a share outstanding throughout each year. |
| | | For the Years Ended December 31, | |
| | | 2015 | | 2014 | | 2013 | | 2012 | | 2011 | |
| NET ASSET VALUE, Beginning | | | | | | | | | | | | | | | | | | | | |
| of Year | $ | 21.10 | | | $ | 20.64 | | | $ | 15.23 | | | $ | 12.72 | | | $ | 14.00 | | |
| INVESTMENT OPERATIONS | | | | | | | | | | | | | | | | | | | | |
| Net investment income (a) | | 0.33 | | | | 0.35 | | | | 0.30 | | | | 0.19 | | | | 0.15 | | |
| Net realized and unrealized | | | | | | | | | | | | | | | | | | | | |
| | gain (loss) | | — | (b)(c) | | 0.41 | | | | 5.33 | | | | 2.48 | | | | (1.29 | ) | |
| Total from Investment Operations | | 0.33 | | | | 0.76 | | | | 5.63 | | | | 2.67 | | | | (1.14 | ) | |
| DISTRIBUTIONS TO | | | | | | | | | | | | | | | | | | | | |
| SHAREHOLDERS FROM | | | | | | | | | | | | | | | | | | | | |
| Net investment income | | (0.27 | ) | | | (0.30 | ) | | | (0.22 | ) | | | (0.16 | ) | | | (0.14 | ) | |
| REDEMPTION FEES (a) | | — | (b) | | — | (b) | | — | (b) | | — | (b) | | — | (b) |
| NET ASSET VALUE, End of Year | $ | 21.16 | | | $ | 21.10 | | | $ | 20.64 | | | $ | 15.23 | | | $ | 12.72 | | |
| TOTAL RETURN | | 1.55 | % | | 3.68 | % | | 36.94 | % | | 21.00 | % | | (8.16 | )% |
| | | | | | | | | | | | | | | | | | | | | |
| RATIOS/SUPPLEMENTARY DATA | | | | | | | | | | | | | | | | | | | | |
| Net Assets at End of | | | | | | | | | | | | | | | | | | | | |
| | Year (000's omitted) | $358,793 | | | $276,236 | | | $224,445 | | | $167,003 | | | $151,849 | | |
| Ratios to Average Net Assets: | | | | | | | | | | | | | | | | | | | | |
| Net investment income | | 1.52 | % | | 1.66 | % | | 1.70 | % | | 1.34 | % | | 1.10 | % |
| Net expenses | | 0.99 | % | | 0.99 | % | | 1.04 | % | | 1.36 | % | | 1.36 | % |
| Gross expenses | | 1.27 | %(d) | 1.28 | %(d) | 1.32 | %(d) | 1.36 | % | | 1.36 | % |
| PORTFOLIO TURNOVER RATE | | 5 | % | | 3 | % | | 14 | % | | 14 | % | | 12 | % |
| | | | | | | | | | | | | | | | | | | | | | |
| (a) | Calculated based on average shares outstanding during each year. |
| (b) | Less than $0.01 per share. |
| (c) | Per share amount does not reflect the actual net realized and unrealized gain/(loss) for the year due to the timing of Fund share sales and the amount per share realized and unrealized gains and losses at such time.. |
| (d) | Reflects the expense ratio excluding any waivers and/or reimbursements. |
| See Notes to Financial Statements. | 15 | |
| POLARIS GLOBAL VALUE FUND |
NOTES TO FINANCIAL STATEMENTS |
|
Note 1. Organization
The Polaris Global Value Fund (the “Fund”) is a diversified portfolio of Forum Funds (the “Trust”). The Trust is a Delaware statutory trust that is registered as an open-end, management investment company under the Investment Company Act of 1940 (the “Act”), as amended. Under its Trust Instrument, the Trust is authorized to issue an unlimited number of the Fund’s shares of beneficial interest without par value. The Fund commenced operations June 1, 1998 after it acquired the net assets of Global Value Limited Partnership (the “Partnership”), in exchange for Fund shares. The Partnership commenced operations on July 31, 1989. The Fund seeks capital appreciation.
Note 2. Summary of Significant Accounting Policies
These financial statements are prepared in accordance with accounting principles generally accepted in the United States of America (“GAAP”), which require management to make estimates and assumptions that affect the reported amounts of assets and liabilities, the disclosure of contingent liabilities at the date of the financial statements, and the reported amounts of increases and decreases in net assets from operations during the fiscal year. Actual amounts could differ from those estimates. The following summarizes the significant accounting policies of the Fund:
Security Valuation – Exchange-traded securities and over-the-counter securities are valued using the last quoted trade or official closing price, provided by independent pricing services as of the close of trading on the market or exchange for which they are primarily traded, on each Fund business day. In the absence of a sale, such securities are valued at the mean of the last bid and ask price provided by independent pricing services. Non-exchange-traded securities for which quotations are available are valued using the last quoted sales price, or in the absence of a sale, at the mean of the last bid and ask prices provided by independent pricing services. Forward currency contracts are generally valued at the mean of bid and ask prices for the time period interpolated from rates reported by an independent pricing service for proximate time periods. Shares of open-end mutual funds are valued at net asset value (“NAV”). Short-term investments that mature in 60 days or less may be valued at amortized cost.
The Fund values its investments at fair value pursuant to procedures adopted by the Trust's Board of Trustees (the "Board") if (1) market quotations are insufficient or not readily available or (2) the adviser believes that the values available are unreliable. The Trust’s Valuation Committee, as defined in the Fund’s registration statement, performs certain functions as they relate to the administration and oversight of the Fund’s valuation procedures. Under these procedures, the Valuation Committee convenes on a regular and ad-hoc basis to review such investments and considers a number of factors, including valuation methodologies and significant unobservable inputs, when arriving at fair value.
The Valuation Committee may work with the adviser to provide valuation inputs. In determining fair valuations, inputs may include market-based analytics which may consider related or comparable assets or liabilities, recent transactions, market multiples, book values and other relevant investment information. Adviser inputs may include an income-based approach in which the anticipated future cash flows of the investment are discounted in determining fair value. Discounts may also be applied based on the nature or duration of any restrictions on the disposition of the investments. The Valuation Committee performs regular reviews of valuation methodologies, key inputs and assumptions, disposition analysis and market activity.
Fair valuation is based on subjective factors and, as a result, the fair value price of an investment may differ from the
| POLARIS GLOBAL VALUE FUND |
NOTES TO FINANCIAL STATEMENTS |
|
security’s market price and may not be the price at which the asset may be sold. Fair valuation could result in a different NAV than a NAV determined by using market quotes.
The Fund has a three-tier fair value hierarchy. The basis of the tiers is dependent upon the various “inputs” used to determine the value of the Fund’s investments. These inputs are summarized in the three broad levels listed below:
Level 1 — quoted prices in active markets for identical assets and liabilities
Level 2 — other significant observable inputs (including quoted prices of similar securities, interest rates, prepayment speeds, credit risk, etc.)
Level 3 — significant unobservable inputs (including the Fund’s own assumptions in determining the fair value of investments)
The aggregate value by input level, as of December 31, 2015, for the Fund’s investments is included at the end of the Fund’s Schedule of Investments.
Security Transactions, Investment Income and Realized Gain and Loss – Investment transactions are accounted for on the trade date. Dividend income is recorded on the ex-dividend date. Foreign dividend income is recorded on the ex-dividend date or as soon as possible after the Fund determines the existence of a dividend declaration after exercising reasonable due diligence. Income and capital gains on some foreign securities may be subject to foreign withholding taxes, which are accrued as applicable. Interest income is recorded on an accrual basis. Premium is amortized and discount is accreted using the effective interest method. Identified cost of investments sold is used to determine the gain and loss for both financial statement and federal income tax purposes.
Foreign Currency Translations – Foreign currency amounts are translated into U.S. dollars as follows: (1) assets and liabilities at the rate of exchange at the end of the respective period; and (2) purchases and sales of securities and income and expenses at the rate of exchange prevailing on the dates of such transactions. The portion of the results of operations arising from changes in the exchange rates and the portion due to fluctuations arising from changes in the market prices of securities are not isolated. Such fluctuations are included with the net realized and unrealized gain or loss on investments.
Foreign Currency Transactions – The Fund may enter into transactions to purchase or sell foreign currency contracts and options on foreign currency. Forward currency contracts are agreements to exchange one currency for another at a future date and at a specified price. A fund may use forward currency contracts to facilitate transactions in foreign securities, to manage a fund’s foreign currency exposure and to protect the U.S. dollar value of its underlying portfolio securities against the effect of possible adverse movements in foreign exchange rates. These contracts are intrinsically valued daily based on forward rates, and a fund’s net equity therein, representing unrealized gain or loss on the contracts as measured by the difference between the forward foreign exchange rates at the dates of entry into the contracts and the forward rates at the reporting date, is recorded as a component of net asset value. These instruments involve market risk, credit risk, or both kinds of risks, in excess of the amount recognized in the Statement of Assets and Liabilities. Risks arise from the possible inability of counterparties to meet the terms of their contracts and from movement in currency and securities values and interest rates. Due to the risks associated with these transactions, a fund could incur losses up to the entire contract amount, which may exceed the net unrealized value included in its net asset value.
| POLARIS GLOBAL VALUE FUND |
NOTES TO FINANCIAL STATEMENTS |
|
Distributions to Shareholders – Distributions to shareholders of net investment income and net capital gains, if any, are declared and paid at least annually. Distributions to shareholders are recorded on the ex-dividend date. Distributions are based on amounts calculated in accordance with applicable federal income tax regulations, which may differ from GAAP. These differences are due primarily to differing treatments of income and gain on various investment securities held by the Fund, timing differences and differing characterizations of distributions made by the Fund.
Federal Taxes – The Fund intends to continue to qualify each year as a regulated investment company under Subchapter M of the Internal Revenue Code and to distribute all of its taxable income to shareholders. In addition, by distributing in each calendar year substantially all of its net investment income and capital gains, if any, the Fund will not be subject to a federal excise tax. Therefore, no federal income or excise tax provision is required. The Fund files a U.S. federal income and excise tax return as required. A fund’s federal income tax returns are subject to examination by the Internal Revenue Service for a period of three fiscal years after they are filed. As of December 31, 2015, there are no uncertain tax positions that would require financial statement recognition, de-recognition or disclosure.
Income and Expense Allocation – The Trust accounts separately for the assets, liabilities and operations of each of its investment portfolios. Expenses that are directly attributable to more than one investment portfolio are allocated among the respective investment portfolios in an equitable manner.
Redemption Fees – A shareholder who redeems or exchanges shares within 180 days of purchase will incur a redemption fee of 1.00% of the current net asset value of shares redeemed or exchanged, subject to certain limitations. The fee is charged for the benefit of the remaining shareholders and will be paid to the Fund to help offset transaction costs. The fee is accounted for as an addition to paid-in capital. The Fund reserves the right to modify the terms of or terminate the fee at any time. There are limited exceptions to the imposition of the redemption fee.
Commitments and Contingencies – In the normal course of business, the Fund enters into contracts that provide general indemnifications by the Fund to the counterparty to the contract. The Fund’s maximum exposure under these arrangements is dependent on future claims that may be made against the Fund and, therefore, cannot be estimated; however, based on experience, the risk of loss from such claims is considered remote.
Note 3. Cash – Concentration in Uninsured Account
For cash management purposes the Fund may concentrate cash with the Fund’s custodian. This typically results in cash balances exceeding the Federal Deposit Insurance Corporation (“FDIC”) insurance limits. As of December 31, 2015, the Fund held $10,097,583 as cash reserves at MUFG Union Bank, N.A. that exceeded the FDIC insurance limit.
Note 4. Fees and Expenses
Investment Adviser – Polaris Capital Management, LLC (the “Adviser”) is the investment adviser to the Fund. Pursuant to an investment advisory agreement, the Adviser receives an advisory fee from the Fund at an annual rate of 1.00% of the Fund’s average daily net assets.
Shareholder Service Plan – The Trust has adopted a shareholder service plan for the Fund under which the Fund may reimburse the Fund’s administrator for amounts paid by the administrator for providing shareholder service activities
| POLARIS GLOBAL VALUE FUND |
NOTES TO FINANCIAL STATEMENTS |
|
that are not otherwise provided by the transfer agent. The Fund’s administrator may make such payments to various financial institutions, including the Adviser, that provide shareholder servicing to their customers invested in the Fund in amounts of up to 0.25% annually of the average daily net assets of the shares held by such customers. During the year ended December 31, 2015, the Fund did not make any payments under the shareholder service plan.
Distribution – Foreside Fund Services, LLC serves as the Fund’s distributor (the “Distributor”). The Fund does not have a distribution (12b-1) plan; accordingly, the Distributor does not receive compensation from the Fund for its distribution (12b-1) services. The Adviser compensates the Distributor directly for its services. The Distributor is not affiliated with the Adviser or Atlantic Fund Administration, LLC (d/b/a Atlantic Fund Services) (“Atlantic”) or their affiliates.
Other Service Providers – Atlantic provides fund accounting, fund administration, compliance and transfer agency services to the Fund. Atlantic also provides certain shareholder report production, and EDGAR conversion and filing services. Pursuant to an Atlantic services agreement, the Fund pays Atlantic customary fees for its services. Atlantic provides a Principal Executive Officer, a Principal Financial Officer, a Chief Compliance Officer, and an Anti-Money Laundering Officer to the Fund, as well as certain additional compliance support functions.
Trustees and Officers – The Trust pays each independent Trustee an annual fee of $50,000 for service to the Trust ($66,000 for the Chairman). The Audit Committee Chairman receives an additional $6,000 annually. Effective April 1, 2015, the Vice Chairman receives an additional $6,000 annually.The Trustees and Chairman may receive additional fees for special Board meetings. Each Trustee is also reimbursed for all reasonable out-of-pocket expenses incurred in connection with his duties as a Trustee, including travel and related expenses incurred in attending Board meetings. The amount of Trustees’ fees attributable to the Fund is disclosed in the Statement of Operations. Certain officers of the Trust are also officers or employees of the above named service providers, and during their terms of office received no compensation from the Fund.
Note 5. Fees Waived
The Adviser has contractually agreed to waive its fee and/or reimburse Fund expenses to limit annual operating expenses to 0.99% (excluding all taxes, interest, portfolio transaction expenses, dividend and interest expense on short sales, acquired fund fees and expenses, proxy expenses and extraordinary expenses), through April 30, 2016. Other fund service providers have voluntarily agreed to waive and reimburse a portion of their fees. These voluntary fee waivers and reimbursements may be reduced or eliminated at any time. For the year ended December 31, 2015, fees waived were as follows:
| Investment Adviser Fees Waived | | Other Waivers | | Total Fees Waived |
| $ | 856,674 | | $ | 52,500 | | $ | 909,174 |
Note 6. Security Transactions
The cost of purchases and proceeds from sales of investment securities (including maturities), other than short-term investments during the year ended December 31, 2015, were $98,707,674 and $17,027,274, respectively.
| POLARIS GLOBAL VALUE FUND |
NOTES TO FINANCIAL STATEMENTS |
|
Note 7. Federal Income Tax
Distributions paid during the fiscal years ended as noted were characterized for tax purposes as follows:
| | | | 2015 | | 2014 | |
| | Ordinary Income | | $ | 4,487,790 | | $ | 3,865,393 | |
As of December 31, 2015, distributable earnings (accumulated loss) on a tax basis were as follows:
| | Undistributed Ordinary Income | | $ | 5,010,419 | | |
| | Capital and Other Losses | | | (113,555,528 | ) | |
| | Unrealized Appreciation | | | 59,944,374 | | |
| | Total | | $ | (48,600,735 | ) | |
The difference between components of distributable earnings on a tax basis and the amounts reflected in the Statement of Assets and Liabilities are primarily due to wash sales and investments in passive foreign investment companies.
As of December 31, 2015, capital loss carryforwards to offset future capital gains were as follows with the respective expiration dates:
| 2016 | | 2017 | | 2018 | |
| $ | 34,508,433 | | $ | 59,164,411 | | $ | 15,622,903 | |
In addition, the Fund has $684,722 of available short-term capital loss carryforwards and $3,575,059 of available long-term capital loss carryforwards that have no expiration date.
On the Statement of Assets and Liabilities, as a result of permanent book to tax differences, certain amounts have been reclassified for the year ended December 31, 2015. The following reclassification was the result of currency gain/loss and has no impact on the net assets of the Fund.
| | Undistributed Net Investment Income (Loss) | | $ | (12,615 | ) | |
| | Accumulated Net Realized Gain (Loss) | | | 12,615 | | |
Note 8. Subsequent Events
Subsequent events occurring after the date of this report through the date these financial statements were issued have been evaluated for potential impact and the Fund has had no such events.
| |
REPORT OF INDEPENDENT REGISTERED PUBLIC ACCOUNTING FIRM |
|
To the Shareholders of Polaris Global Value Fund and the Board of Trustees of Forum Funds
We have audited the accompanying statement of assets and liabilities of the Polaris Global Value Fund (the "Fund"), a series of shares of beneficial interest in Forum Funds, including the schedule of investments, as of December 31, 2015, and the related statement of operations for the year then ended, the statements of changes in net assets for each of the years in the two-year period then ended and the financial highlights for each of the years in the five-year period then ended. These financial statements and financial highlights are the responsibility of the Fund’s management. Our responsibility is to express an opinion on these financial statements and financial highlights based on our audits.
We conducted our audits in accordance with the standards of the Public Company Accounting Oversight Board (United States). Those standards require that we plan and perform the audits to obtain reasonable assurance about whether the financial statements and financial highlights are free of material misstatement. An audit includes examining, on a test basis, evidence supporting the amounts and disclosures in the financial statements. Our procedures included confirmation of securities owned as of December 31, 2015 by correspondence with the custodian and brokers. An audit also includes assessing the accounting principles used and significant estimates made by management, as well as evaluating the overall financial statement presentation. We believe that our audits provide a reasonable basis for our opinion.
In our opinion, the financial statements and financial highlights referred to above present fairly, in all material respects, the financial position of Polaris Global Value Fund as of December 31, 2015, and the results of its operations for the year then ended, the changes in its net assets for each of the years in the two-year period then ended and its financial highlights for each of the years in the five-year period then ended, in conformity with accounting principles generally accepted in the United States of America.

BBD, LLP
Philadelphia, Pennsylvania
February 23, 2016
| POLARIS GLOBAL VALUE FUND |
ADDITIONAL INFORMATION (Unaudited) |
|
Proxy Voting Information
A description of the policies and procedures that the Fund uses to determine how to vote proxies relating to securities held in the Fund’s portfolio is available, without charge and upon request, by calling (888) 263-5594 or visit the Fund's website at www.polarisfunds.com and on the U.S. Securities and Exchange Commission’s (the “SEC”) website at www.sec.gov. The Fund’s proxy voting record for the most recent twelve-month period ended June 30 is available, without charge and upon request, by calling (888) 263-5594 or visit the Fund's website at www.polarisfunds.com and on the SEC’s website at www.sec.gov.
Availability of Quarterly Portfolio Schedules
The Fund files its complete schedule of portfolio holdings with the SEC for the first and third quarters of each fiscal year on Form N-Q. These filings are available, without charge and upon request on the SEC’s website at www.sec.gov or may be reviewed and copied at the SEC’s Public Reference Room in Washington, DC. Information on the operation of the Public Reference Room may be obtained by calling (800) SEC-0330.
Shareholder Expense Example
As a shareholder of the Fund, you incur two types of costs: (1) transaction costs, including redemption fees and exchange fees, and (2) ongoing costs, including management fees and other Fund expenses. This example is intended to help you understand your ongoing costs (in dollars) of investing in the Fund, and to compare these costs with the ongoing costs of investing in other mutual funds.
The example is based on an investment of $1,000 invested at the beginning of the period and held for the entire period from July 1, 2015, through December 31, 2015.
Actual Expenses – The first line of the table below provides information about actual account values and actual expenses. You may use the information in this line, together with the amount you invested, to estimate the expenses that you paid over the period. Simply divide your account value by $1,000 (for example, an $8,600 account value divided by $1,000 = 8.6), then multiply the result by the number in the first line under the heading entitled “Expenses Paid During Period” to estimate the expenses you paid on your account during the period.
Hypothetical Example for Comparison Purposes – The second line of the table below provides information about hypothetical account values and hypothetical expenses based on the Fund’s actual expense ratio and an assumed rate of return of 5% per year before expenses, which is not the Fund’s actual return. The hypothetical account values and expenses may not be used to estimate the actual ending account balance or expenses you paid for the period. You may use this information to compare the ongoing costs of investing in the Fund and other funds. To do so, compare this 5% hypothetical example with the 5% hypothetical examples that appear in the shareholder reports of other funds.
Please note that the expenses shown in the table are meant to highlight your ongoing costs only and do not reflect any transactional costs, such as redemption fees and exchange fees. Therefore, the second line of the table is useful in comparing ongoing costs only, and will not help you determine the relative total costs of owning different funds. In addition, if these transactional costs were included, your costs would have been higher.
| POLARIS GLOBAL VALUE FUND |
ADDITIONAL INFORMATION (Unaudited) |
|
| | Beginning | | Ending | | Expenses | | Annualized |
| | Account Value | | Account Value | | Paid During | | Expense |
| | July 1, 2015 | | December 31, 2015 | | Period* | | Ratio* |
| Actual | $ | 1,000.00 | | $ | 957.45 | | $ | 4.88 | | 0.99 | % |
| Hypothetical (5% return before taxes) | $ | 1,000.00 | | $ | 1,020.21 | | $ | 5.04 | | 0.99 | % |
| * | Expenses are equal to the Fund’s annualized expense ratio multiplied by the average account value over the period, multiplied by the number of days in the most recent fiscal half-year divided by 365 to reflect the half-year period. |
Federal Tax Status of Dividends Declared during the Fiscal Year
For federal income tax purposes, dividends from short-term capital gains are classified as ordinary income. The Fund designates 48.02% of its income dividend distributed as qualifying for the corporate dividends-received deduction (DRD) and 100.00% for the qualified dividend rate (QDI) as defined in Section 1(h)(11) of the Internal Revenue Code. The Fund also designates 0.26% as qualified interest income exempt from U.S. tax for foreign shareholders (QII).
Trustees and Officers of the Trust
The Board is responsible for oversight of the management of the Trust’s business affairs and of the exercise of all the Trust’s powers except those reserved for the shareholders. The following table provides information about each Trustee and certain officers of the Trust. Each Trustee and officer holds office until the person resigns, is removed, or is replaced. Unless otherwise noted, the persons have held their principal occupations for more than five years. The address for all Trustees and officers is Three Canal Plaza, Suite 600, Portland, Maine 04101. Mr. Keffer is considered an Interested Trustee due to his affiliation with Atlantic. The Fund’s Statement of Additional Information includes additional information about the Trustees and is available, without charge and upon request, by calling (888) 263-5594 or visit the Fund's website at www.polarisfunds.com.
| POLARIS GLOBAL VALUE FUND |
ADDITIONAL INFORMATION (Unaudited) |
|
| Name and Year of Birth | Position with the Trust | Length of Time Served | Principal Occupation(s) During Past Five Years | Number of Series of Fund Complex¹ Overseen by Trustee | Other Directorships Held by Trustee |
Independent Trustees | | | | | |
J. Michael Parish Born: 1943 | Chairman of the Board; Trustee; Chairman, Nominating Committee and Qualified Legal Compliance Committee | Since 1989 (Chairman since 2004) | Retired since 2003; formerly, Partner, Wolf, Block, Schorr and Solis-Cohen, LLP (law firm) 2002-2003; Partner, Thelen Reid & Priest LLP (law firm) 1995-2002. | 26 | None |
Costas Azariadis Born: 1943 | Trustee | Since 1989 | Professor of Economics, Washington University since 2006. | 26 | None |
James C. Cheng Born: 1942 | Trustee; Chairman, Audit Committee | Since 1989 | President, Technology Marketing Associates (marketing company for small- and medium-sized businesses in New England) since 1991. | 26 | None |
David Tucker Born: 1958 | Trustee; Vice Chairman | Since 2011 (Vice Chairman since 2015) | Director, Blue Sky Experience (a charitable endeavor) since 2008; Senior Vice President & General Counsel, American Century Companies 1998-2008. | 46 | Trustee, Forum Funds II, Forum ETF Trust and U.S. Global Investors Funds |
Interested Trustee | | | | | |
John Y. Keffer2 Born: 1942 | Trustee; Vice Chairman | Since 1989 | Chairman, Atlantic since 2008; President, Forum Investment Advisors, LLC since 2011; President, Forum Foundation (a charitable organization) since 2005; President, Forum Trust, LLC (a non-depository trust company chartered in the State of Maine) since 1997. | 46 | Director, Wintergreen Fund, Inc.; Trustee, Forum Funds II, Forum ETF Trust, ALTMFX Trust and U.S. Global Investors Funds |
Officers | | | | | |
Jessica Chase Born: 1970 | President; Principal Executive Officer | Since 2015 | Senior Vice President, Atlantic since 2008. | N/A | N/A |
Karen Shaw Born: 1972 | Treasurer; Principal Financial Officer | Since 2008 | Senior Vice President, Atlantic since 2008. | N/A | N/A |
Zachary Tackett Born: 1988 | Vice President; Secretary; Anti-Money Laundering Compliance Officer | Since 2014 | Associate Counsel, Atlantic since 2014; Intern Associate, Coakley & Hyde, PLLC, 2010-2013. | N/A | N/A |
Michael J. McKeen Born: 1971 | Vice President | Since 2009 | Senior Vice President, Atlantic since 2008. | N/A | N/A |
Timothy Bowden Born: 1969 | Vice President | Since 2009 | Manager, Atlantic since 2008. | N/A | N/A |
Geoffrey Ney Born: 1975 | Vice President | Since 2013 | Manager, Atlantic since 2013; Senior Fund Accountant, Atlantic, 2008-2013. | N/A | N/A |
Todd Proulx Born: 1978 | Vice President | Since 2013 | Manager, Atlantic since 2013; Senior Fund Accountant, Atlantic, 2008-2013. | N/A | N/A |
1The Fund Complex includes the Trust, Forum Funds II, Forum ETF Trust and U.S Global Investors Funds and is overseen by different Boards of Trustees. 2Atlantic is a subsidiary of Forum Holdings Corp. I, a Delaware corporation that is wholly owned by Mr. Keffer. |
| LEBENTHAL LISANTI SMALL CAP GROWTH FUND |
| A MESSAGE TO OUR SHAREHOLDERS (Unaudited) |
| DECEMBER 31, 2015 |
Dear Shareholder,
The second half of the year was more challenging than the first half of 2015. The Russell 2000 Growth Index declined by 9.32% in the second half of the year. The Lebenthal Lisanti Small Cap Growth Fund underperformed for the second half of the year, declining 11.12% versus the benchmark’s 9.32% decline. Most of the underperformance came in the fourth quarter of the year, as fears of a domestic recession gripped the market. Consumer discretionary, information technology and materials were positive contributors to performance; financials and healthcare were the most significant detractors to performance. Among our underperformers in the second half of the year were AAC Holdings, Inc., which is a provider of drug and alcohol rehabilitation centers that had some legal issues with the State of California; Adeptus Health, Inc., which experienced multiple contractions as investors became nervous about healthcare stocks; and Boot Barn Holdings, which made an acquisition that is proving to be more difficult to integrate than initially expected. Among the positive contributors to performance were Pacira Pharmaceuticals, which rebounded as it received a label for its drug from the FDA; Thoratec Corporation, which was taken over by a larger medical device company; and Francesca’s Holdings, which is in the midst of an operational turnaround under new management.
The second half of the year was marked by a number of macro dislocations: oil prices began to decline precipitously, as Saudi Arabia refused to curtail production; the anticipation that the Federal Reserve would raise interest rates led to a strong appreciation of our currency; and the industrial side of the economy experienced significant contraction, as the increase in our currency made many of their products, which are sold primarily overseas, uncompetitive relative to local products. The rapidly rising currency created significant headwinds for revenues and earnings of many U.S. companies. Even the smaller companies were not spared—in addition to the industrial companies, many of the technology companies and health care related issues, and even a number of consumer companies, sell their products overseas. As a result, top line revenue growth slowed, and earnings came under pressure, which further fed fears of a recession. And let us add, we had the warmest winter in some parts of the country that we have had in 100 years!
We normally do not spend much time talking about macro issues, as we are fundamental focused investors, but the dislocations were unusually high in a relatively short period of time—for instance, as of this writing, oil prices have dropped from a high of $110 to around $37. While historically lower energy prices have had a positive influence on consumer spending, it usually takes several quarters for the effect to work its way through. The drop in energy prices did lead to a sharp drop in capital expenditures on the part of our domestic energy complex—as much as 70%--as they responded very quickly to the drop in the commodity price. The net result of all of this was a sharp drop in our GDP growth—currently, it appears that fourth quarter GDP was only 0.7%. This speed of these dislocations raised concerns of a recession—either an actual recession, or an earnings recession—and sparked a decline in smaller cap growth stocks.
As students of history, we know that the stock market forecasts many more recessions than actually occur. We talk to hundreds of companies in the course of a year, as we employ our investment process to uncover great growth stocks for your portfolio. That research leads us to believe that our economy is mutable, flexible, and highly innovative—in short, better positioned to withstand these dislocations than current valuations
| LEBENTHAL LISANTI SMALL CAP GROWTH FUND |
| A MESSAGE TO OUR SHAREHOLDERS (Unaudited) |
| DECEMBER 31, 2015 |
would suggest. Usually, smaller cap growth stocks are the “canaries in the coal mine” with regard to recessions—they tend to feel it first. While we are seeing pockets of slower growth, or adjustments to secular pressures, we are not seeing indications that it is widespread, nor is it very deep (the energy complex is the exception to that statement). Again, based on our research, we believe one of the reasons for investor concern and confusion is that, in addition to cyclical concerns, there are significant secular shifts occurring at the same time. For instance, in the consumer space, it is estimated that online retailers such as Amazon took 50% of consumer spending for the Christmas season—is it any wonder, then, that Macy’s had to significantly cut back its store inventory? These kinds of changes and challenges are occurring in almost every sector of our economy. As you know, our process attempts to identify these changes and find the winners in the change curve—we call them themes—and we find that part of our process very helpful in the current environment.
While the environment of the last half of 2016 has been challenging, we believe that the future is bright. Just from the law of numbers, oil probably will not decline as sharply in the future as it has in the last six months of 2016. As oil prices stabilize, we will probably see consolidation in the space, and a gradual increase in spending in our domestic energy industry. We are not big believers that the Federal Reserve will raise interest rates significantly—the global economy just does not seem strong enough to warrant such a pattern, nor is there a lot of inflation that should cause concern. As it becomes clear that the pace of interest rate increases will be gradual, we believe the U.S. dollar will also stabilize—which will provide a lift to our exporters and also a tailwind to earnings. We have no crystal ball to see when this will happen, but we believe that all of the changes that battered our market in the second half of 2015, should settle down in the next few months.
Challenges always create opportunity, and we see a lot of opportunity in the smaller cap growth market. We continue to see great opportunities in healthcare, as the healthcare industry is experiencing an enormous wave of change that is occurring across all sectors. Several trends are converging: the first is the expansion of healthcare to those previously uncovered, which has now been upheld by the Supreme Court. The second is the shift from a cost, or payments based healthcare system, to an outcomes, or quality based system. Lastly, the advent of high deductible healthcare plans is intersecting with newer technologies and methods of delivering healthcare information. All of these trends create enormous opportunity and enormous risk. We see opportunity particularly in medical devices. After five years of declining revenue growth and margin pressures, the medical device sector is beginning to see improvement in its prospects, as procedure volumes continue to rise. The proposed lifting of the medical device tax for the next several years, included in the recent spending bill, is a positive for the industry. The sector will likely also benefit if the dollar weakens, as many companies have international exposure. In contrast, we believe that one must be much more selective in the biotechnology area this coming year. Many of the smaller companies, a number of which came public last year, have 3-5 years of development before we see products, and that time frame may just be too long in the current environment, particularly given the opportunities in other sectors created by the market decline.
We are overweight consumer discretionary as we believe that consumer confidence and lower unemployment will continue to drive consumer demand for home ownership, restaurants, leisure activities and some specialty retailers.
| LEBENTHAL LISANTI SMALL CAP GROWTH FUND |
| A MESSAGE TO OUR SHAREHOLDERS (Unaudited) |
| DECEMBER 31, 2015 |
We remain cautious on the industrials sector, although we continue to be vigilant for a pickup in global growth, which might make the sector more attractive. We remain focused on the domestically oriented industrials for now, such as those in the building space. But we remain aware that there could be opportunities in industrials that have international exposure as we head into 2016 given the easier sales comparisons these companies will be facing and the potential for a more stable dollar.
We think that once the energy sector sorts out, there will be opportunities, especially in companies in the exploration and production sector that have strong balance sheets, have significantly cut costs and have large core acreage positions in such areas as the Permian Basin. However, it might take a quarter or two for the opportunities to be revealed.
As we typically do, we sought to use the market volatility to our investors’ advantage; we used the correction to purchase some stocks that had heretofore been too expensive, but given the correction, came into our price range. We believe that as one looks out to 2016 this could be a continued buying opportunity.
The public equity small cap growth market in the United States is truly a “market of stocks” as opposed to a “stock market.” We believe that 2016 will turn out to be another “stockpicker’s market,” with wide disparity in companies’ stock returns, depending upon their individual fortunes. We continue to work hard on your behalf and thank you for investing in the strategy.
Sincerely,

Mary Lisanti, CFA
President & Portfolio Manager
| LEBENTHAL LISANTI SMALL CAP GROWTH FUND |
| A MESSAGE TO OUR SHAREHOLDERS (Unaudited) |
| DECEMBER 31, 2015 |
IMPORTANT RISKS AND DISCLOSURES
An investment in the Fund is subject to risk, including the possible loss of principal amount invested. The Fund invests in smaller companies, which carry greater risk than is associated with larger companies for various reasons such as narrower markets, limited financial resources and less liquid stock.
The Russell 2000 Growth Index measures the performance of the small-cap growth segment of the U.S. equity universe. It includes those Russell 2000 companies with higher price-to-value ratios and higher forecasted growth values. One cannot invest directly in an index.
The views in this report were those of the Fund manager as of December 31, 2015, and may not necessarily reflect her views on the date this report is first published or anytime thereafter. These views are intended to assist shareholders in understanding the Fund’s investment methodology and do not constitute investment advice. Although the Adviser believes it has a reasonable basis for any opinions or views expressed, actual results may differ, sometimes significantly so, from those expected or expressed. All current and future holdings of the Fund are subject to risk and are subject to change.
Effective March 2, 2015, the Fund changed its Adviser, formerly, AH Lisanti Capital Growth, LLC, to Lebenthal Lisanti Capital Growth, LLC, and its name, formerly the Adams Harkness Small Cap Growth Fund.
| LEBENTHAL LISANTI SMALL CAP GROWTH FUND |
PERFORMANCE CHART AND ANALYSIS (Unaudited) |
| DECEMBER 31, 2015 |
The following chart reflects the change in the value of a hypothetical $10,000 investment, including reinvested dividends and distributions, in Lebenthal Lisanti Small Cap Growth Fund (the “Fund”) compared with the performance of the benchmark, Russell 2000 Growth Index ("Russell 2000 Growth"), over the past ten fiscal years. The Russell 2000 Growth, the Fund‘s primary performance benchmark, measures the performance of those Russell 2000 Growth companies with higher price-to-value ratios and higher forecasted growth values. The total return of the Russell 2000 Growth includes the reinvestment of dividends and income. The total return of the Fund includes operating expenses that reduce returns, while the total return of the Russell 2000 Growth does not include expenses. The Fund is professionally managed while the Russell 2000 Growth is unmanaged and is not available for investment.
Comparison of Change in Value of a $10,000 Investment
Lebenthal Lisanti Small Cap Growth Fund vs. Russell 2000 Growth Index
| Average Annual Total Returns | | | | | | |
| as of December 31, 2015 | | One Year | | Five Years | | Ten Years |
| Lebenthal Lisanti Small Cap Growth Fund | | -0.18 | % | | 10.55 | % | | 6.37 | % |
| Russell 2000 Growth Index | | -1.38 | % | | 10.67 | % | | 7.95 | % |
Performance data quoted represents past performance and is no guarantee of future results. Current performance may be lower or higher than the performance data quoted. Investment return and principal value will fluctuate so that shares, when redeemed, may be worth more or less than original cost. As stated in the Fund's prospectus, the annual operating expense ratio (gross) is 2.27%. However, the Fund’s Adviser has agreed to contractually waive a portion of its fees and/or reimburse expenses to cap the expense ratio at 1.80% through April 30, 2016. Shares redeemed or exchanged within 30 days of purchase will be charged a 1.00% redemption fee. The performance table and graph do not reflect the deduction of taxes that a shareholder would pay on Fund distributions or the redemption of Fund shares. Returns greater than one year are annualized.
| LEBENTHAL LISANTI SMALL CAP GROWTH FUND |
|
| DECEMBER 31, 2015 |
| | Shares | | Security Description | | Value | |
Common Stock - 95.1% |
Airlines - 0.9% |
| | 15,765 | | SkyWest, Inc. | $ | 299,850 | |
Biotechnology - 1.2% |
| | 4,694 | | ACADIA Pharmaceuticals, Inc. (a) | | 167,341 | |
| | 7,070 | | FibroGen, Inc. (a) | | 215,423 | |
| | | 382,764 | |
Consumer Discretionary - 13.9% |
| | 11,385 | | 2U, Inc. (a) | | 318,552 | |
| | 15,080 | | Abercrombie & Fitch Co. | | 407,160 | |
| | 17,105 | | Boyd Gaming Corp. (a) | | 339,876 | |
| | 4,555 | | Burlington Stores, Inc. (a) | | 195,410 | |
| | 11,220 | | Chuy's Holdings, Inc. (a) | | 351,635 | |
| | 12,760 | | Dave & Buster's Entertainment, Inc. (a) | | 532,602 | |
| | 23,855 | | Duluth Holdings, Inc. (a) | | 348,044 | |
| | 25,365 | | Francesca's Holdings Corp. (a) | | 441,605 | |
| | 9,580 | | Malibu Boats, Inc., Class A (a) | | 156,825 | |
| | 5,910 | | Motorcar Parts of America, Inc. (a) | | 199,817 | |
| | 22,790 | | Planet Fitness, Inc., Class A (a) | | 356,208 | |
| | 11,345 | | Sonic Corp. | | 366,557 | |
| | 28,705 | | Tile Shop Holdings, Inc. (a) | | 470,762 | |
| | 4,995 | | Vera Bradley, Inc. (a) | | 78,721 | |
| | | 4,563,774 | |
Consumer Staples - 0.7% |
| | 6,550 | | Snyder's-Lance, Inc. | | 224,665 | |
Educational Services - 2.1% |
| | 10,160 | | Bright Horizons Family Solutions, Inc. (a) | 678,688 | |
Energy - 1.0% |
| | 4,715 | | Diamondback Energy, Inc. (a) | | 315,433 | |
Engineering & Construction - 1.0% |
| | 4,640 | | Dycom Industries, Inc. (a) | | 324,614 | |
Financial Services - 5.2% |
| | 14,315 | | Bank of the Ozarks, Inc. | | 708,020 | |
| | 4,225 | | LendingTree, Inc. (a) | | 377,208 | |
| | 8,365 | | On Deck Capital, Inc. (a) | | 86,159 | |
| | 14,880 | | Opus Bank | | 550,114 | |
| | | 1,721,501 | |
Health-Care - 26.7% |
| | 3,000 | | Acadia Healthcare Co., Inc. (a) | | 187,380 | |
| | 14,145 | | AMN Healthcare Services, Inc. (a) | | 439,202 | |
| | 7,365 | | Amsurg Corp. (a) | | 559,740 | |
| | 6,595 | | Cempra, Inc. (a) | | 205,302 | |
| | 6,110 | | Cynosure, Inc., Class A (a) | | 272,934 | |
| | 9,550 | | Diplomat Pharmacy, Inc. (a) | | 326,801 | |
| | 4,060 | | Glaukos Corp. (a) | | 100,241 | |
| | 9,940 | | Halozyme Therapeutics, Inc. (a) | | 172,260 | |
| | Shares | | Security Description | | Value | |
Health-Care (continued)
| | 13,785 | | Healthcare Services Group, Inc. | $ | 480,683 | |
| | 9,515 | | HealthEquity, Inc. (a) | | 238,541 | |
| | 8,740 | | INC Research Holdings, Inc., Class A (a) | 423,978 | |
| | 5,170 | | Inogen, Inc. (a) | | 207,265 | |
| | 10,540 | | Insulet Corp. (a) | | 398,517 | |
| | 13,290 | | K2M Group Holdings, Inc. (a) | | 262,345 | |
| | 8,595 | | LHC Group, Inc. (a) | | 389,268 | |
| | 740 | | Ligand Pharmaceuticals, Inc. (a) | | 80,231 | |
| | 10,625 | | Natus Medical, Inc. (a) | | 510,531 | |
| | 5,465 | | Nevro Corp. (a) | | 368,942 | |
| | 16,195 | | NxStage Medical, Inc. (a) | | 354,833 | |
| | 1,750 | | Ophthotech Corp. (a) | | 137,428 | |
| | 7,895 | | Pacira Pharmaceuticals, Inc. (a) | | 606,257 | |
| | 6,645 | | Penumbra, Inc. (a) | | 357,568 | |
| | 5,000 | | PRA Health Sciences, Inc. (a) | | 226,350 | |
| | 19,515 | | Press Ganey Holdings, Inc. (a) | | 615,698 | |
| | 6,600 | | STERIS PLC | | 497,244 | |
| | 1,435 | | Ultragenyx Pharmaceutical, Inc. (a) | | 160,978 | |
| | 5,810 | | Zeltiq Aesthetics, Inc. (a) | | 165,759 | |
| | | 8,746,276 | |
Home Builders - 1.4% |
| | 21,070 | | WCI Communities, Inc. (a) | | 469,440 | |
Industrials - 10.1% |
| | 15,415 | | Beacon Roofing Supply, Inc. (a) | | 634,790 | |
| | 28,535 | | Headwaters, Inc. (a) | | 481,385 | |
| | 6,800 | | John Bean Technologies Corp. | | 338,844 | |
| | 11,155 | | Kforce, Inc. | | 281,998 | |
| | 3,650 | | Lithia Motors, Inc., Class A | | 389,345 | |
| | 9,120 | | On Assignment, Inc. (a) | | 409,944 | |
| | 31,955 | | PowerSecure International, Inc. (a) | | 480,923 | |
| | 4,795 | | Proto Labs, Inc. (a) | | 305,394 | |
| | | 3,322,623 | |
Pharmaceuticals - 2.6% |
| | 8,390 | | Neurocrine Biosciences, Inc. (a) | | 474,623 | |
| | 7,145 | | Portola Pharmaceuticals, Inc. (a) | | 367,610 | |
| | | 842,233 | |
Technology - 28.3% |
| | 12,335 | | Appfolio, Inc., Class A (a) | | 180,091 | |
| | 3,435 | | Blackbaud, Inc. | | 226,229 | |
| | 10,610 | | CommVault Systems, Inc. (a) | | 417,504 | |
| | 6,980 | | Electronics For Imaging, Inc. (a) | | 326,245 | |
| | 4,705 | | Euronet Worldwide, Inc. (a) | | 340,783 | |
| | 6,865 | | Fabrinet (a) | | 163,524 | |
| | 8,975 | | Fleetmatics Group PLC (a) | | 455,840 | |
| | 22,135 | | Gigamon, Inc. (a) | | 588,127 | |
| | 6,500 | | HubSpot, Inc. (a) | | 366,015 | |
| | 8,140 | | Imperva, Inc. (a) | | 515,343 | |
| See Notes to Financial Statements. | 6 | |
| LEBENTHAL LISANTI SMALL CAP GROWTH FUND |
|
| DECEMBER 31, 2015 |
| | Shares | | Security Description | | Value | |
Technology (continued)
| | 10,405 | | Inphi Corp. (a) | $ | 281,143 | |
| | 14,795 | | Integrated Device Technology, Inc. (a) | | 389,848 | |
| | 10,455 | | LogMeIn, Inc. (a) | | 701,531 | |
| | 15,215 | | M/A-COM Technology Solutions Holdings, Inc. (a) | | 622,141 | |
| | 9,050 | | Manhattan Associates, Inc. (a) | | 598,839 | |
| | 9,045 | | Microsemi Corp. (a) | | 294,777 | |
| | 8,275 | | Monolithic Power Systems, Inc. | | 527,200 | |
| | 8,390 | | Paycom Software, Inc. (a) | | 315,716 | |
| | 3,675 | | Paylocity Holding Corp. (a) | | 149,021 | |
| | 8,530 | | Proofpoint, Inc. (a) | | 554,535 | |
| | 24,040 | | Q2 Holdings, Inc. (a) | | 633,935 | |
| | 10,855 | | Silver Spring Networks, Inc. (a) | | 156,421 | |
| | 2,840 | | Tyler Technologies, Inc. (a) | | 495,069 | |
| | | 9,299,877 | |
Total Common Stock (Cost $29,481,989) | | 31,191,738 | |
Total Investments - 95.1% (Cost $29,481,989)* | $ | 31,191,738 | |
| Other Assets & Liabilities, Net – 4.9% | | 1,616,817 | |
| Net Assets – 100.0% | $ | 32,808,555 | |
| PLC | Public Limited Company |
| (a) | Non-income producing security. |
| * | Cost for federal income tax purposes is $29,727,732 and net unrealized appreciation consists of: |
| Gross Unrealized Appreciation | | $ | 2,528,966 | |
| Gross Unrealized Depreciation | | | (1,064,960 | ) |
| Net Unrealized Appreciation | | $ | 1,464,006 | |
The inputs or methodology used for valuing securities are not necessarily an indication of the risks associated with investing in those securities. For more information on valuation inputs, and their aggregation into the levels used in the table below, please refer to the Security Valuation section in Note 2 of the accompanying Notes to Financial Statements.
| Valuation Inputs | | Investments in Securities |
| Level 1 - Quoted Prices | | $ | 31,191,738 | |
| Level 2 - Other Significant Observable Inputs | | | - | |
| Level 3 - Significant Unobservable Inputs | | | - | |
| Total | | $ | 31,191,738 | |
The Level 1 value displayed in this table is Common Stock. Refer to this Schedule of Investments for a further breakout of each security by industry.
The Fund utilizes the end of period methodology when determining transfers. There were no transfers among Level 1, Level 2 and Level 3 for the year ended December 31, 2015.
| PORTFOLIO HOLDINGS | | |
| % of Total Investments | | |
| Airlines | 1.0 | % |
| Biotechnology | 1.2 | % |
| Consumer Discretionary | 14.6 | % |
| Consumer Staples | 0.7 | % |
| Educational Services | 2.2 | % |
| Energy | 1.0 | % |
| Engineering & Construction | 1.1 | % |
| Financial Services | 5.5 | % |
| Health-Care | 28.0 | % |
| Home Builders | 1.5 | % |
| Industrials | 10.7 | % |
| Pharmaceuticals | 2.7 | % |
| Technology | 29.8 | % |
| | 100.0 | % |
| See Notes to Financial Statements. | 7 | |
| LEBENTHAL LISANTI SMALL CAP GROWTH FUND |
STATEMENT OF ASSETS AND LIABILITIES |
| DECEMBER 31, 2015 |
| ASSETS | | | | |
| | Total investments, at value (Cost $29,481,989) | | $ | 31,191,738 | |
| | Cash | | | 1,550,196 | |
| | Receivables: | | | | |
| | | Fund shares sold | | | 155,369 | |
| | | Dividends and interest | | | 2,564 | |
| | Prepaid expenses | | | 8,852 | |
| Total Assets | | | 32,908,719 | |
| | | | | | | |
| LIABILITIES | | | | |
| | Payables: | | | | |
| | | Fund shares redeemed | | | 32,227 | |
| | Accrued Liabilities: | | | | |
| | | Investment adviser fees | | | 23,657 | |
| | | Trustees’ fees and expenses | | | 30 | |
| | | Fund services fees | | | 12,191 | |
| | | Other expenses | | | 32,059 | |
| Total Liabilities | | | 100,164 | |
| | | | | | | |
| NET ASSETS | | $ | 32,808,555 | |
| | | | | | | |
| COMPONENTS OF NET ASSETS | | | | |
| | Paid-in capital | | $ | 31,527,258 | |
| | Accumulated net realized loss | | | (428,452 | ) |
| | Net unrealized appreciation | | | 1,709,749 | |
| NET ASSETS | | $ | 32,808,555 | |
| SHARES OF BENEFICIAL INTEREST AT NO PAR VALUE (UNLIMITED SHARES AUTHORIZED) | | | 1,848,441 | |
NET ASSET VALUE, OFFERING AND REDEMPTION PRICE PER SHARE* | | $ | 17.75 | |
| * | Shares redeemed or exchanged within 30 days of purchase are charged a 1.00% redemption fee. | | |
| See Notes to Financial Statements. | 8 | |
| LEBENTHAL LISANTI SMALL CAP GROWTH FUND |
|
YEAR ENDED DECEMBER 31, 2015 |
| INVESTMENT INCOME | | | | | |
| | Dividend income | . | | $ | 41,009 | |
| | Interest income | | | 1,923 | |
| Total Investment Income | | | | 42,932 | |
| Adviser | | | | | |
| EXPENSES | | | | | |
| | Investment adviser fees | | | 280,004 | |
| | Fund services fees | | | 184,648 | |
| | Shareholder service fees | | | | 70,001 | |
| | Custodian fees | | | 5,000 | |
| | Registration fees | | | 20,666 | |
| | Professional fees | | | 37,138 | |
| | Trustees' fees and expenses | | | 4,150 | |
| | Miscellaneous expenses | | | 32,351 | |
| Total Expenses | | | | 633,958 | |
| | Fees waived and expenses reimbursed | | | (129,985 | ) |
| Net Expenses | | | | 503,973 | |
| | | | | | | |
| NET INVESTMENT LOSS | | | | (461,041 | ) |
| | | | | | | |
| NET REALIZED AND UNREALIZED GAIN (LOSS) | | | | | |
| | Net realized gain on investments | | | 1,686,800 | |
| | Net change in unrealized appreciation (depreciation) on investments | | | (1,870,087 | ) |
| NET REALIZED AND UNREALIZED LOSS | | | | (183,287 | ) |
| DECREASE IN NET ASSETS RESULTING FROM OPERATIONS | | | $ | (644,328 | ) |
| | | | | | | |
| See Notes to Financial Statements. | 9 | |
| LEBENTHAL LISANTI SMALL CAP GROWTH FUND |
STATEMENTS OF CHANGES IN NET ASSETS |
|
| | | | | For the Year Ended December 31, 2015 | | | For the Year Ended December 31, 2014 |
| OPERATIONS | | | | | | | | | |
| | Net investment loss | | $ | (461,041 | ) | | | $ | (445,594 | ) |
| | Net realized gain | | | 1,686,800 | | | | | 394,459 | |
| | Net change in unrealized appreciation (depreciation) | | | (1,870,087 | ) | | | | (337,424 | ) |
| Decrease in Net Assets Resulting from Operations | | | (644,328 | ) | | | | (388,559 | ) |
| | | | | | | | | | | | |
| DISTRIBUTIONS TO SHAREHOLDERS FROM | | | | | | | | | |
| | Net realized gain | | | (1,692,923 | ) | | | | (1,218,666 | ) |
| Total Distributions to Shareholders | | | (1,692,923 | ) | | | | (1,218,666 | ) |
| | | | | | | | | | | | |
| CAPITAL SHARE TRANSACTIONS | | | | | | | | | |
| | Sale of shares | | | 17,254,090 | | | | | 8,145,314 | |
| | Reinvestment of distributions | | | 1,525,725 | | | | | 1,168,489 | |
| | Redemption of shares (a) | | | (7,611,664 | ) | | | | (16,124,007 | ) |
| | Redemption fees | | | 2,106 | | | | | 1,675 | |
| Increase (Decrease) in Net Assets from Capital Share Transactions | | 11,170,257 | | | | | (6,808,529 | ) |
| Increase (Decrease) in Net Assets | | | 8,833,006 | | | | | (8,415,754 | ) |
| | | | | | | | | | | | |
| NET ASSETS | | | | | | | | | |
| | Beginning of Year | | | 23,975,549 | | | | | 32,391,303 | |
| | End of Year | | $ | 32,808,555 | | | | $ | 23,975,549 | |
| | | | | | | | | | | | |
| SHARE TRANSACTIONS | | | | | | | | | |
| | Sale of shares | | | 874,809 | | | | | 424,225 | |
| | Reinvestment of distributions | | | 86,345 | | | | | 64,557 | |
| | Redemption of shares | | | (392,806 | ) | | | | (866,775 | ) |
| Increase (Decrease) in Shares | | | 568,348 | | | | | (377,993 | ) |
| (a) | The amount includes $979,752 from a redemption-in-kind for the year ended December 31, 2015. | | |
| See Notes to Financial Statements. | 10 | |
| LEBENTHAL LISANTI SMALL CAP GROWTH FUND |
|
| |
| These financial highlights reflect selected data for a share outstanding throughout each year. | | | | | |
| | | For the Years Ended December 31, | |
| 2015 | | 2014 | | 2013 | | 2012 | | 2011 | |
| NET ASSET VALUE, Beginning | | | | | | | | | | | | | | | | | | | | |
| of Year | $ | 18.73 | | | $ | 19.54 | | | $ | 13.36 | | | $ | 11.83 | | | $ | 12.59 | | |
| INVESTMENT OPERATIONS | | | | | | | | | | | | | | | | | | | | |
| Net investment loss (a) | | (0.32 | ) | | | (0.31 | ) | | | (0.29 | ) | | | (0.17 | ) | | | (0.20 | ) | |
| Net realized and unrealized | | | | | | | | | | | | | | | | | | | | |
| | gain (loss) | | 0.28 | (b) | | | 0.50 | | | | 7.43 | | | | 1.70 | | | | (0.56 | ) | |
| Total from Investment Operations | | (0.04 | ) | | | 0.19 | | | | 7.14 | | | | 1.53 | | | | (0.76 | ) | |
| DISTRIBUTIONS TO | | | | | | | | | | | | | | | | | | | | |
| SHAREHOLDERS FROM | | | | | | | | | | | | | | | | | | | | |
| Net investment income | | — | | | | — | | | | (0.13 | ) | | | — | | | | — | | |
| Net realized gain | | (0.94 | ) | | | (1.00 | ) | | | (0.83 | ) | | | — | | | | — | | |
| Total Distributions to Shareholders | | (0.94 | ) | | | (1.00 | ) | | | (0.96 | ) | | | — | | | | — | | |
| REDEMPTION FEES (a) | | — | (c) | | — | (c) | | — | (c) | | — | | | | — | (c) |
| NET ASSET VALUE, End | | | | | | | | | | | | | | | | | | | | |
| of Year | $ | 17.75 | | | $ | 18.73 | | | $ | 19.54 | | | $ | 13.36 | | | $ | 11.83 | | |
| TOTAL RETURN | | (0.18 | )% | | 1.14 | % | | 54.15 | % | | 12.93 | % | | (6.04 | )% |
| RATIOS/SUPPLEMENTARY DATA | | | | | | | | | | | | | | | | | | | | |
| Net Assets at End of | | | | | | | | | | | | | | | | | | | | |
| | Year (000's omitted) | $32,809 | | | $23,976 | | | $32,391 | | | $11,396 | | | $10,765 | | |
| Ratios to Average Net Assets: | | | | | | | | | | | | | | | | | | | | |
| Net investment loss | | (1.65 | )% | | (1.65 | )% | | (1.66 | )% | | (1.26 | )% | | (1.59 | )% |
| Net expenses | | 1.80 | % | | 1.80 | % | | 1.80 | % | | 1.80 | % | | 1.80 | % |
| Gross expenses (d) | | 2.26 | % | | 2.27 | % | | 2.71 | % | | 3.44 | % | | 3.40 | % |
| PORTFOLIO TURNOVER RATE | | 196 | % | | 263 | % | | 295 | % | | 294 | % | | 324 | % |
| | | | | | | | | | | | | | | | | | | | | | |
| (a) | Calculated based on average shares outstanding during each year. |
| (b) | The net realized and unrealized gain (loss) per share does not correlate to the aggregate of the net realized and unrealized gain (loss) in the Statement of Operations, primarily due to the timing of the sales and repurchases of the Fund's shares in relation to fluctuating market values for the Fund's portfolio. |
| (c) | Less than $0.01 per share. |
| (d) | Reflects the expense ratio excluding any waivers and/or reimbursements. |
| See Notes to Financial Statements. | 11 | |
| LEBENTHAL LISANTI SMALL CAP GROWTH FUND |
NOTES TO FINANCIAL STATEMENTS |
|
Note 1. Organization
The Lebenthal Lisanti Small Cap Growth Fund (the “Fund”) is a diversified portfolio of Forum Funds (the “Trust”). The Trust is a Delaware statutory trust that is registered as an open-end, management investment company under the Investment Company Act of 1940 (the “Act”), as amended. Under its Trust Instrument, the Trust is authorized to issue an unlimited number of the Fund’s shares of beneficial interest without par value. The Fund commenced operations on February 27, 2004. The Fund seeks maximum capital appreciation. Prior to March 2, 2015, the Fund was named Adams Harkness Small Cap Growth Fund.
Note 2. Summary of Significant Accounting Policies
These financial statements are prepared in accordance with accounting principles generally accepted in the United States of America (“GAAP”), which require management to make estimates and assumptions that affect the reported amounts of assets and liabilities, the disclosure of contingent liabilities at the date of the financial statements, and the reported amounts of increases and decreases in net assets from operations during the fiscal period. Actual amounts could differ from those estimates. The following summarizes the significant accounting policies of the Fund:
Security Valuation – Exchange-traded securities and over-the-counter securities are valued using the last quoted trade or official closing price, provided by independent pricing services as of the close of trading on the market or exchange for which they are primarily traded, on each Fund business day. In the absence of a sale, such securities are valued at the mean of the last bid and ask price provided by independent pricing services. Non-exchange-traded securities for which quotations are available are valued using the last quoted sales price, or in the absence of a sale, at the mean of the last bid and ask prices provided by independent pricing services. Shares of open-end mutual funds are valued at net asset value (“NAV”). Short-term investments that mature in 60 days or less may be valued at amortized cost.
The Fund values its investments at fair value pursuant to procedures adopted by the Trust's Board of Trustees (the "Board") if (1) market quotations are insufficient or not readily available or (2) the adviser believes that the values available are unreliable. The Trust’s Valuation Committee, as defined in the Fund’s registration statement, performs certain functions as they relate to the administration and oversight of the Fund’s valuation procedures. Under these procedures, the Valuation Committee convenes on a regular and ad-hoc basis to review such investments and considers a number of factors, including valuation methodologies and significant unobservable inputs, when arriving at fair value.
The Valuation Committee may work with the adviser to provide valuation inputs. In determining fair valuations, inputs may include market-based analytics which may consider related or comparable assets or liabilities, recent transactions, market multiples, book values and other relevant investment information. Adviser inputs may include an income-based approach in which the anticipated future cash flows of the investment are discounted in determining fair value. Discounts may also be applied based on the nature or duration of any restrictions on the disposition of the investments. The Valuation Committee performs regular reviews of valuation methodologies, key inputs and assumptions, disposition analysis and market activity.
| LEBENTHAL LISANTI SMALL CAP GROWTH FUND |
NOTES TO FINANCIAL STATEMENTS |
|
Fair valuation is based on subjective factors and, as a result, the fair value price of an investment may differ from the security’s market price and may not be the price at which the asset may be sold. Fair valuation could result in a different NAV than a NAV determined by using market quotes.
The Fund has a three-tier fair value hierarchy. The basis of the tiers is dependent upon the various “inputs” used to determine the value of the Fund’s investments. These inputs are summarized in the three broad levels listed below:
Level 1 — quoted prices in active markets for identical assets and liabilities
Level 2 — other significant observable inputs (including quoted prices of similar securities, interest rates, prepayment speeds, credit risk, etc.)
Level 3 — significant unobservable inputs (including the Fund’s own assumptions in determining the fair value of investments)
The aggregate value by input level, as of December 31, 2015, for the Fund’s investments is included in the Fund’s Schedule of Investments.
Security Transactions, Investment Income and Realized Gain and Loss – Investment transactions are accounted for on the trade date. Dividend income is recorded on the ex-dividend date. Foreign dividend income is recorded on the ex-dividend date or as soon as possible after the Fund determines the existence of a dividend declaration after exercising reasonable due diligence. Income and capital gains on some foreign securities may be subject to foreign withholding taxes, which are accrued as applicable. Interest income is recorded on an accrual basis. Premium is amortized and discount is accreted using the effective interest method. Identified cost of investments sold is used to determine the gain and loss for both financial statement and federal income tax purposes.
Distributions to Shareholders – Distributions to shareholders of net investment income, if any, are declared and paid at least quarterly. Distributions to shareholders of net capital gains, if any, are declared and paid at least annually. Distributions to shareholders are recorded on the ex-dividend date. Distributions are based on amounts calculated in accordance with applicable federal income tax regulations, which may differ from GAAP. These differences are due primarily to differing treatments of income and gain on various investment securities held by the Fund, timing differences and differing characterizations of distributions made by the Fund.
Federal Taxes – The Fund intends to continue to qualify each year as a regulated investment company under Subchapter M of the Internal Revenue Code and to distribute all of its taxable income to shareholders. In addition, by distributing in each calendar year substantially all of its net investment income and capital gains, if any, the Fund will not be subject to a federal excise tax. Therefore, no federal income or excise tax provision is required. The Fund files a U.S. federal income and excise tax return as required. A fund’s federal income tax returns are subject to examination by the Internal Revenue Service for a period of three fiscal years after they
| LEBENTHAL LISANTI SMALL CAP GROWTH FUND |
NOTES TO FINANCIAL STATEMENTS |
|
are filed. As of December 31, 2015, there are no uncertain tax positions that would require financial statement recognition, de-recognition or disclosure.
Income and Expense Allocation – The Trust accounts separately for the assets, liabilities and operations of each of its investment portfolios. Expenses that are directly attributable to more than one investment portfolio are allocated among the respective investment portfolios in an equitable manner.
Commitments and Contingencies – In the normal course of business, the Fund enters into contracts that provide general indemnifications by the Fund to the counterparty to the contract. The Fund’s maximum exposure under these arrangements is dependent on future claims that may be made against the Fund and, therefore, cannot be estimated; however, based on experience, the risk of loss from such claims is considered remote.
Redemption Fees – A shareholder who redeems or exchanges shares within 30 days of purchase will incur a redemption fee of 1.00% of the current net asset value of shares redeemed or exchanged, subject to certain limitations. The fee is charged for the benefit of the remaining shareholders and will be paid to the Fund to help offset transaction costs. The fee is accounted for as an addition to paid-in capital. The Fund reserves the right to modify the terms of or terminate the fee at any time. There are limited exceptions to the imposition of the redemption fee.
Note 3. Cash – Concentration in Uninsured Account
For cash management purposes the Fund may concentrate cash with the Fund’s custodian. This typically results in cash balances exceeding the Federal Deposit Insurance Corporation (“FDIC”) insurance limits. As of December 31, 2015, the Fund held $1,300,196 as cash reserves at MUFG Union Bank, N.A. that exceeded the FDIC insurance limit.
Note 4. Fees and Expenses
Investment Adviser – Lebenthal Lisanti Capital Growth, LLC (the “Adviser”) is the investment adviser to the Fund. Prior to March 2, 2015, the Adviser was AH Lisanti Capital Growth, LLC. Pursuant to an investment advisory agreement, the Adviser receives an advisory fee from the Fund at an annual rate of 1.00% of the Fund’s average daily net assets.
Shareholder Service Plan – The Trust has adopted a shareholder service plan for the Fund under which the Fund may reimburse the Fund’s administrator for amounts paid by the administrator for providing shareholder service activities that are not otherwise provided by the transfer agent. The Fund’s administrator may make such payments to various financial institutions, including the Adviser, that provide shareholder servicing to their customers invested in the Fund in amounts of up to 0.25% annually of the average daily net assets of the shares held by such customers.
| LEBENTHAL LISANTI SMALL CAP GROWTH FUND |
NOTES TO FINANCIAL STATEMENTS |
|
Distribution – Foreside Fund Services, LLC serves as the Fund’s distributor (the “Distributor”). The Fund does not have a distribution (12b-1) plan; accordingly, the Distributor does not receive compensation from the Fund for its distribution (12b-1) services. The Adviser compensates the Distributor directly for its services. The Distributor is not affiliated with the Adviser or Atlantic Fund Administration, LLC (d/b/a Atlantic Fund Services) (“Atlantic”) or their affiliates.
Other Service Providers – Atlantic provides fund accounting, fund administration, compliance and transfer agency services to the Fund. Atlantic also provides certain shareholder report production, and EDGAR conversion and filing services. Pursuant to an Atlantic services agreement, the Fund pays Atlantic customary fees for its services. Atlantic provides a Principal Executive Officer, a Principal Financial Officer, a Chief Compliance Officer, and an Anti-Money Laundering Officer to the Fund, as well as certain additional compliance support functions.
Trustees and Officers – The Trust pays each independent Trustee an annual fee of $50,000 for service to the Trust ($66,000 for the Chairman). The Audit Committee Chairman receives an additional $6,000 annually. Effective April 1, 2015, the Vice Chairman receives an additional $6,000 annually.The Trustees and Chairman may receive additional fees for special Board meetings. Each Trustee is also reimbursed for all reasonable out-of-pocket expenses incurred in connection with his duties as a Trustee, including travel and related expenses incurred in attending Board meetings. The amount of Trustees’ fees attributable to the Fund is disclosed in the Statement of Operations. Certain officers of the Trust are also officers or employees of the above named service providers, and during their terms of office received no compensation from the Fund.
Note 5. Fees Waived
The Adviser has contractually agreed to waive its fees and/or reimburse expenses to limit total annual operating expenses (excluding all taxes, interest, portfolio transaction expenses, proxy expenses, and extraordinary expenses) to 1.80% for the period through April 30, 2016. During the period, certain Fund service providers have voluntarily agreed to waive a portion of their fees. These voluntary waivers may be reduced or eliminated at any time. For the year ended December 31, 2015, fees waived were as follows:
| Investment Adviser Fees Waived | | Other Waivers | | Total Fees Waived |
| $ | 79,985 | | $ | 50,000 | | $ | 129,985 |
| | | | | | | | |
| LEBENTHAL LISANTI SMALL CAP GROWTH FUND |
NOTES TO FINANCIAL STATEMENTS |
|
The Fund may repay the Adviser for fees waived and expenses reimbursed pursuant to the expense cap if such payment is made within three years of the fee waiver or expense reimbursement and the resulting expenses do not exceed 1.80%. As of December 31, 2015, the following amounts are subject to recapture by the Adviser:
| | | Amount of Fees Waived and/or Expenses Reimbursed | | Expiration Date to Recoup Fees Waived and/or Expenses Reimbursed | | Fees Recouped |
| December 31, 2015 | | $ | 79,985 | | December 31, 2018 | | $ | - |
Note 6. In-Kind Redemptions
On December 28, 2015, the Fund distributed portfolio securities rather than cash as payment for certain redemptions of fund shares (in-kind redemptions). The proceeds for the in-kind redemptions, which are included in Redemption of shares in the Statements of Changes in Net Assets, were $979,752 and represented 2.99% of the Fund’s net assets on December 28, 2015. For financial reporting purposes, the fund recognized gains on the in-kind redemptions in the amount of $107,232. For tax purposes, the gains are not recognized.
Note 7. Security Transactions
The cost of purchases and proceeds from sales of investment securities (including maturities), other than short-term investment and in-kind purchases and redemptions during the year ended December 31, 2015, were $60,319,764 and $52,272,464, respectively.
Note 8. Federal Income Tax
Distributions paid during the fiscal years ended as noted were characterized for tax purposes as follows:
| | Ordinary Income | | $ | 410,098 | | $ | 910,220 | |
| | Long-Term Capital Gain | | | 1,282,825 | | | 308,446 | |
| | | | $ | 1,692,923 | | $ | 1,218,666 | |
As of December 31, 2015, distributable earnings (accumulated loss) on a tax basis were as follows:
| | Undistributed Long-Term Gain | | $ | 398,631 | | |
| | Capital and Other Losses | | | (581,340 | ) | |
| | Unrealized Appreciation | | | 1,464,006 | | |
| | Total | | $ | 1,281,297 | | |
The difference between components of distributable earnings on a tax basis and the amounts reflected in the Statement of Assets and Liabilities are primarily due to wash sales.
| LEBENTHAL LISANTI SMALL CAP GROWTH FUND |
NOTES TO FINANCIAL STATEMENTS |
|
For tax purposes, the current post October-loss was $581,340 (realized during the period November 1, 2015 through December 31, 2015). This loss will be recognized for tax purposes on the first business day of the Fund’s next fiscal year, January 1, 2016.
On the Statement of Assets and Liabilities, as a result of permanent book to tax differences, certain amounts have been reclassified for the year ended December 31, 2015. The following reclassification was the result of losses offsetting short-term gains and tax adjustments from an in-kind redemption and has no impact on the net assets of the Fund.
| | Undistributed Net Investment Income (Loss) | | $ | 461,041 | | |
| | Accumulated Net Realized Gain (Loss) | | | (567,427 | ) | |
| | Paid-In Capital | | | 106,386 | | |
Note 9. Subsequent Events
Subsequent events occurring after the date of this report through the date these financial statements were issued have been evaluated for potential impact and the Fund has had no such events.
| |
REPORT OF INDEPENDENT REGISTERED PUBLIC ACCOUNTING FIRM |
|
To the Shareholders of the Lebenthal Lisanti Small Cap Growth Fund
and the Board of Trustees of Forum Funds
We have audited the accompanying statement of assets and liabilities of the Lebenthal Lisanti Small Cap Growth Fund (formerly known as Adams Harkness Small Cap Growth Fund) (the "Fund"), a series of shares of beneficial interest in the Forum Funds, including the schedule of investments, as of December 31, 2015, and the related statement of operations for the year then ended, the statements of changes in net assets for each of the years in the two-year period then ended and the financial highlights for each of the years in the five-year period then ended. These financial statements and financial highlights are the responsibility of the Fund’s management. Our responsibility is to express an opinion on these financial statements and financial highlights based on our audits.
We conducted our audits in accordance with the standards of the Public Company Accounting Oversight Board (United States). Those standards require that we plan and perform the audits to obtain reasonable assurance about whether the financial statements and financial highlights are free of material misstatement. An audit includes examining, on a test basis, evidence supporting the amounts and disclosures in the financial statements. Our procedures included confirmation of securities owned as of December 31, 2015 by correspondence with the custodian. An audit also includes assessing the accounting principles used and significant estimates made by management, as well as evaluating the overall financial statement presentation. We believe that our audits provide a reasonable basis for our opinion.
In our opinion, the financial statements and financial highlights referred to above present fairly, in all material respects, the financial position of Lebenthal Lisanti Small Cap Growth Fund as of December 31, 2015, and the results of its operations for the year then ended, the changes in its net assets for each of the years in the two-year period then ended and its financial highlights for each of the years in the five-year period then ended, in conformity with accounting principles generally accepted in the United States of America.

BBD, LLP
Philadelphia, Pennsylvania
February 22, 2016
| LEBENTHAL LISANTI SMALL CAP GROWTH FUND |
ADDITIONAL INFORMATION (Unaudited) |
|
Proxy Voting Information
A description of the policies and procedures that the Fund uses to determine how to vote proxies relating to securities held in the Fund’s portfolio is available, without charge and upon request, by calling (800) 441-7031, on the Fund's website at www.lebenthal-lisantismallcap.com and on the U.S. Securities and Exchange Commission’s (the “SEC”) website at www.sec.gov. The Fund’s proxy voting record for the most recent twelve-month period ended June 30 is available, without charge and upon request, by calling (800) 441-7031, on the Fund's website at www.lebenthal-lisantismallcap.com and on the SEC’s website at www.sec.gov.
Availability of Quarterly Portfolio Schedules
The Fund files its complete schedule of portfolio holdings with the SEC for the first and third quarters of each fiscal year on Form N-Q. These filings are available, without charge and upon request on the SEC’s website at www.sec.gov or may be reviewed and copied at the SEC’s Public Reference Room in Washington, DC. Information on the operation of the Public Reference Room may be obtained by calling (800) SEC-0330.
Shareholder Expense Example
As a shareholder of the Fund, you incur two types of costs: (1) transaction costs, including redemption fees and exchange fees, and (2) ongoing costs, including management fees and other Fund expenses. This example is intended to help you understand your ongoing costs (in dollars) of investing in the Fund, and to compare these costs with the ongoing costs of investing in other mutual funds.
The example is based on an investment of $1,000 invested at the beginning of the period and held for the entire period from July 1, 2015, through December 31, 2015.
Actual Expenses – The first line of the table below provides information about actual account values and actual expenses. You may use the information in this line, together with the amount you invested, to estimate the expenses that you paid over the period. Simply divide your account value by $1,000 (for example, an $8,600 account value divided by $1,000 = 8.6), then multiply the result by the number in the first line under the heading entitled “Expenses Paid During Period” to estimate the expenses you paid on your account during the period.
Hypothetical Example for Comparison Purposes – The second line of the table below provides information about hypothetical account values and hypothetical expenses based on the Fund’s actual expense ratio and an assumed rate of return of 5% per year before expenses, which is not the Fund’s actual return. The hypothetical account values and expenses may not be used to estimate the actual ending account balance or expenses you paid for the period. You may use this information to compare the ongoing costs of investing in the Fund and other funds. To do so, compare this 5% hypothetical example with the 5% hypothetical examples that appear in the shareholder reports of other funds.
Please note that the expenses shown in the table are meant to highlight your ongoing costs only and do not
| LEBENTHAL LISANTI SMALL CAP GROWTH FUND |
ADDITIONAL INFORMATION (Unaudited) |
|
reflect any transactional costs, such as redemption fees and exchange fees. Therefore, the second line of the table is useful in comparing ongoing costs only, and will not help you determine the relative total costs of owning different funds. In addition, if these transactional costs had been included, your costs would have been higher.
| | Beginning | | Ending | | Expenses | | Annualized |
| | Account Value | | Account Value | | Paid During | | Expense |
| | July 1, 2015 | | December 31, 2015 | | Period* | | Ratio* |
| Actual | $ | 1,000.00 | | $ | 881.50 | | $ | 8.54 | | 1.80 | % |
| Hypothetical (5% return before taxes) | $ | 1,000.00 | | $ | 1,016.13 | | $ | 9.15 | | 1.80 | % |
| * | Expenses are equal to the Fund’s annualized expense ratio multiplied by the average account value over the period, multiplied by the number of days in the most recent fiscal half-year divided by 365 to reflect the half-year period. |
Federal Tax Status of Dividends Declared during the Fiscal Year
For federal income tax purposes, dividends from short-term capital gains are classified as ordinary income. The Fund designates 8.73% of its income dividend distributed as qualifying for the corporate dividends-received deduction (DRD) and 8.38% for the qualified dividend rate (QDI) as defined in Section 1(h)(11) of the Internal Revenue Code. The Fund also designates 100.00% as short-term capital gain dividends exempt from U.S. tax for foreign shareholders (QSD).
Trustees and Officers of the Trust
The Board is responsible for oversight of the management of the Trust’s business affairs and of the exercise of all the Trust’s powers except those reserved for the shareholders. The following table provides information about each Trustee and certain officers of the Trust. Each Trustee and officer holds office until the person resigns, is removed, or is replaced. Unless otherwise noted, the persons have held their principal occupations for more than five years. The address for all Trustees and officers is Three Canal Plaza, Suite 600, Portland, Maine 04101. Mr. Keffer is considered an Interested Trustee due to his affiliation with Atlantic. The Fund’s Statement of Additional Information includes additional information about the Trustees and is available, without charge and upon request, by calling (800) 441-7031, on the Fund's website at www.lebenthal-lisantismallcap.com.
| LEBENTHAL LISANTI SMALL CAP GROWTH FUND |
ADDITIONAL INFORMATION (Unaudited) |
|
| Name and Year of Birth | Position with the Trust | Length of Time Served | Principal Occupation(s) During Past Five Years | Number of Series of Fund Complex¹ Overseen by Trustee | Other Directorships Held by Trustee |
Independent Trustees | | | | | |
J. Michael Parish Born: 1943 | Chairman of the Board; Trustee; Chairman, Nominating Committee and Qualified Legal Compliance Committee | Since 1989 (Chairman since 2004) | Retired since 2003; formerly, Partner, Wolf, Block, Schorr and Solis-Cohen, LLP (law firm) 2002-2003; Partner, Thelen Reid & Priest LLP (law firm) 1995-2002. | 26 | None |
Costas Azariadis Born: 1943 | Trustee | Since 1989 | Professor of Economics, Washington University since 2006. | 26 | None |
James C. Cheng Born: 1942 | Trustee; Chairman, Audit Committee | Since 1989 | President, Technology Marketing Associates (marketing company for small- and medium-sized businesses in New England) since 1991. | 26 | None |
David Tucker Born: 1958 | Trustee; Vice Chairman | Since 2011 (Vice Chairman since 2015) | Director, Blue Sky Experience (a charitable endeavor) since 2008; Senior Vice President & General Counsel, American Century Companies 1998-2008. | 46 | Trustee, Forum Funds II, Forum ETF Trust and U.S. Global Investors Funds |
Interested Trustee | | | | | |
John Y. Keffer2 Born: 1942 | Trustee; Vice Chairman | Since 1989 | Chairman, Atlantic since 2008; President, Forum Investment Advisors, LLC since 2011; President, Forum Foundation (a charitable organization) since 2005; President, Forum Trust, LLC (a non-depository trust company chartered in the State of Maine) since 1997. | 46 | Director, Wintergreen Fund, Inc.; Trustee, Forum Funds II, Forum ETF Trust, ALTMFX Trust and U.S. Global Investors Funds |
Officers | | | | | |
Jessica Chase Born: 1970 | President; Principal Executive Officer | Since 2015 | Senior Vice President, Atlantic since 2008. | N/A | N/A |
Karen Shaw Born: 1972 | Treasurer; Principal Financial Officer | Since 2008 | Senior Vice President, Atlantic since 2008. | N/A | N/A |
Zachary Tackett Born: 1988 | Vice President; Secretary; Anti-Money Laundering Compliance Officer | Since 2014 | Associate Counsel, Atlantic since 2014; Intern Associate, Coakley & Hyde, PLLC, 2010-2013. | N/A | N/A |
Michael J. McKeen Born: 1971 | Vice President | Since 2009 | Senior Vice President, Atlantic since 2008. | N/A | N/A |
1The Fund Complex includes the Trust, Forum Funds II, Forum ETF Trust and U.S. Global Investors Funds and is overseen by different Boards of Trustees.
2Atlantic is a subsidiary of Forum Holdings Corp. I, a Delaware corporation that is wholly owned by Mr. Keffer.
| LEBENTHAL LISANTI SMALL CAP GROWTH FUND |
ADDITIONAL INFORMATION (Unaudited) |
|
Name and Year of Birth | Position with the Trust | Length of Time Served | Principal Occupation(s) During Past Five Years | Number of Series of Fund Complex¹ Overseen by Trustee | Other Directorships Held by Trustee |
Officers | | | | | |
Timothy Bowden Born: 1969 | Vice President | Since 2009 | Manager, Atlantic since 2008. | N/A | N/A |
Geoffrey Ney Born: 1975 | Vice President | Since 2013 | Manager, Atlantic since 2013; Senior Fund Accountant, Atlantic, 2008-2013. | N/A | N/A |
Todd Proulx Born: 1978 | Vice President | Since 2013 | Manager, Atlantic since 2013; Senior Fund Accountant, Atlantic, 2008-2013. | N/A | N/A |
1The Fund Complex includes the Trust, Forum Funds II, Forum ETF Trust and U.S. Global Investors Funds and is overseen by different Boards of Trustees. |
| A Message to Our Shareholders (Unaudited) | 1 |
| Performance Chart and Analysis (Unaudited) | 4 |
| Schedule of Investments | 5 |
| Statement of Assets and Liabilities | 6 |
| Statement of Operations | 7 |
| Statements of Changes in Net Assets | 8 |
| Financial Highlights | 9 |
| Notes to Financial Statements | 10 |
| Report of Independent Registered Public Accounting Firm | 14 |
| Additional Information (Unaudited) | 15 |
The views expressed in this report are those of the investment advisor of The BeeHive Fund (the “Fund”) as of December 31, 2015, and may not reflect their views on the date this report is first published or any time thereafter. These views are intended to assist shareholders of the Fund in understanding their investments in the Fund and do not constitute investment advice. The Fund is subject to various forms of risk, including the possible loss of principal. Investing in foreign securities entails risks not associated with domestic equities, including economic and political instability and currency fluctuations. Investing in fixed income securities includes the risk that rising interest rates will cause a decline in values. Focused investments in particular industries or market sectors can entail increased volatility and greater market risk than is the case with more broadly diversified investments. Investments in securities of small and mid-capitalization companies involve the possibility of greater volatility than investments in larger capitalization companies. Investments in American Depositary Receipts involve many of the same risks as investing in foreign securities.
|
A MESSAGE TO OUR SHAREHOLDERS (Unaudited) |
|
Dear Shareholder,
Market observers spent much of 2015 wondering when, or even if, the governors of the Federal Reserve Board would attempt to abandon the zero interest rate policy that had governed the monetary environment since the financial crisis. By mid-December, when Fed Chair Janet Yellen revealed the decision to raise the Fed Funds target range to 0.25 to 0.50%, the widely anticipated announcement had all the suspense of the Rockefeller Center Christmas Tree Lighting. The outcome was no longer in doubt. The hours and days that followed did feel the rustling leaves of moderate market volatility, but there was no seismic activity recorded. Had a modern day Rip Van Winkle wakened at year-end after a brief 12-month nap, he would have hardly noticed a difference.
To close the year, the ten year U.S. Treasury note yielded 2.27%; virtually the same as a year earlier. The S&P 500 Index (“S&P 500”) finished the year within 100 points of its starting level, though the stability of beginning to end belied turbulence in between. Much like Dr. Seuss’s “Cat in the Hat” tales, there was a period of chaos followed by a rapid, almost miraculous cleanup. The S&P 500, which was down 6.44% in the third quarter, rebounded 8.44% in October alone. However, the recent volatility was not the most important stock market story of 2015.
The S&P 500, generally considered the best proxy for U.S. stock market performance, is a capitalization weighted average. This means that the biggest companies have far more influence on the calculation than the smallest do. Rarely has the weighting effect had more impact than it did in 2015. The 10 largest companies in the S&P 500 had an average return of 17%, while the other 490 actually lost money on average (down 5%) See chart below.
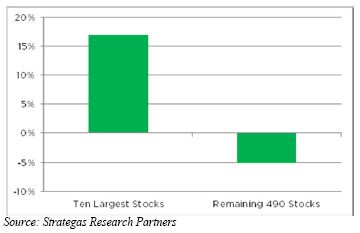
As it happens, your Fund is invested in four of the ten largest companies: Apple, Microsoft, Alphabet (Google) and GE. These, along with positions in the healthcare sector, were meaningful contributors to performance. But it is an old investor’s maxim that one never owns enough of the good ones, and 2015 was an uphill battle for investors who did not have relatively big positions in the largest companies.
The steepest hill was found in the energy patch, the old “cronies, rather the worse for the wear and tear of time.” The sector once commanded more than 30% of the total market capitalization of the S&P 500. Today it is less than 7%, about the same as the combined market value of Alphabet and Apple (the “rising generation”).
The energy sector finished the year down nearly 25%. To put it bluntly, we did not escape the carnage. We did make some good decisions with our energy holdings. We reduced risk in February and August by selling positions in exploration and production companies (Marathon Oil Corporation and Devon Energy Corporation) that are highly exposed to the price of crude oil and natural gas. These proved to be prescient decisions; our former holdings finished the year at approximately half the price for which we sold them.
|
A MESSAGE TO OUR SHAREHOLDERS (Unaudited) |
|
We thought we were taking shelter on higher ground by focusing on companies in the energy pipeline business (Williams Companies Inc. and Kinder Morgan Inc.). Pipelines are known as the “mid-stream” because they simply transport oil and gas from well to refinery or other end-user. We calculated that mid-stream companies would provide a greater degree of safety for two reasons: 1) their revenues should be steady because they are tied to the volume of oil or gas that passes through their pipes, not the declining price of the commodity itself. 2) The stocks had relatively high dividend yields that we expected would provide cushions in a turbulent market. We were right about revenue, but dead wrong about the yield. Investors began to question the sustainability of the dividends and the companies’ ability to raise the capital needed to grow. These stocks declined meaningfully in the fourth quarter.
Our losses in mid-stream companies painfully highlight the vulnerability of a business that requires frequent access to capital markets to fund growth. We were not blind to this risk, but failed to appreciate how quickly the negative feedback loop of lower equity prices and higher debt costs would progress in the absence of meaningful deterioration in the underlying business. Once this spiral took hold, traditional valuation methods were rendered obsolete.
Many have expressed concern that Fed actions to raise interest rates will prove to be a negative for stocks in general. We do not believe that is currently a significant risk. In fact, we feel there is a very strong case to be made that only short term rates will rise and that longer term rates may stay level or even fall slightly. This is known as a “flattening of the yield curve”. The laws of supply and demand should keep longer term rates in check. There is nothing new on the demand side of the equation. Traditional investors, like insurance companies and pension funds, buy the longest dated securities in order to match their liabilities. Foreign buyers continue to have an incentive to buy long-term U.S. bonds because our currency has been strong and our rates, as low as they are, are among the highest in the developed markets (see table below).
| | Country | 10 Year Government Bond Yield (%) | |
| | United States | 2.31 | |
| | United Kingdom | 1.99 | |
| | France | 0.99 | |
| | Germany | 0.63 | |
| | Japan | 0.26 | |
Source: FactSet
While demand for treasury securities should remain robust, net new supply will remain relatively constant year-over-year; however the mix of new issuance will be weighted with shorter maturing liabilities (treasury bills). The Fed also plans to reinvest the proceeds of approximately $200 billion of maturing securities that it owns through its Quantitative Easing strategy (quantitative easing (QE) is a monetary policy used by central banks to stimulate the economy when standard monetary policy has become ineffective). The result is that the global markets will likely have fewer, longer U.S. Treasury securities available to them compared to last year, at a time when global demand for those securities appears to be higher. There simply will not be enough longer notes and bonds to go around, which should cause interest rates on those securities to remain stable. If this is the case, the interest rate environment itself should not be an impediment to the stock market.
We are keeping an eye on a couple of conditions that are sometimes early warning signals of a potential stock market decline. Within the bond market, there is observable stress. Junk bond spreads have been widening. In short, despite the fact that rates on U.S. Treasury securities have stayed flat, low quality borrowers have had to offer higher interest on their bonds to attract lenders. This is usually a sign that investors are losing confidence in junk bond issuers. An alternative, no less worrisome, explanation is that bond investors are already anticipating an environment in which credit is generally less available and lower quality issuers will have to pay higher rates to meet their borrowing needs. Tight money and deteriorating credit conditions are not a good backdrop for a strong stock market.
The other condition that worries us is known as market “breadth,” to which we alluded earlier by pointing out the lopsided strength of a small number of the largest companies. A “narrow” market, when only a handful of stocks advance, usually means that the average investor is not fully participating in market gains.
|
A MESSAGE TO OUR SHAREHOLDERS (Unaudited) |
|
Given the robust market environment since 2009, wide bond spreads and narrow stock market breadth could be signs that investors are starting to worry that the party might be over. Confidence is a fragile commodity; nervousness in one asset class can spread to others. However, it is important to note that the fundamental backdrop is nowhere near as risky as it was before the financial crisis. Excess leverage simply does not exist to the extent it once did. The U.S. economy continues to grow; we do not believe it will be derailed by slightly higher short-term interest rates. Europe still seems to be improving. China is struggling, but its woes alone are not sufficient to create a dangerous global bear market.
We believe our portfolios are well positioned to withstand market volatility. If other investors make poorly calculated decisions based on fear, we stand ready to capitalize on their mistakes. We are not predicting a downdraft, but should one occur we believe it will create more opportunity than risk.
Spears Abacus
|
PERFORMANCE CHART AND ANALYSIS (Unaudited) |
|
The following chart reflects the change in the value of a hypothetical $10,000 investment, including reinvested dividends and distributions, in The BeeHive Fund compared with the performance of the benchmark S&P 500 Index (the “S&P 500”) since inception. The S&P 500 is a broad-based, unmanaged measurement of changes in stock market conditions based on the average of 500 widely held common stocks. The total return of the S&P 500 includes the reinvestment of dividends and income. The total return of the Fund includes operating expenses that reduce returns, while the total return of the S&P 500 does not include expenses. The Fund is professionally managed while the S&P 500 is unmanaged and is not available for investment.
Comparison of Change in Value of a $10,000 Investment
in The BeeHive Fund vs. S&P 500 Index
| Average Annual Total Returns as of 12/31/15 | | One Year | | Five Year | | Since Inception 09/02/08 | |
| The BeeHive Fund | | -1.42 | % | | 8.73 | % | | 7.88 | % | |
| S&P 500 Index | | 1.38 | % | | 12.57 | % | | 8.98 | % | |
Performance data quoted represents past performance and is no guarantee of future results. Current performance may be lower or higher than the performance data quoted. Investment return and principal value will fluctuate so that shares, when redeemed, may be worth more or less than original cost. For the most recent month-end performance, please call (866) 684-4915. As stated in the Fund’s prospectus, the annual operating expense ratio (gross) is 0.99%. The Fund’s advisor has agreed to contractually waive its fees and/or reimburse Fund expenses to limit total annual Fund operating expenses (excluding taxes, interest, portfolio transaction expenses and extraordinary expenses) to 0.99%, through April 30, 2016 (the “Expense Cap”). The Fund may repay the Advisor for fees waived and expenses reimbursed pursuant to the Expense Cap if such payment is made within three years of the fees waived or expense reimbursement and the resulting expenses do not exceed 0.99%. The performance table and graph do not reflect the deduction of taxes that a shareholder would pay on Fund distributions or the redemption of Fund shares. Returns greater than one year are annualized.
| | Shares | | Security Description | | Value | |
Common Stock - 95.8% |
Consumer Discretionary - 12.6% |
| | 85,300 | | Comcast Corp., Class A | $ | 4,813,479 | |
| | 66,030 | | Delphi Automotive PLC | | 5,660,752 | |
| | 96,300 | | Johnson Controls, Inc. | | 3,802,887 | |
| | | 14,277,118 | |
Energy - 3.8% |
| | 73,140 | | Kinder Morgan, Inc. | | 1,091,249 | |
| | 46,400 | | Schlumberger, Ltd. | | 3,236,400 | |
| | | 4,327,649 | |
Financials - 24.7% |
| | 51,120 | | ACE, Ltd. | | 5,973,372 | |
| | 105,250 | | American International Group, Inc. | | 6,522,342 | |
| | 115,901 | | CIT Group, Inc. | | 4,601,270 | |
| | 114,177 | | Citigroup, Inc. | | 5,908,660 | |
| | 102,904 | | MetLife, Inc. | | 4,961,002 | |
| | | 27,966,646 | |
Health Care - 16.4% |
| | 16,700 | | Allergan PLC (a) | | 5,218,750 | |
| | 40,340 | | Celgene Corp. (a) | | 4,831,118 | |
| | 12,850 | | Gilead Sciences, Inc. | | 1,300,292 | |
| | 50,700 | | Thermo Fisher Scientific, Inc. | | 7,191,795 | |
| | | 18,541,955 | |
Industrials - 20.8% |
| | 58,130 | | Danaher Corp. | | 5,399,114 | |
| | 78,610 | | Delta Air Lines, Inc. | | 3,984,741 | |
| | 187,310 | | General Electric Co. | | 5,834,706 | |
| | 81,510 | | Republic Services, Inc. | | 3,585,625 | |
| | 49,190 | | United Parcel Service, Inc., Class B | | 4,733,554 | |
| | | 23,537,740 | |
Software & Services - 12.2% |
| | 3,082 | | Alphabet, Inc., Class A (a) | | 2,397,827 | |
| | 4,862 | | Alphabet, Inc., Class C (a) | | 3,689,675 | |
| | 81,405 | | Microsoft Corp. | | 4,516,349 | |
| | 89,710 | | Oracle Corp. | | 3,277,106 | |
| | | 13,880,957 | |
Technology Hardware & Equipment - 5.3% |
| | 45,250 | | Apple, Inc. | | 4,763,015 | |
| | 56,240 | | Trimble Navigation, Ltd. (a) | | 1,206,348 | |
| | | 5,969,363 | |
Total Common Stock (Cost $72,639,421) | | 108,501,428 | |
Money Market Fund - 4.2% |
| | 4,812,619 | | Fidelity Institutional Cash Money Market Fund, 0.28% (b) (Cost $4,812,619) | 4,812,619 | |
Total Investments - 100.0% (Cost $77,452,040)* | $ | 113,314,047 | |
| Other Assets & Liabilities, Net – 0.0% | | (1,278 | ) |
| Net Assets – 100.0% | $ | 113,312,769 | |
| PLC | Public Limited Company |
| (a) | Non-income producing security. |
| (b) | Variable rate security. Rate presented is as of December 31, 2015. |
| * | Cost for federal income tax purposes is $77,483,976 and net unrealized appreciation consists of: |
| Gross Unrealized Appreciation | | $ | 37,835,387 | |
| Gross Unrealized Depreciation | | | (2,005,316 | ) |
| Net Unrealized Appreciation | | $ | 35,830,071 | |
The following is a summary of the inputs used to value the Fund’s investments as of December 31, 2015.
The inputs or methodology used for valuing securities are not necessarily an indication of the risks associated with investing in those securities. For more information on valuation inputs, and their aggregation into the levels used in the table below, please refer to the Security Valuation section in Note 2 of the accompanying Notes to Financial Statements.
| Valuation Inputs | | Investments in Securities |
| Level 1 - Quoted Prices | | $ | 108,501,428 | |
| Level 2 - Other Significant Observable Inputs | | | 4,812,619 | |
| Level 3 - Significant Unobservable Inputs | | | - | |
| Total | | $ | 113,314,047 | |
The Level 1 value displayed in this table is Common Stock. The Level 2 value displayed in this table is a Money Market Fund. Refer to this Schedule of Investments for a further breakout of each security by type.
The Fund utilizes the end of period methodology when determining transfers. There were no transfers among Level 1, Level 2 and Level 3 for the year ended December 31, 2015.
| PORTFOLIO HOLDINGS | | |
| % of Total Investments | | |
| Consumer Discretionary | 12.6 | % |
| Energy | 3.8 | % |
| Financials | 24.7 | % |
| Health Care | 16.3 | % |
| Industrials | 20.8 | % |
| Software & Services | 12.3 | % |
| Technology Hardware & Equipment | 5.3 | % |
| Money Market Fund | 4.2 | % |
| | 100.0 | % |
| See Notes to Financial Statements. | 5 | |
|
STATEMENT OF ASSETS AND LIABILITIES |
|
| ASSETS | | | | |
| . | Total investments, at value (Cost $77,452,040) | | $ | 113,314,047 | |
| | Receivables: | | | | |
| | | Dividends | | | 168,984 | |
| | Prepaid expenses | | | 3,488 | |
| Total Assets | | | 113,486,519 | |
| | | | | | | |
| LIABILITIES | | | | |
| | Payables: | | | | |
| | | Fund shares redeemed | | | 51,017 | |
| | | Distributions payable | | | 9,630 | |
| | Accrued Liabilities: | | | | |
| | | Investment advisor fees | | | 72,941 | |
| | | Trustees’ fees and expenses | | | 150 | |
| | | Fund services fees | | | 14,947 | |
| | | Other expenses | | | 25,065 | |
| Total Liabilities | | | 173,750 | |
| | | | | | | |
| NET ASSETS | | $ | 113,312,769 | |
| | | | | | | |
| COMPONENTS OF NET ASSETS | | | | |
| | Paid-in capital | | $ | 78,614,486 | |
| | Undistributed net investment income | | | 19 | |
| | Accumulated net realized loss | | | (1,163,743 | ) |
| | Net unrealized appreciation | | | 35,862,007 | |
| NET ASSETS | | $ | 113,312,769 | |
| SHARES OF BENEFICIAL INTEREST AT NO PAR VALUE (UNLIMITED SHARES AUTHORIZED) | | | 8,307,023 | |
| NET ASSET VALUE, OFFERING AND REDEMPTION PRICE PER SHARE | | $ | 13.64 | |
| | | | | | | |
| See Notes to Financial Statements. | 6 | |
|
|
YEAR ENDED DECEMBER 31, 2015 |
| INVESTMENT INCOME | | | | | | |
| | Dividend income | . | | $ | 1,823,174 | | |
| Total Investment Income | | | | 1,823,174 | | |
| Advisor | | | | | | |
| EXPENSES | | | | | | |
| | Investment advisor fees | | | 875,264 | | |
| | Investment advisor expense reimbursements recouped | | | 7,611 | | |
| | Fund services fees | | | 179,519 | | |
| | Custodian fees | | | 11,745 | | |
| | Registration fees | | | 5,211 | | |
| | Professional fees | | | 40,182 | | |
| | Trustees' fees and expenses | | | 8,326 | | |
| | Miscellaneous expenses | | | 27,484 | | |
| Total Expenses | | | | 1,155,342 | | |
| | | | | | | | |
| NET INVESTMENT INCOME | | | | 667,832 | | |
| | | | | | | | |
| NET REALIZED AND UNREALIZED LOSS | | | | | | |
| | Net realized loss on investments | | | (1,099,346 | ) | |
| | Net change in unrealized appreciation (depreciation) on investments | | | (1,225,425 | ) | |
| NET REALIZED AND UNREALIZED LOSS | | | | (2,324,771 | ) | |
| DECREASE IN NET ASSETS RESULTING FROM OPERATIONS | | | $ | (1,656,939 | ) | |
| | | | | | | | |
| See Notes to Financial Statements. | 7 | |
|
STATEMENTS OF CHANGES IN NET ASSETS |
|
| | | December 31, 2016 | # | | 42369 | # | # | | | 42004 | |
| | | | | For the Year Ended December 31, 2015 | | | For the Year Ended December 31, 2014 |
| OPERATIONS | | | | | | | | | |
| | Net investment income | | $ | 667,832 | | | | $ | 565,701 | |
| | Net realized gain (loss) | | | (1,099,346 | ) | | | | 6,667,766 | |
| | Net change in unrealized appreciation (depreciation) | | | (1,225,425 | ) | | | | 1,389,724 | |
| Increase (Decrease) in Net Assets Resulting from Operations | | | (1,656,939 | ) | | | | 8,623,191 | |
| | | | | | | | | | | | |
| DISTRIBUTIONS TO SHAREHOLDERS FROM | | | | | | | | | |
| | Net investment income | | | (667,776 | ) | | | | (565,703 | ) |
| | Net realized gain | | | (1,703,272 | ) | | | | (4,884,364 | ) |
| Total Distributions to Shareholders | | | (2,371,048 | ) | | | | (5,450,067 | ) |
| | | | | | | | | | | | |
| CAPITAL SHARE TRANSACTIONS | | | | | | | | | |
| | Sale of shares | | | 3,327,908 | | | | | 5,753,440 | |
| | Reinvestment of distributions | | | 2,337,365 | | | | | 5,431,478 | |
| | Redemption of shares | | | (5,375,932 | ) | | | | (9,196,930 | ) |
| Increase in Net Assets from Capital Share Transactions | | | 289,341 | | | | | 1,987,988 | |
| Increase (Decrease) in Net Assets | | | (3,738,646 | ) | | | | 5,161,112 | |
| | | | | | | | | | | | |
| NET ASSETS | | | | | | | | | |
| | Beginning of Year | | | 117,051,415 | | | | | 111,890,303 | |
| | End of Year (Including line (a)) | | $ | 113,312,769 | | | | $ | 117,051,415 | |
| | | | | | | | | | | | |
| SHARE TRANSACTIONS | | | | | | | | | |
| | Sale of shares | | | 238,415 | | | | | 407,605 | |
| | Reinvestment of distributions | | | 171,001 | | | | | 392,376 | |
| | Redemption of shares | | | (385,818 | ) | | | | (654,637 | ) |
| Increase in Shares | | | 23,598 | | | | | 145,344 | |
| | | | | | | | | | | | |
| (a) | Undistributed net investment income | | $ | 19 | | | | $ | - | |
| See Notes to Financial Statements. | 8 | |
| These financial highlights reflect selected data for a share outstanding throughout each year. | | | | | | |
| | | For the Years Ended December 31, | |
| 2015 | | 2014 | | 2013 | | 2012 | | 2011 |
| NET ASSET VALUE, Beginning of Year | $ | 14.13 | | | $ | 13.75 | | | $ | 10.80 | | | $ | 10.35 | | | $ | 11.14 | | |
| INVESTMENT OPERATIONS | | | | | | | | | | | | | | | | | | | | |
| Net investment income (a) | | 0.08 | | | | 0.07 | | | | 0.05 | | | | 0.07 | | | | 0.02 | | |
| Net realized and unrealized gain (loss) | | (0.28 | ) | | | 1.00 | | | | 3.71 | | | | 1.11 | | | | (0.59 | ) | |
| Total from Investment Operations | | (0.20 | ) | | | 1.07 | | | | 3.76 | | | | 1.18 | | | | (0.57 | ) | |
| DISTRIBUTIONS TO | | | | | | | | | | | | | | | | | | | | |
| SHAREHOLDERS FROM | | | | | | | | | | | | | | | | | | | | |
| Net investment income | | (0.08 | ) | | | (0.07 | ) | | | (0.05 | ) | | | (0.07 | ) | | | (0.02 | ) | |
| Net realized gain | | (0.21 | ) | | | (0.62 | ) | | | (0.76 | ) | | | (0.66 | ) | | | (0.20 | ) | |
| Total Distributions to Shareholders | | (0.29 | ) | | | (0.69 | ) | | | (0.81 | ) | | | (0.73 | ) | | | (0.22 | ) | |
| NET ASSET VALUE, End of Year | $ | 13.64 | | | $ | 14.13 | | | $ | 13.75 | | | $ | 10.80 | | | $ | 10.35 | | |
| TOTAL RETURN | | (1.42 | )% | | 7.87 | % | | 35.13 | % | | 11.46 | % | | (5.10 | )% |
| RATIOS/SUPPLEMENTARY DATA | | | | | | | | | | | | | | | | | | | | |
| Net Assets at End of Year (000's omitted) | $113,313 | | | $117,051 | | | $111,890 | | | $86,930 | | | $82,398 | | |
| Ratios to Average Net Assets: | | | | | | | | | | | | | | | | | | | | |
| Net investment income | | 0.57 | % | | 0.50 | % | | 0.41 | % | | 0.62 | % | | 0.16 | % |
| Net expenses | | 0.99 | %(b) | 0.99 | %(b) | 0.99 | % | | 0.99 | % | | 0.99 | % |
| Gross expenses | | 0.98 | % | | 0.98 | % | | 1.01 | %(c) | 1.04 | %(c) | 1.07 | %(c) |
| PORTFOLIO TURNOVER RATE | | 17 | % | | 25 | % | | 28 | % | | 40 | % | | 34 | % |
| | | | | | | | | | | | | | | | | | | | | | |
| | | | | | | | | | | | | | | | | | | | | | |
| (a) | Calculated based on average shares outstanding during each year. |
| (b) | The fees are inclusive of recoupment which amounted to 0.01% for the year. |
| (c) | Reflects the expense ratio excluding any waivers and/or reimbursements. |
| See Notes to Financial Statements. | 9 | |
|
NOTES TO FINANCIAL STATEMENTS |
|
Note 1. Organization
The BeeHive Fund (the “Fund”) is a diversified portfolio of Forum Funds (the “Trust”). The Trust is a Delaware statutory trust that is registered as an open-end, management investment company under the Investment Company Act of 1940 (the “Act”), as amended. Under its Trust Instrument, the Trust is authorized to issue an unlimited number of the Fund’s shares of beneficial interest without par value. The Fund commenced operations on September 2, 2008. The Fund seeks capital appreciation.
Note 2. Summary of Significant Accounting Policies
These financial statements are prepared in accordance with accounting principles generally accepted in the United States of America (“GAAP”), which require management to make estimates and assumptions that affect the reported amounts of assets and liabilities, the disclosure of contingent liabilities at the date of the financial statements, and the reported amounts of increases and decreases in net assets from operations during the fiscal period. Actual amounts could differ from those estimates. The following summarizes the significant accounting policies of the Fund:
Security Valuation – Exchange-traded securities and over-the-counter securities are valued using the last quoted trade or official closing price, provided by independent pricing services as of the close of trading on the market or exchange for which they are primarily traded, on each Fund business day. In the absence of a sale, such securities are valued at the mean of the last bid and ask price provided by independent pricing services. Non-exchange-traded securities for which quotations are available are valued using the last quoted sales price, or in the absence of a sale, at the mean of the last bid and ask prices provided by independent pricing services. Shares of open-end mutual funds are valued at net asset value (“NAV”). Short-term investments that mature in 60 days or less may be valued at amortized cost.
The Fund values its investments at fair value pursuant to procedures adopted by the Trust’s Board of Trustees (the “Board”) if (1) market quotations are insufficient or not readily available or (2) the Advisor believes that the values available are unreliable. The Trust’s Valuation Committee, as defined in the Fund’s registration statement, performs certain functions as they relate to the administration and oversight of the Fund’s valuation procedures. Under these procedures, the Valuation Committee convenes on a regular and ad-hoc basis to review such investments and considers a number of factors, including valuation methodologies and significant unobservable inputs, when arriving at fair value.
The Valuation Committee may work with the Advisor to provide valuation inputs. In determining fair valuations, inputs may include market-based analytics which may consider related or comparable assets or liabilities, recent transactions, market multiples, book values and other relevant investment information. Advisor inputs may include an income-based approach in which the anticipated future cash flows of the investment are discounted in determining fair value. Discounts may also be applied based on the nature or duration of any restrictions on the disposition of the investments. The Valuation Committee performs regular reviews of valuation methodologies, key inputs and assumptions, disposition analysis and market activity.
Fair valuation is based on subjective factors and, as a result, the fair value price of an investment may differ from the security’s market price and may not be the price at which the asset may be sold. Fair valuation could result in a different NAV than a NAV determined by using market quotes.
The Fund has a three-tier fair value hierarchy. The basis of the tiers is dependent upon the various “inputs” used to determine the value of the Fund’s investments. These inputs are summarized in the three broad levels listed below:
Level 1 — quoted prices in active markets for identical assets and liabilities
Level 2 — other significant observable inputs (including quoted prices of similar securities, interest rates, prepayment speeds, credit risk, etc.)
Level 3 — significant unobservable inputs (including the Fund’s own assumptions in determining the fair value of investments)
The aggregate value by input level, as of December 31, 2015, for the Fund’s investments is included at the end of the Fund’s Schedule of Investments.
|
NOTES TO FINANCIAL STATEMENTS |
|
Security Transactions, Investment Income and Realized Gain and Loss – Investment transactions are accounted for on the trade date. Dividend income is recorded on the ex-dividend date. Foreign dividend income is recorded on the ex-dividend date or as soon as possible after the Fund determines the existence of a dividend declaration after exercising reasonable due diligence. Income and capital gains on some foreign securities may be subject to foreign withholding taxes, which are accrued as applicable. Interest income is recorded on an accrual basis. Premium is amortized and discount is accreted using the effective interest method. Identified cost of investments sold is used to determine the gain and loss for both financial statement and federal income tax purposes.
Distributions to Shareholders – Distributions to shareholders of net investment income and net capital gains, if any, are declared and paid at least annually. Distributions to shareholders are recorded on the ex-dividend date. Distributions are based on amounts calculated in accordance with applicable federal income tax regulations, which may differ from GAAP. These differences are due primarily to differing treatments of income and gain on various investment securities held by the Fund, timing differences and differing characterizations of distributions made by the Fund.
Federal Taxes – The Fund intends to continue to qualify each year as a regulated investment company under Subchapter M of the Internal Revenue Code and to distribute all of its taxable income to shareholders. In addition, by distributing in each calendar year substantially all of its net investment income and capital gains, if any, the Fund will not be subject to a federal excise tax. Therefore, no federal income or excise tax provision is required. The Fund files a U.S. federal income and excise tax return as required. A fund’s federal income tax returns are subject to examination by the Internal Revenue Service for a period of three fiscal years after they are filed. As of December 31, 2015, there are no uncertain tax positions that would require financial statement recognition, de-recognition or disclosure.
Income and Expense Allocation – The Trust accounts separately for the assets, liabilities and operations of each of its investment portfolios. Expenses that are directly attributable to more than one investment portfolio are allocated among the respective investment portfolios in an equitable manner.
Commitments and Contingencies – In the normal course of business, the Fund enters into contracts that provide general indemnifications by the Fund to the counterparty to the contract. The Fund’s maximum exposure under these arrangements is dependent on future claims that may be made against the Fund and, therefore, cannot be estimated; however, based on experience, the risk of loss from such claims is considered remote.
Note 3. Fees and Expenses
Investment Advisor – Spears Abacus Advisors LLC (the “Advisor”) is the investment Advisor to the Fund. Pursuant to an investment advisory agreement, the Advisor receives an advisory fee from the Fund at an annual rate of 0.75% of the Fund’s average daily net assets.
Distribution – Foreside Fund Services, LLC serves as the Fund’s distributor (the “Distributor”). The Distributor is not affiliated with the Advisor or Atlantic Fund Administration, LLC (d/b/a Atlantic Fund Services) (“Atlantic”) or their affiliates. The Fund has adopted a distribution plan in accordance with Rule 12b-1 of the Act. The Fund may pay the Distributor and/or any other entity as authorized by the Board a fee up to 0.25% of the Fund’s average daily net assets. The Fund has suspended payments under its Rule 12b-1 plan until further notice and has not paid any distribution fees to date. The Fund may remove the suspension and make payments under the Rule 12b-1 plan at any time, subject to Board approval.
Other Service Providers – Atlantic provides fund accounting, fund administration, compliance and transfer agency services to the Fund. Atlantic also provides certain shareholder report production, and EDGAR conversion and filing services. Pursuant to an Atlantic services agreement, the Fund pays Atlantic customary fees for its services. Atlantic provides a Principal Executive Officer, a Principal Financial Officer, a Chief Compliance Officer, and an Anti-Money Laundering Officer to the Fund, as well as certain additional compliance support functions.
Trustees and Officers – The Trust pays each independent Trustee an annual fee of $50,000 for service to the Trust ($66,000 for the Chairman). The Audit Committee Chairman receives an additional $6,000 annually. Effective April 1, 2015, the Vice Chairman receives an additional $6,000 annually.The Trustees and Chairman may receive additional fees for special Board meetings. Each Trustee is also reimbursed for all reasonable out-of-pocket expenses incurred in connection with his duties as a Trustee, including
|
NOTES TO FINANCIAL STATEMENTS |
|
travel and related expenses incurred in attending Board meetings. The amount of Trustees’ fees attributable to the Fund is disclosed in the Statement of Operations. Certain officers of the Trust are also officers or employees of the above named service providers, and during their terms of office received no compensation from the Fund.
Note 4. Expense Reimbursements and Fees Waived
The Advisor has contractually agreed to waive a portion of its fee and reimburse certain expenses through April 30, 2016, to limit total annual Fund operating expenses (excluding taxes, interest, portfolio transaction expenses and extraordinary expenses) to 0.99%. For the year ended December 31, 2015, there were no fees waived or expenses reimbursed.
The Fund may repay the Advisor for fees waived and expenses reimbursed pursuant to the expense cap if such payment is made within three years of the fee waiver or expense reimbursement and the resulting expenses do not exceed 0.99%. As of December 31, 2015, the following amounts are subject to recapture by the Advisor:
| | | Amount of Fees Waived and/or Expenses Reimbursed | | Expiration Date to Recoup Fees Waived and/or Expenses Reimbursed | | Fees Recouped |
| December 31, 2012 | | $ | 41,182 | | December 31, 2015 | | $ | 7,611 |
| December 31, 2013 | | $ | 17,224 | | December 31, 2016 | | $ | - |
Note 5. Security Transactions
The cost of purchases and proceeds from sales of investment securities (including maturities), other than short-term investments during the year ended December 31, 2015, were $18,602,660 and $20,752,193, respectively.
Note 6. Federal Income Tax
Distributions paid during the fiscal years ended as noted were characterized for tax purposes as follows:
| | Ordinary Income | | $ | 667,813 | | $ | 565,701 | |
| | Long-Term Capital Gain | | | 1,703,235 | | | 4,884,366 | |
| | | | $ | 2,371,048 | | $ | 5,450,067 | |
As of December 31, 2015, distributable earnings (accumulated loss) on a tax basis were as follows:
| | Undistributed Ordinary Income | | $ | 19 | | |
| | Capital and Other Losses | | | (1,131,807 | ) | |
| | Unrealized Appreciation | | | 35,830,071 | | |
| | Total | | $ | 34,698,283 | | |
The difference between components of distributable earnings on a tax basis and the amounts reflected in the Statement of Assets and Liabilities are primarily due to wash sales.
As of December 31, 2015, the Fund had the following available short term and long term capital loss carry forwards that have no expiration date:
| | Short Term | | Long Term | |
| $ | 485,857 | $ | 645,950 | |
|
NOTES TO FINANCIAL STATEMENTS |
|
On the Statement of Assets and Liabilities, as a result of permanent book to tax differences, certain amounts have been reclassified for the period ended December 31, 2015. The following reclassification was the result of reclassification of distributions and has no impact on the net assets of the Fund.
| | Undistributed Net Investment Income (Loss) | | $ | (37 | ) | |
| | Accumulated Net Realized Gain (Loss) | | | 37 | | |
Note 7. Subsequent Events
Subsequent events occurring after the date of this report through the date these financial statements were issued have been evaluated for potential impact and the Fund has had no such events.
|
REPORT OF INDEPENDENT REGISTERED PUBLIC ACCOUNTING FIRM |
|
To the Shareholders of The BeeHive Fund and the Board of Trustees of Forum Funds
We have audited the accompanying statement of assets and liabilities of The BeeHive Fund (the “Fund”), a series of shares of beneficial interest in Forum Funds, including the schedule of investments, as of December 31, 2015, and the related statement of operations for the year then ended, the statements of changes in net assets for each of the years in the two-year period then ended and the financial highlights for each of the years in the five-year period then ended. These financial statements and financial highlights are the responsibility of the Fund’s management. Our responsibility is to express an opinion on these financial statements and financial highlights based on our audits.
We conducted our audits in accordance with the standards of the Public Company Accounting Oversight Board (United States). Those standards require that we plan and perform the audits to obtain reasonable assurance about whether the financial statements and financial highlights are free of material misstatement. An audit includes examining, on a test basis, evidence supporting the amounts and disclosures in the financial statements. Our procedures included confirmation of securities owned as of December 31, 2015 by correspondence with the custodian. An audit also includes assessing the accounting principles used and significant estimates made by management, as well as evaluating the overall financial statement presentation. We believe that our audits provide a reasonable basis for our opinion.
In our opinion, the financial statements and financial highlights referred to above present fairly, in all material respects, the financial position of The BeeHive Fund as of December 31, 2015, and the results of its operations for the year then ended, the changes in its net assets for each of the years in the two-year period then ended and its financial highlights for each of the years in the five-year period then ended, in conformity with accounting principles generally accepted in the United States of America.

BBD, LLP
Philadelphia, Pennsylvania
February 22, 2016
|
ADDITIONAL INFORMATION (Unaudited) |
|
Investment Advisory Agreement Approval
At the September 11, 2015 Board meeting, the Board, including the Independent Trustees, considered the approval of the continuance of the investment advisory agreement between the Advisor and the Trust pertaining to the Fund (the “Advisory Agreement”). In preparation for its deliberations, the Board requested and reviewed written responses from the Advisor to a due diligence questionnaire circulated on the Board's behalf concerning the Advisor’s personnel, operations, financial condition, performance, and services provided by the Advisor. The Board also discussed the materials with Fund Counsel and, as necessary, with the Trust's administrator, Atlantic Fund Services. During its deliberations, the Board received an oral presentation from the Advisor, and was assisted by the advice of Trustee Counsel.
At the meeting, the Board reviewed, among other matters: (1) the nature, extent and quality of the services provided to the Fund by the Advisor, including information on the investment performance of the Fund and the Advisor; (2) the costs of the services provided and profitability to the Advisor of its relationship with the Fund; (3) the advisory fee and total expense ratio of the Fund compared to a relevant peer group of funds; (4) the extent to which economies of scale may be realized as the Fund grows and whether the advisory fee enables the Fund's investors to share in the benefits of economies of scale; and (5) other benefits received by the Advisor from its relationship with the Fund.
Nature, Extent and Quality of Services
Based on written materials received, a presentation from senior representatives of the Advisor and a discussion with the Advisor about the Advisor’s personnel, operations and financial condition and with the Trust’s CCO about the Advisor, the Board considered the quality of services provided by the Advisor under the Advisory Agreement. In this regard, the Board considered information regarding the experience, qualifications and professional background of the portfolio manager and other personnel at the Advisor with principal responsibility for the Fund, as well as the investment philosophy and decision-making process of those professionals and the capability and integrity of the Advisor’s senior management and staff.
The Board considered also the adequacy of the Advisor’s resources. The Board noted the Advisor’s representation that the firm is in stable financial condition and that the Advisor has the operational capability needed to provide high-quality investment advisory services to the Fund for the foreseeable future. Based on the presentation and the materials provided by the Advisor in connection with the Board’s consideration of the renewal of the Advisory Agreement, the Board concluded that, overall, it was satisfied with the nature, extent and quality of services to be provided to the Fund under the Advisory Agreement.
Performance
In connection with a presentation by the Advisor regarding its approach to managing the Fund, the Board reviewed the performance of the Fund compared to its benchmark. The Board observed that the Fund underperformed the S&P 500 Index, the primary benchmark for the Fund, for the one-, three-, and five-year periods ended June 30, 2015. The Board also considered the Fund’s performance relative to its Lipper, Inc. (“Lipper”) peer group, noting that, based on the information provided by Lipper, the Fund underperformed the median of its Lipper peers for the one- and five-year periods ended June 30, 2015, but outperformed the median of its Lipper peers for the three-year period ended June 30, 2015. The Board noted the Advisor’s representation that the Fund’s underperformance over the one-year period relative to its benchmark and Lipper peers was attributable primarily to the Fund’s overweight position in a sector that had not performed well during the period, but further noted the Advisor’s representation that firms comprising the sector were generating healthy returns and had started to experience a recovery in their share prices. The Board also noted the Advisor’s representation that the Fund’s investment strategy was designed to address a longer-term investment horizon and, from that perspective, noted that the Fund’s performance for the three- and five-year periods ended June 30, 2015, and for the period since the Fund’s inception in 2008, were only marginally below the benchmark index. Based on the foregoing, the Board determined that the Fund’s performance was reasonable and that the Fund and its shareholders could benefit from the Advisor’s continued management of the Fund.
Compensation
The Board evaluated the Advisor’s compensation for providing advisory services to the Fund and analyzed comparative information on “actual” advisory fee rates (i.e., after the application of an expense cap and waivers) and actual total expenses of the Fund’s Lipper peer group. The Board noted that the Fund was operating slightly below a contractual expense cap entered into between the Trust and
|
ADDITIONAL INFORMATION (Unaudited) |
|
the Advisor. The Board noted further that although the Advisor’s actual advisory fee rate and the actual total expense ratio for the Fund were each higher than the median of the Lipper peers, neither was substantially higher than the median of its peers and the total expense ratio was only slightly higher than the median of its peers. The Board further noted the Advisor’s representation that the Advisor’s standard fee schedule is applied with respect to the Fund, although regulatory requirements necessitate a disproportionate amount of time and effort be spent on the Fund as compared to the Advisor’s other accounts. Based on the foregoing, the Board concluded that the Advisor’s advisory fee rate charged to the Fund was reasonable.
Cost of Services and Profitability
The Board considered information provided by the Advisor regarding the costs of services and its profitability with respect to the Fund. In this regard, the Board considered the Advisor’s resources devoted to the Fund, as well as the Advisor’s discussion of the aggregate costs and profitability of its mutual fund activities. The Board also noted the Advisor’s representation that the Fund produces a lower margin than the Advisor’s overall advisory business due to the larger allocation of time and expense required by the administrative and compliance efforts necessary to manage the Fund. Based on these and other applicable considerations, the Board concluded that the Advisor’s profits attributable to management of the Fund were reasonable in the context of all factors considered.
Economies of Scale
The Board evaluated whether the Fund would benefit from any economies of scale. In this respect, the Board noted the Advisor’s representation that the Advisor was open to considering breakpoints in the future if assets increased significantly, but in view of the current level of assets of the Advisor, did not believe that breakpoints would be appropriate at this time. Based on the foregoing, and in light of the size of the Fund, the Board concluded that economies of scale were not a material factor to consider in approving the continuation of the Advisory Agreement.
Other Benefits
The Board noted the Advisor’s representation that, aside from its contractual advisory fees, it does not benefit in a material way from its relationship with the Fund. Based on the foregoing representation and in the absence of any reports indicating the existence of transactions with affiliates or other benefits received by the Advisor, the Board concluded that other benefits received by the Advisor from its relationship with the Fund were not a material factor to consider in approving the continuation of the Advisory Agreement.
Conclusion
The Board did not identify any single factor as being of paramount importance, and different Trustees may have given different weight to different factors. The Board reviewed a memorandum from Fund Counsel discussing the legal standards applicable to its consideration of the Advisory Agreement. Based on its review, including consideration of each of the factors referenced above, the Board determined, in the exercise of its reasonable business judgment, that the advisory arrangement, as outlined in the Advisory Agreement, was fair and reasonable in light of the services performed or to be performed, expenses incurred or to be incurred and such other matters as the Board considered relevant.
Proxy Voting Information
A description of the policies and procedures that the Fund uses to determine how to vote proxies relating to securities held in the Fund’s portfolio is available, without charge and upon request, by calling (866) 684-4915 and on the U.S. Securities and Exchange Commission’s (the “SEC”) website at www.sec.gov. The Fund’s proxy voting record for the most recent twelve-month period ended June 30 is available, without charge and upon request, by calling (866) 684-4915 and on the SEC’s website at www.sec.gov.
|
ADDITIONAL INFORMATION (Unaudited) |
|
Availability of Quarterly Portfolio Schedules
The Fund files its complete schedule of portfolio holdings with the SEC for the first and third quarters of each fiscal year on Form N-Q. These filings are available, without charge and upon request on the SEC’s website at www.sec.gov or may be reviewed and copied at the SEC’s Public Reference Room in Washington, DC. Information on the operation of the Public Reference Room may be obtained by calling (800) SEC-0330.
Shareholder Expense Example
As a shareholder of the Fund, you incur ongoing costs, including management fees and other Fund expenses. This example is intended to help you understand your ongoing costs (in dollars) of investing in the Fund and to compare these costs with the ongoing costs of investing in other mutual funds.
The example is based on an investment of $1,000 invested at the beginning of the period and held for the entire period from July 1, 2015, through December 31, 2015.
Actual Expenses – The first line of the table below provides information about actual account values and actual expenses. You may use the information in this line, together with the amount you invested, to estimate the expenses that you paid over the period. Simply divide your account value by $1,000 (for example, an $8,600 account value divided by $1,000 = 8.6), then multiply the result by the number in the first line under the heading entitled “Expenses Paid During Period” to estimate the expenses you paid on your account during the period.
Hypothetical Example for Comparison Purposes – The second line of the table below provides information about hypothetical account values and hypothetical expenses based on the Fund’s actual expense ratio and an assumed rate of return of 5% per year before expenses, which is not the Fund’s actual return. The hypothetical account values and expenses may not be used to estimate the actual ending account balance or expenses you paid for the period. You may use this information to compare the ongoing costs of investing in the Fund and other funds. To do so, compare this 5% hypothetical example with the 5% hypothetical examples that appear in the shareholder reports of other funds.
Please note that the expenses shown in the table are meant to highlight your ongoing costs only. Therefore, the second line of the table is useful in comparing ongoing costs only, and will not help you determine the relative total costs of owning different funds.
| | Beginning | | Ending | | Expenses | | Annualized |
| | Account Value | | Account Value | | Paid During | | Expense |
| | July 1, 2015 | | December 31, 2015 | | Period* | | Ratio* |
| Actual | $ | 1,000.00 | | $ | 967.35 | | $ | 4.91 | | 0.99 | % |
| Hypothetical (5% return before taxes) | $ | 1,000.00 | | $ | 1,020.21 | | $ | 5.04 | | 0.99 | % |
| * | Expenses are equal to the Fund’s annualized expense ratio multiplied by the average account value over the period, multiplied by the number of days in the most recent fiscal half-year divided by 365 to reflect the half-year period. |
Federal Tax Status of Dividends Declared during the Fiscal Year
For federal income tax purposes, dividends from short-term capital gains are classified as ordinary income. The Fund designates 100% of its income dividend distributed as qualifying for the corporate dividends-received deduction and 100% for the qualified dividend rate as defined in Section 1(h)(11) of the Internal Revenue Code.
Trustees and Officers of the Trust
The Board is responsible for oversight of the management of the Trust’s business affairs and of the exercise of all the Trust’s powers except those reserved for the shareholders. The following table provides information about each Trustee and certain officers of the Trust. Each Trustee and officer holds office until the person resigns, is removed, or is replaced. Unless otherwise noted, the persons
|
ADDITIONAL INFORMATION (Unaudited) |
|
have held their principal occupations for more than five years. The address for all Trustees and officers is Three Canal Plaza, Suite 600, Portland, Maine 04101. Mr. Keffer is considered an Interested Trustee due to his affiliation with Atlantic. The Fund’s Statement of Additional Information includes additional information about the Trustees and is available, without charge and upon request, by calling (866) 684-4915.
| Name and Year of Birth | Position with the Trust | Length of Time Served | Principal Occupation(s) During Past Five Years | Number of Series of Fund Complex¹ Overseen by Trustee | Other Directorships Held by Trustee |
Independent Trustees | | | | | |
J. Michael Parish Born: 1943 | Chairman of the Board; Trustee; Chairman, Nominating Committee and Qualified Legal Compliance Committee | Since 1989 (Chairman since 2004) | Retired since 2003; formerly, Partner, Wolf, Block, Schorr and Solis-Cohen, LLP (law firm) 2002-2003; Partner, Thelen Reid & Priest LLP (law firm) 1995-2002. | 26 | None |
Costas Azariadis Born: 1943 | Trustee | Since 1989 | Professor of Economics, Washington University since 2006. | 26 | None |
James C. Cheng Born: 1942 | Trustee; Chairman, Audit Committee | Since 1989 | President, Technology Marketing Associates (marketing company for small- and medium-sized businesses in New England) since 1991. | 26 | None |
David Tucker Born: 1958 | Trustee; Vice Chairman | Since 2011 (Vice Chairman since 2015) | Director, Blue Sky Experience (a charitable endeavor) since 2008; Senior Vice President & General Counsel, American Century Companies 1998-2008. | 46 | Trustee, Forum Funds II, Forum ETF Trust, and U.S. Global Investors Funds |
Interested Trustee | | | | | |
John Y. Keffer2 Born: 1942 | Trustee; Vice Chairman | Since 1989 | Chairman, Atlantic since 2008; President, Forum Investment Advisors, LLC since 2011; President, Forum Foundation (a charitable organization) since 2005; President, Forum Trust, LLC (a non-depository trust company chartered in the State of Maine) since 1997. | 46 | Director, Wintergreen Fund, Inc.; Trustee, Forum Funds II, Forum ETF Trust, ALTMFX Trust and U.S. Global Investors Funds |
Officers | | | | | |
Jessica Chase Born: 1970 | President; Principal Executive Officer | Since 2015 | Senior Vice President, Atlantic since 2008. | N/A | N/A |
Karen Shaw Born: 1972 | Treasurer; Principal Financial Officer | Since 2008 | Senior Vice President, Atlantic since 2008. | N/A | N/A |
Zachary Tackett Born: 1988 | Vice President; Secretary; Anti-Money Laundering Compliance Officer | Since 2014 | Associate Counsel, Atlantic since 2014; Intern Associate, Coakley & Hyde, PLLC, 2010-2013. | N/A | N/A |
Michael J. McKeen Born: 1971 | Vice President | Since 2009 | Senior Vice President, Atlantic since 2008. | N/A | N/A |
Timothy Bowden Born: 1969 | Vice President | Since 2009 | Manager, Atlantic since 2008. | N/A | N/A |
Geoffrey Ney Born: 1975 | Vice President | Since 2013 | Manager, Atlantic since 2013; Senior Fund Accountant, Atlantic, 2008-2013. | N/A | N/A |
Todd Proulx Born: 1978 | Vice President | Since 2013 | Manager, Atlantic since 2013; Senior Fund Accountant, Atlantic, 2008-2013. | N/A | N/A |
1The Fund Complex includes the Trust, Forum Funds II, Forum ETF Trust and U.S. Global Investors Fund and is overseen by different Boards of Trustees. 2Atlantic is a subsidiary of Forum Holdings Corp. I, a Delaware corporation that is wholly owned by Mr. Keffer. |
ITEM 2. CODE OF ETHICS.
| (a) | As of the end of the period covered by this report, Forum Funds (the “Registrant”) has adopted a code of ethics, which applies to its Principal Executive Officer and Principal Financial Officer (the “Code of Ethics”). |
| (c) | There have been no amendments to the Registrant’s Code of Ethics during the period covered by this report. |
| (d) | There have been no waivers to the Registrant’s Code of Ethics during the period covered by this report. |
(f) (1) A copy of the Code of Ethics is being filed under Item 12(a) hereto.
ITEM 3. AUDIT COMMITTEE FINANCIAL EXPERT.
The Board of Trustees has determined that no member of the Audit Committee is an "audit committee financial expert" as that term is defined under applicable regulatory guidelines.
ITEM 4. PRINCIPAL ACCOUNTANT FEES AND SERVICES.
(a) Audit Fees - The aggregate fees billed for each of the last two fiscal years (the “Reporting Periods”) for professional services rendered by the Registrant’s principal accountant for the audit of the Registrant’s annual financial statements, or services that are normally provided by the principal accountant in connection with the statutory and regulatory filings or engagements for the Reporting Periods, were $43,300 in 2014 and $43,300 in 2015.
(b) Audit-Related Fees – The aggregate fees billed in the Reporting Periods for assurance and related services rendered by the principal accountant that were reasonably related to the performance of the audit of the Registrant’s financial statements and are not reported under paragraph (a) of this Item 4 were $0 in 2014 and $0 in 2015.
(c) Tax Fees - The aggregate fees billed in the Reporting Periods for professional services rendered by the principal accountant to the Registrant for tax compliance, tax advice and tax planning were $9,000 in 2014 and $9,000 in 2015. These services consisted of review or preparation of U.S. federal, state, local and excise tax returns.
(d) All Other Fees - The aggregate fees billed in the Reporting Periods for products and services provided by the principal accountant to the Registrant, other than the services reported in paragraphs (a) through (c) of this Item, were $0 in 2014 and $0 in 2015.
(e) (1) The Audit Committee reviews and approves in advance all audit and “permissible non-audit services” (as that term is defined by the rules and regulations of the Securities and Exchange Commission) to be rendered to a series of the Registrant (each, a “Series”). In addition, the Audit Committee reviews and approves in advance all “permissible non-audit services” to be provided to an investment adviser (not including any sub-adviser) of a Series, or an affiliate of such investment adviser, that is controlling, controlled by or under common control with the investment adviser and provides on-going services to the Registrant (“Affiliate”), by the Series’ principal accountant if the engagement relates directly to the operations and financial reporting of the Series. The Audit Committee considers whether fees paid by a Series’ investment adviser or an Affiliate to the Series’ principal accountant for audit and permissible non-audit services are consistent with the principal accountant’s independence.
(e) (2) No services included in (b) - (d) above were approved pursuant to paragraph (c)(7)(i)(C) of Rule 2-01 of Regulation S-X.
(f) Not applicable
(g) The aggregate non-audit fees billed by the principal accountant for services rendered to the Registrant for the Reporting Periods were $0 in 2013 and $0 in 2014. There were no fees billed in either of the Reporting Periods for non-audit services rendered by the principal accountant to the Registrant’s investment adviser or any Affiliate.
(h) During the Reporting Period, the Registrant's principal accountant provided no non-audit services to the investment advisers or any entity controlling, controlled by or under common control with the investment advisers to the series of the Registrant to which this report relates.
ITEM 5. AUDIT COMMITTEE OF LISTED REGISTRANTS.
Not applicable.
ITEM 6. INVESTMENTS.
| (a) | Included as part of report to shareholders under Item 1. |
ITEM 7. DISCLOSURE OF PROXY VOTING POLICIES AND PROCEDURES FOR CLOSED-END
MANAGEMENT INVESTMENT COMPANIES.
Not applicable.
ITEM 8. PORTFOLIO MANAGERS OF CLOSED-END MANAGEMENT INVESTMENT COMPANIES.
Not applicable.
ITEM 9. PURCHASES OF EQUITY SECURITIES BY CLOSED-END MANAGEMENT INVESTMENT COMPANY AND AFFILIATED PURCHASERS.
Not applicable.
ITEM 10. SUBMISSION OF MATTERS TO A VOTE OF SECURITY HOLDERS
The Registrant does not accept nominees to the board of trustees from shareholders.
ITEM 11. CONTROLS AND PROCEDURES
(a) The Registrant’s Principal Executive Officer and Principal Financial Officer have concluded that the Registrant’s disclosure controls and procedures (as defined in Rule 30a-3(c) under the Investment Company Act of 1940 (the “Act”)) are effective, based on their evaluation of the controls and procedures required by Rule 30a-3(b) under the Act and Rules 13a-15(b) or 15d-15(b) under the Securities Exchange Act of 1934, as of a date within 90 days of the filing date of this report.
(b) There were no changes in the Registrant’s internal control over financial reporting (as defined in
Rule 30a-3(d) under the Act) that occurred during the second fiscal quarter of the period covered by this report that have materially affected, or are reasonably likely to materially affect, the Registrant’s internal control over financial reporting.
ITEM 12. EXHIBITS.
(a)(1) Code of Ethics (Exhibit filed herewith).
(a)(2) Certifications pursuant to Rule 30a-2(a) of the Act, and Section 302 of the Sarbanes-Oxley Act of 2002. (Exhibits filed herewith)
(a)(3) Not applicable.
(b) Certifications pursuant to Rule 30a-2(b) of the Act, and Section 906 of the Sarbanes-Oxley Act of 2002. (Exhibit filed herewith)
SIGNATURES
Pursuant to the requirements of the Securities Exchange Act of 1934 and the Investment Company Act of 1940, the Registrant has duly caused this report to be signed on its behalf by the undersigned, thereunto duly authorized.
Registrant Forum Funds
| By | /s/ Jessica Chase | | |
| | Jessica Chase, Principal Executive Officer | | |
| | | | |
| Date | February 22, 2016 | | |
Pursuant to the requirements of the Securities Exchange Act of 1934 and the Investment Company Act of 1940, this report has been signed below by the following persons on behalf of the Registrant and in the capacities and on the dates indicated.
| By | /s/ Jessica Chase | | |
| | Jessica Chase, Principal Executive Officer | | |
| | | | |
| Date | February 22, 2016 | | |
| By | /s/ Karen Shaw | | |
| | Karen Shaw, Principal Financial Officer | | |
| | | | |
| Date | February 22, 2016 | | |