As filed with the Securities and Exchange Commission on June 6, 2016
UNITED STATES
SECURITIES AND EXCHANGE COMMISSION
WASHINGTON, D.C. 20549
FORM N-CSR
CERTIFIED SHAREHOLDER REPORT OF REGISTERED MANAGEMENT
INVESTMENT COMPANIES
Investment Company Act file number 811-03023
FORUM FUNDS
Three Canal Plaza, Suite 600
Portland, Maine 04101
Jessica Chase, Principal Executive Officer
Three Canal Plaza, Suite 600
Portland, Maine 04101
207-347-2000
Date of fiscal year end: March 31
Date of reporting period: April 1, 2015 – March 31, 2016
ITEM 1. REPORT TO STOCKHOLDERS.
The views in this report were those of Absolute Strategies Fund, Absolute Credit Opportunities Fund and Absolute Capital Opportunities Fund's (each a "Fund" and collectively the "Funds") adviser as of March 31, 2016, and may not reflect their views on the date this report is first published or any time thereafter. These views are intended to assist shareholders in understanding their investment in the Funds and do not constitute investment advice. None of the information presented should be construed as an offer to sell or recommendation of any security mentioned herein.
Since the Funds utilize multi-manager strategies with multiple sub-advisers, they may be exposed to varying forms of risk. These risks include, but are not limited to, general market risk, multi-manager risk, non-diversification risk, small company risk, foreign risk, interest rate risk, credit risk, prepayment risk, IPO risk, liquidity risk, high turnover risk, leverage risk, pooled investment vehicle risk, derivatives risk and cash and cash equivalents holdings risk. For a complete description of the Funds' principal investment risks, please refer to each Fund's prospectus.
Beta is a measure of an asset's sensitivity to broad market moves, as measured for instance by the S&P 500® Index. A fund with a realized beta of 0.5 with respect to the S&P 500®Index infers that about 50% of the fund's returns were explained by the performance of the index (the rest of the performance was independent of the index). Standard deviation indicates the volatility of a fund's total returns and is useful because it identifies the spread of a fund's short-term fluctuations. The HFR Indices are equally weighted performance indexes, utilized by numerous hedge fund managers as a benchmark for their own hedge funds. One cannot invest directly in an index.
Absolute Strategies Fund, Absolute Funds, and Absolute Investment Advisers are registered service marks of Absolute Investment Advisers LLC ("AIA" and "Absolute") and the respective logos and Absolute Credit Opportunities Fund and Absolute Capital Opportunities Fund are service marks of AIA; and other marks referred to herein are the trademarks, service marks or registered trademarks of their respective owners.
|
ABSOLUTE STRATEGIES FUND A MESSAGE TO OUR SHAREHOLDERS (Unaudited) MARCH 31, 2016 |
|
Dear Shareholder,
We are pleased to present the Annual Report for the Absolute Strategies Fund (the "Fund") for the year ended March 31, 2016. The Fund (Institutional Shares) returned 2.05% over the 12 months ended March 31. The Fund outperformed both the S&P 500 Index, which returned 1.78%, and the HFRX Global Hedge Fund Index, which returned negative 7.36%, over the period.
As a reminder, the Fund is designed with a high degree of flexibility to invest long and short across equity, credit, and/or commodity interests through a number of different managers/strategies. This flexibility allows the Fund to be constructed based on the most attractive risk-reward areas, whether they are long or short or relative value. It also allows for the Fund to be positioned more aggressively at times and more defensively at others.
This is very different than most traditional funds, and many alternative funds, that just maintain static (long) exposures to match a benchmark or peer group. Performance over the last twelve months particularly highlights how different the Fund's investment approach is than most hedge funds and other alternative funds. Broadly, we have noticed that many alternative funds have become very short term oriented and prone to chasing investment performance. We believe this could make them vulnerable to losses when markets change course. The Fund's approach can be viewed as somewhat contrarian. This has allowed the Fund to generate its best performance when markets have changed course or become volatile.
The Fund has remained in a defensive posture over the last year. Increased volatility did provide an opportunity to move exposures from a bit more or a bit less defensive during shorter periods. Net exposure has been towards the low end of its historical range and beta to traditional equity indices has been negative.
The Fund has preserved a balance of long and short exposures. Allocations continue to be mostly in equity related strategies. This is due in large part to the risks facing the credit markets, particularly liquidity risk. The Fund's credit exposure is limited to strategies where there is a natural hedge component (convertible arbitrage) or where the manager has the flexibility to run a portfolio with a low net exposure (credit long-short).
Aggregate positioning on the long side of the Fund has been dominated by large-cap companies with strong balance sheets and the ability to withstand a variety of different economic environments, particularly margin pressure. Smaller, more unique companies and situations have been increasing as a percentage of the Fund. Aggregate positioning on the short side of the Fund has been dominated by index hedges and single name equities based on companies with sensitivity to slowing global growth – financials, industrials, consumer cyclicals, and most recently aerospace. Some of the short exposure is derived by Sub-Advisers (single name equity, index related hedges); some short exposure has been derived by Absolute (index related hedges). We have also supplemented the portfolio with additional allocations to energy, mining, and precious metal securities. These areas may profit individually, or benefit if central banks pursue policies based on creating broad based asset inflation.
Short exposure to European and Asian financials was one area the Fund benefited from during the period. A sell-off in these equities is one example of how investors seem to be in the early stages of looking beyond central bank activity and focusing more on company/industry specific dynamics. It's not surprising then that they would shy away from some of these banks given exceptionally high leverage, significant credit risk, and increasing non-performing loans. We still think this is an attractive area that has not fully priced in these risks.
The market environment is evolving into one of the best we've seen since we started our business nearly 12 years ago. We believe that the "no risk" straight up buying frenzy from 2012-2014 is history. It appears as if we are entering an entirely new period that, at a minimum, has proven to be quite volatile from month to month and quarter to quarter. At worst, markets may be entering a lengthy bear market.
Regardless of whether markets are volatile and range bound or headed much lower, we believe this environment is well suited for the Fund's approach, as evidenced during the period as two of the Fund's best months came during flat months for the S&P 500 Index. There continue to be ample opportunities on both the long and short side and we expect the Fund to take advantage of volatility as much as possible while managing risk.
|
ABSOLUTE STRATEGIES FUND A MESSAGE TO OUR SHAREHOLDERS (Unaudited) MARCH 31, 2016 |
|
for the macro environment, we may be witnessing the largest divergence between market prices and fundamentals in history. Markets are trading near all-time highs while our analysis indicates that fundamentals continue to deteriorate. The S&P 500 has risen dramatically since 2011, almost entirely on the back of multiple expansion. Revenue and cash flow levels are actually well BELOW 2007 levels. This is quite remarkable. We believe that market appreciation has been driven by financial engineering, and also investors' willingness to speculate on hope at the expense of any fundamental analysis. As can be seen in the chart below, the growth in cash flow or earnings before interest, taxes, depreciation and amortization ("EBITDA") per share for the S&P 500 has actually been negative, while price has gone nearly parabolic. To put this into perspective, the ratio of price to EBITDA is at year 2000 bubble levels.
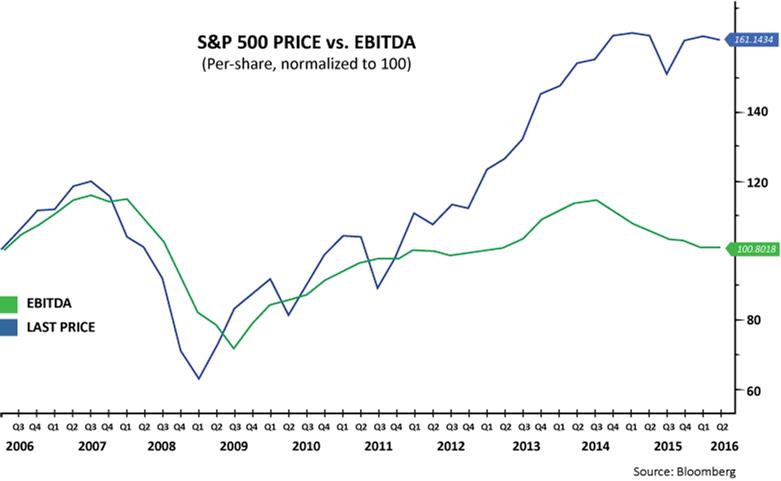
This is a picture of central banking in the mania phase and, in our view, probably the single greatest misallocation of capital in history: massive, unproductive leveraging of corporate America for the sole purpose of inflating per share earnings through stock buybacks. This would make sense if stocks were undervalued, but it does not make sense given the most expensive Price/EBITDA in history. If the return on investment (ROI) for buying back stock is negative, it does not matter how low the interest rate was on the newly issued debt. We believe most corporate stock buybacks at recent levels will incur ROIs of -20% or more.
In our opinion, the above analysis is old fashioned, unemotional common sense. We are simply attempting to point out what we believe will be obvious in hindsight. We believe that central bank policies are borrowing growth from the future. Yet we now have debt levels rising with no growth in operating cash flow. There's little funding for research and development or capital expenditures, just stock buybacks. Markets are very fragile and they also sense that there is no end game. Some markets are beginning to move contrary to central bank actions, as witnessed by recent stimulus attempts by both the Bank of Japan and the European Central Bank. As we've discussed for the past year, we believe markets are signaling that central bank credibility is breaking down and volatility lies ahead.
Looking forward, we believe this market environment may be highly advantageous for nimble, liquid strategies like ours. We expect the Fund to be very active when opportunities arise to either take or hedge risk.
Sincerely,
Jay Compson
Portfolio Manager
Absolute Investment Advisers LLC
|
ABSOLUTE CREDIT OPPORTUNITIES FUND A MESSAGE TO OUR SHAREHOLDERS (Unaudited) MARCH 31, 2016 |
Dear Shareholder,
We are pleased to present the annual report for the Absolute Credit Opportunities Fund (the "Fund") for the 12 months ended March 31, 2016. During the period, the Fund was down 2.40% while the the HFRX Fixed Income Credit Index, the Fund's primary benchmark, was down 7.15% and the HFRX Global Hedge Fund Index was down 7.36%.
On October 1, 2014, the Fund name was changed from the Absolute Opportunities Fund to the Absolute Credit Opportunities Fund. The name was changed to reflect the Fund's shift from employing a multi-strategy approach to an approach focused specifically on credit strategies. The Fund currently utilizes two credit related strategies – convertible arbitrage and corporate long-short credit. The Fund's sub-advisers for these strategies have a great deal of flexibility to go long or short, and use cash to adapt to the various market conditions that emerge during the course of a complete market cycle.
We regard this flexibility as important because we believe that traditional bond markets currently face significant risks - including interest rate risk, credit risk and/or liquidity risk. We also believe that low yields (which have even become negative in some cases) do not compensate most long-only bond holders for these risks, yet funds that are tied to a benchmark or style box have a narrow ability to hedge such risks.
The Fund's flexible strategy, however, allows it to hedge as appropriate, and it has been positioned conservatively over the last year. Credit exposure has been limited to areas where there is a natural hedge component (convertible arbitrage) or where the manager has been running the portfolio with a low net exposure (corporate long-short credit). Over the period, corporate long-short credit fared slightly better than convertible arbitrage. Gains and losses were in a somewhat tight range, however, gross of fees.
In our view, investors attempting to create a balanced portfolio seem to be facing a diminishing set of options within credit and fixed income. As bond prices have risen and yields declined, the risks have gone up and the potential diversification opportunities have gone down. Many recent product launches, such as nontraditional bond funds and credit-oriented hedge funds, seem to trade reduced risk in one area (interest rate) for increased risk in another (credit risk). We have designed the Fund's current more conservative approach to provide better diversification for an overall portfolio and specifically the bond portion of a portfolio. The Fund however is maintaining "dry powder" to put to work on the long side in potential distressed areas should bond markets continue to weaken.
Sincerely,
Jay Compson
Portfolio Manager
Absolute Investment Advisers LLC
|
ABSOLUTE STRATEGIES FUND PERFORMANCE CHART AND ANALYSIS (Unaudited) MARCH 31, 2016 |
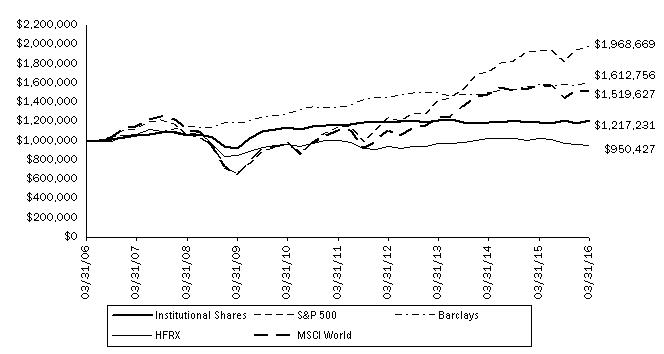
The following charts reflect the change in the value of a hypothetical $1,000,000 investment in Institutional Shares and a $250,000 investment in R Shares, including reinvested dividends and distributions, in Absolute Strategies Fund (the "Fund") compared with the performance of the benchmark, S&P 500 Index ("S&P 500"), Barclays Capital U.S. Aggregate Bond Index ("Barclays Index"), the HFRX Global Hedge Fund Index ("HFRX") and the MSCI World Index ("MSCI World"), since inception. The S&P 500 is a broad-based, unmanaged measurement of changes in stock market conditions based on the average of 500 widely held common stocks. The Barclays Index covers the U.S. dollar-denominated, investment-grade, fixed-rate, taxable bond market of SEC-registered securities. The HFRX is designed to be representative of the overall composition of the hedge fund universe; it is comprised of eight strategies - convertible arbitrage, distressed securities, equity hedge, equity market neutral, event driven, macro, merger arbitrage, and relative value arbitrage. The strategies are asset-weighted based on the distribution of assets in the hedge fund industry. The MSCI World measures the performance of a diverse range of 24 developed countries' stock markets including the United States, Canada, Europe, the Middle East and the Pacific. The total return of the indices include the reinvestment of dividends and income. The total return of the Fund includes operating expenses that reduce returns, while the total return of the indices do not include expenses. The Fund is professionally managed while the indices are unmanaged and are not available for investment.
Comparison of Change in Value of a $1,000,000 Investment
Absolute Strategies Fund - Institutional Shares vs. S&P 500 Index,
Barclays Capital U.S. Aggregate Bond Index,
HFRX Global Hedge Fund Index and MSCI World Index
| Average Annual Total Returns | | | | | | |
| Periods Ended March 31, 2016 | | One Year | | Five Years | | Ten Years |
| Absolute Strategies Fund - Institutional Shares | | 2.05 | % | | 0.98 | % | | 1.99 | % |
| S&P 500 Index | | 1.78 | % | | 11.58 | % | | 7.01 | % |
| Barclays Capital U.S. Aggregate Bond Index | | 1.96 | % | | 3.78 | % | | 4.90 | % |
| HFRX Global Hedge Fund Index | | -7.36 | % | | -1.18 | % | | -0.51 | % |
| MSCI World Index | | -3.45 | % | | 6.51 | % | | 4.27 | % |
|
ABSOLUTE STRATEGIES FUND PERFORMANCE CHART AND ANALYSIS (Unaudited) MARCH 31, 2016 |
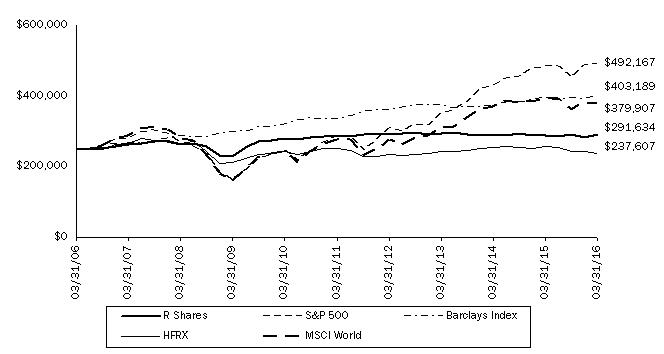
Comparison of Change in Value of a $250,000 Investment
Absolute Strategies Fund - R Shares vs. S&P 500 Index, Barclays Capital U.S. Aggregate Bond Index,
HFRX Global Hedge Fund Index and MSCI World Index
| Average Annual Total Returns | | | | | | |
| Periods Ended March 31, 2016 | | One Year | | Five Years | | Ten Years |
| Absolute Strategies Fund - R Shares | | 1.41 | % | | 0.48 | % | | 1.55 | % |
| S&P 500 Index | | 1.78 | % | | 11.58 | % | | 7.01 | % |
| Barclays Capital U.S. Aggregate Bond Index | | 1.96 | % | | 3.78 | % | | 4.90 | % |
| HFRX Global Hedge Fund Index | | -7.36 | % | | -1.18 | % | | -0.51 | % |
| MSCI World Index | | -3.45 | % | | 6.51 | % | | 4.27 | % |
Performance data quoted represents past performance and is no guarantee of future results. Current performance may be lower or higher than the performance data quoted. Investment return and principal value will fluctuate so that shares, when redeemed, may be worth more or less than original cost. For the most recent month-end performance, please call (888) 992-2765. As stated in the Fund's prospectus, the annual operating expense ratios (gross) for Institutional Shares and R Shares are 2.60% and 3.11%, respectively. Excluding the effect of expenses attributable to dividends and interest on short sales and acquired fund fees and expenses, the Fund's total annual operating expense ratios would be 1.79% and 2.30% for Institutional Shares and R Shares, respectively. To the extent that the Fund invests in any investment company or exchange-traded fund sponsored by the Fund's adviser or its affiliates, the adviser may waive certain fees and expenses. The performance table and graph do not reflect the deduction of taxes that a shareholder would pay on Fund distributions or the redemption of Fund shares. Returns greater than one year are annualized.
|
ABSOLUTE CREDIT OPPORTUNITIES FUND PERFORMANCE CHART AND ANALYSIS (Unaudited) MARCH 31, 2016 |
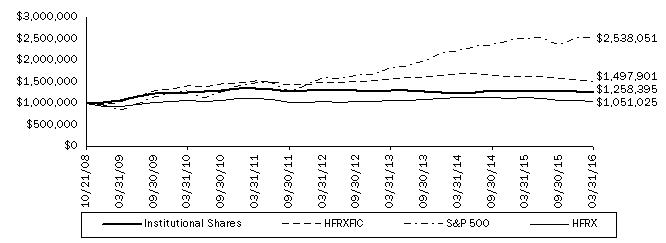
The following chart reflects the change in the value of a hypothetical $1,000,000 investment in Institutional Shares, including reinvested dividends and distributions, in Absolute Credit Opportunities Fund (the "Fund") compared with the performance of the benchmark, the HFRX Fixed Income Credit Index ("HFRXFIC"), the S&P 500 Index ("S&P 500") and the HFRX Global Hedge Fund Index ("HFRX"), since inception. The HFRXFIC includes strategies with exposure to credit across a broad continuum of credit sub-strategies, including Corporate, Sovereign, Distressed, Convertible, Asset Backed, Capital Structure Arbitrage, Multi-Strategy and other Relative Value and Event Driven sub-strategies. Investment thesis across all strategies is predicated on realization of a valuation discrepancy between the related credit instruments. Strategies may also include and utilize equity securities, credit derivatives, government fixed income, commodities, currencies or other hybrid securities. The S&P 500 is a broad-based, unmanaged measurement of changes in stock market conditions based on the average of 500 widely held common stocks. The HFRX is designed to be representative of the overall composition of the hedge fund universe; it is comprised of eight strategies - convertible arbitrage, distressed securities, equity hedge, equity market neutral, event driven, macro, merger arbitrage, and relative value arbitrage. The strategies are asset-weighted based on the distribution of assets in the hedge fund industry. The total return of the indices include the reinvestment of dividends and income. The total return of the Fund includes operating expenses that reduce returns, while the total return of the indices do not include expenses. The Fund is professionally managed while the indices are unmanaged and are not available for investment.
Comparison of Change in Value of a $1,000,000 Investment
Absolute Credit Opportunities - Institutional Shares vs. HFRX Fixed Income Credit Index,
S&P 500 Index, and HFRX Global Hedge Fund Index
| Average Annual Total Returns | | | | | | Since Inception |
| Periods Ended March 31, 2016 | | One Year | | Five Years | | 10/21/08 |
| Absolute Credit Opportunities Fund - Institutional Shares | | -2.40 | % | | -1.38 | % | | 3.14 | % |
| HFRX Fixed Income Credit Index | | -7.15 | % | | -0.11 | % | | 5.60 | % |
| S&P 500 Index | | 1.78 | % | | 11.58 | % | | 13.33 | % |
| HFRX Global Hedge Fund Index | | -7.36 | % | | -1.18 | % | | 0.67 | % |
Performance data quoted represents past performance and is no guarantee of future results. Current performance may be lower or higher than the performance data quoted. Investment return and principal value will fluctuate so that shares, when redeemed, may be worth more or less than original cost. For the most recent month-end performance, please call (888) 992-2765. As stated in the Fund's prospectus, the annual operating expense ratio (gross) is 2.71%. Excluding the effect of expenses attributable to dividends and interest on short sales, the Fund's total annual operating expense ratio would be 2.20%. However, the Fund's adviser has agreed to contractually waive a portion of its fees and to reimburse expenses such that total operating expenses do not exceed 1.95% (excluding all taxes, interest, portfolio transaction expenses, dividends and interest expense on short sales, acquired fund fees and expenses, proxy expenses, and extraordinary expenses), which is in effect through August 1, 2017. During the period, certain fees were waived and/or expenses reimbursed; otherwise returns would have been lower. The performance table and graph do not reflect the deduction of taxes that a shareholder would pay on Fund distributions or the redemption of Fund shares. Returns greater than one year are annualized.
Beck, Mack & Oliver International Fund | |
A Message to Our Shareholders (Unaudited) | 2 |
Performance Chart and Analysis (Unaudited) | 6 |
Portfolio Profile (Unaudited) | 7 |
Schedule of Investments | 8 |
Statement of Assets and Liabilities | 12 |
Statement of Operations | 13 |
Statements of Changes in Net Assets | 14 |
Financial Highlights | 15 |
| |
Beck, Mack & Oliver Partners Fund | |
A Message to Our Shareholders (Unaudited) | 16 |
Performance Chart and Analysis (Unaudited) | 20 |
Portfolio Profile (Unaudited) | 21 |
| Schedule of Investments | 22 |
Statement of Assets and Liabilities | 23 |
Statement of Operations | 24 |
Statements of Changes in Net Assets | 25 |
Financial Highlights | 26 |
| |
Notes to Financial Statements | 27 |
Report of Independent Registered Public Accounting Firm | 34 |
| Additional Information (Unaudited) | 35 |
|
BECK, MACK & OLIVER INTERNATIONAL FUND A MESSAGE TO OUR SHAREHOLDERS (Unaudited) MARCH 31, 2016 |
|
Dear Shareholders:
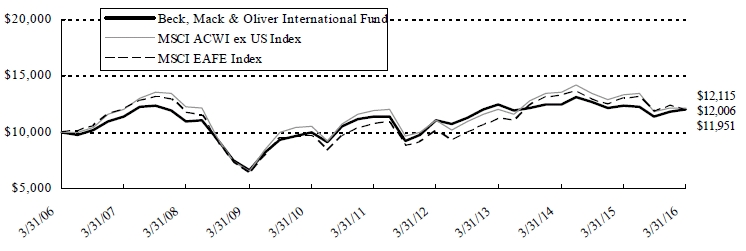
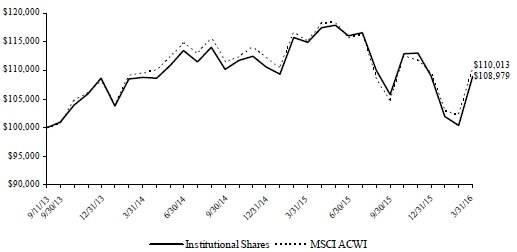
The Beck, Mack & Oliver International Fund (the "International Fund") ended its fiscal year on March 31, 2016 (the "Fiscal Year" or the "Period") with a net asset value ("NAV") of $15.61 per share, realizing a return of -2.84% for the Period. The International Fund's fiscal return compares with a return of -9.19% for the International Fund's benchmark, the MSCI ACWI ex U.S. Index (the "MSCI ACWI ex U.S." or the "Benchmark") and a -8.27% return for the MSCI EAFE Index ("MSCI EAFE").1 For a longer term perspective, the International Fund's 3-, 5-, 10-year, and since inception average annual total returns as of March 31, 2016 were as follows:
| Average Annual Total Return as of 03/31/2016 | | One Year | | Three Years | | Five Years | | Ten Years | | Since Inception (12/08/93) |
| Beck, Mack & Oliver International Fund | | -2.84% | | -1.24% | | 1.11% | | 1.85% | | 6.62% |
MSCI ACWI ex U.S. Index1 | | -9.19% | | 0.32% | | 0.31% | | 1.94% | | N/A |
MSCI EAFE Index1 | | -8.27% | | 2.23% | | 2.29% | | 1.80% | | 4.98% |
(Performance data quoted represents past performance and is no guarantee of future results. Current performance may be lower or higher than the performance data quoted. Investment return and principal value will fluctuate so that an investor's shares, when redeemed, may be worth more or less than original cost. For the most recent month-end performance, please call (800) 943-6786. Shares redeemed or exchanged within 60 days of purchase will be charged a 2.00% redemption fee. As stated in the current prospectus, the International Fund's annual operating expense ratio (gross) is 2.17%. However, the International Fund's adviser has agreed to contractually waive its fees and/or reimburse expenses to limit total operating expenses to 1.50% through at least July 31, 2016. During the period certain fees were waived and/or expenses reimbursed, otherwise returns would have been lower. Returns greater than one year are annualized.)
During the Period the International Fund outperformed its relevant benchmarks. Contributors to the International Fund's performance during the Fiscal Year included NIIT, Ltd (India) up 105.7% from the International Fund's first purchase in April 2015 through completion of its exit in November 2015, Tarkett SA (Russian Federation) up 33.9%, and Media Nusantara Citra Tbk PT (Indonesia) up 9.0% since the position was initiated in June 2015. Detractors from performance during the Period included Bank Pan Indonesia Tbk PT (Indonesia) down 50.9%, Panin Financial Tbk PT (Indonesia) down 50.6%, and Dewan Housing Finance Corp., Ltd. (India) down 13.0%.2
The following tables provide details of the International Fund's top 10 positions at the end of the Period as well as positions added and exited since our 9/30/15 semi-annual report. The decisions to exit positions resulted from a combination of the securities hitting our valuation targets or better opportunities elsewhere.
1 The MSCI ACWI ex U.S. is a stock market index that is a free float adjusted market capitalization weighted index that is designed to measure the equity market performance of developed and emerging markets. Net index data is not available prior to its inception on 01/01/01. The MSCI EAFE Index is a stock market index that is designed to measure the equity market performance of developed markets outside of the United States and Canada. The total return of the MSCI EAFE includes the reinvestment of dividends and income. It is not possible to invest directly in any index.
2 Returns reflect the performance of the stock in local currency over the Fiscal Year unless the position was initiated or fully exited during the Period as reported by Bloomberg.
|
BECK, MACK & OLIVER INTERNATIONAL FUND A MESSAGE TO OUR SHAREHOLDERS (Unaudited) MARCH 31, 2016 |
|
| Top 10 Common Stock Holdings as of 03/31/16 | | Country | | Sector | | % of Net Assets |
| Dufry AG | | Switzerland | | Consumer Discretionary | | 6.3% |
| First Pacific Co., Ltd. | | Hong Kong | | Conglomerates | | 6.2% |
| Media Nusantara Citra Tbk PT | | Indonesia | | Consumer Discretionary | | 5.7% |
| Fairfax India Holdings Corp. | | India | | Financials | | 5.7% |
| GP Investments, Ltd. | | Brazil | | Asset Management | | 5.6% |
| Tarkett SA | | Russian Federation | | Consumer Discretionary | | 5.6% |
| Dewan Housing Finance Corp., Ltd. | | India | | Financials | | 5.6% |
| Genting Hong Kong, Ltd. | | Hong Kong | | Conglomerates | | 5.3% |
| Fairfax Fianancial Holdings, Ltd. | | Canada | | Insurance | | 5.2% |
| BBA Aviation PLC | | United States | | Transportation | | 3.1% |
| Total | | | | | | 54.3% |
| New Positions Established as of 03/31/16 | | % of Net Assets | | Portfolio Positions Eliminated | | % of Net Assets3 |
| CVC Brasil Operadora e Agencia de Viagens SA | | 0.7% | | Phoenix Satellite Television Holdings, Ltd. | | 1.5% |
| GS Home Shopping, Inc. | | 3.0% | | NIIT, Ltd. | | 4.5% |
| Liberty Global PLC | | 2.9% | | Coca-Cola Femsa SAB de CV | | 2.4% |
| | | | | Nestle SA | | 1.7% |
| | | | | Brightwood Capital Fund III-U, LP | | 0.7% |
| | | 6.6% | | | | 10.8% |
Securities markets were tumultuous during the Period as equity and fixed income markets exhibited volatility. Fund management remains focused on the underlying operating performance and growth potential of the portfolio companies, which are sound. We believe the portfolio is attractive both from a valuation and a growth standpoint. In line with our name and mandate change we have continued to restructure the portfolio over the past few quarters to reflect these changes and expose the International Fund primarily to companies domiciled outside of the U.S. The International Fund's assets are focused and concentrated on select, long-term investments. One might even consider the portfolio an "anti-index" fund as, in contrast to the International Fund, an index fund usually consists of a great number of securities within its structure. We believe the International Fund is a sound compliment to a broad indexed portfolio.
Contrary to current negative sentiment on investments outside the U.S., we believe the opportunity in international markets is in the purchase of securities with attractive growth prospects at reasonable prices. Our investment in Dufry AG exemplifies this. While short-term currency fluctuations as well as sentiment around the company's recent acquisitions weighed on its shares, we remained focused on the long-term benefits of its industry position and growth opportunity. Dufry has been able to make accretive acquisitions historically and is poised to realize growth from its recent transformative acquisitions, which place it as the largest travel retail company in the world as measured by market share. It has also become well-balanced from a geographic perspective, benefiting from ever-shifting terms of trade. We have confidence that management will continue to execute on plan. Dufry exemplifies what we look for in an investment: a good growth opportunity at reasonable cost. Dufry's growth is fostered by the continued increase in global air passenger traffic which positively impacts retail sales at its airline terminal facilities. In addition, we believe the investment will continue to benefit from the close alignment of Dufry's management with the interests of shareholders.
3 Percent of net asset value ("NAV") for exited positions reflect holdings at the previous reporting period ending 9/30/2015.
|
BECK, MACK & OLIVER INTERNATIONAL FUND A MESSAGE TO OUR SHAREHOLDERS (Unaudited) MARCH 31, 2016 |
|
We initiated three new investments recently in the International Fund including CVC Brasil Operadora e Agencia de Viagens SA ("CVC"). This portfolio acquisition was made despite a dour outlook for the Brazilian economy and country. At this writing the negative headlines continue. Our investment in CVC checked the key boxes of our research process: a very good business trading at what we believe is a bargain price (below 10x earnings at purchase) with a good financial profile and an owner-operated, highly motivated management team comprised of the company's founding family and Carlyle, the private equity group. Brazilians love to travel and CVC has a leading and profitable position to help them do so. Importantly, the company has very little debt and strong cash generation.
Of course, we did not solely invent the concept of having a checklist in an important decision-making situation; for that we have the writings of a surgeon articulating this extremely well. In his seminal book "The Checklist Manifesto" Atul Gawande writes of his experience at striving to be the best he and his hospital can be in the most crucial circumstances: "Good checklists, on the other hand are precise. They are efficient, to the point, and easy to use even in the most difficult situations. They do not try to spell out everything – a checklist cannot fly a plane. Instead they provide reminders of only the most critical and important steps – the one that even the highly skilled professional using them could miss. Good checklists are above all, practical."
We strive to check the boxes in our investment research process and will continue to do so on behalf of investors in the International Fund, including ourselves. We know that patience is a rare commodity especially in these days of "Insta – Gratification." We believe your patience will be rewarded. Thank you for investing alongside us as stewards of your capital in international markets.
Sincerely,
| | |
David E. Rappa Co-Manager | | Peter A Vlachos Co-Manager |
| | |
| Robert C. Beck Co-Manager | |
|
BECK, MACK & OLIVER INTERNATIONAL FUND A MESSAGE TO OUR SHAREHOLDERS (Unaudited) MARCH 31, 2016 |
|
IMPORTANT RISKS AND DISCLOSURE:
There is no assurance that the International Fund will achieve its investment objective. Investing overseas involves special risks, including the volatility of currency exchange rates and, in some cases, political and economic instability, and relatively illiquid markets. Emerging markets involve greater risks than more developed markets as they may be more volatile and less liquid. The International Fund's exposure to foreign currencies may not be fully hedged at all times. Private fund securities are typically illiquid and difficult to value. The International Fund may invest in small and mid-sized capitalization companies, meaning that these companies carry greater risk than is customarily associated with larger companies for various reasons such as narrower markets, limited financial resources and less liquid stock.
The views in this report were those of the International Fund managers as of March 31, 2016 and may not reflect their views on the date this report is first published or any time thereafter. These views are intended to assist shareholders in understanding their investment in the International Fund and do not constitute investment advice. This letter may contain discussions about certain investments both held and not held in the portfolio. All current and future holdings are subject to risk and to change.
LMCG GLOBAL MARKET NEUTRAL FUND
LMCG GLOBAL MULTICAP FUND
Annual Report
March 31, 2016
|
LMCG GLOBAL MARKET NEUTRAL FUND A MESSAGE TO OUR SHAREHOLDERS (Unaudited) MARCH 31, 2016 |
|
Dear Shaerholder:
The LMCG Global Market Neutral Fund (the "Fund") was slightly down over the last twelve months, returning -0.36% over the period versus 0.08% for the Citigroup 3-Month U.S. T-Bill Index. Since its May 21, 2013 inception, the Fund has returned an annualized +3.49% versus +0.05% for the Citigroup 3-Month U.S. T-Bill Index. The Fund invests primarily in small-mid cap companies in the U.S. and large cap companies internationally. For the year, large cap equities in the U.S. outperformed their international peers with the Russell 1000 Index returning +0.5% while the MSCI EAFE Index fell -8.3%. Smaller cap companies in the U.S., which is where the Fund primarily invests, substantially underperformed large caps with a return of -9.8% for the period. While the Fund did not produce positive returns for the period, it did provide investors some protection versus many other asset classes.
The performance data quoted represents past performance and is no guarantee of future results. Investment return and principal value of an investment will fluctuate so that an investor's shares, when redeemed, may be worth more or less than their original cost. Current performance may be lower or higher than the performance data quoted. For the most recent month-end performance, please call (877)591-4667.
The timing of the Fed's decision to raise interest rates combined with a volatile oil market created tremendous uncertainty and global equities struggled. Investors tended to focus more on macroeconomic news than company fundamentals, which is more challenging for active stock picking. The strategy is managed using a quantitative approach that seeks to add value primarily through stock selection while minimizing market risk. The strategy is centered on fundamental principles and reviews well-known investment metrics to evaluate securities in a quantitative framework that has four major components: Valuation, Earnings Revision, Price Momentum, and Earnings Quality.
Throughout the year, it was primarily a Price Momentum market but there were three sharp negative reversals – April, October and the last two months. In general, stocks that had good price performance were favored over cheap stocks which were perceived as more risky as economic concerns weighed heavily on stock markets. However, in periods when markets strengthened on positive economic news, Price Momentum suffered. Valuation tended to matter a bit more when Price Momentum wasn't working but was weak during the other months. In the U.S., there were only two months where both Price Momentum and Valuation were working at the same time. Internationally, there was only one month. When factors work strongly and in different directions, it is difficult to capitalize on the success of the one factor that is working if another is not working by the same magnitude. Earnings Quality and Estimate Revision did work in both universes but not strong enough to offset the volatility in Price Momentum and Valuation.
One of the key strengths of the strategy is the diversification in sources for absolute return. This is important as it helps provide a steadier stream of returns. The strategy achieves diversification through its investments in a broad universe of global stocks as well its ability to invest long and short. The strategy invests globally using customized stock selection models for the U.S. and developed market portions of the Fund. This year, the U.S. stock selection model was much more effective than the international model. Consequently, the U.S. stocks in the portfolio contributed more positively to return. Outside of the U.S., stock selection in France and Germany added most to returns while those in Japan detracted most. In terms of sectors, positive stock selection in Energy, Consumer Discretionary and Materials helped most to offset negative stock selection in Industrials and Information Technology. More of the Fund's performance came from our long holdings.
Outlook
Equity markets are off to a rocky start in 2016. In January and the first part of February, most major stock market indexes were down in the neighborhood of -10%. In mid-February, the Organization of the Petroleum Exporting Countries (OPEC) announced that it would work to freeze output in an effort to stabilize oil prices. Following this news, global equity markets became euphoric and posted strong returns, which essentially erased the earlier downdraft. This stark difference in market returns between the two periods coincided with a dramatic shift in strategy performance and the behavior of our stock selection factors. The most notable differences were related to Price Momentum and Valuation. For the first part of the quarter, Price Momentum was most effective while Valuation was additive but to a much lesser degree. During this time, the Fund posted strong results. In the later period, Price Momentum turned substantially negative and Valuation became more important. However, Valuation did not work well enough to offset such a sharp reversal to Price Momentum. The question going forward is whether the strong positive performance will continue, and if so, how best to position the strategy. Given the uncertainty, we continue to believe that it is important to balance the strategy across our stock selection factors so that the strategy has a better chance of outperforming in either an up or down market.
The Fund seeks capital appreciation regardless of equity market conditions. In an environment where the yield on the 10-year Treasury is below 2%, we believe that a Fund that has the potential to generate alpha on the long and short side – while also
|
LMCG GLOBAL MARKET NEUTRAL FUND A MESSAGE TO OUR SHAREHOLDERS (Unaudited) MARCH 31, 2016 |
|
maintaining a competitive risk level to the overall equity market – may serve an important role within an investment program.
Sincerely,
| | |
| Gordon Johnson | Shannon Ericson | |
| Co-Portfolio Manager | Co-Portfolio Manager | |
| LMCG Investments, LLC | LMCG Investments, LLC | |
INVESTMENT CONSIDERATIONS
Alpha - Alpha is the incremental return of a manager when the market is stationary. This risk-adjusted measurement takes into account both the performance of the market as a whole and the volatility of a manager. A positive alpha indicates that a selected portfolio has produced returns above the expected level at that level of risk, and vice versa for a negative alpha.
Diversification - Diversification is a method of reducing risk by investing in a variety of types of investments. Diversification does not guarantee a profit nor protect against a loss.
Long Position - Long positions involve buying a security outright and then selling it later, with the hope that the security price rises over time.
Short Position - To establish a short stock position, the Fund borrows shares of stock from another party, sells the shares and receives cash. The Fund is then obligated to buy the stock and return the shares at some point in the future. If the price falls after the short sale, the Fund can profit from buying the shares back at a lower price and returning the borrowed shares. However, if the price of the security rises after the short sale, the Fund will experience losses.
There can be no guarantee that any strategy (risk management or otherwise) will be successful. All investing involves risk, including potential loss of principal.
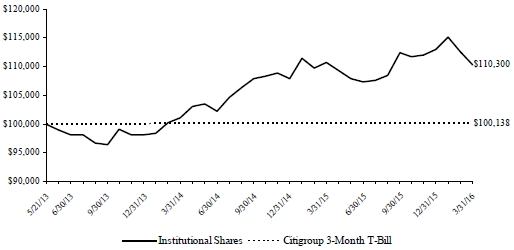
The following chart reflects the change in the value of a hypothetical $100,000 investment in Institutional Shares, including reinvested dividends and distributions, in the LMCG Global Market Neutral Fund (the "Fund") compared with the performance of the benchmark, the Citigroup 3-Month U.S. T-Bill Index, since inception. The Citigroup 3-Month U.S. T-Bill Index measures return equivalents of yield averages that are not marked to market and consists of the last three three-month Treasury bill month-end rates. The total return of the Citigroup 3-Month U.S. T-Bill Index includes the reinvestment of distributions. The total return of the Fund includes operating expenses that reduce returns, while the total return of the Citigroup 3-Month U.S. T-Bill Index does not include expenses. The Fund is professionally managed while the Citigroup 3-Month U.S. T-Bill Index is unmanaged and is not available for investment.
Comparison of Change in Value of a $100,000 Investment
LMCG Global Market Neutral Fund - Institutional Shares vs. Citigroup 3-Month U.S. T-Bill Index
| Average Annual Total Returns | | | | |
| Periods Ended March 31, 2016 | | One Year | | Since Inception(1) |
| LMCG Global Market Neutral Fund — Institutional Shares | | -0.36 | % | | 3.49 | % |
LMCG Global Market Neutral Fund — Investor Shares(2) | | -0.63 | % | | 3.39 | % |
| Citigroup 3-Month U.S. T-Bill Index | | 0.08 | % | | 0.05 | % |
(1) Institutional Shares commenced operations on May 21, 2013, and Investor Shares commenced operations on December 18, 2014.
(2) Performance for the since inception period is a blended average annual return, which include the returns of the Institutional Shares prior to the commencement of the Investor Shares.
Performance data quoted represents past performance and is no guarantee of future results. Current performance may be lower or higher than the performance data quoted. Investment return and principal value will fluctuate so that shares, when redeemed, may be worth more or less than original cost. For the most recent month-end performance, please call (877) 591-4667. As stated in the Fund's prospectus, the estimated annual operating expense ratio (gross) for Investor Shares and Institutional Shares is 5.73% and 4.63%, respectively. Excluding the effect of expenses attributable to dividends and interest on short sales, the estimated total annual operating expense ratio for Investor Shares and Institutional Shares would be 4.28% and 3.32%, respectively. However, LMCG Investments, LLC (the "Adviser") has agreed to contractually waive its fees and/or reimburse Fund expenses to limit total annual Fund operating expenses (excluding all taxes, interest, portfolio transaction expenses, dividend and interest expenses on short sales, acquired fund fees and expenses, proxy expenses and extraordinary expenses) of Investor Shares and Institutional Shares to 1.85% and 1.60%, respectively through at least July 31, 2016. The Fund may repay the Adviser for fees waived and expenses reimbursed pursuant to the expense cap if such payment is made within three years of the fees waived or reimbursed and the reimbursement does not cause the Fund's total annual operating expenses to exceed 1.85% and 1.60% for Investor Shares and Institutional Shares, respectively. The performance table and graph do not reflect the deduction of taxes that a shareholder would pay on Fund distributions or the redemption of Fund shares. Returns greater than one year are annualized.
| Shares | | Security Description | | Value |
| Short Positions - (93.7)% |
| Common Stock - (93.7)% |
| Austria - (0.5)% |
| | (19,797) | | ams AG | | $ | (678,430) |
| Bermuda - (1.4)% |
| | (12,820) | | Axis Capital Holdings, Ltd. | | (710,997) |
| | (36,269) | | Golar LNG, Ltd. | | (651,754) |
| | (26,559) | | Hiscox, Ltd. | | (369,066) |
| | | | | | (1,731,817) |
| Canada - (0.6)% |
| | (10,627) | | lululemon athletica, Inc. | | (719,554) |
| Denmark - (0.8)% |
| | (9,810) | | Chr Hansen Holding A/S | | (657,871) |
| | (7,965) | | SimCorp A/S | | (367,155) |
| | | | | | (1,025,026) |
| Finland - (0.5)% |
| | (43,389) | | Fortum OYJ | | (656,198) |
| France - (3.5)% |
| | (5,224) | | Aeroports de Paris | | (645,150) |
| | (8,242) | | DBV Technologies SA | | (536,611) |
| | (7,985) | | Fonciere Des Regions REIT | | (753,028) |
| | (1,897) | | Hermes International | | (667,027) |
| | (6,516) | | Ingenico Group SA | | (746,940) |
| | (2,106) | | Virbac SA | | (365,365) |
| | (30,390) | | Zodiac Aerospace | | (606,915) |
| | | | | | (4,321,036) |
| Germany - (2.5)% |
| | (8,117) | | Beiersdorf AG | | (731,132) |
| | (5,220) | | Bertrandt AG | | (597,773) |
| | (24,674) | | Deutsche Post AG | | (684,799) |
| | (17,554) | | Leoni AG | | (604,113) |
| | (8,241) | | MorphoSys AG | | (396,728) |
| | | | | | (3,014,545) |
| Hong Kong - (1.1)% |
| | (65,000) | | Cheung Kong Infrastructure Holdings, Ltd. | | (635,651) |
| | (108,000) | | Henderson Land Development Co., Ltd. | | (664,115) |
| | | | | | (1,299,766) |
| Italy - (2.2)% |
| | (22,791) | | Atlantia SpA | | (631,474) |
| | (28,854) | | Azimut Holding SpA | | (663,559) |
| | (30,487) | | Interpump Group SpA | | (445,370) |
| | (90,438) | | Unione di Banche Italiane SpA | | (334,019) |
| | (21,714) | | Yoox Net-A-Porter Group SpA | | (665,371) |
| | | | | | (2,739,793) |
| Japan - (10.5)% |
| | (42,300) | | Coca-Cola East Japan Co., Ltd. | | (701,107) |
| | (24,600) | | Daiseki Co., Ltd. | | (402,137) |
| | (15,700) | | Denso Corp. | | (630,207) |
| | (16,800) | | Exedy Corp. | | (371,139) |
| | (80,700) | | F@N Communications, Inc. | | (605,620) |
| | (50,000) | | Fuji Kyuko Co., Ltd. | | (686,879) |
| | (9,400) | | GMO Payment Gateway, Inc. | | (635,102) |
| | (26,700) | | Hamamatsu Photonics KK | | (735,826) |
| | (15,800) | | Japan Tobacco, Inc. | | (657,638) |
| | (41,800) | | Kakaku.com, Inc. | | (775,023) |
| | (39,900) | | Kansai Paint Co., Ltd. | | (640,450) |
| | (27,500) | | MonotaRO Co., Ltd. | | (817,453) |
| | (9,500) | | Nidec Corp. | | (650,013) |
| | (37,500) | | Nippon Paint Holdings Co., Ltd. | | (829,465) |
| | (14,500) | | Nissin Foods Holdings Co., Ltd. | | (681,053) |
| | (31,300) | | Pigeon Corp. | | (815,583) |
| | (34,300) | | Seibu Holdings, Inc. | | (725,304) |
| | (11,600) | | SHO-BOND Holdings Co., Ltd. | | (440,831) |
| | (109,000) | | The Gunma Bank, Ltd. | | (450,206) |
| | (29,200) | | Unicharm Corp. | | (635,548) |
| | | (12,886,584) |
| Netherlands - (0.6)% |
| | (7,047) | | ASML Holding NV | | (709,171) |
| New Zealand - (0.6)% |
| | (119,722) | | Ryman Healthcare, Ltd. | | (690,842) |
| Norway - (1.1)% |
| | (47,938) | | Marine Harvest ASA | | (738,045) |
| | (19,324) | | Schibsted ASA, Class A | | (563,775) |
| | | | | | (1,301,820) |
| Spain - (0.5)% |
| | (52,902) | | Zardoya Otis SA | | (614,042) |
| Sweden - (3.4)% |
| | (42,688) | | Alfa Laval AB | | (697,222) |
| | (42,023) | | Betsson AB | | (651,162) |
| | (67,989) | | Hexpol AB | | (754,337) |
| | (45,079) | | Lundin Petroleum AB | | (761,985) |
| | (67,585) | | Skandinaviska Enskilda Banken AB, Class A | | (644,506) |
| | (50,435) | | Svenska Handelsbanken AB, Class A | | (639,824) |
| | | | | | (4,149,036) |
| Switzerland - (3.6)% |
| | (29,658) | | ABB, Ltd. | | (577,777) |
| | (5,928) | | Basilea Pharmaceutica AG | | (417,697) |
| | (115) | | Chocoladefabriken Lindt & Spruengli AG | | (712,544) |
| | (34,503) | | GAM Holding AG | | (498,538) |
| Shares | | Security Description | | Value |
| Switzerland - (continued) |
| | (13,172) | | LafargeHolcim, Ltd. | | $ | (618,552) |
| | (43,287) | | OC Oerlikon Corp. AG | | (446,442) |
| | (5,093) | | Sonova Holding AG | | (649,993) |
| | (8,217) | | Sunrise Communications Group AG | | (564,037) |
| | | | | | (4,485,580) |
| United Kingdom - (5.7)% |
| | (143,798) | | Aberdeen Asset Management PLC | | (570,816) |
| | (72,044) | | BHP Billiton PLC | | (806,775) |
| | (31,657) | | Big Yellow Group PLC REIT | | (350,753) |
| | (75,786) | | BTG PLC | | (675,518) |
| | (32,590) | | Burberry Group PLC | | (637,129) |
| | (93,459) | | ICAP PLC | | (635,660) |
| | (42,986) | | IMI PLC | | (587,136) |
| | (60,888) | | Rolls-Royce Holdings PLC | | (595,077) |
| | (229,907) | | Rotork PLC | | (602,739) |
| | (67,519) | | The Restaurant Group PLC | | (380,060) |
| | (203,015) | | Tullow Oil PLC | | (570,987) |
| | (10,015) | | Whitbread PLC | | (568,513) |
| | | | | | (6,981,163) |
| United States - (54.6)% |
| | (22,467) | | Aerojet Rocketdyne Holdings, Inc. | | (368,009) |
| | (15,135) | | Albemarle Corp. | | (967,581) |
| | (19,241) | | Ameris Bancorp | | (569,149) |
| | (25,378) | | Aqua America, Inc. | | (807,528) |
| | (23,323) | | Artisan Partners Asset Management, Inc., Class A | | (719,281) |
| | (4,794) | | athenahealth, Inc. | | (665,311) |
| | (24,458) | | AtriCure, Inc. | | (411,628) |
| | (13,154) | | Bank of Hawaii Corp. | | (898,155) |
| | (8,810) | | Banner Corp. | | (370,372) |
| | (84,271) | | BioDelivery Sciences International, Inc. | | (272,195) |
| | (8,651) | | Bio-Techne Corp. | | (817,693) |
| | (24,158) | | Bottomline Technologies de, Inc. | | (736,577) |
| | (25,647) | | Brown & Brown, Inc. | | (918,163) |
| | (5,134) | | Buffalo Wild Wings, Inc. | | (760,448) |
| | (14,831) | | Cabela's, Inc. | | (722,121) |
| | (34,833) | | Calgon Carbon Corp. | | (488,359) |
| | (37,847) | | Callidus Software, Inc. | | (631,288) |
| | (21,006) | | Cheniere Energy, Inc. | | (710,633) |
| | (16,013) | | Choice Hotels International, Inc. | | (865,503) |
| | (14,606) | | CLARCOR, Inc. | | (844,081) |
| | (25,337) | | Clifton Bancorp, Inc. | | (383,095) |
| | (30,183) | | ClubCorp Holdings, Inc. | | (423,769) |
| | (12,368) | | Cognex Corp. | | (481,734) |
| | (23,724) | | CommVault Systems, Inc. | | (1,024,165) |
| | (10,522) | | Compass Minerals International, Inc. | | (745,589) |
| | (19,138) | | comScore, Inc. | | (574,906) |
| | (25,438) | | Consolidated Communications Holdings, Inc. | | (655,283) |
| | (23,999) | | Cornerstone OnDemand, Inc. | | (786,447) |
| | (42,221) | | Covanta Holding Corp. | | (711,846) |
| | (39,917) | | Crocs, Inc. | | (384,002) |
| | (42,404) | | CVB Financial Corp. | | (739,950) |
| | (21,520) | | CyrusOne, Inc. REIT | | (982,388) |
| | (11,753) | | Deckers Outdoor Corp. | | (704,122) |
| | (51,143) | | Del Frisco's Restaurant Group, Inc. | | (847,951) |
| | (9,854) | | DexCom, Inc. | | (669,185) |
| | (14,506) | | Duluth Holdings, Inc. | | (282,722) |
| | (61,701) | | Endologix, Inc. | | (515,820) |
| | (20,766) | | Energen Corp. | | (759,828) |
| | (14,538) | | FARO Technologies, Inc. | | (468,269) |
| | (24,993) | | First Financial Bankshares, Inc. | | (739,293) |
| | (5,858) | | FleetCor Technologies, Inc. | | (871,377) |
| | (14,817) | | Fortune Brands Home & Security, Inc. | | (830,345) |
| | (70,457) | | GenMark Diagnostics, Inc. | | (371,308) |
| | (29,810) | | Greenhill & Co., Inc. | | (661,782) |
| | (24,554) | | Gulfport Energy Corp. | | (695,860) |
| | (22,636) | | Healthcare Services Group, Inc. | | (833,231) |
| | (43,080) | | Heartland Express, Inc. | | (799,134) |
| | (18,063) | | HomeStreet, Inc. | | (375,891) |
| | (39,547) | | Inovalon Holdings, Inc., Class A | | (732,410) |
| | (21,589) | | Kennametal, Inc. | | (485,537) |
| | (25,330) | | Keysight Technologies, Inc. | | (702,654) |
| | (49,883) | | Krispy Kreme Doughnuts, Inc. | | (777,676) |
| | (16,822) | | La Jolla Pharmaceutical Co. | | (351,748) |
| | (130,874) | | Lattice Semiconductor Corp. | | (743,364) |
| | (10,379) | | Macquarie Infrastructure Corp. | | (699,960) |
| | (19,921) | | Marketo, Inc. | | (389,854) |
| | (10,132) | | MEDNAX, Inc. | | (654,730) |
| | (15,117) | | Mercury General Corp. | | (838,993) |
| | (23,940) | | Mobile Mini, Inc. | | (790,499) |
| | (39,799) | | Momenta Pharmaceuticals, Inc. | | (367,743) |
| | (10,758) | | Monro Muffler Brake, Inc. | | (768,874) |
| | (17,465) | | Natural Grocers by Vitamin Cottage, Inc. | | (371,481) |
| | (41,778) | | Nektar Therapeutics | | (574,447) |
| | (9,525) | | NetSuite, Inc. | | (652,367) |
| | (71,865) | | Nimble Storage, Inc. | | (563,422) |
| | (14,957) | | Northwest Natural Gas Co. | | (805,434) |
| | (43,673) | | NOW, Inc. | | (773,886) |
| | (29,426) | | OneBeacon Insurance Group, Ltd., Class A | | (374,593) |
| | (71,187) | | ORBCOMM, Inc. | | (721,124) |
| | (29,696) | | Party City Holdco, Inc. | | (446,628) |
| | (43,811) | | Performance Sports Group, Ltd. | | (139,319) |
| | (61,700) | | PGT, Inc. | | (607,128) |
| | (90,905) | | Platform Specialty Products Corp. | | (781,783) |
| | (11,147) | | Proto Labs, Inc. | | (859,322) |
| | (11,194) | | Puma Biotechnology, Inc. | | (328,768) |
| | (17,115) | | QTS Realty Trust, Inc., Class A REIT | | (810,909) |
| Shares | | Security Description | | Value |
| United States - (continued) |
| | (32,958) | | Raven Industries, Inc. | | $ | (527,987) |
| | (8,390) | | Restoration Hardware Holdings, Inc. | | (351,541) |
| | (9,851) | | RLI Corp. | | (658,638) |
| | (20,675) | | Royal Gold, Inc. | | (1,060,421) |
| | (64,145) | | Ruckus Wireless, Inc. | | (629,262) |
| | (19,694) | | Rush Enterprises, Inc., Class A | | (359,219) |
| | (37,085) | | Select Comfort Corp. | | (719,078) |
| | (14,855) | | Southside Bancshares, Inc. | | (387,270) |
| | (8,672) | | Spectrum Brands Holdings, Inc. | | (947,676) |
| | (89,377) | | Synergy Resources Corp. | | (694,459) |
| | (15,841) | | TESARO, Inc. | | (697,479) |
| | (31,993) | | Textura Corp. | | (596,030) |
| | (40,499) | | TFS Financial Corp. | | (703,468) |
| | (36,407) | | The Spectranetics Corp. | | (528,630) |
| | (20,109) | | TowneBank/Portsmouth VA | | (385,892) |
| | (18,360) | | Trex Co., Inc. | | (879,995) |
| | (15,500) | | Tupperware Brands Corp. | | (898,690) |
| | (21,238) | | Ultratech, Inc. | | (463,838) |
| | (14,904) | | UMB Financial Corp. | | (769,494) |
| | (12,674) | | Universal Display Corp. | | (685,663) |
| | (85,549) | | Valley National Bancorp | | (816,137) |
| | (34,419) | | Varonis Systems, Inc. | | (628,147) |
| | (12,574) | | ViaSat, Inc. | | (923,938) |
| | (26,848) | | Waddell & Reed Financial, Inc., Class A | | (632,002) |
| | (107,528) | | WPX Energy, Inc. | | (751,621) |
| | (22,160) | | Zayo Group Holdings, Inc. | | (537,158) |
| | (11,092) | | Zebra Technologies Corp. | | (765,348) |
| | | | | | (66,977,101) |
Total Common Stock
(Proceeds $(115,674,546)) | | (114,981,504) |
Total Short Positions - (93.7)%
(Proceeds $(115,674,546)) | | $ | (114,981,504) |
See Notes to Financial Statements. | 9 | LMCG FUNDS |
|
LMCG GLOBAL MARKET NEUTRAL FUND NOTES TO SCHEDULES OF INVESTMENTS AND SECURITIES SOLD SHORT MARCH 31, 2016 |
|
| LLC | Limited Liability Company |
| PLC | Public Limited Company |
| REIT | Real Estate Investment Trust |
| (a) | All or portion of these securities are held as collateral for securities sold short. |
| (b) | Non-income producing security. |
| (c) | Variable rate security. Rate presented is as of March 31, 2016. |
* Cost for federal income tax purposes is $12,169,923 and net unrealized appreciation consists of:
| Gross Unrealized Appreciation | | $ | 16,745,348 | |
| Gross Unrealized Depreciation | | | (14,216,082 | ) |
| Net Unrealized Appreciation | | $ | 2,529,266 | |
The following is a summary of the inputs used to value the Fund's investments and liabilities as of March 31, 2016.
The inputs or methodology used for valuing securities are not necessarily an indication of the risks associated with investing in those securities. For more information on valuation inputs, and their aggregation into the levels used in the table below, please refer to the Security Valuation section in Note 2 of the accompanying Notes to Financial Statements.
| | Level 1 | | Level 2 | | Level 3 | | Total |
| Assets |
| Investments At Value |
| Common Stock | | | | | | | | | | | | | | | | |
| Australia | | $ | - | | | $ | 1,158,806 | | | $ | - | | | $ | 1,158,806 | |
| Austria | | | - | | | | 655,898 | | | | - | | | | 655,898 | |
| Bermuda | | | 850,923 | | | | - | | | | - | | | | 850,923 | |
| Finland | | | - | | | | 1,893,543 | | | | - | | | | 1,893,543 | |
| France | | | - | | | | 3,670,077 | | | | - | | | | 3,670,077 | |
| Germany | | | - | | | | 5,750,834 | | | | - | | | | 5,750,834 | |
| Israel | | | - | | | | 512,507 | | | | - | | | | 512,507 | |
| Italy | | | - | | | | 957,955 | | | | - | | | | 957,955 | |
| Japan | | | - | | | | 14,583,902 | | | | - | | | | 14,583,902 | |
| Netherlands | | | - | | | | 1,967,862 | | | | - | | | | 1,967,862 | |
| Norway | | | - | | | | 2,645,573 | | | | - | | | | 2,645,573 | |
| Puerto Rico | | | 1,024,971 | | | | - | | | | - | | | | 1,024,971 | |
| Spain | | | - | | | | 668,114 | | | | - | | | | 668,114 | |
| Sweden | | | - | | | | 1,996,113 | | | | - | | | | 1,996,113 | |
| Switzerland | | | - | | | | 4,434,561 | | | | - | | | | 4,434,561 | |
| Thailand | | | 687,049 | | | | - | | | | - | | | | 687,049 | |
| United Kingdom | | | - | | | | 5,561,007 | | | | - | | | | 5,561,007 | |
| United States | | | 65,295,742 | | | | - | | | | - | | | | 65,295,742 | |
| Money Market Fund | | | - | | | | 15,365,256 | | | | - | | | | 15,365,256 | |
| Total Investments At Value | | $ | 67,858,685 | | | $ | 61,822,008 | | | $ | - | | | $ | 129,680,693 | |
| Total Assets | | $ | 67,858,685 | | | $ | 61,822,008 | | | $ | - | | | $ | 129,680,693 | |
See Notes to Financial Statements. | 10 | LMCG FUNDS |
|
LMCG GLOBAL MARKET NEUTRAL FUND NOTES TO SCHEDULES OF INVESTMENTS AND SECURITIES SOLD SHORT MARCH 31, 2016 |
|
| | Level 1 | | Level 2 | | Level 3 | | Total |
| Liabilities | | | | | | | | | | | | | | | | |
| Securities Sold Short | | | | | | | | | | | | | | | | |
| Common Stock | | | | | | | | | | | | | | | | |
| Austria | | $ | - | | | $ | (678,430 | ) | | $ | - | | | $ | (678,430 | ) |
| Bermuda | | | (1,362,751 | ) | | | (369,066 | ) | | | - | | | | (1,731,817 | ) |
| Canada | | | (719,554 | ) | | | - | | | | - | | | | (719,554 | ) |
| Denmark | | | - | | | | (1,025,026 | ) | | | - | | | | (1,025,026 | ) |
| Finland | | | - | | | | (656,198 | ) | | | - | | | | (656,198 | ) |
| France | | | - | | | | (4,321,036 | ) | | | - | | | | (4,321,036 | ) |
| Germany | | | - | | | | (3,014,545 | ) | | | - | | | | (3,014,545 | ) |
| Hong Kong | | | - | | | | (1,299,766 | ) | | | - | | | | (1,299,766 | ) |
| Italy | | | - | | | | (2,739,793 | ) | | | - | | | | (2,739,793 | ) |
| Japan | | | - | | | | (12,886,584 | ) | | | - | | | | (12,886,584 | ) |
| Netherlands | | | - | | | | (709,171 | ) | | | - | | | | (709,171 | ) |
| New Zealand | | | - | | | | (690,842 | ) | | | - | | | | (690,842 | ) |
| Norway | | | - | | | | (1,301,820 | ) | | | - | | | | (1,301,820 | ) |
| Spain | | | - | | | | (614,042 | ) | | | - | | | | (614,042 | ) |
| Sweden | | | - | | | | (4,149,036 | ) | | | - | | | | (4,149,036 | ) |
| Switzerland | | | - | | | | (4,485,580 | ) | | | - | | | | (4,485,580 | ) |
| United Kingdom | | | - | | | | (6,981,163 | ) | | | - | | | | (6,981,163 | ) |
| United States | | | (66,977,101 | ) | | | - | | | | - | | | | (66,977,101 | ) |
| Total Securities Sold Short | | $ | (69,059,406 | ) | | $ | (45,922,098 | ) | | $ | - | | | $ | (114,981,504 | ) |
| Total Liabilities | | $ | (69,059,406 | ) | | $ | (45,922,098 | ) | | $ | - | | | $ | (114,981,504 | ) |
The Fund utilizes the end of period methodology when determining transfers. There were no transfers among Level 1, Level 2 and Level 3 for the year ended March 31, 2016.
At March 31, 2016, foreign securities representing the following percentage of net assets of the Fund were fair valued by independent pricing services and are classified as using Level 2 inputs within the valuation inputs disclosure on the Fund's Schedule of Investments:
LMCG Global Market Neutral Fund
Long Securities 37.86%
Short Securities (37.43)%
See Notes to Financial Statements. | 11 | LMCG FUNDS |
|
LMCG GLOBAL MARKET NEUTRAL FUND NOTES TO SCHEDULES OF INVESTMENTS AND SECURITIES SOLD SHORT MARCH 31, 2016 |
|
| PORTFOLIO HOLDINGS | | | | | |
| % of Total Investments | Long | | | Short | |
| Australia | 0.9 | % | | 0.0 | % |
| Austria | 0.5 | % | | 0.6 | % |
| Bermuda | 0.7 | % | | 1.5 | % |
| Canada | 0.0 | % | | 0.6 | % |
| Denmark | 0.0 | % | | 0.9 | % |
| Finland | 1.5 | % | | 0.6 | % |
| France | 2.9 | % | | 3.8 | % |
| Germany | 4.5 | % | | 2.6 | % |
| Hong Kong | 0.0 | % | | 1.1 | % |
| Israel | 0.4 | % | | 0.0 | % |
| Italy | 0.7 | % | | 2.4 | % |
| Japan | 11.4 | % | | 11.2 | % |
| Netherlands | 1.5 | % | | 0.6 | % |
| New Zealand | 0.0 | % | | 0.6 | % |
| Norway | 2.1 | % | | 1.1 | % |
| Puerto Rico | 0.8 | % | | 0.0 | % |
| Spain | 0.5 | % | | 0.5 | % |
| Sweden | 1.6 | % | | 3.6 | % |
| Switzerland | 3.4 | % | | 3.9 | % |
| Thailand | 0.5 | % | | 0.0 | % |
| United Kingdom | 4.3 | % | | 6.1 | % |
| United States | 61.8 | %* | | 58.3 | % |
| | 100.0 | % | | 100.0 | % |
* Includes Money Market Fund totaling 11.0%.
See Notes to Financial Statements. | 12 | LMCG FUNDS |
|
LMCG GLOBAL MARKET NEUTRAL FUND STATEMENT OF ASSETS AND LIABILITIES MARCH 31, 2016 |
|
| ASSETS | | | | |
| . | Total investments, at value (Cost $126,800,675) | | $ | 129,680,693 | |
| | Deposits with brokers | | | 104,764,509 | |
| | Cash | | | 2,151,023 | |
| | Foreign currency (Cost $6,001) | | | 6,350 | |
| | Receivables: | | | | |
| | | Fund shares sold | | | 1,047,635 | |
| | | Dividends | | | 287,231 | |
| | Prepaid expenses | | | 18,150 | |
| Total Assets | | | 237,955,591 | |
| | | | | | | |
| LIABILITIES | | | | |
| | Securities sold short, at value (Proceeds $115,674,546) | | | 114,981,504 | |
| | Payables: | | | | |
| | | Fund shares redeemed | | | 27,010 | |
| | | Dividends on securities sold short | | | 133,823 | |
| | Accrued Liabilities: | | | | |
| | | Investment adviser fees | | | 42,107 | |
| | | Trustees' fees and expenses | | | 75 | |
| | | Fund services fees | | | 14,894 | |
| | | Other expenses | | | 60,609 | |
| Total Liabilities | | | 115,260,022 | |
| | | | | | | |
| NET ASSETS | | $ | 122,695,569 | |
| | | | | | | |
| COMPONENTS OF NET ASSETS | | | | |
| | Paid-in capital | | $ | 121,399,387 | |
| | Accumulated net investment loss | | | (625,956 | ) |
| | Accumulated net realized loss | | | (1,651,562 | ) |
| | Net unrealized appreciation | | | 3,573,700 | |
| NET ASSETS | | $ | 122,695,569 | |
| | | | | | | |
| SHARES OF BENEFICIAL INTEREST AT NO PAR VALUE (UNLIMITED SHARES AUTHORIZED) | | | | |
| | Investor Shares | | | 1,406,767 | |
| | Institutional Shares | | | 9,722,387 | |
| | | | | | | |
| NET ASSET VALUE, OFFERING AND REDEMPTION PRICE PER SHARE | | | | |
| | Investor Shares (based on net assets of $15,467,880) | | $ | 11.00 | |
| | Institutional Shares (based on net assets of $107,227,689) | | $ | 11.03 | |
See Notes to Financial Statements. | 13 | LMCG FUNDS |
|
LMCG GLOBAL MARKET NEUTRAL FUND STATEMENT OF OPERATIONS YEAR ENDED MARCH 31, 2016 |
|
| INVESTMENT INCOME | | | | | |
| | Dividend income (Net of foreign withholding taxes of $102,157) | . | | $ | 1,322,559 | |
| | Interest income | | | 53,762 | |
| Total Investment Income | | | | 1,376,321 | |
| | | | | | |
| EXPENSES | | | | | |
| | Investment adviser fees | | | 851,695 | |
| | Fund services fees | | | 215,791 | |
| | Transfer agent fees: | | | | |
| | Investor Shares | | | 1,712 | |
| | Institutional Shares | | | 5,737 | |
| | Distribution fees: | | | | |
| | Investor Shares | | | 26,789 | |
| | Custodian fees | | | 565,830 | |
| | Registration fees: | | | | |
| | Investor Shares | | | 7,706 | |
| | Institutional Shares | | | 14,330 | |
| | Professional fees | | | 46,504 | |
| | Trustees' fees and expenses | | | 6,316 | |
| | Dividend expense on securities sold short | | | 1,318,757 | |
| | Miscellaneous expenses | | | 155,304 | |
| Total Expenses | | | | 3,216,471 | |
| | Fees waived | | | (508,217 | ) |
| Net Expenses | | | | 2,708,254 | |
| | | | | | | |
| NET INVESTMENT LOSS | | | | (1,331,933 | ) |
| | | | | | | |
| NET REALIZED AND UNREALIZED GAIN (LOSS) | | | | | |
| | Net realized gain (loss) on: | | | | |
| | Investments | | | (2,152,341 | ) |
| | Foreign currency transactions | | | (86,771 | ) |
| | Securities sold short | | | 1,330,524 | |
| | Net realized loss | | | (908,588 | ) |
| | Net change in unrealized appreciation (depreciation) on: | | | | |
| | Investments | | | (1,067,292 | ) |
| | Foreign currency translations | | | 2,486 | |
| | Securities sold short | | | 1,786,417 | |
| | Net change in unrealized appreciation (depreciation) | | | 721,611 | |
| NET REALIZED AND UNREALIZED LOSS | | | | (186,977 | ) |
| DECREASE IN NET ASSETS RESULTING FROM OPERATIONS | | | $ | (1,518,910 | ) |
| | | | | | | |
See Notes to Financial Statements. | 14 | LMCG FUNDS |
|
LMCG GLOBAL MARKET NEUTRAL FUND STATEMENTS OF CHANGES IN NET ASSETS |
|
| | | | | For the Year Ended March 31, 2016 | | | For the Year Ended March 31, 2015 |
| OPERATIONS | | | | | | | | | |
| | Net investment loss | | $ | (1,331,933 | ) | | | $ | (371,717 | ) |
| | Net realized gain (loss) | | | (908,588 | ) | | | | 35,228 | |
| | Net change in unrealized appreciation (depreciation) | | | 721,611 | | | | | 1,999,397 | |
| Increase (Decrease) in Net Assets Resulting from Operations | | | (1,518,910 | ) | | | | 1,662,908 | |
| | | | | | | | | | | | |
| CAPITAL SHARE TRANSACTIONS | | | | | | | | | |
| | Sale of shares: | | | | | | | | | |
| | | Investor Shares | | | 13,677,091 | | | | | 5,720,391 | |
| | | Institutional Shares | | | 58,496,549 | | | | | 46,594,732 | |
| | Redemption of shares: | | | | | | | | | |
| | | Investor Shares | | | (3,692,502 | ) | | | | (84,269 | ) |
| | | Institutional Shares | | | (8,269,340 | ) | | | | (1,291,828 | ) |
| | Redemption fees | | | - | | | | | 19 | |
| Increase in Net Assets from Capital Share Transactions | | | 60,211,798 | | | | | 50,939,045 | |
| Increase in Net Assets | | | 58,692,888 | | | | | 52,601,953 | |
| | | | | | | | | | | | |
| NET ASSETS | | | | | | | | | |
| | Beginning of Year | | | 64,002,681 | | | | | 11,400,728 | |
| | End of Year (Including line (a)) | | $ | 122,695,569 | | | | $ | 64,002,681 | |
| | | | | | | | | | | | |
| SHARE TRANSACTIONS | | | | | | | | | |
| | Sale of shares: | | | | | | | | | |
| | | Investor Shares | | | 1,224,668 | | | | | 521,198 | |
| | | Institutional Shares | | | 5,199,050 | | | | | 4,258,398 | |
| | Redemption of shares: | | | | | | | | | |
| | | Investor Shares | | | (331,429 | ) | | | | (7,670 | ) |
| | | Institutional Shares | | | (743,813 | ) | | | | (118,516 | ) |
| Increase in Shares | | | 5,348,476 | | | | | 4,653,410 | |
| | | | | | | | | | | | |
| (a) | Accumulated net investment loss | | $ | (625,956 | ) | | | $ | (214,742 | ) |
See Notes to Financial Statements. | 15 | LMCG FUNDS |
|
LMCG GLOBAL MARKET NEUTRAL FUND FINANCIAL HIGHLIGHTS |
|
These financial highlights reflect selected data for a share outstanding throughout each period. |
| | | For the Year Ended March 31, 2016 | | December 18, 2014 (a) Through March 31, 2015 | |
| INVESTOR SHARES | | | | | | | | |
| NET ASSET VALUE, Beginning of Period | $ | 11.07 | | | $ | 10.87 | | |
| INVESTMENT OPERATIONS | | | | | | | | |
| Net investment loss (b) | | (0.20 | ) | | | (0.05 | ) | |
| Net realized and unrealized gain | | 0.13 | (c) | | 0.25 | | |
| Total from Investment Operations | | (0.07 | ) | | | 0.20 | | |
| NET ASSET VALUE, End of Period | $ | 11.00 | | | $ | 11.07 | | |
| TOTAL RETURN | | (0.63 | )% | | 1.84 | %(d) |
| | | | | | | | | |
| RATIOS/SUPPLEMENTARY DATA | | | | | | | | |
| Net Assets at End of Period (000's omitted) | $15,468 | | | $5,683 | | |
| Ratios to Average Net Assets: | | | | | | | | |
| Net investment loss | | (1.81 | )% | | (1.73 | )%(e) |
| Net expenses including dividend expenses | | 3.38 | % | | 3.30 | %(e) |
| Dividend expenses | | 1.53 | % | | 1.45 | %(e) |
| Net expenses without dividend expenses | | 1.85 | % | | 1.85 | %(e) |
| Gross expenses (f) | | 4.09 | % | | 5.73 | %(e) |
| PORTFOLIO TURNOVER RATE | | 124 | % | | 104 | %(d) |
| | | | | | | | | | |
| (a) | Commencement of operations. |
| (b) | Calculated based on average shares outstanding during each period. |
| (c) | Per share amount does not reflect the actual net realized and unrealized gain/(loss) for the year due to the timing of Fund share sales and the amount of per share realized and unrealized gains and losses at such time. |
| (d) | Not annualized. |
| (e) | Annualized. |
| (f) | Reflects the expense ratio excluding any waivers and/or reimbursements. |
See Notes to Financial Statements. | 16 | LMCG FUNDS |
|
LMCG GLOBAL MARKET NEUTRAL FUND FINANCIAL HIGHLIGHTS |
|
These financial highlights reflect selected data for a share outstanding throughout each period. |
| | | For the Year Ended March 31, 2016 | | For the Year Ended March 31, 2015 | | May 21, 2013 (a) Through March 31, 2014 | |
| INSTITUTIONAL SHARES | | | | | | | | | | | | |
| NET ASSET VALUE, Beginning of Period | $ | 11.07 | | | $ | 10.11 | | | $ | 10.00 | | |
| INVESTMENT OPERATIONS | | | | | | | | | | | | |
| Net investment loss (b) | | (0.17 | ) | | | (0.16 | ) | | | (0.11 | ) | |
| Net realized and unrealized gain | | 0.13 | (c) | | 1.12 | | | | 0.22 | | |
| Total from Investment Operations | | (0.04 | ) | | | 0.96 | | | | 0.11 | | |
| REDEMPTION FEES (b) | | — | | | | — | (d) | | — | | |
| NET ASSET VALUE, End of Period | $ | 11.03 | | | $ | 11.07 | | | $ | 10.11 | | |
| TOTAL RETURN | | (0.36 | )% | | 9.50 | % | | 1.10 | %(e) |
| | | | | | | | | | | | | |
| RATIOS/SUPPLEMENTARY DATA | | | | | | | | | | | | |
| Net Assets at End of Period (000's omitted) | $107,228 | | | $58,320 | | | $11,401 | | |
| Ratios to Average Net Assets: | | | | | | | | | | | | |
| Net investment loss | | (1.53 | )% | | (1.49 | )% | | (1.27 | )%(f) |
| Net expenses including dividend expenses | | 3.15 | % | | 2.91 | % | | 2.94 | %(f) |
| Dividend expenses | | 1.55 | % | | 1.31 | % | | 1.34 | %(f) |
| Net expenses without dividend expenses | | 1.60 | % | | 1.60 | % | | 1.60 | %(f) |
| Gross expenses (g) | | 3.74 | % | | 4.63 | % | | 8.73 | %(f) |
| PORTFOLIO TURNOVER RATE | | 124 | % | | 104 | % | | 62 | %(e) |
| | | | | | | | | | | | | | |
| (a) | Commencement of operations. |
| (b) | Calculated based on average shares outstanding during each period. |
| (c) | Per share amount does not reflect the actual net realized and unrealized gain/(loss) for the year due to the timing of Fund share sales and the amount of per share realized and unrealized gains and losses at such time. |
| (d) | Less than $0.01 per share. |
| (e) | Not annualized. |
| (f) | Annualized. |
| (g) | Reflects the expense ratio excluding any waivers and/or reimbursements. |
See Notes to Financial Statements. | 17 | LMCG FUNDS |
|
LMCG GLOBAL MULTICAP FUND A MESSAGE TO OUR SHAREHOLDERS (Unaudited) MARCH 31, 2016 |
|
Dear Shareholder:
The last 12 months were extremely volatile for equity markets worldwide. A market surge in the second quarter of 2015 was abruptly reversed beginning in August, a possibility we discussed in our shareholder letter last year. The fall of global markets was severe, particularly in the December 2015 to February 2016 period, but reversed itself partially in the middle of the first quarter of 2016. In spite of a strong bounce back in equity markets from the low in February, the LMCG Global MultiCap Fund (the "Fund") finished the year ending March 31, 2016 down -5.11% versus -4.36% for its benchmark, the MSCI All Country World Investable Market Index.
The Fund strives to combine added value from both stock selection and asset allocation with the goal of producing more consistent and robust returns over time. This year, defense came from asset allocation while stock selection, particularly within the United States, produced stiff headwinds. Fortunately, the combination of the two offsetting forces prevented a significant lag during a year of decline, and we anticipate getting benefits from both approaches sooner rather than later.
The year was not without stock selection success stories. Information technology "beneficiaries" contributed significantly to the returns of the portfolio both in the United States and in Asia. Businesses that are technology beneficiaries include payroll processing, retail distribution, and financial services support applications; a number of stocks in these areas posted strong positive returns over the year. Companies that benefitted from lower energy and materials prices among American and European industrial conglomerates also posted strong gains. These businesses seem to be positioned well for a new, and long awaited, capital expenditure cycle. Low commodity prices will likely stimulate this economic activity in the medium term. However, near term, we sense that stress in the financial system is creating a great deal of uncertainty in stock and bond markets, and we are trying to balance our defense with our offense.
In contrast, the casualties of the collapse in energy and commodity prices were evident across the portfolio for the year. In last year's shareholder letter, we discussed the protection that non-U.S. investments provided against weaker oil prices. Additionally, fears of an economic decline in China created a simultaneous collapse of commodity prices along with oil and gas prices. This punished shares in Latin America, South Africa, Canada, Australia, and just about every region in the United States where extraction industries are based.
The fall in commodity prices likely created significant stress in credit markets as well. This not only impacted high yield bonds, but drove share prices of companies with high debt exposure sharply lower. Banks that lent to these industries suffered the double impact of debtor stress and falling interest rates.
U.S. large cap stocks are well represented in the portfolio and provided the most solid equity returns for the year. Many investors examining their investment returns for 2015 may be wondering if there is reason to invest in anything except the S&P 500 Index ("S&P 500"). Disappointing returns came from U.S. small and mid-cap stocks. The Russell 2500 Index declined over -7% for the year, which rivaled poor returns posted by large non-U.S. companies in Europe, the Pacific Rim, and in Latin America. The major casualty was in emerging markets, which have large sensitivity to oil and commodity pricing. The MSCI Emerging Markets Index posted a decline of nearly -12% for the year, primarily driven down by poor returns in Latin America, China, and South Africa. The Fund's underweight Emerging Market exposure by approximately 2% helped contain the damage caused by the sell-off in this region. The surprise of the year, however, came from the returns of small stocks in Japan and in Europe, which outpaced even the S&P 500 for the year and posted a 1-year positive return of +3.2% as measured by the MSCI EAFE Small Cap Index. The Fund's holdings approached an 8% weighting in international small cap stocks before we took profits in late 2015. We intend to commit the Fund to this small but dynamic asset class for the long run, although its exposure will vary.
In short, we felt markets were due for a correction; we experienced that correction, and ended with a slight loss for the year.
those scenarios occur in the next year. We continue to strive to find competitive returns within the global equity markets while balancing risks in a turbulent investment landscape.
Sincerely,
Jeffrey P. Davis
Portfolio Manager
LMCG Investments, LLC
INVESTMENT CONSIDERATIONS
Equity Risk - The Fund's equity holdings, including common stocks, may decline in value. The value of a security may decline for a number of reasons, which are detailed in the prospectus.
Foreign and Emerging Markets Investing Risks - As a result of political or economic instability in foreign coun-tries, there can be special risks associated with investing in foreign securities, including fluctuations in currency exchange rates, increased price volatility and difficulty obtaining information. In addition, emerging markets may present additional risk due to potential for greater economic and political instability in less developed countries.
Market Events Risk - Turbulence in the financial markets and reduced liquidity in equity, credit and fixed-income markets may negatively affect issuers, which could adversely effect the Fund.
There can be no guarantee that any strategy (risk management or otherwise) will be successful. All investing involves risk, including the potential loss of principal.
| Shares | | Security Description | | Value | |
| Equity Securities - 92.4% |
| Common Stock - 91.7% |
| Australia - 1.2% |
| | 1,950 | | SAI Global, Ltd. | | $ | 5,634 | |
| | 4,456 | | Scentre Group REIT | | 15,168 | |
| | 452 | | South32, Ltd. (a) | | 508 | |
| | | 21,310 | |
| Belgium - 1.1% |
| | 106 | | Anheuser-Busch InBev SA/NV | | 13,169 | |
| | 160 | | Bekaert SA | | 6,491 | |
| | | 19,660 | |
| Brazil - 0.2% |
| | 400 | | Fibria Celulose SA | | 3,371 | |
| Canada - 2.0% |
| | 202 | | Canadian National Railway Co. | | 12,623 | |
| | 659 | | Goldcorp, Inc. | | 10,695 | |
| | 200 | | Intact Financial Corp. | | 14,003 | |
| | | 37,321 | |
| China - 1.0% |
| | 14,000 | | Industrial & Commercial Bank of China, Ltd., Class H | | 7,843 | |
| | 500 | | Tencent Holdings, Ltd. | | 10,222 | |
| | | 18,065 | |
| Denmark - 1.4% |
| | 329 | | DSV A/S | | 13,684 | |
| | 77 | | NKT Holding A/S | | 4,439 | |
| | 165 | | Royal Unibrew A/S | | 7,957 | |
| | | 26,080 | |
| France - 2.7% |
| | 197 | | BNP Paribas SA | | 9,897 | |
| | 113 | | Sanofi | | 9,085 | |
| | 298 | | TOTAL SA | | 13,559 | |
| | 223 | | Vinci SA | | 16,552 | |
| | | 49,093 | |
| Germany - 4.8% |
| | 77 | | Allianz SE | | 12,505 | |
| | 160 | | BASF SE | | 12,031 | |
| | 120 | | Bayer AG | | 14,062 | |
| | 154 | | Daimler AG | | 11,786 | |
| | 154 | | Freenet AG | | 4,600 | |
| | 57 | | Pfeiffer Vacuum Technology AG | | 6,380 | |
| | 150 | | SAP SE | | 12,070 | |
| | 138 | | Siemens AG | | 14,595 | |
| | | 88,029 | |
| Hong Kong - 0.3% |
| | 500 | | China Mobile, Ltd. | | 5,537 | |
| India - 0.8% |
| | 330 | | Infosys, Ltd., ADR | | 6,277 | |
| | 270 | | Reliance Industries, Ltd., GDR (b) | | 8,275 | |
| | | 14,552 | |
| Italy - 1.5% |
| | 95 | | DiaSorin SpA | | | 5,486 | |
| | 1,052 | | Enel SpA | | 4,663 | |
| | 563 | | Eni SpA | | 8,503 | |
| | 3,120 | | Intesa Sanpaolo SpA | | 8,627 | |
| | | 27,279 | |
| Japan - 5.6% |
| | 200 | | Coca-Cola West Co., Ltd. | | 4,945 | |
| | 300 | | Exedy Corp. | | 6,628 | |
| | 400 | | Honda Motor Co., Ltd. | | 10,937 | |
| | 300 | | Hoya Corp. | | 11,403 | |
| | 4 | | Japan Logistics Fund, Inc. REIT | | 8,356 | |
| | 2,000 | | Mitsubishi UFJ Financial Group, Inc. | | 9,267 | |
| | 3,000 | | Mitsui Engineering & Shipbuilding Co., Ltd. | | 4,475 | |
| | 4 | | Nomura Real Estate Master Fund, Inc. REIT | | 5,954 | |
| | 400 | | NS Solutions Corp. | | 7,846 | |
| | 800 | | Sumitomo Electric Industries, Ltd. | | 9,701 | |
| | 200 | | Tokyo Seimitsu Co., Ltd. | | 3,924 | |
| | 1,000 | | Toray Industries, Inc. | | 8,534 | |
| | 200 | | Toyota Motor Corp. | | 10,607 | |
| | | 102,577 | |
| Malaysia - 0.4% |
| | 4,800 | | IHH Healthcare Bhd | | 8,068 | |
| Malta - 0.5% |
| | 792 | | Unibet Group PLC, SDR | | 8,978 | |
| Mexico - 0.7% |
| | 5,500 | | America Movil SAB de CV, Class L | | 4,278 | |
| | 4,270 | | Gentera SAB de CV | | 8,428 | |
| | | 12,706 | |
| Netherlands - 0.6% |
| | 219 | | Royal Dutch Shell PLC, ADR | | 10,611 | |
| New Zealand - 0.3% |
| | 1,797 | | Trade Me Group, Ltd. | | 5,473 | |
| Russian Federation - 0.3% |
| | 180 | | Tatneft PAO, ADR | | 5,731 | |
| Singapore - 0.7% |
| | 4,000 | | Singapore Press Holdings, Ltd. | | 11,864 | |
| South Africa - 0.3% |
| | 1,120 | | Sappi, Ltd. (a) | | 4,955 | |
See Notes to Financial Statements. | 22 | LMCG FUNDS |
|
LMCG GLOBAL MULTICAP FUND SCHEDULE OF INVESTMENTS MARCH 31, 2016 |
| Shares | | Security Description | | Value | |
| South Korea - 1.1% |
| | 90 | | Dongbu Insurance Co., Ltd. | | $ | 5,986 | |
| | 323 | | Industrial Bank of Korea | | 3,460 | |
| | 7 | | Samsung Electronics Co., Ltd. | | 8,033 | |
| | 111 | | SK Hynix, Inc. | | 2,733 | |
| | | 20,212 | |
| Spain - 0.4% |
| | 1,643 | | Banco Santander SA | | 7,216 | |
| Sweden - 1.4% |
| | 434 | | Investor AB, Class B | | 15,342 | |
| | 979 | | Telefonaktiebolaget LM Ericsson, ADR | | 9,819 | |
| | | 25,161 | |
| Switzerland - 1.6% |
| | 232 | | Nestle SA | | 17,312 | |
| | 211 | | Wolseley PLC | | 11,911 | |
| | | 29,223 | |
| Taiwan - 1.6% |
| | 8,800 | | China Life Insurance Co., Ltd. | | 6,773 | |
| | 2,050 | | Hon Hai Precision Industry Co., Ltd. | | 5,396 | |
| | 2,000 | | Taiwan Semiconductor Manufacturing Co., Ltd. | | 9,976 | |
| | 4,347 | | Uni-President Enterprises Corp. | | 7,634 | |
| | | 29,779 | |
| United Kingdom - 5.6% |
| | 452 | | BHP Billiton PLC | | 5,062 | |
| | 2,462 | | BP PLC | | 12,318 | |
| | 205 | | British American Tobacco PLC | | 11,988 | |
| | 311 | | Galliford Try PLC | | 6,399 | |
| | 463 | | GlaxoSmithKline PLC | | 9,373 | |
| | 1,425 | | HSBC Holdings PLC | | 8,862 | |
| | 576 | | Royal Dutch Shell PLC, Class B | | 14,017 | |
| | 129 | | STERIS PLC | | 9,165 | |
| | 2,300 | | Taylor Wimpey PLC | | 6,268 | |
| | 160 | | Whitbread PLC | | 9,083 | |
| | 78 | | Willis Towers Watson PLC | | 9,255 | |
| | | 101,790 | |
| United States - 53.6% |
| | 303 | | Abbott Laboratories | | 12,674 | |
| | 153 | | AbbVie, Inc. | | 8,739 | |
| | 364 | | ACADIA Pharmaceuticals, Inc. (a) | | 10,177 | |
| | 620 | | AES Corp. | | 7,316 | |
| | 121 | | AGL Resources, Inc. | | 7,882 | |
| | 70 | | Akamai Technologies, Inc. (a) | | 3,890 | |
| | 36 | | Alphabet, Inc., Class A (a) | | 27,464 | |
| | 36 | | Amazon.com, Inc. (a) | | 21,371 | |
| | 495 | | American Eagle Outfitters, Inc. | | 8,252 | |
| | 227 | | AmerisourceBergen Corp. | | 19,647 | |
| | 274 | | Apache Corp. | | 13,374 | |
| | 395 | | Apple, Inc. | | 43,051 | |
| | 635 | | Applied Materials, Inc. | | 13,449 | |
| | 75 | | athenahealth, Inc. (a) | | 10,408 | |
| | 48 | | BlackRock, Inc. | | 16,347 | |
| | 46 | | Buffalo Wild Wings, Inc. (a) | | 6,814 | |
| | 198 | | Cabot Corp. | | 9,569 | |
| | 522 | | Cadence Design Systems, Inc. (a) | | 12,309 | |
| | 194 | | Capital One Financial Corp. | | 13,446 | |
| | 91 | | Casey's General Stores, Inc. | | 10,312 | |
| | 114 | | Caterpillar, Inc. | | 8,726 | |
| | 135 | | Cavium, Inc. (a) | | 8,257 | |
| | 96 | | Charles River Laboratories International, Inc. (a) | | 7,290 | |
| | 79 | | Chevron Corp. | | 7,537 | |
| | 378 | | Cisco Systems, Inc. | | 10,762 | |
| | 247 | | Comerica, Inc. | | 9,354 | |
| | 142 | | Danaher Corp. | | 13,470 | |
| | 743 | | Darling Ingredients, Inc. (a) | | 9,785 | |
| | 240 | | Dick's Sporting Goods, Inc. | | 11,220 | |
| | 244 | | Diebold, Inc. | | 7,054 | |
| | 188 | | Eagle Materials, Inc. | | 13,181 | |
| | 803 | | Fifth Third Bancorp | | 13,402 | |
| | 684 | | General Electric Co. | | 21,744 | |
| | 162 | | Gilead Sciences, Inc. | | 14,881 | |
| | 264 | | HealthSouth Corp. | | 9,934 | |
| | 303 | | International Paper Co. | | 12,435 | |
| | 1,246 | | Investors Bancorp, Inc. | | 14,503 | |
| | 488 | | JPMorgan Chase & Co. | | 28,899 | |
| | 266 | | Korn/Ferry International | | 7,525 | |
| | 89 | | Lithia Motors, Inc., Class A | | 7,772 | |
| | 286 | | Marsh & McLennan Cos., Inc. | | 17,386 | |
| | 52 | | Martin Marietta Materials, Inc. | | 8,295 | |
| | 161 | | MasterCard, Inc., Class A | | 15,214 | �� |
| | 139 | | MAXIMUS, Inc. | | 7,317 | |
| | 266 | | Merck & Co., Inc. | | 14,074 | |
| | 576 | | Micron Technology, Inc. (a) | | 6,031 | |
| | 378 | | Microsemi Corp. (a) | | 14,481 | |
| | 264 | | Microsoft Corp. | | 14,581 | |
| | 176 | | Neurocrine Biosciences, Inc. (a) | | 6,961 | |
| | 247 | | Nexstar Broadcasting Group, Inc., Class A | | 10,935 | |
| | 193 | | Oracle Corp. | | 7,896 | |
| | 200 | | PAREXEL International Corp. (a) | | 12,546 | |
| | 114 | | PepsiCo, Inc. | | 11,683 | |
| | 273 | | Pfizer, Inc. | | 8,092 | |
| | 50 | | Pioneer Natural Resources Co. | | 7,037 | |
| | 232 | | Portland General Electric Co. | | 9,162 | |
| | 256 | | Premier, Inc., Class A (a) | | 8,540 | |
| | 138 | | Quintiles Transnational Holdings, Inc. (a) | | 8,984 | |
| | 158 | | Regal Beloit Corp. | | 9,968 | |
| | 81 | | Rockwell Automation, Inc. | | 9,214 | |
| | 148 | | Schlumberger, Ltd. | | 10,915 | |
| | 258 | | Sonic Corp. | | 9,071 | |
| | 720 | | Southwestern Energy Co. (a) | | 5,810 | |
| | 348 | | Spectra Energy Corp. | | 10,649 | |
| | Level 1 | | Level 2 | | Level 3 | | Total |
| Investments At Value |
| Common Stock | | | | | | | | | | | | | | | | |
| Australia | | $ | - | | | $ | 21,310 | | | $ | - | | | $ | 21,310 | |
| Belgium | | | - | | | | 19,660 | | | | - | | | | 19,660 | |
| Brazil | | | 3,371 | | | | - | | | | - | | | | 3,371 | |
| Canada | | | 37,321 | | | | - | | | | - | | | | 37,321 | |
| China | | | - | | | | 18,065 | | | | - | | | | 18,065 | |
| Denmark | | | - | | | | 26,080 | | | | - | | | | 26,080 | |
| France | | | - | | | | 49,093 | | | | - | | | | 49,093 | |
| Germany | | | - | | | | 88,029 | | | | - | | | | 88,029 | |
| Hong Kong | | | - | | | | 5,537 | | | | - | | | | 5,537 | |
| India | | | 14,552 | | | | - | | | | - | | | | 14,552 | |
| Italy | | | - | | | | 27,279 | | | | - | | | | 27,279 | |
| Japan | | | - | | | | 102,577 | | | | - | | | | 102,577 | |
| Malaysia | | | - | | | | 8,068 | | | | - | | | | 8,068 | |
| Malta | | | - | | | | 8,978 | | | | - | | | | 8,978 | |
| Mexico | | | 12,706 | | | | - | | | | - | | | | 12,706 | |
| Netherlands | | | 10,611 | | | | - | | | | - | | | | 10,611 | |
| New Zealand | | | - | | | | 5,473 | | | | - | | | | 5,473 | |
| Russian Federation | | | 5,731 | | | | - | | | | - | | | | 5,731 | |
| Singapore | | | - | | | | 11,864 | | | | - | | | | 11,864 | |
| South Africa | | | - | | | | 4,955 | | | | - | | | | 4,955 | |
| South Korea | | | - | | | | 20,212 | | | | - | | | | 20,212 | |
| Spain | | | - | | | | 7,216 | | | | - | | | | 7,216 | |
| Sweden | | | 9,819 | | | | 15,342 | | | | - | | | | 25,161 | |
| Switzerland | | | - | | | | 29,223 | | | | - | | | | 29,223 | |
| Taiwan | | | - | | | | 29,779 | | | | - | | | | 29,779 | |
| United Kingdom | | | 18,420 | | | | 83,370 | | | | - | | | | 101,790 | |
| United States | | | 978,322 | | | | - | | | | - | | | | 978,322 | |
| Preferred Stock | | | | | | | | | | | | | | | | |
| Brazil | | | 12,113 | | | | - | | | | - | | | | 12,113 | |
| Exchange Traded Note | | | 9,795 | | | | - | | | | - | | | | 9,795 | |
| Investment Companies | | | 90,343 | | | | - | | | | - | | | | 90,343 | |
| Money Market Fund | | | - | | | | 11,124 | | | | - | | | | 11,124 | |
| Total Investments At Value | | $ | 1,203,104 | | | $ | 593,234 | | | $ | - | | | $ | 1,796,338 | |
The Fund utilizes the end of period methodology when determining transfers. There were no transfers among Level 1, Level 2 and Level 3 for the year ended March 31, 2016.
At March 31, 2016, foreign securities representing the following percentage of net assets of the Fund were fair valued by independent pricing services and are classified as using Level 2 inputs within the valuation inputs disclosure on the Fund's Schedule of Investments:
LMCG Global MultiCap Fund
Long Securities 31.91%
| PORTFOLIO HOLDINGS | | |
| % of Total Investments | | |
| Australia | 1.2 | % |
| Belgium | 1.1 | % |
| Brazil | 0.9 | % |
| Canada | 2.1 | % |
| China | 1.0 | % |
| Denmark | 1.4 | % |
| France | 2.7 | % |
| Germany | 4.9 | % |
| Hong Kong | 0.3 | % |
| India | 0.8 | % |
| Italy | 1.5 | % |
| Japan | 5.7 | % |
| Malaysia | 0.4 | % |
| Malta | 0.5 | % |
| Mexico | 0.7 | % |
| Netherlands | 0.6 | % |
| New Zealand | 0.3 | % |
| Russian Federation | 0.3 | % |
| Singapore | 0.7 | % |
| South Africa | 0.3 | % |
| South Korea | 1.1 | % |
| Spain | 0.4 | % |
| Sweden | 1.4 | % |
| Switzerland | 1.6 | % |
| Taiwan | 1.7 | % |
| United Kingdom | 5.7 | % |
| United States* | 60.7 | % |
| 100.0 | % |
| *Includes Money Market Fund totaling 0.6%. | | |
The aggregate value by input level, as of March 31, 2016, for each Fund's investments is included at the end of each Fund's Schedule of Investments.
Security Transactions, Investment Income and Realized Gain and Loss – Investment transactions are accounted for on the trade date. Dividend income and expense are recorded on the ex-dividend date. Foreign dividend income and expense are recorded on the ex-dividend date or as soon as possible after each Fund determines the existence of a dividend declaration after exercising reasonable due diligence. Income and capital gains on some foreign securities may be subject to foreign withholding taxes, which are accrued as applicable. Interest income is recorded on an accrual basis. Premium is amortized and discount is accreted using the effective interest method. Identified cost of investments sold is used to determine the gain and loss for both financial statement and federal income tax purposes.
Foreign Currency Translations – Foreign currency amounts are translated into U.S. dollars as follows: (1) assets and liabilities at the rate of exchange at the end of the respective period; and (2) purchases and sales of securities and income and expenses at the rate of exchange prevailing on the dates of such transactions. The portion of the results of operations arising from changes in the exchange rates and the portion due to fluctuations arising from changes in the market prices of securities are not isolated. Such fluctuations are included with the net realized and unrealized gain or loss on investments.
Foreign Currency Transactions – Each Fund may enter into transactions to purchase or sell foreign currency contracts and options on foreign currency. Forward currency contracts are agreements to exchange one currency for another at a future date and at a specified price. A fund may use forward currency contracts to facilitate transactions in foreign securities, to manage a fund's foreign currency exposure and to protect the U.S. dollar value of its underlying portfolio securities against the effect of possible adverse movements in foreign exchange rates. These contracts are intrinsically valued daily based on forward rates, and a fund's net equity therein, representing unrealized gain or loss on the contracts as measured by the difference between the forward foreign exchange rates at the dates of entry into the contracts and the forward rates at the reporting date, is recorded as a component of net asset value. These instruments involve market risk, credit risk, or both kinds of risks, in excess of the amount recognized in the Statements of Assets and Liabilities. Risks arise from the possible inability of counterparties to meet the terms of their contracts and from movement in currency and securities values and interest rates. Due to the risks associated with these transactions, a fund could incur losses up to the entire contract amount, which may exceed the net unrealized value included in its net asset value.
Securities Sold Short – The LMCG Global Market Neutral Fund may sell a security short to increase investment returns. The LMCG Global Market Neutral Fund may also sell a security short in anticipation of a decline in the market value of a security. A short sale is a transaction in which a Fund sells a security that it does not own. To complete the transaction, the Fund must borrow the security in order to deliver it to the buyer. The Fund must replace the borrowed security by purchasing it at market price at the time of replacement; the price may be higher or lower than the price at which the Fund sold the security. The Fund incurs a loss from a short sale if the price of the security increases between the date of the short sale and the date on which the Fund replaces the borrowed security. The Fund realizes a profit if the price of the security declines between those dates.
Until the Fund replaces the borrowed security, the Fund will maintain on its books and records cash and long securities to sufficiently cover its short position on a daily basis. The collateral for the securities sold short includes the Deposits with Brokers as shown on the Statement of Assets and Liabilities and the securities held long as shown on the Schedule of Investments. Dividends and interest paid on securities sold short are recorded as an expense on the LMCG Global Market Neutral Fund's Statement of Operations.
Distributions to Shareholders – Distributions to shareholders of net investment income and net capital gains, if any, are declared and paid at least annually. Distributions to shareholders are recorded on the ex-dividend date. Distributions are based on amounts calculated in accordance with applicable federal income tax regulations, which may differ from GAAP. These differences are due primarily to differing treatments of income and gain on various investment securities held by each Fund, timing differences and differing characterizations of distributions made by each Fund.
Federal Taxes – Each Fund intends to qualify each year as a regulated investment company under Subchapter M of the Internal Revenue Code of 1986, as amended ("Code") and to distribute all of its taxable income to shareholders. In addition, by distributing in each calendar year substantially all of its net investment income and capital gains, if any, the Fund will not be subject to a federal excise tax. Therefore, no federal income or excise tax provision is required. Each Fund files a U.S. federal income and excise tax return as required. A fund's federal income tax returns are subject to examination by the Internal Revenue Service for a period of three fiscal years after they are filed. As of March 31, 2016, there are no uncertain tax positions that would require financial statement recognition, de-recognition, or disclosure.
Income and Expense Allocation – The Trust accounts separately for the assets, liabilities and operations of each of its investment
|
LMCG FUNDS NOTES TO FINANCIAL STATEMENTS MARCH 31, 2016 |
portfolios. Expenses that are directly attributable to more than one investment portfolio are allocated among the respective investment portfolios in an equitable manner.
The Funds' class-specific expenses are charged to the operations of that class of shares. Income and expenses (other than expenses attributable to a specific class) and realized and unrealized gains or losses on investments are allocated to each class of shares based on the class' respective net assets to the total net assets of each Fund.
Commitments and Contingencies – In the normal course of business, each Fund enters into contracts that provide general indemnifications by each Fund to the counterparty to the contract. Each Fund's maximum exposure under these arrangements is dependent on future claims that may be made against each Fund and, therefore, cannot be estimated; however, based on experience, the risk of loss from such claims is considered remote.
Note 3. Fees and Expenses
Investment Adviser – LMCG Investments, LLC (the "Adviser") is the investment adviser to the Funds. Pursuant to an Investment Advisory Agreement, the Adviser receives an advisory fee at an annual rate of 1.00% and 0.85% of the average daily net assets of LMCG Global Market Neutral Fund and LMCG Global MultiCap Fund, respectively.
Distribution – Foreside Fund Services, LLC serves as each Fund's distributor (the "Distributor"). The Distributor is not affiliated with the Adviser or Atlantic Fund Administration, LLC (d/b/a Atlantic Fund Services) ("Atlantic") or their affiliates. The Funds have adopted a Distribution Plan (the "Plan") for Investor Shares in accordance with Rule 12b-1 of the Act. Under the Plan, the Funds pay the Distributor and/or any other entity as authorized by the Board a fee of up to 0.25% of the average daily net assets of Investor Shares.
Other Service Providers – Atlantic provides fund accounting, fund administration, compliance and transfer agency services to each Fund. Atlantic also provides certain shareholder report production, and EDGAR conversion and filing services. Pursuant to an Atlantic services agreement, each Fund pays Atlantic customary fees for its services. Atlantic provides a Principal Executive Officer, a Principal Financial Officer, a Chief Compliance Officer, and an Anti-Money Laundering Officer to each Fund, as well as certain additional compliance support functions.
Trustees and Officers – The Trust pays each independent Trustee an annual retainer fee of $50,000 for service to the Trust ($66,000 for the Chairman), and the Audit Committee Chairman and Vice Chairman receive an additional $6,000 annually. The Trustees and Chairman may receive additional fees for special Board meetings. Each Trustee is also reimbursed for all reasonable out-of-pocket expenses incurred in connection with his duties as a Trustee, including travel and related expenses incurred in attending Board meetings. The amount of Trustees' fees attributable to each Fund is disclosed in the Statements of Operations. Certain officers of the Trust are also officers or employees of the above named service providers, and during their terms of office received no compensation from each Fund.
Note 4. Expense Reimbursements and Fees Waived
The Adviser has contractually agreed to waive a portion of its fees and reimburse certain expenses through at least July 31, 2016, to limit total annual operating expenses (excluding all taxes, interest, portfolio transaction expenses, dividend and interest expenses on short sales, acquired fund fees and expenses, proxy expenses and extraordinary expenses) of Investor Shares and Institutional Shares to 1.85% and 1.60%, respectively of the LMCG Global Market Neutral Fund. The Adviser has also contractually agreed to waive a portion of its fees and reimburse certain expenses through at least July 31, 2016, to limit total annual operating expenses (excluding all taxes, interest, portfolio transaction expenses, acquired fund fees and expenses, proxy expenses and extraordinary expenses) of Investor Shares and Institutional Shares to 1.45% and 1.20%, respectively of the LMCG Global MultiCap Fund. Other Fund service providers have voluntarily agreed to waive a portion of their fees. The contractual waivers may be changed or eliminated at any time with consent of the Board and voluntary fee waivers and expense reimbursements may be reduced or eliminated at any time. For the year ended March 31, 2016, fees waived and expenses reimbursed were as follows:
| | Investment Adviser Fees Waived | | Investment Adviser Expenses Reimbursed | | Other Waivers | | Total Fees Waived and Expenses Reimbursed |
| LMCG Global Market Neutral Fund | $ | 434,999 | | $ | - | | $ | 73,218 | | $ | 508,217 |
| LMCG Global MultiCap Fund | | 15,754 | | | 160,873 | | | 113,997 | | | 290,624 |
Each Fund may repay the Adviser for fees waived and expenses reimbursed pursuant to the expense cap if such payment is made within three years of the fees waived or expense reimbursement and the resulting expenses do not exceed 1.85% and 1.60% for
|
LMCG FUNDS NOTES TO FINANCIAL STATEMENTS MARCH 31, 2016 |
Investor Shares and Institutional Shares, respectively of the LMCG Global Market Neutral Fund and 1.45% and 1.20% for Investor Shares and Institutional Shares, respectively of the LMCG Global MultiCap Fund. As of March 31, 2016, the amount of waived fees and reimbursed expenses subject to recapture by the Adviser are as follows:
| | | Amount of Fees Waived and/or Expenses Reimbursed | | Expiration Date to Recoup Fees Waived and/or Expenses Reimbursed | | Fees Recouped |
| LMCG Global Market Neutral Fund | | | | | | | | |
| March 31, 2014 | | $ | 214,404 | | March 31, 2017 | | $ | - |
| March 31, 2015 | | | 326,616 | | March 31, 2018 | | | - |
| March 31, 2016 | | | 434,999 | | March 31, 2019 | | | - |
| LMCG Global MultiCap Fund | | | | | | | | |
| March 31, 2014 | | | 97,994 | | March 31, 2017 | | | - |
| March 31, 2015 | | | 161,537 | | March 31, 2018 | | | - |
| March 31, 2016 | | | 176,627 | | March 31, 2019 | | | - |
Note 5. Security Transactions
The cost of purchases and proceeds from sales of investment securities (including maturities), other than short-term investments during the year ended March 31, 2016, were as follows:
| | Purchases | | Sales |
| LMCG Global Market Neutral Fund | | $ | 155,238,280 | | $ | 98,849,706 |
| LMCG Global MultiCap Fund | | | 849,601 | | | 795,258 |
Note 6. Federal Income Tax
Distributions paid during the fiscal years ended as noted were characterized for tax purposes as follows:
| | | Ordinary Income | | | | Long-Term Capital Gain | | | | Total | |
| LMCG Global MultiCap Fund | | | | | | | | | | | | |
| 2016 | | $ | 24,936 | | | $ | 24,810 | | | $ | 49,746 | |
| 2015 | | | 27,058 | | | | - | | | | 27,058 | |
There were no distributions paid during the fiscal year ended March 31, 2016, for the LMCG Global Market Neutral Fund.
As of March 31, 2016, distributable earnings (accumulated loss) on a tax basis were as follows:
| | | | Capital and Other Losses | | | | Unrealized Appreciation | | | | Total | |
| LMCG Global Market Neutral Fund | | $ | (1,233,724 | ) | | $ | 2,529,906 | | | $ | 1,296,182 | |
| LMCG Global MultiCap Fund | | | (17,176 | ) | | | 15,290 | | | | (1,886 | ) |
The difference between components of distributable earnings on a tax basis and the amounts reflected in the Statements of Assets and Liabilities are primarily due to differing book to tax treatment of investments in passive foreign investment holdings (PFICs) and wash sales for the LMCG Global Market Neutral Fund and PFICs, wash sales and reclassification of dividend income to return of capital on corporate securities for the LMCG Global MultiCap Fund.
For tax purposes, the current year post-October loss was $17,176 for LMCG Global MultiCap Fund, and the current deferred late year ordinary loss was $364,007 for the LMCG Global Market Neutral Fund (realized during the period November 1, 2015 through March 31, 2016). These losses will be recognized for tax purposes on the first business day of each Fund's next fiscal year, April 1, 2016.
The LMCG Global Market Neutral Fund has $869,717 available short term capital loss carryforwards that have no expiration date.
On the Statements of Assets and Liabilities, as a result of permanent book to tax differences, certain amounts have been reclassified for the year ended March 31, 2016. The following reclassifications were the result of net operating losses, short dividends, currency gain/loss, PFICs, Partnerships, reclassification of distributions and real estate investment trust return of capital and have no impact on the net assets of each Fund.
|
LMCG FUNDS NOTES TO FINANCIAL STATEMENTS MARCH 31, 2016 |
To Shareholders of the LMCG Global Market Neutral Fund and LMCG Global MultiCap Fund
and the Board of Trustees of Forum Funds
We have audited the accompanying statements of assets and liabilities of LMCG Global Market Neutral Fund and LMCG Global MultiCap Fund (the "Funds"), each a series of shares of beneficial interest in the Forum Funds, including the schedules of investments, as of March 31, 2016, and the related statements of operations for the year then ended, the statements of changes in net assets for each of the years in the two-year period then ended and the financial highlights for each of the years in the two-year period then ended and for the period May 21, 2013 (commencement of operations) through March 31, 2014 for LMCG Global Market Neutral Fund and for the period September 11, 2013 (commencement of operations) through March 31, 2014 for LMCG Global MultiCap Fund. These financial statements and financial highlights are the responsibility of the Funds' management. Our responsibility is to express an opinion on these financial statements and financial highlights based on our audits.
We conducted our audits in accordance with the standards of the Public Company Accounting Oversight Board (United States). Those standards require that we plan and perform the audits to obtain reasonable assurance about whether the financial statements and financial highlights are free of material misstatement. An audit includes examining, on a test basis, evidence supporting the amounts and disclosures in the financial statements. Our procedures included confirmation of securities owned as of March 31, 2016 by correspondence with the custodian and brokers. An audit also includes assessing the accounting principles used and significant estimates made by management, as well as evaluating the overall financial statement presentation. We believe that our audits provide a reasonable basis for our opinion.
In our opinion, the financial statements and financial highlights referred to above present fairly, in all material respects, the financial position of LMCG Global Market Neutral Fund and LMCG Global MultiCap Fund as of March 31, 2016, and the results of their operations for the year then ended, the changes in their net assets for each of the years in the two-year period then ended and their financial highlights for each of the years in the two-year period then ended and for the period May 21, 2013 through March 31, 2014 for LMCG Global Market Neutral Fund and for the period September 11, 2013 through March 31, 2014 for LMCG Global MultiCap Fund, in conformity with accounting principles generally accepted in the United States of America.
BBD, LLP
Philadelphia, Pennsylvania
May 24, 2016
|
LMCG FUNDS ADDITIONAL INFORMATION (Unaudited) MARCH 31, 2016 |
Investment Advisory Agreement Approval
At the December 11, 2015 Board meeting, the Board, including the Independent Trustees, considered the approval of the continuance of the investment advisory agreement between the Adviser and the Trust pertaining to the LMCG Global Market Neutral Fund and the LMCG Global MultiCap Fund (the "Advisory Agreement"). In preparation for its deliberations, the Board requested and reviewed written responses from the Adviser to a due diligence questionnaire circulated on the Board's behalf. The Board also discussed the materials with Trustee counsel and, as necessary, with the Trust's administrator, Atlantic Fund Services. During its deliberations, the Board received an oral presentation from the Adviser, and was assisted by the advice of Trustee counsel.
At the meeting, the Board reviewed, among other matters: (1) the nature, extent and quality of the services provided or to be provided to the Funds by the Adviser, including information on the investment performance of the Funds and Adviser; (2) the costs of the services provided or to be provided and profitability to the Adviser based on its relationship with the Funds; (3) the advisory fee and total expense ratio of the Funds compared to a relevant peer group of funds; (4) the extent to which economies of scale may be realized as the Funds grow and whether the advisory fee enables each Fund's investors to share in the benefits of economies of scale; and (5) other benefits received by the Adviser from its relationship with the Funds.
Nature, Extent and Quality of Services
Based on written materials received, a presentation from senior representatives of the Adviser and a discussion with the Adviser about the Adviser's personnel, operations and financial condition and with the Trust's CCO about the Adviser, the Board considered the quality of services provided (or to be provided) by the Adviser under the Advisory Agreement. In this regard, the Board considered information regarding the experience, qualifications and professional background of the portfolio managers and other personnel at the Adviser with principal responsibility for the Funds, as well as the investment philosophy and decision-making process of those professionals and the capability and integrity of the Adviser's senior management and staff.
The Board considered also the adequacy of the Adviser's resources. The Board noted the Adviser's representations that the firm is in stable financial condition and concluded that the firm's financial condition would not impair its ability to provide high-quality advisory services to the Funds. Based on the presentation and the materials provided by the Adviser in connection with the Board's consideration of the approval of the Advisory Agreement, the Board concluded that, overall, it was satisfied with the nature, extent and quality of services to be provided to the Funds under the Advisory Agreement.
Performance
In connection with a presentation by the Adviser regarding its management of the Funds, the Board reviewed the performance of the Funds compared to their respective benchmarks and a peer group. With respect to the LMCG Global MultiCap Fund, the Board observed that the Fund outperformed its primary benchmark, the MSCI All Country World Investable Market Index, for the one-year period ended September 30, 2015. The Board also observed that the LMCG Global MultiCap Fund had outperformed its benchmark for the period since the Fund's inception on September 11, 2013. The Board also considered the LMCG Global MultiCap Fund's performance relative to its Lipper, Inc. ("Lipper") peer group, noting that the Fund outperformed the median of its Lipper peers for the one-year period ended September 30, 2015. The Board noted the Adviser's representation that the LMCG Global MultiCap Fund's performance compared to its benchmark and Lipper peers could be attributed, in part, to asset allocation and stock selection in certain market sectors that performed well during the period.
With respect to the LMCG Global Market Neutral Fund, the Board observed that the Fund had outperformed its primary benchmark, the Citigroup 3-Month U.S. T-Bill Index, for the one-year period ended September 30, 2015. The Board observed that the LMCG Global Market Neutral Fund had also outperformed its benchmark for the period since the Fund's inception on May 21, 2013. The Board also considered the LMCG Global Market Neutral Fund's performance relative to its Lipper peer group, noting that the LMCG Global Market Neutral Fund had outperformed the median of its Lipper peers for the one-year period ended September 30, 2015. The Board noted the Adviser's representation that the recent outperformance of the LMCG Global Market Neutral Fund relative to its benchmark and peer group could be attributed to stock selection and, to a lesser extent, sector and asset allocation. Based on the foregoing, the Board determined that each Fund's performance was reasonable and that the Funds and their shareholders could benefit from the Adviser's management.
Compensation
The Board evaluated the Adviser's compensation for providing advisory services to the Funds and analyzed comparative information on actual advisory fee rates and actual total expenses of each Fund's relevant Lipper peer group. The Board noted that the Adviser's actual advisory fee rate for the LMCG Global MultiCap Fund was the lowest of its Lipper peer group, but that the actual total expense ratio was higher than the median of its Lipper peer group. The Board noted that the Adviser's actual advisory
|
LMCG FUNDS ADDITIONAL INFORMATION (Unaudited) MARCH 31, 2016 |
fee rate for the LMCG Global Market Neutral Fund was the lowest in the peer group and that actual total expenses for the LMCG Global Market Neutral Fund were lower than the median of the peer group. Based on the foregoing, the Board concluded that the Adviser's advisory fee rate charged to each Fund was reasonable.
Cost of Services and Profitability
The Board considered information provided by the Adviser regarding the costs of services and its profitability with respect to each Fund. In this regard, the Board considered the Adviser's resources devoted to the Funds in the aggregate, as well as the Adviser's discussion of the aggregate costs and profitability of its mutual fund activities. Based on these and other applicable considerations, the Board concluded that the Adviser's profits attributable to management of the Funds were reasonable in the context of all factors considered.
Economies of Scale
The Board considered whether the Funds would benefit from any economies of scale. In this respect, the Board noted the Adviser's representation that each Fund could benefit from economies of scale as assets grow, but that the Adviser had determined that breakpoints were not appropriate at this time. The Board noted that the Funds had been in operation for fewer than three years. Based on the foregoing information, the Board concluded that economies of scale were not a material factor in approving the continuation of the Advisory Agreement.
Other Benefits
The Board noted the Adviser's representation that it would be receiving a benefit arising from the use of soft dollars in connection with Fund trades, which will be used for the acquisition of research that may benefit not only the Funds, but potentially other clients of the Adviser. The Board concluded that the other benefits received were not a material factor in approving the continuation of the Advisory Agreement.
Conclusion
The Board did not identify any single factor as being of paramount importance, and different Trustees may have given different weight to different factors. The Board reviewed a memorandum from Fund Counsel discussing the legal standards applicable to its consideration of the Advisory Agreement. Based on its review, including consideration of each of the factors referenced above, the Board determined, in the exercise of its reasonable business judgment, that the advisory arrangement, as outlined in the Advisory Agreement, was fair and reasonable in light of the services performed or to be performed, expenses incurred or to be incurred and such other matters as the Board considered relevant.
Proxy Voting Information
A description of the policies and procedures that each Fund uses to determine how to vote proxies relating to securities held in each Fund's portfolio is available, without charge and upon request, by calling (877) 591-4667 and on the U.S. Securities and Exchange Commission's (the "SEC") website at www.sec.gov. Each Fund's proxy voting record for the most recent twelve-month period ended June 30 is available, without charge and upon request, by calling (877) 591-4667 and on the SEC's website at www.sec.gov.
Availability of Quarterly Portfolio Schedules
Each Fund files its complete schedule of portfolio holdings with the SEC for the first and third quarters of each fiscal year on Form N-Q. These filings are available, without charge and upon request on the SEC's website at www.sec.gov or may be reviewed and copied at the SEC's Public Reference Room in Washington, DC. Information on the operation of the Public Reference Room may be obtained by calling (800) SEC-0330.
Shareholder Expense Example
As a shareholder of the Funds, you incur ongoing costs, including management fees and other Fund expenses. This example is intended to help you understand your ongoing costs (in dollars) of investing in the Funds and to compare these costs with the ongoing costs of investing in other mutual funds.
The example is based on an investment of $1,000 invested at the beginning of the period and held for the entire period from October 1, 2015, through March 31, 2016.
|
LMCG FUNDS ADDITIONAL INFORMATION (Unaudited) MARCH 31, 2016 |
Actual Expenses – The first line under each share class of the table below provides information about actual account values and actual expenses. You may use the information in this line, together with the amount you invested, to estimate the expenses that you paid over the period. Simply divide your account value by $1,000 (for example, an $8,600 account value divided by $1,000 = 8.6), then multiply the result by the number in the first line under the heading entitled "Expenses Paid During Period" to estimate the expenses you paid on your account during the period.
Hypothetical Example for Comparison Purposes – The second line under each share class of the table below provides information about hypothetical account values and hypothetical expenses based on each Fund's actual expense ratio and an assumed rate of return of 5% per year before expenses, which is not each Fund's actual return. The hypothetical account values and expenses may not be used to estimate the actual ending account balance or expenses you paid for the period. You may use this information to compare the ongoing costs of investing in each Fund and other funds. To do so, compare this 5% hypothetical example with the 5% hypothetical examples that appear in the shareholder reports of other funds.
Please note that the expenses shown in the table are meant to highlight your ongoing costs only. Therefore, the second line of the table is useful in comparing ongoing costs only, and will not help you determine the relative total costs of owning different funds.
| | Beginning | | Ending | | Expenses | | Annualized |
| | Account Value | | Account Value | | Paid During | | Expense |
| | October 1, 2015 | | March 31, 2016 | | Period* | | Ratio* |
| LMCG Global Market Neutral Fund | | | | | | | | | | | |
| Investor Shares | | | | | | | | | | | |
| Actual | $ | 1,000.00 | | $ | 979.52 | | $ | 9.16 | | 1.85 | % |
| Hypothetical (5% return before taxes) | $ | 1,000.00 | | $ | 1,015.75 | | $ | 9.32 | | 1.85 | % |
| Institutional Shares | | | | | | | | | | | |
| Actual | $ | 1,000.00 | | $ | 980.45 | | $ | 7.92 | | 1.60 | % |
| Hypothetical (5% return before taxes) | $ | 1,000.00 | | $ | 1,017.00 | | $ | 8.07 | | 1.60 | % |
| LMCG Global MultiCap Fund | | | | | | | | | | | |
| Investor Shares | | | | | | | | | | | |
| Actual | $ | 1,000.00 | | $ | 1,029.68 | | $ | 7.36 | | 1.45 | % |
| Hypothetical (5% return before taxes) | $ | 1,000.00 | | $ | 1,017.75 | | $ | 7.31 | | 1.45 | % |
| Institutional Shares | | | | | | | | | | | |
| Actual | $ | 1,000.00 | | $ | 1,030.77 | | $ | 6.09 | | 1.20 | % |
| Hypothetical (5% return before taxes) | $ | 1,000.00 | | $ | 1,019.00 | | $ | 6.06 | | 1.20 | % |
| * | Expenses are equal to each Fund's annualized expense ratio multiplied by the average account value over the period, multiplied by the number of days in the most recent fiscal half-year divided by 366 to reflect the half-year period. |
Federal Tax Status of Dividends Declared during the Fiscal Year
For federal income tax purposes, dividends from short-term capital gains are classified as ordinary income. LMCG Global MultiCap Fund designates 77.66% of its income dividend distributed as qualifying for the corporate dividends received deduction (DRD) and 95.46% for the qualified dividend rate (QDI) as defined in Section 1(h)(11) of the Internal Revenue Code.
Trustees and Officers of the Trust
The Board is responsible for oversight of the management of the Trust's business affairs and of the exercise of all the Trust's powers except those reserved for the shareholders. The following table provides information about each Trustee and certain officers of the Trust. Each Trustee and officer holds office until the person resigns, is removed, or is replaced. Unless otherwise noted, the persons have held their principal occupations for more than five years. The address for all Trustees and officers is Three Canal Plaza, Suite 600, Portland, Maine 04101. Mr. Keffer is considered an Interested Trustee due to his affiliation with Atlantic. Each Fund's Statement of Additional Information includes additional information about the Trustees and is available, without charge and upon request, by calling (877) 591-4667.
|
LMCG FUNDS ADDITIONAL INFORMATION (Unaudited) MARCH 31, 2016 |
FOR MORE INFORMATION:
P.O. Box 588
Portland, ME 04112
(877) 591-4667 (toll free)
INVESTMENT ADVISER
LMCG Investments, LLC
200 Clarendon Street, 28th Floor
Boston, MA 02116
TRANSFER AGENT
Atlantic Fund Services
P.O. Box 588
Portland, ME 04112
www.atlanticfundservices.com
DISTRIBUTOR
Foreside Fund Services, LLC
Three Canal Plaza, Suite 100
Portland, Maine 04101
www.foreside.com
This report is submitted for the general information of the shareholders of the Funds. It is not authorized for distribution to prospective investors unless preceded or accompanied by an effective prospectus, which includes information regarding the Funds' risks, objectives, fees and expenses, experience of its management, and other information.
210-ANR-0316
| |
A MESSAGE TO OUR SHAREHOLDERS (Unaudited) | MARCH 31, 2016 |
Dear Shareholder,
We present the annual report for the Merk Hard Currency Fund®, and Merk Absolute Return Currency Fund® (individually a "Fund" and collectively the "Funds") with respect to the period April 1, 2015 through March 31, 2016 (the "Period").
| · | The Merk Hard Currency Fund seeks to profit from a rise in hard currencies relative to the U.S. dollar. |
| · | The Merk Absolute Return Currency Fund seeks to generate positive absolute returns by investing in securities and instruments that create exposure to currencies. |

Merk Hard Currency Fund Investor Shares posted a return of +3.37% for the 12-month period ended March 31, 2016. In comparison, the JPMorgan 3-Month Global Cash Index ("reference basket") posted a return of +4.08% during the Period. As of March 31, 2016, the Investor Shares of the Fund had a five-year annualized return of -3.47% and an annualized return of +1.91% since inception on May 10, 2005; this compares to a five-year annualized return of -3.47% and an annualized return of +1.02% since May 10, 2005 for the reference basket. The Fund's performance data represents past performance and is no guarantee of future results. Current performance may be lower or higher than the performance data quoted. Investment return and principal value will fluctuate so that an investor's shares, when redeemed, may be worth more or less than original cost. Please visit www.merkfunds.com for most recent month end performance. The Fund's expense ratio for the Investor Shares is 1.30%.
The Fund's performance is foremost influenced by changes in exchange rates of currencies to which the Fund has exposure. Over the Period the Japanese yen returned +6.72%, the Swedish krona returned +6.33%, the Euro returned +6.05%, the Singapore dollar returned +1.77%, the Swiss franc returned +1.13%, the Australian dollar returned +0.66%, the Canadian dollar returned -2.45%, the Norwegian krone returned -2.51%, the British pound returned -3.09%, and the New Zealand dollar returned -7.51%. Gold returned +4.16% during the Period, as measured by the spot price of gold per troy ounce.
We adapt currency allocations as our analysis of monetary policies and economic environments evolves. In the second quarter of 2015, the U.S. dollar had a broad pullback from the prior year's rally. In Q3 2015, the Japanese yen was the best performer along with the euro in a risk-off environment. Both currencies likely had been used as "funding" currencies for long positions in so-called "risk assets," such as global equities (one refers to a funding currency when investors borrow in a currency with low interest rates to buy higher yielding assets; this process equates to a shorting of the currency, exerting downward pressure). The Q3 rally in the euro was likely related to position unwinding in light of the global correction in risk assets.
In Q4 gold and the currencies of two oil producing countries in which the Fund invests, the Canadian dollar and the Norwegian krone, underperformed as the Federal Reserve ("Fed") hiked rates and oil made new lows. The Fund closed its three-year strategic short position in the Japanese yen and entered a tactical long position.
In Q1 2016 the U.S. dollar weakened broadly, falling versus all G10 currencies with the exception of the British pound. The dollar fell most notably against gold and the Japanese yen, where the Fund benefited given its strategic gold position and new long Japanese yen position. The Canadian dollar and the Norwegian krone were strong in the quarter likely because of the contemporaneous rebound in oil prices. British pound weakness was likely driven by concerns over a potential British exit from the European Union. The Fund was well positioned on the British pound as its long exposure was closed in late Q4 2015. The dollar decline accelerated following the March Fed meeting, when the Fed lowered rate guidance.
Merk Absolute Return Currency Fund Investor Shares posted a return of +1.72% for the 12-month period ending March 31, 2016. In comparison, the Citigroup 3-Month U.S. T-Bill Index ("reference basket") increased +0.08% during the Period. As of March 31, 2016, the Investor Shares had a five-year annualized return of -1.88% and an annualized return of -0.84% since inception on September 9, 2009; this compares to a five-year annualized return of +0.06% and an annualized return of +0.07% since August 31, 2009 for the reference basket.1 The Fund's performance data represents past performance and is no guarantee of future results. Current performance may be lower or higher than the performance data quoted. Investment return and principal value will fluctuate so that an investor's shares, when redeemed, may be worth more or less than original cost. Please visit www.merkfunds.com for most recent month end performance. The Fund's expense ratio for the Investor Shares is 1.30%.
The Fund's performance is foremost influenced by changes in exchange rates of currencies to which the Fund has exposure. The Fund employs a periodic currency allocation process based on strategic and tactical considerations. We consider factors that lead to gradual allocation changes to be "strategic," in contrast we consider factors that lead to allocation changes over shorter periods "tactical." As such, currency exposures can change significantly from one holding period to the next and the Fund may have a net long or net short U.S. dollar currency exposure at any time.
The Fund can take offsetting positions in otherwise highly correlated2 currencies, on a short-term view that such currency positioning may yield profitable returns. Indeed, during the Period, the Fund held both long and short positions at various points in time in the majority of currencies the Fund invests in. Such allocations may generate returns that are unlikely to be correlated to traditional asset classes. Holding offsetting positions in otherwise correlated currencies may also help contain the volatility of the Fund.
1 Note that data is not available for the reference basket on the inception date of the Merk Absolute Return Currency Fund (September 9, 2009). As such, performance for the reference basket is calculated for the time period August 31, 2009 through March 31, 2016, whereas performance for the Fund is calculated for the period since inception through March 31, 2016.
2 A statistical measure of how two variables move in relation to each other.
The Fund's investment process integrates the Merk hard currency strategy investment process to the underlying quantitative model and employs frequent currency rebalancing to be able to swiftly react to changing market sentiment. The result is a hybrid quantitative and systematic macro discretionary approach. The quantitative model provides a rules-based discipline while the tactical allocation includes a systematic discretionary macro overlay seeking to manage risk and capture upside potential based on more qualitative judgments. The enhanced investment process provides for a more active management that incorporates a holistic approach to risk management in response to increased policy intervention risk globally.
Outlook
In last year's outlook we suggested that the Fed's attempt to exit ultra-accommodative monetary policy might not go entirely smoothly. Over the past year we have seen two sharp declines in the U.S. equity markets around attempted Fed hikes, with the Fed actually following through on a rate hike at their December 2015 meeting. Our view continues to be that the Fed will have difficulty raising rates without destabilizing global economies, particularly China and emerging markets, both tied closely to the U.S. dollar as the world's reserve currency. Negative effects to China would likely spill back to the U.S. economy, therefore we view it as unlikely that the Fed will pursue even the gradual rate path currently projected in the Federal Open Market Committee's ("FOMC") Summary of Economic Projections.
In our view, the Fed's March 2016 meeting marked a significant, and likely lasting, shift in stance from the Fed. Notably, Chair Yellen backed away from her view that as the unemployment rate falls inflationary pressures will build. In our view, the message from the Fed was that deflationary pressures are more significant than previously thought and with concerns about global growth, particularly with respect to China, the risks are asymmetric to the downside. We think that going forward, the Fed will be guided by the outlook for global growth and by incoming inflation readings. It may be that the Fed will be "behind the curve," meaning that the rate hikes will only come as inflation ticks up. As a result, interest rates net of inflation, i.e. real rates of return, may be near zero or even negative for the foreseeable future.
The dollar could remain weak throughout 2016 if expectations about Fed rate hikes continue to adjust lower. Dollar weakness may be exacerbated by the fact that the European Central Bank (ECB) indicated at its March press conference that interest rates may not go any lower. While it may be premature to reach conclusions, market perception may be sinking in that the U.S. is nearing the top of its interest rate cycle just as other major economies may be near the lower bound on interest rates. We continue to see long term value in gold with a Fed that promises to be gradual with interest rate increases and a lower for longer approach to interest rates globally.
If you know of friends who might benefit from the Merk Funds, please ask them to call us or visit merkfunds.com to learn more about the Funds.
Sincerely,
Axel G. Merk
President & Chief Investment Officer
The views in this Report were those of the Fund Manager as of March 31, 2016 and may not reflect the views of the Manager on the date this Report is first published or anytime thereafter. These views are intended to assist shareholders of the Fund in understanding their investments in a Fund and do not constitute investment advice.
Since the Funds primarily invest in foreign currencies, changes in currency exchange rates will affect the value of what the respective Fund owns and the price of the Fund's shares. Investing in foreign instruments bears a greater risk than investing in domestic instruments for reasons such as volatility of currency exchange rates and, in some cases, limited geographic focus, political and economic instability, and relatively illiquid markets. The Funds are subject to interest rate risk, which is the risk that debt securities in a Fund's portfolio will decline in value because of increases in market interest rates. As a non-diversified fund, the Merk Hard Currency Fund will be subject to more investment risk and potential for volatility than a diversified fund because its portfolio may, at times, focus on a limited number of issuers. The Funds may also invest in derivative securities, which can be volatile and involve various types and degrees of risk.
The Citigroup 3-Month U.S. T-Bill Index is an unmanaged index representing monthly return equivalents of yield averages of the last 3-month Treasury Bill issues. It is not possible to invest directly in an unmanaged index.
The JPMorgan 3-Month Global Cash Index tracks total returns of three-month constant maturity euro-currency deposits. The euro-currency deposits are the only short-term securities consistent across all markets in terms of liquidity, maturity and credit quality. The index is unmanaged and includes reinvested distributions. One cannot invest directly in an index, nor is an index representative of the Fund's portfolio.
JPMorgan does not sponsor, endorse or promote the Merk Hard Currency Fund in connection with any reference to the JPMorgan 3-Month Global Cash Index. JPMorgan makes no representation or warranty, express or implied regarding the advisability of investing in securities generally or in any product particularly or the ability of the JPMorgan 3-Month Global Cash Index to track general bond market performance.
| |
MERK HARD CURRENCY FUND PERFORMANCE CHART AND ANALYSIS (Unaudited) | MARCH 31, 2016 |
The following chart reflects the change in the value of a hypothetical $10,000 investment in Investor Shares, including reinvested dividends and distributions, in Merk Hard Currency Fund (the "Fund") compared with the performance of the benchmark, JPMorgan 3-Month Global Cash Index, since inception. The JPMorgan 3-Month Global Cash Index tracks total returns of three-month constant maturity euro-currency deposits. The euro-currency deposits are the only short-term securities consistent across all markets in terms of liquidity, maturity and credit quality. The total return of the JPMorgan 3-Month Global Cash Index includes reinvestment of distributions. The total return of the Fund includes operating expenses that reduce returns, while the total return of the JPMorgan 3-Month Global Cash Index does not include expenses. The Fund is professionally managed while the JPMorgan 3-Month Global Cash Index is unmanaged and is not available for investment, nor is the JPMorgan 3-Month Global Cash Index representative of the Fund's portfolio.
Comparison of Change in Value of a $10,000 Investment
Merk Hard Currency Fund Investor Shares vs. JPMorgan 3-Month Global Cash Index
| Average Annual Total Returns | | | | | | | | Since Inception |
| Periods Ended March 31, 2016 | | One Year | | Five Year | | Ten Year | | (05/10/05) |
| Merk Hard Currency Fund Investor Shares | | 3.37 | % | | -3.47 | % | | 2.12 | % | | 1.91 | % |
| Merk Hard Currency Fund Institutional Shares* | | 3.66 | % | | -3.20 | % | | 2.30 | % | | 2.07 | % |
| JPMorgan 3-Month Global Cash Index | | 4.08 | % | | -3.47 | % | | 1.47 | % | | 1.02 | % |
| | | | | | | | | | | | | |
| * | For the Institutional Shares, performance for the above five year, ten year and since inception periods are blended average annual returns which include the returns of the Investor Shares prior to April 1, 2010, the commencement of operations of the Institutional Shares. |
Performance data quoted represents past performance and is no guarantee of future results. Current performance may be lower or higher than the performance data quoted. Investment return and principal value will fluctuate so that shares, when redeemed, may be worth more or less than original cost. As stated in the Fund's prospectus, the annual operating expense ratios (gross) for Investor and Institutional Class are 1.30% and 1.05%, respectively. The performance table and graph do not reflect the deduction of taxes that a shareholder would pay on Fund distributions or the redemption of Fund shares. Returns greater than one year are annualized. For the most recent month-end performance, please call (866) 637-5386 or visit www.merkfunds.com.
| |
MERK ABSOLUTE RETURN CURRENCY FUND PERFORMANCE CHART AND ANALYSIS (Unaudited) | MARCH 31, 2016 |
The following chart reflects the change in the value of a hypothetical $10,000 investment in Investor Shares, including reinvested dividends and distributions, in Merk Absolute Return Currency Fund (the "Fund") compared with the performance of the benchmark, Citigroup 3-Month U.S. T-Bill Index, since inception. The Citigroup 3-Month U.S. T-Bill Index measures return equivalents of yield averages that are not marked to market and consists of the last three three-month Treasury bill month-end rates. The total return of the Citigroup 3-Month U.S. T-Bill Index includes reinvestment of distributions. The total return of the Fund includes operating expenses that reduce returns, while the total return of the Citigroup 3-Month U.S. T-Bill Index does not include expenses. The Fund is professionally managed while the Citigroup 3-Month U.S. T-Bill Index is unmanaged and is not available for investment, nor is the Citigroup 3-Month U.S. T-Bill Index representative of the Fund's portfolio.
Comparison of Change in Value of a $10,000 Investment
Merk Absolute Return Currency Fund Investor Shares vs. Citigroup 3-Month U.S. T-Bill Index
| Average Annual Total Returns | | | | | | | Since Inception |
| Periods Ended March 31, 2016 | | One Year | | Five Year | | (09/09/09) | |
| Merk Absolute Return Currency Fund Investor Shares | | 1.72 | % | | -1.88 | % | | | -0.84 | % |
| Merk Absolute Return Currency Fund Institutional Shares* | | 1.93 | % | | -1.63 | % | | | 0.59 | % |
| Citigroup 3-Month U.S. T-Bill Index** | | 0.08 | % | | 0.06 | % | | | 0.07 | % |
| | | | | | | | | | | |
| * | For the Institutional Shares, performance for the above five year and since inception periods are blended average annual returns which include the returns of the Investor Shares prior to April 1, 2010, the commencement of operations of the Institutional Shares. |
| ** | Since inception return for the Citigroup 3-Month U.S. T-Bill Index is for the period beginning August 31, 2009. |
Performance data quoted represents past performance and is no guarantee of future results. Current performance may be lower or higher than the performance data quoted. Investment return and principal value will fluctuate so that shares, when redeemed, may be worth more or less than original cost. As stated in the Fund's prospectus, the annual operating expense ratios (gross) for Investor and Institutional Class are 1.30% and 1.05%, respectively. The performance table and graph do not reflect the deduction of taxes that a shareholder would pay on Fund distributions or the redemption of Fund shares. Returns greater than one year are annualized. For the most recent month-end performance, please call (866) 637-5386 or visit www.merkfunds.com.
| |
MERK HARD CURRENCY FUND SCHEDULE OF INVESTMENTS | MARCH 31, 2016 |
| Principal | | Security Description | | Currency | | Rate | | Maturity | | Value in USD |
Foreign Bonds(a) - 48.7% |
| Non-U.S. Government - Australia - 1.4% |
| | 2,200,000 | | Australia Government Bond, Series 130 (b) | | AUD | | 4.750 | % | 06/15/16 | $ | 1,695,832 | |
| Non-U.S. Government - Austria - 2.0% |
| | 2,000,000 | | Austria Government Bond (b) | | EUR | | 1.950 | | 06/18/19 | | 2,446,992 | |
| Non-U.S. Government - New Zealand - 0.3% |
| | 500,000 | | New Zealand Government Bond, Series 1217 (b) | | NZD | | 6.000 | | 12/15/17 | | 368,837 | |
| Non-U.S. Government Agency - Germany - 4.7% |
| | 5,000,000 | | KFW | | EUR | | 1.375 | | 02/21/17 | | 5,777,305 | |
| Non-U.S. Government Agency - Norway - 1.3% |
| | 13,000,000 | | Kommunalbanken AS, EMTN (b) | | NOK | | 3.000 | | 09/02/16 | | 1,582,677 | |
| Non-U.S. Government Agency - Sweden - 15.6% |
| | 155,000,000 | | Kommuninvest I Sverige AB, Series 1610, MTN | | SEK | | 2.000 | | 10/12/16 | | 19,350,442 | |
| Regional Authority - Australia - 2.5% |
| | 4,000,000 | | New South Wales Treasury Corp., Series 16 | | AUD | | 6.000 | | 04/01/16 | | 3,066,520 | |
| Regional Authority - Canada - 3.6% |
| | 1,700,000 | | Province of Alberta Canada | | CAD | | 1.850 | | 09/01/16 | | 1,315,312 | |
| | 4,000,000 | | Province of Saskatchewan Canada | | CAD | | 4.500 | | 08/23/16 | | 3,125,775 | |
| | 4,441,087 | |
| Regional Authority - Norway - 0.4% |
| | 4,000,000 | | City of Oslo Norway | | NOK | | 4.650 | | 11/10/16 | | 492,451 | |
| Regional Authority - Sweden - 2.1% |
| | 14,000,000 | | City of Gothenburg Sweden, EMTN | | SEK | | 1.630 | | 12/05/16 | | 1,746,671 | |
| | 7,000,000 | | City of Gothenburg Sweden, EMTN | | SEK | | 4.325 | | 04/10/17 | | 902,727 | |
| | 2,649,398 | |
| Supranational - Europe - 14.8% |
| | 4,850,000 | | European Financial Stability Facility, EMTN (b) | | EUR | | 2.750 | | 12/05/16 | | 5,634,113 | |
| | 4,100,000 | | European Investment Bank, EMTN | | EUR | | 3.125 | | 03/03/17 | | 4,814,243 | |
| | 5,000,000 | | European Stability Mechanism, EMTN (b)(c) | | EUR | | 0.000 | | 10/28/16 | | 5,701,009 | |
| | 18,530,000 | | Nordic Investment Bank, EMTN | | NOK | | 3.000 | | 09/01/16 | | 2,257,018 | |
| | 18,406,383 | |
| Total Foreign Bonds (Cost $58,295,535) | 60,277,924 | |
Foreign Treasury Securities(a) - 14.9% |
| Non-U.S. Government - Belgium - 4.1% |
| | 4,497,000 | | Belgium Treasury Bill, Series 12M (c) | | EUR | | 0.000 | | 04/14/16 | | 5,117,841 | |
| Non-U.S. Government - Canada - 1.4% |
| | 2,200,000 | | Canadian Treasury Bill (c) | | CAD | | 0.440 | | 04/21/16 | | 1,693,513 | |
| Non-U.S. Government - France - 4.6% |
| | 5,000,000 | | France Treasury Bill BTF (b)(c) | | EUR | | 0.000 | | 06/22/16 | | 5,695,257 | |
| Non-U.S. Government - Norway - 1.4% |
| | 14,500,000 | | Norway Treasury Bill, Series 31 (b)(c) | | NOK | | 0.582 | | 06/15/16 | | 1,750,975 | |
| Non-U.S. Government - Sweden - 3.4% |
| | 19,000,000 | | Sweden Treasury Bill (c) | | SEK | | 0.000 | | 06/15/16 | | 2,343,842 | |
| | 14,500,000 | | Sweden Treasury Bill, Series 194D (c) | | SEK | | 0.000 | | 06/15/16 | | 1,788,721 | |
| | 4,132,563 | |
| Total Foreign Treasury Securities(Cost $17,933,744) | 18,390,149 | |
| |
MERK HARD CURRENCY FUND SCHEDULE OF INVESTMENTS | MARCH 31, 2016 |
The following is a summary of the inputs used to value the Fund's investments and other financial instruments and liabilities as of March 31, 2016.
The inputs or methodology used for valuing securities are not necessarily an indication of the risks associated with investing in those securities. For more information on valuation inputs, and their aggregation into the levels used in the table below, please refer to the Security Valuation section in Note 2 of the accompanying Notes to Financial Statements.
| | Level 1 | | Level 2 | | Level 3 | | Total |
| Assets |
| Investments At Value |
| Foreign Bonds | | $ | - | | | $ | 60,277,924 | | | $ | - | | | $ | 60,277,924 | |
| Foreign Treasury Securities | | | - | | | | 18,390,149 | | | | - | | | | 18,390,149 | |
| U.S. Treasury Bills | | | - | | | | 18,992,827 | | | | - | | | | 18,992,827 | |
| Exchange Traded Product | | | 23,618,816 | | | | - | | | | - | | | | 23,618,816 | |
| Money Market Fund | | | - | | | | 1,473,014 | | | | - | | | | 1,473,014 | |
| Total Investments At Value | | $ | 23,618,816 | | | $ | 99,133,914 | | | $ | - | | | $ | 122,752,730 | |
| Other Financial Instruments** | | | | | | | | | | | | | | | | |
| Forward Currency Contracts | | | - | | | | 19,737 | | | | - | | | | 19,737 | |
| Total Assets | | $ | 23,618,816 | | | $ | 99,153,651 | | | $ | - | | | $ | 122,772,467 | |
| Liabilities |
| Other Financial Instruments** | | | | | | | | | | | | | | | | |
| Futures | | $ | (5,925 | ) | | $ | - | | | $ | - | | | $ | (5,925 | ) |
| Total Liabilities | | $ | (5,925 | ) | | $ | - | | | $ | - | | | $ | (5,925 | ) |
**Other Financial Instruments are derivatives not reflected in the Schedule of Investments, such as futures and forward currency contracts, which are valued at the unrealized appreciation (depreciation) at year end.
The Fund utilizes the end of period methodology when determining transfers. There were no transfers among Level 1, Level 2 and Level 3 for the year ended March 31, 2016.
| PORTFOLIO HOLDINGS | | |
| % of Net Assets | | |
| Foreign Bonds | 48.7 | % |
| Foreign Treasury Securities | 14.9 | % |
| U.S. Treasury Bills | 15.3 | % |
| Exchange Traded Product | 19.1 | % |
| Money Market Fund | 1.2 | % |
| Foreign Currencies | 0.3 | % |
| Net Unrealized Gain/Loss on Forward Currency Contracts | 0.0 | % |
| Other Assets and Liabilities, Net | 0.5 | % |
| | 100.0 | % |
| |
MERK ABSOLUTE REUTURN CURRENCY FUND SCHEDULE OF INVESTMENTS | MARCH 31, 2016 |
| Principal | | Security Description | | Currency | | Rate | | Maturity | | Value in USD |
Foreign Bonds (a) - 77.7% |
| Non-U.S. Government - Australia - 4.8% |
| | 2,000,000 | | Australia Government Bond, Series 130 (b) | | AUD | | | 4.750 | % | 06/15/16 | $ | 1,541,666 | |
| Non-U.S. Government - New Zealand - 4.6% |
| | 2,000,000 | | New Zealand Government Bond, Series 1217 (b) | | NZD | | | 6.000 | | 12/15/17 | | 1,475,347 | |
| Non-U.S. Government - United Kingdom - 4.1% |
| | 900,000 | | United Kingdom Gilt (b) | | GBP | | | 4.000 | | 09/07/16 | | 1,312,666 | |
| Non-U.S. Government Agency - Germany - 4.3% |
| | 950,000 | | KFW, EMTN | | GBP | | | 3.750 | | 09/07/16 | | 1,382,464 | |
| Non-U.S. Government Agency - Norway - 4.6% |
| | 12,000,000 | | Kommunalbanken AS, EMTN (b) | | NOK | | | 3.000 | | 09/02/16 | | 1,460,932 | |
| Non-U.S. Government Agency - Sweden - 19.8% |
| | 51,000,000 | | Kommuninvest I Sverige AB, Series 1610, MTN | | SEK | | | 2.000 | | 10/12/16 | | 6,366,920 | |
| Regional Authority - Australia - 17.4% |
| | 1,750,000 | | New South Wales Treasury Corp., Series 16 | | AUD | | 6.000 | | 04/01/16 | | 1,341,602 | |
| | 2,000,000 | | Queensland Treasury Corp., Series 16 (b) | | AUD | | 6.000 | | 04/21/16 | | 1,536,331 | |
| | 2,000,000 | | Treasury Corp of Victoria, Series 1116 | | AUD | | 5.750 | | 11/15/16 | | 1,567,256 | |
| | 1,500,000 | | Western Australian Treasury Corp., Series 16 | | AUD | | | 3.000 | | 06/08/16 | | 1,151,563 | |
| | | 5,596,752 | |
| Regional Authority - Canada - 8.7% |
| | 1,800,000 | | Province of Manitoba Canada | | CAD | | 2.050 | | 12/01/16 | | 1,398,782 | |
| | 1,800,000 | | Province of Saskatchewan Canada | | CAD | | | 4.500 | | 08/23/16 | | 1,406,598 | |
| | | 2,805,380 | |
| Supranational - Europe - 9.4% |
| | 1,300,000 | | European Financial Stability Facility, EMTN (b) | | EUR | | 2.750 | | 07/18/16 | | 1,492,604 | |
| | 1,300,000 | | European Investment Bank, EMTN | | EUR | | | 3.875 | | 10/15/16 | | 1,512,410 | |
| | | 3,005,014 | |
| Total Foreign Bonds (Cost $24,414,137) | | 24,947,141 | |
Foreign Treasury Securities(a) - 13.0% |
| Non-U.S. Government - Belgium - 3.5% |
| | 993,000 | | Belgium Treasury Bill, Series 12M (c) | | EUR | | | 0.000 | | 04/14/16 | | 1,130,090 | |
| Non-U.S. Government - Canada - 4.8% |
| | 2,000,000 | | Canadian Treasury Bill (c) | | CAD | | | 0.471 | | 06/16/16 | | 1,538,510 | |
| Non-U.S. Government - Norway - 4.7% |
| | 12,500,000 | | Norway Treasury Bill, Series 32 (b)(c) | | NOK | | | 0.360 | | 09/21/16 | | 1,508,129 | |
| Total Foreign Treasury Securities (Cost $4,005,270) | | 4,176,729 | |
| U.S. Government & Agency Obligations - 10.3% |
U.S. Treasury Bills(a) - 10.3% |
| | 1,500,000 | | U.S. Treasury Bill (d) | | USD | | 0.251-0.262 | | 04/21/16 | | 1,499,918 | |
| | 1,800,000 | | U.S. Treasury Bill (d) | | USD | | | 0.166 | | 06/30/16 | | 1,799,073 | |
| Total U.S. Government & Agency Obligations (Cost $3,299,041) | | 3,298,991 | |
| Money Market Fund - 6.4% |
| | 2,046,043 | | Morgan Stanley Institutional Liquidity Fund (e) (Cost $2,046,043) | | USD | | | 0.186 | | | | 2,046,043 | |
| Total Investments – 107.4% (Cost $33,764,491)* | $ | 34,468,904 | |
| Foreign Currencies – 0.1% (Cost $22,144) | | 22,447 | |
| Net Unrealized Gain/Loss on Forward Currency Contracts – (2.9)% | | (919,181 | ) |
| Other Assets and Liabilities, Net – (4.6)% | | (1,492,551 | ) |
| NET ASSETS – 100.0% | $ | 32,079,619 | |
EMTN MTN | European Medium Term Note Medium Term Note |
| (a) | All or a portion of these securities are segregated to cover forward currency contract exposure. |
| (b) | Security exempt from registration under Rule 144A under the Securities Act of 1933. At the period end, the value of these securities amounted to $10,327,675 or 32.2% of net assets. |
| (c) | Zero coupon bond. Interest rate presented is yield to maturity. |
| (d) | Rate presented is yield to maturity. |
| (e) | Variable rate security. Rate presented is as of March 31, 2016. |
* Cost for federal income tax purposes is $33,764,531 and net unrealized appreciation consists of:
| Gross Unrealized Appreciation | | $ | 964,807 | |
| Gross Unrealized Depreciation | | | (260,434 | ) |
| Net Unrealized Appreciation | | $ | 704,373 | |
As of March 31, 2016, the Merk Absolute Return Currency Fund had the following forward currency contracts outstanding:
| Counterparty | | Contracts to Purchase/(Sell) | | Settlement Date | | Settlement Value | | Net Unrealized Appreciation (Depreciation) |
| Barclays Capital, Inc. | | (259,850,000 | ) | | Japanese Yen | | 04/20/16 | | $ | (2,291,900 | ) | | $ | (18,368 | ) |
| | | (4,570,000 | ) | | New Zealand Dollar | | 04/20/16 | | | (3,088,045 | ) | | | (67,389 | ) |
| | | (100,810,000 | ) | | Norwegian Krone | | 04/20/16 | | | (11,788,024 | ) | | | (393,845 | ) |
| | | 22,750,000 | | | Norwegian Krone | | 04/20/16 | | | 2,732,712 | | | | 16,395 | |
| | | 40,550,000 | | | Norwegian Krone | | 04/20/16 | | | 4,837,163 | | | | 62,894 | |
| | | 47,900,000 | | | Norwegian Krone | | 04/20/16 | | | 5,648,463 | | | | 139,767 | |
| | | (14,460,000 | ) | | Swedish Krona | | 04/20/16 | | | (1,762,044 | ) | | | (20,385 | ) |
| | | 11,570,000 | | | Swedish Krona | | 04/20/16 | | | 1,399,780 | | | | 26,409 | |
| | | 30,150,000 | | | Swedish Krona | | 04/20/16 | | | 3,723,660 | | | | (7,186 | ) |
| | | 72,530,000 | | | Swedish Krona | | 04/20/16 | | | 8,686,046 | | | | 254,448 | |
| BNY Brokerage, Inc. | | 440,000 | | | Australian Dollar | | 04/20/16 | | | 327,875 | | | | 9,099 | |
| | | 410,000 | | | Canadian Dollars | | 04/20/16 | | | 306,810 | | | | 8,886 | |
| | | (2,840,000 | ) | | Euro | | 04/20/16 | | | (3,211,759 | ) | | | (21,808 | ) |
| | | 150,000 | | | Euro | | 04/20/16 | | | 166,842 | | | | 3,945 | |
| | | (4,765,000 | ) | | New Zealand Dollar | | 04/20/16 | | | (3,183,506 | ) | | | (106,568 | ) |
| | | 540,000 | | | New Zealand Dollar | | 04/20/16 | | | 356,556 | | | | 16,297 | |
| | | 4,350,000 | | | Norwegian Krone | | 04/20/16 | | | 508,397 | | | | 17,257 | |
| | | (3,820,000 | ) | | Pounds Sterling | | 04/20/16 | | | (5,407,267 | ) | | | (79,536 | ) |
| | | (685,000 | ) | | Pounds Sterling | | 04/20/16 | | | (986,354 | ) | | | 2,464 | |
| | | 60,000 | | | Pounds Sterling | | 04/20/16 | | | 84,977 | | | | 1,203 | |
| | | 1,095,000 | | | Pounds Sterling | | 04/20/16 | | | 1,554,460 | | | | 18,328 | |
| | | 3,935,000 | | | Pounds Sterling | | 04/20/16 | | | 5,665,558 | | | | (13,576 | ) |
| | | 230,000 | | | Swedish Krona | | 04/20/16 | | | 27,724 | | | | 627 | |
| J.P. Morgan Securities LLC | | (7,050,000 | ) | | Australian Dollar | | 04/20/16 | | | (5,293,714 | ) | | | (105,528 | ) |
| | | (5,735,000 | ) | | Australian Dollar | | 04/20/16 | | | (4,409,094 | ) | | | 16,944 | |
| | | (1,475,000 | ) | | Australian Dollar | | 04/20/16 | | | (1,110,572 | ) | | | (19,056 | ) |
| | | (895,000 | ) | | Australian Dollar | | 04/20/16 | | | (667,241 | ) | | | (18,195 | ) |
| | | 636,000 | | | Australian Dollar | | 04/20/16 | | | 475,073 | | | | 12,008 | |
| | | 5,955,000 | | | Australian Dollar | | 04/20/16 | | | 4,503,382 | | | | 57,255 | |
| | | (5,850,000 | ) | | Canadian Dollars | | 04/20/16 | | | (4,493,950 | ) | | | (10,497 | ) |
| | | (2,445,000 | ) | | Canadian Dollars | | 04/20/16 | | | (1,849,581 | ) | | | (33,047 | ) |
| | | (1,930,000 | ) | | Canadian Dollars | | 04/20/16 | | | (1,495,452 | ) | | | 9,370 | |
| | | (1,080,000 | ) | | Canadian Dollars | | 04/20/16 | | | (827,926 | ) | | | (3,664 | ) |
| | | 2,565,000 | | | Canadian Dollars | | 04/20/16 | | | 1,959,401 | | | | 15,625 | |
| | | 4,330,000 | | | Canadian Dollars | | 04/20/16 | | | 3,345,978 | | | | (11,917 | ) |
| | | 7,500,000 | | | Canadian Dollars | | 04/20/16 | | | 5,601,710 | | | | 173,221 | |
| | | (4,620,000 | ) | | Euro | | 04/20/16 | | | (5,228,921 | ) | | | (31,318 | ) |
| | | (2,075,000 | ) | | Euro | | 04/20/16 | | | (2,340,898 | ) | | | (21,655 | ) |
| | | 1,175,000 | | | Euro | | 04/20/16 | | | 1,313,844 | | | | 23,987 | |
| | | 1,510,000 | | | Euro | | 04/20/16 | | | 1,693,368 | | | | 25,887 | |
| | | 1,595,000 | | | Euro | | 04/20/16 | | | 1,817,984 | | | | (1,949 | ) |
| | | 1,995,000 | | | Euro | | 04/20/16 | | | 2,220,710 | | | | 50,757 | |
| | | 3,050,000 | | | Euro | | 04/20/16 | | | 3,384,146 | | | | 88,522 | |
| | | 4,335,000 | | | Euro | | 04/20/16 | | | 4,824,934 | | | | 110,809 | |
| | | (1,040,900,000 | ) | | Japanese Yen | | 04/20/16 | | | (9,322,634 | ) | | | 68,221 | |
| | | (797,600,000 | ) | | Japanese Yen | | 04/20/16 | | | (7,077,266 | ) | | | (14,020 | ) |
| Counterparty | | Contracts to Purchase/(Sell) | | Settlement Date | | Settlement Value | | Net Unrealized Appreciation (Depreciation) |
| J.P. Morgan Securities LLC | | (715,950,000 | ) | | Japanese Yen | | 04/20/16 | | $ | (6,357,774 | ) | | $ | (7,579 | ) |
| | | (571,300,000 | ) | | Japanese Yen | | 04/20/16 | | | (5,091,352 | ) | | | 12,049 | |
| | | (214,250,000 | ) | | Japanese Yen | | 04/20/16 | | | (1,901,675 | ) | | | (3,175 | ) |
| | | 199,250,000 | | | Japanese Yen | | 04/20/16 | | | 1,785,948 | | | | (14,461 | ) |
| | | 512,300,000 | | | Japanese Yen | | 04/20/16 | | | 4,599,121 | | | | (44,374 | ) |
| | | 684,750,000 | | | Japanese Yen | | 04/20/16 | | | 6,033,565 | | | | 54,396 | |
| | | 758,850,000 | | | Japanese Yen | | 04/20/16 | | | 6,743,674 | | | | 3,094 | |
| | | 1,469,600,000 | | | Japanese Yen | | 04/20/16 | | | 13,056,558 | | | | 9,332 | |
| | | (4,855,000 | ) | | New Zealand Dollar | | 04/20/16 | | | (3,275,266 | ) | | | (76,951 | ) |
| | | (3,305,000 | ) | | New Zealand Dollar | | 04/20/16 | | | (2,171,716 | ) | | | (110,277 | ) |
| | | 845,000 | | | New Zealand Dollar | | 04/20/16 | | | 586,582 | | | | (3,138 | ) |
| | | 1,100,000 | | | New Zealand Dollar | | 04/20/16 | | | 736,709 | | | | 22,805 | |
| | | 1,670,000 | | | New Zealand Dollar | | 04/20/16 | | | 1,136,808 | | | | 16,272 | |
| | | 2,540,000 | | | New Zealand Dollar | | 04/20/16 | | | 1,718,012 | | | | 35,774 | |
| | | 4,790,000 | | | New Zealand Dollar | | 04/20/16 | | | 3,177,051 | | | | 130,285 | |
| | | (8,760,000 | ) | | Norwegian Krone | | 04/20/16 | | | (1,019,663 | ) | | | (38,895 | ) |
| | | (6,745,000 | ) | | Pounds Sterling | | 04/20/16 | | | (9,579,774 | ) | | | (108,311 | ) |
| | | (3,290,000 | ) | | Pounds Sterling | | 04/20/16 | | | (4,767,836 | ) | | | 42,291 | |
| | | (2,340,000 | ) | | Pounds Sterling | | 04/20/16 | | | (3,370,741 | ) | | | 9,715 | |
| | | (2,255,000 | ) | | Pounds Sterling | | 04/20/16 | | | (3,238,750 | ) | | | (187 | ) |
| | | (2,140,000 | ) | | Pounds Sterling | | 04/20/16 | | | (3,010,354 | ) | | | (63,404 | ) |
| | | 875,000 | | | Pounds Sterling | | 04/20/16 | | | 1,258,069 | | | | (1,275 | ) |
| | | 2,775,000 | | | Pounds Sterling | | 04/20/16 | | | 3,923,462 | | | | 62,370 | |
| | | (38,440,000 | ) | | Swedish Krona | | 04/20/16 | | | (4,708,552 | ) | | | (29,798 | ) |
| | | (37,775,000 | ) | | Swedish Krona | | 04/20/16 | | | (4,460,863 | ) | | | (195,516 | ) |
| | | (15,560,000 | ) | | Swedish Krona | | 04/20/16 | | | (1,869,337 | ) | | | (48,684 | ) |
| | | (11,420,000 | ) | | Swedish Krona | | 04/20/16 | | | (1,375,053 | ) | | | (32,646 | ) |
| | | (10,090,000 | ) | | Swedish Krona | | 04/20/16 | | | (1,229,299 | ) | | | (14,457 | ) |
| | | (7,705,000 | ) | | Swiss Franc | | 04/20/16 | | | (7,709,431 | ) | | | (310,850 | ) |
| | | (4,055,000 | ) | | Swiss Franc | | 04/20/16 | | | (4,209,340 | ) | | | (11,586 | ) |
| | | (3,600,000 | ) | | Swiss Franc | | 04/20/16 | | | (3,719,362 | ) | | | (27,946 | ) |
| | | 680,000 | | | Swiss Franc | | 04/20/16 | | | 688,013 | | | | 19,812 | |
| | | 1,415,000 | | | Swiss Franc | | 04/20/16 | | | 1,453,210 | | | | 19,690 | |
| | | 2,660,000 | | | Swiss Franc | | 04/20/16 | | | 2,774,365 | | | | (5,521 | ) |
| | | 2,765,000 | | | Swiss Franc | | 04/20/16 | | | 2,806,883 | | | | 71,258 | |
| | | 5,070,000 | | | Swiss Franc | | 04/20/16 | | | 5,236,565 | | | | 40,894 | |
| RBC Capital Markets, LLC | | (13,170,000 | ) | | Australian Dollar | | 04/20/16 | | | (9,876,038 | ) | | | (210,206 | ) |
| | | (1,255,000 | ) | | Australian Dollar | | 04/20/16 | | | (930,347 | ) | | | (30,795 | ) |
| | | 11,990,000 | | | Australian Dollar | | 04/20/16 | | | 9,189,855 | | | | (7,314 | ) |
| | | (17,560,000 | ) | | Canadian Dollars | | 04/20/16 | | | (13,260,997 | ) | | | (260,043 | ) |
| | | (10,165,000 | ) | | Canadian Dollars | | 04/20/16 | | | (7,604,861 | ) | | | (222,096 | ) |
| | | (8,290,000 | ) | | Canadian Dollars | | 04/20/16 | | | (6,235,558 | ) | | | (147,666 | ) |
| | | (13,055,000 | ) | | Euro | | 04/20/16 | | | (14,318,554 | ) | | | (545,604 | ) |
| | | (279,400,000 | ) | | Japanese Yen | | 04/20/16 | | | (2,462,976 | ) | | | (21,108 | ) |
| | | 1,264,750,000 | | | Japanese Yen | | 04/20/16 | | | 11,349,330 | | | | (104,716 | ) |
| | | (1,680,000 | ) | | New Zealand Dollar | | 04/20/16 | | | (1,131,005 | ) | | | (28,980 | ) |
| | | 9,970,000 | | | Norwegian Krone | | 04/20/16 | | | 1,205,457 | | | | (683 | ) |
| | | 11,080,000 | | | Norwegian Krone | | 04/20/16 | | | 1,304,079 | | | | 34,827 | |
| | | 19,730,000 | | | Norwegian Krone | | 04/20/16 | | | 2,327,091 | | | | 57,080 | |
| | | 4,565,000 | | | Swiss Franc | | 04/20/16 | | | 4,639,364 | | | | 112,431 | |
| Societe Generale Securities | | (1,110,000 | ) | | Canadian Dollars | | 04/20/16 | | | (827,365 | ) | | | (27,325 | ) |
| | | 13,855,000 | | | Canadian Dollars | | 04/20/16 | | | 10,324,958 | | | | 343,266 | |
| | | (1,970,000 | ) | | Euro | | 04/20/16 | | | (2,224,881 | ) | | | (18,121 | ) |
| | | 9,005,000 | | | Euro | | 04/20/16 | | | 10,027,414 | | | | 225,497 | |
| | | (126,750,000 | ) | | Japanese Yen | | 04/20/16 | | | (1,127,999 | ) | | | 1,093 | |
| | | (30,800,000 | ) | | Norwegian Krone | | 04/20/16 | | | (3,676,119 | ) | | | (45,750 | ) |
| | | (11,350,000 | ) | | Norwegian Krone | | 04/20/16 | | | (1,338,747 | ) | | | (32,785 | ) |
| | | 18,860,000 | | | Norwegian Krone | | 04/20/16 | | | 2,227,546 | | | | 51,495 | |
| | | 41,815,000 | | | Norwegian Krone | | 04/20/16 | | | 4,872,527 | | | | 180,393 | |
| | | (4,265,000 | ) | | Pounds Sterling | | 04/20/16 | | | (6,096,477 | ) | | | (29,496 | ) |
| | | 3,470,000 | | | Pounds Sterling | | 04/20/16 | | | 4,926,280 | | | | 57,806 | |
| Counterparty | | Contracts to Purchase/(Sell) | | Settlement Date | | Settlement Value | | Net Unrealized Appreciation (Depreciation) |
| Societe Generale Securities | | (10,920,000 | ) | | Swedish Krona | | 04/20/16 | | $ | (1,329,361 | ) | | $ | (16,705 | ) |
| | | 15,000,000 | | | Swedish Krona | | 04/20/16 | | | 1,816,990 | | | | 32,002 | |
| | | 31,100,000 | | | Swedish Krona | | 04/20/16 | | | 3,731,379 | | | | 102,198 | |
| | | | | | | | | | | | | | $ | (919,181 | ) |
The following is a summary of the inputs used to value the Fund's investments and other financial instruments and liabilities as of March 31, 2016.
The inputs or methodology used for valuing securities are not necessarily an indication of the risks associated with investing in those securities. For more information on valuation inputs, and their aggregation into the levels used in the table below, please refer to the Security Valuation section in Note 2 of the accompanying Notes to Financial Statements.
| | Level 1 | | Level 2 | | Level 3 | | Total |
| Assets |
| Investments At Value |
| Foreign Bonds | | $ | - | | | $ | 24,947,141 | | | $ | - | | | $ | 24,947,141 | |
| Foreign Treasury Securities | | | - | | | | 4,176,729 | | | | - | | | | 4,176,729 | |
| U.S. Treasury Bills | | | - | | | | 3,298,991 | | | | - | | | | 3,298,991 | |
| Money Market Fund | | | - | | | | 2,046,043 | | | | - | | | | 2,046,043 | |
| Total Investments At Value | | $ | - | | | $ | 34,468,904 | | | $ | - | | | $ | 34,468,904 | |
| Other Financial Instruments** | | | | | | | | | | | | | | | | |
| Forward Currency Contracts | | | - | | | | 2,978,750 | | | | - | | | | 2,978,750 | |
| Total Assets | | $ | - | | | $ | 37,447,654 | | | $ | - | | | $ | 37,447,654 | |
| Liabilities |
| Other Financial Instruments** | | | | | | | | | | | | | | | | |
| Forward Currency Contracts | | $ | - | | | $ | (3,897,931 | ) | | $ | - | | | $ | (3,897,931 | ) |
| Total Liabilities | | $ | - | | | $ | (3,897,931 | ) | | $ | - | | | $ | (3,897,931 | ) |
**Other Financial Instruments are derivatives not reflected in the Schedule of Investments, such as forward currency contracts, which are valued at the unrealized appreciation (depreciation) at year end.
The Fund utilizes the end of period methodology when determining transfers. There were no transfers among Level 1, Level 2 and Level 3 for the year ended March 31, 2016.
| PORTFOLIO HOLDINGS | | |
| % of Net Assets | | |
| Foreign Bonds | 77.7 | % |
| Foreign Treasury Securities | 13.0 | % |
| U.S. Treasury Bills | 10.3 | % |
| Money Market Fund | 6.4 | % |
| Foreign Currencies | 0.1 | % |
| Net Unrealized Gain/Loss on Forward Currency Contracts | (2.9) | % |
| Other Assets and Liabilities, Net | (4.6) | % |
| 100.0 | % |
| |
STATEMENTS OF ASSETS AND LIABILITIES | MARCH 31, 2016 |
| | | | | | MERK HARD CURRENCY FUND | | | | MERK ABSOLUTE RETURN CURRENCY FUND | |
| ASSETS | | | | | | | | |
| . | Total investments, at value (Cost $96,691,401 and $33,764,491, respectively) | $ | 99,133,914 | | | $ | 34,468,904 | |
| | Total investments in affiliates, at value (Cost $24,676,580 and $0, respectively) | 23,618,816 | | | | - | |
| | Total Investments | | | 122,752,730 | | | | 34,468,904 | |
| | Deposits with brokers | | | 22,500 | | | | - | |
| | Foreign currency (Cost $422,627 and $22,144, respectively) | | | 430,473 | | | | 22,447 | |
| | Receivables: | | | | | | | | |
| | | Fund shares sold | | | 146,938 | | | | 58,929 | |
| | | Dividends and interest | | | 541,801 | | | | 356,959 | |
| | | Variation margin | | | 3,500 | | | | - | |
| | Unrealized gain on forward currency contracts | | | 19,737 | | | | 2,978,750 | |
| Total Assets | | | 123,917,679 | | | | 37,885,989 | |
| | | | | | | | | | | |
| LIABILITIES | | | | | | | | |
| | Unrealized loss on forward currency contracts | | | - | | | | 3,897,931 | |
| | Payables: | | | | | | | | |
| | | Investment securities purchased | | | - | | | | 1,799,253 | |
| | | Fund shares redeemed | | | 105,658 | | | | 83,721 | |
| | Accrued Liabilities: | | | | | | | | |
| | | Investment adviser fees | | | 72,493 | | | | 19,764 | |
| | | Distribution fees | | | 21,999 | | | | 4,338 | |
| | | Other expenses | | | 5,166 | | | | 1,363 | |
| Total Liabilities | | | 205,316 | | | | 5,806,370 | |
| | | | | | | | | | | |
| NET ASSETS | | $ | 123,712,363 | | | $ | 32,079,619 | |
| | | | | | | | | | | |
| COMPONENTS OF NET ASSETS | | | | | | | | |
| | Paid-in capital | | $ | 132,416,569 | | | $ | 32,177,683 | |
| | Undistributed (distributions in excess of) net investment income | | (1,065,798 | ) | | | 103,579 | |
| | Accumulated net realized loss | | | (9,066,322 | ) | | | (1,459 | ) |
| | Net unrealized appreciation (depreciation) | | | 1,427,914 | | | | (200,184 | ) |
| NET ASSETS | | $ | 123,712,363 | | | $ | 32,079,619 | |
| SHARES OF BENEFICIAL INTEREST AT NO PAR VALUE (UNLIMITED SHARES AUTHORIZED) | | | | | | | | |
| | Investor Shares | | | 10,744,439 | | | | 2,310,798 | |
| | Institutional Shares | | | 1,848,074 | | | | 1,290,936 | |
| NET ASSET VALUE, OFFERING AND REDEMPTION PRICE PER SHARE | | | | | |
| | Investor Shares (based on net assets of $105,416,793 and $20,496,977, respectively) | | $ | 9.81 | | | $ | 8.87 | |
| | Institutional Shares (based on net assets of $18,295,570 and $11,582,642, respectively) | | $ | 9.90 | | | $ | 8.97 | |
| |
STATEMENTS OF OPERATIONS | YEAR ENDED MARCH 31, 2016 |
| | | | | | MERK HARD CURRENCY FUND | | | | MERK ABSOLUTE RETURN CURRENCY FUND | | |
| INVESTMENT INCOME | | | | | | | | | | |
| | Dividend income | | | $ | 735 | | | $ | 393 | | |
| | Interest income (Net of foreign withholding taxes of $11,469 and $10,036, respectively) | | | 229,777 | | | | 244,224 | | |
| Total Investment Income | | | | 230,512 | | | | 244,617 | | |
| | | | | | | | | | | |
| EXPENSES | | | | | | | | | | |
| | Investment adviser fees | | | 1,362,882 | | | | 344,403 | | |
| | Non 12b-1 shareholder servicing fees: | | | | | | | | | |
| | Investor Shares | | | 56,352 | | | | 11,109 | | |
| | Institutional Shares | | | 11,793 | | | | 6,112 | | |
| | Distribution fees: | | | | | | | | | |
| | Investor Shares | | | 281,753 | | | | 55,544 | | |
| | Interest expense | | | 510 | | | | 344 | | |
| Total Expenses | | | | 1,713,290 | | | | 417,512 | | |
| | Fees waived by Adviser | | | (94,995 | ) | | | - | | |
| Net Expenses | | | | 1,618,295 | | | | 417,512 | | |
| | | | | | | | | | | | |
| NET INVESTMENT LOSS | | | | (1,387,783 | ) | | | (172,895 | ) | |
| | | | | | | | | | | | |
| NET REALIZED AND UNREALIZED GAIN (LOSS) | | | | | | | | | | |
| | Net realized gain (loss) on: | | | | | | | | | |
| | Investments in unaffiliated issuers | | | (8,495,587 | ) | | | (3,171,621 | ) | |
| | Investments in affiliated issuers | | | (1,061,041 | ) | | | - | | |
| | Foreign currency transactions | | | 749,366 | | | | 527,713 | | |
| | Futures | | | 20,728 | | | | - | | |
| | Net realized loss | | | (8,786,534 | ) | | | (2,643,908 | ) | |
| | Net change in unrealized appreciation (depreciation) on: | | | | | | | | | |
| | Investments in unaffiliated issuers | | | 11,806,055 | | | | 3,520,729 | | |
| | Investments in affiliated issuers | | | 1,701,489 | | | | - | | |
| | Foreign currency translations | | | 375,098 | | | | (184,720 | ) | |
| | Futures | | | 1,845 | | | | - | | |
| | Net change in unrealized appreciation (depreciation) | | | 13,884,487 | | | | 3,336,009 | | |
| NET REALIZED AND UNREALIZED GAIN | | | | 5,097,953 | | | | 692,101 | | |
| INCREASE IN NET ASSETS RESULTING FROM OPERATIONS | | | $ | 3,710,170 | | | $ | 519,206 | | |
| | | | | | | | | | | | |
| |
STATEMENTS OF CHANGES IN NET ASSETS | |
| | | | | MERK HARD CURRENCY FUND | | MERK ABSOLUTE RETURN CURRENCY FUND |
| | | | | For the Year Ended March 31, 2016 | | | For the Year Ended March 31, 2015 | | For the Year Ended March 31, 2016 | | | For the Year Ended March 31, 2015 |
| OPERATIONS | | | | | | | | | | | | | | | | | | |
| | Net investment loss | | $ | (1,387,783 | ) | | | $ | (1,521,403 | ) | | $ | (172,895 | ) | | | $ | (168,694 | ) |
| | Net realized gain (loss) | | | (8,786,534 | ) | | | | (34,274,506 | ) | | | (2,643,908 | ) | | | | 233,865 | |
| | Net change in unrealized appreciation (depreciation) | | | 13,884,487 | | | | | (6,351,622 | ) | | | 3,336,009 | | | | | (3,446,825 | ) |
| Increase (Decrease) in Net Assets Resulting from Operations | | | 3,710,170 | | | | | (42,147,531 | ) | | | 519,206 | | | | | (3,381,654 | ) |
| | | | | | | | | | | | | | | | | | | | | |
| DISTRIBUTIONS TO SHAREHOLDERS FROM | | | | | | | | | | | | | | | | | | |
| | Net investment income: | | | | | | | | | | | | | | | | | | |
| | | Investor Shares | | | - | | | | | (1,673,443 | ) | | | - | | | | | (477,971 | ) |
| | | Institutional Shares | | | - | | | | | (422,330 | ) | | | - | | | | | (265,320 | ) |
| Total Distributions to Shareholders | | | - | | | | | (2,095,773 | ) | | | - | | | | | (743,291 | ) |
| | | | | | | | | | | | | | | | | | | | | |
| CAPITAL SHARE TRANSACTIONS | | | | | | | | | | | | | | | | | | |
| | Sale of shares: | | | | | | | | | | | | | | | | | | |
| | | Investor Shares | | | 11,846,783 | | | | | 25,771,773 | | | | 3,881,820 | | | | | 19,802,199 | |
| | | Institutional Shares | | | 890,570 | | | | | 14,828,359 | | | | 4,829,525 | | | | | 20,141,007 | |
| | Reinvestment of distributions: | | | | | | | | | | | | | | | | | | |
| | | Investor Shares | | | - | | | | | 1,556,133 | | | | - | | | | | 409,678 | |
| | | Institutional Shares | | | - | | | | | 408,745 | | | | - | | | | | 261,019 | |
| | Redemption of shares: | | | | | | | | | | | | | | | | | | |
| | | Investor Shares | | | (36,085,357 | ) | | | | (118,670,153 | ) | | | (7,795,822 | ) | | | | (16,887,682 | ) |
| | | Institutional Shares | | | (12,126,216 | ) | | | | (33,879,813 | ) | | | (11,297,516 | ) | | | | (12,751,655 | ) |
| Increase (Decrease) in Net Assets from Capital Share Transactions | | (35,474,220 | ) | | | | (109,984,956 | ) | | | (10,381,993 | ) | | | | 10,974,566 | |
| Increase (Decrease) in Net Assets | | | (31,764,050 | ) | | | | (154,228,260 | ) | | | (9,862,787 | ) | | | | 6,849,621 | |
| | | | | | | | | | | | | | | | | | | | | |
| NET ASSETS | | | | | | | | | | | | | | | | | | |
| | Beginning of Year | | | 155,476,413 | | | | | 309,704,673 | | | | 41,942,406 | | | | | 35,092,785 | |
| | End of Year (Including line (a)) | | $ | 123,712,363 | | | | $ | 155,476,413 | | | $ | 32,079,619 | | | | $ | 41,942,406 | |
| | | | | | | | | | | | | | | | | | | | | |
| SHARE TRANSACTIONS | | | | | | | | | | | | | | | | | | |
| | Sale of shares: | | | | | | | | | | | | | | | | | | |
| | | Investor Shares | | | 1,241,543 | | | | | 2,359,037 | | | | 442,760 | | | | | 2,153,525 | |
| | | Institutional Shares | | | 91,370 | | | | | 1,327,748 | | | | 551,578 | | | | | 2,164,257 | |
| | Reinvestment of distributions: | | | | | | | | | | | | | | | | | | |
| | | Investor Shares | | | - | | | | | 135,316 | | | | - | | | | | 44,725 | |
| | | Institutional Shares | | | - | | | | | 35,389 | | | | - | | | | | 28,341 | |
| | Redemption of shares: | | | | | | | | | | | | | | | | | | |
| | | Investor Shares | | | (3,819,818 | ) | | | | (11,053,749 | ) | | | (896,223 | ) | | | | (1,848,924 | ) |
| | | Institutional Shares | | | (1,282,016 | ) | | | | (3,165,083 | ) | | | (1,286,330 | ) | | | | (1,427,427 | ) |
| Increase (Decrease) in Shares | | | (3,768,921 | ) | | | | (10,361,342 | ) | | | (1,188,215 | ) | | | | 1,114,497 | |
| | | | | | | | | | | | | | | | | | | | | |
| (a) | Undistributed (distributions in excess of) net investment income | | $ | (1,065,798 | ) | | | $ | (20,345,926 | ) | | $ | 103,579 | | | | $ | 318,405 | |
These financial highlights reflect selected data for a share outstanding throughout each year. | | | | | | |
| | | For the Years Ended March 31, |
| MERK HARD CURRENCY FUND | | 2016 | | | | 2015 | | | | 2014 | | | | 2013 | | | | 2012 | | |
| INVESTOR SHARES | | | | | | | | | | | | | | | | | | | | |
| NET ASSET VALUE, Beginning of Year | $ | 9.49 | | | $ | 11.58 | | | $ | 11.91 | | | $ | 12.04 | | | $ | 12.58 | | |
| INVESTMENT OPERATIONS | | | | | | | | | | | | | | | | | | | | |
| Net investment loss (a) | | (0.10 | ) | | | (0.07 | ) | | | (0.09 | ) | | | (0.04 | ) | | | — | (b) |
| Net realized and unrealized gain (loss) | | 0.42 | | | | (1.94 | ) | | | 0.09 | (c) | | 0.02 | (c) | | (0.22 | ) | |
| Total from Investment Operations | | 0.32 | | | | (2.01 | ) | | | — | | | | (0.02 | ) | | | (0.22 | ) | |
| DISTRIBUTIONS TO SHAREHOLDERS FROM | | | | | | | | | | | | | | | |
| Net investment income | | — | | | | (0.08 | ) | | | (0.21 | ) | | | — | | | | (0.15 | ) | |
| Net realized gain | | — | | | | — | | | | (0.12 | ) | | | (0.11 | ) | | | (0.17 | ) | |
| Total Distributions to Shareholders | | — | | | | (0.08 | ) | | | (0.33 | ) | | | (0.11 | ) | | | (0.32 | ) | |
| NET ASSET VALUE, End of Year | $ | 9.81 | | | $ | 9.49 | | | $ | 11.58 | | | $ | 11.91 | | | $ | 12.04 | | |
| TOTAL RETURN | | 3.37 | % | | (17.47 | )% | | 0.08 | % | | (0.15 | )% | | (1.68 | )% |
| RATIOS/SUPPLEMENTARY DATA | | | | | | | | | | | | | | | | | | | | |
| Net Assets at End of Year (000's omitted) | $105,417 | | | $126,449 | | | $253,432 | | | $464,720 | | | $468,130 | | |
| Ratios to Average Net Assets: | | | | | | | | | | | | | | | | | | | | |
| Net investment loss | | (1.06 | )% | | (0.66 | )% | | (0.76 | )% | | (0.30 | )% | | (0.01 | )% |
| Net expenses | | 1.23 | % | | 1.24 | % | | 1.30 | % | | 1.30 | % | | 1.30 | % |
| Gross expenses | | 1.30 | %(d) | 1.30 | %(d) | 1.30 | % | | 1.30 | % | | 1.30 | % |
| PORTFOLIO TURNOVER RATE(e) | | 85 | % | | 116 | % | | 45 | % | | 56 | % | | 94 | % |
| | | For the Years Ended March 31, |
| INSTITUTIONAL SHARES | | 2016 | | | | 2015 | | | | 2014 | | | | 2013 | | | | 2012 | | |
| NET ASSET VALUE, Beginning of Year | $ | 9.55 | | | $ | 11.62 | | | $ | 11.95 | | | $ | 12.05 | | | $ | 12.59 | | |
| INVESTMENT OPERATIONS | | | | | | | | | | | | | | | | | | | | |
| Net investment income (loss) (a) | | (0.08 | ) | | | (0.05 | ) | | | (0.06 | ) | | | (0.02 | ) | | | 0.03 | | |
| Net realized and unrealized gain (loss) | | 0.43 | | | | (1.93 | ) | | | 0.10 | (c) | | 0.03 | (c) | | (0.23 | ) | |
| Total from Investment Operations | | 0.35 | | | | (1.98 | ) | | | 0.04 | | | | 0.01 | | | | (0.20 | ) | |
| DISTRIBUTIONS TO SHAREHOLDERS FROM | | | | | | | | | | | | | | |
| Net investment income | | — | | | | (0.09 | ) | | | (0.25 | ) | | | — | | | | (0.17 | ) | |
| Net realized gain | | — | | | | — | | | | (0.12 | ) | | | (0.11 | ) | | | (0.17 | ) | |
| Total Distributions to Shareholders | | — | | | | (0.09 | ) | | | (0.37 | ) | | | (0.11 | ) | | | (0.34 | ) | |
| NET ASSET VALUE, End of Year | $ | 9.90 | | | $ | 9.55 | | | $ | 11.62 | | | $ | 11.95 | | | $ | 12.05 | | |
| TOTAL RETURN | | 3.66 | % | | (17.18 | )% | | 0.38 | % | | 0.10 | % | | (1.49 | )% |
| RATIOS/SUPPLEMENTARY DATA | | | | | | | | | | | | | | | | | | | | |
| Net Assets at End of Year (000's omitted) | $18,296 | | | $29,027 | | | $56,273 | | | $75,547 | | | $83,055 | | |
| Ratios to Average Net Assets: | | | | | | | | | | | | | | | | | | | | |
| Net investment income (loss) | | (0.81 | )% | | (0.41 | )% | | (0.52 | )% | | (0.15 | )% | | 0.26 | % |
| Net expenses | | 0.98 | % | | 0.99 | % | | 1.05 | % | | 1.05 | % | | 1.05 | % |
| Gross expenses | | 1.05 | %(d) | 1.05 | %(d) | 1.05 | % | | 1.05 | % | | 1.05 | % |
| PORTFOLIO TURNOVER RATE(e) | | 85 | % | | 116 | % | | 45 | % | | 56 | % | | 94 | % |
| (a) | Calculated based on average shares outstanding during each year. |
| (b) | Less than $0.01 per share. |
| (c) | The net realized and unrealized gain (loss) per share does not correlate to the aggregate of the net realized and unrealized loss in the Statement of Operations, primarily due to the timing of the sales and repurchases of the Fund's shares in relation to fluctuating market values for the Fund's portfolio. |
| (d) | Reflects the expense ratio excluding any waivers and/or reimbursements. |
| (e) | The portfolio turnover rate is calculated without regard to any securities whose maturities or expiration dates at the time of acquisition were one year or less. | | |
These financial highlights reflect selected data for a share outstanding throughout each year. | | | | | | |
| | | For the Years Ended March 31, | |
| MERK ABSOLUTE RETURN CURRENCY FUND | 2016 | | | | 2015 | | | | 2014 | | | | 2013 | | | | 2012 | | |
| INVESTOR SHARES | | | | | | | | | | | | | | | | | | | | |
| NET ASSET VALUE, Beginning of Year | $ | 8.72 | | | $ | 9.53 | | | $ | 9.18 | | | $ | 9.37 | | | $ | 10.27 | | |
| INVESTMENT OPERATIONS | | | | | | | | | | | | | | | | | | | | |
| Net investment loss (a) | | (0.05 | ) | | | (0.05 | ) | | | (0.05 | ) | | | (0.09 | ) | | | (0.11 | ) | |
| Net realized and unrealized gain (loss) | | 0.20 | | | | (0.57 | ) | | | 0.57 | | | | (0.10 | ) | | | (0.66 | ) | |
| Total from Investment Operations | | 0.15 | | | | (0.62 | ) | | | 0.52 | | | | (0.19 | ) | | | (0.77 | ) | |
| DISTRIBUTIONS TO SHAREHOLDERS FROM | | | | | | | | | | | | | | | | | | |
| Net investment income | | — | | | | (0.19 | ) | | | (0.17 | ) | | | — | | | | (0.13 | ) | |
| Net realized gain | | — | | | | — | | | | — | | | | — | | | | — | | |
| Total Distributions to Shareholders | | — | | | | (0.19 | ) | | | (0.17 | ) | | | — | | | | (0.13 | ) | |
| NET ASSET VALUE, End of Year | $ | 8.87 | | | $ | 8.72 | | | $ | 9.53 | | | $ | 9.18 | | | $ | 9.37 | | |
| TOTAL RETURN | | 1.72 | % | | (6.59 | )% | | 5.68 | % | | (2.03 | )% | | (7.57 | )% |
| RATIOS/SUPPLEMENTARY DATA | | | | | | | | | | | | | | | | | | | | |
| Net Assets at End of Year (000's omitted) | $20,497 | | | $24,113 | | | $23,016 | | | $10,733 | | | $19,662 | | |
| Ratios to Average Net Assets: | | | | | | | | | | | | | | | | | | | |
| Net investment loss | | (0.59 | )% | | (0.53 | )% | | (0.53 | )% | | (0.98 | )% | | (1.18 | )% |
| Net expenses | | 1.30 | % | | 1.30 | % | | 1.30 | % | | 1.30 | % | | 1.30 | % |
| Gross expenses | | 1.30 | % | | 1.30 | % | | 1.30 | % | | 1.30 | % | | 1.30 | % |
| PORTFOLIO TURNOVER RATE(b) | | 59 | % | | 58 | % | | 0 | % | | 0 | % | | 0 | % |
| | | For the Years Ended March 31, |
| INSTITUTIONAL SHARES | | 2016 | | | | 2015 | | | | 2014 | | | | 2013 | | | | 2012 | | |
| NET ASSET VALUE, Beginning of Year | $ | 8.80 | | | $ | 9.58 | | | $ | 9.22 | | | $ | 9.39 | | | $ | 10.28 | | |
| INVESTMENT OPERATIONS | | | | | | | | | | | | | | | | | | | | |
| Net investment loss (a) | | (0.03 | ) | | | (0.02 | ) | | | (0.03 | ) | | | (0.06 | ) | | | (0.09 | ) | |
| Net realized and unrealized gain (loss) | | 0.20 | | | | (0.56 | ) | | | 0.58 | | | | (0.11 | ) | | | (0.67 | ) | |
| Total from Investment Operations | | 0.17 | | | | (0.58 | ) | | | 0.55 | | | | (0.17 | ) | | | (0.76 | ) | |
| DISTRIBUTIONS TO SHAREHOLDERS FROM | | | | | | | | | | | | | | | | | | |
| Net investment income | | — | | | | (0.20 | ) | | | (0.19 | ) | | | — | | | | (0.13 | ) | |
| Net realized gain | | — | | | | — | | | | — | | | | — | | | | — | | |
| Total Distributions to Shareholders | | — | | | | (0.20 | ) | | | (0.19 | ) | | | — | | | | (0.13 | ) | |
| NET ASSET VALUE, End of Year | $ | 8.97 | | | $ | 8.80 | | | $ | 9.58 | | | $ | 9.22 | | | $ | 9.39 | | |
| TOTAL RETURN | | 1.93 | % | | (6.18 | )% | | 5.94 | % | | (1.81 | )% | | (7.41 | )% |
| RATIOS/SUPPLEMENTARY DATA | | | | | | | | | | | | | | | | | | | | |
| Net Assets at End of Year (000's omitted) | $11,583 | | | $17,829 | | | $12,077 | | | $6,120 | | | $5,578 | | |
| Ratios to Average Net Assets: | | | | | | | | | | | | | | | | | | | | |
| Net investment loss | | (0.34 | )% | | (0.27 | )% | | (0.28 | )% | | (0.67 | )% | | (0.94 | )% |
| Net expenses | | 1.05 | % | | 1.05 | % | | 1.05 | % | | 1.05 | % | | 1.05 | % |
| Gross expenses | | 1.05 | % | | 1.05 | % | | 1.05 | % | | 1.05 | % | | 1.05 | % |
| PORTFOLIO TURNOVER RATE(b) | | 59 | % | | 58 | % | | 0 | % | | 0 | % | | 0 | % |
| (a) | Calculated based on average shares outstanding during each year. |
| (b) | The portfolio turnover rate is calculated without regard to any securities whose maturities or expiration dates at the time of acquisition were one year or less. |
| |
NOTES TO FINANCIAL STATEMENTS | MARCH 31, 2016 |
Note 1. Organization
The Merk Hard Currency Fund and the Merk Absolute Return Currency Fund (individually included in the defined term, "Fund" and, collectively included in the defined term, "Funds") are a non-diversified portfolio and a diversified portfolio of Forum Funds (the "Trust"), respectively. The Trust is a Delaware statutory trust that is registered as an open-end, management investment company under the Investment Company Act of 1940 (the "Act"), as amended. Under its Trust Instrument, the Trust is authorized to issue an unlimited number of each Fund's shares of beneficial interest without par value. Each Fund currently offers two classes of shares: Investor Shares and Institutional Shares. The Merk Hard Currency Fund seeks to profit from a rise in hard currencies relative to the U.S. dollar. The Merk Absolute Return Currency Fund seeks to generate positive absolute returns by investing in securities and instruments that create exposure to currencies. The Merk Hard Currency Fund Investor Shares and Institutional Shares commenced operations on May 10, 2005 and April 1, 2010, respectively. The Merk Absolute Return Currency Fund Investor Shares and Institutional Shares commenced operations on September 9, 2009 and April 1, 2010, respectively.
Note 2. Summary of Significant Accounting Policies
These financial statements are prepared in accordance with accounting principles generally accepted in the United States of America ("GAAP"), which require management to make estimates and assumptions that affect the reported amounts of assets and liabilities, the disclosure of contingent liabilities at the date of the financial statements, and the reported amounts of increases and decreases in net assets from operations during the fiscal period. Actual amounts could differ from those estimates. The following summarizes the significant accounting policies of each Fund:
Security Valuation – Exchange-traded securities and over-the-counter securities are valued using the last quoted trade or official closing price, provided by independent pricing services as of the close of trading on the market or exchange for which they are primarily traded, on each Fund business day. In the absence of a sale, such securities are valued at the mean of the last bid and ask price provided by independent pricing services. Non-exchange-traded securities for which quotations are available are valued using the last quoted sales price, or in the absence of a sale, at the mean of the last bid and ask prices provided by independent pricing services. Debt securities may be valued at prices supplied by a fund's pricing agent based on broker or dealer supplied valuations or matrix pricing, a method of valuing securities by reference to the value of other securities with similar characteristics such as rating, interest rate and maturity. Shares of open-end mutual funds are valued at net asset value ("NAV"). Futures contracts listed for trading on a securities exchange or board of trade shall be valued at the last quoted sales price or in the absence of a sale at the mean of the last bid and asked prices. Forward currency contracts are generally valued at the mean of bid and ask prices for the time period interpolated from rates reported by an independent pricing service for proximate time periods. Short-term investments that mature in 60 days or less may be valued at amortized cost.
Each Fund values its investments at fair value pursuant to procedures adopted by the Trust's Board of Trustees (the "Board") if (1) market quotations are insufficient or not readily available or (2) the adviser believes that the values available are unreliable. The Trust's Valuation Committee, as defined in each Fund's registration statement, performs certain functions as they relate to the administration and oversight of each Fund's valuation procedures. Under these procedures, the Valuation Committee convenes on a regular and ad-hoc basis to review such investments and considers a number of factors, including valuation methodologies and significant unobservable inputs, when arriving at fair value.
The Valuation Committee may work with the adviser to provide valuation inputs. In determining fair valuations, inputs may include market-based analytics which may consider related or comparable assets or liabilities, recent transactions, market multiples, book values and other relevant investment information. Adviser inputs may include an income-based approach in which the anticipated future cash flows of the investment are discounted in determining fair value. Discounts may also be applied based on the nature or duration of any restrictions on the disposition of the investments. The Valuation Committee performs regular reviews of valuation methodologies, key inputs and assumptions, disposition analysis and market activity.
Fair valuation is based on subjective factors and, as a result, the fair value price of an investment may differ from the security's market price and may not be the price at which the asset may be sold. Fair valuation could result in a different Net Asset Value ("NAV") than a NAV determined by using market quotes.
Each Fund has a three-tier fair value hierarchy. The basis of the tiers is dependent upon the various "inputs" used to determine the value of each Fund's investments. These inputs are summarized in the three broad levels listed below:
Level 1 — quoted prices in active markets for identical assets and liabilities
Level 2 — other significant observable inputs (including quoted prices of similar securities, interest rates, prepayment speeds, credit risk, etc.)
Level 3 — significant unobservable inputs (including each Fund's own assumptions in determining the fair value of investments)
The aggregate value by input level, as of March 31, 2016, for each Fund's investments is included at the end of each Fund's Schedule
of Investments.
Security Transactions, Investment Income and Realized Gain and Loss – Investment transactions are accounted for on the trade date. Income and capital gains on some foreign securities may be subject to foreign withholding taxes, which are accrued as applicable. Interest income is recorded on an accrual basis. Premium is amortized and discount is accreted using the effective interest method. Identified cost of investments sold is used to determine the gain and loss for both financial statement and federal income tax purposes.
Foreign Currency Translations – Foreign currency amounts are translated into U.S. dollars as follows: (1) assets and liabilities at the rate of exchange at the end of the respective period; and (2) purchases and sales of securities and income and expenses at the rate of exchange prevailing on the dates of such transactions. The portion of the results of operations arising from changes in the exchange rates and the portion due to fluctuations arising from changes in the market prices of securities are not isolated. Such fluctuations are included with the net realized and unrealized gain or loss on investments.
Foreign Currency Transactions – Each Fund may enter into transactions to purchase or sell foreign currency contracts and options on foreign currency. Forward currency contracts are agreements to exchange one currency for another at a future date and at a specified price. A fund may use forward currency contracts to facilitate transactions in foreign securities, to manage a fund's foreign currency exposure and to protect the U.S. dollar value of its underlying portfolio securities against the effect of possible adverse movements in foreign exchange rates. These contracts are intrinsically valued daily based on forward rates, and a fund's net equity therein, representing unrealized gain or loss on the contracts as measured by the difference between the forward foreign exchange rates at the dates of entry into the contracts and the forward rates at the reporting date, is recorded as a component of net asset value. These instruments involve market risk, credit risk, or both kinds of risks, in excess of the amount recognized in the Statements of Assets and Liabilities. Risks arise from the possible inability of counterparties to meet the terms of their contracts and from movement in currency and securities values and interest rates. Due to the risks associated with these transactions, a fund could incur losses up to the entire contract amount, which may exceed the net unrealized value included in its net asset value.
The values of each individual forward currency contract outstanding as of March 31, 2016, are disclosed in each Fund's Schedule of Investments.
Futures Contracts – Each Fund may purchase futures contracts to gain exposure to market changes, which may be more efficient or cost effective than actually buying the securities. A futures contract is an agreement between parties to buy or sell a security at a set price on a future date. Upon entering into such a contract, a fund is required to pledge to the broker an amount of cash, U.S. Government obligations or other high-quality debt securities equal to the minimum "initial margin" requirements of the exchange on which the futures contract is traded. Pursuant to the contract, the fund agrees to receive from or pay to the broker an amount of cash equal to the daily fluctuation in the value of the contract. Such receipts or payments are known as "variation margin" and are recorded by the fund as unrealized gains or losses. When the contract is closed, the fund records a realized gain or loss equal to the difference between the value of the contract at the time it was opened and value at the time it was closed. Risks of entering into futures contracts include the possibility that there may be an illiquid market and that a change in the value of the contract may not correlate with changes in the value of the underlying securities.
Distributions to Shareholders – Distributions to shareholders of net investment income, if any, are declared and paid at least quarterly. Distributions to shareholders of net capital gains, if any, are declared and paid at least annually. Distributions to shareholders are recorded on the ex-dividend date. Distributions are based on amounts calculated in accordance with applicable federal income tax regulations, which may differ from GAAP. These differences are due primarily to differing treatments of income and gain on various investment securities held by each Fund, timing differences and differing characterizations of distributions made by each Fund.
Federal Taxes – Each Fund intends to qualify each year as a regulated investment company under Subchapter M of the Internal Revenue Code of 1986, as amended ("Code") and to distribute all of its taxable income to shareholders. In addition, by distributing in each calendar year substantially all of its net investment income and capital gains, if any, the Funds will not be subject to a federal excise tax. Therefore, no federal income or excise tax provision is required. Each Fund files a U.S. federal income and excise tax return as required. A fund's federal income tax returns are subject to examination by the Internal Revenue Service for a period of three fiscal years after they are filed. As of March 31, 2016, there are no uncertain tax positions that would require financial statement recognition, de-recognition, or disclosure.
Income and Expense Allocation – The Trust accounts separately for the assets, liabilities and operations of each of its investment portfolios. Expenses that are directly attributable to more than one investment portfolio are allocated among the respective investment portfolios in an equitable manner.
The Funds' class-specific expenses are charged to the operations of that class of shares. Income and expenses (other than expenses attributable to a specific class) and realized and unrealized gains or losses on investments are allocated to each class of shares based on the class' respective net assets to the total net assets of each Fund.
Commitments and Contingencies – In the normal course of business, each Fund enters into contracts that provide general indemnifications by each Fund to the counterparty to the contract. Each Fund's maximum exposure under these arrangements is
dependent on future claims that may be made against each Fund and, therefore, cannot be estimated; however, based on experience, the risk of loss from such claims is considered remote.
Note 3. Fees and Expenses
Investment Adviser – Merk Investments LLC (the "Adviser") is the investment adviser to each Fund. Pursuant to an investment advisory agreement, the Adviser receives an advisory fee from the Funds at an annual rate of 1.00% of each Fund's average daily net assets.
Under the terms of the Investment Advisory Agreement for the Funds the Adviser is obligated to pay all expenses of each Fund except any expenses it is authorized to pay under Rule 12b-1, brokerage costs, commissions, borrowing costs, taxes, the non 12b-1 shareholder servicing fees, acquired fund fees and expenses and extraordinary and non-recurring expenses.
Distribution – Foreside Fund Services, LLC serves as each Fund's distributor (the "Distributor"). The Distributor is not affiliated with the Adviser or Atlantic Fund Administration, LLC (d/b/a Atlantic Fund Services) ("Atlantic") or their affiliates. The Trust, on behalf of the Funds, has adopted a Distribution Plan (the "Plan") for Investor Shares of the Funds in accordance with Rule 12b-1 of the Act. Under the Plan, the Funds pay the Distributor and/or any other entity as authorized by the Board a fee of up to 0.25% of the average daily net assets of each Fund's Investor Shares for the marketing of fund shares and for services provided to shareholders.
Other Service Providers – Atlantic provides fund accounting, fund administration, compliance and transfer agency services to each Fund. Atlantic also provides certain shareholder report production, and EDGAR conversion and filing services. Atlantic provides a Principal Executive Officer, a Principal Financial Officer, a Chief Compliance Officer, and an Anti-Money Laundering Officer to each Fund, as well as certain additional compliance support functions.
Note 4. Fees Waived
During this period, Merk Hard Currency Fund invested in VanEck Merk Gold Trust, an Exchange Traded Product sponsored by the Adviser. As of March 31, 2016, Merk Hard Currency Fund owned approximately 24.0% of VanEck Merk Gold Trust. The Adviser has agreed to waive fees in an amount equal to the fee it receives from VanEck Merk Gold Trust based on Merk Hard Currency Fund's investment in VanEck Merk Gold Trust (NYSE:OUNZ). For the year ended March 31, 2016, the Adviser waived fees of $94,995 for Merk Hard Currency Fund.
Note 5. Security Transactions
The cost of purchases and proceeds from sales of investment securities (including maturities), other than short-term investments during the year ended March 31, 2016, were as follows:
| | | Purchases | | Sales |
| Merk Hard Currency Fund | | $ | 49,589,022 | | $ | 58,604,193 |
| Merk Absolute Return Currency Fund | | | 8,929,305 | | | 4,119,784 |
| | | | | | | |
Note 6. Summary of Derivative Activity
The volume of open derivative positions may vary on a daily basis as each Fund transacts derivative contracts in order to achieve the exposure desired by the Adviser. The notional value of activity for the year ended March 31, 2016 for any derivative type that was held during the year is as follows:
| | | Merk Hard Currency Fund | | Merk Absolute Return Currency Fund |
| Forward Currency Contracts | | $ | 248,630,812 | | | | $ | 6,361,654,068 | | |
| Futures | | | 6,862,264 | | | | | - | | |
Each Fund's use of derivatives during the year ended March 31, 2016, was limited to futures and forward currency contracts.
Following is a summary of the effect of derivatives on the Statements of Assets and Liabilities for each Fund as of March 31, 2016:
| Merk Hard Currency Fund | | | | |
| Location: | | Currency Contracts | | Commodity Contracts |
| Asset derivatives: | | | | | | | | |
| Receivable – variation margin | | $ | - | | | $ | 3,500 | |
| Unrealized gain on forward currency contracts | | | 19,737 | | | | - | |
| Total Asset derivatives | | $ | 19,737 | | | $ | 3,500 | |
| Merk Absolute Return Currency Fund | | |
| Location: | | Currency Contracts |
| Asset derivatives: | | | | |
| Unrealized gain on forward currency contracts | | $ | 2,978,750 | |
| | | | | |
| Liability derivatives: | | | | |
| Unrealized loss on forward currency contracts | | $ | (3,897,931 | ) |
Realized and unrealized gains and losses on derivatives contracts during the year ended March 31, 2016, by each Fund are recorded in the following locations on the Statements of Operations:
| Merk Hard Currency Fund | | | | |
| Location: | | Currency Contracts | | Commodity Contracts |
| Net realized gain (loss) on: | | | | | | | | |
| Futures | | $ | - | | | $ | 20,728 | |
| Foreign currency transactions | | | 1,162,380 | | | | - | |
| Total net realized gain (loss) | | $ | 1,162,380 | | | $ | 20,728 | |
| | | | | | | | | |
| Net change in unrealized appreciation (depreciation) on: | | | | | | | | |
| Futures | | $ | - | | | $ | 1,845 | |
| Foreign currency translations | | | 186,134 | | | | - | |
| | | $ | 186,134 | | | $ | 1,845 | |
| Merk Absolute Return Currency Fund | | |
| Location: | | Currency Contracts |
| Net realized gain (loss) on: | | | | |
| Foreign currency transactions | | $ | 704,841 | |
| | | | | |
| Net change in unrealized appreciation (depreciation) on: | | | | |
| Foreign currency translations | | $ | (224,574 | ) |
Asset (Liability) amounts shown in the table below represent amounts for derivative related investments for each Fund at March 31, 2016. These amounts may be collateralized by cash or financial instruments.
| | | Gross Asset (Liability) as Presented in the Statements of Assets and Liabilities | | Financial Instruments (Received) Pledged** | | Cash Collateral (Received) Pledged** | | Net Amount | |
| Merk Hard Currency Fund | | | | | | | | | |
| Assets: | | | | | | | | | | | | | | | | | |
| Over-the-counter derivatives* | | $ | 23,237 | | | $ | - | | | $ | - | | | $ | 23,237 | |
| Merk Absolute Return Currency Fund | | | | | | | | | | | | | | | | |
| Assets: | | | | | | | | | | | | | | | | |
| Over-the-counter derivatives* | | $ | 2,987,750 | | | $ | - | | | $ | - | | | $ | 2,987,750 | |
| Liabilities: | | | | | | | | | | | | | | | | |
| Over-the-counter derivatives* | | | (3,897,931 | ) | | | 3,897,931 | | | | - | | | | - | |
* Over-the-counter derivatives may consist of forward currency contracts and futures contracts. The amounts disclosed above represent the exposure to one or more counterparties. For further detail on individual derivative contracts and the corresponding unrealized appreciation (depreciation), see the Schedule of Investments.
** The actual financial instruments and cash collateral (received) pledged may be in excess of the amounts shown in the table. The table only reflects collateral amounts up to the amount of the financial instrument disclosed on the Statements of Assets and Liabilities.
Trustees and Officers of the Trust
The Board is responsible for oversight of the management of the Trust's business affairs and of the exercise of all the Trust's powers except those reserved for the shareholders. The following table provides information about each Trustee and certain officers of the Trust. Each Trustee and officer holds office until the person resigns, is removed, or is replaced. Unless otherwise noted, the persons have held their principal occupations for more than five years. The address for all Trustees and officers is Three Canal Plaza, Suite 600, Portland, Maine 04101. Mr. Keffer is considered an Interested Trustee due to his affiliation with Atlantic. Each Fund's Statement of Additional Information includes additional information about the Trustees and is available, without charge and upon request, by calling (866) 637-5386.
| Name and Year of Birth | Position with the Trust | Length of Time Served | Principal Occupation(s) During Past Five Years | Number of Series of Fund Complex¹ Overseen by Trustee | Other Directorships Held by Trustee |
| Independent Trustees | | | | | |
J. Michael Parish Born: 1943 | Chairman of the Board; Trustee; Chairman, Nominating Committee and Qualified Legal Compliance Committee | Since 1989 (Chairman since 2004) | Retired since 2003; formerly, Partner, Wolf, Block, Schorr and Solis-Cohen, LLP (law firm) 2002-2003; Partner, Thelen Reid & Priest LLP (law firm) 1995-2002. | 26 | None |
Costas Azariadis Born: 1943 | Trustee | Since 1989 | Professor of Economics, Washington University since 2006. | 26 | None |
James C. Cheng Born: 1942 | Trustee; Chairman, Audit Committee | Since 1989 | President, Technology Marketing Associates (marketing company for small- and medium-sized businesses in New England) since 1991. | 26 | None |
David Tucker Born: 1958 | Trustee; Vice Chairman | Since 2011 (Vice Chairman since 2015) | Director, Blue Sky Experience (a charitable endeavor) since 2008; Senior Vice President & General Counsel, American Century Companies (an investment management firm) 1998-2008. | 48 | Trustee, Forum Funds II, Forum ETF Trust and U.S. Global Investors Funds |
| Interested Trustee | | | | | |
John Y. Keffer2 Born: 1942 | Trustee; Vice Chairman | Since 1989 | Chairman, Atlantic since 2008; President, Forum Investment Advisors, LLC since 2011; President, Forum Foundation (a charitable organization) since 2005; President, Forum Trust, LLC (a non-depository trust company chartered in the State of Maine) since 1997. | 48 | Director, Wintergreen Fund, Inc.; Trustee, Forum Funds II, Forum ETF Trust and U.S. Global Investors Funds |
| Officers | | | | | |
Jessica Chase Born: 1970 | President; Principal Executive Officer | Since 2015 | Senior Vice President, Atlantic since 2008. | N/A | N/A |
Karen Shaw Born: 1972 | Treasurer; Principal Financial Officer | Since 2008 | Senior Vice President, Atlantic since 2008. | N/A | N/A |
Zachary Tackett Born: 1988 | Vice President; Secretary; Anti-Money Laundering Compliance Officer | Since 2014 | Associate Counsel, Atlantic since 2014; Intern Associate, Coakley & Hyde, PLLC, 2010-2013. | N/A | N/A |
Michael J. McKeen Born: 1971 | Vice President | Since 2009 | Senior Vice President, Atlantic since 2008. | N/A | N/A |
Timothy Bowden Born: 1969 | Vice President | Since 2009 | Manager, Atlantic since 2008. | N/A | N/A |
Geoffrey Ney Born: 1975 | Vice President | Since 2013 | Manager, Atlantic since 2013; Senior Fund Accountant, Atlantic, 2008-2013. | N/A | N/A |
Todd Proulx Born: 1978 | Vice President | Since 2013 | Manager, Atlantic since 2013; Senior Fund Accountant, Atlantic, 2008-2013. | N/A | N/A |
1The Fund Complex includes the Trust, Forum Funds II, Forum ETF Trust and U.S. Global Investors Funds and is overseen by different Boards of Trustees. 2Atlantic is a subsidiary of Forum Holdings Corp. I, a Delaware corporation that is wholly owned by Mr. Keffer. |

|
PAYSON TOTAL RETURN FUND TABLE OF CONTENTS MARCH 31, 2016 |
|
A Message to Our Shareholders (Unaudited) | 1 |
Performance Chart and Analysis (Unaudited) | 3 |
Schedule of Investments | 4 |
Statement of Assets and Liabilities | 6 |
Statement of Operations | 7 |
Statements of Changes in Net Assets | 8 |
Financial Highlights | 9 |
Notes to Financial Statements | 10 |
Report of Independent Registered Public Accounting Firm | 14 |
| Additional Information (Unaudited) | 15 |
IMPORTANT INFORMATION
An investment in the Fund is subject to risk, including the possible loss of principal. Other Fund risks include equity risk, debt securities risk, exchange-traded funds risk, interest rate risk, credit risk, liquidity risk, inflation indexed security risk, government securities risk and value investment risk. Foreign investing involves certain risks and increased volatility not associated with investing solely in the U.S., including currency fluctuations, economic or financial instability, lack of timely or reliable financial information or unfavorable political or legal developments. Mortgage-related and other asset-backed securities risks include extension risk and prepayment risk. In addition, the Fund invests in midcap companies which pose greater risks than those associated with larger, more established companies. There is no assurance that the Fund will achieve its investment objective.
Dear Payson Total Return Fund Shareholder,
The Payson Total Return Fund (the "Fund") provided a total return of -3.94% for the fiscal year ending March 31, 2016. These results compare to the total return for the S&P 500 Index (the "Index") over that same time period of 1.78%. From a longer-term perspective, the Fund generated a 3-year annualized return of 6.91% as compared to the Index of 11.82% over that same time period. On a 5-year basis, the Fund posted annualized results of 7.38%, which was less than the 11.58% results posted by the Index over that same time period.
For a longer-term perspective, the Fund's ten-year average annual total return for the period ended March 31,2016 was 5.45%. Performance data quoted represents past performance and is no guarantee of future results. Current performance may be lower or higher than the performance data quoted. Investment return and principal value will fluctuate so that an investor's shares, when redeemed, may be worth more or less than original cost. As stated in the current prospectus, the Fund's annual gross operating expense ratio is 0.97%. For the most recent month end performance, please call (800) 805-8258. Total returns include reinvestment of dividend and capital gains. For some of the periods reported, a portion of the Fund's fees were waived or expenses reimbursed, otherwise total return would have been lower.
Many of the factors that impacted the U.S. stock market as cited in last fiscal year's annual report persisted in 2015. Specifically, we believe that falling energy prices, declining global interest rates and a rising U.S. Dollar continued to contribute to heightened volatility and investor caution. As such, stock prices generally showed little advancement as slowing earnings growth and, in our opinion, elevated stock valuations proved to be strong head winds. In fact, the average stock declined last year under these circumstances, with the Index supported by a small number of large companies.
Given this environment, we believe it's more important than ever to be highly focused on companies that can generate strong cash flows with managements that have a proven track record of using that cash flow to their shareholder's benefit. This can take the form of a company increasing dividends, repurchasing its own stock when it's reasonably priced, and increasing capital expenditures when management is confident it will generate growth above the company's cost of capital. Given the slowdown in global growth and the persistent trends mentioned above, we have been increasingly challenged to find such opportunities, particularly those that we believe are reasonably priced. Nevertheless, we believe the portfolio continues to exhibit excellent comparative investment characteristics and is poised to outperform its benchmark over the long term.
Turning to last year's results, the Fund once again was rewarded for its overweight position in technology stocks relative to the Index. More and more companies across the globe are turning to outsourced technology solutions to improve productivity. Many of the companies held in the portfolio have been direct beneficiaries of this trend, providing new and innovative products and services to those companies that require it to continue their own growth. At the same time, these companies have enjoyed robust cash flow and have enjoyed an expanding propensity to share that cash flow in the form of rising dividends.
With the dramatic decline in oil and natural gas prices this past year, stocks in the energy sector represented the weakest segment of the market, declining by over 15% in the past fiscal year. The Fund was modestly overweight the energy sector relative to the Index during this time period, focusing on large capitalized
companies poised to grow market share once the underlying commodities stabilized. With energy prices only stabilizing in the final quarter of the fiscal year, the choice to overweight the sector proved to be a factor that led to the Fund's overall underperformance.
Lastly, with the ongoing decline in interest rates, several sectors that are typically interest rate sensitive, namely utilities and telecommunications, provided some of the best performance in the past year. The Fund finds little value or sustainable growth in either of these sectors and as such has little to no representation in these sectors. This lack of exposure also contributed negatively to the Fund's relative performance.
The best performing stocks in the Fund portfolio for the fiscal year included McDonalds Corp. (+33.3%), Alphabet Corp, Cl A (37.53%) Microsoft Corp. (39.54%) General Electric Corp. (+32.40%) and Visa Inc. (+17.75%). Some of the worst performing stocks for the fiscal year in the Fund portfolio included Valeant Pharmaceuticals (-52.79%), Williams Companies. Inc. (-67.26%), Viacom Inc. Cl A (-37.43%), and Devon Energy (-25.19%). Returns shown are the full year total return if the stock was held for the full year in the Fund portfolio, or if the stock was held for less than the full year then the total return from the stock while held in the Fund's portfolio is shown above.
We remain disciplined in our security selection process and approach to managing the Fund. We are highly focused on maintaining attractive portfolio characteristics, avoiding what we believe to be overvalued segments of the market while seeking out reasonably priced opportunities that provide sustainable long term growth of profit margins and cash flow. We believe that this approach to investing the Fund assets will be critically important in the current heightened level of global uncertainty and below average economic growth.
The following chart reflects the change in the value of a hypothetical $10,000 investment, including reinvested dividends and distributions, in the Payson Total Return Fund (the "Fund") compared with the performance of the benchmark, S&P 500 Index (the "S&P 500"), over the past ten fiscal years. The S&P 500 is a broad-based, unmanaged measurement of changes in stock market conditions based on the average of 500 widely held common stocks. The total return of the S&P 500 includes the reinvestment of dividends and income. The total return of the Fund includes operating expenses that reduce returns, while the total return of the S&P 500 does not include expenses. The Fund is professionally managed while the S&P 500 is unmanaged and is not available for investment.
Comparison of Change in Value of a $10,000 Investment
Payson Total Return Fund vs. S&P 500 Index
Average Annual Total Returns Periods Ended March 31, 2016 | | One Year | | Five Years | | Ten Years |
| Payson Total Return Fund | | -3.94 | % | | 7.38 | % | | 5.45 | % |
| S&P 500 Index | | 1.78 | % | | 11.58 | % | | 7.01 | % |
Performance data quoted represents past performance and is no guarantee of future results. Current performance may be lower or higher than the performance data quoted. Investment return and principal value will fluctuate so that shares, when redeemed, may be worth more or less than original cost. For the most recent month-end performance, please call (800) 805-8258. As stated in the Fund's prospectus, the annual operating expense ratio (gross) is 0.97%. The performance table and graph do not reflect the deduction of taxes that a shareholder would pay on Fund distributions or the redemption of Fund shares. Returns greater than one year are annualized.
| Shares | | Security Description | | Value | |
| Common Stock - 96.1% |
| Consumer Discretionary - 14.1% |
| | 31,237 | | Discovery Communications, Inc., Class A (a) | $ | 894,315 | |
| | 63,090 | | Johnson Controls, Inc. | | 2,458,617 | |
| | 16,255 | | McDonald's Corp. | | 2,042,928 | |
| | 19,148 | | The TJX Cos., Inc. | | 1,500,246 | |
| | 12,000 | | Thor Industries, Inc. | | 765,240 | |
| | 88,181 | | Twenty-First Century Fox, Inc., Class B | | 2,486,704 | |
| | 8,659 | | Viacom, Inc., Class B | | 357,444 | |
| | | | | | 10,505,494 | |
| Consumer Staples - 7.6% |
| | 14,150 | | Diageo PLC, ADR | | 1,526,361 | |
| | 14,720 | | PepsiCo, Inc. | | 1,508,506 | |
| | 38,305 | | Wal-Mart Stores, Inc. | | 2,623,509 | |
| | | | | | 5,658,376 | |
| Energy - 3.0% |
| | 17,652 | | Exxon Mobil Corp. | | 1,475,531 | |
| | 8,485 | | Phillips 66 | | 734,716 | |
| | | | | | 2,210,247 | |
| Financial - 22.2% |
| | 33,000 | | Aflac, Inc. | | 2,083,620 | |
| | 27,440 | | American Express Co. | | 1,684,816 | |
| | 43,150 | | American International Group, Inc. | | 2,332,257 | |
| | 16,336 | | Berkshire Hathaway, Inc., Class B (a) | | 2,317,752 | |
| | 30,030 | | Discover Financial Services | | 1,529,128 | |
| | 40,230 | | JPMorgan Chase & Co. | | 2,382,420 | |
| | 21,000 | | MasterCard, Inc., Class A | | 1,984,500 | |
| | 29,100 | | Visa, Inc., Class A | | 2,225,568 | |
| | | | | | 16,540,061 | |
| Health Care - 15.5% |
| | 44,079 | | Abbott Laboratories | | 1,843,825 | |
| | 21,908 | | Gilead Sciences, Inc. | | 2,012,469 | |
| | 15,055 | | Johnson & Johnson | | 1,628,951 | |
| | 22,684 | | Merck & Co., Inc. | | 1,200,210 | |
| | 38,210 | | Mylan NV (a) | | 1,771,033 | |
| | 9,378 | | Perrigo Co PLC | | 1,199,728 | |
| | 65,537 | | Pfizer, Inc. | | 1,942,517 | |
| | | | | | 11,598,733 | |
| Industrials - 11.9% |
| | 20,212 | | Cummins, Inc. | | 2,222,107 | |
| | 10,034 | | Danaher Corp. | | 951,825 | |
| | 14,865 | | General Dynamics Corp. | | 1,952,815 | |
| | 61,448 | | General Electric Co. | | 1,953,432 | |
| | 17,834 | | United Technologies Corp. | | 1,785,184 | |
| | | | | | 8,865,363 | |
| Technology - 21.8% |
| | 4,425 | | Alphabet, Inc., Class A (a) | | 3,375,832 | |
| | 33,574 | | Apple, Inc. | | 3,659,230 | |
| | 16,848 | | IBM | | 2,551,630 | |
| | 86,718 | | Intel Corp. | | 2,805,327 | |
| | 43,147 | | Microsoft Corp. | | 2,383,009 | |
| | 28,550 | | QUALCOMM, Inc. | | 1,460,047 | |
| | | | | | 16,235,075 | |
Total Common Stock (Cost $60,114,743) | | 71,613,349 | |
Total Investments - 96.1% (Cost $60,114,743)* | $ | 71,613,349 | |
| Other Assets & Liabilities, Net – 3.9% | | 2,900,438 | |
| Net Assets – 100.0% | $ | 74,513,787 | |
| ADR | American Depositary Receipt |
| PLC | Public Limited Company |
| (a) | Non-income producing security. |
* Cost for federal income tax purposes is $60,144,014 and net unrealized appreciation consists of:
| Gross Unrealized Appreciation | | $ | 14,398,960 | |
| Gross Unrealized Depreciation | | | (2,929,625 | ) |
| Net Unrealized Appreciation | | $ | 11,469,335 | |
The following is a summary of the inputs used to value the Fund's investments as of March 31, 2016.
The inputs or methodology used for valuing securities are not necessarily an indication of the risks associated with investing in those securities. For more information on valuation inputs, and their aggregation into the levels used in the table below, please refer to the Security Valuation section in Note 2 of the accompanying Notes to Financial Statements.
| Valuation Inputs | | Investment in Securities |
| Level 1 - Quoted Prices | | $ | 71,613,349 | |
| Level 2 - Other Significant Observable Inputs | | | - | |
| Level 3 - Significant Unobservable Inputs | | | - | |
| Total | | $ | 71,613,349 | |
The Level 1 value displayed in this table is Common Stock. Refer to this Schedule of Investments for a further breakout of each security by industry.
The Fund utilizes the end of period methodology when determining transfers. There were no transfers among Level 1, Level 2 and Level 3 for the year ended March 31, 2016.
| PORTFOLIO HOLDINGS | | |
| % of Total Investments | | |
| Consumer Discretionary | 14.6 | % |
| Consumer Staples | 7.9 | % |
| Energy | 3.1 | % |
| Financial | 23.1 | % |
| Health Care | 16.2 | % |
| Industrials | 12.4 | % |
| Technology | 22.7 | % |
| | 100.0 | % |
| ASSETS | | | | |
| . | Total investments, at value (Cost $60,114,743) | | $ | 71,613,349 | |
| | Cash | | | 2,248,698 | |
| | Receivables: | | | | |
| | | Investment securities sold | | | 1,820,595 | |
| | | Dividends and interest | | | 89,339 | |
| | Prepaid expenses | | | 9,869 | |
| Total Assets | | | 75,781,850 | |
| | | | | | | |
| LIABILITIES | | | | |
| | Payables: | | | | |
| | | Investment securities purchased | | | 932,340 | |
| | | Fund shares redeemed | | | 117,188 | |
| | | Distributions payable | | | 141,091 | |
| | Accrued Liabilities: | | | | |
| | | Investment adviser fees | | | 37,276 | |
| | | Trustees' fees and expenses | | | 15 | |
| | | Fund services fees | | | 14,848 | |
| | | Other expenses | | | 25,305 | |
| Total Liabilities | | | 1,268,063 | |
| | | | | | | |
| NET ASSETS | | $ | 74,513,787 | |
| | | | | | | |
| COMPONENTS OF NET ASSETS | | | | |
| | Paid-in capital | | $ | 65,197,194 | |
| | Distributions in excess of net investment income | | | (244 | ) |
| | Accumulated net realized loss | | | (2,181,769 | ) |
| | Net unrealized appreciation | | | 11,498,606 | |
| NET ASSETS | | $ | 74,513,787 | |
| SHARES OF BENEFICIAL INTEREST AT NO PAR VALUE (UNLIMITED SHARES AUTHORIZED) | | | 5,345,290 | |
| NET ASSET VALUE, OFFERING AND REDEMPTION PRICE PER SHARE | | $ | 13.94 | |
| | | | | | | |
| INVESTMENT INCOME | | | | | | |
| | Dividend income (Net of foreign withholding taxes of $1,233) | | | $ | 1,589,251 | | |
| | Interest income | | | 724 | | |
| Total Investment Income | | | | 1,589,975 | | |
| | | | | | | |
| EXPENSES | | | | | | |
| | Investment adviser fees | | | 458,982 | | |
| | Fund services fees | | | 178,019 | | |
| | Custodian fees | | | 7,963 | | |
| | Registration fees | | | 19,185 | | |
| | Professional fees | | | 39,418 | | |
| | Trustees' fees and expenses | | | 6,374 | | |
| | Miscellaneous expenses | | | 32,745 | | |
| Total Expenses | | | | 742,686 | | |
| NET INVESTMENT INCOME | | | | 847,289 | | |
| | | | | | | | |
| NET REALIZED AND UNREALIZED LOSS | | | | | | |
| | Net realized loss on investments | | | (2,152,498 | ) | |
| | Net change in unrealized appreciation (depreciation) on investments | | | (1,822,677 | ) | |
| NET REALIZED AND UNREALIZED LOSS | | | | (3,975,175 | ) | |
| DECREASE IN NET ASSETS RESULTING FROM OPERATIONS | | | $ | (3,127,886 | ) | |
| | | | | | | | |
| | | | | For the Years Ended March 31, |
| | | | | 2016 | | | 2015 |
| OPERATIONS | | | | | | | | | |
| | Net investment income | | $ | 847,289 | | | | $ | 784,369 | |
| | Net realized gain (loss) | | | (2,152,498 | ) | | | | 3,485,250 | |
| | Net change in unrealized appreciation (depreciation) | | | (1,822,677 | ) | | | | 317,672 | |
| Increase (Decrease) in Net Assets Resulting from Operations | | | (3,127,886 | ) | | | | 4,587,291 | |
| | | | | | | | | | | | |
| DISTRIBUTIONS TO SHAREHOLDERS FROM | | | | | | | | | |
| | Net investment income | | | (847,202 | ) | | | | (784,962 | ) |
| | Net realized gain | | | (2,642,363 | ) | | | | (3,729,870 | ) |
| Total Distributions to Shareholders | | | (3,489,565 | ) | | | | (4,514,832 | ) |
| | | | | | | | | | | | |
| CAPITAL SHARE TRANSACTIONS | | | | | | | | | |
| | Sale of shares | | | 8,963,123 | | | | | 8,484,691 | |
| | Reinvestment of distributions | | | 2,989,581 | | | | | 4,045,084 | |
| | Redemption of shares | | | (7,696,815 | ) | | | | (6,762,116 | ) |
| Increase in Net Assets from Capital Share Transactions | | | 4,255,889 | | | | | 5,767,659 | |
| Increase (Decrease) in Net Assets | | | (2,361,562 | ) | | | | 5,840,118 | |
| | | | | | | | | | | | |
| NET ASSETS | | | | | | | | | |
| | Beginning of Year | | | 76,875,349 | | | | | 71,035,231 | |
| | End of Year (Including line (a)) | | $ | 74,513,787 | | | | $ | 76,875,349 | |
| | | | | | | | | | | | |
| SHARE TRANSACTIONS | | | | | | | | | |
| | Sale of shares | | | 615,083 | | | | | 551,447 | |
| | Reinvestment of distributions | | | 212,927 | | | | | 271,995 | |
| | Redemption of shares | | | (536,430 | ) | | | | (438,050 | ) |
| Increase in Shares | | | 291,580 | | | | | 385,392 | |
| | | | | | | | | | | | |
| (a) | Distributions in excess of net investment income | | $ | (244 | ) | | | $ | (328 | ) |
These financial highlights reflect selected data for a share outstanding throughout each year. | | | | | | |
| | | For the Years Ended March 31, | |
| | | 2016 | | 2015 | | 2014 | | 2013 | | 2012 | |
| NET ASSET VALUE, Beginning of Year | $ | 15.21 | | | $ | 15.22 | | | $ | 13.89 | | | $ | 14.47 | | | $ | 14.00 | | |
| INVESTMENT OPERATIONS | | | | | | | | | | | | | | | | | | | | |
| Net investment income (a) | | 0.16 | | | | 0.16 | | | | 0.42 | | | | 0.20 | | | | 0.20 | | |
| | Net realized and unrealized gain (loss) | | (0.76 | ) | | | 0.77 | | | | 2.23 | | | | 0.45 | | | | 1.25 | | |
| | Total from Investment Operations | | (0.60 | ) | | | 0.93 | | | | 2.65 | | | | 0.65 | | | | 1.45 | | |
| DISTRIBUTIONS TO | | | | | | | | | | | | | | | | | | | | |
| SHAREHOLDERS FROM | | | | | | | | | | | | | | | | | | | | |
| Net investment income | | (0.16 | ) | | | (0.16 | ) | | | (0.41 | ) | | | (0.20 | ) | | | (0.19 | ) | |
| Net realized gain | | (0.51 | ) | | | (0.78 | ) | | | (0.91 | ) | | | (1.03 | ) | | | (0.79 | ) | |
| | Total Distributions to Shareholders | | (0.67 | ) | | | (0.94 | ) | | | (1.32 | ) | | | (1.23 | ) | | | (0.98 | ) | |
| NET ASSET VALUE, End of Year | $ | 13.94 | | | $ | 15.21 | | | $ | 15.22 | | | $ | 13.89 | | | $ | 14.47 | | |
| TOTAL RETURN | | (3.94 | )% | | 6.32 | % | | 19.62 | % | | 4.94 | % | | 11.35 | % |
| | | | | | | | | | | | | | | | | | | | | |
| RATIOS/SUPPLEMENTARY DATA | | | | | | | | | | | | | | | | | | | | |
| | Net Assets at End of Year (000's omitted) | $74,514 | | | $76,875 | | | $71,035 | | | $61,852 | | | $54,743 | | |
| Ratios to Average Net Assets: | | | | | | | | | | | | | | | | | | | | |
| Net investment income | | 1.11 | % | | 1.05 | % | | 2.84 | % | | 1.47 | % | | 1.45 | % |
| Net expenses | | 0.97 | % | | 0.97 | % | | 1.01 | % | | 1.07 | % | | 1.15 | % |
| Gross expenses | | 0.97 | % | | 0.97 | % | | 1.01 | % | | 1.07 | % | | 1.15 | % |
| PORTFOLIO TURNOVER RATE | | 55 | % | | 41 | % | | 47 | % | | 103 | % | | 101 | % |
| | | | | | | | | | | | | | | | | | | | | | |
| | | | | | | | | | | | | | | | | | | | | | |
| (a) | Calculated based on average shares outstanding during each year. |
Note 1. Organization
The Payson Total Return Fund (the "Fund") is a diversified portfolio of Forum Funds (the "Trust"). The Trust is a Delaware statutory trust that is registered as an open-end, management investment company under the Investment Company Act of 1940 (the "Act"), as amended. Under its Trust Instrument, the Trust is authorized to issue an unlimited number of the Fund's shares of beneficial interest without par value. The Fund commenced operations on November 25, 1991. The Fund seeks a combination of high current income and capital appreciation.
Note 2. Summary of Significant Accounting Policies
These financial statements are prepared in accordance with accounting principles generally accepted in the United States of America ("GAAP"), which require management to make estimates and assumptions that affect the reported amounts of assets and liabilities, the disclosure of contingent liabilities at the date of the financial statements, and the reported amounts of increases and decreases in net assets from operations during the fiscal year. Actual amounts could differ from those estimates. The following summarizes the significant accounting policies of the Fund:
Security Valuation – Exchange-traded securities and over-the-counter securities are valued using the last quoted trade or official closing price, provided by independent pricing services as of the close of trading on the market or exchange for which they are primarily traded, on each Fund business day. In the absence of a sale, such securities are valued at the mean of the last bid and ask price provided by independent pricing services. Non-exchange-traded securities for which quotations are available are valued using the last quoted sales price, or in the absence of a sale, at the mean of the last bid and ask prices provided by independent pricing services. Shares of open-end mutual funds are valued at net asset value ("NAV"). Short-term investments that mature in 60 days or less may be valued at amortized cost.
The Fund values its investments at fair value pursuant to procedures adopted by the Trust's Board of Trustees (the "Board") if (1) market quotations are insufficient or not readily available or (2) the Fund's adviser believes that the values available are unreliable. The Trust's Valuation Committee, as defined in the Fund's registration statement, performs certain functions as they relate to the administration and oversight of the Fund's valuation procedures. Under these procedures, the Valuation Committee convenes on a regular and ad-hoc basis to review such investments and considers a number of factors, including valuation methodologies and significant unobservable inputs, when arriving at fair value.
The Valuation Committee may work with the Fund's adviser to provide valuation inputs. In determining fair valuations, inputs may include market-based analytics which may consider related or comparable assets or liabilities, recent transactions, market multiples, book values and other relevant investment information. Adviser inputs may include an income-based approach in which the anticipated future cash flows of the investment are discounted in determining fair value. Discounts may also be applied based on the nature or duration of any restrictions on the disposition of the investments. The Valuation Committee performs regular reviews of valuation methodologies, key inputs and assumptions, disposition analysis and market activity.
Fair valuation is based on subjective factors and, as a result, the fair value price of an investment may differ
from the security's market price and may not be the price at which the asset may be sold. Fair valuation could result in a different NAV than a NAV determined by using market quotes.
The Fund has a three-tier fair value hierarchy. The basis of the tiers is dependent upon the various "inputs" used to determine the value of the Fund's investments. These inputs are summarized in the three broad levels listed below:
Level 1 — quoted prices in active markets for identical assets and liabilities
Level 2 — other significant observable inputs (including quoted prices of similar securities, interest rates, prepayment speeds, credit risk, etc.)
Level 3 — significant unobservable inputs (including the Fund's own assumptions in determining the fair value of investments)
The aggregate value by input level, as of March 31, 2016, for the Fund's investments is included at the end of the Fund's Schedule of Investments.
Security Transactions, Investment Income and Realized Gain and Loss – Investment transactions are accounted for on the trade date. Dividend income is recorded on the ex-dividend date. Non-cash dividend income is recorded at the fair market value of the securities received. Foreign dividend income is recorded on the ex-dividend date or as soon as possible after the Fund determines the existence of a dividend declaration after exercising reasonable due diligence. Income and capital gains on some foreign securities may be subject to foreign withholding taxes, which are accrued as applicable. Interest income is recorded on an accrual basis. Premium is amortized and discount is accreted using the effective interest method. Identified cost of investments sold is used to determine the gain and loss for both financial statement and federal income tax purposes.
Distributions to Shareholders – Distributions to shareholders of net investment income, if any, are declared and paid at least quarterly. Distributions to shareholders of net capital gains, if any, are declared and paid at least annually. Distributions to shareholders are recorded on the ex-dividend date. Distributions are based on amounts calculated in accordance with applicable federal income tax regulations, which may differ from GAAP. These differences are due primarily to differing treatments of income and gain on various investment securities held by the Fund, timing differences and differing characterizations of distributions made by the Fund.
Federal Taxes – The Fund intends to qualify each year as a regulated investment company under Subchapter M of the Internal Revenue Code of 1986, as amended ("Code") and to distribute all of its taxable income to shareholders. In addition, by distributing in each calendar year substantially all of its net investment income and capital gains, if any, the Fund will not be subject to a federal excise tax. Therefore, no federal income or excise tax provision is required. The Fund files a U.S. federal income and excise tax return as required. A fund's federal income tax returns are subject to examination by the Internal Revenue Service for a period of three fiscal years after they are filed. As of March 31, 2016, there are no uncertain tax positions that would require financial statement recognition, de-recognition, or disclosure.
Income and Expense Allocation – The Trust accounts separately for the assets, liabilities and operations of each of its investment portfolios. Expenses that are directly attributable to more than one investment portfolio are allocated among the respective investment portfolios in an equitable manner.
Commitments and Contingencies – In the normal course of business, the Fund enters into contracts that provide general indemnifications by the Fund to the counterparty to the contract. The Fund's maximum exposure under these arrangements is dependent on future claims that may be made against the Fund and, therefore, cannot be estimated; however, based on experience, the risk of loss from such claims is considered remote.
Note 3. Fees and Expenses
Investment Adviser – H.M. Payson & Co. (the "Adviser") is the investment Fund's adviser to the Fund. Pursuant to an investment advisory agreement, the Adviser receives an advisory fee from the Fund at an annual rate of 0.60% of the Fund's average daily net assets.
Distribution – Foreside Fund Services, LLC serves as the Fund's distributor (the "Distributor"). The Fund does not have a distribution (12b-1) plan; accordingly, the Distributor does not receive compensation from the Fund for its distribution (12b-1) services. The Adviser compensates the Distributor directly for its services. The Distributor is not affiliated with the Adviser or Atlantic Fund Administration, LLC (d/b/a Atlantic Fund Services) ("Atlantic") or their affiliates.
Other Service Providers – Atlantic provides fund accounting, fund administration, compliance and transfer agency services to the Fund. Atlantic also provides certain shareholder report production, and EDGAR conversion and filing services. Pursuant to an Atlantic services agreement, the Fund pays Atlantic customary fees for its services. Atlantic provides a Principal Executive Officer, a Principal Financial Officer, a Chief Compliance Officer, and an Anti-Money Laundering Officer to the Fund, as well as certain additional compliance support functions.
Trustees and Officers – The Trust pays each independent Trustee an annual retainer fee of $50,000 for service to the Trust ($66,000 for the Chairman), and the Audit Committee Chairman and Vice Chairman receive an additional $6,000 annually. The Trustees and Chairman may receive additional fees for special Board meetings. Each Trustee is also reimbursed for all reasonable out-of-pocket expenses incurred in connection with his duties as a Trustee, including travel and related expenses incurred in attending Board meetings. The amount of Trustees' fees attributable to the Fund is disclosed in the Statement of Operations. Certain officers of the Trust are also officers or employees of the above named service providers, and during their terms of office received no compensation from the Fund.
Note 4. Security Transactions
The cost of purchases and proceeds from sales of investment securities (including maturities), other than short-term investments during the year ended March 31, 2016, were $41,209,656 and $42,041,610, respectively.
Proxy Voting Information
A description of the policies and procedures that the Fund uses to determine how to vote proxies relating to securities held in the Fund's portfolio is available, without charge and upon request, by calling (800) 805-8258 and on the U.S. Securities and Exchange Commission's (the "SEC") website at www.sec.gov. The Fund's proxy voting record for the most recent twelve-month period ended June 30 is available, without charge and upon request, by calling (800) 805-8258 and on the SEC's website at www.sec.gov.
Availability of Quarterly Portfolio Schedules
The Fund files its complete schedule of portfolio holdings with the SEC for the first and third quarters of each fiscal year on Form N-Q. These filings are available, without charge and upon request on the SEC's website at www.sec.gov or may be reviewed and copied at the SEC's Public Reference Room in Washington, DC. Information on the operation of the Public Reference Room may be obtained by calling (800) SEC-0330.
Shareholder Expense Example
As a shareholder of the Fund, you incur ongoing costs, including management fees and other Fund expenses. This example is intended to help you understand your ongoing costs (in dollars) of investing in the Fund and to compare these costs with the ongoing costs of investing in other mutual funds.
The example is based on an investment of $1,000 invested at the beginning of the period and held for the entire period from October 1, 2015, through March 31, 2016.
Actual Expenses – The first line of the table below provides information about actual account values and actual expenses. You may use the information in this line, together with the amount you invested, to estimate the expenses that you paid over the period. Simply divide your account value by $1,000 (for example, an $8,600 account value divided by $1,000 = 8.6), then multiply the result by the number in the first line under the heading entitled "Expenses Paid During Period" to estimate the expenses you paid on your account during the period.
Hypothetical Example for Comparison Purposes – The second line of the table below provides information about hypothetical account values and hypothetical expenses based on the Fund's actual expense ratio and an assumed rate of return of 5% per year before expenses, which is not the Fund's actual return. The hypothetical account values and expenses may not be used to estimate the actual ending account balance or expenses you paid for the period. You may use this information to compare the ongoing costs of investing in the Fund and other funds. To do so, compare this 5% hypothetical example with the 5% hypothetical examples that appear in the shareholder reports of other funds.
Please note that the expenses shown in the table are meant to highlight your ongoing costs only. Therefore, the second line of the table is useful in comparing ongoing costs only, and will not help you determine the relative total costs of owning different funds.
| | Beginning | | Ending | | Expenses | | Annualized |
| | Account Value | | Account Value | | Paid During | | Expense |
| | October 1, 2015 | | March 31, 2016 | | Period* | | Ratio* |
| Actual | $ | 1,000.00 | | $ | 1,041.76 | | $ | 5.00 | | 0.98 | % |
| Hypothetical (5% return before taxes) | $ | 1,000.00 | | $ | 1,020.10 | | $ | 4.95 | | 0.98 | % |
| | | | | | | | | | | | |
| * | Expenses are equal to the Fund's annualized expense ratio multiplied by the average account value over the period, multiplied by the number of days in the most recent fiscal half-year divided by 366 to reflect the half-year period. |
Federal Tax Status of Dividends Declared during the Fiscal Year
For federal income tax purposes, dividends from short-term capital gains are classified as ordinary income. The Fund designates 100.00% of its income dividend distributed as qualifying for the corporate dividends-received deduction (DRD) and 100.00% for the qualified dividend rate (QDI) as defined in Section 1(h)(11) of the Code. The Fund also designates 0.07% as qualified interest income exempt from U.S. tax for foreign shareholders (QII).
Trustees and Officers of the Trust
The Board is responsible for oversight of the management of the Trust's business affairs and of the exercise of all the Trust's powers except those reserved for the shareholders. The following table provides information about each Trustee and certain officers of the Trust. Each Trustee and officer holds office until the person resigns, is removed, or is replaced. Unless otherwise noted, the persons have held their principal occupations for more than five years. The address for all Trustees and officers is Three Canal Plaza, Suite 600, Portland, Maine 04101. Mr. Keffer is considered an Interested Trustee due to his affiliation with Atlantic. The Fund's Statement of Additional Information includes additional information about the Trustees and is available, without charge and upon request, by calling (800) 805-8258.
[INTENTIONALLY LEFT BLANK]

ITEM 2. CODE OF ETHICS.
| (a) | As of the end of the period covered by this report, Forum Funds (the "Registrant") has adopted a code of ethics, which applies to its Principal Executive Officer and Principal Financial Officer (the "Code of Ethics"). |
| (c) | There have been no amendments to the Registrant's Code of Ethics during the period covered by this report. |
| (d) | There have been no waivers to the Registrant's Code of Ethics during the period covered by this report. |
(f) (1) A copy of the Code of Ethics is being filed under Item 12(a) hereto.
ITEM 3. AUDIT COMMITTEE FINANCIAL EXPERT.
The Board of Trustees has determined that no member of the Audit Committee is an "audit committee financial expert" as that term is defined under applicable regulatory guidelines.
ITEM 4. PRINCIPAL ACCOUNTANT FEES AND SERVICES.
(a) Audit Fees - The aggregate fees billed for each of the last two fiscal years (the "Reporting Periods") for professional services rendered by the Registrant's principal accountant for the audit of the Registrant's annual financial statements, or services that are normally provided by the principal accountant in connection with the statutory and regulatory filings or engagements for the Reporting Periods, were $185,800 in 2015 and $199,800 in 2016.
(b) Audit-Related Fees – The aggregate fees billed in the Reporting Periods for assurance and related services rendered by the principal accountant that were reasonably related to the performance of the audit of the Registrant's financial statements and are not reported under paragraph (a) of this Item 4 were $0 in 2015 and $0 in 2016.
(c) Tax Fees - The aggregate fees billed in the Reporting Periods for professional services rendered by the principal accountant to the Registrant for tax compliance, tax advice and tax planning were $38,000 in 2015 and $41,000 in 2016. These services consisted of review or preparation of U.S. federal, state, local and excise tax returns.
(d) All Other Fees - The aggregate fees billed in the Reporting Periods for products and services provided by the principal accountant to the Registrant, other than the services reported in paragraphs (a) through (c) of this Item, were $0 in 2015 and $0 in 2016.
(e) (1) The Audit Committee reviews and approves in advance all audit and "permissible non-audit services" (as that term is defined by the rules and regulations of the Securities and Exchange Commission) to be rendered to a series of the Registrant (each, a "Series"). In addition, the Audit Committee reviews and approves in advance all "permissible non-audit services" to be provided to an investment adviser (not including any sub-adviser) of a Series, or an affiliate of such investment adviser, that is controlling, controlled by or under common control with the investment adviser and provides on-going services to the Registrant ("Affiliate"), by the Series' principal accountant if the engagement relates directly to the operations and financial reporting of the Series. The Audit Committee considers whether fees paid by a Series' investment adviser or an Affiliate to the Series' principal accountant for audit and permissible non-audit services are consistent with the principal accountant's independence.
(e) (2) No services included in (b) - (d) above were approved pursuant to paragraph (c)(7)(i)(C) of Rule 2-01 of Regulation S-X.
(f) Not applicable
(g) The aggregate non-audit fees billed by the principal accountant for services rendered to the Registrant for the Reporting Periods were $0 in 2015 and $0 in 2016. There were no fees billed in either of the Reporting Periods for non-audit services rendered by the principal accountant to the Registrant's investment adviser or any Affiliate.
(h) During the Reporting Period, the Registrant's principal accountant provided no non-audit services to the investment advisers or any entity controlling, controlled by or under common control with the investment advisers to the series of the Registrant to which this report relates.
ITEM 5. AUDIT COMMITTEE OF LISTED REGISTRANTS.
Not applicable.
ITEM 6. INVESTMENTS.
| (a) | Included as part of report to shareholders under Item 1. |
ITEM 7. DISCLOSURE OF PROXY VOTING POLICIES AND PROCEDURES FOR CLOSED-END
MANAGEMENT INVESTMENT COMPANIES.
Not applicable.
ITEM 8. PORTFOLIO MANAGERS OF CLOSED-END MANAGEMENT INVESTMENT COMPANIES.
Not applicable.
ITEM 9. PURCHASES OF EQUITY SECURITIES BY CLOSED-END MANAGEMENT INVESTMENT COMPANY AND AFFILIATED PURCHASERS.
Not applicable.
ITEM 10. SUBMISSION OF MATTERS TO A VOTE OF SECURITY HOLDERS
The Registrant does not accept nominees to the board of trustees from shareholders.
ITEM 11. CONTROLS AND PROCEDURES
(a) The Registrant's Principal Executive Officer and Principal Financial Officer have concluded that the Registrant's disclosure controls and procedures (as defined in Rule 30a-3(c) under the Investment Company Act of 1940 (the "Act")) are effective, based on their evaluation of the controls and procedures required by Rule 30a-3(b) under the Act and Rules 13a-15(b) or 15d-15(b) under the Securities Exchange Act of 1934, as of a date within 90 days of the filing date of this report.
(b) There were no changes in the Registrant's internal control over financial reporting (as defined in
Rule 30a-3(d) under the Act) that occurred during the second fiscal quarter of the period covered by this report that have materially affected, or are reasonably likely to materially affect, the Registrant's internal control over financial reporting.
ITEM 12. EXHIBITS.
(a)(1) Code of Ethics (Exhibit filed herewith).
(a)(2) Certifications pursuant to Rule 30a-2(a) of the Act, and Section 302 of the Sarbanes-Oxley Act of 2002. (Exhibits filed herewith)
(a)(3) Not applicable.
(b) Certifications pursuant to Rule 30a-2(b) of the Act, and Section 906 of the Sarbanes-Oxley Act of 2002. (Exhibit filed herewith)
SIGNATURES
Pursuant to the requirements of the Securities Exchange Act of 1934 and the Investment Company Act of 1940, the Registrant has duly caused this report to be signed on its behalf by the undersigned, thereunto duly authorized.
Registrant Forum Funds
| By | /s/ Jessica Chase | | |
| | Jessica Chase, Principal Executive Officer | | |
| Date | May 31, 2016 | | |
Pursuant to the requirements of the Securities Exchange Act of 1934 and the Investment Company Act of 1940, this report has been signed below by the following persons on behalf of the Registrant and in the capacities and on the dates indicated.
| By | /s/ Jessica Chase | | |
| | Jessica Chase, Principal Executive Officer | | |
| Date | May 31, 2016 | | |
| By | /s/ Karen Shaw | | |
| | Karen Shaw, Principal Financial Officer | | |
| Date | May 31, 2016 | | |