As filed with the Securities and Exchange Commission on August 30, 2016
UNITED STATES
SECURITIES AND EXCHANGE COMMISSION
WASHINGTON, D.C. 20549
FORM N-CSR
CERTIFIED SHAREHOLDER REPORT OF REGISTERED MANAGEMENT
INVESTMENT COMPANIES
Investment Company Act file number 811-03023
FORUM FUNDS
Three Canal Plaza, Suite 600
Portland, Maine 04101
Jessica Chase, Principal Executive Officer
Three Canal Plaza, Suite 600
Portland, Maine 04101
207-347-2000
Date of fiscal year end: June 30
Date of reporting period: July 1, 2015 – June 30, 2016
ITEM 1. REPORT TO STOCKHOLDERS.
Auxier Focus Fund
Annual Report
June 30, 2016
Fund Adviser:
Auxier Asset Management LLC
5285 Meadows Road
Suite 333
Lake Oswego, Oregon 97035
Toll Free: (877) 3AUXIER or (877) 328-9437
|
AUXIER FOCUS FUND A MESSAGE TO OUR SHAREHOLDERS (Unaudited) JUNE 30, 2016 |
|
June's shocking vote by Great Britain to exit the European Union added to volatility for the second quarter. I remember like yesterday investing in the 1990s when negative headlines out of international markets were relentless. Japan's stock market crashed off an immense bubble that peaked in 1989. Mexico suffered a severe Peso devaluation in 1994. Russia defaulted after the energy bust in 1998. East Asia faced a severe financial crisis and meltdown at the same time. Despite such alarming headlines, the superior businesses we owned endured and thrived. And investment flows returned to the US as investors increasingly valued the integrity of our markets and rule of law. These inflows ultimately contributed to bubble valuations in US blue chips in the late 1990s, when we were forced to lighten up. A classic example was Coca Cola, then trading at 50 times earnings.
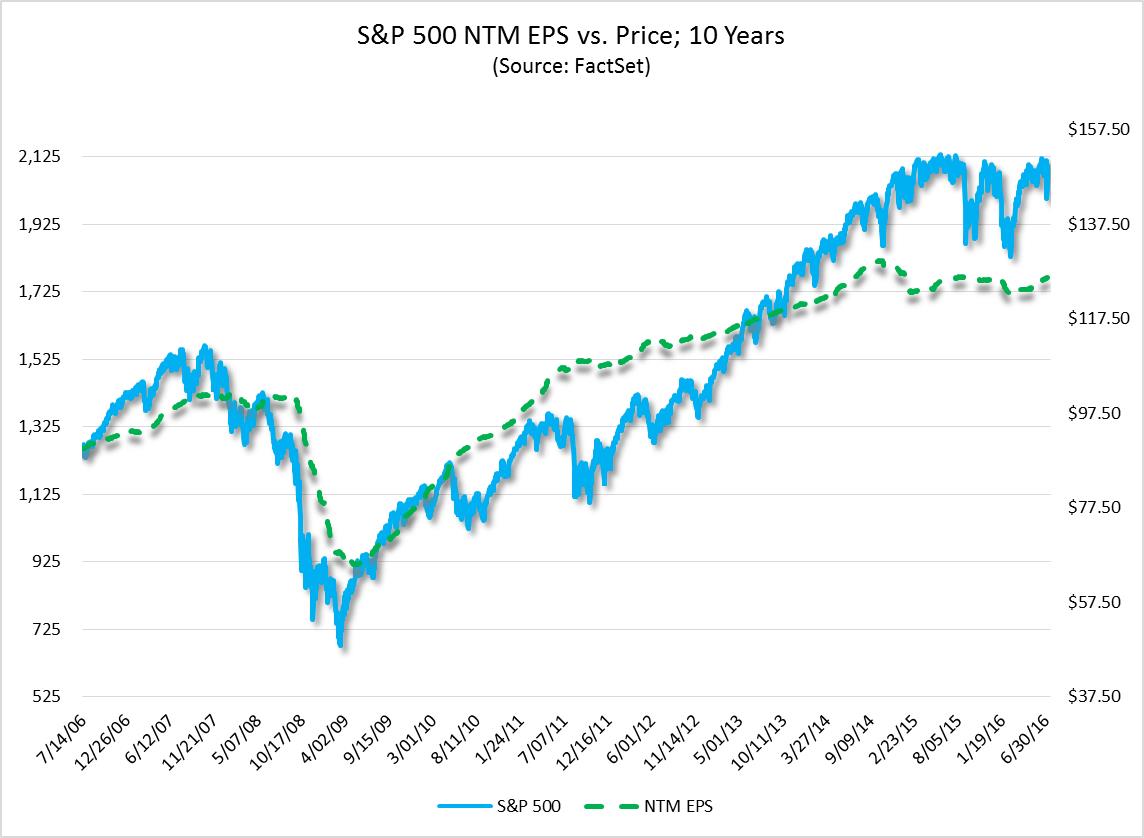
Today we have similar gloom out of China—the result of an extraordinary borrowing binge. Venezuela is bankrupt and should default. Brazil is in the worst economic downturn in 100 years. And the banking industry in Europe is severely undercapitalized. That is why we have focused not on predicting markets but on valuing individual companies. We strive to own businesses that survive and thrive even when faced with the most extreme macroeconomic challenges. We believe longer term it is more rewarding to be an exceptional business analyst as opposed to a market analyst. One with an eye on knowable fundamentals. To enjoy the fruits of compounding that high return businesses can provide, investors need to stay in the game and not be scared out by negative headlines. Central banks in the US, Japan and Europe continue to add to the distortion in asset values by driving interest rates negative. This is leading to rapid growth in debt accumulation and a "flight to safety" mentality rampant among many investors chasing for yield—often blindly.
At current interest rate levels, there is no chance to maintain purchasing power in the years ahead. Central banks have far too much power to print money and need to be checked. Regarding the misperception that bonds are currently "safe," author Jim Grant recently dusted off his copy of A History of Interest Rates, first published in 1963 by Sidney Homer and Richard Sylla. Grant figures that over $13 trillion in sovereign bonds globally now yield negative interest. This is a phenomenon that has never taken place in over 3000 years. So corresponding prices are dangerously expensive. Usually rates rise when corporate balance sheets deteriorate in a free market pricing environment. Central banks have interrupted and impeded the market through bond purchases (some estimates as high as 15% of global corporate and sovereign issues). In the past twenty years, we have seen extreme bubble valuations in tech-telecom, housing and commodities. Now the price extreme is in income vehicles perceived to be "safe." In order to maintain the compounding process, it is critical to identify bubble valuations and systemically sell into them to reduce exposure. Traveling throughout the country I see rents rising (9% annually in Portland and Seattle), home prices trending higher, healthcare premium renewals rising 12-18%, costs of maintenance, repair and property taxes surging, and wage gains as shortages abound among skilled workers. Traffic is jammed, airports are packed. This is not a depression environment that warrants zero interest rates. There is talk of instigating even more aggressive money printing policies (so-called helicopter money) in Japan. It is helpful to revisit such devastating policies during Germany's Weimar Republic after World War I. Then the bulk of German investors were hiding out in bonds during a recessionary economy. In 1921 the German currency stabilized at 90 marks to the US dollar. By November 1923, the American dollar was worth 4,210,500,000,000 marks. On a recent research trip, I saw a bumper sticker that read, "Sure You Can Trust The Government, Just Ask An Indian." When it comes to your investments you can trust a little, but you need to constantly verify the facts and fundamentals.
AUXIER FOCUS FUND
PERFORMANCE UPDATE
June 30, 2016
| ANNUALIZED |
| | Inception * | Ten Year | Five Year | Three Year | One Year |
Auxier Focus Fund Investor Class Shares | 6.94% | 6.57% | 7.34% | 6.39% | 1.58% |
| S&P 500 Index | 4.37% | 7.42% | 12.10% | 11.66% | 3.99% |
| CUMULATIVE |
| | Inception * | Ten Year | Five Year | Three Year | One Year |
Auxier Focus Fund Investor Class Shares | 212.47% | 88.88% | 42.49% | 20.41% | 1.58% |
| S&P 500 Index | 106.74% | 104.65% | 77.02% | 39.20% | 3.99% |
| * Fund inception: July 9, 1999 | | | | |
|
AUXIER FOCUS FUND A MESSAGE TO OUR SHAREHOLDERS (Unaudited) JUNE 30, 2016 |
|
Performance data quoted represents past performance and is no guarantee of future results. Current performance may be lower or higher than the performance data quoted. Investment return and principal value will fluctuate so that an investor's shares, when redeemed, may be worth more or less than original cost. As stated in the current prospectus, the Fund's Investor Class Share's annual operating expense ratio (gross) is 1.27%. The Fund's adviser has contractually agreed to waive a portion of its fee and/or reimburse Fund expenses to limit total annual operating expenses to 1.14%, which is in effect until October 31, 2016. Other share classes may vary. The Fund charges a 2.0% redemption fee on shares redeemed within 180 days of purchase. For the most recent month-end performance, please call (877)328-9437 or visit the Advisor's website at www.auxierasset.com. The recent growth rate in the stock market has helped to produce short-term returns that are not typical and may not continue in the future.
Portfolio Highlights
Auxier Focus Fund's equities returned 2.62% in second quarter 2016, with 15% in foreign stocks and 11% in cash and short-term cash equivalents. The total portfolio gained 2% for the second quarter and 2.55% year to date. The S&P 500 index returned 2.46% and 3.84% for the same periods, respectively. We continue to seek out bargains among businesses that sport strong balance sheets, historically high returns on invested capital and attractive and growing free cash flow yields. Such impressive companies tend to have the strength to raise dividends over time and survive the harshest economic conditions. When stock prices are too high, we park some of our cash in "market agnostic" short-term investments that we refer to as workouts. We track earnings, cash flow and mandatory capital spending closely for each business. If the earnings and cash flow decline over the next five years, the stock will surely be lower.
Where We're Finding Value in Volatile Times

We see attractive values in industry leading biotech companies like Biogen. It has a powerful research culture that dominates the field of multiple sclerosis drugs and is a potential leader in Alzheimer's with the drug Aducanumab. There are 5.4 million Americans suffering from Alzheimer's. Biogen recently went on sale for 13 times earnings, a steep discount to its five-year trading range with a free cash flow yield more than triple the prevailing ten-year government bond yield. That valuation also might prove enticing to cash rich competitors as a takeover prospect. Core Fund holdings like Medtronic project generating over $40 billion in free cash the next five years (Omar Ishrak, CEO). S&P Global Market Intelligence expects 2016 healthcare earnings to be up 6.5%—higher than all but one sector. Other top Fund holdings executing in healthcare include UnitedHealth, Johnson & Johnson, Zimmer Biomet, and CVS. Again, many of these holdings have recent free cash flow yields far in excess of the prevailing long bond yields. Merck is leading advances in immunotherapy for cancer cures with the drug Keytruda, where sales have increased from $110 million to over $314 million in the past year. I recently spent time visiting companies involved in medical marijuana. I strongly believe that the anti-inflammatory properties of Cannabinoid (the nondrug part of the plant) will be proved effective in replacing often-addictive painkillers. Twenty-five states in the US have legalized medicinal marijuana. Germany's Health Minister said the country will legalize in 2017 with health insurers reimbursing as well. Canada, Australia and Italy look as if they may follow within the next couple of years.
Lower energy prices ultimately are good for a US economy that is 70% consumption and 85% service oriented. There now is a glut of refined fuel partly due to the expansion of refinery capacity in Asia. This opens the door for a very palatable 10 cent gas tax that could fund badly needed infrastructure in the US as online shopping (and deliveries) continue to show greatest growth in retail spending. US construction spending on infrastructure (as a percentage of GDP) is running the lowest in over 30 years—and odds favor a big boost after the elections. Every energy crash that I have invested through has led to very strong fundamentals for our economy and higher interest rates. Low fuel prices and mobile technology are contributing to a travel boom as Americans have logged over 3 trillion road miles this past year. Convenience store purchases for foods and beverages continue to be strong. On the negative side, a flood of capital into big grocery chains has created excess capacity
|
AUXIER FOCUS FUND A MESSAGE TO OUR SHAREHOLDERS (Unaudited) JUNE 30, 2016 |
|
and hypercompetitive pricing of goods. Improved data analytics make it easier to overproduce and oversupply. We see numerous businesses afflicted with gluts. These are problems of "abundance."
Fund holdings Molson Coors and Altria were beneficiaries of the buyout of SABMiller by AB InBev. This is a case where cumulative knowledge in an industry helped enhance returns in a flat market. Molson appreciated over 150% since our purchase four years ago as the industry has consolidated. Altria was a major shareholder of SABMiller, and Molson will be able to buy joint venture assets of Miller at attractive price levels as part of this buyout deal. We see the need for media content consolidation led by Liberty Media founder John Malone. We also see attractive valuations in companies like Discovery Communications (Malone is its largest individual shareholder). Discovery owns its content and trades at a steep discount to private market value. While domestic banks are very cheap, they continue to suffer from headwinds of souring energy loans, low net-interest margins and deteriorating subprime car loans. Look for more trouble for banks directly exposed to the oil patch as well as the farm belt. Insurers suffer with zero interest rates as investment portfolio "float" becomes worth less. I believe autonomous cars ultimately will pose a material risk for auto insurers as accident rates are sure to fall. Technology disruption ranks as one of the biggest risks to investing in today's markets. The growth of online shopping, mobile communications and data analytics is transforming entire industries. In highly valued stock markets, risk management becomes more critical to minimize the threat of "torpedoes." These are pricey stocks with very high investor expectations that can suddenly disappoint, crash and torpedo the portfolio. In allocating, we see a strong need to maintain cash and/or market agnostic positions to take advantage of bargain purchases that result when the electronic herd panics. Historically, market indices can be flat for decades. The Dow Jones Industrials rose one measly point between 1964-1981. For my money, I want to trust in a focused daily research effort to identify compelling opportunities. This process combines price discovery and cumulative industry knowledge to quantify and reduce risk while improving odds of success. Investing is the "craft of the specific." Our returns depend on carefully studied company selection, not the market. Life savings are too important to be left to chance. With regard to holding excess cash in portfolios, in market crashes there tends to be 85% correlation on the downside. So we view the cash in the portfolio as integral to make exceptional buys in times of panic.
We appreciate your trust.
Jeff Auxier
Fund returns (i) assume the reinvestment of all dividends and capital gain distributions and (ii) would have been lower during the period if certain fees and expenses had not been waived. Performance shown is for the Fund's Investor Class shares; returns for other share classes will vary. Performance for Investor Class shares for periods prior to December 10, 2004 reflects performance of the applicable share class of Auxier Focus Fund, a series of Unified Series Trust (the "Predecessor Fund"). Prior to January 3, 2003, the Predecessor Fund was a series of Ameriprime Funds. The performance of the Fund's Investor Class shares for the period prior to December 10, 2004 reflects the expenses of the Predecessor Fund.
The Fund may invest in value and/or growth stocks. Investments in value stocks are subject to risk that their intrinsic value may never be realized and investments in growth stocks may be susceptible to rapid price swings, especially during periods of economic uncertainty. In addition, the Fund may invest in mid-sized companies which generally carry greater risk than is customarily associated with larger companies. Moreover, if the Fund's portfolio is overweighted in a sector, any negative development affecting that sector will have a greater impact on the Fund than a fund that is not overweighted in that sector. An increase in interest rates typically causes a fall in the value of a debt security (Fixed-Income Securities Risk) with corresponding changes to the Fund's value.
The S&P 500 Index is a broad-based, unmanaged measurement of changes in stock market conditions based on 500 widely held common stocks. The Dow Jones Industrial Average is a price-weighted average of 30 significant stocks traded on the New York Stock Exchange and the Nasdaq. One cannot invest directly in an index or average.
The views in this shareholder letter were those of the Fund Manager as of the letter's publication date and may not reflect his views on the date this letter is first distributed or anytime thereafter. These views are intended to assist readers in understanding the Fund's investment methodology and do not constitute investment advice.
|
AUXIER FOCUS FUND PERFORMANCE CHART AND ANALYSIS (Unaudited) JUNE 30, 2016 |
|
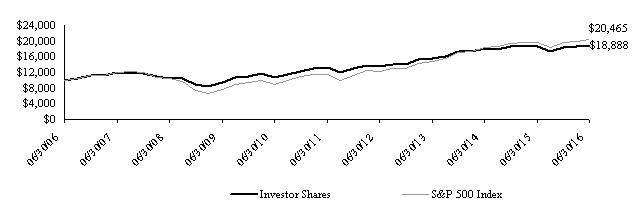
The following chart reflects the change in the value of a hypothetical $10,000 investment in Investor Shares, including reinvested dividends and distributions, in the Fund compared with the performance of the benchmark, the S&P 500 Index ("S&P 500"), over the past ten fiscal years. The S&P 500 is a broad-based, unmanaged measurement of changes in stock market conditions based on the average of 500 widely held common stocks. The total return of the Fund's classes includes the maximum sales charge of 5.75% (A Shares only) and operating expenses that reduce returns, while the total return of the S&P 500 does not include the effect of sales charges and expenses. A Shares are subject to a 1.00% contingent deferred sales charge on shares purchased without an initial sales charge and redeemed less than one year after purchase. The total return of the S&P 500 includes the reinvestment of dividends and income. The total return of the Fund includes operating expenses that reduce returns, while the total return of the S&P 500 does not include expenses. The Fund is professionally managed, while the S&P 500 is unmanaged and is not available for investment.
Comparison of Change in Value of a $10,000 Investment
Investor Shares vs. S&P 500 Index
Average Annual Total Returns Periods Ended June 30, 2016: | | 1 Year | | 5 Years | | 10 Years | | Since Inception(1) |
| Investor Shares | | 1.58 | % | | 7.34 | % | | 6.57 | % | | 6.94 | % |
| S&P 500 Index (Since July 9, 1999) | | 3.99 | % | | 12.10 | % | | 7.42 | % | | 4.37 | % |
A Shares (with sales charge)(2)(3) | | -4.34 | % | | 6.05 | % | | 5.91 | % | | 6.56 | % |
Institutional Shares(3) | | 1.74 | % | | 7.53 | % | | 6.66 | % | | 7.00 | % |
| (1) | Investor, A Shares and Institutional Shares commenced operations on July 9, 1999, July 8, 2005, and May 9, 2012, respectively. |
| (2) | Due to shareholder redemptions on August 21, 2005, net assets of the class were zero from the close of business on that date until September 22, 2005. Financial information presented for the period August 21, 2005 to September 22, 2005 reflects performance of Investor Shares of the Fund. |
| (3) | For Institutional Shares, performance for the 5-year, 10-year and since inception periods are blended average annual returns which include the returns of the Investor Shares prior to commencement of operations of the Institutional Shares. For A Shares, performance for the since inception period is a blended average annual which includes the return of the Investor Shares prior to commencement of operations of the A Shares. |
Performance data quoted represents past performance and is no guarantee of future results. Current performance may be lower or higher than the performance data quoted. Investment return and principal value will fluctuate so that shares, when redeemed, may be worth more or less than original cost. For the most recent month-end performance, please visit the website of the Fund's investment adviser at www.auxierasset.com or call (877) 328-9437. As stated in the Fund's prospectus, the annual operating expense ratios (gross) for Investor Shares, A Shares and Institutional Shares are 1.27%, 1.56% and 1.36%, respectively. However, the Fund's adviser has contractually agreed to waive a portion of its fees and/or to reimburse expenses to limit total annual fund operating expenses (excluding all taxes, interest, portfolio transaction expenses, dividend expenses on short sales, and extraordinary expenses) to 1.14%, 1.25% and 1.00% for Investor Shares, A Shares and Institutional Shares, respectively through October 31, 2016. Shares redeemed or exchanged within 180 days of purchase will be charged a 2.00% redemption fee. The performance table and graph do not reflect the deduction of taxes that a shareholder would pay on Fund distributions or the redemption of Fund shares. Returns greater than one year are annualized.
Performance for Investor Shares for periods prior to December 10, 2004, reflects performance and expenses of Auxier Focus Fund, a series of Unified Series Trust (the "Predecessor Fund"). Prior to January 3, 2003, the Predecessor Fund was a series of Ameriprime Funds.
|
AUXIER FOCUS FUND SCHEDULE OF INVESTMENTS JUNE 30, 2016 |
|
| Shares | | Security Description | | Value | |
| Common Stock - 89.7% |
| Communications - 3.3% |
| | 289,525 | | America Movil SAB de CV, ADR | $ | 3,549,577 | |
| | 23,159 | | Cisco Systems, Inc. | | 664,432 | |
| | 1,100 | | eBay, Inc. (a) | | 25,751 | |
| | 249,738 | | Telefonica SA, ADR | | 2,367,516 | |
| | 37,860 | | Twenty-First Century Fox, Inc., Class A | | 1,024,113 | |
| | 11,845 | | Viacom, Inc., Class B | | 491,212 | |
| | | 8,122,601 | |
| Consumer Discretionary - 7.7% |
| | 47,475 | | Apollo Education Group, Inc., Class A (a) | | 432,972 | |
| | 18,000 | | Arcos Dorados Holdings, Inc., Class A (a) | | 85,860 | |
| | 119 | | Charter Communications, Inc., Class A (a) | | 27,208 | |
| | 37,860 | | Comcast Corp., Class A | | 2,468,093 | |
| | 16,020 | | CST Brands, Inc. | | 690,142 | |
| | 9,990 | | CVS Health Corp. | | 956,443 | |
| | 113,377 | | Discovery Communications, Inc., Class A (a) | | 2,860,502 | |
| | 4,641 | | Discovery Communications, Inc., Class C (a) | | 110,688 | |
| | 16,250 | | General Motors Co. | | 459,875 | |
| | 67,162 | | H&R Block, Inc. | | 1,544,726 | |
| | 230,433 | | Lincoln Educational Services Corp. (a) | | 345,649 | |
| | 18,550 | | Lowe's Cos., Inc. | | 1,468,603 | |
| | 7,656 | | McDonald's Corp. | | 921,323 | |
| | 2,100 | | Michael Kors Holdings, Ltd. (a) | | 103,908 | |
| | 1,160 | | Red Robin Gourmet Burgers, Inc. (a) | | 55,019 | |
| | 3,250 | | Sally Beauty Holdings, Inc. (a) | | 95,583 | |
| | 1,176 | | The Andersons, Inc. | | 41,795 | |
| | 4,725 | | The Home Depot, Inc. | | 603,335 | |
| | 12,650 | | Time Warner, Inc. | | 930,281 | |
| | 28,135 | | Vitamin Shoppe, Inc. (a) | | 860,087 | |
| | 50,050 | | Wal-Mart Stores, Inc. | | 3,654,651 | |
| | 7,050 | | Yum! Brands, Inc. | | 584,586 | |
| | | 19,301,329 | |
| Consumer Staples - 25.5% |
| | 62,500 | | Altria Group, Inc. | | 4,310,000 | |
| | 15,100 | | British American Tobacco PLC, ADR | | 1,955,148 | |
| | 5,351 | | Cal-Maine Foods, Inc. | | 237,156 | |
| | 13,200 | | Coca-Cola HBC AG, ADR (a) | | 265,188 | |
| | 48,435 | | ConAgra Foods, Inc. | | 2,315,677 | |
| | 8,785 | | Diageo PLC, ADR | | 991,651 | |
| | 30,050 | | Dr. Pepper Snapple Group, Inc. | | 2,903,732 | |
| | 20,100 | | Kelly Services, Inc., Class A | | 381,297 | |
| | 73,707 | | Molson Coors Brewing Co., Class B | | 7,453,989 | |
| | 12,100 | | Monster Beverage Corp. (a) | | 1,944,591 | |
| | 91,660 | | PepsiCo, Inc. | | 9,710,460 | |
| | 82,520 | | Philip Morris International, Inc. | | 8,393,934 | |
| | 449,921 | | Tesco PLC, ADR (a) | | 3,158,445 | |
| | 64,300 | | The Coca-Cola Co. | | 2,914,719 | |
| | 2,845 | | The JM Smucker Co. | | 433,606 | |
| | 203,368 | | The Kroger Co. | | 7,481,909 | |
| | 32,925 | | The Procter & Gamble Co. | | 2,787,760 | |
| | 109,720 | | The Western Union Co. | | 2,104,430 | |
| | 81,550 | | Unilever NV, ADR | | 3,827,957 | |
| | | 63,571,649 | |
| Energy - 3.4% |
| | 144,810 | | BP PLC, ADR | | 5,142,203 | |
| | 11,130 | | Chevron Corp. | | 1,166,758 | |
| | 15,600 | | ConocoPhillips | | 680,160 | |
| | 7,800 | | Phillips 66 | | 618,852 | |
| | 19,100 | | Valero Energy Corp. | | 974,100 | |
| | | 8,582,073 | |
| Financials - 16.5% |
| | 42,250 | | Aflac, Inc. | | 3,048,760 | |
| | 39,000 | | American International Group, Inc. | | 2,062,710 | |
| | 1,280 | | Ameriprise Financial, Inc. | | 115,008 | |
| | 213,649 | | Bank of America Corp. | | 2,835,122 | |
| | 16,415 | | Berkshire Hathaway, Inc., Class B (a) | | 2,376,728 | |
| | 70,374 | | Central Pacific Financial Corp. | | 1,660,826 | |
| | 23,650 | | Citigroup, Inc. | | 1,002,523 | |
| | 5,616 | | Colliers International Group, Inc. | | 191,730 | |
| | 132,268 | | Credit Suisse Group AG, ADR | | 1,415,268 | |
| | 5,616 | | FirstService Corp. | | 257,381 | |
| | 82,110 | | Franklin Resources, Inc. | | 2,740,011 | |
| | 24,900 | | Legg Mason, Inc. | | 734,301 | |
| | 10,525 | | Marsh & McLennan Cos., Inc. | | 720,541 | |
| | 60,150 | | MasterCard, Inc., Class A | | 5,296,809 | |
| | 1,100 | | PayPal Holdings, Inc. (a) | | 40,161 | |
| | 217,200 | | The Bank of New York Mellon Corp. | | 8,438,220 | |
| | 38,418 | | The Travelers Cos., Inc. | | 4,573,279 | |
| | 7,350 | | U.S. Bancorp | | 296,426 | |
| | 21,849 | | Unum Group | | 694,580 | |
| | 31,600 | | Visa, Inc., Class A | | 2,343,772 | |
| | 23,000 | | Waddell & Reed Financial, Inc., Class A | | 396,060 | |
| | 500 | | Wells Fargo & Co. | | 23,665 | |
| | | 41,263,881 | |
| Health Care - 23.1% |
| | 42,600 | | Abbott Laboratories | | 1,674,606 | |
| | 2,900 | | Alkermes PLC (a) | | 125,338 | |
| | 550 | | Allergan PLC (a) | | 127,100 | |
| | 23,591 | | Anthem, Inc. | | 3,098,442 | |
| | 17,200 | | Becton Dickinson and Co. | | 2,916,948 | |
| | 10,125 | | Biogen, Inc. (a) | | 2,448,428 | |
| | 13,580 | | Community Health Systems, Inc. (a) | | 163,639 | |
| | 47,424 | | Express Scripts Holding Co. (a) | | 3,594,739 | |
| | 525 | | Gilead Sciences, Inc. | | 43,796 | |
| | 44,300 | | GlaxoSmithKline PLC, ADR | | 1,919,962 | |
| | 59,240 | | Johnson & Johnson | | 7,185,812 | |
| | 1,100 | | Laboratory Corp. of America Holdings (a) | | 143,297 | |
| | 95,003 | | Medtronic PLC | | 8,243,410 | |
| | 105,169 | | Merck & Co., Inc. | | 6,058,786 | |
| | 13,582 | | Pfizer, Inc. | | 478,222 | |
| | 50,267 | | Quest Diagnostics, Inc. | | 4,092,236 | |
| | 1,303 | | Shire PLC, ADR | | 239,856 | |
| | 10,280 | | St. Jude Medical, Inc. | | 801,840 | |
| | 60,674 | | UnitedHealth Group, Inc. | | 8,567,169 | |
| | 47,400 | | Zimmer Biomet Holdings, Inc. | | 5,706,012 | |
| | | 57,629,638 | |
| Industrials - 3.3% |
| | 1,400 | | AGCO Corp. | | 65,982 | |
| | 256,341 | | Corning, Inc. | | 5,249,864 | |
| | 12,500 | | Raytheon Co. | | 1,699,375 | |
| | 5,675 | | Textainer Group Holdings, Ltd. | | 63,220 | |
| | 2,550 | | The Boeing Co. | | 331,168 | |
| | 8,515 | | United Parcel Service, Inc., Class B | | 917,236 | |
| | | 8,326,845 | |
| Information Technology - 3.9% |
| | 10,275 | | Intel Corp. | | 337,020 | |
| | 115,147 | | Microsoft Corp. | | 5,892,072 | |
| | 82,320 | | Oracle Corp. | | 3,369,358 | |
| | | 9,598,450 | |
| Materials - 2.7% |
| | 30,715 | | E.I. du Pont de Nemours & Co. | | 1,990,332 | |
See Notes to Financial Statements. | 5 | |
|
AUXIER FOCUS FUND SCHEDULE OF INVESTMENTS JUNE 30, 2016 |
|
| Shares | | Security Description | | Value | |
| | 25,870 | | LyondellBasell Industries NV, Class A | $ | 1,925,245 | |
| | 47,350 | | The Dow Chemical Co. | | 2,353,768 | |
| | 21,675 | | The Mosaic Co. | | 567,452 | |
| | | 6,836,797 | |
| Telecommunications - 0.2% |
| | 7,335 | | Verizon Communications, Inc. | | 409,586 | |
| | | | |
| Transportation - 0.1% |
| | 3,160 | | Union Pacific Corp. | | 275,710 | |
| | | | |
Total Common Stock (Cost $146,573,543) | | 223,918,559 | |
| | Principal | | | | Rate | | Maturity | | Value | |
| Corporate Non-Convertible Bonds - 0.3% |
| Energy - 0.0% |
| $ | 18,000 | | Devon Energy Corp. | | 2.25 | % | 12/15/18 | | 17,884 | |
| | | | |
| Financials - 0.3% |
| | 290,000 | | Bank of America Corp. (b) | | 8.00 | | 12/29/49 | | 288,550 | |
| | 500,000 | | Bank of America Corp., Series M (b) | | 8.13 | | 11/15/49 | | 501,875 | |
| | | 790,425 | |
Total Corporate Non-Convertible Bonds (Cost $801,594) | | 808,309 | |
Total Investments - 90.0% (Cost $147,375,137)* | $ | 224,726,868 | |
| Other Assets & Liabilities, Net – 10.0% | | 24,861,017 | |
| Net Assets – 100.0% | $ | 249,587,885 | |
| ADR | American Depositary Receipt |
| PLC | Public Limited Company |
| (a) | Non-income producing security. |
| (b) | Variable rate security. Rate presented is as of June 30, 2016. |
* Cost for federal income tax purposes is $147,393,109 and net unrealized appreciation consists of:
| Gross Unrealized Appreciation | | $ | 92,477,704 | |
| Gross Unrealized Depreciation | | | (15,143,945 | ) |
| Net Unrealized Appreciation | | $ | 77,333,759 | |
The following is a summary of the inputs used to value the Fund's investments as of June 30, 2016.
The inputs or methodology used for valuing securities are not necessarily an indication of the risks associated with investing in those securities. For more information on valuation inputs, and their aggregation into the levels used in the table below, please refer to the Security Valuation section in Note 2 of the accompanying Notes to Financial Statements.
| | Level 1 | | Level 2 | | Level 3 | | Total |
| Investments At Value |
| Common Stock | | | | | | | | | | | | | | | | |
| Communications | | $ | 8,122,601 | | | $ | - | | | $ | - | | | $ | 8,122,601 | |
| Consumer Discretionary | | | 19,301,329 | | | | - | | | | - | | | | 19,301,329 | |
| Consumer Staples | | | 63,571,649 | | | | - | | | | - | | | | 63,571,649 | |
| Energy | | | 8,582,073 | | | | - | | | | - | | | | 8,582,073 | |
| Financials | | | 41,263,881 | | | | - | | | | - | | | | 41,263,881 | |
| Health Care | | | 57,629,638 | | | | - | | | | - | | | | 57,629,638 | |
| Industrials | | | 8,326,845 | | | | - | | | | - | | | | 8,326,845 | |
| Information Technology | | | 9,598,450 | | | | - | | | | - | | | | 9,598,450 | |
| Materials | | | 6,836,797 | | | | - | | | | - | | | | 6,836,797 | |
| Telecommunications | | | 409,586 | | | | - | | | | - | | | | 409,586 | |
| Transportation | | | 275,710 | | | | - | | | | - | | | | 275,710 | |
| Corporate Non-Convertible Bonds | | | - | | | | 808,309 | | | | - | | | | 808,309 | |
| Total Investments At Value | | $ | 223,918,559 | | | $ | 808,309 | | | $ | - | | | $ | 224,726,868 | |
The Fund utilizes the end of period methodology when determining transfers. There were no transfers among Level 1, Level 2 and Level 3 for the year ended June 30, 2016.
| PORTFOLIO HOLDINGS | | |
| % of Net Assets | | |
| Common Stock | 89.7 | % |
| Corporate Non-Convertible Bonds | 0.3 | % |
| Cash and Other Net Assets | 10.0 | % |
| | 100.0 | % |
See Notes to Financial Statements. | 7 | |
|
AUXIER FOCUS FUND STATEMENT OF OPERATIONS YEAR ENDED JUNE 30, 2016 |
|
| INVESTMENT INCOME | | | | | | |
| | Dividend income (Net of foreign withholding taxes of $55,372) | | | $ | 5,628,697 | | |
| | Interest income | | | 47,710 | | |
| Total Investment Income | | | | 5,676,407 | | |
| | | | | | | |
| EXPENSES | | | | | | |
| | Investment adviser fees | | | 2,535,612 | | |
| | Fund services fees | | | 330,763 | | |
| | Transfer agent fees: | | | | | |
| | Investor Shares | | | 72,083 | | |
| | A Shares | | | 1,516 | | |
| | Institutional Shares | | | 420 | | |
| | Distribution fees: | | | | | |
| | A Shares | | | 9,626 | | |
| | Custodian fees | | | 25,706 | | |
| | Registration fees: | | | | | |
| | Investor Shares | | | 20,308 | | |
| | A Shares | | | 4,055 | | |
| | Institutional Shares | | | 13,109 | | |
| | Professional fees | | | 43,222 | | |
| | Trustees' fees and expenses | | | 18,115 | | |
| | Miscellaneous expenses | | | 233,763 | | |
| Total Expenses | | | | 3,308,298 | | |
| | Fees waived and expenses reimbursed | | | (463,564 | ) | |
| Net Expenses | | | | 2,844,734 | | |
| | | | | | | | |
| NET INVESTMENT INCOME | | | | 2,831,673 | | |
| | | | | | | | |
| NET REALIZED AND UNREALIZED GAIN (LOSS) | | | | | | |
| | Net realized gain on investments | | | 9,730,243 | | |
| | Net change in unrealized appreciation (depreciation) on investments | | | (8,819,697 | ) | |
| NET REALIZED AND UNREALIZED GAIN | | | | 910,546 | | |
| INCREASE IN NET ASSETS RESULTING FROM OPERATIONS | | | $ | 3,742,219 | | |
| | | | | | | | |
See Notes to Financial Statements. | 8 | |
|
AUXIER FOCUS FUND STATEMENTS OF CHANGES IN NET ASSETS |
|
| | | | | For the Year Ended June 30, 2016 | | For the Year Ended June 30, 2015 | |
| OPERATIONS | | | | | | Shares | | | | | | | Shares | | |
| | Net investment income | | $ | 2,831,673 | | | | | | $ | 2,442,638 | | | | | |
| | Net realized gain | | | 9,730,243 | | | | | | | 7,121,019 | | | | | |
| | Net change in unrealized appreciation (depreciation) | | | (8,819,697 | ) | | | | | | (1,503,747 | ) | | | | |
| Increase in Net Assets Resulting from Operations | | | 3,742,219 | | | | | | | 8,059,910 | | | | | |
| | | | | | | | | | | | | | | | | | |
| DISTRIBUTIONS TO SHAREHOLDERS FROM | | | | | | | | | | | | | | | |
| | Net investment income: | | | | | | | | | | | | | | | |
| | | Investor Shares | | | (2,248,905 | ) | | | | | | (2,637,509 | ) | | | | |
| | | A Shares | | | (22,824 | ) | | | | | | (39,538 | ) | | | | |
| | | Institutional Shares | | | (385,094 | ) | | | | | | (70,657 | ) | | | | |
| | Net realized gain: | | | | | | | | | | | | | | | |
| | | Investor Shares | | | (9,632,084 | ) | | | | | | (7,849,090 | ) | | | | |
| | | A Shares | | | (170,302 | ) | | | | | | (148,394 | ) | | | | |
| | | Institutional Shares | | | (1,612,577 | ) | | | | | | (238,876 | ) | | | | |
| Total Distributions to Shareholders | | | (14,071,786 | ) | | | | | | (10,984,064 | ) | | | | |
| | | | | | | | | | | | | | | | | | |
| CAPITAL SHARE TRANSACTIONS | | | | | | | | | | | | | | | |
| | Sale of shares: | | | | | | | | | | | | | | | |
| | | Investor Shares | | | 20,810,841 | | | 1,061,055 | | | | 26,562,823 | | | 1,276,816 | | |
| | | A Shares | | | 11,861 | | | 568 | | | | 873,139 | | | 41,598 | | |
| | | Institutional Shares | | | 13,491,947 | | | 684,197 | | | | 21,941,682 | | | 1,039,287 | | |
| | Reinvestment of distributions: | | | | | | | | | | | | | | | |
| | | Investor Shares | | | 11,337,657 | | | 585,561 | | | | 10,140,585 | | | 499,068 | | |
| | | A Shares | | | 172,938 | | | 8,861 | | | | 177,386 | | | 8,692 | | |
| | | Institutional Shares | | | 1,964,718 | | | 100,186 | | | | 309,533 | | | 15,098 | | |
| | Redemption of shares: | | | | | | | | | | | | | | | |
| | | Investor Shares | | | (50,933,072 | ) | | (2,604,822 | ) | | | (87,469,825 | ) | | (4,198,398 | ) | |
| | | A Shares | | | (2,827,075 | ) | | (142,309 | ) | | | (564,363 | ) | | (26,856 | ) | |
| | | Institutional Shares | | | (941,455 | ) | | (47,755 | ) | | | (443,719 | ) | | (21,158 | ) | |
| | Redemption fees | | | 11,282 | | | - | | | | 11,230 | | | - | | |
| Decrease in Net Assets from Capital Share Transactions | | | (6,900,358 | ) | | (354,458 | ) | | | (28,461,529 | ) | | (1,365,853 | ) | |
| Decrease in Net Assets | | | (17,229,925 | ) | | | | | | (31,385,683 | ) | | | | |
| | | | | | | | | | | | | | | | | | |
| NET ASSETS | | | | | | | | | | | | | | | |
| | Beginning of Year | | | 266,817,810 | | | | | | | 298,203,493 | | | | | |
| | End of Year (Including line (a)) | | $ | 249,587,885 | | | | | | $ | 266,817,810 | | | | | |
| (a) | Undistributed net investment income | | $ | 1,407,648 | | | | | | $ | 1,232,798 | | | | | |
See Notes to Financial Statements. | 9 | |
|
AUXIER FOCUS FUND FINANCIAL HIGHLIGHTS |
|
These financial highlights reflect selected data for a share outstanding throughout each year. | | | | | | |
| | | For the Year Ended June 30, | |
| INVESTOR SHARES | | 2016 | | | | 2015 | | | | 2014 | | | | 2013 | | | | 2012 | | |
| NET ASSET VALUE, Beginning of Year | $ | 20.50 | | | $ | 20.75 | | | $ | 18.59 | | | $ | 16.49 | | | $ | 16.45 | | |
| INVESTMENT OPERATIONS | | | | | | | | | | | | | | | | | | | | |
| Net investment income (a) | | 0.21 | | | | 0.17 | | | | 0.20 | | | | 0.21 | | | | 0.22 | | |
| Net realized and unrealized gain | | 0.08 | | | | 0.38 | | | | 2.63 | | | | 2.23 | | | | 0.20 | (b) |
| Total from Investment Operations | | 0.29 | | | | 0.55 | | | | 2.83 | | | | 2.44 | | | | 0.42 | | |
| DISTRIBUTIONS TO SHAREHOLDERS FROM | | | | | | | | | | | | | | | | | |
| Net investment income | | (0.20 | ) | | | (0.20 | ) | | | (0.22 | ) | | | (0.22 | ) | | | (0.16 | ) | |
| Net realized gain | | (0.90 | ) | | | (0.60 | ) | | | (0.45 | ) | | | (0.12 | ) | | | (0.23 | ) | |
| Total Distributions to Shareholders | | (1.10 | ) | | | (0.80 | ) | | | (0.67 | ) | | | (0.34 | ) | | | (0.39 | ) | |
| REDEMPTION FEES (a) | | — | (c) | | — | (c) | | — | (c) | | — | (c) | | 0.01 | | |
| NET ASSET VALUE, End of Year | $ | 19.69 | | | $ | 20.50 | | | $ | 20.75 | | | $ | 18.59 | | | $ | 16.49 | | |
| TOTAL RETURN | | 1.58 | % | | 2.69 | % | | 15.43 | % | | 15.06 | % | | 2.84 | % |
| RATIOS/SUPPLEMENTARY DATA | | | | | | | | | | | | | | | | | | | | |
| Net Assets at End of Year (000's omitted) | $203,921 | | | $231,911 | | | $285,094 | | | $277,536 | | | $243,366 | | |
| Ratios to Average Net Assets: | | | | | | | | | | | | | | | | | | | | |
| Net investment income | | 1.10 | % | | 0.83 | % | | 1.00 | % | | 1.22 | % | | 1.36 | % |
| Net expenses | | 1.14 | % | | 1.24 | % | | 1.24 | % | | 1.25 | % | | 1.25 | % |
| Gross expenses (d) | | 1.30 | % | | 1.27 | % | | 1.26 | % | | 1.28 | % | | 1.27 | % |
| PORTFOLIO TURNOVER RATE | | 6 | % | | 4 | % | | 9 | % | | 11 | % | | 8 | % |
| | | | | | | | | | | | | | | | | | | | | | |
| | | | | | | | | | | | | | | | | | | | | | |
| (a) | Calculated based on average shares outstanding during each year. |
| (b) | The net realized and unrealized gain (loss) per share does not correlate to the aggregate of the net realized and unrealized loss in the Statement of Operations for the year ended June 30, 2012, primarily due to the timing of the sales and repurchases of the Fund's shares in relation to fluctuating market values for the Fund's portfolio. |
| (c) | Less than $0.01 per share. |
| (d) | Reflects the expense ratio excluding any waivers and/or reimbursements. |
See Notes to Financial Statements. | 10 | |
|
AUXIER FOCUS FUND FINANCIAL HIGHLIGHTS |
|
These financial highlights reflect selected data for a share outstanding throughout each year. | | | | | | |
| | | For the Year Ended June 30, | |
| A SHARES | | 2016 | | | | 2015 | | | | 2014 | | | | 2013 | | | | 2012 | | |
| NET ASSET VALUE, Beginning of Year | $ | 20.64 | | | $ | 20.85 | | | $ | 18.63 | | | $ | 16.49 | | | $ | 16.45 | | |
| INVESTMENT OPERATIONS | | | | | | | | | | | | | | | | | | | | |
| Net investment income (a) | | 0.19 | | | | 0.18 | | | | 0.20 | | | | 0.21 | | | | 0.22 | | |
| Net realized and unrealized gain | | 0.09 | | | | 0.36 | | | | 2.64 | | | | 2.24 | | | | 0.21 | (b) |
| Total from Investment Operations | | 0.28 | | | | 0.54 | | | | 2.84 | | | | 2.45 | | | | 0.43 | | |
| DISTRIBUTIONS TO SHAREHOLDERS FROM | | | | | | | | | | | | | | | | | | |
| Net investment income | | (0.12 | ) | | | (0.15 | ) | | | (0.17 | ) | | | (0.19 | ) | | | (0.16 | ) | |
| Net realized gain | | (0.90 | ) | | | (0.60 | ) | | | (0.45 | ) | | | (0.12 | ) | | | (0.23 | ) | |
| Total Distributions to Shareholders | | (1.02 | ) | | | (0.75 | ) | | | (0.62 | ) | | | (0.31 | ) | | | (0.39 | ) | |
| REDEMPTION FEES (a) | | — | (c) | | — | (c) | | — | (c) | | — | (c) | | — | (c) |
| NET ASSET VALUE, End of Year | $ | 19.90 | | | $ | 20.64 | | | $ | 20.85 | | | $ | 18.63 | | | $ | 16.49 | | |
| TOTAL RETURN (d) | | 1.49 | % | | 2.63 | % | | 15.45 | % | | 15.06 | % | | 2.84 | % |
| RATIOS/SUPPLEMENTARY DATA | | | | | | | | | | | | | | | | | | | | |
| Net Assets at End of Year (000's omitted) | $2,698 | | | $5,541 | | | $5,108 | | | $2,158 | | | $1,694 | | |
| Ratios to Average Net Assets: | | | | | | | | | | | | | | | | | | | | |
| Net investment income | | 0.94 | % | | 0.84 | % | | 1.02 | % | | 1.22 | % | | 1.39 | % |
| Net expenses | | 1.25 | % | | 1.25 | % | | 1.25 | % | | 1.25 | % | | 1.25 | % |
| Gross expenses (e) | | 1.61 | % | | 1.56 | % | | 1.62 | % | | 1.62 | % | | 1.52 | % |
| PORTFOLIO TURNOVER RATE | | 6 | % | | 4 | % | | 9 | % | | 11 | % | | 8 | % |
| | | | | | | | | | | | | | | | | | | | | | |
| | | | | | | | | | | | | | | | | | | | | | |
| (a) | Calculated based on average shares outstanding during each year. |
| (b) | The net realized and unrealized gain (loss) per share does not correlate to the aggregate of the net realized and unrealized loss in the Statement of Operations for the year ended June 30, 2012, primarily due to the timing of the sales and repurchases of the Fund's shares in relation to fluctuating market values for the Fund's portfolio. |
| (c) | Less than $0.01 per share. |
| (d) | Total Return does not include the effect of front end sales charge or contingent deferred sales charge. |
| (e) | Reflects the expense ratio excluding any waivers and/or reimbursements. |
See Notes to Financial Statements. | 11 | |
|
AUXIER FOCUS FUND FINANCIAL HIGHLIGHTS |
|
These financial highlights reflect selected data for a share outstanding throughout each period. | | | | | | |
| | | For the Year Ended June 30, | | May 9, 2012 (a) through | |
| INSTITUTIONAL SHARES | | 2016 | | | | 2015 | | | | 2014 | | | | 2013 | | | June 30, 2012 | |
| NET ASSET VALUE, Beginning of Period | $ | 20.74 | | | $ | 20.91 | | | $ | 18.66 | | | $ | 16.50 | | | $ | 16.27 | | |
| INVESTMENT OPERATIONS | | | | | | | | | | | | | | | | | | | | |
| Net investment income (b) | | 0.25 | | | | 0.24 | | | | 0.25 | | | | 0.26 | | | | 0.04 | | |
| Net realized and unrealized gain | | 0.08 | | | | 0.36 | | | | 2.64 | | | | 2.22 | | | | 0.19 | | |
| Total from Investment Operations | | 0.33 | | | | 0.60 | | | | 2.89 | | | | 2.48 | | | | 0.23 | | |
| DISTRIBUTIONS TO SHAREHOLDERS FROM | | | | | | | | | | | | | | | | | | |
| Net investment income | | (0.21 | ) | | | (0.17 | ) | | | (0.19 | ) | | | (0.20 | ) | | | — | | |
| Net realized gain | | (0.90 | ) | | | (0.60 | ) | | | (0.45 | ) | | | (0.12 | ) | | | — | | |
| Total Distributions to Shareholders | | (1.11 | ) | | | (0.77 | ) | | | (0.64 | ) | | | (0.32 | ) | | | — | | |
| REDEMPTION FEES (b) | | — | (c) | | | — | (c) | | — | (c) | | — | (c) | | — | (c) |
| NET ASSET VALUE, End of Period | $ | 19.96 | | | $ | 20.74 | | | $ | 20.91 | | | $ | 18.66 | | | $ | 16.50 | | |
| TOTAL RETURN | | 1.74 | % | | 2.93 | % | | 15.73 | % | | 15.28 | % | | 1.41 | %(d) |
| RATIOS/SUPPLEMENTARY DATA | | | | | | | | | | | | | | | | | | | | |
| Net Assets at End of Period (000's omitted) | $42,969 | | | $29,366 | | | $8,001 | | | $5,313 | | | $1,230 | | |
| Ratios to Average Net Assets: | | | | | | | | | | | | | | | | | | | | |
| Net investment income | | 1.27 | % | | 1.13 | % | | 1.25 | % | | 1.48 | % | | 1.62 | %(e) |
| Net expenses | | 1.00 | % | | 1.00 | % | | 1.00 | % | | 1.00 | % | | 1.10 | %(e) |
| Gross expenses (f) | | 1.31 | % | | 1.36 | % | | 1.47 | % | | 1.55 | % | | 1.50 | %(e) |
| PORTFOLIO TURNOVER RATE | | 6 | % | | 4 | % | | 9 | % | | 11 | % | | 8 | %(d) |
| | | | | | | | | | | | | | | | | | | | | | |
| (a) | Commencement of operations. |
| (b) | Calculated based on average shares outstanding during each period. |
| (c) | Less than $0.01 per share. |
| (d) | Not annualized. |
| (e) | Annualized. |
| (f) | Reflects the expense ratio excluding any waivers and/or reimbursements. |
See Notes to Financial Statements. | 12 | |
|
AUXIER FOCUS FUND NOTES TO FINANCIAL STATEMENTS JUNE 30, 2016 |
|
Note 1. Organization
The Auxier Focus Fund (the "Fund") is a diversified portfolio of Forum Funds (the "Trust"). The Trust is a Delaware statutory trust that is registered as an open-end, management investment company under the Investment Company Act of 1940, as amended (the "Act"). Under its Trust Instrument, the Trust is authorized to issue an unlimited number of the Fund's shares of beneficial interest without par value.
The Fund currently offers three classes of shares: Investor Shares, A Shares and Institutional Shares. A Shares are offered at net asset value plus a maximum sales charge of 5.75%. A Shares are also subject to contingent deferred sales charge ("CDSC") of 1.00% on purchases without an initial sales charge and redeemed less than one year after they are purchased. Investor Shares and Institutional Shares are not subject to a sales charge. Investor Shares, A Shares and Institutional Shares commenced operations on July 9, 1999, July 8, 2005 and May 9, 2012, respectively. The Fund's investment objective is to provide long-term capital appreciation.
Note 2. Summary of Significant Accounting Policies
These financial statements are prepared in accordance with accounting principles generally accepted in the United States of America ("GAAP"), which require management to make estimates and assumptions that affect the reported amounts of assets and liabilities, the disclosure of contingent liabilities at the date of the financial statements, and the reported amounts of increases and decreases in net assets from operations during the fiscal year. Actual amounts could differ from those estimates. The following summarizes the significant accounting policies of the Fund:
Security Valuation – Exchange-traded securities and over-the-counter securities are valued using the last quoted trade or official closing price, provided by independent pricing services as of the close of trading on the market or exchange for which they are primarily traded, on each Fund business day. In the absence of a sale, such securities are valued at the mean of the last bid and ask price provided by independent pricing services. Non-exchange-traded securities for which quotations are available are valued using the last quoted sales price, or in the absence of a sale, at the mean of the last bid and ask prices provided by independent pricing services. Debt securities may be valued at prices supplied by a fund's pricing agent based on broker or dealer supplied valuations or matrix pricing, a method of valuing securities by reference to the value of other securities with similar characteristics such as rating, interest rate and maturity. Shares of open-end mutual funds are valued at net asset value ("NAV"). Short-term investments that mature in 60 days or less may be valued at amortized cost.
The Fund values its investments at fair value pursuant to procedures adopted by the Trust's Board of Trustees (the "Board") if (1) market quotations are insufficient or not readily available or (2) the Adviser, as defined in Note 4, believes that the values available are unreliable. The Trust's Valuation Committee, as defined in the Fund's registration statement, performs certain functions as they relate to the administration and oversight of the Fund's valuation procedures. Under these procedures, the Valuation Committee convenes on a regular and ad-hoc basis to review such investments and considers a number of factors, including valuation methodologies and significant unobservable inputs, when arriving at fair value.
The Valuation Committee may work with the Adviser to provide valuation inputs. In determining fair valuations, inputs may include market-based analytics which may consider related or comparable assets or liabilities, recent transactions, market multiples, book values and other relevant investment information. Adviser inputs may include an income-based approach in which the anticipated future cash flows of the investment are discounted in determining fair value. Discounts may also be applied based on the nature or duration of any restrictions on the disposition of the investments. The Valuation Committee performs regular reviews of valuation methodologies, key inputs and assumptions, disposition analysis and market activity.
Fair valuation is based on subjective factors and, as a result, the fair value price of an investment may differ from the security's market price and may not be the price at which the asset may be sold. Fair valuation could result in a different Net Asset Value ("NAV") than a NAV determined by using market quotes.
The Fund has a three-tier fair value hierarchy. The basis of the tiers is dependent upon the various "inputs" used to determine the value of the Fund's investments. These inputs are summarized in the three broad levels listed below:
Level 1 — quoted prices in active markets for identical assets and liabilities
Level 2 — other significant observable inputs (including quoted prices of similar securities, interest rates, prepayment speeds, credit risk, etc.)
Level 3 — significant unobservable inputs (including the Fund's own assumptions in determining the fair value of investments)
The aggregate value by input level, as of June 30, 2016, for the Fund's investments is included at the end of the Fund's Schedule of Investments.
Security Transactions, Investment Income and Realized Gain and Loss – Investment transactions are accounted for on the trade date. Dividend income is recorded on the ex-dividend date. Foreign dividend income is recorded on the ex-dividend date or as soon as possible after the Fund determines the existence of a dividend declaration after exercising reasonable due diligence. Income and capital gains on some foreign securities may be subject to foreign withholding taxes, which are accrued as applicable. Interest income is recorded on an accrual basis. Premium is amortized and discount is accreted using the effective interest method. Identified cost of investments sold is used to determine the gain and loss for both financial statement and federal income tax purposes.
Foreign Currency Translations – Foreign currency amounts are translated into U.S. dollars as follows: (1) assets and liabilities at the rate of exchange at the end of the respective period; and (2) purchases and sales of securities and income and expenses at the rate of exchange prevailing on the dates of such transactions. The portion of the results of operations arising from changes in the exchange rates and the portion due to fluctuations arising from changes in the market prices of securities are not isolated. Such fluctuations are included with the net realized and unrealized gain or loss on investments.
Distributions to Shareholders – Distributions to shareholders of net investment income and net capital gains, if any, are declared and paid at least annually. Distributions to shareholders are recorded on the ex-dividend date. Distributions are based on amounts calculated in accordance with applicable federal income tax regulations, which may differ from GAAP. These differences are due primarily to differing treatments of income and gain on various investment securities held by the Fund, timing differences and differing characterizations of distributions made by the Fund.
Federal Taxes – The Fund intends to continue to qualify each year as a regulated investment company under Subchapter M of Chapter 1, Subtitle A, of the Internal Revenue Code of 1986, as amended ("Code"), and to distribute all of its taxable income to shareholders. In addition, by distributing in each calendar year substantially all of its net investment income and capital gains, if any, the Fund will not be subject to a federal excise tax. Therefore, no federal income or excise tax provision is required. The Fund files a U.S. federal income and excise tax return as required. The Fund's federal income tax returns are subject to examination by the Internal Revenue Service for a period of three fiscal years after they are filed. As of June 30, 2016, there are no uncertain tax positions that would require financial statement recognition, de-recognition or disclosure.
Income and Expense Allocation – The Trust accounts separately for the assets, liabilities and operations of each of its investment portfolios. Expenses that are directly attributable to more than one investment portfolio are allocated among the respective investment portfolios in an equitable manner.
The Fund's class-specific expenses are charged to the operations of that class of shares. Income and expenses (other than expenses attributable to a specific class) and realized and unrealized gains or losses on investments are allocated to each class of shares based on the class' respective net assets to the total net assets of the Fund.
Redemption Fees – A shareholder who redeems shares within 180 days of purchase will incur a redemption fee of 2.00% of the current net asset value of shares redeemed, subject to certain limitations. The fee is charged for the benefit of the remaining shareholders and will be paid to the Fund to help offset transaction costs. The fee is accounted for as an addition to paid-in capital. The Fund reserves the right to modify the terms of or terminate the fee at any time. There are limited exceptions to the imposition of the redemption fee.
|
AUXIER FOCUS FUND NOTES TO FINANCIAL STATEMENTS JUNE 30, 2016 |
|
Commitments and Contingencies – In the normal course of business, the Fund enters into contracts that provide general indemnifications by the Fund to the counterparty to the contract. The Fund's maximum exposure under these arrangements is dependent on future claims that may be made against the Fund and, therefore, cannot be estimated; however, based on experience, the risk of loss from such claims is considered remote.
Note 3. Cash – Concentration in Uninsured Account
For cash management purposes the Fund may concentrate cash with the Fund's custodian. This typically results in cash balances exceeding the Federal Deposit Insurance Corporation ("FDIC") insurance limits. As of June 30, 2016, the Fund held $24,381,851 as cash reserves at MUFG Union Bank, N.A. that exceeded the FDIC insurance limit.
Note 4. Fees and Expenses
Investment Adviser – Auxier Asset Management LLC (the "Adviser"), is the investment adviser to the Fund. Pursuant to an investment advisory agreement, the Adviser receives an advisory fee from the Fund at an annual rate of 1.00% of the Fund's average daily assets.
Distribution – Foreside Fund Services, LLC serves as the Fund's distributor (the "Distributor"). The Distributor is not affiliated with the Adviser or Atlantic Fund Administration, LLC (d/b/a Atlantic Fund Services) ("Atlantic") or their affiliates. The Fund has adopted a Distribution Plan (the "Plan") for A Shares of the Fund in accordance with Rule 12b-1 of the Act. Under the Plan, the Fund pays the Distributor and/or any other entity as authorized by the Board a fee of up to 0.25% of the average daily net assets of A Shares. The Distributor has no role in determining the investment policies or which securities are to be purchased or sold by the Trust or its Funds.
For the year ended June 30, 2016, there were $724 in front-end sales charges assessed on the sale of A Shares and no contingent deferred sales charges were assessed on the sale of A Shares. The Distributor received $94 of the total front-end sales charges. Such amounts are set aside by the Distributor and used solely for distribution-related expenses.
Other Service Providers – Atlantic provides fund accounting, fund administration, compliance and transfer agency services to the Fund. Atlantic also provides certain shareholder report production and EDGAR conversion and filing services. Atlantic provides a Principal Executive Officer, a Principal Financial Officer, a Chief Compliance Officer and an Anti-Money Laundering Officer to the Fund, as well as certain additional compliance support functions.
Trustees and Officers – The Trust pays each independent Trustee an annual retainer fee of $50,000 for service to the Trust ($66,000 for the Chairman). The Audit Committee Chairman and Vice Chairman receive an additional $6,000 annually. The Trustees and Chairman may receive additional fees for special Board meetings. Each Trustee is also reimbursed for all reasonable out-of-pocket expenses incurred in connection with his duties as a Trustee, including travel and related expenses incurred in attending Board meetings. The amount of Trustees' fees attributable to the Fund is disclosed in the Statement of Operations. Certain officers of the Trust are also officers or employees of the above named service providers, and during their terms of office received no compensation from the Fund.
Note 5. Expense Reimbursements and Fees Waived
The Adviser has contractually agreed to waive a portion of its fees and reimburse expenses through October 31, 2016, to the extent necessary to maintain the total operating expenses (excluding all taxes, interest, portfolio transaction expenses, dividend expenses on short sales, and extraordinary expenses) at 1.14%, 1.25% and 1.00% of average daily net assets of the Investor Shares, A Shares and Institutional Shares respectively. These contractual waivers may only be raised or eliminated with consent of the Board. Other fund service providers have voluntarily agreed to waive a portion of their fees. These voluntary reductions may be reduced or eliminated at any time. For the year ended June 30, 2016, fees waived and expenses reimbursed were as follows:
|
AUXIER FOCUS FUND NOTES TO FINANCIAL STATEMENTS JUNE 30, 2016 |
|
| Investment Adviser Fees Waived | | Investment Adviser Expenses Reimbursed | | Other Waivers | | Total Fees Waived |
| $ | 336,700 | $ | 61,613 | | $ | 65,251 | | $ | 463,564 |
| | | | | | | | | | |
Note 6. Security Transactions
The cost of purchases and proceeds from sales of investment securities (including maturities), other than short-term investments during the year ended June 30, 2016, were $13,930,062 and $31,225,987, respectively.
Note 7. Federal Income Tax
Distributions paid during the fiscal years ended as noted were characterized for tax purposes as follows:
| Ordinary Income | | $ | 2,683,607 | | $ | 2,785,128 |
| Long-Term Capital Gain | | | 11,388,179 | | | 8,198,936 |
| | | $ | 14,071,786 | | $ | 10,984,064 |
As of June 30, 2016, distributable earnings (accumulated loss) on a tax basis were as follows:
| Undistributed Ordinary Income | | $ | 1,794,306 | |
| Undistributed Long-Term Gain | | | 2,895,797 | |
| Unrealized Appreciation | | | 77,333,759 | |
| Total | | $ | 82,023,862 | |
The difference between components of distributable earnings on a tax basis and the amounts reflected in the Statement of Assets and Liabilities are primarily due to wash sales.
Note 8. Subsequent Events
Subsequent events occurring after the date of this report through the date these financial statements were issued have been evaluated for potential impact, and the Fund has had no such events.
Proxy Voting Information
A description of the policies and procedures that the Fund uses to determine how to vote proxies relating to securities held in the Fund's portfolio is available, without charge and upon request, by calling (877) 328-9437, on the Fund's website at www.auxierasset.com and on the U.S. Securities and Exchange Commission's (the "SEC") website at www.sec.gov. The Fund's proxy voting record for the most recent twelve-month period ended June 30 is available, without charge and upon request, by calling (877) 328-9437 and on the SEC's website at www.sec.gov.
Availability of Quarterly Portfolio Schedules
The Fund files its complete schedule of portfolio holdings with the SEC for the first and third quarters of each fiscal year on Form N-Q. These filings are available, without charge and upon request on the SEC's website at www.sec.gov or may be reviewed and copied at the SEC's Public Reference Room in Washington, DC. Information on the operation of the Public Reference Room may be obtained by calling (800) SEC-0330.
Shareholder Expense Example
As a shareholder of the Fund, you incur two types of costs: (1) transaction costs, including sales charges (loads) on purchase payments on certain classes, redemption fees, exchange fees, and CDSC fees, and (2) ongoing costs, including management fees, 12b-1 fees, and other Fund expenses. This example is intended to help you understand your ongoing costs (in dollars) of investing in the Fund, and to compare these costs with the ongoing costs of investing in other mutual funds.
The example is based on an investment of $1,000 invested at the beginning of the period and held for the entire period from January 1, 2016, through June 30, 2016.
Actual Expenses – The first line under each share class of the table below provides information about actual account values and actual expenses. You may use the information in this line, together with the amount you invested, to estimate the expenses that you paid over the period. Simply divide your account value by $1,000 (for example, an $8,600 account value divided by $1,000 = 8.6), then multiply the result by the number in the first line under the heading entitled "Expenses Paid During Period" to estimate the expenses you paid on your account during the period.
Hypothetical Example for Comparison Purposes – The second line under each share class of the table below provides information about hypothetical account values and hypothetical expenses based on the Fund's actual expense ratio and an assumed rate of return of 5% per year before expenses, which is not the Fund's actual return. The hypothetical account values and expenses may not be used to estimate the actual ending account balance or expenses you paid for the period. You may use this information to compare the ongoing costs of investing in the Fund and other funds. To do so, compare this 5% hypothetical example with the 5% hypothetical examples that appear in the shareholder reports of other funds.
Please note that the expenses shown in the table are meant to highlight your ongoing costs only and do not reflect any transactional costs, such as sales charges (loads) on purchase payments on certain classes, redemption fees, exchange fees, and CDSC fees. Therefore, the second line of the table is useful in comparing ongoing costs only, and will not help you determine the relative total costs of owning different funds. In addition, if these transactional costs were included, your costs would have been higher.
| | Beginning | | Ending | | Expenses | | Annualized |
| | Account Value | | Account Value | | Paid During | | Expense |
| | January 1, 2016 | | June 30, 2016 | | Period* | | Ratio* |
| Investor Shares | | | | | | | | | | | |
| Actual | $ | 1,000.00 | | $ | 1,025.51 | | $ | 5.74 | | 1.14 | % |
| Hypothetical (5% return before taxes) | $ | 1,000.00 | | $ | 1,019.19 | | $ | 5.72 | | 1.14 | % |
| A Shares | | | | | | | | | | | |
| Actual | $ | 1,000.00 | | $ | 1,024.71 | | $ | 6.29 | | 1.25 | % |
| Hypothetical (5% return before taxes) | $ | 1,000.00 | | $ | 1,018.65 | | $ | 6.27 | | 1.25 | % |
|
AUXIER FOCUS FUND ADDITIONAL INFORMATION (Unaudited) JUNE 30, 2016 |
|
| | Beginning | | Ending | | Expenses | | Annualized |
| | Account Value | | Account Value | | Paid During | | Expense |
| | January 1, 2016 | | June 30, 2016 | | Period* | | Ratio* |
| Institutional Shares | | | | | | | | | | | |
| Actual | $ | 1,000.00 | | $ | 1,026.22 | | $ | 5.04 | | 1.00 | % |
| Hypothetical (5% return before taxes) | $ | 1,000.00 | | $ | 1,019.89 | | $ | 5.02 | | 1.00 | % |
| | | | | | | | | | | | |
| * | Expenses are equal to the Fund's annualized expense ratio multiplied by the average account value over the period, multiplied by the number of days in the most recent fiscal half-year divided by 366 to reflect the half-year period. |
Federal Tax Status of Dividends Declared during the Fiscal Year
For federal income tax purposes, dividends from short-term capital gains are classified as ordinary income. The Fund designates 100.00% of its income dividend distributed as qualifying for the corporate dividends-received deduction (DRD) and 100.00% for the qualified dividend rate (QDI) as defined in Section 1(h)(11) of the Internal Revenue Code. The Fund also designates 0.55% of its income dividends as qualified interest income exempt from U.S. tax for foreign shareholders (QII) and 1.00% of its income dividends as qualified short-term gain exempt from U.S. tax for foreign shareholders (QSD).
Trustees and Officers of the Trust
The Board is responsible for oversight of the management of the Trust's business affairs and of the exercise of all the Trust's powers except those reserved for the shareholders. The following table provides information about each Trustee and certain officers of the Trust. Each Trustee and officer holds office until the person resigns, is removed, or is replaced. Unless otherwise noted, the persons have held their principal occupations for more than five years. The address for all Trustees and officers is Three Canal Plaza, Suite 600, Portland, Maine 04101. Mr. Keffer is considered an Interested Trustee due to his affiliation with Atlantic. The Fund's Statement of Additional Information includes additional information about the Trustees and is available, without charge and upon request, by calling (877) 328-9437.
| Name and Year of Birth | Position with the Trust | Length of Time Served | Principal Occupation(s) During Past Five Years | Number of Series of Fund Complex¹ Overseen by Trustee | Other Directorships Held by Trustee |
| Independent Trustees | | | | | |
J. Michael Parish Born: 1943 | Chairman of the Board; Trustee; Chairman, Nominating Committee and Qualified Legal Compliance Committee | Since 1989 (Chairman since 2004) | Retired since 2003; formerly, Partner, Wolf, Block, Schorr and Solis-Cohen, LLP (law firm) 2002-2003; Partner, Thelen Reid & Priest LLP (law firm) 1995-2002. | 24 | None |
Costas Azariadis Born: 1943 | Trustee | Since 1989 | Professor of Economics, Washington University since 2006. | 24 | None |
James C. Cheng Born: 1942 | Trustee; Chairman, Audit Committee | Since 1989 | President, Technology Marketing Associates (marketing company for small- and medium-sized businesses in New England) since 1991. | 24 | None |
David Tucker Born: 1958 | Trustee; Vice Chairman | Since 2011 (Vice Chairman since 2015) | Director, Blue Sky Experience (a charitable endeavor) since 2008; Senior Vice President & General Counsel, American Century Companies (an investment management firm) 1998-2008. | 46 | Trustee, Forum Funds II, Forum ETF Trust and U.S. Global Investors Funds |
1The Fund Complex includes the Trust, Forum Funds II, Forum ETF Trust and U.S. Global Investors Funds and is overseen by different Boards of Trustees. |
|
AUXIER FOCUS FUND ADDITIONAL INFORMATION (Unaudited) JUNE 30, 2016 |
|
| Name and Year of Birth | Position with the Trust | Length of Time Served | Principal Occupation(s) During Past Five Years | Number of Series of Fund Complex¹ Overseen by Trustee | Other Directorships Held by Trustee |
| Interested Trustee | | | | | |
John Y. Keffer2 Born: 1942 | Trustee; Vice Chairman | Since 1989 | Chairman, Atlantic since 2008; President, Forum Investment Advisors, LLC since 2011; President, Forum Foundation (a charitable organization) since 2005; President, Forum Trust, LLC (a non-depository trust company chartered in the State of Maine) since 1997. | 46 | Director, Wintergreen Fund, Inc.; Trustee, Forum Funds II, Forum ETF Trust and U.S. Global Investors Funds |
| Officers | | | | | |
Jessica Chase Born: 1970 | President; Principal Executive Officer | Since 2015 | Senior Vice President, Atlantic since 2008. | N/A | N/A |
Karen Shaw Born: 1972 | Treasurer; Principal Financial Officer | Since 2008 | Senior Vice President, Atlantic since 2008. | N/A | N/A |
Zachary Tackett Born: 1988 | Vice President; Secretary; Anti-Money Laundering Compliance Officer | Since 2014 | Associate Counsel, Atlantic since 2014; Intern Associate, Coakley & Hyde, PLLC, 2010-2013. | N/A | N/A |
Michael J. McKeen Born: 1971 | Vice President | Since 2009 | Senior Vice President, Atlantic since 2008. | N/A | N/A |
Timothy Bowden Born: 1969 | Vice President | Since 2009 | Manager, Atlantic since 2008. | N/A | N/A |
Geoffrey Ney Born: 1975 | Vice President | Since 2013 | Manager, Atlantic since 2013; Senior Fund Accountant, Atlantic, 2008-2013. | N/A | N/A |
Todd Proulx Born: 1978 | Vice President | Since 2013 | Manager, Atlantic since 2013; Senior Fund Accountant, Atlantic, 2008-2013. | N/A | N/A |
1The Fund Complex includes the Trust, Forum Funds II, Forum ETF Trust and U.S. Global Investors Funds and is overseen by different Boards of Trustees. 2Atlantic is a subsidiary of Forum Holdings Corp. I, a Delaware corporation that is wholly owned by Mr. Keffer. |
Auxier Focus Fund
FOR MORE INFORMATION
P.O. Box 588
Portland, Maine 04112
(877) 3AUXIER
(877) 328-9437
INVESTMENT ADVISER
Auxier Asset Management LLC
5285 Meadows Road
Suite 333
Lake Oswego, Oregon 97035
TRANSFER AGENT
Atlantic Fund Services
P.O. Box 588
Portland, Maine 04112
www.atlanticfundservices.com
DISTRIBUTOR
Foreside Fund Services, LLC
Three Canal Plaza, Suite 100
Portland, Maine 04101
www.foreside.com
This report is submitted for the general information of the shareholders of the Fund. It is not authorized for
distribution to prospective investors unless preceded or accompanied by an effective prospectus, which includes
information regarding the Fund's risks, objectives, fees and expenses, experience of its management, and other
information.
204-ANR-0616
|
DF DENT GROWTH FUNDS TABLE OF CONTENTS JUNE 30, 2016 |
| |
DF DENT PREMIER GROWTH FUND A MESSAGE TO OUR SHAREHOLDERS (Unaudited) JUNE 30, 2016 |
Dear Fellow Shareholder,
Performance for the three DF Dent Growth Funds "(Funds") is detailed in the below table.
Performance (for periods ending 06/30/2016)
| | | DF Dent Premier Growth | | DF Dent Midcap Growth | | DF Dent Small Cap Growth |
| Benchmark | | S&P 500 | | Russell Midcap Growth | | Russell 2000 Growth |
| 6 Months | | | | | | | | | | | | |
| Fund | | - | 0.85 | % | | + | 2.81 | % | | + | 7.99 | % |
| Benchmark | | + | 3.84 | % | | + | 2.15 | % | | - | 1.59 | % |
| Fund vs Benchmark | | - | 4.69 | % | | + | 0.66 | % | | + | 9.58 | % |
| | | | | | | | | | | | | |
| 12 Months | | | | | | | | | | | | |
| Fund | | - | 2.06 | % | | - | 2.49 | % | | - | 5.06 | % |
| Benchmark | | + | 3.99 | % | | - | 2.14 | % | | - | 10.75 | % |
| Fund vs Benchmark | | - | 6.05 | % | | - | 0.35 | % | | + | 5.69 | % |
| | | | | | | | | | | | | |
| 5 Years | | | | | | | | | | | | |
| Fund | | + | 9.52 | %* | | | N/A | | | | N/A | |
| Benchmark | | + | 12.10 | %* | | | N/A | | | | N/A | |
| Fund vs Benchmark | | - | 2.58 | %* | | | N/A | | | | N/A | |
| | | | | | | | | | | | | |
| Cumulative 5 Years | | | | | | | | | | | | |
| Fund | | + | 57.59 | % | | | N/A | | | | N/A | |
| Benchmark | | + | 77.02 | % | | | N/A | | | | N/A | |
| Fund vs Benchmark | | - | 19.43 | % | | | N/A | | | | N/A | |
| | | | | | | | | | | | | |
| 10 Years | | | | | | | | | | | | |
| Fund | | + | 6.80 | %* | | | N/A | | | | N/A | |
| Benchmark | | + | 7.42 | %* | | | N/A | | | | N/A | |
| Fund vs Benchmark | | - | 0.62 | %* | | | N/A | | | | N/A | |
| | | | | | | | | | | | | |
| Cumulative 10 Years | | | | | | | | | | | | |
| Fund | | + | 93.07 | % | | | N/A | | | | N/A | |
| Benchmark | | + | 104.65 | % | | | N/A | | | | N/A | |
| Fund vs Benchmark | | - | 11.58 | % | | | N/A | | | | N/A | |
| | | | | | | | | | | | | |
| Since Inception | | | | | | | | | | | | |
| Fund | | + | 7.47 | %* | | + | 11.39 | %* | | + | 6.09 | %* |
| Benchmark | | + | 5.90 | %* | | + | 9.64 | %* | | + | 3.47 | %* |
| Fund vs Benchmark | | + | 1.57 | %* | | + | 1.75 | %* | | + | 2.62 | %* |
| * annualized | | | | | | | | | | | | |
| | | | | | | | | | | | | |
| Cumulative Since Inception | | | | | | | | | | | | |
| Fund | | + | 193.71 | % | | + | 71.52 | % | | + | 17.04 | % |
| Benchmark | | + | 135.53 | % | | + | 58.43 | % | | + | 9.49 | % |
| Fund vs Benchmark | | + | 58.18 | % | | + | 13.09 | % | | + | 7.55 | % |
| Inception Date | | 07/16/2001 | | 07/01/2011 | | 11/01/2013 |
Performance data quoted represents past performance and is no guarantee of future results. Current performance may be lower or higher than the performance data quoted. Investment return and principal value will fluctuate so that an investor's shares, when redeemed, may be worth more or less than original cost. For the
DF DENT PREMIER GROWTH FUND A MESSAGE TO OUR SHAREHOLDERS (Unaudited) JUNE 30, 2016 |
most recent month-end performance, please call (866) 233-3368. As stated in the current prospectus, the DF Dent Premier Growth Fund's and DF Dent Midcap Growth Fund's annual operating expense ratios (gross) are 1.20% and 1.84%, respectively. However, D.F. Dent and Company, Inc., the Funds' investment adviser ("Adviser"), has contractually agreed to waive a portion of its fees and/or reimburse certain expenses to limit total operating expenses to 1.10% on the first $150 million in Fund net assets and to 0.90% on net assets exceeding $150 million. This agreement is in effect through October 31, 2019. As stated in the current prospectus, the DF Dent Small Cap Growth Fund's annual operating expense ratio (gross) is 5.16%. However, the Adviser has contractually agreed to waive a portion of its fees and/or reimburse certain expenses to limit total operating expense to 1.25% through October 31, 2019. These expense caps may be changed or eliminated prior to their expiration date only with the consent of the Board of Trustees. Both the DF Dent Midcap Growth Fund and DF Dent Small Cap Growth Fund charge a 2.00% redemption fee on shares redeemed within 60 days of purchase. Fund performance returns shown do not reflect fees; if reflected, the returns would have been lower. Returns greater than one year are annualized.
The DF Dent Premier Growth Fund's ( the "Fund" ) return for the fiscal year ending 06/30/2016 of -2.06% trailed the S&P 500's (the "Index") return of +3.99% by 6.05%. As a category, growth funds experienced negative returns on average during this period as reported by Arthur Lipper versus our Funds in the below comparison:
Clearly, each of our three mutual funds performed well within its Lipper peer group for the past 12 months. However, our Premier Growth Fund significantly underperformed its benchmark, our Mid-Cap Growth Fund slightly underperformed its benchmark, and our Small-Cap Growth Fund significantly outperformed its benchmark. The dispersion of results seems unusual.
How do we explain these results?
We believe the answer lies within the 2016 Investment Company Institute (ICI) Fact Book:
"Funds Indexed to the S&P 500 held 31 percent of Index Mutual Fund Assets"
The 2016 ICI Fact book goes on to state that "Index-based domestic equity ETFs (exchange traded funds) have grown particularly quickly - attracting almost twice the flows of index domestic equity funds." According to the ICI Fact Book indexing constitutes $2.2 trillion of US equity mutual funds and 94% of the $2.1 trillion of US ETFs. Flows into both these categories accelerated in 2015. While domestic equity mutual funds have experienced net outflows for 10 consecutive years, domestic index funds have experienced net inflows for 10 consecutive years. At the same time, ETFs have experienced a net inflow of $1.6 trillion, which has been almost entirely indexed. On a consolidated basis, mutual funds and ETFs have experienced massive positive flows of capital (now exceeding $4 trillion) with a very large portion going into the Index. In an article in the
DF DENT PREMIER GROWTH FUND A MESSAGE TO OUR SHAREHOLDERS (Unaudited) JUNE 30, 2016 |
Wall Street Journal from November 9, 2015 titled 'The Ease of Index Funds Comes With Risk', David Blitzer, Chairman of the index committee of S&P Global, one of your Fund's holdings, has stated that being in the Index increases the value of a company in many ways. Inclusion of stocks in the Index has forced indexers to buy these stocks indiscriminately. Academic studies have concluded the inclusion of a stock has driven up the valuation of such stocks by as much as 9%. The point is that the Index has performed unusually well, but the Index has become a very "crowded trade" owing to the massive capital flows into the S&P 500 index funds and ETFs for the past 10 years resulting in a premium valuation if not overvaluation based on the underlying fundamentals of its component companies. Most market trends run in cycles, and one should consider the impact on the Index and index funds should the positive flow of the past ten years subside or perhaps reverse. It can happen, as happened in January and late June of this year during market sell offs.
Enough on the Index. Your Fund's performance in the fiscal year was helped by avoiding the Energy Sector but hurt by the absence of Telecommunication Services and Utilities, the two best performing Sectors in the Index. These two Sectors performed quite well as it appears that yield-hungry investors sought income in a low yield environment. The vast majority of stocks in these two sectors are income vehicles and not appropriate for a growth fund. We believe this is another factor behind the overall underperformance of the Lipper growth groups' averages versus the Index. Further comments on what helped and what hurt performance can be found in the Management Discussion of Fund Performance section found later in this Report.
Themes
The Adviser has invested consistent with major socio-economic trends that are ongoing and impact multiple industries. Industrial diversification is fine to a point, but we believe that there are major underlying trends that reach across many different industries that are key elements of long-term sustained growth. Your Fund is structured to seek participation in the following areas, which we believe are ongoing major investment themes:
| 1. | Dominant leaders of advanced technologies in healthcare: Illumina, Intuitive Surgical |
| 2. | Electronic payments displacing cash/checks globally: Visa, MasterCard, Discover Financial Services |
| 3. | Software improving productivity in legacy industries: Blackbaud, Tyler Technologies, Costar Group, Ansys |
| 4. | Consumer Businesses that are enhanced- not disintermediated- by technology and e-commerce: Signet Jewelers, LKQ Corp., CarMax, IMAX Corp |
| 5. | Financial Services: Markel, S&P Global, Moody's, Envestnet, SEI Investments |
| 6. | Pioneering use of data to add value: Verisk, Alphabet (Google), Ecolab, Trimble |
DF DENT PREMIER GROWTH FUND A MESSAGE TO OUR SHAREHOLDERS (Unaudited) JUNE 30, 2016 |
Expense Ratio Management
Your Fund's Adviser has again agreed to maintain the Fund's expense ratio at a net 1.10% on the first $150 million of net assets and 0.90% on net assets exceeding $150 million through October 31, 2019 by reimbursing expenses and waiving management fees. The record of expense reimbursement and management fee waivers for the first fifteen years of your Fund is as follows:
Portfolio Turnover
Annual portfolio turnover since inception has been as follows:
Portfolio Turnover*
DF DENT PREMIER GROWTH FUND A MESSAGE TO OUR SHAREHOLDERS (Unaudited) JUNE 30, 2016 |
Management Ownership of Fund
The Adviser's retirement plan, employees and related family members of the Adviser collectively own 17% of the Fund as well as 30% and 58% of the DF Dent Midcap and DF Dent Small Cap Funds respectively. The Fund is the largest investment of the Adviser's retirement plan (at 24.8% of the retirement plan's assets). 32.7% of the Adviser's retirement plan is invested the three DF Dent Funds. In our opinion, few advisers can demonstrate this level of conviction and alignment with shareholders in their funds.
Asset Allocation
DF DENT PREMIER GROWTH FUND A MESSAGE TO OUR SHAREHOLDERS (Unaudited) JUNE 30, 2016 |
| Top 10 Holdings | | 06/30/09 | | 06/30/10 | | 06/30/11 | | 06/30/12 | | 06/30/13 | | 06/30/14 | | 06/30/15 | | 06/30/16 |
| % of the Fund | | 55.82 | % | | 54.97 | % | | 52.46 | % | | 49.35 | % | | 44.95 | % | | 42.36 | % | | 42.80 | % | | 43.92 | % |
Average Size Of Top 10 | | 5.6 | % | | 5.5 | % | | 5.2 | % | | 4.9 | % | | 4.5 | % | | 4.2 | % | | 4.3 | % | | 4.4 | % |
If all 36 positions in the Fund were equally weighted, then each position would represent almost 2.8%. Your Adviser believes a weighting of 4-5% in its highest conviction companies strikes the right balance.
Commentary
It is well known that the markets abhor uncertainty. Yet, despite heightened political and economic uncertainty in the past year, the equity market has been reasonably stable although accompanied by occasional volatility. Valuations have become stretched, in our opinion, as prices of stocks have appreciated more than underlying earnings growth. With interest rates near all-time lows and normalization of rates by the Fed appearing to be delayed, worrisome geopolitical events, and a sluggish economic outlook, the equity market was reaching new all-time highs at the end of the fiscal year. Why should this be? To us, the simple answer appears to be that there are few other places for investors to go. In our opinion, with no real return in the bond market, commodities under pressure due to excess capacity in many industries, poor performance from hedge funds, and greater uncertainty in international markets, investors appear to have defaulted to domestic equities. As written earlier in this letter from the ICI Fact Book, these investors have chosen index funds and, in many cases, ETFs for their trading liquidity.
What investment strategy might one consider in such an environment? If one believes that the massive cash flow of the past 10 years into both mutual fund and ETF indexing will continue unabated, then one should continue to join in that crowded investment as that cash flow drives valuation to even higher levels. If, however, the investor recalls the excesses of the "Nifty Fifty" of the 1970s, the dot com/internet craze of the late 1990s, and the emerging markets hype of the past decade, all of which had bad endings, then that investor might wonder what happens when the recent flows into indexing reverse. While your Fund's Adviser cannot predict performance, we do believe that "money chases performance" and that markets over time experience cycles in leadership. What is popular today seems to have attracted investors who collectively bid up prices to the point of overvaluation. At some point, that overvaluation becomes apparent, causing a sell off and declining relative performance, which begets liquidation as "money chases performance" once again.
As an investment strategy, growth has recently lagged value and indexing. We foresee the continuation of a slow growth economy in the U.S. for the next year. In such an environment, we believe that well managed sustainable growth companies that have been able to deliver earnings growth well in excess of GDP growth offer attractive investment opportunities.
As in the past, we appreciate your investment in the DF Dent Premier Growth Fund and will continue to work diligently for you, our shareholders.
DF DENT PREMIER GROWTH FUND A MESSAGE TO OUR SHAREHOLDERS (Unaudited) JUNE 30, 2016 |
Respectively Submitted,
Daniel F. Dent Bruce L. Kennedy Matthew F. Dent
IMPORTANT INFORMATION:
The recent growth rate in the global equity markets has helped to produce short-term returns for some sectors/asset classes that are not typical and may not continue in the future. Because of ongoing market volatility, Fund performance may be subject to substantial short-term changes.
Investing involves risks, including the possible loss of principal. The DF Dent Premier Growth Fund may invest in small and medium size companies. Investments in these companies, especially smaller companies, carry greater risk than is customarily associated with larger companies for various reasons such as increased volatility of earnings and prospects, narrower markets, limited financial resources and less liquid stock. The Fund will typically invest in the securities of fewer issuers. If the Fund's portfolio is over weighted in a sector, any negative development affecting that sector will have a greater impact on the Fund than a fund that is not over weighted in that sector.
The DF Dent Midcap Growth Fund also invests in small and medium size companies. With non-diversification risk, the Fund will typically invest in securities of fewer issuers, which exposes the Fund to greater market risk. Investing in American Depositary Receipts (ADRs) carries risks of political and financial instability, less liquidity and greater volatility, as well as risks associated with the lack of reliable accounting and financial information. The Fund is also subject to other risks, such as the risk associated with real estate investment trusts (REITs) like possible real estate market declines, which are detailed in the Fund's prospectus.
The DF Dent Small Cap Growth Fund invests in small size companies, which carry greater risk than is customarily associated with larger, more established companies. With non-diversification risk, the Fund will typically invest in securities of fewer issuers, which exposes the Fund to greater market risk. Investing in ADRs (American Depositary Receipts) carries risks of political and financial instability, less liquidity and greater volatility, as well as risks associated with the lack of reliable accounting and financial information. The Fund is also subject to other risks, such as REIT (Real Estate Investment Trust) risk with possible real estate market declines, which are detailed in the Fund's prospectus. The Fund is newly created and has a limited operating history.
The S&P 500 Index is a broad-based, unmanaged measurement of changes in stock market conditions based on the average of 500 widely held stocks. The Russell Midcap Growth Index measures the performance of the mid-cap growth segment of the U.S. equity universe. It includes those Russell Midcap Index companies with higher price-to-book ratios and higher forecasted growth values. The Russell 2000 Growth Index measures the performance of the small cap growth segment of the U.S. equity universe. It includes those Russell Small Cap Index companies with higher price-to-book ratios and higher forecasted growth values. One cannot invest directly in an index.
DF DENT PREMIER GROWTH FUND MANAGEMENT DISCUSSION OF FUND PERFORMANCE (Unaudited) JUNE 30, 2016 |
Recent Performance
For the fiscal year ending June 30, 2016, DF Dent Premier Growth Fund (the "Fund") experienced a total return of -2.06% versus a total return of +3.99% for the S&P 500 Index (the "Index"), the benchmark we use for performance comparisons. Performance versus the Index for various periods ending June 30, 2016 was as follows:
DF DENT PREMIER GROWTH FUND MANAGEMENT DISCUSSION OF FUND PERFORMANCE (Unaudited) JUNE 30, 2016 |
from such companies' equities in an extremely low yield environment. Second, exchange-traded funds and index funds have experienced net inflows of over $3 trillion in the past five years, largely at the expense of conventional mutual funds. This massive cash flow into indexing likely has buoyed the valuation of those stocks held in index funds, thereby driving up the valuation of many indices. As discussed in the preceding Letter to Shareholders, Arthur Lipper has reported that the Index outperformed most mutual fund managers. We believe this was the result of large flows out of actively-managed mutual funds into the Index.
| · | Significant market factors affecting the Fund's performance were: Dollar strength- The strong dollar in the Fund's fiscal year hurt exports from U.S. companies and caused lower earnings from operations outside the U.S. due to the foreign exchange disadvantage. This affected all companies with operations overseas or exporting from the U.S. in varying degrees. We think both of these effects should lessen in late 2016 based on current exchange rates. |
| · | Volatility- D.F. Dent and Company, Inc. (your "Adviser") took advantage of the stock market's selloff in late January 2016 and late June 2016 caused by the United Kingdom's vote to leave the European Union (Brexit) to build positions in favored companies that had previously traded above their buy points. Volatility, often caused by market uncertainty, can represent opportunity. |
| · | Energy- While the avoidance of energy stocks helped your Fund's performance, some of the portfolio companies with energy end markets, such as Fastenal and Ecolab, experienced weakness in their business with energy customers. |
| · | Absence of Utilities and Telecommunication Services- Utilities and Telecommunication Services were the two best performing sectors within the Index in the past year. Equities in these sectors are often income vehicles generating relatively high yields, which are more appropriate for income investors than growth investors such as your Fund. As mentioned above, income has performed better than growth recently as income-starved investors have sought yield. |
The overriding strategy in managing the Fund has always been to identify promising investment prospects, patiently await buying opportunities in those prospects, and build positions in these companies when there are opportunities to do so. We use multiple valuation and trading pattern measures to determine those buying points. Most often, we project earnings out for five years for a "terminal value" of those earnings and discount that "terminal value" back by a required rate of return to establish the acceptable present buying price. That may appear complicated, but it is simply an objective mathematical exercise to calculate value and return.
When will we have greater subjective confidence that the market has reached an attractive valuation level? This requires a greater sense of when the bad news, perceived or real, is discounted within a stock's price. For instance, if there is negative news and a particular stock does not decline, that is a positive indication to us that the bad news is already discounted in that stock's price. What seemed to work well in January and June of 2016 was to buy when national evening news networks reported that investors' retirement accounts
DF DENT PREMIER GROWTH FUND MANAGEMENT DISCUSSION OF FUND PERFORMANCE (Unaudited) JUNE 30, 2016 |
had declined dramatically in value over a short period. That will not always work, but we find it is helpful to think about buying when the crowd is selling, or as Warren Buffett has said, "Be greedy when others are fearful."
Sector Allocation and Attribution
The following bar chart presents the sector weightings of your Fund (DFDPX) versus the sector weightings of the Index as of June 30, 2016:
Source: FactSet
The greatest factor negatively affecting your Fund's performance in the fiscal year was poor stock selection within the Consumer Discretionary Sector. In particular, the disruption caused by Chipotle's well publicized food safety problems impacted the company's operations, customer traffic, and stock price. Chipotle responded admirably in addressing these issues, in our opinion, but the damage to sales and the stock price was significant. We did not foresee this occurring in multiple locations at first and should have exited the position earlier. This was an unanticipated event, a "Black Swan," if you will. In addition, we think that apparent investor concerns about companies dependent on consumer credit caused weakness in both CarMax and Signet Jewelers, both holdings of your Fund. These concerns impacted performance more negatively than offsetting good earnings growth from both companies. In Signet's case, a one-off news story picked up apparently by short sellers about a customer accusing Signet of swapping her high quality diamond with a lower quality one negatively affected the stock's price. We have confidence in the integrity of Signet's management and therefore, have continued to hold this security. Lastly within Consumer Discretionary, IMAX performed poorly. Although we had high expectations which were achieved from the box office with the success of films such as Star Wars, ongoing concerns about China where IMAX is experiencing strong growth
DF DENT PREMIER GROWTH FUND MANAGEMENT DISCUSSION OF FUND PERFORMANCE (Unaudited) JUNE 30, 2016 |
in theaters and attendance weighed heavily on the stock's performance.
Although the Financial Sector has historically been a strong contributor to your Fund's performance, two financial companies hurt performance in the fiscal year. Moody's stock lagged owing to a slowdown in corporate debt issuance, which Moody's rates for investors. PRA Group, which buys nonperforming debt, had disappointing earnings and also suffered, we believe, due to investor concerns about the consumer credit market.
Positive contributors to performance resulted from being under-weighted in Health Care and over weighted in Industrials. Your Fund's continued avoidance of Energy, as compared to the Index, helped performance for the year despite the recovery in energy prices in the first half of 2016. Your Fund received a cash tender offer for ExamWorks in April at a 22% premium over the company's 90-day weighted average share price. The following list of Best Contributors was an eclectic lot. We consider each company on this list to be a best-in-class* leader in its particular market possessing attractive growth prospects. In addition, American Tower, Health Care Services Group, Exponent, Blackbaud, and Alphabet (Google) made positive contributions to the Fund. The two latter companies were new additions to the Fund in the fiscal year.
Your Fund has followed a policy of not investing in any derivative securities.
Best and Worst Performers
DF DENT PREMIER GROWTH FUND MANAGEMENT DISCUSSION OF FUND PERFORMANCE (Unaudited) JUNE 30, 2016 |
Capital Gains Distribution Policy
As previously reported, it is the Adviser's policy to distribute all net realized capital gains in December of each year. On December 15, 2015, your Fund distributed a net capital gain of $19,330,439, or $3.32 per share, to shareholders. As a result of gains realized in the recent fiscal year, we anticipate a more modest capital gain distribution in December of 2016 based upon the current share count, which will change depending upon shareholder purchases and redemptions in the Fund as well as any further realized capital gains. Although our estimates cannot be very precise at the present time, we provide some information below (based on the five largest Fund holdings) in response to shareholder requests for guidance for tax planning purposes.
FIVE LARGEST EQUITY HOLDINGS
JUNE 30, 2016
DF DENT PREMIER GROWTH FUND PERFORMANCE CHART AND ANALYSIS (Unaudited) JUNE 30, 2016 |
The following chart reflects the change in the value of a hypothetical $10,000 investment, including reinvested dividends and distributions, in the DF Dent Premier Growth Fund (the "Fund") compared with the performance of the benchmark, S&P 500 Index ("S&P 500"), over the past ten fiscal years. The S&P 500 is a broad-based, unmanaged measurement of changes in stock market conditions based on the average of 500 widely held common stocks. The total return of the S&P 500 includes the reinvestment of dividends and income. The total return of the Fund includes operating expenses that reduce returns, while the total return of the S&P 500 does not include expenses. The Fund is professionally managed, while the S&P 500 is unmanaged and is not available for investment.
Comparison of Change in Value of a $10,000 Investment
DF Dent Premier Growth Fund vs. S&P 500 Index
| Average Annual Total Returns | | | | | | |
| Periods Ended June 30, 2016 | | One Year | | Five Years | | Ten Years |
| DF Dent Premier Growth Fund | | -2.06 | % | | 9.52 | % | | 6.80 | % |
| S&P 500 Index | | 3.99 | % | | 12.10 | % | | 7.42 | % |
Performance data quoted represents past performance and is no guarantee of future results. Current performance may be lower or higher than the performance data quoted. Investment return and principal value will fluctuate so that shares, when redeemed, may be worth more or less than original cost. For the most recent month-end performance, please call (866) 233-3368. As stated in the Fund's current prospectus, the annual operating expense ratio (gross) is 1.20%. However, the Fund's adviser has contractually agreed to waive a portion of its fees and/or reimburse expenses to limit total operating expenses (excluding all taxes, interest, portfolio transaction expenses, and extraordinary expenses) to 1.10% on the first $150 million in Fund net assets and to 0.90% on net assets exceeding the $150 million, through October 31, 2019. During the period, certain fees were waived and/or expenses reimbursed; otherwise, returns would have been lower. The performance table and graph do not reflect the deduction of taxes that a shareholder would pay on Fund distributions or the redemption of Fund shares. Returns greater than one year are annualized.
DF DENT PREMIER GROWTH FUND SCHEDULE OF INVESTMENTS JUNE 30, 2016 |
| Shares | | Security Description | | Value | |
DF DENT PREMIER GROWTH FUND SCHEDULE OF INVESTMENTS JUNE 30, 2016 |
| PORTFOLIO HOLDINGS | | |
| % of Net Assets | | |
| Consumer Discretionary | 13.4 | % |
| Financials | 18.4 | % |
| Health Care | 9.1 | % |
| Industrials | 23.9 | % |
| Information Technology | 31.1 | % |
| Materials | 4.3 | % |
| Other Assets & Liabilities, Net | (0.2 | )% |
| | 100.0 | % |
See Notes to Financial Statements. | 15 | DF DENT GROWTH FUNDS |
DF DENT PREMIER GROWTH FUND STATEMENT OF ASSETS AND LIABILITIES JUNE 30, 2016 |
| ASSETS | | | | |
| | Total investments, at value (Cost $93,493,861) | | $ | 147,345,650 | |
| | Cash | | | 171,659 | |
| | Receivables: | | | | |
| | | Fund shares sold | | | 37 | |
| | | Dividends and interest | | | 41,350 | |
| | Prepaid expenses | | | 14,866 | |
| Total Assets | | | 147,573,562 | |
| | | | | | | |
| LIABILITIES | | | | |
| | Payables: | | | | |
| | | Fund shares redeemed | | | 188,878 | |
| | Accrued Liabilities: | | | | |
| | | Investment adviser fees | | | 343,582 | |
| | | Trustees' fees and expenses | | | 180 | |
| | | Fund services fees | | | 11,740 | |
| | | Other expenses | | | 26,413 | |
| Total Liabilities | | | 570,793 | |
| | | | | | | |
| NET ASSETS | | $ | 147,002,769 | |
| | | | | | | |
| COMPONENTS OF NET ASSETS | | | | |
| | Paid-in capital | | $ | 92,535,620 | |
| | Accumulated net investment loss | | | (390,987 | ) |
| | Accumulated net realized gain | | | 1,006,347 | |
| | Net unrealized appreciation | | | 53,851,789 | |
| NET ASSETS | | $ | 147,002,769 | |
| SHARES OF BENEFICIAL INTEREST AT NO PAR VALUE (UNLIMITED SHARES AUTHORIZED) | | | 6,019,869 | |
| NET ASSET VALUE, OFFERING AND REDEMPTION PRICE PER SHARE | | $ | 24.42 | |
See Notes to Financial Statements. | 16 | DF DENT GROWTH FUNDS |
DF DENT PREMIER GROWTH FUND STATEMENT OF OPERATIONS YEAR ENDED JUNE 30, 2016 |
| INVESTMENT INCOME | | | | | |
| | Dividend income | | | $ | 898,141 | |
| | Interest income | | | 921 | |
| Total Investment Income | | | | 899,062 | |
| | | | | | |
| EXPENSES | | | | | |
| | Investment adviser fees | | | 1,579,833 | |
| | Fund services fees | | | 215,768 | |
| | Custodian fees | | | 16,182 | |
| | Registration fees | | | 17,806 | |
| | Professional fees | | | 45,053 | |
| | Trustees' fees and expenses | | | 12,745 | |
| | Miscellaneous expenses | | | 35,040 | |
| Total Expenses | | | | 1,922,427 | |
| | Fees waived and expenses reimbursed | | | (203,498 | ) |
| Net Expenses | | | | 1,718,929 | |
| | | | | | | |
| NET INVESTMENT LOSS | | | | (819,867 | ) |
| | | | | | | |
| NET REALIZED AND UNREALIZED GAIN (LOSS) | | | | | |
| | Net realized gain on investments | | | 6,952,199 | |
| | Net change in unrealized appreciation (depreciation) on investments | | | (9,609,670 | ) |
| NET REALIZED AND UNREALIZED LOSS | | | | (2,657,471 | ) |
| DECREASE IN NET ASSETS RESULTING FROM OPERATIONS | | | $ | (3,477,338 | ) |
See Notes to Financial Statements. | 17 | DF DENT GROWTH FUNDS |
DF DENT PREMIER GROWTH FUND STATEMENTS OF CHANGES IN NET ASSETS |
| | | | | For the Years Ended June 30, |
| | | | | 2016 | | | 2015 |
| OPERATIONS | | | | | | | | | |
| | Net investment loss | | $ | (819,867 | ) | | | $ | (690,199 | ) |
| | Net realized gain | | | 6,952,199 | | | | | 28,131,116 | |
| | Net change in unrealized appreciation (depreciation) | | | (9,609,670 | ) | | | | (13,254,017 | ) |
| Increase (Decrease) in Net Assets Resulting from Operations | | | (3,477,338 | ) | | | | 14,186,900 | |
| | | | | | | | | | | | |
| DISTRIBUTIONS TO SHAREHOLDERS FROM | | | | | | | | | |
| | Net realized gain | | | (19,330,439 | ) | | | | - | |
| | | | | | | | | | | | |
| CAPITAL SHARE TRANSACTIONS | | | | | | | | | |
| | Sale of shares | | | 4,257,020 | | | | | 2,492,341 | |
| | Reinvestment of distributions | | | 15,030,720 | | | | | - | |
| | Redemption of shares | | | (23,413,211 | ) | | | | (42,152,583 | ) |
| Decrease in Net Assets from Capital Share Transactions | | | (4,125,471 | ) | | | | (39,660,242 | ) |
| Decrease in Net Assets | | | (26,933,248 | ) | | | | (25,473,342 | ) |
| | | | | | | | | | | | |
| NET ASSETS | | | | | | | | | |
| | Beginning of Year | | | 173,936,017 | | | | | 199,409,359 | |
| | End of Year (Including line (a)) | | $ | 147,002,769 | | | | $ | 173,936,017 | |
| | | | | | | | | | | | |
| SHARE TRANSACTIONS | | | | | | | | | |
| | Sale of shares | | | 164,264 | | | | | 93,371 | |
| | Reinvestment of distributions | | | 614,502 | | | | | - | |
| | Redemption of shares | | | (900,483 | ) | | | | (1,572,825 | ) |
| Decrease in Shares | | | (121,717 | ) | | | | (1,479,454 | ) |
| | | | | | | | | | | | |
| (a) | Accumulated net investment loss | | $ | (390,987 | ) | | | $ | (341,550 | ) |
See Notes to Financial Statements. | 18 | DF DENT GROWTH FUNDS |
DF DENT PREMIER GROWTH FUND |
| These financial highlights reflect selected data for a share outstanding throughout each year. |
| | | For the Years Ended June 30, | |
| | | 2016 | | 2015 | | 2014 | | 2013 | | 2012 | |
| NET ASSET VALUE, Beginning | | | | | | | | | | | | | | | | | | | | |
| of Year | $ | 28.32 | | | $ | 26.17 | | | $ | 21.54 | | | $ | 17.73 | | | $ | 17.60 | | |
| INVESTMENT OPERATIONS | | | | | | | | | | | | | | | | | | | | |
| Net investment loss (a) | | (0.13 | ) | | | (0.10 | ) | | | (0.08 | ) | | | (0.01 | ) | | | (0.05 | ) | |
| Net realized and unrealized | | | | | | | | | | | | | | | | | | | | |
| | gain (loss) | | (0.45 | ) | | | 2.25 | | | | 4.71 | | | | 3.82 | | | | 0.18 | | |
| Total from Investment | | | | | | | | | | | | | | | | | | | | |
| | Operations | | (0.58 | ) | | | 2.15 | | | | 4.63 | | | | 3.81 | | | | 0.13 | | |
| DISTRIBUTIONS TO | | | | | | | | | | | | | | | | | | | | |
| SHAREHOLDERS FROM | | | | | | | | | | | | | | | | | | | | |
| Net realized gain | | (3.32 | ) | | | — | | | | — | | | | — | | | | — | | |
| NET ASSET VALUE, End | | | | | | | | | | | | | | | | | | | | |
| of Year | $ | 24.42 | | | $ | 28.32 | | | $ | 26.17 | | | $ | 21.54 | | | $ | 17.73 | | |
| TOTAL RETURN | | (2.06 | )% | | 8.22 | % | | 21.49 | % | | 21.49 | % | | 0.74 | % |
| | | | | | | | | | | | | | | | | | | | | |
| RATIOS/SUPPLEMENTARY DATA | | | | | | | | | | | | | | | | | | | | |
| Net Assets at End of | | | | | | | | | | | | | | | | | | | | |
| | Year (000's omitted) | $147,003 | | | $173,936 | | | $199,409 | | | $174,808 | | | $148,886 | | |
| Ratios to Average Net Assets: | | | | | | | | | | | | | | | | | | | | |
| Net investment loss | | (0.52 | )% | | (0.38 | )% | | (0.31 | )% | | (0.05 | )% | | (0.28 | )% |
| Net expenses | | 1.09 | % | | 1.06 | % | | 1.05 | % | | 1.09 | % | | 1.10 | % |
| Gross expenses (b) | | 1.22 | % | | 1.20 | % | | 1.20 | % | | 1.26 | % | | 1.29 | % |
| PORTFOLIO TURNOVER RATE | | 20 | % | | 25 | % | | 25 | % | | 19 | % | | 14 | % |
| | | | | | | | | | | | | | | | | | | | | | |
| (a) | Calculated based on average shares outstanding during each year. |
| (b) | Reflects the expense ratio excluding any waivers and/or reimbursements. |
See Notes to Financial Statements. | 19 | DF DENT GROWTH FUNDS |
DF DENT MIDCAP GROWTH FUND A MESSAGE TO OUR SHAREHOLDERS (Unaudited) JUNE 30, 2016 |
Dear Fellow Shareholders:
Performance
For the period July 1, 2015, through June 30, 2016, the DF Dent Midcap Growth Fund (the "Fund") experienced a total return of -2.49%, underperforming the total return of -2.14% for the Russell Midcap Growth Index (the "Index"), which is the benchmark we use for performance comparisons, by 0.35%.
Expense Ratio
Your Fund's investment adviser, D.F. Dent and Company, Inc. (the "Adviser"), has contractually agreed to maintain your Fund's expense ratio through October 31, 2019 at a net 1.10% on the first $150 million of net assets and 0.90% on net assets exceeding $150 million by reimbursing expenses and/or waiving a portion of management fees. Per the prospectus, the Fund's total operating expense ratio is 1.84%.
Concentration
The Fund's concentration in its top 10 holdings is as follows:
DF DENT MIDCAP GROWTH FUND A MESSAGE TO OUR SHAREHOLDERS (Unaudited) JUNE 30, 2016 |
However, Brexit aside, we believe that growth might be disappointingly slow for the foreseeable future, and that the remainder of 2016 and 2017 could be a challenging environment for investors. Even in an environment where earnings growth seems difficult to achieve, some stocks have continued to appreciate. As a result, the market has not gotten any cheaper. Using the S&P 500 as a proxy for the market, the chart below shows the S&P 500's next twelve-month (NTM) P/E ratio close to a six-year high. We question the sustainability of this trend as it applies to companies that dominate the large, market-weighted indices.
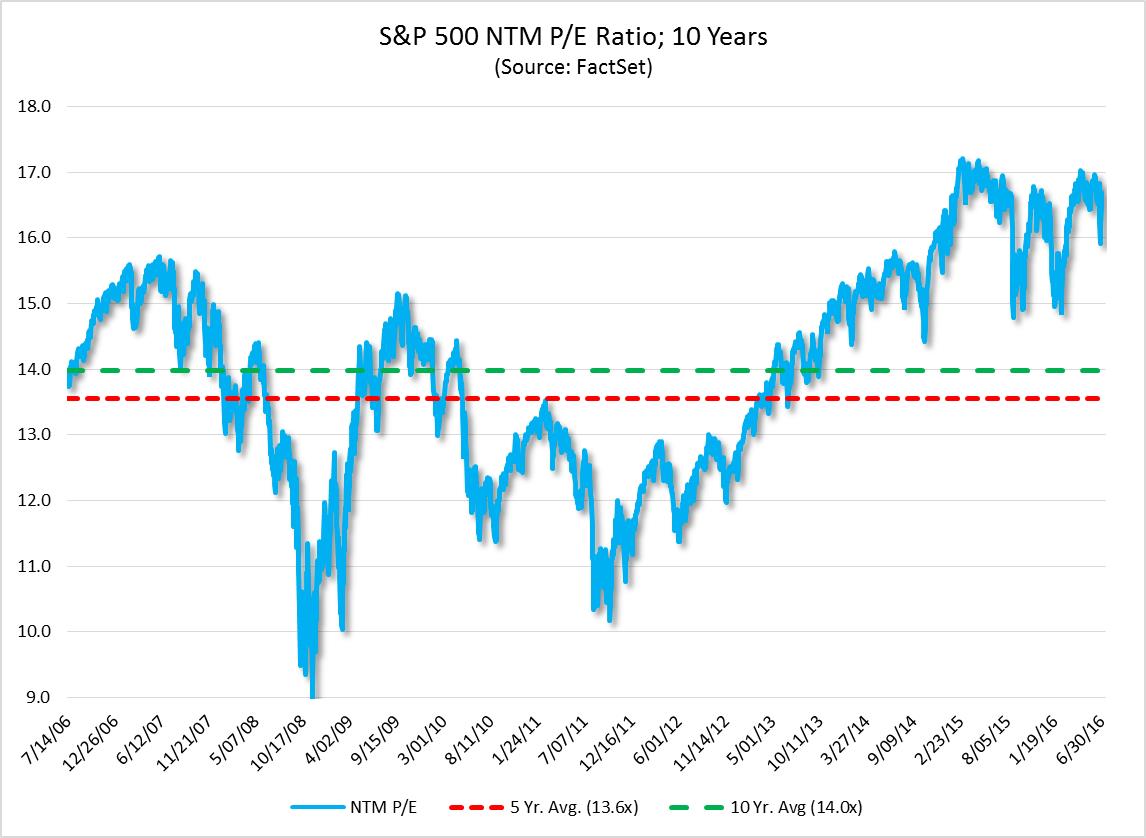
In addition, we doubt that market appreciation can outpace earnings growth on a long-term basis. In fact, as the chart below illustrates, S&P 500 stock prices have been stuck in a trading range since mid-2015, and this stagnant period of stock performance has corresponded with stagnant earnings growth. This relationship supports one of D.F. Dent's core theories: stock price appreciation is highly correlated with earnings growth over the long term. If we can invest your portfolios in companies that are at attractive valuations and historically have grown their earnings faster than the market over a long period, then there is potential for stock price appreciation.
In sum, we believe that in this low-growth environment, the stocks in your portfolio – "best-in-class*", niche-focused, midcap companies, led by what we believe to be talented and ethical managers, with operational and capital-allocation experience – appear poised to grow their earnings significantly faster than the market and offer attractive investment returns over the next market cycle.
Attribution Analysis
The following bar chart presents the sector weightings of your Fund versus the sector weightings of the Index as of June 30, 2016:
DF DENT MIDCAP GROWTH FUND A MESSAGE TO OUR SHAREHOLDERS (Unaudited) JUNE 30, 2016 |
Source: FactSet
Your Fund was over-weighted versus the Index in Financials, Industrials, Information Technology and Telecommunication Services. In Financials and Telecommunication Services, the over-weighting contributed slightly to performance, but stock selection detracted from performance. In Industrials and Information Technology, both the over-weighting and stock selection contributed to performance.
Your Fund was under-weighted versus the Index in Consumer Discretionary, Consumer Staples, Energy, Health Care, Materials, and Utilities. Your Fund's under-weighting in Consumer Discretionary contributed to performance, but stock selection detracted from performance. In Energy, the under-weighting and stock selection both detracted from performance. In Health Care and Materials, the under-weighting and stock selection both contributed to performance. Your Fund did not hold any names in the Consumer Staples and Utilities sectors, which detracted from performance slightly compared to the Index.
Amid all of the volatility caused by Brexit, we took the opportunity to trim or sell several names that had held up well and to redeploy the capital in high conviction names. At times like these, frequent meetings with companies' management teams help us make these determinations.
Themes
The Adviser has invested consistent with major socio-economic trends that are ongoing and impact multiple
DF DENT MIDCAP GROWTH FUND A MESSAGE TO OUR SHAREHOLDERS (Unaudited) JUNE 30, 2016 |
industries. Industrial diversification is fine to a point, but we believe major underlying trends that reach across many different industries are key elements of long-term sustained growth. Your Fund is structured to seek participation in the following ongoing major investment themes:
| 1. | Dominant leaders of advanced technologies in healthcare: Illumina, Intuitive Surgical |
| 2. | Software improving productivity in legacy industries: Blackbaud, Tyler Technologies, Costar Group, Ansys |
| 3. | Consumer Businesses that are enhanced- not disintermediated- by technology and e-commerce: Signet Jewelers, LKQ Corp., CarMax, IMAX Corp. |
| 4. | Financial Services: Markel, Moody's, SEI Investments |
| 5. | Pioneering use of data to add value: Verisk, Ecolab, Trimble |
DF DENT MIDCAP GROWTH FUND A MESSAGE TO OUR SHAREHOLDERS (Unaudited) JUNE 30, 2016 |
FIVE LARGEST EQUITY HOLDINGS
JUNE 30, 2016
Quantity | | Security | | | Total Cost | | | Market Value | | Percent of Net Assets of the Fund | |
| 50,359 | | LKQ Corp. | | $ | 1,229,382 | | $ | 1,596,380 | | 6.66 | % |
| 15,081 | | ANSYS, Inc. | | | 1,117,387 | | | 1,368,601 | | 5.71 | |
| 18,226 | | WageWorks, Inc. | | | 603,214 | | | 1,090,097 | | 4.55 | |
| 6,335 | | Roper Technologies, Inc. | | | 865,965 | | | 1,080,498 | | 4.51 | |
| 13,233 | | Verisk Analytics, Inc., Class A | | | 850,578 | | | 1,072,932 | | 4.48 | |
| | | | | $ | 4,666,526 | | $ | 6,208,508 | | 25.91 | % |
As always, we acknowledge the responsibility you have conveyed by making your investment in the DF Dent Midcap Growth Fund and will work diligently on your behalf.
Respectively Submitted,
Thomas F. O'Neil, Jr. Matthew F. Dent
Gary D. Mitchell Bruce L. Kennedy
* The determination of "best-in-class" is solely the opinion of the Fund's Adviser, and such opinion is subject to change. Those companies that hold leading market share positions, strong growth potential, historically good profitability, and management teams known for integrity and good corporate governance are generally considered to be "best-in-class."
DF DENT MIDCAP GROWTH FUND A MESSAGE TO OUR SHAREHOLDERS (Unaudited) JUNE 30, 2016 |
IMPORTANT INFORMATION:
Investing involves risks, including the possible loss of principal. The Fund invests in small- and medium-size companies, which carry greater risk than is customarily associated with larger, more established companies. With non-diversification risk, the Fund will typically invest in securities of fewer issuers, which exposes the Fund to greater market risk. Investing in American Depository Receipts (ADRs) carries risks of political and financial instability, less liquidity and greater volatility, as well as risks associated with the lack of reliable accounting and financial information. The Fund is also subject to other risks, such as the risk associated with investing in Real Estate Investment Trusts (REITs) like possible real estate market declines, which are detailed in the Fund's prospectus.
The Russell Midcap Growth Index measures the performance of the mid-cap growth segment of the U.S. equity universe. It includes those Russell Midcap Index companies with higher price-to-book ratios and higher forecasted growth values. One cannot invest directly in an index. Price-to-earnings ("P/E") ratio is the valuation of a company's current share price relative to company earnings. Earnings-per-share ("EPS") is the portion of a company's profit allocated to each outstanding share of common stock.
The views in this report contained herein were those of the Fund's Adviser as of June 30, 2016, and may not reflect the Adviser's views on the date this report is first published or anytime thereafter. This report may contain discussions about certain investments both held and not held in the portfolio as of the report date. All current and future holdings are subject to risk and are subject to change. While these views are intended to assist shareholders in understanding their investment in the Fund, they do not constitute investment or tax advice, are not a guarantee of future performance and are not intended as an offer or solicitation with respect to the purchase or sale of any security.
DF DENT MIDCAP GROWTH FUND PERFORMANCE CHART AND ANALYSIS (Unaudited) JUNE 30, 2016 |
The following chart reflects the change in the value of a hypothetical $10,000 investment, including reinvested dividends and distributions, in the DF Dent Midcap Growth Fund (the "Fund") compared with the performance of the benchmark, the Russell Midcap Growth Index ("Russell Midcap Growth"), since inception. The Russell Midcap Growth measures the performance of the mid-cap growth segment of the U.S. equity universe. It includes those Russell Midcap Index companies with higher price-to-book ratios and higher forecasted growth values. The total return of the Russell Midcap Growth includes the reinvestment of dividends and income. The total return of the Fund includes operating expenses that reduce returns, while the total return of the Russell Midcap Growth does not include expenses. The Fund is professionally managed, while the Russell Midcap Growth is unmanaged and is not available for investment.
Comparison of Change in Value of a $10,000 Investment
DF Dent Midcap Growth Fund vs. Russell Midcap Growth Index
| Average Annual Total Returns | | | | Since Inception |
| Periods Ended June 30, 2016 | | One Year | | 07/01/11 |
| DF Dent Midcap Growth Fund | | -2.49 | % | | 11.39 | % |
| Russell Midcap Growth Index | | -2.14 | % | | 9.64 | % |
DF DENT MIDCAP GROWTH FUND SCHEDULE OF INVESTMENTS JUNE 30, 2016 |
| Shares | | Security Description | | Value | |
DF DENT MIDCAP GROWTH FUND SCHEDULE OF INVESTMENTS JUNE 30, 2016 |
| PORTFOLIO HOLDINGS | | |
| % of Net Assets | | |
| Consumer Discretionary | 18.0 | % |
| Financials | 13.8 | % |
| Health Care | 9.8 | % |
| Industrials | 27.3 | % |
| Information Technology | 24.4 | % |
| Materials | 4.0 | % |
| Telecommunication Services | 2.6 | % |
| Other Assets & Liabilities, Net | 0.1 | % |
| | 100.0 | % |
See Notes to Financial Statements. | 29 | DF DENT GROWTH FUNDS |
DF DENT MIDCAP GROWTH FUND STATEMENT OF ASSETS AND LIABILITIES JUNE 30, 2016 |
| ASSETS | | | | |
| | Total investments, at value (Cost $19,569,840) | | $ | 23,932,735 | |
| | Cash | | | 126,716 | |
| | Receivables: | | | | |
| | | Dividends and interest | | | 3,414 | |
| | Prepaid expenses | | | 5,915 | |
| Total Assets | | | 24,068,780 | |
| | | | | | | |
| LIABILITIES | | | | |
| | Payables: | | | | |
| | | Investment securities purchased | | | 50,695 | |
| | Accrued Liabilities: | | | | |
| | | Investment adviser fees | | | 27,270 | |
| | | Fund services fees | | | 6,993 | |
| | | Other expenses | | | 20,543 | |
| Total Liabilities | | | 105,501 | |
| | | | | | | |
| NET ASSETS | | $ | 23,963,279 | |
| | | | | | | |
| COMPONENTS OF NET ASSETS | | | | |
| | Paid-in capital | | $ | 19,858,422 | |
| | Accumulated net investment loss | | | (76,368 | ) |
| | Accumulated net realized loss | | | (181,670 | ) |
| | Net unrealized appreciation | | | 4,362,895 | |
| NET ASSETS | | $ | 23,963,279 | |
| SHARES OF BENEFICIAL INTEREST AT NO PAR VALUE (UNLIMITED SHARES AUTHORIZED) | | | 1,559,358 | |
NET ASSET VALUE, OFFERING AND REDEMPTION PRICE PER SHARE* | | $ | 15.37 | |
| * | Shares redeemed or exchanged within 60 days of purchase are charged a 2.00% redemption fee. |
See Notes to Financial Statements. | 30 | DF DENT GROWTH FUNDS |
DF DENT MIDCAP GROWTH FUND STATEMENT OF OPERATIONS YEAR ENDED JUNE 30, 2016 |
| INVESTMENT INCOME | | | | | |
| | Dividend income | | | $ | 84,371 | |
| | Interest income | | | 1,089 | |
| Total Investment Income | | | | 85,460 | |
| | | | | | |
| EXPENSES | | | | | |
| | Investment adviser fees | | | 220,202 | |
| | Fund services fees | | | 124,387 | |
| | Custodian fees | | | 5,000 | |
| | Registration fees | | | 7,300 | |
| | Professional fees | | | 24,517 | |
| | Trustees' fees and expenses | | | 4,395 | |
| | Miscellaneous expenses | | | 15,246 | |
| Total Expenses | | | | 401,047 | |
| | Fees waived and expenses reimbursed | | | (158,825 | ) |
| Net Expenses | | | | 242,222 | |
| | | | | | | |
| NET INVESTMENT LOSS | | | | (156,762 | ) |
| | | | | | | |
| NET REALIZED AND UNREALIZED GAIN (LOSS) | | | | | |
| | Net realized gain on investments | | | 242,086 | |
| | Net change in unrealized appreciation (depreciation) on investments | | | (541,009 | ) |
| NET REALIZED AND UNREALIZED LOSS | | | | (298,923 | ) |
| DECREASE IN NET ASSETS RESULTING FROM OPERATIONS | | | $ | (455,685 | ) |
See Notes to Financial Statements. | 31 | DF DENT GROWTH FUNDS |
DF DENT MIDCAP GROWTH FUND STATEMENTS OF CHANGES IN NET ASSETS |
| | | | | For the Years Ended June 30, |
| | | | | 2016 | | | 2015 |
| OPERATIONS | | | | | | | | | |
| | Net investment loss | | $ | (156,762 | ) | | | $ | (128,527 | ) |
| | Net realized gain | | | 242,086 | | | | | 979,913 | |
| | Net change in unrealized appreciation (depreciation) | | | (541,009 | ) | | | | 1,189,087 | |
| Increase (Decrease) in Net Assets Resulting from Operations | | | (455,685 | ) | | | | 2,040,473 | |
| | | | | | | | | | | | |
| DISTRIBUTIONS TO SHAREHOLDERS FROM | | | | | | | | | |
| | Net realized gain | | | (677,047 | ) | | | | (863,974 | ) |
| | | | | | | | | | | | |
| CAPITAL SHARE TRANSACTIONS | | | | | | | | | |
| | Sale of shares | | | 2,595,222 | | | | | 5,193,362 | |
| | Reinvestment of distributions | | | 674,372 | | | | | 856,042 | |
| | Redemption of shares | | | (930,371 | ) | | | | (501,579 | ) |
| Increase in Net Assets from Capital Share Transactions | | | 2,339,223 | | | | | 5,547,825 | |
| Increase in Net Assets | | | 1,206,491 | | | | | 6,724,324 | |
| | | | | | | | | | | | |
| NET ASSETS | | | | | | | | | |
| | Beginning of Year | | | 22,756,788 | | | | | 16,032,464 | |
| | End of Year (Including line (a)) | | $ | 23,963,279 | | | | $ | 22,756,788 | |
| | | | | | | | | | | | |
| SHARE TRANSACTIONS | | | | | | | | | |
| | Sale of shares | | | 176,331 | | | | | 335,890 | |
| | Reinvestment of distributions | | | 45,199 | | | | | 58,393 | |
| | Redemption of shares | | | (61,269 | ) | | | | (32,215 | ) |
| Increase in Shares | | | 160,261 | | | | | 362,068 | |
| | | | | | | | | | | | |
| (a) | Accumulated net investment loss | | $ | (76,368 | ) | | | $ | (71,155 | ) |
See Notes to Financial Statements. | 32 | DF DENT GROWTH FUNDS |
DF DENT MIDCAP GROWTH FUND |
| These financial highlights reflect selected data for a share outstanding throughout each period. |
| | | For the Years Ended June 30, | | July 1, 2011 (a) through June 30, | |
| | | 2016 | | 2015 | | 2014 | | 2013 | | 2012 | |
| NET ASSET VALUE, Beginning | | | | | | | | | | | | | | | | | | | | |
| of Period | $ | 16.27 | | | $ | 15.46 | | | $ | 13.01 | | | $ | 10.32 | | | $ | 10.00 | | |
| INVESTMENT OPERATIONS | | | | | | | | | | | | | | | | | | | | |
| Net investment loss (b) | | (0.11 | ) | | | (0.10 | ) | | | (0.09 | ) | | | (0.04 | ) | | | (0.05 | ) | |
| Net realized and unrealized | | | | | | | | | | | | | | | | | | | | |
| | gain (loss) | | (0.31 | ) | | | 1.57 | | | | 3.06 | | | | 2.73 | | | | 0.37 | | |
| Total from Investment | | | | | | | | | | | | | | | | | | | | |
| | Operations | | (0.42 | ) | | | 1.47 | | | | 2.97 | | | | 2.69 | | | | 0.32 | | |
| DISTRIBUTIONS TO | | | | | | | | | | | | | | | | | | | | |
| SHAREHOLDERS FROM | | | | | | | | | | | | | | | | | | | | |
| Net realized gain | | (0.48 | ) | | | (0.66 | ) | | | (0.52 | ) | | | — | | | | — | | |
| REDEMPTION FEES (b) | | — | | | | — | | | | — | (c) | | — | | | | — | | |
| NET ASSET VALUE, End | | | | | | | | | | | | | | | | | | | | |
| of Period | $ | 15.37 | | | $ | 16.27 | | | $ | 15.46 | | | $ | 13.01 | | | $ | 10.32 | | |
| TOTAL RETURN | | (2.49 | )% | | 9.97 | % | | 22.95 | % | | 26.07 | % | | 3.20 | %(d) |
| | | | | | | | | | | | | | | | | | | | | |
| RATIOS/SUPPLEMENTARY DATA | | | | | | | | | | | | | | | | | | | | |
| Net Assets at End of | | | | | | | | | | | | | | | | | | | | |
| | Period (000's omitted) | $23,963 | | | $22,757 | | | $16,032 | | | $9,679 | | | $6,423 | | |
| Ratios to Average Net Assets: | | | | | | | | | | | | | | | | | | | | |
| Net investment loss | | (0.71 | )% | | (0.65 | )% | | (0.63 | )% | | (0.38 | )% | | (0.55 | )%(e) |
| Net expenses | | 1.10 | % | | 1.10 | % | | 1.10 | % | | 1.10 | % | | 1.10 | %(e) |
| Gross expenses (f) | | 1.82 | % | | 1.84 | % | | 2.08 | % | | 1.86 | % | | 3.45 | %(e) |
| PORTFOLIO TURNOVER RATE | | 29 | % | | 45 | % | | 32 | % | | 35 | % | | 24 | %(d) |
| | | | | | | | | | | | | | | | | | | | | | |
| (a) | Commencement of operations. |
| (b) | Calculated based on average shares outstanding during each period. |
| (c) | Less than $0.01 per share. |
| (d) | Not annualized. |
| (e) | Annualized. |
| (f) | Reflects the expense ratio excluding any waivers and/or reimbursements. |
See Notes to Financial Statements. | 33 | DF DENT GROWTH FUNDS |
DF DENT SMALL CAP GROWTH FUND A MESSAGE TO OUR SHAREHOLDERS (Unaudited) JUNE 30, 2016 |
Dear Fellow Shareholders:
Performance
For the fiscal year ended June 30, 2016, the DF Dent Small Cap Growth Fund (the "Fund") experienced a total return of -5.06%. This return is net of fees and represents an outperformance of 5.69% relative to the total return of -10.75% for the Russell 2000 Growth Index (the "Index"), which is the benchmark we use for performance comparisons.
Expense Ratio
The gross operating expense ratio for the Fund is currently 5.16%, which is high given the small size of Fund assets relative to certain fixed expenses. However, per the Fund's prospectus, your Fund's investment adviser, D.F. Dent and Company, Inc. (the "Adviser"), has contractually agreed to reimburse expenses and/or waive a portion of its fees so as to maintain your Fund's expense ratio at a net 1.25% through October 31, 2019.
Concentration
The Fund's concentration in its top 10 holdings is as follows:
| Top 10 Holdings | | | 06/30/16 |
| % of the Fund | | | 29.92 | % |
| Average Position Size of Top 10 | | | 2.92 | % |
We believe that the current concentration in the Fund's top 10 positions is appropriate at its current level and has the potential to enhance long-term performance.
Management Ownership of Fund
Employees, their families, and the Adviser's retirement plan owned approximately 58% of the Fund as of June 30, 2016. There were only management purchases and no management redemptions during the fiscal year ended June 30, 2016.
Portfolio Commentary
Over the last twelve months, in what is the seventh year of a post-recession recovery, equity markets have struggled to continue to produce broad-based gains. Market leadership is narrow, as it appears that investors have strongly favored more defensive equity sectors. Over the past year, gains have been led by Utilities, Telecom and Consumer Staples, while cyclical sectors such as Energy, Materials and Financials are all down materially. Beyond sector dispersion, other forms of defensive positioning have outperformed over the last twelve months: larger capitalization stocks have trumped smaller stocks; fixed income securities (and in particular, U.S. Treasuries) have generally outperformed equities; value stocks have outperformed growth
DF DENT SMALL CAP GROWTH FUND A MESSAGE TO OUR SHAREHOLDERS (Unaudited) JUNE 30, 2016 |
stocks; and high-dividend-paying issues have bested non-dividend paying ones. In this environment, it is no surprise that the small cap-focused Index has trailed, down more than 10% over the last twelve months.
While the Fund had a negative return, it notably outperformed the Index over this period, but it is not impervious to such rotations in investor positioning. Some of the Fund's more cyclical, smaller and growth-oriented names have certainly lagged. Nevertheless, we do not expect this trend to continue in perpetuity. Defensive names are trading at earnings multiples far in excess of their earnings growth rates and, as Blackrock chief equity strategist Kate Moore recently noted, the valuation premium for dividend-yielding "bond proxy" stocks "has reached an all-time high." While we cannot predict exactly when, we are confident that markets will eventually reward stock price appreciation commensurate with earnings per share growth as they have throughout time. Eventually, we believe this may favor some of the stocks in your Fund – "best-in-class*", niche-focused companies led by seemingly talented and ethical managers with operational and capital-allocation experience –which we view as companies that possess sustainable earnings prospects and we believe offer superior long-term growth characteristics.
Investment Tenet Highlight: Niche-Focused
Continuing a practice we started with our first June Shareholder Letter in 2014, we would like to discuss and expound upon another investment tenet that is important to the framework we use to determine which securities to own in your Fund. In 2014, we introduced the importance of capital allocation and explained that, while often underappreciated by the market, prudent capital allocation decisions can have a profound effect on the company's success and ultimately total shareholder return. In 2015, we discussed the value of "moats," or sustainable competitive advantages that enable a company and its stock to produce outsize growth over long periods of time. This year we discuss the merits of being niche-focused.
In our view, a niche-focused company is one that concentrates its efforts on a particular type of product or service or within a specific market segment. While many businesses start out as niche-focused companies with tightly-defined specializations, fewer remain niche-focused as they grow. We have found that those companies that "stick to their knitting" tend to have tangible advantages over those that do not and, therefore, their stocks often outperform over time. The first such advantage of niche companies is that their singular focus tends to produce greater industry expertise and, with that, deeper understanding of their customers. An example of this within your Fund is Tyler Technologies, which is focused solely on providing information technology solutions to local governments. Tyler has tailored its software and technology offerings to specifically meet the needs of its government customers and knows the importance they place on solutions that are cost-effective, seamlessly integrated, easy to use, and connected across governmental functions and departments.
Successful niche-focused companies also tend to have reputational and marketing advantages. Do one thing really well and your company's name and brand become synonymous with that success. An example within your Fund is IMAX, a company that, since its inception, has been focused on creating the most immersive movie-watching experience. IMAX's brand has become synonymous with the highest-quality way to watch a movie. Studios, directors and exhibitors alike seek partnerships with IMAX and provide the company
DF DENT SMALL CAP GROWTH FUND A MESSAGE TO OUR SHAREHOLDERS (Unaudited) JUNE 30, 2016 |
unparalleled marketing (e.g., "see it in IMAX") and impressive growth: today there are more than 1,000 IMAX locations globally, and in 2015, as global box office grew by 4%, IMAX box office grew by more than 30%.
Finally, by virtue of sticking to what they are best at, niche-focused companies often have produced better profits and returns on investment than diversified companies. Internally we have noted that, in many cases, when companies diversify away from their core competencies, they have often, unfortunately, "de-worse-ified" their businesses. But concentrating on continuous improvement of their core business often has the opposite effect. An example of this within your Fund is Healthcare Services Group ("HCSG"), a company whose sole business is to provide outsourced ancillary services (housekeeping, laundry and food service) to healthcare facilities. We believe that HCSG has succeeded by relentlessly driving operational efficiencies, while at the same time improving service quality and overall cost for the facility. HCSG's focus has led to admirable revenue growth and increasingly higher returns on invested capital over time, with return on invested capital rising from 12% to nearly 21% over the last decade.
Moving forward, we endeavor to continue to populate the Fund with such companies whose niche-focused operations aim to improve operational effectiveness and drive long-term sustainable earnings growth and potential shareholder returns.
Attribution Analysis
Your Fund's greatest source of outperformance relative to the Index came from the Industrials sector. The outperformance was principally due to favorable stock selection among a broad number of industrial names, and secondarily to the Fund's overweight position within the sector, our largest overweighting of any sector relative to the Index. We continue to believe that well-run industrial companies with market-leading positions and above-average, high-return growth opportunities represent excellent investments for the Fund.
The Information Technology and Health Care sectors were also sources of material outperformance over the year. Within IT, all of the outperformance came from stock selection, as the Fund's average weighting of the sector over the year was in line with that of the Index. Health Care outperformance benefitted both from favorable security selection and from the Fund's underweighting of the sector relative to the Index. As we noted last year, "your Fund is underweight mania-driven biotech stocks that have dominated the Index's returns, soaring on, we believe, overly optimistic forecasts, hype and momentum," and these very stocks meaningfully underperformed last year, leading Health Care to be the weakest performing sector within the Index, accounting for the majority of its decline.
Your Fund's largest source of underperformance relative to the Index came from the Financials sector. The underperformance was driven by stock selection, due mostly to one investment in PRA Group, an outsourced receivables collector that reported disappointing earnings. Partially offsetting stock selection was your Fund's overweight position in financials, which had a positive effect on relative performance.
The Fund's next largest source of underperformance relative to the Index came from the Consumer Discretionary sector. The underperformance was driven by stock selection, due entirely to one investment in Performance
DF DENT SMALL CAP GROWTH FUND A MESSAGE TO OUR SHAREHOLDERS (Unaudited) JUNE 30, 2016 |
Sports Group, a sports equipment producer that has seen profitability collapse from a seeming combination of foreign currency headwinds, end market weakness, and retail partner bankruptcies, all while the company is over-levered due to a recent large acquisition of a competitor. Excluding this PRA Group investment, stock selection contributed positively to performance. Your Fund was overweight Consumer Discretionary stocks, though the overweight position had no material effect on relative performance.
Rounding out the sectors, your Fund had an underweight position in Consumer Staples, Energy, Materials, Telecommunication Services and Utilities. While none of these sectors are particularly large parts of the Index, only the underweight position in Energy contributed positively to performance; the rest translated to modest negative relative performance.
All in, the Adviser feels comfortable with the portfolio of investments your Fund holds, both in terms of sector weightings and the favorable attributes of the underlying securities, including what we believe are high levels of earnings growth, solid management teams and durable, cash flow-generating franchises.
The following bar chart presents the sector weightings of your Fund versus the sector weightings of the Index as of June 30, 2016 (note this may differ slightly with the commentary above, which relates to average weightings as opposed to period-end weightings):
DF DENT SMALL CAP GROWTH FUND A MESSAGE TO OUR SHAREHOLDERS (Unaudited) JUNE 30, 2016 |
Best and Worst Performers
Five Best Contributors Investments | | Fund Realized and Unrealized Appreciation and Income in Fiscal Year 2016 | | Fund Per Share As of 6/30/16 | |
| Duluth Holdings, Inc., Class B | | $ | 90,158 | | $ | 0.14 | |
| WageWorks, Inc. | | | 87,502 | | | 0.13 | |
| Tyler Technologies, Inc. | | | 71,320 | | | 0.11 | |
| Ellie Mae, Inc. | | | 67,794 | | | 0.10 | |
| PROS Holdings, Inc. | | | 55,285 | | | 0.08 | |
| | | $ | 372,059 | | $ | 0.56 | |
Five Worst Contributors Investments | | Fund Realized and Unrealized Loss and Income in Fiscal Year 2016 | | Fund Per Share As of 6/30/16 | |
| Performance Sports Group, Ltd. | | $ | (210,691) | | $ | (0.32) | |
| PRA Group, Inc. | | | (158,027) | | | (0.24) | |
| AAC Holdings, Inc. | | | (106,606) | | | (0.16) | |
| Good Times Restaurants, Inc. | | | (87,107) | | | (0.13) | |
| IMAX Corp. | | | (74,369) | | | (0.11) | |
| | | $ | (636,800) | | $ | (0.96) | |
FIVE LARGEST EQUITY HOLDINGS JUNE 30, 2016
DF DENT SMALL CAP GROWTH FUND A MESSAGE TO OUR SHAREHOLDERS (Unaudited) JUNE 30, 2016 |
* The determination of "best-in-class" is solely the opinion of the Fund's Adviser, and such opinion is subject to change. Those companies that hold leading market share positions, strong growth potential, historically good profitability, and management teams known for integrity and good corporate governance are generally considered to be "best in class."
IMPORTANT INFORMATION:
Investing involves risks, including the possible loss of principal. The Fund invests in small- and medium-size companies, which carry greater risk than is customarily associated with larger, more established companies. With non-diversification risk, the Fund will typically invest in securities of fewer issuers, which exposes the Fund to greater market risk. Investing in American Depository Receipts (ADRs) carries risks of political and financial instability, less liquidity and greater volatility, as well as risks associated with the lack of reliable accounting and financial information. The Fund is also subject to other risks, such as the risk associated with Real Estate Investment Trusts (REITs) like possible real estate market declines, which are detailed in the Fund's prospectus.
The Russell 2000 Growth Index measures the performance of the small-cap growth segment of the U.S. equity universe. One cannot invest directly in an index.
The views in this report contained herein were those of the Fund's Adviser as of June 30, 2016, and may not reflect the Adviser's views on the date this report is first published or anytime thereafter. This report may contain discussions about certain investments both held and not held in the portfolio as of the report date. All current and future holdings are subject to risk and are subject to change. While these views are intended to assist shareholders in understanding their investment in the Fund, they do not constitute investment or tax advice, are not a guarantee of future performance and are not intended as an offer or solicitation with respect to the purchase or sale of any security.
DF DENT SMALL CAP GROWTH FUND PERFORMANCE CHART AND ANALYSIS (Unaudited) JUNE 30, 2016 |
The following chart reflects the change in the value of a hypothetical $10,000 investment, including reinvested dividends and distributions, in DF Dent Small Cap Growth Fund (the "Fund") compared with the performance of the benchmark, the Russell 2000 Growth Index ("Russell 2000 Growth"), since inception. The Russell 2000 Growth, the Fund's primary performance benchmark, measures the performance of those Russell 2000 Growth companies with higher price-to-value ratios and higher forecasted growth values. The total return of the Russell 2000 Growth includes the reinvestment of dividends and income. The total return of the Fund includes operating expenses that reduce returns, while the total return of the Russell 2000 Growth does not include expenses. The Fund is professionally managed, while the Russell 2000 Growth is unmanaged and is not available for investment.
Comparison of Change in Value of a $10,000 Investment
DF Dent Small Cap Growth Fund vs. Russell 2000 Growth Index
| Average Annual Total Returns | | | | Since Inception |
| Periods Ended June 30, 2016 | | One Year | | 11/01/13 |
| DF Dent Small Cap Growth Fund | | -5.06 | % | | 6.09 | % |
| Russell 2000 Growth Index | | -10.75 | % | | 3.47 | % |
Performance data quoted represents past performance and is no guarantee of future results. Current performance may be lower or higher than the performance data quoted. Investment return and principal value will fluctuate so that shares, when redeemed, may be worth more or less than original cost. For the most recent month-end performance, please call (866) 233-3368. As stated in the Fund's current prospectus, the annual operating expense ratio (gross) is 5.16%. However, the Fund's adviser has contractually agreed to waive a portion of its fees and/or reimburse expenses to limit total operating expenses (excluding all taxes, interest, portfolio transaction expenses, and extraordinary expenses) to 1.25%, through October 31, 2019. During the period, certain fees were waived and/or expenses reimbursed; otherwise, returns would have been lower. Shares redeemed within 60 days of purchase will be charged a 2.00% redemption fee. The performance table and graph do not reflect the deduction of taxes that a shareholder would pay on Fund distributions or the redemption of Fund shares. Returns greater than one year are annualized.
DF DENT SMALL CAP GROWTH FUND SCHEDULE OF INVESTMENTS JUNE 30, 2016 |
| Shares | | Security Description | | Value | |
DF DENT SMALL CAP GROWTH FUND SCHEDULE OF INVESTMENTS JUNE 30, 2016 |
The following is a summary of the inputs used to value the Fund's investments as of June 30, 2016.
The inputs or methodology used for valuing securities are not necessarily an indication of the risks associated with investing in those securities. For more information on valuation inputs, and their aggregation into the levels used in the table below, please refer to the Security Valuation section in Note 2 of the accompanying Notes to Financial Statements.
| Valuation Inputs | | Investments in Securities |
DF DENT SMALL CAP GROWTH FUND STATEMENT OF ASSETS AND LIABILITIES JUNE 30, 2016 |
| ASSETS | | | | |
| | Total investments, at value (Cost $6,615,600) | | $ | 7,409,007 | |
| | Cash | | | 185,569 | |
| | Receivables: | | | | |
| | | Investment securities sold | | | 137,728 | |
| | | Dividends and interest | | | 2,341 | |
| | | From investment adviser | | | 10,158 | |
| | Prepaid expenses | | | 3,519 | |
| Total Assets | | | 7,748,322 | |
| | | | | | | |
| LIABILITIES | | | | |
| | Payables: | | | | |
| | | Investment securities purchased | | | 187,889 | |
| | Accrued Liabilities: | | | | |
| | | Trustees' fees and expenses | | | 10 | |
| | | Fund services fees | | | 6,784 | |
| | | Other expenses | | | 20,191 | |
| Total Liabilities | | | 214,874 | |
| | | | | | | |
| NET ASSETS | | $ | 7,533,448 | |
| | | | | | | |
| COMPONENTS OF NET ASSETS | | | | |
| | Paid-in capital | | $ | 7,113,627 | |
| | Accumulated net investment loss | | | (484 | ) |
| | Accumulated net realized loss | | | (373,102 | ) |
| | Net unrealized appreciation | | | 793,407 | |
| NET ASSETS | | $ | 7,533,448 | |
| SHARES OF BENEFICIAL INTEREST AT NO PAR VALUE (UNLIMITED SHARES AUTHORIZED) | | | 655,798 | |
NET ASSET VALUE, OFFERING AND REDEMPTION PRICE PER SHARE* | | $ | 11.49 | |
| * | Shares redeemed or exchanged within 60 days of purchase are charged a 2.00% redemption fee. |
See Notes to Financial Statements. | 43 | DF DENT GROWTH FUNDS |
DF DENT SMALL CAP GROWTH FUND STATEMENT OF OPERATIONS YEAR ENDED JUNE 30, 2016 |
| INVESTMENT INCOME | | | | | |
| | Dividend income (Net of foreign withholding taxes of $390) | | | $ | 74,894 | |
| | Interest income | | | 158 | |
| Total Investment Income | | | | 75,052 | |
| | | | | | |
| EXPENSES | | | | | |
| | Investment adviser fees | | | 65,397 | |
| | Fund services fees | | | 122,067 | |
| | Custodian fees | | | 5,000 | |
| | Registration fees | | | 3,780 | |
| | Professional fees | | | 22,175 | |
| | Trustees' fees and expenses | | | 3,454 | |
| | Miscellaneous expenses | | | 13,559 | |
| Total Expenses | | | | 235,432 | |
| | Fees waived and expenses reimbursed | | | (153,686 | ) |
| Net Expenses | | | | 81,746 | |
| | | | | | | |
| NET INVESTMENT LOSS | | | | (6,694 | ) |
| | | | | | | |
| NET REALIZED AND UNREALIZED GAIN (LOSS) | | | | | |
| | Net realized loss on investments | | | (365,704 | ) |
| | Net change in unrealized appreciation (depreciation) on investments | | | 160,741 | |
| NET REALIZED AND UNREALIZED LOSS | | | | (204,963 | ) |
| DECREASE IN NET ASSETS RESULTING FROM OPERATIONS | | | $ | (211,657 | ) |
| | | | | | | |
See Notes to Financial Statements. | 44 | DF DENT GROWTH FUNDS |
DF DENT SMALL CAP GROWTH FUND STATEMENTS OF CHANGES IN NET ASSETS |
| | | | | For the Years Ended June 30, |
| | | | | 2016 | | | 2015 |
| OPERATIONS | | | | | | | | | |
| | Net investment loss | | $ | (6,694 | ) | | | $ | (14,649 | ) |
| | Net realized gain (loss) | | | (365,704 | ) | | | | 96,064 | |
| | Net change in unrealized appreciation (depreciation) | | | 160,741 | | | | | 529,881 | |
| Increase (Decrease) in Net Assets Resulting from Operations | | | (211,657 | ) | | | | 611,296 | |
| | | | | | | | | | | | |
| DISTRIBUTIONS TO SHAREHOLDERS FROM | | | | | | | | | |
| | Net realized gain | | | (66,101 | ) | | | | (33,240 | ) |
| | | | | | | | | | | | |
| CAPITAL SHARE TRANSACTIONS | | | | | | | | | |
| | Sale of shares | | | 2,544,250 | | | | | 2,416,306 | |
| | Reinvestment of distributions | | | 66,049 | | | | | 33,193 | |
| | Redemption of shares | | | (180,814 | ) | | | | (2,000 | ) |
| Increase in Net Assets from Capital Share Transactions | | | 2,429,485 | | | | | 2,447,499 | |
| Increase in Net Assets | | | 2,151,727 | | | | | 3,025,555 | |
| | | | | | | | | | | | |
| NET ASSETS | | | | | | | | | |
| | Beginning of Year | | | 5,381,721 | | | | | 2,356,166 | |
| | End of Year (Including line (a)) | | $ | 7,533,448 | | | | $ | 5,381,721 | |
| | | | | | | | | | | | |
| SHARE TRANSACTIONS | | | | | | | | | |
| | Sale of shares | | | 225,889 | | | | | 220,718 | |
| | Reinvestment of distributions | | | 6,105 | | | | | 3,096 | |
| | Redemption of shares | | | (16,504 | ) | | | | (179 | ) |
| Increase in Shares | | | 215,490 | | | | | 223,635 | |
| | | | | | | | | | | | |
| (a) | Accumulated net investment loss | | $ | (484 | ) | | | $ | (2,241 | ) |
See Notes to Financial Statements. | 45 | DF DENT GROWTH FUNDS |
DF DENT SMALL CAP GROWTH FUND |
| These financial highlights reflect selected data for a share outstanding throughout each period. |
| | | For the Year Ended June 30, 2016 | | For the Year Ended June 30, 2015 | | November 1, 2013 (a) through June 30, 2014 | |
| NET ASSET VALUE, Beginning of Period | $ | 12.22 | | | $ | 10.87 | | | $ | 10.00 | | |
| INVESTMENT OPERATIONS | | | | | | | | | | | | |
| Net investment loss (b) | | (0.01 | ) | | | (0.04 | ) | | | (0.03 | ) | |
| Net realized and unrealized gain (loss) | | (0.61 | ) | | | 1.48 | | | | 0.90 | | |
| Total from Investment Operations | | (0.62 | ) | | | 1.44 | | | | 0.87 | | |
| DISTRIBUTIONS TO SHAREHOLDERS FROM | | | | | | | | | | | | |
| Net realized gain | | (0.11 | ) | | | (0.09 | ) | | | — | | |
| NET ASSET VALUE, End of Period | $ | 11.49 | | | $ | 12.22 | | | $ | 10.87 | | |
| TOTAL RETURN | | (5.06 | )% | | 13.41 | % | | 8.70 | %(c) |
| | | | | | | | | | | | | |
| RATIOS/SUPPLEMENTARY DATA | | | | | | | | | | | | |
| Net Assets at End of Period (000's omitted) | $7,533 | | | $5,382 | | | $2,356 | | |
| Ratios to Average Net Assets: | | | | | | | | | | | | |
| Net investment loss | | (0.10 | )% | | (0.39 | )% | | (0.50 | )%(d) |
| Net expenses | | 1.25 | % | | 1.25 | % | | 1.25 | %(d) |
| Gross expenses (e) | | 3.60 | % | | 5.16 | % | | 10.69 | %(d) |
| PORTFOLIO TURNOVER RATE | | 39 | % | | 38 | % | | 37 | %(c) |
| | | | | | | | | | | | | | |
| (a) | Commencement of operations. |
| (b) | Calculated based on average shares outstanding during each period. |
| (c) | Not annualized. |
| (d) | Annualized. |
| (e) | Reflects the expense ratio excluding any waivers and/or reimbursements. |
See Notes to Financial Statements. | 46 | DF DENT GROWTH FUNDS |
DF DENT GROWTH FUNDS NOTES TO FINANCIAL STATEMENTS JUNE 30, 2016 |
Note 1. Organization
DF Dent Premier Growth Fund is a diversified portfolio of Forum Funds (the "Trust") and DF Dent Midcap Growth Fund and DF Dent Small Cap Growth Fund (individually, a "Fund" and, collectively the "Funds") are non-diversified portfolios of the Trust. The Trust is a Delaware statutory trust that is registered as an open-end, management investment company under the Investment Company Act of 1940, as amended (the "Act"). Under its Trust Instrument, the Trust is authorized to issue an unlimited number of each Fund's shares of beneficial interest without par value. DF Dent Premier Growth Fund, DF Dent Midcap Growth Fund and DF Dent Small Cap Growth Fund commenced operations on July 16, 2001, July 1, 2011, and November 1, 2013, respectively. The Funds seek long-term capital appreciation.
Note 2. Summary of Significant Accounting Policies
These financial statements are prepared in accordance with accounting principles generally accepted in the United States of America ("GAAP"), which require management to make estimates and assumptions that affect the reported amounts of assets and liabilities, the disclosure of contingent liabilities at the date of the financial statements, and the reported amounts of increases and decreases in net assets from operations during the fiscal year. Actual amounts could differ from those estimates. The following summarizes the significant accounting policies of each Fund:
Security Valuation – Exchange-traded securities and over-the-counter securities are valued using the last quoted trade or official closing price, provided by independent pricing services as of the close of trading on the market or exchange for which they are primarily traded, on each Fund business day. In the absence of a sale, such securities are valued at the mean of the last bid and ask price provided by independent pricing services. Non-exchange-traded securities for which quotations are available are valued using the last quoted sales price, or in the absence of a sale, at the mean of the last bid and ask prices provided by independent pricing services. Shares of open-end mutual funds are valued at net asset value ("NAV"). Short-term investments that mature in 60 days or less may be valued at amortized cost.
Each Fund values its investments at fair value pursuant to procedures adopted by the Trust's Board of Trustees (the "Board") if (1) market quotations are insufficient or not readily available or (2) the Adviser, as defined in Note 3, believes that the values available are unreliable. The Trust's Valuation Committee, as defined in each Fund's registration statement, performs certain functions as they relate to the administration and oversight of each Fund's valuation procedures. Under these procedures, the Valuation Committee convenes on a regular and ad-hoc basis to review such investments and considers a number of factors, including valuation methodologies and significant unobservable inputs, when arriving at fair value.
The Valuation Committee may work with the Adviser to provide valuation inputs. In determining fair valuations, inputs may include market-based analytics which may consider related or comparable assets or liabilities, recent transactions, market multiples, book values and other relevant investment information. Adviser inputs may include an income-based approach in which the anticipated future cash flows of the investment are discounted in determining fair value. Discounts may also be applied based on the nature or duration of any
DF DENT GROWTH FUNDS NOTES TO FINANCIAL STATEMENTS JUNE 30, 2016 |
restrictions on the disposition of the investments. The Valuation Committee performs regular reviews of valuation methodologies, key inputs and assumptions, disposition analysis and market activity.
Fair valuation is based on subjective factors and, as a result, the fair value price of an investment may differ from the security's market price and may not be the price at which the asset may be sold. Fair valuation could result in a different NAV than a NAV determined by using market quotes.
Each Fund has a three-tier fair value hierarchy. The basis of the tiers is dependent upon the various "inputs" used to determine the value of each Fund's investments. These inputs are summarized in the three broad levels listed below:
Level 1 — quoted prices in active markets for identical assets and liabilities
Level 2 — other significant observable inputs (including quoted prices of similar securities, interest rates, prepayment speeds, credit risk, etc.)
Level 3 — significant unobservable inputs (including each Fund's own assumptions in determining the fair value of investments)
The aggregate value by input level, as of June 30, 2016, for each Fund's investments is included at the end of each Fund's Schedule of Investments.
Security Transactions, Investment Income and Realized Gain and Loss – Investment transactions are accounted for on the trade date. Dividend income is recorded on the ex-dividend date. Foreign dividend income is recorded on the ex-dividend date or as soon as possible after each Fund determines the existence of a dividend declaration after exercising reasonable due diligence. Income and capital gains on some foreign securities may be subject to foreign withholding taxes, which are accrued as applicable. Interest income is recorded on an accrual basis. Premium is amortized and discount is accreted using the effective interest method. Identified cost of investments sold is used to determine the gain and loss for both financial statement and federal income tax purposes.
Distributions to Shareholders – Distributions to shareholders of net investment income and net capital gains, if any, are declared and paid at least annually. Distributions to shareholders are recorded on the ex-dividend date. Distributions are based on amounts calculated in accordance with applicable federal income tax regulations, which may differ from GAAP. These differences are due primarily to differing treatments of income and gain on various investment securities held by each Fund, timing differences and differing characterizations of distributions made by each Fund.
Federal Taxes – Each Fund intends to continue to qualify each year as a regulated investment company under Subchapter M of Chapter 1, Subtitle A, of the Internal Revenue Code of 1986, as amended ("Code"), and to distribute all of its taxable income to shareholders. In addition, by distributing in each calendar year substantially all of its net investment income and capital gains, if any, the Fund will not be subject to a federal
DF DENT GROWTH FUNDS NOTES TO FINANCIAL STATEMENTS JUNE 30, 2016 |
excise tax. Therefore, no federal income or excise tax provision is required. Each Fund files a U.S. federal income and excise tax return as required. Each Fund's federal income tax returns are subject to examination by the Internal Revenue Service for a period of three fiscal years after they are filed. As of June 30, 2016, there are no uncertain tax positions that would require financial statement recognition, de-recognition or disclosure.
Income and Expense Allocation – The Trust accounts separately for the assets, liabilities and operations of each of its investment portfolios. Expenses that are directly attributable to more than one investment portfolio are allocated among the respective investment portfolios in an equitable manner.
Redemption Fees – A shareholder who redeems shares of DF Dent Midcap Growth Fund and DF Dent Small Cap Growth Fund within 60 days of purchase may incur a redemption fee of 2.00% of the current net asset value of shares redeemed, subject to certain limitations. The fee is charged for the benefit of the remaining shareholders and will be paid to each Fund to help offset transaction costs. The fee is accounted for as an addition to paid-in capital. Each Fund reserves the right to modify the terms of or terminate the fee at any time. There are limited exceptions to the imposition of the redemption fee.
Commitments and Contingencies – In the normal course of business, each Fund enters into contracts that provide general indemnifications by each Fund to the counterparty to the contract. Each Fund's maximum exposure under these arrangements is dependent on future claims that may be made against each Fund and, therefore, cannot be estimated; however, based on experience, the risk of loss from such claims is considered remote.
Note 3. Fees and Expenses
Investment Adviser – D.F. Dent and Company, Inc. (the "Adviser") is the investment adviser to each Fund. Pursuant to an investment advisory agreement, the Adviser receives an advisory fee from each Fund at an annual rate of 1.00% of each Fund's average daily net assets.
Distribution – Foreside Fund Services, LLC serves as each Fund's distributor (the "Distributor"). The Funds do not have a distribution (12b-1) plan; accordingly, the Distributor does not receive compensation from the Funds for its distribution (12b-1) services. The Adviser compensates the Distributor directly for its services. The Distributor is not affiliated with the Adviser or Atlantic Fund Administration, LLC (d/b/a Atlantic Fund Services) ("Atlantic") or their affiliates.
Other Service Providers – Atlantic provides fund accounting, fund administration, compliance and transfer agency services to each Fund. Atlantic also provides certain shareholder report production and EDGAR conversion and filing services. Pursuant to an Atlantic services agreement, each Fund pays Atlantic customary fees for its services. Atlantic provides a Principal Executive Officer, a Principal Financial Officer, a Chief Compliance Officer and an Anti-Money Laundering Officer to each Fund, as well as certain additional compliance support functions.
DF DENT GROWTH FUNDS NOTES TO FINANCIAL STATEMENTS JUNE 30, 2016 |
Trustees and Officers – The Trust pays each independent Trustee an annual retainer fee of $50,000 for service to the Trust ($66,000 for the Chairman). The Audit Committee Chairman and Vice Chairman receive an additional $6,000 annually. The Trustees and Chairman may receive additional fees for special Board meetings. Each Trustee is also reimbursed for all reasonable out-of-pocket expenses incurred in connection with his duties as a Trustee, including travel and related expenses incurred in attending Board meetings. The amount of Trustees' fees attributable to each Fund is disclosed in the Statement of Operations. Certain officers of the Trust are also officers or employees of the above named service providers, and during their terms of office received no compensation from each Fund.
Note 4. Expenses Reimbursed and Fees Waived
The Adviser has contractually agreed to waive a portion of its fee and/or reimburse expenses through October 31, 2019, for DF Dent Premier Growth Fund and DF Dent Midcap Growth Fund, to the extent that total annual operating expenses (excluding all taxes, interest, portfolio transaction expenses, and extraordinary expenses) exceed 1.10% on the first $150 million of net assets and to the extent that annual operating expenses exceed 0.90% on net assets exceeding $150 million of each Fund. The Adviser has also contractually agreed to waive a portion of its fee and/or reimburse expenses to limit total annual operating expenses (excluding all taxes, interest, portfolio transaction expenses, and extraordinary expenses) to 1.25% through October 31, 2019, for DF Dent Small Cap Growth Fund. Other fund service providers have voluntarily agreed to waive and reimburse a portion of their fees. These voluntary fee waivers and reimbursements may be reduced or eliminated at any time. For the year ended June 30, 2016, fees waived and expenses reimbursed were as follows:
| | | Investment Adviser Fees Waived | | Investment Adviser Expenses Reimbursed | | Other Waivers | | Total Fees Waived and Expenses Reimbursed |
| DF Dent Premier Growth Fund | | $ | 135,822 | | $ | - | | $ | 67,676 | | $ | 203,498 |
| DF Dent Midcap Growth Fund | | | 114,663 | | | - | | | 44,162 | | | 158,825 |
| DF Dent Small Cap Growth Fund | | | 65,397 | | | 44,127 | | | 44,162 | | | 153,686 |
Note 5. Security Transactions
The cost of purchases and proceeds from sales of investment securities (including maturities), other than short-term investments during the year ended June 30, 2016, were as follows:
| | Purchases | | Sales |
| DF Dent Premier Growth Fund | | $ | 30,953,887 | | $ | 51,135,761 |
| DF Dent Midcap Growth Fund | | | 9,462,496 | | | 6,205,527 |
| DF Dent Small Cap Growth Fund | | | 5,002,429 | | | 2,538,033 |
Note 6. Federal Income Tax
Distributions paid during the fiscal years ended as noted were characterized for tax purposes as follows:
DF DENT GROWTH FUNDS NOTES TO FINANCIAL STATEMENTS JUNE 30, 2016 |
| | | Ordinary Income | | Long-Term Capital Gain | | Total |
| DF Dent Premier Growth Fund |
| 2016 | | $ | - | | | $ | 19,330,439 | | | $ | 19,330,439 | |
| 2015 | | | - | | | | - | | | | - | |
| DF Dent Midcap Growth Fund |
| 2016 | | | 37,091 | | | | 639,956 | | | | 677,047 | |
| 2015 | | | 165,539 | | | | 698,435 | | | | 863,974 | |
| DF Dent Small Cap Growth Fund |
| 2016 | | | 64,913 | | | | 1,188 | | | | 66,101 | |
| 2015 | | | 33,240 | | | | - | | | | 33,240 | |
As of June 30, 2016, distributable earnings (accumulated loss) on a tax basis were as follows:
| | | Undistributed Long- Term Gain | | Capital and Other Losses | | Unrealized Appreciation | | Total |
| DF Dent Premier Growth Fund | | $ | 1,008,582 | | | $ | (390,987 | ) | | $ | 53,849,554 | | | $ | 54,467,149 | |
| DF Dent Midcap Growth Fund | | | 24,713 | | | | (191,759 | ) | | | 4,271,903 | | | | 4,104,857 | |
| DF Dent Small Cap Growth Fund | | | - | | | | (354,432 | ) | | | 774,253 | | | | 419,821 | |
The difference between components of distributable earnings on a tax basis and the amounts reflected in the Statements of Assets and Liabilities are primarily due to passive foreign investment holdings (PFICs) and wash sales.
For tax purposes, the current year post-October loss was $115,391 for DF Dent Midcap Growth Fund (realized during the period November 1, 2015 through June 30, 2016), and the current deferred late year ordinary loss was $390,987 and $76,368 for DF Dent Premier Growth Fund and DF Dent Midcap Growth Fund, respectively (realized during the period January 1, 2016 through June 30, 2016). These losses will be recognized for tax purposes on the first business day of each Fund's next fiscal year, July 1, 2016.
As of June 30, 2016, the DF Dent Small Cap Growth Fund had $129,463 of available short-term capital loss carryforwards and $224,969 of available long-term capital loss carryforwards that have no expiration date.
On the Statements of Assets and Liabilities, as a result of permanent book to tax differences, certain amounts have been reclassified for the year ended June 30, 2016. The following reclassifications were the result of real estate investment trusts (REITs) and net operating losses and have no impact on the net assets of each Fund.
| | Accumulated Net Investment Income (Loss) | | Accumulated Net Realized Gain (Loss) | | Paid-in Capital |
DF DENT GROWTH FUNDS NOTES TO FINANCIAL STATEMENTS JUNE 30, 2016 |
Note 7. Subsequent Events
Subsequent events occurring after the date of this report through the date these financial statements were issued have been evaluated for potential impact, and each Fund has had no such events.
REPORT OF INDEPENDENT REGISTERED PUBLIC ACCOUNTING FIRM |
To the Board of Trustees of Forum Funds and the Shareholders of DF Dent Premier Growth Fund, DF Dent Midcap Growth Fund and DF Dent Small Cap Growth Fund
We have audited the accompanying statements of assets and liabilities of the of DF Dent Premier Growth Fund, DF Dent Midcap Growth Fund, and DF Dent Small Cap Growth Fund (the "Funds"), each a series of shares of beneficial interest in the Forum Funds, including the schedules of investments, as of June 30, 2016, and the related statements of operations for the year then ended, the statements of changes in net assets for each of the years in the two-year period then ended and the financial highlights for each of the years or periods in the five-year period then ended. These financial statements and financial highlights are the responsibility of the Funds' management. Our responsibility is to express an opinion on these financial statements and financial highlights based on our audits.
We conducted our audits in accordance with the standards of the Public Company Accounting Oversight Board (United States). Those standards require that we plan and perform the audits to obtain reasonable assurance about whether the financial statements and financial highlights are free of material misstatement. An audit includes examining, on a test basis, evidence supporting the amounts and disclosures in the financial statements. Our procedures included confirmation of securities owned as of June 30, 2016 by correspondence with the custodian and brokers. An audit also includes assessing the accounting principles used and significant estimates made by management, as well as evaluating the overall financial statement presentation. We believe that our audits provide a reasonable basis for our opinion.
In our opinion, the financial statements and financial highlights referred to above present fairly, in all material respects, the financial position of the of DF Dent Premier Growth Fund, DF Dent Midcap Growth Fund, and DF Dent Small Cap Growth Fund as of June 30, 2016, and the results of their operations for the year then ended, the changes in their net assets for each of the years in the two-year period then ended and their financial highlights for each of the years or periods in the five-year period then ended, in conformity with accounting principles generally accepted in the United States of America.
BBD, LLP
Philadelphia, Pennsylvania
August 24, 2016
DF DENT GROWTH FUNDS ADDITIONAL INFORMATION (Unaudited) JUNE 30, 2016 |
Investment Advisory Agreement Approval
At the June 9, 2016 Board meeting, the Board, including all of the Independent Trustees, considered the approval of the continuance of the investment advisory agreement between the Adviser and the Trust pertaining to the Funds (the "Advisory Agreement"). In preparation for its deliberations, the Board requested written responses from the Adviser to a due diligence questionnaire circulated on the Board's behalf concerning the Adviser's personnel, operations, financial condition, performance, and services provided by the Adviser. The Board also discussed the materials with Fund counsel and, as necessary, with the Trust's administrator, Atlantic Fund Services. During its deliberations, the Board received an oral presentation from the Adviser, and was assisted by the advice of Trustee counsel.
At the meeting, the Board reviewed, among other matters: (1) the nature, extent and quality of the services provided to the Funds by the Adviser, including information on the investment performance of the Funds and Adviser; (2) the costs of the services provided and profitability to the Adviser with respect to its relationship with the Funds; (3) the advisory fee and total expense ratio of the Funds compared to a relevant peer group of funds; (4) the extent to which economies of scale may be realized as the Funds grow and whether the advisory fee enables each Fund's investors to share in the benefits of economies of scale; and (5) other benefits received by the Adviser from its relationship with the Funds.
Nature, Extent and Quality of Services
Based on written materials received, a presentation from senior representatives of the Adviser and discussions with the Adviser about the Adviser's personnel, operations and financial condition, and with the Trust's CCO about the Adviser, the Board considered the quality of services provided by the Adviser under the Advisory Agreement. In this regard, the Board considered information regarding the experience, qualifications and professional background of the portfolio managers and other personnel at the Adviser with principal responsibility for the Funds, as well as the investment philosophy and decision-making process of those professionals and the capability and integrity of the Adviser's senior management and staff.
The Board considered also the adequacy of the Adviser's resources. The Board noted the Adviser's representation that the firm is in good financial condition and was able to continue to provide high-quality advisory services to the Funds. Based on the presentation and the materials provided by the Adviser in connection with the Board's consideration of the renewal of the Advisory Agreement, the Board concluded that, overall, it was satisfied with the nature, extent and quality of services to be provided to the Funds under the Advisory Agreement.
Performance
In connection with a presentation by the Adviser regarding its approach to managing the Funds, the Board reviewed the performance of the each Fund compared to its respective benchmark. The Board observed that the DF Dent Premier Growth Fund underperformed its primary benchmark, the S&P 500 Index, for the one-, three-, five, and ten-year periods ended March 31, 2016. The Board also considered the DF Dent Premier Growth Fund's performance relative to its Broadridge Financial Solutions, Inc. ("Broadridge") peer group,
DF DENT GROWTH FUNDS ADDITIONAL INFORMATION (Unaudited) JUNE 30, 2016 |
noting that, based on information provided by Broadridge, the DF Dent Premier Growth Fund had outperformed the median of its Broadridge peer group for the one-year period ended March 31, 2016, but had underperformed the median of its peer group for the three- and five-year periods ended March 31, 2016. The Board noted the Adviser's representation that the DF Dent Premier Growth Fund's performance during the periods was negatively impacted, in part, as a result of its underweight position in certain sectors relative to the index. The Board also observed that the DF Dent Premier Growth Fund had outperformed its primary benchmark for the period since the DF Dent Premier Growth Fund's inception on July 16, 2001 and noted the Adviser's representation that, because of the long-term orientation of the DF Dent Premier Growth Fund's investment strategy, the Adviser expected the DF Dent Premier Growth Fund to experience periods of underperformance relative to the benchmark in the near term, but outperform the market over the long term.
The Board observed that the DF Dent Midcap Growth Fund outperformed the Russell Midcap Growth Index, the DF Dent Midcap Growth Fund's primary benchmark, for the one-year period ended March 31, 2016, but had underperformed the primary benchmark for the three-year period ended March 31, 2016. The Board also observed that the DF Dent Midcap Growth Fund had outperformed the benchmark since the DF Dent Midcap Growth Fund's inception on July 1, 2011, and that the DF Dent Midcap Growth Fund had also outperformed the median of its Broadridge peer group for the one- and three-year periods ended March 31, 2016.
The Board observed that the DF Dent Small Cap Growth Fund had outperformed the Russell 2000 Growth Index, the DF Dent Small Cap Growth Fund's primary benchmark, for the one-year period ended March 31, 2016 and since the DF Dent Small Cap Growth Fund's inception on November 1, 2013. He stated that the DF Dent Small Cap Growth Fund had also outperformed the median of its Broadridge peer group for the one-year period ended March 31, 2016.
In light of the foregoing, the Board concluded that the performance of each Fund was reasonable and that each Fund and its shareholders could benefit from the Adviser's continued management of the Funds.
Compensation
The Board evaluated the Adviser's compensation for providing advisory services to each of the Funds and analyzed comparative information on actual advisory fee rates and actual total expenses of the Funds' Broadridge peer groups. The Board noted that the Adviser's actual advisory fee rate and total expense ratio for the DF Dent Premier Growth Fund were each among the highest in its Broadridge peer group. The Board considered the Adviser's representation that it had agreed to maintain an expense cap for the DF Dent Premier Growth Fund of 110 basis points on the first $150 million in fund net assets and to cap the DF Dent Premier Growth Fund's expenses at 90 basis points on net assets exceeding $150 million. Based on the foregoing and other relevant factors, the Board concluded that the Adviser's advisory fee rate charged to the DF Dent Premier Growth Fund was reasonable.
With respect to the DF Dent Midcap Growth Fund, the Board noted that the Adviser's actual advisory fee rate and the Fund's actual total expense ratio were each lower than the median of its Broadridge peer group, and that the Adviser had agreed to maintain an expense cap for the DF Dent Midcap Growth Fund of 110 basis points on the first $150 million in fund net assets and to cap the DF Dent Midcap Growth Fund's expenses at
DF DENT GROWTH FUNDS ADDITIONAL INFORMATION (Unaudited) JUNE 30, 2016 |
90 basis points on net assets exceeding $150 million. Based on the foregoing and other relevant factors, the Board concluded that the Adviser's advisory fee rate charged to the DF Dent Midcap Growth Fund was reasonable.
With respect to the DF Dent Small Cap Growth Fund, the Board observed that the Adviser's actual advisory fee rate was the lowest in its Broadridge peer group. The Board also observed that the DF Dent Small Cap Growth Fund's actual total expense ratio was below the median of its Broadridge peer group. Based on the foregoing and other relevant factors, the Board concluded that the Adviser's advisory fee rate charged to the DF Dent Small Cap Growth Fund was reasonable.
Cost of Services and Profitability
The Board considered information provided by the Adviser regarding the costs of services and its profitability with respect to the Funds. In this regard, the Board considered the Adviser's operating expenses and other resources devoted to the Funds, as well as the Adviser's discussion of costs and profitability. The Board noted that the actual advisory fee and actual total expenses were generally in line with those of the Funds' respective Broadridge peers and that the Adviser had in place a contractual expense waiver to ensure the expense ratios for the Funds remained at reasonable levels, including a tiered breakpoint schedule for the DF Dent Premier Growth Fund and DF Dent Midcap Growth Fund. The Board also noted the Adviser's representation that the Funds were less profitable than the Adviser's overall investment management business because the Funds represented a relatively small percentage of the Adviser's total assets under management, yet the Funds represented a relatively high percentage of the Adviser's overall administrative, reporting, and compliance expenses. Based on these and other applicable considerations, the Board concluded that the Adviser's profits attributable to management of the Funds were reasonable in the context of all factors considered.
Economies of Scale
The Board evaluated whether the Funds would benefit from any economies of scale. In this respect, the Board noted the Adviser's representation that each Fund could benefit from economies of scale as assets grow, and that the Adviser had contractually agreed to cap the DF Dent Premier Growth Fund's and the DF Dent Midcap Growth Fund's total expenses (excluding all taxes, interest, portfolio transaction expenses, and extraordinary expenses) through October 31, 2019 at 1.10% on assets of up to $150 million and at 0.90% on assets exceeding $150 million. The Board further noted that currently the shareholders of both the DF Dent Premier Growth and DF Dent Midcap Growth Funds were benefitting from the expense caps, and, because the DF Dent Premier Growth Fund's assets were greater than $150 million, the Adviser was subsidizing the DF Dent Premier Growth Fund's expenses to the extent that they exceeded 1.10%. With respect to the DF Dent Small Cap Growth Fund, the Board noted that the Adviser had contractually agreed to cap the DF Dent Small Cap Growth Fund's total expenses (excluding all taxes, interest, portfolio transaction expenses, and extraordinary expenses) so that they do not exceed 1.25% through October 31, 2019. The Board also noted the Adviser's representation that the DF Dent Small Cap Growth Fund potentially could benefit from economies of scale as assets grow, but the Adviser was not proposing breakpoints or changes in fees at this time because the DF Dent Small Cap Growth Fund only commenced operations in November 2013 and had not yet achieved scale.
DF DENT GROWTH FUNDS ADDITIONAL INFORMATION (Unaudited) JUNE 30, 2016 |
Other Benefits
The Board noted the Adviser's representation that, aside from its contractual advisory fees, it does not benefit in a material way from its relationship with the Funds. Based on the foregoing representation, the Board concluded that other benefits received by the Adviser from its relationship with the Funds were not a material factor to consider in approving the continuation of the Advisory Agreement.
Conclusion
The Board did not identify any single factor as being of paramount importance, and different Trustees may have given different weight to different factors. The Board reviewed a memorandum from Fund counsel discussing the legal standards applicable to its consideration of the Advisory Agreement. Based on its review, including consideration of each of the factors referenced above, the Board determined, in the exercise of its business judgment, that the advisory arrangement, as outlined in the Advisory Agreement, was fair and reasonable in light of the services performed or to be performed, expenses incurred or to be incurred and such other matters as the Board considered relevant.
Proxy Voting Information
A description of the policies and procedures that each Fund uses to determine how to vote proxies relating to securities held in each Fund's portfolio is available, without charge and upon request, by calling (866) 233-3368 and on the U.S. Securities and Exchange Commission's (the "SEC") website at www.sec.gov. Each Fund's proxy voting record for the most recent twelve-month period ended June 30 is available, without charge and upon request, by calling (866) 233-3368 and on the SEC's website at www.sec.gov.
Availability of Quarterly Portfolio Schedules
Each Fund files its complete schedule of portfolio holdings with the SEC for the first and third quarters of each fiscal year on Form N-Q. These filings are available, without charge and upon request on the SEC's website at www.sec.gov or may be reviewed and copied at the SEC's Public Reference Room in Washington, DC. Information on the operation of the Public Reference Room may be obtained by calling (800) SEC-0330.
Shareholder Expense Example
As a shareholder of the Funds, you incur two types of costs: (1) transaction costs, including redemption fees, and (2) ongoing costs, including management fees and other Fund expenses. This example is intended to help you understand your ongoing costs (in dollars) of investing in the Funds, and to compare these costs with the ongoing costs of investing in other mutual funds.
The example is based on an investment of $1,000 invested at the beginning of the period and held for the entire period from January 1, 2016, through June 30, 2016.
DF DENT GROWTH FUNDS ADDITIONAL INFORMATION (Unaudited) JUNE 30, 2016 |
Actual Expenses – The first line of the table below provides information about actual account values and actual expenses. You may use the information in this line, together with the amount you invested, to estimate the expenses that you paid over the period. Simply divide your account value by $1,000 (for example, an $8,600 account value divided by $1,000 = 8.6), then multiply the result by the number in the first line under the heading entitled "Expenses Paid During Period" to estimate the expenses you paid on your account during the period.
Hypothetical Example for Comparison Purposes – The second line of the table below provides information about hypothetical account values and hypothetical expenses based on each Fund's actual expense ratio and an assumed rate of return of 5% per year before expenses, which is not each Fund's actual return. The hypothetical account values and expenses may not be used to estimate the actual ending account balance or expenses you paid for the period. You may use this information to compare the ongoing costs of investing in each Fund and other funds. To do so, compare this 5% hypothetical example with the 5% hypothetical examples that appear in the shareholder reports of other funds.
Please note that the expenses shown in the table are meant to highlight your ongoing costs only and do not reflect any transactional costs, such as redemption fees. Therefore, the second line of the table is useful in comparing ongoing costs only, and will not help you determine the relative total costs of owning different funds. In addition, if these transactional costs were included, your costs would have been higher.
| | Beginning | | Ending | | Expenses | | Annualized |
| | Account Value | | Account Value | | Paid During | | Expense |
| | January 1, 2016 | | June 30, 2016 | | Period* | | Ratio* |
| DF Dent Premier Growth Fund | | | | | | | | | | | |
| Actual | $ | 1,000.00 | | $ | 991.48 | | $ | 5.45 | | 1.10 | % |
| Hypothetical (5% return before taxes) | $ | 1,000.00 | | $ | 1,019.39 | | $ | 5.52 | | 1.10 | % |
| DF Dent Midcap Growth Fund | | | | | | | | | | | |
| Actual | $ | 1,000.00 | | $ | 1,028.10 | | $ | 5.55 | | 1.10 | % |
| Hypothetical (5% return before taxes) | $ | 1,000.00 | | $ | 1,019.39 | | $ | 5.52 | | 1.10 | % |
| DF Dent Small Cap Growth Fund | | | | | | | | | | | |
| Actual | $ | 1,000.00 | | $ | 1,079.89 | | $ | 6.46 | | 1.25 | % |
| Hypothetical (5% return before taxes) | $ | 1,000.00 | | $ | 1,018.65 | | $ | 6.27 | | 1.25 | % |
* Expenses are equal to each Fund's annualized expense ratio multiplied by the average account value over the period, multiplied by the number of days in the most recent fiscal half-year divided by 366 to reflect the half-year period.
Federal Tax Status of Dividends Declared during the Fiscal Year
For federal income tax purposes, dividends from short-term capital gains are classified as ordinary income. DF Dent Midcap Growth Fund designates 100.00% of its income dividend distributed as qualifying for the corporate dividends received deduction (DRD) and 100.00% for the qualified dividend rate (QDI) as defined in Section 1(h)(11) of the Code. DF Dent Midcap Growth Fund also designates 100.00% as short-term capital gain dividends exempt from U.S. tax for foreign shareholders (QSD). DF Dent Small Cap Growth Fund designates 35.63% as DRD, 38.71% as QDI and 99.99% for QSD.
DF DENT GROWTH FUNDS ADDITIONAL INFORMATION (Unaudited) JUNE 30, 2016 |
Trustees and Officers of the Trust
The Board is responsible for oversight of the management of the Trust's business affairs and of the exercise of all the Trust's powers except those reserved for the shareholders. The following table provides information about each Trustee and certain officers of the Trust. Each Trustee and officer holds office until the person resigns, is removed, or is replaced. Unless otherwise noted, the persons have held their principal occupations for more than five years. The address for all Trustees and officers is Three Canal Plaza, Suite 600, Portland, Maine 04101. Mr. Keffer is considered an Interested Trustee due to his affiliation with Atlantic. Each Fund's Statement of Additional Information includes additional information about the Trustees and is available, without charge and upon request, by calling (866) 233-3368.
Name and Year of Birth | Position with the Trust | Length of Time Served | Principal Occupation(s) During Past Five Years | Number of Series of Fund Complex¹ Overseen by Trustee | Other Directorships Held by Trustee |
| Independent Trustees | | | | | |
J. Michael Parish Born: 1943 | Chairman of the Board; Trustee; Chairman, Nominating Committee and Qualified Legal Compliance Committee | Since 1989 (Chairman since 2004) | Retired since 2003; formerly, Partner, Wolf, Block, Schorr and Solis-Cohen, LLP (law firm) 2002-2003; Partner, Thelen Reid & Priest LLP (law firm) 1995-2002. | 24 | None |
Costas Azariadis Born: 1943 | Trustee | Since 1989 | Professor of Economics, Washington University since 2006. | 24 | None |
James C. Cheng Born: 1942 | Trustee; Chairman, Audit Committee | Since 1989 | President, Technology Marketing Associates (marketing company for small- and medium-sized businesses in New England) since 1991. | 24 | None |
David Tucker Born: 1958 | Trustee; Vice Chairman | Since 2011 (Vice Chairman since 2015) | Director, Blue Sky Experience (a charitable endeavor) since 2008; Senior Vice President & General Counsel, American Century Companies (an investment management firm) 1998-2008. | 46 | Trustee, Forum Funds II, Forum ETF Trust and U.S. Global Investors Funds |
| Interested Trustee | | | | | |
John Y. Keffer2 Born: 1942 | Trustee; Vice Chairman | Since 1989 | Chairman, Atlantic since 2008; President, Forum Investment Advisors, LLC since 2011; President, Forum Foundation (a charitable organization) since 2005; President, Forum Trust, LLC (a non-depository trust company chartered in the State of Maine) since 1997. | 46 | Director, Wintergreen Fund, Inc.; Trustee, Forum Funds II, Forum ETF Trust and U.S. Global Investors Funds |
1The Fund Complex includes the Trust, Forum Funds II, Forum ETF Trust and U.S. Global Investors Funds and is overseen by different Boards of Trustees. 2Atlantic is a subsidiary of Forum Holdings Corp. I, a Delaware corporation that is wholly owned by Mr. Keffer. |
DF DENT GROWTH FUNDS ADDITIONAL INFORMATION (Unaudited) JUNE 30, 2016 |
Name and Year of Birth | Position with the Trust | Length of Time Served | Principal Occupation(s) During Past Five Years | Number of Series of Fund Complex¹ Overseen by Trustee | Other Directorships Held by Trustee |
| Officers | | | | | |
Jessica Chase Born: 1970 | President; Principal Executive Officer | Since 2015 | Senior Vice President, Atlantic since 2008. | N/A | N/A |
Karen Shaw Born: 1972 | Treasurer; Principal Financial Officer | Since 2008 | Senior Vice President, Atlantic since 2008. | N/A | N/A |
Zachary Tackett Born: 1988 | Vice President; Secretary; Anti-Money Laundering Compliance Officer | Since 2014 | Associate Counsel, Atlantic since 2014; Intern Associate, Coakley & Hyde, PLLC, 2010-2013. | N/A | N/A |
Michael J. McKeen Born: 1971 | Vice President | Since 2009 | Senior Vice President, Atlantic since 2008. | N/A | N/A |
Timothy Bowden Born: 1969 | Vice President | Since 2009 | Manager, Atlantic since 2008. | N/A | N/A |
Geoffrey Ney Born: 1975 | Vice President | Since 2013 | Manager, Atlantic since 2013; Senior Fund Accountant, Atlantic, 2008-2013. | N/A | N/A |
Todd Proulx Born: 1978 | Vice President | Since 2013 | Manager, Atlantic since 2013; Senior Fund Accountant, Atlantic, 2008-2013. | N/A | N/A |
1The Fund Complex includes the Trust, Forum Funds II, Forum ETF Trust and U.S. Global Investors Funds and is overseen by different Boards of Trustees. |
ITEM 2. CODE OF ETHICS.
| (a) | As of the end of the period covered by this report, Forum Funds (the "Registrant") has adopted a code of ethics, which applies to its Principal Executive Officer and Principal Financial Officer (the "Code of Ethics"). |
| (c) | There have been no amendments to the Registrant's Code of Ethics during the period covered by this report. |
| (d) | There have been no waivers to the Registrant's Code of Ethics during the period covered by this report. |
(f) (1) A copy of the Code of Ethics is being filed under Item 12(a) hereto.
ITEM 3. AUDIT COMMITTEE FINANCIAL EXPERT.
The Board of Trustees has determined that no member of the Audit Committee is an "audit committee financial expert" as that term is defined under applicable regulatory guidelines.
ITEM 4. PRINCIPAL ACCOUNTANT FEES AND SERVICES.
(a) Audit Fees - The aggregate fees billed for each of the last two fiscal years (the "Reporting Periods") for professional services rendered by the Registrant's principal accountant for the audit of the Registrant's annual financial statements, or services that are normally provided by the principal accountant in connection with the statutory and regulatory filings or engagements for the Reporting Periods, were $53,200 in 2015 and $51,600 in 2016.
(b) Audit-Related Fees – The aggregate fees billed in the Reporting Periods for assurance and related services rendered by the principal accountant that were reasonably related to the performance of the audit of the Registrant's financial statements and are not reported under paragraph (a) of this Item 4 were $0 in 2015 and $0 in 2016.
(c) Tax Fees - The aggregate fees billed in the Reporting Periods for professional services rendered by the principal accountant to the Registrant for tax compliance, tax advice and tax planning were $12,000 in 2015 and $12,000 in 2016. These services consisted of review or preparation of U.S. federal, state, local and excise tax returns.
(d) All Other Fees - The aggregate fees billed in the Reporting Periods for products and services provided by the principal accountant to the Registrant, other than the services reported in paragraphs (a) through (c) of this Item, were $0 in 2015 and $0 in 2016.
(e) (1) The Audit Committee reviews and approves in advance all audit and "permissible non-audit services" (as that term is defined by the rules and regulations of the Securities and Exchange Commission) to be rendered to a series of the Registrant (each, a "Series"). In addition, the Audit Committee reviews and approves in advance all "permissible non-audit services" to be provided to an investment adviser (not including any sub-adviser) of a Series, or an affiliate of such investment adviser, that is controlling, controlled by or under common control with the investment adviser and provides on-going services to the Registrant ("Affiliate"), by the Series' principal accountant if the engagement relates directly to the operations and financial reporting of the Series. The Audit Committee considers whether fees paid by a Series' investment adviser or an Affiliate to the Series' principal accountant for audit and permissible non-audit services are consistent with the principal accountant's independence.
(e) (2) No services included in (b) - (d) above were approved pursuant to paragraph (c)(7)(i)(C) of Rule 2-01 of Regulation S-X.
(f) Not applicable
(g) The aggregate non-audit fees billed by the principal accountant for services rendered to the Registrant for the Reporting Periods were $0 in 2015 and $0 in 2016. There were no fees billed in either of the Reporting Periods for non-audit services rendered by the principal accountant to the Registrant's investment adviser or any Affiliate.
(h) During the Reporting Period, the Registrant's principal accountant provided no non-audit services to the investment advisers or any entity controlling, controlled by or under common control with the investment advisers to the series of the Registrant to which this report relates.
ITEM 5. AUDIT COMMITTEE OF LISTED REGISTRANTS.
Not applicable.
ITEM 6. INVESTMENTS.
| (a) | Included as part of report to shareholders under Item 1. |
ITEM 7. DISCLOSURE OF PROXY VOTING POLICIES AND PROCEDURES FOR CLOSED-END
MANAGEMENT INVESTMENT COMPANIES.
Not applicable.
ITEM 8. PORTFOLIO MANAGERS OF CLOSED-END MANAGEMENT INVESTMENT COMPANIES.
Not applicable.
ITEM 9. PURCHASES OF EQUITY SECURITIES BY CLOSED-END MANAGEMENT INVESTMENT COMPANY AND AFFILIATED PURCHASERS.
Not applicable.
ITEM 10. SUBMISSION OF MATTERS TO A VOTE OF SECURITY HOLDERS
The Registrant does not accept nominees to the board of trustees from shareholders.
ITEM 11. CONTROLS AND PROCEDURES
(a) The Registrant's Principal Executive Officer and Principal Financial Officer have concluded that the Registrant's disclosure controls and procedures (as defined in Rule 30a-3(c) under the Investment Company Act of 1940 (the "Act")) are effective, based on their evaluation of the controls and procedures required by Rule 30a-3(b) under the Act and Rules 13a-15(b) or 15d-15(b) under the Securities Exchange Act of 1934, as of a date within 90 days of the filing date of this report.
(b) There were no changes in the Registrant's internal control over financial reporting (as defined in
Rule 30a-3(d) under the Act) that occurred during the second fiscal quarter of the period covered by this report that have materially affected, or are reasonably likely to materially affect, the Registrant's internal control over financial reporting.
ITEM 12. EXHIBITS.
(a)(1) Code of Ethics (Exhibit filed herewith).
(a)(2) Certifications pursuant to Rule 30a-2(a) of the Act, and Section 302 of the Sarbanes-Oxley Act of 2002. (Exhibits filed herewith)
(a)(3) Not applicable.
(b) Certifications pursuant to Rule 30a-2(b) of the Act, and Section 906 of the Sarbanes-Oxley Act of 2002. (Exhibit filed herewith)
SIGNATURES
Pursuant to the requirements of the Securities Exchange Act of 1934 and the Investment Company Act of 1940, the Registrant has duly caused this report to be signed on its behalf by the undersigned, thereunto duly authorized.
| By | /s/ Jessica Chase | | |
| | Jessica Chase, Principal Executive Officer | | |
| Date | August 25, 2016 | | |
Pursuant to the requirements of the Securities Exchange Act of 1934 and the Investment Company Act of 1940, this report has been signed below by the following persons on behalf of the Registrant and in the capacities and on the dates indicated.
| By | /s/ Jessica Chase | | |
| | Jessica Chase, Principal Executive Officer | | |
| Date | August 25, 2016 | | |
| | | | |
| By | /s/ Karen Shaw | | |
| | Karen Shaw, Principal Financial Officer | | |
| Date | August 25, 2016 | | |