As filed with the Securities and Exchange Commission on February 28, 2017
UNITED STATES
SECURITIES AND EXCHANGE COMMISSION
WASHINGTON, D.C. 20549
FORM N-CSR
CERTIFIED SHAREHOLDER REPORT OF REGISTERED MANAGEMENT
INVESTMENT COMPANIES
Investment Company Act file number 811-03023
FORUM FUNDS
Three Canal Plaza, Suite 600
Portland, Maine 04101
Jessica Chase, Principal Executive Officer
Three Canal Plaza, Suite 600
Portland, Maine 04101
207-347-2000
Date of fiscal year end: December 31
Date of reporting period: January 1, 2016 – December 31, 2016
ITEM 1. REPORT TO STOCKHOLDERS.
POLARIS GLOBAL VALUE FUND A MESSAGE TO OUR SHAREHOLDERS (Unaudited) DECEMBER 31, 2016 |
Dear Fellow Shareholder,
For the year ended December 31, 2016, the Polaris Global Value Fund (the "Fund") gained 11.67%, outperforming the MSCI World Index benchmark, which returned 7.51%. In the first six weeks of 2016, global markets plummeted, only to reignite a positive upward trajectory through the rest of the year. Political events, like the U.K. BREXIT vote and the U.S. presidential race, had differing impacts on markets. Banking crises in Europe and dour growth assumptions in China and India created volatility. In such an environment, we are pleased that the Fund surpassed the MSCI World Index by more than 400 basis points for the year, in addition to achieving outperformance over all longer time periods as reflected below. The Fund holds a four-star Morningstar Overall Rating™ for risk-adjusted performance among 848 World Stock funds for the period ended December 31, 2016.
Strong Fund results were attributable to current U.S. bank holdings, all of which posted returns in excess of 10%, with a notable few up more than 50% for the year. The materials sector saw double-digit stock price gains from 9 of 11 portfolio companies. In particular, German specialty chemicals manufacturer LANXESS AG and Australian commodity producer BHP Billiton capitalized on higher commodity prices. The Fund's holdings in industrials, information technology, energy and utilities sectors also added to positive results. Greencore Group was the most notable detractor, impacted by concerns about U.S. operations profitability and price competition in U.K. supermarkets. However, we expect a recovery at Greencore in 2017, as it completed the acquisition of Peacock Foods, which effectively quadrupled U.S. sales. Pharmaceutical companies Allergan Plc and Teva Pharmaceuticals suffered losses due to pricing pressure on branded and generic drugs.
POLARIS GLOBAL VALUE FUND A MESSAGE TO OUR SHAREHOLDERS (Unaudited) DECEMBER 31, 2016 |
included JP Morgan Chase & Co, Independent Bank Corp, International Bancshares and Webster Financial. The stock price of Ameris Bancorp rose nearly 30%, after the bank reported record net income, greater loan activity, decreases in non-performing assets and growth in the retail mortgage, warehouse lending and SBA business lines. The bank also launched a joint venture with US Premium Finance, one of the nation's largest property/casualty insurance premium finance companies, whereby Ameris will be the exclusive provider of credit on USPF's platform. Puerto Rico bank, Popular Inc., was up more than 25%, as the institution benefitted from progress the Financial Oversight and Management Board for Puerto Rico made with local government officials. That Board recommended implementation of a fiscal and economic framework to handle the Commonwealth's debt. Popular, Inc. also settled outstanding litigation with the Federal Deposit Insurance Corporation ("FDIC"), eliminating that overhang on the stock.
Materials sector stocks added measurably, led by LANXESS, BHP Billiton, Showa Denko and Methanex. The market approved of LANXESS' strategic acquisitions, including the purchase of Chemours' clean/disinfect chemical unit and Chemtura, a lubricant and flame retardant business. Showa Denko's petrochemical division raised earnings estimates, pointing to stronger ethylene and hard disk drive media business. The purchase of SunAllomer is expected to further Showa Denko's footprint in the high-margin polypropylene market. Higher oil and coal prices increased costs for Chinese production of methanol and fertilizer; the supply-demand equation shifted favorably for low-cost commodity producers. Canadian methanol producer, Methanex, was able to exact higher prices, increase production and capture new customers; the stock was up more than 35% by year end. Yara International is expected to leverage this development as well; however, the fertilizer/nitrogen-based chemical producer has yet to fully recover from earlier losses due to softer agricultural prices.
U.S.-based Wesco International Inc. gained more than 50% for the year, after outlining efforts to streamline operations and use free cash flow to reduce debt, pay shareholder dividends and grow via M&A activity. The market-approved acquisition of Atlanta Electrical Distributors in mid-March exemplifies this approach, which subsequently boosted Wesco's stock price. Konecranes reported improved profitability in the second half of the year on the back of cost-saving initiatives and restructuring. The company received approval from U.S. and E.U. antitrust regulators to purchase the materials/port solutions unit from U.S. equipment maker Terex Corp., conditioned on the divestment of Konecranes' STAHL CraneSystems. The acquisition proceeded smoothly and was completed in early January 2017. General Dynamics' stock price jumped after the election, as the global aerospace and defense company seeks to benefit from a larger U.S. defense budget fostered by a Republican administration. On the opposite spectrum, Trevi Finanziaria, the Italian engineering and drilling company, declined immediately following a subpar third quarter earnings announcement. The company encountered various headwinds, ranging from slower oil- and gas-based revenues to project delays in South America, the Middle East and Italy. However, Trevi's backlog grew within the foundation division, and the company retained a key strategic contract to repair the Mosul Dam in Iraq.
Samsung Electronics advanced, reporting its biggest operating profit in two years on strong Galaxy S7 sales, as the company increased its cellphone market share. The stock price rose further on news of management's proactive restructuring efforts to avoid tax and/or share count issues in a changing regulatory environment. Other notable performers hailed from defensive sectors: energy and utilities. Australian engineering contractor WorleyParsons met both top- and bottom-line metrics, reporting increased customer demand and effective cost reduction programs. ALLETE, Inc. gained more than 30% after the utility posted strong earnings on the back of healthy net income and operating revenue.
International Game Technology had a stellar year, with the company posting solid quarterly earnings, while engaging in joint ventures with Italian lottery concessions and signing lottery license extensions in certain U.S. states. Christian Dior capitalized on the uptick in luxury goods spending trends in both China and the U.S. These gains couldn't offset losses elsewhere in the consumer discretionary sector. British homebuilders suffered double-digit losses on heightened concerns about a possible national recession and housing slump following the BREXIT vote. We believed the price decline was unwarranted, but it allowed us an opportunity to add to our positions in these fundamentally-strong companies. The homebuilders began to recover in the second half of the year. Swedish consumer goods firm Duni AB was down more than 15% after reporting decreasing revenues in its Central European tabletop business; the company was also impacted by the weak British Pound. Kia Motors faced difficulties during the year, reporting lackluster sales in the U.S. and emerging markets.
Much like its industry competitors, UnitedHealth Group made the decision to exit the Affordable Care Act ("ACA") state exchanges in 2016, thereby mitigating future losses. The company stock price rose more than 35%, due in part to the ACA decision and to the recent drug distribution partnership with CVS. Quest Diagnostics was up after announcing satisfactory earnings and gaining U.S. Food and Drug Administration ("FDA") approval for a Zika virus test. Elsewhere in the healthcare sector, branded and generic drug pricing fell more than expected, causing stock declines at Allergan and Teva Pharmaceuticals. Teva sought to introduce three generic drugs to the market in the fourth quarter of 2016; the launch was postponed due to FDA delays. The sale of Allergan's generics business to Teva Pharmaceutical is moving forward, although on a protracted timeline.
The following table shows the Fund's asset allocation at December 31, 2016.
worldwide. In the U.S., many companies have expressed optimism that operating conditions and regulations may improve under a pro-business president. Rising interest rates may provide a better real return to U.S. investors, incentivizing saving and investment. It may also stimulate consumer spending over the medium term. Conversely, rising interest rates have the potential to decrease the value of longer-term bond portfolios. While U.S. prospects are promising, we are worried about European markets, in particular the banking environment. Capital flight from China has also been troubling, although anecdotal evidence from our portfolio companies suggests that growth in China may be stronger than expected. We will be watching trends carefully.
Performance in 2016 was mainly attributable to the research done over the past several years. As the analyst team expanded, we conducted even more on-the-ground research, traveling worldwide to pinpoint companies added to our 250+ stock watch list. Pockets of volatility allowed us to buy companies previously relegated to the watch list. We capitalized on negative market events, opportunistically picking up companies at good valuations. We will continue to execute on this strategy throughout 2017, seeking continued strong Fund performance.
As always, we welcome your questions and comments.
Sincerely,
Bernard R. Horn, Jr., Portfolio Manager
POLARIS GLOBAL VALUE FUND A MESSAGE TO OUR SHAREHOLDERS (Unaudited) DECEMBER 31, 2016 |
As of December 31, 2016, the Fund's largest equity holdings and the percentages they represent in the Fund's portfolio market value were as follows and are subject to change:
On June 1, 1998, a limited partnership managed by the adviser reorganized into the Fund. The predecessor limited partnership maintained an investment objective and investment policies that were, in all material respects, equivalent to those of the Fund. The Fund's performance for the periods before June 1, 1998 is that of the limited partnership and includes the expenses of the limited partnership. If the limited partnership's performance had been readjusted to reflect the second year expenses of the Fund, the Fund's performance for all the periods would have been lower. The limited partnership was not registered under the Investment Company Act of 1940, as amended ("1940 Act"), and was not subject to certain investment limitations, diversification requirements, and other restrictions imposed by the 1940 Act and the Internal Revenue Code, which, if applicable, may have adversely affected its performance.
Past performance is no guarantee of future results. The Morningstar Rating™ for funds, or "star rating", is calculated for managed products (including mutual funds, variable annuity and variable life subaccounts, exchange-traded funds, closed-end funds, and separate accounts) with at least a three-year history. Exchange-traded funds and open-ended mutual funds are considered a single population for comparative purposes. It is calculated based on a Morningstar Risk-Adjusted Return measure that accounts for variation in a managed product's monthly excess performance, placing more emphasis on downward variations and rewarding consistent performance. The top 10% of products in each product category receive 5 stars, the next 22.5% receive 4 stars, the next 35% receive 3 stars, the next 22.5% receive 2 stars, and the bottom 10% receive 1 star. The Overall Morningstar Rating for a managed product is derived from a weighted average of the performance figures associated with its three-, five-, and 10-year (if applicable) Morningstar Rating metrics. The weights are: 100% three-year rating for 36-59 months of total returns, 60% five-year rating/40% three-year rating for 60-119 months of total returns, and 50% 10-year rating/30% five-year rating/20% three-year rating for 120 or more months of total returns. While the 10-year overall star rating formula seems to give the most weight to the 10-year period, the most recent three-year period actually has the greatest impact because it is included in all three rating periods. The Morningstar Rating is for the share class specified only; ratings for other share classes will vary. The Fund received a Morningstar Rating of a 4-star, 5-stars, 5-star and 3-star against the World Stock Funds for the following periods: Overall (out of 848 funds), three-year (out of 848 funds), five-year (out of 669 funds) and ten-year (out of 372 funds), respectively.
© 2017 Morningstar, Inc. All Rights Reserved. The information contained herein: (1) is proprietary to Morningstar; (2) may not be copied or distributed; and (3) is not warranted to be accurate, complete or timely. Neither Morningstar nor its content providers are responsible for any damages or losses arising from any use of this information.
The MSCI World Index, net dividends reinvested, measures the performance of a diverse range of global stock markets in the United States, Canada, Europe, Australia, New Zealand and the Far East. The MSCI World Index is unmanaged and does include the reinvestment of dividends, net of withholding taxes. One cannot invest directly in an index. 1 basis point is equal to 0.01%.
The views in this letter were those of the Fund manager as of December 31, 2016 and may not reflect the views of the manager after the publication date. These views are intended to assist shareholders of the Fund in understanding their investment and do not constitute investment advice.
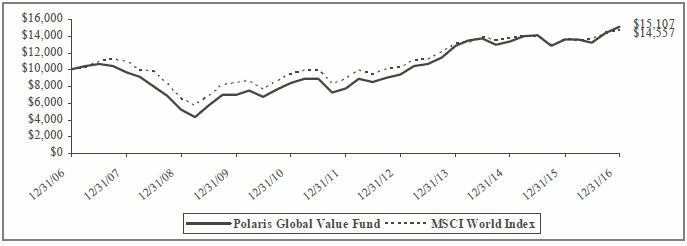
The following chart reflects the change in the value of a hypothetical $10,000 investment, including reinvested dividends and distributions, in Polaris Global Value Fund (the "Fund") compared with the performance of the benchmark, MSCI World Index, over the past ten fiscal years. The MSCI World Index captures large and mid cap representation across 23 developed markets countries: Australia, Austria, Belgium, Canada, Denmark, Finland, France, Germany, Hong Kong, Ireland, Israel, Italy, Japan, the Netherlands, New Zealand, Norway, Portugal, Singapore, Spain, Sweden, Switzerland, the United Kingdom and the United States. The total return of the MSCI World Index includes the reinvestment of dividends and income. The total return of the Fund includes operating expenses that reduce returns, while the total return of the MSCI World Index does not include expenses. The Fund is professionally managed, while the MSCI World Index is unmanaged and is not available for investment.
Comparison of Change in Value of a $10,000 Investment
Polaris Global Value Fund vs. MSCI World Index
Average Annual Total Returns Periods Ended December 31, 2016 | | One Year | | Five Year | | Ten Year |
| Polaris Global Value Fund | | 11.67 | % | | 14.27 | % | | 4.21 | % |
| MSCI World Index | | 7.51 | % | | 10.41 | % | | 3.83 | % |
Performance data quoted represents past performance and is no guarantee of future results. Current performance may be lower or higher than the performance data quoted. Investment return and principal value will fluctuate so that shares, when redeemed, may be worth more or less than original cost. For the most recent month-end performance, please call (888) 263-5594 or visit the Fund's website at www.polarisfunds.com. As stated in the Fund's current prospectus, the annual operating expense ratio (gross) is 1.27%. However, the Fund's adviser has contractually agreed to waive its fee and/or reimburse expenses to limit total operating expenses to 0.99% (excluding all taxes, interest, portfolio transaction expenses, dividend and interest expense on short sales, acquired fund fees and expenses, proxy expenses and extraordinary expenses), through April 30, 2017. During the period, certain fees were waived and/or expenses reimbursed; otherwise, returns would have been lower. Shares redeemed or exchanged within 180 days of purchase will be charged a 1.00% redemption fee. The performance table and graph do not reflect the deduction of taxes that a shareholder would pay on Fund distributions or the redemption of Fund shares. Returns greater than one year are annualized. Because of ongoing market volatility, Fund performance may be subject to substantial short-term changes.
| Shares | | Security Description | | Value | |
| Common Stock - 99.8% |
| Australia - 2.2% |
| | 152,900 | | BHP Billiton PLC, ADR | | $ | 4,810,234 | |
| | 497,400 | | WorleyParsons, Ltd. (a) | | 3,488,982 | |
| | | 8,299,216 | |
| Austria - 1.3% |
| | 101,700 | | ANDRITZ AG | | 5,105,967 | |
| Belgium - 1.5% |
| | 49,670 | | Solvay SA, Class A | | 5,821,951 | |
| Canada - 1.2% |
| | 108,237 | | Methanex Corp. | | 4,747,385 | |
| Finland - 3.6% |
| | 155,410 | | Caverion Corp. | | 1,295,652 | |
| | 108,876 | | Kone Oyj, Class B | | 4,878,878 | |
| | 149,320 | | Konecranes Oyj | | 5,309,600 | |
| | 264,210 | | YIT Oyj | | 2,110,936 | |
| | | 13,595,066 | |
| France - 6.0% |
| | 26,065 | | Christian Dior SE | | 5,466,889 | |
| | 47,900 | | Cie Generale des Etablissements Michelin, Class B | | 5,329,601 | |
| | 65,441 | | Imerys SA | | 4,964,650 | |
| | 66,707 | | IPSOS | | 2,095,690 | |
| | 77,000 | | Vinci SA | | 5,244,199 | |
| | | 23,101,029 | |
| Germany - 9.3% |
| | 38,900 | | BASF SE | | 3,616,127 | |
| | 248,664 | | Deutsche Telekom AG | | 4,281,024 | |
| | 119,890 | | Freenet AG | | 3,377,173 | |
| | 42,500 | | Hannover Rueck SE | | 4,599,030 | |
| | 92,486 | | LANXESS AG | | 6,070,111 | |
| | 31,200 | | Linde AG | | 5,126,744 | |
| | 22,600 | | Muenchener Rueckversicherungs-Gesellschaft AG in Muenchen, Class R | | 4,273,855 | |
| | 67,251 | | Symrise AG | | 4,093,889 | |
| | | 35,437,953 | |
| India - 1.0% |
| | 257,420 | | Infosys, Ltd., ADR | | 3,817,539 | |
| Shares | | Security Description | | Value | |
| Ireland - 2.5% |
| | 3,103,103 | | Greencore Group PLC | | $ | 9,426,810 | |
| Israel - 0.6% |
| | 65,600 | | Teva Pharmaceutical Industries, Ltd., ADR | | 2,378,000 | |
| Italy - 0.3% |
| | 1,045,169 | | TREVI - Finanziaria Industriale SpA (a) | | 1,079,294 | |
| Japan - 3.4% |
| | 141,600 | | Asahi Group Holdings, Ltd. | | 4,470,622 | |
| | 143,100 | | KDDI Corp. | | 3,623,568 | |
| | 353,300 | | Showa Denko KK | | 5,060,314 | |
| | | 13,154,504 | |
| Norway - 3.3% |
| | 336,096 | | DNB ASA | | 4,997,450 | |
| | 588,181 | | SpareBank 1 SR-Bank ASA | | 4,137,875 | |
| | 87,900 | | Yara International ASA | | 3,460,890 | |
| | | 12,596,215 | |
| Puerto Rico - 1.5% |
| | 132,900 | | Popular, Inc. | | 5,823,678 | |
| Russian Federation - 0.7% |
| | 226,900 | | Sberbank of Russia PJSC, ADR | | 2,626,368 | |
| Singapore - 1.3% |
| | 344,200 | | United Overseas Bank, Ltd. | | 4,848,724 | |
| South Korea - 2.4% |
| | 103,200 | | Kia Motors Corp. | | 3,353,701 | |
| | 3,937 | | Samsung Electronics Co., Ltd. | | 5,873,881 | |
| | | 9,227,582 | |
| Sweden - 3.3% |
| | 285,200 | | Duni AB, Class A | | 3,913,024 | |
| | 138,703 | | Loomis AB, Class B | | 4,127,322 | |
| | 321,700 | | Svenska Handelsbanken AB, Class A | | 4,470,312 | |
| | | 12,510,658 | |
POLARIS GLOBAL VALUE FUND SCHEDULE OF INVESTMENTS DECEMBER 31, 2016 |
| Shares | | Security Description | | Value | |
| Switzerland - 1.8% |
| | 22,544 | | Chubb, Ltd. | | $ | 2,978,513 | |
| | 52,500 | | Novartis AG | | 3,820,338 | |
| | | 6,798,851 | |
| Thailand - 2.8% |
| | 1,341,500 | | Siam Commercial Bank PCL, Series F | | 5,712,814 | |
| | 2,468,350 | | Thai Oil PCL | | 4,980,056 | |
| | | 10,692,870 | |
| United Kingdom - 8.8% |
| | 895,755 | | Barratt Developments PLC | | 5,104,564 | |
| | 1,114,509 | | BBA Aviation PLC | | 3,891,184 | |
| | 164,988 | | Bellway PLC | | 5,034,480 | |
| | 217,389 | | International Game Technology PLC | | 5,547,767 | |
| | 210,092 | | Persimmon PLC | | 4,598,372 | |
| | 518,044 | | Standard Chartered PLC (a) | | 4,236,670 | |
| | 2,764,143 | | Taylor Wimpey PLC | | 5,229,023 | |
| | | 33,642,060 | |
| United States - 41.0% |
| | 17,389 | | Allergan PLC (a) | | 3,651,864 | |
| | 70,900 | | ALLETE, Inc. | | 4,551,071 | |
| | 128,950 | | Ameris Bancorp | | 5,622,220 | |
| | 36,600 | | Anthem, Inc. | | 5,261,982 | |
| | 110,500 | | Avnet, Inc. | | 5,260,905 | |
| | 121,920 | | BNC Bancorp | | 3,889,248 | |
| | 202,300 | | Brookline Bancorp, Inc. | | 3,317,720 | |
| | 61,200 | | Capital One Financial Corp. | | 5,339,088 | |
| | 45,451 | | Carter's, Inc. | | 3,926,512 | |
| | 169,774 | | Colony Bankcorp, Inc. (a) | | 2,241,017 | |
| | 188,300 | | Dime Community Bancshares, Inc. | | 3,784,830 | |
| | 127,700 | | Franklin Resources, Inc. | | 5,054,366 | |
| | 898,614 | | Frontier Communications Corp. | | 3,037,315 | |
| | 32,167 | | General Dynamics Corp. | | 5,553,954 | |
| | 80,500 | | Hewlett Packard Enterprise Co. | | 1,862,770 | |
| | 93,224 | | Independent Bank Corp. | | 6,567,631 | |
| | 142,563 | | International Bancshares Corp. | | 5,816,570 | |
| | 82,500 | | JPMorgan Chase & Co. | | 7,118,925 | |
| | 80,582 | | Marathon Petroleum Corp. | | 4,057,304 | |
| | 87,200 | | Microsoft Corp. | | 5,418,608 | |
| | 40,444 | | NextEra Energy, Inc. | | 4,831,440 | |
| | 42,965 | | Praxair, Inc. | | 5,035,068 | |
| | 61,733 | | Quest Diagnostics, Inc. | | 5,673,263 | |
| | 246,024 | | Regal Entertainment Group, Class A | | 5,068,094 | |
| Shares | | Security Description | | Value | |
| United States - (continued) |
| | 141,897 | | Southwest Bancorp, Inc. | | $ | 4,115,013 | |
| | 30,300 | | The J.M. Smucker Co. | | 3,880,218 | |
| | 234,600 | | The Western Union Co. | | 5,095,512 | |
| | 36,968 | | UnitedHealth Group, Inc. | | 5,916,359 | |
| | 92,651 | | Verizon Communications, Inc. | | 4,945,710 | |
| | 263,200 | | Web.com Group, Inc. (a) | | 5,566,680 | |
| | 103,938 | | Webster Financial Corp. | | 5,641,755 | |
| | 92,511 | | WESCO International, Inc. (a) | | 6,156,607 | |
| | 420,100 | | Xerox Corp. | | 3,667,473 | |
| | | 156,927,092 | |
Total Common Stock (Cost $329,585,221) | | 381,658,812 | |
| | Principal | | Security Description | | Rate | | Maturity | | Value | |
| Short-Term Investments - 0.0% |
| Certificates of Deposit - 0.0% |
| $ | 33,334 | | Middlesex Federal Savings Bank | | 1.34 | % | 06/18/17 | | 33,334 | |
| | 33,444 | | Salem Five Financial | | 0.25 | | 11/24/17 | | 33,443 | |
Total Certificates of Deposit (Cost $66,777) | | 66,777 | |
Total Short-Term Investments (Cost $66,777) | | 66,777 | |
Total Investments - 99.8% (Cost $329,651,998)* | $ | 381,725,589 | |
Other Assets & Liabilities, Net – 0.2% | | 610,804 | |
Net Assets – 100.0% | $ | 382,336,393 | |
| ADR | American Depositary Receipt |
| PCL | Public Company Limited |
| PLC | Public Limited Company |
| (a) | Non-income producing security. |
* Cost for federal income tax purposes is $329,111,172 and net unrealized appreciation consists of:
The following is a summary of the inputs used to value the Fund's investments as of December 31, 2016.
The inputs or methodology used for valuing securities are not necessarily an indication of the risks associated with investing in those securities. For more information on valuation inputs, and their aggregation into the levels used in the table below, please refer to the Security Valuation section in Note 2 of the accompanying Notes to Financial Statements.
| PORTFOLIO HOLDINGS | | |
| % of Total Investments | | |
| Consumer Discretionary | 14.3 | % |
| Consumer Staples | 4.7 | % |
| Energy | 3.3 | % |
| Financials | 28.1 | % |
| Health Care | 7.0 | % |
| Industrials | 11.7 | % |
| Information Technology | 9.6 | % |
| Materials | 13.8 | % |
| Telecommunication Services | 5.0 | % |
| Utilities | 2.5 | % |
| Short-Term Investments | 0.0 | % |
| | 100.0 | % |
POLARIS GLOBAL VALUE FUND STATEMENT OF ASSETS AND LIABILITIES DECEMBER 31, 2016 |
| ASSETS | | | | |
| | Total investments, at value (Cost $329,651,998) | | $ | 381,725,589 | |
| | Cash | | | 1,243,700 | |
| | Receivables: | | | | |
| | | Fund shares sold | | | 301,201 | |
| | | Dividends and interest | | | 1,045,015 | |
| | Prepaid expenses | | | 11,314 | |
| Total Assets | | | 384,326,819 | |
| | | | | | | |
| LIABILITIES | | | | |
| | Payables: | | | | |
| | | Fund shares redeemed | | | 934,815 | |
| | | Distributions payable | | | 331,533 | |
| | | Foreign capital gains tax payable | | | 384,113 | |
| | Accrued Liabilities: | | | | |
| | | Investment adviser fees | | | 229,208 | |
| | | Trustees' fees and expenses | | | 990 | |
| | | Fund services fees | | | 40,161 | |
| | | Other expenses | | | 69,606 | |
| Total Liabilities | | | 1,990,426 | |
| | | | | | | |
| NET ASSETS | | $ | 382,336,393 | |
| | | | | | | |
| COMPONENTS OF NET ASSETS | | | | |
| | Paid-in capital | | $ | 395,476,487 | |
| | Undistributed net investment income | | | 4,510,002 | |
| | Accumulated net realized loss | | | (69,272,681 | ) |
| | Net unrealized appreciation | | | 51,622,585 | |
| NET ASSETS | | $ | 382,336,393 | |
| SHARES OF BENEFICIAL INTEREST AT NO PAR VALUE (UNLIMITED SHARES AUTHORIZED) | | | 16,397,957 | |
NET ASSET VALUE, OFFERING AND REDEMPTION PRICE PER SHARE* | | $ | 23.32 | |
| * | Shares redeemed or exchanged within 180 days of purchase are charged a 1.00% redemption fee. | | | | |
POLARIS GLOBAL VALUE FUND STATEMENT OF OPERATIONS YEAR ENDED DECEMBER 31, 2016 |
| INVESTMENT INCOME | | | | | |
| | Dividend income (Net of foreign withholding taxes of $770,544) | | | $ | 8,850,194 | |
| | Interest income | | | 8,063 | |
| Total Investment Income | | | | 8,858,257 | |
| | | | | | |
| EXPENSES | | | | | |
| | Investment adviser fees | | | 3,587,903 | |
| | Fund services fees | | | 523,186 | |
| | Custodian fees | | | 63,631 | |
| | Registration fees | | | 38,502 | |
| | Professional fees | | | 61,556 | |
| | Trustees' fees and expenses | | | 23,196 | |
| | Miscellaneous expenses | | | 275,682 | |
| Total Expenses | | | | 4,573,656 | |
| | Fees waived | | | (1,021,629 | ) |
| Net Expenses | | | | 3,552,027 | |
| | | | | | | |
| NET INVESTMENT INCOME | | | | 5,306,230 | |
| | | | | | | |
| NET REALIZED AND UNREALIZED GAIN (LOSS) | | | | | |
| | Net realized gain (loss) on: | | | | |
| | Investments | | | 44,830,123 | |
| | Foreign currency transactions | | | (140,082 | ) |
| | Net realized gain | | | 44,690,041 | |
| | Net change in unrealized appreciation (depreciation) on: | | | | |
| | Investments | | | (9,359,742 | ) |
| | Deferred foreign capital gains taxes | | | (178,323 | ) |
| | Foreign currency translations | | | 12,923 | |
| | Net change in unrealized appreciation (depreciation) | | | (9,525,142 | ) |
| NET REALIZED AND UNREALIZED GAIN | | | | 35,164,899 | |
| INCREASE IN NET ASSETS RESULTING FROM OPERATIONS | | | $ | 40,471,129 | |
| | | | | | | |
POLARIS GLOBAL VALUE FUND STATEMENTS OF CHANGES IN NET ASSETS |
| | | | | For the Years Ended December 31, |
| | | | | 2016 | | | 2015 |
| OPERATIONS | | | | | | | | | |
| | Net investment income | | $ | 5,306,230 | | | | $ | 4,976,255 | |
| | Net realized gain (loss) | | | 44,690,041 | | | | | (4,230,424 | ) |
| | Net change in unrealized appreciation (depreciation) | | | (9,525,142 | ) | | | | 1,606,318 | |
| Increase in Net Assets Resulting from Operations | | | 40,471,129 | | | | | 2,352,149 | |
| | | | | | | | | | | | |
| DISTRIBUTIONS TO SHAREHOLDERS FROM | | | | | | | | | |
| | Net investment income | | | (5,010,488 | ) | | | | (4,487,790 | ) |
| Total Distributions to Shareholders | | | (5,010,488 | ) | | | | (4,487,790 | ) |
| | | | | | | | | | | | |
| CAPITAL SHARE TRANSACTIONS | | | | | | | | | |
| | Sale of shares | | | 35,733,158 | | | | | 132,763,905 | |
| | Reinvestment of distributions | | | 4,678,955 | | | | | 4,270,819 | |
| | Redemption of shares | | | (52,383,637 | ) | | | | (52,375,114 | ) |
| | Redemption fees | | | 54,242 | | | | | 33,251 | |
| Increase (Decrease) in Net Assets from Capital Share Transactions | | (11,917,282 | ) | | | | 84,692,861 | |
| Increase in Net Assets | | | 23,543,359 | | | | | 82,557,220 | |
| | | | | | | | | | | | |
| NET ASSETS | | | | | | | | | |
| | Beginning of Year | | | 358,793,034 | | | | | 276,235,814 | |
| | End of Year (Including line (a)) | | $ | 382,336,393 | | | | $ | 358,793,034 | |
| | | | | | | | | | | | |
| SHARE TRANSACTIONS | | | | | | | | | |
| | Sale of shares | | | 1,682,887 | | | | | 6,065,950 | |
| | Reinvestment of distributions | | | 200,641 | | | | | 201,834 | |
| | Redemption of shares | | | (2,438,818 | ) | | | | (2,407,133 | ) |
| Increase (Decrease) in Shares | | | (555,290 | ) | | | | 3,860,651 | |
| | | | | | | | | | | | |
| (a) | Undistributed net investment income. | | $ | 4,510,002 | | | | $ | 3,944,315 | |
POLARIS GLOBAL VALUE FUND |
| These financial highlights reflect selected data for a share outstanding throughout each year. |
| | | For the Years Ended December 31, |
| | | 2016 | | 2015 | | 2014 | | 2013 | | 2012 | |
| NET ASSET VALUE, Beginning | | | | | | | | | | | | | | | | | | | | |
| of Year | $ | 21.16 | | | $ | 21.10 | | | $ | 20.64 | | | $ | 15.23 | | | $ | 12.72 | | |
| INVESTMENT OPERATIONS | | | | | | | | | | | | | | | | | | | | |
| Net investment income (a) | | 0.32 | | | | 0.33 | | | | 0.35 | | | | 0.30 | | | | 0.19 | | |
| Net realized and unrealized | | | | | | | | | | | | | | | | | | | | |
| | gain (loss) | | 2.15 | | | | — | (b)(c) | | 0.41 | | | | 5.33 | | | | 2.48 | | |
| Total from Investment Operations | | 2.47 | | | | 0.33 | | | | 0.76 | | | | 5.63 | | | | 2.67 | | |
| DISTRIBUTIONS TO | | | | | | | | | | | | | | | | | | | | |
| SHAREHOLDERS FROM | | | | | | | | | | | | | | | | | | | | |
| Net investment income | | (0.31 | ) | | | (0.27 | ) | | | (0.30 | ) | | | (0.22 | ) | | | (0.16 | ) | |
| REDEMPTION FEES (a) | | — | (b) | | — | (b) | | — | (b) | | — | (b) | | — | (b) |
| NET ASSET VALUE, End of Year | $ | 23.32 | | | $ | 21.16 | | | $ | 21.10 | | | $ | 20.64 | | | $ | 15.23 | | |
| TOTAL RETURN | | 11.67 | % | | 1.55 | % | | 3.68 | % | | 36.94 | % | | 21.00 | % |
| | | | | | | | | | | | | | | | | | | | | |
| RATIOS/SUPPLEMENTARY DATA | | | | | | | | | | | | | | | | | | | |
| Net Assets at End of | | | | | | | | | | | | | | | | | | | | |
| | Year (000's omitted) | $382,336 | | | $358,793 | | | $276,236 | | | $224,445 | | | $167,003 | | |
| Ratios to Average Net Assets: | | | | | | | | | | | | | | | | | | | | |
| Net investment income | | 1.48 | % | | 1.52 | % | | 1.66 | % | | 1.70 | % | | 1.34 | % |
| Net expenses | | 0.99 | % | | 0.99 | % | | 0.99 | % | | 1.04 | % | | 1.36 | % |
| Gross expenses | | 1.27 | %(d) | 1.27 | %(d) | 1.28 | %(d) | 1.32 | %(d) | 1.36 | % |
| PORTFOLIO TURNOVER RATE | | 33 | % | | 5 | % | | 3 | % | | 14 | % | | 14 | % |
| | | | | | | | | | | | | | | | | | | | | | |
| (a) | Calculated based on average shares outstanding during each year. |
| (b) | Less than $0.01 per share. |
| (c) | Per share amount does not reflect the actual net realized and unrealized gain/(loss) for the year due to the timing of Fund share sales and the amount per share realized and unrealized gains and losses at such time. |
| (d) | Reflects the expense ratio excluding any waivers and/or reimbursements. |
POLARIS GLOBAL VALUE FUND NOTES TO FINANCIAL STATEMENTS DECEMBER 31, 2016 |
Note 1. Organization
The Polaris Global Value Fund (the "Fund") is a diversified portfolio of Forum Funds (the "Trust"). The Trust is a Delaware statutory trust that is registered as an open-end, management investment company under the Investment Company Act of 1940, as amended (the "Act"). Under its Trust Instrument, the Trust is authorized to issue an unlimited number of the Fund's shares of beneficial interest without par value. The Fund commenced operations June 1, 1998 after it acquired the net assets of Global Value Limited Partnership (the "Partnership"), in exchange for Fund shares. The Partnership commenced operations on July 31, 1989. The Fund seeks capital appreciation.
Note 2. Summary of Significant Accounting Policies
The Fund is an investment company and follows accounting and reporting guidance under Financial Accounting Standards Board ("FASB") Accounting Standards Codification ("ASC") Topic 946, "Financial Services-Investment Companies". These financial statements are prepared in accordance with accounting principles generally accepted in the United States of America ("GAAP"), which require management to make estimates and assumptions that affect the reported amounts of assets and liabilities, the disclosure of contingent liabilities at the date of the financial statements, and the reported amounts of increases and decreases in net assets from operations during the fiscal year. Actual amounts could differ from those estimates. The following summarizes the significant accounting policies of the Fund:
Security Valuation – Securities are valued at market prices using the last quoted trade or official closing price from the principal exchange where the security is traded, as provided by independent pricing services on each Fund business day. In the absence of a last trade, securities are valued at the mean of the last bid and ask price provided by the pricing service. Forward currency contracts are generally valued at the mean of bid and ask prices for the time period interpolated from rates reported by an independent pricing service for proximate time periods. Shares of open-end mutual funds are valued at net asset value ("NAV"). Short-term investments that mature in 60 days or less may be valued at amortized cost.
The Fund values its investments at fair value pursuant to procedures adopted by the Trust's Board of Trustees (the "Board") if (1) market quotations are insufficient or not readily available or (2) the Fund believes that the values available are unreliable. The Trust's Valuation Committee, as defined in the Fund's registration statement, performs certain functions as they relate to the administration and oversight of the Fund's valuation procedures. Under these procedures, the Valuation Committee convenes on a regular and ad-hoc basis to review such investments and considers a number of factors, including valuation methodologies and significant unobservable inputs, when arriving at fair value.
The Valuation Committee may work with the Adviser, as defined in Note 4, to provide valuation inputs. In determining fair valuations, inputs may include market-based analytics which may consider related or comparable assets or liabilities, recent transactions, market multiples, book values and other relevant investment information. Adviser inputs may include an income-based approach in which the anticipated future cash flows of the investment are discounted in determining fair value. Discounts may also be applied based on the nature or duration of any restrictions on the disposition of the investments. The Valuation Committee performs regular reviews of valuation methodologies, key inputs and assumptions, disposition analysis and market activity.
Fair valuation is based on subjective factors and, as a result, the fair value price of an investment may differ from the
POLARIS GLOBAL VALUE FUND NOTES TO FINANCIAL STATEMENTS DECEMBER 31, 2016 |
security's market price and may not be the price at which the asset may be sold. Fair valuation could result in a different NAV than a NAV determined by using market quotes.
The Fund has a three-tier fair value hierarchy. The basis of the tiers is dependent upon the various "inputs" used to determine the value of the Fund's investments. These inputs are summarized in the three broad levels listed below:
Level 1 — quoted prices in active markets for identical assets and liabilities
Level 2 — other significant observable inputs (including quoted prices of similar securities, interest rates, prepayment speeds, credit risk, etc.)
Level 3 — significant unobservable inputs (including the Fund's own assumptions in determining the fair value of investments)
The aggregate value by input level, as of December 31, 2016, for the Fund's investments is included at the end of the Fund's Schedule of Investments.
Security Transactions, Investment Income and Realized Gain and Loss – Investment transactions are accounted for on the trade date. Dividend income is recorded on the ex-dividend date. Foreign dividend income is recorded on the ex-dividend date or as soon as possible after the Fund determines the existence of a dividend declaration after exercising reasonable due diligence. Income and capital gains on some foreign securities may be subject to foreign withholding taxes, which are accrued as applicable. Interest income is recorded on an accrual basis. Premium is amortized and discount is accreted using the effective interest method. Identified cost of investments sold is used to determine the gain and loss for both financial statement and federal income tax purposes.
Foreign Currency Translations – Foreign currency amounts are translated into U.S. dollars as follows: (1) assets and liabilities at the rate of exchange at the end of the respective period; and (2) purchases and sales of securities and income and expenses at the rate of exchange prevailing on the dates of such transactions. The portion of the results of operations arising from changes in the exchange rates and the portion due to fluctuations arising from changes in the market prices of securities are not isolated. Such fluctuations are included with the net realized and unrealized gain or loss on investments.
Foreign Currency Transactions – The Fund may enter into transactions to purchase or sell foreign currency contracts and options on foreign currency. Forward currency contracts are agreements to exchange one currency for another at a future date and at a specified price. A fund may use forward currency contracts to facilitate transactions in foreign securities, to manage a fund's foreign currency exposure and to protect the U.S. dollar value of its underlying portfolio securities against the effect of possible adverse movements in foreign exchange rates. These contracts are intrinsically valued daily based on forward rates, and a fund's net equity therein, representing unrealized gain or loss on the contracts as measured by the difference between the forward foreign exchange rates at the dates of entry into the contracts and the forward rates at the reporting date, is recorded as a component of NAV. These instruments involve market risk, credit risk, or both kinds of risks, in excess of the amount recognized in the Statement of Assets and Liabilities. Risks arise from the possible inability of counterparties to meet the terms of their contracts and from movement in currency and securities values and interest rates. Due to the risks associated with these transactions, a fund could incur losses up to the entire contract amount, which may exceed the net unrealized value included in its NAV.
Distributions to Shareholders – The Fund declares any dividends from net investment income and pays them annually. Any net capital gains realized by the Fund are distributed at least annually. Distributions to shareholders are recorded on the ex-dividend date. Distributions are based on amounts calculated in accordance with applicable federal income tax regulations, which may differ from GAAP. These differences are due primarily to differing treatments of income and gain on various investment securities held by the Fund, timing differences and differing characterizations of distributions made by the Fund.
Federal Taxes – The Fund intends to continue to qualify each year as a regulated investment company under Subchapter M of Chapter 1, Subtitle A, of the Internal Revenue Code of 1986, as amended ("Code"), and to distribute all of its taxable income to shareholders. In addition, by distributing in each calendar year substantially all of its net investment income and capital gains, if any, the Fund will not be subject to a federal excise tax. Therefore, no federal income or excise tax provision is required. The Fund files a U.S. federal income and excise tax return as required. The Fund's federal income tax returns are subject to examination by the Internal Revenue Service for a period of three fiscal years after they are filed. As of December 31, 2016, there are no uncertain tax positions that would require financial statement recognition, de-recognition or disclosure.
Income and Expense Allocation – The Trust accounts separately for the assets, liabilities and operations of each of its investment portfolios. Expenses that are directly attributable to more than one investment portfolio are allocated among the respective investment portfolios in an equitable manner.
Redemption Fees – A shareholder who redeems or exchanges shares within 180 days of purchase will incur a redemption fee of 1.00% of the current NAV of shares redeemed or exchanged, subject to certain limitations. The fee is charged for the benefit of the remaining shareholders and will be paid to the Fund to help offset transaction costs. The fee is accounted for as an addition to paid-in capital. The Fund reserves the right to modify the terms of or terminate the fee at any time. There are limited exceptions to the imposition of the redemption fee. Redemption fees incurred for the Fund, if any, are reflected on the Statements of Changes in Net Assets.
Commitments and Contingencies – In the normal course of business, the Fund enters into contracts that provide general indemnifications by the Fund to the counterparty to the contract. The Fund's maximum exposure under these arrangements is dependent on future claims that may be made against the Fund and, therefore, cannot be estimated; however, based on experience, the risk of loss from such claims is considered remote.
Note 3. Cash – Concentration in Uninsured Account
For cash management purposes the Fund may concentrate cash with the Fund's custodian. This typically results in cash balances exceeding the Federal Deposit Insurance Corporation ("FDIC") insurance limits. As of December 31, 2016, the Fund held $993,700 as cash reserves at MUFG Union Bank, N.A. that exceeded the FDIC insurance limit.
Note 4. Fees and Expenses
Investment Adviser – Polaris Capital Management, LLC (the "Adviser") is the investment adviser to the Fund. Pursuant to an investment advisory agreement, the Adviser receives an advisory fee, payable monthly, from the Fund at an annual rate of 1.00% of the Fund's average daily net assets.
Shareholder Service Plan – The Trust has adopted a shareholder service plan for the Fund under which the Fund may reimburse the Fund's administrator for amounts paid by the administrator for providing shareholder service activities that are not otherwise provided by the transfer agent. The Fund's administrator may make such payments to various financial institutions, including the Adviser, that provide shareholder servicing to their customers invested in the Fund in amounts of up to 0.25% annually of the average daily net assets of the shares held by such customers. During the year ended December 31, 2016, the Fund did not make any payments under the shareholder service plan.
Distribution – Foreside Fund Services, LLC serves as the Fund's distributor (the "Distributor"). The Fund does not have a distribution (12b-1) plan; accordingly, the Distributor does not receive compensation from the Fund for its distribution (12b-1) services. The Adviser compensates the Distributor directly for its services. The Distributor is not affiliated with the Adviser or Atlantic Fund Administration, LLC (d/b/a Atlantic Fund Services) ("Atlantic") or their affiliates.
Other Service Providers – Atlantic provides fund accounting, fund administration, compliance and transfer agency services to the Fund. The fees related to these services are included in Fund services fees within the Statement of Operations. Atlantic also provides certain shareholder report production and EDGAR conversion and filing services. Pursuant to an Atlantic services agreement, the Fund pays Atlantic customary fees for its services. Atlantic provides a Principal Executive Officer, a Principal Financial Officer, a Chief Compliance Officer and an Anti-Money Laundering Officer to the Fund, as well as certain additional compliance support functions.
Trustees and Officers – The Trust pays each independent Trustee an annual fee of $50,000 for service to the Trust ($66,000 for the Chairman), and the Audit Committee Chairman and Vice Chairman receive an additional $6,000 annually. The Trustees and Chairman may receive additional fees for special Board meetings. Each Trustee is also reimbursed for all reasonable out-of-pocket expenses incurred in connection with his duties as a Trustee, including travel and related expenses incurred in attending Board meetings. The amount of Trustees' fees attributable to the Fund is disclosed in the Statement of Operations. Certain officers of the Trust are also officers or employees of the above named service providers, and during their terms of office received no compensation from the Fund.
Note 5. Fees Waived
The Adviser has contractually agreed to waive its fee and/or reimburse Fund expenses to limit annual operating expenses to 0.99% (excluding all taxes, interest, portfolio transaction expenses, dividend and interest expense on short sales, acquired fund fees and expenses, proxy expenses and extraordinary expenses), through April 30, 2017. Other fund service providers have voluntarily agreed to waive and reimburse a portion of their fees. These voluntary fee waivers and reimbursements may be reduced or eliminated at any time. For the year ended December 31, 2016, fees waived were as follows:
Note 6. Security Transactions
The cost of purchases and proceeds from sales of investment securities (including maturities), other than short-term investments during the year ended December 31, 2016, were $116,624,051 and $124,064,304, respectively.
POLARIS GLOBAL VALUE FUND NOTES TO FINANCIAL STATEMENTS DECEMBER 31, 2016 |
Note 7. Federal Income Tax
Distributions paid during the fiscal years ended as noted were characterized for tax purposes as follows:
To the Board of Trustees of Forum Funds
and the Shareholders of Polaris Global Value Fund
We have audited the accompanying statement of assets and liabilities of Polaris Global Value Fund (the "Fund"), a series of shares of beneficial interest in Forum Funds, including the schedule of investments, as of December 31, 2016, and the related statement of operations for the year then ended, the statements of changes in net assets for each of the years in the two-year period then ended and the financial highlights for each of the years in the five-year period then ended. These financial statements and financial highlights are the responsibility of the Fund's management. Our responsibility is to express an opinion on these financial statements and financial highlights based on our audits.
We conducted our audits in accordance with the standards of the Public Company Accounting Oversight Board (United States). Those standards require that we plan and perform the audits to obtain reasonable assurance about whether the financial statements and financial highlights are free of material misstatement. An audit includes examining, on a test basis, evidence supporting the amounts and disclosures in the financial statements. Our procedures included confirmation of securities owned as of December 31, 2016 by correspondence with the custodian. An audit also includes assessing the accounting principles used and significant estimates made by management, as well as evaluating the overall financial statement presentation. We believe that our audits provide a reasonable basis for our opinion.
In our opinion, the financial statements and financial highlights referred to above present fairly, in all material respects, the financial position of Polaris Global Value Fund as of December 31, 2016, and the results of its operations for the year then ended, the changes in its net assets for each of the years in the two-year period then ended and its financial highlights for each of the years in the five-year period then ended, in conformity with accounting principles generally accepted in the United States of America.
BBD, LLP
Philadelphia, Pennsylvania
February 22, 2017
Proxy Voting Information
A description of the policies and procedures that the Fund uses to determine how to vote proxies relating to securities held in the Fund's portfolio is available, without charge and upon request, by calling (888) 263-5594 or visit the Fund's website at www.polarisfunds.com and on the SEC's website at www.sec.gov. The Fund's proxy voting record for the most recent twelve-month period ended June 30 is available, without charge and upon request, by calling (888) 263-5594 or visit the Fund's website at www.polarisfunds.com and on the SEC's website at www.sec.gov.
Availability of Quarterly Portfolio Schedules
The Fund files its complete schedule of portfolio holdings with the SEC for the first and third quarters of each fiscal year on Form N-Q. These filings are available, without charge and upon request on the SEC's website at www.sec.gov or may be reviewed and copied at the SEC's Public Reference Room in Washington, DC. Information on the operation of the Public Reference Room may be obtained by calling (800) SEC-0330.
Shareholder Expense Example
As a shareholder of the Fund, you incur two types of costs: (1) transaction costs, including redemption fees and exchange fees, and (2) ongoing costs, including management fees and other Fund expenses. This example is intended to help you understand your ongoing costs (in dollars) of investing in the Fund, and to compare these costs with the ongoing costs of investing in other mutual funds.
The example is based on an investment of $1,000 invested at the beginning of the period and held for the entire period from July 1, 2016, through December 31, 2016.
Actual Expenses – The first line of the table below provides information about actual account values and actual expenses. You may use the information in this line, together with the amount you invested, to estimate the expenses that you paid over the period. Simply divide your account value by $1,000 (for example, an $8,600 account value divided by $1,000 = 8.6), then multiply the result by the number in the first line under the heading entitled "Expenses Paid During Period" to estimate the expenses you paid on your account during the period.
Hypothetical Example for Comparison Purposes – The second line of the table below provides information about hypothetical account values and hypothetical expenses based on the Fund's actual expense ratio and an assumed rate of return of 5% per year before expenses, which is not the Fund's actual return. The hypothetical account values and expenses may not be used to estimate the actual ending account balance or expenses you paid for the period. You may use this information to compare the ongoing costs of investing in the Fund and other funds. To do so, compare this 5% hypothetical example with the 5% hypothetical examples that appear in the shareholder reports of other funds.
Please note that the expenses shown in the table are meant to highlight your ongoing costs only and do not reflect any transactional costs, such as redemption fees and exchange fees. Therefore, the second line of the table is useful in comparing ongoing costs only, and will not help you determine the relative total costs of owning different funds. In addition, if these transactional costs were included, your costs would have been higher.
| | Beginning | | Ending | | Expenses | | Annualized |
| | Account Value | | Account Value | | Paid During | | Expense |
| | July 1, 2016 | | December 31, 2016 | | Period* | | Ratio* |
| Actual | $ | 1,000.00 | | $ | 1,146.46 | | $ | 5.34 | | 0.99 | % |
| Hypothetical (5% return before expenses) | $ | 1,000.00 | | $ | 1,020.16 | | $ | 5.03 | | 0.99 | % |
| * | Expenses are equal to the Fund's annualized expense ratio multiplied by the average account value over the period, multiplied by the number of days in the most recent fiscal half-year (184) divided by 366 to reflect the half-year period. |
Federal Tax Status of Dividends Declared during the Fiscal Year
For federal income tax purposes, dividends from short-term capital gains are classified as ordinary income. The Fund designates 55.33% of its income dividend distributed as qualifying for the corporate dividends-received deduction (DRD) and 100.00% for the qualified dividend rate (QDI) as defined in Section 1(h)(11) of the Internal Revenue Code. The Fund also designates 0.26% as qualified interest income exempt from U.S. tax for foreign shareholders (QII).
Trustees and Officers of the Trust
The Board is responsible for oversight of the management of the Trust's business affairs and of the exercise of all the Trust's powers except those reserved for the shareholders. The following table provides information about each Trustee and certain officers of the Trust. Each Trustee and officer holds office until the person resigns, is removed, or is replaced. Unless otherwise noted, the persons have held their principal occupations for more than five years. The address for all Trustees and officers is Three Canal Plaza, Suite 600, Portland, Maine 04101. Mr. Keffer is considered an Interested Trustee due to his affiliation with Atlantic. The Fund's Statement of Additional Information includes additional information about the Trustees and is available, without charge and upon request, by calling (888) 263-5594 or visit the Fund's website at www.polarisfunds.com.
| Name and Year of Birth | Position(s) with the Trust | Length of Time Served | Principal Occupation(s) During Past Five Years | Number of Series of Fund Complex¹ Overseen by Trustee | Other Directorships Held by Trustee |
| Interested Trustee | | | | | |
John Y. Keffer2 Born: 1942 | Trustee; Vice Chairman | Since 1989 | Chairman, Atlantic since 2008; President, Forum Investment Advisors, LLC since 2011; President, Forum Foundation (a charitable organization) since 2005; President, Forum Trust, LLC (a non-depository trust company chartered in the State of Maine) since 1997. | 46 | Director, Wintergreen Fund, Inc.; Trustee, Forum Funds II, Forum ETF Trust and U.S. Global Investors Funds |
| Officers | | | | | |
Jessica Chase Born: 1970 | President; Principal Executive Officer | Since 2015 | Senior Vice President, Atlantic since 2008. | N/A | N/A |
Karen Shaw Born: 1972 | Treasurer; Principal Financial Officer | Since 2008 | Senior Vice President, Atlantic since 2008. | N/A | N/A |
Zachary Tackett Born: 1988 | Vice President; Secretary; Anti-Money Laundering Compliance Officer | Since 2014 | Counsel, Atlantic since 2014; Intern Associate, Coakley & Hyde, PLLC, 2010-2013. | N/A | N/A |
Michael J. McKeen Born: 1971 | Vice President | Since 2009 | Senior Vice President, Atlantic since 2008. | N/A | N/A |
Timothy Bowden Born: 1969 | Vice President | Since 2009 | Manager, Atlantic since 2008. | N/A | N/A |
Geoffrey Ney Born: 1975 | Vice President | Since 2013 | Manager, Atlantic since 2013; Senior Fund Accountant, Atlantic, 2008-2013. | N/A | N/A |
Todd Proulx Born: 1978 | Vice President | Since 2013 | Manager, Atlantic since 2013; Senior Fund Accountant, Atlantic, 2008-2013. | N/A | N/A |
Carlyn Edgar Born: 1963 | Vice President | Since 2008 | Senior Vice President, Atlantic since 2008; Chief Compliance Officer, 2008-2016. | N/A | N/A |
Dennis Mason Born: 1967 | Chief Compliance Officer | Since 2016 | Fund Compliance Officer, Atlantic since 2013; Senior Specialist, Atlantic 2011-2013; Senior Analyst, Atlantic 2008-2011. | N/A | N/A |
1The Fund Complex includes the Trust, Forum Funds II, Forum ETF Trust and U.S. Global Investors Funds and is overseen by different Boards of Trustees. 2Atlantic is a subsidiary of Forum Holdings Corp. I, a Delaware corporation that is wholly owned by Mr. Keffer. |
LEBENTHAL LISANTI SMALL CAP GROWTH FUND A MESSAGE TO OUR SHAREHOLDERS (Unaudited) DECEMBER 31, 2016 |
Dear Shareholder,
For the year ended December 31, 2016 ("Period"), the Lebenthal Lisanti Small Cap Growth Fund ("Fund") underperformed its benchmark, the Russell 2000 Growth Index ("Index"), returning 7.32% versus 11.32%.
2016 saw an unusually high amount of volatility in publicly traded equities. The trend that started in the fall of 2015 away from growth equities and risk assets towards safer assets such as US Treasuries and lower beta stocks continued through the first part of 2016. Key market concerns were still relatively low oil prices, which the market interpreted as a leading indicator of an economic slowdown, a slowdown in corporate earnings, the decline in China GDP, continued weakness in Europe and Latin America, the UK's surprise vote to exit the European Union, the uncertainty of the Presidential elections in the US and concerns that the expansive economic policies around the world would do little to alleviate concerns about economic growth. The September quarter saw a sharp snapback in the equity markets, which continued into November, with the surprise Republican sweep.
For the Fund, it was also a tale of two markets. The backdrop in the first half of the year is one of the most difficult ones for our strategy. The cornerstones of our investment process are that improving returns on invested capital drive outperformance; in smaller growth companies, that is usually expressed as earnings growth. When investors are concerned about a recession, earnings growth (both current and future) is called into question. Price/earnings multiples also tend to compress, as what investors are willing to pay for stocks shrinks as uncertainty about the future grows. Thus, the Fund underperformed in the first part of the year, given that backdrop. As investor sentiment turned, and investors began to focus on the prospects for individual companies, the investments in the Fund rebounded. We were able to take advantage of some of the negative market trends in the first part of the year by adding stocks in the portfolio within the Technology, Healthcare and Energy sectors, which was helpful to performance in the back half of the year.
For the year, the Energy, Healthcare, Materials and Financials sectors were the sectors most additive to performance; the Technology, Consumer Discretionary and Industrial sectors detracted the most from performance.
The biggest surprise to us, for the year, was the strong outperformance of small cap value versus small cap growth. The Russell 2000 Value Index beat The Russell 2000 Growth Index by over 2000 basis points; this was the widest gap in style performance since the Tech bubble burst in 2000, according to Jefferies Group research. Within the Russell 2000 Growth Index, the companies that had the fastest sales growth declined 1.0%, while those with the slowest sales growth increased 11.3%. The performance gap between fastest and slowest growers crossed the one standard deviation line, according to Jefferies. That historically has marked the height in terms of this trend, and it usually reverses, although not always immediately.
Currently, there is more than the usual uncertainty in the outlook, given that much depends on actions taken in the government. If we get tax reform this year, while it should in general be positive for small cap growth stocks, particularly those domestically focused, it could also create some disruption depending upon the details (does it contain a border adjustment tax? If so, how is it written?) Is the Affordable Care Act repealed, or is it repealed and replaced? As I write this, we are probably at the point of maximum uncertainty in terms of
LEBENTHAL LISANTI SMALL CAP GROWTH FUND A MESSAGE TO OUR SHAREHOLDERS (Unaudited) DECEMBER 31, 2016 |
understanding what the new administration wants to accomplish, as the President has only just been inaugurated; once we understand it, we will then have to see if it can be implemented. The speed with which those policies become law and are implemented, in turn, could potentially have an impact on GDP growth, inflation and the pace of interest rate hikes undertaken by the Federal Reserve.
Like some of the sectors mentioned above, every sector has both challenges and opportunities. While we believe good opportunities exist potentially in the Consumer Discretionary sector, we also believe that it has more challenges, especially retailers that are seeing declines in traffic as more shoppers go online. While we like select financial stocks, we also believe that banks face challenges due to continued scrutiny and regulation, slower trading and low interest rates that are hurting Net Interest Margins. And again, while we also find select Healthcare stocks attractive, we believe that the healthcare sector, especially drug and biotechnology companies will face continued pressures due to increased scrutiny of drug pricing. In the smaller cap growth sector of the market, given the enormous policy changes contemplated, we believe it is much more a "stock by stock" decision, as certain companies are very well positioned, regardless of changes to the tax code or regulation, and others are less so. In sum, it is the quintessential stockpicker's market. Our strategy in this environment is to be as sector neutral as possible, within reason. We are underweight Real Estate Investment Trusts, as we believe that sector is primarily a yield vehicle. We believe the market's focus on earnings growth will continue, and may even be exaggerated by some of the new administration's policies.
The overriding theme of the market, we believe, will be earnings growth, as opposed to multiple expansion. Historically, according to Furey Research Partners, when GDP is over 3% and inflation moves above 2%, value tends to outperform growth on the smaller end of the spectrum. One could argue that the market anticipated much of that, given that value significantly outperformed growth in 2016, at least in the smaller end of the market. As you know, our process focuses on improving returns on invested capital, and inflection points for such; we tend to be sector agnostic in our search for that improvement.
We continue to be constructive on small cap growth stocks. We believe that the end of the industrial and energy recessions are positive for this group, as it will lead to a pickup in domestic GDP. We also believe that the changes the administration is proposing in the tax code could be significant positives for this group. For the first time in a very long time, should these proposals become law, one could make a multi-year case for outperformance of the asset class. As always, though, the challenge will be that the areas that could show the most earnings growth are not traditionally the areas in which many growth managers spend much time. As you know, our process is sector agnostic—we look for improvements in ROIC (return on invested capital) that are long lasting. They can be driven by secular changes, structural changes, or internal drivers. Currently, we see them in every sector, but they are most compelling in the areas that have been long neglected. While we expect to see challenges throughout the year, we believe that 2017 will turn out to be another "stockpicker's market." We continue to work hard on your behalf and thank you for investing in the strategy.
Sincerely,
Mary Lisanti, CFA
President & Portfolio Manager
LEBENTHAL LISANTI SMALL CAP GROWTH FUND A MESSAGE TO OUR SHAREHOLDERS (Unaudited) DECEMBER 31, 2016 |
IMPORTANT RISKS AND DISCLOSURES
An investment in the Fund is subject to risk, including the possible loss of principal amount invested. The Fund invests in smaller companies, which carry greater risk than is associated with larger companies for various reasons such as narrower markets, limited financial resources and less liquid stock. The Fund's investments in growth securities may be more sensitive to company earnings and more volatile than the market in general.
The Russell 2000 Growth Index measures the performance of the small-cap growth segment of the U.S. equity universe. It includes those Russell 2000 companies with higher price-to-value ratios and higher forecasted growth values. One cannot invest directly in an index.
The views in this report were those of the Fund manager as of December 31, 2016, and may not necessarily reflect her views on the date this report is first published or anytime thereafter. These views are intended to assist shareholders in understanding the Fund's investment methodology and do not constitute investment advice. Although the Fund manager believes she has a reasonable basis for any opinions or views expressed, actual results may differ, sometimes significantly so, from those expected or expressed. All current and future holdings of the Fund are subject to risk and are subject to change.
LEBENTHAL LISANTI SMALL CAP GROWTH FUND PERFORMANCE CHART AND ANALYSIS (Unaudited) DECEMBER 31, 2016 |
The following chart reflects the change in the value of a hypothetical $10,000 investment, including reinvested dividends and distributions, in Lebenthal Lisanti Small Cap Growth Fund (the "Fund") compared with the performance of the benchmark, Russell 2000 Growth Index ("Russell 2000 Growth"), over the past ten fiscal years. The Russell 2000 Growth, the Fund's primary performance benchmark, measures the performance of those Russell 2000 Growth companies with higher price-to-value ratios and higher forecasted growth values. The total return of the Russell 2000 Growth includes the reinvestment of dividends and income. The total return of the Fund includes operating expenses that reduce returns, while the total return of the Russell 2000 Growth does not include expenses. The Fund is professionally managed, while the Russell 2000 Growth is unmanaged and is not available for investment.
Comparison of Change in Value of a $10,000 Investment
Lebenthal Lisanti Small Cap Growth Fund vs. Russell 2000 Growth Index
| Average Annual Total Returns as of December 31, 2016 | | One Year | | Five Years | | Ten Years |
| Lebenthal Lisanti Small Cap Growth Fund | | 7.32 | % | | 13.53 | % | | 6.83 | % |
| Russell 2000 Growth Index | | 11.32 | % | | 13.74 | % | | 7.76 | % |
Performance data quoted represents past performance and is no guarantee of future results. Current performance may be lower or higher than the performance data quoted. Investment return and principal value will fluctuate so that shares, when redeemed, may be worth more or less than original cost. As stated in the Fund's prospectus, the annual operating expense ratio (gross) is 2.26%. However, the Fund's Adviser has contractually agreed to waive a portion of its fee and/or reimburse expenses to limit total operating expenses (excluding all taxes, interest, portfolio transaction expenses, proxy expenses, and extraordinary expenses) to 1.80% through at least April 30, 2017 ("Expense Cap"). The adviser may recoup from the Fund fees waived and expenses reimbursed pursuant to the Expense Cap if such payment is made within three years of the fee waiver or expense reimbursement and does not cause the Total Annual Fund Operating Expenses After Fee Waiver and/or Expense Reimbursement to exceed the (i) the then-current expense cap, or (ii) the expense cap in place at the time the fees/expenses were waived or reimbursed. Shares redeemed or exchanged within 30 days of purchase will be charged a 1.00% redemption fee. The performance table and graph do not reflect the deduction of taxes that a shareholder would pay on Fund distributions or the redemption of Fund shares. Returns greater than one year are annualized.
LEBENTHAL LISANTI SMALL CAP GROWTH FUND SCHEDULE OF INVESTMENTS DECEMBER 31, 2016 |
| Shares | | Security Description | | Value | |
| Common Stock - 98.1% |
| Consumer Discretionary - 19.1% |
| | 4,630 | | Burlington Stores, Inc. (a) | $ | 392,392 | |
| | 6,485 | | Dave & Buster's Entertainment, Inc. (a) | | 365,105 | |
| | 5,277 | | Dorman Products, Inc. (a) | | 385,538 | |
| | 4,460 | | Duluth Holdings, Inc., Class B (a) | | 113,284 | |
| | 17,815 | | Fox Factory Holding Corp. (a) | | 494,366 | |
| | 11,495 | | Francesca's Holdings Corp. (a) | | 207,255 | |
| | 2,935 | | Grand Canyon Education, Inc. (a) | | 171,551 | |
| | 1,950 | | Jack in the Box, Inc. | | 217,698 | |
| | 7,680 | | Ollie's Bargain Outlet Holdings, Inc. (a) | | 218,496 | |
| | 18,655 | | Planet Fitness, Inc., Class A (a) | | 374,965 | |
| | 925 | | Pool Corp. | | 96,515 | |
| | 2,745 | | Standard Motor Products, Inc. | | 146,089 | |
| | 6,690 | | Steven Madden, Ltd. (a) | | 239,168 | |
| | 12,925 | | Tailored Brands, Inc. | | 330,234 | |
| | 5,290 | | The Cheesecake Factory, Inc. | | 316,765 | |
| | 10,534 | | Tile Shop Holdings, Inc. (a) | | 205,940 | |
| | 1,200 | | Vail Resorts, Inc. | | 193,572 | |
| | 3,970 | | Wingstop, Inc. (a) | | 117,472 | |
| | | 4,586,405 | |
| Consumer Staples - 0.5% |
| | 4,236 | | elf Beauty, Inc. (a) | | 122,590 | |
| Energy - 6.0% |
| | 14,695 | | Callon Petroleum Co. (a) | | 225,862 | |
| | 14,190 | | Fairmount Santrol Holdings, Inc. (a) | | 167,300 | |
| | 6,400 | | Parsley Energy, Inc., Class A (a) | | 225,536 | |
| | 9,530 | | Patterson-UTI Energy, Inc. | | 256,548 | |
| | 25,100 | | Synergy Resources Corp. (a) | | 223,641 | |
| | 5,930 | | US Silica Holdings, Inc. | | 336,112 | |
| | | 1,434,999 | |
| Financial Services - 8.1% |
| | 7,005 | | Bank of the Ozarks, Inc. | | 368,393 | |
| | 6,825 | | FCB Financial Holdings, Inc., Class A (a) | | 325,553 | |
| | 12,899 | | Kinsale Capital Group, Inc. | | 438,695 | |
| | 5,620 | | Pinnacle Financial Partners, Inc. | | 389,466 | |
| | 8,850 | | Western Alliance Bancorp. (a) | | 431,083 | |
| | | 1,953,190 | |
| Health-Care - 18.2% |
| | 3,320 | | Almost Family, Inc. (a) | | 146,412 | |
| | 18,695 | | ARIAD Pharmaceuticals, Inc. (a) | | 232,566 | |
| | 14,975 | | Cardiovascular Systems, Inc. (a) | | 362,545 | |
| | 9,695 | | Dermira, Inc. (a) | | 294,049 | |
| | 2,565 | | Eagle Pharmaceuticals, Inc. (a) | | 203,507 | |
| | 6,035 | | HealthEquity, Inc. (a) | | 244,538 | |
| | 3,165 | | INC Research Holdings, Inc., Class A (a) | | 166,479 | |
| Shares | | Security Description | | Value | |
| Health-Care (continued) |
| | 5,500 | | Inogen, Inc. (a) | $ | 369,435 | |
| | 2,585 | | Insulet Corp. (a) | | 97,403 | |
| | 14,305 | | K2M Group Holdings, Inc. (a) | | 286,672 | |
| | 2,590 | | Masimo Corp. (a) | | 174,566 | |
| | 5,564 | | Medpace Holdings, Inc. (a) | | 200,694 | |
| | 9,670 | | MiMedx Group, Inc. (a) | | 85,676 | |
| | 3,580 | | NuVasive, Inc. (a) | | 241,149 | |
| | 2,735 | | NxStage Medical, Inc. (a) | | 71,684 | |
| | 4,519 | | PRA Health Sciences, Inc. (a) | | 249,087 | |
| | 7,560 | | Repligen Corp. (a) | | 232,999 | |
| | 3,035 | | Sage Therapeutics, Inc. (a) | | 154,967 | |
| | 12,435 | | Supernus Pharmaceuticals, Inc. (a) | | 313,984 | |
| | 505 | | TESARO, Inc. (a) | | 67,912 | |
| | 4,125 | | Zeltiq Aesthetics, Inc. (a) | | 179,520 | |
| | | 4,375,844 | |
| Industrials - 19.7% |
| | 7,995 | | Astec Industries, Inc. | | 539,343 | |
| | 2,745 | | Beacon Roofing Supply, Inc. (a) | | 126,462 | |
| | 6,300 | | HEICO Corp. | | 486,045 | |
| | 7,465 | | John Bean Technologies Corp. | | 641,617 | |
| | 5,400 | | Kennametal, Inc. | | 168,804 | |
| | 6,805 | | Knight Transportation, Inc. | | 224,905 | |
| | 9,280 | | MasTec, Inc. (a) | | 354,960 | |
| | 7,300 | | Mercury Systems, Inc. (a) | | 220,606 | |
| | 2,615 | | MSC Industrial Direct Co., Inc. | | 241,600 | |
| | 18,305 | | Mueller Water Products, Inc., Class A | | 243,640 | |
| | 6,570 | | SkyWest, Inc. | | 239,476 | |
| | 11,905 | | Swift Transportation Co. (a) | | 290,006 | |
| | 4,300 | | Trex Co., Inc. (a) | | 276,920 | |
| | 5,205 | | WageWorks, Inc. (a) | | 377,362 | |
| | 7,075 | | XPO Logistics, Inc. (a) | | 305,357 | |
| | | 4,737,103 | |
| Materials - 4.0% |
| | 10,300 | | Berry Plastics Group, Inc. (a) | | 501,919 | |
| | 7,980 | | United States Steel Corp. | | 263,420 | |
| | 3,030 | | US Concrete, Inc. (a) | | 198,465 | |
| | | 963,804 | |
| Technology - 22.5% |
| | 6,790 | | Advanced Energy Industries, Inc. (a) | | 371,752 | |
| | 1,410 | | Belden, Inc. | | 105,426 | |
| | 2,945 | | Cavium, Inc. (a) | | 183,886 | |
| | 4,875 | | Ciena Corp. (a) | | 118,999 | |
| | 2,830 | | Coherent, Inc. (a) | | 388,800 | |
| | 6,140 | | CommVault Systems, Inc. (a) | | 315,596 | |
| | 5,600 | | Fabrinet (a) | | 225,680 | |
| | 2,935 | | FARO Technologies, Inc. (a) | | 105,660 | |
| | 5,325 | | Inphi Corp. (a) | | 237,601 | |
See Notes to Financial Statements. | 5 | |
LEBENTHAL LISANTI SMALL CAP GROWTH FUND SCHEDULE OF INVESTMENTS DECEMBER 31, 2016 |
| Shares | | Security Description | | Value | |
| Technology (continued) |
| | 5,454 | | Itron, Inc. (a) | $ | 342,784 | |
| | 2,500 | | Littelfuse, Inc. | | 379,425 | |
| | 1,790 | | LogMeIn, Inc. (a) | | 172,824 | |
| | 2,925 | | Lumentum Holdings, Inc. (a) | | 113,051 | |
| | 4,850 | | MACOM Technology Solutions Holdings, Inc. (a) | | 224,458 | |
| | 7,070 | | Microsemi Corp. (a) | | 381,568 | |
| | 8,035 | | MKS Instruments, Inc. | | 477,279 | |
| | 6,205 | | Monolithic Power Systems, Inc. | | 508,376 | |
| | 21,970 | | Oclaro, Inc. (a) | | 196,631 | |
| | 3,340 | | Proofpoint, Inc. (a) | | 235,971 | |
| | 3,910 | | Q2 Holdings, Inc. (a) | | 112,804 | |
| | 7,625 | | Varonis Systems, Inc. (a) | | 204,350 | |
| | | 5,402,921 | |
Total Common Stock (Cost $20,267,647) | | 23,576,856 | |
Total Investments - 98.1% (Cost $20,267,647)* | $ | 23,576,856 | |
Other Assets & Liabilities, Net – 1.9% | | 445,099 | |
Net Assets – 100.0% | $ | 24,021,955 | |
(a) Non-income producing security.
* Cost for federal income tax purposes is $20,344,680 and net unrealized appreciation consists of:
| ASSETS | | | | |
| | Total investments, at value (Cost $20,267,647) | | $ | 23,576,856 | |
| | Cash | | | 446,870 | |
| | Receivables: | | | | |
| | | Fund shares sold | | | 38,994 | |
| | | Dividends and interest | | | 3,628 | |
| | Prepaid expenses | | | 11,462 | |
| Total Assets | | | 24,077,810 | |
| | | | | | | |
| LIABILITIES | | | | |
| | Payables: | | | | |
| | | Fund shares redeemed | | | 5,373 | |
| | Accrued Liabilities: | | | | |
| | | Investment adviser fees | | | 7,516 | |
| | | Trustees' fees and expenses | | | 50 | |
| | | Fund services fees | | | 11,780 | |
| | | Other expenses | | | 31,136 | |
| Total Liabilities | | | 55,855 | |
| | | | | | | |
| NET ASSETS | | $ | 24,021,955 | |
| | | | | | | |
| COMPONENTS OF NET ASSETS | | | | |
| | Paid-in capital | | $ | 21,822,934 | |
| | Undistributed net investment income | | | 4,654 | |
| | Accumulated net realized loss | | | (1,114,842 | ) |
| | Net unrealized appreciation | | | 3,309,209 | |
| NET ASSETS | | $ | 24,021,955 | |
| SHARES OF BENEFICIAL INTEREST AT NO PAR VALUE (UNLIMITED SHARES AUTHORIZED) | | | 1,281,998 | |
NET ASSET VALUE, OFFERING AND REDEMPTION PRICE PER SHARE* | | $ | 18.74 | |
| * | Shares redeemed or exchanged within 30 days of purchase are charged a 1.00% redemption fee. |
See Notes to Financial Statements. | 7 | |
LEBENTHAL LISANTI SMALL CAP GROWTH FUND STATEMENT OF OPERATIONS YEAR ENDED DECEMBER 31, 2016 |
| INVESTMENT INCOME | | | | | |
| | Dividend income | . | | $ | 71,938 | |
| | Interest income | | | 935 | |
| Total Investment Income | | | | 72,873 | |
| Adviser | | | | | |
| EXPENSES | | | | | |
| | Investment adviser fees | | | 238,473 | |
| | Fund services fees | | | 192,322 | |
| | Shareholder service fees | | | | 59,618 | |
| | Custodian fees | | | 5,000 | |
| | Registration fees | | | 20,435 | |
| | Professional fees | | | 36,734 | |
| | Trustees' fees and expenses | | | 6,917 | |
| | Miscellaneous expenses | | | 32,693 | |
| Total Expenses | | | | 592,192 | |
| | Fees waived and expenses reimbursed | | | (162,942 | ) |
| Net Expenses | | | | 429,250 | |
| | | | | | | |
| NET INVESTMENT LOSS | | | | (356,377 | ) |
| | | | | | | |
| NET REALIZED AND UNREALIZED GAIN (LOSS) | | | | | |
| | Net realized loss on investments | | | (294,222 | ) |
| | Net change in unrealized appreciation (depreciation) on investments | | | 1,599,460 | |
| NET REALIZED AND UNREALIZED GAIN | | | | 1,305,238 | |
| INCREASE IN NET ASSETS RESULTING FROM OPERATIONS | | | $ | 948,861 | |
| | | | | | | |
See Notes to Financial Statements. | 8 | |
LEBENTHAL LISANTI SMALL CAP GROWTH FUND STATEMENTS OF CHANGES IN NET ASSETS |
| | | | | For the Year Ended December 31, 2016 | | | For the Year Ended December 31, 2015 |
| OPERATIONS | | | | | | | | | |
| | Net investment loss | | $ | (356,377 | ) | | | $ | (461,041 | ) |
| | Net realized gain (loss) | | | (294,222 | ) | | | | 1,686,800 | |
| | Net change in unrealized appreciation (depreciation) | | | 1,599,460 | | | | | (1,870,087 | ) |
| Increase (Decrease) in Net Assets Resulting from Operations | | | 948,861 | | | | | (644,328 | ) |
| | | | | | | | | | | | |
| DISTRIBUTIONS TO SHAREHOLDERS FROM | | | | | | | | | |
| | Net realized gain | | | (398,638 | ) | | | | (1,692,923 | ) |
| | | | | | | | | | | | |
| CAPITAL SHARE TRANSACTIONS | | | | | | | | | |
| | Sale of shares | | | 4,113,175 | | | | | 17,254,090 | |
| | Reinvestment of distributions | | | 376,478 | | | | | 1,525,725 | |
| | Redemption of shares | | | (13,826,967 | ) | | | | (7,611,664 | )* |
| | Redemption fees | | | 491 | | | | | 2,106 | |
| Increase (Decrease) in Net Assets from Capital Share Transactions | | (9,336,823 | ) | | | | 11,170,257 | |
| Increase (Decrease) in Net Assets | | | (8,786,600 | ) | | | | 8,833,006 | |
| | | | | | | | | | | | |
| NET ASSETS | | | | | | | | | |
| | Beginning of Year | | | 32,808,555 | | | | | 23,975,549 | |
| | End of Year (Including line (a)) | | $ | 24,021,955 | | | | $ | 32,808,555 | |
| | | | | | | | | | | | |
| SHARE TRANSACTIONS | | | | | | | | | |
| | Sale of shares | | | 245,187 | | | | | 874,809 | |
| | Reinvestment of distributions | | | 19,846 | | | | | 86,345 | |
| | Redemption of shares | | | (831,476 | ) | | | | (392,806 | ) |
| Increase (Decrease) in Shares | | | (566,443 | ) | | | | 568,348 | |
(a) | Undistributed net investment income. | | $ | 4,654 | | | | $ | - | |
| * | The amount includes $979,752 from a redemption-in-kind for the year ended December 31, 2015. | |
See Notes to Financial Statements. | 9 | |
LEBENTHAL LISANTI SMALL CAP GROWTH FUND |
| These financial highlights reflect selected data for a share outstanding throughout each year. | | | | | |
| | | For the Years Ended December 31, | |
| | | 2016 | | 2015 | | 2014 | | 2013 | | 2012 | |
| NET ASSET VALUE, Beginning | | | | | | | | | | | | | | | | | | | | |
| of Year | $ | 17.75 | | | $ | 18.73 | | | $ | 19.54 | | | $ | 13.36 | | | $ | 11.83 | | |
| INVESTMENT OPERATIONS | | | | | | | | | | | | | | | | | | | | |
| Net investment loss (a) | | (0.25 | ) | | | (0.32 | ) | | | (0.31 | ) | | | (0.29 | ) | | | (0.17 | ) | |
| Net realized and unrealized gain | | 1.55 | | | | 0.28 | (b) | | | 0.50 | | | | 7.43 | | | | 1.70 | | |
| Total from Investment Operations | | 1.30 | | | | (0.04 | ) | | | 0.19 | | | | 7.14 | | | | 1.53 | | |
| DISTRIBUTIONS TO SHAREHOLDERS FROM | | | | | | | | | | | | | | | | | | |
| Net investment income | | — | | | | — | | | | — | | | | (0.13 | ) | | | — | | |
| Net realized gain | | (0.31 | ) | | | (0.94 | ) | | | (1.00 | ) | | | (0.83 | ) | | | — | | |
| Total Distributions to Shareholders | | (0.31 | ) | | | (0.94 | ) | | | (1.00 | ) | | | (0.96 | ) | | | — | | |
| REDEMPTION FEES (a) | | — | (c) | | — | (c) | | — | (c) | | — | (c) | | — | | |
| NET ASSET VALUE, End of Year | $ | 18.74 | | | $ | 17.75 | | | $ | 18.73 | | | $ | 19.54 | | | $ | 13.36 | | |
| TOTAL RETURN | | 7.32 | % | | (0.18 | )% | | 1.14 | % | | 54.15 | % | | 12.93 | % |
| RATIOS/SUPPLEMENTARY DATA | | | | | | | | | | | | | | | | | | | | |
| Net Assets at End of | | | | | | | | | | | | | | | | | | | | |
| | Year (000's omitted) | $24,022 | | | $32,809 | | | $23,976 | | | $32,391 | | | $11,396 | | |
| Ratios to Average Net Assets: | | | | | | | | | | | | | | | | | | | | |
| Net investment loss | | (1.49 | )% | | (1.65 | )% | | (1.65 | )% | | (1.66 | )% | | (1.26 | )% |
| Net expenses | | 1.80 | % | | 1.80 | % | | 1.80 | % | | 1.80 | % | | 1.80 | % |
| Gross expenses (d) | | 2.48 | % | | 2.26 | % | | 2.27 | % | | 2.71 | % | | 3.44 | % |
| PORTFOLIO TURNOVER RATE | | 268 | % | | 196 | % | | 263 | % | | 295 | % | | 294 | % |
| | | | | | | | | | | | | | | | | | | | | | |
| (a) | Calculated based on average shares outstanding during each year. |
| (b) | The net realized and unrealized gain (loss) per share does not correlate to the aggregate of the net realized and unrealized gain (loss) in the Statement of Operations, primarily due to the timing of the sales and repurchases of the Fund's shares in relation to fluctuating market values for the Fund's portfolio. |
| (c) | Less than $0.01 per share. |
| (d) | Reflects the expense ratio excluding any waivers and/or reimbursements. |
See Notes to Financial Statements. | 10 | |
LEBENTHAL LISANTI SMALL CAP GROWTH FUND NOTES TO FINANCIAL STATEMENTS DECEMBER 31, 2016 |
Note 1. Organization
The Lebenthal Lisanti Small Cap Growth Fund (the "Fund") is a diversified portfolio of Forum Funds (the "Trust"). The Trust is a Delaware statutory trust that is registered as an open-end, management investment company under the Investment Company Act of 1940, as amended (the "Act"). Under its Trust Instrument, the Trust is authorized to issue an unlimited number of the Fund's shares of beneficial interest without par value. The Fund commenced operations on February 27, 2004. The Fund seeks maximum capital appreciation. Prior to March 2, 2015, the Fund was named Adams Harkness Small Cap Growth Fund.
Note 2. Summary of Significant Accounting Policies
The Fund is an investment company and follows accounting and reporting guidance under Financial Accounting Standards Board ("FASB") Accounting Standards Codification ("ASC") Topic 946, "Financial Services-Investment Companies". These financial statements are prepared in accordance with accounting principles generally accepted in the United States of America ("GAAP"), which require management to make estimates and assumptions that affect the reported amounts of assets and liabilities, the disclosure of contingent liabilities at the date of the financial statements, and the reported amounts of increases and decreases in net assets from operations during the fiscal year. Actual amounts could differ from those estimates. The following summarizes the significant accounting policies of the Fund:
Security Valuation – Securities are valued at market prices using the last quoted trade or official closing price from the principal exchange where the security is traded, as provided by independent pricing services on each Fund business day. In the absence of a last trade, securities are valued at the mean of the last bid and ask price provided by the pricing service. Shares of non-exchange-traded open-end mutual funds are valued at net asset value ("NAV"). Short-term investments that mature in 60 days or less may be valued at amortized cost.
The Fund values its investments at fair value pursuant to procedures adopted by the Trust's Board of Trustees (the "Board") if (1) market quotations are insufficient or not readily available or (2) the Fund believes that the values available are unreliable. The Trust's Valuation Committee, as defined in the Fund's registration statement, performs certain functions as they relate to the administration and oversight of the Fund's valuation procedures. Under these procedures, the Valuation Committee convenes on a regular and ad-hoc basis to review such investments and considers a number of factors, including valuation methodologies and significant unobservable inputs, when arriving at fair value.
The Valuation Committee may work with the Adviser, as defined in Note 4, to provide valuation inputs. In determining fair valuations, inputs may include market-based analytics which may consider related or comparable assets or liabilities, recent transactions, market multiples, book values and other relevant investment information. Adviser inputs may include an income-based approach in which the anticipated future cash flows of the investment are discounted in determining fair value. Discounts may also be applied based on the nature or duration of any restrictions on the disposition of the investments. The Valuation Committee performs regular reviews of valuation methodologies, key inputs and assumptions, disposition analysis and market activity.
Fair valuation is based on subjective factors and, as a result, the fair value price of an investment may differ from the security's market price and may not be the price at which the asset may be sold. Fair valuation could result in a different NAV than a NAV determined by using market quotes.
The Fund has a three-tier fair value hierarchy. The basis of the tiers is dependent upon the various "inputs" used to determine the value of the Fund's investments. These inputs are summarized in the three broad levels listed below:
Level 1 — quoted prices in active markets for identical assets and liabilities
Level 2 — other significant observable inputs (including quoted prices of similar securities, interest rates, prepayment speeds, credit risk, etc.)
Level 3 — significant unobservable inputs (including the Fund's own assumptions in determining the fair value of investments)
The aggregate value by input level, as of December 31, 2016, for the Fund's investments is included in the Fund's Schedule of Investments.
Security Transactions, Investment Income and Realized Gain and Loss – Investment transactions are accounted for on the trade date. Dividend income is recorded on the ex-dividend date. Foreign dividend income is recorded on the ex-dividend date or as soon as possible after the Fund determines the existence of a dividend declaration after exercising reasonable due diligence. Income and capital gains on some foreign securities may be subject to foreign withholding taxes, which are accrued as applicable. Interest income is recorded on an accrual basis. Premium is amortized and discount is accreted using the effective interest method. Identified cost of investments sold is used to determine the gain and loss for both financial statement and federal income tax purposes.
Distributions to Shareholders – Distributions to shareholders of net investment income, if any, are declared and paid quarterly. Distributions to shareholders of net capital gains, if any, are declared and paid at least annually. Distributions to shareholders are recorded on the ex-dividend date. Distributions are based on amounts calculated in accordance with applicable federal income tax regulations, which may differ from GAAP. These differences are due primarily to differing treatments of income and gain on various investment securities held by the Fund, timing differences and differing characterizations of distributions made by the Fund.
Federal Taxes – The Fund intends to continue to qualify each year as a regulated investment company under Subchapter M of Chapter 1, Subtitle A, of the Internal Revenue Code of 1986, as amended ("Code"), and to distribute all of its taxable income to shareholders. In addition, by distributing in each calendar year substantially all of its net investment income and capital gains, if any, the Fund will not be subject to a federal excise tax. Therefore, no federal income or excise tax provision is required. The Fund files a U.S. federal income and excise tax return as required. The Fund's federal income tax returns are subject to examination by
LEBENTHAL LISANTI SMALL CAP GROWTH FUND NOTES TO FINANCIAL STATEMENTS DECEMBER 31, 2016 |
the Internal Revenue Service for a period of three fiscal years after they are filed. As of December 31, 2016, there are no uncertain tax positions that would require financial statement recognition, de-recognition or disclosure.
Income and Expense Allocation – The Trust accounts separately for the assets, liabilities and operations of each of its investment portfolios. Expenses that are directly attributable to more than one investment portfolio are allocated among the respective investment portfolios in an equitable manner.
Commitments and Contingencies – In the normal course of business, the Fund enters into contracts that provide general indemnifications by the Fund to the counterparty to the contract. The Fund's maximum exposure under these arrangements is dependent on future claims that may be made against the Fund and, therefore, cannot be estimated; however, based on experience, the risk of loss from such claims is considered remote.
Redemption Fees – A shareholder who redeems or exchanges shares within 30 days of purchase will incur a redemption fee of 1.00% of the current NAV of shares redeemed or exchanged, subject to certain limitations. The fee is charged for the benefit of the remaining shareholders and will be paid to the Fund to help offset transaction costs. The fee is accounted for as an addition to paid-in capital. The Fund reserves the right to modify the terms of or terminate the fee at any time. There are limited exceptions to the imposition of the redemption fee. Redemption fees incurred for the Fund, if any, are reflected on the Statements of Changes in Net Assets.
Note 3. Cash – Concentration in Uninsured Account
For cash management purposes the Fund may concentrate cash with the Fund's custodian. This typically results in cash balances exceeding the Federal Deposit Insurance Corporation ("FDIC") insurance limits. As of December 31, 2016, the Fund held $196,870 as cash reserves at MUFG Union Bank, N.A. that exceeded the FDIC insurance limit.
Note 4. Fees and Expenses
Investment Adviser – Lebenthal Lisanti Capital Growth, LLC (the "Adviser") is the investment adviser to the Fund. Pursuant to an investment advisory agreement, the Adviser receives an advisory fee from the Fund at an annual rate of 1.00% of the Fund's average daily net assets.
Shareholder Service Plan – The Trust has adopted a shareholder service plan for the Fund under which the Fund may reimburse the Fund's administrator for amounts paid by the administrator for providing shareholder service activities that are not otherwise provided by the transfer agent. The Fund's administrator may make such payments to various financial institutions, including the Adviser, that provide shareholder servicing to their customers invested in the Fund in amounts of up to 0.25% annually of the average daily net assets of the shares held by such customers.
Distribution – Foreside Fund Services, LLC serves as the Fund's distributor (the "Distributor"). The Fund does not have a distribution (12b-1) plan; accordingly, the Distributor does not receive compensation from the Fund for its distribution (12b-1) services. The Adviser compensates the Distributor directly for its services. The Distributor is not affiliated with the Adviser or Atlantic Fund Administration, LLC (d/b/a Atlantic Fund Services) ("Atlantic") or their affiliates.
Other Service Providers – Atlantic provides fund accounting, fund administration, compliance and transfer agency services to the Fund. The fees related to these services are included in Fund services fees within the Statement of Operations. Atlantic also provides certain shareholder report production and EDGAR conversion and filing services. Pursuant to an Atlantic services agreement, the Fund pays Atlantic customary fees for its services. Atlantic provides a Principal Executive Officer, a Principal Financial Officer, a Chief Compliance Officer and an Anti-Money Laundering Officer to the Fund, as well as certain additional compliance support functions.
Trustees and Officers – The Trust pays each independent Trustee an annual fee of $50,000 for service to the Trust ($66,000 for the Chairman), and the Audit Committee Chairman and Vice Chairman receive an additional $6,000 annually. The Trustees and Chairman may receive additional fees for special Board meetings. Each Trustee is also reimbursed for all reasonable out-of-pocket expenses incurred in connection with his duties as a Trustee, including travel and related expenses incurred in attending Board meetings. The amount of Trustees' fees attributable to the Fund is disclosed in the Statement of Operations. Certain officers of the Trust are also officers or employees of the above named service providers, and during their terms of office received no compensation from the Fund.
Note 5. Fees Waived
The Adviser has contractually agreed to waive its fee and/or reimburse expenses to limit total annual fund operating expenses (excluding all taxes, interest, portfolio transaction expenses, proxy expenses, and extraordinary expenses) to 1.80% for the period through April 30, 2017. Other Fund service providers have voluntarily agreed to waive a portion of their fees. The contractual waivers may be changed or eliminated at any time with the consent of the Board and voluntary fee waivers may be reduced or eliminated at any time. For the year ended December 31, 2016, fees waived were as follows:
Note 6. Security Transactions
The cost of purchases and proceeds from sales of investment securities (including maturities), other than short-term investments during the year ended December 31, 2016, were $63,217,474 and $72,083,185, respectively.
Note 7. Federal Income Tax
Distributions paid during the fiscal years ended as noted were characterized for tax purposes as follows:
have on the Fund's financial statements and related disclosures.
Note 9. Subsequent Events
Subsequent events occurring after the date of this report through the date these financial statements were issued have been evaluated for potential impact, and the Fund has had no such events.
REPORT OF INDEPENDENT REGISTERED PUBLIC ACCOUNTING FIRM |
To the Board of Trustees of Forum Funds
and the Shareholders of Lebenthal Lisanti Small Cap Growth Fund
We have audited the accompanying statement of assets and liabilities of Lebenthal Lisanti Small Cap Growth Fund (the "Fund"), a series of shares of beneficial interest in Forum Funds, including the schedule of investments, as of December 31, 2016, and the related statement of operations for the year then ended, the statements of changes in net assets for each of the years in the two-year period then ended and the financial highlights for each of the years in the five-year period then ended. These financial statements and financial highlights are the responsibility of the Fund's management. Our responsibility is to express an opinion on these financial statements and financial highlights based on our audits.
We conducted our audits in accordance with the standards of the Public Company Accounting Oversight Board (United States). Those standards require that we plan and perform the audits to obtain reasonable assurance about whether the financial statements and financial highlights are free of material misstatement. An audit includes examining, on a test basis, evidence supporting the amounts and disclosures in the financial statements. Our procedures included confirmation of securities owned as of December 31, 2016 by correspondence with the custodian. An audit also includes assessing the accounting principles used and significant estimates made by management, as well as evaluating the overall financial statement presentation. We believe that our audits provide a reasonable basis for our opinion.
In our opinion, the financial statements and financial highlights referred to above present fairly, in all material respects, the financial position of Lebenthal Lisanti Small Cap Growth Fund as of December 31, 2016, and the results of its operations for the year then ended, the changes in its net assets for each of the years in the two-year period then ended and its financial highlights for each of the years in the five-year period then ended, in conformity with accounting principles generally accepted in the United States of America.
BBD, LLP
Philadelphia, Pennsylvania
February 22, 2017
LEBENTHAL LISANTI SMALL CAP GROWTH FUND ADDITIONAL INFORMATION (Unaudited) DECEMBER 31, 2016 |
Investment Advisory Agreement Approval
At the September 8, 2016 Board meeting, the Board, including the Independent Trustees, considered the approval of the continuance of the investment advisory agreement between the Adviser and the Trust pertaining to the Fund (the "Advisory Agreement"). In preparation for its deliberations, the Board requested and reviewed written responses from the Adviser to a due diligence questionnaire circulated on the Board's behalf concerning the Adviser's personnel, operations, financial condition, performance, and services provided by the Adviser. The Board also discussed the materials with Fund counsel and, as necessary, with the Trust's administrator, Atlantic Fund Services. During its deliberations, the Board received an oral presentation from the Adviser, and was assisted by the advice of Trustee counsel.
At the meeting, the Board reviewed, among other matters: (1) the nature, extent and quality of the services provided to the Fund by the Adviser, including information on the investment performance of the Fund and Adviser; (2) the costs of the services provided and profitability to the Adviser of its relationship with the Fund; (3) the advisory fee and total expense ratio of the Fund compared to a relevant peer group of funds; (4) the extent to which economies of scale may be realized as the Fund grows and whether the advisory fee enables the Fund's investors to share in the benefits of economies of scale; and (5) other benefits received by the Adviser from its relationship with the Fund.
Nature, Extent and Quality of Services
Based on written materials received, a presentation from a senior representative of the Adviser, a discussion with the Adviser about the personnel, operations and financial condition of the Adviser, and a discussion with the Trust Chief Compliance Officer about the Adviser, the Board considered the quality of services provided by the Adviser under the Advisory Agreement. In this regard, the Board considered information regarding the experience, qualifications and professional background of the portfolio manager and other personnel at the Adviser with principal responsibility for the Fund, as well as the investment philosophy and decision-making process of such professionals and the capability and integrity of the Adviser's senior management and staff.
The Board considered also the adequacy of the Adviser's resources. The Board noted the Adviser's representation that the firm remained financially stable and has the operational capability and the necessary staffing and experience to continue providing high-quality investment advisory services to the Fund. The Board also noted the Adviser's representation that it was pleased with the advantages that resulted from its recent association with Lebenthal Asset Management, including the benefits derived from the consolidation and scaling of certain back office and compliance functions and the marketing advantages from being linked to a well-established name in the financial services industry. Based on the presentation and the materials provided by the Adviser in connection with the Board's consideration of the renewal of the Advisory Agreement, the Board concluded that, overall, it was satisfied with the nature, extent and quality of services to be provided to the Fund under the Advisory Agreement.
LEBENTHAL LISANTI SMALL CAP GROWTH FUND ADDITIONAL INFORMATION (Unaudited) DECEMBER 31, 2016 |
Performance
In connection with a presentation by the Adviser regarding its approach to managing the Fund, the Board reviewed the performance of the Fund compared to its benchmark. The Board observed that the Fund underperformed the Russell 2000 Growth Index, the Fund's primary benchmark index, for the one-, three-, five-, and 10-year periods ended June 30, 2016. The Board also considered the Fund's performance relative to an independent peer group of funds identified by Broadridge Financial Solutions, Inc. ("Broadridge") noting that, based on the information provided by Broadridge, the Fund underperformed the median of its Broadridge peers over the one- and three-year periods ended June 30, 2016, but had outperformed the median of its Broadridge peers over the five-year period ended June 30, 2016. The Board noted the Adviser's representation that the Fund's underperformance for the applicable periods could be attributed, in part, to the Fund's sector allocations relative to the primary benchmark index and the Fund's Broadridge peers. The Board noted the Adviser's representation that, although performance was down for small capitalization growth companies generally over the periods, the performance of the Fund since its inception had been positive. The Board also noted the Adviser's representation that the Fund's performance had rebounded more recently, having outperformed the index over the three-month period ended August 31, 2016. Based on the foregoing, the Board determined that the Fund's performance was reasonable and that the Fund and its shareholders could expect to benefit from the Adviser's management under the Advisory Agreement.
Compensation
The Board evaluated the Adviser's compensation for providing advisory services to the Fund and analyzed comparative information on actual advisory fee rates and actual total expenses of the relevant Broadridge peer group of the Fund. The Board noted that the Adviser's actual advisory fee rate for the Fund was less than the median of its Broadridge peer group, but that the actual total expense ratio was higher than the median of its Broadridge peer group. The Board also noted that the Adviser had entered into a contractual expense cap with respect to the Fund in order to limit the net annual operating expenses paid by the Fund. The Board concluded that the advisory fee rate charged to the Fund appeared to be within a reasonable range in light of the services the Adviser provides to the Fund.
Cost of Services and Profitability
The Board considered information provided by the Adviser regarding its costs of services and its profitability with respect to the Fund. In this regard, the Board considered the Adviser's resources devoted to the Fund, as well as the Adviser's discussion of the aggregate costs and profitability of its Fund activities. The Board noted the Adviser's representation that it does not maintain separately identifiable profit and loss information for the Fund, but that the Fund was believed to be less profitable than the Adviser's other advisory business due, in part, to the costs of compliance with regulatory requirements applicable to the Fund, and due to the added level of client service resources dedicated to the Fund relative to its other advisory business. The Board also noted the Adviser's representation that it continued to subsidize the Fund to ensure that the expenses of the Fund remained at a competitive level. Based on these and other applicable considerations, the Board concluded that the projected profits attributable to the Adviser's management of the Fund were reasonable.
Economies of Scale
The Board evaluated whether the Fund would benefit from any economies of scale. In this respect, the Board noted the small size of the Fund and the Adviser's representation that the Fund could benefit from economies of scale as assets grow, but that the Adviser had determined that breakpoints were not appropriate at this time, particularly in light of the payments that the Adviser has made, and continues to make, under the contractual expense cap. The Board further noted the Adviser's representation that it was not an industry standard to provide for breakpoints on small capitalization growth funds because of the costly, research-intensive nature of operating such funds. Based on the foregoing information, the Board concluded that economies of scale were not a material factor in approving the Advisory Agreement.
Other Benefits
The Board noted the Adviser's representation that it would be receiving a benefit arising from the use of soft dollars in connection with Fund trades, which will be used for the acquisition of research that may benefit not only the Fund, but potentially other clients of the Adviser. The Board concluded that the other benefits received were not a material factor in approving the Advisory Agreement.
Conclusion
The Board did not identify any single factor as being of paramount importance, and different Trustees may have given different weight to different factors. The Board reviewed a memorandum from Fund counsel discussing the legal standards applicable to its consideration of the Advisory Agreement. Based on its review, including consideration of each of the factors referenced above, the Board determined, in the exercise of its reasonable business judgment, that the advisory arrangements, as outlined in the Advisory Agreement, were fair and reasonable in light of the services performed or to be performed, expenses incurred or to be incurred and such other matters as the Board considered relevant.
Proxy Voting Information
A description of the policies and procedures that the Fund uses to determine how to vote proxies relating to securities held in the Fund's portfolio is available, without charge and upon request, by calling (800) 441-7031, on the Fund's website at www.lebenthal-lisantismallcap.com and on the SEC's website at www.sec.gov. The Fund's proxy voting record for the most recent twelve-month period ended June 30 is available, without charge and upon request, by calling (800) 441-7031, on the Fund's website at www.lebenthal-lisantismallcap.com and on the SEC's website at www.sec.gov.
Availability of Quarterly Portfolio Schedules
The Fund files its complete schedule of portfolio holdings with the SEC for the first and third quarters of each fiscal year on Form N-Q. These filings are available, without charge and upon request on the SEC's website at www.sec.gov or may be reviewed and copied at the SEC's Public Reference Room in Washington, DC. Information on the operation of the Public Reference Room may be obtained by calling (800) SEC-0330.
Shareholder Expense Example
As a shareholder of the Fund, you incur two types of costs: (1) transaction costs, including redemption fees and exchange fees, and (2) ongoing costs, including management fees and other Fund expenses. This example is intended to help you understand your ongoing costs (in dollars) of investing in the Fund, and to compare these costs with the ongoing costs of investing in other mutual funds.
The example is based on an investment of $1,000 invested at the beginning of the period and held for the entire period from July 1, 2016, through December 31, 2016.
Actual Expenses – The first line of the table below provides information about actual account values and actual expenses. You may use the information in this line, together with the amount you invested, to estimate the expenses that you paid over the period. Simply divide your account value by $1,000 (for example, an $8,600 account value divided by $1,000 = 8.6), then multiply the result by the number in the first line under the heading entitled "Expenses Paid During Period" to estimate the expenses you paid on your account during the period.
Hypothetical Example for Comparison Purposes – The second line of the table below provides information about hypothetical account values and hypothetical expenses based on the Fund's actual expense ratio and an assumed rate of return of 5% per year before expenses, which is not the Fund's actual return. The hypothetical account values and expenses may not be used to estimate the actual ending account balance or expenses you paid for the period. You may use this information to compare the ongoing costs of investing in the Fund and other funds. To do so, compare this 5% hypothetical example with the 5% hypothetical examples that appear in the shareholder reports of other funds.
Please note that the expenses shown in the table are meant to highlight your ongoing costs only and do not reflect any transactional costs, such as redemption fees and exchange fees. Therefore, the second line of the table is useful in comparing ongoing costs only, and will not help you determine the relative total costs of owning different funds. In addition, if these transactional costs had been included, your costs would have been higher.
| | Beginning | | Ending | | Expenses | | Annualized |
| | Account Value | | Account Value | | Paid During | | Expense |
| | July 1, 2016 | | December 31, 2016 | | Period* | | Ratio* |
| Actual | $ | 1,000.00 | | $ | 1,165.87 | | $ | 9.80 | | 1.80 | % |
| Hypothetical (5% return before expenses) | $ | 1,000.00 | | $ | 1,016.09 | | $ | 9.12 | | 1.80 | % |
* Expenses are equal to the Fund's annualized expense ratio multiplied by the average account value over the period, multiplied by the number of days in the most recent fiscal half-year (184) divided by 366 to reflect the half-year period.
Trustees and Officers of the Trust
The Board is responsible for oversight of the management of the Trust's business affairs and of the exercise of all the Trust's powers except those reserved for the shareholders. The following table provides information about each Trustee and certain officers of the Trust. Each Trustee and officer holds office until the person resigns, is removed, or is replaced. Unless otherwise noted, the persons have held their principal occupations for more than five years. The address for all Trustees and officers is Three Canal Plaza, Suite 600, Portland, Maine 04101. Mr. Keffer is considered an Interested Trustee due to his affiliation with Atlantic. The Fund's Statement of Additional Information includes additional information about the Trustees and is available, without charge and upon request, by calling (800) 441-7031, on the Fund's website at www.lebenthal-lisantismallcap.com.
LEBENTHAL LISANTI SMALL CAP GROWTH FUND ADDITIONAL INFORMATION (Unaudited) DECEMBER 31, 2016 |

The views expressed in this report are those of the investment advisor of The BeeHive Fund (the "Fund") as of December 31, 2016, and may not reflect its views on the date this report is first published or any time thereafter. These views are intended to assist shareholders of the Fund in understanding their investments in the Fund and do not constitute investment advice. The Fund is subject to various forms of risk, including the possible loss of principal. Investing in foreign securities entails risks not associated with domestic equities, including economic and political instability and currency fluctuations. Investing in fixed income securities includes the risk that rising interest rates will cause a decline in values. Focused investments in particular industries or market sectors can entail increased volatility and greater market risk than is the case with more broadly diversified investments. Investments in securities of small and mid-capitalization companies involve the possibility of greater volatility than investments in larger capitalization companies. Investments in American Depositary Receipts involve many of the same risks as investing in foreign securities.
THE BEEHIVE FUND A MESSAGE TO OUR SHAREHOLDERS (Unaudited) DECEMBER 31, 2016 |
Dear Shareholder,
A Look Back
It is useful to view 2016 in two parts, each with distinctly different market environments. To do so, it is easy to point to a single date that served as the inflection point, and provided a change of leadership. The dividing date was not, however, November 8, but February 11.
Over the first five and a half weeks of the year, the S&P 500 index declined nearly 11%. A sharp decline in the corporate bond market accompanied by a near liquidity crisis in junk bonds made it feel worse. Only the utility sector eked out a positive return; the consumer staple sector was the runner-up with a negative 2% return.
Even without the benefit of a precipitating event, stock and bond markets turned on a dime on February 11. The S&P 500 advanced more than 25% from that date to year-end, accompanied by a clear change in market leadership. The former leaders faded and were replaced by financials and energy, which showed substantial appreciation (50% and 45% respectively) for the duration of the year. The next best performers during the period were industrials and materials, both advancing by more than 33%.
Out of these dry facts, a clear pattern emerges. While safety was of paramount concern at the beginning of the year, by mid-winter, investors began to move decisively toward those industries that benefit most from a stronger economy (energy, materials and industrials) and higher interest rates (financials).
The BeeHive Fund
The BeeHive Fund ("Fund") has benefitted from this rotation and has kept pace with the strong market rise since February. That pattern of results held true for the fourth quarter. Having been a significant drag on returns in January and February, Fund positions in the financial sector have since been meaningfully positive contributors. This was especially true over the last three months. As forcefully as we could, we argued that the group was simply too cheap during the first half of the year. Extremely attractive valuations gave us the patience to maintain significant exposure to high quality banks and insurance companies. Our patience was rewarded.
Unfortunately, the same cannot yet be said for our healthcare investments. As a whole, healthcare has been the most challenging of the broad economic sectors, being the only one to exhibit a negative return for the year. Rising healthcare costs are a concern to all and became an oft-mentioned feature of the campaign trail. As we have written before, a number of bad actors cast an unflattering light on the entire sector. Understandably, investors shied away.
The underperformance was exacerbated over the last few weeks of the year, as investors scrambled to realize whatever tax losses might be available. Just as we did with financial stocks earlier, we firmly believe that the Fund's healthcare investments have potential for meaningful future appreciation. The companies we hold are not bad actors. Their earnings should grow at an attractive rate. Valuations are well below normal. We believe that the laggards of 2016 will become leaders of the future.
Looking Forward
Price is always a good indicator of what investors think, or hope, will happen next. The market as a whole is trading at its highest valuation (as measured by a multiple of anticipated earnings) since the 2008 crisis. Economically sensitive sectors are likewise at high valuations. Defensive sectors (utilities, consumer staples and healthcare) are not. Investors are banking on stronger economic growth leading to an above average increase in earnings.
In order for this to occur, investors seem to be assuming that the U.S. economy will receive assistance from the new administration. Growth-friendly policies might include lower individual and corporate taxes (including some form of incentive for corporations to repatriate at least a portion of the $2.6 trillion they hold abroad) and higher government spending. To a certain extent, the assumption
THE BEEHIVE FUND A MESSAGE TO OUR SHAREHOLDERS (Unaudited) DECEMBER 31, 2016 |
of lower corporate taxes is already reflected in stock prices. Since the election, those companies that would benefit most have outperformed those with already low tax rates.
We think there is a potential wild-card that may contribute to stronger economic growth. We have come to the conclusion that ultra-low interest rates have had the unintended consequence of dampening consumer confidence, thereby keeping a lid on spending.
The theory of aggressive monetary stimulus is that lower interest rates will induce consumers and corporations alike to borrow cheap money and spend more aggressively. In fact, U.S. consumers did just the opposite, paying down mortgage and credit-card debt, while spending (as a percentage of Gross Domestic Product ("GDP")) stagnated even in the face of the massive windfall of lower energy prices. We think the most logical explanation for this phenomenon is that consumers (especially baby-boomers) recognized that they had to spend less and save more because their capital was earning an inadequate rate of return to fund retirement.
Corporations did in fact take advantage of cheap money by increasing their debt. However, faced with few opportunities to grow revenues, the proceeds of their borrowings went to stock buybacks rather than expanding operations and hiring workers.
Starting in mid-summer, interest rates began to rise around the world. We think that a more normal environment may increase confidence and lead to stronger consumer spending. Personal consumption is roughly two-thirds of total GDP, so the impact could be meaningful. The most recent robust reading of the Michigan Consumer Sentiment survey, and early reports of increased holiday sales, seem to support this theory, but it is too soon to know for sure.
Given high valuations, it appears that optimism is built into markets. Unfortunately, the environment is not without risk. A new administration always introduces an element of forecasting uncertainty; this one seems less predictable than normal. We do not think that investors have adequately accounted for foreign-policy risks, particularly those arising from trade.
Though unlikely, we believe that trade policies that live up to campaign rhetoric could cause a very negative shift in investor sentiment. While we think outright trade wars are improbable, even isolated skirmishes can have unforeseeably negative outcomes. Likewise, greater economic instability in the Eurozone or expanding hostilities in the Middle East could send investors to the sidelines.
Finally, there is always the risk that the most firmly held beliefs will turn out to be unexpectedly wrong. Today there seems to an absolute consensus that U.S. interest rates will continue to rise as the Federal Reserve follows through on its stated intention to increase the overnight borrowing rate. Tied to this is the uniformly held expectation that the U.S. dollar will continue to strengthen indefinitely. We can point to no specific evidence to suggest the imminent reversal of either of those trends; however, unvarying opinion is generally a good cause for healthy skepticism.
Looking forward, we will continue to focus on individual companies and try to take advantage of idiosyncratic opportunities. We will stick to our bedrock belief that successful investing is the product of careful study of the specific rather than the general. We believe the healthcare sector overall is undervalued, but some companies are well positioned to prosper; others will face significant challenges, just as banks and insurance companies outperformed other constituents of the financial sector.
We will not ignore the broader market environment, especially considering the unusually high level of unpredictability surrounding the new administration. As one does, we have drawn a line down the middle of a legal pad and stacked the reasons for optimism on the left and caution on the right. As a backdrop to the overall investment climate, the two columns are fairly well-balanced. Higher than average current valuations, however, argue for somewhat greater than usual caution. Consequently, we have maintained larger than average cash reserves. In part this should serve as a cushion in case of a broad market sell-off. More likely, the cash will allow us to take advantage of bargains should surprises create opportunities.
Regards,
Spears Abacus
THE BEEHIVE FUND PERFORMANCE CHART AND ANALYSIS (Unaudited) DECEMBER 31, 2016 |
The following chart reflects the change in the value of a hypothetical $10,000 investment, including reinvested dividends and distributions, in The BeeHive Fund compared with the performance of the benchmark S&P 500 Index (the "S&P 500") since inception. The S&P 500 is a broad-based, unmanaged measurement of changes in stock market conditions based on the average of 500 widely held common stocks. The total return of the S&P 500 includes the reinvestment of dividends and income. The total return of the Fund includes operating expenses that reduce returns, while the total return of the S&P 500 does not include expenses. The Fund is professionally managed, while the S&P 500 is unmanaged and is not available for investment.
Comparison of Change in Value of a $10,000 Investment
in The BeeHive Fund vs. S&P 500 Index
| Average Annual Total Returns as of 12/31/16 | | One Year | | Five Year | | Since Inception 09/02/08 |
| The BeeHive Fund | | 6.11 | % | | 11.19 | % | | 7.66 | % |
| S&P 500 Index | | 11.96 | % | | 14.66 | % | | 9.33 | % |
Performance data quoted represents past performance and is no guarantee of future results. Current performance may be lower or higher than the performance data quoted. Investment return and principal value will fluctuate so that shares, when redeemed, may be worth more or less than original cost. For the most recent month-end performance, please call (866) 684-4915. As stated in the Fund's prospectus, the annual operating expense ratio (gross) is 0.98%. However, the Fund's advisor has contractually agreed to waive its fee and/or reimburse expenses to limit Total Annual Fund Operating Expenses (excluding taxes, interest, portfolio transaction expenses, and extraordinary expenses) to 0.99%, through April 30, 2017 ("Expense Cap"). The advisor may be reimbursed by the Fund for fees waived and expenses reimbursed by the advisor pursuant to the Expense Cap if such payment is made within three years of the fee waiver or expense reimbursement and does not cause the Fund's total operating expenses (excluding taxes, interest, portfolio transaction expenses, and extraordinary expenses) to exceed the annual rate of average daily assets of the Fund. The Expense Cap may be raised or eliminated only with the consent of the Board of Trustees. Total Annual Fund Operating Expenses After Fee Waiver and/or Expense Reimbursement will increase if exclusions from the Expense Cap apply.The performance table and graph do not reflect the deduction of taxes that a shareholder would pay on Fund distributions or the redemption of Fund shares. Returns greater than one year are annualized.
THE BEEHIVE FUND SCHEDULE OF INVESTMENTS DECEMBER 31, 2016 |
| Shares | | Security Description | | Value | |
| Common Stock - 92.8% |
| Consumer Discretionary - 11.2% |
| | 8,047 | | Adient PLC (a) | $ | 471,554 | |
| | 83,880 | | Comcast Corp., Class A | | 5,791,914 | |
| | 64,850 | | Delphi Automotive PLC | | 4,367,648 | |
| | 13,930 | | Whirlpool Corp. | | 2,532,056 | |
| | | 13,163,172 | |
| Energy - 2.6% |
| | 36,420 | | Schlumberger, Ltd. | | 3,057,459 | |
| Financials - 26.2% |
| | 105,250 | | American International Group, Inc. | | 6,873,878 | |
| | 44,350 | | Chubb, Ltd. | | 5,859,522 | |
| | 100,430 | | CIT Group, Inc. | | 4,286,352 | |
| | 63,437 | | Citigroup, Inc. | | 3,770,061 | |
| | 53,700 | | JPMorgan Chase & Co. | | 4,633,773 | |
| | 100,874 | | MetLife, Inc. | | 5,436,100 | |
| | | 30,859,686 | |
| Health Care - 14.4% |
| | 23,372 | | Allergan PLC (a) | | 4,908,354 | |
| | 40,340 | | Celgene Corp. (a) | | 4,669,355 | |
| | 27,955 | | Gilead Sciences, Inc. | | 2,001,858 | |
| | 38,345 | | Thermo Fisher Scientific, Inc. | | 5,410,479 | |
| | | 16,990,046 | |
| Industrials - 19.7% |
| | 58,130 | | Danaher Corp. | | 4,524,839 | |
| | 76,820 | | Delta Air Lines, Inc. | | 3,778,776 | |
| | 29,065 | | Fortive Corp. | | 1,558,756 | |
| | 187,310 | | General Electric Co. | | 5,918,996 | |
| | 80,477 | | Johnson Controls International PLC | | 3,314,848 | |
| | 36,355 | | United Parcel Service, Inc., Class B | | 4,167,737 | |
| | | 23,263,952 | |
| Materials - 2.6% |
| | 40,150 | | Ball Corp. | | 3,014,060 | |
| Software & Services - 11.7% |
| | 3,082 | | Alphabet, Inc., Class A (a) | | 2,442,331 | |
| | 2,251 | | Alphabet, Inc., Class C (a) | | 1,737,367 | |
| | 79,830 | | Microsoft Corp. | | 4,960,636 | |
| | 119,780 | | Oracle Corp. | | 4,605,541 | |
| | | 13,745,875 | |
| Technology Hardware & Equipment - 4.4% |
| | 45,250 | | Apple, Inc. | | 5,240,855 | |
Total Common Stock (Cost $69,475,390) | | 109,335,105 | |
| Money Market Fund - 7.2% |
| | 8,486,086 | | Goldman Sachs Financial Square Funds, 0.36% (b) (Cost $8,486,086) | | 8,486,086 | |
Total Investments - 100.0% (Cost $77,961,476)* | $ | 117,821,191 | |
Other Assets & Liabilities, Net – 0.0% | | 27,542 | |
Net Assets – 100.0% | $ | 117,848,733 | |
| PLC | Public Limited Company |
| (a) | Non-income producing security. |
| (b) | Variable rate security. Rate presented is as of December 31, 2016. |
* Cost for federal income tax purposes is $77,993,412 and net unrealized appreciation consists of:
| ASSETS | | | | |
| . | Total investments, at value (Cost $77,961,476) | | $ | 117,821,191 | |
| | Cash | | | 13,400 | |
| | Receivables: | | | | |
| | | Dividends | | | 152,225 | |
| | Prepaid expenses | | | 3,971 | |
| Total Assets | | | 117,990,787 | |
| | | | | | | |
| LIABILITIES | | | | |
| | Payables: | | | | |
| | | Fund shares redeemed | | | 14,525 | |
| | | Distributions payable | | | 10,810 | |
| | Accrued Liabilities: | | | | |
| | | Investment advisor fees | | | 74,580 | |
| | | Trustees' fees and expenses | | | 260 | |
| | | Fund services fees | | | 15,263 | |
| | | Other expenses | | | 26,616 | |
| Total Liabilities | | | 142,054 | |
| | | | | | | |
| NET ASSETS | | $ | 117,848,733 | |
| | | | | | | |
| COMPONENTS OF NET ASSETS | | | | |
| | Paid-in capital | | $ | 78,020,886 | |
| | Undistributed net investment income | | | 48 | |
| | Accumulated net realized loss | | | (31,916 | ) |
| | Net unrealized appreciation | | | 39,859,715 | |
| NET ASSETS | | $ | 117,848,733 | |
| SHARES OF BENEFICIAL INTEREST AT NO PAR VALUE (UNLIMITED SHARES AUTHORIZED) | | | 8,261,560 | |
| NET ASSET VALUE, OFFERING AND REDEMPTION PRICE PER SHARE | | $ | 14.26 | |
| | | | | | | |
See Notes to Financial Statements. | 5 | |
THE BEEHIVE FUND STATEMENT OF OPERATIONS YEAR ENDED DECEMBER 31, 2016 |
| INVESTMENT INCOME | | | | | | |
| | Dividend income | . | | $ | 2,192,314 | | |
| Total Investment Income | | | | 2,192,314 | | |
| Advisor | | | | | | |
| EXPENSES | | | | | | |
| | Investment advisor fees | | | 829,657 | | |
| | Fund services fees | | | 175,204 | | |
| | Custodian fees | | | 11,969 | | |
| | Registration fees | | | 5,902 | | |
| | Professional fees | | | 41,986 | | |
| | Trustees' fees and expenses | | | 10,966 | | |
| | Miscellaneous expenses | | | 28,831 | | |
| Total Expenses | | | | 1,104,515 | | |
| | Fees waived and expenses reimbursed | | | (9,371 | ) | |
| Net Expenses | | | | 1,095,144 | | |
| | | | | | | | |
| NET INVESTMENT INCOME | | | | 1,097,170 | | |
| | | | | | | | |
| NET REALIZED AND UNREALIZED GAIN (LOSS) | | | | | | |
| | Net realized gain on investments | | | 1,783,848 | | |
| | Net change in unrealized appreciation (depreciation) on investments | | | 3,997,708 | | |
| NET REALIZED AND UNREALIZED GAIN | | | | 5,781,556 | | |
| INCREASE IN NET ASSETS RESULTING FROM OPERATIONS | | | $ | 6,878,726 | | |
See Notes to Financial Statements. | 6 | |
THE BEEHIVE FUND STATEMENTS OF CHANGES IN NET ASSETS |
| | | | | For the Year Ended December 31, 2016 | | | For the Year Ended December 31, 2015 |
| OPERATIONS | | | | | | | | | |
| | Net investment income | | $ | 1,097,170 | | | | $ | 667,832 | |
| | Net realized gain (loss) | | | 1,783,848 | | | | | (1,099,346 | ) |
| | Net change in unrealized appreciation (depreciation) | | | 3,997,708 | | | | | (1,225,425 | ) |
| Increase (Decrease) in Net Assets Resulting from Operations | | | 6,878,726 | | | | | (1,656,939 | ) |
| | | | | | | | | | | | |
| DISTRIBUTIONS TO SHAREHOLDERS FROM | | | | | | | | | |
| | Net investment income | | | (1,097,141 | ) | | | | (667,776 | ) |
| | Net realized gain | | | (652,021 | ) | | | | (1,703,272 | ) |
| Total Distributions to Shareholders | | | (1,749,162 | ) | | | | (2,371,048 | ) |
| | | | | | | | | | | | |
| CAPITAL SHARE TRANSACTIONS | | | | | | | | | |
| | Sale of shares | | | 3,170,306 | | | | | 3,327,908 | |
| | Reinvestment of distributions | | | 1,731,885 | | | | | 2,337,365 | |
| | Redemption of shares | | | (5,495,791 | ) | | | | (5,375,932 | ) |
| Increase (Decrease) in Net Assets from Capital Share Transactions | | (593,600 | ) | | | | 289,341 | |
| Increase (Decrease) in Net Assets | | | 4,535,964 | | | | | (3,738,646 | ) |
| | | | | | | | | | | | |
| NET ASSETS | | | | | | | | | |
| | Beginning of Year | | | 113,312,769 | | | | | 117,051,415 | |
| | End of Year (Including line (a)) | | $ | 117,848,733 | | | | $ | 113,312,769 | |
| | | | | | | | | | | | |
| SHARE TRANSACTIONS | | | | | | | | | |
| | Sale of shares | | | 244,010 | | | | | 238,415 | |
| | Reinvestment of distributions | | | 120,518 | | | | | 171,001 | |
| | Redemption of shares | | | (409,991 | ) | | | | (385,818 | ) |
| Increase (Decrease) in Shares | | | (45,463 | ) | | | | 23,598 | |
| | | | | | | | | | | | |
| (a) | Undistributed net investment income | | $ | 48 | | | | $ | 19 | |
See Notes to Financial Statements. | 7 | |
| These financial highlights reflect selected data for a share outstanding throughout each year. | | | | | | |
| | | For the Years Ended December 31, | |
| | | 2016 | | 2015 | | 2014 | | 2013 | | 2012 | |
| NET ASSET VALUE, Beginning of Year | $ | 13.64 | | | $ | 14.13 | | | $ | 13.75 | | | $ | 10.80 | | | $ | 10.35 | | |
| INVESTMENT OPERATIONS | | | | | | | | | | | | | | | | | | | | |
| Net investment income (a) | | 0.13 | | | | 0.08 | | | | 0.07 | | | | 0.05 | | | | 0.07 | | |
| Net realized and unrealized gain (loss) | | 0.70 | | | | (0.28 | ) | | | 1.00 | | | | 3.71 | | | | 1.11 | | |
| Total from Investment Operations | | 0.83 | | | | (0.20 | ) | | | 1.07 | | | | 3.76 | | | | 1.18 | | |
| DISTRIBUTIONS TO SHAREHOLDERS FROM | | | | | | | | | | | | | | | | | | | | |
| Net investment income | | (0.13 | ) | | | (0.08 | ) | | | (0.07 | ) | | | (0.05 | ) | | | (0.07 | ) | |
| Net realized gain | | (0.08 | ) | | | (0.21 | ) | | | (0.62 | ) | | | (0.76 | ) | | | (0.66 | ) | |
| Total Distributions to Shareholders | | (0.21 | ) | | | (0.29 | ) | | | (0.69 | ) | | | (0.81 | ) | | | (0.73 | ) | |
| NET ASSET VALUE, End of Year | $ | 14.26 | | | $ | 13.64 | | | $ | 14.13 | | | $ | 13.75 | | | $ | 10.80 | | |
| TOTAL RETURN | | 6.11 | % | | (1.42 | )% | | 7.87 | % | | 35.13 | % | | 11.46 | % |
| RATIOS/SUPPLEMENTARY DATA | | | | | | | | | | | | | | | | | | | | |
| Net Assets at End of Year (000's omitted) | $117,849 | | | $113,313 | | | $117,051 | | | $111,890 | | | $86,930 | | |
| Ratios to Average Net Assets: | | | | | | | | | | | | | | | | | | | | |
| Net investment income | | 0.99 | % | | 0.57 | % | | 0.50 | % | | 0.41 | % | | 0.62 | % |
| Net expenses | | 0.99 | % | | 0.99 | %(b) | 0.99 | %(b) | 0.99 | % | | 0.99 | % |
| Gross expenses | | 1.00 | %(c) | 0.98 | % | | 0.98 | % | | 1.01 | %(c) | 1.04 | %(c) |
| PORTFOLIO TURNOVER RATE | | 15 | % | | 17 | % | | 25 | % | | 28 | % | | 40 | % |
| | | | | | | | | | | | | | | | | | | | | | |
| | | | | | | | | | | | | | | | | | | | | | |
| (a) | Calculated based on average shares outstanding during each year. |
| (b) | The fees are inclusive of recoupment, which amounted to 0.01% for the year. |
| (c) | Reflects the expense ratio excluding any waivers and/or reimbursements. |
See Notes to Financial Statements. | 8 | |
THE BEEHIVE FUND NOTES TO FINANCIAL STATEMENTS DECEMBER 31, 2016 |
Note 1. Organization
The BeeHive Fund (the "Fund") is a diversified portfolio of Forum Funds (the "Trust"). The Trust is a Delaware statutory trust that is registered as an open-end, management investment company under the Investment Company Act of 1940, as amended (the "Act"). Under its Trust Instrument, the Trust is authorized to issue an unlimited number of the Fund's shares of beneficial interest without par value. The Fund commenced operations on September 2, 2008. The Fund seeks capital appreciation.
Note 2. Summary of Significant Accounting Policies
The Fund is an investment company and follows accounting and reporting guidance under Financial Accounting Standards Board ("FASB") Accounting Standards Codification ("ASC") Topic 946, "Financial Services-Investment Companies". These financial statements are prepared in accordance with accounting principles generally accepted in the United States of America ("GAAP"), which require management to make estimates and assumptions that affect the reported amounts of assets and liabilities, the disclosure of contingent liabilities at the date of the financial statements, and the reported amounts of increases and decreases in net assets from operations during the fiscal year. Actual amounts could differ from those estimates. The following summarizes the significant accounting policies of the Fund:
Security Valuation – Securities are valued at market prices using the last quoted trade or official closing price from the principal exchange where the security is traded, as provided by independent pricing services on each Fund business day. In the absence of a last trade, securities are valued at the mean of the last bid and ask price provided by the pricing service. Shares of non-exchange-traded open-end mutual funds are valued at net asset value ("NAV"). Short-term investments that mature in 60 days or less may be valued at amortized cost.
The Fund values its investments at fair value pursuant to procedures adopted by the Trust's Board of Trustees (the "Board") if (1) market quotations are insufficient or not readily available or (2) the Fund believes that the values available are unreliable. The Trust's Valuation Committee, as defined in the Fund's registration statement, performs certain functions as they relate to the administration and oversight of the Fund's valuation procedures. Under these procedures, the Valuation Committee convenes on a regular and ad-hoc basis to review such investments and considers a number of factors, including valuation methodologies and significant unobservable inputs, when arriving at fair value.
The Valuation Committee may work with the Advisor, as defined in Note 3, to provide valuation inputs. In determining fair valuations, inputs may include market-based analytics which may consider related or comparable assets or liabilities, recent transactions, market multiples, book values and other relevant investment information. Advisor inputs may include an income-based approach in which the anticipated future cash flows of the investment are discounted in determining fair value. Discounts may also be applied based on the nature or duration of any restrictions on the disposition of the investments. The Valuation Committee performs regular reviews of valuation methodologies, key inputs and assumptions, disposition analysis and market activity.
Fair valuation is based on subjective factors and, as a result, the fair value price of an investment may differ from the security's market price and may not be the price at which the asset may be sold. Fair valuation could result in a different NAV than a NAV determined by using market quotes.
The Fund has a three-tier fair value hierarchy. The basis of the tiers is dependent upon the various "inputs" used to determine the value of the Fund's investments. These inputs are summarized in the three broad levels listed below:
Level 1 — quoted prices in active markets for identical assets and liabilities
Level 2 — other significant observable inputs (including quoted prices of similar securities, interest rates, prepayment speeds, credit risk, etc.)
Level 3 — significant unobservable inputs (including the Fund's own assumptions in determining the fair value of investments)
The aggregate value by input level, as of December 31, 2016, for the Fund's investments is included at the end of the Fund's Schedule of Investments.
Security Transactions, Investment Income and Realized Gain and Loss – Investment transactions are accounted for on the trade date. Dividend income is recorded on the ex-dividend date. Foreign dividend income is recorded on the ex-dividend date or as soon as possible after the Fund determines the existence of a dividend declaration after exercising reasonable due diligence. Income and capital gains on some foreign securities may be subject to foreign withholding taxes, which are accrued as applicable. Interest income is recorded on an accrual basis. Premium is amortized and discount is accreted using the effective interest method. Identified cost of investments sold is used to determine the gain and loss for both financial statement and federal income tax purposes.
Distributions to Shareholders – The Fund declares any dividends from net investment income and pays them annually. Any net capital gains realized by the Fund are distributed at least annually. Distributions to shareholders are recorded on the ex-dividend date. Distributions are based on amounts calculated in accordance with applicable federal income tax regulations, which may differ from GAAP. These differences are due primarily to differing treatments of income and gain on various investment securities held by the Fund, timing differences and differing characterizations of distributions made by the Fund.
Federal Taxes – The Fund intends to continue to qualify each year as a regulated investment company under Subchapter M of Chapter 1, Subtitle A, of the Internal Revenue Code of 1986, as amended ("Code"), and to distribute all of its taxable income to shareholders. In addition, by distributing in each calendar year substantially all of its net investment income and capital gains, if any, the Fund will not be subject to a federal excise tax. Therefore, no federal income or excise tax provision is required. The Fund files a U.S. federal income and excise tax return as required. The Fund's federal income tax returns are subject to examination by the Internal Revenue Service for a period of three fiscal years after they are filed. As of December 31, 2016, there are no uncertain tax positions that would require financial statement recognition, de-recognition or disclosure.
Income and Expense Allocation – The Trust accounts separately for the assets, liabilities and operations of each of its investment portfolios. Expenses that are directly attributable to more than one investment portfolio are allocated among the respective investment portfolios in an equitable manner.
Commitments and Contingencies – In the normal course of business, the Fund enters into contracts that provide general indemnifications by the Fund to the counterparty to the contract. The Fund's maximum exposure under these arrangements is dependent on future claims that may be made against the Fund and, therefore, cannot be estimated; however, based on experience, the risk of loss from such claims is considered remote.
Note 3. Fees and Expenses
Investment Advisor – Spears Abacus Advisors LLC (the "Advisor") is the investment advisor to the Fund. Pursuant to an investment advisory agreement, the Advisor receives an advisory fee, payable monthly, from the Fund at an annual rate of 0.75% of the Fund's average daily net assets.
Distribution – Foreside Fund Services, LLC serves as the Fund's distributor (the "Distributor"). The Distributor is not affiliated with the Advisor or Atlantic Fund Administration, LLC (d/b/a Atlantic Fund Services) ("Atlantic") or their affiliates. The Fund has adopted a distribution plan in accordance with Rule 12b-1 of the Act. The Fund may pay the Distributor and/or any other entity as authorized by the Board a fee up to 0.25% of the Fund's average daily net assets. The Fund has suspended payments under its Rule 12b-1 plan until further notice and has not paid any distribution fees to date. The Fund may remove the suspension and make payments under the Rule 12b-1 plan at any time, subject to Board approval.
Other Service Providers – Atlantic provides fund accounting, fund administration, compliance and transfer agency services to the Fund. The fees related to these services are included in Fund services fees within the Statement of Operations. Atlantic also provides certain shareholder report production and EDGAR conversion and filing services. Pursuant to an Atlantic services agreement, the Fund pays Atlantic customary fees for its services. Atlantic provides a Principal Executive Officer, a Principal Financial Officer, a Chief Compliance Officer and an Anti-Money Laundering Officer to the Fund, as well as certain additional compliance support functions.
Trustees and Officers – The Trust pays each independent Trustee an annual fee of $50,000 for service to the Trust ($66,000 for the Chairman), and the Audit Committee Chairman and Vice Chairman receive an additional $6,000 annually. The Trustees and Chairman may receive additional fees for special Board meetings. Each Trustee is also reimbursed for all reasonable out-of-pocket
THE BEEHIVE FUND NOTES TO FINANCIAL STATEMENTS DECEMBER 31, 2016 |
expenses incurred in connection with his duties as a Trustee, including travel and related expenses incurred in attending Board meetings. The amount of Trustees' fees attributable to the Fund is disclosed in the Statement of Operations. Certain officers of the Trust are also officers or employees of the above named service providers, and during their terms of office received no compensation from the Fund.
Note 4. Expense Reimbursements and Fees Waived
The Advisor has contractually agreed to waive a portion of its fee and reimburse certain expenses through April 30, 2017, to limit total annual Fund operating expenses (excluding taxes, interest, portfolio transaction expenses and extraordinary expenses) to 0.99%. For the year ended December 31, 2016, the Advisor waived $9,371.
The Fund may repay the Advisor for fees waived and expenses reimbursed pursuant to the expense cap if such payment is made within three years of the fee waiver or expense reimbursement and the resulting expenses do not exceed the lesser of (i) the then-current expense cap, or (ii) the expense cap in place at the time the fees/expenses were waived/reimbursed. As of December 31, 2016, $9,371 is subject to recapture by the Advisor.
Note 5. Security Transactions
The cost of purchases and proceeds from sales of investment securities (including maturities), other than short-term investments during the year ended December 31, 2016, were $15,621,828 and $20,374,306, respectively.
Note 6. Federal Income Tax
Distributions paid during the fiscal years ended as noted were characterized for tax purposes as follows:
To the Board of Trustees of Forum Funds
and the Shareholders of The BeeHive Fund
We have audited the accompanying statement of assets and liabilities of The BeeHive Fund (the "Fund"), a series of shares of beneficial interest in Forum Funds, including the schedule of investments, as of December 31, 2016, and the related statement of operations for the year then ended, the statements of changes in net assets for each of the years in the two-year period then ended and the financial highlights for each of the years in the five-year period then ended. These financial statements and financial highlights are the responsibility of the Fund's management. Our responsibility is to express an opinion on these financial statements and financial highlights based on our audits.
We conducted our audits in accordance with the standards of the Public Company Accounting Oversight Board (United States). Those standards require that we plan and perform the audits to obtain reasonable assurance about whether the financial statements and financial highlights are free of material misstatement. An audit includes examining, on a test basis, evidence supporting the amounts and disclosures in the financial statements. Our procedures included confirmation of securities owned as of December 31, 2016 by correspondence with the custodian. An audit also includes assessing the accounting principles used and significant estimates made by management, as well as evaluating the overall financial statement presentation. We believe that our audits provide a reasonable basis for our opinion.
In our opinion, the financial statements and financial highlights referred to above present fairly, in all material respects, the financial position of The BeeHive Fund as of December 31, 2016, and the results of its operations for the year then ended, the changes in its net assets for each of the years in the two-year period then ended and its financial highlights for each of the years in the five-year period then ended, in conformity with accounting principles generally accepted in the United States of America.
BBD, LLP
Philadelphia, Pennsylvania
February 22, 2017
THE BEEHIVE FUND ADDITIONAL INFORMATION (Unaudited) DECEMBER 31, 2016 |
Investment Advisory Agreement Approval
At the September 8, 2016 Board meeting, the Board, including the Independent Trustees, considered the approval of the continuance of the investment advisory agreement between the Advisor and the Trust pertaining to the Fund (the "Advisory Agreement"). In preparation for its deliberations, the Board requested and reviewed written responses from the Advisor to a due diligence questionnaire circulated on the Board's behalf concerning the Advisor's personnel, operations, financial condition, performance, and services provided by the Advisor. The Board also discussed the materials with Fund counsel and, as necessary, with the Trust's administrator, Atlantic Fund Services. During its deliberations, the Board received an oral presentation from the Advisor, and was assisted by the advice of Trustee counsel.
At the meeting, the Board reviewed, among other matters: (1) the nature, extent and quality of the services provided to the Fund by the Advisor, including information on the investment performance of the Fund and the Advisor; (2) the costs of the services provided and profitability to the Advisor of its relationship with the Fund; (3) the advisory fee and total expense ratio of the Fund compared to a relevant peer group of funds; (4) the extent to which economies of scale may be realized as the Fund grows and whether the advisory fee enables the Fund's investors to share in the benefits of economies of scale; and (5) other benefits received by the Advisor from its relationship with the Fund.
Nature, Extent and Quality of Services
Based on written materials received, a presentation from senior representatives of the Advisor and a discussion with the Advisor about the Advisor's personnel, operations and financial condition and with the Trust's Chief Compliance Officer about the Advisor, the Board considered the quality of services provided by the Advisor under the Advisory Agreement. In this regard, the Board considered information regarding the experience, qualifications and professional background of the portfolio manager and other personnel at the Advisor with principal responsibility for the Fund, as well as the investment philosophy and decision-making process of those professionals and the capability and integrity of the Advisor's senior management and staff.
The Board considered also the adequacy of the Advisor's resources. The Board noted the Advisor's representation that the firm is in stable financial condition and that the Advisor has the operational capability and the necessary staffing and experience to continue providing high-quality investment advisory services to the Fund for the foreseeable future. Based on the presentation and the materials provided by the Advisor in connection with the Board's consideration of the renewal of the Advisory Agreement, the Board concluded that, overall, it was satisfied with the nature, extent and quality of services to be provided to the Fund under the Advisory Agreement.
Performance
In connection with a presentation by the Advisor regarding its approach to managing the Fund, the Board reviewed the performance of the Fund compared to its benchmark. The Board observed that the Fund underperformed the S&P 500 Index, the primary benchmark for the Fund, for the one-, three-, and five-year periods ended June 30, 2016. The Board also considered the Fund's performance relative to an independent peer group of funds identified by Broadridge Financial Solutions, Inc. ("Broadridge") noting that, based on the information provided by Broadridge, the Fund underperformed the median of its Broadridge peers for the one-, three-, and five-year periods ended June 30, 2016. The Board noted the Advisor's representation that the Fund's underperformance relative to its peer group and benchmark index over the short-term could be attributed to the Fund's overweight positions in non-REIT financial stocks, which were out of favor in the market, and the Fund's absence of any investments in the consumer staples and utility stocks, which were believed by the Advisor to be overvalued, but experienced periods of outperformance relative to the market as a whole. The Board also noted the Advisor's representation that the Fund's longer-term underperformance was largely attributable to the effects on performance during the past two years of a decline in interest rates, which had resulted in increased investments in securities such as consumer staples and utilities stocks, that in the Fund's view caused them to be overvalued. Finally, the Board noted the Advisor's representation that the Fund's holdings that were primary factors in negatively affecting the Fund's performance over the short term had largely stabilized or recovered since the end of June 2016, that the Fund's portfolio possessed favorable growth prospects, and that the stocks were believed to have started to favorably contribute to the Fund's relative performance. Based on the foregoing, the Board determined that the Fund's performance was reasonable and that the Fund and its shareholders could benefit from the Advisor's continued management of the Fund.
THE BEEHIVE FUND ADDITIONAL INFORMATION (Unaudited) DECEMBER 31, 2016 |
Compensation
The Board evaluated the Advisor's compensation for providing advisory services to the Fund and analyzed comparative information on actual advisory fee rates and actual total expenses of the Fund's relevant Broadridge peer group. The Board noted that the Advisor's actual advisory fee rate and the actual total expense ratio for the Fund were each higher than the median of the Broadridge peers. The Board further noted the Advisor's representation that the Advisor's standard fee schedule is applied with respect to the Fund, although regulatory requirements necessitate a disproportionate amount of time and effort be spent on the Fund as compared to the Advisor's other accounts. Based on the foregoing, the Board concluded that the Advisor's advisory fee rate charged to the Fund was reasonable.
Cost of Services and Profitability
The Board considered information provided by the Advisor regarding the costs of services and its profitability with respect to the Fund. In this regard, the Board considered the Advisor's resources devoted to the Fund, as well as the Advisor's discussion of the aggregate costs and profitability of its mutual fund activities. The Board also noted the Advisor's representation that, although the Advisor does not maintain a separate profit and loss analysis specific to the Fund, nor does the Advisor allocate proportional expenses to the Fund, the Fund produces a lower margin than the Advisor's overall advisory business due to the larger allocation of time and expense required by the administrative and compliance efforts necessary to manage the Fund. Based on these and other applicable considerations, the Board concluded that the Advisor's profits attributable to management of the Fund were reasonable in the context of all factors considered.
Economies of Scale
The Board evaluated whether the Fund would benefit from any economies of scale. In this respect, the Board noted the Advisor's representation that the Advisor was open to considering breakpoints in the future if assets increased significantly, but in view of the current level of assets of the Fund, did not believe that breakpoints would be appropriate at this time. Based on the foregoing, and in light of the size of the Fund, the Board concluded that economies of scale were not a material factor to consider in approving the continuation of the Advisory Agreement.
Other Benefits
The Board noted the Advisor's representation that, aside from its contractual advisory fees, it does not benefit in a material way from its relationship with the Fund. Based on the foregoing representation, the Board concluded that other benefits received by the Advisor from its relationship with the Fund were not a material factor to consider in approving the continuation of the Advisory Agreement.
Conclusion
The Board did not identify any single factor as being of paramount importance, and different Trustees may have given different weight to different factors. The Board reviewed a memorandum from Fund counsel discussing the legal standards applicable to its consideration of the Advisory Agreement. Based on its review, including consideration of each of the factors referenced above, the Board determined, in the exercise of its reasonable business judgment, that the advisory arrangement, as outlined in the Advisory Agreement, was fair and reasonable in light of the services performed or to be performed, expenses incurred or to be incurred and such other matters as the Board considered relevant.
Proxy Voting Information
A description of the policies and procedures that the Fund uses to determine how to vote proxies relating to securities held in the Fund's portfolio is available, without charge and upon request, by calling (866) 684-4915 and on the SEC's website at www.sec.gov. The Fund's proxy voting record for the most recent twelve-month period ended June 30 is available, without charge and upon request, by calling (866) 684-4915 and on the SEC's website at www.sec.gov.
Availability of Quarterly Portfolio Schedules
The Fund files its complete schedule of portfolio holdings with the SEC for the first and third quarters of each fiscal year on Form N-Q. These filings are available, without charge and upon request on the SEC's website at www.sec.gov or may be reviewed and copied at the SEC's Public Reference Room in Washington, D.C. Information on the operation of the Public Reference Room may be obtained by calling (800) SEC-0330.
Shareholder Expense Example
As a shareholder of the Fund, you incur ongoing costs, including management fees and other Fund expenses. This example is intended to help you understand your ongoing costs (in dollars) of investing in the Fund and to compare these costs with the ongoing costs of investing in other mutual funds.
The example is based on an investment of $1,000 invested at the beginning of the period and held for the entire period from July 1, 2016, through December 31, 2016.
Actual Expenses – The first line of the table below provides information about actual account values and actual expenses. You may use the information in this line, together with the amount you invested, to estimate the expenses that you paid over the period. Simply divide your account value by $1,000 (for example, an $8,600 account value divided by $1,000 = 8.6), then multiply the result by the number in the first line under the heading entitled "Expenses Paid During Period" to estimate the expenses you paid on your account during the period.
Hypothetical Example for Comparison Purposes – The second line of the table below provides information about hypothetical account values and hypothetical expenses based on the Fund's actual expense ratio and an assumed rate of return of 5% per year before expenses, which is not the Fund's actual return. The hypothetical account values and expenses may not be used to estimate the actual ending account balance or expenses you paid for the period. You may use this information to compare the ongoing costs of investing in the Fund and other funds. To do so, compare this 5% hypothetical example with the 5% hypothetical examples that appear in the shareholder reports of other funds.
Please note that the expenses shown in the table are meant to highlight your ongoing costs only. Therefore, the second line of the table is useful in comparing ongoing costs only, and will not help you determine the relative total costs of owning different funds.
600, Portland, Maine 04101. Mr. Keffer is considered an Interested Trustee due to his affiliation with Atlantic. The Fund's Statement of Additional Information includes additional information about the Trustees and is available, without charge and upon request, by calling (866) 684-4915.
ITEM 2. CODE OF ETHICS.
| (a) | As of the end of the period covered by this report, Forum Funds (the "Registrant") has adopted a code of ethics, which applies to its Principal Executive Officer and Principal Financial Officer (the "Code of Ethics"). |
| (c) | There have been no amendments to the Registrant's Code of Ethics during the period covered by this report. |
| (d) | There have been no waivers to the Registrant's Code of Ethics during the period covered by this report. |
(f) (1) A copy of the Code of Ethics is being filed under Item 12(a) hereto.
ITEM 3. AUDIT COMMITTEE FINANCIAL EXPERT.
The Board of Trustees has determined that no member of the Audit Committee is an "audit committee financial expert" as that term is defined under applicable regulatory guidelines.
ITEM 4. PRINCIPAL ACCOUNTANT FEES AND SERVICES.
(a) Audit Fees - The aggregate fees billed for each of the last two fiscal years (the "Reporting Periods") for professional services rendered by the Registrant's principal accountant for the audit of the Registrant's annual financial statements, or services that are normally provided by the principal accountant in connection with the statutory and regulatory filings or engagements for the Reporting Periods, were $43,300 in 2015 and $44,900 in 2016.
(b) Audit-Related Fees – The aggregate fees billed in the Reporting Periods for assurance and related services rendered by the principal accountant that were reasonably related to the performance of the audit of the Registrant's financial statements and are not reported under paragraph (a) of this Item 4 were $0 in 2015 and $0 in 2016.
(c) Tax Fees - The aggregate fees billed in the Reporting Periods for professional services rendered by the principal accountant to the Registrant for tax compliance, tax advice and tax planning were $9,000 in 2015 and $9,000 in 2016. These services consisted of review or preparation of U.S. federal, state, local and excise tax returns.
(d) All Other Fees - The aggregate fees billed in the Reporting Periods for products and services provided by the principal accountant to the Registrant, other than the services reported in paragraphs (a) through (c) of this Item, were $0 in 2015 and $0 in 2016.
(e) (1) The Audit Committee reviews and approves in advance all audit and "permissible non-audit services" (as that term is defined by the rules and regulations of the Securities and Exchange Commission) to be rendered to a series of the Registrant (each, a "Series"). In addition, the Audit Committee reviews and approves in advance all "permissible non-audit services" to be provided to an investment adviser (not including any sub-adviser) of a Series, or an affiliate of such investment adviser, that is controlling, controlled by or under common control with the investment adviser and provides on-going services to the Registrant ("Affiliate"), by the Series' principal accountant if the engagement relates directly to the operations and financial reporting of the Series. The Audit Committee considers whether fees paid by a Series' investment adviser or an Affiliate to the Series' principal accountant for audit and permissible non-audit services are consistent with the principal accountant's independence.
(e) (2) No services included in (b) - (d) above were approved pursuant to paragraph (c)(7)(i)(C) of Rule 2-01 of Regulation S-X.
(f) Not applicable
(g) The aggregate non-audit fees billed by the principal accountant for services rendered to the Registrant for the Reporting Periods were $0 in 2015 and $0 in 2016. There were no fees billed in either of the Reporting Periods for non-audit services rendered by the principal accountant to the Registrant's investment adviser or any Affiliate.
(h) During the Reporting Period, the Registrant's principal accountant provided no non-audit services to the investment advisers or any entity controlling, controlled by or under common control with the investment advisers to the series of the Registrant to which this report relates.
ITEM 5. AUDIT COMMITTEE OF LISTED REGISTRANTS.
Not applicable.
ITEM 6. INVESTMENTS.
| (a) | Included as part of report to shareholders under Item 1. |
ITEM 7. DISCLOSURE OF PROXY VOTING POLICIES AND PROCEDURES FOR CLOSED-END
MANAGEMENT INVESTMENT COMPANIES.
Not applicable.
ITEM 8. PORTFOLIO MANAGERS OF CLOSED-END MANAGEMENT INVESTMENT COMPANIES.
Not applicable.
ITEM 9. PURCHASES OF EQUITY SECURITIES BY CLOSED-END MANAGEMENT INVESTMENT COMPANY AND AFFILIATED PURCHASERS.
Not applicable.
ITEM 10. SUBMISSION OF MATTERS TO A VOTE OF SECURITY HOLDERS
The Registrant does not accept nominees to the board of trustees from shareholders.
ITEM 11. CONTROLS AND PROCEDURES
(a) The Registrant's Principal Executive Officer and Principal Financial Officer have concluded that the Registrant's disclosure controls and procedures (as defined in Rule 30a-3(c) under the Investment Company Act of 1940 (the "Act")) are effective, based on their evaluation of the controls and procedures required by Rule 30a-3(b) under the Act and Rules 13a-15(b) or 15d-15(b) under the Securities Exchange Act of 1934, as of a date within 90 days of the filing date of this report.
(b) There were no changes in the Registrant's internal control over financial reporting (as defined in Rule 30a-3(d) under the Act) that occurred during the second fiscal quarter of the period covered by this report that have materially affected, or are reasonably likely to materially affect, the Registrant's internal control over financial reporting.
ITEM 12. EXHIBITS.
(a)(1) Code of Ethics (Exhibit filed herewith).
(a)(2) Certifications pursuant to Rule 30a-2(a) of the Act, and Section 302 of the Sarbanes-Oxley Act of 2002. (Exhibits filed herewith)
(a)(3) Not applicable.
(b) Certifications pursuant to Rule 30a-2(b) of the Act, and Section 906 of the Sarbanes-Oxley Act of 2002. (Exhibit filed herewith)
SIGNATURES
Pursuant to the requirements of the Securities Exchange Act of 1934 and the Investment Company Act of 1940, the Registrant has duly caused this report to be signed on its behalf by the undersigned, thereunto duly authorized.
Registrant Forum Funds
| By: | /s/ Jessica Chase | |
| | Jessica Chase, Principal Executive Officer | |
| | | |
| Date: | February 15, 2017 | |
Pursuant to the requirements of the Securities Exchange Act of 1934 and the Investment Company Act of 1940, this report has been signed below by the following persons on behalf of the Registrant and in the capacities and on the dates indicated.
| By: | /s/ Jessica Chase | |
| | Jessica Chase, Principal Executive Officer | |
| | | |
| Date: | February 15, 2017 | |
| By: | /s/ Karen Shaw | |
| | Karen Shaw, Principal Financial Officer | |
| | | |
| Date: | February 15, 2017 | |