As filed with the Securities and Exchange Commission on June 1, 2017
UNITED STATES
SECURITIES AND EXCHANGE COMMISSION
WASHINGTON, D.C. 20549
FORM N-CSR
CERTIFIED SHAREHOLDER REPORT OF REGISTERED MANAGEMENT
INVESTMENT COMPANIES
Investment Company Act file number 811-03023
FORUM FUNDS
Three Canal Plaza, Suite 600
Portland, Maine 04101
Jessica Chase, Principal Executive Officer
Three Canal Plaza, Suite 600
Portland, Maine 04101
207-347-2000
Date of fiscal year end: March 31
Date of reporting period: April 1, 2016 – March 31, 2017
ITEM 1. REPORT TO STOCKHOLDERS.

The views in this report were those of Absolute Strategies Fund and Absolute Capital Opportunities Fund's (each a "Fund" and collectively the "Funds") adviser as of March 31, 2017, and may not reflect their views on the date this report is first published or any time thereafter. These views are intended to assist shareholders in understanding their investment in the Funds and do not constitute investment advice. None of the information presented should be construed as an offer to sell or recommendation of any security mentioned herein.
Since the Funds utilize multi-manager strategies with multiple sub-advisers, they may be exposed to varying forms of risk. These risks include, but are not limited to, general market risk, multi-manager risk, focused portfolio risk, small company risk, foreign risk, interest rate risk, credit risk, prepayment risk, IPO risk, liquidity risk, high turnover risk, leverage risk, derivatives risk and cash and cash equivalents holdings risk. For a complete description of the Funds' principal investment risks, please refer to each Fund's prospectus.
Beta is a measure of an asset's sensitivity to broad market moves, as measured for instance by the S&P 500® Index. A fund with a realized beta of 0.5 with respect to the S&P 500®Index infers that about 50% of the fund's returns were explained by the performance of the index (the rest of the performance was independent of the index). Standard deviation indicates the volatility of a fund's total returns and is useful because it identifies the spread of a fund's short-term fluctuations. The HFR Indices are equally weighted performance indexes, utilized by numerous hedge fund managers as a benchmark for their own hedge funds. One cannot invest directly in an index.
Absolute Strategies Fund, Absolute Funds, and Absolute Investment Advisers are registered service marks of Absolute Investment Advisers LLC ("AIA" and "Absolute") and the respective logos and Absolute Capital Opportunities Fund are service marks of AIA; and other marks referred to herein are the trademarks, service marks or registered trademarks of their respective owners.
ABSOLUTE STRATEGIES FUND A MESSAGE TO OUR SHAREHOLDERS (Unaudited) MARCH 31, 2017 |
Dear Shareholder,
We are pleased to present the Annual Report for the Absolute Strategies Fund (the "Fund") for the year ended March 31, 2017.
In this regard, The Fund seeks to provide long-term capital appreciation with an emphasis on absolute (positive) returns and low sensitivity to traditional financial market indices such as the Standard & Poor's 500® Index ("S&P 500® Index"). Achieving this over the course of an investment cycle often means constructing a portfolio of investments that looks very different from other investment funds, including alternative ones. It requires being defensive at times when others are overly aggressive. It requires looking for value in areas of the market that are over-looked or unloved by other investors. Achieving these goals also means that the Fund's performance is likely to go through periods of under-performance as well as out-performance versus other strategies. Over time the uniqueness of this creates significant diversification properties. In this regard, the Fund (Institutional Shares) returned -3.40% over the 12 months ended March 31. By comparison, the HRFX Global Hedge Fund Index returned 6.19% and the S&P 500 Index returned 17.17%.
We believe that recent dynamics have resulted in a market that is narrow and highly inefficient (see more below). While this has been frustrating, we are excited in that this type of inefficiency creates an opportunity to set up a portfolio that can generate significant performance once the latest cycle of abnormal market conditions exhausts itself. We believe it may be setting up for an extensive long/short opportunity.
During the year, the Fund has maintained a balance of long and short exposures. Net exposure has been at the low end of its historical range and sensitivity to traditional equity indices has been negative. Allocations have been concentrated around a diverse, but limited, number of equity strategies with a moderate allocation to convertible arbitrage. The Fund has also employed certain opportunistic trades. These trades may be short-term in nature and expressed through purchases and sales of index related securities. The trades have individual merits but also can allow the Fund to take advantage of spikes of volatility.
In general, many of the Fund's long securities haven't had a big story or theme attached to them and may not have been a major part of an index. The Fund's short securities were deemed to be expensive and/or exhibiting low growth with significant economic sensitivity. Equity index securities were also used on the short side to create relative-value arbitrage opportunities versus Fund long securities. Certain of the Fund's derivative positions were used to achieve this positioning as well as to control the Fund's broader market sensitivity.
Sub-adviser strategies based on long equity exposure were the Fund's top performers over the last year. Energy related securities, which were somewhat new to the Fund in 2016, did particularly well. Long exposure to precious metals related securities provided modest returns during the period. Convertible arbitrage also performed well during the period. This was notable because the strategy typically exhibits low sensitivity to equity markets. Strategies that included short exposure were the largest detractors. Shorting has been particularly difficult as few things seemed to have gone down in price regardless of how poorly a company or group of companies performed. The Fund's short exposure remains flexible and has varied over the past year as large spikes in volatility have offered opportunities to monetize short term gains. During periods of low volatility the Fund has maintained a large amount of short exposure due to historically high valuations and weak fundamentals (see below). The timing is uncertain but we believe the payoff in short opportunities could be significant. Long periods of low volatility and high valuations have historically given way to periods of high volatility, leading to market valuations reverting to the mean.
We remain steadfast in our investment philosophy. Fundamental bias, patience, and diversification are our discipline. For anyone with a similar philosophy, this environment has been punishing. Passive investing and risk-parity strategies are the crowd themes for this cycle. While many have chosen to maintain a passive bias, not one investor or advisor we've met with is actively betting client capital on another asset bubble. No, this current situation has been created by a willingness to ignore inflated prices and continue to hope for another year of escape. Asset allocation has become the antithesis of the "efficient market hypothesis." What analysis is actually being performed? Who is left to perform individual stock selection and to allocate capital based on all available information? Most of the survivors left in the active management industry do not focus on alpha; they are marketing behemoths. We believe, much of the world of investment management have decided fundamental research is no longer necessary. As such, the overall market structure has become even narrower and more inefficient. How ironic.
ABSOLUTE STRATEGIES FUND A MESSAGE TO OUR SHAREHOLDERS (Unaudited) MARCH 31, 2017 |
The following are just some of the insights we note when evaluating the current environment:
| · | The cumulative market cap of the Russell 2500 has grown 16% since 2014, while net income has dropped 20%. (FPA LLC, Bloomberg) |
| · | The S&P 500 Price to Sales ratio is at September 2000 levels, 25% higher than 2007 peak. (Bloomberg) |
| · | The S&P 500 Enterprise Value to Earnings before Interest, Taxes, Depreciation and Amortization ("EBITDA") is at September 2000 levels. (Bloomberg) |
· The Russell 2000 Enterprise Value to EBITDA is 80% above its previous record level. (Bloomberg)
| · | The S&P 500 Median Price to Earnings ratio is over 24; the median since 1965 is 17. (Ned Davis Research) |
| · | The S&P 500 Median Price to Sales is 35% above the previous record in 2007. (Ned Davis Research) |
| · | The S&P 500 (ex financials) Debt to EBITDA is higher than both the 2002 and 2009 recession peaks. (Citigroup) |
· The CBOE SPX Volatility Index recently broke below 10, a level last reached in 2007. (Bloomberg)
· Stock market capitalization to GDP is the highest in history outside the 2000 bubble.
| · | The Shiller Cyclically Adjusted Price-to-Earnings Ratio ("CAPE") ratio recently hit 29, nearly the same level as the 1929 peak. |
| · | Three of the largest consumer credit companies in the U.S., have all recently reported sharply higher net charge-offs (NCOs). (Bloomberg) |
| · | Auto sales and auto lending also appear to have peaked and are turning down while loan delinquencies have risen. (Bloomberg) |
| · | Home Capital Group, the largest non-bank mortgage lender in Canada, appears to be having a Bear Stearns moment; risk is now spreading to others. Bear Stearns, of course, collapsed quickly when mortgages it owned started to become delinquent and sources of funding dried up. |
We have a market environment that combines some of the highest valuation levels in history with an aggregate collection of price-insensitive buyers. Couple that with structurally low growth, record high corporate leverage, central banks that desire raising rates and shrinking balance sheets, extremely low levels of volatility, cresting auto sales, deteriorating consumer credit, and a potentially hostile geo-political environment and you have the potential for severe volatility dead ahead.
At some point, we believe most everything currently driving frothy, overvalued market conditions could suddenly stop working and reverse. As such, we are maintaining a negative beta bias. Certainly there is a risk that this abnormal market cycle can go on longer. If so, we plan to remain flexible around sizable bumps in volatility. However, at this point we believe the risk is more likely to be a final, short-term upside thrust. Our long portfolio includes very cheap out-of-the-money call option protection should this event happen.
We continue to believe our disciplined approach is rare in today's crowded financial market landscape. The active alternatives space has already gone through a significant bear market relative to major market indices; this experience is not dissimilar from that of value investors in the late 1990s. In addition, it has proven that very few strategies are providing any source of return outside of beta. Should market forces and volatility awaken again, it's clear from drawdown studies that almost no combination of these competing products will diversify away market risk. The allocation math is quite simple. Even a small allocation to a strategy positioned for alpha like ours would likely provide much more diversification potential vs funds that provide correlated market performance. The potential for upside returns during critical drawdown periods cannot be understated during periods of historically high valuations. When asset prices cheapen again, we will most certainly participate. If the current environment is indeed similar to 1999 or 2007 (as the above insights may suggest), then we could have a generational long/short opportunity at hand.
Sincerely,
Jay Compson
Portfolio Manager
Absolute Investment Advisers LLC
ABSOLUTE STRATEGIES FUND PERFORMANCE CHART AND ANALYSIS (Unaudited) MARCH 31, 2017 |
The following charts reflect the change in the value of a hypothetical $1,000,000 investment in Institutional Shares and a $250,000 investment in R Shares, including reinvested dividends and distributions, in Absolute Strategies Fund (the "Fund") compared with the performance of the benchmark, S&P 500 Index ("S&P 500"), Barclays Capital U.S. Aggregate Bond Index ("Barclays Index"), the HFRX Global Hedge Fund Index ("HFRX") and the MSCI World Index ("MSCI World"), over the past ten fiscal years. The S&P 500 is a broad-based, unmanaged measurement of changes in stock market conditions based on the average of 500 widely held common stocks. The Barclays Index covers the U.S. dollar-denominated, investment-grade, fixed-rate, taxable bond market of SEC-registered securities. The HFRX is designed to be representative of the overall composition of the hedge fund universe; it is comprised of eight strategies - convertible arbitrage, distressed securities, equity hedge, equity market neutral, event driven, macro, merger arbitrage, and relative value arbitrage. The strategies are asset-weighted based on the distribution of assets in the hedge fund industry. The MSCI World measures the performance of a diverse range of 24 developed countries' stock markets including the United States, Canada, Europe, the Middle East and the Pacific. The total return of the indices include the reinvestment of dividends and income. The total return of the Fund includes operating expenses that reduce returns, while the total return of the indices do not include expenses. The Fund is professionally managed, while the indices are unmanaged and are not available for investment.
Comparison of Change in Value of a $1,000,000 Investment
Absolute Strategies Fund - Institutional Shares vs. S&P 500 Index,
Barclays Capital U.S. Aggregate Bond Index,
HFRX Global Hedge Fund Index and MSCI World Index
| Average Annual Total Returns | | | | | | | |
| Periods Ended March 31, 2017 | | One Year | | Five Years | | Ten Years | |
| Absolute Strategies Fund - Institutional Shares | | -3.40 | % | | -0.34 | % | | 1.10 | % | |
| S&P 500 Index | | 17.17 | % | | 13.30 | % | | 7.51 | % | |
| Barclays Capital U.S. Aggregate Bond Index | | 0.44 | % | | 2.34 | % | | 4.27 | % | |
| HFRX Global Hedge Fund Index | | 6.19 | % | | 1.35 | % | | (0.57 | )% | |
| MSCI World Index | | 14.77 | % | | 9.37 | % | | 4.21 | % | |
ABSOLUTE STRATEGIES FUND PERFORMANCE CHART AND ANALYSIS (Unaudited) MARCH 31, 2017 |
Comparison of Change in Value of a $250,000 Investment
Absolute Strategies Fund - R Shares vs. S&P 500 Index, Barclays Capital U.S. Aggregate Bond Index,
HFRX Global Hedge Fund Index and MSCI World Index
| Average Annual Total Returns | | | | | | | |
| Periods Ended March 31, 2017 | | One Year | | Five Years | | Ten Years | |
| Absolute Strategies Fund - R Shares | | -3.89 | % | | -0.82 | % | | 0.65 | % | |
| S&P 500 Index | | 17.17 | % | | 13.30 | % | | 7.51 | % | |
| Barclays Capital U.S. Aggregate Bond Index | | 0.44 | % | | 2.34 | % | | 4.27 | % | |
| HFRX Global Hedge Fund Index | | 6.19 | % | | 1.35 | % | | (0.57 | )% | |
| MSCI World Index | | 14.77 | % | | 9.37 | % | | 4.21 | % | |
Performance data quoted represents past performance and is no guarantee of future results. Current performance may be lower or higher than the performance data quoted. Investment return and principal value will fluctuate so that shares, when redeemed, may be worth more or less than original cost. For the most recent month-end performance, please call (888) 992-2765. As stated in the Fund's prospectus, the annual operating expense ratios (gross) for Institutional Shares and R Shares are 2.68% and 3.26%, respectively. Excluding the effect of expenses attributable to dividends and interest on short sales and acquired fund fees and expenses, the Fund's total annual operating expense ratios would be 1.85% and 2.41% for Institutional Shares and R Shares, respectively. To the extent that the Fund invests in any investment company or exchange-traded fund sponsored by the Fund's adviser or its affiliates, the adviser may waive certain fees and expenses. The performance table and graph do not reflect the deduction of taxes that a shareholder would pay on Fund distributions or the redemption of Fund shares. Returns greater than one year are annualized.
ABSOLUTE CAPITAL OPPORTUNITIES FUND A MESSAGE TO OUR SHAREHOLDERS (Unaudited) MARCH 31, 2017 |
Dear Shareholder,
For the period ending March 31, 2017, the Absolute Capital Opportunities Fund (the "Fund") returned 7.44%. By comparison, the HFRX Equity Hedge Index returned 5.90%.
The Fund combines two Sub-Advisers with a flexible approach to equity investing. Both managers typically invest in a concentrated number of positions on the long side, balanced with different hedging methods. St James Investment Company will opportunistically utilize cash levels as a hedge. Kovitz Investment Group will opportunistically utilize individual stocks, ETFs, or options to hedge. The result is a Fund that maintains a positive net long bias but with exposures that change and the ability to avoid being fully exposed to equity market risk at all times.
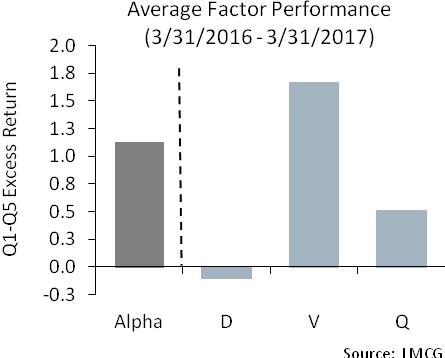
Over the last year, Fund performance benefitted from maintaining a net long bias in a market that generally trended higher. The two Sub-Advisers' focus on value oriented positions also helped as value out-performed growth (as measured by the Russell 3000 Value & Growth Indices) for the first time in several years (fiscal periods). Being disciplined and not chasing high flying stocks also was a plus - poor market timing seems to be one of the factors that has created negative alpha in many hedge fund strategies in recent years.
We believe the Fund is well positioned well for a variety of market environments.
Sincerely,
Jay Compson
Portfolio Manager
Absolute Investment Advisers LLC
ABSOLUTE CAPITAL OPPORTUNITIES FUND PERFORMANCE CHART AND ANALYSIS (Unaudited) MARCH 31, 2017 |
The following chart reflects the change in the value of a hypothetical $1,000,000 investment, including reinvested dividends and distributions, in Absolute Capital Opportunities Fund (the "Fund") compared with the performance of the benchmark, the HFRX Equity Hedge Fund Index ("HFRX Equity") and the S&P 500 Index ("S&P 500"), since inception. HFRX Equity tracks strategies that maintain positions both long and short in primarily equity and equity derivative securities. The S&P 500 is a broad-based, unmanaged measurement of changes in stock market conditions based on the average of 500 widely held common stocks. The total return of the index includes the reinvestment of dividends and income. The total return of the Fund includes operating expenses that reduce returns, while the total return of the index does not include expenses. The Fund is professionally managed, while the index is unmanaged and is not available for investment.
Comparison of Change in Value of a $1,000,000 Investment
Absolute Capital Opportunities Fund vs. HFRX Equity Hedge Index
and S&P 500 Index
| Average Annual Total Returns | | | | Since Inception |
| Periods Ended March 31, 2017 | | One Year | | 12/30/15 |
| Absolute Capital Opportunities Fund - Shares | | 7.44 | % | | 7.67 | % |
| HFRX Equity Hedge Index | | 5.90 | % | | 2.08 | % |
| S&P 500 Index | | 17.17 | % | | 13.85 | % |
Performance data quoted represents past performance and is no guarantee of future results. Current performance may be lower or higher than the performance data quoted. Investment return and principal value will fluctuate so that shares, when redeemed, may be worth more or less than original cost. For the most recent month-end performance, please call (888) 992-2765. As stated in the Fund's prospectus, the annual operating expense ratio (gross) is 4.37%. Excluding the effect of expenses attributable to dividends and interest on short sales, the Fund's total annual operating expense ratio would be 4.12%. However, the Fund's adviser has agreed to contractually waive a portion of its fees and to reimburse expenses such that total operating expenses (excluding all taxes, interest, portfolio transaction expenses, dividend and interest expenses on short sales, acquired fund fees and expenses, proxy expenses and extraordinary expenses) to 1.85% on net assets up to $100 million, 1.75% on net assets between $100 million and $200 million, and 1.65% on net assets over $200 million through August 1, 2019 (the "Expense Cap"). The adviser may be reimbursed by the Fund for fees waived and expenses reimbursed pursuant to the Expense Cap if such payment is made within three years of the fee waiver or expense reimbursement and does not cause the Total Annual Fund Operating Expenses After Fee Waiver and/or Expense Reimbursement to exceed the lesser of (i) the then-current expense cap, or (ii) the expense cap in place at the time the fees/expenses were waived or reimbursed. During the period, certain fees were waived and/or expenses reimbursed; otherwise returns would have been lower. The performance table and graph do not reflect the deduction of taxes that a shareholder would pay on Fund distributions or the redemption of Fund shares. Returns greater than one year are annualized.
ABSOLUTE STRATEGIES FUND PORTFOLIO HOLDINGS SUMMARY (Unaudited) MARCH 31, 2017 |
| Portfolio Breakdown (% of Net Assets) |
| Long Positions |
| Equity Securities | 34.5% | |
| Asset Backed Obligations | 0.2% | |
| Corporate Convertible Bonds | 13.7% | |
| Corporate Non-Convertible Bonds | 5.2% | |
| Exchange Traded Notes | 0.0% | |
| Syndicated Loans | 0.5% | |
| Investment Companies | 17.7% | |
| Money Market Fund | 20.6% | |
| Purchased Options | 1.4% | |
| Short Positions |
| Equity Securities | -29.4% | |
| Investment Companies | -9.5% | |
| Written Options | -0.2% | |
| Other Assets less Liabilities* | 45.3% | |
| | 100.0% | |
*Consists of deposits with the custodian and/or brokers for securities sold short, cash, foreign currency, prepaid expenses, receivables, payables and accrued liabilities. Deposits with the custodian and/or brokers for securities sold short represents 41.3% of net assets. See Note 2 of the accompanying Notes to Financial Statements.
| | (% of Equity Holdings) |
| Sector Breakdown | Long | Short |
| Consumer Discretionary | 13.0% | 17.0% | |
| Consumer Staples | 18.6% | 14.0% | |
| Energy | 21.7% | 3.3% | |
| Financial | 17.3% | 24.7% | |
| Healthcare | 1.6% | 1.5% | |
| Industrial | 10.5% | 24.3% | |
| Information Technology | 3.5% | 11.2% | |
| Materials | 9.6% | 2.2% | |
| Telecommunication Services | 2.8% | 1.7% | |
| Utilities | 1.4% | 0.1% | |
| | 100.0% | 100.0% | |
ABSOLUTE STRATEGIES FUND SCHEDULE OF INVESTMENTS MARCH 31, 2017 |
| Shares | | Security Description | | Value | |
| Long Positions - 93.8% |
| Equity Securities - 34.5% |
| Common Stock - 34.5% |
| Consumer Discretionary - 4.5% |
| | 28,449 | | American Airlines Group, Inc. (a)(b) | $ | 1,203,393 | |
| | 5,026 | | Buffalo Wild Wings, Inc. (c) | | 767,722 | |
| | 4,632 | | CarMax, Inc. (c) | | 274,307 | |
| | 58,795 | | CVS Health Corp. | | 4,615,407 | |
| | 173,506 | | Drive Shack, Inc. (a) | | 720,050 | |
| | 26,109 | | Extended Stay America, Inc. (a) | | 416,177 | |
| | 83,774 | | Freshpet, Inc. (c) | | 921,514 | |
| | 51,404 | | General Motors Co. (a) | | 1,817,645 | |
| | 83,774 | | Green Plains Partners LP (a) | | 1,683,857 | |
| | 14,589 | | Harley-Davidson, Inc. (a)(b)(d) | | 882,635 | |
| | 15,359 | | Lithia Motors, Inc., Class A (a) | | 1,315,498 | |
| | 185,699 | | Luby's, Inc. (c) | | 577,524 | |
| | 27,349 | | Macy's, Inc. (a) | | 810,624 | |
| | 21,416 | | Motorcar Parts of America, Inc. (c) | | 658,114 | |
| | 15,949 | | Nexeo Solutions, Inc. (a)(c) | | 141,308 | |
| | 3,909 | | Panera Bread Co., Class A (c) | | 1,023,650 | |
| | 23,946 | | Robert Half International, Inc. | | 1,169,283 | |
| | 57,246 | | The Habit Restaurants, Inc., Class A (a)(c) | | 1,013,254 | |
| | 7,984 | | The Walt Disney Co. | | 905,306 | |
| | 35,000 | | VF Corp. | | 1,923,950 | |
| | 5,910 | | Walgreens Boots Alliance, Inc. | | 490,826 | |
| | | 23,332,044 | |
| Consumer Staples - 6.4% |
| | 3,170 | | AMERCO (c) | | 1,208,372 | |
| | 19,547 | | Calavo Growers, Inc. | | 1,184,548 | |
| | 46,000 | | Diageo PLC, ADR | | 5,316,680 | |
| | 17,333 | | Lamb Weston Holdings, Inc., Class A (a) | | 729,026 | |
| | 80,000 | | Nestle SA, ADR | | 6,152,000 | |
| | 116,800 | | Nomad Foods, Ltd. (a)(c) | | 1,337,360 | |
| | 37,202 | | PFSweb, Inc. (c) | | 242,929 | |
| | 32,113 | | Phibro Animal Health Corp., Class A | | 902,375 | |
| | 22,000 | | Philip Morris International, Inc. | | 2,483,800 | |
| | 71,208 | | Pilgrim's Pride Corp. (a)(c) | | 1,602,536 | |
| | 19,827 | | Post Holdings, Inc. (a)(c) | | 1,735,259 | |
| | 110,000 | | Sanofi, ADR | | 4,977,500 | |
| | 53,057 | | Sprouts Farmers Market, Inc. (a)(c) | | 1,226,678 | |
| | 36,157 | | SUPERVALU, Inc. (c) | | 139,566 | |
| | 25,132 | | The Hain Celestial Group, Inc. (b)(c) | | 934,911 | |
| | 27,925 | | Tyson Foods, Inc., Class A (a) | | 1,723,252 | |
| | 29,321 | | Zoetis, Inc. (a) | | 1,564,862 | |
| | | 33,461,654 | |
| Energy - 7.5% |
| | 11,470 | | Anadarko Petroleum Corp. | | 711,140 | |
| | 21,866 | | California Resources Corp. (a)(c) | | 328,865 | |
| | 30,076 | | Cheniere Energy, Inc. (c) | | 1,421,692 | |
| | 34,763 | | Comstock Resources, Inc. (c) | | 320,862 | |
| | 128,800 | | Cone Midstream Partners LP (a) | | 3,040,968 | |
| | 17,093 | | Devon Energy Corp. | | 713,120 | |
| | 10,142 | | Dominion Midstream Partners LP | | 324,037 | |
| | 108,240 | | Enbridge, Inc. | | 4,528,762 | |
| | 53,640 | | Energy Transfer Equity LP | | 1,058,317 | |
| | 39,598 | | Energy Transfer Partners LP | | 1,446,119 | |
| | 85,927 | | EnLink Midstream Partners LP | | 1,572,464 | |
| | 80,848 | | Enterprise Products Partners LP (a) | | 2,232,213 | |
| | 51,661 | | Green Plains, Inc. (a) | | 1,278,610 | |
| | 52,806 | | Halliburton Co. (a)(d) | | 2,598,583 | |
| | 71,389 | | Kinder Morgan, Inc. | | 1,551,997 | |
| | 9,634 | | Marathon Petroleum Corp. | | 486,902 | |
| Shares | | Security Description | | Value | |
| | 44,592 | | MPLX LP | $ | 1,608,879 | |
| | 23,377 | | Patterson-UTI Energy, Inc. | | 567,360 | |
| | 6,319 | | Phillips 66 Partners LP | | 324,481 | |
| | 77,614 | | Plains All American Pipeline LP | | 2,453,379 | |
| | 7,014 | | Plains GP Holdings LP, Class A | | 219,258 | |
| | 35,299 | | Rice Energy, Inc. (c) | | 836,586 | |
| | 83,307 | | Rice Midstream Partners LP | | 2,101,003 | |
| | 21,193 | | Schlumberger, Ltd. | | 1,655,173 | |
| | 11,586 | | Sprague Resources LP | | 313,981 | |
| | 30,296 | | Targa Resources Corp. | | 1,814,730 | |
| | 5,692 | | The Williams Cos., Inc. | | 168,426 | |
| | 27,529 | | TransMontaigne Partners LP | | 1,229,996 | |
| | 22,208 | | Western Gas Partners LP | | 1,342,474 | |
| | 18,380 | | Williams Partners LP | | 750,455 | |
| | | 39,000,832 | |
| Financial - 6.0% |
| | 24,010 | | American Express Co. (a)(d) | | 1,899,431 | |
| | 14,154 | | Aon PLC (a) | | 1,679,938 | |
| | 89,592 | | Bank of America Corp. (a) | | 2,113,475 | |
| | 41,515 | | Berkshire Hathaway, Inc., Class B (a)(c) | | 6,919,720 | |
| | 110,000 | | Brookfield Asset Management, Inc., Class A | | 4,010,600 | |
| | 41,572 | | CBRE Group, Inc., Class A (a)(c) | | 1,446,290 | |
| | 23,951 | | Citigroup, Inc. (a) | | 1,432,749 | |
| | 29,167 | | JPMorgan Chase & Co. (a) | | 2,562,029 | |
| | 64,448 | | Leucadia National Corp. (a) | | 1,675,648 | |
| | 61,595 | | Medical Properties Trust, Inc. REIT (a) | | 793,960 | |
| | 80,000 | | The Bank of New York Mellon Corp. | | 3,778,400 | |
| | 40,000 | | WR Berkley Corp. | | 2,825,200 | |
| | | 31,137,440 | |
| Healthcare - 0.5% |
| | 17,481 | | Allscripts Healthcare Solutions, Inc. (c) | | 221,659 | |
| | 7,000 | | Becton Dickinson and Co. | | 1,284,080 | |
| | 9,400 | | McKesson Corp. | | 1,393,644 | |
| | | 2,899,383 | |
| Industrial - 3.6% |
| | 69,812 | | Briggs & Stratton Corp. (a) | | 1,567,279 | |
| | 8,377 | | Deere & Co. | | 911,920 | |
| | 16,218 | | Delta Air Lines, Inc. (b) | | 745,379 | |
| | 7,231 | | Dycom Industries, Inc. (a)(c) | | 672,122 | |
| | 57,000 | | Expeditors International of Washington, Inc. | | 3,219,930 | |
| | 29,542 | | Forterra, Inc. (a)(c) | | 576,069 | |
| | 28,185 | | Jacobs Engineering Group, Inc. (a) | | 1,558,067 | |
| | 7,540 | | John Bean Technologies Corp. | | 663,143 | |
| | 15,018 | | MasTec, Inc. (a)(c) | | 601,471 | |
| | 79,398 | | Quanta Services, Inc. (a)(c)(d) | | 2,946,460 | |
| | 11,414 | | The Boeing Co. (a)(b)(d) | | 2,018,680 | |
| | 29,321 | | Trimble, Inc. (c) | | 938,565 | |
| | 5,951 | | United Parcel Service, Inc., Class B (a) | | 638,542 | |
| | 11,094 | | Valmont Industries, Inc. (a) | | 1,725,117 | |
| | | 18,782,744 | |
| Information Technology - 1.2% |
| | 22,946 | | Apple, Inc. (a)(b) | | 3,296,422 | |
| | 14,645 | | BroadSoft, Inc. (a)(c) | | 588,729 | |
| | 83,171 | | Nuance Communications, Inc. (a)(c) | | 1,439,690 | |
| | 16,199 | | Silicon Motion Technology Corp., ADR | | 757,303 | |
| | 20,212 | | Unisys Corp. (c) | | 281,958 | |
| | | 6,364,102 | |
| Materials - 3.3% |
| | 12,566 | | Agrium, Inc. (a) | | 1,200,681 | |
| | 597,595 | | Atlas Iron, Ltd. (c) | | 13,697 | |
See Notes to Financial Statements. | 8 | |
ABSOLUTE STRATEGIES FUND SCHEDULE OF INVESTMENTS MARCH 31, 2017 |
| Shares | | Security Description | | Value | |
| | 87,000 | | Cameco Corp. | $ | 963,090 | |
| | 82,587 | | Constellium NV, Class A (c) | | 536,816 | |
| | 25,807 | | Fairmount Santrol Holdings, Inc. (c) | | 189,165 | |
| | 55,611 | | Monsanto Co. (a) | | 6,295,165 | |
| | 25,000 | | Praxair, Inc. | | 2,965,000 | |
| | 65,000 | | Royal Gold, Inc. | | 4,553,250 | |
| | 18,837 | | Westlake Chemical Partners LP | | 473,751 | |
| | | 17,190,615 | |
| Telecommunication Services - 1.0% |
| | 1,244 | | Alphabet, Inc., Class A (c) | | 1,054,663 | |
| | 419 | | Alphabet, Inc., Class C (c) | | 347,586 | |
| | 90,864 | | Attunity, Ltd. (a)(c) | | 719,643 | |
| | 28,203 | | CBS Corp., Class B, Non-Voting Shares (a) | | 1,956,160 | |
| | 71,796 | | Harmonic, Inc. (c) | | 427,186 | |
| | 71,106 | | Spark Networks, Inc. (a)(c) | | 73,239 | |
| | 15,857 | | Twenty-First Century Fox, Inc., Class A (a) | | 513,609 | |
| | | 5,092,086 | |
| Utilities - 0.5% |
| | 86,392 | | Vistra Energy Corp. (c) | | 1,408,190 | |
| | 22,583 | | Western Gas Equity Partners LP | | 1,041,076 | |
| | | 2,449,266 | |
| Total Common Stock (Cost $139,031,121) | | 179,710,166 | |
| Total Equity Securities (Cost $139,031,121) | | 179,710,166 | |
| | Principal | | Security Description | | Rate | | Maturity | | Value | |
| Fixed Income Securities - 19.6% |
| Asset Backed Obligations - 0.2% |
| $ | 64,207 | | Adjustable Rate Mortgage Trust, Series 2005-12 2A1 (e) | | 3.49 | % | 03/25/36 | | 56,292 | |
| | 40,410 | | Adjustable Rate Mortgage Trust, Series 2006-1 3A3 (e) | | 3.31 | | 03/25/36 | | 33,591 | |
| | 30,332 | | Banc of America Funding Corp., Series 2006-E 2A1 (e) | | 3.32 | | 06/20/36 | | 25,277 | |
| | 69,117 | | Banc of America Funding Corp., Series 2007-E 4A1 (e) | | 3.05 | | 07/20/47 | | 57,202 | |
| | 78,294 | | CitiMortgage Alternative Loan Trust, Series 2006-A7 1A12 | | 6.00 | | 12/25/36 | | 69,503 | |
| | 30,250 | | CitiMortgage Alternative Loan Trust, Series 2007-A4 1A6 | | 5.75 | | 04/25/37 | | 26,093 | |
| | 35,333 | | Countrywide Alternative Loan Trust, Series 2005-50CB 1A1 | | 5.50 | | 11/25/35 | | 34,206 | |
| | 178,889 | | Countrywide Alternative Loan Trust, Series 2006-36T2 1A1 (e) | | 1.30 | | 12/25/36 | | 90,754 | |
| | Principal | | Security Description | | Rate | | Maturity | | Value | |
| $ | 49,338 | | Countrywide Home Loan Mortgage Pass Through Trust, Series 2007-HY5 1A1 (e) | | 3.30 | % | 09/25/47 | $ | 45,027 | |
| | 59,129 | | Indymac Index Mortgage Loan Trust, Series 2006-AR25 3A1 (e) | | 3.39 | | 09/25/36 | | 48,923 | |
| | 29,056 | | JP Morgan Mortgage Trust, Series 2007-A2 4A1M (e) | | 3.31 | | 04/25/37 | | 26,836 | |
| | 131,825 | | Lehman XS Trust, Series 2005-6 1A1 (e) | | 1.50 | | 11/25/35 | | 89,433 | |
| | 134,449 | | Residential Accredit Loans, Inc., Series 2006-QS17 A4 | | 6.00 | | 12/25/36 | | 114,160 | |
| | 109,701 | | Residential Accredit Loans, Inc., Series 2007-QS5 A1 | | 5.50 | | 03/25/37 | | 87,792 | |
| | 1,052,847 | | Residential Asset Securitization Trust, Series 2007-A5 1A2 (e) | | 1.38 | | 05/25/37 | | 223,907 | |
| | 42,156 | | Structured Adjustable Rate Mortgage Loan Trust, Series 2007-3 3A1 (e) | | 3.35 | | 04/25/47 | | 33,027 | |
Total Asset Backed Obligations (Cost $1,218,912) | | 1,062,023 | |
| Corporate Convertible Bonds - 13.7% |
| Consumer Discretionary - 0.6% |
| | 1,000,000 | | Horizon Global Corp. | | 2.75 | | 07/01/22 | | 910,625 | |
| | 1,200,000 | | JAKKS Pacific, Inc. (a)(f) | | 4.88 | | 06/01/20 | | 1,087,500 | |
| | 1,000,000 | | M/I Homes, Inc. | | 3.25 | | 09/15/17 | | 1,132,500 | |
| | | 3,130,625 | |
| Consumer Staples - 3.5% |
| | 2,000,000 | | Acorda Therapeutics, Inc. (a) | | 1.75 | | 06/15/21 | | 1,710,000 | |
| | 2,250,000 | | Albany Molecular Research, Inc. (a) | | 2.25 | | 11/15/18 | | 2,459,531 | |
| | 700,000 | | Ascent Capital Group, Inc. (a) | | 4.00 | | 07/15/20 | | 539,000 | |
| | 2,100,000 | | Carriage Services, Inc. (a) | | 2.75 | | 03/15/21 | | 2,737,875 | |
| | 450,000 | | Ctrip.com International, Ltd. (a)(f) | | 1.25 | | 09/15/22 | | 468,000 | |
| | 1,500,000 | | Depomed, Inc. (a) | | 2.50 | | 09/01/21 | | 1,406,250 | |
See Notes to Financial Statements. | 9 | |
ABSOLUTE STRATEGIES FUND SCHEDULE OF INVESTMENTS MARCH 31, 2017 |
| | Principal | | Security Description | | Rate | | Maturity | | Value | |
| $ | 2,000,000 | | Ironwood Pharmaceuticals, Inc. (a) | | 2.25 | % | 06/15/22 | $ | 2,496,250 | |
| | 700,000 | | Macquarie Infrastructure Corp. | | 2.00 | | 10/01/23 | | 689,500 | |
| | 1,600,000 | | Sucampo Pharmaceuticals, Inc. (f) | | 3.25 | | 12/15/21 | | 1,591,000 | |
| | 500,000 | | The Spectranetics Corp. | | 2.63 | | 06/01/34 | | 572,188 | |
| | 500,000 | | Theravance Biopharma, Inc. | | 3.25 | | 11/01/23 | | 633,125 | |
| | 1,750,000 | | Tivity Health, Inc. (a) | | 1.50 | | 07/01/18 | | 2,698,281 | |
| | | 18,001,000 | |
| Energy - 1.5% |
| | 1,500,000 | | Clean Energy Fuels Corp. (a)(f) | | 5.25 | | 10/01/18 | | 1,457,813 | |
| | 1,700,000 | | Ensco Jersey Finance, Ltd. (a)(f) | | 3.00 | | 01/31/24 | | 1,662,812 | |
| | 1,000,000 | | Newpark Resources, Inc. (f) | | 4.00 | | 12/01/21 | | 1,136,250 | |
| | 3,000,000 | | Renewable Energy Group, Inc. (f) | | 4.00 | | 06/15/36 | | 3,401,250 | |
| | | 7,658,125 | |
| Financial - 0.7% |
| | 2,700,000 | | Encore Capital Group, Inc. (a) | | 3.00 | | 07/01/20 | | 2,559,938 | |
| | 1,000,000 | | Encore Capital Group, Inc. (f) | | 3.25 | | 03/15/22 | | 923,750 | |
| | | 3,483,688 | |
| Healthcare - 0.9% |
| | 2,000,000 | | Quidel Corp. | | 3.25 | | 12/15/20 | | 2,058,750 | |
| | 2,000,000 | | Repligen Corp. | | 2.13 | | 06/01/21 | | 2,562,500 | |
| | | 4,621,250 | |
| Industrial - 1.4% |
| | 1,550,000 | | Echo Global Logistics, Inc.(a) | | 2.50 | | 05/01/20 | | 1,467,656 | |
| | 2,400,000 | | Fluidigm Corp. (a) | | 2.75 | | 02/01/34 | | 1,644,000 | |
| | 500,000 | | Golar LNG, Ltd. (f) | | 2.75 | | 02/15/22 | | 506,875 | |
| | 1,500,000 | | Kaman Corp. (a)(f) | | 3.25 | | 11/15/17 | | 2,168,438 | |
| | 1,000,000 | | TTM Technologies, Inc. | | 1.75 | | 12/15/20 | | 1,764,375 | |
| | | 7,551,344 | |
| Information Technology - 2.4% |
| | 1,400,000 | | Advanced Micro Devices, Inc. (a) | | 2.13 | | 09/01/26 | | 2,768,500 | |
| | 2,300,000 | | Avid Technology, Inc. (a) | | 2.00 | | 06/15/20 | | 1,634,438 | |
| | 834,000 | | Ciena Corp. | | 0.88 | | 06/15/17 | | 834,521 | |
| | 2,500,000 | | Envestnet, Inc. (a) | | 1.75 | | 12/15/19 | | 2,335,937 | |
| | 975,000 | | Nuance Communi-cations, Inc. | | 2.75 | | 11/01/31 | | 982,922 | |
| | 1,300,000 | | ON Semiconductor Corp. (f) | | 1.63 | | 10/15/23 | | 1,354,438 | |
| | 2,200,000 | | Quantum Corp. | | 4.50 | | 11/15/17 | | 2,194,500 | |
| | Principal | | Security Description | | Rate | | Maturity | | Value | |
| $ | 300,000 | | Veeco Instruments, Inc. | | 2.70 | % | 01/15/23 | $ | 314,625 | |
| | | 12,419,881 | |
| Materials - 0.9% |
| | 1,300,000 | | Aceto Corp. (a) | | 2.00 | | 11/01/20 | | 1,194,375 | |
| | 200,000 | | Pretium Resources, Inc. (f) | | 2.25 | | 03/15/22 | | 201,875 | |
| | 3,500,000 | | Silver Standard Resources, Inc. | | 2.88 | | 02/01/33 | | 3,438,750 | |
| | | 4,835,000 | |
| Telecommunication Services - 1.3% |
| | 716,000 | | Clearwire Commun-ications, LLC/Clearwire Finance, Inc. (f) | | 8.25 | | 12/01/40 | | 743,745 | |
| | 2,250,000 | | Global Eagle Entertainment, Inc. (a) | | 2.75 | | 02/15/35 | | 1,144,687 | |
| | 2,350,000 | | Harmonic, Inc. (a) | | 4.00 | | 12/01/20 | | 2,937,500 | |
| | 2,000,000 | | Pandora Media, Inc. | | 1.75 | | 12/01/20 | | 2,015,000 | |
| | | 6,840,932 | |
| Utilities - 0.5% |
| | 3,350,000 | | EnerNOC, Inc. (a) | | 2.25 | | 08/15/19 | | 2,803,531 | |
Total Corporate Convertible Bonds (Cost $66,354,405) | | 71,345,376 | |
| | Principal | | Security Description | | Rate | | Maturity | | Value | |
| Industrial - 0.5% |
| $ | 500,000 | | Park-Ohio Industries, Inc. | | 8.13 | % | 04/01/21 | $ | 516,035 | |
| | 1,561,000 | | USG Corp. | | 8.25 | | 01/15/18 | | 1,642,953 | |
| | 303,000 | | XPO CNW, Inc. | | 7.25 | | 01/15/18 | | 313,605 | |
| | | 2,472,593 | |
| Information Technology - 0.3% |
| | 1,667,000 | | NXP BV / NXP Funding, LLC (f) | | 3.75 | | 06/01/18 | | 1,704,508 | |
| Materials - 0.2% |
| | 980,000 | | International Wire Group, Inc. (f) | | 10.75 | | 08/01/21 | | 955,500 | |
| Teleommunication Services - 1.7% |
| | 1,471,000 | | CSC Holdings, LLC | | 7.88 | | 02/15/18 | | 1,537,195 | |
| | 400,000 | | DISH DBS Corp. | | 4.63 | | 07/15/17 | | 403,500 | |
| | 1,290,000 | | FairPoint Commun-ications, Inc. (f) | | 8.75 | | 08/15/19 | | 1,330,828 | |
| | 925,000 | | iHeartCommunications, Inc. | | 9.00 | | 12/15/19 | | 789,719 | |
| | 2,024,000 | | Level 3 Financing, Inc. (e) | | 4.76 | | 01/15/18 | | 2,035,385 | |
| | 895,000 | | Sprint Commun-ications, Inc. (f) | | 9.00 | | 11/15/18 | | 976,669 | |
| | 520,000 | | T-Mobile USA, Inc. | | 6.46 | | 04/28/19 | | 521,950 | |
| | 520,000 | | T-Mobile USA, Inc. | | 6.54 | | 04/28/20 | | 531,050 | |
| | 749,000 | | ViaSat, Inc. | | 6.88 | | 06/15/20 | | 768,661 | |
| | | 8,894,957 | |
| Utilities - 0.1% |
| | 538,000 | | NRG Energy, Inc. | | 7.63 | | 01/15/18 | | 558,175 | |
Total Corporate Non-Convertible Bonds (Cost $27,479,577) | | 27,242,223 | |
| Exchange Traded Notes - 0.0% |
| | 250 | | iPATH S&P 500 VIX Mid-Term Futures ETN (a)(c) (Cost $9,104) | | 6,575 | |
| Syndicated Loans - 0.5% |
| | 471,736 | | Atlas Iron, Ltd. (e) | | 5.58 | | 04/30/21 | | 449,918 | |
| | 2,000,000 | | Energy Future Intermediate Holding Co., LLC (e) | | 4.25 | | 06/30/17 | | 2,002,083 | |
| Total Syndicated Loans (Cost $2,472,370) | | 2,452,001 | |
Total Fixed Income Securities (Cost $97,534,368) | | 102,108,198 | |
| | Shares | | Security Description | | Value | |
| Investment Companies - 17.7% |
| | 1,289,545 | | Absolute Capital Opportunities Fund (c)(g) | | 14,146,311 | |
| | 306,535 | | SPDR S&P 500 ETF Trust (a)(b) | | 72,262,561 | |
| | 258,000 | | VanEck Vectors Gold Miners ETF | | 5,884,980 | |
| Total Investment Companies (Cost $52,603,576) | | 92,293,852 | |
| | Shares | | Security Description | | Value | |
| Money Market Fund - 20.4% |
| | 106,669,534 | | State Street Institutional Treasury Money Market Fund, Premier Share Class, 0.55% (e) (Cost $106,669,534) | $ | 106,669,534 | |
| | Contracts | | Security Description | | | Strike Price | | Exp. Date | | Value | |
| Purchased Options - 1.4% |
| Call Options Purchased - 1.3% |
| | 24,933,410 | | Atlas Iron, Ltd. | | $ | 0.08 | | 08/17 | | 19,049 | |
| | 5,122 | | SPDR S&P 500 ETF Trust | | | 265.00 | | 01/18 | | 407,199 | |
| | 2,290 | | SPDR S&P 500 ETF Trust | | | 255.00 | | 01/18 | | 551,890 | |
| | 20,000 | | VanEck Vectors Gold Miners ETF | | | 28.00 | | 01/18 | | 2,620,000 | |
| | 10,000 | | VanEck Vectors Gold Miners ETF | | | 23.00 | | 01/18 | | 3,050,000 | |
Total Call Options Purchased (Premiums Paid $9,923,690) | | 6,648,138 | |
| Put Options Purchased - 0.1% |
| | 189 | | Altisource Portfolio Solutions SA | | | 25.00 | | 07/17 | | 27,405 | |
| | 10 | | iShares Russell 2000 ETF | | | 135.00 | | 05/17 | | 2,075 | |
| | 33 | | SPDR S&P 500 ETF Trust | | | 226.00 | | 04/17 | | 1,056 | |
| | 83 | | SPDR S&P 500 ETF Trust | | | 225.00 | | 04/17 | | 2,241 | |
| | 30 | | SPDR S&P 500 ETF Trust | | | 227.00 | | 06/17 | | 7,035 | |
| | 859 | | SPDR S&P 500 ETF Trust | | | 200.00 | | 01/18 | | 282,611 | |
| | 128 | | The Hain Celestial Group, Inc. | | | 25.00 | | 08/17 | | 128 | |
| | 5,000 | | VanEck Vectors Semiconductor ETF | | | 70.00 | | 05/17 | | 150,000 | |
Total Put Options Purchased (Premiums Paid $3,089,219) | | 472,551 | |
Total Purchased Options (Premiums Paid $13,012,909) | | 7,120,689 | |
Total Long Positions - 93.6% (Cost $408,851,508)* | | 487,902,439 | |
Total Short Positions - (38.9)% (Proceeds $(207,621,258))* | | (202,573,125 | ) |
Total Written Options - (0.2)%
(Premiums Received $(1,720,115))* | | (1,011,209 | ) |
| Other Assets & Liabilities, Net – 45.5% | | 236,871,575 | |
| Net Assets – 100.0% | $ | 521,189,680 | |
See Notes to Financial Statements. | 11 | |
ABSOLUTE STRATEGIES FUND SCHEDULE OF SECURITIES SOLD SHORT MARCH 31, 2017 |
| Shares | | Security Description | | Value |
| Short Positions - (38.9)% |
| Common Stock - (29.4)% |
| Consumer Discretionary - (5.0)% |
| | (1,250) | | Amazon.com, Inc. | $ | (1,108,175) |
| | (3,406) | | Best Buy Co., Inc. | | (167,405) |
| | (1,912) | | Big Lots, Inc. | | (93,076) |
| | (26,529) | | Bojangles', Inc. | | (543,845) |
| | (9,215) | | Brinker International, Inc. | | (405,091) |
| | (5,258) | | CarMax, Inc. | | (311,379) |
| | (16,500) | | Carnival Corp. | | (972,015) |
| | (1,676) | | Chipotle Mexican Grill, Inc., Class A | | (746,692) |
| | (2,793) | | Cracker Barrel Old Country Store, Inc. | | (444,785) |
| | (26,529) | | Del Frisco's Restaurant Group, Inc. | | (478,848) |
| | (48,400) | | DR Horton, Inc. | | (1,612,204) |
| | (71,000) | | Fiat Chrysler Automobiles NV | | (776,364) |
| | (15,359) | | Fiesta Restaurant Group, Inc. | | (371,688) |
| | (180,752) | | Ford Motor Co. | | (2,103,953) |
| | (59,400) | | General Motors Co. | | (2,100,384) |
| | (39,600) | | HD Supply Holdings, Inc. | | (1,628,550) |
| | (23,300) | | Horizon Global Corp. | | (323,404) |
| | (63,100) | | JAKKS Pacific, Inc. | | (347,050) |
| | (36,000) | | Leggett & Platt, Inc. | | (1,811,520) |
| | (4,857) | | LGI Homes, Inc. | | (164,701) |
| | (25,645) | | M/I Homes, Inc. | | (628,303) |
| | (5,026) | | McDonald's Corp. | | (651,420) |
| | (6,950) | | Mohawk Industries, Inc. | | (1,594,955) |
| | (5,890) | | Movado Group, Inc. | | (146,956) |
| | (67,019) | | Noodles & Co. | | (385,359) |
| | (11,270) | | PetMed Express, Inc. | | (226,978) |
| | (5,585) | | Texas Roadhouse, Inc. | | (248,700) |
| | (3,389) | | The Cheesecake Factory, Inc. | | (214,727) |
| | (6,980) | | The Home Depot, Inc. | | (1,024,873) |
| | (560) | | The Priceline Group, Inc. | | (996,783) |
| | (20,943) | | Titan International, Inc. | | (216,551) |
| | (8,377) | | Tractor Supply Co. | | (577,762) |
| | (3,250) | | Ulta Beauty, Inc. | | (926,998) |
| | (20,943) | | Vista Outdoor, Inc. | | (431,216) |
| | (59,500) | | Volvo AB, Class B | | (878,491) |
| | (2,562) | | Williams-Sonoma, Inc. | | (137,374) |
| | (1,011) | | WW Grainger, Inc. | | (235,320) |
| | | (26,033,895) |
| Consumer Staples - (4.1)% |
| | (6,795) | | Abaxis, Inc. | | (329,557) |
| | (23,100) | | Acorda Therapeutics, Inc. | | (485,100) |
| | (41,200) | | AerCap Holdings NV | | (1,893,964) |
| | (83,900) | | Albany Molecular Research, Inc. | | (1,177,117) |
| | (37,707) | | Amira Nature Foods, Ltd. | | (202,109) |
| | (41,664) | | Amplify Snack Brands, Inc. | | (349,978) |
| | (13,962) | | Archer-Daniels-Midland Co. | | (642,810) |
| | (2,100) | | Ascent Capital Group, Inc., Class A | | (29,673) |
| | (8,859) | | Avis Budget Group, Inc. | | (262,049) |
| | (71,500) | | Carriage Services, Inc. | | (1,939,080) |
| | (5,543) | | Cenveo, Inc. | | (27,826) |
| | (6,404) | | CoreLogic, Inc. | | (260,771) |
| | (3,250) | | Ctrip.com International, Ltd., ADR | | (159,737) |
| | (51,100) | | Depomed, Inc. | | (641,305) |
| | (5,864) | | Dr. Pepper Snapple Group, Inc. | | (574,203) |
| | (15,100) | | FleetCor Technologies, Inc. | | (2,286,593) |
| | (29,321) | | Flowers Foods, Inc. | | (569,121) |
| | (8,936) | | General Mills, Inc. | | (527,313) |
| | (36,764) | | Hostess Brands, Inc. | | (583,445) |
| | (5,306) | | Ingredion, Inc. | | (639,002) |
| Shares | | Security Description | | Value |
| | (94,700) | | Ironwood Pharmaceuticals, Inc. | $ | (1,615,582) |
| | (1,000) | | Macquarie Infrastructure Corp. | | (80,580) |
| | (31,761) | | Pacific Biosciences of California, Inc. | | (164,204) |
| | (5,864) | | PepsiCo, Inc. | | (655,947) |
| | (11,558) | | Sanderson Farms, Inc. | | (1,200,183) |
| | (55,400) | | Sucampo Pharmaceuticals, Inc., Class A | | (609,400) |
| | (11,000) | | The Spectranetics Corp. | | (320,375) |
| | (10,900) | | Theravance Biopharma, Inc. | | (401,338) |
| | (72,800) | | Tivity Health, Inc. | | (2,118,480) |
| | (3,630) | | TreeHouse Foods, Inc. | | (307,316) |
| | (7,801) | | USANA Health Sciences, Inc. | | (449,338) |
| | | (21,503,496) |
| Energy - (1.0)% |
| | (9,324) | | Antero Midstream Partners LP | | (309,184) |
| | (18,113) | | Enbridge Energy Partners LP | | (344,147) |
| | (7,769) | | Enbridge, Inc. | | (325,055) |
| | (87,500) | | Ensco PLC, Class A | | (783,125) |
| | (71,600) | | Newpark Resources, Inc. | | (579,960) |
| | (224,600) | | Renewable Energy Group, Inc. | | (2,347,070) |
| | (7,484) | | Spectra Energy Partners LP | | (326,751) |
| | | (5,015,292) |
| Financial - (7.3)% |
| | (2,925,000) | | Agricultural Bank of China, Ltd., Class H | | (1,347,423) |
| | (31,500) | | Air Lease Corp. | | (1,220,625) |
| | (13,500) | | Ameriprise Financial, Inc. | | (1,750,680) |
| | (309,942) | | Banco Santander SA, ADR | | (1,881,348) |
| | (97,550) | | Bank of America Corp. | | (2,301,204) |
| | (2,648,000) | | Bank of China, Ltd., Class H | | (1,315,226) |
| | (1,282,000) | | Bank of Communications Co., Ltd., Class H | | (996,369) |
| | (2,005,000) | | China CITIC Bank Corp., Ltd., Class H | | (1,328,669) |
| | (1,531,000) | | China Construction Bank Corp., Class H | | (1,231,262) |
| | (1,020,000) | | China Galaxy Securities Co., Ltd., Class H | | (941,054) |
| | (439,000) | | China Merchants Bank Co., Ltd., Class H | | (1,160,838) |
| | (469,000) | | CITIC Securities Co., Ltd., Class H | | (965,579) |
| | (34,500) | | Citigroup, Inc. | | (2,063,790) |
| | (2,850) | | Credit Acceptance Corp. | | (568,319) |
| | (71,600) | | Deutsche Bank AG | | (1,228,656) |
| | (37,000) | | Encore Capital Group, Inc. | | (1,139,600) |
| | (47,200) | | Erste Group Bank AG | | (1,537,024) |
| | (9,700) | | Home Capital Group, Inc. | | (189,864) |
| | (1,988,000) | | Industrial & Commercial Bank of China, Ltd., Class H | | (1,299,497) |
| | (336,500) | | Intesa Sanpaolo SpA | | (913,958) |
| | (51,750) | | Morgan Stanley | | (2,216,970) |
| | (120,800) | | Nordea Bank AB | | (1,379,123) |
| | (89,975) | | OTP Bank PLC | | (2,517,082) |
| | (90,400) | | Swedbank AB, Class A | | (2,094,384) |
| | (84,400) | | The Blackstone Group LP | | (2,506,680) |
| | (39,000) | | The Charles Schwab Corp. | | (1,591,590) |
| | (14,900) | | UniCredit SpA | | (229,687) |
| | | (37,916,501) |
| Healthcare - (0.4)% |
| | (27,900) | | Quidel Corp. | | (631,656) |
See Notes to Financial Statements. | 12 | |
ABSOLUTE STRATEGIES FUND SCHEDULE OF SECURITIES SOLD SHORT MARCH 31, 2017 |
| Shares | | Security Description | | Value |
| | (45,500) | | Repligen Corp. | $ | (1,601,600) |
| | | | | | (2,233,256) |
| Industrial - (7.1)% |
| | (8,400) | | Acuity Brands, Inc. | | (1,713,600) |
| | (12,751) | | American Outdoor Brands Corp. | | (252,597) |
| | (27,100) | | Atlas Copco AB, Class A | | (956,597) |
| | (3,037) | | Caterpillar, Inc. | | (281,712) |
| | (26,200) | | Eaton Corp. PLC | | (1,942,730) |
| | (14,000) | | Echo Global Logistics, Inc. | | (298,900) |
| | (42,000) | | Emerson Electric Co. | | (2,514,120) |
| | (18,200) | | Fluidigm Corp. | | (103,558) |
| | (46,500) | | Fluor Corp. | | (2,446,830) |
| | (90,600) | | General Electric Co. | | (2,699,880) |
| | (8,450) | | Golar LNG, Ltd. | | (236,009) |
| | (18,900) | | IDEX Corp. | | (1,767,339) |
| | (12,050) | | Illinois Tool Works, Inc. | | (1,596,264) |
| | (43,500) | | Kaman Corp. | | (2,093,655) |
| | (4,600) | | Martin Marietta Materials, Inc. | | (1,003,950) |
| | (2,064) | | OSI Systems, Inc. | | (150,651) |
| | (8,377) | | Raven Industries, Inc. | | (243,352) |
| | (27,500) | | Sensata Technologies Holding NV | | (1,200,925) |
| | (40,000) | | SKF AB, Class B | | (791,460) |
| | (33,075) | | Spirit AeroSystems Holdings, Inc., Class A | | (1,915,704) |
| | (4,452) | | Sturm Ruger & Co., Inc. | | (238,405) |
| | (54,100) | | Textron, Inc. | | (2,574,619) |
| | (14,650) | | The Boeing Co. | | (2,590,999) |
| | (13,900) | | The Middleby Corp. | | (1,896,655) |
| | (1,607) | | TransDigm Group, Inc. | | (353,797) |
| | (92,500) | | TTM Technologies, Inc. | | (1,492,025) |
| | (11,900) | | Vulcan Materials Co. | | (1,433,712) |
| | (33,700) | | Wartsila OYJ Abp | | (1,802,950) |
| | (30,717) | | Welbilt, Inc. | | (602,975) |
| | | (37,195,970) |
| Information Technology - (3.3)% |
| | (158,800) | | Advanced Micro Devices, Inc. | | (2,310,540) |
| | (10,600) | | Akamai Technologies, Inc. | | (632,820) |
| | (7,175) | | Alliance Data Systems Corp. | | (1,786,575) |
| | (12,050) | | Autodesk, Inc. | | (1,041,963) |
| | (40,100) | | Avid Technology, Inc. | | (186,866) |
| | (68,400) | | CA, Inc. | | (2,169,648) |
| | (8,234) | | Envestnet, Inc. | | (265,958) |
| | (78,600) | | Intel Corp. | | (2,835,102) |
| | (12,300) | | International Business Machines Corp. | | (2,141,922) |
| | (2,674) | | Medidata Solutions, Inc. | | (154,263) |
| | (36,100) | | ON Semiconductor Corp. | | (559,189) |
| | (24,600) | | Oracle Corp. | | (1,097,406) |
| | (94,900) | | Quantum Corp. | | (82,563) |
| | (20,400) | | salesforce.com, Inc. | | (1,682,796) |
| | (6,630) | | Sigma Designs, Inc. | | (41,438) |
| | (4,600) | | Veeco Instruments, Inc. | | (137,310) |
| | | (17,126,359) |
| Materials - (0.7)% |
| | (13,700) | | Aceto Corp. | | (216,597) |
| | (90,755) | | AgroFresh Solutions, Inc. | | (396,599) |
| | (27,925) | | American Vanguard Corp. | | (463,555) |
| | (15,359) | | CF Industries Holdings, Inc. | | (450,787) |
| | (5,585) | | Compass Minerals International, Inc. | | (378,942) |
| | (4,189) | | FMC Corp. | | (291,512) |
| | (29,321) | | Potash Corp. of Saskatchewan, Inc. | | (500,803) |
| Shares | | Security Description | | Value |
| | (6,100) | | Pretium Resources, Inc. | $ | (65,331) |
| | (56,396) | | Silver Standard Resources, Inc. | | (598,362) |
| | | (3,362,488) |
| Telecommunication Services - (0.5)% |
| | (37,500) | | Global Eagle Entertainment, Inc. | | (119,625) |
| | (285,400) | | Harmonic, Inc. | | (1,698,130) |
| | (59,300) | | Pandora Media, Inc. | | (700,333) |
| | (2,606) | | WebMD Health Corp. | | (137,284) |
| | | (2,655,372) |
| Utilities - (0.0)% |
| | (31,400) | | EnerNOC, Inc. | | (188,400) |
Total Common Stock
(Proceeds $(158,075,222)) | | (153,231,029) |
| Investment Companies - (9.5)% |
| | (16,148) | | iShares Russell 2000 ETF | | (2,220,027) |
| | (199,890) | | SPDR S&P 500 ETF Trust | | (47,122,069) |
Total Investment Companies
(Proceeds $(49,546,036)) | | (49,342,096) |
Total Short Positions - (38.9)%
(Proceeds $(207,621,258)) | $ | (202,573,125) |
See Notes to Financial Statements. | 13 | |
ABSOLUTE STRATEGIES FUND SCHEDULE OF CALL AND PUT OPTIONS WRITTEN MARCH 31, 2017 |
| Contracts | | Security Description | | | Strike Price | | Exp. Date | | Value |
| Written Options - (0.2)% |
| Call Options Written - (0.1)% |
| (121) | | American Express Co. | | $ | 80.00 | | 01/18 | $ | (63,525) |
| (205) | | Halliburton Co. | | | 55.00 | | 01/18 | | (49,713) |
| (88) | | Harley-Davidson, Inc. | | | 50.00 | | 01/18 | | (111,100) |
| (382) | | Quanta Services, Inc. | | | 39.00 | | 08/17 | | (71,625) |
| (57) | | The Boeing Co. | | | 185.00 | | 01/18 | | (46,170) |
Total Call Options Written
(Premiums Received $(320,175)) | | (342,133) |
| Put Options Written - (0.1)% |
| (114) | | American Airlines Group, Inc. | | | 42.00 | | 01/18 | | (55,290) |
| (53) | | Apple, Inc. | | | 75.00 | | 01/18 | | (795) |
| (62) | | AutoNation, Inc. | | | 40.00 | | 10/17 | | (15,190) |
| (106) | | Delta Air Lines, Inc. | | | 45.00 | | 01/18 | | (45,580) |
| (88) | | Harley-Davidson, Inc. | | | 40.00 | | 01/18 | | (8,624) |
| (10) | | iShares Russell 2000 ETF | | | 120.00 | | 05/17 | | (260) |
| (42) | | Johnson & Johnson | | | 105.00 | | 01/18 | | (7,014) |
| (126) | | Patterson Cos., Inc. (h) | | | 35.00 | | 07/17 | | (126) |
| (18) | | SPDR S&P 500 ETF Trust | | | 215.00 | | 04/17 | | (216) |
| (33) | | SPDR S&P 500 ETF Trust | | | 210.00 | | 04/17 | | (330) |
| (65) | | SPDR S&P 500 ETF Trust | | | 205.00 | | 04/17 | | (455) |
| (15) | | SPDR S&P 500 ETF Trust | | | 212.00 | | 06/17 | | (1,215) |
| (15) | | SPDR S&P 500 ETF Trust | | | 205.00 | | 06/17 | | (780) |
| (859) | | SPDR S&P 500 ETF Trust | | | 215.00 | | 01/18 | | (477,174) |
| (61) | | The Boeing Co. | | | 100.00 | | 01/18 | | (4,057) |
| (128) | | The Hain Celestial Group, Inc. | | | 35.00 | | 08/17 | | (22,400) |
| (42) | | Time Warner, Inc. | | | 90.00 | | 01/19 | | (24,570) |
| (5,000) | | VanEck Vectors Semiconductor ETF | | | 55.00 | | 05/17 | | (5,000) |
Total Put Options Written
(Premiums Received $(1,399,940)) | | (669,076) |
Total Written Options - (0.2)%
(Premiums Received $(1,720,115)) | $ | (1,011,209) |
See Notes to Financial Statements. | 14 | |
ABSOLUTE STRATEGIES FUND NOTES TO SCHEDULES OF INVESTMENTS, SECURITIES SOLD SHORT AND CALL AND PUT OPTIONS WRITTEN MARCH 31, 2017 |
ADR American Depositary Receipt
ETF Exchange Traded Fund
ETN Exchange Traded Note
LLC Limited Liability Company
LP Limited Partnership
PLC Public Limited Company
REIT Real Estate Investment Trust
(a) All or a portion of this security is held as collateral for securities sold short.
(b) Subject to put option written by the Fund.
(c) Non-income producing security.
(d) Subject to call option written by the Fund.
(e) Variable rate security. Rate presented is as of March 31, 2017.
(f) Security exempt from registration under Rule 144A under the Securities Act of 1933. At the period end, the value of these securities amounted to $26,225,063 or 5.0% of net assets.
(g) Affiliated Company.
(h) Security fair valued in accordance with procedures adopted by the Board of Trustees. At the period end, the value of these securities amounted to $(126) or (0.0)% of net assets.
Credit Default Swaps – Buy Protection
(1) Credit spreads are an indication of the seller's performance risk, related to the likelihood of a credit event occurring that would require a seller to make payment to a buyer. Credit spreads are used to determine the value of swap contracts and reflect the cost of buying/selling protection, which may include upfront payments made to enter into the contract.
See Notes to Financial Statements. | 15 | |
ABSOLUTE STRATEGIES FUND NOTES TO SCHEDULES OF INVESTMENTS, SECURITIES SOLD SHORT AND CALL AND PUT OPTIONS WRITTEN MARCH 31, 2017 |
At March 31, 2017, the Fund held the following exchange traded futures contracts:
| | Level 1 | | Level 2 | | Level 3 | | Total |
| Liabilities |
| Securities Sold Short |
| Common Stock | | $ | (153,231,029 | ) | | $ | - | | | $ | - | | | $ | (153,231,029 | ) |
| Investment Companies | | | (49,342,096 | ) | | | - | | | | - | | | | (49,342,096 | ) |
| Total Securities Sold Short | | $ | (202,573,125 | ) | | $ | - | | | $ | - | | | $ | (202,573,125 | ) |
| Other Financial Instruments** |
| Written Options | | | (158,111 | ) | | | (852,972 | ) | | | (126 | ) | | | (1,011,209 | ) |
| Credit Default Swaps | | | - | | | | (981,271 | ) | | | - | | | | (981,271 | ) |
| Futures | | | (2,913,974 | ) | | | - | | | | - | | | | (2,913,974 | ) |
| Total Other Financial Instruments** | | $ | (3,072,085 | ) | | $ | (1,834,243 | ) | | $ | (126 | ) | | $ | (4,906,454 | ) |
| Total Liabilities | | $ | (205,645,210 | ) | | $ | (1,834,243 | ) | | $ | (126 | ) | | $ | (207,479,579 | ) |
** Other Financial Instruments are derivative instruments not reflected in the Schedule of Investments and Schedule of Securities Sold Short, such as credit default swaps and futures, which are valued at the unrealized appreciation/(depreciation) of the instrument. Written options are reported at their market value at year end.
The following is a reconciliation of Level 3 investments for which significant unobservable inputs were used to determine fair value.
| Portfolio Breakdown (% of Net Assets) |
| Long Positions |
| Common Stock | 54.3% | |
| Money Market Fund | 44.3% | |
| Purchased Options | 0.7% | |
| Short Positions |
| Investment Companies | -35.5% | |
| Written Options | -0.7% | |
| Other Assets less Liabilities* | 36.9% | |
| | 100.0% | |
* Consists of deposits with the custodian and/or brokers for securities sold short, cash, foreign currency, prepaid expenses, receivables, payables and accrued liabilities. Deposits with the custodian and/or brokers for securities sold short represent 37.1% of net assets. See Note 2 of the accompanying Notes to Financial Statements.
See Notes to Financial Statements. | 18 | |
ABSOLUTE CAPITAL OPPORTUNITIES FUND SCHEDULE OF INVESTMENTS MARCH 31, 2017 |
| Shares | | Security Description | | Value | |
| Long Positions - 99.3% |
| Common Stock - 54.3% |
| Consumer Discretionary - 6.7% |
| | 2,835 | | American Airlines Group, Inc. (a)(b) | $ | 119,921 | |
| | 385 | | CarMax, Inc. (a)(c) | | 22,800 | |
| | 3,235 | | CVS Health Corp. | | 253,947 | |
| | 1,800 | | Delta Air Lines, Inc. (b) | | 82,728 | |
| | 4,305 | | General Motors Co. (a) | | 152,225 | |
| | 1,560 | | Harley-Davidson, Inc. (a)(b)(d) | | 94,380 | |
| | 2,315 | | Macy's, Inc. (a) | | 68,617 | |
| | 1,985 | | VF Corp. | | 109,115 | |
| | 565 | | Walgreens Boots Alliance, Inc. | | 46,923 | |
| | | 950,656 | |
| Consumer Staples - 12.5% |
| | 330 | | AMERCO | | 125,793 | |
| | 2,475 | | Diageo PLC, ADR | | 286,060 | |
| | 1,025 | | McKesson Corp. | | 151,966 | |
| | 4,500 | | Nestle SA, ADR | | 346,050 | |
| | 1,460 | | Philip Morris International, Inc. | | 164,834 | |
| | 8,360 | | Quanta Services, Inc. (a)(c)(d) | | 310,240 | |
| | 2,300 | | Robert Half International, Inc. | | 112,309 | |
| | 6,140 | | Sanofi, ADR | | 277,835 | |
| | | 1,775,087 | |
| Energy - 3.5% |
| | 4,792 | | Enbridge, Inc. | | 200,497 | |
| | 3,480 | | Halliburton Co. (a)(d) | | 171,251 | |
| | 700 | | National Oilwell Varco, Inc. (a) | | 28,063 | |
| | 1,255 | | Schlumberger, Ltd. (a) | | 98,015 | |
| | | 497,826 | |
| Financial - 14.4% |
| | 2,030 | | American Express Co. (a)(d) | | 160,593 | |
| | 1,275 | | Aon PLC (a) | | 151,330 | |
| | 9,460 | | Bank of America Corp. (a) | | 223,162 | |
| | 2,500 | | Berkshire Hathaway, Inc., Class B (a)(c) | | 416,700 | |
| | 6,055 | | Brookfield Asset Management, Inc., Class A | | 220,765 | |
| | 3,875 | | CBRE Group, Inc., Class A (a)(c) | | 134,811 | |
| | 2,010 | | Citigroup, Inc. (a) | | 120,238 | |
| | 2,590 | | JPMorgan Chase & Co. (a) | | 227,506 | |
| | 4,800 | | The Bank of New York Mellon Corp. | | 226,704 | |
| | 2,200 | | WR Berkley Corp. | | 155,386 | |
| | | 2,037,195 | |
| Healthcare - 0.5% |
| | 410 | | Becton Dickinson and Co. | | 75,210 | |
| Industrial - 6.3% |
| | 3,000 | | Expeditors International of Washington, Inc. | | 169,470 | |
| | 2,935 | | Jacobs Engineering Group, Inc. (a) | | 162,247 | |
| | 5,765 | | Leucadia National Corp. (a) | | 149,890 | |
| | 1,200 | | The Boeing Co. (a)(b)(d) | | 212,232 | |
| | 500 | | United Parcel Service, Inc., Class B (a) | | 53,650 | |
| | 930 | | Valmont Industries, Inc. (a) | | 144,615 | |
| | | 892,104 | |
| Information Technology - 2.1% |
| | 2,095 | | Apple, Inc. (a)(b) | | 300,968 | |
| Materials - 5.6% |
| | 4,830 | | Cameco Corp. | | 53,468 | |
| | 2,390 | | Monsanto Co. | | 270,548 | |
| | 1,595 | | Praxair, Inc. | | 189,167 | |
| Shares | | Security Description | | Value |
| Short Positions - (35.5)% |
| Investment Companies - (35.5)% |
| | (21,363) | | SPDR S&P 500 ETF Trust (Proceeds $(5,056,911)) | $ | (5,036,114) |
Total Short Positions - (35.5)%
(Proceeds $(5,056,911)) | $ | (5,036,114) |
See Notes to Financial Statements. | 20 | |
ABSOLUTE CAPITAL OPPORTUNITIES FUND SCHEDULE OF CALL AND PUT OPTIONS WRITTEN MARCH 31, 2017 |
| | | | | | | | | | |
| Contracts | | Security Description | | | Strike Price | | Exp. Date | | Value |
| Written Options - (0.7)% |
| Call Options Written - (0.2)% |
| (13) | | American Express Co. | | $ | 80.00 | | 01/18 | $ | (6,825) |
| (21) | | Halliburton Co. | | | 55.00 | | 01/18 | | (5,093) |
| (7) | | Harley-Davidson, Inc. | | | 50.00 | | 01/18 | | (8,837) |
| (41) | | Quanta Services, Inc. | | | 39.00 | | 08/17 | | (7,688) |
| (6) | | The Boeing Co. | | | 185.00 | | 01/18 | | (4,860) |
Total Call Options Written
(Premiums Received $(32,419)) | | (33,303) |
| Put Options Written - (0.5)% |
| (12) | | American Airlines Group, Inc. | | | 42.00 | | 01/18 | | (5,820) |
| (5) | | Apple, Inc. | | | 75.00 | | 01/18 | | (75) |
| (7) | | AutoNation, Inc. | | | 40.00 | | 10/17 | | (1,715) |
| (12) | | Delta Air Lines, Inc. | | | 45.00 | | 01/18 | | (5,160) |
| (7) | | Harley-Davidson, Inc. | | | 40.00 | | 01/18 | | (686) |
| (5) | | Johnson & Johnson | | | 105.00 | | 01/18 | | (835) |
| (14) | | Patterson Cos., Inc. (f) | | | 35.00 | | 07/17 | | (14) |
| (92) | | SPDR S&P 500 ETF Trust | | | 215.00 | | 01/18 | | (51,106) |
| (5) | | The Boeing Co. | | | 100.00 | | 01/18 | | (333) |
| (13) | | The Hain Celestial Group, Inc. | | | 35.00 | | 08/17 | | (2,275) |
| (5) | | Time Warner, Inc. | | | 90.00 | | 01/19 | | (2,925) |
Total Put Options Written
(Premiums Received $(99,602)) | | (70,944) |
Total Written Options - (0.7)%
(Premiums Received $(132,021)) | $ | (104,247) |
See Notes to Financial Statements. | 21 | |
ABSOLUTE CAPITAL OPPORTUNITIES FUND NOTES TO SCHEDULES OF INVESTMENTS, SECURITIES SOLD SHORT AND CALL AND PUT OPTIONS WRITTEN MARCH 31, 2017 |
ADR American Depositary Receipt
ETF Exchange Traded Fund
PLC Public Limited Company
(a) All or a portion of this security is held as collateral for securities sold short.
(b) Subject to put option written by the Fund.
(c) Non-income producing security.
(d) Subject to call option written by the Fund.
(e) Variable rate security. Rate presented is as of March 31, 2017.
(f) Security fair valued in accordance with procedures adopted by the Board of Trustees. At year end, the value of these securities amounted to $(14) or (0.0%) of net assets.
* Cost for federal income tax purposes is $7,177,867 and net unrealized appreciation consists of:
The following is a reconciliation of Level 3 investments for which significant unobservable inputs were used to determine fair value.
| | | | | | ABSOLUTE STRATEGIES FUND | | | | ABSOLUTE CAPITAL OPPORTUNITIES FUND | |
| ASSETS | | | | | | | | |
| . | Total investments, at value (Cost $395,841,508 and $12,362,185, respectively) | $ | 473,756,128 | | | $ | 14,091,327 | |
| | Total investment in affiliates, at value (Cost $13,010,000 and $0, respectively) | | 14,146,311 | | | | - | |
| | Total investments | | 487,902,439 | | | | 14,091,327 | |
| | Deposits with brokers | | | 215,327,547 | | | | 5,257,004 | |
| | Cash | | | 22,339,250 | | | | - | |
| | Foreign currency (Cost $4,819,830 and $0, respectively) | | | 4,897,718 | | | | - | |
| | Receivables: | | | | | | | | |
| | | Fund shares sold | | | 1,455,552 | | | | - | |
| | | Investment securities sold | | | 7,018,985 | | | | - | |
| | | Dividends and interest | | | 1,660,933 | | | | 11,890 | |
| | Swap premiums paid | | | 940,225 | | | | - | |
| | Prepaid expenses | | | 10,748 | | | | 10,870 | |
| Total Assets | | | 741,553,397 | | | | 19,371,091 | |
| | | | | | | | | | | |
| LIABILITIES | | | | | | | | |
| | Swap premiums received | | | 321,198 | | | | - | |
| | Unrealized loss on swap agreements | | | 981,271 | | | | - | |
| | Securities sold short, at value (Proceeds $207,621,258 and $5,056,911, respectively) | | | 202,573,125 | | | | 5,036,114 | |
| | Call options written, at value (Premiums received $320,175 and $32,419, respectively) | | | 342,133 | | | | 33,303 | |
| | Put options written, at value (Premiums received $1,399,940 and $99,602, respectively) | | | 669,076 | | | | 70,944 | |
| | Payables: | | | | | | | | |
| | | Investment securities purchased | | | 10,932,366 | | | | - | |
| | | Fund shares redeemed | | | 3,268,848 | | | | - | |
| | | Dividends on securities sold short | | | 244,869 | | | | - | |
| | | Other | | | 10,064 | | | | 454 | |
| | Accrued Liabilities: | | | | | | | | |
| | | Investment adviser fees | | | 715,786 | | | | 10,387 | |
| | | Trustees' fees and expenses | | | 1,935 | | | | 50 | |
| | | Fund services fees | | | 61,273 | | | | 3,582 | |
| | | Other expenses | | | 241,773 | | | | 28,553 | |
| Total Liabilities | | | 220,363,717 | | | | 5,183,387 | |
| | | | | | | | | | | |
| NET ASSETS | | $ | 521,189,680 | | | $ | 14,187,704 | |
| | | | | | | | | | | |
| COMPONENTS OF NET ASSETS | | | | | | | | |
| | Paid-in capital | | $ | 527,202,008 | | | $ | 12,865,861 | |
| | Accumulated net investment loss | | | (2,836,297 | ) | | | (40,691 | ) |
| | Accumulated net realized loss | | | (84,627,315 | ) | | | (415,179 | ) |
| | Net unrealized appreciation | | | 81,451,284 | | | | 1,777,713 | |
| NET ASSETS | | $ | 521,189,680 | | | $ | 14,187,704 | |
| | | | | | | | | | | |
| SHARES OF BENEFICIAL INTEREST AT NO PAR VALUE (UNLIMITED SHARES AUTHORIZED) | | | | | | | | |
| | Institutional Shares | | | 57,273,110 | | | | 1,293,233 | |
| | R Shares | | | 2,276,358 | | | | - | |
| | | | | | | | | | | |
| NET ASSET VALUE, OFFERING AND REDEMPTION PRICE PER SHARE | | | | | | | | |
| | Institutional Shares (based on net assets of $501,865,916 and $14,187,704, respectively) | | $ | 8.76 | | | $ | 10.97 | |
| | R Shares (Based on net assets of $19,323,764 and $0, respectively) | | $ | 8.49 | | | $ | - | |
See Notes to Financial Statements. | 24 | |
ABSOLUTE FUNDS STATEMENTS OF OPERATIONS YEAR ENDED MARCH 31, 2017 |
| | | | | | ABSOLUTE STRATEGIES FUND | | | | ABSOLUTE CAPITAL OPPORTUNITIES FUND | | |
| INVESTMENT INCOME | | | | | | | | | | |
| | Dividend income (Net of foreign withholding taxes of $224,439 and $3,420, respectively) | . | | $ | 8,339,796 | | | $ | 140,739 | | |
| | Interest income | | | 6,657,721 | | | | - | | |
| Total Investment Income | | | | 14,997,517 | | | | 140,739 | | |
| Adviser | | | | | | | | | | |
| EXPENSES | | | | | | | | | | |
| | Investment adviser fees | | | 12,694,831 | | | | 207,310 | | |
| | Fund services fees | | | 654,129 | | | | 40,110 | | |
| | Transfer agent fees: | | | | | | | | | |
| | Institutional Shares | | | 112,145 | | | | - | | |
| | R Shares | | | 59,200 | | | | - | | |
| | Distribution fees: | | | | | | | | | |
| | R Shares | | | 58,864 | | | | - | | |
| | Custodian fees | | | 745,892 | | | | 15,326 | | |
| | Registration fees: | | | | | | | | | |
| | Institutional Shares | | | 33,924 | | | | 10,025 | | |
| | R Shares | | | 15,235 | | | | - | | |
| | Professional fees | | | 193,065 | | | | 29,530 | | |
| | Trustees' fees and expenses | | | 48,064 | | | | 6,397 | | |
| | Offering costs | | | - | | | | 59,679 | | |
| | Dividend expense on securities sold short | | | 5,647,161 | # | | | 49,827 | # | |
| | Interest expense on securities sold short | | | 1,950,603 | 0 | | | 40,751 | 0 | |
| | Miscellaneous expenses | | | 881,441 | | | | 21,729 | | |
| Total Expenses | | | | 23,094,554 | | | | 480,684 | | |
| | Fees waived | | | (206,518 | ) | | | (140,851 | ) | |
| Net Expenses | | | | 22,888,036 | | | | 339,833 | | |
| | | | | | | | | | | | |
| NET INVESTMENT LOSS | | | | (7,890,519 | ) | | | (199,094 | ) | |
| | | | | | | | | | | | |
| NET REALIZED AND UNREALIZED GAIN (LOSS) | | | | | | | | | | |
| | Net realized gain (loss) on: | | | | | | | | | |
| | Investments | | | 60,399,563 | | | | 423,470 | | |
| | Foreign currency transactions | | | 268,593 | | | | - | | |
| | Futures | | | (30,425,853 | ) | | | - | | |
| | Securities sold short | | | (28,628,264 | ) | | | (658,513 | ) | |
| | Written options | | | 4,118,973 | | | | 165,441 | | |
| | Swaps | | | (2,135,277 | ) | | | - | | |
| | Net realized gain (loss) | | | 3,597,735 | | | | (69,602 | ) | |
| | Net change in unrealized appreciation (depreciation) on: | | | | | | | | | |
| | Investments in unaffiliated issuers | | | 10,935,577 | | | | 1,140,476 | | |
| | Investments in affiliated issuers | | | 928,058 | | | | - | | |
| | Foreign currency translations | | | (745,384 | ) | | | - | | |
| | Futures | | | 5,211,320 | | | | - | | |
| | Securities sold short | | | (31,556,366 | ) | | | 55,068 | | |
| | Written options | | | 80,289 | | | | (1,899 | ) | |
| | Swaps | | | (1,282,681 | ) | | | - | | |
| | Net change in unrealized appreciation (depreciation) | | | (16,429,187 | ) | | | 1,193,645 | | |
| NET REALIZED AND UNREALIZED GAIN (LOSS) | | | | (12,831,452 | ) | | | 1,124,043 | | |
| INCREASE (DECREASE) IN NET ASSETS RESULTING FROM OPERATIONS | | | $ | (20,721,971 | ) | | $ | 924,949 | | |
See Notes to Financial Statements. | 25 | |
ABSOLUTE FUNDS STATEMENTS OF CHANGES IN NET ASSETS |
| | | | | ABSOLUTE STRATEGIES FUND | | ABSOLUTE CAPITAL OPPORTUNITIES FUND |
| | | | | For the Year Ended March 31, 2017 | | | For the Year Ended March 31, 2016 | | For the Year Ended March 31, 2017 | | | December 30, 2015* Through March 31, 2016 |
| OPERATIONS | | | | | | | | | | | | | | | | | | |
| | Net investment loss | | $ | (7,890,519 | ) | | | $ | (12,395,892 | ) | | $ | (199,094 | ) | | | $ | (27,991 | ) |
| | Net realized gain (loss) | | | 3,597,735 | | | | | 163,750,355 | | | | (69,602 | ) | | | | (345,570 | ) |
| | Net change in unrealized appreciation (depreciation) | | | (16,429,187 | ) | | | | (135,984,502 | ) | | | 1,193,645 | | | | | 584,068 | |
| Increase (Decrease) in Net Assets Resulting from Operations | | | (20,721,971 | ) | | | | 15,369,961 | | | | 924,949 | | | | | 210,507 | |
| | | | �� | | | | | | | | | | | | | | | | | |
| DISTRIBUTIONS TO SHAREHOLDERS FROM | | | | | | | | | | | | | | | | | | |
| | Net realized gain: | | | | | | | | | | | | | | | | | | |
| | | Institutional Shares | | | (85,840,670 | ) | | | | (80,762,590 | ) | | | - | | | | | - | |
| | | R Shares | | | (3,055,044 | ) | | | | (2,260,518 | ) | | | - | | | | | - | |
| Total Distributions to Shareholders | | | (88,895,714 | ) | | | | (83,023,108 | ) | | | - | | | | | - | |
| | | | | | | | | | | | | | | | | | | | | |
| CAPITAL SHARE TRANSACTIONS | | | | | | | | | | | | | | | | | | |
| | Sale of shares: | | | | | | | | | | | | | | | | | | |
| | | Institutional Shares | | | 245,205,577 | | | | | 215,827,423 | | | | 1,042,238 | | | | | 12,010,010 | |
| | | R Shares | | | 12,641,234 | | | | | 15,701,944 | | | | - | | | | | - | |
| | Reinvestment of distributions: | | | | | | | | | | | | | | | | | | |
| | | Institutional Shares | | | 78,733,255 | | | | | 72,366,513 | | | | - | | | | | - | |
| | | R Shares | | | 2,739,828 | | | | | 2,150,061 | | | | - | | | | | - | |
| | Redemption of shares: | | | | | | | | | | | | | | | | | | |
| | 1 | Institutional Shares | | | (633,166,321 | ) | | | | (898,554,282 | ) | | | - | | | | | - | |
| | 2 | R Shares | | | (18,077,731 | ) | | | | (38,555,236 | ) | | | - | | | | | - | |
| Increase (Decrease) in Net Assets from Capital Share Transactions | | (311,924,158 | ) | | | | (631,063,577 | ) | | | 1,042,238 | | | | | 12,010,010 | |
| Increase (Decrease) in Net Assets | | | (421,541,843 | ) | | | | (698,716,724 | ) | | | 1,967,187 | | | | | 12,220,517 | |
| | | | | | | | | | | | | | | | | | | | | |
| NET ASSETS | | | | | | | | | | | | | | | | | | |
| | Beginning of Year | | | 942,731,523 | | | | | 1,641,448,247 | | | | 12,220,517 | | | | | - | |
| | End of Year (Including line (a)) | | $ | 521,189,680 | | | | $ | 942,731,523 | | | $ | 14,187,704 | | | | $ | 12,220,517 | |
| | | | | | | | | | | | | | | | | | | | | |
| SHARE TRANSACTIONS | | | | | | | | | | | | | | | | | | |
| | Sale of shares: | | | | | | | | | | | | | | | | | | |
| | | Institutional Shares | | | 24,990,146 | | | | | 20,104,305 | | | | 96,537 | | | | | 1,196,696 | |
| | | R Shares | | | 1,377,012 | | | | | 1,473,324 | | | | - | | | | | - | |
| | Reinvestment of distributions: | | | | | | | | | | | | | | | | | | |
| | | Institutional Shares | | | 8,846,433 | | | | | 7,150,841 | | | | - | | | | | - | |
| | | R Shares | | | 317,110 | | | | | 216,740 | | | | - | | | | | - | |
| | Redemption of shares: | | | | | | | | | | | | | | | | | | |
| | | Institutional Shares | | | (64,717,097 | ) | | | | (83,374,581 | ) | | | - | | | | | - | |
| | | R Shares | | | (1,972,440 | ) | | | | (3,601,304 | ) | | | - | | | | | - | |
| Increase (Decrease) in Shares | | | (31,158,836 | ) | | | | (58,030,675 | ) | | | 96,537 | | | | | 1,196,696 | |
| | | | | | | | | | | | | | | | | | | | | |
| (a) | Accumulated net investment loss | | $ | (2,836,297 | ) | | | $ | (291,374 | ) | | $ | (40,691 | ) | | | $ | (11,075 | ) |
| * | Commencement of operations. | | | | | | | | | | | | | | | | | | |
See Notes to Financial Statements. | 26 | |
| | | | | | Investment Operations | | Distributions to Shareholders from: | | | | | | | | |
| | Period Ended | Net Asset Value, Beginning of Period | | Net Investment Loss(a) | | Net Realized and Unrealized Gains (Losses) on Investments | | Total from Investment Operations | | | Net Realized Gains | | Total Distribution to Shareholders | | Net Asset Value, End of Period | | Total
Return | | Net Assets, End of Period (000's) | |
| ABSOLUTE STRATEGIES FUND | | | | | | | | | | |
| INSTITUTIONAL SHARES | | | | | | | | | | |
| 03/31/17 | | $10.40 | | $(0.10 | ) | $(0.23 | ) | $(0.33 | ) | $(1.31 | ) | $(1.31 | ) | $8.76 | | (3.40 | )% | $501,866 | | |
| 03/31/16 | | 11.04 | | (0.11 | ) | 0.31 | | 0.20 | | (0.84 | ) | (0.84 | ) | 10.40 | | 2.05 | | 916,747 | | |
| 03/31/15 | | 11.01 | | (0.08 | ) | 0.11 | | 0.03 | | — | | — | | 11.04 | | 0.27 | | 1,592,872 | | |
| 03/31/14 | | 11.24 | | (0.10 | ) | (0.13 | ) | (0.23 | ) | — | | — | | 11.01 | | (2.05 | ) | 2,697,675 | | |
| 03/31/13 | | 11.09 | | (0.10 | ) | 0.25 | | 0.15 | | — | | — | | 11.24 | | 1.35 | | 3,799,857 | | |
| R SHARES | | | | | | | | | | | | | | | | | | | |
| 03/31/17 | | 10.17 | | (0.11 | ) | (0.26 | ) | (0.37 | ) | (1.31 | ) | (1.31 | ) | 8.49 | | (3.89 | ) | 19,324 | | |
| 03/31/16 | | 10.88 | | (0.17 | ) | 0.30 | | 0.13 | | (0.84 | ) | (0.84 | ) | 10.17 | | 1.41 | | 25,985 | | |
| 03/31/15 | | 10.90 | | (0.13 | ) | 0.11 | | (0.02 | ) | — | | — | | 10.88 | | (0.18 | ) | 48,577 | | |
| 03/31/14 | | 11.18 | | (0.14 | ) | (0.14 | ) | (0.28 | ) | — | | — | | 10.90 | | (2.50 | ) | 66,589 | | |
| 03/31/13 | | 11.08 | | (0.15 | ) | 0.25 | | 0.10 | | — | | — | | 11.18 | | 0.90 | | 88,390 | | |
| | | | | | | | | | | | | | | | | | | | | | | |
| ABSOLUTE CAPITAL OPPORTUNITIES FUND | | | | | | | | | | |
| INSTITUTIONAL SHARES | | | | | | | | | | |
| 03/31/17 | | $10.21 | | $(0.16 | ) | $0.92 | | $0.76 | | $— | | $— | | $10.97 | | 7.44 | % | $14,188 | | |
| 03/31/16(c) | | 10.00 | | (0.03 | ) | 0.24 | | 0.21 | | — | | — | | 10.21 | | 2.10 | (d) | 12,221 | | |
| | | | | | | | | | | | | | | | | | | | | |
| | | | | | | | | | | | | | | | | | | | | | | |
| (a) | Calculated based on average shares outstanding during each period. | | | | | | | | |
| (b) | Reflects the expense ratio excluding any waivers and/or reimbursements. | | | | | | | | |
| (c) | Commencement of operations was December 30, 2015. | | | | | | | | |
| (d) | Not annualized. | | | | | | | | |
| (e) | Annualized. | | | | | | | | |
See Notes to Financial Statements. | 27 | |
| | Ratios/Supplemental Data (Ratios to Average Net Assets) |
| Net Investment Loss | | Net Expenses | | Dividend and Interest Expenses | | Net Expenses without Dividend and Interest Expenses | | Gross Expenses | | Portfolio Turnover Rate | |
| | | | | | | | | | | | | | | | | |
| | | | | | | | | | | | | | | | | |
| | (0.99 | )% | 2.86 | % | 0.95 | % | 1.91 | % | 2.89 | %(b) | 72 | % |
| | (1.02 | ) | 2.65 | | | 0.81 | | | 1.84 | | | 2.66 | (b) | 70 | |
| | (0.70 | ) | 2.58 | | | 0.79 | | | 1.79 | | | 2.58 | | 78 | |
| | (0.85 | ) | 2.45 | | | 0.72 | | | 1.73 | | | 2.47 | (b) | 75 | |
| | (0.87 | ) | 2.57 | | | 0.84 | | | 1.73 | | | 2.57 | | 68 | |
| | | | | | | | | | | | | | | | | |
| | (1.14 | ) | 3.50 | | | 1.01 | | | 2.49 | | | 3.52 | (b) | 72 | |
| | (1.59 | ) | 3.23 | | | 0.83 | | | 2.40 | | | 3.24 | (b) | 70 | |
| | (1.17 | ) | 3.09 | | | 0.79 | | | 2.30 | | | 3.09 | | 78 | |
| | (1.23 | ) | 2.92 | | | 0.73 | | | 2.19 | | | 2.93 | (b) | 75 | |
| | (1.34 | ) | 2.98 | | | 0.84 | | | 2.14 | | | 2.98 | | 68 | |
| | | | | | | | | | | | | | | | | |
| | | | | | | | | | | | | | | | | |
| | | | | | | | | | | | | | | | | |
| | (1.53 | )% | 2.62 | % | 0.70 | % | 1.92 | % | 3.70 | %(b) | 29 | % |
| | (1.13 | )(e) | 2.20 | (e) | 0.25 | (e) | 1.95 | (e) | 4.37 | (b)(e) | 6 | (d) |
| | | | | | | | | | | | | | | | | |
| | | | | | | | | | | | | | | | | |
See Notes to Financial Statements. | 28 | |
ABSOLUTE FUNDS NOTES TO FINANCIAL STATEMENTS MARCH 31, 2017 |
Note 1. Organization
Absolute Strategies Fund and Absolute Capital Opportunities Fund (individually, a "Fund" and collectively, the "Funds") are diversified portfolios of Forum Funds (the "Trust").
The Trust is a Delaware statutory trust that is registered as an open-end, management investment company under the Investment Company Act of 1940, as amended (the "Act"). Under its Trust Instrument, the Trust is authorized to issue an unlimited number of each Fund's shares of beneficial interest without par value. Absolute Strategies Fund currently offers two classes of shares: Institutional Shares and R Shares. Institutional and R Shares commenced operations on July 11, 2005. Absolute Strategies Fund seeks to achieve long-term capital appreciation with an emphasis on absolute (positive) returns and low sensitivity to traditional financial market indices, such as the S&P 500 Index. Absolute Capital Opportunities Fund currently offers Institutional Shares. Absolute Capital Opportunities Fund commenced operations on December 30, 2015. Absolute Capital Opportunities Fund seeks to achieve long-term capital appreciation with a lower sensitivity to traditional financial market indices, such as the S&P 500 Index.
Note 2. Summary of Significant Accounting Policies
The Funds are investment companies and follow accounting and reporting guidance under Financial Accounting Standards Board ("FASB") Accounting Standards Codification ("ASC") Topic 946, "Financial Services-Investment Companies". These financial statements are prepared in accordance with accounting principles generally accepted in the United States of America ("GAAP"), which require management to make estimates and assumptions that affect the reported amounts of assets and liabilities, the disclosure of contingent liabilities at the date of the financial statements, and the reported amounts of increases and decreases in net assets from operations during the fiscal year. Actual amounts could differ from those estimates. The following summarizes the significant accounting policies of each Fund:
Security Valuation – Securities are valued at market prices using the last quoted trade or official closing price from the principal exchange where the security is traded, as provided by independent pricing services on each Fund business day. In the absence of a last trade, securities are valued at the mean of the last bid and ask price provided by the pricing service. Debt securities may be valued at prices supplied by a fund's pricing agent based on broker or dealer supplied valuations or matrix pricing, a method of valuing securities by reference to the value of other securities with similar characteristics such as rating, interest rate and maturity. Exchange-traded options for which the last quoted sale price is outside the closing bid and ask price, will be valued at the mean of the closing bid and ask price. Shares of non-exchange-traded open-end mutual funds are valued at net asset value ("NAV"). Futures contracts are valued at the day's settlement price on the exchange where the contract is traded. Short-term investments that mature in 60 days or less may be valued at amortized cost.
Each Fund values its investments at fair value pursuant to procedures adopted by the Trust's Board of Trustees (the "Board") if (1) market quotations are not readily available or (2) the Adviser, as defined in Note 4, believes that the values available are unreliable. The Trust's Valuation Committee, as defined in each Fund's registration statement, performs certain functions as they relate to the administration and oversight of each Fund's valuation procedures. Under these procedures, the Valuation Committee convenes on a regular and ad hoc basis to review such investments and considers a number of factors, including valuation methodologies and significant unobservable inputs, when arriving at fair value.
The Valuation Committee may work with the Adviser to provide valuation inputs. In determining fair valuations, inputs may include market-based analytics that may consider related or comparable assets or liabilities, recent transactions, market multiples, book values and other relevant investment information. Adviser inputs may include an income-based approach in which the anticipated future cash flows of the investment are discounted in determining fair value. Discounts may also be applied based on the nature or duration of any restrictions on the disposition of the investments. The Valuation Committee performs regular reviews of valuation methodologies, key inputs and assumptions, disposition analysis and market activity.
ABSOLUTE FUNDS NOTES TO FINANCIAL STATEMENTS MARCH 31, 2017 |
Fair valuation is based on subjective factors and, as a result, the fair value price of an investment may differ from the security's market price and may not be the price at which the asset may be sold. Fair valuation could result in a different NAV than a NAV determined by using market quotes.
Each Fund has a three-tier fair value hierarchy. The basis of the tiers is dependent upon the various "inputs" used to determine the value of each Fund's investments. These inputs are summarized in the three broad levels listed below:
Level 1 — quoted prices in active markets for identical assets and liabilities
Level 2 — other significant observable inputs (including quoted prices of similar securities, interest rates, prepayment speeds, credit risk, etc.)
Level 3 — significant unobservable inputs (including each Fund's own assumptions in determining the fair value of investments)
The aggregate value by input level, as of March 31, 2017, for each Fund's investments is included in each Fund's Notes to Schedules of Investments, Securities Sold Short and Call and Put Options Written.
Security Transactions, Investment Income and Realized Gain and Loss – Investment transactions are accounted for on the trade date. Dividend income and expense are recorded on the ex-dividend date. Foreign dividend income and expense are recorded on the ex-dividend date or as soon as possible after determining the existence of a dividend declaration after exercising reasonable due diligence. Income and capital gains on some foreign securities may be subject to foreign withholding taxes, which are accrued as applicable. Interest income is recorded on an accrual basis. Premium is amortized and discount is accreted using the effective interest method. Identified cost of investments sold is used to determine the gain and loss for both financial statement and federal income tax purposes. Each Fund estimates components of distributions from real estate investment trusts ("REITs"). Distributions received in excess of income are recorded as a reduction of the cost of the related investments.
Foreign Currency Translations – Foreign currency amounts are translated into U.S. dollars as follows: (1) assets and liabilities at the rate of exchange at the end of the respective period; and (2) purchases and sales of securities and income and expenses at the rate of exchange prevailing on the dates of such transactions. The portion of the results of operations arising from changes in the exchange rates and the portion due to fluctuations arising from changes in the market prices of securities are not isolated. Such fluctuations are included with the net realized and unrealized gain or loss on investments.
Foreign Currency Transactions – Each Fund may enter into transactions to purchase or sell foreign currency contracts and options on foreign currency. Forward currency contracts are agreements to exchange one currency for another at a future date and at a specified price. A fund may use forward currency contracts to facilitate transactions in foreign securities, to manage a fund's foreign currency exposure and to protect the U.S. dollar value of its underlying portfolio securities against the effect of possible adverse movements in foreign exchange rates. These contracts are intrinsically valued daily based on forward rates, and a fund's net equity therein, representing unrealized gain or loss on the contracts as measured by the difference between the forward foreign exchange rates at the dates of entry into the contracts and the forward rates at the reporting date, is recorded as a component of NAV. These instruments involve market risk, credit risk, or both kinds of risks, in excess of the amount recognized in the Statements of Assets and Liabilities. Risks arise from the possible inability of counterparties to meet the terms of their contracts and from movement in currency and securities values and interest rates. Due to the risks associated with these transactions, a fund could incur losses up to the entire contract amount, which may exceed the net unrealized value included in its NAV.
Futures Contracts – Each Fund may purchase futures contracts to gain exposure to market changes, which may be more efficient or cost effective than actually buying the securities. A futures contract is an agreement between
ABSOLUTE FUNDS NOTES TO FINANCIAL STATEMENTS MARCH 31, 2017 |
parties to buy or sell a security at a set price on a future date. Upon entering into such a contract, a fund is required to pledge to the broker an amount of cash, U.S. Government obligations or other high-quality debt securities equal to the minimum "initial margin" requirements of the exchange on which the futures contract is traded. Pursuant to the contract, the fund agrees to receive from or pay to the broker an amount of cash equal to the daily fluctuation in the value of the contract. Such receipts or payments are known as "variation margin" and are recorded by the fund as unrealized gains or losses. When the contract is closed, the fund records a realized gain or loss equal to the difference between the value of the contract at the time it was opened and value at the time it was closed. Risks of entering into futures contracts include the possibility that there may be an illiquid market and that a change in the value of the contract may not correlate with changes in the value of the underlying securities.
Notional amounts of each individual futures contract outstanding as of March 31, 2017, for each Fund, are disclosed in the Notes to Schedule of Investments, Securities Sold Short and Call and Put Options Written.
Securities Sold Short – Each Fund may sell a security short to increase investment returns. Each Fund may also sell a security short in anticipation of a decline in the market value of a security. A short sale is a transaction in which the Fund sells a security that it does not own. To complete the transaction, the Fund must borrow the security in order to deliver it to the buyer. The Fund must replace the borrowed security by purchasing it at market price at the time of replacement; the price may be higher or lower than the price at which the Fund sold the security. The Fund incurs a loss from a short sale if the price of the security increases between the date of the short sale and the date on which the Fund replaces the borrowed security. The Fund realizes a profit if the price of the security declines between those dates.
Until the Fund replaces the borrowed security, the Fund will maintain on its books and records cash and long securities to sufficiently cover its short position on a daily basis. The collateral for the securities sold short includes the Deposits with Brokers as shown on the Statements of Assets and Liabilities and the securities held long as shown on the Schedules of Investments. Dividends and interest paid on securities sold short are recorded as an expense on each Fund's Statement of Operations.
Purchased Options – When a fund purchases an option, an amount equal to the premium paid by the fund is recorded as an investment and is subsequently adjusted to the current value of the option purchased. If an option expires on the stipulated expiration date or if the fund enters into a closing sale transaction, a gain or loss is realized. If a call option is exercised, the cost of the security acquired is increased by the premium paid for the call. If a put option is exercised, a gain or loss is realized from the sale of the underlying security, and the proceeds from such sale are decreased by the premium originally paid. Purchased options are non-income producing securities.
The values of each individual purchased option outstanding as of March 31, 2017, are disclosed in each Fund's Schedule of Investments.
Written Options – When a fund writes an option, an amount equal to the premium received by the fund is recorded as a liability and is subsequently adjusted to the current value of the option written. Premiums received from writing options that expire unexercised are treated by the fund on the expiration date as realized gain from written options. The difference between the premium and the amount paid on effecting a closing purchase transaction, including brokerage commissions, is also treated as a realized gain, or if the premium is less than the amount paid for the closing purchase transaction, as a realized loss. If a call option is exercised, the premium is added to the proceeds from the sale of the underlying security in determining whether the fund has realized a gain or loss. If a put option is exercised, the premium reduces the cost basis of the securities purchased by the fund. The fund, as writer of an option, bears the market risk of an unfavorable change in the price of the security underlying the written option. Written options are non-income producing securities.
ABSOLUTE FUNDS NOTES TO FINANCIAL STATEMENTS MARCH 31, 2017 |
The values of each individual written option outstanding as of March 31, 2017, are disclosed in each Fund's Schedule of Call and Put Options Written. Transactions in written options during the year ended March 31, 2017, were as follows:
| | | | | | | | | | | | | | | |
| Absolute Strategies Fund | | | | | | | | | | | | | | |
| | | Calls | | Puts |
| | | Number of | | | | | | Number of | | | | |
| | | Contracts | | | Premiums | | Contracts | | Premiums |
| Options Outstanding, March 31, 2016 | | (7,438 | ) | | $ | (1,733,180 | ) | | (7,234 | ) | | $ | (3,705,331 | ) |
| Options written | | (1,103 | ) | | | (415,429 | ) | | (34,631 | ) | | | (3,608,648 | ) |
| Options terminated in closing transactions | | 7,426 | | | 1,723,446 | | 34,059 | | | 5,635,957 | |
| Options exercised | | 36 | | | 2,583 | | 268 | | | 78,955 | |
| Options expired | | 226 | | | 102,405 | | 701 | | | 199,127 | |
| Options Outstanding, March 31, 2017 | | (853 | ) | | $ | (320,175 | ) | | (6,837 | ) | | $ | (1,399,940 | ) |
occurs, the counterparty would keep the stream of payments and would have no further obligations to the fund.
Notional amounts of each individual credit default swap agreement outstanding as of March 31, 2017, for each Fund, if any, are disclosed in each Fund's Notes to Schedule of Investments, Securities Sold Short and Call and Put Options Written.
Interest Rate Swaps – Each Fund may enter into interest rate swaps for investment purposes to manage exposure to fluctuations in interest rates or to add leverage.
Interest rate swaps represent an agreement between two counterparties to exchange cash flows based on the difference in two interest rates, applied to the notional principal amount for a specified period. The payment flows are usually netted against each other, with the difference being paid by one party to the other. The Fund settles accrued net receivables or payables under the swap contracts on a periodic basis.
The primary risk associated with interest rate swaps is that unfavorable changes in interest rates could adversely impact the Funds.
Notional amounts of each individual interest rate swap agreement outstanding as of March 31, 2017, if any, are disclosed in each Fund's Notes to Schedule of Investments, Securities Sold Short and Call and Put Options Written. The Funds did not enter into any interest rate swaps during the year ended March 31, 2017.
Restricted Securities – Each Fund may invest in securities that are subject to legal or contractual restrictions on resale ("restricted securities"). Restricted securities may be resold in transactions that are exempt from registration under the Federal securities laws or if the securities are registered to the public. The sale or other disposition of these securities may involve additional expenses and the prompt sale of these securities at an acceptable price may be difficult. Information regarding restricted securities held by each Fund is included in their Schedule of Investments, if applicable.
When-Issued Transactions – Each Fund may purchase securities on a forward commitment or 'when-issued' basis. A fund records a when-issued transaction on the trade date and will segregate with the custodian qualifying assets that have a value sufficient to make payment for the securities purchased. Securities purchased on a when-issued basis are marked-to-market daily and the fund begins earning interest on the settlement date. Losses may arise due to changes in the market value of the underlying securities or if the counterparty does not perform under the contract.
Distributions to Shareholders – Distributions to shareholders of net investment income, if any, are declared and paid semi-annually. Distributions to shareholders of net capital gains and net foreign currency gains, if any, are declared and paid at least annually. Distributions to shareholders are recorded on the ex-dividend date. Distributions are based on amounts calculated in accordance with applicable federal income tax regulations, which may differ from GAAP. These differences are due primarily to differing treatments of income and gain on various investment securities held by each Fund, timing differences and differing characterizations of distributions made by each Fund.
Federal Taxes – Each Fund intends to continue to qualify each year as a regulated investment company under Subchapter M of Chapter 1, Subtitle A, of the Internal Revenue Code of 1986, as amended ("Code"), and to distribute all of their taxable income to shareholders. In addition, by distributing in each calendar year substantially all of their net investment income and capital gains, if any, the Funds will not be subject to a federal excise tax. Therefore, no federal income or excise tax provision is required. Each Fund files a U.S. federal income and excise tax return as required. Each Fund's federal income tax returns are subject to examination by the Internal Revenue Service for a period of three fiscal years after they are filed. As of March 31, 2017, there are no uncertain tax positions that would require financial statement recognition, de-recognition or disclosure.
Income and Expense Allocation – The Trust accounts separately for the assets, liabilities and operations of each
ABSOLUTE FUNDS NOTES TO FINANCIAL STATEMENTS MARCH 31, 2017 |
of its investment portfolios. Expenses that are directly attributable to more than one investment portfolio are allocated among the respective investment portfolios in an equitable manner.
Absolute Strategies Fund's class specific expenses are charged to the operations of that class of shares. Income and expenses (other than expenses attributable to a specific class) and realized and unrealized gains or losses on investments are allocated to each class of shares based on the class' respective net assets to the total net assets of the Fund.
Commitments and Contingencies – In the normal course of business, each Fund enters into contracts that provide general indemnifications by each Fund to the counterparty to the contract. Each Fund's maximum exposure under these arrangements is dependent on future claims that may be made against each Fund and, therefore, cannot be estimated; however, based on experience, the risk of loss from such claims is considered remote.
Offering Costs – Offering costs for the Absolute Capital Opportunities Fund of $79,572 consisted of fees related to the mailing and printing of the initial prospectus, certain startup legal costs, and initial registration filings. Such costs are amortized over a twelve-month period beginning with the commencement of operations of the Absolute Capital Opportunities Fund.
Note 3. Cash – Concentration in Uninsured Account
For cash management purposes, each Fund may concentrate cash with each Fund's custodian. This typically results in cash balances exceeding the Federal Deposit Insurance Corporation ("FDIC") insurance limits. As of March 31, 2017, the Absolute Strategies Fund Fund had $22,089,250 at State Street Bank and Trust Company that exceeded the FDIC insurance limit.
Note 4. Fees and Expenses
Investment Adviser – Absolute Investment Advisers LLC (the "Adviser") is the investment adviser to each Fund. Pursuant to an investment advisory agreement, the Adviser receives an advisory fee from each Fund at an annual rate of 1.60% of each Fund's average daily net assets.
Each sub-advisory fee, calculated as a percentage of each Fund's average daily net assets managed by each sub-adviser, is paid by the Adviser.
Distribution – Foreside Fund Services, LLC serves as each Fund's distributor (the "Distributor"). The Distributor is not affiliated with the Adviser or Atlantic Fund Administration, LLC (d/b/a Atlantic Fund Services) ("Atlantic") or their affiliates. Absolute Strategies Fund has adopted a Distribution Plan (the "Plan") for R Shares of the Fund in accordance with Rule 12b-1 of the Act. Under the Plan, R Shares are subject to a Rule 12b-1 fee of up to 0.35% of the R Shares average daily net assets; however, currently the Board limits 12b-1 fees on R Shares to 0.25% of average daily net assets.
Other Service Providers – Atlantic provides fund accounting, fund administration, compliance and transfer agency services to each Fund. The fees related to these services are included in Fund services fees within the Statements of Operations. Atlantic also provides certain shareholder report production and EDGAR conversion and filing services. Pursuant to an Atlantic services agreement, each Fund pays Atlantic customary fees for its services. Atlantic provides a Principal Executive Officer, a Principal Financial Officer, a Chief Compliance Officer and an Anti-Money Laundering Officer to each Fund, as well as certain additional compliance support functions.
Trustees and Officers – The Trust pays each independent Trustee an annual retainer fee of $50,000 for service to the Trust ($66,000 for the Chairman), and the Audit Committee Chairman and Vice Chairman receive an additional $6,000 annually. The Trustees and Chairman may receive additional fees for special Board meetings. Each Trustee is also reimbursed for all reasonable out-of-pocket expenses incurred in connection with his duties as a Trustee, including travel and related expenses incurred in attending Board meetings. The amount of Trustees' fees
ABSOLUTE FUNDS NOTES TO FINANCIAL STATEMENTS MARCH 31, 2017 |
attributable to each Fund is disclosed in the Statements of Operations. Certain officers of the Trust are also officers or employees of the above named service providers, and during their terms of office received no compensation from each Fund.
Note 5. Expense Reimbursements and Fees Waived
The Adviser has contractually agreed to waive its fee and/or reimburse expenses to limit total annual operating expenses (excluding all taxes, interest, portfolio transaction expenses, dividend and interest expenses on short sales, acquired fund fees and expenses, proxy expenses and extraordinary expenses) of Absolute Capital Opportunities to 1.85% on net assets up to $100 million, 1.75% on net assets between $100 million and $200 million, and 1.65% on net assets over $200 million through August 1, 2019. Prior to January 3, 2017, the Adviser contractually agreed to waive its fee and/or reimbursed expenses to 1.95%. The Adviser waived fees of $140,851 for Absolute Capital Opportunities Fund, for the year ended March 31, 2017.
During the year, Absolute Strategies Fund invested in Absolute Capital Opportunities Fund. As of March 31, 2017, Absolute Strategies Fund owned approximately 99.7% of Absolute Capital Opportunities Fund. The Adviser has agreed to waive fees in an amount equal to the fee it receives from Absolute Capital Opportunities Fund based on Absolute Strategies Fund's investment in Absolute Capital Opportunities Fund. For the year ended March 31, 2017, the Adviser waived fees of $206,518 for Absolute Strategies Fund.
The Absolute Capital Opportunities Fund may repay the Adviser for fees waived and expenses reimbursed pursuant to the expense cap if such payment is made within three years of the fee waiver or expense reimbursement and the resulting expenses do not exceed the lesser of (i) the then current expense cap, or (ii) the expense cap in place at the time the fees/expenses were waived/reimbursed. As of March 31, 2017, $194,449 is subject to recapture by the Adviser.
Note 6. Security Transactions
The cost of purchases and proceeds from sales of investment securities (including maturities), other than short-term investments during the year ended March 31, 2017, were as follows:
| Absolute Capital Opportunities Fund |
| |
| Non-U.S. Government Obligations | | |
| Purchases | | Sales | | | | |
| $ | 2,002,522 | | $ | 1,993,849 | | | | | | |
Note 7. Summary of Derivative Activity
The volume of open derivative positions may vary on a daily basis as each Fund transacts derivative contracts in order to achieve the exposure desired by the Adviser. The notional value of activity for the year ended March 31, 2017, for any derivative type during the year is as follows:
forward currency contracts and futures contracts.
Following is a summary of the effect of derivatives on the Statements of Assets and Liabilities as of March 31, 2017:
| Absolute Capital Opportunities Fund | | | |
| Location: | | Equity Contracts | |
| Net realized gain (loss) on: | | | | | |
| Investments | | $ | 168,079 | | |
| Written Options | | | 165,441 | | |
| Total net realized gain (loss) | | $ | 333,520 | | |
| | | | | | |
| Net change in unrealized appreciation (depreciation) on: | | | | | |
| Investments | | $ | (45,419 | ) | |
| Written Options | | | (1,899 | ) | |
| Total net change in unrealized appreciation (depreciation) | | $ | (47,318 | ) | |
Asset (Liability) amounts shown in the table below represent amounts for derivative related investments at March 31, 2017. These amounts may be collateralized by cash or financial instruments.
| | | Gross Asset (Liability) as Presented in the Statement of Assets and Liabilities | | Financial Instruments (Received)Pledged** | | Cash Collateral (Received) Pledged** | | Net Amount |
| | | | | | | | | | | | | | | | | |
| Absolute Strategies Fund | | | | | | | | | | | | | | | | |
| | | | | | | | | | | | | | | | | |
| Assets: | | | | | | | | | | | | | | | | |
| Over-the-counter derivatives* | | $ | 8,060,914 | | | $ | - | | | $ | - | | | $ | 8,060,914 | |
| Liabilities: | | | | | | | | | | | | | | | | |
| Over-the-counter derivatives* | | | (2,313,678 | ) | | | 1,007,953 | | | | 1,305,725 | | | | - | |
| Absolute Capital Opportunities Fund | | | | | | | | |
| | | | | | | | | |
| Assets: | | | | | | | | | | | | | | | | |
| Over-the-counter derivatives* | | $ | 102,757 | | | $ | - | | | $ | - | | | $ | 102,757 | |
| Liabilities: | | | | | | | | | | | | | | | | |
| Over-the-counter derivatives* | | | (104,247 | ) | | | 104,247 | | | | - | | | | - | |
* Over-the-counter derivatives may consist of options contracts, futures contracts and swap agreements. The amounts disclosed above represent the exposure to one or more counterparties. For further detail on individual derivative contracts and the corresponding unrealized appreciation (depreciation), see the Notes to Schedules of Investments, Securities Sold Short and Call and Put Options Written.
** The actual financial instruments and cash collateral (received) pledged may be in excess of the amounts shown in the table. The table only reflects collateral amounts up to the amount of the financial instrument disclosed on the Statements of Assets and Liabilities.
Note 8. Federal Income Tax
Distributions paid during the fiscal years ended as noted were characterized for tax purposes as follows:
Distributions above for Absolute Strategies Fund for 2016 are different from amounts reported in the 2016 annual report because of equalization adjustments.
As of March 31, 2017, distributable earnings (accumulated loss) on a tax basis were as follows:
As of March 31, 2017, the Absolute Strategies Fund and Absolute Capital Opportunities Fund had $36,981,646 and $331,575, respectively, of available short-term capital loss carryforwards that have no expiration date.
For tax purposes, the current year post-October loss was $78,990 for Absolute Capital Opportunities Fund (realized during the period November 1, 2016 through March 31, 2017), and the current deferred late year ordinary loss was $1,744,100 and $40,691 for Absolute Strategies Fund and Absolute Capital Opportunities Fund, respectively (realized during the period January 1, 2017 through March 31, 2017). These losses were recognized for tax purposes on the first business day of the Fund's current fiscal year, April 1, 2017.
On the Statements of Assets and Liabilities, as a result of permanent book to tax differences, certain amounts have been reclassified for the year ended March 31, 2017. The following reclassifications were the result of book to tax differences resulting from real estate investment trusts, equity return of capital distributions, partnerships, passive foreign investment holdings, straddles, constructive sales, short dividend reclassifications, currency, paydowns, convertible bond deemed distributions, convertible bond premium adjustments, contingent payment debt instruments, credit default swap income, organization cost amortization and net operating losses and has no impact on the net assets of each Fund.
To the Board of Trustees of Forum Funds
and the Shareholders of Absolute Strategies Fund
and Absolute Capital Opportunities Fund
We have audited the accompanying statements of assets and liabilities of Absolute Strategies Fund and Absolute Capital Opportunities Fund, each a series of shares of beneficial interest in the Forum Funds (the "Funds"), including the schedules of investments, as of March 31, 2017, and the related statements of operations for the year then ended and the statements of changes in net assets and the financial highlights for each of the years or periods presented. These financial statements and financial highlights are the responsibility of the Funds' management. Our responsibility is to express an opinion on these financial statements and financial highlights based on our audits.
We conducted our audits in accordance with the standards of the Public Company Accounting Oversight Board (United States). Those standards require that we plan and perform the audits to obtain reasonable assurance about whether the financial statements and financial highlights are free of material misstatement. An audit includes examining, on a test basis, evidence supporting the amounts and disclosures in the financial statements. Our procedures included confirmation of securities owned as of March 31, 2017 by correspondence with the custodian, agent banks, counterparties, and brokers, or by other appropriate auditing procedures where responses from brokers were not received. An audit also includes assessing the accounting principles used and significant estimates made by management, as well as evaluating the overall financial statement presentation. We believe that our audits provide a reasonable basis for our opinion.
In our opinion, the financial statements and financial highlights referred to above present fairly, in all material respects, the financial position of Absolute Strategies Fund and Absolute Capital Opportunities Fund as of March 31, 2017, and the results of their operations for the year then ended and the changes in their net assets and financial highlights for each of the years or periods presented, in conformity with accounting principles generally accepted in the United States of America.
BBD, LLP
Philadelphia, Pennsylvania
May 25, 2017
ABSOLUTE FUNDS ADDITIONAL INFORMATION (Unaudited) MARCH 31, 2017 |
Investment Advisory Agreement Approval
At the December 9, 2016 Board meeting, the Board, including the Independent Trustees, considered the approval of the continuance of the investment advisory agreements between Absolute Investment Advisers LLC (the "Adviser") and the Trust pertaining to the Absolute Funds (the "Advisory Agreements") and the subadvisory agreements between the Adviser and the following subadvisers to the Absolute Funds: Harvest Capital Strategies LLC; Kovitz Investment Group Partners, LLC; LakeWater Capital LLC; Longhorn Capital Partners, LLC; Mohican Financial Management, LLC; Sabal Capital Management, LLC; St. James Investment Company, LLC; The Boston Company Asset Management, LLC; and Yacktman Asset Management LP (the "Subadvisers") (the "Subadvisory Agreements"). In preparation for its deliberations, the Board requested and reviewed written responses from the Adviser and Subadvisers to due diligence questionnaires circulated on the Board's behalf concerning the personnel, operations, financial condition, performance, and services provided by the Adviser and each Subadviser. The Board also discussed the materials with Fund counsel and, as necessary, with the Trust's administrator, Atlantic Fund Services. During its deliberations, the Board also received an oral presentation from the Adviser and was assisted by the advice of Trustee counsel.
At the meeting, the Board reviewed, among other matters: (1) the nature, extent and quality of the services provided to each of the Absolute Funds by the Adviser and Subadvisers, including information on the investment performance of each of the Absolute Funds and Subadvisers; (2) the costs of the services provided and profitability to the Adviser with respect to its relationship with each of the Absolute Funds; (3) the advisory fee and total expense ratio each of the Absolute Funds compared to a relevant peer group of funds; (4) the extent to which economies of scale may be realized as each of the Absolute Funds grows and whether the advisory fee enables each of the Absolute Fund's investors to share in the benefits of economies of scale; and (5) other benefits received by the Adviser and Subadvisers from their respective relationships with the Absolute Funds.
Nature, Extent and Quality of Services
Based on written materials received and a presentation from senior representatives of the Adviser, a discussion with the Adviser about the personnel, operations and financial condition of itself and each Subadviser, and discussions with the Trust's Chief Compliance Officer regarding the Adviser and the Subadvisers, the Board considered the quality of services provided by the Adviser under the Advisory Agreements and by each Subadviser under each Subadvisory Agreement. In this regard, the Board considered information regarding the experience, qualifications and professional background of the portfolio managers and other personnel at the Adviser and the Subadvisers with principal responsibility for the Absolute Funds' investments; the investment philosophy and decision-making processes of the Adviser's and Subadvisers' investment professionals; the capability and integrity of the Adviser's and each Subadviser's senior management and staff; the quality of the Adviser's and each Subadviser's services with respect to regulatory compliance; and the Adviser's and each Subadviser's representation regarding its financial condition and that each firm's financial condition would not impair its ability to provide high-quality advisory services to the applicable Fund. The Board also considered the Adviser's analysis of and recommendations regarding each Subadviser. The Board concluded that, overall, it was satisfied with the nature, extent and quality of services to be provided to the Absolute Funds by the Adviser under the Advisory Agreements and each Subadviser under its Subadvisory Agreement.
Performance
In connection with a presentation by the Adviser regarding its approach to managing the Absolute Funds, including the investment objective and strategy and the Adviser's discussion of the performance of each of the Subadvisers, the Board reviewed the performance of the Absolute Funds compared to their respective benchmark indices. The Board observed that the Absolute Strategies Fund ("Strategies Fund") underperformed its primary benchmark index, the S&P 500 Index, for the one-, three-, five-, and 10-year periods ended September 30, 2016. The Board observed that the Absolute Capital Opportunities Fund ("Capital Opps Fund") outperformed its primary benchmark index, the HFRX Equity Hedge Index, for the since-inception period ended September 30, 2016, noting that the Capital Opps Fund commenced operations on December 30, 2015 and did not have a full year of performance available to report.
ABSOLUTE FUNDS ADDITIONAL INFORMATION (Unaudited) MARCH 31, 2017 |
The Board noted the Adviser's representation that it was not the objective of the Absolute Funds to outperform specific market indices because the Absolute Funds employ unique investment strategies intended to seek absolute returns, irrespective of any benchmark or market performance. The Board also noted the Adviser's representation that the Absolute Funds tended to deviate from the performance of equity indices, in part, because the Absolute Funds' portfolios have comprised a balance of both long and short positions for the past several years, unlike the corresponding indices and, in part, because the Absolute Funds' investment strategies include a countercyclical component that is designed to enable the Absolute Funds to outperform the indices in declining markets and that causes the Absolute Funds to underperform their indices in rising markets. In recognition of the hedge fund-like strategies employed by the Strategies Fund, the Board also considered the performance of the Strategies Fund compared to the HFRX Global Hedge Fund Index, an index designed to be representative of the overall composition of the hedge fund universe. In that regard, the Board observed that the Strategies Fund underperformed the HFRX Global Hedge Fund Index for the one- and five-year periods ended September 30, 2016, and outperformed the HFRX Global Hedge Fund Index for the three- and 10-year periods ended September 30, 2016.
The Board also considered each Absolute Fund's performance relative to an independent peer group of funds identified by Broadridge Financial Solutions, Inc. ("Broadridge") as having characteristics similar to those of each Absolute Fund. The Board observed that the Strategies Fund underperformed the median of its Broadridge peers for the one-, three-, and five-year periods ended September 30, 2016. The Board observed that, as of September 30, 2016, the Capital Opps Fund outperformed the median of its Broadridge peers for the period since the Capital Opps Fund's inception.
Addressing the Absolute Funds' apparent underperformance relative to their respective Broadridge peer groups, the Adviser represented that it does not view the peer funds identified by Broadridge to be the most suitable comparison to the Absolute Funds because of the Absolute Funds' hedge-fund-like strategies and because the funds identified by Broadridge were not necessarily multi-manager, multi-strategy funds, such as the Absolute Funds. At the Adviser's request, the Board reviewed each of the Absolute Fund's performance compared to additional groups of funds selected by the Adviser for each of the Absolute Funds and believed by the Adviser to provide a more meaningful comparison than the respective Broadridge peer group (each a "Comparable Fund Group"). The Board observed that the Strategies Fund outperformed the median of its Comparable Fund Group for the one-year period and performed at the median of its Comparable Fund Group for the three-year period, as of November 11, 2016, noting that a number of the funds comprising the Comparable Fund Group for the Strategies Fund were newer funds with performance records of less than three years. The Board observed that the Capital Opps Fund outperformed the median of its Comparable Fund Group for the year-to-date period, as of November 11, 2016, noting that the Capital Opps Fund had slightly less than one full year of performance information, having commenced operations at the end of December 2015.
The Board also evaluated the Adviser's assessment of each Subadviser's performance, noting that the Adviser had expressed satisfaction with the performance of each Subadviser and that the Adviser had recommended the continuance of each of the Subadvisory Agreements. The Board acknowledged the Adviser's representation that the different Subadvisers could be expected to achieve different performance results in light of the differences in their strategies, allocated assets, and market environment. The Board also considered the Adviser's explanation that, standing alone, no Subadviser should necessarily be expected to perform in line with the market or with the relevant Fund's benchmarks. In this regard, the Board noted that the Adviser emphasized its responsibility for allocating each Fund's assets among Subadvisers on an ongoing basis in order to achieve the applicable Fund's investment objective. In view of the respective roles of the Adviser and Subadvisers, the Board determined that it was appropriate to evaluate the contribution of each Subadviser to the performance of the Fund for which each subadviser managed assets as a whole. The Board concluded that the Absolute Funds and their shareholders could benefit from the renewal of the Advisory Agreements and of each of the Subadvisory Agreements.
ABSOLUTE FUNDS ADDITIONAL INFORMATION (Unaudited) MARCH 31, 2017 |
Compensation
The Board evaluated the Adviser's compensation for providing advisory services to each of the Absolute Funds and analyzed comparative information on the actual advisory fee rates and actual total expenses of the relevant Broadridge peer group for each of the Absolute Funds. The Board observed that the actual advisory fee rate and actual total expenses for the Strategies Fund was higher than the median of its Broadridge peers. The Board observed that the actual advisory fee rate for the Capital Opps Fund was lower than the median of its Broadridge peers, though the actual total expenses were higher than the median of its Broadridge peers. The Board considered the Adviser's representation that the advisory fee rates and actual total expense ratios of hedge funds provide more suitable points of comparison for the Absolute Funds than the fee rates and expense ratios of the funds in the Broadridge peer groups. In this regard, the Board considered the Adviser's explanation that the complex strategies of hedge funds are more similar to the strategies of each of the Absolute Funds than to those of the mutual funds in the Broadridge peer groups. In addition, with respect to advisory fee rates and total expenses, the Board noted the Adviser's representation that hedge funds' fees typically consist of a higher base advisory fee and an additional performance-based fee. The Board recognized that the Adviser's fees do not include performance fees and that the Adviser pays all of the Subadvisers out of its advisory fee. In this regard, the Board observed that the Absolute Funds do not directly pay any subadvisory fees.
The Board noted that, although the Adviser had implemented breakpoints that would reduce the advisory fee rate charged to the Strategies Fund, the Strategies Fund did not currently have assets under management that exceed the Strategies Fund's first fee schedule breakpoint.
Under these circumstances, the Board concluded that it was difficult to make meaningful comparisons between the Absolute Funds' actual advisory fee rates and total expense ratios and those of the Absolute Funds' respective Broadridge peers due to, among other things, variations between the services provided by the Adviser to the Absolute Funds and those provided to the Broadridge peer group of funds by their advisers. Further, the Board concluded that the complex investment strategies utilized by the Adviser for the Absolute Funds are comparable to the strategies provided to hedge funds by their advisers at much higher advisory fee rates than those charged by the Adviser. At the request of the Adviser, the Board also reviewed the advisory fee rate and total expenses of the Absolute Funds compared to each of the Absolute Fund's respective Comparable Fund Group, as provided by the Adviser. The Board observed that the advisory fee rate and total expenses of the Strategies Fund were each lower than the median of its Comparable Fund Group. The Board observed that the advisory fee rate for the Capital Opps Fund was higher than the median of its Comparable Fund Groups, and the total expenses of the Capital Opps Fund was lower than the median of its respective Comparable Fund Groups. . Based on the foregoing, and on all of the information presented, the Board concluded that the advisory fees paid to the Adviser by the Absolute Funds were reasonable.
Cost of Services and Profitability
The Board considered information provided by the Adviser regarding the costs of services and its profitability with respect to each of the Absolute Funds. In this regard, the Board considered the Adviser's resources devoted to each of the Absolute Funds as well as the Adviser's discussion of the costs and profitability of its mutual fund activities, including the percentage and amount of the Adviser's fee that the Adviser retained and the percentage and amount of the Adviser's fee that was paid to the Subadvisers. Based on these and other applicable considerations, the Board concluded that the Adviser's profits attributable to the management of each of the Absolute Funds were reasonable.
The Board did not consider information regarding the costs of services provided or profits realized by each Subadviser from its relationship with the Absolute Funds, noting instead the arms-length nature of the relationship between the Adviser and the Subadvisers with respect to the negotiation of the subadvisory fee rate on behalf of each Absolute Fund and that the Adviser, and not the Fund, was responsible for paying the subadvisory fees due under each Subadvisory Agreement. Under these circumstances, the Board concluded that each Subadviser's profitability was not a material factor in determining whether to approve the Subadvisory Agreements.
ABSOLUTE FUNDS ADDITIONAL INFORMATION (Unaudited) MARCH 31, 2017 |
Economies of Scale
The Board considered whether any of the Absolute Funds could benefit from economies of scale. The Board noted that, with respect to the Strategies Fund, the Adviser had implemented fee schedule breakpoints by contractually waiving its advisory fee at certain asset levels, although the Strategies Fund was not currently operating at asset levels that would result in these lower fee rates being achieved. Based on the foregoing, the Board concluded that the Strategies Fund was positioned to benefit from economies of scale should its assets increase. With respect to the Capital Opps Fund, the Board considered the Adviser's representation that the Capital Opps Fund could potentially benefit from economies of scale as assets grow, but that the Adviser had determined not to recommend breakpoints as appropriate at this time due to the size of the Capital Opps Fund. Based on the foregoing information, and other considerations, the Board concluded that economies of scale was not yet a material factor to be considered with respect to the Capital Opps Fund.
Other Benefits
The Board noted the Adviser's representation that, aside from its contractual advisory fees, it does not benefit in a material way from its relationship with the Absolute Funds. Based on the foregoing representation, the Board concluded that other benefits received by the Adviser from its relationship with the Absolute Funds were not a material factor in approving the continuation of the Advisory Agreements.
Conclusion
The Board did not identify any single factor as being of paramount importance, and different Trustees may have given different weight to different factors. In light of the fact that each Absolute Fund is a multi-manager Fund, however, for which the Adviser identifies Subadvisers whose strategies it seeks to combine to achieve the Fund's investment objective, when considering the renewal of the Subadvisory Agreements, the Board gave significant weight to the Adviser's recommendation that each Subadvisory Agreement be renewed and to the Adviser's representation that the reappointment of the Subadvisers would positively contribute to the Adviser's successful execution of each of the Absolute Funds' overall strategies. The Board reviewed a memorandum from Fund counsel discussing the legal standards applicable to its consideration of the Advisory Agreements and Subadvisory Agreements. Based on its review, including consideration of each of the factors referenced above, the Board determined, in the exercise of its reasonable business judgment, that the advisory arrangement, as outlined in each Advisory Agreement and in each Subadvisory Agreement, was fair and reasonable in light of the services performed or to be performed, expenses incurred or to be incurred and such other matters as the Board considered relevant.
Proxy Voting Information
A description of the policies and procedures that each Fund uses to determine how to vote proxies relating to securities held in each Fund's portfolio is available, without charge and upon request, by calling (888) 992-2765 and on the U.S. Securities and Exchange Commission's (the "SEC") website at www.sec.gov. Each Fund's proxy voting record for the most recent twelve-month period ended June 30 is available, without charge and upon request, by calling (888) 992-2765 and on the SEC's website at www.sec.gov.
Availability of Quarterly Portfolio Schedules
Each Fund files its complete schedule of portfolio holdings with the SEC for the first and third quarters of each fiscal year on Form N-Q. These filings are available, without charge and upon request on the SEC's website at www.sec.gov or may be reviewed and copied at the SEC's Public Reference Room in Washington, DC. Information on the operation of the Public Reference Room may be obtained by calling (800) SEC-0330.
ABSOLUTE FUNDS ADDITIONAL INFORMATION (Unaudited) MARCH 31, 2017 |
Shareholder Expense Example
As a shareholder of the Funds, you incur ongoing costs, including management fees, distribution (12b-1) fees and other Fund expenses. This example is intended to help you understand your ongoing costs (in dollars) of investing in the Funds and to compare these costs with the ongoing costs of investing in other mutual funds.
The example is based on an investment of $1,000 invested at the beginning of the period and held for the entire period from October 1, 2016, through March 31, 2017.
Actual Expenses – The first line under each share class of the table below provides information about actual account values and actual expenses. You may use the information in this line, together with the amount you invested, to estimate the expenses that you paid over the period. Simply divide your account value by $1,000 (for example, an $8,600 account value divided by $1,000 = 8.6), then multiply the result by the number in the first line under the heading entitled "Expenses Paid During Period" to estimate the expenses you paid on your account during the period.
Hypothetical Example for Comparison Purposes – The second line under each share class of the table below provides information about hypothetical account values and hypothetical expenses based on each Fund's actual expense ratio and an assumed rate of return of 5% per year before expenses, which is not each Fund's actual return. The hypothetical account values and expenses may not be used to estimate the actual ending account balance or expenses you paid for the period. You may use this information to compare the ongoing costs of investing in each Fund and other funds. To do so, compare this 5% hypothetical example with the 5% hypothetical examples that appear in the shareholder reports of other funds.
Please note that the expenses shown in the table are meant to highlight your ongoing costs only. Therefore, the second line of the table is useful in comparing ongoing costs only, and will not help you determine the relative total costs of owning different funds.
Trustees and Officers of the Trust
The Board is responsible for oversight of the management of the Trust's business affairs and of the exercise of all the Trust's powers except those reserved for the shareholders. The following table provides information about each Trustee and certain officers of the Trust. Each Trustee and officer holds office until the person resigns, is removed, or is replaced. Unless otherwise noted, the persons have held their principal occupations for more than five years. The address for all Trustees and officers is Three Canal Plaza, Suite 600, Portland, Maine 04101. Mr. Keffer is considered an Interested Trustee due to his affiliation with Atlantic. Each Fund's Statement of Additional Information includes additional information about the Trustees and is available, without charge and upon request, by calling (888) 992-2765.
ADALTA INTERNATIONAL FUND A MESSAGE TO OUR SHAREHOLDERS (Unaudited) MARCH 31, 2017 |
Dear Shareholders:
The Adalta International Fund (the "International Fund") ended its fiscal year on March 31, 2017 (the "Fiscal Year" or the "Period") with a net asset value ("NAV") of $17.58 per share, realizing a return of 13.94% for the Period. The International Fund's fiscal return compares with a return of 13.13% for the International Fund's benchmark, the MSCI ACWI ex US Index (the "MSCI ACWI ex US" or the "Benchmark") and an 11.67% return for the MSCI EAFE Index ("MSCI EAFE").1 For a longer term perspective, the International Fund's 3-, 5-, 10-year, and since inception average annual total returns as of March 31, 2017 were as follows:
| Average Annual Total Return as of 03/31/2017 | | One Year | | Three Years | | Five Years | | Ten Years | | Since Inception (12/08/93) |
| Adalta International Fund | | 13.94% | | 3.34% | | 4.46% | | 1.91% | | 6.92% |
MSCI ACWI ex US Index1 | | 13.13% | | 0.56% | | 4.38% | | 1.35% | | N/A |
MSCI EAFE Index1 | | 11.67% | | 0.50% | | 5.83% | | 1.05% | | 5.26% |
(Performance data quoted represents past performance and is no guarantee of future results. Current performance may be lower or higher than the performance data quoted. Investment return and principal value will fluctuate so that an investor's shares, when redeemed, may be worth more or less than original cost. For the most recent month-end performance, please call (800) 943-6786. Shares redeemed or exchanged within 60 days of purchase will be charged a 2.00% redemption fee. As stated in the current prospectus, the International Fund's annual operating expense ratio (gross) is 2.14%. However, the International Fund's adviser has agreed to contractually waive its fees and/or reimburse expenses to limit total operating expenses to 1.50% through at least September 30, 2017. During the period certain fees were waived and/or expenses reimbursed, otherwise returns would have been lower. Returns greater than one year are annualized.)
During the Period the International Fund outperformed its relevant benchmarks. Contributors to the International Fund's performance during the Fiscal Year included Dewan Housing Finance Corp., Ltd., Tarkett SA, Dufry AG and GS Home Shopping, Inc. Holdings that detracted from the International Fund's performance during the Period included Fairfax Financial Holdings, Ltd., GP Investments, Ltd., Baidu, Inc. and Countrywide PLC.
The following tables provide details of the International Fund's top 10 positions at the end of the Period as well as positions added and exited since our 9/30/16 semi-annual report. The decisions to exit positions resulted from a combination of the securities hitting our valuation targets or better opportunities elsewhere.
1 The MSCI ACWI ex US is a stock market index that is a free float adjusted market capitalization weighted index that is designed to measure the equity market performance of developed and emerging markets. Net index data is not available prior to its inception on 01/01/01. The MSCI EAFE Index is a stock market index that is designed to measure the equity market performance of developed markets outside of the United States and Canada. The total return of the MSCI EAFE includes the reinvestment of dividends and income. It is not possible to invest directly in any index.
ADALTA INTERNATIONAL FUND A MESSAGE TO OUR SHAREHOLDERS (Unaudited) MARCH 31, 2017 |
| Top 10 Common Stock Holdings as of 03/31/17 | | Country | | Sector | | % of Net Assets |
| Dewan Housing Finance Corp., Ltd. | | India | | Financials | | 7.59% |
| GS Home Shopping, Inc. | | South Korea | | Consumer Discretionary | | 7.29% |
| Tarkett SA | | Russian Federation | | Consumer Discretionary | | 6.75% |
| Dufry AG | | Switzerland | | Consumer Discretionary | | 6.73% |
| NIIT Technologies, Ltd. | | India | | Technology | | 6.66% |
| GP Investments, Ltd. | | Brazil | | Asset Management | | 6.01% |
| Genting Hong Kong, Ltd. | | Hong Kong | | Conglomerates | | 5.73% |
| Roche Holding AG | | Switzerland | | Consumer Staples | | 5.44% |
| Baidu, Inc., ADR | | China | | Telecommunication Services | | 4.92% |
| Penn West Petroleum, Ltd. | | Canada | | Energy | | 4.41% |
| Total | | | | | | 61.53% |
| New Positions Established as of 03/31/17 | | % of Net Assets | | Portfolio Positions Eliminated | | % of Net Assets2 |
| Penn West Petroleum, Ltd. | | 4.41% | | First Pacific Co., Ltd. | | 5.63% |
| KKR & Co. LP | | 3.48% | | Greatview Aseptic Packaging Co., Ltd. | | 4.05% |
| The Blackstone Group LP | | 3.16% | | FANUC Corp. | | 2.52% |
| Anheuser-Busch InBev NV, ADR | | 2.16% | | Fairfax India Holdings Corp. | | 1.64% |
| Granite Real Estate Investment Trust REIT | | 1.86% | | Countrywide PLC | | 0.82% |
| Grupo Aeroporutario del Pacifico SAB de CV, ADR | | 1.42% | | Media Nusantara Citra Tbk PT | | 0.70% |
| Philex Mining Corp | | 1.37% | | Liberty Global PLC LiLAC, Class A | | 0.56% |
| Mobileye NV | | 1.08% | | Hitachi Zosen Fukui Corp. | | 0.47% |
| | | | | Prairie Provident Resources, Inc. | | 0.21% |
| | | | | The Kansai Electric Power Co., Inc. | | 0.14% |
| | | 18.94% | | | | 16.74% |
During 3Q17 the International Fund's investment in Switch Communications of Nevada was acquired. This investment was made in conjunction with Brightwood Capital Advisors. Switch is led by a visionary owner-operator management team that has built a unique, hard to replicate collection of data center assets. Our position was acquired at a 2.1 multiple of where we initially invested.
The International Fund's investment in Dufry has continued to perform very well. The business is the dominant travel retailer worldwide with a presence in 64 countries with over 380 locations. Dufry is a global market share leader in owning and operating duty free stores. The company has consolidated this market globally and is now realizing significant synergies as a result. Dufry's geographic diversification has been designed strategically by management to allow Dufry to participate in the global growth trends of the travel retail industry while serving to mitigate potential local events. The market underestimated the value previously, but it now appears to be priced into the stock as people understand the power of its market leading position.
The International Fund recently initiated a position in Grupo Aeroportuario, a Mexican airport operator headquartered in Guadalajara, Mexico. The company operates 12 airports in Mexico's Pacific region and is the second largest airport services company by passenger traffic in Mexico. The company's key business lines include management, operation and development of airport facilities. It also maintains comprehensive insurance coverage and leases space to shops inside
2 Percent of net asset value ("NAV") for exited positions reflect holdings at the previous reporting period ending 9/30/2016.
ADALTA INTERNATIONAL FUND A MESSAGE TO OUR SHAREHOLDERS (Unaudited) MARCH 31, 2017 |
the airports. The business share price was impacted by the U.S. election results in November 2016, with the threat of less travel from Mexico to the U.S. and vice versa. We saw this as an opportunity to buy a great business which has generated in excess of 12% return on invested capital ("ROIC"), has operated with low debt, owns and operates five out of the ten largest airports in Mexico, and has a management team with a wealth of history and experience.
Mobileye NV, an Israeli based software developer for camera-based Advanced Driver Assistance Systems (ADAS), was another new investment made by the International Fund during the Period. The company is considered a global leader for camera-based ADAS and has a strong clientele. The company's software is capable of interpreting the environment and anticipates any obstacles in the way. Additionally, it is also capable of reading traffic signs and lights. The International Fund invested in the business because we recognized the company's important product and patent portfolio in a burgeoning market for transportation related artificial intelligence. After we initiated the position, the company announced in March 2017 that it had entered into a definitive agreement to be acquired by Intel corporation at a premium of 34.4% to the $47.27 closing price of its shares on March 10, 2017.
According to the April 2017 International Monetary Fund's (IMF) World Economic Outlook (WEO) (the "Report") the extended and substantial economic and monetary stimulus provided by most of the world's central banks is bearing fruit. In the Report the IMF outlines its case that we are at the cusp of a global economic pick-up. The Report's forecast of economic growth varies according to region and country, however in the aggregate global activity is expected to rise to 3.5% in 2017 and 3.6% in 2018. As indicated in the Report, the recovery is broad based but moderate in the advanced economies with the U.S. and Eurozone increase projected at 2.3% and 1.7%, respectively, in 2017. The world's improved economic trend is stronger in the developing and emerging countries than in developed economies and in the Asian region versus the Western geographical region. In the aggregate emerging and developing economies are forecast to increase by 4.5% and 4.8% in 2017 and 2018, respectively, contrasted to the 2.0% increase in 2017 and 2018 in developed countries. Leading the growth in the emerging and developing economies are China, India and other Asian countries. The foregoing is an encouraging background for our continued investment in emerging and developing markets.
Thank you for your continued trust and support. We believe your patience will be rewarded, and we remain enthusiastic shareholders with you in the International Fund.
Sincerely,
Adalta Capital Management LLC
IMPORTANT RISKS AND DISCLOSURE:
Effective June 30, 2016 the Beck, Mack & Oliver International Fund was re-named the Adalta International Fund. Additionally, the Investment Adviser is now Adalta Capital Management LLC, formerly advised by Beck, Mack & Oliver LLC.
There is no assurance that the International Fund will achieve its investment objective. Investing overseas involves special risks, including the volatility of currency exchange rates and, in some cases, political and economic instability, and relatively illiquid markets. Emerging markets involve greater risks than more developed markets as they may be
ADALTA INTERNATIONAL FUND A MESSAGE TO OUR SHAREHOLDERS (Unaudited) MARCH 31, 2017 |
more volatile and less liquid. The International Fund's exposure to foreign currencies may not be fully hedged at all times. Private fund securities are typically illiquid and difficult to value. The International Fund may invest in small and mid-sized capitalization companies meaning that these companies carry greater risk than is customarily associated with larger companies for various reasons such as narrower markets, limited financial resources and less liquid stock. The risk of investing in Europe may be heightened due to the recent referendum in which the United Kingdom voted to withdraw from the European Union (EU). Also, if one or more countries were to exit the EU or abandon use of the euro, the value of investments tied to those countries or the euro could decline significantly and unpredictably.
The views in this report were those of the International Fund managers as of March 31, 2017 and may not reflect their views on the date this report is first published or any time thereafter. These views are intended to assist shareholders in understanding their investment in the International Fund and do not constitute investment advice. This letter may contain discussions about certain investments both held and not held in the portfolio. All current and future holdings are subject to risk and to change.
The following chart reflects the change in the value of a hypothetical $10,000 investment, including reinvested dividends and distributions, in Adalta International Fund (the "Fund") compared with the performance of the primary benchmark, the MSCI All Cap World Index except United States ("MSCI ACWI ex US"), and the secondary benchmark, the MSCI EAFE Index ("MSCI EAFE") over the past ten years. The MSCI ACWI ex US is a stock market index that is a free float adjusted market capitalization weighted index that is designed to measure the equity market performance of developed and emerging markets outside of the United States. The MSCI EAFE is a stock market index that is designed to measure the equity market performance with dividends reinvested of developed markets outside of the United States and Canada. The total returns of both the MSCI ACWI ex US and MSCI EAFE include the reinvestment of dividends and income. The total return of the Fund includes operating expenses that reduce returns, while the total returns of the MSCI ACWI ex US and MSCI EAFE do not include expenses. The Fund is professionally managed, while the MSCI ACWI ex US and MSCI EAFE are unmanaged and are not available for investment.
Comparison of a $10,000 Investment
Adalta International Fund vs. MSCI ACWI ex US Index and MSCI EAFE Index
| PORTFOLIO HOLDINGS | | |
| % of Common Stock | | |
| Consumer Discretionary | 29.0 | % |
| Financials | 20.5 | % |
| Consumer Staples | 8.6 | % |
| Technology | 7.5 | % |
| Asset Management | 6.8 | % |
| Conglomerates | 6.4 | % |
| Telecommunication Services | 5.5 | % |
| Energy | 5.0 | % |
| Insurance | 4.3 | % |
| Real Estate | 3.3 | % |
| Industrials | 1.6 | % |
| Materials | 1.5 | % |
| | 100.0 | % |
ADALTA INTERNATIONAL FUND SCHEDULE OF INVESTMENTS MARCH 31, 2017 |
| Shares | | Security Description | | Value | |
| Common Stock - 88.7% |
| Belgium - 2.2% |
| | 3,700 | | Anheuser-Busch InBev NV, ADR | $ | 406,112 | |
| Brazil - 6.0% |
| | 535,300 | | GP Investments, Ltd. (a) | | 1,128,531 | |
| Canada - 10.1% |
| | 1,566 | | Fairfax Financial Holdings, Ltd. | | 712,669 | |
| | 10,000 | | Granite Real Estate Investment Trust REIT | | 349,814 | |
| | 486,750 | | Penn West Petroleum, Ltd. (a) | | 827,475 | |
| | | 1,889,958 | |
| China - 4.9% |
| | 5,361 | | Baidu, Inc., ADR (a) | | 924,880 | |
| Cyprus - 2.9% |
| | 2,021,534 | | Secure Property Development & Investment PLC (a) | | 544,548 | |
| Hong Kong - 5.7% |
| | 3,590,300 | | Genting Hong Kong, Ltd. (a) | | 1,077,090 | |
| India - 14.3% |
| | 252,100 | | Dewan Housing Finance Corp., Ltd. | | 1,425,402 | |
| | 186,500 | | NIIT Technologies, Ltd. | | 1,251,088 | |
| | | 2,676,490 | |
| Indonesia - 2.1% |
| | 24,199,300 | | Panin Financial Tbk PT (a) | | 384,995 | |
| Israel - 1.1% |
| | 3,289 | | Mobileye NV (a) | | 201,945 | |
| Japan - 3.8% |
| | 21,300 | | Sony Corp. | | 720,523 | |
| Mexico - 1.4% |
| | 2,749 | | Grupo Aeroportuario del Pacifico SAB de CV, ADR | | 266,928 | |
| Philippines - 1.4% |
| | 1,535,800 | | Philex Mining Corp. | | 256,502 | |
| Russian Federation - 6.7% |
| | 29,326 | | Tarkett SA | | 1,267,198 | |
| South Korea - 7.3% |
| | 6,660 | | GS Home Shopping, Inc. | | 1,369,758 | |
| Switzerland - 12.2% |
| | 8,293 | | Dufry AG (a) | | 1,263,427 | |
| | 4,000 | | Roche Holding AG | | 1,021,515 | |
| | | 2,284,942 | |
* Cost for federal income tax purposes is $15,965,397 and net unrealized appreciation consists of:
An affiliate is an entity in which the Fund has ownership of at least 5% of the voting securities. Transactions during the year with affiliates were as follows:
| | | Private Equity Fund |
| | | Brightwood Switch SPV, LP** |
| Balance 03/31/16 | | |
| Principal | $ | 1,200,000 |
| Cost | $ | 1,200,000 |
| Value | $ | 2,667,002 |
| Gross Additions | | |
| Principal | $ | - |
| Cost | $ | - |
| Gross Reductions | | |
| Principal | $ | (1,200,000) |
| Cost | $ | (1,200,000) |
| Proceeds | $ | 2,554,321 |
| Balance 03/31/17 | | |
| Principal | $ | - |
| Cost | $ | - |
| Value | $ | - |
| Realized gain/(loss) | $ | 1,354,321 |
| Investment Income | $ | 81,950 |
** No longer an affiliate as of March 31, 2017.
The inputs or methodology used for valuing securities are not necessarily an indication of the risks associated with investing in those securities. For more information on valuation inputs, and their aggregation into the levels used in the table below, please refer to the Security Valuation section in Note 2 of the accompanying Notes to Financial Statements.
The following is a summary of the inputs used to value the Fund's investments as of March 31, 2017.
| ASSETS | | | | |
| . | Total investments, at value (Cost $15,718,048) | | $ | 17,898,010 | |
| | Cash | | | 872,725 | |
| | Foreign currency (Cost $13,236) | | | 13,236 | |
| | Receivables: | | | | |
| | | Fund shares sold | | | 16 | |
| | | Dividends and interest | | | 93,777 | |
| | Prepaid expenses | | | 10,449 | |
| Total Assets | | | 18,888,213 | |
| | | | | | | |
| LIABILITIES | | | | |
| | Payables: | | | | |
| | | Investment securities purchased | | | 56,442 | |
| | | Foreign capital gains tax payable | | | 6,456 | |
| | Accrued Liabilities: | | | | |
| | | Investment adviser fees | | | 65 | |
| | | Trustees' fees and expenses | | | 65 | |
| | | Fund services fees | | | 5,416 | |
| | | Other expenses | | | 34,945 | |
| Total Liabilities | | | 103,389 | |
| | | | | | | |
| NET ASSETS | | $ | 18,784,824 | |
| | | | | | | |
| COMPONENTS OF NET ASSETS | | | | |
| | Paid-in capital | | $ | 18,877,236 | |
| | Undistributed net investment income | | | 237,417 | |
| | Accumulated net realized loss | | | (2,502,406 | ) |
| | Net unrealized appreciation | | | 2,172,577 | |
| NET ASSETS | | $ | 18,784,824 | |
| SHARES OF BENEFICIAL INTEREST AT NO PAR VALUE (UNLIMITED SHARES AUTHORIZED) | | | 1,068,802 | |
NET ASSET VALUE, OFFERING AND REDEMPTION PRICE PER SHARE* | | $ | 17.58 | |
* Shares redeemed or exchanged within 60 days of purchase are charged a 2.00% redemption fee. |
See Notes to Financial Statements. | 9 | |
ADALTA INTERNATIONAL FUND STATEMENT OF OPERATIONS YEAR ENDED MARCH 31, 2017 |
| INVESTMENT INCOME | | | | | | |
| | Dividend income of unaffiliated issuers (Net of foreign withholding taxes of $154,553) | . | | $ | 484,802 | | |
| | Dividend income of affiliated issuers | | | | 81,950 | | |
| | Interest income | | | 3,171 | | |
| Total Investment Income | | | | 569,923 | | |
| Adviser | | | | | | |
| EXPENSES | | | | | | |
| | Investment adviser fees | | | 413,766 | | |
| | Fund services fees | | | 177,870 | | |
| | Custodian fees | | | 42,665 | | |
| | Registration fees | | | 19,651 | | |
| | Professional fees | | | 94,855 | | |
| | Trustees' fees and expenses | | | 9,550 | | |
| | Miscellaneous expenses | | | 75,783 | | |
| Total Expenses | | | | 834,140 | | |
| | Fees waived and expenses reimbursed | | | (420,347 | ) | |
| Net Expenses | | | | 413,793 | | |
| | | | | | | | |
| NET INVESTMENT INCOME | | | | 156,130 | | |
| | | | | | | | |
| NET REALIZED AND UNREALIZED GAIN (LOSS) | | | | | | |
| | Net realized gain (loss) on: | | | | | |
| | Investments in unaffiliated issuers | | | 1,197,261 | | |
| | Investments in affiliated issuers | | | 1,354,321 | | |
| | Foreign currency transactions | | | (234,857 | ) | |
| | Net realized gain | | | 2,316,725 | | |
| | Net change in unrealized appreciation (depreciation) on: | | | | | |
| | Investments in unaffiliated issuers | | | 1,280,057 | | |
| | Investments in affiliated issuers | | | (1,467,002 | ) | |
| | Deferred foreign capital gains taxes | | | (2,131 | ) | |
| | Foreign currency translations | | | 260,062 | | |
| | Net change in unrealized appreciation (depreciation) | | | 70,986 | | |
| NET REALIZED AND UNREALIZED GAIN | | | | 2,387,711 | | |
| INCREASE IN NET ASSETS RESULTING FROM OPERATIONS | | | $ | 2,543,841 | | |
See Notes to Financial Statements. | 10 | |
ADALTA INTERNATIONAL FUND STATEMENTS OF CHANGES IN NET ASSETS |
| | | March 31, 2017 | # | 42825 For the Years Ended March 31, |
| | | | | 2017 | | | 2016 |
| OPERATIONS | | | | | | | | | |
| | Net investment income | | $ | 156,130 | | | | $ | 364,242 | |
| | Net realized gain | | | 2,316,725 | | | | | 1,652,629 | |
| | Net change in unrealized appreciation (depreciation) | | | 70,986 | | | | | (3,989,966 | ) |
| Increase (Decrease) in Net Assets Resulting from Operations | | | 2,543,841 | | | | | (1,973,095 | ) |
| | | | | | | | | | | | |
| DISTRIBUTIONS TO SHAREHOLDERS FROM | | | | | | | | | |
| | Net investment income | | | (211,892 | ) | | | | (3,336,081 | ) |
| Total Distributions to Shareholders | | | (211,892 | ) | | | | (3,336,081 | ) |
| | | | | | | | | | | | |
| CAPITAL SHARE TRANSACTIONS | | | | | | | | | |
| | Sale of shares | | | 182,535 | | | | | 549,747 | |
| | Reinvestment of distributions | | | 191,469 | | | | | 1,905,297 | |
| | Redemption of shares | | | (31,016,736 | ) | | | | (18,576,494 | ) |
| | Redemption fees | | | 5 | | | | | 134 | |
| Decrease in Net Assets from Capital Share Transactions | | | (30,642,727 | ) | | | | (16,121,316 | ) |
| Decrease in Net Assets | | | (28,310,778 | ) | | | | (21,430,492 | ) |
| | | | | | | | | | | | |
| NET ASSETS | | | | | | | | | |
| | Beginning of Year | | | 47,095,602 | | | | | 68,526,094 | |
| | End of Year (Including line (a)) | | $ | 18,784,824 | | | | $ | 47,095,602 | |
| | | | | | | | | | | | |
| SHARE TRANSACTIONS | | | | | | | | | |
| | Sale of shares | | | 11,589 | | | | | 32,491 | |
| | Reinvestment of distributions | | | 12,329 | | | | | 123,801 | |
| | Redemption of shares | | | (1,971,193 | ) | | | | (1,127,189 | ) |
| Decrease in Shares | | | (1,947,275 | ) | | | | (970,897 | ) |
| | | | | | | | | | | | |
| (a) | Undistributed net investment income | | $ | 237,417 | | | | $ | 105,937 | |
See Notes to Financial Statements. | 11 | |
ADALTA INTERNATIONAL FUND |
| These financial highlights reflect selected data for a share outstanding throughout each year. | | | | | | |
| | | For the Years Ended March 31, | |
| | | 2017 | | 2016 | | 2015 | | 2014 | | 2013 | |
| NET ASSET VALUE, Beginning of Year | $ | 15.61 | | | $ | 17.19 | | | $ | 18.50 | | | $ | 20.73 | | | $ | 18.88 | | |
| INVESTMENT OPERATIONS | | | | | | | | | | | | | | | | | | | | |
| Net investment income (a) | | 0.09 | | | | 0.11 | | | | 0.15 | | | | 0.18 | | | | 0.13 | | |
| Net realized and unrealized gain (loss) | | 2.06 | | | | (0.61 | ) | | | (0.23 | ) | | | (0.30 | ) | | | 2.36 | | |
| Total from Investment Operations | | 2.15 | | | | (0.50 | ) | | | (0.08 | ) | | | (0.12 | ) | | | 2.49 | | |
| DISTRIBUTIONS TO | | | | | | | | | | | | | | | | | | | | |
| SHAREHOLDERS FROM | | | | | | | | | | | | | | | | | | | | |
| Net investment income | | (0.18 | ) | | | (1.08 | ) | | | (0.48 | ) | | | (1.46 | ) | | | — | | |
| Net realized gain | | — | | | | — | | | | (0.75 | ) | | | (0.65 | ) | | | (0.64 | ) | |
| Total Distributions to Shareholders | | (0.18 | ) | | | (1.08 | ) | | | (1.23 | ) | | | (2.11 | ) | | | (0.64 | ) | |
| REDEMPTION FEES (a) | | — | (b) | | — | (b) | | — | (b) | | — | (b) | | — | (b) |
| NET ASSET VALUE, End of Year | $ | 17.58 | | | $ | 15.61 | | | $ | 17.19 | | | $ | 18.50 | | | $ | 20.73 | | |
| TOTAL RETURN | | 13.94 | % | | (2.84 | )% | | (0.32 | )% | | (0.54 | )% | | 13.35 | % |
| RATIOS/SUPPLEMENTARY DATA | | | | | | | | | | | | | | | | | | | | |
| Net Assets at End of Year (000's omitted) | $18,785 | | | $47,096 | | | $68,526 | | | $91,898 | | | $101,861 | | |
| Ratios to Average Net Assets: | | | | | | | | | | | | | | | | | | | | |
| Net investment income | | 0.56 | % | | 0.66 | % | | 0.84 | % | | 0.90 | % | | 0.66 | % |
| Net expenses | | 1.50 | % | | 1.50 | % | | 1.50 | % | | 1.41 | % | | 1.25 | % |
| Gross expenses (c) | | 3.02 | % | | 2.14 | % | | 1.90 | % | | 1.90 | % | | 1.88 | % |
| PORTFOLIO TURNOVER RATE | | 42 | % | | 38 | % | | 52 | % | | 39 | % | | 67 | % |
| | | | | | | | | | | | | | | | | | | | | | |
| | | | | | | | | | | | | | | | | | | | | | |
| (a) | Calculated based on average shares outstanding during each year. |
| (b) | Less than $0.01 per share. |
| (c) | Reflects the expense ratio excluding any waivers and/or reimbursements. |
See Notes to Financial Statements. | 12 | |
ADALTA INTERNATIONAL FUND NOTES TO FINANCIAL STATEMENTS MARCH 31, 2017 |
Note 1. Organization
The Adalta International Fund (the "Fund") is a diversified portfolio of Forum Funds (the "Trust"). The Trust is a Delaware statutory trust that is registered as an open-end, management investment company under the Investment Company Act of 1940, as amended (the "Act"). Under its Trust Instrument, the Trust is authorized to issue an unlimited number of the Fund's shares of beneficial interest without par value. The Fund commenced operations on December 8, 1993, and seeks capital appreciation by investing primarily in a portfolio of common stock and securities convertible into common stock. Effective June 30, 2016, Beck Mack & Oliver International Fund was renamed Adalta International Fund. From August 1, 2014 through June 30, 2016 the Fund was named the Beck, Mack & Oliver International Fund. From June 24, 2009 through August 1, 2014, the Fund was named Beck Mack & Oliver Global Equity Fund. Prior to June 24, 2009, the Fund was named Austin Global Equity Fund.
Note 2. Summary of Significant Accounting Policies
The Fund is an investment company and follows accounting and reporting guidance under Financial Accounting Standards Board ("FASB") Accounting Standards Codification ("ASC") Topic 946, "Financial Services-Investment Companies". These financial statements are prepared in accordance with accounting principles generally accepted in the United States of America ("GAAP"), which require management to make estimates and assumptions that affect the reported amounts of assets and liabilities, the disclosure of contingent liabilities at the date of the financial statements, and the reported amounts of increases and decreases in net assets from operations during the fiscal year. Actual amounts could differ from those estimates. The following summarizes the significant accounting policies of the Fund:
Security Valuation – Securities are valued at market prices using the last quoted trade or official closing price from the principal exchange where the security is traded, as provided by independent pricing services on each Fund business day. In the absence of a last trade, securities are valued at the mean of the last bid and ask price provided by the pricing service. Debt securities may be valued at prices supplied by a fund's pricing agent based on broker or dealer supplied valuations or matrix pricing, a method of valuing securities by reference to the value of other securities with similar characteristics such as rating, interest rate and maturity. Forward currency contracts are generally valued based on interpolation of forward curve data points obtained from major banking institutions that deal in foreign currencies and currency dealers. Exchange-traded options for which the last quoted sale price is outside the closing bid and ask price, will be valued at the mean of the closing bid and ask price. Shares of open-end mutual funds are valued at net asset value ("NAV"). Interests in private investments will generally be subject to fair valuation. Short-term investments that mature in 60 days or less may be valued at amortized cost.
The Fund values its investments at fair value pursuant to procedures adopted by the Trust's Board of Trustees (the "Board") if (1) market quotations are not readily available or (2) the Adviser, as defined in Note 4, believes that the values available are unreliable. The Trust's Valuation Committee, as defined in the Fund's registration statement, performs certain functions as they relate to the administration and oversight of the Fund's valuation procedures. Under these procedures, the Valuation Committee convenes on a regular and ad hoc basis to review such investments and considers a number of factors, including valuation methodologies and significant unobservable inputs, when arriving at fair value.
The Valuation Committee may work with the Adviser to provide valuation inputs. In determining fair valuations, inputs may include market-based analytics that may consider related or comparable assets or liabilities, recent transactions, market multiples, book values and other relevant investment information. Adviser inputs may include an income-based approach in which the anticipated future cash flows of the investment are discounted in determining fair value. Discounts may also be applied based on the nature or duration of any restrictions on the disposition of the investments. The Valuation Committee performs regular reviews of valuation methodologies, key inputs and assumptions, disposition analysis and market activity.
As permitted by GAAP, as a practical expedient, the Valuation Committee may measure the fair value of its investments in investment companies on the basis of the net asset value per share of such investments (or the equivalent) if the net asset value per share of such investments (or the equivalent) is calculated in a manner consistent with the measurement principles of applicable authoritative guidance as of the Fund's reporting date. The fair value of the Fund's investments in investment companies is based on the information provided by such investment company's management, which reflects the Fund's share of the fair value of the net assets of such investment company (i.e., the practical expedient is used). If the Valuation Committee determines, based on its own due diligence and investment valuation procedures, that alternative valuation techniques are more appropriate for any of the Fund's investments in investment companies, such investments may be fair valued by the Valuation Committee using other suitable sources.
The Valuation Committee performs regular reviews of valuation methodologies, key inputs and assumptions, disposition and market activity.
Fair valuation is based on subjective factors and, as a result, the fair value price of an investment may differ from the security's market price and may not be the price at which the asset may be sold. Fair valuation could result in a different NAV than a NAV determined by using market quotes.
The Fund has a three-tier fair value hierarchy. The basis of the tiers is dependent upon the various "inputs" used to determine the value of the Fund's investments. These inputs are summarized in the three broad levels listed below:
Level 1 — quoted prices in active markets for identical assets and liabilities
Level 2 — other significant observable inputs (including quoted prices of similar securities, interest rates, prepayment speeds, credit risk, etc.)
Level 3 — significant unobservable inputs (including the Fund's own assumptions in determining the fair value of investments)
The aggregate value by input level, as of March 31, 2017, for the Fund's investments is included at the end of the Fund's Schedule of Investments.
Security Transactions, Investment Income and Realized Gain and Loss – Investment transactions are accounted for on the trade date. Dividend income is recorded on the ex-dividend date. Foreign dividend income is recorded on the ex-dividend date or as soon as possible after determining the existence of a dividend declaration after exercising reasonable
ADALTA INTERNATIONAL FUND NOTES TO FINANCIAL STATEMENTS MARCH 31, 2017 |
due diligence. Income and capital gains on some foreign securities may be subject to foreign withholding taxes, which are accrued as applicable. Interest income is recorded on an accrual basis. Premium is amortized and discount is accreted using the effective interest method. Identified cost of investments sold is used to determine the gain and loss for both financial statement and federal income tax purposes.
Foreign Currency Translations – Foreign currency amounts are translated into U.S. dollars as follows: (1) assets and liabilities at the rate of exchange at the end of the respective period; and (2) purchases and sales of securities and income and expenses at the rate of exchange prevailing on the dates of such transactions. The portion of the results of operations arising from changes in the exchange rates and the portion due to fluctuations arising from changes in the market prices of securities are not isolated. Such fluctuations are included with the net realized and unrealized gain or loss on investments.
Foreign Currency Transactions – The Fund may enter into transactions to purchase or sell foreign currency contracts and options on foreign currency. Forward currency contracts are agreements to exchange one currency for another at a future date and at a specified price. A fund may use forward currency contracts to facilitate transactions in foreign securities, to manage a fund's foreign currency exposure and to protect the U.S. dollar value of its underlying portfolio securities against the effect of possible adverse movements in foreign exchange rates. These contracts are intrinsically valued daily based on forward rates, and a fund's net equity therein, representing unrealized gain or loss on the contracts as measured by the difference between the forward foreign exchange rates at the dates of entry into the contracts and the forward rates at the reporting date, is recorded as a component of NAV. These instruments involve market risk, credit risk, or both kinds of risks, in excess of the amount recognized in the Statement of Assets and Liabilities. Risks arise from the possible inability of counterparties to meet the terms of their contracts and from movement in currency and securities values and interest rates. Due to the risks associated with these transactions, a fund could incur losses up to the entire contract amount, which may exceed the net unrealized value included in its NAV.
Purchased Options – When a fund purchases an option, an amount equal to the premium paid by the fund is recorded as an investment and is subsequently adjusted to the current value of the option purchased. If an option expires on the stipulated expiration date or if the fund enters into a closing sale transaction, a gain or loss is realized. If a call option is exercised, the cost of the security acquired is increased by the premium paid for the call. If a put option is exercised, a gain or loss is realized from the sale of the underlying security, and the proceeds from such sale are decreased by the premium originally paid. Purchased options are non-income producing securities.
Distributions to Shareholders – The Fund declares any dividends from net investment income and pays them annually. Any net capital gains and net foreign currency gains realized by the Fund are distributed at least annually. Distributions to shareholders are recorded on the ex-dividend date. Distributions are based on amounts calculated in accordance with applicable federal income tax regulations, which may differ from GAAP. These differences are due primarily to differing treatments of income and gain on various investment securities held by the Fund, timing differences and differing characterizations of distributions made by the Fund.
Federal Taxes – The Fund intends to continue to qualify each year as a regulated investment company under Subchapter M of Chapter 1, Subtitle A, of the Internal Revenue Code of 1986, as amended ("Code"), and to distribute all of its taxable income to shareholders. In addition, by distributing in each calendar year substantially all of its net investment income and capital gains, if any, the Fund will not be subject to a federal excise tax. Therefore, no federal income or
ADALTA INTERNATIONAL FUND NOTES TO FINANCIAL STATEMENTS MARCH 31, 2017 |
excise tax provision is required. The Fund files a U.S. federal income and excise tax return as required. The Fund's federal income tax returns are subject to examination by the Internal Revenue Service for a period of three fiscal years after they are filed. As of March 31, 2017, there are no uncertain tax positions that would require financial statement recognition, de-recognition or disclosure.
Income and Expense Allocation – The Trust accounts separately for the assets, liabilities and operations of each of its investment portfolios. Expenses that are directly attributable to more than one investment portfolio are allocated among the respective investment portfolios in an equitable manner.
Redemption Fees – A shareholder who redeems or exchanges shares within 60 days of purchase will incur a redemption fee of 2.00% of the current NAV of shares redeemed or exchanged, subject to certain limitations. The fee is charged for the benefit of the remaining shareholders and will be paid to the Fund to help offset transaction costs. The fee is accounted for as an addition to paid-in capital. The Fund reserves the right to modify the terms of or terminate the fee at any time. There are limited exceptions to the imposition of the redemption fee. Redemption fees incurred for the Fund, if any, are reflected on the Statements of Changes in Net Assets.
Commitments and Contingencies – In the normal course of business, the Fund enters into contracts that provide general indemnifications by the Fund to the counterparty to the contract. The Fund's maximum exposure under these arrangements is dependent on future claims that may be made against the Fund and, therefore, cannot be estimated; however, based on experience, the risk of loss from such claims is considered remote.
Note 3. Cash – Concentration in Uninsured Account
For cash management purposes, the Fund may concentrate cash with the Fund's custodian. This typically results in cash balances exceeding the Federal Deposit Insurance Corporation ("FDIC") insurance limits. As of March 31, 2017, the Adalta International Fund had $622,725 at MUFG Union Bank, N.A. that exceeded the FDIC insurance limit.
Note 4. Fees and Expenses
Investment Adviser – Adalta Capital Management LLC (the "Adviser") is the investment adviser to the Fund. Pursuant to an investment advisory agreement, the Adviser receives an advisory fee, payable monthly, from the Fund at an annual rate of 1.50% of the Fund's average daily net assets.
Distribution – Foreside Fund Services, LLC serves as the Fund's distributor (the "Distributor"). The Fund does not have a distribution (12b-1) plan; accordingly, the Distributor does not receive compensation from the Fund for its distribution services. The Adviser compensates the Distributor directly for its services. The Distributor is not affiliated with the Adviser or Atlantic Fund Administration, LLC (d/b/a Atlantic Fund Services) ("Atlantic") or their affiliates.
Other Service Providers – Atlantic provides fund accounting, fund administration, compliance and transfer agency services to the Fund. The fees related to these services are included in Fund services fees within the Statement of Operations. Atlantic also provides certain shareholder report production and EDGAR conversion and filing services. Pursuant to an Atlantic services agreement, the Fund pays Atlantic customary fees for its services. Atlantic provides a
ADALTA INTERNATIONAL FUND NOTES TO FINANCIAL STATEMENTS MARCH 31, 2017 |
Principal Executive Officer, a Principal Financial Officer, a Chief Compliance Officer and an Anti-Money Laundering Officer to the Fund, as well as certain additional compliance support functions.
Trustees and Officers – The Trust pays each independent Trustee an annual retainer fee of $50,000 for service to the Trust ($66,000 for the Chairman), and the Audit Committee Chairman and Vice Chairman receive an additional $6,000 annually. The Trustees and Chairman may receive additional fees for special Board meetings. Each Trustee is also reimbursed for all reasonable out-of-pocket expenses incurred in connection with his duties as a Trustee, including travel and related expenses incurred in attending Board meetings. The amount of Trustees' fees attributable to the Fund is disclosed in the Statement of Operations. Certain officers of the Trust are also officers or employees of the above named service providers, and during their terms of office received no compensation from the Fund.
Note 5. Expense Reimbursement and Fees Waived
The Adviser has contractually agreed to waive a portion of its fee and reimburse certain expenses to limit total annual operating expenses to 1.50% of average daily net assets of the Fund through at least September 30, 2017. Other fund service providers have voluntarily agreed to waive a portion of their fees. The contractual waivers may be changed or eliminated at any time with the consent of the Board and voluntary fee waivers and expense reimbursements may be reduced or eliminated at any time. For the year ended March 31, 2017, fees waived were as follows:
| Investment Adviser Fees Waived | | Other Waivers | | Total Fees Waived |
| $ | 385,838 | | $ | 34,509 | | $ | 420,347 |
Note 6. Security Transactions
The cost of purchases and proceeds from sales of investment securities (including maturities), other than short-term investments during the year ended March 31, 2017, were $10,747,397 and $37,964,559, respectively.
Note 7. Summary of Derivative Activity
The volume of open derivative positions may vary on a daily basis as the Fund transacts derivative contracts in order to achieve the exposure desired by the Adviser. The notional value of activity for the year ended March 31, 2017, for any derivative type that was held during the period is as follows:
Realized and unrealized gains and losses on derivatives contracts during the year ended March 31, 2017, by the Fund are recorded in the following locations on the Statement of Operations:
amendments to Regulation S-X is required for financial statements filed with the SEC on or after August 1, 2017. Management is currently evaluating the impact that the amendments will have on the Fund's financial statements and related disclosures.
Note 10. Subsequent Events
Subsequent events occurring after the date of this report through the date these financial statements were issued have been evaluated for potential impact, and the Fund has had no such events.
To the Board of Trustees of Forum Funds
and the Shareholders of Adalta International Fund
We have audited the accompanying statement of assets and liabilities of Adalta International Fund (formerly known as Beck, Mack & Oliver International Fund), a series of shares of beneficial interest in the Forum Funds (the "Fund"), including the schedule of investments, as of March 31, 2017, and the related statement of operations for the year then ended, the statements of changes in net assets for each of the years in the two-year period then ended and the financial highlights for each of the years in the five-year period then ended. These financial statements and financial highlights are the responsibility of the Fund's management. Our responsibility is to express an opinion on these financial statements and financial highlights based on our audits.
We conducted our audits in accordance with the standards of the Public Company Accounting Oversight Board (United States). Those standards require that we plan and perform the audits to obtain reasonable assurance about whether the financial statements and financial highlights are free of material misstatement. An audit includes examining, on a test basis, evidence supporting the amounts and disclosures in the financial statements. Our procedures included confirmation of securities owned as of March 31, 2017 by correspondence with the custodian, counterparties, brokers and investee companies, or by other appropriate auditing procedures where replies from investee companies were not received. An audit also includes assessing the accounting principles used and significant estimates made by management, as well as evaluating the overall financial statement presentation. We believe that our audits provide a reasonable basis for our opinion.
In our opinion, the financial statements and financial highlights referred to above present fairly, in all material respects, the financial position of Adalta International Fund as of March 31, 2017, and the results of its operations for the year then ended, the changes in its net assets for each of the years in the two-year period then ended and its financial highlights for each of the years in the five-year period then ended, in conformity with accounting principles generally accepted in the United States of America.
BBD, LLP
Philadelphia, Pennsylvania
May 24, 2017
ADALTA INTERNATIONAL FUND ADDITIONAL INFORMATION (Unaudited) MARCH 31, 2017 |
Proxy Voting Information
A description of the policies and procedures that the Fund uses to determine how to vote proxies relating to securities held in the Fund's portfolio is available, without charge and upon request, by calling (844) 284-9829 and on the SEC website at www.sec.gov. The Fund's proxy voting record for the most recent twelve-month period ended June 30 is available, without charge and upon request, by calling (844) 284-9829 and on the SEC's website at www.sec.gov.
Availability of Quarterly Portfolio Schedules
The Fund files its complete schedule of portfolio holdings with the SEC for the first and third quarters of each fiscal year on Form N-Q. These filings are available, without charge and upon request on the SEC's website at www.sec.gov or may be reviewed and copied at the SEC's Public Reference Room in Washington, DC. Information on the operation of the Public Reference Room may be obtained by calling (800) SEC-0330.
Shareholder Expense Example
As a shareholder of the Fund, you incur two types of costs: (1) transaction costs, including redemption fees and exchange fees, and (2) ongoing costs, including management fees and other Fund expenses. This example is intended to help you understand your ongoing costs (in dollars) of investing in the Fund, and to compare these costs with the ongoing costs of investing in other mutual funds.
The example is based on an investment of $1,000 invested at the beginning of the period and held for the entire period from October 1, 2016, through March 31, 2017.
Actual Expenses – The first line of the table below provides information about actual account values and actual expenses. You may use the information in this line, together with the amount you invested, to estimate the expenses that you paid over the period. Simply divide your account value by $1,000 (for example, an $8,600 account value divided by $1,000 = 8.6), then multiply the result by the number in the first line under the heading entitled "Expenses Paid During Period" to estimate the expenses you paid on your account during the period.
Hypothetical Example for Comparison Purposes – The second line of the table below provides information about hypothetical account values and hypothetical expenses based on the Fund's actual expense ratio and an assumed rate of return of 5% per year before expenses, which is not the Fund's actual return. The hypothetical account values and expenses may not be used to estimate the actual ending account balance or expenses you paid for the period. You may use this information to compare the ongoing costs of investing in the Fund and other funds. To do so, compare this 5% hypothetical example with the 5% hypothetical examples that appear in the shareholder reports of other funds.
Please note that the expenses shown in the table are meant to highlight your ongoing costs only and do not reflect any transactional costs, such as redemption fees and exchange fees. Therefore, the second line of the table is useful in comparing ongoing costs only, and will not help you determine the relative total costs of owning different funds. In addition, if these transactional costs were included, your costs would have been higher.
ADALTA INTERNATIONAL FUND ADDITIONAL INFORMATION (Unaudited) MARCH 31, 2017 |
| | Beginning | | Ending | | Expenses | | Annualized |
| | Account Value | | Account Value | | Paid During | | Expense |
| | October 1, 2016 | | March 31, 2017 | | Period* | | Ratio* |
| Actual | $ | 1,000.00 | | $ | 1,092.54 | | $ | 7.83 | | 1.50 | % |
| Hypothetical (5% return before expenses) | $ | 1,000.00 | | $ | 1,017.45 | | $ | 7.54 | | 1.50 | % |
| * | Expenses are equal to the Fund's annualized expense ratio multiplied by the average account value over the period, multiplied by the number of days in the most recent fiscal half-year (182) divided by 365 to reflect the half-year period. |
Federal Tax Status of Dividends Declared during the Fiscal Year
For federal income tax purposes, dividends from short-term capital gains are classified as ordinary income. The Fund designates 84.08% of its income dividend distributed as qualifying for the qualified dividend rate (QDI) as defined in Section 1(h)(11) of the Internal Revenue Code. The Fund also designates 1.84% as qualified interest income exempt from U.S. tax for foreign shareholders (QII).
Trustees and Officers of the Trust
The Board is responsible for oversight of the management of the Trust's business affairs and of the exercise of all the Trust's powers except those reserved for the shareholders. The following table provides information about each Trustee and certain officers of the Trust. Each Trustee and officer holds office until the person resigns, is removed, or is replaced. Unless otherwise noted, the persons have held their principal occupations for more than five years. The address for all Trustees and officers is Three Canal Plaza, Suite 600, Portland, Maine 04101. Mr. Keffer is considered an Interested Trustee due to his affiliation with Atlantic. The Fund's Statement of Additional Information includes additional information about the Trustees and is available, without charge and upon request, by calling (844) 284-9829.
| Name and Year of Birth | Position(s) with the Trust | Length of Time Served | Principal Occupation(s) During Past Five Years | Number of Series of Fund Complex¹ Overseen by Trustee | Other Directorships Held by Trustee |
| Independent Trustees | | | | | |
David Tucker Born: 1958 | Trustee; Vice Chairman | Since 2011 (Vice Chairman since 2015) | Director, Blue Sky Experience (a charitable endeavor) since 2008; Senior Vice President & General Counsel, American Century Companies (an investment management firm) 1998-2008. | 47 | Trustee, Forum Funds II, Forum ETF Trust and U.S. Global Investors Funds |
| Interested Trustee | | | | | |
John Y. Keffer2 Born: 1942 | Trustee; Vice Chairman | Since 1989 | Chairman, Atlantic since 2008; President, Forum Investment Advisors, LLC since 2011; President, Forum Foundation (a charitable organization) since 2005; President, Forum Trust, LLC (a non-depository trust company chartered in the State of Maine) since 1997. | 47 | Director, Wintergreen Fund, Inc.; Trustee, Forum Funds II, Forum ETF Trust and U.S. Global Investors Funds |
| Officers | | | | | |
Jessica Chase Born: 1970 | President; Principal Executive Officer | Since 2015 | Senior Vice President, Atlantic since 2008. | N/A | N/A |
Karen Shaw Born: 1972 | Treasurer; Principal Financial Officer | Since 2008 | Senior Vice President, Atlantic since 2008. | N/A | N/A |
Zachary Tackett Born: 1988 | Vice President; Secretary; Anti-Money Laundering Compliance Officer | Since 2014 | Counsel, Atlantic since 2014; Intern Associate, Coakley & Hyde, PLLC, 2010-2013. | N/A | N/A |
Michael J. McKeen Born: 1971 | Vice President | Since 2009 | Senior Vice President, Atlantic since 2008. | N/A | N/A |
Timothy Bowden Born: 1969 | Vice President | Since 2009 | Manager, Atlantic since 2008. | N/A | N/A |
Geoffrey Ney Born: 1975 | Vice President | Since 2013 | Manager, Atlantic since 2013; Senior Fund Accountant, Atlantic, 2008-2013. | N/A | N/A |
Todd Proulx Born: 1978 | Vice President | Since 2013 | Manager, Atlantic since 2013; Senior Fund Accountant, Atlantic, 2008-2013. | N/A | N/A |
Carlyn Edgar Born: 1963 | Vice President | Since 2008 | Senior Vice President, Atlantic since 2008; Chief Compliance Officer, 2008-2016. | N/A | N/A |
Dennis Mason Born: 1967 | Chief Compliance Officer | Since 2016 | Fund Compliance Officer, Atlantic since 2013; Senior Specialist, Atlantic 2011-2013; Senior Analyst, Atlantic 2008-2011. | N/A | N/A |
1The Fund Complex includes the Trust, Forum Funds II, Forum ETF Trust and U.S. Global Investors Funds and is overseen by different Boards of Trustees. 2Atlantic is a subsidiary of Forum Holdings Corp. I, a Delaware corporation that is wholly owned by Mr. Keffer. |


BECK, MACK & OLIVER PARTNERS FUND A MESSAGE TO OUR SHAREHOLDERS (Unaudited) MARCH 31, 2017 |
Dear Fellow Shareholder:
The Beck, Mack & Oliver Partners Fund (the "Partners Fund") returned +15.45% net of fees and expenses for the fiscal year ended March 31, 2017 (the "Fiscal Year"), resulting in a net asset value of $10.26. By comparison, during the Fiscal Year, the S&P 500 Index, which is the Partners Fund's principal benchmark, returned +17.17%.1 Since its December 1, 2009, reorganization from a limited partnership, the Partners Fund has returned +7.73% annualized versus +13.24% annualized for the S&P 500 Index. Total returns for the Partners Fund and the S&P 500 Index for the periods ended March 31, 2017, were as follows:
| | | | | Annualized Returns |
| Returns as of 03/31/17 | | One Year | | Three Years | | Five Years | | Since 12/01/2009 Reorg* | | Ten Years |
| Beck, Mack & Oliver Partners Fund | | +15.45% | | -3.21% | | +3.98% | | +7.73% | | +2.77% |
| S&P 500 Index | | +17.17% | | +10.37% | | +13.30% | | +13.24% | | +7.51% |
(Performance data quoted represent past performance and are no guarantee of future results. Current performance may be lower or higher than the performance data quoted. Investment return and principal value will fluctuate so that an investor's shares, when redeemed, may be worth more or less than original cost. Shares redeemed or exchanged within 60 days of purchase will be charged a 2.00% redemption fee. As stated in the current prospectus, the Partners Fund's annual operating expense ratio (gross) is 1.44%. However, the Partners Fund's adviser has agreed to contractually waive its fees and/or reimburse expenses to limit total operating expenses to 1.00% through at least July 31, 2017; otherwise performance shown would have been lower. For the most recent month-end performance, please call (800) 943-6786. Returns greater than one year are annualized.)
*Excludes performance prior to the Partners Fund's reorganization from a limited partnership. See important risks and disclosures regarding performance at the bottom of page 6.
Performance and Portfolio Update
Before discussing the Partners Fund's performance for the Fiscal Year and the changes made to the portfolio during that time, we would like to address the Partners Fund's performance over longer time periods and to provide some context for that performance.
As noted above, while the Partners Fund returned +15.45% during the Fiscal Year, which only modestly underperformed a very strong return by the S&P 500 Index, the Partners Fund's performance over longer time periods has been extremely disappointing. This longer-term underperformance is almost entirely a function of underperformance during the fiscal years ended March 31, 2015, and March 31, 2016. The table below shows total returns for the Partners Fund and the S&P 500 Index over three time periods: (i) from the 2009 reorganization until March 31, 2014; (ii) from March 31, 2014, until March 31, 2016; and (iii) from March 31, 2016, until March 31, 2017.
1 We will no longer be providing performance data regarding Russell indices, as the company that sponsors those indices has prohibited us from providing such performance data without a license.
BECK, MACK & OLIVER PARTNERS FUND A MESSAGE TO OUR SHAREHOLDERS (Unaudited) MARCH 31, 2017 |
| | 12/1/09 – 3/31/14 | | 3/31/14 – 3/31/16 | | 3/31/16 – 3/31/17 |
| Beck, Mack & Oliver Partners Fund | +90.28% | | -21.46% | | +15.45% |
| S&P 500 Index | +85.01% | | +14.74% | | +17.17% |
As indicated in the table above, the Partners Fund outperformed the S&P Index by over 5% from the 2009 reorganization until March 31, 2014. Over the next two fiscal years, the Partners Fund dramatically underperformed the S&P 500 Index. The annual letters for those two fiscal years include detailed discussions of investment performance, but the single largest factor contributing to underperformance relative to the S&P 500 Index in both years was the Partners Fund's relatively high exposure to the energy sector during a period in which the energy sector underwent a severe downturn.
As discussed in the letter pertaining to the six-month semi-annual period ended September 30, 2015, Robert C. Beck, who is the Senior Member of Beck, Mack & Oliver LLC, replaced Zachary Wydra as sole manager of the Partners Fund, effective October 1, 2015. During the Fiscal Year, Richard Fitzgerald, who joined Beck, Mack & Oliver LLC as a Portfolio Manager in January 2016, became co-manager of the Partners Fund. Messrs. Beck and Fitzgerald are jointly responsible for the day-to-day management of the Partners Fund and perform all of the functions related to the management of the portfolio. Following the management changes noted above, there has been a recovery in the absolute and relative investment performance of the Partners Fund during the Fiscal Year, as compared to the fiscal years ended March 31, 2015, and March 31, 2016.
As of the end of the Fiscal Year, the Partners Fund held 30 equity positions, with the 10 largest positions representing 50.0% of net assets. This compares to 34 equity positions, with the 10 largest positions representing 51.9% of net assets, as of the beginning of the Fiscal Year. We initiated four new positions and exited eight positions, each of which is discussed below.
The largest sector exposures for the Partners Fund remained financials (26.7% of net assets as of the end of the Fiscal Year), healthcare (19.9%), and energy (15.1%). Exposures to financials and energy were reduced from 35.6% and 18.3%, respectively, as of the beginning of the Fiscal Year, while exposure to healthcare increased from 16.4%. The reduction in financials exposure was partly driven by the creation of a new Global Industry Classification Standard for the real estate sector during the Fiscal Year. Exposure to real estate as of the end of the Fiscal Year was 5.0%, so the combined exposure to financials and real estate was 31.7%, compared to 35.6% at the beginning of the Fiscal Year. Cash represented less than 1% of net assets as of the end of the Fiscal Year.
During the Fiscal Year, the S&P 500 Index returned +17.17% and every industry sector generated a positive total return, though there was a large disparity between the best-performing sector (financials +32.55%) and the worst (real estate +1.01%). With respect to sector exposures, the Partners Fund's performance benefited from its significant exposure to financials, but this was largely offset by the Partners Fund's relative underexposure to technology (+24.91%) and to materials (+19.22%) and by its relative overexposure to healthcare (+11.59%). Although we are never happy when the Partners Fund underperforms the broader market, we acknowledge that, over time and based on our disciplined approach to value investing, the Partners Fund tends to be relatively more likely to underperform big up-markets, just as it tends to be relatively more likely to outperform big down-markets.
The table below indicates the largest positive and negative contributors to investment performance as well as the total returns of the underlying securities during the Fiscal Year2:
| Largest Positive Contributors | | Largest Negative Contributors |
| Position | | Contribution | | Total Return | | Position | | Contribution | | Total Return |
| Devon Energy Corp. | | +1.84% | | +52.9% | | Gilead Sciences, Inc. | | -0.83% | | -24.1% |
| Apollo Global Management, LLC | +1.82% | | +25.5% | | AgroFresh Solutions, Inc. | | -0.74% | | -31.7% |
| Matador Resources Co. | | +0.64% | | +26.1% | | Chicago Bridge & Iron Co. NV | | -0.44% | | -15.2% |
Largest Positive Contributors
Two of the Partners Fund's three largest positive contributors during the Fiscal Year were Devon Energy Corporation ("Devon") and Matador Resources Company ("Matador"), which combined represented approximately 65% of the Partners Fund's total energy exposure as of the end of the Fiscal Year. (Our other two energy investments were also positive contributors to performance.) During the Fiscal Year, both Devon and Matador significantly outperformed the broader energy sector (+14.26%), while Devon's total return was also significantly in excess of the increase in the price of oil during that time (+31.98%). We remain constructive on energy in the medium- and long-term and continue to believe that the Partners Fund's energy investments present compelling risk/reward opportunities even in the absence of a materially higher oil price.
Apollo Global Management, LLC ("Apollo") was also one of the largest positive contributors during the Fiscal Year. Apollo, which is an alternative asset manager, generated strong fundamental performance driven by growth in assets under management and accrued performance fees. The Partners Fund also owns The Blackstone Group L.P., which is another alternative asset manager and which was also a positive contributor to performance during the Fiscal Year, and we remain quite excited about the prospects for both companies.
Largest Negative Contributors
The largest negative contributor during the Fiscal Year was Gilead Sciences, Inc. ("Gilead"), which is a biotechnology company that was one of three new positions initiated in the Partner's Fund in the fiscal year ended March 31, 2016, and which we discussed in last year's letter. The original investment thesis was that the company's hepatitis C franchise is more durable than the market believes, the valuation is very cheap, the management team has an excellent track record and allocates capital well, and the company has an underappreciated pipeline of new drugs. While the hepatitis C franchise underwent a steeper than expected decline during the Fiscal Year, we believe that expectations for this franchise have now been appropriately reset and that all of the other facets of the thesis remain intact. The company continues to generate substantial free cash flow and to grow its net cash balance, which we expect management to deploy partly into accretive acquisitions, which we believe will be a positive catalyst for the stock.
The second-largest negative contributor was AgroFresh Solutions, Inc. ("AgroFresh"). AgroFresh, which manufactures chemicals that retain freshness in produce, suffered primarily as a result of new competitors entering its core markets more quickly than anticipated. This development was sufficient for us to conclude that our original investment thesis was no longer intact and we therefore exited the investment. While we of course strive to avoid errors, when we do
2 Total return refers to the underlying security's price appreciation plus reinvested dividends during the Fiscal Year. Contribution refers to the total return during the period of the Partners Fund's ownership multiplied by the percentage of the Partners Fund's net assets that the security represents.
BECK, MACK & OLIVER PARTNERS FUND A MESSAGE TO OUR SHAREHOLDERS (Unaudited) MARCH 31, 2017 |
determine that we have made an investment error, we promptly take action. The other significant negative contributor was Chicago Bridge & Iron Company ("CBI"), which we discussed in detail in our recent letter pertaining to the six-month semi-annual period ended September 30, 2016 ("the Semi-Annual Letter"). The litigation between CBI and Westinghouse Electric Company LLC has since moved to arbitration and we remain confident that the matter will be resolved in CBI's favor. CBI stock returned in excess of 10% between September 30, 2016, and the end of the Fiscal Year, but we believe that substantial potential upside still exists.
The table below indicates the four new positions that were initiated and the eight positions that were exited during the Fiscal Year:
during the remainder of the Fiscal Year.
QUALCOMM, Inc.
In the Semi-Annual Letter, we discussed the Partners Fund's exit from the QUALCOMM, Inc. ("Qualcomm") investment after a period of disappointing operational and financial performance and we also acknowledged that we would have been better off if we had been more patient given the subsequent recovery in fundamental performance and in the share price. Two major events have occurred since then, which prompted us to reestablish a position in Qualcomm. First, the company announced the acquisition of NXP Semiconductors NV ("NXP"), which we believe will be a transformative transaction for Qualcomm as (i) it will significantly augment the company's presence in connected vehicles and the "internet of things", which are growing rapidly and have strong tailwinds, and (ii) it will generate substantial earnings accretion due to the realization of cost synergies and to Qualcomm's ability to utilize its sizeable non-US-domiciled cash balance to finance part of the acquisition. Second, Qualcomm and Apple Inc. ("Apple") have recently become involved in a lawsuit regarding royalty payments that Apple regularly makes to Qualcomm by virtue of Apple's use of Qualcomm's intellectual property. We believe that the litigation is essentially a business negotiation between the two companies regarding royalty payments and will ultimately be resolved in a manner that is acceptable to Qualcomm. The Partners Fund reestablished a position in Qualcomm around the same price at which it previously exited its prior position. Although we usually eschew such trading "in and out of" positions, in this case we believe that the NXP transaction will create significant shareholder value over time, while the Apple litigation, which provided the opportunity for us to reestablish the position as it had a negative impact on the share price, will prove to be a temporary headwind.
Roper Technologies, Inc.
Roper Technologies, Inc. ("Roper") has been one of the best-performing stocks in the U.S. market over the last couple of decades. Over a long period of time, the company has demonstrated an impressive and persistent ability to acquire asset-light companies that are accretive to Roper's return on investment and free cash flow per share growth. As Roper becomes larger, it will in principle become more difficult for management to find acquisitions that meet the company's operational and financial criteria. Although Roper's management team, to its credit, continues to find value-enhancing acquisitions, our decision to exit the investment was motivated in large part by Roper's increasingly expensive valuation. We strive to own quality businesses at cheap valuations and we could no longer justify owning Roper at its premium valuation, notwithstanding the company's track record.
Other Exited Positions
During the Fiscal Year, we also exited positions in American Express Company, Baxter International Inc., Leucadia National Corporation, and U.S. Bancorp, all of which were discussed in the Semi-Annual Letter.
Outlook
We write this letter to you in a rather different market environment than when we wrote last year's letter. Back then, we were just recovering from a sharp market sell-off during the first couple of months of 2016, when investors were quite anxious in the face of a growth slowdown and foreign exchange volatility in China as well as a severe downturn in the energy industry, among other things. Those fears had largely abated by the time of the United Kingdom's "Brexit" referendum in late June, which interrupted the market's expansion only briefly. The next major event was the election of Donald Trump as U.S. President, which has been perceived bullishly by most investors on the basis of expectations of
BECK, MACK & OLIVER PARTNERS FUND A MESSAGE TO OUR SHAREHOLDERS (Unaudited) MARCH 31, 2017 |
tax reform, regulatory reform, and infrastructure stimulus.
While we are hopeful that the new administration may be able to enact changes that promote economic growth and hence corporate profits, which should redound to the benefit of equity markets, we are realistic about the "sausage-making" process in Washington, D.C., and none of the Partners Fund's investments is predicated on any kind of legislative or regulatory change. In the meantime, we remain cognizant of the widening gap between "hard" and "soft" economic data. For instance, while sentiment and confidence and other subjective measures of economic well-being have improved since the election, more objective measures of the economy's performance, such as payrolls and loan growth, have been decidedly mixed. With the S&P 500 Index currently trading at more than 18x 2017 price/earnings, we remain vigilant in identifying quality businesses and not overpaying for them and in reducing or exiting positions where the valuations are no longer justified by the fundamentals.
Thank you for your continued support.
Yours sincerely,
Robert C. Beck & Richard C. Fitzgerald
IMPORTANT RISKS AND DISCLOSURE:
There is no assurance that the Partners Fund will achieve its investment objective. An investment in the Partners Fund is subject to risk, including the possible loss of principal amount invested. The risks associated with the Partners Fund include: equity and convertible securities risk, foreign securities risk, management risk, debt securities risk, noninvestment grade securities risk, liquidity risk and non-diversification risk. The Partners Fund may invest in small and mid-sized capitalization companies meaning that these companies carry greater risk than is customarily associated with larger companies for various reasons such as narrower markets, limited financial resources and less liquid stock.
The S&P 500 Index is a broad-based, unmanaged measurement of changes in stock market conditions based on the average of 500 widely held common stocks. The total return of the S&P 500 Index and of the Partners Fund includes the reinvestment of dividends and income. The total return of the Partners Fund includes operating expenses that reduce returns, while the total return of the S&P 500 Index does not include expenses. The Partners Fund is professionally managed while the S&P 500 Index is unmanaged and is not available for investment. It is not possible to invest directly in an index.
This letter may contain discussions about certain investments both held and not held in the portfolio. All current and future holdings are subject to risk and to change. The views in this report were those of the Partners Fund managers as of March 31, 2017, and may not reflect their views on the date this report is first published or any
BECK, MACK & OLIVER PARTNERS FUND A MESSAGE TO OUR SHAREHOLDERS (Unaudited) MARCH 31, 2017 |
time thereafter. These views are intended to assist shareholders in understanding their investment in the Partners Fund and do not constitute investment advice.
On December 1, 2009, a limited partnership managed by the adviser reorganized into the Partners Fund. The predecessor limited partnership maintained an investment objective and investment policies that were, in all material respects, equivalent to those of the Partners Fund. The Partners Fund's performance for the periods before December 1, 2009 is that of the limited partnership and includes the expenses of the limited partnership, which were lower than the Partners Fund's current expenses, except for 2008 where the expenses of the limited partnership were higher. The performance prior to December 1, 2009 is based on calculations that are different from the standardized method of calculations by the SEC. If the limited partnership's performance had been readjusted to reflect the estimated expenses of the Partners Fund for its first fiscal year, the performance would have been lower. The limited partnership was not registered under the Investment Company Act of 1940 ("1940 Act") and was not subject to certain investment limitations, diversification requirements, and other restrictions imposed by the 1940 Act and the Internal Revenue Code of 1986, which, if applicable, may have adversely affected its performance.
Comparison of a $10,000 Investment
Beck, Mack & Oliver Partners Fund vs. S&P 500 Index
| PORTFOLIO HOLDINGS |
| % of Total Investments |
BECK, MACK & OLIVER PARTNERS FUND SCHEDULE OF INVESTMENTS MARCH 31, 2017 |
| Shares | | Security Description | | Value | |
| Common Stock - 99.3% |
| Consumer Discretionary - 3.9% |
| | 41,000 | | Liberty Global PLC, Class A (a) | $ | 1,470,670 | |
| Consumer Staples - 4.5% |
| | 9,000 | | Anheuser-Busch InBev NV, ADR | | 987,840 | |
| | 70,000 | | Crimson Wine Group, Ltd. (a) | | 700,000 | |
| | | 1,687,840 | |
| Energy - 15.1% |
| | 27,000 | | Devon Energy Corp. | | 1,126,440 | |
| | 107,000 | | Matador Resources Co. (a) | | 2,545,530 | |
| | 99,650 | | San Juan Basin Royalty Trust | | 721,466 | |
| | 16,500 | | Schlumberger, Ltd. | | 1,288,650 | |
| | | 5,682,086 | |
| Financials - 26.7% |
| | 78,000 | | Apollo Global Management, LLC | | 1,896,960 | |
| | 63,000 | | Boulevard Acquisition Corp. II (a) | | 657,720 | |
| | 8,000 | | Credit Acceptance Corp. (a) | | 1,595,280 | |
| | 13,800 | | Enstar Group, Ltd. (a) | | 2,639,940 | |
| | 18,000 | | JPMorgan Chase & Co. | | 1,581,120 | |
| | 58,000 | | The Blackstone Group LP | | 1,722,600 | |
| | | 10,093,620 | |
| Healthcare - 19.9% |
| | 26,000 | | Abbott Laboratories | | 1,154,660 | |
| | 29,000 | | Gilead Sciences, Inc. | | 1,969,680 | |
| | 52,200 | | Grifols SA, ADR | | 985,275 | |
| | 8,800 | | Laboratory Corp. of America Holdings (a) | | 1,262,536 | |
| | 18,000 | | Merck & Co., Inc. | | 1,143,720 | |
| | 6,500 | | Waters Corp. (a) | | 1,016,015 | |
| | | 7,531,886 | |
| Industrials - 9.9% |
| | 25,000 | | Armstrong World Industries, Inc. (a) | | 1,151,250 | |
| | 32,000 | | Chicago Bridge & Iron Co. NV | | 984,000 | |
| | 7,000 | | Dover Corp. | | 562,450 | |
| | 20,000 | | Fluor Corp. | | 1,052,400 | |
| | | 3,750,100 | |
| Real Estate - 5.0% |
| | 49,000 | | Colony NorthStar, Inc., Class A REIT | | 632,590 | |
| | 28,080 | | Homefed Corp. (a) | | 1,263,600 | |
| | | 1,896,190 | |
| Technology - 10.2% |
| | 2,275 | | Alphabet, Inc., Class C (a) | | 1,887,249 | |
| | 23,500 | | Microsoft Corp. | | 1,547,710 | |
| | 7,000 | | QUALCOMM, Inc. | | 401,380 | |
| | | 3,836,339 | |
| Telecommunication Services - 4.1% |
| | 27,000 | | Level 3 Communications, Inc. (a) | | 1,544,940 | |
Total Common Stock (Cost $33,510,803) | | 37,493,671 | |
| INVESTMENT INCOME | | | | | | |
| | Dividend income (Net of foreign withholding taxes of $9,878) | . | | $ | 639,260 | | |
| | Interest income | | | 1,736 | | |
| Total Investment Income | | | | 640,996 | | |
| Adviser | | | | | | |
| EXPENSES | | | | | | |
| | Investment adviser fees | | | 355,530 | | |
| | Fund services fees | | | 180,672 | | |
| | Custodian fees | | | 10,549 | | |
| | Registration fees | | | 18,662 | | |
| | Professional fees | | | 40,244 | | |
| | Trustees' fees and expenses | | | 7,566 | | |
| | Miscellaneous expenses | | | 32,743 | | |
| Total Expenses | | | | 645,966 | | |
| | Fees waived and expenses reimbursed | | | (290,497 | ) | |
| Net Expenses | | | | 355,469 | | |
| | | | | | | | |
| NET INVESTMENT INCOME | | | | 285,527 | | |
| | | | | | | | |
| NET REALIZED AND UNREALIZED GAIN | | | | | | |
| | Net realized gain on investments | | | 885,490 | | |
| | Net change in unrealized appreciation (depreciation) on investments | | | 4,051,877 | | |
| NET REALIZED AND UNREALIZED GAIN | | | | 4,937,367 | | |
| INCREASE IN NET ASSETS RESULTING FROM OPERATIONS | | | $ | 5,222,894 | | |
See Notes to Financial Statements. | 12 | |
BECK, MACK & OLIVER PARTNERS FUND STATEMENTS OF CHANGES IN NET ASSETS |
| | | | | For the Years Ended March 31, |
| | | | | 2017 | | | 2016 |
| OPERATIONS | | | | | | | | | |
| | Net investment income | | $ | 285,527 | | | | $ | 704,149 | |
| | Net realized gain (loss) | | | 885,490 | | | | | (17,482,150 | ) |
| | Net change in unrealized appreciation (depreciation) | | | 4,051,877 | | | | | 5,135,296 | |
| Increase (Decrease) in Net Assets Resulting from Operations | | | 5,222,894 | | | | | (11,642,705 | ) |
| | | | | | | | | | | | |
| DISTRIBUTIONS TO SHAREHOLDERS FROM | | | | | | | | | |
| | Net investment income | | | (361,274 | ) | | | | (308,291 | ) |
| | Net realized gain | | | - | | | | | (8,634,822 | ) |
| Total Distributions to Shareholders | | | (361,274 | ) | | | | (8,943,113 | ) |
| | | | | | | | | | | | |
| CAPITAL SHARE TRANSACTIONS | | | | | | | | | |
| | Sale of shares | | | 10,071,093 | | | | | 8,076,597 | |
| | Reinvestment of distributions | | | 325,372 | | | | | 8,468,833 | |
| | Redemption of shares | | | (12,077,450 | ) | | | | (85,479,991 | ) |
| | Redemption fees | | | 1,186 | | | | | 5,404 | |
| Decrease in Net Assets from Capital Share Transactions | | | (1,679,799 | ) | | | | (68,929,157 | ) |
| Increase (Decrease) in Net Assets | | | 3,181,821 | | | | | (89,514,975 | ) |
| | | | | | | | | | | | |
| NET ASSETS | | | | | | | | | |
| | Beginning of Year | | | 34,587,058 | | | | | 124,102,033 | |
| | End of Year (Including line (a)) | | $ | 37,768,879 | | | | $ | 34,587,058 | |
| | | | | | | | | | | | |
| SHARE TRANSACTIONS | | | | | | | | | |
| | Sale of shares | | | 1,058,015 | | | | | 659,088 | |
| | Reinvestment of distributions | | | 32,833 | | | | | 924,898 | |
| | Redemption of shares | | | (1,261,209 | ) | | | | (7,719,226 | ) |
| Decrease in Shares | | | (170,361 | ) | | | | (6,135,240 | ) |
| | | | | | | | | | | | |
| (a) | Undistributed net investment income | | $ | 34,262 | | | | $ | 361,254 | |
See Notes to Financial Statements. | 13 | |
BECK, MACK & OLIVER PARTNERS FUND |
| These financial highlights reflect selected data for a share outstanding throughout each year. | | | | | | |
| | | For the Years Ended March 31, |
| | | 2017 | | 2016 | | 2015 | | 2014 | | 2013 | |
| NET ASSET VALUE, Beginning of Year | $ | 8.98 | | | $ | 12.42 | | | $ | 14.82 | | | $ | 13.76 | | | $ | 12.16 | | |
| INVESTMENT OPERATIONS | | | | | | | | | | | | | | | | | | | | |
| Net investment income (a) | | 0.08 | | | | 0.10 | | | | 0.11 | | | | 0.04 | | | | 0.06 | | |
| Net realized and unrealized gain (loss) | | 1.30 | | | | (1.57 | ) | | | (1.70 | ) | | | 1.91 | | | | 1.97 | | |
| Total from Investment Operations | | 1.38 | | | | (1.47 | ) | | | (1.59 | ) | | | 1.95 | | | | 2.03 | | |
| DISTRIBUTIONS TO | | | | | | | | | | | | | | | | | | | | |
| SHAREHOLDERS FROM | | | | | | | | | | | | | | | | | | | | |
| Net investment income | | (0.10 | ) | | | (0.07 | ) | | | (0.09 | ) | | | (0.03 | ) | | | (0.05 | ) | |
| Net realized gain | | — | | | | (1.90 | ) | | | (0.72 | ) | | | (0.86 | ) | | | (0.38 | ) | |
| Total Distributions to Shareholders | | (0.10 | ) | | | (1.97 | ) | | | (0.81 | ) | | | (0.89 | ) | | | (0.43 | ) | |
| REDEMPTION FEES (a) | | — | (b) | | — | (b) | | — | (b) | | — | (b) | | — | (b) |
| NET ASSET VALUE, End of Year | $ | 10.26 | | | $ | 8.98 | | | $ | 12.42 | | | $ | 14.82 | | | $ | 13.76 | | |
| TOTAL RETURN | | 15.45 | % | | (12.05 | )% | | (10.70 | )% | | 14.59 | % | | 16.97 | % |
| RATIOS/SUPPLEMENTARY DATA | | | | | | | | | | | | | | | | | | | | |
| Net Assets at End of Year (000's omitted) | $37,769 | | | $34,587 | | | $124,102 | | | $186,315 | | | $116,038 | | |
| Ratios to Average Net Assets: | | | | | | | | | | | | | | | | | | | | |
| Net investment income | | 0.80 | % | | 0.87 | % | | 0.75 | % | | 0.31 | % | | 0.46 | % |
| Net expenses | | 1.00 | % | | 1.00 | % | | 1.00 | % | | 1.00 | % | | 1.00 | % |
| Gross expenses (c) | | 1.81 | % | | 1.44 | % | | 1.29 | % | | 1.29 | % | | 1.42 | % |
| PORTFOLIO TURNOVER RATE | | 26 | % | | 50 | % | | 41 | % | | 32 | % | | 37 | % |
| | | | | | | | | | | | | | | | | | | | | | |
| | | | | | | | | | | | | | | | | | | | | | |
| (a) | Calculated based on average shares outstanding during each year. |
| (b) | Less than $0.01 per share. |
| (c) | Reflects the expense ratio excluding any waivers and/or reimbursements. |
See Notes to Financial Statements. | 14 | |
BECK, MACK & OLIVER PARTNERS FUND NOTES TO FINANCIAL STATEMENTS MARCH 31, 2017 |
Note 1. Organization
The Beck, Mack & Oliver Partners Fund (the "Fund") is a non-diversified portfolio of Forum Funds (the "Trust"). The Trust is a Delaware statutory trust that is registered as an open-end, management investment company under the Investment Company Act of 1940, as amended (the "Act"). Under its Trust Instrument, the Trust is authorized to issue an unlimited number of the Fund's shares of beneficial interest without par value. The Fund commenced operations on December 1, 2009, after it acquired the net assets of BMO Partners Fund, L.P. (the "Partnership"), in exchange for Fund shares. The Partnership commenced operations in 1991. The Fund seeks long-term capital appreciation consistent with the preservation of capital.
Note 2. Summary of Significant Accounting Policies
The Fund is an investment company and follows accounting and reporting guidance under Financial Accounting Standards Board ("FASB") Accounting Standards Codification ("ASC") Topic 946, "Financial Services-Investment Companies". These financial statements are prepared in accordance with accounting principles generally accepted in the United States of America ("GAAP"), which require management to make estimates and assumptions that affect the reported amounts of assets and liabilities, the disclosure of contingent liabilities at the date of the financial statements, and the reported amounts of increases and decreases in net assets from operations during the fiscal period. Actual amounts could differ from those estimates. The following summarizes the significant accounting policies of the Fund:
Security Valuation – Securities are valued at market prices using the last quoted trade or official closing price from the principal exchange where the security is traded, as provided by independent pricing services on each Fund business day. In the absence of a last trade, securities are valued at the mean of the last bid and ask price provided by the pricing service. Debt securities may be valued at prices supplied by a fund's pricing agent based on broker or dealer supplied valuations or matrix pricing, a method of valuing securities by reference to the value of other securities with similar characteristics such as rating, interest rate and maturity. Shares of open-end mutual funds are valued at net asset value ("NAV"). Short-term investments that mature in 60 days or less may be valued at amortized cost.
The Fund values its investments at fair value pursuant to procedures adopted by the Trust's Board of Trustees (the "Board") if (1) market quotations are not readily available or (2) the Adviser, as defined in Note 3, believes that the values available are unreliable. The Trust's Valuation Committee, as defined in the Fund's registration statement, performs certain functions as they relate to the administration and oversight of the Fund's valuation procedures. Under these procedures, the Valuation Committee convenes on a regular and ad hoc basis to review such investments and considers a number of factors, including valuation methodologies and significant unobservable inputs, when arriving at fair value.
The Valuation Committee may work with the Adviser to provide valuation inputs. In determining fair valuations, inputs may include market-based analytics that may consider related or comparable assets or liabilities, recent transactions, market multiples, book values and other relevant investment information. Adviser inputs may include an income-based approach in which the anticipated future cash flows of the investment are discounted in determining fair value. Discounts may also be applied based on the nature or duration of any restrictions on the disposition of the investments. The Valuation Committee performs regular reviews of valuation methodologies, key inputs and assumptions, disposition
BECK, MACK & OLIVER PARTNERS FUND NOTES TO FINANCIAL STATEMENTS MARCH 31, 2017 |
analysis and market activity.
Fair valuation is based on subjective factors and, as a result, the fair value price of an investment may differ from the security's market price and may not be the price at which the asset may be sold. Fair valuation could result in a different NAV than a NAV determined by using market quotes.
The Fund has a three-tier fair value hierarchy. The basis of the tiers is dependent upon the various "inputs" used to determine the value of the Fund's investments. These inputs are summarized in the three broad levels listed below:
Level 1 — quoted prices in active markets for identical assets and liabilities
Level 2 — other significant observable inputs (including quoted prices of similar securities, interest rates, prepayment speeds, credit risk, etc.)
Level 3 — significant unobservable inputs (including the Fund's own assumptions in determining the fair value of investments)
The aggregate value by input level, as of March 31, 2017, for the Fund's investments is included at the end of the Fund's schedule of investments.
Security Transactions, Investment Income and Realized Gain and Loss – Investment transactions are accounted for on the trade date. Dividend income is recorded on the ex-dividend date. Foreign dividend income is recorded on the ex-dividend date or as soon as possible after determining the existence of a dividend declaration after exercising reasonable due diligence. Income and capital gains on some foreign securities may be subject to foreign withholding taxes, which are accrued as applicable. Interest income is recorded on an accrual basis. Premium is amortized and discount is accreted using the effective interest method. Identified cost of investments sold is used to determine the gain and loss for both financial statement and federal income tax purposes.
Distributions to Shareholders – The Fund declares any dividends from net investment income and pays them annually. Any net capital gains and net foreign currency gains realized by the Fund are distributed at least annually. Distributions to shareholders are recorded on the ex-dividend date. Distributions are based on amounts calculated in accordance with applicable federal income tax regulations, which may differ from GAAP. These differences are due primarily to differing treatments of income and gain on various investment securities held by the Fund, timing differences and differing characterizations of distributions made by the Fund.
Federal Taxes – The Fund intends to continue to qualify each year as a regulated investment company under Subchapter M of Chapter 1, Subtitle A, of the Internal Revenue Code of 1986, as amended ("Code"), and to distribute all of its taxable income to shareholders. In addition, by distributing in each calendar year substantially all of its net investment income and capital gains, if any, the Fund will not be subject to a federal excise tax. Therefore, no federal income or excise tax provision is required. The Fund files a U.S. federal income and excise tax return as required. The Fund's federal income tax returns are subject to examination by the Internal Revenue Service for a period of three fiscal years after they are filed. As of March 31, 2017, there are no uncertain tax positions that would require financial statement
BECK, MACK & OLIVER PARTNERS FUND NOTES TO FINANCIAL STATEMENTS MARCH 31, 2017 |
recognition, de-recognition or disclosure.
Income and Expense Allocation – The Trust accounts separately for the assets, liabilities and operations of each of its investment portfolios. Expenses that are directly attributable to more than one investment portfolio are allocated among the respective investment portfolios in an equitable manner.
Redemption Fees – A shareholder who redeems or exchanges shares within 60 days of purchase will incur a redemption fee of 2.00% of the current NAV of shares redeemed or exchanged, subject to certain limitations. The fee is charged for the benefit of the remaining shareholders and will be paid to the Fund to help offset transaction costs. The fee is accounted for as an addition to paid-in capital. The Fund reserves the right to modify the terms of or terminate the fee at any time. There are limited exceptions to the imposition of the redemption fee. Redemption fees incurred for the Fund, if any, are reflected on the Statements of Changes in Net Assets.
Commitments and Contingencies – In the normal course of business, the Fund enters into contracts that provide general indemnifications by the Fund to the counterparty to the contract. The Fund's maximum exposure under these arrangements is dependent on future claims that may be made against the Fund and, therefore, cannot be estimated; however, based on experience, the risk of loss from such claims is considered remote.
Note 3. Fees and Expenses
Investment Adviser – Beck, Mack & Oliver LLC (the "Adviser") is the investment adviser to the Fund. Pursuant to an investment advisory agreement, the Adviser receives an advisory fee, payable monthly, from the Fund at an annual rate of 1.00% of the Fund's average daily net assets.
Distribution – Foreside Fund Services, LLC serves as the Fund's distributor (the "Distributor"). The Fund does not have a distribution (12b-1) plan; accordingly, the Distributor does not receive compensation from the Fund for its distribution services. The Adviser compensates the Distributor directly for its services. The Distributor is not affiliated with the Adviser or Atlantic Fund Administration, LLC (d/b/a Atlantic Fund Services) ("Atlantic") or their affiliates.
Other Service Providers – Atlantic provides fund accounting, fund administration, compliance and transfer agency services to the Fund. The fees related to these services are included in Fund services fees within the Statement of Operations. Atlantic also provides certain shareholder report production and EDGAR conversion and filing services. Pursuant to an Atlantic services agreement, the Fund pays Atlantic customary fees for its services. Atlantic provides a Principal Executive Officer, a Principal Financial Officer, a Chief Compliance Officer and an Anti-Money Laundering Officer to the Fund, as well as certain additional compliance support functions.
Trustees and Officers – The Trust pays each independent Trustee an annual retainer fee of $50,000 for service to the Trust ($66,000 for the Chairman), and the Audit Committee Chairman and Vice Chairman receive an additional $6,000 annually. The Trustees and Chairman may receive additional fees for special Board meetings. Each Trustee is also reimbursed for all reasonable out-of-pocket expenses incurred in connection with his duties as a Trustee, including travel and related expenses incurred in attending Board meetings. The amount of Trustees' fees attributable to the Fund is disclosed in the Statement of Operations. Certain officers of the Trust are also officers or employees of the above named
BECK, MACK & OLIVER PARTNERS FUND NOTES TO FINANCIAL STATEMENTS MARCH 31, 2017 |
service providers, and during their terms of office received no compensation from the Fund.
Note 4. Expense Reimbursement and Fees Waived
The Adviser has contractually agreed to waive its fee and reimburse Fund expenses to limit total annual operating expenses (excluding all taxes, interest, portfolio transaction expenses, acquired fund fees and expenses, proxy expenses and extraordinary expenses) to 1.00% through at least July 31, 2017. For the year ended March 31, 2017, fees waived were $290,497.
Note 5. Security Transactions
The cost of purchases and proceeds from sales of investment securities (including maturities), other than short-term investments during the year ended March 31, 2017, were $9,097,729 and $11,054,913, respectively.
Note 6. Federal Income Tax
Distributions during the fiscal years as noted were characterized for tax purposes as follows:
Note 7. Recent Accounting Pronouncements
In October 2016, the U.S. Securities and Exchange Commission ("SEC") issued a new rule, Investment Company Reporting Modernization, which, among other provisions, amends Regulation S-X to require standardized, enhanced disclosures, particularly related to derivatives, in investment company financial statements. Compliance with the amendments to Regulation S-X is required for financial statements filed with the SEC on or after August 1, 2017. Management is currently evaluating the impact that the amendments will have on the Fund's financial statements and related disclosures.
Note 8. Subsequent Events
Subsequent events occurring after the date of this report through the date these financial statements were issued have been evaluated for potential impact, and the Fund has had no such events.
To the Board of Trustees of Forum Funds
and the Shareholders of Beck, Mack & Oliver Partners Fund
We have audited the accompanying statement of assets and liabilities of Beck, Mack & Oliver Partners Fund (the "Fund"), a series of shares of beneficial interest in the Forum Funds, including the schedule of investments, as of March 31, 2017, and the related statement of operations for the year then ended, the statements of changes in net assets for each of the years in the two-year period then ended and the financial highlights for each of the years in the five-year period then ended. These financial statements and financial highlights are the responsibility of the Fund's management. Our responsibility is to express an opinion on these financial statements and financial highlights based on our audits.
We conducted our audits in accordance with the standards of the Public Company Accounting Oversight Board (United States). Those standards require that we plan and perform the audits to obtain reasonable assurance about whether the financial statements and financial highlights are free of material misstatement. An audit includes examining, on a test basis, evidence supporting the amounts and disclosures in the financial statements. Our procedures included confirmation of securities owned as of March 31, 2017 by correspondence with the custodian. An audit also includes assessing the accounting principles used and significant estimates made by management, as well as evaluating the overall financial statement presentation. We believe that our audits provide a reasonable basis for our opinion.
In our opinion, the financial statements and financial highlights referred to above present fairly, in all material respects, the financial position of Beck, Mack & Oliver Partners Fund as of March 31, 2017, and the results of its operations for the year then ended, the changes in its net assets for each of the years in the two-year period then ended and its financial highlights for each of the years in the five-year period then ended, in conformity with accounting principles generally accepted in the United States of America.
BBD, LLP
Philadelphia, Pennsylvania
May 23, 2017
BECK, MACK & OLIVER PARTNERS FUND ADDITIONAL INFORMATION (Unaudited) MARCH 31, 2017 |
Investment Advisory Agreement Approval
At the March 24, 2017 Board meeting, the Board, including the Independent Trustees, considered the approval of the continuance of the investment advisory agreement between the Adviser and the Trust pertaining to the Fund (the "Advisory Agreement"). In preparation for its deliberations, the Board requested and reviewed written responses from the Adviser to a due diligence questionnaire circulated on the Board's behalf concerning the Adviser's personnel, operations, financial condition, performance, and services provided by the Adviser. The Board also discussed the materials with Fund counsel and, as necessary, with the Trust's administrator, Atlantic Fund Services. During its deliberations, the Board received an oral presentation from the Adviser, and was assisted by the advice of Trustee counsel.
At the meeting, the Board reviewed, among other matters: (1) the nature, extent and quality of the services provided to the Fund by the Adviser, including information on the investment performance of the Fund and the Adviser; (2) the costs of the services provided and profitability to the Adviser with respect to its relationship with the Fund; (3) the advisory fee and total expense ratio of the Fund compared to a relevant peer group of funds; (4) the extent to which economies of scale may be realized as the Fund grows and whether the advisory fees enable the Fund's investors to share in the benefits of economies of scale; and (5) other benefits received by the Adviser from its relationship with the Fund.
Nature, Extent and Quality of Services
Based on written materials received, a presentation from senior representatives of the Adviser, and a discussion with the Adviser about the Adviser's personnel, operations and financial condition, the Board considered the quality of services provided by the Adviser under the Advisory Agreement. In this regard, the Board considered information regarding the experience, qualifications and professional background of the portfolio managers and other personnel at the Adviser with principal investment responsibility for the Fund's investments as well as the investment philosophy and decision-making processes of the Adviser and the capability and integrity of the Adviser's senior management and staff.
The Board considered also the adequacy of the Adviser's resources and the Adviser's commitment to improving its compliance procedures. The Board noted the Adviser's representation that the firm is in stable financial condition, that the firm is able to meet its expense reimbursement obligations to the Fund, and that the firm has the operational capability and necessary staffing and experience to continue providing high-quality investment advisory services to the Fund. Based on the presentation and the materials provided by the Adviser in connection with the Board's consideration of the renewal of the Advisory Agreement, the Board concluded that, overall, it was satisfied with the nature, extent, and quality of services provided to the Fund under the Advisory Agreement.
Performance
In connection with a presentation by the Adviser regarding its approach to managing the Fund, the Board reviewed the performance of the Fund compared to its benchmark. The Board observed that the Fund underperformed the S&P 500 Index, the Fund's primary benchmark index, for the one-, three-, five-, and 10-year periods ended December 31, 2016, as well as the period since the Fund's inception on April 19, 1991. The Board noted the Adviser's statement that the Fund's underperformance relative to the benchmark could be attributed, in part, to the Fund's sector allocation, as well as the effects of the Fund's larger-than-usual cash position as a result of the Adviser implementing changes to the Fund's portfolio manager,
BECK, MACK & OLIVER PARTNERS FUND ADDITIONAL INFORMATION (Unaudited) MARCH 31, 2017 |
investment strategy and portfolio holdings, which provided a drag on performance that impacted the performance of the Fund in subsequent years.
The Board also reviewed the Fund's performance relative to an independent peer group identified by Broadridge Financial Solutions, Inc. ("Broadridge") as having characteristics similar to those of the Fund. The Board observed that, based on the information provided by Broadridge, the Fund met the median of its Broadridge peer group for the one-year period ended December 31, 2016, and underperformed the median of its Broadridge peer group for the three- and five-year periods ended December 31, 2016. Addressing the Fund's relative underperformance for the three- and five-year periods, the Adviser asserted that it does not view the funds in the peer group identified by Broadridge to be comparable to the Fund and explained the basis for this assertion. Accordingly, the Board reviewed the Fund's performance compared to a peer group of funds provided by the Adviser and intended to represent a meaningful comparison ("Comparable Fund Peers"). The Board considered the Adviser's explanation as to why the performance of the Comparable Fund Peers should be taken into account in evaluating the performance of the Fund, and considered the Fund's performance relative to the Comparable Fund Peers, which were consistent with those provided in prior years. In that regard, the Board noted that the Fund outperformed the median of the Comparable Fund Peers for the one-year period ended December 31, 2016, and underperformed the median of the Comparable Fund Peers for the three- and five-year periods ended December 31, 2016. Finally, the Board observed that, historically, the Fund had experienced periods of outperformance relative to its benchmark and the Broadridge peer group, and that the Adviser had recently taken remedial steps that could be expected to improve the Fund's future performance.
Based on the Adviser's investment style and the foregoing performance information, the Board determined that the Fund and its shareholders could expect to benefit from the Adviser's management under the Advisory Agreement.
Compensation
The Board evaluated the Adviser's compensation for providing advisory services to the Fund and analyzed comparative information on actual advisory fee rates and actual total expenses of the relevant Broadridge peer group of the Fund. The Board observed that the Adviser's actual advisory fee rate and actual total expenses were each lower than the median of its Broadridge peer group. The Board also noted the Adviser's representation that the advisory fee charged to the Fund was in line with the fee charged by the Adviser to its separately managed accounts. Based on the foregoing, the Board concluded that the Adviser's advisory fee rate charged to the Fund was reasonable.
Costs of Services and Profitability
The Board considered information provided by the Adviser regarding its costs of services and its profitability with respect to the Fund. In this regard, the Board considered the Adviser's resources devoted to the Fund, as well as the Adviser's discussion of the aggregate costs and profitability of its mutual fund activities. The Board considered also the Adviser's representation that the Adviser does not conduct a formal, comprehensive cost allocation with respect to its mutual fund activities and separately managed accounts, but that the Adviser believed that the Fund was comparatively less profitable than its separately managed account activities as a result of the low assets of the Fund and the expense cap in place. Based on these and other applicable considerations, the Board concluded that the Adviser's profits attributable to the management of the Fund were reasonable.
BECK, MACK & OLIVER PARTNERS FUND ADDITIONAL INFORMATION (Unaudited) MARCH 31, 2017 |
Economies of Scale
The Board evaluated whether the Fund would benefit from any economies of scale. In this respect, the Board considered the Adviser's statement that, although the Fund potentially could benefit from economies of scale if the Fund's assets increased, the consideration of breakpoints was not appropriate at this time. Based on the foregoing information, the Board concluded that economies of scale were not a material factor in renewing the Advisory Agreement.
Other Benefits
The Board noted the Adviser's representation that, other than its contractual advisory fees, and the benefit from using a portion of the brokerage commissions generated by the Fund to pay for third party research services that augment the Adviser's internal research processes and benefit both the Fund and the Adviser's separately managed accounts, the Adviser does not benefit in a material way from its relationship with the Fund. Based on the foregoing representation, the Board concluded that other benefits received by the Adviser from its relationship with the Fund were not a material factor to consider in approving the continuation of the Advisory Agreement.
Conclusion
The Board did not identify any single factor as being of paramount importance, and different Trustees may have given different weight to different factors. The Board reviewed a memorandum from Fund counsel discussing the legal standards applicable to its consideration of the Advisory Agreement. Based on its review, including consideration of each of the factors referenced above, the Board determined, in the exercise of its reasonable business judgment, that the advisory arrangement, as outlined in the Advisory Agreement, was fair and reasonable in light of the services performed or to be performed, expenses incurred or to be incurred and such other matters as the Board considered relevant.
Proxy Voting Information
A description of the policies and procedures that the Fund uses to determine how to vote proxies relating to securities held in the Fund's portfolio is available, without charge and upon request, by calling (800) 943-6786 and on the SEC website at www.sec.gov. The Fund's proxy voting record for the most recent twelve-month period ended June 30 is available, without charge and upon request, by calling (800) 943-6786 and on the SEC's website at www.sec.gov.
Availability of Quarterly Portfolio Schedules
The Fund files its complete schedule of portfolio holdings with the SEC for the first and third quarters of each fiscal year on Form N-Q. These filings are available, without charge and upon request on the SEC's website at www.sec.gov or may be reviewed and copied at the SEC's Public Reference Room in Washington, DC. Information on the operation of the Public Reference Room may be obtained by calling (800) SEC-0330.
Shareholder Expense Example
As a shareholder of the Fund, you incur two types of costs: (1) transaction costs, including redemption fees and
BECK, MACK & OLIVER PARTNERS FUND ADDITIONAL INFORMATION (Unaudited) MARCH 31, 2017 |
exchange fees, and (2) ongoing costs, including management fees and other Fund expenses. This example is intended to help you understand your ongoing costs (in dollars) of investing in the Fund, and to compare these costs with the ongoing costs of investing in other mutual funds.
The example is based on an investment of $1,000 invested at the beginning of the period and held for the entire period from October 1, 2016, through March 31, 2017.
Actual Expenses – The first line of the table below provides information about actual account values and actual expenses. You may use the information in this line, together with the amount you invested, to estimate the expenses that you paid over the period. Simply divide your account value by $1,000 (for example, an $8,600 account value divided by $1,000 = 8.6), then multiply the result by the number in the first line under the heading entitled "Expenses Paid During Period" to estimate the expenses you paid on your account during the period.
Hypothetical Example for Comparison Purposes – The second line of the table below provides information about hypothetical account values and hypothetical expenses based on the Fund's actual expense ratio and an assumed rate of return of 5% per year before expenses, which is not the Fund's actual return. The hypothetical account values and expenses may not be used to estimate the actual ending account balance or expenses you paid for the period. You may use this information to compare the ongoing costs of investing in the Fund and other funds. To do so, compare this 5% hypothetical example with the 5% hypothetical examples that appear in the shareholder reports of other funds.
Please note that the expenses shown in the table are meant to highlight your ongoing costs only and do not reflect any transactional costs, such as redemption fees and exchange fees. Therefore, the second line of the table is useful in comparing ongoing costs only, and will not help you determine the relative total costs of owning different funds. In addition, if these transactional costs were included, your costs would have been higher.
Trustees and Officers of the Trust
The Board is responsible for oversight of the management of the Trust's business affairs and of the exercise of all the Trust's powers except those reserved for the shareholders. The following table provides information about each Trustee and certain officers of the Trust. Each Trustee and officer holds office until the person resigns, is removed, or is replaced. Unless otherwise noted, the persons have held their principal occupations for more than five years. The address for all Trustees and officers is Three Canal Plaza, Suite 600, Portland, Maine 04101. Mr. Keffer is considered an Interested Trustee due to his affiliation with Atlantic. The Fund's Statement of Additional Information includes additional information about the Trustees and is available, without charge and upon request, by calling (800) 943-6786.
| Name and Year of Birth | Position(s) with the Trust | Length of Time Served | Principal Occupation(s) During Past Five Years | Number of Series of Fund Complex¹ Overseen by Trustee | Other Directorships Held by Trustee |
| Independent Trustees | | | | | |
J. Michael Parish Born: 1943 | Chairman of the Board; Trustee; Chairman, Nominating Committee and Qualified Legal Compliance Committee | Since 1989 (Chairman since 2004) | Retired since 2003; formerly, Partner, Wolf, Block, Schorr and Solis-Cohen, LLP (law firm) 2002-2003; Partner, Thelen Reid & Priest LLP (law firm) 1995-2002. | 24 | None |
Costas Azariadis Born: 1943 | Trustee | Since 1989 | Professor of Economics, Washington University since 2006. | 24 | None |
James C. Cheng Born: 1942 | Trustee; Chairman, Audit Committee | Since 1989 | President, Technology Marketing Associates (marketing company for small- and medium-sized businesses in New England) since 1991. | 24 | None |
David Tucker Born: 1958 | Trustee; Vice Chairman | Since 2011 (Vice Chairman since 2015) | Director, Blue Sky Experience (a charitable endeavor) since 2008; Senior Vice President & General Counsel, American Century Companies (an investment management firm) 1998-2008. | 47 | Trustee, Forum Funds II, Forum ETF Trust and U.S. Global Investors Funds |
| Interested Trustee | | | | | |
John Y. Keffer2 Born: 1942 | Trustee; Vice Chairman | Since 1989 | Chairman, Atlantic since 2008; President, Forum Investment Advisors, LLC since 2011; President, Forum Foundation (a charitable organization) since 2005; President, Forum Trust, LLC (a non-depository trust company chartered in the State of Maine) since 1997. | 47 | Director, Wintergreen Fund, Inc.; Trustee, Forum Funds II, Forum ETF Trust and U.S. Global Investors Funds |
| Name and Year of Birth | Position(s) with the Trust | Length of Time Served | Principal Occupation(s) During Past Five Years | Number of Series of Fund Complex¹ Overseen by Trustee | Other Directorships Held by Trustee |
| Officers | | | | | |
Jessica Chase Born: 1970 | President; Principal Executive Officer | Since 2015 | Senior Vice President, Atlantic since 2008. | N/A | N/A |
Karen Shaw Born: 1972 | Treasurer; Principal Financial Officer | Since 2008 | Senior Vice President, Atlantic since 2008. | N/A | N/A |
Zachary Tackett Born: 1988 | Vice President; Secretary; Anti-Money Laundering Compliance Officer | Since 2014 | Counsel, Atlantic since 2014; Intern Associate, Coakley & Hyde, PLLC, 2010-2013. | N/A | N/A |
Michael J. McKeen Born: 1971 | Vice President | Since 2009 | Senior Vice President, Atlantic since 2008. | N/A | N/A |
Timothy Bowden Born: 1969 | Vice President | Since 2009 | Manager, Atlantic since 2008. | N/A | N/A |
Geoffrey Ney Born: 1975 | Vice President | Since 2013 | Manager, Atlantic since 2013; Senior Fund Accountant, Atlantic, 2008-2013. | N/A | N/A |
Todd Proulx Born: 1978 | Vice President | Since 2013 | Manager, Atlantic since 2013; Senior Fund Accountant, Atlantic, 2008-2013. | N/A | N/A |
Carlyn Edgar Born: 1963 | Vice President | Since 2008 | Senior Vice President, Atlantic since 2008; Chief Compliance Officer, 2008-2016. | N/A | N/A |
Dennis Mason Born: 1967 | Chief Compliance Officer | Since 2016 | Fund Compliance Officer, Atlantic since 2013; Senior Specialist, Atlantic 2011-2013; Senior Analyst, Atlantic 2008-2011. | N/A | N/A |
1The Fund Complex includes the Trust, Forum Funds II, Forum ETF Trust and U.S. Global Investors Funds and is overseen by different Boards of Trustees. |
LMCG FUNDS TABLE OF CONTENTS MARCH 31, 2017 |

IMPORTANT INFORMATION
An investment in the LMCG Global Market Neutral Fund, the LMCG Global MultiCap Fund, and the LMCG International Small Cap Fund (the "Funds") is subject to risk, including the possible loss of principal. Investments in small and/or midsize companies increase the risk of greater price fluctuations. Stock prices may fall or fail to rise over time for several reasons, including general financial market conditions and factors related to a specific issuer or industry. As a result of political or economic instability in foreign countries, there can be special risks associated with investing in foreign securities, including fluctuations in currency exchange rates, increased price volatility and difficulty obtaining information. In addition, emerging markets may present additional risk due to potential for greater economic and political instability in less developed countries.
Investing in a market neutral style may involve the use of short sales. There is no guarantee that the use of long and short positions will succeed in limiting the LMCG Global Market Neutral Fund's exposure to stock market movements, capitalization, or other risk factors. Investments involved in long and short selling may cause higher turnover rates. This will likely result in additional tax consequences. Short selling involves certain risks, including additional costs associated with covering short positions and a possibility of unlimited loss on certain short sale positions.
There is no assurance that the Funds will achieve their investment objectives.
LMCG GLOBAL MARKET NEUTRAL FUND A MESSAGE TO OUR SHAREHOLDERS (Unaudited) MARCH 31, 2017 |
Dear Shareholder:
The LMCG Global Market Neutral Fund (the "Fund") Institutional Shares declined over the last twelve months, down 2.81% over the period versus a 0.34% gain for the Citigroup 3-Month U.S. T-Bill Index (the "Index"). Since its May 21, 2013 inception, the Institutional Shares have returned an annualized 1.82% versus 0.12% for the Index. The Fund has invested primarily in long and short positions of small-mid cap companies in the U.S. and large cap companies internationally. For the year, large cap equities in the U.S. outperformed their international peers with the Russell 1000 Index returning 17.43% while the MSCI EAFE Index posted an 11.67% return. Smaller cap companies in the U.S. (proxied by the Russell 2000 Index), which is where the Fund primarily invests, substantially outperformed large caps with a return of 26.22% for the period.
The performance data quoted represents past performance and is no guarantee of future results. Investment return and principal value of an investment will fluctuate so that an investor's shares, when redeemed, may be worth more or less than their original cost. Current performance may be lower or higher than the performance data quoted. For the most recent month-end performance, please call (877) 591-4667.
The year included some significant macro events; the UK's Brexit vote in late June and the US presidential election in November. While April and May were fairly benign months in the US and international equity markets, volatility returned with a vengeance in June in the run-up to the Brexit vote. The Fund struggled in this April – June period, as fundamentals drove markets seemingly less than headlines. The strategy is managed using a quantitative approach that seeks to add value primarily through stock selection while minimizing market risk. Stocks are selected using a multi-factor model that has three major components: Market Dynamics, Valuation and Earnings Quality. For this reason, the model typically has been more robust in periods where fundamentals drive security prices.
The last six months of 2016 proved to be a better environment for the Fund, and it posted positive results in five of the six months. While macro events (including the US presidential election) and investor sentiment again appeared to drive the markets more than fundamentals, the quantitative model was fairly effective. This effectiveness waned, however, as we moved into 2017. Investors were initially inclined to believe that the Trump agenda would be conducive to strong company earnings and a strong equity market. As that road became rockier when the healthcare initiative failed, the risk in equities was perceived to be greater towards the latter part of the quarter. In each of these environments however, fundamentals played less of a role than general sentiment. And unlike the latter part of 2016, our quantitative model was less effective in these environments.
Attribution
In any given period, stock selection factors can work better in one universe versus the other. This year, the U.S. stock selection model was much less effective than the international model. In addition, the short side of the Fund struggled more than the long side during the period, with approximately two-thirds of the negative alpha coming from the short side. The two largest country contributors were Australia and Italy, which generated positive value add on both the long and short side. The United States, the largest country weight at approximately 60% average over the 12-month period, was also the largest detractor to performance, with breakeven results in the long portion and negative results on the short side. There was wide dispersion in sector results for the 12-month period. Financials and Materials were the most significant contributors and Energy and Healthcare were the largest detractors.
Model Efficacy
In the model's US universe1, Valuation was the largest contributor to performance over the one-year period, followed by Earnings Quality. Market Dynamics (which includes Earnings Revision and Price Momentum) was negative for the same period. A similar pattern can be seen in the international universe2 although Earnings Quality was flattish rather than positive.
1 The US universe is primarily stocks in the Russell 2000 Index.
2 The international universe is primarily the MSCI EAFE Index.
Frank Russell Company ("Russell") is the source and owner of the trademarks, service marks and copyrights related to the Russell Indexes. Russell® is a trademark of Frank Russell Company. Neither Russell nor its licensors accept any liability for any errors or omissions in the Russell Indexes and / or Russell ratings or underlying data and no party may rely on any Russell Indexes and / or Russell ratings and / or underlying data contained in this communication. No further distribution of Russell Data is permitted without Russell's express written consent. Russell does not promote, sponsor or endorse the content of this communication.
A MESSAGE TO OUR SHAREHOLDERS (Unaudited) MARCH 31, 2017 |
The graph below shows the difference in payoffs of our model's three factors for the one-year period in the US and international investment universes. This data is calculated by subtracting the 5th quintile stock performance for each factor in our US and international universes from the performance of those in their respective 1st quintile. Payoffs in the Fund's portfolio vary from the model, since the Fund does not own all of the 1st quintile stocks or short all of the 5th quintile stocks, and the Fund owns stocks below the 1st quintile and shorts stocks above the 5th quintile.

Source: LMCG
Outlook
The U.S. equity market is starting to show some signs of age. It is currently the second longest bull market in duration and ranks third in terms of capital appreciation. Of course, we could see additional advances in equity markets in the near term, but ultimately markets move in cycles and bull markets are typically followed by corrections or bear markets. While volatility has remained fairly low since the election in November, this could change fairly quickly especially if investors become uneasy about potential corrections.
We believe that an alternative investment like the Fund – with little or no correlation to equity or fixed income markets – may serve as an important diversifier and risk dampener in the case of a market correction.
The Fund is designed to perform well regardless of the equity market environment. In an environment where the yield on the 10-yr Treasury is just 2.3%, we believe that a fund that has the ability to generate alpha on the long and short side – at a risk level approximately one-third of the equity market – could serve an important role within an overall investment program.
Sincerely,
| | |
| Gordon Johnson | Shannon Ericson | |
| Co-Portfolio Manager | Co-Portfolio Manager | |
| LMCG Investments, LLC | LMCG Investments, LLC | |
A MESSAGE TO OUR SHAREHOLDERS (Unaudited) MARCH 31, 2017 |
INVESTMENT CONSIDERATIONS
Market Events Risk - Turbulence in the financial markets and reduced liquidity in equity, credit and fixed-income markets may negatively affect issuers, which could adversely affect the Fund.
Market Neutral Style Risk - As a result of the Fund's use of short selling, the Fund will not participate to the same level as a long only mutual fund in a "bull" market.
Short Selling Risk - The Fund may engage in short sales of securities by borrowing a security and then selling it. The Fund may incur losses from unsuccessful short sales, and due to the nature of short selling, such losses may be theoretically unlimited. Short selling requires segregated account of cash and/or liquid assets with Fund's custodian which may lead to high levels of cash or liquid assets. A more detailed discussion of the Fund's risks, including risks that are unique to the Fund, can be found in its prospectus.
Equity Risk - The Fund's equity holdings may decline in value because of changes in price of a particular holding or a broad stock market decline.
Foreign Investments Risk - Foreign investments may be subject to the same risks as domestic investments and to additional risks which include international trade, currency, political, regulatory and diplomatic risks, which may affect their value.
There can be no guarantee that any strategy (risk management or otherwise) will be successful. All investing involves risk, including potential loss of principal.
The following chart reflects the change in the value of a hypothetical $100,000 investment in Institutional Shares, including reinvested dividends and distributions, in the LMCG Global Market Neutral Fund (the "Fund") compared with the performance of the benchmark, the Citigroup 3-Month U.S. T-Bill Index, since inception. The Citigroup 3-Month U.S. T-Bill Index measures return equivalents of yield averages that are not marked to market and consists of the last three three-month Treasury bill month-end rates. The total return of the Citigroup 3-Month U.S. T-Bill Index includes the reinvestment of distributions. The total return of the Fund includes operating expenses that reduce returns, while the total return of the Citigroup 3-Month U.S. T-Bill Index does not include expenses. The Fund is professionally managed while the Citigroup 3-Month U.S. T-Bill Index is unmanaged and is not available for investment.
Comparison of Change in Value of a $100,000 Investment
LMCG Global Market Neutral Fund - Institutional Shares vs. Citigroup 3-Month U.S. T-Bill Index
| Average Annual Total Returns | | | | |
| Periods Ended March 31, 2017 | | One Year | | Since Inception(1) |
| LMCG Global Market Neutral Fund — Institutional Shares | | -2.81 | % | | 1.82 | % |
LMCG Global Market Neutral Fund — Investor Shares(2) | | -3.09 | % | | 1.67 | % |
| Citigroup 3-Month U.S. T-Bill Index | | 0.34 | % | | 0.12 | % |
(1) Institutional Shares commenced operations on May 21, 2013, and Investor Shares commenced operations on December 18, 2014.
(2) Performance for the since inception period is a blended average annual return, which include the returns of the Institutional Shares prior to the commencement of the Investor Shares.
Performance data quoted represents past performance and is no guarantee of future results. Current performance may be lower or higher than the performance data quoted. Investment return and principal value will fluctuate so that shares, when redeemed, may be worth more or less than original cost. For the most recent month-end performance, please call (877) 591-4667. As stated in the Fund's prospectus, the annual operating expense ratio (gross) for Investor Shares and Institutional Shares is 4.09% and 3.74%, respectively. Excluding the effect of expenses attributable to dividends and interest on short sales, the total annual operating expense ratio for Investor Shares and Institutional Shares would be 2.56% and 2.19%, respectively. However, LMCG Investments, LLC (the "Adviser") has agreed to contractually waive its fees and/or reimburse Fund expenses to limit total annual Fund operating expenses (excluding all taxes, interest, portfolio transaction expenses, dividend and interest expenses on short sales, acquired fund fees and expenses, proxy expenses and extraordinary expenses) of Investor Shares and Institutional Shares to 1.85% and 1.60%, respectively through at least July 31, 2017. The Fund may repay the Adviser for fees waived and expenses reimbursed pursuant to the expense cap if such payment is made within three years of the fees waived or reimbursed and the reimbursement does not cause the Fund's total annual operating expenses to exceed 1.85% and 1.60% for Investor Shares and Institutional Shares, respectively. The performance table and graph do not reflect the deduction of taxes that a shareholder would pay on Fund distributions or the redemption of Fund shares. Returns greater than one year are annualized.
| Shares | | Security Description | | Value | |
| Long Positions - 99.4%% |
Equity Securities(a) - 94.9% |
| Common Stock - 94.6% |
| Australia - 1.4% |
| | 39,592 | | BlueScope Steel, Ltd. | | $ | 371,164 | |
| | 47,840 | | Dexus Property Group REIT | | 357,058 | |
| | 33,812 | | Seven Group Holdings, Ltd. | | 276,578 | |
| | | 1,004,800 | |
| Austria - 0.7% |
| | 12,085 | | OMV AG | | 476,261 | |
| Belgium - 0.4% |
| | 12,758 | | bpost SA | | 299,326 | |
| Denmark - 1.0% |
| | 8,544 | | ISS A/S | | 323,004 | |
| | 5,015 | | Vestas Wind Systems A/S | | 407,921 | |
| | | 730,925 | |
| Finland - 2.0% |
| | 5,460 | | Kesko OYJ, Class B | | 260,304 | |
| | 9,558 | | Neste Oyj | | 373,745 | |
| | 30,441 | | Stora Enso OYJ, Class R | | 359,940 | |
| | 18,847 | | UPM-Kymmene OYJ | | 442,510 | |
| | | 1,436,499 | |
| France - 5.2% |
| | 2,474 | | Atos SE | | 305,738 | |
| | 5,539 | | BNP Paribas SA | | 368,588 | |
| | 1,450 | | Christian Dior SE | | 336,584 | |
| | 27,816 | | Credit Agricole SA | | 375,980 | |
| | 3,232 | | Ipsen SA | | 323,142 | |
| | 1,834 | | L'Oreal SA | | 352,747 | |
| | 56,766 | | Natixis SA | | 349,461 | |
| | 5,361 | | Nexity SA (b) | | 263,490 | |
| | 4,173 | | Renault SA | | 362,518 | |
| | 3,868 | | Sanofi | | 349,649 | |
| | 7,503 | | Societe Generale SA | | 380,142 | |
| | | 3,768,039 | |
| Germany - 1.8% |
| | 1,859 | | Bechtle AG | | 201,745 | |
| | 23,736 | | Deutsche Lufthansa AG | | 385,066 | |
| | 4,452 | | Fresenius SE & Co. KGaA | | 357,745 | |
| | 15,859 | | Suedzucker AG | | 397,440 | |
| | | 1,341,996 | |
| Ireland - 0.7% |
| | 30,899 | | Grafton Group PLC | | 276,383 | |
| | 25,383 | | UDG Healthcare PLC | | 222,884 | |
| | | 499,267 | |
| Shares | | Security Description | | Value | |
| Italy - 1.8% |
| | 37,361 | | Amplifon SpA | | $ | 449,913 | |
| | 17,992 | | ASTM SpA | | 269,861 | |
| | 15,938 | | Buzzi Unicem SpA | | 230,212 | |
| | 11,833 | | Recordati SpA | | 400,669 | |
| | | 1,350,655 | |
| Japan - 6.7% |
| | 11,900 | | Canon Marketing Japan, Inc. | | 236,988 | |
| | 9,800 | | Hitachi High-Technologies Corp. | | 400,327 | |
| | 22,900 | | ITOCHU Corp. | | 326,012 | |
| | 11,200 | | KYORIN Holdings, Inc. | | 236,969 | |
| | 11,700 | | Megmilk Snow Brand Co., Ltd. | | 322,553 | |
| | 19,400 | | Mitsubishi Gas Chemical Co, Inc. | | 404,070 | |
| | 70,200 | | Nippon Suisan Kaisha, Ltd. | | 350,658 | |
| | 7,400 | | Nippon Telegraph & Telephone Corp. | | 316,374 | |
| | 6,000 | | Oracle Corp. Japan | | 343,975 | |
| | 55,000 | | Sankyu, Inc. | | 334,533 | |
| | 22,200 | | Sega Sammy Holdings, Inc. | | 298,591 | |
| | 7,800 | | Subaru Corp. | | 286,091 | |
| | 25,300 | | Sumitomo Corp. | | 341,319 | |
| | 3,400 | | Tokyo Electron, Ltd. | | 372,220 | |
| | 9,100 | | Toyo Suisan Kaisha, Ltd. | | 339,497 | |
| | | 4,910,177 | |
| Jersey - 0.4% |
| | 31,603 | | Phoenix Group Holdings | | 296,177 | |
| Netherlands - 2.4% |
| | 14,550 | | ABN AMRO Group NV (c) | | 352,816 | |
| | 7,946 | | EXOR NV | | 410,870 | |
| | 18,012 | | ING Groep NV | | 272,058 | |
| | 5,258 | | Koninklijke DSM NV | | 355,595 | |
| | 8,539 | | Wolters Kluwer NV | | 354,389 | |
| | | 1,745,728 | |
| Norway - 1.1% |
| | 24,785 | | Austevoll Seafood ASA | | 181,932 | |
| | 5,372 | | Leroy Seafood Group ASA | | 235,260 | |
| | 6,993 | | Salmar ASA | | 150,796 | |
| | 10,165 | | TGS Nopec Geophysical Co ASA | | 215,853 | |
| | | 783,841 | |
| Puerto Rico - 1.2% |
| | 24,622 | | OFG Bancorp | | 290,540 | |
| | 11,332 | | Popular, Inc. | | 461,552 | |
| | 9,126 | | Triple-S Management Corp., Class B (b) | | 160,344 | |
| | | 912,436 | |
| Singapore - 0.5% |
| | 11,200 | | Jardine Cycle & Carriage, Ltd. | | 350,805 | |
| Shares | | Security Description | | Value | |
| South Africa - 0.5% |
| | 14,281 | | Mondi PLC | | $ | 345,048 | |
| Spain - 3.1% |
| | 4,577 | | Acciona SA | | 366,086 | |
| | 12,644 | | ACS Actividades de Construccion y Servicios SA | | 429,803 | |
| | 15,232 | | Endesa SA | | 357,489 | |
| | 17,376 | | Gamesa Corp Tecnologica SA | | 411,026 | |
| | 25,682 | | Mediaset Espana Comunicacion SA | | 330,677 | |
| | 31,932 | | Telefonica SA | | 357,425 | |
| | | 2,252,506 | |
| Sweden - 1.3% |
| | 18,406 | | Alfa Laval AB | | 346,913 | |
| | 11,447 | | JM AB | | 361,484 | |
| | 25,371 | | Peab AB | | 241,999 | |
| | | 950,396 | |
| Switzerland - 4.1% |
| | 13,797 | | Coca-Cola HBC AG (b) | | 356,185 | |
| | 153 | | Forbo Holding AG | | 234,002 | |
| | 85,423 | | Glencore PLC (b) | | 335,162 | |
| | 1,493 | | Kuehne + Nagel International AG | | 210,817 | |
| | 11,512 | | Logitech International SA, Class R | | 365,840 | |
| | 1,808 | | Lonza Group AG | | 341,750 | |
| | 676 | | Partners Group Holding AG | | 363,291 | |
| | 1,256 | | Swiss Life Holding AG (b) | | 405,013 | |
| | 1,294 | | Zurich Insurance Group AG | | 345,318 | |
| | | 2,957,378 | |
| United Kingdom - 4.1% |
| | 18,516 | | Anglo American PLC (b) | | 282,906 | |
| | 18,443 | | Belmond, Ltd., Class A (b) | | 223,160 | |
| | 29,985 | | Britvic PLC | | 243,330 | |
| | 36,209 | | Crest Nicholson Holdings PLC | | 245,974 | |
| | 30,070 | | Fiat Chrysler Automobiles NV (b) | | 328,524 | |
| | 35,973 | | Inchcape PLC | | 379,263 | |
| | 73,700 | | Kingfisher PLC | | 301,551 | |
| | 9,051 | | Schroders PLC | | 343,501 | |
| | 11,021 | | Spectris PLC | | 344,576 | |
| | 17,951 | | SSE PLC | | 331,754 | |
| | | 3,024,539 | |
| United States - 54.2% |
| | 29,470 | | 8x8, Inc. (b) | | 449,418 | |
| | 10,345 | | Acorda Therapeutics, Inc. (b) | | 217,245 | |
| | 12,689 | | Aircastle, Ltd. | | 306,186 | |
| | 11,069 | | Alpha & Omega Semiconductor, Ltd. (b) | | 190,276 | |
| | 7,446 | | AMAG Pharmaceuticals, Inc. (b) | | 167,907 | |
| | 4,917 | | American Financial Group, Inc. | | 469,180 | |
| | 9,462 | | AMN Healthcare Services, Inc. (b) | | 384,157 | |
| | 12,788 | | ArcBest Corp. | | 332,488 | |
| | 17,804 | | ARMOUR Residential REIT, Inc. | | 404,329 | |
| | 9,892 | | BankUnited, Inc. | | 369,071 | |
| Shares | | Security Description | | Value | |
| United States - (continued) |
| | 17,286 | | Barracuda Networks, Inc. (b) | | $ | 399,479 | |
| | 23,606 | | Black Box Corp. | | 211,274 | |
| | 10,972 | | Booz Allen Hamilton Holding Corp. | | 388,299 | |
| | 22,762 | | Brooks Automation, Inc. | | 509,869 | |
| | 4,597 | | Burlington Stores, Inc. (b) | | 447,242 | |
| | 8,481 | | BWX Technologies, Inc. | | 403,696 | |
| | 3,174 | | CACI International, Inc., Class A (b) | | 372,310 | |
| | 9,980 | | Cathay General Bancorp | | 376,046 | |
| | 6,521 | | Centene Corp. (b) | | 464,686 | |
| | 38,355 | | Century Aluminum Co. (b) | | 486,725 | |
| | 27,073 | | Chico's FAS, Inc. | | 384,437 | |
| | 17,967 | | Cohu, Inc. | | 331,671 | |
| | 18,416 | | Commercial Metals Co. | | 352,298 | |
| | 6,319 | | Computer Sciences Corp. | | 436,074 | |
| | 24,364 | | Conduent, Inc. (b) | | 408,828 | |
| | 12,607 | | CryoLife, Inc. (b) | | 209,907 | |
| | 21,021 | | Dean Foods Co. | | 413,273 | |
| | 12,667 | | Delek US Holdings, Inc. | | 307,428 | |
| | 7,562 | | DeVry Education Group, Inc. | | 268,073 | |
| | 5,668 | | Dick's Sporting Goods, Inc. | | 275,805 | |
| | 3,967 | | EMCOR Group, Inc. | | 249,723 | |
| | 8,510 | | Emergent BioSolutions, Inc. (b) | | 247,130 | |
| | 8,519 | | Employers Holdings, Inc. | | 323,296 | |
| | 6,742 | | Enanta Pharmaceuticals, Inc. (b) | | 207,654 | |
| | 15,274 | | FibroGen, Inc. (b) | | 376,504 | |
| | 10,621 | | First American Financial Corp. | | 417,193 | |
| | 825 | | First Citizens BancShares, Inc., Class A | | 276,680 | |
| | 8,129 | | First Interstate BancSystem, Inc., Class A | | 322,315 | |
| | 5,842 | | First Merchants Corp. | | 229,707 | |
| | 18,623 | | First Midwest Bancorp, Inc. | | 440,993 | |
| | 4,195 | | Five Prime Therapeutics, Inc. (b) | | 151,649 | |
| | 24,917 | | FutureFuel Corp. | | 353,323 | |
| | 6,368 | | Genesco, Inc. (b) | | 353,106 | |
| | 820 | | Graham Holdings Co., Class B | | 491,631 | |
| | 9,745 | | Great Western Bancorp, Inc. | | 413,285 | |
| | 18,598 | | Green Plains, Inc. | | 460,300 | |
| | 11,773 | | Halyard Health, Inc. (b) | | 448,434 | |
| | 8,869 | | Hawaiian Holdings, Inc. (b) | | 411,965 | |
| | 4,898 | | Heartland Financial USA, Inc. | | 244,655 | |
| | 10,114 | | Horizon Pharma PLC (b) | | 149,485 | |
| | 33,506 | | Houghton Mifflin Harcourt Co. (b) | | 340,086 | |
| | 2,586 | | ICU Medical, Inc. (b) | | 394,882 | |
| | 7,807 | | INC Research Holdings, Inc., Class A (b) | | 357,951 | |
| | 11,937 | | Insight Enterprises, Inc. (b) | | 490,491 | |
| | 5,583 | | Insperity, Inc. | | 494,933 | |
| | 11,173 | | INTL. FCStone, Inc. (b) | | 424,127 | |
| | 27,809 | | Invesco Mortgage Capital, Inc. REIT | | 428,815 | |
| | 17,336 | | Jabil Circuit, Inc. | | 501,357 | |
| Shares | | Security Description | | Value |
| Short Positions - (95.2)% |
| Equity Securities - (95.2)% |
| Common Stock - (94.8)% |
| Austria - (0.6)% |
| | (18,303) | | Raiffeisen Bank International AG | | $ | (412,765) |
| Belgium - (0.3)% |
| | (7,288) | | Ontex Group NV | | (233,906) |
| Bermuda - (0.5)% |
| | (12,750) | | Golar LNG, Ltd. | | (356,108) |
| Denmark - (1.5)% |
| | (8,340) | | Bavarian Nordic A/S | | (423,293) |
| | (3,672) | | Carlsberg A/S, Class B | | (339,082) |
| | (9,262) | | Novozymes A/S, Class B | | (366,957) |
| | | | | | (1,129,332) |
| Finland - (0.9)% |
| | (9,229) | | Huhtamaki OYJ | | (328,424) |
| | (7,190) | | Sampo Oyj, Class A | | (341,171) |
| | | | | | (669,595) |
| France - (5.3)% |
| | (2,969) | | Aeroports de Paris | | (366,807) |
| | (16,961) | | Bureau Veritas SA | | (357,514) |
| | (4,122) | | Dassault Systemes SE | | (356,519) |
| | (4,686) | | DBV Technologies SA | | (327,680) |
| | (34,159) | | Groupe Eurotunnel SE | | (343,364) |
| | (818) | | Hermes International | | (387,229) |
| | (3,752) | | Ingenico Group SA | | (353,875) |
| | (3,461) | | Remy Cointreau SA | | (338,591) |
| | (4,840) | | Safran SA | | (361,228) |
| | (11,922) | | SFR Group SA | | (374,401) |
| | (65,800) | | Technicolor SA | | (302,402) |
| | | | | | (3,869,610) |
| Germany - (2.4)% |
| | (15,503) | | alstria office REIT-AG | | (189,563) |
| | (3,952) | | Beiersdorf AG | | (373,974) |
| | (2,239) | | Bertrandt AG | | (217,382) |
| | (5,012) | | HUGO BOSS AG | | (365,492) |
| | (13,558) | | K+S AG | | (315,142) |
| | (4,734) | | Symrise AG | | (314,818) |
| | | | | | (1,776,371) |
| Hong Kong - (0.4)% |
| | (37,000) | | Cheung Kong Infrastructure Holdings, Ltd. | | (290,570) |
| Ireland - (0.4)% |
| | (3,371) | | Kerry Group PLC, Class A | | (267,274) |
| Shares | | Security Description | | Value |
| Italy - (0.9)% |
| | (50,797) | | Anima Holding SpA | | $ | (303,263) |
| | (14,188) | | Buzzi Unicem SpA | | (362,667) |
| | | | | | (665,930) |
| Japan - (6.5)% |
| | (10,500) | | Calbee, Inc. | | (358,640) |
| | (1,800) | | FANUC Corp. | | (370,568) |
| | (1,100) | | Fast Retailing Co., Ltd. | | (346,152) |
| | (5,300) | | GMO Payment Gateway, Inc. | | (264,038) |
| | (11,200) | | Hamamatsu Photonics KK | | (323,261) |
| | (19,900) | | Kakaku.com, Inc. | | (271,666) |
| | (11,200) | | MonotaRO Co., Ltd. | | (347,095) |
| | (3,100) | | Nidec Corp. | | (296,064) |
| | (13,300) | | Ono Pharmaceutical Co., Ltd. | | (275,812) |
| | (2,400) | | Shimano, Inc. | | (351,523) |
| | (31,000) | | Sumitomo Metal Mining Co., Ltd. | | (443,335) |
| | (7,900) | | Suntory Beverage & Food, Ltd. | | (333,737) |
| | (19,500) | | Topcon Corp. | | (349,294) |
| | (16,700) | | Unicharm Corp. | | (401,344) |
| | | | | | (4,732,529) |
| Jordan - (0.5)% |
| | (14,894) | | Hikma Pharmaceuticals PLC | | (369,956) |
| Luxembourg - (0.5)% |
| | (20,621) | | Tenaris SA | | (356,586) |
| Netherlands - (2.3)% |
| | (18,221) | | Altice NV, Class A | | (412,136) |
| | (5,170) | | Euronext NV | | (225,437) |
| | (5,885) | | Gemalto NV | | (328,300) |
| | (18,540) | | OCI NV | | (355,800) |
| | (36,174) | | TomTom NV | | (352,036) |
| | | | | | (1,673,709) |
| New Zealand - (0.7)% |
| | (41,101) | | Fisher & Paykel Healthcare Corp., Ltd. | | (279,298) |
| | (43,172) | | Ryman Healthcare, Ltd. | | (254,397) |
| | | | | | (533,695) |
| Norway - (0.8)% |
| | (19,037) | | Marine Harvest ASA | | (290,398) |
| | (8,581) | | Yara International ASA | | (330,521) |
| | | | | | (620,919) |
| Peru - (0.6)% |
| | (12,628) | | Southern Copper Corp. | | (453,219) |
| Singapore - (0.5)% |
| | (50,800) | | Oversea-Chinese Banking Corp., Ltd. | | (352,858) |
| Shares | | Security Description | | Value |
| Spain - (1.3)% |
| | (21,120) | | Atresmedia Corp de Medios de Comunicacion SA | | $ | (266,450) |
| | (48,134) | | Inmobiliaria Colonial SA | | (359,823) |
| | (16,227) | | Red Electrica Corp. SA | | (311,143) |
| | (1,467) | | Zardoya Otis SA | | (13,547) |
| | | | | | (950,963) |
| Sweden - (2.7)% |
| | (18,514) | | Assa Abloy AB, Class B | | (380,605) |
| | (24,799) | | Castellum AB | | (328,700) |
| | (3,350) | | L E Lundbergforetagen AB, Class B | | (227,054) |
| | (15,281) | | Lundin Petroleum AB | | (310,146) |
| | (10,695) | | Swedish Match AB | | (347,575) |
| | (17,489) | | Trelleborg AB, Class B | | (374,416) |
| | | | | | (1,968,496) |
| Switzerland - (3.7)% |
| | (3,370) | | Basilea Pharmaceutica AG | | (291,034) |
| | (65) | | Chocoladefabriken Lindt & Spruengli AG | | (368,310) |
| | (21,516) | | Credit Suisse Group AG | | (320,128) |
| | (1,199) | | Daetwyler Holding AG | | (184,987) |
| | (3,649) | | PSP Swiss Property AG | | (332,025) |
| | (4,507) | | The Swatch Group AG | | (313,851) |
| | (1,063) | | The Swatch Group AG - BR | | (380,584) |
| | (72,686) | | Weatherford International PLC | | (483,362) |
| | | | | | (2,674,281) |
| United Kingdom - (6.7)% |
| | (38,977) | | 3i Group PLC | | (365,958) |
| | (25,461) | | Aggreko PLC | | (281,586) |
| | (28,898) | | Babcock International Group PLC | | (319,310) |
| | (10,215) | | Derwent London PLC REIT | | (359,846) |
| | (37,717) | | Inmarsat PLC | | (401,827) |
| | (6,897) | | Next PLC | | (373,106) |
| | (45,899) | | Pearson PLC | | (391,374) |
| | (40,827) | | Rolls-Royce Holdings PLC | | (385,695) |
| | (4,014) | | Shire PLC | | (233,884) |
| | (45,848) | | Standard Chartered PLC | | (438,533) |
| | (18,197) | | Travis Perkins PLC | | (345,215) |
| | (115,397) | | Tullow Oil PLC | | (340,385) |
| | (25,905) | | United Utilities Group PLC | | (322,543) |
| | (12,630) | | Victrex PLC | | (301,003) |
| | | | | | (4,860,265) |
| United States - (54.8)% |
| | (7,561) | | Acadia Healthcare Co., Inc. | | (329,660) |
| | (7,315) | | ACADIA Pharmaceuticals, Inc. | | (251,490) |
| | (13,957) | | Aerojet Rocketdyne Holdings, Inc. | | (302,867) |
| | (33,530) | | Amicus Therapeutics, Inc. | | (239,069) |
| | (12,173) | | Aqua America, Inc. | | (391,362) |
| | (4,310) | | athenahealth, Inc. | | (485,694) |
| | (6,481) | | AZZ, Inc. | | (385,619) |
| | (18,005) | | Banc of California, Inc. | | (372,703) |
| | (4,690) | | Bank of Hawaii Corp. | | (386,268) |
| Shares | | Security Description | | Value |
| United States - (continued) |
| | (7,901) | | Banner Corp. | | $ | (439,612) |
| | (15,008) | | Bottomline Technologies de, Inc. | | (354,939) |
| | (8,765) | | Brinker International, Inc. | | (385,309) |
| | (9,711) | | Brown & Brown, Inc. | | (405,143) |
| | (1,905) | | Buffalo Wild Wings, Inc. | | (290,989) |
| | (23,511) | | Callidus Software, Inc. | | (501,960) |
| | (50,845) | | Cerus Corp. | | (226,260) |
| | (10,035) | | Cheniere Energy, Inc. | | (474,354) |
| | (7,333) | | Chuy's Holdings, Inc. | | (218,523) |
| | (18,436) | | Ciena Corp. | | (435,274) |
| | (15,739) | | Clifton Bancorp, Inc. | | (254,814) |
| | (5,938) | | Cohen & Steers, Inc. | | (237,342) |
| | (8,897) | | Commerce Bancshares, Inc. | | (499,656) |
| | (5,475) | | Compass Minerals International, Inc. | | (371,479) |
| | (7,746) | | Computer Programs and Systems, Inc. | | (216,888) |
| | (11,644) | | Cornerstone OnDemand, Inc. | | (452,835) |
| | (26,228) | | Covanta Holding Corp. | | (411,780) |
| | (6,123) | | DexCom, Inc. | | (518,802) |
| | (28,943) | | Diplomat Pharmacy, Inc. | | (461,641) |
| | (54,804) | | Endologix, Inc. | | (396,781) |
| | (8,950) | | Envestnet, Inc. | | (289,085) |
| | (7,575) | | Ethan Allen Interiors, Inc. | | (232,174) |
| | (11,153) | | Federated Investors, Inc., Class B | | (293,770) |
| | (6,036) | | Fiesta Restaurant Group, Inc. | | (146,071) |
| | (6,975) | | FirstCash, Inc. | | (342,821) |
| | (9,279) | | Five Below, Inc. | | (401,873) |
| | (33,039) | | Flotek Industries, Inc. | | (422,569) |
| | (22,793) | | Flowers Foods, Inc. | | (442,412) |
| | (33,129) | | GenMark Diagnostics, Inc. | | (424,714) |
| | (11,513) | | Gigamon, Inc. | | (409,287) |
| | (47,232) | | GNC Holdings, Inc., Class A | | (347,628) |
| | (4,633) | | Graco, Inc. | | (436,151) |
| | (7,238) | | Guidewire Software, Inc. | | (407,717) |
| | (14,980) | | H&E Equipment Services, Inc. | | (367,310) |
| | (11,827) | | Healthcare Services Group, Inc. | | (509,625) |
| | (8,927) | | Healthcare Trust of America, Inc., Class A REIT | | (280,843) |
| | (19,165) | | Heartland Express, Inc. | | (384,258) |
| | (63,685) | | Hecla Mining Co. | | (336,894) |
| | (4,273) | | Helen of Troy, Ltd. | | (402,517) |
| | (13,688) | | Heron Therapeutics, Inc. | | (205,320) |
| | (13,823) | | Impinj, Inc. | | (418,422) |
| | (52,629) | | Infinera Corp. | | (538,395) |
| | (4,352) | | IPG Photonics Corp. | | (525,286) |
| | (23,115) | | Kate Spade & Co. | | (536,961) |
| | (12,134) | | Keysight Technologies, Inc. | | (438,523) |
| | (11,796) | | Knight Transportation, Inc. | | (369,805) |
| | (4,747) | | La Jolla Pharmaceutical Co. | | (141,698) |
| | (21,567) | | MaxLinear, Inc., Class A | | (604,954) |
| | (11,764) | | Meridian Bioscience, Inc. | | (162,343) |
| | (6,683) | | Monro Muffler Brake, Inc. | | (348,184) |
| Shares | | Security Description | | Value |
| United States - (continued) |
| | (13,645) | | Nektar Therapeutics | | $ | (320,248) |
| | (28,674) | | New York Community Bancorp, Inc. | | (400,576) |
| | (13,223) | | NN, Inc. | | (333,220) |
| | (14,980) | | Northfield Bancorp, Inc. | | (269,940) |
| | (21,611) | | Northwest Bancshares, Inc. | | (363,929) |
| | (16,102) | | Oceaneering International, Inc. | | (436,042) |
| | (7,461) | | OceanFirst Financial Corp. | | (210,214) |
| | (18,280) | | OneBeacon Insurance Group, Ltd., Class A | | (292,480) |
| | (31,545) | | ORBCOMM, Inc. | | (301,255) |
| | (13,418) | | Oritani Financial Corp. | | (228,106) |
| | (4,974) | | OSI Systems, Inc. | | (363,052) |
| | (51,704) | | Pacific Biosciences of California, Inc. | | (267,310) |
| | (3,444) | | Palo Alto Networks, Inc. | | (388,070) |
| | (29,319) | | Pandora Media, Inc. | | (346,257) |
| | (38,329) | | PGT Innovations, Inc. | | (412,037) |
| | (23,038) | | Physicians Realty Trust REIT | | (457,765) |
| | (3,964) | | Polaris Industries, Inc. | | (332,183) |
| | (11,571) | | Portola Pharmaceuticals, Inc. | | (453,467) |
| | (5,243) | | ProAssurance Corp. | | (315,891) |
| | (6,924) | | Proto Labs, Inc. | | (353,816) |
| | (5,882) | | Puma Biotechnology, Inc. | | (218,810) |
| | (18,348) | | Rambus, Inc. | | (241,093) |
| | (18,945) | | Rice Energy, Inc. | | (448,996) |
| | (6,119) | | RLI Corp. | | (367,262) |
| | (12,825) | | Sabre Corp. | | (271,762) |
| | (3,981) | | Seattle Genetics, Inc. | | (250,246) |
| | (22,334) | | SeaWorld Entertainment, Inc. | | (408,042) |
| | (6,562) | | SEI Investments Co. | | (330,987) |
| | (11,210) | | South Jersey Industries, Inc. | | (399,636) |
| | (20,511) | | Sportsman's Warehouse Holdings, Inc. | | (98,043) |
| | (55,522) | | SRC Energy, Inc. | | (468,606) |
| | (6,964) | | Stewart Information Services Corp. | | (307,670) |
| | (18,830) | | Syntel, Inc. | | (316,909) |
| | (15,735) | | TASER International, Inc. | | (358,601) |
| | (6,340) | | Team, Inc. | | (171,497) |
| | (25,158) | | TFS Financial Corp. | | (418,126) |
| | (11,179) | | The Advisory Board Co. | | (523,177) |
| | (2,471) | | The Boston Beer Co., Inc., Class A | | (357,430) |
| | (3,010) | | The Middleby Corp. | | (410,714) |
| | (34,601) | | TherapeuticsMD, Inc. | | (249,127) |
| | (17,729) | | Tile Shop Holdings, Inc. | | (341,283) |
| | (19,536) | | Twitter, Inc. | | (292,063) |
| | (4,607) | | Universal Display Corp. | | (396,663) |
| | (7,099) | | US Concrete, Inc. | | (458,240) |
| | (10,886) | | USG Corp. | | (346,175) |
| | (4,935) | | ViaSat, Inc. | | (314,952) |
| | (19,522) | | Virtu Financial, Inc., Class A | | (331,874) |
| | (16,678) | | Waddell & Reed Financial, Inc., Class A | | (283,526) |
| Shares | | Security Description | | Value |
| United States - (continued) |
| | (15,589) | | Werner Enterprises, Inc. | | $ | (408,432) |
| | (7,341) | | Williams-Sonoma, Inc. | | (393,624) |
| | (36,547) | | WisdomTree Investments, Inc. | | (331,847) |
| | (5,356) | | Zebra Technologies Corp. | | (488,735) |
| | (11,835) | | Zoe's Kitchen, Inc. | | (218,948) |
| | | | | | (39,935,677) |
Total Common Stock
(Proceeds $(66,274,578)) | | (69,154,614) |
| Preferred Stock - (0.4)% |
| Germany - (0.4)% |
| | (3,108) | | Sartorius AG REIT (Proceeds $(223,795)) | | (272,588) |
Total Equity Securities
(Proceeds $(66,498,373)) | | (69,427,202) |
Total Short Positions - (95.2)%
(Proceeds $(66,498,373)) | | $ | (69,427,202) |
| PLC | Public Limited Company |
| REIT | Real Estate Investment Trust |
| (a) | All or portion of these securities are held as collateral for securities sold short. |
| (b) | Non-income producing security. |
| (c) | Security exempt from registration under Rule 144A under the Securities Act of 1933. At the period end, the value of these securities amounted to $352,816 or 0.5% of net assets. |
| (d) | Variable rate security. Rate presented is as of March 31, 2017. |
* Cost for federal income tax purposes is $(3,276,928) and net unrealized appreciation consists of:
| | Level 1 | | Level 2 | | Level 3 | | Total |
| Securities Sold Short |
| Common Stock | | | | | | | | | | | | | | | | |
| Austria | | $ | - | | | $ | (412,765 | ) | | $ | - | | | $ | (412,765 | ) |
| Belgium | | | - | | | | (233,906 | ) | | | - | | | | (233,906 | ) |
| Bermuda | | | (356,108 | ) | | | - | | | | - | | | | (356,108 | ) |
| Denmark | | | - | | | | (1,129,332 | ) | | | - | | | | (1,129,332 | ) |
| Finland | | | - | | | | (669,595 | ) | | | - | | | | (669,595 | ) |
| France | | | - | | | | (3,869,610 | ) | | | - | | | | (3,869,610 | ) |
| Germany | | | - | | | | (1,776,371 | ) | | | - | | | | (1,776,371 | ) |
| Hong Kong | | | - | | | | (290,570 | ) | | | - | | | | (290,570 | ) |
| Ireland | | | - | | | | (267,274 | ) | | | - | | | | (267,274 | ) |
| Italy | | | - | | | | (665,930 | ) | | | - | | | | (665,930 | ) |
| Japan | | | - | | | | (4,732,529 | ) | | | - | | | | (4,732,529 | ) |
| Jordan | | | - | | | | (369,956 | ) | | | - | | | | (369,956 | ) |
| Luxembourg | | | - | | | | (356,586 | ) | | | - | | | | (356,586 | ) |
| Netherlands | | | - | | | | (1,673,709 | ) | | | - | | | | (1,673,709 | ) |
| New Zealand | | | - | | | | (533,695 | ) | | | - | | | | (533,695 | ) |
| Norway | | | - | | | | (620,919 | ) | | | - | | | | (620,919 | ) |
| Peru | | | (453,219 | ) | | | - | | | | - | | | | (453,219 | ) |
| Singapore | | | - | | | | (352,858 | ) | | | - | | | | (352,858 | ) |
| Spain | | | - | | | | (950,963 | ) | | | - | | | | (950,963 | ) |
| Sweden | | | - | | | | (1,968,496 | ) | | | - | | | | (1,968,496 | ) |
| Switzerland | | | (483,362 | ) | | | (2,190,919 | ) | | | - | | | | (2,674,281 | ) |
| United Kingdom | | | - | | | | (4,860,265 | ) | | | - | | | | (4,860,265 | ) |
| United States | | | (39,935,677 | ) | | | - | | | | - | | | | (39,935,677 | ) |
| Preferred Stock | | | | | | | | | | | | | | | | |
| Germany | | | - | | | | (272,588 | ) | | | - | | | | (272,588 | ) |
| Total Securities Sold Short | | $ | (41,228,366 | ) | | $ | (28,198,836 | ) | | $ | - | | | $ | (69,427,202 | ) |
The Fund utilizes the end of period methodology when determining transfers. There were no transfers among Level 1, Level 2 and Level 3 for the year ended March 31, 2017.
At March 31, 2017, foreign securities representing the following percentage of net assets of the Fund were fair valued by independent pricing services and are classified as using Level 2 inputs within the valuation inputs disclosure on the Fund's Schedule of Investments:
LMCG Global Market Neutral Fund
Long Securities 39.14%
Short Securities (38.68)%
| PORTFOLIO HOLDINGS | | | | | |
| % of Total Investments | Long | | | Short | |
| Australia | 1.4 | % | | 0.0 | % |
| Austria | 0.6 | % | | 0.6 | % |
| Belgium | 0.4 | % | | 0.3 | % |
| Bermuda | 0.0 | % | | 0.5 | % |
| Denmark | 1.0 | % | | 1.6 | % |
| Finland | 2.0 | % | | 1.0 | % |
| France | 5.2 | % | | 5.6 | % |
| Germany | 2.2 | % | | 2.9 | % |
| Hong Kong | 0.0 | % | | 0.4 | % |
| Ireland | 0.7 | % | | 0.4 | % |
| Italy | 1.8 | % | | 1.0 | % |
| Japan | 6.8 | % | | 6.8 | % |
| Jersey | 0.4 | % | | 0.0 | % |
| Jordan | 0.0 | % | | 0.5 | % |
| Luxembourg | 0.0 | % | | 0.5 | % |
| Netherlands | 2.4 | % | | 2.4 | % |
| New Zealand | 0.0 | % | | 0.8 | % |
| Norway | 1.1 | % | | 0.9 | % |
| Peru | 0.0 | % | | 0.7 | % |
| Puerto Rico | 1.2 | % | | 0.0 | % |
| Singapore | 0.5 | % | | 0.5 | % |
| South Africa | 0.5 | % | | 0.0 | % |
| Spain | 3.1 | % | | 1.4 | % |
| Sweden | 1.3 | % | | 2.8 | % |
| Switzerland | 4.1 | % | | 3.9 | % |
| United Kingdom | 4.2 | % | | 7.0 | % |
| United States | 59.1 | %* | | 57.5 | % |
| | 100.0 | % | | 100.0 | % |
*Includes Money Market Fund totaling 4.6%.
| ASSETS | | | | |
| . | Total investments, at value (Cost $62,632,170) | | $ | 72,489,231 | |
| | Deposits with brokers | | | 69,614,231 | |
| | Cash | | | 2,763 | |
| | Foreign currency (Cost $81,736) | | | 81,989 | |
| | Receivables: | | | | |
| | | Fund shares sold | | | 72,819 | |
| | | Dividends | | | 201,603 | |
| | Prepaid expenses | | | 20,505 | |
| Total Assets | | | 142,483,141 | |
| | | | | | | |
| LIABILITIES | | | | |
| | Securities sold short, at value (Proceeds $66,498,373) | | | 69,427,202 | |
| | Payables: | | | | �� |
| | | Fund shares redeemed | | | 21,359 | |
| | | Dividends on securities sold short | | | 37,797 | |
| | Accrued Liabilities: | | | | |
| | | Investment adviser fees | | | 33,496 | |
| | | Trustees' fees and expenses | | | 260 | |
| | | Fund services fees | | | 15,288 | |
| | | Professional fees | | | 22,258 | |
| | | Other expenses | | | 24,470 | |
| Total Liabilities | | | 69,582,130 | |
| | | | | | | |
| NET ASSETS | | $ | 72,901,011 | |
| | | | | | | |
| COMPONENTS OF NET ASSETS | | | | |
| | Paid-in capital | | $ | 74,263,969 | |
| | Accumulated net investment loss | | | (170,901 | ) |
| | Accumulated net realized loss | | | (8,119,072 | ) |
| | Net unrealized appreciation | | | 6,927,015 | |
| NET ASSETS | | $ | 72,901,011 | |
| | | | | | | |
| SHARES OF BENEFICIAL INTEREST AT NO PAR VALUE (UNLIMITED SHARES AUTHORIZED) | | | | |
| | Investor Shares | | | 514,043 | |
| | Institutional Shares | | | 6,287,205 | |
| | | | | | | |
| NET ASSET VALUE, OFFERING AND REDEMPTION PRICE PER SHARE | | | | |
| | Investor Shares (based on net assets of $5,480,004) | | $ | 10.66 | |
| | Institutional Shares (based on net assets of $67,421,007) | | $ | 10.72 | |
See Notes to Financial Statements. | 14 | |
| INVESTMENT INCOME | | | | | |
| | Dividend income (Net of foreign withholding taxes of $131,732) | . | | $ | 1,574,888 | |
| | Interest income | | | 141,423 | |
| Total Investment Income | | | | 1,716,311 | |
| Adviser | | | | | |
| EXPENSES | | | | | |
| | Investment adviser fees | | | 825,373 | |
| | Fund services fees | | | 214,392 | |
| | Transfer agent fees: | | | | |
| | Investor Shares | | | 2,522 | |
| | Institutional Shares | | | 25,359 | |
| | Distribution fees: | | | | |
| | Investor Shares | | | 18,891 | |
| | Custodian fees | | | 502,416 | |
| | Registration fees: | | | | |
| | Investor Shares | | | 12,321 | |
| | Institutional Shares | | | 12,211 | |
| | Professional fees | | | 67,717 | |
| | Trustees' fees and expenses | | | 10,113 | |
| | Dividend expense on securities sold short | | | 1,320,258 | # |
| | Other expenses | | | 143,112 | |
| Total Expenses | | | | 3,154,685 | |
| | Fees waived | | | (494,940 | ) |
| Net Expenses | | | | 2,659,745 | |
| | | | | | | |
| NET INVESTMENT LOSS | | | | (943,434 | ) |
| | | | | | | |
| NET REALIZED AND UNREALIZED GAIN (LOSS) | | | | | |
| | Net realized gain (loss) on: | | | | |
| | Investments | | | 5,792,528 | |
| | Foreign currency transactions | | | (17,707 | ) |
| | Securities sold short | | | (11,844,698 | ) |
| | Net realized loss | | | (6,069,877 | ) |
| | Net change in unrealized appreciation (depreciation) on: | | | | |
| | Investments | | | 6,977,043 | |
| | Foreign currency translations | | | (1,857 | ) |
| | Securities sold short | | | (3,621,871 | ) |
| | Net change in unrealized appreciation (depreciation) | | | 3,353,315 | |
| NET REALIZED AND UNREALIZED LOSS | | | | (2,716,562 | ) |
| DECREASE IN NET ASSETS RESULTING FROM OPERATIONS | | | $ | (3,659,996 | ) |
See Notes to Financial Statements. | 15 | |
| | | | | For the Year Ended March 31, 2017 | | | For the Year Ended March 31, 2016 |
| OPERATIONS | | | | | | | | | |
| | Net investment loss | | $ | (943,434 | ) | | | $ | (1,331,933 | ) |
| | Net realized loss | | | (6,069,877 | ) | | | | (908,588 | ) |
| | Net change in unrealized appreciation (depreciation) | | | 3,353,315 | | | | | 721,611 | |
| Decrease in Net Assets Resulting from Operations | | | (3,659,996 | ) | | | | (1,518,910 | ) |
| | | | | | | | | | | | |
| CAPITAL SHARE TRANSACTIONS | | | | | | | | | |
| | Sale of shares: | | | | | | | | | |
| | | Investor Shares | | | 3,158,386 | | | | | 13,677,091 | |
| | | Institutional Shares | | | 27,319,837 | | | | | 58,496,549 | |
| | Redemption of shares: | | | | | | | | | |
| | 1 | Investor Shares | | | (12,675,187 | ) | | | | (3,692,502 | ) |
| | 2 | Institutional Shares | | | (63,937,598 | ) | | | | (8,269,340 | ) |
| Increase (Decrease) in Net Assets from Capital Share Transactions | | (46,134,562 | ) | | | | 60,211,798 | |
| Increase (Decrease) in Net Assets | | | (49,794,558 | ) | | | | 58,692,888 | |
| | | | | | | | | | | | |
| NET ASSETS | | | | | | | | | |
| | Beginning of Year | | | 122,695,569 | | | | | 64,002,681 | |
| | End of Year (Including line (a)) | | $ | 72,901,011 | | | | $ | 122,695,569 | |
| | | | | | | | | | | | |
| SHARE TRANSACTIONS | | | | | | | | | |
| | Sale of shares: | | | | | | | | | |
| | | Investor Shares | | | 294,651 | | | | | 1,224,668 | |
| | | Institutional Shares | | | 2,533,406 | | | | | 5,199,050 | |
| | Redemption of shares: | | | | | | | | | |
| | | Investor Shares | | | (1,187,375 | ) | | | | (331,429 | ) |
| | | Institutional Shares | | | (5,968,588 | ) | | | | (743,813 | ) |
| Increase (Decrease) in Shares | | | (4,327,906 | ) | | | | 5,348,476 | |
| | | | | | | | | | | | |
| (a) | Accumulated net investment loss | | $ | (170,901 | ) | | | $ | (625,956 | ) |
| These financial highlights reflect selected data for a share outstanding throughout each period. |
| | | For the Year Ended March 31, 2017 | | For the Year Ended March 31, 2016 | | December 18, 2014 (a) Through March 31, 2015 | |
| INVESTOR SHARES | | | | | | | | | | | | |
| NET ASSET VALUE, Beginning of Period | $ | 11.00 | | | $ | 11.07 | | | $ | 10.87 | | |
| INVESTMENT OPERATIONS | | | | | | | | | | | | |
| Net investment loss (b) | | (0.15 | ) | | | (0.20 | ) | | | (0.05 | ) | |
| Net realized and unrealized gain (loss) | | (0.19 | ) | | | 0.13 | (c) | | 0.25 | | |
| Total from Investment Operations | | (0.34 | ) | | | (0.07 | ) | | | 0.20 | | |
| NET ASSET VALUE, End of Period | $ | 10.66 | | | $ | 11.00 | | | $ | 11.07 | | |
| TOTAL RETURN | | (3.09 | )% | | (0.63 | )% | | 1.84 | %(d) |
| | | | | | | | | | | | | |
| RATIOS/SUPPLEMENTARY DATA | | | | | | | | | | | | |
| Net Assets at End of Period (000's omitted) | $5,480 | | | $15,468 | | | $5,683 | | |
| Ratios to Average Net Assets: | | | | | | | | | | | | |
| Net investment loss | | (1.42 | )% | | (1.81 | )% | | (1.73 | )%(e) |
| Net expenses including dividend expenses | | 3.56 | % | | 3.38 | % | | 3.30 | %(e) |
| Dividend expenses | | 1.71 | % | | 1.53 | % | | 1.45 | %(e) |
| Net expenses without dividend expenses | | 1.85 | % | | 1.85 | % | | 1.85 | %(e) |
| Gross expenses (f) | | 4.38 | % | | 4.09 | % | | 5.73 | %(e) |
| PORTFOLIO TURNOVER RATE | | 95 | % | | 124 | % | | 104 | %(d) |
| | | | | | | | | | | | | | |
| (a) | Commencement of operations. |
| (b) | Calculated based on average shares outstanding during each period. |
| (c) | Per share amount does not reflect the actual net realized and unrealized gain/(loss) for the year due to the timing of Fund share sales and the amount of per share realized and unrealized gains and losses at such time. |
| (d) | Not annualized. |
| (e) | Annualized. |
| (f) | Reflects the expense ratio excluding any waivers and/or reimbursements. |
See Notes to Financial Statements. | 17 | |
| These financial highlights reflect selected data for a share outstanding throughout each period. | | |
| | | For the Year Ended March 31, 2017 | | For the Year Ended March 31, 2016 | | For the Year Ended March 31, 2015 | | May 21, 2013 (a) Through March 31, 2014 | |
| INSTITUTIONAL SHARES | | | | | | | | | | | | | | | | |
| NET ASSET VALUE, Beginning of Period | $ | 11.03 | | | $ | 11.07 | | | $ | 10.11 | | | $ | 10.00 | | |
| INVESTMENT OPERATIONS | | | | | | | | | | | | | | | | |
| Net investment loss (b) | | (0.12 | ) | | | (0.17 | ) | | | (0.16 | ) | | | (0.11 | ) | |
| Net realized and unrealized gain (loss) | | (0.19 | ) | | | 0.13 | (c) | | 1.12 | | | | 0.22 | | |
| Total from Investment Operations | | (0.31 | ) | | | (0.04 | ) | | | 0.96 | | | | 0.11 | | |
| REDEMPTION FEES (b) | | — | | | | — | | | | — | (d) | | — | | |
| NET ASSET VALUE, End of Period | $ | 10.72 | | | $ | 11.03 | | | $ | 11.07 | | | $ | 10.11 | | |
| TOTAL RETURN | | (2.81 | )% | | (0.36 | )% | | 9.50 | % | | 1.10 | %(e) |
| | | | | | | | | | | | | | | | | |
| RATIOS/SUPPLEMENTARY DATA | | | | | | | | | | | | | | | | |
| Net Assets at End of Period (000's omitted) | $67,421 | | | $107,228 | | | $58,320 | | | $11,401 | | |
| Ratios to Average Net Assets: | | | | | | | | | | | | | | | | |
| Net investment loss | | (1.11 | )% | | (1.53 | )% | | (1.49 | )% | | (1.27 | )%(f) |
| Net expenses including dividend expenses | | 3.18 | % | | 3.15 | % | | 2.91 | % | | 2.94 | %(f) |
| Dividend expenses | | 1.58 | % | | 1.55 | % | | 1.31 | % | | 1.34 | %(f) |
| Net expenses without dividend expenses | | 1.60 | % | | 1.60 | % | | 1.60 | % | | 1.60 | %(f) |
| Gross expenses (g) | | 3.76 | % | | 3.74 | % | | 4.63 | % | | 8.73 | %(f) |
| PORTFOLIO TURNOVER RATE | | 95 | % | | 124 | % | | 104 | % | | 62 | %(e) |
| | | | | | | | | | | | | | | | | | |
| (a) | Commencement of operations. |
| (b) | Calculated based on average shares outstanding during each period. |
| (c) | Per share amount does not reflect the actual net realized and unrealized gain/(loss) for the year due to the timing of Fund share sales and the amount of per share realized and unrealized gains and losses at such time. |
| (d) | Less than $0.01 per share. |
| (e) | Not annualized. |
| (f) | Annualized. |
| (g) | Reflects the expense ratio excluding any waivers and/or reimbursements. |
See Notes to Financial Statements. | 18 | |
Dear Shareholder:
The last twelve months ending March 31, 2017 exceeded our expectations in many ways. We are pleased to report that the LMCG Global MultiCap Fund (the "Fund") weathered several surprises in world politics. While so much has been said about the longer term implications of the stunning Brexit vote in June and the even greater surprise of the Trump election in November, we would point out these events offered disciplined investors compelling opportunities to add value.
The Fund strives to combine added value from both stock selection and asset allocation with the goal of producing more consistent as well as robust returns over time. Stock selection continued to be challenging in nearly every asset class while asset allocation and risk management had one of its finest years since inception of the Fund. The Brexit vote and the U.S. election created a great deal of short term disruption in markets which opens the door for one of our favorite investment disciplines – to rebalance into market over-reaction. The Brexit vote pushed the British pound sharply lower relative to nearly every world currency and the Euro itself was also shaken by the vote which was seen as a negative referendum on the currency itself. From the vantage point of a long term equity investor, European shares that were already inexpensive relative to American and Asian counterparts with equivalent growth prospects, were marked down to attractive levels for several weeks. We brought UK and European equities back to pre-Brexit targets and enjoyed the benefits well into the first quarter of 2017.
Risk balancing played an important strategic role for us during the U.S. election. We have been overweight to U.S. banks for some time feeling that we were both protecting the Fund's investments from surprise re-inflation (banks would profit from rising interest rates associated with inflation) and would offset a potential fall in non-U.S. dollar currency that would accompany strong U.S. economic growth. The election of Donald Trump also brought with it the possibility of banking de-regulation along with a surprise interest rate increase. The surge in bank shares helped produce one of the strongest quarters in the Fund's history. We sold down bank stocks in the fourth quarter, but we added to the Fund's European financials in the first quarter for similar reasons – interest rate risk protection but at a much more affordable price than in the United States.
Election losers turn around in early 2017: Health care stocks, whose share prices split dramatically along the lines of the Affordable Care Act winners and losers following the Trump victory, reversed course in the first quarter of 2017. Failure to repeal and replace the Affordable Care Act was a surprise, however, and that failure diminished expectations somewhat for strengthening the insurance foundation of the health care industry. Efforts to adjust U.S. corporate tax code replaced the efforts to repeal the Affordable Care Act. As a result, health care stock selection was the most difficult area for the Fund post-election, but strong markets kept the share prices steady.
Bond markets remain supportive as central bank policies evolve: So far the potential for budget-straining expenditures on infrastructure and the inevitable reversal of central bank quantitative easing and balance sheet maintenance has not been felt in the bond market. Corporate bond and high yield debt markets in the U.S. and in Europe have been accommodating. While anxiety has been increasing within the Eurozone as French elections loom in May, yields on sovereign debt have been relatively unaffected. Interest rate sensitive "bond surrogates" regained leadership as rate pressures eased through the quarter.
Outlook and Strategy – Spring and Summer – 2017
When the best sources of investment perspective tell you that what is happening in Washington, DC on policy will likely drive investment returns in 2017, the NASCAR yellow caution flag should immediately be waved. Let the flag waving begin, because the summer news headlines will likely be dominated by Washington-centric tax policy issues.
The good news, first and foremost, is that corporate tax policy reform in the United States could yield a near-term dividend and long-term improvement in capital allocation that would likely stimulate stalled productivity growth. We find it healthy that the strange distortions our tax code now creates for U.S. companies that do business in foreign markets – which is just about any sizable corporation outside of the electric utilities industry – may actually be resolved within the next year.
For better and for worse, a significant share of the world's economic activity is controlled by a narrowing group of global enterprises generating profits in multiple locations around the world. A growing portion of those profits earned by U.S. companies outside of the United States are not "brought back" to this country for a very rational reason – they would be taxed at a 35% rate, a rate higher than nearly every other country in the world. Capital Economics of London recently estimated that around $2.5 trillion of cash from these repatriated profits are invested overseas – where companies have logically and legally sheltered those profits. That sum is over six times higher than a similar estimate of $400 million made in 2002. Many of these "global brand exporters" would stand to benefit from a corporate "tax holiday" that the Trump administration has been promoting.
Many other issues will be influencing share prices in the next few months, not the least of which includes the presidential election in France, which has become, in part, a referendum on the Euro. We are watching for financial strains that may emanate from a bad outcome. Interest rates have dropped further in the U.S. and worldwide over the past month, and we don't necessarily think that's good news.
Our only changes in the Fund's portfolio in the first quarter included a small increase in emerging markets exposure, specifically we added exposure to Mexico and an increase in European financials with proceeds from gains taken from International Small Cap stocks and larger European stocks. These shifts are consistent with our approach to rebalancing. We also added to the Fund's position in U.S. small cap value stocks for their potential defensive qualities.
Sincerely,
Jeffrey P. Davis
Portfolio Manager
LMCG Investments, LLC
INVESTMENT CONSIDERATIONS
Equity Risk - The Fund's equity holdings, including common stocks, may decline in value. The value of a security may decline for a number of reasons, which are detailed in the prospectus.
Foreign & Emerging Markets Investing Risks - As a result of political or economic instability in foreign coun-tries, there can be special risks associated with investing in foreign securities, including fluctuations in currency exchange rates, increased price volatility and difficulty obtaining information. In addition, emerging markets may present additional risk due to potential for greater economic and political instability in less developed countries.
Market Events Risk - Turbulence in the financial markets and reduced liquidity in equity, credit and fixed-income markets may negatively affect issuers, which could adversely affect the Fund.
There can be no guarantee that any strategy (risk management or otherwise) will be successful. All investing involves risk, including the potential loss of principal.
The following chart reflects the change in the value of a hypothetical $100,000 investment in Institutional Shares, including reinvested dividends and distributions, in the LMCG Global MultiCap Fund (the "Fund") compared with the performance of the benchmark, the MSCI All Country World Investable Market Index (the "MSCI ACWI"), since inception. The MSCI ACWI is a stock market index that is designed to measure the equity market performance of developed and emerging markets. The total return of the MSCI ACWI includes the reinvestment of dividends and income. The total return of the Fund includes operating expenses that reduce returns, while the total return of the MSCI ACWI does not include expenses. The Fund is professionally managed, while the MSCI ACWI is unmanaged and is not available for investment.
Comparison of Change in Value of a $100,000 Investment
LMCG Global MultiCap Fund - Institutional Shares vs. MSCI All Country World Investable Market Index
| Average Annual Total Returns | | | | |
| Periods Ended March 31, 2017 | | One Year | | Since Inception(1) |
| LMCG Global MultiCap Fund — Institutional Shares | | 18.11 | % | | 7.37 | % |
LMCG Global MultiCap Fund — Investor Shares (2) | | 17.76 | % | | 7.19 | % |
MSCI All Country World Investable Market Index (3) | | 15.37 | % | | 6.95 | % |
(1) Institutional Shares commenced operations on September 11, 2013, and Investor Shares commenced operations on March 3, 2015.
| (2) | Performance for the since inception period is a blended average annual return, which include the returns of the Institutional Shares prior to the commencement of the Investor Shares. |
| (3) | MSCI All Country World Investable Market Index, net of foreign withholding taxes (reflects no deduction for fees or expenses). |
Performance data quoted represents past performance and is no guarantee of future results. Current performance may be lower or higher than the performance data quoted. Investment return and principal value will fluctuate so that shares, when redeemed, may be worth more or less than original cost. For the most recent month-end performance, please call (877) 591-4667. As stated in the Fund's prospectus, the annual operating expense ratio (gross) for Investor Shares and Institutional Shares is 149.96% and 16.24%, respectively. However, LMCG Investments, LLC (the "Adviser") has agreed to contractually waive its fees and/or reimburse Fund expenses to limit total annual Fund operating expenses (excluding all taxes, interest, portfolio transaction expenses, acquired fund fees and expenses, proxy expenses and extraordinary expenses) of Investor Shares and Institutional Shares to 1.45% and 1.20%, respectively through at least July 31, 2017. The Fund may repay the Adviser for fees waived and expenses reimbursed pursuant to the expense cap if such payment is made within three years of the fees waived or reimbursed and the reimbursement does not cause the Fund's total annual operating expenses to exceed 1.45% and 1.20% for Investor Shares and Institutional Shares, respectively. The performance table and graph do not reflect the deduction of taxes that a shareholder would pay on Fund distributions or the redemption of Fund shares. Returns greater than one year are annualized.
| Shares | | Security Description | | Value | |
| Equity Securities - 97.2% |
| Common Stock - 96.2% |
| Australia - 0.3% |
| | 1,311 | | Downer EDI, Ltd. | | $ | 5,802 | |
| Austria - 0.2% |
| | 220 | | CA Immobilien Anlagen AG (a) | | 4,829 | |
| Belgium - 0.5% |
| | 84 | | Anheuser-Busch InBev SA/NV | | 9,204 | |
| Canada - 2.0% |
| | 200 | | Canadian National Railway Co. | | 14,763 | |
| | 594 | | Goldcorp, Inc. | | 8,666 | |
| | 200 | | Intact Financial Corp. | | 14,224 | |
| | | 37,653 | |
| China - 3.7% |
| | 56 | | Alibaba Group Holding, Ltd., ADR (a) | | 6,038 | |
| | 15,000 | | Bank of China, Ltd., Class H | | 7,459 | |
| | 9,000 | | Bank of Communications Co., Ltd., Class H | | 7,006 | |
| | 10,000 | | China Construction Bank Corp., Class H | | 8,057 | |
| | 11,000 | | Geely Automobile Holdings, Ltd. | | 16,858 | |
| | 3,300 | | Guangzhou R&F Properties Co., Ltd., Class H | | 5,156 | |
| | 13,000 | | Industrial & Commercial Bank of China, Ltd., Class H | | 8,507 | |
| | 400 | | Tencent Holdings, Ltd. | | 11,524 | |
| | | 70,605 | |
| Denmark - 0.6% |
| | 330 | | Danske Bank A/S | | 11,252 | |
| France - 3.6% |
| | 450 | | AXA SA | | 11,626 | |
| | 184 | | BNP Paribas SA | | 12,244 | |
| | 100 | | Nexity SA (a) | | 4,915 | |
| | 106 | | Sanofi | | 9,582 | |
| | 280 | | TOTAL SA | | 14,158 | |
| | 201 | | Vinci SA | | 15,961 | |
| | | 68,486 | |
| Germany - 4.4% |
| | 83 | | Allianz SE | | 15,392 | |
| | 146 | | BASF SE | | 14,456 | |
| | 111 | | Bayer AG | | 12,789 | |
| | 146 | | Daimler AG | | 10,775 | |
| | 143 | | SAP SE | | 14,029 | |
| | 118 | | Siemens AG | | 16,163 | |
| | | 83,604 | |
| Hong Kong - 0.3% |
| | 500 | | China Mobile, Ltd. | | 5,499 | |
| Shares | | Security Description | | Value | |
| India - 0.3% |
| | 393 | | Infosys, Ltd., ADR | | $ | 6,209 | |
| Ireland - 0.5% |
| | 219 | | AerCap Holdings NV (a) | | 10,067 | |
| Italy - 1.1% |
| | 980 | | Enel SpA | | 4,611 | |
| | 519 | | Eni SpA | | 8,498 | |
| | 2,895 | | Intesa Sanpaolo SpA | | 7,875 | |
| | | 20,984 | |
| Japan - 4.5% |
| | 300 | | Credit Saison Co., Ltd. | | 5,376 | |
| | 100 | | DIC Corp. | | 3,698 | |
| | 400 | | Honda Motor Co., Ltd. | | 12,076 | |
| | 195 | | Hoya Corp. | | 9,421 | |
| | 1,800 | | Mitsubishi UFJ Financial Group, Inc. | | 11,338 | |
| | 1,000 | | Penta-Ocean Construction Co., Ltd. | | 4,840 | |
| | 800 | | Sumitomo Electric Industries, Ltd. | | 13,299 | |
| | 205 | | Tokyo Seimitsu Co., Ltd. | | 6,473 | |
| | 1,000 | | Toray Industries, Inc. | | 8,900 | |
| | 200 | | Toyota Motor Corp. | | 10,855 | |
| | | 86,276 | |
| Malaysia - 0.4% |
| | 2,300 | | Tenaga Nasional Bhd | | 7,128 | |
| Malta - 0.2% |
| | 400 | | Kindred Group PLC, SDR | | 4,143 | |
| Mexico - 0.2% |
| | 1,800 | | Wal-Mart de Mexico SAB de CV | | 4,153 | |
| Netherlands - 1.9% |
| | 1,000 | | ING Groep NV | | 15,104 | |
| | 270 | | InterXion Holding NV (a) | | 10,681 | |
| | 198 | | Royal Dutch Shell PLC, ADR | | 10,441 | |
| | | 36,226 | |
| Norway - 0.1% |
| | 62 | | Leroy Seafood Group ASA | | 2,715 | |
| Russian Federation - 0.3% |
| | 170 | | Tatneft PJSC, ADR | | 6,264 | |
| Singapore - 0.5% |
| | 3,500 | | Singapore Press Holdings, Ltd. | | 8,882 | |
| South Africa - 0.3% |
| | 110 | | Capitec Bank Holdings, Ltd. | | 6,245 | |
| Shares | | Security Description | | Value | |
| South Korea - 2.4% |
| | 16 | | CJ CheilJedang Corp. | | $ | 5,051 | |
| | 80 | | Dongbu Insurance Co., Ltd. | | 4,579 | |
| | 42 | | Hyosung Corp. | | 5,090 | |
| | 97 | | Korea Electric Power Corp. | | 4,038 | |
| | 130 | | LG Electronics, Inc. | | 7,897 | |
| | 22 | | POSCO | | 5,714 | |
| | 7 | | Samsung Electronics Co., Ltd. | | 12,883 | |
| | | 45,252 | |
| Spain - 1.0% |
| | 3,000 | | Banco Santander SA (a) | | 18,364 | |
| Sweden - 0.9% |
| | 402 | | Investor AB, Class B | | 16,903 | |
| Switzerland - 1.9% |
| | 550 | | ABB, Ltd. | | 12,873 | |
| | 30 | | Flughafen Zuerich AG | | 6,392 | |
| | 216 | | Nestle SA | | 16,578 | |
| | | 35,843 | |
| Taiwan - 2.0% |
| | 5,680 | | China Life Insurance Co., Ltd. | | 5,617 | |
| | 2,000 | | Formosa Chemicals & Fibre Corp. | | 6,222 | |
| | 2,442 | | Hon Hai Precision Industry Co., Ltd. | | 7,324 | |
| | 3,000 | | Nan Ya Plastics Corp. | | 7,108 | |
| | 2,000 | | Taiwan Semiconductor Manufacturing Co., Ltd. | | 12,541 | |
| | | 38,812 | |
| Thailand - 0.3% |
| | 600 | | PTT PCL, NVDR | | 6,757 | |
| United Kingdom - 6.0% |
| | 420 | | BHP Billiton PLC | | 6,478 | |
| | 2,184 | | BP PLC | | 12,571 | |
| | 178 | | British American Tobacco PLC | | 11,810 | |
| | 430 | | GlaxoSmithKline PLC | | 8,941 | |
| | 2,107 | | HSBC Holdings PLC | | 17,187 | |
| | 322 | | Liberty Global PLC, Class C (a) | | 11,283 | |
| | 13,000 | | Lloyds Banking Group PLC | | 10,812 | |
| | 534 | | Royal Dutch Shell PLC, Class B | | 14,679 | |
| | 82 | | Spirax-Sarco Engineering PLC | | 4,902 | |
| | 2,138 | | Taylor Wimpey PLC | | 5,171 | |
| | 79 | | Willis Towers Watson PLC | | 10,340 | |
| | | 114,174 | |
| United States - 55.8% |
| | 273 | | Abbott Laboratories | | 12,124 | |
| | 197 | | AbbVie, Inc. | | 12,837 | |
| | 42 | | Acuity Brands, Inc. | | 8,568 | |
| | 559 | | AES Corp. | | 6,250 | |
| | 123 | | Akamai Technologies, Inc. (a) | | 7,343 | |
| | 33 | | Alphabet, Inc., Class A (a) | | 27,977 | |
| Shares | | Security Description | | Value | |
| |
| | 25 | | Amazon.com, Inc. (a) | | $ | 22,164 | |
| | 126 | | Ameriprise Financial, Inc. | | 16,340 | |
| | 86 | | Anthem, Inc. | | 14,223 | |
| | 247 | | Apache Corp. | | 12,693 | |
| | 154 | | Apogee Enterprises, Inc. | | 9,180 | |
| | 268 | | Apple, Inc. | | 38,501 | |
| | 573 | | Applied Materials, Inc. | | 22,290 | |
| | 189 | | Beacon Roofing Supply, Inc. (a) | | 9,291 | |
| | 180 | | Berry Plastics Group, Inc. (a) | | 8,743 | |
| | 279 | | BorgWarner, Inc. | | 11,659 | |
| | 589 | | Brixmor Property Group, Inc. REIT | | 12,640 | |
| | 282 | | Capital One Financial Corp. | | 24,438 | |
| | 276 | | Carrizo Oil & Gas, Inc. (a) | | 7,910 | |
| | 214 | | Cavium, Inc. (a) | | 15,335 | |
| | 87 | | Charles River Laboratories International, Inc. (a) | | 7,826 | |
| | 72 | | Chevron Corp. | | 7,731 | |
| | 341 | | Cisco Systems, Inc. | | 11,526 | |
| | 170 | | Clean Harbors, Inc. (a) | | 9,455 | |
| | 128 | | Danaher Corp. | | 10,948 | |
| | 672 | | Darling Ingredients, Inc. (a) | | 9,757 | |
| | 217 | | Dick's Sporting Goods, Inc. | | 10,559 | |
| | 124 | | Dollar General Corp. | | 8,647 | |
| | 116 | | DTE Energy Co. | | 11,845 | |
| | 251 | | Envision Healthcare Corp. (a) | | 15,391 | |
| | 140 | | Euronet Worldwide, Inc. (a) | | 11,973 | |
| | 626 | | Fifth Third Bancorp | | 15,900 | |
| | 61 | | Gartner, Inc. (a) | | 6,587 | |
| | 618 | | General Electric Co. | | 18,416 | |
| | 146 | | Gilead Sciences, Inc. | | 9,916 | |
| | 146 | | Hexcel Corp. | | 7,964 | |
| | 157 | | INC Research Holdings, Inc., Class A (a) | | 7,199 | |
| | 428 | | Intel Corp. | | 15,438 | |
| | 298 | | ITT, Inc. | | 12,224 | |
| | 158 | | j2 Global, Inc. | | 13,258 | |
| | 311 | | JPMorgan Chase & Co. | | 27,318 | |
| | 249 | | KAR Auction Services, Inc. | | 10,874 | |
| | 80 | | M&T Bank Corp. | | 12,378 | |
| | 60 | | MarketAxess Holdings, Inc. | | 11,249 | |
| | 161 | | MAXIMUS, Inc. | | 10,014 | |
| | 239 | | Merck & Co., Inc. | | 15,186 | |
| | 521 | | Micron Technology, Inc. (a) | | 15,057 | |
| | 238 | | Microsoft Corp. | | 15,675 | |
| | 202 | | Murphy USA, Inc. (a) | | 14,831 | |
| | 117 | | National Beverage Corp. (a) | | 9,890 | |
| | 86 | | Nevro Corp. (a) | | 8,058 | |
| | 222 | | Nexstar Media Group, Inc. | | 15,573 | |
| | 192 | | Pacira Pharmaceuticals, Inc. (a) | | 8,755 | |
| | 272 | | Patterson Cos., Inc. | | 12,303 | |
| | 366 | | Pfizer, Inc. | | 12,521 | |
| | 45 | | Pioneer Natural Resources Co. | | 8,380 | |
| | Level 1 | | Level 2 | | Level 3 | | Total | |
| Investments At Value |
| Common Stock | | | | | | | | | | | | | | | | |
| Australia | | $ | - | | | $ | 5,802 | | | $ | - | | | $ | 5,802 | |
| Austria | | | - | | | | 4,829 | | | | - | | | | 4,829 | |
| Belgium | | | - | | | | 9,204 | | | | - | | | | 9,204 | |
| Canada | | | 37,653 | | | | - | | | | - | | | | 37,653 | |
| China | | | 6,038 | | | | 64,567 | | | | - | | | | 70,605 | |
| Denmark | | | - | | | | 11,252 | | | | - | | | | 11,252 | |
| France | | | - | | | | 68,486 | | | | - | | | | 68,486 | |
| Germany | | | - | | | | 83,604 | | | | - | | | | 83,604 | |
| Hong Kong | | | - | | | | 5,499 | | | | - | | | | 5,499 | |
| India | | | 6,209 | | | | - | | | | - | | | | 6,209 | |
| Ireland | | | 10,067 | | | | - | | | | - | | | | 10,067 | |
| Italy | | | - | | | | 20,984 | | | | - | | | | 20,984 | |
| Japan | | | - | | | | 86,276 | | | | - | | | | 86,276 | |
| Malaysia | | | - | | | | 7,128 | | | | - | | | | 7,128 | |
| Malta | | | - | | | | 4,143 | | | | - | | | | 4,143 | |
| Mexico | | | 4,153 | | | | - | | | | - | | | | 4,153 | |
| Netherlands | | | 21,122 | | | | 15,104 | | | | - | | | | 36,226 | |
| Norway | | | - | | | | 2,715 | | | | - | | | | 2,715 | |
| Russian Federation | | | 6,264 | | | | - | | | | - | | | | 6,264 | |
| Singapore | | | - | | | | 8,882 | | | | - | | | | 8,882 | |
| South Africa | | | - | | | | 6,245 | | | | - | | | | 6,245 | |
| South Korea | | | - | | | | 45,252 | | | | - | | | | 45,252 | |
| Spain | | | - | | | | 18,364 | | | | - | | | | 18,364 | |
| Sweden | | | - | | | | 16,903 | | | | - | | | | 16,903 | |
| Switzerland | | | - | | | | 35,843 | | | | - | | | | 35,843 | |
| Taiwan | | | - | | | | 38,812 | | | | - | | | | 38,812 | |
| Thailand | | | - | | | | 6,757 | | | | - | | | | 6,757 | |
| United Kingdom | | | 21,623 | | | | 92,551 | | | | - | | | | 114,174 | |
| United States | | | 1,064,958 | | | | - | | | | - | | | | 1,064,958 | |
| Preferred Stock | | | | | | | | | | | | | | | | |
| Brazil | | | 17,718 | | | | - | | | | - | | | | 17,718 | |
| Exchange Traded Note | | | 7,926 | | | | - | | | | - | | | | 7,926 | |
| Rights | | | 5 | | | | - | | | | - | | | | 5 | |
| Investment Companies | | | 25,155 | | | | - | | | | - | | | | 25,155 | |
| Money Market Fund | | | - | | | | 7,273 | | | | - | | | | 7,273 | |
| Total Investments At Value | | $ | 1,228,891 | | | $ | 666,475 | | | $ | - | | | $ | 1,895,366 | |
The Fund utilizes the end of period methodology when determining transfers. There were no transfers among Level 1, Level 2 and Level 3 for the year ended March 31, 2017.
At March 31, 2017, foreign securities representing the following percentage of net assets of the Fund were fair valued by independent pricing services and are classified as using Level 2 inputs within the valuation inputs disclosure on the Fund's Schedule of Investments:
LMCG Global MultiCap Fund
Long Securities 34.52%
| PORTFOLIO HOLDINGS | | |
| % of Total Investments | | |
| Australia | 0.3 | % |
| Austria | 0.3 | % |
| Belgium | 0.5 | % |
| Brazil | 0.9 | % |
| Canada | 2.0 | % |
| China | 3.7 | % |
| Denmark | 0.6 | % |
| France | 3.6 | % |
| Germany | 4.4 | % |
| Hong Kong | 0.3 | % |
| India | 0.3 | % |
| Ireland | 0.5 | % |
| Italy | 1.1 | % |
| Japan | 4.6 | % |
| Malaysia | 0.4 | % |
| Malta | 0.2 | % |
| Mexico | 0.2 | % |
| Netherlands | 1.9 | % |
| Norway | 0.1 | % |
| Russian Federation | 0.3 | % |
| Singapore | 0.5 | % |
| South Africa | 0.3 | % |
| South Korea | 2.4 | % |
| Spain | 1.0 | % |
| Sweden | 0.9 | % |
| Switzerland | 1.9 | % |
| Taiwan | 2.1 | % |
| Thailand | 0.4 | % |
| United Kingdom | 6.0 | % |
| United States** | 58.3 | % |
| | 100.0 | % |
| ASSETS | | | | |
| . | Total investments, at value (Cost $1,652,401) | | $ | 1,895,366 | |
| | Foreign currency (Cost $9,373) | | | 9,345 | |
| | Receivables: | | | | |
| | | Dividends | | | 3,778 | |
| | | From investment adviser | | | 17,334 | |
| | Prepaid expenses | | | 22,081 | |
| Total Assets | | | 1,947,904 | |
| | | | | | | |
| LIABILITIES | | | | |
| | | Foreign capital gains tax payable | | | 137 | |
| | Accrued Liabilities: | | | | |
| | | Trustees' fees and expenses | | | 7 | |
| | | Fund services fees | | | 9,149 | |
| | | Professional fees | | | 19,320 | |
| | | Other expenses | | | 9,838 | |
| Total Liabilities | | | 38,451 | |
| | | | | | | |
| NET ASSETS | | $ | 1,909,453 | |
| | | | | | | |
| COMPONENTS OF NET ASSETS | | | | |
| | Paid-in capital | | $ | 1,633,459 | |
| | Distributions in excess of net investment income | | | (4,090 | ) |
| | Accumulated net realized gain | | | 37,256 | |
| | Net unrealized appreciation | | | 242,828 | |
| NET ASSETS | | $ | 1,909,453 | |
| | | | | | | |
| SHARES OF BENEFICIAL INTEREST AT NO PAR VALUE (UNLIMITED SHARES AUTHORIZED) | | | | |
| | Investor Shares | | | 4,329 | |
| | Institutional Shares | | | 154,781 | |
| | | | | | | |
| NET ASSET VALUE, OFFERING AND REDEMPTION PRICE PER SHARE | | | | |
| | Investor Shares (based on net assets of $51,795) | | $ | 11.96 | |
| | Institutional Shares (based on net assets of $1,857,658) | | $ | 12.00 | |
See Notes to Financial Statements. | 26 | |
| INVESTMENT INCOME | | | | | |
| | Dividend income (Net of foreign withholding taxes of $5,631) | . | | $ | 39,165 | |
| Total Investment Income | | | | 39,165 | |
| | | | | | |
| EXPENSES | | | | | |
| | Investment adviser fees | | | 15,740 | |
| | Fund services fees | | | 185,038 | |
| | Transfer agent fees: | | | | |
| | Investor Shares | | | 2,496 | |
| | Institutional Shares | | | 2,567 | |
| | Distribution fees: | | | | |
| | Investor Shares | | | 51 | |
| | Custodian fees | | | 25,494 | |
| | Registration fees: | | | | |
| | Investor Shares | | | 15,752 | |
| | Institutional Shares | | | 16,040 | |
| | Professional fees | | | 25,223 | |
| | Trustees' fees and expenses | | | 5,841 | |
| | Pricing fees | | | 20,162 | |
| | Other expenses | | | 22,560 | |
| Total Expenses | | | | 336,964 | |
| | Fees waived and expenses reimbursed | | | (314,692 | ) |
| Net Expenses | | | | 22,272 | |
| | | | | | | |
| NET INVESTMENT INCOME | | | | 16,893 | |
| | | | | | | |
| NET REALIZED AND UNREALIZED GAIN (LOSS) | | | | | |
| | Net realized gain (loss) on: | | | | |
| | Investments | | | 72,741 | |
| | Foreign currency transactions | | | (221 | ) |
| | Net realized gain | | | 72,520 | |
| | Net change in unrealized appreciation (depreciation) on: | | | | |
| | Investments | | | 222,308 | |
| | Deferred foreign capital gains taxes | | | (137 | ) |
| | Foreign currency translations | | | (31 | ) |
| | Net change in unrealized appreciation (depreciation) | | | 222,140 | |
| NET REALIZED AND UNREALIZED GAIN | | | | 294,660 | |
| INCREASE IN NET ASSETS RESULTING FROM OPERATIONS | | | $ | 311,553 | |
| | | | | For the Year Ended March 31, 2017 | | | For the Year Ended March 31, 2016 |
| OPERATIONS | | | | | | | | | |
| | Net investment income | | $ | 16,893 | | | | $ | 18,784 | |
| | Net realized gain | | | 72,520 | | | | | 8,599 | |
| | Net change in unrealized appreciation (depreciation) | | | 222,140 | | | | | (127,513 | ) |
| Increase (Decrease) in Net Assets Resulting from Operations | | | 311,553 | | | | | (100,130 | ) |
| | | | | | | | | | | | |
| DISTRIBUTIONS TO SHAREHOLDERS FROM | | | | | | | | | |
| | Net investment income: | | | | | | | | | |
| | | Investor Shares | | | (440 | ) | | | | (120 | ) |
| | | Institutional Shares | | | (18,893 | ) | | | | (27,011 | ) |
| | Net realized gain: | | | | | | | | | |
| | | Investor Shares | | | (92 | ) | | | | (116 | ) |
| | | Institutional Shares | | | (14,248 | ) | | | | (22,499 | ) |
| Total Distributions to Shareholders | | | (33,673 | ) | | | | (49,746 | ) |
| | | | | | | | | | | | |
| CAPITAL SHARE TRANSACTIONS | | | | | | | | | |
| | Sale of shares: | | | | | | | | | |
| | | Investor Shares | | | 39,350 | | | | | 400 | |
| | | Institutional Shares | | | 268,003 | | | | | 41,000 | |
| | Reinvestment of distributions: | | | | | | | | | |
| | | Investor Shares | | | 532 | | | | | 237 | |
| | | Institutional Shares | | | 33,141 | | | | | 49,510 | |
| | Redemption of shares: | | | | | | | | | |
| | 1 | Investor Shares | | | (1,498 | ) | | | | - | |
| | 2 | Institutional Shares | | | (532,204 | ) | | | | (9,000 | ) |
| Increase (Decrease) in Net Assets from Capital Share Transactions | | (192,676 | ) | | | | 82,147 | |
| Increase (Decrease) in Net Assets | | | 85,204 | | | | | (67,729 | ) |
| | | | | | | | | | | | |
| NET ASSETS | | | | | | | | | |
| | Beginning of Year | | | 1,824,249 | | | | | 1,891,978 | |
| | End of Year (Including line (a)) | | $ | 1,909,453 | | | | $ | 1,824,249 | |
| | | | | | | | | | | | |
| SHARE TRANSACTIONS | | | | | | | | | |
| | Sale of shares: | | | | | | | | | |
| | | Investor Shares | | | 3,470 | | | | | 38 | |
| | | Institutional Shares | | | 25,015 | | | | | 3,699 | |
| | Reinvestment of distributions: | | | | | | | | | |
| | | Investor Shares | | | 48 | | | | | 23 | |
| | | Institutional Shares | | | 2,936 | | | | | 4,752 | |
| | Redemption of shares: | | | | | | | | | |
| | | Investor Shares | | | (136 | ) | | | | - | |
| | | Institutional Shares | | | (48,560 | ) | | | | (893 | ) |
| Increase (Decrease) in Shares | | | (17,227 | ) | | | | 7,619 | |
| | | | | | | | | | | | |
| (a) | Distributions in excess of net investment income | | $ | (4,090 | ) | | | $ | (5,113 | ) |
| These financial highlights reflect selected data for a share outstanding throughout each period. |
| | | For the Year Ended March 31, 2017 | | For the Year Ended March 31, 2016 | | March 3, 2015 (a) Through March 31, 2015 | |
| INVESTOR SHARES | | | | | | | | | | | | |
| NET ASSET VALUE, Beginning of Period | $ | 10.34 | | | $ | 11.21 | | | $ | 11.29 | | |
| INVESTMENT OPERATIONS | | | | | | | | | | | | |
| Net investment income (b) | | 0.05 | | | | 0.08 | | | | 0.02 | | |
| Net realized and unrealized gain (loss) | | 1.77 | | | | (0.69 | ) | | | (0.10 | )(c) |
| Total from Investment Operations | | 1.82 | | | | (0.61 | ) | | | (0.08 | ) | |
| DISTRIBUTIONS TO | | | | | | | | | | | | |
| SHAREHOLDERS FROM | | | | | | | | | | | | |
| Net investment income | | (0.11 | ) | | | (0.13 | ) | | | — | | |
| Net realized gain | | (0.09 | ) | | | (0.13 | ) | | | — | | |
| Total Distributions to Shareholders | | (0.20 | ) | | | (0.26 | ) | | | — | | |
| NET ASSET VALUE, End of Period | $ | 11.96 | | | $ | 10.34 | | | $ | 11.21 | | |
| TOTAL RETURN | | 17.76 | % | | (5.39 | )% | | (0.71 | )%(d) |
| | | | | | | | | | | | | |
| RATIOS/SUPPLEMENTARY DATA | | | | | | | | | | | | |
| Net Assets at End of Period (000's omitted) | $52 | | | $10 | | | $10 | | |
| Ratios to Average Net Assets: | | | | | | | | | | | | |
| Net investment income | | 0.48 | % | | 0.77 | % | | 2.45 | %(e) |
| Net expenses | | 1.45 | % | | 1.45 | % | | 1.45 | %(e) |
| Gross expenses (f) | | 110.82 | % | | 149.94 | % | | 31.89 | %(e) |
| PORTFOLIO TURNOVER RATE | | 73 | % | | 44 | % | | 74 | %(d) |
| | | | | | | | | | | | | | |
| (a) | Commencement of operations. |
| (b) | Calculated based on average shares outstanding during each period. |
| (c) | Per share amount does not reflect the actual net realized and unrealized gain/(loss) for the year due to the timing of Fund share sales and the amount of per share realized and unrealized gains and losses at such time. |
| (d) | Not annualized. |
| (e) | Annualized. |
| (f) | Reflects the expense ratio excluding any waivers and/or reimbursements. |
See Notes to Financial Statements. | 29 | |
| These financial highlights reflect selected data for a share outstanding throughout each period. | | |
| | | For the Year Ended March 31, 2017 | | For the Year Ended March 31, 2016 | | For the Year Ended March 31, 2015 | | September 11, 2013 (a) Through March 31, 2014 |
| INSTITUTIONAL SHARES | | | | | | | | | | | | | | | | |
| NET ASSET VALUE, Beginning of Period | $ | 10.35 | | | $ | 11.21 | | | $ | 10.80 | | | $ | 10.00 | | |
| INVESTMENT OPERATIONS | | | | | | | | | | | | | | | | |
| Net investment income (b) | | 0.10 | | | | 0.11 | | | | 0.10 | | | | 0.02 | | |
| Net realized and unrealized gain (loss) | | 1.76 | | | | (0.68 | ) | | | 0.49 | | | | 0.86 | | |
| Total from Investment Operations | | 1.86 | | | | (0.57 | ) | | | 0.59 | | | | 0.88 | | |
| DISTRIBUTIONS TO | | | | | | | | | | | | | | | | |
| SHAREHOLDERS FROM | | | | | | | | | | | | | | | | |
| Net investment income | | (0.12 | ) | | | (0.16 | ) | | | (0.08 | ) | | | (0.06 | ) | |
| Net realized gain | | (0.09 | ) | | | (0.13 | ) | | | (0.10 | ) | | | (0.02 | ) | |
| Total Distributions to Shareholders | | (0.21 | ) | | | (0.29 | ) | | | (0.18 | ) | | | (0.08 | ) | |
| NET ASSET VALUE, End of Period | $ | 12.00 | | | $ | 10.35 | | | $ | 11.21 | | | $ | 10.80 | | |
| TOTAL RETURN | | 18.11 | % | | (5.11 | )% | | 5.57 | % | | 8.79 | %(c) |
| | | | | | | | | | | | | | | | | |
| RATIOS/SUPPLEMENTARY DATA | | | | | | | | | | | | | | | | |
| Net Assets at End of Period (000's omitted) | $1,858 | | | $1,814 | | | $1,882 | | | $1,344 | | |
| Ratios to Average Net Assets: | | | | | | | | | | | | | | | | |
| Net investment income | | 0.92 | % | | 1.02 | % | | 0.95 | % | | 0.31 | %(d) |
| Net expenses | | 1.20 | % | | 1.20 | % | | 1.20 | % | | 1.20 | %(d) |
| Gross expenses (e) | | 17.14 | % | | 16.22 | % | | 17.65 | % | | 24.97 | %(d) |
| PORTFOLIO TURNOVER RATE | | 73 | % | | 44 | % | | 74 | % | | 32 | %(c) |
| | | | | | | | | | | | | | | | | | |
| (a) | Commencement of operations. |
| (b) | Calculated based on average shares outstanding during each period. |
| (c) | Not annualized. |
| (d) | Annualized. |
| (e) | Reflects the expense ratio excluding any waivers and/or reimbursements. |
Dear Shareholder:
The LMCG International Small Cap Fund (the "Fund") Institutional Shares gained 10.55% in the 12-month period ending March 31, 2017, slightly trailing the MSCI EAFE Small Cap Index (the "Index") return of 10.99%. Since inception, the Institutional Shares have gained 12.30% vs. 10.06% for the Index, both on an annualized basis. Under normal circumstances the Fund invests at least 80% of its assets in the equity securities of small-cap companies. The Fund considers companies small cap which at the time of purchase fall within the range of the Index. At an index level, the performance of international small-cap companies slightly lagged their large-cap counterparts, with the MSCI EAFE Index advancing 11.67% in the one year period.
As of March 31, 2017, the average annual five year return for the Institutional Shares was 11.75% vs. 9.20% for the Index. The performance data quoted represents past performance and is no guarantee of future results. Investment return and principal value of an investment will fluctuate so that an investor's shares, when redeemed, may be worth more or less than their original cost. Current performance may be lower or higher than the performance data quoted. For the most recent month-end performance, please call (877) 591-4667.
Inception 8/26/2010. The Fund has adopted the historical performance of LMCG International Small Cap Collective Fund, a separate collective investment fund of LMCG Collective Trust (the "Predecessor Fund") managed by LMCG Investments, LLC as the result of a reorganization in which the Fund acquired all of the assets, subject to liabilities, of the Predecessor Fund, effective as of the close of business on March 31, 2016. The returns presented for the Fund prior to this date reflect the performance of the Predecessor Fund. The Predecessor Fund commenced operations on August 26, 2010. The Predecessor Fund had an investment objective and strategies that were, in all material respects, equivalent to those of the Fund. The Predecessor Fund was not registered as an investment company under the Investment Company Act of 1940, and therefore the Predecessor Fund was not subject to certain investment limitations, diversification requirements, liquidity requirements, and other restrictions imposed by the Investment Company Act of 1940 and the Internal Revenue Code of 1986 which, if applicable, may have adversely affected its performance. The Fund's performance for periods prior to the commencement of operations, as that of the Predecessor Fund, was based on calculations that are different from the standardized method of calculations adopted by the Securities and Exchange Commission (the "SEC"). The performance of the Predecessor Fund was calculated net of the Predecessor Fund's fees and expenses. The performance of the Predecessor Fund is not the perfor-mance information of the Fund, and has not been restated to reflect the fees, estimated expenses and fee waivers and/or expense limitations of the Fund. If the performance of the Predecessor Fund had been restated to reflect the applicable fees and expenses of the Fund, the performance may have been lower than the performance shown.
The year included some significant macro events; the UK's Brexit vote in late June and the U.S. presidential election in November. While April and May were fairly benign months in the U.S. and international equity markets, volatility returned with a vengeance in June in the run-up to the Brexit vote. The Fund struggled in this April – June period, as fundamentals drove markets seemingly less than headlines. The strategy is managed using a quantitative approach that seeks to add value primarily through stock selection while minimizing market risk. Stocks are selected using a multi-factor model that has three major components: Market Dynamics, Valuation and Earnings Quality. For this reason, the model typically has been more robust in periods where fundamentals drive security prices.
The post-Brexit rebound in the third quarter of 2016 was beneficial to international small cap stocks and the Fund advanced over 8.0% – in line with the Index. The Institutional Shares returned -4.19% (vs. -2.85% for the Index) in the final quarter of 2016 as the strong U.S. dollar provided a headwind to U.S. investors in international company funds. While most small cap company revenues are not as impacted as multinational large cap companies, translating stocks priced in local currencies back to a stronger dollar hurts performance. Macro events (including the U.S. presidential election) and investor sentiment again appeared to drive the markets more than fundamentals. While the Valuation factor was fairly robust in the last three months of 2016, Market Dynamics and Quality were less so in the headline-driven markets.
Global equity markets demonstrated strong performance in the first quarter of 2017, with both developed and emerging markets posting strong gains. The "Trump bump" rally continued into the New Year in the U.S. and most non-U.S. markets advanced as well. The U.S. dollar weakened – which benefitted the Fund as investments in local currencies were translated back to U.S. dollars. The Fund posted strong absolute and relative returns in this three-month period, returning 9.16% for Institutional Shares vs. 7.97% for the Index.
As of March 31, the Fund was well-diversified across more than 15 countries and 10 sectors. The largest country allocations in both the portfolio and the benchmark were Japan (approximately 25% in each) and the United Kingdom (over 15% in each). The Fund seeks to add value primarily from stock selection – not making significant over- or under-weight decisions versus countries or sectors. We believe that this is an important element of risk control in the portfolio and has historically resulted in the Fund having
similar volatility as the benchmark.
Attribution
Looking at performance through a country lens, the positive stock selection in Australia, the UK and Taiwan contributed the most to performance over the 12-month period. Stocks in Sweden, Denmark and Japan were the largest detractors. From a sector perspective, the vast majority of performance came from three sectors; Financials, Materials and Healthcare. Consumer Discretionary, Industrials and Technology stocks were the biggest laggards.
Model Efficacy
Analyzing the investment universe1 from a factor perspective, Valuation (V) was the largest contributor to performance over the one-year period, followed by Earnings Quality (Q). Market Dynamics (D) (which includes Earnings Revision and Price Momentum) was slightly negative for the same period. Most of the 12-month period was a "risk-on" environment, where Valuation typically responds favorably.
The graph shows the difference in payoffs of our model's three factors for the one-year period in the international small cap universe. This data is calculated by subtracting the 5th quintile stock performance for each factor from the performance of those in the 1st quintile. Payoffs in the Fund's portfolio vary from the model, since the Fund does not own all of the 1st quintile stocks, and owns stocks below the 1st quintile.
Outlook
Going forward, we are likely to continue to see events which could contribute to higher levels of macroeconomic uncertainty. In 2016, there was the Brexit vote in June, followed by the U.S. election in November. So far in 2017 the uncertainty is primarily related to the Trump administration's agenda and how much of it the Republicans will be successful in getting implemented. Based on history, we believe these events will continue to matter less to small-cap companies – especially international small-cap companies. As noted earlier – a benefit of smaller companies is that a larger percentage of their revenue tends to derive from local markets, so they are somewhat insulated from large geopolitical-type events that are more likely to impact multinational large-cap companies.
Sincerely,
| | |
| Gordon Johnson | Shannon Ericson | |
| Co-Portfolio Manager | Co-Portfolio Manager | |
| LMCG Investments, LLC | LMCG Investments, LLC | |
1 The investment universe is those companies in the MSCI EAFE Small Cap Index.
INVESTMENT CONSIDERATIONS
Equity Risk - The Fund's equity holdings, including common stocks, may decline in value. The value of a security may decline for a number of reasons, which are detailed in the prospectus.
Foreign & Emerging Markets Investing Risks - As a result of political or economic instability in foreign coun-tries, there can be special risks associated with investing in foreign securities, including fluctuations in currency exchange rates, increased price volatility and difficulty obtaining information. In addition, emerging markets may present additional risk due to potential for greater economic and political instability in less developed countries.
Market Events Risk - Turbulence in the financial markets and reduced liquidity in equity, credit and fixed-income markets may negatively affect issuers, which could adversely affect the Fund.
Small Cap Risk - The Fund's investments in small capitalization companies may be less liquid and their securities' prices may fluctuate more than those of larger, more established companies.
There can be no guarantee that any strategy (risk management or otherwise) will be successful. All investing involves risk, including the potential loss of principal.
The following chart reflects the change in the value of a hypothetical $100,000 investment in Institutional Shares, including reinvested dividends and distributions, in the LMCG International Small Cap Fund (the "Fund") compared with the performance of the benchmark, the MSCI EAFE Small Cap Index, since inception. The MSCI EAFE Small Cap Index is an equity index which captures small cap representation across Developed Market countries around the world, excluding the United States and Canada. The total return of the MSCI EAFE Small Cap Index includes the reinvestment of dividends and income. The total return of the Fund includes operating expenses that reduce returns, while the total return of the MSCI EAFE Small Cap Index does not include expenses. The Fund is professionally managed, while the MSCI EAFE Small Cap Index is unmanaged and is not available for investment.
Comparison of Change in Value of a $100,000 Investment
LMCG International Small Cap Fund - Institutional Shares vs. MSCI EAFE Small Cap Index
| Average Annual Total Returns | | | | | | Since Inception |
| Periods Ended March 31, 2017 | | One Year | | Five Years | | (8/26/10) |
| LMCG International Small Cap Fund — Institutional Shares* | | 10.55 | % | | 11.74 | % | | 12.29 | % |
| LMCG International Small Cap Fund — Investor Shares* | | 10.22 | % | | 11.67 | % | | 12.24 | % |
| MSCI EAFE Small Cap Index | | 10.99 | % | | 9.20 | % | | 10.06 | % |
| * | Institutional Shares commenced operations on April 1, 2016, and Investor Shares commenced operations on April 18, 2016. Performance for the periods prior to commencement reflects the performance and expenses of a collective investment trust previously managed by the Fund's Adviser and portfolio management team. This collective investment trust was organized and commenced operations on August 26, 2010. |
Performance data quoted represents past performance and is no guarantee of future results. Current performance may be lower or higher than the performance data quoted. Investment return and principal value will fluctuate so that shares, when redeemed, may be worth more or less than original cost. For the most recent month-end performance, please call (877) 591-4667. As stated in the Fund's prospectus, the estimated annual operating expense ratio (gross) for Investor Shares and Institutional Shares is 2.37% and 1.94%, respectively. However, LMCG Investments, LLC (the "Adviser") has agreed to contractually waive its fees and/or reimburse Fund expenses to limit total annual Fund operating expenses (excluding all taxes, interest, portfolio transactions expenses, dividend and interest expenses on short sales, acquired fund fees and expenses, proxy expenses and extraordinary expenses) of Investor Shares and Institutional Shares to 1.10% and 0.85%, respectively through at least July 31, 2017. The Fund may repay the Adviser for fees waived and expenses reimbursed pursuant to the expense cap if such payment is made within three years of the fees waived or reimbursed and the reimbursement does not cause the Fund's total annual operating expenses to exceed 1.10% and 0.85% for Investor Shares and Institutional Shares, respectively. The performance table and graph do not reflect the deduction of taxes that a shareholder would pay on Fund distributions or the redemption of Fund shares. Returns greater than one year are annualized.
| Shares | | Security Description | | Value | |
| Equity Securities - 91.7% |
| Common Stock - 91.0% |
| Australia - 9.1% |
| | 7,500 | | BlueScope Steel, Ltd. | | $ | 70,310 | |
| | 10,158 | | Charter Hall Group REIT | | 42,825 | |
| | 12,721 | | Charter Hall Retail REIT | | 42,180 | |
| | 49,487 | | Cleanaway Waste Management, Ltd. | | 45,359 | |
| | 11,054 | | Downer EDI, Ltd. | | 48,918 | |
| | 6,267 | | GrainCorp, Ltd., Class A | | 43,539 | |
| | 28,157 | | Metcash, Ltd. (a) | | 53,107 | |
| | 42,237 | | Myer Holdings, Ltd. | | 39,204 | |
| | 9,470 | | OZ Minerals, Ltd. | | 56,657 | |
| | 6,031 | | Seven Group Holdings, Ltd. | | 49,333 | |
| | 37,740 | | Sigma Pharmaceuticals, Ltd. | | 37,174 | |
| | 35,352 | | Southern Cross Media Group, Ltd. | | 37,793 | |
| | | 566,399 | |
| Austria - 2.0% |
| | 1,828 | | BUWOG AG (a) | | 46,066 | |
| | 1,674 | | CA Immobilien Anlagen AG (a) | | 36,744 | |
| | 5,678 | | UNIQA Insurance Group AG | | 44,060 | |
| | | 126,870 | |
| Belgium - 2.8% |
| | 6,471 | | AGFA-Gevaert NV (a) | | 31,617 | |
| | 1,141 | | Bekaert SA | | 55,717 | |
| | 1,639 | | bpost SA | | 38,454 | |
| | 1,008 | | D'ieteren SA/NV | | 47,165 | |
| | | 172,953 | |
| Canada - 0.8% |
| | 3,556 | | Celestica, Inc. (a) | | 51,669 | |
| China - 0.7% |
| | 46,000 | | Xinyi Glass Holdings, Ltd. | | 40,518 | |
| Denmark - 2.9% |
| | 876 | | FLSmidth & Co. A/S | | 46,776 | |
| | 1,137 | | Royal Unibrew A/S | | 47,882 | |
| | 777 | | SimCorp A/S | | 46,749 | |
| | 1,543 | | Topdanmark A/S (a) | | 39,129 | |
| | | 180,536 | |
| France - 3.5% |
| | 759 | | Ipsen SA | | 75,886 | |
| | 1,203 | | Neopost SA | | 46,126 | |
| | 834 | | Nexity SA (a) | | 40,991 | |
| | 560 | | Orpea | | 53,736 | |
| | | 216,739 | |
| Georgia - 0.7% |
| | 1,152 | | BGEO Group PLC | | 46,322 | |
| Germany - 5.8% |
| | 1,201 | | Aareal Bank AG | | 46,432 | |
| | 807 | | Aurubis AG | | 54,111 | |
| Shares | | Security Description | | Value | |
| Germany - (continued) |
| | 3,374 | | Kloeckner & Co. SE | | $ | 36,432 | |
| | 441 | | MTU Aero Engines AG | | 57,333 | |
| | 1,401 | | Salzgitter AG | | 50,641 | |
| | 880 | | STADA Arzneimittel AG | | 53,898 | |
| | 2,434 | | Suedzucker AG | | 60,998 | |
| | | 359,845 | |
| Hong Kong - 1.4% |
| | 5,600 | | Dah Sing Financial Holdings, Ltd. | | 42,664 | |
| | 10,500 | | Television Broadcasts, Ltd. | | 42,427 | |
| | | 85,091 | |
| Italy - 5.5% |
| | 30,337 | | A2A SpA | | 45,825 | |
| | 786 | | DiaSorin SpA | | 53,014 | |
| | 15,365 | | Hera SpA | | 42,682 | |
| | 13,017 | | Maire Tecnimont SpA | | 48,544 | |
| | 1,756 | | Recordati SpA | | 59,459 | |
| | 22,687 | | Saras SpA | | 43,320 | |
| | 6,338 | | Societa Cattolica di Assicurazioni SCRL | | 50,717 | |
| | | 343,561 | |
| Japan - 24.9% |
| | 3,000 | | Avex Group Holdings, Inc. | | 43,439 | |
| | 1,400 | | Coca-Cola Bottlers Japan, Inc. | | 45,234 | |
| | 2,300 | | Cosmo Energy Holdings Co., Ltd. | | 39,647 | |
| | 2,100 | | Credit Saison Co., Ltd. | | 37,634 | |
| | 20,000 | | Daikyo, Inc. | | 39,796 | |
| | 1,900 | | DIC Corp. | | 70,258 | |
| | 2,800 | | EDION Corp. | | 25,817 | |
| | 1,500 | | Furukawa Electric Co., Ltd. | | 53,964 | |
| | 2,500 | | Geo Holdings Corp. | | 27,497 | |
| | 6,000 | | Hazama Ando Corp. | | 40,383 | |
| | 2,400 | | Hitachi Maxell, Ltd. | | 43,863 | |
| | 13,100 | | JVC Kenwood Corp. | | 34,182 | |
| | 1,800 | | Kanamoto Co., Ltd. | | 48,457 | |
| | 21,000 | | Kanematsu Corp. | | 37,838 | |
| | 2,700 | | Kohnan Shoji Co., Ltd. | | 51,144 | |
| | 2,000 | | Lion Corp. | | 36,044 | |
| | 800 | | Matsumotokiyoshi Holdings Co., Ltd. | | 38,110 | |
| | 17,000 | | Mitsui Mining & Smelting Co., Ltd. | | 57,859 | |
| | 5,500 | | NET One Systems Co., Ltd. | | 44,646 | |
| | 4,000 | | Nichias Corp. | | 40,283 | |
| | 6,000 | | Nippon Electric Glass Co., Ltd. | | 36,346 | |
| | 4,800 | | Nippon Sheet Glass Co., Ltd. (a) | | 34,917 | |
| | 8,600 | | Nippon Suisan Kaisha, Ltd. | | 42,958 | |
| | 4,000 | | Nipro Corp. | | 56,491 | |
| | 5,000 | | Onward Holdings Co., Ltd. | | 34,354 | |
| | 24 | | Orix JREIT, Inc. REIT | | 37,999 | |
| | 4,000 | | Osaki Electric Co., Ltd. | | 34,795 | |
| | 8,000 | | Penta-Ocean Construction Co., Ltd. | | 38,717 | |
| | 8,000 | | Sankyu, Inc. | | 48,659 | |
| | 5,300 | | Shinko Electric Industries Co., Ltd. | | 35,573 | |
| | 4,600 | | Sodick Co., Ltd. | | 45,488 | |
| PLC | Public Limited Company |
| REIT | Real Estate Investment Trust |
| SDR | Swedish Depositary Receipt |
| (a) | Non-income producing security. |
| (b) | Variable rate security. Rate presented is as of March 31, 2017. |
* Cost for federal income tax purposes is $5,504,887 and net unrealized appreciation consists of:
| ASSETS | | | | |
| . | Total investments, at value (Cost $5,467,069) | | $ | 6,097,558 | |
| | Cash | | | 303 | |
| | Foreign currency (Cost $9,864) | | | 9,903 | |
| | Receivables: | | | | |
| | | Fund shares sold | | | 65,736 | |
| | | Investment securities sold | | | 40,034 | |
| | | Dividends | | | 28,607 | |
| | | From investment adviser | | | 33,325 | |
| | Prepaid expenses | | | 23,787 | |
| Total Assets | | | 6,299,253 | |
| | | | | | | |
| LIABILITIES | | | | |
| | Payables: | | | | |
| | | Investment securities purchased | | | 46,419 | |
| | Accrued Liabilities: | | | | |
| | | Trustees' fees and expenses | | | 21 | |
| | | Fund services fees | | | 7,113 | |
| | | Professional fees | | | 16,581 | |
| | | Other expenses | | | 14,291 | |
| Total Liabilities | | | 84,425 | |
| | | | | | | |
| NET ASSETS | | $ | 6,214,828 | |
| | | | | | | |
| COMPONENTS OF NET ASSETS | | | | |
| | Paid-in capital | | $ | 5,623,932 | |
| | Undistributed net investment income | | | 9,408 | |
| | Accumulated net realized loss | | | (48,970 | ) |
| | Net unrealized appreciation | | | 630,458 | |
| NET ASSETS | | $ | 6,214,828 | |
| | | | | | | |
| SHARES OF BENEFICIAL INTEREST AT NO PAR VALUE (UNLIMITED SHARES AUTHORIZED) | | | | |
| | Investor Shares | | | 3,922 | |
| | Institutional Shares | | | 575,493 | |
| | | | | | | |
| NET ASSET VALUE, OFFERING AND REDEMPTION PRICE PER SHARE | | | | |
| | Investor Shares (based on net assets of $42,021) | | $ | 10.71 | |
| | Institutional Shares (based on net assets of $6,172,807) | | $ | 10.73 | |
See Notes to Financial Statements. | 38 | |
| INVESTMENT INCOME | | | | | |
| | Dividend income (Net of foreign withholding taxes of $18,488) | . | | $ | 131,342 | |
| | Interest income | | | 35 | |
| Total Investment Income | | | | 131,377 | |
| | | | | | |
| EXPENSES | | | | | |
| | Investment adviser fees | | | 34,996 | |
| | Fund services fees | | | 183,626 | |
| | Transfer agent fees: | | | | |
| | Investor Shares | | | 2,850 | |
| | Institutional Shares | | | 3,111 | |
| | Distribution fees: | | | | |
| | Investor Shares | | | 77 | |
| | Custodian fees | | | 42,243 | |
| | Registration fees: | | | | |
| | Investor Shares | | | 224 | |
| | Institutional Shares | | | 624 | |
| | Professional fees | | | 30,143 | |
| | Trustees' fees and expenses | | | 4,110 | |
| | Offering costs | | | 91,620 | |
| | Pricing fees | | | 31,055 | |
| | Other expenses | | | 19,193 | |
| Total Expenses | | | | 443,872 | |
| | Fees waived and expenses reimbursed | | | (401,301 | ) |
| Net Expenses | | | | 42,571 | |
| | | | | | | |
| NET INVESTMENT INCOME | | | | 88,806 | |
| | | | | | | |
| NET REALIZED AND UNREALIZED GAIN (LOSS) | | | | | |
| | Net realized gain (loss) on: | | | | |
| | Investments | | | 29,786 | |
| | Foreign currency transactions | | | (1,962 | ) |
| | Net realized gain | | | 27,824 | |
| | Net change in unrealized appreciation (depreciation) on: | | | | |
| | Investments | | | 445,107 | |
| | Foreign currency translations | | | (31 | ) |
| | Net change in unrealized appreciation (depreciation) | | | 445,076 | |
| NET REALIZED AND UNREALIZED GAIN | | | | 472,900 | |
| INCREASE IN NET ASSETS RESULTING FROM OPERATIONS | | | $ | 561,706 | |
| | | | | | | |
| * | Commencement of operations was April 1, 2016. | | | | | |
| | | | | April 1, 2016* Through March 31, 2017 |
| OPERATIONS | | | | |
| | Net investment income | | $ | 88,806 | |
| | Net realized gain | | | 27,824 | |
| | Net change in unrealized appreciation (depreciation) | | | 445,076 | |
| Increase in Net Assets Resulting from Operations | | | 561,706 | |
| | | | | | | |
| DISTRIBUTIONS TO SHAREHOLDERS FROM | | | | |
| | Net investment income: | | | | |
| | | Investor Shares | | | (1,118 | ) |
| | | Institutional Shares | | | (155,074 | ) |
| Total Distributions to Shareholders | | | (156,192 | ) |
| | | | | | | |
| CAPITAL SHARE TRANSACTIONS | | | | |
| | Sale of shares: | | | | |
| | | Investor Shares | | | 62,205 | |
| | | Institutional Shares (See Note 1) | | | 5,985,369 | |
| | Reinvestment of distributions: | | | | |
| | | Investor Shares | | | 1,118 | |
| | | Institutional Shares | | | 155,074 | |
| | Redemption of shares: | | | | |
| | 1 | Investor Shares | | | (23,994 | ) |
| | 2 | Institutional Shares | | | (370,458 | ) |
| Increase in Net Assets from Capital Share Transactions | | | 5,809,314 | |
| Increase in Net Assets | | | 6,214,828 | |
| | | | | | | |
| NET ASSETS | | | | |
| | Beginning of Period | | | - | |
| | End of Period (Including line (a)) | | $ | 6,214,828 | |
| | | | | | | |
| SHARE TRANSACTIONS | | | | |
| | Sale of shares: | | | | |
| | | Investor Shares | | | 6,066 | |
| | | Institutional Shares (See Note 1) | | | 595,908 | |
| | Reinvestment of distributions: | | | | |
| | | Investor Shares | | | 114 | |
| | | Institutional Shares | | | 15,776 | |
| | Redemption of shares: | | | | |
| | | Investor Shares | | | (2,258 | ) |
| | | Institutional Shares | | | (36,191 | ) |
| Increase in Shares | | | 579,415 | |
| | | | | | | |
| (a) | Undistributed net investment income | | $ | 9,408 | |
| * | Commencement of operations. | | | | |
| These financial highlights reflect selected data for a share outstanding throughout the period. |
| | | April 18, 2016 (a) Through March 31, 2017 | |
| INVESTOR SHARES | | | | |
| NET ASSET VALUE, Beginning of Period | $ | 10.09 | | |
| INVESTMENT OPERATIONS | | | | |
| Net investment income (b) | | 0.09 | | |
| Net realized and unrealized gain | | 0.82 | | |
| Total from Investment Operations | | 0.91 | | |
| DISTRIBUTIONS TO SHAREHOLDERS FROM | | | | |
| Net investment income | | (0.29 | ) | |
| NET ASSET VALUE, End of Period | $ | 10.71 | | |
| TOTAL RETURN | | 9.24 | %(c) |
| | | | | |
| RATIOS/SUPPLEMENTARY DATA | | | | |
| Net Assets at End of Period (000's omitted) | $42 | | |
| Ratios to Average Net Assets: | | | | |
| Net investment income | | 0.96 | %(d) |
| Net expenses | | 1.10 | %(d) |
| Gross expenses (e) | | 60.04 | %(d) |
| PORTFOLIO TURNOVER RATE | | 112 | %(c) |
| | | | | | |
| (a) | Commencement of operations. |
| (b) | Calculated based on average shares outstanding during the period. |
| (c) | Not annualized. |
| (d) | Annualized. |
| (e) | Reflects the expense ratio excluding any waivers and/or reimbursements. |
| These financial highlights reflect selected data for a share outstanding throughout the period. |
| | | April 1, 2016 (a) Through March 31, 2017 | |
| INSTITUTIONAL SHARES | | | | |
| NET ASSET VALUE, Beginning of Period | $ | 10.00 | | |
| INVESTMENT OPERATIONS | | | | |
| Net investment income (b) | | 0.18 | | |
| Net realized and unrealized gain | | 0.85 | | |
| Total from Investment Operations | | 1.03 | | |
| DISTRIBUTIONS TO SHAREHOLDERS FROM | | | | |
| Net investment income | | (0.30 | ) | |
| NET ASSET VALUE, End of Period | $ | 10.73 | | |
| TOTAL RETURN | | 10.55 | %(c) |
| | | | | |
| RATIOS/SUPPLEMENTARY DATA | | | | |
| Net Assets at End of Period (000's omitted) | $6,173 | | |
| Ratios to Average Net Assets: | | | | |
| Net investment income | | 1.78 | %(d) |
| Net expenses | | 0.85 | %(d) |
| Gross expenses (e) | | 8.57 | %(d) |
| PORTFOLIO TURNOVER RATE | | 112 | %(c) |
| | | | | | |
| (a) | Commencement of operations. |
| (b) | Calculated based on average shares outstanding during the period. |
| (c) | Not annualized. |
| (d) | Annualized. |
| (e) | Reflects the expense ratio excluding any waivers and/or reimbursements. |
Note 1. Organization
LMCG Global Market Neutral Fund, LMCG Global MultiCap Fund, and LMCG International Small Cap Fund (individually, a "Fund" and collectively, the "Funds") are diversified portfolios of Forum Funds (the "Trust"). The Trust is a Delaware statutory trust that is registered as an open-end, management investment company under the Investment Company Act of 1940, as amended (the "Act"). Under its Trust Instrument, the Trust is authorized to issue an unlimited number of each Fund's shares of beneficial interest without par value. Each Fund currently offers two classes of shares: Investor Shares and Institutional Shares. The LMCG Global Market Neutral Fund Investor Shares and Institutional Shares commenced operations on December 18, 2014, and May 21, 2013, respectively. The LMCG Global MultiCap Fund Investor Shares and Institutional Shares commenced operations on March 3, 2015, and September 11, 2013, respectively. The LMCG Global Market Neutral Fund seeks capital appreciation independent of equity market conditions. The LMCG Global MultiCap Fund seeks long-term capital appreciation. The LMCG International Small Cap Fund seeks long-term capital appreciation.
The LMCG International Small Cap Fund Investor Shares and Institutional Shares commenced operations on April 18, 2016, and April 1, 2016, respectively. On April 1, 2016, the LMCG International Small Cap Fund commenced operations through a reorganization of a collective investment trust into the Fund. The collective investment trust was previously managed by the Fund's Adviser, as defined in Note 3, and portfolio management team. This collective investment trust was organized and commenced operations on August 26, 2010. The collective investment trust had an investment objective and strategies that were, in all material respects, identical to those of the Fund. The net assets and unrealized gain received by the Fund from this tax free reorganization were as follows:
Fair valuation is based on subjective factors and, as a result, the fair value price of an investment may differ from the security's market price and may not be the price at which the asset may be sold. Fair valuation could result in a different NAV than a NAV determined by using market quotes.
Each Fund has a three-tier fair value hierarchy. The basis of the tiers is dependent upon the various "inputs" used to determine the value of each Fund's investments. These inputs are summarized in the three broad levels listed below:
Level 1 — quoted prices in active markets for identical assets
Level 2 — other significant observable inputs (including quoted prices of similar securities, interest rates, prepayment speeds, credit risk, etc.)
Level 3 — significant unobservable inputs (including each Fund's own assumptions in determining the fair value of investments)
The aggregate value by input level, as of March 31, 2017, for each Fund's investments is included at the end of each Fund's Schedule of Investments.
Security Transactions, Investment Income and Realized Gain and Loss – Investment transactions are accounted for on the trade date. Dividend income and expense are recorded on the ex-dividend date. Foreign dividend income and expense are recorded on the ex-dividend date or as soon as possible after determining the existence of a dividend declaration after exercising reasonable due diligence. Income and capital gains on some foreign securities may be subject to foreign withholding taxes, which are accrued as applicable. Interest income is recorded on an accrual basis. Premium is amortized and discount is accreted using the effective interest method. Identified cost of investments sold is used to determine the gain and loss for both financial statement and federal income tax purposes.
Foreign Currency Translations – Foreign currency amounts are translated into U.S. dollars as follows: (1) assets and liabilities at the rate of exchange at the end of the respective period; and (2) purchases and sales of securities and income and expenses at the rate of exchange prevailing on the dates of such transactions. The portion of the results of operations arising from changes in the exchange rates and the portion due to fluctuations arising from changes in the market prices of securities are not isolated. Such fluctuations are included with the net realized and unrealized gain or loss on investments.
Foreign Currency Transactions – Each Fund may enter into transactions to purchase or sell foreign currency contracts and options on foreign currency. Forward currency contracts are agreements to exchange one currency for another at a future date and at a specified price. A fund may use forward currency contracts to facilitate transactions in foreign securities, to manage a fund's foreign currency exposure and to protect the U.S. dollar value of its underlying portfolio securities against the effect of possible adverse movements in foreign exchange rates. These contracts are intrinsically valued daily based on forward rates, and a fund's net equity therein, representing unrealized gain or loss on the contracts as measured by the difference between the forward foreign exchange rates at the dates of entry into the contracts and the forward rates at the reporting date, is recorded as a component of NAV. These instruments involve market risk, credit risk, or both kinds of risks, in excess of the amount recognized in the Statements of Assets and Liabilities. Risks arise from the possible inability of counterparties to meet the terms of their contracts and from movement in currency and securities values and interest rates. Due to the risks associated with these transactions, a fund could incur losses up to the entire contract amount, which may exceed the net unrealized value included in its NAV.
Securities Sold Short – The LMCG Global Market Neutral Fund may sell a security short to increase investment returns. The LMCG Global Market Neutral Fund may also sell a security short in anticipation of a decline in the market value of a security. A short sale is a transaction in which the Fund sells a security that it does not own. To complete the transaction, the Fund must borrow the security in order to deliver it to the buyer. The Fund must replace the borrowed security by purchasing it at market price at the time of replacement; the price may be higher or lower than the price at which the Fund sold the security. The Fund incurs a loss from a short sale if the price of the security increases between the date of the short sale and the date on which the Fund replaces the borrowed security. The Fund realizes a profit if the price of the security declines between those dates.
Until the Fund replaces the borrowed security, the Fund will maintain on its books and records cash and long securities to sufficiently cover its short position on a daily basis. The collateral for the securities sold short includes the Deposits with Brokers as shown on the Statement of Assets and Liabilities and the securities held long as shown on the Schedule of Investments. Dividends and interest paid on securities sold short are recorded as an expense on the LMCG Global Market Neutral Fund's Statement of Operations.
Distributions to Shareholders – Each Fund declares any dividends from net investment income and pays them annually. Any net capital gains and net foregin currency gains realized by the Funds are distributed at least annually. Distributions to shareholders are
recorded on the ex-dividend date. Distributions are based on amounts calculated in accordance with applicable federal income tax regulations, which may differ from GAAP. These differences are due primarily to differing treatments of income and gain on various investment securities held by each Fund, timing differences and differing characterizations of distributions made by each Fund.
Federal Taxes – Each Fund intends to continue to qualify each year as a regulated investment company under Subchapter M of Chapter 1, Subtitle A, of the Internal Revenue Code of 1986, as amended ("Code"), and to distribute all of its taxable income to shareholders. In addition, by distributing in each calendar year substantially all of its net investment income and capital gains, if any, the Funds will not be subject to a federal excise tax. Therefore, no federal income or excise tax provision is required. Each Fund files a U.S. federal income and excise tax return as required. Each Fund's federal income tax returns are subject to examination by the Internal Revenue Service for a period of three fiscal years after they are filed. As of March 31, 2017, there are no uncertain tax positions that would require financial statement recognition, de-recognition or disclosure.
Income and Expense Allocation – The Trust accounts separately for the assets, liabilities and operations of each of its investment portfolios. Expenses that are directly attributable to more than one investment portfolio are allocated among the respective investment portfolios in an equitable manner.
The Funds' class-specific expenses are charged to the operations of that class of shares. Income and expenses (other than expenses attributable to a specific class) and realized and unrealized gains or losses on investments are allocated to each class of shares based on the class' respective net assets to the total net assets of each Fund.
Commitments and Contingencies – In the normal course of business, each Fund enters into contracts that provide general indemnifications by each Fund to the counterparty to the contract. Each Fund's maximum exposure under these arrangements is dependent on future claims that may be made against each Fund and, therefore, cannot be estimated; however, based on experience, the risk of loss from such claims is considered remote.
Note 3. Fees and Expenses
Investment Adviser – LMCG Investments, LLC (the "Adviser") is the investment adviser to the Funds. Pursuant to an Investment Advisory Agreement, the Adviser receives an advisory fee, payable monthly, at an annual rate of 1.00%, 0.85% and 0.70% of the average daily net assets of LMCG Global Market Neutral Fund, LMCG Global MultiCap Fund, and LMCG International Small Cap Fund, respectively.
Distribution – Foreside Fund Services, LLC serves as each Fund's distributor (the "Distributor"). The Distributor is not affiliated with the Adviser or Atlantic Fund Administration, LLC (d/b/a Atlantic Fund Services) ("Atlantic") or their affiliates. The Funds have adopted a Distribution Plan (the "Plan") for Investor Shares in accordance with Rule 12b-1 of the Act. Under the Plan, the Funds pay the Distributor and/or any other entity as authorized by the Board a fee of up to 0.25% of the average daily net assets of Investor Shares.
Other Service Providers – Atlantic provides fund accounting, fund administration, compliance and transfer agency services to each Fund. The fees related to these services are included in Fund services fees within the Statements of Operations. Atlantic also provides certain shareholder report production and EDGAR conversion and filing services. Pursuant to an Atlantic services agreement, each Fund pays Atlantic customary fees for its services. Atlantic provides a Principal Executive Officer, a Principal Financial Officer, a Chief Compliance Officer and an Anti-Money Laundering Officer to each Fund, as well as certain additional compliance support functions.
Trustees and Officers – The Trust pays each independent Trustee an annual retainer fee of $50,000 for service to the Trust ($66,000 for the Chairman), and the Audit Committee Chairman and Vice Chairman receive an additional $6,000 annually. The Trustees and Chairman may receive additional fees for special Board meetings. Each Trustee is also reimbursed for all reasonable out-of-pocket expenses incurred in connection with his duties as a Trustee, including travel and related expenses incurred in attending Board meetings. The amount of Trustees' fees attributable to each Fund is disclosed in the Statements of Operations. Certain officers of the Trust are also officers or employees of the above named service providers, and during their terms of office received no compensation from each Fund.
Note 4. Expense Reimbursements and Fees Waived
The Adviser has contractually agreed to waive a portion of its fees and reimburse certain expenses through at least July 31, 2017, to limit total annual operating expenses (excluding all taxes, interest, portfolio transaction expenses, dividend and interest expenses on
short sales, acquired fund fees and expenses, proxy expenses and extraordinary expenses) as follows:
| | Investor Shares | | Institutional Shares |
| LMCG Global Market Neutral Fund | 1.85 | % | | 1.60 | % |
| LMCG Global MultiCap Fund | 1.45 | % | | 1.20 | % |
| LMCG International Small Cap Fund | 1.10 | % | | 0.85 | % |
Other Fund service providers have voluntarily agreed to waive a portion of their fees. The contractual waivers may be changed or eliminated at any time with consent of the Board and voluntary fee waivers and expense reimbursements may be reduced or eliminated at any time. For the period ended March 31, 2017, fees waived and expenses reimbursed were as follows:
The Funds may repay the Adviser for fees waived and expenses reimbursed pursuant to the expense cap if such payment is made within three years of the fee waiver or expense reimbursement and the resulting expenses do not exceed the lesser of (i) the then-current expense cap, or (ii) the expense cap in place at the time the fees/expenses were waived/reimbursed. As of March 31, 2017, $1,204,632, $572,495, and $295,333 in the LMCG Global Market Neutral Fund, LMCG Global MultiCap Fund, and LMCG International Small Cap Fund, respectively is subject to recapture by the Adviser. Other Waivers are not eligible for recoupment.
Note 5. Security Transactions
The cost of purchases and proceeds from sales of investment securities (including maturities), other than short-term investments during the period ended March 31, 2017, were as follows:
The LMCG Global Market Neutral Fund and LMCG International Small Cap Fund have $7,700,698 and $47,521, respectively, of available short term capital loss carryforwards that have no expiration date.
On the Statements of Assets and Liabilities, as a result of permanent book to tax differences, certain amounts have been reclassified for the year ended March 31, 2017. The following reclassifications were the result of net operating losses, short dividends, currency gain/loss, PFICs, REITs, partnerships, and equity return of capital and have no impact on the net assets of each Fund.
To the Board of Trustees of Forum Funds
and the Shareholders of the LMCG Global Market Neutral Fund, LMCG Global MultiCap Fund, and LMCG International Small Cap Fund
We have audited the accompanying statements of assets and liabilities of LMCG Global Market Neutral Fund, LMCG Global MultiCap Fund, and LMCG International Small Cap Fund, each a series of shares of beneficial interest in the Forum Funds (the "Funds"), including the schedules of investments, as of March 31, 2017, and the related statements of operations for the year or period then ended, the statements of changes in net assets for each of the two years in the period then ended and for the period April 1, 2016 (commencement of operations) through March 31, 2017 for LMCG International Small Cap Fund and the financial highlights for each of the years or periods presented. These financial statements and financial highlights are the responsibility of the Funds' management. Our responsibility is to express an opinion on these financial statements and financial highlights based on our audits.
We conducted our audits in accordance with the standards of the Public Company Accounting Oversight Board (United States). Those standards require that we plan and perform the audits to obtain reasonable assurance about whether the financial statements and financial highlights are free of material misstatement. An audit includes examining, on a test basis, evidence supporting the amounts and disclosures in the financial statements. Our procedures included confirmation of securities owned as of March 31, 2017 by correspondence with the custodian and brokers. An audit also includes assessing the accounting principles used and significant estimates made by management, as well as evaluating the overall financial statement presentation. We believe that our audits provide a reasonable basis for our opinion.
In our opinion, the financial statements and financial highlights referred to above present fairly, in all material respects, the financial position of LMCG Global Market Neutral Fund, LMCG Global MultiCap Fund, and LMCG International Small Cap Fund as of March 31, 2017, and the results of their operations, the changes in their net assets, and their financial highlights for each of the years or periods presented, in conformity with accounting principles generally accepted in the United States of America.
BBD, LLP
Philadelphia, Pennsylvania
May 25, 2017
Investment Advisory Agreement Approval
At the December 9, 2016 Board meeting, the Board, including the Independent Trustees, considered the approval of the continuance of the investment advisory agreement between the Adviser and the Trust as it relates to services provided to the LMCG Global Market Neutral Fund, LMCG Global MultiCap Fund, and LMCG International Small Cap Fund (the "Advisory Agreement"). In preparation for its deliberations, the Board requested and reviewed written responses from the Adviser to a due diligence questionnaire circulated on the Board's behalf concerning the Adviser's personnel, operations, financial condition, performance, and services provided by the Adviser. The Board also discussed the materials with Fund counsel and, as necessary, with the Trust's administrator, Atlantic Fund Services. During its deliberations, the Board received an oral presentation from the Adviser, and was assisted by the advice of Trustee counsel.
At the meeting, the Board reviewed, among other matters: (1) the nature, extent and quality of the services provided to the Funds by the Adviser, including information on the investment performance of the Funds and Adviser; (2) the costs of the services provided and profitability to the Adviser of its relationship with each of the Funds; (3) the advisory fee and total expense ratio of each of the Funds compared to a relevant peer group of funds; (4) the extent to which economies of scale may be realized as each of the Funds grows and whether each Fund's advisory fee enables the Funds' investors to share in the benefits of economies of scale; and (5) other benefits received by the Adviser from its relationship with the Funds.
Nature, Extent and Quality of Services
Based on written materials received, a presentation from senior representatives of the Adviser, a discussion with the Adviser about the Adviser's personnel, operations and financial condition, and a discussion with the Trust's Chief Compliance Officer about the Adviser, the Board considered the quality of services provided by the Adviser under the Advisory Agreement. In this regard, the Board considered information regarding the experience, qualifications and professional background of the portfolio managers and other personnel at the Adviser with principal responsibility for the Funds, as well as the investment philosophy and decision-making process of those professionals and the capability and integrity of the Adviser's senior management and staff.
The Board considered also the adequacy of the Adviser's resources. The Board noted the Adviser's representations that the firm is in stable financial condition and has the operational capability and the necessary staffing and experience to continue providing high-quality investment advisory services and to meet its financial commitments to each of the Funds. Based on the presentation and the materials provided by the Adviser in connection with the Board's consideration of the approval of the Advisory Agreement, the Board concluded that, overall, it was satisfied with the nature, extent and quality of services to be provided to the Funds under the Advisory Agreement.
Performance
In connection with a presentation by the Adviser regarding its management of the Funds, the Board reviewed the performance of the Funds compared to their respective benchmarks and compared to independent peer groups of funds identified by Broadridge Financial Solutions, Inc. ("Broadridge") as having characteristics similar to those of the Funds.
The Board observed that the LMCG Global Market Neutral Fund underperformed the Citigroup 3-Month Treasury Bill Index, the LMCG Global Market Neutral Fund's primary benchmark index, for the one-year period ended September 30, 2016. The Board observed that the LMCG Global Market Neutral Fund outperformed its benchmark index for the three-year period ended September 30, 2016 and for the period since the LMCG Global Market Neutral Fund's inception on May 21, 2013. The Board also considered the LMCG Global Market Neutral Fund's performance relative to its Broadridge peer group, noting that the LMCG Global Market Neutral Fund underperformed the median of its Broadridge peers for the one-year period ended September 30, 2016 and outperformed the median of its Broadridge peers for the three-year period ended September 30, 2016. The Board noted the Adviser's representation that the LMCG Global Market Neutral Fund's performance was negatively impacted by slow growth and heightened levels of political uncertainty in Europe stemming, in part, from the Brexit vote and that the LMCG Global Market Neutral Fund's core-style, balanced stock selection approach was intended to outperform over the longer term.
The Board observed that the LMCG International Small Cap Fund underperformed the MSCI EAFE Small Cap Net Total Return Index, the LMCG International Small Cap Fund's primary benchmark index, for the six-month period ended September 30, 2016. The Board also considered the LMCG International Small Cap Fund's performance relative to its Broadridge peer group, noting that the ISC Fund underperformed the median of its Broadridge peers for the six-month period ended September 30, 2016. The Board noted the Adviser's representation that the LMCG International Small Cap Fund had commenced operations as a new series of the Trust after reorganizing from a separate collective investment fund ("Predecessor Fund") on April 1, 2016. The Board noted the Adviser's representation that the performance achieved by the LMCG International Small Cap Fund for periods preceding the last
six months had been carried over from the Predecessor Fund upon the LMCG International Small Cap Fund's reorganization into the Trust and, in that regard, the Board observed that the LMCG International Small Cap Fund had underperformed the index over the one-year period ended September 30, 2016 and outperformed the index over the three-year period ended September 30, 2016 and over the period since the Predecessor Fund's inception on August 26, 2010. The Board noted the Adviser's representation that the LMCG International Small Cap Fund's underperformance over the six-month and one-year periods relative to the index and peer group could be attributed, in part, to the slow growth and heightened levels of political uncertainty in Europe.
The Board observed that the LMCG Global MultiCap Fund narrowly underperformed the MSCI ACWI Market Index, the LMCG Global MultiCap Fund's primary benchmark index, for the one- and three-year periods ended September 30, 2016 and noted that the LMCG Global MultiCap Fund outperformed the benchmark index since the LMCG Global MultiCap Fund's inception on September 11, 2013. The Board also considered the LMCG Global MultiCap Fund's performance relative to its Broadridge peer group, noting that the LMCG Global MultiCap Fund outperformed the median of its Broadridge peer group for the one- and three-year periods ended September 30, 2016. The Board noted the Adviser's representation that the LMCG Global MultiCap Fund had recently been awarded a four-star Morningstar rating and continued to outperform the benchmark index during the latter half of 2016.
Based on the foregoing, the Board determined that the performance of each of the Funds was reasonable and that the Funds and their shareholders could benefit from the Adviser's continued management of the Funds under the Advisory Agreement.
Compensation
The Board evaluated the Adviser's compensation for providing advisory services to each of the Funds and analyzed comparative information on actual advisory fee rates and actual total expenses of each of the Fund's relevant Broadridge peer group. The Board noted that the Adviser's actual advisory fee rate for each of the Funds was below the median of its respective Broadridge peer group. The Board noted that the actual total expenses of the LMCG Global Market Neutral Fund and LMCG Global MultiCap Fund were higher than the median of their respective Broadridge peers and that the actual total expenses of the LMCG International Small Cap Fund were below the median of its Broadridge peers. Based on the foregoing, the Board concluded that the advisory fee rate charged to each of the Funds appeared to be within a reasonable range in light of the services the Adviser provides to each relevant Fund.
Cost of Services and Profitability
The Board considered information provided by the Adviser regarding the costs of services and its profitability with respect to the Funds in the aggregate. In this regard, the Board considered the Adviser's resources devoted to the Funds in the aggregate, as well as the Adviser's discussion of the aggregate costs and profitability of its mutual fund activities. The Board also noted the Adviser's representation that it continued to subsidize the Funds to ensure that the expenses of the Funds remained at competitive levels. Based on these and other applicable considerations, the Board concluded that the Adviser's profits attributable to management of each of the Funds were reasonable.
Economies of Scale
The Board considered whether the Funds would benefit from any economies of scale. In this respect, the Board noted the Adviser's observation that, although each of the Funds could benefit from economies of scale as assets grow, given the current low asset levels associated with each of the Funds, consideration of breakpoints at this time would be premature. Based on the foregoing information, the Board concluded that economies of scale were not a material factor in approving the continuation of the Advisory Agreement.
Other Benefits
The Board noted the Adviser's representation that it would be receiving a benefit arising from the use of soft dollars resulting from trading for the Funds to acquire research that would benefit the Adviser's clients generally. The Board concluded that the other benefits received were not a material factor in approving the Advisory Agreement.
Conclusion
The Board did not identify any single factor as being of paramount importance, and different Trustees may have given different weight to different factors. The Board reviewed a memorandum from Fund counsel discussing the legal standards applicable to its consideration of the Advisory Agreement. Based on its review, including consideration of each of the factors referenced above, the Board determined, in the exercise of its reasonable business judgment, that the advisory arrangement, as outlined in the Advisory Agreement, was fair and reasonable in light of the services performed or to be performed, expenses incurred or to be incurred and such other matters as the Board considered relevant.
Proxy Voting Information
A description of the policies and procedures that each Fund uses to determine how to vote proxies relating to securities held in each Fund's portfolio is available, without charge and upon request, by calling (877) 591-4667 and on the U.S. Securities and Exchange Commission's (the "SEC") website at www.sec.gov. The LMCG Global Market Neutral Fund and the LMCG Global MultiCap Fund's proxy voting record for the most recent twelve-month period ended June 30 is available, without charge and upon request, by calling (877) 591-4667 and on the SEC's website at www.sec.gov. The LMCG International Small Cap Fund's proxy voting record for the period from the Fund's commencement of operations to the period ended June 30 is available, without charge and upon request, by calling (877) 591-4667 and on the SEC's website at www.sec.gov.
Availability of Quarterly Portfolio Schedules
Each Fund files its complete schedule of portfolio holdings with the SEC for the first and third quarters of each fiscal year on Form N-Q. These filings are available, without charge and upon request on the SEC's website at www.sec.gov or may be reviewed and copied at the SEC's Public Reference Room in Washington, DC. Information on the operation of the Public Reference Room may be obtained by calling (800) SEC-0330.
Shareholder Expense Example
As a shareholder of the Funds, you incur ongoing costs, including management fees and other Fund expenses. This example is intended to help you understand your ongoing costs (in dollars) of investing in the Funds and to compare these costs with the ongoing costs of investing in other mutual funds.
The example is based on an investment of $1,000 invested at the beginning of the period and held for the entire period from October 1, 2016 , through March 31, 2017.
Actual Expenses – The first line under each share class of the table below provides information about actual account values and actual expenses. You may use the information in this line, together with the amount you invested, to estimate the expenses that you paid over the period. Simply divide your account value by $1,000 (for example, an $8,600 account value divided by $1,000 = 8.6), then multiply the result by the number in the first line under the heading entitled "Expenses Paid During Period" to estimate the expenses you paid on your account during the period.
Hypothetical Example for Comparison Purposes – The second line under each share class of the table below provides information about hypothetical account values and hypothetical expenses based on each Fund's actual expense ratio and an assumed rate of return of 5% per year before expenses, which is not each Fund's actual return. The hypothetical account values and expenses may not be used to estimate the actual ending account balance or expenses you paid for the period. You may use this information to compare the ongoing costs of investing in each Fund and other funds. To do so, compare this 5% hypothetical example with the 5% hypothetical examples that appear in the shareholder reports of other funds.
Please note that the expenses shown in the table are meant to highlight your ongoing costs only. Therefore, the second line of the table is useful in comparing ongoing costs only, and will not help you determine the relative total costs of owning different funds.
| | Beginning | | Ending | | Expenses | | Annualized |
| | Account Value | | Account Value | | Paid During | | Expense |
| | October 1, 2016 | | March 31, 2017 | | Period* | | Ratio* |
| LMCG Global Market Neutral Fund | | | | | | | | | | | |
| Investor Shares | | | | | | | | | | | |
| Actual | $ | 1,000.00 | | $ | 1,006.61 | | $ | 9.26 | | 1.85 | % |
| Hypothetical (5% return before expenses) | $ | 1,000.00 | | $ | 1,015.71 | | $ | 9.30 | | 1.85 | % |
| Institutional Shares | | | | | | | | | | | |
| Actual | $ | 1,000.00 | | $ | 1,007.52 | | $ | 8.01 | | 1.60 | % |
| Hypothetical (5% return before expenses) | $ | 1,000.00 | | $ | 1,016.95 | | $ | 8.05 | | 1.60 | % |
| LMCG Global MultiCap Fund | | | | | | | | | | | |
| Investor Shares | | | | | | | | | | | |
| Actual | $ | 1,000.00 | | $ | 1,095.03 | | $ | 7.57 | | 1.45 | % |
| Hypothetical (5% return before expenses) | $ | 1,000.00 | | $ | 1,017.70 | | $ | 7.29 | | 1.45 | % |
| Institutional Shares | | | | | | | | | | | |
| Actual | $ | 1,000.00 | | $ | 1,096.36 | | $ | 6.27 | | 1.20 | % |
| Hypothetical (5% return before expenses) | $ | 1,000.00 | | $ | 1,018.95 | | $ | 6.04 | | 1.20 | % |
| LMCG International Small Cap Fund | | | | | | | | | | | |
| Investor Shares | | | | | | | | | | | |
| Actual | $ | 1,000.00 | | $ | 1,043.73 | | $ | 5.60 | | 1.10 | % |
| Hypothetical (5% return before expenses) | $ | 1,000.00 | | $ | 1,019.45 | | $ | 5.54 | | 1.10 | % |
| Institutional Shares | | | | | | | | | | | |
| Actual | $ | 1,000.00 | | $ | 1,045.87 | | $ | 4.34 | | 0.85 | % |
| Hypothetical (5% return before expenses) | $ | 1,000.00 | | $ | 1,020.69 | | $ | 4.28 | | 0.85 | % |
| * | Expenses are equal to each Fund's annualized expense ratio multiplied by the average account value over the period, multiplied by the number of days in the most recent fiscal half-year (182) divided by 365 to reflect the half-year period. |
Federal Tax Status of Dividends Declared during the Fiscal Year
For federal income tax purposes, dividends from short-term capital gains are classified as ordinary income. LMCG Global MultiCap Fund designates 45.61% of its income dividend distributed as qualifying for the corporate dividends received deduction (DRD) and 100.00% for the qualified dividend rate (QDI) as defined in Section 1(h)(11) of the Code. LMCG International Small Cap Fund also designates 48.34% as QDI and 0.01% as qualified interest income exempt from U.S. tax for foreign shareholders (QII).
Trustees and Officers of the Trust
The Board is responsible for oversight of the management of the Trust's business affairs and of the exercise of all the Trust's powers except those reserved for the shareholders. The following table provides information about each Trustee and certain officers of the Trust. Each Trustee and officer holds office until the person resigns, is removed, or is replaced. Unless otherwise noted, the persons have held their principal occupations for more than five years. The address for all Trustees and officers is Three Canal Plaza, Suite 600, Portland, Maine 04101. Mr. Keffer is considered an Interested Trustee due to his affiliation with Atlantic. Each Fund's Statement of Additional Information includes additional information about the Trustees and is available, without charge and upon request, by calling (877) 591-4667.
Name and Year of Birth | Position(s) with the Trust | Length of Time Served | Principal Occupation(s) During Past Five Years | Number of Series of Fund Complex¹ Overseen by Trustee | Other Directorships Held by Trustee |
| Independent Trustees | | | | | |
J. Michael Parish Born: 1943 | Chairman of the Board; Trustee; Chairman, Nominating Committee and Qualified Legal Compliance Committee | Since 1989 (Chairman since 2004) | Retired since 2003; formerly, Partner, Wolf, Block, Schorr and Solis-Cohen, LLP (law firm) 2002-2003; Partner, Thelen Reid & Priest LLP (law firm) 1995-2002. | 24 | None |
Costas Azariadis Born: 1943 | Trustee | Since 1989 | Professor of Economics, Washington University since 2006. | 24 | None |
James C. Cheng Born: 1942 | Trustee; Chairman, Audit Committee | Since 1989 | President, Technology Marketing Associates (marketing company for small- and medium-sized businesses in New England) since 1991. | 24 | None |
David Tucker Born: 1958 | Trustee; Vice Chairman | Since 2011 (Vice Chairman since 2015) | Director, Blue Sky Experience (a charitable endeavor) since 2008; Senior Vice President & General Counsel, American Century Companies (an investment management firm) 1998-2008. | 47 | Trustee, Forum Funds II, Forum ETF Trust and U.S. Global Investors Funds |
| Interested Trustee | | | | | |
John Y. Keffer2 Born: 1942 | Trustee; Vice Chairman | Since 1989 | Chairman, Atlantic since 2008; President, Forum Investment Advisors, LLC since 2011; President, Forum Foundation (a charitable organization) since 2005; President, Forum Trust, LLC (a non-depository trust company chartered in the State of Maine) since 1997. | 47 | Director, Wintergreen Fund, Inc.; Trustee, Forum Funds II, Forum ETF Trust and U.S. Global Investors Funds |
| Officers | | | | | |
Jessica Chase Born: 1970 | President; Principal Executive Officer | Since 2015 | Senior Vice President, Atlantic since 2008. | N/A | N/A |
Karen Shaw Born: 1972 | Treasurer; Principal Financial Officer | Since 2008 | Senior Vice President, Atlantic since 2008. | N/A | N/A |
Zachary Tackett Born: 1988 | Vice President; Secretary; Anti-Money Laundering Compliance Officer | Since 2014 | Counsel, Atlantic since 2014; Intern Associate, Coakley & Hyde, PLLC, 2010-2013. | N/A | N/A |
Michael J. McKeen Born: 1971 | Vice President | Since 2009 | Senior Vice President, Atlantic since 2008. | N/A | N/A |
Timothy Bowden Born: 1969 | Vice President | Since 2009 | Manager, Atlantic since 2008. | N/A | N/A |
Geoffrey Ney Born: 1975 | Vice President | Since 2013 | Manager, Atlantic since 2013; Senior Fund Accountant, Atlantic, 2008-2013. | N/A | N/A |
Todd Proulx Born: 1978 | Vice President | Since 2013 | Manager, Atlantic since 2013; Senior Fund Accountant, Atlantic, 2008-2013. | N/A | N/A |
Carlyn Edgar Born: 1963 | Vice President | Since 2008 | Senior Vice President, Atlantic since 2008; Chief Compliance Officer, 2008-2016. | N/A | N/A |
Dennis Mason Born: 1967 | Chief Compliance Officer | Since 2016 | Fund Compliance Officer, Atlantic since 2013; Senior Specialist, Atlantic 2011-2013; Senior Analyst, Atlantic 2008-2011. | N/A | N/A |
1The Fund Complex includes the Trust, Forum Funds II, Forum ETF Trust and U.S. Global Investors Funds and is overseen by different Boards of Trustees. 2Atlantic is a subsidiary of Forum Holdings Corp. I, a Delaware corporation that is wholly owned by Mr. Keffer. |
| |
A MESSAGE TO OUR SHAREHOLDERS (Unaudited) | MARCH 31, 2017 |
Dear Shareholder,
We present the annual report for the Merk Hard Currency Fund®, and Merk Absolute Return Currency Fund® (individually a "Fund" and collectively the "Funds") with respect to the period April 1, 2016 through March 31, 2017 (the "Period").
| · | The Merk Hard Currency Fund seeks to profit from a rise in hard currencies relative to the U.S. dollar. |
Over the Period the New Zealand dollar returned +1.40%, the Japanese yen returned +1.06%, the Australian dollar returned -0.37%, the Canadian dollar returned -2.36%, the Norwegian krone returned -3.84%, the Swiss franc returned -4.07%, the Euro returned -6.40%, the Swedish krona returned -9.51%, the British pound returned -12.60%. Gold returned +1.33% during the Period, as measured by the spot price of gold per troy ounce.
| | As of March 31, 2017 (annualized return) |
| | 1 year | 5 year | 10 year | Since inception 5/10/05 |
| Merk Hard Currency Fund Investor Shares (MERKX) | -5.50% | -4.23% | +0.45% | +1.27% |
| JPMorgan 3-Month Global Cash Index ("reference basket") | -5.27% | -4.08% | -0.21% | +0.47% |
The Fund's performance data represents past performance and is no guarantee of future results. Current performance may be lower or higher than the performance data quoted. Investment return and principal value will fluctuate so that an investor's shares, when redeemed, may be worth more or less than original cost. Please visit www.merkfunds.com for most recent month end performance. The Fund's expense ratio for the Investor Shares is 1.30%.
| · | The Merk Absolute Return Currency Fund seeks to generate positive absolute returns by investing in securities and instruments that create exposure to currencies. |
The Fund employs a periodic currency allocation process based on strategic and tactical considerations. We consider factors that lead to gradual allocation changes to be "strategic," in contrast we consider factors that lead to allocation changes over shorter periods "tactical." As such, currency exposures can change significantly from one holding period to the next.
| | As of March 31, 2017 (annualized return) |
| | 1 year | 5 year | Since updates 6/30/12 | Since inception 9/9/09 |
| Merk Absolute Return Currency Fund Investor Shares (MABFX) | +2.74% | +0.21% | +2.38% | -0.37% |
| Citigroup 3-Month U.S. T-Bill Index ("reference basket") | +0.34% | +0.11% | +0.12% | +0.11%1 |
The Fund's performance data represents past performance and is no guarantee of future results. Current performance may be lower or higher than the performance data quoted. Investment return and principal value will fluctuate so that an investor's shares, when redeemed, may be worth more or less than original cost. Please visit www.merkfunds.com for most recent month end performance. The Fund's expense ratio for the Investor Shares is 1.30%.
Merk Hard Currency Fund
In Q2 2016, the U.S. dollar strengthened as the Fed minutes and Fed chair Janet Yellen communicated a likely 2016 summer rate hike, which was more hawkish than we had previously expected. Rate hike expectations were subsequently reduced by a weak May jobs report and a "Leave" outcome from the U.K. referendum ("Brexit"). While the weak jobs report lead to dollar weakness, the dollar benefited as a relative safe haven from Brexit. The Fund fared relatively well in the run-up and immediate aftermath of the Brexit vote, as positioning was fairly balanced given its gold exposure and underweight to the British pound.
In Q3 2016, the Norwegian krone was the best performer in G10 currencies, in large part driven by rising interest rate expectations in Norway versus the rest of the G10. The British pound was the worst performer, hurt by continuing trade uncertainty and new easing
1 Note that data is not available for the reference basket on the inception date of the Merk Absolute Return Currency Fund (September 9, 2009). As such, performance for the reference basket is calculated for the time period August 31, 2009 through March 31, 2017, whereas performance for the Fund is calculated for the period since inception through March 31, 2017.
measures from the Bank of England following the Brexit decision. The euro appreciated modestly versus the U.S. dollar. The Fund was flat at (0.00% return) over the quarter, primarily held back by an overweight position in the Swedish krona, which underperformed in the quarter. The Fund also reestablished a strategic short position in the Japanese yen.
In Q4 2016 the U.S. dollar strengthened versus all G10 currencies. Most notably, the Trump election victory contributed to a rise in US Treasury yields, which supported the dollar versus the Japanese yen and gold in particular. The yen was particularly weak given the Bank of Japan's policy, initiated at their September meeting, to target 10-year government yields near 0.0%. As global rates rose in Q4 interest rate differentials hurt the yen the most. Not only did Trump win the election, but Republicans came out with majorities in both the House and the Senate, greatly increasing the chances of meaningful tax reform. At the December meeting the Fed raised its median projection for 2017 rate hikes from two hikes to three hikes, further supporting dollar strength into the end of Q4.
In Q1 2017 the US dollar weakened versus all G10 currencies and gold. In general, there was a reversal of the "Trump trades" that had done well in Q4 2016. In part, it seems the weaker U.S. dollar theme was driven by the market realization that pro-growth legislation might be tougher to pass than initially expected, even with Republican majorities in the House and Senate. The Fed hiked rates at their March Federal Open Market Committee ("FOMC") meeting but disappointed market expectations in terms of forward guidance on rates, which further weakened the U.S. dollar. Contributing to the Fund's quarterly return of 1.53% were the euro, Swedish krona, as well as gold long positions; detracting from performance was the Japanese yen short position.
As the U.S. Dollar Index2 has been up four years in a row through 2016, dollar bullishness appeared to reach new highs at the end of 2016. As Q1 of this year has shown, the dollar has started to decline. We believe the dollar bull market may have come to an end. The reasons for our assessment include long-term purchasing power parity valuation as well as our monetary and fiscal policy outlooks. With regard to valuation in a historic context, we believe the dollar has become overvalued versus most G10 currencies. Regarding monetary policy, it shall be noted that we do not see evidence of the dollar generally rising during Fed hiking cycles. Additionally, we see the Fed falling further "behind the curve," meaning the Fed's reluctance to raise rates may cause inflationary pressures to build, a potential medium term negative for the currency. On the other side of the coin, our view is that Quantitative Easing ("QE") and negative interest rates in Europe may soon give way to expectations of monetary policy tightening that are not priced in. Perhaps just as important as U.S. monetary policy will be U.S. fiscal policy: there may be further disappointment this year in terms of reforms that were assumed to help the dollar.
Merk Absolute Return Currency Fund
Since implementation of strategy enhancements3 on June 30, 2012 through March 31, 2017, the Investor Shares had a cumulative return of +11.81% (annualized +2.38%) at an annualized volatility of 6.74%. Over the past 12 months, ending in March 31, 2017, the Investor Shares had a cumulative performance of 2.74% at an annualized volatility of 6.17%.
The Investor Shares closed the calendar year 2016 with a total gain of 8.26%, at a Sharpe Ratio4 of 1.1. Profits were mostly driven by a series of risk events, during which the Fund was able to exploit resulting market turbulence for trading profits. These included a disappointing U.S. jobs report in May, and a larger volatility transition around the U.K. referendum. The strong risk-on rally across global markets in November following the U.S. election outcome provided alpha generating opportunities from a shift in risk sentiment, which the Fund profitably navigated.
During Q1 of 2017, currency volatility again declined, eventually falling to multi-year lows in March. As a result, the Fund gradually shifted from more tactical trading to a primarily strategic macro-driven allocation, dictated by the Fund's systematic market regime analysis. Long positions in the Norwegian krone, the Swedish krona, and the euro, drove profits in January and March, but led to losses in February. A strategic short weight in the Japanese yen was overall the main detractor to performance in Q1, for which the Fund posted a return of -0.73%.
Equities have reached new all-time highs at the beginning of March, extending an eight-year stock market rally that was boosted by the prospects of deregulation, fiscal stimulus and trade policy plans proposed by the new administration. However, market conviction may be fading of late, as the effectiveness of such policies is put in question. The so-called "Trump Reflation Trade" along with broader U.S. dollar strength has notably reversed in the past few weeks of the quarter.
Meanwhile, asset volatility still appears to be suppressed. Currency volatility is the lowest since late 2014 and the VIX, a measure of implied volatility in stocks, has recorded the lowest quarterly average since late 2006. Similarly, bond volatility is at the lower end of the past three years, while the Federal Reserve ("Fed") is striking an overly hawkish tone as of late, and building up expectations of several rate hikes for this year.
2 U.S. Dollar (DXY) Index and Inverse DXY is a measure of the value of the United States dollar relative to a static basket of currencies with Euro (EUR) 57.6% weight, Japanese yen (JPY) 13.6%, Pound Sterling (GBP) 11.9%, Canadian dollar (CAD) 9.1%, Swiss franc (CHF) 3.6% and Swedish krona (SEK) 4.2% weight.
3 Effective 06/30/2012, risk sentiment & macro models ("strategy enhancements") were added for this Fund. Please refer to the website for a full description of this strategy change.
4 Sharpe Ratio is a measure of the excess return per unit of risk in an investment asset or a trading strategy.
While it seems that complacency has returned to markets, we believe it to be unsustainable and caution that the market is exposing itself to turbulence. In our view, financial assets have prematurely priced in optimistic expectations about fiscal and monetary policy and underpriced the probability for market disruptions. Along with other political risk catalysts such as the upcoming French elections and current trade tensions between the U.S. and China, we see increased potential for resurgence in asset volatility.
As the Merk Absolute Return Currency Fund employs a systematic foreign exchange trading strategy that seeks to identify and take advantages of such risk transitions, we believe that the current market environment presents profit opportunities for the Fund.
In the dynamics that might ensue in the currency space – we dub them "Currency Wars", investors may want to consider a combination of the Merk Funds as part of their tool box. If you know of friends who might benefit from the Merk Funds, please ask them to visit merkfunds.com to learn more about the Funds.
Sincerely,
Axel G. Merk
President & Chief Investment Officer
The views in this Report were those of the Fund Manager as of March 31, 2017 and may not reflect the views of the Manager on the date this Report is first published or anytime thereafter. These views are intended to assist shareholders of the Fund in understanding their investments in a Fund and do not constitute investment advice. The Funds' performances are influenced by changes in exchange rates of currencies to which the Funds may have had exposure to through derivatives. Over time, the Funds seek to generate more gains from securities than derivatives.
Since the Funds primarily invest in foreign currencies, changes in currency exchange rates will affect the value of what the respective Fund owns and the price of the Fund's shares. Investing in foreign instruments bears a greater risk than investing in domestic instruments for reasons such as volatility of currency exchange rates and, in some cases, limited geographic focus, political and economic instability, and relatively illiquid markets. The Funds are subject to interest rate risk, which is the risk that debt securities in a Fund's portfolio will decline in value because of increases in market interest rates. As a non-diversified fund, the Merk Hard Currency Fund will be subject to more investment risk and potential for volatility than a diversified fund because its portfolio may, at times, focus on a limited number of issuers. The Funds may also invest in derivative securities, which can be volatile and involve various types and degrees of risk.
The Citigroup 3-Month U.S. T-Bill Index is an unmanaged index representing monthly return equivalents of yield averages of the last 3-month Treasury Bill issues. It is not possible to invest directly in an unmanaged index.
The JPMorgan 3-Month Global Cash Index tracks total returns of three-month constant maturity euro-currency deposits. The euro-currency deposits are the only short-term securities consistent across all markets in terms of liquidity, maturity and credit quality. The index is unmanaged and includes reinvested distributions. One cannot invest directly in an index, nor is an index representative of the Fund's portfolio.
JPMorgan does not sponsor, endorse or promote the Merk Hard Currency Fund in connection with any reference to the JPMorgan 3-Month Global Cash Index. JPMorgan makes no representation or warranty, express or implied regarding the advisability of investing in securities generally or in any product particularly or the ability of the JPMorgan 3-Month Global Cash Index to track general bond market performance.
The following chart reflects the change in the value of a hypothetical $10,000 investment in Investor Shares, including reinvested dividends and distributions, in Merk Hard Currency Fund (the "Fund") compared with the performance of the benchmark, JPMorgan 3-Month Global Cash Index, since inception. The JPMorgan 3-Month Global Cash Index tracks total returns of three-month constant maturity euro-currency deposits. The euro-currency deposits are the only short-term securities consistent across all markets in terms of liquidity, maturity and credit quality. The total return of the JPMorgan 3-Month Global Cash Index includes reinvestment of distributions. The total return of the Fund includes operating expenses that reduce returns, while the total return of the JPMorgan 3-Month Global Cash Index does not include expenses. The Fund is professionally managed while the JPMorgan 3-Month Global Cash Index is unmanaged and is not available for investment, nor is the JPMorgan 3-Month Global Cash Index representative of the Fund's portfolio.
Comparison of Change in Value of a $10,000 Investment
Merk Hard Currency Fund Investor Shares vs. JPMorgan 3-Month Global Cash Index
| Average Annual Total Returns | | | | | | |
| Periods Ended March 31, 2017 | | One Year | | Five Year | | Ten Year |
| Merk Hard Currency Fund Investor Shares | | -5.50 | % | | -4.23 | % | | 0.45 | % |
| Merk Hard Currency Fund Institutional Shares* | | -5.25 | % | | -3.95 | % | | 0.65 | % |
| JPMorgan 3-Month Global Cash Index | | -5.27 | % | | -4.08 | % | | -0.21 | % |
| | | | | | | | | | |
| * | For the Institutional Shares, performance for the above ten year period is a blended average annual return which includes the return of the Investor Shares prior to April 1, 2010, the commencement of operations of the Institutional Shares. |
Performance data quoted represents past performance and is no guarantee of future results. Current performance may be lower or higher than the performance data quoted. Investment return and principal value will fluctuate so that shares, when redeemed, may be worth more or less than original cost. As stated in the Fund's prospectus, the annual operating expense ratios (gross) for Investor and Institutional Class are 1.30% and 1.05%, respectively. The performance table and graph do not reflect the deduction of taxes that a shareholder would pay on Fund distributions or the redemption of Fund shares. Returns greater than one year are annualized. For the most recent month-end performance, please call (866) 637-5386 or visit www.merkfunds.com.
The following chart reflects the change in the value of a hypothetical $10,000 investment in Investor Shares, including reinvested dividends and distributions, in Merk Absolute Return Currency Fund (the "Fund") compared with the performance of the benchmark, Citigroup 3-Month U.S. T-Bill Index, since inception. The Citigroup 3-Month U.S. T-Bill Index measures return equivalents of yield averages that are not marked to market and consists of the last three three-month Treasury bill month-end rates. The total return of the Citigroup 3-Month U.S. T-Bill Index includes reinvestment of distributions. The total return of the Fund includes operating expenses that reduce returns, while the total return of the Citigroup 3-Month U.S. T-Bill Index does not include expenses. The Fund is professionally managed while the Citigroup 3-Month U.S. T-Bill Index is unmanaged and is not available for investment, nor is the Citigroup 3-Month U.S. T-Bill Index representative of the Fund's portfolio.
Comparison of Change in Value of a $10,000 Investment
Merk Absolute Return Currency Fund vs. Citigroup 3-Month U.S. T-Bill Index
| Average Annual Total Returns | | | | | | Since Inception |
| Periods Ended March 31, 2017 | | One Year | | Five Year | | (09/09/09) |
| Merk Absolute Return Currency Fund Investor Shares | | 2.74 | % | | 0.21 | % | | -0.37 | % |
| Merk Absolute Return Currency Fund Institutional Shares* | | 3.02 | % | | 0.49 | % | | -0.12 | % |
| Citigroup 3-Month U.S. T-Bill Index** | | 0.34 | % | | 0.11 | % | | 0.11 | % |
| | | | | | | | | | |
| * | For the Institutional Shares, performance for the above since inception period is a blended average annual return which includes the return of the Investor Shares prior to April 1, 2010, the commencement of operations of the Institutional Shares. |
| ** | Since inception return for the Citigroup 3-Month U.S. T-Bill Index is for the period beginning August 31, 2009. |
Performance data quoted represents past performance and is no guarantee of future results. Current performance may be lower or higher than the performance data quoted. Investment return and principal value will fluctuate so that shares, when redeemed, may be worth more or less than original cost. As stated in the Fund's prospectus, the annual operating expense ratios (gross) for Investor and Institutional Class are 1.30% and 1.05%, respectively. The performance table and graph do not reflect the deduction of taxes that a shareholder would pay on Fund distributions or the redemption of Fund shares. Returns greater than one year are annualized. For the most recent month-end performance, please call (866) 637-5386 or visit www.merkfunds.com.
| Principal | | Security Description | | Currency | | Rate | | Maturity | | Value in USD |
Foreign Bonds (a) - 57.8% |
| Automotive - Netherlands - 3.3% |
| | 3,300,000 | | BMW Finance NV, EMTN | | EUR | | | 3.625 | % | 01/29/18 | $ | 3,630,541 | |
| Financials - Netherlands - 1.9% |
| | 17,900,000 | | Bank Nederlandse Gemeenten NV, EMTN | | SEK | | | 2.125 | | 02/13/19 | | 2,073,047 | |
| Financials - Norway - 2.3% |
| | 21,000,000 | | SpareBank 1 Boligkreditt AS, EMTN | | NOK | | | 5.950 | | 06/18/18 | | 2,584,094 | |
| Healthcare - France - 5.2% |
| | 5,300,000 | | Sanofi, EMTN | | EUR | | | 1.000 | | 11/14/17 | | 5,695,709 | |
| Non-U.S. Government - Austria - 2.0% |
| | 2,000,000 | | Republic of Austria Government Bond (b) | | EUR | | | 1.950 | | 06/18/19 | | 2,255,642 | |
| Non-U.S. Government - New Zealand - 1.5% |
| | 2,250,000 | | New Zealand Government Bond, Series 1217 | | NZD | | | 6.000 | | 12/15/17 | | 1,623,192 | |
| Non-U.S. Government - Sweden - 1.7% |
| | 1,700,000 | | Sweden Government International Bond, EMTN | | EUR | | | 0.875 | | 01/31/18 | | 1,834,124 | |
| Non-U.S. Government Agency - Sweden - 13.2% |
| | 128,000,000 | | Kommuninvest I Sverige AB, Series 1708, MTN | | SEK | | | 4.000 | | 08/12/17 | | 14,516,804 | |
| Regional Authority - Australia - 2.2% |
| | 3,160,000 | | Treasury Corp. of Victoria | | AUD | | | 3.500 | | 11/17/17 | | 2,441,320 | |
| Regional Authority - Canada - 2.2% |
| | 3,200,000 | | Province of Alberta Canada | | CAD | | | 1.750 | | 06/15/17 | | 2,411,797 | |
| Regional Authority - Norway - 4.7% |
| | 44,000,000 | | City of Oslo Norway | | NOK | | | 5.000 | | 05/15/17 | | 5,144,969 | |
| Regional Authority - Sweden - 1.6% |
| | 7,000,000 | | City of Gothenburg Sweden, EMTN | | SEK | | 4.325 | | 04/10/17 | | 781,793 | |
| | 8,650,000 | | City of Gothenburg Sweden, EMTN | | SEK | | | 2.125 | | 03/19/18 | | 985,926 | |
| | | 1,767,719 | |
| Supranational - Europe - 16.0% |
| | 4,800,000 | | European Financial Stability Facility, EMTN | | EUR | | 1.625 | | 09/15/17 | | 5,170,847 | |
| | 4,100,000 | | European Investment Bank, EMTN | | EUR | | 1.000 | | 07/13/18 | | 4,461,422 | |
| | 3,500,000 | | European Stability Mechanism, EMTN | | EUR | | 1.250 | | 10/15/18 | | 3,836,064 | |
| | 5,030,000 | | International Bank for Reconstruction & Development, GDIF | | SEK | | 1.375 | | 06/23/19 | | 580,258 | |
| | 31,500,000 | | International Bank for Reconstruction & Development, EMTN GDIF | | SEK | | | 3.250 | | 12/15/17 | | 3,604,942 | |
| | | 17,653,533 | |
| Total Foreign Bonds (Cost $64,998,459) | | 63,632,491 | |
Foreign Treasury Securities(a) - 30.0% |
| Non-U.S. Government - Belgium - 3.1% |
| | 3,200,000 | | Belgium Treasury Bill, Series 12M (c) | | EUR | | | 0.000 | | 04/13/17 | | 3,414,350 | |
| Non-U.S. Government - Canada - 4.8% |
| | 7,100,000 | | Canadian Treasury Bill (c) | | CAD | | | 0.530 | | 06/01/17 | | 5,334,036 | |
| Non-U.S. Government - France - 4.9% |
| | 5,000,000 | | French Discount Treasury Bill (c) | | EUR | | | 0.000 | | 04/26/17 | | 5,335,727 | |
| Non-U.S. Government - Ireland - 13.1% |
| | 7,300,000 | | Republic of Ireland Treasury Bill (c) | | EUR | | 0.000 | | 09/18/17 | | 7,798,370 | |
| | 6,200,000 | | Republic of Ireland Treasury Bill (c) | | EUR | | | 0.000 | | 12/18/17 | | 6,632,347 | |
| | | 14,430,717 | |
| Non-U.S. Government - Norway - 4.1% |
| | 39,000,000 | | Norway Treasury Bill, Series 35 (b)(c) | | NOK | | | 0.381-0.465 | | 06/21/17 | | 4,539,084 | |
| Total Foreign Treasury Securities (Cost $33,737,345) | | 33,053,914 | |
See Notes to Financial Statements. | 6 | |
The following is a summary of the inputs used to value the Fund's investments and other financial instruments and liabilities as of March 31, 2017.
The inputs or methodology used for valuing securities are not necessarily an indication of the risks associated with investing in those securities. For more information on valuation inputs, and their aggregation into the levels used in the table below, please refer to the Security Valuation section in Note 2 of the accompanying Notes to Financial Statements.
| | Level 1 | | Level 2 | | Level 3 | | Total |
| Assets |
| Investments At Value |
| Foreign Bonds | | $ | - | | | $ | 63,632,491 | | | $ | - | | | $ | 63,632,491 | |
| Foreign Treasury Securities | | | - | | | | 33,053,914 | | | | - | | | | 33,053,914 | |
| Exchange Traded Product | | | 9,898,524 | | | | - | | | | - | | | | 9,898,524 | |
| Money Market Fund | | | - | | | | 2,006,462 | | | | - | | | | 2,006,462 | |
| Total Investments At Value | | $ | 9,898,524 | | | $ | 98,692,867 | | | $ | - | | | $ | 108,591,391 | |
| Total Assets | | $ | 9,898,524 | | | $ | 98,692,867 | | | $ | - | | | $ | 108,591,391 | |
| Liabilities |
| Other Financial Instruments** |
| Forward Currency Contracts | | $ | - | | | $ | (94,695 | ) | | $ | - | | | $ | (94,695 | ) |
| Futures | | | (1,815 | ) | | | - | | | | - | | | | (1,815 | ) |
| Total Liabilities | | $ | (1,815 | ) | | $ | (94,695 | ) | | $ | - | | | $ | (96,510 | ) |
| Principal | | Security Description | | Currency | | Rate | | Maturity | | Value in USD | |
Foreign Bonds(a) - 74.5% |
| Automotive - Netherlands - 4.2% |
| | 1,300,000 | | BMW Finance NV, EMTN | | EUR | | | 3.625 | % | 01/29/18 | $ | 1,430,213 | |
| Non-U.S. Government - Australia - 4.6% |
| | 2,000,000 | | Australia Government Bond, Series 135 | | AUD | | | 4.250 | | 07/21/17 | | 1,540,825 | |
| Non-U.S. Government - New Zealand - 4.3% |
| | 2,000,000 | | New Zealand Government Bond, Series 1217 | | NZD | | | 6.000 | | 12/15/17 | | 1,442,837 | |
| Non-U.S. Government - United Kingdom - 3.0% |
| | 800,000 | | United Kingdom Gilt | | GBP | | | 1.000 | | 09/07/17 | | 1,006,584 | |
| Non-U.S. Government Agency - Germany - 3.8% |
| | 1,000,000 | | KFW, EMTN | | GBP | | | 5.625 | | 08/25/17 | | 1,279,099 | |
| Non-U.S. Government Agency - Sweden - 16.5% |
| | 49,000,000 | | Kommuninvest I Sverige AB, Series 1708, MTN | | SEK | | | 4.000 | | 08/12/17 | | 5,557,214 | |
| Regional Authority - Australia - 16.9% |
| | 1,700,000 | | New South Wales Treasury Corp., Series 18 | | AUD | | 6.000 | | 02/01/18 | | 1,344,930 | |
| | 1,500,000 | | Queensland Treasury Corp. (b) | | AUD | | 3.500 | | 09/21/17 | | 1,155,697 | |
| | 2,240,000 | | Treasury Corp. of Victoria | | AUD | | 3.500 | | 11/17/17 | | 1,730,556 | |
| | 1,900,000 | | Western Australian Treasury Corp., Series 17 | | AUD | | | 8.000 | | 07/15/17 | | 1,479,241 | |
| | | 5,710,424 | |
| Regional Authority - Canada - 17.4% |
| | 1,800,000 | | Province of Alberta Canada | | CAD | | 1.750 | | 06/15/17 | | 1,356,636 | |
| | 2,100,000 | | Province of British Columbia Canada | | CAD | | 4.700 | | 12/01/17 | | 1,620,909 | |
| | 1,800,000 | | Province of Manitoba Canada | | CAD | | 1.850 | | 06/01/17 | | 1,356,311 | |
| | 2,000,000 | | Province of Saskatchewan Canada | | CAD | | | 4.650 | | 09/05/17 | | 1,529,135 | |
| | | 5,862,991 | |
| Regional Authority - Norway - 3.8% |
| | 11,000,000 | | City of Oslo Norway | | NOK | | | 5.000 | | 05/15/17 | | 1,286,242 | |
| Total Foreign Bonds (Cost $25,742,470) | | 25,116,429 | |
Foreign Treasury Securities(a) - 16.3% |
| Non-U.S. Government - Belgium - 3.1% |
| | 975,000 | | Belgium Treasury Bill, Series 12M (c) | | EUR | | | 0.000 | | 04/13/17 | | 1,040,310 | |
| Non-U.S. Government - Canada - 4.5% |
| | 2,000,000 | | Canadian Treasury Bill (c) | | CAD | | | 0.539 | | 06/01/17 | | 1,502,545 | |
| Non-U.S. Government - Ireland - 4.1% |
| | 1,295,000 | | Republic of Ireland Treasury Bill (c) | | EUR | | | 0.000 | | 12/18/17 | | 1,385,305 | |
| Non-U.S. Government - Norway - 4.6% |
| | 13,400,000 | | Norway Treasury Bill, Series 35 (b)(c) | | NOK | | | 0.421 | | 06/21/17 | | 1,559,583 | |
| Total Foreign Treasury Securities(Cost $5,576,450) | | 5,487,743 | |
| U.S. Government & Agency Obligations - 4.5% |
U.S. Treasury Bill(a)- 4.5% |
| | 1,500,000 | | U.S. Treasury Bill(d) (Cost $1,497,946) | | USD | | | 0.726 | | 06/08/17 | | 1,498,075 | |
| Shares | | | | | | |
| Money Market Fund - 2.2% |
| | 748,696 | | Morgan Stanley Institutional Liquidity Funds Treasury Securities Portfolio, Institutional Class (e) (Cost $748,696) | | USD | | | 0.570 | | | | 748,696 | |
| Total Investments – 97.5% (Cost $33,565,562)* | $ | 32,850,943 | |
| Foreign Currencies – 9.9% (Cost $3,314,305) | | 3,346,525 | |
| Net Unrealized Gain/Loss on Forward Currency Contracts – (0.1)% | | (39,480 | ) |
| Other Assets and Liabilities, Net – (7.3)% | | (2,454,083 | ) |
| NET ASSETS – 100.0% | $ | 33,703,905 | |
See Notes to Financial Statements. | 9 | |
| EMTN | European Medium Term Note |
| (a) | All or a portion of these securities are segregated to cover forward currency contract exposure. |
| (b) | Security exempt from registration under Rule 144A under the Securities Act of 1933. At the year end, the value of these securities amounted to $2,715,280 or 8.1% of net assets. |
| (c) | Zero coupon bond. Interest rate presented is yield to maturity. |
| (d) | Rate presented is yield to maturity. |
| (e) | Variable rate security. Rate presented is as of March 31, 2017. |
* Cost for federal income tax purposes is $33,565,562 and net unrealized depreciation consists of:
| Counterparty | | Contracts to Purchase/(Sell) | | Settlement Date | | Settlement Value | | Net Unrealized Appreciation (Depreciation) |
| RBC Capital Markets, LLC | | 9,260,000 | | | Norwegian Krone | | 04/12/17 | | $ | 1,076,777 | | | $ | 1,833 | |
| (continued) | | 92,380,000 | | | Norwegian Krone | | 04/12/17 | | | 10,879,896 | | | | (119,423 | ) |
| | | (8,685,000 | ) | | Pounds Sterling | | 04/12/17 | | | (10,623,640 | ) | | | (260,857 | ) |
| | | (16,340,000 | ) | | Swedish Krona | | 04/12/17 | | | (1,806,868 | ) | | | (17,679 | ) |
| | | 93,980,000 | | | Swedish Krona | | 04/12/17 | | | 10,579,618 | | | | (85,683 | ) |
| | | (6,290,000 | ) | | Swiss Franc | | 04/12/17 | | | (6,323,248 | ) | | | 39,263 | |
| | | 720,000 | | | Swiss Franc | | 04/12/17 | | | 726,312 | | | | (7,001 | ) |
| | | 1,550,000 | | | Swiss Franc | | 04/12/17 | | | 1,538,310 | | | | 10,207 | |
| Societe Generale Securities | | (13,640,000 | ) | | Australian Dollar | | 04/12/17 | | | (10,430,404 | ) | | | 11,628 | |
| | | 10,820,000 | | | Australian Dollar | | 04/12/17 | | | 8,258,890 | | | | 5,858 | |
| | | (3,625,000 | ) | | Canadian Dollars | | 04/12/17 | | | (2,725,883 | ) | | | (464 | ) |
| | | (10,465,000 | ) | | European Union Euro | | 04/12/17 | | | (11,296,094 | ) | | | 126,004 | |
| | | 1,065,000 | | | European Union Euro | | 04/12/17 | | | 1,124,146 | | | | 12,609 | |
| | | (449,500,000 | ) | | Japanese Yen | | 04/12/17 | | | (4,038,181 | ) | | | (1,333 | ) |
| | | 991,150,000 | | | Japanese Yen | | 04/12/17 | | | 8,736,889 | | | | 170,261 | |
| | | 8,930,000 | | | New Zealand Dollar | | 04/12/17 | | | 6,277,145 | | | | (19,110 | ) |
| | | 11,170,000 | | | Norwegian Krone | | 04/12/17 | | | 1,328,001 | | | | (26,913 | ) |
| | | (5,670,000 | ) | | Pounds Sterling | | 04/12/17 | | | (7,029,794 | ) | | | (76,147 | ) |
| | | 1,460,000 | | | Pounds Sterling | | 04/12/17 | | | 1,840,931 | | | | (11,183 | ) |
| | | 9,820,000 | | | Pounds Sterling | | 04/12/17 | | | 12,064,450 | | | | 242,489 | |
| | | (11,160,000 | ) | | Swedish Krona | | 04/12/17 | | | (1,234,738 | ) | | | (11,403 | ) |
| | | 35,210,000 | | | Swedish Krona | | 04/12/17 | | | 3,910,951 | | | | 20,644 | |
| | | (3,310,000 | ) | | Swiss Franc | | 04/12/17 | | | (3,352,672 | ) | | | 45,837 | |
| State Street Brokerage | | (17,415,000 | ) | | Australian Dollar | | 04/12/17 | | | (13,311,305 | ) | | | 9,034 | |
| | | (2,015,000 | ) | | Canadian Dollars | | 04/12/17 | | | (1,500,428 | ) | | | (15,045 | ) |
| | | 2,060,000 | | | Canadian Dollars | | 04/12/17 | | | 1,538,955 | | | | 10,362 | |
| | | (5,345,000 | ) | | European Union Euro | | 04/12/17 | | | (5,665,331 | ) | | | (39,793 | ) |
| | | (1,310,000 | ) | | European Union Euro | | 04/12/17 | | | (1,423,546 | ) | | | 25,284 | |
| | | 990,000 | | | European Union Euro | | 04/12/17 | | | 1,065,576 | | | | (8,874 | ) |
| | | (1,906,500,000 | ) | | Japanese Yen | | 04/12/17 | | | (16,775,479 | ) | | | (357,632 | ) |
| | | (512,000,000 | ) | | Japanese Yen | | 04/12/17 | | | (4,632,742 | ) | | | 31,559 | |
| | | 1,865,000 | | | New Zealand Dollar | | 04/12/17 | | | 1,306,792 | | | | 177 | |
| | | (20,280,000 | ) | | Norwegian Krone | | 04/12/17 | | | (2,376,143 | ) | | | 13,917 | |
| | | (4,660,000 | ) | | Norwegian Krone | | 04/12/17 | | | (542,209 | ) | | | (591 | ) |
| | | (4,795,000 | ) | | Pounds Sterling | | 04/12/17 | | | (5,912,871 | ) | | | (96,474 | ) |
| | | 8,880,000 | | | Pounds Sterling | | 04/12/17 | | | 10,867,411 | | | | 261,469 | |
| | | 7,695,000 | | | Swiss Franc | | 04/12/17 | | | 7,743,846 | | | | (56,205 | ) |
| | | | | | | | | | | | | | | | |
| | | | | | | | | | | | | | $ | (39,480 | ) |
The following is a summary of the inputs used to value the Fund's investments and other financial instruments and liabilities as of March 31, 2017.
The inputs or methodology used for valuing securities are not necessarily an indication of the risks associated with investing in those securities. For more information on valuation inputs, and their aggregation into the levels used in the table below, please refer to the Security Valuation section in Note 2 of the accompanying Notes to Financial Statements.
**Other Financial Instruments are derivatives not reflected in the Schedule of Investments, such as forward currency contracts, which are valued at the unrealized appreciation (depreciation) at year end.
See Notes to Financial Statements. | 11 | |
The Fund utilizes the end of period methodology when determining transfers. There were no transfers among Level 1, Level 2 and Level 3 for the year ended March 31, 2017.
| | | | | | MERK HARD CURRENCY FUND | | | | MERK ABSOLUTE RETURN CURRENCY FUND | |
| ASSETS | | | | | | | | |
| . | Investments, at value (Cost $100,742,266 and $33,565,562, respectively) | $ | 98,692,867 | | | $ | 32,850,943 | |
| | Investments in affiliated issuers, at value (Cost $10,120,259 and $0, respectively) | | | 9,898,524 | | | | - | |
| | Total Investments, at value (Cost $110,862,525 and $33,565,562, respectively) | | | 108,591,391 | | | | 32,850,943 | |
| | Deposits with brokers | | | 52,800 | | | | - | |
| | Foreign currency (Cost $2,699,929 and $3,314,305, respectively) | | | 2,682,227 | | | | 3,346,525 | |
| | Receivables: | | | | | | | | |
| | | Fund shares sold | | | 50,220 | | | | 63,671 | |
| | | Dividends and interest | | | 1,027,417 | | | | 388,124 | |
| | | Variation margin | | | 3,520 | | | | - | |
| | Unrealized gain on forward currency contracts | | | - | | | | 3,153,025 | |
| Total Assets | | | 112,407,575 | | | | 39,802,288 | |
| | | | | | | | | | | |
| LIABILITIES | | | | | | | | |
| | Unrealized loss on forward currency contracts | | | 94,695 | | | | 3,192,505 | |
| | Payables: | | | | | | | | |
| | | Investment securities purchased | | | 1,987,544 | | | | 2,860,204 | |
| | | Fund shares redeemed | | | 40,335 | | | | 15,021 | |
| | Accrued Liabilities: | | | | | | | | |
| | | Investment adviser fees | | | 84,981 | | | | 24,873 | |
| | | Distribution fees | | | 19,804 | | | | 4,337 | |
| | | Other expenses | | | 4,715 | | | | 1,443 | |
| Total Liabilities | | | 2,232,074 | | | | 6,098,383 | |
| | | | | | | | | | | |
| NET ASSETS | | $ | 110,175,501 | | | $ | 33,703,905 | |
| | | | | | | | | | | |
| COMPONENTS OF NET ASSETS | | | | | | | | |
| | Paid-in capital | | $ | 124,319,085 | | | $ | 33,590,201 | |
| | Undistributed net investment income (loss) | | | (2,055,021 | ) | | | 837,409 | |
| | Accumulated net realized loss | | | (9,691,317 | ) | | | (1,431 | ) |
| | Net unrealized depreciation | | | (2,397,246 | ) | | | (722,274 | ) |
| NET ASSETS | | $ | 110,175,501 | | | $ | 33,703,905 | |
| | | | | | | | | | | |
| SHARES OF BENEFICIAL INTEREST AT NO PAR VALUE (UNLIMITED SHARES AUTHORIZED) | | | | | | | | |
| | Investor Shares | | | 9,959,181 | | | | 2,259,159 | |
| | Institutional Shares | | | 1,899,365 | | | | 1,497,634 | |
| | | | | | | | | | | |
| NET ASSET VALUE, OFFERING AND REDEMPTION PRICE PER SHARE | | | | | | | | |
| | Investor Shares (based on net assets of $92,354,553 and $20,177,779, respectively) | | $ | 9.27 | | | $ | 8.93 | |
| | Institutional Shares (based on net assets of $17,820,948 and $13,526,126, respectively) | | $ | 9.38 | | | $ | 9.03 | |
See Notes to Financial Statements. | 13 | |
| | | | | | MERK HARD CURRENCY FUND | | | | MERK ABSOLUTE RETURN CURRENCY FUND | | |
| INVESTMENT INCOME | | | | | | | | | | |
| | Dividend income | . | | $ | 4,123 | | | $ | 5,802 | | |
| | Interest income (Net of foreign withholding taxes of $10,372 and $8,496, respectively) | | | 1,786,936 | | | | 933,708 | | |
| | Net amortization expense | | | (1,820,498 | ) | | | (734,942 | ) | |
| Total Investment Income (Loss) | | | | (29,439 | ) | | | 204,568 | | |
| Adviser | | | | | | | | | | |
| EXPENSES | | | | | | | | | | |
| | Investment adviser fees | | | 1,198,188 | | | | 361,486 | | |
| | Non 12b-1 shareholder servicing fees: | | | | | | | | | |
| | Investor Shares | | | 50,428 | | | | 11,912 | | |
| | Institutional Shares | | | 9,480 | | | | 6,164 | | |
| | Distribution fees: | | | | | | | | | |
| | Investor Shares | | | 252,143 | | | | 59,555 | | |
| | Interest expense | | | 3,144 | 0 | | | 6 | 0 | |
| Total Expenses | | | | 1,513,383 | | | | 439,123 | | |
| | Fees waived | | | (68,293 | ) | | | - | | |
| Net Expenses | | | | 1,445,090 | | | | 439,123 | | |
| | | | | | | | | | | | |
| NET INVESTMENT LOSS | | | | (1,474,529 | ) | | | (234,555 | ) | |
| | | | | | | | | | | | |
| NET REALIZED AND UNREALIZED GAIN (LOSS) | | | | | | | | | | |
| | Net realized gain (loss) on: | | | | | | | | | |
| | Investments in unaffiliated issuers | | | (2,447,570 | ) | | | (114,046 | ) | |
| | Investments in affiliated issuers | | | (692,193 | ) | | | - | | |
| | Foreign currency transactions | | | 1,318,788 | | | | 1,803,501 | | |
| | Futures | | | (11,445 | ) | | | - | | |
| | Net realized gain (loss) | | | (1,832,420 | ) | | | 1,689,455 | | |
| | Net change in unrealized appreciation (depreciation) on: | | | | | | | | | |
| | Investments in unaffiliated issuers | | | (4,491,911 | ) | | | (1,419,032 | ) | |
| | Investments in affiliated issuers | | | 836,029 | | | | - | | |
| | Foreign currency translations | | | (173,388 | ) | | | 896,942 | | |
| | Futures | | | 4,110 | | | | - | | |
| | Net change in unrealized appreciation (depreciation) | | | (3,825,160 | ) | | | (522,090 | ) | |
| NET REALIZED AND UNREALIZED GAIN (LOSS) | | | | (5,657,580 | ) | | | 1,167,365 | | |
| INCREASE (DECREASE) IN NET ASSETS RESULTING FROM OPERATIONS | | | $ | (7,132,109 | ) | | $ | 932,810 | | |
See Notes to Financial Statements. | 14 | |
| | | | | MERK HARD CURRENCY FUND | | MERK ABSOLUTE RETURN CURRENCY FUND |
| | | | | For the Year Ended March 31, 2017 | | | For the Year Ended March 31, 2016 | | For the Year Ended March 31, 2017 | | | For the Year Ended March 31, 2016 |
| OPERATIONS | | | | | | | | | | | | | | | | | | |
| | Net investment loss | | $ | (1,474,529 | ) | | | $ | (1,387,783 | ) | | $ | (234,555 | ) | | | $ | (172,895 | ) |
| | Net realized gain (loss) | | | (1,832,420 | ) | | | | (8,786,534 | ) | | | 1,689,455 | | | | | (2,643,908 | ) |
| | Net change in unrealized appreciation (depreciation) | | | (3,825,160 | ) | | | | 13,884,487 | | | | (522,090 | ) | | | | 3,336,009 | |
| Increase (Decrease) in Net Assets Resulting from Operations | | | (7,132,109 | ) | | | | 3,710,170 | | | | 932,810 | | | | | 519,206 | |
| | | | | | | | | | | | | | | | | | | | | |
| DISTRIBUTIONS TO SHAREHOLDERS FROM | | | | | | | | | | | | | | | | | | |
| | Net investment income: | | | | | | | | | | | | | | | | | | |
| | | Investor Shares | | | - | | | | | - | | | | (407,188 | ) | | | | - | |
| | | Institutional Shares | | | - | | | | | - | | | | (313,854 | ) | | | | - | |
| Total Distributions to Shareholders | | | - | | | | | - | | | | (721,042 | ) | | | | - | |
| | | | | | | | | | | | | | | | | | | | | |
| CAPITAL SHARE TRANSACTIONS | | | | | | | | | | | | | | | | | | |
| | Sale of shares: | | | | | | | | | | | | | | | | | | |
| | | Investor Shares | | | 22,251,875 | | | | | 11,846,783 | | | | 9,963,058 | | | | | 3,881,820 | |
| | | Institutional Shares | | | 17,004,065 | | | | | 890,570 | | | | 3,475,835 | | | | | 4,829,525 | |
| | Reinvestment of distributions: | | | | | | | | | | | | | | | | | | |
| | | Investor Shares | | | - | | | | | - | | | | 400,417 | | | | | - | |
| | | Institutional Shares | | | - | | | | | - | | | | 304,150 | | | | | - | |
| | Redemption of shares: | | | | | | | | | | | | | | | | | | |
| | 2 | Investor Shares | | | (29,345,801 | ) | | | | (36,085,357 | ) | | | (10,870,540 | ) | | | | (7,795,822 | ) |
| | 4 | Institutional Shares | | | (16,314,892 | ) | | | | (12,126,216 | ) | | | (1,860,402 | ) | | | | (11,297,516 | ) |
| Increase (Decrease) in Net Assets from Capital Share Transactions | | (6,404,753 | ) | | | | (35,474,220 | ) | | | 1,412,518 | | | | | (10,381,993 | ) |
| Increase (Decrease) in Net Assets | | | (13,536,862 | ) | | | | (31,764,050 | ) | | | 1,624,286 | | | | | (9,862,787 | ) |
| | | | | | | | | | | | | | | | | | | | | |
| NET ASSETS | | | | | | | | | | | | | | | | | | |
| | Beginning of Year | | | 123,712,363 | | | | | 155,476,413 | | | | 32,079,619 | | | | | 41,942,406 | |
| | End of Year (Including line (a)) | | $ | 110,175,501 | | | | $ | 123,712,363 | | | $ | 33,703,905 | | | | $ | 32,079,619 | |
| | | | | | | | | | | | | | | | | | | | | |
| SHARE TRANSACTIONS | | | | | | | | | | | | | | | | | | |
| | Sale of shares: | | | | | | | | | | | | | | | | | | |
| | | Investor Shares | | | 2,303,794 | | | | | 1,241,543 | | | | 1,092,991 | | | | | 442,760 | |
| | | Institutional Shares | | | 1,736,272 | | | | | 91,370 | | | | 375,492 | | | | | 551,578 | |
| | Reinvestment of distributions: | | | | | | | | | | | | | | | | | | |
| | | Investor Shares | | | - | | | | | - | | | | 44,689 | | | | | - | |
| | | Institutional Shares | | | - | | | | | - | | | | 33,571 | | | | | - | |
| | Redemption of shares: | | | | | | | | | | | | | | | | | | |
| | | Investor Shares | | | (3,089,052 | ) | | | | (3,819,818 | ) | | | (1,189,319 | ) | | | | (896,223 | ) |
| | | Institutional Shares | | | (1,684,981 | ) | | | | (1,282,016 | ) | | | (202,365 | ) | | | | (1,286,330 | ) |
| Increase (Decrease) in Shares | | | (733,967 | ) | | | | (3,768,921 | ) | | | 155,059 | | | | | (1,188,215 | ) |
| | | | | | | | | | | | | | | | | | | | | |
| (a) | Undistributed net investment income (loss) | | $ | (2,055,021 | ) | | | $ | (1,065,798 | ) | | $ | 837,409 | | | | $ | 103,579 | |
See Notes to Financial Statements. | 15 | |
| These financial highlights reflect selected data for a share outstanding throughout each year. | | | | | | |
| | | For the Years Ended March 31, | |
| MERK HARD CURRENCY FUND | | 2017 | | | | 2016 | | | | 2015 | | | | 2014 | | | | 2013 | | |
| INVESTOR SHARES | | | | | | | | | | | | | | | | | | | | |
| NET ASSET VALUE, Beginning of Year | $ | 9.81 | | | $ | 9.49 | | | $ | 11.58 | | | $ | 11.91 | | | $ | 12.04 | | |
| INVESTMENT OPERATIONS | | | | | | | | | | | | | | | | | | | | |
| Net investment loss (a) | | (0.12 | ) | | | (0.10 | ) | | | (0.07 | ) | | | (0.09 | ) | | | (0.04 | ) | |
| Net realized and unrealized gain (loss) | | (0.42 | ) | | | 0.42 | | | | (1.94 | ) | | | 0.09 | (b) | | 0.02 | (b) | |
| Total from Investment Operations | | (0.54 | ) | | | 0.32 | | | | (2.01 | ) | | | — | | | | (0.02 | ) | |
| DISTRIBUTIONS TO SHAREHOLDERS FROM | | | | | | | | | | | | | | | | | | |
| Net investment income | | — | | | | — | | | | (0.08 | ) | | | (0.21 | ) | | | — | | |
| Net realized gain | | — | | | | — | | | | — | | | | (0.12 | ) | | | (0.11 | ) | |
| Total Distributions to Shareholders | | — | | | | — | | | | (0.08 | ) | | | (0.33 | ) | | | (0.11 | ) | |
| NET ASSET VALUE, End of Year | $ | 9.27 | | | $ | 9.81 | | | $ | 9.49 | | | $ | 11.58 | | | $ | 11.91 | | |
| TOTAL RETURN | | (5.50 | )% | | 3.37 | % | | (17.47 | )% | | 0.08 | % | | (0.15 | )% |
| RATIOS/SUPPLEMENTARY DATA | | | | | | | | | | | | | | | | | | | | |
| Net Assets at End of Year (000's omitted) | $92,355 | | | $105,417 | | | $126,449 | | | $253,432 | | | $464,720 | | |
| Ratios to Average Net Assets: | | | | | | | | | | | | | | | | | | | | |
| Net investment loss | | (1.27 | )% | | (1.06 | )% | | (0.66 | )% | | (0.76 | )% | | (0.30 | )% |
| Net expenses | | 1.24 | % | | 1.23 | % | | 1.24 | % | | 1.30 | % | | 1.30 | % |
| Gross expenses | | 1.30 | %(c) | 1.30 | %(c) | 1.30 | %(c) | 1.30 | % | | 1.30 | % |
| PORTFOLIO TURNOVER RATE(d) | | 81 | % | | 85 | % | | 116 | % | | 45 | % | | 56 | % |
| | For the Years Ended March 31, | |
| INSTITUTIONAL SHARES | | 2017 | | | | 2016 | | | | 2015 | | | | 2014 | | | | 2013 | | |
| NET ASSET VALUE, Beginning of Year | $ | 9.90 | | | $ | 9.55 | | | $ | 11.62 | | | $ | 11.95 | | | $ | 12.05 | | |
| INVESTMENT OPERATIONS | | | | | | | | | | | | | | | | | | | | |
| Net investment loss (a) | | (0.10 | ) | | | (0.08 | ) | | | (0.05 | ) | | | (0.06 | ) | | | (0.02 | ) | |
| Net realized and unrealized gain (loss) | | (0.42 | ) | | | 0.43 | | | | (1.93 | ) | | | 0.10 | (b) | | 0.03 | (b) |
| Total from Investment Operations | | (0.52 | ) | | | 0.35 | | | | (1.98 | ) | | | 0.04 | | | | 0.01 | | |
| DISTRIBUTIONS TO SHAREHOLDERS FROM | | | | | | | | | | | | | | | | | | |
| Net investment income | | — | | | | — | | | | (0.09 | ) | | | (0.25 | ) | | | — | | |
| Net realized gain | | — | | | | — | | | | — | | | | (0.12 | ) | | | (0.11 | ) | |
| Total Distributions to Shareholders | | — | | | | — | | | | (0.09 | ) | | | (0.37 | ) | | | (0.11 | ) | |
| NET ASSET VALUE, End of Year | $ | 9.38 | | | $ | 9.90 | | | $ | 9.55 | | | $ | 11.62 | | | $ | 11.95 | | |
| TOTAL RETURN | | (5.25 | )% | | 3.66 | % | | (17.18 | )% | | 0.38 | % | | 0.10 | % |
| RATIOS/SUPPLEMENTARY DATA | | | | | | | | | | | | | | | | | | | | |
| Net Assets at End of Year (000's omitted) | $17,821 | | | $18,296 | | | $29,027 | | | $56,273 | | | $75,547 | | |
| Ratios to Average Net Assets: | | | | | | | | | | | | | | | | | | | | |
| Net investment loss | | (1.02 | )% | | (0.81 | )% | | (0.41 | )% | | (0.52 | )% | | (0.15 | )% |
| Net expenses | | 0.99 | % | | 0.98 | % | | 0.99 | % | | 1.05 | % | | 1.05 | % |
| Gross expenses | | 1.05 | %(c) | 1.05 | %(c) | 1.05 | %(c) | 1.05 | % | | 1.05 | % |
| PORTFOLIO TURNOVER RATE(d) | | 81 | % | | 85 | % | | 116 | % | | 45 | % | | 56 | % |
| | |
| (a) | Calculated based on average shares outstanding during each year. |
| (b) | The net realized and unrealized gain (loss) per share does not correlate to the aggregate of the net realized and unrealized loss in the Statement of Operations primarily due to the timing of the sales and repurchases of the Fund's shares in relation to fluctuating market values for the Fund's portfolio. |
| (c) | Reflects the expense ratio excluding any waivers and/or reimbursements. |
| (d) | The portfolio turnover rate is calculated without regard to any securities whose maturities or expiration dates at the time of acquisition were one year or less. | | |
See Notes to Financial Statements. | 16 | |
| These financial highlights reflect selected data for a share outstanding throughout each year. | | | | | | |
| | | For the Years Ended March 31, | |
| MERK ABSOLUTE RETURN CURRENCY FUND | 2017 | | | | 2016 | | | | 2015 | | | | 2014 | | | | 2013 | | |
| INVESTOR SHARES | | | | | | | | | | | | | | | | | | | | | |
| NET ASSET VALUE, Beginning of Year | $ | 8.87 | | | $ | 8.72 | | | $ | 9.53 | | | $ | 9.18 | | | $ | 9.37 | | |
| INVESTMENT OPERATIONS | | | | | | | | | | | | | | | | | | | | |
| Net investment loss (a) | | (0.07 | ) | | | (0.05 | ) | | | (0.05 | ) | | | (0.05 | ) | | | (0.09 | ) | |
| Net realized and unrealized gain (loss) | | 0.31 | | | | 0.20 | | | | (0.57 | ) | | | 0.57 | | | | (0.10 | ) | |
| Total from Investment Operations | | 0.24 | | | | 0.15 | | | | (0.62 | ) | | | 0.52 | | | | (0.19 | ) | |
| DISTRIBUTIONS TO SHAREHOLDERS FROM | | | | | | | | | | | | | | | | | | |
| Net investment income | | (0.18 | ) | | | — | | | | (0.19 | ) | | | (0.17 | ) | | | — | | |
| NET ASSET VALUE, End of Year | $ | 8.93 | | | $ | 8.87 | | | $ | 8.72 | | | $ | 9.53 | | | $ | 9.18 | | |
| TOTAL RETURN | | 2.74 | % | | 1.72 | % | | (6.59 | )% | | 5.68 | % | | (2.03 | )% |
| RATIOS/SUPPLEMENTARY DATA | | | | | | | | | | | | | | | | | | | | |
| Net Assets at End of Year (000's omitted) | $20,178 | | | $20,497 | | | $24,113 | | | $23,016 | | | $10,733 | | |
| Ratios to Average Net Assets: | | | | | | | | | | | | | | | | | | | | |
| Net investment loss | | (0.73 | )% | | (0.59 | )% | | (0.53 | )% | | (0.53 | )% | | (0.98 | )% |
| Net expenses | | 1.30 | % | | 1.30 | % | | 1.30 | % | | 1.30 | % | | 1.30 | % |
| Gross expenses | | 1.30 | % | | 1.30 | % | | 1.30 | % | | 1.30 | % | | 1.30 | % |
| PORTFOLIO TURNOVER RATE(b) | | 71 | % | | 59 | % | | 58 | % | | 0 | % | | 0 | % |
See Notes to Financial Statements. | 17 | |
Note 1. Organization
The Merk Hard Currency Fund and the Merk Absolute Return Currency Fund (individually included in the defined term, "Fund" and, collectively included in the defined term, "Funds") are a non-diversified portfolio and a diversified portfolio of Forum Funds (the "Trust"), respectively. The Trust is a Delaware statutory trust that is registered as an open-end, management investment company under the Investment Company Act of 1940, as amended (the "Act"). Under its Trust Instrument, the Trust is authorized to issue an unlimited number of each Fund's shares of beneficial interest without par value. Each Fund currently offers two classes of shares: Investor Shares and Institutional Shares. The Merk Hard Currency Fund seeks to profit from a rise in hard currencies relative to the U.S. dollar. The Merk Absolute Return Currency Fund seeks to generate positive absolute returns by investing in securities and instruments that create exposure to currencies. The Merk Hard Currency Fund Investor Shares and Institutional Shares commenced operations on May 10, 2005 and April 1, 2010, respectively. The Merk Absolute Return Currency Fund Investor Shares and Institutional Shares commenced operations on September 9, 2009 and April 1, 2010, respectively.
Note 2. Summary of Significant Accounting Policies
The Funds are investment companies and follow accounting and reporting guidance under Financial Accounting Standards Board ("FASB") Accounting Standards Codification ("ASC") Topic 946, "Financial Services-Investment Companies". These financial statements are prepared in accordance with accounting principles generally accepted in the United States of America ("GAAP"), which require management to make estimates and assumptions that affect the reported amounts of assets and liabilities, the disclosure of contingent liabilities at the date of the financial statements, and the reported amounts of increases and decreases in net assets from operations during the fiscal year. Actual amounts could differ from those estimates. The following summarizes the significant accounting policies of each Fund:
Security Valuation – Securities are valued at market prices using the last quoted trade or official closing price from the principal exchange where the security is traded, as provided by independent pricing services on each Fund business day. In the absence of a last trade, securities are valued at the mean of the last bid and ask price provided by the pricing service. Debt securities may be valued at prices supplied by a fund's pricing agent based on broker or dealer supplied valuations or matrix pricing, a method of valuing securities by reference to the value of other securities with similar characteristics such as rating, interest rate and maturity. Shares of open-end mutual funds are valued at net asset value ("NAV"). Futures contracts are valued at the day's settlement price on the exchange where the contract is traded. Forward currency contracts are generally valued based on interpolation of forward curve data points obtained from major banking institutions that deal in foreign currencies and currency dealers. Short-term investments that mature in 60 days or less may be valued at amortized cost.
Each Fund values its investments at fair value pursuant to procedures adopted by the Trust's Board of Trustees (the "Board") if (1) market quotations are not readily available or (2) the Adviser, as defined in Note 3, believes that the values available are unreliable. The Trust's Valuation Committee, as defined in each Fund's registration statement, performs certain functions as they relate to the administration and oversight of each Fund's valuation procedures. Under these procedures, the Valuation Committee convenes on a regular and ad hoc basis to review such investments and considers a number of factors, including valuation methodologies and significant unobservable inputs, when arriving at fair value.
The Valuation Committee may work with the Adviser to provide valuation inputs. In determining fair valuations, inputs may include market-based analytics that may consider related or comparable assets or liabilities, recent transactions, market multiples, book values and other relevant investment information. Adviser inputs may include an income-based approach in which the anticipated future cash flows of the investment are discounted in determining fair value. Discounts may also be applied based on the nature or duration of any restrictions on the disposition of the investments. The Valuation Committee performs regular reviews of valuation methodologies, key inputs and assumptions, disposition analysis and market activity.
Fair valuation is based on subjective factors and, as a result, the fair value price of an investment may differ from the security's market price and may not be the price at which the asset may be sold. Fair valuation could result in a different Net Asset Value ("NAV") than a NAV determined by using market quotes.
Each Fund has a three-tier fair value hierarchy. The basis of the tiers is dependent upon the various "inputs" used to determine the value of each Fund's investments. These inputs are summarized in the three broad levels listed below:
Level 1 — quoted prices in active markets for identical assets and liabilities
Level 2 — other significant observable inputs (including quoted prices of similar securities, interest rates, prepayment speeds, credit risk, etc.)
Level 3 — significant unobservable inputs (including each Fund's own assumptions in determining the fair value of investments)
The aggregate value by input level, as of March 31, 2017, for each Fund's investments is included at the end of each Fund's Schedule of Investments.
Security Transactions, Investment Income and Realized Gain and Loss – Investment transactions are accounted for on the trade date. Income and capital gains on some foreign securities may be subject to foreign withholding taxes, which are accrued as applicable. Interest income is recorded on an accrual basis. Premium is amortized and discount is accreted using the effective interest method. Identified cost of investments sold is used to determine the gain and loss for both financial statement and federal income tax purposes.
Foreign Currency Translations – Foreign currency amounts are translated into U.S. dollars as follows: (1) assets and liabilities at the rate of exchange at the end of the respective period; and (2) purchases and sales of securities and income and expenses at the rate of exchange prevailing on the dates of such transactions. The portion of the results of operations arising from changes in the exchange rates and the portion due to fluctuations arising from changes in the market prices of securities are not isolated. Such fluctuations are included with the net realized and unrealized gain or loss on investments.
Foreign Currency Transactions – Each Fund may enter into transactions to purchase or sell foreign currency contracts and options on foreign currency. Forward currency contracts are agreements to exchange one currency for another at a future date and at a specified price. A fund may use forward currency contracts to facilitate transactions in foreign securities, to manage a fund's foreign currency exposure and to protect the U.S. dollar value of its underlying portfolio securities against the effect of possible adverse movements in foreign exchange rates. These contracts are intrinsically valued daily based on forward rates, and a fund's net equity therein, representing unrealized gain or loss on the contracts as measured by the difference between the forward foreign exchange rates at the dates of entry into the contracts and the forward rates at the reporting date, is recorded as a component of NAV. These instruments involve market risk, credit risk, or both kinds of risks, in excess of the amount recognized in the Statements of Assets and Liabilities. Risks arise from the possible inability of counterparties to meet the terms of their contracts and from movement in currency and securities values and interest rates. Due to the risks associated with these transactions, a fund could incur losses up to the entire contract amount, which may exceed the net unrealized value included in its NAV.
The values of each individual forward currency contract outstanding as of March 31, 2017, are disclosed in each Fund's Schedule of Investments.
Futures Contracts – Each Fund may purchase futures contracts to gain exposure to market changes, which may be more efficient or cost effective than actually buying the securities. A futures contract is an agreement between parties to buy or sell a security at a set price on a future date. Upon entering into such a contract, a fund is required to pledge to the broker an amount of cash, U.S. Government obligations or other high-quality debt securities equal to the minimum "initial margin" requirements of the exchange on which the futures contract is traded. Pursuant to the contract, the fund agrees to receive from or pay to the broker an amount of cash equal to the daily fluctuation in the value of the contract. Such receipts or payments are known as "variation margin" and are recorded by the fund as unrealized gains or losses. When the contract is closed, the fund records a realized gain or loss equal to the difference between the value of the contract at the time it was opened and value at the time it was closed. Risks of entering into futures contracts include the possibility that there may be an illiquid market and that a change in the value of the contract may not correlate with changes in the value of the underlying securities.
Distributions to Shareholders – Distributions to shareholders of net investment income, if any, are declared and paid quarterly. Distributions to shareholders of net capital gains and net foreign currency gains, if any, are declared and paid at least annually. Distributions to shareholders are recorded on the ex-dividend date. Distributions are based on amounts calculated in accordance with applicable federal income tax regulations, which may differ from GAAP. These differences are due primarily to differing treatments of income and gain on various investment securities held by each Fund, timing differences and differing characterizations of distributions made by each Fund.
Federal Taxes – Each Fund intends to continue to qualify each year as a regulated investment company under Subchapter M of Chapter 1, Subtitle A, of the Internal Revenue Code of 1986, as amended ("Code"), and to distribute all of its taxable income to shareholders. In addition, by distributing in each calendar year substantially all of its net investment income and capital gains, if any, the Funds will not be subject to a federal excise tax. Therefore, no federal income or excise tax provision is required. Each Fund files a U.S. federal income and excise tax return as required. Each Fund's federal income tax returns are subject to examination by the Internal Revenue Service for a period of three fiscal years after they are filed. As of March 31, 2017, there are no uncertain tax positions that would require financial statement recognition, de-recognition or disclosure.
Income and Expense Allocation – The Trust accounts separately for the assets, liabilities and operations of each of its investment portfolios. Expenses that are directly attributable to more than one investment portfolio are allocated among the respective investment portfolios in an equitable manner.
The Funds' class-specific expenses are charged to the operations of that class of shares. Income and expenses (other than expenses attributable to a specific class) and realized and unrealized gains or losses on investments are allocated to each class of shares based on the class' respective net assets to the total net assets of each Fund.
Commitments and Contingencies – In the normal course of business, each Fund enters into contracts that provide general indemnifications by each Fund to the counterparty to the contract. Each Fund's maximum exposure under these arrangements is
dependent on future claims that may be made against each Fund and, therefore, cannot be estimated; however, based on experience, the risk of loss from such claims is considered remote.
Note 3. Fees and Expenses
Investment Adviser – Merk Investments LLC (the "Adviser") is the investment adviser to each Fund. Pursuant to an investment advisory agreement, the Adviser receives an advisory fee from the Funds at an annual rate of 1.00% of each Fund's average daily net assets.
Under the terms of the Investment Advisory Agreement for the Funds the Adviser is obligated to pay all expenses of each Fund except Board-approved administrative service fees, borrowing costs, taxes, brokerage costs, commissions, and extraordinary and non-recurring expenses and expenses that the Funds are authorized to pay under Rule 12b-1.
Distribution – Foreside Fund Services, LLC serves as each Fund's distributor (the "Distributor"). The Distributor is not affiliated with the Adviser or Atlantic Fund Administration, LLC (d/b/a Atlantic Fund Services) ("Atlantic") or their affiliates. The Trust, on behalf of the Funds, has adopted a Distribution Plan (the "Plan") for Investor Shares of the Funds in accordance with Rule 12b-1 of the Act. Under the Plan, the Funds pay the Distributor and/or any other entity as authorized by the Board a fee of up to 0.25% of the average daily net assets of each Fund's Investor Shares for the marketing of fund shares and for services provided to shareholders.
Other Service Providers – Atlantic provides fund accounting, fund administration, compliance and transfer agency services to each Fund. Atlantic also provides certain shareholder report production and EDGAR conversion and filing services. Atlantic provides a Principal Executive Officer, a Principal Financial Officer, a Chief Compliance Officer and an Anti-Money Laundering Officer to each Fund, as well as certain additional compliance support functions.
Note 4. Fees Waived
During this period, Merk Hard Currency Fund invested in VanEck Merk Gold Trust, an exchange traded product sponsored by the Adviser. As of March 31, 2017, Merk Hard Currency Fund owned approximately 7.8% of VanEck Merk Gold Trust. The Adviser has agreed to waive fees in an amount equal to the fee it receives from VanEck Merk Gold Trust based on Merk Hard Currency Fund's investment in VanEck Merk Gold Trust (NYSE:OUNZ). For the year ended March 31, 2017, the Adviser waived fees of $68,293 for Merk Hard Currency Fund.
Note 5. Security Transactions
The cost of purchases and proceeds from sales of investment securities (including maturities), other than short-term investments during the year ended March 31, 2017, were as follows:
| Merk Absolute Return Currency Fund | | |
| Location: | | Currency Contracts |
| Asset derivatives: | | | | |
| Unrealized gain on forward currency contracts | | $ | 3,153,025 | |
| | | | | |
| Liability derivatives: | | | | |
| Unrealized loss on forward currency contracts | | $ | (3,192,505 | ) |
Realized and unrealized gains and losses on derivatives contracts during the year ended March 31, 2017, by each Fund are recorded in the following locations on the Statements of Operations:
Note 7. Federal Income Tax
There were no distributions paid during the fiscal year ended March 31, 2016, for either Fund. There were no distributions paid during the fiscal year ended March 31, 2017, for the Merk Hard Currency Fund. Distributions paid during the fiscal year ended March 31, 2017, for the Merk Absolute Return Currency Fund were characterized for tax purposes as follows:
To the Board of Trustees of Forum Funds and
the Shareholders of Merk Hard Currency Fund and
Merk Absolute Return Currency Fund
We have audited the accompanying statements of assets and liabilities of Merk Hard Currency Fund and Merk Absolute Return Currency Fund, each a series of shares of beneficial interest in the Forum Funds (the "Funds"), including the schedules of investments, as of March 31, 2017, and the related statements of operations for the year then ended, the statements of changes in net assets for each of the years in the two-year period then ended and the financial highlights for each of the years in the five-year period then ended. These financial statements and financial highlights are the responsibility of the Funds' management. Our responsibility is to express an opinion on these financial statements and financial highlights based on our audits.
We conducted our audits in accordance with the standards of the Public Company Accounting Oversight Board (United States). Those standards require that we plan and perform the audits to obtain reasonable assurance about whether the financial statements and financial highlights are free of material misstatement. An audit includes examining, on a test basis, evidence supporting the amounts and disclosures in the financial statements. Our procedures included confirmation of securities owned as of March 31, 2017 by correspondence with the custodian and brokers. An audit also includes assessing the accounting principles used and significant estimates made by management, as well as evaluating the overall financial statement presentation. We believe that our audits provide a reasonable basis for our opinion.
In our opinion, the financial statements and financial highlights referred to above present fairly, in all material respects, the financial position of Merk Hard Currency Fund and Merk Absolute Return Currency Fund as of March 31, 2017, and the results of their operations for the year then ended, the changes in their net assets for each of the years in the two-year period then ended and their financial highlights for each of the years in the five-year period then ended, in conformity with accounting principles generally accepted in the United States of America.
BBD, LLP
Philadelphia, Pennsylvania
May 24, 2017
Proxy Voting Information
A description of the policies and procedures that each Fund uses to determine how to vote proxies relating to securities held in each Fund's portfolio is available, without charge and upon request, by calling (866) 637-5386 and on the U.S. Securities and Exchange Commission's website at www.sec.gov. Each Fund's proxy voting record for the most recent twelve-month period ended June 30 is available, without charge and upon request, by calling (866) 637-5386 and on the SEC's website at www.sec.gov.
Availability of Quarterly Portfolio Schedules
Each Fund files its complete schedule of portfolio holdings with the SEC for the first and third quarters of each fiscal year on Form N-Q. These filings are available, without charge and upon request on the SEC's website at www.sec.gov or may be reviewed and copied at the SEC's Public Reference Room in Washington, DC. Information on the operation of the Public Reference Room may be obtained by calling (800) SEC-0330.
Shareholder Expense Example
As a shareholder of the Funds, you incur ongoing costs, including management fees, distribution and/or service (12b-1) fees and other Fund expenses. This example is intended to help you understand your ongoing costs (in dollars) of investing in the Funds and to compare these costs with the ongoing costs of investing in other mutual funds.
The example is based on an investment of $1,000 invested at the beginning of the period and held for the entire period from October 1, 2016, through March 31, 2017.
Actual Expenses – The first line under each Fund of the table below provides information about actual account values and actual expenses. You may use the information in this line, together with the amount you invested, to estimate the expenses that you paid over the period. Simply divide your account value by $1,000 (for example, an $8,600 account value divided by $1,000 = 8.6), then multiply the result by the number in the first line under the heading entitled "Expenses Paid During Period" to estimate the expenses you paid on your account during the period.
Hypothetical Example for Comparison Purposes – The second line under each Fund of the table below provides information about hypothetical account values and hypothetical expenses based on each Fund's actual expense ratio and an assumed rate of return of 5% per year before expenses, which is not each Fund's actual return. The hypothetical account values and expenses may not be used to estimate the actual ending account balance or expenses you paid for the period. You may use this information to compare the ongoing costs of investing in each Fund and other funds. To do so, compare this 5% hypothetical example with the 5% hypothetical examples that appear in the shareholder reports of other funds.
Please note that the expenses shown in the table are meant to highlight your ongoing costs only. Therefore, the second line of the table is useful in comparing ongoing costs only, and will not help you determine the relative total costs of owning different funds.
Federal Tax Status of Dividends Declared during the Fiscal Year
For federal income tax purposes, dividends from short-term capital gains are classified as ordinary income. The Merk Absolute Return Currency Fund designates 0.06% as qualified interest income exempt from U.S. tax for foreign shareholders (QII).
Trustees and Officers of the Trust
The Board is responsible for oversight of the management of the Trust's business affairs and of the exercise of all the Trust's powers except those reserved for the shareholders. The following table provides information about each Trustee and certain officers of the Trust. Each Trustee and officer holds office until the person resigns, is removed, or is replaced. Unless otherwise noted, the persons have held their principal occupations for more than five years. The address for all Trustees and officers is Three Canal Plaza, Suite 600, Portland, Maine 04101. Mr. Keffer is considered an Interested Trustee due to his affiliation with Atlantic. Each Fund's Statement of Additional Information includes additional information about the Trustees and is available, without charge and upon request, by calling (866) 637-5386.
| Name and Year of Birth | Position(s) with the Trust | Length of Time Served | Principal Occupation(s) During Past Five Years | Number of Series of Fund Complex¹ Overseen by Trustee | Other Directorships Held by Trustee |
| Officers | | | | | |
Jessica Chase Born: 1970 | President; Principal Executive Officer | Since 2015 | Senior Vice President, Atlantic since 2008. | N/A | N/A |
Karen Shaw Born: 1972 | Treasurer; Principal Financial Officer | Since 2008 | Senior Vice President, Atlantic since 2008. | N/A | N/A |
Zachary Tackett Born: 1988 | Vice President; Secretary; Anti-Money Laundering Compliance Officer | Since 2014 | Counsel, Atlantic since 2014; Intern Associate, Coakley & Hyde, PLLC, 2010-2013. | N/A | N/A |
Michael J. McKeen Born: 1971 | Vice President | Since 2009 | Senior Vice President, Atlantic since 2008. | N/A | N/A |
Timothy Bowden Born: 1969 | Vice President | Since 2009 | Manager, Atlantic since 2008. | N/A | N/A |
Geoffrey Ney Born: 1975 | Vice President | Since 2013 | Manager, Atlantic since 2013; Senior Fund Accountant, Atlantic, 2008-2013. | N/A | N/A |
Todd Proulx Born: 1978 | Vice President | Since 2013 | Manager, Atlantic since 2013; Senior Fund Accountant, Atlantic, 2008-2013. | N/A | N/A |
Carlyn Edgar Born: 1963 | Vice President | Since 2008 | Senior Vice President, Atlantic since 2008; Chief Compliance Officer, 2008-2016. | N/A | N/A |
Dennis Mason Born: 1967 | Chief Compliance Officer | Since 2016 | Fund Compliance Officer, Atlantic since 2013; Senior Specialist, Atlantic 2011-2013; Senior Analyst, Atlantic 2008-2011. | N/A | N/A |
1The Fund Complex includes the Trust, Forum Funds II, Forum ETF Trust and U.S. Global Investors Funds and is overseen by different Boards of Trustees. |


PAYSON TOTAL RETURN FUND TABLE OF CONTENTS MARCH 31, 2017 |
An investment in the Fund is subject to risk, including the possible loss of principal. Other Fund risks include equity risk, convertible securities risk, debt securities risk, exchange-traded funds risk, interest rate risk, credit risk, inflation indexed security risk, government securities risk, value investment risk, mortgage-related and other asset-backed securities risk, and foreign investments risk. Foreign investing involves certain risks and increased volatility not associated with investing solely in the U.S., including currency fluctuations, economic or financial instability, lack of timely or reliable financial information or unfavorable political or legal developments. Mortgage-related and other asset-backed securities risks include extension risk and prepayment risk. In addition, the Fund invests in midcap companies, which pose greater risks than those associated with larger, more established companies. There is no assurance that the Fund will achieve its investment objective.
PAYSON TOTAL RETURN FUND A MESSAGE TO OUR SHAREHOLDERS (Unaudited) MARCH 31, 2017 |
Dear Payson Total Return Fund Shareholder,
The Payson Total Return Fund (the "Fund") provided a total return of 17.41% for the fiscal year ending March 31, 2017. These results compare favorably to the total return of the S&P 500 Index (the "Index") over that same time period of 17.17%.
During the above mentioned time period the US economy generated positive momentum as reflected by strong employment results, manufacturing data, consumer demand, and, ultimately, corporate earnings. Stock prices during this time period however advanced at a faster rate than corporate earnings particularly after the US Presidential election. Investors bid up stock prices aggressively with the expectation that the new administration would take steps to stimulate growth in the economy thereby fueling higher earnings growth. Also, interest rates turned dramatically higher after the election with investors anticipating a rise in inflation if in fact the economy picked up steam. In fact, the sectors that saw the greatest appreciation were those that typically are considered more economically sensitive. Specifically, Technology, Financial, Industrial and Materials sectors led the market during this time period while less cyclical sectors such as Health Care, Consumer Staples and Utilities lagged.
With this as a backdrop, the portfolio managers are pleased with the results of the Fund this past fiscal year. Not only did the Fund manage to outperform the Index during this time period but did so while maintaining a disciplined approach to the underlying fundamental characteristics of the Fund portfolio. The long term strategy of the managers is to maintain a portfolio of securities that generate above average cash flow growth while at the same time striving to keep the valuation characteristics of the Fund portfolio below that of the Index. As was the case with the previous fiscal year, this approach to managing the Fund has led to an overweight in Technology stocks relative to the Index. The portfolio managers remain attracted to many large capitalized companies within the sector that continue to generate growing revenues, cash flow and net income. Fund investors were rewarded for this exposure as the technology sector outperformed the Index and the technology stocks held in the Fund outperformed the sector.
Conversely, the Fund has no exposure to Basic Materials, Utilities and Telecommunication Sectors as the portfolio managers see little long term earnings growth, below average cash flow and unattractive balance sheets in most companies in these sectors. Although Basic Materials performed well last calendar year, outperforming the overall Index, the other two sectors underperformed in response to rising interest rates.
Over the course of the past fiscal year the Health Care Sector has struggled to perform well as companies grapple with the ever changing political and economic headwinds that have hung over the sector for several years. The Fund continues to maintain exposure to this sector as many companies within Health Care are managing to perform reasonably well under the circumstances and valuations of the stocks appear attractive in the portfolio managers' view. Nevertheless, this exposure has been a negative contributor to the Fund's overall performance.
The top five contributors to the Fund's performance based on their total returns relative to the Index include JPMorgan Chase & Co. (+52.52%), Skyworks Solutions, Inc. (+46.07%), General Dynamics Corp. (+45.46%), Cummins, Inc. (+41.88%), and Apple, Inc. (+34.60%). The lowest five contributors in the Fund this past year
PAYSON TOTAL RETURN FUND A MESSAGE TO OUR SHAREHOLDERS (Unaudited) MARCH 31, 2017 |
were Perrigo Co. PLC (-30.93%), Gilead Sciences, Inc. (-24.32%), Mylan NV (-15.88%), Discovery Communications, Inc. (-9.71%), and Viacom, Inc. (-9.99%).
The portfolio managers remain focused on a disciplined process when selecting securities to invest in the Fund. They believe this approach will lead to better than Index returns in both down markets and when markets are rising. Given the market's appreciation this past year and since the lows reached in 2009, it has become increasingly challenging to find securities that meet their strict criteria. Nevertheless, the Fund remains fully invested and the portfolio managers take advantage of volatility in the markets, even as volatility has declined over the past year, to both add to positions they still find attractive or to add new securities.
PAYSON TOTAL RETURN FUND PERFORMANCE CHART AND ANALYSIS (Unaudited) MARCH 31, 2017 |
The following chart reflects the change in the value of a hypothetical $10,000 investment, including reinvested dividends and distributions, in the Payson Total Return Fund (the "Fund") compared with the performance of the benchmark, S&P 500 Index (the "S&P 500"), over the past ten fiscal years. The S&P 500 is a broad-based, unmanaged measurement of changes in stock market conditions based on the average of 500 widely held common stocks. The total return of the S&P 500 includes the reinvestment of dividends and income. The total return of the Fund includes operating expenses that reduce returns, while the total return of the S&P 500 does not include expenses. The Fund is professionally managed, while the S&P 500 is unmanaged and is not available for investment.
Comparison of Change in Value of a $10,000 Investment
Payson Total Return Fund vs. S&P 500 Index
Average Annual Total Returns Periods Ended March 31, 2017 | | One Year | | Five Years | | Ten Years |
| Payson Total Return Fund | | 17.41 | % | | 8.52 | % | | 6.32 | % |
| S&P 500 Index | | 17.17 | % | | 13.30 | % | | 7.51 | % |
Performance data quoted represents past performance and is no guarantee of future results. Current performance may be lower or higher than the performance data quoted. Investment return and principal value will fluctuate so that shares, when redeemed, may be worth more or less than original cost. For the most recent month-end performance, please call (800) 805-8258. As stated in the Fund's prospectus, the annual operating expense ratio (gross) is 0.97%. The performance table and graph do not reflect the deduction of taxes that a shareholder would pay on Fund distributions or the redemption of Fund shares. Returns greater than one year are annualized.
PAYSON TOTAL RETURN FUND SCHEDULE OF INVESTMENTS MARCH 31, 2017 |
| Shares | | Security Description | | Value | |
| Common Stock - 99.3% |
| Consumer Discretionary - 19.3% |
| | 30,000 | | Adient PLC | $ | 2,180,100 | |
| | 2,560 | | Amazon.com, Inc. (a) | | 2,269,542 | |
| | 20,657 | | Delphi Automotive PLC | | 1,662,682 | |
| | 14,592 | | McDonald's Corp. | | 1,891,269 | |
| | 19,148 | | The TJX Cos., Inc. | | 1,514,224 | |
| | 10,000 | | The Walt Disney Co. | | 1,133,900 | |
| | 18,560 | | Thor Industries, Inc. | | 1,784,173 | |
| | 88,181 | | Twenty-First Century Fox, Inc., Class B | | 2,802,392 | |
| | | 15,238,282 | |
| Consumer Staples - 2.7% |
| | 43,630 | | Unilever PLC, ADR | | 2,152,704 | |
| Energy - 4.4% |
| | 17,652 | | Exxon Mobil Corp. | | 1,447,641 | |
| | 25,315 | | Phillips 66 | | 2,005,454 | |
| | | 3,453,095 | |
| Financial - 21.1% |
| | 31,188 | | Aflac, Inc. | | 2,258,635 | |
| | 24,040 | | American Express Co. | | 1,901,804 | |
| | 33,298 | | American International Group, Inc. | | 2,078,794 | |
| | 8,976 | | Berkshire Hathaway, Inc., Class B (a) | | 1,496,120 | |
| | 26,000 | | Discover Financial Services | | 1,778,140 | |
| | 21,251 | | JPMorgan Chase & Co. | | 1,866,688 | |
| | 23,745 | | Mastercard, Inc., Class A | | 2,670,600 | |
| | 29,100 | | Visa, Inc., Class A | | 2,586,117 | |
| | | 16,636,898 | |
| Health Care - 13.2% |
| | 22,694 | | Abbott Laboratories | | 1,007,841 | |
| | 10,000 | | Amgen, Inc. | | 1,640,700 | |
| | 15,055 | | Johnson & Johnson | | 1,875,100 | |
| | 28,845 | | Merck & Co., Inc. | | 1,832,811 | |
| | 47,410 | | Mylan NV (a) | | 1,848,516 | |
| | 65,537 | | Pfizer, Inc. | | 2,242,021 | |
| | | 10,446,989 | |
| Industrials - 8.0% |
| | 13,652 | | Cummins, Inc. | | 2,064,182 | |
| | 7,786 | | Danaher Corp. | | 665,937 | |
| | 10,265 | | General Dynamics Corp. | | 1,921,608 | |
| | 14,500 | | United Technologies Corp. | | 1,627,045 | |
| | | 6,278,772 | |
| Technology - 30.6% |
| | 8,000 | | Accenture PLC, Class A | | 959,040 | |
| | 4,425 | | Alphabet, Inc., Class A (a) | | 3,751,515 | |
| | 33,162 | | Apple, Inc. | | 4,764,053 | |
| Shares | | Security Description | | Value | |
| | 66,403 | | Cisco Systems, Inc. | $ | 2,244,421 | |
| | 16,000 | | IBM | | 2,786,240 | |
| | 88,808 | | Intel Corp. | | 3,203,305 | |
| | 26,140 | | Microsoft Corp. | | 1,721,580 | |
| | 40,035 | | QUALCOMM, Inc. | | 2,295,607 | |
| | 24,800 | | Skyworks Solutions, Inc. | | 2,429,904 | |
| | | 24,155,665 | |
Total Common Stock (Cost $57,784,983) | | 78,362,405 | |
Total Investments - 99.3% (Cost $57,784,983)* | $ | 78,362,405 | |
| Other Assets & Liabilities, Net – 0.7% | | 525,928 | |
| Net Assets – 100.0% | $ | 78,888,333 | |
| ADR | American Depositary Receipt |
| PLC | Public Limited Company |
| (a) | Non-income producing security. |
* Cost for federal income tax purposes is $57,814,254 and net unrealized appreciation consists of:
| PORTFOLIO HOLDINGS | | |
| % of Total Investments | | |
| Consumer Discretionary | 19.5 | % |
| Consumer Staples | 2.8 | % |
| Energy | 4.4 | % |
| Financial | 21.2 | % |
| Health Care | 13.3 | % |
| Industrials | 8.0 | % |
| Technology | 30.8 | % |
| | 100.0 | % |
See Notes to Financial Statements. | 5 | |
PAYSON TOTAL RETURN FUND STATEMENT OF ASSETS AND LIABILITIES MARCH 31, 2017 |
| ASSETS | | | | |
| . | Total investments, at value (Cost $57,784,983) | | $ | 78,362,405 | |
| | Cash | | | 628,398 | |
| | Receivables: | | | | |
| | | Fund shares sold | | | 23,259 | |
| | | Dividends and interest | | | 51,300 | |
| | Prepaid expenses | | | 8,828 | |
| Total Assets | | | 79,074,190 | |
| | | | | | | |
| LIABILITIES | | | | |
| | Payables: | | | | |
| | | Fund shares redeemed | | | 1,174 | |
| | | Distributions payable | | | 102,339 | |
| | Accrued Liabilities: | | | | |
| | | Investment adviser fees | | | 40,111 | |
| | | Trustees' fees and expenses | | | 275 | |
| | | Fund services fees | | | 14,837 | |
| | | Professional fees | | | 21,593 | |
| | | Other expenses | | | 5,528 | |
| Total Liabilities | | | 185,857 | |
| | | | | | | |
| NET ASSETS | | $ | 78,888,333 | |
| | | | | | | |
| COMPONENTS OF NET ASSETS | | | | |
| | Paid-in capital | | $ | 58,313,367 | |
| | Distributions in excess of net investment income | | | (44 | ) |
| | Accumulated net realized loss | | | (2,412 | ) |
| | Net unrealized appreciation | | | 20,577,422 | |
| NET ASSETS | | $ | 78,888,333 | |
| SHARES OF BENEFICIAL INTEREST AT NO PAR VALUE (UNLIMITED SHARES AUTHORIZED) | | | 4,887,880 | |
| NET ASSET VALUE, OFFERING AND REDEMPTION PRICE PER SHARE | | $ | 16.14 | |
See Notes to Financial Statements. | 6 | |
PAYSON TOTAL RETURN FUND STATEMENT OF OPERATIONS YEAR ENDED MARCH 31, 2017 |
| INVESTMENT INCOME | | | | | | |
| | Dividend income | . | | $ | 1,588,082 | | |
| | Interest income | | | 1,106 | | |
| Total Investment Income | | | | 1,589,188 | | |
| Adviser | | | | | | |
| EXPENSES | | | | | | |
| | Investment adviser fees | | | 458,609 | | |
| | Fund services fees | | | 177,884 | | |
| | Custodian fees | | | 8,514 | | |
| | Registration fees | | | 19,713 | | |
| | Professional fees | | | 40,175 | | |
| | Trustees' fees and expenses | | | 9,747 | | |
| | Other expenses | | | 32,846 | | |
| Total Expenses | | | | 747,488 | | |
| NET INVESTMENT INCOME | | | | 841,700 | | |
| | | | | | | | |
| NET REALIZED AND UNREALIZED GAIN (LOSS) | | | | | | |
| | Net realized gain on investments | | | 2,414,460 | | |
| | Net change in unrealized appreciation (depreciation) on investments | | | 9,078,816 | | |
| NET REALIZED AND UNREALIZED GAIN | | | | 11,493,276 | | |
| INCREASE IN NET ASSETS RESULTING FROM OPERATIONS | | | $ | 12,334,976 | | |
See Notes to Financial Statements. | 7 | |
PAYSON TOTAL RETURN FUND STATEMENTS OF CHANGES IN NET ASSETS |
| | | | | For the Year Ended March 31, 2017 | | | For the Year Ended March 31, 2016 |
| OPERATIONS | | | | | | | | | |
| | Net investment income | | $ | 841,700 | | | | $ | 847,289 | |
| | Net realized gain (loss) | | | 2,414,460 | | | | | (2,152,498 | ) |
| | Net change in unrealized appreciation (depreciation) | | | 9,078,816 | | | | | (1,822,677 | ) |
| Increase (Decrease) in Net Assets Resulting from Operations | | | 12,334,976 | | | | | (3,127,886 | ) |
| | | | | | | | | | | | |
| DISTRIBUTIONS TO SHAREHOLDERS FROM | | | | | | | | | |
| | Net investment income | | | (1,076,603 | ) | | | | (847,202 | ) |
| | Net realized gain | | | - | | | | | (2,642,363 | ) |
| Total Distributions to Shareholders | | | (1,076,603 | ) | | | | (3,489,565 | ) |
| | | | | | | | | | | | |
| CAPITAL SHARE TRANSACTIONS | | | | | | | | | |
| | Sale of shares | | | 5,194,635 | | | | | 8,963,123 | |
| | Reinvestment of distributions | | | 465,432 | | | | | 2,989,581 | |
| | Redemption of shares | | | (12,543,894 | ) | | | | (7,696,815 | ) |
| Increase (Decrease) in Net Assets from Capital Share Transactions | | (6,883,827 | ) | | | | 4,255,889 | |
| Increase (Decrease) in Net Assets | | | 4,374,546 | | | | | (2,361,562 | ) |
| | | | | | | | | | | | |
| NET ASSETS | | | | | | | | | |
| | Beginning of Year | | | 74,513,787 | | | | | 76,875,349 | |
| | End of Year (Including line (a)) | | $ | 78,888,333 | | | | $ | 74,513,787 | |
| | | | | | | | | | | | |
| SHARE TRANSACTIONS | | | | | | | | | |
| | Sale of shares | | | 347,371 | | | | | 615,083 | |
| | Reinvestment of distributions | | | 31,121 | | | | | 212,927 | |
| | Redemption of shares | | | (835,902 | ) | | | | (536,430 | ) |
| Increase (Decrease) in Shares | | | (457,410 | ) | | | | 291,580 | |
| | | | | | | | | | | | |
| (a) | Distributions in excess of net investment income | | $ | (44 | ) | | | $ | (244 | ) |
See Notes to Financial Statements. | 8 | |
| These financial highlights reflect selected data for a share outstanding throughout each year. | | | | | | |
| | | For the Years Ended March 31, |
| 2017 | | 2016 | | 2015 | | 2014 | | 2013 | |
| NET ASSET VALUE, Beginning of Year | $ | 13.94 | | | $ | 15.21 | | | $ | 15.22 | | | $ | 13.89 | | | $ | 14.47 | | |
| INVESTMENT OPERATIONS | | | | | | | | | | | | | | | | | | | | |
| Net investment income (a) | | 0.16 | | | | 0.16 | | | | 0.16 | | | | 0.42 | | | | 0.20 | | |
| Net realized and unrealized gain (loss) | | 2.25 | | | | (0.76 | ) | | | 0.77 | | | | 2.23 | | | | 0.45 | | |
| Total from Investment Operations | | 2.41 | | | | (0.60 | ) | | | 0.93 | | | | 2.65 | | | | 0.65 | | |
| DISTRIBUTIONS TO | | | | | | | | | | | | | | | | | | | | |
| SHAREHOLDERS FROM | | | | | | | | | | | | | | | | | | | | |
| Net investment income | | (0.21 | ) | | | (0.16 | ) | | | (0.16 | ) | | | (0.41 | ) | | | (0.20 | ) | |
| Net realized gain | | — | | | | (0.51 | ) | | | (0.78 | ) | | | (0.91 | ) | | | (1.03 | ) | |
| Total Distributions to Shareholders | | (0.21 | ) | | | (0.67 | ) | | | (0.94 | ) | | | (1.32 | ) | | | (1.23 | ) | |
| NET ASSET VALUE, End of Year | $ | 16.14 | | | $ | 13.94 | | | $ | 15.21 | | | $ | 15.22 | | | $ | 13.89 | | |
| TOTAL RETURN | | 17.41 | % | | (3.94 | )% | | 6.32 | % | | 19.62 | % | | 4.94 | % |
| RATIOS/SUPPLEMENTARY DATA | | | | | | | | | | | | | | | | | | | | |
| Net Assets at End of Year (000's omitted) | $78,888 | | | $74,514 | | | $76,875 | | | $71,035 | | | $61,852 | | |
| Ratios to Average Net Assets: | | | | | | | | | | | | | | | | | | | | |
| Net investment income | | 1.10 | % | | 1.11 | % | | 1.05 | % | | 2.84 | % | | 1.47 | % |
| Net expenses | | 0.98 | % | | 0.97 | % | | 0.97 | % | | 1.01 | % | | 1.07 | % |
| Gross expenses | | 0.98 | % | | 0.97 | % | | 0.97 | % | | 1.01 | % | | 1.07 | % |
| PORTFOLIO TURNOVER RATE | | 30 | % | | 55 | % | | 41 | % | | 47 | % | | 103 | % |
| | | | | | | | | | | | | | | | | | | | | | |
| | | | | | | | | | | | | | | | | | | | | | |
| (a) | Calculated based on average shares outstanding during each year. |
See Notes to Financial Statements. | 9 | |
PAYSON TOTAL RETURN FUND NOTES TO FINANCIAL STATEMENTS MARCH 31, 2017 |
Note 1. Organization
The Payson Total Return Fund (the "Fund") is a diversified portfolio of Forum Funds (the "Trust"). The Trust is a Delaware statutory trust that is registered as an open-end, management investment company under the Investment Company Act of 1940, as amended (the "Act"). Under its Trust Instrument, the Trust is authorized to issue an unlimited number of the Fund's shares of beneficial interest without par value. The Fund commenced operations on November 25, 1991. The Fund seeks a combination of high current income and capital appreciation.
Note 2. Summary of Significant Accounting Policies
The Fund is an investment company and follows accounting and reporting guidance under Financial Accounting Standards Board ("FASB") Accounting Standards Codification ("ASC") Topic 946, "Financial Services-Investment Companies". These financial statements are prepared in accordance with accounting principles generally accepted in the United States of America ("GAAP"), which require management to make estimates and assumptions that affect the reported amounts of assets and liabilities, the disclosure of contingent liabilities at the date of the financial statements, and the reported amounts of increases and decreases in net assets from operations during the fiscal year. Actual amounts could differ from those estimates. The following summarizes the significant accounting policies of the Fund:
Security Valuation – Securities are valued at market prices using the last quoted trade or official closing price from the principal exchange where the security is traded, as provided by independent pricing services on each Fund business day. In the absence of a last trade, securities are valued at the mean of the last bid and ask price provided by the pricing service.
The Fund values its investments at fair value pursuant to procedures adopted by the Trust's Board of Trustees (the "Board") if (1) market quotations are not readily available or (2) the Adviser, as defined in Note 4, believes that the values available are unreliable. The Trust's Valuation Committee, as defined in the Fund's registration statement, performs certain functions as they relate to the administration and oversight of the Fund's valuation procedures. Under these procedures, the Valuation Committee convenes on a regular and ad hoc basis to review such investments and considers a number of factors, including valuation methodologies and significant unobservable inputs, when arriving at fair value.
The Valuation Committee may work with the Adviser to provide valuation inputs. In determining fair valuations, inputs may include market-based analytics that may consider related or comparable assets or liabilities, recent transactions, market multiples, book values and other relevant investment information. Adviser inputs may include an income-based approach in which the anticipated future cash flows of the investment are discounted in determining fair value. Discounts may also be applied based on the nature or duration of any restrictions on the disposition of the investments. The Valuation Committee performs regular reviews of valuation methodologies, key inputs and assumptions, disposition analysis and market activity.
Fair valuation is based on subjective factors and, as a result, the fair value price of an investment may differ from the security's market price and may not be the price at which the asset may be sold. Fair valuation could result in a different net asset value ("NAV") than a NAV determined by using market quotes.
PAYSON TOTAL RETURN FUND NOTES TO FINANCIAL STATEMENTS MARCH 31, 2017 |
The Fund has a three-tier fair value hierarchy. The basis of the tiers is dependent upon the various "inputs" used to determine the value of the Fund's investments. These inputs are summarized in the three broad levels listed below:
Level 1 — quoted prices in active markets for identical assets and liabilities
Level 2 — other significant observable inputs (including quoted prices of similar securities, interest rates, prepayment speeds, credit risk, etc.)
Level 3 — significant unobservable inputs (including the Fund's own assumptions in determining the fair value of investments)
The aggregate value by input level, as of March 31, 2017, for the Fund's investments is included at the end of the Fund's Schedule of Investments.
Security Transactions, Investment Income and Realized Gain and Loss – Investment transactions are accounted for on the trade date. Dividend income is recorded on the ex-dividend date. Non-cash dividend income is recorded at the fair market value of the securities received. Foreign dividend income is recorded on the ex-dividend date or as soon as possible after determining the existence of a dividend declaration after exercising reasonable due diligence. Income and capital gains on some foreign securities may be subject to foreign withholding taxes, which are accrued as applicable. Interest income is recorded on an accrual basis. Premium is amortized and discount is accreted using the effective interest method. Identified cost of investments sold is used to determine the gain and loss for both financial statement and federal income tax purposes.
Distributions to Shareholders – Distributions to shareholders of net investment income, if any, are declared and paid quarterly. Distributions to shareholders of net capital gains and net foreign currency gains, if any, are declared and paid at least annually. Distributions to shareholders are recorded on the ex-dividend date. Distributions are based on amounts calculated in accordance with applicable federal income tax regulations, which may differ from GAAP. These differences are due primarily to differing treatments of income and gain on various investment securities held by the Fund, timing differences and differing characterizations of distributions made by the Fund.
Federal Taxes – The Fund intends to continue to qualify each year as a regulated investment company under Subchapter M of Chapter 1, Subtitle A, of the Internal Revenue Code of 1986, as amended ("Code"), and to distribute all of its taxable income to shareholders. In addition, by distributing in each calendar year substantially all of its net investment income and capital gains, if any, the Fund will not be subject to a federal excise tax. Therefore, no federal income or excise tax provision is required. The Fund files a U.S. federal income and excise tax return as required. The Fund's federal income tax returns are subject to examination by the Internal Revenue Service for a period of three fiscal years after they are filed. As of March 31, 2017, there are no uncertain tax positions that would require financial statement recognition, de-recognition or disclosure.
Income and Expense Allocation – The Trust accounts separately for the assets, liabilities and operations of
PAYSON TOTAL RETURN FUND NOTES TO FINANCIAL STATEMENTS MARCH 31, 2017 |
each of its investment portfolios. Expenses that are directly attributable to more than one investment portfolio are allocated among the respective investment portfolios in an equitable manner.
Commitments and Contingencies – In the normal course of business, the Fund enters into contracts that provide general indemnifications by the Fund to the counterparty to the contract. The Fund's maximum exposure under these arrangements is dependent on future claims that may be made against the Fund and, therefore, cannot be estimated; however, based on experience, the risk of loss from such claims is considered remote.
Note 3. Cash – Concentration in Uninsured Account
For cash management purposes, the Fund may concentrate cash with the Fund's custodian. This typically results in cash balances exceeding the Federal Deposit Insurance Corporation ("FDIC") insurance limits. As of March 31, 2017, the Fund had $378,398 at MUFG Union Bank, N.A. that exceeded the FDIC insurance limit.
Note 4. Fees and Expenses
Investment Adviser – H.M. Payson & Co. (the "Adviser") is the investment adviser to the Fund. Pursuant to an investment advisory agreement, the Adviser receives an advisory fee, payable monthly, from the Fund at an annual rate of 0.60% of the Fund's average daily net assets.
Distribution – Foreside Fund Services, LLC serves as the Fund's distributor (the "Distributor"). The Fund does not have a distribution (12b-1) plan; accordingly, the Distributor does not receive compensation from the Fund for its distribution services. The Adviser compensates the Distributor directly for its services. The Distributor is not affiliated with the Adviser or Atlantic Fund Administration, LLC (d/b/a Atlantic Fund Services) ("Atlantic") or their affiliates.
Other Service Providers – Atlantic provides fund accounting, fund administration, compliance and transfer agency services to the Fund. The fees related to these services are included in Fund services fees within the Statement of Operations. Atlantic also provides certain shareholder report production and EDGAR conversion and filing services. Pursuant to an Atlantic services agreement, the Fund pays Atlantic customary fees for its services. Atlantic provides a Principal Executive Officer, a Principal Financial Officer, a Chief Compliance Officer and an Anti-Money Laundering Officer to the Fund, as well as certain additional compliance support functions.
Trustees and Officers – The Trust pays each independent Trustee an annual retainer fee of $50,000 for service to the Trust ($66,000 for the Chairman), and the Audit Committee Chairman and Vice Chairman receive an additional $6,000 annually. The Trustees and Chairman may receive additional fees for special Board meetings. Each Trustee is also reimbursed for all reasonable out-of-pocket expenses incurred in connection with his duties as a Trustee, including travel and related expenses incurred in attending Board meetings. The amount of Trustees' fees attributable to the Fund is disclosed in the Statement of Operations. Certain officers of the Trust are also officers or employees of the above named service providers, and during their terms of office received no compensation from the Fund.
Note 5. Security Transactions
The cost of purchases and proceeds from sales of investment securities (including maturities), other than short-term investments during the year ended March 31, 2017, were $23,021,949 and $27,381,585, respectively.
Note 6. Federal Income Tax
Distributions paid during the fiscal years ended as noted were characterized for tax purposes as follows:
Note 8. Subsequent Events
Subsequent events occurring after the date of this report through the date these financial statements were issued have been evaluated for potential impact, and the Fund has had no such events.
To the Board of Trustees of Forum Funds
and the Shareholders of Payson Total Return Fund
We have audited the accompanying statement of assets and liabilities of Payson Total Return Fund, a series of shares of beneficial interest in the Forum Funds, (the "Fund") including the schedule of investments, as of March 31, 2017, and the related statement of operations for the year then ended, the statements of changes in net assets for each of the years in the two-year period then ended and the financial highlights for each of the years in the five-year period then ended. These financial statements and financial highlights are the responsibility of the Fund's management. Our responsibility is to express an opinion on these financial statements and financial highlights based on our audits.
We conducted our audits in accordance with the standards of the Public Company Accounting Oversight Board (United States). Those standards require that we plan and perform the audits to obtain reasonable assurance about whether the financial statements and financial highlights are free of material misstatement. An audit includes examining, on a test basis, evidence supporting the amounts and disclosures in the financial statements. Our procedures included confirmation of securities owned as of March 31, 2017 by correspondence with the custodian. An audit also includes assessing the accounting principles used and significant estimates made by management, as well as evaluating the overall financial statement presentation. We believe that our audits provide a reasonable basis for our opinion.
In our opinion, the financial statements and financial highlights referred to above present fairly, in all material respects, the financial position of Payson Total Return Fund as of March 31, 2017, and the results of its operations for the year then ended, the changes in its net assets for each of the years in the two-year period then ended and its financial highlights for each of the years in the five-year period then ended, in conformity with accounting principles generally accepted in the United States of America.
BBD, LLP
Philadelphia, Pennsylvania
May 22, 2017
PAYSON TOTAL RETURN FUND ADDITIONAL INFORMATION (Unaudited) MARCH 31, 2017 |
Proxy Voting Information
A description of the policies and procedures that the Fund uses to determine how to vote proxies relating to securities held in the Fund's portfolio is available, without charge and upon request, by calling (800) 805-8258 and on the SEC website at www.sec.gov. The Fund's proxy voting record for the most recent twelve-month period ended June 30 is available, without charge and upon request, by calling (800) 805-8258 and on the SEC's website at www.sec.gov.
Availability of Quarterly Portfolio Schedules
The Fund files its complete schedule of portfolio holdings with the SEC for the first and third quarters of each fiscal year on Form N-Q. These filings are available, without charge and upon request on the SEC's website at www.sec.gov or may be reviewed and copied at the SEC's Public Reference Room in Washington, DC. Information on the operation of the Public Reference Room may be obtained by calling (800) SEC-0330.
Shareholder Expense Example
As a shareholder of the Fund, you incur ongoing costs, including management fees and other Fund expenses. This example is intended to help you understand your ongoing costs (in dollars) of investing in the Fund and to compare these costs with the ongoing costs of investing in other mutual funds.
The example is based on an investment of $1,000 invested at the beginning of the period and held for the entire period from October 1, 2016, through March 31, 2017.
Actual Expenses – The first line of the table below provides information about actual account values and actual expenses. You may use the information in this line, together with the amount you invested, to estimate the expenses that you paid over the period. Simply divide your account value by $1,000 (for example, an $8,600 account value divided by $1,000 = 8.6), then multiply the result by the number in the first line under the heading entitled "Expenses Paid During Period" to estimate the expenses you paid on your account during the period.
Hypothetical Example for Comparison Purposes – The second line of the table below provides information about hypothetical account values and hypothetical expenses based on the Fund's actual expense ratio and an assumed rate of return of 5% per year before expenses, which is not the Fund's actual return. The hypothetical account values and expenses may not be used to estimate the actual ending account balance or expenses you paid for the period. You may use this information to compare the ongoing costs of investing in the Fund and other funds. To do so, compare this 5% hypothetical example with the 5% hypothetical examples that appear in the shareholder reports of other funds.
Please note that the expenses shown in the table are meant to highlight your ongoing costs only. Therefore, the second line of the table is useful in comparing ongoing costs only, and will not help you determine the relative total costs of owning different funds.
| | Beginning | | Ending | | Expenses | | Annualized |
| | Account Value | | Account Value | | Paid During | | Expense |
| | October 1, 2016 | | March 31, 2017 | | Period* | | Ratio* |
| Actual | $ | 1,000.00 | | $ | 1,101.44 | | $ | 5.13 | | 0.98 | % |
| Hypothetical (5% return before expenses) | $ | 1,000.00 | | $ | 1,020.04 | | $ | 4.94 | | 0.98 | % |
| * | Expenses are equal to the Fund's annualized expense ratio multiplied by the average account value over the period, multiplied by the number of days in the most recent fiscal half-year (182) divided by 365 to reflect the half-year period. |
Federal Tax Status of Dividends Declared during the Fiscal Year
For federal income tax purposes, dividends from short-term capital gains are classified as ordinary income. The Fund designates 100.00% of its income dividend distributed as qualifying for the corporate dividends-received deduction (DRD) and 100.00% for the qualified dividend rate (QDI) as defined in Section 1(h)(11) of the Code. The Fund also designates 0.06% as qualified interest income exempt from U.S. tax for foreign shareholders (QII).
Trustees and Officers of the Trust
The Board is responsible for oversight of the management of the Trust's business affairs and of the exercise of all the Trust's powers except those reserved for the shareholders. The following table provides information about each Trustee and certain officers of the Trust. Each Trustee and officer holds office until the person resigns, is removed, or is replaced. Unless otherwise noted, the persons have held their principal occupations for more than five years. The address for all Trustees and officers is Three Canal Plaza, Suite 600, Portland, Maine 04101. Mr. Keffer is considered an Interested Trustee due to his affiliation with Atlantic. The Fund's Statement of Additional Information includes additional information about the Trustees and is available, without charge and upon request, by calling (800) 805-8258.
| Name and Year of Birth | Position(s) with the Trust | Length of Time Served | Principal Occupation(s) During Past Five Years | Number of Series of Fund Complex¹ Overseen by Trustee | Other Directorships Held by Trustee |
| Independent Trustees | | | | | |
J. Michael Parish Born: 1943 | Chairman of the Board; Trustee; Chairman, Nominating Committee and Qualified Legal Compliance Committee | Since 1989 (Chairman since 2004) | Retired since 2003; formerly, Partner, Wolf, Block, Schorr and Solis-Cohen, LLP (law firm) 2002-2003; Partner, Thelen Reid & Priest LLP (law firm) 1995-2002. | 24 | None |
Costas Azariadis Born: 1943 | Trustee | Since 1989 | Professor of Economics, Washington University since 2006. | 24 | None |
James C. Cheng Born: 1942 | Trustee; Chairman, Audit Committee | Since 1989 | President, Technology Marketing Associates (marketing company for small- and medium-sized businesses in New England) since 1991. | 24 | None |
David Tucker Born: 1958 | Trustee; Vice Chairman | Since 2011 (Vice Chairman since 2015) | Director, Blue Sky Experience (a charitable endeavor) since 2008; Senior Vice President & General Counsel, American Century Companies (an investment management firm) 1998-2008. | 47 | Trustee, Forum Funds II, Forum ETF Trust and U.S. Global Investors Funds |
| Interested Trustee | | | | | |
John Y. Keffer2 Born: 1942 | Trustee; Vice Chairman | Since 1989 | Chairman, Atlantic since 2008; President, Forum Investment Advisors, LLC since 2011; President, Forum Foundation (a charitable organization) since 2005; President, Forum Trust, LLC (a non-depository trust company chartered in the State of Maine) since 1997. | 47 | Director, Wintergreen Fund, Inc.; Trustee, Forum Funds II, Forum ETF Trust and U.S. Global Investors Funds |
1The Fund Complex includes the Trust, Forum Funds II, Forum ETF Trust and U.S. Global Investors Funds and is overseen by different Boards of Trustees. 2Atlantic is a subsidiary of Forum Holdings Corp. I, a Delaware corporation that is wholly owned by Mr. Keffer. |
PAYSON TOTAL RETURN FUND ADDITIONAL INFORMATION (Unaudited) MARCH 31, 2017 |
| Name and Year of Birth | Position(s) with the Trust | Length of Time Served | Principal Occupation(s) During Past Five Years | Number of Series of Fund Complex¹ Overseen by Trustee | Other Directorships Held by Trustee |
| Officers | | | | | |
Jessica Chase Born: 1970 | President; Principal Executive Officer | Since 2015 | Senior Vice President, Atlantic since 2008. | N/A | N/A |
Karen Shaw Born: 1972 | Treasurer; Principal Financial Officer | Since 2008 | Senior Vice President, Atlantic since 2008. | N/A | N/A |
Zachary Tackett Born: 1988 | Vice President; Secretary; Anti-Money Laundering Compliance Officer | Since 2014 | Counsel, Atlantic since 2014; Intern Associate, Coakley & Hyde, PLLC, 2010-2013. | N/A | N/A |
Michael J. McKeen Born: 1971 | Vice President | Since 2009 | Senior Vice President, Atlantic since 2008. | N/A | N/A |
Timothy Bowden Born: 1969 | Vice President | Since 2009 | Manager, Atlantic since 2008. | N/A | N/A |
Geoffrey Ney Born: 1975 | Vice President | Since 2013 | Manager, Atlantic since 2013; Senior Fund Accountant, Atlantic, 2008-2013. | N/A | N/A |
Todd Proulx Born: 1978 | Vice President | Since 2013 | Manager, Atlantic since 2013; Senior Fund Accountant, Atlantic, 2008-2013. | N/A | N/A |
Carlyn Edgar Born: 1963 | Vice President | Since 2008 | Senior Vice President, Atlantic since 2008; Chief Compliance Officer, 2008-2016. | N/A | N/A |
Dennis Mason Born: 1967 | Chief Compliance Officer | Since 2016 | Fund Compliance Officer, Atlantic since 2013; Senior Specialist, Atlantic 2011-2013; Senior Analyst, Atlantic 2008-2011. | N/A | N/A |
1The Fund Complex includes the Trust, Forum Funds II, Forum ETF Trust and U.S. Global Investors Funds and is overseen by different Boards of Trustees. |

ITEM 2. CODE OF ETHICS.
| (a) | As of the end of the period covered by this report, Forum Funds (the "Registrant") has adopted a code of ethics, which applies to its Principal Executive Officer and Principal Financial Officer (the "Code of Ethics"). |
| (c) | There have been no amendments to the Registrant's Code of Ethics during the period covered by this report. |
| (d) | There have been no waivers to the Registrant's Code of Ethics during the period covered by this report. |
(f) (1) A copy of the Code of Ethics is being filed under Item 12(a) hereto.
ITEM 3. AUDIT COMMITTEE FINANCIAL EXPERT.
The Board of Trustees has determined that no member of the Audit Committee is an "audit committee financial expert" as that term is defined under applicable regulatory guidelines.
ITEM 4. PRINCIPAL ACCOUNTANT FEES AND SERVICES.
(a) Audit Fees - The aggregate fees billed for each of the last two fiscal years (the "Reporting Periods") for professional services rendered by the Registrant's principal accountant for the audit of the Registrant's annual financial statements, or services that are normally provided by the principal accountant in connection with the statutory and regulatory filings or engagements for the Reporting Periods, were $166,800 in 2016 and $190,200 in 2017.
(b) Audit-Related Fees – The aggregate fees billed in the Reporting Periods for assurance and related services rendered by the principal accountant that were reasonably related to the performance of the audit of the Registrant's financial statements and are not reported under paragraph (a) of this Item 4 were $0 in 2016 and $0 in 2017.
(c) Tax Fees - The aggregate fees billed in the Reporting Periods for professional services rendered by the principal accountant to the Registrant for tax compliance, tax advice and tax planning were $34,000 in 2016 and $37,000 in 2017. These services consisted of review or preparation of U.S. federal, state, local and excise tax returns.
(d) All Other Fees - The aggregate fees billed in the Reporting Periods for products and services provided by the principal accountant to the Registrant, other than the services reported in paragraphs (a) through (c) of this Item, were $0 in 2016 and $0 in 2017.
(e) (1) The Audit Committee reviews and approves in advance all audit and "permissible non-audit services" (as that term is defined by the rules and regulations of the Securities and Exchange Commission) to be rendered to a series of the Registrant (each, a "Series"). In addition, the Audit Committee reviews and approves in advance all "permissible non-audit services" to be provided to an investment adviser (not including any sub-adviser) of a Series, or an affiliate of such investment adviser, that is controlling, controlled by or under common control with the investment adviser and provides on-going services to the Registrant ("Affiliate"), by the Series' principal accountant if the engagement relates directly to the operations and financial reporting of the Series. The Audit Committee considers whether fees paid by a Series' investment adviser or an Affiliate to the Series' principal accountant for audit and permissible non-audit services are consistent with the principal accountant's independence.
(e) (2) No services included in (b) - (d) above were approved pursuant to paragraph (c)(7)(i)(C) of Rule 2-01 of Regulation S-X.
(f) Not applicable
(g) The aggregate non-audit fees billed by the principal accountant for services rendered to the Registrant for the Reporting Periods were $0 in 2015 and $0 in 2016. There were no fees billed in either of the Reporting Periods for non-audit services rendered by the principal accountant to the Registrant's investment adviser or any Affiliate.
(h) During the Reporting Period, the Registrant's principal accountant provided no non-audit services to the investment advisers or any entity controlling, controlled by or under common control with the investment advisers to the series of the Registrant to which this report relates.
ITEM 5. AUDIT COMMITTEE OF LISTED REGISTRANTS.
Not applicable.
ITEM 6. INVESTMENTS.
| (a) | Included as part of report to shareholders under Item 1. |
ITEM 7. DISCLOSURE OF PROXY VOTING POLICIES AND PROCEDURES FOR CLOSED-END
MANAGEMENT INVESTMENT COMPANIES.
Not applicable.
ITEM 8. PORTFOLIO MANAGERS OF CLOSED-END MANAGEMENT INVESTMENT COMPANIES.
Not applicable.
ITEM 9. PURCHASES OF EQUITY SECURITIES BY CLOSED-END MANAGEMENT INVESTMENT COMPANY AND AFFILIATED PURCHASERS.
Not applicable.
ITEM 10. SUBMISSION OF MATTERS TO A VOTE OF SECURITY HOLDERS
The Registrant does not accept nominees to the board of trustees from shareholders.
ITEM 11. CONTROLS AND PROCEDURES
(a) The Registrant's Principal Executive Officer and Principal Financial Officer have concluded that the Registrant's disclosure controls and procedures (as defined in Rule 30a-3(c) under the Investment Company Act of 1940 (the "Act")) are effective, based on their evaluation of the controls and procedures required by Rule 30a-3(b) under the Act and Rules 13a-15(b) or 15d-15(b) under the Securities Exchange Act of 1934, as of a date within 90 days of the filing date of this report.
(b) There were no changes in the Registrant's internal control over financial reporting (as defined in
Rule 30a-3(d) under the Act) that occurred during the second fiscal quarter of the period covered by this report that have materially affected, or are reasonably likely to materially affect, the Registrant's internal control over financial reporting.
ITEM 12. EXHIBITS.
(a)(1) Code of Ethics (Exhibit filed herewith).
(a)(2) Certifications pursuant to Rule 30a-2(a) of the Act, and Section 302 of the Sarbanes-Oxley Act of 2002. (Exhibits filed herewith)
(a)(3) Not applicable.
(b) Certifications pursuant to Rule 30a-2(b) of the Act, and Section 906 of the Sarbanes-Oxley Act of 2002. (Exhibit filed herewith)
SIGNATURES
Pursuant to the requirements of the Securities Exchange Act of 1934 and the Investment Company Act of 1940, the Registrant has duly caused this report to be signed on its behalf by the undersigned, thereunto duly authorized.
Registrant Forum Funds
| By: | /s/ Jessica Chase | |
| | Jessica Chase, Principal Executive Officer | |
| | | |
| Date: | May 26, 2017 | |
Pursuant to the requirements of the Securities Exchange Act of 1934 and the Investment Company Act of 1940, this report has been signed below by the following persons on behalf of the Registrant and in the capacities and on the dates indicated.
| By: | /s/ Jessica Chase | |
| | Jessica Chase, Principal Executive Officer | |
| | | |
| Date: | May 26, 2017 | |
| By: | /s/ Karen Shaw | |
| | Karen Shaw, Principal Financial Officer | |
| | | |
| Date: | May 26, 2017 | |