As filed with the Securities and Exchange Commission on June 4, 2018
UNITED STATES
SECURITIES AND EXCHANGE COMMISSION
WASHINGTON, D.C. 20549
FORM N-CSR
CERTIFIED SHAREHOLDER REPORT OF REGISTERED MANAGEMENT
INVESTMENT COMPANIES
Investment Company Act file number 811-03023
FORUM FUNDS
Three Canal Plaza, Suite 600
Portland, Maine 04101
Jessica Chase, Principal Executive Officer
Three Canal Plaza, Suite 600
Portland, Maine 04101
207-347-2000
Date of fiscal year end: March 31
Date of reporting period: April 1, 2017 – March 31, 2018
ITEM 1. REPORT TO STOCKHOLDERS.
ANNUAL REPORT
MARCH 31, 2018

The views in this report were those of Absolute Investment Advisers LLC (“AIA” and “Absolute”), the investment adviser to the Absolute Strategies Fund, Absolute Capital Opportunities Fund and Absolute Convertible Arbitrage Fund (each a “Fund” and collectively the “Funds”) as of March 31, 2018, and may not reflect their views on the date this report is first published or any time thereafter. These views are intended to assist shareholders in understanding their investment in the Funds and do not constitute investment advice. None of the information presented should be construed as an offer to sell or recommendation of any security mentioned herein.
The Absolute Strategies Fund utilizes multi-manager strategies with multiple sub-advisers, they may be exposed to varying forms of risk. These risks include, but are not limited to, general market risk, multi-manager risk, focused portfolio risk, small company risk, foreign risk, interest rate risk, credit risk, prepayment risk, IPO risk, liquidity risk, high turnover risk, leverage risk, derivatives risk and cash and cash equivalents holdings risk. For a complete description of the Funds’ principal investment risks, please refer to each Fund’s prospectus.
Beta is a measure of an asset’s sensitivity to broad market moves, as measured for instance by the S&P 500® Index. A fund with a realized beta of 0.5 with respect to the S&P 500® Index infers that about 50% of the fund’s returns were explained by the performance of the index (the rest of the performance was independent of the index). The HFR Indices are equally weighted performance indexes, utilized by numerous hedge fund managers as a benchmark for their own hedge funds. One cannot invest directly in an index.
Absolute Strategies Fund, Absolute Funds, and Absolute Investment Advisers are registered service marks. Other marks referred to herein are the trademarks, service marks or registered trademarks of their respective owners.
ABSOLUTE STRATEGIES FUNDA MESSAGE TO OUR SHAREHOLDERS (Unaudited)
MARCH 31, 2018
Dear Shareholder,
We are pleased to present the Annual Report for the Absolute Strategies Fund (the “Fund”) for the year ended March 31, 2018.
Capital preservation/downside protection through unique risk and return positioning that helps diversify traditional portfolios are important themes of the Fund. Achieving these over the course of an investment cycle often means constructing a portfolio of investments that looks very different from other investment funds, including alternative ones. It requires being defensive at times when others are overly aggressive. It requires looking for value in areas of the market that are over-looked or unloved by other investors. Achieving these goals also means that the Fund’s performance is likely to go through periods of under-performance as well as out-performance versus other strategies. We believe that over time the uniqueness of the strategy creates significant non-correlation and diversification characteristics. The markets provided favorable conditions for the Fund during the volatile months of February and March of 2018. For those two months the Fund (Institutional Shares) returned 3.46% vs. -3.38% and -6.13% for the HRFX Global Hedge Fund Index and the S&P 500 Index respectively. For much of the remainder of the Fund’s fiscal year, however, extreme low levels of volatility hindered our ability to generate performance and the Fund (Institutional Shares) returned -4.45% over the 12 months ended March 31, 2018. By comparison, the HRFX Global Hedge Fund Index returned 3.20% and the S&P 500 Index returned 13.99%.
We believe that recent dynamics have resulted in a market that is narrow and highly inefficient. Since the introduction of asset purchases by central banks (also known as quantitative easing), financial assets have become increasingly expensive and highly correlated; price-discovery and volatility are artificially suppressed. We believe that constructing a portfolio of various industry-favored hedge fund strategies will not achieve the risk-adjusted results we desire. Traditional assets classes and most hedge fund strategies have become a correlated beta trade that acts in unison with the overall equity markets. We believe there is little, if any, potential for a diversified portfolio of typical hedge fund strategies to produce anything other than the returns of a traditional portfolio. In effect, the entire hedge fund universe has become as crowded as the ETF universe, and both are taking nearly the same risks that also require abnormally low levels of volatility. A repricing of financial markets caused by artificially suppressed interest rates would very likely result in large losses across equities, fixed income and many alternative investments. To produce alpha within such an environment would require an investment strategy to do something very different including, at times, to take the other side. While this approach has been frustrating over the past few years, we believe the eventual unwind of correlated asset risks creates an opportunity to set up a portfolio that can generate significant outperformance. We believe markets are setting up for an extensive long/short opportunity that takes advantage of confusion and continuous volatility. In fact, it may have already begun. Extended periods of extreme low levels of volatility are an historical anomaly. We believe the long-awaited return to normal levels of market volatility will provide a much improved environment for the Fund’s performance while creating challenges for funds geared toward passive market beta.
During the year, our discipline and process was preserved and the Fund maintained a balance of long and short exposures. We continue to allocate capital based on opportunities to be long and short. The challenge has come from a market cycle that has been skewed by central bank intrusions. In this regard, as prudent investors who view markets through a lens of capital at risk, we must take into account what we believe are extreme levels of high valuations, the proliferation of momentum/trend investing, and artificially suppressed volatility when constructing the Fund’s portfolio. All of these have been coiled against us in both time and price. From a long/short perspective, we tend to favor underpriced or out of favor long ideas vs a short portfolio of overpriced or crowded areas. Many of these positions are simply relative-value relationships that revert to the mean as assets begin to seek value once areas of perfection eventually turn out to be illusory. Volatility is used to help monetize these relationships over time. Our performance has been directly impacted by a lack of volatility, and an extreme turn of the market cycle that has punished out-of-favor longs while rewarding crowded, over-valued indexing. This has created a large spread between our long and short positions that has pushed our overall portfolio to opportunity levels we have not seen since 2009. We are now currently positioned for extensive mean reversion opportunities that have been stretched over several
ABSOLUTE STRATEGIES FUNDA MESSAGE TO OUR SHAREHOLDERS (Unaudited)
MARCH 31, 2018
years and have recently reached historic levels. Details of these opportunities along with recent performance are outlined below.
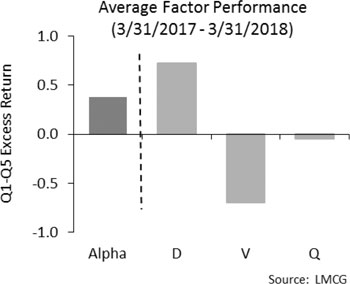
Value vs Growth. One major side effect from all of the central bank activity and momentum chasing is that value investing is currently stuck in one of the worst stretches on record. Value stocks have significantly lagged growth stocks over the past year, compounding a gap that has persisted since the end of the financial crisis almost ten years ago. Growth has outperformed value by 14% over the past 12 months and by approximately 70% since 2007. This has caused the bulk of our poor returns this year. However, the last time value underperformed growth to this degree was in 1999. During the next three years, value outperformed growth by more than 100%. We believe this is a significant market-neutral, risk/reward opportunity. Approximately 40-45% of our portfolio is positioned for this mean reversion idea of long value, short growth/indices.
Short Equity. Market indices are trading at valuation levels only seen near 1929 and 2000 peaks. The median price/ sales for the S&P 500 is over 2.5x, or nearly 50% higher than the prior peak in 2007. The Russell 2000 Index trades for a P/E near 100. The Nasdaq Composite P/E is over 50. While having a net short equity allocation has had a negative impact on Fund performance, we believe many securities in various global markets and sectors are at risk of significant repricing, some upwards of 50% or more. Approximately 20% of the portfolio is currently positioned net short equity securities.
Convertible Arbitrage. Convertible arbitrage is one of few areas of the financial markets that is not flooded with excess capital and has provided modest returns. Hedged convertible securities currently offer attractive return and risk characteristics relative to most other areas of the bond market. This strategy also offers a relatively steady return profile to diversify away from other areas of our portfolio. Approximately 20% of the portfolio is allocated to convertible arbitrage.
Energy. Energy is another area that is seeing significant divergence as compared to the overall market. The energy sector is close to its lowest weighting in the S&P 500 on record of only 4-5%; this was last seen near the 2000 bubble peak. Oil services companies recently traded near 2009 financial crisis lows. Relative underperformance of energy year to date versus the S&P 500 is -25%, and this has contributed to negative performance. However, following the last low weighting in the S&P in 2000, energy companies outperformed the S&P by over 50% during the next three years and over 150% during the next six years. Approximately 10-12% of our portfolio is positioned long energy vs short market indices.
Commodities. Other commodities are also at an extreme low vs overall equity market indices. The CRB Commodity Index has underperformed the S&P 500 by 40% over the last few years, a deficit nearly identical to that during the late 1990s. The ratio of commodities/S&P 500 is also on par with the early 1970s, a period that preceded significant commodity inflation. Both time periods saw commodities outperform the S&P 500 by over 100% during the following three years. A more modest 5-7% of our portfolio is targeted for long commodity-sensitive securities vs market indices.
Volatility. Up until very recently, volatility has never been more compressed than it is today. The US equity market recently set a record for the number of days without a 3% dip in prices. Market players across financial markets are now using volatility as an input for risk taking. This is most certainly the case with risk parity strategies, but institutions and retail investors are also using short volatility trading to generate income or excess yield. This is very similar to the idea of selling credit default swaps (selling insurance) during the housing bubble which then led to the financial crisis. It is estimated that risk parity, quants and Commodity Trading Adviser (CTA) strategies amount to $1 trillion in implicit short volatility strategies. Additionally, tens of billions are being bet directly on short volatility through ETFs. Volatility has never been more suppressed and, as seen in recent months, can return quickly. We believe our overall portfolio is set up to benefit from an increase in volatility and should be able to capitalize on large spikes in market movements both long and short.
In summary, many of the Fund’s long securities don’t have a big story or theme attached to them and may not be a major part of an index. The Fund’s short securities may be expensive and/or exhibiting low growth with significant economic
ABSOLUTE STRATEGIES FUNDA MESSAGE TO OUR SHAREHOLDERS (Unaudited)
MARCH 31, 2018
sensitivity. Equity index securities are also used on the short side to create relative-value arbitrage opportunities versus Fund long securities. Sub-adviser strategies based on long equity exposure were the Fund’s top performers over the last year with the exception of energy related securities, which provided negative performance. Convertible arbitrage also performed well during the period. This is notable because the strategy typically exhibits low sensitivity to equity markets. Strategies that included short exposure were the largest detractors. Shorting has been particularly difficult as few things seemed to have gone down in price regardless of how poorly a company or group of companies performed. The Fund’s short exposure remains flexible and has varied over the past year as large spikes in volatility have offered opportunities to monetize short term gains. During periods of low volatility the Fund has maintained a large amount of short exposure due to historically high valuations and weak fundamentals (see below). The timing is uncertain but we believe the payoff in short opportunities could be significant. Long periods of low volatility and high valuations have historically given way to periods of high volatility, leading to market valuations reverting to the mean.
We believe markets move in cycles over time. Occasionally cycles reach extremes, which has actually been a common occurrence over the past 20 years. Additionally, some markets may be nearing the end of an extreme bull cycle while others may be ending an extreme bear cycle. It is very difficult to know the timing of when a market cycle turns, and patience can be especially tested when both long and short positions are fighting the last trend.
In late 2008, it seemed as if the market would never stop going down. Price-insensitive sellers dominated the market. Yet, we removed the bulk of our shorts and increased our net long position to the largest ever at the time. We were early, but the opportunity was very large. Today, we see the inverse of that cycle. The market seems as if it will never go down and price-insensitive buyers are dominating the market. Again, we may be early but the opportunity warrants our positioning.
Comment on recent market volatility and positioning:
In a prior commentary, we stressed that much of the distortions in asset prices were being leveraged further by large momentum players betting on short volatility, which could contribute a spark for an eventual market turbulence and we were well positioned for this turbulence in early 2018:
“We have witnessed historic financial market intrusions by central banks that has created extreme distortions in asset prices and caused volatility to collapse. A lack of volatility has led risk-parity strategies, quant funds and momentum players to bet further on these extremes. We are even witnessing a massive bet on “short volatility” which is essentially a replay of the “selling of insurance” gravy train that led up to the financial crisis. Is this a permanent new paradigm? Is it really different this time? Those questions have been repeated throughout history and the predictions have always proved incorrect.”
We continue to remind investors of what we see as extreme market risks in our dialogue, and it should, at a minimum, serve as a warning for what could eventually materialize into a much larger problem. It is hard to tell exactly where we go from here but we feel certain that downside risks are as great as anything we can analyze historically. At this time, we are maintaining our positioning. Should markets experience a large drawdown, there may be a short term opportunity to reduce some of our net short exposure. Option positions have also been utilized opportunistically for
ABSOLUTE STRATEGIES FUNDA MESSAGE TO OUR SHAREHOLDERS (Unaudited)
MARCH 31, 2018
both upside and downside tail risk. In effect, the Fund may capitalize on either significant spikes up or down in market indices.
The volatility shock of February 2018 should serve as a glimpse of what we believe is likely to come in the future. Just as the sub-prime and CDS crisis, it may not happen all at once. Sometimes a slower progression with large intermediate swings in asset prices can hurt just the same as an undiversified portfolio erodes over time.
Sincerely,
Jay Compson
Portfolio Manager
Absolute Investment Advisers LLC
ABSOLUTE STRATEGIES FUNDPERFORMANCE CHART AND ANALYSIS (Unaudited)
MARCH 31, 2018
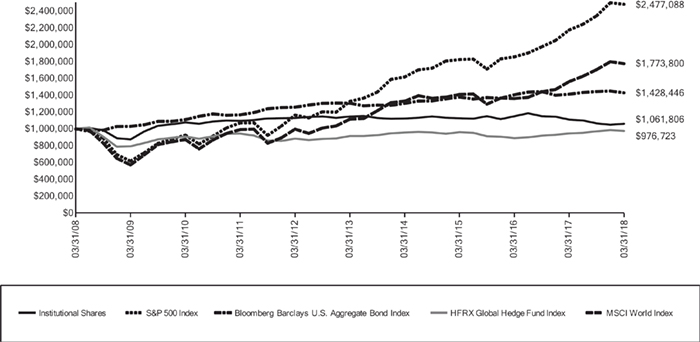
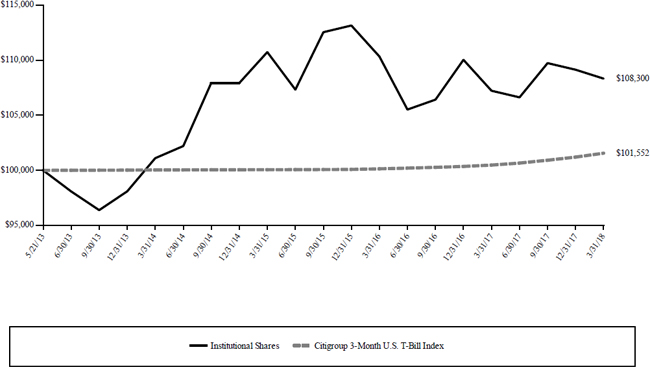
The following charts reflect the change in the value of a hypothetical $1,000,000 investment in Institutional Shares and a $250,000 investment in R Shares, including reinvested dividends and distributions, in Absolute Strategies Fund (the “Fund”) compared with the performance of the benchmarks, S&P 500 Index (“S&P 500”), Bloomberg Barclays U.S. Aggregate Bond Index (“Barclays Index”), the HFRX Global Hedge Fund Index (“HFRX”) and the MSCI World Index (“MSCI World”), over the past ten fiscal years. The S&P 500 is a broad-based, measurement of the U.S. stock market based on the performance of 500 widely held large capitalization common stocks. The Barclays Index is a broad based measurement of the U.S. dollar-denominated, investment-grade, fixed-rate, SEC registered taxable bond market. The HFRX is a broad-based measurement of the performance of the hedge fund universe; it is comprised of eight strategies - convertible arbitrage, distressed securities, equity hedge, equity market neutral, event driven, macro, merger arbitrage, and relative value arbitrage. The strategies are asset-weighted based on the distribution of assets in the hedge fund industry. The MSCI World measures the performance of a diverse range of 24 developed countries’ stock markets including the United States and Canada, and countries in Europe, the Middle East; Asia and the Pacific. The total return of the indices include the reinvestment of dividends and income. The total return of the Fund includes operating expenses that reduce returns, while the total return of the indices do not include expenses. The Fund is professionally managed, while the indices are unmanaged and are not available for investment.
Comparison of Change in Value of a $1,000,000 Investment
Absolute Strategies Fund - Institutional Shares vs. S&P 500 Index, Bloomberg Barclays U.S. Aggregate Bond Index,
HFRX Global Hedge Fund Index and MSCI World Index
| | Average Annual Total Returns Periods Ended March 31, 2018 | One Year | Five Year | Ten Year | |
| | Absolute Strategies Fund - Institutional Shares | -4.45% | -1.54% | 0.60% | |
| | S&P 500 Index | 13.99% | 13.31% | 9.49% | |
| | Bloomberg Barclays U.S. Aggregate Bond Index | 1.20% | 1.82% | 3.63% | |
| | HFRX Global Hedge Fund Index | 3.20% | 1.29% | -0.24% | |
| | MSCI World Index | 13.59% | 9.70% | 5.90% | |
ABSOLUTE STRATEGIES FUNDPERFORMANCE CHART AND ANALYSIS (Unaudited)
MARCH 31, 2018
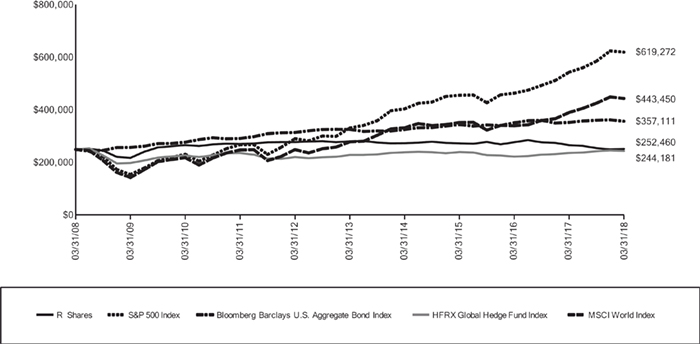
Comparison of Change in Value of a $250,000 Investment
Absolute Strategies Fund - R Shares vs. S&P 500 Index, Bloomberg Barclays U.S. Aggregate Bond Index,
HFRX Global Hedge Fund Index and MSCI World Index
| | Average Annual Total Returns Periods Ended March 31, 2018 | One Year | Five Year | Ten Year | |
| | Absolute Strategies Fund - R Shares | -5.30% | -2.12% | 0.10% | |
| | S&P 500 Index | 13.99% | 13.31% | 9.49% | |
| | Bloomberg Barclays U.S. Aggregate Bond Index | 1.20% | 1.82% | 3.63% | |
| | HFRX Global Hedge Fund Index | 3.20% | 1.29% | -0.24% | |
| | MSCI World Index | 13.59% | 9.70% | 5.90% | |
Performance data quoted represents past performance and is no guarantee of future results. Current performance may be lower or higher than the performance data quoted. Investment return and principal value will fluctuate so that shares, when redeemed, may be worth more or less than original cost. As stated in the Fund’s prospectus, the annual operating expense ratios (gross) for Institutional Shares and R Shares are 2.94% and 3.56%, respectively. Excluding the effect of expenses attributable to dividends and interest on short sales and acquired fund fees and expenses, the Fund's total annual operating expense ratios for Institutional Shares and R Shares would be 1.94% and 2.51%, respectively. However, the Fund’s adviser has contractually agreed to waive its fee and/or reimburse Fund expenses to limit Total Annual Fund Operating Expenses After Fee Waiver and/or Expense Reimbursement (excluding all taxes, interest, portfolio transaction expenses, dividend and interest expenses on short sales, acquired fund fees and expenses, proxy expenses and extraordinary expenses) to 1.99% and 2.24% for Institutional Shares and R Shares, respectively, through August 1, 2019 (the “Expense Cap”). The adviser may be reimbursed by the Fund for fees waived and expenses reimbursed by the adviser pursuant to the Expense Cap if such payment is made within three years of the fee waiver or expense reimbursement, and does not cause the Total Annual Fund Operating Expenses After Fee Waiver and/or Expense Reimbursement to exceed the lesser of (i) the then-current expense cap, or (ii) the expense cap in place at the time the fees/expenses were waived/reimbursed. During the period, certain fees were waived and/or expenses reimbursed; otherwise, returns would have been lower. To the extent that the Fund invests in another fund sponsored by the Fund's adviser or its affiliates, the adviser may waive certain fees and expenses. The performance table and graph do not reflect the deduction of taxes that a shareholder would pay on Fund distributions or the redemption of Fund shares. Returns greater than one year are annualized. For the most recent month-end performance, please call (888) 992-2765.
ABSOLUTE CAPITAL OPPORTUNITIES FUNDA MESSAGE TO OUR SHAREHOLDERS (Unaudited)
MARCH 31, 2018
Dear Shareholder,
For the year ending March 31, 2018, the Absolute Capital Opportunities Fund (the “Fund”) returned 14.13%. By comparison, the HFRX Equity Hedge Index returned 8.35%.
Over the past year, the Fund has been positioned defensively but has also owned broad market equity options, mostly on the S&P 500 Index, that should benefit from increased stock market volatility regardless of direction. Much of the Fund’s return was generated from these options in the first quarter of 2018 when market volatility returned. The options also detracted from performance in parts of 2017 when volatility was muted.
Kovitz Investment Group Partners, LLC (“Kovitz”), the Fund’s subadviser, utilizes a core equity long-short portfolio with opportunistic tail hedging, both upside and downside. This hedging allowed the Fund to generate a solid return, despite maintaining a value bias on the long side, in an environment where value under-performed growth by a significant margin (as measured by Russell 3000 Value and Growth Indices).
The Fund continues to be positioned much as it was in the first quarter of 2018. The Fund continues to be well hedged toward the downside. Kovitz believes the level of defensive positioning is prudent given the heightened starting valuations, low but potentially rising interest rates, and the potential (not probable) for geopolitical missteps. It is worth noting that the Fund does own a portfolio of competitively advantaged businesses generally trading at 12-16 times Kovitz’ estimation of normalized earnings, and call options designed to benefit from continued upside volatility or a generally rising stock market.
We believe the Fund is positioned well for a variety of market environments, particularly if equity markets remain volatile.
Sincerely,
Jay Compson
Portfolio Manager
Absolute Investment Advisers LLC
ABSOLUTE CAPITAL OPPORTUNITIES FUNDPERFORMANCE CHART AND ANALYSIS (Unaudited)
MARCH 31, 2018
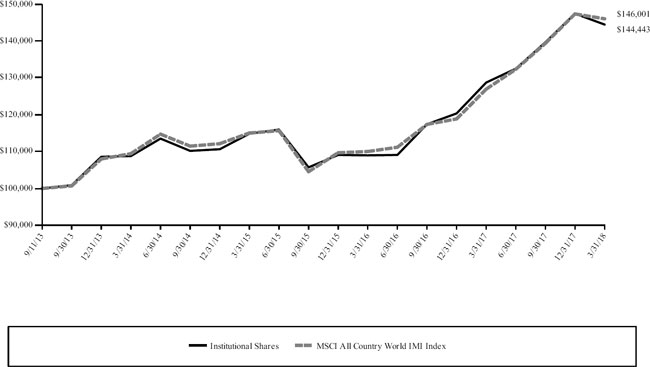
The following chart reflects the change in the value of a hypothetical $1,000,000 investment, including reinvested dividends and distributions, in the Absolute Capital Opportunities Fund (the “Fund”) compared with the performance of the benchmarks, the HFRX Equity Hedge Index (“HFRX Equity”) and the S&P 500 Index (“S&P 500”), since inception. HFRX Equity measures the performance of strategies that maintain positions both long and short in primarily equity and equity derivative securities. The S&P 500 is a broad-based measurement of the U.S. stock market based on the performance of 500 widely held large capitalization common stocks. The total return of the indices includes the reinvestment of dividends and income. The total return of the Fund includes operating expenses that reduce returns, while the total return of the indices do not include expenses. The Fund is professionally managed, while the indices are unmanaged and are not available for investment.
Comparison of Change in Value of a $1,000,000 Investment
Absolute Capital Opportunities Fund vs. HFRX Equity Hedge Index
and S&P 500 Index
Average Annual Total Returns Periods Ended March 31, 2018 | One Year | Since Inception 12/30/15 |
| Absolute Capital Opportunities Fund | 14.13% | 10.49% |
| HFRX Equity Hedge Index | 8.35% | 4.82% |
| S&P 500 Index | 13.99% | 13.91% |
Performance data quoted represents past performance and is no guarantee of future results. Current performance may be lower or higher than the performance data quoted. Investment return and principal value will fluctuate so that shares, when redeemed, may be worth more or less than original cost. As stated in the Fund’s prospectus, the annual operating expense ratio (gross) is 3.51%. Excluding the effect of expenses attributable to dividends and interest on short sales, the Fund's total annual operating expense ratio would be 2.81%. However, the Fund’s adviser has contractually agreed to waive its fee and/or reimburse Fund expenses to limit Total Annual Fund Operating Expenses After Fee Waiver and/or Expense Reimbursement (excluding all taxes, interest, portfolio transaction expenses, dividend and interest expenses on short sales, acquired fund fees and expenses, proxy expenses and extraordinary expenses) to 1.75%, through August 1, 2019 (the “Expense Cap”). The adviser may be reimbursed by the Fund for fees waived and expenses reimbursed by the adviser pursuant to the Expense Cap if such payment is made within three years of the fee waiver or expense reimbursement, and does not cause the Total Annual Fund Operating Expenses After Fee Waiver and/or Expense Reimbursement to exceed the lesser of (i) the then-current expense cap, or (ii) the expense cap in place at the time the fees/expenses were waived/reimbursed. During the period, certain fees were waived and/or expenses reimbursed; otherwise, returns would have been lower. The performance table and graph do not reflect the deduction of taxes that a shareholder would pay on Fund distributions or the redemption of Fund shares. Returns greater than one year are annualized. For the most recent month-end performance, please call (888) 992-2765.
ABSOLUTE CONVERTIBLE ARBITRAGE FUNDA MESSAGE TO OUR SHAREHOLDERS (Unaudited)
MARCH 31, 2018
Dear Shareholder,
For the period ending March 31, 2018, the Absolute Convertible Arbitrage Fund (the “Fund”) returned 5.94%. By comparison, the HFRX Fixed Income Convertible Arbitrage Index returned 4.71%.
The Fund’s subadviser, Mohican Financial Management, LLC (“Mohican”), executes a convertible arbitrage strategy with a particular focus on small and mid-cap issues. Even though convertible bonds are hybrid securities, they are fixed income securities with some exposure to interest rates. Interest rates rose steadily during the period which put downward pressure on valuations.
Performance can be classified as “slow and steady” over the past year. Returns in each month were positive and the Fund exhibited extremely low volatility. Sensitivity to broad equity and fixed income markets has also been very low.
Mohican believes that the convertible asset class today looks healthy in terms of credit quality, short durations, security profile and liquidity. There were no convertible defaults in the first quarter following a year where the default rate was less than 1%. The average duration for the asset class is about 3 years, which we believe provides investors significant protection against interest rate fluctuations. Despite the recent drawdowns in equities, stock prices remain overvalued which means the convertible market continues to offer ample supply of “in-the-money”, heavier hedged, volatility arbitrage opportunities, and we expect liquidity to steadily improve.
Mohican also notes that convertible new issuance in the first quarter of 2018 was strong. 32 deals were priced which annualizes to 128 – well in excess of the 104 deals priced in 2017. Importantly, 30 of the 32 deals were issued by small and mid- cap companies and 31 of the 32 deals were not rated by the rating agencies. Mohican believes non-rated, small and mid-cap convertibles offer a consistent source of inefficiencies and value in the convertibles marketplace where returns can be extracted.
We believe the Fund is positioned for a variety of market environments, particularly if credit markets remain volatile.
Sincerely,
Jay Compson
Portfolio Manager
Absolute Investment Advisers LLC
ABSOLUTE CONVERTIBLE ARBITRAGE FUNDPERFORMANCE CHART AND ANALYSIS (Unaudited)
MARCH 31, 2018
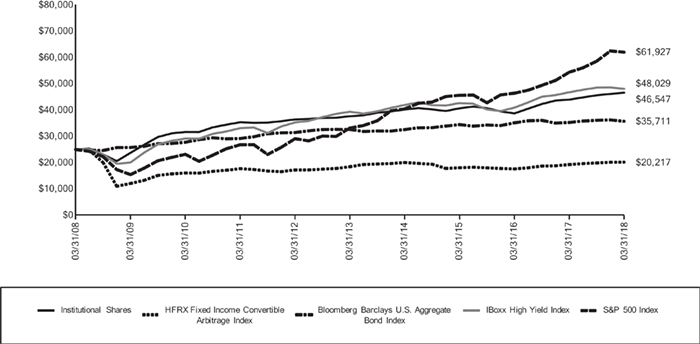
The following chart reflects the change in the value of a hypothetical $25,000 investment, including reinvested dividends and distributions, in Absolute Convertible Arbitrage Fund (the “Fund”) compared with the performance of the benchmarks, HFRX Fixed Income Convertible Arbitrage Index ("HFRX Fixed Income"), Bloomberg Barclays U.S. Aggregate Bond Index ('Barclays Index'), IBoxx High Yield Index ("iBoxx Index") and the S&P 500 Index ("S&P 500"), over the past ten fiscal years. The HFRX Fixed Income measures the performance of hedge fund strategies that are predicated on realizing of a spread between related instruments at least one of which is a convertible fixed income instrument. The iBoxx Index consists of liquid USD high yield bonds, selected to provide a balanced representation of the broad USD high yield corporate bond universe. The S&P 500 is a broad-based measurement of the U.S. stock market based on the performance of 500 widely held large capitalization common stocks. The Barclays Index is a broad based measurement of the U.S. dollar-denominated, investment-grade, fixed-rate, SEC registered taxable bond market. The total return of the indices include the reinvestment of dividends and income. The total return of the Fund includes operating expenses that reduce returns, while the total return of the indices do not include expenses. The Fund is professionally managed, while the indices are unmanaged and are not available for investment.
Comparison of Change in Value of a $25,000 Investment
Absolute Convertible Arbitrage Fund vs. HFRX Fixed Income Convertible Arbitrage Index, Bloomberg Barclays U.S. Aggregate Bond Index,
iBoxx High Yield Index and S&P 500 Index
| | Average Annual Total Returns Periods Ended March 31, 2018 | One Year | Five Year | Ten Year | |
| | Absolute Convertible Arbitrage Fund - Institutional Shares | 5.94% | 4.35% | 6.41% | |
| | HFRX Fixed Income Convertible Arbitrage Index | 4.71% | 1.82% | -2.10% | |
| | Bloomberg Barclays U.S. Aggregate Bond Index | 1.20% | 1.82% | 3.63% | |
| | IBoxx High Yield Index | 2.83% | 4.07% | 6.75% | |
| | S&P 500 Index | 13.99% | 13.31% | 9.49% | |
Performance data quoted represents past performance and is no guarantee of future results. Current performance may be lower or higher than the performance data quoted. Investment return and principal value will fluctuate so that shares, when redeemed, may be worth more or less than original cost. As stated in the Fund’s prospectus, the annual operating expense ratio (gross) is 2.83%. Excluding the effect of expenses attributable to dividends and interest on short sales, the Fund's total annual operating expense ratio would be 2.58%. However, the Fund’s adviser has contractually agreed to waive its fee and/or reimburse Fund expenses to limit Total Annual Fund Operating Expenses After Fee Waiver and/or Expense Reimbursement (excluding all taxes, interest, portfolio transaction expenses, dividend and interest on short sales, acquired fund fees and expenses, proxy expenses and extraordinary expenses) to 1.60%, through August 1, 2019 (the “Expense Cap”). The adviser may be reimbursed by the Fund for fees waived and expenses reimbursed by the adviser pursuant to the Expense Cap if such payment is made within three years of the fee waiver or expense reimbursement, and does not cause the Total Annual Fund Operating Expenses After Fee Waiver and/or Expense Reimbursement to exceed the lesser of (i) the then-current expense cap, or (ii) the expense cap in place at the time the fees/expenses were waived/reimbursed. During the period, certain fees were waived and/or expenses reimbursed; otherwise, returns would have been lower. The performance table and graph do not reflect the
ABSOLUTE CONVERTIBLE ARBITRAGE FUNDPERFORMANCE CHART AND ANALYSIS (Unaudited)
MARCH 31, 2018
deduction of taxes that a shareholder would pay on Fund distributions or the redemption of Fund shares. Returns greater than one year are annualized. For the most recent month-end performance, please call (888) 992-2765.
In August 2017, a hedge fund managed by Mohican Financial Management LLC reorganized into the Fund. The Fund’s performance for periods prior to the commencement of operations is that of the hedge fund and is based on calculations that are different from the standardized method of calculations adopted by the SEC. The performance of the hedge fund was calculated net of the hedge fund’s fees and expenses. The performance of the hedge fund is not the performance of the Fund, has not been restated to reflect the fees, estimated expenses and fee waivers and/or expense limitations of the Fund, and is not necessarily indicative of the Fund’s future performance. If the performance of the hedge fund had been restated to reflect the applicable fees and expenses of the Fund, the performance may have been lower. The hedge fund was not registered under the Investment Company Act of 1940 (“1940 Act”) and was not subject to certain investment limitations, diversification requirements and other restrictions imposed by the 1940 Act and the Internal Revenue Code of 1986, which, if applicable, may have adversely affected its performance.
ABSOLUTE STRATEGIES FUND
PORTFOLIO HOLDINGS SUMMARY (Unaudited)
MARCH 31, 2018
| Portfolio Breakdown (% of Net Assets) |
| Long Positions |
| Common Stock | 29.7% |
| Asset Backed Obligations | 0.2% |
| Investment Companies | 38.0% |
| Money Market Fund | 24.3% |
| Purchased Options | 0.4% |
| Short Positions |
| Common Stock | (17.6)% |
| Investment Company | (1.4)% |
Other Assets & Liabilities, Net * | 26.4% |
| | 100.0% |
| * | Consists of deposits with the custodian and/or brokers for securities sold short, cash, foreign currency, prepaid expenses, receivables, payables and accrued liabilities. Deposits with the custodian and/or brokers for securities sold short represent 24.6% of net assets. See Note 2 of the accompanying Notes to Financial Statements. |
| | (% of Equity Holdings) |
| Sector Breakdown | Long | Short |
| Consumer Discretionary | 11.9% | 31.5% |
| Consumer Staples | 10.9% | 13.8% |
| Energy | 32.8% | 0.0% |
| Financial | 12.9% | 23.9% |
| Healthcare | 5.1% | 0.0% |
| Industrial | 8.9% | 19.6% |
| Information Technology | 1.9% | 7.4% |
| Materials | 11.5% | 0.8% |
| Telecommunication Services | 2.1% | 3.0% |
| Utilities | 2.0% | 0.0% |
| | 100.0% | 100.0% |
| See Notes to Financial Statements. | 12 | ABSOLUTE FUNDS |
ABSOLUTE STRATEGIES FUND
SCHEDULE OF INVESTMENTS
MARCH 31, 2018
| Shares | | Security Description | | Value | |
| Long Positions - 92.6% | |
| Common Stock - 29.7% | |
| Consumer Discretionary - 3.6% | |
| | 7,000 | | Anheuser-Busch InBev SA/NV, ADR | | $ | 769,580 | |
| | 20,000 | | CVS Health Corp. | | | 1,244,200 | |
| | 39,630 | | Freshpet, Inc. (a)(b) | | | 651,914 | |
| | 52,588 | | Green Plains Partners LP (a) | | | 915,031 | |
| | 6,859 | | Lithia Motors, Inc., Class A (a) | | | 689,467 | |
| | 106,698 | | Luby's, Inc. (b) | | | 296,620 | |
| | 12,194 | | PetIQ, Inc. (a)(b) | | | 324,360 | |
| | 14,600 | | The TJX Cos., Inc. | | | 1,190,776 | |
| | | | | | | 6,081,948 | |
| Consumer Staples - 3.2% | |
| | 8,383 | | Calavo Growers, Inc. (a) | | | 772,912 | |
| | 16,767 | | General Mills, Inc. | | | 755,521 | |
| | 10,000 | | Nestle SA, ADR | | | 790,500 | |
| | 31,247 | | Pilgrim's Pride Corp. (a)(b) | | | 768,989 | |
| | 11,432 | | Post Holdings, Inc. (a)(b) | | | 866,088 | |
| | 28,961 | | Sprouts Farmers Market, Inc. (a)(b) | | | 679,715 | |
| | 12,194 | | Tyson Foods, Inc., Class A (a) | | | 892,479 | |
| | | | | | | 5,526,204 | |
| Energy - 9.7% | | | | | | |
| | 5,221 | | Andeavor | | | 525,024 | |
| | 9,833 | | Antero Midstream GP LP | | | 157,230 | |
| | 11,791 | | Antero Resources Corp. (b) | | | 234,051 | |
| | 33,872 | | Cabot Oil & Gas Corp. | | | 812,251 | |
| | 23,434 | | Centennial Resource Development, Inc., Class A (b) | | | 430,014 | |
| | 18,270 | | Cheniere Energy, Inc. (b) | | | 976,532 | |
| | 2,627 | | Cimarex Energy Co. | | | 245,624 | |
| | 2,029 | | Concho Resources, Inc. (b) | | | 305,019 | |
| | 10,562 | | Continental Resources, Inc./OK (b) | | | 622,630 | |
| | 12,389 | | Devon Energy Corp. | | | 393,846 | |
| | 5,070 | | Diamondback Energy, Inc. (b) | | | 641,456 | |
| | 60,000 | | Enbridge, Inc. | | | 1,888,200 | |
| | 17,991 | | Energy Transfer Partners LP | | | 291,814 | |
| | 9,455 | | EOG Resources, Inc. | | | 995,328 | |
| | 18,127 | | EQT Corp. | | | 861,214 | |
| | 8,082 | | FTS International, Inc. (b) | | | 148,628 | |
| | 9,566 | | Halliburton Co. | | | 449,028 | |
| | 6,177 | | HollyFrontier Corp. | | | 301,808 | |
| | 9,716 | | Keane Group, Inc. (b) | | | 143,797 | |
| | 6,424 | | Marathon Petroleum Corp. | | | 469,659 | |
| | 12,774 | | MPLX LP | | | 422,053 | |
| | 6,347 | | ONEOK, Inc. | | | 361,271 | |
| | 1,929 | | Phillips 66 | | | 185,030 | |
| | 1,750 | | Pioneer Natural Resources Co. | | | 300,615 | |
| | 16,965 | | Plains GP Holdings, LP | | | 368,989 | |
| | 13,980 | | ProPetro Holding Corp. (b) | | | 222,142 | |
| | 11,681 | | RSP Permian, Inc. (b) | | | 547,605 | |
| | 15,000 | | Schlumberger, Ltd. | | | 971,700 | |
| | 29,190 | | Tallgrass Energy GP LP | | | 555,194 | |
| | 13,401 | | Targa Resources Corp. | | | 589,644 | |
| | 37,865 | | The Williams Cos., Inc. | | | 941,324 | |
| | 20,860 | | WPX Energy, Inc. (b) | | | 308,311 | |
| | | | | | | 16,667,031 | |
| Financial - 3.8% | | | | | | |
| | 6,600 | | Berkshire Hathaway, Inc., Class B (b) | | | 1,316,568 | |
| | 35,000 | | Brookfield Asset Management, Inc., Class A | | | 1,365,000 | |
| | 20,000 | | Loews Corp. | | | 994,600 | |
| | 25,000 | | The Bank of New York Mellon Corp. | | | 1,288,250 | |
| | 3,000 | | The Howard Hughes Corp. (b) | | | 417,390 | |
| | 16,000 | | WR Berkley Corp. | | | 1,163,200 | |
| | | | | | | 6,545,008 | |
| See Notes to Financial Statements. | 13 | ABSOLUTE FUNDS |
ABSOLUTE STRATEGIES FUND
SCHEDULE OF INVESTMENTS
MARCH 31, 2018
| Shares | | Security Description | | Value | |
| Healthcare - 1.5% | | | |
| | 45,000 | | Sanofi, ADR | | $ | 1,803,600 | |
| | 9,603 | | Zoetis, Inc. (a) | | | 801,947 | |
| | | | | | | 2,605,547 | |
| Industrial - 2.7% | | | | |
| | 6,432 | | Alamo Group, Inc. | | | 706,877 | |
| | 32,771 | | Briggs & Stratton Corp. (a) | | | 701,627 | |
| | 6,097 | | Deere & Co. (a) | | | 946,986 | |
| | 10,000 | | Expeditors International of Washington, Inc. | | | 633,000 | |
| | 6,402 | | John Bean Technologies Corp. (a) | | | 725,987 | |
| | 22,102 | | Trimble, Inc. (a)(b) | | | 793,019 | |
| | | | | | | 4,507,496 | |
| Information Technology - 0.6% | | | | |
| | 53,000 | | Conduent, Inc. (b) | | | 987,920 | |
| Materials - 3.4% | | | | |
| | 21,000 | | Axalta Coating Systems, Ltd. (b) | | | 633,990 | |
| | 60,000 | | Cameco Corp. | | | 545,400 | |
| | 8,383 | | Compass Minerals International, Inc. | | | 505,495 | |
| | 8,383 | | Innophos Holdings, Inc. | | | 337,080 | |
| | 5,000 | | Monsanto Co. | | | 583,450 | |
| | 14,327 | | Nutrien, Ltd. (a) | | | 677,094 | |
| | 19,500 | | Royal Gold, Inc. | | | 1,674,465 | |
| | 8,534 | | US Silica Holdings, Inc. | | | 217,788 | |
| | 5,911 | | Westlake Chemical Corp. | | | 657,008 | |
| | | | | | | 5,831,770 | |
| Telecommunication Services - 0.6% | | | | |
| | 25,000 | | Liberty Global PLC, Class C (b) | | | 760,750 | |
| | 20,000 | | News Corp., Class A | | | 316,000 | |
| | | | | | | 1,076,750 | |
| | Utilities - 0.6% | | | | | | |
| | 14,900 | | Dominion Energy, Inc. | | | 1,004,707 | |
| | | | | | | | |
| Total Common Stock (Cost $44,295,545) | | | 50,834,381 | |
| Principal | | Security Description | | Rate | | Maturity | | Value | |
| Asset Backed Obligations - 0.2% | | | | | | | |
| $ | 48,385 | | Adjustable Rate Mortgage Trust, Series 2005-12 2A1 (c) | | 3.74 | % | 03/25/36 | | | 44,586 | |
| | 35,424 | | Adjustable Rate Mortgage Trust, Series 2006-1 3A3 (c) | | 3.58 | | 03/25/36 | | | 31,456 | |
| | 22,655 | | Banc of America Funding Corp., Series 2006-E 2A1 (c) | | 3.70 | | 06/20/36 | | | 22,192 | |
| | 44,630 | | Banc of America Funding Corp., Series 2007-E 4A1 (c) | | 3.54 | | 07/20/47 | | | 37,523 | |
| | 65,788 | | CitiMortgage Alternative Loan Trust, Series 2006-A7 1A12 | | 6.00 | | 12/25/36 | | | 62,377 | |
| | 25,202 | | CitiMortgage Alternative Loan Trust, Series 2007-A4 1A6 | | 5.75 | | 04/25/37 | | | 23,952 | |
| | 28,238 | | Countrywide Alternative Loan Trust, Series 2005-50CB 1A1 | | 5.50 | | 11/25/35 | | | 26,332 | |
| | 38,397 | | Countrywide Home Loan Mortgage Pass-Through Trust, Series 2007-HY5 1A1 (c) | | 3.80 | | 09/25/47 | | | 37,424 | |
| | 50,643 | | IndyMac Index Mortgage Loan Trust, Series 2006-AR25 3A1 (c) | | 3.65 | | 09/25/36 | | | 43,875 | |
| | 22,714 | | JPMorgan Mortgage Trust, Series 2007-A2 4A1M (c) | | 3.61 | | 04/25/37 | | | 21,936 | |
| | 32,375 | | Structured Adjustable Rate Mortgage Loan Trust, Series 2007-3 3A1 (c) | | 3.63 | | 04/25/47 | | | 24,894 | |
| Total Asset Backed Obligations (Cost $249,667) | | | | | | | 376,547 | |
| Shares | | Security Description | | Value | |
| Investment Companies - 38.0% | | | | |
| | 1,529,930 | | Absolute Capital Opportunities Fund (b)(d) | | | 19,154,722 | |
| | 2,840,976 | | Absolute Convertible Arbitrage Fund (d) | | | 29,233,640 | |
| | 52,835 | | SPDR S&P 500 ETF Trust | | | 13,903,530 | |
| | 125,000 | | VanEck Vectors Gold Miners ETF | | | 2,747,500 | |
| Total Investment Companies (Cost $53,720,351) | | | 65,039,392 | |
| Shares | | Security Description | | Value | |
| Money Market Fund - 24.3% | | | | |
| | 41,734,470 | | State Street Institutional Treasury Money Market Fund, Premier Share Class, 1.50% (e)
(Cost $41,734,470) | | | 41,734,470 | |
| See Notes to Financial Statements. | 14 | ABSOLUTE FUNDS |
ABSOLUTE STRATEGIES FUND
SCHEDULE OF INVESTMENTS
MARCH 31, 2018
| Contracts | | Security Description | | Strike Price | | | Exp. Date | | | Notional Contract Value | | | Value | |
| Purchased Options - 0.4% | |
| Call Options Purchased - 0.0% | |
| | 3,429 | | PowerShares DB Commodity Index Tracking Fund ETF
(Premiums Paid $97,315) | | $ | 17.00 | | | | 04/18 | | | $ | 5,829,300 | | | $ | 68,580 | |
| Put Options Purchased - 0.4% | | | | | | | | | | | | | | | | |
| | 1,860 | | iShares Russell 2000 ETF (Premiums Paid $574,187) | | | 150.00 | | | | 05/18 | | | | 28,240,380 | | | | 619,380 | |
| Total Purchased Options (Premiums Paid $671,502) | | | | | | | | | | | | | | | 687,960 | |
| Total Long Positions - 92.6% (Cost $140,671,535) | | | | | | | | | | | | | | | 158,672,750 | |
| Total Short Positions - (19.0)% (Proceeds $(34,589,488)) | | | | | | | | | | | | | | | (32,481,023 | ) |
| Other Assets & Liabilities, Net - 26.4% | | | | | | | | | | | | | | | 45,132,462 | |
| Net Assets - 100.0% | | | | | | | | | | | | | | $ | 171,324,189 | |
| See Notes to Financial Statements. | 15 | ABSOLUTE FUNDS |
ABSOLUTE STRATEGIES FUND
SCHEDULE OF SECURITIES SOLD SHORT
MARCH 31, 2018
| Shares | | Security Description | | Value | |
| Short Positions - (19.0)% | |
| Common Stock - (17.6)% | |
| Consumer Discretionary - (5.5)% | |
| (365 | ) | Amazon.com, Inc. | | $ | (528,279 | ) |
| | (21,035 | ) | Bojangles', Inc. | | | (291,335 | ) |
| | (6,859 | ) | Brinker International, Inc. | | | (247,610 | ) |
| | (7,050 | ) | Carnival Corp. | | | (462,339 | ) |
| | (1,067 | ) | Chipotle Mexican Grill, Inc. | | | (344,758 | ) |
| | (1,981 | ) | Cracker Barrel Old Country Store, Inc. | | | (315,375 | ) |
| | (6,402 | ) | Dave & Buster's Entertainment, Inc. | | | (267,220 | ) |
| | (2,439 | ) | Dollarama, Inc. | | | (296,425 | ) |
| | (13,250 | ) | DR Horton, Inc. | | | (580,880 | ) |
| | (18,291 | ) | Duluth Holdings, Inc., Class B | | | (342,590 | ) |
| | (6,097 | ) | Dunkin' Brands Group, Inc. | | | (363,930 | ) |
| | (10,200 | ) | Fiat Chrysler Automobiles NV | | | (207,110 | ) |
| | (8,688 | ) | Fiesta Restaurant Group, Inc. | | | (160,728 | ) |
| | (4,400 | ) | HD Supply Holdings, Inc. | | | (166,936 | ) |
| | (2,743 | ) | LCI Industries | | | (285,684 | ) |
| | (8,470 | ) | Leggett & Platt, Inc. | | | (375,729 | ) |
| | (5,680 | ) | Lowe's Cos., Inc. | | | (498,420 | ) |
| | (2,290 | ) | Mohawk Industries, Inc. | | | (531,784 | ) |
| | (36,582 | ) | Noodles & Co. | | | (276,194 | ) |
| | (6,097 | ) | Red Robin Gourmet Burgers, Inc. | | | (353,626 | ) |
| | (6,707 | ) | Shake Shack, Inc. | | | (279,212 | ) |
| | (21,993 | ) | The Habit Restaurants, Inc., Class A | | | (193,538 | ) |
| | (2,830 | ) | The Home Depot, Inc. | | | (504,419 | ) |
| | (9,000 | ) | Tractor Supply Co. | | | (567,180 | ) |
| | (820 | ) | Ulta Beauty, Inc. | | | (167,501 | ) |
| | (15,242 | ) | Vista Outdoor, Inc. | | | (248,750 | ) |
| | (14,700 | ) | Volvo AB, Class B | | | (268,039 | ) |
| | (1,219 | ) | WW Grainger, Inc. | | | (344,087 | ) |
| | | | | | | (9,469,678 | ) |
| Consumer Staples - (2.4)% | |
| | (8,530 | ) | AerCap Holdings NV | | | (432,642 | ) |
| | (20,582 | ) | Amira Nature Foods, Ltd. | | | (85,827 | ) |
| | (8,993 | ) | Archer-Daniels-Midland Co. | | | (390,026 | ) |
| | (1,829 | ) | Dr. Pepper Snapple Group, Inc. | | | (216,517 | ) |
| | (2,050 | ) | FleetCor Technologies, Inc. | | | (415,125 | ) |
| | (15,242 | ) | Flowers Foods, Inc. | | | (333,190 | ) |
| | (20,882 | ) | Hostess Brands, Inc. | | | (308,845 | ) |
| | (2,591 | ) | Ingredion, Inc. | | | (334,032 | ) |
| | (10,670 | ) | Macquarie Infrastructure Corp. | | | (394,043 | ) |
| | (3,201 | ) | McCormick & Co., Inc., Non-Voting Shares | | | (340,554 | ) |
| | (3,201 | ) | PepsiCo., Inc. | | | (349,389 | ) |
| | (2,591 | ) | Sanderson Farms, Inc. | | | (308,381 | ) |
| | (3,811 | ) | The Kraft Heinz Co. | | | (237,387 | ) |
| | | | | | | (4,145,958 | ) |
| Financial - (4.2)% | | | | |
| | (330,000 | ) | Agricultural Bank of China, Ltd., Class H | | | (187,535 | ) |
| | (8,840 | ) | Air Lease Corp. | | | (376,761 | ) |
| | (2,025 | ) | Alliance Data Systems Corp. | | | (431,041 | ) |
| | (3,280 | ) | Ameriprise Financial, Inc. | | | (485,243 | ) |
| | (71,158 | ) | Banco Santander SA, ADR | | | (466,085 | ) |
| | (18,550 | ) | Bank of America Corp. | | | (556,315 | ) |
| | (338,000 | ) | Bank of China, Ltd., Class H | | | (181,745 | ) |
| | (228,000 | ) | Bank of Communications Co., Ltd., Class H | | | (178,666 | ) |
| | (245,000 | ) | China CITIC Bank Corp., Ltd., Class H | | | (167,326 | ) |
| | (177,000 | ) | China Construction Bank Corp., Class H | | | (181,778 | ) |
| | (232,000 | ) | China Galaxy Securities Co., Ltd., Class H | | | (154,309 | ) |
| | (47,000 | ) | China Merchants Bank Co., Ltd., Class H | | | (192,536 | ) |
| | (76,000 | ) | CITIC Securities Co., Ltd., Class H | | | (173,921 | ) |
| | (20,800 | ) | Deutsche Bank AG | | | (290,784 | ) |
| | (7,100 | ) | Fastighets AB Balder | | | (178,227 | ) |
| | (237,000 | ) | Industrial & Commercial Bank of China, Ltd., Class H | | | (203,234 | ) |
| | (61,700 | ) | Intesa Sanpaolo SpA | | | (224,226 | ) |
| See Notes to Financial Statements. | 16 | ABSOLUTE FUNDS |
ABSOLUTE STRATEGIES FUND
SCHEDULE OF SECURITIES SOLD SHORT
MARCH 31, 2018
| Shares | | Security Description | | Value | |
| Financial - (4.2)% (continued) | | | |
| | (2,650 | ) | M&T Bank Corp. | | $ | (488,554 | ) |
| | (4,775 | ) | OTP Bank PLC | | | (214,814 | ) |
| | (9,300 | ) | Swedbank AB, Class A | | | (208,280 | ) |
| | (16,200 | ) | Synchrony Financial | | | (543,186 | ) |
| | (17,900 | ) | The Blackstone Group LP | | | (571,905 | ) |
| | (10,250 | ) | The Charles Schwab Corp. | | | (535,255 | ) |
| | | | | | | (7,191,726 | ) |
| Industrial - (3.4)% | | | | |
| | (3,811 | ) | AGCO Corp. | | | (247,143 | ) |
| | (5,800 | ) | Atlas Copco AB, Class A | | | (250,899 | ) |
| | (6,530 | ) | Eaton Corp. PLC | | | (521,812 | ) |
| | (5,200 | ) | Emerson Electric Co. | | | (355,160 | ) |
| | (3,060 | ) | Illinois Tool Works, Inc. | | | (479,380 | ) |
| | (7,800 | ) | Jacobs Engineering Group, Inc. | | | (461,370 | ) |
| | (1,430 | ) | Martin Marietta Materials, Inc. | | | (296,439 | ) |
| | (16,700 | ) | Peab AB | | | (150,204 | ) |
| | (11,900 | ) | SKF AB, Class B | | | (242,994 | ) |
| | (1,905 | ) | Snap-on, Inc. | | | (281,064 | ) |
| | (6,725 | ) | Spirit AeroSystems Holdings, Inc., Class A | | (562,882 | ) |
| | (4,800 | ) | Textron, Inc. | | | (283,056 | ) |
| | (1,160 | ) | The Boeing Co. | | | (380,341 | ) |
| | (5,704 | ) | The Middleby Corp. | | | (706,098 | ) |
| | (2,170 | ) | Vulcan Materials Co. | | | (247,749 | ) |
| | (5,300 | ) | Wartsila OYJ Abp | | | (117,059 | ) |
| | (15,395 | ) | Welbilt, Inc. | | | (299,433 | ) |
| | | | | | | (5,883,083 | ) |
| Information Technology - (1.3)% | | | | |
| | (2,170 | ) | Autodesk, Inc. | | | (272,508 | ) |
| | (9,600 | ) | CA, Inc. | | | (325,440 | ) |
| | (9,000 | ) | Intel Corp. | | | (468,720 | ) |
| | (1,440 | ) | NVIDIA Corp. | | | (333,490 | ) |
| | (6,600 | ) | Oracle Corp. | | | (301,950 | ) |
| | (4,430 | ) | salesforce.com, Inc. | | | (515,209 | ) |
| | | | | | | (2,217,317 | ) |
| Materials - (0.2)% | | | | |
| | (12,194 | ) | American Vanguard Corp. | | | (246,319 | ) |
| Telecommunication Services - (0.6)% | | | | |
| | (175 | ) | Booking Holdings, Inc. | | | (364,068 | ) |
| | (3,460 | ) | Facebook, Inc., Class A | | | (552,874 | ) |
| | | | | | | (916,942 | ) |
| Total Common Stock (Proceeds $(32,569,391)) | | | (30,071,023 | ) |
| Shares | | Security Description | | Value | |
| Investment Company - (1.4)% | |
| | (20,000 | ) | First Trust Dow Jones Internet Index Fund ETF (Proceeds $(2,020,097)) | | | (2,410,000 | ) |
| Total Short Positions - (19.0)% (Proceeds $(34,589,488)) | | $ | (32,481,023 | ) |
| See Notes to Financial Statements. | 17 | ABSOLUTE FUNDS |
ABSOLUTE STRATEGIES FUND
NOTES TO SCHEDULES OF INVESTMENTS AND SECURITIES SOLD SHORT
MARCH 31, 2018
| ADR | American Depositary Receipt |
| ETF | Exchange Traded Fund |
| LP | Limited Partnership |
| PLC | Public Limited Company |
| (a) | All or a portion of this security is held as collateral for securities sold short. |
| (b) | Non-income producing security. |
| (c) | Variable rate security, the interest rate of which adjusts periodically based on changes in current interest rates. Rate represented is as of March 31, 2018. |
| (e) | Dividend yield changes daily to reflect current market conditions. Rate was the quoted yield as of March 31, 2018. |
At March 31, 2018, the Fund held the following exchange traded futures contracts:
| Contracts | | Type | | Expiration Date | | Notional Contract Value | | | Value | | | Net Unrealized Appreciation (Depreciation) | |
(150 | ) | CME E-Mini Russell Future | | 06/15/18 | | $ | (11,373,647 | ) | | $ | (11,484,000 | ) | | $ | (110,353 | ) |
(475 | ) | S&P 500 E-mini Future | | 06/15/18 | | | (64,716,974 | ) | | | (62,771,250 | ) | | | 1,945,724 | |
25 | | Silver Future | | 05/29/18 | | | 2,075,692 | | | | 2,033,500 | | | | (42,192 | ) |
| | | | | | | $ | (74,014,929 | ) | | $ | (72,221,750 | ) | | $ | 1,793,179 | |
Affiliated investments are investments that are managed by the adviser, and are noted in the Absolute Strategies Fund’s Schedule of Investments. Transactions during the year with affiliates were as follows:
| Investment Companies | | | | | | | | | | | | | | | | | | | | | |
| Absolute Capital Opportunities Fund | | Balance 3/31/2017 | | | Gross Additions | | | Gross Reductions | | | Change in Unrealized Appreciation | | | Balance 3/31/2018 | | | Realized Gain/(Loss) | | | Investment Income | |
| Shares/Principal | | | 1,289,545 | | | | 240,385 | | | | – | | | | – | | | | 1,529,930 | | | | | | | |
| Cost | | $ | 13,010,000 | | | $ | 3,000,000 | | | $ | – | | | $ | – | | | $ | 16,010,000 | | | $ | – | | | $ | – | |
| Value | | | 14,146,311 | | | | – | | | | – | | | | 2,008,411 | | | | 19,154,722 | | | | | | | | | |
| Absolute Convertible Arbitrage Fund | | Balance 3/31/2017 | | | Gross Additions | | | Gross Reductions | | | Change in Unrealized Appreciation | | | Balance 3/31/2018 | | | Realized Gain/(Loss) | | | Investment Income | |
| Shares/Principal | | | – | | | | 2,840,976 | | | | – | | | | – | | | | 2,840,976 | | | | | | | | | |
| Cost | | $ | – | | | $ | 29,047,189 | | | $ | – | | | $ | – | | | $ | 29,047,189 | | | $ | – | | | $ | 47,189 | |
| Value | | | – | | | | – | | | | – | | | | 186,451 | | | | 29,233,640 | | | | | | | | | |
The following is a summary of the inputs used to value the Fund's investments and other financial instruments and liabilities as of March 31, 2018.
The inputs or methodology used for valuing securities are not necessarily an indication of the risks associated with investing in those securities. For more information on valuation inputs, and their aggregation into the levels used in the table below, please refer to the Security Valuation section in Note 2 of the accompanying Notes to Financial Statements.
| | | Level 1 | | | Level 2 | | | Level 3 | | | Total | |
| Assets | | | | | | | | | | | | |
| Investments at Value | | | | | | | | | | | | |
| Common Stock | | | | | | | | | | | | |
| Consumer Discretionary | | $ | 6,081,948 | | | $ | – | | | $ | – | | | $ | 6,081,948 | |
| Consumer Staples | | | 5,526,204 | | | | – | | | | – | | | | 5,526,204 | |
| Energy | | | 16,667,031 | | | | – | | | | – | | | | 16,667,031 | |
| Financial | | | 6,545,008 | | | | – | | | | – | | | | 6,545,008 | |
| Healthcare | | | 2,605,547 | | | | – | | | | – | | | | 2,605,547 | |
| Industrial | | | 4,507,496 | | | | – | | | | – | | | | 4,507,496 | |
| Information Technology | | | 987,920 | | | | – | | | | – | | | | 987,920 | |
| Materials | | | 5,831,770 | | | | – | | | | – | | | | 5,831,770 | |
| Telecommunication Services | | | 1,076,750 | | | | – | | | | – | | | | 1,076,750 | |
| Utilities | | | 1,004,707 | | | | – | | | | – | | | | 1,004,707 | |
| Asset Backed Obligations | | | – | | | | 376,547 | | | | – | | | | 376,547 | |
| Investment Companies | | | 65,039,392 | | | | – | | | | – | | | | 65,039,392 | |
| Money Market Fund | | | – | | | | 41,734,470 | | | | – | | | | 41,734,470 | |
| See Notes to Financial Statements. | 18 | ABSOLUTE FUNDS |
ABSOLUTE STRATEGIES FUND
NOTES TO SCHEDULES OF INVESTMENTS AND SECURITIES SOLD SHORT
MARCH 31, 2018
| | | Level 1 | | | Level 2 | | | Level 3 | | | Total | |
| Purchased Options | | $ | 687,960 | | | $ | – | | | $ | – | | | $ | 687,960 | |
| Investments at Value | | $ | 116,561,733 | | | $ | 42,111,017 | | | $ | – | | | $ | 158,672,750 | |
| Other Financial Instruments* | | | | | | | | | | | | | | | | |
| Futures | | | 1,945,724 | | | | – | | | | – | | | | 1,945,724 | |
| Total Other Financial Instruments* | | $ | 1,945,724 | | | $ | – | | | $ | – | | | $ | 1,945,724 | |
| Total Assets | | $ | 118,507,457 | | | $ | 42,111,017 | | | $ | – | | | $ | 160,618,474 | |
| | | | | | | | | | | | | | | | | |
| Liabilities | | | | | | | | | | | | | | | | |
| Securities Sold Short | | | | | | | | | | | | | | | | |
| Common Stock | | $ | (30,071,023 | ) | | $ | – | | | $ | – | | | $ | (30,071,023 | ) |
| Investment Company | | | (2,410,000 | ) | | | – | | | | – | | | | (2,410,000 | ) |
| Securities Sold Short | | $ | (32,481,023 | ) | | $ | – | | | $ | – | | | $ | (32,481,023 | ) |
| Other Financial Instruments* | | | | | | | | | | | | | | | | |
| Futures | | | (152,545 | ) | | | – | | | | – | | | | (152,545 | ) |
| Total Liabilities | | $ | (32,633,568 | ) | | $ | – | | | $ | – | | | $ | (32,633,568 | ) |
| * | Other Financial Instruments are derivatives not reflected in the Schedule of Investments and Schedule of Securities Sold Short, such as futures, which are valued at the unrealized appreciation/(depreciation) at year end. |
The following is a reconciliation of Level 3 investments for which significant unobservable inputs were used to determine fair value.
| | | | Written Options | | |
| | Balance as of 03/31/17 | | $ | (126 | ) | |
| | Change in Unrealized Appreciation /(Depreciation) | | | (26,271 | ) | |
| | Sales/Covers | | | 229 | | |
| | Realized Gain (Loss) | | | 26,168 | | |
| | Balance as of 03/31/18 | | $ | - | | |
| | Net change in unrealized appreciation / (depreciation) from investments held as of 03/31/18 | | $ | - | | |
The Fund utilizes the end of period methodology when determining transfers. There were no transfers among Level 1, Level 2 and Level 3 for the year ended March 31, 2018.
| See Notes to Financial Statements. | 19 | ABSOLUTE FUNDS |
ABSOLUTE CAPITAL OPPORTUNITIES FUNDPORTFOLIO HOLDINGS SUMMARY (Unaudited)
MARCH 31, 2018
| Portfolio Breakdown (% of Net Assets) | |
| Long Positions | |
| Common Stock | 60.1% |
| Money Market Fund | 29.5% |
| Purchased Options | 2.1% |
| Short Positions | |
| Common Stock | (1.0)% |
| Investment Company | (36.6)% |
| Written Options | (0.4)% |
| Other Assets & Liabilities, Net * | 46.3% |
| | 100.0% |
| * | Consists of deposits with the custodian and/or brokers for securities sold short, cash, prepaid expenses, receivables, payables and accrued liabilities. Deposits with the custodian and/or brokers for securities sold short represent 45.0% of net assets. See Note 2 of the accompanying Notes to Financial Statements. |
| See Notes to Financial Statements. | 20 | ABSOLUTE FUNDS |
ABSOLUTE CAPITAL OPPORTUNITIES FUNDSCHEDULE OF INVESTMENTS
MARCH 31, 2018
| Shares | | Security Description | | Value | |
| Long Positions - 91.7% | | | |
| Common Stock - 60.1% | | | |
| Consumer Discretionary - 7.9% | | | |
| | 9,556 | | American Airlines Group, Inc. (a) | | $ | 496,530 | |
| | 1,838 | | CarMax, Inc. (a)(b) | | | 113,846 | |
| | 20,382 | | General Motors Co. (a)(c) | | | 740,682 | |
| | 7,328 | | Harley-Davidson, Inc. (a)(c)(d) | | | 314,224 | |
| | 7,595 | | Robert Half International, Inc. | | | 439,674 | |
| | 4,276 | | The Cheesecake Factory, Inc. | | | 206,189 | |
| | 2,529 | | The Walt Disney Co. (a)(c) | | | 254,013 | |
| | | | | | | 2,565,158 | |
| Consumer Staples - 1.6% | |
| | 1,473 | | AMERCO (b) | | | 508,332 | |
| | | | | | | | |
| Energy - 2.7% | |
| | 14,559 | | Halliburton Co. (a) | | | 683,400 | |
| | 2,850 | | Schlumberger, Ltd. (a) | | | 184,623 | |
| | | | | | | 868,023 | |
| Financial - 18.1% | |
| | 4,221 | | American Express Co. (a) | | | 393,735 | |
| | 3,584 | | Aon PLC (a) | | | 502,943 | |
| | 29,019 | | Bank of America Corp. (a) | | | 870,280 | |
| | 5,756 | | Berkshire Hathaway, Inc., Class B (a)(b) | | | 1,148,207 | |
| | 13,833 | | CBRE Group, Inc., Class A (a)(b) | | | 653,194 | |
| | 6,792 | | Citigroup, Inc. (a) | | | 458,460 | |
| | 8,238 | | JPMorgan Chase & Co. (a) | | | 905,933 | |
| | 13,593 | | The Blackstone Group LP | | | 434,296 | |
| | 1,991 | | The Goldman Sachs Group, Inc. | | | 501,453 | |
| | | | | | | 5,868,501 | |
| Healthcare - 3.8% | |
| | 2,757 | | Bayer AG | | | 311,384 | |
| | 9,449 | | Henry Schein, Inc. (b) | | | 635,067 | |
| | 2,044 | | McKesson Corp. | | | 287,938 | |
| | | | | | | 1,234,389 | |
| Industrial - 9.0% | |
| | 5,881 | | Delta Air Lines, Inc. | | | 322,338 | |
| | 16,995 | | General Electric Co. | | | 229,092 | |
| | 12,767 | | Jacobs Engineering Group, Inc. (a) | | | 755,168 | |
| | 25,542 | | Quanta Services, Inc. (a)(b) | | | 877,368 | |
| | 1,284 | | The Boeing Co. (a) | | | 420,998 | |
| | 2,785 | | United Parcel Service, Inc., Class B (a) | | | 291,478 | |
| | | | | | | 2,896,442 | |
| Information Technology - 6.6% | |
| | 5,899 | | Analog Devices, Inc. | | | 537,576 | |
| | 7,185 | | Apple, Inc. (a) | | | 1,205,499 | |
| | 613 | | IBM | | | 94,053 | |
| | 2,145 | | Intel Corp. | | | 111,712 | |
| | 2,145 | | Micron Technology, Inc. (b)(d) | | | 111,840 | |
| | 1,379 | | QUALCOMM, Inc. | | | 76,410 | |
| | | | | | | 2,137,090 | |
| Materials - 1.3% | |
| | 3,754 | | PPG Industries, Inc. | | | 418,946 | |
| | | | | | | | |
| Telecommunication Services - 9.1% | |
| | 491 | | Alphabet, Inc., Class A (a)(b) | | | 509,236 | |
| | 327 | | Alphabet, Inc., Class C (a)(b) | | | 337,395 | |
| | 22,715 | | CBS Corp., Class B (a) | | | 1,167,324 | |
| | 2,298 | | Comcast Corp., Class A | | | 78,523 | |
| | 1,838 | | DISH Network Corp., Class A (b) | | | 69,642 | |
| | 4,202 | | Facebook, Inc., Class A (b)(c) | | | 671,437 | |
| | 1,225 | | Omnicom Group, Inc. | | | 89,021 | |
| | 2,449 | | Spark Networks SE, ADR (b) | | | 36,490 | |
| | | | | | | 2,959,068 | |
| Total Common Stock (Cost $18,794,321) | | | 19,455,949 | |
| See Notes to Financial Statements. | 21 | ABSOLUTE FUNDS |
ABSOLUTE CAPITAL OPPORTUNITIES FUNDSCHEDULE OF INVESTMENTS
MARCH 31, 2018
| Shares | | Security Description | | Value | |
| Money Market Fund - 29.5% | | | |
| | 9,538,969 | | State Street Institutional Treasury Money Market Fund, Premier Share Class, 1.50% (e)
(Cost $9,538,969) | | $ | 9,538,969 | |
| Contracts | | Security Description | | Strike Price | | | Exp. Date | | | Notional Contract Value | | | Value | |
| Purchased Options - 2.1% | | | | | | | | | | | | |
| Call Options Purchased - 0.4% | | | | | | | | | | | | |
| | 42 | | Caterpillar, Inc. | | $ | 200.00 | | | 01/19 | | | $ | 840,000 | | | | 6,762 | |
| | 455 | | General Motors Co. | | | 65.00 | | | 01/19 | | | | 2,957,500 | | | | 910 | |
| | 400 | | General Motors Co. | | | 55.00 | | | 01/19 | | | | 2,200,000 | | | | 4,400 | |
| | 239 | | Harley-Davidson, Inc. | | | 65.00 | | | 01/19 | | | | 1,553,500 | | | | 5,497 | |
| | 3,084 | | SPDR S&P 500 ETF Trust | | | 285.00 | | | 04/18 | | | | 87,894,000 | | | | 24,672 | |
| | 72 | | United Continental Holdings, Inc. | | | 65.00 | | | 01/19 | | | | 468,000 | | | | 82,800 | |
| Total Call Options Purchased (Premiums Paid $345,244) | | | | | | | | | | | | | | 125,041 | |
| Put Options Purchased - 1.7% | | | | | | | | | | | | | | | |
| | 22 | | Comcast Corp. | | | 40.00 | | | 01/20 | | | | 75,174 | | | | 18,040 | |
| | 19 | | DISH Network Corp. | | | 47.50 | | | 01/20 | | | | 71,991 | | | | 25,080 | |
| | 7 | | IBM | | | 165.00 | | | 01/20 | | | | 107,401 | | | | 18,410 | |
| | 21 | | Intel Corp. | | | 42.00 | | | 01/20 | | | | 109,368 | | | | 6,615 | |
| | 21 | | Micron Technology, Inc. | | | 42.00 | | | 01/20 | | | | 109,494 | | | | 13,493 | |
| | 12 | | Omnicom Group, Inc. | | | 72.50 | | | 01/20 | | | | 87,204 | | | | 10,440 | |
| | 13 | | QUALCOMM, Inc. | | | 65.00 | | | 01/20 | | | | 72,033 | | | | 20,150 | |
| | 472 | | SPDR S&P 500 ETF Trust | | | 271.00 | | | 04/18 | | | | 12,420,680 | | | | 432,824 | |
| Total Put Options Purchased (Premiums Paid $519,902) | | | 545,052 | |
| Total Purchased Options (Premiums Paid $865,146) | | | 670,093 | |
| Total Long Positions - 91.7% (Cost $29,198,436) | | | 29,665,011 | |
| Total Short Positions - (37.6)% (Proceeds $(12,506,272)) | | | (12,139,511 | ) |
| Total Written Options - (0.4)% (Premiums Received $(138,666)) | | | (141,259 | ) |
| Other Assets & Liabilities, Net - 46.3% | | | 14,953,693 | |
| Net Assets - 100.0% | | $ | 32,337,934 | |
| See Notes to Financial Statements. | 22 | ABSOLUTE FUNDS |
ABSOLUTE CAPITAL OPPORTUNITIES FUNDSCHEDULE OF SECURITIES SOLD SHORT
MARCH 31, 2018
| Shares | | Security Description | | Value | |
| Short Positions - (37.6)% | | | |
| Common Stock - (1.0)% | | | |
| Industrial - (1.0)% | | | |
| | (2,065 | ) | Caterpillar, Inc. (Proceeds $(294,377)) | | $ | (304,340 | ) |
| Investment Company - (36.6)% | | | | |
| | (44,975 | ) | SPDR S&P 500 ETF Trust (Proceeds $(12,211,895)) | | | (11,835,171 | ) |
| Total Short Positions - (37.6)% (Proceeds $(12,506,272)) | | $ | (12,139,511 | ) |
| See Notes to Financial Statements. | 23 | ABSOLUTE FUNDS |
ABSOLUTE CAPITAL OPPORTUNITIES FUNDSCHEDULE OF CALL AND PUT OPTIONS WRITTEN
MARCH 31, 2018
| Contracts | | Security Description | | Strike Price | | | Exp. Date | | | Notional Contract Value | | | Value | |
| Written Options - (0.4)% | | | | | | | | | | | | |
| Call Options Written - (0.1)% | | | | | | | | | | | | |
| | (215 | ) | Harley-Davidson, Inc. | | $ | 75.00 | | | 01/19 | | | $ | 921,920 | | | $ | (215 | ) |
| | (21 | ) | Micron Technology, Inc. | | | 70.00 | | | 01/20 | | | | 109,494 | | | | (17,955 | ) |
| | (72 | ) | United Continental Holdings, Inc. | | | 100.00 | | | 01/19 | | | | 500,184 | | | | (8,280 | ) |
| Total Call Options Written (Premiums Received $(30,459)) | | | | | | | | | | | | | | (26,450 | ) |
| Put Options Written - (0.3)% | | | | | | | | | | | | | | | |
| | (16 | ) | Facebook, Inc., Class A | | | 165.00 | | | 01/19 | | | | 264,000 | | | | (30,640 | ) |
| | (33 | ) | General Motors Co. | | | 45.00 | | | 01/20 | | | | 148,500 | | | | (36,795 | ) |
| | (14 | ) | Harley-Davidson, Inc. | | | 55.00 | | | 01/20 | | | | 77,000 | | | | (20,685 | ) |
| | (42 | ) | NIKE, Inc., Class B | | | 45.00 | | | 01/19 | | | | 189,000 | | | | (2,940 | ) |
| | (55 | ) | The Kroger Co. | | | 22.00 | | | 04/18 | | | | 121,000 | | | | (935 | ) |
| | (12 | ) | The Walt Disney Co. | | | 90.00 | | | 01/19 | | | | 108,000 | | | | (4,410 | ) |
| | (20 | ) | Time Warner, Inc. | | | 90.00 | | | 01/19 | | | | 180,000 | | | | (10,700 | ) |
| | (72 | ) | United Continental Holdings, Inc. | | | 45.00 | | | 01/19 | | | | 324,000 | | | | (7,704 | ) |
| Total Put Options Written (Premiums Received $(108,207)) | | | | (114,809 | ) |
| Total Written Options - (0.4)% (Premiums Received $(138,666)) | | | $ | (141,259 | ) |
| See Notes to Financial Statements. | 24 | ABSOLUTE FUNDS |
ABSOLUTE CAPITAL OPPORTUNITIES FUNDNOTES TO SCHEDULES OF INVESTMENTS, SECURITIES SOLD SHORT AND CALL AND PUT OPTIONS WRITTEN
MARCH 31, 2018
| ADR | American Depositary Receipt |
| PLC | Public Limited Company |
| (a) | All or a portion of this security is held as collateral for securities sold short. |
| (b) | Non-income producing security. |
| (c) | Subject to put option written by the Fund. |
| (d) | Subject to call option written by the Fund. |
| (e) | Dividend yield changes daily to reflect current market conditions. Rate was the quoted yield as of March 31, 2018. |
The following is a summary of the inputs used to value the Fund's investments and other financial instruments and liabilities as of March 31, 2018.
The inputs or methodology used for valuing securities are not necessarily an indication of the risks associated with investing in those securities. For more information on valuation inputs, and their aggregation into the levels used in the table below, please refer to the Security Valuation section in Note 2 of the accompanying Notes to Financial Statements.
| | | Level 1 | | | Level 2 | | | Level 3 | | | Total | |
| Assets | | | | | | | | | | | | |
| Investments at Value | | | | | | | | | | | | |
| Common Stock | | | | | | | | | | | | |
| Consumer Discretionary | | $ | 2,565,158 | | | $ | – | | | $ | – | | | $ | 2,565,158 | |
| Consumer Staples | | | 508,332 | | | | – | | | | – | | | | 508,332 | |
| Energy | | | 868,023 | | | | – | | | | – | | | | 868,023 | |
| Financial | | | 5,868,501 | | | | – | | | | – | | | | 5,868,501 | |
| Healthcare | | | 1,234,389 | | | | – | | | | – | | | | 1,234,389 | |
| Industrial | | | 2,896,442 | | | | – | | | | – | | | | 2,896,442 | |
| Information Technology | | | 2,137,090 | | | | – | | | | – | | | | 2,137,090 | |
| Materials | | | 418,946 | | | | – | | | | – | | | | 418,946 | |
| Telecommunication Services | | | 2,959,068 | | | | – | | | | – | | | | 2,959,068 | |
| Money Market Fund | | | – | | | | 9,538,969 | | | | – | | | | 9,538,969 | |
| Purchased Options | | | 140,976 | | | | 529,117 | | | | – | | | | 670,093 | |
| Investments at Value | | $ | 19,596,925 | | | $ | 10,068,086 | | | $ | – | | | $ | 29,665,011 | |
| Total Assets | | $ | 19,596,925 | | | $ | 10,068,086 | | | $ | – | | | $ | 29,665,011 | |
| | | | | | | | | | | | | | | | | |
| Liabilities | | | | | | | | | | | | | | | | |
| Securities Sold Short | | | | | | | | | | | | | | | | |
| Common Stock | | $ | (304,340 | ) | | $ | – | | | $ | – | | | $ | (304,340 | ) |
| Investment Company | | | (11,835,171 | ) | | | – | | | | – | | | | (11,835,171 | ) |
| Securities Sold Short | | $ | (12,139,511 | ) | | $ | – | | | $ | – | | | $ | (12,139,511 | ) |
| Other Financial Instruments* | | | | | | | | | | | | | | | | |
| Written Options | | | (105,249 | ) | | | (36,010 | ) | | | – | | | | (141,259 | ) |
| Total Liabilities | | $ | (12,244,760 | ) | | $ | (36,010 | ) | | $ | – | | | $ | (12,280,770 | ) |
| * | Other Financial Instruments are derivatives not reflected in the Schedule of Investments and Schedule of Securities Sold Short, such as written options, which are reported at their market value at year end. |
The following is a reconciliation of Level 3 investments for which significant unobservable inputs were used to determine fair value.
| | | Written Options | |
| Balance as of 03/31/17 | | $ | (14 | ) |
| Change in Unrealized Appreciation/(Depreciation) | | | (2,919 | ) |
| Sales/Covers | | | - | |
| Realized Gain (Loss) | | | 2,933 | |
| Balance as of 03/31/18 | | $ | - | |
| Net change in unrealized appreciation/(depreciation) from investments held as of 03/31/18 | | $ | - | |
The Fund utilizes the end of period methodology when determining transfers. There were no transfers among Level 1, Level 2 and Level 3 for the year ended March 31, 2018.
| See Notes to Financial Statements. | 25 | ABSOLUTE FUNDS |
ABSOLUTE CONVERTIBLE ARBITRAGE
PORTFOLIO HOLDINGS SUMMARY (Unaudited)
MARCH 31, 2018
| Portfolio Breakdown (% of Net Assets) | |
| Long Positions | |
| Corporate Convertible Bonds | 78.8% |
| Money Market Fund | 60.4% |
| Short Positions | |
| Common Stock | (38.5)% |
| Other Assets & Liabilities, Net * | (0.7)% |
| | 100.0% |
| * | Consists of prepaid expenses, deferred offering costs, receivables, payables and accrued liabilities. See Note 2 of the accompanying Notes to Financial Statements. |
| See Notes to Financial Statements. | 26 | ABSOLUTE FUNDS |
ABSOLUTE CONVERTIBLE ARBITRAGESCHEDULE OF INVESTMENTS
MARCH 31, 2018
| Principal | | Security Description | | Rate | | Maturity | | Value | |
| Long Positions - 139.2% (a) | | | | | | | |
| Corporate Convertible Bonds - 78.8% | | | | | | | |
| Consumer Discretionary - 3.0% | | | | | | | |
| $ | 500,000 | | Horizon Global Corp. | | 2.75 | % | 07/01/22 | | $ | 412,326 | |
| | 1,000,000 | | Live Nation Entertainment, Inc. (b) | | 2.50 | | 03/15/23 | | | 1,011,681 | |
| | 250,000 | | Marriott Vacations Worldwide Corp. (b) | | 1.50 | | 09/15/22 | | | 274,231 | |
| | | | | | | | | | | 1,698,238 | |
| Consumer Staples - 1.7% | | | | | | | | |
| | 600,000 | | Carriage Services, Inc. | | 2.75 | | 03/15/21 | | | 789,404 | |
| | 125,000 | | Flexion Therapeutics, Inc. (b) | | 3.38 | | 05/01/24 | | | 142,639 | |
| | | | | | | | | | | 932,043 | |
| Energy - 4.2% | | | | | | | | | | |
| | 250,000 | | Bristow Group, Inc. | | 4.50 | | 06/01/23 | | | 276,737 | |
| | 150,000 | | Helix Energy Solutions Group, Inc. | | 4.25 | | 05/01/22 | | | 142,377 | |
| | 500,000 | | Helix Energy Solutions Group, Inc. | | 4.13 | | 09/15/23 | | | 506,512 | |
| | 500,000 | | Newpark Resources, Inc. (b) | | 4.00 | | 12/01/21 | | | 581,250 | |
| | 750,000 | | Renewable Energy Group, Inc. | | 2.75 | | 06/15/19 | | | 843,119 | |
| | | | | | | | | | | 2,349,995 | |
| Financial - 1.7% | | | | | | | | | | |
| | 300,000 | | Encore Capital Group, Inc. | | 3.00 | | 07/01/20 | | | 344,100 | |
| | 628,000 | | Encore Capital Group, Inc. | | 2.88 | | 03/15/21 | | | 629,884 | |
| | | | | | | | | | | 973,984 | |
| Healthcare - 21.0% | | | | | | | | |
| | 500,000 | | Accelerate Diagnostics, Inc. (b) | | 2.50 | | 03/15/23 | | | 484,816 | |
| | 1,000,000 | | Accuray, Inc. (b) | | 3.75 | | 07/15/22 | | | 1,140,000 | |
| | 1,300,000 | | Alder Biopharmaceuticals, Inc. | | 2.50 | | 02/01/25 | | | 1,201,534 | |
| | 500,000 | | Avadel Finance Cayman, Ltd. (b) | | 4.50 | | 02/01/23 | | | 505,750 | |
| | 500,000 | | DexCom, Inc. (b) | | 0.75 | | 05/15/22 | | | 515,681 | |
| | 1,000,000 | | Exact Sciences Corp. | | 1.00 | | 01/15/25 | | | 893,388 | |
| | 1,400,000 | | Insmed, Inc. | | 1.75 | | 01/15/25 | | | 1,237,898 | |
| | 700,000 | | Insulet Corp. (b) | | 1.38 | | 11/15/24 | | | 802,915 | |
| | 400,000 | | Ironwood Pharmaceuticals, Inc. | | 2.25 | | 06/15/22 | | | 472,848 | |
| | 750,000 | | Jazz Investments I, Ltd. (b) | | 1.50 | | 08/15/24 | | | 734,147 | |
| | 650,000 | | Novavax, Inc. | | 3.75 | | 02/01/23 | | | 462,790 | |
| | 500,000 | | Pacira Pharmaceuticals, Inc. | | 2.38 | | 04/01/22 | | | 458,125 | |
| | 750,000 | | Quidel Corp. | | 3.25 | | 12/15/20 | | | 1,301,025 | |
| | 750,000 | | Repligen Corp. | | 2.13 | | 06/01/21 | | | 976,564 | |
| | 100,000 | | Senseonics Holdings, Inc. | | 5.25 | | 02/01/23 | | | 107,900 | |
| | 500,000 | | Theravance Biopharma, Inc. | | 3.25 | | 11/01/23 | | | 508,423 | |
| | | | | | | | | | | 11,803,804 | |
| Industrial - 10.6% | | | | | | | | |
| | 750,000 | | Fluidigm Corp. | | 2.75 | | 02/01/34 | | | 688,428 | |
| | 461,000 | | Fluidigm Corp. | | 2.75 | | 02/01/34 | | | 393,606 | |
| | 1,150,000 | | II-VI, Inc. (b) | | 0.25 | | 09/01/22 | | | 1,273,050 | |
| | 1,100,000 | | Kaman Corp. (b) | | 3.25 | | 05/01/24 | | | 1,253,385 | |
| | 1,000,000 | | Team, Inc. (b) | | 5.00 | | 08/01/23 | | | 992,562 | |
| | 350,000 | | TimkenSteel Corp. | | 6.00 | | 06/01/21 | | | 514,745 | |
| | 500,000 | | TTM Technologies, Inc. | | 1.75 | | 12/15/20 | | | 833,438 | |
| | | | | | | | | | | 5,949,214 | |
| Information Technology - 26.1% | | | | | | | | |
| | 1,048,000 | | Advanced Micro Devices, Inc. | | 2.13 | | 09/01/26 | | | 1,536,158 | |
| | 700,000 | | Apptio, Inc. (b) | | 0.88 | | 04/01/23 | | | 690,900 | |
| | 500,000 | | Avid Technology, Inc. | | 2.00 | | 06/15/20 | | | 421,750 | |
| | 1,365,000 | | Carbonite, Inc. (b) | | 2.50 | | 04/01/22 | | | 1,782,266 | |
| | 1,090,000 | | Coupa Software, Inc. (b) | | 0.38 | | 01/15/23 | | | 1,320,643 | |
| | 500,000 | | Integrated Device Technology, Inc. | | 0.88 | | 11/15/22 | | | 564,500 | |
| | 1,000,000 | | Nutanix, Inc. (b)(c) | | 0.00 | | 01/15/23 | | | 1,205,803 | |
| | 1,000,000 | | Red Hat, Inc. | | 0.25 | | 10/01/19 | | | 2,027,092 | |
| | 1,500,000 | | ServiceNow, Inc. (b)(c) | | 0.00 | | 06/01/22 | | | 1,994,475 | |
| | 1,000,000 | | Silicon Laboratories, Inc. | | 1.38 | | 03/01/22 | | | 1,160,000 | |
| | 500,000 | | Teradyne, Inc. | | 1.25 | | 12/15/23 | | | 763,603 | |
| | 1,250,000 | | Veeco Instruments, Inc. | | 2.70 | | 01/15/23 | | | 1,140,871 | |
| | | | | | | | | | | 14,608,061 | |
| See Notes to Financial Statements. | 27 | ABSOLUTE FUNDS |
ABSOLUTE CONVERTIBLE ARBITRAGE
SCHEDULE OF INVESTMENTS
MARCH 31, 2018
| Principal | | Security Description | | Rate | | Maturity | | Value | |
| Materials - 1.7% | | | | | | | |
| $ | 500,000 | | Aceto Corp. | | 2.00 | % | 11/01/20 | | $ | 441,274 | |
| | 500,000 | | SSR Mining, Inc. | | 2.88 | | 02/01/33 | | | 497,188 | |
| | | | | | | | | | | 938,462 | |
| Telecommunication Services - 8.8% | | | | | | | | |
| | 569,000 | | CalAmp Corp. | | 1.63 | | 05/15/20 | | | 609,583 | |
| | 1,000,000 | | Chegg, Inc. (b) | | 0.25 | | 05/15/23 | | | 1,030,302 | |
| | 500,000 | | Global Eagle Entertainment, Inc. | | 3.25 | | 02/15/35 | | | 316,000 | |
| | 1,000,000 | | Harmonic, Inc. | | 4.00 | | 12/01/20 | | | 986,250 | |
| | 550,000 | | Pandora Media, Inc. | | 1.75 | | 12/01/20 | | | 503,597 | |
| | 500,000 | | Quotient Technology, Inc. (b) | | 1.75 | | 12/01/22 | | | 519,413 | |
| | 750,000 | | RingCentral, Inc. (b)(c) | | 0.00 | | 03/15/23 | | | 755,550 | |
| | 250,000 | | Wayfair, Inc. (b) | | 0.38 | | 09/01/22 | | | 238,000 | |
| | | | | | | | | | | 4,958,695 | |
| Total Corporate Convertible Bonds (Cost $42,637,553) | | | | | | | 44,212,496 | |
| Shares | | Security Description | | Value | |
| Money Market Fund - 60.4% | | | |
| | 33,852,237 | | State Street Institutional Treasury Money Market Fund, Premier Share Class, 1.50%(d) (Cost $33,852,237) | | | 33,852,237 | |
| | | | | |
| Total Long Positions - 139.2% (Cost $76,489,790) | | | 78,064,733 | |
| Total Short Positions - (38.5)% (Proceeds $(21,171,559)) | | | (21,593,223 | ) |
| Other Assets & Liabilities, Net - (0.7)% | | | (406,814 | ) |
| Net Assets - 100.0% | | $ | 56,064,696 | |
| See Notes to Financial Statements. | 28 | ABSOLUTE FUNDS |
ABSOLUTE CONVERTIBLE ARBITRAGE
SCHEDULE OF SECURITIES SOLD SHORT
MARCH 31, 2018
| Shares | | Security Description | | Value | |
| Short Positions - (38.5)% | | | |
| Common Stock - (38.5)% | | | |
| Consumer Discretionary - (0.8)% | | | |
| | (5,380 | ) | Horizon Global Corp. | | $ | (44,331 | ) |
| | (6,400 | ) | Live Nation Entertainment, Inc. | | | (269,696 | ) |
| | (953 | ) | Marriott Vacations Worldwide Corp. | | | (126,940 | ) |
| | | | | | | (440,967 | ) |
| Consumer Staples - (1.2)% | | | | |
| | (21,436 | ) | Carriage Services, Inc. | | | (592,920 | ) |
| | (2,900 | ) | Flexion Therapeutics, Inc. | | | (64,989 | ) |
| | | | | | | (657,909 | ) |
| Energy - (1.6)% | | | | |
| | (11,100 | ) | Bristow Group, Inc. | | | (144,300 | ) |
| | (22,683 | ) | Helix Energy Solutions Group, Inc. | | | (131,334 | ) |
| | (35,600 | ) | Newpark Resources, Inc. | | | (288,360 | ) |
| | (26,982 | ) | Renewable Energy Group, Inc. | | | (345,370 | ) |
| | | | | | | (909,364 | ) |
| Financial - (0.8)% | | | | |
| | (9,577 | ) | Encore Capital Group, Inc. | | | (432,880 | ) |
| Healthcare - (9.4)% | | | | |
| | (1,800 | ) | Accelerate Diagnostics, Inc. | | | (41,130 | ) |
| | (117,700 | ) | Accuray, Inc. | | | (588,500 | ) |
| | (41,700 | ) | Alder Biopharmaceuticals, Inc. | | | (529,590 | ) |
| | (21,800 | ) | Avadel Pharmaceuticals PLC, ADR | | | (158,922 | ) |
| | (2,320 | ) | DexCom, Inc. | | | (172,051 | ) |
| | (7,650 | ) | Exact Sciences Corp. | | | (308,524 | ) |
| | (22,000 | ) | Insmed, Inc. | | | (495,440 | ) |
| | (4,900 | ) | Insulet Corp. | | | (424,732 | ) |
| | (17,560 | ) | Ironwood Pharmaceuticals, Inc. | | | (270,951 | ) |
| | (1,762 | ) | Jazz Pharmaceuticals PLC | | | (266,044 | ) |
| | (51,200 | ) | Novavax, Inc. | | | (107,520 | ) |
| | (2,750 | ) | Pacira Pharmaceuticals, Inc. | | | (85,663 | ) |
| | (19,034 | ) | Quidel Corp. | | | (986,152 | ) |
| | (16,500 | ) | Repligen Corp. | | | (596,970 | ) |
| | (1,000 | ) | Senseonics Holdings, Inc. | | | (3,000 | ) |
| | (9,000 | ) | Theravance Biopharma, Inc. | | | (218,250 | ) |
| | | | | | | (5,253,439 | ) |
| Industrial - (5.2)% | | | | |
| | (34,250 | ) | Fluidigm Corp. | | | (200,020 | ) |
| | (16,200 | ) | II-VI, Inc. | | | (662,580 | ) |
| | (10,400 | ) | Kaman Corp. | | | (646,048 | ) |
| | (26,000 | ) | Team, Inc. | | | (357,500 | ) |
| | (21,940 | ) | TimkenSteel Corp. | | | (333,269 | ) |
| | (46,900 | ) | TTM Technologies, Inc. | | | (717,101 | ) |
| | | | | | | (2,916,518 | ) |
| Information Technology - (16.5)% | | | | |
| | (109,580 | ) | Advanced Micro Devices, Inc. | | | (1,101,279 | ) |
| | (8,422 | ) | Apptio, Inc., Class A | | | (238,680 | ) |
| | (4,000 | ) | Avid Technology, Inc. | | | (18,160 | ) |
| | (38,800 | ) | Carbonite, Inc. | | | (1,117,440 | ) |
| | (17,628 | ) | Coupa Software, Inc. | | | (804,189 | ) |
| | (10,497 | ) | Integrated Device Technology, Inc. | | | (320,788 | ) |
| | (14,540 | ) | Nutanix, Inc., Class A | | | (714,059 | ) |
| | (13,372 | ) | Red Hat, Inc. | | | (1,999,248 | ) |
| | (8,954 | ) | ServiceNow, Inc. | | | (1,481,439 | ) |
| | (7,300 | ) | Silicon Laboratories, Inc. | | | (656,270 | ) |
| | (13,350 | ) | Teradyne, Inc. | | | (610,229 | ) |
| | (11,000 | ) | Veeco Instruments, Inc. | | | (187,000 | ) |
| | | | | | | (9,248,781 | ) |
| Materials - 0.0% | | | | |
| | (300 | ) | Aceto Corp. | | | (2,280 | ) |
| | (3,000 | ) | SSR Mining, Inc. | | | (28,800 | ) |
| | | | | | | (31,080 | ) |
| See Notes to Financial Statements. | 29 | ABSOLUTE FUNDS |
ABSOLUTE CONVERTIBLE ARBITRAGE
SCHEDULE OF SECURITIES SOLD SHORT
MARCH 31, 2018
| Shares | | Security Description | | Value | |
| Telecommunication Services - (3.0)% | | | |
| (10,903 | ) | CalAmp Corp. | | $ | (249,461 | ) |
| | (22,000 | ) | Chegg, Inc. | | | (454,520 | ) |
| | (4,200 | ) | Global Eagle Entertainment, Inc. | | | (6,174 | ) |
| | (76,400 | ) | Harmonic, Inc. | | | (290,320 | ) |
| | (2,887 | ) | Pandora Media, Inc. | | | (14,522 | ) |
| | (17,600 | ) | Quotient Technology, Inc. | | | (230,560 | ) |
| | (5,725 | ) | RingCentral, Inc., Class A | | | (363,537 | ) |
| | (1,380 | ) | Wayfair, Inc., Class A | | | (93,191 | ) |
| | | | | | | (1,702,285 | ) |
| Total Common Stock (Proceeds $(21,171,559)) | | | (21,593,223 | ) |
| Total Short Positions - (38.5)% (Proceeds $(21,171,559)) | | $ | (21,593,223 | ) |
| See Notes to Financial Statements. | 30 | ABSOLUTE FUNDS |
ABSOLUTE CONVERTIBLE ARBITRAGE
NOTES TO SCHEDULES OF INVESTMENTS AND SECURITIES SOLD SHORT
MARCH 31, 2018
| ADR | American Depositary Receipt |
PLC | Public Limited Company |
| (a) | All or a portion of these securities are held as collateral for securities sold short. |
| (b) | Security exempt from registration under Rule 144A under the Securities Act of 1933. At the period end, the value of these securities amounted to $19,249,459 or 34.3% of net assets. |
| (c) | Zero coupon bond. Interest rate presented is yield to maturity. |
| (d) | Dividend yield changes daily to reflect current market conditions. Rate was the quoted yield as of March 31, 2018. |
The following is a summary of the inputs used to value the Fund's investments and other financial instruments and liabilities as of March 31, 2018.
The inputs or methodology used for valuing securities are not necessarily an indication of the risks associated with investing in those securities. For more information on valuation inputs, and their aggregation into the levels used in the table below, please refer to the Security Valuation section in Note 2 of the accompanying Notes to Financial Statements.
| | | Level 1 | | | Level 2 | | | Level 3 | | | Total | |
| Assets | | | | | | | | | | | | |
| Investments at Value | | | | | | | | | | | | |
| Corporate Convertible Bonds | | $ | – | | | $ | 44,212,496 | | | $ | – | | | $ | 44,212,496 | |
| Money Market Fund | | | – | | | | 33,852,237 | | | | – | | | | 33,852,237 | |
| Investments at Value | | $ | – | | | $ | 78,064,733 | | | $ | – | | | $ | 78,064,733 | |
| Total Assets | | $ | – | | | $ | 78,064,733 | | | $ | – | | | $ | 78,064,733 | |
| | | | | | | | | | | | | | | | | |
| Liabilities | | | | | | | | | | | | | | | | |
| Securities Sold Short | | | | | | | | | | | | | | | | |
| Common Stock | | $ | (21,593,223 | ) | | $ | – | | | $ | – | | | $ | (21,593,223 | ) |
| Securities Sold Short | | $ | (21,593,223 | ) | | $ | – | | | $ | – | | | $ | (21,593,223 | ) |
| Total Liabilities | | $ | (21,593,223 | ) | | $ | – | | | $ | – | | | $ | (21,593,223 | ) |
The Fund utilizes the end of period methodology when determining transfers. There were no transfers among Level 1, Level 2 and Level 3 for the year ended March 31, 2018.
| See Notes to Financial Statements. | 31 | ABSOLUTE FUNDS |
ABSOLUTE FUNDSSTATEMENTS OF ASSETS AND LIABILITIES
MARCH 31, 2018
| | | ABSOLUTE STRATEGIES FUND | | | ABSOLUTE CAPITAL OPPORTUNITIES FUND | | | ABSOLUTE CONVERTIBLE ARBITRAGE FUND | |
| ASSETS | | | | | | | | | |
| Investments, at value (Cost $95,614,346, $29,198,436 and $76,489,790, respectively) | | $ | 110,284,388 | | | $ | 29,665,011 | | | $ | 78,064,733 | |
| Investments in affiliates, at value (Cost $45,057,189, $0 and $0, respectively) | | | 48,388,362 | | | | – | | | | – | |
| | | $ | 158,672,750 | | | $ | 29,665,011 | | | $ | 78,064,733 | |
| Cash | | | 4,529,451 | | | | 2,614 | | | | – | |
| Deposits with broker | | | 42,161,700 | | | | 14,568,191 | | | | – | |
| Foreign currency (Cost $108,878, $0 and $0, respectively) | | | 110,970 | | | | – | | | | – | |
| Receivables: | | | | | | | | | | | | |
| Fund shares sold | | | 42,803 | | | | 432,006 | | | | 94,926 | |
| Investment securities sold | | | 2,487,952 | | | | 46 | | | | 1,008,207 | |
| Dividends and interest | | | 238,300 | | | | 20,598 | | | | 235,136 | |
| Prepaid expenses | | | 12,500 | | | | 11,724 | | | | 1,904 | |
| Deferred offering costs | | | – | | | | – | | | | 11,964 | |
| Total Assets | | | 208,256,426 | | | | 44,700,190 | | | | 79,416,870 | |
| LIABILITIES | | | | | | | | | | | | |
| Call options written, at value (Premiums received $0, $30,459 and $0, respectively) | | | – | | | | 26,450 | | | | – | |
| Put options written, at value (Premiums received $0, $108,207 and $0, respectively) | | | – | | | | 114,809 | | | | – | |
| Securities sold short, at value (Proceeds $34,589,488, $12,506,272 and $21,171,559, respectively) | | | 32,481,023 | | | | 12,139,511 | | | | 21,593,223 | |
| Payables: | | | | | | | | | | | | |
| Investment securities purchased | | | 3,852,363 | | | | 30,639 | | | | 1,542,044 | |
| Fund shares redeemed | | | 377,941 | | | | – | | | | – | |
| Due to custodian | | | – | | | | – | | | | 45,341 | |
| Dividends on securities sold short | | | 18,832 | | | | – | | | | 2,090 | |
| Accrued Liabilities: | | | | | | | | | | | | |
| Investment adviser fees | | | 3,627 | | | | 13,418 | | | | 104,217 | |
| Trustees’ fees and expenses | | | 400 | | | | 50 | | | | 50 | |
| Fund services fees | | | 33,638 | | | | 4,747 | | | | 2,424 | |
| Other expenses | | | 164,413 | | | | 32,632 | | | | 62,785 | |
| Total Liabilities | | | 36,932,237 | | | | 12,362,256 | | | | 23,352,174 | |
| NET ASSETS | | $ | 171,324,189 | | | $ | 32,337,934 | | | $ | 56,064,696 | |
| COMPONENTS OF NET ASSETS | | | | | | | | | | | | |
| Paid-in capital | | $ | 196,537,608 | | | $ | 29,145,174 | | | $ | 55,294,361 | |
| Undistributed net investment income (Accumulated net investment loss) | | | (585,480 | ) | | | – | | | | 310,066 | |
| Accumulated net realized gain (loss) | | | (46,533,183 | ) | | | 2,361,991 | | | | (693,010 | ) |
| Net unrealized appreciation | | | 21,905,244 | | | | 830,769 | | | | 1,153,279 | |
| NET ASSETS | | $ | 171,324,189 | | | $ | 32,337,934 | | | $ | 56,064,696 | |
| SHARES OF BENEFICIAL INTEREST AT NO PAR VALUE (UNLIMITED SHARES AUTHORIZED) | | | | | | | | | | | | |
| Institutional Shares | | | 19,869,235 | | | | 2,583,325 | | | | 5,448,972 | |
| R Shares | | | 615,709 | | | | – | | | | – | |
| | | | | | | | | | | | | |
| NET ASSET VALUE, OFFERING AND REDEMPTION PRICE PER SHARE | | | | | | | | | | | | |
| Institutional Shares (based on net assets of $166,373,325, $32,337,934 and $56,064,696, respectively) | | $ | 8.37 | | | $ | 12.52 | | | $ | 10.29 | |
| R Shares (based on net assets of $4,950,864, $0 and $0) | | $ | 8.04 | | | $ | – | | | $ | – | |
| See Notes to Financial Statements. | 32 | ABSOLUTE FUNDS |
ABSOLUTE FUNDSSTATEMENTS OF OPERATIONS
YEAR OR PERIOD ENDED MARCH 31, 2018
| | | ABSOLUTE STRATEGIES FUND | | | ABSOLUTE CAPITAL OPPORTUNITIES FUND | | | ABSOLUTE CONVERTIBLE ARBITRAGE FUND* | |
| INVESTMENT INCOME | | | | | | | | | |
| Dividend income (Net of foreign withholding taxes of $136,736, $5,713 and $0, respectively) | | $ | 4,454,873 | | | $ | 214,436 | | | $ | 139,043 | |
| Dividend income from affiliated investment | | | 47,189 | | | | – | | | | – | |
| Interest income | | | 2,150,544 | | | | – | | | | 320,109 | |
| Net amortization expense | | | – | | | | – | | | | (429,427 | ) |
| Total Investment Income | | | 6,652,606 | | | | 214,436 | | | | 29,725 | |
| EXPENSES | | | | | | | | | | | | |
| Investment adviser fees | | | 5,580,081 | | | | 246,156 | | | | 277,313 | |
| Fund services fees | | | 486,104 | | | | 48,409 | | | | 42,503 | |
| Transfer agent fees: | | | | | | | | | | | | |
| Institutional Shares | | | 100,515 | | | | – | | | | – | |
| R Shares | | | 54,648 | | | | – | | | | – | |
| Distribution fees: | | | | | | | | | | | | |
| R Shares | | | 31,193 | | | | – | | | | – | |
| Custodian fees | | | 554,466 | | | | 30,308 | | | | 42,091 | |
| Registration fees: | | | | | | | | | | | | |
| Institutional Shares | | | 22,387 | | | | 19,166 | | | | 116 | |
| R Shares | | | 18,822 | | | | – | | | | – | |
| Professional fees | | | 150,294 | | | | 47,985 | | | | 64,791 | |
| Trustees' fees and expenses | | | 33,236 | | | | 5,955 | | | | 3,384 | |
| Offering costs | | | – | | | | – | | | | 59,870 | |
| Dividend expense on securities sold short | | | 2,359,961 | | | | 114,052 | | | | 10,978 | |
| Interest expense | | | 504,093 | | | | 22,643 | | | | 108,147 | |
| Other expenses | | | 446,362 | | | | 22,798 | | | | 15,343 | |
| Total Expenses | | | 10,342,162 | | | | 557,472 | | | | 624,536 | |
| Fees waived | | | (565,273 | ) | | | (136,243 | ) | | | (179,010 | ) |
| Net Expenses | | | 9,776,889 | | | | 421,229 | | | | 445,526 | |
| NET INVESTMENT LOSS | | | (3,124,283 | ) | | | (206,793 | ) | | | (415,801 | ) |
| NET REALIZED AND UNREALIZED GAIN (LOSS) | | | | | | | | | | | | |
| Net realized gain (loss) on: | | | | | | | | | | | | |
| Investments in unaffiliated issuers | | | 85,735,917 | | | | 3,960,258 | | | | 820,141 | |
| Foreign currency transactions | | | 343,372 | | | | (3,395 | ) | | | – | |
| Securities sold short | | | (21,589,630 | ) | | | (1,007,520 | ) | | | (692,699 | ) |
| Written options | | | 1,567,689 | | | | 75,311 | | | | – | |
| Futures | | | (23,935,334 | ) | | | – | | | | – | |
| Swaps | | | (1,402,368 | ) | | | – | | | | – | |
| Net realized gain | | | 40,719,646 | | | | 3,024,654 | | | | 127,442 | |
| Net change in unrealized appreciation (depreciation) on: | | | | | | | | | | | | |
| Investments in unaffiliated issuers | | | (63,244,578 | ) | | | (1,262,567 | ) | | | 1,574,943 | |
| Investments in affiliated issuers | | | 2,194,862 | | | | – | | | | – | |
| Foreign currency translations | | | (75,514 | ) | | | 26 | | | | – | |
| Securities sold short | | | (2,939,668 | ) | | | 345,964 | | | | (421,664 | ) |
| Written options | | | (708,906 | ) | | | (30,367 | ) | | | – | |
| Futures | | | 4,246,493 | | | | – | | | | – | |
| Swaps | | | 981,271 | | | | – | | | | – | |
| Net change in unrealized appreciation (depreciation) | | | (59,546,040 | ) | | | (946,944 | ) | | | 1,153,279 | |
| NET REALIZED AND UNREALIZED GAIN (LOSS) | | | (18,826,394 | ) | | | 2,077,710 | | | | 1,280,721 | |
| INCREASE (DECREASE) IN NET ASSETS RESULTING FROM OPERATIONS | | $ | (21,950,677 | ) | | $ | 1,870,917 | | | $ | 864,920 | |
| * | Commencement of operations was August 14, 2017. |
| See Notes to Financial Statements. | 33 | ABSOLUTE FUNDS |
ABSOLUTE FUNDSSTATEMENTS OF CHANGES IN NET ASSETS
| | | ABSOLUTE STRATEGIES FUND | | | ABSOLUTE CAPITAL OPPORTUNITIES FUND | | | ABSOLUTE CONVERTIBLE ARBITRAGE FUND | |
| | | | | | | | | | |
| | | For the Years Ended March 31, | | | For the Years Ended March 31, | | | August 14, 2017* through March 31, 2018 | |
| | | 2018 | | | 2017 | | | 2018 | | | 2017 | |
| OPERATIONS | | | | | | | | | | | | | | | |
| Net investment loss | | $ | (3,124,283 | ) | | $ | (7,890,519 | ) | | $ | (206,793 | ) | | $ | (199,094 | ) | | $ | (415,801 | ) |
| Net realized gain (loss) | | | 40,719,646 | | | | 3,597,735 | | | | 3,024,654 | | | | (69,602 | ) | | | 127,442 | |
| Net change in unrealized appreciation (depreciation) | | | (59,546,040 | ) | | | (16,429,187 | ) | | | (946,944 | ) | | | 1,193,645 | | | | 1,153,279 | |
| Increase (Decrease) in Net Assets Resulting from Operations | | | (21,950,677 | ) | | | (20,721,971 | ) | | | 1,870,917 | | | | 924,949 | | | | 864,920 | |
| | | | | | | | | | | | | | | | | | | | | |
| DISTRIBUTIONS TO SHAREHOLDERS FROM | | | | | | | | | | | | | | | | | |
| Net realized gain: | | | | | | | | | | | | | | | | | | | | |
| Institutional Shares | | | – | | | | (85,840,670 | ) | | | – | | | | – | | | | (94,585 | ) |
| R Shares | | | – | | | | (3,055,044 | ) | | | – | | | | – | | | | – | |
| Total Distributions to Shareholders | | | – | | | | (88,895,714 | ) | | | – | | | | – | | | | (94,585 | ) |
| | | | | | | | | | | | | | | | | | | | | |
| CAPITAL SHARE TRANSACTIONS | | | | | | | | | | | | | | | | | |
| Sale of shares: | | | | | | | | | | | | | | | | | | | | |
| Institutional Shares | | | 40,442,084 | | | | 245,205,577 | | | | 16,426,763 | | | | 1,042,238 | | | | 55,873,359 | |
| R Shares | | | 4,996,291 | | | | 12,641,234 | | | | – | | | | – | | | | – | |
| Reinvestment of distributions: | | | | | | | | | | | | | | | | | | | | |
| Institutional Shares | | | – | | | | 78,733,255 | | | | – | | | | – | | | | 94,585 | |
| R Shares | | | – | | | | 2,739,828 | | | | – | | | | – | | | | – | |
| Redemption of shares: | | | | | | | | | | | | | | | | | | | | |
| Institutional Shares | | | (354,894,965 | ) | | | (633,166,321 | ) | | | (147,450 | ) | | | – | | | | (673,583 | ) |
| R Shares | | | (18,458,224 | ) | | | (18,077,731 | ) | | | – | | | | – | | | | – | |
| Increase (Decrease) in Net Assets from Capital Share Transactions | | | (327,914,814 | ) | | | (311,924,158 | ) | | | 16,279,313 | | | | 1,042,238 | | | | 55,294,361 | |
| Increase (Decrease) in Net Assets | | | (349,865,491 | ) | | | (421,541,843 | ) | | | 18,150,230 | | | | 1,967,187 | | | | 56,064,696 | |
| | | | | | | | | | | | | | | | | | | | | |
| NET ASSETS | | | | | | | | | | | | | | | | | | | | |
| Beginning of Period | | | 521,189,680 | | | | 942,731,523 | | | | 14,187,704 | | | | 12,220,517 | | | | – | |
| End of Period (Including line (a)) | | $ | 171,324,189 | | | $ | 521,189,680 | | | $ | 32,337,934 | | | $ | 14,187,704 | | | $ | 56,064,696 | |
| | | | | | | | | | | | | | | | | | | | | |
| SHARE TRANSACTIONS | | | | | | | | | | | | | | | | | | | | |
| Sale of shares: | | | | | | | | | | | | | | | | | | | | |
| Institutional Shares | | | 4,731,888 | | | | 24,990,146 | | | | 1,302,256 | | | | 96,537 | | | | 5,506,489 | |
| R Shares | | | 599,477 | | | | 1,377,012 | | | | – | | | | – | | | | – | |
| Reinvestment of distributions: | | | | | | | | | | | | | | | | | | | | |
| Institutional Shares | | | – | | | | 8,846,433 | | | | – | | | | – | | | | 9,273 | |
| R Shares | | | – | | | | 317,110 | | | | – | | | | – | | | | – | |
| Redemption of shares: | | | | | | | | | | | | | | | | | | | | |
| Institutional Shares | | | (42,135,763 | ) | | | (64,717,097 | ) | | | (12,164 | ) | | | – | | | | (66,790 | ) |
| R Shares | | | (2,260,126 | ) | | | (1,972,440 | ) | | | – | | | | – | | | | – | |
| Increase (Decrease) in Shares | | | (39,064,524 | ) | | | (31,158,836 | ) | | | 1,290,092 | | | | 96,537 | | | | 5,448,972 | |
| | | | | | | | | | | | | | | | | | | | | |
| (a) Undistributed net investment income (Accumulated net investment loss) | | $ | (585,480 | ) | | $ | (2,836,297 | ) | | $ | – | | | $ | (40,691 | ) | | $ | 310,066 | |
| * | Commencement of operations. |
| See Notes to Financial Statements. | 34 | ABSOLUTE FUNDS |
ABSOLUTE FUNDSFINANCIAL HIGHLIGHTS
| | | | | | Investment Operations | | | Distributions to Shareholders from: | | | | | | | | | | |
| Period Ended | | Net Asset Value, Beginning of Period | | | Net Investment Income (Loss)(a) | | | Net Realized and Unrealized Gains (Losses) on Investments | | | Total from Investment Operations | | | Net Realized Gains | | | Total Distribution to Shareholders | | | Net Asset Value, End of Period | | | Total Return | | | Net Assets, End of Period (000's) | |
| ABSOLUTE STRATEGIES FUND | | | | | | | | | | | | | | | | | | | |
| INSTITUTIONAL SHARES | | | | | | | | | | | | | | | | | | | |
| 03/31/18 | | $ | 8.76 | | | $ | (0.07 | ) | | $ | (0.32 | ) | | $ | (0.39 | ) | | $ | — | | | $ | — | | | $ | 8.37 | | | | (4.45 | )% | | $ | 166,373 | |
| 03/31/17 | | | 10.40 | | | | (0.10 | ) | | | (0.23 | ) | | | (0.33 | ) | | | (1.31 | ) | | | (1.31 | ) | | | 8.76 | | | | (3.40 | ) | | | 501,866 | |
| 03/31/16 | | | 11.04 | | | | (0.11 | ) | | | 0.31 | | | | 0.20 | | | | (0.84 | ) | | | (0.84 | ) | | | 10.40 | | | | 2.05 | | | | 916,747 | |
| 03/31/15 | | | 11.01 | | | | (0.08 | ) | | | 0.11 | | | | 0.03 | | | | — | | | | — | | | | 11.04 | | | | 0.27 | | | | 1,592,872 | |
| 03/31/14 | | | 11.24 | | | | (0.10 | ) | | | (0.13 | ) | | | (0.23 | ) | | | — | | | | — | | | | 11.01 | | | | (2.05 | ) | | | 2,697,675 | |
| R SHARES | | | | | | | | | | | | | | | | | | | | | | | | | | | | | | | | | | | | |
| 03/31/18 | | | 8.49 | | | | (0.13 | ) | | | (0.32 | ) | | | (0.45 | ) | | | — | | | | — | | | | 8.04 | | | | (5.30 | ) | | | 4,951 | |
| 03/31/17 | | | 10.17 | | | | (0.11 | ) | | | (0.26 | ) | | | (0.37 | ) | | | (1.31 | ) | | | (1.31 | ) | | | 8.49 | | | | (3.89 | ) | | | 19,324 | |
| 03/31/16 | | | 10.88 | | | | (0.17 | ) | | | 0.30 | | | | 0.13 | | | | (0.84 | ) | | | (0.84 | ) | | | 10.17 | | | | 1.41 | | | | 25,985 | |
| 03/31/15 | | | 10.90 | | | | (0.13 | ) | | | 0.11 | | | | (0.02 | ) | | | — | | | | — | | | | 10.88 | | | | (0.18 | ) | | | 48,577 | |
| 03/31/14 | | | 11.18 | | | | (0.14 | ) | | | (0.14 | ) | | | (0.28 | ) | | | — | | | | — | | | | 10.90 | | | | (2.50 | ) | | | 66,589 | |
| ABSOLUTE CAPITAL OPPORTUNITIES FUND | | | | | | | | | | | | | | | | | |
| INSTITUTIONAL SHARES | | | | | | | | | | | | | | | | | | | | | | | | | | | | | |
| 03/31/18 | | $ | 10.97 | | | $ | (0.15 | ) | | $ | 1.70 | | | $ | 1.55 | | | $ | — | | | $ | — | | | $ | 12.52 | | | | 14.13 | % | | $ | 32,338 | |
| 03/31/17 | | | 10.21 | | | | (0.16 | ) | | | 0.92 | | | | 0.76 | | | | — | | | | — | | | | 10.97 | | | | 7.44 | | | | 14,188 | |
| 03/31/16(c) | | | 10.00 | | | | (0.03 | ) | | | 0.24 | | | | 0.21 | | | | — | | | | — | | | | 10.21 | | | | 2.10 | (d) | | | 12,221 | |
| ABSOLUTE CONVERTIBLE ARBITRAGE FUND | | | | | | | | | | | | | | | | | |
| INSTITUTIONAL SHARES | | | | | | | | | | | | | | | | | | | | | | | | | |
| 03/31/18(f) | | $ | 10.00 | | | $ | (0.13 | ) | | $ | 0.44 | | | $ | 0.31 | | | $ | (0.02 | ) | | $ | (0.02 | ) | | $ | 10.29 | | | | 3.14 | %(d) | | $ | 56,065 | |
| (a) | Calculated based on average shares outstanding during each period. |
| (b) | Reflects the expense ratio excluding any waivers and/or reimbursements. |
| (c) | Commencement of operations was December 30, 2015. |
| (f) | Commencement of operations was August 14, 2017. |
| See Notes to Financial Statements. | 35 | ABSOLUTE FUNDS |
ABSOLUTE FUNDSFINANCIAL HIGHLIGHTS
| Ratios/Supplemental Data (Ratios to Average Net Assets) | | |
| Net Investment Income (Loss) | | | Net Expenses | | | Dividend and Interest Expenses | | | Net Expenses without Dividend and Interest Expenses | | | Gross Expenses | | | Portfolio Turnover | | |
| | | | | | | | | | | | | | | | | | |
| (0.87 | )% | | | 2.78 | % | | | 0.82 | % | | | 1.96 | % | | | 2.94 | %(b) | | | 86 | % | |
| (0.99 | ) | | | 2.86 | | | | 0.95 | | | | 1.91 | | | | 2.89 | (b) | | | 72 | | |
| (1.02 | ) | | | 2.65 | | | | 0.81 | | | | 1.84 | | | | 2.66 | (b) | | | 70 | | |
| (0.70 | ) | | | 2.58 | | | | 0.79 | | | | 1.79 | | | | 2.58 | | | | 78 | | |
| (0.85 | ) | | | 2.45 | | | | 0.72 | | | | 1.73 | | | | 2.47 | (b) | | | 75 | | |
| (1.59 | ) | | | 3.50 | % | | | 0.83 | % | | | 2.67 | % | | | 3.76 | %(b) | | | 86 | % | |
| (1.14 | ) | | | 3.50 | | | | 1.01 | | | | 2.49 | | | | 3.52 | (b) | | | 72 | | |
| (1.59 | ) | | | 3.23 | | | | 0.83 | | | | 2.40 | | | | 3.24 | (b) | | | 70 | | |
| (1.17 | ) | | | 3.09 | | | | 0.79 | | | | 2.30 | | | | 3.09 | | | | 78 | | |
| (1.23 | ) | | | 2.92 | | | | 0.73 | | | | 2.19 | | | | 2.93 | (b) | | | 75 | | |
| | | | | | | | | | | | | | | | | | | | | | | |
| (1.30 | )% | | | 2.66 | % | | | 0.86 | % | | | 1.79 | % | | | 3.52 | %(b) | | | 66 | % | |
| (1.53 | ) | | | 2.62 | | | | 0.70 | | | | 1.92 | | | | 3.70 | (b) | | | 29 | | |
| (1.13 | )(e) | | | 2.20 | (e) | | | 0.25 | (e) | | | 1.95 | (e) | | | 4.37 | (b)(e) | | | 6 | (d) | |
| | | | | | | | | | | | | | | | | | | | | | | |
| (2.08 | )%(e) | | | 2.23 | %(e) | | | 0.60 | %(e) | | | 1.63 | %(e) | | | 3.13 | %(b)(e) | | | 76 | %(d) | |
| See Notes to Financial Statements. | 36 | ABSOLUTE FUNDS |
ABSOLUTE FUNDSNOTES TO FINANCIAL STATEMENTS
MARCH 31, 2018
Note 1. Organization
Absolute Strategies Fund, Absolute Capital Opportunities Fund and Absolute Convertible Arbitrage Fund (individually, a “Fund” and collectively, the “Funds”) are diversified portfolios of Forum Funds (the “Trust”). The Trust is a Delaware statutory trust that is registered as an open-end, management investment company under the Investment Company Act of 1940, as amended (the “Act”). Under its Trust Instrument, the Trust is authorized to issue an unlimited number of each Fund’s shares of beneficial interest without par value. Absolute Strategies Fund currently offers two classes of shares: Institutional Shares and R Shares. Institutional and R Shares commenced operations on July 11, 2005. Absolute Strategies Fund seeks to achieve long-term capital appreciation with an emphasis on absolute (positive) returns and low sensitivity to traditional financial market indices, such as the S&P 500 Index. Absolute Capital Opportunities Fund currently offers Institutional Shares. Absolute Capital Opportunities Fund commenced operations on December 30, 2015. Absolute Capital Opportunities Fund seeks to achieve long-term capital appreciation with a lower sensitivity to traditional financial market indices, such as the S&P 500 Index.
The Absolute Convertible Arbitrage Fund commenced operations on August 14, 2017, after it acquired the net assets of the Mohican VCA Fund, LP, a privately offered hedge fund (the “Predecessor Fund”), in exchange for Fund shares. The Predecessor Fund commenced operations in 2002. The Absolute Convertible Arbitrage Fund seeks to achieve positive absolute returns over the long-term with low volatility when compared to traditional market indices. The Predecessor Fund had an investment objective and strategies that were, in all material respects, identical to those of the Absolute Convertible Arbitrage Fund. On August 14, 2017, the Predecessor Fund reorganized into the Absolute Convertible Arbitrage Fund. The reorganization of net assets from this transaction was as follows:
| | Date of Contribution | | Net Assets | | | Shares | | | Market Value of Investments | | |
| | August 14, 2017 | | $ | 16,686,633 | | | | 1,668,929 | | | $ | 10,790,692 | | |
In addition to the securities transferred in, as noted above, $5,895,941 of cash and other receivables were also transferred in as part of the reorganization.
Note 2. Summary of Significant Accounting Policies
The Funds are investment companies and follow accounting and reporting guidance under Financial Accounting Standards Board (“FASB”) Accounting Standards Codification (“ASC”) Topic 946, “Financial Services-Investment Companies”. These financial statements are prepared in accordance with accounting principles generally accepted in the United States of America (“GAAP”), which require management to make estimates and assumptions that affect the reported amounts of assets and liabilities, the disclosure of contingent liabilities at the date of the financial statements, and the reported amounts of increases and decreases in net assets from operations during the fiscal year. Actual amounts could differ from those estimates. The following summarizes the significant accounting policies of each Fund:
Security Valuation – Securities are valued at market prices using the last quoted trade or official closing price from the principal exchange where the security is traded, as provided by independent pricing services on each Fund business day. In the absence of a last trade, securities are valued at the mean of the last bid and ask price provided by the pricing service. Debt securities may be valued at prices supplied by a fund’s pricing agent based on broker or dealer supplied valuations or matrix pricing, a method of valuing securities by reference to the value of other securities with similar characteristics such as rating, interest rate and maturity. Futures contracts are valued at the day’s settlement price on the exchange where the contract is traded. Forward currency contracts are generally valued based on interpolation of forward curve data points obtained from major banking institutions that deal in foreign currencies and currency dealers. Exchange-traded options for which the last quoted sale price is outside the closing bid and ask price, will be valued at the mean of the closing bid and ask price. Shares of non-exchange traded open-end mutual funds are valued at net asset value (“NAV”). Short-term investments that mature in sixty days or less may be valued at amortized cost.
ABSOLUTE FUNDSNOTES TO FINANCIAL STATEMENTS
MARCH 31, 2018
Each Fund values its investments at fair value pursuant to procedures adopted by the Trust’s Board of Trustees (the “Board”) if (1) market quotations are not readily available or (2) the Adviser, as defined in Note 4, believes that the values available are unreliable. The Trust’s Valuation Committee, as defined in each Fund’s registration statement, performs certain functions as they relate to the administration and oversight of each Fund’s valuation procedures. Under these procedures, the Valuation Committee convenes on a regular and ad hoc basis to review such investments and considers a number of factors, including valuation methodologies and significant unobservable inputs, when arriving at fair value.
The Valuation Committee may work with the Adviser to provide valuation inputs. In determining fair valuations, inputs may include market-based analytics that may consider related or comparable assets or liabilities, recent transactions, market multiples, book values and other relevant investment information. Adviser inputs may include an income-based approach in which the anticipated future cash flows of the investment are discounted in determining fair value. Discounts may also be applied based on the nature or duration of any restrictions on the disposition of the investments. The Valuation Committee performs regular reviews of valuation methodologies, key inputs and assumptions, disposition analysis and market activity.
Fair valuation is based on subjective factors and, as a result, the fair value price of an investment may differ from the security’s market price and may not be the price at which the asset may be sold. Fair valuation could result in a different NAV than a NAV determined by using market quotes.
GAAP has a three-tier fair value hierarchy. The basis of the tiers is dependent upon the various “inputs” used to determine the value of each Fund’s investments. These inputs are summarized in the three broad levels listed below:
Level 1 - Quoted prices in active markets for identical assets and liabilities.
Level 2 - Prices determined using significant other observable inputs (including quoted prices for similar securities, interest rates, prepayment speeds, credit risk, etc.). Short-term securities with maturities of sixty days or less are valued at amortized cost, which approximates market value, and are categorized as Level 2 in the hierarchy. Municipal securities, long-term U.S. government obligations and corporate debt securities are valued in accordance with the evaluated price supplied by the pricing service and generally categorized as Level 2 in the hierarchy. Other securities that are categorized as Level 2 in the hierarchy include, but are not limited to, warrants that do not trade on an exchange, securities valued at the mean between the last reported bid and ask quotation and international equity securities valued by an independent third party with adjustments for changes in value between the time of the securities respective local market closes and the close of the U.S. market.
Level 3 - Significant unobservable inputs (including each Fund’s own assumptions in determining the fair value of investments).
The aggregate value by input level, as of March 31, 2018, for each Fund’s investments is included in each Fund’s Notes to Schedules of Investments, Securities Sold Short and Call and Put Options Written.
Security Transactions, Investment Income and Realized Gain and Loss – Investment transactions are accounted for on the trade date. Dividend income and expense recorded on the ex-dividend date. Non-cash dividend income is recorded at the fair market value of the securities received. Foreign dividend income and expense recorded on the ex-dividend date or as soon as possible after determining the existence of a dividend declaration after exercising reasonable due diligence. Income and capital gains on some foreign securities may be subject to foreign withholding taxes, which are accrued as applicable. Interest income is recorded on an accrual basis. Premium is amortized and discount is accreted using the effective interest method. Identified cost of investments sold is used to determine the gain and loss for both financial statement and federal income tax purposes. Each Fund estimates components of distributions from real estate investment trusts (“REITs”). Distributions received in excess of income are recorded as a reduction of the cost of the related investments.
Foreign Currency Translations – Foreign currency amounts are translated into U.S. dollars as follows: (1) assets and liabilities at the rate of exchange at the end of the respective period; and (2) purchases and sales of securities and
ABSOLUTE FUNDSNOTES TO FINANCIAL STATEMENTS
MARCH 31, 2018
income and expenses at the rate of exchange prevailing on the dates of such transactions. The portion of the results of operations arising from changes in the exchange rates and the portion due to fluctuations arising from changes in the market prices of securities are not isolated. Such fluctuations are included with the net realized and unrealized gain or loss on investments.
Foreign Currency Transactions – Each Fund may enter into transactions to purchase or sell foreign currency contracts and options on foreign currency. Forward currency contracts are agreements to exchange one currency for another at a future date and at a specified price. A fund may use forward currency contracts to facilitate transactions in foreign securities, to manage a fund’s foreign currency exposure and to protect the U.S. dollar value of its underlying portfolio securities against the effect of possible adverse movements in foreign exchange rates. These contracts are intrinsically valued daily based on forward rates, and a fund’s net equity therein, representing unrealized gain or loss on the contracts as measured by the difference between the forward foreign exchange rates at the dates of entry into the contracts and the forward rates at the reporting date, is recorded as a component of NAV. These instruments involve market risk, credit risk, or both kinds of risks, in excess of the amount recognized in the Statements of Assets and Liabilities. Risks arise from the possible inability of counterparties to meet the terms of their contracts and from movement in currency and securities values and interest rates. Due to the risks associated with these transactions, a fund could incur losses up to the entire contract amount, which may exceed the net unrealized value included in its NAV.
Futures Contracts – Each Fund may purchase futures contracts to gain exposure to market changes, which may be more efficient or cost effective than actually buying the securities. A futures contract is an agreement between parties to buy or sell a security at a set price on a future date. Upon entering into such a contract, a fund is required to pledge to the broker an amount of cash, U.S. Government obligations or other high-quality debt securities equal to the minimum “initial margin” requirements of the exchange on which the futures contract is traded. Pursuant to the contract, the fund agrees to receive from or pay to the broker an amount of cash equal to the daily fluctuation in the value of the contract. Such receipts or payments are known as “variation margin” and are recorded by the fund as unrealized gains or losses. When the contract is closed, the fund records a realized gain or loss equal to the difference between the value of the contract at the time it was opened and value at the time it was closed. Risks of entering into futures contracts include the possibility that there may be an illiquid market and that a change in the value of the contract may not correlate with changes in the value of the underlying securities.
Notional amounts of each individual futures contract outstanding as of March 31, 2018, for Absolute Strategies Fund, are disclosed in the Notes to Schedule of Investments and Securities Sold Short.
Securities Sold Short – Each Fund may sell a security short to increase investment returns. Each Fund may also sell a security short in anticipation of a decline in the market value of a security. A short sale is a transaction in which the Fund sells a security that it does not own. To complete the transaction, the Fund must borrow the security in order to deliver it to the buyer. The Fund must replace the borrowed security by purchasing it at market price at the time of replacement; the price may be higher or lower than the price at which the Fund sold the security. The Fund incurs a loss from a short sale if the price of the security increases between the date of the short sale and the date on which the Fund replaces the borrowed security. The Fund realizes a profit if the price of the security declines between those dates.
Until the Fund replaces the borrowed security, the Fund will maintain on its books and records cash and long securities to sufficiently cover its short position on a daily basis. The collateral for the securities sold short includes the Deposits with Brokers as shown on the Statements of Assets and Liabilities and the securities held long as shown on the Schedules of Investments. Dividends and interest paid on securities sold short are recorded as an expense on the Statements of Operations.
Purchased Options – When a fund purchases an option, an amount equal to the premium paid by the fund is recorded as an investment and is subsequently adjusted to the current value of the option purchased. If an option expires on the stipulated expiration date or if the fund enters into a closing sale transaction, a gain or loss is realized. If a call option is exercised, the cost of the security acquired is increased by the premium paid for the call. If a put option
ABSOLUTE FUNDSNOTES TO FINANCIAL STATEMENTS
MARCH 31, 2018
is exercised, a gain or loss is realized from the sale of the underlying security, and the proceeds from such sale are decreased by the premium originally paid. Purchased options are non-income producing securities.
The values of each individual purchased option outstanding as of March 31, 2018, for each Fund, if any, are disclosed in each Fund’s Schedule of Investments.
Written Options – When a fund writes an option, an amount equal to the premium received by the fund is recorded as a liability and is subsequently adjusted to the current value of the option written. Premiums received from writing options that expire unexercised are treated by the fund on the expiration date as realized gain from written options. The difference between the premium and the amount paid on effecting a closing purchase transaction, including brokerage commissions, is also treated as a realized gain, or if the premium is less than the amount paid for the closing purchase transaction, as a realized loss. If a call option is exercised, the premium is added to the proceeds from the sale of the underlying security in determining whether the fund has realized a gain or loss. If a put option is exercised, the premium reduces the cost basis of the securities purchased by the fund. The fund, as writer of an option, bears the market risk of an unfavorable change in the price of the security underlying the written option. Written options are non-income producing securities.
The values of each individual written option outstanding as of March 31, 2018, for each Fund, if any, are disclosed in each Fund’s Schedule of Call and Put Options Written.
Credit Default Swaps – Each Fund may invest in credit default swaps. A credit default swap gives one party (the buyer) the right to recoup the economic value of a decline in the value of debt securities of the reference issuer (including sovereign debt obligations) if a credit event (a downgrade or default) occurs. This value is obtained by delivering a debt security of the reference issuer to the party in return for a previously agreed payment from the other party (frequently, the par value of the debt security). Credit default swaps may require initial premium (discount) payments as well as periodic payments (receipts) related to the interest leg of the swap or to the default of a reference obligation.
If a fund is a seller of a credit default swap contract, the fund would be required to pay the par (or other agreed upon) value of a referenced debt obligation to the counterparty in the event of a default or other credit event by the reference issuer, such as a U.S. or foreign corporate issuer, with respect to such debt obligations. In return, the fund would receive from the counterparty a periodic stream of payments over the term of the contract provided that no event of default has occurred. If no default occurs, the fund would keep the stream of payments and would have no payment obligations. As the seller, the fund would be subject to investment exposure on the notional amount of the swap.
If a fund is the buyer of a credit default swap contract, the fund would have the right to deliver a referenced debt obligation and receive the par (or other agreed-upon) value of such debt obligation from the counterparty in the event of a default or other credit event (such as a credit downgrade) by the reference issuer, such as a U.S. or foreign corporation, with respect to its debt obligations. In return, the fund would pay the counterparty a periodic stream of payments over the term of the contract provided that no event of default has occurred. If no default occurs, the counterparty would keep the stream of payments and would have no further obligations to the fund.
As of March 31, 2018, there were no credit default swap agreements outstanding.
Interest Rate Swaps – Each Fund may enter into interest rate swaps for investment purposes to manage exposure to fluctuations in interest rates or to add leverage.
Interest rate swaps represent an agreement between two counterparties to exchange cash flows based on the difference in two interest rates, applied to the notional principal amount for a specified period. The payment flows are usually netted against each other, with the difference being paid by one party to the other. The Fund settles accrued net receivables or payables under the swap contracts on a periodic basis.
The primary risk associated with interest rate swaps is that unfavorable changes in interest rates could adversely impact the Funds.
ABSOLUTE FUNDSNOTES TO FINANCIAL STATEMENTS
MARCH 31, 2018
The Funds did not enter into any interest rate swaps during the year ended March 31, 2018.
Restricted Securities – Each Fund may invest in securities that are subject to legal or contractual restrictions on resale (“restricted securities”). Restricted securities may be resold in transactions that are exempt from registration under the Federal securities laws or if the securities are registered to the public. The sale or other disposition of these securities may involve additional expenses and the prompt sale of these securities at an acceptable price may be difficult. Information regarding restricted securities held by each Fund is included in their Schedule of Investments, if applicable.
When-Issued Transactions – Each Fund may purchase securities on a forward commitment or ‘when-issued’ basis. A fund records a when-issued transaction on the trade date and will segregate with the custodian qualifying assets that have a value sufficient to make payment for the securities purchased. Securities purchased on a when-issued basis are marked-to-market daily and the fund begins earning interest on the settlement date. Losses may arise due to changes in the market value of the underlying securities or if the counterparty does not perform under the contract.
Distributions to Shareholders – Distributions to shareholders of net investment income, if any, are declared and paid semi-annually. Distributions to shareholders of net capital gains and foreign currency gains, if any, are declared and paid at least annually. Distributions to shareholders are recorded on the ex-dividend date. Distributions are based on amounts calculated in accordance with applicable federal income tax regulations, which may differ from GAAP. These differences are due primarily to differing treatments of income and gain on various investment securities held by each Fund, timing differences and differing characterizations of distributions made by each Fund.
Federal Taxes – Each Fund intends to continue to qualify each year as a regulated investment company under Subchapter M of Chapter 1, Subtitle A, of the Internal Revenue Code of 1986, as amended (“Code”), and to distribute all of their taxable income to shareholders. In addition, by distributing in each calendar year substantially all of their net investment income and capital gains, if any, the Funds will not be subject to a federal excise tax. Therefore, no federal income or excise tax provision is required. Each Fund files a U.S. federal income and excise tax return as required. Each Fund’s federal income tax returns are subject to examination by the Internal Revenue Service for a period of three fiscal years after they are filed. As of March 31, 2018, there are no uncertain tax positions that would require financial statement recognition, de-recognition or disclosure.
Income and Expense Allocation – The Trust accounts separately for the assets, liabilities and operations of each of its investment portfolios. Expenses that are directly attributable to more than one investment portfolio are allocated among the respective investment portfolios in an equitable manner.
Absolute Strategies Fund's class-specific expenses are charged to the operations of that class of shares. Income and expenses (other than expenses attributable to a specific class) and realized and unrealized gains or losses on investments are allocated to each class of shares based on the class’ respective net assets to the total net assets of the Fund.
Commitments and Contingencies – In the normal course of business, each Fund enters into contracts that provide general indemnifications by each Fund to the counterparty to the contract. Each Fund’s maximum exposure under these arrangements is dependent on future claims that may be made against each Fund and, therefore, cannot be estimated; however, based on experience, the risk of loss from such claims is considered remote. Each Fund has determined that none of these arrangements requires disclosure on each Fund’s balance sheet.
Offering Costs – Offering costs for the Absolute Convertible Arbitrage Fund of $71,834 consisted of fees related to the mailing and printing of the initial prospectus, certain startup legal costs, and initial registration filings. Such costs are amortized over a twelve-month period beginning with the commencement of operations of the Absolute Convertible Arbitrage Fund.
ABSOLUTE FUNDSNOTES TO FINANCIAL STATEMENTS
MARCH 31, 2018
Note 3. Cash – Concentration in Uninsured Account
For cash management purposes, each Fund may concentrate cash with each Fund’s custodian. This typically results in cash balances exceeding the Federal Deposit Insurance Corporation (“FDIC”) insurance limits. As of March 31, 2018, Absolute Strategies and Absolute Capital Opportunities Fund had a total of $45,690,161 and $14,320,805, respectively, at State Street Bank and Trust Company and the Fund’s brokers that exceeded the FDIC insurance limit imposed at each institution.
Note 4. Fees and Expenses
Investment Adviser – Absolute Investment Advisers LLC (the “Adviser”) is the investment adviser to each Fund. Pursuant to an investment advisory agreement, the Adviser receives an advisory fee from Absolute Strategies Fund, Absolute Capital Opportunities Fund and Absolute Convertible Arbitrage Fund at an annual rate of 1.60%, 1.40% and 1.40%, respectively, of each Fund’s average daily net assets. Prior to February 2, 2018, the Adviser received an advisory fee from Absolute Capital Opportunities Fund and Absolute Convertible Arbitrage Fund at an annual rate of 1.60%.
Each sub-advisory fee, calculated as a percentage of each Fund’s average daily net assets managed by each subadviser, is paid by the Adviser.
Distribution – Foreside Fund Services, LLC serves as each Fund’s distributor (the “Distributor”). The Distributor is not affiliated with the Adviser or Atlantic Fund Administration, LLC (d/b/a Atlantic Fund Services) (“Atlantic”) or their affiliates. Absolute Strategies Fund has adopted a Distribution Plan (the “Plan”) for R Shares of the Fund in accordance with Rule 12b-1 of the Act. Under the Plan, R Shares are subject to a Rule 12b-1 fee of up to 0.35% of the R Shares average daily net assets; however, currently the Board limits 12b-1 fees on R Shares to 0.25% of average daily net assets.
Other Service Providers – Atlantic provides fund accounting, fund administration, compliance and transfer agency services to each Fund. The fees related to these services are included in Fund services fees within the Statements of Operations. Atlantic also provides certain shareholder report production and EDGAR conversion and filing services. Pursuant to an Atlantic services agreement, each Fund pays Atlantic customary fees for its services. Atlantic provides a Principal Executive Officer, a Principal Financial Officer, a Chief Compliance Officer and an Anti-Money Laundering Officer to each Fund, as well as certain additional compliance support functions.
Trustees and Officers – Through December 31, 2017, the Trust paid each independent Trustee an annual retainer fee of $50,000 for service to the Trust ($66,000 for the Chairman), and the Audit Committee Chairman and Vice Chairman received an additional $6,000 annually. Effective January 1, 2018, each independent Trustee’s annual retainer is $31,000 ($41,000 for the Chairman), and the Audit Committee Chairman receives an additional $2,000 annually. The Trustees and Chairman may receive additional fees for special Board meetings. Each Trustee is also reimbursed for all reasonable out-of-pocket expenses incurred in connection with his duties as a Trustee, including travel and related expenses incurred in attending Board meetings. The amount of Trustees’ fees attributable to each Fund is disclosed in the Statement of Operations. Certain officers of the Trust are also officers or employees of the above named service providers, and during their terms of office received no compensation from each Fund.
Note 5. Expense Reimbursement and Fees Waived
Effective September 29, 2017, the Adviser has contractually agreed to waive its fee and/or reimburse Fund expenses to limit total annual operating expenses (excluding all taxes, interest, portfolio transaction expenses, dividend and interest expenses on short sales, acquired fund fees and expenses, proxy expenses and extraordinary expenses) of Absolute Strategies Fund’s Institutional Shares and R Shares to 1.99% and 2.24%, respectively, through August 1, 2019. During the year, Absolute Strategies Fund invested in Absolute Capital Opportunities Fund and Absolute Convertible Arbitrage Fund. As of March 31, 2018, Absolute Strategies Fund owned approximately 59.2% and 52.1% of Absolute Capital Opportunities Fund and Absolute Convertible Arbitrage Fund, respectively. The Adviser has agreed to waive fees in an amount equal to the fee it receives plus all operating expenses, if any, from Absolute Capital
ABSOLUTE FUNDSNOTES TO FINANCIAL STATEMENTS
MARCH 31, 2018
Opportunities Fund and Absolute Convertible Arbitrage Fund based on Absolute Strategies Fund’s investment in Absolute Capital Opportunities Fund and Absolute Convertible Arbitrage Fund. Other Fund service providers have voluntarily agreed to waive a portion of their fees. For the year ended March 31, 2018, the Adviser waived fees of $529,394 and Other Fund service providers waived fees of $35,879 for Absolute Strategies Fund.
The Adviser has contractually agreed to waive its fee and/or reimburse expenses to limit total annual operating expenses (excluding all taxes, interest, portfolio transaction expenses, dividend and interest expenses on short sales, acquired fund fees and expenses, proxy expenses and extraordinary expenses) of Absolute Capital Opportunities to 1.75% through August 1, 2019. Prior to February 2, 2018, the Adviser had contractually agreed to waive its fee and/ or reimburse expenses to 1.85% on net assets up to $100 million, 1.75% on net assets between $100 million and $200 million, and 1.65% on net assets over $200 million. The Adviser waived fees of $136,243 for Absolute Capital Opportunities Fund for the year ended March 31, 2018.
The Adviser has also contractually agreed to waive its fee and/or reimburse expenses to limit total annual operating expenses (excluding all taxes, interest, portfolio transaction expenses, dividend and interest expenses on short sales, acquired fund fees and expenses, proxy expenses and extraordinary expenses) of Absolute Convertible Arbitrage Fund to 1.60% through August 1, 2019. Prior to February 2, 2018, the Adviser had contractually agreed to waive its fee and/or reimburse expenses to 1.75% on net assets up to $25 million and 1.49% on net assets exceeding $25 million. Other Fund service providers have voluntarily agreed to waive a portion of their fees. The Adviser waived fees of $163,671 and Other Fund service providers waived fees of $15,339, for Absolute Convertible Arbitrage Fund, for the period ended March 31, 2018.
The Absolute Capital Opportunities Fund and Absolute Convertible Arbitrage Fund may repay the Adviser for fees waived and expenses reimbursed pursuant to the expense cap if such payment is made within three years of the fee waiver or expense reimbursement and does not cause the total annual fund operating expenses after fee waiver and/or expense reimbursement of the Funds to exceed the lesser of (i) the then current expense cap, or (ii) the expense cap in place at the time the fees/expenses were waived/reimbursed. As of March 31, 2018, $330,692 and $163,671 for Absolute Capital Opportunities Fund and Absolute Convertible Arbitrage Fund, respectively, is subject to recapture by the Adviser.
Note 6. Security Transactions
The cost of purchases and proceeds from sales of investment securities (including maturities), other than short-term investments during the year or period ended March 31, 2018, were as follows:
| | | | Non-U.S. Government Obligations | | |
| | | | Purchases | | | Sales | | |
| | Absolute Strategies Fund | | $ | 213,981,415 | | | $ | 491,683,224 | | |
| | Absolute Capital Opportunities Fund | | | 18,227,303 | | | | 6,670,792 | | |
| | Absolute Convertible Arbitrage Fund | | | 51,335,710 | * | | | 18,856,794 | | |
| * | Amount excludes the in-kind contribution of securities from the Predecessor Fund. |
Note 7. Summary of Derivative Activity
The volume of open derivative positions may vary on a daily basis as each Fund transacts derivative contracts in order to achieve the exposure desired by the Adviser. The notional value of activity for the year ended March 31, 2018, for any derivative type during the year is as follows:
| | | | Absolute Strategies Fund | | | Absolute Capital Opportunities Fund | | |
| | Forward Currency Contracts | | $ | 40,682,989 | | | $ | – | | |
| | Futures Contracts | | | 4,930,094,295 | | | | – | | |
| | Purchased Options | | | 11,609,655 | | | | 2,222,807 | | |
| | Written Options | | | (1,269,739 | ) | | | (149,038 | ) | |
ABSOLUTE FUNDSNOTES TO FINANCIAL STATEMENTS
MARCH 31, 2018
Each Fund’s use of derivatives for the year ended March 31, 2018, was limited to options, forward currency contracts, futures contracts and credit default swaps.
Following is a summary of the effect of derivatives on the Statements of Assets and Liabilities as of March 31, 2018:
Absolute Strategies Fund
| | Location: | | Equity Risk | | |
| | Asset derivatives: | | |
| | Investments, at value | | $ | 687,960 | | |
Absolute Capital Opportunities Fund
| | Location: | | Equity Risk | | |
| | Asset derivatives: | | |
| | Investments, at value | | $ | 670,093 | | |
| | Liability derivatives: | | | | | |
| | Call options written | | $ | (26,450 | ) | |
| | Put options written | | $ | (114,809 | ) | |
| | Total liability derivatives | | $ | (141,259 | ) | |
Realized and unrealized gains and losses on derivatives contracts for the year ended March 31, 2018, are recorded by each Fund in the following locations on the Statements of Operations:
Absolute Strategies Fund
Location: | | Commodity Contracts | | | Credit Contracts | | | Currency Contracts | | | Equity Contracts | | | Interest Contracts | | | Total | |
| Net realized gain (loss) on: | | | | | | | | | | | | | | | | |
| Investments | | $ | – | | | $ | – | | | $ | – | | | $ | (3,088,935 | ) | | $ | – | | | $ | (3,088,935 | ) |
| Foreign currency transactions | | | – | | | | – | | | | (6,567 | ) | | | – | | | | – | | | | (6,567 | ) |
| Written options | | | – | | | | – | | | | – | | | | 1,567,689 | | | | – | | | | 1,567,689 | |
| Futures | | | 1,324,839 | | | | – | | | | 707,068 | | | | (26,503,735 | ) | | | 536,494 | | | | (23,935,334 | ) |
| Swaps | | | – | | | | (1,402,368 | ) | | | – | | | | – | | | | – | | | | (1,402,368 | ) |
| Total net realized gain (loss) | | $ | 1,324,839 | | | $ | (1,402,368 | ) | | $ | 700,501 | | | $ | (28,024,981 | ) | | $ | 536,494 | | | $ | (25,463,147 | ) |
| | | | | | | | | | | | | | | | | | | | | | | | | |
| Net change in unrealized appreciation (depreciation) on: | |
| Investments | | $ | – | | | $ | – | | | $ | – | | | $ | 5,908,678 | | | $ | – | | | $ | 5,908,678 | |
| Written options | | | – | | | | – | | | | – | | | | (708,906 | ) | | | – | | | | (708,906 | ) |
| Futures | | | (298,202 | ) | | | – | | | | – | | | | 4,707,938 | | | | (163,243 | ) | | | 4,246,493 | |
| Swaps | | | – | | | | 981,271 | | | | – | | | | – | | | | – | | | | 981,271 | |
| Total net change in unrealized appreciation (depreciation) | | $ | (298,202 | ) | | $ | 981,271 | | | $ | – | | | $ | 9,907,710 | | | $ | (163,243 | ) | | $ | 10,427,536 | |
Absolute Capital Opportunities Fund
Location: | | Equity Contracts | |
| Net realized gain (loss) on: | |
| Investments | | $ | 2,466,037 | |
| Written options | | | 75,311 | |
| Total net realized gain (loss) | | $ | 2,541,348 | |
| Net change in unrealized appreciation (depreciation) on: | | | | |
| Investments | | $ | (149,346 | ) |
| Written options | | | (30,367 | ) |
| Total net change in unrealized appreciation (depreciation) | | $ | (179,713 | ) |
ABSOLUTE FUNDSNOTES TO FINANCIAL STATEMENTS
MARCH 31, 2018
Asset (Liability) amounts shown in the table below represent amounts for derivative related investments at March 31, 2018. These amounts may be collateralized by cash or financial instruments.
| | | Gross Asset (Liability) as Presented in the Statement of Assets and Liabilities | | | Financial Instruments(Received) Pledged* | | | Cash Collateral (Received) Pledged* | | | Net Amount | |
| Absolute Strategies Fund | | | | | | | | | | | | |
| Assets: | | | | | | | | | | | | |
| Over-the-counter derivatives** | | $ | 687,960 | | | $ | – | | | $ | – | | | $ | 687,960 | |
| Absolute Capital Opportunities Fund | | | | | | | | | | | | | | | | |
| Assets: | | | | | | | | | | | | | | | | |
| Over-the-counter derivatives** | | | 670,093 | | | | – | | | | – | | | | 670,093 | |
| Liabilities: | | | | | | | | | | | | | | | | |
| Over-the-counter derivatives** | | | (141,259 | ) | | | 141,259 | | | | – | | | | – | |
| * | The actual financial instruments and cash collateral (received) pledged may be in excess of the amounts shown in the table. The table only reflects collateral amounts up to the amount of the financial instrument disclosed on the Statement of Assets and Liabilities. |
| ** | Over-the-counter derivatives may consist of options contracts. The amounts disclosed above represent the exposure to one or more counterparties. For further detail on individual derivative contracts and the corresponding unrealized appreciation (depreciation), see the Schedule of Call and Put Options Written. |
Note 8. Federal Income Tax
As of March 31, 2018, cost for federal income tax and net unrealized appreciation (depreciation) consists of:
| | | | Tax Cost of Investments | | | Gross Unrealized Appreciation | | | Gross Unrealized Depreciation | | | Net Unrealized Appreciation (Depreciation) | |
| | Absolute Strategies Fund | | $ | 111,815,399 | | | $ | 17,903,362 | | | $ | (3,527,034 | ) | | $ | 14,376,328 | |
| | Absolute Capital Opportunities Fund | | �� | 17,307,516 | | | | 1,180,952 | | | | (1,104,227 | ) | | | 76,725 | |
| | Absolute Convertible Arbitrage Fund | | | 56,635,814 | | | | 2,070,909 | | | | (2,235,213 | ) | | | (164,304 | ) |
Distributions paid during the fiscal years ended as noted were characterized for tax purposes as follows:
| | | | Ordinary Income | | | Long-Term Capital Gain | | | Total | |
| | Absolute Strategies Fund | | | | | | | | | |
| | 2018 | | $ | – | | | $ | – | | | $ | – | |
| | 2017 | | | 34,763,539 | | | | 54,132,175 | | | | 88,895,714 | |
| | Absolute Capital Opportunities Fund | |
| | 2018 | | | – | | | | – | | | | – | |
| | 2017 | | | – | | | | – | | | | – | |
| | Absolute Convertible Arbitrage Fund | |
| | 2018 | | | 94,585 | | | | – | | | | 94,585 | |
As of March 31, 2018, distributable earnings (accumulated loss) on a tax basis were as follows:
| | | Undistributed Ordinary Income | | | Undistributed Long-Term Gain | | | Capital and Other Losses | | | Unrealized Appreciation (Depreciation) | | | Total | |
| Absolute Strategies Fund | | $ | – | | | $ | – | | | $ | (39,592,131 | ) | | $ | 14,378,712 | | | $ | (25,213,419 | ) |
| Absolute Capital Opportunities Fund | | | 1,812,983 | | | | 1,303,026 | | | | – | | | | 76,751 | | | | 3,192,760 | |
| Absolute Convertible Arbitrage Fund | | | 934,639 | | | | – | | | | – | | | | (164,304 | ) | | | 770,335 | |
The difference between components of distributable earnings on a tax basis and the amounts reflected in the Statements of Assets and Liabilities are primarily due to wash sales, futures, constructive sales, straddles, cover loss deferrals, short dividends, equity return of capital, convertible bond deemed distributions, partnerships and convertible bond premium.
ABSOLUTE FUNDSNOTES TO FINANCIAL STATEMENTS
MARCH 31, 2018
As of March 31, 2018, the Absolute Strategies Fund had $39,310,239 of available short-term capital loss carryforwards that have no expiration date.
For tax purposes, the current deferred late year ordinary loss was $281,892 for Absolute Strategies Fund (realized during the period January 1, 2018 through March 31, 2018). These losses were recognized for tax purposes on the first business day of the Fund’s current fiscal year, April 1, 2018.
On the Statements of Assets and Liabilities, as a result of permanent book to tax differences, certain amounts have been reclassified for the year ended March 31, 2018. The following reclassifications were the result of book to tax differences resulting from real estate investment trusts, equity return of capital distributions, partnerships, passive foreign investment holdings, straddles, constructive sales, short dividend reclassifications, currency, paydowns, convertible bond deemed distributions, convertible bond premium adjustments, contingent payment debt instruments, credit default swap income, organization cost amortization and net operating losses and has no impact on the net assets of each Fund.
| | | | Undistributed Net Investment Income | | | Accumulated Net Realized Loss | | | Paid-in-Capital | |
| | Absolute Strategies Fund | | $ | 5,375,100 | | | $ | (2,625,514 | ) | | $ | (2,749,586 | ) |
| | Absolute Capital Opportunities Fund | | | 247,484 | | | | (247,484 | ) | | | – | |
| | Absolute Convertible Arbitrage Fund | | | 725,867 | | | | (725,867 | ) | | | – | |
Note 9. Underlying Investment in Other Investment Companies
The Absolute Capital Opportunities Fund and Absolute Convertible Arbitrage Fund currently seek to achieve their investment objective by investing a portion of their assets in State Street Institutional Treasury Money Market Fund, Premier Share Class (the “Premier”), a registered open-end management investment company organized as a Massachusetts business trust. The Absolute Capital Opportunities Fund and Absolute Convertible Arbitrage Fund may redeem their investments from Premier at any time if the Adviser determines that it is in the best interest of the Fund and its shareholders to do so. The latest financial statements for Premier can be found at www.sec.gov.
The performance of the Absolute Capital Opportunities Fund and Absolute Convertible Arbitrage Fund may be directly affected by the performance of Premier. As of March 31, 2018, the percentage of net assets invested in Premier was 29.5% and 60.4% for the Absolute Capital Opportunities Fund and Absolute Convertible Arbitrage Fund, respectively.
Note 10. Recent Accounting Pronouncements
In March 2017, the Financial Accounting Standards Board (FASB) issued Accounting Standards Update (ASU) No. 2017-08, Receivables—Nonrefundable Fees and Other Costs (Subtopic 310-20): Premium Amortization on Purchased Callable Debt Securities. The amendments in the ASU shorten the amortization period for certain callable debt securities, held at a premium, to be amortized to the earliest call date. The ASU does not require an accounting change for securities held at a discount; which continues to be amortized to maturity. The ASU is effective for fiscal years and interim periods within those fiscal years beginning after December 15, 2018. Management is currently evaluating the impact, if any, of applying this provision.
Note 11. Subsequent Events
Subsequent events occurring after the date of this report through the date these financial statements were issued have been evaluated for potential impact, and each Fund has had no such events.
REPORT OF INDEPENDENT REGISTERED PUBLIC ACCOUNTING FIRM
To the Board of Trustees of Forum Funds
and the Shareholders of Absolute Strategies Fund,
Absolute Capital Opportunities Fund, and Absolute Convertible Arbitrage Fund
Opinion on the Financial Statements
We have audited the accompanying statements of assets and liabilities of Absolute Strategies Fund, Absolute Capital Opportunities Fund, and Absolute Convertible Arbitrage Fund, each a series of shares of beneficial interest in Forum Funds (the “Funds”), including the schedules of investments, as of March 31, 2018, and the related statements of operations for the year or period then ended, the statements of changes in net assets for each of the years or period in the two-year period then ended and the financial highlights for each of the years or periods in the five-year period then ended, and the related notes (collectively referred to as the “financial statements”). In our opinion, the financial statements present fairly, in all material respects, the financial position of the Funds as of March 31, 2018, and the results of their operations for the year or period then ended, the changes in their net assets for each of the years or period in the two-year period then ended and their financial highlights for each of the years or periods in the five-year period then ended, in conformity with accounting principles generally accepted in the United States of America.
Basis for Opinion
These financial statements are the responsibility of the Funds' management. Our responsibility is to express an opinion on the Funds’ financial statements based on our audits. We are a public accounting firm registered with the Public Company Accounting Oversight Board (United States) (“PCAOB”) and are required to be independent with respect to the Funds in accordance with the U.S. federal securities law and the applicable rules and regulations of the Securities and Exchange Commission and the PCAOB.
We conducted our audits in accordance with the standards of the PCAOB. Those standards require that we plan and perform the audits to obtain reasonable assurance about whether the financial statements are free of material misstatement, whether due to error or fraud. The Funds are not required to have, nor were we engaged to perform, an audit of their internal control over financial reporting. As part of our audits we are required to obtain an understanding of internal control over financial reporting but not for the purpose of expressing an opinion on the effectiveness of the Funds’ internal control over financial reporting. Accordingly, we express no such opinion.
Our audits included performing procedures to assess the risk of material misstatement of those financial statements, whether due to error or fraud, and performing procedures that respond to those risks. Such procedures included examining, on a test basis, evidence regarding the amounts and disclosures in the financial statements. Our procedures included confirmation of securities owned as of March 31, 2018 by correspondence with the custodian and brokers, or by other appropriate auditing procedures where replies from brokers were not received. Our audits also included evaluating the accounting principles used and significant estimates made by management, as well as evaluating the overall presentation of the financial statements. We believe that our audits provide a reasonable basis for our opinion.
BBD, LLP
We have served as the auditor of one or more of the Funds in the Forum Funds since 2009.
Philadelphia, Pennsylvania
May 30, 2018
ABSOLUTE FUNDSADDITIONAL INFORMATION (Unaudited)
MARCH 31, 2018
Investment Advisory Agreement Approval
At the March 27, 2018 Board meeting, the Board, including the Independent Trustees, considered the approval of a new investment subadvisory agreement between Absolute Investment Advisers LLC (the “Adviser”) and Tortoise Capital Advisors, L.L.C. (the “Subadviser”) pertaining to the Fund (the “Subadvisory Agreement”). The Subadvisory Agreement was being considered in connection with the earlier termination of the original subadvisory agreement between the Adviser and the Subadviser (the “Original Agreement”) in connection with an anticipated change in control transaction involving the Subadviser’s parent entity (“Transaction”). In preparation for its deliberations, the Board requested and reviewed written responses from the Subadviser to due diligence questionnaires circulated on the Board's behalf concerning the services to be provided by the Subadviser with respect to the portion of the Fund managed by the Subadviser (the “Managed Portion”). In addition, the Board recognized that the Original Agreement between the Adviser and Subadviser had just recently been approved at an in-person meeting of the Board held on December 8, 2017 and, in this regard, the Board considered information provided by the Subadviser at that time. The Board also discussed the materials with Fund counsel and, as necessary, with the Trust's administrator, Atlantic Fund Services. During its deliberations, the Board received an oral presentation from the Adviser and was advised by Trustee counsel.
Nature, Extent and Quality of Services
The Board received a presentation from senior representatives of the Adviser and discussed the Subadviser’s personnel, operations and financial condition. In this context, the Board considered the adequacy of the Subadviser’s resources and the quality of services to be provided by the Subadviser under the Subadvisory Agreement. The Board reviewed information regarding the experience, qualifications and professional background of the portfolio managers and other personnel at the Subadviser who, under the Original Agreement had, and under the Subadvisory Agreement would continue to have, responsibility for the Managed Portion. The Board considered the Subadviser’s representation that the portfolio managers who were responsible for the Managed Portion under the Original Agreement would continue in that role as portfolio managers under the Subadvisory Agreement and that, notwithstanding turnover on the Subadviser’s investment committee in connection with the Transaction, there would be continuity and stability with respect to the Subadviser’s investment processes. The Board considered the investment philosophy and decision-making processes of the Subadviser and the capability and integrity of the Subadviser’s senior management and staff. The Board also evaluated the anticipated quality of the Subadviser’s services with respect to regulatory compliance and compliance with client investment policies and restrictions. In addition, the Board took into consideration the Adviser’s recommendation that the Board approve the Subadviser. The Board noted the Subadviser’s representation that it is financially stable and able to provide high-quality investment advisory services to the Managed Portion. The Board concluded that, overall, it was satisfied with the nature, extent, and quality of services to be provided to the Managed Portion by the Subadviser under the Subadvisory Agreement.
Performance
Recognizing that the Subadviser was relatively new and had not yet managed the Managed Portion for a meaningful period of time, the Board evaluated the Adviser’s assessment of the Subadviser’s historical performance in managing a strategy similar to the one to be employed for the Managed Portion, noting the Adviser had expressed satisfaction with the performance and had recommended the approval of the Subadvisory Agreement. Based on the Adviser’s evaluation of the Subadviser’s performance and the Adviser’s recommendation that the Board engage the Subadviser, among other relevant facts and circumstances, the Board concluded that the Subadviser’s management of the Managed Portion could benefit the Fund and its shareholders.
Compensation
The Board reviewed the Subadviser’s proposed compensation for providing subadvisory services to the Fund and noted that the total advisory fee paid by the Fund would not change because the subadvisory fees are paid by the Adviser and not the Fund. The Board considered information regarding the proposed compensation to be paid to the Subadviser by the Adviser and also noted the arm’s-length nature of the relationship between the Adviser and the
ABSOLUTE FUNDSADDITIONAL INFORMATION (Unaudited)
MARCH 31, 2018
Subadviser with respect to the negotiation of such subadvisory fee rate. As a result, the Board concluded that the compensation to be paid to the Subadviser for providing subadvisory services to the Fund was not a material factor in considering the approval of the Subadvisory Agreement.
Cost of Services and Profitability
The Board noted that the Adviser, and not the Fund, was responsible for paying the subadvisory fees due under the Subadvisory Agreement. In that regard, the Board emphasized the arm’s length nature of the relationship between the Adviser and the Subadviser with respect to the negotiation of the subadvisory fee rate that would apply. The Board concluded that the Subadviser’s anticipated profitability was not a material factor in determining whether or not to approve the Subadvisory Agreement.
Economies of Scale
The Board considered whether the Fund would benefit from any economies of scale with respect to the Subadvisory Agreement. The Board noted that because the Adviser, and not the Fund, pays the subadvisory fee, shareholders would not benefit from any economies of scale in the form of breakpoints in the subadvisory fee rate. Based on the foregoing information and other materials presented, the Board concluded that economies of scale were not a material factor in approving the Subadvisory Agreement.
Other Benefits
The Board noted the Subadviser’s representation that, aside from its contractual subadvisory fees, it could benefit from its relationship with the Fund by way of additional market exposure. The Board concluded that other benefits accrued by the Subadviser were not a material factor in approving the Subadvisory Agreement.
Conclusion
The Board did not identify any single factor as being of paramount importance, and different Trustees may have given different weight to different factors; however, in light of the fact that the Fund is a multi-manager Fund for which the Adviser identifies subadvisers whose strategies it seeks to combine to achieve the Fund’s investment objective, the Board gave significant weight to the Adviser’s recommendation that the Subadviser be appointed as a subadviser to the Fund and to the Adviser’s representation that the appointment of the Subadviser would positively contribute to the Adviser successfully executing the overall strategy of the Fund. Based on its review, including consideration of each of the factors referenced above, the Board (including a majority of the Independent Trustees) determined, in the exercise of its reasonable business judgment, that the subadvisory arrangement, as outlined in the Subadvisory Agreement, was fair and reasonable in light of the services to be performed, expenses to be incurred by the Fund and such other matters as the Board considered relevant.
Shareholder Proxy Vote
At a special meeting of shareholders for all the Funds in the Trust, held on December 8, 2017, shares were voted as follows on the proposals presented to shareholders:
| Matter | For | Against | Abstain |
| To elect David Tucker to the Board of Trustees of the Trust | 108,303,928.779 | 1,542,957.994 | 0 |
| To elect Jennifer Brown-Strabley to the Board of Trustees of the Trust | 108,183,952.495 | 1,662,934.278 | 0 |
| To elect Mark D. Moyer to the Board of Trustees of the Trust. | 108,142,412.946 | 1,704,473.827 | 0 |
| To elect Jessica Chase to the Board of Trustees of the Trust. | 107,632,924.803 | 2,213,961.970 | 0 |
| To elect Stacey E. Hong to the Board of Trustees of the Trust. | 105,777,266.997 | 4,069,619.776 | 0 |
Proxy Voting Information
A description of the policies and procedures that each Fund uses to determine how to vote proxies relating to securities held in each Fund’s portfolio is available, without charge and upon request, by calling (888) 992-2765 and
ABSOLUTE FUNDSADDITIONAL INFORMATION (Unaudited)
MARCH 31, 2018
on the U.S. Securities and Exchange Commission’s (the “SEC”) website at www.sec.gov. Each Fund’s proxy voting record for the most recent twelve-month period ended June 30 is available, without charge and upon request, by calling (888) 992-2765 and on the SEC’s website at www.sec.gov.
Availability of Quarterly Portfolio Schedules
Each Fund files its complete schedule of portfolio holdings with the SEC for the first and third quarters of each fiscal year on Form N-Q. These filings are available, without charge and upon request on the SEC’s website at www.sec.gov or may be reviewed and copied at the SEC’s Public Reference Room in Washington, DC. Information on the operation of the Public Reference Room may be obtained by calling (800) SEC-0330.
Shareholder Expense Example
As a shareholder of the Funds, you incur ongoing costs, including management fees, distribution (12b-1) fees and other Fund expenses. This example is intended to help you understand your ongoing costs (in dollars) of investing in the Funds and to compare these costs with the ongoing costs of investing in other mutual funds.
The example is based on an investment of $1,000 invested at the beginning of the period and held for the entire period from October 1, 2017 through March 31, 2018.
Actual Expenses – The first line of the table below provides information about actual account values and actual expenses. You may use the information in this line, together with the amount you invested, to estimate the expenses that you paid over the period. Simply divide your account value by $1,000 (for example, an $8,600 account value divided by $1,000 = 8.6), then multiply the result by the number in the first line under the heading entitled “Expenses Paid During Period” to estimate the expenses you paid on your account during the period.
Hypothetical Example for Comparison Purposes – The second line of the table below provides information about hypothetical account values and hypothetical expenses based on each Fund’s actual expense ratio and an assumed rate of return of 5% per year before expenses, which is not each Fund’s actual return. The hypothetical account values and expenses may not be used to estimate the actual ending account balance or expenses you paid for the period. You may use this information to compare the ongoing costs of investing in each Fund and other funds. To do so, compare this 5% hypothetical example with the 5% hypothetical examples that appear in the shareholder reports of other funds.
Please note that the expenses shown in the table are meant to highlight your ongoing costs only. Therefore, the second line of the table is useful in comparing ongoing costs only and will not help you determine the relative total costs of owning different funds.
ABSOLUTE FUNDSADDITIONAL INFORMATION (Unaudited)
MARCH 31, 2018
| | | Beginning Account Value October 1, 2017 | | | Ending Account Value March 31, 2018 | | | Expenses Paid During Period* | | | Annualized Expense Ratio* | |
| Absolute Strategies Fund | | | | | | | | | | | | |
| Institutional Shares | | | | | | | | | | | | |
| Actual | | $ | 1,000.00 | | | $ | 1,000.00 | | | $ | 10.37 | | | | 2.08 | % |
| Hypothetical (5% return before expenses) | | $ | 1,000.00 | | | $ | 1,014.56 | | | $ | 10.45 | | | | 2.08 | % |
| R Shares | | | | | | | | | | | | | | | | |
| Actual | | $ | 1,000.00 | | | $ | 1,000.00 | | | $ | 15.26 | | | | 3.06 | % |
| Hypothetical (5% return before expenses) | | $ | 1,000.00 | | | $ | 1,009.67 | | | $ | 15.33 | | | | 3.06 | % |
| Absolute Capital Opportunities Fund | | | | | | | | | | | | | | | | |
| Actual | | $ | 1,000.00 | | | $ | 1,123.88 | | | $ | 9.27 | | | | 1.75 | % |
| Hypothetical (5% return before expenses) | | $ | 1,000.00 | | | $ | 1,016.21 | | | $ | 8.80 | | | | 1.75 | % |
| Absolute Convertible Arbitrage Fund | | | | | | | | | | | | | | | | |
| Actual | | $ | 1,000.00 | | | $ | 1,021.22 | | | $ | 8.26 | | | | 1.64 | % |
| Hypothetical (5% return before expenses) | | $ | 1,000.00 | | | $ | 1,016.75 | | | $ | 13.09 | | | | 1.64 | % |
| * | Expenses are equal to the Fund’s annualized expense ratio multiplied by the average account value over the period, multiplied by the number of days in the most recent fiscal half-year (182) divided by 365 to reflect the half-year period. |
Federal Tax Status of Dividends Declared during the Fiscal Year
For federal income tax purposes, dividends from short-term capital gains are classified as ordinary income. The Absolute Convertible Arbitrage Fund designates 100.00% of its income dividends as short term capital gain dividends exempt from U.S. tax for foreign shareholders (QSD).
Trustees and Officers of the Trust
The Board is responsible for oversight of the management of the Trust’s business affairs and of the exercise of all the Trust’s powers except those reserved for the shareholders. The following table provides information about each Trustee and certain officers of the Trust. Each Trustee and officer holds office until the person resigns, is removed, or is replaced. Unless otherwise noted, the persons have held their principal occupations for more than five years. The address for all Trustees and officers is Three Canal Plaza, Suite 600, Portland, Maine 04101. Each Fund’s Statement of Additional Information includes additional information about the Trustees and is available, without charge and upon request, by calling (888) 992-2765.
| Name and Year of Birth | Position with the Trust | Length of Time Served | Principal Occupation(s) During Past Five Years | Number of Series in Fund Complex Overseen By Trustee | Other Directorships Held By Trustee During Past Five Years |
| Independent Trustees |
David Tucker
Born: 1958 | Trustee; Chairman of the Board | Since 2011 and Chairman since 2018 | Director, Blue Sky Experience (a charitable endeavor) since 2008; Senior Vice President & General Counsel, American Century Companies (an investment management firm) 1998-2008. | 3 | Trustee, Forum Funds II, Forum ETF Trust and U.S. Global Investors Funds |
ABSOLUTE FUNDSADDITIONAL INFORMATION (Unaudited)
MARCH 31, 2018
| Name and Year of Birth | Position with the Trust | Length of Time Served | Principal Occupation(s) During Past Five Years | Number of Series in Fund Complex Overseen By Trustee | Other Directorships Held By Trustee During Past Five Years |
Mark D. Moyer Born: 1959 | Trustee | Since 2018 | Chief Financial Officer, Freedom House (a NGO advocating political freedom and democracy) since 2017; independent consultant providing interim CFO services, principally to non-profit organizations, 2011-2017; Chief Financial Officer, Institute of International Education (a NGO administering international educational exchange programs), 2008- 2011; Chief Financial Officer and Chief Restructuring Officer, Ziff Davis Media Inc. (an integrated media company), 2005-2008; Adjunct Professor of Accounting, Fairfield University from 2009-2012. | 3 | Trustee, Forum Funds II, Forum ETF Trust and U.S. Global Investors Funds |
Jennifer Brown-Strabley Born: 1964 | Trustee | Since 2018 | Principal, Portland Global Advisors, 1996-2010. | 3 | Trustee, Forum Funds II, Forum ETF Trust and U.S. Global Investors Funds |
| Interested Trustee |
Stacey E. Hong(1) Born: 1966 | Trustee | Since 2018 | President, Atlantic since 2008. | 3 | Trustee, Forum Funds II and U.S. Global Investors Funds |
Jessica Chase(1) Born: 1970 | Trustee | Since 2018 | Senior Vice President, Atlantic since 2008. | 3 | None |
(1) | Stacey E. Hong is currently treated as an interested person of the Trust, as defined in the 1940 Act, due to his affiliation with Atlantic. Jessica Chase is currently treated as an interested person of the Trust, as defined in the 1940 Act, due to her affiliation with Atlantic and her role as President of the Trust. |
ABSOLUTE FUNDSADDITIONAL INFORMATION (Unaudited)
MARCH 31, 2018
| Name and Year of Birth | Position with the Trust | Length of Time Served | Principal Occupation(s) During Past 5 Years |
| Officers |
Jessica Chase Born: 1970 | President; Principal Executive Officer | Since 2015 | Senior Vice President, Atlantic since 2008. |
Karen Shaw Born: 1972 | Treasurer; Principal Financial Officer | Since 2008 | Senior Vice President, Atlantic since 2008. |
Zachary Tackett Born: 1988 | Vice President; Secretary and Anti-Money Laundering Compliance Officer | Since 2014 | Counsel, Atlantic since 2014; Intern Associate, Coakley & Hyde, PLLC, 2010- 2013. |
Michael J. McKeen Born: 1971 | Vice President | Since 2009 | Senior Vice President, Atlantic since 2008. |
Timothy Bowden Born: 1969 | Vice President | Since 2009 | Manager, Atlantic since 2008. |
Geoffrey Ney Born: 1975 | Vice President | Since 2013 | Manager, Atlantic since 2013; Senior Fund Accountant, Atlantic, 2008–2013. |
Todd Proulx Born: 1978 | Vice President | Since 2013 | Manager, Atlantic since 2013; Senior Fund Accountant, Atlantic, 2008–2013. |
Carlyn Edgar Born: 1963 | Vice President | Since 2008 | Senior Vice President, Atlantic since 2008; Chief Compliance Officer, 2008-2016 |
Dennis Mason Born: 1967 | Chief Compliance Officer | Since 2016 | Fund Compliance Officer, Atlantic since 2013; Senior Specialist, Atlantic, 2011- 2013; Senior Analyst, Atlantic, 2008-2011 |
P.O. BOX 588
PORTLAND, MAINE 04112
(888) 992-2765 (TOLL FREE)
(888) 99-ABSOLUTE (TOLL FREE)
INVESTMENT ADVISER
Absolute Investment Advisers LLC
18 Shipyard Drive, Suite 3C
Hingham, Massachusetts 02043
www.absoluteadvisers.com
TRANSFER AGENT
Atlantic Fund Services
P.O. Box 588
Portland, Maine 04112
(888) 992-2765 (Toll Free)
(888) 99-ABSOLUTE (Toll Free)
www.atlanticfundservices.com
DISTRIBUTOR
Foreside Fund Services, LLC
Three Canal Plaza, Suite 100
Portland, Maine 04101
www.foreside.com
This report is submitted for the general information of the shareholders of the Funds. It is not authorized for distribution to prospective investors unless preceded or accompanied by an effective prospectus, which includes information regarding the Funds’ risks, objectives, fees and expenses, experience of its managements and other information.
212-ANR-0318
ADALTA INTERNATIONAL FUNDA MESSAGE TO OUR SHAREHOLDERS (Unaudited)
MARCH 31, 2018
Dear Shareholders:
We are pleased to provide the Adalta International Fund’s (the “International Fund’s”) annual report for the fiscal year ending March 31, 2018 (the “Fiscal Year” or the “Period”). The International Fund’s net asset value (“NAV”) was $17.54 per share as of March 31, 2018, realizing a return of 1.85% for the Fiscal Year. This return compares with a return of 16.53% for the International Fund’s benchmark, the MSCI ACWI ex US Index (the “MSCI ACWI ex US” or the “Benchmark”) and a 14.80% return for the MSCI EAFE Index (“MSCI EAFE”)1. For the 2017 calendar year, the International Fund returned 19.97% versus 27.19% for the MSCI ACWI ex US and 25.03% for the MSCI EAFE. For a longer perspective, the International Fund’s 1-, 3-, 5-, 10-year, and since inception average annual total returns as of March 31, 2018 are as follows:
| Average Annual Total Returns Periods Ended March 31, 2018 | One Year | Three Year | Five Year | Ten Year | Since Inception 12/08/93 |
| Adalta International Fund | 1.85% | 4.08% | 2.25% | 2.43% | 6.71% |
| MSCI ACWI ex US Index | 16.53% | 6.18% | 5.89% | 2.70% | N/A |
| MSCI EAFE Index | 14.80% | 5.55% | 6.50% | 2.74% | 5.64% |
(Performance data quoted represents past performance and is no guarantee of future results. Current performance may be lower or higher than the performance data quoted. Investment return and principal value will fluctuate so that an investor’s shares, when redeemed, may be worth more or less than original cost. For the most recent month-end performance, please call (800) 943-6786. Shares redeemed or exchanged within 60 days of purchase will be charged a 2.00% redemption fee. As stated in the current prospectus, the International Fund’s annual operating expense ratio (gross) is 3.28%. However, the International Fund’s adviser has agreed to contractually waive its fees and/or reimburse expenses to limit total operating expenses to 1.76% through at least September 30, 2018. During the period certain fees were waived and/or expenses reimbursed, otherwise returns would have been lower. Returns greater than one year are annualized.)
During the Period, the International Fund underperformed its relevant benchmarks as a result of stock selection and allocation. Contributors to the International Fund’s performance during the Fiscal Year included NIIT Technologies, Ltd. (India), STMicroelectronics NV, ADR (Switzerland), Sony Corp. (Japan), Yoox Net-A-Porter Group S.p.A. (Italy), Dewan Housing Finance Corp., Ltd. (India), and Baidu, Inc., ADR (China). Holdings that detracted from the International Fund’s performance during the period included Controladora Vuela Compañia de Aviación SAB de CV, ADR (Mexico), Secure Property Development & Investment PLC (Cyprus), Kandi Technologies Group, Inc. (China), Genting Hong Kong, Ltd. (Hong Kong), Obsidian Energy, Ltd. (Canada), and Tarkett SA (Russian Federation).
The following tables provide details of the International Fund’s top 10 positions at the end of the Period as well as positions added and exited since our September 30, 2017 semi-annual report. The decisions to exit positions resulted from a combination of the securities hitting our valuation targets or better opportunities elsewhere.
1 | The MSCI ACWI ex US is a stock market index that is a free float adjusted market capitalization weighted index that is designed to measure the equity market performance of developed and emerging markets. Net index data is not available prior to its inception on 01/01/01. The MSCI EAFE Index is a stock market index that is designed to measure the equity market performance of developed markets outside of the United States and Canada. The total return of the MSCI EAFE includes the reinvestment of dividends and income. It is not possible to invest directly in any index. |
ADALTA INTERNATIONAL FUNDA MESSAGE TO OUR SHAREHOLDERS (Unaudited)
MARCH 31, 2018
| Top 10 Common Stock Holdings as of 3/31/2018 | Country | Sector | % of Net Assets |
| NIIT Technologies, Ltd. | India | Technology | 6.84% |
| TCG BDC, Inc. | United States | Asset Management | 6.33% |
| GP Investments, Ltd., BDR | Brazil | Asset Management | 6.01% |
| Dewan Housing Finance Corp., Ltd. | India | Financials | 5.84% |
| Sony Corp. | Japan | Consumer Discretionary | 5.63% |
| Baidu, Inc., ADR | China | Telecommunication Services | 5.53% |
| Dufry AG | Switzerland | Consumer Discretionary | 4.81% |
| BYD Co., Ltd., Class H | China | Consumer Discretionary | 4.48% |
| Cellnex Telecom SA | Spain | Telecommunication Services | 4.32% |
| KKR & Co. LP | United States | Asset Management | 4.25% |
| Total | | | 54.04% |
| New Positions Established as of 03/31/18 | % of Net Assets | | Portfolio Positions Eliminated | % of Net Assets(2) |
| Koninklijke Phillips NV, ADR | 2.28% | | Rakuten, Inc. | 2.88% |
| Kandi Technologies Group, Inc. | 2.58% | | Granite REIT | 2.12% |
| Silvershore Internet Opportunity Fund I LP | 2.87% | | Panin Financial TBK PT | 2.32% |
| Silvershore GO I LP | 2.25% | | Yoox Net-A-Porter Group SpA | 1.85% |
| Migo | 1.75% | | | |
During the Fiscal Year, the International Fund invested in Kandi Technologies Group, Inc. (Kandi). Based in China, Kandi, through its subsidiaries, is engaged in the research, development, manufacturing, and sales of different vehicle products, including electric vehicles, all-terrain vehicles, battery packs, automobile motors, controllers for electric vehicles, and air-conditioning systems. Since 2013, Kandi has increased its focus on developing pure electric vehicles and expanding its market share in China, the largest market for electric vehicles. Kandi has a 50/50 joint venture with Geely Automobile Holdings Limited (one of the largest car brands in China) involved in the production of electric vehicles. While the stock has underperformed since the International Fund’s position was initiated in the fourth quarter of 2017, we believe the company is well-positioned to perform in a market that is projected to experience significant future growth.
Based in China and founded in 2000, International Fund holding Baidu, Inc. (Baidu) operates as an internet search provider which offers marketing and search solutions. Baidu also offers an e-commerce platform, online payment tools, web application software, and human resources-related services, among others. China has the largest internet user population in the world, totaling 731 million users as of December 2016. Outside of China, Baidu sees significant opportunity in countries like Brazil, Indonesia, Thailand, Egypt and Japan. As of December 2015, Baidu had more than 260 million active users internationally. The stock rallied in the third quarter of 2017 after the company announced a 14% revenue increase and plans to strengthen its mobile and artificial intelligence services.
2 | Percent of net asset value (“NAV”) for exited positions reflect holdings at the previous reporting period ending 9/30/2017. |
ADALTA INTERNATIONAL FUNDA MESSAGE TO OUR SHAREHOLDERS (Unaudited)
MARCH 31, 2018
During the fourth quarter of 2017 and the first quarter of 2018 the International Fund also undertook select private investments in what we believe are compelling opportunities for the International Fund. These investments included: Philippines based Migo, which looks to deliver digital products and services to consumers underserved by existing digital technologies; an e-commerce platform based in South Korea; and, the leading ride sharing platform in Southeast Asia.
According to the January 2018 International Monetary Fund’s (IMF) World Economic Outlook (WEO) (the “Report”), global output is estimated to have grown 3.7% in 2017, with broad-based growth and upside surprises in Europe and Asia. The Report maintains that the global economy is expected to grow 3.9% in both 2018 and 2019; this includes growth of 2.3% and 2.2% in Advanced Economies for 2018 and 2019, respectively, and growth of 4.9% and 5.0% in Emerging Markets and Developing Economies for 2018 and 2019, respectively. The Tax Cuts and Jobs Act approved last December in the US is expected to stimulate US economic activity and have a positive effect for its trading partners. The tax reform is expected to enable publicly traded companies to invest in expansion, return capital to shareholders in the form of higher dividends and repurchases of shares, and increase their employment base, therefore benefitting the US economy. Among the risks to this growth outlook are the tightening of financial terms from current low interest rates, less than expected impact from US tax reform, increased regulatory and trade barriers, and geopolitical tensions. During the first quarter of 2018, the newly appointed Federal Reserve Chairman, Jerome Powell, announced that the Fed will continue its interest rate hike program, raising the benchmark Federal Funds Rate by a 0.25% and anticipating another two rate hikes this year. The desire of the Federal Reserve is to achieve more normal interest rate levels without negatively impacting economic growth. If the foregoing fiscal and monetary policy are successful, we believe it portends an attractive environment for our investment portfolio.
Thank you for your continued trust and support. We believe your patience will be rewarded, and we remain enthusiastic shareholders with you in the International Fund.
Sincerely,
Adalta Capital Management LLC
IMPORTANT RISKS AND DISCLOSURE:
There is no assurance that the International Fund will achieve its investment objective. Investing overseas involves special risks, including the volatility of currency exchange rates and, in some cases, political and economic instability, and relatively illiquid markets. Emerging markets involve greater risks than more developed markets as they may be more volatile and less liquid. The International Fund’s exposure to foreign currencies may not be fully hedged at all times. Private fund securities are typically illiquid and difficult to value. The International Fund may invest in small and mid-sized capitalization companies meaning that these companies carry greater risk than is customarily associated with larger companies for various reasons such as narrower markets, limited financial resources and less liquid stock. The risk of investing in Europe may be heightened due to the recent referendum in which the United Kingdom voted to withdraw from the European Union (EU). Also, if one or more countries were to exit the EU or abandon use of the euro, the value of investments tied to those countries or the euro could decline significantly and unpredictably. The risk of investing in China may be heightened by the potential trade policy modification between the US and China.
ADALTA INTERNATIONAL FUNDA MESSAGE TO OUR SHAREHOLDERS (Unaudited)
MARCH 31, 2018
The views in this report were those of the International Fund managers as of March 31, 2018 and may not reflect their views on the date this report is first published or any time thereafter. These views are intended to assist shareholders in understanding their investment in the International Fund and do not constitute investment advice. This letter may contain discussions about certain investments both held and not held in the portfolio. All current and future holdings are subject to risk and to change.
ADALTA INTERNATIONAL FUNDPERFORMANCE CHART AND ANALYSIS (Unaudited)
MARCH 31, 2018
The following chart reflects the change in the value of a hypothetical $10,000 investment, including reinvested dividends and distributions, in Adalta International Fund (the “Fund”) compared with the performance of the benchmarks, the MSCI All Cap World Index except United States (“MSCI ACWI ex US”), and the secondary benchmark, the MSCI EAFE Index (“MSCI EAFE”), over the past ten years. The MSCI ACWI ex US is a stock market index that is a free float adjusted market capitalization weighted index that is designed to measure the equity market performance of developed and emerging markets outside of the United States. The MSCI EAFE is a stock market index that is designed to measure the equity market performance with dividends reinvested of developed markets outside of the United States and Canada. The total return of the indices include the reinvestment of dividends and income. The total return of the Fund includes operating expenses that reduce returns, while the total return of the indices do not include expenses. The Fund is professionally managed, while the indices are unmanaged and are not available for investment.
Comparison of a $10,000 Investment
Adalta International Fund vs. MSCI ACWI ex US Index and MSCI EAFE Index
| Average Annual Total Returns Periods Ended March 31, 2018 | One Year | Five Years | Ten Years |
| Adalta International Fund | 1.85% | 2.25% | 2.43% |
| MSCI ACWI ex US Index | 16.53% | 5.89% | 2.70% |
| MSCI EAFE Index | 14.80% | 6.50% | 2.74% |
Performance data quoted represents past performance and is no guarantee of future results. Current performance may be lower or higher than the performance data quoted. Investment return and principal value will fluctuate so that shares, when redeemed, may be worth more or less than original cost. As stated in the Fund’s prospectus, the annual operating expense ratio (gross) is 3.28% and the annual operating expenses after the fee waiver and/ or expense reimbursement (net) is 1.76% including acquired fund fees and expenses of 0.26%. However, the Fund’s adviser has contractually agreed to waive its fee and/or reimburse Fund expenses to limit Total Annual Fund Operating Expenses After Fee Waiver and/or Expense Reimbursement (excluding all taxes, interest, portfolio transaction expenses, acquired fund fees and expenses, proxy expenses and extraordinary expenses) to 1.50%, through at least September 30, 2018 (the “Expense Cap”). During the period, certain fees were waived and/or expenses reimbursed; otherwise, returns would have been lower. Shares redeemed or exchanged within 60 days of purchase will be charged a 2.00% redemption fee. The performance table and graph do not reflect the deduction of taxes that a shareholder would pay on Fund distributions or the redemption of Fund shares. Returns greater than one year are annualized. For the most recent month-end performance, please call (844) 284-9829.
ADALTA INTERNATIONAL FUNDPORTFOLIO PROFILE (Unaudited)
MARCH 31, 2018
| | PORTFOLIO HOLDINGS (Unaudited) | | |
| | % of Common Stock | | |
| | Consumer Discretionary | 30.1% | |
| | Asset Management | 18.0% | |
| | Telecommunication Services | 11.3% | |
| | Technology | 11.2% | |
| | Financials | 10.4% | |
| | Industrials | 5.5% | |
| | Conglomerates | 4.0% | |
| | Consumer Staples | 3.8% | |
| | Energy | 3.6% | |
| | Real Estate | 2.1% | |
| | | 100.0% | |
ADALTA INTERNATIONAL FUND
SCHEDULE OF INVESTMENTS
MARCH 31, 2018
| Shares | | Security Description | | Value | |
| Common Stock - 91.8% | | | |
| Belgium - 3.5% | | | |
| | 5,390 | | Anheuser-Busch InBev SA/NV, ADR | | $ | 592,577 | |
| Brazil - 6.0% | | | | |
| | 535,300 | | GP Investments, Ltd., BDR (a) | | | 1,029,595 | |
| Canada - 3.8% | | | | |
| | 576,750 | | Obsidian Energy, Ltd. (a) | | | 564,581 | |
| | 9,300 | | Points International, Ltd. (a) | | | 90,861 | |
| | | | | | | 655,442 | |
| China - 12.6% | | | | |
| | 4,246 | | Baidu, Inc., ADR (a) | | | 947,665 | |
| | 98,500 | | BYD Co., Ltd., Class H | | | 768,105 | |
| | 91,172 | | Kandi Technologies Group, Inc. (a) | | | 442,184 | |
| | | | | | | 2,157,954 | |
| Cyprus - 1.9% | | | | |
| | 2,021,534 | | Secure Property Development & Investment PLC (a) | | | 326,165 | |
| Hong Kong - 3.6% | | | | |
| | 3,590,300 | | Genting Hong Kong, Ltd. | | | 624,712 | |
| India - 12.7% | | | | |
| | 127,950 | | Dewan Housing Finance Corp., Ltd. | | | 1,000,797 | |
| | 88,400 | | NIIT Technologies, Ltd. | | | 1,172,401 | |
| | | | | | | 2,173,198 | |
| Indonesia - 0.0% | | | | |
| | 100 | | Panin Financial Tbk PT (a) | | | 2 | |
| Japan - 5.6% | | | | |
| | 20,100 | | Sony Corp. | | | 965,284 | |
| Mexico - 6.6% | | | | |
| | 80,506 | | Controladora Vuela Cia de Aviacion SAB de CV, ADR (a) | | | 656,124 | |
| | 4,779 | | Grupo Aeroportuario del Pacifico SAB de CV, ADR | | | 476,179 | |
| | | | | | | 1,132,303 | |
| Netherlands - 2.3% | | | | |
| | 10,200 | | Koninklijke Philips NV, ADR | | | 390,762 | |
| Russian Federation - 4.2% | | | | |
| | 21,465 | | Tarkett SA | | | 718,924 | |
| South Korea - 2.2% | | | | |
| | 2,108 | | GS Home Shopping, Inc. | | | 371,604 | |
| Spain - 4.3% | | | | | | |
| | 27,764 | | Cellnex Telecom SA (b) | | | 740,978 | |
| Switzerland - 8.2% | | | | |
| | 6,293 | | Dufry AG (a) | | | 823,817 | |
| | 26,278 | | STMicroelectronics NV, ADR | | | 585,736 | |
| | | | | | | 1,409,553 | |
| Shares | | Security Description | | Value | |
| United States - 14.3% | | | |
| | 35,846 | | KKR & Co. LP | | $ | 727,674 | |
| | 60,604 | | TCG BDC, Inc. | | | 1,084,813 | |
| | 20,000 | | The Blackstone Group LP | | | 639,000 | |
| | | | | | | 2,451,487 | |
| Total Common Stock (Cost $15,052,801) | | | 15,740,540 | |
| Principal | | Security Description | | Value | |
| Private Equity Funds - 5.1% | | | |
| Cayman Islands - 2.9% | | | |
| $ | 492,966 | | Silvershore Internet Opportunity Fund I LP (a)(c)(d) | | | 491,347 | |
| India - 0.0% | | | | |
| | 36,915 | | Bharat Investors LP (a)(e)(f) | | | 3,132 | |
| South Korea - 2.2% | | | | |
| | 400,000 | | Silvershore GO I LP (a)(d)(g)(h) | | | 386,023 | |
| Total Private Equity Funds (Cost $929,882) | | | 880,502 | |
| Principal | | Security Description | | Rate | | Maturity | | Value | |
| Fixed Income Securities - 1.8% | | | | | |
| Corporate Convertible Bond - 1.8% | | | | | |
| Philippines - 1.8% | | | | | | | |
| $ | 300,000 | | Migo (e)(i) (Cost $300,000) | | 7.50 | % | 06/14/19 | | | 300,000 | |
| Investments, at value - 98.7% (Cost $16,282,683) | | $ | 16,921,042 | |
| Other Assets & Liabilities, Net - 1.3% | | | 218,828 | |
| Net Assets - 100.0% | | $ | 17,139,870 | |
| ADR | American Depositary Receipt |
| BDR | Brazilian Depositary Receipt |
| PLC | Public Limited Company |
| (a) | Non-income producing security. |
| (b) | Security exempt from registration under Rule 144A under the Securities Act of 1933. At the period end, the value of these securities amounted to $740,978 or 4.3% of net assets. |
| (c) | Private equity fund purchased on 03/02/18 that invests in Grab, Inc. Illiquid investment in which redemptions are not accepted. Unfunded commitments of $7,034 as of March 31, 2018. |
| (d) | Investment is valued using the practical expedient. For more information on the practical expedient, please refer to the Security Valuation section in Note 2 of the accompanying Notes to Financial Statements. |
| (e) | Security fair valued in accordance with procedures adopted by the Board of Trustees. At the period end, the value of these securities amounted to $303,132 or 1.8% of net assets. |
See Notes to Financial Statements.
ADALTA INTERNATIONAL FUND
SCHEDULE OF INVESTMENTS
MARCH 31, 2018
| (f) | Private equity fund purchased on 03/08/13 that invests in Unitech Corporate Parks PLC. Redemptions may be made on the last day of each calendar quarter upon 60 days written notice. No unfunded commitments as of March 31, 2018. |
| (h) | Private equity fund purchased on 02/01/18 that invests in Greenoaks Opportunity Partners I LLC. Illiquid investment in which redemptions are not accepted. No unfunded commitments as of March 31, 2018. |
| (i) | Corporate convertible bond purchased on 12/13/17. Security fair valued using private transaction cost. |
The following is a summary of the inputs used to value the Fund's inputs as of March 31, 2018.
The inputs or methodology used for valuing securities are not necessarily an indication of the risks associated with investing in those securities. For more information on valuation inputs, and their aggregation into the levels used in the table below, please refer to the Security Valuation section in Note 2 of the accompanying Notes to Financial Statements.
| Valuation Inputs | | Investments in Securities | |
| Practical expedient* | | $ | 877,370 | |
| Level 1 – Quoted Prices | | | 15,740,540 | |
| Level 2 - Other Significant Observable Inputs | | | – | |
| Level 3 - Significant Unobservable Inputs | | | 303,132 | |
| Total | | $ | 16,921,042 | |
| * | As a practical expedient, certain investments that are measured at fair value using the net asset value per share (or its equivalent) have not been |
categorized in the fair value hierarchy. The fair value amount presented in this table are intended to permit reconciliation of the fair value hierarchy to the amounts presented in the Schedule of Investments.
The Level 1 value displayed in this table is Common Stock. The Level 3 value displayed in this table is a Private Equity Fund and a Corporate Convertible Bond. Refer to this Schedule of Investments for a further breakout of each security by country and instrument type.
An affiliate is an entity in which the Fund has ownership of at least 5% of the voting securities. Transactions during the year with affiliates were as follows:
| | | Private Equity Fund | |
| Balance 03/31/17 | | | |
| Principal | | $ | – | |
| Cost | | $ | – | |
| Value | | $ | – | |
| Gross Additions | | | | |
| Principal | | $ | 400,000 | |
| Cost | | $ | 400,000 | |
| Gross Reductions | | | | |
| Principal | | $ | – | |
| Cost | | $ | – | |
| Balance 03/31/18 | | | | |
| Principal | | $ | 400,000 | |
| Cost | | $ | 400,000 | |
| Value | | $ | 386,023 | |
| Realized Gain/(Loss) | | $ | – | |
| Unrealized Depreciation | | $ | (13,977 | ) |
The following is a reconciliation of Level 3 investments for which significant unobservable inputs were used to determine fair value.
| | | Preferred Stock | | | Private Equity Funds | | | Corporate Convertible Bond | |
| Balance as of 03/31/17 | | $ | - | | | $ | 4,693 | | | $ | - | |
| Purchases | | | - | | | | - | | | | 300,000 | |
| Realized loss | | | (200,000 | ) | | | - | | | | - | |
| Change in unrealized appreciation/(depreciation) | | | 200,000 | | | | (1,561 | ) | | | - | |
| Balance as of 03/31/18 | | $ | - | | | $ | 3,132 | | | $ | 300,000 | |
| Net change in unrealized appreciation/(depreciation) from investments held as of 03/31/18** | | $ | 200,000 | | | $ | (1,561 | ) | | $ | - | |
| ** | The change in unrealized appreciation/(depreciation) is included in net change in unrealized appreciation/(depreciation) of investments in the accompanying Statement of Operations. |
The Fund utilizes the end of period methodology when determining transfers. There were no transfers among Level 1, Level 2 and Level 3 for the year ended March 31, 2018.
See Notes to Financial Statements.
ADALTA INTERNATIONAL FUND
STATEMENT OF ASSETS AND LIABILITIES
MARCH 31, 2018
| ASSETS | | | |
| Investments, at value (Cost $15,882,683) | | $ | 16,535,019 | |
| Investments in affiliates, at value (Cost $400,000) | | | 386,023 | |
| Investments, at value | | | 16,921,042 | |
| Cash | | | 116,344 | |
| Foreign currency (Cost $56,462) | | | 57,151 | |
| Receivables: | | | | |
| Fund shares sold | | | 66 | |
| Dividends and interest | | | 72,810 | |
| From investment adviser | | | 775 | |
| Prepaid expenses | | | 12,010 | |
| Total Assets | | | 17,180,198 | |
| LIABILITIES | | | | |
| Accrued Liabilities: | | | | |
| Trustees’ fees and expenses | | | 50 | |
| Fund services fees | | | 5,416 | |
| Other expenses | | | 34,862 | |
| Total Liabilities | | | 40,328 | |
| NET ASSETS | | $ | 17,139,870 | |
| | | | | |
| COMPONENTS OF NET ASSETS | | | | |
| Paid-in capital | | $ | 17,191,042 | |
| Undistributed net investment income | | | 77,289 | |
| Accumulated net realized loss | | | (768,239 | ) |
| Net unrealized appreciation | | | 639,778 | |
| NET ASSETS | | $ | 17,139,870 | |
| SHARES OF BENEFICIAL INTEREST AT NO PAR VALUE (UNLIMITED SHARES AUTHORIZED) | | | 977,395 | |
| NET ASSET VALUE, OFFERING AND REDEMPTION PRICE PER SHARE* | | $ | 17.54 | |
| * | Shares redeemed or exchanged within 60 days of purchase are charged a 2.00% redemption fee. |
See Notes to Financial Statements.
ADALTA INTERNATIONAL FUND
STATEMENT OF OPERATIONS
YEAR ENDED MARCH 31, 2018
| INVESTMENT INCOME | | | |
| Dividend income | | $ | 440,370 | |
| Interest income | | | 7,769 | |
| Total Investment Income | | | 448,139 | |
| EXPENSES | | | | |
| Investment adviser fees | | | 282,550 | |
| Fund services fees | | | 178,115 | |
| Custodian fees | | | 25,648 | |
| Registration fees | | | 18,929 | |
| Professional fees | | | 45,228 | |
| Trustees' fees and expenses | | | 6,018 | |
| Other expenses | | | 36,103 | |
| Total Expenses | | | 592,591 | |
| Fees waived | | | (310,041 | ) |
| Net Expenses | | | 282,550 | |
| NET INVESTMENT INCOME | | | 165,589 | |
| NET REALIZED AND UNREALIZED GAIN (LOSS) | | | | |
| Net realized gain (loss) on: | | | | |
| Investments (Net of foreign withholding taxes of $2,391) | | | 1,795,605 | |
| Foreign currency transactions | | | (12,733 | ) |
| Net realized gain | | | 1,782,872 | |
| Net change in unrealized appreciation (depreciation) on: | | | | |
| Investments in unaffiliated issuers | | | (1,527,626 | ) |
| Investments in affiliated issuers | | | (13,977 | ) |
| Deferred foreign capital gains taxes | | | 6,456 | |
| Foreign currency translations | | | 2,348 | |
| Net change in unrealized appreciation (depreciation) | | | (1,532,799 | ) |
| NET REALIZED AND UNREALIZED GAIN | | | 250,073 | |
| INCREASE IN NET ASSETS RESULTING FROM OPERATIONS | | $ | 415,662 | |
See Notes to Financial Statements.
ADALTA INTERNATIONAL FUND
STATEMENTS OF CHANGES IN NET ASSETS
| | | For the Years Ended March 31, | |
| | | | | | | |
| | | 2018 | | | 2017 | |
| OPERATIONS | | | | | | |
| Net investment income | | $ | 165,589 | | | $ | 156,130 | |
| Net realized gain | | | 1,782,872 | | | | 2,316,725 | |
| Net change in unrealized appreciation (depreciation) | | | (1,532,799 | ) | | | 70,986 | |
| Increase in Net Assets Resulting from Operations | | | 415,662 | | | | 2,543,841 | |
| | | | | | | | | |
| DISTRIBUTIONS TO SHAREHOLDERS FROM | | | | | | | | |
| Net investment income | | | (376,234 | ) | | | (211,892 | ) |
| Total Distributions to Shareholders | | | (376,234 | ) | | | (211,892 | ) |
| | | | | | | | | |
| CAPITAL SHARE TRANSACTIONS | | | | | | | | |
| Sale of shares | | | 213,469 | | | | 182,535 | |
| Reinvestment of distributions | | | 349,137 | | | | 191,469 | |
| Redemption of shares | | | (2,247,042 | ) | | | (31,016,736 | ) |
| Redemption fees | | | 54 | | | | 5 | |
| Decrease in Net Assets from Capital Share Transactions | | | (1,684,382 | ) | | | (30,642,727 | ) |
| Decrease in Net Assets | | | (1,644,954 | ) | | | (28,310,778 | ) |
| | | | | | | | | |
| NET ASSETS | | | | | | | | |
| Beginning of Year | | | 18,784,824 | | | | 47,095,602 | |
| End of Year (Including line (a)) | | $ | 17,139,870 | | | $ | 18,784,824 | |
| | | | | | | | | |
| SHARE TRANSACTIONS | | | | | | | | |
| Sale of shares | | | 11,678 | | | | 11,589 | |
| Reinvestment of distributions | | | 19,131 | | | | 12,329 | |
| Redemption of shares | | | (122,216 | ) | | | (1,971,193 | ) |
| Decrease in Shares | | | (91,407 | ) | | | (1,947,275 | ) |
| | | | | | | | | |
| (a) Undistributed net investment income | | $ | 77,289 | | | $ | 237,417 | |
See Notes to Financial Statements.
ADALTA INTERNATIONAL FUND
FINANCIAL HIGHLIGHTS
These financial highlights reflect selected data for a share outstanding throughout each year.
| | | For the Years Ended March 31, | |
| | | 2018 | | | 2017 | | | 2016 | | | 2015 | | | 2014 | |
| NET ASSET VALUE, Beginning of Year | | $ | 17.58 | | | $ | 15.61 | | | $ | 17.19 | | | $ | 18.50 | | | $ | 20.73 | |
| INVESTMENT OPERATIONS | | | | | | | | | | | | | | | | | | | | |
| Net investment income (a) | | | 0.16 | | | | 0.09 | | | | 0.11 | | | | 0.15 | | | | 0.18 | |
| Net realized and unrealized gain (loss) | | | 0.18 | | | | 2.06 | | | | (0.61 | ) | | | (0.23 | ) | | | (0.30 | ) |
| Total from Investment Operations | | | 0.34 | | | | 2.15 | | | | (0.50 | ) | | | (0.08 | ) | | | (0.12 | ) |
| | | | | | | | | | | | | | | | | | | | | |
| DISTRIBUTIONS TO SHAREHOLDERS FROM | | | | | | | | | | | | | | | | | | | | |
| Net investment income | | | (0.38 | ) | | | (0.18 | ) | | | (1.08 | ) | | | (0.48 | ) | | | (1.46 | ) |
| Net realized gain | | | – | | | | – | | | | – | | | | (0.75 | ) | | | (0.65 | ) |
| Total Distributions to Shareholders | | | (0.38 | ) | | | (0.18 | ) | | | (1.08 | ) | | | (1.23 | ) | | | (2.11 | ) |
| REDEMPTION FEES(a) | | | 0.00 | (b) | | | 0.00 | (b) | | | 0.00 | (b) | | | 0.00 | (b) | | | 0.00 | (b) |
| NET ASSET VALUE, End of Year | | $ | 17.54 | | | $ | 17.58 | | | $ | 15.61 | | | $ | 17.19 | | | $ | 18.50 | |
| TOTAL RETURN | | | 1.85 | % | | | 13.94 | % | | | (2.84 | )% | | | (0.32 | )% | | | (0.54 | )% |
| | | | | | | | | | | | | | | | | | | | | |
| RATIOS/SUPPLEMENTARY DATA | | | | | | | | | | | | | | | | | | | | |
| Net Assets at End of Year (000s omitted) | | $ | 17,140 | | | $ | 18,785 | | | $ | 47,096 | | | $ | 68,526 | | | $ | 91,898 | |
| Ratios to Average Net Assets: | | | | | | | | | | | | | | | | | | | | |
| Net investment income | | | 0.87 | % | | | 0.56 | % | | | 0.66 | % | | | 0.84 | % | | | 0.90 | % |
| Net expenses | | | 1.50 | % | | | 1.50 | % | | | 1.50 | % | | | 1.50 | % | | | 1.41 | % |
| Gross expenses (c) | | | 3.15 | % | | | 3.02 | % | | | 2.14 | % | | | 1.90 | % | | | 1.90 | % |
| PORTFOLIO TURNOVER RATE | | | 44 | % | | | 42 | % | | | 38 | % | | | 52 | % | | | 39 | % |
| (a) | Calculated based on average shares outstanding during each year. |
| (b) | Less than $0.01 per share. |
| (c) | Reflects the expense ratio excluding any waivers and/or reimbursements. |
See Notes to Financial Statements.
ADALTA INTERNATIONAL FUND
NOTES TO FINANCIAL STATEMENTS
MARCH 31, 2018
Note 1. Organization
The Adalta International Fund (the “Fund”) is a diversified portfolio of Forum Funds (the “Trust”). The Trust is a Delaware statutory trust that is registered as an open-end, management investment company under the Investment Company Act of 1940, as amended (the “Act”). Under its Trust Instrument, the Trust is authorized to issue an unlimited number of the Fund’s shares of beneficial interest without par value. The Fund commenced operations on December 8, 1993, and seeks capital appreciation by investing primarily in a portfolio of common stock and securities convertible into common stock. From August 1, 2014 through June 30, 2016 the Fund was named the Beck, Mack & Oliver International Fund. From June 24, 2009 through August 1, 2014, the Fund was named Beck, Mack & Oliver Global Equity Fund. Prior to June 24, 2009, the Fund was named Austin Global Equity Fund.
Note 2. Summary of Significant Accounting Policies
The Fund is an investment company and follows accounting and reporting guidance under Financial Accounting Standards Board (“FASB”) Accounting Standards Codification (“ASC”) Topic 946, “Financial Services-Investment Companies”. These financial statements are prepared in accordance with accounting principles generally accepted in the United States of America (“GAAP”), which require management to make estimates and assumptions that affect the reported amounts of assets and liabilities, the disclosure of contingent liabilities at the date of the financial statements, and the reported amounts of increases and decreases in net assets from operations during the fiscal year. Actual amounts could differ from those estimates. The following summarizes the significant accounting policies of the Fund:
Security Valuation – Securities are valued at market prices using the last quoted trade or official closing price from the principal exchange where the security is traded, as provided by independent pricing services on each Fund business day. In the absence of a last trade, securities are valued at the mean of the last bid and ask price provided by the pricing service. Debt securities may be valued at prices supplied by a fund’s pricing agent based on broker or dealer supplied valuations or matrix pricing, a method of valuing securities by reference to the value of other securities with similar characteristics such as rating, interest rate and maturity. Forward currency contracts are generally valued based on interpolation of forward curve data points obtained from major banking institutions that deal in foreign currencies and currency dealers. Exchange-traded options for which the last quoted sale price is outside the closing bid and ask price, will be valued at the mean of the closing bid and ask price. Shares of non-exchange traded open-end mutual funds are valued at net asset value (“NAV”). Interests in private investments will generally be subject to fair valuation. Short-term investments that mature in sixty days or less may be valued at amortized cost.
The Valuation Committee performs regular reviews of valuation methodologies, key inputs and assumptions, disposition and market activity. The Fund values its investments at fair value pursuant to procedures adopted by the Trust’s Board of Trustees (the “Board”) if (1) market quotations are not readily available or (2) the Adviser, as defined in Note 3, believes that the values available are unreliable. The Trust’s Valuation Committee, as defined in the Fund’s registration statement, performs certain functions as they relate to the administration and oversight of the Fund’s valuation procedures. Under these procedures, the Valuation Committee convenes on a regular and ad hoc basis to review such investments and considers a number of factors, including valuation methodologies and significant unobservable inputs, when arriving at fair value.
ADALTA INTERNATIONAL FUND
NOTES TO FINANCIAL STATEMENTS
MARCH 31, 2018
The Valuation Committee may work with the Adviser to provide valuation inputs. In determining fair valuations, inputs may include market-based analytics that may consider related or comparable assets or liabilities, recent transactions, market multiples, book values and other relevant investment information. Adviser inputs may include an income-based approach in which the anticipated future cash flows of the investment are discounted in determining fair value. Discounts may also be applied based on the nature or duration of any restrictions on the disposition of the investments. As permitted by GAAP, as a practical expedient, the Valuation Committee may measure the fair value of its investments in investment companies on the basis of the net asset value per share of such investments (or the equivalent) if the net asset value per share of such investments (or the equivalent) is calculated in a manner consistent with the measurement principles of applicable authoritative guidance as of the Fund’s reporting date. The fair value of the Fund’s investments in investment companies is based on the information provided by such investment company’s management, which reflects the Fund’s share of the fair value of the net assets of such investment company (i.e., the practical expedient is used). If the Valuation Committee determines, based on its own due diligence and investment valuation procedures, that alternative valuation techniques are more appropriate for any of the Fund’s investments in investment companies, such investments may be fair valued by the Valuation Committee using other suitable sources. The Valuation Committee performs regular reviews of valuation methodologies, key inputs and assumptions, disposition analysis and market activity.
Fair valuation is based on subjective factors and, as a result, the fair value price of an investment may differ from the security’s market price and may not be the price at which the asset may be sold. Fair valuation could result in a different NAV than a NAV determined by using market quotes.
GAAP has a three-tier fair value hierarchy. The basis of the tiers is dependent upon the various “inputs” used to determine the value of the Fund’s investments. These inputs are summarized in the three broad levels listed below:
Level 1 - Quoted prices in active markets for identical assets and liabilities.
Level 2 - Prices determined using significant other observable inputs (including quoted prices for similar securities, interest rates, prepayment speeds, credit risk, etc.). Short-term securities with maturities of sixty days or less are valued at amortized cost, which approximates market value, and are categorized as Level 2 in the hierarchy. Municipal securities, long-term U.S. government obligations and corporate debt securities are valued in accordance with the evaluated price supplied by the pricing service and generally categorized as Level 2 in the hierarchy. Other securities that are categorized as Level 2 in the hierarchy include, but are not limited to, warrants that do not trade on an exchange, securities valued at the mean between the last reported bid and ask quotation and international equity securities valued by an independent third party with adjustments for changes in value between the time of the securities respective local market closes and the close of the U.S. market.
Level 3 - Significant unobservable inputs (including the Fund’s own assumptions in determining the fair value of investments).
The aggregate value by input level, as of March 31, 2018, for the Fund’s investments is included at the end of the Fund’s Schedule of Investments.
Security Transactions, Investment Income and Realized Gain and Loss – Investment transactions are accounted for on the trade date. Dividend income is recorded on the ex-dividend date. Foreign dividend income is recorded on the ex-
ADALTA INTERNATIONAL FUND
NOTES TO FINANCIAL STATEMENTS
MARCH 31, 2018
dividend date or as soon as possible after determining the existence of a dividend declaration after exercising reasonable due diligence. Income and capital gains on some foreign securities may be subject to foreign withholding taxes, which are accrued as applicable. Interest income is recorded on an accrual basis. Premium is amortized and discount is accreted using the effective interest method. Identified cost of investments sold is used to determine the gain and loss for both financial statement and federal income tax purposes.
Foreign Currency Translations – Foreign currency amounts are translated into U.S. dollars as follows: (1) assets and liabilities at the rate of exchange at the end of the respective period; and (2) purchases and sales of securities and income and expenses at the rate of exchange prevailing on the dates of such transactions. The portion of the results of operations arising from changes in the exchange rates and the portion due to fluctuations arising from changes in the market prices of securities are not isolated. Such fluctuations are included with the net realized and unrealized gain or loss on investments.
Foreign Currency Transactions – The Fund may enter into transactions to purchase or sell foreign currency contracts and options on foreign currency. Forward currency contracts are agreements to exchange one currency for another at a future date and at a specified price. A fund may use forward currency contracts to facilitate transactions in foreign securities, to manage a fund’s foreign currency exposure and to protect the U.S. dollar value of its underlying portfolio securities against the effect of possible adverse movements in foreign exchange rates. These contracts are intrinsically valued daily based on forward rates, and a fund’s net equity therein, representing unrealized gain or loss on the contracts as measured by the difference between the forward foreign exchange rates at the dates of entry into the contracts and the forward rates at the reporting date, is recorded as a component of NAV. These instruments involve market risk, credit risk, or both kinds of risks, in excess of the amount recognized in the Statement of Assets and Liabilities. Risks arise from the possible inability of counterparties to meet the terms of their contracts and from movement in currency and securities values and interest rates. Due to the risks associated with these transactions, a fund could incur losses up to the entire contract amount, which may exceed the net unrealized value included in its NAV.
Distributions to Shareholders – The Fund declares any dividends from net investment income and pays them annually. Any net capital gains and net foreign currency gains realized by the Fund are distributed at least annually. Distributions to shareholders are recorded on the ex-dividend date. Distributions are based on amounts calculated in accordance with applicable federal income tax regulations, which may differ from GAAP. These differences are due primarily to differing treatments of income and gain on various investment securities held by the Fund, timing differences and differing characterizations of distributions made by the Fund.
Federal Taxes – The Fund intends to continue to qualify each year as a regulated investment company under Subchapter M of Chapter 1, Subtitle A, of the Internal Revenue Code of 1986, as amended (“Code”), and to distribute all of its taxable income to shareholders. In addition, by distributing in each calendar year substantially all of its net investment income and capital gains, if any, the Fund will not be subject to a federal excise tax. Therefore, no federal income or excise tax provision is required. The Fund files a U.S. federal income and excise tax return as required. The Fund’s federal income tax returns are subject to examination by the Internal Revenue Service for a period of three fiscal years after they are filed. As of March 31, 2018, there are no uncertain tax positions that would require financial statement recognition, de-recognition or disclosure.
ADALTA INTERNATIONAL FUND
NOTES TO FINANCIAL STATEMENTS
MARCH 31, 2018
Income and Expense Allocation – The Trust accounts separately for the assets, liabilities and operations of each of its investment portfolios. Expenses that are directly attributable to more than one investment portfolio are allocated among the respective investment portfolios in an equitable manner.
Redemption Fees – A shareholder who redeems or exchanges shares within 60 days of purchase will incur a redemption fee of 2.00% of the current NAV of shares redeemed or exchanged, subject to certain limitations. The fee is charged for the benefit of the remaining shareholders and will be paid to the Fund to help offset transaction costs. The fee is accounted for as an addition to paid-in capital. The Fund reserves the right to modify the terms of or terminate the fee at any time. There are limited exceptions to the imposition of the redemption fee. Redemption fees incurred for the Fund, if any, are reflected on the Statements of Changes in Net Assets.
Commitments and Contingencies – In the normal course of business, the Fund enters into contracts that provide general indemnifications by the Fund to the counterparty to the contract. The Fund’s maximum exposure under these arrangements is dependent on future claims that may be made against the Fund and, therefore, cannot be estimated; however, based on experience, the risk of loss from such claims is considered remote. The Fund has determined that none of these arrangements requires disclosure on the Fund’s balance sheet.
Note 3. Fees and Expenses
Investment Adviser – Adalta Capital Management LLC (the “Adviser”) is the investment adviser to the Fund. Pursuant to an investment advisory agreement, the Adviser receives an advisory fee, payable monthly, from the Fund at an annual rate of 1.50% of the Fund’s average daily net assets.
Distribution – Foreside Fund Services, LLC serves as the Fund’s distributor (the “Distributor”). The Fund does not have a distribution (12b-1) plan; accordingly, the Distributor does not receive compensation from the Fund for its distribution services. The Adviser compensates the Distributor directly for its services. The Distributor is not affiliated with the Adviser or Atlantic Fund Administration, LLC (d/b/a Atlantic Fund Services) (“Atlantic”) or their affiliates.
Other Service Providers – Atlantic provides fund accounting, fund administration, compliance and transfer agency services to the Fund. The fees related to these services are included in Fund services fees within the Statement of Operations. Atlantic also provides certain shareholder report production and EDGAR conversion and filing services. Pursuant to an Atlantic services agreement, the Fund pays Atlantic customary fees for its services. Atlantic provides a Principal Executive Officer, a Principal Financial Officer, a Chief Compliance Officer and an Anti-Money Laundering Officer to the Fund, as well as certain additional compliance support functions.
Trustees and Officers – Through December 31, 2017, the Trust paid each independent Trustee an annual retainer fee of $50,000 for service to the Trust ($66,000 for the Chairman), and the Audit Committee Chairman and Vice Chairman received an additional $6,000 annually. Effective January 1, 2018, each independent Trustee’s annual retainer is $31,000 ($41,000 for the Chairman), and the Audit Committee Chairman receives an additional $2,000 annually. The Trustees and Chairman may receive additional fees for special Board meetings. Each Trustee is also reimbursed for all reasonable out-of-pocket expenses incurred in connection with his duties as a Trustee, including travel and related expenses incurred in attending Board meetings. The amount of Trustees’ fees attributable to the Fund is disclosed in the Statement of Operations.
ADALTA INTERNATIONAL FUND
NOTES TO FINANCIAL STATEMENTS
MARCH 31, 2018
Certain officers of the Trust are also officers or employees of the above named service providers, and during their terms of office received no compensation from the Fund.
Note 4. Expense Reimbursement and Fees Waived
The Adviser has contractually agreed to waive its fee and/or reimburse Fund expenses to limit Total Annual Fund Operating Expenses After Fee Waiver and/or Expense Reimbursement (excluding all taxes, interest, portfolio transaction expenses, acquired fund fees and expenses, proxy expenses and extraordinary expenses) to 1.50%, through at least September 30, 2018. Other fund service providers have voluntarily agreed to waive a portion of their fees. The contractual waivers may be changed or eliminated at any time with the consent of the Board and voluntary fee waivers and expense reimbursements may be reduced or eliminated at any time. For the year ended March 31, 2018, fees waived were as follows:
| | | Investment Adviser Fees Waived | | Other Waivers | | | Total Fees Waived | | |
| | | $ | 196,926 | | $ | 113,115 | | | $ | 310,041 | | |
Note 5. Security Transactions
The cost of purchases and proceeds from sales of investment securities (including maturities), other than short-term investments during the year ended March 31, 2018, were $7,887,383 and $9,110,757, respectively.
Note 6. Federal Income Tax
As of March 31, 2018, the cost of investments for federal income tax purposes is $16,414,558 and the components of net unrealized appreciation were as follows:
| | Gross Unrealized Appreciation | | $ | 3,373,102 | | |
| | Gross Unrealized Depreciation | | | (2,866,618 | ) | |
| | Net Unrealized Appreciation | | $ | 506,484 | | |
Distributions paid during the fiscal years ended as noted were characterized for tax purposes as follows:
| | | | 2018 | | | 2017 | | |
| | Ordinary Income | | $ | 376,234 | | | $ | 211,892 | | |
As of March 31, 2018, distributable earnings (accumulated loss) on a tax basis were as follows:
| | Undistributed Ordinary Income | | $ | 98,322 | | |
| | Capital and Other Losses | | | (657,397 | ) | |
| | Net Unrealized Appreciation | | | 507,903 | | |
| | Total | | $ | (51,172 | ) | |
The difference between components of distributable earnings on a tax basis and the amounts reflected in the Statement
ADALTA INTERNATIONAL FUND
NOTES TO FINANCIAL STATEMENTS
MARCH 31, 2018
of Assets and Liabilities are primarily due to partnerships, wash sales and investments in passive foreign investment companies.
The Fund has $127,575 of available short-term capital loss carryforwards and $529,822 of available long-term capital loss carryforwards that have no expiration date.
On the Statement of Assets and Liabilities, as a result of permanent book to tax differences, certain amounts have been reclassified for the year ended March 31, 2018. The following reclassification was the result of currency gain/loss reclassifications, partnership distributions, K-1 income and investments in passive foreign investment companies and has no impact on the net assets of the Fund.
| | Undistributed Net Investment Income | | $ | 50,517 | | |
| | Accumulated Net Realized Loss | | | (48,705 | ) | |
| | Paid-in-Capital | | | (1,812 | ) | |
Note 7. Subsequent Events
Subsequent events occurring after the date of this report through the date these financial statements were issued have been evaluated for potential impact, and the Fund has had no such events.
REPORT OF INDEPENDENT REGISTERED PUBLIC ACCOUNTING FIRM
To the Board of Trustees of Forum Funds
and the Shareholders of Adalta International Fund
Opinion on the Financial Statements
We have audited the accompanying statement of assets and liabilities of Adalta International Fund, a series of shares of beneficial interest in Forum Funds (the “Fund”), including the schedule of investments, as of March 31, 2018, and the related statement of operations for the year then ended, the statements of changes in net assets for each of the years in the two-year period then ended and the financial highlights for each of the years in the five-year period then ended, and the related notes (collectively referred to as the “financial statements”). In our opinion, the financial statements present fairly, in all material respects, the financial position of the Fund as of March 31, 2018, and the results of its operations for the year then ended, the changes in its net assets for each of the years in the two-year period then ended and its financial highlights for each of the years in the five-year period then ended, in conformity with accounting principles generally accepted in the United States of America.
Basis for Opinion
These financial statements are the responsibility of the Fund's management. Our responsibility is to express an opinion on the Fund’s financial statements based on our audits. We are a public accounting firm registered with the Public Company Accounting Oversight Board (United States) (“PCAOB”) and are required to be independent with respect to the Fund in accordance with the U.S. federal securities law and the applicable rules and regulations of the Securities and Exchange Commission and the PCAOB.
We conducted our audits in accordance with the standards of the PCAOB. Those standards require that we plan and perform the audits to obtain reasonable assurance about whether the financial statements are free of material misstatement, whether due to error or fraud. The Fund is not required to have, nor were we engaged to perform, an audit of its internal control over financial reporting. As part of our audits we are required to obtain an understanding of internal control over financial reporting but not for the purpose of expressing an opinion on the effectiveness of the Fund’s internal control over financial reporting. Accordingly, we express no such opinion.
Our audits included performing procedures to assess the risk of material misstatement of the financial statements, whether due to error or fraud, and performing procedures that respond to those risks. Such procedures include examining, on a test basis, evidence regarding the amounts and disclosures in the financial statements. Our procedures included confirmation of securities owned as of March 31, 2018 by correspondence with the custodian, counterparties, and investee companies. Our audits also included evaluating the accounting principles used and significant estimates made by management, as well as evaluating the overall presentation of the financial statements. We believe that our audits provide a reasonable basis for our opinion.
BBD, LLP
We have served as the auditor of one or more of the Funds in the Forum Funds since 2009.
Philadelphia, Pennsylvania
May 29, 2018
ADALTA INTERNATIONAL FUND
ADDITIONAL INFORMATION (Unaudited)
MARCH 31, 2018
Investment Advisory Agreement Approval
At the March 27, 2018 Board meeting, the Board, including the Independent Trustees, considered the approval of the continuance of the investment advisory agreement between the Adviser and the Trust pertaining to the Fund (the “Advisory Agreement”). In preparation for its deliberations, the Board requested and reviewed written responses from the Adviser to a due diligence questionnaire circulated on the Board's behalf concerning the services provided by the Adviser. The Board also discussed the materials with Fund counsel and, as necessary, with the Trust's administrator, Atlantic Fund Services. During its deliberations, the Board received an oral presentation from the Adviser, and was advised by Trustee counsel.
At the meeting, the Board reviewed, among other matters: (1) the nature, extent and quality of the services provided to the Fund by the Adviser, including information on the investment performance of the Fund and Adviser; (2) the costs of the services provided and profitability to the Adviser of its relationship with the Fund; (3) the advisory fee and total expense ratio of the Fund compared to a relevant peer group of funds; (4) the extent to which economies of scale may be realized as the Fund grows and whether the advisory fee enables the Fund's investors to share in the benefits of economies of scale; and (5) other benefits received by the Adviser from its relationship with the Fund. In addition, the Board recognized that the evaluation process with respect to the Adviser was an ongoing one and, in this regard, the Board considered information provided by the Adviser at regularly scheduled meetings during the past year.
Nature, Extent and Quality of Services
Based on written materials received, a presentation from a senior representative of the Adviser, and a discussion with the Adviser about the Adviser’s personnel, operations and financial condition, the Board considered the quality of services provided by the Adviser under the Advisory Agreement. In this regard, the Board considered information regarding the experience, qualifications and professional background of the portfolio manager at the Adviser with principal responsibility for the Fund, as well as the investment philosophy and decision-making process of the Adviser and the capability and integrity of the Adviser’s senior management and staff.
The Board considered also the adequacy of the Adviser’s resources and the Adviser’s recent enhancements to its compliance, cyber security and business continuity programs. The Board noted the Adviser’s representations that the firm is in stable financial condition, that the firm is able to meet its expense reimbursement obligations to the Fund, and that the Adviser has the operational capability and the necessary staffing and experience to continue providing high-quality investment advisory services to the Fund. Based on the presentation and the materials provided by the Adviser in connection with the Board’s consideration of the renewal of the Advisory Agreement, among other relevant factors, the Board concluded that, overall, it was satisfied with the nature, extent and quality of services provided to the Fund under the Advisory Agreement.
Performance
In connection with a presentation by the Adviser regarding its approach to managing the Fund, the Board reviewed the performance of the Fund compared to its primary benchmark index, the MSCI ACWI Ex U.S. Index. The Board observed that the Fund underperformed benchmark index for the one-, three-, and five-year periods ended December 31, 2017 and outperformed the benchmark for the 10-year period ended December 31, 2017. The Board also considered the Fund’s performance relative to an independent peer group of funds identified by Broadridge Financial Solutions, Inc. (“Broadridge”)
ADALTA INTERNATIONAL FUND
ADDITIONAL INFORMATION (Unaudited)
MARCH 31, 2018
as having characteristics similar to those of the Fund. The Board observed that the Fund underperformed the median of its Broadridge peer group for the one-, three-, and five-year periods ended December 31, 2017. The Board noted the Adviser’s representation that the Fund’s relative underperformance during the periods could be attributed, in part, to the Adviser’s stock selection and geographic exposure. The Board also noted the Adviser’s representation that the Fund did not maintain a high degree of correlation to the primary benchmark, which was under review by the Adviser for appropriateness. Based on the Adviser’s investment style and the foregoing performance information, among other relevant considerations, the Board determined that the Fund and its shareholders could benefit from the Adviser’s continued management of the Fund.
Compensation
The Board evaluated the Adviser’s compensation for providing advisory services to the Fund and analyzed comparative information on actual advisory fee rates and actual total expenses of the Fund’s Broadridge peer group. The Board noted that the Adviser’s actual advisory fee rate was lower than the median of its Broadridge peer group and the Fund’s actual total expenses were higher than the median of its Broadridge peer group. The Board considered that the Adviser had contractually agreed to cap the Fund’s expenses to ensure they remain at competitive levels and that the Adviser had agreed to a breakpoint in the advisory fee at certain asset levels which had not yet been reached. Based on the foregoing and other relevant factors, the Board concluded that the Adviser’s advisory fee rate charged to the Fund was not unreasonable.
Costs of Services and Profitability
The Board considered information provided by the Adviser regarding the costs of services and its profitability with respect to the Fund. In this regard, the Board considered the Adviser’s resources devoted to the Fund, as well as the Adviser’s discussion of costs and profitability. The Board noted the Adviser’s representation that the Fund was not profitable for the Adviser due to the low asset levels resulting and that the Adviser was currently subsidizing the Fund’s operations pursuant to the contractual expense cap. Based on these and other applicable considerations, the Board concluded that the Adviser’s profits attributable to management of the Fund were reasonable in the context of all factors considered.
Economies of Scale
The Board considered whether the Fund would benefit from any economies of scale. In this respect, the Board noted the Adviser’s representation that the Fund could benefit from economies of scale at higher asset levels, and that the Adviser had agreed to a contractual breakpoint in the advisory fee upon reaching certain, higher asset levels. Based on the foregoing information and other applicable considerations, and in light of the size of the Fund, the Board concluded that economies of scale were not a material factor in approving the continuation of the Advisory Agreement.
Other Benefits
The Board noted the Adviser’s representation that, aside from its contractual advisory fees, it does not benefit in a material way from its relationship with the Fund. Based on the foregoing representation, the Board concluded that other benefits received by the Adviser from its relationship with the Fund were not a material factor in approving the continuation of the Advisory Agreement.
ADALTA INTERNATIONAL FUND
ADDITIONAL INFORMATION (Unaudited)
MARCH 31, 2018
Conclusion
The Board did not identify any single factor as being of paramount importance, and different Trustees may have given different weight to different factors. The Board reviewed a memorandum from Fund counsel discussing the legal standards applicable to its consideration of the Advisory Agreement. Based on its review, including consideration of each of the factors referenced above, the Board determined, in the exercise of its reasonable business judgment, that the advisory arrangement, as outlined in the Advisory Agreement, was fair and reasonable in light of the services performed, expenses incurred and such other matters as the Board considered relevant.
Shareholder Proxy Vote
At a special meeting of shareholders for all the Funds in the Trust, held on December 8, 2017, shares were voted as follows on the proposals presented to shareholders:
| Matter | | For | | Against | | Abstain |
| To elect David Tucker to the Board of Trustees of the Trust | | 108,303,928.779 | | 1,542,957.994 | | 0 |
| To elect Jennifer Brown-Strabley to the Board of Trustees of the Trust | | 108,183,952.495 | | 1,662,934.278 | | 0 |
| To elect Mark D. Moyer to the Board of Trustees of the Trust. | | 108,142,412.946 | | 1,704,473.827 | | 0 |
| To elect Jessica Chase to the Board of Trustees of the Trust. | | 107,632,924.803 | | 2,213,961.970 | | 0 |
| To elect Stacey E. Hong to the Board of Trustees of the Trust. | | 105,777,266.997 | | 4,069,619.776 | | 0 |
Proxy Voting Information
A description of the policies and procedures that the Fund uses to determine how to vote proxies relating to securities held in the Fund’s portfolio is available, without charge and upon request, by calling (844) 284-9829 and on the Securities and Exchange Commission's ("SEC") website at www.sec.gov. The Fund’s proxy voting record for the most recent twelve-month period ended June 30 is available, without charge and upon request, by calling (844) 284-9829 and on the SEC’s website at www.sec.gov.
Availability of Quarterly Portfolio Schedules
The Fund files its complete schedule of portfolio holdings with the SEC for the first and third quarters of each fiscal year on Form N-Q. These filings are available, without charge and upon request on the SEC’s website at www.sec.gov or may be reviewed and copied at the SEC’s Public Reference Room in Washington, DC. Information on the operation of the Public Reference Room may be obtained by calling (800) SEC-0330.
Shareholder Expense Example
As a shareholder of the Fund, you incur two types of costs: (1) transaction costs, including redemption fees and exchange fees, and (2) ongoing costs, including management fees and other Fund expenses. This example is intended to help you understand your ongoing costs (in dollars) of investing in the Fund, and to compare these costs with the ongoing costs of investing in other mutual funds.
ADALTA INTERNATIONAL FUND
ADDITIONAL INFORMATION (Unaudited)
MARCH 31, 2018
The example is based on an investment of $1,000 invested at the beginning of the period and held for the entire period from October 1, 2017 through March 31, 2018.
Actual Expenses – The first line of the table below provides information about actual account values and actual expenses. You may use the information in this line, together with the amount you invested, to estimate the expenses that you paid over the period. Simply divide your account value by $1,000 (for example, an $8,600 account value divided by $1,000 = 8.6), then multiply the result by the number in the first line under the heading entitled “Expenses Paid During Period” to estimate the expenses you paid on your account during the period.
Hypothetical Example for Comparison Purposes – The second line of the table below provides information about hypothetical account values and hypothetical expenses based on the Fund’s actual expense ratio and an assumed rate of return of 5% per year before expenses, which is not the Fund’s actual return. The hypothetical account values and expenses may not be used to estimate the actual ending account balance or expenses you paid for the period. You may use this information to compare the ongoing costs of investing in the Fund and other funds. To do so, compare this 5% hypothetical example with the 5% hypothetical examples that appear in the shareholder reports of other funds.
Please note that the expenses shown in the table are meant to highlight your ongoing costs only and do not reflect any transactional costs, such as redemption fees and exchange fees. Therefore, the second line of the table is useful in comparing ongoing costs only and will not help you determine the relative total costs of owning different funds. In addition, if these transactional costs were included, your costs would have been higher.
| | | Beginning Account Value October 1, 2017 | | | Ending Account Value March 31, 2018 | | | Expenses Paid During Period* | | | Annualized Expense Ratio* | |
| Actual | | $ | 1,000.00 | | | $ | 956.00 | | | $ | 7.31 | | | | 1.50 | % |
| Hypothetical (5% return before expenses) | | $ | 1,000.00 | | | $ | 1,017.45 | | | $ | 7.54 | | | | 1.50 | % |
| * | Expenses are equal to the Fund’s annualized expense ratio multiplied by the average account value over the period, multiplied by the number of days in the most recent fiscal half-year (182) divided by 365 to reflect the half-year period. |
Federal Tax Status of Dividends Declared during the Fiscal Year
For federal income tax purposes, dividends from short-term capital gains are classified as ordinary income. The Fund designates 63.96% of its income dividend distributed as qualifying for the qualified dividend rate (QDI) as defined in Section 1(h)(11) of the Internal Revenue Code. The Fund also designates 0.34% as qualified interest income exempt from U.S. tax for foreign shareholders (QII).
Trustees and Officers of the Trust
The Board is responsible for oversight of the management of the Trust’s business affairs and of the exercise of all the Trust’s powers except those reserved for the shareholders. The following table provides information about each Trustee and certain officers of the Trust. Each Trustee and officer holds office until the person resigns, is removed, or is replaced. Unless otherwise noted, the persons have held their principal occupations for more than five years. The address for all Trustees and
ADALTA INTERNATIONAL FUNDADDITIONAL INFORMATION (Unaudited)
MARCH 31, 2018
officers is Three Canal Plaza, Suite 600, Portland, Maine 04101. The Fund’s Statement of Additional Information includes additional information about the Trustees and is available, without charge and upon request, by calling (844) 284-9829.
Name and Year of Birth | Position with the Trust | Length of Time Served | Principal Occupation(s) During Past Five Years | Number of Series in Fund Complex Overseen By Trustee | Other Directorships Held By Trustee During Past Five Years |
| Independent Trustees |
David Tucker Born: 1958 | Trustee; Chairman of the Board | Since 2011 and Chairman since 2018 | Director, Blue Sky Experience (a charitable endeavor) since 2008; Senior Vice President & General Counsel, American Century Companies (an investment management firm) 1998-2008. | 1 | Trustee, Forum Funds II, Forum ETF Trust and U.S. Global Investors Funds |
Mark D. Moyer Born: 1959 | Trustee | Since 2018 | Chief Financial Officer, Freedom House (a NGO advocating political freedom and democracy) since 2017; independent consultant providing interim CFO services, principally to non-profit organizations, 2011-2017; Chief Financial Officer, Institute of International Education (a NGO administering international educational exchange programs), 2008-2011; Chief Financial Officer and Chief Restructuring Officer, Ziff Davis Media Inc. (an integrated media company), 2005-2008; Adjunct Professor of Accounting, Fairfield University from 2009-2012. | 1 | Trustee, Forum Funds II, Forum ETF Trust and U.S. Global Investors Funds |
Jennifer Brown- Strabley Born: 1964 | Trustee | Since 2018 | Principal, Portland Global Advisors, 1996-2010. | 1 | Trustee, Forum Funds II, Forum ETF Trust and U.S. Global Investors Funds |
| Interested Trustee |
Stacey E. Hong(1) Born: 1966 | Trustee | Since 2018 | President, Atlantic since 2008. | 1 | Trustee, Forum Funds II and U.S. Global Investors Funds |
ADALTA INTERNATIONAL FUNDADDITIONAL INFORMATION (Unaudited)
MARCH 31, 2018
Name and Year of Birth | Position with the Trust | Length of Time Served | Principal Occupation(s) During Past Five Years | Number of Series in Fund Complex Overseen By Trustee | Other Directorships Held By Trustee During Past Five Years |
Jessica Chase(1) Born: 1970 | Trustee | Since 2018 | Senior Vice President, Atlantic since 2008. | 1 | None |
(1) | Stacey E. Hong is currently treated as an interested person of the Trust, as defined in the 1940 Act, due to his affiliation with Atlantic. Jessica Chase is currently treated as an interested person of the Trust, as defined in the 1940 Act, due to her affiliation with Atlantic and her role as President of the Trust. |
Name and Year of Birth | Position with the Trust | Length of Time Served | Principal Occupation(s) During Past 5 Years |
| Officers |
Jessica Chase Born: 1970 | President; Principal Executive Officer | Since 2015 | Senior Vice President, Atlantic since 2008. |
Karen Shaw Born: 1972 | Treasurer; Principal Financial Officer | Since 2008 | Senior Vice President, Atlantic since 2008. |
Zachary Tackett Born: 1988 | Vice President; Secretary and Anti- Money Laundering Compliance Officer | Since 2014 | Counsel, Atlantic since 2014; Intern Associate, Coakley & Hyde, PLLC, 2010-2013. |
Michael J. McKeen Born: 1971 | Vice President | Since 2009 | Senior Vice President, Atlantic since 2008. |
Timothy Bowden Born: 1969 | Vice President | Since 2009 | Manager, Atlantic since 2008. |
Geoffrey Ney Born: 1975 | Vice President | Since 2013 | Manager, Atlantic since 2013; Senior Fund Accountant, Atlantic, 2008–2013. |
Todd Proulx Born: 1978 | Vice President | Since 2013 | Manager, Atlantic since 2013; Senior Fund Accountant, Atlantic, 2008–2013. |
Carlyn Edgar Born: 1963 | Vice President | Since 2008 | Senior Vice President, Atlantic since 2008; Chief Compliance Officer, 2008-2016 |
Dennis Mason Born: 1967 | Chief Compliance Officer | Since 2016 | Fund Compliance Officer, Atlantic since 2013; Senior Specialist, Atlantic, 2011-2013; Senior Analyst, Atlantic, 2008-2011 |
BECK, MACK & OLIVER PARTNERS FUNDA MESSAGE TO OUR SHAREHOLDERS (Unaudited)
MARCH 31, 2018
The Beck, Mack & Oliver Partners Fund (the “Partners Fund”) returned +12.77% net of fees and expenses for the fiscal year ended March 31, 2018 (the “Fiscal Year”), resulting in a net asset value (“NAV”) of $11.56. By comparison, during the Fiscal Year, the S&P 500 Index, which is the Partners Fund’s principal benchmark, returned +13.99%.
Performance Update
Below is an updated version of a performance comparison table that was introduced in the letter for the fiscal year ended March 31, 2017 (the “March 2017 Letter”), and that was updated in the letter for the six-month semi-annual period ended September 30, 2017 (the “September 2017 Letter”). Among other things, we believe that this table is useful for evaluating the performance of the Partners Fund under its current management. For more details on the changes to the management of the Partners Fund that were completed in early calendar 2016, please see the September 2017 Letter and the March 2017 Letter, which are available at the following link: https://www.beckmack.com/USStrategy.aspx?category=shareholderReports.
| | 12/1/09 – 3/31/14 | 3/31/14 – 3/31/16 | 3/31/16 – 3/31/18 |
| Beck, Mack & Oliver Partners Fund | +90.28% | -21.46% | +30.19% |
| S&P 500 Index | +85.01% | +14.74% | +33.57% |
(Performance data quoted represent past performance and are no guarantee of future results. Current performance may be lower or higher than the performance data quoted. Investment return and principal value will fluctuate so that an investor’s shares, when redeemed, may be worth more or less than original cost. For the most recent month-end performance, please call (800) 943-6786.)
Over the last two fiscal years, during which the Partners Fund has been managed by Robert C. Beck and Richard C. Fitzgerald, the Partners Fund generated a cumulative total return of +30.19% vs. +33.57% for the S&P 500 Index. While the NAV of the Partners Fund increased significantly during that period, there are two important observations to make about the relative performance over the last two years:
| ● | First, the +33.57% cumulative total return for the S&P 500 Index corresponds to an annualized total return of +15.57%, which is well in excess of the S&P 500 Index’s annualized total returns over long periods of time. Over the 10, 20, 30, 40, and 50 years ended March 31, 2018, the annualized total return of the S&P 500 Index was +9.49%, +6.45%, +10.45%, +11.94%, and +10.22%, respectively. The annualized total return of the Partners Fund over the last two years was +14.10%. |
| ● | Second, over the last two fiscal years, the S&P 500 Growth Index has generated a cumulative total return of +38.09%, while the S&P 500 Value Index has generated a cumulative total return of +27.76%. While any distinction between “growth” and “value” is not absolute, we believe that the investment strategy of the Partners Fund— which emphasizes long-term fundamentals and seeks to purchase securities at prices below their intrinsic value—is generally more comparable to “value”-oriented investment strategies. Furthermore, over long periods of time, the total returns of the S&P 500 Growth Index and the S&P 500 Value Index tend to approximately converge on those of the S&P 500 Index. For instance, over the 20 years ended March 31, 2018, the annualized total return of the S&P 500 Growth Index was +6.63% vs. +5.95% for the S&P 500 Value Index and +6.45% for the S&P 500 Index. Hence, while “growth”-oriented investment strategies have generally outperformed “value”-oriented investment |
BECK, MACK & OLIVER PARTNERS FUNDA MESSAGE TO OUR SHAREHOLDERS (Unaudited)
MARCH 31, 2018
| | strategies over the last couple of years, periods during which “growth” or “value” significantly outperforms the other tend to be followed by periods during which “growth” or “value” underperforms the other. |
To be clear, we continue to manage the Partners Fund with a focus on preserving your capital and outperforming the broader equity market (for which the S&P 500 Index is an appropriate proxy) over long periods of time. The observations made above are intended merely to provide relevant context for the relative performance of the Partners Fund over the last two years. Each investment professional of Beck, Mack & Oliver LLC (“BM&O”), which is the investment adviser to the Partners Fund, personally owns shares of the Partners Fund.
Largest Positive & Negative Contributors
The table below indicates the largest positive and negative single-security contributors to investment performance as well as the total returns of the underlying securities during the Fiscal Year.1
| Largest Positive Contributors | | Largest Negative Contributors |
| Position | Contribution | Total Return | | Position | Contribution | Total Return |
| Credit Acceptance Corp. | +2.50% | +65.7% | | Chicago Bridge & Iron Co. NV | -1.43% | -52.9% |
| Matador Resources Co. | +1.55% | +25.7% | | CenturyLink, Inc. | -0.45% | -21.7% |
| Microsoft Corp. | +1.48% | +41.5% | | Schlumberger, Ltd. | -0.40% | -14.5% |
Credit Acceptance Corp.
The largest positive contributor to investment performance during the Fiscal Year was Credit Acceptance Corp. (“Credit Acceptance”), which is a subprime automotive lender with a unique business model based on making advances to the automotive dealer, who shares repayment risk with Credit Acceptance. Due primarily to valuation multiple expansion, we reduced the size of the Credit Acceptance position towards the end of the Fiscal Year, though it remains a core holding of the Partners Fund. We also discussed the Credit Acceptance position in the September 2017 Letter.
Matador Resources Co.
Fiscal 2018 represents the second consecutive fiscal year in which Matador Resources Co. (“Matador”) was among the three largest positive contributors to investment performance. Matador is an energy company primarily focused on the exploration and production of oil and natural gas, with a sizeable presence in the Permian Basin as well as a valuable midstream asset. BM&O has been a major shareholder of Matador since calendar 2013 and we have a high degree of confidence that the management team—led by co-founder, Chairman, and CEO Joe Foran—can continue to create shareholder value over time across a range of industry and market conditions.
1 | Total return refers to the underlying security’s price appreciation plus reinvested dividends during the Fiscal Year. Contribution refers to the total return during the period of the Partners Fund’s ownership within the Fiscal Year multiplied by the percentage of the Partners Fund’s net assets that the security represents. |
BECK, MACK & OLIVER PARTNERS FUNDA MESSAGE TO OUR SHAREHOLDERS (Unaudited)
MARCH 31, 2018
Microsoft Corp.
Microsoft Corp. (“Microsoft”) was also a major positive contributor to investment performance during the Fiscal Year. Under CEO Satya Nadella, Microsoft has been an innovative leader in enterprise software and cloud services. We believe that the company continues to benefit from multiple tailwinds and that the valuation of the stock remains attractive in light of prospective earnings growth, strong cash flow characteristics, and a solid balance sheet.
Other Positive Contributors
In addition to the three positive contributors discussed above, three other positions—Apollo Global Management, LLC; Alphabet, Inc.; and JPMorgan Chase & Co.—each contributed more than +1% to investment performance during the Fiscal Year. All six positions remain core holdings of the Partners Fund.
Chicago Bridge & Iron Co. NV
The largest negative contributor to investment performance during the Fiscal Year—by a long shot—was Chicago Bridge & Iron Co. NV (“CBI”). Not only was the negative contribution from CBI more than threefold that of the next largest negative contributor, but CBI has the dubious distinction of being among the three largest negative contributors in each of the last two fiscal years. We discussed the CBI position in the September 2017 Letter, the March 2017 Letter, and the letter for the six-month semi-annual period ended September 30, 2016 (“the September 2016 Letter”).
In the September 2017 Letter, we wrote: “While the Westinghouse litigation was indeed resolved in CBI’s favor [which we predicted in the March 2017 Letter and the September 2016 Letter], poor fundamental execution and management turnover nevertheless weighed heavily on the stock during the Semi-Annual Period. We recently had the opportunity to meet with the new CEO and are cautiously optimistic that the worst is behind CBI…While we have refrained from adding to our position in CBI, we intend to maintain our valuation discipline in regard to the timing of our exit.”
In December 2017, CBI and McDermott International, Inc. (“McDermott”) announced that McDermott would acquire CBI in an all-stock transaction, pursuant to which each share of CBI would be exchanged for approximately 2.47 shares of McDermott. Although the share exchange ratio implied little premium to where CBI stock was trading at the time, we view this transaction favorably as the combined company (i) is likely to be much stronger financially than CBI was on its own and (ii) will be led by McDermott’s management team, including CEO David Dickson, whom we have had the opportunity to meet and who was very successful in turning around McDermott after he became CEO in late calendar 2013. Consistent with our message in the September 2017 Letter, we have continued to refrain from adding to our position in CBI, which was 1.5% of net assets as of the end of the Fiscal Year, but we intend to maintain our valuation discipline in regard to the timing of our exit and we believe that McDermott stock is trading meaningfully below its intrinsic value. The transaction with CBI is expected to close in May 2018. We look forward to updating you in future letters.
CenturyLink, Inc.
The next largest negative contributor to investment performance during the Fiscal Year was CenturyLink, Inc. (“CenturyLink”), which we discussed in the September 2017 Letter. CenturyLink completed the acquisition of Level 3 Communications, Inc. (“Level 3”) in early November 2017. Much of CenturyLink’s underperformance occurred in the
BECK, MACK & OLIVER PARTNERS FUNDA MESSAGE TO OUR SHAREHOLDERS (Unaudited)
MARCH 31, 2018
months leading up to the completion of the Level 3 acquisition as well as in the month or so after that. The primary factors contributing to CenturyLink’s underperformance during that time included: (i) worsening sentiment regarding the so-called “legacy wireline” sector; (ii) delays in closing the Level 3 acquisition; (iii) concerns about the combined company’s ability to cover its dividend obligations through free cash flow generation; and (iv) interest rate pressures.
Despite having a different business mix and a much stronger balance sheet, CenturyLink historically was often compared to “legacy wireline” companies such as Windstream Holdings, Inc. (“Windstream”) and Frontier Communications Corp. (“Frontier”). During the Fiscal Year, Windstream and Frontier generated total returns of -73.2% and -73.4%, respectively. Notwithstanding the fact that CenturyLink was fundamentally differentiated from Windstream and Frontier, the severely negative performance of the latter two companies adversely affected sentiment throughout the sector. (Since completing the Level 3 acquisition, CenturyLink is now even further differentiated from these other two companies.)
Separately, one of the principal anticipated benefits of the Level 3 acquisition is the considerable accretion to free cash flow per share, based on the realization of synergies and Level 3’s more favorable revenue growth characteristics. Our confidence in the company’s free cash flow outlook was strengthened after we met in December 2017 with Jeff Storey and Sunit Patel, who were the CEO and CFO, respectively, of Level 3 and who are now running CenturyLink. Shortly after that meeting, several CenturyLink insiders acquired stock in the open market, signaling confidence on behalf of the Board of Directors and the management team in the company’s prospects. When CenturyLink reported earnings in February 2018, management introduced calendar 2018 financial guidance, which further underscored the company’s ability to more than cover its dividend.
Between late November 2017 and the end of the Fiscal Year, CenturyLink generated a total return of +24.4% vs. +2.2% for the S&P 500 Index. Even after this period of relative outperformance, CenturyLink remains materially undervalued, in our view. As of the end of the Fiscal Year, CenturyLink’s share price was $16.43, which corresponded to a dividend yield of more than 13%. By comparison, the yield on the 10-year U.S. Treasury as of the end of the Fiscal Year was 2.74%. We believe that the “spread” between CenturyLink’s dividend yield and Treasury yields will meaningfully compress as Storey and Patel successfully integrate the two companies, achieve synergies, and drive free cash flow per share growth—and that such spread compression is likely to more than offset any rise in underlying Treasury yields, resulting in capital appreciation as well as continued income from the substantial dividend.
Schlumberger, Ltd.
Schlumberger, Ltd. (“Schlumberger”) was the third largest negative contributor to investment performance during the Fiscal Year. Schlumberger, which is one of the leading global oil services companies, generated a total return of -14.5% during the Fiscal Year, which is markedly inferior to Matador’s +25.7% total return (see above). Much of this return differential can be attributed to the broader underperformance of oil services companies compared to energy exploration and production companies as well as to Schlumberger’s greater exposure to international energy markets, whose recovery has lagged that of the U.S. market. As many international energy markets currently appear to be at or near positive inflection points, we remain bullish on the outlook for Schlumberger. The Partners Fund’s energy portfolio as a whole contributed more than +1% to investment performance during the Fiscal Year.
BECK, MACK & OLIVER PARTNERS FUNDA MESSAGE TO OUR SHAREHOLDERS (Unaudited)
MARCH 31, 2018
New & Exited Positions
The table below indicates the eight new positions that were initiated and the seven positions that were exited during the Fiscal Year:
| | New Positions | Exited Positions | |
| | BlackBerry, Ltd. | Boulevard Acquisition Corp. II | |
| | CenturyLink, Inc. | Colony NorthStar, Inc. | |
| | Discovery Communications, Inc., Class C | Devon Energy Corp. | |
| | Enterprise Products Partners LP | Dover Corp. | |
| | Kinder Morgan, Inc. | Fluor Corp. | |
| | Oaktree Capital Group, LLC | Kinder Morgan, Inc. | |
| | RadNet, Inc. | Level 3 Communications, Inc. | |
| | Wabtec Corp. | | |
BlackBerry, Ltd.; Boulevard Acquisition Corp. II; CenturyLink, Inc.; Colony NorthStar, Inc.; Dover Corp.; Enterprise Products Partners LP; Kinder Morgan, Inc.; Level 3 Communications, Inc.; and Wabtec Corp. were all discussed in the September 2017 Letter (and CenturyLink and Level 3 were also discussed earlier in this letter).
Discovery Communications, Inc.
Discovery Communications, Inc. (“Discovery”) owns the popular cable networks the Discovery Channel, TLC, and Animal Planet, among several others. It recently completed the acquisition of Scripps Networks Interactive, Inc. (“Scripps”), whose primary networks include HGTV, the Food Network, and the Travel Channel. The combined company will be the leading owner of non-fiction video programming and will account for approximately 20% of primetime cable viewership in the U.S. In addition to providing critical mass in the U.S. market, the transaction is expected to generate material cost synergies and to create an opportunity to monetize Scripps’s content internationally, where Discovery already has a strong presence but where Scripps does not.
For the last several years, BM&O had followed without investing in Discovery, attracted to its valuable content, strong cash flow characteristics, and compelling valuation. For much of this time, not owning Discovery turned out to be the correct investment decision, as the share price fell from over $40 in calendar 2014 to $15 in late calendar 2017. We finally decided to invest in Discovery towards the end of the Fiscal Year based on the transformative nature of the Scripps transaction, the combined company’s highly attractive valuation, and our belief that the management team—led by CEO David Zaslav—will be able to continue to successfully navigate the quickly evolving landscape of video consumption, which has been characterized by the rise of “over-the-top” streaming services, “cord-cutting,” consumption on mobile devices, and “skinny” bundles.
Oaktree Capital Group, LLC
Oaktree Capital Group, LLC (“Oaktree”) is an alternative asset manager with approximately $100 billion in assets under management. BM&O has closely followed the alternative asset management industry over the last several years and Apollo Global Management, LLC (“Apollo”) and The Blackstone Group LP (“Blackstone”) continue to be core holdings of the Partners Fund. We believe that Oaktree, like Apollo and Blackstone, is both significantly undervalued and somewhat
BECK, MACK & OLIVER PARTNERS FUNDA MESSAGE TO OUR SHAREHOLDERS (Unaudited)
MARCH 31, 2018
misunderstood by the broader market, with such misunderstanding in part reflecting the industry’s relative youth within public markets. (In 2007, Blackstone was among the first of the major private equity firms to go public; Apollo and Oaktree went public in 2011 and 2012, respectively.) Oaktree is differentiated from Blackstone and Apollo by having a greater relative exposure to credit and distressed debt and something of a “hidden” asset in its 20% stake in DoubleLine Capital LP, which itself has more than $100 billion in assets under management and which is led by Jeffrey Gundlach. We believe that Oaktree’s focus on credit and distressed debt will serve it particularly well during the next down-cycle in capital markets. Given the Partners Fund’s existing investments in Blackstone and Apollo, we have consciously limited the size the Oaktree position, which was 1.4% of net assets as of the end of the Fiscal Year.
RadNet, Inc.
RadNet, Inc. (“RadNet”) is the largest owner and operator of fixed-site diagnostic imaging centers in the U.S., with nearly 300 locations. Through acquisitions and joint ventures, RadNet continues to consolidate a large and highly fragmented market, as imaging volumes shift from higher-cost hospital settings to lower-cost non-hospital settings. In addition, over the last few years, RadNet has delevered its balance sheet and successfully grown its capitation business, while reimbursement pressures have eased materially. We believe that the valuation is quite compelling and are encouraged by the fact that insiders own approximately 20% of the company. In an environment in which healthcare costs need to be managed more effectively and managed care and healthcare services companies are increasingly looking to control the provision of care, we further believe that RadNet would make an attractive acquisition candidate (though our underwriting of the investment does not assume that RadNet is acquired). The Partners Fund purchased RadNet at an average price of $9.87 and RadNet’s share price as of the end of the Fiscal Year was $14.40.
Exited Positions
In the September 2017 Letter, we discussed the new positions in Enterprise Products Partners LP (“Enterprise”) and Kinder Morgan, Inc. (“Kinder”) and remarked that they “tend to be fundamentally more levered to commodity volumes than to commodity prices. As such, our view is that the underlying cash flows generated by these businesses, unlike those of upstream energy companies, are not especially dependent on the vagaries of commodity prices.” In light of these new energy investments, we elected to exit our position in Devon Energy Corp. (“Devon”) because the stock was both highly dependent on the oil price and generally lacked positive company-specific catalysts compared to our other energy investments. In addition, subsequent to our initial purchases of Enterprise and Kinder, we decided to increase the position size of Enterprise and to exit the Kinder position. While we continue to be bullish on prospects for both companies, we have higher conviction in Enterprise and chose to concentrate our energy portfolio on our very best ideas while managing the total amount of capital allocated to the energy sector. The Partners Fund generated a small gain on its Kinder position and since the Partners Fund exited its Kinder position, Enterprise has considerably outperformed Kinder.
In the September 2017 Letter, we wrote that Fluor Corp.’s “fundamental execution has underperformed our expectations. In response, we have meaningfully reduced our position in Fluor [Corp.], which is now one of the smallest positions in the Partners Fund.” Fluor Corp.’s share price appreciated significantly in the next few months and we took the opportunity to exit the position at what we deemed to be attractive levels.
BECK, MACK & OLIVER PARTNERS FUNDA MESSAGE TO OUR SHAREHOLDERS (Unaudited)
MARCH 31, 2018
Other Portfolio Observations
As of the end of the Fiscal Year, the Partners Fund held 31 equity positions, with the 10 largest positions representing 50.7% of net assets. This compares to 30 equity positions, with the 10 largest positions representing 50.0% of net assets, as of the beginning of the Fiscal Year.
As of the end of the Fiscal Year, the largest sector exposures were financials (26.4% of net assets), healthcare (18.6%), and technology (14.4%) and cash represented less than 2% of net assets.
As of the end of the Fiscal Year, the Partners Fund had an estimated net capital loss per share of approximately $4.84.
Outlook
In the September 2017 Letter, we discussed how the market environment at the time was “characterized by the S&P 500 Index near its all-time highs [and] volatility near its all-time lows”. These conditions generally remained in place until the final two months of the Fiscal Year. In February and March of 2018, the S&P 500 Index generated a total return of -3.69% and -2.54%, respectively, which were the first negative-return months for the S&P 500 Index since October 2016. Similarly, volatility, after remaining quiescent more or less since the U.S. elections in November 2016, increased sharply in February 2018 and has not returned to its former lower levels.
Some of the main risks currently weighing on sentiment include: (i) policy tightening by the U.S. Federal Reserve, which just underwent a change in leadership, and by other central banks; (ii) strengthening inflationary pressures; (iii) potentially slower global economic growth compared to a few months ago; (iv) an ongoing dispute between the U.S. and China, the two largest national economies in the world, regarding trade imbalances and the threat of punitive and retaliatory tariffs; (v) geopolitical tensions with respect to North Korea, Iran, Syria, and Russia, among others; and (vi) the ongoing U.S. Special Counsel investigation.
As if the foregoing list was not enough to be concerned about, we are fast approaching the 10th year of both the economic expansion and the equity bull market in the U.S. It is a question of when rather than if we will have another economic recession and equity bear market. As long-term fundamental investors, we believe that our core competence is not to predict market or macroeconomic inflection points, but to find and to own high-quality companies that are trading at discounts to their intrinsic value. We thereby strive to preserve your (and our) capital and are focused on outperforming the broader equity market over long periods of time and through various economic cycles.
As the earlier discussion of the Partners Fund’s new investments during the Fiscal Year indicates, we have, over the last 12 months, found a number of new companies that meet our investment criteria and about whose prospects we are quite enthusiastic. Moreover, we believe that the current market environment of somewhat elevated levels of volatility, interest rates, and risk-aversion may well turn out to be more auspicious for our brand of stock-picking than the market environment of the last few years, which has been characterized by a combination of low volatility, depressed interest rates, tight credit spreads, and an equity market that has appreciated at rates far in excess of its long-term averages. Such equity market appreciation, to a large extent, has been disproportionately driven by a cohort of widely owned, mostly technology-related companies (see the earlier discussion of “growth” vs. “value”) and has occurred against a backdrop of rising so-called
BECK, MACK & OLIVER PARTNERS FUNDA MESSAGE TO OUR SHAREHOLDERS (Unaudited)
MARCH 31, 2018
“passive” ownership (e.g., index investment strategies). We would surmise some degree of mutual reinforcement between the technology-led bull market and “passive” capital flows, any unwinding of which could be disruptive to financial markets more generally. Knowing that we do not know how any such unwinding would play out exactly, we believe that our brand of stock-picking—looking for high-quality companies that are out of favor and not chasing crowded or “consensus” ideas— should hold up relatively well in potentially more turbulent market conditions.
Thank you for your continued support.
Yours sincerely,
| |
| | |
| Robert C. Beck & | Richard C. Fitzgerald |
Appendix: Historical Performance
Total returns for the Partners Fund and the S&P 500 Index for the periods ended March 31, 2018, were as follows:
| | | Annualized Returns |
| Returns as of 03/31/18 | One Year | Three Years | Five Years | Since 12/01/2009 Reorg* | Ten Years |
| Beck, Mack & Oliver Partners Fund | +12.77% | +4.62% | +3.22% | +8.32% | +4.34% |
| S&P 500® Index | +13.99% | +10.78% | +13.31% | +13.33% | +9.49% |
(Performance data quoted represent past performance and are no guarantee of future results. Current performance may be lower or higher than the performance data quoted. Investment return and principal value will fluctuate so that an investor’s shares, when redeemed, may be worth more or less than original cost. Shares redeemed or exchanged within 60 days of purchase will be charged a 2.00% redemption fee. As stated in the current prospectus, the Partners Fund’s annual operating expense ratio (gross) is 1.81%. However, the Partners Fund’s adviser has agreed to contractually waive its fees and/or reimburse expenses to limit total operating expenses to 1.00% through at least July 31, 2018; otherwise performance shown would have been lower. For the most recent month-end performance, please call (800) 943-6786. Returns greater than one year are annualized.)
| * | Excludes performance prior to the Partners Fund’s reorganization from a limited partnership. See important risks and disclosures regarding performance at the bottom of page 9. |
IMPORTANT RISKS AND DISCLOSURE:
There is no assurance that the Partners Fund will achieve its investment objective. An investment in the Partners Fund is subject to risk, including the possible loss of principal amount invested. The risks associated with the Partners Fund include: equity and convertible securities risk, foreign securities risk, management risk, debt securities risk, noninvestment grade
BECK, MACK & OLIVER PARTNERS FUNDA MESSAGE TO OUR SHAREHOLDERS (Unaudited)
MARCH 31, 2018
securities risk, liquidity risk and non-diversification risk. The Partners Fund may invest in small and mid-sized capitalization companies meaning that these companies carry greater risk than is customarily associated with larger companies for various reasons such as narrower markets, limited financial resources and less liquid stock.
The S&P 500 Index is a broad-based, unmanaged measurement of changes in stock market conditions based on the average of 500 widely held common stocks. The total return of the S&P 500 Index and of the Partners Fund includes the reinvestment of dividends and income. The total return of the Partners Fund includes operating expenses that reduce returns, while the total return of the S&P 500 Index does not include expenses. The Partners Fund is professionally managed while the S&P 500 Index is unmanaged and is not available for investment. It is not possible to invest directly in an index.
This letter may contain discussions about certain investments both held and not held in the portfolio. All current and future holdings are subject to risk and to change. The views in this report were those of the Partners Fund managers as of March 31, 2018, and may not reflect their views on the date this report is first published or any time thereafter. These views are intended to assist shareholders in understanding their investment in the Partners Fund and do not constitute investment advice.
On December 1, 2009, a limited partnership managed by the adviser reorganized into the Partners Fund. The predecessor limited partnership maintained an investment objective and investment policies that were, in all material respects, equivalent to those of the Partners Fund. The Partners Fund’s performance for the periods before December 1, 2009 is that of the limited partnership and includes the expenses of the limited partnership, which were lower than the Partners Fund’s current expenses, except for 2008 where the expenses of the limited partnership were higher. The performance prior to December 1, 2009 is based on calculations that are different from the standardized method of calculations by the SEC. If the limited partnership’s performance had been readjusted to reflect the estimated expenses of the Partners Fund for its first Fiscal Year, the performance would have been lower. The limited partnership was not registered under the Investment Company Act of 1940 (“1940 Act”) and was not subject to certain investment limitations, diversification requirements, and other restrictions imposed by the 1940 Act and the Internal Revenue Code of 1986, which, if applicable, may have adversely affected its performance.
BECK, MACK & OLIVER PARTNERS FUND
PERFORMANCE CHART AND ANALYSIS (Unaudited)
MARCH 31, 2018
The following chart reflects the change in the value of a hypothetical $10,000 investment, including reinvested dividends and distributions, in Beck, Mack & Oliver Partners Fund (the “Fund”) compared with the performance of the benchmark, S&P 500 Index (the “S&P 500”), over the past 10 fiscal years. The S&P 500 is a broad-based, unmanaged measurement of changes in stock market conditions based on the average of 500 widely held common stocks. The total return of the index includes the reinvestment of dividends and income. The total return of the Fund includes operating expenses that reduce returns, while the total return of the index does not include expenses. The Fund is professionally managed, while the index is unmanaged and is not available for investment.
Comparison of a $10,000 Investment
Beck, Mack & Oliver Partners Fund vs. S&P 500 Index
Average Annual Total Returns Periods Ended March 31, 2018 | | One Year | | Five Year | | Ten Year |
| Beck, Mack & Oliver Partners Fund | | 12.77% | | 3.22% | | 4.34% |
| S&P 500 Index | | 13.99% | | 13.31% | | 9.49% |
Performance data quoted represents past performance and is no guarantee of future results. Current performance may be lower or higher than the performance data quoted. Investment return and principal value will fluctuate so that shares, when redeemed, may be worth more or less than original cost. As stated in the Fund’s prospectus, the annual operating expense ratio (gross) is 1.81%. However, the Fund’s adviser has contractually agreed to waive its fee and/or reimburse Fund expenses to limit Total Annual Fund Operating Expenses After Fee Waiver and/or Expense Reimbursement (excluding all taxes, interest, portfolio transaction expenses, acquired fund fees and expenses, proxy expenses and extraordinary expenses) to 1.00%, through at least July 31, 2018 (the “Expense Cap”). During the period, certain fees were waived and/or expenses reimbursed; otherwise, returns would have been lower. Shares redeemed or exchanged within 60 days of purchase will be charged a 2.00% redemption fee. The performance table and graph do not reflect the deduction of taxes that a shareholder would pay on Fund distributions or the redemption of Fund shares. Returns greater than one year are annualized. For the most recent month-end performance, please call (800) 943-6786.
BECK, MACK & OLIVER PARTNERS FUND
PORTFOLIO PROFILE (Unaudited)
MARCH 31, 2018
PORTFOLIO HOLDINGS
% of Total Investments
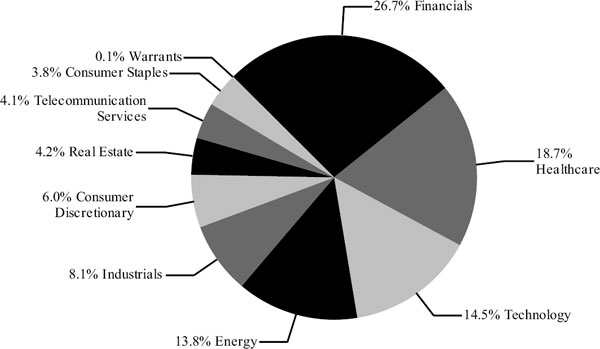
BECK, MACK & OLIVER PARTNERS FUND
SCHEDULE OF INVESTMENTS
MARCH 31, 2018
| Shares | | Security Description | | Value | |
| Common Stock - 99.1% | | | |
| Consumer Discretionary - 6.0% | | | |
| 40,000 | | Discovery Communications, Inc., Class C (a) | | $ | 780,800 | |
| 48,000 | | Liberty Global PLC, Class A (a) | | | 1,502,880 | |
| | | | | | 2,283,680 | |
| Consumer Staples - 3.8% | | | | |
| 7,000 | | Anheuser-Busch InBev SA/NV, ADR | | | 769,580 | |
| 70,000 | | Crimson Wine Group, Ltd. (a) | | | 692,300 | |
| | | | | | 1,461,880 | |
| Energy - 13.7% | | | | |
| 44,000 | | Enterprise Products Partners LP | | | 1,077,120 | |
| 90,000 | | Matador Resources Co. (a) | | | 2,691,900 | |
| 90,000 | | San Juan Basin Royalty Trust | | | 711,000 | |
| 12,000 | | Schlumberger, Ltd. | | | 777,360 | |
| | | | | | 5,257,380 | |
| Financials - 26.4% | | | | |
| 70,000 | | Apollo Global Management, LLC | | | 2,073,400 | |
| 4,500 | | Credit Acceptance Corp. (a) | | | 1,486,845 | |
| 11,500 | | Enstar Group, Ltd. (a) | | | 2,417,875 | |
| 16,000 | | JPMorgan Chase & Co. | | | 1,759,520 | |
| 14,000 | | Oaktree Capital Group, LLC | | | 554,400 | |
| 58,000 | | The Blackstone Group LP | | | 1,853,100 | |
| | | | | | 10,145,140 | |
| Healthcare - 18.6% | | | | |
| 13,000 | | Abbott Laboratories | | | 778,960 | |
| 20,000 | | Gilead Sciences, Inc. | | | 1,507,800 | |
| 48,000 | | Grifols SA, ADR | | | 1,017,600 | |
| 8,500 | | Laboratory Corp. of America Holdings (a) | | | 1,374,875 | |
| 18,000 | | Merck & Co., Inc. | | | 980,460 | |
| 40,000 | | RadNet, Inc. (a) | | | 576,000 | |
| 4,500 | | Waters Corp. (a) | | | 893,925 | |
| | | | | | 7,129,620 | |
| Industrials - 8.0% | | | | |
| 24,000 | | Armstrong World Industries, Inc. (a) | | | 1,351,200 | |
| 40,000 | | Chicago Bridge & Iron Co. NV | | | 576,000 | |
| 14,000 | | Wabtec Corp. | | | 1,139,600 | |
| | | | | | 3,066,800 | |
| Real Estate - 4.2% | | | | |
| 28,080 | | Homefed Corp. (a) | | | 1,607,861 | |
| Technology - 14.4% | | | | |
| 2,000 | | Alphabet, Inc., Class C (a) | | | 2,063,580 | |
| 75,000 | | BlackBerry, Ltd. (a) | | | 862,500 | |
| 21,000 | | Microsoft Corp. | | | 1,916,670 | |
| 12,000 | | QUALCOMM, Inc. | | | 664,920 | |
| | | | | | 5,507,670 | |
| Shares | | Security Description | | Value | |
| Telecommunication Services - 4.0% | | | |
| 94,000 | | CenturyLink, Inc. | | $ | 1,544,420 | |
| | | | | |
| Total Common Stock (Cost $31,072,268) | | | 38,004,451 | |
| Contracts | | Security Description | | Exercise Price | | Exp. Date | | Value | |
| Warrants - 0.1% | | | | | | | |
| 75,675 | | AgroFresh Solutions, Inc. (a) | | | | | | | | | |
| | (Cost $171,744) | | $ | 11.50 | | 02/19/19 | | | 40,864 | |
| Investments, at value - 99.2% (Cost $31,244,012) | | $ | 38,045,315 | |
| Other Assets & Liabilities, Net- 0.8% | | | 322,928 | |
| Net Assets - 100.0% | | $ | 38,368,243 | |
| ADR | American Depositary Receipt |
| LLC | Limited Liability Company |
| PLC | Public Limited Company |
| (a) | Non-income producing security. |
The following is a summary of the inputs used to value the Fund’s investments as of March 31, 2018.
The inputs or methodology used for valuing securities are not necessarily an indication of the risks associated with investing in those securities. For more information on valuation inputs, and their aggregation into the levels used in the table below, please refer to the Security Valuation section in Note 2 of the accompanying Notes to Financial Statements.
| Valuation Inputs | | Investments in Securities | |
| Level 1 - Quoted Prices | | $ | 38,045,315 | |
| Level 2 - Other Significant Observable Inputs | | | – | |
| Level 3 - Significant Unobservable Inputs | | | – | |
| Total | | $ | 38,045,315 | |
The Level 1 value displayed in this table includes Common Stock and a Warrant. Refer to this Schedule of Investments for a further breakout of each security by industry.
The Fund utilizes the end of period methodology when determining transfers. There were no transfers among Level 1, Level 2 and Level 3 for the year ended March 31, 2018.
See Notes to Financial Statements.
BECK, MACK & OLIVER PARTNERS FUNDSTATEMENT OF ASSETS AND LIABILITIES
MARCH 31, 2018
| ASSETS | | | |
| Investments, at value (Cost $31,244,012) | | $ | 38,045,315 | |
| Cash | | | 594,275 | |
| Receivables: | | | | |
| Fund shares sold | | | 479 | |
| Dividends and interest | | | 18,669 | |
| Prepaid expenses | | | 9,682 | |
| Total Assets | | | 38,668,420 | |
| | | | | |
| LIABILITIES | | | | |
| Payables: | | | | |
| Investment securities purchased | | | 241,959 | |
| Fund shares redeemed | | | 3,308 | |
| Accrued Liabilities: | | | | |
Investment adviser fees | | | 11,428 | |
| Trustees’ fees and expenses | | | 50 | |
| Fund services fees | | | 15,223 | |
| Other expenses | | | 28,209 | |
| Total Liabilities | | | 300,177 | |
| | | | | |
| NET ASSETS | | $ | 38,368,243 | |
| | | | | |
| COMPONENTS OF NET ASSETS | | | | |
| Paid-in capital | | $ | 47,195,421 | |
| Distributions in excess of net investment income | | | (45,738 | ) |
| Accumulated net realized loss | | | (15,582,743 | ) |
| Net unrealized appreciation | | | 6,801,303 | |
| NET ASSETS | | $ | 38,368,243 | |
| | | | | |
| SHARES OF BENEFICIAL INTEREST AT NO PAR VALUE (UNLIMITED SHARES AUTHORIZED) | | | 3,317,620 | |
| | | | | |
| NET ASSET VALUE, OFFERING AND REDEMPTION PRICE PER SHARE* | | $ | 11.56 | |
| * | Shares redeemed or exchanged within 60 days of purchase are charged a 2.00% redemption fee. |
See Notes to Financial Statements.
BECK, MACK & OLIVER PARTNERS FUNDSTATEMENT OF OPERATIONS
YEAR ENDED MARCH 31, 2018
| INVESTMENT INCOME | | | |
| Dividend income (Net of foreign withholding taxes of $10,128) | | $ | 844,853 | |
| Interest income | | | 1,611 | |
| Total Investment Income | | | 846,464 | |
| | | | | |
| EXPENSES | | | | |
Investment adviser fees | | | 390,568 | |
| Fund services fees | | | 182,759 | |
| Custodian fees | | | 10,046 | |
| Registration fees | | | 20,263 | |
| Professional fees | | | 45,418 | |
| Trustees' fees and expenses | | | 7,184 | |
| Other expenses | | | 31,572 | |
| Total Expenses | | | 687,810 | |
| Fees waived | | | (297,211 | ) |
| Net Expenses | | | 390,599 | |
| | | | | |
| NET INVESTMENT INCOME | | | 455,865 | |
| | | | | |
| NET REALIZED AND UNREALIZED GAIN | | | | |
| Net realized gain on investments | | | 1,268,937 | |
| Net change in unrealized appreciation (depreciation) on investments | | | 2,970,504 | |
| NET REALIZED AND UNREALIZED GAIN | | | 4,239,441 | |
| INCREASE IN NET ASSETS RESULTING FROM OPERATIONS | | $ | 4,695,306 | |
See Notes to Financial Statements.
BECK, MACK & OLIVER PARTNERS FUNDSTATEMENTS OF CHANGES IN NET ASSETS
| | | For the
Year Ended
March 31, 2018 | | | For the
Year Ended
March 31, 2017 | |
| OPERATIONS | | | | | | |
| Net investment income | | $ | 455,865 | | | $ | 285,527 | |
| Net realized gain | | | 1,268,937 | | | | 885,490 | |
| Net change in unrealized appreciation (depreciation) | | | 2,970,504 | | | | 4,051,877 | |
| Increase in Net Assets Resulting from Operations | | | 4,695,306 | | | | 5,222,894 | |
| | | | | | | | | |
| DISTRIBUTIONS TO SHAREHOLDERS FROM | | | | | | | | |
| Net investment income | | | (34,294 | ) | | | (361,274 | ) |
| Total Distributions to Shareholders | | | (34,294 | ) | | | (361,274 | ) |
| | | | | | | | | |
| CAPITAL SHARE TRANSACTIONS | | | | | | | | |
| Sale of shares | | | 2,901,960 | | | | 10,071,093 | |
| Reinvestment of distributions | | | 30,422 | | | | 325,372 | |
| Redemption of shares | | | (6,994,229 | ) | | | (12,077,450 | ) |
| Redemption fees | | | 199 | | | | 1,186 | |
| Decrease in Net Assets from Capital Share Transactions | | | (4,061,648 | ) | | | (1,679,799 | ) |
| Increase in Net Assets | | | 599,364 | | | | 3,181,821 | |
| | | | | | | | | |
| NET ASSETS | | | | | | | | |
| Beginning of Year | | | 37,768,879 | | | | 34,587,058 | |
| End of Year (Including line (a)) | | $ | 38,368,243 | | | $ | 37,768,879 | |
| | | | | | | | | |
| SHARE TRANSACTIONS | | | | | | | | |
| Sale of shares | | | 260,983 | | | | 1,058,015 | |
| Reinvestment of distributions | | | 2,607 | | | | 32,833 | |
| Redemption of shares | | | (628,561 | ) | | | (1,261,209 | ) |
| Decrease in Shares | | | (364,971 | ) | | | (170,361 | ) |
| | | | | | | | | |
| (a) Undistributed (distributions in excess of) net investment income | | $ | (45,738 | ) | | $ | 34,262 | |
See Notes to Financial Statements.
BECK, MACK & OLIVER PARTNERS FUNDFINANCIAL HIGHLIGHTS
These financial highlights reflect selected data for a share outstanding throughout each year.
| | | For the Years Ended March 31, | |
| | | 2018 | | | 2017 | | | 2016 | | | 2015 | | | 2014 | |
| NET ASSET VALUE, Beginning of Year | | $ | 10.26 | | | $ | 8.98 | | | $ | 12.42 | | | $ | 14.82 | | | $ | 13.76 | |
| INVESTMENT OPERATIONS | | | | | | | | | | | | | | | | | | | | |
| Net investment income (a) | | | 0.13 | | | | 0.08 | | | | 0.10 | | | | 0.11 | | | | 0.04 | |
| Net realized and unrealized gain (loss) | | | 1.18 | | | | 1.30 | | | | (1.57 | ) | | | (1.70 | ) | | | 1.91 | |
| Total from Investment Operations | | | 1.31 | | | | 1.38 | | | | (1.47 | ) | | | (1.59 | ) | | | 1.95 | |
| | | | | | | | | | | | | | | | | | | | | |
| DISTRIBUTIONS TO SHAREHOLDERS FROM | | | | | | | | | | | | | | | | | | | | |
| Net investment income | | | (0.01 | ) | | | (0.10 | ) | | | (0.07 | ) | | | (0.09 | ) | | | (0.03 | ) |
| Net realized gain | | | – | | | | – | | | | (1.90 | ) | | | (0.72 | ) | | | (0.86 | ) |
| Total Distributions to Shareholders | | | (0.01 | ) | | | (0.10 | ) | | | (1.97 | ) | | | (0.81 | ) | | | (0.89 | ) |
| REDEMPTION FEES (a) | | | 0.00 | (b) | | | 0.00 | (b) | | | 0.00 | (b) | | | 0.00 | (b) | | | 0.00 | (b) |
| NET ASSET VALUE, End of Year | | $ | 11.56 | | | $ | 10.26 | | | $ | 8.98 | | | $ | 12.42 | | | $ | 14.82 | |
| TOTAL RETURN | | | 12.77 | % | | | 15.45 | % | | | (12.05 | )% | | | (10.70 | )% | | | 14.59 | % |
| | | | | | | | | | | | | | | | | | | | | |
| RATIOS/SUPPLEMENTARY DATA | | | | | | | | | | | | | | | | | | | | |
| Net Assets at End of Year (000s omitted) | | $ | 38,368 | | | $ | 37,769 | | | $ | 34,587 | | | $ | 124,102 | | | $ | 186,315 | |
| Ratios to Average Net Assets: | | | | | | | | | | | | | | | | | | | | |
| Net investment income | | | 1.17 | % | | | 0.80 | % | | | 0.87 | % | | | 0.75 | % | | | 0.31 | % |
| Net expenses | | | 1.00 | % | | | 1.00 | % | | | 1.00 | % | | | 1.00 | % | | | 1.00 | % |
| Gross expenses (c) | | | 1.76 | % | | | 1.81 | % | | | 1.44 | % | | | 1.29 | % | | | 1.29 | % |
| PORTFOLIO TURNOVER RATE | | | 19 | % | | | 26 | % | | | 50 | % | | | 41 | % | | | 32 | % |
| (a) | Calculated based on average shares outstanding during each year. |
| (b) | Less than $0.01 per share. |
| (c) | Reflects the expense ratio excluding any waivers and/or reimbursements. |
See Notes to Financial Statements.
BECK, MACK & OLIVER PARTNERS FUND
NOTES TO FINANCIAL STATEMENTS
MARCH 31, 2018
Note 1. Organization
The Beck, Mack & Oliver Partners Fund (the “Fund”) is a non-diversified portfolio of Forum Funds (the “Trust”). The Trust is a Delaware statutory trust that is registered as an open-end, management investment company under the Investment Company Act of 1940, as amended (the “Act”). Under its Trust Instrument, the Trust is authorized to issue an unlimited number of the Fund’s shares of beneficial interest without par value. The Fund commenced operations on December 1, 2009, after it acquired the net assets of BMO Partners Fund, L.P. (the “Partnership”), in exchange for Fund shares. The Partnership commenced operations in 1991. The Fund seeks long-term capital appreciation consistent with the preservation of capital.
Note 2. Summary of Significant Accounting Policies
The Fund is an investment company and follows accounting and reporting guidance under Financial Accounting Standards Board (“FASB”) Accounting Standards Codification (“ASC”) Topic 946, “Financial Services-Investment Companies”. These financial statements are prepared in accordance with accounting principles generally accepted in the United States of America (“GAAP”), which require management to make estimates and assumptions that affect the reported amounts of assets and liabilities, the disclosure of contingent liabilities at the date of the financial statements, and the reported amounts of increases and decreases in net assets from operations during the fiscal period. Actual amounts could differ from those estimates. The following summarizes the significant accounting policies of the Fund:
Security Valuation – Securities are valued at market prices using the last quoted trade or official closing price from the principal exchange where the security is traded, as provided by independent pricing services on each Fund business day. In the absence of a last trade, securities are valued at the mean of the last bid and ask price provided by the pricing service. Debt securities may be valued at prices supplied by a fund’s pricing agent based on broker or dealer supplied valuations or matrix pricing, a method of valuing securities by reference to the value of other securities with similar characteristics such as rating, interest rate and maturity. Shares of non-exchange traded open-end mutual funds are valued at net asset value (“NAV”). Short-term investments that mature in sixty days or less may be valued at amortized cost.
The Fund values its investments at fair value pursuant to procedures adopted by the Trust’s Board of Trustees (the “Board”) if (1) market quotations are not readily available or (2) the Adviser, as defined in Note 4, believes that the values available are unreliable. The Trust’s Valuation Committee, as defined in the Fund’s registration statement, performs certain functions as they relate to the administration and oversight of the Fund’s valuation procedures. Under these procedures, the Valuation Committee convenes on a regular and ad hoc basis to review such investments and considers a number of factors, including valuation methodologies and significant unobservable inputs, when arriving at fair value.
The Valuation Committee may work with the Adviser to provide valuation inputs. In determining fair valuations, inputs may include market-based analytics that may consider related or comparable assets or liabilities, recent transactions, market multiples, book values and other relevant investment information. Adviser inputs may include an income-based approach in which the anticipated future cash flows of the investment are discounted in determining fair value. Discounts may also be applied based on the nature or duration of any restrictions on the disposition of the investments. The Valuation Committee performs regular reviews of valuation methodologies, key inputs and assumptions, disposition analysis and market activity.
BECK, MACK & OLIVER PARTNERS FUND
NOTES TO FINANCIAL STATEMENTS
MARCH 31, 2018
Fair valuation is based on subjective factors and, as a result, the fair value price of an investment may differ from the security’s market price and may not be the price at which the asset may be sold. Fair valuation could result in a different NAV than a NAV determined by using market quotes.
GAAP has a three-tier fair value hierarchy. The basis of the tiers is dependent upon the various “inputs” used to determine the value of the Fund’s investments. These inputs are summarized in the three broad levels listed below:
Level 1 - Quoted prices in active markets for identical assets and liabilities.
Level 2 - Prices determined using significant other observable inputs (including quoted prices for similar securities, interest rates, prepayment speeds, credit risk, etc.). Short-term securities with maturities of sixty days or less are valued at amortized cost, which approximates market value, and are categorized as Level 2 in the hierarchy. Municipal securities, long-term U.S. government obligations and corporate debt securities are valued in accordance with the evaluated price supplied by the pricing service and generally categorized as Level 2 in the hierarchy. Other securities that are categorized as Level 2 in the hierarchy include, but are not limited to, warrants that do not trade on an exchange, securities valued at the mean between the last reported bid and ask quotation and international equity securities valued by an independent third party with adjustments for changes in value between the time of the securities respective local market closes and the close of the U.S. market.
Level 3 - Significant unobservable inputs (including the Fund’s own assumptions in determining the fair value of investments).
The aggregate value by input level, as of March 31, 2018, for the Fund’s investments is included at the end of the Fund’s schedule of investments.
Security Transactions, Investment Income and Realized Gain and Loss – Investment transactions are accounted for on the trade date. Dividend income is recorded on the ex-dividend date. Foreign dividend income is recorded on the ex-dividend date or as soon as possible after determining the existence of a dividend declaration after exercising reasonable due diligence. Income and capital gains on some foreign securities may be subject to foreign withholding taxes, which are accrued as applicable. Interest income is recorded on an accrual basis. Premium is amortized and discount is accreted using the effective interest method. Identified cost of investments sold is used to determine the gain and loss for both financial statement and federal income tax purposes.
Distributions to Shareholders – The Fund declares any dividends from net investment income and pays them annually. Any net capital gains and net foreign currency gains realized by the Fund are distributed at least annually. Distributions to shareholders are recorded on the ex-dividend date. Distributions are based on amounts calculated in accordance with applicable federal income tax regulations, which may differ from GAAP. These differences are due primarily to differing treatments of income and gain on various investment securities held by the Fund, timing differences and differing characterizations of distributions made by the Fund.
Federal Taxes – The Fund intends to continue to qualify each year as a regulated investment company under Subchapter M of Chapter 1, Subtitle A, of the Internal Revenue Code of 1986, as amended (“Code”), and to distribute all of its taxable income to shareholders. In addition, by distributing in each calendar year substantially all of its net investment income and
BECK, MACK & OLIVER PARTNERS FUND
NOTES TO FINANCIAL STATEMENTS
MARCH 31, 2018
capital gains, if any, the Fund will not be subject to a federal excise tax. Therefore, no federal income or excise tax provision is required. The Fund files a U.S. federal income and excise tax return as required. The Fund’s federal income tax returns are subject to examination by the Internal Revenue Service for a period of three fiscal years after they are filed. As of March 31, 2018, there are no uncertain tax positions that would require financial statement recognition, de-recognition or disclosure.
Income and Expense Allocation – The Trust accounts separately for the assets, liabilities and operations of each of its investment portfolios. Expenses that are directly attributable to more than one investment portfolio are allocated among the respective investment portfolios in an equitable manner.
Redemption Fees – A shareholder who redeems or exchanges shares within 60 days of purchase will incur a redemption fee of 2.00% of the current NAV of shares redeemed or exchanged, subject to certain limitations. The fee is charged for the benefit of the remaining shareholders and will be paid to the Fund to help offset transaction costs. The fee is accounted for as an addition to paid-in capital. The Fund reserves the right to modify the terms of or terminate the fee at any time. There are limited exceptions to the imposition of the redemption fee. Redemption fees incurred for the Fund, if any, are reflected on the Statements of Changes in Net Assets.
Commitments and Contingencies – In the normal course of business, the Fund enters into contracts that provide general indemnifications by the Fund to the counterparty to the contract. The Fund’s maximum exposure under these arrangements is dependent on future claims that may be made against the Fund and, therefore, cannot be estimated; however, based on experience, the risk of loss from such claims is considered remote. The Fund has determined that none of these arrangements requires disclosure on the Fund’s balance sheet.
Note 3. Cash – Concentration in Uninsured Account
For cash management purposes, the Fund may concentrate cash with the Fund’s custodian. This typically results in cash balances exceeding the Federal Deposit Insurance Corporation (“FDIC”) insurance limits. As of March 31, 2018, the Fund had $344,275 at MUFG Union Bank, N.A. that exceeded the FDIC insurance limit.
Note 4. Fees and Expenses
Investment Adviser – Beck, Mack & Oliver LLC (the “Adviser”) is the investment adviser to the Fund. Pursuant to an investment advisory agreement, the Adviser receives an advisory fee, payable monthly, from the Fund at an annual rate of 1.00% of the Fund’s average daily net assets.
Distribution – Foreside Fund Services, LLC serves as the Fund’s distributor (the “Distributor”). The Fund does not have a distribution (12b-1) plan; accordingly, the Distributor does not receive compensation from the Fund for its distribution services. The Adviser compensates the Distributor directly for its services. The Distributor is not affiliated with the Adviser or Atlantic Fund Administration, LLC (d/b/a Atlantic Fund Services) (“Atlantic”) or their affiliates.
BECK, MACK & OLIVER PARTNERS FUND
NOTES TO FINANCIAL STATEMENTS
MARCH 31, 2018
Other Service Providers – Atlantic provides fund accounting, fund administration, compliance and transfer agency services to the Fund. The fees related to these services are included in Fund services fees within the Statement of Operations. Atlantic also provides certain shareholder report production and EDGAR conversion and filing services. Pursuant to an Atlantic services agreement, the Fund pays Atlantic customary fees for its services. Atlantic provides a Principal Executive Officer, a Principal Financial Officer, a Chief Compliance Officer and an Anti-Money Laundering Officer to the Fund, as well as certain additional compliance support functions.
Trustees and Officers – Through December 31, 2017, the Trust paid each independent Trustee an annual retainer fee of $50,000 for service to the Trust ($66,000 for the Chairman), and the Audit Committee Chairman and Vice Chairman received an additional $6,000 annually. Effective January 1, 2018, each independent Trustee’s annual retainer is $31,000 ($41,000 for the Chairman), and the Audit Committee Chairman receives an additional $2,000 annually. The Trustees and Chairman may receive additional fees for special Board meetings. Each Trustee is also reimbursed for all reasonable out-of-pocket expenses incurred in connection with his duties as a Trustee, including travel and related expenses incurred in attending Board meetings. The amount of Trustees’ fees attributable to the Fund is disclosed in the Statement of Operations. Certain officers of the Trust are also officers or employees of the above named service providers, and during their terms of office received no compensation from the Fund.
Note 5. Expense Reimbursement and Fees Waived
The Adviser has contractually agreed to waive its fee and/or reimburse Fund expenses to limit Total Annual Fund Operating Expenses After Fee Waiver and/or Expense Reimbursement (excluding all taxes, interest, portfolio transaction expenses, acquired fund fees and expenses, proxy expenses and extraordinary expenses) to 1.00%, through at least July 31, 2018. During the year ended March 31, 2018, fees waived were $297,211.
Note 6. Security Transactions
The cost of purchases and proceeds from sales of investment securities (including maturities), other than short-term investments, during the year ended March 31, 2018 were $7,176,167 and $10,153,158 respectively.
Note 7. Federal Income Tax
As of March 31, 2018, the cost of investments for federal income tax purposes is $30,812,064 and the components of net unrealized appreciation were as follows:
| | Gross Unrealized Appreciation | | $ | 9,943,765 | | |
| | Gross Unrealized Depreciation | | | (2,710,514 | ) | |
| | Net Unrealized Appreciation | | $ | 7,233,251 | | |
Distributions paid during the fiscal years ended as noted were characterized for tax purposes as follows:
| | | | 2018 | | | 2017 | | |
| | Ordinary Income | | $ | 34,294 | | | $ | 361,274 | | |
BECK, MACK & OLIVER PARTNERS FUND
NOTES TO FINANCIAL STATEMENTS
MARCH 31, 2018
As of March 31, 2018, distributable earnings (accumulated loss) on a tax basis were as follows:
| | Capital and Other Losses | | $ | (16,060,429 | ) | |
| | Net Unrealized Appreciation | | | 7,233,251 | | |
| | Total | | $ | (8,827,178 | ) | |
The difference between components of distributable earnings on a tax basis and the amounts reflected in the Statement of Assets and Liabilities are primarily due to equity return of capital, partnerships, grantor trusts and wash sales.
The Fund has $5,141,993 of available short-term capital loss carryforwards and $10,918,436 of available long-term capital loss carryforwards that have no expiration date.
On the Statement of Assets and Liabilities, as a result of permanent book to tax differences, certain amounts have been reclassified for the year ended March 31, 2018. The following reclassification was the result of net operating loss, equity return of capital, real estate investment trusts, grantor trusts and partnership adjustments and has no impact on the net assets of the Fund.
| | Distributions in Excess of Net Investment Income | | $ | (501,571 | ) | |
| | Accumulated Net Realized Loss | | | 547,457 | | |
| | Paid-in-Capital | | | (45,886 | ) | |
Note 8. Subsequent Events
Subsequent events occurring after the date of this report through the date these financial statements were issued have been evaluated for potential impact, and the Fund has had no such events.
REPORT OF INDEPENDENT REGISTERED PUBLIC ACCOUNTING FIRM
To the Board of Trustees of Forum Funds
and the Shareholders of Beck, Mack & Oliver Partners Fund
Opinion on the Financial Statements
We have audited the accompanying statement of assets and liabilities of Beck, Mack & Oliver Partners Fund, a series of shares of beneficial interest in Forum Funds (the “Fund”), including the schedule of investments, as of March 31, 2018, and the related statement of operations for the year then ended, the statements of changes in net assets for each of the years in the two-year period then ended and the financial highlights for each of the years in the five-year period then ended, and the related notes (collectively referred to as the “financial statements”). In our opinion, the financial statements present fairly, in all material respects, the financial position of the Fund as of March 31, 2018, and the results of its operations for the year then ended, the changes in its net assets for each of the years in the two-year period then ended and its financial highlights for each of the years in the five-year period then ended, in conformity with accounting principles generally accepted in the United States of America.
Basis for Opinion
These financial statements are the responsibility of the Fund’s management. Our responsibility is to express an opinion on the Fund’s financial statements based on our audits. We are a public accounting firm registered with the Public Company Accounting Oversight Board (United States) (“PCAOB”) and are required to be independent with respect to the Fund in accordance with the U.S. federal securities law and the applicable rules and regulations of the Securities and Exchange Commission and the PCAOB.
We conducted our audits in accordance with the standards of the PCAOB. Those standards require that we plan and perform the audits to obtain reasonable assurance about whether the financial statements are free of material misstatement, whether due to error or fraud. The Fund is not required to have, nor were we engaged to perform, an audit of its internal control over financial reporting. As part of our audits we are required to obtain an understanding of internal control over financial reporting but not for the purpose of expressing an opinion on the effectiveness of the Fund’s internal control over financial reporting. Accordingly, we express no such opinion.
Our audits included performing procedures to assess the risk of material misstatement of the financial statements, whether due to error or fraud, and performing procedures that respond to those risks. Such procedures include examining, on a test basis, evidence regarding the amounts and disclosures in the financial statements. Our procedures included confirmation of securities owned as of March 31, 2018 by correspondence with the custodian and brokers. Our audits also included evaluating the accounting principles used and significant estimates made by management, as well as evaluating the overall presentation of the financial statements. We believe that our audits provide a reasonable basis for our opinion.
BBD, LLP
We have served as the auditor of one or more of the Funds in the Forum Funds since 2009.
Philadelphia, Pennsylvania
May 24, 2018
BECK, MACK & OLIVER PARTNERS FUND
ADDITIONAL INFORMATION (Unaudited)
MARCH 31, 2018
Investment Advisory Agreement Approval
At the March 27, 2018 Board meeting, the Board, including the Independent Trustees, considered the approval of the continuance of the investment advisory agreement between the Adviser and the Trust pertaining to the Fund (the “Advisory Agreement”). In preparation for its deliberations, the Board requested and reviewed written responses from the Adviser to a due diligence questionnaire circulated on the Board’s behalf concerning the Adviser’s personnel, operations, financial condition, performance, and services provided by the Adviser. The Board also discussed the materials with Fund counsel and, as necessary, with the Trust’s administrator, Atlantic Fund Services. During its deliberations, the Board received an oral presentation from the Adviser, and was assisted by the advice of Trustee counsel.
At the meeting, the Board reviewed, among other matters: (1) the nature, extent and quality of the services provided to the Fund by the Adviser, including information on the investment performance of the Fund and the Adviser; (2) the costs of the services provided and profitability to the Adviser with respect to its relationship with the Fund; (3) the advisory fee and total expense ratio of the Fund compared to a relevant peer group of funds; (4) the extent to which economies of scale may be realized as the Fund grows and whether the advisory fees enable the Fund’s investors to share in the benefits of economies of scale; and (5) other benefits received by the Adviser from its relationship with the Fund.
Nature, Extent and Quality of Services
Based on written materials received, a presentation from senior representatives of the Adviser, and a discussion with the Adviser about the Adviser’s personnel, operations and financial condition, the Board considered the quality of services provided by the Adviser under the Advisory Agreement. In this regard, the Board considered information regarding the experience, qualifications and professional background of the portfolio managers and other personnel at the Adviser with principal investment responsibility for the Fund’s investments as well as the investment philosophy and decision-making processes of the Adviser and the capability and integrity of the Adviser’s senior management and staff.
The Board considered also the adequacy of the Adviser’s resources and the Adviser’s recent enhancements to its compliance, cyber security and business continuity programs. The Board noted the Adviser’s representation that the firm is in stable financial condition, that the firm is able to meet its expense reimbursement obligations to the Fund, that the firm has the operational capability and the necessary staffing and experience to continue providing high-quality investment advisory services to the Fund. Based on the presentation and the materials provided by the Adviser in connection with the Board’s consideration of the renewal of the Advisory Agreement, the Board concluded that, overall, it was satisfied with the nature, extent, and quality of services provided to the Fund under the Advisory Agreement.
Performance
In connection with a presentation by the Adviser regarding its approach to managing the Fund, the Board reviewed the performance of the Fund compared to its benchmark. The Board observed that the Fund underperformed the S&P 500 Index, the Fund’s primary benchmark index, for all periods reviewed ended December 31, 2017. The Board noted the Adviser’s statement that the Fund’s underperformance relative to the benchmark over the short term was attributable, at least in part, to the Fund’s sector allocation and, in particular, the Fund’s underweight exposure to the technology sector, which had outperformed the overall market in recent years. The Board considered the Adviser’s representation that the Fund’s underperformance over the longer term was largely a result of the Fund’s overexposure to the energy sector during
BECK, MACK & OLIVER PARTNERS FUND
ADDITIONAL INFORMATION (Unaudited)
MARCH 31, 2018
the calendar years 2014 and 2015 and noted that the Adviser had since changed its portfolio manager and repositioned the Fund’s energy exposure.
The Board also reviewed the Fund’s performance relative to an independent peer group identified by Broadridge Financial Solutions, Inc. (“Broadridge”) as having characteristics similar to those of the Fund. The Board observed that, based on the information provided by Broadridge, the Fund outperformed the median of the Broadridge peers for the one-year period ended December 31, 2017, and underperformed the median of its Broadridge peer group for the three- and five-year periods ended December 31, 2017. With respect to the Fund’s relative underperformance for the three- and five-year periods, the Board considered the Adviser’s assertion that the peer group identified by Broadridge is not the most suitable comparison for the Fund and at the request of the Adviser, reviewed the Fund’s performance compared to a second peer group of funds provided by the Adviser as a more meaningful comparison (“Comparable Fund Peers”). The Board considered the Adviser’s explanation of the Comparable Fund Peers as an appropriate point of comparison for the Fund in evaluating its performance and considered the Fund’s performance relative to the Comparable Fund Peers. In that regard, the Board noted that the Fund outperformed the median of the Comparable Fund Peers for the one-year period ended December 31, 2017, and underperformed the median of the Comparable Fund Peers for the three- and five-year periods ended December 31, 2017. Finally, the Board observed that the Adviser had taken steps that were expected to improve the Fund’s future performance.
Based on the Adviser’s investment style and the foregoing performance information, among other factors, the Board determined that the Fund and its shareholders could expect to benefit from the Adviser’s continued management of the Fund.
Compensation
The Board evaluated the Adviser’s compensation for providing advisory services to the Fund and analyzed comparative information on actual advisory fee rates and actual total expenses of the Fund’s Broadridge peer group. The Board observed that the Adviser’s actual advisory fee rate and actual total expenses were each less than the median of the Broadridge peers and were each less than the median of the Comparable Fund Peers. The Board further noted that the Adviser was currently waiving a significant portion of its advisory fee in an effort to keep the Fund’s expenses at competitive levels. The Board also noted the Adviser’s representation that the advisory fee charged to the Fund was consistent with the fee charged by the Adviser to its smaller separately managed accounts. Based on the foregoing, the Board concluded that the Adviser’s advisory fee rate charged to the Fund was reasonable.
Costs of Services and Profitability
The Board considered information provided by the Adviser regarding its costs of services and its profitability with respect to the Fund. In this regard, the Board considered the Adviser’s resources devoted to the Fund, as well as the Adviser’s discussion of the aggregate costs and profitability of its mutual fund activities. The Board considered also the Adviser’s representation that the Adviser does not conduct a formal, comprehensive cost allocation with respect to its mutual fund activities and separately managed accounts, but that the Adviser believed that the Fund was comparatively less profitable than its separately managed account activities as a result of the low level of the Fund’s assets, costs incurred in connection with regulatory compliance applicable to registered investment companies, and the expense cap currently in place. Based
BECK, MACK & OLIVER PARTNERS FUND
ADDITIONAL INFORMATION (Unaudited)
MARCH 31, 2018
on these and other applicable considerations, the Board concluded that the Adviser’s profits attributable to the management of the Fund were reasonable.
Economies of Scale
The Board evaluated whether the Fund would benefit from any economies of scale. In this respect, the Board considered the Adviser’s statement that, although the Fund’s shareholders potentially could benefit from economies of scale if the Fund’s assets increased, the consideration of breakpoints was not appropriate at this time because of the Fund’s low asset levels. Based on the foregoing information, the Board concluded that economies of scale were not a material factor in renewing the Advisory Agreement.
Other Benefits
The Board noted the Adviser’s representation that, other than its contractual advisory fees and the soft dollar benefits accrued from Fund brokerage commissions and used to obtain third party research for the benefit of both the Fund and the Adviser’s separately managed accounts, the Adviser does not benefit in a material way from its relationship with the Fund. Based on the foregoing representation, the Board concluded that other benefits received by the Adviser from its relationship with the Fund were not a material factor to consider in approving the continuation of the Advisory Agreement.
Conclusion
The Board did not identify any single factor as being of paramount importance, and different Trustees may have given different weight to different factors. The Board reviewed a memorandum from Fund counsel discussing the legal standards applicable to its consideration of the Advisory Agreement. Based on its review, including consideration of each of the factors referenced above, the Board determined, in the exercise of its reasonable business judgment, that the advisory arrangement, as outlined in the Advisory Agreement, was fair and reasonable in light of the services performed or to be performed, expenses incurred or to be incurred and such other matters as the Board considered relevant.
Shareholder Proxy Vote
At a special meeting of shareholders for all the Funds in the Trust, held on December 8, 2017, shares were voted as follows on the proposals presented to shareholders:
| Matter | | For | | Against | | Abstain |
| To elect David Tucker to the Board of Trustees of the Trust | | 108,303,928.779 | | 1,542,957.994 | | 0 |
| To elect Jennifer Brown-Strabley to the Board of Trustees of the Trust | | 108,183,952.495 | | 1,662,934.278 | | 0 |
| To elect Mark D. Moyer to the Board of Trustees of the Trust. | | 108,142,412.946 | | 1,704,473.827 | | 0 |
| To elect Jessica Chase to the Board of Trustees of the Trust. | | 107,632,924.803 | | 2,213,961.970 | | 0 |
| To elect Stacey E. Hong to the Board of Trustees of the Trust. | | 105,777,266.997 | | 4,069,619.776 | | 0 |
Proxy Voting Information
A description of the policies and procedures that the Fund uses to determine how to vote proxies relating to securities held in the Fund’s portfolio is available, without charge and upon request, by calling (800) 943-6786 and on the U.S. Securities
BECK, MACK & OLIVER PARTNERS FUND
ADDITIONAL INFORMATION (Unaudited)
MARCH 31, 2018
and Exchange Commission’s (“SEC”) website at www.sec.gov. The Fund’s proxy voting record for the most recent twelve-month period ended June 30 is available, without charge and upon request, by calling (800) 943-6786 and on the SEC’s website at www.sec.gov.
Availability of Quarterly Portfolio Schedules
The Fund files its complete schedule of portfolio holdings with the SEC for the first and third quarters of each fiscal year on Form N-Q. These filings are available, without charge and upon request on the SEC’s website at www.sec.gov or may be reviewed and copied at the SEC’s Public Reference Room in Washington, DC. Information on the operation of the Public Reference Room may be obtained by calling (800) SEC-0330.
Shareholder Expense Example
As a shareholder of the Fund, you incur two types of costs: (1) transaction costs, including redemption fees and exchange fees, and (2) ongoing costs, including management fees and other Fund expenses. This example is intended to help you understand your ongoing costs (in dollars) of investing in the Fund, and to compare these costs with the ongoing costs of investing in other mutual funds.
The example is based on an investment of $1,000 invested at the beginning of the period and held for the entire period from October 1, 2017 through March 31, 2018.
Actual Expenses – The first line of the table below provides information about actual account values and actual expenses. You may use the information in this line, together with the amount you invested, to estimate the expenses that you paid over the period. Simply divide your account value by $1,000 (for example, an $8,600 account value divided by $1,000 = 8.6), then multiply the result by the number in the first line under the heading entitled “Expenses Paid During Period” to estimate the expenses you paid on your account during the period.
Hypothetical Example for Comparison Purposes – The second line of the table below provides information about hypothetical account values and hypothetical expenses based on the Fund’s actual expense ratio and an assumed rate of return of 5% per year before expenses, which is not the Fund’s actual return. The hypothetical account values and expenses may not be used to estimate the actual ending account balance or expenses you paid for the period. You may use this information to compare the ongoing costs of investing in the Fund and other funds. To do so, compare this 5% hypothetical example with the 5% hypothetical examples that appear in the shareholder reports of other funds.
Please note that the expenses shown in the table are meant to highlight your ongoing costs only and do not reflect any transactional costs, such as redemption fees and exchange fees. Therefore, the second line of the table is useful in comparing ongoing costs only and will not help you determine the relative total costs of owning different funds.
BECK, MACK & OLIVER PARTNERS FUNDADDITIONAL INFORMATION (Unaudited)
MARCH 31, 2018
| | | Beginning Account Value October 1, 2017 | | | Ending Account Value March 31, 2018 | | | Expenses Paid During Period* | | Annualized Expense Ratio* | |
| Actual | | $1,000.00 | | | $1,041.43 | | | $5.09 | | 1.00% | |
| Hypothetical (5% return before expenses) | | $1,000.00 | | | $1,019.95 | | | $5.04 | | 1.00% | |
| * | Expenses are equal to the Fund’s annualized expense ratio multiplied by the average account value over the period, multiplied by the number of days in the most recent fiscal half-year (182) divided by 365 to reflect the half-year period. |
Federal Tax Status of Dividends Declared during the Fiscal Year
The Fund designates 100.00% of its income dividend distributed as qualifying for the corporate dividends-received deduction (DRD) and 100.00% for the qualified dividend rate (QDI) as defined in Section 1(h)(11) of the Internal Revenue Code. The Fund also designates 0.45% as qualified interest income exempt from U.S. tax for foreign shareholders (QII).
Trustees and Officers of the Trust
The Board is responsible for oversight of the management of the Trust’s business affairs and of the exercise of all the Trust’s powers except those reserved for the shareholders. The following table provides information about each Trustee and certain officers of the Trust. Each Trustee and officer holds office until the person resigns, is removed, or is replaced. Unless otherwise noted, the persons have held their principal occupations for more than five years. The address for all Trustees and officers is Three Canal Plaza, Suite 600, Portland, Maine 04101. The Fund’s Statement of Additional Information includes additional information about the Trustees and is available, without charge and upon request, by calling (800) 943-6786.
| Name and Year of Birth | Position with the Trust | Length of Time Served | Principal Occupation(s) During Past Five Years | Number of Series in Fund Complex Overseen By Trustee | Other Directorships Held By Trustee During Past Five Years |
| Independent Trustees |
David Tucker Born: 1958 | Trustee; Chairman of the Board | Since 2011 and Chairman since 2018 | Director, Blue Sky Experience (a charitable endeavor) since 2008; Senior Vice President & General Counsel, American Century Companies (an investment management firm) 1998-2008. | 1 | Trustee, Forum Funds II, Forum ETF Trust and U.S. Global Investors Funds |
BECK, MACK & OLIVER PARTNERS FUNDADDITIONAL INFORMATION (Unaudited)
MARCH 31, 2018
| Name and Year of Birth | Position with the Trust | Length of Time Served | Principal Occupation(s) During Past Five Years | Number of Series in Fund Complex Overseen By Trustee | Other Directorships Held By Trustee During Past Five Years |
Mark D. Moyer Born: 1959 | Trustee | Since 2018 | Chief Financial Officer, Freedom House (a NGO advocating political freedom and democracy) since 2017; independent consultant providing interim CFO services, principally to non-profit organizations, 2011- 2017; Chief Financial Officer, Institute of International Education (a NGO administering international educational exchange programs), 2008-2011; Chief Financial Officer and Chief Restructuring Officer, Ziff Davis Media Inc. (an integrated media company), 2005-2008; Adjunct Professor of Accounting, Fairfield University from 2009-2012. | 1 | Trustee, Forum Funds II, Forum ETF Trust and U.S. Global Investors Funds |
Jennifer Brown-Strabley
Born: 1964 | Trustee | Since 2018 | Principal, Portland Global Advisors, 1996-2010. | 1 | Trustee, Forum Funds II, Forum ETF Trust and U.S. Global Investors Funds |
| Interested Trustee |
Stacey E. Hong(1)
Born: 1966 | Trustee | Since 2018 | President, Atlantic since 2008. | 1 | Trustee, Forum Funds II and U.S. Global Investors Funds |
Jessica Chase(1) Born: 1970 | Trustee | Since 2018 | Senior Vice President, Atlantic since 2008. | 1 | None |
(1) | Stacey E. Hong is currently treated as an interested person of the Trust, as defined in the 1940 Act, due to his affiliation with Atlantic. Jessica Chase is currently treated as an interested person of the Trust, as defined in the 1940 Act, due to her affiliation with Atlantic and her role as President of the Trust. |
BECK, MACK & OLIVER PARTNERS FUNDADDITIONAL INFORMATION (Unaudited)
MARCH 31, 2018
Name and Year of Birth | Position with the Trust | Length of Time Served | Principal Occupation(s) During Past 5 Years |
| Officers |
Jessica Chase Born: 1970 | President; Principal Executive Officer | Since 2015 | Senior Vice President, Atlantic since 2008. |
Karen Shaw
Born: 1972 | Treasurer; Principal Financial Officer | Since 2008 | Senior Vice President, Atlantic since 2008. |
Zachary Tackett
Born: 1988 | Vice President; Secretary and Anti- Money Laundering Compliance Officer | Since 2014 | Counsel, Atlantic since 2014; Intern Associate, Coakley & Hyde, PLLC, 2010-2013. |
Michael J. McKeen Born: 1971 | Vice President | Since 2009 | Senior Vice President, Atlantic since 2008. |
Timothy Bowden
Born: 1969 | Vice President | Since 2009 | Manager, Atlantic since 2008. |
Geoffrey Ney
Born: 1975 | Vice President | Since 2013 | Manager, Atlantic since 2013; Senior Fund Accountant, Atlantic, 2008–2013. |
Todd Proulx
Born: 1978 | Vice President | Since 2013 | Manager, Atlantic since 2013; Senior Fund Accountant, Atlantic, 2008–2013. |
Carlyn Edgar Born: 1963 | Vice President | Since 2008 | Senior Vice President, Atlantic since 2008; Chief Compliance Officer, 2008-2016 |
Dennis Mason
Born: 1967 | Chief Compliance Officer | Since 2016 | Fund Compliance Officer, Atlantic since 2013; Senior Specialist, Atlantic, 2011-2013; Senior Analyst, Atlantic, 2008-2011 |
LMCG FUNDS
LMCG GLOBAL MARKET NEUTRAL FUND
LMCG GLOBAL MULTICAP FUND
LMCG INTERNATIONAL SMALL CAP FUND
Annual Report
March 31, 2018
LMCG FUNDS
TABLE OF CONTENTS
MARCH 31, 2018
| LMCG Global Market Neutral Fund | |
| A Message to Our Shareholders (Unaudited) | 1 |
| Performance Chart and Analysis (Unaudited) | 4 |
| Schedule of Investments | 5 |
| Schedule of Securities Sold Short | 7 |
| Notes to Schedules of Investments and Securities Sold Short | 9 |
| Statement of Assets and Liabilities | 11 |
| Statement of Operations | 12 |
| Statements of Changes in Net Assets | 13 |
| Financial Highlights | 14 |
| | |
| LMCG Global MultiCap Fund | |
| A Message to Our Shareholders (Unaudited) | 16 |
| Performance Chart and Analysis (Unaudited) | 19 |
| Schedule of Investments | 20 |
| Statement of Assets and Liabilities | 23 |
| Statement of Operations | 24 |
| Statements of Changes in Net Assets | 25 |
| Financial Highlights | 26 |
| | |
| LMCG International Small Cap Fund | |
| A Message to Our Shareholders (Unaudited) | 28 |
| Performance Chart and Analysis (Unaudited) | 31 |
| Schedule of Investments | 32 |
| Statement of Assets and Liabilities | 35 |
| Statement of Operations | 36 |
| Statements of Changes in Net Assets | 37 |
| Financial Highlights | 38 |
| | |
| Notes to Financial Statements | 40 |
| Report of Independent Registered Public Accounting Firm | 46 |
| Additional Information (Unaudited) | 47 |
IMPORTANT INFORMATION
An investment in the LMCG Global Market Neutral Fund, the LMCG Global MultiCap Fund, and the LMCG International Small Cap Fund (the “Funds”) is subject to risk, including the possible loss of principal. Investments in small and/or midsize companies increase the risk of greater price fluctuations. Stock prices may fall or fail to rise over time for several reasons, including general financial market conditions and factors related to a specific issuer or industry. As a result of political or economic instability in foreign countries, there can be special risks associated with investing in foreign securities, including fluctuations in currency exchange rates, increased price volatility and difficulty obtaining information. In addition, emerging markets may present additional risk due to potential for greater economic and political instability in less developed countries.
Investing in a market neutral style may involve the use of short sales. There is no guarantee that the use of long and short positions will succeed in limiting the LMCG Global Market Neutral Fund's exposure to stock market movements, capitalization, or other risk factors. Investments involved in long and short selling may cause higher turnover rates. This will likely result in additional tax consequences. Short selling involves certain risks, including additional costs associated with covering short positions and a possibility of unlimited loss on certain short sale positions.
There is no assurance that the Funds will achieve their investment objectives.
LMCG GLOBAL MARKET NEUTRAL FUND
A MESSAGE TO OUR SHAREHOLDERS (Unaudited)
MARCH 31, 2018
Dear Shareholder:
The LMCG Global Market Neutral Fund (the “Fund”) Institutional Shares advanced 1.03% over the last twelve months versus a 1.07% gain for the Citigroup 3-Month U.S. T-Bill Index (the “Index”). Since its May 21, 2013 inception, the Institutional Shares has returned an annualized 1.65% versus 0.32% for the Index. The Fund invests primarily in small-mid cap companies in the U.S. and large cap companies internationally. For the year, large cap equities in the U.S. underperformed their international peers with the Russell 1000 Index returning 13.98% while the MSCI EAFE Index posted a 14.80% return. Smaller cap companies in the U.S. (proxied by the Russell 2000 Index), which is where the Fund primarily invests, moderately underperformed large caps with a return of 11.79% for the period.
The performance data quoted represents past performance and is no guarantee of future results. Investment return and principal value of an investment will fluctuate so that an investor's shares, when redeemed, may be worth more or less than their original cost. Current performance may be lower or higher than the performance data quoted. For the most recent month-end performance, please call (877) 591-4667.
The year included a variety of capital market environments – it was primarily a continuation of the extended bull market until February 2018. But the low volatility environment that was evidenced in most of 2017 disappeared in February-March 2018, and investors became nervous about a variety of issues: trade wars, higher inflation, higher interest rates and geo-political conflicts. The February-March period witnessed many global equity indexes moving into corrective phases (declines of 10%). In general, it appeared that headlines (rather than data) were behind the market moves. The economic data continued to be favorable, e.g. unemployment remained low, inflation remained under control and earnings outlooks were favorable for most companies. The stock selection model is fundamentally-based, so it has typically been most effective when fundamentals – not headlines – drive security prices.
The Fund generated mixed results during the 12-month period. The strong third (calendar) quarter return of 2.91% for Institutional Shares offset three quarters of modest negative returns between zero and -1.0%. The global equity market backdrop in the last three quarters of 2017 produced strong equity returns accompanied by very low volatility. Fixed income markets also produced solid investment results in this time period. One of the hallmarks of the Fund is its lack of correlation to either equity or fixed income markets. Therefore, in a strong equity market, the Fund does not benefit from a beta effect. The Fund met its investment objective of delivering capital appreciation independent of equity market conditions for the year – however we were disappointed that the magnitude of the gain was muted by the three negative quarters.
Attribution
In any given period, stock selection factors can work better in one universe versus the other. This year, the results were materially better in the U.S. sleeve of the portfolio. Additionally, the long side of the Fund was much more productive than the short side. The largest country contributor was the Netherlands, which delivered positive results both on the long and short side. The U.S. was the second biggest contributor from a country perspective – but there was a wide dichotomy between longs and shorts – as the longs generated significant returns while the U.S. shorts detracted from performance. The U.S. constitutes approximately 60% of the Fund’s weight. There was wide dispersion in sector results for the 12-month period. Energy, Health Care and Consumer Discretionary were the strongest sectors (net results of long and short positions), while Industrials, Materials and Real Estate lagged (also on a net basis).
Model Efficacy
In the model’s U.S. universe1, market dynamics (which includes earnings revision and price momentum) was the largest contributor to performance over the one-year period, followed by earnings quality. Value was negative for the same period. The pattern was similar in the international universe2although earnings quality was slightly negative.
1 | The U.S. universe is primarily stocks in the Russell 2000 Index. |
2 | The international universe is primarily the MSCI EAFE Index. |
Frank Russell Company (“Russell”) is the source and owner of the trademarks, service marks and copyrights related to the Russell Indexes. Russell® is a trademark of Frank Russell Company. Neither Russell nor its licensors accept any liability for any errors or omissions in the Russell Indexes and / or Russell ratings or underlying data and no party may rely on any Russell Indexes and / or Russell ratings and / or underlying data contained in this communication. No further distribution of Russell Data is permitted without Russell’s express written consent. Russell does not promote, sponsor or endorse the content of this communication.
LMCG GLOBAL MARKET NEUTRAL FUND
A MESSAGE TO OUR SHAREHOLDERS (Unaudited)
MARCH 31, 2018
The graph below shows the difference in performance of our model’s three factors for the one-year period in the U.S. and international investment universes. This data is calculated by subtracting the 5th quintile stock performance for each factor in our U.S. and international universes from the performance of those in their respective 1st quintile. Performance in the Fund’s portfolio varies from the model, since the Fund does not own all of the 1st quintile stocks or short all of the 5th quintile stocks, and the Fund owns stocks below the 1st quintile and shorts stocks above the 5th quintile.
Source: LMCG
Outlook
We have been discussing the strength of the long running bull market in recent quarterly commentaries – and the pullback that we were likely to get at some point. That pullback occurred in February and March, as many equity indexes witnessed a 10% decline. Fixed income securities also posted negative returns in the quarter – providing investors with few “safe havens.” Volatility, which had been benign for a long time returned with a vengeance in February, resulting in wild daily market swings. We think a good definition of market volatility is “when buyers and sellers can’t agree on a fair price for an asset” – it certainly seemed to be an apt description for the global equity markets for a good part of February and March.
One feature of a low or non-correlating investment should be resiliency in a declining equity market. But when that declining market is feeding off of headlines rather than fundamentals, the Fund is typically less effective. If the weak equity markets we witnessed in February and March persist in 2018, and that weakness is more based on deteriorating fundamentals such as lower earnings or higher interest rates than anticipated, we believe that the Fund should provide a good risk dampener to an investor’s equity allocation.
Sincerely,
 | |
Gordon Johnson Co-Portfolio Manager LMCG Investments, LLC | Shannon Ericson Co-Portfolio Manager LMCG Investments, LLC |
LMCG GLOBAL MARKET NEUTRAL FUND
A MESSAGE TO OUR SHAREHOLDERS (Unaudited)
MARCH 31, 2018
INVESTMENT CONSIDERATIONS
Market Events Risk - Turbulence in the financial markets and reduced liquidity in equity, credit and fixed-income markets may negatively affect issuers, which could adversely affect the Fund.
Market Neutral Style Risk - As a result of the Fund’s use of short selling, the Fund will not participate to the same level as a long only mutual fund in a “bull” market.
Short Selling Risk - The Fund may engage in short sales of securities by borrowing a security and then selling it. The Fund may incur losses from unsuccessful short sales, and due to the nature of short selling, such losses may be theoretically unlimited. Short selling requires segregated account of cash and/or liquid assets with Fund’s custodian which may lead to high levels of cash or liquid assets. A more detailed discussion of the Fund’s risks, including risks that are unique to the Fund, can be found in its prospectus.
Equity Risk - The Fund’s equity holdings may decline in value because of changes in price of a particular holding or a broad stock market decline.
Foreign Investments Risk - Foreign investments may be subject to the same risks as domestic investments and to additional risks which include international trade, currency, political, regulatory and diplomatic risks, which may affect their value.
There can be no guarantee that any strategy (risk management or otherwise) will be successful. All investing involves risk, including potential loss of principal.
LMCG FUNDS
LMCG GLOBAL MARKET NEUTRAL FUND
PERFORMANCE CHART AND ANALYSIS (Unaudited)
MARCH 31, 2018
The following chart reflects the change in the value of a hypothetical $100,000 investment in Institutional Shares, including reinvested dividends and distributions, in the LMCG Global Market Neutral Fund (the “Fund”) compared with the performance of the benchmark, Citigroup 3-Month U.S. T-Bill Index, since inception. The Citigroup 3-Month U.S. T-Bill Index measures return equivalents of yield averages that are not marked to market and consists of the last three three-month Treasury bill month-end rates. The total return of the index includes the reinvestment of dividends and income. The total return of the Fund includes operating expenses that reduce returns, while the total return of the index does not include expenses. The Fund is professionally managed, while the index is unmanaged and is not available for investment.
Comparison of Change in Value of a $100,000 Investment
LMCG Global Market Neutral Fund - Institutional Shares vs. Citigroup 3-Month U.S. T-Bill Index
Average Annual Total Returns Periods Ended March 31, 2018 | One Year | Since Inception(1) |
| LMCG Global Market Neutral Fund - Institutional Shares | 1.03% | 1.65% |
LMCG Global Market Neutral Fund - Investor Shares(2) | 0.75% | 1.48% |
| Citigroup 3-Month U.S. T-Bill Index | 1.07% | 0.32% |
(1) | Institutional Shares commenced operations on May 21, 2013 and Investor Shares commenced operations on December 18, 2014. |
(2) | Performance for the since inception period is a blended average annual return, which include the returns of the Institutional Shares prior to the commencement of the Investor Shares. |
Performance data quoted represents past performance and is no guarantee of future results. Current performance may be lower or higher than the performance data quoted. Investment return and principal value will fluctuate so that shares, when redeemed, may be worth more or less than original cost. As stated in the Fund’s prospectus, the annual operating expense ratios (gross) for Institutional Shares and Investor Shares are 3.77% and 4.39%, respectively. Excluding the effect of expenses attributable to dividend and interest expenses on short sales, the Fund's total annual operating expense ratios for Institutional Shares and Investor Shares would be 2.19% and 2.68%, respectively. However, the Fund’s adviser has contractually agreed to waive its fee and/or reimburse Fund expenses to limit Total Annual Fund Operating Expenses After Fee Waiver and/or Expense Reimbursement (excluding all taxes, interest, portfolio transaction expenses, dividend and interest expenses on short sales, acquired fund fees and expenses, proxy expenses and extraordinary expenses) to 1.60% and 1.85% of Institutional Shares and Investor Shares, respectively, through at least July 31, 2018 (the “Expense Cap”). The adviser may be reimbursed by the Fund for fees waived and expenses reimbursed by the adviser pursuant to the Expense Cap if such payment is made within three years of the fee waiver or expense reimbursement, and does not cause the Total Annual Fund Operating Expenses After Fee Waiver and/or Expense Reimbursement to exceed the lesser of (i) the then-current expense cap, or (ii) the expense cap in place at the time the fees/expenses were waived/ reimbursed. The performance table and graph do not reflect the deduction of taxes that a shareholder would pay on Fund distributions or the redemption of Fund shares. Returns greater than one year are annualized.
LMCG FUNDS
LMCG GLOBAL MARKET NEUTRAL FUND
SCHEDULE OF INVESTMENTS
MARCH 31, 2018
| Shares | | Security Description | | Value | |
| Long Positions - 95.5% | | | |
| Equity Securities - 90.5% (a) | | | |
| Common Stock - 90.0% | | | |
| Australia - 1.6% | | | |
| 13,466 | | Aristocrat Leisure, Ltd. | | $ | 251,417 | |
| 9,794 | | Caltex Australia, Ltd. | | | 237,907 | |
| 3,293 | | Macquarie Group, Ltd. | | | 262,575 | |
| | | | | | 751,899 | |
| Austria - 0.3% | | | | |
| 12,279 | | UNIQA Insurance Group AG | | | 142,944 | |
| Belgium - 0.9% | | | | |
| 8,431 | | bpost SA | | | 190,479 | |
| 2,910 | | UCB SA | | | 236,986 | |
| | | | | | 427,465 | |
| Bermuda - 0.5% | | | | |
| 10,768 | | Marvell Technology Group, Ltd. | | | 226,128 | |
| Denmark - 0.6% | | | | |
| 4,849 | | H Lundbeck A/S | | | 272,351 | |
| Finland - 1.2% | | | | |
| 12,308 | | Fortum OYJ | | | 264,413 | |
| 16,492 | | Stora Enso OYJ, Class R | | | 303,228 | |
| | | | | | 567,641 | |
| France - 3.5% | | | | |
| 10,489 | | CNP Assurances | | | 264,786 | |
| 2,268 | | Eiffage SA | | | 258,305 | |
| 206 | | Hermes International | | | 122,107 | |
| 1,842 | | ICADE REIT | | | 178,830 | |
| 30,604 | | Natixis SA | | | 251,115 | |
| 2,214 | | Renault SA | | | 268,664 | |
| 2,556 | | Sanofi | | | 205,094 | |
| 10,292 | | Television Francaise 1 | | | 139,763 | |
| | | | | | 1,688,664 | |
| Germany - 2.7% | | | | |
| 2,415 | | BASF SE | | | 244,923 | |
| 2,456 | | Bechtle AG | | | 199,228 | |
| 2,215 | | Covestro AG (b) | | | 218,105 | |
| 7,767 | | Deutsche Lufthansa AG | | | 248,292 | |
| 6,672 | | METRO AG | | | 118,029 | |
| 2,083 | | Rheinmetall AG | | | 295,670 | |
| | | | | | 1,324,247 | |
| Ireland - 0.9% | | | | |
| 20,419 | | Grafton Group PLC | | | 220,452 | |
| 16,774 | | UDG Healthcare PLC | | | 204,337 | |
| | | | | | 424,789 | |
| Italy - 0.5% | | | | | | |
| 11,431 | | Azimut Holding SpA | | | 245,714 | |
| Japan - 7.3% | | | | | | |
| 14,000 | | GMO internet, Inc. | | | 302,688 | |
| 33,000 | | Hitachi, Ltd. | | | 240,359 | |
| 14,800 | | Itoham Yonekyu Holdings, Inc. | | | 128,899 | |
| 7,700 | | Megmilk Snow Brand Co., Ltd. | | | 209,139 | |
| 46,400 | | Nippon Suisan Kaisha, Ltd. | | | 241,642 | |
| 4,900 | | Nippon Telegraph & Telephone Corp. | | | 228,600 | |
| 2,900 | | Nitto Denko Corp. | | | 219,179 | |
| 8,200 | | NOK Corp. | | | 160,127 | |
| 21,400 | | Sanwa Holdings Corp. | | | 275,943 | |
| 16,700 | | Sumitomo Corp. | | | 279,767 | |
| 4,400 | | Suzuki Motor Corp. | | | 238,891 | |
| 4,700 | | Taiheiyo Cement Corp. | | | 168,821 | |
| 4,200 | | Terumo Corp. | | | 218,450 | |
| 1,300 | | Tokyo Electron, Ltd. | | | 240,488 | |
| 3,500 | | Ulvac, Inc. | | | 198,009 | |
| 6,100 | | Yamaha Motor Co., Ltd. | | | 181,487 | |
| | | | | | 3,532,489 | |
| Shares | | Security Description | | Value | |
| Netherlands - 2.1% | |
| 2,548 | | BE Semiconductor Industries NV | | $ | 261,375 | |
| 3,261 | | EXOR NV | | | 232,131 | |
| 2,852 | | Koninklijke DSM NV | | | 283,480 | |
| 4,873 | | Wolters Kluwer NV | | | 259,170 | |
| | | | | | 1,036,156 | |
| Norway - 2.1% | | | | |
| 24,841 | | Orkla ASA | | | 267,711 | |
| 10,728 | | Statoil ASA | | | 253,910 | |
| 11,574 | | Telenor ASA | | | 263,206 | |
| 9,505 | | TGS NOPEC Geophysical Co. ASA | | | 233,183 | |
| | | | | | 1,018,010 | |
| Portugal - 0.4% | | | | |
| 11,811 | | Jeronimo Martins SGPS SA | | | 214,825 | |
| Puerto Rico - 0.7% | | | | |
| 7,812 | | Popular, Inc. | | | 325,135 | |
| Singapore - 0.6% | | | | |
| 27,600 | | Oversea-Chinese Banking Corp., Ltd. | | | 271,888 | |
| Spain - 0.6% | | | | | | |
| 6,489 | | Ebro Foods SA | | | 165,088 | |
| 2,157 | | Viscofan SA | | | 148,953 | |
| | | | | | 314,041 | |
| Sweden - 2.7% | | | | |
| 9,610 | | Axfood AB | | | 164,502 | |
| 22,346 | | Dometic Group AB (b) | | | 204,711 | |
| 2,173 | | Evolution Gaming Group AB (b) | | | 119,422 | |
| 9,246 | | Fabege AB | | | 200,731 | |
| 20,619 | | Peab AB | | | 186,155 | |
| 15,114 | | Swedish Orphan Biovitrum AB (c) | | | 270,632 | |
| 8,458 | | Volvo AB, Class B | | | 154,819 | |
| | | | | | 1,300,972 | |
| Switzerland - 3.3% | | | | |
| 7,452 | | Coca-Cola HBC AG (c) | | | 275,774 | |
| 10,453 | | GAM Holding AG (c) | | | 176,011 | |
| 6,579 | | Logitech International SA, Class R | | | 241,482 | |
| 980 | | Lonza Group AG | | | 231,122 | |
| 3,078 | | Novartis AG | | | 248,952 | |
| 98 | | SGS SA | | | 241,073 | |
| 616 | | Zurich Insurance Group AG | | | 203,195 | |
| | | | | | 1,617,609 | |
| United Kingdom - 4.8% | | | | |
| 38,094 | | BP PLC | | | 256,948 | |
| 10,806 | | easyJet PLC | | | 243,588 | |
| 23,772 | | Inchcape PLC | | | 230,478 | |
| 10,330 | | Intermediate Capital Group PLC | | | 142,679 | |
| 30,278 | | International Consolidated Airlines Group SA | | | 262,143 | |
| 48,703 | | Kingfisher PLC | | | 199,794 | |
| 4,305 | | Rightmove PLC | | | 262,795 | |
| 4,847 | | Schroders PLC | | | 217,477 | |
| 5,440 | | Severn Trent PLC | | | 140,834 | |
| 11,862 | | SSE PLC | | | 212,797 | |
| 21,069 | | Tate & Lyle PLC | | | 160,917 | |
| | | | | | 2,330,450 | |
| United States - 52.7% | | | | |
| 3,276 | | 1st Source Corp. | | | 165,831 | |
| 6,941 | | Allison Transmission Holdings, Inc. | | | 271,115 | |
| 3,292 | | Amedisys, Inc. (c) | | | 198,639 | |
| 2,569 | | American Financial Group, Inc. | | | 288,293 | |
| 3,346 | | Arrow Electronics, Inc. (c) | | | 257,709 | |
| 5,235 | | Athene Holding, Ltd., Class A (c) | | | 250,285 | |
| 3,231 | | BancFirst Corp. | | | 171,566 | |
| 8,793 | | Beazer Homes USA, Inc. (c) | | | 140,248 | |
| 1,175 | | Bio-Techne Corp. | | | 177,472 | |
| 7,446 | | Boise Cascade Co. | | | 287,416 | |
| See Notes to Financial Statements. | LMCG FUNDS |
LMCG GLOBAL MARKET NEUTRAL FUND
SCHEDULE OF INVESTMENTS
MARCH 31, 2018
| Shares | | Security Description | | Value | |
| United States - 52.7% (continued) | |
| 5,088 | | Bruker Corp. | | $ | 152,233 | |
| 2,315 | | Burlington Stores, Inc. (c) | | | 308,242 | |
| 2,189 | | CACI International, Inc., Class A (c) | | | 331,305 | |
| 22,385 | | Caesars Entertainment Corp. (c) | | | 251,831 | |
| 6,481 | | Catalent, Inc. (c) | | | 266,110 | |
| 6,880 | | Cathay General Bancorp | | | 275,062 | |
| 3,301 | | Centene Corp. (c) | | | 352,778 | |
| 11,135 | | CNO Financial Group, Inc. | | | 241,295 | |
| 12,386 | | Cohu, Inc. | | | 282,525 | |
| 7,722 | | Concert Pharmaceuticals, Inc. (c) | | | 176,834 | |
| 4,887 | | Covenant Transportation Group, Inc. (c) | | | 145,779 | |
| 22,385 | | Crocs, Inc. (c) | | | 363,756 | |
| 7,385 | | CVR Energy, Inc. | | | 223,175 | |
| 8,734 | | Delek U.S. Holdings, Inc. | | | 355,474 | |
| 3,352 | | Dillard's, Inc. | | | 269,300 | |
| 3,215 | | DXC Technology Co. | | | 323,204 | |
| 2,735 | | EMCOR Group, Inc. | | | 213,138 | |
| 4,447 | | Emergent BioSolutions, Inc. (c) | | | 234,135 | |
| 3,180 | | Enanta Pharmaceuticals, Inc. (c) | | | 257,294 | |
| 4,890 | | Exterran Corp. (c) | | | 130,563 | |
| 10,826 | | Ferro Corp. (c) | | | 251,380 | |
| 5,513 | | First American Financial Corp. | | | 323,503 | |
| 569 | | First Citizens BancShares, Inc., Class A | | | 235,134 | |
| 6,331 | | Fortinet, Inc. (c) | | | 339,215 | |
| 6,502 | | FTI Consulting, Inc. (c) | | | 314,762 | |
| 8,671 | | Gaming and Leisure Properties, Inc. REIT | | | 290,218 | |
| 3,356 | | Globus Medical, Inc. (c) | | | 167,196 | |
| 566 | | Graham Holdings Co., Class B | | | 340,873 | |
| 4,226 | | Green Dot Corp., Class A (c) | | | 271,140 | |
| 10,901 | | Harsco Corp. (c) | | | 225,106 | |
| 5,870 | | HollyFrontier Corp. | | | 286,808 | |
| 6,813 | | Insight Enterprises, Inc. (c) | | | 237,978 | |
| 5,421 | | Insperity, Inc. | | | 377,031 | |
| 10,531 | | International Game Technology PLC | | | 281,494 | |
| 4,118 | | INTL. FCStone, Inc. (c) | | | 175,756 | |
| 19,172 | | Invesco Mortgage Capital, Inc. REIT | | | 314,037 | |
| 11,952 | | Jabil, Inc. | | | 343,381 | |
| 10,373 | | K12, Inc. (c) | | | 147,089 | |
| 6,332 | | Kennametal, Inc. | | | 254,293 | |
| 3,171 | | Lakeland Financial Corp. | | | 146,595 | |
| 6,078 | | La-Z-Boy, Inc., Class Z | | | 182,036 | |
| 4,252 | | LHC Group, Inc. (c) | | | 261,753 | |
| 2,482 | | Lithia Motors, Inc., Class A | | | 249,491 | |
| 13,735 | | Louisiana-Pacific Corp. | | | 395,156 | |
| 6,351 | | LPL Financial Holdings, Inc. | | | 387,856 | |
| 3,476 | | Magellan Health, Inc. (c) | | | 372,280 | |
| 2,446 | | ManpowerGroup, Inc. | | | 281,535 | |
| 3,974 | | ManTech International Corp., Class A | | | 220,438 | |
| 4,493 | | Marcus & Millichap, Inc. (c) | | | 162,018 | |
| 10,499 | | MDU Resources Group, Inc. | | | 295,652 | |
| 6,235 | | Medpace Holdings, Inc. (c) | | | 217,664 | |
| 5,994 | | Merit Medical Systems, Inc. (c) | | | 271,828 | |
| 11,919 | | Meritor, Inc. (c) | | | 245,055 | |
| 23,815 | | MGIC Investment Corp. (c) | | | 309,595 | |
| 4,488 | | Movado Group, Inc. | | | 172,339 | |
| 7,553 | | MTGE Investment Corp. REIT | | | 135,199 | |
| 12,160 | | OraSure Technologies, Inc. (c) | | | 205,382 | |
| 3,865 | | Owens Corning | | | 310,746 | |
| 9,825 | | Owens-Illinois, Inc. (c) | | | 212,809 | |
| 8,940 | | PBF Energy, Inc. | | | 303,066 | |
| 6,707 | | PennyMac Financial Services, Inc., Class A (c) | | | 151,914 | |
| 4,535 | | Penske Automotive Group, Inc. | | | 201,037 | |
| 3,608 | | Phibro Animal Health Corp. | | | 143,238 | |
| 8,035 | | PNM Resources, Inc. | | | 307,339 | |
| Shares | | Security Description | | Value | |
| United States - 52.7% (continued) | |
| 6,561 | | Primoris Services Corp. | | $ | 163,894 | |
| 4,724 | | Qualys, Inc. (c) | | | 343,671 | |
| 15,137 | | QuinStreet, Inc. (c) | | | 193,299 | |
| 13,499 | | Radian Group, Inc. | | | 257,021 | |
| 3,033 | | Reliance Steel & Aluminum Co. | | | 260,049 | |
| 2,806 | | RH (c) | | | 267,356 | |
| 3,537 | | Ryder System, Inc. | | | 257,458 | |
| 6,696 | | SkyWest, Inc. | | | 364,262 | |
| 5,068 | | Sotheby's (c) | | | 260,039 | |
| 5,513 | | SpartanNash Co. | | | 94,879 | |
| 6,163 | | SPX FLOW, Inc. (c) | | | 303,158 | |
| 17,467 | | SUPERVALU, Inc. (c) | | | 266,022 | |
| 2,334 | | SYNNEX Corp. | | | 276,346 | |
| 16,738 | | Tailored Brands, Inc. | | | 419,454 | |
| 3,269 | | Tech Data Corp. (c) | | | 278,290 | |
| 1,248 | | Teleflex, Inc. | | | 318,215 | |
| 8,134 | | Teradyne, Inc. | | | 371,805 | |
| 6,457 | | Textainer Group Holdings, Ltd. (c) | | | 109,446 | |
| 13,086 | | The Bancorp, Inc. (c) | | | 141,329 | |
| 5,581 | | The Greenbrier Cos., Inc. | | | 280,445 | |
| 6,669 | | Titan Machinery, Inc. (c) | | | 157,122 | |
| 4,009 | | T-Mobile US, Inc. (c) | | | 244,709 | |
| 6,281 | | Ultra Clean Holdings, Inc. (c) | | | 120,909 | |
| 14,495 | | Vishay Intertechnology, Inc. | | | 269,607 | |
| 5,655 | | Voya Financial, Inc. | | | 285,577 | |
| 3,138 | | Wintrust Financial Corp. | | | 270,025 | |
| 2,032 | | Zebra Technologies Corp. (c) | | | 282,834 | |
| | | | | | 25,538,243 | |
| Total Common Stock (Cost $37,232,479) | | | 43,571,660 | |
| Shares | | Security Description | | Rate | | | Value | |
| Preferred Stock - 0.5% | | | | | | |
| Germany - 0.5% | | | | | | |
| 1,292 | | Volkswagen AG | | | | | | | | |
| | (Cost $168,984) | | | 2.06 | % | | | 257,514 | |
| Total Equity Securities (Cost $37,401,463) | | | | 43,829,174 | |
| Shares | | Security Description | | Value | |
| Money Market Fund - 5.0% | |
| 2,410,991 | | Dreyfus Treasury Prime Cash Management, Institutional Shares, 1.46% (d) | | | | |
| | (Cost $2,410,991) | | | 2,410,991 | |
| Total Long Positions - 95.5% (Cost $39,812,454) | | $ | 46,240,165 | |
| Total Short Positions - (90.5)% (Proceeds $(46,381,951)) | | $ | (43,838,068 | ) |
| Other Assets & Liabilities, Net - 95.0% | | | 46,021,822 | |
| Net Assets - 100.0% | | $ | 48,423,919 | |
| See Notes to Financial Statements. | LMCG FUNDS |
LMCG GLOBAL MARKET NEUTRAL FUNDSCHEDULE OF SECURITIES SOLD SHORT
MARCH 31, 2018
| Shares | | | Security Description | | Value | |
| Short Positions - (90.5)% | | | |
| Common Stock - (90.5)% | | | |
| Belgium - (0.6)% | | | |
| (4,910 | ) | | Ontex Group NV | | $ | (131,193 | ) |
| (876 | ) | | Sofina SA | | | (148,615 | ) |
| | | | | | | (279,808 | ) |
| Bermuda - (1.2)% | | | | |
| (12,791 | ) | | Golar LNG, Ltd. | | | (349,962 | ) |
| (6,263 | ) | | James River Group Holdings, Ltd. | | | (222,148 | ) |
| | | | | | | (572,110 | ) |
| Denmark - (1.9)% | | | | |
| (9,817 | ) | | Ambu A/S | | | (222,197 | ) |
| (134 | ) | | AP Moller - Maersk A/S, Class A | | | (197,413 | ) |
| (2,891 | ) | | Chr Hansen Holding A/S | | | (250,208 | ) |
| (3,983 | ) | | FLSmidth & Co. A/S | | | (257,523 | ) |
| | | | | | | (927,341 | ) |
| Finland - (0.9)% | | | | |
| (8,221 | ) | | DNA OYJ | | | (178,437 | ) |
| (6,217 | ) | | Huhtamaki OYJ | | | (272,803 | ) |
| | | | | | | (451,240 | ) |
| France - (3.7)% | | | | |
| (9,195 | ) | | Bureau Veritas SA | | | (239,015 | ) |
| (23,012 | ) | | Getlink SE | | | (328,516 | ) |
| (206 | ) | | Hermes International | | | (122,107 | ) |
| (3,319 | ) | | Legrand SA | | | (260,411 | ) |
| (2,113 | ) | | Sartorius Stedim Biotech | | | (190,755 | ) |
| (5,743 | ) | | SPIE SA | | | (127,072 | ) |
| (44,327 | ) | | Technicolor SA | | | (74,953 | ) |
| (1,463 | ) | | Teleperformance | | | (226,877 | ) |
| (3,710 | ) | | Valeo SA | | | (245,417 | ) |
| | | | | | | (1,815,123 | ) |
| Germany - (3.2)% | | | | |
| (2,531 | ) | | Bayerische Motoren Werke AG | | | (275,296 | ) |
| (3,914 | ) | | Carl Zeiss Meditec AG | | | (249,494 | ) |
| (13,777 | ) | | Deutsche Bank AG | | | (192,195 | ) |
| (9,133 | ) | | K+S AG | | | (263,780 | ) |
| (378 | ) | | KWS Saat SE | | | (146,704 | ) |
| (5,559 | ) | | Rocket Internet SE | | | (170,708 | ) |
| (3,189 | ) | | Symrise AG | | | (256,777 | ) |
| | | | | | | (1,554,954 | ) |
| Ireland - (0.7)% | | | | |
| (978 | ) | | COSMO Pharmaceuticals NV | | | (135,227 | ) |
| (10,032 | ) | | Ryanair Holdings PLC | | | (197,831 | ) |
| | | | | | | (333,058 | ) |
| Italy - (1.1)% | | | | |
| (4,601 | ) | | Luxottica Group SpA | | | (285,835 | ) |
| (8,166 | ) | | Salvatore Ferragamo SpA | | | (224,971 | ) |
| | | | | | | (510,806 | ) |
| Japan - (7.5)% | | | | |
| (7,100 | ) | | Calbee, Inc. | | | (241,257 | ) |
| (4,400 | ) | | Coca-Cola Bottlers Japan Holdings, Inc. | | | (181,709 | ) |
| (6,200 | ) | | CyberAgent, Inc. | | | (322,143 | ) |
| (5,400 | ) | | Dentsu, Inc. | | | (238,642 | ) |
| (2,800 | ) | | FP Corp. | | | (182,019 | ) |
| (44,000 | ) | | Fujitsu, Ltd. | | | (267,385 | ) |
| (13,600 | ) | | Ibiden Co., Ltd. | | | (201,789 | ) |
| (12,000 | ) | | JGC Corp. | | | (261,271 | ) |
| (6,600 | ) | | Mitsubishi Heavy Industries, Ltd. | | | (254,489 | ) |
| (1,800 | ) | | Murata Manufacturing Co., Ltd. | | | (248,458 | ) |
| (7,100 | ) | | Nippon Paint Holdings Co., Ltd. | | | (261,515 | ) |
| (3,800 | ) | | Nissin Foods Holdings Co., Ltd. | | | (263,646 | ) |
| (1,700 | ) | | Shimano, Inc. | | | (245,321 | ) |
| (2,300 | ) | | Taisho Pharmaceutical Holdings Co., Ltd. | | | (227,394 | ) |
| (13,200 | ) | | Topcon Corp. | | | (258,855 | ) |
| | | | | | | (3,655,893 | ) |
| Shares | | | Security Description | | Value | |
| Jordan - (0.3)% | |
| (10,033 | ) | | Hikma Pharmaceuticals PLC | | $ | (170,630 | ) |
| Luxembourg - (0.6)% | | | | |
| (6,570 | ) | | Ardagh Group SA | | | (122,728 | ) |
| (2,434 | ) | | Millicom International Cellular SA, SDR | | | (166,570 | ) |
| | | | | | | (289,298 | ) |
| Netherlands - (1.4)% | | | | |
| (7,156 | ) | | Altice NV | | | (59,084 | ) |
| (12,275 | ) | | Altice NV, Class A | | | (101,446 | ) |
| (6,110 | ) | | Koninklijke Vopak NV | | | (300,001 | ) |
| (9,686 | ) | | OCI NV | | | (224,121 | ) |
| | | | | | | (684,652 | ) |
| Norway - (1.5)% | | | | |
| (10,212 | ) | | Gjensidige Forsikring ASA | | | (187,822 | ) |
| (13,498 | ) | | Marine Harvest ASA | | | (272,841 | ) |
| (5,782 | ) | | Yara International ASA | | | (247,066 | ) |
| | | | | | | (707,729 | ) |
| Spain - (2.3)% | | | | |
| (14,228 | ) | | Atresmedia Corp. de Medios de Comunicacion SA | | | (135,736 | ) |
| (56,443 | ) | | Distribuidora Internacional de Alimentacion SA | | | (239,908 | ) |
| (15,742 | ) | | Indra Sistemas SA | | | (217,953 | ) |
| (16,542 | ) | | Merlin Properties Socimi SA REIT | | | (253,399 | ) |
| (12,802 | ) | | Red Electrica Corp. SA | | | (264,264 | ) |
| (1,467 | ) | | Zardoya Otis SA | | | (14,781 | ) |
| | | | | | | (1,126,041 | ) |
| Sweden - (2.8)% | | | | |
| (13,260 | ) | | Getinge AB, Class B | | | (151,000 | ) |
| (10,398 | ) | | Hennes & Mauritz AB, Class B | | | (155,337 | ) |
| (9,487 | ) | | Industrivarden AB | | | (221,257 | ) |
| (7,952 | ) | | Kinnevik AB, Class B | | | (287,292 | ) |
| (2,257 | ) | | L E Lundbergforetagen AB, Class B | | | (162,251 | ) |
| (15,654 | ) | | Nibe Industrier AB | | | (148,670 | ) |
| (35,790 | ) | | Telefonaktiebolaget LM Ericsson, Class B | | | (227,909 | ) |
| | | | | | | (1,353,716 | ) |
| Switzerland - (2.0)% | | | | |
| (8,914 | ) | | Aryzta AG | | | (198,537 | ) |
| (2,271 | ) | | Basilea Pharmaceutica AG | | | (157,811 | ) |
| (284 | ) | | dormakaba Holding AG | | | (222,400 | ) |
| (9,340 | ) | | Idorsia, Ltd. | | | (224,690 | ) |
| (68,680 | ) | | Weatherford International PLC | | | (157,277 | ) |
| | | | | | | (960,715 | ) |
| United Kingdom - (7.0)% | | | | |
| (20,730 | ) | | Aggreko PLC | | | (213,603 | ) |
| (3,832 | ) | | Associated British Foods PLC | | | (133,973 | ) |
| (8,969 | ) | | Burford Capital, Ltd. | | | (169,160 | ) |
| (5,904 | ) | | Derwent London PLC REIT | | | (257,001 | ) |
| (10,945 | ) | | Hargreaves Lansdown PLC | | | (251,227 | ) |
| (26,057 | ) | | Inmarsat PLC | | | (132,490 | ) |
| (3,280 | ) | | Metro Bank PLC | | | (161,588 | ) |
| (14,062 | ) | | Pennon Group PLC | | | (127,129 | ) |
| (2,607 | ) | | Reckitt Benckiser Group PLC | | | (220,051 | ) |
| (23,232 | ) | | Rolls-Royce Holdings PLC | | | (284,037 | ) |
| (31,962 | ) | | RSA Insurance Group PLC | | | (282,975 | ) |
| (4,513 | ) | | Shire PLC | | | (224,611 | ) |
| (33,588 | ) | | Sophos Group PLC | | | (204,599 | ) |
| (21,716 | ) | | Standard Chartered PLC | | | (217,646 | ) |
| (97,694 | ) | | Tullow Oil PLC | | | (269,314 | ) |
| (22,980 | ) | | United Utilities Group PLC | | | (230,782 | ) |
| | | | | | | (3,380,186 | ) |
| United States - (51.8)% | | | | |
| (21,989 | ) | | A10 Networks, Inc. | | | (127,976 | ) |
| (5,533 | ) | | Acadia Healthcare Co., Inc. | | | (216,783 | ) |
| (12,656 | ) | | Aceto Corp. | | | (96,186 | ) |
| (8,758 | ) | | Aclaris Therapeutics, Inc. | | | (153,440 | ) |
| (9,571 | ) | | Actua Corp. | | | (11,007 | ) |
| See Notes to Financial Statements. | LMCG FUNDS |
LMCG GLOBAL MARKET NEUTRAL FUNDSCHEDULE OF SECURITIES SOLD SHORT
MARCH 31, 2018
| Shares | | | Security Description | | Value | |
| United States - (51.8)% (continued) | | | |
| (8,493 | ) | | Actuant Corp. | | $ | (197,462 | ) |
| (7,024 | ) | | Advanced Disposal Services, Inc. | | | (156,495 | ) |
| (2,914 | ) | | Aerie Pharmaceuticals, Inc. | | | (158,084 | ) |
| (10,222 | ) | | Aerojet Rocketdyne Holdings, Inc. | | | (285,909 | ) |
| (3,590 | ) | | Almost Family, Inc. | | | (201,040 | ) |
| (4,654 | ) | | Ambarella, Inc. | | | (227,999 | ) |
| (19,691 | ) | | American Outdoor Brands Corp. | | | (203,211 | ) |
| (3,456 | ) | | Appfolio, Inc. | | | (141,178 | ) |
| (8,907 | ) | | Aqua America, Inc. | | | (303,372 | ) |
| (5,726 | ) | | Audentes Therapeutics, Inc. | | | (172,066 | ) |
| (1,272 | ) | | Avexis, Inc. | | | (157,194 | ) |
| (4,742 | ) | | AZZ, Inc. | | | (207,225 | ) |
| (5,663 | ) | | Bank of the Ozarks | | | (273,353 | ) |
| (5,032 | ) | | Benefitfocus, Inc. | | | (122,781 | ) |
| (6,141 | ) | | BioTelemetry, Inc. | | | (190,678 | ) |
| (5,985 | ) | | Black Knight, Inc. | | | (281,894 | ) |
| (8,200 | ) | | Boyd Gaming Corp. | | | (261,252 | ) |
| (6,710 | ) | | Brown & Brown, Inc. | | | (170,702 | ) |
| (57,865 | ) | | Cerus Corp. | | | (317,100 | ) |
| (1,999 | ) | | Chesapeake Utilities Corp. | | | (140,630 | ) |
| (5,365 | ) | | Chuy's Holdings, Inc. | | | (140,563 | ) |
| (2,730 | ) | | CIRCOR International, Inc. | | | (116,462 | ) |
| (5,678 | ) | | Cohen & Steers, Inc. | | | (230,867 | ) |
| (12,261 | ) | | Coherus Biosciences, Inc. | | | (135,484 | ) |
| (4,007 | ) | | Compass Minerals International, Inc. | | | (241,622 | ) |
| (6,917 | ) | | Core-Mark Holding Co., Inc. | | | (147,055 | ) |
| (19,191 | ) | | Covanta Holding Corp. | | | (278,270 | ) |
| (4,120 | ) | | Cree, Inc. | | | (166,077 | ) |
| (12,437 | ) | | Cross Country Healthcare, Inc. | | | (138,175 | ) |
| (2,661 | ) | | Cubic Corp. | | | (169,240 | ) |
| (6,294 | ) | | Dermira, Inc. | | | (50,289 | ) |
| (4,492 | ) | | DexCom, Inc. | | | (333,127 | ) |
| (8,954 | ) | | Electronics For Imaging, Inc. | | | (244,713 | ) |
| (3,164 | ) | | Ellie Mae, Inc. | | | (290,898 | ) |
| (40,101 | ) | | Endologix, Inc. | | | (169,627 | ) |
| (5,542 | ) | | Ethan Allen Interiors, Inc. | | | (127,189 | ) |
| (8,160 | ) | | Federated Investors, Inc., Class B | | | (272,544 | ) |
| (8,006 | ) | | Fiesta Restaurant Group, Inc. | | | (148,111 | ) |
| (5,858 | ) | | Financial Engines, Inc. | | | (205,030 | ) |
| (17,151 | ) | | Finisar Corp. | | | (271,157 | ) |
| (12,129 | ) | | First Midwest Bancorp, Inc. | | | (298,252 | ) |
| (3,970 | ) | | First Republic Bank/CA | | | (367,662 | ) |
| (36,357 | ) | | Flotek Industries, Inc. | | | (221,778 | ) |
| (5,386 | ) | | Franklin Financial Network, Inc. | | | (175,584 | ) |
| (3,772 | ) | | Genesee & Wyoming, Inc., Class A | | | (267,020 | ) |
| (8,389 | ) | | Granite Point Mortgage Trust, Inc. REIT | | | (138,754 | ) |
| (11,335 | ) | | Greenhill & Co., Inc. | | | (209,698 | ) |
| (46,599 | ) | | Hecla Mining Co. | | | (171,018 | ) |
| (2,915 | ) | | Heska Corp. | | | (230,489 | ) |
| (4,927 | ) | | HNI Corp. | | | (177,815 | ) |
| (5,972 | ) | | HomeStreet, Inc. | | | (171,098 | ) |
| (31,416 | ) | | Infinera Corp. | | | (341,178 | ) |
| (7,229 | ) | | Inphi Corp. | | | (217,593 | ) |
| (8,426 | ) | | Invacare Corp. | | | (146,612 | ) |
| (3,172 | ) | | John B Sanfilippo & Son, Inc. | | | (183,564 | ) |
| (10,664 | ) | | K2M Group Holdings, Inc. | | | (202,083 | ) |
| (2,427 | ) | | Kirby Corp. | | | (186,758 | ) |
| (9,710 | ) | | Knowles Corp. | | | (122,249 | ) |
| (10,456 | ) | | Laureate Education, Inc. | | | (143,770 | ) |
| (806 | ) | | LendingTree, Inc. | | | (264,489 | ) |
| (10,814 | ) | | Liberty Interactive Corp. QVC Group | | | (272,188 | ) |
| (1,566 | ) | | Lindsay Corp. | | | (143,195 | ) |
| (7,231 | ) | | Macquarie Infrastructure Corp. | | | (267,041 | ) |
| (1,411 | ) | | Mesa Laboratories, Inc. | | | (209,449 | ) |
| (4,584 | ) | | Monro, Inc. | | | (245,702 | ) |
| (17,509 | ) | | MRC Global, Inc. | | | (287,848 | ) |
| Shares | | | Security Description | | Value | |
| United States - (51.8)% (continued) | |
| (44,513 | ) | | Nabors Industries, Ltd. | | $ | (311,146 | ) |
| (13,562 | ) | | Nautilus, Inc. | | | (182,409 | ) |
| (16,408 | ) | | NCS Multistage Holdings, Inc. | | | (246,120 | ) |
| (631 | ) | | NewMarket Corp. | | | (253,460 | ) |
| (8,287 | ) | | Northfield Bancorp, Inc. | | | (129,360 | ) |
| (18,457 | ) | | NOW, Inc. | | | (188,631 | ) |
| (2,358 | ) | | NuVasive, Inc. | | | (123,111 | ) |
| (46,014 | ) | | Oclaro, Inc. | | | (439,894 | ) |
| (23,081 | ) | | ORBCOMM, Inc. | | | (216,269 | ) |
| (9,818 | ) | | Oritani Financial Corp. | | | (150,706 | ) |
| (3,640 | ) | | OSI Systems, Inc. | | | (237,583 | ) |
| (50,867 | ) | | Pandora Media, Inc. | | | (255,861 | ) |
| (4,525 | ) | | Papa John's International, Inc. | | | (259,283 | ) |
| (8,069 | ) | | PRA Group, Inc. | | | (306,622 | ) |
| (6,405 | ) | | PROS Holdings, Inc. | | | (211,429 | ) |
| (3,815 | ) | | Prosperity Bancshares, Inc. | | | (277,083 | ) |
| (13,425 | ) | | Rambus, Inc. | | | (180,298 | ) |
| (4,478 | ) | | RLI Corp. | | | (283,860 | ) |
| (16,341 | ) | | SeaWorld Entertainment, Inc. | | | (242,337 | ) |
| (6,682 | ) | | Shutterfly, Inc. | | | (542,913 | ) |
| (61,401 | ) | | Southwestern Energy Co. | | | (265,866 | ) |
| (5,796 | ) | | Spirit Airlines, Inc. | | | (218,973 | ) |
| (34,803 | ) | | Sportsman's Warehouse Holdings, Inc. | | | (141,996 | ) |
| (5,095 | ) | | Stewart Information Services Corp. | | | (223,874 | ) |
| (40,596 | ) | | Sunrun, Inc. | | | (362,522 | ) |
| (13,682 | ) | | Surgery Partners, Inc. | | | (234,646 | ) |
| (14,285 | ) | | Switch, Inc. | | | (227,274 | ) |
| (11,018 | ) | | Tanger Factory Outlet Centers, Inc. REIT | | | (242,396 | ) |
| (12,575 | ) | | Team, Inc. | | | (172,906 | ) |
| (3,382 | ) | | Tempur Sealy International, Inc. | | | (153,171 | ) |
| (2,127 | ) | | Tennant Co. | | | (143,998 | ) |
| (18,408 | ) | | TFS Financial Corp. | | | (270,414 | ) |
| (12,086 | ) | | TG Therapeutics, Inc. | | | (171,621 | ) |
| (9,198 | ) | | The GEO Group, Inc. REIT | | | (188,283 | ) |
| (18,608 | ) | | The KeyW Holding Corp. | | | (146,259 | ) |
| (11,620 | ) | | TimkenSteel Corp. | | | (176,508 | ) |
| (3,819 | ) | | TreeHouse Foods, Inc. | | | (146,153 | ) |
| (4,278 | ) | | U.S. Concrete, Inc. | | | (258,391 | ) |
| (2,454 | ) | | Universal Electronics, Inc. | | | (127,731 | ) |
| (13,006 | ) | | Veeco Instruments, Inc. | | | (221,102 | ) |
| (4,674 | ) | | ViaSat, Inc. | | | (307,175 | ) |
| (3,649 | ) | | Wabtec Corp. | | | (297,029 | ) |
| (5,371 | ) | | Williams-Sonoma, Inc. | | | (283,374 | ) |
| (26,740 | ) | | WisdomTree Investments, Inc. | | | (245,206 | ) |
| (4,062 | ) | | WR Berkley Corp. | | | (295,307 | ) |
| (13,145 | ) | | Zoe's Kitchen, Inc. | | | (189,814 | ) |
| | | | | | | (25,064,768 | ) |
| Total Common Stock (Proceeds $(46,381,951)) | | | (43,838,068 | ) |
| Total Short Positions - (90.5)% (Proceeds $(46,381,951)) | | $ | (43,838,068 | ) |
| See Notes to Financial Statements. | LMCG FUNDS |
LMCG GLOBAL MARKET NEUTRAL FUND
NOTES TO SCHEDULES OF INVESTMENTS AND SECURITIES SOLD SHORT
MARCH 31, 2018
| PLC | Public Limited Company |
| REIT | Real Estate Investment Trust |
| SDR | Swedish Depositary Receipt |
| (a) | All or a portion of these securities are held as collateral for securities sold short. |
| (b) | Security exempt from registration under Rule 144A under the Securities Act of 1933. At the period end, the value of these securities amounted to $542,238 or 1.1% of net assets. |
| (c) | Non-income producing security. |
| (d) | Dividend yield changes daily to reflect current market conditions. Rate was the quoted yield as of March 31, 2018. |
The following is a summary of the inputs used to value the Fund's investments as of March 31, 2018.
The inputs or methodology used for valuing securities are not necessarily an indication of the risks associated with investing in those securities. For more information on valuation inputs, and their aggregation into the levels used in the table below, please refer to the Security Valuation section in Note 2 of the accompanying Notes to Financial Statements.
| | | Level 1 | | | Level 2 | | | Level 3 | | | Total | |
| Investments at Value | | | | | | | | | | | | |
| Common Stock | | | | | | | | | | | | |
| Australia | | $ | – | | | $ | 751,899 | | | $ | – | | | $ | 751,899 | |
| Austria | | | – | | | | 142,944 | | | | – | | | | 142,944 | |
| Belgium | | | – | | | | 427,465 | | | | – | | | | 427,465 | |
| Bermuda | | | 226,128 | | | | – | | | | – | | | | 226,128 | |
| Denmark | | | – | | | | 272,351 | | | | – | | | | 272,351 | |
| Finland | | | – | | | | 567,641 | | | | – | | | | 567,641 | |
| France | | | – | | | | 1,688,664 | | | | – | | | | 1,688,664 | |
| Germany | | | – | | | | 1,324,247 | | | | – | | | | 1,324,247 | |
| Ireland | | | – | | | | 424,789 | | | | – | | | | 424,789 | |
| Italy | | | – | | | | 245,714 | | | | – | | | | 245,714 | |
| Japan | | | – | | | | 3,532,489 | | | | – | | | | 3,532,489 | |
| Netherlands | | | – | | | | 1,036,156 | | | | – | | | | 1,036,156 | |
| Norway | | | – | | | | 1,018,010 | | | | – | | | | 1,018,010 | |
| Portugal | | | – | | | | 214,825 | | | | – | | | | 214,825 | |
| Puerto Rico | | | 325,135 | | | | – | | | | – | | | | 325,135 | |
| Singapore | | | – | | | | 271,888 | | | | – | | | | 271,888 | |
| Spain | | | – | | | | 314,041 | | | | – | | | | 314,041 | |
| Sweden | | | – | | | | 1,300,972 | | | | – | | | | 1,300,972 | |
| Switzerland | | | – | | | | 1,617,609 | | | | – | | | | 1,617,609 | |
| United Kingdom | | | – | | | | 2,330,450 | | | | – | | | | 2,330,450 | |
| United States | | | 25,538,243 | | | | – | | | | – | | | | 25,538,243 | |
| Preferred Stock | | | | | | | | | | | | | | | | |
| Germany | | | – | | | | 257,514 | | | | – | | | | 257,514 | |
| Money Market Fund | | | – | | | | 2,410,991 | | | | – | | | | 2,410,991 | |
| Investments at Value | | $ | 26,089,506 | | | $ | 20,150,659 | | | $ | – | | | $ | 46,240,165 | |
| | | | | | | | | | | | | | | | | |
| Securities Sold Short | | | | | | | | | | | | | | | | |
| Common Stock | | | | | | | | | | | | | | | | |
| Belgium | | | – | | | | (279,808 | ) | | | – | | | | (279,808 | ) |
| Bermuda | | | (572,110 | ) | | | – | | | | – | | | | (572,110 | ) |
| Denmark | | | – | | | | (927,341 | ) | | | – | | | | (927,341 | ) |
| Finland | | | – | | | | (451,240 | ) | | | – | | | | (451,240 | ) |
| France | | | – | | | | (1,815,123 | ) | | | – | | | | (1,815,123 | ) |
| Germany | | | – | | | | (1,554,954 | ) | | | – | | | | (1,554,954 | ) |
| Ireland | | | – | | | | (333,058 | ) | | | – | | | | (333,058 | ) |
| Italy | | | – | | | | (510,806 | ) | | | – | | | | (510,806 | ) |
| Japan | | | – | | | | (3,655,893 | ) | | | – | | | | (3,655,893 | ) |
| Jordan | | | – | | | | (170,630 | ) | | | – | | | | (170,630 | ) |
| Luxembourg | | | (122,728 | ) | | | (166,570 | ) | | | – | | | | (289,298 | ) |
| Netherlands | | | – | | | | (684,652 | ) | | | – | | | | (684,652 | ) |
| Norway | | | – | | | | (707,729 | ) | | | – | | | | (707,729 | ) |
| Spain | | | – | | | | (1,126,041 | ) | | | – | | | | (1,126,041 | ) |
| Sweden | | | – | | | | (1,353,716 | ) | | | – | | | | (1,353,716 | ) |
| Switzerland | | | (157,277 | ) | | | (803,438 | ) | | | – | | | | (960,715 | ) |
| United Kingdom | | | – | | | | (3,380,186 | ) | | | – | | | | (3,380,186 | ) |
| United States | | | (25,064,768 | ) | | | – | | | | – | | | | (25,064,768 | ) |
| Securities Sold Short | | $ | (25,916,883 | ) | | $ | (17,921,185 | ) | | $ | – | | | $ | (43,838,068 | ) |
| See Notes to Financial Statements. | LMCG FUNDS |
LMCG GLOBAL MARKET NEUTRAL FUND
NOTES TO SCHEDULES OF INVESTMENTS AND SECURITIES SOLD SHORT
MARCH 31, 2018
The Fund utilizes the end of period methodology when determining transfers. There were no transfers among Level 1, Level 2 and Level 3 for the year ended March 31, 2018.
At March 31, 2018, foreign securities representing the following percentage of net assets of the Fund were fair valued by independent pricing services and are classified as using Level 2 inputs within the valuation inputs disclosure on the Fund’s Schedule of Investments:
| LMCG Global Market Neutral Fund | | |
| Long Securities | | 36.63% |
| Short Securities | | (37.01)% |
| PORTFOLIO HOLDINGS (Unaudited) |
| % of Total Investments | Long | | Short |
| Australia | 1.6% | | 0.0% |
| Austria | 0.3% | | 0.0% |
| Belgium | 0.9% | | 0.6% |
| Bermuda | 0.5% | | 1.3% |
| Denmark | 0.6% | | 2.1% |
| Finland | 1.2% | | 1.0% |
| France | 3.7% | | 4.1% |
| Germany | 3.5% | | 3.5% |
| Ireland | 0.9% | | 0.8% |
| Italy | 0.5% | | 1.2% |
| Japan | 7.6% | | 8.3% |
| Jordan | 0.0% | | 0.4% |
| Luxembourg | 0.0% | | 0.7% |
| Netherlands | 2.3% | | 1.6% |
| Norway | 2.2% | | 1.6% |
| Portugal | 0.5% | | 0.0% |
| Puerto Rico | 0.7% | | 0.0% |
| Singapore | 0.6% | | 0.0% |
| Spain | 0.7% | | 2.6% |
| Sweden | 2.8% | | 3.1% |
| Switzerland | 3.5% | | 2.2% |
| United Kingdom | 5.0% | | 7.7% |
| United States | 60.4%* | | 57.2% |
| | 100.0% | | 100.0% |
| * | Includes Money Market Fund totaling 5.2%. |
| See Notes to Financial Statements. | LMCG FUNDS |
LMCG GLOBAL MARKET NEUTRAL FUND
STATEMENT OF ASSETS AND LIABILITIES
MARCH 31, 2018
| ASSETS | | | |
| Investments, at value (Cost $39,812,454) | | $ | 46,240,165 | |
| Cash | | | 678,437 | |
| Deposits with broker | | | 44,995,382 | |
| Foreign currency (Cost $375,353) | | | 376,010 | |
| Receivables: | | | | |
| Fund shares sold | | | 8,124 | |
| Dividends | | | 137,885 | |
| Prepaid expenses | | | 20,942 | |
| Total Assets | | | 92,456,945 | |
| | | | | |
| LIABILITIES | | | | |
| Securities sold short, at value (Proceeds $46,381,951) | | | 43,838,068 | |
| Payables: | | | | |
| Dividends on securities sold short | | | 64,741 | |
| Accrued Liabilities: | | | | |
| Investment adviser fees | | | 74,259 | |
| Trustees’ fees and expenses | | | 50 | |
| Fund services fees | | | 13,012 | |
| Professional fees | | | 22,183 | |
| Other expenses | | | 20,713 | |
| Total Liabilities | | | 44,033,026 | |
| | | | | |
| NET ASSETS | | $ | 48,423,919 | |
| | | | | |
| COMPONENTS OF NET ASSETS | | | | |
| Paid-in capital | | $ | 49,076,845 | |
| Accumulated net investment loss | | | (431,693 | ) |
| Accumulated net realized loss | | | (9,196,945 | ) |
| Net unrealized appreciation | | | 8,975,712 | |
| NET ASSETS | | $ | 48,423,919 | |
| | |
| SHARES OF BENEFICIAL INTEREST AT NO PAR VALUE (UNLIMITED SHARES AUTHORIZED) | |
| Institutional Shares | | | 4,062,096 | |
| Investor Shares | | | 412,482 | |
| | | | | |
| NET ASSET VALUE, OFFERING AND REDEMPTION PRICE PER SHARE | | | | |
| Institutional Shares (based on net assets of $43,993,544) | | $ | 10.83 | |
| Investor Shares (based on net assets of $4,430,375) | | $ | 10.74 | |
See Notes to Financial Statements. | LMCG FUNDS |
LMCG GLOBAL MARKET NEUTRAL FUND
STATEMENT OF OPERATIONS
YEAR ENDED MARCH 31, 2018
| INVESTMENT INCOME | | | |
| Dividend income (Net of foreign withholding taxes of $101,403) | | $ | 1,039,667 | |
| Interest income | | | 243,199 | |
| Total Investment Income | | | 1,282,866 | |
| | | | | |
| EXPENSES | | | | |
Investment adviser fees | | | 557,533 | |
| Fund services fees | | | 208,558 | |
| Transfer agent fees: | | | | |
| Institutional Shares | | | 24,715 | |
| Investor Shares | | | 2,537 | |
| Distribution fees: | | | | |
| Investor Shares | | | 11,114 | |
| Custodian fees | | | 172,971 | |
| Registration fees: | | | | |
| Institutional Shares | | | 15,242 | |
| Investor Shares | | | 14,808 | |
| Professional fees | | | 44,926 | |
| Trustees' fees and expenses | | | 8,412 | |
| Dividend expense on securities sold short | | | 1,152,364 | |
| Other expenses | | | 97,525 | |
| Total Expenses | | | 2,310,705 | |
| Fees waived | | | (255,097 | ) |
| Net Expenses | | | 2,055,608 | |
| | | | | |
| NET INVESTMENT LOSS | | | (772,742 | ) |
| | | | | |
| NET REALIZED AND UNREALIZED GAIN (LOSS) | | | | |
| Net realized gain (loss) on: | | | | |
| Investments | | | 12,060,943 | |
| Foreign currency transactions | | | 13,991 | |
| Securities sold short | | | (12,822,920 | ) |
| Net realized loss | | | (747,986 | ) |
| Net change in unrealized appreciation (depreciation) on: | | | | |
| Investments | | | (3,429,350 | ) |
| Foreign currency translations | | | 5,335 | |
| Securities sold short | | | 5,472,712 | |
| Net change in unrealized appreciation (depreciation) | | | 2,048,697 | |
| NET REALIZED AND UNREALIZED GAIN | | | 1,300,711 | |
| INCREASE IN NET ASSETS RESULTING FROM OPERATIONS | | $ | 527,969 | |
See Notes to Financial Statements. | LMCG FUNDS |
LMCG GLOBAL MARKET NEUTRAL FUND
STATEMENTS OF CHANGES IN NET ASSETS
| | For the Years Ended March 31, | |
| | | 2018 | | | 2017 | |
| OPERATIONS | | | | | | |
| Net investment loss | | $ | (772,742 | ) | | $ | (943,434 | ) |
| Net realized loss | | | (747,986 | ) | | | (6,069,877 | ) |
| Net change in unrealized appreciation (depreciation) | | | 2,048,697 | | | | 3,353,315 | |
| Increase (Decrease) in Net Assets Resulting from Operations | | | 527,969 | | | | (3,659,996 | ) |
| | | | | | | | | |
| CAPITAL SHARE TRANSACTIONS | | | | | | | | |
| Sale of shares: | | | | | | | | |
| Institutional Shares | | | 6,853,565 | | | | 27,319,837 | |
| Investor Shares | | | 1,510,944 | | | | 3,158,386 | |
| Redemption of shares: | | | | | | | | |
| Institutional Shares | | | (30,780,163 | ) | | | (63,937,598 | ) |
| Investor Shares | | | (2,589,407 | ) | | | (12,675,187 | ) |
| Decrease in Net Assets from Capital Share Transactions | | | (25,005,061 | ) | | | (46,134,562 | ) |
| Decrease in Net Assets | | | (24,477,092 | ) | | | (49,794,558 | ) |
| | | | | | | | | |
| NET ASSETS | | | | | | | | |
| Beginning of Year | | | 72,901,011 | | | | 122,695,569 | |
| End of Year (Including line (a)) | | $ | 48,423,919 | | | $ | 72,901,011 | |
| | | | | | | | | |
| SHARE TRANSACTIONS | | | | | | | | |
| Sale of shares: | | | | | | | | |
| Institutional Shares | | | 630,431 | | | | 2,533,406 | |
| Investor Shares | | | 139,835 | | | | 294,651 | |
| Redemption of shares: | | | | | | | | |
| Institutional Shares | | | (2,855,540 | ) | | | (5,968,588 | ) |
| Investor Shares | | | (241,396 | ) | | | (1,187,375 | ) |
| Decrease in Shares | | | (2,326,670 | ) | | | (4,327,906 | ) |
| | | | | | | | | |
| (a) Accumulated net investment loss | | $ | (431,693 | ) | | $ | (170,901 | ) |
See Notes to Financial Statements. | LMCG FUNDS |
LMCG GLOBAL MARKET NEUTRAL FUND
FINANCIAL HIGHLIGHTS
These financial highlights reflect selected data for a share outstanding throughout each period.
| | | For the Years Ended March 31, | | | May 21,
2013 (a) Through | |
| | | 2018 | | | 2017 | | | 2016 | | | 2015 | | | March 31,
2014 | |
| INSTITUTIONAL SHARES | | | | | | | | | | | | | | | |
| NET ASSET VALUE, Beginning of Period | | $ | 10.72 | | | $ | 11.03 | | | $ | 11.07 | | | $ | 10.11 | | | $ | 10.00 | |
| INVESTMENT OPERATIONS | | | | | | | | | | | | | | | | | | | | |
| Net investment loss (b) | | | (0.15 | ) | | | (0.12 | ) | | | (0.17 | ) | | | (0.16 | ) | | | (0.11 | ) |
| Net realized and unrealized gain (loss) | | | 0.26 | | | | (0.19 | ) | | | 0.13(c | ) | | | 1.12 | | | | 0.22 | |
| Total from Investment Operations | | | 0.11 | | | | (0.31 | ) | | | (0.04 | ) | | | 0.96 | | | | 0.11 | |
| | | | | | | | | | | | | | | | | | | | | |
| REDEMPTION FEES(b) | | | – | | | | – | | | | – | | | | 0.00(d | ) | | | – | |
| NET ASSET VALUE, End of Period | | $ | 10.83 | | | $ | 10.72 | | | $ | 11.03 | | | $ | 11.07 | | | $ | 10.11 | |
| TOTAL RETURN | | | 1.03 | % | | | (2.81 | )% | | | (0.36 | )% | | | 9.50 | % | | | 1.10 | %(e) |
| | | | | | | | | | | | | | | | | | | | | |
| RATIOS/SUPPLEMENTARY DATA | | | | | | | | | | | | | | | | | | | | |
| Net Assets at End of Period (000s omitted) | | $ | 43,994 | | | $ | 67,421 | | | $ | 107,228 | | | $ | 58,320 | | | $ | 11,401 | |
| Ratios to Average Net Assets: | | | | | | | | | | | | | | | | | | | | |
| Net investment loss | | | (1.36 | )% | | | (1.11 | )% | | | (1.53 | )% | | | (1.49 | )% | | | (1.27 | )%(f) |
| Net expenses including dividend expenses | | | 3.67 | % | | | 3.18 | % | | | 3.15 | % | | | 2.91 | % | | | 2.94 | %(f) |
| Dividend expenses | | | 2.07 | % | | | 1.58 | % | | | 1.55 | % | | | 1.31 | % | | | 1.34 | %(f) |
| Net expenses without dividend expenses | | | 1.60 | % | | | 1.60 | % | | | 1.60 | % | | | 1.60 | % | | | 1.60 | %(f) |
| Gross expenses (g) | | | 4.10 | % | | | 3.76 | % | | | 3.74 | % | | | 4.63 | % | | | 8.73 | %(f) |
| PORTFOLIO TURNOVER RATE | | | 81 | % | | | 95 | % | | | 124 | % | | | 104 | % | | | 62 | %(e) |
| (a) | Commencement of operations. |
| (b) | Calculated based on average shares outstanding during each period. |
| (c) | Per share amount does not accord with the amount reported in the statement of operations due to the timing of Fund share sales. |
| (d) | Less than $0.01 per share. |
| (g) | Reflects the expense ratio excluding any waivers and/or reimbursements. |
See Notes to Financial Statements. | LMCG FUNDS |
LMCG GLOBAL MARKET NEUTRAL FUND
FINANCIAL HIGHLIGHTS
These financial highlights reflect selected data for a share outstanding throughout each period.
| | | For the Years Ended March 31, | | | December 18,
2014 (a) Through | |
| | | 2018 | | | 2017 | | | 2016 | | | March 31,
2015 | |
| INVESTOR SHARES | | | | | | | | | | | | |
| NET ASSET VALUE, Beginning of Period | | $ | 10.66 | | | $ | 11.00 | | | $ | 11.07 | | | $ | 10.87 | |
| INVESTMENT OPERATIONS | | | | | | | | | | | | | | | | |
| Net investment loss (b) | | | (0.18 | ) | | | (0.15 | ) | | | (0.20 | ) | | | (0.05 | ) |
| Net realized and unrealized gain (loss) | | | 0.26 | | | | (0.19 | ) | | | 0.13(c | ) | | | 0.25 | |
| Total from Investment Operations | | | 0.08 | | | | (0.34 | ) | | | (0.07 | ) | | | 0.20 | |
| | | | | | | | | | | | | | | | | |
| NET ASSET VALUE, End of Period | | $ | 10.74 | | | $ | 10.66 | | | $ | 11.00 | | | $ | 11.07 | |
| TOTAL RETURN | | | 0.75 | % | | | (3.09 | )% | | | (0.63 | )% | | | 1.84 | %(d) |
| | | | | | | | | | | | | | | | | |
| RATIOS/SUPPLEMENTARY DATA | | | | | | | | | | | | | | | | |
| Net Assets at End of Period (000s omitted) | | $ | 4,430 | | | $ | 5,480 | | | $ | 15,468 | | | $ | 5,683 | |
| Ratios to Average Net Assets: | | | | | | | | | | | | | | | | |
| Net investment loss | | | (1.64 | )% | | | (1.42 | )% | | | (1.81 | )% | | | (1.73 | )%(e) |
| Net expenses including dividend expenses | | | 3.88 | % | | | 3.56 | % | | | 3.38 | % | | | 3.30 | %(e) |
| Dividend expenses | | | 2.03 | % | | | 1.71 | % | | | 1.53 | % | | | 1.45 | %(e) |
| Net expenses without dividend expenses | | | 1.85 | % | | | 1.85 | % | | | 1.85 | % | | | 1.85 | %(e) |
| Gross expenses (f) | | | 4.71 | % | | | 4.38 | % | | | 4.09 | % | | | 5.73 | %(e) |
| PORTFOLIO TURNOVER RATE | | | 81 | % | | | 95 | % | | | 124 | % | | | 104 | %(d) |
| (a) | Commencement of operations. |
| (b) | Calculated based on average shares outstanding during each period. |
| (c) | Per share amount does not accord with the amount reported in the statement of operations due to the timing of Fund share sales. |
| (f) | Reflects the expense ratio excluding any waivers and/or reimbursements. |
See Notes to Financial Statements. | LMCG FUNDS |
LMCG GLOBAL MULTICAP FUNDA MESSAGE TO OUR SHAREHOLDERS (Unaudited)
MARCH 31, 2018
Dear Shareholder:
For the year ended March 31, 2018, the LMCG Global MultiCap Fund (the “Fund”) Institutional Shares returned 12.22% vs. 15.03% for the MSCI All Country World IMI Index. Market levels and valuations crept higher and higher until a sharp correction in February and again in March 2018 tempered gains. The portfolio had a difficult time keeping up with the rising market as we began to move it into a more defensive position.
The performance data quoted represents past performance and is no guarantee of future results. Investment return and principal value of an investment will fluctuate so that an investor's shares, when redeemed, may be worth more or less than their original cost. Current performance may be lower or higher than the performance data quoted. For the most recent month-end performance, please call (877) 591-4667.
We are striving to maintain a reasonable exposure to future potential gains while providing investors a cushion should markets end their extended run and the economy moderate its current robust growth cycle. More traditional approaches to protecting gains as valuation get extended (for example buying higher yielding shares or consumer staples companies) have become much more sensitive to interest rate surprises. Instead, we hope to add shares of higher quality companies, which tend to have less leverage, in addition to emphasizing more value-oriented investments in the United States and among less speculative foreign markets. The tax cut bill that passed in the United States at the close of 2017 created an opportunity for growth, but the forecast deficits in the future as a result are adding a debt load danger. Economic overheating and rising debts are the main risks we see of the tax cut.
The largest detractors to the portfolio over the 12 months were both our asset allocation to U.S. Small and Mid Size (SMID) stocks as well as our selection among those stocks. The common issue that seems to confound stock pickers and asset allocators alike is the strong price momentum that continues to affect securities prices. Put simply, many industries are pricing in a “winner take all” premium as the largest stocks, particularly in the internet commerce area, continue to post remarkable gains. The year closed amid political clashes between the White House and the head of Amazon as well as a scandal from data breach at Facebook, highlighting the potential limits to growth for some of the winners. While we shifted our bias in the SMID cap asset class from growth to value in January 2018, the Fund still maintains a relatively large exposure. We believe that valuations in SMID as well as in specific areas of Europe and Asia should boost potential returns with lower relative risk.
We managed to offset the lagging returns in the U.S. with strong gains from the Fund’s exposure to emerging markets. While the Fund averaged over 12% of the portfolio invested in these markets, it held a more significant weight throughout most of 2017. We still feel optimistic about valuations and growth prospects of emerging markets, but as we enter an important election period in many key countries, we took profits and reduced the Fund’s position to 10% by the end of the fund’s fiscal year.
Global MultiCap Outlook and Strategy – The Fog of Trade War
Valuation Breathing Room
When prices fall while revenue and earnings rise, good things happen to valuations. That means new buyers are paying less, and the conclusion from many history lessons on markets is that the chance of meeting return goals improves investing at lower valuations.
The U.S. is still historically more expensive than non-U.S. markets by a significant margin after the turmoil of the first quarter. The Fund’s allocation to non-U.S. equities is similar to where it was before the market reversal in February. Increasing trade tensions could potentially change the U.S. premium – a tariff war between the U.S. and China, for instance would harm both these economies.
Trade War – Business Cycle Ending or Foundation for New Growth?
Tariffs tend to harm economic growth in order to protect specific interests. However, few see damage done yet to the real economies, but stock markets are reactive with violent swings to news as we open the second quarter. At this stage, most analysts think tariffs will be short-lived and eliminated by negotiation before real damage is inflicted. Country and currency diversification should help defend the Fund’s portfolio should this outlook turn out to be overly optimistic.
LMCG GLOBAL MULTICAP FUNDA MESSAGE TO OUR SHAREHOLDERS (Unaudited)
MARCH 31, 2018
The Long-Term China Investment Question
China is growing in importance for investors, but not necessarily because of the hardball negotiations over trade. The Chinese equity market already dominates the major indexes for emerging markets equity investors. China represents nearly 30% of the MSCI Emerging Markets Index, the foundation of many of the largest passive funds, exchange traded funds, and institutional asset pools in the world. This weighting does not include the mainland Chinese “A” share market, and MSCI has opted for a gradualist approach to adding these shares over time. The A shares market poses many issues for foreign investors which are being addressed as a part of a long running negotiation between the major index publishers and the Chinese stock exchanges. When you add in the trade war threats, Chinese President Xi’s recent elimination of term limits, and Xi’s push for more Communist Party influence in foreign corporation joint ventures, one wonders about the future of shareholder rights.
For long-term investors, we believe the right issue to consider is this – if an industry requires tariff protection to survive within the United States or within China, is that really an area with an attractive investment future? And after nearly 30 years of dislocation of industries from globalization – where we as global investors could benefit from improving productivity wherever it may locate itself – do we need to give up these benefits to relocate these industries? Investors certainly have plenty of issues with China investments now in the wake of the political changes taking place in mainland China, and the disturbing increase in the presence of Communist Party members on boards of directors, let alone the true trade imbalances that do need addressing.
The biggest issue facing the U.S. and China markets may turn out to be the security breach of Facebook and the possibility of regulatory action in its wake. The privacy issues that ‘face’ Facebook are likely to impact Chinese internet giants Tencent and Alibaba as well.
We continue to look for ways to play late-economic-cycle defense. Utilities seemed to be the one place to hide among equities during the market retreats in the first quarter, but we believe that they do not hold the promise of competitive total returns over long investment horizons.
Current Investment Positioning and Outlook
We are actively building a quality bias into the Fund’s large cap U.S. equity portfolio – we see this as our best defense for a true end-of-cycle bear market. We are targeting fundamentally stable names that have the potential to generate healthy free cash flow margins. We believe such firms have a lower probability of cutting their dividend in times of stress.
However, the Fund is still fully invested in banks in the U.S. and Europe (U.S. and Canada 5.3%, Europe 5.5%, Rest of World 2%), which we believe helps give us the ability to keep up with a global economy that begins to overheat. We took profits in emerging markets in January reducing the Fund’s position to approximately 10% of the portfolio while boosting active value strategies in U.S. small and mid-cap stocks which have had an extended period of underperformance and should provide good defense with upside potential.
We thank you for your trust and support for the Fund.
Sincerely,
Jeffrey P. Davis
Portfolio Manager
LMCG Investments, LLC
LMCG GLOBAL MULTICAP FUNDA MESSAGE TO OUR SHAREHOLDERS (Unaudited)
MARCH 31, 2018
INVESTMENT CONSIDERATIONS
Equity Risk - The Fund’s equity holdings, including common stocks, may decline in value. The value of a security may decline for a number of reasons, which are detailed in the prospectus.
Foreign & Emerging Markets Investing Risks - As a result of political or economic instability in foreign countries, there can be special risks associated with investing in foreign securities, including fluctuations in currency exchange rates, increased price volatility and difficulty obtaining information. In addition, emerging markets may present additional risk due to potential for greater economic and political instability in less developed countries.
Market Events Risk - Turbulence in the financial markets and reduced liquidity in equity, credit and fixed-income markets may negatively affect issuers, which could adversely affect the Fund.
There can be no guarantee that any strategy (risk management or otherwise) will be successful. All investing involves risk, including the potential loss of principal.
LMCG GLOBAL MULTICAP FUNDPERFORMANCE CHART AND ANALYSIS (Unaudited)
MARCH 31, 2018
The following chart reflects the change in the value of a hypothetical $100,000 investment in Institutional Shares, including reinvested dividends and distributions, in the LMCG Global MultiCap Fund (the “Fund”) compared with the performance of the benchmark, MSCI All Country World IMI Index, since inception. The MSCI All Country World IMI Index is a stock market index that is designed to measure the equity market performance of developed and emerging markets. The total return of the index includes the reinvestment of dividends and income. The total return of the Fund includes operating expenses that reduce returns, while the total return of the index does not include expenses. The Fund is professionally managed, while the index is unmanaged and is not available for investment.
Comparison of Change in Value of a $100,000 Investment
LMCG Global MultiCap Fund - Institutional Shares vs. MSCI All Country World IMI Index
Average Annual Total Returns Periods Ended March 31, 2018 | One Year | Since Inception(1) |
| LMCG Global MultiCap Fund - Institutional Shares | 12.22% | 8.42% |
LMCG Global MultiCap Fund - Investor Shares(2) | 12.20% | 8.27% |
MSCI All Country World IMI Index(3) | 15.03% | 8.67% |
| (1) | Institutional Shares commenced operations on September 11, 2013 and Investor Shares commenced operations on March 3, 2015. |
| (2) | Performance for the since inception period is a blended average annual return, which include the returns of the Institutional Shares prior to the commencement of the Investor Shares. |
| (3) | MSCI All Country World Investable Market Index, net of foreign withholding taxes (reflects no deduction for fees or expenses). |
Performance data quoted represents past performance and is no guarantee of future results. Current performance may be lower or higher than the performance data quoted. Investment return and principal value will fluctuate so that shares, when redeemed, may be worth more or less than original cost. As stated in the Fund’s prospectus, the annual operating expense ratios (gross) for Institutional Shares and Investor Shares are 16.90% and 111.78%, respectively. However, the Fund’s adviser has contractually agreed to waive its fee and/or reimburse Fund expenses to limit Total Annual Fund Operating Expenses After Fee Waiver and/or Expense Reimbursement (excluding all taxes, interest, portfolio transaction expenses, dividend and interest expenses on short sales, acquired fund fees and expenses, proxy expenses and extraordinary expenses) to 0.90% and 1.15% of Insitutional Shares and Investor Shares, respectively, through at least July 31, 2018 (the “Expense Cap”). The adviser may be reimbursed by the Fund for fees waived and expenses reimbursed by the adviser pursuant to the Expense Cap if such payment is made within three years of the fee waiver or expense reimbursement, and does not cause the Total Annual Fund Operating Expenses After Fee Waiver and/or Expense Reimbursement to exceed the lesser of (i) the then-current expense cap, or (ii) the expense cap in place at the time the fees/expenses were waived/reimbursed. The performance table and graph do not reflect the deduction of taxes that a shareholder would pay on Fund distributions or the redemption of Fund shares. Returns greater than one year are annualized.
LMCG GLOBAL MULTICAP FUNDSCHEDULE OF INVESTMENTS
MARCH 31, 2018
| Shares | | | Security Description | | Value | |
| Equity Securities - 94.7% | | | |
| Common Stock - 94.0% | | | |
| Australia - 0.2% | | | |
| 213 | | | Ansell, Ltd. | | $ | 4,170 | |
| Belgium - 0.4% | | | | |
| 79 | | | Anheuser-Busch InBev SA/NV | | | 8,686 | |
| Canada - 1.7% | | | | |
| 200 | | | Canadian National Railway Co. | | | 14,617 | |
| 200 | | | Intact Financial Corp. | | | 15,029 | |
| 200 | | | Maple Leaf Foods, Inc. | | | 4,874 | |
| | | | | | | 34,520 | |
| China - 3.2% | | | | |
| 4,000 | | | Agile Group Holdings, Ltd. | | | 8,342 | |
| 69 | | | Alibaba Group Holding, Ltd., ADR (a) | | | 12,664 | |
| 9,000 | | | China Construction Bank Corp., Class H | | | 9,400 | |
| 6,000 | | | CNOOC, Ltd. | | | 8,884 | |
| 12,000 | | | Industrial & Commercial Bank of China, Ltd., Class H | | | 10,458 | |
| 316 | | | Tencent Holdings, Ltd. | | | 16,963 | |
| | | | | | | 66,711 | |
| Denmark - 0.6% | | | | |
| 310 | | | Danske Bank A/S | | | 11,615 | |
| France - 3.2% | | | | |
| 424 | | | AXA SA | | | 11,271 | |
| 173 | | | BNP Paribas SA | | | 12,830 | |
| 100 | | | Sanofi | | | 8,024 | |
| 264 | | | TOTAL SA | | | 15,132 | |
| 190 | | | Vinci SA | | | 18,714 | |
| | | | | | | 65,971 | |
| Georgia - 0.3% | | | | |
| 109 | | | BGEO Group PLC | | | 5,440 | |
| Germany - 4.3% | | | | |
| 78 | | | Allianz SE | | | 17,632 | |
| 138 | | | BASF SE | | | 13,996 | |
| 104 | | | Bayer AG | | | 11,724 | |
| 138 | | | Daimler AG | | | 11,758 | |
| 135 | | | SAP SE | | | 14,172 | |
| 112 | | | Siemens AG | | | 14,291 | |
| 283 | | | TAG Immobilien AG | | | 5,872 | |
| | | | | | | 89,445 | |
| Hong Kong - 0.2% | | | | |
| 520 | | | China Mobile, Ltd. | | | 4,766 | |
| India - 0.3% | | | | |
| 377 | | | Infosys, Ltd., ADR | | | 6,729 | |
| Italy - 1.2% | | | | |
| 923 | | | Enel SpA | | | 5,648 | |
| 488 | | | Eni SpA | | | 8,596 | |
| 2,726 | | | Intesa Sanpaolo SpA | | | 9,926 | |
| | | | | | | 24,170 | |
| Japan - 4.3% | | | | |
| 100 | | | Azbil Corp. | | | 4,710 | |
| 500 | | | Honda Motor Co., Ltd. | | | 17,308 | |
| 203 | | | Hoya Corp. | | | 10,254 | |
| 1,800 | | | Mitsubishi UFJ Financial Group, Inc. | | | 11,962 | |
| 1,100 | | | Penta-Ocean Construction Co., Ltd. | | | 8,116 | |
| 800 | | | Sumitomo Electric Industries, Ltd. | | | 12,227 | |
| 1,100 | | | Toray Industries, Inc. | | | 10,464 | |
| 200 | | | Toyota Motor Corp. | | | 12,986 | |
| | | | | | | 88,027 | |
| Malaysia - 0.5% | | | | |
| 2,400 | | | Tenaga Nasional Bhd | | | 10,043 | |
| Shares | | | Security Description | | Value | |
| Malta - 0.2% | | | |
| 362 | | | Kindred Group PLC, SDR | | $ | 4,966 | |
| Mexico - 0.2% | | | | |
| 1,770 | | | Wal-Mart de Mexico SAB de CV | | | 4,504 | |
| Netherlands - 1.9% | | | | |
| 206 | | | AerCap Holdings NV (a) | | | 10,448 | |
| 941 | | | ING Groep NV | | | 15,880 | |
| 200 | | | Royal Dutch Shell PLC, ADR, Class B | | | 12,762 | |
| | | | | | | 39,090 | |
| Russian Federation - 0.2% | | | | |
| 700 | | | Evraz PLC | | | 4,269 | |
| Singapore - 0.3% | | | | |
| 3,300 | | | Singapore Press Holdings, Ltd. | | | 6,367 | |
| South Africa - 0.7% | | | | |
| 33 | | | Naspers, Ltd., Class N | | | 8,076 | |
| 1,666 | | | Rand Merchant Investment Holdings, Ltd. | | | 5,632 | |
| | | | | | | 13,708 | |
| South Korea - 2.4% | | | | |
| 122 | | | LG Electronics, Inc. | | | 12,588 | |
| 27 | | | POSCO | | | 8,618 | |
| 7 | | | Samsung Electronics Co., Ltd. | | | 16,355 | |
| 145 | | | Shinhan Financial Group Co., Ltd. | | | 6,186 | |
| 78 | | | SK Hynix, Inc. | | | 5,976 | |
| | | | | | | 49,723 | |
| Spain - 0.9% | | | | |
| 2,825 | | | Banco Santander SA | | | 18,491 | |
| Sweden - 0.8% | | | | |
| 380 | | | Investor AB, Class B | | | 16,881 | |
| Switzerland - 1.7% | | | | |
| 518 | | | ABB, Ltd. | | | 12,317 | |
| 17 | | | Bucher Industries AG | | | 7,104 | |
| 202 | | | Nestle SA | | | 15,966 | |
| | | | | | | 35,387 | |
| Taiwan - 1.5% | | | | |
| 3,000 | | | Nan Ya Plastics Corp. | | | 8,495 | |
| 17,000 | | | Shin Kong Financial Holding Co., Ltd. | | | 6,515 | |
| 2,000 | | | Taiwan Semiconductor Manufacturing Co., Ltd. | | | 16,940 | |
| | | | | | | 31,950 | |
| Thailand - 0.5% | | | | |
| 624 | | | PTT PCL, NVDR | | | 10,990 | |
| United Kingdom - 4.9% | | | | |
| 395 | | | BHP Billiton PLC | | | 7,806 | |
| 2,057 | | | BP PLC | | | 13,875 | |
| 167 | | | British American Tobacco PLC | | | 9,654 | |
| 406 | | | GlaxoSmithKline PLC | | | 7,885 | |
| 1,984 | | | HSBC Holdings PLC | | | 18,631 | |
| 12,240 | | | Lloyds Banking Group PLC | | | 11,134 | |
| 503 | | | Royal Dutch Shell PLC, Class B | | | 16,186 | |
| 47 | | | Spirax-Sarco Engineering PLC | | | 3,791 | |
| 74 | | | Willis Towers Watson PLC | | | 11,262 | |
| | | | | | | 100,224 | |
| United States - 57.4% | | | |
| 273 | | | Abbott Laboratories | | | 16,358 | |
| 187 | | | AbbVie, Inc. | | | 17,700 | |
| 593 | | | AES Corp. | | | 6,742 | |
| 137 | | | Agios Pharmaceuticals, Inc. (a) | | | 11,204 | |
| 31 | | | Alphabet, Inc., Class A (a) | | | 32,151 | |
| 23 | | | Amazon.com, Inc. (a) | | | 33,289 | |
| 283 | | | American Campus Communities, Inc. REIT | | | 10,930 | |
| 119 | | | Ameriprise Financial, Inc. | | | 17,605 | |
| 107 | | | Amgen, Inc. | | | 18,241 | |
| See Notes to Financial Statements. | | LMCG FUNDS |
LMCG GLOBAL MULTICAP FUNDSCHEDULE OF INVESTMENTS
MARCH 31, 2018
| Shares | | | Security Description | | | Value | |
| United States - 57.4% (continued) | | | | |
| 81 | | | Anthem, Inc. | | | $ | 17,796 | |
| 253 | | | Apple, Inc. | | | | 42,448 | |
| 429 | | | Applied Materials, Inc. | | | | 23,857 | |
| 285 | | | BankUnited, Inc. | | | | 11,394 | |
| 223 | | | Berry Global Group, Inc. (a) | | | | 12,223 | |
| 35 | | | Biogen, Inc. (a) | | | | 9,584 | |
| 264 | | | BorgWarner, Inc. | | | | 13,261 | |
| 557 | | | Brixmor Property Group, Inc. REIT | | | | 8,494 | |
| 268 | | | Capital One Financial Corp. | | | | 25,680 | |
| 545 | | | Carrizo Oil & Gas, Inc. (a) | | | | 8,720 | |
| 91 | | | Charles River Laboratories International, Inc. (a) | | | | 9,713 | |
| 74 | | | Chevron Corp. | | | | 8,439 | |
| 97 | | | Cimarex Energy Co. | | | | 9,070 | |
| 335 | | | Cisco Systems, Inc. | | | | 14,368 | |
| 162 | | | Clean Harbors, Inc. (a) | | | | 7,907 | |
| 463 | | | Comcast Corp., Class A | | | | 15,821 | |
| 240 | | | CVS Health Corp. | | | | 14,930 | |
| 120 | | | Danaher Corp. | | | | 11,749 | |
| 636 | | | Darling Ingredients, Inc. (a) | | | | 11,003 | |
| 461 | | | Devon Energy Corp. | | | | 14,655 | |
| 118 | | | Dollar General Corp. | | | | 11,039 | |
| 109 | | | DTE Energy Co. | | | | 11,380 | |
| 105 | | | Eagle Materials, Inc. | | | | 10,820 | |
| 237 | | | Envision Healthcare Corp. (a) | | | | 9,108 | |
| 738 | | | FNB Corp. | | | | 9,926 | |
| 586 | | | General Electric Co. | | | | 7,899 | |
| 139 | | | Gilead Sciences, Inc. | | | | 10,479 | |
| 172 | | | Hexcel Corp. | | | | 11,110 | |
| 253 | | | Intel Corp. | | | | 13,176 | |
| 282 | | | ITT, Inc. | | | | 13,812 | |
| 178 | | | j2 Global, Inc. | | | | 14,048 | |
| 103 | | | John Bean Technologies Corp. | | | | 11,680 | |
| 253 | | | JPMorgan Chase & Co. | | | | 27,822 | |
| 236 | | | KAR Auction Services, Inc. | | | | 12,791 | |
| 243 | | | Kennametal, Inc. | | | | 9,759 | |
| 68 | | | Ligand Pharmaceuticals, Inc. (a) | | | | 11,231 | |
| 150 | | | Lincoln National Corp. | | | | 10,959 | |
| 87 | | | LogMeIn, Inc. | | | | 10,053 | |
| 176 | | | Lowe’s Cos., Inc. | | | | 15,444 | |
| 75 | | | M&T Bank Corp. | | | | 13,827 | |
| 280 | | | MACOM Technology Solutions Holdings, Inc. (a) | | | | 4,648 | |
| 227 | | | Merck & Co., Inc. | | | | 12,365 | |
| 364 | | | Micron Technology, Inc. (a) | | | | 18,979 | |
| 226 | | | Microsoft Corp. | | | | 20,627 | |
| 137 | | | Murphy USA, Inc. (a) | | | | 9,974 | |
| 408 | | | Newfield Exploration Co. (a) | | | | 9,963 | |
| 210 | | | Nexstar Media Group, Inc., Class A | | | | 13,965 | |
| 243 | | | PacWest Bancorp | | | | 12,036 | |
| 258 | | | Patterson Cos., Inc. | | | | 5,735 | |
| 481 | | | Pfizer, Inc. | | | | 17,071 | |
| 198 | | | Portland General Electric Co. | | | | 8,021 | |
| 142 | | | PPG Industries, Inc. | | | | 15,847 | |
| 269 | | | Prestige Brands Holdings, Inc. (a) | | | | 9,071 | |
| 189 | | | PTC, Inc. (a) | | | | 14,744 | |
| 291 | | | RealPage, Inc. (a) | | | | 14,987 | |
| 134 | | | Regal Beloit Corp. | | | | 9,829 | |
| 70 | | | Rockwell Automation, Inc. | | | | 12,194 | |
| 437 | | | Sinclair Broadcast Group, Inc., Class A | | | | 13,678 | |
| 154 | | | State Street Corp. | | | | 15,358 | |
| 112 | | | Stericycle, Inc. (a) | | | | 6,555 | |
| 72 | | | SVB Financial Group (a) | | | | 17,281 | |
| 198 | | | Target Corp. | | | | 13,747 | |
| 201 | | | The Allstate Corp. | | | | 19,055 | |
| Shares | | Security Description | | Value | |
| United States - 57.4% (continued) | | | |
| 178 | | The Brink’s Co. | | $ | 12,700 | |
| 72 | | The Goldman Sachs Group, Inc. | | | 18,134 | |
| 211 | | The Hartford Financial Services Group, Inc. | | | 10,871 | |
| 380 | | TransUnion (a) | | | 21,576 | |
| 190 | | TreeHouse Foods, Inc. (a) | | | 7,271 | |
| 323 | | Unum Group | | | 15,378 | |
| 60 | | Vail Resorts, Inc. | | | 13,302 | |
| 120 | | Valero Energy Corp. | | | 11,132 | |
| 121 | | VMware, Inc., Class A (a) | | | 14,674 | |
| 171 | | Walgreens Boots Alliance, Inc. | | | 11,195 | |
| 182 | | Walmart, Inc. | | | 16,193 | |
| 308 | | Wells Fargo & Co. | | | 16,142 | |
| 118 | | WR Grace & Co. | | | 7,225 | |
| 321 | | Zayo Group Holdings, Inc. (a) | | | 10,965 | |
| | | | | | 1,184,183 | |
| Total Common Stock (Cost $1,592,254) | | | 1,941,026 | |
| Shares | | | Security Description | | Rate | | | Value | |
| Preferred Stock - 0.7% | | | | | | |
| Brazil - 0.7% | | | | | | |
| 850 | | | Itau Unibanco Holding SA | | | | |
| | | (Cost $4,341) | | 0.02 | % | | 13,296 | |
| Total Equity Securities (Cost $1,596,595) | | | | 1,954,322 | |
| Shares | | | Security Description | | Value | |
| Investment Companies - 2.7% | | | |
| 188 | | | iShares MSCI ACWI ETF | | | 13,479 | |
| 150 | | | iShares MSCI EAFE ETF | | | 10,452 | |
| 104 | | | iShares MSCI EAFE Small-Cap ETF | | | 6,780 | |
| 385 | | | iShares MSCI India ETF | | | 13,140 | |
| 304 | | | iShares MSCI Turkey ETF | | | 12,896 | |
| Total Investment Companies (Cost $55,042) | | | 56,747 | |
| | | | | | | | |
| Shares | | | Security Description | | Value | |
| Money Market Fund - 1.9% | | | | |
| 38,581 | | | Dreyfus Treasury Prime Cash Management, Institutional Shares, 1.46% (b) | | | | |
| | | (Cost $38,581) | | | 38,581 | |
| Investments, at value - 99.3% (Cost $1,690,218) | | $ | 2,049,650 | |
| Other Assets & Liabilities, Net - 0.7% | | | 14,951 | |
| Net Assets - 100.0% | | $ | 2,064,601 | |
| ADR | American Depositary Receipt |
| NVDR | Non-Voting Depositary Receipt |
| PCL | Public Company Limited |
| PLC | Public Limited Company |
| REIT | Real Estate Investment Trust |
| SDR | Swedish Depositary Receipt |
| (a) | Non-income producing security. |
| (b) | Dividend yield changes daily to reflect current market conditions. Rate was the quoted yield as of March 31, 2018. |
The following is a summary of the inputs used to value the Fund’s investments as of March 31, 2018.
The inputs or methodology used for valuing securities are not necessarily an indication of the risks associated with investing in those securities. For more information on valuation inputs, and their aggregation into the levels used in the table below, please refer to the Security Valuation section in Note 2 of the accompanying Notes to Financial Statements.
| See Notes to Financial Statements. | | LMCG FUNDS |
LMCG GLOBAL MULTICAP FUNDSCHEDULE OF INVESTMENTS
MARCH 31, 2018
| | Level 1 | | | Level 2 | | | Level 3 | | | Total | |
| Investments at Value | | | | | | | | | | | | |
| Common Stock | | | | | | | | | | | | |
| Australia | | $ | – | | | $ | 4,170 | | | $ | – | | | $ | 4,170 | |
| Belgium | | | – | | | | 8,686 | | | | – | | | | 8,686 | |
| Canada | | | 34,520 | | | | – | | | | – | | | | 34,520 | |
| China | | | 12,664 | | | | 54,047 | | | | – | | | | 66,711 | |
| Denmark | | | – | | | | 11,615 | | | | – | | | | 11,615 | |
| France | | | – | | | | 65,971 | | | | – | | | | 65,971 | |
| Georgia | | | – | | | | 5,440 | | | | – | | | | 5,440 | |
| Germany | | | – | | | | 89,445 | | | | – | | | | 89,445 | |
| Hong Kong | | | – | | | | 4,766 | | | | – | | | | 4,766 | |
| India | | | 6,729 | | | | – | | | | – | | | | 6,729 | |
| Italy | | | – | | | | 24,170 | | | | – | | | | 24,170 | |
| Japan | | | – | | | | 88,027 | | | | – | | | | 88,027 | |
| Malaysia | | | – | | | | 10,043 | | | | – | | | | 10,043 | |
| Malta | | | – | | | | 4,966 | | | | – | | | | 4,966 | |
| Mexico | | | 4,504 | | | | – | | | | – | | | | 4,504 | |
| Netherlands | | | 23,210 | | | | 15,880 | | | | – | | | | 39,090 | |
| Russian Federation | | | – | | | | 4,269 | | | | – | | | | 4,269 | |
| Singapore | | | – | | | | 6,367 | | | | – | | | | 6,367 | |
| South Africa | | | – | | | | 13,708 | | | | – | | | | 13,708 | |
| South Korea | | | – | | | | 49,723 | | | | – | | | | 49,723 | |
| Spain | | | – | | | | 18,491 | | | | – | | | | 18,491 | |
| Sweden | | | – | | | | 16,881 | | | | – | | | | 16,881 | |
| Switzerland | | | – | | | | 35,387 | | | | – | | | | 35,387 | |
| Taiwan | | | – | | | | 31,950 | | | | – | | | | 31,950 | |
| Thailand | | | – | | | | 10,990 | | | | – | | | | 10,990 | |
| United Kingdom | | | 11,262 | | | | 88,962 | | | | – | | | | 100,224 | |
| United States | | | 1,184,183 | | | | – | | | | – | | | | 1,184,183 | |
| Preferred Stock | | | | | | | | | | | | | | | | |
| Brazil | | | 13,296 | | | | – | | | | – | | | | 13,296 | |
| Investment Companies | | | 56,747 | | | | – | | | | – | | | | 56,747 | |
| Money Market Fund | | | – | | | | 38,581 | | | | – | | | | 38,581 | |
| Investments at Value | | $ | 1,347,115 | | | $ | 702,535 | | | $ | – | | | $ | 2,049,650 | |
The Fund utilizes the end of period methodology when determining transfers. There were no transfers among Level 1, Level 2 and Level 3 for the year ended March 31, 2018.
At March 31, 2018, foreign securities representing the following percentage of net assets of the Fund were fair valued by independent pricing services and are classified as using Level 2 inputs within the valuation inputs disclosure on the Fund’s Schedule of Investments:
| LMCG Global MultiCap Fund | |
| | |
| Long Securities | 32.16% |
| PORTFOLIO HOLDINGS (Unaudited) | |
| % of Total Investments | |
| Australia | 0.2% |
| Belgium | 0.4% |
| Brazil | 0.6% |
| Canada | 1.7% |
| China | 3.3% |
| Denmark | 0.6% |
| France | 3.2% |
| Georgia | 0.3% |
| Germany | 4.4% |
| Hong Kong | 0.2% |
| India | 0.3% |
| Italy | 1.2% |
| Japan | 4.3% |
| Malaysia | 0.5% |
| Malta | 0.2% |
| Mexico | 0.2% |
| Netherlands | 1.9% |
| Russian Federation | 0.2% |
| Singapore | 0.3% |
| South Africa | 0.7% |
| South Korea | 2.4% |
| Spain | 0.9% |
| Sweden | 0.8% |
| Switzerland | 1.7% |
| Taiwan | 1.6% |
| Thailand | 0.5% |
| United Kingdom | 4.9% |
| United States* | 62.5% |
| | 100.0% |
| * | Includes Money Market Fund totaling 1.9%. |
| See Notes to Financial Statements. | | LMCG FUNDS |
LMCG GLOBAL MULTICAP FUNDSTATEMENT OF ASSETS AND LIABILITIES
MARCH 31, 2018
| ASSETS | | | |
| Investments, at value (Cost $1,690,218) | | $ | 2,049,650 | |
| Cash | | | 236 | |
| Foreign currency (Cost $5,206) | | | 5,278 | |
| Receivables: | | | | |
| Dividends | | | 3,595 | |
| From investment adviser | | | 22,230 | |
| Prepaid expenses | | | 21,065 | |
| Total Assets | | | 2,102,054 | |
| LIABILITIES | | | | |
| Payables: | | | | |
| Foreign capital gains tax payable | | | 633 | |
| Accrued Liabilities: | | | | |
| Fund services fees | | | 9,152 | |
| Professional fees | | | 19,201 | |
| Other expenses | | | 8,467 | |
| Total Liabilities | | | 37,453 | |
| NET ASSETS | | $ | 2,064,601 | |
| COMPONENTS OF NET ASSETS | | | | |
| Paid-in capital | | $ | 1,669,651 | |
| Distributions in excess of net investment income | | | (8,874 | ) |
| Accumulated net realized gain | | | 44,943 | |
| Net unrealized appreciation | | | 358,881 | |
| NET ASSETS | | $ | 2,064,601 | |
| SHARES OF BENEFICIAL INTEREST AT NO PAR VALUE (UNLIMITED SHARES AUTHORIZED) | | | | |
| Institutional Shares | | | 157,511 | |
| Investor Shares | | | 4,785 | |
| NET ASSET VALUE, OFFERING AND REDEMPTION PRICE PER SHARE | | | | |
| Institutional Shares (based on net assets of $2,003,611) | | $ | 12.72 | |
| Investor Shares (based on net assets of $60,990) | | $ | 12.75 | |
| See Notes to Financial Statements. | | LMCG FUNDS |
LMCG GLOBAL MULTICAP FUNDSTATEMENT OF OPERATIONS
YEAR ENDED MARCH 31, 2018
| INVESTMENT INCOME | | | |
| Dividend income (Net of foreign withholding taxes of $4,113) | | $ | 41,674 | |
| Total Investment Income | | | 41,674 | |
| EXPENSES | | | | |
| Investment adviser fees | | | 15,600 | |
| Fund services fees | | | 185,496 | |
| Transfer agent fees: | | | | |
| Institutional Shares | | | 2,586 | |
| Investor Shares | | | 2,507 | |
| Distribution fees: | | | | |
| Investor Shares | | | 91 | |
| Custodian fees | | | 16,749 | |
| Registration fees: | | | | |
| Institutional Shares | | | 14,752 | |
| Investor Shares | | | 15,199 | |
| Professional fees | | | 25,655 | |
| Trustees’ fees and expenses | | | 4,969 | |
| Pricing fees | | | 16,804 | |
| Other expenses | | | 18,919 | |
| Total Expenses | | | 319,327 | |
| Fees waived and expenses reimbursed | | | (298,359 | ) |
| Net Expenses | | | 20,968 | |
| NET INVESTMENT INCOME | | | 20,706 | |
| NET REALIZED AND UNREALIZED GAIN (LOSS) | | | | |
| Net realized gain on: | | | | |
| Investments (Net of foreign withholding taxes of $28) | | | 104,623 | |
| Foreign currency transactions | | | 103 | |
| Net realized gain | | | 104,726 | |
| Net change in unrealized appreciation (depreciation) on: | | | | |
| Investments | | | 116,467 | |
| Deferred foreign capital gains taxes | | | (496 | ) |
| Foreign currency translations | | | 82 | |
| Net change in unrealized appreciation (depreciation) | | | 116,053 | |
| NET REALIZED AND UNREALIZED GAIN | | | 220,779 | |
| INCREASE IN NET ASSETS RESULTING FROM OPERATIONS | | $ | 241,485 | |
| See Notes to Financial Statements. | | LMCG FUNDS |
LMCG GLOBAL MULTICAP FUNDSTATEMENTS OF CHANGES IN NET ASSETS
| | | For the Years Ended March 31, | |
| | | 2018 | | | 2017 | |
| OPERATIONS | | | | | | |
| Net investment income | | $ | 20,706 | | | $ | 16,893 | |
| Net realized gain | | | 104,726 | | | | 72,520 | |
| Net change in unrealized appreciation (depreciation) | | | 116,053 | | | | 222,140 | |
| Increase in Net Assets Resulting from Operations | | | 241,485 | | | | 311,553 | |
| | | | | | | | | |
| DISTRIBUTIONS TO SHAREHOLDERS FROM | | | | | | | | |
| Net investment income: | | | | | | | | |
| Institutional Shares | | | (36,084 | ) | | | (18,893 | ) |
| Investor Shares | | | (302 | ) | | | (440 | ) |
| Net realized gain: | | | | | | | | |
| Institutional Shares | | | (85,141 | ) | | | (14,248 | ) |
| Investor Shares | | | (1,002 | ) | | | (92 | ) |
| Total Distributions to Shareholders | | | (122,529 | ) | | | (33,673 | ) |
| | | | | | | | | |
| CAPITAL SHARE TRANSACTIONS | | | | | | | | |
| Sale of shares: | | | | | | | | |
| Institutional Shares | | | 156,797 | | | | 268,003 | |
| Investor Shares | | | 42,924 | | | | 39,350 | |
| Reinvestment of distributions: | | | | | | | | |
| Institutional Shares | | | 121,225 | | | | 33,141 | |
| Investor Shares | | | 1,304 | | | | 532 | |
| Redemption of shares: | | | | | | | | |
| Institutional Shares | | | (250,431 | ) | | | (532,204 | ) |
| Investor Shares | | | (35,627 | ) | | | (1,498 | ) |
| Increase (Decrease) in Net Assets from Capital Share Transactions | | | 36,192 | | | | (192,676 | ) |
| Increase in Net Assets | | | 155,148 | | | | 85,204 | |
| | | | | | | | | |
| NET ASSETS | | | | | | | | |
| Beginning of Year | | | 1,909,453 | | | | 1,824,249 | |
| End of Year (Including line (a)) | | $ | 2,064,601 | | | $ | 1,909,453 | |
| | | | | | | | | |
| SHARE TRANSACTIONS | | | | | | | | |
| Sale of shares: | | | | | | | | |
| Institutional Shares | | | 12,333 | | | | 25,015 | |
| Investor Shares | | | 3,246 | | | | 3,470 | |
| Reinvestment of distributions: | | | | | | | | |
| Institutional Shares | | | 9,289 | | | | 2,936 | |
| Investor Shares | | | 100 | | | | 48 | |
| Redemption of shares: | | | | | | | | |
| Institutional Shares | | | (18,892 | ) | | | (48,560 | ) |
| Investor Shares | | | (2,890 | ) | | | (136 | ) |
| Increase (Decrease) in Shares | | | 3,186 | | | | (17,227 | ) |
| | | | | | | | | |
| (a) Distributions in excess of net investment income | | $ | (8,874 | ) | | $ | (4,090 | ) |
| See Notes to Financial Statements. | | LMCG FUNDS |
LMCG GLOBAL MULTICAP FUNDFINANCIAL HIGHLIGHTS
These financial highlights reflect selected data for a share outstanding throughout each period.
| | | For the Years Ended March 31, | | | September 11, 2013 (a) Through | |
| | | 2018 | | | 2017 | | | 2016 | | | 2015 | | | March 31, 2014 | |
| INSTITUTIONAL SHARES | | | | | | | | | | | | | | | |
| NET ASSET VALUE, Beginning of Period | | $ | 12.00 | | | $ | 10.35 | | | $ | 11.21 | | | $ | 10.80 | | | $ | 10.00 | |
| INVESTMENT OPERATIONS | | | | | | | | | | | | | | | | | | | | |
| Net investment income (b) | | | 0.13 | | | | 0.10 | | | | 0.11 | | | | 0.10 | | | | 0.02 | |
| Net realized and unrealized gain (loss) | | | 1.35 | | | | 1.76 | | | | (0.68 | ) | | | 0.49 | | | | 0.86 | |
| Total from Investment Operations | | | 1.48 | | | | 1.86 | | | | (0.57 | ) | | | 0.59 | | | | 0.88 | |
| | | | | | | | | | | | | | | | | | | | | |
| DISTRIBUTIONS TO SHAREHOLDERS FROM | | | | | | | | | | | | | | | | | | | | |
| Net investment income | | | (0.23 | ) | | | (0.12 | ) | | | (0.16 | ) | | | (0.08 | ) | | | (0.06 | ) |
| Net realized gain | | | (0.53 | ) | | | (0.09 | ) | | | (0.13 | ) | | | (0.10 | ) | | | (0.02 | ) |
| Total Distributions to Shareholders | | | (0.76 | ) | | | (0.21 | ) | | | (0.29 | ) | | | (0.18 | ) | | | (0.08 | ) |
| NET ASSET VALUE, End of Period | | $ | 12.72 | | | $ | 12.00 | | | $ | 10.35 | | | $ | 11.21 | | | $ | 10.80 | |
| TOTAL RETURN | | | 12.22 | % | | | 18.11 | % | | | (5.11 | )% | | | 5.57 | % | | | 8.79 | %(c) |
| | | | | | | | | | | | | | | | | | | | | |
| RATIOS/SUPPLEMENTARY DATA | | | | | | | | | | | | | | | | | | | | |
| Net Assets at End of Period (000s omitted) | | $ | 2,004 | | | $ | 1,858 | | | $ | 1,814 | | | $ | 1,882 | | | $ | 1,344 | |
| Ratios to Average Net Assets: | | | | | | | | | | | | | | | | | | | | |
| Net investment income | | | 0.99 | % | | | 0.92 | % | | | 1.02 | % | | | 0.95 | % | | | 0.31 | %(d) |
| Net expenses | | | 1.00 | % | | | 1.20 | % | | | 1.20 | % | | | 1.20 | % | | | 1.20 | %(d) |
| Gross expenses (e) | | | 14.39 | % | | | 17.14 | % | | | 16.22 | % | | | 17.65 | % | | | 24.97 | %(d) |
| PORTFOLIO TURNOVER RATE | | | 43 | % | | | 73 | % | | | 44 | % | | | 74 | % | | | 32 | %(c) |
| (a) | Commencement of operations. |
| (b) | Calculated based on average shares outstanding during each period. |
| (e) | Reflects the expense ratio excluding any waivers and/or reimbursements. |
| See Notes to Financial Statements. | | LMCG FUNDS |
LMCG GLOBAL MULTICAP FUNDFINANCIAL HIGHLIGHTS
These financial highlights reflect selected data for a share outstanding throughout each period.
| | | For the Years Ended March 31, | | | March 3, 2015 (a) Through | |
| | | 2018 | | | 2017 | | | 2016 | | | March 31, 2015 | |
| INVESTOR SHARES | | | | | | | | | | | | |
| NET ASSET VALUE, Beginning of Period | | $ | 11.96 | | | $ | 10.34 | | | $ | 11.21 | | | $ | 11.29 | |
| INVESTMENT OPERATIONS | | | | | | | | | | | | | | | | |
| Net investment income (b) | | | 0.12 | | | | 0.05 | | | | 0.08 | | | | 0.02 | |
| Net realized and unrealized gain (loss) | | | 1.35 | | | | 1.77 | | | | (0.69 | ) | | | (0.10 | )(c) |
| Total from Investment Operations | | | 1.47 | | | | 1.82 | | | | (0.61 | ) | | | (0.08 | ) |
| | | | | | | | | | | | | | | | | |
| DISTRIBUTIONS TO SHAREHOLDERS FROM | | | | | | | | | | | | | | | | |
| Net investment income | | | (0.15 | ) | | | (0.11 | ) | | | (0.13 | ) | | | – | |
| Net realized gain | | | (0.53 | ) | | | (0.09 | ) | | | (0.13 | ) | | | – | |
| Total Distributions to Shareholders | | | (0.68 | ) | | | (0.20 | ) | | | (0.26 | ) | | | – | |
| NET ASSET VALUE, End of Period | | $ | 12.75 | | | $ | 11.96 | | | $ | 10.34 | | | $ | 11.21 | |
| TOTAL RETURN | | | 12.20 | % | | | 17.76 | % | | | (5.39 | )% | | | (0.71 | )%(d) |
| | | | | | | | | | | | | | | | | |
| RATIOS/SUPPLEMENTARY DATA | | | | | | | | | | | | | | | | |
| Net Assets at End of Period (000s omitted) | | $ | 61 | | | $ | 52 | | | $ | 10 | | | $ | 10 | |
| Ratios to Average Net Assets: | | | | | | | | | | | | | | | | |
| Net investment income | | | 0.91 | % | | | 0.48 | % | | | 0.77 | % | | | 2.45 | %(e) |
| Net expenses | | | 1.25 | % | | | 1.45 | % | | | 1.45 | % | | | 1.45 | %(e) |
| Gross expenses (f) | | | 65.97 | % | | | 110.82 | % | | | 149.94 | % | | | 31.89 | %(e) |
| PORTFOLIO TURNOVER RATE | | | 43 | % | | | 73 | % | | | 44 | % | | | 74 | %(d) |
| (a) | Commencement of operations. |
| (b) | Calculated based on average shares outstanding during each period. |
| (c) | Per share amount does not reflect the actual net realized and unrealized gain/(loss) for the period due to the timing of Fund share sales and the amount of per share realized and unrealized gains and losses at such time. |
| (f) | Reflects the expense ratio excluding any waivers and/or reimbursements. |
| See Notes to Financial Statements. | | LMCG FUNDS |
LMCG INTERNATIONAL SMALL CAP FUNDA MESSAGE TO OUR SHAREHOLDERS (Unaudited)
MARCH 31, 2018
Dear Shareholder:
The LMCG International Small Cap Fund (the “Fund”) Institutional Shares gained 21.99% in the 12-month period ending March 31, 2018, trailing the MSCI EAFE Small Cap Index (the “Index”) return of 23.49%. Since inception1, the Institutional Shares have gained 13.52% vs. 11.74% for the Index, both on an annualized basis. Under normal circumstances the Fund invests at least 80% of its assets in the equity securities of small-cap companies. The Fund considers companies small cap which at the time of purchase fall within the range of the Index. At an index level, the performance of international small-cap companies dramatically outperformed their large-cap counterparts, with the MSCI EAFE Index (as a proxy for international large-cap securities) advancing 14.80% in the one-year period.
The performance data quoted represents past performance and is no guarantee of future results. Investment return and principal value of an investment will fluctuate so that an investor's shares, when redeemed, may be worth more or less than their original cost. Current performance may be lower or higher than the performance data quoted. For the most recent month-end performance, please call (877) 591-4667.
The past three years have been challenging for our core active strategy to consistently add value due to a wide divergence between how value and growth styles have been rewarded in the marketplace. While the effect has been stronger among U.S. stocks, international small cap stocks have also been impacted. While political and macro uncertainty has centered on the U.S. as the Trump administration came into power, international small cap stocks have been impacted. The dominant investment style has flipped from growth in 2015 to value in 2016 and then back to growth again for 2017. In international small caps, the magnitude of the spreads for the last two years was not as wide as it was in the U.S., but the change in direction between the growth and value styles was in line with what happened in the U.S. The smaller magnitude of the swings is consistent with our belief that international small caps are less impacted by macro events than international large cap companies or small or large companies in the U.S.
So far in 2018, we believe the investment environment can be divided into two distinct periods, the month of January and the remaining two months. In January, developed markets performed quite well, with the MSCI EAFE Small Cap Index returning +5.1%. In February and March, markets pulled back on fears that U.S. interest rates would increase faster than expected to keep inflation in check. President Trump’s plans to increase tariffs on Chinese goods further shook markets. We expected our stock selection factors to work quite differently in the two periods as investors attitude toward risk changed dramatically. Valuation tends to work better in risk-on (January) environments and our more growth-oriented factors such as Estimate Revision and Price Momentum tend to work better in risk-off environments (February and March). We did not see the factors work as we expected and instead they were mixed from month to month. However, the change in risk preference did play out as expected in risk factor performance. For instance, high beta stocks dramatically outperformed low beta stocks in January and then the reverse in February and March. We suspect our stock selection factors did not behave in line with expectations in international small caps as investors paid less attention to corporate fundamentals and more on headlines related to Trump’s trade policy and the possibility of slowing global economic growth. We are disappointed that our approach was not able to add much value over the benchmark for the past few months. However, the diversification of our stock selection factors combined with risk control has allowed us to keep pace with the benchmark in the first three months of 2018 in a very volatile market environment.
As of March 31, 2018, the Fund was well-diversified across 23 countries and 10 sectors. The largest country allocations in both the portfolio and the benchmark were Japan (over 25% in each) and the United Kingdom (over 17% in each). The Fund seeks to add value primarily from stock selection – not making significant over- or under-weight decisions versus countries or sectors. We believe that this is an important element of risk control in the portfolio and has historically resulted in the Fund having similar volatility as the benchmark.
Attribution
Looking at performance through a country lens, the positive stock selection in New Zealand, Singapore and Spain contributed the most to performance over the 12-month period. Stocks in Australia, Belgium and Japan were the largest detractors. From a sector perspective, the vast majority of performance came from Materials and Consumer Staples. Technology and Industrials stock selections were the biggest laggards.
LMCG INTERNATIONAL SMALL CAP FUND
A MESSAGE TO OUR SHAREHOLDERS (Unaudited)
MARCH 31, 2018
Model Efficacy
Analyzing the investment universe2from a factor perspective, market dynamics (D) (which includes earnings revision and price momentum) was the largest contributor to performance over the one- year period. earnings quality (Q) was slightly negative for the same period. Valuation was the biggest detractor from performance. Most of the 12-month period was a “risk-off” environment, where market dynamics typically responds favorably and valuation is not effective.
The graph shows the difference in payoffs of our model and its three main composite factors for the one-year period in the international small cap universe. This data is calculated by subtracting the 5th quintile stock performance for each factor from the performance of those in the 1st quintile. Payoffs in the Fund’s portfolio vary from the model, since the Fund does not own all of the 1st quintile stocks, and also owns stocks below the 1st quintile.
Outlook
We are optimistic about international small cap equity market returns in 2018. However, we expect stock market volatility to remain elevated as negotiations on trade tariffs between the U.S. and China continue. So far this year, investors in developed markets have been more focused on macro news events rather than company fundamentals which is a difficult environment for an active strategy such as ours. However, our core approach which combines value and growth characteristics, has been able to keep pace with the Index despite the extreme market gyrations so far in 2018. Our more growth-oriented factors have worked better and have been able to partially offset our value factors which have not worked.
We continue to employ a balanced approach with respect to our major stock selection components: valuation, market dynamics and quality. We believe it is important to invest in stocks with good valuations that also have a catalyst such as estimate revision or price momentum. In addition, we continue to pay close attention to risk control to avoid any unwanted biases.
Sincerely,
| |
Gordon Johnson Co-Portfolio Manager LMCG Investments, LLC | Shannon Ericson Co-Portfolio Manager LMCG Investments, LLC |
1 | Inception 8/26/2010. The Fund has adopted the historical performance of LMCG International Small Cap Collective Fund, a separate collective investment fund of LMCG Collective Trust (the “Predecessor Fund”) managed by LMCG Investments, LLC as the result of a reorganization in which the Fund acquired all of the assets, subject to liabilities, of the Predecessor Fund, effective as of the close of business on April 1, 2016. The returns presented for the Fund prior to this date reflect the performance of the Predecessor Fund. The Predecessor Fund commenced operations on August 26, 2010. The Predecessor Fund was not registered as an investment company under the Investment Company Act of 1940, and therefore the Predecessor Fund was not subject to certain investment limitations, diversification requirements, liquidity requirements, and other restrictions imposed by the Investment Company Act of 1940 and the Internal Revenue Code of 1986 which, if applicable, may have adversely affected its performance. The Predecessor Fund had an investment objective and strategies that were, in all material respects, equivalent to those of the Fund. |
The Fund’s performance for periods prior to the commencement of operations is that of the Predecessor Fund and is based on calculations that are different from the standardized method of calculations adopted by the Securities and Exchange Commission (the “SEC”). The performance of the Predecessor Fund was calculated net of the Predecessor Fund’s fees and expenses. The performance of the Predecessor Fund is not the performance information of the Fund, and has not been restated to reflect the fees, estimated expenses and fee waivers and/or expense limitations of the Fund. If the performance of the Predecessor Fund had been restated to reflect the applicable fees and expenses of the Fund, the performance may have been higher or lower than the performance shown.
2 | The investment universe is those companies in the MSCI EAFE Small Cap Index. |
LMCG INTERNATIONAL SMALL CAP FUNDA MESSAGE TO OUR SHAREHOLDERS (Unaudited)
MARCH 31, 2018
INVESTMENT CONSIDERATIONS
Equity Risk - The Fund’s equity holdings, including common stocks, may decline in value. The value of a security may decline for a number of reasons, which are detailed in the prospectus.
Foreign & Emerging Markets Investing Risks - As a result of political or economic instability in foreign countries, there can be special risks associated with investing in foreign securities, including fluctuations in currency exchange rates, increased price volatility and difficulty obtaining information. In addition, emerging markets may present additional risk due to potential for greater economic and political instability in less developed countries.
Market Events Risk - Turbulence in the financial markets and reduced liquidity in equity, credit and fixed-income markets may negatively affect issuers, which could adversely affect the Fund.
Small Cap Risk - The Fund’s investments in small capitalization companies may be less liquid and their securities’ prices may fluctuate more than those of larger, more established companies.
There can be no guarantee that any strategy (risk management or otherwise) will be successful. All investing involves risk, including the potential loss of principal.
LMCG INTERNATIONAL SMALL CAP FUNDPERFORMANCE CHART AND ANALYSIS (Unaudited)
MARCH 31, 2018
The following chart reflects the change in the value of a hypothetical $100,000 investment in Institutional Shares, including reinvested dividends and distributions, in the LMCG International Small Cap Fund (the “Fund”) compared with the performance of the benchmark, MSCI EAFE Small Cap Index, since inception. The MSCI EAFE Small Cap Index is an equity index which captures small cap representation across Developed Market countries around the world, excluding the United States and Canada. The total return of the index includes the reinvestment of dividends and income. The total return of the Fund includes operating expenses that reduce returns, while the total return of the index does not include expenses. The Fund is professionally managed, while the index is unmanaged and is not available for investment.
Comparison of Change in Value of a $100,000 Investment
LMCG International Small Cap Fund - Institutional Shares vs. MSCI EAFE Small Cap Index
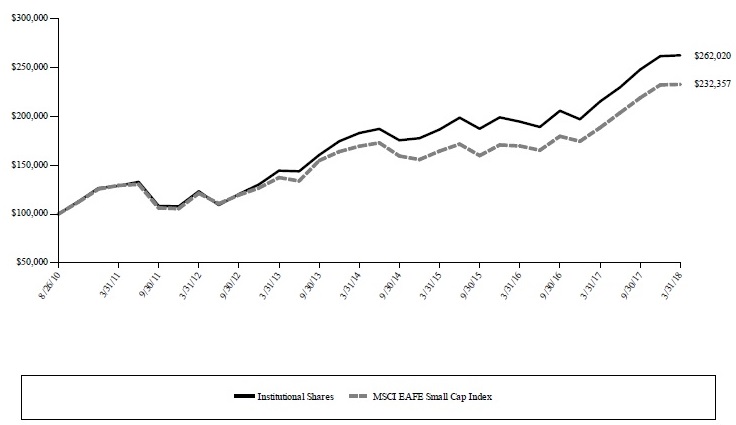
Average Annual Total Returns Periods Ended March 31, 2018 | One Year | Five Years | Since Inception (08/26/10) |
| LMCG International Small Cap Fund - Institutional Shares* | 21.99% | 12.67% | 13.52% |
| LMCG International Small Cap Fund - Investor Shares* | 21.74% | 12.56% | 13.45% |
| MSCI EAFE Small Cap Index | 23.49% | 11.10% | 11.74% |
| * | Institutional Shares commenced operations on April 1, 2016, and Investor Shares commenced operations on April 18, 2016. Performance for the periods prior to commencement reflects the performance and expenses of a collective investment trust previously managed by the Fund’s Adviser and portfolio management team. This collective investment trust was organized and commenced operations on August 26, 2010. |
Performance data quoted represents past performance and is no guarantee of future results. Current performance may be lower or higher than the performance data quoted. Investment return and principal value will fluctuate so that shares, when redeemed, may be worth more or less than original cost. As stated in the Fund’s prospectus, the annual operating expense ratios (gross) for Institutional Shares and Investor Shares are 8.57% and 60.04%, respectively. However, the Fund’s adviser has contractually agreed to waive its fee and/or reimburse Fund expenses to limit Total Annual Fund Operating Expenses After Fee Waiver and/or Expense Reimbursement (excluding all taxes, interest, portfolio transaction expenses, dividend and interest expenses on short sales, acquired fund fees and expenses, proxy expenses and extraordinary expenses) to 0.85% and 1.10% of Institutional Shares and Investor Shares, respectively, through at least July 31, 2018 (the “Expense Cap”). The adviser may be reimbursed by the Fund for fees waived and expenses reimbursed by the adviser pursuant to the Expense Cap if such payment is made within three years of the fee waiver or expense reimbursement, and does not cause the Total Annual Fund Operating Expenses After Fee Waiver and/or Expense Reimbursement to exceed the lesser of (i) the then-current expense cap, or (ii) the expense cap in place at the time the fees/expenses were waived/reimbursed. The performance table and graph do not reflect the deduction of taxes that a shareholder would pay on Fund distributions or the redemption of Fund shares. Returns greater than one year are annualized.
LMCG FUNDS
LMCG INTERNATIONAL SMALL CAP FUNDSCHEDULE OF INVESTMENTS
MARCH 31, 2018
| Shares | | Security Description | | Value | |
| Equity Securities - 95.7% | | | |
| Common Stock - 95.0% | | | |
| Australia - 7.4% | | | |
| | 17,144 | | Ansell, Ltd. | | $ | 335,619 | |
| | 59,412 | | Charter Hall Group REIT | | | 262,988 | |
| | 377,276 | | Cromwell Property Group REIT | | | 310,661 | |
| | 92,327 | | Eclipx Group, Ltd. | | | 255,693 | |
| | 133,163 | | Metcash, Ltd. | | | 322,239 | |
| | 25,305 | | Monadelphous Group, Ltd. | | | 298,295 | |
| | 228,909 | | Nine Entertainment Co. Holdings, Ltd. | | | 402,027 | |
| | 52,909 | | Sandfire Resources NL | | | 301,434 | |
| | 25,665 | | Sims Metal Management, Ltd. | | | 288,298 | |
| | 124,000 | | St Barbara, Ltd. | | | 382,467 | |
| | | | | | | 3,159,721 | |
| Austria - 1.6% | | | | |
| | 10,177 | | AT&S Austria Technologie & Systemtechnik AG | | | 276,337 | |
| | 33,206 | | UNIQA Insurance Group AG | | | 386,562 | |
| | | | | | | 662,899 | |
| Belgium - 1.4% | | | | |
| | 37,849 | | AGFA-Gevaert NV (a) | | | 146,586 | |
| | 9,589 | | bpost SA | | | 216,642 | |
| | 5,893 | | D'ieteren SA/NV | | | 238,776 | |
| | | | | | | 602,004 | |
| Canada - 1.2% | | | | |
| | 10,100 | | Canadian Western Bank | | | 259,095 | |
| | 9,500 | | Maple Leaf Foods, Inc. | | | 231,537 | |
| | | | | | | 490,632 | |
| China - 1.0% | | | | |
| | 270,000 | | Xinyi Glass Holdings, Ltd. | | | 410,982 | |
| Denmark - 3.0% | | | | |
| | 1,351 | | Rockwool International A/S, Class B | | | 402,447 | |
| | 6,649 | | Royal Unibrew A/S | | | 441,420 | |
| | 9,028 | | Topdanmark A/S (a) | | | 426,282 | |
| | | | | | | 1,270,149 | |
| Finland - 0.7% | | | | |
| | 37,511 | | YIT OYJ | | | 314,206 | |
| France - 2.4% | | | | |
| | 2,412 | | Ipsen SA | | | 374,911 | |
| | 10,947 | | Metropole Television SA | | | 282,036 | |
| | 5,649 | | Nexity SA (a) | | | 361,794 | |
| | | | | | | 1,018,741 | |
| Georgia - 0.8% | | | | |
| | 6,751 | | BGEO Group PLC | | | 336,900 | |
| Germany - 4.7% | | | | |
| | 6,555 | | CTS Eventim AG & Co. KGaA | | | 307,287 | |
| | 20,083 | | Deutsche Pfandbriefbank AG (b) | | | 316,640 | |
| | 19,718 | | Kloeckner & Co. SE | | | 247,747 | |
| | 4,974 | | Leoni AG | | | 318,191 | |
| | 8,197 | | Salzgitter AG | | | 419,325 | |
| | 19,414 | | TAG Immobilien AG | | | 402,804 | |
| | | | | | | 2,011,994 | |
| Ireland - 0.8% | | | | |
| | 29,915 | | Grafton Group PLC | | | 322,975 | |
| Italy - 1.5% | | | | |
| | 89,868 | | Hera SpA | | | 329,289 | |
| | 30,361 | | Societa Cattolica di Assicurazioni SCRL | | | 323,287 | |
| | | | | | | 652,576 | |
| Japan - 28.0% | | | | |
| | 7,400 | | Azbil Corp. | | | 348,526 | |
| | 31,800 | | Citizen Watch Co., Ltd. | | | 224,347 | |
| | 13,500 | | COMSYS Holdings Corp. | | | 358,912 | |
| | 6,100 | | Daiichikosho Co., Ltd. | | | 320,837 | |
| | 8,800 | | DTS Corp. | | | 306,310 | |
| Shares | | Security Description | | Value | |
| Japan - 28.0% (continued) | | | |
| | 13,500 | | Fancl Corp. | | $ | 496,883 | |
| | 8,100 | | Fuji Soft, Inc. | | | 323,059 | |
| | 14,200 | | Geo Holdings Corp. | | | 225,598 | |
| | 15,500 | | H2O Retailing Corp. | | | 287,620 | |
| | 6,700 | | Hanwa Co., Ltd. | | | 278,259 | |
| | 419 | | Japan Hotel REIT Investment Corp. | | | 297,889 | |
| | 11,500 | | Japan Petroleum Exploration Co., Ltd. | | | 261,703 | |
| | 85,100 | | JVC Kenwood Corp. | | | 281,936 | |
| | 24,300 | | Kanematsu Corp. | | | 327,770 | |
| | 16,200 | | Kohnan Shoji Co., Ltd. | | | 390,498 | |
| | 9,500 | | Matsumotokiyoshi Holdings Co., Ltd. | | | 402,510 | |
| | 6,100 | | Meitec Corp. | | | 334,150 | |
| | 7,400 | | Mitsui Mining & Smelting Co., Ltd. | | | 328,117 | |
| | 31,800 | | NET One Systems Co., Ltd. | | | 466,986 | |
| | 11,400 | | Nihon Kohden Corp. | | | 324,894 | |
| | 50,700 | | Nippon Suisan Kaisha, Ltd. | | | 264,035 | |
| | 9,400 | | Nishio Rent All Co., Ltd. | | | 292,607 | |
| | 12,200 | | Nomura Co., Ltd. | | | 261,677 | |
| | 31,800 | | Onward Holdings Co., Ltd. | | | 277,064 | |
| | 46,600 | | Penta-Ocean Construction Co., Ltd. | | | 343,808 | |
| | 9,500 | | Sankyu, Inc. | | | 472,700 | |
| | 24,300 | | Shikoku Electric Power Co., Inc. | | | 292,826 | |
| | 9,500 | | Ship Healthcare Holdings, Inc. | | | 337,456 | |
| | 26,300 | | Sodick Co., Ltd. | | | 345,121 | |
| | 16,200 | | Star Micronics Co., Ltd. | | | 300,690 | |
| | 6,100 | | Taiyo Holdings Co., Ltd. | | | 262,543 | |
| | 37,800 | | The Hiroshima Bank, Ltd. | | | 288,333 | |
| | 8,800 | | The Nisshin Oillio Group, Ltd. | | | 245,493 | |
| | 8,800 | | Tokyo Seimitsu Co., Ltd. | | | 357,068 | |
| | 8,800 | | TS Tech Co., Ltd. | | | 350,815 | |
| | 10,800 | | Ube Industries, Ltd. | | | 316,467 | |
| | 10,800 | | Unizo Holdings Co., Ltd. | | | 265,772 | |
| | | | | | | 11,861,279 | |
| Malaysia - 1.5% | | | | |
| | 348,000 | | AirAsia Bhd | | | 357,724 | |
| | 612,900 | | Felda Global Ventures Holdings Bhd | | | 264,348 | |
| | | | | | | 622,072 | |
| Malta - 0.8% | | | | |
| | 26,395 | | Kindred Group PLC, SDR | | | 362,128 | |
| Netherlands - 1.6% | | | | |
| | 9,048 | | ASR Nederland NV | | | 386,876 | |
| | 7,636 | | Philips Lighting NV (b) | | | 287,091 | |
| | | | | | | 673,967 | |
| New Zealand - 1.2% | | | | |
| | 56,470 | | a2 Milk Co., Ltd. (a) | | | 510,640 | |
| Norway - 1.6% | | | | |
| | 13,001 | | Aker BP ASA | | | 352,455 | |
| | 39,295 | | Storebrand ASA | | | 323,144 | |
| | | | | | | 675,599 | |
| Portugal - 1.6% | | | | |
| | 46,890 | | NOS SGPS SA | | | 276,363 | |
| | 65,196 | | The Navigator Co. SA | | | 384,106 | |
| | | | | | | 660,469 | |
| Russian Federation - 0.9% | | | | |
| | 63,047 | | Evraz PLC | | | 384,460 | |
| Singapore - 2.2% | | | | |
| | 369,600 | | Mapletree Greater China Commercial Trust | | | | |
| REIT | | | 324,820 | |
| | 28,400 | | Venture Corp., Ltd. | | | 614,203 | |
| | | | | | | 939,023 | |
| See Notes to Financial Statements. | LMCG FUNDS |
LMCG INTERNATIONAL SMALL CAP FUND
SCHEDULE OF INVESTMENTS
MARCH 31, 2018
| Shares | | Security Description | | Value | |
| South Korea - 2.0% | | | |
| | 6,920 | | Hyundai Marine & Fire Insurance Co., Ltd. | | $ | 256,666 | |
| | 14,454 | | Meritz Fire & Marine Insurance Co., Ltd. | | | 287,941 | |
| | 9,717 | | WONIK IPS Co., Ltd. | | | 302,560 | |
| | | | | | | 847,167 | |
| Spain - 1.3% | | | | |
| | 70,981 | | Ence Energia y Celulosa SA | | | 535,780 | |
| Sweden - 3.6% | | | | |
| | 34,274 | | Dometic Group AB (b) | | | 313,983 | |
| | 6,534 | | Holmen AB, Class B | | | 355,406 | |
| | 20,083 | | Mycronic AB | | | 257,823 | |
| | 44,760 | | Resurs Holding AB (b) | | | 317,062 | |
| | 52,472 | | SSAB AB, Class A | | | 297,021 | |
| | | | | | | 1,541,295 | |
| Switzerland - 3.6% | | | | |
| | 838 | | Bucher Industries AG | | | 350,167 | |
| | 290 | | Georg Fischer AG | | | 388,273 | |
| | 12,623 | | Logitech International SA, Class R | | | 463,326 | |
| | 3,859 | | Sunrise Communications Group AG (a)(b) | | | 323,749 | |
| | | | | | | 1,525,515 | |
| Taiwan - 1.1% | | | | |
| | 157,181 | | China Life Insurance Co., Ltd. | | | 163,957 | |
| | 95,000 | | Powertech Technology, Inc. | | | 299,484 | |
| | | | | | | 463,441 | |
| United Kingdom - 17.5% | | | | |
| | 23,570 | | Abcam PLC | | | 409,352 | |
| | 8,724 | | Bellway PLC | | | 373,344 | |
| | 21,218 | | Bovis Homes Group PLC | | | 339,009 | |
| | 21,847 | | CVS Group PLC | | | 298,950 | |
| | 27,691 | | Dart Group PLC | | | 323,600 | |
| | 53,972 | | Electrocomponents PLC | | | 454,604 | |
| | 18,718 | | Greggs PLC | | | 323,055 | |
| | 23,361 | | Halma PLC | | | 386,701 | |
| | 161,720 | | Hansteen Holdings PLC REIT | | | 289,757 | |
| | 144,968 | | Hays PLC | | | 383,502 | |
| | 53,621 | | Howden Joinery Group PLC | | | 347,083 | |
| | 37,727 | | IG Group Holdings PLC | | | 422,530 | |
| | 59,290 | | JD Sports Fashion PLC | | | 279,645 | |
| | 42,390 | | Jupiter Fund Management PLC | | | 281,024 | |
| | 54,371 | | National Express Group PLC | | | 294,772 | |
| | 6,494 | | Rightmove PLC | | | 396,421 | |
| | 5,041 | | Spirax-Sarco Engineering PLC | | | 406,650 | |
| | 100,342 | | Spire Healthcare Group PLC (b) | | | 295,786 | |
| | 45,971 | | SSP Group PLC | | | 394,894 | |
| | 33,855 | | The UNITE Group PLC REIT | | | 375,690 | |
| | 10,021 | | Victrex PLC | | | 361,307 | |
| | | | | | | 7,437,676 | |
| Total Common Stock (Cost $36,237,470) | | | 40,294,290 | |
| Shares | | Security Description | | Rate | | Value | |
| Preferred Stock - 0.7% | | | | | | |
| Germany - 0.7% | | | | | | |
| | 3,196 | | Draegerwerk AG & Co. KGaA | | | | | | |
| | | | (Cost $310,056) | | 0.46% | | | 303,773 | |
| | | | | | | | | | |
| Total Equity Securities (Cost $36,547,526) | | | 40,598,063 | |
| Shares | | Security Description | | Value | |
| Investment Company - 1.9% | | | | |
| | 11,258 | | iShares MSCI EAFE ETF | | | | |
| | | | (Cost $735,948) | | | 784,457 | |
| Shares | | Security Description | | Value | |
| Money Market Fund - 1.9% | | | |
| | 825,356 | | Dreyfus Treasury Prime Cash Management, Institutional Shares, 1.46% (c) | | | | |
| | | | (Cost $825,356) | | $ | 825,356 | |
| | | | | |
| Investments, at value - 99.5% (Cost $38,108,830) | | $ | 42,207,876 | |
| Other Assets & Liabilities, Net - 0.5% | | | 196,607 | |
| Net Assets - 100.0% | | $ | 42,404,483 | |
| PLC | Public Limited Company |
| REIT | Real Estate Investment Trust |
| SDR | Swedish Depositary Receipt |
| (a) | Non-income producing security. |
| (b) | Security exempt from registration under Rule 144A under the Securities Act of 1933. At the period end, the value of these securities amounted to $1,854,310 or 4.4% of net assets. |
| (c) | Dividend yield changes daily to reflect current market conditions. Rate was the quoted yield as of March 31, 2018. |
The following is a summary of the inputs used to value the Fund's investments as of March 31, 2018.
The inputs or methodology used for valuing securities are not necessarily an indication of the risks associated with investing in those securities. For more information on valuation inputs, and their aggregation into the levels used in the table below, please refer to the Security Valuation section in Note 2 of the accompanying Notes to Financial Statements.
| | | Level 1 | | | Level 2 | | | Level 3 | | | Total | |
| Investments at Value | | | | | | | | | | | | |
| Common Stock | | | | | | | | | | | | |
| Australia | | $ | – | | | $ | 3,159,721 | | | $ | – | | | $ | 3,159,721 | |
| Austria | | | – | | | | 662,899 | | | | – | | | | 662,899 | |
| Belgium | | | – | | | | 602,004 | | | | – | | | | 602,004 | |
| Canada | | | 490,632 | | | | – | | | | – | | | | 490,632 | |
| China | | | – | | | | 410,982 | | | | – | | | | 410,982 | |
| Denmark | | | – | | | | 1,270,149 | | | | – | | | | 1,270,149 | |
| Finland | | | – | | | | 314,206 | | | | – | | | | 314,206 | |
| France | | | – | | | | 1,018,741 | | | | – | | | | 1,018,741 | |
| Georgia | | | – | | | | 336,900 | | | | – | | | | 336,900 | |
| Germany | | | – | | | | 2,011,994 | | | | – | | | | 2,011,994 | |
| Ireland | | | – | | | | 322,975 | | | | – | | | | 322,975 | |
| Italy | | | – | | | | 652,576 | | | | – | | | | 652,576 | |
| Japan | | | – | | | | 11,861,279 | | | | – | | | | 11,861,279 | |
| Malaysia | | | – | | | | 622,072 | | | | – | | | | 622,072 | |
| Malta | | | – | | | | 362,128 | | | | – | | | | 362,128 | |
| Netherlands | | | – | | | | 673,967 | | | | – | | | | 673,967 | |
| New Zealand | | | – | | | | 510,640 | | | | – | | | | 510,640 | |
| Norway | | | – | | | | 675,599 | | | | – | | | | 675,599 | |
| Portugal | | | – | | | | 660,469 | | | | – | | | | 660,469 | |
| Russian Federation | | | – | | | | 384,460 | | | | – | | | | 384,460 | |
| Singapore | | | – | | | | 939,023 | | | | – | | | | 939,023 | |
| South Korea | | | – | | | | 847,167 | | | | – | | | | 847,167 | |
| Spain | | | – | | | | 535,780 | | | | – | | | | 535,780 | |
| Sweden | | | – | | | | 1,541,295 | | | | – | | | | 1,541,295 | |
| Switzerland | | | – | | | | 1,525,515 | | | | – | | | | 1,525,515 | |
| Taiwan | | | – | | | | 463,441 | | | | – | | | | 463,441 | |
| United Kingdom | | | – | | | | 7,437,676 | | | | – | | | | 7,437,676 | |
| Preferred Stock | | | | | | | | | | | | | | | | |
| Germany | | | – | | | | 303,773 | | | | – | | | | 303,773 | |
| Investment Company | | | 784,457 | | | | – | | | | – | | | | 784,457 | |
| Money Market Fund | | | – | | | | 825,356 | | | | – | | | | 825,356 | |
| Investments at Value | | $ | 1,275,089 | | | $ | 40,932,787 | | | $ | – | | | $ | 42,207,876 | |
| See Notes to Financial Statements. | LMCG FUNDS |
LMCG INTERNATIONAL SMALL CAP FUND
SCHEDULE OF INVESTMENTS
MARCH 31, 2018
The Fund utilizes the end of period methodology when determining transfers. There were no transfers among Level 1, Level 2 and Level 3 for the year ended March 31, 2018.
At March 31, 2018, foreign securities representing the following percentage of net assets of the Fund were fair valued by independent pricing services and are classified as using Level 2 inputs within the valuation inputs disclosure on the Fund’s Schedule of Investments:
| LMCG International Small Cap Fund | | | |
| Long Securities | | | 94.58 | % |
PORTFOLIO HOLDINGS (Unaudited) % of Total Investments | | | |
| Australia | | | 7.5 | % |
| Austria | | | 1.6 | % |
| Belgium | | | 1.4 | % |
| Canada | | | 1.2 | % |
| China | | | 1.0 | % |
| Denmark | | | 3.0 | % |
| Finland | | | 0.7 | % |
| France | | | 2.4 | % |
| Georgia | | | 0.8 | % |
| Germany | | | 5.5 | % |
| Ireland | | | 0.8 | % |
| Italy | | | 1.5 | % |
| Japan | | | 28.1 | % |
| Malaysia | | | 1.5 | % |
| Malta | | | 0.9 | % |
| Netherlands | | | 1.6 | % |
| New Zealand | | | 1.2 | % |
| Norway | | | 1.6 | % |
| Portugal | | | 1.6 | % |
| Russian Federation | | | 0.9 | % |
| Singapore | | | 2.2 | % |
| South Korea | | | 2.0 | % |
| Spain | | | 1.3 | % |
| Sweden | | | 3.6 | % |
| Switzerland | | | 3.6 | % |
| Taiwan | | | 1.1 | % |
| United Kingdom | | | 17.6 | % |
United States** | | | 3.8 | % |
| | | | 100.0 | % |
| * | Includes Money Market Fund totaling 2.0%. |
| See Notes to Financial Statements. | LMCG FUNDS |
LMCG INTERNATIONAL SMALL CAP FUNDSTATEMENT OF ASSETS AND LIABILITIES
MARCH 31, 2018
| ASSETS | | | |
| Investments, at value (Cost $38,108,830) | | $ | 42,207,876 | |
| Cash | | | 5,343 | |
| Receivables: | | | | |
| Fund shares sold | | | 25,946 | |
| Dividends | | | 197,642 | |
| Prepaid expenses | | | 21,573 | |
| Total Assets | | | 42,458,380 | |
| LIABILITIES | | | | |
| Accrued Liabilities: | | | | |
Investment adviser fees | | | 3,668 | |
| Trustees’ fees and expenses | | | 10 | |
| Fund services fees | | | 7,846 | |
| Professional fees | | | 25,401 | |
| Other expenses | | | 16,972 | |
| Total Liabilities | | | 53,897 | |
| NET ASSETS | | $ | 42,404,483 | |
| COMPONENTS OF NET ASSETS | | | | |
| Paid-in capital | | $ | 38,363,308 | |
| Distributions in excess of net investment income | | | (122,250 | ) |
| Accumulated net realized gain | | | 63,088 | |
| Net unrealized appreciation | | | 4,100,337 | |
| NET ASSETS | | $ | 42,404,483 | |
| | |
| SHARES OF BENEFICIAL INTEREST AT NO PAR VALUE (UNLIMITED SHARES AUTHORIZED) | |
| Institutional Shares | | | 3,216,678 | |
| Investor Shares | | | 84,150 | |
| | | | | |
| NET ASSET VALUE, OFFERING AND REDEMPTION PRICE PER SHARE | | | | |
| Institutional Shares (based on net assets of $41,325,132) | | $ | 12.85 | |
| Investor Shares (based on net assets of $1,079,351) | | $ | 12.83 | |
| See Notes to Financial Statements. | LMCG FUNDS |
LMCG INTERNATIONAL SMALL CAP FUNDSTATEMENT OF OPERATIONS
YEAR ENDED MARCH 31, 2018
| INVESTMENT INCOME | | | |
| Dividend income (Net of foreign withholding taxes of $72,036) | | $ | 573,172 | |
| Total Investment Income | | | 573,172 | |
| EXPENSES | | | | |
Investment adviser fees | | | 189,478 | |
| Fund services fees | | | 191,148 | |
| Transfer agent fees: | | | | |
| Institutional Shares | | | 3,364 | |
| Investor Shares | | | 2,489 | |
| Distribution fees: | | | | |
| Investor Shares | | | 1,659 | |
| Custodian fees | | | 60,379 | |
| Registration fees: | | | | |
| Institutional Shares | | | 17,574 | |
| Investor Shares | | | 16,116 | |
| Professional fees | | | 39,664 | |
| Trustees' fees and expenses | | | 6,116 | |
| Pricing fees | | | 27,885 | |
| Other expenses | | | 26,397 | |
| Total Expenses | | | 582,269 | |
| Fees waived and expenses reimbursed | | | (350,530 | ) |
| Net Expenses | | | 231,739 | |
| NET INVESTMENT INCOME | | | 341,433 | |
| NET REALIZED AND UNREALIZED GAIN (LOSS) | | | | |
| Net realized gain (loss) on: | | | | |
| Investments | | | 361,637 | |
| Foreign currency transactions | | | (13,492 | ) |
| Net realized gain | | | 348,145 | |
| Net change in unrealized appreciation (depreciation) on: | | | | |
| Investments | | | 3,468,557 | |
| Foreign currency translations | | | 1,322 | |
| Net change in unrealized appreciation (depreciation) | | | 3,469,879 | |
| NET REALIZED AND UNREALIZED GAIN | | | 3,818,024 | |
| INCREASE IN NET ASSETS RESULTING FROM OPERATIONS | | $ | 4,159,457 | |
| See Notes to Financial Statements. | LMCG FUNDS |
LMCG INTERNATIONAL SMALL CAP FUNDSTATEMENTS OF CHANGES IN NET ASSETS
| | | For the Year Ended March 31, 2018 | | | April 1, 2016* Through March 31, 2017 | |
| OPERATIONS | | | | | | |
| Net investment income | | $ | 341,433 | | | $ | 88,806 | |
| Net realized gain | | | 348,145 | | | | 27,824 | |
| Net change in unrealized appreciation (depreciation) | | | 3,469,879 | | | | 445,076 | |
| Increase in Net Assets Resulting from Operations | | | 4,159,457 | | | | 561,706 | |
| | | | | | | | | |
| DISTRIBUTIONS TO SHAREHOLDERS FROM | | | | | | | | |
| Net investment income: | | | | | | | | |
| Institutional Shares | | | (691,739 | ) | | | (155,074 | ) |
| Investor Shares | | | (17,439 | ) | | | (1,118 | ) |
| Total Distributions to Shareholders | | | (709,178 | ) | | | (156,192 | ) |
| | | | | | | | | |
| CAPITAL SHARE TRANSACTIONS | | | | | | | | |
| Sale of shares: | | | | | | | | |
| Institutional Shares (See Note 1) | | | 31,800,489 | | | | 5,985,369 | |
| Investor Shares | | | 1,294,315 | | | | 62,205 | |
| Reinvestment of distributions: | | | | | | | | |
| Institutional Shares | | | 681,057 | | | | 155,074 | |
| Investor Shares | | | 17,439 | | | | 1,118 | |
| Redemption of shares: | | | | | | | | |
| Institutional Shares | | | (710,168 | ) | | | (370,458 | ) |
| Investor Shares | | | (343,756 | ) | | | (23,994 | ) |
| Increase in Net Assets from Capital Share Transactions | | | 32,739,376 | | | | 5,809,314 | |
| Increase in Net Assets | | | 36,189,655 | | | | 6,214,828 | |
| | | | | | | | | |
| NET ASSETS | | | | | | | | |
| Beginning of Period | | | 6,214,828 | | | | – | |
| End of Period (Including line (a)) | | $ | 42,404,483 | | | $ | 6,214,828 | |
| | | | | | | | | |
| SHARE TRANSACTIONS | | | | | | | | |
| Sale of shares: | | | | | | | | |
| Institutional Shares (See Note 1) | | | 2,644,469 | | | | 595,908 | |
| Investor Shares | | | 105,505 | | | | 6,066 | |
| Reinvestment of distributions: | | | | | | | | |
| Institutional Shares | | | 53,166 | | | | 15,776 | |
| Investor Shares | | | 1,363 | | | | 114 | |
| Redemption of shares: | | | | | | | | |
| Institutional Shares | | | (56,450 | ) | | | (36,191 | ) |
| Investor Shares | | | (26,640 | ) | | | (2,258 | ) |
| Increase in Shares | | | 2,721,413 | | | | 579,415 | |
| (a) Undistributed (distributions in excess of ) net investment income | | $ | (122,250 | ) | | $ | 9,408 | |
| * | Commencement of operations. |
| See Notes to Financial Statements. | LMCG FUNDS |
LMCG INTERNATIONAL SMALL CAP FUNDFINANCIAL HIGHLIGHTS
These financial highlights reflect selected data for a share outstanding throughout each period.
| | | For the Year Ended March 31, 2018 | | | April 1, 2016 (a) Through March 31, 2017 | |
| INSTITUTIONAL SHARES | | | | | | |
| NET ASSET VALUE, Beginning of Period | | $ | 10.73 | | | $ | 10.00 | |
| INVESTMENT OPERATIONS | | | | | | | | |
| Net investment income (b) | | | 0.16 | | | | 0.18 | |
| Net realized and unrealized gain | | | 2.20 | | | | 0.85 | |
| Total from Investment Operations | | | 2.36 | | | | 1.03 | |
| | | | | | | | | |
| DISTRIBUTIONS TO SHAREHOLDERS FROM | | | | | | | | |
| Net investment income | | | (0.24 | ) | | | (0.30 | ) |
| Total Distributions to Shareholders | | | (0.24 | ) | | | (0.30 | ) |
| NET ASSET VALUE, End of Period | | $ | 12.85 | | | $ | 10.73 | |
| TOTAL RETURN | | | 21.99 | % | | | 10.55 | %(c) |
| | | | | | | | | |
| RATIOS/SUPPLEMENTARY DATA | | | | | | | | |
| Net Assets at End of Period (000s omitted) | | $ | 41,325 | | | $ | 6,173 | |
| Ratios to Average Net Assets: | | | | | | | | |
| Net investment income | | | 1.27 | % | | | 1.78 | %(d) |
| Net expenses | | | 0.85 | % | | | 0.85 | %(d) |
| Gross expenses (e) | | | 2.08 | % | | | 8.57 | %(d) |
| PORTFOLIO TURNOVER RATE | | | 83 | % | | | 112 | %(c) |
| (a) | Commencement of operations. |
| (b) | Calculated based on average shares outstanding during each period. |
| (e) | Reflects the expense ratio excluding any waivers and/or reimbursements. |
| See Notes to Financial Statements. | LMCG FUNDS |
LMCG INTERNATIONAL SMALL CAP FUNDFINANCIAL HIGHLIGHTS
These financial highlights reflect selected data for a share outstanding throughout each period.
| | | For the Year Ended March 31, 2018 | | | April 18, 2016 (a) Through March 31, 2017 | |
| INVESTOR SHARES | | | | | | |
| NET ASSET VALUE, Beginning of Period | | $ | 10.71 | | | $ | 10.09 | |
| INVESTMENT OPERATIONS | | | | | | | | |
| Net investment income (b) | | | 0.11 | | | | 0.09 | |
| Net realized and unrealized gain | | | 2.22 | | | | 0.82 | |
| Total from Investment Operations | | | 2.33 | | | | 0.91 | |
| | | | | | | | | |
| DISTRIBUTIONS TO SHAREHOLDERS FROM | | | | | | | | |
| Net investment income | | | (0.21 | ) | | | (0.29 | ) |
| Total Distributions to Shareholders | | | (0.21 | ) | | | (0.29 | ) |
| NET ASSET VALUE, End of Period | | $ | 12.83 | | | $ | 10.71 | |
| TOTAL RETURN | | | 21.74 | % | | | 9.24 | %(c) |
| | | | | | | | | |
| RATIOS/SUPPLEMENTARY DATA | | | | | | | | |
| Net Assets at End of Period (000s omitted) | | $ | 1,079 | | | $ | 42 | |
| Ratios to Average Net Assets: | | | | | | | | |
| Net investment income | | | 0.91 | % | | | 0.96 | %(d) |
| Net expenses | | | 1.10 | % | | | 1.10 | %(d) |
| Gross expenses (e) | | | 5.01 | % | | | 60.04 | %(d) |
| PORTFOLIO TURNOVER RATE | | | 83 | % | | | 112 | %(c) |
| (a) | Commencement of operations. |
| (b) | Calculated based on average shares outstanding during each period. |
| (e) | Reflects the expense ratio excluding any waivers and/or reimbursements. |
| See Notes to Financial Statements. | LMCG FUNDS |
LMCG FUNDSNOTES TO FINANCIAL STATEMENTS
MARCH 31, 2018
Note 1. Organization
LMCG Global Market Neutral Fund, LMCG Global MultiCap Fund, and LMCG International Small Cap Fund (individually, a “Fund” and collectively, the “Funds”) are diversified portfolios of Forum Funds (the “Trust”). The Trust is a Delaware statutory trust that is registered as an open-end, management investment company under the Investment Company Act of 1940, as amended (the “Act”). Under its Trust Instrument, the Trust is authorized to issue an unlimited number of each Fund’s shares of beneficial interest without par value. Each Fund currently offers two classes of shares: Investor Shares and Institutional Shares. The LMCG Global Market Neutral Fund Investor Shares and Institutional Shares commenced operations on December 18, 2014, and May 21, 2013, respectively. The LMCG Global MultiCap Fund Investor Shares and Institutional Shares commenced operations on March 3, 2015, and September 11, 2013, respectively. The LMCG Global Market Neutral Fund seeks capital appreciation independent of equity market conditions. The LMCG Global MultiCap Fund seeks long-term capital appreciation. The LMCG International Small Cap Fund seeks long-term capital appreciation.
The LMCG International Small Cap Fund Investor Shares and Institutional Shares commenced operations on April 18, 2016, and April 1, 2016, respectively. On April 1, 2016, the LMCG International Small Cap Fund commenced operations through a reorganization of a collective investment trust into the Fund. The collective investment trust was previously managed by the Fund’s Adviser, as defined in Note 3, and portfolio management team. This collective investment trust was organized and commenced operations on August 26, 2010. The collective investment trust had an investment objective and strategies that were, in all material respects, identical to those of the Fund. The net assets and unrealized gain received by the Fund from this tax free reorganization were as follows:
| Date of Contribution | Net Assets | | | Shares Issued | | Cost of Investments Transferred | | Unrealized Gain on Investments | |
| April 1, 2016 | | $ | 4,792,193 | | | | 479,219 | | | $ | 4,360,020 | | | $ | 185,382 | |
In addition to the securities transferred in, as noted above, $246,791 of cash and other receivables, net of liabilities, were also transferred in as part of the reorganization.
Note 2. Summary of Significant Accounting Policies
The Funds are investment companies and follow accounting and reporting guidance under Financial Accounting Standards Board (“FASB”) Accounting Standards Codification (“ASC”) Topic 946, “Financial Services-Investment Companies”. These financial statements are prepared in accordance with accounting principles generally accepted in the United States of America (“GAAP”), which require management to make estimates and assumptions that affect the reported amounts of assets and liabilities, the disclosure of contingent liabilities at the date of the financial statements, and the reported amounts of increases and decreases in net assets from operations during the fiscal year. Actual amounts could differ from those estimates. The following summarizes the significant accounting policies of each Fund:
Security Valuation – Securities are valued at market prices using the last quoted trade or official closing price from the principal exchange where the security is traded, as provided by independent pricing services on each Fund business day. In the absence of a last trade, securities are valued at the mean of the last bid and ask price provided by the pricing service. Shares of non-exchange traded open-end mutual funds are valued at net asset value (“NAV”). Short-term investments that mature in sixty days or less may be valued at amortized cost.
Each Fund values its investments at fair value pursuant to procedures adopted by the Trust’s Board of Trustees (the “Board”) if (1) market quotations are not readily available or (2) the Adviser, as defined in Note 3, believes that the values available are unreliable. The Trust’s Valuation Committee, as defined in each Fund’s registration statement, performs certain functions as they relate to the administration and oversight of each Fund’s valuation procedures. Under these procedures, the Valuation Committee convenes on a regular and ad hoc basis to review such investments and considers a number of factors, including valuation methodologies and significant unobservable inputs, when arriving at fair value.
The Valuation Committee may work with the Adviser to provide valuation inputs. In determining fair valuations, inputs may include market-based analytics that may consider related or comparable assets or liabilities, recent transactions, market multiples, book values and other relevant investment information. Adviser inputs may include an income-based approach in which the anticipated future cash flows of the investment are discounted in determining fair value. Discounts may also be applied based on the nature or duration of any restrictions on the disposition of the investments. Foreign securities’ prices may be fair valued by independent pricing services in consideration of events occurring after the close of overseas markets and prior to the close of the NYSE. To the extent that securities
LMCG FUNDS
LMCG FUNDSNOTES TO FINANCIAL STATEMENTS
MARCH 31, 2018
are valued using this service, they will be classified as Level 2 securities in the fair value measurement framework described below. The Valuation Committee performs regular reviews of valuation methodologies, key inputs and assumptions, disposition analysis and market activity.
Fair valuation is based on subjective factors and, as a result, the fair value price of an investment may differ from the security’s market price and may not be the price at which the asset may be sold. Fair valuation could result in a different NAV than a NAV determined by using market quotes.
GAAP has a three-tier fair value hierarchy. The basis of the tiers is dependent upon the various “inputs” used to determine the value of each Fund’s investments. These inputs are summarized in the three broad levels listed below:
Level 1 - Quoted prices in active markets for identical assets and liabilities.
Level 2 - Prices determined using significant other observable inputs (including quoted prices for similar securities, interest rates, prepayment speeds, credit risk, etc.). Short-term securities with maturities of sixty days or less are valued at amortized cost, which approximates market value, and are categorized as Level 2 in the hierarchy. Municipal securities, long-term U.S. government obligations and corporate debt securities are valued in accordance with the evaluated price supplied by the pricing service and generally categorized as Level 2 in the hierarchy. Other securities that are categorized as Level 2 in the hierarchy include, but are not limited to, warrants that do not trade on an exchange, securities valued at the mean between the last reported bid and ask quotation and international equity securities valued by an independent third party with adjustments for changes in value between the time of the securities respective local market closes and the close of the U.S. market.
Level 3 - Significant unobservable inputs (including each Fund’s own assumptions in determining the fair value of investments).
The aggregate value by input level, as of March 31, 2018, for each Fund’s investments is included at the end of each Fund’s Schedule of Investments.
Security Transactions, Investment Income and Realized Gain and Loss – Investment transactions are accounted for on the trade date. Dividend income and expense are recorded on the ex-dividend date. Foreign dividend income and expense are recorded on the ex-dividend date or as soon as possible after determining the existence of a dividend declaration after exercising reasonable due diligence. Income and capital gains on some foreign securities may be subject to foreign withholding taxes, which are accrued as applicable. Interest income is recorded on an accrual basis. Premium is amortized and discount is accreted using the effective interest method. Identified cost of investments sold is used to determine the gain and loss for both financial statement and federal income tax purposes.
Foreign Currency Translations – Foreign currency amounts are translated into U.S. dollars as follows: (1) assets and liabilities at the rate of exchange at the end of the respective period; and (2) purchases and sales of securities and income and expenses at the rate of exchange prevailing on the dates of such transactions. The portion of the results of operations arising from changes in the exchange rates and the portion due to fluctuations arising from changes in the market prices of securities are not isolated. Such fluctuations are included with the net realized and unrealized gain or loss on investments.
Foreign Currency Transactions – Each Fund may enter into transactions to purchase or sell foreign currency contracts and options on foreign currency. Forward currency contracts are agreements to exchange one currency for another at a future date and at a specified price. A fund may use forward currency contracts to facilitate transactions in foreign securities, to manage a fund’s foreign currency exposure and to protect the U.S. dollar value of its underlying portfolio securities against the effect of possible adverse movements in foreign exchange rates. These contracts are intrinsically valued daily based on forward rates, and a fund’s net equity therein, representing unrealized gain or loss on the contracts as measured by the difference between the forward foreign exchange rates at the dates of entry into the contracts and the forward rates at the reporting date, is recorded as a component of NAV. These instruments involve market risk, credit risk, or both kinds of risks, in excess of the amount recognized in the Statements of Assets and Liabilities. Risks arise from the possible inability of counterparties to meet the terms of their contracts and from movement in currency and securities values and interest rates. Due to the risks associated with these transactions, a fund could incur losses up to the entire contract amount, which may exceed the net unrealized value included in its NAV.
Securities Sold Short – The LMCG Global Market Neutral Fund may sell a security short to increase investment returns. The LMCG Global Market Neutral Fund may also sell a security short in anticipation of a decline in the market value of a security. A short sale is a transaction in which the Fund sells a security that it does not own. To complete the transaction, the Fund must borrow the security in
LMCG FUNDS
LMCG FUNDSNOTES TO FINANCIAL STATEMENTS
MARCH 31, 2018
order to deliver it to the buyer. The Fund must replace the borrowed security by purchasing it at market price at the time of replacement; the price may be higher or lower than the price at which the Fund sold the security. The Fund incurs a loss from a short sale if the price of the security increases between the date of the short sale and the date on which the Fund replaces the borrowed security. The Fund realizes a profit if the price of the security declines between those dates.
Until the Fund replaces the borrowed security, the Fund will maintain on its books and records cash and long securities to sufficiently cover its short position on a daily basis. The collateral for the securities sold short includes the Deposits with Broker as shown on the LMCG Global Market Neutral Fund's Statement of Assets and Liabilities and the securities held long as shown on the Schedule of Investments. Dividends and interest paid on securities sold short are recorded as an expense on the LMCG Global Market Neutral Fund's Statement of Operations.
Distributions to Shareholders – Each Fund declares any dividends from net investment income and pays them annually. Any net capital gains and net foreign currency gains realized by the Funds are distributed at least annually. Distributions to shareholders are recorded on the ex-dividend date. Distributions are based on amounts calculated in accordance with applicable federal income tax regulations, which may differ from GAAP. These differences are due primarily to differing treatments of income and gain on various investment securities held by each Fund, timing differences and differing characterizations of distributions made by each Fund.
Federal Taxes – Each Fund intends to continue to qualify each year as a regulated investment company under Subchapter M of Chapter 1, Subtitle A, of the Internal Revenue Code of 1986, as amended (“Code”), and to distribute all of its taxable income to shareholders. In addition, by distributing in each calendar year substantially all of its net investment income and capital gains, if any, the Funds will not be subject to a federal excise tax. Therefore, no federal income or excise tax provision is required. Each Fund files a U.S. federal income and excise tax return as required. Each Fund’s federal income tax returns are subject to examination by the Internal Revenue Service for a period of three fiscal years after they are filed. As of March 31, 2018, there are no uncertain tax positions that would require financial statement recognition, de-recognition or disclosure.
Income and Expense Allocation – The Trust accounts separately for the assets, liabilities and operations of each of its investment portfolios. Expenses that are directly attributable to more than one investment portfolio are allocated among the respective investment portfolios in an equitable manner.
The Funds' class-specific expenses are charged to the operations of that class of shares. Income and expenses (other than expenses attributable to a specific class) and realized and unrealized gains or losses on investments are allocated to each class of shares based on the class’ respective net assets to the total net assets of each Fund.
Commitments and Contingencies – In the normal course of business, each Fund enters into contracts that provide general indemnifications by each Fund to the counterparty to the contract. Each Fund’s maximum exposure under these arrangements is dependent on future claims that may be made against each Fund and, therefore, cannot be estimated; however, based on experience, the risk of loss from such claims is considered remote. Each Fund has determined that none of these arrangements requires disclosure on each Fund’s balance sheet.
Note 3. Fees and Expenses
Investment Adviser – LMCG Investments, LLC (the “Adviser”) is the investment adviser to the Funds. Pursuant to an investment advisory agreement, the Adviser receives an advisory fee, payable monthly, at an annual rate of 1.00%, 0.70% and 0.70% of the average daily net assets of LMCG Global Market Neutral Fund, LMCG Global MultiCap Fund, and LMCG International Small Cap Fund, respectively. Prior to August 1, 2017, the Adviser received an advisory fee from the LMCG Global MultiCap Fund at an annual rate of 0.85%.
Distribution – Foreside Fund Services, LLC serves as each Fund’s distributor (the “Distributor”). The Funds have adopted a Distribution Plan (the “Plan”) for Investor Shares in accordance with Rule 12b-1 of the Act. Under the Plan, the Funds pay the Distributor and/or any other entity as authorized by the Board a fee of up to 0.25% of the average daily net assets of Investor Shares. The Distributor is not affiliated with the Adviser or Atlantic Fund Administration, LLC (d/b/a Atlantic Fund Services) (“Atlantic”) or their affiliates.
Other Service Providers – Atlantic provides fund accounting, fund administration, compliance and transfer agency services to each Fund. The fees related to these services are included in Fund services fees within the Statements of Operations. Atlantic also provides certain shareholder report production and EDGAR conversion and filing services. Pursuant to an Atlantic services agreement, each Fund pays Atlantic customary fees for its services. Atlantic provides a Principal Executive Officer, a Principal Financial Officer, a Chief Compliance Officer and an Anti-Money Laundering Officer to each Fund, as well as certain additional compliance support functions.
LMCG FUNDS
LMCG FUNDSNOTES TO FINANCIAL STATEMENTS
MARCH 31, 2018
Trustees and Officers – Through December 31, 2017, the Trust paid each independent Trustee an annual retainer fee of $50,000 for service to the Trust ($66,000 for the Chairman), and the Audit Committee Chairman and Vice Chairman received an additional $6,000 annually. Effective January 1, 2018, each independent Trustee’s annual retainer is $31,000 ($41,000 for the Chairman), and the Audit Committee Chairman receives an additional $2,000 annually. The Trustees and Chairman may receive additional fees for special Board meetings. Each Trustee is also reimbursed for all reasonable out-of-pocket expenses incurred in connection with his duties as a Trustee, including travel and related expenses incurred in attending Board meetings. The amount of Trustees’ fees attributable to each Fund is disclosed in the Statement of Operations. Certain officers of the Trust are also officers or employees of the above named service providers, and during their terms of office received no compensation from each Fund.
Note 4. Expense Reimbursement and Fees Waived
The Adviser has contractually agreed to waive a portion of its fees and reimburse certain expenses through at least July 31, 2018, to limit total annual operating expenses (excluding all taxes, interest, portfolio transaction expenses, dividend and interest expenses on short sales, acquired fund fees and expenses, proxy expenses and extraordinary expenses) as follows:
| | | Investor Shares | Institutional Shares | |
| | LMCG Global Market Neutral Fund | 1.85% | 1.60% | |
| | LMCG Global MultiCap Fund* | 1.15% | 0.90% | |
| | LMCG International Small Cap Fund | 1.10% | 0.85% | |
| * | Prior to August 1, 2017, the Adviser had contractually agreed to waive a portion of its fees and reimburse certain expenses of the LMCG Global MultiCap Fund Investor Shares and Institutional Shares to 1.45% and 1.20%, respectively. |
Other Fund service providers have voluntarily agreed to waive a portion of their fees. The contractual waivers may be changed or eliminated at any time with consent of the Board and voluntary fee waivers and expense reimbursements may be reduced or eliminated at any time. For the year ended March 31, 2018, fees waived and expenses reimbursed were as follows:
| | | Investment Adviser Fees Waived | | | Investment Adviser Expenses Reimbursed | | | Other Waivers | | | Total Fees Waived and Expenses Reimbursed | |
| LMCG Global Market Neutral Fund | | $ | 182,838 | | | $ | – | | | $ | 72,259 | | | $ | 255,097 | |
| LMCG Global MultiCap Fund | | | 15,600 | | | | 202,002 | | | | 80,757 | | | | 298,359 | |
| LMCG International Small Cap Fund | | | 189,478 | | | | 54,430 | | | | 106,622 | | | | 350,530 | |
The Adviser may be reimbursed by each Fund for fees waived and expenses reimbursed by the Adviser pursuant to the Expense Cap if such payment is made within three years of the fee waiver or expense reimbursement, and does not cause the Total Annual Fund Operating Expenses After Fee Waiver and/or Expense Reimbursement to exceed the lesser of (i) the then-current expense cap, or (ii) the expense cap in place at the time the fees/expenses were waived/reimbursed.
As of March 31, 2018, $1,060,854, $628,560 and $539,241 in the LMCG Global Market Neutral Fund, LMCG Global MultiCap Fund, and LMCG International Small Cap Fund, respectively is subject to recapture by the Adviser. Other Waivers are not eligible for recoupment.
Note 5. Security Transactions
The cost of purchases and proceeds from sales of investment securities (including maturities), other than short-term investments during the year ended March 31, 2018, were as follows:
| | | | Purchases | | | Sales | | |
| | LMCG Global Market Neutral Fund | | $ | 42,985,530 | | | $ | 76,668,368 | | |
| | LMCG Global MultiCap Fund | | | 881,707 | | | | 975,205 | | |
| | LMCG International Small Cap Fund | | | 53,767,940 | | | | 22,001,364 | | |
LMCG FUNDSNOTES TO FINANCIAL STATEMENTS
MARCH 31, 2018
Note 6. Federal Income Tax
As of March 31, 2018, the cost of federal income tax purposes and the components of net unrealized appreciation (depreciation) were as follows:
| | | Tax Cost of Investments | | | Gross Unrealized Appreciation | | | Gross Unrealized Depreciation | | | Net Unrealized Appreciation | |
| LMCG Global Market Neutral Fund | | $ | (6,149,865 | ) | | $ | 12,637,181 | | | $ | (4,085,219 | ) | | $ | 8,551,962 | |
| LMCG Global MultiCap Fund | | | 1,714,862 | | | | 430,183 | | | | (95,395 | ) | | | 334,788 | |
| LMCG International Small Cap Fund | | | 38,718,786 | | | | 4,490,197 | | | | (1,001,107 | ) | | | 3,489,090 | |
Distributions paid during the fiscal years/periods ended as noted were characterized for tax purposes as follows:
| | | Ordinary Income | | | Long-Term Capital Gain | | | Total | |
| LMCG Global Market Neutral Fund | | | | | | | | | |
| 2018 | | $ | – | | | $ | – | | | $ | – | |
| 2017 | | | – | | | | – | | | | – | |
| LMCG Global MultiCap Fund | | | | | | | | | | | | |
| 2018 | | | 58,948 | | | | 63,581 | | | | 122,529 | |
| 2017 | | | 19,333 | | | | 14,340 | | | | 33,673 | |
| LMCG International Small Cap Fund | | | | | | | | | | | | |
| 2018 | | | 709,178 | | | | – | | | | 709,178 | |
| 2017 | | | 156,192 | | | | – | | | | 156,192 | |
As of March 31, 2018, distributable earnings (accumulated loss) on a tax basis were as follows:
| | | Undistributed Ordinary Income | | | Undistributed Long-Term Gain | | | Capital and Other Losses | | | Unrealized Appreciation | | | Total | |
| LMCG Global Market Neutral Fund | | $ | – | | | $ | – | | | $ | (9,209,006 | ) | | $ | 8,556,080 | | | $ | (652,926 | ) |
| LMCG Global MultiCap Fund | | | 20,919 | | | | 39,794 | | | | – | | | | 334,237 | | | | 394,950 | |
| LMCG International Small Cap Fund | | | 483,970 | | | | 66,824 | | | | – | | | | 3,490,381 | | | | 4,041,175 | |
The difference between components of distributable earnings on a tax basis and the amounts reflected in the Statements of Assets and Liabilities are primarily due to differing book to tax treatment of investments in real estate investment trusts (REITs), passive foreign investment holdings (PFICs), straddles, wash sales, reclassification of dividend income to return of capital on corporate securities, and short dividends for the LMCG Global Market Neutral Fund; REITs, PFICs, wash sales and reclassification of dividend income to return of capital on corporate securities for the LMCG Global MultiCap Fund; and PFICs and wash sales for the LMCG International Small Cap Fund.
The LMCG Global Market Neutral Fund has $9,017,557 of available short term capital loss carryforwards that have no expiration date.
For tax purposes, the current year late year ordinary loss was $191,449 for the LMCG Global Market Neutral Fund (realized during the period November 1, 2017 through March 31, 2018). This loss will be recognized for tax purposes on the first business day of the Fund’s next fiscal year, April 1, 2018.
On the Statements of Assets and Liabilities, as a result of permanent book to tax differences, certain amounts have been reclassified for the year ended March 31, 2018. The following reclassifications were the result of net operating losses, short dividends, currency gain/ loss, PFICs, REITs, and equity return of capital and have no impact on the net assets of each Fund.
| | | Undistributed Net Investment Income (Loss) | | | Accumulated Net Realized Gain (Loss) | | | Paid-in-Capital | |
| LMCG Global Market Neutral Fund | | $ | 511,950 | | | $ | (329,887 | ) | | $ | (182,063 | ) |
| LMCG Global MultiCap Fund | | | 10,896 | | | | (10,896 | ) | | | – | |
| LMCG International Small Cap Fund | | | 236,087 | | | | (236,087 | ) | | | – | |
Note 7. Risk of Concentration
Because The LMCG International Small Cap Fund’s investments may be concentrated in a particular geographic region or country, the value of The LMCG International Small Cap Fund’s shares may be affected by events that adversely affect that region or country and may fluctuate more than that of a less concentrated fund.
LMCG FUNDS
LMCG FUNDSNOTES TO FINANCIAL STATEMENTS
MARCH 31, 2018
Note 8. Subsequent Events
Subsequent events occurring after the date of this report through the date these financial statements were issued have been evaluated for potential impact, and each Fund has had no such events.
LMCG FUNDS
REPORT OF INDEPENDENT REGISTERED PUBLIC ACCOUNTING FIRM
To the Board of Trustees of Forum Funds
and the Shareholders of the LMCG Global Market Neutral Fund,
LMCG Global MultiCap Fund, and LMCG International Small Cap Fund
Opinion on the Financial Statements
We have audited the accompanying statements of assets and liabilities of LMCG Global Market Neutral Fund, LMCG Global MultiCap Fund, and LMCG International Small Cap Fund, each a series of shares of beneficial interest in Forum Funds (the “Funds”), including the schedules of investments, as of March 31, 2018, and the related statements of operations for the year then ended, the statements of changes in net assets for each of the years or period in the two-year period then ended and the financial highlights for each of the years or periods in the five-year period then ended, and the related notes (collectively referred to as the “financial statements”). In our opinion, the financial statements present fairly, in all material respects, the financial position of the Funds as of March 31, 2018, and the results of their operations for the year then ended, the changes in their net assets for each of the years or period in the two-year period then ended and their financial highlights for each of the years or periods in the five-year period then ended, in conformity with accounting principles generally accepted in the United States of America.
Basis for Opinion
These financial statements are the responsibility of the Funds' management. Our responsibility is to express an opinion on the Funds’ financial statements based on our audits. We are a public accounting firm registered with the Public Company Accounting Oversight Board (United States) (“PCAOB”) and are required to be independent with respect to the Funds in accordance with the U.S. federal securities law and the applicable rules and regulations of the Securities and Exchange Commission and the PCAOB.
We conducted our audits in accordance with the standards of the PCAOB. Those standards require that we plan and perform the audits to obtain reasonable assurance about whether the financial statements are free of material misstatement, whether due to error or fraud. The Funds are not required to have, nor were we engaged to perform, an audit of their internal control over financial reporting. As part of our audits we are required to obtain an understanding of internal control over financial reporting but not for the purpose of expressing an opinion on the effectiveness of the Funds’ internal control over financial reporting. Accordingly, we express no such opinion.
Our audits included performing procedures to assess the risk of material misstatement of those financial statements, whether due to error or fraud, and performing procedures that respond to those risks. Such procedures included examining, on a test basis, evidence regarding the amounts and disclosures in the financial statements. Our procedures included confirmation of securities owned as of March 31, 2018 by correspondence with the custodian and broker. Our audits also included evaluating the accounting principles used and significant estimates made by management, as well as evaluating the overall presentation of the financial statements. We believe that our audits provide a reasonable basis for our opinion.
BBD, LLP
We have served as the auditor of one or more of the Funds in the Forum Funds since 2009.
Philadelphia, Pennsylvania
May 24, 2018
LMCG FUNDS
LMCG FUNDSADDITIONAL INFORMATION (Unaudited)
MARCH 31, 2018
Investment Advisory Agreement Approval
At the December 8, 2017 Board meeting, the Board, including the Independent Trustees, considered the approval of the continuance of the investment advisory agreement between the Adviser and the Trust as it relates to services provided to the LMCG Global Market Neutral Fund, LMCG Global MultiCap Fund, and LMCG International Small Cap Fund (the “Advisory Agreement”). In preparation for its deliberations, the Board requested and reviewed written responses from the Adviser to a due diligence questionnaire circulated on the Board's behalf concerning the services provided by the Adviser. The Board also discussed the materials with Fund counsel and, as necessary, with the Trust's administrator, Atlantic Fund Services. During its deliberations, the Board received an oral presentation from the Adviser, and was advised by Trustee counsel.
At the meeting, the Board reviewed, among other matters: (1) the nature, extent and quality of the services provided to the Funds by the Adviser, including information on the investment performance of the Funds and Adviser; (2) the costs of the services provided and profitability to the Adviser of its relationship with each of the Funds; (3) the advisory fee and total expense ratio of each of the Funds compared to a relevant peer group of funds; (4) the extent to which economies of scale may be realized as each of the Funds grows and whether each Fund’s advisory fee enables the Funds’ investors to share in the benefits of economies of scale; and (5) other benefits received by the Adviser from its relationship with each of the Funds. In addition, the Board recognized that the evaluation process with respect to the Adviser was an ongoing one and, in this regard, the Board considered information provided by the Adviser at regularly scheduled meetings during the past year.
Nature, Extent and Quality of Services
Based on written materials received, a presentation from senior representatives of the Adviser, and a discussion with the Adviser about the Adviser’s personnel, operations and financial condition, the Board considered the quality of services provided by the Adviser under the Advisory Agreement. In this regard, the Board considered information regarding the experience, qualifications and professional background of the portfolio managers and other personnel at the Adviser with principal responsibility for the Funds, as well as the investment philosophy and decision-making process of those professionals and the capability and integrity of the Adviser’s senior management and staff.
The Board considered also the adequacy of the Adviser’s resources. The Board noted the Adviser’s representations that the firm is in stable financial condition and has the operational capability and the necessary staffing and experience to continue providing high-quality investment advisory services and to meet its financial commitments to each of the Funds. Based on the presentation and the materials provided by the Adviser in connection with the Board’s consideration of the approval of the Advisory Agreement, the Board concluded that, overall, it was satisfied with the nature, extent and quality of services to be provided to the Funds under the Advisory Agreement.
Performance
In connection with a presentation by the Adviser regarding its management of the Funds, the Board reviewed the performance of the Funds compared to their respective benchmarks and compared to independent peer groups of funds identified by Broadridge Financial Solutions, Inc. (“Broadridge”).
The Board observed that the LMCG Global Market Neutral Fund outperformed the Citigroup 3-Month Treasury Bill Index, the LMCG Global Market Neutral Fund’s primary benchmark index, for the one- and three-year periods ended September 30, 2017 and for the period since the LMCG Global Market Neutral Fund’s inception on May 21, 2013. The Board also considered the LMCG Global Market Neutral Fund’s performance relative to its Broadridge peer group, noting that the LMCG Global Market Neutral Fund underperformed the median of its Broadridge peers for the one- and three-year periods ended September 30, 2017. The Board noted the Adviser’s representation that the LMCG Global Market Neutral Fund’s performance was negatively impacted by allocations to countries and sectors that underperformed the overall market during the periods, as well as political risk in the U.S. and abroad that contributed to elevated levels of macro uncertainty and detracted from performance. The Board noted the Adviser’s representation that the LMCG Global Market Neutral Fund was believed to be well-positioned and that the LMCG Global Market Neutral Fund’s core-style, which included a balanced stock selection approach, was intended to outperform over the longer term.
The Board observed that the LMCG International Small Cap Fund underperformed the MSCI EAFE Small Cap Net Total Return Index, the LMCG International Small Cap Fund’s primary benchmark index, for the one-year period ended September 30, 2017. The Board observed that the LMCG International Small Cap Fund outperformed the primary benchmark index for the three- and five-year periods ended September 30, 2017 and for the period since the LMCG International Small Cap Fund’s inception on August 26, 2010, noting
LMCG FUNDS
LMCG FUNDSADDITIONAL INFORMATION (Unaudited)
MARCH 31, 2018
that that the LMCG International Small Cap Fund had commenced operations as a new series of the Trust after reorganizing from a separate collective investment fund on April 1, 2016. The Board also considered the LMCG International Small Cap Fund’s performance relative to its Broadridge peer group, noting that the LMCG International Small Cap Fund underperformed the median of its Broadridge peers for the one-year period ended September 30, 2017. The Board noted the Adviser’s representation that the LMCG International Small Cap Fund’s underperformance over the one-year period relative to the index and peer group could be attributed, in part, to asset allocations to countries and sectors that underperformed the overall market during the period. The Board also noted the Adviser’s representation that it was confident in the LMCG International Small Cap Fund’s strategy and expected the LMCG International Small Cap Fund to outperform in the long-run, as evidenced by the LMCG International Small Cap Fund’s outperformance during the period since inception.
The Board observed that the LMCG Global MultiCap Fund outperformed the MSCI ACWI Market Index, the LMCG Global MultiCap Fund’s primary benchmark index, for the one- and three-year periods ended September 30, 2017 and for the period since the LMCG Global MultiCap Fund’s inception on September 11, 2013. The Board also considered the LMCG Global MultiCap Fund’s performance relative to its Broadridge peer group, noting that the LMCG Global MultiCap Fund outperformed the median of its Broadridge peer group for the one- and three-year periods ended September 30, 2017. The Board noted the Adviser’s representation that the LMCG Global MultiCap Fund benefited from its overweight exposures to emerging market countries, as well as financial services companies within the U.S.
Based on the foregoing and other applicable considerations, the Board determined that the performance of each of the Funds was reasonable and that the Funds and their shareholders could benefit from the Adviser’s continued management of the Funds under the Advisory Agreement.
Compensation
The Board evaluated the Adviser’s compensation for providing advisory services to each of the Funds and analyzed comparative information on actual advisory fee rates and actual total expenses of each of the Fund’s relevant Broadridge peer group. The Board noted that the Adviser’s actual advisory fee rate for each of the Funds was below the median of its respective Broadridge peer group. The Board noted that the actual total expenses of the LMCG Global Market Neutral Fund and LMCG Global MultiCap Fund were higher than the median of their respective Broadridge peers and that the actual total expenses of the LMCG International Small Cap Fund were below the median of its Broadridge peers. The Board noted the Adviser’s representation that it had agreed to contractually cap the expenses of each of the Funds to ensure those expenses remained at competitive levels. The Board further noted that the Adviser had recently lowered the expense cap for the LMCG Global Market Neutral Fund. Based on the foregoing and other applicable considerations, the Board concluded that the advisory fee rate charged to each of the Funds were reasonable.
Cost of Services and Profitability
The Board considered information provided by the Adviser regarding the costs of services and its profitability with respect to the Funds in the aggregate. In this regard, the Board considered the Adviser’s resources devoted to the Funds in the aggregate, as well as the Adviser’s discussion of the aggregate costs and profitability of its mutual fund activities. The Board also noted the Adviser’s representation that it continued to subsidize the Funds to ensure that the expenses of the Funds remained at competitive levels. Based on these and other applicable considerations, the Board concluded that the Adviser’s profits attributable to management of each of the Funds were reasonable.
Economies of Scale
The Board considered whether the Funds would benefit from any economies of scale. In this respect, the Board noted the Adviser’s observation that, although each of the Funds could benefit from economies of scale as assets grow, given the current low asset levels associated with each of the Funds, consideration of breakpoints at this time would be premature. Based on the foregoing information, the Board concluded that economies of scale were not a material factor in approving the continuation of the Advisory Agreement.
Other Benefits
The Board noted the Adviser’s representation that it would be receiving a benefit arising from the use of soft dollars resulting from trading for the Funds to acquire research that would benefit the Adviser’s clients generally. The Board concluded that the Adviser’s receipt of other benefits was not a material factor in the Board’s approval of the Advisory Agreement.
LMCG FUNDS
LMCG FUNDSADDITIONAL INFORMATION (Unaudited)
MARCH 31, 2018
Conclusion
The Board did not identify any single factor as being of paramount importance, and different Trustees may have given different weight to different factors. The Board reviewed a memorandum from Fund counsel discussing the legal standards applicable to its consideration of the Advisory Agreement. Based on its review, including consideration of each of the factors referenced above, the Board determined, in the exercise of its reasonable business judgment, that the advisory arrangement, as outlined in the Advisory Agreement, was fair and reasonable in light of the services performed, expenses incurred and such other matters as the Board considered relevant.
Shareholder Proxy Vote
At a special meeting of shareholders for all the Funds in the Trust, held on December 8, 2017, shares were voted as follows on the proposals presented to shareholders:
| Matter | For | Against | Abstain |
To elect David Tucker to the Board of Trustees of the Trust. | 108,303,928.779 | 1,542,957.997 | 0 |
To elect Jennifer Brown-Strabley to the Board of Trustees of the Trust. | 108,183,952.495 | 1,662,934.278 | 0 |
To elect Mark D. Moyer to the Board of Trustees of the Trust. | 108,142,412.946 | 1,704,473.827 | 0 |
To elect Jessica Chase to the Board of Trustees of the Trust. | 107,632,924.803 | 2,213,961.970 | 0 |
To elect Stacey E. Hong to the Board of Trustees of the Trust. | 105,777,266.997 | 4,069,619.776 | 0 |
Proxy Voting Information
A description of the policies and procedures that each Fund uses to determine how to vote proxies relating to securities held in each Fund’s portfolio is available, without charge and upon request, by calling (877) 591-4667 and on the U.S. Securities and Exchange Commission’s (the “SEC”) website at www.sec.gov. Each Fund’s proxy voting record for the most recent twelve-month period ended June 30 is available, without charge and upon request, by calling (877) 591-4667 and on the SEC’s website at www.sec.gov.
Availability of Quarterly Portfolio Schedules
Each Fund files its complete schedule of portfolio holdings with the SEC for the first and third quarters of each fiscal year on Form N-Q. These filings are available, without charge and upon request on the SEC’s website at www.sec.gov or may be reviewed and copied at the SEC’s Public Reference Room in Washington, DC. Information on the operation of the Public Reference Room may be obtained by calling (800) SEC-0330.
Shareholder Expense Example
As a shareholder of the Funds, you incur ongoing costs, including management fees and other Fund expenses. This example is intended to help you understand your ongoing costs (in dollars) of investing in the Funds and to compare these costs with the ongoing costs of investing in other mutual funds.
The example is based on an investment of $1,000 invested at the beginning of the period and held for the entire period from October 1, 2017 through March 31, 2018.
Actual Expenses – The first line under each share class of the table below provides information about actual account values and actual expenses. You may use the information in this line, together with the amount you invested, to estimate the expenses that you paid over the period. Simply divide your account value by $1,000 (for example, an $8,600 account value divided by $1,000 = 8.6), then multiply the result by the number in the first line under the heading entitled “Expenses Paid During Period” to estimate the expenses you paid on your account during the period.
LMCG FUNDS
LMCG FUNDSADDITIONAL INFORMATION (Unaudited)
MARCH 31, 2018
Hypothetical Example for Comparison Purposes – The second line under each share class of the table below provides information about hypothetical account values and hypothetical expenses based on each Fund’s actual expense ratio and an assumed rate of return of 5% per year before expenses, which is not each Fund’s actual return. The hypothetical account values and expenses may not be used to estimate the actual ending account balance or expenses you paid for the period. You may use this information to compare the ongoing costs of investing in each Fund and other funds. To do so, compare this 5% hypothetical example with the 5% hypothetical examples that appear in the shareholder reports of other funds.
Please note that the expenses shown in the table are meant to highlight your ongoing costs only. Therefore, the second line of the table is useful in comparing ongoing costs only and will not help you determine the relative total costs of owning different funds.
| | | Beginning Account Value October 1, 2017 | | | Ending Account Value March 31, 2018 | | | Expenses Paid During Period* | | Annualized Expense Ratio* | |
| LMCG Global Market Neutral Fund | | | | | | | | | | | |
| Institutional Shares | | | | | | | | | | | |
| Actual | | $1,000.00 | | | $987.24 | | | $7.93 | | 1.60% | |
| Hypothetical (5% return before expenses) | | $1,000.00 | | | $1,016.95 | | | $8.05 | | 1.60% | |
| Investor Shares | | | | | | | | | | | |
| Actual | | $1,000.00 | | | $985.32 | | | $9.16 | | 1.85% | |
| Hypothetical (5% return before expenses) | | $1,000.00 | | | $1,015.71 | | | $9.30 | | 1.85% | |
| LMCG Global MultiCap Fund | | | | | | | | | | | |
| Institutional Shares | | | | | | | | | | | |
| Actual | | $1,000.00 | | | $1,034.29 | | | $5.38 | | 1.06% | |
| Hypothetical (5% return before expenses) | | $1,000.00 | | | $1,019.65 | | | $5.34 | | 1.06% | |
| Investor Shares | | | | | | | | | | | |
| Actual | | $1,000.00 | | | $1,033.87 | | | $6.39 | | 1.26% | |
| Hypothetical (5% return before expenses) | | $1,000.00 | | | $1,018.65 | | | $6.34 | | 1.26% | |
| LMCG International Small Cap Fund | | | | | | | | | | | |
| Institutional Shares | | | | | | | | | | | |
| Actual | | $1,000.00 | | | $1,058.97 | | | $4.36 | | 0.85% | |
| Hypothetical (5% return before expenses) | | $1,000.00 | | | $1,020.69 | | | $4.28 | | 0.85% | |
| Investor Shares | | | | | | | | | | | |
| Actual | | $1,000.00 | | | $1,058.33 | | | $5.64 | | 1.10% | |
| Hypothetical (5% return before expenses) | | $1,000.00 | | | $1,019.45 | | | $5.54 | | 1.10% | |
| * | Expenses are equal to the Fund’s annualized expense ratio multiplied by the average account value over the period, multiplied by the number of days in the most recent fiscal half-year (182) divided by 365 to reflect the half-year period. |
Federal Tax Status of Dividends Declared during the Fiscal Year
For federal income tax purposes, dividends from short-term capital gains are classified as ordinary income. LMCG Global MultiCap Fund designates 30.50% of its income dividend distributed as qualifying for the corporate dividends received deduction (DRD), 70.78% for the qualified dividend rate (QDI), and 38.27% as qualified short term capital gain dividends exempt from U.S. tax for foreign shareholders (QSD) as defined in Section 1(h)(11) of the Code. LMCG International Small Cap Fund also designates 35.50% as QDI.
Trustees and Officers of the Trust
The Board is responsible for oversight of the management of the Trust’s business affairs and of the exercise of all the Trust’s powers except those reserved for the shareholders. The following table provides information about each Trustee and certain officers of the Trust. Each Trustee and officer holds office until the person resigns, is removed, or is replaced. Unless otherwise noted, the persons have held their principal occupations for more than five years. The address for all Trustees and officers is Three Canal Plaza, Suite 600, Portland, Maine 04101. Each Fund’s Statement of Additional Information includes additional information about the Trustees and is available, without charge and upon request, by calling (877) 591-4667.
LMCG FUNDS
LMCG FUNDSADDITIONAL INFORMATION (Unaudited)
MARCH 31, 2018
Name and Year of Birth | Position with the Trust | Length of Time Served | Principal Occupation(s) During Past Five Years | Number of Series in Fund Complex Overseen By Trustee | Other Directorships Held By Trustee During Past Five Years |
| Independent Trustees |
David Tucker Born: 1958 | Trustee; Chairman of the Board | Since 2011 and Chairman since 2018 | Director, Blue Sky Experience (a charitable endeavor) since 2008; Senior Vice President & General Counsel, American Century Companies (an investment management firm) 1998-2008. | 3 | Trustee, Forum Funds II, Forum ETF Trust and U.S. Global Investors Funds |
Mark D. Moyer Born: 1959 | Trustee | Since 2018 | Chief Financial Officer, Freedom House (a NGO advocating political freedom and democracy) since 2017; independent consultant providing interim CFO services, principally to non-profit organizations, 2011- 2017; Chief Financial Officer, Institute of International Education (a NGO administering international educational exchange programs), 2008-2011; Chief Financial Officer and Chief Restructuring Officer, Ziff Davis Media Inc. (an integrated media company), 2005-2008; Adjunct Professor of Accounting, Fairfield University from 2009-2012. | 3 | Trustee, Forum Funds II, Forum ETF Trust and U.S. Global Investors Funds |
Jennifer Brown-Strabley Born: 1964 | Trustee | Since 2018 | Principal, Portland Global Advisors, 1996-2010. | 3 | Trustee, Forum Funds II, Forum ETF Trust and U.S. Global Investors Funds |
| Interested Trustee |
Stacey E. Hong(1) Born: 1966 | Trustee | Since 2018 | President, Atlantic since 2008. | 3 | Trustee, Forum Funds II and U.S. Global Investors Funds |
Jessica Chase(1) Born: 1970 | Trustee | Since 2018 | Senior Vice President, Atlantic since 2008. | 3 | None |
(1) | Stacey E. Hong is currently treated as an interested person of the Trust, as defined in the 1940 Act, due to his affiliation with Atlantic. Jessica Chase is currently treated as an interested person of the Trust, as defined in the 1940 Act, due to her affiliation with Atlantic and her role as President of the Trust. |
LMCG FUNDS
LMCG FUNDSADDITIONAL INFORMATION (Unaudited)
MARCH 31, 2018
Name and Year of Birth | Position with the Trust | Length of Time Served | Principal Occupation(s) During Past 5 Years |
| Officers |
Jessica Chase Born: 1970 | President; Principal Executive Officer | Since 2015 | Senior Vice President, Atlantic since 2008. |
Karen Shaw Born: 1972 | Treasurer; Principal Financial Officer | Since 2008 | Senior Vice President, Atlantic since 2008. |
Zachary Tackett Born: 1988 | Vice President; Secretary and Anti- Money Laundering Compliance Officer | Since 2014 | Counsel, Atlantic since 2014; Intern Associate, Coakley & Hyde, PLLC, 2010-2013. |
Michael J. McKeen Born: 1971 | Vice President | Since 2009 | Senior Vice President, Atlantic since 2008. |
Timothy Bowden Born: 1969 | Vice President | Since 2009 | Manager, Atlantic since 2008. |
Geoffrey Ney Born: 1975 | Vice President | Since 2013 | Manager, Atlantic since 2013; Senior Fund Accountant, Atlantic, 2008–2013. |
Todd Proulx Born: 1978 | Vice President | Since 2013 | Manager, Atlantic since 2013; Senior Fund Accountant, Atlantic, 2008–2013. |
Carlyn Edgar Born: 1963 | Vice President | Since 2008 | Senior Vice President, Atlantic since 2008; Chief Compliance Officer, 2008-2016 |
Dennis Mason Born: 1967 | Chief Compliance Officer | Since 2016 | Fund Compliance Officer, Atlantic since 2013; Senior Specialist, Atlantic, 2011-2013; Senior Analyst, Atlantic, 2008-2011 |
LMCG FUNDS
FOR MORE INFORMATION:
P.O. Box 588
Portland, ME 04112
(877) 591-4667 (toll free)
INVESTMENT ADVISER
LMCG Investments, LLC
200 Clarendon Street, 28th Floor
Boston, MA 02116
TRANSFER AGENT
Atlantic Fund Services
P.O. Box 588
Portland, ME 04112
www.atlanticfundservices.com
DISTRIBUTOR
Foreside Fund Services, LLC
Three Canal Plaza, Suite 100
Portland, Maine 04101
www.foreside.com
This report is submitted for the general information of the shareholders of the Funds. It is not authorized for distribution to prospective investors unless preceded or accompanied by an effective prospectus, which includes information regarding the Funds’ risks, objectives, fees and expenses, experience of its management, and other information.
210-ANR-0318
A MESSAGE TO OUR SHAREHOLDERS (Unaudited) | MARCH 31, 2018 |
Dear Shareholder,
We present the annual report for the Merk Hard Currency Fund®, and Merk Absolute Return Currency Fund® (individually a “Fund” and collectively the “Funds”) with respect to the period April 1, 2017 through March 31, 2018 (the “Period”).
| • | The Merk Hard Currency Fund seeks to profit from a rise in hard currencies relative to the U.S. dollar. |
| • | The Adviser will determine currency allocations based on its analysis of monetary policies pursued by central banks and economic environments. |
| | As of March 31, 2018
(annualized return) |
| | 1 year | 5 year | 10 year | Since inception 5/10/05 |
| Merk Hard Currency Fund Investor Shares (MERKX) | +9.54% | -2.44% | -0.54% | +1.88% |
| JPMorgan 3-Month Global Cash Index (“reference basket”) | +9.88% | -1.81% | -1.10% | +1.17% |
The Fund’s performance data represents past performance and is no guarantee of future results. Current performance may be lower or higher than the performance data quoted. Investment return and principal value will fluctuate so that an investor’s shares, when redeemed, may be worth more or less than original cost. Please visit www.merkfunds.com for most recent month end performance. The Fund’s expense ratio for the Investor Shares is 1.30%.
| • | The Merk Absolute Return Currency Fund seeks to generate positive absolute returns by investing in securities and instruments that create exposure to currencies. |
| • | In seeking to achieve positive absolute returns, the Adviser makes strategic and tactical currency exposure allocations based on quantitative and qualitative analyses. Systematic trading signals are derived from these analyses and may be integrated using market regime analysis. The Adviser uses a proprietary statistical framework to identify dynamics in market regimes that are defined by risk characteristics. Market regime analysis and statistical analysis are utilized to provide a probabilistic-based system for aggregating trading signals received from quantitative and qualitative analyses. |
| | As of March 31, 2018
(annualized return) |
| | 1 year | 5 year | Since updates*
6/30/12 | Since inception 9/9/09 |
| Merk Absolute Return Currency Fund Investor Shares (MABFX) | +2.35% | +1.09% | +2.38% | -0.06% |
| Citigroup 3-Month U.S. T-Bill Index (“reference basket”) | +1.07% | +0.31% | +0.28% | +0.22%(1) |
| * | Effective 06/30/2012, risk sentiment & macro models were added to Merk Absolute Return Currency Fund. |
The Fund’s performance data represents past performance and is no guarantee of future results. Current performance may be lower or higher than the performance data quoted. Investment return and principal value will fluctuate so that an investor’s shares, when redeemed, may be worth more or less than original cost. Please visit www.merkfunds.com for most recent month end performance. The Fund’s expense ratio for the Investor Shares is 1.31%.
1 | Note that data is not available for the reference basket on the inception date of the Merk Absolute Return Currency Fund (September 9, 2009). As such, performance for the reference basket is calculated for the time period August 31, 2009 through March 31, 2018, whereas performance for the Fund is calculated for the period since inception through March 31, 2018. |
Merk Hard Currency Fund
In Q2 2017 the U.S. dollar weakened versus all G10 currencies (10 of the most heavily traded currencies in the world) except for the Japanese yen and gold, which were slightly weaker in the period. The euro was the best performer, appreciating 7.27% against the U.S. dollar. Hawkish rhetoric from European Central Bank (ECB) President was a driver of euro strength as the market moved to price in ECB tapering. The Fund closed its short position in the yen.
In Q3 2017 the U.S. dollar was mostly weaker versus G10 currencies. The Fund benefited most from long positions in the euro, the Swedish krona, and the Norwegian krone. The very small position in the New Zealand dollar limited the adverse impact of the decline in that currency versus the U.S. dollar.
In Q4 2017 the U.S. dollar was mixed versus G10 currencies. The best performer was the euro, which appreciated 1.62% vs the U.S. dollar. The Norwegian krone was the worst performer and declined 2.94% versus the U.S. dollar. The Swedish krona was also down. The Fund benefited from the long position in the euro, but the Norwegian krone and Swedish krona positions more than offset the euro gains even as the Fund had trimmed those positions during the quarter.
In Q1 2018 the U.S. dollar was weak versus most G10 currencies. The Japanese yen was the best performer and the Swedish krona the worst performer. The Fund was up 1.85% for the quarter, primarily on the euro and Japanese yen positions. The yen was the second largest position in the fund, behind the euro. During the quarter the Fund slightly reduced the Australian dollar and euro positions, and slightly increased the Canadian dollar position.
We continue to believe the market is under-pricing higher rates that may take place over time in various countries outside the U.S., notably in the Eurozone where the European Central Bank (“ECB”) is likely to end its quantitative easing (“QE”) program after September 2018. Together with the Fed’s balance sheet reduction, we expect financial conditions to further tighten, that is risk premia to increase. This means the recent selloff in so-called risk assets, notably equities and junk bonds, might continue. The combination of higher rates gradually being priced in outside the U.S., as well as possibly lower or stable yields in U.S. Treasuries due to tighter financial conditions, may serve as a catalyst for the U.S. dollar to continue its decline.
Rising trade tensions may also hurt the U.S. dollar. To explain why, consider that the current account balance is defined as savings minus investments. As such, the current account balance is a dependent variable. To give an example, if tariffs are introduced to make it more expensive for Americans to buy goods from China, our analysis suggests it makes it more difficult for China to finance U.S. government budget deficits, possibly leading to a weaker dollar, higher U.S. rates, or both. Indeed, that is exactly what we have seen of late: a weaker U.S. dollar despite higher U.S. rates. Should trade tensions escalate, we may well see further dollar weakness.
In this context, we encourage investors to consider the Merk Hard Currency Fund to potentially profit from a rise in hard currencies versus the U.S. dollar.
Merk Absolute Return Currency Fund
Since implementation of strategy enhancements on June 30, 2012 through March 31, 2018, the Merk Absolute Return Currency Fund (here “MABFX” or “the Fund”) had a cumulative return of +14.43% (annualized +2.38%) at an annualized volatility, (the measure of variability of returns on an annualized basis), of 6.46%. Over the past 12 months, ending in March 31, 2018, MABFX had a cumulative performance of 2.35% at an annualized volatility of 4.86%.
In 2017, MABFX posted gains for both Q2 and Q3, driven in part by tactical trading opportunities surrounding the French elections in May, and by strategic long positioning in the Norwegian krone. The Fund added a gain in Q4, positively attributed by profits from tactically trading the Canadian dollar.
In January of 2018, MABFX suffered from general U.S. dollar weakness, as the Fund held key short positions in the Swiss franc and the New Zealand dollar. As the U.S. dollar recovered in February, Fund performance was detracted by strategic long positions in the Canadian dollar and Swedish krona. The Fund posted a 0.34% gain for March, mostly attributable to a long position in the Japanese yen, and closed Q1 with a -2.95% loss.
Quietly, there has been pressure building in U.S. dollar funding, in part due to regulatory changes in money markets, tax repatriation of overseas corporate earnings, and a flood of U.S. T-Bill issuances. Although seemingly structural in nature, the full consequences of this funding pressure have yet to be seen. Higher levels of volatility and wider credit spreads have been historically precursors of late stages in the credit cycle. And while fixed income and currency markets have so far been largely isolated from an increase in implied volatility, we believe it is a matter of time until volatility transfers and the market experiences a more sustainable decompression of risk.
We continue to urge investors to prepare for this change in market conditions. The Fund’s systematic foreign exchange strategy seeks to capitalize from risk transitions, and we believe this year’s market environment may create profit opportunities for MABFX, providing investors in the Fund with upside potential and diversification to their portfolios through its uncorrelated returns.
In the dynamics that might ensue in the currency space – we dub them “Currency Wars”, investors may want to consider a combination of the Merk Funds as part of their tool box. If you know of friends who might benefit from the Merk Funds, please ask them to visit merkfunds.com to learn more about the Funds.
Sincerely,
Axel G. Merk
President & Chief Investment Officer
The views in this Report were those of the Fund Manager as of March 31, 2018 and may not reflect the views of the Manager on the date this Report is first published or anytime thereafter. These views are intended to assist shareholders of the Fund in understanding their investments in a Fund and do not constitute investment advice. The Funds’ performances are influenced by changes in exchange rates of currencies to which the Funds may have had exposure to through derivatives. Over time, the Funds seek to generate more gains from securities than derivatives.
Since the Funds are primarily exposed to foreign currencies, changes in currency exchange rates will affect the value of what the respective Fund owns and the price of the Fund’s shares. Investing in foreign instruments bears a greater risk than investing in domestic instruments for reasons such as volatility of currency exchange rates and, in some cases, limited geographic focus, political and economic instability, and relatively illiquid markets. The Funds are subject to interest rate risk, which is the risk that debt securities in a Fund’s portfolio will decline in value because of increases in market interest rates. As a non-diversified fund, the Merk Hard Currency Fund will be subject to more investment risk and potential for volatility than a diversified fund because its portfolio may, at times, focus on a limited number of issuers. The Funds may also invest in derivative securities, which can be volatile and involve various types and degrees of risk.
The Citigroup 3-Month U.S. T-Bill Index is an unmanaged index representing monthly return equivalents of yield averages of the last 3-month Treasury Bill issues. It is not possible to invest directly in an unmanaged index.
The JPMorgan 3-Month Global Cash Index tracks total returns of three-month constant maturity euro-currency deposits. The euro-currency deposits are the only short-term securities consistent across all markets in terms of liquidity, maturity and credit quality. The index is unmanaged and includes reinvested distributions. One cannot invest directly in an index, nor is an index representative of the Fund's portfolio. JPMorgan does not sponsor, endorse or promote the Merk Hard Currency Fund in connection with any reference to the JPMorgan 3-Month Global Cash Index. JPMorgan makes no representation or warranty, express or implied regarding the advisability of investing in securities generally or in any product particularly or the ability of the JPMorgan 3-Month Global Cash Index to track general bond market performance.
| MERK HARD CURRENCY FUND | MARCH 31, 2018 |
PERFORMANCE CHART AND ANALYSIS (Unaudited) | |
The following chart reflects the change in the value of a hypothetical $10,000 investment in Investor Shares, including reinvested dividends and distributions, in the Merk Hard Currency Fund (the “Fund”) compared with the performance of the benchmark, JPMorgan 3-Month Global Cash Index, over the past ten fiscal years. The JPMorgan 3-Month Global Cash Index tracks total returns of three-month constant maturity euro-currency deposits. The euro-currency deposits are the only short-term securities consistent across all markets in terms of liquidity, maturity and credit quality. The total return of the index includes the reinvestment of dividends and income. The total return of the Fund includes operating expenses that reduce returns, while the total return of the index does not include expenses. The Fund is professionally managed, while the index is unmanaged and is not available for investment.
Comparison of Change in Value of a $10,000 Investment
Merk Hard Currency Fund Investor Shares vs. JPMorgan 3-Month Global Cash Index
Average Annual Total Returns
Periods Ended March 31, 2018 | One Year | Five Year | Ten Year |
| Merk Hard Currency Fund Investor Shares | 9.54% | -2.44% | -0.54% |
| Merk Hard Currency Fund Institutional Shares* | 9.82% | -2.16% | -0.32% |
| JPMorgan 3-Month Global Cash Index | 9.88% | -1.81% | -1.10% |
| * | For the Institutional Shares, performance for the above ten year period is a blended average annual return which is based on the return of the Investor Shares prior to April 1, 2010, the commencement of operations of the Institutional Shares. |
Performance data quoted represents past performance and is no guarantee of future results. Current performance may be lower or higher than the performance data quoted. Investment return and principal value will fluctuate so that shares, when redeemed, may be worth more or less than original cost. As stated in the Fund’s prospectus, the annual operating expense ratios (gross) for Investor Shares and Institutional Shares are 1.30% and 1.05%, respectively. The performance table and graph do not reflect the deduction of taxes that a shareholder would pay on Fund distributions or the redemption of Fund shares. Returns greater than one year are annualized. For the most recent month-end performance, please call (866) 637-5386 or visit www.merkfunds.com.
| MERK ABSOLUTE RETURN CURRENCY FUND | MARCH 31, 2018 |
PERFORMANCE CHART AND ANALYSIS (Unaudited) | |
The following chart reflects the change in the value of a hypothetical $10,000 investment in Investor Shares, including reinvested dividends and distributions, in the Merk Absolute Return Currency Fund (the “Fund”) compared with the performance of the benchmark, Citigroup 3-Month U.S. T-Bill Index, since inception. The Citigroup 3-Month U.S. T-Bill Index measures return equivalents of yield averages that are not marked to market and consists of the last three three-month Treasury bill month-end rates. The total return of the index includes the reinvestment of dividends and income. The total return of the Fund includes operating expenses that reduce returns, while the total return of the index does not include expenses. The Fund is professionally managed, while the index is unmanaged and is not available for investment.
Comparison of Change in Value of a $10,000 Investment
Merk Absolute Return Currency Fund Investor Shares vs. Citigroup 3-Month U.S. T-Bill Index
Average Annual Total Returns
Periods Ended March 31, 2018 | One Year | Five Year | Since Inception 09/09/09 |
| Merk Absolute Return Currency Fund Investor Shares | 2.35% | 1.09% | -0.06% |
| Merk Absolute Return Currency Fund Institutional Shares* | 2.74% | 1.41% | 0.21% |
| Citigroup 3-Month U.S. T-Bill Index** | 1.07% | 0.31% | 0.22% |
| * | For the Institutional Shares, performance for the above since inception period is a blended average annual return which is based on the return of the Investor Shares prior to April 1, 2010, the commencement of operations of the Institutional Shares. |
| ** | Since inception return for the Citigroup 3-Month U.S. T-Bill Index is for the period beginning August 31, 2009. |
Performance data quoted represents past performance and is no guarantee of future results. Current performance may be lower or higher than the performance data quoted. Investment return and principal value will fluctuate so that shares, when redeemed, may be worth more or less than original cost. As stated in the Fund’s prospectus, the annual operating expense ratios (gross) for Investor Shares and Institutional Shares are 1.31% and 1.06%, respectively. The performance table and graph do not reflect the deduction of taxes that a shareholder would pay on Fund distributions or the redemption of Fund shares. Returns greater than one year are annualized. For the most recent month-end performance, please call (866) 637-5386 or visit www.merkfunds.com.
MERK HARD CURRENCY FUND
SCHEDULE OF INVESTMENTS | MARCH 31, 2018 |
| Principal | | Security Description | | Currency | | Rate | | Maturity | | | Value in USD | |
Foreign Bonds - 39.9% (a) | | | | | | | | | | |
| Aerospace/Defense-Equipment - Netherlands - 3.5% | | | | | | | | | | |
| $ | 3,000,000 | | Airbus Finance BV, EMTN | | EUR | | | 5.500 | % | 09/25/18 | | | $ | 3,793,086 | |
| Automotive - Netherlands - 3.4% | | | | | | | | | | | | |
| | 3,000,000 | | Daimler International Finance BV, EMTN (b) | | EUR | | | 0.000 | | 03/15/19 | | | | 3,697,292 | |
| Financials - Netherlands - 2.0% | | | | | | | | | | | | |
| | 17,900,000 | | Bank Nederlandse Gemeenten NV, EMTN | | SEK | | | 2.125 | | 02/13/19 | | | | 2,183,126 | |
| Financials - Norway - 3.9% | | | | | | | | | | | | |
| | 33,000,000 | | SpareBank 1 Boligkreditt AS, EMTN | | NOK | | | 5.950 | | 06/18/18 | | | | 4,250,453 | |
| Financials - Sweden - 1.7% | | | | | | | | | | | | |
| | 1,450,000 | | Investor AB, EMTN | | EUR | | | 3.250 | | 09/17/18 | | | | 1,811,801 | |
| Non-U.S. Government - Austria - 2.3% | | | | | | | | | | | | |
| | 2,000,000 | | Republic of Austria Government Bond (c) | | EUR | | | 1.950 | | 06/18/19 | | | | 2,536,934 | |
| Non-U.S. Government Agency - Sweden - 5.5% | | | | | | | | | | | | |
| | 22,000,000 | | Kommuninvest I Sverige AB, MTN | | SEK | | | 2.250 | | 03/12/19 | | | | 2,698,029 | |
| | 26,900,000 | | Kommuninvest I Sverige AB, Series 1806, MTN | | SEK | | | 1.000 | | 06/20/18 | | | | 3,231,408 | |
| | | | | | | | | | | | 5,929,437 | |
| Regional Authority - Australia - 1.5% | | | | | | | | | | | | |
| | 2,150,000 | | Treasury Corp. of Victoria | | AUD | | | 5.500 | | 11/15/18 | | | | 1,687,698 | |
| Regional Authority - Canada - 3.4% | | | | | | | | | | | | |
| | 4,700,000 | | Province of British Columbia Canada | | CAD | | | 5.600 | | 06/01/18 | | | | 3,673,541 | |
| Supranational Bank - Europe - 12.7% | | | | | | | | | | | | |
| | 3,000,000 | | European Financial Stability Facility, EMTN | | EUR | | | 1.250 | | 01/22/19 | | | | 3,743,017 | |
| | 4,100,000 | | European Investment Bank, EMTN | | EUR | | | 1.000 | | 07/13/18 | | | | 5,066,476 | |
| | 3,500,000 | | European Stability Mechanism, EMTN | | EUR | | | 1.250 | | 10/15/18 | | | | 4,348,107 | |
| | 5,030,000 | | International Bank for Reconstruction & Development, GDIF | | SEK | | | 1.375 | | 06/23/19 | | | | 613,924 | |
| | | | | | | | | | | | | | | 13,771,524 | |
| Total Foreign Bonds (Cost $40,717,418) | | | | | | | | | | | 43,334,892 | |
Foreign Treasury Securities - 22.3% (a) | | | | | | | | | | | | |
| Non-U.S. Government - Belgium - 3.4% | | | | | | | | | | | | |
| | 3,000,000 | | Kingdom of Belgium Treasury Bill, Series 12M (b) | | EUR | | | 0.000 | | 04/12/18 | | | | 3,691,918 | |
| Non-U.S. Government - Canada - 7.7% | | | | | | | | | | | | |
| | 10,800,000 | | Canadian Treasury Bill (b) | | CAD | | | 1.305 - 1.311 | | 09/20/18 | | | | 8,332,602 | |
| Non-U.S. Government - Ireland - 5.2% | | | | | | | | | | | | |
| | 4,600,000 | | Republic of Ireland Treasury Bill (b) | | EUR | | | 0.000 | | 09/24/18 | | | | 5,667,449 | |
| Non-U.S. Government - Norway - 6.0% | | | | | | | | | | | | |
| | 50,840,000 | | Norway Treasury Bill (b) | | NOK | | | 0.555 | | 12/19/18 | | | | 6,462,526 | |
| Total Foreign Treasury Securities (Cost $23,573,303) | | | | | | | | | | | 24,154,495 | |
| U.S. Government & Agency Obligations - 18.7% | | | | | | | | | | | | |
| U.S. Treasury Securities - 18.7% | | | | | | | | | | | | |
| | 20,300,000 | | U.S. Treasury Bill (d) | | | | | | | | | | | | |
| | | | (Cost $20,259,750) | | USD | | | 1.557 - 1.568 | | 05/17/18 | | | | 20,258,470 | |
| Shares | | Security Description | | Currency | | | | | | | | | Value in USD | |
| Exchange Traded Product - 8.1% (a) | | | | | | | | | | | | |
| | 677,800 | | VanEck Merk Gold Trust ETF (e)(f) | | | | | | | | | | | | |
| | | | (Cost $8,510,046) | | USD | | | | | | | | | 8,844,612 | |
| Shares | | Security Description | | Currency | | Rate | | | | | Value in USD | |
| Money Market Fund - 0.6% | | | | | | | | | | | |
| | 626,935 | | Morgan Stanley Institutional Liquidity Funds Treasury Securities Portfolio, Institutional Class (g) | | | | | | | | | | | |
| | | | (Cost $626,935) | | USD | | | 1.457 | | | | | 626,935 | |
| | | | | | | | | | | | | | | | |
| Investments, at value - 89.6% (Cost $93,687,452) | | | | | | | | | | $ | 97,219,404 | |
| Foreign Currencies – 10.0% (Cost $10,820,907) | | | | | | | | | | | 10,899,471 | |
| Net Unrealized Gain/Loss on Forward Currency Contracts – (0.1)% | | | | | | | | | (57,093 | ) |
| Other Assets & Liabilities, Net – 0.5% | | | | | | | | | | | 436,140 | |
| NET ASSETS – 100.0% | | | | | | | | | | $ | 108,497,922 | |
See Notes to Financial Statements.
| EMTN | European Medium Term Note |
| GDIF | Global Debt Issuance Facility |
| (a) | All or a portion of these securities are segregated to cover outstanding forward currency contract exposure. |
| (b) | Zero coupon bond. Interest rate presented is yield to maturity. |
| (c) | Security exempt from registration under Rule 144A under the Securities Act of 1933. At the period end, the value of these securities amounted to $2,536,934 or 2.3% of net assets. |
| (d) | Rate presented is yield to maturity. |
| (f) | Non-income producing security. |
| (g) | Dividend yield changes daily to reflect current market conditions. Rate was the quoted yield as of March 31, 2018. |
Affiliated investments are investments that are managed by the Adviser, and are noted in the Merk Hard Currency Fund’s Schedule of Investments. Transactions during the period with affiliates were as follows:
| Exchange Traded Product | | | | | | | | | | | | | | | | | | | | | |
VanEck Merk Gold Trust ETF | | Balance 3/31/2017 | | | Gross Additions | | | Gross Reductions | | | Change in Unrealized Depreciation | | | Balance 3/31/2018 | | | Realized Loss | | | Investment Income | |
| Shares/Principal | | | 802,800 | | | | – | | | | (125,000 | ) | | | – | | | | 677,800 | | | | | | | |
| Cost | | $ | 10,120,259 | | | $ | – | | | $ | (1,610,213 | ) | | $ | – | | | $ | 8,510,046 | | | $ | (3,372 | ) | | $ | – | |
| Value | | | 9,898,524 | | | | – | | | | – | | | | 556,301 | | | | 8,844,612 | | | | | | | | | |
At March 31, 2018, the Merk Hard Currency Fund held the following exchange traded futures contract:
Contracts | | Type | | Expiration Date | | Notional Contract Value | | | Net Unrealized Depreciation | |
| 11 | | Gold 100 oz. Future | | 06/27/18 | | $ | 1,460,855 | | | $ | (825 | ) |
As of March 31, 2018, the Merk Hard Currency Fund had the following forward currency contracts outstanding:
Counterparty | | Contracts to Purchase/(Sell) | | Settlement Date | | Settlement Value | | | Net Unrealized Appreciation (Depreciation) | |
| BNY Brokerage, Inc. | | | 2,090,000,000 | | Japanese Yen | | 04/25/18 | | $ | 19,730,178 | | | $ | (57,342 | ) |
| J.P. Morgan Securities, LLC | | | (243,611 | ) | Euro | | 04/04/18 | | | (300,000 | ) | | | 249 | |
| | | | | | | | | | | | | | $ | (57,093 | ) |
The following is a summary of the inputs used to value the Fund's investments and other financial instruments and liabilities as of March 31, 2018.
The inputs or methodology used for valuing securities are not necessarily an indication of the risks associated with investing in those securities. For more information on valuation inputs, and their aggregation into the levels used in the table below, please refer to the Security Valuation section in Note 2 of the accompanying Notes to Financial Statements.
| | | Level 1 | | | Level 2 | | | Level 3 | | | Total | |
| Assets | | | | | | | | | | | | |
| Investments at Value | | | | | | | | | | | | |
| Foreign Bonds | | $ | – | | | $ | 43,334,892 | | | $ | – | | | $ | 43,334,892 | |
| Foreign Treasury Securities | | | – | | | | 24,154,495 | | | | – | | | | 24,154,495 | |
| U.S. Government & Agency Obligations | | | – | | | | 20,258,470 | | | | – | | | | 20,258,470 | |
| Exchange Traded Product | | | 8,844,612 | | | | – | | | | – | | | | 8,844,612 | |
| Money Market Fund | | | – | | | | 626,935 | | | | – | | | | 626,935 | |
| Investments, at value | | $ | 8,844,612 | | | $ | 88,374,792 | | | $ | – | | | $ | 97,219,404 | |
Other Financial Instruments* | | | | | | | | | | | | | | | | |
| Forward Currency Contracts | | | – | | | | 249 | | | | – | | | | 249 | |
Total Other Financial Instruments* | | $ | – | | | $ | 249 | | | $ | – | | | $ | 249 | |
| Total Assets | | $ | 8,844,612 | | | $ | 88,375,041 | | | $ | – | | | $ | 97,219,653 | |
| Liabilities | | | | | | | | | | | | | | | | |
Other Financial Instruments* | | | | | | | | | | | | | | | | |
| Forward Currency Contracts | | $ | – | | | $ | (57,342 | ) | | $ | – | | | $ | (57,342 | ) |
| Futures | | $ | (825 | ) | | $ | – | | | $ | – | | | $ | (825 | ) |
Total Other Financial Instruments* | | $ | (825 | ) | | $ | (57,342 | ) | | $ | – | | | $ | (58,167 | ) |
| Total Liabilities | | $ | (825 | ) | | $ | (57,342 | ) | | $ | – | | | $ | (58,167 | ) |
| * | Other Financial Instruments are derivatives not reflected in the Schedule of Investments, such as forward currency contracts and futures, which are valued at the unrealized appreciation (depreciation) at year end. |
See Notes to Financial Statements.
The Fund utilizes the end of period methodology when determining transfers. There were no transfers among Level 1, Level 2 and Level 3 for the year ended March 31, 2018.
PORTFOLIO HOLDINGS (Unaudited) % of Net Assets | | | |
| Foreign Bonds | | | 39.9 | % |
| Foreign Treasury Securities | | | 22.3 | % |
| U.S. Government & Agency Obligations | | | 18.7 | % |
| Exchange Traded Product | | | 8.1 | % |
| Money Market Fund | | | 0.6 | % |
| Foreign Currencies | | | 10.0 | % |
| Net Unrealized Gain/Loss on Forward Currency Contracts | | | (0.1 | )% |
| Other Assets and Liabilities, Net | | | 0.5 | % |
| | | | 100.0 | % |
See Notes to Financial Statements.
MERK ABSOLUTE RETURN CURRENCY FUND
SCHEDULE OF INVESTMENTS | MARCH 31, 2018 |
| Principal | | Security Description | | Currency | | Rate | | Maturity | | | Value in USD | |
| Foreign Bonds - 62.4% (a) | | | | | | | | | | |
| Financials - Norway - 4.6% | | | | | | | | | | |
| $ | 8,000,000 | | SpareBank 1 Boligkreditt AS, EMTN | | NOK | | | 5.950 | % | 06/18/18 | | | $ | 1,030,413 | |
| Non-U.S. Government - Australia - 4.9% | | | | | | | | | | | | |
| | 1,400,000 | | Australia Government Bond | | AUD | | | 3.250 | | 10/21/18 | | | | 1,083,260 | |
| Non-U.S. Government - New Zealand - 4.5% | | | | | | | | | | | | |
| | 1,350,000 | | New Zealand Government Bond | | NZD | | | 5.000 | | 03/15/19 | | | | 1,005,754 | |
| Non-U.S. Government Agency - Sweden - 11.9% | | | | | | | | | | | | |
| | 22,000,000 | | Kommuninvest I Sverige AB, Series 1806, MTN | | SEK | | | 1.000 | | 06/20/18 | | | | 2,642,788 | |
| Regional Authority - Australia - 17.7% | | | | | | | | | | | | |
| | 1,300,000 | | New South Wales Treasury Corp. | | AUD | | | 3.500 | | 03/20/19 | | | | 1,013,389 | |
| | 1,100,000 | | Queensland Treasury Corp. (b) | | AUD | | | 4.000 | | 06/21/19 | | | | 865,020 | |
| | 1,350,000 | | Treasury Corp. of Victoria | | AUD | | | 5.500 | | 11/15/18 | | | | 1,059,717 | |
| | 1,300,000 | | Western Australian Treasury Corp., Series 18 | | AUD | | | 3.750 | | 10/23/18 | | | | 1,008,231 | |
| | | | | | | | | | | | | | | 3,946,357 | |
| Regional Authority - Canada - 18.8% | �� | | | | | | | | | | | |
| | 1,400,000 | | Province of Alberta Canada | | CAD | | | 1.600 | | 06/15/18 | | | | 1,087,248 | |
| | 1,400,000 | | Province of British Columbia Canada | | CAD | | | 5.600 | | 06/01/18 | | | | 1,094,246 | |
| | 1,300,000 | | Province of Manitoba Canada | | CAD | | | 1.850 | | 09/05/18 | | | | 1,010,788 | |
| | 1,300,000 | | Province of Saskatchewan Canada | | CAD | | | 1.950 | | 03/01/19 | | | | 1,011,797 | |
| | | | | | | | | | | | | | | 4,204,079 | |
| Total Foreign Bonds (Cost $14,063,680) | | | | | | | | | | | 13,912,651 | |
Foreign Treasury Securities - 26.1% (a) | | | | | | | | | | | | |
| Non-U.S. Government - Belgium - 4.4% | | | | | | | | | | | | |
| | 800,000 | | Kingdom of Belgium Treasury Bill, Series 12M (c) | | EUR | | | 0.000 | | 04/12/18 | | | | 984,511 | |
| Non-U.S. Government - Canada - 4.5% | | | | | | | | | | | | |
| | 1,300,000 | | Canadian Treasury Bill (c) | | CAD | | | 1.305 | | 09/20/18 | | | | 1,002,999 | |
| Non-U.S. Government - France - 3.9% | | | | | | | | | | | | |
| | 700,000 | | France Treasury Bill BTF (c) | | EUR | | | 0.000 | | 05/30/18 | | | | 862,097 | |
| Non-U.S. Government - Norway - 4.4% | | | | | | | | | | | | |
| | 7,750,000 | | Norway Treasury Bill (c) | | NOK | | | 0.212 | | 12/19/18 | | | | 985,141 | |
| Non-U.S. Government - Sweden - 4.4% | | | | | | | | | | | | |
| | 8,250,000 | | Sweden Treasury Bill (c) | | SEK | | | 0.000 | | 06/20/18 | | | | 989,821 | |
| Non-U.S. Government - United Kingdom - 4.5% | | | | | | | | | | | | |
| | 720,000 | | U.K. Treasury Bill (c) | | GBP | | | 0.450 | | 08/28/18 | | | | 1,008,109 | |
| Total Foreign Treasury Securities (Cost $5,634,115) | | | | | | | | | | | 5,832,678 | |
U.S. Government & Agency Obligations - 2.9% (a) | | | | | | | | | | | | |
| U.S. Treasury Securities - 2.9% | | | | | | | | | | | | |
| | 650,000 | | U.S. Treasury Bill (d) | | | | | | | | | | | | |
| | | | (Cost $648,713) | | USD | | | 1.556 | | 05/17/18 | | | | 648,670 | |
| Shares | | Security Description | | Currency | | Rate | | | | | Value in USD | |
| Money Market Fund - 1.6% | | | | | | | | | | |
| | 369,213 | | Morgan Stanley Institutional Liquidity Funds Treasury Securities Portfolio, Institutional Class (e) | | | | | | | | | | | | |
| | | | (Cost $369,213) | | USD | | | 1.457 | | | | | | 369,213 | |
| | | | | | | | | | | | | | | | |
| Investments, at value - 93.0% (Cost $20,715,721) | | | | | | | | | | $ | 20,763,212 | |
| Foreign Currencies – 9.4% (Cost $2,104,946) | | | | | | | | | | | 2,107,647 | |
| Net Unrealized Gain/Loss on Forward Currency Contracts – 1.2% | | | | | | | | | | | 269,530 | |
| Other Assets & Liabilities, Net – (3.6)% | | | | | | | | | | | (823,937 | ) |
| NET ASSETS – 100.0% | | | | | | | | | | $ | 22,316,452 | |
| EMTN | European Medium Term Note |
| (a) | All or a portion of these securities are segregated to cover outstanding forward currency contract exposure. |
| (b) | Security exempt from registration under Rule 144A under the Securities Act of 1933. At the period end, the value of these securities amounted to $865,020 or 3.9% of net assets. |
| (c) | Zero coupon bond. Interest rate presented is yield to maturity. |
| (d) | Rate presented is yield to maturity. |
| (e) | Dividend yield changes daily to reflect current market conditions. Rate was the quoted yield as of March 31, 2018. |
See Notes to Financial Statements.
As of March 31, 2018, the Merk Absolute Return Currency Fund had the following forward currency contracts outstanding:
Counterparty | | Contracts to Purchase/(Sell) | | Settlement Date | | Settlement Value | | | Net Unrealized Appreciation(Depreciation) | |
| Barclays Capital, Inc. | | | 7,105,000 | | Australian Dollar | | 04/18/18 | | $ | 5,477,150 | | | $ | (20,123 | ) |
| | | | (2,015,000 | ) | British Pound Sterling | | 04/18/18 | | | (2,853,794 | ) | | | 24,584 | |
| | | | (660,000 | ) | British Pound Sterling | | 04/18/18 | | | (924,727 | ) | | | (1,962 | ) |
| | | | 2,020,000 | | British Pound Sterling | | 04/18/18 | | | 2,847,069 | | | | (10,839 | ) |
| | | | (12,575,000 | ) | Canadian Dollar | | 04/18/18 | | | (9,777,351 | ) | | | 13,394 | |
| | | | 10,045,000 | | Canadian Dollar | | 04/18/18 | | | 7,783,157 | | | | 16,363 | |
| | | | 514,550,000 | | Japanese Yen | | 04/18/18 | | | 4,871,258 | | | | (30,011 | ) |
| | | | (28,650,000 | ) | Norwegian Krone | | 04/18/18 | | | (3,720,273 | ) | | | 63,372 | |
| | | | (31,190,000 | ) | Swedish Krona | | 04/18/18 | | | (3,791,607 | ) | | | 51,351 | |
| | | | (20,870,000 | ) | Swedish Krona | | 04/18/18 | | | (2,497,842 | ) | | | (4,855 | ) |
| | | | 82,955,000 | | Swedish Krona | | 04/18/18 | | | 10,055,708 | | | | (107,875 | ) |
| | | | (3,730,000 | ) | Swiss Franc | | 04/18/18 | | | (3,962,783 | ) | | | 55,341 | |
| | | | 970,000 | | Swiss Franc | | 04/18/18 | | | 1,020,284 | | | | (4,139 | ) |
| BNY Brokerage, Inc. | | | 24,240,000 | | Norwegian Krone | | 04/18/18 | | | 3,151,791 | | | | (57,784 | ) |
| J.P. Morgan Securities, LLC | | | (17,595,000 | ) | Australian Dollar | | 04/18/18 | | | (13,865,823 | ) | | | 351,882 | |
| | | | 11,300,000 | | Australian Dollar | | 04/18/18 | | | 8,784,898 | | | | (105,867 | ) |
| | | | (3,880,000 | ) | British Pound Sterling | | 04/18/18 | | | (5,430,264 | ) | | | (17,546 | ) |
| | | | 1,090,000 | | British Pound Sterling | | 04/18/18 | | | 1,536,424 | | | | (5,983 | ) |
| | | | (8,365,000 | ) | Canadian Dollar | | 04/18/18 | | | (6,517,901 | ) | | | 22,831 | |
| | | | (3,100,000 | ) | Canadian Dollar | | 04/18/18 | | | (2,391,998 | ) | | | (15,022 | ) |
| | | | (4,000,000 | ) | Euro | | 04/18/18 | | | (4,946,599 | ) | | | 18,486 | |
| | | | 5,680,000 | | Euro | | 04/18/18 | | | 7,042,098 | | | | (44,177 | ) |
| | | | (381,400,000 | ) | Japanese Yen | | 04/18/18 | | | (3,578,443 | ) | | | (10,035 | ) |
| | | | (117,200,000 | ) | Japanese Yen | | 04/18/18 | | | (1,104,929 | ) | | | 2,229 | |
| | | | 405,950,000 | | Japanese Yen | | 04/18/18 | | | 3,829,980 | | | | (10,518 | ) |
| | | | (1,225,000 | ) | New Zealand Dollar | | 04/18/18 | | | (893,476 | ) | | | 8,206 | |
| | | | 5,270,000 | | New Zealand Dollar | | 04/18/18 | | | 3,779,096 | | | | 29,374 | |
| | | | (38,685,000 | ) | Norwegian Krone | | 04/18/18 | | | (5,005,321 | ) | | | 67,548 | |
| | | | 32,270,000 | | Norwegian Krone | | 04/18/18 | | | 4,176,541 | | | | (57,581 | ) |
| | | | (18,600,000 | ) | Swedish Krona | | 04/18/18 | | | (2,273,541 | ) | | | 43,059 | |
| | | | (995,000 | ) | Swiss Franc | | 04/18/18 | | | (1,047,810 | ) | | | 5,477 | |
| | | | 3,945,000 | | Swiss Franc | | 04/18/18 | | | 4,175,275 | | | | (42,605 | ) |
| RBC Capital Markets, LLC | | | (7,110,000 | ) | Australian Dollar | | 04/18/18 | | | (5,522,021 | ) | | | 61,145 | |
| | | | (1,370,000 | ) | Australian Dollar | | 04/18/18 | | | (1,051,330 | ) | | | (907 | ) |
| | | | (2,205,000 | ) | British Pound Sterling | | 04/18/18 | | | (3,110,640 | ) | | | 14,656 | |
| | | | (485,000 | ) | British Pound Sterling | | 04/18/18 | | | (678,498 | ) | | | (2,478 | ) |
| | | | (2,770,000 | ) | Canadian Dollar | | 04/18/18 | | | (2,134,422 | ) | | | (16,366 | ) |
| | | | (6,895,000 | ) | Euro | | 04/18/18 | | | (8,538,263 | ) | | | 43,427 | |
| | | | (2,385,000 | ) | Euro | | 04/18/18 | | | (2,937,156 | ) | | | (1,231 | ) |
| | | | 1,810,000 | | Euro | | 04/18/18 | | | 2,226,461 | | | | 3,510 | |
| | | | 4,320,000 | | Euro | | 04/18/18 | | | 5,351,280 | | | | (28,918 | ) |
| | | | (535,900,000 | ) | Japanese Yen | | 04/18/18 | | | (5,077,243 | ) | | | 35,121 | |
| | | | 321,550,000 | | Japanese Yen | | 04/18/18 | | | 3,046,066 | | | | (20,698 | ) |
| | | | (15,195,000 | ) | New Zealand Dollar | | 04/18/18 | | | (11,081,407 | ) | | | 100,438 | |
| | | | (5,150,000 | ) | New Zealand Dollar | | 04/18/18 | | | (3,706,779 | ) | | | (14,971 | ) |
| | | | 10,750,000 | | New Zealand Dollar | | 04/18/18 | | | 7,804,279 | | | | (35,578 | ) |
| | | | (13,440,000 | ) | Norwegian Krone | | 04/18/18 | | | (1,737,101 | ) | | | 21,613 | |
| | | | (5,110,000 | ) | Norwegian Krone | | 04/18/18 | | | (651,955 | ) | | | (288 | ) |
| | | | 10,600,000 | | Norwegian Krone | | 04/18/18 | | | 1,348,498 | | | | 4,491 | |
| | | | 62,060,000 | | Norwegian Krone | | 04/18/18 | | | 8,048,154 | | | | (126,784 | ) |
| | | | (71,340,000 | ) | Swedish Krona | | 04/18/18 | | | (8,692,227 | ) | | | 137,247 | |
| | | | (3,010,000 | ) | Swedish Krona | | 04/18/18 | | | (360,895 | ) | | | (59 | ) |
| | | | 12,400,000 | | Swedish Krona | | 04/18/18 | | | 1,518,453 | | | | (31,465 | ) |
| | | | (1,225,000 | ) | Swiss Franc | | 04/18/18 | | | (1,294,785 | ) | | | 11,510 | |
| | | | 5,945,000 | | Swiss Franc | | 04/18/18 | | | 6,280,696 | | | | (52,883 | ) |
| Societe Generale Securities | | | (8,505,000 | ) | Australian Dollar | | 04/18/18 | | | (6,529,338 | ) | | | (2,976 | ) |
| | | | (250,000 | ) | British Pound Sterling | | 04/18/18 | | | (351,136 | ) | | | 117 | |
| | | | 3,530,000 | | Euro | | 04/18/18 | | | 4,349,183 | | | | (124 | ) |
| | | | 60,450,000 | | Japanese Yen | | 04/18/18 | | | 568,037 | | | | 719 | |
| | | | 8,510,000 | | Swedish Krona | | 04/18/18 | | | 1,043,438 | | | | (22,932 | ) |
| | | | (1,670,000 | ) | Swiss Franc | | 04/18/18 | | | (1,763,321 | ) | | | 13,877 | |
| | | | (810,000 | ) | Swiss Franc | | 04/18/18 | | | (847,081 | ) | | | (1,452 | ) |
| | | | 6,780,000 | | Swiss Franc | | 04/18/18 | | | 7,186,371 | | | | (83,836 | ) |
See Notes to Financial Statements.
Counterparty | | Contracts to Purchase/(Sell) | Settlement Date | | Settlement Value | | | Net Unrealized Appreciation(Depreciation) | |
| State Street Brokerage | | | (1,430,000 | ) | British Pound Sterling | 04/18/18 | | $ | (2,033,184 | ) | | $ | 25,357 | |
| | | | 4,985,000 | | British Pound Sterling | 04/18/18 | | | 7,046,321 | | | | (47,010 | ) |
| | | | 1,475,000 | | Canadian Dollar | 04/18/18 | | | 1,150,008 | | | | (4,732 | ) |
| | | | 3,870,000 | | Canadian Dollar | 04/18/18 | | | 2,975,399 | | | | 29,493 | |
| | | | 2,775,000 | | Euro | 04/18/18 | | | 3,441,194 | | | | (22,316 | ) |
| | | | (367,700,000 | ) | Japanese Yen | 04/18/18 | | | (3,476,624 | ) | | | 17,046 | |
| | | | 84,850,000 | | Japanese Yen | 04/18/18 | | | 798,696 | | | | (367 | ) |
| | | | 194,000,000 | | Japanese Yen | 04/18/18 | | | 1,824,550 | | | | 737 | |
| | | | 5,540,000 | | New Zealand Dollar | 04/18/18 | | | 4,026,869 | | | | (23,277 | ) |
| | | | (57,040,000 | ) | Norwegian Krone | 04/18/18 | | | (7,370,884 | ) | | | 90,269 | |
| | | | 12,190,000 | | Swedish Krona | 04/18/18 | | | 1,488,785 | | | | (26,980 | ) |
| | | | 1,160,000 | | Swiss Franc | 04/18/18 | | | 1,214,373 | | | | 810 | |
| | | | | | | | | | | | | $ | 269,530 | |
The following is a summary of the inputs used to value the Fund's investments and other financial instruments and liabilities as of March 31, 2018.
The inputs or methodology used for valuing securities are not necessarily an indication of the risks associated with investing in those securities. For more information on valuation inputs, and their aggregation into the levels used in the table below, please refer to the Security Valuation section in Note 2 of the accompanying Notes to Financial Statements.
| | | Level 1 | | | Level 2 | | | Level 3 | | | Total | |
| Assets | | | | | | | | | | | | |
| Investments at Value | | | | | | | | | | | | |
| Foreign Bonds | | $ | – | | | $ | 13,912,651 | | | $ | – | | | $ | 13,912,651 | |
| Foreign Treasury Securities | | | – | | | | 5,832,678 | | | | – | | | | 5,832,678 | |
| U.S. Government & Agency Obligations | | | – | | | | 648,670 | | | | – | | | | 648,670 | |
| Money Market Fund | | | – | | | | 369,213 | | | | – | | | | 369,213 | |
| Total Investments at Value | | $ | – | | | $ | 20,763,212 | | | $ | – | | | $ | 20,763,212 | |
Other Financial Instruments* | | | | | | | | | | | | | | | | |
| Forward Currency Contracts | | | – | | | | 1,385,077 | | | | – | | | | 1,385,077 | |
| Total Assets | | $ | – | | | $ | 22,148,289 | | | $ | – | | | $ | 22,148,289 | |
| Liabilities | | | | | | | | | | | | | | | | |
Other Financial Instruments* | | | | | | | | | | | | | | | | |
| Forward Currency Contracts | | $ | – | | | $ | (1,115,547 | ) | | $ | – | | | $ | (1,115,547 | ) |
| Total Liabilities | | $ | – | | | $ | (1,115,547 | ) | | $ | – | | | $ | (1,115,547 | ) |
| * | Other Financial Instruments are derivatives not reflected in the Schedule of Investments, such as forward currency contracts, which are valued at the unrealized appreciation (depreciation) at year end. |
The Fund utilizes the end of period methodology when determining transfers. There were no transfers among Level 1, Level 2 and Level 3 for the year ended March 31, 2018.
PORTFOLIO HOLDINGS (Unaudited) % of Net Assets | | | |
| Foreign Bonds | | | 62.4 | % |
| Foreign Treasury Securities | | | 26.1 | % |
| U.S. Government & Agency Obligations | | | 2.9 | % |
| Money Market Fund | | | 1.6 | % |
| Foreign Currencies | | | 9.4 | % |
| Net Unrealized Gain/Loss on Forward Currency Contracts | | | 1.2 | % |
| Other Assets and Liabilities, Net | | | (3.6 | )% |
| | | | 100.0 | % |
See Notes to Financial Statements.
| STATEMENTS OF ASSETS AND LIABILITIES | MARCH 31, 2018 |
| | | MERK HARD CURRENCY FUND | | | MERK ABSOLUTE RETURN CURRENCY FUND | |
| ASSETS | | | | | | |
| Investments, at value (Cost $85,177,406 and $20,715,721, respectively) | | $ | 88,374,792 | | | $ | 20,763,212 | |
| Investments in affiliates, at value (Cost $8,510,046 and $0, respectively) | | | 8,844,612 | | | | – | |
| Deposits with brokers | | | 34,100 | | | | – | |
| Foreign currency (Cost $10,820,907 and $2,104,946, respectively) | | | 10,899,471 | | | | 2,107,647 | |
| Receivables: | | | | | | | | |
| Fund shares sold | | | 54,779 | | | | – | |
| Dividends and interest | | | 583,008 | | | | 163,017 | |
| Unrealized gain on forward currency contracts | | | 249 | | | | 1,385,077 | |
| Total Assets | | | 108,791,011 | | | | 24,418,953 | |
| | | | | | | | | |
| LIABILITIES | | | | | | | | |
| Unrealized loss on forward currency contracts | | | 57,342 | | | | 1,115,547 | |
| Payables: | | | | | | | | |
| Investment securities purchased | | | – | | | | 862,106 | |
| Fund shares redeemed | | | 124,897 | | | | 106,903 | |
| Variation margin | | | 2,970 | | | | – | |
| Accrued Liabilities: | | | | | | | | |
| Investment adviser fees | | | 84,792 | | | | 14,963 | |
| Distribution fees | | | 18,432 | | | | 2,026 | |
| Other expenses | | | 4,656 | | | | 956 | |
| Total Liabilities | | | 293,089 | | | | 2,102,501 | |
| | | | | | | | | |
| NET ASSETS | | $ | 108,497,922 | | | $ | 22,316,452 | |
| | | | | | | | | |
| COMPONENTS OF NET ASSETS | | | | | | | | |
| Paid-in capital | | $ | 113,609,095 | | | $ | 22,154,800 | |
| Undistributed (Distributions in excess of) net investment income | | | 927,956 | | | | (155,195 | ) |
| Accumulated net realized loss | | | (9,599,024 | ) | | | (1,752 | ) |
| Net unrealized appreciation | | | 3,559,895 | | | | 318,599 | |
| NET ASSETS | | $ | 108,497,922 | | | $ | 22,316,452 | |
| | | | | | | | | |
| SHARES OF BENEFICIAL INTEREST AT NO PAR VALUE (UNLIMITED SHARES AUTHORIZED) | | | | | | | | |
| Investor Shares | | | 8,537,078 | | | | 1,066,884 | |
| Institutional Shares | | | 2,223,002 | | | | 1,431,477 | |
| | | | | | | | | |
| NET ASSET VALUE, OFFERING AND REDEMPTION PRICE PER SHARE | | | | | | | | |
| Investor Shares (based on net assets of $85,874,023 and $9,467,176, respectively) | | $ | 10.06 | | | $ | 8.87 | |
| Institutional Shares (based on net assets of $22,623,899 and $12,849,276, respectively) | | $ | 10.18 | | | $ | 8.98 | |
See Notes to Financial Statements.
| STATEMENTS OF OPERATIONS | YEAR ENDED MARCH 31, 2018 |
| | | MERK HARD CURRENCY FUND | | | MERK ABSOLUTE RETURN CURRENCY FUND | |
| INVESTMENT INCOME | | | | | | |
| Dividend income | | $ | 4,286 | | | $ | 3,946 | |
| Interest income (Net of foreign withholding taxes of $2,193 and $7,442, respectively) | | | 1,596,104 | | | | 693,138 | |
| Net amortization expense | | | (1,534,663 | ) | | | (542,162 | ) |
| Total Investment Income | | | 65,727 | | | | 154,922 | |
| | | | | | | | | |
| EXPENSES | | | | | | | | |
| Investment adviser fees | | | 1,116,559 | | | | 267,767 | |
| Non 12b-1 shareholder servicing fees: | | | | | | | | |
| Investor Shares | | | 45,387 | | | | 5,793 | |
| Institutional Shares | | | 10,441 | | | | 7,598 | |
| Distribution fees: | | | | | | | | |
| Investor Shares | | | 226,929 | | | | 28,961 | |
| Total Expenses | | | 1,399,316 | | | | 310,119 | |
| Fees waived | | | (37,752 | ) | | | – | |
| Net Expenses | | | 1,361,564 | | | | 310,119 | |
| | | | | | | | | |
| NET INVESTMENT LOSS | | | (1,295,837 | ) | | | (155,197 | ) |
| | | | | | | | | |
| NET REALIZED AND UNREALIZED GAIN (LOSS) | | | | | | | | |
| Net realized gain (loss) on: | | | | | | | | |
| Investments in unaffiliated issuers | | | 4,074,451 | | | | 697,395 | |
| Investments in affiliated issuers | | | (3,372 | ) | | | – | |
| Foreign currency transactions | | | 1,311,738 | | | | (661,727 | ) |
| Futures | | | 54,764 | | | | – | |
| Net realized gain | | | 5,437,581 | | | | 35,668 | |
| Net change in unrealized appreciation on: | | | | | | | | |
| Investments in unaffiliated issuers | | | 5,246,783 | | | | 762,110 | |
| Investments in affiliated issuers | | | 556,301 | | | | – | |
| Foreign currency translations | | | 153,067 | | | | 278,763 | |
| Futures | | | 990 | | | | – | |
| Net change in unrealized appreciation | | | 5,957,141 | | | | 1,040,873 | |
| NET REALIZED AND UNREALIZED GAIN | | | 11,394,722 | | | | 1,076,541 | |
| INCREASE IN NET ASSETS RESULTING FROM OPERATIONS | | $ | 10,098,885 | | | $ | 921,344 | |
See Notes to Financial Statements.
STATEMENTS OF CHANGES IN NET ASSETS
| | | MERK HARD CURRENCY FUND | | | MERK ABSOLUTE RETURN CURRENCY FUND | |
| | | For the Year Ended March 31, 2018 | | | For the Year Ended March 31, 2017 | | | For the Year Ended March 31, 2018 | | | For the Year Ended March 31, 2017 | |
| OPERATIONS | | | | | | | | | | | | |
| Net investment loss | | $ | (1,295,837 | ) | | $ | (1,474,529 | ) | | $ | (155,197 | ) | | $ | (234,555 | ) |
| Net realized gain (loss) | | | 5,437,581 | | | | (1,832,420 | ) | | | 35,668 | | | | 1,689,455 | |
| Net change in unrealized appreciation (depreciation) | | | 5,957,141 | | | | (3,825,160 | ) | | | 1,040,873 | | | | (522,090 | ) |
| Increase (Decrease) in Net Assets Resulting from Operations | | | 10,098,885 | | | | (7,132,109 | ) | | | 921,344 | | | | 932,810 | |
| | | | | | | | | | | | | | | | | |
| DISTRIBUTIONS TO SHAREHOLDERS FROM | | | | | | | | | | | | | | | | |
| Net investment income: | | | | | | | | | | | | | | | | |
| Investor Shares | | | (798,276 | ) | | | – | | | | (312,354 | ) | | | (407,188 | ) |
| Institutional Shares | | | (268,198 | ) | | | – | | | | (561,042 | ) | | | (313,854 | ) |
| Total Distributions to Shareholders | | | (1,066,474 | ) | | | – | | | | (873,396 | ) | | | (721,042 | ) |
| | | | | | | | | | | | | | | | | |
| CAPITAL SHARE TRANSACTIONS | | | | | | | | | | | | | | | | |
| Sale of shares: | | | | | | | | | | | | | | | | |
| Investor Shares | | | 9,667,721 | | | | 22,251,875 | | | | 2,405,840 | | | | 9,963,058 | |
| Institutional Shares | | | 7,075,522 | | | | 17,004,065 | | | | 10,411,059 | | | | 3,475,835 | |
| Reinvestment of distributions: | | | | | | | | | | | | | | | | |
| Investor Shares | | | 775,401 | | | | – | | | | 304,990 | | | | 400,417 | |
| Institutional Shares | | | 251,596 | | | | – | | | | 542,481 | | | | 304,150 | |
| Redemption of shares: | | | | | | | | | | | | | | | | |
| Investor Shares | | | (24,380,386 | ) | | | (29,345,801 | ) | | | (13,408,974 | ) | | | (10,870,540 | ) |
| Institutional Shares | | | (4,099,844 | ) | | | (16,314,892 | ) | | | (11,690,797 | ) | | | (1,860,402 | ) |
| Increase (Decrease) in Net Assets from Capital Share Transactions | | | (10,709,990 | ) | | | (6,404,753 | ) | | | (11,435,401 | ) | | | 1,412,518 | |
| Increase (Decrease) in Net Assets | | | (1,677,579 | ) | | | (13,536,862 | ) | | | (11,387,453 | ) | | | 1,624,286 | |
| | | | | | | | | | | | | | | | | |
| NET ASSETS | | | | | | | | | | | | | | | | |
| Beginning of Year | | | 110,175,501 | | | | 123,712,363 | | | | 33,703,905 | | | | 32,079,619 | |
| End of Year (Including line (a)) | | $ | 108,497,922 | | | $ | 110,175,501 | | | $ | 22,316,452 | | | $ | 33,703,905 | |
| | | | | | | | | | | | | | | | | |
| SHARE TRANSACTIONS | | | | | | | | | | | | | | | | |
| Sale of shares: | | | | | | | | | | | | | | | | |
| Investor Shares | | | 971,718 | | | | 2,303,794 | | | | 265,775 | | | | 1,092,991 | |
| Institutional Shares | | | 708,760 | | | | 1,736,272 | | | | 1,147,134 | | | | 375,492 | |
| Reinvestment of distributions: | | | | | | | | | | | | | | | | |
| Investor Shares | | | 77,231 | | | | – | | | | 34,169 | | | | 44,689 | |
| Institutional Shares | | | 24,763 | | | | – | | | | 60,107 | | | | 33,571 | |
| Redemption of shares: | | | | | | | | | | | | | | | | |
| Investor Shares | | | (2,471,052 | ) | | | (3,089,052 | ) | | | (1,492,219 | ) | | | (1,189,319 | ) |
| Institutional Shares | | | (409,886 | ) | | | (1,684,981 | ) | | | (1,273,398 | ) | | | (202,365 | ) |
| Increase (Decrease) in Shares | | | (1,098,466 | ) | | | (733,967 | ) | | | (1,258,432 | ) | | | 155,059 | |
| | | | | | | | | | | | | | | | | |
| (a) Undistributed (Distributions in excess of) net investment income | | $ | 927,956 | | | $ | (2,055,021 | ) | | $ | (155,195 | ) | | $ | 837,409 | |
See Notes to Financial Statements.
| FINANCIAL HIGHLIGHTS | MARCH 31, 2018 |
These financial highlights reflect selected data for a share outstanding throughout each year.
| | | For the Years Ended March 31, | |
| MERK HARD CURRENCY FUND | | 2018 | | | 2017 | | | 2016 | | | 2015 | | | 2014 | |
| INVESTOR SHARES | | | | | | | | | | | | | | | |
| NET ASSET VALUE, Beginning of Year | | $ | 9.27 | | | $ | 9.81 | | | $ | 9.49 | | | $ | 11.58 | | | $ | 11.91 | |
| INVESTMENT OPERATIONS | | | | | | | | | | | | | | | | | | | | |
| Net investment loss (a) | | | (0.12 | ) | | | (0.12 | ) | | | (0.10 | ) | | | (0.07 | ) | | | (0.09 | ) |
| Net realized and unrealized gain (loss) | | | 1.00 | | | | (0.42 | ) | | | 0.42 | | | | (1.94 | ) | | | 0.09 | (b) |
| Total from Investment Operations | | | 0.88 | | | | (0.54 | ) | | | 0.32 | | | | (2.01 | ) | | | – | |
| | | | | | | | | | | | | | | | | | | | | |
| DISTRIBUTIONS TO SHAREHOLDERS FROM | | | | | | | | | | | | | | | | | | | | |
| Net investment income | | | (0.09 | ) | | | – | | | | – | | | | (0.08 | ) | | | (0.21 | ) |
| Net realized gain | | | – | | | | – | | | | – | | | | – | | | | (0.12 | ) |
| Total Distributions to Shareholders | | | (0.09 | ) | | | – | | | | – | | | | (0.08 | ) | | | (0.33 | ) |
| NET ASSET VALUE, End of Year | | $ | 10.06 | | | $ | 9.27 | | | $ | 9.81 | | | $ | 9.49 | | | $ | 11.58 | |
| TOTAL RETURN | | | 9.54 | % | | | (5.50 | )% | | | 3.37 | % | | | (17.47 | )% | | | 0.08 | % |
| | | | | | | | | | | | | | | | | | | | | |
| RATIOS/SUPPLEMENTARY DATA | | | | | | | | | | | | | | | | | | | | |
| Net Assets at End of Year (000's omitted) | | $ | 85,874 | | | $ | 92,355 | | | $ | 105,417 | | | $ | 126,449 | | | $ | 253,432 | |
| Ratios to Average Net Assets: | | | | | | | | | | | | | | | | | | | | |
| Net investment loss | | | (1.21 | )% | | | (1.27 | )% | | | (1.06 | )% | | | (0.66 | )% | | | (0.76 | )% |
| Net expenses | | | 1.27 | % | | | 1.24 | % | | | 1.23 | % | | | 1.24 | % | | | 1.30 | % |
| Gross expenses | | | 1.30 | %(c) | | | 1.30 | %(c) | | | 1.30 | %(c) | | | 1.30 | %(c) | | | 1.30 | % |
| PORTFOLIO TURNOVER RATE (d) | | | 35 | % | | | 81 | % | | | 85 | % | | | 116 | % | | | 45 | % |
| | | | | | | | | | | | | | | | | | | | | |
| INSTITUTIONAL SHARES | | | | | | | | | | | | | | | | | | | | |
| NET ASSET VALUE, Beginning of Year | | $ | 9.38 | | | $ | 9.90 | | | $ | 9.55 | | | $ | 11.62 | | | $ | 11.95 | |
| INVESTMENT OPERATIONS | | | | | | | | | | | | | | | | | | | | |
| Net investment loss (a) | | | (0.10 | ) | | | (0.10 | ) | | | (0.08 | ) | | | (0.05 | ) | | | (0.06 | ) |
| Net realized and unrealized gain (loss) | | | 1.02 | | | | (0.42 | ) | | | 0.43 | | | | (1.93 | ) | | | 0.10 | (b) |
| Total from Investment Operations | | | 0.92 | | | | (0.52 | ) | | | 0.35 | | | | (1.98 | ) | | | 0.04 | |
| | | | | | | | | | | | | | | | | | | | | |
| DISTRIBUTIONS TO SHAREHOLDERS FROM | | | | | | | | | | | | | | | | | | | | |
| Net investment income | | | (0.12 | ) | | | – | | | | – | | | | (0.09 | ) | | | (0.25 | ) |
| Net realized gain | | | – | | | | – | | | | – | | | | – | | | | (0.12 | ) |
| Total Distributions to Shareholders | | | (0.12 | ) | | | – | | | | – | | | | (0.09 | ) | | | (0.37 | ) |
| NET ASSET VALUE, End of Year | | $ | 10.18 | | | $ | 9.38 | | | $ | 9.90 | | | $ | 9.55 | | | $ | 11.62 | |
| TOTAL RETURN | | | 9.82 | % | | | (5.25 | )% | | | 3.66 | % | | | (17.18 | )% | | | 0.38 | % |
| | | | | | | | | | | | | | | | | | | | | |
| RATIOS/SUPPLEMENTARY DATA | | | | | | | | | | | | | | | | | | | | |
| Net Assets at End of Year (000's omitted) | | $ | 22,624 | | | $ | 17,821 | | | $ | 18,296 | | | $ | 29,027 | | | $ | 56,273 | |
| Ratios to Average Net Assets: | | | | | | | | | | | | | | | | | | | | |
| Net investment loss | | | (0.95 | )% | | | (1.02 | )% | | | (0.81 | )% | | | (0.41 | )% | | | (0.52 | )% |
| Net expenses | | | 1.02 | % | | | 0.99 | % | | | 0.98 | % | | | 0.99 | % | | | 1.05 | % |
| Gross expenses | | | 1.05 | %(c) | | | 1.05 | %(c) | | | 1.05 | %(c) | | | 1.05 | %(c) | | | 1.05 | % |
| PORTFOLIO TURNOVER RATE (d) | | | 35 | % | | | 81 | % | | | 85 | % | | | 116 | % | | | 45 | % |
| (a) | Calculated based on average shares outstanding during each year. |
| (b) | The net realized and unrealized gain (loss) per share does not correlate to the aggregate of the net realized and unrealized loss in the Statement of Operations primarily due to the timing of the sales and repurchases of the Fund's shares in relation to fluctuating market values for the Fund's portfolio. |
| (c) | Reflects the expense ratio excluding any waivers and/or reimbursements. |
| (d) | The portfolio turnover rate is calculated without regard to any securities whose maturities or expiration dates at the time of acquisition were one year or less. |
See Notes to Financial Statements.
| FINANCIAL HIGHLIGHTS | MARCH 31, 2018 |
These financial highlights reflect selected data for a share outstanding throughout each year.
| | | For the Years Ended March 31, | |
| MERK ABSOLUTE RETURN CURRENCY FUND | | 2018 | | | 2017 | | | 2016 | | | 2015 | | | 2014 | |
| INVESTOR SHARES | | | | | | | | | | | | | | | |
| NET ASSET VALUE, Beginning of Year | | $ | 8.93 | | | $ | 8.87 | | | $ | 8.72 | | | $ | 9.53 | | | $ | 9.18 | |
| INVESTMENT OPERATIONS | | | | | | | | | | | | | | | | | | | | |
| Net investment loss (a) | | | (0.06 | ) | | | (0.07 | ) | | | (0.05 | ) | | | (0.05 | ) | | | (0.05 | ) |
| Net realized and unrealized gain (loss) | | | 0.27 | | | | 0.31 | | | | 0.20 | | | | (0.57 | ) | | | 0.57 | |
| Total from Investment Operations | | | 0.21 | | | | 0.24 | | | | 0.15 | | | | (0.62 | ) | | | 0.52 | |
| | | | | | | | | | | | | | | | | | | | | |
| DISTRIBUTIONS TO SHAREHOLDERS FROM | | | | | | | | | | | | | | | | | | | | |
| Net investment income | | | (0.27 | ) | | | (0.18 | ) | | | – | | | | (0.19 | ) | | | (0.17 | ) |
| Total Distributions to Shareholders | | | (0.27 | ) | | | (0.18 | ) | | | – | | | | (0.19 | ) | | | (0.17 | ) |
| NET ASSET VALUE, End of Year | | $ | 8.87 | | | $ | 8.93 | | | $ | 8.87 | | | $ | 8.72 | | | $ | 9.53 | |
| TOTAL RETURN | | | 2.35 | % | | | 2.74 | % | | | 1.72 | % | | | (6.59 | )% | | | 5.68 | % |
| | | | | | | | | | | | | | | | | | | | | |
| RATIOS/SUPPLEMENTARY DATA | | | | | | | | | | | | | | | | | | | | |
| Net Assets at End of Year (000's omitted) | | $ | 9,467 | | | $ | 20,178 | | | $ | 20,497 | | | $ | 24,113 | | | $ | 23,016 | |
| Ratios to Average Net Assets: | | | | | | | | | | | | | | | | | | | | |
| Net investment loss | | | (0.70 | )% | | | (0.73 | )% | | | (0.59 | )% | | | (0.53 | )% | | | (0.53 | )% |
| Net expenses | | | 1.30 | % | | | 1.30 | % | | | 1.30 | % | | | 1.30 | % | | | 1.30 | % |
| Gross expenses | | | 1.30 | % | | | 1.30 | % | | | 1.30 | % | | | 1.30 | % | | | 1.30 | % |
| PORTFOLIO TURNOVER RATE (b) | | | 97 | % | | | 71 | % | | | 59 | % | | | 58 | % | | | 0 | % |
| | | | | | | | | | | | | | | | | | | | | |
| INSTITUTIONAL SHARES | | | | | | | | | | | | | | | | | | | | |
| NET ASSET VALUE, Beginning of Year | | $ | 9.03 | | | $ | 8.97 | | | $ | 8.80 | | | $ | 9.58 | | | $ | 9.22 | |
| INVESTMENT OPERATIONS | | | | | | | | | | | | | | | | | | | | |
| Net investment loss (a) | | | (0.04 | ) | | | (0.04 | ) | | | (0.03 | ) | | | (0.02 | ) | | | (0.03 | ) |
| Net realized and unrealized gain (loss) | | | 0.29 | | | | 0.31 | | | | 0.20 | | | | (0.56 | ) | | | 0.58 | |
| Total from Investment Operations | | | 0.25 | | | | 0.27 | | | | 0.17 | | | | (0.58 | ) | | | 0.55 | |
| | | | | | | | | | | | | | | | | | | | | |
| DISTRIBUTIONS TO SHAREHOLDERS FROM | | | | | | | | | | | | | | | | | | | | |
| Net investment income | | | (0.30 | ) | | | (0.21 | ) | | | – | | | | (0.20 | ) | | | (0.19 | ) |
| Total Distributions to Shareholders | | | (0.30 | ) | | | (0.21 | ) | | | – | | | | (0.20 | ) | | | (0.19 | ) |
| NET ASSET VALUE, End of Year | | $ | 8.98 | | | $ | 9.03 | | | $ | 8.97 | | | $ | 8.80 | | | $ | 9.58 | |
| TOTAL RETURN | | | 2.74 | % | | | 3.02 | % | | | 1.93 | % | | | (6.18 | )% | | | 5.94 | % |
| �� | | | | | | | | | | | | | | | | | | | | |
| RATIOS/SUPPLEMENTARY DATA | | | | | | | | | | | | | | | | | | | | |
| Net Assets at End of Year (000's omitted) | | $ | 12,849 | | | $ | 13,526 | | | $ | 11,583 | | | $ | 17,829 | | | $ | 12,077 | |
| Ratios to Average Net Assets: | | | | | | | | | | | | | | | | | | | | |
| Net investment loss | | | (0.49 | )% | | | (0.48 | )% | | | (0.34 | )% | | | (0.27 | )% | | | (0.28 | )% |
| Net expenses | | | 1.05 | % | | | 1.05 | % | | | 1.05 | % | | | 1.05 | % | | | 1.05 | % |
| Gross expenses | | | 1.05 | % | | | 1.05 | % | | | 1.05 | % | | | 1.05 | % | | | 1.05 | % |
| PORTFOLIO TURNOVER RATE (b) | | | 97 | % | | | 71 | % | | | 59 | % | | | 58 | % | | | 0 | % |
| (a) | Calculated based on average shares outstanding during each year. |
| (b) | The portfolio turnover rate is calculated without regard to any securities whose maturities or expiration dates at the time of acquisition were one year or less. |
See Notes to Financial Statements.
| NOTES TO FINANCIAL STATEMENTS | MARCH 31, 2018 |
Note 1. Organization
The Merk Hard Currency Fund and the Merk Absolute Return Currency Fund (individually, a “Fund” and collectively, the “Funds”) are a non-diversified portfolio and a diversified portfolio of Forum Funds (the “Trust”), respectively. The Trust is a Delaware statutory trust that is registered as an open-end, management investment company under the Investment Company Act of 1940, as amended (the “Act”). Under its Trust Instrument, the Trust is authorized to issue an unlimited number of each Fund’s shares of beneficial interest without par value. Each Fund currently offers two classes of shares: Investor Shares and Institutional Shares. The Merk Hard Currency Fund seeks to profit from a rise in hard currencies relative to the U.S. dollar. The Merk Absolute Return Currency Fund seeks to generate positive absolute returns by investing in securities and instruments that create exposure to currencies. The Merk Hard Currency Fund Investor Shares and Institutional Shares commenced operations on May 10, 2005 and April 1, 2010, respectively. The Merk Absolute Return Currency Fund Investor Shares and Institutional Shares commenced operations on September 9, 2009 and April 1, 2010, respectively.
Note 2. Summary of Significant Accounting Policies
The Funds are investment companies and follow accounting and reporting guidance under Financial Accounting Standards Board (“FASB”) Accounting Standards Codification (“ASC”) Topic 946, “Financial Services-Investment Companies”. These financial statements are prepared in accordance with accounting principles generally accepted in the United States of America (“GAAP”), which require management to make estimates and assumptions that affect the reported amounts of assets and liabilities, the disclosure of contingent liabilities at the date of the financial statements, and the reported amounts of increases and decreases in net assets from operations during the fiscal year. Actual amounts could differ from those estimates. The following summarizes the significant accounting policies of each Fund:
Security Valuation – Securities are valued at market prices using the last quoted trade or official closing price from the principal exchange where the security is traded, as provided by independent pricing services on each Fund business day. In the absence of a last trade, securities are valued at the mean of the last bid and ask price provided by the pricing service. Debt securities may be valued at prices supplied by a fund’s pricing agent based on broker or dealer supplied valuations or matrix pricing, a method of valuing securities by reference to the value of other securities with similar characteristics such as rating, interest rate and maturity. Futures contracts are valued at the day’s settlement price on the exchange where the contract is traded. Forward currency contracts are generally valued based on interpolation of forward curve data points obtained from major banking institutions that deal in foreign currencies and currency dealers. Shares of non-exchange traded open-end mutual funds are valued at net asset value (“NAV”). Short-term investments that mature in sixty days or less may be valued at amortized cost.
Each Fund values its investments at fair value pursuant to procedures adopted by the Trust's Board of Trustees (the “Board”) if (1) market quotations are not readily available or (2) the Adviser, as defined in Note 3, believes that the values available are unreliable. The Trust’s Valuation Committee, as defined in each Fund’s registration statement, performs certain functions as they relate to the administration and oversight of each Fund’s valuation procedures. Under these procedures, the Valuation Committee convenes on a regular and ad hoc basis to review such investments and considers a number of factors, including valuation methodologies and significant unobservable inputs, when arriving at fair value.
The Valuation Committee may work with the Adviser to provide valuation inputs. In determining fair valuations, inputs may include market-based analytics that may consider related or comparable assets or liabilities, recent transactions, market multiples, book values and other relevant investment information. Adviser inputs may include an income-based approach in which the anticipated future cash flows of the investment are discounted in determining fair value. Discounts may also be applied based on the nature or duration of any restrictions on the disposition of the investments. The Valuation Committee performs regular reviews of valuation methodologies, key inputs and assumptions, disposition analysis and market activity.
Fair valuation is based on subjective factors and, as a result, the fair value price of an investment may differ from the security’s market price and may not be the price at which the asset may be sold. Fair valuation could result in a different Net Asset Value (“NAV”) than a NAV determined by using market quotes.
GAAP has a three-tier fair value hierarchy. The basis of the tiers is dependent upon the various “inputs” used to determine the value of each Fund’s investments. These inputs are summarized in the three broad levels listed below:
Level 1 - Quoted prices in active markets for identical assets and liabilities.
Level 2 - Prices determined using significant other observable inputs (including quoted prices for similar securities, interest rates, prepayment speeds, credit risk, etc.). Short-term securities with maturities of sixty days or less are valued at amortized cost, which approximates market value, and are categorized as Level 2 in the hierarchy. Municipal securities, long-term U.S. government obligations and corporate debt securities are valued in accordance with the evaluated price supplied by the pricing service and generally categorized as Level 2 in the hierarchy. Other securities that are categorized as Level 2 in the hierarchy include, but are not limited to, warrants that do not trade on an exchange, securities valued at the mean between the last reported bid and ask quotation and international equity securities valued by an independent third party with adjustments for changes in value between the time of the securities respective local market closes and the close of the U.S. market.
Level 3 - Significant unobservable inputs (including each Fund’s own assumptions in determining the fair value of investments).
The aggregate value by input level, as of March 31, 2018, for each Fund’s investments is included at the end of each Fund’s Schedule of Investments.
Security Transactions, Investment Income and Realized Gain and Loss – Investment transactions are accounted for on the trade date. Dividend income is recorded on the ex-dividend date. Income and capital gains on some foreign securities may be subject to foreign withholding taxes, which are accrued as applicable. Interest income is recorded on an accrual basis. Premium is amortized and discount is accreted using the effective interest method. Identified cost of investments sold is used to determine the gain and loss for both financial statement and federal income tax purposes.
Foreign Currency Translations – Foreign currency amounts are translated into U.S. dollars as follows: (1) assets and liabilities at the rate of exchange at the end of the respective period; and (2) purchases and sales of securities and income and expenses at the rate of exchange prevailing on the dates of such transactions. The portion of the results of operations arising from changes in the exchange rates and the portion due to fluctuations arising from changes in the market prices of securities are not isolated. Such fluctuations are included with the net realized and unrealized gain or loss on investments.
Foreign Currency Transactions – Each Fund may enter into transactions to purchase or sell foreign currency contracts and options on foreign currency. Forward currency contracts are agreements to exchange one currency for another at a future date and at a specified price. A fund may use forward currency contracts to facilitate transactions in foreign securities, to manage a fund’s foreign currency exposure and to protect the U.S. dollar value of its underlying portfolio securities against the effect of possible adverse movements in foreign exchange rates. These contracts are intrinsically valued daily based on forward rates, and a fund’s net equity therein, representing unrealized gain or loss on the contracts as measured by the difference between the forward foreign exchange rates at the dates of entry into the contracts and the forward rates at the reporting date, is recorded as a component of NAV. These instruments involve market risk, credit risk, or both kinds of risks, in excess of the amount recognized in the Statements of Assets and Liabilities. Risks arise from the possible inability of counterparties to meet the terms of their contracts and from movement in currency and securities values and interest rates. Due to the risks associated with these transactions, a fund could incur losses up to the entire contract amount, which may exceed the net unrealized value included in its NAV.
The values of each individual forward currency contract outstanding as of March 31, 2018, are disclosed in each Fund’s Schedule of Investments.
Futures Contracts – Each Fund may purchase futures contracts to gain exposure to market changes, which may be more efficient or cost effective than actually buying the securities. A futures contract is an agreement between parties to buy or sell a security at a set price on a future date. Upon entering into such a contract, a fund is required to pledge to the broker an amount of cash, U.S. Government obligations or other high-quality debt securities equal to the minimum “initial margin” requirements of the exchange on which the futures contract is traded. Pursuant to the contract, the fund agrees to receive from or pay to the broker an amount of cash equal to the daily fluctuation in the value of the contract. Such receipts or payments are known as “variation margin” and are recorded by the fund as unrealized gains or losses. When the contract is closed, the fund records a realized gain or loss equal to the difference between the value of the contract at the time it was opened and value at the time it was closed. Risks of entering into futures contracts include the possibility that there may be an illiquid market and that a change in the value of the contract may not correlate with changes in the value of the underlying securities.
Distributions to Shareholders – Distributions to shareholders of net investment income, if any, are declared and paid quarterly. Distributions to shareholders of net capital gains and foreign currency gains, if any, are declared and paid at least annually. Distributions to shareholders are recorded on the ex-dividend date. Distributions are based on amounts calculated in accordance with applicable federal income tax regulations, which may differ from GAAP. These differences are due primarily to differing treatments of income and gain on various investment securities held by each Fund, timing differences and differing characterizations of distributions made by each Fund.
Federal Taxes – Each Fund intends to continue to qualify each year as a regulated investment company under Subchapter M of Chapter 1, Subtitle A, of the Internal Revenue Code of 1986, as amended (“Code”), and to distribute all of their taxable income to shareholders. In addition, by distributing in each calendar year substantially all of their net investment income and capital gains, if any, the Funds will not be subject to a federal excise tax. Therefore, no federal income or excise tax provision is required. Each Fund files a U.S. federal income and excise tax return as required. Each Fund’s federal income tax returns are subject to examination by the Internal Revenue Service for a period of three fiscal years after they are filed. As of March 31, 2018, there are no uncertain tax positions that would require financial statement recognition, de-recognition or disclosure.
Income and Expense Allocation – The Trust accounts separately for the assets, liabilities and operations of each of its investment portfolios. Expenses that are directly attributable to more than one investment portfolio are allocated among the respective investment portfolios in an equitable manner.
Each Fund's class-specific expenses are charged to the operations of that class of shares. Income and expenses (other than expenses attributable to a specific class) and realized and unrealized gains or losses on investments are allocated to each class of shares based on the class’ respective net assets to the total net assets of each Fund.
Commitments and Contingencies – In the normal course of business, each Fund enters into contracts that provide general indemnifications by each Fund to the counterparty to the contract. Each Fund’s maximum exposure under these arrangements is dependent on future claims that may be made against each Fund and, therefore, cannot be estimated; however, based on experience, the risk of loss from such claims is considered remote. Each Fund has determined that none of these arrangements requires disclosure on each Fund’s balance sheet.
Note 3. Fees and Expenses
Investment Adviser – Merk Investments LLC (the “Adviser”) is the investment adviser to each Fund. Pursuant to an investment advisory agreement, the Adviser receives an advisory fee from the Funds at an annual rate of 1.00% of each Fund’s average daily net assets.
Under the terms of the Investment Advisory Agreement for the Funds the Adviser is obligated to pay all expenses of each Fund except Board-approved administrative service fees, borrowing costs, taxes, brokerage costs, commissions, and extraordinary and non-recurring expenses and expenses that the Funds are authorized to pay under Rule 12b-1.
Distribution – Foreside Fund Services, LLC serves as each Fund’s distributor (the “Distributor”). The Funds have adopted a Distribution Plan (the “Plan”) for Investor Shares in accordance with Rule 12b-1 of the Act. Under the Plan, the Funds pay the Distributor and/or any other entity as authorized by the Board a fee of up to 0.25% of the average daily net assets of Investor Shares. The Distributor is not affiliated with the Adviser or Atlantic Fund Administration, LLC (d/b/a Atlantic Fund Services) (“Atlantic”) or their affiliates.
Other Service Providers – Atlantic provides fund accounting, fund administration, compliance and transfer agency services to each Fund. The fees related to these services are included in Fund services fees within the Statements of Operations. Atlantic also provides certain shareholder report production and EDGAR conversion and filing services. Atlantic provides a Principal Executive Officer, a Principal Financial Officer, a Chief Compliance Officer and an Anti-Money Laundering Officer to each Fund, as well as certain additional compliance support functions.
Trustees and Officers – Through December 31, 2017, the Trust paid each independent Trustee an annual retainer fee of $50,000 for service to the Trust ($66,000 for the Chairman), and the Audit Committee Chairman and Vice Chairman received an additional $6,000 annually. Effective January 1, 2018, each independent Trustee's annual retainer is $31,000 ($41,000 for the Chairman), and the Audit Committee Chairman receives an additional $2,000 annually. The Trustees and Chairman may receive additional fees for special Board meetings. Each Trustee is also reimbursed for all reasonable out-of-pocket expenses incurred in connection with his duties as a Trustee, including travel and related expenses incurred in attending Board meetings. Certain officers of the Trust are also officers or employees of the above named service providers, and during their terms of office received no compensation from the Fund. Pursuant to the terms of the investment advisory agreement, the Trustees' fees attributable to each Fund are paid by the Adviser.
Note 4. Fees Waived
During this period, Merk Hard Currency Fund invested in VanEck Merk Gold Trust, an exchange traded product sponsored by the Adviser. As of March 31, 2018, Merk Hard Currency Fund owned approximately 6.1% of VanEck Merk Gold Trust. The Adviser has agreed to waive fees in an amount equal to the fee it receives from VanEck Merk Gold Trust based on Merk Hard Currency Fund’s investment in VanEck Merk Gold Trust (NYSE:OUNZ). For the year ended March 31, 2018, the Adviser waived fees of $37,752 for Merk Hard Currency Fund.
Note 5. Security Transactions
The cost of purchases and proceeds from sales of investment securities (including maturities), other than short-term investments during the year ended March 31, 2018, were as follows:
| | | | Purchases | | | Sales | | |
| | Merk Hard Currency Fund | | $ | 17,045,686 | | | $ | 28,438,381 | | |
| | Merk Absolute Return Currency Fund | | | 6,004,253 | | | | 8,944,965 | | |
Note 6. Summary of Derivative Activity
The volume of open derivative positions may vary on a daily basis as each Fund transacts derivative contracts in order to achieve the exposure desired by the Adviser. The notional value of activity for the year ended March 31, 2018 for any derivative type that was held during the year is as follows:
| | | | Merk Hard Currency Fund | | | Merk Absolute Return Currency Fund | | |
| | Forward Currency Contracts | | $ | 331,778,212 | | | $ | 6,632,625,238 | | |
| | Futures | | | 14,236,586 | | | | – | | |
The Merk Hard Currency Fund’s use of derivatives during the year ended March 31, 2018, was limited to futures and forward currency contracts. The Merk Absolute Return Currency Fund’s use of derivatives during the year ended March 31, 2018, was limited to forward currency contracts.
Following is a summary of the effect of derivatives on the Statements of Assets and Liabilities for each Fund as of March 31, 2018:
| | Merk Hard Currency Fund | | | | | | | | | | |
| | Location: | | Commodity Contracts | | | Currency Contracts | | | Total | | |
| | Asset derivatives: | | | | | | | | |
| | Unrealized gain on forward currency contracts | | $ | – | | | $ | 249 | | | $ | 249 | | |
| | Liability derivatives: | | | | | | | | | | | | | |
| | Unrealized loss on forward currency contracts | | $ | – | | | $ | (57,342 | ) | | $ | (57,342 | ) | |
| | Payable - variation margin | | $ | (2,970 | ) | | $ | – | | | $ | (2,970 | ) | |
| | Merk Absolute Return Currency Fund | | | | | | | |
| | Location: | | Currency Contracts | | | Total | | |
| | Asset derivatives: | | | | | |
| | Unrealized gain on forward currency contracts | | $ | 1,385,077 | | | $ | 1,385,077 | | |
| | Liability derivatives: | | | | | | | | | |
| | Unrealized loss on forward currency contracts | | $ | (1,115,547 | ) | | $ | (1,115,547 | ) | |
Realized and unrealized gains and losses on derivatives contracts during the year ended March 31, 2018, by each Fund are recorded in the following locations on the Statements of Operations:
| | Merk Hard Currency Fund | | | | | | | | | | |
| | Location: | | Commodity Contracts | | | Currency Contracts | | | Total | | |
| | Net realized gain on: | | | | | | | | |
| | Futures | | $ | 54,764 | | | $ | – | | | $ | 54,764 | | |
| | Foreign currency transactions | | | – | | | | 974,396 | | | | 974,396 | | |
| | Total net realized gain | | $ | 54,764 | | | $ | 974,396 | | | | 1,029,160 | | |
| | | | | | | | | | | | | | | |
| | Net change in unrealized appreciation on: | | | | | | | | | | | | | |
| | Futures | | | 990 | | | | – | | | | 990 | | |
| | Foreign currency translations | | | – | | | | 37,601 | | | | 37,601 | | |
| | Total net change in unrealized appreciation | | $ | 990 | | | $ | 37,601 | | | $ | 38,591 | | |
| | Merk Absolute Return Currency Fund | | | | | | | |
| | Location: | | Currency Contracts | | | Total | | |
| | Net realized loss on: | | | | | |
| | Foreign currency transactions | | $ | (851,071 | ) | | $ | (851,071 | ) | |
| | Total net realized loss | | $ | (851,071 | ) | | | (851,071 | ) | |
| | | | | | | | | | | |
| | Net change in unrealized appreciation on: | | | | | | | | | |
| | Foreign currency translations | | | 309,010 | | | | 309,010 | | |
| | Total net change in unrealized appreciation | | $ | 309,010 | | | $ | 309,010 | | |
Asset (Liability) amounts shown in the table below represent amounts for derivative related investments for each Fund at March 31, 2018. These amounts may be collateralized by cash or financial instruments.
| | | Gross Asset (Liability) as Presented in the Statements of Assets and Liabilities | | | Financial Instruments (Received) Pledged* | | | Cash Collateral (Received) Pledged* | | | Net Amount | | |
| Merk Hard Currency Fund | | |
| Assets: | | |
| Over-the-counter derivatives** | | $ | 249 | | | $ | – | | | $ | – | | | $ | 249 | | |
| Liabilities: | | |
| Over-the-counter derivatives** | | | (60,312 | ) | | | 60,312 | | | | – | | | | – | | |
| Merk Absolute Return Currency Fund | | |
| Assets: | | |
| Over-the-counter derivatives** | | $ | 1,385,077 | | | $ | – | | | $ | – | | | $ | 1,385,077 | | |
| Liabilities: | | |
| Over-the-counter derivatives** | | | (1,115,547 | ) | | | 1,115,547 | | | | – | | | | – | | |
| * | The actual financial instruments and cash collateral (received) pledged may be in excess of the amounts shown in the table. The table only reflects collateral amounts up to the amount of the financial instrument disclosed on the Statements of Assets and Liabilities. |
| ** | Over-the-counter derivatives may consist of forward currency contracts and futures contracts. The amounts disclosed above represent the exposure to one or more counterparties. For further detail on individual derivative contracts and the corresponding unrealized appreciation (depreciation), see the Schedule of Investments. |
Note 7. Federal Income Tax
As of March 31, 2018, the cost for federal income tax and the components of net unrealized appreciation (depreciation) were as follows:
| | | | Tax Cost of Investments | | | Gross Unrealized Appreciation | | | Gross Unrealized Depreciation | | | Net Unrealized Appreciation | | |
| | Merk Hard Currency Fund | | $ | 94,602,720 | | | $ | 2,905,110 | | | $ | (288,426 | ) | | $ | 2,616,684 | | |
| | Merk Absolute Return Currency Fund | | $ | 20,715,721 | | | $ | 321,485 | | | $ | (273,994 | ) | | $ | 47,491 | | |
Distributions paid during the fiscal year ended as noted were characterized for tax purposes as follows:
| | | | | Ordinary Income | | |
| | Merk Hard Currency Fund | 2018 | | $ | 1,066,474 | | |
| | | 2017 | | | - | | |
| | Merk Absolute Return Currency Fund | 2018 | | | 873,396 | | |
| | | 2017 | | | 721,042 | | |
As of March 31, 2018, distributable earnings (accumulated loss) on a tax basis were as follows:
| | | | Undistributed Ordinary Income | | | Capital and Other Losses | | | Unrealized Appreciation | | | Total | | |
| | Merk Hard Currency Fund | | $ | 870,863 | | | $ | (8,684,581 | ) | | $ | 2,702,545 | | | $ | (5,111,173 | ) | |
| | Merk Absolute Return Currency Fund | | | 114,335 | | | | (1,752 | ) | | | 49,069 | | | | 161,652 | | |
The difference between components of distributable earnings on a tax basis and the amounts reflected in the Statements of Assets and Liabilities are primarily due to grantor trust adjustments, futures contracts, forward contracts and wash sales.
For tax purposes, the current year post-October loss was $75,846 and $85 for the Merk Hard Currency Fund and Merk Absolute Return Currency Fund, respectively, (realized during the period November 1, 2017 through March 31, 2018). These losses were recognized for tax purposes on the first business day of the Fund’s current fiscal year, April 1, 2018.
As of March 31, 2018, the Funds had the following available short term and long term capital loss carry forwards that have no expiration date:
| | | | Short Term | | | Long Term | | |
| | Merk Hard Currency Fund | | $ | 489,538 | | | $ | 8,119,197 | | |
| | Merk Absolute Return Currency Fund | | | 1,667 | | | | – | | |
For the year ended March 31, 2018, each Fund recorded the following reclassifications to the accounts listed below. The reclassifications were primarily as a result of grantor trusts and currency gain/loss reclassifications.
| | | | Undistributed Net Investment Income | | | Accumulated Net Realized Loss | | |
| | Merk Hard Currency Fund | | $ | 5,345,288 | | | $ | (5,345,288 | ) | |
| | Merk Absolute Return Currency Fund | | | 35,989 | | | | (35,989 | ) | |
Note 8. Underlying Investments in Other Pooled Investment Vehicles
The Merk Hard Currency Fund currently invests a portion of its assets in the VanEck Merk Gold Trust. The Merk Hard Currency Fund may eliminate its investments at any time if the Adviser determines that it is in the best interest of the Fund and its shareholders.
The performance of the Merk Hard Currency Fund may be directly affected by the performance of the VanEck Merk Gold Trust. The financial statements of the VanEck Merk Gold Trust, including the schedule of investments, can be found at the Merk Funds website www.merkfunds.com, or the Securities and Exchange Commission’s website www.sec.govand should be read in conjunction with the Merk Hard Currency Fund’s financial statements. As of March 31, 2018 the percentage of the Merk Hard Currency Fund’s net assets invested in the VanEck Merk Gold Trust was 8.1%.
Note 9. Subsequent Events
Subsequent events occurring after the date of this report through the date these financial statements were issued have been evaluated for potential impact, and each Fund has had no such events.
REPORT OF INDEPENDENT REGISTERED
PUBLIC ACCOUNTING FIRM | MARCH 31, 2018 |
To the Board of Trustees of Forum Funds and
the Shareholders of Merk Hard Currency Fund and
Merk Absolute Return Currency Fund
Opinion on the Financial Statements
We have audited the accompanying statements of assets and liabilities of Merk Hard Currency Fund and Merk Absolute Return Currency Fund, each a series of shares of beneficial interest in Forum Funds (the “Funds”), including the schedules of investments, as of March 31, 2018, and the related statements of operations for the year then ended, the statements of changes in net assets for each of the years in the two-year period then ended and the financial highlights for each of the years in the five-year period then ended, and the related notes (collectively referred to as the “financial statements”). In our opinion, the financial statements present fairly, in all material respects, the financial position of the Funds as of March 31, 2018, and the results of their operations for the year then ended, the changes in their net assets for each of the years in the two-year period then ended and their financial highlights for each of the years in the five-year period then ended, in conformity with accounting principles generally accepted in the United States of America.
Basis for Opinion
These financial statements are the responsibility of the Funds' management. Our responsibility is to express an opinion on the Funds’ financial statements based on our audits. We are a public accounting firm registered with the Public Company Accounting Oversight Board (United States) (“PCAOB”) and are required to be independent with respect to the Funds in accordance with the U.S. federal securities law and the applicable rules and regulations of the Securities and Exchange Commission and the PCAOB.
We conducted our audits in accordance with the standards of the PCAOB. Those standards require that we plan and perform the audits to obtain reasonable assurance about whether the financial statements are free of material misstatement, whether due to error or fraud. The Funds are not required to have, nor were we engaged to perform, an audit of their internal control over financial reporting. As part of our audits we are required to obtain an understanding of internal control over financial reporting but not for the purpose of expressing an opinion on the effectiveness of the Funds’ internal control over financial reporting. Accordingly, we express no such opinion.
Our audits included performing procedures to assess the risk of material misstatement of those financial statements, whether due to error or fraud, and performing procedures that respond to those risks. Such procedures included examining, on a test basis, evidence regarding the amounts and disclosures in the financial statements. Our procedures included confirmation of securities owned as of March 31, 2018 by correspondence with the custodian and brokers. Our audits also included evaluating the accounting principles used and significant estimates made by management, as well as evaluating the overall presentation of the financial statements. We believe that our audits provide a reasonable basis for our opinion.
BBD, LLP
We have served as the auditor of one or more of the Funds in the Forum Funds since 2009.
Philadelphia, Pennsylvania
May 24, 2018
ADDITIONAL INFORMATION (Unaudited) | MARCH 31, 2018 |
Shareholder Proxy Vote
At a special meeting of shareholders for all the Funds in the Trust, held on December 8, 2017, shares were voted as follows on the proposals presented to shareholders:
| Matter | For | Against | Abstain |
To elect David Tucker to the Board of Trustees of the Trust. | 108,303,928.779 | 1,542,957.994 | 0 |
To elect Jennifer Brown-Strabley
to the Board of Trustees of the Trust. | 108,183,952.495 | 1,662,934.278 | 0 |
To elect Mark D. Moyer to the Board of Trustees of the Trust. | 108,142,412.946 | 1,704,473.827 | 0 |
To elect Jessica Chase to the Board of Trustees of the Trust. | 107,632,924.803 | 2,213,961.970 | 0 |
To elect Stacey E. Hong to the Board of Trustees of the Trust. | 105,777,266.997 | 4,069,619.776 | 0 |
Proxy Voting Information
A description of the policies and procedures that each Fund uses to determine how to vote proxies relating to securities held in each Fund’s portfolio is available, without charge and upon request, by calling (866) 637-5386 and on the U.S. Securities and Exchange Commission’s website at www.sec.gov. Each Fund’s proxy voting record for the most recent twelve-month period ended June 30 is available, without charge and upon request, by calling (866) 637-5386 and on the SEC’s website at www.sec.gov.
Availability of Quarterly Portfolio Schedules
Each Fund files its complete schedule of portfolio holdings with the SEC for the first and third quarters of each fiscal year on Form N-Q. These filings are available, without charge and upon request on the SEC’s website at www.sec.gov or may be reviewed and copied at the SEC’s Public Reference Room in Washington, DC. Information on the operation of the Public Reference Room may be obtained by calling (800) SEC-0330.
Shareholder Expense Example
As a shareholder of the Funds, you incur ongoing costs, including management fees, distribution and/or service (12b-1) fees and other Fund expenses. This example is intended to help you understand your ongoing costs (in dollars) of investing in the Funds and to compare these costs with the ongoing costs of investing in other mutual funds.
The example is based on an investment of $1,000 invested at the beginning of the period and held for the entire period from October 1, 2017 through March 31, 2018.
Actual Expenses – The first line under each share class of the table below provides information about actual account values and actual expenses. You may use the information in this line, together with the amount you invested, to estimate the expenses that you paid over the period. Simply divide your account value by $1,000 (for example, an $8,600 account value divided by $1,000 = 8.6), then multiply the result by the number in the first line under the heading entitled “Expenses Paid During Period” to estimate the expenses you paid on your account during the period.
Hypothetical Example for Comparison Purposes – The second line under each share class of the table below provides information about hypothetical account values and hypothetical expenses based on each Fund’s actual expense ratio and an assumed rate of return of 5% per year before expenses, which is not each Fund’s actual return. The hypothetical account values and expenses may not be used to estimate the actual ending account balance or expenses you paid for the period. You may use this information to compare the ongoing costs of investing in each Fund and other funds. To do so, compare this 5% hypothetical example with the 5% hypothetical examples that appear in the shareholder reports of other funds.
Please note that the expenses shown in the table are meant to highlight your ongoing costs only. Therefore, the second line of the table is useful in comparing ongoing costs only and will not help you determine the relative total costs of owning different funds.
| | Beginning Account Value October 1, 2017 | Ending Account Value March 31, 2018 | Expenses Paid During Period* | Annualized Expense Ratio* |
| Merk Hard Currency Fund | | | | |
| Investor Shares | | | | |
| Actual | $1,000.00 | $1,011.39 | $6.52 | 1.30% |
| Hypothetical (5% return before expenses) | $1,000.00 | $1,018.45 | $6.54 | 1.30% |
| Institutional Shares | | | | |
| Actual | $1,000.00 | $1,012.93 | $5.32 | 1.06% |
| Hypothetical (5% return before expenses) | $1,000.00 | $1,019.65 | $5.34 | 1.06% |
| Merk Absolute Return Currency Fund | | | | |
| Investor Shares | | | | |
| Actual | $1,000.00 | $977.98 | $6.41 | 1.30% |
| Hypothetical (5% return before expenses) | $1,000.00 | $1,018.45 | $6.54 | 1.30% |
| Institutional Shares | | | | |
| Actual | $1,000.00 | $980.20 | $5.18 | 1.05% |
| Hypothetical (5% return before expenses) | $1,000.00 | $1,019.70 | $5.29 | 1.05% |
| * | Expenses are equal to the Fund’s annualized expense ratio multiplied by the average account value over the period, multiplied by the number of days in the most recent fiscal half-year (182) divided by 365 to reflect the half-year period. |
Federal Tax Status of Dividends Declared during the Fiscal Year
For federal income tax purposes, dividends from short-term capital gains are classified as ordinary income. The Merk Hard Currency Fund designates 3.72% and Merk Absolute Return Currency Fund designates 0.29% as qualified interest income exempt from U.S. tax for foreign shareholders (QII).
Trustees and Officers of the Trust
The Board is responsible for oversight of the management of the Trust’s business affairs and of the exercise of all the Trust’s powers except those reserved for the shareholders. The following table provides information about each Trustee and certain officers of the Trust. Each Trustee and officer holds office until the person resigns, is removed, or is replaced. Unless otherwise noted, the persons have held their principal occupations for more than five years. The address for all Trustees and officers is Three Canal Plaza, Suite 600, Portland, Maine 04101. Each Fund’s Statement of Additional Information includes additional information about the Trustees and is available, without charge and upon request, by calling (866) 637-5386.
| Name and Year of Birth | Position with the Trust | Length of Time Served | Principal Occupation(s) During Past Five Years | Number of Series in Fund Complex Overseen By Trustee | Other Directorships Held By Trustee During Past Five Years |
| Independent Trustees |
David Tucker Born: 1958 | Trustee; Chairman of the Board | Since 2011 and Chairman since 2018 | Director, Blue Sky Experience (a charitable endeavor) since 2008; Senior Vice President & General Counsel, American Century Companies (an investment management firm) 1998-2008. | 2 | Trustee, Forum Funds II, Forum ETF Trust and U.S. Global Investors Funds |
Mark D. Moyer Born: 1959 | Trustee | Since 2018 | Chief Financial Officer, Freedom House (a NGO advocating political freedom and democracy) since 2017; independent consultant providing interim CFO services, principally to non-profit organizations, 2011-2017; Chief Financial Officer, Institute of International Education (a NGO administering international educational exchange programs), 2008-2011; Chief Financial Officer and Chief Restructuring Officer, Ziff Davis Media Inc. (an integrated media company), 2005-2008; Adjunct Professor of Accounting, Fairfield University from 2009-2012. | 2 | Trustee, Forum Funds II, Forum ETF Trust and U.S. Global Investors Funds |
Jennifer Brown-Strabley Born: 1964 | Trustee | Since 2018 | Principal, Portland Global Advisors, 1996-2010. | 2 | Trustee, Forum Funds II, Forum ETF Trust and U.S. Global Investors Funds |
| Interested Trustee |
Stacey E. Hong(1) Born: 1966 | Trustee | Since 2018 | President, Atlantic since 2008. | 2 | Trustee, Forum Funds II and U.S. Global Investors Funds |
Jessica Chase(1) Born: 1970 | Trustee | Since 2018 | Senior Vice President, Atlantic since 2008. | 2 | None |
(1) | Stacey E. Hong is currently treated as an interested person of the Trust, as defined in the 1940 Act, due to his affiliation with Atlantic. Jessica Chase is currently treated as an interested person of the Trust, as defined in the 1940 Act, due to her affiliation with Atlantic and her role as President of the Trust. |
Name and Year of Birth | Position with the Trust | Length of Time Served | Principal Occupation(s) During Past 5 Years |
| Officers |
Jessica Chase Born: 1970 | President; Principal Executive Officer | Since 2015 | Senior Vice President, Atlantic since 2008. |
Karen Shaw Born: 1972 | Treasurer; Principal Financial Officer | Since 2008 | Senior Vice President, Atlantic since 2008. |
Zachary Tackett Born: 1988 | Vice President; Secretary and Anti-Money Laundering Compliance Officer | Since 2014 | Counsel, Atlantic since 2014; Intern Associate, Coakley & Hyde, PLLC, 2010- 2013. |
Michael J. McKeen Born: 1971 | Vice President | Since 2009 | Senior Vice President, Atlantic since 2008. |
Timothy Bowden Born: 1969 | Vice President | Since 2009 | Manager, Atlantic since 2008. |
Geoffrey Ney Born: 1975 | Vice President | Since 2013 | Manager, Atlantic since 2013; Senior Fund Accountant, Atlantic, 2008–2013. |
Todd Proulx Born: 1978 | Vice President | Since 2013 | Manager, Atlantic since 2013; Senior Fund Accountant, Atlantic, 2008–2013. |
Carlyn Edgar Born: 1963 | Vice President | Since 2008 | Senior Vice President, Atlantic since 2008; Chief Compliance Officer, 2008-2016 |
Dennis Mason Born: 1967 | Chief Compliance Officer | Since 2016 | Fund Compliance Officer, Atlantic since 2013; Senior Specialist, Atlantic, 2011- 2013; Senior Analyst, Atlantic, 2008-2011 |
[INTENTIONALLY LEFT BLANK]
[INTENTIONALLY LEFT BLANK]
PAYSON TOTAL RETURN FUNDTABLE OF CONTENTS
MARCH 31, 2018
| A Message to Our Shareholders (Unaudited) | 1 |
| Performance Chart and Analysis (Unaudited) | 3 |
| Schedule of Investments | 4 |
| Statement of Assets and Liabilities | 6 |
| Statement of Operations | 7 |
| Statements of Changes in Net Assets | 8 |
| Financial Highlights | 9 |
| Notes to Financial Statements | 10 |
| Report of Independent Registered Public Accounting Firm | 15 |
| Additional Information (Unaudited) | 17 |
IMPORTANT INFORMATION
An investment in the Fund is subject to risk, including the possible loss of principal. Other Fund risks include equity risk, convertible securities risk, debt securities risk, exchange-traded funds risk, interest rate risk, credit risk, inflation indexed security risk, government securities risk, value investment risk, mortgage-related and other asset-backed securities risk, and foreign investments risk. Foreign investing involves certain risks and increased volatility not associated with investing solely in the U.S., including currency fluctuations, economic or financial instability, lack of timely or reliable financial information or unfavorable political or legal developments. Mortgage-related and other asset-backed securities risks include extension risk and prepayment risk. In addition, the Fund invests in midcap companies, which pose greater risks than those associated with larger, more established companies. There is no assurance that the Fund will achieve its investment objective.
PAYSON TOTAL RETURN FUNDA MESSAGE TO OUR SHAREHOLDERS (Unaudited)
MARCH 31, 2018
Dear Payson Total Return Fund Shareholder,
The managers of the Payson Total Return Fund (the “Fund”) are pleased to report that the Fund produced a total return of 15.39% for the fiscal year ending March 31, 2018. These results compare favorably to the total return of the S&P 500 (the “Index”) for the same period which produced total returns of 13.99%. These favorable results came about by a disciplined security selection process focusing on companies that are sustaining above averages margins while deploying capital to the benefit of the shareholder. This strategy leads the Fund to be concentrated in certain sectors while underweight others, relative to the Index.
While the US equity markets experienced some price erosion the last two months of the fiscal year, generally stock prices rose through this time period. The combination of low interest rates, low inflation, strong employment results, the passing of favorable tax legislation and continued reduction in regulations all contributed to a continuation of higher corporate earnings this past fiscal year. In addition, foreign economies also experienced positive momentum which in turn helped US companies doing business overseas.
Turning to specific factors that contributed to the Fund’s success this past year, the managers chose to overweight certain companies relative to the weight of the company within the index based on their comparatively superior profit margin and valuation characteristics. At the same time the managers avoided certain sectors they deemed to detract from the portfolio characteristics. The managers of the Fund find that many companies in the Technology sector, for example, exhibit these positive attributes. As the US economy benefits from and becomes increasingly dependent on the productivity improvements that technology can deliver, the sector has become a larger component of the S&P 500. Conversely, low and cyclical margin, capital intensive, highly leveraged sectors such as Energy, Basic Materials and Telecommunications are experiencing declining market capitalization and are shrinking within the Index. These sectors, as such, have a relatively small presence, if any, in the Fund.
The health care sector, where the managers found a number of opportunities that fit their strategy, underperformed the overall Index. More specifically, the pharmaceutical and biotech industries failed to generate the operating results as anticipated over the course of the year. These disappointing results led to relatively poor stock price performance. In addition, uncertainty surrounding the possible imposition of drug price controls by the government have also cast a cloud over the future profitability of the sector. Although the managers continue to find opportunities in this sector generally, they have gradually reduced exposure in this area.
The top five contributors to the Fund’s performance this past year based on their total returns relative to the Index include Amazon Inc. (+63.26%), Mastercard Inc. (+56.81%), Intel Corp. (+48.38%), Visa Inc. (+35.53%) and Accenture (+30.63%). The lowest five contributors in the Fund this past year were Celgene Corp. (-34.08%), Enbridge Inc. (-21.42%), Mylan N.V. (-18.47%), Twenty-First Century Fox Inc. Cl B (-15.74%), Merck & Co. Inc. (-11.51%). Of these five holdings, as of March 31, 2018, the fund continued to hold Merck and Twenty First Century Fox.
The managers of the Fund believe the positive economic backdrop described above has staying power both in the US and overseas and as such they see room for further corporate earnings improvement. Although rising
PAYSON TOTAL RETURN FUNDA MESSAGE TO OUR SHAREHOLDERS (Unaudited)
MARCH 31, 2018
interest rates have the potential to pose a headwind to the economy and potentially competition, in terms of return, to stocks, the managers do not yet believe we have reached the point that would warrant a change in allocation. In their view, the recent market volatility, brought about in some respect by the rise in interest rates, presents an opportunity to add to equity positions at more favorable valuations while maintaining the strategic discipline of finding companies that meet the manager’s strict characteristic thresholds described above.
PAYSON TOTAL RETURN FUNDPERFORMANCE CHART AND ANALYSIS (Unaudited)
MARCH 31, 2018
The following chart reflects the change in the value of a hypothetical $10,000 investment, including reinvested dividends and distributions, in Payson Total Return Fund (the “Fund”) compared with the performance of the benchmark, S&P 500 Index (the “S&P 500”), over the past ten fiscal years. The S&P 500 is a broad-based, unmanaged measurement of changes in stock market conditions based on the average of 500 widely held common stocks. The total return of the index includes the reinvestment of dividends and income. The total return of the Fund includes operating expenses that reduce returns, while the total return of the index does not include expenses. The Fund is professionally managed, while the index is unmanaged and is not available for investment.
Comparison of Change in Value of a $10,000 Investment
Payson Total Return Fund vs. S&P 500 Index
| | Average Annual Total Returns
Periods Ended March 31, 2018 | One Year | Five Year | Ten Year | |
| | Payson Total Return Fund | 15.39% | 10.61% | 8.43% | |
| | S&P 500 Index | 13.99% | 13.31% | 9.49% | |
Performance data quoted represents past performance and is no guarantee of future results. Current performance may be lower or higher than the performance data quoted. Investment return and principal value will fluctuate so that shares, when redeemed, may be worth more or less than original cost. As stated in the Fund’s prospectus, the annual operating expense ratio (gross) is 0.98%. The performance table and graph do not reflect the deduction of taxes that a shareholder would pay on Fund distributions or the redemption of Fund shares. Returns greater than one year are annualized. For the most recent month-end performance, please call (800) 805-8258.
PAYSON TOTAL RETURN FUNDSCHEDULE OF INVESTMENTS
MARCH 31, 2018
| Shares | | | Security Description | | | Value | |
| Common Stock - 98.9% | | | | |
| Consumer Discretionary - 16.9% | | | | |
| | 2,560 | | | Amazon.com, Inc. (a) | | | $ | 3,705,190 | |
| | 26,957 | | | Aptiv PLC | | | | 2,290,536 | |
| | 1,322 | | | Booking Holdings, Inc. (a) | | | | 2,750,276 | |
| | 7,837 | | | McDonald’s Corp. | | | | 1,225,550 | |
| | 200 | | | NVR, Inc. (a) | | | | 560,000 | |
| | 10,431 | | | The Home Depot, Inc. | | | | 1,859,221 | |
| | 28,148 | | | The TJX Cos., Inc. | | | | 2,295,751 | |
| | 12,680 | | | Thor Industries, Inc. | | | | 1,460,356 | |
| | | | | | | | | 16,146,880 | |
| Consumer Staples - 1.6% | | | | | |
| | 27,515 | | | Unilever PLC, ADR | | | | 1,528,733 | |
| Energy - 2.9% | | | | | |
| | 34,262 | | | Enbridge, Inc. | | | | 1,078,225 | |
| | 17,255 | | | Phillips 66 | | | | 1,655,100 | |
| | | | | | | | | 2,733,325 | |
| Financial - 17.4% | | | | | |
| | 62,376 | | | Aflac, Inc. | | | | 2,729,574 | |
| | 24,040 | | | American Express Co. | | | | 2,242,451 | |
| | 10,616 | | | Berkshire Hathaway, Inc., Class B (a) | | | | 2,117,680 | |
| | 21,251 | | | JPMorgan Chase & Co. | | | | 2,336,972 | |
| | 20,995 | | | Mastercard, Inc., Class A | | | | 3,677,484 | |
| | 29,100 | | | Visa, Inc., Class A | | | | 3,480,942 | |
| | | | | | | | | 16,585,103 | |
| Health Care - 16.0% | | | | | |
| | 15,807 | | | Amgen, Inc. | | | | 2,694,778 | |
| | 26,621 | | | Danaher Corp. | | | | 2,606,462 | |
| | 26,530 | | | Gilead Sciences, Inc. | | | | 2,000,097 | |
| | 30,335 | | | Johnson & Johnson | | | | 3,887,430 | |
| | 28,845 | | | Merck & Co., Inc. | | | | 1,571,187 | |
| | 71,337 | | | Pfizer, Inc. | | | | 2,531,750 | |
| | | | | | | | | 15,291,704 | |
| Industrials - 8.1% | | | | | |
| | 17,870 | | | CSX Corp. | | | | 995,538 | |
| | 38,775 | | | Fortive Corp. | | | | 3,005,838 | |
| | 4,227 | | | General Dynamics Corp. | | | | 933,744 | |
| | 72,630 | | | General Electric Co. | | | | 979,053 | |
| | 14,500 | | | United Technologies Corp. | | | | 1,824,390 | |
| | | | | | | | | 7,738,563 | |
| Technology - 36.0% | | | | | |
| | 17,804 | | | Accenture PLC, Class A | | | | 2,732,914 | |
| | 4,425 | | | Alphabet, Inc., Class A (a) | | | | 4,589,345 | |
| | 19,027 | | | Apple, Inc. | | | | 3,192,350 | |
| Shares | | | Security Description | | | Value | |
| Technology - 36.0% (continued) | | | | |
| | 52,533 | | | Applied Materials, Inc. | | | $ | 2,921,360 | |
| | 67,903 | | | Cisco Systems, Inc. | | | | 2,912,360 | |
| | 3,270 | | | Facebook, Inc., Class A (a) | | | | 522,513 | |
| | 14,270 | | | IBM | | | | 2,189,446 | |
| | 88,808 | | | Intel Corp. | | | | 4,625,121 | |
| | 29,660 | | | Microsoft Corp. | | | | 2,707,068 | |
| | 46,035 | | | QUALCOMM, Inc. | | | | 2,550,799 | |
| | 28,015 | | | Skyworks Solutions, Inc. | | | | 2,808,784 | |
| | 32,000 | | | Worldpay, Inc., Class A (a) | | | | 2,631,680 | |
| | | | | | | | | 34,383,740 | |
| Total Common Stock (Cost $65,197,275) | | | | 94,408,048 | |
| Investments, at value - 98.9% (Cost $65,197,275) | | | $ | 94,408,048 | |
| Other Assets & Liabilities, Net - 1.1% | | | | 1,081,027 | |
| Net Assets - 100.0% | | | $ | 95,489,075 | |
| ADR | American Depositary Receipt |
| PLC | Public Limited Company |
| (a) | Non-income producing security. |
The following is a summary of the inputs used to value the Fund’s investments as of March 31, 2018.
The inputs or methodology used for valuing securities are not necessarily an indication of the risks associated with investing in those securities. For more information on valuation inputs, and their aggregation into the levels used in the table below, please refer to the Security Valuation section in Note 2 of the accompanying Notes to Financial Statements.
| Valuation Inputs | | Investments in Securities | |
| Level 1 - Quoted Prices | | $ | 94,408,048 | |
| Level 2 - Other Significant Observable Inputs | | | – | |
| Level 3 - Significant Unobservable Inputs | | | – | |
| Total | | $ | 94,408,048 | |
The Level 1 value displayed in this table is Common Stock. Refer to this Schedule of Investments for a further breakout of each security by industry.
The Fund utilizes the end of period methodology when determining transfers. There were no transfers among Level 1, Level 2 and Level 3 for the year ended March 31, 2018.
See Notes to Financial Statements.
PAYSON TOTAL RETURN FUNDSCHEDULE OF INVESTMENTS
MARCH 31, 2018
| PORTFOLIO HOLDINGS (Unaudited) | | | |
| % of Total Investments | | | |
| Consumer Discretionary | | | 17.1 | % |
| Consumer Staples | | | 1.6 | % |
| Energy | | | 2.9 | % |
| Financial | | | 17.6 | % |
| Health Care | | | 16.2 | % |
| Industrials | | | 8.2 | % |
| Technology | | | 36.4 | % |
| | | | 100.0 | % |
See Notes to Financial Statements.
PAYSON TOTAL RETURN FUNDSTATEMENT OF ASSETS AND LIABILITIES
MARCH 31, 2018
| ASSETS | | | |
| Investments, at value (Cost $65,197,275) | | $ | 94,408,048 | |
| Cash | | | 1,500,597 | |
| Receivables: | | | | |
| Fund shares sold | | | 210,201 | |
| Dividends and interest | | | 31,712 | |
| Prepaid expenses | | | 8,826 | |
| Total Assets | | | 96,159,384 | |
| | | | | |
| LIABILITIES | | | | |
| Payables: | | | | |
| Investment securities purchased | | | 523,003 | |
| Fund shares redeemed | | | 259 | |
| Distributions payable | | | 52,561 | |
| Accrued Liabilities: | | | | |
| Investment adviser fees | | | 49,326 | |
| Trustees’ fees and expenses | | | 50 | |
| Fund services fees | | | 14,855 | |
| Other expenses | | | 30,255 | |
| Total Liabilities | | | 670,309 | |
| | | | | |
| NET ASSETS | | $ | 95,489,075 | |
| | | | | |
| COMPONENTS OF NET ASSETS | | | | |
| Paid-in capital | | $ | 67,090,679 | |
| Distributions in excess of net investment income | | | (3,254 | ) |
| Accumulated net realized loss | | | (809,123 | ) |
| Net unrealized appreciation | | | 29,210,773 | |
| NET ASSETS | | $ | 95,489,075 | |
| | | | | |
| SHARES OF BENEFICIAL INTEREST AT NO PAR VALUE (UNLIMITED SHARES AUTHORIZED) | | | 5,375,471 | |
| | | | | |
| NET ASSET VALUE, OFFERING AND REDEMPTION PRICE PER SHARE | | $ | 17.76 | |
See Notes to Financial Statements.
PAYSON TOTAL RETURN FUNDSTATEMENT OF OPERATIONS
YEAR ENDED MARCH 31, 2018
| INVESTMENT INCOME | | | |
| Dividend income (Net of foreign withholding taxes of $7,772) | | $ | 1,512,760 | |
| Interest income | | | 10,098 | |
| Total Investment Income | | | 1,522,858 | |
| | | | | |
| EXPENSES | | | | |
| Investment adviser fees | | | 520,190 | |
| Fund services fees | | | 178,184 | |
| Custodian fees | | | 9,745 | |
| Registration fees | | | 20,431 | |
| Professional fees | | | 43,345 | |
| Trustees’ fees and expenses | | | 9,851 | |
| Other expenses | | | 34,020 | |
| Total Expenses | | | 815,766 | |
| | | | | |
| NET INVESTMENT INCOME | | | 707,092 | |
| | | | | |
| NET REALIZED AND UNREALIZED GAIN | | | | |
| Net realized gain on investments | | | 2,832,668 | |
| Net change in unrealized appreciation (depreciation) on investments | | | 8,633,351 | |
| NET REALIZED AND UNREALIZED GAIN | | | 11,466,019 | |
| INCREASE IN NET ASSETS RESULTING FROM OPERATIONS | | $ | 12,173,111 | |
See Notes to Financial Statements.
PAYSON TOTAL RETURN FUNDSTATEMENTS OF CHANGES IN NET ASSETS
| | | For the Year
Ended
March 31, 2018 | | | For the Year Ended March 31, 2017 | |
| OPERATIONS | | | | | | |
| Net investment income | | $ | 707,092 | | | $ | 841,700 | |
| Net realized gain | | | 2,832,668 | | | | 2,414,460 | |
| Net change in unrealized appreciation (depreciation) | | | 8,633,351 | | | | 9,078,816 | |
| Increase in Net Assets Resulting from Operations | | | 12,173,111 | | | | 12,334,976 | |
| | | | | | | | | |
| DISTRIBUTIONS TO SHAREHOLDERS FROM | | | | | | | | |
| Net investment income | | | (612,740 | ) | | | (1,076,603 | ) |
| Net realized gain | | | (3,736,941 | ) | | | – | |
| Total Distributions to Shareholders | | | (4,349,681 | ) | | | (1,076,603 | ) |
| | | | | | | | | |
| CAPITAL SHARE TRANSACTIONS | | | | | | | | |
| Sale of shares | | | 13,283,006 | | | | 5,194,635 | |
| Reinvestment of distributions | | | 3,943,748 | | | | 465,432 | |
| Redemption of shares | | | (8,449,442 | ) | | | (12,543,894 | ) |
| Increase (Decrease) in Net Assets from Capital Share Transactions | | | 8,777,312 | | | | (6,883,827 | ) |
| Increase in Net Assets | | | 16,600,742 | | | | 4,374,546 | |
| | | | | | | | | |
| NET ASSETS | | | | | | | | |
| Beginning of Year | | | 78,888,333 | | | | 74,513,787 | |
| End of Year (Including line (a)) | | $ | 95,489,075 | | | $ | 78,888,333 | |
| | | | | | | | | |
| SHARE TRANSACTIONS | | | | | | | | |
| Sale of shares | | | 747,377 | | | | 347,371 | |
| Reinvestment of distributions | | | 223,983 | | | | 31,121 | |
| Redemption of shares | | | (483,769 | ) | | | (835,902 | ) |
| Increase (Decrease) in Shares | | | 487,591 | | | | (457,410 | ) |
| | | | | | | | | |
| (a) Distributions in excess of net investment income | | $ | (3,254 | ) | | $ | (44 | ) |
See Notes to Financial Statements.
PAYSON TOTAL RETURN FUNDFINANCIAL HIGHLIGHTS
These financial highlights reflect selected data for a share outstanding throughout each year.
| | | For the Years Ended March 31, | |
| | | 2018 | | | 2017 | | | 2016 | | | 2015 | | | 2014 | |
| NET ASSET VALUE, Beginning of Year | | $ | 16.14 | | | $ | 13.94 | | | $ | 15.21 | | | $ | 15.22 | | | $ | 13.89 | |
| INVESTMENT OPERATIONS | | | | | | | | | | | | | | | | | | | | |
| Net investment income (a) | | | 0.14 | | | | 0.16 | | | | 0.16 | | | | 0.16 | | | | 0.42 | |
| Net realized and unrealized gain (loss) | | | 2.33 | | | | 2.25 | | | | (0.76 | ) | | | 0.77 | | | | 2.23 | |
| Total from Investment Operations | | | 2.47 | | | | 2.41 | | | | (0.60 | ) | | | 0.93 | | | | 2.65 | |
| | | | | | | | | | | | | | | | | | | | | |
| DISTRIBUTIONS TO SHAREHOLDERS FROM | | | | | | | | | | | | | | | | | | | | |
| Net investment income | | | (0.12 | ) | | | (0.21 | ) | | | (0.16 | ) | | | (0.16 | ) | | | (0.41 | ) |
| Net realized gain | | | (0.73 | ) | | | – | | | | (0.51 | ) | | | (0.78 | ) | | | (0.91 | ) |
| Total Distributions to Shareholders | | | (0.85 | ) | | | (0.21 | ) | | | (0.67 | ) | | | (0.94 | ) | | | (1.32 | ) |
| NET ASSET VALUE, End of Year | | $ | 17.76 | | | $ | 16.14 | | | $ | 13.94 | | | $ | 15.21 | | | $ | 15.22 | |
| TOTAL RETURN | | | 15.39 | % | | | 17.41 | % | | | (3.94 | )% | | | 6.32 | % | | | 19.62 | % |
| | | | | | | | | | | | | | | | | | | | | |
| RATIOS/SUPPLEMENTARY DATA | | | | | | | | | | | | | | | | | | | | |
| Net Assets at End of Year (000s omitted) | | $ | 95,489 | | | $ | 78,888 | | | $ | 74,514 | | | $ | 76,875 | | | $ | 71,035 | |
| Ratios to Average Net Assets: | | | | | | | | | | | | | | | | | | | | |
| Net investment income | | | 0.82 | % | | | 1.10 | % | | | 1.11 | % | | | 1.05 | % | | | 2.84 | % |
| Net expenses | | | 0.94 | % | | | 0.98 | % | | | 0.97 | % | | | 0.97 | % | | | 1.01 | % |
| Gross expenses | | | 0.94 | % | | | 0.98 | % | | | 0.97 | % | | | 0.97 | % | | | 1.01 | % |
| PORTFOLIO TURNOVER RATE | | | 38 | % | | | 30 | % | | | 55 | % | | | 41 | % | | | 47 | % |
| (a) | Calculated based on average shares outstanding during each year. |
See Notes to Financial Statements.
PAYSON TOTAL RETURN FUNDNOTES TO FINANCIAL STATEMENTS
MARCH 31, 2018
Note 1. Organization
The Payson Total Return Fund (the “Fund”) is a diversified portfolio of Forum Funds (the “Trust”). The Trust is a Delaware statutory trust that is registered as an open-end, management investment company under the Investment Company Act of 1940, as amended (the “Act”). Under its Trust Instrument, the Trust is authorized to issue an unlimited number of the Fund’s shares of beneficial interest without par value. The Fund commenced operations on November 25, 1991. The Fund seeks a combination of high current income and capital appreciation.
Note 2. Summary of Significant Accounting Policies
The Fund is an investment company and follows accounting and reporting guidance under Financial Accounting Standards Board (“FASB”) Accounting Standards Codification (“ASC”) Topic 946, “Financial Services-Investment Companies”. These financial statements are prepared in accordance with accounting principles generally accepted in the United States of America (“GAAP”), which require management to make estimates and assumptions that affect the reported amounts of assets and liabilities, the disclosure of contingent liabilities at the date of the financial statements, and the reported amounts of increases and decreases in net assets from operations during the fiscal year. Actual amounts could differ from those estimates. The following summarizes the significant accounting policies of the Fund:
Security Valuation – Securities are valued at market prices using the last quoted trade or official closing price from the principal exchange where the security is traded, as provided by independent pricing services on each Fund business day. In the absence of a last trade, securities are valued at the mean of the last bid and ask price provided by the pricing service.
The Fund values its investments at fair value pursuant to procedures adopted by the Trust’s Board of Trustees (the “Board”) if (1) market quotations are not readily available or (2) the Adviser, as defined in Note 4, believes that the values available are unreliable. The Trust’s Valuation Committee, as defined in the Fund’s registration statement, performs certain functions as they relate to the administration and oversight of the Fund’s valuation procedures. Under these procedures, the Valuation Committee convenes on a regular and ad hoc basis to review such investments and considers a number of factors, including valuation methodologies and significant unobservable inputs, when arriving at fair value.
The Valuation Committee may work with the Adviser to provide valuation inputs. In determining fair valuations, inputs may include market-based analytics that may consider related or comparable assets or liabilities, recent transactions, market multiples, book values and other relevant investment information. Adviser inputs may include an income-based approach in which the anticipated future cash flows of the investment are discounted in determining fair value. Discounts may also be applied based on the nature or duration of any restrictions on the disposition of the investments. The Valuation Committee performs regular reviews of valuation methodologies, key inputs and assumptions, disposition analysis and market activity.
PAYSON TOTAL RETURN FUNDNOTES TO FINANCIAL STATEMENTS
MARCH 31, 2018
Fair valuation is based on subjective factors and, as a result, the fair value price of an investment may differ from the security’s market price and may not be the price at which the asset may be sold. Fair valuation could result in a different net asset value (“NAV”) than a NAV determined by using market quotes.
GAAP has a three-tier fair value hierarchy. The basis of the tiers is dependent upon the various “inputs” used to determine the value of the Fund’s investments. These inputs are summarized in the three broad levels listed below:
Level 1 - Quoted prices in active markets for identical assets and liabilities.
Level 2 - Prices determined using significant other observable inputs (including quoted prices for similar securities, interest rates, prepayment speeds, credit risk, etc.). Short-term securities with maturities of sixty days or less are valued at amortized cost, which approximates market value, and are categorized as Level 2 in the hierarchy. Municipal securities, long-term U.S. government obligations and corporate debt securities are valued in accordance with the evaluated price supplied by the pricing service and generally categorized as Level 2 in the hierarchy. Other securities that are categorized as Level 2 in the hierarchy include, but are not limited to, warrants that do not trade on an exchange, securities valued at the mean between the last reported bid and ask quotation and international equity securities valued by an independent third party with adjustments for changes in value between the time of the securities respective local market closes and the close of the U.S. market.
Level 3 - Significant unobservable inputs (including the Fund’s own assumptions in determining the fair value of investments).
The aggregate value by input level, as of March 31, 2018, for the Fund’s investments is included at the end of the Fund’s Schedule of Investments.
Security Transactions, Investment Income and Realized Gain and Loss – Investment transactions are accounted for on the trade date. Dividend income is recorded on the ex-dividend date. Non-cash dividend income is recorded at the fair market value of the securities received. Foreign dividend income is recorded on the ex-dividend date or as soon as possible after determining the existence of a dividend declaration after exercising reasonable due diligence. Income and capital gains on some foreign securities may be subject to foreign withholding taxes, which are accrued as applicable. Interest income is recorded on an accrual basis. Premium is amortized and discount is accreted using the effective interest method. Identified cost of investments sold is used to determine the gain and loss for both financial statement and federal income tax purposes.
Distributions to Shareholders – Distributions to shareholders of net investment income, if any, are declared and paid quarterly. Distributions to shareholders of net capital gains and net foreign currency gains, if any, are declared and paid at least annually. Distributions to shareholders are recorded on the ex-dividend date. Distributions are based on amounts calculated in accordance with applicable federal income tax regulations, which may differ from GAAP. These differences are due primarily to differing treatments of income and gain on various investment securities held by the Fund, timing differences and differing characterizations of distributions made by the Fund.
PAYSON TOTAL RETURN FUNDNOTES TO FINANCIAL STATEMENTS
MARCH 31, 2018
Federal Taxes – The Fund intends to continue to qualify each year as a regulated investment company under Subchapter M of Chapter 1, Subtitle A, of the Internal Revenue Code of 1986, as amended (“Code”), and to distribute all of its taxable income to shareholders. In addition, by distributing in each calendar year substantially all of its net investment income and capital gains, if any, the Fund will not be subject to a federal excise tax. Therefore, no federal income or excise tax provision is required. The Fund files a U.S. federal income and excise tax return as required. The Fund’s federal income tax returns are subject to examination by the Internal Revenue Service for a period of three fiscal years after they are filed. As of March 31, 2018, there are no uncertain tax positions that would require financial statement recognition, de-recognition or disclosure.
Income and Expense Allocation – The Trust accounts separately for the assets, liabilities and operations of each of its investment portfolios. Expenses that are directly attributable to more than one investment portfolio are allocated among the respective investment portfolios in an equitable manner.
Commitments and Contingencies – In the normal course of business, the Fund enters into contracts that provide general indemnifications by the Fund to the counterparty to the contract. The Fund’s maximum exposure under these arrangements is dependent on future claims that may be made against the Fund and, therefore, cannot be estimated; however, based on experience, the risk of loss from such claims is considered remote. The Fund has determined that none of these arrangements requires disclosure on the Fund’s balance sheet.
Note 3. Cash – Concentration in Uninsured Account
For cash management purposes, the Fund may concentrate cash with the Fund’s custodian. This typically results in cash balances exceeding the Federal Deposit Insurance Corporation (“FDIC”) insurance limits. As of March 31, 2018, the Fund had $1,250,597 at MUFG Union Bank, N.A. that exceeded the FDIC insurance limit.
Note 4. Fees and Expenses
Investment Adviser – H.M. Payson & Co. (the “Adviser”) is the investment adviser to the Fund. Pursuant to an investment advisory agreement, the Adviser receives an advisory fee, payable monthly, from the Fund at an annual rate of 0.60% of the Fund’s average daily net assets.
Distribution – Foreside Fund Services, LLC serves as the Fund’s distributor (the “Distributor”). The Fund does not have a distribution (12b-1) plan; accordingly, the Distributor does not receive compensation from the Fund for its distribution services. The Adviser compensates the Distributor directly for its services. The Distributor is not affiliated with the Adviser or Atlantic Fund Administration, LLC (d/b/a Atlantic Fund Services) (“Atlantic”) or their affiliates.
Other Service Providers – Atlantic provides fund accounting, fund administration, compliance and transfer agency services to the Fund. The fees related to these services are included in Fund services fees within the Statement of Operations. Atlantic also provides certain shareholder report production and EDGAR conversion and filing services. Pursuant to an Atlantic services agreement, the Fund pays Atlantic customary fees for its
PAYSON TOTAL RETURN FUNDNOTES TO FINANCIAL STATEMENTS
MARCH 31, 2018
services. Atlantic provides a Principal Executive Officer, a Principal Financial Officer, a Chief Compliance Officer and an Anti-Money Laundering Officer to the Fund, as well as certain additional compliance support functions.
Trustees and Officers – Through December 31, 2017, the Trust paid each independent Trustee an annual retainer fee of $50,000 for service to the Trust ($66,000 for the Chairman), and the Audit Committee Chairman and Vice Chairman received an additional $6,000 annually. Effective January 1, 2018, each independent Trustee’s annual retainer is $31,000 ($41,000 for the Chairman), and the Audit Committee Chairman receives an additional $2,000 annually. The Trustees and Chairman may receive additional fees for special Board meetings. Each Trustee is also reimbursed for all reasonable out-of-pocket expenses incurred in connection with his duties as a Trustee, including travel and related expenses incurred in attending Board meetings. The amount of Trustees’ fees attributable to the Fund is disclosed in the Statement of Operations. Certain officers of the Trust are also officers or employees of the above named service providers, and during their terms of office received no compensation from the Fund.
Note 5. Security Transactions
The cost of purchases and proceeds from sales of investment securities (including maturities), other than short-term investments, during the year ended March 31, 2018 were $36,234,128 and $31,653,905, respectively.
Note 6. Federal Income Tax
As of March 31, 2018, the cost of investments for federal income tax purposes is $65,099,787 and the components of net unrealized appreciation were as follows:
| | Gross Unrealized Appreciation | | $ | 30,053,286 | | |
| | Gross Unrealized Depreciation | | | (745,025 | ) | |
| | Net Unrealized Appreciation | | $ | 29,308,261 | | |
Distributions paid during the fiscal years ended as noted were characterized for tax purposes as follows:
| | | | 2018 | | | 2017 | | |
| | Ordinary Income | | $ | 911,875 | | | $ | 1,115,355 | | |
| | Long-Term Capital Gain | | | 3,487,584 | | | | – | | |
| | | | $ | 4,399,459 | | | $ | 1,115,355 | | |
As of March 31, 2018, distributable earnings (accumulated loss) on a tax basis were as follows:
| | Undistributed Ordinary Income | | $ | 49,307 | | |
| | Capital and Other Losses | | | (906,611 | ) | |
| | Net Unrealized Appreciation | | | 29,308,261 | | |
| | Other Temporary Differences | | | (52,561 | ) | |
| | Total | | $ | 28,398,396 | | |
PAYSON TOTAL RETURN FUNDNOTES TO FINANCIAL STATEMENTS
MARCH 31, 2018
The difference between components of distributable earnings on a tax basis and the amounts reflected in the Statement of Assets and Liabilities are primarily due to wash sales, treatment of distributions payable and equity return of capital.
On the Statement of Assets and Liabilities, as a result of permanent book to tax differences, certain amounts have been reclassified for the year ended March 31, 2018. The following reclassification was the result of equity return of capital and has no impact on the net assets of the Fund.
| | Distributions in Excess of Net Investment Income | | $ | (97,562 | ) | |
| | Accumulated Net Realized Gain (Loss) | | | 97,562 | | |
For tax purposes, the current year post-October loss was $906,611 for the Payson Total Return Fund (realized during the period November 1, 2017 through March 31, 2018). This loss will be recognized for tax purposes on the first business day of the Fund’s next fiscal year, April 1, 2018.
Note 7. Subsequent Events
Subsequent events occurring after the date of this report through the date these financial statements were issued have been evaluated for potential impact, and the Fund has had no such events.
REPORT OF INDEPENDENT REGISTERED PUBLIC ACCOUNTING FIRM
To the Board of Trustees of Forum Funds
and the Shareholders of Payson Total Return Fund
Opinion on the Financial Statements
We have audited the accompanying statement of assets and liabilities of Payson Total Return Fund, a series of shares of beneficial interest in Forum Funds (the “Fund”), including the schedule of investments, as of March 31, 2018, and the related statement of operations for the year then ended, the statements of changes in net assets for each of the years in the two-year period then ended and the financial highlights for each of the years in the five-year period then ended, and the related notes (collectively referred to as the “financial statements”). In our opinion, the financial statements present fairly, in all material respects, the financial position of the Fund as of March 31, 2018, and the results of its operations for the year then ended, the changes in its net assets for each of the years in the two-year period then ended and its financial highlights for each of the years in the five-year period then ended, in conformity with accounting principles generally accepted in the United States of America.
Basis for Opinion
These financial statements are the responsibility of the Fund’s management. Our responsibility is to express an opinion on the Fund’s financial statements based on our audits. We are a public accounting firm registered with the Public Company Accounting Oversight Board (United States) (“PCAOB”) and are required to be independent with respect to the Fund in accordance with the U.S. federal securities law and the applicable rules and regulations of the Securities and Exchange Commission and the PCAOB.
We conducted our audits in accordance with the standards of the PCAOB. Those standards require that we plan and perform the audits to obtain reasonable assurance about whether the financial statements are free of material misstatement, whether due to error or fraud. The Fund is not required to have, nor were we engaged to perform, an audit of its internal control over financial reporting. As part of our audits we are required to obtain an understanding of internal control over financial reporting but not for the purpose of expressing an opinion on the effectiveness of the Fund’s internal control over financial reporting. Accordingly, we express no such opinion.
REPORT OF INDEPENDENT REGISTERED PUBLIC ACCOUNTING FIRM
Our audits included performing procedures to assess the risk of material misstatement of the financial statements, whether due to error or fraud, and performing procedures that respond to those risks. Such procedures include examining, on a test basis, evidence regarding the amounts and disclosures in the financial statements. Our procedures included confirmation of securities owned as of March 31, 2018 by correspondence with the custodian and brokers. Our audits also included evaluating the accounting principles used and significant estimates made by management, as well as evaluating the overall presentation of the financial statements. We believe that our audits provide a reasonable basis for our opinion.
We have served as the auditor of one or more of the Funds in Forum Funds since 2009.
Philadelphia, Pennsylvania
May 24, 2018
PAYSON TOTAL RETURN FUNDADDITIONAL INFORMATION (Unaudited)
MARCH 31, 2018
At a special meeting of shareholders for all the Funds in the Trust, held on December 8, 2017, shares were voted as follows on the proposals presented to shareholders:
| Matter | For | Against | Abstain |
| To elect David Tucker to the Board of Trustees of the Trust | 108,303,928.779 | 1,542,957.994 | 0 |
| To elect Jennifer Brown-Strabley to the Board of Trustees of the Trust | 108,183,952.495 | 1,662,934.278 | 0 |
| To elect Mark D. Moyer to the Board of Trustees of the Trust. | 108,142,412.946 | 1,704,473.827 | 0 |
| To elect Jessica Chase to the Board of Trustees of the Trust. | 107,632,924.803 | 2,213,961.970 | 0 |
| To elect Stacey E. Hong to the Board of Trustees of the Trust. | 105,777,266.997 | 4,069,619.776 | 0 |
A description of the policies and procedures that the Fund uses to determine how to vote proxies relating to securities held in the Fund’s portfolio is available, without charge and upon request, by calling (800) 805-8258 and on the SEC website at www.sec.gov. The Fund’s proxy voting record for the most recent twelve-month period ended June 30 is available, without charge and upon request, by calling (800) 805-8258 and on the SEC’s website at www.sec.gov.
Availability of Quarterly Portfolio Schedules
The Fund files its complete schedule of portfolio holdings with the SEC for the first and third quarters of each fiscal year on Form N-Q. These filings are available, without charge and upon request on the SEC’s website at www.sec.gov or may be reviewed and copied at the SEC’s Public Reference Room in Washington, DC. Information on the operation of the Public Reference Room may be obtained by calling (800) SEC-0330.
Shareholder Expense Example
As a shareholder of the Fund, you incur ongoing costs, including management fees and other Fund expenses. This example is intended to help you understand your ongoing costs (in dollars) of investing in the Fund and to compare these costs with the ongoing costs of investing in other mutual funds.
The example is based on an investment of $1,000 invested at the beginning of the period and held for the entire period from October 1, 2017 through March 31, 2018.
Actual Expenses –The first line of the table below provides information about actual account values and actual expenses. You may use the information in this line, together with the amount you invested, to estimate the expenses that you paid over the period. Simply divide your account value by $1,000 (for example, an $8,600 account value divided by $1,000 = 8.6), then multiply the result by the number in the first line under the heading entitled “Expenses Paid During Period” to estimate the expenses you paid on your account during the period.
PAYSON TOTAL RETURN FUNDADDITIONAL INFORMATION (Unaudited)
MARCH 31, 2018
Hypothetical Example for Comparison Purposes - The second line of the table below provides information about hypothetical account values and hypothetical expenses based on the Fund’s actual expense ratio and an assumed rate of return of 5% per year before expenses, which is not the Fund’s actual return. The hypothetical account values and expenses may not be used to estimate the actual ending account balance or expenses you paid for the period. You may use this information to compare the ongoing costs of investing in the Fund and other funds. To do so, compare this 5% hypothetical example with the 5% hypothetical examples that appear in the shareholder reports of other funds.
Please note that the expenses shown in the table are meant to highlight your ongoing costs only. Therefore, the second line of the table is useful in comparing ongoing costs only and will not help you determine the relative total costs of owning different funds.
| | | Beginning Account Value October 1, 2017 | | | Ending Account Value March 31, 2018 | | | Expenses Paid During Period* | | | | |
| Actual | | $1,000.00 | | | $1,067.11 | | | $4.74 | | | 0.92% | |
| Hypothetical (5% return before expenses) | | $1,000.00 | | | $1,020.34 | | | $ 4.63 | | | 0.92% | |
| * | Expenses are equal to the Fund’s annualized expense ratio multiplied by the average account value over the period, multiplied by the number of days in the most recent fiscal half-year (182) divided by 365 to reflect the half-year period. |
Federal Tax Status of Dividends Declared during the Fiscal Year
For federal income tax purposes, dividends from short-term capital gains are classified as ordinary income. The Fund designates 100.00% of its income dividend distributed as qualifying for the corporate dividends received deduction (DRD) and 100.00% for the qualified dividend rate (QDI) as defined in Section 1(h)(11) of the Code. The Fund also designates 27.34% as short-term capital gain dividends exempt from U.S. tax for foreign shareholders (QSD). The Fund also designates 0.53% as qualified interest income exempt from U.S. tax for foreign shareholders (Qll).
Trustees and Officers of the Trust
The Board is responsible for oversight of the management of the Trust’s business affairs and of the exercise of all the Trust’s powers except those reserved for the shareholders. The following table provides information about each Trustee and certain officers of the Trust. Each Trustee and officer holds office until the person resigns, is removed, or is replaced. Unless otherwise noted, the persons have held their principal occupations for more than five years. The address for all Trustees and officers is Three Canal Plaza, Suite 600, Portland, Maine 04101. The Fund’s Statement of Additional Information includes additional information about the Trustees and is available, without charge and upon request, by calling (800) 805-8258.
PAYSON TOTAL RETURN FUNDADDITIONAL INFORMATION (Unaudited)
MARCH 31, 2018
| Name and Year of Birth | Position with the Trust | | Principal Occupation(s) During Past Five Years | Number of Series in Fund Complex Overseen By Trustee | Other Directorships Held By Trustee During Past Five Years |
| Independent Trustees |
David Tucker Born: 1958 | Trustee; Chairman of the Board | Since 2011 and Chairman since 2018 | Director, Blue Sky Experience (a charitable endeavor) since 2008; Senior Vice President & General Counsel, American Century Companies (an investment management firm) 1998-2008. | 1 | Trustee, Forum Funds II, Forum ETF Trust and U.S. Global Investors Funds |
Mark D. Moyer Born: 1959 | Trustee | Since 2018 | Chief Financial Officer, Freedom House (a NGO advocating political freedom and democracy) since 2017; independent consultant providing interim CFO services, principally to non-profit organizations, 2011-2017; Chief Financial Officer, Institute of International Education (a NGO administering international educational exchange programs), 2008-2011; Chief Financial Officer and Chief Restructuring Officer, Ziff Davis Media Inc. (an integrated media company), 2005-2008; Adjunct Professor of Accounting, Fairfield University from 2009-2012. | 1 | Trustee, Forum Funds II, Forum ETF Trust and U.S. Global Investors Funds |
Jennifer Brown-Strabley Born: 1964 | Trustee | Since 2018 | Principal, Portland Global Advisors, 1996-2010. | 1 | Trustee, Forum Funds II, Forum ETF Trust and U.S. Global Investors Funds |
| Interested Trustee |
Stacey E. Hong(1) Born: 1966 | Trustee | Since 2018 | President, Atlantic since 2008. | 1 | Trustee, Forum Funds II and U.S. Global Investors Funds |
PAYSON TOTAL RETURN FUNDADDITIONAL INFORMATION (Unaudited)
MARCH 31, 2018
| Name and Year of Birth | Position with the Trust | Length of Time Served | Principal Occupation(s) During Past Five Years | Number of Series in Fund Complex Overseen By Trustee | Other Directorships Held By Trustee During Past Five Years |
Jessica Chase(1) Born: 1970 | Trustee | Since 2018 | Senior Vice President, Atlantic since 2008. | 1 | None |
(1) | Stacey E. Hong is currently treated as an interested person of the Trust, as defined in the 1940 Act, due to his affiliation with Atlantic. Jessica Chase is currently treated as an interested person of the Trust, as defined in the 1940 Act, due to her affiliation with Atlantic and her role as President of the Trust. |
| Name and Year of Birth | Position with the Trust | Length of Time Served | Principal Occupation(s) During Past 5 Years |
| Officers | | |
Jessica Chase Born: 1970 | President; Principal Executive Officer | Since 2015 | Senior Vice President, Atlantic since 2008. |
Karen Shaw Born: 1972 | Treasurer; Principal Financial Officer | Since 2008 | Senior Vice President, Atlantic since 2008. |
Zachary Tackett Born: 1988 | Vice President; Secretary and Anti-Money Laundering Compliance Officer | Since 2014 | Counsel, Atlantic since 2014; Intern Associate, Coakley & Hyde, PLLC, 2010-2013. |
Michael J. McKeen Born: 1971 | Vice President | Since 2009 | Senior Vice President, Atlantic since 2008. |
Timothy Bowden Born: 1969 | Vice President | Since 2009 | Manager, Atlantic since 2008. |
Geoffrey Ney Born: 1975 | Vice President | Since 2013 | Manager, Atlantic since 2013; Senior Fund Accountant, Atlantic, 2008–2013. |
Todd Proulx Born: 1978 | Vice President | Since 2013 | Manager, Atlantic since 2013; Senior Fund Accountant, Atlantic, 2008–2013. |
Carlyn Edgar Born: 1963 | Vice President | Since 2008 | Senior Vice President, Atlantic since 2008; Chief Compliance Officer, 2008-2016 |
Dennis Mason Born: 1967 | Chief Compliance Officer | Since 2016 | Fund Compliance Officer, Atlantic since 2013; Senior Specialist, Atlantic, 2011-2013; Senior Analyst, Atlantic, 2008-2011 |

ITEM 2. CODE OF ETHICS.
| (a) | As of the end of the period covered by this report, Forum Funds (the "Registrant") has adopted a code of ethics, which applies to its Principal Executive Officer and Principal Financial Officer (the "Code of Ethics"). |
| (c) | There have been no amendments to the Registrant's Code of Ethics during the period covered by this report. |
| (d) | There have been no waivers to the Registrant's Code of Ethics during the period covered by this report. |
(f) (1) A copy of the Code of Ethics is being filed under Item 12(a) hereto.
ITEM 3. AUDIT COMMITTEE FINANCIAL EXPERT.
The Board of Trustees has determined that no member of the Audit Committee is an "audit committee financial expert" as that term is defined under applicable regulatory guidelines.
ITEM 4. PRINCIPAL ACCOUNTANT FEES AND SERVICES.
(a) Audit Fees - The aggregate fees billed for each of the last two fiscal years (the "Reporting Periods") for professional services rendered by the Registrant's principal accountant for the audit of the Registrant's annual financial statements, or services that are normally provided by the principal accountant in connection with the statutory and regulatory filings or engagements for the Reporting Periods, were $190,200 in 2017 and $191,300 in 2018.
(b) Audit-Related Fees – The aggregate fees billed in the Reporting Periods for assurance and related services rendered by the principal accountant that were reasonably related to the performance of the audit of the Registrant's financial statements and are not reported under paragraph (a) of this Item 4 were $0 in 2017 and $0 in 2018.
(c) Tax Fees - The aggregate fees billed in the Reporting Periods for professional services rendered by the principal accountant to the Registrant for tax compliance, tax advice and tax planning were $37,000 in 2017 and $37,500 in 2018. These services consisted of review or preparation of U.S. federal, state, local and excise tax returns.
(d) All Other Fees - The aggregate fees billed in the Reporting Periods for products and services provided by the principal accountant to the Registrant, other than the services reported in paragraphs (a) through (c) of this Item, were $0 in 2017 and $0 in 2018.
(e) (1) The Audit Committee reviews and approves in advance all audit and "permissible non-audit services" (as that term is defined by the rules and regulations of the Securities and Exchange Commission) to be rendered to a series of the Registrant (each, a "Series"). In addition, the Audit Committee reviews and approves in advance all "permissible non-audit services" to be provided to an investment adviser (not including any sub-adviser) of a Series, or an affiliate of such investment adviser, that is controlling, controlled by or under common control with the investment adviser and provides on-going services to the Registrant ("Affiliate"), by the Series' principal accountant if the engagement relates directly to the operations and financial reporting of the Series. The Audit Committee considers whether fees paid by a Series' investment adviser or an Affiliate to the Series' principal accountant for audit and permissible non-audit services are consistent with the principal accountant's independence.
(e) (2) No services included in (b) - (d) above were approved pursuant to paragraph (c)(7)(i)(C) of Rule 2-01 of Regulation S-X.
(f) Not applicable
(g) The aggregate non-audit fees billed by the principal accountant for services rendered to the Registrant for the Reporting Periods were $0 in 2017 and $0 in 2018. There were no fees billed in either of the Reporting Periods for non-audit services rendered by the principal accountant to the Registrant's investment adviser or any Affiliate.
(h) During the Reporting Period, the Registrant's principal accountant provided no non-audit services to the investment advisers or any entity controlling, controlled by or under common control with the investment advisers to the series of the Registrant to which this report relates.
ITEM 5. AUDIT COMMITTEE OF LISTED REGISTRANTS.
Not applicable.
ITEM 6. INVESTMENTS.
| (a) | Included as part of report to shareholders under Item 1. |
ITEM 7. DISCLOSURE OF PROXY VOTING POLICIES AND PROCEDURES FOR CLOSED-END
MANAGEMENT INVESTMENT COMPANIES.
Not applicable.
ITEM 8. PORTFOLIO MANAGERS OF CLOSED-END MANAGEMENT INVESTMENT COMPANIES.
Not applicable.
ITEM 9. PURCHASES OF EQUITY SECURITIES BY CLOSED-END MANAGEMENT INVESTMENT COMPANY AND AFFILIATED PURCHASERS.
Not applicable.
ITEM 10. SUBMISSION OF MATTERS TO A VOTE OF SECURITY HOLDERS
The Registrant does not accept nominees to the board of trustees from shareholders.
ITEM 11. CONTROLS AND PROCEDURES
(a) The Registrant's Principal Executive Officer and Principal Financial Officer have concluded that the Registrant's disclosure controls and procedures (as defined in Rule 30a-3(c) under the Investment Company Act of 1940 (the "Act")) are effective, based on their evaluation of the controls and procedures required by Rule 30a-3(b) under the Act and Rules 13a-15(b) or 15d-15(b) under the Securities Exchange Act of 1934, as of a date within 90 days of the filing date of this report.
(b) There were no changes in the Registrant's internal control over financial reporting (as defined in
Rule 30a-3(d) under the Act) that occurred during the second fiscal quarter of the period covered by this report that have materially affected, or are reasonably likely to materially affect, the Registrant's internal control over financial reporting.
ITEM 12. DISCLOSURE OF SECURITIES LENDING ACTIVITIES FOR CLOSED-END MANAGEMENT INVESTMENT COMPANIES.
Not applicable.
ITEM 13. EXHIBITS.
(a)(1) Not applicable.
(a)(2) Certifications pursuant to Rule 30a-2(a) of the Act, and Section 302 of the Sarbanes-Oxley Act of 2002. (Exhibits filed herewith)
(a)(3) Not applicable.
(b) Certifications pursuant to Rule 30a-2(b) of the Act, and Section 906 of the Sarbanes-Oxley Act of 2002. (Exhibit filed herewith)
SIGNATURES
Pursuant to the requirements of the Securities Exchange Act of 1934 and the Investment Company Act of 1940, the Registrant has duly caused this report to be signed on its behalf by the undersigned, thereunto duly authorized.
Registrant Forum Funds
| By: | /s/ Jessica Chase | |
| | Jessica Chase, Principal Executive Officer | |
| | | |
| Date: | May 29, 2018 | |
Pursuant to the requirements of the Securities Exchange Act of 1934 and the Investment Company Act of 1940, this report has been signed below by the following persons on behalf of the Registrant and in the capacities and on the dates indicated.
| By: | /s/ Jessica Chase | |
| | Jessica Chase, Principal Executive Officer | |
| | | |
| Date: | May 29, 2018 | |
| By: | /s/ Karen Shaw | |
| | Karen Shaw, Principal Financial Officer | |
| | | |
| Date: | May 29, 2018 | |