As filed with the Securities and Exchange Commission on November 22, 2017
UNITED STATES
SECURITIES AND EXCHANGE COMMISSION
WASHINGTON, D.C. 20549
FORM N-CSR
CERTIFIED SHAREHOLDER REPORT OF REGISTERED MANAGEMENT
INVESTMENT COMPANIES
Investment Company Act file number 811-03023
FORUM FUNDS
Three Canal Plaza, Suite 600
Portland, Maine 04101
Jessica Chase, Principal Executive Officer
Three Canal Plaza, Suite 600
Portland, Maine 04101
207-347-2000
Date of fiscal year end: September 30
Date of reporting period: October 1, 2016 – September 30, 2017
ITEM 1. REPORT TO STOCKHOLDERS.
Annual Report
September 30, 2017
Managed by Steinberg Asset Management, LLC
STEINBERG SELECT FUND A MESSAGE TO OUR SHAREHOLDERS (Unaudited) SEPTEMBER 30, 2017 |
Dear Shareholder,
Performance and Commentary
For the 12-month period ending September 30, 2017, the Steinberg Select Fund (the "Fund") returned 9.62% as compared to the Russell 3000 Value Index, which returned 15.53%. The Fund's 2017 year-to-date returns ending September 30, 2017 were 10.14% as compared to the Russell 3000 Value Index, which returned 7.72%. Nearly half of the market's returns during the 12-month period came during the fourth quarter of 2016. Following the U.S. presidential election, equities surged as investors embraced the view that the Trump administration's pro-growth agenda — tax cuts, infrastructure spending and regulatory reform — would usher in an acceleration of economic growth and rising corporate profits. The Trump rally, during the final months of 2016 and the 12 month period ending September 2017, disproportionally benefitted both lower quality cyclical companies and financials, where we tend to be underweight as compared to the broader market.
The following selected holdings contributed positively to performance for the 12-month period ending September 30, 2017. Visteon Corp. (3.2% of net assets as of September 30, 2017): Visteon has a best-in-class CEO and dominant market share in the secularly growing cockpit electronics space, where content per vehicle is growing rapidly. Golar LNG Ltd (9.2%): Golar is a pioneer in the development of floating liquefaction vessels and in partnership with Schlumberger is, in our view, singularly positioned to capitalize on this very large market and do so as the low-cost producer. Charter Communications, Inc. (2.5%): Charter advanced as the company made significant operational and financial improvements to the legacy operations and completed the value-creating acquisitions of Time Warner Cable and Bright House; FedEx Corp. (3.4%): FedEx is a leading provider of transportation services - shares benefitted from the continued success of its cost-cutting program, the secular trend towards e-commerce, and continued pricing increases; and Arch Capital Group, Ltd. (3.8%): Arch is a high-quality insurance company with an exceptional management team - the acquisition of AIG's mortgage insurance business in early 2017 diversified the earnings power and increased the expected return on equity which should boost earnings growth during the continued challenging P&C market.
The following stocks detracted from performance for the 12-month period ending September 30, 2017. Hudson's Bay Company (0% of net assets as of September 30, 2017): Hudson's Bay declined as the company reported disappointing sales and earnings guidance, which, along with the ongoing depressed state of the retail industry, overshadowed the company's valuable real estate portfolio; AMC Entertainment Holdings Inc. (0.3%): AMC weighed on performance as the exhibitor industry struggled with a decline in box office revenue, and with investor concerns regarding the possibility of film studios changing the industry model; ViaSat Inc. (4.9%): VisSat is the global leader in high throughput satellites which enable high speed broadband for communication and data applications – shares declined following a delayed satellite launch and equity offering, but we see a compelling long-term opportunity in ViaSat, as the company continues to expand current coverage, and is likely a prime beneficiary of increased government use of satellites and continued growth in the in-flight Wi-Fi market; And both Brookdale Senior Living, Inc. (1.7%) and Capital Senior Living Corp. (2.0%): Brookdale and Capital Senior declined as the senior living industry was pressured by an increase of new supply despite the expectation of a favorable supply-demand environment for senior housing in the coming years.
Our focus is on identifying businesses that we believe will be successful in creating large and enduring value relative to the price we pay for a share of the business. We have chosen this approach because we believe it will lead to superior long-term returns. Because we hold a highly differentiated, concentrated portfolio of investments, performance will in large part be driven by stock-specific developments, which means that in any given quarter or year, our portfolio returns can meaningfully diverge from those of the market.
We are constructive on the portfolio and can clearly identify a number of positive developments in key holdings we anticipate will further unlock value and drive returns in both the coming year and over the long term.
Equity Markets
Major stock market indices finished the third quarter of 2017 at record highs, marking their eighth quarterly advance in a row and moving this bull market into the record books as the second longest in history. A combination of factors – moderate economic growth, rising earnings, low inflation and interest rates near historic lows – continued to drive equities higher. More recently, investor expectations have been buoyed further by the prospects of an overhaul of federal tax laws that holds the potential to accelerate economic growth and corporate profits.
STEINBERG SELECT FUND A MESSAGE TO OUR SHAREHOLDERS (Unaudited) SEPTEMBER 30, 2017 |
Changing Investment Landscape
The Federal Reserve Board (the "Fed") has signaled that it soon will begin rolling back the policy elements that comprised its historic level of support of financial markets. Begun nearly a decade ago in response to the worst financial crisis since 1929, the Fed's combination of traditional monetary accommodation and quantitative easing (QE) has served investors well. The resulting ultra-low interest rate environment nurtured steady advances in economic activity and corporate earnings while also supporting higher stock-price multiples that contributed significantly to market returns. As the Fed begins unwinding these policies, the tailwinds that pushed equity markets higher can be expected to subside.
As this era of easy monetary policy concludes, important questions arise for investors, including whether the Fed will manage the transition to normalization in a manner that avoids dislocating the economy and financial markets. The answer to this question is clouded by uncertainty surrounding inflation and all the unknowns that come with the first-ever unwinding of a $4.5 trillion Fed balance sheet.
Uncertainty Tied to The Fed
Inflation has been rising at a rate below the Fed's target for an extended period and the monetary authorities have not been able to explain exactly why this is happening. Have the forces of technology, demographics, and globalization conspired to create a structural change that will keep a lid on inflation? Or are there, as the Fed chair postulates, transitory forces at work that will soon dissipate?
The answer is important because if interest rates rise noticeably above inflation, then economic activity could suffer as the higher real cost of money causes the demand for credit to fall. The Fed's announced gradualist approach to raising interest rates would appear to be the soundest way to address this conundrum. Of all policy options, it is the one least likely to get too far ahead of or behind inflation. It permits more modest adjustments to monetary policy to be made and is best suited to modulating swings in investor expectations and sentiment. It does not, however, eliminate the risk attached to an unexpected surge or acceleration in the rate of inflation that could force the Fed to abandon its gradualist approach.
The uncertainties surrounding the Fed's move away from a policy of ultra-easy money are compounded by difficulties in predicting what effects the unwinding of the Fed's multi-trillion-dollar balance sheet will have on interest rates since this has never been done before. Again, a gradualist approach is best suited for avoiding a major policy error.
Increased Volatility Likely
The developing shift in monetary policy is likely to create challenges for investors that will be reflected in greater volatility than has been experienced since the onset of the financial crisis. The unknowns surrounding inflation and the unwinding of the Fed's balance sheet are likely to require policy adjustments along the path to normalization and those may not always be consistent with investor expectations. To be sure, there are factors beyond Fed policy that could unsettle investors and create periods of market volatility. These include developments surrounding a resolution of tensions between the U.S. and North Korea, the upcoming appointment of Chairman of the Federal Reserve Board, political developments in Washington, or the changes in the market's structure toward programmatic trading and away from fundamental investing that we discussed in last quarter's letter. These all hold the potential to create sharp moves in the market at any time, particularly since equity markets are trading at elevated levels. However, ultimately it will be the ability of the Fed to successfully navigate the path to normalization that most heavily informs investors' long-term returns.
Positioned for the Long Term
With inflation and interest rates likely trending higher in the longer-term, the effects will be widespread: investors will no longer benefit from the tailwind of rising price-earnings ratios, U.S.-based multinational businesses will likely face headwinds caused by a strengthening dollar as higher U.S. interest rates attract foreign capital, and fixed income investments will suffer from rising interest rates that cause the value of bonds to decline. The challenges that such an environment may present to equities could be offset by investors shifting the weight of their portfolios more towards stocks and away from bonds. This would be particularly beneficial for portfolios built around businesses where the return profiles are tied to discrete developments and/or business characteristics that can drive an inflection in earnings growth. Since our inception as a firm, this has represented a core element of our investment strategy, and this is an important reason why we believe the Fund is and will be well positioned.
STEINBERG SELECT FUND A MESSAGE TO OUR SHAREHOLDERS (Unaudited) SEPTEMBER 30, 2017 |
Risks – The Steinberg Select Fund is subject to various forms of risk including the possible loss of principal. Investing in foreign securities entails risks not associated with domestic equities, including economic and political instability and currency fluctuations. Investing in fixed-income securities includes the risk that rising interest rates will cause a decline in values. Concentration in particular industries or market sectors can cause increased volatility and market risk than is the case with more broadly diversified investments. Investments in securities of small and mid-capitalization companies involve the possibility of greater volatility than investments in larger capitalization companies. Investments in American Depository Receipts involve many of the same risks as investing in foreign securities. Please see the prospectus for a more detailed explanation of these risks.
STEINBERG SELECT FUND PERFORMANCE CHART AND ANALYSIS (Unaudited) SEPTEMBER 30, 2017 |
The following chart reflects the change in the value of a hypothetical $100,000 investment in Institutional Shares, including reinvested dividends and distributions, in Steinberg Select Fund (the "Fund") compared with the performance of the primary benchmark, Russell 3000® Value Index ("Russell 3000® Value"), and the secondary benchmark, S&P 500 Index ("S&P 500") since inception. The Russell 3000® Value measures the performance of those Russell 3000® Index companies with lower price-to-book ratios and lower forecasted growth values. The S&P 500 is a broad-based, unmanaged measurement of changes in stock market conditions based on the average of 500 widely held common stocks. The total returns of the Russell 3000® Value and S&P 500 include the reinvestment of dividends and income. The total return of the Fund includes operating expenses that reduce returns, while the total returns of the Russell 3000® Value and S&P 500 do not include expenses. The Fund is professionally managed, while the Russell 3000® Value and S&P 500 are unmanaged and are not available for investment.
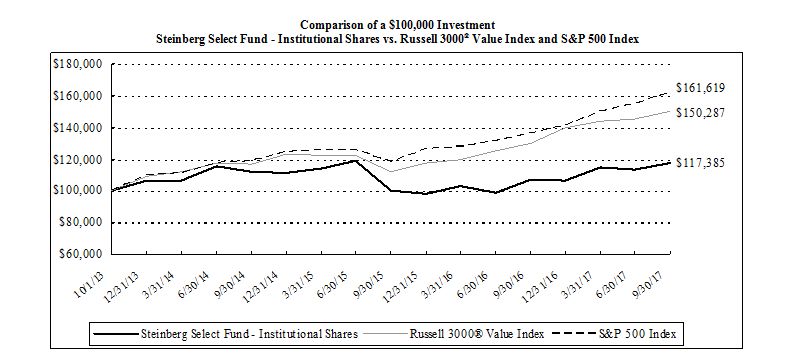
| Average Annual Total Returns for Periods Ended September 30, 2017: | | One Year | | Since Inception (10/01/13) |
| Steinberg Select Fund - Institutional Shares | | 9.62 | % | | 4.09 | % |
Russell 3000® Value Index | | 15.53 | % | | 10.73 | % |
| S&P 500 Index | | 18.61 | % | | 12.76 | % |
Performance data quoted represents past performance and is no guarantee of future results. Current performance may be lower or higher than the performance data quoted. Investment return and principal value will fluctuate so that shares, when redeemed, may be worth more or less than original cost. For the most recent month-end performance, please call (855) 330-7085. As stated in the Fund's prospectus, the annual operating expense ratio (gross) for Institutional Shares is 1.54%. However, the Fund's adviser has agreed to contractually waive its fees and/or reimburse expenses such that total operating expenses (excluding all taxes, interest, portfolio transaction expenses, acquired fund fees and expenses, proxy expenses and extraordinary expenses) do not exceed 0.75% for Institutional Shares through January 31, 2018 (the "Expense Cap"). The Fund may repay the Adviser for fees waived and expenses reimbursed pursuant to the Expense Cap if such payment is made within three years of the fees waiver or expense reimbursement and does not cause the Total Annual Fund Operating Expenses After Fee Waiver and/or Expense Reimbursement of a class to exceed the lesser of (i) the then-current Expense Cap, or (ii) the Expense Cap in place at the time the fees/expenses were waived or reimbursed. During the period, certain fees were waived and/or expenses reimbursed, otherwise returns would have been lower. The performance table and graph do not reflect the deductions of taxes that a shareholder would pay on Fund distributions or the redemption of Fund shares. Returns greater than one year are annualized.
STEINBERG SELECT FUND SCHEDULE OF INVESTMENTS SEPTEMBER 30, 2017 |
| Shares | | Security Description | | Value | |
| Common Stock - 93.5% |
| Consumer Discretionary - 24.9% |
| | 8,690 | | AMC Entertainment Holdings, Inc. | $ | 127,743 | |
| | 26,810 | | Aramark | | 1,088,754 | |
| | 2,495 | | Charter Communications, Inc., Class A (a) | | 906,733 | |
| | 57,397 | | Liberty Global PLC LiLAC, Class C (a) | | 1,337,350 | |
| | 45,215 | | Liberty Global PLC, Class C (a) | | 1,478,531 | |
| | 27,280 | | LKQ Corp. (a) | | 981,807 | |
| | 21,700 | | ServiceMaster Global Holdings, Inc. (a) | | 1,014,041 | |
| | 4,580 | | The Madison Square Garden Co., Class A (a) | | 980,578 | |
| | 9,545 | | Visteon Corp. (a) | | 1,181,385 | |
| | | 9,096,922 | |
| Energy - 14.9% |
| | 41,780 | | Golar LNG Partners LP | | 970,549 | |
| | 147,688 | | Golar LNG, Ltd. | | 3,339,226 | |
| | 102,520 | | Navigator Holdings, Ltd. (a) | | 1,137,972 | |
| | | 5,447,747 | |
| Financial - 9.3% |
| | 14,138 | | Arch Capital Group, Ltd. (a) | | 1,392,593 | |
| | 385 | | Markel Corp. (a) | | 411,172 | |
| | 16,200 | | Sterling Bancorp | | 399,330 | |
| | 7,620 | | Willis Towers Watson PLC | | 1,175,233 | |
| | | 3,378,328 | |
| Health Care - 21.9% |
| | 17,735 | | Abbott Laboratories | | 946,340 | |
| | 7,029 | | Allergan PLC | | 1,440,593 | |
| | 59,380 | | Brookdale Senior Living, Inc. (a) | | 629,428 | |
| | 57,330 | | Capital Senior Living Corp. (a) | | 719,491 | |
| | 9,775 | | Laboratory Corp. of America Holdings (a) | | 1,475,732 | |
| | 15,714 | | Quintiles IMS Holdings, Inc. (a) | | 1,493,930 | |
| | 6,795 | | Thermo Fisher Scientific, Inc. | | 1,285,614 | |
| | | 7,991,128 | |
| Industrials - 9.8% |
| | 41,805 | | AECOM (a) | | 1,538,842 | |
| | 5,430 | | FedEx Corp. | | 1,224,899 | |
| | 7,585 | | Republic Services, Inc. | | 501,065 | |
| | 4,820 | | XPO Logistics, Inc. (a) | | 326,700 | |
| | | 3,591,506 | |
| Information Technology - 12.7% |
| | 465 | | Alphabet, Inc., Class C (a) | | 445,986 | |
| | 101,265 | | Flex, Ltd. (a) | | 1,677,961 | |
| | 18,840 | | NCR Corp. (a) | | 706,877 | |
| | 28,055 | | ViaSat, Inc. (a) | | 1,804,498 | |
| | | 4,635,322 | |
Total Common Stock (Cost $28,375,349) | | 34,140,953 | |
Investments, at value - 93.5% (Cost $28,375,349) | $ | 34,140,953 | |
| Other Assets & Liabilities, Net – 6.5% | | 2,364,026 | |
| Net Assets – 100.0% | $ | 36,504,979 | |
| PLC | Public Limited Company |
| (a) | Non-income producing security. |
The following is a summary of the inputs used to value the Fund's investments as of September 30, 2017.
The inputs or methodology used for valuing securities are not necessarily an indication of the risks associated with investing in those securities. For more information on valuation inputs, and their aggregation into the levels used in the table below, please refer to the Security Valuation section in Note 2 of the accompanying Notes to Financial Statements.
| Valuation Inputs | | Investments in Securities |
| Level 1 - Quoted Prices | | $ | 34,140,953 | |
| Level 2 - Other Significant Observable Inputs | | | - | |
| Level 3 - Significant Unobservable Inputs | | | - | |
| Total | | $ | 34,140,953 | |
The Level 1 value displayed in this table is Common Stock. Refer to this Schedule of Investments for a further breakout of each security by industry.
The Fund utilizes the end of period methodology when determining transfers. There were no transfers among Level 1, Level 2 and Level 3 for the year ended September 30, 2017.
| PORTFOLIO HOLDINGS | | |
| % of Investments | | |
| Consumer Discretionary | 26.6 | % |
| Energy | 16.0 | % |
| Financial | 9.9 | % |
| Health Care | 23.4 | % |
| Industrials | 10.5 | % |
| Information Technology | 13.6 | % |
| | 100.0 | % |
| See Notes to Financial Statements. | 5 | |
STEINBERG SELECT FUND STATEMENT OF ASSETS AND LIABILITIES SEPTEMBER 30, 2017 |
| ASSETS | | | | |
| . | Investments, at value (Cost $28,375,349) | | $ | 34,140,953 | |
| | Cash | | | 2,182,987 | |
| | Receivables: | | | | |
| | | Investment securities sold | | | 264,173 | |
| | | Dividends and interest | | | 19,523 | |
| | Prepaid expenses | | | 24,875 | |
| Total Assets | | | 36,632,511 | |
| | | | | | | |
| LIABILITIES | | | | |
| | Payables: | | | | |
| | | Investment securities purchased | | | 91,325 | |
| | Accrued Liabilities: | | | | |
| | | Investment adviser fees | | | 4,354 | |
| | | Fund services fees | | | 8,125 | |
| | | Other expenses | | | 23,728 | |
| Total Liabilities | | | 127,532 | |
| | | | | | | |
| NET ASSETS | | $ | 36,504,979 | |
| | | | | | | |
| COMPONENTS OF NET ASSETS | | | | |
| | Paid-in capital | | $ | 30,139,503 | |
| | Accumulated net realized gain | | | 599,830 | |
| | Net unrealized appreciation on investments and foreign currency | | | 5,765,646 | |
| NET ASSETS | | $ | 36,504,979 | |
| SHARES OF BENEFICIAL INTEREST AT NO PAR VALUE (UNLIMITED SHARES AUTHORIZED) | | | | |
| Institutional Shares (see note 1) | | | 3,537,864 | |
| NET ASSET VALUE, OFFERING AND REDEMPTION PRICE PER SHARE | | | | |
| Institutional Shares (see note 1) (based on net assets of $36,504,979) | | $ | 10.32 | |
| | | | | | | |
| See Notes to Financial Statements. | 6 | |
STEINBERG SELECT FUND STATEMENT OF OPERATIONS YEAR ENDED SEPTEMBER 30, 2017 |
| INVESTMENT INCOME | | | | | | |
| | Dividend income (Net of foreign withholding taxes of $3,154) | . | | $ | 166,990 | | |
| | Interest income | | | 14,571 | | |
| Total Investment Income | | | | 181,561 | | |
| | | | | | | |
| EXPENSES | | | | | | |
| | Investment adviser fees | | | 375,257 | | |
| | Fund services fees | | | 172,000 | | |
| | Transfer agent fees: | | | | | |
| | Institutional Shares | | | 698 | | |
| | Custodian fees | | | 5,606 | | |
| | Registration fees: | | | | | |
| | Institutional Shares | | | 31,604 | | |
| | Professional fees | | | 37,938 | | |
| | Trustees' fees and expenses | | | 7,731 | | |
| | Other expenses | | | 21,004 | | |
| Total Expenses | | | | 651,838 | | |
| | Fees waived and expenses reimbursed | | | (356,205 | ) | |
| Net Expenses | | | | 295,633 | | |
| | | | | | | | |
| NET INVESTMENT LOSS | | | | (114,072 | ) | |
| | | | | | | | |
| NET REALIZED AND UNREALIZED GAIN | | | | | | |
| | Net realized gain on: | | | | | |
| | Investments | | | 1,288,302 | | |
| | Foreign currency transactions | | | 1,624 | | |
| | Net realized gain | | | 1,289,926 | | |
| | Net change in unrealized appreciation (depreciation) on: | | | | | |
| | Investments | | | 2,512,707 | | |
| | Foreign currency translations | | | 116 | | |
| | Net change in unrealized appreciation (depreciation) | | | 2,512,823 | | |
| NET REALIZED AND UNREALIZED GAIN | | | | 3,802,749 | | |
| INCREASE IN NET ASSETS RESULTING FROM OPERATIONS | | | $ | 3,688,677 | | |
| | | | | | | | |
| See Notes to Financial Statements. | 7 | |
STEINBERG SELECT FUND STATEMENT OF CHANGES IN NET ASSETS |
| | | | | For the Year Ended September 30, 2017 | | | For the Year Ended September 30, 2016 |
| OPERATIONS | | | | | | | | | |
| | Net investment income (loss) | | $ | (114,072 | ) | | | $ | 250,028 | |
| | Net realized gain (loss) | | | 1,289,926 | | | | | (119,840 | ) |
| | Net change in unrealized appreciation (depreciation) | | | 2,512,823 | | | | | 2,444,406 | |
| Increase in Net Assets Resulting from Operations | | | 3,688,677 | | | | | 2,574,594 | |
| | | | | | | | | | | | |
| DISTRIBUTIONS TO SHAREHOLDERS FROM | | | | | | | | | |
| | Net investment income | | | | | | | | | |
| | | Institutional Shares | | | (177,792 | ) | | | | (179,190 | ) |
| | Net realized gain | | | | | | | | | |
| | | Institutional Shares | | | (247,728 | ) | | | | (455,889 | ) |
| Total Distributions to Shareholders | | | (425,520 | ) | | | | (635,079 | ) |
| | | | | | | | | | | | |
| CAPITAL SHARE TRANSACTIONS | | | | | | | | | |
| | Sale of shares: | | | | | | | | | |
| | | Institutional Shares | | | 458,602 | | | | | 117,198 | |
| | Reinvestment of distributions: | | | | | | | | | |
| | | Institutional Shares | | | 303,993 | | | | | 501,135 | |
| | Redemption of shares: | | | | | | | | | |
| | 1 | Institutional Shares | | | (10,716,567 | ) | | | | (9,928,395 | ) |
| Decrease in Net Assets from Capital Share Transactions | | | (9,953,972 | ) | | | | (9,310,062 | ) |
| Decrease in Net Assets | | | (6,690,815 | ) | | | | (7,370,547 | ) |
| | | | | | | | | | | | |
| NET ASSETS | | | | | | | | | |
| | Beginning of Year | | | 43,195,794 | | | | | 50,566,341 | |
| | End of Year (Including line (a)) | | $ | 36,504,979 | | | | $ | 43,195,794 | |
| | | | | | | | | | | | |
| SHARE TRANSACTIONS | | | | | | | | | |
| | Sale of shares: | | | | | | | | | |
| | | Institutional Shares | | | 47,159 | | | | | 13,155 | |
| | Reinvestment of distributions: | | | | | | | | | |
| | | Institutional Shares | | | 32,138 | | | | | 57,939 | |
| | Redemption of shares: | | | | | | | | | |
| | | Institutional Shares | | | (1,084,341 | ) | | | | (1,118,507 | ) |
| Decrease in Shares | | | (1,005,044 | ) | | | | (1,047,413 | ) |
| | | | | | | | | | | | |
| (a) | Undistributed net investment income | | $ | - | | | | $ | 177,765 | |
| See Notes to Financial Statements. | 8 | |
STEINBERG SELECT FUND FINANCIAL HIGHLIGHTS |
| These financial highlights reflect selected data for a share outstanding throughout each period. | | | |
| | | For the Years Ended September 30, | | October 1, 2013 (a) through September 30, 2014 | | |
| 2017 | | 2016 | | 2015 | |
| INSTITUTIONAL SHARES | | | | | | | | | | | | | | | | | |
| NET ASSET VALUE, Beginning | | | | | | | | | | | | | | | | | |
| of Period | $ | 9.51 | | | $ | 9.05 | | | $ | 11.08 | | | $ | 10.00 | | | |
| INVESTMENT OPERATIONS | | | | | | | | | | | | | | | | | |
| Net investment income (loss) (b) | | (0.03 | ) | | | 0.05 | | | | 0.02 | | | | 0.06 | | | |
| Net realized and unrealized gain (loss) | | 0.94 | | | | 0.52 | | | | (1.12 | ) | | | 1.15 | | | |
| Total from Investment Operations | | 0.91 | | | | 0.57 | | | | (1.10 | ) | | | 1.21 | | | |
| DISTRIBUTIONS TO SHAREHOLDERS FROM | | | | | | | | | | | | | | | | | |
| Net investment income | | (0.04 | ) | | | (0.03 | ) | | | (0.05 | ) | | | (0.02 | ) | | |
| Net realized gain | | (0.06 | ) | | | (0.08 | ) | | | (0.88 | ) | | | (0.11 | ) | | |
| Total Distributions to Shareholders | | (0.10 | ) | | | (0.11 | ) | | | (0.93 | ) | | | (0.13 | ) | | |
| NET ASSET VALUE, End of Period | $ | 10.32 | | | $ | 9.51 | | | $ | 9.05 | | | $ | 11.08 | | | |
| TOTAL RETURN | | 9.62 | % | | 6.49 | % | (10.43 | )% | | | 12.26 | %(c) |
| RATIOS/SUPPLEMENTARY DATA | | | | | | | | | | | | | | | | |
| Net Assets at End of Period (000's omitted) | $36,505 | | | $43,196 | | | $50,566 | | | $59,620 | | | |
| Ratios to Average Net Assets: | | | | | | | | | | | | | | | | | |
| Net investment income (loss) | | (0.29 | )% | | 0.54 | % | | 0.23% | | | 0.59 | %(d) | |
| Net expenses | | 0.75 | % | | 0.75 | % | | 0.75% | | | 0.75 | %(d) | |
| Gross expenses (e) | | 1.65 | % | | 1.54 | % | | 1.39% | | | 1.54 | %(d) | |
| PORTFOLIO TURNOVER RATE | | 32 | % | | 35 | % | | 46% | | | 44 | %(c) | |
| | | | | | | | | | | | | | | | | | | |
| | | | | | | | | | | | | | | | | | | |
| (a) | Commencement of operations. | |
| (b) | Calculated based on average shares outstanding during each period. | |
| (c) | Not annualized. | |
| (d) | Annualized. | |
| (e) | Reflects the expense ratio excluding any waivers and/or reimbursements. | |
| See Notes to Financial Statements. | 9 | |
STEINBERG SELECT FUND NOTES TO FINANCIAL STATEMENTS SEPTEMBER 30, 2017 |
Note 1. Organization
The Steinberg Select Fund (the "Fund") is a non-diversified portfolio of Forum Funds (the "Trust"). The Trust is a Delaware statutory trust that is registered as an open-end, management investment company under the Investment Company Act of 1940, as amended (the "Act"). Under its Trust Instrument, the Trust is authorized to issue an unlimited number of the Fund's shares of beneficial interest without par value. The Fund currently offers two classes of shares: Institutional Shares and Investor Shares. Institutional Shares and Investor Shares commenced operations on October 1, 2013, and July 17, 2014, respectively. As of September 30, 2017, the Investor Shares class had no shares outstanding. The Fund seeks long-term capital appreciation.
Note 2. Summary of Significant Accounting Policies
The Fund is an investment company and follows accounting and reporting guidance under Financial Accounting Standards Board ("FASB") Accounting Standards Codification ("ASC") Topic 946, "Financial Services-Investment Companies". These financial statements are prepared in accordance with accounting principles generally accepted in the United States of America ("GAAP"), which require management to make estimates and assumptions that affect the reported amounts of assets and liabilities, the disclosure of contingent liabilities at the date of the financial statements, and the reported amounts of increases and decreases in net assets from operations during the fiscal year. Actual amounts could differ from those estimates. The following summarizes the significant accounting policies of the Fund:
Security Valuation – Securities are valued at market prices using the last quoted trade or official closing price from the principal exchange where the security is traded, as provided by independent pricing services on each Fund business day. In the absence of a last trade, securities are valued at the mean of the last bid and ask price provided by the pricing service. Short-term investments that mature in 60 days or less may be valued at amortized cost.
The Fund values its investments at fair value pursuant to procedures adopted by the Trust's Board of Trustees (the "Board") if (1) market quotations are not readily available or (2) the Adviser, as defined in Note 4, believes that the values available are unreliable. The Trust's Valuation Committee, as defined in the Fund's registration statement, performs certain functions as they relate to the administration and oversight of the Fund's valuation procedures. Under these procedures, the Valuation Committee convenes on a regular and ad hoc basis to review such investments and considers a number of factors, including valuation methodologies and significant unobservable inputs, when arriving at fair value.
The Valuation Committee may work with the Adviser to provide valuation inputs. In determining fair valuations, inputs may include market-based analytics that may consider related or comparable assets or liabilities, recent transactions, market multiples, book values and other relevant investment information. Adviser inputs may include an income-based approach in which the anticipated future cash flows of the investment are discounted in determining fair value. Discounts may also be applied based on the nature or duration of any restrictions on the disposition of the investments. The Valuation Committee performs regular reviews of valuation methodologies, key inputs and assumptions, disposition analysis and market activity.
Fair valuation is based on subjective factors and, as a result, the fair value price of an investment may differ from the security's market price and may not be the price at which the asset may be sold. Fair valuation could result in a different Net Asset Value ("NAV") than a NAV determined by using market quotes.
GAAP has a three-tier fair value hierarchy. The basis of the tiers is dependent upon the various "inputs" used to determine the value of the Fund's investments. These inputs are summarized in the three broad levels listed below:
Level 1 — Quoted prices in active markets for identical assets and liabilities
Level 2 – Prices determined using significant other observable inputs (including quoted prices for similar securities, interest rates, prepayment speeds, credit risk, etc.). Short-term securities with maturities of sixty days or less are valued at amortized cost, which approximates market value, and are categorized as Level 2 in the hierarchy. Municipal securities, long-term U.S. government obligations and corporate debt securities are valued in accordance with the evaluated price supplied by the pricing service and generally categorized as Level 2 in the hierarchy. Other securities that are categorized as Level 2 in the hierarchy include, but are not limited to, warrants that do not trade on an exchange, securities valued at the mean between the last reported bid and ask quotation and international equity securities valued by an independent third party with adjustments for changes in value between the time of the securities respective local market closes and the close of the U.S. market.
STEINBERG SELECT FUND NOTES TO FINANCIAL STATEMENTS SEPTEMBER 30, 2017 |
Level 3 — Significant unobservable inputs (including the Fund's own assumptions in determining the fair value of investments)
The aggregate value by input level, as of September 30, 2017, for the Fund's investments is included at the end of the Fund's Schedule of Investments.
Security Transactions, Investment Income and Realized Gain and Loss – Investment transactions are accounted for on the trade date. Dividend income is recorded on the ex-dividend date. Foreign dividend income is recorded on the ex-dividend date or as soon as possible after determining the existence of a dividend declaration after exercising reasonable due diligence. Income and capital gains on some foreign securities may be subject to foreign withholding taxes, which are accrued as applicable. Interest income is recorded on an accrual basis. Premium is amortized and discount is accreted using the effective interest method. Identified cost of investments sold is used to determine the gain and loss for both financial statement and federal income tax purposes.
Foreign Currency Translations – Foreign currency amounts are translated into U.S. dollars as follows: (1) assets and liabilities at the rate of exchange at the end of the respective period; and (2) purchases and sales of securities and income and expenses at the rate of exchange prevailing on the dates of such transactions. The portion of the results of operations arising from changes in the exchange rates and the portion due to fluctuations arising from changes in the market prices of securities are not isolated. Such fluctuations are included with the net realized and unrealized gain or loss on investments.
Distributions to Shareholders – The Fund declares any dividends from net investment income and pays them annually. Any net capital gains realized by the Fund are distributed at least annually. Distributions to shareholders are recorded on the ex-dividend date. Distributions are based on amounts calculated in accordance with applicable federal income tax regulations, which may differ from GAAP. These differences are due primarily to differing treatments of income and gain on various investment securities held by the Fund, timing differences and differing characterizations of distributions made by the Fund.
Federal Taxes – The Fund intends to qualify each year as a regulated investment company under Subchapter M of the Internal Revenue Code and to distribute all of its taxable income to shareholders. In addition, by distributing in each calendar year substantially all of its net investment income and capital gains, if any, the Fund will not be subject to a federal excise tax. Therefore, no federal income or excise tax provision is required. The Fund files a U.S. federal income and excise tax return as required. A fund's federal income tax returns are subject to examination by the Internal Revenue Service for a period of three fiscal years after they are filed. As of September 30, 2017, there are no uncertain tax positions that would require financial statement recognition, de-recognition, or disclosure.
Income and Expense Allocation – The Trust accounts separately for the assets, liabilities and operations of each of its investment portfolios. Expenses that are directly attributable to more than one investment portfolio are allocated among the respective investment portfolios in an equitable manner. The Fund's class-specific expenses are charged to the operations of that class of shares. Income and expenses (other than expenses attributable to a specific class) and realized and unrealized gains or losses on investments are allocated to each class of shares based on the class' respective net assets to the total net assets of the Fund.
Commitments and Contingencies – In the normal course of business, the Fund enters into contracts that provide general indemnifications by the Fund to the counterparty to the contract. The Fund's maximum exposure under these arrangements is dependent on future claims that may be made against the Fund and, therefore, cannot be estimated; however, based on experience, the risk of loss from such claims is considered remote.
Note 3. Cash – Concentration in Uninsured Account
For cash management purposes, the Fund may concentrate cash with the Fund's custodian. This typically results in cash balances exceeding the Federal Deposit Insurance Corporation ("FDIC") insurance limits. As of September 30, 2017, the Fund had $1,932,987 at MUFG Union Bank, N.A. that exceeded the FDIC insurance limit.
Note 4. Fees and Expenses
Investment Adviser – Steinberg Asset Management, LLC (the "Adviser") is the investment adviser to the Fund. Pursuant to an investment advisory agreement, the Adviser receives an advisory fee, payable monthly, from the Fund at an annual rate of 0.95% of the Fund's average daily net assets.
Distribution – Foreside Fund Services, LLC serves as the Fund's distributor (the "Distributor"). The Distributor is not affiliated
STEINBERG SELECT FUND NOTES TO FINANCIAL STATEMENTS SEPTEMBER 30, 2017 |
with the Adviser or Atlantic Fund Administration, LLC (d/b/a Atlantic Fund Services) ("Atlantic") or their affiliates. The Fund has adopted a Distribution Plan (the "Plan") for Investor Class shares in accordance with Rule 12b-1 of the Act. Under the Plan, the Fund pays the Distributor and/or any other entity as authorized by the Board a fee of 0.25% of the average daily net assets of the Investor Shares.
Other Service Providers – Atlantic provides fund accounting, fund administration, compliance and transfer agency services to the Fund. The fees related to these services are included in Fund services fees within the Statement of Operations. Atlantic also provides certain shareholder report production and EDGAR conversion and filing services. Pursuant to an Atlantic services agreement, the Fund pays Atlantic customary fees for its services. Atlantic provides a Principal Executive Officer, a Principal Financial Officer, a Chief Compliance Officer and an Anti-Money Laundering Officer to the Fund, as well as certain additional compliance support functions.
Trustees and Officers – The Trust pays each independent Trustee an annual retainer fee of $50,000 for service to the Trust ($66,000 for the Chairman), and the Audit Committee Chairman and Vice Chairman receive an additional $6,000 annually. The Trustees and Chairman may receive additional fees for special Board meetings. Each Trustee is also reimbursed for all reasonable out-of-pocket expenses incurred in connection with his duties as a Trustee, including travel and related expenses incurred in attending Board meetings. The amount of Trustees' fees attributable to the Fund is disclosed in the Statement of Operations. Certain officers of the Trust are also officers or employees of the above named service providers, and during their terms of office received no compensation from the Fund.
Note 5. Expense Reimbursements and Fees Waived
The Adviser has contractually agreed to waive a portion of its fee and/or reimburse Fund expenses through January 31, 2018, to limit annual operating expenses (excluding all taxes, interest, portfolio transaction expenses, acquired fund fees and expenses, proxy expenses and extraordinary expenses) to 0.75% for Institutional Shares. Other Fund service providers have voluntarily agreed to waive a portion of their fees. The contractual waivers may be changed or eliminated at any time with the consent of the Board and voluntary fee waivers and expense reimbursements may be reduced or eliminated at any time. For the year ended September 30, 2017, fees waived and expenses reimbursed were as follows:
| Investment Adviser Fees Waived | | Other Waivers | | Total Fees Waived |
| $ | 280,995 | | $ | 75,210 | | $ | 356,205 |
| | | | | | | | |
The Fund may repay the Adviser for fees waived and expenses reimbursed pursuant to the expense cap if such payment is made within three years of the fee waiver or expense reimbursement and the resulting expenses do not exceed the lesser of (i) the then-current expense cap, or (ii) the expense cap in place at the time the fees/expenses were waived or reimbursed. As of September 30, 2017, $890,535 is subject to recapture by the Adviser.
Note 6. Security Transactions
The cost of purchases and proceeds from sales of investment securities (including maturities), other than short-term investments during the year ended September 30, 2017, were $11,463,011 and $20,073,622, respectively.
Note 7. Line of Credit
The Fund has a committed $2,500,000 unsecured line of credit agreement with MUFG Union Bank, N.A. The Fund may temporarily borrow from the line of credit to satisfy redemption requests or settle investment transactions. Interest is charged to the Fund based on its borrowings at an amount above the LIBOR rate. During the year ended September 30, 2017, the Fund had no outstanding balances pursuant to this line of credit.
STEINBERG SELECT FUND NOTES TO FINANCIAL STATEMENTS SEPTEMBER 30, 2017 |
Note 8. Federal Income Tax
As of September 30, 2017, cost for federal income tax purposes is $28,916,232 and net unrealized appreciation consists of:
| Gross Unrealized Appreciation | | | $ | 6,342,343 | |
| Gross Unrealized Depreciation | | | | (1,117,622 | ) |
| Net Unrealized Appreciation | | | $ | 5,224,721 | |
Distributions paid during the fiscal years ended as noted were characterized for tax purposes as follows:
| | | 2017 | | 2016 |
| Ordinary Income | | $ | 110,720 | | $ | 74,017 |
| Long-Term Capital Gain | | | 314,800 | | | 561,062 |
| | | $ | 425,520 | | $ | 635,079 |
As of September 30, 2017, distributable earnings (accumulated loss) on a tax basis were as follows:
| Undistributed Ordinary Income | | | $ | 168,638 | |
| Undistributed Long-Term Gain | | | | 972,075 | |
| Unrealized Appreciation | | | | 5,224,763 | |
| Total | | | $ | 6,365,476 | |
The difference between components of distributable earnings on a tax basis and the amounts reflected in the Statement of Assets and Liabilities are primarily due to wash sales.
On the Statement of Assets and Liabilities, as a result of permanent book to tax differences, certain amounts have been reclassified for the year ended September 30, 2017. The following reclassifications were the result of return of capital distribution, dividend reclass and currency gain/loss and have no impact on the net assets of the Fund.
| | Undistributed Net Investment Income (Loss) | $ | 114,099 | |
| | Accumulated Net Realized Gain (Loss) | | (114,099 | ) |
Note 9. Subsequent Events
Subsequent events occurring after the date of this report through the date these financial statements were issued have been evaluated for potential impact, and the Fund has had no such events.
REPORT OF INDEPENDENT REGISTERED PUBLIC ACCOUNTING FIRM |
To the Board of Trustees of Forum Funds
and the Shareholders of Steinberg Select Fund
We have audited the accompanying statement of assets and liabilities of Steinberg Select Fund, a series of shares of beneficial interest in Forum Funds, (the "Fund") including the schedule of investments, as of September 30, 2017, and the related statement of operations for the year then ended, the statements of changes in net assets for each of the years in the two-year period then ended and the financial highlights for each of the years in the three-year period then ended and for the period October 1, 2013 (commencement of operations) through September 30, 2014. These financial statements and financial highlights are the responsibility of the Fund's management. Our responsibility is to express an opinion on these financial statements and financial highlights based on our audits.
We conducted our audits in accordance with the standards of the Public Company Accounting Oversight Board (United States). Those standards require that we plan and perform the audits to obtain reasonable assurance about whether the financial statements and financial highlights are free of material misstatement. An audit includes examining, on a test basis, evidence supporting the amounts and disclosures in the financial statements. Our procedures included confirmation of securities owned as of September 30, 2017 by correspondence with the custodian and brokers. An audit also includes assessing the accounting principles used and significant estimates made by management, as well as evaluating the overall financial statement presentation. We believe that our audits provide a reasonable basis for our opinion.
In our opinion, the financial statements and financial highlights referred to above present fairly, in all material respects, the financial position of Steinberg Select Fund as of September 30, 2017, and the results of its operations for the year then ended, the changes in its net assets for each of the years in the two-year period then ended and its financial highlights for each of the years in the three-year period then ended and for the period October 1, 2013 through September 30, 2014, in conformity with accounting principles generally accepted in the United States of America.
BBD, LLP
Philadelphia, Pennsylvania
November 22, 2017
STEINBERG SELECT FUND ADDITIONAL INFORMATION (Unaudited) SEPTEMBER 30, 2017 |
Investment Advisory Agreement Approval
At the June 15, 2017 Board meeting, the Board, including the Independent Trustees, considered the approval of the continuance of the investment advisory agreement between the Adviser and the Trust pertaining to the Fund (the "Advisory Agreement"). In preparation for its deliberations, the Board requested and reviewed written responses from the Adviser to a due diligence questionnaire circulated on the Board's behalf concerning the Adviser's personnel, operations, financial condition, performance, and services provided by the Adviser. The Board also discussed the materials with Fund counsel and, as necessary, with the Trust's administrator, Atlantic Fund Services. During its deliberations, the Board received an oral presentation from the Adviser, and was assisted by the advice of Trustee counsel.
At the meeting, the Board reviewed, among other matters: (1) the nature, extent and quality of the services provided to the Fund by the Adviser, including information on the investment performance of the Fund and Adviser; (2) the costs of the services provided and profitability to the Adviser of its relationship with the Fund; (3) the advisory fee and total expense ratio of the Fund compared to those of a relevant peer group of funds; (4) the extent to which economies of scale may be realized as the Fund grows and whether the advisory fee enables the Fund's investors to share in the benefits of economies of scale; and (5) other benefits received by the Adviser from its relationship with the Fund.
Nature, Extent and Quality of Services
Based on written materials received, a presentation from senior representatives of the Adviser and a discussion with the Adviser about the Adviser's personnel, operations and financial condition, the Board considered the quality of services provided by the Adviser under the Advisory Agreement. In this regard, the Board considered information regarding the experience, qualifications and professional background of the portfolio managers and other personnel at the Adviser with principal responsibility for the Fund, as well as the investment philosophy and decision-making process of the Adviser and the capability and integrity of the Adviser's senior management and staff. In addition, the Board recognized that the evaluation process with respect to the Adviser was an ongoing one and, in this regard, the Board considered information provided by the Adviser at regularly scheduled meetings during the past year.
The Board considered also the adequacy of the Adviser's resources. The Board noted the Adviser's representation that the firm is in stable financial condition, that the firm is able to meet its expense reimbursement obligations to the Fund, and that the firm has the operational capability, the staffing and experience, and the financial strength necessary to continue providing high-quality investment advisory services to the Fund. Based on the presentation and the materials provided by the Adviser in connection with the Board's consideration of the renewal of the Advisory Agreement, the Board concluded that, overall, it was satisfied with the nature, extent and quality of services provided to the Fund under the Advisory Agreement.
Performance
In connection with a presentation by the Adviser regarding its approach to managing the Fund, the Board reviewed the performance of the Fund compared to its benchmarks. The Board observed that the Fund underperformed the Russell 3000 Value Index and S&P 500 Index, the Fund's benchmarks, for the one- and three-year periods ended March 31, 2017, and for the period since the Fund's inception on October 1, 2013. The Board also considered the Fund's performance relative to an independent peer group of funds identified by Broadridge Financial Solutions, Inc. ("Broadridge") as having characteristics similar to those of the Fund. The Board observed that, based on the information provided by Broadridge, the Fund underperformed the median of its Broadridge peers for the one- and three-year periods ended March 31, 2017. The Board considered the Adviser's explanation that the Fund's underperformance in relation to the Fund's benchmark during the periods could be attributed to the Fund's sector allocations and the disproportionate impact of certain sectors on index returns. The Board also noted the Adviser's representation that the Fund's performance was also negatively impacted by a larger than usual cash position as a consequence of recent portfolio changes.
The Board further noted the Adviser's presentation of a peer group of funds identified by the Adviser as being more representative of the Fund's investment strategy ("Comparable Funds") than the Broadridge peer group. The Board observed that the Fund's performance was more nearly approximated with the performance of the Comparable Funds than the performance of the Broadridge peers for the one- and three-year periods ended March 31, 2017. Based on the foregoing, the Board concluded that the Fund and its shareholders could benefit from the Adviser's management under the Advisory Agreement.
STEINBERG SELECT FUND ADDITIONAL INFORMATION (Unaudited) SEPTEMBER 30, 2017 |
Compensation
The Board evaluated the Adviser's compensation for providing advisory services to the Fund and analyzed comparative information on actual advisory fee rates and actual total expenses of the Fund's relevant Broadridge peer group. The Board noted that the Adviser's actual advisory fee rate and the Fund's actual total expense ratio were each lower than the median of the Broadridge peer group. The Board also noted that the Fund's net expenses (after waivers) were the lowest among the Comparable Funds. Based on the foregoing, the Board concluded that the Adviser's advisory fee rate charged to the Fund was reasonable.
Cost of Services and Profitability
The Board considered information provided by the Adviser regarding the costs of services and its profitability with respect to the Fund. In this regard, the Board considered the Adviser's resources devoted to the Fund, as well as the Adviser's discussion of costs and profitability. The Board noted the Adviser's representation that it does not allocate indirect or marketing expenses attributable to the Fund separately from those of the Adviser's other clients and that the management fees received for the services rendered to the Fund represented a relatively small portion of the Adviser's overall advisory business revenue. Based on these and other applicable considerations, the Board concluded that the Adviser's profits attributable to management of the Fund were not unreasonable in the context of all factors considered.
Economies of Scale
The Board evaluated whether the Fund would benefit from any economies of scale. In this respect, the Board considered the Adviser's representation that the current advisory fee rate was lower than the Adviser's standard fee rate for managed accounts in the strategy and among the lowest in its Broadridge peer group. Based on the foregoing information, and in light of the current asset level of the Fund, the Board concluded that economies of scale were not a material factor in approving the Advisory Agreement.
Other Benefits
The Board noted the Adviser's representation that, aside from its contractual advisory fees, it does not benefit in a material way from its relationship with the Fund. Based on the foregoing representation, the Board concluded that other benefits received by the Adviser from its relationship with the Fund were not a material factor to consider in approving the continuation of the Advisory Agreement.
Conclusion
The Board did not identify any single factor as being of paramount importance, and different Trustees may have given different weight to different factors. The Board reviewed a memorandum from Fund counsel discussing the legal standards applicable to its consideration of the Advisory Agreement. Based on its review, including consideration of each of the factors referenced above, and its consideration of information received throughout the year from the Adviser, the Board determined, in the exercise of its business judgment, that the advisory arrangement, as outlined in the Advisory Agreement, was fair and reasonable in light of the services performed or to be performed, expenses incurred or to be incurred and such other matters as the Board considered relevant.
Proxy Voting Information
A description of the policies and procedures that the Fund uses to determine how to vote proxies relating to securities held in the Fund's portfolio is available, without charge and upon request, by calling (855) 330-7085 and on the U.S. Securities and Exchange Commission's (the "SEC") website at www.sec.gov. The Fund's proxy voting record for the most recent twelve-month period ended June 30 is available, without charge and upon request, by calling (855) 330-7085 and on the SEC's website at www.sec.gov.
Availability of Quarterly Portfolio Schedules
The Fund files its complete schedule of portfolio holdings with the SEC for the first and third quarters of each fiscal year on Form N-Q. These filings are available, without charge and upon request on the SEC's website at www.sec.gov or may be reviewed and copied at the SEC's Public Reference Room in Washington, DC. Information on the operation of the Public Reference Room may be obtained by calling (800) SEC-0330.
STEINBERG SELECT FUND ADDITIONAL INFORMATION (Unaudited) SEPTEMBER 30, 2017 |
Shareholder Expense Example
As a shareholder of the Fund, you incur ongoing costs, including management fees, distribution (12b-1) fees and other Fund expenses. This example is intended to help you understand your ongoing costs (in dollars) of investing in the Fund, and to compare these costs with the ongoing costs of investing in other mutual funds.
The example is based on an investment of $1,000 invested at the beginning of the period and held for the entire period from April 1, 2017 through September 30, 2017.
Actual Expenses – The first line of the table below provides information about actual account values and actual expenses. You may use the information in this line, together with the amount you invested, to estimate the expenses that you paid over the period. Simply divide your account value by $1,000 (for example, an $8,600 account value divided by $1,000 = 8.6), then multiply the result by the number in the first line under the heading entitled "Expenses Paid During Period" to estimate the expenses you paid on your account during the period.
Hypothetical Example for Comparison Purposes – The second line of the table below provides information about hypothetical account values and hypothetical expenses based on the Fund's actual expense ratio and an assumed rate of return of 5% per year before expenses, which is not the Fund's actual return. The hypothetical account values and expenses may not be used to estimate the actual ending account balance or expenses you paid for the period. You may use this information to compare the ongoing costs of investing in the Fund and other funds. To do so, compare this 5% hypothetical example with the 5% hypothetical examples that appear in the shareholder reports of other funds.
Please note that the expenses shown in the table are meant to highlight your ongoing costs only. Therefore, the second line of the table is useful in comparing ongoing costs only and will not help you determine the relative total costs of owning different funds.
| | Beginning | | Ending | | Expenses | | Annualized |
| | Account Value | | Account Value | | Paid During | | Expense |
| | April 1, 2017 | | September 30, 2017 | | Period* | | Ratio* |
| Institutional Shares | | | | | | | | | | | |
| Actual | $ | 1,000.00 | | $ | 1,022.79 | | $ | 3.80 | | 0.75 | % |
| Hypothetical (5% return before expenses) | $ | 1,000.00 | | $ | 1,021.31 | | $ | 3.80 | | 0.75 | % |
* Expenses are equal to the Fund's annualized expense ratio multiplied by the average account value over the period, multiplied by the number of days in the most recent fiscal half-year (183) divided by 365 to reflect the half-year period. |
Federal Tax Status of Dividends Declared during the Fiscal Year
For federal income tax purposes, dividends from short-term capital gains are classified as ordinary income. The Fund designates 25.64% of its income dividend distributed as qualifying for the corporate dividends-received deduction (DRD) and 72.57% for the qualified dividend rate (QDI) as defined in Section 1(h)(11) of the Internal Revenue Code. The fund also designates 100.00% as short-term capital gain dividends exempt from U.S. tax for foreign shareholders (QSD).
Trustees and Officers of the Trust
The Board is responsible for oversight of the management of the Trust's business affairs and of the exercise of all the Trust's powers except those reserved for the shareholders. The following table provides information about each Trustee and certain officers of the Trust. Each Trustee and officer holds office until the person resigns, is removed, or is replaced. Unless otherwise noted, the persons have held their principal occupations for more than five years. The address for all Trustees and officers is Three Canal Plaza, Suite 600, Portland, Maine 04101. Mr. Keffer is considered an Interested Trustee due to his affiliation with Atlantic. The Fund's Statement of Additional Information includes additional information about the Trustees and is available, without charge and upon request, by calling (855) 330-7085.
STEINBERG SELECT FUND ADDITIONAL INFORMATION (Unaudited) SEPTEMBER 30, 2017 |
| Name and Year of Birth | Position(s) with the Trust | Length of Time Served | Principal Occupation(s) During Past Five Years | Number of Series of Fund Complex¹ Overseen by Trustee | Other Directorships Held by Trustee |
| Independent Trustees | | | | | |
J. Michael Parish Born: 1943 | Chairman of the Board; Trustee; Chairman, Nominating Committee and Qualified Legal Compliance Committee | Since 1989 (Chairman since 2004) | Retired since 2003; formerly, Partner, Wolf, Block, Schorr and Solis-Cohen, LLP (law firm) 2002-2003; Partner, Thelen Reid & Priest LLP (law firm) 1995-2002. | 21 | None |
Costas Azariadis Born: 1943 | Trustee | Since 1989 | Professor of Economics, Washington University since 2006. | 21 | None |
James C. Cheng Born: 1942 | Trustee; Chairman, Audit Committee | Since 1989 | President, Technology Marketing Associates (marketing company for small- and medium-sized businesses in New England) since 1991. | 21 | None |
David Tucker Born: 1958 | Trustee; Vice Chairman | Since 2011 (Vice Chairman since 2015) | Director, Blue Sky Experience (a charitable endeavor) since 2008; Senior Vice President & General Counsel, American Century Companies (an investment management firm) 1998-2008. | 45 | Trustee, Forum Funds II, Forum ETF Trust and U.S. Global Investors Funds |
| Interested Trustee | | | | | |
John Y. Keffer2 Born: 1942 | Trustee; Vice Chairman | Since 1989 | Chairman, Atlantic since 2008; President, Forum Investment Advisors, LLC since 2011; President, Forum Foundation (a charitable organization) since 2005; President, Forum Trust, LLC (a non-depository trust company chartered in the State of Maine) since 1997. | 45 | Director, Wintergreen Fund, Inc.; Trustee, Forum Funds II, Forum ETF Trust and U.S. Global Investors Funds |
| Officers | | | | | |
Jessica Chase Born: 1970 | President; Principal Executive Officer | Since 2015 | Senior Vice President, Atlantic since 2008. | N/A | N/A |
Karen Shaw Born: 1972 | Treasurer; Principal Financial Officer | Since 2008 | Senior Vice President, Atlantic since 2008. | N/A | N/A |
Zachary Tackett Born: 1988 | Vice President; Secretary; Anti-Money Laundering Compliance Officer | Since 2014 | Counsel, Atlantic since 2014; Intern Associate, Coakley & Hyde, PLLC, 2010-2013. | N/A | N/A |
Michael J. McKeen Born: 1971 | Vice President | Since 2009 | Senior Vice President, Atlantic since 2008. | N/A | N/A |
Timothy Bowden Born: 1969 | Vice President | Since 2009 | Manager, Atlantic since 2008. | N/A | N/A |
Geoffrey Ney Born: 1975 | Vice President | Since 2013 | Manager, Atlantic since 2013; Senior Fund Accountant, Atlantic, 2008-2013. | N/A | N/A |
Todd Proulx Born: 1978 | Vice President | Since 2013 | Manager, Atlantic since 2013; Senior Fund Accountant, Atlantic, 2008-2013. | N/A | N/A |
Carlyn Edgar Born: 1963 | Vice President | Since 2008 | Senior Vice President, Atlantic since 2008; Chief Compliance Officer, 2008-2016. | N/A | N/A |
Dennis Mason Born: 1967 | Chief Compliance Officer | Since 2016 | Fund Compliance Officer, Atlantic since 2013; Senior Specialist, Atlantic 2011-2013; Senior Analyst, Atlantic 2008-2011. | N/A | N/A |
1The Fund Complex includes the Trust, Forum Funds II, Forum ETF Trust and U.S. Global Investors Funds and is overseen by different Boards of Trustees. 2Atlantic and Forum Investment Advisers, LLC are subsidiaries of Forum Holdings Corp. I, a Delaware corporation that is wholly owned by Mr. Keffer. |
STEINBERG SELECT FUND
FOR MORE INFORMATION:
P.O. Box 588
Portland, ME 04112
(855) 330-7085 (toll free)
INVESTMENT ADVISER
Steinberg Asset Management, LLC
12 East 49th Street, Suite 1202
New York, NY 10017
TRANSFER AGENT
Atlantic Fund Services
P.O. Box 588
Portland, ME 04112
www.atlanticfundservices.com
DISTRIBUTOR
Foreside Fund Services, LLC
Three Canal Plaza, Suite 100
Portland, Maine 04101
www.foreside.com
This report is submitted for the general information of the shareholders of the Fund. It is not authorized for distribution to prospective investors unless preceded or accompanied by an effective prospectus, which includes information regarding the Fund's risks, objectives, fees and expenses, experience of its management, and other information.
216-ANR-0917
ITEM 2. CODE OF ETHICS.
| (a) | As of the end of the period covered by this report, Forum Funds (the "Registrant") has adopted a code of ethics, which applies to its Principal Executive Officer and Principal Financial Officer (the "Code of Ethics"). |
| (c) | There have been no amendments to the Registrant's Code of Ethics during the period covered by this report. |
| (d) | There have been no waivers to the Registrant's Code of Ethics during the period covered by this report. |
(f) (1) A copy of the Code of Ethics is being filed under Item 12(a) hereto.
ITEM 3. AUDIT COMMITTEE FINANCIAL EXPERT.
The Board of Trustees has determined that no member of the Audit Committee is an "audit committee financial expert" as that term is defined under applicable regulatory guidelines.
ITEM 4. PRINCIPAL ACCOUNTANT FEES AND SERVICES.
(a) Audit Fees - The aggregate fees billed for each of the last two fiscal years (the "Reporting Periods") for professional services rendered by the Registrant's principal accountant for the audit of the Registrant's annual financial statements, or services that are normally provided by the principal accountant in connection with the statutory and regulatory filings or engagements for the Reporting Periods, were $12,900 in 2016 and $13,400 in 2017.
(b) Audit-Related Fees – The aggregate fees billed in the Reporting Periods for assurance and related services rendered by the principal accountant that were reasonably related to the performance of the audit of the Registrant's financial statements and are not reported under paragraph (a) of this Item 4 were $0 in 2016 and $0 in 2017.
(c) Tax Fees - The aggregate fees billed in the Reporting Periods for professional services rendered by the principal accountant to the Registrant for tax compliance, tax advice and tax planning were $3,000 in 2016 and $3,000 in 2017. These services consisted of review or preparation of U.S. federal, state, local and excise tax returns.
(d) All Other Fees - The aggregate fees billed in the Reporting Periods for products and services provided by the principal accountant to the Registrant, other than the services reported in paragraphs (a) through (c) of this Item, were $0 in 2016 and $0 in 2017.
(e) (1) The Audit Committee reviews and approves in advance all audit and "permissible non-audit services" (as that term is defined by the rules and regulations of the Securities and Exchange Commission) to be rendered to a series of the Registrant (each, a "Series"). In addition, the Audit Committee reviews and approves in advance all "permissible non-audit services" to be provided to an investment adviser (not including any sub-adviser) of a Series, or an affiliate of such investment adviser, that is controlling, controlled by or under common control with the investment adviser and provides on-going services to the Registrant ("Affiliate"), by the Series' principal accountant if the engagement relates directly to the operations and financial reporting of the Series. The Audit Committee considers whether fees paid by a Series' investment adviser or an Affiliate to the Series' principal accountant for audit and permissible non-audit services are consistent with the principal accountant's independence.
(e) (2) No services included in (b) - (d) above were approved pursuant to paragraph (c)(7)(i)(C) of Rule 2-01 of Regulation S-X.
(f) Not applicable
(g) The aggregate non-audit fees billed by the principal accountant for services rendered to the Registrant for the Reporting Periods were $0 in 2016 and $0 in 2017. There were no fees billed in either of the Reporting Periods for non-audit services rendered by the principal accountant to the Registrant's investment adviser or any Affiliate.
(h) During the Reporting Period, the Registrant's principal accountant provided no non-audit services to the investment advisers or any entity controlling, controlled by or under common control with the investment advisers to the series of the Registrant to which this report relates.
ITEM 5. AUDIT COMMITTEE OF LISTED REGISTRANTS.
Not applicable.
ITEM 6. INVESTMENTS.
| (a) | Included as part of report to shareholders under Item 1. |
ITEM 7. DISCLOSURE OF PROXY VOTING POLICIES AND PROCEDURES FOR CLOSED-END
MANAGEMENT INVESTMENT COMPANIES.
Not applicable.
ITEM 8. PORTFOLIO MANAGERS OF CLOSED-END MANAGEMENT INVESTMENT COMPANIES.
Not applicable.
ITEM 9. PURCHASES OF EQUITY SECURITIES BY CLOSED-END MANAGEMENT INVESTMENT COMPANY AND AFFILIATED PURCHASERS.
Not applicable.
ITEM 10. SUBMISSION OF MATTERS TO A VOTE OF SECURITY HOLDERS
The Registrant does not accept nominees to the board of trustees from shareholders.
ITEM 11. CONTROLS AND PROCEDURES
(a) The Registrant's Principal Executive Officer and Principal Financial Officer have concluded that the Registrant's disclosure controls and procedures (as defined in Rule 30a-3(c) under the Investment Company Act of 1940 (the "Act")) are effective, based on their evaluation of the controls and procedures required by Rule 30a-3(b) under the Act and Rules 13a-15(b) or 15d-15(b) under the Securities Exchange Act of 1934, as of a date within 90 days of the filing date of this report.
(b) There were no changes in the Registrant's internal control over financial reporting (as defined in
Rule 30a-3(d) under the Act) that occurred during the second fiscal quarter of the period covered by this report that have materially affected, or are reasonably likely to materially affect, the Registrant's internal control over financial reporting.
ITEM 12. EXHIBITS.
(a)(1) Code of Ethics (Exhibit filed herewith).
(a)(2) Certifications pursuant to Rule 30a-2(a) of the Act, and Section 302 of the Sarbanes-Oxley Act of 2002. (Exhibits filed herewith)
(a)(3) Not applicable.
(b) Certifications pursuant to Rule 30a-2(b) of the Act, and Section 906 of the Sarbanes-Oxley Act of 2002. (Exhibit filed herewith)
SIGNATURES
Pursuant to the requirements of the Securities Exchange Act of 1934 and the Investment Company Act of 1940, the Registrant has duly caused this report to be signed on its behalf by the undersigned, thereunto duly authorized.
Registrant Forum Funds
| By | /s/ Jessica Chase | | |
| | Jessica Chase, Principal Executive Officer | | |
| Date | November 20, 2017 | | |
Pursuant to the requirements of the Securities Exchange Act of 1934 and the Investment Company Act of 1940, this report has been signed below by the following persons on behalf of the Registrant and in the capacities and on the dates indicated.
| By | /s/ Jessica Chase | | |
| | Jessica Chase, Principal Executive Officer | | |
| Date | November 20, 2017 | | |
| By | /s/ Karen Shaw | | |
| | Karen Shaw, Principal Financial Officer | | |
| Date | November 20, 2017 | | |