As filed with the Securities and Exchange Commission on October 30, 2018
UNITED STATES
SECURITIES AND EXCHANGE COMMISSION
WASHINGTON, D.C. 20549
FORM N-CSR
CERTIFIED SHAREHOLDER REPORT OF REGISTERED MANAGEMENT
INVESTMENT COMPANIES
Investment Company Act file number 811-03023
FORUM FUNDS
Three Canal Plaza, Suite 600
Portland, Maine 04101
Jessica Chase, Principal Executive Officer
Three Canal Plaza, Suite 600
Portland, Maine 04101
207-347-2000
Date of fiscal year end: August 31
Date of reporting period: September 1, 2017 – August 31, 2018
ITEM 1. REPORT TO STOCKHOLDERS.
TABLE OF CONTENTS
| A Message to Our Shareholders (Unaudited) | 1 |
| Performance Chart and Analysis (Unaudited) | 3 |
| Schedule of Investments | 4 |
| Schedule of Call and Put Options Written | 7 |
| Notes to Schedules of Investments and Call and Put Options Written | 8 |
| Statement of Assets and Liabilities | 10 |
| Statement of Operations | 11 |
| Statements of Changes in Net Assets | 12 |
| Financial Highlights | 13 |
| Notes to Financial Statements | 15 |
| Report of Independent Registered Public Accounting Firm | 21 |
| Additional Information (Unaudited) | 22 |
IMPORTANT INFORMATION
The views expressed in this report are those of the MAI Managed Volatility Fund (the “Fund”) managers as of August 31, 2018, and may not reflect their views on the date this report is first published or anytime thereafter. These views are intended to assist shareholders of the Fund in understanding their investments in the Fund and do not constitute investment advice.
An investment in the Fund is subject to risk, including the possible loss of principal amount invested. The Fund may invest in securities issued by smaller and medium-sized companies, which typically involves greater risk than investing in larger, more established companies. Selling call options risk occurs if the Fund is required to sell an underlying security and forego gains if the market price exceeds the exercise price before the expiration date. Selling put options risk occurs if the Fund is required to buy an underlying security and forego gains if the market price is below the exercise price before the expiration date. Option risks include, but are not limited to, the possibility of an imperfect correlation between the movement in the options’ prices and that of the securities/indices hedged (or used for cover), which may render a given hedge unable to achieve its objective; possible loss of the premium paid for options; and potential inability to benefit from the appreciation of an underlying security above the exercise price. ADRs (American Depositary Receipt) may be subject to international trade, currency, political, regulatory and diplomatic risks. The Fund is also subject to other risks, such as fixed-income securities risk, which are detailed in the Fund’s prospectus. Diversification does not assure a profit or protect against a loss in a declining market.
A put is an option contract giving the owner the right, but not the obligation, to sell a specified amount of an underlying asset at a set price within a specified time. A cash-secured put is a put for which the writer deposits an amount of cash equal to the option’s exercise price. A call is an option contract giving the owner the right (but not the obligation) to buy a specified amount of an underlying security at a specified price within a specified time. A covered call is an options strategy whereby an investor holds a (long) position in an asset and writes (sells) call options on that same asset in an effort to, potentially, generate increased income from the asset. A call option is out-of-the-money if the stock price is below its strike price and a put option is out-of-the-money if the stock price is above its strike price. The spread to strike price is the difference between the current price of the security and the strike price. Strike price is the price at which a specific options contract can be exercised. Beta is a measure of a fund’s sensitivity to market movements. A portfolio with a beta greater than 1 is more volatile than the market, and a portfolio with a beta less than 1 is less volatile than the market. Premium realized through the sale of options is not distributable as quarterly income. Sharpe ratio measures risk-adjusted performance. The greater a portfolio’s sharpe ratio, the better its risk-adjusted performance has been. Standard deviation is a statistical measure of the volatility of the fund’s returns. In general, the higher the standard deviation, the greater the volatility of the return.
MAI MANAGED VOLATILITY FUND
A MESSAGE TO OUR SHAREHOLDERS (Unaudited)
AUGUST 31, 2018
Dear Shareholder,
Over the fiscal year ending August 31, 2018, the MAI Managed Volatility Income Fund’s (the “Fund”) Institutional Class returned 9.02%. Over the same period, the S&P 500® Index (the “S&P 500”) gained 19.66%. Volatility of the Fund's monthly returns, as measured by standard deviation, was 4.15% compared to 9.08% for the S&P 500 enabling the Fund to exhibit a risk-adjusted return slightly below the market’s as reflected in their Sharpe ratios of 1.81 and 2.00 respectively.
The Fund seeks to achieve capital appreciation and income; however we differ from a traditional long equity fund in our equity exposure and use of an option overlay strategy. Premiums received from writing options provide a potential source of return to the Fund that is not dependent on economic growth.
In early 2017 we began to become more selective in writing puts on individual equities while maintaining the option revenue generation rate by writing puts on indexes. In our letter last year we noted that we were expanding the Fund’s option strategy to write call options on indexes too. We believe that this has worked very well in a market that has narrowed in its leadership but is still exhibiting volatility well below its long term average.
Index options have become an important tool for managing volatility. Consistent with our thoughts since inception, we believe the combination of equity contribution, option premiums, dividends and interest income positions the Fund to pursue its objective with less downside deviation than traditional equity investment strategies by, in effect, managing volatility.
In the past year, the Fund’s limited equity allocation, combined with the strong performance of stocks - and growth stocks in particular - were the primary drivers of the gap between the Fund’s performance and a market that was increasingly driven by a narrowing group of the largest capitalization firms.
The evolution of the strategy to utilize more index options has reduced the impact of dispersion within the equity portfolio, increased tax efficiency and, in combination with a relatively stable group of underliers, has contributed to our lowest turnover ratios to date.
As we continue to manage through a low volatility environment, option premiums and dividends combined have been at the lower end of the range we target, however, we are getting increased contribution from interest income on collateral.
As the U.S. Federal Reserve has continued its march to normalize U.S. monetary policy, the short end of the yield curve has risen. This has enabled us to make better use of our collateral and collect a measurable amount of interest income while maintaining a low risk profile and necessary liquidity. Treasury securities continue to make up the bulk of the Fund’s cash collateral portfolio.
While we hope this ten year, record setting bull market continues for the next several years, we believe the likelihood of that actually happening is improbable. While earnings growth has been impressive, the tailwind of U.S. federal tax reform is responsible for a significant portion of the earnings growth; we believe this effect will moderate over the next year. The U.S. Federal Reserve continues to raise rates and the yield curve has flirted with inversion. On a price/earnings basis valuations are fair at best. With our emphasis on managing portfolio volatility we believe we are part of the preparation process, and when markets become volatile we want to be a resource for our investors.
We thank you for your support.
MAI MANAGED VOLATILITY FUND
A MESSAGE TO OUR SHAREHOLDERS (Unaudited)
AUGUST 31, 2018
Sincerely,
 |  |  |
| | | |
| Seth E. Shalov | Kurt D. Nye | Richard J. Buoncore |
MAI MANAGED VOLATILITY FUND
PERFORMANCE CHART AND ANALYSIS (Unaudited)
AUGUST 31, 2018
The following chart reflects the change in the value of a hypothetical $50,000 investment in the Institutional Class, including reinvested dividends and distributions, in the MAI Managed Volatility Fund (the “Fund”) compared with the performance of the benchmark, the S&P 500 Index (“S&P 500”), since inception. The S&P 500 is a broad-based measurement of the U.S. stock market based on the performance of 500 widely held large capitalization common stocks. The total return of the index includes the reinvestment of dividends and income. The total return of the Fund includes operating expenses that reduce returns, while the total return of the index does not include expenses. The Fund is professionally managed, while the index is unmanaged and is not available for investment.
Comparison of Change in Value of a $50,000 Investment
MAI Managed Volatility Fund - Institutional Class vs. S&P 500 Index
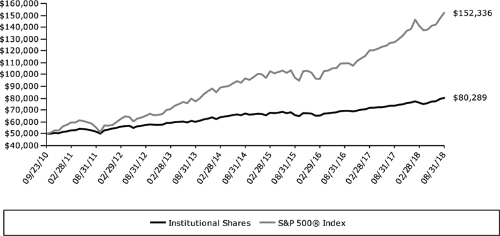
Average Annual Total Returns
Periods Ended August 31, 2018 | | One Year | | | Five Year | | | Since
Inception* | |
| MAI Managed Volatility Fund - Institutional Class | | | 9.02 | % | | | 6.00 | % | | | 6.15 | % |
| MAI Managed Volatility Fund - Investor Class | | | 8.81 | % | | | 5.79 | % | | | 5.81 | % |
| S&P 500 Index (since September 23, 2010) | | | 19.66 | % | | | 14.52 | % | | | 15.07 | % |
| * | Institutional Class and Investor Class commenced operations on September 23, 2010, and December 2, 2010, respectively. |
Performance data quoted represents past performance and is no guarantee of future results. Current performance may be lower or higher than the performance data quoted. Investment return and principal value will fluctuate so that shares, when redeemed, may be worth more or less than original cost. As stated in the Fund’s prospectus, the annual operating expense ratios (gross) for Institutional Class and Investor Class are 1.18% and 4.66%, respectively. However, the Fund’s Adviser has contractually agreed to waive its fee and/or reimburse Fund expenses to limit Total Annual Fund Operating Expenses After Fee Waiver and/or Expense Reimbursement (excluding other expenses, taxes, leverage interest, acquired fund fees and expenses, dividends or interest on short positions, other interest expenses, brokerage commissions, and extraordinary expenses such as litigation) to 0.99% and 1.24%, for Institutional Class and Investor Class, respectively, through January 1, 2019 (the “Expense Cap”). The net operating expenses after fee waiver and/or expense reimbursements are 1.03% and 1.28%, respectively. The Adviser may be reimbursed by the Fund for fees waived and expenses reimbursed by the Adviser pursuant to the Expense Cap if such payment is made within three years of the fee waiver or expense reimbursement, and does not cause the Total Annual Fund Operating Expenses After Fee Waiver and/or Expense Reimbursement to exceed the lesser of (i) the then-current expense cap, or (ii) the expense cap in place at the time the fees/expenses were waived/reimbursed. During the period, certain fees were waived and/or expenses reimbursed; otherwise, returns would have been lower. The performance table and graph do not reflect the deduction of taxes that a shareholder would pay on Fund distributions or the redemption of Fund shares. Returns greater than one year are annualized. For the most recent month-end performance, please call (877) 414-7884.
MAI MANAGED VOLATILITY FUND
SCHEDULE OF INVESTMENTS
AUGUST 31, 2018
| Shares | | | Security Description | | Value | |
| Common Stock - 51.8% | | | |
| Communications - 1.5% | | | |
| | 31,522 | | | AT&T, Inc. | | $ | 1,006,813 | |
| | 16,900 | | | Verizon Communications, Inc. | | | 918,853 | |
| | | | | | | | 1,925,666 | |
| Consumer Discretionary - 5.4% | | | | |
| | 700 | | | Amazon.com, Inc. (a)(b) | | | 1,408,897 | |
| | 30,000 | | | Comcast Corp., Class A | | | 1,109,700 | |
| | 2,600 | | | McDonald's Corp. | | | 421,798 | |
| | 9,900 | | | NIKE, Inc., Class B | | | 813,780 | |
| | 9,300 | | | The Home Depot, Inc. | | | 1,867,161 | |
| | 11,100 | | | The Walt Disney Co. | | | 1,243,422 | |
| | | | | | | | 6,864,758 | |
| Consumer Staples - 4.4% | | | | |
| | 11,600 | | | Altria Group, Inc. | | | 678,832 | |
| | 6,600 | | | Anheuser-Busch InBev SA/NV, ADR | | | 615,318 | |
| | 1,200 | | | Costco Wholesale Corp. | | | 279,756 | |
| | 8,900 | | | CVS Health Corp. | | | 669,636 | |
| | 5,400 | | | Diageo PLC, ADR | | | 752,814 | |
| | 15,500 | | | Mondelez International, Inc., Class A | | | 662,160 | |
| | 9,300 | | | PepsiCo., Inc. | | | 1,041,693 | |
| | 5,000 | | | The Procter & Gamble Co. | | | 414,750 | |
| | 5,800 | | | Walmart, Inc. | | | 555,988 | |
| | | | | | | | 5,670,947 | |
| Energy - 4.2% | | | | |
| | 6,000 | | | Chevron Corp. | | | 710,760 | |
| | 5,700 | | | EOG Resources, Inc. | | | 673,911 | |
| | 10,500 | | | Exxon Mobil Corp. | | | 841,785 | |
| | 57,500 | | | Kinder Morgan, Inc. | | | 1,017,750 | |
| | 7,500 | | | Marathon Petroleum Corp. | | | 617,175 | |
| | 8,800 | | | Occidental Petroleum Corp. | | | 702,856 | |
| | 12,900 | | | Schlumberger, Ltd. | | | 814,764 | |
| | | | | | | | 5,379,001 | |
| Financials - 7.1% | | | | |
| | 49,000 | | | Bank of America Corp. | | | 1,515,570 | |
| | 3,900 | | | Berkshire Hathaway, Inc., Class B (a) | | | 814,008 | |
| | 6,500 | | | Chubb, Ltd. | | | 879,060 | |
| | 13,200 | | | Citigroup, Inc. | | | 940,368 | |
| | 11,900 | | | JPMorgan Chase & Co. | | | 1,363,502 | |
| | 14,000 | | | MetLife, Inc. | | | 642,460 | |
| | 12,000 | | | The Charles Schwab Corp. | | | 609,480 | |
| | 15,800 | | | U.S. Bancorp | | | 854,938 | |
| | 24,400 | | | Wells Fargo & Co. | | | 1,426,912 | |
| | | | | | | | 9,046,298 | |
| Health Care - 7.4% | | | | |
| | 14,700 | | | Abbott Laboratories | | | 982,548 | |
| | 6,600 | | | AbbVie, Inc. | | | 633,468 | |
| | 2,400 | | | Allergan PLC | | | 460,104 | |
| | 6,500 | | | Amgen, Inc. | | | 1,298,765 | |
| | 10,600 | | | Bristol-Myers Squibb Co. | | | 641,830 | |
| | 4,000 | | | Gilead Sciences, Inc. | | | 302,920 | |
| | 9,100 | | | Johnson & Johnson | | | 1,225,679 | |
| | 10,025 | | | Medtronic PLC | | | 966,510 | |
| | 6,300 | | | Merck & Co., Inc. | | | 432,117 | |
| | 19,900 | | | Pfizer, Inc. | | | 826,248 | |
| | 6,200 | | | UnitedHealth Group, Inc. | | | 1,664,452 | |
| | | | | | | | 9,434,641 | |
See Notes to Financial Statements.
4
MAI MANAGED VOLATILITY FUND
SCHEDULE OF INVESTMENTS
AUGUST 31, 2018
| Shares | | | Security Description | | Value | |
| Industrials - 5.0% | | | |
| | 74,500 | | | General Electric Co. | | $ | 964,030 | |
| | 8,500 | | | Honeywell International, Inc. | | | 1,352,010 | |
| | 3,700 | | | Raytheon Co. | | | 737,928 | |
| | 3,300 | | | The Boeing Co. | | | 1,131,207 | |
| | 4,600 | | | Union Pacific Corp. | | | 692,852 | |
| | 7,200 | | | United Parcel Service, Inc., Class B | | | 884,736 | |
| | 5,000 | | | United Technologies Corp. | | | 658,500 | |
| | | | | | | | 6,421,263 | |
| Information Technology - 13.2% | | | | |
| | 1,400 | | | Alphabet, Inc., Class A (a) | | | 1,724,520 | |
| | 12,700 | | | Apple, Inc. | | | 2,890,901 | |
| | 2,400 | | | Broadcom, Inc. | | | 525,672 | |
| | 27,300 | | | Cisco Systems, Inc. | | | 1,304,121 | |
| | 7,000 | | | Facebook, Inc., Class A (a) | | | 1,230,110 | |
| | 16,100 | | | Intel Corp. | | | 779,723 | |
| | 27,000 | | | Microsoft Corp. (b) | | | 3,032,910 | |
| | 23,800 | | | Oracle Corp. | | | 1,156,204 | |
| | 17,000 | | | QUALCOMM, Inc. | | | 1,168,070 | |
| | 14,400 | | | Visa, Inc., Class A | | | 2,115,216 | |
| | 11,200 | | | Xilinx, Inc. | | | 871,696 | |
| | | | | | | | 16,799,143 | |
| Materials - 1.1% | | | | |
| | 2,200 | | | Air Products & Chemicals, Inc. | | | 365,838 | |
| | 15,700 | | | DowDuPont, Inc. | | | 1,101,041 | |
| | | | | | | | 1,466,879 | |
| Real Estate - 1.2% | | | | |
| | 4,300 | | | American Tower Corp. REIT | | | 641,216 | |
| | 24,000 | | | Weyerhaeuser Co. REIT | | | 833,040 | |
| | | | | | | | 1,474,256 | |
| Utilities - 1.3% | | | | |
| | 9,700 | | | NextEra Energy, Inc. | | | 1,649,970 | |
| | | | | | | | | |
| Total Common Stock (Cost $54,875,557) | | | 66,132,822 | |
| Principal | | Security Description | | Rate | | | Maturity | | | Value | |
| Fixed Income Securities - 35.8% | | | | | | | | | |
| Corporate Non-Convertible Bond - 0.4% | | | | | | | | | |
| Financial - 0.4% | | | | | | | | | |
| $ | 483,000 | | JPMorgan Chase & Co. | | | | | | | | | | | | |
| | | (Cost $479,870) | | | 2.20 | % | | | 10/22/19 | | | | 480,136 | |
| | | | | | | | | | |
| U.S. Government & Agency Obligations - 35.4% | | | | | | | | | |
| U.S. Treasury Securities - 35.4% | | | | | | | | | |
| | 6,050,000 | | U.S. Treasury Bill (c) | | | 1.28 | | | | 09/13/18 | | | | 6,047,123 | |
| | 3,000,000 | | U.S. Treasury Bill (c) | | | 1.41 | | | | 10/11/18 | | | | 2,993,964 | |
| | 3,000,000 | | U.S. Treasury Bill (c) | | | 1.50 | | | | 11/08/18 | | | | 2,988,977 | |
| | 3,040,000 | | U.S. Treasury Bill (c) | | | 1.65 | | | | 12/06/18 | | | | 3,023,645 | |
| | 3,040,000 | | U.S. Treasury Bill (c) | | | 1.78 | | | | 01/03/19 | | | | 3,018,364 | |
| | 3,080,000 | | U.S. Treasury Bill (c) | | | 1.86 | | | | 01/31/19 | | | | 3,052,210 | |
| | 3,100,000 | | U.S. Treasury Bill (c) | | | 2.02 | | | | 02/28/19 | | | | 3,066,278 | |
| | 3,030,000 | | U.S. Treasury Bill (c) | | | 2.21 | | | | 04/25/19 | | | | 2,985,729 | |
| | 6,060,000 | | U.S. Treasury Bill (c) | | | 2.30 | | | | 06/20/19 | | | | 5,947,622 | |
| | 6,100,000 | | U.S. Treasury Bill (c) | | | 2.42 | | | | 08/15/19 | | | | 5,961,161 | |
| | 6,130,000 | | U.S. Treasury Note | | | 2.25 | | | | 03/31/20 | | | | 6,097,794 | |
| | | | | | | | | | | | 45,182,867 | |
| Total U.S. Government & Agency Obligations (Cost $45,223,489) | | | | | | | | | | | 45,182,867 | |
| Total Fixed Income Securities (Cost $45,703,359) | | | | | | | | | | | 45,663,003 | |
See Notes to Financial Statements.
5
MAI MANAGED VOLATILITY FUND
SCHEDULE OF INVESTMENTS
AUGUST 31, 2018
| Shares | | Security Description | | Value | |
| Money Market Fund - 11.1% | | | |
| 14,233,020 | | Fidelity Investments Money Market Government Portfolio, Class I, 1.82% (d)(e) | | | | |
| | | (Cost $14,233,020) | | $ | 14,233,020 | |
| | | | | | | |
| Investments, at value - 98.7% (Cost $114,811,936) | | $ | 126,028,845 | |
| Total Written Options - (0.8)% (Premiums Received $(798,017)) | | | (1,047,652 | ) |
| Other Assets & Liabilities, Net - 2.1% | | | 2,719,403 | |
| Net Assets - 100.0% | | $ | 127,700,596 | |
See Notes to Financial Statements.
6
MAI MANAGED VOLATILITY FUND
SCHEDULE OF CALL AND PUT OPTIONS WRITTEN
AUGUST 31, 2018
| Contracts | | | Security Description | | Strike Price | | | Exp. Date | | Notional Contract
Value | | | Value | |
| Written Options - (0.8)% | | | | | | | | | |
| Call Options Written - (0.7)% | | | | | | | | | | | | |
| | (3 | ) | | Amazon.com, Inc. | | $ | 1,820 | | | | 10/18 | | $ | 603,813 | | | $ | (63,300 | ) |
| | (6 | ) | | CBOE S&P 500 INDEX S&P 500 | | | 2,840 | | | | 09/18 | | | 1,740,912 | | | | (44,520 | ) |
| | (9 | ) | | CBOE S&P 500 INDEX S&P 500 | | | 2,880 | | | | 09/18 | | | 2,611,368 | | | | (40,599 | ) |
| | (26 | ) | | CBOE S&P 500 INDEX S&P 500 | | | 2,850 | | | | 09/18 | | | 7,543,952 | | | | (182,130 | ) |
| | (14 | ) | | CBOE S&P 500 INDEX S&P 500 | | | 2,835 | | | | 09/18 | | | 4,062,128 | | | | (116,060 | ) |
| | (10 | ) | | CBOE S&P 500 INDEX S&P 500 | | | 2,900 | | | | 10/18 | | | 2,901,520 | | | | (44,600 | ) |
| | (35 | ) | | CBOE S&P 500 INDEX S&P 500 | | | 2,880 | | | | 10/18 | | | 10,155,320 | | | | (200,900 | ) |
| | (5 | ) | | CBOE S&P 500 INDEX S&P 500 | | | 2,850 | | | | 10/18 | | | 1,450,760 | | | | (40,425 | ) |
| | (6 | ) | | CBOE S&P 500 INDEX S&P 500 | | | 2,890 | | | | 10/18 | | | 1,740,912 | | | | (35,190 | ) |
| | (5 | ) | | CBOE S&P 500 INDEX S&P 500 | | | 2,920 | | | | 11/18 | | | 1,450,760 | | | | (24,640 | ) |
| | (9 | ) | | CBOE S&P 500 INDEX S&P 500 | | | 2,900 | | | | 11/18 | | | 2,611,368 | | | | (55,710 | ) |
| | (106 | ) | | Microsoft Corp. | | | 110 | | | | 10/18 | | | 1,190,698 | | | | (48,230 | ) |
| Total Call Options Written (Premiums Received $(358,231)) | | | | | | | | | | (896,304 | ) |
| Put Options Written - (0.1)% | | | | | | | | | | | |
| | (3 | ) | | CBOE S&P 500 INDEX S&P 500 | | | 2,675 | | | | 09/18 | | | 802,500 | | | | (180 | ) |
| | (5 | ) | | CBOE S&P 500 INDEX S&P 500 | | | 2,575 | | | | 09/18 | | | 1,287,500 | | | | (825 | ) |
| | (9 | ) | | CBOE S&P 500 INDEX S&P 500 | | | 2,550 | | | | 09/18 | | | 2,295,000 | | | | (1,305 | ) |
| | (5 | ) | | CBOE S&P 500 INDEX S&P 500 | | | 2,675 | | | | 09/18 | | | 1,337,500 | | | | (2,025 | ) |
| | (16 | ) | | CBOE S&P 500 INDEX S&P 500 | | | 2,660 | | | | 09/18 | | | 4,256,000 | | | | (6,000 | ) |
| | (5 | ) | | CBOE S&P 500 INDEX S&P 500 | | | 2,650 | | | | 09/18 | | | 1,325,000 | | | | (1,800 | ) |
| | (21 | ) | | CBOE S&P 500 INDEX S&P 500 | | | 2,620 | | | | 09/18 | | | 5,502,000 | | | | (6,615 | ) |
| | (5 | ) | | CBOE S&P 500 INDEX S&P 500 | | | 2,575 | | | | 09/18 | | | 1,287,500 | | | | (1,313 | ) |
| | (10 | ) | | CBOE S&P 500 INDEX S&P 500 | | | 2,800 | | | | 10/18 | | | 2,800,000 | | | | (16,200 | ) |
| | (10 | ) | | CBOE S&P 500 INDEX S&P 500 | | | 2,650 | | | | 10/18 | | | 2,650,000 | | | | (7,000 | ) |
| | (6 | ) | | CBOE S&P 500 INDEX S&P 500 | | | 2,640 | | | | 10/18 | | | 1,584,000 | | | | (4,050 | ) |
| | (22 | ) | | CBOE S&P 500 INDEX S&P 500 | | | 2,630 | | | | 10/18 | | | 5,786,000 | | | | (14,190 | ) |
| | (10 | ) | | CBOE S&P 500 INDEX S&P 500 | | | 2,755 | | | | 10/18 | | | 2,755,000 | | | | (16,200 | ) |
| | (6 | ) | | CBOE S&P 500 INDEX S&P 500 | | | 2,700 | | | | 10/18 | | | 1,620,000 | | | | (7,260 | ) |
| | (16 | ) | | CBOE S&P 500 INDEX S&P 500 | | | 2,650 | | | | 10/18 | | | 4,240,000 | | | | (15,360 | ) |
| | (5 | ) | | CBOE S&P 500 INDEX S&P 500 | | | 2,750 | | | | 11/18 | | | 1,375,000 | | | | (11,925 | ) |
| | (5 | ) | | CBOE S&P 500 INDEX S&P 500 | | | 2,695 | | | | 11/18 | | | 1,347,500 | | | | (8,875 | ) |
| | (10 | ) | | CBOE S&P 500 INDEX S&P 500 | | | 2,640 | | | | 11/18 | | | 2,640,000 | | | | (13,850 | ) |
| | (5 | ) | | CBOE S&P 500 INDEX S&P 500 | | | 2,630 | | | | 11/18 | | | 1,315,000 | | | | (6,650 | ) |
| | (5 | ) | | CBOE S&P 500 INDEX S&P 500 | | | 2,660 | | | | 11/18 | | | 1,330,000 | | | | (9,725 | ) |
| Total Put Options Written (Premiums Received $(439,786)) | | | | | | | | | | | | (151,348 | ) |
| Total Written Options - (0.8)% | | | | | | | | | | | | | | |
| (Premiums Received $(798,017)) | | | | | | | | | | | | $ | (1,047,652 | ) |
See Notes to Financial Statements.
7
MAI MANAGED VOLATILITY FUND
NOTES TO SCHEDULES OF INVESTMENTS AND CALL AND PUT OPTIONS WRITTEN
AUGUST 31, 2018
| ADR | American Depositary Receipt |
| PLC | Public Limited Company |
| REIT | Real Estate Investment Trust |
| (a) | Non-income producing security. |
| (b) | Subject to call option written by the Fund. |
| (c) | Rate presented is yield to maturity. |
| (d) | All or a portion of this security is held as collateral for written options. |
| (e) | Dividend yield changes daily to reflect current market conditions. Rate was the quoted yield as of August 31, 2018. |
The following is a summary of the inputs used to value the Fund's investments and other financial instruments and liabilities as of August 31, 2018.
The inputs or methodology used for valuing securities are not necessarily an indication of the risks associated with investing in those securities. For more information on valuation inputs, and their aggregation into the levels used in the table below, please refer to the Security Valuation section in Note 2 of the accompanying Notes to Financial Statements.
| | | Level 1 | | | Level 2 | | | Level 3 | | | Total | |
| Assets | | | | | | | | | | | | |
| Investments at Value | | | | | | | | | | | | |
| Common Stock | | | | | | | | | | | | | | | | |
| Communications | | $ | 1,925,666 | | | $ | – | | | $ | – | | | $ | 1,925,666 | |
| Consumer Discretionary | | | 6,864,758 | | | | – | | | | – | | | | 6,864,758 | |
| Consumer Staples | | | 5,670,947 | | | | – | | | | – | | | | 5,670,947 | |
| Energy | | | 5,379,001 | | | | – | | | | – | | | | 5,379,001 | |
| Financials | | | 9,046,298 | | | | – | | | | – | | | | 9,046,298 | |
| Health Care | | | 9,434,641 | | | | – | | | | – | | | | 9,434,641 | |
| Industrials | | | 6,421,263 | | | | – | | | | – | | | | 6,421,263 | |
| Information Technology | | | 16,799,143 | | | | – | | | | – | | | | 16,799,143 | |
| Materials | | | 1,466,879 | | | | – | | | | – | | | | 1,466,879 | |
| Real Estate | | | 1,474,256 | | | | – | | | | – | | | | 1,474,256 | |
| Utilities | | | 1,649,970 | | | | – | | | | – | | | | 1,649,970 | |
| Corporate Non-Convertible Bond | | | – | | | | 480,136 | | | | – | | | | 480,136 | |
| U.S. Government & Agency Obligations | | | – | | | | 45,182,867 | | | | – | | | | 45,182,867 | |
| Money Market Fund | | | – | | | | 14,233,020 | | | | – | | | | 14,233,020 | |
| Investments at Value | | $ | 66,132,822 | | | $ | 59,896,023 | | | $ | – | | | $ | 126,028,845 | |
| Total Assets | | $ | 66,132,822 | | | $ | 59,896,023 | | | $ | – | | | $ | 126,028,845 | |
| | | | | | | | | | | | | | | | | |
| Liabilities | | | | | | | | | | | | | | | | |
| Other Financial Instruments* | | | | | | | | | | | | | | | | |
| Written Options | | | (378,674 | ) | | | (668,978 | ) | | | – | | | | (1,047,652 | ) |
| Total Liabilities | | $ | (378,664 | ) | | $ | (668,978 | ) | | $ | – | | | $ | (1,047,652 | ) |
| * | Other Financial Instruments are derivative instruments reflected in separate schedules such as written options, which appear in the Schedule of Call and Put Options Written and are valued at their market value at year end. |
The Fund utilizes the end of period methodology when determining transfers. There were no transfers among Level 1, Level 2 and Level 3 for the year ended August 31, 2018.
| PORTFOLIO HOLDINGS | |
| % of Net Assets | |
| Common Stock | 51.8% |
| Corporate Non-Convertible Bond | 0.4% |
| U.S. Government & Agency Obligations | 35.4% |
| Money Market Fund*** | 11.1% |
| Written Options | (0.8)% |
| Other Assets & Liabilities, Net | 2.1% |
| | 100.0% |
| *** | Used to meet the collateral requirements of a tri-party agreement between the prime broker, custodian and the Fund. |
See Notes to Financial Statements.
8
MAI MANAGED VOLATILITY FUND
NOTES TO SCHEDULES OF INVESTMENTS AND CALL AND PUT OPTIONS WRITTEN
AUGUST 31, 2018
| PORTFOLIO HOLDINGS | |
| % of Common Stock | |
| Information Technology | 25.4% |
| Health Care | 14.3% |
| Financials | 13.7% |
| Consumer Discretionary | 10.4% |
| Industrials | 9.7% |
| Consumer Staples | 8.6% |
| Energy | 8.1% |
| Communications | 2.9% |
| Utilities | 2.5% |
| Materials | 2.2% |
| Real Estate | 2.2% |
| | 100.0% |
See Notes to Financial Statements.
9
MAI MANAGED VOLATILITY FUND
STATEMENT OF ASSETS AND LIABILITIES
AUGUST 31, 2018
| ASSETS | | | |
| Investments, at value (Cost $114,811,936) | | $ | 126,028,845 | |
| Deposits with broker | | | 1,808,014 | |
| Receivables: | | | | |
| Fund shares sold | | | 746,573 | |
| Investment securities sold | | | 18,669 | |
| Dividends and interest | | | 235,077 | |
| Prepaid expenses | | | 23,963 | |
| Total Assets | | | 128,861,141 | |
| | | | | |
| LIABILITIES | | | | |
| Call options written, at value (Premiums received $358,231) | | | 896,304 | |
| Put options written, at value (Premiums received $439,786) | | | 151,348 | |
| Payables: | | | | |
| Fund shares redeemed | | | 243 | |
| Accrued Liabilities: | | | | |
| Investment adviser fees | | | 51,075 | |
| Fund services fees | | | 19,630 | |
| Other expenses | | | 41,945 | |
| Total Liabilities | | | 1,160,545 | |
| | | | | |
| NET ASSETS | | $ | 127,700,596 | |
| | | | | |
| COMPONENTS OF NET ASSETS | | | | |
| Paid-in capital | | $ | 115,730,795 | |
| Undistributed net investment income | | | 255,198 | |
| Accumulated net realized gain | | | 747,329 | |
| Net unrealized appreciation | | | 10,967,274 | |
| NET ASSETS | | $ | 127,700,596 | |
| | | | | |
| SHARES OF BENEFICIAL INTEREST AT NO PAR VALUE (UNLIMITED SHARES AUTHORIZED) | | | | |
| Institutional Shares | | | 10,714,866 | |
| Investor Shares | | | 40,160 | |
| | | | | |
| NET ASSET VALUE, OFFERING AND REDEMPTION PRICE PER SHARE | | | | |
| Institutional Shares (based on net assets of $127,214,437) | | $ | 11.87 | |
| Investor Shares (based on net assets of $486,159) | | $ | 12.11 | |
See Notes to Financial Statements.
10
MAI MANAGED VOLATILITY FUND
STATEMENT OF OPERATIONS
YEAR ENDED AUGUST 31, 2018
| INVESTMENT INCOME | | | |
| Dividend income (Net of foreign withholding taxes of $5,647) | | $ | 1,601,302 | |
| Interest income | | | 630,840 | |
| Total Investment Income | | | 2,232,142 | |
| | | | | |
| EXPENSES | | | | |
| Investment adviser fees | | | 909,738 | |
| Fund services fees | | | 197,499 | |
| Transfer agent fees: | | | | |
| Institutional Shares | | | 26,620 | |
| Investor Shares | | | 2,622 | |
| Non 12b-1 shareholder servicing fees: | | | | |
| Institutional Shares | | | 85,298 | |
| Investor Shares | | | 556 | |
| Distribution fees: | | | | |
| Investor Shares | | | 1,308 | |
| Custodian fees | | | 14,378 | |
| Registration fees: | | | | |
| Institutional Shares | | | 19,580 | |
| Investor Shares | | | 18,172 | |
| Professional fees | | | 57,910 | |
| Trustees' fees and expenses | | | 9,018 | |
| Other expenses | | | 45,464 | |
| Total Expenses | | | 1,388,163 | |
| Fees waived | | | (185,998 | ) |
| Net Expenses | | | 1,202,165 | |
| | | | | |
| NET INVESTMENT INCOME | | | 1,029,977 | |
| | | | | |
| NET REALIZED AND UNREALIZED GAIN (LOSS) | | | | |
| Net realized gain on: | | | | |
| Investments | | | 1,177,097 | |
| Written options | | | 1,442,441 | |
| Net realized gain | | | 2,619,538 | |
| Net change in unrealized appreciation (depreciation) on: | | | | |
| Investments | | | 7,444,188 | |
| Written options | | | (598,523 | ) |
| Net change in unrealized appreciation (depreciation) | | | 6,845,665 | |
| NET REALIZED AND UNREALIZED GAIN | | | 9,465,203 | |
| INCREASE IN NET ASSETS RESULTING FROM OPERATIONS | | $ | 10,495,180 | |
See Notes to Financial Statements.
11
MAI MANAGED VOLATILITY FUND
STATEMENTS OF CHANGES IN NET ASSETS
| | | For the Years Ended August 31, | |
| | | 2018 | | | 2017 | |
| OPERATIONS | | | | | | |
| Net investment income | | $ | 1,029,977 | | | $ | 638,782 | |
| Net realized gain | | | 2,619,538 | | | | 3,160,747 | |
| Net change in unrealized appreciation (depreciation) | | | 6,845,665 | | | | 2,735,930 | |
| Increase in Net Assets Resulting from Operations | | | 10,495,180 | | | | 6,535,459 | |
| | | | | | | | | |
| DISTRIBUTIONS TO SHAREHOLDERS FROM | | | | | | | | |
| Net investment income: | | | | | | | | |
| Institutional Shares | | | (889,665 | ) | | | (419,779 | ) |
| Net realized gain: | | | | | | | | |
| Institutional Shares | | | (1,995,462 | ) | | | (293,792 | ) |
| Investor Shares | | | (10,333 | ) | | | (1,617 | ) |
| Total Distributions to Shareholders | | | (2,895,460 | ) | | | (715,188 | ) |
| | | | | | | | | |
| CAPITAL SHARE TRANSACTIONS | | | | | | | | |
| Sale of shares: | | | | | | | | |
| Institutional Shares | | | 22,435,014 | | | | 26,096,528 | |
| Investor Shares | | | 15,414 | | | | 34,062 | |
| Reinvestment of distributions: | | | | | | | | |
| Institutional Shares | | | 2,800,086 | | | | 698,511 | |
| Investor Shares | | | 10,333 | | | | 1,617 | |
| Redemption of shares: | | | | | | | | |
| Institutional Shares | | | (22,872,433 | ) | | | (18,731,297 | ) |
| Investor Shares | | | (209,539 | ) | | | (30,267 | ) |
| Increase in Net Assets from Capital Share Transactions | | | 2,178,875 | | | | 8,069,154 | |
| Increase in Net Assets | | | 9,778,595 | | | | 13,889,425 | |
| | | | | | | | | |
| NET ASSETS | | | | | | | | |
| Beginning of Year | | | 117,922,001 | | | | 104,032,576 | |
| End of Year (Including line (a)) | | $ | 127,700,596 | | | $ | 117,922,001 | |
| | | | | | | | | |
| SHARE TRANSACTIONS | | | | | | | | |
| Sale of shares: | | | | | | | | |
| Institutional Shares | | | 1,958,767 | | | | 2,401,968 | |
| Investor Shares | | | 1,303 | | | | 3,071 | |
| Reinvestment of distributions: | | | | | | | | |
| Institutional Shares | | | 247,046 | | | | 65,376 | |
| Investor Shares | | | 896 | | | | 149 | |
| Redemption of shares: | | | | | | | | |
| Institutional Shares | | | (2,014,098 | ) | | | (1,727,950 | ) |
| Investor Shares | | | (18,184 | ) | | | (2,759 | ) |
| Increase in Shares | | | 175,730 | | | | 739,855 | |
| | | | | | | | | |
| (a) Undistributed net investment income | | $ | 255,198 | | | $ | 203,131 | |
See Notes to Financial Statements.
12
MAI MANAGED VOLATILITY FUND
FINANCIAL HIGHLIGHTS
These financial highlights reflect selected data for a share outstanding throughout each year.
| | | For the Years Ended August 31, | |
| | | 2018 | | | 2017 | | | 2016 | | | 2015 | | | 2014 | |
| INSTITUTIONAL CLASS | | | | | | | | | | | | | | | | | | | | |
| NET ASSET VALUE, Beginning of Year | | $ | 11.15 | | | $ | 10.57 | | | $ | 10.40 | | | $ | 11.49 | | | $ | 10.93 | |
| INVESTMENT OPERATIONS | | | | | | | | | | | | | | | | | | | | |
| Net investment income (a) | | | 0.10 | | | | 0.06 | | | | 0.06 | | | | 0.06 | | | | 0.04 | |
| Net realized and unrealized gain (loss) | | | 0.89 | | | | 0.59 | | | | 0.51 | | | | (0.29 | ) | | | 1.18 | |
| Total from Investment Operations | | | 0.99 | | | | 0.65 | | | | 0.57 | | | | (0.23 | ) | | | 1.22 | |
| | | | | | | | | | | | | | | | | | | | | |
| DISTRIBUTIONS TO SHAREHOLDERS FROM | | | | | | | | | | | | | | | | | | | | |
| Net investment income | | | (0.08 | ) | | | (0.04 | ) | | | (0.04 | ) | | | (0.04 | ) | | | (0.03 | ) |
| Net realized gain | | | (0.19 | ) | | | (0.03 | ) | | | (0.36 | ) | | | (0.82 | ) | | | (0.63 | ) |
| Total Distributions to Shareholders | | | (0.27 | ) | | | (0.07 | ) | | | (0.40 | ) | | | (0.86 | ) | | | (0.66 | ) |
| | | | | | | | | | | | | | | | | | | | | |
| NET ASSET VALUE, End of Year | | $ | 11.87 | | | $ | 11.15 | | | $ | 10.57 | | | $ | 10.40 | | | $ | 11.49 | |
| TOTAL RETURN | | | 9.02 | % | | | 6.20 | % | | | 5.65 | % | | | (1.99 | )% | | | 11.62 | % |
| | | | | | | | | | | | | | | | | | | | | |
| RATIOS/SUPPLEMENTARY DATA | | | | | | | | | | | | | | | | | | | | |
| Net Assets at End of Year (000s omitted) | | $ | 127,214 | | | $ | 117,287 | | | $ | 103,436 | | | $ | 105,857 | | | $ | 83,343 | |
| Ratios to Average Net Assets: | | | | | | | | | | | | | | | | | | | | |
| Net investment income | | | 0.85 | % | | | 0.59 | % | | | 0.55 | % | | | 0.53 | % | | | 0.32 | % |
| Net expenses | | | 0.99 | % | | | 0.99 | % | | | 0.99 | % | | | 0.99 | % | | | 0.99 | % |
| Gross expenses (b) | | | 1.13 | % | | | 1.14 | % | | | 1.17 | % | | | 1.11 | % | | | 1.17 | % |
| PORTFOLIO TURNOVER RATE | | | 21 | % | | | 60 | % | | | 85 | % | | | 147 | % | | | 203 | % |
| (a) | Calculated based on average shares outstanding during each year. |
| (b) | Reflects the expense ratio excluding any waivers and/or reimbursements. |
See Notes to Financial Statements.
13
MAI MANAGED VOLATILITY FUND
FINANCIAL HIGHLIGHTS
These financial highlights reflect selected data for a share outstanding throughout each year.
| | | For the Years Ended August 31, |
| | | 2018 | | | 2017 | | | 2016 | | | 2015 | | | 2014 | |
| INVESTOR CLASS | | | | | | | | | | | | | | | | | | | | |
| NET ASSET VALUE, Beginning of Year | | $ | 11.31 | | | $ | 10.71 | | | $ | 10.51 | | | $ | 11.60 | | | $ | 11.00 | |
| INVESTMENT OPERATIONS | | | | | | | | | | | | | | | | | | | | |
| Net investment income (a) | | | 0.07 | | | | 0.04 | | | | 0.03 | | | | 0.03 | | | | 0.01 | |
| Net realized and unrealized gain (loss) | | | 0.92 | | | | 0.59 | | | | 0.53 | | | | (0.30 | ) | | | 1.22 | |
| Total from Investment Operations | | | 0.99 | | | | 0.63 | | | | 0.56 | | | | (0.27 | ) | | | 1.23 | |
| | | | | | | | | | | | | | | | | | | | | |
| DISTRIBUTIONS TO SHAREHOLDERS FROM | | | | | | | | | | | | | | | | | | | | |
| Net realized gain | | | (0.19 | ) | | | (0.03 | ) | | | (0.36 | ) | | | (0.82 | ) | | | (0.63 | ) |
| Total Distributions to Shareholders | | | (0.19 | ) | | | (0.03 | ) | | | (0.36 | ) | | | (0.82 | ) | | | (0.63 | ) |
| | | | | | | | | | | | | | | | | | | | | |
| NET ASSET VALUE, End of Year | | $ | 12.11 | | | $ | 11.31 | | | $ | 10.71 | | | $ | 10.51 | | | $ | 11.60 | |
| TOTAL RETURN | | | 8.81 | % | | | 5.89 | % | | | 5.46 | % | | | (2.33 | )% | | | 11.62 | % |
| | | | | | | | | | | | | | | | | | | | | |
| RATIOS/SUPPLEMENTARY DATA | | | | | | | | | | | | | | | | | | | | |
| Net Assets at End of Year (000s omitted) | | $ | 486 | | | $ | 635 | | | $ | 596 | | | $ | 796 | | | $ | 912 | |
| Ratios to Average Net Assets: | | | | | | | | | | | | | | | | | | | | |
| Net investment income | | | 0.57 | % | | | 0.33 | % | | | 0.29 | % | | | 0.29 | % | | | 0.07 | % |
| Net expenses | | | 1.24 | % | | | 1.24 | % | | | 1.24 | % | | | 1.24 | % | | | 1.24 | % |
| Gross expenses (b) | | | 5.53 | % | | | 4.62 | % | | | 4.33 | % | | | 3.54 | % | | | 3.40 | % |
| PORTFOLIO TURNOVER RATE | | | 21 | % | | | 60 | % | | | 85 | % | | | 147 | % | | | 203 | % |
| (a) | Calculated based on average shares outstanding during each year. |
| (b) | Reflects the expense ratio excluding any waivers and/or reimbursements. |
See Notes to Financial Statements.
14
MAI MANAGED VOLATILITY FUND
NOTES TO FINANCIAL STATEMENTS
AUGUST 31, 2018
Note 1. Organization
The MAI Managed Volatility Fund (the “Fund”) is a diversified portfolio of Forum Funds (the “Trust”). The Trust is a Delaware statutory trust that is registered as an open-end, management investment company under the Investment Company Act of 1940, as amended (the “Act”). Under its Trust Instrument, the Trust is authorized to issue an unlimited number of the Fund’s shares of beneficial interest without par value. The Fund currently offers two classes of shares: Institutional Class and Investor Class. Institutional Class and Investor Class commenced operations on September 23, 2010, and December 2, 2010, respectively. The Fund’s investment objective is income and long-term capital appreciation. Prior to September 28, 2015, the Fund was named Dividend Plus+ Income Fund.
Note 2. Summary of Significant Accounting Policies
The Fund is an investment company and follows accounting and reporting guidance under Financial Accounting Standards Board (“FASB”) Accounting Standards Codification (“ASC”) Topic 946, “Financial Services-Investment Companies”. These financial statements are prepared in accordance with accounting principles generally accepted in the United States of America (“GAAP”), which require management to make estimates and assumptions that affect the reported amounts of assets and liabilities, the disclosure of contingent liabilities at the date of the financial statements, and the reported amounts of increases and decreases in net assets from operations during the fiscal period. Actual amounts could differ from those estimates. The following summarizes the significant accounting policies of the Fund:
Security Valuation – Securities are valued at market prices using the last quoted trade or official closing price from the principal exchange where the security is traded, as provided by independent pricing services on each Fund business day. In the absence of a last trade, securities are valued at the mean of the last bid and ask price provided by the pricing service. Debt securities may be valued at prices supplied by a fund’s pricing agent based on broker or dealer supplied valuations or matrix pricing, a method of valuing securities by reference to the value of other securities with similar characteristics such as rating, interest rate and maturity. Exchange-traded options for which the last quoted sale price is outside the closing bid and ask price, will be valued at the mean of the closing bid and ask price. Short-term investments that mature in sixty days or less may be valued at amortized cost.
The Fund values its investments at fair value pursuant to procedures adopted by the Trust’s Board of Trustees (the “Board”) if (1) market quotations are not readily available or (2) the Adviser, as defined in Note 3, believes that the values available are unreliable. The Trust’s Valuation Committee, as defined in the Fund’s registration statement, performs certain functions as they relate to the administration and oversight of the Fund’s valuation procedures. Under these procedures, the Valuation Committee convenes on a regular and ad hoc basis to review such investments and considers a number of factors, including valuation methodologies and significant unobservable inputs, when arriving at fair value.
The Valuation Committee may work with the Adviser to provide valuation inputs. In determining fair valuations, inputs may include market-based analytics that may consider related or comparable assets or liabilities, recent transactions, market multiples, book values and other relevant investment information. Adviser inputs may include an income-based approach in which the anticipated future cash flows of the investment are discounted in determining fair value. Discounts may also be applied based on the nature or duration of any restrictions on the disposition of the investments. The Valuation Committee performs regular reviews of valuation methodologies, key inputs and assumptions, disposition analysis and market activity.
Fair valuation is based on subjective factors and, as a result, the fair value price of an investment may differ from the security’s market price and may not be the price at which the asset may be sold. Fair
MAI MANAGED VOLATILITY FUND
NOTES TO FINANCIAL STATEMENTS
AUGUST 31, 2018
valuation could result in a different Net Asset Value (“NAV”) than a NAV determined by using market quotes.
GAAP has a three-tier fair value hierarchy. The basis of the tiers is dependent upon the various “inputs” used to determine the value of the Fund’s investments. These inputs are summarized in the three broad levels listed below:
Level 1 – Quoted prices in active markets for identical assets and liabilities.
Level 2 – Prices determined using significant other observable inputs (including quoted prices for similar securities, interest rates, prepayment speeds, credit risk, etc.). Short-term securities with maturities of sixty days or less are valued at amortized cost, which approximates market value, and are categorized as Level 2 in the hierarchy. Municipal securities, long-term U.S. government obligations and corporate debt securities are valued in accordance with the evaluated price supplied by the pricing service and generally categorized as Level 2 in the hierarchy. Other securities that are categorized as Level 2 in the hierarchy include, but are not limited to, warrants that do not trade on an exchange, securities valued at the mean between the last reported bid and ask quotation and international equity securities valued by an independent third party with adjustments for changes in value between the time of the securities respective local market closes and the close of the U.S. market.
Level 3 – Significant unobservable inputs (including the Fund’s own assumptions in determining the fair value of investments).
The aggregate value by input level, as of August 31, 2018, for the Fund’s investments is included in the Fund’s Notes to Schedules of Investments and Call and Put Options Written.
Security Transactions, Investment Income and Realized Gain and Loss – Investment transactions are accounted for on the trade date. Dividend income is recorded on the ex-dividend date. Foreign dividend income is recorded on the ex-dividend date or as soon as possible after determining the existence of a dividend declaration after exercising reasonable due diligence. Income and capital gains on some foreign securities may be subject to foreign withholding taxes, which are accrued as applicable. Interest income is recorded on an accrual basis. Premium is amortized and discount is accreted using the effective interest method. Identified cost of investments sold is used to determine the gain and loss for both financial statement and federal income tax purposes.
Written Options – When a fund writes an option, an amount equal to the premium received by the fund is recorded as a liability and is subsequently adjusted to the current value of the option written. Premiums received from writing options that expire unexercised are treated by the fund on the expiration date as realized gain from written options. The difference between the premium and the amount paid on effecting a closing purchase transaction, including brokerage commissions, is also treated as a realized gain, or if the premium is less than the amount paid for the closing purchase transaction, as a realized loss. If a call option is exercised, the premium is added to the proceeds from the sale of the underlying security in determining whether the fund has realized a gain or loss. If a put option is exercised, the premium reduces the cost basis of the securities purchased by the fund. The fund, as writer of an option, bears the market risk of an unfavorable change in the price of the security underlying the written option. Written options are non-income producing securities.
The values of each individual written option outstanding as of August 31, 2018, are disclosed in the Fund’s Schedule of Call and Put Options Written.
Distributions to Shareholders – Distributions to shareholders of net investment income, if any, are declared and paid at least quarterly. Distributions to shareholders of net capital gains, if any, are declared and paid at least annually. Distributions to shareholders are recorded on the ex-dividend
MAI MANAGED VOLATILITY FUND
NOTES TO FINANCIAL STATEMENTS
AUGUST 31, 2018
date. Distributions are based on amounts calculated in accordance with applicable federal income tax regulations, which may differ from GAAP. These differences are due primarily to differing treatments of income and gain on various investment securities held by the Fund, timing differences and differing characterizations of distributions made by the Fund.
Federal Taxes – The Fund intends to continue to qualify each year as a regulated investment company under Subchapter M of Chapter 1, Subtitle A, of the Internal Revenue Code of 1986, as amended (“Code”), and to distribute all of its taxable income to shareholders. In addition, by distributing in each calendar year substantially all of its net investment income and capital gains, if any, the Fund will not be subject to a federal excise tax. Therefore, no federal income or excise tax provision is required. The Fund files a U.S. federal income and excise tax return as required. The Fund’s federal income tax returns are subject to examination by the Internal Revenue Service for a period of three fiscal years after they are filed. As of August 31, 2018, there are no uncertain tax positions that would require financial statement recognition, de-recognition or disclosure.
Income and Expense Allocation – The Trust accounts separately for the assets, liabilities and operations of each of its investment portfolios. Expenses that are directly attributable to more than one investment portfolio are allocated among the respective investment portfolios in an equitable manner.
The Fund's class-specific expenses are charged to the operations of that class of shares. Income and expenses (other than expenses attributable to a specific class) and realized and unrealized gains or losses on investments are allocated to each class of shares based on the class’ respective net assets to the total net assets of the Fund.
Commitments and Contingencies – In the normal course of business, the Fund enters into contracts that provide general indemnifications by the Fund to the counterparty to the contract. The Fund’s maximum exposure under these arrangements is dependent on future claims that may be made against the Fund and, therefore, cannot be estimated; however, based on experience, the risk of loss from such claims is considered remote. The Fund has determined that none of these arrangements requires disclosure on the Fund’s balance sheet.
Note 3. Fees and Expenses
Investment Adviser – MAI Capital Management, LLC (the “Adviser”) is the investment Adviser to the Fund. Pursuant to an investment advisory agreement, the Adviser receives an advisory fee, payable monthly, from the Fund at an annual rate of 0.75% of the Fund’s average daily net assets.
Distribution – Foreside Fund Services, LLC serves as the Fund’s distributor (the “Distributor”). The Fund has adopted a Distribution Plan (the “Plan”) for Investor Class shares in accordance with Rule 12b-1 of the Act. Under the Plan, the Fund pays the Distributor and/or any other entity as authorized by the Board a fee of up to 0.25% of the average daily net assets of Investor Class shares. The Distributor is not affiliated with the Adviser or Atlantic Fund Administration, LLC (d/b/a Atlantic Fund Services) (“Atlantic”) or their affiliates.
Other Service Providers – Atlantic provides fund accounting, fund administration, compliance and transfer agency services to the Fund. The fees related to these services are included in Fund services fees within the Statement of Operations. Atlantic also provides certain shareholder report production and EDGAR conversion and filing services. Pursuant to an Atlantic services agreement, the Fund pays Atlantic customary fees for its services. Atlantic provides a Principal Executive Officer, a Principal Financial Officer, a Chief Compliance Officer and an Anti-Money Laundering Officer to the Fund, as well as certain additional compliance support functions.
MAI MANAGED VOLATILITY FUND
NOTES TO FINANCIAL STATEMENTS
AUGUST 31, 2018
Trustees and Officers – Through December 31, 2017, the Trust paid each Independent Trustee an annual retainer fee of $50,000 for service to the Trust ($66,000 for the Chairman), and the Audit Committee Chairman and Vice Chairman receive an additional $6,000 annually. Effective January 1, 2018, each Independent Trustee’s annual retainer is $31,000 ($41,000 for the Chairman), and the Audit Committee Chairman receives an additional $2,000 annually. The Trustees and Chairman may receive additional fees for special Board meetings. Each Trustee is also reimbursed for all reasonable out-of-pocket expenses incurred in connection with his or her duties as a Trustee, including travel and related expenses incurred in attending Board meetings. The amount of Trustees’ fees attributable to the Fund is disclosed in the Statement of Operations. Certain officers of the Trust are also officers or employees of the above named service providers, and during their terms of office received no compensation from the Fund.
Note 4. Expense Reimbursements and Fees Waived
The Adviser has contractually agreed to waive its fee and/or reimburse Fund expenses to limit Total Annual Fund Operating Expenses After Fee Waiver and/or Expense Reimbursement (excluding other expenses, taxes, leverage interest, acquired fund fees and expenses, dividends or interest on short positions, other interest expenses, brokerage commissions, and extraordinary expenses such as litigation) to 0.99% and 1.24%, of the Institutional Class and Investor Class, respectively, through January 1, 2019. The contractual waivers may be changed or eliminated at any time with consent of the Board. During the year ended August 31, 2018, fees waived were $185,998.
The Adviser may be reimbursed by the Fund for fees waived and expenses reimbursed by the Adviser pursuant to the Expense Cap if such payment is made within three years of the fee waiver or expense reimbursement, and does not cause the Total Annual Fund Operating Expenses After Fee Waiver and/or Expense Reimbursement to exceed the lesser of (i) the then-current expense cap, or (ii) the expense cap in place at the time the fees/expenses were waived/reimbursed. As of August 31, 2018, $568,705 is subject to recapture by the Adviser.
Note 5. Security Transactions
Investment transactions for the year ended August 31, 2018, excluding U.S. Government and Agency securities and short-term investments, were as follows:
| Purchases | | | Sales |
| $ | 16,472,374 | | | $ | 13,328,633 |
Investment transactions in U.S. Government and Agency securities for the year ended August 31, 2018 were as follows:
| Purchases | | | Sales |
| $ | 6,116,227 | | | $ | - |
Note 6. Summary of Derivative Activity
The volume of open derivative positions may vary on a daily basis as the Fund transacts derivative contracts in order to achieve the exposure desired by the Adviser. The notional value of activity for the year ended August 31, 2018, for any derivative type that was held during the period is as follows:
| Written Options | | $ | (6,899,422 | ) |
The Fund’s use of derivatives during the year ended August 31, 2018, was limited to written options.
MAI MANAGED VOLATILITY FUND
NOTES TO FINANCIAL STATEMENTS
AUGUST 31, 2018
Following is a summary of the effect of derivatives on the Statement of Assets and Liabilities as of August 31, 2018:
| Location | | Equity Contracts | |
| Liability derivatives: | | | | |
| Call options written | | $ | (896,304 | ) |
| Put options written | | | (151,348 | ) |
| Total liability derivatives | | $ | (1,047,652 | ) |
Realized and unrealized gains and losses on derivatives contracts during the year ended August 31, 2018 by the Fund are recorded in the following locations on the Statement of Operations:
| Location | | Equity Contracts | |
| Net realized gain on: | | | | |
| Written options | | $ | 1,442,441 | |
| | | | | |
| Net change in unrealized | | | | |
| appreciation (depreciation) on: | | | | |
| Written options | | $ | (598,523 | ) |
Asset (Liability) amounts shown in the table below represent amounts for derivative related investments at August 31, 2018. These amounts may be collateralized by cash or financial instruments.
| | | Gross Asset (Liability) as Presented in the Statement of Assets and Liabilities | | | Financial Instruments (Received) Pledged* | | | Cash Collateral (Received) Pledged* | | | Net Amount | |
| Liabilities: | | | | | | | | | | | | |
| Over-the-counter derivatives** | | $ | (1,047,652 | ) | | $ | 1,047,652 | | | $ | - | | | $ | - | |
| * | The actual financial instruments and cash collateral (received) pledged may be in excess of the amounts shown in the table. The table only reflects collateral amounts up to the amount of the financial instrument disclosed on the Statement of Assets and Liabilities |
| ** | Over-the-counter derivatives may consist of written options contracts. The amounts disclosed above represent the exposure to one or more counterparties. For further detail on individual derivative contracts and the corresponding unrealized appreciation (depreciation), see the Schedule of Call and Put Options Written. |
Note 7. Federal Income Tax
As of August 31, 2018, the cost of investments for federal income tax purposes is $115,522,492 and the components of net appreciation were as follows:
| Gross Unrealized Appreciation | | $ | 12,135,500 | |
| Gross Unrealized Depreciation | | | (2,676,799 | ) |
| Net Unrealized Appreciation | | $ | 9,458,701 | |
Distributions paid during the fiscal years ended as noted were characterized for tax purposes as follows:
| | | 2018 | | | 2017 | |
| Ordinary Income | | $ | 2,895,460 | | | $ | 715,188 | |
MAI MANAGED VOLATILITY FUND
NOTES TO FINANCIAL STATEMENTS
AUGUST 31, 2018
As of August 31, 2018, distributable earnings (accumulated loss) on a tax basis were as follows:
| Undistributed Ordinary Income | | $ | 918,019 | |
| Undistributed Long-Term Gain | | | 1,593,081 | |
| Unrealized Appreciation | | | 9,458,701 | |
| Total | | $ | 11,969,801 | |
The difference between components of distributable earnings on a tax basis and the amounts reflected in the Statement of Assets and Liabilities are primarily due to temporary book/tax differences related to wash sales, straddles, index options and equity return of capital.
On the Statement of Assets and Liabilities, as a result of permanent book to tax difference, certain amounts have been reclassified for the year August 31, 2018. The following reclassification was the result of real estate investment trust distributions and equity return of capital and has no impact on the net assets of the Fund.
| Undistributed Net Investment Income | | $ | (88,245 | ) |
| Accumulated Net Realized Gain | | | 88,245 | |
Note 8. Recent Accounting Pronouncements
In August 2018, the Financial Accounting Standards Board (“FASB”) issued Accounting Standards Update (ASU) No. 2018-13 “Fair Value Measurement (Topic 820): Disclosure Framework - Changes to the Disclosure Requirements for Fair Value Measurement” (“ASU 2018-13”) which includes amendments intended to improve the effectiveness of disclosures in the notes to financial statements. For example, ASU 2018-13 includes additional disclosures regarding the range and weighted average of significant unobservable inputs used to develop Level 3 fair value measurements, and clarifications to the narrative description of measurement uncertainty disclosures. ASU 2018-13 is effective for interim and annual periods beginning after December 15, 2019. Management is currently evaluating the impact that ASU 2018- 13 will have on the Funds' financial statements and related disclosures.
In September 2018, the Securities and Exchange Commission released Final Rule 33-10532 captioned “Disclosure Update and Simplification” which is intended to amend certain disclosure requirements that have become redundant, duplicative, overlapping, outdated, or superseded, in light of other Commission disclosure requirements, GAAP, or changes in the information environment. These changes will be effective November 5, 2018. Management is currently evaluating the impact that this release will have on the Fund’s financial statements and related disclosures.
In March 2017, the FASB issued ASU No. 2017-08, Receivables—Nonrefundable Fees and Other Costs (Subtopic 310-20): Premium Amortization on Purchased Callable Debt Securities. The amendments in the ASU shorten the amortization period for certain callable debt securities, held at a premium, to be amortized to the earliest call date. The ASU does not require an accounting change for securities held at a discount; which continues to be amortized to maturity. The ASU is effective for fiscal years and interim periods within those fiscal years beginning after December 15, 2018. Management is currently evaluating the impact, if any, of applying this provision.
Note 9. Subsequent Events
Subsequent events occurring after the date of this report through the date these financial statements were issued have been evaluated for potential impact, and the Fund has had no such events.
REPORT OF INDEPENDENT REGISTERED PUBLIC ACCOUNTING FIRM
To the Board of Trustees of Forum Funds
and the Shareholders of MAI Managed Volatility Fund
Opinion on the Financial Statements
We have audited the accompanying statement of assets and liabilities of MAI Managed Volatility Fund, a series of shares of beneficial interest in Forum Funds (the “Fund”), including the schedule of investments, as of August 31, 2018, and the related statement of operations for the year then ended, the statements of changes in net assets for each of the years in the two-year period then ended and the financial highlights for each of the years in the five-year period then ended, and the related notes (collectively referred to as the “financial statements”). In our opinion, the financial statements present fairly, in all material respects, the financial position of the Fund as of August 31, 2018, and the results of its operations for the year then ended, the changes in its net assets for each of the years in the two-year period then ended and its financial highlights for each of the years in the five-year period then ended, in conformity with accounting principles generally accepted in the United States of America.
Basis for Opinion
These financial statements are the responsibility of the Fund's management. Our responsibility is to express an opinion on the Fund’s financial statements based on our audits. We are a public accounting firm registered with the Public Company Accounting Oversight Board (United States) (“PCAOB”) and are required to be independent with respect to the Fund in accordance with the U.S. federal securities law and the applicable rules and regulations of the Securities and Exchange Commission and the PCAOB.
We conducted our audits in accordance with the standards of the PCAOB. Those standards require that we plan and perform the audits to obtain reasonable assurance about whether the financial statements are free of material misstatement, whether due to error or fraud. The Fund is not required to have, nor were we engaged to perform, an audit of its internal control over financial reporting. As part of our audits we are required to obtain an understanding of internal control over financial reporting but not for the purpose of expressing an opinion on the effectiveness of the Fund’s internal control over financial reporting. Accordingly, we express no such opinion.
Our audits included performing procedures to assess the risk of material misstatement of the financial statements, whether due to error or fraud, and performing procedures that respond to those risks. Such procedures include examining, on a test basis, evidence regarding the amounts and disclosures in the financial statements. Our procedures included confirmation of securities owned as of August 31, 2018 by correspondence with the custodian and brokers. Our audits also included evaluating the accounting principles used and significant estimates made by management, as well as evaluating the overall presentation of the financial statements. We believe that our audits provide a reasonable basis for our opinion.

BBD, LLP
We have served as the auditor of one or more of the Funds in the Forum Funds since 2009.
Philadelphia, Pennsylvania
October 18, 2018
MAI MANAGED VOLATILITY FUND
ADDITIONAL INFORMATION (Unaudited)
AUGUST 31, 2018
Proxy Voting Information
A description of the policies and procedures that the Fund uses to determine how to vote proxies relating to securities held in the Fund’s portfolio is available, without charge and upon request, by calling (877) 414-7884 and on the U.S. Securities and Exchange Commission’s (the “SEC”) website at www.sec.gov. The Fund’s proxy voting record for the most recent twelve-month period ended June 30 is available, without charge and upon request, by calling (877) 414-7884 and on the SEC’s website at www.sec.gov.
Availability of Quarterly Portfolio Schedules
The Fund files its complete schedule of portfolio holdings with the SEC for the first and third quarters of each fiscal year on Form N-Q. These filings are available, without charge and upon request on the SEC’s website at www.sec.gov or may be reviewed and copied at the SEC’s Public Reference Room in Washington, DC. Information on the operation of the Public Reference Room may be obtained by calling (800) SEC-0330.
Shareholder Expense Example
As a shareholder of the Fund, you incur ongoing costs, including management fees, distribution (12b- 1) fees and other Fund expenses. This example is intended to help you understand your ongoing costs (in dollars) of investing in the Fund and to compare these costs with the ongoing costs of investing in other mutual funds.
The example is based on an investment of $1,000 invested at the beginning of the period and held for the entire period from March 1, 2018 through August 31, 2018.
Actual Expenses – The first line under each share class of the table below provides information about actual account values and actual expenses. You may use the information in this line, together with the amount you invested, to estimate the expenses that you paid over the period. Simply divide your account value by $1,000 (for example, an $8,600 account value divided by $1,000 = 8.6), then multiply the result by the number in the first line under the heading entitled “Expenses Paid During Period” to estimate the expenses you paid on your account during the period.
Hypothetical Example for Comparison Purposes – The second line under each share class of the table below provides information about hypothetical account values and hypothetical expenses based on the Fund’s actual expense ratio and an assumed rate of return of 5% per year before expenses, which is not the Fund’s actual return. The hypothetical account values and expenses may not be used to estimate the actual ending account balance or expenses you paid for the period. You may use this information to compare the ongoing costs of investing in the Fund and other funds. To do so, compare this 5% hypothetical example with the 5% hypothetical examples that appear in the shareholder reports of other funds.
Please note that the expenses shown in the table are meant to highlight your ongoing costs only. Therefore, the second line of the table is useful in comparing ongoing costs only and will not help you determine the relative total costs of owning different funds.
MAI MANAGED VOLATILITY FUND
ADDITIONAL INFORMATION (Unaudited)
AUGUST 31, 2018
| | | Beginning Account Value March 1, 2018 | | | Ending Account Value August 31, 2018 | | | Expenses Paid During Period* | | | Annualized Expense Ratio* | |
| Institutional Shares | | | | | | | | | | | | |
| Actual | | $ | 1,000.00 | | | $ | 1,054.39 | | | $ | 5.13 | | | | 0.99 | % |
| Hypothetical (5% return before expenses) | | $ | 1,000.00 | | | $ | 1,020.21 | | | $ | 5.04 | | | | 0.99 | % |
| Investor Shares | | | | | | | | | | | | | | | | |
| Actual | | $ | 1,000.00 | | | $ | 1,053.05 | | | $ | 6.41 | | | | 1.24 | % |
| Hypothetical (5% return before expenses) | | $ | 1,000.00 | | | $ | 1,018.95 | | | $ | 6.31 | | | | 1.24 | % |
| * | Expenses are equal to the Fund’s annualized expense ratio multiplied by the average account value over the period, multiplied by the number of days in the most recent fiscal half-year (184) divided by 365 to reflect the half-year period. |
Federal Tax Status of Dividends Declared during the Fiscal Year
For federal income tax purposes, dividends from short-term capital gains are classified as ordinary income. The Fund designates 51.98% of its income dividend distributed as qualifying for the corporate dividends-received deduction (DRD) and 57.44% for the qualified dividend rate (QDI) as defined in Section 1(h)(11) of the Code. The Fund also designates 69.27% as short-term capital gain dividends exempt from U.S. tax for foreign shareholders (QSD). The Fund also designates 11.74% as qualified interest income exempt from U.S. tax for foreign shareholders (QII).
Trustees and Officers of the Trust
The Board is responsible for oversight of the management of the Trust’s business affairs and of the exercise of all the Trust’s powers except those reserved for the shareholders. The following table provides information about each Trustee and certain officers of the Trust. Each Trustee and officer holds office until the person resigns, is removed, or is replaced. Unless otherwise noted, the persons have held their principal occupations for more than five years. The address for all Trustees and officers is Three Canal Plaza, Suite 600, Portland, Maine 04101. The Fund’s Statement of Additional Information includes additional information about the Trustees and is available, without charge and upon request, by calling (877) 414-7884.
MAI MANAGED VOLATILITY FUND
ADDITIONAL INFORMATION (Unaudited)
AUGUST 31, 2018
Name and Year of Birth | Position with the Trust | Length of Time Served | Principal Occupation(s) During Past Five Years | Number of Series in Fund Complex Overseen By Trustee | Other Directorships Held By Trustee During Past Five Years |
| Independent Trustees |
David Tucker Born: 1958 | Trustee; Chairman of the Board | Since 2011 and Chairman since 2018 | Director, Blue Sky Experience (a charitable endeavor) since 2008; Senior Vice President & General Counsel, American Century Companies (an investment management firm) 1998-2008. | 1 | Trustee, Forum Funds II, Forum ETF Trust and U.S. Global In- vestors Funds |
Mark D. Moyer Born: 1959 | Trustee | Since 2018 | Chief Financial Officer, Freedom House (a NGO advocating political freedom and democracy) since 2017; independent consultant providing interim CFO services, principally to non-profit organizations, 2011-2017; Chief Financial Officer, Institute of International Education (a NGO administering international educational exchange programs), 2008-2011; Chief Financial Officer and Chief Restructuring Officer, Ziff Davis Media Inc. (an integrated media company), 2005-2008; Adjunct Professor of Accounting, Fairfield University from 2009- 2012. | 1 | Trustee, Forum Funds II, Forum ETF Trust and U.S. Global In- vestors Funds |
Jennifer Brown- Strabley Born: 1964 | Trustee | Since 2018 | Principal, Portland Global Advisors, 1996-2010. | 1 | Trustee, Forum Funds II, Forum ETF Trust and U.S. Global In- vestors Funds |
| Interested Trustees |
Stacey E. Hong(1) Born: 1966 | Trustee | Since 2018 | President, Atlantic since 2008. | 1 | Trustee, Forum Funds II and U.S. Global In- vestors Funds |
Jessica Chase(1) Born: 1970 | Trustee | Since 2018 | Senior Vice President, Atlantic since 2008. | 1 | None |
| (1) | Stacey E. Hong is currently treated as an interested person of the Trust, as defined in the 1940 Act, due to his affiliation with Atlantic. Jessica Chase is currently treated as an interested person of the Trust, as defined in the 1940 Act, due to her affiliation with Atlantic and her role as President of the Trust. |
MAI MANAGED VOLATILITY FUND
ADDITIONAL INFORMATION (Unaudited)
AUGUST 31, 2018
Name and Year of Birth | Position with the Trust | Length of Time Served | Principal Occupation(s) During Past 5 Years |
| Officers |
Jessica Chase Born: 1970 | President; Principal Executive Officer | Since 2015 | Senior Vice President, Atlantic since 2008. |
Karen Shaw Born: 1972 | Treasurer; Principal Financial Officer | Since 2008 | Senior Vice President, Atlantic since 2008. |
Zachary Tackett Born: 1988 | Vice President; Secretary and Anti-Money Laundering Compliance Officer | Since 2014 | Counsel, Atlantic since 2014; Intern Associate, Coakley & Hyde, PLLC, 2010-2013. |
Michael J. McKeen Born: 1971 | Vice President | Since 2009 | Senior Vice President, Atlantic since 2008. |
Timothy Bowden Born: 1969 | Vice President | Since 2009 | Manager, Atlantic since 2008. |
Geoffrey Ney Born: 1975 | Vice President | Since 2013 | Manager, Atlantic since 2013; Senior Fund Accountant, Atlantic, 2008-2013. |
Todd Proulx Born: 1978 | Vice President | Since 2013 | Manager, Atlantic since 2013; Senior Fund Accountant, Atlantic, 2008-2013. |
Carlyn Edgar Born: 1963 | Vice President | Since 2008 | Senior Vice President, Atlantic since 2008; Chief Compliance Officer, 2008-2016 |
Dennis Mason Born: 1967 | Chief Compliance Officer | Since 2016 | Fund Compliance Officer, Atlantic since 2013; Senior Specialist, Atlantic, 2011-2013; Senior Analyst, Atlantic, 2008-2011 |

ITEM 2. CODE OF ETHICS.
| (a) | As of the end of the period covered by this report, Forum Funds (the "Registrant") has adopted a code of ethics, which applies to its Principal Executive Officer and Principal Financial Officer (the "Code of Ethics"). |
| (c) | There have been no amendments to the Registrant's Code of Ethics during the period covered by this report. |
| (d) | There have been no waivers to the Registrant's Code of Ethics during the period covered by this report. |
(f) (1) A copy of the Code of Ethics is being filed under Item 13(a) hereto.
ITEM 3. AUDIT COMMITTEE FINANCIAL EXPERT.
The Board of Trustees has determined that no member of the Audit Committee is an "audit committee financial expert" as that term is defined under applicable regulatory guidelines.
ITEM 4. PRINCIPAL ACCOUNTANT FEES AND SERVICES.
(a) Audit Fees - The aggregate fees billed for each of the last two fiscal years (the "Reporting Periods") for professional services rendered by the Registrant's principal accountant for the audit of the Registrant's annual financial statements, or services that are normally provided by the principal accountant in connection with the statutory and regulatory filings or engagements for the Reporting Periods, were $15,000 in 2017 and $15,000 in 2018.
(b) Audit-Related Fees – The aggregate fees billed in the Reporting Periods for assurance and related services rendered by the principal accountant that were reasonably related to the performance of the audit of the Registrant's financial statements and are not reported under paragraph (a) of this Item 4 were $0 in 2017 and $0 in 2018.
(c) Tax Fees - The aggregate fees billed in the Reporting Periods for professional services rendered by the principal accountant to the Registrant for tax compliance, tax advice and tax planning were $3,000 in 2017 and $3,000 in 2018. These services consisted of review or preparation of U.S. federal, state, local and excise tax returns.
(d) All Other Fees - The aggregate fees billed in the Reporting Periods for products and services provided by the principal accountant to the Registrant, other than the services reported in paragraphs (a) through (c) of this Item, were $0 in 2017 and $0 in 2018.
(e) (1) The Audit Committee reviews and approves in advance all audit and "permissible non-audit services" (as that term is defined by the rules and regulations of the Securities and Exchange Commission) to be rendered to a series of the Registrant (each, a "Series"). In addition, the Audit Committee reviews and approves in advance all "permissible non-audit services" to be provided to an investment adviser (not including any sub-adviser) of a Series, or an affiliate of such investment adviser, that is controlling, controlled by or under common control with the investment adviser and provides on-going services to the Registrant ("Affiliate"), by the Series' principal accountant if the engagement relates directly to the operations and financial reporting of the Series. The Audit Committee considers whether fees paid by a Series' investment adviser or an Affiliate to the Series' principal accountant for audit and permissible non-audit services are consistent with the principal accountant's independence.
(e) (2) No services included in (b) - (d) above were approved pursuant to paragraph (c)(7)(i)(C) of Rule 2-01 of Regulation S-X.
(f) Not applicable
(g) The aggregate non-audit fees billed by the principal accountant for services rendered to the Registrant for the Reporting Periods were $0 in 2017 and $0 in 2018. There were no fees billed in either of the Reporting Periods for non-audit services rendered by the principal accountant to the Registrant's investment adviser or any Affiliate.
(h) During the Reporting Period, the Registrant's principal accountant provided no non-audit services to the investment advisers or any entity controlling, controlled by or under common control with the investment advisers to the series of the Registrant to which this report relates.
ITEM 5. AUDIT COMMITTEE OF LISTED REGISTRANTS.
Not applicable.
ITEM 6. INVESTMENTS.
| (a) | Included as part of report to shareholders under Item 1. |
ITEM 7. DISCLOSURE OF PROXY VOTING POLICIES AND PROCEDURES FOR CLOSED-END
MANAGEMENT INVESTMENT COMPANIES.
Not applicable.
ITEM 8. PORTFOLIO MANAGERS OF CLOSED-END MANAGEMENT INVESTMENT COMPANIES.
Not applicable.
ITEM 9. PURCHASES OF EQUITY SECURITIES BY CLOSED-END MANAGEMENT INVESTMENT COMPANY AND AFFILIATED PURCHASERS.
Not applicable.
ITEM 10. SUBMISSION OF MATTERS TO A VOTE OF SECURITY HOLDERS
The Registrant does not accept nominees to the board of trustees from shareholders.
ITEM 11. CONTROLS AND PROCEDURES
(a) The Registrant's Principal Executive Officer and Principal Financial Officer have concluded that the Registrant's disclosure controls and procedures (as defined in Rule 30a-3(c) under the Investment Company Act of 1940 (the "Act")) are effective, based on their evaluation of the controls and procedures required by Rule 30a-3(b) under the Act and Rules 13a-15(b) or 15d-15(b) under the Securities Exchange Act of 1934, as of a date within 90 days of the filing date of this report.
(b) There were no changes in the Registrant's internal control over financial reporting (as defined in
Rule 30a-3(d) under the Act) that occurred during the second fiscal quarter of the period covered by this report that have materially affected, or are reasonably likely to materially affect, the Registrant's internal control over financial reporting.
ITEM 12. DISCLOSURE OF SECURITIES LENDING ACTIVITIES FOR CLOSED-END MANAGEMENT INVESTMENT COMPANIES.
Not applicable.
ITEM 13. EXHIBITS.
(a)(1) Code of Ethics (Exhibit filed herewith).
(a)(2) Certifications pursuant to Rule 30a-2(a) of the Act, and Section 302 of the Sarbanes-Oxley Act of 2002. (Exhibits filed herewith)
(a)(3) Not applicable.
(b) Certifications pursuant to Rule 30a-2(b) of the Act, and Section 906 of the Sarbanes-Oxley Act of 2002. (Exhibit filed herewith)
SIGNATURES
Pursuant to the requirements of the Securities Exchange Act of 1934 and the Investment Company Act of 1940, the Registrant has duly caused this report to be signed on its behalf by the undersigned, thereunto duly authorized.
Registrant Forum Funds
| By: | /s/ Jessica Chase | |
| | Jessica Chase, Principal Executive Officer | |
| | | |
| Date: | October 26, 2018 | |
Pursuant to the requirements of the Securities Exchange Act of 1934 and the Investment Company Act of 1940, this report has been signed below by the following persons on behalf of the Registrant and in the capacities and on the dates indicated.
| By: | /s/ Jessica Chase | |
| | Jessica Chase, Principal Executive Officer | |
| | | |
| Date: | October 26, 2018 | |
| By: | /s/ Karen Shaw | |
| | Karen Shaw, Principal Financial Officer | |
| | | |
| Date: | October 26, 2018 | |