As filed with the Securities and Exchange Commission on November 29, 2018
UNITED STATES
SECURITIES AND EXCHANGE COMMISSION
WASHINGTON, D.C. 20549
FORM N-CSR
CERTIFIED SHAREHOLDER REPORT OF REGISTERED MANAGEMENT
INVESTMENT COMPANIES
Investment Company Act file number 811-03023
FORUM FUNDS
Three Canal Plaza, Suite 600
Portland, Maine 04101
Jessica Chase, Principal Executive Officer
Three Canal Plaza, Suite 600
Portland, Maine 04101
207-347-2000
Date of fiscal year end: September 30
Date of reporting period: October 1, 2017 – September 30, 2018
ITEM 1. REPORT TO STOCKHOLDERS.

Annual Report
September 30, 2018
Managed by Steinberg Asset Management, LLC
STEINBERG SELECT FUND
A MESSAGE TO OUR SHAREHOLDERS (Unaudited)
SEPTEMBER 30, 2018
Dear Fellow Shareholders,
Broad equity indices rose in the third quarter with the S&P 500 registering a 7.7% gain. Growth indices again significantly outpaced value indices and Apple became the first company with a market capitalization of greater than $1 trillion. Amazon also hit this milestone, albeit briefly. Weeks later this seems like ancient history as investors confront the market’s first correction in nearly three years and signs of fragility in large cap technology shares, which have led this historic bull market.
As highlighted over the past several quarters, we expect earnings growth not multiple expansion to drive further appreciation in equities. (Earnings multiples measure the ratio of companies’ share prices to their earnings. For example, a company with a share price of $10 and earnings of $1 per share has a price/earnings multiple of 10x.) Indeed, multiples compressed in the third quarter and continued to do so in the October market decline. Until recently the impact of multiple compression has been muted because of rapid earnings growth, spurred at least in part by economic stimulus in the form of the 2017 tax and spending bills. As the impact of this stimulus wanes, we believe that investors will likely be faced with the prospect that the rate of earnings growth will decelerate.
Fund Performance and Holdings Update
The Steinberg Select Fund lagged its benchmark, the Russell 3000 Value Index, by 144 bps in the third quarter of 2018. During the quarter, our investment in HCA Healthcare (HCA) contributed to fund performance, while our investment in Visteon Corporation (VC) detracted from performance.
As always, we seek to invest in discrete investments where we believe business-specific characteristics will allow for long-term value creation without unduly risking permanent impairment of capital. We are confident this approach will continue to serve our investors well over the long term.
Shares of HCA Healthcare, the largest public hospital company in the U.S., increased in the third quarter by 36%. HCA continued to deliver strong results with reported second quarter earnings per share (EPS), EBITDA (earnings before interest, taxes, depreciation and amortization) and sales all above consensus estimates. This quarter adjusted EBITDA from facilities open at least one year (“same-facility”) was up around 11% year-over-year, surprisingly strong performance given that the company’s long-term goal is to grow adjusted EBITDA of existing facilities by 4-6%, a target that many sell-side analysts thought unachievable as recently as a year ago. We continue to be optimistic on the prospects for HCA, as the company continues to execute on its plan to expand in markets with favorable population demographics and rewards shareholders with buybacks/dividends from its growing free cash flow.
Shares of Visteon Corporation, a supplier of automotive cockpit electronics, fell by 28% in the third quarter. Visteon’s stock fell as concerns about global auto demand weighed on auto suppliers. In addition, worries about the effect of tariffs and a trade war have added uncertainty to the industry outlook. The company has set a target of $4.7bn in sales in 2021, up from an estimated $3.0bn in 2018. Even if sales were to come in 20% lower than this target and EBITDA margins remained at their current level of 11%, as compared to the company’s 14% target, we would expect shares of the company to trade significantly higher than the current share price. As a consequence we believe the shares represent a compelling risk/reward profile.
Slowing Growth and Effects of Trade War Will Challenge Earnings
2018 has experienced a seamless passing of the stimulus baton between monetary and fiscal policy makers. Going forward we believe it to be unlikely that there will be additional, material fiscal stimulus, meaning financial conditions will continue to tighten. The one exception would be if the democratic majority in the house and republican majority in the senate agreed to an infrastructure program. Barring this low probability (but not impossible) event it seems economic growth will moderate as the Fed continues along its path of rate increases designed to keep inflation in check.
Economic growth could also be challenged by an escalating trade war with China. Currently $250 billion of Chinese goods are subject to a 10% tariff. This is slated to increase on January 1, 2019 to 25%. However, there are $267 billion of additional Chinese imports that the Trump administration could subject to tariffs. If the U.S. imposes tariffs on all or most of these goods it is estimated that the aggregate earnings of the companies in the S&P 500 for 2019 would fall to $159 from the current consensus estimate of $177, erasing all of the expected earnings growth in the S&P 500.
STEINBERG SELECT FUND
A MESSAGE TO OUR SHAREHOLDERS (Unaudited)
SEPTEMBER 30, 2018
In addition to depressing corporate earnings, tariffs increase the cost of goods and so have an inflationary impact. While this impact has not been felt in earnest yet, we believe an impact will be felt if there is not a resolution before the tariffs increase to 25% in January, and/ or if additional goods are impacted.
Rising Labor and Transport Costs Add Inflationary Pressure
Other inflationary pressures have increased and are impacting businesses. Wages rose 3.1% in October as compared to the prior year period, up from 2.8% growth in September. This is the first time since 2009 that wages have increased more than 3%. Transportation costs are another area where businesses are facing substantial cost increases and limited capacity. As prices rise businesses have two choices: raise prices or assume the increased costs themselves thereby decreasing their margins. We believe that this is important to consider when confronting the investing landscape going forward as it will be necessary to find businesses that have pricing power or have company specific catalysts that will allow for earnings growth in the face of a slowing economy characterized by inflationary pressures.
We believe that inflationary pressure will likely not be the only driver of higher interest rates. The U.S. budget deficit increased 17% in FY 2018 (the government has a September fiscal year) to $779 billion and is expected to reach $1 trillion in 2019. This would not be cause for alarm if there was some prospect that the trend of rapidly growing deficits would reverse. However, policy makers in both parties show no appetite for prioritizing the deficit. In fact, both parties have proposed fiscal policy prescriptions that would add materially to the deficit. Republicans have hinted at a second round of tax cuts and Democrats, including several potential presidential candidates, have put forth a number of policies from “Medicare for all” to “housing for all,” which we believe, independent of their efficacy in achieving their stated goals, would add to, not reduce federal deficits.
Because politicians of all stripes have shown no interest in addressing growing deficits, we anticipate: 1) that the deficit will continue to grow; and 2) as the U.S. increases the supply of its borrowings to pay for rising deficits, the rates required to attract capital will go up.
In summary, we believe that interest rates are likely to continue to rise, not because economic growth is accelerating (as noted we expect the rate of U.S. economic growth and corporate earnings to wane), but rather because wage inflation, input costs and tariffs are driving inflation up and the supply of government borrowings is growing.
Objective – The Steinberg Select Fund, managed by the Adviser, Steinberg Asset Management, LLC, seeks long-term capital appreciation by investing primarily in a portfolio of companies with equity securities listed on a U.S. exchange. The Fund primarily invests in equity securities which include common and preferred stock. Consistent with its investment objective, the Fund intends to invest opportunistically in all market capitalization segments and to vary its allocations to small, mid and large capitalization companies as appropriate, based on the Adviser’s assessment of investment opportunities.
Strategy – The “Adviser’s Process” for selecting securities for the Fund’s portfolio involves conducting in-depth, bottom-up, proprietary, fundamental research on issuers. The Adviser’s Process is primarily qualitative and is aimed at identifying securities that exhibit asymmetric risk/reward profiles.
Risks – The Steinberg Select Fund is subject to various forms of risk including the possible loss of principal. Investing in foreign securities entails risks not associated with domestic equities, including economic and political instability and currency fluctuations. Investments in securities of small and midcapitalization companies involve the possibility of greater volatility than investments in larger capitalization companies. Investments in American Depository Receipts involve many of the same risks as investing in foreign securities. Please see the prospectus for a more detailed explanation of these risks.
STEINBERG SELECT FUND
A MESSAGE TO OUR SHAREHOLDERS (Unaudited)
SEPTEMBER 30, 2018
| Holdings Mentioned in this Letter as of September 30, 2018 | % Assets |
| Visteon Corp. | 2.0% |
| HCA Healthcare, Inc. | 4.7% |
| Top Holdings as of September 30, 2018 | % Assets |
| Golar LNG, Ltd. | 9.3% |
| HCA Healthcare, Inc. | 4.7% |
| ViaSat, Inc. | 4.5% |
| Flex, Ltd. | 4.3% |
| IQVIA Holdings, Inc. | 4.1% |
| ServiceMaster Global Holdings, Inc. | 3.7% |
| Thermo Fisher Scientific, Inc. | 3.6% |
| Laboratory Corp. of America Holdings | 3.4% |
| Arch Capital Group, Ltd. | 3.3% |
| Charter Communications, Inc., Class A | 3.3% |
This letter is for informational purposes only and should not be deemed as investment advice or as a recommendation to purchase and/ or sell any individual securities discussed in this report. Past performance is no guarantee of future returns. All investing involves risk including the possible loss of principal.
The opinions, forecasts, assumptions, estimates, and commentary contained in this report are based on information provided to Steinberg on both a formal and informal basis which Steinberg believes to be reliable. However, Steinberg cannot represent or warrant their accuracy. The impact on Steinberg’s opinions, forecasts, assumptions, estimates, and commentary due to inaccurate information, incomplete information or information taken out of context may be substantial. Further, all opinions, forecasts, assumptions, estimates, and commentary in this letter are made only as of the date indicated and are subject to change at any time without prior notice.
Discussions and calculations regarding potential future events and their potential impact are based solely on historic information and Steinberg’s estimates and/or opinions, and are provided for illustrative purposes only. No guarantee can be made of the occurrence of such events or the actual impact such events would have on the performance of the companies described in this letter.
STEINBERG SELECT FUND
PERFORMANCE CHART AND ANALYSIS (Unaudited)
SEPTEMBER 30, 2018
The following chart refelcts the change in the value of a hypothetical $100,000 investment in Institutional Shares, including reinvested dividends and distributions, in Steinberg Select Fund (the “Fund”) compared with the performance of the benchmarks, Russell 3000® Value Index (“Russell 3000® Value”), and the secondary benchmark, S&P 500 Index (“S&P 500”), since inception. The Russell 3000® Value measures the performance of those Russell 3000® Index companies with lower price-to-book ratios and lower forecasted growth values. The S&P 500 is a broad-based measurement of the U.S. stock market based on the performance of 500 widely held large capitalization common stocks. The total returns of the Russell 3000® Value and S&P 500 include the reinvestment of dividends and income. The total return of the Fund includes operating expenses that reduce returns, while the total return of the Russell 3000® Value and S&P 500 do not include expenses. The Fund is professionally managed, while the Russell 3000® Value and S&P 500 are unmanaged and are not available for investment.
Comparison of a $100,000 Investment
Steinberg Select Fund - Institutional Shares vs. Russell 3000® Value Index and S&P 500 Index
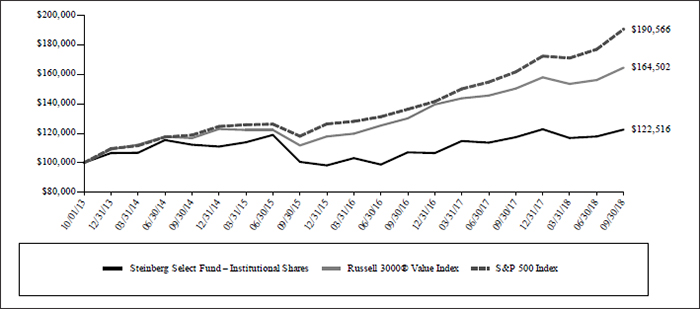
Average Annual Total Returns Periods Ended September 30, 2018 | One Year | Five Year | Since Inception
(10/01/13) |
| Steinberg Select Fund - Institutional Shares | 4.37% | 4.15% | 4.15% |
| Russell 3000® Value Index | 9.46% | 10.47% | 10.47% |
| S&P 500 Index | 17.91% | 13.77% | 13.77% |
Performance data quoted represents past performance and is no guarantee of future results. Current performance may be lower or higher than the performance data quoted. Investment return and principal value will fluctuate so that shares, when redeemed, may be worth more or less than original cost. As stated in the Fund’s prospectus, the annual operating expense ratio (gross) is 1.65%. However, the Fund’s adviser has contractually agreed to waive its fee and/or reimburse Fund expenses to limit Total Annual Fund Operating Expenses After Fee Waiver and/or Expense Reimbursement (excluding all taxes, interest, portfolio transaction expenses, acquired fund fees and expenses, proxy expenses and extraordinary expenses) to 0.75% for Institutional Shares, through January 31, 2019 (the “Expense Cap”). The adviser may be reimbursed by the Fund for fees waived and expenses reimbursed by the adviser pursuant to the Expense Cap if such payment is made within three years of the fee waiver or expense reimbursement, and does not cause the Total Annual Fund Operating Expenses After Fee Waiver and/or Expense Reimbursement to exceed the lesser of (i) the then-current expense cap, or (ii) the expense cap in place at the time the fees/expenses were waived/reimbursed. The performance table and graph do not reflect the deduction of taxes that a shareholder would pay on Fund distributions or the redemption of Fund shares. Returns greater than one year are annualized. For the most recent month-end performance, please call (855) 330-7085.
STEINBERG SELECT FUND
SCHEDULE OF INVESTMENTS
SEPTEMBER 30, 2018
| Shares | | Security Description | | Value | |
| Common Stock - 83.3% | | | |
| Communication Services - 12.6% | | | | |
| 520 | | Alphabet, Inc., Class C (a) | | $ | 620,605 | |
| 2,150 | | Charter Communications, Inc., Class A (a) | | | 700,642 | |
| 16,645 | | Liberty Global PLC, Class C (a) | | | 468,723 | |
| 18,110 | | Liberty Latin America, Ltd., Class C (a) | | | 373,609 | |
| 3,540 | | Nexstar Media Group, Inc., Class A | | | 288,156 | |
| 800 | | The Madison Square Garden Co., Class A (a) | | | 252,256 | |
| | | | | | 2,703,991 | |
| Consumer Discretionary - 10.0% | | | | |
| 4,680 | | Dollar General Corp. | | | 511,524 | |
| 12,800 | | LKQ Corp. (a) | | | 405,376 | |
| 12,620 | | ServiceMaster Global Holdings, Inc. (a) | | | 782,819 | |
| 4,715 | | Visteon Corp. (a) | | | 438,023 | |
| | | | | | 2,137,742 | |
| Energy - 14.2% | | | | |
| 27,910 | | Golar LNG Partners LP | | | 399,950 | |
| 71,758 | | Golar LNG, Ltd. | | | 1,994,873 | |
| 54,050 | | Navigator Holdings, Ltd. (a) | | | 654,005 | |
| | | | | | 3,048,828 | |
| Financial - 6.7% | | | | |
| 23,964 | | Arch Capital Group, Ltd. (a) | | | 714,367 | |
| 205 | | Markel Corp. (a) | | | 243,640 | |
| 21,250 | | Sterling Bancorp | | | 467,500 | |
| | | | | | 1,425,507 | |
| Health Care - 20.6% | | | | |
| 4,605 | | Abbott Laboratories | | | 337,823 | |
| 220 | | Allergan PLC | | | 41,906 | |
| 44,550 | | Brookdale Senior Living, Inc. (a) | | | 437,926 | |
| 21,990 | | Capital Senior Living Corp. (a) | | | 207,586 | |
| 7,210 | | HCA Healthcare, Inc. | | | 1,003,055 | |
| 6,794 | | IQVIA Holdings, Inc. (a) | | | 881,453 | |
| 4,131 | | Laboratory Corp. of America Holdings (a) | | | 717,472 | |
| 3,175 | | Thermo Fisher Scientific, Inc. | | | 774,954 | |
| | | | | | 4,402,175 | |
| Industrials - 6.1% | | | | |
| 19,335 | | AECOM (a) | | | 631,481 | |
| 1,730 | | FedEx Corp. | | | 416,567 | |
| 2,230 | | XPO Logistics, Inc. (a) | | | 254,599 | |
| | | | | | 1,302,647 | |
| Information Technology - 13.1% | | | | |
| 5,180 | | CDK Global, Inc. | | | 324,061 | |
| 70,835 | | Flex, Ltd. (a) | | | 929,355 | |
| 11,610 | | Oracle Corp. | | | 598,612 | |
| 15,065 | | ViaSat, Inc. (a) | | | 963,407 | |
| | | | | | 2,815,435 | |
| Total Common Stock (Cost $13,931,777) | | | 17,836,325 | |
| Investments, at value - 83.3% (Cost $13,931,777) | | $ | 17,836,325 | |
| Other Assets & Liabilities, Net - 16.7% | | | 3,587,631 | |
| Net Assets - 100.0% | | $ | 21,423,956 | |
| LP | Limited Partnership |
| PLC | Public Limited Company |
| (a) | Non-income producing security. |
The following is a summary of the inputs used to value the Fund's inputs as of September 30, 2018.
The inputs or methodology used for valuing securities are not necessarily an indication of the risks associated with investing in those securities. For more information on valuation inputs, and their aggregation into the levels used in the table below, please refer to the Security Valuation section in Note 2 of the accompanying Notes to Financial Statements.
| Valuation Inputs | | | Investments in Securities | |
| Level 1 - Quoted Prices | | $ | 17,836,325 | |
| Level 2 - Other Significant Observable Inputs | | | – | |
| Level 3 - Significant Unobservable Inputs | | | – | |
| Total | | $ | 17,836,325 | |
The Level 1 value displayed in this table is Common Stock. Refer to this Schedule of Investments for a further breakout of each security by industry.
The Fund utilizes the end of period methodology when determining transfers. There were no transfers among Level 1, Level 2 and Level 3 for the year ended September 30, 2018.
| PORTFOLIO HOLDINGS | |
| % of Total Investments | |
| Communication Services | 15.1% |
| Consumer Discretionary | 12.0% |
| Energy | 17.1% |
| Financial | 8.0% |
| Health Care | 24.7% |
| Industrials | 7.3% |
| Information Technology | 15.8% |
| | 100.0% |
See Notes to Financial Statements.
STEINBERG SELECT FUND
STATEMENT OF ASSETS AND LIABILITIES
SEPTEMBER 30, 2018
| ASSETS | | | |
| Investments, at value (Cost $13,931,777) | | $ | 17,836,325 | |
| Cash | | | 3,336,944 | |
| Receivables: | | | | |
| Investment securities sold | | | 242,510 | |
| Dividends and interest | | | 12,894 | |
| From investment adviser | | | 11,256 | |
| Prepaid expenses | | | 15,417 | |
| Total Assets | | | 21,455,346 | |
| | | | | |
| LIABILITIES | | | | |
| Accrued Liabilities: | | | | |
| Fund services fees | | | 8,119 | |
| Other expenses | | | 23,271 | |
| Total Liabilities | | | 31,390 | |
| | | | | |
| NET ASSETS | | $ | 21,423,956 | |
| | | | | |
| COMPONENTS OF NET ASSETS | | | | |
| Paid-in capital | | $ | 16,340,628 | |
| Accumulated net realized gain | | | 1,178,761 | |
| Net unrealized appreciation | | | 3,904,567 | |
| NET ASSETS | | $ | 21,423,956 | |
| | | | | |
| SHARES OF BENEFICIAL INTEREST AT NO PAR VALUE (UNLIMITED SHARES AUTHORIZED) | | | | |
| Institutional Shares (see note 1) | | | 2,086,963 | |
| | | | | |
| NET ASSET VALUE, OFFERING AND REDEMPTION PRICE PER SHARE | | | | |
| Institutional Shares (see note 1) (based on net assets of $21,423,956) | | $ | 10.27 | |
See Notes to Financial Statements.
STEINBERG SELECT FUND
STATEMENT OF OPERATIONS
YEAR ENDED SEPTEMBER 30, 2018
| INVESTMENT INCOME | | | |
| Dividend income | | $ | 121,568 | |
| Interest income | | | 7,243 | |
| Total Investment Income | | | 128,811 | |
| | | | | |
| EXPENSES | | | | |
| Investment adviser fees | | | 241,233 | |
| Fund services fees | | | 172,000 | |
| Transfer agent fees: | | | | |
| Institutional Shares | | | 643 | |
| Custodian fees | | | 5,000 | |
| Registration fees: | | | | |
| Institutional Shares | | | 30,208 | |
| Professional fees | | | 41,389 | |
| Trustees' fees and expenses | | | 4,715 | |
| Other expenses | | | 19,728 | |
| Total Expenses | | | 514,916 | |
| Fees waived | | | (324,469 | ) |
| Net Expenses | | | 190,447 | |
| | | | | |
| NET INVESTMENT LOSS | | | (61,636 | ) |
| | | | | |
| NET REALIZED AND UNREALIZED GAIN (LOSS) | | | | |
| Net realized gain on investments | | | 3,182,377 | |
| Net change in unrealized appreciation (depreciation) on: | | | | |
| Investments | | | (1,861,056 | ) |
| Foreign currency translations | | | (23 | ) |
| Net change in unrealized appreciation (depreciation) | | | (1,861,079 | ) |
| NET REALIZED AND UNREALIZED GAIN | | | 1,321,298 | |
| INCREASE IN NET ASSETS RESULTING FROM OPERATIONS | | $ | 1,259,662 | |
See Notes to Financial Statements.
STEINBERG SELECT FUND
STATEMENTS OF CHANGES IN NET ASSETS
| | | For the Years Ended September 30, | |
| | | 2018 | | | 2017 | |
| OPERATIONS | | | | | | |
| Net investment loss | | $ | (61,636 | ) | | $ | (114,072 | ) |
| Net realized gain | | | 3,182,377 | | | | 1,289,926 | |
| Net change in unrealized appreciation (depreciation) | | | (1,861,079 | ) | | | 2,512,823 | |
| Increase in Net Assets Resulting from Operations | | | 1,259,662 | | | | 3,688,677 | |
| | | | | | | | | |
| DISTRIBUTIONS TO SHAREHOLDERS FROM | | | | | | | | |
| Net investment income: | | | | | | | | |
| Institutional Shares | | | — | | | | (177,792 | ) |
| Net realized gain: | | | | | | | | |
| Institutional Shares | | | (1,741,656 | ) | | | (247,728 | ) |
| Total Distributions to Shareholders | | | (1,741,656 | ) | | | (425,520 | ) |
| | | | | | | | | |
| CAPITAL SHARE TRANSACTIONS | | | | | | | | |
| Sale of shares: | | | | | | | | |
| Institutional Shares | | | 458,406 | | | | 458,602 | |
| Reinvestment of distributions: | | | | | | | | |
| Institutional Shares | | | 533,952 | | | | 303,993 | |
| Redemption of shares: | | | | | | | | |
| Institutional Shares | | | (15,591,387 | ) | | | (10,716,567 | ) |
| Decrease in Net Assets from Capital Share Transactions | | | (14,599,029 | ) | | | (9,953,972 | ) |
| Decrease in Net Assets | | | (15,081,023 | ) | | | (6,690,815 | ) |
| | | | | | | | | |
| NET ASSETS | | | | | | | | |
| Beginning of Year | | | 36,504,979 | | | | 43,195,794 | |
| End of Year | | $ | 21,423,956 | | | $ | 36,504,979 | |
| | | | | | | | | |
| SHARE TRANSACTIONS | | | | | | | | |
| Sale of shares: | | | | | | | | |
| Institutional Shares | | | 44,468 | | | | 47,159 | |
| Reinvestment of distributions: | | | | | | | | |
| Institutional Shares | | | 52,814 | | | | 32,138 | |
| Redemption of shares: | | | | | | | | |
| Institutional Shares | | | (1,548,183 | ) | | | (1,084,341 | ) |
| Decrease in Shares | | | (1,450,901 | ) | | | (1,005,044 | ) |
See Notes to Financial Statements.
STEINBERG SELECT FUND
FINANCIAL HIGHLIGHTS
These financial highlights reflect selected data for a share outstanding throughout each period.
| | | For the Years Ended September 30, | | | October 1, 2013 | |
| | | | | | | | | | | | | | | | | | | | (a) Through September 30, | |
| | | | 2018 | | | | 2017 | | | | 2016 | | | | 2015 | | | | 2014 | |
| INSTITUTIONAL SHARES | | | | | | | | | | | | | | | | | | | | |
| NET ASSET VALUE, Beginning of Period | | $ | 10.32 | | | $ | 9.51 | | | $ | 9.05 | | | $ | 11.08 | | | $ | 10.00 | |
| INVESTMENT OPERATIONS | | | | | | | | | | | | | | | | | | | | |
| Net investment income (loss) (b) | | | (0.02 | ) | | | (0.03 | ) | | | 0.05 | | | | 0.02 | | | | 0.06 | |
| Net realized and unrealized gain (loss) | | | 0.46 | | | | 0.94 | | | | 0.52 | | | | (1.12 | ) | | | 1.15 | |
| Total from Investment Operations | | | 0.44 | | | | 0.91 | | | | 0.57 | | | | (1.10 | ) | | | 1.21 | |
| | | | | | | | | | | | | | | | | | | | | |
| DISTRIBUTIONS TO SHAREHOLDERS FROM | | | | | | | | | | | | | | | | | | | | |
| Net investment income | | | — | | | | (0.04 | ) | | | (0.03 | ) | | | (0.05 | ) | | | (0.02 | ) |
| Net realized gain | | | (0.49 | ) | | | (0.06 | ) | | | (0.08 | ) | | | (0.88 | ) | | | (0.11 | ) |
| Total Distributions to Shareholders | | | (0.49 | ) | | | (0.10 | ) | | | (0.11 | ) | | | (0.93 | ) | | | (0.13 | ) |
| NET ASSET VALUE, End of Period | | $ | 10.27 | | | $ | 10.32 | | | $ | 9.51 | | | $ | 9.05 | | | $ | 11.08 | |
| TOTAL RETURN | | | 4.37 | % | | | 9.62 | % | | | 6.49 | % | | | (10.43 | )% | | | 12.26 | %(c) |
| | | | | | | | | | | | | | | | | | | | | |
| RATIOS/SUPPLEMENTARY DATA | | | | | | | | | | | | | | | | | | | | |
| Net Assets at End of Period (000s omitted) | | $ | 21,424 | | | $ | 36,505 | | | $ | 43,196 | | | $ | 50,566 | | | $ | 59,620 | |
| Ratios to Average Net Assets: | | | | | | | | | | | | | | | | | | | | |
| Net investment income (loss) | | | (0.24 | )% | | | (0.29 | )% | | | 0.54 | % | | | 0.23 | % | | | 0.59 | %(d) |
| Net expenses | | | 0.75 | % | | | 0.75 | % | | | 0.75 | % | | | 0.75 | % | | | 0.75 | %(d) |
| Gross expenses (e) | | | 2.03 | % | | | 1.65 | % | | | 1.54 | % | | | 1.39 | % | | | 1.54 | %(d) |
| PORTFOLIO TURNOVER RATE | | | 31 | % | | | 32 | % | | | 35 | % | | | 46 | % | | | 44 | %(c) |
| (a) | Commencement of operations. |
| (b) | Calculated based on average shares outstanding during each period. |
| (c) | Not annualized. |
| (e) | Reflects the expense ratio excluding any waivers and/or reimbursements. |
See Notes to Financial Statements.
STEINBERG SELECT FUND
NOTES TO FINANCIAL STATEMENTS
SEPTEMBER 30, 2018
Note 1. Organization
The Steinberg Select Fund (the “Fund”) is a non-diversified portfolio of Forum Funds (the “Trust”). The Trust is a Delaware statutory trust that is registered as an open-end, management investment company under the Investment Company Act of 1940, as amended (the “Act”). Under its Trust Instrument, the Trust is authorized to issue an unlimited number of the Fund’s shares of beneficial interest without par value. The Fund currently offers two classes of shares: Institutional Shares and Investor Shares. Institutional Shares and Investor Shares commenced operations on October 1, 2013, and July 17, 2014, respectively. As of September 30, 2018, the Investor Shares class had no shares outstanding. The Fund seeks long-term capital appreciation.
Note 2. Summary of Significant Accounting Policies
The Fund is an investment company and follows accounting and reporting guidance under Financial Accounting Standards Board (“FASB”) Accounting Standards Codification (“ASC”) Topic 946, “Financial Services-Investment Companies”. These financial statements are prepared in accordance with accounting principles generally accepted in the United States of America (“GAAP”), which require management to make estimates and assumptions that affect the reported amounts of assets and liabilities, the disclosure of contingent liabilities at the date of the financial statements, and the reported amounts of increases and decreases in net assets from operations during the fiscal period. Actual amounts could differ from those estimates. The following summarizes the significant accounting policies of the Fund:
Security Valuation – Securities are valued at market prices using the last quoted trade or official closing price from the principal exchange where the security is traded, as provided by independent pricing services on each Fund business day. In the absence of a last trade, securities are valued at the mean of the last bid and ask price provided by the pricing service. Short-term investments that mature in sixty days or less may be valued at amortized cost.
The Fund values its investments at fair value pursuant to procedures adopted by the Trust’s Board of Trustees (the “Board”) if (1) market quotations are not readily available or (2) the Adviser, as defined in Note 4, believes that the values available are unreliable. The Trust’s Valuation Committee, as defined in the Fund’s registration statement, performs certain functions as they relate to the administration and oversight of the Fund’s valuation procedures. Under these procedures, the Valuation Committee convenes on a regular and ad hoc basis to review such investments and considers a number of factors, including valuation methodologies and significant unobservable inputs, when arriving at fair value.
The Valuation Committee may work with the Adviser to provide valuation inputs. In determining fair valuations, inputs may include market-based analytics that may consider related or comparable assets or liabilities, recent transactions, market multiples, book values and other relevant investment information. Adviser inputs may include an income-based approach in which the anticipated future cash flows of the investment are discounted in determining fair value. Discounts may also be applied based on the nature or duration of any restrictions on the disposition of the investments. The Valuation Committee performs regular reviews of valuation methodologies, key inputs and assumptions, disposition analysis and market activity.
Fair valuation is based on subjective factors and, as a result, the fair value price of an investment may differ from the security’s market price and may not be the price at which the asset may be sold. Fair valuation could result in a different Net Asset Value (“NAV”) than a NAV determined by using market quotes.
GAAP has a three-tier fair value hierarchy. The basis of the tiers is dependent upon the various “inputs” used to determine the value of the Fund’s investments. These inputs are summarized in the three broad levels listed below:
Level 1 - Quoted prices in active markets for identical assets and liabilities.
Level 2 - Prices determined using significant other observable inputs (including quoted prices for similar securities, interest rates, prepayment speeds, credit risk, etc.). Short-term securities with maturities of sixty days or less are valued at amortized cost, which approximates market value, and are categorized as Level 2 in the hierarchy. Municipal securities, long-term U.S. government obligations and corporate debt securities are valued in accordance with the evaluated price supplied by the pricing service and generally categorized as Level 2 in the hierarchy. Other securities that are categorized as Level 2 in the hierarchy include, but are not limited to, warrants that do not trade on an exchange, securities valued at the mean between the last reported bid and ask quotation and international equity securities valued by an independent third party with adjustments for changes in value between the time of the securities respective local market closes and the close of the U.S. market.
STEINBERG SELECT FUND
NOTES TO FINANCIAL STATEMENTS
SEPTEMBER 30, 2018
Level 3 - Significant unobservable inputs (including the Fund’s own assumptions in determining the fair value of investments).
The aggregate value by input level, as of September 30, 2018, for the Fund’s investments is included at the end of the Fund’s Schedule of Investments.
Security Transactions, Investment Income and Realized Gain and Loss – Investment transactions are accounted for on the trade date. Dividend income is recorded on the ex-dividend date. Foreign dividend income is recorded on the ex-dividend date or as soon as possible after determining the existence of a dividend declaration after exercising reasonable due diligence. Income and capital gains on some foreign securities may be subject to foreign withholding taxes, which are accrued as applicable. Interest income is recorded on an accrual basis. Premium is amortized and discount is accreted using the effective interest method. Identified cost of investments sold is used to determine the gain and loss for both financial statement and federal income tax purposes.
Foreign Currency Translations – Foreign currency amounts are translated into U.S. dollars as follows: (1) assets and liabilities at the rate of exchange at the end of the respective period; and (2) purchases and sales of securities and income and expenses at the rate of exchange prevailing on the dates of such transactions. The portion of the results of operations arising from changes in the exchange rates and the portion due to fluctuations arising from changes in the market prices of securities are not isolated. Such fluctuations are included with the net realized and unrealized gain or loss on investments.
Distributions to Shareholders – The Fund declares any dividends from net investment income and pays them annually. Any net capital gains realized by the Fund are distributed at least annually. Distributions to shareholders are recorded on the ex-dividend date. Distributions are based on amounts calculated in accordance with applicable federal income tax regulations, which may differ from GAAP. These differences are due primarily to differing treatments of income and gain on various investment securities held by the Fund, timing differences and differing characterizations of distributions made by the Fund.
Federal Taxes – The Fund intends to continue to qualify each year as a regulated investment company under Subchapter M of Chapter 1, Subtitle A, of the Internal Revenue Code of 1986, as amended (“Code”), and to distribute all of its taxable income to shareholders. In addition, by distributing in each calendar year substantially all of its net investment income and capital gains, if any, the Fund will not be subject to a federal excise tax. Therefore, no federal income or excise tax provision is required. The Fund files a U.S. federal income and excise tax return as required. The Fund’s federal income tax returns are subject to examination by the Internal Revenue Service for a period of three fiscal years after they are filed. As of September 30, 2018, there are no uncertain tax positions that would require financial statement recognition, de-recognition or disclosure.
Income and Expense Allocation – The Trust accounts separately for the assets, liabilities and operations of each of its investment portfolios. Expenses that are directly attributable to more than one investment portfolio are allocated among the respective investment portfolios in an equitable manner.
The Fund's class-specific expenses are charged to the operations of that class of shares. Income and expenses (other than expenses attributable to a specific class) and realized and unrealized gains or losses on investments are allocated to each class of shares based on the class’ respective net assets to the total net assets of the Fund.
Commitments and Contingencies – In the normal course of business, the Fund enters into contracts that provide general indemnifications by the Fund to the counterparty to the contract. The Fund’s maximum exposure under these arrangements is dependent on future claims that may be made against the Fund and, therefore, cannot be estimated; however, based on experience, the risk of loss from such claims is considered remote. The Fund has determined that none of these arrangements requires disclosure on the Fund’s balance sheet.
Note 3. Cash – Concentration in Uninsured Account
For cash management purposes, the Fund may concentrate cash with the Fund’s custodian. This typically results in cash balances exceeding the Federal Deposit Insurance Corporation (“FDIC”) insurance limits. As of September 30, 2018, the Fund had $3,086,944 at MUFG Union Bank, N.A. that exceeded the FDIC insurance limit.
STEINBERG SELECT FUND
NOTES TO FINANCIAL STATEMENTS
SEPTEMBER 30, 2018
Note 4. Fees and Expenses
Investment Adviser – Steinberg Asset Management, LLC (the “Adviser”) is the investment adviser to the Fund. Pursuant to an investment advisory agreement, the Adviser receives an advisory fee, payable monthly, from the Fund at an annual rate of 0.95% of the Fund’s average daily net assets.
Distribution – Foreside Fund Services, LLC serves as the Fund’s distributor (the “Distributor”). The Fund has adopted a Distribution Plan (the “Plan”) for Investor Class shares in accordance with Rule 12b-1 of the Act. Under the Plan, the Fund pays the Distributor and/or any other entity as authorized by the Board a fee of up to 0.25% of the average daily net assets of Investor Class shares. The Distributor is not affiliated with the Adviser or Atlantic Fund Administration, LLC (d/b/a Atlantic Fund Services) (“Atlantic”) or their affiliates.
Other Service Providers – Atlantic provides fund accounting, fund administration, compliance and transfer agency services to the Fund. The fees related to these services are included in Fund services fees within the Statement of Operations. Atlantic also provides certain shareholder report production and EDGAR conversion and filing services. Pursuant to an Atlantic services agreement, the Fund pays Atlantic customary fees for its services. Atlantic provides a Principal Executive Officer, a Principal Financial Officer, a Chief Compliance Officer and an Anti-Money Laundering Officer to the Fund, as well as certain additional compliance support functions.
Trustees and Officers – Through December 31, 2017, the Trust paid each Independent Trustee an annual retainer fee of $50,000 for service to the Trust ($66,000 for the Chairman), and the Audit Committee Chairman and Vice Chairman receive an additional $6,000 annually. Effective January 1, 2018, each Independent Trustee’s annual retainer is $31,000 ($41,000 for the Chairman), and the Audit Committee Chairman receives an additional $2,000 annually. The Trustees and Chairman may receive additional fees for special Board meetings. Each Trustee is also reimbursed for all reasonable out-of-pocket expenses incurred in connection with his or her duties as a Trustee, including travel and related expenses incurred in attending Board meetings. The amount of Trustees’ fees attributable to the Fund is disclosed in the Statement of Operations. Certain officers of the Trust are also officers or employees of the above named service providers, and during their terms of office received no compensation from the Fund.
Note 5. Expense Reimbursements and Fees Waived
The Adviser has contractually agreed to waive its fee and/or reimburse Fund expenses to limit Total Annual Fund Operating Expenses After Fee Waiver and/or Expense Reimbursement (excluding all taxes, interest, portfolio transaction expenses, acquired fund fees and expenses, proxy expenses and extraordinary expenses) to 0.75% for Institutional Shares, through at least January 31, 2019. Other Fund service providers have voluntarily agreed to waive a portion of their fees. The contractual waivers may be changed or eliminated at any time with the consent of the Board and voluntary fee waivers and expense reimbursements may be reduced or eliminated at any time. For the year ended September 30, 2018, fees waived and expenses reimbursed were as follows:
| | Investment Adviser Fees Waived | | | Other Waivers | | | Total Fees Waived and Expenses Reimbursed | |
| | $ | 220,242 | | | $ | 104,227 | | | $ | 324,469 | |
The Adviser may be reimbursed by the Fund for fees waived and expenses reimbursed by the Adviser pursuant to the Expense Cap if such payment is made within three years of the fee waiver or expense reimbursement, and does not cause the Total Annual Fund Operating Expenses After Fee Waiver and/or Expense Reimbursement to exceed the lesser of (i) the then-current expense cap, or (ii) the expense cap in place at the time the fees/expenses were waived/reimbursed. As of September 30, 2018, $820,153 is subject to recapture by the Adviser.
Note 6. Security Transactions
The cost of purchases and proceeds from sales of investment securities (including maturities), other than short-term investments, during the year ended September 30, 2018 were $7,223,611 and $24,797,275 respectively.
STEINBERG SELECT FUND
NOTES TO FINANCIAL STATEMENTS
SEPTEMBER 30, 2018
Note 7. Line of Credit
The Fund has a committed $1,250,000 unsecured line of credit agreement with MUFG Union Bank, N.A. The Fund may temporarily borrow from the line of credit to satisfy redemption requests or settle investment transactions. Interest is charged to the Fund based on its borrowings at an amount above the LIBOR rate. During the year ended September 30, 2018, the Fund had no outstanding balances pursuant to this line of credit.
Note 8. Federal Income Tax
As of September 30, 2018, the cost of investments for federal income tax purposes is $14,213,575 and the components of net appreciation were as follows:
| | Gross Unrealized Appreciation | | $ | 4,054,060 | | |
| | Gross Unrealized Depreciation | | | (431,310 | ) | |
| | Net Unrealized Appreciation | | $ | 3,622,750 | | |
Distributions paid during the fiscal years ended as noted were characterized for tax purposes as follows:
| | | | 2018 | | | 2017 | | |
| | Ordinary Income | | $ | 94,508 | | | $ | 110,720 | | |
| | Long-Term Capital Gain | | | 2,473,941 | | | | 314,800 | | |
| | | | $ | 2,568,449 | | | $ | 425,520 | | |
As of September 30, 2018, distributable earnings (accumulated loss) on a tax basis were as follows:
| | Undistributed Long-Term Gain | | $ | 1,460,559 | | |
| | Unrealized Appreciation | | | 3,622,769 | | |
| | Total | | $ | 5,083,328 | | |
The difference between components of distributable earnings on a tax basis and the amounts reflected in the Statement of Assets and Liabilities are primarily due to wash sales.
Equalization debits included in the distributions were as follows:
| | | | Long-Term Capital Gain | | |
| | 2018 | | $ | 826,793 | | |
On the Statement of Assets and Liabilities, as a result of permanent book to tax differences, certain amounts have been reclassified for the year ended September 30, 2018. The following reclassifications were the result of equity return of capital distributions, unused net investment losses, and equalization and have no impact on the net assets of the Fund.
| | Undistributed Net Investment Income | | $ | 61,636 | | |
| | Accumulated Net Realized Loss | | | (861,790 | ) | |
| | Paid-in-Capital | | | 800,154 | | |
Note 9. Recent Accounting Pronouncements
In August 2018, the Financial Accounting Standards Board (“FASB”) issued Accounting Standards Update (ASU) No. 2018-13 “Fair Value Measurement (Topic 820): Disclosure Framework – Changes to the Disclosure Requirements for Fair Value Measurement” (“ASU 2018-13”) which includes amendments intended to improve the effectiveness of disclosures in the notes to financial statements. For example, ASU 2018-13 includes additional disclosures regarding the range and weighted average of significant unobservable inputs used to develop Level 3 fair value measurements, and clarifications to the narrative description of measurement uncertainty disclosures. ASU 2018-13 is effective for interim and annual periods beginning after December 15, 2019. Management is currently evaluating the impact that ASU 2018-13 will have on the Fund's financial statements and related disclosures.
In September 2018, the Securities and Exchange Commission released Final Rule 33-10532 captioned “Disclosure Update and Simplification” which is intended to amend certain disclosure requirements that have become redundant, duplicative, overlapping,
STEINBERG SELECT FUND
NOTES TO FINANCIAL STATEMENTS
SEPTEMBER 30, 2018
outdated, or superseded, in light of other Commission disclosure requirements, GAAP, or changes in the information environment. These changes will be effective November 5, 2018. Management is currently evaluating the impact that this release will have on the Fund's financial statements and related disclosures.
Note 10. Subsequent Events
Subsequent events occurring after the date of this report through the date these financial statements were issued have been evaluated for potential impact, and the Fund has had no such events.
REPORT OF INDEPENDENT REGISTERED PUBLIC ACCOUNTING FIRM
To the Board of Trustees of Forum Funds
and the Shareholders of Steinberg Select Fund
Opinion on the Financial Statements
We have audited the accompanying statement of assets and liabilities of Steinberg Select Fund (the “Fund”), a series of shares of beneficial interest in Forum Funds, including the schedule of investments, as of September 30, 2018, and the related statement of operations for the year then ended, the statements of changes in net assets for each of the years in the two-year period then ended and the financial highlights for each of the years in the four-year period then ended, and for the period October 1, 2013 (commencement of operations) through September 30, 2014, and the related notes (collectively referred to as the “financial statements”). In our opinion, the financial statements present fairly, in all material respects, the financial position of the Fund as of September 30, 2018, and the results of its operations for the year then ended, the changes in its net assets for each of the years in the two-year period then ended and its financial highlights for each of the years in the four-year period then ended and for the period October 1, 2013 through September 30, 2014, in conformity with accounting principles generally accepted in the United States of America.
Basis for Opinion
These financial statements are the responsibility of the Fund's management. Our responsibility is to express an opinion on the Fund’s financial statements based on our audits. We are a public accounting firm registered with the Public Company Accounting Oversight Board (United States) (“PCAOB”) and are required to be independent with respect to the Fund in accordance with the U.S. federal securities law and the applicable rules and regulations of the Securities and Exchange Commission and the PCAOB.
We conducted our audits in accordance with the standards of the PCAOB. Those standards require that we plan and perform the audits to obtain reasonable assurance about whether the financial statements are free of material misstatement, whether due to error or fraud. The Fund is not required to have, nor were we engaged to perform, an audit of its internal control over financial reporting. As part of our audits we are required to obtain an understanding of internal control over financial reporting but not for the purpose of expressing an opinion on the effectiveness of the Fund’s internal control over financial reporting. Accordingly, we express no such opinion.
Our audits included performing procedures to assess the risk of material misstatement of the financial statements, whether due to error or fraud, and performing procedures that respond to those risks. Such procedures include examining, on a test basis, evidence regarding the amounts and disclosures in the financial statements. Our procedures included confirmation of securities owned as of September 30, 2018 by correspondence with the custodian. Our audits also included evaluating the accounting principles used and significant estimates made by management, as well as evaluating the overall presentation of the financial statements. We believe that our audits provide a reasonable basis for our opinion.

BBD, LLP
We have served as the auditor of one or more of the Funds in the Forum Funds since 2009.
Philadelphia, Pennsylvania
November 26, 2018
STEINBERG SELECT FUND
ADDITIONAL INFORMATION (Unaudited)
SEPTEMBER 30, 2018
Investment Advisory Agreement Approval
At the June 14, 2018 Board meeting, the Board, including the Independent Trustees, considered the approval of the continuance of the investment advisory agreement between the Adviser and the Trust pertaining to the Fund (the “Advisory Agreement”). In preparation for its deliberations, the Board requested and reviewed written responses from the Adviser to a due diligence questionnaire circulated on the Board's behalf concerning the services provided by the Adviser. The Board also discussed the materials with Fund counsel and, as necessary, with the Trust's administrator, Atlantic Fund Services. During its deliberations, the Board received an oral presentation from the Adviser, and was assisted by the advice of Trustee counsel.
At the meeting, the Board reviewed, among other matters: (1) the nature, extent and quality of the services provided to the Fund by the Adviser, including information on the investment performance of the Fund and Adviser; (2) the costs of the services provided and profitability to the Adviser of its relationship with the Fund; (3) the advisory fee and total expense ratio of the Fund compared to those of relevant peer groups of funds; (4) the extent to which economies of scale may be realized as the Fund grows and whether the advisory fee enables the Fund's investors to share in the benefits of economies of scale; and (5) other benefits received by the Adviser from its relationship with the Fund. In addition, the Board recognized that the evaluation process with respect to the Adviser was an ongoing one and, in this regard, the Board considered information provided by the Adviser at regularly scheduled meetings during the past year.
Nature, Extent and Quality of Services
Based on written materials received, a presentation from senior representatives of the Adviser and a discussion with the Adviser about the Adviser’s personnel, operations and financial condition, the Board considered the quality of services provided by the Adviser under the Advisory Agreement. In this regard, the Board considered information regarding the experience, qualifications and professional background of the portfolio managers and other personnel at the Adviser with principal responsibility for the Fund, as well as the investment philosophy and decision-making process of the Adviser and the capability and integrity of the Adviser’s senior management and staff.
The Board considered also the adequacy of the Adviser’s resources. The Board noted the Adviser’s representation that the firm is in stable financial condition, that the firm is able to meet its expense reimbursement obligations to the Fund, and that the firm has the operational capability and the staffing and experience necessary to continue providing high-quality investment advisory services to the Fund. Based on the presentation and the materials provided by the Adviser in connection with the Board’s consideration of the renewal of the Advisory Agreement, the Board concluded that, overall, it was satisfied with the nature, extent and quality of services provided to the Fund under the Advisory Agreement.
Performance
In connection with a presentation by the Adviser regarding its approach to managing the Fund, the Board reviewed the performance of the Fund compared to its benchmarks. The Board observed that the Fund underperformed the Russell 3000 Value Index and S&P 500 Index, the Fund’s benchmarks, for the one- and three-year periods ended March 31, 2018, and for the period since the Fund’s inception on October 1, 2013. The Board also considered the Fund’s performance relative to an independent peer group of funds identified by Broadridge Financial Solutions, Inc. (“Broadridge”) as having characteristics similar to those of the Fund. The Board observed that, based on the information provided by Broadridge, the Fund underperformed the median of its Broadridge peers for the one- and three- year periods ended March 31, 2018. The Board considered the Adviser’s explanation that the Fund’s underperformance in relation to the Fund’s benchmark during the periods could be attributed to the Fund’s investment style and value bias, which have been out of favor over the past few years in the current financial and market environment, which generally favored growth oriented strategies. The Board also noted the Adviser’s representation that it remained confident in its investment style and believed that the Fund’s portfolio remained well positioned to achieve its investment objective going forward, as evidenced by certain periods of the Adviser’s history when periods of underperformance by the Adviser’s investment style were followed by periods of outperformance.
The Board further noted the Adviser’s presentation of a peer group of funds identified by the Adviser as being more representative of the Fund’s investment strategy (“Comparable Funds”) than the Broadridge peer group. The Board observed that the Fund underperformed the median of the Comparable Funds for the one- and three-year periods ended March 31, 2018 but that the Fund’s performance more closely approximated the performance of the Comparable Funds than the performance of the Broadridge peers.
Based on the foregoing, the Board concluded that the Fund and its shareholders could benefit from the Adviser’s management under the Advisory Agreement.
STEINBERG SELECT FUND
ADDITIONAL INFORMATION (Unaudited)
SEPTEMBER 30, 2018
Compensation
The Board evaluated the Adviser’s compensation for providing advisory services to the Fund and analyzed comparative information on actual advisory fee rates and actual total expenses of the Fund's relevant Broadridge peer group. The Board noted that the Adviser’s actual advisory fee rate and the Fund's actual total expense ratio were each lower than the median of the Broadridge peer group. The Board also noted that the Fund’s net expenses (after waivers) were the lowest among the Comparable Funds. Based on the foregoing, the Board concluded that the Adviser’s advisory fee rate charged to the Fund was reasonable.
Cost of Services and Profitability
The Board considered information provided by the Adviser regarding the costs of services and its profitability with respect to the Fund. In this regard, the Board considered the Adviser’s resources devoted to the Fund, as well as the Adviser’s discussion of costs and profitability. The Board noted the Adviser’s representation that it does not allocate indirect or marketing expenses attributable to the Fund separately from those of the Adviser’s other clients and that the management fees received for the services rendered to the Fund represented a relatively small portion of the Adviser’s overall advisory business revenue. Based on these and other applicable considerations, the Board concluded that the Adviser’s profits attributable to management of the Fund were not unreasonable in the context of all factors considered.
Economies of Scale
The Board evaluated whether the Fund would benefit from any economies of scale. In this respect, the Board considered the Adviser’s representation that the shareholders could potentially benefit from breakpoints in the advisory fee as assets increased but that breakpoints were not an appropriate consideration at this time. Based on the foregoing information, and in light of the current low asset level of the Fund, the Board concluded that economies of scale were not a material factor in approving the Advisory Agreement.
Other Benefits
The Board noted the Adviser’s representation that, aside from its contractual advisory fees, it does not benefit in a material way from its relationship with the Fund. Based on the foregoing representation, the Board concluded that other benefits received by the Adviser from its relationship with the Fund were not a material factor to consider in approving the continuation of the Advisory Agreement.
Conclusion
The Board did not identify any single factor as being of paramount importance, and different Trustees may have given different weight to different factors. The Board reviewed a memorandum from Fund counsel discussing the legal standards applicable to its consideration of the Advisory Agreement. Based on its review, including consideration of each of the factors referenced above, and its consideration of information received throughout the year from the Adviser, the Board determined, in the exercise of its business judgment, that the advisory arrangement, as outlined in the Advisory Agreement, was fair and reasonable in light of the services performed or to be performed, expenses incurred or to be incurred and such other matters as the Board considered relevant.
Proxy Voting Information
A description of the policies and procedures that the Fund uses to determine how to vote proxies relating to securities held in the Fund’s portfolio is available, without charge and upon request, by calling (855) 330-7085 and on the U.S. Securities and Exchange Commission’s (the “SEC”) website at www.sec.gov. The Fund’s proxy voting record for the most recent twelve-month period ended June 30 is available, without charge and upon request, by calling (855) 330-7085 and on the SEC’s website at www.sec.gov.
Availability of Quarterly Portfolio Schedules
The Fund files its complete schedule of portfolio holdings with the SEC for the first and third quarters of each fiscal year on Form N-Q. These filings are available, without charge and upon request on the SEC’s website at www.sec.gov or may be reviewed and copied at the SEC’s Public Reference Room in Washington, DC. Information on the operation of the Public Reference Room may be obtained by calling (800) SEC-0330.
STEINBERG SELECT FUND
ADDITIONAL INFORMATION (Unaudited)
SEPTEMBER 30, 2018
Shareholder Expense Example
As a shareholder of the Fund, you incur ongoing costs, including management fees, distribution (12b-1) fees and other Fund expenses. This example is intended to help you understand your ongoing costs (in dollars) of investing in the Fund, and to compare these costs with the ongoing costs of investing in other mutual funds.
The example is based on an investment of $1,000 invested at the beginning of the period and held for the entire period from April 1, 2018 through September 30, 2018.
Actual Expenses – The first line of the table below provides information about actual account values and actual expenses. You may use the information in this line, together with the amount you invested, to estimate the expenses that you paid over the period. Simply divide your account value by $1,000 (for example, an $8,600 account value divided by $1,000 = 8.6), then multiply the result by the number in the first line under the heading entitled “Expenses Paid During Period” to estimate the expenses you paid on your account during the period.
Hypothetical Example for Comparison Purposes – The second line of the table below provides information about hypothetical account values and hypothetical expenses based on the Fund’s actual expense ratio and an assumed rate of return of 5% per year before expenses, which is not the Fund’s actual return. The hypothetical account values and expenses may not be used to estimate the actual ending account balance or expenses you paid for the period. You may use this information to compare the ongoing costs of investing in the Fund and other funds. To do so, compare this 5% hypothetical example with the 5% hypothetical examples that appear in the shareholder reports of other funds.
Please note that the expenses shown in the table are meant to highlight your ongoing costs only. Therefore, the second line of the table is useful in comparing ongoing costs only and will not help you determine the relative total costs of owning different funds.
| | | Beginning
Account Value
April 1, 2018 | | | Ending
Account Value
September 30, 2018 | | | Expenses
Paid During
Period* | | | Annualized
Expense
Ratio* | |
| Institutional Shares | | | | | | | | | | | | | | | | |
| Actual | | $ | 1,000.00 | | | $ | 1,049.03 | | | $ | 3.85 | | | | 0.75 | % |
| Hypothetical (5% return before expenses) | | $ | 1,000.00 | | | $ | 1,021.31 | | | $ | 3.80 | | | | 0.75 | % |
| * | Expenses are equal to the Fund’s annualized expense ratio multiplied by the average account value over the period, multiplied by the number of days in the most recent fiscal half-year (183) divided by 365 to reflect the half-year period. |
Federal Tax Status of Dividends Declared during the Fiscal Year
For federal income tax purposes, dividends from short-term capital gains are classified as ordinary income. The Fund designates 34.91% of its income dividend distributed as qualifying for the corporate dividends-received deduction (DRD) and 62.66% for the qualified dividend rate (QDI) as defined in Section 1(h)(11) of the Internal Revenue Code. The fund also designates 100.00% as short-term capital gain dividends exempt from U.S. tax for foreign shareholders (QSD).
Trustees and Officers of the Trust
The Board is responsible for oversight of the management of the Trust’s business affairs and of the exercise of all the Trust’s powers except those reserved for the shareholders. The following table provides information about each Trustee and certain officers of the Trust. Each Trustee and officer holds office until the person resigns, is removed, or is replaced. Unless otherwise noted, the persons have held their principal occupations for more than five years. The address for all Trustees and officers is Three Canal Plaza, Suite 600, Portland, Maine 04101. The Fund’s Statement of Additional Information includes additional information about the Trustees and is available, without charge and upon request, by calling (855) 330-7085.
STEINBERG SELECT FUND
ADDITIONAL INFORMATION (Unaudited)
SEPTEMBER 30, 2018
Name and Year
of Birth | Position with
the Trust | Length of
Time
Served | Principal
Occupation(s) During
Past Five Years | Number of Series
in Fund Complex
Overseen By
Trustee | Other
Directorships Held
By Trustee During
Past Five Years |
| Independent Trustees |
David Tucker
Born: 1958 | Trustee;
Chairman of the Board | Since 2011 and Chairman since 2018 | Director, Blue Sky Experience (a charitable endeavor) since 2008; Senior Vice President & General Counsel, American Century Companies (an investment management firm) 1998-2008. | 1 | Trustee, Forum Funds II, Forum ETF Trust and U.S. Global Investors Funds |
Mark D. Moyer
Born: 1959 | Trustee | Since 2018 | Chief Financial Officer, Freedom House (a NGO advocating political freedom and democracy) since 2017; independent consultant providing interim CFO services, principally to non-profit organizations, 2011-2017; Chief Financial Officer, Institute of International Education (a NGO administering international educational exchange programs), 2008-2011; Chief Financial Officer and Chief Restructuring Officer, Ziff Davis Media Inc. (an integrated media company), 2005-2008; Adjunct Professor of Accounting, Fairfield University from 2009-2012. | 1 | Trustee, Forum Funds II, Forum ETF Trust and U.S. Global Investors Funds |
Jennifer Brown-Strabley
Born: 1964 | Trustee | Since 2018 | Principal, Portland Global Advisors, 1996-2010. | 1 | Trustee, Forum Funds II, Forum ETF Trust and U.S. Global Investors Funds |
| Interested Trustees |
Stacey E. Hong(1)
Born: 1966 | Trustee | Since 2018 | President, Atlantic since 2008. | 1 | Trustee, Forum Funds II and U.S. Global Investors Funds |
Jessica Chase(1) Born: 1970 | Trustee | Since 2018 | Senior Vice President, Atlantic since 2008. | 1 | None |
| (1) | Stacey E. Hong is currently treated as an interested person of the Trust, as defined in the 1940 Act, due to his affiliation with Atlantic. Jessica Chase is currently treated as an interested person of the Trust, as defined in the 1940 Act, due to her affiliation with Atlantic and her role as President of the Trust. |
STEINBERG SELECT FUND
ADDITIONAL INFORMATION (Unaudited)
SEPTEMBER 30, 2018
Name and Year of
Birth | Position
with the
Trust | Length of Time
Served | Principal Occupation(s)
During
Past 5 Years |
| Officers |
Jessica Chase
Born: 1970 | President; Principal Executive Officer | Since 2015 | Senior Vice President, Atlantic since 2008. |
Karen Shaw
Born: 1972 | Treasurer; Principal Financial Officer | Since 2008 | Senior Vice President, Atlantic since 2008. |
Zachary Tackett
Born: 1988 | Vice President; Secretary and Anti-Money Laundering Compliance Officer | Since 2014 | Counsel, Atlantic since 2014; Intern Associate, Coakley & Hyde, PLLC, 2010-2013. |
Michael J. McKeen
Born: 1971 | Vice President | Since 2009 | Senior Vice President, Atlantic since 2008. |
Timothy Bowden
Born: 1969 | Vice President | Since 2009 | Manager, Atlantic since 2008. |
Geoffrey Ney
Born: 1975 | Vice President | Since 2013 | Manager, Atlantic since 2013; Senior Fund Accountant, Atlantic, 2008–2013. |
Todd Proulx
Born: 1978 | Vice President | Since 2013 | Manager, Atlantic since 2013; Senior Fund Accountant, Atlantic, 2008–2013. |
Carlyn Edgar
Born: 1963 | Vice President | Since 2008 | Senior Vice President, Atlantic since 2008; Chief Compliance Officer, 2008-2016 |
Dennis Mason
Born: 1967 | Chief Compliance Officer | Since 2016 | Fund Compliance Officer, Atlantic since 2013; Senior Specialist, Atlantic, 2011-2013; Senior Analyst, Atlantic, 2008-2011 |
STEINBERG SELECT FUND
FOR MORE INFORMATION:
P.O. Box 588
Portland, ME 04112
(855) 330-7085 (toll free)
INVESTMENT ADVISER
Steinberg Asset Management, LLC
12 East 49th Street, Suite 1202
New York, NY 10017
TRANSFER AGENT
Atlantic Fund Services
P.O. Box 588
Portland, ME 04112
www.atlanticfundservices.com
DISTRIBUTOR
Foreside Fund Services, LLC
Three Canal Plaza, Suite 100
Portland, Maine 04101
www.foreside.com
This report is submitted for the general information of the shareholders of the Fund. It is not authorized for distribution to prospective investors unless preceded or accompanied by an effective prospectus, which includes information regarding the Fund’s risks, objectives, fees and expenses, experience of its management, and other information.
216-ANR-0918
ITEM 2. CODE OF ETHICS.
| (a) | As of the end of the period covered by this report, Forum Funds (the "Registrant") has adopted a code of ethics, which applies to its Principal Executive Officer and Principal Financial Officer (the "Code of Ethics"). |
| (c) | There have been no amendments to the Registrant's Code of Ethics during the period covered by this report. |
| (d) | There have been no waivers to the Registrant's Code of Ethics during the period covered by this report. |
(f) (1) A copy of the Code of Ethics is being filed under Item 13(a) hereto.
ITEM 3. AUDIT COMMITTEE FINANCIAL EXPERT.
The Board of Trustees has determined that no member of the Audit Committee is an "audit committee financial expert" as that term is defined under applicable regulatory guidelines.
ITEM 4. PRINCIPAL ACCOUNTANT FEES AND SERVICES.
(a) Audit Fees - The aggregate fees billed for each of the last two fiscal years (the "Reporting Periods") for professional services rendered by the Registrant's principal accountant for the audit of the Registrant's annual financial statements, or services that are normally provided by the principal accountant in connection with the statutory and regulatory filings or engagements for the Reporting Periods, were $13,400 in 2017 and $13,400 in 2018.
(b) Audit-Related Fees – The aggregate fees billed in the Reporting Periods for assurance and related services rendered by the principal accountant that were reasonably related to the performance of the audit of the Registrant's financial statements and are not reported under paragraph (a) of this Item 4 were $0 in 2017 and $0 in 2018.
(c) Tax Fees - The aggregate fees billed in the Reporting Periods for professional services rendered by the principal accountant to the Registrant for tax compliance, tax advice and tax planning were $3,000 in 2017 and $3,000 in 2018. These services consisted of review or preparation of U.S. federal, state, local and excise tax returns.
(d) All Other Fees - The aggregate fees billed in the Reporting Periods for products and services provided by the principal accountant to the Registrant, other than the services reported in paragraphs (a) through (c) of this Item, were $0 in 2017 and $0 in 2018.
(e) (1) The Audit Committee reviews and approves in advance all audit and "permissible non-audit services" (as that term is defined by the rules and regulations of the Securities and Exchange Commission) to be rendered to a series of the Registrant (each, a "Series"). In addition, the Audit Committee reviews and approves in advance all "permissible non-audit services" to be provided to an investment adviser (not including any sub-adviser) of a Series, or an affiliate of such investment adviser, that is controlling, controlled by or under common control with the investment adviser and provides on-going services to the Registrant ("Affiliate"), by the Series' principal accountant if the engagement relates directly to the operations and financial reporting of the Series. The Audit Committee considers whether fees paid by a Series' investment adviser or an Affiliate to the Series' principal accountant for audit and permissible non-audit services are consistent with the principal accountant's independence.
(e) (2) No services included in (b) - (d) above were approved pursuant to paragraph (c)(7)(i)(C) of Rule 2-01 of Regulation S-X.
(f) Not applicable
(g) The aggregate non-audit fees billed by the principal accountant for services rendered to the Registrant for the Reporting Periods were $0 in 2017 and $0 in 2018. There were no fees billed in either of the Reporting Periods for non-audit services rendered by the principal accountant to the Registrant's investment adviser or any Affiliate.
(h) During the Reporting Period, the Registrant's principal accountant provided no non-audit services to the investment advisers or any entity controlling, controlled by or under common control with the investment advisers to the series of the Registrant to which this report relates.
ITEM 5. AUDIT COMMITTEE OF LISTED REGISTRANTS.
Not applicable.
ITEM 6. INVESTMENTS.
| (a) | Included as part of report to shareholders under Item 1. |
ITEM 7. DISCLOSURE OF PROXY VOTING POLICIES AND PROCEDURES FOR CLOSED-END
MANAGEMENT INVESTMENT COMPANIES.
Not applicable.
ITEM 8. PORTFOLIO MANAGERS OF CLOSED-END MANAGEMENT INVESTMENT COMPANIES.
Not applicable.
ITEM 9. PURCHASES OF EQUITY SECURITIES BY CLOSED-END MANAGEMENT INVESTMENT COMPANY AND AFFILIATED PURCHASERS.
Not applicable.
ITEM 10. SUBMISSION OF MATTERS TO A VOTE OF SECURITY HOLDERS
The Registrant does not accept nominees to the board of trustees from shareholders.
ITEM 11. CONTROLS AND PROCEDURES
(a) The Registrant's Principal Executive Officer and Principal Financial Officer have concluded that the Registrant's disclosure controls and procedures (as defined in Rule 30a-3(c) under the Investment Company Act of 1940 (the "Act")) are effective, based on their evaluation of the controls and procedures required by Rule 30a-3(b) under the Act and Rules 13a-15(b) or 15d-15(b) under the Securities Exchange Act of 1934, as of a date within 90 days of the filing date of this report.
(b) There were no changes in the Registrant's internal control over financial reporting (as defined in
Rule 30a-3(d) under the Act) that occurred during the second fiscal quarter of the period covered by this report that have materially affected, or are reasonably likely to materially affect, the Registrant's internal control over financial reporting.
ITEM 12. DISCLOSURE OF SECURITIES LENDING ACTIVITIES FOR CLOSED-END MANAGEMENT INVESTMENT COMPANIES.
Not applicable.
ITEM 13. EXHIBITS.
(a)(1) Code of Ethics (Exhibit filed herewith).
(a)(2) Certifications pursuant to Rule 30a-2(a) of the Act, and Section 302 of the Sarbanes-Oxley Act of 2002. (Exhibits filed herewith)
(a)(3) Not applicable.
(b) Certifications pursuant to Rule 30a-2(b) of the Act, and Section 906 of the Sarbanes-Oxley Act of 2002. (Exhibit filed herewith)
SIGNATURES
Pursuant to the requirements of the Securities Exchange Act of 1934 and the Investment Company Act of 1940, the Registrant has duly caused this report to be signed on its behalf by the undersigned, thereunto duly authorized.
Registrant Forum Funds
| By: | /s/ Jessica Chase | |
| | Jessica Chase, Principal Executive Officer | |
| | | |
| Date: | November 26, 2018 | |
Pursuant to the requirements of the Securities Exchange Act of 1934 and the Investment Company Act of 1940, this report has been signed below by the following persons on behalf of the Registrant and in the capacities and on the dates indicated.
| By: | /s/ Jessica Chase | |
| | Jessica Chase, Principal Executive Officer | |
| | | |
| Date: | November 26, 2018 | |
| By: | /s/ Karen Shaw | |
| | Karen Shaw, Principal Financial Officer | |
| | | |
| Date: | November 26, 2018 | |