UNITED STATES
SECURITIES AND EXCHANGE COMMISSION
WASHINGTON, D.C. 20549
FORM N-CSR
CERTIFIED SHAREHOLDER REPORT OF REGISTERED MANAGEMENT
INVESTMENT COMPANIES
Investment Company Act file number 811-03023
FORUM FUNDS
Three Canal Plaza, Suite 600
Portland, Maine 04101
Zachary Tackett, Principal Executive Officer
Three Canal Plaza, Suite 600
Portland, Maine 04101
207-347-2000
Date of fiscal year end June 30
Date of reporting period: July 1, 2024 – December 31, 2024
ITEM 1. REPORT TO SHAREHOLDERS.
(a) A copy of the report transmitted to stockholders pursuant to Rule 30e-1 under the Investment Company Act, as amended (“Act”), is attached hereto.
DF Dent Premier Growth Fund
Semi-Annual Shareholder Report - December 31, 2024
This semi-annual shareholder report contains important information about the DF Dent Premier Growth Fund for the period of July 1, 2024, to December 31, 2024. You can find additional information about the Fund at https://dfdent.com/literature/. You can also request this information by contacting us at (866) 233-3368.
What were the Fund's costs for the last six months?
(based on a hypothetical $10,000 investment)
| Fund Name | Costs of a $10,000 investment | Costs paid as a percentage of a $10,000 investment |
|---|
| DF Dent Premier Growth Fund | $51 | 0.99% |
|---|
How did the Fund perform in the last six months?
During the period from July 2024 to December 2024, the DF Dent Premier Growth Fund underperformed its benchmark, the S&P 500 Index. The underperformance was influenced by both sector allocation and stock selection. The largest detractors were stock selection in Industrials and Information Technology and an overweight to Health Care. Within Information Technology, our position in semiconductors has broadly detracted from performance. Both stock selection and our underweight to Consumer Discretionary also detracted from performance. Notably, the Real Estate and Health Care sectors contributed positively to the portfolio’s performance, as did an underweight in the Energy sector.
The Consumer Discretionary and Financials sectors were the largest contributors to the benchmark’s return. In the Fund, the Consumer Discretionary sector underperformed, driven by both stock selection and sector allocation. Similarly, the Industrials sector underperformed in the portfolio due to stock selection. The Energy and Health Care sectors detracted the most from the benchmark’s performance.
The Fund experienced fluctuating performance relative to the S&P 500 Index, starting with a positive July, followed by losses through October. A slight recovery was observed in November, but the year concluded with a significant decline in December. Initially the outperformance was driven by positive stock selection and favorable sector allocation, but the subsequent months, particularly December, showed a reversal with both stock selection and sector allocation contributing to the underperformance.
CBRE Group, Inc., Class A
Mastercard, Inc., Class A
Monolithic Power Systems, Inc.
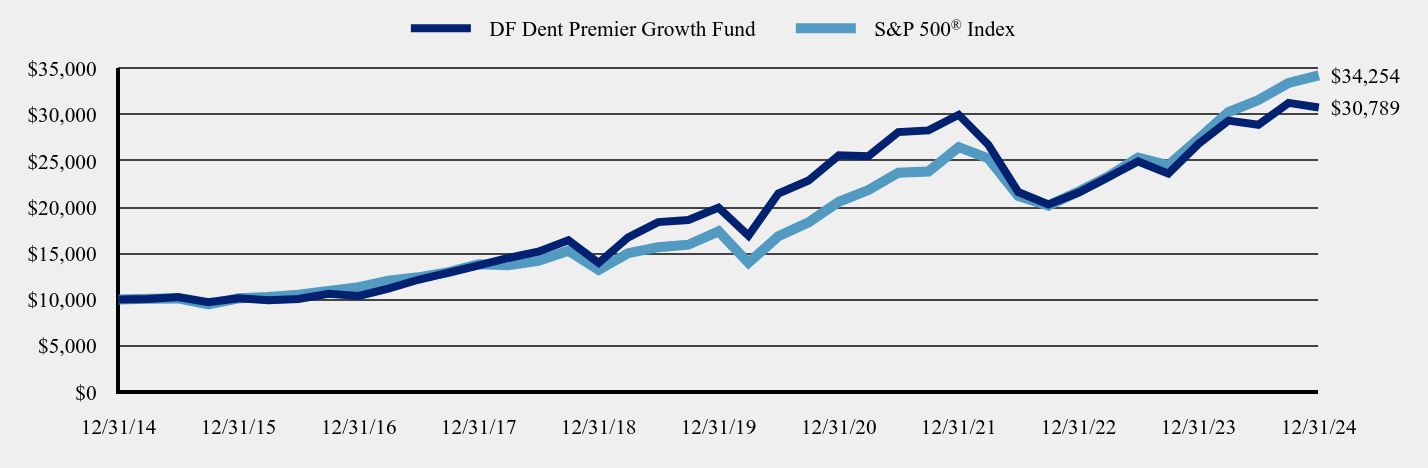
Total Return Based on a $10,000 Investment
| Date | DF Dent Premier Growth Fund | S&P 500® Index |
|---|
| 12/31/14 | $10,000 | $10,000 |
|---|
| 03/31/15 | $10,073 | $10,095 |
|---|
| 06/30/15 | $10,279 | $10,123 |
|---|
| 09/30/15 | $9,706 | $9,471 |
|---|
| 12/31/15 | $10,154 | $10,138 |
|---|
| 03/31/16 | $9,919 | $10,275 |
|---|
| 06/30/16 | $10,067 | $10,527 |
|---|
| 09/30/16 | $10,624 | $10,933 |
|---|
| 12/31/16 | $10,401 | $11,351 |
|---|
| 03/31/17 | $11,197 | $12,039 |
|---|
| 06/30/17 | $12,144 | $12,411 |
|---|
| 09/30/17 | $12,914 | $12,967 |
|---|
| 12/31/17 | $13,712 | $13,829 |
|---|
| 03/31/18 | $14,505 | $13,724 |
|---|
| 06/30/18 | $15,176 | $14,195 |
|---|
| 09/30/18 | $16,418 | $15,290 |
|---|
| 12/31/18 | $13,967 | $13,223 |
|---|
| 03/31/19 | $16,739 | $15,027 |
|---|
| 06/30/19 | $18,384 | $15,674 |
|---|
| 09/30/19 | $18,610 | $15,940 |
|---|
| 12/31/19 | $19,958 | $17,386 |
|---|
| 03/31/20 | $16,917 | $13,979 |
|---|
| 06/30/20 | $21,476 | $16,850 |
|---|
| 09/30/20 | $22,889 | $18,355 |
|---|
| 12/31/20 | $25,612 | $20,585 |
|---|
| 03/31/21 | $25,516 | $21,856 |
|---|
| 06/30/21 | $28,125 | $23,724 |
|---|
| 09/30/21 | $28,306 | $23,862 |
|---|
| 12/31/21 | $29,997 | $26,494 |
|---|
| 03/31/22 | $26,763 | $25,276 |
|---|
| 06/30/22 | $21,644 | $21,206 |
|---|
| 09/30/22 | $20,294 | $20,170 |
|---|
| 12/31/22 | $21,583 | $21,696 |
|---|
| 03/31/23 | $23,237 | $23,322 |
|---|
| 06/30/23 | $24,951 | $25,361 |
|---|
| 09/30/23 | $23,626 | $24,531 |
|---|
| 12/31/23 | $26,853 | $27,399 |
|---|
| 03/31/24 | $29,370 | $30,291 |
|---|
| 06/30/24 | $28,912 | $31,589 |
|---|
| 09/30/24 | $31,283 | $33,448 |
|---|
| 12/31/24 | $30,789 | $34,254 |
|---|
The above chart represents historical performance of a hypothetical $10,000 investment over the past 10 years.
Average Annual Total Returns
| | One Year | Five Year | Ten Year |
|---|
| DF Dent Premier Growth Fund | 14.66% | 9.06% | 11.90% |
|---|
S&P 500® Index | 25.02% | 14.53% | 13.10% |
|---|
The Fund’s past performance is not a good predictor of how the Fund will perform in the future. The graph and table do not reflect the deduction of taxes that a shareholder would pay on Fund distributions or redemption of Fund shares.
| Total Net Assets | $229,987,612 |
|---|
| # of Portfolio Holdings | 40 |
|---|
| Portfolio Turnover Rate | 7% |
|---|
| Investment Advisory Fees (Net of fees waived) | $1,012,285 |
|---|
Top Ten Holdings
(% total investments)*
| Amazon.com, Inc. | 6.10% |
| Visa, Inc., Class A | 5.18% |
| Mastercard, Inc., Class A | 4.99% |
| Alphabet, Inc., Class C | 4.67% |
| Microsoft Corp. | 4.08% |
| S&P Global, Inc. | 3.86% |
| HEICO Corp., Class A | 3.59% |
| TransDigm Group, Inc. | 3.41% |
| Guidewire Software, Inc. | 3.20% |
| Danaher Corp. | 3.16% |
* excluding cash equivalents
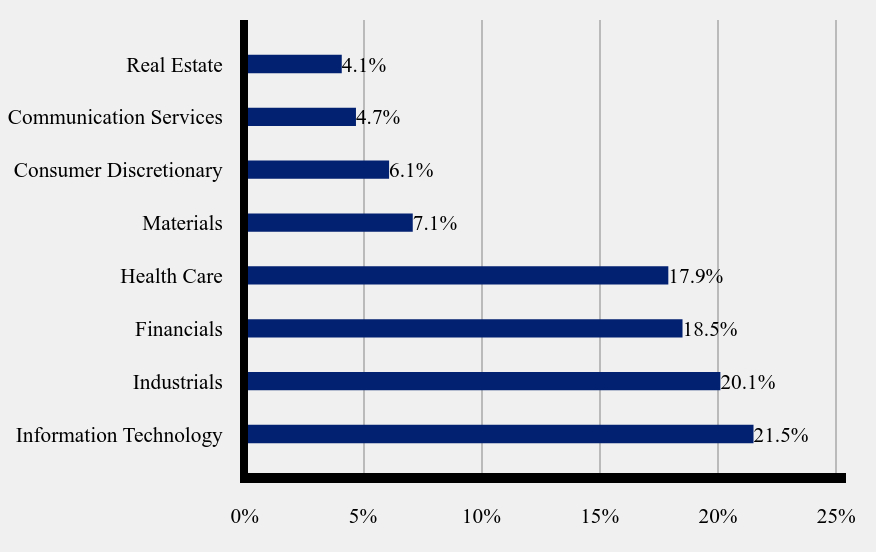
Sector Weightings
(% total investments)*
| Value | Value |
|---|
| Information Technology | 21.5% |
| Industrials | 20.1% |
| Financials | 18.5% |
| Health Care | 17.9% |
| Materials | 7.1% |
| Consumer Discretionary | 6.1% |
| Communication Services | 4.7% |
| Real Estate | 4.1% |
* excluding cash equivalents
Where can I find additional information about the fund?
Additional information is available by scanning the QR code or at https://dfdent.com/literature/, including its:
prospectus
financial information
holdings
proxy information
DF Dent Premier Growth Fund
Semi-Annual Shareholder Report - December 31, 2024
DF Dent Midcap Growth Fund
Semi-Annual Shareholder Report - December 31, 2024
This semi-annual shareholder report contains important information about the DF Dent Midcap Growth Fund for the period of July 1, 2024, to December 31, 2024. You can find additional information about the Fund at https://dfdent.com/literature/. You can also request this information by contacting us at (866) 233-3368.
What were the Fund's costs for the last six months?
(based on a hypothetical $10,000 investment)
| Class Name | Costs of a $10,000 investment | Costs paid as a percentage of a $10,000 investment |
|---|
| Investor Shares | $47 | 0.90% |
|---|
How did the Fund perform in the last six months?
During the period from July 2024 to December 2024, the DF Dent Midcap Growth Fund outperformed the Russell 2500 Index while underperforming the Russell Midcap Growth Index.
The outperformance relative to the Russell 2500 Index was driven primarily by stock selection within Real Estate and Financials. Being overweight Technology and underweight Energy also contributed to performance. This was offset by stock selection in Industrials and our overweight to Life Sciences within Health Care as they detracted from performance.
The underperformance relative to the Russell Midcap Growth Index was primarily due to our cautious view towards AI-driven investment themes. Not owning AI winners Palantir Technologies, Inc. (PLTR) and AppLovin Corp. (APP) alone accounted for our portfolio’s shortfall for the past 6 months. Stock selection in Industrials and Technology and our overweight to Materials and Healthcare also detracted from performance. On the positive side, stock selection within Financials, Real Estate, and Health Care and being underweight in both Consumer Staples and Consumer Discretionary were the largest contributors to performance.
The Fund experienced fluctuating performance relative to the Russell 2500 Index, starting with a positive July and August followed by losses through November. A slight recovery was observed in December.
The Fund experienced fluctuating performance relative to the Russell Midcap Growth Index, starting with a positive July, followed by losses through October. A slight recovery was observed in November, but the year concluded with a significant decline in December.
Goosehead Insurance, Inc., Class A
CBRE Group, Inc., Class A
Veeva Systems, Inc., Class A
Edwards Lifesciences Corp.
Microchip Technology, Inc.
Mettler-Toledo International, Inc.
Total Return Based on a $10,000 Investment
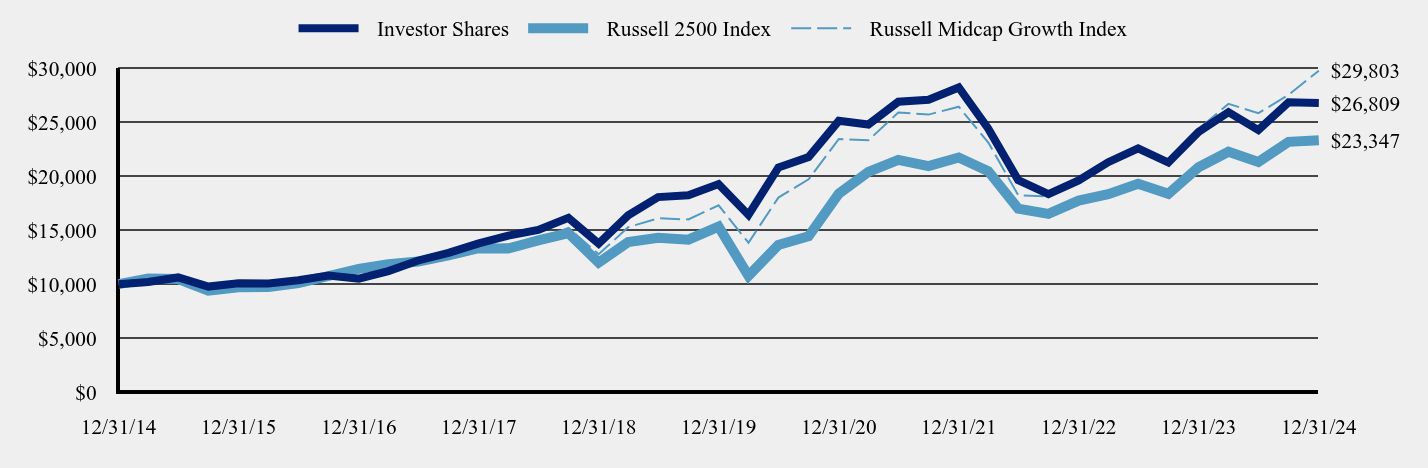
| Date | Investor Shares | Russell 2500 Index | Russell Midcap Growth Index |
|---|
| 12/31/14 | $10,000 | $10,000 | $10,000 |
|---|
| 03/31/15 | $10,209 | $10,517 | $10,538 |
|---|
| 06/30/15 | $10,627 | $10,481 | $10,418 |
|---|
| 09/30/15 | $9,778 | $9,402 | $9,585 |
|---|
| 12/31/15 | $10,079 | $9,710 | $9,980 |
|---|
| 03/31/16 | $10,059 | $9,748 | $10,038 |
|---|
| 06/30/16 | $10,362 | $10,096 | $10,195 |
|---|
| 09/30/16 | $10,800 | $10,759 | $10,663 |
|---|
| 12/31/16 | $10,506 | $11,418 | $10,711 |
|---|
| 03/31/17 | $11,215 | $11,847 | $11,450 |
|---|
| 06/30/17 | $12,200 | $12,099 | $11,932 |
|---|
| 09/30/17 | $12,902 | $12,673 | $12,563 |
|---|
| 12/31/17 | $13,786 | $13,337 | $13,418 |
|---|
| 03/31/18 | $14,510 | $13,305 | $13,710 |
|---|
| 06/30/18 | $15,031 | $14,065 | $14,143 |
|---|
| 09/30/18 | $16,148 | $14,725 | $15,214 |
|---|
| 12/31/18 | $13,760 | $12,003 | $12,781 |
|---|
| 03/31/19 | $16,392 | $13,902 | $15,288 |
|---|
| 06/30/19 | $18,079 | $14,313 | $16,114 |
|---|
| 09/30/19 | $18,240 | $14,130 | $16,005 |
|---|
| 12/31/19 | $19,283 | $15,336 | $17,314 |
|---|
| 03/31/20 | $16,424 | $10,778 | $13,844 |
|---|
| 06/30/20 | $20,816 | $13,641 | $18,033 |
|---|
| 09/30/20 | $21,790 | $14,443 | $19,724 |
|---|
| 12/31/20 | $25,150 | $18,402 | $23,475 |
|---|
| 03/31/21 | $24,810 | $20,413 | $23,342 |
|---|
| 06/30/21 | $26,921 | $21,524 | $25,927 |
|---|
| 09/30/21 | $27,112 | $20,947 | $25,730 |
|---|
| 12/31/21 | $28,244 | $21,748 | $26,463 |
|---|
| 03/31/22 | $24,426 | $20,483 | $23,134 |
|---|
| 06/30/22 | $19,660 | $17,005 | $18,259 |
|---|
| 09/30/22 | $18,348 | $16,526 | $18,140 |
|---|
| 12/31/22 | $19,624 | $17,753 | $19,392 |
|---|
| 03/31/23 | $21,314 | $18,355 | $21,163 |
|---|
| 06/30/23 | $22,597 | $19,314 | $22,483 |
|---|
| 09/30/23 | $21,285 | $18,390 | $21,308 |
|---|
| 12/31/23 | $24,120 | $20,846 | $24,408 |
|---|
| 03/31/24 | $25,956 | $22,289 | $26,726 |
|---|
| 06/30/24 | $24,295 | $21,336 | $25,867 |
|---|
| 09/30/24 | $26,867 | $23,202 | $27,559 |
|---|
| 12/31/24 | $26,809 | $23,347 | $29,803 |
|---|
The above chart represents historical performance of a hypothetical $10,000 investment over the past 10 years. Effective June 1, 2024, the Fund changed its primary benchmark index from the Russell Midcap Growth Index to the Russell 2500 Index due to regulatory requirements. The Fund retained the Russell Midcap Growth Index as a secondary benchmark because the Russell Midcap Growth Index more closely reflects the market sectors in which the Fund invests.
Average Annual Total Returns
| | One Year | Five Year | Ten Year |
|---|
| Investor Shares | 11.15% | 6.81% | 10.36% |
|---|
| Russell 2500 Index | 12.00% | 8.77% | 8.85% |
|---|
| Russell Midcap Growth Index | 22.10% | 11.47% | 11.54% |
|---|
The Fund’s past performance is not a good predictor of how the Fund will perform in the future. The graph and table do not reflect the deduction of taxes that a shareholder would pay on Fund distributions or redemption of Fund shares.
| Total Net Assets | $407,379,623 |
|---|
| # of Portfolio Holdings | 39 |
|---|
| Portfolio Turnover Rate | 25% |
|---|
| Investment Advisory Fees (Net of fees waived) | $1,608,046 |
|---|
Top Ten Holdings
(% total investments)*
| Vulcan Materials Co. | 5.21% |
| Ecolab, Inc. | 4.69% |
| Veeva Systems, Inc., Class A | 4.55% |
| CoStar Group, Inc. | 4.20% |
| CBRE Group, Inc., Class A | 4.09% |
| Veralto Corp. | 4.02% |
| Markel Group, Inc. | 3.97% |
| Bio-Techne Corp. | 3.79% |
| HEICO Corp., Class A | 3.79% |
| Old Dominion Freight Line, Inc. | 3.78% |
* excluding cash equivalents
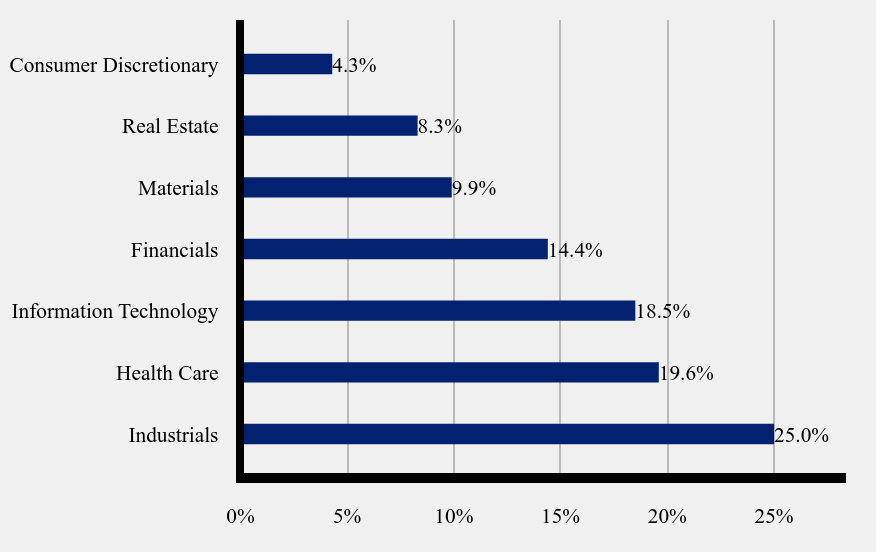
Sector Weightings
(% total investments)*
| Value | Value |
|---|
| Industrials | 25.0% |
| Health Care | 19.6% |
| Information Technology | 18.5% |
| Financials | 14.4% |
| Materials | 9.9% |
| Real Estate | 8.3% |
| Consumer Discretionary | 4.3% |
* excluding cash equivalents
Where can I find additional information about the fund?
Additional information is available by scanning the QR code or at https://dfdent.com/literature/, including its:
prospectus
financial information
holdings
proxy information
DF Dent Midcap Growth Fund
Semi-Annual Shareholder Report - December 31, 2024
DF Dent Midcap Growth Fund
Semi-Annual Shareholder Report - December 31, 2024
This semi-annual shareholder report contains important information about the DF Dent Midcap Growth Fund for the period of July 1, 2024, to December 31, 2024. You can find additional information about the Fund at https://dfdent.com/literature/. You can also request this information by contacting us at (866) 233-3368.
What were the Fund's costs for the last six months?
(based on a hypothetical $10,000 investment)
| Class Name | Costs of a $10,000 investment | Costs paid as a percentage of a $10,000 investment |
|---|
| Institutional Shares | $45 | 0.85% |
|---|
How did the Fund perform in the last six months?
During the period from July 2024 to December 2024, the DF Dent Midcap Growth Fund outperformed the Russell 2500 Index while underperforming the Russell Midcap Growth Index.
The outperformance relative to the Russell 2500 Index was driven primarily by stock selection within Real Estate and Financials. Being overweight Technology and underweight Energy also contributed to performance. This was offset by stock selection in Industrials and our overweight to Life Sciences within Health Care as they detracted from performance.
The underperformance relative to the Russell Midcap Growth Index was primarily due to our cautious view towards AI-driven investment themes. Not owning AI winners Palantir Technologies, Inc. (PLTR) and AppLovin Corp. (APP) alone accounted for our portfolio’s shortfall for the past 6 months. Stock selection in Industrials and Technology and our overweight to Materials and Healthcare also detracted from performance. On the positive side, stock selection within Financials, Real Estate, and Health Care and being underweight in both Consumer Staples and Consumer Discretionary were the largest contributors to performance.
The Fund experienced fluctuating performance relative to the Russell 2500 Index, starting with a positive July and August followed by losses through November. A slight recovery was observed in December.
The Fund experienced fluctuating performance relative to the Russell Midcap Growth Index, starting with a positive July, followed by losses through October. A slight recovery was observed in November, but the year concluded with a significant decline in December.
Goosehead Insurance, Inc., Class A
CBRE Group, Inc., Class A
Veeva Systems, Inc., Class A
Edwards Lifesciences Corp.
Microchip Technology, Inc.
Mettler-Toledo International, Inc.
Total Return Based on a $500,000 Investment
| Date | Institutional SharesFootnote Reference1 | Russell 2500 Index | Russell Midcap Growth Index |
|---|
| 12/31/14 | $500,000 | $500,000 | $500,000 |
|---|
| 3/31/15 | $510,451 | $525,842 | $526,890 |
|---|
| 6/30/15 | $531,352 | $524,044 | $520,880 |
|---|
| 9/30/15 | $488,896 | $470,084 | $479,264 |
|---|
| 12/31/15 | $503,947 | $485,492 | $499,001 |
|---|
| 3/31/16 | $502,936 | $487,399 | $501,890 |
|---|
| 6/30/16 | $518,105 | $504,812 | $509,732 |
|---|
| 9/30/16 | $540,015 | $537,941 | $533,139 |
|---|
| 12/31/16 | $525,308 | $570,886 | $535,571 |
|---|
| 3/31/17 | $560,734 | $592,329 | $572,493 |
|---|
| 6/30/17 | $609,992 | $604,972 | $596,625 |
|---|
| 9/30/17 | $645,080 | $633,658 | $628,144 |
|---|
| 12/31/17 | $689,307 | $666,854 | $670,897 |
|---|
| 3/31/18 | $725,515 | $665,260 | $685,485 |
|---|
| 6/30/18 | $751,910 | $703,238 | $707,129 |
|---|
| 9/30/18 | $808,083 | $736,265 | $760,691 |
|---|
| 12/31/18 | $688,694 | $600,156 | $639,026 |
|---|
| 3/31/19 | $820,624 | $695,086 | $764,409 |
|---|
| 6/30/19 | $905,661 | $715,667 | $805,701 |
|---|
| 9/30/19 | $913,710 | $706,490 | $800,274 |
|---|
| 12/31/19 | $966,588 | $766,796 | $865,686 |
|---|
| 3/31/20 | $823,612 | $538,890 | $692,203 |
|---|
| 6/30/20 | $1,043,901 | $682,045 | $901,670 |
|---|
| 9/30/20 | $1,093,325 | $722,166 | $986,189 |
|---|
| 12/31/20 | $1,262,037 | $920,104 | $1,173,753 |
|---|
| 3/31/21 | $1,245,040 | $1,020,661 | $1,167,119 |
|---|
| 6/30/21 | $1,350,918 | $1,076,207 | $1,296,343 |
|---|
| 9/30/21 | $1,360,833 | $1,047,346 | $1,286,492 |
|---|
| 12/31/21 | $1,417,427 | $1,087,397 | $1,323,151 |
|---|
| 3/31/22 | $1,225,814 | $1,024,144 | $1,156,695 |
|---|
| 6/30/22 | $986,844 | $850,234 | $912,959 |
|---|
| 9/30/22 | $920,908 | $826,277 | $906,997 |
|---|
| 12/31/22 | $985,022 | $887,651 | $969,593 |
|---|
| 3/31/23 | $1,069,900 | $917,745 | $1,058,174 |
|---|
| 6/30/23 | $1,134,378 | $965,696 | $1,124,143 |
|---|
| 9/30/23 | $1,068,443 | $919,516 | $1,065,418 |
|---|
| 12/31/23 | $1,211,242 | $1,042,308 | $1,220,396 |
|---|
| 3/31/24 | $1,303,406 | $1,114,431 | $1,336,291 |
|---|
| 6/30/24 | $1,220,349 | $1,066,793 | $1,293,352 |
|---|
| 9/30/24 | $1,349,306 | $1,160,123 | $1,377,954 |
|---|
| 12/31/24 | $1,346,391 | $1,167,334 | $1,490,141 |
|---|
| Footnote | Description |
Footnote1 | Institutional Shares commenced operations on November 29, 2017. Performance for the periods prior to November 29, 2017 are a blended average annual return which includes the returns of Investor Shares prior to the commencement of operations of Institutional Shares. |
The above chart represents historical performance of a hypothetical $500,000 investment over the past 10 years. Effective June 1, 2024, the Fund changed its primary benchmark index from the Russell Midcap Growth Index to the Russell 2500 Index due to regulatory requirements. The Fund retained the Russell Midcap Growth Index as a secondary benchmark because the Russell Midcap Growth Index more closely reflects the market sectors in which the Fund invests.
Average Annual Total Returns
| | One Year | Five Year | Ten Year |
|---|
Institutional SharesFootnote Reference1 | 11.16% | 6.85% | 10.41% |
|---|
| Russell 2500 Index | 12.00% | 8.77% | 8.85% |
|---|
| Russell Midcap Growth Index | 22.10% | 11.47% | 11.54% |
|---|
| Footnote | Description |
Footnote1 | Institutional Shares commenced operations on November 29, 2017. Performance for the 10 year period is a blended average annual return which includes the returns of Investor Shares prior to the commencement of operations of Institutional Shares. |
The Fund’s past performance is not a good predictor of how the Fund will perform in the future. The graph and table do not reflect the deduction of taxes that a shareholder would pay on Fund distributions or redemption of Fund shares.
| Total Net Assets | $407,379,623 |
|---|
| # of Portfolio Holdings | 39 |
|---|
| Portfolio Turnover Rate | 25% |
|---|
| Investment Advisory Fees (Net of fees waived) | $1,608,046 |
|---|
Top Ten Holdings
(% total investments)*
| Vulcan Materials Co. | 5.21% |
| Ecolab, Inc. | 4.69% |
| Veeva Systems, Inc., Class A | 4.55% |
| CoStar Group, Inc. | 4.20% |
| CBRE Group, Inc., Class A | 4.09% |
| Veralto Corp. | 4.02% |
| Markel Group, Inc. | 3.97% |
| Bio-Techne Corp. | 3.79% |
| HEICO Corp., Class A | 3.79% |
| Old Dominion Freight Line, Inc. | 3.78% |
* excluding cash equivalents
Sector Weightings
(% total investments)*
| Value | Value |
|---|
| Industrials | 25.0% |
| Health Care | 19.6% |
| Information Technology | 18.5% |
| Financials | 14.4% |
| Materials | 9.9% |
| Real Estate | 8.3% |
| Consumer Discretionary | 4.3% |
* excluding cash equivalents
Where can I find additional information about the fund?
Additional information is available by scanning the QR code or at https://dfdent.com/literature/, including its:
prospectus
financial information
holdings
proxy information
DF Dent Midcap Growth Fund
Semi-Annual Shareholder Report - December 31, 2024
DF Dent Midcap Growth Fund
: Institutional Plus Shares
Semi-Annual Shareholder Report - December 31, 2024
This semi-annual shareholder report contains important information about the DF Dent Midcap Growth Fund for the period of July 1, 2024, to December 31, 2024. You can find additional information about the Fund at https://dfdent.com/literature/. You can also request this information by contacting us at (866) 233-3368.
What were the Fund's costs for the last six months?
(based on a hypothetical $10,000 investment)
| Class Name | Costs of a $10,000 investment | Costs paid as a percentage of a $10,000 investment |
|---|
| Institutional Plus Shares | $42 | 0.79% |
|---|
How did the Fund perform in the last six months?
During the period from July 2024 to December 2024, the DF Dent Midcap Growth Fund outperformed the Russell 2500 Index while underperforming the Russell Midcap Growth Index.
The outperformance relative to the Russell 2500 Index was driven primarily by stock selection within Real Estate and Financials. Being overweight Technology and underweight Energy also contributed to performance. This was offset by stock selection in Industrials and our overweight to Life Sciences within Health Care as they detracted from performance.
The underperformance relative to the Russell Midcap Growth Index was primarily due to our cautious view towards AI-driven investment themes. Not owning AI winners Palantir Technologies, Inc. (PLTR) and AppLovin Corp. (APP) alone accounted for our portfolio’s shortfall for the past 6 months. Stock selection in Industrials and Technology and our overweight to Materials and Healthcare also detracted from performance. On the positive side, stock selection within Financials, Real Estate, and Health Care and being underweight in both Consumer Staples and Consumer Discretionary were the largest contributors to performance.
The Fund experienced fluctuating performance relative to the Russell 2500 Index, starting with a positive July and August followed by losses through November. A slight recovery was observed in December.
The Fund experienced fluctuating performance relative to the Russell Midcap Growth Index, starting with a positive July, followed by losses through October. A slight recovery was observed in November, but the year concluded with a significant decline in December.
Goosehead Insurance, Inc., Class A
CBRE Group, Inc., Class A
Veeva Systems, Inc., Class A
Edwards Lifesciences Corp.
Microchip Technology, Inc.
Mettler-Toledo International, Inc.
Total Return Based on a $100,000,000 Investment
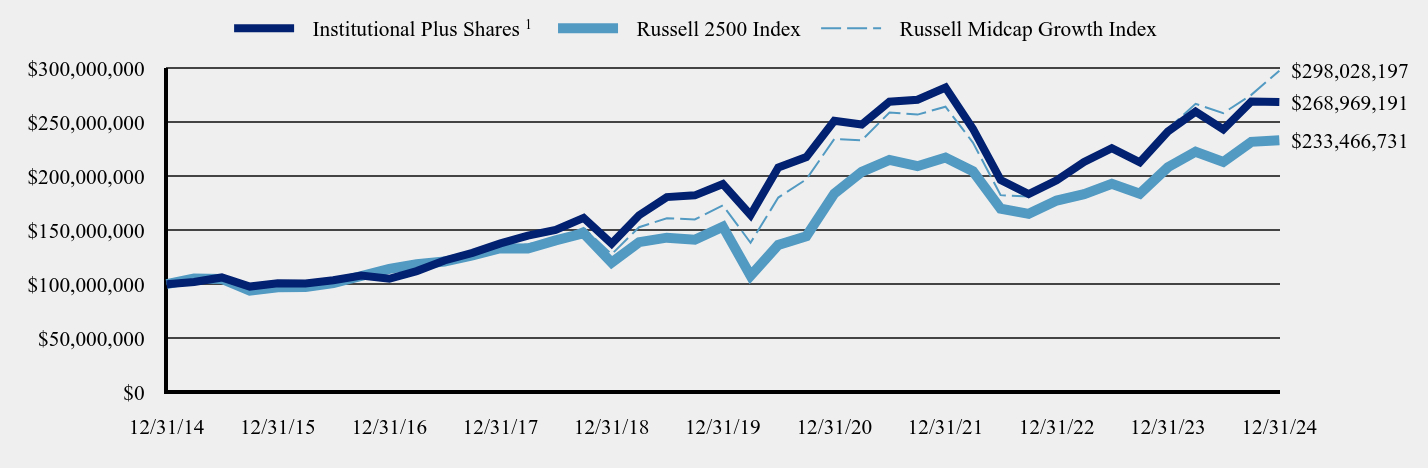
| Date | Institutional Plus SharesFootnote Reference1 | Russell 2500 Index | Russell Midcap Growth Index |
|---|
| 12/31/14 | $100,000,000 | $100,000,000 | $100,000,000 |
|---|
| 3/31/15 | $102,090,137 | $105,168,412 | $105,377,989 |
|---|
| 6/30/15 | $106,270,411 | $104,808,744 | $104,176,040 |
|---|
| 9/30/15 | $97,779,229 | $94,016,866 | $95,852,849 |
|---|
| 12/31/15 | $100,789,386 | $97,098,350 | $99,800,149 |
|---|
| 3/31/16 | $100,587,133 | $97,479,890 | $100,377,918 |
|---|
| 6/30/16 | $103,620,927 | $100,962,356 | $101,946,419 |
|---|
| 9/30/16 | $108,003,074 | $107,588,277 | $106,627,770 |
|---|
| 12/31/16 | $105,061,698 | $114,177,137 | $107,114,138 |
|---|
| 3/31/17 | $112,146,783 | $118,465,819 | $114,498,691 |
|---|
| 6/30/17 | $121,998,426 | $120,994,435 | $119,324,957 |
|---|
| 9/30/17 | $129,016,035 | $126,731,512 | $125,628,798 |
|---|
| 12/31/17 | $137,861,394 | $133,370,799 | $134,179,307 |
|---|
| 3/31/18 | $145,103,009 | $133,052,018 | $137,097,065 |
|---|
| 6/30/18 | $150,314,265 | $140,647,646 | $141,425,811 |
|---|
| 9/30/18 | $161,481,241 | $147,253,032 | $152,138,219 |
|---|
| 12/31/18 | $137,603,339 | $120,031,167 | $127,805,140 |
|---|
| 3/31/19 | $163,920,153 | $139,017,169 | $152,881,789 |
|---|
| 6/30/19 | $180,788,111 | $143,133,308 | $161,140,194 |
|---|
| 9/30/19 | $182,397,916 | $141,297,905 | $160,054,888 |
|---|
| 12/31/19 | $192,833,442 | $153,359,134 | $173,137,239 |
|---|
| 3/31/20 | $164,236,758 | $107,778,014 | $138,440,592 |
|---|
| 6/30/20 | $208,155,616 | $136,409,026 | $180,333,970 |
|---|
| 9/30/20 | $217,899,672 | $144,433,279 | $197,237,743 |
|---|
| 12/31/20 | $251,502,680 | $184,020,875 | $234,750,683 |
|---|
| 3/31/21 | $248,103,038 | $204,132,117 | $233,423,756 |
|---|
| 6/30/21 | $269,209,149 | $215,241,318 | $259,268,696 |
|---|
| 9/30/21 | $271,121,447 | $209,469,124 | $257,298,408 |
|---|
| 12/31/21 | $282,395,878 | $217,479,404 | $264,630,251 |
|---|
| 3/31/22 | $244,220,542 | $204,828,732 | $231,338,909 |
|---|
| 6/30/22 | $196,682,814 | $170,046,720 | $182,591,721 |
|---|
| 9/30/22 | $183,619,011 | $165,255,474 | $181,399,433 |
|---|
| 12/31/22 | $196,392,507 | $177,530,134 | $193,918,553 |
|---|
| 3/31/23 | $213,375,451 | $183,548,932 | $211,634,755 |
|---|
| 6/30/23 | $226,221,524 | $193,139,262 | $224,828,682 |
|---|
| 9/30/23 | $213,085,145 | $183,903,193 | $213,083,677 |
|---|
| 12/31/23 | $241,607,781 | $208,461,688 | $244,079,145 |
|---|
| 3/31/24 | $260,042,259 | $222,886,158 | $267,258,249 |
|---|
| 6/30/24 | $243,494,775 | $213,358,648 | $258,670,326 |
|---|
| 9/30/24 | $269,477,228 | $232,024,654 | $275,590,769 |
|---|
| 12/31/24 | $268,969,191 | $233,466,731 | $298,028,197 |
|---|
| Footnote | Description |
Footnote1 | Institutional Plus Shares commenced operations on December 3, 2021. Performance for the periods prior to December 3, 2021 are a blended average annual return which includes the returns of Investor Shares prior to the commencement of operations of Institutional Plus Shares. |
The above chart represents historical performance of a hypothetical $100,000,000 investment over the past 10 years. Effective June 1, 2024, the Fund changed its primary benchmark index from the Russell Midcap Growth Index to the Russell 2500 Index due to regulatory requirements. The Fund retained the Russell Midcap Growth Index as a secondary benchmark because the Russell Midcap Growth Index more closely reflects the market sectors in which the Fund invests.
Average Annual Total Returns
| | One Year | Five Year | Ten Year |
|---|
Institutional Plus SharesFootnote Reference1 | 11.32% | 6.88% | 10.40% |
|---|
| Russell 2500 Index | 12.00% | 8.77% | 8.85% |
|---|
| Russell Midcap Growth Index | 22.10% | 11.47% | 11.54% |
|---|
| Footnote | Description |
Footnote1 | Institutional Plus Shares commenced operations on December 3, 2021. Performance for the 5 year and 10 year periods is a blended average annual return which includes the returns of Investor Shares prior to the commencement of operations of Institutional Plus Shares. |
The Fund’s past performance is not a good predictor of how the Fund will perform in the future. The graph and table do not reflect the deduction of taxes that a shareholder would pay on Fund distributions or redemption of Fund shares.
| Total Net Assets | $407,379,623 |
|---|
| # of Portfolio Holdings | 39 |
|---|
| Portfolio Turnover Rate | 25% |
|---|
| Investment Advisory Fees (Net of fees waived) | $1,608,046 |
|---|
Top Ten Holdings
(% total investments)*
| Vulcan Materials Co. | 5.21% |
| Ecolab, Inc. | 4.69% |
| Veeva Systems, Inc., Class A | 4.55% |
| CoStar Group, Inc. | 4.20% |
| CBRE Group, Inc., Class A | 4.09% |
| Veralto Corp. | 4.02% |
| Markel Group, Inc. | 3.97% |
| Bio-Techne Corp. | 3.79% |
| HEICO Corp., Class A | 3.79% |
| Old Dominion Freight Line, Inc. | 3.78% |
* excluding cash equivalents
Sector Weightings
(% total investments)*
| Value | Value |
|---|
| Industrials | 25.0% |
| Health Care | 19.6% |
| Information Technology | 18.5% |
| Financials | 14.4% |
| Materials | 9.9% |
| Real Estate | 8.3% |
| Consumer Discretionary | 4.3% |
* excluding cash equivalents
Where can I find additional information about the fund?
Additional information is available by scanning the QR code or at https://dfdent.com/literature/, including its:
prospectus
financial information
holdings
proxy information
DF Dent Midcap Growth Fund
: Institutional Plus Shares
Semi-Annual Shareholder Report - December 31, 2024
DF Dent Small Cap Growth Fund
Semi-Annual Shareholder Report - December 31, 2024
This semi-annual shareholder report contains important information about the DF Dent Small Cap Growth Fund for the period of July 1, 2024, to December 31, 2024. You can find additional information about the Fund at https://dfdent.com/literature/. You can also request this information by contacting us at (866) 233-3368.
What were the Fund's costs for the last six months?
(based on a hypothetical $10,000 investment)
| Class Name | Costs of a $10,000 investment | Costs paid as a percentage of a $10,000 investment |
|---|
| Investor Shares | $55 | 1.04% |
|---|
How did the Fund perform in the last six months?
During the period from July 2024 to December 2024, the DF Dent Small Cap Growth Fund outperformed both its benchmarks, the Russell 2000 Index and the Russell 2000 Growth Index.
The outperformance relative to the Russell 2000 Index was driven primarily by sector allocation. Notably, being underweight the benchmark in the Energy sector and overweight the benchmark in the Information Technology sector contributed to the Fund’s performance, as did stock selection in the Financials and Materials sectors. Stock selection in the Consumer Staples, Industrials, and Information Technology sectors detracted the most from performance.
The outperformance relative to the Russell 2000 Growth Index was also driven primarily by sector allocation. Notably, being underweight the benchmark in the Energy sector and overweight the benchmark in the Financials sector contributed to the Fund’s performance, as did stock selection in the Financials and Materials sectors. Stock selection in the Consumer Discretionary, Information Technology, and Industrials sectors detracted the most from performance.
Financials, Industrials, and Information Technology were the top performing sectors in the Russell 2000 Index. All the benchmark’s sectors, other than Energy, contributed to performance with the Materials sector contributing the least.
Financials, Industrials, Information Technology, and Consumer Discretionary were the top performing sectors in the Russell 2000 Growth Index. All the benchmark’s sectors, other than Energy, contributed to performance with the Utilities sector contributing the least.
Goosehead Insurance, Inc., Class A
Perimeter Solutions, Inc.
Hamilton Lane, Inc., Class A
Charles River Laboratories International, Inc.
Total Return Based on a $10,000 Investment
| Date | Investor Shares | Russell 2000® Index | Russell 2000 Growth Index |
|---|
| 12/31/14 | $10,000 | $10,000 | $10,000 |
|---|
| 03/31/15 | $10,268 | $10,432 | $10,663 |
|---|
| 06/30/15 | $10,901 | $10,475 | $10,874 |
|---|
| 09/30/15 | $9,679 | $9,227 | $9,453 |
|---|
| 12/31/15 | $9,584 | $9,559 | $9,862 |
|---|
| 03/31/16 | $9,512 | $9,413 | $9,400 |
|---|
| 06/30/16 | $10,349 | $9,770 | $9,705 |
|---|
| 09/30/16 | $11,034 | $10,654 | $10,600 |
|---|
| 12/31/16 | $11,160 | $11,595 | $10,978 |
|---|
| 03/31/17 | $11,394 | $11,881 | $11,565 |
|---|
| 06/30/17 | $11,971 | $12,174 | $12,073 |
|---|
| 09/30/17 | $12,484 | $12,864 | $12,823 |
|---|
| 12/31/17 | $12,899 | $13,294 | $13,411 |
|---|
| 03/31/18 | $13,322 | $13,283 | $13,720 |
|---|
| 06/30/18 | $14,385 | $14,312 | $14,712 |
|---|
| 09/30/18 | $15,646 | $14,824 | $15,525 |
|---|
| 12/31/18 | $12,703 | $11,830 | $12,163 |
|---|
| 03/31/19 | $14,870 | $13,555 | $14,248 |
|---|
| 06/30/19 | $16,543 | $13,839 | $14,640 |
|---|
| 09/30/19 | $15,982 | $13,507 | $14,029 |
|---|
| 12/31/19 | $17,319 | $14,849 | $15,628 |
|---|
| 03/31/20 | $13,804 | $10,303 | $11,601 |
|---|
| 06/30/20 | $18,045 | $12,922 | $15,149 |
|---|
| 09/30/20 | $19,184 | $13,559 | $16,234 |
|---|
| 12/31/20 | $23,325 | $17,813 | $21,040 |
|---|
| 03/31/21 | $23,356 | $20,075 | $22,066 |
|---|
| 06/30/21 | $25,010 | $20,937 | $22,930 |
|---|
| 09/30/21 | $25,261 | $20,024 | $21,634 |
|---|
| 12/31/21 | $26,727 | $20,453 | $21,636 |
|---|
| 03/31/22 | $22,486 | $18,914 | $18,904 |
|---|
| 06/30/22 | $18,677 | $15,661 | $15,264 |
|---|
| 09/30/22 | $17,886 | $15,319 | $15,301 |
|---|
| 12/31/22 | $18,626 | $16,273 | $15,933 |
|---|
| 03/31/23 | $20,238 | $16,718 | $16,901 |
|---|
| 06/30/23 | $21,316 | $17,589 | $18,093 |
|---|
| 09/30/23 | $20,638 | $16,687 | $16,769 |
|---|
| 12/31/23 | $22,774 | $19,028 | $18,906 |
|---|
| 03/31/24 | $24,663 | $20,013 | $20,340 |
|---|
| 06/30/24 | $22,887 | $19,357 | $19,746 |
|---|
| 09/30/24 | $25,638 | $21,152 | $21,407 |
|---|
| 12/31/24 | $25,258 | $21,223 | $21,772 |
|---|
The above chart represents historical performance of a hypothetical $10,000 investment over the past 10 years. Effective June 1, 2024, the Fund changed its primary benchmark index from the Russell 2000 Growth Index to the Russell 2000 Index due to regulatory requirements. The Fund retained the Russell 2000 Growth Index as a secondary benchmark because the Russell 2000 Growth Index more closely reflects the market sectors in which the Fund invests.
Average Annual Total Returns
| | One Year | Five Year | Ten Year |
|---|
| Investor Shares | 10.91% | 7.84% | 9.71% |
|---|
Russell 2000® Index | 11.54% | 7.40% | 7.82% |
|---|
| Russell 2000 Growth Index | 15.15% | 6.86% | 8.09% |
|---|
The Fund’s past performance is not a good predictor of how the Fund will perform in the future. The graph and table do not reflect the deduction of taxes that a shareholder would pay on Fund distributions or redemption of Fund shares.
| Total Net Assets | $217,513,780 |
|---|
| # of Portfolio Holdings | 49 |
|---|
| Portfolio Turnover Rate | 18% |
|---|
| Investment Advisory Fees (Net of fees waived) | $869,720 |
|---|
Top Ten Holdings
(% total investments)*
| Core & Main, Inc., Class A | 3.68% |
| HEICO Corp., Class A | 3.47% |
| Hamilton Lane, Inc., Class A | 3.32% |
| Bio-Techne Corp. | 3.30% |
| Goosehead Insurance, Inc., Class A | 3.28% |
| Murphy USA, Inc. | 3.20% |
| Kinsale Capital Group, Inc. | 3.19% |
| Guidewire Software, Inc. | 3.11% |
| Appfolio, Inc. | 3.10% |
| Repligen Corp. | 2.91% |
* excluding cash equivalents
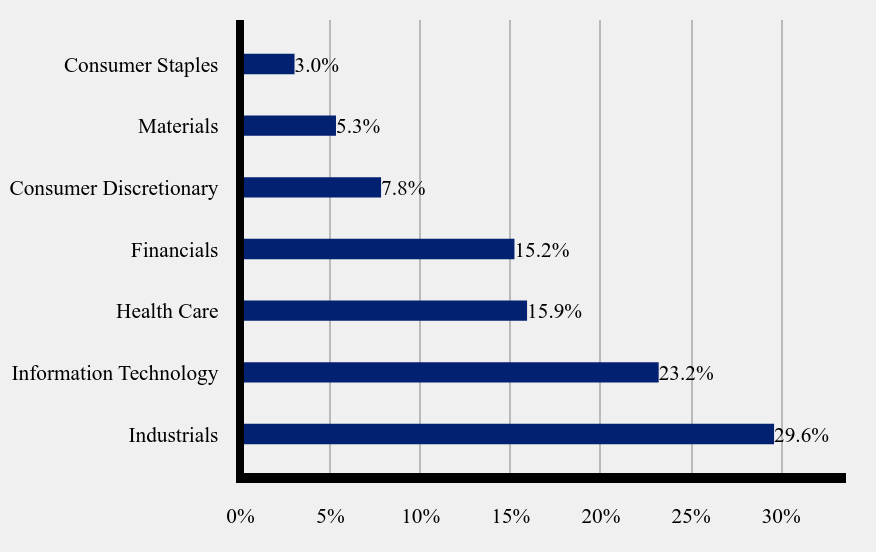
Sector Weightings
(% total investments)*
| Value | Value |
|---|
| Industrials | 29.6% |
| Information Technology | 23.2% |
| Health Care | 15.9% |
| Financials | 15.2% |
| Consumer Discretionary | 7.8% |
| Materials | 5.3% |
| Consumer Staples | 3.0% |
* excluding cash equivalents
Where can I find additional information about the fund?
Additional information is available by scanning the QR code or at https://dfdent.com/literature/, including its:
prospectus
financial information
holdings
proxy information
DF Dent Small Cap Growth Fund
Semi-Annual Shareholder Report - December 31, 2024
DF Dent Small Cap Growth Fund
Semi-Annual Shareholder Report - December 31, 2024
This semi-annual shareholder report contains important information about the DF Dent Small Cap Growth Fund for the period of July 1, 2024, to December 31, 2024. You can find additional information about the Fund at https://dfdent.com/literature/. You can also request this information by contacting us at (866) 233-3368.
What were the Fund's costs for the last six months?
(based on a hypothetical $10,000 investment)
| Class Name | Costs of a $10,000 investment | Costs paid as a percentage of a $10,000 investment |
|---|
| Institutional Shares | $50 | 0.94% |
|---|
How did the Fund perform in the last six months?
During the period from July 2024 to December 2024, the DF Dent Small Cap Growth Fund outperformed both its benchmarks, the Russell 2000 Index and the Russell 2000 Growth Index.
The outperformance relative to the Russell 2000 Index was driven primarily by sector allocation. Notably, being underweight the benchmark in the Energy sector and overweight the benchmark in the Information Technology sector contributed to the Fund’s performance, as did stock selection in the Financials and Materials sectors. Stock selection in the Consumer Staples, Industrials, and Information Technology sectors detracted the most from performance.
The outperformance relative to the Russell 2000 Growth Index was also driven primarily by sector allocation. Notably, being underweight the benchmark in the Energy sector and overweight the benchmark in the Financials sector contributed to the Fund’s performance, as did stock selection in the Financials and Materials sectors. Stock selection in the Consumer Discretionary, Information Technology, and Industrials sectors detracted the most from performance.
Financials, Industrials, and Information Technology were the top performing sectors in the Russell 2000 Index. All the benchmark’s sectors, other than Energy, contributed to performance with the Materials sector contributing the least.
Financials, Industrials, Information Technology, and Consumer Discretionary were the top performing sectors in the Russell 2000 Growth Index. All the benchmark’s sectors, other than Energy, contributed to performance with the Utilities sector contributing the least.
Goosehead Insurance, Inc., Class A
Perimeter Solutions, Inc.
Hamilton Lane, Inc., Class A
Charles River Laboratories International, Inc.
Total Return Based on a $500,000 Investment
| Date | Institutional SharesFootnote Reference1 | Russell 2000® Index | Russell 2000 Growth Index |
|---|
| 12/31/14 | $500,000 | $500,000 | $500,000 |
|---|
| 3/31/15 | $513,381 | $521,577 | $533,149 |
|---|
| 6/30/15 | $545,049 | $523,772 | $543,689 |
|---|
| 9/30/15 | $483,943 | $461,350 | $472,674 |
|---|
| 12/31/15 | $479,191 | $477,930 | $493,092 |
|---|
| 3/31/16 | $475,588 | $470,672 | $470,001 |
|---|
| 6/30/16 | $517,472 | $488,519 | $485,234 |
|---|
| 9/30/16 | $551,700 | $532,710 | $529,979 |
|---|
| 12/31/16 | $558,005 | $579,767 | $548,900 |
|---|
| 3/31/17 | $569,715 | $594,063 | $578,260 |
|---|
| 6/30/17 | $598,538 | $608,699 | $603,639 |
|---|
| 9/30/17 | $624,209 | $643,203 | $641,175 |
|---|
| 12/31/17 | $644,926 | $664,687 | $670,573 |
|---|
| 3/31/18 | $666,544 | $664,127 | $685,992 |
|---|
| 6/30/18 | $719,237 | $715,622 | $735,608 |
|---|
| 9/30/18 | $783,189 | $741,215 | $776,237 |
|---|
| 12/31/18 | $635,580 | $591,478 | $608,157 |
|---|
| 3/31/19 | $744,412 | $677,740 | $712,424 |
|---|
| 6/30/19 | $828,576 | $691,939 | $732,002 |
|---|
| 9/30/19 | $800,521 | $675,327 | $701,455 |
|---|
| 12/31/19 | $867,835 | $742,453 | $781,381 |
|---|
| 3/31/20 | $691,618 | $515,153 | $580,059 |
|---|
| 6/30/20 | $904,159 | $646,097 | $757,465 |
|---|
| 9/30/20 | $961,589 | $677,963 | $811,684 |
|---|
| 12/31/20 | $1,169,627 | $890,653 | $1,051,991 |
|---|
| 3/31/21 | $1,171,633 | $1,003,757 | $1,103,278 |
|---|
| 6/30/21 | $1,254,855 | $1,046,844 | $1,146,499 |
|---|
| 9/30/21 | $1,267,389 | $1,001,198 | $1,081,692 |
|---|
| 12/31/21 | $1,341,679 | $1,022,638 | $1,081,813 |
|---|
| 3/31/22 | $1,128,673 | $945,676 | $945,208 |
|---|
| 6/30/22 | $937,738 | $783,066 | $763,215 |
|---|
| 9/30/22 | $898,216 | $765,938 | $765,061 |
|---|
| 12/31/22 | $935,685 | $813,647 | $796,674 |
|---|
| 3/31/23 | $1,016,781 | $835,923 | $845,054 |
|---|
| 6/30/23 | $1,071,187 | $879,435 | $904,652 |
|---|
| 9/30/23 | $1,037,311 | $834,337 | $838,443 |
|---|
| 12/31/23 | $1,145,097 | $951,388 | $945,321 |
|---|
| 3/31/24 | $1,240,565 | $1,000,671 | $1,016,994 |
|---|
| 6/30/24 | $1,151,257 | $967,872 | $987,306 |
|---|
| 9/30/24 | $1,290,352 | $1,057,622 | $1,070,340 |
|---|
| 12/31/24 | $1,271,874 | $1,061,159 | $1,088,578 |
|---|
| Footnote | Description |
Footnote1 | Institutional Shares commenced operations on November 20, 2017. Performance for the periods prior to November 20, 2017 are a blended average annual return which includes the returns of Investor Shares prior to the commencement of operations of Institutional Shares. |
The above chart represents historical performance of a hypothetical $500,000 investment over the past 10 years. Effective June 1, 2024, the Fund changed its primary benchmark index from the Russell 2000 Growth Index to the Russell 2000 Index due to regulatory requirements. The Fund retained the Russell 2000 Growth Index as a secondary benchmark because the Russell 2000 Growth Index more closely reflects the market sectors in which the Fund invests.
Average Annual Total Returns
| | One Year | Five Year | Ten Year |
|---|
Institutional SharesFootnote Reference1 | 11.07% | 7.94% | 9.79% |
|---|
Russell 2000® Index | 11.54% | 7.40% | 7.82% |
|---|
| Russell 2000 Growth Index | 15.15% | 6.86% | 8.09% |
|---|
| Footnote | Description |
Footnote1 | Institutional Shares commenced operations on November 20, 2017. Performance for the 10 year period is a blended average annual return which includes the returns of Investor Shares prior to the commencement of operations of Institutional Shares. |
The Fund’s past performance is not a good predictor of how the Fund will perform in the future. The graph and table do not reflect the deduction of taxes that a shareholder would pay on Fund distributions or redemption of Fund shares.
| Total Net Assets | $217,513,780 |
|---|
| # of Portfolio Holdings | 49 |
|---|
| Portfolio Turnover Rate | 18% |
|---|
| Investment Advisory Fees (Net of fees waived) | $869,720 |
|---|
Top Ten Holdings
(% total investments)*
| Core & Main, Inc., Class A | 3.68% |
| HEICO Corp., Class A | 3.47% |
| Hamilton Lane, Inc., Class A | 3.32% |
| Bio-Techne Corp. | 3.30% |
| Goosehead Insurance, Inc., Class A | 3.28% |
| Murphy USA, Inc. | 3.20% |
| Kinsale Capital Group, Inc. | 3.19% |
| Guidewire Software, Inc. | 3.11% |
| Appfolio, Inc. | 3.10% |
| Repligen Corp. | 2.91% |
* excluding cash equivalents
Sector Weightings
(% total investments)*
| Value | Value |
|---|
| Industrials | 29.6% |
| Information Technology | 23.2% |
| Health Care | 15.9% |
| Financials | 15.2% |
| Consumer Discretionary | 7.8% |
| Materials | 5.3% |
| Consumer Staples | 3.0% |
* excluding cash equivalents
Where can I find additional information about the fund?
Additional information is available by scanning the QR code or at https://dfdent.com/literature/, including its:
prospectus
financial information
holdings
proxy information
DF Dent Small Cap Growth Fund
Semi-Annual Shareholder Report - December 31, 2024
(b) Not applicable.
ITEM 2. CODE OF ETHICS.
Not applicable.
ITEM 3. AUDIT COMMITTEE FINANCIAL EXPERT.
Not applicable.
ITEM 4. PRINCIPAL ACCOUNTANT FEES AND SERVICES.
Not applicable.
ITEM 5. AUDIT COMMITTEE OF LISTED REGISTRANTS.
Not applicable.
ITEM 6. INVESTMENTS.
(a) Included as part of financial statements filed under Item 7(a).
(b) Not applicable.
ITEM 7. FINANCIAL STATEMENTS AND FINANCIAL HIGHLIGHTS FOR OPEN-END MANAGEMENT INVESTMENT COMPANIES.
(a)
SEMI-ANNUAL
FINANCIALS
AND
OTHER
INFORMATION
(Unaudited)
DF
DENT
GROWTH
FUNDS
TABLE
OF
CONTENTS
DECEMBER
31,
2024
DF
Dent
Premier
Growth
Fund
Schedule
of
Investments
1
Statement
of
Assets
and
Liabilities
3
Statement
of
Operations
4
Statements
of
Changes
in
Net
Assets
5
Financial
Highlights
6
DF
Dent
Midcap
Growth
Fund
Schedule
of
Investments
7
Statement
of
Assets
and
Liabilities
9
Statement
of
Operations
10
Statements
of
Changes
in
Net
Assets
11
Financial
Highlights
12
DF
Dent
Small
Cap
Growth
Fund
Schedule
of
Investments
15
Statement
of
Assets
and
Liabilities
17
Statement
of
Operations
18
Statements
of
Changes
in
Net
Assets
19
Financial
Highlights
20
DF
Dent
Growth
Funds
Notes
to
Financial
Statements
22
Other
Information
28
See
Notes
to
Financial
Statements.
DF
DENT
PREMIER
GROWTH
FUND
SCHEDULE
OF
INVESTMENTS
DECEMBER
31,
2024
The
following
is
a
summary
of
the
inputs
used
to
value
the
Fund's investments
as
of
December
31,
2024.
The
inputs
or
methodology
used
for
valuing
securities
are
not
necessarily
an
indication
of
the
risks
associated
with
investing
in
those
securities.
For
more
information
on
valuation
inputs,
and
their
aggregation
into
the
levels
used
in
the
table
below,
please
refer
to
the
Security
Valuation
section
in
Note
2
of
the
accompanying
Notes
to
Financial
Statements.
The
Level
1
value
displayed
in
this
table
is
Common
Stock
and
a
Money
Market
Fund.
Refer
to
this
Schedule
of
Investments
for
a
further
breakout
of
each
security
by
industry.
Shares
Security
Description
Value
Common
Stock
-
98.2%
Communication
Services
-
4.6%
55,417
Alphabet,
Inc.,
Class C
$
10,553,613
Consumer
Discretionary
-
6.0%
62,761
Amazon.com,
Inc.
(a)
13,769,136
Financials
-
18.2%
8,283
Kinsale
Capital
Group,
Inc.
3,852,672
21,400
Mastercard,
Inc.,
Class A
11,268,598
13,356
Moody's
Corp.
6,322,330
17,527
S&P
Global,
Inc.
(a)
8,728,972
36,992
Visa,
Inc.,
Class A
11,690,951
41,863,523
Health
Care
-
17.6%
85,000
Bio-Techne
Corp.
6,122,550
31,077
Danaher
Corp.
7,133,725
12,771
Intuitive
Surgical,
Inc.
(a)
6,665,951
10,950
Thermo
Fisher
Scientific,
Inc.
5,696,519
28,327
Veeva
Systems,
Inc.,
Class A
(a)
5,955,752
18,000
West
Pharmaceutical
Services,
Inc.
5,896,080
18,481
Zoetis,
Inc.
3,011,109
40,481,686
Industrials
-
19.7%
53,226
Copart,
Inc.
(a)
3,054,640
54,254
Fastenal
Co.
3,901,405
43,532
HEICO
Corp.,
Class A
8,100,435
35,836
Old
Dominion
Freight
Line,
Inc.
6,321,470
16,000
SiteOne
Landscape
Supply,
Inc.
(a)
2,108,320
6,070
TransDigm
Group,
Inc.
(a)
7,692,390
40,323
Uber
Technologies,
Inc.
(a)
2,432,283
56,652
Veralto
Corp.
5,770,006
34,386
Waste
Connections,
Inc.
5,899,950
45,280,899
Information
Technology
-
21.1%
20,000
ANSYS,
Inc.
(a)
6,746,600
2,730
ASML
Holding
NV
1,892,108
12,701
Atlassian
Corp.,
Class A
(a)
3,091,169
11,450
Cadence
Design
Systems,
Inc.
(a)
3,440,267
42,912
Guidewire
Software,
Inc.
(a)
7,234,105
7,636
Intuit,
Inc.
4,799,226
10,100
Manhattan
Associates,
Inc.
(a)
2,729,424
21,874
Microsoft
Corp.
9,219,891
8,165
Monolithic
Power
Systems,
Inc.
4,831,231
3,150
ServiceNow,
Inc.
(a)
3,339,378
2,315
Tyler
Technologies,
Inc.
(a)
1,334,922
48,658,321
Shares
Security
Description
Value
Materials
-
7.0%
20,247
Ecolab,
Inc.
$
4,744,277
13,216
The
Sherwin-Williams
Co.
4,492,515
26,673
Vulcan
Materials
Co.
6,861,096
16,097,888
Real
Estate
-
4.0%
44,590
CBRE
Group,
Inc.,
Class A
(a)
5,854,221
45,990
CoStar
Group,
Inc.
(a)
3,292,424
9,146,645
Total
Common
Stock
(Cost
$95,933,290)
225,851,711
Money
Market
Fund
-
0.4%
804,441
First
American
Treasury
Obligations
Fund,
Class X,
4.37%
(b)
(Cost
$804,441)
804,441
Investments,
at
value
-
98.6%
(Cost
$96,737,731)
$
226,656,152
Other
Assets
&
Liabilities,
Net
-
1.4%
3,331,460
Net
Assets
-
100.0%
$
229,987,612
(a)
Non-income
producing
security.
(b)
Dividend
yield
changes
daily
to
reflect
current
market
conditions.
Rate
was
the
quoted
yield
as
of
December
31,
2024.
Valuation
Inputs
Investments
in
Securities
Level
1
-
Quoted
Prices
$
226,656,152
Level
2
-
Other
Significant
Observable
Inputs
–
Level
3
-
Significant
Unobservable
Inputs
–
Total
$
226,656,152
See
Notes
to
Financial
Statements.
DF
DENT
PREMIER
GROWTH
FUND
SCHEDULE
OF
INVESTMENTS
DECEMBER
31,
2024
PORTFOLIO
HOLDINGS
%
of
Total
Net
Assets
Communication
Services
4.6%
Consumer
Discretionary
6.0%
Financials
18.2%
Health
Care
17.6%
Industrials
19.7%
Information
Technology
21.1%
Materials
7.0%
Real
Estate
4.0%
Money
Market
Fund
0.4%
Other
Assets
&
Liabilities,
Net
1.4%
100.0%
See
Notes
to
Financial
Statements.
DF
DENT
PREMIER
GROWTH
FUND
STATEMENT
OF
ASSETS
AND
LIABILITIES
DECEMBER
31,
2024
ASSETS
Investments,
at
value
(Cost
$96,737,731)
$
226,656,152
Receivables:
Fund
shares
sold
1,153
Investment
securities
sold
3,852,446
Dividends
50,008
Prepaid
expenses
11,157
Total
Assets
230,570,916
LIABILITIES
Payables:
Fund
shares
redeemed
47,851
Accrued
Liabilities:
Investment
adviser
fees
509,549
Fund
services
fees
11,807
Other
expenses
14,097
Total
Liabilities
583,304
NET
ASSETS
$
229,987,612
COMPONENTS
OF
NET
ASSETS
Paid-in
capital
$
97,242,610
Distributable
Earnings
132,745,002
NET
ASSETS
$
229,987,612
SHARES
OF
BENEFICIAL
INTEREST
AT
NO
PAR
VALUE
(UNLIMITED
SHARES
AUTHORIZED)
6,192,397
NET
ASSET
VALUE,
OFFERING
AND
REDEMPTION
PRICE
PER
SHARE
$
37.14
See
Notes
to
Financial
Statements.
DF
DENT
PREMIER
GROWTH
FUND
STATEMENT
OF
OPERATIONS
SIX
MONTHS
ENDED
DECEMBER
31,
2024
INVESTMENT
INCOME
Dividend
income
(Net
of
foreign
withholding
taxes
of
$5,159)
$
938,117
Total
Investment
Income
938,117
EXPENSES
Investment
adviser
fees
1,175,703
Fund
services
fees
88,920
Custodian
fees
18,128
Registration
fees
10,151
Professional
fees
28,528
Trustees'
fees
and
expenses
7,367
Other
expenses
30,238
Total
Expenses
1,359,035
Fees
waived
(184,163)
Net
Expenses
1,174,872
NET
INVESTMENT
LOSS
(236,755)
NET
REALIZED
AND
UNREALIZED
GAIN
(LOSS)
Net
realized
gain
on
investments
14,006,137
Net
change
in
unrealized
appreciation
(depreciation)
on
investments
1,062,565
NET
REALIZED
AND
UNREALIZED
GAIN
15,068,702
INCREASE
IN
NET
ASSETS
RESULTING
FROM
OPERATIONS
$
14,831,947
See
Notes
to
Financial
Statements.
DF
DENT
PREMIER
GROWTH
FUND
STATEMENTS
OF
CHANGES
IN
NET
ASSETS
For
the
Six
Months
Ended
December
31,
2024
For
the
Year
Ended
June
30,
2024
OPERATIONS
Net
investment
loss
$
(236,755)
$
(826,765)
Net
realized
gain
14,006,137
30,137,857
Net
change
in
unrealized
appreciation
(depreciation)
1,062,565
2,428,258
Increase
in
Net
Assets
Resulting
from
Operations
14,831,947
31,739,350
DISTRIBUTIONS
TO
SHAREHOLDERS
Total
Distributions
Paid
(30,116,196)
(36,525,907)
CAPITAL
SHARE
TRANSACTIONS
Sale
of
shares
1,851,394
13,503,081
Reinvestment
of
distributions
28,195,477
34,549,001
Redemption
of
shares
(16,168,669)
(59,143,595)
Increase
(Decrease)
in
Net
Assets
from
Capital
Share
Transactions
13,878,202
(11,091,513)
Decrease
in
Net
Assets
(1,406,047)
(15,878,070)
NET
ASSETS
Beginning
of
Period
231,393,659
247,271,729
End
of
Period
$
229,987,612
$
231,393,659
SHARE
TRANSACTIONS
Sale
of
shares
45,086
342,232
Reinvestment
of
distributions
722,405
984,863
Redemption
of
shares
(397,965)
(1,529,032)
Increase
(Decrease)
in
Shares
369,526
(201,937)
See
Notes
to
Financial
Statements.
DF
DENT
PREMIER
GROWTH
FUND
FINANCIAL
HIGHLIGHTS
These
financial
highlights
reflect
selected
data
for
a
share
outstanding
throughout
each
period
.
For
the
Six
Months
Ended
December
31,
2024
For
the
Years
Ended
June
30,
2024
2023
2022
2021
2020
NET
ASSET
VALUE,
Beginning
of
Period
$
39.74
$
41.04
$
35.60
$
49.79
$
38.91
$
35.75
INVESTMENT
OPERATIONS
Net
investment
loss
(a)
(0.04)
(0.14)
(0.11)
(0.27)
(0.25)
(0.11)
Net
realized
and
unrealized
gain
(loss)
2.88
5.74
5.55
(10.28)
12.16
5.88
Total
from
Investment
Operations
2.84
5.60
5.44
(10.55)
11.91
5.77
DISTRIBUTIONS
TO
SHAREHOLDERS
FROM
Net
realized
gain
(5.44)
(6.90)
–
(3.64)
(1.03)
(2.61)
Total
Distributions
to
Shareholders
(5.44)
(6.90)
–
(3.64)
(1.03)
(2.61)
REDEMPTION
FEES(a)
–
–
–
0.00(b)
0.00(b)
–
NET
ASSET
VALUE,
End
of
Period
$
37.14
$
39.74
$
41.04
$
35.60
$
49.79
$
38.91
TOTAL
RETURN
6.50%(c)
15.87%
15.28%
(23.05)%
30.96%
16.82%
RATIOS/SUPPLEMENTARY
DATA
Net
Assets
at
End
of
Period
(000s
omitted)
$
229,988
$
231,394
$
247,272
$
278,936
$
430,924
$
343,711
Ratios
to
Average
Net
Assets:
Net
investment
loss
(0.20)%(d)
(0.36)%
(0.30)%
(0.58)%
(0.57)%
(0.30)%
Net
expenses
0.99%(d)
0.99%
0.99%
0.99%
0.99%
1.00%
Gross
expenses
(e)
1.14%(d)
1.14%
1.13%
1.10%
1.11%
1.15%
PORTFOLIO
TURNOVER
RATE
7%(c)
19%
20%
18%
14%
23%
footertext
(a)
Calculated
based
on
average
shares
outstanding
during
each
period.
(b)
Less
than
$0.01
per
share.
(c)
Not
annualized.
(d)
Annualized.
(e)
Reflects
the
expense
ratio
excluding
any
waivers
and/or
reimbursements.
Expense
waivers
and/or
reimbursements
would
decrease
the
total
return
had
such
reductions
not
occurred.
See
Notes
to
Financial
Statements.
DF
DENT
MIDCAP
GROWTH
FUND
SCHEDULE
OF
INVESTMENTS
DECEMBER
31,
2024
The
following
is
a
summary
of
the
inputs
used
to
value
the
Fund's investments
as
of
December
31,
2024.
The
inputs
or
methodology
used
for
valuing
securities
are
not
necessarily
an
indication
of
the
risks
associated
with
investing
in
those
securities.
For
more
information
on
valuation
inputs,
and
their
aggregation
into
the
levels
used
in
the
table
below,
please
refer
to
the
Security
Valuation
section
in
Note
2
of
the
accompanying
Notes
to
Financial
Statements.
The
Level
1
value
displayed
in
this
table
is
Common
Stock
and
a
Money
Market
Fund.
Refer
to
this
Schedule
of
Investments
for
a
further
breakout
of
each
security
by
industry.
Shares
Security
Description
Value
Common
Stock
-
97.1%
Consumer
Discretionary
-
4.2%
126,774
CarMax,
Inc.
(a)
$
10,365,043
68,436
Floor
&
Decor
Holdings,
Inc.,
Class A
(a)
6,823,069
17,188,112
Financials
-
13.9%
135,757
Goosehead
Insurance,
Inc.,
Class A
(a)
14,555,866
18,984
Kinsale
Capital
Group,
Inc.
8,830,028
9,098
Markel
Group,
Inc.
(a)
15,705,241
20,523
Moody's
Corp.
9,714,972
13,253
MSCI,
Inc.
7,951,932
56,758,039
Health
Care
-
19.1%
208,251
Bio-Techne
Corp.
15,000,320
105,905
Edwards
Lifesciences
Corp.
(a)
7,840,147
16,176
Medpace
Holdings,
Inc.
(a)
5,374,153
7,290
Mettler-Toledo
International,
Inc.
(a)
8,920,627
69,686
Repligen
Corp.
(a)
10,030,603
85,632
Veeva
Systems,
Inc.,
Class A
(a)
18,004,128
38,315
West
Pharmaceutical
Services,
Inc.
12,550,461
77,720,439
Industrials
-
24.2%
49,009
Fastenal
Co.
3,524,237
80,554
HEICO
Corp.,
Class A
14,989,488
29,640
IDEX
Corp.
6,203,356
84,862
Old
Dominion
Freight
Line,
Inc.
14,969,657
50,163
SiteOne
Landscape
Supply,
Inc.
(a)
6,609,978
9,752
TransDigm
Group,
Inc.
(a)
12,358,515
155,972
Veralto
Corp.
15,885,748
16,580
Verisk
Analytics,
Inc.
4,566,629
66,763
Waste
Connections,
Inc.
11,455,196
172,264
WNS
Holdings,
Ltd.
(a)
8,163,591
98,726,395
Information
Technology
-
18.0%
26,794
ANSYS,
Inc.
(a)
9,038,420
52,933
Appfolio,
Inc.
(a)
13,059,630
28,236
Atlassian
Corp.,
Class A
(a)
6,872,078
27,486
Cadence
Design
Systems,
Inc.
(a)
8,258,443
98,230
Endava
PLC,
ADR
(a)
3,035,307
56,838
Entegris,
Inc.
5,630,372
63,762
Guidewire
Software,
Inc.
(a)
10,748,998
97,923
Microchip
Technology,
Inc.
5,615,884
11,137
Monolithic
Power
Systems,
Inc.
6,589,763
7,636
Tyler
Technologies,
Inc.
(a)
4,403,223
73,252,118
Shares
Security
Description
Value
Materials
-
9.6%
79,073
Ecolab,
Inc.
$
18,528,385
80,169
Vulcan
Materials
Co.
20,621,872
39,150,257
Real
Estate
-
8.1%
123,293
CBRE
Group,
Inc.,
Class A
(a)
16,187,138
232,294
CoStar
Group,
Inc.
(a)
16,629,927
32,817,065
Total
Common
Stock
(Cost
$268,498,425)
395,612,425
Money
Market
Fund
-
2.9%
11,961,320
First
American
Treasury
Obligations
Fund,
Class X,
4.37%
(b)
(Cost
$11,961,320)
11,961,320
Investments,
at
value
-
100.0%
(Cost
$280,459,745)
$
407,573,745
Other
Assets
&
Liabilities,
Net
-
0.0%
(194,122)
Net
Assets
-
100.0%
$
407,379,623
ADR
American
Depositary
Receipt
PLC
Public
Limited
Company
(a)
Non-income
producing
security.
(b)
Dividend
yield
changes
daily
to
reflect
current
market
conditions.
Rate
was
the
quoted
yield
as
of
December
31,
2024.
Valuation
Inputs
Investments
in
Securities
Level
1
-
Quoted
Prices
$
407,573,745
Level
2
-
Other
Significant
Observable
Inputs
–
Level
3
-
Significant
Unobservable
Inputs
–
Total
$
407,573,745
See
Notes
to
Financial
Statements.
DF
DENT
MIDCAP
GROWTH
FUND
SCHEDULE
OF
INVESTMENTS
DECEMBER
31,
2024
PORTFOLIO
HOLDINGS
%
of
Total
Net
Assets
Consumer
Discretionary
4.2%
Financials
13.9%
Health
Care
19.1%
Industrials
24.2%
Information
Technology
18.0%
Materials
9.6%
Real
Estate
8.1%
Money
Market
Fund
2.9%
Other
Assets
&
Liabilities,
Net
0.0%
100.0%
See
Notes
to
Financial
Statements.
DF
DENT
MIDCAP
GROWTH
FUND
STATEMENT
OF
ASSETS
AND
LIABILITIES
DECEMBER
31,
2024
ASSETS
Investments,
at
value
(Cost
$280,459,745)
$
407,573,745
Receivables:
Fund
shares
sold
230,457
Investment
securities
sold
360,086
Dividends
151,648
Prepaid
expenses
31,062
Total
Assets
408,346,998
LIABILITIES
Payables:
Fund
shares
redeemed
180,094
Accrued
Liabilities:
Investment
adviser
fees
762,301
Fund
services
fees
21,951
Other
expenses
3,029
Total
Liabilities
967,375
NET
ASSETS
$
407,379,623
COMPONENTS
OF
NET
ASSETS
Paid-in
capital
$
295,372,339
Distributable
Earnings
112,007,284
NET
ASSETS
$
407,379,623
SHARES
OF
BENEFICIAL
INTEREST
AT
NO
PAR
VALUE
(UNLIMITED
SHARES
AUTHORIZED)
Investor
Shares
3,522,776
Institutional
Shares
6,312,149
Institutional
Plus
Shares
1,199,569
NET
ASSET
VALUE,
OFFERING
AND
REDEMPTION
PRICE
PER
SHARE
Investor
Shares
(based
on
net
assets
of
$129,593,856)
$
36.79
Institutional
Shares
(based
on
net
assets
of
$233,333,346)
$
36.97
Institutional
Plus
Shares
(based
on
net
assets
of
$44,452,421)
$
37.06
See
Notes
to
Financial
Statements.
DF
DENT
MIDCAP
GROWTH
FUND
STATEMENT
OF
OPERATIONS
SIX
MONTHS
ENDED
DECEMBER
31,
2024
INVESTMENT
INCOME
Dividend
income
(Net
of
foreign
withholding
taxes
of
$7,147)
$
1,631,175
Total
Investment
Income
1,631,175
EXPENSES
Investment
adviser
fees
1,668,791
Fund
services
fees
162,950
Transfer
agent
fees:
Investor
Shares
13,668
Institutional
Shares
3,716
Institutional
Plus
Shares
2,295
Custodian
fees
27,298
Registration
fees:
Investor
Shares
8,093
Institutional
Shares
8,141
Institutional
Plus
Shares
7,936
Professional
fees
38,806
Trustees'
fees
and
expenses
10,848
Other
expenses
54,379
Total
Expenses
2,006,921
Fees
waived
(111,293)
Net
Expenses
1,895,628
NET
INVESTMENT
LOSS
(264,453)
NET
REALIZED
AND
UNREALIZED
GAIN
(LOSS)
Net
realized
gain
on
investments
51,611,702
Net
change
in
unrealized
appreciation
(depreciation)
on
investments
(9,934,807)
NET
REALIZED
AND
UNREALIZED
GAIN
41,676,895
INCREASE
IN
NET
ASSETS
RESULTING
FROM
OPERATIONS
$
41,412,442
See
Notes
to
Financial
Statements.
DF
DENT
MIDCAP
GROWTH
FUND
STATEMENTS
OF
CHANGES
IN
NET
ASSETS
For
the
Six
Months
Ended
December
31,
2024
For
the
Year
Ended
June
30,
2024
OPERATIONS
Net
investment
loss
$
(264,453)
$
(1,319,495)
Net
realized
gain
51,611,702
29,664,974
Net
change
in
unrealized
appreciation
(depreciation)
(9,934,807)
9,987,698
Increase
in
Net
Assets
Resulting
from
Operations
41,412,442
38,333,177
CAPITAL
SHARE
TRANSACTIONS
Sale
of
shares:
Investor
Shares
2,730,501
9,054,453
Institutional
Shares
18,755,962
15,648,066
Institutional
Plus
Shares
11,015,743
23,347,127
Redemption
of
shares:
Investor
Shares
(19,297,612)
(48,679,959)
Institutional
Shares
(26,604,791)
(58,573,179)
Institutional
Plus
Shares
(149,753,881)
(38,141,409)
Decrease
in
Net
Assets
from
Capital
Share
Transactions
(163,154,078)
(97,344,901)
Decrease
in
Net
Assets
(121,741,636)
(59,011,724)
NET
ASSETS
Beginning
of
Period
529,121,259
588,132,983
End
of
Period
$
407,379,623
$
529,121,259
SHARE
TRANSACTIONS
Sale
of
shares:
Investor
Shares
75,187
277,060
Institutional
Shares
494,157
475,454
Institutional
Plus
Shares
301,712
730,558
Redemption
of
shares:
Investor
Shares
(535,412)
(1,534,257)
Institutional
Shares
(726,520)
(1,862,941)
Institutional
Plus
Shares
(4,380,362)
(1,182,450)
Decrease
in
Shares
(4,771,238)
(3,096,576)
See
Notes
to
Financial
Statements.
DF
DENT
MIDCAP
GROWTH
FUND
FINANCIAL
HIGHLIGHTS
These
financial
highlights
reflect
selected
data
for
a
share
outstanding
throughout
each
period
.
For
the
Six
Months
Ended
December
31,
2024
For
the
Years
Ended
June
30,
2024
2023
2022
2021
2020
INVESTOR
SHARES
NET
ASSET
VALUE,
Beginning
of
Period
$
33.34
$
31.01
$
26.98
$
38.01
$
29.48
$
25.83
INVESTMENT
OPERATIONS
Net
investment
loss
(a)
(0.02)
(0.09)
(0.09)
(0.20)
(0.18)
(0.08)
Net
realized
and
unrealized
gain
(loss)
3.47
2.42
4.12
(9.75)
8.81
3.93
Total
from
Investment
Operations
3.45
2.33
4.03
(9.95)
8.63
3.85
DISTRIBUTIONS
TO
SHAREHOLDERS
FROM
Net
realized
gain
–
–
–
(1.08)
(0.11)
(0.24)
Total
Distributions
to
Shareholders
–
–
–
(1.08)
(0.11)
(0.24)
REDEMPTION
FEES(a)
–
–
–
0.00(b)
0.01
0.04
NET
ASSET
VALUE,
End
of
Period
$
36.79
$
33.34
$
31.01
$
26.98
$
38.01
$
29.48
TOTAL
RETURN
10.35%(c)
7.51%
14.94%
(26.97)%
29.33%
15.14%
RATIOS/SUPPLEMENTARY
DATA
Net
Assets
at
End
of
Period
(000s
omitted)
$
129,594
$
132,811
$
162,503
$
184,717
$
307,341
$
243,855
Ratios
to
Average
Net
Assets:
Net
investment
loss
(0.13)%(d)
(0.28)%
(0.33)%
(0.55)%
(0.54)%
(0.28)%
Net
expenses
0.90%(d)
0.88%
0.87%
0.85%
0.89%
0.98%
Gross
expenses
(f)
0.92%(d)
0.90%
0.89%
0.86%
0.91%(e)
1.01%(e)
PORTFOLIO
TURNOVER
RATE
25%(c)
29%
27%
35%
30%
31%
footertext
(a)
Calculated
based
on
average
shares
outstanding
during
each
period.
(b)
Less
than
$0.01
per
share.
(c)
Not
annualized.
(d)
Annualized.
(e)
Ratio
includes
recoupment,
which
amounted
to
0.03%
and
0.06%,
respectively.
(f)
Reflects
the
expense
ratio
excluding
any
waivers
and/or
reimbursements.
Expense
waivers
and/or
reimbursements
would
decrease
the
total
return
had
such
reductions
not
occurred.
See
Notes
to
Financial
Statements.
DF
DENT
MIDCAP
GROWTH
FUND
FINANCIAL
HIGHLIGHTS
These
financial
highlights
reflect
selected
data
for
a
share
outstanding
throughout
each
period
.
For
the
Six
Months
Ended
December
31,
2024
For
the
Years
Ended
June
30,
2024
2023
2022
2021
2020
INSTITUTIONAL
SHARES
NET
ASSET
VALUE,
Beginning
of
Period
$
33.50
$
31.14
$
27.09
$
38.15
$
29.57
$
25.88
INVESTMENT
OPERATIONS
Net
investment
loss
(a)
(0.01)
(0.08)
(0.09)
(0.19)
(0.17)
(0.04)
Net
realized
and
unrealized
gain
(loss)
3.48
2.44
4.14
(9.79)
8.86
3.97
Total
from
Investment
Operations
3.47
2.36
4.05
(9.98)
8.69
3.93
DISTRIBUTIONS
TO
SHAREHOLDERS
FROM
Net
realized
gain
–
–
–
(1.08)
(0.11)
(0.24)
Total
Distributions
to
Shareholders
–
–
–
(1.08)
(0.11)
(0.24)
REDEMPTION
FEES(a)
–
–
–
–
0.00(b)
0.00(b)
NET
ASSET
VALUE,
End
of
Period
$
36.97
$
33.50
$
31.14
$
27.09
$
38.15
$
29.57
TOTAL
RETURN
10.36%(c)
7.58%
14.95%
(26.95)%
29.41%
15.26%
RATIOS/SUPPLEMENTARY
DATA
Net
Assets
at
End
of
Period
(000s
omitted)
$
233,333
$
219,229
$
247,019
$
231,134
$
406,489
$
122,454
Ratios
to
Average
Net
Assets:
Net
investment
loss
(0.08)%(d)
(0.25)%
(0.32)%
(0.53)%
(0.50)%
(0.15)%
Net
expenses
0.85%(d)
0.84%
0.85%
0.83%
0.85%
0.85%
Gross
expenses
(e)
0.89%(d)
0.88%
0.87%
0.85%
0.86%
0.94%
PORTFOLIO
TURNOVER
RATE
25%(c)
29%
27%
35%
30%
31%
footertext
(a)
Calculated
based
on
average
shares
outstanding
during
each
period.
(b)
Less
than
$0.01
per
share.
(c)
Not
annualized.
(d)
Annualized.
(e)
Reflects
the
expense
ratio
excluding
any
waivers
and/or
reimbursements.
Expense
waivers
and/or
reimbursements
would
decrease
the
total
return
had
such
reductions
not
occurred.
See
Notes
to
Financial
Statements.
DF
DENT
MIDCAP
GROWTH
FUND
FINANCIAL
HIGHLIGHTS
These
financial
highlights
reflect
selected
data
for
a
share
outstanding
throughout
each
period
.
For
the
Six
Months
Ended
December
31,
2024
For
the
Years
Ended
June
30,
December
3,
2021
(a)
Through
June
30,
2022
2024
2023
INSTITUTIONAL
PLUS
SHARES
NET
ASSET
VALUE,
Beginning
of
Period
$
33.55
$
31.17
$
27.10
$
38.47
INVESTMENT
OPERATIONS
Net
investment
loss
(b)
(0.04)
(0.06)
(0.07)
(0.08)
Net
realized
and
unrealized
gain
(loss)
3.55
2.44
4.14
(10.21)
Total
from
Investment
Operations
3.51
2.38
4.07
(10.29)
DISTRIBUTIONS
TO
SHAREHOLDERS
FROM
Net
realized
gain
–
–
–
(1.08)
Total
Distributions
to
Shareholders
–
–
–
(1.08)
NET
ASSET
VALUE,
End
of
Period
$
37.06
$
33.55
$
31.17
$
27.10
TOTAL
RETURN
10.46%(c)
7.64%
15.02%
(27.53)%(c)
RATIOS/SUPPLEMENTARY
DATA
Net
Assets
at
End
of
Period
(000s
omitted)
$
44,452
$
177,081
$
178,611
$
210,030
Ratios
to
Average
Net
Assets:
Net
investment
loss
(0.23)%(d)
(0.19)%
(0.26)%
(0.44)%(d)
Net
expenses
0.79%(d)
0.78%
0.79%
0.79%(d)
Gross
expenses
(e)
0.92%(d)
0.88%
0.88%
0.90%(d)
PORTFOLIO
TURNOVER
RATE
25%(c)
29%
27%
35%(c)
footertext
(a)
Commencement
of
operations.
(b)
Calculated
based
on
average
shares
outstanding
during
each
period.
(c)
Not
annualized.
(d)
Annualized.
(e)
Reflects
the
expense
ratio
excluding
any
waivers
and/or
reimbursements.
Expense
waivers
and/or
reimbursements
would
decrease
the
total
return
had
such
reductions
not
occurred.
See
Notes
to
Financial
Statements.
DF
DENT
SMALL
CAP
GROWTH
FUND
SCHEDULE
OF
INVESTMENTS
DECEMBER
31,
2024
The
following
is
a
summary
of
the
inputs
used
to
value
the
Fund's investments
as
of
December
31,
2024.
The
inputs
or
methodology
used
for
valuing
securities
are
not
necessarily
an
indication
of
the
risks
associated
with
investing
in
those
securities.
For
more
information
on
valuation
inputs,
and
their
aggregation
into
the
levels
used
in
the
table
below,
please
refer
to
the
Security
Valuation
section
in
Note
2
of
the
accompanying
Notes
to
Financial
Statements.
Shares
Security
Description
Value
Common
Stock
-
95.4%
Consumer
Discretionary
-
7.5%
22,163
Bright
Horizons
Family
Solutions,
Inc.
(a)
$
2,456,769
48,033
CarMax,
Inc.
(a)
3,927,178
31,975
Floor
&
Decor
Holdings,
Inc.,
Class A
(a)
3,187,907
13,248
Murphy
USA,
Inc.
6,647,184
16,219,038
Consumer
Staples
-
2.9%
212,740
Utz
Brands,
Inc.
3,331,509
11,884
WD-40
Co.
2,884,009
6,215,518
Financials
-
14.5%
80,665
EVERTEC,
Inc.
2,785,362
63,542
Goosehead
Insurance,
Inc.,
Class A
(a)
6,812,973
46,439
Hamilton
Lane,
Inc.,
Class A
6,875,294
14,215
Kinsale
Capital
Group,
Inc.
6,611,823
15,768
Morningstar,
Inc.
5,310,032
64,638
Trupanion,
Inc.
(a)
3,115,552
31,511,036
Health
Care
-
15.1%
95,099
Bio-Techne
Corp.
6,849,981
21,795
Charles
River
Laboratories
International,
Inc.
(a)
4,023,357
51,738
HealthEquity,
Inc.
(a)
4,964,261
34,266
LeMaitre
Vascular,
Inc.
3,157,269
15,101
Medpace
Holdings,
Inc.
(a)
5,017,005
41,976
Repligen
Corp.
(a)
6,042,026
83,653
RxSight,
Inc.
(a)
2,875,990
32,929,889
Industrials
-
28.2%
4,522
Applied
Industrial
Technologies,
Inc.
1,082,883
44,476
Casella
Waste
Systems,
Inc.
(a)
4,706,006
149,955
Core
&
Main,
Inc.,
Class A
(a)
7,634,209
12,023
CSW
Industrials,
Inc.
4,241,714
152,784
Douglas
Dynamics,
Inc.
3,610,286
39,625
Exponent,
Inc.
3,530,588
12,153
Federal
Signal
Corp.
1,122,816
284,051
Hayward
Holdings,
Inc.
(a)
4,343,140
38,699
HEICO
Corp.,
Class A
7,201,110
32,354
JBT
Marel
Corp.
4,112,193
9,055
Kadant,
Inc.
3,123,884
15,201
RBC
Bearings,
Inc.
(a)
4,547,227
18,757
Simpson
Manufacturing
Co.,
Inc.
3,110,473
31,577
SiteOne
Landscape
Supply,
Inc.
(a)
4,160,901
51,260
WillScot
Holdings
Corp.
(a)
1,714,647
Shares
Security
Description
Value
Industrials
-
28.2%
(continued)
67,417
WNS
Holdings,
Ltd.
(a)
$
3,194,892
61,436,969
Information
Technology
-
22.1%
20,620
Agilysys,
Inc.
(a)
2,715,860
65,714
Alarm.com
Holdings,
Inc.
(a)
3,995,411
26,078
Appfolio,
Inc.
(a)
6,433,964
51,280
Endava
PLC,
ADR
(a)
1,584,552
38,251
Guidewire
Software,
Inc.
(a)
6,448,354
19,504
Manhattan
Associates,
Inc.
(a)
5,270,761
36,109
Novanta,
Inc.
(a)
5,516,372
59,787
Procore
Technologies,
Inc.
(a)
4,479,840
18,360
ServiceTitan,
Inc.
(a)
1,888,693
22,552
SPS
Commerce,
Inc.
(a)
4,149,343
49,557
The
Descartes
Systems
Group,
Inc.
(a)
5,629,675
48,112,825
Materials
-
5.1%
23,369
Eagle
Materials,
Inc.
5,766,534
414,452
Perimeter
Solutions,
Inc.
(a)
5,296,697
11,063,231
Total
Common
Stock
(Cost
$169,185,141)
207,488,506
Money
Market
Fund
-
4.7%
10,309,721
First
American
Treasury
Obligations
Fund,
Class X,
4.37%
(b)
(Cost
$10,309,721)
10,309,721
Investments,
at
value
-
100.1%
(Cost
$179,494,862)
$
217,798,227
Other
Assets
&
Liabilities,
Net
-
(0.1)%
(284,447)
Net
Assets
-
100.0%
$
217,513,780
ADR
American
Depositary
Receipt
PLC
Public
Limited
Company
(a)
Non-income
producing
security.
(b)
Dividend
yield
changes
daily
to
reflect
current
market
conditions.
Rate
was
the
quoted
yield
as
of
December
31,
2024.
See
Notes
to
Financial
Statements.
DF
DENT
SMALL
CAP
GROWTH
FUND
SCHEDULE
OF
INVESTMENTS
DECEMBER
31,
2024
The
Level
1
value
displayed
in
this
table
is
Common
Stock
and
a
Money
Market
Fund.
Refer
to
this
Schedule
of
Investments
for
a
further
breakout
of
each
security
by
industry.
Valuation
Inputs
Investments
in
Securities
Level
1
-
Quoted
Prices
$
217,798,227
Level
2
-
Other
Significant
Observable
Inputs
–
Level
3
-
Significant
Unobservable
Inputs
–
Total
$
217,798,227
PORTFOLIO
HOLDINGS
%
of
Total
Net
Assets
Consumer
Discretionary
7.5%
Consumer
Staples
2.9%
Financials
14.5%
Health
Care
15.1%
Industrials
28.2%
Information
Technology
22.1%
Materials
5.1%
Money
Market
Fund
4.7%
Other
Assets
&
Liabilities,
Net
(0.1)%
100.0%
See
Notes
to
Financial
Statements.
DF
DENT
SMALL
CAP
GROWTH
FUND
STATEMENT
OF
ASSETS
AND
LIABILITIES
DECEMBER
31,
2024
ASSETS
Investments,
at
value
(Cost
$179,494,862)
$
217,798,227
Receivables:
Fund
shares
sold
112,328
Dividends
85,790
Prepaid
expenses
21,072
Total
Assets
218,017,417
LIABILITIES
Payables:
Fund
shares
redeemed
33,874
Accrued
Liabilities:
Investment
adviser
fees
445,533
Fund
services
fees
15,161
Other
expenses
9,069
Total
Liabilities
503,637
NET
ASSETS
$
217,513,780
COMPONENTS
OF
NET
ASSETS
Paid-in
capital
$
189,813,370
Distributable
Earnings
27,700,410
NET
ASSETS
$
217,513,780
SHARES
OF
BENEFICIAL
INTEREST
AT
NO
PAR
VALUE
(UNLIMITED
SHARES
AUTHORIZED)
Investor
Shares
971,647
Institutional
Shares
7,814,074
NET
ASSET
VALUE,
OFFERING
AND
REDEMPTION
PRICE
PER
SHARE
Investor
Shares
(based
on
net
assets
of
$23,906,332)
$
24.60
Institutional
Shares
(based
on
net
assets
of
$193,607,448)
$
24.78
See
Notes
to
Financial
Statements.
DF
DENT
SMALL
CAP
GROWTH
FUND
STATEMENT
OF
OPERATIONS
SIX
MONTHS
ENDED
DECEMBER
31,
2024
INVESTMENT
INCOME
Dividend
income
$
592,042
Total
Investment
Income
592,042
EXPENSES
Investment
adviser
fees
930,185
Fund
services
fees
82,816
Transfer
agent
fees:
Investor
Shares
11,614
Institutional
Shares
11,820
Custodian
fees
10,563
Registration
fees:
Investor
Shares
8,166
Institutional
Shares
9,464
Professional
fees
27,936
Trustees'
fees
and
expenses
7,167
Other
expenses
31,868
Total
Expenses
1,131,599
Fees
waived
(85,933)
Net
Expenses
1,045,666
NET
INVESTMENT
LOSS
(453,624)
NET
REALIZED
AND
UNREALIZED
GAIN
(LOSS)
Net
realized
gain
on
investments
2,499,171
Net
change
in
unrealized
appreciation
(depreciation)
on
investments
18,678,967
NET
REALIZED
AND
UNREALIZED
GAIN
21,178,138
INCREASE
IN
NET
ASSETS
RESULTING
FROM
OPERATIONS
$
20,724,514
See
Notes
to
Financial
Statements.
DF
DENT
SMALL
CAP
GROWTH
FUND
STATEMENTS
OF
CHANGES
IN
NET
ASSETS
For
the
Six
Months
Ended
December
31,
2024
For
the
Year
Ended
June
30,
2024
OPERATIONS
Net
investment
loss
$
(453,624)
$
(372,773)
Net
realized
gain
(loss)
2,499,171
(2,649,453)
Net
change
in
unrealized
appreciation
(depreciation)
18,678,967
7,765,496
Increase
in
Net
Assets
Resulting
from
Operations
20,724,514
4,743,270
CAPITAL
SHARE
TRANSACTIONS
Sale
of
shares:
Investor
Shares
1,269,545
7,672,280
Institutional
Shares
13,509,021
106,816,162
Redemption
of
shares:
Investor
Shares
(2,623,653)
(4,201,324)
Institutional
Shares
(12,111,338)
(12,041,037)
Increase
in
Net
Assets
from
Capital
Share
Transactions
43,575
98,246,081
Increase
in
Net
Assets
20,768,089
102,989,351
NET
ASSETS
Beginning
of
Period
196,745,691
93,756,340
End
of
Period
$
217,513,780
$
196,745,691
SHARE
TRANSACTIONS
Sale
of
shares:
Investor
Shares
52,125
335,266
Institutional
Shares
550,018
4,680,496
Redemption
of
shares:
Investor
Shares
(106,111)
(190,911)
Institutional
Shares
(487,222)
(544,463)
Increase
in
Shares
8,810
4,280,388
See
Notes
to
Financial
Statements.
DF
DENT
SMALL
CAP
GROWTH
FUND
FINANCIAL
HIGHLIGHTS
These
financial
highlights
reflect
selected
data
for
a
share
outstanding
throughout
each
period
.
For
the
Six
Months
Ended
December
31,
2024
For
the
Years
Ended
June
30,
2024
2023
2022
2021
2020
INVESTOR
SHARES
NET
ASSET
VALUE,
Beginning
of
Period
$
22.29
$
20.76
$
18.19
$
24.94
$
18.38
$
17.10
INVESTMENT
OPERATIONS
Net
investment
loss
(a)
(0.06)
(0.10)
(0.10)
(0.15)
(0.13)
(0.09)
Net
realized
and
unrealized
gain
(loss)
2.37
1.63
2.67
(6.01)
7.16
1.63
Total
from
Investment
Operations
2.31
1.53
2.57
(6.16)
7.03
1.54
DISTRIBUTIONS
TO
SHAREHOLDERS
FROM
Net
realized
gain
–
–
–
(0.60)
(0.48)
(0.26)
Total
Distributions
to
Shareholders
–
–
–
(0.60)
(0.48)
(0.26)
REDEMPTION
FEES(a)
–
–
–
0.01
0.01
0.00(b)
NET
ASSET
VALUE,
End
of
Period
$
24.60
$
22.29
$
20.76
$
18.19
$
24.94
$
18.38
TOTAL
RETURN
10.36%(c)
7.37%
14.13%
(25.32)%
38.60%
9.08%
RATIOS/SUPPLEMENTARY
DATA
Net
Assets
at
End
of
Period
(000s
omitted)
$
23,906
$
22,859
$
18,295
$
18,105
$
29,472
$
8,394
Ratios
to
Average
Net
Assets:
Net
investment
loss
(0.50)%(d)
(0.44)%
(0.54)%
(0.64)%
(0.58)%
(0.50)%
Net
expenses
1.04%(d)
1.04%
1.05%
1.05%
1.05%
1.05%
Gross
expenses
(e)
1.19%(d)
1.25%
1.30%
1.23%
1.30%
1.66%
PORTFOLIO
TURNOVER
RATE
18%(c)
30%
41%
46%
34%
38%
footertext
(a)
Calculated
based
on
average
shares
outstanding
during
each
period.
(b)
Less
than
$0.01
per
share.
(c)
Not
annualized.
(d)
Annualized.
(e)
Reflects
the
expense
ratio
excluding
any
waivers
and/or
reimbursements.
Expense
waivers
and/or
reimbursements
would
decrease
the
total
return
had
such
reductions
not
occurred.
See
Notes
to
Financial
Statements.
DF
DENT
SMALL
CAP
GROWTH
FUND
FINANCIAL
HIGHLIGHTS
These
financial
highlights
reflect
selected
data
for
a
share
outstanding
throughout
each
period
.
For
the
Six
Months
Ended
December
31,
2024
For
the
Years
Ended
June
30,
2024
2023
2022
2021
2020
INSTITUTIONAL
SHARES
NET
ASSET
VALUE,
Beginning
of
Period
$
22.43
$
20.87
$
18.27
$
25.03
$
18.42
$
17.13
INVESTMENT
OPERATIONS
Net
investment
loss
(a)
(0.05)
(0.07)
(0.08)
(0.12)
(0.11)
(0.07)
Net
realized
and
unrealized
gain
(loss)
2.40
1.63
2.68
(6.04)
7.20
1.62
Total
from
Investment
Operations
2.35
1.56
2.60
(6.16)
7.09
1.55
DISTRIBUTIONS
TO
SHAREHOLDERS
FROM
Net
realized
gain
–
–
–
(0.60)
(0.48)
(0.26)
Total
Distributions
to
Shareholders
–
–
–
(0.60)
(0.48)
(0.26)
REDEMPTION
FEES(a)
–
–
–
–
0.00(b)
0.00(b)
NET
ASSET
VALUE,
End
of
Period
$
24.78
$
22.43
$
20.87
$
18.27
$
25.03
$
18.42
TOTAL
RETURN
10.48%(c)
7.48%
14.23%
(25.27)%
38.79%
9.12%
RATIOS/SUPPLEMENTARY
DATA
Net
Assets
at
End
of
Period
(000s
omitted)
$
193,607
$
173,886
$
75,462
$
60,847
$
52,591
$
14,626
Ratios
to
Average
Net
Assets:
Net
investment
loss
(0.40)%(d)
(0.31)%
(0.43)%
(0.52)%
(0.49)%
(0.40)%
Net
expenses
0.94%(d)
0.94%
0.95%
0.95%
0.95%
0.95%
Gross
expenses
(e)
1.01%(d)
1.07%
1.12%
1.09%
1.18%
1.72%
PORTFOLIO
TURNOVER
RATE
18%(c)
30%
41%
46%
34%
38%
footertext
(a)
Calculated
based
on
average
shares
outstanding
during
each
period.
(b)
Less
than
$0.01
per
share.
(c)
Not
annualized.
(d)
Annualized.
(e)
Reflects
the
expense
ratio
excluding
any
waivers
and/or
reimbursements.
Expense
waivers
and/or
reimbursements
would
decrease
the
total
return
had
such
reductions
not
occurred.
DF
DENT
GROWTH
FUNDS
NOTES
TO
FINANCIAL
STATEMENTS
DECEMBER
31,
2024
Note
1.
Organization
DF
Dent
Premier
Growth
Fund,
DF
Dent
Midcap
Growth
Fund,
and
DF
Dent
Small
Cap
Growth
Fund
(individually,
a
“Fund”
and
collectively,
the
“Funds”)
are
diversified
portfolios
of
Forum
Funds
(the
“Trust”).
The
Trust
is
a
Delaware
statutory
trust
that
is
registered
as
an
open-end,
management
investment
company
under
the
Investment
Company
Act
of
1940,
as
amended
(the
“Act”).
Under
its
Trust
Instrument,
the
Trust
is
authorized
to
issue
an
unlimited
number
of
each
Fund’s
shares
of
beneficial
interest
without
par
value.
DF
Dent
Premier
Growth
Fund
commenced
operations
on
July
16,
2001.
DF
Dent
Midcap
Growth
Fund’s
Investor
Shares,
Institutional
Shares,
and
Institutional
Plus
Shares
commenced
operations
on
July
1,
2011,
November
29,
2017,
and
December
3,
2021,
respectively.
DF
Dent
Small
Cap
Growth
Fund’s
Investor
Shares
and
Institutional
Shares
commenced
operations
on
November
1,
2013
and
November
20,
2017,
respectively.
Additionally,
the
DF
Dent
Small
Cap
Growth
Fund
currently
offers
Institutional
Plus
Shares,
which
as
of
December
31,
2024
had
not
commenced
operations.
The
Funds
seek
long-term
capital
appreciation.
Each
Fund
included
herein
is
deemed
to
be
an
individual
reporting
segment
and
is
not
part
of
a
consolidated
reporting
entity.
The
objective
and
strategy
of
each
Fund
is
used
by
the
Adviser,
as
defined
in
Note
3,
to
make
investment
decisions,
and
the
results
of
the
operations,
as
shown
on
the
Statements
of
Operations
and
the
financial
highlights
for
each
Fund
is
the
information
utilized
for
the
day-to-day
management
of
the
Funds.
Each
Fund
is
party
to
the
expense
agreements
as
disclosed
in
the
Notes
to
the
Financial
Statements
and
there
are
no
resources
allocated
to
the
Funds
based
on
performance
measurements.
Due
to
the
significance
of
oversight
and
their
role,
the
Adviser
is
deemed
to
be
the
Chief
Operating
Decision
Maker.
Note
2.
Summary
of
Significant
Accounting
Policies
The
Funds
are
investment
companies
and
follow
accounting
and
reporting
guidance
under
Financial
Accounting
Standards
Board
Accounting
Standards
Codification
Topic
946,
“Financial
Services
–
Investment
Companies.”
These
financial
statements
are
prepared
in
accordance
with
accounting
principles
generally
accepted
in
the
United
States
of
America
(“GAAP”),
which
require
management
to
make
estimates
and
assumptions
that
affect
the
reported
amounts
of
assets
and
liabilities,
the
disclosure
of
contingent
liabilities
at
the
date
of
the
financial
statements,
and
the
reported
amounts
of
increases
and
decreases
in
net
assets
from
operations
during
the
fiscal
period.
Actual
amounts
could
differ
from
those
estimates.
The
following
summarizes
the
significant
accounting
policies
of
each
Fund:
Security
Valuation
–
Securities
are
recorded
at
fair
value
using
last
quoted
trade
or
official
closing
price
from
the
principal
exchange
where
the
security
is
traded,
as
provided
by
independent
pricing
services
on
each
Fund
business
day.
In
the
absence
of
a
last
trade,
securities
are
valued
at
the
mean
of
the
last
bid
and
ask
price
provided
by
the
pricing
service.
Shares
of
non-exchange
traded
open-end
mutual
funds
are
valued
at
net
asset
value
per
share
(“NAV”).
Short-term
investments
that
mature
in
sixty
days
or
less
may
be
recorded
at
amortized
cost,
which
approximates
fair
value.
Pursuant
to
Rule
2a-5
under
the
Investment
Company
Act,
the
Trust’s
Board
of
Trustees
(the
“Board”)
has
designated
the
Adviser
as
each
Fund’s
valuation
designee
to
perform
any
fair
value
determinations
for
securities
DF
DENT
GROWTH
FUNDS
NOTES
TO
FINANCIAL
STATEMENTS
DECEMBER
31,
2024
and
other
assets
held
by
each
Fund.
The
Adviser
is
subject
to
the
oversight
of
the
Board
and
certain
reporting
and
other
requirements
intended
to
provide
the
Board
the
information
needed
to
oversee
the
Adviser’s
fair
value
determinations.
The
Adviser
is
responsible
for
determining
the
fair
value
of
investments
for
which
market
quotations
are
not
readily
available
in
accordance
with
policies
and
procedures
that
have
been
approved
by
the
Board.
Under
these
procedures,
the
Adviser
convenes
on
a
regular
and
ad
hoc
basis
to
review
such
investments
and
considers
a
number
of
factors,
including
valuation
methodologies
and
significant
unobservable
inputs,
when
arriving
at
fair
value.
The
Board
has
approved
the
Adviser’s
fair
valuation
procedures
as
a
part
of
each
Fund’s
compliance
program
and
will
review
any
changes
made
to
the
procedures.
The
Adviser
provides
fair
valuation
inputs.
In
determining
fair
valuations,
inputs
may
include
market-based
analytics
that
may
consider
related
or
comparable
assets
or
liabilities,
recent
transactions,
market
multiples,
book
values
and
other
relevant
investment
information.
Adviser
inputs
may
include
an
income-based
approach
in
which
the
anticipated
future
cash
flows
of
the
investment
are
discounted
in
determining
fair
value.
Discounts
may
also
be
applied
based
on
the
nature
or
duration
of
any
restrictions
on
the
disposition
of
the
investments.
The
Adviser
performs
regular
reviews
of
valuation
methodologies,
key
inputs
and
assumptions,
disposition
analysis
and
market
activity.
Fair
valuation
is
based
on
subjective
factors
and,
as
a
result,
the
fair
value
of
an
investment
may
differ
from
the
security’s
market
price
and
may
not
be
the
price
at
which
the
asset
may
be
sold.
Fair
valuation
could
result
in
a
different
NAV
than
a
NAV
determined
by
using
market
quotes.
GAAP
has
a
three-tier
fair
value
hierarchy.
The
basis
of
the
tiers
is
dependent
upon
the
level
of
various
“inputs”
used
to
determine
the
value
of
each
Fund’s
investments.
These
inputs
are
summarized
in
the
three
broad
levels
listed
below:
Level
1
-
Quoted
prices
in
active
markets
for
identical
assets
and
liabilities.
Level
2
-
Prices
determined
using
significant
other
observable
inputs
(including
quoted
prices
for
similar
securities,
interest
rates,
prepayment
speeds,
credit
risk,
etc.).
Short-term
securities
are
valued
at
amortized
cost,
which
approximates
market
value,
are
categorized
as
Level
2
in
the
hierarchy.
Municipal
securities,
long-
term
U.S.
government
obligations
and
corporate
debt
securities
are
valued
in
accordance
with
the
evaluated
price
supplied
by
a
pricing
service
and
generally
categorized
as
Level
2
in
the
hierarchy.
Other
securities
that
are
categorized
as
Level
2
in
the
hierarchy
include,
but
are
not
limited
to,
warrants
that
do
not
trade
on
an
exchange,
securities
valued
at
the
mean
between
the
last
reported
bid
and
ask
quotation
and
international
equity
securities
valued
by
an
independent
third
party
with
adjustments
for
changes
in
value
between
the
time
of
the
securities’
respective
local
market
closes
and
the
close
of
the
U.S.
market.
Level
3
-
Significant
unobservable
inputs
(including
each
Fund’s
own
assumptions
in
determining
the
fair
value
of
investments).
The
aggregate
value
by
input
level,
as
of
December
31,
2024,
for
each
Fund’s
investments
is
included
at
the
end
of
each
Fund’s
Schedule
of
Investments.
DF
DENT
GROWTH
FUNDS
NOTES
TO
FINANCIAL
STATEMENTS
DECEMBER
31,
2024
Security
Transactions,
Investment
Income
and
Realized
Gain
and
Loss
–
Investment
transactions
are
accounted
for
on
the
trade
date.
Dividend
income
is
recorded
on
the
ex-dividend
date.
Foreign
dividend
income
is
recorded
on
the
ex-dividend
date
or
as
soon
as
possible
after
determining
the
existence
of
a
dividend
declaration
after
exercising
reasonable
due
diligence.
Income
and
capital
gains
on
some
foreign
securities
may
be
subject
to
foreign
withholding
taxes,
which
are
accrued
as
applicable.
Interest
income
is
recorded
on
an
accrual
basis.
Premium
is
amortized
to
the
next
call
date
above
par,
and
discount
is
accreted
to
maturity
using
the
effective
interest
method
and
included
in
interest
income.
Identified
cost
of
investments
sold
is
used
to
determine
the
gain
and
loss
for
both
financial
statement
and
federal
income
tax
purposes.
Distributions
to
Shareholders
–
Each
Fund
declares
any
dividends
from
net
investment
income
and
pays
them
annually.
Any
net
capital
gains
realized
by
the
Funds
are
distributed
at
least
annually.
Distributions
to
shareholders
are
recorded
on
the
ex-dividend
date.
Distributions
are
based
on
amounts
calculated
in
accordance
with
applicable
federal
income
tax
regulations,
which
may
differ
from
GAAP.
These
differences
are
due
primarily
to
differing
treatments
of
income
and
gain
on
various
investment
securities
held
by
each
Fund,
timing
differences
and
differing
characterizations
of
distributions
made
by
each
Fund.
Federal
Taxes
–
Each
Fund
intends
to
continue
to
qualify
each
year
as
a
regulated
investment
company
under
Subchapter
M
of
Chapter
1,
Subtitle
A,
of
the
Internal
Revenue
Code
of
1986,
as
amended
(“Code”),
and
to
distribute
all
of
its
taxable
income
to
shareholders.
In
addition,
by
distributing
in
each
calendar
year
substantially
all
of
their
net
investment
income
and
capital
gains,
if
any,
the
Funds
will
not
be
subject
to
a
federal
excise
tax.
Therefore,
no
federal
income
or
excise
tax
provision
is
required.
Each
Fund
recognizes
interest
and
penalties,
if
any,
related
to
unrecognized
tax
benefits
as
income
tax
expense
in
the
Statements
of
Operations.
During
the
period,
each
Fund
did
not
incur
any
interest
or
penalties.
Each
Fund
files
a
U.S.
federal
income
and
excise
tax
return
as
required.
Each
Fund’s
federal
income
tax
returns
are
subject
to
examination
by
the
Internal
Revenue
Service
for
a
period
of
three
fiscal
years
after
they
are
filed.
As
of
December
31,
2024,
there
are
no
uncertain
tax
positions
that
would
require
financial
statement
recognition,
de-recognition
or
disclosure.
Income
and
Expense
Allocation
–
The
Trust
accounts
separately
for
the
assets,
liabilities
and
operations
of
each
of
its
investment
portfolios.
Expenses
that
are
directly
attributable
to
more
than
one
investment
portfolio
are
allocated
among
the
respective
investment
portfolios
in
an
equitable
manner.
The
DF
Dent
Midcap
Growth
Fund's
and
DF
Dent
Small
Cap
Growth
Fund's
class-specific
expenses
are
charged
to
the
operations
of
that
class
of
shares.
Income
and
expenses
(other
than
expenses
attributable
to
a
specific
class)
and
realized
and
unrealized
gains
or
losses
on
investments
are
allocated
to
each
class
of
shares
based
on
the
class’
respective
net
assets
to
the
total
net
assets
of
each
Fund.
Commitments
and
Contingencies
–
In
the
normal
course
of
business,
each
Fund
enters
into
contracts
that
provide
general
indemnifications
by
each
Fund
to
the
counterparty
to
the
contract.
Each
Fund’s
maximum
exposure
under
these
arrangements
is
dependent
on
future
claims
that
may
be
made
against
each
Fund
and,
therefore,
cannot
be
estimated;
however,
based
on
experience,
the
risk
of
loss
from
such
claims
is
considered
remote.
Each
Fund
has
determined
that
none
of
these
arrangements
requires
disclosure
on
each
Fund’s
Statement
of
Assets
and
Liabilities.
DF
DENT
GROWTH
FUNDS
NOTES
TO
FINANCIAL
STATEMENTS
DECEMBER
31,
2024
Note
3.
Fees
and
Expenses
Investment
Adviser
–
D.F.
Dent
and
Company,
Inc.
(the
“Adviser”)
is
the
investment
adviser
to
the
Funds.
Pursuant
to
an
investment
advisory
agreement,
the
Adviser
receives
an
advisory
fee,
payable
monthly,
at
an
annual
rate
of
0.99%,
0.75%,
and
0.85%
of
the
average
daily
net
assets
of
DF
Dent
Premier
Growth
Fund,
DF
Dent
Midcap
Growth
Fund
and
DF
Dent
Small
Cap
Growth
Fund,
respectively.
Distribution
–
Foreside
Fund
Services,
LLC,
a
wholly
owned
subsidiary
of
Foreside
Financial
Group,
LLC
(d/b/a
ACA
Group)
(the
“Distributor”),
acts
as
the
agent
of
the
Trust
in
connection
with
the
continuous
offering
of
shares
of
the
Funds.
The
Funds
do
not
have
a
distribution
(12b-1)
plan;
accordingly,
the
Distributor
does
not
receive
compensation
from
the
Funds
for
its
distribution
services.
The
Adviser
compensates
the
Distributor
directly
for
its
services.
The
Distributor
is
not
affiliated
with
the
Adviser
or
Atlantic
Fund
Administration,
LLC,
a
wholly
owned
subsidiary
of
Apex
US
Holdings
LLC
(d/b/a
Apex
Fund
Services)
(“Apex”)
or
their
affiliates.
Other
Service
Providers
–
Apex
provides
fund
accounting,
fund
administration,
compliance
and
transfer
agency
services
to
each
Fund.
The
fees
related
to
these
services
are
included
in
Fund
services
fees
within
the
Statements
of
Operations.
Apex
also
provides
certain
shareholder
report
production
and
EDGAR
conversion
and
filing
services.
Pursuant
to
an
Apex
Services
Agreement,
each
Fund
pays
Apex
customary
fees
for
its
services.
Apex
provides
a
Principal
Executive
Officer,
a
Principal
Financial
Officer,
a
Chief
Compliance
Officer
and
an
Anti-
Money
Laundering
Officer
to
each
Fund,
as
well
as
certain
additional
compliance
support
functions.
Trustees
and
Officers
–
Each
Independent
Trustee’s
annual
retainer
is
$45,000
($55,000
for
the
Chairman).
The
Audit
Committee
Chairman
receives
an
additional
$2,000
annually.
Effective
January
1,
2025,
each
Independent
Trustee’s
annual
retainer
is
$60,000
($70,000
for
the
Chairman),
and
the
Audit
Committee
Chairman
receives
an
additional
$5,000
annually.
The
Trustees
and
the
Chairman
may
receive
additional
fees
for
special
Board
meetings.
Each
Trustee
is
also
reimbursed
for
all
reasonable
out-of-pocket
expenses
incurred
in
connection
with
his
or
her
duties
as
a
Trustee,
including
travel
and
related
expenses
incurred
in
attending
Board
meetings.
The
amount
of
Trustees’
fees
attributable
to
each
Fund
is
disclosed
in
the
Statements
of
Operations.
Certain
officers
of
the
Trust
are
also
officers
or
employees
of
the
above
named
service
providers,
and
during
their
terms
of
office
received
no
compensation
from
each
Fund.
Note
4.
Expense
Reimbursement
and
Fees
Waived
The
Adviser
has
contractually
agreed
to
waive
a
portion
of
its
fee
and/or
reimburse
Fund
expenses
to
limit
Total
Annual
Fund
Operating
Expenses
(excluding
all
taxes,
interest,
portfolio
transaction
expenses,
and
extraordinary
expenses)
to
0.99%,
through
October
31,
2025
(the
“Expense
Cap”).
Additionally,
the
Adviser
has
contractually
agreed
to
waive
a
portion
of
its
fee
and/or
reimburse
Fund
expenses
to
limit
Total
Annual
Fund
Operating
Expenses
After
Fee
Waiver
and/or
Expense
Reimbursement
(excluding
all
taxes,
interest,
portfolio
transaction
expenses,
and
extraordinary
expenses)
of
Investor
Shares,
Institutional
Shares
and
Institutional
Plus
Shares
to
0.98%,
0.85%,
and
0.79%,
respectively,
through
October
31,
2025,
for
DF
Dent
Midcap
Growth
Fund.
The
Adviser
has
also
contractually
agreed
to
waive
a
portion
of
its
fee
and/or
reimburse
Fund
expenses
to
limit
Total
Annual
Fund
Operating
Expenses
After
Fee
Waiver
and/or
Expense
Reimbursement
(excluding
all
taxes,
interest,
DF
DENT
GROWTH
FUNDS
NOTES
TO
FINANCIAL
STATEMENTS
DECEMBER
31,
2024
portfolio
transaction
expenses,
and
extraordinary
expenses)
of
Investor
Shares
and
Institutional
Shares
to
1.05%
and
0.95%,
respectively,
through
October
31,
2025,
for
DF
Dent
Small
Cap
Growth
Fund.
The
Expense
Cap
may
only
be
raised
or
eliminated
with
the
consent
of
the
Board
of
Trustees.
Other
fund
service
providers
have
agreed
to
waive
a
portion
of
their
fees
and
such
waivers
may
be
changed
or
eliminated
with
the
approval
of
the
Board
of
Trustees
of
the
Trust.
For
the
period
ended
December
31,
2024
,
fees
waived
and
expenses
reimbursed
were
as
follows:
The
Adviser
may
be
reimbursed
by
each
Fund
for
fees
waived
and
expenses
reimbursed
by
the
Adviser
pursuant
to
the
Expense
Cap
if
such
payment
is
made
within
three
years
of
the
fee
waiver
or
expense
reimbursement,
and
does
not
cause
the
Total
Annual
Fund
Operating
Expenses
After
Fee
Waiver
and/or
Expense
Reimbursement
to
exceed
the
lesser
of
(i)
the
then-current
expense
cap,
or
(ii)
the
expense
cap
in
place
at
the
time
the
fees/expenses
were
waived/reimbursed.
As
of
December
31,
2024
,
$958,202,
$475,489
and
$405,296
are
subject
to
recoupment
by
the
Adviser
for
the
DF
Dent
Premier
Growth
Fund,
DF
Dent
Midcap
Growth
Fund,
and
DF
Dent
Small
Cap
Growth
Fund,
respectively.
Note
5.
Security
Transactions
The
cost
of
purchases
and
proceeds
from
sales
of
investment
securities
(including
maturities),
other
than
short-
term
investments
during
the
period
ended
December
31,
2024
,
were
as
follows:
Note
6.
Federal
Income
Tax
As
of
December
31,
2024
,
cost
for
federal
income
tax
purposes
is
substantially
the
same
as
for
financial
statement
purposes
and
net
unrealized
appreciation
consists
of:
Investment
Adviser
Fees
Waived
Other
Waivers
Total
Fees
Waived
DF
Dent
Premier
Growth
Fund
$
163,418
$
20,745
$
184,163
DF
Dent
Midcap
Growth
Fund
60,745
50,548
111,293
DF
Dent
Small
Cap
Growth
Fund
60,465
25,468
85,933
Purchases
Sales
DF
Dent
Premier
Growth
Fund
$
15,786,357
$
36,827,528
DF
Dent
Midcap
Growth
Fund
112,165,462
271,856,580
DF
Dent
Small
Cap
Growth
Fund
39,689,889
37,407,863
Gross
Unrealized
Appreciation
Gross
Unrealized
Depreciation
Net
Unrealized
Appreciation
DF
Dent
Premier
Growth
Fund
$
130,683,896
$
(765,475)
$
129,918,421
DF
Dent
Midcap
Growth
Fund
137,733,516
(10,619,516)
127,114,000
DF
Dent
Small
Cap
Growth
Fund
43,387,619
(5,084,254)
38,303,365
DF
DENT
GROWTH
FUNDS
NOTES
TO
FINANCIAL
STATEMENTS
DECEMBER
31,
2024
As
of
June
30,
2024
,
distributable
earnings/accumulated
loss
on
a
tax
basis
were
as
follows:
The
difference
between
components
of
distributable
earnings/accumulated
loss
on
a
tax
basis
and
the
amounts
reflected
in
the
Statements
of
Assets
and
Liabilities
are
primarily
due
to
wash
sales
and
equity
return
of
capital.
For
tax
purposes,
the
prior
year
late-year
ordinary
loss
was
$
631,990
,
$1,192,139,
and
$198,571
for
the
DF
Dent
Premier
Growth
Fund,
DF
Dent
Midcap
Growth
Fund,
and
DF
Dent
Small
Cap
Growth
Fund,
respectively,
(realized
during
the
period
January
1,
2024
through
June
30,
2024
).
These
losses
were
recognized
for
tax
purposes
on
the
first
business
day
of
each
Fund’s
current
year,
July
1,
202
4
.
As
of
June
30,
2024
,
the
DF
Dent
Midcap
Growth
Fund
and
DF
Dent
Small
Cap
Growth
Fund
had
$19,323,990
and
$1,
335,237
,
respectively,
of
available
short-term
capital
loss
carryforwards
and
the
DF
Dent
Midcap
Growth
Fund
and
DF
Dent
Small
Cap
Growth
Fund
had
$32,381,921
and
$5,971,014
,
respectively,
of
available
long-
term
capital
loss
carryforwards
that
have
no
expiration
date.
Note
7.
Subsequent
Events
Subsequent
events
occurring
after
the
date
of
this
report
through
the
date
these
financial
statements
were
issued
have
been
evaluated
for
potential
impact,
and
each
Fund
has
had
no
such
events.
Undistributed
Long-Term
Gain
Capital
and
Other
Losses
Net
Unrealized
Appreciation
Total
DF
Dent
Premier
Growth
Fund
$
19,826,318
$
(631,990)
$
128,834,923
$
148,029,251
DF
Dent
Midcap
Growth
Fund
–
(52,898,050)
123,492,892
70,594,842
DF
Dent
Small
Cap
Growth
Fund
–
(7,504,822)
14,480,718
6,975,896
DF
DENT
GROWTH
FUNDS
OTHER
INFORMATION
DECEMBER
31,
2024
Changes
in
and
Disagreements
with
Accountants
(Item
8
of
Form
N-CSR)
N/A
Proxy
Disclosure
(Item
9
of
Form
N-CSR)
N/A
Remuneration
Paid
to
Directors,
Officers,
and
Others
(Item
10
of
Form
N-CSR)
Please
see
financial
statements
in
Item
7.
Statement
Regarding
the
Basis
for
the
Board’s
Approval
of
Investment
Advisory
Contract
(Item
11
of
Form
N-CSR)
N/A
DF
Dent
Premier
Growth
Fund
–
DFDPX
DF
Dent
Midcap
Growth
Fund
Investor
Shares
–
DFDMX
DF
Dent
Midcap
Growth
Fund
Institutional
Shares
–
DFMGX
DF
Dent
Midcap
Growth
Fund
Institutional
Plus
Shares
–
DFMLX
DF
Dent
Small
Cap
Growth
Fund
Investor
Shares
–
DFDSX
DF
Dent
Small
Cap
Growth
Fund
Institutional
Shares
–
DFSGX
DF
Dent
Small
Cap
Growth
Fund
Institutional
Plus
Shares
–
DFSLX
INVESTMENT
ADVISER
D.F.
Dent
and
Company,
Inc.
400
E.
Pratt
Street,
7th
Floor
Baltimore,
MD
21202
www.dfdent.com
TRANSFER
AGENT
Apex
Fund
Services
P.O.
Box
588
Portland,
ME
04112
(866)
2DF-DENT
www.apexgroup.com
221-SAR-1224
This
report
is
submitted
for
the
general
information
of
the
shareholders
of
the
Funds.
It
is
not
authorized
for
distribution
to
prospective
investors
unless
preceded
or
accompanied
by
an
effective
prospectus,
which
includes
information
regarding
the
Funds'
risks,
objectives,
fees
and
expenses,
experience
of
its
management,
and
other
information.
(b) Included as part of financial statements filed under Item 7(a).
ITEM 8. CHANGES IN AND DISAGREEMENTS WITH ACCOUNTANTS FOR OPEN-END MANAGEMENT INVESTMENT COMPANIES.
Not applicable.
ITEM 9. PROXY DISCLOSURES FOR OPEN-END MANAGEMENT INVESTMENT COMPANIES.
Not applicable.
ITEM 10. REMUNERATION PAID TO DIRECTORS, OFFICERS, AND OTHERS OF OPEN-END MANAGEMENT INVESTMENT COMPANIES.
Included as part of financial statements filed under Item 7(a).
ITEM 11. STATEMENT REGARDING BASIS FOR APPROVAL OF INVESTMENT ADVISORY CONTRACT.
Not applicable.
ITEM 12. DISCLOSURE OF PROXY VOTING POLICIES AND PROCEDURES FOR CLOSED-END MANAGEMENT INVESTMENT COMPANIES.
Not applicable.
ITEM 13. PORTFOLIO MANAGERS OF CLOSED-END MANAGEMENT INVESTMENT COMPANIES.
Not applicable.
ITEM 14. PURCHASES OF EQUITY SECURITIES BY CLOSED-END MANAGEMENT INVESTMENT COMPANY AND AFFILIATED PURCHASERS.
Not applicable.
ITEM 15. SUBMISSION OF MATTERS TO A VOTE OF SECURITY HOLDERS
The Registrant does not accept nominees to the Board of Trustees from shareholders.
ITEM 16. CONTROLS AND PROCEDURES
(a) The Registrant’s Principal Executive Officer and Principal Financial Officer have concluded that the Registrant’s disclosure controls and procedures (as defined in Rule 30a-3(c) under the Act are effective, based on their evaluation of the controls and procedures required by Rule 30a-3(b) under the Act and Rules 13a-15(b) or 15d-15(b) under the Securities Exchange Act of 1934, as of a date within 90 days of the filing date of this report.
(b) There were no changes in the Registrant’s internal control over financial reporting (as defined in Rule 30a-3(d) under the Act) that occurred during the Reporting Period that have materially affected, or are reasonably likely to materially affect, the Registrant’s internal control over financial reporting.
ITEM 17. DISCLOSURE OF SECURITIES LENDING ACTIVITIES FOR CLOSED-END MANAGEMENT INVESTMENT COMPANIES.
Not applicable.
ITEM 18. RECOVERY OF ERRONEOUSLY AWARDED COMPENSATION.
Not applicable.
ITEM 19. EXHIBITS.
(a)(1) Not applicable.
(a)(2) Not applicable.
(a)(4) Not applicable.
(a)(5) Not applicable.
SIGNATURES
Pursuant to the requirements of the Securities Exchange Act of 1934 and the Investment Company Act of 1940, the Registrant has duly caused this report to be signed on its behalf by the undersigned, thereunto duly authorized.
Registrant Forum Funds
| By: | /s/ Zachary Tackett | |
| | Zachary Tackett, Principal Executive Officer | |
| | | |
| Date: | February 12, 2025 | |
Pursuant to the requirements of the Securities Exchange Act of 1934 and the Investment Company Act of 1940, this report has been signed below by the following persons on behalf of the Registrant and in the capacities and on the dates indicated.
| By: | /s/ Zachary Tackett | |
| | Zachary Tackett, Principal Executive Officer | |
| | | |
| Date: | February 12, 2025 | |
| By: | /s/ Karen Shaw | |
| | Karen Shaw, Principal Financial Officer | |
| | | |
| Date: | February 12, 2025 | |