UNITED STATES
SECURITIES AND EXCHANGE COMMISSION
WASHINGTON, D.C. 20549
FORM N-CSR
CERTIFIED SHAREHOLDER REPORT OF REGISTERED MANAGEMENT
INVESTMENT COMPANIES
Investment Company Act file number 811-03023
FORUM FUNDS
Three Canal Plaza, Suite 600
Portland, Maine 04101
Zachary Tackett, Principal Executive Officer
Three Canal Plaza, Suite 600
Portland, Maine 04101
207-347-2000
Date of fiscal year end December 31
Date of reporting period: July 1, 2024 – December 31, 2024
ITEM 1. REPORT TO SHAREHOLDERS.
(a) A copy of the report transmitted to stockholders pursuant to Rule 30e-1 under the Investment Company Act, as amended (“Act”), is attached hereto.
Semi-Annual Shareholder Report - December 31, 2024
This semi-annual shareholder report contains important information about the Auxier Focus Fund for the period of July 1, 2024, to December 31, 2024. You can find additional information about the Fund at https://auxierasset.com/prospectus-and-reports. You can also request this information by contacting us at (877) 328-9437.
What were the Fund's costs for the last six months?
(based on a hypothetical $10,000 investment)
| Class Name | Costs of a $10,000 investment | Costs paid as a percentage of a $10,000 investment |
|---|
| A shares Class | $64 | 1.24% |
|---|
| Total Net Assets | $281,432,100 |
|---|
| # of Portfolio Holdings | 115 |
|---|
| Portfolio Turnover Rate | 1% |
|---|
| Investment Advisory Fees (Net of fees waived) | $850,185 |
|---|
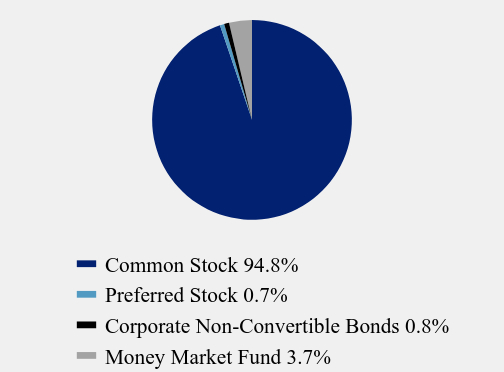
Asset Class Weightings
(% of total investments)
| Value | Value |
|---|
| Common Stock | 94.8% |
| Preferred Stock | 0.7% |
| Corporate Non-Convertible Bonds | 0.8% |
| Money Market Fund | 3.7% |
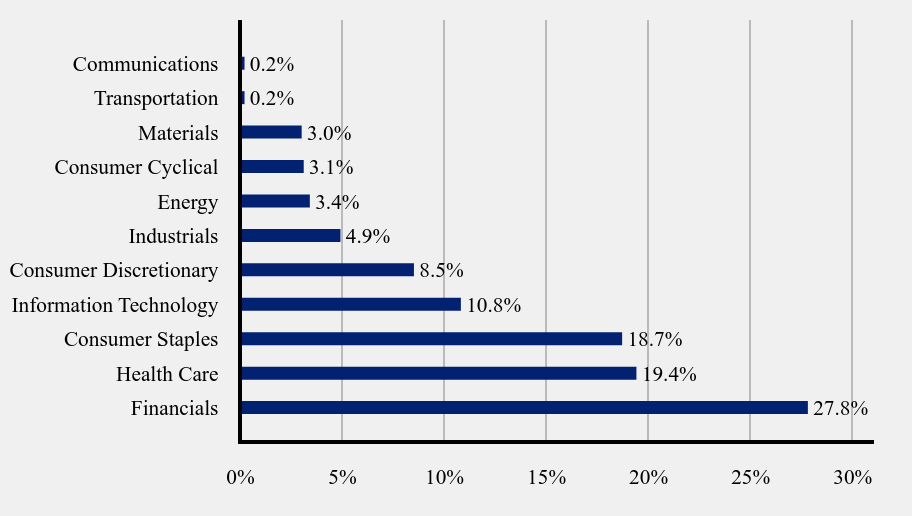
Sector Weightings
(% of total investments)
| Value | Value |
|---|
| Financials | 27.8% |
| Health Care | 19.4% |
| Consumer Staples | 18.7% |
| Information Technology | 10.8% |
| Consumer Discretionary | 8.5% |
| Industrials | 4.9% |
| Energy | 3.4% |
| Consumer Cyclical | 3.1% |
| Materials | 3.0% |
| Transportation | 0.2% |
| Communications | 0.2% |
* excluding fixed income securities and cash equivalents
Top Ten Holdings
(% total investments)
| Microsoft Corp. | 6.18% |
| Mastercard, Inc., Class A | 5.83% |
| UnitedHealth Group, Inc. | 5.01% |
| The Kroger Co. | 4.24% |
| Philip Morris International, Inc. | 3.82% |
| The Bank of New York Mellon Corp. | 3.81% |
| Fidelity Investments Treasury Only Portfolio, Institutional Class, 4.38% | 3.71% |
| Visa, Inc., Class A | 3.29% |
| Bank of America Corp. | 3.12% |
| Alphabet, Inc., Class A | 2.73% |
Where can I find additional information about the fund?
If you wish to view additional information about the Fund; including but not limited to its prospectus, holdings, financial information, and proxy information, please visit https://auxierasset.com/prospectus-and-reports or scan the QR code.
Semi-Annual Shareholder Report - December 31, 2024
Semi-Annual Shareholder Report - December 31, 2024
This semi-annual shareholder report contains important information about the Auxier Focus Fund for the period of July 1, 2024, to December 31, 2024. You can find additional information about the Fund at https://auxierasset.com/prospectus-and-reports. You can also request this information by contacting us at (877) 328-9437.
What were the Fund's costs for the last six months?
(based on a hypothetical $10,000 investment)
| Class Name | Costs of a $10,000 investment | Costs paid as a percentage of a $10,000 investment |
|---|
| Institutional Shares | $41 | 0.79% |
|---|
| Total Net Assets | $281,432,100 |
|---|
| # of Portfolio Holdings | 115 |
|---|
| Portfolio Turnover Rate | 1% |
|---|
| Investment Advisory Fees (Net of fees waived) | $850,185 |
|---|
Asset Class Weightings
(% of total investments)
| Value | Value |
|---|
| Common Stock | 94.8% |
| Preferred Stock | 0.7% |
| Corporate Non-Convertible Bonds | 0.8% |
| Money Market Fund | 3.7% |
Sector Weightings
(% of total investments)
| Value | Value |
|---|
| Financials | 27.8% |
| Health Care | 19.4% |
| Consumer Staples | 18.7% |
| Information Technology | 10.8% |
| Consumer Discretionary | 8.5% |
| Industrials | 4.9% |
| Energy | 3.4% |
| Consumer Cyclical | 3.1% |
| Materials | 3.0% |
| Transportation | 0.2% |
| Communications | 0.2% |
* excluding fixed income securities and cash equivalents
Top Ten Holdings
(% total investments)
| Microsoft Corp. | 6.18% |
| Mastercard, Inc., Class A | 5.83% |
| UnitedHealth Group, Inc. | 5.01% |
| The Kroger Co. | 4.24% |
| Philip Morris International, Inc. | 3.82% |
| The Bank of New York Mellon Corp. | 3.81% |
| Fidelity Investments Treasury Only Portfolio, Institutional Class, 4.38% | 3.71% |
| Visa, Inc., Class A | 3.29% |
| Bank of America Corp. | 3.12% |
| Alphabet, Inc., Class A | 2.73% |
Where can I find additional information about the fund?
If you wish to view additional information about the Fund; including but not limited to its prospectus, holdings, financial information, and proxy information, please visit https://auxierasset.com/prospectus-and-reports or scan the QR code.
Semi-Annual Shareholder Report - December 31, 2024
Semi-Annual Shareholder Report - December 31, 2024
This semi-annual shareholder report contains important information about the Auxier Focus Fund for the period of July 1, 2024, to December 31, 2024. You can find additional information about the Fund at https://auxierasset.com/prospectus-and-reports. You can also request this information by contacting us at (877) 328-9437.
What were the Fund's costs for the last six months?
(based on a hypothetical $10,000 investment)
| Class Name | Costs of a $10,000 investment | Costs paid as a percentage of a $10,000 investment |
|---|
| Investor Shares | $47 | 0.91% |
|---|
| Total Net Assets | $281,432,100 |
|---|
| # of Portfolio Holdings | 115 |
|---|
| Portfolio Turnover Rate | 1% |
|---|
| Investment Advisory Fees (Net of fees waived) | $850,185 |
|---|
Asset Class Weightings
(% of total investments)
| Value | Value |
|---|
| Common Stock | 94.8% |
| Preferred Stock | 0.7% |
| Corporate Non-Convertible Bonds | 0.8% |
| Money Market Fund | 3.7% |
Sector Weightings
(% of total investments)
| Value | Value |
|---|
| Financials | 27.8% |
| Health Care | 19.4% |
| Consumer Staples | 18.7% |
| Information Technology | 10.8% |
| Consumer Discretionary | 8.5% |
| Industrials | 4.9% |
| Energy | 3.4% |
| Consumer Cyclical | 3.1% |
| Materials | 3.0% |
| Transportation | 0.2% |
| Communications | 0.2% |
* excluding fixed income securities and cash equivalents
Top Ten Holdings
(% total investments)
| Microsoft Corp. | 6.18% |
| Mastercard, Inc., Class A | 5.83% |
| UnitedHealth Group, Inc. | 5.01% |
| The Kroger Co. | 4.24% |
| Philip Morris International, Inc. | 3.82% |
| The Bank of New York Mellon Corp. | 3.81% |
| Fidelity Investments Treasury Only Portfolio, Institutional Class, 4.38% | 3.71% |
| Visa, Inc., Class A | 3.29% |
| Bank of America Corp. | 3.12% |
| Alphabet, Inc., Class A | 2.73% |
Where can I find additional information about the fund?
If you wish to view additional information about the Fund; including but not limited to its prospectus, holdings, financial information, and proxy information, please visit https://auxierasset.com/prospectus-and-reports or scan the QR code.
Semi-Annual Shareholder Report - December 31, 2024
(b) Not applicable.
ITEM 2. CODE OF ETHICS.
Not applicable.
ITEM 3. AUDIT COMMITTEE FINANCIAL EXPERT.
Not applicable.
ITEM 4. PRINCIPAL ACCOUNTANT FEES AND SERVICES.
Not applicable.
ITEM 5. AUDIT COMMITTEE OF LISTED REGISTRANTS.
Not applicable.
ITEM 6. INVESTMENTS.
(a) Included as part of financial statements filed under Item 7(a).
(b) Not applicable.
ITEM 7. FINANCIAL STATEMENTS AND FINANCIAL HIGHLIGHTS FOR OPEN-END MANAGEMENT INVESTMENT COMPANIES.
(a)
Semi
Annual
Financials
and
Other
Information
December
31,
2024
Fund
Adviser:
Auxier
Asset
Management
LLC
15668
NE
Eilers
Road
Aurora,
Oregon
97002
Toll
Free:
(877)
3AUXIER
or
(877)
328-9437
Schedule
of
Investments
1
Statement
of
Assets
and
Liabilities
3
Statement
of
Operations
4
Statements
of
Changes
in
Net
Assets
5
Financial
Highlights
6
Notes
to
Financial
Statements
9
Other
Information
13
AUXIER
FOCUS
FUND
SCHEDULE
OF
INVESTMENTS
December
31,
2024
See
Notes
to
Financial
Statements.
Shares
Security
Description
Value
Equity
Securities
-
95.5%
Common
Stock
-
94.8%
Communications
-
0.2%
16,900
America
Movil
SAB
de
CV,
ADR
$
241,839
1,719
Cisco
Systems,
Inc.
101,765
34,119
Telefonica
SA,
ADR
137,158
300
Uber
Technologies,
Inc.
(a)
18,096
498,858
Consumer
Cyclical
-
2.9%
200
Airbnb,
Inc.,
Class A
(a)
26,282
1,241
Booking
Holdings,
Inc.
6,165,809
14,025
DR
Horton,
Inc.
1,960,976
8,153,067
Consumer
Discretionary
-
8.1%
115,518
Arcos
Dorados
Holdings,
Inc.,
Class A
840,971
34,000
Becle
SAB
de
CV
37,400
39,408
Comcast
Corp.,
Class A
1,478,982
12,753
CVS
Health
Corp.
572,482
400
Domino's
Pizza,
Inc.
167,904
15,600
General
Motors
Co.
831,012
3,775
Genuine
Parts
Co.
440,769
13,500
Grand
Canyon
Education,
Inc.
(a)
2,211,300
210,501
Lincoln
Educational
Services
Corp.
(a)
3,330,126
17,975
Lowe's
Cos.,
Inc.
4,436,230
4,846
McDonald's
Corp.
1,404,807
61,302
Sally
Beauty
Holdings,
Inc.
(a)
640,606
3,870
The
Home
Depot,
Inc.
1,505,391
700
Ulta
Beauty,
Inc.
(a)
304,451
37,350
Walmart,
Inc.
3,374,573
4,550
Yum
China
Holdings,
Inc.
219,174
7,050
Yum!
Brands,
Inc.
945,828
22,742,006
Consumer
Staples
-
17.7%
65,455
Altria
Group,
Inc.
3,422,642
85,855
British
American
Tobacco
PLC,
ADR
3,118,254
13,200
Coca-Cola
HBC
AG,
ADR
(a)
448,140
3,535
Diageo
PLC,
ADR
449,404
11,221
Kenvue,
Inc.
239,568
8,000
Keurig
Dr
Pepper,
Inc.
256,960
50,327
Molson
Coors
Beverage
Co.,
Class B
2,884,744
69,600
Monster
Beverage
Corp.
(a)
3,658,176
38,595
PepsiCo.,
Inc.
5,868,756
89,375
Philip
Morris
International,
Inc.
10,756,281
36,044
The
Coca-Cola
Co.
2,244,099
5,225
The
Hershey
Co.
884,854
195,126
The
Kroger
Co.
11,931,955
3,140
The
Procter
&
Gamble
Co.
526,421
54,421
Unilever
PLC,
ADR
3,085,671
49,775,925
Energy
-
3.2%
127,510
BP
PLC,
ADR
3,769,196
7,630
Chevron
Corp.
1,105,129
13,600
ConocoPhillips
1,348,712
4,000
Devon
Energy
Corp.
130,920
2,700
Occidental
Petroleum
Corp.
133,407
7,800
Phillips
66
888,654
14,415
Valero
Energy
Corp.
1,767,135
9,143,153
Financials
-
26.4%
53,260
Aflac,
Inc.
5,509,214
51,145
American
International
Group,
Inc.
3,723,356
2,780
Ameriprise
Financial,
Inc.
1,480,155
400
Aon
PLC,
Class A
143,664
2,830
Arch
Capital
Group,
Ltd.
(a)
261,351
Shares
Security
Description
Value
Financials
-
26.4%
(continued)
199,824
Bank
of
America
Corp.
$
8,782,265
16,545
Berkshire
Hathaway,
Inc.,
Class B
(a)
7,499,518
60,674
Central
Pacific
Financial
Corp.
1,762,580
25,975
Citigroup,
Inc.
1,828,380
5,616
Colliers
International
Group,
Inc.
763,608
5,616
FirstService
Corp.
1,016,608
2,025
Marsh
&
McLennan
Cos.,
Inc.
430,130
31,139
Mastercard,
Inc.,
Class A
16,396,863
1,100
PayPal
Holdings,
Inc.
(a)
93,885
1,700
Ryan
Specialty
Holdings,
Inc.
109,072
139,625
The
Bank
of
New
York
Mellon
Corp.
10,727,389
650
The
Charles
Schwab
Corp.
48,106
11,068
The
Travelers
Cos.,
Inc.
2,666,171
3,200
U.S.
Bancorp
153,056
15,249
Unum
Group
1,113,634
29,300
Visa,
Inc.,
Class A
9,259,972
7,000
Wells
Fargo
&
Co.
491,680
74,260,657
Health
Care
-
18.4%
28,084
Abbott
Laboratories
3,176,581
2,563
AbbVie,
Inc.
455,445
150
Amgen,
Inc.
39,096
5,400
Becton
Dickinson
&
Co.
1,225,098
4,295
Biogen,
Inc.
(a)
656,791
11,451
Elevance
Health,
Inc.
4,224,274
38,711
Johnson
&
Johnson
5,598,385
80,518
Medtronic
PLC
6,431,778
68,854
Merck
&
Co.,
Inc.
6,849,596
8,370
Organon
&
Co.
124,880
6,282
Pfizer,
Inc.
166,662
14,397
Quest
Diagnostics,
Inc.
2,171,931
13,990
The
Cigna
Group
3,863,199
27,840
UnitedHealth
Group,
Inc.
14,083,142
26,750
Zimmer
Biomet
Holdings,
Inc.
2,825,603
51,892,461
Industrials
-
4.7%
41,235
CAE,
Inc.
(a)
1,046,544
1,240
Caterpillar,
Inc.
449,822
97,791
Corning,
Inc.
4,647,028
1,550
FedEx
Corp.
436,062
700
Ferguson
Enterprises,
Inc.
121,499
69,382
Gates
Industrial
Corp.
PLC
(a)
1,427,188
300
General
Dynamics
Corp.
79,047
3,500
Johnson
Controls
International
PLC
276,255
28,275
RTX
Corp.
3,271,983
2,780
The
Boeing
Co.
(a)
492,060
7,440
United
Parcel
Service,
Inc.,
Class B
938,184
13,185,672
Information
Technology
-
10.2%
40,550
Alphabet,
Inc.,
Class A
7,676,115
18,125
Cognizant
Technology
Solutions
Corp.,
Class A
1,393,812
26,462
Forrester
Research,
Inc.
(a)
414,660
3,155
Meta
Platforms,
Inc.,
Class A
1,847,284
41,257
Microsoft
Corp.
17,389,826
28,721,697
Materials
-
2.8%
14,225
Celanese
Corp.,
Class A
984,512
30,258
Corteva,
Inc.
1,723,496
28,458
Dow,
Inc.
1,142,020
24,040
DuPont
de
Nemours,
Inc.
1,833,050
2,149
International
Flavors
&
Fragrances,
Inc.
181,698
25,505
LyondellBasell
Industries
NV,
Class A
1,894,256
AUXIER
FOCUS
FUND
SCHEDULE
OF
INVESTMENTS
December
31,
2024
See
Notes
to
Financial
Statements.
The
following
is
a
summary
of
the
inputs
used
to
value
the
Fund's investments
as
of
December
31,
2024.
The
inputs
or
methodology
used
for
valuing
securities
are
not
necessarily
an
indication
of
the
risks
associated
with
investing
in
those
securities.
For
more
information
on
valuation
inputs,
and
their
aggregation
into
the
levels
used
in
the
table
below,
please
refer
to
the
Security
Valuation
section
in
Note
2
of
the
accompanying
Notes
to
Financial
Statements.
Shares
Security
Description
Value
Materials
-
2.8%
(continued)
4,980
The
Mosaic
Co.
$
122,408
7,881,440
Transportation
-
0.2%
2,610
Union
Pacific
Corp.
595,184
Total
Common
Stock
(Cost
$88,677,512)
266,850,120
Shares
Security
Description
Rate
Value
Preferred
Stock
-
0.7%
Information
Technology
-
0.7%
118,059
Iterate
Studio,
Inc.
(Cost
$1,999,990)
0.00%
1,999,990
Total
Equity
Securities
(Cost
$90,677,502)
268,850,110
Principal
Security
Description
Rate
Maturity
Value
Fixed
Income
Securities
-
0.8%
Corporate
Non-Convertible
Bonds
-
0.8%
Energy
-
0.1%
$
400,000
Energy
Transfer
LP
(callable
at
100)
(b)(c)
6.63%
02/15/45
394,890
Financials
-
0.6%
300,000
JPMorgan
Chase
&
Co.
(callable
at
100)
(b)(c)
3.65
09/01/69
291,775
500,000
JPMorgan
Chase
&
Co.
(callable
at
100)
(b)(c)
7.41
11/01/22
503,798
345,000
The
Goldman
Sachs
Group,
Inc.
(callable
at
100)
(b)(c)
6.13
11/10/64
341,417
400,000
Truist
Financial
Corp.
(callable
at
100)
(b)(c)
5.13
06/15/49
391,847
1,528,837
Utilities
-
0.1%
345,000
Sempra
(b)
6.40
10/01/54
342,939
Total
Corporate
Non-Convertible
Bonds
(Cost
$2,243,259)
2,266,666
Total
Fixed
Income
Securities
(Cost
$2,243,259)
2,266,666
Shares
Security
Description
Value
Money
Market
Fund
-
3.7%
10,443,271
Fidelity
Investments
Treasury
Only
Portfolio,
Institutional
Class,
4.38%
(d)
(Cost
$10,443,271)
10,443,271
Investments,
at
value
-
100.0%
(Cost
$103,364,032)
$
281,560,047
Other
Assets
&
Liabilities,
Net
-
0.0%
(127,947)
Net
Assets
-
100.0%
$
281,432,100
ADR
American
Depositary
Receipt
LP
Limited
Partnership
PLC
Public
Limited
Company
(a)
Non-income
producing
security.
(b)
Variable
or
adjustable
rate
security,
the
interest
rate
of
which
adjusts
periodically
based
on
changes
in
current
interest
rates.
Rate
represented
is
as
of
December
31,
2024.
(c)
Perpetual
maturity
security.
(d)
Dividend
yield
changes
daily
to
reflect
current
market
conditions.
Rate
was
the
quoted
yield
as
of
December
31,
2024.
Level
1
Level
2
Level
3
Total
Investments
at
Value
Common
Stock
Communications
$
498,858
$
–
$
–
$
498,858
Consumer
Cyclical
8,153,067
–
–
8,153,067
Consumer
Discretionary
22,742,006
–
–
22,742,006
Consumer
Staples
49,775,925
–
–
49,775,925
Energy
9,143,153
–
–
9,143,153
Financials
74,260,657
–
–
74,260,657
Health
Care
51,892,461
–
–
51,892,461
Industrials
13,185,672
–
–
13,185,672
Information
Technology
28,721,697
–
–
28,721,697
Materials
7,881,440
–
–
7,881,440
Transportation
595,184
–
–
595,184
Preferred
Stock
Information
Technology
–
1,999,990
–
1,999,990
Corporate
Non-
Convertible
Bonds
–
2,266,666
–
2,266,666
Money
Market
Fund
10,443,526
–
–
10,443,526
Investments
at
Value
$
277,293,646
$
4,266,656
$
–
$
281,560,302
AUXIER
FOCUS
FUND
STATEMENT
OF
ASSETS
AND
LIABILITIES
December
31,
2024
See
Notes
to
Financial
Statements.
ASSETS
Investments,
at
value
(Cost
$103,364,032)
$
281,560,047
Receivables:
Fund
shares
sold
4,410,195
Dividends
and
interest
519,648
Prepaid
expenses
24,116
Total
Assets
286,514,006
LIABILITIES
Payables:
Fund
shares
redeemed
597,924
Distributions
payable
4,273,423
Accrued
Liabilities:
Investment
Adviser
fees
143,479
Fund
services
fees
28,079
Other
expenses
39,001
Total
Liabilities
5,081,906
NET
ASSETS
$
281,432,100
COMPONENTS
OF
NET
ASSETS
Paid-in
capital
$
102,879,865
Distributable
Earnings
178,552,235
NET
ASSETS
$
281,432,100
SHARES
OF
BENEFICIAL
INTEREST
AT
NO
PAR
VALUE
(UNLIMITED
SHARES
AUTHORIZED)
Investor
Shares
4,720,808
A
Shares
40,586
Institutional
Shares
4,799,258
NET
ASSET
VALUE,
OFFERING
AND
REDEMPTION
PRICE
PER
SHARE*
Investor
Shares
(based
on
net
assets
of
$136,625,181)
$
28.94
A
Shares
(based
on
net
assets
of
$1,223,173)
$
30.14
A
Shares
Maximum
Public
Offering
Price
Per
Share
(net
asset
value
per
share/(100%-5.75%))
$
31.98
Institutional
Shares
(based
on
net
assets
of
$143,583,746)
$
29.92
AUXIER
FOCUS
FUND
STATEMENT
OF
OPERATIONS
FOR
THE
SIX
MONTHS
ENDED
DECEMBER
31,
2024
See
Notes
to
Financial
Statements.
INVESTMENT
INCOME
Dividend
income
(Net
of
foreign
withholding
taxes
of
$119)
$
3,238,811
Interest
income
74,967
Total
Investment
Income
3,313,778
EXPENSES
Investment
Adviser
fees
1,160,270
Fund
services
fees
180,121
Transfer
agent
fees:
Investor
Shares
23,667
A
Shares
577
Institutional
Shares
6,403
Distribution
fees:
A
Shares
1,659
Custodian
fees
20,013
Registration
fees:
Investor
Shares
8,861
A
Shares
2,432
Institutional
Shares
8,601
Professional
fees
32,935
Trustees'
fees
and
expenses
8,341
Other
expenses
139,718
Total
Expenses
1,593,598
Fees
waived
(356,198)
Net
Expenses
1,237,400
NET
INVESTMENT
INCOME
2,076,378
NET
REALIZED
AND
UNREALIZED
GAIN
(LOSS)
Net
realized
gain
(loss)
on:
Investments
1,297,126
Foreign
currency
transactions
(3)
Net
realized
gain
1,297,123
Net
change
in
unrealized
appreciation
(depreciation)
on
investments
11,264,705
NET
REALIZED
AND
UNREALIZED
GAIN
12,561,828
INCREASE
IN
NET
ASSETS
RESULTING
FROM
OPERATIONS
$
14,638,206
AUXIER
FOCUS
FUND
STATEMENTS
OF
CHANGES
IN
NET
ASSETS
See
Notes
to
Financial
Statements.
For
the
Six
Months
Ended
December
31,
2024
For
the
Year
Ended
June
30,
2024
OPERATIONS
Shares
Shares
Net
investment
income
$
2,076,378
$
4,470,627
Net
realized
gain
1,297,123
7,354,823
Net
change
in
unrealized
appreciation
(depreciation)
11,264,705
16,696,985
Increase
in
Net
Assets
Resulting
from
Operations
14,638,206
28,522,435
DISTRIBUTIONS
TO
SHAREHOLDERS
Investor
Shares
(4,570,570)
(6,074,386)
A
Shares
(28,453)
(46,356)
Institutional
Shares
(4,663,596)
(5,413,508)
Total
Distributions
Paid
(9,262,619)
(11,534,250)
CAPITAL
SHARE
TRANSACTIONS
Sale
of
shares:
Investor
Shares
3,332,910
110,719
4,328,392
159,251
Institutional
Shares
7,271,368
233,899
6,460,989
229,640
Reinvestment
of
distributions:
Investor
Shares
4,438,286
149,537
5,927,570
221,271
A
Shares
28,273
912
45,958
1,671
Institutional
Shares
4,634,444
151,100
5,375,849
194,588
Redemption
of
shares:
Investor
Shares
(16,118,852)
(538,699)
(23,511,819)
(860,824)
A
Shares
(167,109)
(5,392)
(149,833)
(5,320)
Institutional
Shares
(7,489,765)
(241,526)
(8,952,273)
(317,280)
Redemption
fees:
Investor
Shares
873
–
785
–
A
Shares
6
–
6
–
Institutional
Shares
922
–
1,242
–
Decrease
in
Net
Assets
from
Capital
Share
Transactions
(4,068,644)
(139,450)
(10,473,134)
(377,003)
Increase
in
Net
Assets
1,306,943
6,515,051
NET
ASSETS
Beginning
of
Period
280,125,157
273,610,106
End
of
Period
$
281,432,100
$
280,125,157
AUXIER
FOCUS
FUND
FINANCIAL
HIGHLIGHTS
See
Notes
to
Financial
Statements.
These
financial
highlights
reflect
selected
data
for
a
share
outstanding
throughout
each
period.
For
the
Six
Months
Ended
December
31,
2024
For
the
Years
Ended
June
30,
2024
2023
2022
2021
2020
INVESTOR
SHARES
NET
ASSET
VALUE,
Beginning
of
Period
$
28.43
$
26.79
$
25.05
$
26.69
$
20.39
$
22.34
INVESTMENT
OPERATIONS
Net
investment
income
(a)
0.21
0.43
0.37
0.27
0.27
0.29
Net
realized
and
unrealized
gain
(loss)
1.29
2.39
2.14
(1.22)
6.59
(0.87)
Total
from
Investment
Operations
1.50
2.82
2.51
(0.95)
6.86
(0.58)
DISTRIBUTIONS
TO
SHAREHOLDERS
FROM
Net
investment
income
(0.45)
(0.44)
(0.33)
(0.28)
(0.30)
(0.29)
Net
realized
gain
(0.54)
(0.74)
(0.44)
(0.41)
(0.26)
(1.08)
Total
Distributions
to
Shareholders
(0.99)
(1.18)
(0.77)
(0.69)
(0.56)
(1.37)
REDEMPTION
FEES(a)
0.00(b)
0.00(b)
0.00(b)
0.00(b)
0.00(b)
0.00(b)
NET
ASSET
VALUE,
End
of
Period
$
28.94
$
28.43
$
26.79
$
25.05
$
26.69
$
20.39
TOTAL
RETURN
5.21%(c)
10.83%
10.14%
(3.77)%
34.03%
(3.17)%
RATIOS/SUPPLEMENTARY
DATA
Net
Assets
at
End
of
Period
(000s
omitted)
$
136,625
$
142,152
$
146,783
$
141,242
$
142,915
$
113,810
Ratios
to
Average
Net
Assets:
Net
investment
income
1.36%(d)
1.56%
1.43%
0.99%
1.13%
1.34%
Net
expenses
0.91%(d)
0.91%
0.92%
0.92%
0.92%
0.95%
Gross
expenses
(e)
1.10%(d)
1.10%
1.10%
1.08%
1.09%
1.10%
PORTFOLIO
TURNOVER
RATE
1%(c)
2%
1%
1%
1%
2%
(a)
Calculated
based
on
average
shares
outstanding
during
each
period.
(b)
Less
than
$0.01
per
share.
(c)
Not
annualized.
(d)
Annualized.
(e)
Reflects
the
expense
ratio
excluding
any
waivers
and/or
reimbursements.
AUXIER
FOCUS
FUND
FINANCIAL
HIGHLIGHTS
See
Notes
to
Financial
Statements.
These
financial
highlights
reflect
selected
data
for
a
share
outstanding
throughout
each
period.
For
the
Six
Months
Ended
December
31,
2024
For
the
Years
Ended
June
30,
2024
2023
2022
2021
2020
A
SHARES
NET
ASSET
VALUE,
Beginning
of
Period
$
29.36
$
27.50
$
25.60
$
27.20
$
20.76
$
22.70
INVESTMENT
OPERATIONS
Net
investment
income
(a)
0.16
0.35
0.29
0.18
0.19
0.23
Net
realized
and
unrealized
gain
(loss)
1.34
2.47
2.19
(1.25)
6.72
(0.89)
Total
from
Investment
Operations
1.50
2.82
2.48
(1.07)
6.91
(0.66)
DISTRIBUTIONS
TO
SHAREHOLDERS
FROM
Net
investment
income
(0.18)
(0.22)
(0.14)
(0.12)
(0.21)
(0.20)
Net
realized
gain
(0.54)
(0.74)
(0.44)
(0.41)
(0.26)
(1.08)
Total
Distributions
to
Shareholders
(0.72)
(0.96)
(0.58)
(0.53)
(0.47)
(1.28)
REDEMPTION
FEES(a)
0.00(b)
0.00(b)
0.00(b)
0.00(b)
0.00(b)
0.00(b)
NET
ASSET
VALUE,
End
of
Period
$
30.14
$
29.36
$
27.50
$
25.60
$
27.20
$
20.76
TOTAL
RETURN(c)
5.03%(d)
10.52%
9.77%
(4.07)%
33.60%
(3.47)%
RATIOS/SUPPLEMENTARY
DATA
Net
Assets
at
End
of
Period
(000s
omitted)
$
1,223
$
1,323
$
1,340
$
1,703
$
2,443
$
2,770
Ratios
to
Average
Net
Assets:
Net
investment
income
1.04%(e)
1.24%
1.09%
0.64%
0.78%
1.06%
Net
expenses
1.24%(e)
1.24%
1.25%
1.25%
1.25%
1.25%
Gross
expenses
(f)
1.97%(e)
1.86%
1.76%
1.65%
1.52%
1.51%
PORTFOLIO
TURNOVER
RATE
1%(d)
2%
1%
1%
1%
2%
(a)
Calculated
based
on
average
shares
outstanding
during
each
period.
(b)
Less
than
$0.01
per
share.
(c)
Total
Return
does
not
include
the
effect
of
front
end
sales
charge
or
contingent
deferred
sales
charge.
(d)
Not
annualized.
(e)
Annualized.
(f)
Reflects
the
expense
ratio
excluding
any
waivers
and/or
reimbursements.
AUXIER
FOCUS
FUND
FINANCIAL
HIGHLIGHTS
See
Notes
to
Financial
Statements.
These
financial
highlights
reflect
selected
data
for
a
share
outstanding
throughout
each
period.
For
the
Six
Months
Ended
December
31,
2024
For
the
Years
Ended
June
30,
2024
2023
2022
2021
2020
INSTITUTIONAL
SHARES
NET
ASSET
VALUE,
Beginning
of
Period
$
29.35
$
27.59
$
25.74
$
27.38
$
20.88
$
22.81
INVESTMENT
OPERATIONS
Net
investment
income
(a)
0.23
0.48
0.41
0.31
0.31
0.33
Net
realized
and
unrealized
gain
(loss)
1.34
2.46
2.21
(1.26)
6.75
(0.88)
Total
from
Investment
Operations
1.57
2.94
2.62
(0.95)
7.06
(0.55)
DISTRIBUTIONS
TO
SHAREHOLDERS
FROM
Net
investment
income
(0.46)
(0.44)
(0.33)
(0.28)
(0.30)
(0.30)
Net
realized
gain
(0.54)
(0.74)
(0.44)
(0.41)
(0.26)
(1.08)
Total
Distributions
to
Shareholders
(1.00)
(1.18)
(0.77)
(0.69)
(0.56)
(1.38)
REDEMPTION
FEES(a)
0.00(b)
0.00(b)
0.00(b)
0.00(b)
0.00(b)
0.00(b)
NET
ASSET
VALUE,
End
of
Period
$
29.92
$
29.35
$
27.59
$
25.74
$
27.38
$
20.88
TOTAL
RETURN
5.27%(c)
10.98%
10.30%
(3.66)%
34.19%
(3.00)%
RATIOS/SUPPLEMENTARY
DATA
Net
Assets
at
End
of
Period
(000s
omitted)
$
143,584
$
136,650
$
125,487
$
111,723
$
116,907
$
88,103
Ratios
to
Average
Net
Assets:
Net
investment
income
1.50%(d)
1.69%
1.56%
1.11%
1.25%
1.51%
Net
expenses
0.79%(d)
0.79%
0.80%
0.80%
0.80%
0.80%
Gross
expenses
(e)
1.09%(d)
1.09%
1.08%
1.08%
1.09%
1.10%
PORTFOLIO
TURNOVER
RATE
1%(c)
2%
1%
1%
1%
2%
(a)
Calculated
based
on
average
shares
outstanding
during
each
period.
(b)
Less
than
$0.01
per
share.
(c)
Not
annualized.
(d)
Annualized.
(e)
Reflects
the
expense
ratio
excluding
any
waivers
and/or
reimbursements.
AUXIER
FOCUS
FUND
NOTES
TO
FINANCIAL
STATEMENTS
December
31,
2024
Note
1.
Organization
The
Auxier
Focus
Fund
(the
“Fund”)
is
a
diversified
portfolio
of
Forum
Funds
(the
“Trust”).
The
Trust
is
a
Delaware
statutory
trust
that
is
registered
as
an
open-end,
management
investment
company
under
the
Investment
Company
Act
of
1940,
as
amended
(the
“Act”).
Under
its
Trust
Instrument,
the
Trust
is
authorized
to
issue
an
unlimited
number
of
the
Fund’s
shares
of
beneficial
interest
without
par
value.
The
Fund
currently
offers
three
classes
of
shares:
Investor
Shares,
A
Shares
and
Institutional
Shares.
A
Shares
are
offered
at
net
asset
value
plus
a
maximum
sales
charge
of
5.75%.
A
Shares
are
also
subject
to
contingent
deferred
sales
charge
(“CDSC”)
of
1.00%
on
purchases
without
an
initial
sales
charge
and
redeemed
less
than
one
year
after
they
are
purchased.
Investor
Shares
and
Institutional
Shares
are
not
subject
to
a
sales
charge.
Investor
Shares,
A
Shares
and
Institutional
Shares
commenced
operations
on
July
9,
1999,
July
8,
2005
and
May
9,
2012,
respectively.
The
Fund’s
investment
objective
is
to
provide
long-term
capital
appreciation.
The
Fund
included
herein
is
deemed
to
be
an
individual
reporting
segment
and
is
not
part
of
a
consolidated
reporting
entity.
The
objective
and
strategy
of
the
Fund
is
used
by
the
Adviser,
as
defined
in
Note
3,
to
make
investment
decisions,
and
the
results
of
the
operations,
as
shown
on
the
Statement
of
Operations
and
the
financial
highlights
for
the
Fund
is
the
information
utilized
for
the
day-
to-day
management
of
the
Fund.
The
Fund
is
party
to
the
expense
agreements
as
disclosed
in
the
Notes
to
the
Financial
Statements
and
there
are
no
resources
allocated
to
the
Fund
based
on
performance
measurements.
Due
to
the
significance
of
oversight
and
their
role,
the
Adviser
is
deemed
to
be
the
Chief
Operating
Decision
Maker.
Note
2.
Summary
of
Significant
Accounting
Policies
The
Fund
is
an
investment
company
and
follows
accounting
and
reporting
guidance
under
Financial
Accounting
Standards
Board
Accounting
Standards
Codification
Topic
946,
“Financial
Services
–
Investment
Companies.”
These
financial
statements
are
prepared
in
accordance
with
accounting
principles
generally
accepted
in
the
United
States
of
America
(“GAAP”),
which
require
management
to
make
estimates
and
assumptions
that
affect
the
reported
amounts
of
assets
and
liabilities,
the
disclosure
of
contingent
liabilities
at
the
date
of
the
financial
statements,
and
the
reported
amounts
of
increases
and
decreases
in
net
assets
from
operations
during
the
fiscal
period.
Actual
amounts
could
differ
from
those
estimates.
The
following
summarizes
the
significant
accounting
policies
of
the
Fund:
Security
Valuation
–
Securities
are
recorded
at
fair
value
using
last
quoted
trade
or
official
closing
price
from
the
principal
exchange
where
the
security
is
traded,
as
provided
by
independent
pricing
services
on
each
Fund
business
day.
In
the
absence
of
a
last
trade,
securities
are
valued
at
the
mean
of
the
last
bid
and
ask
price
provided
by
the
pricing
service.
Debt
securities
may
be
valued
at
prices
supplied
by
a
fund’s
pricing
agent
based
on
broker
or
dealer
supplied
valuations
or
matrix
pricing,
a
method
of
valuing
securities
by
reference
to
the
value
of
other
securities
with
similar
characteristics
such
as
rating,
interest
rate
and
maturity.
Shares
of
non-exchange
traded
open-end
mutual
funds
are
valued
at
net
asset
value
per
share
(“NAV”).
Short-term
investments
that
mature
in
sixty
days
or
less
may
be
recorded
at
amortized
cost,
which
approximates
fair
value.
Pursuant
to
Rule
2a-5
under
the
Investment
Company
Act,
the
Trust’s
Board
of
Trustees
(the
“Board”)
has
designated
the
Adviser
as
the
Fund’s
valuation
designee
to
perform
any
fair
value
determinations
for
securities
and
other
assets
held
by
the
Fund.
The
Adviser
is
subject
to
the
oversight
of
the
Board
and
certain
reporting
and
other
requirements
intended
to
provide
the
Board
the
information
needed
to
oversee
the
Adviser’s
fair
value
determinations.
The
Adviser
is
responsible
for
determining
the
fair
value
of
investments
for
which
market
quotations
are
not
readily
available
in
accordance
with
policies
and
procedures
that
have
been
approved
by
the
Board.
Under
these
procedures,
the
Adviser
convenes
on
a
regular
and
ad
hoc
basis
to
review
such
investments
and
considers
a
number
of
factors,
including
valuation
methodologies
and
significant
unobservable
inputs,
when
arriving
at
fair
value.
The
Board
has
approved
the
Adviser’s
fair
valuation
procedures
as
a
part
of
the
Fund’s
compliance
program
and
will
review
any
changes
made
to
the
procedures.
The
Adviser
provides
fair
valuation
inputs.
In
determining
fair
valuations,
inputs
may
include
market-based
analytics
that
may
consider
related
or
comparable
assets
or
liabilities,
recent
transactions,
market
multiples,
book
values
and
other
relevant
investment
information.
Adviser
inputs
may
include
an
income-based
approach
in
which
the
anticipated
future
cash
flows
of
the
investment
are
discounted
in
determining
fair
value.
Discounts
may
also
be
applied
based
on
the
nature
or
duration
of
any
restrictions
on
the
AUXIER
FOCUS
FUND
NOTES
TO
FINANCIAL
STATEMENTS
December
31,
2024
disposition
of
the
investments.
The
Adviser
performs
regular
reviews
of
valuation
methodologies,
key
inputs
and
assumptions,
disposition
analysis
and
market
activity.
Fair
valuation
is
based
on
subjective
factors
and,
as
a
result,
the
fair
value
of
an
investment
may
differ
from
the
security’s
market
price
and
may
not
be
the
price
at
which
the
asset
may
be
sold.
Fair
valuation
could
result
in
a
different
NAV
than
a
NAV
determined
by
using
market
quotes.
GAAP
has
a
three-tier
fair
value
hierarchy.
The
basis
of
the
tiers
is
dependent
upon
the
level
of
various
“inputs”
used
to
determine
the
value
of
the
Fund’s
investments.
These
inputs
are
summarized
in
the
three
broad
levels
listed
below:
Level
1
-
Quoted
prices
in
active
markets
for
identical
assets
and
liabilities.
Level
2
-
Prices
determined
using
significant
other
observable
inputs
(including
quoted
prices
for
similar
securities,
interest
rates,
prepayment
speeds,
credit
risk,
etc.).
Short-term
securities
are
valued
at
amortized
cost,
which
approximates
market
value,
are
categorized
as
Level
2
in
the
hierarchy.
Municipal
securities,
long-term
U.S.
government
obligations
and
corporate
debt
securities
are
valued
in
accordance
with
the
evaluated
price
supplied
by
a
pricing
service
and
generally
categorized
as
Level
2
in
the
hierarchy.
Other
securities
that
are
categorized
as
Level
2
in
the
hierarchy
include,
but
are
not
limited
to,
warrants
that
do
not
trade
on
an
exchange,
securities
valued
at
the
mean
between
the
last
reported
bid
and
ask
quotation
and
international
equity
securities
valued
by
an
independent
third
party
with
adjustments
for
changes
in
value
between
the
time
that
the
securities’
respective
local
market
closes
and
the
close
of
the
U.S.
market.
Level
3
-
Significant
unobservable
inputs
(including
the
Fund’s
own
assumptions
in
determining
the
fair
value
of
investments).
The
aggregate
value
by
input
level,
as
of
December
31,
2024,
for
the
Fund’s
investments
is
included
at
the
end
of
the
Fund’s
Schedule
of
Investments.
Security
Transactions,
Investment
Income
and
Realized
Gain
and
Loss
–
Investment
transactions
are
accounted
for
on
the
trade
date.
Dividend
income
is
recorded
on
the
ex-dividend
date.
Foreign
dividend
income
is
recorded
on
the
ex-dividend
date
or
as
soon
as
possible
after
determining
the
existence
of
a
dividend
declaration
after
exercising
reasonable
due
diligence.
Income
and
capital
gains
on
some
foreign
securities
may
be
subject
to
foreign
withholding
taxes,
which
are
accrued
as
applicable.
Interest
income
is
recorded
on
an
accrual
basis.
Premium
is
amortized
to
the
next
call
date
above
par,
and
discount
is
accreted
to
maturity
using
the
effective
interest
method
and
included
in
interest
income.
Identified
cost
of
investments
sold
is
used
to
determine
the
gain
and
loss
for
both
financial
statement
and
federal
income
tax
purposes.
Foreign
Currency
Translations
–
Foreign
currency
amounts
are
translated
into
U.S.
dollars
as
follows:
(1)
assets
and
liabilities
at
the
rate
of
exchange
at
the
end
of
the
respective
period;
and
(2)
purchases
and
sales
of
securities
and
income
and
expenses
at
the
rate
of
exchange
prevailing
on
the
dates
of
such
transactions.
The
portion
of
the
results
of
operations
arising
from
changes
in
the
exchange
rates
and
the
portion
due
to
fluctuations
arising
from
changes
in
the
market
prices
of
securities
are
not
isolated.
Such
fluctuations
are
included
with
the
net
realized
and
unrealized
gain
or
loss
on
investments.
Distributions
to
Shareholders
–
The
Fund
declares
any
dividends
from
net
investment
income
and
pays
them
annually.
Any
net
capital
gains
and
net
foreign
currency
gains
realized
by
the
Fund
are
distributed
at
least
annually.
Distributions
to
shareholders
are
recorded
on
the
ex-dividend
date.
Distributions
are
based
on
amounts
calculated
in
accordance
with
applicable
federal
income
tax
regulations,
which
may
differ
from
GAAP.
These
differences
are
due
primarily
to
differing
treatments
of
income
and
gain
on
various
investment
securities
held
by
the
Fund,
timing
differences
and
differing
characterizations
of
distributions
made
by
the
Fund.
Federal
Taxes
–
The
Fund
intends
to
continue
to
qualify
each
year
as
a
regulated
investment
company
under
Subchapter
M
of
Chapter
1,
Subtitle
A,
of
the
Internal
Revenue
Code
of
1986,
as
amended
(“Code”),
and
to
distribute
all
of
its
taxable
income
to
shareholders.
In
addition,
by
distributing
in
each
calendar
year
substantially
all
of
its
net
investment
income
and
capital
gains,
if
any,
the
Fund
will
not
be
subject
to
a
federal
excise
tax.
Therefore,
no
federal
income
or
excise
tax
provision
is
required.
The
Fund
recognizes
interest
and
penalties,
if
any,
related
to
unrecognized
tax
benefits
as
income
tax
expense
in
the
Statement
of
Operations.
During
the
period,
the
Fund
did
not
incur
any
interest
or
penalties.
The
Fund
files
a
U.S.
federal
income
and
excise
tax
return
as
required.
The
Fund’s
federal
income
tax
returns
are
subject
to
examination
by
the
Internal
Revenue
Service
for
a
period
of
three
AUXIER
FOCUS
FUND
NOTES
TO
FINANCIAL
STATEMENTS
December
31,
2024
fiscal
years
after
they
are
filed.
As
of
December
31,
2024,
there
are
no
uncertain
tax
positions
that
would
require
financial
statement
recognition,
de-recognition
or
disclosure.
Income
and
Expense
Allocation
–
The
Trust
accounts
separately
for
the
assets,
liabilities
and
operations
of
each
of
its
investment
portfolios.
Expenses
that
are
directly
attributable
to
more
than
one
investment
portfolio
are
allocated
among
the
respective
investment
portfolios
in
an
equitable
manner.
The
Fund's
class-specific
expenses
are
charged
to
the
operations
of
that
class
of
shares.
Income
and
expenses
(other
than
expenses
attributable
to
a
specific
class)
and
realized
and
unrealized
gains
or
losses
on
investments
are
allocated
to
each
class
of
shares
based
on
the
class’
respective
net
assets
to
the
total
net
assets
of
the
Fund.
Redemption
Fees
–
A
shareholder
who
redeems
or
exchanges
shares
within
180
days
of
purchase
will
incur
a
redemption
fee
of
2.00%
of
the
current
NAV
of
shares
redeemed
or
exchanged,
subject
to
certain
limitations.
The
fee
is
charged
for
the
benefit
of
the
remaining
shareholders
and
will
be
paid
to
the
Fund
to
help
offset
transaction
costs.
The
fee
is
accounted
for
as
an
addition
to
paid-in
capital.
The
Fund
reserves
the
right
to
modify
the
terms
of
or
terminate
the
fee
at
any
time.
There
are
limited
exceptions
to
the
imposition
of
the
redemption
fee.
Redemption
fees
incurred
for
the
Fund,
if
any,
are
reflected
on
the
Statements
of
Changes
in
Net
Assets.
Commitments
and
Contingencies
–
In
the
normal
course
of
business,
the
Fund
enters
into
contracts
that
provide
general
indemnifications
by
the
Fund
to
the
counterparty
to
the
contract.
The
Fund’s
maximum
exposure
under
these
arrangements
is
dependent
on
future
claims
that
may
be
made
against
the
Fund
and,
therefore,
cannot
be
estimated;
however,
based
on
experience,
the
risk
of
loss
from
such
claims
is
considered
remote.
The
Fund
has
determined
that
none
of
these
arrangements
requires
disclosure
on
the
Fund’s
Statement
of
Assets
and
Liabilities.
Note
3.
Fees
and
Expenses
Investment
Adviser
–
Auxier
Asset
Management
LLC
(the
“Adviser”)
is
the
investment
adviser
to
the
Fund.
Pursuant
to
an
investment
advisory
agreement,
the
Adviser
receives
an
advisory
fee,
payable
monthly,
from
the
Fund
at
an
annual
rate
of
0.80%
of
the
Fund’s
average
daily
net
assets.
Distribution
–
Foreside
Fund
Services,
LLC,
a
wholly
owned
subsidiary
of
Foreside
Financial
Group,
LLC
(d/b/a
ACA
Group)
(the
“Distributor”),
acts
as
the
agent
of
the
Trust
in
connection
with
the
continuous
offering
of
shares
of
the
Fund.
The
Distributor
is
not
affiliated
with
the
Adviser
or
Atlantic
Fund
Administration,
LLC,
a
wholly
owned
subsidiary
of
Apex
US
Holdings
LLC
(d/b/a
Apex
Fund
Services)
(“Apex”)
or
their
affiliates.
The
Fund
has
adopted
a
Distribution
Plan
(the
“Plan”)
for
A
Shares
of
the
Fund
in
accordance
with
Rule
12b-1
of
the
Act.
Under
the
Plan,
the
Fund
pays
the
Distributor
and/or
any
other
entity
as
authorized
by
the
Board
a
fee
of
up
to
0.25%
of
the
average
daily
net
assets
of
A
Shares.
The
Distributor
has
no
role
in
determining
the
investment
policies
or
which
securities
are
to
be
purchased
or
sold
by
the
Trust
or
its
Funds.
For
the
period
ended
December
31,
2024
,
there
were
no
front-end
sales
charges
assessed
on
the
sale
of
A
Shares
and
no
contingent
deferred
sales
charges
were
assessed
on
the
sale
of
A
Shares.
Other
Service
Providers
–
Apex
provides
fund
accounting,
fund
administration,
compliance
and
transfer
agency
services
to
the
Fund.
The
fees
related
to
these
services
are
included
in
Fund
services
fees
within
the
Statement
of
Operations.
Apex
also
provides
certain
shareholder
report
production
and
EDGAR
conversion
and
filing
services.
Apex
provides
a
Principal
Executive
Officer,
a
Principal
Financial
Officer,
a
Chief
Compliance
Officer
and
an
Anti-Money
Laundering
Officer
to
the
Fund,
as
well
as
certain
additional
compliance
support
functions.
Trustees
and
Officers
–
Each
Independent
Trustee’s
annual
retainer
is
$45,000
($55,000
for
the
Chairman).
The
Audit
Committee
Chairman
receives
an
additional
$2,000
annually.
Effective
January
1,
2025,
each
Independent
Trustee’s
annual
retainer
is
$60,000
($70,000
for
the
Chairman),
and
the
Audit
Committee
Chairman
receives
an
additional
$5,000
annually.
The
Trustees
and
the
Chairman
may
receive
additional
fees
for
special
Board
meetings.
Each
Trustee
is
also
reimbursed
for
all
reasonable
out-of-pocket
expenses
incurred
in
connection
with
his
or
her
duties
as
a
Trustee,
including
travel
and
related
expenses
incurred
in
attending
Board
meetings.
The
amount
of
Trustees’
fees
attributable
to
the
Fund
is
disclosed
in
the
Statement
of
Operations.
Certain
officers
of
the
AUXIER
FOCUS
FUND
NOTES
TO
FINANCIAL
STATEMENTS
December
31,
2024
Trust
are
also
officers
or
employees
of
the
above
named
service
providers,
and
during
their
terms
of
office
received
no
compensation
from
the
Fund.
Note
4.
Expense
Reimbursement
and
Fees
Waived
The
Adviser
has
contractually
agreed
to
waive
its
fee
and/or
reimburse
Fund
expenses
to
limit
Total
Annual
Fund
Operating
Expenses
After
Fee
Waiver
and/or
Expense
Reimbursement
(excluding
all
taxes,
interest,
portfolio
transaction
expenses,
dividend
expenses
on
short
sales,
and
extraordinary
expenses
)
to
0.92%,
1.25%
and
0.80%
of
the
Investor
Shares,
A
Shares
and
Institutional
Shares,
respectively
,
through
at
least
October
31,
2025.
These
contractual
waivers
may
only
be
raised
or
eliminated
with
consent
of
the
Board.
Other
fund
service
providers
have
agreed
to
waive
a
portion
of
their
fees
and
such
waivers
may
be
changed
or
eliminated
with
the
approval
of
the
Board
of
Trustees
of
the
Trust.
For
the
period
ended
December
31,
2024
,
the
fees
waived
and
expenses
reimbursed
were
as
follows:
The
Adviser
may
be
reimbursed
by
the
Fund
for
fees
waived
and
expenses
reimbursed
by
the
Adviser
pursuant
to
the
Expense
Cap
if
such
payment
is
made
within
three
years
of
the
fee
waiver
or
expense
reimbursement,
and
does
not
cause
the
Total
Annual
Fund
Operating
Expenses
After
Fee
Waiver
and/or
Expense
Reimbursement
to
exceed
the
lesser
of
(i)
the
then-current
expense
cap,
or
(ii)
the
expense
cap
in
place
at
the
time
the
fees/expenses
were
waived/reimbursed.
As
of
December
31,
2024
,
$1,659,429
is
subject
to
recapture
by
the
Adviser.
Other
Waivers
are
not
eligible
for
recoupment.
Note
5.
Security
Transactions
The
cost
of
purchases
and
proceeds
from
sales
of
investment
securities
(including
maturities),
other
than
short-term
investments,
during
the
period
ended
December
31,
2024
,
totaled
$3,482,259
and
$5,552,628
.
Note
6.
Federal
Income
Tax
As
of
December
31,
2024
,
cost
for
federal
income
tax
purposes
is
substantially
the
same
as
for
financial
statement
purposes
and
net
unrealized
appreciation
consists
of:
As
of
June
30,
2024,
distributable
earnings
(accumulated
loss)
on
a
tax
basis
were
as
follows:
The
difference
between
components
of
distributable
earnings
on
a
tax
basis
and
the
amounts
reflected
in
the
Statement
of
Assets
and
Liabilities
are
primarily
due
to
wash
sales
and
equity
return
of
capital.
Note
7.
Subsequent
Events
Subsequent
events
occurring
after
the
date
of
this
report
through
the
date
these
financial
statements
were
issued
have
been
evaluated
for
potential
impact,
and
the
Fund
has
had
no
such
events.
Investment
Adviser
Expenses
Reimbursed
Other
Waivers
Total
Fees
Waived
and
Expenses
Reimbursed
$
310,085
$
46,113
$
356,198
Gross
Unrealized
Appreciation
$
180,978,789
Gross
Unrealized
Depreciation
(2,782,774)
Net
Unrealized
Appreciation
$
178,196,015
Undistributed
Ordinary
Income
$
2,247,190
Undistributed
Long-Term
Gain
4,006,854
Net
Unrealized
Appreciation
166,922,604
Total
$
173,176,648
AUXIER
FOCUS
FUND
OTHER
INFORMATION
December
31,
2024
Changes
in
and
Disagreements
with
Accountants
(Item
8
of
Form
N-CSR)
N/A
Proxy
Disclosure
(Item
9
of
Form
N-CSR)
N/A
Remuneration
Paid
to
Directors,
Officers,
and
Others
(Item
10
of
Form
N-CSR)
Please
see
financial
statements
in
Item
7.
Statement
Regarding
the
Basis
for
the
Board’s
Approval
of
Investment
Advisory
Contract
(Item
11
of
Form
N-CSR)
At
the
September
20,
2024
Board
meeting,
the
Board,
including
the
Independent
Trustees,
considered
the
approval
of
the
continuance
of
the
investment
advisory
agreement
between
the
Adviser
and
the
Trust
pertaining
to
the
Fund
(the
“Advisory
Agreement”).
In
preparation
for
its
deliberations,
the
Board
requested
and
reviewed
written
responses
from
the
Adviser
to
a
due
diligence
questionnaire
circulated
on
the
Board's
behalf
concerning
the
services
provided
by
the
Adviser.
The
Board
also
discussed
the
materials
with
Fund
counsel
and,
as
necessary,
with
the
Trust's
administrator,
Apex
Fund
Services.
During
its
deliberations,
the
Board
received
an
oral
presentation
from
the
Adviser
and
was
assisted
by
the
advice
of
independent
Trustee
counsel.
At
the
Meeting,
the
Board
reviewed,
among
other
matters:
(i)
the
nature,
extent
and
quality
of
the
services
provided
to
the
Fund
by
the
Adviser,
including
information
on
the
investment
performance
of
the
Fund
and
the
Adviser;
(ii)
the
costs
of
the
services
provided
and
profitability
to
the
Adviser
of
its
relationship
with
the
Fund;
(iii)
the
advisory
fee
and
total
expense
ratio
of
the
Fund
as
compared
to
those
of
a
relevant
peer
group
of
funds;
(iv)
the
extent
to
which
economies
of
scale
may
be
realized
as
the
Fund
grows
and
whether
the
advisory
fee
enables
the
Fund's
investors
to
share
in
the
benefits
of
economies
of
scale;
and
(v)
other
benefits
received
by
the
Adviser
from
its
relationship
with
the
Fund.
The
Board
recognized
that
the
evaluation
process
with
respect
to
the
Adviser
was
an
ongoing
one
and,
in
this
regard,
the
Board
considered
information
provided
by
the
Adviser
at
regularly
scheduled
meetings
during
the
past
year.
Nature,
Extent
and
Quality
of
Services
Based
on
written
materials
received,
a
presentation
from
a
senior
representative
of
the
Adviser,
and
a
discussion
with
the
Adviser
about
the
Adviser’s
personnel,
operations
and
financial
condition,
the
Board
considered
the
quality
of
services
provided
by
the
Adviser
under
the
Advisory
Agreement.
In
this
regard,
the
Board
considered
information
regarding
the
experience,
qualifications
and
professional
background
of
the
portfolio
manager
and
other
personnel
at
the
Adviser
providing
services
to
the
Fund,
as
well
as
the
investment
philosophy
and
decision-making
process
of
the
Adviser
and
the
capability
and
integrity
of
the
Adviser’s
senior
management
and
staff.
The
Board
considered
also
the
adequacy
of
the
Adviser’s
resources.
The
Board
noted
the
Adviser’s
representations
that
the
firm
is
in
stable
financial
condition
and
has
the
operational
capability
and
the
necessary
staffing
and
experience
to
continue
providing
high-
quality
investment
advisory
services
to
the
Fund.
Based
on
the
presentation
and
the
materials
provided
by
the
Adviser
in
connection
with
the
Board’s
consideration
of
the
renewal
of
the
Advisory
Agreement,
among
other
relevant
factors,
the
Board
concluded
that,
overall,
it
was
satisfied
with
the
nature,
extent
and
quality
of
services
to
be
provided
to
the
Fund
under
the
Advisory
Agreement.
Performance
In
connection
with
a
presentation
by
the
Adviser
regarding
its
approach
to
managing
the
Fund,
the
Board
reviewed
the
performance
of
the
Fund
compared
to
its
primary
benchmark
index.
The
Board
observed
that
the
Fund
underperformed
the
S&P
500
Index,
the
Fund’s
primary
benchmark
index,
for
the
one-,
three-,
five-,
and
10-year
periods
ended
June
30,
2024,
and
that
the
Fund’s
Investor
and
Institutional
Class
Shares
outperformed
the
S&P
500
Index
for
the
period
since
inception
on
July
9,
1999
and
May
9,
2012,
respectively.
The
Board
noted
the
Adviser’s
representation
that
the
Fund
seeks
capital
appreciation
over
the
long-term
and
that,
in
the
Adviser’s
view,
the
Fund
executed
its
investment
objective
without
undue
risk,
as
evidenced
by
the
Fund’s
performance
since
its
inception,
on
both
a
cumulative
and
average
annual
basis.
The
Board
also
noted
the
Adviser’s
representation
that
the
AUXIER
FOCUS
FUND
OTHER
INFORMATION
December
31,
2024
Adviser’s
conservative
approach
to
asset
allocation
tended
to
outperform
the
benchmark
in
declining
market
environments
and
lag
the
performance
of
the
benchmark
during
periods
of
significant
market
appreciation,
such
as
the
market
environment
over
the
latest
one-,
three-,
five-,
and
10-year
periods.
The
Board
noted
further
that
the
Fund
maintains
a
material
cash
position,
which
could
result
in
a
drag
on
performance
during
bull
markets
relative
to
the
Fund’s
primary
benchmark,
and
that
the
Fund
tended
to
invest
in
a
greater
number
of
small-
and
mid-capitalization
companies
relative
to
the
S&P
500
Index,
which
detracted
from
performance
during
recent
years.
At
the
Adviser’s
request,
the
Board
also
considered
the
Fund’s
performance
relative
to
the
S&P
1000
Value
Index,
noting
that,
although
the
Fund
underperformed
the
S&P
1000
Value
Index
over
the
periods
discussed,
the
Fund’s
performance
more
closely
approximated
that
of
the
S&P
1000
Value
Index
than
that
of
the
S&P
500
Index.
The
Board
also
considered
the
Fund’s
performance
relative
to
an
independent
peer
group
of
funds
identified
by
Strategic
Insight,
Inc.
(“Strategic
Insight”)
as
having
characteristics
similar
to
the
Fund,
noting
that,
based
on
the
information
provided
by
Strategic
Insight,
the
Fund
underperformed
the
average
of
its
Strategic
Insight
peer
group
for
the
one-,
three-,
five-,
and
10-year
periods
ended
June
30,
2024.
The
Board
noted
the
Adviser’s
representation
that
the
Fund’s
categorization
as
“large
value”
did
not
fully
represent
the
Fund’s
portfolio
characteristics
due
to
the
Fund’s
holdings
in
small-
and
mid-capitalization
companies,
which
tended
to
underperform
the
large
capitalization
companies
in
recent
years.
Based
on
the
Adviser’s
investment
style,
including
the
risk-averse
nature
of
the
portfolio
construction,
and
the
foregoing
performance
information,
among
other
applicable
considerations,
the
Board
determined
that
the
Fund
and
its
shareholders
could
benefit
from
the
Adviser’s
continued
management
of
the
Fund.
Compensation
The
Board
evaluated
the
Adviser’s
compensation
for
providing
advisory
services
to
the
Fund
and
analyzed
comparative
information
on
the
net
advisory
fee
and
total
expense
ratio
of
the
Fund
compared
to
its
Strategic
Insight
peer
group.
The
Board
observed
that,
although
the
net
advisory
fee
rate
for
the
Fund
was
higher
than
the
median
of
its
Strategic
Insight
peer
group,
it
was
within
a
reasonable
range.
The
Board
also
observed
that
the
Fund’s
total
expense
ratio
was
lower
than
the
median
of
the
Strategic
Insight
peer
group.
The
Board
further
noted
the
Adviser’s
representation
that
it
continued
to
waive
fees
and
reimburse
Fund
expenses
in
order
to
keep
the
Fund’s
total
expense
ratio
at
competitive
levels.
Based
on
the
foregoing
and
other
relevant
factors,
the
Board
concluded
that
the
Adviser’s
advisory
fee
rate
charged
to
the
Fund
was
reasonable.
Cost
of
Services
and
Profitability
The
Board
considered
information
provided
by
the
Adviser
regarding
the
costs
of
services
and
its
profitability
with
respect
to
the
Fund.
In
this
regard,
the
Board
considered
the
Adviser’s
resources
devoted
to
the
Fund,
as
well
as
the
Adviser’s
discussion
of
costs
and
profitability
of
its
Fund
activities.
The
Board
noted
the
Adviser’s
belief
that
its
profit
margin
from
the
Fund
was
reasonable
considering
the
services
provided
and
that
the
Fund
required
significantly
more
attention
and
resources
than
other
accounts
managed
by
the
Adviser
due
to
the
regulatory
requirements
associated
with
investment
companies
registered
under
the
Investment
Company
Act
of
1940.
The
Board
also
noted
the
Adviser’s
representation
that
the
Adviser
was
subsidizing
the
Fund’s
operations
by
forgoing
a
portion
of
its
advisory
fee
in
accordance
with
the
contractual
expense
cap.
Based
on
these
and
other
applicable
considerations,
including
financial
statements
from
the
Adviser
indicating
its
profitability
and
expenses
from
overall
operations,
the
Board
concluded
that
the
Adviser’s
costs
of
services
and
profits
attributable
to
management
of
the
Fund
were
reasonable.
Economies
of
Scale
The
Board
evaluated
whether
the
Fund
would
benefit
from
any
economies
of
scale.
In
this
regard,
the
Board
considered
the
Fund’s
fee
structure,
asset
size,
and
net
expense
ratio.
The
Board
also
considered
the
Adviser’s
representation
that
the
Fund
could
potentially
benefit
from
economies
of
scale
if
its
assets
were
to
increase
but
that,
in
light
of
the
Fund’s
stable
asset
levels,
the
Adviser
was
not
proposing
breakpoints
in
the
advisory
fee
at
this
time.
Based
on
the
foregoing
and
other
applicable
considerations,
including
the
size
of
the
Fund,
the
Board
concluded
that
the
information
presented
was
consistent
with
the
renewal
of
the
Advisory
Agreement
at
current
fee
levels.
Other
Benefits
The
Board
noted
the
Adviser’s
representation
that,
aside
from
its
contractual
advisory
fees,
it
does
not
benefit
in
a
material
way
from
its
relationship
with
the
Fund.
Based
on
the
foregoing
representation,
the
Board
concluded
that
other
benefits
received
by
the
Adviser
AUXIER
FOCUS
FUND
OTHER
INFORMATION
December
31,
2024
from
its
relationship
with
the
Fund
were
not
a
material
factor
to
consider
in
approving
the
continuation
of
the
Advisory
Agreement.
Conclusion
The
Board
did
not
identify
any
single
factor
as
being
of
paramount
importance,
and
different
Trustees
may
have
given
different
weight
to
different
factors.
The
Board
reviewed
a
memorandum
from
Fund
counsel
discussing
the
legal
standards
applicable
to
its
consideration
of
the
Advisory
Agreement.
Based
on
its
review,
including
consideration
of
each
of
the
factors
referenced
above,
the
Board
determined,
in
the
exercise
of
its
reasonable
business
judgment,
that
the
advisory
arrangement,
as
outlined
in
the
Advisory
Agreement,
was
fair
and
reasonable
in
light
of
the
services
performed
or
to
be
performed,
expenses
incurred
or
to
be
incurred
and
such
other
matters
as
the
Board
considered
relevant.
FOR
MORE
INFORMATION
P.O.
Box
588
Portland,
Maine
04112
(877)
3AUXIER
(877)
328-9437
INVESTMENT
ADVISER
Auxier
Asset
Management
LLC
15668
NE
Eilers
Road
Aurora,
Oregon
97002
TRANSFER
AGENT
Apex
Fund
Services
P.O.
Box
588
Portland,
Maine
04112
www.apexgroup.com
This
report
is
submitted
for
the
general
information
of
the
shareholders
of
the
Fund.
It
is
not
authorized
for
distribution
to
prospective
investors
unless
preceded
or
accompanied
by
an
effective
prospectus,
which
includes
information
regarding
the
Fund’s
risks,
objectives,
fees
and
expenses,
experience
of
its
management,
and
other
information.
204-SAR-1224
(b) Included as part of financial statements filed under Item 7(a).
ITEM 8. CHANGES IN AND DISAGREEMENTS WITH ACCOUNTANTS FOR OPEN-END MANAGEMENT INVESTMENT COMPANIES.
Not applicable.
ITEM 9. PROXY DISCLOSURES FOR OPEN-END MANAGEMENT INVESTMENT COMPANIES.
Not applicable.
ITEM 10. REMUNERATION PAID TO DIRECTORS, OFFICERS, AND OTHERS OF OPEN-END MANAGEMENT INVESTMENT COMPANIES.
Included as part of financial statements filed under Item 7(a).
ITEM 11. STATEMENT REGARDING BASIS FOR APPROVAL OF INVESTMENT ADVISORY CONTRACT.
Included as part of other information filed under Item 7(a).
ITEM 12. DISCLOSURE OF PROXY VOTING POLICIES AND PROCEDURES FOR CLOSED-END MANAGEMENT INVESTMENT COMPANIES.
Not applicable.
ITEM 13. PORTFOLIO MANAGERS OF CLOSED-END MANAGEMENT INVESTMENT COMPANIES.
Not applicable.
ITEM 14. PURCHASES OF EQUITY SECURITIES BY CLOSED-END MANAGEMENT INVESTMENT COMPANY AND AFFILIATED PURCHASERS.
Not applicable.
ITEM 15. SUBMISSION OF MATTERS TO A VOTE OF SECURITY HOLDERS
The Registrant does not accept nominees to the Board of Trustees from shareholders.
ITEM 16. CONTROLS AND PROCEDURES
(a) The Registrant’s Principal Executive Officer and Principal Financial Officer have concluded that the Registrant’s disclosure controls and procedures (as defined in Rule 30a-3(c) under the Act are effective, based on their evaluation of the controls and procedures required by Rule 30a-3(b) under the Act and Rules 13a-15(b) or 15d-15(b) under the Securities Exchange Act of 1934, as of a date within 90 days of the filing date of this report.
(b) There were no changes in the Registrant’s internal control over financial reporting (as defined in Rule 30a-3(d) under the Act) that occurred during the Reporting Period that have materially affected, or are reasonably likely to materially affect, the Registrant’s internal control over financial reporting.
ITEM 17. DISCLOSURE OF SECURITIES LENDING ACTIVITIES FOR CLOSED-END MANAGEMENT INVESTMENT COMPANIES.
Not applicable.
ITEM 18. RECOVERY OF ERRONEOUSLY AWARDED COMPENSATION.
Not applicable.
ITEM 19. EXHIBITS.
(a)(1) Not applicable.
(a)(2) Not applicable.
(a)(4) Not applicable.
(a)(5) Not applicable.
SIGNATURES
Pursuant to the requirements of the Securities Exchange Act of 1934 and the Investment Company Act of 1940, the Registrant has duly caused this report to be signed on its behalf by the undersigned, thereunto duly authorized.
Registrant Forum Funds
| By: | /s/ Zachary Tackett | |
| | Zachary Tackett, Principal Executive Officer | |
| | | |
| Date: | February 12, 2025 | |
Pursuant to the requirements of the Securities Exchange Act of 1934 and the Investment Company Act of 1940, this report has been signed below by the following persons on behalf of the Registrant and in the capacities and on the dates indicated.
| By: | /s/ Zachary Tackett | |
| | Zachary Tackett, Principal Executive Officer | |
| | | |
| Date: | February 12, 2025 | |
| By: | /s/ Karen Shaw | |
| | Karen Shaw, Principal Financial Officer | |
| | | |
| Date: | February 12, 2025 | |